UNITED STATES
SECURITIES AND EXCHANGE COMMISSION
Washington, D.C. 20549
FORM N-CSR
CERTIFIED SHAREHOLDER REPORT OF REGISTERED MANAGEMENT
INVESTMENT COMPANIES
| Investment Company Act file number: |
811-05186 | |
| Exact name of registrant as specified in charter: |
American Skandia Trust | |
| Address of principal executive offices: |
One Corporate Drive | |
| Shelton, Connecticut 06484 | ||
| Name and address of agent for service: |
Jonathan D. Shain | |
| Gateway Center 3, | ||
| 100 Mulberry Street, | ||
| Newark, New Jersey 07102 | ||
| Registrant’s telephone number, including area code: |
973-802-6469 | |
| Date of fiscal year end: |
12/31/2004 | |
| Date of reporting period: |
12/31/2004 | |
Item 1 – Reports to Stockholders – [ INSERT REPORT ]
AMERICAN SKANDIA
TRUST
Financial Statements
For the Annual Period Ended
December 31, 2004
This report has been prepared to provide information to owners of American Skandia Life Assurance Corporation’s annuities based on information provided by the underlying portfolios. Investors should consider the contract and the underlying portfolios’ investment objectives, risks, and charges and expenses carefully before investing. The contract’s prospectus and the underlying portfolios’ prospectuses contain information relating to investment objectives, risks, and charges and expenses as well as other important information. Contact your financial professional for the contract’s prospectus together with the prospectuses for the portfolios of American Skandia Trust (“Trust”). You should read the prospectuses carefully before investing or sending any money.
Past performance does not guarantee future results. The investment return and principal value of an investment will fluctuate so that an investor’s shares, when redeemed, may be worth more or less than their original costs. Current performance may be lower or higher than the past performance data quoted.

IFS-A087705
A description of the Trust’s proxy voting policies and procedures is available, without charge, upon request. Owners of variable annuity contracts should call 888-778-2888 to obtain descriptions of the Trust’s proxy voting policies and procedures. The description is also available on the website of the Securities and Exchange Commission (“the Commission”) at www.sec.gov. Information regarding how the Trust voted proxies relating to portfolio securities during the most recent 12-month period ended December 31, 2004 is available on the website of the Commission at www.sec.gov and on the Trust’s website at www.irrc.com/prudential.
The Trust files with the Commission a complete listing of portfolio holdings as of its first and third quarter-end on Form N-Q. Form N-Q is available on the Commission’s website at www.sec.gov or by visiting the Commission’s Public Reference Room. For more information on the Commission’s Public Reference Room, please visit the Commission’s website or call 1-800-SEC-0330. Form N-Q is also available on the Trust’s website at www.americanskandia.prudential.com or by calling 888-778-2888.
| I. American Skandia Trust |
||
| Schedules of Investments: |
||
| 41 | ||
| 44 | ||
| 46 | ||
| 49 | ||
| 52 | ||
| 55 | ||
| 60 | ||
| 64 | ||
| 70 | ||
| 81 | ||
| 86 | ||
| 89 | ||
| 92 | ||
| 95 | ||
| 98 | ||
| 103 | ||
| 106 | ||
| 109 | ||
| 113 | ||
| 116 | ||
| 119 | ||
| 123 | ||
| 126 | ||
| 129 | ||
| 133 | ||
| 135 | ||
| 140 | ||
| 145 | ||
| 148 | ||
| 149 | ||
| 160 | ||
| 193 | ||
| 207 | ||
| 226 | ||
| 239 | ||
| 251 | ||
| 261 | ||
| 264 |
January 31, 2005
Dear Contract Holder:
We hope that you find the annual report for the American Skandia Trust to be a valuable source of information about your investments. Your success is important to us.
As the New Year begins, we are taking this opportunity to remind you of the importance of asset allocation, a strategy that takes a long-term, disciplined approach and can help minimize risk through a diversified portfolio. Investing in a strategic mix of assets can help you avoid the negative impact of a downturn in one asset class and can help better position your investments as asset classes rotate in and out of favor.
Your investment professional can help you create a diversified investment plan that considers your reasons for investing, personal investment horizon and risk tolerance. A carefully chosen and broad mix of assets — reviewed periodically over time — can help you stay focused on meeting your long-term objectives, despite fluctuations in the market.
At Prudential, we are committed to helping you grow and protect your wealth by providing financial solutions that meet your needs — today and in the future. We look forward to continuing our relationship with you and thank you for your confidence in our products.
Sincerely,

David R. Odenath, Jr.
President,
American Skandia Trust
IFS-A094832
Performance Information and Commentary
The following pages present information on the investment performance of each Portfolio, which had been in operation for six months or more at December 31, 2004, including comparisons with relevant market indexes. Commentary by each Portfolio’s sub-advisor regarding its performance and relevant market conditions is also provided.
Explanations of Market Indexes
Balanced Blended Index — The Balanced Blended Index is calculated by weighting the S&P 500 Index at 60% and the Lehman Brothers Aggregate Bond Index at 40%. The Lehman Brothers Aggregate Bond Index is an unmanaged index comprised of more than 5,000 government and corporate bonds.
Blended Index — The Blended Index is calculated by weighting the Russell 3000 Index at 50%, the Lehman Brothers Aggregate Bond Index at 40% and the MSCI EAFE Index at 10%. The Russell 3000 Index is an unmanaged capitalization-weighted index which is comprised of 3,000 of the largest capitalized U.S. domiciled companies whose common stock is traded in the U.S. on the New York Stock Exchange, American Stock Exchange and over-the-counter market.
Lehman Brothers Aggregate Bond Index — The Lehman Brothers Aggregate Bond Index is an unmanaged capitalization-weighted measure of treasury issues, agency issues, corporate bond issues and mortgage securities.
Lehman Brothers Global Aggregate Bond Index — The Lehman Brothers Global Aggregate Bond Index is an unmanaged measure of the global investment grade bond markets and is composed of the U.S. Aggregate Index, Pan European Aggregate Index, Asian-Pacific Aggregate Index and treasury obligations of Australia, Canada and New Zealand.
Lehman Brothers U.S. Corporate High Yield Index — The Lehman Brothers U.S. Corporate High Yield Index is an unmanaged index of fixed-rate, non-investment-grade debt securities with at least one year remaining to maturity. It gives a broad look at how high yield (“junk”) bonds have performed.
ML 1-3 Year Index — The Merrill Lynch 1-3 Year Treasury Index is an unmanaged index of treasury issues with maturities ranging from 1-2.99 years.
ML U.S. High Yield Master II Index — The Merrill Lynch U.S. High Yield Master II Index is an unmanaged index of publicly traded non-convertible U.S. bonds rated below investment grade.
MSCI EAFE Index — The Morgan Stanley Capital International Europe, Australasia, Far East Index is an unmanaged capitalization-weighted index generally accepted as a benchmark for major overseas markets.
MSCI World Index — The Morgan Stanley Capital International World Index is an unmanaged capitalization-weighted index which includes the equity markets of Australia, Austria, Belgium, Canada, Denmark, Finland, France, Germany, Hong Kong, Ireland, Italy, Japan, Malaysia, Netherlands, New Zealand, Norway, Singapore, Spain, Sweden, Switzerland, United Kingdom and United States.
Performance Information and Commentary (Continued)
NAREIT Equity Index — The NAREIT Equity REIT Index is an unmanaged capitalization-weighted index comprised of all tax-qualifed Real Estate Investment Trusts listed on the New York Stock Exchange, American Stock Exchange and Nasdaq National Market System.
Russell 2000 Index — The Russell 2000 Index is an unmanaged capitalization-weighted index which is comprised of 2,000 of the smallest capitalized U.S. domiciled companies whose common stock is traded in the U.S. on the New York Stock Exchange, American Stock Exchange and over-the-counter market.
Russell 2000 Growth Index is a market cap-weighted index that measures the performance of those Russell 2000 companies with higher price-to-book ratios and higher forecasted growth values.
SB Extended Market Index — The Salomon Brothers Extended Market Index is an unmanaged capitalization-weighted index of the smallest 20%, based on market capitalization, of all institutionally available non-U.S. stocks.
S&P 500 Index — The Standard & Poor’s 500 Index is an unmanaged capitalization-weighted measure of 500 widely held common stocks listed on the New York Stock Exchange, American Stock Exchange, and over-the-counter market.
S&P MidCap 400 Index is a widely accepted, unmanaged total return index measuring the performance of the mid-size company segment of the U.S. stock market.
All index returns assume reinvestment of dividends and, unlike Portfolio returns, do not reflect any fees or expenses. It is not possible to invest directly in an index.
AST JPMorgan International Equity Portfolio
For the year ended December 31, 2004, the AST JPMorgan International Equity Portfolio had a total return of 17.11%, compared with the return of 20.25% for the unmanaged MSCI EAFE Index, and 17.94% for the Lipper (VIP) International Core Funds Average. Management of the Portfolio was transferred from Strong to JPMorgan Fleming on February 23, 2004.
JPMorgan managed the Portfolio for most of the year, and accounted for most of its underperformance of the MSCI EAFE Index. The Index ended on a strong note, gaining more than 15% in the fourth quarter of 2004. With oil drifting back from its highs and a clear victory in the U.S. general election, markets rallied. The dollar moderated its precipitous slide toward the end of the term, but still posted significant falls against major currencies. The Portfolio’s underperformance was due primarily to selection among consumer discretionary and industrial stocks. Within the consumer discretionary sector, Koninklijke Philips Electroniss hurt performance most. The stock was overweighted and posted a double-digit negative return. In industrials, positions in Adecco and Deutsche Post were the largest detractors. The Portfolio’s strongest performance was in healthcare and consumer staples. In consumer staples, overweight positions in Altadis and Tesco boosted performance. Altadis ended the year with better-than-expected third quarter earnings. Tesco shares rallied as the market reacted positively to its expansion into new markets such as South Korea. In healthcare, the Portfolio benefited from not having a position in AstraZeneca, as the stock plunged after the Food and Drug Administration announced plans to review several of its drugs.

| 1 Year |
5 Year |
10 Year |
|||||||
| AVERAGE ANNUAL TOTAL RETURNS |
17.11 | % | –6.66 | % | 7.12 | % |
Past performance does not guarantee future returns. Portfolio performance is net of investment fees and fund expenses, but not product charges. If product charges were included, the performance quoted would be significantly lower. The investment return and principal value of an investment will fluctuate so that an investor’s shares, when redeemed, may be worth more or less than their original cost. Current performance may be lower or higher than the past performance data quoted.
Performance is historical, assumes reinvestment of all dividends and capital gains, and is not indicative of future results.
For a complete listing of holdings, please refer to the Schedule of Investments section of this report.
1
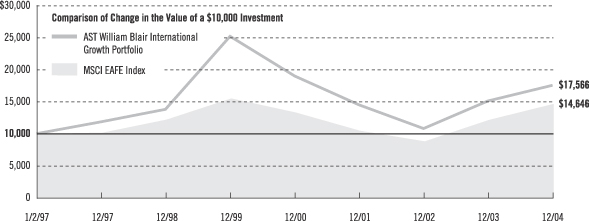
AST William Blair International Growth Portfolio
For the year ended December 31, 2004, the AST William Blair International Growth Portfolio had a total return of 16.15%, compared with a return of 20.25% for the unmanaged MSCI EAFE Index, and 17.36% for the Lipper (VIP) International Growth Funds Average.
Relative performance during 2004 was hampered by the Portfolio’s quality growth discipline, which was not rewarded in the value-led market, as value stocks outperformed their growth counterparts by approximately 8%. As a result, the Portfolio’s focus on Asian cyclical stocks at the expense of European value stocks was the largest driver of its underperformance. Conversely, the Portfolio’s emerging markets and Canadian holdings augmented both absolute and relative results. Overall stock selection was positive for the year, with selection in telecommunication services, financials, and energy adding the most value.
As of year end, the Portfolio remained tilted towards emerging markets and Canada at the expense of Europe and the United Kingdom, which is the direct result of the individual stock selection process. By sector, the Portfolio remained most overweighted in the information technology and consumer discretionary sectors and underweighted in materials, telecommunications, and financials.
| 1 Year |
5 Year |
Since Inception |
|||||||
| AVERAGE ANNUAL TOTAL RETURNS |
16.15 | % | –6.96 | % | 7.30 | % |
Past performance does not guarantee future returns. Portfolio performance is net of investment fees and fund expenses, but not product charges. If product charges were included, the performance quoted would be significantly lower. The investment return and principal value of an investment will fluctuate so that an investor’s shares, when redeemed, may be worth more or less than their original cost. Current performance may be lower or higher than the past performance data quoted.
Performance is historical, assumes reinvestment of all dividends and capital gains, and is not indicative of future results.
For a complete listing of holdings, please refer to the Schedule of Investments section of this report.
2
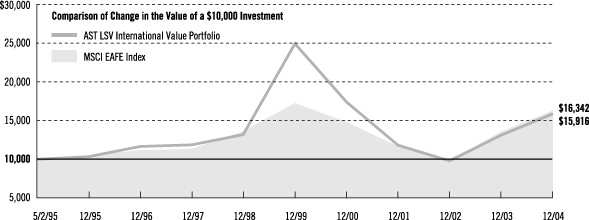
AST LSV International Value Portfolio
For the year ended December 31, 2004, the AST LSV International Value Portfolio (formerly AST DeAM International Equity Portfolio) had a total return of 21.04%, compared with the return of 20.25% for the unmanaged MSCI EAFE Index and 17.94% for the Lipper (VIP) International Core Funds Average. Management of the Portfolio was transferred from Deutsche to LSV on November 19, 2004.
The period Deutsche managed the Portfolio covered most of the year and accounted for its outperformance of the EAFE Index. Capital goods, food beverage & tobacco, and banks were the industry groups that contributed most. A position in SAB Miller rose after its fiscal first-half profit more than doubled. Its earnings in South Africa increased, demand for Miller Lite improved in the United States, and it sold a stake in a Chinese brewery. Amadeus Global Travel Distribution moved higher on news that it had good quarterly earnings and on rumors that the company was looking for potential buyers. Metals and mining-related holdings such as Rautaruukki and BHP Billiton benefited from rising commodity prices. On the negative side the transportation, retailing, and automobiles & components industry groups were the largest detractors from relative performance. Airline companies such as Deutsche Lufthansa and KLM-Kon Luchtwaart declined as higher oil prices hurt their profits.
LSV did not manage the Portfolio for long enough in 2004 to have a material impact on its return for the year. LSV seeks to buy undervalued companies that appear to be emerging from extended periods of poor financial and stock price performance. The Portfolio is kept broadly diversified by country, sector, and industry.
| 1 Year |
5 Year |
Since Inception |
|||||||
| AVERAGE ANNUAL TOTAL RETURNS |
21.04 | % | –8.67 | % | 4.93 | % |
Past performance does not guarantee future returns. Portfolio performance is net of investment fees and fund expenses, but not product charges. If product charges were included, the performance quoted would be significantly lower. The investment return and principal value of an investment will fluctuate so that an investor’s shares, when redeemed, may be worth more or less than their original cost. Current performance may be lower or higher than the past performance data quoted.
Performance is historical, assumes reinvestment of all dividends and capital gains, and is not indicative of future results.
For a complete listing of holdings, please refer to the Schedule of Investments section of this report.
3
AST MFS Global Equity Portfolio
For the year ended December 31, 2004, the AST MFS Global Equity Portfolio had a total return of 18.39%, compared with a return of 14.72% for the unmanaged MSCI World Index, 20.25% for the unmanaged MSCI EAFE Index, and 13.84% for the Lipper (VIP) Global Core Funds Average.
Relative to the MSCI World Index, technology, healthcare, retailing, and financial services were the Portfolio’s strongest-performing sectors. The Portfolio benefited from avoiding or underweighting several poor performers in the benchmark. A relative underweighting in the poor-performing technology sector also contributed to results. Positions in several fashion purveyors were among the Portfolio’s top contributors to relative performance, including Hong Kong-headquartered Esprit Holdings, U.K.-based Next, and Stockholm-based Hennes & Mauritz. Selection in the financial services area was helped by positions in OTP Bank in Hungary, Erste Bank in Austria, and Australian insurer QBE Insurance Group. The single largest contributor to relative performance was U.K.-based household products conglomerate Reckitt Benckiser. Since holdings of the Portfolio and its benchmark may be denominated in different currencies, shifts in currency valuations were a significant contributor to performance relative to the benchmark.
Leisure, utilities and communications, and industrial goods and services were the Portfolio’s weakest-performing sectors relative to its benchmark. Holdings in other sectors that held back relative performance included pharmaceutical firm AstraZeneca and financial services company AMVESCAP, both headquartered in the United Kingdom.

| 1 Year |
5 Year |
Since Inception |
|||||||
| AVERAGE ANNUAL TOTAL RETURNS |
18.39 | % | 1.99 | % | 3.87 | % |
Past performance does not guarantee future returns. Portfolio performance is net of investment fees and fund expenses, but not product charges. If product charges were included, the performance quoted would be significantly lower. The investment return and principal value of an investment will fluctuate so that an investor’s shares, when redeemed, may be worth more or less than their original cost. Current performance may be lower or higher than the past performance data quoted.
Performance is historical, assumes reinvestment of all dividends and capital gains, and is not indicative of future results.
For a complete listing of holdings, please refer to the Schedule of Investments section of this report.
4
AST State Street Research Small-Cap Growth Portfolio
For the year ended December 31, 2004, the AST State Street Research Small-Cap Growth Portfolio (formerly PBHG Small Cap Growth) had a total return of –6.94%, compared with a return of 10.87% for the unmanaged S&P 500 Index, 14.31% for the unmanaged Russell 2000 Growth Index, and 11.71% for the Lipper (VIP) Small-Cap Growth Funds Average. Management of the Portfolio transferred from PBHG to State Street Research (SSR) on May 1, 2004. During the period PBHG managed the Portfolio, it significantly underperformed the Russell 2000 Growth Index as stock selection across sectors and industries reduced its returns.
During the period SSR managed the Portfolio, its return continued to be very disappointing, hurt by substantial disappointments by several holdings, including Alliance Gaming, Corinthian Colleges, Career Education, eCollege.com, Nektar Therapeutics, and Autobytel. All but Nektar Therapeutics were sold from the Portfolio by period-end. Internet search provider Ask Jeeves also declined following the company’s third quarter earnings release. While earnings growth remained positive, investors had expected it to be higher and were disappointed by the company’s conservative forecasts for fourth-quarter sales. SSR remains invested in the position. In addition, the Portfolio’s energy and producer durables holdings lagged. However, many positions in gaming firms such as Boyd Gaming and Pinnacle Entertainment helped absolute and relative returns.

| 1 Year |
5 Year |
10 Year |
|||||||
| AVERAGE ANNUAL TOTAL RETURNS |
–6.94 | % | –15.54 | % | 6.15 | % |
Past performance does not guarantee future returns. Portfolio performance is net of investment fees and fund expenses, but not product charges. If product charges were included, the performance quoted would be significantly lower. The investment return and principal value of an investment will fluctuate so that an investor’s shares, when redeemed, may be worth more or less than their original cost. Current performance may be lower or higher than the past performance data quoted.
Performance is historical, assumes reinvestment of all dividends and capital gains, and is not indicative of future results.
For a complete listing of holdings, please refer to the Schedule of Investments section of this report.
5
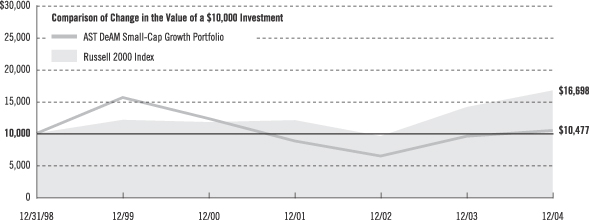
AST DeAM Small-Cap Growth Portfolio
For the year ended December 31, 2004, the AST DeAM Small-Cap Growth Portfolio had a total return of 9.44%, compared with a total return of 18.33% for the unmanaged Russell 2000 Index and 11.71% for the Lipper (VIP) Small-Cap Growth Funds Average.
Holdings in the capital goods, software & services, and transportation industry groups detracted most from performance. The largest individual detractors from relative performance were an underweight in OSI Pharmaceuticals and an overweight in Quidel. DeAm’s valuation model showed OSI’s fundamentals were poorer than its peers. Nevertheless the stock moved higher as OSI’s lung cancer drug, Tarceva, performed well in clinical tests. Quidel develops and markets point-of-care rapid diagnostic tests for the detection and management of a variety of medical conditions and illnesses. Its share price fell as patent infringement lawsuits led to downward revisions in earnings estimates.
On the positive side, stock selection in the internet, materials, and diversified financials industry groups added value. A position in Ameristar Casinos was a key contributor to returns with record financial results for the third quarter of 2004.
| 1 Year |
5 Year |
Since Inception |
|||||||
| AVERAGE ANNUAL TOTAL RETURNS |
9.44 | % | –7.64 | % | 0.78 | % |
Past performance does not guarantee future returns. Portfolio performance is net of investment fees and fund expenses, but not product charges. If product charges were included, the performance quoted would be significantly lower. The investment return and principal value of an investment will fluctuate so that an investor’s shares, when redeemed, may be worth more or less than their original cost. Current performance may be lower or higher than the past performance data quoted.
Performance is historical, assumes reinvestment of all dividends and capital gains, and is not indicative of future results.
For a complete listing of holdings, please refer to the Schedule of Investments section of this report.
6
AST Federated Aggressive Growth Portfolio
For the year ended December 31, 2004, the AST Federated Aggressive Growth Portfolio had a total return of 23.07%, compared with the return of 10.87% for the unmanaged S&P 500 Index, 18.33% for the unmanaged Russell 2000 Index, 14.31% for the unmanaged Russell 2000 Growth Index, and 11.71% for the Lipper (VIP) Small-Cap Growth Funds Average.
The stock market as a whole rose substantially during 2004. Small-cap companies outperformed large-cap and small-cap value stocks outperformed small-cap growth stocks. Economic indicators during the year were mixed, but generally small-cap companies continued to report strong earnings growth. The best performing small-cap growth sectors were energy, materials, and industrials while, the information technology and utilities sectors lagged.
The Portfolio outperformed the Russell 2000 Growth Index primarily due to strong stock selection in the industrials, consumer discretionary, and healthcare sectors. Companies such as Abx Air, Egl, Innovative Solutions, and Forward Air added to performance in the industrials sector. Consumer discretionary companies Central European Media, Petco Animal Supplies, PetsMart, and Advance Auto Parts also contributed to returns. In the healthcare sector, Alexion Pharmaceuticals and Cytyc made the largest contributions. Although the Portfolio’s stock selection was weakest in the consumer staples and information technology sectors, it was underweight in both. Positions in underperforming stocks such as Quality Distribution, Genus, Conexant Systems, Talk America, and Netopia hurt relative performance.
At year-end, the Portfolio had overweights as compared with the Russell 2000 Growth Index in the consumer discretionary and industrials sectors and was underweight in the information technology, healthcare, and financials sectors. Nearly 72% was invested in three large sectors: consumer discretionary, healthcare, and information technology.

| 1 Year |
Since Inception |
|||||
| AVERAGE ANNUAL TOTAL RETURNS |
23.07 | % | 1.56 | % |
Past performance does not guarantee future returns. Portfolio performance is net of investment fees and fund expenses, but not product charges. If product charges were included, the performance quoted would be significantly lower. The investment return and principal value of an investment will fluctuate so that an investor’s shares, when redeemed, may be worth more or less than their original cost. Current performance may be lower or higher than the past performance data quoted.
Performance is historical, assumes reinvestment of all dividends and capital gains, and is not indicative of future results.
For a complete listing of holdings, please refer to the Schedule of Investments section of this report.
7
AST Goldman Sachs Small-Cap Value Portfolio
For the year ended December 31, 2004, the AST Goldman Sachs Small-Cap Value Portfolio had a total return of 20.18%, compared with the return of 10.87% for the unmanaged S&P 500 Index, 18.33% for the unmanaged Russell 2000 Index, 22.25% for the unmanaged Russell 2000 Value Index, and 17.47% for the Lipper (VIP) Small-Cap Core Funds Average.
The Portfolio posted strong absolute results in 2004, but trailed the Russell 2000 Value Index. The Portfolio’s transportation, financial, and energy stocks contributed positively to relative returns, while its holdings in the industrials and consumer cyclicals sectors trailed the respective sectors of the Russell 2000 Value Index. The performance of its industrial stocks was hurt by the fall in GrafTech International, a manufacturer of graphite and carbon, after earnings estimates were reduced on lower expectations for the price increase on graphite electrodes. Consumer cyclical stocks such as Gymboree and Concord Camera also held down performance. Gymboree, a specialty retailer of children’s apparel, reported weaker-than-expected earnings. Concord Camera, an image capture manufacturer, experienced delays in product introductions that led to market share losses. We sold the position during the period.
On the positive side, energy holding Range Resources, an explorer and developer of oil and gas properties, emerged as a top contributor after it announced the purchase of Appalachian oil and gas properties. Accredited Home Lenders was another strong performer after it issued a better-than-expected 2005 outlook. The California-based mortgage bank benefited from exposure to less-volatile loan origination markets, internal cost discipline, and portfolio growth. OMI, an oil tanker company, was a top transportation performer. While continuing to expand its double hulled fleet, it announced record revenues for the period, benefiting from increased world oil demand.

| 1 Year |
5 Year |
Since Inception |
|||||||
| AVERAGE ANNUAL TOTAL RETURNS |
20.18 | % | 18.09 | % | 13.97 | % |
Past performance does not guarantee future returns. Portfolio performance is net of investment fees and fund expenses, but not product charges. If product charges were included, the performance quoted would be significantly lower. The investment return and principal value of an investment will fluctuate so that an investor’s shares, when redeemed, may be worth more or less than their original cost. Current performance may be lower or higher than the past performance data quoted.
Performance is historical, assumes reinvestment of all dividends and capital gains, and is not indicative of future results.
For a complete listing of holdings, please refer to the Schedule of Investments section of this report.
8
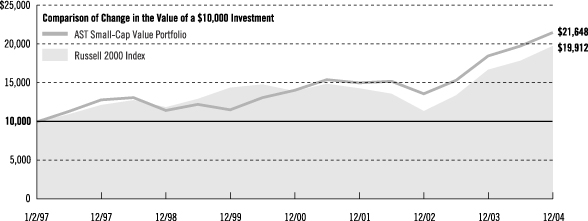
AST Small-Cap Value Portfolio
For the year ended December 31, 2004, the AST Small-Cap Value Portfolio had a total return of 16.44%, compared with the return of 10.87% for the S&P 500 Index and 14.62% for the Lipper (VIP) Multi-Cap Value Funds Average. The Portfolio was managed by Gabelli Asset Management Company (GAMCO) from January 1 through November 19, when the Portfolio’s assets were divided into three segments. JPMorgan manages the largest portion; Lee Munder Investments, and Integrity Asst Management manage smaller segments.
During the period GAMCO managed the Portfolio it outperformed the Russell 2000 Index of small-cap stocks. Positive contributions came from holdings in the industrial sector, many of which were up in excess of 30% (for example, Material Sciences, representing 0.5% of the portfolio was up 65%; GenCorp 0.8%, + 56%; Idex Corp. 0.7%, +44%; Precision Castparts 1.9%, + 43%; and Thomas & Betts 1.7%, + 38%). Several investments in utilities, gaming and wireless telephony had similar increases (XTO Energy 1.3%, +61%; Aztar 1.3%, +50%; Vimpel Communications 1.1%, +59%; Western Wireless 0.9%, +47%; Kerzner International 0.5%, +46%; and Devon Energy 0.6%, +45%).
November was the strongest month of 2004. Once the uncertainty of the Presidential election was behind us, investors refocused on fundamentals, including improving earnings and outlook, and the declines in oil prices.
| 1 Year |
5 Year |
Since Inception |
|||||||
| AVERAGE ANNUAL TOTAL RETURNS |
16.44 | % | 13.31 | % | 10.14 | % |
Past performance does not guarantee future returns. Portfolio performance is net of investment fees and fund expenses, but not product charges. If product charges were included, the performance quoted would be significantly lower. The investment return and principal value of an investment will fluctuate so that an investor’s shares, when redeemed, may be worth more or less than their original cost. Current performance may be lower or higher than the past performance data quoted.
Performance is historical, assumes reinvestment of all dividends and capital gains, and is not indicative of future results.
For a complete listing of holdings, please refer to the Schedule of Investments section of this report.
9
AST DeAM Small-Cap Value Portfolio
For the year ended December 2004, the AST DeAM Small-Cap Value Portfolio had a total return of 22.11%, compared with the return of 18.33% for the unmanaged Russell 2000 Index, 22.25% for the unmanaged Russell 2000 Value Index. and 20.64% for the Lipper (VIP) Small-Cap Value Funds Average.
Stock selection throughout the Portfolio was the key to outperformance. The healthcare equipment & services, energy, and utilities industry groups contributed most to relative performance. Oil and gas related holdings such as Southwestern Energy, Tesoro, and Range Resources added value. Southwestern Energy is an integrated energy company primarily engaged in the exploration and production of natural gas. Rising energy prices and increased production volumes resulted in surging company revenues. Range Resources is engaged in the exploration, development and acquisition of oil and gas properties. The company saw its cash flows reach a 9-year high during the period. In addition, acquisitions it made to increase production capacity were considered positively by investors.
On the negative side, the consumer durables & apparel, materials, and food & drug retailing industry groups detracted from performance. A position in Callaway Golf declined as a change in overall product mix and the need for competitive sales programs to match those being offered by other manufacturers caused a significant drop in its gross profits. A position in Win-Dixie Stores fell as increased competition from non-traditional grocery retailers such as mass-merchandisers (Wal-Mart), discount clubs, and warehouse stores have had a negative impact on its sales.

| 1 Year |
Since Inception |
|||||
| AVERAGE ANNUAL TOTAL RETURNS |
22.11 | % | 12.14 | % |
Past performance does not guarantee future returns. Portfolio performance is net of investment fees and fund expenses, but not product charges. If product charges were included, the performance quoted would be significantly lower. The investment return and principal value of an investment will fluctuate so that an investor’s shares, when redeemed, may be worth more or less than their original cost. Current performance may be lower or higher than the past performance data quoted.
Performance is historical, assumes reinvestment of all dividends and capital gains, and is not indicative of future results.
For a complete listing of holdings, please refer to the Schedule of Investments section of this report.
10
AST Goldman Sachs Mid-Cap Growth Portfolio
For the year ended December 31, 2004, the AST Goldman Sachs Mid-Cap Growth Portfolio had a total return of 16.36%, compared with the return of 15.48% for the Russell Mid-Cap Growth Index, 16.48% for the unmanaged S&P Mid-Cap 400 Index, and 14.75% for the Lipper (VIP) Mid-Cap Growth Funds Average.
The Portfolio had strong absolute and relative performance, aided by its holdings in the technology, retail, and healthcare sectors. Technology stocks that enhanced results included FLIR Systems, Checkfree, and Tessera Technologies. Many of the Portfolio’s retail holdings, including Harman International Industries, Petco Animal Supplies, and Harrah’s Entertainment, also added significantly to its return. In the healthcare sector, positions in Caremark Rx, Biogen Idec, and Charles River Labs, were significant contributors. The Department of Justice approved Caremark’s proposed merger with Advance PCS and it won a large contract from Medco for the Federal Employee Health Benefit (FEHB) Plan. The merger made a difference as FEHB was attracted to the combined company. Caremark will handle the mail order business and Advance PCS currently handles the retail pharmacy business.
The Portfolio’s position in Adtran fell after the company warned that fourth-quarter earnings and sales would be below expectations. Adtran, which supplies products that enable phone companies to deliver DSL high-speed Internet service, said bookings have been weak in recent months. Goldman Sachs Asset Management, L.P. (GSAM) believes this weakness may be short-lived as consumer demand for broadband services continues to grow and business spending begins to improve. Adtran remains a healthy business with sound management. While several holdings in the media sector have not yet been recognized due to a sluggish radio advertising market, GSAM is encouraged by the sector’s attractive valuations and enduring growth prospects.

| 1 Year |
Since Inception |
|||||
| AVERAGE ANNUAL TOTAL RETURNS |
16.36 | % | –16.07 | % |
Past performance does not guarantee future returns. Portfolio performance is net of investment fees and fund expenses, but not product charges. If product charges were included, the performance quoted would be significantly lower. The investment return and principal value of an investment will fluctuate so that an investor’s shares, when redeemed, may be worth more or less than their original cost. Current performance may be lower or higher than the past performance data quoted.
Performance is historical, assumes reinvestment of all dividends and capital gains, and is not indicative of future results.
For a complete listing of holdings, please refer to the Schedule of Investments section of this report.
11
AST Neuberger Berman Mid-Cap Growth Portfolio
For the year ended December 31, 2004, the AST Neuberger Berman Mid-Cap Growth Portfolio had a total return of 16.07%, compared with a return of 10.87% for the unmanaged S&P 500 Index, 16.48% for the unmanaged S&P Mid-Cap 400 Index, 15.48% for the unmanaged Russell Mid-Cap Growth Index, and 14.75% for the Lipper (VIP) Mid-Cap Value Funds Average.
Security selection within the consumer discretionary, information technology, financials, and industrials sectors provided the largest contributions to total returns. In the consumer discretionary sector, an emphasis on casinos and gaming added particularly. In technology, the Portfolio benefited from positions in Alliance Data Systems and Apple Computer Inc. An emphasis on the services area within the financials sector helped results, with strong performers such as Capitalsource. Outperforming industrial stocks included JB Hunt Transport Services and Corporate Executive Board. Energy holdings benefited from companies such as XTO Energy, which are able to increase reserves or the production of oil and gas. An overweight in telecommunication services, one of the strongest performing sectors, added to performance. Overall, however, the Portfolio’s sector allocations detracted from its results.
On the downside, stock selection within healthcare had the most negative impact on relative performance. The environment for generic pharmaceuticals was particularly weak given the lack of pricing power in the industry. Stock selection within the materials sector, a relatively small one, also hurt returns.

| 1 Year |
5 Year |
10 Year |
|||||||
| AVERAGE ANNUAL TOTAL RETURNS |
16.07 | % | –6.59 | % | 8.17 | % |
Past performance does not guarantee future returns. Portfolio performance is net of investment fees and fund expenses, but not product charges. If product charges were included, the performance quoted would be significantly lower. The investment return and principal value of an investment will fluctuate so that an investor’s shares, when redeemed, may be worth more or less than their original cost. Current performance may be lower or higher than the past performance data quoted.
Performance is historical, assumes reinvestment of all dividends and capital gains, and is not indicative of future results.
For a complete listing of holdings, please refer to the Schedule of Investments section of this report.
12
AST Neuberger Berman Mid-Cap Value Portfolio
For the year ended December 31, 2004, the AST Neuberger Berman Mid-Cap Value Portfolio had a total return of 22.84%, compared with a return of 10.87% for the unmanaged S&P 500 Index, 16.48% for the unmanaged S&P 400 Index, 23.70% for the unmanaged Russell Mid-Cap Value Index, and 19.03% for the Lipper (VIP) Mid-Cap Value Funds Average.
The Portfolio’s strong return was driven by the performance of its consumer discretionary and financial holdings. Positions in the healthcare and energy sectors also made substantial contributions. No sectors detracted from total return. The Portfolio had no exposure to the materials or telecommunication services sectors during the year.
The strongest performance relative to the Russell Mid-Cap Value Index was in the energy and healthcare sectors. Not only was there an overweight allocation to the top-performing energy sector, the Portfolio’s energy stocks outperformed their Index counterparts. The overweight in the sector was eliminated because Neuberger Berman believes much of the potential gains were already realized. The Portfolio’s selection in healthcare was strong, producing its second-highest sector return whereas the healthcare sector return was the lowest in the Index. However, the Portfolio’s selection of stocks in industrials and financials underperformed their index sector counterparts, the primary reason for its underperformance.
The Portfolio continues to trade at a P/E discount to the Russell Mid-Cap Value Index and has superior growth and a higher return on equity. In Neuberger Berman’s opinion, it has greater return potential than the Index with less risk.

| 1 Year |
5 Year |
10 Year |
|||||||
| AVERAGE ANNUAL TOTAL RETURNS |
22.84 | % | 13.12 | % | 13.01 | % |
Past performance does not guarantee future returns. Portfolio performance is net of investment fees and fund expenses, but not product charges. If product charges were included, the performance quoted would be significantly lower. The investment return and principal value of an investment will fluctuate so that an investor’s shares, when redeemed, may be worth more or less than their original cost. Current performance may be lower or higher than the past performance data quoted.
Performance is historical, assumes reinvestment of all dividends and capital gains, and is not indicative of future results.
For a complete listing of holdings, please refer to the Schedule of Investments section of this report.
13
AST Alger All-Cap Growth Portfolio
For the year ended December 31, 2004, the AST Alger All-Cap Growth Portfolio had a total return of 8.47%, compared with the return of 10.87% for the S&P 500 Index and 10.40% for the Lipper (VIP) Multi-Cap Growth Funds Average.
The Portfolio’s growth-stock strategy was at a disadvantage in a period in which value stocks outperformed growth. However, it benefited from solid security selection in the consumer staples and information technology sectors, beating the Russell 3000 Growth Index, a broad measure of growth stocks. Yahoo!, eBay, and Research In Motion contributed most. Yahoo! benefited from the rise in Internet advertising. Pay-for-Performance advertising has been a significant revenue driver for Yahoo! and there has been continued strength in core advertising. The eBay position was purchased before their seasonally strongest quarter and benefited from rising revenue and earnings. Research In Motion make the Blackberry. The growing need for mobile communication (including data transfer) has benefited such innovative companies that are providing solutions for wireless connectivity. In the past year, it has doubled its subscriber base by entering new markets and channels, and has continued to introduce compelling new products.

| 1 Year |
5 Year |
Since Inception |
|||||||
| AVERAGE ANNUAL TOTAL RETURNS |
8.47 | % | –11.66 | % | –11.66 | % |
Past performance does not guarantee future returns. Portfolio performance is net of investment fees and fund expenses, but not product charges. If product charges were included, the performance quoted would be significantly lower. The investment return and principal value of an investment will fluctuate so that an investor’s shares, when redeemed, may be worth more or less than their original cost. Current performance may be lower or higher than the past performance data quoted.
Performance is historical, assumes reinvestment of all dividends and capital gains, and is not indicative of future results.
For a complete listing of holdings, please refer to the Schedule of Investments section of this report.
14
AST Gabelli All-Cap Value Portfolio
For the year ended December 31, 2004, the AST Gabelli All-Cap Value Portfolio had a total return of 15.32%, compared with the return of 10.87% for the S&P 500 Index and 16.9% for the unmanaged Russell 3000 Value.
Investor uncertainty depressed equity returns for most of the first ten months of 2004. Early in the year it was the economy, as anemic job growth caused investors to question the strength and endurance of the recovery. As we headed into the spring it was interest rates, as surprisingly strong March employment data convinced investors the Federal Reserve would soon begin tightening. Then the economy remained soft through early fall. Throughout this period, rapidly rising oil prices and political uncertainty also undermined investor confidence. Late in October, the market started to improve. Oil prices declined significantly and the economy regained momentum. The conclusive Republican victory eliminated uncertainty regarding certain government policies. Investors focused on the sturdy economy and respectable corporate earnings growth and stocks took off.
Almost 90% of the Portfolio’s holdings posted positive returns, with nearly 60% gaining 10% or more. In general, investments in the hotel/gaming, housing, and utilities industries performed very well. In addition, eleven holdings were the subject of merger and acquisition activity (completed deals, pending deals, and companies putting themselves up for sale) or major restructurings. This had a direct impact on Portfolio performance and helped increase the values of other holdings in the same industry groups as well. The lackluster performance of advertising-supported media stocks, a sector in which the Portfolio has substantial commitments, prevented it from achieving even better returns.

| 1 Year |
Since Inception |
|||||
| AVERAGE ANNUAL TOTAL RETURNS |
15.32 | % | 4.99 | % |
Past performance does not guarantee future returns. Portfolio performance is net of investment fees and fund expenses, but not product charges. If product charges were included, the performance quoted would be significantly lower. The investment return and principal value of an investment will fluctuate so that an investor’s shares, when redeemed, may be worth more or less than their original cost. Current performance may be lower or higher than the past performance data quoted.
Performance is historical, assumes reinvestment of all dividends and capital gains, and is not indicative of future results.
For a complete listing of holdings, please refer to the Schedule of Investments section of this report.
15
AST T. Rowe Price Natural Resources Portfolio
For the year ended December 31, 2004, The AST T. Rowe Price Natural Resources Portfolio had a total return of 31.19%, compared with a return of 10.87% for the unmanaged S&P 500 Index, and 20.32%% for the Lipper (VIP) Natural Resources Funds Average.
Energy was a strong sector for the Portfolio. Several deep-water drilling holdings, including Diamond Offshore Drilling and Transocean, benefited from improving fundamentals and better pricing. Amerada Hess, a domestic integrated oil company, rebounded from earlier weakness to post strong results. The company is in the midst of revitalizing its asset portfolio, and its Gulf of Mexico exploration program showed increased promise. Management is also taking steps to improve its credibility with investors. The agriculture sector was a significant contributor to performance, reflecting continued good fundamentals and strong commodity prices. Fertilizer company Potash Corp./Saskatchewan was the Portfolio’s largest contributor, rising over 90% for the one-year period. Agricultural products maker IMC Global benefited from lower input costs and better margins. In addition, the company signed an agreement to combine with Cargill Crop Nutrition to create a new publicly traded company (Mosaic - a stock we now own), which we expect will bolster earnings and cash flow over the next several years.
Positions in metal stocks were top contributors as well. Expanding demand from China, along with a pick-up in world-wide economic activity, has pushed up commodity prices and significantly aided those firms whose earnings are closely tied to them. Nucor, a steel stock with excellent fundamentals and sustainable earnings trends, advanced almost 90%. The Russian government’s intervention into the future of oil giant Yukos was disturbing, and the Portfolio’s position detracted from performance. It was sold.

| 1 Year |
5 Year |
Since Inception |
|||||||
| AVERAGE ANNUAL TOTAL RETURNS |
31.19 | % | 16.14 | % | 14.12 | % |
Past performance does not guarantee future returns. Portfolio performance is net of investment fees and fund expenses, but not product charges. If product charges were included, the performance quoted would be significantly lower. The investment return and principal value of an investment will fluctuate so that an investor’s shares, when redeemed, may be worth more or less than their original cost. Current performance may be lower or higher than the past performance data quoted.
Performance is historical, assumes reinvestment of all dividends and capital gains, and is not indicative of future results.
For a complete listing of holdings, please refer to the Schedule of Investments section of this report.
16
AST Alliance Growth Portfolio
For the year ending December 31, 2004, the AST Alliance Growth Portfolio had a total return of 5.75%, compared with the return of 10.87% for the unmanaged S&P 500 Index, 6.30% for the unmanaged Russell 1000 Growth Index and 8.04% for the Lipper (VIP) Large-Cap Growth Funds Average.
The Portfolio lost most ground relative to the Russell 1000 Growth Index in the healthcare sector due to poor stock selection. A mid-sized position in Forest Laboratories (–27.4%) detracted most. The Portfolio gained most relative performance in the consumer discretionary stocks due to both good stock selection and overweighting this outperforming sector. It held, on average, about 26% in the sector compared with about 18% in the Russell 1000 Growth Index. Large positions in eBay (+80.1%) and Yahoo (+67.4%) accounted for most of the outperformance. The Portfolio also benefited from good selection in the technology sector, where a mid-sized position in Marvell Technology Group (+87.0%) contributed most. Good stock selection in the financial services sector also helped. A small position in Franklin Resources (+34.6%) accounted for most of the outperformance.
Alliance believes that investors are underestimating the outlook for the U.S. economy and corporate profitability, providing us with an unusual opportunity to buy superior growth companies at little valuation premium. In an environment that seems conducive to further economic and earnings expansion, the premium for growth stocks relative to the broad market is as low as it has been in the past 25 years.

| 1 Year |
5 Year |
10 Year |
|||||||
| AVERAGE ANNUAL TOTAL RETURNS |
5.75 | % | –7.86 | % | 4.21 | % |
Past performance does not guarantee future returns. Portfolio performance is net of investment fees and fund expenses, but not product charges. If product charges were included, the performance quoted would be significantly lower. The investment return and principal value of an investment will fluctuate so that an investor’s shares, when redeemed, may be worth more or less than their original cost. Current performance may be lower or higher than the past performance data quoted.
Performance is historical, assumes reinvestment of all dividends and capital gains, and is not indicative of future results.
For a complete listing of holdings, please refer to the Schedule of Investments section of this report.
17
AST MFS Growth Portfolio
For the year ended December 31, 2004, the AST MFS Growth Portfolio had a total return of 10.69%, compared with a return of 10.87% for the unmanaged S&P 500 Index, 6.30% for the unmanaged Russell 1000 Growth Index, and 8.04% for the Lipper (VIP) Large-Cap Growth Funds Average.
Selection in the healthcare, technology, and retailing sectors were the strongest contributors to the Portfolio’s outperformance of the Russell 1000 Growth Index. In healthcare, an underweight in the pharmaceutical company Pfizer (which was sold entirely from the Portfolio by period-end) contributed to relative performance, as did a slightly overweighted position in Caremark Rx. In technology, overweighted positions in software company Symantec and internet giant eBay, and an underweight in Intel (which was sold entirely from the Portfolio by period-end) helped relative returns. The Portfolio was helped by a position in Marvell Technology Group, a stock not in the Russell 1000 Growth Index. Other individual contributors to relative performance included Monsanto, Tyco International, and Carnival, none of which were in the benchmark, and an underweight position in The Coca-Cola Company (which was sold by period-end).
The chief detractors from relative performance were a slight underweighting and poor stock selection in the financial services and miscellaneous sectors. Losses on March & McLennan and Corinthian Colleges (both since sold) hurt performance. An overweighting and stock selection in the leisure sector also detracted from relative performance. Not having a position in Starbucks particularly hurt. The largest individual detractors were VERITAS Software, IAC/InterActiveCorp (sold by period-end), and an underweight position in QUALCOMM.

| 1 Year |
5 Year |
10 Year |
|||||||
| AVERAGE ANNUAL TOTAL RETURNS |
10.69 | % | –6.48 | % | –4.01 | % |
Past performance does not guarantee future returns. Portfolio performance is net of investment fees and fund expenses, but not product charges. If product charges were included, the performance quoted would be significantly lower. The investment return and principal value of an investment will fluctuate so that an investor’s shares, when redeemed, may be worth more or less than their original cost. Current performance may be lower or higher than the past performance data quoted.
Performance is historical, assumes reinvestment of all dividends and capital gains, and is not indicative of future results.
For a complete listing of holdings, please refer to the Schedule of Investments section of this report.
18
AST Marisco Capital Growth Portfolio
For the year ending December 31, 2004, the AST Marsico Capital Growth Portfolio had a total return of 15.67%, compared with the return of 10.87% for the unmanaged S&P 500 Index, 6.30% for the unmanaged Russell 1000 Growth Index, and 8.04% for the Lipper (VIP) Large-Cap Growth Funds Average.
The Portfolio’s strong performance as compared to the Russell 1000 Growth Index was primarily due to its stock selection in the healthcare, consumer discretionary, information technology, and financials sectors and in the capital goods industry, while selection in telecommunications services and an underweight in the top-performing energy sector hurt. In healthcare, it overweighted the equipment & services industry and underweighted the pharmaceuticals & biotechnology industry. This significantly enhanced its return. UnitedHealth Group (+51%) and Genentech (+16%) were among its largest holdings and the largest positive contributors to overall performance. Its strength in the consumer discretionary sector was largely due to holdings in the hotels, restaurants & leisure industry, including Wynn Resorts (+139%). Having little exposure to semiconductors helped its technology performance. It also had a good selection of hardware & equipment stocks, including QUALCOMM (+58%) and Dell (+24%). Among capital goods stocks, General Electric (+21%), Tyco International (+36%), and Caterpillar (+20%) were among the largest contributors, while SLM Corp. (+44%), Countrywide Financial (+48%), and Chicago Mercantile Exchange (+38%) were the main reasons for strength in financials.

| 1 Year |
5 Year |
Since Inception |
|||||||
| AVERAGE ANNUAL TOTAL RETURNS |
15.67 | % | –2.88 | % | 9.34 | % |
Past performance does not guarantee future returns. Portfolio performance is net of investment fees and fund expenses, but not product charges. If product charges were included, the performance quoted would be significantly lower. The investment return and principal value of an investment will fluctuate so that an investor’s shares, when redeemed, may be worth more or less than their original cost. Current performance may be lower or higher than the past performance data quoted.
Performance is historical, assumes reinvestment of all dividends and capital gains, and is not indicative of future results.
For a complete listing of holdings, please refer to the Schedule of Investments section of this report.
19
AST Goldman Sachs Concentrated Growth Portfolio
For the year ended December 31, 2004, the AST Goldman Sachs Concentrated Growth Portfolio had a total return of 3.69%, compared with the return of 10.87% for the unmanaged S&P 500 Index, 6.30% for the Russell 1000 Growth Index, and 8.04% for the Lipper (VIP) Large-Cap Growth Funds Average.
The Portfolio’s exposure to the Media sector detracted from its return. Clear Channel Communications and Viacom were weak as companies exposed to the radio market underperformed. A sluggish national radio market hurt these businesses as automotive, retailers, and telecommunications companies spent less money in 2004 in comparison to 2003. We remain confident that Clear Channel’s business can rebound as it is making changes to its advertising structure, which should result in less ad time and firmer pricing. The Portfolio’s underweight in the energy and cyclical sectors also hurt its relative performance. Typically, businesses in these sectors do not have the pricing power and strong business franchises that GSAM prefers, but their stocks were very strong this year.
The Portfolio’s positions in high-quality technology companies performed well, including QUALCOMM, Dell, Yahoo!, and eBay. QUALCOMM’s stock enjoyed a strong run in 2004. Demand for third generation (3G) wireless capability, which wholly depends on the Code-Division Multiple Access (CDMA) technology QUALCOMM licenses, continues to increase. The Portfolio’s consumer staples holdings PepsiCo and Wm. Wrigley Jr. were also top contributors.

| 1 Year |
5 Year |
10 Year |
|||||||
| AVERAGE ANNUAL TOTAL RETURNS |
3.69 | % | –15.54 | % | 9.83 | % |
Past performance does not guarantee future returns. Portfolio performance is net of investment fees and fund expenses, but not product charges. If product charges were included, the performance quoted would be significantly lower. The investment return and principal value of an investment will fluctuate so that an investor’s shares, when redeemed, may be worth more or less than their original cost. Current performance may be lower or higher than the past performance data quoted.
Performance is historical, assumes reinvestment of all dividends and capital gains, and is not indicative of future results.
For a complete listing of holdings, please refer to the Schedule of Investments section of this report.
20
AST DeAM Large-Cap Value Portfolio
For the year ended December 31, 2004, the AST DeAM Large-Cap Value Portfolio had a total return of 18.17% compared with the return of 10.87% for the unmanaged S&P 500 Index, 16.49% for the unmanaged Russell 1000 Value Index, and 14.62% for the Lipper (VIP) Multi-Cap Value Funds Average.
The Portfolio outperformed the Russell 1000 Value Index primarily because of good stock selection, particularly in the materials, diversified financials, and media industry groups. Holdings such as Monsanto and United States Steel added value in the materials group. Monsanto provides agricultural products and integrated solutions for farmers worldwide. A weakening U.S. dollar substantially aided its overseas sales. It increased the dividend payment, as well as its earnings projections for 2005. United States Steel increased net sales through all four quarters of 2004 due to the impact of strong global economic growth on demand for steel.
On the negative side, the pharmaceuticals & biotechnology and healthcare equipment & services industry groups detracted most from relative performance. The Portfolio’s underweight in Humana hurt its relative performance in healthcare. Humana is one of the nation’s largest publicly traded health benefits companies. Its stock price increased as launch of a new product, a high-deductible health insurance plan, helped it capture market share.
The individual position that hurt relative performance most was an underweight in ChevronTexaco, which benefited from higher oil prices. However, energy positions such as Occidental Petroleum and Apache, which appeared more attractive on DeAm’s valuation model, more than offset the impact of not holding ChevronTexaco.

| 1 Year |
Since Inception |
|||||
| AVERAGE ANNUAL TOTAL RETURNS |
18.17 | % | 4.01 | % |
Past performance does not guarantee future returns. Portfolio performance is net of investment fees and fund expenses, but not product charges. If product charges were included, the performance quoted would be significantly lower. The investment return and principal value of an investment will fluctuate so that an investor’s shares, when redeemed, may be worth more or less than their original cost. Current performance may be lower or higher than the past performance data quoted.
Performance is historical, assumes reinvestment of all dividends and capital gains, and is not indicative of future results.
For a complete listing of holdings, please refer to the Schedule of Investments section of this report.
21
AST Hotchkis & Wiley Large-Cap Value Portfolio
For the year ended December 31, 2004, the AST Hotchkis & Wiley Large-Cap Value Portfolio had a total return of 15.45%, compared with the return of 10.87% for the unmanaged S&P 500 Index, 16.49% for the unmanaged Russell 1000 Value Index, and 13.64% for the Lipper (VIP) Equity Income Funds Average. Management of the Portfolio was transferred from INVESCO to Hotchkis & Wiley on May 1, 2004.
During the period INVESCO advised the Portfolio, it trailed the broad S&P 500 Index and the style-specific Russell 1000 Value Index, which differed only immaterially in total return. It underperformed the Russell 1000 Value Index primarily because of poor stock selection, including positions in Fannie Mae and Radian Group Cisco Systems, and Amgen. The Portfolio also emphasized underperforming industries within sectors, particularly in the technology sector, and large companies during a period when stocks of smaller firms performed better.
During the period Hotchkis & Wiley advised the Portfolio, it benefited from stock selection within the consumer discretionary sector. The Portfolio’s strongest contributor during this period, Sears Roebuck, initially surged in November after Vornado Realty Trust took a significant stake in the company. Following this, Kmart announced its plan to acquire/merge with Sears, increasing the stock’s price another 20%. Other contributors to performance included Aetna and Electronic Data Systems. The latter beat third quarter earnings expectations and also benefited from news of improvements on its Navy contract.

| 1 Year |
5 Year |
10 Year |
|||||||
| AVERAGE ANNUAL TOTAL RETURNS |
15.45 | % | 1.81 | % | 10.04 | % |
Past performance does not guarantee future returns. Portfolio performance is net of investment fees and fund expenses, but not product charges. If product charges were included, the performance quoted would be significantly lower. The investment return and principal value of an investment will fluctuate so that an investor’s shares, when redeemed, may be worth more or less than their original cost. Current performance may be lower or higher than the past performance data quoted.
Performance is historical, assumes reinvestment of all dividends and capital gains, and is not indicative of future results.
For a complete listing of holdings, please refer to the Schedule of Investments section of this report.
22
AST Alliance/Bernstein Growth + Value Portfolio
For the year ended December 31, 2004, the AST Alliance/Bernstein Growth + Value Portfolio had a total return of 10.07%, compared with the return of 10.87% for the S&P 500 Index and 8.59% for the Lipper (VIP) Large-Cap Core Funds Average.
Energy stocks led the market as record high oil prices lifted industry profits. Technology and consumer growth stocks were the major underperforming sectors. The market favored value rather than growth in 2004. Much of this can be attributed to the outsized outperformance for most of the year of commodity- and interest-rate-sensitive sectors, which make up a much bigger proportion of the value benchmark than the growth. With technology and consumer-growth stocks rallying strongly in the fourth quarter, however, the relative performance of the two style indexes was much closer.
The value component of the Portfolio outperformed the S&P 500 Stock Index while the growth component trailed the Index. The late year rally in technology stocks was particularly beneficial to the Portfolio’s relative returns in the fourth quarter, as both value and growth segments had significant commitments to the sector. For the year, strong stock selection in technology and energy was offset by the underperformance of large holdings in the media, Internet-related, and health care industries.
Notable contributors to performance during the year included Yahoo, Ebay, UnitedHealth Group, Nortel Networks and Norfolk Southern. Detractors included Veritas Software, Viacom, Avon Products, Broadcom and Comcast.

| 1 Year |
Since Inception |
|||||
| AVERAGE ANNUAL TOTAL RETURNS |
10.07 | % | 0.32 | % |
Past performance does not guarantee future returns. Portfolio performance is net of investment fees and fund expenses, but not product charges. If product charges were included, the performance quoted would be significantly lower. The investment return and principal value of an investment will fluctuate so that an investor’s shares, when redeemed, may be worth more or less than their original cost. Current performance may be lower or higher than the past performance data quoted.
Performance is historical, assumes reinvestment of all dividends and capital gains, and is not indicative of future results.
For a complete listing of holdings, please refer to the Schedule of Investments section of this report.
23
AST Sanford Bernstein Core Value Portfolio
For the year ended December 31, 2004, the AST Sanford Bernstein Core Value Portfolio had a total return of 13.92%, compared with the return of 10.87% for the S&P 500 Index and 14.62% for the Lipper (VIP) Multi-Cap Value Funds Average.
Equity markets enjoyed another strong year in 2004. Value and smaller company stocks outperformed growth and large company stocks, resulting in the Portfolio’s outperformance of the S&P 500 Index. Late in the year, electronics manufacturing services stocks came under pressure due to cautious guidance statements or weak sales. Bernstein believes that the industry’s earnings growth will improve as these companies streamline operations, improve capacity utilization, and benefit from a recovery in spending for technology. An overweight in consumer cyclicals, particularly General Motors and several auto-parts companies, also hurt returns. Bernstein’s research suggests that investors are overly gloomy about GM’s long-term earnings power and they continue to expect auto-parts suppliers to benefit from continued growth in content per vehicle and market-share gains outside of the US.
The Utilities sector contributed significantly to performance, led by Sprint Corp, Bellsouth and SBC Communications. Positions in railroad companies Norfolk Southern and Burlington Northern also strongly outperformed; they continue to benefit from insufficient capacity in the trucking industry and strong demand for transportation in the US.

| 1 Year |
Since Inception |
|||||
| AVERAGE ANNUAL TOTAL RETURNS |
13.92 | % | 7.09 | % |
Past performance does not guarantee future returns. Portfolio performance is net of investment fees and fund expenses, but not product charges. If product charges were included, the performance quoted would be significantly lower. The investment return and principal value of an investment will fluctuate so that an investor’s shares, when redeemed, may be worth more or less than their original cost. Current performance may be lower or higher than the past performance data quoted.
Performance is historical, assumes reinvestment of all dividends and capital gains, and is not indicative of future results.
For a complete listing of holdings, please refer to the Schedule of Investments section of this report.
24
AST Cohen & Steers Realty Portfolio
For the year ended December 31, 2004, the AST Cohen & Steers Realty Portfolio had a total return of 37.95%, compared with the return of 10.87% for the unmanaged S&P 500 Index, 31.58% for the NAREIT Index, and 33.71% for the Lipper (VIP) Real Estate Funds Average.
The Portfolio’s major theme all year, and the primary driver of REIT stock price appreciation, has been the resurgence in both cash flow and dividend growth. Cohen & Steers’s believes that performance this year demonstrated that real estate fundamentals are what matter most. Within the REIT sector, regional mall companies continued to lead the industry. It was the greatest single contributor to the Portfolio’s outperformance because of the Portfolio was overweight in this sector selected stocks well within it. The apartment sector was the second largest contributor because of stock selection and also the decision to move from an underweight to an overweight earlier in the year. Manufactured housing was the weakest sector, as lower apartment rents and affordable housing for sale continued to disadvantage this low-priced housing alternative.
Looking ahead, Cohen & Steers anticipates that economic fundamentals in 2005 will be substantially similar to 2004 and even better in a few ways. This should provide a continued positive backdrop for real estate, producing higher occupancies, rents, and cash flows for most property types in most regions of the country.

| 1 Year |
5 Year |
Since Inception |
|||||||
| AVERAGE ANNUAL TOTAL RETURNS |
37.95 | % | 20.36 | % | 11.71 | % |
Past performance does not guarantee future returns. Portfolio performance is net of investment fees and fund expenses, but not product charges. If product charges were included, the performance quoted would be significantly lower. The investment return and principal value of an investment will fluctuate so that an investor’s shares, when redeemed, may be worth more or less than their original cost. Current performance may be lower or higher than the past performance data quoted.
Performance is historical, assumes reinvestment of all dividends and capital gains, and is not indicative of future results.
For a complete listing of holdings, please refer to the Schedule of Investments section of this report.
25
AST Sanford Bernstein Managed Index 500 Portfolio
For the year ended December 31, 2004, the AST Sanford Bernstein Managed Index 500 Portfolio had a total return of 9.98%, compared with a return of 10.87% for the unmanaged S&P 500 Index, and 8.59% for the Lipper (VIP) Large-Cap Core Funds Average.
The Portfolio performed well on an absolute basis, but lagged the broad market due to a combination of sector and security selection. Selection among consumer cyclical stocks was the largest contributor to the Portfolio’s relative performance over the period. It had large positions in eBay (+80.1%) and Yahoo (+67.4%). Finance and industrial commodities holdings also performed well. UnitedHealth Group (+51.4%), Wellpoint Health (+43.1%), and US Steel (+47.2%) were noteworthy positive performers. The largest detractors were investments in medical stocks such as Pfizer and Forest Labs. In the capital equipment sector, General Motors also hurt performance.
Although the Portfolio’s sector weightings were generally close to those of the S&P 500 Index, differences in sector weights nonetheless detracted from performance. Because the energy sector had by far the Index’s highest return, almost 31%, the Portfolio’s underweight of energy was the largest detractor from its relative performance.

| 1 Year |
5 Year |
Since Inception |
|||||||
| AVERAGE ANNUAL TOTAL RETURNS |
9.98 | % | –1.83 | % | 5.08 | % |
Past performance does not guarantee future returns. Portfolio performance is net of investment fees and fund expenses, but not product charges. If product charges were included, the performance quoted would be significantly lower. The investment return and principal value of an investment will fluctuate so that an investor’s shares, when redeemed, may be worth more or less than their original cost. Current performance may be lower or higher than the past performance data quoted.
Performance is historical, assumes reinvestment of all dividends and capital gains, and is not indicative of future results.
For a complete listing of holdings, please refer to the Schedule of Investments section of this report.
26
AST American Century Income & Growth Portfolio
For the year ended December 31, 2004, the AST American Century Income & Growth Portfolio had a total return of 12.59%, compared with the return of 10.87% for the S&P 500 Index, and 14.62% for the Lipper (VIP) Multi-Cap Value Funds Average.
The year 2004 marked the second straight year of positive performance for the U.S. stock market — the first time that has happened since 1998-99. Stocks were mired in a narrow trading range for most of the year, held in check by concerns ranging from soaring oil prices and weak job growth to terrorism and a potentially contentious presidential election. However, a number of these concerns were resolved during the last three months of the year, allowing stocks to finish the year with a strong rally.
The top contributors to the Portfolio’s return were sectors that typically benefit from a strong economy, including financial, energy, and consumer-oriented stocks. The only two sectors of the portfolio to decline during the year were healthcare and information technology. Stock selection was the key to the Portfolio’s outperformance of the S&P 500. It worked best in the consumer staples and materials sectors where selections among beverage and chemicals stocks provided the greatest lift to relative performance. The financial sector also contributed positively to relative results thanks to favorable stock selection in commercial banks and insurance. On the downside, stock selection detracted from relative performance in the healthcare and information technology sectors.

| 1 Year |
5 Year |
Since Inception |
|||||||
| AVERAGE ANNUAL TOTAL RETURNS |
12.59 | % | –1.02 | % | 6.09 | % |
Past performance does not guarantee future returns. Portfolio performance is net of investment fees and fund expenses, but not product charges. If product charges were included, the performance quoted would be significantly lower. The investment return and principal value of an investment will fluctuate so that an investor’s shares, when redeemed, may be worth more or less than their original cost. Current performance may be lower or higher than the past performance data quoted.
Performance is historical, assumes reinvestment of all dividends and capital gains, and is not indicative of future results.
For a complete listing of holdings, please refer to the Schedule of Investments section of this report.
27
AST Alliance Growth & Income Portfolio
For the year ending December 31, 2004, the AST Alliance Growth & Income Portfolio had a total return of 11.01%, compared with the return of 10.87% for the unmanaged S&P 500 Index and 16.49% for the unmanaged Russell 1000 Value Index.
The Russell 1000 Value Index showed remarkable strength in 2004. It is heavily skewed to the commodity-related and interest-sensitive stock groups that led the market in 2004, areas of the market that Alliance’s high quality bias typically avoids. The Portfolio’s underperformance was attributed to both sector and security selection. Overweights in media (notably Viacom), property and casualty insurance (American International Group and ACE), and healthcare (Pfizer and Boston Scientific) were the primary detractors from relative performance. These groups were hit by intense negative publicity throughout the year. Underweights in financials and utilities also held back relative performance. The largest individual detractors included Viacom, Pfizer, Clear Channel Communications, Forest Laboratories and Union Pacific. On the other hand, the Portfolio benefited from not being exposed to Merck, the worst-performing drug stock in 2004, and from several energy and managed-care positions. Notable individual contributors to performance included, Bank One, WellPoint Health Networks, Burlington Northern and ConocoPhillips.
Alliance believes that style and size anomalies such as we saw in 2004 cannot persist indefinitely. Markets return to emphasizing fundamentals, and the Portfolio’s holdings, on average, have better earnings stability, higher dividend growth, and healthier balance sheets than the Russell 1000 Value Index. Moreover, after the long-running outperformance of smaller-cap, lower-quality companies, the stocks it favors are selling at unusually low valuations.

| 1 Year |
5 Year |
10 Year |
|||||||
| AVERAGE ANNUAL TOTAL RETURNS |
11.01 | % | 3.44 | % | 11.35 | % |
Past performance does not guarantee future returns. Portfolio performance is net of investment fees and fund expenses, but not product charges. If product charges were included, the performance quoted would be significantly lower. The investment return and principal value of an investment will fluctuate so that an investor’s shares, when redeemed, may be worth more or less than their original cost. Current performance may be lower or higher than the past performance data quoted.
Performance is historical, assumes reinvestment of all dividends and capital gains, and is not indicative of future results.
For a complete listing of holdings, please refer to the Schedule of Investments section of this report.
28
AST DeAM Global Allocation Portfolio
For the year ended December 31, 2004, the AST DeAM Global Allocation Portfolio had a total return of 11.09% compared with the return of 9.73% for the custom-blended index (50% Russell 3000 Index, 40% Lehman Brothers Aggregate Index, and 10% MSCI EAFE Index), and 8.25% for the Lipper (VIP) Flexible Portfolio Funds Average.
The year 2004 was surprising in the financial markets in many ways. First, the economic recovery, while continuing to move forward, did not engender the type of bullish sentiment strategists expected, despite a very powerful profits recovery. Second, U.S. and global bond interest rates were largely unchanged for the calendar year despite very strong economic performance. Much of this unusual market behavior was due to the headwinds of perniciously high energy prices, geopolitical concerns, a third-quarter temporary soft patch in economic growth, and an uncertain U.S. election outcome. As these factors relented around the U.S. November presidential election, the markets breathed a sigh of relief and delivered a solid rally. Despite this appetite for financial assets, the U.S. dollar weakened significantly over the period due to concerns over the growing budget and trade deficits. This helped international equities outperform U.S. equities. Although tactical asset allocation was a positive contributor to the Portfolio’s performance in the first, second, and fourth quarters, the third quarter’s negative asset allocation contribution offset much of the benefit. Tactical asset allocation moves contributed only slightly for the year. The Portfolio outperformed its customized benchmark and its Lipper peers through the period, primarily because of the performance of its U.S. equity managers and, to a lesser extent, its fixed income manager.

| 1 Year |
5 Year |
10 Year |
|||||||
| AVERAGE ANNUAL TOTAL RETURNS |
11.09 | % | –1.06 | % | 7.63 | % |
Past performance does not guarantee future returns. Portfolio performance is net of investment fees and fund expenses, but not product charges. If product charges were included, the performance quoted would be significantly lower. The investment return and principal value of an investment will fluctuate so that an investor’s shares, when redeemed, may be worth more or less than their original cost. Current performance may be lower or higher than the past performance data quoted.
Performance is historical, assumes reinvestment of all dividends and capital gains, and is not indicative of future results.
For a complete listing of holdings, please refer to the Schedule of Investments section of this report.
29
AST American Century Strategic Balanced Portfolio
For the year ended December 31, 2004, the AST American Century Strategic Balanced Portfolio had a total return of 8.99%, compared with the return of 8.29% for the S&P 500/Lehman Brothers Aggregate 60/40 benchmark, and 8.55% for the Lipper (VIP) Balanced Funds Average.
Equities generally languished in a range-bound trading pattern for much of 2004, paralyzed by investor concerns about soaring energy prices, the threat of higher inflation, rising interest rates, a slowing pace of economic growth, terrorism alerts, the outcome of the U.S. presidential election, and the declining U.S. dollar. By the end of the third quarter, the S&P 500 Index had gained only 1.51%, while the Lehman Aggregate — on its way to having a surprisingly good year — was up 3.35%. But the stock market finished 2004 with a flourish. The S&P 500 Index gained 10.7% from October 25 to year end as oil prices plummeted and President Bush was re-elected, reducing investors’ uncertainty.
The Portfolio’s equity segment made the largest contribution to its total return, led by its consumer discretionary holdings. Homebuilder NVR (+65%) and Black & Decker (+81%) were the largest contributors. The Portfolio beat its benchmark because its equity segment outpaced the S&P 500 Index. The largest contributors to that outperformance were overweightings and favorable stock selection in the utilities sector, particularly an overweight in electric utility TXU (+178%). In the bond segment, the best-performing major sector was corporate securities, followed by mortgage-backed and Treasury securities.
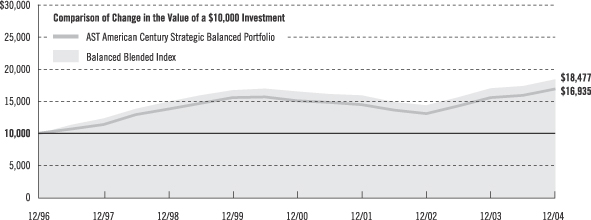
| 1 Year |
5 Year |
Since Inception |
|||||||
| AVERAGE ANNUAL TOTAL RETURNS |
8.99 | % | 1.74 | % | 6.81 | % |
Past performance does not guarantee future returns. Portfolio performance is net of investment fees and fund expenses, but not product charges. If product charges were included, the performance quoted would be significantly lower. The investment return and principal value of an investment will fluctuate so that an investor’s shares, when redeemed, may be worth more or less than their original cost. Current performance may be lower or higher than the past performance data quoted.
Performance is historical, assumes reinvestment of all dividends and capital gains, and is not indicative of future results.
For a complete listing of holdings, please refer to the Schedule of Investments section of this report.
30
AST T. Rowe Price Asset Allocation Portfolio
For the year ended December 31, 2004, the AST T. Rowe Price Asset Allocation Portfolio had a total return of 11.17%, compared with a return of 8.25% for the 60/40 blend of the unmanaged S&P 500 Index and the unmanaged Lehman Brothers Government Credit Index, and 8.55% for the Lipper (VIP) Balanced Funds Average.
U.S. stocks rose in 2004, though they struggled to make headway for much of the year as economic growth moderated amid surging energy costs and a heated presidential campaign. Stock prices rose as oil prices backed away from their late-October peak of $55 per barrel, and gains accelerated following the re-election of President Bush. U.S. bonds generated less robust returns. Short-term interest rates rose in tandem with the federal funds rate — which the Federal Reserve gradually increased from 1.00% to 2.25% — but long-term rates declined in the second half of the year after peaking in the spring. High-yield bonds fared best, but long-term government and investment-grade corporate bonds also produced good returns. Other fixed-income sectors lagged. Non-U.S. stocks strongly outperformed their U.S. counterparts, thanks partially to a weakening U.S. dollar.
The Portfolio was overweighted in stocks relative to bonds throughout 2004, and the overweighting was increased to 7% over the year. This was a strong contributor to its outperformance as stocks performed better than bonds for the year. The S&P 500 Index returned 10.87% versus 4.19% for the Lehman Brothers U.S. Government/Credit Index. The Portfolio’s overweighting in international stocks was also beneficial.

| 1 Year |
5 Year |
10 Year |
|||||||
| AVERAGE ANNUAL TOTAL RETURNS |
11.17 | % | 3.32 | % | 9.77 | % |
Past performance does not guarantee future returns. Portfolio performance is net of investment fees and fund expenses, but not product charges. If product charges were included, the performance quoted would be significantly lower. The investment return and principal value of an investment will fluctuate so that an investor’s shares, when redeemed, may be worth more or less than their original cost. Current performance may be lower or higher than the past performance data quoted.
Performance is historical, assumes reinvestment of all dividends and capital gains, and is not indicative of future results.
For a complete listing of holdings, please refer to the Schedule of Investments section of this report.
31
AST T. Rowe Price Global Bond Portfolio
For the year ended December 31, 2004, the AST T. Rowe Price Global Bond Portfolio had a total return of 8.64%, compared with a 9.27% gain on the Lehman Brothers Global Aggregate Index.
The Portfolio benefited from a generally weaker U.S. dollar, currency selection, country and duration positioning, and a rally in European government bonds. Most of the Portfolio’s relative value was derived from currency selection, particularly an overweight exposure to the Polish zloty that strengthened versus the euro. The Portfolio’s emerging-market currency exposures were increased during the fourth quarter of 2004 in light of the weaker U.S. dollar. Overweight positions in the Mexican peso and Turkish lira (both versus the U.S. dollar) were particularly helpful to the Portfolio’s relative return. The Mexican peso benefited from central bank rate hikes and strong oil prices, while Turkish bond and currency markets were buoyed by the European Union’s decision to set a fixed date (October 2005) to start membership discussions with Turkey.
Positioning in the Japanese yen against the euro and U.S. dollar had the most negative impact on the Portfolio’s relative performance. The Japanese recovery seemed to be gaining momentum in the first half of the year, which was expected to aid the yen. But post fiscal year end selling, expectations of Federal Reserve rate hikes, and concern about the impact of higher oil prices weakened the yen in the second and third quarters.
From a country/duration perspective, spread trades against the U.S. market were the most successful for the Portfolio. Given uncertainties surrounding trends in economic data in the United States during 2004, the Portfolio looked to diversify most of its U.S. short duration position against Europe, Canada, and Mexico. The European position added the most value to the Portfolio, with a strong euro currency and weaker economic data supporting bonds, particularly at the short-end.

| 1 Year |
5 Year |
10 Year |
|||||||
| AVERAGE ANNUAL TOTAL RETURNS |
8.64 | % | 7.58 | % | 5.60 | % |
Past performance does not guarantee future returns. Portfolio performance is net of investment fees and fund expenses, but not product charges. If product charges were included, the performance quoted would be significantly lower. The investment return and principal value of an investment will fluctuate so that an investor’s shares, when redeemed, may be worth more or less than their original cost. Current performance may be lower or higher than the past performance data quoted.
Performance is historical, assumes reinvestment of all dividends and capital gains, and is not indicative of future results.
For a complete listing of holdings, please refer to the Schedule of Investments section of this report.
32
AST Goldman Sachs High Yield Portfolio
For the year ended December 31, 2004, the AST Goldman Sachs High Yield Portfolio had a total return of 11.08%, compared with an 11.13% for the Lehman Brothers U.S. Corporate High Yield Index (the Index). From January 1, 2004 through April 30, 2005 — the first four months of the year — the Portfolio was managed by Federated Investment Management Company, which was replaced by Goldman Sachs Asset Management, L.P. as of May 1, 2004.
Federated Investment Management Company
For the first four months of 2004, high yield bonds (commonly called “junk” bonds) were supported by improvement in corporate profitability and credit quality. The Portfolio benefited during the period from having a duration that was shorter than that of the Index. Volatile intra-period cash flows within the Portfolio negatively affected its relative performance. In addition, the Portfolio was hurt by its exposure to Qwest Communications (Telecommunications), Dex Media and its affiliates (Non-Cable Media), El Paso Corp. and Calpine Corp. (Utilities), and New World Pasta Company (Food & Beverage), which defaulted during the period. The factors that aided the Fund’s performance included its underweight exposure to the Airline and Utility sectors and its overweight position in the Consumer Products and Textile sectors. Among its positions that benefited the Fund were Neenah Corp. (Industrial), Land O’ Lakes (Food & Beverage), MMI Products (Building & Construction), and XM Satellite Radio (Media Non-Cable).
Goldman Sachs Asset Management, L.P.
For most of the remaining eight months of the year, the high yield market had very strong performance, supported by robust technical factors and strength in the riskier segments of the market. The Portfolio’s results were positively affected by its underweight to BB-rated debt securities, as this rating category was adversely affected by the considerable volatility in the U.S. Treasury market. The Portfolio also benefited from its overweight exposure to the Chemicals sector and certain Cyclical debt securities. However, this was partially offset by an underweight to the riskier segments of the high yield market, as they rallied sharply toward the end of the reporting period. In particular, the Portfolio’s lack of exposure to the Utilities, Airline, and Wireline Telecommunications sectors late in the year detracted from its return.

| 1 Year |
5 Year |
10 Year |
|||||||
| AVERAGE ANNUAL TOTAL RETURNS |
11.08 | % | 4.09 | % | 7.03 | % |
Past performance does not guarantee future returns. Portfolio performance is net of investment fees and fund expenses, but not product charges. If product charges were included, the performance quoted would be significantly lower. The investment return and principal value of an investment will fluctuate so that an investor’s shares, when redeemed, may be worth more or less than their original cost. Current performance may be lower or higher than the past performance data quoted.
Performance is historical, assumes reinvestment of all dividends and capital gains, and is not indicative of future results.
For a complete listing of holdings, please refer to the Schedule of Investments section of this report.
33
AST Lord Abbett Bond-Debenture Portfolio
For the year ended December 31, 2004, the AST Lord Abbett Bond-Debenture Portfolio had a total return of 7.42%, compared with a 10.87% return for the unmanaged Merrill Lynch US High Yield Master II Index (the Index).
Lower-rated bonds outperformed higher-rated bonds across all sectors of the high yield corporate bond market in 2004. (High yield bonds are commonly called “junk” bonds because of their below-investment-grade ratings.) Within the high yield market, C-rated bonds outperformed B-rated bonds, which outperformed the higher quality BB-rated bonds. In the convertible market, speculative-grade issues also beat investment-grade issues. Even in the high-grade portion of the market, the lower-quality investment-grade companies led that sector’s advance.
The Portfolio benefited from its large allocation to high yield corporate bonds, which represented over 60% of the Portfolio. However, performance was held back versus the Index due to the higher overall quality of the Portfolio. The Portfolio had an average credit quality of BB- versus B for the Index. A “shortage of yield” continued to support the mid- and lower-quality segments of the fixed income market. Within its high yield holdings, the Portfolio’s emphasis on lower-rated bonds proved beneficial during the year. It was overweight B-rated debt securities, which tended to outperform BB-rated debt securities.
Among its convertible holdings the Portfolio had an investment-grade bias, which held back performance along with other investment-grade corporate bonds and mortgage-backed securities. Convertible securities benefited from rising earnings and participation in the stock market uptrend.

| 1 Year |
Since Inception |
|||||
| AVERAGE ANNUAL TOTAL RETURNS |
7.42 | % | 7.22 | % |
Past performance does not guarantee future returns. Portfolio performance is net of investment fees and fund expenses, but not product charges. If product charges were included, the performance quoted would be significantly lower. The investment return and principal value of an investment will fluctuate so that an investor’s shares, when redeemed, may be worth more or less than their original cost. Current performance may be lower or higher than the past performance data quoted.
Performance is historical, assumes reinvestment of all dividends and capital gains, and is not indicative of future results.
For a complete listing of holdings, please refer to the Schedule of Investments section of this report.
34
AST PIMCO Total Return Bond Portfolio
For the year ended December 31, 2004, the AST PIMCO Total Return Bond Portfolio had a total return of 4.96%, compared with a 4.34% return for the unmanaged Lehman Brothers U.S. Aggregate Bond Index.
During the early part of the year, concern about the durability of the U.S. economic recovery pushed interest rates lower and demand for relatively safe assets also rose amid renewed fears of terrorist attacks after the Madrid bombing. However, from April through June, employment reports showed strength, which convinced markets that the Federal Reserve (the Fed) would soon begin a tightening campaign. On June 30, 2004, the Fed met market expectations with a 25 basis point increase in the federal funds rate and raised rates a total of five times in 2004 to end the year at 2.25%.
Signs of rising inflation fueled anxiety that central banks may need to move aggressively to combat it. Inflation concerns were driven by higher oil prices as well as slower productivity growth. The Fed helped to calm markets by commenting that it would raise rates gradually. Economic data releases suggested moderate economic growth, as job numbers, inflation and consumer confidence all fell short of analyst expectations.
The Portfolio outperformed its benchmark for its reporting period. Diversifying beyond core index sectors helped protect the Portfolio during difficult market periods and also added to returns in sectors where interest rates actually fell. Overall, below index U.S. duration was positive for returns as short- and intermediate-term rates rose in the United States. Additionally, Euroland duration contributed to returns as intermediate- and long-term rates fell. Active management across a variety of strategies, including “rolling down” a steep yield curve, active security selection of mortgage-backed securities and corporate bonds, exposure to Treasury Inflation Protected Securities, Euroland exposure, and emerging-market exposure all contributed to the Portfolio’s performance during the year.

| 1 Year |
5 Year |
10 Year |
|||||||
| AVERAGE ANNUAL TOTAL RETURNS |
4.96 | % | 7.96 | % | 7.92 | % |
Past performance does not guarantee future returns. Portfolio performance is net of investment fees and fund expenses, but not product charges. If product charges were included, the performance quoted would be significantly lower. The investment return and principal value of an investment will fluctuate so that an investor’s shares, when redeemed, may be worth more or less than their original cost. Current performance may be lower or higher than the past performance data quoted.
Performance is historical, assumes reinvestment of all dividends and capital gains, and is not indicative of future results.
For a complete listing of holdings, please refer to the Schedule of Investments section of this report.
35
AST PIMCO Limited Maturity Bond Portfolio
For the year ended December 31, 2004, the AST PIMCO Limited Maturity Bond Portfolio had a total return of 2.07%, compared with a 0.91% return for the unmanaged Merrill Lynch 1-3 Year Treasury Index.
During the early part of the reporting period, concern about the durability of the U.S. economic recovery pushed interest rates lower and in addition demand for relatively safe assets also rose amid renewed fears of terrorist attacks after the Madrid bombing. However, from April through June, employment reports showed strength, which convinced markets that the Federal Reserve (the Fed) would soon begin a tightening campaign. On June 30, 2004, the Fed met market expectations with a 25 basis point increase in the federal funds rate and raised rates a total of five times in 2004 to end the year at 2.25%.
Signs of rising inflation fueled anxiety that central banks may need to move aggressively to combat it. Inflation concerns were driven by higher oil prices as well as slower productivity growth. The Fed helped to calm markets by commenting that it would raise rates gradually. Economic data releases suggested moderate economic growth, as job numbers, inflation and consumer confidence all fell short of analyst expectations.
The Portfolio outperformed its benchmark during its reporting period. Diversifying beyond core index sectors helped protect the Portfolio during difficult market periods and also added to returns in sectors where interest rates actually fell. Overall, below index U.S. duration was positive for returns as short- and intermediate-term rates rose in the United States. Additionally, Euroland duration contributed to returns as intermediate- and long-term rates fell. Active management across a variety of strategies, including “rolling down” a steep yield curve, active security selection of mortgage-backed securities and corporate bonds, Euroland exposure, and emerging-market exposure all contributed to the Portfolio’s performance during the year.

| 1 Year |
5 Year |
Since Inception |
|||||||
| AVERAGE ANNUAL TOTAL RETURNS |
2.07 | % | 5.56 | % | 5.48 | % |
Past performance does not guarantee future returns. Portfolio performance is net of investment fees and fund expenses, but not product charges. If product charges were included, the performance quoted would be significantly lower. The investment return and principal value of an investment will fluctuate so that an investor’s shares, when redeemed, may be worth more or less than their original cost. Current performance may be lower or higher than the past performance data quoted.
Performance is historical, assumes reinvestment of all dividends and capital gains, and is not indicative of future results.
For a complete listing of holdings, please refer to the Schedule of Investments section of this report.
36
AST Money Market Portfolio
For the year ended December 31, 2004, the AST Money Market Portfolio returned 0.84% compared with a return of 0.83% for the Lipper VP Money Market Funds Average.
The general level of interest rates increased over the year. At the end of 2003, the federal funds rate stood at 1.00%. By the end of 2004, that rate had risen to 2.25% after being increased by 0.25% at each of five consecutive meetings of the Federal Open Market Committee beginning on June 30, 2004. Longer-term money market yields began to rise at the end of March 2004.
The Portfolio’s average maturity decreased from 72 days at the end of 2003 to 38 days by June 30, 2004. This increased the sensitivity of the Portfolio’s yield to changes in interest rates and greatly enhanced performance. As rates continued to increase, the Portfolio’s average maturity was gradually increased, further adding incremental yield. By the end of 2004, the Portfolio’s average maturity stood at 55 days.
The portion of the Portfolio invested in very short-term securities (those maturing within two weeks) increased from 12% on December 31, 2003 to 34% on December 31, 2004. At the end of its fiscal year, the largest sector exposures was commercial paper at 44% of the Portfolio’s assets. Other large sector exposures were corporate obligations, bank time deposits and certificates of deposit. The Portfolio’s investment in the somewhat higher yielding, but marginally less liquid variable-rate note sector fell from 28% of the Portfolio to 23%.

| 1 Year |
5 Year |
10 Year |
|||||||
| AVERAGE ANNUAL TOTAL RETURNS |
0.84 | % | 2.50 | % | 3.79 | % | |||
| Money Market 7-day current net yield |
1.70 | % |
Past performance does not guarantee future returns. Portfolio performance is net of investment fees and fund expenses, but not product charges. If product charges were included, the performance quoted would be significantly lower. The investment return and principal value of an investment will fluctuate so that an investor’s shares, when redeemed, may be worth more or less than their original cost. Current performance may be lower or higher than the past performance data quoted.
Performance is historical, assumes reinvestment of all dividends and capital gains. The Yield quotation more closely reflects the performance of the ASR Money Market Portfolio than the total return.
An investment in the American Skandia Trust Money Market Portfolio is neither insured nor guaranteed by the Federal Deposit Insurance Corporation or any other government agency. Although the Portfolio seeks to preserve the values of your investment at $1.00 per share, it is possible to lose money by investing in the Portfolio.
For a complete listing of holdings, please refer to the Schedule of Investments section of this report.
37
Fees and Expenses (unaudited)
As a contract owner investing in Portfolios of the Fund through a variable annuity or variable life contract, you incur ongoing costs, including management fees, distribution and service (12b-1) fees, and other Portfolio expenses. This example is intended to help you understand your ongoing costs (in dollars) of investing in the Fund and to compare these costs with the ongoing costs of investing in other investment options. This example does not reflect fees and charges under your variable annuity or variable life contract. If contract charges were included, the costs shown below would be higher. Please consult the prospectus for your contract for more information about contract fees and charges.
The example is based on an investment of $1,000 invested at the beginning of the period and held for the entire period July 1, 2004 through December 31, 2004.
Actual Expenses
The first line of the table below provides information about actual account values and actual expenses. You may use this information, together with the amount you invested, to estimate the Portfolio expenses that you paid over the period. Simply divide your account value by $1,000 (for example, an $8,600 account value divided by $1,000 = 8.6), then multiply the result by the number in the first line under the heading entitled “Expenses Paid During Period” to estimate the Portfolio expenses you paid on your account during this period. As noted above, the table does not reflect variable contract fees and charges.
Hypothetical Example for Comparison Purposes
The second line of the table below provides information about hypothetical account values and hypothetical expenses based on the Portfolio’s actual expense ratio and an assumed rate of return of 5% per year before expenses, which is not the Portfolio’s actual return. The hypothetical account values and expenses may not be used to estimate the actual ending account balance or expenses you paid for the period. You may use this information to compare the ongoing costs of investing in the Portfolio and other investment options. To do so, compare this 5% hypothetical example with the 5% hypothetical examples that appear in the shareholder reports of the other investment options.
Please note that the expenses shown in the table are meant to highlight your ongoing Portfolio costs only and do not reflect any contract fees and charges, such as sales charges (loads), insurance charges or administrative charges. Therefore the second line of the table is useful to compare ongoing investment option costs only, and will not help you determine the relative total costs of owning different contracts. In addition, if these contract fee and charges were included, your costs would have been higher.
| America Skandia Trust Portfolios | Beginning Portfolio Value July 1, 2004 |
Ending Portfolio December 31, 2004 |
Annualized Expense Ratio |
Expenses Paid During the Six- Month Period* | ||||||||||
| AST JP Morgan International Equity Portfolio (Class I) | Actual | $ | 1,000 | $ | 1,149 | 1.13 | % | $ | 6.10 | |||||
| Hypothetical | $ | 1,000 | $ | 1,019 | 1.13 | % | $ | 5.73 | ||||||
| AST William Blair International Growth Portfolio (Class I) | Actual | $ | 1,000 | $ | 1,135 | 1.12 | % | $ | 6.01 | |||||
| Hypothetical | $ | 1,000 | $ | 1,020 | 1.12 | % | $ | 5.69 | ||||||
| AST LSV International Value Portfolio (Class I) | Actual | $ | 1,000 | $ | 1,160 | 1.25 | % | $ | 6.79 | |||||
| Hypothetical | $ | 1,000 | $ | 1,019 | 1.25 | % | $ | 6.34 | ||||||
| AST MFS Global Equity Portfolio (Class I) | Actual | $ | 1,000 | $ | 1,117 | 1.37 | % | $ | 7.29 | |||||
| Hypothetical | $ | 1,000 | $ | 1,018 | 1.37 | % | $ | 6.95 | ||||||
38
| America Skandia Trust Portfolios | Beginning Portfolio Value July 1, 2004 |
Ending Portfolio December 31, 2004 |
Annualized Expense Ratio |
Expenses Paid During the Six- Month Period* | ||||||||||
| AST State Street Research Small-Cap Growth Portfolio (Class I) | Actual | $ | 1,000 | $ | 987 | 1.17 | % | $ | 5.84 | |||||
| Hypothetical | $ | 1,000 | $ | 1,019 | 1.17 | % | $ | 5.94 | ||||||
| AST DeAM Small-Cap Growth Portfolio (Class I) | Actual | $ | 1,000 | $ | 1,072 | 1.03 | % | $ | 5.36 | |||||
| Hypothetical | $ | 1,000 | $ | 1,020 | 1.03 | % | $ | 5.23 | ||||||
| AST Federated Aggressive Growth Portfolio (Class I) | Actual | $ | 1,000 | $ | 1,124 | 1.18 | % | $ | 6.30 | |||||
| Hypothetical | $ | 1,000 | $ | 1,019 | 1.18 | % | $ | 5.99 | ||||||
| AST Goldman Sachs Small-Cap Value Portfolio (Class I) | Actual | $ | 1,000 | $ | 1,139 | 1.19 | % | $ | 6.40 | |||||
| Hypothetical | $ | 1,000 | $ | 1,019 | 1.19 | % | $ | 6.04 | ||||||
| AST Small-Cap Value Portfolio (Class I) | Actual | $ | 1,000 | $ | 1,087 | 1.08 | % | $ | 5.67 | |||||
| Hypothetical | $ | 1,000 | $ | 1,020 | 1.08 | % | $ | 5.48 | ||||||
| AST DeAM Small-Cap Value Portfolio (Class I) | Actual | $ | 1,000 | $ | 1,139 | 1.12 | % | $ | 6.02 | |||||
| Hypothetical | $ | 1,000 | $ | 1,020 | 1.12 | % | $ | 5.69 | ||||||
| AST Goldman Sachs Mid-Cap Growth Portfolio (Class I) | Actual | $ | 1,000 | $ | 1,097 | 1.11 | % | $ | 5.85 | |||||
| Hypothetical | $ | 1,000 | $ | 1,020 | 1.11 | % | $ | 5.64 | ||||||
| AST Neuberger Berman Mid-Cap Growth Portfolio (Class I) | Actual | $ | 1,000 | $ | 1,080 | 1.10 | % | $ | 5.75 | |||||
| Hypothetical | $ | 1,000 | $ | 1,020 | 1.10 | % | $ | 5.59 | ||||||
| AST Neuberger Berman Mid-Cap Value Portfolio (Class I) | Actual | $ | 1,000 | $ | 1,137 | 1.03 | % | $ | 5.53 | |||||
| Hypothetical | $ | 1,000 | $ | 1,020 | 1.03 | % | $ | 5.23 | ||||||
| AST Alger All-Cap Growth Portfolio (Class I) | Actual | $ | 1,000 | $ | 1,019 | 1.17 | % | $ | 5.94 | |||||
| Hypothetical | $ | 1,000 | $ | 1,019 | 1.17 | % | $ | 5.94 | ||||||
| AST Gabelli All-Cap Value Portfolio (Class I) | Actual | $ | 1,000 | $ | 1,100 | 1.21 | % | $ | 6.39 | |||||
| Hypothetical | $ | 1,000 | $ | 1,019 | 1.21 | % | $ | 6.14 | ||||||
| AST T. Rowe Price Natural Resources Portfolio (Class I) | Actual | $ | 1,000 | $ | 1,207 | 1.16 | % | $ | 6.44 | |||||
| Hypothetical | $ | 1,000 | $ | 1,019 | 1.16 | % | $ | 5.89 | ||||||
| AST Alliance Growth Portfolio (Class I) | Actual | $ | 1,000 | $ | 1,034 | 1.09 | % | $ | 5.57 | |||||
| Hypothetical | $ | 1,000 | $ | 1,020 | 1.09 | % | $ | 5.53 | ||||||
| AST MFS Growth Portfolio (Class I) | Actual | $ | 1,000 | $ | 1,065 | 1.05 | % | $ | 5.45 | |||||
| Hypothetical | $ | 1,000 | $ | 1,020 | 1.05 | % | $ | 5.33 | ||||||
| AST Marsico Capital Growth Portfolio (Class I) | Actual | $ | 1,000 | $ | 1,128 | 1.01 | % | $ | 5.40 | |||||
| Hypothetical | $ | 1,000 | $ | 1,020 | 1.01 | % | $ | 5.13 | ||||||
| AST Goldman Sachs Concentrated Growth Portfolio (Class I) | Actual | $ | 1,000 | $ | 1,056 | 1.00 | % | $ | 5.17 | |||||
| Hypothetical | $ | 1,000 | $ | 1,020 | 1.00 | % | $ | 5.08 | ||||||
| AST DeAM Large-Cap Value Portfolio (Class I) | Actual | $ | 1,000 | $ | 1,124 | 0.99 | % | $ | 5.29 | |||||
| Hypothetical | $ | 1,000 | $ | 1,020 | 0.99 | % | $ | 5.03 | ||||||
| AST Hotchkis & Wiley Large-Cap Value Portfolio (Class I) | Actual | $ | 1,000 | $ | 1,143 | 0.89 | % | $ | 4.79 | |||||
| Hypothetical | $ | 1,000 | $ | 1,021 | 0.89 | % | $ | 4.52 | ||||||
39
| America Skandia Trust Portfolios | Beginning Portfolio Value July 1, 2004 |
Ending Portfolio December 31, 2004 |
Annualized Expense Ratio |
Expenses Paid During the Six- Month Period* | ||||||||||
| AST Alliance/Bernstein Growth + Value Portfolio (Class I) | Actual | $ | 1,000 | $ | 1,060 | 1.23 | % | $ | 6.37 | |||||
| Hypothetical | $ | 1,000 | $ | 1,019 | 1.23 | % | $ | 6.24 | ||||||
| AST Sanford Berstein Core Value Portfolio (Class I) | Actual | $ | 1,000 | $ | 1,093 | 0.99 | % | $ | 5.21 | |||||
| Hypothetical | $ | 1,000 | $ | 1,020 | 0.99 | % | $ | 5.03 | ||||||
| AST Cohen & Steers Realty Portfolio (Class I) | Actual | $ | 1,000 | $ | 1,287 | 1.04 | % | $ | 5.98 | |||||
| Hypothetical | $ | 1,000 | $ | 1,020 | 1.04 | % | $ | 5.28 | ||||||
| AST Sanford Berstein Managed Index 500 Portfolio (Class I) | Actual | $ | 1,000 | $ | 1,063 | 0.77 | % | $ | 3.99 | |||||
| Hypothetical | $ | 1,000 | $ | 1,021 | 0.77 | % | $ | 3.91 | ||||||
| AST American Century Income & Growth Portfolio (Class I) | Actual | $ | 1,000 | $ | 1,077 | 0.96 | % | $ | 5.01 | |||||
| Hypothetical | $ | 1,000 | $ | 1,020 | 0.96 | % | $ | 4.87 | ||||||
| AST Alliance Growth & Income Portfolio (Class I) | Actual | $ | 1,000 | $ | 1,079 | 0.87 | % | $ | 4.55 | |||||
| Hypothetical | $ | 1,000 | $ | 1,021 | 0.87 | % | $ | 4.42 | ||||||
| AST DeAM Global Allocation Portfolio (Class I) | Actual | $ | 1,000 | $ | 1,074 | 0.14 | % | $ | 0.73 | |||||
| Hypothetical | $ | 1,000 | $ | 1,024 | 0.14 | % | $ | 0.71 | ||||||
| AST American Century Strategic Balanced Portfolio (Class I) | Actual | $ | 1,000 | $ | 1,064 | 1.08 | % | $ | 5.60 | |||||
| Hypothetical | $ | 1,000 | $ | 1,020 | 1.08 | % | $ | 5.48 | ||||||
| AST T. Rowe Price Asset Allocation Portfolio (Class I) | Actual | $ | 1,000 | $ | 1,079 | 1.07 | % | $ | 5.59 | |||||
| Hypothetical | $ | 1,000 | $ | 1,020 | 1.07 | % | $ | 5.43 | ||||||
| AST T. Rowe Price Global Bond Portfolio (Class I) | Actual | $ | 1,000 | $ | 1,100 | 1.08 | % | $ | 5.70 | |||||
| Hypothetical | $ | 1,000 | $ | 1,020 | 1.08 | % | $ | 5.48 | ||||||
| AST Goldman Sachs High Yield Bond Portfolio (Class I) | Actual | $ | 1,000 | $ | 1,093 | 0.93 | % | $ | 4.89 | |||||
| Hypothetical | $ | 1,000 | $ | 1,020 | 0.93 | % | $ | 4.72 | ||||||
| AST Lord Abbett Bond-Debenture Portfolio (Class I) | Actual | $ | 1,000 | $ | 1,076 | 0.93 | % | $ | 4.85 | |||||
| Hypothetical | $ | 1,000 | $ | 1,020 | 0.93 | % | $ | 4.72 | ||||||
| AST PIMCO Total Return Bond Portfolio (Class I) | Actual | $ | 1,000 | $ | 1,044 | 0.77 | % | $ | 3.96 | |||||
| Hypothetical | $ | 1,000 | $ | 1,021 | 0.77 | % | $ | 3.91 | ||||||
| AST PIMCO Limited Maturity Bond Portfolio (Class I) | Actual | $ | 1,000 | $ | 1,018 | 0.78 | % | $ | 3.96 | |||||
| Hypothetical | $ | 1,000 | $ | 1,021 | 0.78 | % | $ | 3.96 | ||||||
| AST Money Market Portfolio (Class I) | Actual | $ | 1,000 | $ | 1,006 | 0.58 | % | $ | 2.92 | |||||
| Hypothetical | $ | 1,000 | $ | 1,022 | 0.58 | % | $ | 2.95 | ||||||
| * | Fund expenses for each share class are equal to the annualized expense ratio for each share class (provided in the table), multiplied by the average account value over the period, multiplied by the 184 days in the six-month period ended December 31, 2004, and divided by the 366 days in the Fund’s fiscal year ended December 31, 2004 (to reflect the six-month period). |
40
AST JPMORGAN INTERNATIONAL EQUITY PORTFOLIO
SCHEDULE OF INVESTMENTS
DECEMBER 31, 2004
| SHARES |
VALUE (NOTE 2) | ||||
| LONG-TERM INVESTMENTS — 90.2% |
|||||
| COMMON STOCK |
|||||
| AUSTRALIA — 1.6% |
|||||
| BHP Billiton Ltd. |
310,900 | $ | 3,738,589 | ||
| News Corp., Inc. — CDI (Class “B” Stock) |
121,150 | 2,327,707 | |||
| Woodside Petroleum Ltd. |
7,375 | 116,204 | |||
| 6,182,500 | |||||
| BELGIUM — 1.2% |
|||||
| Dexia |
195,400 | 4,493,908 | |||
| BRAZIL — 1.1% |
|||||
| Companhia Vale do Rio Doce [ADR] |
147,414 | 4,276,480 | |||
| FINLAND — 1.0% |
|||||
| Nokia Oyj |
239,200 | 3,778,040 | |||
| FRANCE — 10.6% |
|||||
| Axa SA |
203,000 | 5,016,365 | |||
| BNP Paribas SA |
74,100 | 5,368,397 | |||
| Compagnie de Saint-Gobain |
95,200 | 5,735,033 | |||
| Dassault Systemes SA |
53,900 | 2,718,078 | |||
| Imerys SA |
50,000 | 4,196,683 | |||
| Lafarge SA |
32,800 | 3,165,421 | |||
| Total SA |
65,000 | 14,198,044 | |||
| 40,398,021 | |||||
| GERMANY — 5.2% |
|||||
| BASF AG |
41,700 | 3,004,078 | |||
| Bayerische Motoren Werke AG |
112,200 | 5,063,259 | |||
| Deutsche Post AG |
165,900 | 3,810,942 | |||
| Schering AG |
39,600 | 2,960,984 | |||
| Siemens AG |
58,200 | 4,934,778 | |||
| 19,774,041 | |||||
| IRELAND — 0.8% |
|||||
| Bank of Ireland |
179,200 | 2,983,825 | |||
| ITALY — 3.2% |
|||||
| Eni SpA |
489,100 | 12,245,782 | |||
| JAPAN — 18.4% |
|||||
| Canon, Inc. |
126,000 | 6,799,843 | |||
| Chugai Pharmaceutical Co. Ltd. |
134,700 | 2,226,816 | |||
| Credit Saison Co. Ltd. |
49,300 | 1,794,564 | |||
| Daikin Industries Ltd. |
77,000 | 2,224,261 | |||
| Fanuc Ltd. |
38,700 | 2,530,399 | |||
| Honda Motor Co. Ltd. |
110,700 | 5,736,478 | |||
| Hoya Corp. |
40,200 | 4,539,026 | |||
| Kao Corp. |
121,000 | 3,093,784 | |||
| Matsushita Electric Industrial Co. Ltd. |
165,000 | 2,618,230 | |||
| Mitsubishi Corp. |
209,000 | 2,700,459 | |||
| Mitsubishi Tokyo Financial Group, Inc. |
400 | 4,059,725 | |||
| Nikko Cordial Corp. |
589,000 | 3,121,177 | |||
| Nintendo Co. Ltd. |
19,200 | 2,411,477 | |||
| Nippon Telegraph and Telephone Corp. |
300 | 1,346,736 | |||
| Nippon Paper Group, Inc. |
300 | 1,346,736 | |||
| Nitto Denko Corp. |
49,100 | 2,692,905 | |||
| Secom Co. Ltd. |
68,000 | 2,720,796 | |||
| Sharp Corp. |
138,000 | 2,253,089 | |||
| Shin-Etsu Chemical Co. Ltd. |
68,600 | 2,811,750 | |||
| SMC Corp. |
20,700 | 2,369,581 | |||
| Sumitomo Corp. |
429,000 | 3,700,947 | |||
| Takefuji Corp. |
29,250 | 1,978,164 | |||
| Yamanouchi Pharmaceutical Co. Ltd. |
120,700 | 4,699,843 | |||
| 69,776,786 | |||||
| KOREA — 1.6% |
|||||
| Posco [ADR] |
35,337 | 1,573,557 | |||
| Samsung Electronics Co. Ltd. [GDR]* |
14,500 | 3,155,066 | |||
| SK Telecom Co. Ltd. [ADR] |
68,600 | 1,526,350 | |||
| 6,254,973 | |||||
| MEXICO — 0.5% |
|||||
| Fomento Economico Mexicano SA de CV [ADR] |
35,400 | 1,862,394 | |||
| NETHERLANDS — 5.4% |
|||||
| ABN AMRO Holding NV |
186,700 | 4,946,016 | |||
| Fortis Bank* |
120,800 | 3,344,700 | |||
| ING Groep NV |
110,800 | 3,352,464 | |||
| Koninklijke (Royal) Philips |
|||||
| Electronics NV |
129,600 | 3,436,857 | |||
| Reed Elsevier NV |
199,500 | 2,719,838 | |||
| Wolters Kluwer NV |
129,400 | 2,597,850 | |||
| 20,397,725 | |||||
| RUSSIA |
|||||
| Yukos [ADR] |
42,200 | 109,720 | |||
| SPAIN — 2.6% |
|||||
| Altadis SA |
85,800 | 3,930,216 | |||
| Banco Popular Espanol SA |
90,600 | 5,972,679 | |||
| 9,902,895 | |||||
| SWEDEN — 0.5% |
|||||
| Ericsson, (L.M.) |
|||||
| Telefonaktiebolaget (Class “B” Stock) |
627,000 | 2,000,241 | |||
| SWITZERLAND — 10.1% |
|||||
| Adecco SA |
81,100 | 4,083,172 | |||
| Holcim Ltd. |
74,128 | 4,465,542 | |||
| Nestle SA |
23,800 | 6,226,805 | |||
| Novartis AG |
131,800 | 6,641,579 | |||
| Roche Holding AG |
55,900 | 6,435,063 | |||
| UBS AG |
82,700 | 6,934,698 | |||
| Zurich Financial Services AG |
22,000 | 3,668,279 | |||
| 38,455,138 | |||||
41
AST JPMORGAN INTERNATIONAL EQUITY PORTFOLIO
SCHEDULE OF INVESTMENTS (CONTINUED)
DECEMBER 31, 2004
| SHARES |
VALUE (NOTE 2) | ||||
| UNITED KINGDOM — 26.4% |
|||||
| Allied Domecq PLC |
257,200 | $ | 2,533,187 | ||
| Aviva PLC |
235,500 | 2,839,419 | |||
| Barclays PLC |
605,200 | 6,808,878 | |||
| BG Group PLC |
692,400 | 4,705,863 | |||
| British Land Co. PLC |
230,800 | 3,970,295 | |||
| Centrica PLC |
507,330 | 2,301,131 | |||
| GlaxoSmithKline PLC |
409,500 | 9,607,361 | |||
| HSBC Holdings PLC |
582,300 | 9,963,836 | |||
| Intercontinental Hotels Group PLC |
175,179 | 2,177,708 | |||
| Kingfisher PLC |
593,300 | 3,528,293 | |||
| National Grid Transco PLC |
389,000 | 3,704,335 | |||
| Reckitt Benckiser PLC |
103,700 | 3,133,737 | |||
| Royal Bank of Scotland Group PLC |
181,900 | 6,118,512 | |||
| Schroder PLC |
202,700 | 2,922,622 | |||
| Smith & Nephew PLC |
258,576 | 2,646,028 | |||
| Standard Chartered PLC |
175,900 | 3,270,728 | |||
| Tesco PLC |
1,069,100 | 6,604,134 | |||
| Vodafone Group PLC |
4,298,900 | 11,658,021 | |||
| William Morrison Supermarkets PLC |
1,381,000 | 5,488,365 | |||
| Wolseley PLC |
303,600 | 5,674,358 | |||
| 99,656,811 | |||||
| TOTAL INVESTMENTS — 90.2% |
342,549,280 | ||||
| OTHER ASSETS IN EXCESS OF LIABILITIES — 9.8% |
37,011,121 | ||||
| NET ASSETS — 100.0% |
$ | 379,560,401 | |||
42
AST JPMORGAN INTERNATIONAL EQUITY PORTFOLIO
SCHEDULE OF INVESTMENTS (CONTINUED)
DECEMBER 31, 2004
THE FOLLOWING ABBREVIATIONS ARE USED THROUGHOUT THE SCHEDULE OF INVESTMENTS:
| ADR | American Depository Receipt |
| GDR | Global Depository Receipt |
THE FOLLOWING ANNOTATION IS USED THROUGHOUT THE SCHEDULE OF INVESTMENTS:
| * | Non-income producing security. |
The industry classification of portfolio holdings and other assets in excess of liabilities shown as a percentage of net assets as of December 31, 2004 was as follows:
| Financial — Bank & Trust |
16.9 | % | |
| Oil & Gas |
8.9 | ||
| Pharmaceuticals |
8.6 | ||
| Building Materials |
6.2 | ||
| Telecommunications |
5.4 | ||
| Electronic Components & Equipment |
4.4 | ||
| Insurance |
3.9 | ||
| Food |
3.4 | ||
| Conglomerates |
3.2 | ||
| Automobile Manufacturers |
2.8 | ||
| Financial Services |
2.6 | ||
| Retail & Merchandising |
2.4 | ||
| Chemicals |
2.2 | ||
| Medical Supplies & Equipment |
1.9 | ||
| Office Equipment |
1.8 | ||
| Consumer Products & Services |
1.6 | ||
| Metals & Mining |
1.5 | ||
| Printing & Publishing |
1.4 | ||
| Semiconductors |
1.3 | ||
| Beverages |
1.2 | ||
| Commercial Services |
1.1 | ||
| Real Estate |
1.1 | ||
| Farming & Agriculture |
1.0 | ||
| Transportation |
1.0 | ||
| Utilities |
1.0 | ||
| Business Services |
0.7 | ||
| Broadcasting |
0.6 | ||
| Entertainment & Leisure |
0.6 | ||
| Hotels & Motels |
0.6 | ||
| Machinery & Equipment |
0.6 | ||
| Paper & Forest Products |
0.3 | ||
| 90.2 | |||
| Other assets in excess of liabilities |
9.8 | ||
| Total |
100.0 | % | |
See Notes to Financial Statements.
43
AST WILLIAM BLAIR INTERNATIONAL GROWTH PORTFOLIO
SCHEDULE OF INVESTMENTS
DECEMBER 31, 2004
| SHARES |
VALUE (NOTE 2) | ||||
| LONG-TERM INVESTMENTS — 98.9% |
|||||
| COMMON STOCK — 97.6% |
|||||
| AUSTRALIA — 4.3% |
|||||
| Macquarie Bank Ltd. |
704,400 | $ | 25,676,390 | ||
| Toll Holdings Ltd. |
1,131,600 | 11,345,539 | |||
| Wesfarmers Ltd. |
679,700 | 21,206,158 | |||
| 58,228,087 | |||||
| AUSTRIA — 2.1% |
|||||
| Erste Bank der Oesterreichischen Sparkassen AG |
534,200 | 28,536,170 | |||
| BERMUDA — 2.0% |
|||||
| Accenture Ltd. (Class “A” Stock)* |
983,200 | 26,546,400 | |||
| CANADA — 6.2% |
|||||
| Alimentation Couche-Tard, Inc. (Class “B” Stock)* |
207,700 | 6,153,946 | |||
| Canadian National Railway Co. |
219,000 | 13,355,865 | |||
| Manulife Financial Corp. |
283,200 | 13,094,587 | |||
| Precision Drilling Corp.* |
150,100 | 9,460,879 | |||
| Research in Motion Ltd.* |
191,500 | 15,787,981 | |||
| Shoppers Drug Mart Corp.* |
257,600 | 8,012,980 | |||
| Suncor Energy, Inc. |
490,600 | 17,361,299 | |||
| 83,227,537 | |||||
| CHINA — 1.3% |
|||||
| CNOOC Ltd. |
33,738,500 | 18,122,176 | |||
| FRANCE — 7.3% |
|||||
| Dassault Systemes SA |
264,100 | 13,318,078 | |||
| Essilor International SA |
187,400 | 14,684,804 | |||
| Hermes International Designs |
33,800 | 6,744,380 | |||
| JC Decaux SA* |
273,200 | 7,976,534 | |||
| LVMH Moet Hennessy Louis Vuitton SA |
91,998 | 7,046,469 | |||
| Sanofi-Aventis |
597,800 | 47,778,496 | |||
| 97,548,761 | |||||
| GERMANY — 10.3% |
|||||
| Celesio AG |
338,900 | 27,565,279 | |||
| Continental AG |
340,740 | 21,643,034 | |||
| Depfa Bank PLC |
110,745 | 1,859,047 | |||
| E.ON AG |
376,100 | 34,281,998 | |||
| Puma AG Rudolf Dassler Sport |
35,510 | 9,764,405 | |||
| SAP AG |
240,570 | 42,967,104 | |||
| 138,080,867 | |||||
| GREECE — 2.6% |
|||||
| Coca-Cola Hellenic Bottling Co. SA |
320,500 | 7,832,799 | |||
| EFG Eurobank Ergasias SA |
384,000 | 13,194,944 | |||
| National Bank of Greece SA |
417,660 | 13,783,858 | |||
| 34,811,601 | |||||
| HONG KONG — 5.1% |
|||||
| Esprit Holdings Ltd. |
2,379,000 | 14,385,349 | |||
| Li & Fung Ltd. |
1,040,000 | 1,752,801 | |||
| Standard Chartered PLC |
2,070,430 | 38,498,089 | |||
| Techtronic Industries Co. Ltd. |
6,234,660 | 13,595,982 | |||
| 68,232,221 | |||||
| HUNGARY — 0.9% |
|||||
| OTP Bank Rt |
375,000 | 11,557,638 | |||
| INDIA — 1.8% |
|||||
| HDFC Bank Ltd. |
592,400 | 7,070,778 | |||
| Infosys Technologies Ltd. |
353,136 | 16,970,350 | |||
| 24,041,128 | |||||
| IRELAND — 0.9% |
|||||
| Anglo Irish Bank Corp. PLC |
513,922 | 12,477,620 | |||
| ISRAEL — 0.1% |
|||||
| Teva Pharmaceutical Industries Ltd. [ADR] |
67,247 | 2,007,995 | |||
| ITALY — 1.5% |
|||||
| Banco Popolare di Verona e Novara Scrl |
1,021,700 | 20,775,631 | |||
| JAPAN — 20.1% |
|||||
| Askul Corp. |
88,700 | 5,453,401 | |||
| Canon, Inc. |
782,400 | 42,223,793 | |||
| Denso Corp. |
1,192,700 | 31,950,440 | |||
| Fast Retailing Co. Ltd. |
180,100 | 13,709,183 | |||
| Hino Motors Ltd. |
2,072,000 | 15,387,840 | |||
| Hoya Corp. |
173,200 | 19,556,202 | |||
| Keyence Corp. |
61,300 | 13,735,220 | |||
| Nidec Corp. |
110,000 | 13,407,827 | |||
| Orix Corp. |
155,100 | 21,069,503 | |||
| Sharp Corp. |
1,889,100 | 30,842,825 | |||
| Shinsei Bank Ltd. |
1,978,000 | 13,473,641 | |||
| SMC Corp. |
121,600 | 13,919,859 | |||
| Sumitomo Trust & Banking Co. Ltd. |
2,960,000 | 21,404,899 | |||
| Toto Ltd. |
594,000 | 5,669,289 | |||
| Yamada Denki Co. Ltd. |
212,000 | 9,082,463 | |||
| 270,886,385 | |||||
| KOREA — 4.4% |
|||||
| Hyundai Motor Co. Ltd.* |
472,490 | 25,331,525 | |||
| Samsung Electronics Co. Ltd. |
76,980 | 33,500,280 | |||
| 58,831,805 | |||||
| MEXICO — 2.2% |
|||||
| America Movil (Class “L” Stock) [ADR] |
89,840 | 4,703,124 | |||
| America Movil SA de CV |
4,311,600 | 11,329,215 | |||
| Wal-Mart de Mexico SA de CV |
3,922,500 | 13,477,326 | |||
| 29,509,665 | |||||
44
AST WILLIAM BLAIR INTERNATIONAL GROWTH PORTFOLIO
SCHEDULE OF INVESTMENTS (CONTINUED)
DECEMBER 31, 2004
| SHARES |
VALUE (NOTE 2) | ||||
| NORWAY — 2.0% |
|||||
| Statoil ASA |
1,719,600 | $ | 26,972,336 | ||
| RUSSIA — 0.4% |
|||||
| Mobile Telesystems [ADR] |
39,018 | 5,404,383 | |||
| SOUTH AFRICA — 1.4% |
|||||
| MTN Group Ltd. |
302,990 | 2,339,483 | |||
| Standard Bank Group Ltd. |
1,366,402 | 15,959,042 | |||
| 18,298,525 | |||||
| SPAIN — 0.9% |
|||||
| Grupo Ferrovial SA |
231,100 | 12,351,301 | |||
| SWEDEN — 2.4% |
|||||
| Ericsson, (L.M.) Telefonaktiebolaget (Class “B” Stock) |
9,933,070 | 31,688,248 | |||
| SWITZERLAND — 3.2% |
|||||
| Nestle SA |
16,740 | 4,379,694 | |||
| Serono SA (Class “B” Stock) |
18,600 | 12,251,693 | |||
| Synthes, Inc.* |
24,000 | 2,691,056 | |||
| UBS AG |
276,460 | 23,182,184 | |||
| 42,504,627 | |||||
| UNITED KINGDOM — 14.2% |
|||||
| BG Group PLC |
5,576,500 | 37,900,415 | |||
| British Sky Broadcasting Group PLC |
212,290 | 2,290,577 | |||
| Capita Group PLC |
2,407,700 | 16,906,967 | |||
| Carnival PLC |
573,210 | 34,974,108 | |||
| Man Group PLC |
241,545 | 6,826,292 | |||
| Next PLC |
418,590 | 13,260,252 | |||
| Reckitt Benckiser PLC |
1,102,685 | 33,322,317 | |||
| Smith & Nephew PLC |
259,000 | 2,650,367 | |||
| Tesco PLC |
6,883,790 | 42,523,123 | |||
| 190,654,418 | |||||
| TOTAL COMMON STOCK |
1,311,295,525 | ||||
| PREFERRED STOCK — 1.3% |
|||||
| BRAZIL |
|||||
| Banco Itau Holding Financeira SA |
115,940 | 17,417,191 | |||
| TOTAL LONG-TERM INVESTMENTS |
1,328,712,716 | ||||
| TOTAL INVESTMENTS — 98.9% |
1,328,712,716 | ||||
| OTHER ASSETS IN EXCESS OF LIABILITIES — 1.1% |
14,166,087 | ||||
| NET ASSETS — 100.0% |
$ | 1,342,878,803 | |||
THE FOLLOWING ABBREVIATIONS ARE USED THROUGHOUT THE SCHEDULE OF INVESTMENTS:
| ADR | American Depository Receipt |
THE FOLLOWING ANNOTATION IS USED THROUGHOUT THE SCHEDULE OF INVESTMENTS:
| * | Non-income producing security. |
The industry classification of portfolio holdings and other assets in excess of liabilities shown as a percentage of net assets as of December 31, 2004 was as follows:
| Financial — Bank & Trust |
16.8 | % | |
| Oil & Gas |
8.2 | ||
| Pharmaceuticals |
7.7 | ||
| Electronic Components & Equipment |
5.8 | ||
| Retail & Merchandising |
5.2 | ||
| Computer Services & Software |
4.5 | ||
| Telecommunications |
4.1 | ||
| Automotive Parts |
4.0 | ||
| Financial Services |
4.0 | ||
| Medical Supplies & Equipment |
3.9 | ||
| Food |
3.5 | ||
| Conglomerates |
3.3 | ||
| Office Equipment |
3.1 | ||
| Automobile Manufacturers |
3.0 | ||
| Business Services |
3.0 | ||
| Consumer Products & Services |
2.9 | ||
| Entertainment & Leisure |
2.6 | ||
| Utilities |
2.5 | % | |
| Machinery & Equipment |
2.0 | ||
| Transportation |
1.8 | ||
| Commercial Services |
1.3 | ||
| Clothing & Apparel |
1.2 | ||
| Computer Hardware |
1.2 | ||
| Insurance |
1.0 | ||
| Construction |
0.9 | ||
| Advertising |
0.6 | ||
| Beverages |
0.6 | ||
| Broadcasting |
0.2 | ||
| 98.9 | |||
| Other assets in excess of liabilities |
1.1 | ||
| Total |
100.0 | % | |
See Notes to Financial Statements.
45
AST LSV INTERNATIONAL VALUE PORTFOLIO
SCHEDULE OF INVESTMENTS
DECEMBER 31, 2004
| SHARES |
VALUE (NOTE 2) | ||||
| LONG-TERM INVESTMENTS — 96.7% |
|||||
| COMMON STOCK |
|||||
| AUSTRALIA — 4.0% |
|||||
| Bluescope Steel Ltd. |
209,900 | $ | 1,357,463 | ||
| CSR Ltd. |
539,900 | 1,125,788 | |||
| David Jones Ltd. |
598,000 | 1,040,677 | |||
| Santos Ltd. |
217,300 | 1,444,499 | |||
| Suncorp-Metway Ltd. |
97,800 | 1,332,448 | |||
| Telstra Corp. Ltd. |
368,600 | 1,418,726 | |||
| 7,719,601 | |||||
| AUSTRIA — 0.4% |
|||||
| Boehler-Uddeholm AG |
6,000 | 758,298 | |||
| BELGIUM — 1.3% |
|||||
| Dexia |
111,000 | 2,552,834 | |||
| DENMARK — 1.0% |
|||||
| Danisco AS |
12,400 | 756,795 | |||
| Danske Bank AS |
38,400 | 1,177,075 | |||
| 1,933,870 | |||||
| FINLAND — 1.3% |
|||||
| Rautaruukki OYJ |
83,600 | 993,155 | |||
| Sampo OYJ |
109,700 | 1,514,954 | |||
| 2,508,109 | |||||
| FRANCE — 8.9% |
|||||
| BNP Paribas SA |
46,200 | 3,347,099 | |||
| Bouygues SA |
42,400 | 1,959,494 | |||
| Ciments Francais SA |
8,400 | 785,538 | |||
| CNP Assurances |
25,800 | 1,848,117 | |||
| Compagnie Generale des Establissements Michelen (Class “B” Stock) |
31,200 | 2,001,261 | |||
| Natexis Banques Populaires |
5,700 | 780,196 | |||
| PSA Peugeot Citroen SA |
26,200 | 1,663,096 | |||
| Renault SA |
16,100 | 1,346,955 | |||
| Suez SA |
104,500 | 2,786,856 | |||
| Total SA |
3,400 | 742,667 | |||
| 17,261,279 | |||||
| GERMANY — 6.8% |
|||||
| BASF AG |
42,500 | 3,061,710 | |||
| Deutsche Bank AG |
35,700 | 3,169,667 | |||
| Fresenius AG |
9,800 | 916,860 | |||
| MAN AG |
34,700 | 1,336,683 | |||
| Rheinmetall AG |
15,000 | 782,928 | |||
| Salzgitter AG |
56,300 | 1,090,492 | |||
| Schering AG |
13,600 | 1,016,904 | |||
| ThyssenKrup AG |
85,700 | 1,887,101 | |||
| 13,262,345 | |||||
| HONG KONG — 1.7% |
|||||
| Chaoda Modern Agriculture Holdings Ltd. |
1,976,000 | 730,891 | |||
| CNOOC Ltd. |
1,349,000 | 724,597 | |||
| Orient Overseas International Ltd. |
277,552 | 1,051,618 | |||
| Shanghai Industrial Holdings Ltd. |
368,000 | 785,930 | |||
| 3,293,036 | |||||
| IRELAND — 1.1% |
|||||
| Allied Irish Banks PLC |
103,500 | 2,159,474 | |||
| ITALY — 4.2% |
|||||
| Benetton Group SpA |
61,200 | 809,401 | |||
| Enel SpA |
215,000 | 2,112,886 | |||
| Eni SpA |
133,200 | 3,334,978 | |||
| Parmalat Finanziaria SpA* (cost $1,180,359; purchased 04/11/02-11/25/03)(g) |
448,250 | 67,021 | |||
| Riunione Adriatica di Sicurta SpA |
83,400 | 1,886,334 | |||
| 8,210,620 | |||||
| JAPAN — 21.0% |
|||||
| Alpine Electronics, Inc. |
72,600 | 976,313 | |||
| Alps Electric Co. Ltd. |
61,900 | 922,429 | |||
| Asahi Breweries Ltd. |
63,800 | 790,106 | |||
| CMK Corp. |
56,000 | 792,974 | |||
| Cosmo Oil Co. Ltd. |
332,000 | 981,712 | |||
| Denki Kagaku Kogyo Kabushiki Kaisha |
328,000 | 1,091,519 | |||
| Hitachi Koki Co. Ltd. |
127,000 | 1,122,885 | |||
| Hitachi Ltd. |
393,000 | 2,723,041 | |||
| Hokkaido Electric Power Co., Inc. |
57,900 | 1,138,563 | |||
| Hokuetsu Paper Mills Ltd. |
179,000 | 1,009,681 | |||
| Honda Motor Co. Ltd. |
35,900 | 1,860,340 | |||
| Hosiden Corp. |
95,500 | 1,057,797 | |||
| Japan Securities Finance Co. Ltd. |
112,000 | 729,033 | |||
| Kaken Pharmaceutical Co. Ltd. |
136,000 | 895,872 | |||
| Marubeni Corp. |
507,000 | 1,405,172 | |||
| Mitsubishi Chemical Corp. |
463,000 | 1,409,739 | |||
| Nippon Telegraph and Telephone Corp. |
600 | 2,693,471 | |||
| Nipro Corp. |
46,800 | 784,187 | |||
| Nissan Motor Co. Ltd. |
212,000 | 2,304,753 | |||
| NSK Ltd. |
286,000 | 1,437,396 | |||
| Okasan Holdings, Inc. |
191,000 | 1,064,321 | |||
| Osaka Gas Co. Ltd. |
447,700 | 1,398,107 | |||
| Rengo Co. Ltd. |
215,000 | 965,161 | |||
| Sumitomo Osaka Cement Co. Ltd. |
411,200 | 1,007,233 | |||
| Sumitomo Trust & Banking Co. Ltd. |
109,000 | 788,221 | |||
| Taiheiyo Cement Corp. |
288,100 | 716,946 | |||
| Takefuji Corp. |
27,300 | 1,846,287 | |||
| Tanabe Seiyaku Co. Ltd. |
107,000 | 1,102,684 | |||
| Tostem Inax Holding Corp. |
41,500 | 753,699 | |||
| Toyota Motor Corp. |
103,800 | 4,224,123 | |||
| UNY Co. Ltd. |
66,000 | 754,231 | |||
| 40,747,996 | |||||
| LIECHTENSTEIN — 0.6% |
|||||
| Verwaltungs Und Privat Bank AG |
6,500 | 1,068,947 | |||
46
AST LSV INTERNATIONAL VALUE PORTFOLIO
SCHEDULE OF INVESTMENTS (CONTINUED)
DECEMBER 31, 2004
| SHARES |
VALUE (NOTE 2) | |||||
| NETHERLANDS — 5.1% |
||||||
| ABN AMRO Holding NV |
79,900 | $ | 2,116,693 | |||
| ING Groep NV |
112,800 | 3,412,978 | ||||
| Koninklijke (Royal) KPN NV |
130,800 | 1,242,751 | ||||
| Koninklijke Luchtvaart Maatschappij NV* (cost $512,052; purchased 03/18/04)(g) |
24,790 | 366,273 | ||||
| Royal Dutch Petroleum Co. |
48,900 | 2,814,891 | ||||
| 9,953,586 | ||||||
| NORWAY — 0.7% |
||||||
| Norsk Hydro ASA |
17,800 | 1,401,864 | ||||
| PORTUGAL — 0.6% |
||||||
| Energias de Portugal SA |
375,900 | 1,139,401 | ||||
| SINGAPORE — 0.7% |
||||||
| Mobileone Ltd. |
608,220 | 678,118 | ||||
| Singapore Telecommunications Ltd. |
501,000 | 730,446 | ||||
| 1,408,564 | ||||||
| SPAIN — 3.7% |
||||||
| Banco Santander Central Hispano SA |
93,300 | 1,157,848 | ||||
| Compania Espanola de Petroleos SA |
19,600 | 791,246 | ||||
| Endesa SA |
115,600 | 2,716,765 | ||||
| Repsol YPF SA |
43,700 | 1,138,089 | ||||
| Union Fenosa SA |
50,400 | 1,325,595 | ||||
| 7,129,543 | ||||||
| SWEDEN — 2.6% |
||||||
| Billerud Aktiebolag |
59,700 | 1,064,563 | ||||
| Nordea Bank AB |
266,700 | 2,688,913 | ||||
| Skanska AB |
100,000 | 1,200,078 | ||||
| 4,953,554 | ||||||
| SWITZERLAND — 6.0% |
||||||
| Ciba Specialty Chemicals AG |
19,300 | 1,468,165 | ||||
| Georg Fischer AG |
3,400 | 880,573 | ||||
| Rieter Holdings AG |
3,700 | 1,073,784 | ||||
| Sulzer AG |
2,400 | 954,533 | ||||
| Swisscom AG |
1,900 | 748,571 | ||||
| UBS AG |
56,000 | 4,695,805 | ||||
| Zurich Financial Services AG |
10,500 | 1,750,770 | ||||
| 11,572,201 | ||||||
| UNITED KINGDOM — 25.0% |
||||||
| Arriva PLC |
117,900 | 1,222,325 | ||||
| Aviva PLC |
232,500 | 2,803,248 | ||||
| BAE Systems PLC |
185,100 | 819,137 | ||||
| Barclays PLC |
328,900 | 3,700,330 | ||||
| Big Food Group PLC |
421,100 | 759,962 | ||||
| Boots Group PLC |
152,000 | 1,912,913 | ||||
| Bradford & Bingley PLC |
239,600 | 1,544,478 | ||||
| Britannic Group PLC |
134,600 | 1,178,390 | ||||
| British Vita PLC |
203,600 | 1,055,408 | ||||
| BT Group PLC |
725,200 | 2,826,395 | ||||
| Dixons Group PLC |
456,200 | 1,331,306 | ||||
| Firstgroup PLC |
170,600 | 1,142,279 | ||||
| GlaxoSmithKline PLC |
48,600 | 1,140,214 | ||||
| HBOS PLC |
213,700 | 3,479,200 | ||||
| Kelda Group PLC |
138,900 | 1,686,715 | ||||
| Lloyds TSB Group PLC |
373,600 | 3,392,712 | ||||
| Mitchells & Butlers PLC |
246,500 | 1,609,070 | ||||
| Northern Foods PLC |
341,400 | 1,122,466 | ||||
| Northumbrian Water Group PLC |
367,500 | 1,245,320 | ||||
| Old Mutual PLC |
714,900 | 1,818,612 | ||||
| Pilkington PLC |
544,700 | 1,150,348 | ||||
| Scottish Power PLC |
267,500 | 2,070,986 | ||||
| Severn Trent PLC |
86,000 | 1,596,629 | ||||
| Shanks Group PLC |
409,400 | 1,092,551 | ||||
| Shell Transport & Trading Co. PLC |
457,500 | 3,899,897 | ||||
| Tate & Lyle PLC |
78,100 | 708,862 | ||||
| TT Electronics PLC |
267,500 | 991,197 | ||||
| Viridian Group PLC |
72,300 | 1,013,305 | ||||
| 48,314,255 | ||||||
| TOTAL LONG-TERM INVESTMENTS |
187,349,377 | |||||
| PRINCIPAL AMOUNT (000) |
||||||
| SHORT-TERM INVESTMENT — 0.3% |
||||||
| U.S. TREASURY OBLIGATIONS |
||||||
| U.S. Treasury Bills |
||||||
| 1.87%, 01/27/05 (Cost $499,325) |
$ | 500 | 499,343 | |||
| TOTAL INVESTMENTS — 97.0% |
187,848,720 | |||||
| OTHER ASSETS IN EXCESS OF LIABILITIES — 3.0% |
5,818,199 | |||||
| NET ASSETS — 100.0% |
$ | 193,666,919 | ||||
47
AST LSV INTERNATIONAL VALUE PORTFOLIO
SCHEDULE OF INVESTMENTS (CONTINUED)
DECEMBER 31, 2004
THE FOLLOWING ANNOTATIONS ARE USED THROUGHOUT THE SCHEDULE OF INVESTMENTS:
| * | Non-income producing security. |
| (g) | Indicates a security that has been deemed illiquid. The aggregate cost of illiquid securities is $1,692,411. The aggregate value, $433,294, represents 0.22% of net assets. |
The industry classification of long-term portfolio holdings, short-term investments, and other assets in excess of liabilities shown as a percentage of net assets as of December 31, 2004 was as follows:
| Financial — Bank & Trust |
20.2 | % | |
| Utilities |
9.7 | ||
| Oil & Gas |
9.6 | ||
| Insurance |
7.6 | ||
| Automobile Manufacturers |
5.9 | ||
| Telecommunications |
5.9 | ||
| Chemicals |
4.2 | ||
| Metals & Mining |
3.9 | ||
| Retail & Merchandising |
3.8 | ||
| Electronic Components & Equipment |
3.3 | ||
| Building Materials |
2.9 | ||
| Financial Services |
2.7 | ||
| Pharmaceuticals |
2.1 | ||
| Transportation |
1.7 | ||
| Construction |
1.6 | ||
| Machinery & Equipment |
1.6 | ||
| Automotive Parts |
1.5 | ||
| Food |
1.4 | ||
| Paper & Forest Products |
1.0 | ||
| Business Services |
0.7 | ||
| Environmental Services |
0.6 | ||
| Finance — Brokerage |
0.6 | ||
| Industrial Products |
0.6 | ||
| Entertainment & Leisure |
0.5 | ||
| Healthcare Services |
0.5 | ||
| Aerospace |
0.4 | ||
| Beverages |
0.4 | ||
| Clothing & Apparel |
0.4 | ||
| Conglomerates |
0.4 | ||
| Farming & Agriculture |
0.4 | ||
| Medical Supplies & Equipment |
0.4 | ||
| Short-Term Investments |
0.3 | ||
| Airlines |
0.2 | ||
| 97.0 | |||
| Other assets in excess of liabilities |
3.0 | ||
| Total |
100.0 | % | |
See Notes to Financial Statements.
48
AST MFS GLOBAL EQUITY PORTFOLIO
SCHEDULE OF INVESTMENTS
DECEMBER 31, 2004
| SHARES |
VALUE (NOTE 2) | ||||
| LONG-TERM INVESTMENTS — 96.2% |
|||||
| COMMON STOCK |
|||||
| AUSTRALIA — 0.8% |
|||||
| QBE Insurance Group Ltd. |
110,153 | $ | 1,325,459 | ||
| AUSTRIA — 1.0% |
|||||
| Erste Bank der Oesterreichischen Sparkassen AG |
31,740 | 1,695,504 | |||
| BRAZIL – 0.4% |
|||||
| Brasil Telecom Participacoes SA [ADR] |
17,130 | 653,510 | |||
| CANADA — 2.5% |
|||||
| BCE, Inc. |
32,789 | 791,435 | |||
| Canadian National Railway Co. |
22,831 | 1,398,399 | |||
| EnCana Corp. |
32,840 | 1,874,770 | |||
| 4,064,604 | |||||
| FRANCE — 9.2% |
|||||
| Axa SA |
90,580 | 2,238,337 | |||
| Business Objects SA* |
28,560 | 721,279 | |||
| Groupe Danone SA |
5,700 | 526,458 | |||
| L’Air Liquide SA |
21,748 | 4,020,290 | |||
| Sanofi-Synthelabo SA |
34,600 | 2,765,366 | |||
| Schneider Electric SA |
23,597 | 1,642,200 | |||
| Total SA |
10,650 | 2,326,295 | |||
| Veolia Environnement |
29,920 | 1,083,009 | |||
| 15,323,234 | |||||
| GERMANY — 2.0% |
|||||
| Bayerische Motoren Werke AG |
35,340 | 1,594,791 | |||
| Schering AG |
23,110 | 1,727,989 | |||
| 3,322,780 | |||||
| HONG KONG — 1.1% |
|||||
| Esprit Holdings Ltd. |
151,500 | 916,091 | |||
| Hutchison Telecommunications International Ltd.* |
1,041,000 | 937,512 | |||
| 1,853,603 | |||||
| HUNGARY — 0.8% |
|||||
| OTP Bank [GDR] |
19,880 | 1,225,417 | |||
| IRELAND — 0.4% |
|||||
| Irish Life & Permanent PLC |
36,420 | 683,153 | |||
| ITALY — 1.0% |
|||||
| Riunione Adriatica di Sicurta SpA |
72,180 | 1,632,561 | |||
| JAPAN — 9.7% |
|||||
| Asahi Glass Co. Ltd. |
29,000 | 319,801 | |||
| Bridgestone Corp. |
75,000 | 1,493,120 | |||
| Canon, Inc. |
47,000 | 2,536,450 | |||
| Chugai Pharmaceutical Co. Ltd. |
66,100 | 1,092,743 | |||
| KDDI Corp. |
157 | 845,750 | |||
| Nintendo Co. Ltd. |
13,800 | 1,732,161 | |||
| Nitto Denko Corp. |
33,600 | 1,842,803 | |||
| NOK Corp. |
26,000 | 814,482 | |||
| Sekisui Chemical Co. Ltd. |
120,000 | 877,135 | |||
| Shinsei Bank Ltd. |
123,000 | 837,845 | |||
| Tokyo Broadcasting System, Inc. |
44,700 | 728,932 | |||
| Tokyo Gas Co. Ltd. |
204,000 | 836,147 | |||
| Toray Industries, Inc. |
155,000 | 726,066 | |||
| Toyota Motor Corp. |
36,700 | 1,493,501 | |||
| 16,176,936 | |||||
| KOREA — 1.3% |
|||||
| Samsung Electronics Co. Ltd. |
5,040 | 2,193,315 | |||
| NETHERLANDS — 0.9% |
|||||
| Reed Elsevier NV |
107,710 | 1,468,440 | |||
| POLAND — 0.3% |
|||||
| Powszechna Kasa Oszczednosci Bank Polski SA* |
49,300 | 457,548 | |||
| SINGAPORE — 2.1% |
|||||
| DBS Group Holdings Ltd. |
146,500 | 1,444,897 | |||
| Singapore Telecommunications Ltd. |
767,357 | 1,118,788 | |||
| United Overseas Bank Ltd. |
113,000 | 955,281 | |||
| 3,518,966 | |||||
| SPAIN — 3.7% |
|||||
| Banco Bilbao Vizcaya Argentaria SA |
96,210 | 1,706,593 | |||
| Iberdrola SA |
71,870 | 1,826,789 | |||
| Telefonica SA |
142,586 | 2,686,207 | |||
| 6,219,589 | |||||
| SWEDEN — 5.2% |
|||||
| Atlas Copco AB (Class “A” Stock) |
46,300 | 2,090,168 | |||
| Ericsson, (L.M.) Telefonaktiebolaget (Class “B” Stock) |
527,290 | 1,682,148 | |||
| Hennes & Mauritz AB (Class “B” Stock) |
51,700 | 1,801,028 | |||
| Sandvik AB |
74,910 | 3,021,019 | |||
| 8,594,363 | |||||
| SWITZERLAND — 6.3% |
|||||
| Nestle SA |
6,400 | 1,674,435 | |||
| Novartis AG |
32,270 | 1,626,129 | |||
| Roche Holding AG |
28,980 | 3,336,101 | |||
| Syngenta AG |
7,806 | 829,272 | |||
| Synthes, Inc.* |
3,250 | 364,414 | |||
| UBS AG |
32,208 | 2,700,759 | |||
| 10,531,110 | |||||
| UNITED KINGDOM — 15.1% |
|||||
| Amvescap PLC |
236,980 | 1,459,343 | |||
| AstraZeneca PLC |
48,860 | 1,772,003 | |||
| BOC Group PLC |
109,770 | 2,093,778 | |||
| BP PLC |
149,790 | 1,460,917 | |||
| British Sky Broadcasting Group PLC |
58,190 | 627,861 | |||
| Diageo PLC |
202,175 | 2,883,999 | |||
| Kingfisher PLC |
439,059 | 2,611,038 | |||
| Next PLC |
44,070 | 1,396,066 | |||
49
AST MFS GLOBAL EQUITY PORTFOLIO
SCHEDULE OF INVESTMENTS (CONTINUED)
DECEMBER 31, 2004
| SHARES |
VALUE (NOTE 2) | |||||
| Reckitt Benckiser PLC |
192,380 | $ | 5,813,579 | |||
| Royal Bank of Scotland Group PLC |
30,117 | 1,013,036 | ||||
| Vodafone Group PLC |
788,104 | 2,137,229 | ||||
| William Hill PLC |
168,860 | 1,828,458 | ||||
| 25,097,307 | ||||||
| UNITED STATES — 32.4% |
||||||
| Accenture Ltd. (Class “A” Stock)* |
108,570 | 2,931,390 | ||||
| Air Products & Chemicals, Inc. |
20,880 | 1,210,414 | ||||
| American Express Co. |
60,650 | 3,418,840 | ||||
| Burlington Northern Santa Fe Corp. |
33,030 | 1,562,649 | ||||
| Caremark Rx, Inc.* |
31,987 | 1,261,232 | ||||
| Cisco Systems, Inc.* |
40,700 | 785,510 | ||||
| Citigroup, Inc. |
49,660 | 2,392,619 | ||||
| Colgate-Palmolive Co. |
16,200 | 828,792 | ||||
| Dell, Inc.* |
64,220 | 2,706,231 | ||||
| Dentsply Corp. |
22,010 | 1,236,962 | ||||
| Disney, (Walt) Co. |
57,880 | 1,609,064 | ||||
| DST Systems, Inc.* |
41,850 | 2,181,222 | ||||
| EOG Resources, Inc. |
10,890 | 777,110 | ||||
| Fisher Scientific International, Inc.* |
36,010 | 2,246,304 | ||||
| Genzyme Corp.* |
35,090 | 2,037,676 | ||||
| Goldman Sachs Group, Inc. |
11,800 | 1,227,672 | ||||
| Janus Capital Group, Inc. |
43,680 | 734,261 | ||||
| Johnson & Johnson |
44,530 | 2,824,092 | ||||
| MBNA Corp. |
60,160 | 1,695,910 | ||||
| Medtronic, Inc. |
30,740 | 1,526,856 | ||||
| News Corp., Inc. — CDI (Class “B” Stock) |
97,713 | 1,877,402 | ||||
| Noble Corp.* |
32,220 | 1,602,623 | ||||
| Oracle Corp.* |
185,480 | 2,544,786 | ||||
| PepsiCo, Inc. |
20,170 | 1,052,874 | ||||
| Praxair, Inc. |
17,440 | 769,976 | ||||
| Symantec Corp.* |
32,020 | 824,835 | ||||
| The Home Depot, Inc. |
30,130 | 1,287,756 | ||||
| Thermo Electron Corp.* |
39,100 | 1,180,429 | ||||
| Time Warner, Inc.* |
88,490 | 1,720,246 | ||||
| TJX Cos., Inc. |
105,840 | 2,659,759 | ||||
| Viacom, Inc. (Class “B” Stock) |
60,720 | 2,209,601 | ||||
| Waters Corp.* |
20,910 | 978,379 | ||||
| 53,903,472 | ||||||
| TOTAL COMMON STOCK |
159,940,871 | |||||
| WARRANTS* |
||||||
| UNITED STATES |
||||||
| Lucent Technologies |
185 | 292 | ||||
| TOTAL LONG-TERM INVESTMENTS |
159,941,163 | |||||
| PRINCIPAL AMOUNT (000) |
||||||
| SHORT-TERM INVESTMENT — 3.8% |
||||||
| U.S. GOVERNMENT AGENCY OBLIGATIONS |
||||||
| Federal National Mortgage Assoc. |
||||||
| 1.25%, 01/03/05 (Cost $6,338,560) |
$ | 6,339 | 6,338,560 | |||
| TOTAL INVESTMENTS — 100.0% |
166,279,723 | |||||
| OTHER ASSETS IN EXCESS OF LIABILITIES |
38,902 | |||||
| NET ASSETS — 100.0% |
$ | 166,318,625 | ||||
THE FOLLOWING ABBREVIATIONS ARE USED THROUGHOUT THE SCHEDULE OF INVESTMENTS:
| ADR | American Depository Receipt |
| EUR | Euro |
| GDR | Global Depository Receipt |
THE FOLLOWING ANNOTATIONS ARE USED THROUGHOUT THE SCHEDULE OF INVESTMENTS:
| * | Non-income producing security. |
50
AST MFS GLOBAL EQUITY PORTFOLIO
SCHEDULE OF INVESTMENTS (CONTINUED)
DECEMBER 31, 2004
Foreign currency exchange contracts outstanding at December 31, 2004:
PURCHASE CONTRACT
| SETTLEMENT MONTH |
TYPE |
CONTRACTS TO RECEIVE |
IN EXCHANGE FOR |
CONTRACTS AT VALUE |
UNREALIZED APPRECIATION | ||||||||
| Jan 05 |
Buy EUR | 88,148 | $ | 119,611 | $ | 119,815 | $ | 204 | |||||
SALE CONTRACT
| SETTLEMENT MONTH |
TYPE |
CONTRACTS TO DELIVER |
IN EXCHANGE FOR |
CONTRACTS AT VALUE |
UNREALIZED APPRECIATION | ||||||||
| Jan 05 |
Sell EUR | 23,296 | $ | 31,735 | $ | 31,666 | $ | 69 | |||||
The industry classification of portfolio holdings and other assets in excess of liabilities shown as a percentage of net assets as of December 31, 2004 was as follows:
| Pharmaceuticals |
8.7 | % | |
| Financial Services |
7.0 | ||
| Telecommunications |
7.0 | ||
| Financial — Bank & Trust |
6.7 | ||
| Chemicals |
6.5 | ||
| Retail & Merchandising |
5.9 | ||
| Broadcasting |
5.3 | ||
| Oil & Gas |
5.3 | ||
| Machinery & Equipment |
4.1 | ||
| Consumer Products & Services |
4.0 | ||
| Electronic Components & Equipment |
4.0 | ||
| Medical Supplies & Equipment |
3.5 | ||
| Insurance |
3.1 | ||
| Computer Hardware |
2.9 | ||
| Beverages |
2.4 | ||
| Entertainment & Leisure |
2.1 | ||
| Computer Services & Software |
2.0 | ||
| Automobile Manufacturers |
1.9 | ||
| Business Services |
1.8 | ||
| Transportation |
1.8 | ||
| Utilities |
1.7 | ||
| Office Equipment |
1.5 | ||
| Automotive Parts |
1.4 | ||
| Food |
1.3 | ||
| Healthcare Services |
1.2 | ||
| Printing & Publishing |
0.9 | ||
| Conglomerates |
0.6 | ||
| Construction |
0.5 | ||
| Internet Services |
0.5 | ||
| Clothing & Apparel |
0.4 | ||
| Building Materials |
0.2 | ||
| Short-Term Investments |
3.8 | ||
| 100.0 | |||
| Other assets in excess of liabilities |
0.0 | ||
| Total |
100.0 | % | |
See Notes to Financial Statements.
51
AST STATE STREET RESEARCH SMALL-CAP GROWTH PORTFOLIO
SCHEDULE OF INVESTMENTS
DECEMBER 31, 2004
| SHARES |
VALUE (NOTE 2) | ||||
| LONG-TERM INVESTMENTS — 99.7% |
|||||
| COMMON STOCK |
|||||
| BROADCASTING — 1.3% |
|||||
| Citadel Broadcasting Co.* |
131,000 | $ | 2,119,580 | ||
| Entravision Communications Corp. (Class “A” Stock)* |
102,200 | 853,370 | |||
| 2,972,950 | |||||
| BUSINESS SERVICES — 6.3% |
|||||
| Advisory Board Co. (The)* |
37,300 | 1,375,624 | |||
| Corporate Executive Board Co. (The)(a) |
51,900 | 3,474,186 | |||
| LECG Corp.* |
177,800 | 3,315,970 | |||
| Resources Connection, Inc.*(a) |
111,000 | 6,028,410 | |||
| 14,194,190 | |||||
| COMPUTER HARDWARE — 0.7% |
|||||
| Mobility Electronics, Inc.* |
194,400 | 1,667,952 | |||
| COMPUTER SERVICES & SOFTWARE — 9.5% |
|||||
| Anteon International Corp.* |
122,000 | 5,106,920 | |||
| BEA Systems, Inc.* |
324,300 | 2,873,298 | |||
| CACI International, Inc. (Class “A” Stock)* |
60,600 | 4,128,678 | |||
| Epicor Software Corp.* |
102,100 | 1,438,589 | |||
| Hyperion Solutions Corp.* |
71,200 | 3,319,344 | |||
| Quest Software, Inc.* |
83,200 | 1,327,040 | |||
| Sybase, Inc.* |
162,500 | 3,241,875 | |||
| 21,435,744 | |||||
| CONSUMER PRODUCTS & SERVICES — 1.5% |
|||||
| Aaron Rents, Inc.(a) |
136,550 | 3,413,750 | |||
| ELECTRONIC COMPONENTS & EQUIPMENT — 4.1% |
|||||
| ESCO Technologies, Inc.* |
14,900 | 1,142,085 | |||
| Essex Corp.* |
40,200 | 814,050 | |||
| Harman International Industries, Inc.(a) |
47,800 | 6,070,600 | |||
| Teradyne, Inc.*(a) |
77,300 | 1,319,511 | |||
| 9,346,246 | |||||
| ENTERTAINMENT & LEISURE — 8.1% |
|||||
| Boyd Gaming Corp. |
154,100 | 6,418,265 | |||
| Pinnacle Entertainment, Inc.* |
258,300 | 5,109,174 | |||
| Shuffle Master, Inc.*(a) |
54,000 | 2,543,400 | |||
| Station Casinos, Inc.(a) |
76,600 | 4,188,488 | |||
| 18,259,327 | |||||
| FINANCIAL — BANK & TRUST — 4.3% |
|||||
| East West Bancorp, Inc. |
46,900 | 1,967,924 | |||
| Southwest Bancorporation of Texas, Inc. |
156,700 | 3,649,543 | |||
| UCBH Holdings, Inc. |
91,600 | 4,197,112 | |||
| 9,814,579 | |||||
| FINANCIAL SERVICES — 5.6% |
|||||
| Affiliated Managers Group, Inc.* |
93,500 | 6,333,690 | |||
| Capital Source, Inc.*(a) |
166,600 | 4,276,622 | |||
| Collegiate Funding Services* |
137,900 | 1,943,011 | |||
| 12,553,323 | |||||
| HEALTHCARE SERVICES — 6.5% |
|||||
| AmSurg Corp.*(a) |
46,900 | 1,385,426 | |||
| Community Health Systems, Inc.* |
111,800 | 3,116,984 | |||
| Cooper Companies, Inc. (The)(a) |
32,700 | 2,308,293 | |||
| LifePoint Hospitals, Inc.* |
93,400 | 3,252,188 | |||
| United Surgical Partners International, Inc.* |
110,100 | 4,591,170 | |||
| 14,654,061 | |||||
| INSURANCE — 1.2% |
|||||
| Bristol West Holdings, Inc. |
131,700 | 2,634,000 | |||
| INTERNET SERVICES — 2.5% |
|||||
| Ask Jeeves, Inc.*(a) |
106,300 | 2,843,525 | |||
| Avocent Corp.* |
40,100 | 1,624,852 | |||
| Jupitermedia Corp.* |
50,900 | 1,210,402 | |||
| 5,678,779 | |||||
| MEDICAL SUPPLIES & EQUIPMENT — 10.6% |
|||||
| Advanced Medical Optics, Inc.*(a) |
99,700 | 4,101,658 | |||
| Animas Corp.* |
96,700 | 1,511,421 | |||
| Cutera, Inc.* |
137,750 | 1,719,120 | |||
| Inamed Corp.* |
68,300 | 4,319,975 | |||
| Invitrogen Corp.*(a) |
40,100 | 2,691,913 | |||
| LCA-Vision, Inc. |
83,850 | 1,961,252 | |||
| Martek Biosciences Corp.*(a) |
79,600 | 4,075,520 | |||
| Protein Design Labs, Inc.* |
112,600 | 2,326,316 | |||
| Wright Medical Group, Inc.* |
45,800 | 1,305,300 | |||
| 24,012,475 | |||||
| METALS & MINING — 1.5% |
|||||
| AK Steel Holding Corp.*(a) |
84,300 | 1,219,821 | |||
| CONSOL Energy, Inc. |
51,300 | 2,105,865 | |||
| 3,325,686 | |||||
| OIL & GAS — 4.0% |
|||||
| Cabot Oil & Gas Corp. |
25,700 | 1,137,225 | |||
| Newpark Resources, Inc.* |
371,100 | 1,911,165 | |||
| Patterson-UTI Energy, Inc. |
81,600 | 1,587,120 | |||
| Pride International, Inc.*(a) |
146,700 | 3,013,218 | |||
| Tidewater, Inc.(a) |
36,500 | 1,299,765 | |||
| 8,948,493 | |||||
| PERSONAL SERVICES — 1.6% |
|||||
| Laureate Education, Inc.* |
83,300 | 3,672,697 | |||
52
AST STATE STREET RESEARCH SMALL-CAP GROWTH PORTFOLIO
SCHEDULE OF INVESTMENTS (CONTINUED)
DECEMBER 31, 2004
| SHARES |
VALUE (NOTE 2) |
||||||
| PHARMACEUTICALS — 4.2% |
|||||||
| Abgenix, Inc.* |
126,000 | $ | 1,302,840 | ||||
| Alkermes, Inc.*(a) |
158,700 | 2,236,083 | |||||
| Covance, Inc.* |
65,000 | 2,518,750 | |||||
| ICOS Corp.* |
63,600 | 1,798,608 | |||||
| MGI Pharma, Inc.* |
56,600 | 1,585,366 | |||||
| 9,441,647 | |||||||
| RESTAURANTS — 2.3% |
|||||||
| Applebee’s International, Inc. |
56,200 | 1,486,490 | |||||
| RARE Hospitality International, Inc.* |
114,100 | 3,635,226 | |||||
| 5,121,716 | |||||||
| RETAIL & MERCHANDISING — 4.3% |
|||||||
| Aeropostale, Inc.* |
53,800 | 1,583,334 | |||||
| Cost Plus, Inc.* |
30,600 | 983,178 | |||||
| Guitar Center, Inc.* |
71,600 | 3,772,604 | |||||
| West Marine, Inc.* |
133,600 | 3,306,600 | |||||
| 9,645,716 | |||||||
| SEMICONDUCTORS — 8.3% |
|||||||
| ATMI, Inc.* |
64,500 | 1,453,185 | |||||
| Cree, Inc.* |
34,700 | 1,390,776 | |||||
| Cymer, Inc.* |
117,900 | 3,482,766 | |||||
| Genesis Microchip, Inc. (Canada)* |
85,100 | 1,380,322 | |||||
| Helix Technology Corp. |
101,900 | 1,772,041 | |||||
| Mattson Technology, Inc.* |
120,700 | 1,359,082 | |||||
| Micrel, Inc.* |
121,800 | 1,342,236 | |||||
| Microsemi Corp.* |
194,000 | 3,367,840 | |||||
| NVIDIA Corp.* |
80,600 | 1,898,936 | |||||
| O2Micro International Ltd.* |
124,100 | 1,419,704 | |||||
| 18,866,888 | |||||||
| TELECOMMUNICATIONS — 11.3% |
|||||||
| Aeroflex, Inc.* |
138,900 | 1,683,468 | |||||
| American Tower Corp. (Class “A” Stock)*(a) |
355,500 | 6,541,199 | |||||
| Anaren, Inc.* |
133,100 | 1,724,976 | |||||
| Andrew Corp.* |
103,500 | 1,410,705 | |||||
| Ditech Communications Corp.* |
82,700 | 1,236,365 | |||||
| Polycom, Inc.* |
279,900 | 6,527,269 | |||||
| Scientific-Atlanta, Inc. |
59,300 | 1,957,493 | |||||
| SpectraLink Corp. |
225,200 | 3,193,336 | |||||
| SpectraSite, Inc.* |
26,800 | 1,551,720 | |||||
| 25,826,531 | |||||||
| TOTAL LONG-TERM INVESTMENTS |
225,486,750 | ||||||
| PRINCIPAL AMOUNT (000) |
|||||||
| SHORT-TERM INVESTMENTS — 22.8% |
|||||||
| CERTIFICATES OF DEPOSIT |
|||||||
| Canadian Imperial Bank of Commerce |
|||||||
| 2.372%, 01/31/05(b)(c) |
$ | 8 | 8,486 | ||||
| COMMERCIAL PAPER — 3.0% |
|||||||
| Citigroup, Inc. |
|||||||
| 2.304%, 01/10/05(b) |
2,777 | 2,771,056 | |||||
| UBS Finance, Inc. |
|||||||
| 2.20%, 01/03/05 |
4,020 | 4,019,508 | |||||
| 6,790,564 | |||||||
| CORPORATE OBLIGATIONS — 2.9% |
|||||||
| Bear Stearns |
|||||||
| 2.28%, 01/03/05(b)(c) |
1,000 | 1,000,037 | |||||
| Merrill Lynch & Co., Inc. |
|||||||
| 2.38%, 01/03/05(b)(c) |
3,119 | 3,119,012 | |||||
| Morgan Stanley |
|||||||
| 2.33%, 01/03/05(b)(c) |
2,325 | 2,325,437 | |||||
| Swedbank NY |
|||||||
| 2.362%, 01/18/05(b)(c) |
157 | 157,297 | |||||
| 6,601,783 | |||||||
| TIME DEPOSIT — 1.9% |
|||||||
| Bank of America NA |
|||||||
| 1.50%, 01/03/05(b) |
4,184 | 4,183,730 | |||||
| SHARES |
|||||||
| NON-REGISTERED INVESTMENT COMPANY — 15.0% |
|||||||
| BlackRock Institutional Money Market Trust(b)(j) |
33,910,655 | 33,910,655 | |||||
| TOTAL SHORT-TERM INVESTMENTS |
51,495,218 | ||||||
| TOTAL INVESTMENTS — 122.5% |
276,981,968 | ||||||
| LIABILITIES IN EXCESS OF OTHER ASSETS — (22.5%) |
(50,850,527 | ) | |||||
| NET ASSETS — 100.0% |
$ | 226,131,441 | |||||
53
AST STATE STREET RESEARCH SMALL-CAP GROWTH PORTFOLIO
SCHEDULE OF INVESTMENTS (CONTINUED)
DECEMBER 31, 2004
THE FOLLOWING ANNOTATION IS USED THROUGHOUT THE SCHEDULE OF INVESTMENTS:
| * | Non-income producing security. |
| (a) | All or a portion of securities on loan. Securities on loan have an aggregate market value of $45,829,298; cash collateral of $47,475,710 (included with liabilities) was received with which the portfolio purchased highly liquid short-term investments. |
| (b) | Represents security purchased with cash collateral for securities on loan. |
| (c) | Indicates a variable rate security. The maturity date presented for these instruments is the next date on which the rate of interest is adjusted. |
| (j) | Security available to institutional investors only. |
The industry classification of long-term portfolio holdings, short-term investments and liabilities in excess of other assets shown as a percentage of net assets as of December 31, 2004 were as follows:
| Telecommunications |
11.3 | % | |
| Medical Supplies & Equipment |
10.6 | ||
| Computer Services & Software |
9.5 | ||
| Semiconductors |
8.3 | ||
| Entertainment & Leisure |
8.1 | ||
| Healthcare Services |
6.5 | ||
| Business Services |
6.3 | ||
| Financial Services |
5.6 | ||
| Financial — Bank & Trust |
4.3 | ||
| Retail & Merchandising |
4.3 | ||
| Pharmaceuticals |
4.2 | ||
| Electronic Components & Equipment |
4.1 | ||
| Oil & Gas |
4.0 | ||
| Internet Services |
2.5 | ||
| Restaurants |
2.3 | ||
| Personal Services |
1.6 | ||
| Consumer Products & Services |
1.5 | ||
| Metals & Mining |
1.5 | ||
| Broadcasting |
1.3 | ||
| Insurance |
1.2 | ||
| Computer Hardware |
0.7 | ||
| Short-Term Investments |
22.8 | ||
| 122.5 | |||
| Liabilities in excess of other assets |
(22.5 | ) | |
| 100.0 | % | ||
See Notes to Financial Statements.
54
AST DEAM SMALL-CAP GROWTH PORTFOLIO
SCHEDULE OF INVESTMENTS
DECEMBER 31, 2004
| SHARES |
VALUE (NOTE 2) | ||||
| LONG-TERM INVESTMENTS — 99.2% |
|||||
| COMMON STOCK |
|||||
| ADVERTISING — 0.3% |
|||||
| ADVO, Inc.(a) |
32,300 | $ | 1,151,495 | ||
| AEROSPACE — 1.8% |
|||||
| Orbital Sciences Corp.* |
174,200 | 2,060,786 | |||
| Teledyne Technologies, Inc.* |
134,700 | 3,964,221 | |||
| 6,025,007 | |||||
| AIRLINES — 1.5% |
|||||
| ExpressJet Holdings, Inc.* |
215,500 | 2,775,640 | |||
| Pinnacle Airlines Corp.* |
172,300 | 2,401,862 | |||
| 5,177,502 | |||||
| AUTOMOBILE MANUFACTURERS — 1.0% |
|||||
| A.S.V., Inc.* |
16,800 | 804,720 | |||
| Monaco Coach Corp. |
119,600 | 2,460,172 | |||
| 3,264,892 | |||||
| AUTOMOTIVE PARTS – 0.8% |
|||||
| Wabash National Corp.* |
106,200 | 2,859,966 | |||
| BUILDING MATERIALS — 0.3% |
|||||
| Drew Industries, Inc.* |
3,700 | 133,829 | |||
| NCI Building Systems, Inc.* |
24,100 | 903,750 | |||
| 1,037,579 | |||||
| BUSINESS SERVICES — 3.6% |
|||||
| Catalina Marketing Corp. |
13,100 | 388,153 | |||
| CoStar Group, Inc.* |
33,800 | 1,560,884 | |||
| CSG Systems International, Inc.* |
76,200 | 1,424,940 | |||
| Dionex Corp.* |
16,100 | 912,387 | |||
| LECG Corp.* |
46,000 | 857,900 | |||
| Navigant Consulting, Inc.* |
130,300 | 3,465,980 | |||
| PDI, Inc.* |
80,100 | 1,784,628 | |||
| TeleTech Holdings, Inc.* |
55,800 | 540,702 | |||
| Ventiv Health, Inc.* |
59,200 | 1,202,944 | |||
| 12,138,518 | |||||
| CABLE TELEVISION — 0.4% |
|||||
| Insight Communications Co., Inc. (Class “A” Stock)* |
75,500 | 699,885 | |||
| Mediacom Communications Corp.* |
95,600 | 597,500 | |||
| 1,297,385 | |||||
| CHEMICALS — 1.5% |
|||||
| Georgia Gulf Corp. |
74,950 | 3,732,510 | |||
| MacDermid, Inc. |
41,000 | 1,480,100 | |||
| 5,212,610 | |||||
| CLOTHING & APPAREL — 1.5% |
|||||
| Guess, Inc.* |
98,700 | 1,238,685 | |||
| J. Jill Group, Inc.* |
149,300 | 2,223,077 | |||
| Wolverine World Wide, Inc. |
55,300 | 1,737,526 | |||
| 5,199,288 | |||||
| COMMERCIAL SERVICES — 0.1% |
|||||
| Quanta Services, Inc.* |
35,300 | 282,400 | |||
| COMPUTER HARDWARE — 0.3% |
|||||
| Dot Hill Systems Corp.* |
95,500 | 748,720 | |||
| Merge Technologies, Inc.* |
7,900 | 175,775 | |||
| 924,495 | |||||
| COMPUTER SERVICES & SOFTWARE — 8.2% |
|||||
| Altiris, Inc.* |
16,800 | 595,224 | |||
| ANSYS, Inc.* |
37,000 | 1,186,220 | |||
| Aspen Technology, Inc.* |
260,400 | 1,617,084 | |||
| Cerner Corp.*(a) |
63,600 | 3,381,611 | |||
| Concur Technologies, Inc.* |
57,500 | 512,325 | |||
| Epicor Software Corp.* |
84,700 | 1,193,423 | |||
| FactSet Research Systems, Inc. |
8,600 | 502,584 | |||
| Intergraph Corp.* |
14,600 | 393,178 | |||
| Kronos, Inc.* |
77,250 | 3,949,792 | |||
| Macrovision Corp.* |
62,800 | 1,615,216 | |||
| MatrixOne, Inc.* |
143,100 | 937,305 | |||
| Micros Systems, Inc.* |
19,400 | 1,514,364 | |||
| Parametric Technology Corp.* |
350,900 | 2,066,801 | |||
| Progress Software Corp.* |
51,000 | 1,190,850 | |||
| SeaChange International, Inc.* |
12,600 | 219,744 | |||
| SS&C Technologies, Inc. |
110,550 | 2,282,858 | |||
| THQ, Inc.* |
71,300 | 1,635,622 | |||
| Transaction Systems Architects, Inc. (Class “A” Stock)* |
79,700 | 1,582,045 | |||
| Tyler Technologies, Inc.* |
24,900 | 208,164 | |||
| Websense, Inc.* |
27,400 | 1,389,728 | |||
| Wind River Systems, Inc.* |
19,200 | 260,160 | |||
| 28,234,298 | |||||
| CONSTRUCTION — 0.5% |
|||||
| Cal Dive International, Inc.* |
28,900 | 1,177,675 | |||
| Dycom Industries, Inc.*(a) |
15,700 | 479,164 | |||
| 1,656,839 | |||||
| CONSUMER PRODUCTS & SERVICES — 2.9% |
|||||
| Aaron Rents, Inc.(a) |
109,950 | 2,748,750 | |||
| Coinstar, Inc.* |
101,400 | 2,720,562 | |||
| Nu Skin Enterprises, Inc. (Class “A” Stock)(a) |
78,100 | 1,982,178 | |||
| Viisage Technology, Inc.* |
254,900 | 2,296,649 | |||
| 9,748,139 | |||||
| CONTAINERS & PACKAGING — 1.7% |
|||||
| Crown Holdings, Inc.* |
110,600 | 1,519,644 | |||
| Silgan Holdings, Inc. |
68,000 | 4,145,280 | |||
| 5,664,924 | |||||
| ELECTRONIC COMPONENTS & EQUIPMENT — 4.5% |
|||||
| Advanced Energy Industries, Inc.* |
90,800 | 829,004 | |||
| BEI Technologies, Inc. |
93,900 | 2,899,632 | |||
| Belden CDT, Inc. |
12,500 | 290,000 | |||
| II-VI, Inc. |
7,700 | 327,173 | |||
55
AST DEAM SMALL-CAP GROWTH PORTFOLIO
SCHEDULE OF INVESTMENTS (CONTINUED)
DECEMBER 31, 2004
| SHARES |
VALUE (NOTE 2) | ||||
| Littelfuse, Inc.* |
94,600 | $ | 3,231,536 | ||
| Microtune, Inc.* |
43,900 | 268,229 | |||
| Rayovac Corp.* |
19,100 | 583,696 | |||
| Sonic Solutions, Inc.*(a) |
90,500 | 2,030,820 | |||
| TTM Technologies, Inc.* |
88,300 | 1,041,940 | |||
| Varian, Inc.* |
59,300 | 2,431,893 | |||
| Vicor Corp. |
28,600 | 374,946 | |||
| WESCO International, Inc.* |
30,800 | 912,912 | |||
| 15,221,781 | |||||
| ENTERTAINMENT & LEISURE — 3.6% |
|||||
| Alliance Gaming Corp.*(a) |
317,700 | 4,387,437 | |||
| Ameristar Casinos, Inc.(a) |
80,600 | 3,474,666 | |||
| Argosy Gaming Co.* |
49,900 | 2,330,330 | |||
| RC2 Corp.* |
36,400 | 1,186,640 | |||
| Winnebago Industries, Inc. |
25,600 | 999,936 | |||
| 12,379,009 | |||||
| ENVIRONMENTAL SERVICES — 0.5% |
|||||
| Casella Waste Systems, Inc.* |
39,100 | 572,424 | |||
| Waste Connections, Inc.* |
33,050 | 1,131,963 | |||
| 1,704,387 | |||||
| EQUIPMENT SERVICES — 0.4% |
|||||
| Global Imaging Systems, Inc.* |
36,300 | 1,433,850 | |||
| FINANCIAL — BANK & TRUST — 5.8% |
|||||
| Accredited Home Lenders Holding Co.* |
68,400 | 3,398,112 | |||
| East West Bancorp, Inc. |
107,000 | 4,489,720 | |||
| First Bancorp |
6,300 | 400,113 | |||
| First Midwest Bancorp, Inc. |
8,400 | 304,836 | |||
| Flagstar Bancorp, Inc.(a) |
41,900 | 946,940 | |||
| Independent Bank Corp. |
35,367 | 1,054,998 | |||
| Pacific Capital Bancorp |
13,933 | 473,583 | |||
| R&G Financial Corp. (Class “B” Stock) |
93,600 | 3,639,168 | |||
| Silicon Valley Bancshares* |
32,600 | 1,461,132 | |||
| Southwest Bancorporation of Texas, Inc. |
27,000 | 628,830 | |||
| Texas Regional Bancshares, Inc. (Class “A” Stock) |
59,580 | 1,947,074 | |||
| Wintrust Financial Corp. |
19,100 | 1,087,936 | |||
| 19,832,442 | |||||
| FINANCIAL SERVICES — 0.2% |
|||||
| Euronet Worldwide, Inc.* |
13,700 | 356,474 | |||
| National Financial Partners Corp. |
7,300 | 283,240 | |||
| 639,714 | |||||
| FOOD — 0.2% |
|||||
| Wild Oats Markets, Inc.* |
80,800 | 711,848 | |||
| FURNITURE — 0.5% |
|||||
| Tempur-Pedic International, Inc.* |
73,800 | 1,564,560 | |||
| HEALTHCARE SERVICES — 5.0% |
|||||
| Allscripts Healthcare Solutions* |
96,300 | 1,027,521 | |||
| Amedisys, Inc.* |
100,000 | 3,239,000 | |||
| America Service Group, Inc.* |
29,400 | 787,038 | |||
| Apria Healthcare Group, Inc.* |
68,100 | 2,243,895 | |||
| Centene Corp.* |
63,200 | 1,791,720 | |||
| Magellan Health Services, Inc.* |
21,000 | 717,360 | |||
| NDCHealth Corp. |
6,500 | 120,835 | |||
| NeighborCare, Inc.*(a) |
12,900 | 396,288 | |||
| Pediatrix Medical Group, Inc.* |
21,200 | 1,357,860 | |||
| Psychiatric Solutions, Inc.* |
25,500 | 932,280 | |||
| Sierra Health Services, Inc.*(a) |
70,500 | 3,885,255 | |||
| United Surgical Partners International, Inc.* |
12,100 | 504,570 | |||
| 17,003,622 | |||||
| INSURANCE — 0.9% |
|||||
| Philadelphia Consolidated Holdings Corp.* |
32,500 | 2,149,550 | |||
| Zenith National Insurance Corp. |
16,800 | 837,312 | |||
| 2,986,862 | |||||
| INTERNET SERVICES — 5.3% |
|||||
| CNET Networks, Inc.*(a) |
105,600 | 1,185,888 | |||
| Cybersource Corp.* |
99,200 | 709,280 | |||
| Digi International, Inc.* |
69,300 | 1,191,267 | |||
| Digital Insight Corp.* |
59,100 | 1,087,440 | |||
| Digital River, Inc.* |
40,700 | 1,693,527 | |||
| EarthLink, Inc.*(a) |
145,500 | 1,676,160 | |||
| eResearch Technology, Inc.* |
109,350 | 1,733,197 | |||
| eSPEED, Inc. (Class “A” Stock)* |
55,600 | 687,772 | |||
| F5 Networks, Inc.* |
35,300 | 1,719,816 | |||
| InfoSpace, Inc.*(a) |
28,800 | 1,369,440 | |||
| Openwave Systems, Inc.* |
99,300 | 1,535,178 | |||
| Priceline.com, Inc.*(a) |
37,683 | 888,942 | |||
| RSA Security, Inc.*(a) |
72,400 | 1,452,344 | |||
| S1 Corp.* |
29,700 | 269,082 | |||
| WebEx Communications, Inc.* |
39,100 | 929,798 | |||
| 18,129,131 | |||||
| MACHINERY & EQUIPMENT — 3.3% |
|||||
| Cognex Corp. |
57,800 | 1,612,620 | |||
| Maverick Tube Corp.* |
38,300 | 1,160,490 | |||
| Middleby Corp. |
43,900 | 2,226,608 | |||
| Nordson Corp. |
9,800 | 392,686 | |||
| Terex Corp.*(a) |
79,100 | 3,769,115 | |||
| Toro Co. (The) |
23,300 | 1,895,455 | |||
| Wabtec Corp. |
13,100 | 279,292 | |||
| 11,336,266 | |||||
| MEDICAL SUPPLIES & EQUIPMENT — 7.6% |
|||||
| Advanced Medical Optics, Inc.* |
31,700 | 1,304,138 | |||
| Align Technology, Inc.* |
204,100 | 2,194,075 | |||
| Biosite, Inc.*(a) |
53,100 | 3,267,774 | |||
| Cypress Bioscience, Inc.* |
12,200 | 171,532 | |||
56
AST DEAM SMALL-CAP GROWTH PORTFOLIO
SCHEDULE OF INVESTMENTS (CONTINUED)
DECEMBER 31, 2004
| SHARES |
VALUE (NOTE 2) | ||||
| Digene Corp.* |
11,600 | $ | 303,340 | ||
| Haemonetics Corp.* |
40,800 | 1,477,368 | |||
| Immucor, Inc.* |
158,325 | 3,722,221 | |||
| Integra LifeSciences Holdings Corp.*(a) |
56,300 | 2,079,159 | |||
| Kensey Nash Corp.* |
6,500 | 224,445 | |||
| Merit Medical Systems, Inc.* |
71,022 | 1,085,216 | |||
| Serologicals Corp.* |
99,200 | 2,194,304 | |||
| Sybron Dental Specialties, Inc.* |
28,300 | 1,001,254 | |||
| Third Wave Technologies, Inc.* |
175,500 | 1,509,300 | |||
| Ventana Medical Systems, Inc.* |
64,700 | 4,140,153 | |||
| VISX, Inc.* |
46,400 | 1,200,368 | |||
| 25,874,647 | |||||
| METALS & MINING — 2.0% |
|||||
| Century Aluminum Co.* |
111,000 | 2,914,860 | |||
| Hecla Mining Co.* |
156,200 | 910,646 | |||
| Steel Dynamics, Inc. |
75,200 | 2,848,576 | |||
| 6,674,082 | |||||
| OFFICE EQUIPMENT — 0.1% |
|||||
| Imagistics International, Inc.* |
12,600 | 424,116 | |||
| OIL & GAS — 5.1% |
|||||
| Cabot Oil & Gas Corp. |
400 | 17,700 | |||
| Comstock Resources, Inc.* |
178,600 | 3,938,130 | |||
| Denbury Resources, Inc.* |
102,200 | 2,805,390 | |||
| KCS Energy, Inc.* |
229,400 | 3,390,532 | |||
| Penn Virginia Corp. |
7,400 | 300,218 | |||
| Remington Oil & Gas Corp.* |
51,900 | 1,414,275 | |||
| Stone Energy Corp.*(a) |
76,900 | 3,467,421 | |||
| Veritas DGC, Inc.* |
69,800 | 1,564,218 | |||
| Whiting Petroleum Corp.* |
12,100 | 366,025 | |||
| 17,263,909 | |||||
| PERSONAL SERVICES — 0.2% |
|||||
| Bright Horizons Family Solutions, Inc.* |
9,700 | 628,172 | |||
| PHARMACEUTICALS — 7.3% |
|||||
| Connetics Corp.*(a) |
73,700 | 1,790,173 | |||
| Enzon Pharmaceuticals, Inc.* |
181,300 | 2,487,436 | |||
| First Horizon Pharmaceutical Corp.* |
75,100 | 1,719,039 | |||
| Kos Pharmaceuticals, Inc.* |
56,000 | 2,107,840 | |||
| Nabi Biopharmaceuticals* |
23,100 | 338,415 | |||
| Noven Pharmaceuticals, Inc.* |
109,900 | 1,874,894 | |||
| Perrigo Co. |
157,000 | 2,711,390 | |||
| POZEN, Inc.* |
92,400 | 671,748 | |||
| Regeneron Pharmaceuticals, Inc.* |
27,100 | 249,591 | |||
| Salix Pharmaceuticals Ltd.* |
31,900 | 561,121 | |||
| SFBC International, Inc.* |
75,250 | 2,972,375 | |||
| United Therapeutics Corp.* |
88,900 | 4,013,835 | |||
| Valeant Pharmaceuticals International(a) |
132,800 | 3,499,280 | |||
| 24,997,137 | |||||
| PRINTING & PUBLISHING — 0.5% |
|||||
| Banta Corp. |
13,400 | 599,784 | |||
| Consolidated Graphics, Inc.* |
16,600 | 761,940 | |||
| Nelson, (Thomas), Inc. |
14,600 | 329,960 | |||
| Readers Digest Association, Inc. |
4,500 | 62,595 | |||
| 1,754,279 | |||||
| REAL ESTATE — 1.3% |
|||||
| Alexandria Real Estate Equities, Inc. [REIT](a) |
12,100 | 900,482 | |||
| Essex Property Trust, Inc. [REIT] |
13,400 | 1,122,920 | |||
| New Century Financial Corp. [REIT](a) |
18,100 | 1,156,771 | |||
| Washington Real Estate Investment Trust [REIT] |
34,200 | 1,158,354 | |||
| 4,338,527 | |||||
| RESTAURANTS — 1.9% |
|||||
| CEC Entertainment, Inc.*(a) |
98,500 | 3,937,045 | |||
| CKE Restaurants, Inc.*(a) |
177,000 | 2,568,270 | |||
| 6,505,315 | |||||
| RETAIL & MERCHANDISING — 4.3% |
|||||
| Aeropostale, Inc.* |
94,200 | 2,772,306 | |||
| Cash America International, Inc. |
24,600 | 731,358 | |||
| Charlotte Russe Holding, Inc.* |
57,000 | 575,700 | |||
| Coldwater Creek, Inc.* |
23,950 | 739,337 | |||
| Dick’s Sporting Goods, Inc.* |
32,800 | 1,152,920 | |||
| Genesco, Inc.* |
41,300 | 1,286,082 | |||
| Gymboree Corp. (The)* |
60,800 | 779,456 | |||
| Pantry, Inc. (The)* |
9,700 | 291,873 | |||
| Select Comfort Corp.* |
67,600 | 1,212,744 | |||
| Stein Mart, Inc.* |
135,300 | 2,308,218 | |||
| Tractor Supply Co.* |
20,400 | 759,084 | |||
| Yankee Candle Co., Inc.* |
65,400 | 2,169,972 | |||
| 14,779,050 | |||||
| SEMICONDUCTORS — 6.6% |
|||||
| Axcelis Technologies, Inc.* |
52,600 | 427,638 | |||
| Cirrus Logic, Inc.* |
339,800 | 1,872,298 | |||
| Helix Technology Corp. |
76,600 | 1,332,074 | |||
| Integrated Device Technology, Inc.* |
219,500 | 2,537,420 | |||
| Kulicke & Soffa Industries, Inc.* |
42,900 | 369,798 | |||
| Micrel, Inc.* |
200,900 | 2,213,918 | |||
| Microsemi Corp.* |
165,200 | 2,867,872 | |||
| Omnivision Technologies, Inc.*(a) |
54,900 | 1,007,415 | |||
| Photronics, Inc.*(a) |
115,900 | 1,912,350 | |||
| Pixelworks, Inc.* |
74,800 | 848,232 | |||
| Silicon Image, Inc.*(a) |
155,200 | 2,554,592 | |||
| Skyworks Solutions, Inc.*(a) |
275,200 | 2,595,136 | |||
| Standard Microsystems Corp.* |
108,600 | 1,936,338 | |||
| 22,475,081 | |||||
57
AST DEAM SMALL-CAP GROWTH PORTFOLIO
SCHEDULE OF INVESTMENTS (CONTINUED)
DECEMBER 31, 2004
| SHARES |
VALUE (NOTE 2) |
||||||
| TELECOMMUNICATIONS — 5.1% |
|||||||
| Alamosa Holdings, Inc.*(a) |
153,300 | $ | 1,911,651 | ||||
| Aspect Communications Corp.* |
190,300 | 2,119,942 | |||||
| C-COR, Inc.* |
235,900 | 2,193,870 | |||||
| Ditech Communications Corp.* |
57,900 | 865,605 | |||||
| Golden Telecom, Inc.(a) |
93,700 | 2,475,554 | |||||
| InterDigital Communications Corp.* |
155,200 | 3,429,920 | |||||
| Ptek Holdings, Inc.* |
246,900 | 2,644,299 | |||||
| RF Micro Devices, Inc.* |
135,800 | 928,872 | |||||
| USA Mobility, Inc.* |
19,135 | 675,657 | |||||
| 17,245,370 | |||||||
| TRANSPORTATION — 0.6% |
|||||||
| Knight Transportation, Inc. |
87,600 | 2,172,480 | |||||
| TOTAL LONG-TERM INVESTMENTS |
337,950,974 | ||||||
| PRINCIPAL AMOUNT (000) |
|||||||
| SHORT-TERM INVESTMENTS — 15.5% |
|||||||
| CERTIFICATES OF DEPOSIT — 1.8% |
|||||||
| Canadian Imperial Bank of Commerce |
|||||||
| 2.372%, 01/31/05(b) |
$ | 240 | 239,952 | ||||
| 1.72%, 05/25/05(b) |
2,869 | 2,868,528 | |||||
| Skandinaviska Enskilda Banken |
|||||||
| 2.35%, 01/28/05(b) |
1,200 | 1,200,271 | |||||
| UBS Bank |
|||||||
| 2.315%, 01/18/05(b) |
1,664 | 1,663,978 | |||||
| 5,972,729 | |||||||
| CORPORATE OBLIGATIONS — 2.7% |
|||||||
| Merrill Lynch & Co., Inc. |
|||||||
| 2.38%, 01/03/05(b)(c) |
1,745 | 1,745,440 | |||||
| Morgan Stanley |
|||||||
| 2.33%, 01/03/05(b)(c) |
1,852 | 1,851,992 | |||||
| Sedna Finance Corporation |
|||||||
| 2.372%, 01/14/05(b)(c) |
442 | 441,914 | |||||
| Swedbank NY |
|||||||
| 2.362%, 01/18/05(b)(c) |
5,241 | 5,240,027 | |||||
| 9,279,373 | |||||||
| TIME DEPOSIT — 0.7% |
|||||||
| Bank of America NA 1.50%, 01/03/05(b) |
2,479 | 2,479,002 | |||||
| U.S. GOVERNMENT AGENCY OBLIGATIONS — 0.2% |
|||||||
| U.S. Treasury Bills |
|||||||
| 1.87%, 01/27/05(k) |
300 | 299,606 | |||||
| 1.91%, 01/27/05(k) |
260 | 259,658 | |||||
| 1.93%, 01/27/05(k) |
70 | 69,908 | |||||
| 629,172 | |||||||
| SHARES |
|||||||
| NON-REGISTERED INVESTMENT COMPANY — 10.1% |
|||||||
| BlackRock Institutional Money Market Trust(b)(j) |
34,541,076 | 34,541,076 | |||||
| TOTAL SHORT-TERM INVESTMENTS |
52,901,352 | ||||||
| TOTAL INVESTMENTS — 114.7% |
390,852,326 | ||||||
| LIABILITIES IN EXCESS OF OTHER ASSETS — (14.7%) |
(50,043,689 | ) | |||||
| NET ASSETS — 100.0% |
$ | 340,808,637 | |||||
THE FOLLOWING ABBREVIATION IS USED THROUGHOUT THE SCHEDULE OF INVESTMENTS:
REIT Real Estate Investment Trust
THE FOLLOWING ANNOTATIONS ARE USED THROUGHOUT THE SCHEDULE OF INVESTMENTS:
| * | Non-income producing security. |
| (a) | All or a portion of securities on loan. Securities on loan have an aggregate market value of $50,307,165; cash collateral of $52,272,180 (included with liabilities) was received with which the portfolio purchased highly liquid short-term investments. |
| (b) | Represents security purchased with cash collateral for securities on loan. |
| (c) | Indicates a variable rate security. The maturity date presented for these instruments is the next date on which the rate of interest is adjusted. |
| (j) | Security available to institutional investors only. |
58
AST DEAM SMALL-CAP GROWTH PORTFOLIO
SCHEDULE OF INVESTMENTS (CONTINUED)
DECEMBER 31, 2004
| (k) | Securities with an aggregate market value of $629,172 have been segregated with the custodian to cover margin requirements for the following open futures contracts at December 31, 2004: |
| NUMBER OF CONTRACTS |
TYPE |
EXPIRATION MONTH |
VALUE AT TRADE DATE |
VALUE AT DECEMBER 31, 2004 |
UNREALIZED APPRECIATION | ||||||||
| LONG POSITIONS: |
|||||||||||||
| 15 |
Russell 2000 | Mar 05 | $ | 4,733,065 | $ | 4,904,625 | $ | 171,560 | |||||
The industry classification of long-term portfolio holdings, short-term investments and liabilities in excess of other assets shown as a percentage of net assets as of December 31, 2004 were as follows:
| Computer Services & Software |
8.2 | % | |
| Medical Supplies & Equipment |
7.6 | ||
| Pharmaceuticals |
7.3 | ||
| Semiconductors |
6.6 | ||
| Financial — Bank & Trust |
5.8 | ||
| Internet Services |
5.3 | ||
| Oil & Gas |
5.1 | ||
| Telecommunications |
5.1 | ||
| Healthcare Services |
5.0 | ||
| Electronic Components & Equipment |
4.5 | ||
| Retail & Merchandising |
4.3 | ||
| Business Services |
3.6 | ||
| Entertainment & Leisure |
3.6 | ||
| Machinery & Equipment |
3.3 | ||
| Consumer Products & Services |
2.9 | ||
| Metals & Mining |
2.0 | ||
| Restaurants |
1.9 | ||
| Aerospace |
1.8 | ||
| Containers & Packaging |
1.7 | ||
| Airlines |
1.5 | ||
| Chemicals |
1.5 | ||
| Clothing & Apparel |
1.5 | ||
| Real Estate |
1.3 | ||
| Automobile Manufacturers |
1.0 | ||
| Insurance |
0.9 | ||
| Automotive Parts |
0.8 | ||
| Transportation |
0.6 | ||
| Construction |
0.5 | ||
| Environmental Services |
0.5 | ||
| Furniture |
0.5 | ||
| Printing & Publishing |
0.5 | ||
| Cable Television |
0.4 | ||
| Equipment Services |
0.4 | ||
| Advertising |
0.3 | ||
| Building Materials |
0.3 | ||
| Computer Hardware |
0.3 | ||
| Financial Services |
0.2 | ||
| Food |
0.2 | ||
| Personal Services |
0.2 | ||
| Commercial Services |
0.1 | ||
| Office Equipment |
0.1 | ||
| Short-Term Investments |
15.5 | ||
| 114.7 | |||
| Liabilities in excess of other assets |
(14.7 | ) | |
| 100.0 | % | ||
See Notes to Financial Statements.
59
AST FEDERATED AGGRESSIVE GROWTH PORTFOLIO
SCHEDULE OF INVESTMENTS
DECEMBER 31, 2004
| SHARES |
VALUE (NOTE 2) | ||||
| LONG-TERM INVESTMENTS — 103.1% |
|||||
| COMMON STOCK — 103.0% |
|||||
| ADVERTISING — 1.3% |
|||||
| Getty Images, Inc.* |
10,400 | $ | 716,040 | ||
| Lamar Advertising Co.* |
27,700 | 1,185,006 | |||
| Monster Worldwide, Inc.* |
54,460 | 1,832,035 | |||
| Valueclick, Inc.* |
51,040 | 680,363 | |||
| 4,413,444 | |||||
| AEROSPACE — 2.9% |
|||||
| DRS Technologies, Inc.* |
78,411 | 3,348,934 | |||
| Innovative Solutions and Support, Inc.* |
198,600 | 6,625,296 | |||
| 9,974,230 | |||||
| AUTOMOTIVE PARTS — 7.2% |
|||||
| Advance Auto Parts, Inc.* |
449,772 | 19,646,041 | |||
| Monro Muffler Brake, Inc.* |
207,731 | 5,255,594 | |||
| 24,901,635 | |||||
| BROADCASTING — 0.7% |
|||||
| Citadel Broadcasting Co.* |
57,000 | 922,260 | |||
| Entercom Communications Corp.* |
6,080 | 218,211 | |||
| SKY Perfect Communications, Inc. (Japan) |
1,256 | 1,360,555 | |||
| 2,501,026 | |||||
| BUILDING MATERIALS — 0.2% |
|||||
| Simpson Manufacturing Co., Inc. |
20,520 | 716,148 | |||
| BUSINESS SERVICES — 5.4% |
|||||
| Arbitron, Inc.* |
16,400 | 642,552 | |||
| Cogent, Inc.* |
55,900 | 1,844,700 | |||
| CoStar Group, Inc.* |
42,257 | 1,951,428 | |||
| Ctrip.com International Ltd. [ADR] (China)* |
61,600 | 2,834,832 | |||
| Discovery Partners |
|||||
| International* |
266,500 | 1,265,875 | |||
| Exponent, Inc.* |
30,635 | 842,156 | |||
| Indus International, Inc.* |
226,400 | 484,270 | |||
| Infocrossing, Inc.* |
204,200 | 3,457,107 | |||
| Informatica Corp.* |
95,095 | 772,171 | |||
| Iron Mountain, Inc.* |
30,900 | 942,141 | |||
| NuCo2, Inc.* |
124,600 | 2,764,874 | |||
| Onvia, Inc.* |
20,500 | 129,560 | |||
| Visual Networks, Inc.* |
180,980 | 629,810 | |||
| 18,561,476 | |||||
| CABLE TELEVISION — 5.4% |
|||||
| Central European Media Enterprises Ltd. (Class “A” Stock)* |
442,888 | 17,264,660 | |||
| Lodgenet Entertainment Corp.* |
88,971 | 1,573,897 | |||
| 18,838,557 | |||||
| CHEMICALS — 0.8% |
|||||
| Cabot Microelectronics Corp.* |
65,770 | 2,634,089 | |||
| CLOTHING & APPAREL — 1.2% |
|||||
| Carter’s, Inc.* |
84,900 | 2,885,751 | |||
| Celebrate Express, Inc.* |
58,900 | 1,119,100 | |||
| 4,004,851 | |||||
| COMMERCIAL SERVICES — 0.7% |
|||||
| 20-20 Technologies, Inc. (Canada)* 144A |
264,800 | 1,480,749 | |||
| TNS, Inc.* |
46,800 | 1,022,580 | |||
| 2,503,329 | |||||
| COMPUTER HARDWARE — 2.4% |
|||||
| Komag, Inc.* |
98,800 | 1,855,464 | |||
| Maxtor Corp.* |
743,200 | 3,938,960 | |||
| Mobility Electronics, Inc.* |
123,500 | 1,059,630 | |||
| SanDisk Corp.* |
16,380 | 409,009 | |||
| Seagate Technology |
57,600 | 994,752 | |||
| 8,257,815 | |||||
| COMPUTER SERVICES & SOFTWARE — 8.1% |
|||||
| Altiris, Inc.* |
69,168 | 2,450,622 | |||
| Business Objects SA [ADR] (France)* |
100,080 | 2,536,027 | |||
| Cognos, Inc. (Canada)* |
16,778 | 739,239 | |||
| Epicor Software Corp.* |
152,900 | 2,154,361 | |||
| FileNET Corp.* |
72,856 | 1,876,771 | |||
| Fundtech Ltd* |
67,600 | 572,572 | |||
| Hummingbird Ltd. (Canada)* |
35,300 | 942,863 | |||
| Hyperion Solutions Corp.* |
60,700 | 2,829,834 | |||
| Magma Design Automation, Inc.* |
116,040 | 1,457,462 | |||
| MicroStrategy, Inc. (Class “A” Stock)* |
26,850 | 1,617,713 | |||
| Motive, Inc.* |
122,900 | 1,398,602 | |||
| NAVTEQ Corp.* |
45,800 | 2,123,288 | |||
| NetIQ Corp.* |
34,800 | 424,908 | |||
| Niku Corp.* |
121,800 | 2,455,488 | |||
| Pervasive Software, Inc.* |
186,744 | 905,708 | |||
| Quest Software, Inc.* |
116,000 | 1,850,200 | |||
| SS&C Technologies, Inc. |
28,100 | 580,265 | |||
| SupportSoft, Inc.* |
151,500 | 1,008,990 | |||
| Telvent GIT S.A. (Spain)* |
18,500 | 235,875 | |||
| 28,160,788 | |||||
| CONSUMER PRODUCTS & SERVICES — 1.4% |
|||||
| 1-800-Flowers.com, Inc.* |
224,400 | 1,887,204 | |||
| 51job, Inc. [ADR] (China)* |
16,300 | 847,111 | |||
| Concorde Career Colleges, Inc.* |
45,100 | 915,530 | |||
| Dollar Thrifty Automotive Group, Inc.* |
41,410 | 1,250,582 | |||
| 4,900,427 | |||||
| EDUCATION — 0.3% |
|||||
| Educate, Inc.* |
69,600 | 921,504 | |||
60
AST FEDERATED AGGRESSIVE GROWTH PORTFOLIO
SCHEDULE OF INVESTMENTS (CONTINUED)
DECEMBER 31, 2004
| SHARES |
VALUE (NOTE 2) | ||||
| ELECTRONIC COMPONENTS & EQUIPMENT — 2.7% |
|||||
| American Power Conversion Corp. |
19,267 | $ | 412,314 | ||
| CEVA, Inc.* |
129,978 | 1,183,710 | |||
| Digital Theater Systems, Inc.* |
38,900 | 783,057 | |||
| M-Systems Flash Disk Pioneers Ltd. (Israel)* |
60,400 | 1,191,088 | |||
| PowerDsine Ltd. (Israel)* |
205,200 | 2,812,266 | |||
| Sonic Solutions, Inc.* |
94,800 | 2,127,312 | |||
| Vicor Corp. |
76,256 | 999,716 | |||
| 9,509,463 | |||||
| ENTERTAINMENT & LEISURE — 1.3% |
|||||
| International Speedway Corp. (Class “A” Stock) |
23,128 | 1,221,158 | |||
| JAMDAT Mobile, Inc.* |
8,500 | 175,525 | |||
| Speedway Motorsports, Inc. |
73,300 | 2,871,894 | |||
| Winnebago Industries, Inc. |
4,100 | 160,146 | |||
| 4,428,723 | |||||
| FINANCIAL — CONSUMER — 0.5% |
|||||
| Advance America Cash Advance Centers, Inc.* |
69,500 | 1,591,550 | |||
| FINANCIAL SERVICES — 1.8% |
|||||
| Affiliated Managers Group, Inc.* |
17,287 | 1,171,021 | |||
| Bankrate, Inc.* |
35,700 | 494,445 | |||
| Federal Agricultural Mortgage Corp. (Class “C” Stock) |
31,938 | 744,155 | |||
| IndyMac Bancorp, Inc. |
17,480 | 602,186 | |||
| QC Holdings, Inc.* |
98,300 | 1,883,428 | |||
| SFGC Co. Ltd. (Japan) |
5,000 | 1,263,785 | |||
| 6,159,020 | |||||
| FOOD — 0.4% |
|||||
| B&G Foods Holding Corp. |
37,700 | 564,746 | |||
| Centerplate, Inc. |
50,600 | 669,438 | |||
| 1,234,184 | |||||
| HEALTHCARE SERVICES — 1.6% |
|||||
| Adeza Biomedical Corp.* |
16,700 | 293,085 | |||
| Magellan Health Services, Inc.* |
45,200 | 1,544,032 | |||
| Northfield Laboratories, Inc.* |
43,600 | 983,180 | |||
| TLC Vision Corp. (Canada)* |
58,500 | 610,155 | |||
| United Surgical Partners International, Inc.* |
49,090 | 2,047,053 | |||
| VCA Antech, Inc.* |
13,100 | 256,760 | |||
| 5,734,265 | |||||
| HOTELS & MOTELS — 0.3% |
|||||
| Orient-Express Hotels Ltd. |
52,793 | 1,085,952 | |||
| INDUSTRIAL PRODUCTS — 0.4% |
|||||
| Interline Brands, Inc.* |
48,200 | 847,838 | |||
| Roper Industries, Inc. |
11,300 | 686,701 | |||
| 1,534,539 | |||||
| INSURANCE — 0.7% |
|||||
| Endurance Specialty Holdings Ltd. |
18,400 | 629,280 | |||
| Mercury General Corp. |
10,500 | 629,160 | |||
| Philadelphia Consolidated Holdings Corp.* |
19,224 | 1,271,475 | |||
| 2,529,915 | |||||
| INTERNET SERVICES — 3.0% |
|||||
| Blackboard, Inc.* |
143,900 | 2,131,159 | |||
| Digital Impact, Inc.* |
463,750 | 658,525 | |||
| eCollege.com, Inc.* |
82,066 | 932,270 | |||
| Macromedia, Inc.* |
21,000 | 653,520 | |||
| Mediagrif Interactive Technologies, Inc. (Canada)* |
159,800 | 1,433,752 | |||
| NIC, Inc.* |
185,792 | 943,823 | |||
| Online Resources Corp.* |
257,159 | 1,959,552 | |||
| Online Resources Corp. (Germany)* 144A |
61,000 | 464,820 | |||
| S1 Corp.* |
124,900 | 1,131,594 | |||
| Stamps.com, Inc. |
6,300 | 99,792 | |||
| 10,408,807 | |||||
| MEDICAL SUPPLIES & EQUIPMENT — 7.9% |
|||||
| ArthroCare Corp.* |
30,800 | 987,448 | |||
| Cambridge Heart, Inc.* |
431,400 | 250,212 | |||
| Ciphergen Biosystems, Inc.* |
273,300 | 1,175,190 | |||
| Conceptus, Inc.* |
800 | 6,492 | |||
| Cytyc Corp.* |
128,148 | 3,533,040 | |||
| Digirad Corp.* |
66,300 | 586,755 | |||
| Endocardial Solutions, Inc.* |
106,400 | 1,244,880 | |||
| Endologix, Inc.* |
89,300 | 609,919 | |||
| Illumina, Inc.* |
74,100 | 702,468 | |||
| Inamed Corp.* |
124,030 | 7,844,899 | |||
| Kyphon, Inc.* |
72,574 | 1,869,506 | |||
| MannKind Corp.* |
82,200 | 1,294,650 | |||
| Orthofix International NV (Netherlands)* |
175,834 | 6,941,750 | |||
| Stratagene Corp.* |
18,800 | 145,700 | |||
| Symmetry Medical, Inc.* |
3,400 | 71,570 | |||
| Zoll Medical Corp.* |
6,200 | 213,280 | |||
| 27,477,759 | |||||
| PHARMACEUTICALS — 9.7% |
|||||
| Abgenix, Inc.* |
361,200 | 3,734,808 | |||
| Acadia Pharmaceuticals, Inc.* |
14,900 | 100,873 | |||
| Acusphere, Inc.* |
176,100 | 1,079,493 | |||
| Adaltis, Inc. (Canada)* 144A |
41,000 | 187,865 | |||
| Adaltis, Inc. (Canada)* |
36,900 | 169,078 | |||
| Alexion Pharmaceuticals, Inc.* |
220,804 | 5,564,260 | |||
| Auxilium Pharmaceuticals, Inc.* |
82,400 | 721,000 | |||
| Biovail Corp. (Canada)* |
89,400 | 1,477,782 | |||
| Cubist Pharmaceuticals, Inc.* |
79,700 | 942,851 | |||
| Dynavax Technologies Corp* |
358,700 | 2,869,600 | |||
| Genaera Corp.* |
596,900 | 2,041,398 | |||
| I-Flow Corp.* |
40,500 | 738,315 | |||
61
AST FEDERATED AGGRESSIVE GROWTH PORTFOLIO
SCHEDULE OF INVESTMENTS (CONTINUED)
DECEMBER 31, 2004
| SHARES |
VALUE (NOTE 2) | ||||
| Neurochem, Inc. (Canada)* |
221,400 | $ | 3,881,142 | ||
| Penwest Pharmaceuticals Co.* |
109,300 | 1,307,228 | |||
| Point Therapeutics, Inc.* |
350,000 | 1,876,000 | |||
| PRA International* |
11,600 | 287,448 | |||
| Progenics Pharmaceuticals, Inc.* |
107,400 | 1,842,984 | |||
| Regeneron Pharmaceuticals, Inc.* |
36,500 | 336,165 | |||
| Spectrum Pharmaceuticals, Inc.* |
67,700 | 450,205 | |||
| Transkaryotic Therapies, Inc.* |
25,200 | 639,828 | |||
| Vertex Pharmaceuticals* |
128,200 | 1,355,074 | |||
| Vical, Inc.* |
369,400 | 1,736,180 | |||
| Xenova Group PLC [ADR] (United Kingdom)* |
135,900 | 176,670 | |||
| YM Biosciences, Inc. (Canada)* |
121,900 | 362,195 | |||
| 33,878,442 | |||||
| REAL ESTATE — 1.9% |
|||||
| BioMed Realty Trust, Inc. [REIT] |
10,400 | 230,984 | |||
| First Potomac Realty Trust [REIT] |
75,000 | 1,710,000 | |||
| Global Signal, Inc. [REIT] |
21,100 | 581,094 | |||
| HouseValues, Inc.* |
50,800 | 763,016 | |||
| U-Store-It Trust [REIT] |
21,900 | 379,965 | |||
| Wetherspoon, (J.D.) PLC (United Kingdom) |
540,916 | 2,648,189 | |||
| ZipRealty, Inc.* |
21,800 | 389,566 | |||
| 6,702,814 | |||||
| RESTAURANTS — 2.3% |
|||||
| Applebee’s International, Inc. |
19,500 | 515,775 | |||
| Buffalo Wild Wings, Inc.* |
53,000 | 1,844,930 | |||
| Cheesecake Factory, Inc. (The)* |
139,542 | 4,530,929 | |||
| Texas Roadhouse, Inc. (Class “A” Stock)* |
42,700 | 1,261,785 | |||
| 8,153,419 | |||||
| RETAIL & MERCHANDISING — 11.0% |
|||||
| A.C. Moore Arts & Crafts, Inc.* |
149,900 | 4,318,619 | |||
| Cabela, Inc.* |
41,100 | 934,614 | |||
| Cache, Inc.* |
184,000 | 3,315,680 | |||
| Cost Plus, Inc.* |
38,500 | 1,237,005 | |||
| Design Within Reach, Inc.* |
26,600 | 387,030 | |||
| Dick’s Sporting Goods, Inc.* |
160,654 | 5,646,988 | |||
| LKQ Corp.* |
54,900 | 1,101,843 | |||
| New York & Company, Inc.* |
164,800 | 2,722,496 | |||
| PC Mall, Inc.* |
96,200 | 2,152,956 | |||
| PETCO Animal Supplies, Inc.* |
367,500 | 14,508,899 | |||
| PETsMART, Inc. |
5,950 | 211,404 | |||
| Select Comfort Corp.* |
102,900 | 1,846,026 | |||
| 38,383,560 | |||||
| SEMICONDUCTORS — 5.7% |
|||||
| ARM Holdings PLC [ADR] (United Kingdom) |
130,829 | 807,215 | |||
| ATI Technologies, Inc. (Canada)* |
86,670 | 1,680,531 | |||
| CSR PLC (United Kingdom)* |
767,700 | 5,748,244 | |||
| Integrated Device Technology, Inc.* |
54,100 | 625,396 | |||
| MEMC Electronic Materials, Inc.* |
199,000 | 2,636,750 | |||
| Microsemi Corp.* |
143,300 | 2,487,688 | |||
| MKS Instruments, Inc.* |
51,600 | 957,180 | |||
| Sigmatel, Inc.* |
83,400 | 2,963,202 | |||
| Ultratech Stepper, Inc.* |
109,700 | 2,067,845 | |||
| 19,974,051 | |||||
| TELECOMMUNICATIONS — 2.7% |
|||||
| ADTRAN, Inc. |
98,300 | 1,881,462 | |||
| Foundry Networks, Inc.* |
38,464 | 506,186 | |||
| Intrado, Inc.* |
55,537 | 671,998 | |||
| MasTec, Inc.* |
102,300 | 1,034,253 | |||
| Orckit Communications Ltd. (Israel)* |
16,200 | 409,374 | |||
| RADVision Ltd. (Israel)* |
221,010 | 2,983,635 | |||
| TALK America Holdings, Inc.* |
108,800 | 720,256 | |||
| Western Wireless Corp. (Class “A” Stock)* |
44,200 | 1,295,060 | |||
| 9,502,224 | |||||
| TRANSPORTATION — 10.9% |
|||||
| ABX Air, Inc.* |
1,691,480 | 15,037,257 | |||
| CNF, Inc. |
36,800 | 1,843,680 | |||
| Expeditors International of Washington, Inc. |
59,996 | 3,352,576 | |||
| Forward Air Corp.* |
135,500 | 6,056,850 | |||
| Overnite Corp. |
163,500 | 6,088,740 | |||
| Quality Distribution, Inc.* |
465,200 | 3,926,288 | |||
| Ryder System, Inc. |
29,900 | 1,428,323 | |||
| 37,733,714 | |||||
| UTILITIES — 0.2% |
|||||
| Cherokee International Corp.* |
37,800 | 363,258 | |||
| Consolidated Water Co. Ltd. |
13,600 | 421,328 | |||
| 784,586 | |||||
| TOTAL COMMON STOCK |
358,096,306 | ||||
| WARRANTS* — 0.1% |
|||||
| PHARMACEUTICALS |
|||||
| Point Therapeutics, Inc., Expiring on 09/25/ 2008(o) (Cost $0) |
175,000 | 472,500 | |||
| TOTAL LONG-TERM INVESTMENTS |
358,568,806 | ||||
| SHORT-TERM INVESTMENTS — 7.9% |
|||||
| REGISTERED INVESTMENT COMPANIES — 0.2% |
|||||
| BlackRock Provident Institutional Funds TempCash Portfolio(j) |
386,915 | 386,915 | |||
| BlackRock Provident Institutional Funds TempFund Portfolio(j) |
386,915 | 386,915 | |||
| 773,830 | |||||
62
AST FEDERATED AGGRESSIVE GROWTH PORTFOLIO
SCHEDULE OF INVESTMENTS (CONTINUED)
DECEMBER 31, 2004
| PRINCIPAL AMOUNT (000) |
VALUE (NOTE 2) |
||||||
| REPURCHASE AGREEMENTS — 7.7% |
|||||||
| Greenwich Capital Markets, Inc. 1.25%, dated 12/31/04, maturing 01/03/05, repurchase price $26,649,776 (Collateralized by U.S. Treasury Bonds, 7.25%, par value $21,645,000, market value $26,661,552, due 05/15/16) |
$ | 26,647 | $ | 26,647,000 | |||
| TOTAL SHORT-TERM INVESTMENTS |
27,420,830 | ||||||
| TOTAL INVESTMENTS — 111.0% |
385,989,636 | ||||||
| LIABILITIES IN EXCESS OF OTHER ASSETS — (11.0%) |
(38,256,239 | ) | |||||
| NET ASSETS — 100.0% |
$ | 347,733,397 | |||||
THE FOLLOWING ABBREVIATIONS ARE USED THROUGHOUT THE SCHEDULE OF INVESTMENTS:
| 144A |
Security was purchased pursuant to Rule 144A under the Securities Act of 1933 and may not be resold subject to that rule except to qualified institutional buyers. Unless otherwise noted 144A securities are deemed to be liquid. | |
| ADR |
American Depository Receipt | |
| REIT |
Real Estate Investment Trust |
THE FOLLOWING ANNOTATIONS ARE USED THROUGHOUT THE SCHEDULE OF INVESTMENTS:
| * | Non-income producing security. |
| (j) | Security available to institutional investors only. |
| (o) | Fair valued security. |
The industry classification of long-term portfolio holdings, short-term investments and liabilities in excess of other assets shown as a percentage of net assets as of December 31, 2004 were as follows:
| Retail & Merchandising |
11.0 | % | |
| Transportation |
10.9 | ||
| Pharmaceuticals |
9.8 | ||
| Computer Services & Software |
8.1 | ||
| Medical Supplies & Equipment |
7.9 | ||
| Automotive Parts |
7.2 | ||
| Semiconductors |
5.7 | ||
| Cable Television |
5.4 | ||
| Business Services |
5.4 | ||
| Internet Services |
3.0 | ||
| Aerospace |
2.9 | ||
| Electronic Components & Equipment |
2.7 | ||
| Telecommunications |
2.7 | ||
| Computer Hardware |
2.4 | ||
| Restaurants |
2.3 | ||
| Real Estate |
1.9 | ||
| Financial Services |
1.8 | ||
| Healthcare Services |
1.6 | ||
| Consumer Products & Services |
1.4 | ||
| Advertising |
1.3 | ||
| Entertainment & Leisure |
1.3 | % | |
| Clothing & Apparel |
1.2 | ||
| Chemicals |
0.8 | ||
| Broadcasting |
0.7 | ||
| Commercial Services |
0.7 | ||
| Insurance |
0.7 | ||
| Financial — Consumer |
0.5 | ||
| Food |
0.4 | ||
| Industrial Products |
0.4 | ||
| Education |
0.3 | ||
| Hotels & Motels |
0.3 | ||
| Building Materials |
0.2 | ||
| Utilities |
0.2 | ||
| Short-Term Investments |
7.9 | ||
| 111.0 | |||
| Liabilities in excess of other assets |
(11.0 | ) | |
| 100.0 | % | ||
See Notes to Financial Statements.
63
AST GOLDMAN SACHS SMALL-CAP VALUE PORTFOLIO
SCHEDULE OF INVESTMENTS
DECEMBER 31, 2004
| SHARES |
VALUE (NOTE 2) | ||||
| LONG-TERM INVESTMENTS — 97.4% |
|||||
| COMMON STOCK — 94.1% |
|||||
| AIRLINES |
|||||
| Frontier Airlines, Inc.* |
11,239 | $ | 128,237 | ||
| AUTOMOTIVE PARTS — 0.1% |
|||||
| Autoliv, Inc. |
8,800 | 425,040 | |||
| BASIC MATERIALS — CHEMICAL — 2.8% |
|||||
| Agrium, Inc. (Canada) |
206,694 | 3,482,794 | |||
| Albemarle Corp. |
48,991 | 1,896,442 | |||
| Minerals Technologies, Inc. |
30,021 | 2,002,401 | |||
| NuCo2, Inc.* |
17,369 | 385,418 | |||
| Penford Corp. |
23,888 | 375,758 | |||
| Rohm & Haas Co. |
21,300 | 942,099 | |||
| 9,084,912 | |||||
| BASIC MATERIALS — FOREST — 2.2% |
|||||
| Caraustar Industries, Inc.* |
267,013 | 4,491,159 | |||
| Packaging Corp. of America(a) |
32,625 | 768,319 | |||
| Universal Forest Products, Inc. |
36,822 | 1,598,075 | |||
| Wausau-Mosinee Paper Corp. |
15,290 | 273,079 | |||
| 7,130,632 | |||||
| BASIC MATERIALS — MINING — 2.3% |
|||||
| Commercial Metals Co. |
74,825 | 3,783,152 | |||
| Maverick Tube Corp.* |
55,566 | 1,683,650 | |||
| Nucor Corp.(a) |
11,898 | 622,741 | |||
| Oregon Steel Mills, Inc.* |
49,988 | 1,014,257 | |||
| Schnitzer Steel Industries, Inc. (Class “A” Stock) |
10,993 | 372,992 | |||
| 7,476,792 | |||||
| BUSINESS SERVICES — 0.2% |
|||||
| LECG Corp.* |
28,426 | 530,145 | |||
| COMPUTER SERVICES & SOFTWARE — 0.4% |
|||||
| MTS Systems Corp. |
3,175 | 107,347 | |||
| Tech Data Corp.*(a) |
14,500 | 658,300 | |||
| Ultimate Software Group, Inc. (The)* |
39,616 | 502,331 | |||
| 1,267,978 | |||||
| CONSUMER CYCLICALS — CONSTRUCTION — 2.4% |
|||||
| Beazer Homes USA, Inc.(a) |
10,947 | 1,600,560 | |||
| ElkCorp |
28,830 | 986,563 | |||
| Lennar Corp. (Class “A” Stock) |
24,400 | 1,382,992 | |||
| Lennox International, Inc. |
44,922 | 914,163 | |||
| Standard Pacific Corp. |
21,798 | 1,398,124 | |||
| Texas Industries, Inc. |
12,712 | 792,975 | |||
| WCI Communities, Inc.* |
17,916 | 526,730 | |||
| 7,602,107 | |||||
| CONSUMER CYCLICALS — CONSUMER DURABLES — 0.6% |
|||||
| Mohawk Industries, Inc.*(a) |
5,600 | 511,000 | |||
| Select Comfort Corp.* |
48,927 | 877,750 | |||
| Stanley Works |
9,900 | 485,001 | |||
| 1,873,751 | |||||
| CONSUMER CYCLICALS — HOTELS — 0.2% |
|||||
| Hilton Hotels Corp. |
23,207 | 527,727 | |||
| CONSUMER CYCLICALS — LEISURE & ENTERTAINMENT — 2.0% |
|||||
| Argosy Gaming Co.* |
40,488 | 1,890,789 | |||
| Fossil, Inc.*(a) |
42,561 | 1,091,264 | |||
| Harrah’s Entertainment, Inc.(a) |
10,044 | 671,843 | |||
| JAKKS Pacific, Inc.*(a) |
55,887 | 1,235,662 | |||
| K2, Inc.* |
85,152 | 1,352,214 | |||
| RC2 Corp.* |
9,036 | 294,574 | |||
| 6,536,346 | |||||
| CONSUMER CYCLICALS — MOTOR VEHICLE — 1.9% |
|||||
| American Axle & Manufacturing Holdings, Inc. |
47,363 | 1,452,150 | |||
| ArvinMeritor, Inc. |
46,410 | 1,038,192 | |||
| Lear Corp. |
9,349 | 570,382 | |||
| Lo-Jack Corp.* |
49,610 | 601,769 | |||
| Methode Electronics, Inc. (Class “A” Stock) |
36,522 | 469,308 | |||
| Monaco Coach Corp. |
25,851 | 531,755 | |||
| Tenneco Automotive, Inc.* |
89,512 | 1,543,187 | |||
| 6,206,743 | |||||
| CONSUMER CYCLICALS — RETAIL APPAREL — 4.8% |
|||||
| Aaron Rents, Inc.(a) |
102,212 | 2,555,299 | |||
| Abercrombie & Fitch Co. |
33,900 | 1,591,605 | |||
| Brookstone, Inc.* |
80,478 | 1,573,345 | |||
| Charlotte Russe Holding, Inc.* |
45,166 | 456,177 | |||
| Federated Department Stores, Inc. |
16,820 | 972,028 | |||
| Gymboree Corp.* |
174,508 | 2,237,192 | |||
| K-Swiss, Inc. (Class “A” Stock) |
32,647 | 950,681 | |||
| Kellwood Co. |
38,046 | 1,312,587 | |||
| OshKosh B’Gosh, Inc. (Class “A” Stock) |
13,447 | 287,766 | |||
| Penney, (J.C.) Co., Inc. |
19,100 | 790,740 | |||
| Ross Stores, Inc. |
15,300 | 441,711 | |||
| Sharper Image Corp.* |
30,780 | 580,203 | |||
| Too, Inc.* |
17,977 | 439,717 | |||
| Zale Corp.* |
41,523 | 1,240,292 | |||
| 15,429,343 | |||||
| CONSUMER PRODUCTS & SERVICES — 0.1% |
|||||
| Reynolds, (R.J.) Tobacco Holdings, Inc.(a) |
6,000 | 471,600 | |||
64
AST GOLDMAN SACHS SMALL-CAP VALUE PORTFOLIO
SCHEDULE OF INVESTMENTS (CONTINUED)
DECEMBER 31, 2004
| SHARES |
VALUE (NOTE 2) | ||||
| CONSUMER STAPLES — FOOD & BEVERAGE — 1.8% |
|||||
| American Italian Pasta Co. (Class “A” Stock)(a) |
36,029 | $ | 837,674 | ||
| Archer-Daniels-Midland Co. |
25,100 | 559,981 | |||
| Hain Celestial Group, Inc.* |
44,967 | 929,468 | |||
| Pepsi Bottling Group, Inc. |
9,400 | 254,176 | |||
| Sensient Technologies Corp.(a) |
130,744 | 3,136,549 | |||
| 5,717,848 | |||||
| CONSUMER STAPLES — HOME PRODUCTS — 2.0% |
|||||
| Clorox Co. |
18,000 | 1,060,740 | |||
| Elizabeth Arden, Inc.* |
101,147 | 2,401,230 | |||
| Helen of Troy Ltd.* |
49,520 | 1,664,367 | |||
| Jarden Corp.* |
13,477 | 585,441 | |||
| Lauder, (Estee) Cos., Inc. (Class “A” Stock) |
6,075 | 278,053 | |||
| Oneida Ltd.*(a) |
106,919 | 327,172 | |||
| 6,317,003 | |||||
| CONSUMER STAPLES — RESTAURANTS — 1.0% |
|||||
| BUCA, Inc.* |
128,322 | 893,121 | |||
| California Pizza Kitchen, Inc.* |
39,550 | 909,651 | |||
| Total Entertainment Restaurant Corp.* |
71,670 | 854,306 | |||
| Yum! Brands, Inc. |
13,400 | 632,212 | |||
| 3,289,290 | |||||
| ENERGY — DIVERSIFIED ENERGY — 0.7% |
|||||
| Western Gas Resources, Inc. |
24,500 | 716,625 | |||
| Williams Cos., Inc. |
89,300 | 1,454,697 | |||
| 2,171,322 | |||||
| ENERGY — ENERGY RESOURCES — 3.4% |
|||||
| EOG Resources, Inc.(a) |
17,900 | 1,277,344 | |||
| Parallel Petroleum Corp.* |
45,545 | 245,943 | |||
| Patina Oil & Gas Corp. |
56,529 | 2,119,838 | |||
| Range Resources Corp. |
247,747 | 5,068,903 | |||
| Whiting Petroleum Corp.* |
77,397 | 2,341,259 | |||
| 11,053,287 | |||||
| ENERGY — OIL REFINING — 0.6% |
|||||
| Frontier Oil Corp. |
70,718 | 1,885,342 | |||
| ENERGY — OIL SERVICES — 0.9% |
|||||
| Hydril Co.* |
12,791 | 582,118 | |||
| Patterson-UTI Energy, Inc. |
56,000 | 1,089,201 | |||
| Petroleum Development Corp.* |
10,562 | 407,376 | |||
| W-H Energy Services, Inc.* |
11,767 | 263,110 | |||
| Willbros Group, Inc. (Panama)* |
29,504 | 680,067 | |||
| 3,021,872 | |||||
| ENTERTAINMENT & LEISURE |
|||||
| Atari, Inc.* |
20,146 | 59,028 | |||
| FINANCIAL — BANKS — 9.1% |
|||||
| Alabama National Bancorp |
28,250 | 1,822,125 | |||
| Alliance Bankshares Corp.* |
20,161 | 313,504 | |||
| Bancorp Bank (The)* |
81,219 | 1,299,504 | |||
| Berkshire Hills Bancorp, Inc. |
22,946 | 852,444 | |||
| Brookline Bancorp, Inc.(a) |
82,905 | 1,353,010 | |||
| Cardinal Financial Corp.* |
51,436 | 573,511 | |||
| Citizens Banking Corp. |
81,246 | 2,790,799 | |||
| Commerce Bancshares, Inc. |
8,995 | 451,549 | |||
| First Community Bancorp |
35,347 | 1,509,317 | |||
| First Niagara Financial Group, Inc.(a) |
157,944 | 2,203,318 | |||
| First Oak Brook Bancshares, Inc. |
15,764 | 510,911 | |||
| Firstmerit Corp. |
31,300 | 891,737 | |||
| IBERIABANK Corp. |
22,700 | 1,506,372 | |||
| Interchange Financial Services Corp. |
7,456 | 193,260 | |||
| KeyCorp |
17,200 | 583,080 | |||
| M&T Bank Corp. |
10,963 | 1,182,250 | |||
| Main Street Banks, Inc. |
32,507 | 1,135,470 | |||
| Millennium Bankshares Corp.* |
56,405 | 507,645 | |||
| Northern Trust Corp.(a) |
11,300 | 548,954 | |||
| Pacific Continental Corp. |
744 | 11,718 | |||
| PFF Bancorp, Inc. |
72,806 | 3,373,101 | |||
| Placer Sierra Bancshares |
33,956 | 965,709 | |||
| Prosperity Bancshares, Inc. |
17,573 | 513,307 | |||
| Regions Financial Corp. |
38,600 | 1,373,774 | |||
| Southcoast Financial Corp.* |
21,849 | 566,637 | |||
| Sterling Bancorp |
21,146 | 597,375 | |||
| Sun Bancorp, Inc.* |
9,833 | 245,628 | |||
| Texas United Bancshares, Inc. |
22,677 | 447,871 | |||
| United Community Banks, Inc. |
35,661 | 960,351 | |||
| West Coast Bancorp |
5,122 | 130,150 | |||
| 29,414,381 | |||||
| FINANCIAL — BROKERS — 0.7% |
|||||
| Bear Stearns Cos., Inc.(a) |
6,122 | 626,342 | |||
| Knight Trading Group, Inc.*(a) |
137,401 | 1,504,541 | |||
| 2,130,883 | |||||
| FINANCIAL — SECURITIES/ASSET MANAGEMENT — 0.6% |
|||||
| Affiliated Managers Group, Inc.* |
29,088 | 1,970,421 | |||
| FINANCIAL — THRIFTS — 2.3% |
|||||
| BankUnited Financial Corp.* |
68,165 | 2,177,872 | |||
| Fidelity Bankshares, Inc. |
40,931 | 1,750,210 | |||
| IndyMac Bancorp, Inc. |
47,714 | 1,643,747 | |||
| Irwin Financial Corp. |
36,164 | 1,026,696 | |||
| NetBank, Inc. |
91,454 | 952,036 | |||
| 7,550,561 | |||||
| FINANCIAL SERVICES — 2.9% |
|||||
| Accredited Home Lenders Holding Co.* |
94,742 | 4,706,783 | |||
| American Capital Strategies Ltd. |
20,100 | 670,335 | |||
| Apollo Investment Corp. |
61,271 | 925,192 | |||
| CIT Group, Inc. |
24,200 | 1,108,844 | |||
| Financial Federal Corp. |
47,420 | 1,858,864 | |||
| 9,270,018 | |||||
65
AST GOLDMAN SACHS SMALL-CAP VALUE PORTFOLIO
SCHEDULE OF INVESTMENTS (CONTINUED)
DECEMBER 31, 2004
| SHARES |
VALUE (NOTE 2) | ||||
| HEALTH CARE — BIOTECHNOLOGY — 1.1% |
|||||
| Cell Therapeutics, Inc.*(a) |
125,273 | $ | 1,019,722 | ||
| MedImmune, Inc.* |
25,300 | 685,883 | |||
| Nabi Biopharmaceuticals* |
20,130 | 294,905 | |||
| Renovis, Inc.* |
39,252 | 564,444 | |||
| United Therapeutics Corp.* |
24,030 | 1,084,954 | |||
| 3,649,908 | |||||
| HEALTH CARE — DRUGS — 0.5% |
|||||
| Charles River Laboratories International |
9,300 | 427,893 | |||
| PAREXEL International Corp.* |
28,848 | 585,614 | |||
| Watson Pharmaceuticals, Inc.* |
14,800 | 485,588 | |||
| 1,499,095 | |||||
| HEALTH CARE — MEDICAL PRODUCTS — 1.7% |
|||||
| Abaxis, Inc.* |
46,326 | 671,264 | |||
| Conceptus, Inc.* |
127,946 | 1,038,282 | |||
| Hillenbrand Industries, Inc. |
3,900 | 216,606 | |||
| NDCHealth Corp. |
73,239 | 1,361,513 | |||
| PSS World Medical, Inc.* |
87,485 | 1,094,875 | |||
| Thermogenesis Corp.* |
174,966 | 1,109,284 | |||
| 5,491,824 | |||||
| HEALTH CARE — MEDICAL PROVIDERS — 0.9% |
|||||
| Psychiatric Solutions, Inc.* |
11,867 | 433,858 | |||
| Radiologix, Inc.* |
230,088 | 1,012,387 | |||
| Symbion, Inc.* |
21,902 | 483,596 | |||
| United Surgical Partners International, Inc.* |
26,314 | 1,097,294 | |||
| 3,027,135 | |||||
| INDUSTRIALS — COMPONENTS — 3.5% |
|||||
| Actuant Corp.* |
45,465 | 2,371,000 | |||
| American Standard Cos., Inc.* |
11,386 | 470,470 | |||
| Applied Industrial Technologies, Inc. |
14,802 | 405,575 | |||
| Eaton Corp. |
13,600 | 984,096 | |||
| Hughes Supply, Inc. |
61,792 | 1,998,971 | |||
| Lindsay Manufacturing Co. |
9,011 | 233,205 | |||
| Wabash National Corp.* |
177,387 | 4,777,031 | |||
| 11,240,348 | |||||
| INDUSTRIALS — DEFENSE/AEROSPACE — 0.9% |
|||||
| Ducommun, Inc.* |
48,622 | 1,013,769 | |||
| EDO Corp. |
36,581 | 1,161,447 | |||
| Rockwell Collins, Inc. |
21,828 | 860,896 | |||
| 3,036,112 | |||||
| INDUSTRIALS — DIVERSIFIED — 1.9% |
|||||
| GrafTech International Ltd.* |
260,620 | 2,465,466 | |||
| Lydall, Inc.* |
118,384 | 1,404,034 | |||
| Mueller Industries, Inc. |
73,926 | 2,380,417 | |||
| 6,249,917 | |||||
| INDUSTRIALS — ELECTRICAL EQUIPMENT — 0.9% |
|||||
| Amphenol Corp.* |
12,700 | 466,598 | |||
| Baldor Electric Co. |
18,292 | 503,579 | |||
| Cummins, Inc. |
8,100 | 678,699 | |||
| Franklin Electric Co., Inc. |
26,430 | 1,116,932 | |||
| 2,765,808 | |||||
| INDUSTRIALS — MACHINERY — 0.6% |
|||||
| Terex Corp.* |
38,009 | 1,811,129 | |||
| INSURANCE — 1.0% |
|||||
| Everest Re Group Ltd. |
10,300 | 922,468 | |||
| PartnerRe Ltd. |
14,623 | 905,749 | |||
| PMI Group, Inc. (The) |
7,400 | 308,950 | |||
| PXRE Group Ltd. |
49,708 | 1,253,138 | |||
| 3,390,305 | |||||
| INSURANCE — HEALTH INSURANCE — 0.4% |
|||||
| Health Net, Inc.*(a) |
39,800 | 1,149,026 | |||
| INSURANCE — LIFE INSURANCE — 0.7% |
|||||
| StanCorp Financial Group, Inc. |
21,747 | 1,794,128 | |||
| Torchmark Corp. |
10,400 | 594,256 | |||
| 2,388,384 | |||||
| INSURANCE — PROPERTY INSURANCE — 2.9% |
|||||
| Ambac Financial Group, Inc. |
7,400 | 607,762 | |||
| Donegal Group, Inc. |
19,158 | 439,293 | |||
| Hub International Ltd. (Canada) |
30,806 | 567,138 | |||
| Navigators Group, Inc.* |
22,615 | 680,938 | |||
| NYMAGIC, Inc. |
19,329 | 489,024 | |||
| ProAssurance Corp.* |
39,879 | 1,559,668 | |||
| Procentury Corp. |
86,330 | 1,070,492 | |||
| RenaissanceRe Holdings Ltd. |
20,469 | 1,066,026 | |||
| RLI Corp. |
40,642 | 1,689,487 | |||
| Willis Group Holdings Ltd. (United Kingdom)(a) |
25,789 | 1,061,733 | |||
| 9,231,561 | |||||
| INTERNET SERVICES — 0.1% |
|||||
| WebMD Corp.*(a) |
48,600 | 396,576 | |||
| METALS & MINING — 0.1% |
|||||
| Peabody Energy Corp. |
4,100 | 331,731 | |||
| REAL ESTATE — 0.2% |
|||||
| Omega Healthcare Investors, Inc. [REIT] |
22,379 | 264,072 | |||
| Spirit Finance Corp. [REIT]*(a) |
26,557 | 335,946 | |||
| 600,018 | |||||
66
AST GOLDMAN SACHS SMALL-CAP VALUE PORTFOLIO
SCHEDULE OF INVESTMENTS (CONTINUED)
DECEMBER 31, 2004
| SHARES |
VALUE (NOTE 2) | ||||
| REAL ESTATE INVESTMENT TRUST — APARTMENT — 1.6% |
|||||
| Apartment Investment & Management Co. (Class “A” Stock) [REIT](a) |
25,500 | $ | 982,770 | ||
| Gables Residential Trust [REIT] |
17,589 | 629,510 | |||
| Post Properties, Inc. [REIT] |
19,289 | 673,186 | |||
| Summit Properties, Inc. [REIT] |
87,458 | 2,847,633 | |||
| 5,133,099 | |||||
| REAL ESTATE INVESTMENT TRUST — HOTELS — 0.4% |
|||||
| LaSalle Hotel Properties [REIT] |
40,465 | 1,288,001 | |||
| REAL ESTATE INVESTMENT TRUST — MORTGAGE — 0.4% |
|||||
| MFA Mortgage Investments, Inc. [REIT] |
136,981 | 1,208,172 | |||
| REAL ESTATE INVESTMENT TRUST — OFFICE INDUSTRIAL — 2.3% |
|||||
| AmeriVest Properties, Inc. [REIT] |
38,200 | 244,480 | |||
| Brandywine Realty Trust [REIT] |
26,433 | 776,866 | |||
| Corporate Office Properties Trust [REIT] |
8,824 | 258,984 | |||
| Lexington Corp. Properties Trust [REIT] |
64,702 | 1,460,971 | |||
| Parkway Properties, Inc. [REIT] |
42,854 | 2,174,841 | |||
| Prentiss Properties Trust [REIT] |
67,680 | 2,585,376 | |||
| 7,501,518 | |||||
| REAL ESTATE INVESTMENT TRUST — OTHER REIT — 4.0% |
|||||
| Affordable Residential Communities, Inc. [REIT] |
36,965 | 530,448 | |||
| BioMed Realty Trust, Inc. [REIT] |
39,426 | 875,651 | |||
| Capital Automotive [REIT] |
55,805 | 1,982,472 | |||
| Commercial Net Lease Realty, Inc. [REIT] |
76,222 | 1,570,173 | |||
| Correctional Properties Trust [REIT] |
57,936 | 1,673,192 | |||
| Entertainment Properties Trust [REIT] |
27,423 | 1,221,695 | |||
| iStar Financial, Inc. [REIT] |
39,103 | 1,769,802 | |||
| Plum Creek Timber Co., Inc. [REIT] |
20,118 | 773,336 | |||
| RAIT Investment Trust [REIT] |
74,405 | 2,081,107 | |||
| U-Store-It Trust [REIT] |
29,023 | 503,549 | |||
| 12,981,425 | |||||
| REAL ESTATE INVESTMENT TRUST — RETAIL — 0.8% |
|||||
| Acadia Realty Trust [REIT] |
44,714 | 728,838 | |||
| Agree Realty Corp. [REIT] |
28,394 | 899,806 | |||
| Developers Diversified Realty Corp. [REIT] |
19,200 | 851,904 | |||
| 2,480,548 | |||||
| SERVICES — ENVIRONMENTAL — 0.6% |
|||||
| Republic Services, Inc. |
18,646 | 625,387 | |||
| TRC Cos., Inc.* |
21,128 | 359,176 | |||
| Waste Connections, Inc.* |
25,522 | 874,128 | |||
| 1,858,691 | |||||
| SERVICES — INDUSTRIAL SERVICES — 1.7% |
|||||
| Harsco Corp. |
12,025 | 670,274 | |||
| Infrasource Services, Inc.* |
48,566 | 631,358 | |||
| ITT Educational Services, Inc.* |
28,398 | 1,350,324 | |||
| Medical Staffing Network Holdings, Inc.* |
110,142 | 902,063 | |||
| PRG-Schultz International, Inc.* |
189,368 | 952,521 | |||
| School Specialty, Inc.* |
22,182 | 855,338 | |||
| 5,361,878 | |||||
| SERVICES — MEDIA — 1.0% |
|||||
| ADVO, Inc. |
32,614 | 1,162,689 | |||
| Emmis Communications Corp. (Class “A” Stock)* |
37,300 | 715,787 | |||
| Lamar Advertising Co.*(a) |
16,774 | 717,592 | |||
| Regent Communications, Inc.* |
148,039 | 784,607 | |||
| 3,380,675 | |||||
| SERVICES — PUBLISHING — 0.4% |
|||||
| Belo Corp. (Class “A” Stock) |
18,862 | 494,939 | |||
| Journal Register Co.* |
48,526 | 938,007 | |||
| 1,432,946 | |||||
| SERVICES — TELEPHONE — 1.6% |
|||||
| CenturyTel, Inc. |
12,100 | 429,187 | |||
| Cincinnati Bell, Inc.* |
208,513 | 865,329 | |||
| Iowa Telecommunications Services, Inc. |
28,311 | 610,668 | |||
| West Corp.* |
94,788 | 3,138,431 | |||
| 5,043,615 | |||||
| TECHNOLOGY — COMPUTER HARDWARE — 2.0% |
|||||
| CDW Corp. |
8,800 | 583,880 | |||
| Ditech Communications Corp.* |
173,576 | 2,594,960 | |||
| Hutchinson Technology, Inc.*(a) |
47,138 | 1,629,561 | |||
| Insight Enterprises, Inc.* |
74,930 | 1,537,564 | |||
| 6,345,965 | |||||
| TECHNOLOGY — COMPUTER SOFTWARE — 1.9% |
|||||
| Activision, Inc.* |
62,450 | 1,260,241 | |||
| Citadel Security Software, Inc.*(a) |
159,921 | 415,795 | |||
| OPNET Technologies, Inc.* |
120,937 | 1,018,290 | |||
| Take-Two Interactive Software, Inc.*(a) |
60,054 | 2,089,278 | |||
| Viisage Technology, Inc.* |
159,006 | 1,432,644 | |||
| 6,216,248 | |||||
| TECHNOLOGY — INFORMATION SERVICES — 1.6% |
|||||
| BearingPoint, Inc.* |
54,200 | 435,226 | |||
| Lionbridge Technologies, Inc.* |
420,187 | 2,823,657 | |||
| MTC Technologies, Inc.* |
61,474 | 2,063,682 | |||
| 5,322,565 | |||||
| TECHNOLOGY — INTERNET — 0.4% |
|||||
| Autobytel, Inc.* |
221,185 | 1,335,957 | |||
67
AST GOLDMAN SACHS SMALL-CAP VALUE PORTFOLIO
SCHEDULE OF INVESTMENTS (CONTINUED)
DECEMBER 31, 2004
| SHARES |
VALUE (NOTE 2) |
||||||
| TECHNOLOGY — SEMICONDUCTORS — 0.8% |
|||||||
| Power Integrations, Inc.* |
16,955 | $ | 335,370 | ||||
| Tessera Technologies, Inc.* |
60,440 | 2,248,972 | |||||
| 2,584,342 | |||||||
| TECHNOLOGY — SUPPLY CHAIN — 0.1% |
|||||||
| ScanSource, Inc.* |
2,858 | 177,653 | |||||
| TECHNOLOGY — WIRELESS — 0.2% |
|||||||
| EFJ, Inc.* |
65,955 | 636,466 | |||||
| TRANSPORTATION |
|||||||
| Forward Air Corp.* |
2,805 | 125,384 | |||||
| TRANSPORTATION — AIRLINES — 0.4% |
|||||||
| AirTran Holdings, Inc.*(a) |
122,789 | 1,313,842 | |||||
| TRANSPORTATION — TRUCK FREIGHT — 1.9% |
|||||||
| Heartland Express, Inc. |
48,550 | 1,090,919 | |||||
| OMI Corp. |
141,138 | 2,378,175 | |||||
| SCS Transportation, Inc.* |
74,881 | 1,749,969 | |||||
| Teekay Shipping Corp. |
11,300 | 475,843 | |||||
| Yellow Roadway Corp.* |
10,400 | 579,384 | |||||
| 6,274,290 | |||||||
| UTILITIES — ELECTRICAL UTILITIES — 3.8% |
|||||||
| Avista Corp. |
25,492 | 450,444 | |||||
| Central Vermont Public Service Corp. |
10,519 | 244,672 | |||||
| Edison International |
10,000 | 320,300 | |||||
| El Paso Electric Co.* |
144,670 | 2,740,049 | |||||
| Entergy Corp. |
10,489 | 708,952 | |||||
| FirstEnergy Corp. |
21,187 | 837,098 | |||||
| MGE Energy, Inc. |
4,198 | 151,254 | |||||
| PG&E Corp.* |
26,100 | 868,608 | |||||
| Pinnacle West Capital Corp. |
5,900 | 262,019 | |||||
| PNM Resources, Inc. |
63,873 | 1,615,348 | |||||
| PPL Corp. |
33,044 | 1,760,584 | |||||
| Southern Union Co.* |
36,514 | 875,595 | |||||
| Westar Energy, Inc. |
41,969 | 959,831 | |||||
| Wisconsin Energy Corp. |
11,700 | 394,407 | |||||
| 12,189,161 | |||||||
| UTILITIES — GAS UTILITIES — 2.8% |
|||||||
| AGL Resources, Inc. |
93,251 | 3,099,663 | |||||
| Atmos Energy Corp. |
35,333 | 966,358 | |||||
| Energen Corp. |
15,765 | 929,347 | |||||
| Northwest Natural Gas Co. |
57,592 | 1,943,154 | |||||
| Piedmont Natural Gas Co., Inc. |
19,653 | 456,736 | |||||
| South Jersey Industries, Inc. |
13,063 | 686,591 | |||||
| WGL Holdings, Inc. |
28,293 | 872,556 | |||||
| 8,954,405 | |||||||
| TOTAL COMMON STOCK |
303,948,332 | ||||||
| EXCHANGE TRADED FUND — 3.2% Ishares Russell 2000 Value Index Fund(a) |
53,837 | 10,374,390 | |||||
| PRINCIPAL AMOUNT (000) |
|||||||
| CORPORATE OBLIGATIONS — 0.1% |
|||||||
| METALS & MINING |
|||||||
| Mueller Industries, Inc., Sub. Notes 6.00%, 11/01/14 |
$ | 383 | 377,255 | ||||
| TOTAL LONG-TERM INVESTMENTS |
314,699,977 | ||||||
| SHORT-TERM INVESTMENTS — 10.9% |
|||||||
| CERTIFICATES OF DEPOSIT — 0.7% |
|||||||
| Banco Santander PR |
|||||||
| 2.315%, 01/07/05(b)(c) |
2,185 | 2,185,094 | |||||
| COMMERCIAL PAPER — 0.1% |
|||||||
| Citigroup Inc. |
|||||||
| 2.304%, 01/10/05(b) |
342 | 341,161 | |||||
| CORPORATE OBLIGATIONS — 1.6% |
|||||||
| Merrill Lynch & Co., Inc. |
|||||||
| 2.38%, 01/03/05(b)(c) |
2,538 | 2,538,256 | |||||
| Natexis Banque NY |
|||||||
| 2.297%, 01/03/05(b)(c) |
1,239 | 1,239,335 | |||||
| Sedna Finance Corporation |
|||||||
| 2.372%, 01/14/05(b)(c) |
252 | 251,796 | |||||
| Swedbank NY |
|||||||
| 2.362%, 01/18/05(b)(c) |
1,210 | 1,210,208 | |||||
| 5,239,595 | |||||||
| TIME DEPOSIT — 0.5% |
|||||||
| Bank of America NA |
|||||||
| 1.50%, 01/03/05(b) |
1,485 | 1,484,598 | |||||
| SHARES |
|||||||
| NON-REGISTERED INVESTMENT COMPANY — 8.0% |
|||||||
| BlackRock Institutional Money Market Trust(b)(j) |
25,892,178 | 25,892,178 | |||||
| TOTAL SHORT-TERM INVESTMENTS |
35,142,626 | ||||||
| TOTAL INVESTMENTS — 108.3% |
349,842,603 | ||||||
| LIABILITIES IN EXCESS OF OTHER ASSETS — (8.3%) |
(26,737,674 | ) | |||||
| NET ASSETS — 100.0% |
$ | 323,104,929 | |||||
68
AST GOLDMAN SACHS SMALL-CAP VALUE PORTFOLIO
SCHEDULE OF INVESTMENTS (CONTINUED)
DECEMBER 31, 2004
THE FOLLOWING ABBREVIATION IS USED THROUGHOUT THE SCHEDULE OF INVESTMENTS:
| REIT Real | Estate Investment Trust |
THE FOLLOWING ANNOTATIONS ARE USED THROUGHOUT THE SCHEDULE OF INVESTMENTS:
| * | Non-income producing security. |
| (a) | All or a portion of securities on loan. Securities on loan have an aggregate market value of $33,533,789; cash collateral of $35,142,626 (included with liabilities) received with which the portfolio purchased highly liquid short-term investments. |
| (b) | Represents security purchased with cash collateral for securities on loan. |
| (c) | Indicates a variable rate security. The maturity date presented for these instruments is the next date on which the rate of interest is adjusted. |
| (j) | Security available to institutional investors only. |
The industry classification of long-term portfolio holdings, short-term investments and liabilities in excess of other assets shown as a percentage of net assets as of December 31, 2004 were as follows:
| Financial — Banks |
9.1 | % | |
| Consumer Cyclicals — Retail Apparel |
4.8 | ||
| Real Estate Investment Trust — Other REIT |
4.0 | ||
| Utilities — Electrical Utilities |
3.8 | ||
| Industrials — Components |
3.5 | ||
| Energy — Energy Resources |
3.4 | ||
| Exchange Traded Fund |
3.2 | ||
| Financial Services |
2.9 | ||
| Insurance — Property Insurance |
2.9 | ||
| Basic Materials — Chemical |
2.8 | ||
| Utilities — Gas Utilities |
2.8 | ||
| Consumer Cyclicals — Construction |
2.4 | ||
| Basic Materials — Mining |
2.3 | ||
| Financial — Thrifts |
2.3 | ||
| Real Estate Investment Trust — Office Industrial |
2.3 | ||
| Basic Materials — Forest |
2.2 | ||
| Consumer Cyclicals — Leisure & Entertainment |
2.0 | ||
| Consumer Staples — Home Products |
2.0 | ||
| Technology — Computer Hardware |
2.0 | ||
| Consumer Cyclicals — Motor Vehicle |
1.9 | ||
| Industrials — Diversified |
1.9 | ||
| Technology — Computer Software |
1.9 | ||
| Transportation — Truck Freight |
1.9 | ||
| Consumer Staples — Food & Beverage |
1.8 | ||
| Health Care — Medical Products |
1.7 | ||
| Services — Industrial Services |
1.7 | ||
| Real Estate Investment Trust — Apartment |
1.6 | ||
| Services — Telephone |
1.6 | ||
| Technology — Information Services |
1.6 | ||
| Health Care — Biotechnology |
1.1 | ||
| Consumer Staples — Restaurants |
1.0 | ||
| Insurance |
1.0 | ||
| Services — Media |
1.0 | ||
| Energy — Oil Services |
0.9 | ||
| Health Care — Medical Providers |
0.9 | ||
| Industrials — Defense/Aerospace |
0.9 | % | |
| Industrials — Electrical Equipment |
0.9 | ||
| Real Estate Investment Trust — Retail |
0.8 | ||
| Technology — Semiconductor |
0.8 | ||
| Energy — Diversified Energy |
0.7 | ||
| Financial — Brokers |
0.7 | ||
| Insurance — Life Insurance |
0.7 | ||
| Consumer Cyclicals — Consumer Durables |
0.6 | ||
| Energy — Oil Refining |
0.6 | ||
| Financial — Securities/Asset Management |
0.6 | ||
| Industrials — Machinery |
0.6 | ||
| Services — Environmental |
0.6 | ||
| Health Care — Drugs |
0.5 | ||
| Computer Services & Software |
0.4 | ||
| Insurance — Health Insurance |
0.4 | ||
| Real Estate Investment Trust — Hotels |
0.4 | ||
| Real Estate Investment Trust — Mortgage |
0.4 | ||
| Services — Publishing |
0.4 | ||
| Technology — Internet |
0.4 | ||
| Transportation — Airlines |
0.4 | ||
| Business Services |
0.2 | ||
| Consumer Cyclicals — Hotels |
0.2 | ||
| Real Estate |
0.2 | ||
| Technology — Wireless |
0.2 | ||
| Automotive Parts |
0.1 | ||
| Consumer Products & Services |
0.1 | ||
| Internet Services |
0.1 | ||
| Metals & Mining |
0.2 | ||
| Technology — Supply Chain |
0.1 | ||
| Short-Term Investments |
10.9 | ||
| 108.3 | |||
| Liabilities in excess of other assets |
(8.3 | ) | |
| 100.0 | % | ||
See Notes to Financial Statements.
69
AST SMALL-CAP VALUE PORTFOLIO
SCHEDULE OF INVESTMENTS
DECEMBER 31, 2004
| SHARES |
VALUE (NOTE 2) | ||||
| LONG-TERM INVESTMENTS — 101.3% |
|||||
| COMMON STOCK — 101.1% |
|||||
| ADVERTISING — 0.5% |
|||||
| Advo, Inc. |
72,440 | $ | 2,582,487 | ||
| R.H. Donnelley Corp.* |
37,790 | 2,231,500 | |||
| 4,813,987 | |||||
| AEROSPACE — 1.3% |
|||||
| AAR Corp.* |
37,400 | 509,388 | |||
| BE Aerospace, Inc.* |
85,000 | 989,400 | |||
| CPI Aerostructures, Inc.* (cost $734,050; purchased 12/08/04-12/29/04)(g) |
68,400 | 783,180 | |||
| Curtiss-Wright Corp. |
48,080 | 2,760,273 | |||
| Ducommun, Inc.* |
11,200 | 233,520 | |||
| Esterline Technologies Corp.* |
41,200 | 1,345,180 | |||
| Heico Corp. |
18,700 | 422,433 | |||
| Kaman Corp. (Class “A” Stock) |
69,400 | 877,910 | |||
| Moog, Inc. (Class “A” Stock)* |
65,700 | 2,979,495 | |||
| Orbital Sciences Corp.* |
44,800 | 529,984 | |||
| Triumph Group, Inc.* |
21,300 | 841,350 | |||
| 12,272,113 | |||||
| AIRLINES — 0.8% |
|||||
| Alaska Air Group, Inc.* |
43,800 | 1,466,862 | |||
| Continental Airlines, Inc. (Class “B” Stock)*(a) |
50,200 | 679,708 | |||
| ExpressJet Holdings, Inc.* |
147,500 | 1,899,800 | |||
| Northwest Airlines Corp.*(a) |
113,150 | 1,236,730 | |||
| SkyWest, Inc. |
118,600 | 2,379,116 | |||
| 7,662,216 | |||||
| AUTOMOBILE MANUFACTURERS — 0.5% |
|||||
| Oshkosh Truck Corp. |
64,100 | 4,383,158 | |||
| AUTOMOTIVE PARTS — 2.1% |
|||||
| Aftermarket Technology Corp.* |
53,900 | 867,790 | |||
| American Axle & Manufacturing Holdings, Inc. |
51,020 | 1,564,273 | |||
| Asbury Automative Group, Inc.* |
99,400 | 1,369,732 | |||
| Cooper Tire & Rubber Co.(a) |
19,200 | 413,760 | |||
| CSK Auto Corp.* |
123,520 | 2,067,725 | |||
| Goodyear Tire & Rubber Co. (The)*(a) |
216,900 | 3,179,754 | |||
| Hayes Lemmerz International, Inc.* |
77,900 | 687,857 | |||
| Keystone Automotive Industries, Inc.* |
17,100 | 397,575 | |||
| Pep Boys — Manny, Moe & Jack, Inc. |
63,600 | 1,085,652 | |||
| Sonic Automotive, Inc. |
13,400 | 332,320 | |||
| Superior Industries International, Inc.(a) |
22,400 | 650,720 | |||
| Tenneco Automotive, Inc.* |
151,700 | 2,615,308 | |||
| Tower Automotive, Inc.*(a) |
64,100 | 153,199 | |||
| TRW Automotive Holdings Corp.* |
30,530 | 631,971 | |||
| Visteon Corp.(a) |
242,600 | 2,370,202 | |||
| Wabash National Corp.* |
37,900 | 1,020,647 | |||
| 19,408,485 | |||||
| BIOTECHNOLOGY — 0.4% |
|||||
| Applera Corp.-Celera Genomics Group* |
24,600 | 338,250 | |||
| Bio-Rad Laboratories, Inc. (Class “A” Stock)* |
18,700 | 1,072,819 | |||
| Cell Genesys, Inc.* |
16,100 | 130,410 | |||
| Cytokinetics, Inc.* |
51,900 | 531,975 | |||
| Genelabs Technologies, Inc.* |
262,200 | 314,640 | |||
| Human Genome Sciences, Inc.* |
64,100 | 770,482 | |||
| Telik, Inc.* |
44,000 | 842,160 | |||
| 4,000,736 | |||||
| BROADCASTING — 0.5% |
|||||
| 4Kids Entertainment, Inc.* |
5,400 | 113,508 | |||
| Belo Corp. (Class “A” Stock) |
47,540 | 1,247,450 | |||
| Gray Television, Inc. |
47,780 | 740,590 | |||
| Liberty Corp. (The) |
34,600 | 1,521,016 | |||
| Media General, Inc. (Class “A” Stock) |
8,300 | 537,923 | |||
| Sinclair Broadcast Group, Inc. (Class “A” Stock) |
13,400 | 123,414 | |||
| 4,283,901 | |||||
| BUILDING MATERIALS — 1.4% |
|||||
| Apogee Enterprises, Inc. |
57,100 | 765,711 | |||
| Eagle Materials, Inc. |
9,650 | 813,495 | |||
| Florida Rock Industries, Inc.(a) |
10,800 | 642,924 | |||
| Genlyte Group, Inc.* |
7,400 | 634,032 | |||
| Modine Manufacturing Co. |
18,000 | 607,860 | |||
| NCI Building Systems, Inc.* |
23,000 | 862,500 | |||
| Texas Industries, Inc. |
47,690 | 2,974,902 | |||
| USG Corp.*(a) |
69,400 | 2,794,738 | |||
| York International Corp.(a) |
50,470 | 1,743,234 | |||
| 12,944,676 | |||||
| BUSINESS SERVICES — 1.1% |
|||||
| Century Business Services, Inc.* |
68,400 | 298,224 | |||
| Charles River Associates, Inc.* |
10,100 | 472,377 | |||
| Clark, Inc.* |
18,100 | 280,912 | |||
| Harland, (John H.) Co. |
48,100 | 1,736,410 | |||
| Informatica Corp.* |
61,048 | 495,710 | |||
| InfoUSA, Inc.* |
11,800 | 132,042 | |||
| Labor Ready, Inc.* |
56,220 | 951,242 | |||
| MAXIMUS, Inc.* |
8,500 | 264,520 | |||
| MPS Group, Inc.* |
86,660 | 1,062,452 | |||
| Navigant International, Inc.* |
49,200 | 598,764 | |||
| PAREXEL International Corp.* |
19,700 | 399,910 | |||
| PDI, Inc.* |
23,000 | 512,440 | |||
| Safeguard Scientifics, Inc.* |
62,500 | 132,500 | |||
| Spherion Corp.* |
117,500 | 987,000 | |||
70
AST SMALL-CAP VALUE PORTFOLIO
SCHEDULE OF INVESTMENTS (CONTINUED)
DECEMBER 31, 2004
| SHARES |
VALUE (NOTE 2) | ||||
| TeleTech Holdings, Inc.* |
91,300 | $ | 884,697 | ||
| UniFirst Corp. |
28,400 | 803,152 | |||
| 10,012,352 | |||||
| CABLE TELEVISION — 0.4% |
|||||
| Charter Communications, Inc. Class “A” Stock)*(a) |
257,500 | 576,800 | |||
| Insight Communications Co., Inc. (Class “A” Stock)* |
59,300 | 549,711 | |||
| Lodgenet Entertainment Corp.* |
91,900 | 1,625,711 | |||
| Mediacom Communications Corp. (Class “A” Stock)* |
215,300 | 1,345,625 | |||
| 4,097,847 | |||||
| CHEMICALS — 3.6% |
|||||
| Airgas, Inc. |
33,880 | 898,159 | |||
| Arch Chemicals, Inc. |
37,780 | 1,087,308 | |||
| Crompton Corp. |
67,300 | 794,140 | |||
| Cytec Industries, Inc. |
86,870 | 4,466,855 | |||
| FMC Corp.* |
55,000 | 2,656,500 | |||
| Fuller, (H.B.) Co. |
66,200 | 1,887,362 | |||
| Georgia Gulf Corp. |
91,250 | 4,544,251 | |||
| Grace, (W.R.) & Co.* |
165,100 | 2,247,011 | |||
| Hercules, Inc.* |
242,280 | 3,597,858 | |||
| Lyondell Chemical Co.(a) |
18,785 | 543,262 | |||
| Minerals Technologies, Inc. |
25,700 | 1,714,190 | |||
| NewMarket Corp.* |
47,000 | 935,300 | |||
| Octel Corp. |
41,600 | 865,696 | |||
| Olin Corp. |
76,260 | 1,679,245 | |||
| OM Group, Inc.* |
13,400 | 434,428 | |||
| PolyOne Corp.* |
364,300 | 3,300,558 | |||
| Schulman, (A.), Inc. |
500 | 10,705 | |||
| Sensient Technologies Corp.(a) |
13,400 | 321,466 | |||
| Valhi, Inc. |
36,900 | 593,721 | |||
| Wellman, Inc. |
84,400 | 902,236 | |||
| 33,480,251 | |||||
| CLOTHING & APPAREL — 1.2% |
|||||
| Brown Shoe Company, Inc. |
32,000 | 954,560 | |||
| Hilfiger, (Tommy) Corp.* |
48,100 | 542,568 | |||
| J. Jill Group, Inc.* |
24,000 | 357,360 | |||
| Kellwood Co. |
94,530 | 3,261,285 | |||
| Kenneth Cole Productions, Inc. (Class “A” Stock) |
27,300 | 842,478 | |||
| Phillips-Van Heusen |
15,900 | 429,300 | |||
| Quiksilver, Inc.* |
38,500 | 1,146,915 | |||
| Reebok International Ltd. |
52,970 | 2,330,680 | |||
| Warnaco Group, Inc. (The)*(a) |
44,190 | 954,504 | |||
| 10,819,650 | |||||
| COMMERCIAL SERVICES — 0.3% |
|||||
| Arbitron, Inc.* |
20,300 | 795,354 | |||
| NCO Group, Inc.* |
16,600 | 429,110 | |||
| Source Interlink Cos., Inc.* |
94,000 | 1,248,320 | |||
| Vertrue, Inc.* |
6,500 | 245,505 | |||
| 2,718,289 | |||||
| COMPUTER HARDWARE — 0.8% |
|||||
| Gateway, Inc.* |
155,500 | 934,555 | |||
| Hutchinson Technology, Inc.* |
46,500 | 1,607,505 | |||
| Insight Enterprises, Inc.* |
53,280 | 1,093,306 | |||
| Komag, Inc.* |
16,100 | 302,358 | |||
| Maxtor Corp.* |
117,500 | 622,750 | |||
| MTS Systems Corp. |
21,900 | 740,439 | |||
| PalmOne, Inc.*(a) |
50,000 | 1,577,500 | |||
| Quantum Corp.* |
130,900 | 342,958 | |||
| StorageNetworks, Inc.* (cost $0; purchased 11/04/03)(g) |
300,000 | 0 | |||
| 7,221,371 | |||||
| COMPUTER SERVICES & SOFTWARE — 3.1% |
|||||
| Agilysys, Inc. |
81,700 | 1,400,338 | |||
| BISYS Group, Inc. (The)* |
149,360 | 2,456,972 | |||
| Black Box Corp. |
25,700 | 1,234,114 | |||
| CACI International, Inc. (Class “A” Stock)* |
15,500 | 1,056,015 | |||
| Ciber, Inc.* |
70,500 | 679,620 | |||
| E.piphany, Inc.* |
27,300 | 131,859 | |||
| FileNET Corp.* |
21,330 | 549,461 | |||
| Gartner, Inc. (Class “A” Stock)*(a) |
75,400 | 939,484 | |||
| Hyperion Solutions Corp.* |
3,200 | 149,184 | |||
| Inter-Tel, Inc. |
86,420 | 2,366,180 | |||
| Intergraph Corp.* |
12,300 | 331,239 | |||
| Magma Design Automation, Inc.* |
9,600 | 120,576 | |||
| Mantech International Corp. (Class “A” Stock)* |
23,500 | 557,890 | |||
| Manugistics Group, Inc.* |
32,500 | 93,275 | |||
| McDATA Corp. (Class “A” Stock)* |
134,700 | 802,812 | |||
| NetIQ Corp.* |
86,390 | 1,054,822 | |||
| Parametric Technology Corp.* |
530,640 | 3,125,469 | |||
| Performance Technologies, Inc.* |
93,780 | 872,154 | |||
| Perot Systems Corp. (Class “A” Stock)* |
103,100 | 1,652,693 | |||
| Pomeroy IT Solutions, Inc.* |
82,500 | 1,254,825 | |||
| Progress Software Corp.* |
34,700 | 810,245 | |||
| Radisys Corp.* |
24,600 | 480,930 | |||
| Redback Networks, Inc.* |
36,400 | 195,104 | |||
| SafeNet, Inc.* |
28,900 | 1,061,786 | |||
| Silicon Graphics, Inc.*(a) |
278,800 | 482,324 | |||
| Sybase, Inc.* |
114,610 | 2,286,470 | |||
| Sykes Enterprises, Inc.* |
43,200 | 300,240 | |||
| Synnex Corp.* |
6,900 | 166,014 | |||
| Systemax, Inc.* |
55,500 | 407,370 | |||
71
AST SMALL-CAP VALUE PORTFOLIO
SCHEDULE OF INVESTMENTS (CONTINUED)
DECEMBER 31, 2004
| SHARES |
VALUE (NOTE 2) | ||||
| THQ, Inc.* |
39,560 | $ | 907,506 | ||
| Tyler Technologies, Inc.* |
48,600 | 406,296 | |||
| 28,333,267 | |||||
| CONGLOMERATES — 0.4% |
|||||
| Griffon Corp.* |
122,650 | 3,311,550 | |||
| CONSTRUCTION — 1.5% |
|||||
| Astec Industries, Inc.* |
13,400 | 230,614 | |||
| Beazer Homes USA, Inc.(a) |
13,400 | 1,959,214 | |||
| Building Materials Holdings Corp. |
18,700 | 716,023 | |||
| Dycom Industries, Inc.*(a) |
26,520 | 809,390 | |||
| Insituform Technologies, Inc. (Class “A” Stock)* |
60,320 | 1,367,454 | |||
| Levitt Corp. (Class “A” Stock) |
34,800 | 1,063,836 | |||
| Meritage Homes Corp.* |
19,700 | 2,220,190 | |||
| URS Corp.* |
29,400 | 943,740 | |||
| Washington Group International, Inc.* |
38,500 | 1,588,125 | |||
| WCI Communities, Inc.* |
86,600 | 2,546,041 | |||
| 13,444,627 | |||||
| CONSUMER PRODUCTS & SERVICES — 3.0% |
|||||
| Aaron Rents, Inc.(a) |
79,500 | 1,987,500 | |||
| American Greetings (Class “A” Stock)(a) |
138,870 | 3,520,355 | |||
| Applica, Inc.* |
34,200 | 206,910 | |||
| Aviall, Inc.* |
89,700 | 2,060,409 | |||
| Callaway Golf Co. |
126,600 | 1,709,100 | |||
| Department 56, Inc.* |
19,700 | 328,005 | |||
| Dimon, Inc. |
50,200 | 337,344 | |||
| Dollar Thrifty Automotive Group, Inc.* |
56,600 | 1,709,320 | |||
| Integrated Electrical Services, Inc.* |
146,205 | 707,632 | |||
| Interpool, Inc. |
28,900 | 686,375 | |||
| Jacuzzi Brands, Inc.* |
123,400 | 1,073,580 | |||
| Jakks Pacific, Inc.* |
55,760 | 1,232,854 | |||
| K2, Inc.* |
46,500 | 738,420 | |||
| National Presto Industries, Inc. |
16,450 | 748,475 | |||
| Nautilus Group, Inc. |
20,840 | 503,703 | |||
| Playtex Products, Inc.* |
60,400 | 482,596 | |||
| Regis Corp. |
41,020 | 1,893,073 | |||
| Rent-Way, Inc.* |
82,800 | 663,228 | |||
| Revlon, Inc. (Class “A” Stock)* |
93,500 | 215,050 | |||
| Steinway Musical Instruments, Inc.* |
28,400 | 821,896 | |||
| Tupperware Corp. |
68,900 | 1,427,608 | |||
| Universal Corp. |
97,800 | 4,678,751 | |||
| Water Pik Technologies, Inc.* |
16,100 | 285,453 | |||
| 28,017,637 | |||||
| CONTAINERS & PACKAGING — 1.1% |
|||||
| Chesapeake Corp. |
30,400 | 825,664 | |||
| Crown Holdings, Inc.* |
198,200 | 2,723,268 | |||
| Greif, Inc. (Class “A” Stock) |
42,200 | 2,363,200 | |||
| Packaging Corp. of America(a) |
24,950 | 587,573 | |||
| Silgan Holdings, Inc. |
64,100 | 3,907,536 | |||
| 10,407,241 | |||||
| DIVERSIFIED OPERATIONS — 0.4% |
|||||
| Ameron International Corp. |
17,100 | 648,090 | |||
| Blount International, Inc.* |
59,930 | 1,043,981 | |||
| Walter Industries, Inc.(a) |
64,100 | 2,162,093 | |||
| 3,854,164 | |||||
| ELECTRONIC COMPONENTS & EQUIPMENT — 2.5% |
|||||
| Ametek, Inc. |
28,470 | 1,015,525 | |||
| Analogic Corp. |
29,500 | 1,321,305 | |||
| Anixter International, Inc. |
37,400 | 1,346,026 | |||
| Arris Group, Inc.* |
148,340 | 1,044,314 | |||
| Artesyn Technologies, Inc.* |
44,850 | 506,805 | |||
| Avnet, Inc.*(a) |
54,150 | 987,696 | |||
| Bel Fuse, Inc. (Class “B” Stock) |
24,600 | 831,234 | |||
| Belden CDT, Inc. |
54,310 | 1,259,992 | |||
| Benchmark Electronics, Inc.* |
52,900 | 1,803,890 | |||
| C-COR, Inc.* |
16,100 | 149,730 | |||
| Checkpoint Systems, Inc.* |
35,300 | 637,165 | |||
| Coherent, Inc.* |
69,370 | 2,111,622 | |||
| CTS Corp. |
80,100 | 1,064,529 | |||
| Electro Scientific Industries, Inc.* |
23,000 | 454,480 | |||
| Electronics for Imaging, Inc.* |
33,100 | 576,271 | |||
| ESCO Technologies, Inc.* |
16,100 | 1,234,065 | |||
| Hypercom Corp.* |
20,300 | 120,176 | |||
| Littelfuse, Inc.* |
21,700 | 741,272 | |||
| Methode Electronics, Inc. (Class “A” Stock) |
59,360 | 762,776 | |||
| Rayovac Corp.* |
58,800 | 1,796,928 | |||
| REMEC, Inc.* |
25,100 | 180,971 | |||
| Stoneridge, Inc.* |
56,100 | 848,793 | |||
| Synopsys, Inc.* |
60,430 | 1,185,637 | |||
| Sypris Solutions, Inc. |
30,200 | 462,362 | |||
| Trimble Navigation Ltd.* |
11,000 | 363,440 | |||
| TTM Technologies, Inc.* |
20,800 | 245,440 | |||
| 23,052,444 | |||||
| ENTERTAINMENT & LEISURE — 1.1% |
|||||
| Argosy Gaming Co.* |
23,000 | 1,074,100 | |||
| Boyd Gaming Corp.(a) |
25,100 | 1,045,415 | |||
| Carmike Cinemas, Inc. |
40,420 | 1,475,330 | |||
| GameStop Corp. (Class “A” Stock)* |
19,700 | 440,492 | |||
| Hollywood Entertainment Corp.* |
76,400 | 1,000,076 | |||
| Isle of Capri Casinos, Inc.* |
19,700 | 505,305 | |||
| Marinemax, Inc.* |
16,910 | 503,242 | |||
| Movie Gallery, Inc. |
83,470 | 1,591,772 | |||
| Penn National Gaming, Inc.* |
20,190 | 1,222,505 | |||
72
AST SMALL-CAP VALUE PORTFOLIO
SCHEDULE OF INVESTMENTS (CONTINUED)
DECEMBER 31, 2004
| SHARES |
VALUE (NOTE 2) | ||||
| Six Flags, Inc.* |
62,500 | $ | 335,625 | ||
| World Wrestling Entertainment, Inc. |
62,000 | 752,060 | |||
| 9,945,922 | |||||
| ENVIRONMENTAL SERVICES — 0.4% |
|||||
| Mine Safety Appliances Co. |
29,900 | 1,515,930 | |||
| Tetra Tech, Inc.* |
62,050 | 1,038,717 | |||
| WCA Waste Corp.* |
100,840 | 1,053,778 | |||
| 3,608,425 | |||||
| EQUIPMENT SERVICES — 0.4% |
|||||
| General Cable Corp.* |
40,600 | 562,310 | |||
| Global Imaging Systems, Inc.* |
5,900 | 233,050 | |||
| RPC, Inc. |
50,800 | 1,276,096 | |||
| United Rentals, Inc.* |
31,700 | 599,130 | |||
| Universal Compression Holdings, Inc.* |
23,000 | 802,930 | |||
| Watsco, Inc. |
17,100 | 602,262 | |||
| 4,075,778 | |||||
| FINANCIAL — BANK & TRUST — 11.3% |
|||||
| ABC Bancorp |
17,100 | 359,100 | |||
| Accredited Home Lenders Holding Co.* |
32,600 | 1,619,568 | |||
| Amcore Financial, Inc. |
61,010 | 1,963,302 | |||
| AmericanWest Bancorp* |
13,400 | 271,350 | |||
| Bancfirst Corp. |
9,600 | 758,208 | |||
| Bank Mutual Corp. |
120,870 | 1,470,988 | |||
| Bank Of The Ozarks, Inc. |
22,400 | 762,272 | |||
| BankAtlantic Bancorp, Inc. (Class “A” Stock) |
105,200 | 2,093,480 | |||
| Banner Corp. |
11,200 | 349,328 | |||
| Capital Bancorp Ltd. |
22,400 | 788,928 | |||
| Capital Corp of The West |
7,400 | 347,807 | |||
| Cardinal Financial Corp.* |
123,230 | 1,374,015 | |||
| Cathay Bancorp, Inc. |
24,000 | 900,000 | |||
| Chemical Financial Corp. |
73,820 | 3,168,354 | |||
| City Holding Co. |
43,030 | 1,559,407 | |||
| Colonial Bancgroup, Inc. |
77,900 | 1,653,817 | |||
| Columbia Banking Systems, Inc. |
21,700 | 542,283 | |||
| Commercial Capital Bancorp, Inc. |
30,500 | 706,990 | |||
| Commercial Federal Corp. |
54,260 | 1,612,065 | |||
| Community Bank Systems, Inc. |
76,400 | 2,158,300 | |||
| Community Trust Bancorp, Inc. |
18,742 | 606,491 | |||
| Corus Bankshares, Inc. |
85,500 | 4,104,855 | |||
| CPB Financial Corp. |
33,600 | 1,215,312 | |||
| Cullen/Frost Bankers, Inc.(a) |
49,200 | 2,391,120 | |||
| EuroBancshares, Inc.* |
44,200 | 928,200 | |||
| Financial Institutions, Inc. |
5,400 | 125,550 | |||
| First Citizens Bancshares, Inc. (Class “A” Stock) |
9,180 | 1,360,935 | |||
| First Financial Holdings, Inc. |
12,800 | 419,072 | |||
| First Indiana Corp. |
60,787 | 1,368,315 | |||
| First Niagara Financial Group, Inc.(a) |
35,700 | 498,015 | |||
| First Oak Brook Bancshares, Inc. |
9,900 | 320,859 | |||
| First Republic Bank |
36,900 | 1,955,700 | |||
| FirstFed Financial Corp.* |
38,210 | 1,981,953 | |||
| FirstMerit Corp. |
91,560 | 2,608,544 | |||
| Flagstar Bancorp, Inc.(a) |
52,900 | 1,195,540 | |||
| Gold Banc Corp, Inc. |
141,600 | 2,070,192 | |||
| Great Southern Bancorp, Inc. |
17,700 | 619,500 | |||
| Greater Bay Bancorp |
97,360 | 2,714,397 | |||
| Hancock Holding Co. |
41,850 | 1,400,301 | |||
| Hudson River Bancorp, Inc. |
101,400 | 2,006,706 | |||
| IBERIABANK Corp. |
57,800 | 3,835,608 | |||
| Independent Bank Corp. (MA) |
64,800 | 2,187,000 | |||
| Independent Bank Corp. (MI) |
66,400 | 1,980,712 | |||
| Irwin Financial Corp. |
77,900 | 2,211,581 | |||
| MAF Bancorp, Inc. |
68,640 | 3,076,445 | |||
| Mainsource Financial Group, Inc. |
12,915 | 308,410 | |||
| MB Financial, Inc. |
13,000 | 547,950 | |||
| Mercantile Bank Corp. |
22,900 | 904,550 | |||
| Mid-State Bancshares |
44,300 | 1,269,195 | |||
| Nara Bancorp, Inc. |
5,400 | 114,858 | |||
| Newalliance Bancshares, Inc. |
71,360 | 1,091,808 | |||
| Ocwen Financial Corp.* |
51,300 | 490,428 | |||
| Old Second Bancorp, Inc. |
9,900 | 315,612 | |||
| Oriental Financial Group, Inc. |
47,520 | 1,345,291 | |||
| Peoples Bancorp, Inc. |
12,900 | 353,847 | |||
| Prosperity Bancshares, Inc. |
29,900 | 873,379 | |||
| Provident Bancshares Corp. |
43,800 | 1,593,006 | |||
| R&G Financial Corp. (Class “B” Stock) |
74,300 | 2,888,784 | |||
| Rainier Pacific Financial Group, Inc. |
68,790 | 1,231,341 | |||
| Republic Bancorp, Inc (MI) |
182,000 | 2,780,960 | |||
| Republic Bancorp, Inc. (KY) (Class “A” Stock) |
9,500 | 244,150 | |||
| Royal Bancshares Of Pennsylvania, Inc. (Class “A” Stock) |
13,158 | 355,529 | |||
| SCBT Financial Corp. |
9,555 | 320,761 | |||
| Silicon Valley Bancshares* |
21,300 | 954,666 | |||
| Simmons First National Corp. (Class “A” Stock) |
18,800 | 544,260 | |||
| Southside Bancshares, Inc. |
18,400 | 420,440 | |||
| Southwest Bancorp, Inc. |
14,900 | 364,752 | |||
| State Financial Services Corp (Class “A” Stock) |
25,800 | 776,580 | |||
| Sterling Financial Corp. (PA) |
38,700 | 1,109,529 | |||
| Sterling Financial Corp./Spokane* |
99,700 | 3,914,222 | |||
| Summit Bancshares, Inc. |
20,800 | 780,000 | |||
| Sun Bancorp, Inc.* |
11,800 | 294,764 | |||
| Susquehanna Bancshares, Inc. |
9,630 | 240,269 | |||
| Taylor Capital Group, Inc. |
24,600 | 824,100 | |||
| TierOne Corp. |
39,700 | 986,545 | |||
| Trico Bancshares |
16,700 | 390,780 | |||
73
AST SMALL-CAP VALUE PORTFOLIO
SCHEDULE OF INVESTMENTS (CONTINUED)
DECEMBER 31, 2004
| SHARES |
VALUE (NOTE 2) | ||||
| UMB Financial Corp. |
42,940 | $ | 2,432,980 | ||
| Umpqua Holdings Corp. |
27,300 | 688,233 | |||
| United Bancshares, Inc. |
55,000 | 2,098,250 | |||
| West Coast Bancorp |
106,800 | 2,713,788 | |||
| Western Sierra Bancorp* |
8,000 | 306,840 | |||
| 104,513,322 | |||||
| FINANCIAL SERVICES — 3.0% |
|||||
| Advanta Corp. (Class “B” Stock) |
88,610 | 2,150,565 | |||
| Affiliated Managers Group* |
25,780 | 1,746,337 | |||
| Dime Community Bancshares |
103,690 | 1,857,088 | |||
| Hanmi Financial Corp. |
116,400 | 4,183,415 | |||
| Investment Technology Group, Inc.* |
97,130 | 1,942,600 | |||
| ITLA Capital Corp.* |
12,300 | 723,117 | |||
| Jones Lang Lasalle, Inc.* |
32,600 | 1,219,566 | |||
| Lakeland Financial Corp. |
2,700 | 107,190 | |||
| MBT Financial Corp. |
16,100 | 374,647 | |||
| Metris Companies, Inc.* |
36,300 | 462,825 | |||
| National Financial Partners Corp. |
15,810 | 613,428 | |||
| Partners Trust Financial Group, Inc. |
35,300 | 411,245 | |||
| Raymond James Financial, Inc. |
43,800 | 1,356,924 | |||
| Sky Financial Group, Inc. |
39,160 | 1,122,717 | |||
| Technology Investment Capital Corp. |
105,100 | 1,577,551 | |||
| Trustmark Corp. |
33,750 | 1,048,613 | |||
| W Holding Co., Inc. |
82,008 | 1,881,264 | |||
| Whitney Holdings Corp. |
29,530 | 1,328,555 | |||
| World Acceptance Corp.* |
91,900 | 2,528,169 | |||
| WSFS Financial Corp. |
20,900 | 1,260,688 | |||
| 27,896,504 | |||||
| FINANCIAL — BROKERAGE — 0.7% |
|||||
| Greenhill & Co., Inc. |
2,700 | 77,490 | |||
| LaBranche & Co., Inc.* |
36,300 | 325,248 | |||
| Instinet Group, Inc.* |
263,620 | 1,589,629 | |||
| Knight Trading Group, Inc. (Class “A” Stock)*(a) |
281,350 | 3,080,782 | |||
| Piper Jaffray Cos., Inc.* |
34,130 | 1,636,534 | |||
| 6,709,683 | |||||
| FOOD — 0.8% |
|||||
| Chiquita Brands International, Inc. |
82,800 | 1,826,568 | |||
| Corn Products International, Inc. |
24,600 | 1,317,576 | |||
| Flowers Foods, Inc. |
23,000 | 726,340 | |||
| Great Atlantic & Pacific Tea Co., Inc.* |
35,300 | 361,825 | |||
| J&J Snack Foods Corp. |
11,200 | 549,136 | |||
| Nash Finch Co. |
15,500 | 585,280 | |||
| Ralcorp Holdings, Inc. |
21,300 | 893,109 | |||
| Sanderson Farms, Inc. |
19,200 | 830,976 | |||
| Smart & Final, Inc.* |
33,100 | 476,309 | |||
| 7,567,119 | |||||
| FURNITURE — 0.1% |
|||||
| Furniture Brands International, Inc. |
15,000 | 375,750 | |||
| Kimball International, Inc. (Class “B” Stock) |
44,800 | 663,488 | |||
| 1,039,238 | |||||
| HEALTHCARE SERVICES — 1.8% |
|||||
| AMERIGROUP Corp.* |
16,600 | 1,255,956 | |||
| Angelica Corp. |
86,600 | 2,342,530 | |||
| First Health Group Corp.* |
59,800 | 1,118,858 | |||
| Gentiva Health Services, Inc.* |
56,600 | 946,352 | |||
| Kindred Healthcare, Inc.* |
93,800 | 2,809,310 | |||
| Magellan Health Services, Inc.* |
16,600 | 567,056 | |||
| National Dentex Corp.* |
30,570 | 930,887 | |||
| Pediatrix Medical Group, Inc.* |
42,200 | 2,702,910 | |||
| Province Healthcare Co.* |
23,000 | 514,050 | |||
| Res-Care, Inc.* |
87,800 | 1,336,316 | |||
| Sierra Health Services, Inc.* |
8,000 | 440,880 | |||
| Triad Hospitals, Inc.* |
30,680 | 1,141,603 | |||
| Universal Health Services, Inc. (Class “B” Stock) |
18,050 | 803,225 | |||
| 16,909,933 | |||||
| HOTELS & MOTELS — 0.5% |
|||||
| Ameristar Casinos, Inc. |
17,100 | 737,181 | |||
| Ashford Hospitality Trust, Inc. |
56,470 | 613,829 | |||
| Aztar Corp.* |
80,600 | 2,814,552 | |||
| La Quinta Corp.* |
78,100 | 709,929 | |||
| 4,875,491 | |||||
| INDUSTRIAL PRODUCTS — 1.4% |
|||||
| Actuant Corp. (Class “A” Stock)* |
41,430 | 2,160,574 | |||
| Acuity Brands, Inc. |
66,540 | 2,115,972 | |||
| AMCOL International Corp. |
43,520 | 874,317 | |||
| Aptargroup, Inc. |
33,550 | 1,770,769 | |||
| Barnes Group, Inc. |
73,700 | 1,953,787 | |||
| Kronos Worldwide, Inc. |
1,200 | 48,900 | |||
| Robbins & Myers, Inc. |
68,230 | 1,625,921 | |||
| Watts Water Technologies, Inc. (Class “A” Stock) |
65,240 | 2,103,338 | |||
| 12,653,578 | |||||
| INSURANCE — 5.5% |
|||||
| AmerUs Group Co.(a) |
87,600 | 3,968,279 | |||
| Argonaut Group, Inc.* |
63,600 | 1,343,868 | |||
| Baldwin & Lyons, Inc. (Class “B” Stock) |
11,900 | 318,801 | |||
| Delphi Financial Group, Inc. (Class “A” Stock)(a) |
112,040 | 5,170,645 | |||
| Direct General Corp. |
27,700 | 889,170 | |||
74
AST SMALL-CAP VALUE PORTFOLIO
SCHEDULE OF INVESTMENTS (CONTINUED)
DECEMBER 31, 2004
| SHARES |
VALUE (NOTE 2) | ||||
| Donegal Group, Inc. |
45,560 | $ | 1,044,691 | ||
| Horace Mann Educators Corp. |
60,520 | 1,154,722 | |||
| Infinity Property & Casualty Corp. |
34,200 | 1,203,840 | |||
| LandAmerica Financial Group, Inc. |
50,800 | 2,739,644 | |||
| Midland Co. |
23,500 | 734,845 | |||
| Nationwide Financial Services, Inc. (Class “A” Stock) |
5,400 | 206,442 | |||
| Navigators Group, Inc.* |
35,970 | 1,083,057 | |||
| NYMAGIC, Inc. |
12,300 | 311,190 | |||
| Odyssey Re Holdings Corp.(a) |
40,940 | 1,032,097 | |||
| Ohio Casualty Corp.* |
57,850 | 1,342,699 | |||
| Phoenix Companies, Inc. |
29,400 | 367,500 | |||
| Platinum Underwriters Holdings Ltd. |
66,750 | 2,075,925 | |||
| PMA Capital Corp. (Class “A” Stock)* |
251,100 | 2,598,885 | |||
| PMI Group, Inc. (The) |
37,420 | 1,562,285 | |||
| ProAssurance Corp.* |
40,600 | 1,587,866 | |||
| PXRE Group Ltd. |
74,320 | 1,873,607 | |||
| RLI Corp. |
49,290 | 2,048,985 | |||
| Safety Insurance Group, Inc. |
45,900 | 1,429,785 | |||
| Selective Insurance Group, Inc.(a) |
45,400 | 2,008,496 | |||
| State Auto Financial Corp. |
17,000 | 439,450 | |||
| Stewart Information Services Corp. |
77,400 | 3,223,710 | |||
| Triad Guaranty, Inc.* |
15,460 | 935,021 | |||
| United Fire & Casualty Co. |
20,200 | 680,942 | |||
| United Insurance Cos., Inc. |
46,500 | 1,576,350 | |||
| Universal American Financial Corp.* |
124,970 | 1,933,286 | |||
| Zenith National Insurance Corp. |
72,700 | 3,623,368 | |||
| 50,509,451 | |||||
| INTERNET SERVICES — 0.6% |
|||||
| Adaptec, Inc.* |
162,900 | 1,236,411 | |||
| aQuantive, Inc.* |
37,900 | 338,826 | |||
| EarthLink, Inc.*(a) |
150,100 | 1,729,152 | |||
| eSpeed, Inc. (Class “A” Stock)* |
5,900 | 72,983 | |||
| Harris Interactive, Inc.* |
14,400 | 113,760 | |||
| Homestore, Inc.* |
176,800 | 535,704 | |||
| Internet Security Systems, Inc.* |
8,000 | 186,000 | |||
| ProQuest Co.* |
13,400 | 397,980 | |||
| United Online, Inc.* |
40,900 | 471,577 | |||
| 5,082,393 | |||||
| MACHINERY & EQUIPMENT — 3.8% |
|||||
| Albany International Corp. (Class “A” Stock) |
41,570 | 1,461,601 | |||
| Applied Industrial |
|||||
| Technologies, Inc. |
212,400 | 5,819,760 | |||
| Briggs & Stratton Corp.(a) |
33,900 | 1,409,562 | |||
| Cascade Corp. |
26,200 | 1,046,690 | |||
| Flowserve Corp.* |
25,100 | 691,254 | |||
| Gardner Denver, Inc.* |
5,900 | 214,111 | |||
| JLG Industries, Inc. |
157,600 | 3,093,688 | |||
| Joy Global, Inc. |
68,400 | 2,970,612 | |||
| Kadant, Inc.* |
61,460 | 1,259,930 | |||
| Kennametal, Inc. |
34,660 | 1,725,028 | |||
| Lennox International, Inc. |
109,000 | 2,218,150 | |||
| Lone Star Technologies, Inc.* |
23,500 | 786,310 | |||
| Nacco Industries, Inc. (Class “A” Stock) |
12,800 | 1,349,120 | |||
| Penn Engineering & Manufacturing Corp. |
16,100 | 291,410 | |||
| Regal-Beloit Corp. |
61,790 | 1,767,194 | |||
| Sauer-Danfoss, Inc. |
32,600 | 711,006 | |||
| Smith, (A.O.) Corp. |
97,000 | 2,904,180 | |||
| Tecumseh Products Co. (Class “A” Stock) |
19,200 | 917,760 | |||
| Terex Corp.* |
27,300 | 1,300,845 | |||
| Toro Co. |
35,800 | 2,912,330 | |||
| Westinghouse Airbrake Technologies Corp. |
29,461 | 628,109 | |||
| 35,478,650 | |||||
| MEDICAL SUPPLIES & EQUIPMENT — 2.1% |
|||||
| Computer Programs and Systems, Inc. |
30,400 | 703,760 | |||
| CONMED Corp.* |
55,800 | 1,585,836 | |||
| Cooper Cos., Inc. (The)(a) |
8,970 | 633,192 | |||
| CTI Molecular Imaging, Inc.* |
25,700 | 364,683 | |||
| Cypress Bioscience, Inc.* |
104,700 | 1,472,082 | |||
| Dade Behring Holdings, Inc.* |
13,480 | 754,880 | |||
| DJ Orthopedics, Inc.* |
37,120 | 795,110 | |||
| Invacare Corp. |
23,540 | 1,088,960 | |||
| Kyphon, Inc.* |
29,900 | 770,224 | |||
| Mettler-Toledo International, Inc.* |
38,750 | 1,988,263 | |||
| Owens & Minor, Inc. |
46,420 | 1,307,651 | |||
| Palatin Technologies, Inc* |
67,300 | 179,018 | |||
| Per-Se Technologies, Inc.* |
65,300 | 1,033,699 | |||
| PSS World Medical, Inc.* |
68,900 | 862,284 | |||
| Schein, (Henry), Inc.* |
13,720 | 955,461 | |||
| Sola International, Inc.* |
68,400 | 1,883,736 | |||
| Steris Corp.* |
27,300 | 647,556 | |||
| SurModics, Inc.*(a) |
3,200 | 104,032 | |||
| Sybron Dental Specialties, Inc.* |
65,110 | 2,303,592 | |||
| 19,434,019 | |||||
| METALS & MINING — 3.1% |
|||||
| AK Steel Holding Corp.*(a) |
143,200 | 2,072,104 | |||
| Brush Engineered Materials, Inc.* |
30,955 | 572,668 | |||
| Century Aluminum Co.* |
47,350 | 1,243,411 | |||
| CIRCOR International, Inc. |
93,840 | 2,173,334 | |||
| Commercial Metals Co. |
52,510 | 2,654,906 | |||
| Encore Wire Corp.* |
47,300 | 630,509 | |||
| Kaydon Corp. |
90,800 | 2,998,216 | |||
| NN, Inc. |
64,000 | 845,440 | |||
75
AST SMALL-CAP VALUE PORTFOLIO
SCHEDULE OF INVESTMENTS (CONTINUED)
DECEMBER 31, 2004
| SHARES |
VALUE (NOTE 2) | ||||
| NS Group, Inc.* |
30,400 | $ | 845,120 | ||
| Quanex Corp. |
47,500 | 3,257,075 | |||
| Reliance Steel & Aluminum Co. |
75,900 | 2,957,064 | |||
| Ryerson Tull, Inc. |
67,800 | 1,067,850 | |||
| Schnitzer Steel Industries, Inc. (Class “A” Stock) |
21,300 | 722,709 | |||
| Steel Dynamics, Inc. |
129,160 | 4,892,580 | |||
| Valmont Industries, Inc. |
74,800 | 1,878,228 | |||
| 28,811,214 | |||||
| OFFICE EQUIPMENT — 0.5% |
|||||
| Imagistics International, Inc.* |
41,200 | 1,386,792 | |||
| United Stationers, Inc.* |
64,900 | 2,998,380 | |||
| 4,385,172 | |||||
| OIL & GAS — 5.5% |
|||||
| AGL Resources, Inc. |
125,740 | 4,179,598 | |||
| Atlas America, Inc.*(a) |
29,830 | 1,066,423 | |||
| Brigham Exploration Co.* |
131,280 | 1,181,520 | |||
| Cal Dive International, Inc.* |
10,100 | 411,575 | |||
| Cimarex Energy Co.* |
27,800 | 1,053,620 | |||
| Comstock Resources, Inc.* |
53,900 | 1,188,495 | |||
| Denbury Resources, Inc.* |
88,200 | 2,421,090 | |||
| Energy Partners Ltd.* |
30,400 | 616,208 | |||
| Hanover Compressor Co.* |
29,900 | 422,487 | |||
| Houston Exploration Co.* |
36,300 | 2,044,053 | |||
| Magnum Hunter Resources, Inc.*(a) |
253,630 | 3,271,827 | |||
| NATCO Group, Inc.* |
65,840 | 579,392 | |||
| Northwest Natural Gas Co. |
11,800 | 398,132 | |||
| Oceaneering International, Inc.* |
21,300 | 794,916 | |||
| Oil States International, Inc.* |
66,700 | 1,286,643 | |||
| Oneok, Inc.(a) |
40,420 | 1,148,736 | |||
| Southwestern Energy Co.* |
129,300 | 6,554,216 | |||
| Spinnaker Exploration Co.* |
31,940 | 1,120,136 | |||
| Stone Energy Corp.*(a) |
45,900 | 2,069,631 | |||
| Swift Energy Co.* |
92,620 | 2,680,423 | |||
| Tesoro Corp.* |
118,600 | 3,778,596 | |||
| Todco (Class A Stock)* |
67,800 | 1,248,876 | |||
| Unit Corp.* |
15,640 | 597,604 | |||
| Veritas DGC, Inc.* |
91,730 | 2,055,669 | |||
| Vintage Petroleum, Inc.(a) |
172,970 | 3,924,689 | |||
| W-H Energy Services, Inc.* |
90,420 | 2,021,791 | |||
| Warren Resources, Inc.* |
78,120 | 710,892 | |||
| WGL Holdings, Inc. |
28,490 | 878,632 | |||
| World Fuel Services Corp. |
11,800 | 587,640 | |||
| 50,293,510 | |||||
| PAPER & FOREST PRODUCTS — 1.1% |
|||||
| CSS Industries, Inc. |
8,800 | 279,488 | |||
| Glatfelter, (P.H.) Co. |
80,590 | 1,231,415 | |||
| Rock-Tenn Co. (Class “A” Stock) |
25,100 | 380,516 | |||
| Schweitzer-Mauduit International, Inc. |
105,300 | 3,574,935 | |||
| Universal Forest Products, Inc. |
78,900 | 3,424,260 | |||
| Wausau-Mosinee Paper Corp. |
84,400 | 1,507,384 | |||
| 10,397,998 | |||||
| PERSONAL SERVICES — 0.8% |
|||||
| Alderwoods Group, Inc.* |
41,200 | 468,856 | |||
| CompuCredit Corp.*(a) |
43,200 | 1,181,088 | |||
| Geo Group, Inc.* |
49,200 | 1,307,736 | |||
| Stewart Enterprises, Inc (Class “A” Stock)* |
518,230 | 3,622,428 | |||
| Volt Information Sciences, Inc* |
14,400 | 423,216 | |||
| 7,003,324 | |||||
| PHARMACEUTICALS — 0.9% |
|||||
| Adolor Corp.* |
48,400 | 480,128 | |||
| Alexion Pharmaceuticals, Inc.* |
5,400 | 136,080 | |||
| Alpharma, Inc. (Class “A” Stock) |
18,700 | 316,965 | |||
| Andrx Corp.* |
23,320 | 509,076 | |||
| Atherogenics, Inc.*(a) |
56,700 | 1,335,852 | |||
| AVANIR Pharmaceuticals, Inc. (Class “A” Stock)* |
462,100 | 1,575,760 | |||
| Covance, Inc.* |
22,690 | 879,238 | |||
| Cubist Pharmaceuticals, Inc.* |
95,100 | 1,125,033 | |||
| Rigel Pharmaceuticals, Inc.* |
6,900 | 168,498 | |||
| United Therapeutics Corp.* |
24,000 | 1,083,600 | |||
| Valeant Pharmaceuticals International(a) |
37,400 | 985,490 | |||
| 8,595,720 | |||||
| PRINTING & PUBLISHING — 1.0% |
|||||
| Banta Corp. |
60,850 | 2,723,646 | |||
| Bowne & Co., Inc. |
79,600 | 1,294,296 | |||
| Consolidated Graphics, Inc.* |
13,400 | 615,060 | |||
| Courier Corp. |
23,446 | 1,217,316 | |||
| Journal Register Co.* |
24,600 | 475,518 | |||
| Pulitzer, Inc. |
15,500 | 1,005,175 | |||
| Valassis Communications, Inc.*(a) |
41,270 | 1,444,863 | |||
| 8,775,874 | |||||
| RAILROADS — 0.4% |
|||||
| Genesse & Wyoming, Inc. (Class “A” Stock)* |
98,930 | 2,782,901 | |||
| RailAmerica, Inc.* |
85,000 | 1,109,250 | |||
| 3,892,151 | |||||
| REAL ESTATE — 11.5% |
|||||
| Affordable Residential Communities, Inc. [REIT] |
85,500 | 1,226,925 | |||
| Alexandria Real Estate Equities, Inc. [REIT] |
22,400 | 1,667,008 | |||
| American Financial Realty Trust [REIT] |
261,200 | 4,226,216 | |||
| American Home Mortgage Investment, Corp. [REIT] |
111,900 | 3,832,575 | |||
76
AST SMALL-CAP VALUE PORTFOLIO
SCHEDULE OF INVESTMENTS (CONTINUED)
DECEMBER 31, 2004
| SHARES |
VALUE (NOTE 2) | ||||
| Anthracite Capital, Inc. [REIT] |
242,000 | $ | 2,991,120 | ||
| Arbor Realty Trust, Inc. [REIT] |
87,540 | 2,148,232 | |||
| Bedford Property Investors, Inc. [REIT] |
57,700 | 1,639,257 | |||
| Brandywine Realty Trust [REIT] |
29,930 | 879,643 | |||
| Capital Automotive [REIT] |
101,260 | 3,597,262 | |||
| Capital Trust, Inc. (Class “A” Stock) [REIT] |
23,000 | 706,330 | |||
| CarrAmerica Realty Corp. [REIT] |
245,200 | 8,091,599 | |||
| CBL & Associates Properties, Inc. [REIT] |
29,050 | 2,217,968 | |||
| Corporate Office Properties Trust [REIT] |
48,300 | 1,417,605 | |||
| Cresent Real Estate Equities Co. [REIT] |
34,700 | 633,622 | |||
| Equity Inns, Inc. [REIT] |
185,900 | 2,182,466 | |||
| FelCor Lodging Trust, Inc. [REIT]* |
59,300 | 868,745 | |||
| First Potomac Realty Trust [REIT] |
27,050 | 616,740 | |||
| Forest City Enterprises, Inc. (Class “A” Stock) |
10,160 | 584,708 | |||
| Gables Residential Trust [REIT] |
111,700 | 3,997,743 | |||
| Government Properties Trust, Inc. [REIT] |
75,900 | 748,374 | |||
| Highland Hospitality Corp. [REIT] |
96,010 | 1,079,152 | |||
| Highwoods Properties, Inc. [REIT] |
105,910 | 2,933,707 | |||
| IMPAC Mortgage Holdings, Inc. [REIT](a) |
99,900 | 2,264,733 | |||
| Innkeepers USA Trust [REIT] |
214,200 | 3,041,640 | |||
| LaSalle Hotel Properties [REIT] |
45,900 | 1,460,997 | |||
| Lexington Corp. Properties Trust [REIT](a) |
205,200 | 4,633,415 | |||
| LTC Properties, Inc. [REIT] |
87,100 | 1,734,161 | |||
| MeriStar Hospitality Corp. [REIT]* |
484,160 | 4,042,736 | |||
| MFA Mortgage Investments, Inc. [REIT] |
69,600 | 613,872 | |||
| Mid-America Apartment Communities, Inc. [REIT] |
138,300 | 5,700,725 | |||
| National Health Investors, Inc. [REIT] |
125,000 | 3,647,500 | |||
| New Century Financial Corp. [REIT](a) |
23,000 | 1,469,930 | |||
| Novastar Financial, Inc. [REIT](a) |
32,000 | 1,584,000 | |||
| Parkway Properties, Inc. [REIT] |
29,900 | 1,517,425 | |||
| Pennsylvania Real Estate Investment Trust [REIT] |
86,000 | 3,680,800 | |||
| Prentiss Properties Trust [REIT] |
101,790 | 3,888,378 | |||
| RAIT Investment Trust [REIT] |
97,200 | 2,718,684 | |||
| Ramco-Gershenson Properties Trust [REIT] |
28,340 | 913,965 | |||
| Saul Centers, Inc. [REIT] |
60,400 | 2,310,300 | |||
| Senior Housing Properties Trust [REIT] |
127,600 | 2,416,744 | |||
| SL Green Realty Corp. [REIT] |
29,240 | 1,770,482 | |||
| Summit Properties, Inc. [REIT] |
33,250 | 1,082,620 | |||
| Sun Communities, Inc. [REIT] |
53,900 | 2,169,475 | |||
| Urstadt Biddle Properties (Class “A” Stock) [REIT] |
13,400 | 228,470 | |||
| Ventas, Inc. [REIT] |
84,400 | 2,313,404 | |||
| Winston Hotels, Inc. [REIT] |
176,060 | 2,079,269 | |||
| 105,570,722 | |||||
| RESTAURANTS — 1.0% |
|||||
| Bob Evans Farms, Inc. |
4,300 | 112,402 | |||
| Brinker International, Inc.* |
19,810 | 694,737 | |||
| California Pizza Kitchen, Inc.* |
30,930 | 711,390 | |||
| CEC Entertainment, Inc.*(a) |
22,980 | 918,511 | |||
| Jack in the Box, Inc.* |
56,100 | 2,068,407 | |||
| Landry’s Restaurants, Inc.(a) |
98,900 | 2,874,033 | |||
| Lone Star Steakhouse & Saloon, Inc. |
31,790 | 890,120 | |||
| Papa John's International, Inc.* |
16,600 | 571,704 | |||
| Ryan’s Restaurant Group, Inc.* |
15,000 | 231,300 | |||
| 9,072,604 | |||||
| RETAIL & MERCHANDISING — 3.6% |
|||||
| Aeropostale, Inc.* |
46,800 | 1,377,324 | |||
| Casey’s General Stores, Inc. |
101,130 | 1,835,510 | |||
| Cash America International, Inc. |
126,600 | 3,763,817 | |||
| Charming Shoppes, Inc.*(a) |
284,200 | 2,662,953 | |||
| Dress Barn, Inc.* |
104,100 | 1,832,160 | |||
| Foot Locker, Inc. |
72,630 | 1,955,926 | |||
| Genesco, Inc.* |
26,700 | 831,438 | |||
| Goody’s Family Clothing, Inc. |
18,700 | 170,918 | |||
| Jo-Ann Stores, Inc.* |
36,200 | 996,948 | |||
| Linens ‘n Things, Inc.* |
3,200 | 79,360 | |||
| Lithia Motors, Inc. (Class “A” Stock) |
52,900 | 1,418,778 | |||
| Movado Group, Inc. |
25,100 | 468,115 | |||
| Pathmark Stores, Inc.* |
42,000 | 244,020 | |||
| Paxar Corp.* |
9,600 | 212,832 | |||
| Payless Shoesource, Inc.* |
74,300 | 913,890 | |||
| PC Connection, Inc.* |
8,500 | 80,920 | |||
| RC2 Corp.* |
39,000 | 1,271,400 | |||
| School Specialty, Inc.* |
37,970 | 1,464,123 | |||
| Sharper Image Corp.* |
42,170 | 794,905 | |||
| ShopKo Stores, Inc.* |
102,500 | 1,914,700 | |||
| Sports Authority, Inc. (The)* |
9,700 | 249,775 | |||
| Stage Stores, Inc.* |
29,300 | 1,216,536 | |||
| The Men's Wearhouse, Inc.* |
73,060 | 2,334,998 | |||
| Too, Inc.* |
50,800 | 1,242,568 | |||
| United Auto Group, Inc. |
16,600 | 491,194 | |||
77
AST SMALL-CAP VALUE PORTFOLIO
SCHEDULE OF INVESTMENTS (CONTINUED)
DECEMBER 31, 2004
| SHARES |
VALUE (NOTE 2) | ||||
| West Marine, Inc.* |
32,410 | $ | 802,148 | ||
| Winn-Dixie Stores, Inc.(a) |
151,200 | 687,960 | |||
| Zale Corp.* |
51,680 | 1,543,682 | |||
| 32,858,898 | |||||
| SEMICONDUCTORS — 1.3% |
|||||
| Actel Corp.* |
17,100 | 299,934 | |||
| Axcelis Technologies, Inc.* |
102,000 | 829,260 | |||
| Cohu, Inc. |
24,000 | 445,440 | |||
| Credence Systems Corp.* |
8,500 | 77,775 | |||
| Cypress Semiconductor Corp.*(a) |
73,980 | 867,785 | |||
| DSP Group, Inc.* |
28,900 | 645,337 | |||
| DuPont Photomasks, Inc.* |
21,720 | 573,625 | |||
| ESS Technology, Inc.* |
9,100 | 64,701 | |||
| Exar Corp.* |
18,700 | 265,353 | |||
| Fairchild Semiconductor International, Inc.* |
45,170 | 734,464 | |||
| Integrated Silicon Solution, Inc.* |
39,600 | 324,720 | |||
| Lattice Semiconductor Corp.* |
81,700 | 465,690 | |||
| MKS Instruments, Inc.* |
15,000 | 278,250 | |||
| MRV Communications, Inc.* |
106,800 | 391,956 | |||
| ON Semiconductor Corp.* |
83,900 | 380,906 | |||
| Photronics, Inc.* |
41,600 | 686,400 | |||
| Richardson Electronics, Ltd. |
157,140 | 1,667,256 | |||
| Silicon Storage Technology, Inc.* |
40,600 | 241,570 | |||
| Skyworks Solutions, Inc.*(a) |
69,400 | 654,442 | |||
| Standard Microsystems Corp.* |
51,780 | 923,238 | |||
| Ultratech Stepper, Inc.* |
29,320 | 552,682 | |||
| Vitesse Semiconductor Corp.* |
64,500 | 227,685 | |||
| 11,598,469 | |||||
| TELECOMMUNICATIONS — 1.5% |
|||||
| AsiaInfo Holdings, Inc.* |
15,500 | 92,380 | |||
| Brightpoint, Inc.* |
70,820 | 1,383,823 | |||
| Broadwing Corp.* |
50,800 | 462,788 | |||
| Cincinnati Bell, Inc.* |
399,500 | 1,657,925 | |||
| Commonwealth Telephone Enterprises, |
15,500 | 769,730 | |||
| CT Communications, Inc. |
103,400 | 1,271,820 | |||
| Ditech Communications Corp.* |
34,700 | 518,765 | |||
| General Communication, Inc. (Class “A” Stock)* |
48,100 | 531,024 | |||
| Mastec, Inc.* |
91,900 | 929,109 | |||
| North Pitsburgh Systems, Inc. |
23,000 | 568,790 | |||
| Premiere Global Services, Inc.* |
346,080 | 3,706,517 | |||
| Primus Telecommunications Group, Inc.* |
95,700 | 304,326 | |||
| Sycamore Networks, Inc.* |
75,400 | 306,124 | |||
| Talk America Holdings, Inc.* |
44,500 | 294,590 | |||
| Time Warner Telecom, Inc. (Class “A” Stock)* |
72,400 | 315,664 | |||
| Unova, Inc.* |
24,000 | 606,960 | |||
| 13,720,335 | |||||
| TRANSPORTATION — 2.4% |
|||||
| Amerco, Inc.* |
15,500 | 712,690 | |||
| Arkansas Best Corp. |
15,500 | 695,795 | |||
| CNF, Inc. |
16,070 | 805,107 | |||
| Covenant Transportation, Inc. (Class “A” Stock)* |
28,900 | 601,698 | |||
| GATX Corp. |
70,500 | 2,083,980 | |||
| Greenbrier Companies, Inc. |
17,700 | 599,145 | |||
| HUB Group, Inc. (Class “A” Stock) (Canada)* |
26,290 | 1,372,864 | |||
| Kansas City Southern* |
80,200 | 1,421,946 | |||
| Offshore Logistics, Inc.* |
32,600 | 1,058,522 | |||
| Overnite Corp. |
59,960 | 2,232,910 | |||
| Overseas Shipholding Group, Inc. |
41,200 | 2,274,240 | |||
| Pacer International, Inc.* |
26,760 | 568,918 | |||
| Quality Distribution, Inc.* |
51,040 | 430,778 | |||
| SCS Transportation, Inc.* |
64,700 | 1,512,039 | |||
| Sirva, Inc.* |
44,930 | 863,555 | |||
| Swift Transportation Co., Inc.* |
20,800 | 446,784 | |||
| U.S. Xpress Enterprises, Inc. (Class “A” Stock)* |
37,100 | 1,087,030 | |||
| USF Corp. |
21,900 | 831,105 | |||
| Werner Enterprises, Inc. |
111,440 | 2,523,001 | |||
| 22,122,107 | |||||
| UTILITIES — 6.1% |
|||||
| Allete, Inc. |
23,190 | 852,233 | |||
| American States Water Co. |
16,600 | 431,600 | |||
| Atmos Energy Corp. |
27,800 | 760,330 | |||
| Avista Corp. |
67,800 | 1,198,026 | |||
| Black Hills Corp. |
20,300 | 622,804 | |||
| California Water Service Group |
16,600 | 624,990 | |||
| Cascade Natural Gas Corp. |
39,930 | 846,516 | |||
| CH Energy Group, Inc. |
33,600 | 1,614,480 | |||
| Cleco Corp. |
49,700 | 1,006,922 | |||
| CMS Energy Corp.*(a) |
307,700 | 3,215,465 | |||
| Comfort Systems USA, Inc.* |
82,740 | 635,443 | |||
| Duratek, Inc.* |
41,380 | 1,030,776 | |||
| El Paso Electric Co.* |
118,600 | 2,246,284 | |||
| EMCOR Group, Inc.* |
10,100 | 456,318 | |||
| Energen Corp. |
87,300 | 5,146,334 | |||
| Idacorp, Inc.(a) |
100,240 | 3,064,337 | |||
| Massey Energy Co. |
17,280 | 603,936 | |||
| New Jersey Resources Corp. |
118,620 | 5,140,990 | |||
| PNM Resources, Inc.(a) |
117,000 | 2,958,930 | |||
| Sierra Pacific Resources* |
397,900 | 4,177,950 | |||
| SJW Corp. |
4,900 | 178,360 | |||
| South Jersey Industries, Inc. |
57,700 | 3,032,712 | |||
| Southern Union Co.* |
156,200 | 3,745,676 | |||
| Southwest Gas Corp. |
120,200 | 3,053,080 | |||
| UGI Corp. |
23,010 | 941,339 | |||
| UIL Holdings Corp. |
19,200 | 984,960 | |||
| Unisource Energy Corp. |
140,500 | 3,387,455 | |||
| Vectran Corp. |
24,750 | 663,300 | |||
78
AST SMALL-CAP VALUE PORTFOLIO
SCHEDULE OF INVESTMENTS (CONTINUED)
DECEMBER 31, 2004
| SHARES |
VALUE (NOTE 2) |
||||||
| Westar Energy, Inc. |
90,270 | $ | 2,064,475 | ||||
| Wisconsin Energy Corp. |
49,420 | 1,665,947 | |||||
| 56,351,968 | |||||||
| TOTAL COMMON STOCK |
932,289,534 | ||||||
| EXCHANGE TRADED FUNDS — 0.2% |
|||||||
| iShares Russell 2000 Index Fund(a) |
13,870 | 1,796,165 | |||||
| RIGHTS* |
|||||||
| FINANCIAL SERVICES |
|||||||
| Technology Investment Capital Corp., expiring 01/25/05(a) (Cost $0) |
105,100 | 52,550 | |||||
| TOTAL LONG-TERM INVESTMENTS |
934,138,249 | ||||||
| PRINCIPAL (000) |
|||||||
| SHORT-TERM INVESTMENTS — 8.8% |
|||||||
| CERTIFICATES OF DEPOSIT |
|||||||
| Westdeutsche Landesbank |
|||||||
| 1.50%, 01/10/05(b) |
$ | 94 | 94,287 | ||||
| CORPORATE OBLIGATIONS — 0.6% |
|||||||
| Bank of America NA |
|||||||
| 2.30%, 01/03/05(b)(c) |
1,459 | 1,459,151 | |||||
| Merrill Lynch & Co., Inc. |
|||||||
| 2.38%, 01/03/05(b)(c) |
3,259 | 3,259,290 | |||||
| Morgan Stanley |
|||||||
| 2.33%, 01/03/05(b)(c) |
554 | 554,093 | |||||
| 5,272,534 | |||||||
| TIME DEPOSIT — 0.5% |
|||||||
| Bank of America NA |
|||||||
| 1.50%, 01/03/05(b) |
4,301 | 4,300,541 | |||||
| SHARES |
|||||||
| NON-REGISTERED INVESTMENT COMPANY — 7.7% |
|||||||
| BlackRock Institutional Money Market Trust(b)(j) |
71,571,700 | 71,571,700 | |||||
| TOTAL SHORT-TERM INVESTMENTS |
81,239,062 | ||||||
| TOTAL INVESTMENTS — 110.1% |
1,015,377,311 | ||||||
| LIABILITIES IN EXCESS OF OTHER ASSETS — (10.1%) |
(93,242,312 | ) | |||||
| NET ASSETS — 100.0% |
$ | 922,134,999 | |||||
THE FOLLOWING ABBREVIATIONS ARE USED THROUGHOUT THE SCHEDULE OF INVESTMENTS:
| REIT | Real Estate Investment Trust |
THE FOLLOWING ANNOTATIONS ARE USED THROUGHOUT THE SCHEDULE OF INVESTMENTS:
| * | Non-income producing security. |
| (a) | All or a portion of securities on loan. Securities on loan have an aggregate market value of $77,030,483; cash collateral of $81,239,062 (included with liabilities) was received with which the portfolio purchased highly liquid short-term investments. |
| (b) | Represents security purchased with cash collateral for securities on loan. |
| (c) | Indicates a variable rate security. The maturity date presented for these instruments is the next date on which the rate of interest is adjusted. |
| (g) | Indicates a security that has been deemed illiquid. The aggregate cost of the illiquid securities is $734,050. The aggregate value, $783,180, represents 0.08% of net assets. |
| (j) | Security available to institutional investors only. |
79
AST SMALL-CAP VALUE PORTFOLIO
SCHEDULE OF INVESTMENTS (CONTINUED)
DECEMBER 31, 2004
The industry classification of long-term portfolio holdings, short-term investments and liabilities in excess of other assets shown as a percentage of net assets as of December 31, 2004 were as follows:
| Real Estate |
11.5 | % | |
| Financial — Bank & Trust |
11.3 | ||
| Utilities |
6.1 | ||
| Insurance |
5.5 | ||
| Oil & Gas |
5.5 | ||
| Machinery & Equipment |
3.8 | ||
| Chemicals |
3.6 | ||
| Retail & Merchandising |
3.6 | ||
| Computer Services & Software |
3.1 | ||
| Metals & Mining |
3.1 | ||
| Consumer Products & Services |
3.0 | ||
| Financial Services |
3.0 | ||
| Electronic Components & Equipment |
2.5 | ||
| Transportation |
2.4 | ||
| Automotive Parts |
2.1 | ||
| Medical Supplies & Equipment |
2.1 | ||
| Healthcare Services |
1.8 | ||
| Construction |
1.5 | ||
| Telecommunications |
1.5 | ||
| Building Materials |
1.4 | ||
| Industrial Products |
1.4 | ||
| Aerospace |
1.3 | ||
| Semiconductors |
1.3 | ||
| Clothing & Apparel |
1.2 | ||
| Business Services |
1.1 | ||
| Containers & Packaging |
1.1 | ||
| Entertainment & Leisure |
1.1 | ||
| Paper & Forest Products |
1.1 | ||
| Printing & Publishing |
1.0 | ||
| Restaurants |
1.0 | ||
| Pharmaceuticals |
0.9 | ||
| Airlines |
0.8 | ||
| Computer Hardware |
0.8 | ||
| Food |
0.8 | ||
| Personal Services |
0.8 | ||
| Financial — Brokerage |
0.7 | ||
| Internet Services |
0.6 | ||
| Advertising |
0.5 | ||
| Automobile Manufacturers |
0.5 | ||
| Broadcasting |
0.5 | ||
| Hotels & Motels |
0.5 | ||
| Office Equipment |
0.5 | ||
| Biotechnology |
0.4 | ||
| Cable Television |
0.4 | ||
| Conglomerates |
0.4 | ||
| Diversified Operations |
0.4 | ||
| Environmental Services |
0.4 | ||
| Equipment Services |
0.4 | ||
| Railroads |
0.4 | ||
| Commercial Services |
0.3 | ||
| Exchange Traded Funds |
0.2 | ||
| Furniture |
0.1 | ||
| Short-Term Investments |
8.8 | ||
| 110.1 | |||
| Liabilities in excess of other assets |
(10.1 | ) | |
| 100.0 | % | ||
See Notes to Financial Statements.
80
AST DEAM SMALL-CAP VALUE PORTFOLIO
SCHEDULE OF INVESTMENTS
DECEMBER 31, 2004
| SHARES |
VALUE (NOTE 2) | ||||
| LONG-TERM INVESTMENTS — 92.8% |
|||||
| COMMON STOCK ADVERTISING — 0.1% |
|||||
| DoubleClick, Inc.* |
17,000 | $ | 132,260 | ||
| AEROSPACE — 2.2% |
|||||
| DRS Technologies, Inc.* |
28,900 | 1,234,319 | |||
| Esterline Technologies Corp.* |
12,300 | 401,595 | |||
| Moog, Inc. (Class “A” Stock)* |
17,300 | 784,555 | |||
| 2,420,469 | |||||
| AIRLINES — 1.4% |
|||||
| Continental Airlines, Inc. (Class “B” Stock)*(a) |
66,200 | 896,348 | |||
| Frontier Airlines, Inc.* |
62,900 | 717,689 | |||
| 1,614,037 | |||||
| AUTOMOBILE MANUFACTURERS — 0.5% |
|||||
| Arctic Cat, Inc. |
19,900 | 527,748 | |||
| AUTOMOTIVE PARTS — 1.2% |
|||||
| Tenneco Automotive, Inc.* |
46,100 | 794,764 | |||
| Wabash National Corp.* |
22,100 | 595,153 | |||
| 1,389,917 | |||||
| BUILDING MATERIALS — 0.5% |
|||||
| American Woodmark Corp. |
4,100 | 179,088 | |||
| Genlyte Group, Inc.* |
4,200 | 359,856 | |||
| 538,944 | |||||
| BUSINESS SERVICES — 0.9% |
|||||
| CSG Systems International, Inc.* |
44,300 | 828,410 | |||
| UniFirst Corp. |
5,200 | 147,056 | |||
| 975,466 | |||||
| CHEMICALS — 3.6% |
|||||
| FMC Corp.* |
22,900 | 1,106,070 | |||
| Georgia Gulf Corp. |
24,700 | 1,230,060 | |||
| NewMarket Corp.* |
24,000 | 477,600 | |||
| Octel Corp. |
31,000 | 645,110 | |||
| Terra Industries, Inc.*(a) |
68,000 | 603,840 | |||
| 4,062,680 | |||||
| CLOTHING & APPAREL — 4.3% |
|||||
| Cato Corp. (Class “A” Stock) |
41,500 | 1,196,030 | |||
| Skechers USA, Inc. (Class “A” Stock)* |
62,700 | 812,592 | |||
| Too, Inc.* |
36,500 | 892,790 | |||
| Warnaco Group, Inc. (The)*(a) |
17,000 | 367,200 | |||
| Wolverine World Wide, Inc. |
47,600 | 1,495,592 | |||
| 4,764,204 | |||||
| COMMERCIAL SERVICES — 0.8% |
|||||
| NCO Group, Inc.* |
35,800 | 925,430 | |||
| COMPUTER SERVICES & SOFTWARE — 4.2% |
|||||
| Agilysys, Inc. |
49,700 | 851,858 | |||
| BISYS Group, Inc. (The)* |
66,300 | 1,090,635 | |||
| Borland Software Corp.*(a) |
75,400 | 880,672 | |||
| E.piphany, Inc.* |
33,300 | 160,839 | |||
| Internet Security Systems, Inc.* |
10,700 | 248,775 | |||
| Parametric Technology Corp.* |
127,400 | 750,386 | |||
| THQ, Inc.* |
29,600 | 679,024 | |||
| 4,662,189 | |||||
| CONSTRUCTION — 0.9% |
|||||
| Dycom Industries, Inc.*(a) |
19,800 | 604,296 | |||
| WCI Communities, Inc.* |
12,400 | 364,560 | |||
| 968,856 | |||||
| CONSUMER PRODUCTS & SERVICES — 4.1% |
|||||
| Buckeye Technologies, Inc.* |
57,300 | 745,473 | |||
| Chemed Corp. |
19,600 | 1,315,356 | |||
| Dollar Thrifty Automotive Group, Inc.* |
30,300 | 915,060 | |||
| Nu Skin Enterprises, Inc. (Class “A” Stock)(a) |
40,400 | 1,025,352 | |||
| Stewart Enterprises, Inc.* |
79,400 | 555,006 | |||
| 4,556,247 | |||||
| CONTAINERS & PACKAGING — 0.7% |
|||||
| Silgan Holdings, Inc. |
12,200 | 743,712 | |||
| ELECTRONIC COMPONENTS & EQUIPMENT — 0.2% |
|||||
| Woodward Governor Co. |
2,800 | 200,508 | |||
| ENTERTAINMENT & LEISURE — 0.9% |
|||||
| Argosy Gaming Co.* |
21,300 | 994,710 | |||
| EQUIPMENT SERVICES — 0.4% |
|||||
| United Rentals, Inc.* |
21,300 | 402,570 | |||
| FINANCIAL — BANK & TRUST — 10.9% |
|||||
| BankUnited Financial Corp.* |
29,800 | 952,110 | |||
| Banner Corp. |
8,400 | 261,996 | |||
| Central Pacific Financial Corp. |
14,300 | 517,231 | |||
| Commercial Capital Bancorp, Inc.(a) |
19,100 | 442,738 | |||
| Corus Bankshares, Inc. |
10,100 | 484,901 | |||
| First Republic Bank Corp. |
17,900 | 948,700 | |||
| FirstFed Financial Corp.* |
28,200 | 1,462,734 | |||
| FNB Corp.(a) |
16,600 | 337,976 | |||
| Harbor Florida Bancshares, Inc. |
15,800 | 546,838 | |||
| PFF Bancorp, Inc. |
11,600 | 537,428 | |||
| Prosperity Bancshares, Inc. |
22,900 | 668,909 | |||
| Provident Bancshares Corp. |
26,300 | 956,531 | |||
| Republic Bancorp, Inc. |
26,500 | 404,920 | |||
| Sterling Bancshares, Inc. |
28,500 | 406,695 | |||
| Sterling Financial Corp.* |
41,604 | 1,633,373 | |||
| Texas Regional Bancshares, Inc. (Class “A” Stock) |
11,700 | 382,356 | |||
| Umpqua Holdings Corp. |
15,300 | 385,713 | |||
| United Bancshares, Inc. |
13,700 | 522,655 | |||
| Wesbanco, Inc. |
8,400 | 268,548 | |||
81
AST DEAM SMALL-CAP VALUE PORTFOLIO
SCHEDULE OF INVESTMENTS (CONTINUED)
DECEMBER 31, 2004
| SHARES |
VALUE (NOTE 2) | ||||
| WestAmerica Bancorp |
2,300 | $ | 134,113 | ||
| Yardville National Bancorp |
2,600 | 89,076 | |||
| 12,345,541 | |||||
| FINANCIAL SERVICES — 2.8% |
|||||
| Compucredit Corp.* |
31,000 | 847,540 | |||
| Downey Financial Corp. |
21,200 | 1,208,400 | |||
| ITLA Capital Corp.* |
5,900 | 346,861 | |||
| West Coast Bancorp |
3,100 | 78,771 | |||
| WSFS Financial Corp. |
10,000 | 603,200 | |||
| 3,084,772 | |||||
| FOOD — 2.9% |
|||||
| Corn Products International, Inc. |
24,400 | 1,306,864 | |||
| J&J Snack Foods Corp. |
5,000 | 245,150 | |||
| Lance, Inc. |
51,600 | 981,948 | |||
| Nash Finch Co. |
18,100 | 683,456 | |||
| 3,217,418 | |||||
| FURNITURE — 0.6% |
|||||
| Haverty Furniture Co., Inc. |
34,500 | 638,250 | |||
| HEALTHCARE SERVICES — 0.8% |
|||||
| Res-Care, Inc.* |
56,200 | 855,364 | |||
| INDUSTRIAL PRODUCTS — 2.3% |
|||||
| Brady Corp. (Class “A” Stock) |
7,600 | 475,532 | |||
| Oregon Steel Mills, Inc.* |
45,700 | 927,253 | |||
| Tredegar Corp. |
59,600 | 1,204,516 | |||
| 2,607,301 | |||||
| INSURANCE — 2.9% |
|||||
| American Physicians Cap, Inc.* |
5,500 | 198,110 | |||
| Commerce Group, Inc. |
7,400 | 451,696 | |||
| LandAmerica Financial Group, Inc.(a) |
15,800 | 852,094 | |||
| Navigators Group, Inc.* |
19,500 | 587,145 | |||
| Stewart Information Services Corp. |
27,800 | 1,157,870 | |||
| 3,246,915 | |||||
| INTERNET SERVICES — 0.2% |
|||||
| EarthLink, Inc.*(a) |
13,000 | 149,760 | |||
| Interwoven, Inc.* |
8,700 | 94,656 | |||
| 244,416 | |||||
| LUMBER & WOOD PRODUCTS — 0.1% |
|||||
| Deltic Timber Corp. |
3,000 | 127,350 | |||
| MACHINERY & EQUIPMENT — 3.9% |
|||||
| Kennametal, Inc. |
21,400 | 1,065,078 | |||
| Rofin-Sinar Technologies, Inc.* |
22,800 | 967,860 | |||
| Stewart & Stevenson Services, Inc. |
56,500 | 1,142,995 | |||
| Terex Corp.* |
25,200 | 1,200,780 | |||
| 4,376,713 | |||||
| MEDICAL SUPPLIES & EQUIPMENT — 1.6% |
|||||
| Haemonetics Corp.* |
33,600 | 1,216,656 | |||
| Sola International, Inc.* |
20,100 | 553,554 | |||
| 1,770,210 | |||||
| METALS & MINING — 1.7% |
|||||
| Hecla Mining Co.* |
84,900 | 494,967 | |||
| Quanex Corp. |
20,900 | 1,433,113 | |||
| 1,928,080 | |||||
| OIL & GAS — 8.9% |
|||||
| Cimarex Energy Co.* |
39,900 | 1,512,210 | |||
| Energen Corp. |
33,600 | 1,980,720 | |||
| Houston Exploration Co.* |
27,800 | 1,565,418 | |||
| Meridian Resource Corp. (The)* |
104,400 | 631,620 | |||
| Piedmont Natural Gas Co., Inc. |
10,200 | 237,048 | |||
| Southwestern Energy Co.* |
30,700 | 1,556,183 | |||
| Tesoro Petroleum Corp.* |
29,200 | 930,312 | |||
| Vintage Petroleum, Inc. |
39,300 | 891,717 | |||
| Whiting Petroleum Corp.* |
22,900 | 692,725 | |||
| 9,997,953 | |||||
| PAPER & FOREST PRODUCTS — 1.8% |
|||||
| Pope & Talbot, Inc. |
34,400 | 588,584 | |||
| Potlatch Corp.(a) |
27,600 | 1,396,008 | |||
| 1,984,592 | |||||
| PHARMACEUTICALS — 2.3% |
|||||
| Alpharma, Inc. (Class “A” Stock) |
51,700 | 876,315 | |||
| Enzon Pharmaceuticals, Inc.* |
56,300 | 772,436 | |||
| Perrigo Co. |
5,500 | 94,985 | |||
| Valeant Pharmaceuticals International(a) |
30,500 | 803,675 | |||
| 2,547,411 | |||||
| PRINTING & PUBLISHING — 1.2% |
|||||
| Consolidated Graphics, Inc.* |
14,000 | 642,600 | |||
| Readers Digest Association, Inc. |
51,000 | 709,410 | |||
| 1,352,010 | |||||
| REAL ESTATE — 11.2% |
|||||
| Alexandria Real Estate Equities, Inc. [REIT](a) |
5,200 | 386,984 | |||
| American Financial Realty Trust [REIT] |
29,900 | 483,782 | |||
| Amli Residential Properties Trust [REIT] |
9,400 | 300,800 | |||
| Brandywine Realty Trust [REIT] |
10,200 | 299,778 | |||
| Capital Automotive [REIT] |
11,800 | 419,195 | |||
| CarrAmerica Realty Corp. [REIT] |
14,200 | 468,600 | |||
| Colonial Properties Trust [REIT] |
7,300 | 286,671 | |||
| Commercial Net Lease Realty, Inc. [REIT] |
18,700 | 385,220 | |||
| Corporate Office Properties Trust [REIT] |
12,000 | 352,200 | |||
| Cousins Properties, Inc. [REIT] |
10,400 | 314,808 | |||
82
AST DEAM SMALL-CAP VALUE PORTFOLIO
SCHEDULE OF INVESTMENTS (CONTINUED)
DECEMBER 31, 2004
| SHARES |
VALUE (NOTE 2) | |||||
| Equity Lifestyle Properties, Inc. |
5,200 | $ | 185,900 | |||
| Essex Property Trust, Inc. [REIT] |
5,100 | 427,380 | ||||
| First Industrial Realty Trust, Inc. [REIT] |
12,000 | 488,760 | ||||
| Gables Residential Trust [REIT] |
10,600 | 379,374 | ||||
| HealthCare Realty Trust, Inc. [REIT] |
12,000 | 488,400 | ||||
| Heritage Property Investment Trust [REIT] |
7,300 | 234,257 | ||||
| Highwoods Properties, Inc. [REIT] |
15,200 | 421,040 | ||||
| Home Properties of New York, Inc. [REIT] |
8,400 | 361,200 | ||||
| IMPAC Mortgage Holdings, Inc. [REIT](a) |
12,200 | 276,574 | ||||
| Jones Lang Lasalle, Inc.* [REIT] |
12,200 | 456,402 | ||||
| Kilroy Realty Corp. [REIT] |
9,800 | 418,950 | ||||
| Lexington Corp. Properties Trust [REIT] |
17,500 | 395,150 | ||||
| Mid-America Apartment Communities, Inc. [REIT] |
8,100 | 333,882 | ||||
| Nationwide Health Properties, Inc. [REIT] |
18,700 | 444,125 | ||||
| Novastar Financial, Inc. [REIT](a) |
7,700 | 381,150 | ||||
| Pennsylvania Real Estate Investment Trust [REIT] |
8,400 | 359,520 | ||||
| Post Properties, Inc. [REIT] |
700 | 24,430 | ||||
| Prentiss Properties Trust [REIT] |
11,700 | 446,940 | ||||
| RAIT Investment Trust [REIT] |
11,500 | 321,655 | ||||
| Realty Income Corp. [REIT] |
10,800 | 546,264 | ||||
| Redwood Trust, Inc. [REIT](a) |
6,400 | 397,376 | ||||
| Senior Housing Properties Trust [REIT] |
17,300 | 327,662 | ||||
| Sovran Self Storage, Inc. [REIT] |
7,400 | 311,836 | ||||
| Taubman Centers, Inc. [REIT] |
5,200 | 155,740 | ||||
| Washington Real Estate Investment Trust [REIT] |
9,300 | 314,991 | ||||
| 12,596,996 | ||||||
| RESTAURANTS — 1.2% |
||||||
| Dave & Buster’s, Inc.* |
41,000 | 828,200 | ||||
| Landry’s Restaurants, Inc.(a) |
18,900 | 549,234 | ||||
| 1,377,434 | ||||||
| RETAIL & MERCHANDISING — 1.5% |
||||||
| Cash America International, Inc. |
32,000 | 951,360 | ||||
| Charming Shoppes, Inc.*(a) |
49,100 | 460,067 | ||||
| Movado Group, Inc. |
16,100 | 300,265 | ||||
| 1,711,692 | ||||||
| SEMICONDUCTORS — 1.8% |
||||||
| Integrated Device Technology, Inc.* |
59,700 | 690,132 | ||||
| Photronics, Inc.*(a) |
43,100 | 711,150 | ||||
| Standard Microsystems Corp.* |
32,600 | 581,258 | ||||
| 1,982,540 | ||||||
| TELECOMMUNICATIONS — 1.4% |
||||||
| Commscope, Inc.* |
28,300 | 534,870 | ||||
| CT Communications, Inc. |
18,700 | 230,010 | ||||
| General Communication, Inc.* |
71,800 | 792,672 | ||||
| 1,557,552 | ||||||
| TRANSPORTATION — 2.3% |
||||||
| Kirby Corp.* |
25,000 | 1,109,500 | ||||
| Overseas Shipholding Group, Inc.(a) |
27,000 | 1,490,400 | ||||
| 2,599,900 | ||||||
| UTILITIES — 1.6% |
||||||
| PNM Resources, Inc. |
42,100 | 1,064,709 | ||||
| Sierra Pacific Resources* |
18,400 | 193,200 | ||||
| South Jersey Industries, Inc. |
2,800 | 147,168 | ||||
| Southern Union Co.* |
15,600 | 374,089 | ||||
| 1,779,166 | ||||||
| TOTAL LONG TERM INVESTMENTS |
103,809,523 | |||||
| PRINCIPAL AMOUNT (000) |
||||||
| SHORT-TERM INVESTMENTS — 10.0% |
||||||
| CERTIFICATES OF DEPOSIT — 0.1% |
||||||
| Canadian Imperial Bank of Commerce |
||||||
| 2.372%, 01/31/05(b)(c) |
$ | 6 | 5,827 | |||
| UBS Bank |
||||||
| 2.315%, 01/18/05(b) |
149 | 148,672 | ||||
| 154,499 | ||||||
| CORPORATE OBLIGATIONS — 1.9% |
||||||
| Merrill Lynch & Co., Inc. |
||||||
| 2.38%, 01/03/05(b)(c) |
954 | 954,349 | ||||
| Morgan Stanley |
||||||
| 2.33%, 01/03/05(b)(c) |
214 | 213,949 | ||||
| Sedna Finance Corporation |
||||||
| 2.372%, 01/14/05(b)(c) |
377 | 376,714 | ||||
| Swedbank NY |
||||||
| 2.362%, 01/18/05(b)(c) |
586 | 586,289 | ||||
| 2,131,301 | ||||||
| TIME DEPOSIT — 0.4% |
||||||
| Bank of America NA |
||||||
| 1.50%, 01/03/05(b) |
486 | 485,753 | ||||
| SHARES |
||||||
| NON-REGISTERED INVESTMENT COMPANY — 7.0% |
||||||
| BlackRock Institutional Money Market Trust(b)(j) |
7,668,211 | 7,668,211 | ||||
83
AST DEAM SMALL-CAP VALUE PORTFOLIO
SCHEDULE OF INVESTMENTS (CONTINUED)
DECEMBER 31, 2004
| PRINCIPAL AMOUNT (000) |
VALUE (NOTE 2) |
||||||
| U.S. GOVERNMENT AGENCY OBLIGATIONS — 0.6% |
|||||||
| U.S. TREASURY BILLS |
|||||||
| 1.84%, 01/27/05(k) |
$ | 20 | $ | 19,974 | |||
| 1.87%, 01/27/05(k) |
500 | 499,343 | |||||
| 1.91%, 01/27/05(k) |
50 | 49,934 | |||||
| 1.93%, 01/27/05(k) |
25 | 24,967 | |||||
| 1.98%, 01/27/05(k) |
100 | 99,857 | |||||
| 694,075 | |||||||
| TOTAL SHORT-TERM INVESTMENTS |
11,133,839 | ||||||
| TOTAL INVESTMENTS — 102.8% |
114,943,362 | ||||||
| LIABILITIES IN EXCESS OF OTHER ASSETS — (2.8%) |
(3,124,262 | ) | |||||
| NET ASSETS — 100.0% |
$ | 111,819,100 | |||||
THE FOLLOWING ABBREVIATION IS USED THROUGHOUT THE SCHEDULE OF INVESTMENTS:
REIT Real Estate Investment Trust
THE FOLLOWING ANNOTATIONS ARE USED THROUGHOUT THE SCHEDULE OF INVESTMENTS:
| * | Non-income producing security. |
| (a) | All or a portion of securities on loan. Securities on loan have an aggregate market value of $10,034,977; cash collateral of $10,439,764 (included with liabilities) was received with which the portfolio purchased highly liquid short-term investments. |
| (b) | Represents security purchased with cash collateral for securities on loan. |
| (c) | Indicates a variable rate security. The maturity date presented for these instruments is the next date on which the rate of interest is adjusted. |
| (j) | Security available to institutional investors only. |
| (k) | Securities with an aggregate market value of $694,075 have been segregated with the custodian to cover margin requirements for the following open futures contracts at December 31, 2004: |
| NUMBER OF CONTRACTS |
TYPE |
EXPIRATION MONTH |
VALUE AT TRADE DATE |
VALUE AT DECEMBER 31, 2004 |
UNREALIZED APPRECIATION | ||||||||
| LONG POSITION: |
|||||||||||||
| 21 |
Russell 2000 | Mar 05 | $ | 6,670,604 | $ | 6,866,475 | $ | 195,871 | |||||
84
AST DEAM SMALL-CAP VALUE PORTFOLIO
SCHEDULE OF INVESTMENTS (CONTINUED)
DECEMBER 31, 2004
The industry classification of long-term portfolio holdings, short-term investments and liabilities in excess of other assets shown as a percentage of net assets as of December 31, 2004 were as follows:
| Real Estate |
11.2 | % | |
| Financial — Bank & Trust |
10.9 | ||
| Oil & Gas |
8.9 | ||
| Clothing & Apparel |
4.3 | ||
| Computer Services & Software |
4.2 | ||
| Consumer Products & Services |
4.1 | ||
| Machinery & Equipment |
3.9 | ||
| Chemicals |
3.6 | ||
| Food |
2.9 | ||
| Insurance |
2.9 | ||
| Financial Services |
2.8 | ||
| Industrial Products |
2.3 | ||
| Pharmaceuticals |
2.3 | ||
| Transportation |
2.3 | ||
| Aerospace |
2.2 | ||
| Paper & Forest Products |
1.8 | ||
| Semiconductors |
1.8 | ||
| Metals & Mining |
1.7 | ||
| Medical Supplies & Equipment |
1.6 | ||
| Utilities |
1.6 | ||
| Retail & Merchandising |
1.5 | ||
| Airlines |
1.4 | ||
| Telecommunications |
1.4 | ||
| Automotive Parts |
1.2 | ||
| Printing & Publishing |
1.2 | ||
| Restaurants |
1.2 | ||
| Business Services |
0.9 | ||
| Construction |
0.9 | ||
| Entertainment & Leisure |
0.9 | ||
| Commercial Services |
0.8 | ||
| Healthcare Services |
0.8 | ||
| Containers & Packaging |
0.7 | ||
| Furniture |
0.6 | ||
| Automobile Manufacturers |
0.5 | ||
| Building Materials |
0.5 | ||
| Equipment Services |
0.4 | ||
| Electronic Components & Equipment |
0.2 | ||
| Internet Services |
0.2 | ||
| Advertising |
0.1 | ||
| Lumber & Wood Products |
0.1 | ||
| Short-Term Investments |
10.0 | ||
| 102.8 | |||
| Liabilities in excess of other assets |
(2.8 | ) | |
| 100.0 | % | ||
See Notes to Financial Statements.
85
AST GOLDMAN SACHS MID-CAP GROWTH PORTFOLIO
SCHEDULE OF INVESTMENTS
DECEMBER 31, 2004
| SHARES |
VALUE (NOTE 2) | ||||
| LONG-TERM INVESTMENTS — 103.0% |
|||||
| COMMON STOCK |
|||||
| AEROSPACE & DEFENSE — 1.9% |
|||||
| Alliant Techsystems, Inc.* |
81,825 | $ | 5,349,719 | ||
| APPAREL/SHOES — 3.5% |
|||||
| Chico’s FAS, Inc.*(a) |
108,875 | 4,957,079 | |||
| Reebok International Ltd. |
108,975 | 4,794,900 | |||
| 9,751,979 | |||||
| AUTO PARTS & RELATED — 2.0% |
|||||
| Gentex Corp.(a) |
152,250 | 5,636,295 | |||
| BANKS — 1.1% |
|||||
| M&T Bank Corp. |
27,925 | 3,011,432 | |||
| BIOTECHNOLOGY — 1.6% |
|||||
| Biogen Idec, Inc.* |
20,650 | 1,375,497 | |||
| Eyetech Pharmaceuticals, Inc.* |
31,675 | 1,441,213 | |||
| MedImmune, Inc.* |
56,950 | 1,543,914 | |||
| 4,360,624 | |||||
| BROADCASTING & CABLE/SATELLITE TV — 7.5% |
|||||
| Cablevision Systems New York |
|||||
| Group (Class “A” Stock)*(a) |
215,775 | 5,372,798 | |||
| Citadel Broadcasting Co.*(a) |
322,979 | 5,225,800 | |||
| EchoStar Communications Corp. (Class “A” Stock)(a) |
94,950 | 3,156,138 | |||
| Entravision Communications Corp. (Class “A” Stock)* |
432,280 | 3,609,538 | |||
| Univision Communications, Inc. (Class “A” Stock)*(a) |
118,000 | 3,453,860 | |||
| 20,818,134 | |||||
| COMMERCIAL SERVICES — 5.8% |
|||||
| ARAMARK Corp. (Class “B” Stock) |
196,475 | 5,208,552 | |||
| Iron Mountain, Inc.*(a) |
146,865 | 4,477,914 | |||
| Moody’s Corp.(a) |
32,925 | 2,859,536 | |||
| Pitney Bowes, Inc. |
72,750 | 3,366,870 | |||
| 15,912,872 | |||||
| COMPUTER HARDWARE — 2.2% |
|||||
| Avocent Corp.* |
151,520 | 6,139,590 | |||
| COMPUTER SERVICES — 1.7% |
|||||
| Fiserv, Inc.*(a) |
114,700 | 4,609,793 | |||
| COMPUTER SOFTWARE — 4.7% |
|||||
| Cognos, Inc. (Canada)* |
83,075 | 3,660,284 | |||
| Manhattan Associates, Inc.* |
120,194 | 2,870,233 | |||
| Mercury Interactive Corp.*(a) |
49,900 | 2,272,945 | |||
| NAVTEQ Corp.* |
25,100 | 1,163,636 | |||
| Salesforce.com, Inc.*(a) |
182,000 | 3,083,080 | |||
| 13,050,178 | |||||
| DRUGS & MEDICINE — 2.0% |
|||||
| Amylin Pharmaceuticals, Inc.*(a) |
61,090 | 1,427,062 | |||
| OSI Pharmaceuticals, Inc.* |
55,100 | 4,124,235 | |||
| 5,551,297 | |||||
| GAMING/LODGING — 4.0% |
|||||
| GTECH Holdings Corp. |
112,400 | 2,916,780 | |||
| Harrah’s Entertainment, Inc.(a) |
78,475 | 5,249,192 | |||
| Las Vegas Sand Corp.* |
10,800 | 518,400 | |||
| Marriott International, Inc. (Class “A” Stock) |
38,475 | 2,423,156 | |||
| 11,107,528 | |||||
| HOUSEHOLD/PERSONAL CARE — 1.1% |
|||||
| Energizer Holdings, Inc.*(a) |
60,700 | 3,016,183 | |||
| INSURANCE — 4.0% |
|||||
| Ambac Financial Group, Inc. |
37,050 | 3,042,917 | |||
| RenaissanceRe Holdings Ltd. |
56,000 | 2,916,480 | |||
| Willis Group Holdings Ltd. (United Kingdom)(a) |
125,325 | 5,159,630 | |||
| 11,119,027 | |||||
| INTERNET & ONLINE — 3.2% |
|||||
| CheckFree Corp.* |
144,175 | 5,490,184 | |||
| CNET Networks, Inc.*(a) |
308,000 | 3,458,840 | |||
| 8,949,024 | |||||
| MANUFACTURING — 0.7% |
|||||
| American Standard Cos., Inc.* |
47,850 | 1,977,162 | |||
| MEDICAL PRODUCTS — 4.7% |
|||||
| Allergan, Inc. |
31,025 | 2,515,197 | |||
| Bard, (C.R.), Inc. |
21,900 | 1,401,162 | |||
| Fisher Scientific International, Inc.*(a) |
79,916 | 4,985,160 | |||
| St. Jude Medical, Inc.* |
100,800 | 4,226,544 | |||
| 13,128,063 | |||||
| MOVIES & ENTERTAINMENT — 0.5% |
|||||
| Lodgenet Entertainment Corp.* |
81,350 | 1,439,082 | |||
| NETWORKING/TELECOM EQUIPMENT — 4.4% |
|||||
| ADTRAN, Inc. |
190,700 | 3,649,998 | |||
| FLIR Systems, Inc.*(a) |
81,800 | 5,218,022 | |||
| Juniper Networks, Inc.*(a) |
121,600 | 3,306,304 | |||
| 12,174,324 | |||||
| OIL & GAS — 0.9% |
|||||
| XTO Energy, Inc. |
73,600 | 2,603,968 | |||
| OTHER CONSUMER DISCRETIONARY — 4.1% |
|||||
| Harman International Industries, Inc. |
38,450 | 4,883,150 | |||
| ITT Educational Services, Inc.* |
92,925 | 4,418,584 | |||
| Select Comfort Corp.* |
109,300 | 1,960,842 | |||
| 11,262,576 | |||||
86
AST GOLDMAN SACHS MID-CAP GROWTH PORTFOLIO
SCHEDULE OF INVESTMENTS (CONTINUED)
DECEMBER 31, 2004
| SHARES |
VALUE (NOTE 2) | |||||
| OTHER ENERGY — 1.8% |
||||||
| Smith International, Inc.*(a) |
93,450 | $ | 5,084,615 | |||
| OTHER HEALTH CARE — 6.6% |
||||||
| Caremark Rx, Inc.*(a) |
173,975 | 6,859,834 | ||||
| Charles River Laboratories International |
140,075 | 6,444,851 | ||||
| Millipore Corp.*(a) |
97,510 | 4,856,973 | ||||
| 18,161,658 | ||||||
| OTHER PRODUCER GOODS & SERVICES — 3.5% |
||||||
| Global Payments, Inc. |
63,300 | 3,705,582 | ||||
| Grainger, (W.W.), Inc. |
90,925 | 6,057,424 | ||||
| 9,763,006 | ||||||
| OTHER TECHNOLOGY — 1.6% |
||||||
| Amphenol Corp.* |
117,500 | 4,316,950 | ||||
| PUBLISHING — 4.5% |
||||||
| Lamar Advertising Co.*(a) |
157,050 | 6,718,599 | ||||
| Scripps, (E.W.) Co. (Class “A” Stock) |
119,160 | 5,753,045 | ||||
| 12,471,644 | ||||||
| REAL ESTATE — 1.4% |
||||||
| MoneyGram International, Inc. |
176,800 | 3,737,552 | ||||
| RESTAURANTS — 1.6% |
||||||
| Chang’s China Bistro, (P.F.), Inc.*(a) |
79,414 | 4,474,979 | ||||
| RETAILING — 9.2% |
||||||
| Bed Bath & Beyond, Inc.*(a) |
62,300 | 2,481,409 | ||||
| CarMax, Inc.*(a) |
151,500 | 4,704,074 | ||||
| Dollar Tree Stores, Inc.*(a) |
123,225 | 3,534,093 | ||||
| Ethan Allen Interiors, Inc.(a) |
76,025 | 3,042,521 | ||||
| PETCO Animal Supplies, Inc.* |
177,070 | 6,990,723 | ||||
| Williams-Sonoma, Inc.*(a) |
125,475 | 4,396,644 | ||||
| 25,149,464 | ||||||
| SEMICONDUCTORS/SEMI CAP — 7.7% |
||||||
| KLA-Tencor Corp.*(a) |
92,225 | 4,295,841 | ||||
| Linear Technology Corp. |
134,996 | 5,232,444 | ||||
| Marvell Technology Group Ltd.* |
123,400 | 4,376,998 | ||||
| Microchip Technology, Inc. |
50,050 | 1,334,333 | ||||
| Tessera Technologies, Inc.* |
165,500 | 6,158,254 | ||||
| 21,397,870 | ||||||
| TELECOMMUNICATIONS — 1.4% |
||||||
| Crown Castle International Corp.* |
239,875 | 3,991,520 | ||||
| TOBACCO — 1.3% |
||||||
| UST, Inc. |
73,725 | 3,546,910 | ||||
| TRANSPORTATION — 0.8% |
||||||
| Robinson Worldwide, (C.H.), Inc.(a) |
38,750 | 2,151,400 | ||||
| TOTAL LONG-TERM INVESTMENTS |
285,216,418 | |||||
| PRINCIPAL AMOUNT (000) |
||||||
| SHORT-TERM INVESTMENTS — 32.5% |
||||||
| CERTIFICATES OF DEPOSIT — 7.5% |
||||||
| Banco Santander PR |
||||||
| 2.315%, 01/07/05(b)(c) |
$ | 5,099 | 5,099,084 | |||
| Canadian Imperial Bank of Commerce |
||||||
| 2.372%, 01/31/05(b)(c) |
1,619 | 1,619,178 | ||||
| First Boston Corp. |
||||||
| 2.36%, 01/24/05(b) |
12,046 | 12,046,198 | ||||
| Skandinaviska Enskilda Banken |
||||||
| 2.35%, 01/28/05(b) |
1,780 | 1,780,407 | ||||
| UBS Bank |
||||||
| 2.315%, 01/18/05(b) |
292 | 291,625 | ||||
| 20,836,492 | ||||||
| CORPORATE OBLIGATIONS — 13.4% |
||||||
| Bank of America NA |
||||||
| 2.30%, 01/03/05(b)(c) |
2,202 | 2,202,450 | ||||
| Bear Stearns |
||||||
| 2.28%, 01/03/05(b)(c) |
2,145 | 2,145,403 | ||||
| 2.28%, 01/03/05(b)(c) |
3,699 | 3,699,478 | ||||
| Merrill Lynch & Co., Inc. |
||||||
| 2.38%, 01/03/05(b)(c) |
10,714 | 10,714,200 | ||||
| Morgan Stanley |
||||||
| 2.33%, 01/03/05(b)(c) |
4,449 | 4,448,966 | ||||
| Natexis Banque NY |
||||||
| 2.297%, 01/03/05(b)(c) |
1,285 | 1,284,915 | ||||
| Sedna Finance Corporation |
||||||
| 2.372%, 01/14/05(b)(c) |
6,549 | 6,549,195 | ||||
| Swedbank NY |
||||||
| 2.362%, 01/18/05(b)(c) |
6,020 | 6,019,142 | ||||
| 37,063,749 | ||||||
| TIME DEPOSIT — 1.1% |
||||||
| Bank of America NA |
||||||
| 1.50%, 01/03/05(b) |
3,077 | 3,076,799 | ||||
87
AST GOLDMAN SACHS MID-CAP GROWTH PORTFOLIO
SCHEDULE OF INVESTMENTS (CONTINUED)
DECEMBER 31, 2004
| SHARES |
VALUE (NOTE 2) |
|||||
| NON-REGISTERED INVESTMENT COMPANY — 10.5% |
||||||
| BlackRock Institutional Money Market Trust(b)(j) |
28,920,212 | $ | 28,920,212 | |||
| TOTAL SHORT-TERM INVESTMENTS |
89,897,252 | |||||
| TOTAL INVESTMENTS — 135.5% |
375,113,670 | |||||
| LIABILITIES IN EXCESS OF OTHER ASSETS — (35.5%) |
(98,372,567 | ) | ||||
| NET ASSETS — 100.0% |
$ | 276,741,103 | ||||
THE FOLLOWING ANNOTATIONS ARE USED THROUGHOUT THE SCHEDULE OF INVESTMENTS:
| * | Non-income producing security. |
| (a) | All or a portion of securities on loan. Securities on loan have an aggregate market value of $86,696,831; cash collateral of $89,897,252 (included with liabilities) was received with which the portfolio purchased highly liquid short-term investments. |
| (b) | Represents security purchased with cash collateral for securities on loan. |
| (c) | Indicates a variable rate security. The maturity date presented for these instruments is the next date on which the rate of interest is adjusted. |
| (j) | Security available to institutional investors only. |
The industry classification of long-term portfolio holdings, short-term investments and liabilities in excess of other assets shown as a percentage of net assets as of December 31, 2004 were as follows:
| Retailing |
9.1 | % | |
| Semiconductors/Semi Cap |
7.8 | ||
| Broadcasting & Cable/Satellite TV |
7.5 | ||
| Other Health Care |
6.6 | ||
| Commercial Services |
5.8 | ||
| Computer Software |
4.7 | ||
| Medical Products |
4.7 | ||
| Publishing |
4.5 | ||
| Networking/Telecom Equipment |
4.4 | ||
| Other Consumer Discretionary |
4.1 | ||
| Gaming/Lodging |
4.0 | ||
| Insurance |
4.0 | ||
| Apparel/Shoes |
3.5 | ||
| Other Producer Goods & Services |
3.5 | ||
| Internet & Online |
3.2 | ||
| Computer Hardware |
2.2 | ||
| Auto Parts & Related |
2.0 | ||
| Drugs & Medicine |
2.0 | ||
| Aerospace & Defense |
1.9 | ||
| Other Energy |
1.8 | ||
| Computer Service |
1.7 | % | |
| Other Technology |
1.6 | ||
| Restaurants |
1.6 | ||
| Biotechnology |
1.6 | ||
| Real Estate |
1.4 | ||
| Telecommunications |
1.4 | ||
| Tobacco |
1.3 | ||
| Banks |
1.1 | ||
| Household/Personal Care |
1.1 | ||
| Oil & Gas |
0.9 | ||
| Transportation |
0.8 | ||
| Manufacturing |
0.7 | ||
| Movies & Entertainment |
0.5 | ||
| Short-Term Investments |
32.5 | ||
| 135.5 | |||
| Liabilities in excess of other assets |
(35.5 | ) | |
| 100.0 | % | ||
See Notes to Financial Statements.
88
AST NEUBERGER BERMAN MID-CAP GROWTH PORTFOLIO
SCHEDULE OF INVESTMENTS
DECEMBER 31, 2004
| SHARES |
VALUE (NOTE 2) | ||||
| LONG-TERM INVESTMENTS — 96.3% |
|||||
| COMMON STOCK |
|||||
| ADVERTISING — 1.2% |
|||||
| Getty Images, Inc.*(a) |
70,000 | $ | 4,819,500 | ||
| AEROSPACE — 0.6% |
|||||
| Rockwell Collins, Inc. |
56,500 | 2,228,360 | |||
| BEVERAGES — 0.6% |
|||||
| Constellation Brands, Inc. (Class “A” Stock)* |
48,500 | 2,255,735 | |||
| BROADCASTING — 1.1% |
|||||
| Univision Communications, Inc. (Class “A” Stock)* |
65,500 | 1,917,185 | |||
| XM Satellite Radio Holdings, Inc.*(a) |
68,500 | 2,576,970 | |||
| 4,494,155 | |||||
| BUSINESS SERVICES — 5.4% |
|||||
| Alliance Data Systems Corp.*(a) |
196,000 | 9,306,080 | |||
| Corporate Executive Board Co. (The)(a) |
107,500 | 7,196,050 | |||
| Hewitt Associates, Inc. (Class “A” Stock)*(a) |
100,000 | 3,201,000 | |||
| Robert Half International, Inc. |
69,500 | 2,045,385 | |||
| 21,748,515 | |||||
| CHEMICALS — 0.4% |
|||||
| Air Products & Chemicals, Inc.(a) |
30,500 | 1,768,085 | |||
| CLOTHING & APPAREL — 1.8% |
|||||
| Coach, Inc.* |
128,000 | 7,219,200 | |||
| COMMERCIAL SERVICES — 0.3% |
|||||
| Jackson Hewitt Tax Service Inc. |
42,500 | 1,073,125 | |||
| COMPUTER HARDWARE — 1.2% |
|||||
| Apple Computer, Inc.* |
75,500 | 4,862,200 | |||
| COMPUTER SERVICES & SOFTWARE — 8.9% |
|||||
| Adobe Systems, Inc.(a) |
53,000 | 3,325,220 | |||
| AutoDesk, Inc. |
70,000 | 2,656,500 | |||
| CACI International, Inc. (Class “A” Stock)* |
35,000 | 2,384,550 | |||
| Cerner Corp.*(a) |
38,500 | 2,047,045 | |||
| Cognizant Technology Solutions Corp. (Class “A” Stock)* |
159,000 | 6,730,470 | |||
| Cognos, Inc. (Canada)* |
72,000 | 3,172,320 | |||
| Mercury Interactive Corp.*(a) |
134,000 | 6,103,700 | |||
| NAVTEQ Corp.* |
40,000 | 1,854,400 | |||
| NCR Corp.* |
33,500 | 2,319,205 | |||
| TIBCO Software, Inc.* |
399,000 | 5,322,660 | |||
| 35,916,070 | |||||
| CONSUMER PRODUCTS & SERVICES — 0.8% |
|||||
| Fortune Brands, Inc. |
40,000 | 3,087,200 | |||
| CONTAINERS & PACKAGING — 1.1% |
|||||
| Pactiv Corp.* |
171,600 | 4,339,764 | |||
| ELECTRONIC COMPONENTS & EQUIPMENT — 5.3% |
|||||
| Garmin Ltd. |
20,000 | 1,216,800 | |||
| Harman International Industries, Inc. |
41,000 | 5,207,000 | |||
| Jabil Circuit, Inc.* |
78,000 | 1,995,240 | |||
| Zebra Technologies Corp. (Class “A” Stock)*(a) |
228,000 | 12,831,840 | |||
| 21,250,880 | |||||
| ENTERTAINMENT & LEISURE — 3.1% |
|||||
| Royal Caribbean Cruises Ltd. |
119,500 | 6,505,580 | |||
| Station Casinos, Inc.(a) |
108,500 | 5,932,780 | |||
| 12,438,360 | |||||
| FINANCIAL SERVICES — 7.5% |
|||||
| Capital Source, Inc.*(a) |
165,500 | 4,248,385 | |||
| Chicago Mercantile Exchange Holding, Inc. |
14,500 | 3,316,150 | |||
| First Marblehead Corp.* |
89,000 | 5,006,250 | |||
| Investors Financial Services Corp.(a) |
116,000 | 5,797,680 | |||
| Legg Mason, Inc. |
63,750 | 4,670,325 | |||
| Moody's Corp. |
62,100 | 5,393,385 | |||
| Providian Financial Corp.* |
112,000 | 1,844,640 | |||
| 30,276,815 | |||||
| FINANCIAL-BROKERAGE — 0.8% |
|||||
| Ameritrade Holding Corp.* |
211,500 | 3,007,530 | |||
| FOOD — 1.1% |
|||||
| Archer-Daniels-Midland Co. |
100,500 | 2,242,155 | |||
| Hershey Foods Corp. |
35,700 | 1,982,778 | |||
| 4,224,933 | |||||
| HEALTHCARE SERVICES — 2.9% |
|||||
| AMERIGROUP Corp.* |
30,500 | 2,307,630 | |||
| PacifiCare Health Systems, Inc.* |
38,500 | 2,176,020 | |||
| Stericycle, Inc.* |
95,000 | 4,365,250 | |||
| VCA Antech, Inc.* |
131,500 | 2,577,400 | |||
| 11,426,300 | |||||
| HOTELS & MOTELS — 2.0% |
|||||
| Marriott International, Inc. (Class “A” Stock)(a) |
69,000 | 4,345,620 | |||
| MGM Mirage, Inc.* |
50,000 | 3,637,000 | |||
| 7,982,620 | |||||
| INDUSTRIAL PRODUCTS — 3.1% |
|||||
| Donaldson Co., Inc.(a) |
128,300 | 4,180,014 | |||
| Fastenal Co. |
98,500 | 6,063,660 | |||
| Nucor Corp.(a) |
41,500 | 2,172,110 | |||
| 12,415,784 | |||||
| INTERNET SERVICES — 4.3% |
|||||
| Check Point Software Technologies Ltd.* |
157,400 | 3,876,762 | |||
| F5 Networks, Inc.* |
67,500 | 3,288,600 | |||
| Juniper Networks, Inc.*(a) |
143,500 | 3,901,765 | |||
| Macromedia, Inc.* |
69,000 | 2,147,280 | |||
89
AST NEUBERGER BERMAN MID-CAP GROWTH PORTFOLIO
SCHEDULE OF INVESTMENTS (CONTINUED)
DECEMBER 31, 2004
| SHARES |
VALUE (NOTE 2) | |||||
| McAfee, Inc.* |
102,500 | $ | 2,965,325 | |||
| VeriSign, Inc.* |
33,500 | 1,122,920 | ||||
| 17,302,652 | ||||||
| MACHINERY & EQUIPMENT — 5.6% |
||||||
| Danaher Corp. |
109,000 | 6,257,690 | ||||
| Eaton Corp. |
53,500 | 3,871,260 | ||||
| Grainger (W.W.), Inc. |
46,500 | 3,097,830 | ||||
| National Oilwell, Inc.*(a) |
52,500 | 1,852,725 | ||||
| Terex Corp.* |
65,000 | 3,097,250 | ||||
| Thermo Electron Corp.* |
139,000 | 4,196,410 | ||||
| 22,373,165 | ||||||
| MEDICAL SUPPLIES & EQUIPMENT — 11.1% |
||||||
| Bard, (C.R.), Inc. |
89,000 | 5,694,220 | ||||
| Cytyc Corp.* |
147,000 | 4,052,790 | ||||
| Genzyme Corp.* |
65,000 | 3,774,550 | ||||
| Invitrogen Corp.* |
55,000 | 3,692,150 | ||||
| Kinetic Concepts, Inc.* |
90,500 | 6,905,150 | ||||
| Kyphon, Inc.* |
107,000 | 2,756,320 | ||||
| Martek Biosciences Corp.*(a) |
63,500 | 3,251,200 | ||||
| Protein Design Labs, Inc.* |
163,500 | 3,377,910 | ||||
| ResMed, Inc.* |
72,500 | 3,704,750 | ||||
| Varian Medical Systems, Inc.* |
100,500 | 4,345,620 | ||||
| Zimmer Holdings, Inc.* |
42,800 | 3,429,136 | ||||
| 44,983,796 | ||||||
| METALS & MINING — 0.6% |
||||||
| Peabody Energy Corp. |
29,000 | 2,346,390 | ||||
| OIL & GAS — 3.7% |
||||||
| Canadian Natural Resources Ltd. |
65,000 | 2,780,050 | ||||
| Quicksilver Resources, Inc.*(a) |
40,000 | 1,471,200 | ||||
| Smith International, Inc.* |
67,700 | 3,683,557 | ||||
| XTO Energy, Inc. |
191,800 | 6,785,884 | ||||
| 14,720,691 | ||||||
| PHARMACEUTICALS — 2.3% |
||||||
| Celgene Corp.*(a) |
148,500 | 3,939,705 | ||||
| Gilead Sciences, Inc.* |
149,000 | 5,213,510 | ||||
| 9,153,215 | ||||||
| RESTAURANTS — 1.1% |
||||||
| Starbucks Corp.*(a) |
70,000 | 4,365,200 | ||||
| RETAIL & MERCHANDISING — 7.3% |
||||||
| Abercrombie & Fitch Co. |
68,000 | 3,192,600 | ||||
| Bed Bath & Beyond, Inc.* |
84,500 | 3,365,635 | ||||
| Dick’s Sporting Goods, Inc.* |
30,000 | 1,054,500 | ||||
| Nordstrom, Inc. |
45,000 | 2,102,850 | ||||
| PETsMART, Inc. |
185,000 | 6,573,050 | ||||
| Staples, Inc. |
118,500 | 3,994,635 | ||||
| Whole Foods Market, Inc.(a) |
53,000 | 5,053,550 | ||||
| Williams-Sonoma, Inc.*(a) |
106,000 | 3,714,240 | ||||
| 29,051,060 | ||||||
| SEMICONDUCTORS — 4.8% |
||||||
| Altera Corp.*(a) |
87,000 | 1,800,900 | ||||
| ATI Technologies, Inc. (Canada)* |
154,000 | 2,986,060 | ||||
| KLA-Tencor Corp.* |
60,000 | 2,794,800 | ||||
| Marvell Technology Group Ltd.* |
88,500 | 3,139,095 | ||||
| Microchip Technology, Inc. |
126,000 | 3,359,160 | ||||
| Microsemi Corp.* |
231,300 | 4,015,368 | ||||
| Varian Semiconductor Equipment Associates, Inc.* |
28,000 | 1,031,800 | ||||
| 19,127,183 | ||||||
| TELECOMMUNICATIONS — 4.2% |
||||||
| American Tower Corp. (Class “A” Stock)* |
112,500 | 2,070,000 | ||||
| Avaya, Inc.* |
131,000 | 2,253,200 | ||||
| Nextel Partners, Inc. (Class “A” Stock)* |
425,000 | 8,304,500 | ||||
| Western Wireless Corp. (Class “A” Stock)*(a) |
150,000 | 4,395,000 | ||||
| 17,022,700 | ||||||
| TRANSPORTATION — 2.1% |
||||||
| C.H. Robinson Worldwide, Inc.(a) |
42,500 | 2,359,600 | ||||
| J.B. Hunt Transport Services, Inc. |
133,000 | 5,965,050 | ||||
| 8,324,650 | ||||||
| TOTAL LONG-TERM INVESTMENTS |
385,605,833 | |||||
| PRINCIPAL AMOUNT (000) |
||||||
| SHORT-TERM INVESTMENTS — 18.9% |
||||||
| CERTIFICATES OF DEPOSIT — 1.9% |
||||||
| Banco Santander PR |
||||||
| 2.315%, 01/07/05(b)(c) |
$ | 3,178 | 3,177,789 | |||
| Canadian Imperial Bank of Commerce |
||||||
| 2.372%, 01/31/05(b)(c) |
1,471 | 1,471,101 | ||||
| First Boston Corp. |
||||||
| 2.36%, 01/24/05(b) |
598 | 598,136 | ||||
| Skandinaviska Enskilda Banken |
||||||
| 2.35%, 01/28/05(b) |
2,232 | 2,231,840 | ||||
| 7,478,866 | ||||||
| COMMERCIAL PAPER — 1.3% |
||||||
| Citigroup, Inc. 2.304%, 01/10/05(b) |
5,353 | 5,342,736 | ||||
| CORPORATE OBLIGATIONS — 6.0% |
||||||
| Goldman Sachs Group, Inc. |
||||||
| 2.33%, 01/03/05(b)(c) |
5,041 | 5,040,536 | ||||
| Merrill Lynch & Co., Inc. |
||||||
| 2.38%, 01/03/05(b)(c) |
5,406 | 5,406,421 | ||||
90
AST NEUBERGER BERMAN MID-CAP GROWTH PORTFOLIO
SCHEDULE OF INVESTMENTS (CONTINUED)
DECEMBER 31, 2004
| PRINCIPAL AMOUNT (000) |
VALUE (NOTE 2) |
||||||
| Morgan Stanley |
|||||||
| 2.33%, 01/03/05(b)(c) |
$ | 4,307 | $ | 4,306,763 | |||
| 2.33%, 01/03/05(b)(c) |
2,286 | 2,286,354 | |||||
| Natexis Banque NY |
|||||||
| 2.297%, 01/03/05(b)(c) |
1,116 | 1,115,486 | |||||
| Sedna Finance Corporation |
|||||||
| 2.372%, 01/14/05(b)(c) |
1,518 | 1,517,709 | |||||
| Swedbank NY |
|||||||
| 2.362%, 01/18/05(b)(c) |
4,405 | 4,404,259 | |||||
| 24,077,528 | |||||||
| TIME DEPOSIT — 0.8% |
|||||||
| Bank of America NA |
|||||||
| 1.50%, 01/03/05(b) |
3,094 | 3,093,857 | |||||
| SHARES |
|||||||
| NON-REGISTERED INVESTMENT COMPANY — 4.9% |
|||||||
| BlackRock Institutional Money Market Trust(b)(j) |
19,786,575 | 19,786,575 | |||||
| REGISTERED INVESTMENT COMPANIES — 4.0% |
|||||||
| BlackRock Provident Institutional Funds TempCash Portfolio(j) |
8,031,993 | 8,031,993 | |||||
| BlackRock Provident Institutional Funds TempFund Portfolio(j) |
8,031,992 | 8,031,992 | |||||
| 16,063,985 | |||||||
| TOTAL SHORT-TERM INVESTMENTS |
75,843,547 | ||||||
| TOTAL INVESTMENTS — 115.2% |
461,449,380 | ||||||
| LIABILITIES IN EXCESS OF OTHER ASSETS — (15.2%) |
(60,896,485 | ) | |||||
| NET ASSETS — 100.0% |
$ | 400,552,895 | |||||
THE FOLLOWING ANNOTATIONS ARE USED THROUGHOUT THE SCHEDULE OF INVESTMENTS:
| * | Non-income producing security. |
| (a) | All or a portion of securities on loan. Securities on loan have an aggregate market value of $57,914,924; cash collateral of $59,779,562 (included with liabilities) was received with which the portfolio purchased highly liquid short-term investments. |
| (b) | Represents security purchased with cash collateral for securities on loan. |
| (c) | Indicates a variable rate security. The maturity date presented for these instruments is the next date on which the rate of interest is adjusted. The interest rate shown reflects the rate in effect at December 31, 2004. |
| (j) | Security available to institutional investors only. |
The industry classification of long-term portfolio holdings, short-term investments and liabilities in excess of other assets shown as a percentage of net assets as of December 31, 2004 were as follows:
| Medical Supplies & Equipment |
11.1 | % | |
| Computer Services & Software |
8.9 | ||
| Financial Services |
7.5 | ||
| Retail & Merchandising |
7.3 | ||
| Machinery & Equipment |
5.6 | ||
| Business Services |
5.4 | ||
| Electronic Components & Equipment |
5.3 | ||
| Semiconductors |
4.8 | ||
| Internet Services |
4.3 | ||
| Telecommunications |
4.2 | ||
| Oil & Gas |
3.7 | ||
| Entertainment & Leisure |
3.1 | ||
| Industrial Products |
3.1 | ||
| Healthcare Services |
2.9 | ||
| Pharmaceuticals |
2.3 | ||
| Transportation |
2.1 | ||
| Hotels & Motels |
2.0 | ||
| Clothing & Apparel |
1.8 | ||
| Advertising |
1.2 | ||
| Computer Hardware |
1.2 | % | |
| Broadcasting |
1.1 | ||
| Containers & Packaging |
1.1 | ||
| Food |
1.1 | ||
| Restaurants |
1.1 | ||
| Consumer Products & Services |
0.8 | ||
| Financial-Brokerage |
0.8 | ||
| Aerospace |
0.6 | ||
| Beverages |
0.6 | ||
| Metals & Mining |
0.6 | ||
| Chemicals |
0.4 | ||
| Commercial Services |
0.3 | ||
| Short-Term Investments |
18.9 | ||
| 115.2 | |||
| Liabilities in excess of other assets |
(15.2 | ) | |
| 100.0 | % | ||
See Notes to Financial Statements.
91
AST NEUBERGER BERMAN MID-CAP VALUE PORTFOLIO
SCHEDULE OF INVESTMENTS
DECEMBER 31, 2004
| SHARES |
VALUE (NOTE 2) | ||||
| LONG-TERM INVESTMENTS — 99.7% |
|||||
| COMMON STOCK |
|||||
| AUTOMOTIVE PARTS — 10.5% |
|||||
| Advance Auto Parts, Inc.*(a) |
625,600 | $ | 27,326,208 | ||
| AutoNation, Inc.*(a) |
459,500 | 8,826,995 | |||
| AutoZone, Inc.*(a) |
364,300 | 33,264,233 | |||
| BorgWarner, Inc.(a) |
621,600 | 33,672,072 | |||
| Lear Corp.(a) |
562,800 | 34,336,428 | |||
| 137,425,936 | |||||
| BEVERAGES — 1.7% |
|||||
| Constellation Brands, Inc. (Class “A” Stock)*(a) |
475,600 | 22,120,156 | |||
| BUSINESS SERVICES — 2.3% |
|||||
| Manpower, Inc.(a) |
623,400 | 30,110,220 | |||
| CLOTHING & APPAREL — 6.4% |
|||||
| Liz Claiborne, Inc. |
567,200 | 23,941,512 | |||
| Reebok International Ltd.(a) |
745,400 | 32,797,600 | |||
| VF Corp. |
490,300 | 27,152,814 | |||
| 83,891,926 | |||||
| COMPUTER HARDWARE — 2.7% |
|||||
| Western Digital Corp.* |
3,235,600 | 35,073,904 | |||
| COMPUTER SERVICES & SOFTWARE — 1.9% |
|||||
| Computer Associates International, Inc.(a) |
814,600 | 25,301,476 | |||
| CONGLOMERATES — 2.3% |
|||||
| Johnson Controls, Inc.(a) |
472,700 | 29,988,088 | |||
| CONSUMER PRODUCTS & SERVICES — 4.0% |
|||||
| Black & Decker Corp.(a) |
196,800 | 17,383,344 | |||
| Whirlpool Corp.(a) |
505,100 | 34,957,971 | |||
| 52,341,315 | |||||
| FINANCIAL — BANK & TRUST — 8.3% |
|||||
| Astoria Financial Corp. |
493,700 | 19,733,189 | |||
| Commerce Bancorp, Inc.(a) |
374,700 | 24,130,680 | |||
| First Horizon National Corp.(a) |
763,100 | 32,897,241 | |||
| North Fork Bancorp, Inc. |
1,113,849 | 32,134,544 | |||
| 108,895,654 | |||||
| FINANCIAL SERVICES — 10.9% |
|||||
| Ambac Financial Group, Inc. |
379,150 | 31,139,590 | |||
| Bear Stearns Cos., Inc.(a) |
306,300 | 31,337,553 | |||
| CIT Group, Inc. |
685,500 | 31,409,610 | |||
| IndyMac Bancorp, Inc. |
869,000 | 29,937,050 | |||
| Waddell & Reed Financial, Inc. (Class “A” Stock) |
833,700 | 19,917,093 | |||
| 143,740,896 | |||||
| FOOD — 2.3% |
|||||
| Del Monte Foods Co.* |
551,400 | 6,076,428 | |||
| Fresh Del Monte Produce, Inc.(a) |
824,400 | 24,410,484 | |||
| 30,486,912 | |||||
| FURNITURE — 1.7% |
|||||
| Mohawk Industries, Inc.*(a) |
244,700 | 22,328,875 | |||
| HEALTHCARE SERVICES — 8.9% |
|||||
| Coventry Health Care, Inc.*(a) |
671,900 | 35,664,452 | |||
| Omnicare, Inc.(a) |
962,100 | 33,307,902 | |||
| Triad Hospitals, Inc.* |
881,300 | 32,793,173 | |||
| Universal Health Services, Inc. (Class “B” Stock) |
333,200 | 14,827,400 | |||
| 116,592,927 | |||||
| INDUSTRIAL PRODUCTS — 4.4% |
|||||
| Ingersoll-Rand Co., Ltd. (Class “A” Stock)(a) |
304,200 | 24,427,260 | |||
| SPX Corp.(a) |
814,000 | 32,608,840 | |||
| 57,036,100 | |||||
| INSURANCE — 14.3% |
|||||
| Arch Capital Group Ltd.* |
470,300 | 18,200,610 | |||
| Endurance Specialty Holdings Ltd. |
294,500 | 10,071,900 | |||
| Jefferson-Pilot Corp. |
62,500 | 3,247,500 | |||
| PartnerRe Ltd. |
429,000 | 26,572,260 | |||
| PMI Group, Inc. (The)(a) |
711,000 | 29,684,250 | |||
| Radian Group, Inc. |
611,600 | 32,561,583 | |||
| RenaissanceRe Holdings Ltd. |
594,200 | 30,945,936 | |||
| WellChoice, Inc.* |
245,500 | 13,109,700 | |||
| WellPoint, Inc.* |
201,000 | 23,115,000 | |||
| 187,508,739 | |||||
| MACHINERY & EQUIPMENT — 0.3% |
|||||
| Briggs & Stratton Corp.(a) |
80,000 | 3,326,400 | |||
| OIL & GAS — 6.0% |
|||||
| Pioneer Natural Resources Co.(a) |
570,600 | 20,028,060 | |||
| Sunoco, Inc.(a) |
287,800 | 23,516,138 | |||
| XTO Energy, Inc.(a) |
976,257 | 34,539,973 | |||
| 78,084,171 | |||||
| RESTAURANTS — 3.3% |
|||||
| Darden Restaurants, Inc. |
662,400 | 18,374,976 | |||
| Ruby Tuesday, Inc.(a) |
928,600 | 24,217,888 | |||
| 42,592,864 | |||||
| RETAIL & MERCHANDISING — 7.5% |
|||||
| Dollar Tree Stores, Inc.*(a) |
350,159 | 10,042,560 | |||
| Foot Locker, Inc. |
1,199,000 | 32,289,070 | |||
92
AST NEUBERGER BERMAN MID-CAP VALUE PORTFOLIO
SCHEDULE OF INVESTMENTS (CONTINUED)
DECEMBER 31, 2004
| SHARES |
VALUE (NOTE 2) |
||||||
| NBTY, Inc.* |
1,010,700 | $ | 24,266,907 | ||||
| Pier 1 Imports, Inc.(a) |
1,601,400 | 31,547,580 | |||||
| 98,146,117 | |||||||
| TOTAL LONG-TERM INVESTMENTS (Cost $1,082,565,794) |
1,304,992,676 | ||||||
| PRINCIPAL (000) |
|||||||
| SHORT-TERM INVESTMENTS — 31.1% |
|||||||
| CERTIFICATES OF DEPOSIT — 5.5% |
|||||||
| Banco Santander PR |
|||||||
| 2.315%, 01/07/05(b)(c) |
$ | 29,061 | 29,061,329 | ||||
| Canadian Imperial Bank of Commerce |
|||||||
| 1.72%, 05/25/05(b) |
1,731 | 1,730,461 | |||||
| First Boston Corp. |
|||||||
| 2.36%, 01/24/05(b) |
2,549 | 2,549,149 | |||||
| Fortis Bank |
|||||||
| 2.055%, 06/08/05(b) |
600 | 599,413 | |||||
| UBS Bank |
|||||||
| 2.315%, 01/18/05(b) |
25,102 | 25,101,891 | |||||
| Westdeutsche Landesbank |
|||||||
| 1.50%, 01/10/05(b) |
13,342 | 13,338,431 | |||||
| 72,380,674 | |||||||
| COMMERCIAL PAPER — 0.1% |
|||||||
| Citigroup, Inc. |
|||||||
| 2.304%, 01/10/05(b) |
1,154 | 1,151,565 | |||||
| CORPORATE OBLIGATIONS — 7.6% |
|||||||
| Bank of America NA |
|||||||
| 2.30% 01/03/05(c) |
3,197 | 3,197,444 | |||||
| Bear Stearns |
|||||||
| 2.28%, 01/03/05(b)(c) |
19,591 | 19,590,678 | |||||
| Goldman Sachs Group, Inc. |
|||||||
| 2.33%, 01/03/05(b)(c) |
14,554 | 14,554,369 | |||||
| Merrill Lynch & Co., Inc. |
|||||||
| 2.38%, 01/03/05(b)(c) |
14,655 | 14,655,322 | |||||
| Morgan Stanley |
|||||||
| 2.33%, 01/03/05(b)(c) |
16,200 | 16,199,913 | |||||
| 2.33%, 01/03/05(b)(c) |
1,353 | 1,352,910 | |||||
| Natexis Banque NY |
|||||||
| 2.297%, 01/03/05(b)(c) |
12,921 | 12,919,772 | |||||
| Sedna Finance Corporation |
|||||||
| 2.372%, 01/14/05(b)(c) |
3,103 | 3,102,742 | |||||
| Swedbank NY |
|||||||
| 2.362%, 01/18/05(b)(c) |
13,617 | 13,614,470 | |||||
| 99,187,620 | |||||||
| TIME DEPOSIT — 1.2% |
|||||||
| Bank of America NA |
|||||||
| 1.50%, 01/03/05(b) |
15,591 | 15,591,326 | |||||
| SHARES |
|||||||
| NON-REGISTERED INVESTMENT COMPANY — 13.8% |
|||||||
| BlackRock Institutional Money Market Trust(b)(j) |
181,910,556 | 181,910,556 | |||||
| REGISTERED INVESTMENT COMPANY — 2.9% |
|||||||
| BlackRock Provident Institutional Funds |
37,544,652 | 37,544,652 | |||||
| TOTAL SHORT-TERM INVESTMENTS |
407,766,393 | ||||||
| TOTAL INVESTMENTS — 130.8% |
1,712,759,069 | ||||||
| LIABILITIES IN EXCESS OF OTHER ASSETS — (30.8%) |
(402,972,805 | ) | |||||
| NET ASSETS — 100.0% |
$ | 1,309,786,264 | |||||
THE FOLLOWING ANNOTATIONS ARE USED THROUGHOUT THE SCHEDULE OF INVESTMENTS:
| * | Non-income producing security. |
| (a) | All or a portion of securities on loan. Securities on loan have an aggregate market value of $359,332,590; cash collateral of $370,221,741 (included with liabilities) was received with which the portfolio purchased highly liquid short-term investments. |
| (b) | Represents security purchased with cash collateral for securities on loan. |
| (c) | Indicates a variable rate security. The maturity date presented for these instruments is the next date on which the rate of interest is adjusted. |
| (j) | Security available to institutional investors only. |
93
AST NEUBERGER BERMAN MID-CAP VALUE PORTFOLIO
SCHEDULE OF INVESTMENTS (CONTINUED)
DECEMBER 31, 2004
The industry classification of long-term portfolio holdings, short-term investments and liabilities in excess of other assets shown as a percentage of net assets as of December 31, 2004 were as follows:
| Insurance |
14.3 | % | |
| Financial Services |
10.9 | ||
| Automotive Parts |
10.5 | ||
| Healthcare Services |
8.9 | ||
| Financial — Bank & Trust |
8.3 | ||
| Retail & Merchandising |
7.5 | ||
| Clothing & Apparel |
6.4 | ||
| Oil & Gas |
6.0 | ||
| Industrial Products |
4.4 | ||
| Consumer Products & Services |
4.0 | ||
| Restaurants |
3.3 | ||
| Computer Hardware |
2.7 | ||
| Business Services |
2.3 | ||
| Conglomerates |
2.3 | ||
| Food |
2.3 | ||
| Computer Services & Software |
1.9 | ||
| Beverages |
1.7 | ||
| Furniture |
1.7 | ||
| Machinery & Equipment |
0.3 | ||
| Short-Term Investments |
31.1 | ||
| 130.8 | |||
| Liabilities in excess of other assets |
(30.8 | ) | |
| 100.0 | % | ||
See Notes to Financial Statements.
94
AST ALGER ALL-CAP GROWTH PORTFOLIO
SCHEDULE OF INVESTMENTS
DECEMBER 31, 2004
| SHARES |
VALUE (NOTE 2) | ||||
| LONG-TERM INVESTMENTS — 98.5% |
|||||
| COMMON STOCK |
|||||
| AEROSPACE — 3.2% |
|||||
| General Dynamics Corp. |
23,400 | $ | 2,447,640 | ||
| Lockheed Martin Corp. |
45,400 | 2,521,970 | |||
| United Technologies Corp. |
54,400 | 5,622,240 | |||
| 10,591,850 | |||||
| BIOTECHNOLOGY — 2.4% |
|||||
| Biogen Idec, Inc.* |
34,600 | 2,304,706 | |||
| Genentech, Inc.*(a) |
60,200 | 3,277,288 | |||
| OSI Pharmaceuticals, Inc.* |
32,000 | 2,395,200 | |||
| 7,977,194 | |||||
| BUSINESS SERVICES — 0.9% |
|||||
| Fair Isaac Corp. |
78,300 | 2,872,044 | |||
| CHEMICALS — 1.0% |
|||||
| Lubrizol Corp. (The) |
94,400 | 3,479,584 | |||
| CLOTHING & APPAREL — 1.1% |
|||||
| Coach, Inc.*(a) |
65,700 | 3,705,480 | |||
| COMMUNICATION EQUIPMENT — 0.4% |
|||||
| Research in Motion Ltd. (Canada)*(a) |
15,250 | 1,256,905 | |||
| COMPUTER HARDWARE — 1.9% |
|||||
| Apple Computer, Inc.* |
73,700 | 4,746,280 | |||
| Palmone, Inc.*(a) |
46,800 | 1,476,540 | |||
| 6,222,820 | |||||
| COMPUTER SERVICES & SOFTWARE — 9.2% |
|||||
| Automatic Data Processing, Inc. |
72,300 | 3,206,505 | |||
| Brocade Communications Systems, Inc.*(a) |
463,600 | 3,541,904 | |||
| Cognos, Inc. (Canada)* |
59,900 | 2,639,194 | |||
| Kanbay International, Inc.* |
49,300 | 1,543,090 | |||
| Mercury Interactive Corp.*(a) |
75,300 | 3,429,915 | |||
| Microsoft Corp. |
319,000 | 8,520,489 | |||
| NAVTEQ Corp.* |
81,400 | 3,773,704 | |||
| Oracle Corp.* |
311,600 | 4,275,152 | |||
| 30,929,953 | |||||
| CONGLOMERATES — 1.8% |
|||||
| Tyco International Ltd. |
164,000 | 5,861,360 | |||
| CONSUMER FINANCE — 1.5% |
|||||
| First Marblehead Corp.* |
86,400 | 4,860,000 | |||
| CONSUMER PRODUCTS & SERVICES — 1.6% |
|||||
| Johnson & Johnson |
82,800 | 5,251,176 | |||
| DIVERSIFIED — 1.5% |
|||||
| General Electric Co. |
135,300 | 4,938,450 | |||
| ELECTRONIC COMPONENTS & EQUIPMENT — 1.8% |
|||||
| Garmin Ltd.(a) |
46,900 | 2,853,396 | |||
| Zebra Technologies Corp. (Class “A” Stock)* |
57,650 | 3,244,542 | |||
| 6,097,938 | |||||
| ENERGY EQUIPMENT — 2.2% |
|||||
| National-Oilwell, Inc.*(a) |
210,900 | 7,442,661 | |||
| ENERGY SERVICES — 1.9% |
|||||
| Peabody Energy Corp. |
77,600 | 6,278,616 | |||
| ENTERTAINMENT & LEISURE — 5.2% |
|||||
| DreamWorks Animation SKG, Inc.* |
7,200 | 270,072 | |||
| Royal Caribbean Cruises Ltd.(a) |
48,700 | 2,651,228 | |||
| Shanda Interactive Entertainment Ltd. [ADR] (China)*(a) |
113,400 | 4,819,500 | |||
| Time Warner, Inc.* |
367,200 | 7,138,368 | |||
| Viacom, Inc. (Class “B” Stock) |
71,500 | 2,601,885 | |||
| 17,481,053 | |||||
| FINANCIAL — BANK & TRUST — 2.5% |
|||||
| Bank of New York Co., Inc. (The) |
98,000 | 3,275,160 | |||
| East West Bancorp, Inc. |
64,650 | 2,712,714 | |||
| Wells Fargo & Co. |
39,700 | 2,467,355 | |||
| 8,455,229 | |||||
| FINANCIAL SERVICES — 3.5% |
|||||
| Capital Source, Inc.*(a) |
14,000 | 359,380 | |||
| Investors Financial Services Corp. |
17,600 | 879,648 | |||
| Lehman Brothers Holdings, Inc. |
47,400 | 4,146,552 | |||
| Merrill Lynch & Co., Inc. |
106,300 | 6,353,551 | |||
| 11,739,131 | |||||
| HEALTH CARE PROVIDER & SERVICES — 0.5% |
|||||
| Wellpoint, Inc.* |
14,600 | 1,679,000 | |||
| HEALTHCARE SERVICES — 4.6% |
|||||
| AMERIGROUP Corp.* |
41,900 | 3,170,154 | |||
| Caremark Rx, Inc.* |
114,750 | 4,524,593 | |||
| PacifiCare Health Systems, Inc.* |
61,200 | 3,459,024 | |||
| UnitedHealth Group, Inc. |
48,900 | 4,304,667 | |||
| 15,458,438 | |||||
| HOTELS & MOTELS — 2.0% |
|||||
| Hilton Hotels Corp. |
296,500 | 6,742,410 | |||
| INSURANCE — 0.6% |
|||||
| CIGNA Corp.(a) |
24,200 | 1,973,994 | |||
| INTERNET SERVICES — 6.5% |
|||||
| Check Point Software Technologies Ltd.* |
198,550 | 4,890,287 | |||
| eBay, Inc.*(a) |
44,150 | 5,133,762 | |||
| VeriSign, Inc.* |
79,550 | 2,666,516 | |||
| Yahoo!, Inc.*(a) |
242,300 | 9,129,863 | |||
| 21,820,428 | |||||
95
AST ALGER ALL-CAP GROWTH PORTFOLIO
SCHEDULE OF INVESTMENTS (CONTINUED)
DECEMBER 31, 2004
| SHARES |
VALUE (NOTE 2) | ||||
| INTERNET SOFTWARE & SERVICES — 3.9% |
|||||
| Google, Inc. (Class “A” Stock)*(a) |
34,700 | $ | 6,700,570 | ||
| MicroStrategy, Inc. (Class “A” Stock)* |
40,150 | 2,419,038 | |||
| Netease.com, Inc. [ADR] (China)*(a) |
74,800 | 3,951,684 | |||
| 13,071,292 | |||||
| MEDICAL SUPPLIES & EQUIPMENT — 5.5% |
|||||
| Beckman Coulter, Inc. |
42,300 | 2,833,677 | |||
| Fisher Scientific International, Inc.* |
66,100 | 4,123,318 | |||
| Genzyme Corp.* |
66,650 | 3,870,366 | |||
| Kinetic Concepts, Inc.* |
67,900 | 5,180,770 | |||
| Serologicals Corp.* |
115,300 | 2,550,436 | |||
| 18,558,567 | |||||
| OIL & GAS — 4.8% |
|||||
| BP PLC [ADR] (United Kingdom) |
61,900 | 3,614,960 | |||
| EOG Resources, Inc.(a) |
53,900 | 3,846,304 | |||
| Patterson-UTI Energy, Inc. |
170,300 | 3,312,335 | |||
| Schlumberger Ltd. |
36,000 | 2,410,200 | |||
| Talisman Energy, Inc. (Canada) |
102,200 | 2,755,312 | |||
| 15,939,111 | |||||
| PHARMACEUTICALS — 8.1% |
|||||
| Allergan, Inc. |
20,700 | 1,678,149 | |||
| Gilead Sciences, Inc.* |
183,300 | 6,413,666 | |||
| IVAX Corp.*(a) |
245,350 | 3,881,437 | |||
| Novartis AG [ADR] (Switzerland) |
37,100 | 1,875,034 | |||
| Pfizer, Inc. |
173,540 | 4,666,491 | |||
| Sanofi-Sythelabo SA [ADR] (France) |
61,400 | 2,459,070 | |||
| Schering-Plough Corp.(a) |
174,700 | 3,647,736 | |||
| Sepracor, Inc.* |
44,100 | 2,618,217 | |||
| 27,239,800 | |||||
| RAILROADS — 1.1% |
|||||
| Burlington Northern Santa Fe Corp. |
78,800 | 3,728,028 | |||
| RETAIL & MERCHANDISING — 4.9% |
|||||
| Abercrombie & Fitch Co. |
73,000 | 3,427,350 | |||
| Bed Bath & Beyond, Inc.* |
101,400 | 4,038,762 | |||
| CVS Corp. |
119,400 | 5,381,358 | |||
| Lowe’s Cos., Inc. |
59,400 | 3,420,846 | |||
| 16,268,316 | |||||
| SEMICONDUCTORS — 4.5% |
|||||
| Advanced Micro Devices, Inc.*(a) |
118,900 | 2,618,178 | |||
| ATI Technologies, Inc. (Canada)* |
251,000 | 4,866,890 | |||
| Broadcom Corp. (Class “A” Stock)* |
26,750 | 863,490 | |||
| Intel Corp. |
105,000 | 2,455,950 | |||
| Skyworks Solutions, Inc.*(a) |
435,800 | 4,109,594 | |||
| 14,914,102 | |||||
| TELECOMMUNICATIONS — 5.1% |
|||||
| Motorola, Inc. |
195,000 | 3,354,000 | |||
| Nokia Corp. (Class “A” Stock) [ADR] (Finland)(a) |
393,200 | 6,161,444 | |||
| Qualcomm, Inc. |
95,800 | 4,061,920 | |||
| SpectraSite, Inc.* |
62,100 | 3,595,590 | |||
| 17,172,954 | |||||
| TRANSPORTATION — 2.8% |
|||||
| FedEx Corp.(a) |
38,000 | 3,742,620 | |||
| UTI Worldwide, Inc. (British Virgin Islands) |
83,100 | 5,652,462 | |||
| 9,395,082 | |||||
| TOTAL LONG-TERM INVESTMENTS |
329,402,966 | ||||
| PRINCIPAL AMOUNT (000) |
|||||
| SHORT-TERM INVESTMENTS — 17.8% |
|||||
| CERTIFICATES OF DEPOSIT — 0.3% |
|||||
| Banco Santander PR |
|||||
| 2.315%, 01/07/05(b)(c) |
$ | 5 | 4,631 | ||
| First Boston Corp. |
|||||
| 2.36%, 01/24/05(b) |
524 | 524,327 | |||
| Fortis Bank NY |
|||||
| 2.055%, 06/08/05(b) |
588 | 587,531 | |||
| 1,116,489 | |||||
| COMMERCIAL PAPER — 0.1% |
|||||
| Ticonderoga Funding, LLC |
|||||
| 2.35%, 01/14/05(b) |
215 | 215,058 | |||
| CORPORATE OBLIGATIONS — 6.0% |
|||||
| Goldman Sachs Group, Inc. |
|||||
| 2.33%, 01/03/05(b)(c) |
551 | 550,598 | |||
| Merrill Lynch & Co., Inc. |
|||||
| 2.38%, 01/03/05(b)(c) |
4,525 | 4,524,631 | |||
| Morgan Stanley |
|||||
| 2.33%, 01/03/05(b)(c) |
8,559 | 8,558,728 | |||
| Natexis Banque NY |
|||||
| 2.297%, 01/03/05(b)(c) |
4,473 | 4,472,305 | |||
| Sedna Finance Corporation |
|||||
| 2.372%, 01/14/05(b)(c) |
1,953 | 1,953,288 | |||
| 20,059,550 | |||||
| TIME DEPOSIT — 0.8% |
|||||
| Bank of America NA |
|||||
| 1.50%, 01/03/05(b) |
2,523 | 2,522,597 | |||
96
AST ALGER ALL-CAP GROWTH PORTFOLIO
SCHEDULE OF INVESTMENTS (CONTINUED)
DECEMBER 31, 2004
| SHARES |
VALUE (NOTE 2) |
|||||
| NON-REGISTERED INVESTMENT COMPANY — 9.0% |
||||||
| BlackRock Institutional Money Market Trust(b)(j) |
30,443,276 | $ | 30,443,276 | |||
| REGISTERED INVESTMENT COMPANIES — 1.6% |
||||||
| BlackRock Provident Institutional Funds TempCash Portfolio(j) |
2,595,589 | 2,595,589 | ||||
| BlackRock Provident Institutional Funds TempFund Portfolio(j) |
2,595,589 | 2,595,589 | ||||
| 5,191,178 | ||||||
| TOTAL SHORT-TERM INVESTMENTS |
59,548,148 | |||||
| TOTAL INVESTMENTS — 116.3% |
388,951,114 | |||||
| LIABILITIES IN EXCESS OF OTHER ASSETS — (16.3%) |
(54,520,647 | ) | ||||
| NET ASSETS — 100.0% |
$ | 334,430,467 | ||||
THE FOLLOWING ABBREVIATION IS USED THROUGHOUT THE SCHEDULE OF INVESTMENTS:
| ADR | American Depositary Receipt |
THE FOLLOWING ANNOTATIONS ARE USED THROUGHOUT THE SCHEDULE OF INVESTMENTS:
| * | Non-income producing security. |
| (a) | All or a portion of securities on loan. Securities on loan have an aggregate market value of $51,878,979; cash collateral of $54,356,970 (included with liabilities) was received with which the portfolio purchased highly liquid short-term investments. |
| (b) | Represents security purchased with cash collateral for securities on loan. |
| (c) | Indicates a variable rate security. The maturity date presented for these instruments is the next date on which the rate of interest is adjusted. |
| (j) | Security available to institutional investors only. |
The industry classification of long-term portfolio holdings, short-term investments and liabilities in excess of other assets shown as a percentage of net assets as of December 31, 2004 were as follows:
| Computer Services & Software |
9.2 | % | |
| Pharmaceuticals |
8.1 | ||
| Internet Services |
6.5 | ||
| Medical Supplies & Equipment |
5.5 | ||
| Entertainment & Leisure |
5.2 | ||
| Telecommunications |
5.1 | ||
| Retail & Merchandising |
4.9 | ||
| Oil & Gas |
4.8 | ||
| Healthcare Services |
4.6 | ||
| Semiconductors |
4.5 | ||
| Internet Software & Services |
3.9 | ||
| Financial Services |
3.5 | ||
| Aerospace |
3.2 | ||
| Transportation |
2.8 | ||
| Financial — Bank & Trust |
2.5 | ||
| Biotechnology |
2.4 | ||
| Energy Equipment |
2.2 | ||
| Hotels & Motels |
2.0 | ||
| Computer Hardware |
1.9 | ||
| Energy Services |
1.9 | % | |
| Conglomerates |
1.8 | ||
| Electronic Components & Equipment |
1.8 | ||
| Consumer Products & Services |
1.6 | ||
| Consumer Finance |
1.5 | ||
| Diversified |
1.5 | ||
| Clothing & Apparel |
1.1 | ||
| Railroads |
1.1 | ||
| Chemicals |
1.0 | ||
| Business Services |
0.9 | ||
| Insurance |
0.6 | ||
| Health Care Providers & Services |
0.5 | ||
| Communication Equipment |
0.4 | ||
| Short-Term Investments |
17.8 | ||
| 116.3 | |||
| Liabilities in excess of other assets |
(16.3 | ) | |
| 100.0 | % | ||
See Notes to Financial Statements.
97
AST GABELLI ALL-CAP VALUE PORTFOLIO
SCHEDULE OF INVESTMENTS
DECEMBER 31, 2004
| SHARES |
VALUE (NOTE 2) | ||||
| LONG-TERM INVESTMENTS — 97.9% |
|||||
| COMMON STOCK |
|||||
| AEROSPACE — 1.1% |
|||||
| Curtiss-Wright Corp. (Class “B” Stock) |
1,400 | $ | 78,764 | ||
| General Dynamics Corp. |
2,000 | 209,200 | |||
| Northrop Grumman Corp. |
12,400 | 674,064 | |||
| Sequa Corp. (Class “A” Stock)* |
12,000 | 733,800 | |||
| Titan Corp.* |
30,000 | 486,000 | |||
| 2,181,828 | |||||
| AUTOMOBILE MANUFACTURERS — 2.0% |
|||||
| DaimlerChrysler AG (Germany)(a) |
40,000 | 1,922,000 | |||
| Monaco Coach Corp. |
8,000 | 164,560 | |||
| Navistar International Corp.*(a) |
35,000 | 1,539,300 | |||
| PACCAR, Inc. |
4,500 | 362,160 | |||
| 3,988,020 | |||||
| AUTOMOTIVE PARTS — 3.9% |
|||||
| AutoNation, Inc.*(a) |
80,000 | 1,536,800 | |||
| AutoZone, Inc.*(a) |
2,000 | 182,620 | |||
| BorgWarner, Inc. |
27,000 | 1,462,590 | |||
| Dana Corp. |
147,000 | 2,547,510 | |||
| Genuine Parts Co. |
40,000 | 1,762,400 | |||
| Midas, Inc.* |
10,000 | 200,000 | |||
| 7,691,920 | |||||
| BEVERAGES — 1.6% |
|||||
| Coca-Cola Co. |
30,000 | 1,248,900 | |||
| Coca-Cola Hellenic Bottling Co. SA [ADR] (Greece) |
2,000 | 47,300 | |||
| Fomento Economico Mexicano SA de CV [ADR] (Mexico) |
35,000 | 1,841,350 | |||
| Pernod Ricard SA (France) |
500 | 76,594 | |||
| 3,214,144 | |||||
| BROADCASTING — 10.0% |
|||||
| Beasley Broadcast Group, Inc.* |
7,500 | 131,475 | |||
| Belo Corp. (Class “A” Stock) |
10,000 | 262,400 | |||
| Crown Media Holdings, Inc.* |
58,000 | 498,800 | |||
| Fox Entertainment Group, Inc. (Class “A” Stock)* |
75,000 | 2,344,500 | |||
| Gray Television, Inc. |
20,000 | 310,000 | |||
| Grupo Televisa SA [ADR] (Brazil) |
22,000 | 1,331,000 | |||
| Liberty Corp. (The) |
5,000 | 219,800 | |||
| Liberty Media Corp. (Class “A” Stock)*(a) |
380,000 | 4,172,400 | |||
| Liberty Media Corp. (Class “B” Stock)* |
500 | 5,800 | |||
| Liberty Media International, Inc. (Class “A” Stock)*(a) |
35,000 | 1,618,050 | |||
| Liberty Media International, Inc. (Class “B” Stock)* |
30 | 1,468 | |||
| Lin TV Corp. (Class “A” Stock)* |
30,000 | 573,000 | |||
| Media General, Inc. (Class “A” Stock) |
20,000 | 1,296,200 | |||
| Mediaset SPA (Italy) |
11,000 | 139,500 | |||
| Meredith Corp. |
6,000 | 325,200 | |||
| Modern Times Group AB (Class “B” Stock) (Sweden)* |
1,600 | 43,579 | |||
| News Corp Inc., (Class “A” Stock) |
49,366 | 921,170 | |||
| News Corp Inc., (Class “B” Stock)(a) |
7,000 | 134,400 | |||
| Paxson Communications Corp.* |
80,000 | 110,400 | |||
| Publishing & Broadcasting Ltd. (Australia) |
12,000 | 164,619 | |||
| Scripps, (E.W.) Co. (Class “A” Stock) |
56,000 | 2,703,680 | |||
| UnitedGlobalCom, Inc. (Class “A” Stock)* |
213,509 | 2,062,497 | |||
| Young Broadcasting, Inc. (Class “A” Stock)* |
25,000 | 264,000 | |||
| 19,633,938 | |||||
| BUILDING MATERIALS — 0.6% |
|||||
| Bouygues SA (France) |
1,750 | 80,875 | |||
| CRH PLC (Ireland) |
5,000 | 133,750 | |||
| Skyline Corp. |
15,000 | 612,001 | |||
| Thomas Industries, Inc. |
10,000 | 399,200 | |||
| 1,225,826 | |||||
| CABLE TELEVISION — 2.4% |
|||||
| Cablevision Systems New York Group (Class “A” Stock)* |
100,000 | 2,490,000 | |||
| Comcast Corp. (Class “A” Stock)* |
20,000 | 665,600 | |||
| DIRECTV Group, Inc. (The)* |
40,000 | 669,600 | |||
| EchoStar Communications Corp. (Class “A” Stock)(a) |
25,000 | 831,000 | |||
| Nippon Television Network Corp. (Japan) |
400 | 60,076 | |||
| PrimaCom AG [ADR] (Germany)* |
14,400 | 14,093 | |||
| 4,730,369 | |||||
| CHEMICALS — 2.4% |
|||||
| Albemarle Corp. |
10,000 | 387,100 | |||
| Dow Chemical Co. |
16,000 | 792,160 | |||
| Great Lakes Chemical Corp.(a) |
33,000 | 940,170 | |||
| Hercules, Inc.*(a) |
95,000 | 1,410,750 | |||
| Sensient Technologies Corp.(a) |
50,000 | 1,199,500 | |||
| 4,729,680 | |||||
| CLOTHING & APPAREL — 0.1% |
|||||
| Dior, (Christian) SA (France) |
1,400 | 95,243 | |||
| Swatch Group AG (Switzerland) |
700 | 102,743 | |||
| 197,986 | |||||
| COMPUTER HARDWARE — 0.2% |
|||||
| Hewlett-Packard Co. |
17,365 | 364,144 | |||
| COMPUTER SERVICES & SOFTWARE — 0.3% |
|||||
| Microsoft Corp. |
20,000 | 534,200 | |||
98
AST GABELLI ALL-CAP VALUE PORTFOLIO
SCHEDULE OF INVESTMENTS (CONTINUED)
DECEMBER 31, 2004
| SHARES |
VALUE (NOTE 2) | ||||
| CONGLOMERATES — 3.1% |
|||||
| Alleghany Corp.* |
1,800 | $ | 513,450 | ||
| Cendant Corp. |
27,800 | 649,964 | |||
| Honeywell International, Inc. |
109,000 | 3,859,690 | |||
| ITT Industries, Inc. |
12,000 | 1,013,400 | |||
| 6,036,504 | |||||
| CONSTRUCTION — 0.8% |
|||||
| Fleetwood Enterprises, Inc.* |
100,000 | 1,346,000 | |||
| Sekisui House Ltd. (Japan) |
6,000 | 69,913 | |||
| Technip-Coflexip SA (France) |
400 | 73,943 | |||
| 1,489,856 | |||||
| CONSUMER PRODUCTS & SERVICES — 2.9% |
|||||
| Altadis SA (Spain) |
3,000 | 137,420 | |||
| Church and Dwight Co., Inc. |
18,000 | 605,160 | |||
| Clorox Co. |
8,000 | 471,440 | |||
| Energizer Holdings, Inc.* |
42,000 | 2,086,980 | |||
| Gallaher Group PLC [ADR] (Great Britain) |
1,000 | 60,710 | |||
| Mattel, Inc. |
15,000 | 292,350 | |||
| Procter & Gamble Co. |
26,000 | 1,432,080 | |||
| Rayovac Corp.* |
15,000 | 458,400 | |||
| Secom Co., Ltd. (Japan) |
1,500 | 60,018 | |||
| 5,604,558 | |||||
| CONTAINERS & PACKAGING — 0.1% |
|||||
| Greif, Inc. (Class “A” Stock) |
4,000 | 224,000 | |||
| DIVERSIFIED MANUFACTURING OPERATIONS — 0.2% |
|||||
| General Electric Co. |
9,000 | 328,500 | |||
| ELECTRONIC COMPONENTS & EQUIPMENT — 1.8% |
|||||
| Agere Systems, Inc. (Class “B” Stock)* |
100,000 | 135,000 | |||
| AMETEK, Inc. |
18,000 | 642,060 | |||
| CTS Corp. |
35,000 | 465,150 | |||
| Keyence Corp. (Japan) |
400 | 89,626 | |||
| Magnetek, Inc.* |
22,000 | 151,800 | |||
| Molex, Inc. |
20,000 | 533,000 | |||
| Thomas & Betts Corp.* |
45,000 | 1,383,750 | |||
| Tokyo Electron Ltd. (Japan) |
800 | 49,263 | |||
| 3,449,649 | |||||
| ENTERTAINMENT & LEISURE — 6.5% |
|||||
| Disney, (Walt) Co. |
80,000 | 2,224,000 | |||
| Dover Downs Gaming & Entertainment, Inc. |
15,365 | 201,282 | |||
| Dover Motorsports, Inc. |
30,000 | 171,900 | |||
| Gaylord Entertainment Co. (Class “A” Stock)* |
18,000 | 747,540 | |||
| Gemstar-TV Guide International, Inc.* |
170,000 | 1,006,400 | |||
| Greek Organization of Football Prognostics (Greece) |
3,000 | 83,023 | |||
| Hilton Group PLC (United Kingdom) |
20,000 | 109,242 | |||
| Kerzner International Ltd.* |
4,000 | 240,200 | |||
| MGM Mirage* |
15,000 | 1,091,100 | |||
| Pixar, Inc.* |
100 | 8,561 | |||
| Time Warner, Inc.* |
200,000 | 3,888,000 | |||
| Viacom, Inc. |
38,000 | 1,409,040 | |||
| Vivendi Universal SA [ADR] (France)* |
46,500 | 1,491,255 | |||
| 12,671,543 | |||||
| ENVIRONMENTAL SERVICES — 1.2% |
|||||
| Waste Management, Inc. |
80,000 | 2,395,200 | |||
| FINANCIAL — BANK & TRUST — 2.1% |
|||||
| Bank of America Corp. |
5,000 | 234,950 | |||
| Bank of Ireland [ADR] (Ireland) |
1,700 | 113,458 | |||
| Bank of New York Co., Inc. (The) |
23,000 | 768,660 | |||
| Deutsche Bank AG [ADR] (Germany) |
13,000 | 1,157,130 | |||
| Lloyds TSB Group PLC (Great Britain) |
6,000 | 54,487 | |||
| UBS AG [ADR] (Germany) |
1,600 | 134,144 | |||
| Wilmington Trust Corp. |
45,000 | 1,626,750 | |||
| 4,089,579 | |||||
| FINANCIAL SERVICES — 5.8% |
|||||
| American Express Co.(a) |
96,000 | 5,411,520 | |||
| BKF Capital Group, Inc. |
7,000 | 265,300 | |||
| Citigroup, Inc. |
8,000 | 385,440 | |||
| Countrywide Financial Corp.(a) |
13,998 | 518,066 | |||
| Irish Life & Permanent PLC (Ireland) |
4,000 | 74,106 | |||
| J.P. Morgan Chase & Co. |
13,500 | 526,635 | |||
| Lehman Brothers Holdings, Inc. |
4,000 | 349,920 | |||
| Merrill Lynch & Co., Inc. |
15,000 | 896,550 | |||
| Nikko Securities Co. Ltd. (Japan) |
15,000 | 79,487 | |||
| PNC Financial Services Group |
15,000 | 861,600 | |||
| Price, (T. Rowe) Group, Inc. |
30,000 | 1,866,000 | |||
| 11,234,624 | |||||
| FOOD — 7.6% |
|||||
| Ajinomoto Co., Inc. (Japan) |
5,000 | 59,530 | |||
| Albertson’s, Inc.(a) |
35,000 | 835,800 | |||
| Archer-Daniels-Midland Co. |
140,000 | 3,123,400 | |||
| Del Monte Foods Co.* |
10,000 | 110,200 | |||
| Diageo PLC [ADR] (Great Britain) |
26,500 | 1,533,820 | |||
| Flowers Foods, Inc. |
52,000 | 1,642,160 | |||
| General Mills, Inc. |
47,000 | 2,336,370 | |||
| Heinz, (H.J.) Co. |
30,000 | 1,169,700 | |||
| Kellogg Co. |
5,000 | 223,300 | |||
| Safeway, Inc.*(a) |
80,000 | 1,579,200 | |||
| Weis Markets, Inc. |
15,000 | 578,550 | |||
| Wrigley, (Wm., Jr.) Co. |
25,000 | 1,729,750 | |||
| 14,921,780 | |||||
| HOTELS & MOTELS — 0.2% |
|||||
| Hilton Hotels Corp. |
15,000 | 341,100 | |||
99
AST GABELLI ALL-CAP VALUE PORTFOLIO
SCHEDULE OF INVESTMENTS (CONTINUED)
DECEMBER 31, 2004
| SHARES |
VALUE (NOTE 2) | ||||
| INDUSTRIAL PRODUCTS — 3.6% |
|||||
| Cooper Industries Ltd. (Class “A” Stock) |
50,000 | $ | 3,394,500 | ||
| Crane Co.(a) |
65,000 | 1,874,600 | |||
| Ingersoll-Rand Co., Ltd. (Class “A” Stock) |
4,000 | 321,200 | |||
| Myers Industries, Inc. |
25,000 | 320,000 | |||
| Precision Castparts Corp. |
17,000 | 1,116,560 | |||
| 7,026,860 | |||||
| INSURANCE — 1.0% |
|||||
| Allianz AG [ADR] (Germany) |
4,000 | 53,160 | |||
| Argonaut Group, Inc.* |
14,000 | 295,820 | |||
| Aviva PLC (United Kingdom) |
6,000 | 72,342 | |||
| Hartford Financial Services Group, Inc. (The) |
5,000 | 346,550 | |||
| Leucadia National Corp. |
4,000 | 277,920 | |||
| Marsh & McLennan Cos., Inc. |
10,000 | 329,000 | |||
| Riunione Adriatica di Sicurta SpA (Italy) |
3,800 | 85,948 | |||
| St. Paul Cos., Inc. |
4,501 | 166,852 | |||
| White Mountain Insurance Group |
600 | 387,600 | |||
| 2,015,192 | |||||
| INTERNET SERVICES — 0.2% |
|||||
| Checkfree Corp.* |
3,000 | 114,240 | |||
| eBay, Inc.* |
200 | 23,256 | |||
| InterActiveCorp*(a) |
6,000 | 165,720 | |||
| 303,216 | |||||
| MACHINERY & EQUIPMENT — 1.9% |
|||||
| Deere & Co. |
20,000 | 1,488,000 | |||
| Flowserve Corp.* |
16,000 | 440,640 | |||
| Gencorp, Inc. |
30,000 | 557,100 | |||
| Thermo Electron Corp.* |
39,000 | 1,177,410 | |||
| 3,663,150 | |||||
| MEDICAL SUPPLIES & EQUIPMENT — 2.4% |
|||||
| Baxter International, Inc. |
8,000 | 276,320 | |||
| Bio-Rad Laboratories, Inc.* |
2,000 | 114,740 | |||
| DENTSPLY International, Inc. |
3,000 | 168,600 | |||
| ICU Medical, Inc.*(a) |
15,000 | 410,100 | |||
| Inamed Corp.* |
15,000 | 948,750 | |||
| Invitrogen Corp.* |
6,000 | 402,780 | |||
| Owens & Minor, Inc. |
15,000 | 422,550 | |||
| Patterson Companies, Inc.* |
3,000 | 130,170 | |||
| Schein, (Henry), Inc.* |
10,000 | 696,400 | |||
| Smith & Nephew PLC (Great Britain) |
1,000 | 51,760 | |||
| Straumann Holding AG (Germany) |
320 | 66,415 | |||
| Sybron Dental Specialties, Inc.* |
27,000 | 955,259 | |||
| Synthes, Inc. (Switzerland)* |
700 | 78,489 | |||
| William Demant Holdings A.S (Denmark)* |
1,000 | 46,962 | |||
| 4,769,295 | |||||
| METALS & MINING — 0.7% |
|||||
| Alcan, Inc. (Canada) |
8,000 | 392,320 | |||
| Alcoa, Inc. |
17,000 | 534,140 | |||
| Harmony Gold Mining Co. [ADR] (South Africa) (a) |
7,000 | 64,890 | |||
| Newmont Mining Corp. |
7,000 | 310,870 | |||
| 1,302,220 | |||||
| OIL & GAS — 5.1% |
|||||
| Baker Hughes, Inc.(a) |
8,200 | 349,894 | |||
| Burlington Resources, Inc. |
50,000 | 2,175,000 | |||
| ConocoPhillips |
18,563 | 1,611,825 | |||
| Devon Energy Corp.(a) |
30,000 | 1,167,600 | |||
| El Paso Corp. |
56,000 | 582,400 | |||
| Eni SpA [ADR] (Italy)(a) |
1,000 | 125,840 | |||
| ENSCO International, Inc. |
4,000 | 126,960 | |||
| Equitable Resources, Inc.(a) |
5,000 | 303,300 | |||
| Halliburton Co.(a) |
7,000 | 274,680 | |||
| Kerr-McGee Corp.(a) |
20,000 | 1,155,800 | |||
| National Fuel Gas Co. |
18,000 | 510,120 | |||
| ONEOK, Inc. |
30,000 | 852,600 | |||
| Petroleo Brasileiro SA (Brazil) |
1,000 | 39,780 | |||
| Questar Corp. |
10,000 | 509,600 | |||
| Total SA [ADR] (France) |
1,100 | 120,824 | |||
| 9,906,223 | |||||
| PAPER & FOREST PRODUCTS — 0.1% |
|||||
| International Paper Co. |
5,000 | 210,000 | |||
| PHARMACEUTICALS — 1.6% |
|||||
| AstraZeneca PLC [ADR] (United Kingdom) |
1,200 | 43,668 | |||
| Bristol-Meyers Squibb Co. |
20,000 | 512,400 | |||
| GlaxoSmithKline PLC [ADR] (United Kingdom) |
1,500 | 71,085 | |||
| Merck & Co., Inc.(a) |
10,000 | 321,400 | |||
| Novartis AG [ADR] (Switzerland) |
2,300 | 116,242 | |||
| Pfizer, Inc. |
48,000 | 1,290,720 | |||
| Roche Holding AG (Switzerland) |
900 | 103,606 | |||
| Sanofi-Sythelabo SA [ADR] |
2,575 | 103,129 | |||
| Takeda Chemical Industries Ltd. (Japan) |
1,500 | 75,534 | |||
| Wyeth |
10,000 | 425,900 | |||
| 3,063,684 | |||||
| PRINTING & PUBLISHING — 5.2% |
|||||
| Knight-Ridder, Inc. |
14,000 | 937,160 | |||
| McGraw-Hill Cos., Inc. |
5,000 | 457,700 | |||
| New York Times Co. (Class “A” Stock)(a) |
30,000 | 1,224,000 | |||
| Pearson PLC [ADR] (Great Britain) |
5,300 | 64,448 | |||
| PRIMEDIA, Inc.* |
40,000 | 152,000 | |||
| Pulitzer, Inc. |
30,000 | 1,945,500 | |||
100
AST GABELLI ALL-CAP VALUE PORTFOLIO
SCHEDULE OF INVESTMENTS (CONTINUED)
DECEMBER 31, 2004
| SHARES |
VALUE (NOTE 2) | ||||
| Readers Digest Association, Inc. |
20,894 | $ | 290,636 | ||
| Tribune Co. |
80,000 | 3,371,200 | |||
| Washington Post Co. (Class “B” Stock) |
1,700 | 1,671,134 | |||
| 10,113,778 | |||||
| REAL ESTATE |
|||||
| Cheung Kong Holdings Ltd. (Hong Kong) |
5,000 | 49,854 | |||
| RETAIL & MERCHANDISING — 0.9% |
|||||
| Big 5 Sporting Goods Corp. |
5,000 | 145,700 | |||
| Compagnie Financiere Richemont AG (Switzerland) |
3,700 | 123,160 | |||
| Matsumotokiyoshi Co. Ltd. (Japan) |
2,100 | 59,842 | |||
| Neiman Marcus Group, Inc. (Class “A” Stock) |
17,000 | 1,216,180 | |||
| Tiffany & Co. |
5,000 | 159,850 | |||
| 1,704,732 | |||||
| SEMICONDUCTORS — 1.0% |
|||||
| Applied Materials, Inc.*(a) |
15,000 | 256,500 | |||
| Freescale Semiconductor, Inc. (Class “B” Stock)* |
12,000 | 220,320 | |||
| Rohm Co. Ltd. (Japan) |
600 | 62,067 | |||
| Texas Instruments, Inc.(a) |
61,000 | 1,501,820 | |||
| 2,040,707 | |||||
| TELECOMMUNICATIONS — 10.3% |
|||||
| AT&T Corp.(a) |
20,000 | 381,200 | |||
| BCE, Inc. |
25,000 | 603,250 | |||
| BT Group PLC [ADR] (Great Britain) |
15,000 | 592,950 | |||
| CenturyTel, Inc.(a) |
65,000 | 2,305,550 | |||
| Cincinnati Bell, Inc.* |
140,000 | 581,000 | |||
| Commonwealth Telephone Enterprises |
14,490 | 719,573 | |||
| Corning, Inc.*(a) |
180,000 | 2,118,600 | |||
| France Telecom SA [ADR] (France) |
1,000 | 33,080 | |||
| Ito-Yokado Co. Ltd. (Japan) |
2,000 | 83,927 | |||
| KDDI Corp. (Japan) |
16 | 86,191 | |||
| Lucent Technologies, Inc.*(a) |
150,000 | 564,000 | |||
| MMO2 PLC [ADR] (Great Britain)* |
60,000 | 1,414,200 | |||
| Motorola, Inc. |
105,000 | 1,806,000 | |||
| Nextel Communications, Inc. (Class “A” Stock)*(a) |
10,000 | 300,000 | |||
| Nextel Partners, Inc. (Class “A” Stock)* |
15,000 | 293,100 | |||
| Nortel Networks Corp. (Canada)* |
130,000 | 453,700 | |||
| Price Communications Corp.* |
31,500 | 585,585 | |||
| Qualcomm, Inc. |
4,000 | 169,600 | |||
| Qwest Communications International, Inc.* |
280,000 | 1,243,200 | |||
| Sprint Corp. |
95,000 | 2,360,749 | |||
| Telecom Italia SPA (Italy) |
25,000 | 102,284 | |||
| Telefonica Moviles SA (Spain) |
7,700 | 96,917 | |||
| Telephone & Data Systems, Inc. |
16,000 | 1,231,200 | |||
| United States Cellular Corp.* |
35,000 | 1,566,600 | |||
| Verizon Communications, Inc. |
3,000 | 121,530 | |||
| Vodafone Group PLC [ADR] (United Kingdom) |
4,000 | 109,520 | |||
| Western Wireless Corp. (Class “A” Stock)*(a) |
10,000 | 293,000 | |||
| 20,216,506 | |||||
| UTILITIES — 7.0% |
|||||
| AES Corp.* |
52,500 | 717,675 | |||
| Allegheny Energy, Inc.* |
100,000 | 1,971,000 | |||
| Aquila, Inc.* |
80,000 | 295,200 | |||
| CH Energy Group, Inc. |
7,000 | 336,350 | |||
| Cinergy Corp. |
36,000 | 1,498,680 | |||
| Constellation Energy Group, Inc. |
30,000 | 1,311,300 | |||
| DPL, Inc. |
18,000 | 451,980 | |||
| Duquesne Light Holdings, Inc.(a) |
30,000 | 565,500 | |||
| El Paso Electric Co.* |
37,000 | 700,780 | |||
| Great Plains Energy, Inc.(a) |
40,000 | 1,211,200 | |||
| Mirant Corp.* |
200,000 | 72,100 | |||
| Northeast Utilities |
70,000 | 1,319,500 | |||
| PPL Corp. |
2,000 | 106,560 | |||
| Sierra Pacific Resources* |
30,000 | 315,000 | |||
| Teco Energy, Inc.(a) |
35,000 | 536,900 | |||
| Unisource Energy Corp. |
30,000 | 723,300 | |||
| Wisconsin Energy Corp. |
18,000 | 606,780 | |||
| Xcel Energy, Inc. |
50,000 | 910,000 | |||
| 13,649,805 | |||||
| TOTAL LONG-TERM INVESTMENTS |
191,314,170 | ||||
| PRINCIPAL AMOUNT (000) |
|||||
| SHORT-TERM INVESTMENTS — 19.9% |
|||||
| CERTIFICATES OF DEPOSIT — 5.6% |
|||||
| Banco Santander PR |
|||||
| 2.315%, 01/07/05(b)(c) |
$ | 1,800 | 1,800,113 | ||
| First Boston Corp. |
|||||
| 2.36%, 01/24/05(b) |
5,373 | 5,373,027 | |||
| Skandinaviska Enskilda Banken |
|||||
| 2.35%, 01/28/05(b) |
1,503 | 1,503,361 | |||
| UBS Bank |
|||||
| 2.315%, 01/18/05(b) |
2,353 | 2,353,108 | |||
| 11,029,609 | |||||
| CORPORATE OBLIGATIONS — 7.9% |
|||||
| Bear Stearns |
|||||
| 2.28%, 01/03/05(b)(c) |
728 | 728,365 | |||
| Goldman Sachs Group, Inc. |
|||||
| 2.33%, 01/03/05(b)(c) |
4,540 | 4,540,176 | |||
| Merrill Lynch & Co., Inc. |
|||||
| 2.38%, 01/03/05(b)(c) |
728 | 727,935 | |||
101
AST GABELLI ALL-CAP VALUE PORTFOLIO
SCHEDULE OF INVESTMENTS (CONTINUED)
DECEMBER 31, 2004
| PRINCIPAL AMOUNT (000) |
VALUE (NOTE 2) |
||||||
| Morgan Stanley |
|||||||
| 2.33%, 01/03/05(b)(c) |
$ | 2,538 | $ | 2,537,674 | |||
| Natexis Banque NY |
|||||||
| 2.297%, 01/03/05(b)(c) |
3,283 | 3,282,973 | |||||
| Sedna Finance Corporation |
|||||||
| 2.372%, 01/14/05(b)(c) |
1,348 | 1,347,953 | |||||
| Swedbank NY |
|||||||
| 2.362%, 01/18/05(b)(c) |
2,207 | 2,206,495 | |||||
| 15,371,571 | |||||||
| TIME DEPOSIT — 0.7% |
|||||||
| Bank of America NA |
|||||||
| 1.50%, 01/03/05(b) |
1,380 | 1,380,244 | |||||
| SHARES |
|||||||
| NON-REGISTERED INVESTMENT COMPANY — 3.5% |
|||||||
| BlackRock Institutional Money Market Trust(b)(j) |
6,842,068 | 6,842,068 | |||||
| REGISTERED INVESTMENT COMPANIES — 2.2% |
|||||||
| BlackRock Provident Institutional Funds TempCash Portfolio(j) |
2,157,264 | 2,157,264 | |||||
| BlackRock Provident Institutional Funds TempFund Portfolio(j) |
2,157,264 | 2,157,264 | |||||
| 4,314,528 | |||||||
| TOTAL SHORT-TERM INVESTMENTS |
38,938,020 | ||||||
| TOTAL INVESTMENTS — 117.8% |
230,252,190 | ||||||
| LIABILITIES IN EXCESS OF OTHER ASSETS — (17.8%) |
(34,870,034 | ) | |||||
| NET ASSETS — 100.0% |
$ | 195,382,156 | |||||
THE FOLLOWING ABBREVIATIONS ARE USED THROUGHOUT THE SCHEDULE OF INVESTMENTS:
| ADR | American Depository Receipt |
THE FOLLOWING ANNOTATIONS ARE USED THROUGHOUT THE SCHEDULE OF INVESTMENTS:
| * | Non-income producing security. |
| (a) | All or a portion of securities on loan. Securities on loan have an aggregate market value of $33,207,455; cash collateral of $34,623,492 (included with liabilities) was received with which the portfolio purchased highly liquid short-term investments. |
| (b) | Represents security purchased with cash collateral for securities on loan. |
| (c) | Indicates a variable rate security. The maturity date presented for these instruments is the next date on which the rate of interest is adjusted. |
| (j) | Security available to institutional investors only. |
The industry classification of long-term portfolio holdings, short-term investments and liabilities in excess of other assets shown as a percentage of net assets as of December 31, 2004 were as follows:
| Telecommunications |
10.3 | % | |
| Broadcasting |
10.0 | ||
| Food |
7.6 | ||
| Utilities |
7.0 | ||
| Entertainment & Leisure |
6.5 | ||
| Financial Services |
5.8 | ||
| Printing & Publishing |
5.2 | ||
| Oil & Gas |
5.1 | ||
| Automotive Parts |
3.9 | ||
| Industrial Products |
3.6 | ||
| Conglomerates |
3.1 | ||
| Consumer Products & Services |
2.9 | ||
| Cable Television |
2.4 | ||
| Chemicals |
2.4 | ||
| Medical Supplies & Equipment |
2.4 | ||
| Financial — Bank & Trust |
2.1 | ||
| Automobile Manufacturers |
2.0 | ||
| Machinery & Equipment |
1.9 | ||
| Electronic Components & Equipment |
1.8 | ||
| Beverages |
1.6 | ||
| Pharmaceuticals |
1.6 | ||
| Environmental Services |
1.2 | ||
| Aerospace |
1.1 | % | |
| Insurance |
1.0 | ||
| Semiconductors |
1.0 | ||
| Retail & Merchandising |
0.9 | ||
| Construction |
0.8 | ||
| Metals & Mining |
0.7 | ||
| Building Materials |
0.6 | ||
| Computer Services & Software |
0.3 | ||
| Computer Hardware |
0.2 | ||
| Diversified Manufacturing Operations |
0.2 | ||
| Hotels & Motels |
0.2 | ||
| Internet Services |
0.2 | ||
| Clothing & Apparel |
0.1 | ||
| Containers & Packaging |
0.1 | ||
| Paper & Forest Products |
0.1 | ||
| Short-Term Investments |
19.9 | ||
| 117.8 | |||
| Liabilities in excess of other assets |
(17.8 | ) | |
| 100.0 | % | ||
See Notes to Financial Statements.
102
AST T. ROWE PRICE NATURAL RESOURCES PORTFOLIO
SCHEDULE OF INVESTMENTS
DECEMBER 31, 2004
| SHARES |
VALUE (NOTE 2) | ||||
| LONG-TERM INVESTMENTS — 96.6% |
|||||
| COMMON STOCK |
|||||
| BUILDING & REAL ESTATE — 3.7% |
|||||
| AMB Property Corp. [REIT] |
36,100 | $ | 1,458,079 | ||
| Archstone Smith Trust [REIT] |
32,500 | 1,244,750 | |||
| Boston Properties, Inc. [REIT] |
18,700 | 1,209,329 | |||
| Camden Property Trust [REIT](a) |
22,700 | 1,157,700 | |||
| Catellus Development Corp. [REIT] |
40,985 | 1,254,141 | |||
| Duke-Weeks Realty Corp. [REIT] |
36,030 | 1,230,064 | |||
| Saint Joe Corp. |
20,300 | 1,303,260 | |||
| 8,857,323 | |||||
| CHEMICALS — 9.3% |
|||||
| Agrium, Inc. (Canada) |
87,800 | 1,479,430 | |||
| Dow Chemical Co. |
62,300 | 3,084,473 | |||
| DuPont, (E.I.) de Nemours & Co. |
48,500 | 2,378,925 | |||
| Lyondell Chemical Co.(a) |
97,090 | 2,807,843 | |||
| Nova Chemicals Corp. (Canada) |
30,300 | 1,433,190 | |||
| Potash Corp. of Saskatchewan, Inc. (Canada) |
87,900 | 7,300,974 | |||
| The Mosaic Co.* |
146,900 | 2,397,408 | |||
| UAP Holding Corp.* |
71,000 | 1,226,170 | |||
| 22,108,413 | |||||
| CONTAINERS & PACKAGING — 1.7% |
|||||
| Packaging Corp. of America(a) |
79,800 | 1,879,290 | |||
| Smurfit-Stone Container Corp.*(a) |
117,962 | 2,203,530 | |||
| 4,082,820 | |||||
| DIVERSIFIED METALS — 6.0% |
|||||
| Companhia Vale Do Rio Doce (Class “A” Shares) [ADR] (Brazil) |
66,600 | 1,623,708 | |||
| Companhia Vale Do Rio Doce [ADR] (Brazil) |
155,200 | 4,502,352 | |||
| Inco Ltd. (Canada)* |
52,600 | 1,934,628 | |||
| Nucor Corp.(a) |
120,200 | 6,291,268 | |||
| 14,351,956 | |||||
| ENERGY SERVICES — 1.6% |
|||||
| Massey Energy Co.(a) |
33,100 | 1,156,845 | |||
| Peabody Energy Corp. |
19,000 | 1,537,290 | |||
| W-H Energy Services, Inc.* |
44,800 | 1,001,728 | |||
| 3,695,863 | |||||
| EXPLORATION & PRODUCTION — 6.5% |
|||||
| Devon Energy Corp.(a) |
132,714 | 5,165,229 | |||
| Encore Acquisition Co.* |
39,700 | 1,385,927 | |||
| Kerr-McGee Corp.(a) |
42,026 | 2,428,683 | |||
| Murphy Oil Corp. |
76,400 | 6,146,379 | |||
| Nexen, Inc. (Canada) |
6,800 | 276,420 | |||
| 15,402,638 | |||||
| FARMING & AGRICULTURE — 0.7% |
|||||
| Delta and Pine Land Co. |
65,300 | 1,781,384 | |||
| GAS TRANSMISSION & DISTRIBUTION — 0.4% |
|||||
| Gazprom [ADR] (Russia) 144A (cost $513,074; purchased 07/02/03-08/04/04)(g) |
25,000 | 887,500 | |||
| INTEGRATED PETROLEUM — 17.1% |
|||||
| Amerada Hess Corp. |
35,500 | 2,924,490 | |||
| Baker Hughes, Inc.(a) |
125,200 | 5,342,284 | |||
| BP PLC [ADR] (United Kingdom) |
103,400 | 6,038,560 | |||
| ChevronTexaco Corp. |
54,756 | 2,875,238 | |||
| ENI Co. SpA [ADR] (Italy)(a) |
27,000 | 3,397,680 | |||
| Exxon Mobil Corp. |
129,800 | 6,653,547 | |||
| Lukoil [ADR] (Russia) |
7,600 | 922,640 | |||
| Marathon Oil Corp. |
41,400 | 1,557,054 | |||
| Royal Dutch Petroleum Co. |
105,000 | 6,024,900 | |||
| Total Fina SA [ADR] (France) |
43,900 | 4,821,976 | |||
| 40,558,369 | |||||
| MACHINERY & EQUIPMENT — 5.1% |
|||||
| Bucyrus International, Inc. (Class “A” Stock) |
24,400 | 991,616 | |||
| Cooper Cameron Corp.*(a) |
59,800 | 3,217,838 | |||
| Deere & Co. |
51,200 | 3,809,280 | |||
| Grant Prideco, Inc.* |
67,300 | 1,349,365 | |||
| Hydril Co.* |
55,100 | 2,507,601 | |||
| Joy Global, Inc. |
7,800 | 338,754 | |||
| 12,214,454 | |||||
| METALS & MINING — 12.5% |
|||||
| Alcoa, Inc. |
62,384 | 1,960,105 | |||
| Arch Coal, Inc. |
92,500 | 3,287,450 | |||
| BHP Billiton Ltd. (Australia) |
494,800 | 5,949,996 | |||
| JSC MMC Norilsk Nickel [ADR] (Russia) |
23,700 | 1,315,350 | |||
| Newmont Mining Corp. |
160,526 | 7,128,960 | |||
| Rio Tinto PLC (United Kingdom) |
117,300 | 3,452,385 | |||
| Teck Cominco Ltd. (Class “B” Stock) (Canada)*(a) |
216,800 | 6,679,608 | |||
| 29,773,854 | |||||
| NON-FERROUS METALS — 0.7% |
|||||
| Phelps Dodge Corp.(a) |
16,100 | 1,592,612 | |||
| OIL & GAS — 10.1% |
|||||
| Bill Barrett Corp.* |
10,700 | 342,293 | |||
| Diamond Offshore Drilling, Inc.(a) |
129,500 | 5,186,475 | |||
| GlobalSantaFe Corp.(a) |
50,900 | 1,685,299 | |||
| Helmerich & Payne, Inc. |
11,700 | 398,268 | |||
| Nabors Industries Ltd.* |
20,000 | 1,025,800 | |||
| Petroleo Brasileiro SA [ADR] (Brazil) |
34,500 | 1,249,245 | |||
| Premcor, Inc. |
29,100 | 1,227,147 | |||
| Schlumberger Ltd. |
58,200 | 3,896,490 | |||
103
AST T. ROWE PRICE NATURAL RESOURCES PORTFOLIO
SCHEDULE OF INVESTMENTS (CONTINUED)
DECEMBER 31, 2004
| SHARES |
VALUE (NOTE 2) | ||||
| Statoil ASA (Norway) |
211,800 | $ | 3,322,134 | ||
| Tidewater, Inc.(a) |
21,600 | 769,176 | |||
| Transocean, Inc.* |
116,100 | 4,921,479 | |||
| 24,023,806 | |||||
| PAPER & FOREST PRODUCTS — 6.9% |
|||||
| Abitibi-Consolidated, Inc. (Canada)* |
162,100 | 1,121,732 | |||
| Bowater, Inc. |
52,300 | 2,299,631 | |||
| International Paper Co. |
94,800 | 3,981,600 | |||
| Kimberly-Clark Corp. |
35,200 | 2,316,512 | |||
| MeadWestvaco Corp. |
80,500 | 2,728,145 | |||
| Neenah Paper, Inc.* |
1,066 | 34,752 | |||
| Potlatch Corp.(a) |
37,100 | 1,876,518 | |||
| Weyerhaeuser Co. |
32,500 | 2,184,650 | |||
| 16,543,540 | |||||
| PETROLEUM EXPLORATION & PRODUCTION — 11.4% |
|||||
| Anadarko Petroleum Corp. |
23,400 | 1,516,554 | |||
| BG Group PLC (United Kingdom) |
261,800 | 1,779,311 | |||
| BJ Services Co. |
75,600 | 3,518,424 | |||
| Burlington Resources, Inc. |
73,600 | 3,201,600 | |||
| Canadian Natural Resources Ltd. (Canada) |
65,200 | 2,788,604 | |||
| ConocoPhillips |
57,139 | 4,961,379 | |||
| FMC Technologies, Inc.* |
34,000 | 1,094,800 | |||
| Noble Corp.*(a) |
47,500 | 2,362,650 | |||
| Pioneer Natural Resources Co. |
16,400 | 575,640 | |||
| Smith International, Inc.*(a) |
55,200 | 3,003,432 | |||
| Ultra Petroleum Corp.* |
6,900 | 332,097 | |||
| Unocal Corp. |
38,900 | 1,682,036 | |||
| XTO Energy, Inc. |
9,457 | 334,589 | |||
| 27,151,116 | |||||
| PRECIOUS METALS — 2.1% |
|||||
| Impala Platinum Holdings, Ltd. (South Africa) |
10,200 | 867,238 | |||
| Meridian Gold, Inc.* |
108,600 | 2,060,142 | |||
| Placer Dome, Inc. (Canada) |
107,400 | 2,025,564 | |||
| 4,952,944 | |||||
| RAILROADS — 0.8% |
|||||
| Burlington Northern Santa Fe Corp. |
27,700 | 1,310,487 | |||
| Union Pacific Corp. |
9,800 | 659,050 | |||
| 1,969,537 | |||||
| TOTAL LONG-TERM INVESTMENTS |
229,948,129 | ||||
| PRINCIPAL AMOUNT (000) |
VALUE (NOTE 2) | |||||
| SHORT-TERM INVESTMENTS — 18.0% |
||||||
| CERTIFICATE OF DEPOSIT — 1.5% |
||||||
| Banco Santander PR |
||||||
| 2.315%, 01/07/05(b)(c) |
$ | 623 | $ | 622,756 | ||
| CS First Boston Corp. |
||||||
| 2.36%, 01/24/05(b) |
2,295 | 2,294,519 | ||||
| Skandinaviska Enskilda Banken |
||||||
| 2.35%, 01/28/05(b) |
591 | 590,972 | ||||
| 3,508,247 | ||||||
| COMMERCIAL PAPER — 2.7% |
||||||
| Citigroup Inc. |
||||||
| 2.304%, 01/10/05(b) |
4,427 | 4,418,019 | ||||
| Wal-Mart Funding Corp. 2.37%, 01/20/05 144A (cost $1,997,498; purchased 12/21/04)(g)(h) |
2,000 | 1,997,498 | ||||
| 6,415,517 | ||||||
| CORPORATE OBLIGATIONS — 4.5% |
||||||
| Goldman Sachs Group, Inc. |
||||||
| 2.33%, 01/03/05(b)(c) |
2,951 | 2,950,872 | ||||
| Merrill Lynch & Co., Inc. |
||||||
| 2.38%, 01/03/05(b)(c) |
1,599 | 1,598,859 | ||||
| Morgan Stanley |
||||||
| 2.33%, 01/03/05(b)(c) |
1,880 | 1,879,931 | ||||
| Natexis Banque NY |
||||||
| 2.297%, 01/03/05(b)(c) |
2,081 | 2,080,495 | ||||
| Sedna Finance Corporation |
||||||
| 2.372%, 01/14/05(b)(c) |
1,549 | 1,549,171 | ||||
| Swedbank NY |
||||||
| 2.362%, 01/18/05(b)(c) |
730 | 730,223 | ||||
| 10,789,551 | ||||||
| TIME DEPOSIT — 0.7% |
||||||
| Bank of America NA |
||||||
| 1.50%, 01/03/05(b) |
1,644 | 1,644,465 | ||||
| SHARES |
||||||
| NON-REGISTERED INVESTMENT COMPANY — 6.1% |
||||||
| BlackRock Institutional Money Market Trust(b)(j) |
14,642,379 | 14,642,378 | ||||
| REGISTERED INVESTMENT COMPANY — 2.5% |
||||||
| BlackRock Provident Institutional Funds TempCash Portfolio(j) |
5,911,459 | 5,911,459 | ||||
| TOTAL SHORT-TERM INVESTMENTS |
42,911,617 | |||||
| TOTAL INVESTMENTS — 114.6% |
272,859,746 | |||||
| LIABILITIES IN EXCESS OF OTHER |
||||||
| ASSETS — (14.6%) |
(34,770,449 | ) | ||||
| NET ASSETS — 100.0% |
$ | 238,089,297 | ||||
104
AST T. ROWE PRICE NATURAL RESOURCES PORTFOLIO
SCHEDULE OF INVESTMENTS (CONTINUED)
DECEMBER 31, 2004
THE FOLLOWING ABBREVIATIONS ARE USED THROUGHOUT THE SCHEDULE OF INVESTMENTS:
| 144A | Security was purchased pursuant to Rule 144A under the Securities Act of 1933 and may not be resold subject to that rule except to qualified institutional buyers. Unless otherwise noted 144A securities are deemed to be liquid. | |
| ADR | American Depository Receipt | |
| REIT | Real Estate Investment Trust |
THE FOLLOWING ANNOTATIONS ARE USED THROUGHOUT THE SCHEDULE OF INVESTMENTS:
| * | Non-income producing security. |
| (a) | All or a portion of securities on loan. Securities on loan have an aggregate market value of $34,032,616; cash collateral of $35,002,660 (included with liabilities) was received with which the portfolio purchased highly liquid short-term investments. |
| (b) | Represents security purchased with cash collateral for securities on loan. |
| (c) | Indicates a variable rate security. The maturity date presented for these instruments is the next date on which the rate of interest is adjusted. |
| (g) | Indicates a security that has been deemed illiquid. The aggregate cost of illiquid securities is $2,510,572. The aggregate value, $2,884,998, represents 1.21% of net assets. |
| (h) | Indicates a restricted security; the aggregate cost of the restricted securities is $1,997,498. The aggregate value, $1,997,498, is approximately 0.84% of net assets. |
| (j) | Security available to institutional investors only. |
The industry classification of long-term portfolio holdings, short-term investments and liabilities in excess of other assets shown as a percentage of net assets as of December 31, 2004 were as follows:
| Integrated Petroleum |
17.1 | % | |
| Metals & Mining |
12.5 | ||
| Petroleum Exploration & Production |
11.4 | ||
| Oil & Gas |
10.1 | ||
| Chemicals |
9.3 | ||
| Paper & Forest Products |
6.9 | ||
| Exploration & Production |
6.5 | ||
| Diversified Metals |
6.0 | ||
| Machinery & Equipment |
5.1 | ||
| Building & Real Estate |
3.7 | ||
| Precious Metals |
2.1 | ||
| Containers & Packaging |
1.7 | ||
| Energy Services |
1.6 | ||
| Railroads |
0.8 | ||
| Farming & Agriculture |
0.7 | ||
| Non-Ferrous Metals |
0.7 | ||
| Gas Transmission & Distribution |
0.4 | ||
| Short-Term Investments |
18.0 | ||
| 114.6 | |||
| Liabilities in excess of other assets |
(14.6 | ) | |
| 100.0 | % | ||
See Notes to Financial Statements.
105
AST ALLIANCE GROWTH PORTFOLIO
SCHEDULE OF INVESTMENTS
DECEMBER 31, 2004
| SHARES |
VALUE (NOTE 2) | ||||
| LONG-TERM INVESTMENTS — 100.2% |
|||||
| COMMON STOCK |
|||||
| BROADCASTING — 1.9% |
|||||
| Scripps, (E.W.) Co. (Class “A” Stock) |
101,900 | $ | 4,919,733 | ||
| COMPUTER HARDWARE — 7.0% |
|||||
| Apple Computer, Inc.* |
45,000 | 2,898,000 | |||
| Dell, Inc.* |
286,900 | 12,089,966 | |||
| Network Appliance, Inc.* |
89,800 | 2,983,156 | |||
| 17,971,122 | |||||
| COMPUTER SERVICES & SOFTWARE — 10.6% |
|||||
| Cisco Systems, Inc.* |
249,600 | 4,817,280 | |||
| Electronic Arts, Inc.* |
148,000 | 9,128,640 | |||
| EMC Corp.* |
34,400 | 511,528 | |||
| Microsoft Corp. |
258,900 | 6,915,219 | |||
| SAP AG [ADR] (Germany)(a) |
78,100 | 3,452,801 | |||
| Symantec Corp.* |
95,300 | 2,454,928 | |||
| 27,280,396 | |||||
| CONGLOMERATES — 1.3% |
|||||
| Tyco International Ltd. |
90,300 | 3,227,322 | |||
| CONSTRUCTION — 0.8% |
|||||
| Lennar Corp. (Class “A” Stock) |
16,000 | 906,880 | |||
| Pulte Corp. |
17,300 | 1,103,740 | |||
| 2,010,620 | |||||
| CONSUMER PRODUCTS & SERVICES — 3.5% |
|||||
| Avon Products, Inc. |
135,700 | 5,251,590 | |||
| Procter & Gamble Co. |
66,500 | 3,662,820 | |||
| 8,914,410 | |||||
| ELECTRONIC COMPONENTS & EQUIPMENT — 2.8% |
|||||
| General Electric Co. |
200,700 | 7,325,550 | |||
| ENTERTAINMENT & LEISURE — 3.4% |
|||||
| Carnival Corp.(a) |
105,200 | 6,062,676 | |||
| Time Warner, Inc.* |
142,000 | 2,760,480 | |||
| 8,823,156 | |||||
| FINANCIAL SERVICES — 10.3% |
|||||
| Citigroup, Inc. |
131,200 | 6,321,216 | |||
| Franklin Resources, Inc. |
54,200 | 3,775,030 | |||
| J.P. Morgan Chase & Co. |
116,000 | 4,525,160 | |||
| Legg Mason, Inc. |
9,900 | 725,274 | |||
| MBNA Corp. |
251,800 | 7,098,242 | |||
| Schwab, (Charles) Corp. |
339,700 | 4,062,812 | |||
| 26,507,734 | |||||
| HEALTHCARE SERVICES — 1.5% |
|||||
| UnitedHealth Group, Inc. |
44,000 | 3,873,320 | |||
| INSURANCE — 4.6% |
|||||
| AFLAC, Inc. |
73,900 | 2,944,176 | |||
| American International Group, Inc. |
110,100 | 7,230,267 | |||
| Wellpoint, Inc.* |
15,900 | 1,828,500 | |||
| 12,002,943 | |||||
| INTERNET SERVICES — 13.3% |
|||||
| eBay, Inc.* |
102,740 | 11,946,607 | |||
| Google, Inc. (Class “A” Stock)*(a) |
13,000 | 2,510,300 | |||
| Juniper Networks, Inc.*(a) |
275,000 | 7,477,250 | |||
| Yahoo!, Inc.*(a) |
336,500 | 12,679,320 | |||
| 34,613,477 | |||||
| MEDICAL SUPPLIES & EQUIPMENT — 11.2% |
|||||
| Alcon, Inc. (Switzerland) |
59,000 | 4,755,400 | |||
| Amgen, Inc.* |
128,800 | 8,262,520 | |||
| Boston Scientific Corp.* |
184,900 | 6,573,195 | |||
| St. Jude Medical, Inc.* |
158,800 | 6,658,484 | |||
| Zimmer Holdings, Inc.* |
33,400 | 2,676,008 | |||
| 28,925,607 | |||||
| OIL & GAS — 4.1% |
|||||
| Baker Hughes, Inc. |
56,500 | 2,410,855 | |||
| Halliburton Co.(a) |
93,000 | 3,649,320 | |||
| Nabors Industries Ltd.* |
89,000 | 4,564,810 | |||
| 10,624,985 | |||||
| PHARMACEUTICALS — 3.2% |
|||||
| Gilead Sciences, Inc.* |
29,100 | 1,018,209 | |||
| Pfizer, Inc. |
92,100 | 2,476,569 | |||
| Teva Pharmaceutical Industries Ltd. [ADR] (Israel)(a) |
156,000 | 4,658,160 | |||
| 8,152,938 | |||||
| RESTAURANTS — 0.5% |
|||||
| Starbucks Corp.*(a) |
22,500 | 1,403,100 | |||
| RETAIL & MERCHANDISING — 6.1% |
|||||
| Lowe’s Cos., Inc. |
154,500 | 8,897,655 | |||
| Target Corp. |
110,000 | 5,712,300 | |||
| Whole Foods Market, Inc.(a) |
12,100 | 1,153,735 | |||
| 15,763,690 | |||||
| SEMICONDUCTORS — 6.0% |
|||||
| Altera Corp.* |
59,700 | 1,235,790 | |||
| Broadcom Corp. (Class “A” Stock)* |
138,500 | 4,470,780 | |||
| Marvell Technology Group Ltd.* |
149,700 | 5,309,859 | |||
| Taiwan Semiconductor Manufacturing Co. Ltd. [ADR] (Taiwan) |
512,100 | 4,347,729 | |||
| 15,364,158 | |||||
106
AST ALLIANCE GROWTH PORTFOLIO
SCHEDULE OF INVESTMENTS (CONTINUED)
DECEMBER 31, 2004
| SHARES |
VALUE (NOTE 2) | ||||
| TELECOMMUNICATIONS — 7.3% |
|||||
| Corning, Inc.* |
705,100 | $ | 8,299,027 | ||
| Qualcomm, Inc. |
212,200 | 8,997,280 | |||
| Research in Motion Ltd. (Canada)*(a) |
19,500 | 1,607,190 | |||
| 18,903,497 | |||||
| TRANSPORTATION — 0.8% |
|||||
| United Parcel Service, Inc. (Class “B” Stock) |
24,700 | 2,110,862 | |||
| TOTAL LONG-TERM INVESTMENTS |
258,718,620 | ||||
| PRINCIPAL AMOUNT (000) |
|||||
| SHORT-TERM INVESTMENTS — 13.1% |
|||||
| CERTIFICATES OF DEPOSIT — 0.7% |
|||||
| Canadian Imperial Bank of Commerce |
|||||
| 1.72%, 05/25/05(b) |
$ | 1,259 | 1,258,628 | ||
| First Boston Corp. |
|||||
| 2.36%, 01/24/05(b) |
445 | 444,813 | |||
| 1,703,441 | |||||
| COMMERCIAL PAPER — 2.6% |
|||||
| Citigroup Inc. |
|||||
| 2.304%, 01/10/05(b) |
6,096 | 6,083,954 | |||
| Ticonderoga Funding, LLC |
|||||
| 2.35%, 01/14/05(b) |
562 | 560,885 | |||
| 6,644,839 | |||||
| CORPORATE OBLIGATIONS — 5.4% |
|||||
| Bank of America NA |
|||||
| 2.30%, 01/03/05(b)(c) |
499 | 499,456 | |||
| Goldman Sachs Group, Inc. |
|||||
| 2.33%, 01/03/05(b)(c) |
5,959 | 5,958,850 | |||
| Morgan Stanley |
|||||
| 2.33%, 01/03/05(b)(c) |
5,690 | 5,690,289 | |||
| Natexis Banque NY |
|||||
| 2.297%, 01/03/05(b)(c) |
1,233 | 1,233,290 | |||
| Sedna Finance Corporation |
|||||
| 2.372%, 01/14/05(b)(c) |
312 | 311,803 | |||
| Swedbank NY |
|||||
| 2.362%, 01/18/05(b)(c) |
420 | 420,124 | |||
| 14,113,812 | |||||
| PRINCIPAL AMOUNT (000) |
VALUE (NOTE 2) | |||||
| TIME DEPOSIT — 0.7% |
||||||
| Bank of America NA |
||||||
| 1.50%, 01/03/05(b) |
$ | 1,719 | $ | 1,718,934 | ||
| SHARES |
||||||
| NON-REGISTERED INVESTMENT COMPANY — 3.7% |
||||||
| BlackRock Institutional Money Market Trust(b)(j) |
9,564,670 | 9,564,670 | ||||
| REGISTERED INVESTMENT COMPANIES |
||||||
| BlackRock Provident Institutional Funds TempCash Portfolio(j) |
7,475 | 7,475 | ||||
| BlackRock Provident Institutional Funds TempFund Portfolio(j) |
7,476 | 7,476 | ||||
| 14,951 | ||||||
| TOTAL SHORT-TERM INVESTMENTS |
33,760,647 | |||||
| TOTAL INVESTMENTS — 113.3% |
292,479,267 | |||||
| LIABILITIES IN EXCESS OF OTHER |
||||||
| ASSETS — (13.3%) |
(34,343,890 | ) | ||||
| NET ASSETS — 100.0% |
$ | 258,135,377 | ||||
107
AST ALLIANCE GROWTH PORTFOLIO
SCHEDULE OF INVESTMENTS (CONTINUED)
DECEMBER 31, 2004
THE FOLLOWING ABBREVIATION IS USED THROUGHOUT THE SCHEDULE OF INVESTMENTS:
| ADR | American Depository Receipt |
THE FOLLOWING ANNOTATIONS ARE USED THROUGHOUT THE SCHEDULE OF INVESTMENTS:
| * | Non-income producing security. |
| (a) | All or a portion of securities on loan. Securities on loan have an aggregate market value of $32,523,825; cash collateral of $33,745,696 (included with liabilities) was received with which the portfolio purchased highly liquid short-term investments. |
| (b) | Represents security purchased with cash collateral for securities on loan. |
| (c) | Indicates a variable rate security. The maturity date presented for these instruments is the next date on which the rate of interest is adjusted. |
| (j) | Security available to institutional investors only. |
The industry classification of long-term portfolio holdings, short-term investments and liabilities in excess of other assets shown as a percentage of net assets as of December 31, 2004 were as follows:
| Internet Services |
13.3 | % | |
| Medical Supplies & Equipment |
11.2 | ||
| Computer Services & Software |
10.6 | ||
| Financial Services |
10.3 | ||
| Telecommunications |
7.3 | ||
| Computer Hardware |
7.0 | ||
| Retail & Merchandising |
6.1 | ||
| Semiconductors |
6.0 | ||
| Insurance |
4.6 | ||
| Oil & Gas |
4.1 | ||
| Consumer Products & Services |
3.5 | ||
| Entertainment & Leisure |
3.4 | ||
| Pharmaceuticals |
3.2 | ||
| Electronic Components & Equipment |
2.8 | ||
| Broadcasting |
1.9 | ||
| Healthcare Services |
1.5 | ||
| Conglomerates |
1.3 | ||
| Construction |
0.8 | ||
| Transportation |
0.8 | ||
| Restaurants |
0.5 | ||
| Short-Term Investments |
13.1 | ||
| 113.3 | |||
| Liabilities in excess of other assets |
(13.3 | ) | |
| 100.0 | % | ||
See Notes to Financial Statements.
108
AST MFS GROWTH PORTFOLIO
SCHEDULE OF INVESTMENTS
DECEMBER 31, 2004
| SHARES |
VALUE (NOTE 2) | ||||
| LONG-TERM INVESTMENTS — 103.0% |
|||||
| COMMON STOCK |
|||||
| ADVERTISING — 0.3% |
|||||
| Omnicom Group, Inc. |
18,100 | $ | 1,526,192 | ||
| AEROSPACE — 0.3% |
|||||
| Northrop Grumman Corp. |
25,640 | 1,393,790 | |||
| BEVERAGES — 1.6% |
|||||
| PepsiCo, Inc. |
163,240 | 8,521,128 | |||
| BIOTECHNOLOGY — 5.3% |
|||||
| Amgen, Inc. |
157,510 | 10,104,267 | |||
| Celgene Corp.*(a) |
108,620 | 2,881,689 | |||
| Genzyme Corp.* |
198,830 | 11,546,058 | |||
| ImClone Systems, Inc. |
86,840 | 4,001,587 | |||
| 28,533,601 | |||||
| BROADCASTING — 1.3% |
|||||
| Grupo Televisa SA [ADR] (Brazil) |
84,220 | 5,095,310 | |||
| News Corp Inc. (Class “A” Stock) |
61,100 | 1,140,126 | |||
| Univision Communications, Inc. (Class “A” Stock)* |
31,570 | 924,054 | |||
| 7,159,490 | |||||
| BUSINESS SERVICES — 2.0% |
|||||
| Accenture Ltd. (Class “A” Stock)* |
290,900 | 7,854,300 | |||
| Fiserv, Inc.* |
65,040 | 2,613,958 | |||
| 10,468,258 | |||||
| CABLE TELEVISION — 1.3% |
|||||
| Comcast Corp. (Class “A” Stock)* |
214,592 | 7,141,622 | |||
| CHEMICALS — 0.5% |
|||||
| Dow Chemical Co. |
57,900 | 2,866,629 | |||
| CLOTHING & APPAREL — 1.1% |
|||||
| NIKE, Inc. (Class “B” Stock) |
62,200 | 5,640,918 | |||
| COMPUTER HARDWARE — 4.1% |
|||||
| Dell, Inc.* |
409,020 | 17,236,102 | |||
| International Business Machines Corp. |
49,320 | 4,861,966 | |||
| 22,098,068 | |||||
| COMPUTER SERVICES & SOFTWARE — 13.4% |
|||||
| Cerner Corp.*(a) |
31,800 | 1,690,806 | |||
| Cisco Systems, Inc.* |
708,480 | 13,673,663 | |||
| Electronic Arts, Inc.* |
151,070 | 9,317,998 | |||
| EMC Corp.* |
738,930 | 10,987,889 | |||
| Mercury Interactive Corp.*(a) |
176,180 | 8,024,999 | |||
| Microsoft Corp. |
423,330 | 11,307,144 | |||
| Oracle Corp.* |
726,660 | 9,969,775 | |||
| Symantec Corp.* |
170,990 | 4,404,702 | |||
| Veritas Software Corp.* |
71,181 | 2,032,218 | |||
| 71,409,194 | |||||
| CONGLOMERATES — 4.1% |
|||||
| 3M Co. |
71,010 | 5,827,791 | |||
| General Electric Co. |
47,750 | 1,742,875 | |||
| Tyco International Ltd. |
405,480 | 14,491,855 | |||
| 22,062,521 | |||||
| CONSUMER PRODUCTS & SERVICES — 4.1% |
|||||
| Avon Products, Inc. |
42,590 | 1,648,233 | |||
| Gillette Co. |
63,970 | 2,864,577 | |||
| Procter & Gamble Co. |
235,660 | 12,980,153 | |||
| Reckitt Benckiser PLC (United Kingdom) |
148,070 | 4,474,565 | |||
| 21,967,528 | |||||
| ELECTRONIC COMPONENTS & EQUIPMENT — 0.3% |
|||||
| Nintendo Co. Ltd. (Japan) |
12,200 | 1,532,292 | |||
| ENTERTAINMENT & LEISURE — 5.0% |
|||||
| Carnival Corp.(a) |
170,860 | 9,846,662 | |||
| Disney, (Walt) Co. |
207,340 | 5,764,052 | |||
| Harley-Davidson, Inc.(a) |
143,050 | 8,690,288 | |||
| Time Warner, Inc.* |
117,480 | 2,283,811 | |||
| 26,584,813 | |||||
| FARMING & AGRICULTURE — 1.6% |
|||||
| Monsanto Co. |
158,300 | 8,793,565 | |||
| FINANCIAL SERVICES — 5.7% |
|||||
| American Express Co.(a) |
142,119 | 8,011,248 | |||
| Countrywide Financial Corp.(a) |
82,050 | 3,036,671 | |||
| Goldman Sachs Group, Inc. |
72,240 | 7,515,850 | |||
| Legg Mason, Inc. |
31,340 | 2,295,968 | |||
| SLM Corp.(a) |
183,760 | 9,810,946 | |||
| 30,670,683 | |||||
| FOOD — 0.8% |
|||||
| SYSCO Corp. |
109,190 | 4,167,782 | |||
| HEALTHCARE SERVICES — 2.9% |
|||||
| Caremark Rx, Inc.* |
189,080 | 7,455,424 | |||
| HCA, Inc.(a) |
21,660 | 865,534 | |||
| WellPoint, Inc.* |
62,740 | 7,215,100 | |||
| 15,536,058 | |||||
| HOTELS & MOTELS — 0.4% |
|||||
| Starwood Hotels & Resorts Worldwide, Inc. |
35,740 | 2,087,216 | |||
| INSURANCE — 1.9% |
|||||
| AFLAC, Inc. |
98,700 | 3,932,208 | |||
| American International Group, Inc. |
90,050 | 5,913,584 | |||
| 9,845,792 | |||||
| INTERNET SERVICES — 3.8% |
|||||
| Check Point Software Technologies Ltd. (Israel)* |
125,630 | 3,094,267 | |||
| eBay, Inc.*(a) |
85,650 | 9,959,382 | |||
109
AST MFS GROWTH PORTFOLIO
SCHEDULE OF INVESTMENTS (CONTINUED)
DECEMBER 31, 2004
| SHARES |
VALUE (NOTE 2) | |||||
| Google, Inc. (Class “A” Stock)*(a) |
15,640 | $ | 3,020,084 | |||
| Yahoo!, Inc.*(a) |
116,920 | 4,405,546 | ||||
| 20,479,279 | ||||||
| MACHINERY & EQUIPMENT — 2.3% |
||||||
| Caterpillar, Inc. |
69,260 | 6,753,543 | ||||
| Danaher Corp. |
48,330 | 2,774,625 | ||||
| Grainger (W.W.), Inc. |
44,170 | 2,942,605 | ||||
| 12,470,773 | ||||||
| MEDICAL SUPPLIES & EQUIPMENT — 5.7% |
||||||
| Boston Scientific Corp.* |
56,710 | 2,016,041 | ||||
| Fisher Scientific International, Inc.*(a) |
127,740 | 7,968,421 | ||||
| Guidant Corp. |
45,960 | 3,313,716 | ||||
| Kinetic Concepts, Inc.* |
20,970 | 1,600,011 | ||||
| Medtronic, Inc. |
154,360 | 7,667,061 | ||||
| Waters Corp.* |
45,490 | 2,128,477 | ||||
| Zimmer Holdings, Inc.* |
68,760 | 5,509,051 | ||||
| 30,202,778 | ||||||
| OIL & GAS — 2.1% |
||||||
| BJ Services Co. |
87,120 | 4,054,565 | ||||
| Halliburton Co.(a) |
183,430 | 7,197,793 | ||||
| 11,252,358 | ||||||
| CONSUMER SERVICES — 1.0% |
||||||
| Apollo Group, Inc. (Class “A” Stock)*(a) |
46,820 | 3,778,842 | ||||
| Career Education Corp.*(a) |
34,350 | 1,374,000 | ||||
| 5,152,842 | ||||||
| PHARMACEUTICALS — 10.5% |
||||||
| Abbott Laboratories |
207,540 | 9,681,741 | ||||
| Allergan, Inc. |
14,310 | 1,160,112 | ||||
| Johnson & Johnson |
350,868 | 22,252,048 | ||||
| Lilly, (Eli) & Co. |
112,860 | 6,404,805 | ||||
| Roche Holding AG (Switzerland) |
39,470 | 4,543,684 | ||||
| Wyeth |
278,060 | 11,842,575 | ||||
| 55,884,965 | ||||||
| PRINTING & PUBLISHING — 1.1% |
||||||
| McGraw-Hill Cos., Inc. |
65,560 | 6,001,362 | ||||
| RAILROADS — 0.4% |
||||||
| Burlington Northern Santa Fe Corp. |
48,580 | 2,298,320 | ||||
| RESTAURANTS — 0.6% |
||||||
| Yum! Brands, Inc. |
62,920 | 2,968,566 | ||||
| RETAIL & MERCHANDISING — 9.5% |
||||||
| Abercrombie & Fitch Co. |
50,960 | 2,392,572 | ||||
| Bed Bath & Beyond, Inc.* |
42,600 | 1,696,758 | ||||
| Best Buy Co., Inc. |
118,500 | 7,041,270 | ||||
| CVS Corp. |
162,960 | 7,344,607 | ||||
| Kohl’s Corp.*(a) |
22,050 | 1,084,199 | ||||
| Lowe’s Cos., Inc. |
146,690 | 8,447,877 | ||||
| Penney, (J.C.) Co., Inc. |
35,820 | 1,482,948 | ||||
| PETsMART, Inc. |
24,070 | 855,207 | ||||
| Staples, Inc. |
108,220 | 3,648,096 | ||||
| Target Corp. |
243,040 | 12,621,067 | ||||
| Tiffany & Co. |
43,060 | 1,376,628 | ||||
| TJX Cos., Inc. |
114,230 | 2,870,600 | ||||
| 50,861,829 | ||||||
| SEMICONDUCTORS — 3.5% |
||||||
| Analog Devices, Inc. |
78,160 | 2,885,667 | ||||
| KLA-Tencor Corp.* |
59,830 | 2,786,881 | ||||
| Marvell Technology Group Ltd.* |
65,660 | 2,328,960 | ||||
| Maxim Integrated Products, Inc.(a) |
66,240 | 2,807,914 | ||||
| Taiwan Semiconductor |
||||||
| Manufacturing Co. Ltd. [ADR] (Taiwan) |
407,280 | 3,457,807 | ||||
| Texas Instruments, Inc.(a) |
67,180 | 1,653,972 | ||||
| Xilinx, Inc. |
99,090 | 2,938,019 | ||||
| 18,859,220 | ||||||
| TELECOMMUNICATIONS — 3.2% |
||||||
| Amdocs Ltd.* |
170,820 | 4,484,025 | ||||
| America Movil SA de CV (Class “L” Stock) [ADR] (Mexico) |
87,180 | 4,563,873 | ||||
| Corning, Inc.* |
73,380 | 863,683 | ||||
| QUALCOMM, Inc. |
45,260 | 1,919,024 | ||||
| Research in Motion Ltd. (Canada)*(a) |
25,500 | 2,101,710 | ||||
| Vodafone Group PLC (United Kingdom) |
1,243,170 | 3,371,304 | ||||
| 17,303,619 | ||||||
| TRANSPORTATION — 1.3% |
||||||
| United Parcel Service, Inc. (Class “B” Stock) |
82,920 | 7,086,343 | ||||
| TOTAL LONG TERM INVESTMENTS |
550,829,394 | |||||
| PRINCIPAL AMOUNT (000) |
||||||
| SHORT-TERM INVESTMENTS — 12.2% |
||||||
| CERTIFICATES OF DEPOSIT — 1.6% |
||||||
| First Boston Corp. 2.36%, |
||||||
| 01/24/05(b) |
$ | 6,745 | 6,745,279 | |||
| Skandinaviska Enskilda Banken |
||||||
| 2.35%, 01/28/05(b) |
476 | 475,873 | ||||
| Societe Generale 2.357%, |
||||||
| 01/14/05(b) |
1,385 | 1,384,281 | ||||
| 8,605,433 | ||||||
110
AST MFS GROWTH PORTFOLIO
SCHEDULE OF INVESTMENTS (CONTINUED)
DECEMBER 31, 2004
| PRINCIPAL AMOUNT (000) |
VALUE (NOTE 2) |
||||||
| COMMERCIAL PAPER — 0.7% |
|||||||
| Citigroup Inc. |
|||||||
| 2.304%, 01/10/05(b) |
$ | 3,411 | $ | 3,403,843 | |||
| Ticonderoga Funding, LLC |
|||||||
| 2.35%, 01/14/05(b) |
175 | 174,967 | |||||
| 3,578,810 | |||||||
| CORPORATE OBLIGATIONS — 5.0% |
|||||||
| Goldman Sachs Group, Inc. |
|||||||
| 2.33%, 01/03/05(b)(c) |
6,512 | 6,511,717 | |||||
| Merrill Lynch & Co., Inc. |
|||||||
| 2.38%, 01/03/05(b)(c) |
1,538 | 1,538,199 | |||||
| Morgan Stanley |
|||||||
| 2.33%, 01/03/05(b)(c) |
2,979 | 2,979,450 | |||||
| Natexis Banque NY |
|||||||
| 2.297%, 01/03/05(b)(c) |
9,019 | 9,017,718 | |||||
| Sedna Finance Corp. |
|||||||
| 2.372%, 01/14/05(b)(c) |
1,039 | 1,039,014 | |||||
| Swedbank NY |
|||||||
| 2.362%, 01/18/05(b)(c) |
6,239 | 6,237,826 | |||||
| 27,323,924 | |||||||
| TIME DEPOSIT — 0.5% |
|||||||
| Bank of America NA |
|||||||
| 1.50%, 01/03/05(b) |
2,519 | 2,518,730 | |||||
| U.S. GOVERNMENT AGENCY OBLIGATIONS — 2.6% |
|||||||
| Federal National Mortgage Assoc. |
|||||||
| 1.25% |
13,666 | 13,665,051 | |||||
| SHARES |
|||||||
| NON-REGISTERED INVESTMENT COMPANY — 1.8% |
|||||||
| BlackRock Institutional Money Market Trust(b)(j) |
9,733,259 | 9,733,259 | |||||
| REGISTERED INVESTMENT COMPANIES |
|||||||
| BlackRock Provident Institutional Funds TempCash Portfolio(j) |
34,885 | 34,885 | |||||
| BlackRock Provident Institutional Funds TempFund Portfolio(j) |
34,884 | 34,884 | |||||
| 69,769 | |||||||
| TOTAL SHORT-TERM INVESTMENTS |
65,494,976 | ||||||
| TOTAL INVESTMENTS — 115.2% |
616,324,370 | ||||||
| LIABILITIES IN EXCESS OF OTHER ASSETS — (15.2%) |
(81,400,174 | ) | |||||
| NET ASSETS — 100.0% |
$ | 534,924,196 | |||||
THE FOLLOWING ABBREVIATION IS USED THROUGHOUT THE SCHEDULE OF INVESTMENTS:
| ADR | American Depository Receipt |
THE FOLLOWING ANNOTATIONS ARE USED THROUGHOUT THE SCHEDULE OF INVESTMENTS:
| * | Non-income producing security. |
| (a) | All or a portion of securities on loan. Securities on loan have an aggregate market value of $49,940,121; cash collateral of $51,760,156 (included with liabilities) was received with which the portfolio purchased highly liquid short-term investments. |
| (b) | Represents security purchased with cash collateral for securities on loan. |
| (c) | Indicates a variable rate security. The maturity date presented for these instruments is the next date on which the rate of interest is adjusted. |
| (j) | Security available to institutional investors only. |
111
AST MFS GROWTH PORTFOLIO
SCHEDULE OF INVESTMENTS (CONTINUED)
DECEMBER 31, 2004
Foreign currency exchange contracts outstanding at December 31, 2004:
The industry classification of long-term portfolio holdings, short-term investments and liabilities in excess of other assets shown as a percentage of net assets as of December 31, 2004 were as follows:
| Computer Services & Software |
13.4 | % | |
| Pharmaceuticals |
10.5 | ||
| Retail & Merchandising |
9.5 | ||
| Medical Supplies & Equipment |
5.7 | ||
| Financial Services |
5.7 | ||
| Biotechnology |
5.3 | ||
| Entertainment & Leisure |
5.0 | ||
| Consumer Products & Services |
4.1 | ||
| Computer Hardware |
4.1 | ||
| Conglomerates |
4.1 | ||
| Internet Services |
3.8 | ||
| Semiconductors |
3.5 | ||
| Telecommunications |
3.2 | ||
| Healthcare Services |
2.9 | ||
| Machinery & Equipment |
2.3 | ||
| Oil & Gas |
2.1 | ||
| Business Services |
2.0 | ||
| Insurance |
1.9 | ||
| Beverages |
1.6 | ||
| Farming & Agriculture |
1.6 | ||
| Broadcasting |
1.3 | ||
| Cable Television |
1.3 | ||
| Transportation |
1.3 | ||
| Clothing & Apparel |
1.1 | ||
| Printing & Publishing |
1.1 | ||
| Consumer Services |
1.0 | ||
| Food |
0.8 | ||
| Restaurants |
0.6 | ||
| Chemicals |
0.5 | ||
| Hotels & Motels |
0.4 | ||
| Railroads |
0.4 | ||
| Advertising |
0.3 | ||
| Aerospace |
0.3 | ||
| Electronic Components & Equipment |
0.3 | ||
| Short-Term Investments |
12.2 | ||
| 115.2 | |||
| Liabilities in excess of other assets |
(15.2 | ) | |
| 100.0 | % | ||
See Notes to Financial Statements.
112
AST MARSICO CAPITAL GROWTH PORTFOLIO
SCHEDULE OF INVESTMENTS
DECEMBER 31, 2004
| SHARES |
VALUE (NOTE 2) | ||||
| LONG-TERM INVESTMENTS — 100.0% |
|||||
| COMMON STOCK |
|||||
| ADVERTISING — 0.7% |
|||||
| Getty Images, Inc.* |
219,584 | $ | 15,118,358 | ||
| AEROSPACE — 1.8% |
|||||
| General Dynamics Corp. |
279,666 | 29,253,063 | |||
| Lockheed Martin Corp. |
234,412 | 13,021,587 | |||
| 42,274,650 | |||||
| BEVERAGES — 0.7% |
|||||
| PepsiCo, Inc. |
301,496 | 15,738,091 | |||
| CLOTHING & APPAREL — 2.1% |
|||||
| NIKE, Inc. (Class “B” Stock) |
533,667 | 48,398,260 | |||
| COMPUTER HARDWARE — 3.0% |
|||||
| Dell, Inc.*(a) |
1,638,417 | 69,042,892 | |||
| COMPUTER SERVICES & SOFTWARE — 3.1% |
|||||
| Electronic Arts, Inc.*(a) |
1,003,301 | 61,883,606 | |||
| Microsoft Corp.(a) |
386,292 | 10,317,859 | |||
| 72,201,465 | |||||
| CONGLOMERATES — 1.9% |
|||||
| Tyco International Ltd.(a) |
1,244,914 | 44,493,226 | |||
| CONSTRUCTION — 3.6% |
|||||
| KB Home |
177,656 | 18,547,286 | |||
| Lennar Corp. (Class “A” Stock)(a) |
661,424 | 37,489,513 | |||
| Lennar Corp. (Class “B” Stock) |
36,910 | 1,927,071 | |||
| MDC Holdings, Inc. |
284,603 | 24,601,083 | |||
| 82,564,953 | |||||
| CONSUMER PRODUCTS & SERVICES — 2.4% |
|||||
| Procter & Gamble Co. |
1,015,180 | 55,916,114 | |||
| ELECTRONIC COMPONENTS & EQUIPMENT — 5.0% |
|||||
| General Electric Co. |
3,145,171 | 114,798,742 | |||
| ENTERTAINMENT & LEISURE — 5.9% |
|||||
| Brunswick Corp. |
95,088 | 4,706,856 | |||
| Harley-Davidson, Inc. |
152,047 | 9,236,855 | |||
| Royal Caribbean Cruises Ltd.(a) |
756,843 | 41,202,533 | |||
| Wynn Resorts Ltd.*(a) |
1,185,639 | 79,342,962 | |||
| 134,489,206 | |||||
| FARMING & AGRICULTURE — 0.5% |
|||||
| Monsanto Co.(a) |
223,701 | 12,426,591 | |||
| FINANCIAL — BANK & TRUST — 0.4% |
|||||
| UCBH Holdings, Inc. |
201,609 | 9,237,724 | |||
| FINANCIAL SERVICES — 16.1% |
|||||
| Chicago Mercantile Exchange Holding, Inc.(a) |
136,917 | 31,312,918 | |||
| Citigroup, Inc. |
1,689,164 | 81,383,922 | |||
| Countrywide Financial Corp. |
1,887,352 | 69,850,898 | |||
| Goldman Sachs Group, Inc.(a) |
350,690 | 36,485,788 | |||
| Merrill Lynch & Co., Inc. |
837,032 | 50,029,403 | |||
| SLM Corp.(a) |
1,836,451 | 98,048,118 | |||
| 367,111,047 | |||||
| HEALTHCARE SERVICES — 9.3% |
|||||
| PacifiCare Health Systems, Inc.* |
168,709 | 9,535,433 | |||
| Quest Diagnostics, Inc.(a) |
304,040 | 29,051,022 | |||
| UnitedHealth Group, Inc.(a) |
1,955,986 | 172,185,448 | |||
| 210,771,903 | |||||
| HOTELS & MOTELS — 2.5% |
|||||
| Four Seasons Hotels, Inc. (Canada)(a) |
545,714 | 44,633,948 | |||
| MGM Mirage, Inc.*(a) |
160,782 | 11,695,283 | |||
| 56,329,231 | |||||
| INSURANCE — 0.8% |
|||||
| Aetna, Inc. |
57,696 | 7,197,576 | |||
| Wellpoint Inc.* |
101,163 | 11,633,745 | |||
| 18,831,321 | |||||
| INTERNET SERVICES — 3.8% |
|||||
| eBay, Inc.*(a) |
759,818 | 88,351,637 | |||
| MACHINERY & EQUIPMENT — 3.1% |
|||||
| Caterpillar, Inc. |
732,537 | 71,429,683 | |||
| MEDICAL SUPPLIES & EQUIPMENT — 6.7% |
|||||
| Boston Scientific Corp.* |
753,124 | 26,773,558 | |||
| Medtronic, Inc. |
707,551 | 35,144,058 | |||
| St. Jude Medical, Inc.* |
1,062,542 | 44,552,386 | |||
| Wright Medical Group, Inc.* |
98,083 | 2,795,366 | |||
| Zimmer Holdings, Inc.* |
564,877 | 45,257,945 | |||
| 154,523,313 | |||||
| METALS & MINING — 0.1% |
|||||
| United States Steel Corp. |
52,638 | 2,697,698 | |||
| PHARMACEUTICALS — 6.7% |
|||||
| Cardinal Health, Inc. |
122,420 | 7,118,723 | |||
| Genentech, Inc.*(a) |
1,839,001 | 100,115,215 | |||
| Pfizer, Inc. |
1,750,235 | 47,063,819 | |||
| 154,297,757 | |||||
| RESTAURANTS — 2.1% |
|||||
| Starbucks Corp.*(a) |
386,908 | 24,127,583 | |||
| Yum! Brands, Inc. |
491,763 | 23,201,378 | |||
| 47,328,961 | |||||
| RETAIL & MERCHANDISING — 6.1% |
|||||
| Bed Bath & Beyond, Inc.* |
484,047 | 19,279,592 | |||
| CVS Corp.(a) |
434,143 | 19,566,825 | |||
| Lowe’s Cos., Inc. |
1,004,065 | 57,824,104 | |||
| Target Corp.(a) |
618,546 | 32,121,094 | |||
| Tiffany & Co. |
358,151 | 11,450,087 | |||
| 140,241,702 | |||||
113
AST MARSICO CAPITAL GROWTH PORTFOLIO
SCHEDULE OF INVESTMENTS (CONTINUED)
DECEMBER 31, 2004
| SHARES |
VALUE (NOTE 2) |
||||||
| SEMICONDUCTORS — 0.1% |
|||||||
| Freescale Semiconductor, Inc. (Class “B” Stock)* |
112,645 | $ | 2,068,162 | ||||
| TELECOMMUNICATIONS — 7.6% |
|||||||
| Motorola, Inc.(a) |
1,020,205 | 17,547,526 | |||||
| Qualcomm, Inc. |
2,617,138 | 110,966,651 | |||||
| Telefonaktiebolaget LM Ericsson [ADR] (Sweden)* |
673,963 | 21,223,095 | |||||
| Verizon Communications, Inc. |
614,028 | 24,874,274 | |||||
| 174,611,546 | |||||||
| TRANSPORTATION — 3.9% |
|||||||
| FedEx Corp. |
904,705 | 89,104,395 | |||||
| TOTAL LONG-TERM INVESTMENTS |
2,294,398,628 | ||||||
| PRINCIPAL AMOUNT (000) |
|||||||
| SHORT-TERM INVESTMENTS — 18.7% |
|||||||
| CERTIFICATES OF DEPOSIT — 3.6% |
|||||||
| Canadian Imperial Bank of Commerce |
|||||||
| 2.372%, 01/31/05(b)(c) |
$ | 2,061 | 2,060,380 | ||||
| First Boston Corp. |
|||||||
| 2.36%, 01/24/05(b) |
47,930 | 47,930,192 | |||||
| Societe Generale |
|||||||
| 2.357%, 01/14/05(b) |
24,711 | 24,701,978 | |||||
| UBS Bank |
|||||||
| 2.315%, 01/18/05(b) |
7,028 | 7,028,254 | |||||
| 81,720,804 | |||||||
| COMMERCIAL PAPER — 0.4% |
|||||||
| Ticonderoga Funding, LLC |
|||||||
| 2.35%, 01/14/05(b) |
9,058 | 9,043,715 | |||||
| CORPORATE OBLIGATIONS — 5.1% |
|||||||
| Bank of America NA |
|||||||
| 2.30%, 01/03/05(b)(c) |
25,281 | 25,281,338 | |||||
| Bear Stearns |
|||||||
| 2.28%, 01/03/05(b)(c) |
1,183 | 1,182,573 | |||||
| 2.28%, 01/03/05(b)(c) |
5,250 | 5,249,904 | |||||
| Goldman Sachs Group, Inc. |
|||||||
| 2.33%, 01/03/05(b)(c) |
274 | 274,147 | |||||
| Merrill Lynch & Co., Inc. |
|||||||
| 2.38%, 01/03/05(b)(c) |
25,812 | 25,811,598 | |||||
| Morgan Stanley |
|||||||
| 2.33%, 01/03/05(b)(c) |
16,614 | 16,613,950 | |||||
| 2.33%, 01/03/05(b)(c) |
2,405 | 2,404,968 | |||||
| Sedna Finance Corporation |
|||||||
| 2.372%, 01/14/05(b)(c) |
3,105 | 3,105,297 | |||||
| Swedbank NY |
|||||||
| 2.362%, 01/18/05(b)(c) |
39,226 | 39,219,741 | |||||
| 119,143,516 | |||||||
| TIME DEPOSIT — 0.6% |
|||||||
| Bank of America NA |
|||||||
| 1.50%, 01/03/05(b) |
14,626 | 14,625,832 | |||||
| SHARES |
|||||||
| NON-REGISTERED INVESTMENT COMPANY — 4.6% |
|||||||
| BlackRock Institutional Money Market Trust(b)(j) |
104,535,196 | 104,535,196 | |||||
| REGISTERED INVESTMENT COMPANIES — 4.4% |
|||||||
| BlackRock Provident Institutional Funds TempCash Portfolio(j) |
50,407,447 | 50,407,447 | |||||
| BlackRock Provident Institutional Funds TempFund Portfolio(j) |
50,407,446 | 50,407,446 | |||||
| 100,814,893 | |||||||
| TOTAL SHORT-TERM INVESTMENTS |
429,883,956 | ||||||
| TOTAL INVESTMENTS — 118.7% |
2,724,282,584 | ||||||
| LIABILITIES IN EXCESS OF OTHER ASSETS — (18.7%) |
(429,262,898 | ) | |||||
| NET ASSETS — 100.0% |
$ | 2,295,019,686 | |||||
THE FOLLOWING ABBREVIATIONS ARE USED THROUGHOUT THE SCHEDULE OF INVESTMENTS:
| ADR American | Depository Receipt |
THE FOLLOWING ANNOTATIONS ARE USED THROUGHOUT THE SCHEDULE OF INVESTMENTS:
| * | Non-income producing security. |
| (a) | All or a portion of securities on loan. Securities on loan have an aggregate market value of $318,667,131; cash collateral of $329,069,063 (included with liabilities) was received with which the portfolio purchased highly liquid short-term investments. |
| (b) | Represents security purchased with cash collateral for securities on loan. |
| (c) | Indicates a variable rate security. The maturity date presented for these instruments is the next date on which the rate of interest is adjusted. |
| (j) | Security available to institutional investors only. |
114
AST MARSICO CAPITAL GROWTH PORTFOLIO
SCHEDULE OF INVESTMENTS (CONTINUED)
DECEMBER 31, 2004
The industry classification of long-term portfolio holdings, short-term investments and liabilities in excess of other assets shown as a percentage of net assets as of December 31, 2004 were as follows:
| Financial Services |
16.1 | % | |
| Healthcare Services |
9.3 | ||
| Telecommunications |
7.6 | ||
| Medical Supplies & Equipment |
6.7 | ||
| Pharmaceuticals |
6.7 | ||
| Retail & Merchandising |
6.1 | ||
| Entertainment & Leisure |
5.9 | ||
| Electronic Components & Equipment |
5.0 | ||
| Transportation |
3.9 | ||
| Internet Services |
3.8 | ||
| Construction |
3.6 | ||
| Computer Services & Software |
3.1 | ||
| Machinery & Equipment |
3.1 | ||
| Computer Hardware |
3.0 | ||
| Hotels & Motels |
2.5 | ||
| Consumer Products & Services |
2.4 | ||
| Clothing & Apparel |
2.1 | ||
| Restaurants |
2.1 | ||
| Conglomerates |
1.9 | ||
| Aerospace |
1.8 | ||
| Insurance |
0.8 | ||
| Advertising |
0.7 | ||
| Beverages |
0.7 | ||
| Farming & Agriculture |
0.5 | ||
| Financial — Bank & Trust |
0.4 | ||
| Metals & Mining |
0.1 | ||
| Semiconductors |
0.1 | ||
| Short-Term Investments |
18.7 | ||
| 118.7 | |||
| Liabilities in excess of other assets |
(18.7 | ) | |
| 100.0 | % | ||
See Notes to Financial Statements.
115
AST GOLDMAN SACHS CONCENTRATED GROWTH PORTFOLIO
SCHEDULE OF INVESTMENTS
DECEMBER 31, 2004
| SHARES |
VALUE (NOTE 2) | ||||
| LONG-TERM INVESTMENTS — 99.3% |
|||||
| BEVERAGES — 3.5% |
|||||
| PepsiCo, Inc. |
648,100 | $ | 33,830,820 | ||
| BROADCASTING & CABLE/SATELLITE TV — 17.4% |
|||||
| Cablevision Systems New York Group (Class “A” Stock)*(a) |
1,387,124 | 34,539,388 | |||
| Clear Channel Communications, Inc.(a) |
991,500 | 33,205,335 | |||
| Comcast Corp. (Special Class “A” Stock)* |
618,040 | 20,296,434 | |||
| EchoStar Communications Corp. (Class “A” Stock)(a) |
537,955 | 17,881,624 | |||
| Entravision Communications Corp. (Class “A” Stock)* |
549,655 | 4,589,619 | |||
| Univision Communications, Inc. (Class “A” Stock)*(a) |
1,574,600 | 46,088,541 | |||
| Westwood One, Inc.* |
439,200 | 11,827,656 | |||
| 168,428,597 | |||||
| COMMERCIAL SERVICES — 4.9% |
|||||
| McGraw-Hill Cos., Inc. |
365,402 | 33,448,899 | |||
| Moody’s Corp.(a) |
158,598 | 13,774,236 | |||
| 47,223,135 | |||||
| COMPUTER HARDWARE — 2.6% |
|||||
| Dell, Inc.* |
609,000 | 25,663,260 | |||
| COMPUTER SERVICES — 4.2% |
|||||
| First Data Corp. |
839,480 | 35,711,479 | |||
| Sabre Holdings Corp. |
230,479 | 5,107,415 | |||
| 40,818,894 | |||||
| COMPUTER SOFTWARE — 4.5% |
|||||
| Electronic Arts, Inc.* |
12,000 | 740,160 | |||
| Microsoft Corp. |
1,611,894 | 43,053,689 | |||
| 43,793,849 | |||||
| DRUGS & MEDICINE — 3.4% |
|||||
| Pfizer, Inc. |
1,234,200 | 33,187,638 | |||
| ELECTRICAL EQUIPMENT — 0.7% |
|||||
| General Electric Co. |
55,200 | 2,014,800 | |||
| Tyco International Ltd. |
121,600 | 4,345,984 | |||
| 6,360,784 | |||||
| FINANCIALS — 11.9% |
|||||
| Fannie Mae |
481,626 | 34,296,587 | |||
| Freddie Mac |
585,080 | 43,120,396 | |||
| MBNA Corp. |
337,700 | 9,519,763 | |||
| Schwab, (Charles) Corp. |
2,375,700 | 28,413,372 | |||
| 115,350,118 | |||||
| FOODS — 1.8% |
|||||
| Wrigley, (Wm., Jr.) Co. |
254,756 | 17,626,568 | |||
| GAMING/LODGING — 6.3% |
|||||
| Carnival Corp.(a) |
56,300 | 3,244,569 | |||
| Harrah’s Entertainment, Inc.(a) |
660,690 | 44,193,554 | |||
| Starwood Hotels & Resorts Worldwide, Inc. |
227,433 | 13,282,087 | |||
| 60,720,210 | |||||
| HOUSEHOLD/PERSONAL CARE — 0.1% |
|||||
| Procter & Gamble Co. |
15,800 | 870,264 | |||
| INTERNET & ONLINE — 4.8% |
|||||
| eBay, Inc.*(a) |
157,120 | 18,269,914 | |||
| Google, Inc. (Class “A” Stock)*(a) |
76,900 | 14,849,390 | |||
| Yahoo!, Inc.*(a) |
360,800 | 13,594,944 | |||
| 46,714,248 | |||||
| MANUFACTURING — 0.1% |
|||||
| 3M Co. |
11,800 | 968,426 | |||
| MOVIES & ENTERTAINMENT — 8.0% |
|||||
| Time Warner, Inc.* |
1,131,724 | 22,000,715 | |||
| Viacom, Inc. (Class “B” Stock) |
1,524,800 | 55,487,472 | |||
| 77,488,187 | |||||
| NETWORKING/TELECOM EQUIPMENT — 2.2% |
|||||
| Cisco Systems, Inc.* |
1,103,900 | 21,305,270 | |||
| OTHER CONSUMER DISCRETIONARY — 5.2% |
|||||
| Cendant Corp. |
2,136,915 | 49,961,073 | |||
| OTHER HEALTHCARE — 2.9% |
|||||
| Caremark Rx, Inc.*(a) |
718,505 | 28,330,652 | |||
| PUBLISHING — 1.1% |
|||||
| Scripps, (E.W.) Co. (Class “A” Stock) |
220,208 | 10,631,642 | |||
| RETAILING — 5.7% |
|||||
| Family Dollar Stores, Inc. |
494,200 | 15,433,866 | |||
| Lowe’s Companies, Inc.(a) |
307,800 | 17,726,202 | |||
| Wal-Mart Stores, Inc. |
413,000 | 21,814,660 | |||
| 54,974,728 | |||||
| SEMICONDUCTORS/SEMI CAPITAL EQUIPMENT — 7.0% |
|||||
| Intel Corp. |
62,100 | 1,452,519 | |||
| Linear Technology Corp. |
258,600 | 10,023,336 | |||
| QUALCOMM, Inc.(a) |
1,334,400 | 56,578,560 | |||
| 68,054,415 | |||||
| TELECOMMUNICATIONS — 1.0% |
|||||
| Crown Castle International Corp.* |
588,230 | 9,788,147 | |||
| TOTAL LONG-TERM INVESTMENTS |
962,090,925 | ||||
116
AST GOLDMAN SACHS CONCENTRATED GROWTH PORTFOLIO
SCHEDULE OF INVESTMENTS (CONTINUED)
DECEMBER 31, 2004
| PRINCIPAL AMOUNT (000) |
VALUE (NOTE 2) |
||||||
| SHORT-TERM INVESTMENTS — 17.1% |
|||||||
| CERTIFICATES OF DEPOSIT — 2.4% |
|||||||
| Canadian Imperial Bank of Commerce |
|||||||
| 2.372%, 01/31/05(b)(c) |
$ | 2,838 | $ | 2,837,989 | |||
| First Boston Corp. |
|||||||
| 2.36%, 01/24/05(b) |
1,705 | 1,704,785 | |||||
| Fortis Bank NY |
|||||||
| 2.055%, 06/08/05(b) |
19,116 | 19,112,710 | |||||
| 23,655,484 | |||||||
| COMMERCIAL PAPER — 0.3% |
|||||||
| Citigroup Inc. |
|||||||
| 2.304%, 01/10/05(b) |
2,799 | 2,793,027 | |||||
| CORPORATE OBLIGATIONS — 8.5% |
|||||||
| Goldman Sachs Group, Inc. |
|||||||
| 2.33%, 01/03/05(b)(c) |
16,089 | 16,089,078 | |||||
| Merrill Lynch & Co., Inc. |
|||||||
| 2.38%, 01/03/05(b)(c) |
34,291 | 34,290,569 | |||||
| Morgan Stanley |
|||||||
| 2.33%, 01/03/05(b)(c) |
14,427 | 14,426,719 | |||||
| Natexis Banque NY |
|||||||
| 2.297%, 01/03/05(b)(c) |
9,165 | 9,163,988 | |||||
| Sedna Finance Corporation |
|||||||
| 2.372%, 01/14/05(b)(c) |
2,860 | 2,859,670 | |||||
| Swedbank NY |
|||||||
| 2.362%, 01/18/05(b)(c) |
5,727 | 5,725,632 | |||||
| 82,555,656 | |||||||
| TIME DEPOSIT — 0.6% |
|||||||
| Bank of America NA |
|||||||
| 1.50%, 01/03/05(b) |
5,535 | 5,535,099 | |||||
| SHARES |
|||||||
| NON-REGISTERED INVESTMENT COMPANY — 5.3% |
|||||||
| BlackRock Institutional Money Market Trust(b)(j) |
50,946,693 | 50,946,693 | |||||
| TOTAL SHORT-TERM INVESTMENTS |
165,485,959 | ||||||
| TOTAL INVESTMENTS — 116.4% |
1,127,576,884 | ||||||
| LIABILITIES IN EXCESS OF OTHER ASSETS — (16.4%) |
(158,799,191 | ) | |||||
| NET ASSETS — 100.0% |
$ | 968,777,693 | |||||
117
AST GOLDMAN SACHS CONCENTRATED GROWTH PORTFOLIO
SCHEDULE OF INVESTMENTS (CONTINUED)
DECEMBER 31, 2004
THE FOLLOWING ANNOTATIONS ARE USED THROUGHOUT THE SCHEDULE OF INVESTMENTS:
| * | Non-income producing security. |
| (a) | All or a portion of securities on loan. Securities on loan have an aggregate market value of $160,709,768; cash collateral of $165,485,959 (included with liabilities) was received with which the portfolio purchased highly liquid short-term investments. |
| (b) | Represents security purchased with cash collateral for securities on loan. |
| (c) | Indicates a variable rate security. The maturity date presented for these instruments is the next date on which the rate of interest is adjusted. |
| (j) | Security available to institutional investors only. |
The industry classification of long-term portfolio holdings, short-term investments and liabilities in excess of other assets shown as a percentage of net assets as of December 31, 2004 were as follows:
| Broadcasting & Cable/Satellite TV |
17.4 | % | |
| Financials |
11.9 | ||
| Movies & Entertainment |
8.0 | ||
| Semiconductors/Semi Capital Equipment |
7.0 | ||
| Gaming/Lodging |
6.3 | ||
| Retailing |
5.7 | ||
| Other Consumer Discretionary |
5.2 | ||
| Commercial Services |
4.9 | ||
| Internet & Online |
4.8 | ||
| Computer Software |
4.5 | ||
| Computer Services |
4.2 | ||
| Beverages |
3.5 | ||
| Drugs & Medicine |
3.4 | ||
| Other Healthcare |
2.9 | ||
| Computer Hardware |
2.6 | ||
| Networking/Telecom Equipment |
2.2 | ||
| Foods |
1.8 | ||
| Publishing |
1.1 | ||
| Telecommunications |
1.0 | ||
| Electrical Equipment |
0.7 | ||
| Household/Personal Care |
0.1 | ||
| Manufacturing |
0.1 | ||
| Short-Term Investments |
17.1 | ||
| 116.4 | |||
| Liabilities in excess of other assets |
(16.4 | ) | |
| 100.0 | % | ||
See Notes to Financial Statements.
118
AST DEAM LARGE-CAP VALUE PORTFOLIO
SCHEDULE OF INVESTMENTS
DECEMBER 31, 2004
| SHARES |
VALUE (NOTE 2) | ||||
| LONG TERM INVESTMENTS — 95.4% |
|||||
| COMMON STOCK |
|||||
| AEROSPACE — 2.4% |
|||||
| General Dynamics Corp. |
16,300 | $ | 1,704,980 | ||
| Raytheon Co. |
75,600 | 2,935,548 | |||
| 4,640,528 | |||||
| AUTOMOTIVE PARTS — 2.0% |
|||||
| American Axle & Manufacturing Holdings, Inc. |
67,400 | 2,066,484 | |||
| Autoliv, Inc. (Germany) |
38,600 | 1,864,380 | |||
| 3,930,864 | |||||
| BEVERAGES — 1.3% |
|||||
| Coors, (Adolph) Co. (Class “B” Stock)(a) |
30,300 | 2,292,801 | |||
| PepsiAmericas, Inc. |
6,300 | 133,812 | |||
| 2,426,613 | |||||
| CHEMICALS — 0.7% |
|||||
| Eastman Chemical Co. |
24,600 | 1,420,158 | |||
| CLOTHING & APPAREL — 1.1% |
|||||
| VF Corp. |
37,200 | 2,060,136 | |||
| COMPUTER HARDWARE — 2.0% |
|||||
| Hewlett-Packard Co. |
14,000 | 293,580 | |||
| Ingram Micro, Inc. (Class “A” Stock)* |
67,200 | 1,397,760 | |||
| International Business Machines Corp. |
21,600 | 2,129,328 | |||
| 3,820,668 | |||||
| COMPUTER SERVICES & SOFTWARE — 2.9% |
|||||
| Computer Sciences Corp.* |
37,400 | 2,108,238 | |||
| Oracle Corp.* |
24,800 | 340,256 | |||
| Sun Microsystems, Inc.* |
305,700 | 1,644,666 | |||
| Unisys Corp.* |
144,500 | 1,471,010 | |||
| 5,564,170 | |||||
| CONGLOMERATES — 2.3% |
|||||
| Altria Group, Inc. |
28,300 | 1,729,130 | |||
| Cendant Corp. |
115,600 | 2,702,728 | |||
| 4,431,858 | |||||
| CONSTRUCTION — 0.1% |
|||||
| Ryland Group, Inc. (The) |
3,200 | 184,128 | |||
| CONSUMER PRODUCTS & SERVICES — 1.4% |
|||||
| Clorox Co. |
10,800 | 636,444 | |||
| Loews Corp. — Carolina Group |
9,200 | 266,340 | |||
| UST, Inc. |
35,600 | 1,712,716 | |||
| 2,615,500 | |||||
| CONTAINERS & PACKAGING — 1.0% |
|||||
| Owens-Illinois, Inc.* |
81,500 | 1,845,975 | |||
| ELECTRONIC COMPONENTS & EQUIPMENT — 4.1% |
|||||
| Emerson Electric Co. |
9,200 | 644,920 | |||
| General Electric Co. |
199,500 | 7,281,750 | |||
| 7,926,670 | |||||
| ENTERTAINMENT & LEISURE — 4.4% |
|||||
| Brunswick Corp. |
9,800 | 485,100 | |||
| Disney, (Walt) Co. |
116,600 | 3,241,480 | |||
| Time Warner, Inc.* |
129,200 | 2,511,648 | |||
| Viacom, Inc. (Class “B” Stock) |
58,300 | 2,121,537 | |||
| 8,359,765 | |||||
| FARMING & AGRICULTURE — 1.4% |
|||||
| Monsanto Co. |
46,700 | 2,594,185 | |||
| FINANCIAL — BANK & TRUST — 11.6% |
|||||
| Associated Banc-Corp. |
5,600 | 185,976 | |||
| Bank of America Corp. |
167,500 | 7,870,825 | |||
| Golden West Financial Corp.(a) |
47,800 | 2,935,876 | |||
| National City Corp. |
105,400 | 3,957,770 | |||
| U.S. Bancorp(a) |
147,000 | 4,604,040 | |||
| UnionBanCal Corp. |
300 | 19,344 | |||
| Wachovia Corp. |
6,100 | 320,860 | |||
| Wells Fargo & Co. |
37,100 | 2,305,765 | |||
| 22,200,456 | |||||
| FINANCIAL SERVICES — 9.2% |
|||||
| Capital One Financial Corp. |
21,600 | 1,818,936 | |||
| CIT Group, Inc. |
17,100 | 783,522 | |||
| Citigroup, Inc. |
96,875 | 4,667,437 | |||
| Freddie Mac |
56,200 | 4,141,940 | |||
| Goldman Sachs Group, Inc. |
1,400 | 145,656 | |||
| JP Morgan Chase & Co. |
104,484 | 4,075,921 | |||
| Morgan Stanley Dean Witter & Co. |
28,900 | 1,604,528 | |||
| Providian Financial Corp.* |
23,200 | 382,104 | |||
| 17,620,044 | |||||
| FOOD — 1.1% |
|||||
| Tyson Foods, Inc. (Class “A” Stock)(a) |
118,100 | 2,173,040 | |||
| HEALTHCARE SERVICES — 0.8% |
|||||
| Caremark Rx, Inc.*(a) |
40,200 | 1,585,086 | |||
| INSURANCE — 5.7% |
|||||
| Alleghany Corp.* |
500 | 142,625 | |||
| Berkley, (W.R.) Corp. |
64,750 | 3,054,258 | |||
| Chubb Corp.(a) |
7,300 | 561,370 | |||
| Fidelity National Financial, Inc. |
17,200 | 785,524 | |||
| Loews Corp. |
44,100 | 3,100,230 | |||
| MetLife, Inc. |
73,500 | 2,977,485 | |||
| Progressive Corp. (The) |
2,700 | 229,068 | |||
| 10,850,560 | |||||
119
AST DEAM LARGE-CAP VALUE PORTFOLIO
SCHEDULE OF INVESTMENTS (CONTINUED)
DECEMBER 31, 2004
| SHARES |
VALUE (NOTE 2) | ||||
| MACHINERY & EQUIPMENT — 2.8% |
|||||
| Cummins, Inc. |
26,400 | $ | 2,212,056 | ||
| Eaton Corp. |
31,600 | 2,286,576 | |||
| Stanley Works(a) |
18,300 | 896,517 | |||
| 5,395,149 | |||||
| MEDICAL SUPPLIES & EQUIPMENT — 1.0% |
|||||
| AmerisourceBergen Corp. |
31,700 | 1,860,156 | |||
| METALS & MINING — 2.2% |
|||||
| Phelps Dodge Corp.(a) |
23,300 | 2,304,836 | |||
| United States Steel Corp.(a) |
37,200 | 1,906,500 | |||
| 4,211,336 | |||||
| OIL & GAS — 11.6% |
|||||
| Anadarko Petroleum Corp.(a) |
45,200 | 2,929,412 | |||
| Apache Corp. |
56,000 | 2,831,920 | |||
| Burlington Resources, Inc. |
69,700 | 3,031,950 | |||
| Chesapeake Energy Corp.(a) |
43,200 | 712,800 | |||
| ChevronTexaco Corp. |
5,300 | 278,303 | |||
| El Paso Corp. |
6,300 | 65,520 | |||
| Exxon Mobil Corp. |
127,200 | 6,520,272 | |||
| Newfield Exploration Co.* |
28,900 | 1,706,545 | |||
| Noble Energy, Inc.(a) |
44,600 | 2,750,036 | |||
| Pioneer Natural Resources Co. |
7,700 | 270,270 | |||
| Valero Energy Corp. |
25,000 | 1,135,000 | |||
| 22,232,028 | |||||
| PAPER & FOREST PRODUCTS — 1.1% |
|||||
| Louisiana-Pacific Corp.(a) |
63,800 | 1,706,012 | |||
| Rayonier, Inc. |
9,600 | 469,536 | |||
| 2,175,548 | |||||
| PHARMACEUTICALS — 1.6% |
|||||
| Bristol-Meyers Squibb Co.(a) |
84,400 | 2,162,328 | |||
| Merck & Co., Inc.(a) |
30,300 | 973,842 | |||
| 3,136,170 | |||||
| REAL ESTATE — 2.2% |
|||||
| Apartment Investment & Management Co. (Class “A” Stock) [REIT](a) |
9,800 | 377,692 | |||
| Avalonbay Communities, Inc. [REIT] |
5,300 | 399,090 | |||
| Boston Properties, Inc. [REIT] |
3,400 | 219,878 | |||
| Equity Office Properties Trust [REIT] |
23,800 | 693,056 | |||
| Equity Residential Properties Trust [REIT](a) |
17,900 | 647,622 | |||
| Federal Realty Investment Trust [REIT] |
2,100 | 108,465 | |||
| Kimco Realty Corp. [REIT] |
4,200 | 243,558 | |||
| Mills Corp. (The) [REIT](a) |
2,700 | 172,152 | |||
| Pan Pacific Retail Properties, Inc. [REIT] |
1,900 | 119,130 | |||
| Public Storage, Inc. [REIT] |
2,400 | 133,800 | |||
| Simon Property Group, Inc. [REIT](a) |
10,500 | 679,035 | |||
| Vornado Realty Trust [REIT](a) |
6,200 | 472,006 | |||
| 4,265,484 | |||||
| RESTAURANTS — 1.8% |
|||||
| McDonald’s Corp. |
107,200 | 3,436,832 | |||
| RETAIL & MERCHANDISING — 2.7% |
|||||
| BJ’s Wholesale Club, Inc.*(a) |
31,500 | 917,595 | |||
| Circuit City Stores, Inc. |
53,400 | 835,176 | |||
| Costco Wholesale Corp.(a) |
56,900 | 2,754,529 | |||
| Nordstrom, Inc. |
13,400 | 626,182 | |||
| SUPERVALU, Inc. |
3,400 | 117,368 | |||
| 5,250,850 | |||||
| SEMICONDUCTORS — 1.3% |
|||||
| Advanced Micro Devices, Inc.*(a) |
50,400 | 1,109,808 | |||
| Micron Technology, Inc.*(a) |
114,800 | 1,417,780 | |||
| 2,527,588 | |||||
| TELECOMMUNICATIONS — 4.9% |
|||||
| ALLTEL Corp. |
21,400 | 1,257,464 | |||
| SBC Communications, Inc.(a) |
19,700 | 507,669 | |||
| Sprint Corp. |
95,600 | 2,375,660 | |||
| Verizon Communications, Inc. |
130,800 | 5,298,708 | |||
| 9,439,501 | |||||
| TRANSPORTATION — 1.3% |
|||||
| FedEx Corp.(a) |
15,500 | 1,526,595 | |||
| Ryder System, Inc. |
21,500 | 1,027,055 | |||
| 2,553,650 | |||||
| UTILITIES — 5.4% |
|||||
| American Electric Power Co., Inc.(a) |
64,900 | 2,228,666 | |||
| Duke Energy Corp.(a) |
50,600 | 1,281,698 | |||
| Exelon Corp.(a) |
96,700 | 4,261,569 | |||
| PG&E Corp.* |
35,600 | 1,184,768 | |||
| PPL Corp. |
3,600 | 191,808 | |||
| Sempra Energy |
25,600 | 939,008 | |||
| Southern Co. (The) |
6,100 | 204,472 | |||
| 10,291,989 | |||||
| TOTAL COMMON STOCK |
183,026,685 | ||||
120
AST DEAM LARGE-CAP VALUE PORTFOLIO
SCHEDULE OF INVESTMENTS (CONTINUED)
DECEMBER 31, 2004
| MOODY'S RATING (UNAUDITED) |
PRINCIPAL AMOUNT (000) |
VALUE (NOTE 2) |
|||||||
| CORPORATE OBLIGATIONS RETAIL & MERCHANDISING |
|||||||||
| Ames Department Stores, Inc., Sr. Notes* |
|||||||||
| 10.00%, 04/15/06 (cost $13,156; purchased 11/17/00- 01/30/01)(g)(i) |
NR | $ | 40 | $ | 4 | ||||
| TOTAL LONG-TERM INVESTMENTS |
183,026,689 | ||||||||
| SHORT-TERM INVESTMENTS — 21.0% |
|||||||||
| CERTIFICATES OF DEPOSIT — 2.6% |
|||||||||
| Banco Santander PR |
|||||||||
| 2.315%, 01/07/05(b)(c) |
1,453 | $ | 1,452,899 | ||||||
| Canadian Imperial Bank of Commerce |
|||||||||
| 2.372%, 01/31/05(b)(c) |
151 | 151,359 | |||||||
| First Boston Corp. |
|||||||||
| 2.36%, 01/24/05(b) |
929 | 928,585 | |||||||
| Fortis Bank |
|||||||||
| 2.055%, 06/08/05(b) |
1,256 | 1,255,437 | |||||||
| Skandinaviska Enskilda Banken |
|||||||||
| 2.35%, 01/28/05(b) |
1,147 | 1,146,556 | |||||||
| 4,934,836 | |||||||||
| CORPORATE OBLIGATIONS — 11.0% |
|||||||||
| Bear Stearns |
|||||||||
| 2.28%, 01/03/05(b)(c) |
1,818 | 1,817,998 | |||||||
| 2.28%, 01/03/05(b)(c) |
4,763 | 4,763,489 | |||||||
| Goldman Sachs Group, Inc. |
|||||||||
| 2.33%, 01/03/05(b)(c) |
4,880 | 4,880,298 | |||||||
| Merrill Lynch & Co., Inc. |
|||||||||
| 2.38%, 01/03/05(b)(c) |
3,110 | 3,109,903 | |||||||
| Natexis Banque NY |
|||||||||
| 2.297%, 01/03/05(b)(c) |
6,391 | 6,390,104 | |||||||
| 20,961,792 | |||||||||
| TIME DEPOSIT — 0.8% |
|||||||||
| Bank of America NA |
|||||||||
| 1.50%, 01/03/05(b) |
1,623 | 1,622,540 | |||||||
| U.S. TREASURY OBLIGATIONS — 0.4% |
|||||||||
| U.S. Treasury Bills |
|||||||||
| 1.84%, 01/27/05(k) |
10 | 9,987 | |||||||
| 1.87%, 01/27/05(k) |
600 | 599,212 | |||||||
| 1.91%, 01/27/05(k) |
50 | 49,934 | |||||||
| 1.93%, 01/27/05(k) |
70 | 69,908 | |||||||
| 1.95%, 01/27/05(k) |
30 | 29,959 | |||||||
| 759,000 | |||||||||
| SHARES |
|||||||||
| NON-REGISTERED INVESTMENT COMPANY — 6.2% |
|||||||||
| BlackRock Institutional Money Market Trust(b)(j) |
11,941,271 | 11,941,271 | |||||||
| TOTAL SHORT-TERM INVESTMENTS |
40,219,439 | ||||||||
| TOTAL INVESTMENTS — 116.4% |
223,246,128 | ||||||||
| LIABILITIES IN EXCESS OF OTHER ASSETS — (16.4%) |
(31,381,162 | ) | |||||||
| NET ASSETS — 100.0% |
$ | 191,864,966 | |||||||
THE FOLLOWING ABBREVIATIONS ARE USED THROUGHOUT THE SCHEDULE OF INVESTMENTS:
| NR | Not Rated by Moody's or Standard & Poors. |
| REIT | Real Estate Investment Trust |
THE FOLLOWING ANNOTATIONS ARE USED THROUGHOUT THE SCHEDULE OF INVESTMENTS:
| * | Non-income producing security. |
| (a) | All or a portion of securities on loan. Securities on loan have an aggregate market value of $38,144,442; cash collateral of $39,460,439 (included with liabilities) was received with which the portfolio purchased highly liquid short-term investments. |
| (b) | Represents security purchased with cash collateral for securities on loan. |
| (c) | Indicates a variable rate security. The maturity date presented for these instruments is the next date on which the rate of interest is adjusted. |
| (g) | Indicates a security that has been deemed illiquid. The aggregate cost of the illiquid security is $13,156. The aggregate value, $4, represents 0.0% of net assets. |
| (i) | Represents issuer in default on interest payments, Non-income producing security. |
121
AST DEAM LARGE-CAP VALUE PORTFOLIO
SCHEDULE OF INVESTMENTS (CONTINUED)
DECEMBER 31, 2004
| (k) | Securities with an aggregate market value of $759,000 have been segregated with the custodian to cover margin requirements for the following open futures contracts at December 31, 2004: |
| NUMBER OF CONTRACTS |
TYPE |
EXPIRATION MONTH |
VALUE AT TRADE DATE |
VALUE AT DECEMBER 31, 2004 |
UNREALIZED APPRECIATION | ||||||||
| LONG POSITIONS: |
|||||||||||||
| 27 |
S&P 500 | Mar 05 | $ | 8,051,912 | $ | 8,192,475 | $ | 140,563 | |||||
The industry classification of long-term portfolio holdings, short-term investments and liabilities in excess of other assets shown as a percentage of net assets as of December 31, 2004 were as follows:
| Financial — Bank & Trust |
11.6 | % | |
| Oil & Gas |
11.6 | ||
| Financial Services |
9.2 | ||
| Insurance |
5.7 | ||
| Utilities |
5.4 | ||
| Telecommunications |
4.9 | ||
| Entertainment & Leisure |
4.4 | ||
| Electronic Components & Equipment |
4.1 | ||
| Computer Services & Software |
2.9 | ||
| Machinery & Equipment |
2.8 | ||
| Retail & Merchandising |
2.7 | ||
| Aerospace |
2.4 | ||
| Conglomerates |
2.3 | ||
| Metals & Mining |
2.2 | ||
| Real Estate |
2.2 | ||
| Automotive Parts |
2.0 | ||
| Computer Hardware |
2.0 | ||
| Restaurants |
1.8 | ||
| Pharmaceuticals |
1.6 | ||
| Consumer Products & Services |
1.4 | ||
| Farming & Agriculture |
1.4 | ||
| Beverages |
1.3 | ||
| Semiconductors |
1.3 | ||
| Transportation |
1.3 | ||
| Clothing & Apparel |
1.1 | ||
| Food |
1.1 | ||
| Paper & Forest Products |
1.1 | ||
| Containers & Packaging |
1.0 | ||
| Medical Supplies & Equipment |
1.0 | ||
| Healthcare Services |
0.8 | ||
| Chemicals |
0.7 | ||
| Construction |
0.1 | ||
| Short-Term Investments |
21.0 | ||
| 116.4 | |||
| Liabilities in excess of other assets |
(16.4 | ) | |
| 100.0 | % | ||
See Notes to Financial Statements.
122
AST HOTCHKIS AND WILEY LARGE-CAP VALUE PORTFOLIO
SCHEDULE OF INVESTMENTS
DECEMBER 31, 2004
| SHARES |
VALUE (NOTE 2) | ||||
| LONG-TERM INVESTMENTS — 98.7% |
|||||
| COMMON STOCK |
|||||
| AEROSPACE & DEFENSE — 4.1% |
|||||
| Lockheed Martin Corp. |
261,400 | $ | 14,520,770 | ||
| Raytheon Co. |
304,800 | 11,835,384 | |||
| 26,356,154 | |||||
| AUTO COMPONENTS — 2.0% |
|||||
| Delphi Corp.(a) |
680,900 | 6,141,718 | |||
| Lear Corp. |
104,600 | 6,381,646 | |||
| 12,523,364 | |||||
| COMMERCIAL BANKS — 2.2% |
|||||
| KeyCorp |
168,700 | 5,718,930 | |||
| UnionBanCal Corp. |
131,800 | 8,498,464 | |||
| 14,217,394 | |||||
| COMMERCIAL SERVICES & SUPPLIES — 3.9% |
|||||
| Cendant Corp.(a) |
572,000 | 13,373,360 | |||
| Waste Management, Inc. |
386,000 | 11,556,840 | |||
| 24,930,200 | |||||
| DIVERSIFIED FINANCIAL SERVICES — 5.1% |
|||||
| CIT Group, Inc. |
278,700 | 12,770,034 | |||
| Principal Financial Group, Inc. |
475,300 | 19,458,782 | |||
| 32,228,816 | |||||
| ELECTRIC UTILITIES — 8.7% |
|||||
| Alliant Energy Corp. |
230,500 | 6,592,300 | |||
| Entergy Corp. |
141,500 | 9,563,985 | |||
| FirstEnergy Corp. |
428,900 | 16,945,839 | |||
| FPL Group, Inc.(a) |
297,600 | 22,245,600 | |||
| 55,347,724 | |||||
| FOOD & STAPLES RETAILING — 2.5% |
|||||
| Albertson's, Inc.(a) |
679,900 | 16,236,012 | |||
| FOOD PRODUCTS — 3.3% |
|||||
| Kraft Foods, Inc. (Class “A” Stock)(a) |
174,500 | 6,213,945 | |||
| Sara Lee Corp. |
265,400 | 6,406,756 | |||
| Unilever Plc [ADR](GBP) |
205,600 | 8,125,312 | |||
| 20,746,013 | |||||
| HEALTHCARE PROVIDERS & SERVICES — 5.9% |
|||||
| Aetna, Inc. |
141,700 | 17,677,075 | |||
| HCA, Inc.(a) |
156,100 | 6,237,756 | |||
| Tenet Healthcare Corp.* |
1,227,400 | 13,476,852 | |||
| 37,391,683 | |||||
| HOTELS, RESTAURANTS & LEISURE — 4.3% |
|||||
| Caesars Entertainment, Inc.*(a) |
666,400 | 13,421,296 | |||
| Mandalay Resort Group(a) |
21,000 | 1,479,030 | |||
| Yum! Brands, Inc. |
264,800 | 12,493,264 | |||
| 27,393,590 | |||||
| HOUSEHOLD DURABLES — 4.1% |
|||||
| Lennar Corp. (Class “A” Stock)(a) |
460,800 | 26,118,144 | |||
| INDUSTRIAL CONGLOMERATES — 2.0% |
|||||
| Tyco International Ltd.(a) |
359,700 | 12,855,678 | |||
| INSURANCE — 15.0% |
|||||
| Allmerica Financial Corp.* |
243,800 | 8,003,954 | |||
| Allstate Corp. (The) |
252,100 | 13,038,612 | |||
| MetLife, Inc. |
768,000 | 31,111,680 | |||
| St. Paul Cos., Inc. |
562,100 | 20,837,047 | |||
| UnumProvident Corp.(a) |
1,262,200 | 22,643,868 | |||
| 95,635,161 | |||||
| IT SERVICES — 5.0% |
|||||
| Electronic Data Systems Corp. |
1,382,500 | 31,935,750 | |||
| LEISURE EQUIPMENT & PRODUCTS — 1.7% |
|||||
| Eastman Kodak Co.(a) |
345,100 | 11,129,475 | |||
| MACHINERY — 1.0% |
|||||
| SPX Corp.(a) |
153,600 | 6,153,216 | |||
| METALS & MINING — 1.7% |
|||||
| Alcoa, Inc. |
349,600 | 10,984,432 | |||
| MULTILINE RETAIL — 5.1% |
|||||
| Sears, Roebuck and Co.(a) |
630,300 | 32,164,209 | |||
| OIL & GAS — 2.4% |
|||||
| Sunoco, Inc.(a) |
155,200 | 12,681,392 | |||
| Teekay Shipping Corp.(a) |
56,900 | 2,396,059 | |||
| 15,077,451 | |||||
| PAPER & FOREST PRODUCTS — 1.2% |
|||||
| Weyerhaeuser Co.(a) |
118,100 | 7,938,682 | |||
| REAL ESTATE — 3.4% |
|||||
| Apartment Investment & Management Co. (Class “A” Stock) [REIT](a) |
196,600 | 7,576,964 | |||
| New Century Financial Corp. [REIT](a) |
120,900 | 7,726,719 | |||
| Plum Creek Timber Co., Inc. [REIT] |
162,100 | 6,231,124 | |||
| 21,534,807 | |||||
| ROAD & RAIL — 0.8% |
|||||
| Union Pacific Corp. |
71,900 | 4,835,275 | |||
| SOFTWARE — 4.0% |
|||||
| Computer Associates International, Inc.(a) |
828,400 | 25,730,104 | |||
| TEXTILES, APPAREL & LUXURY GOODS — 1.0% |
|||||
| Jones Apparel Group, Inc.(a) |
177,500 | 6,491,175 | |||
| THRIFTS & MORTGAGE FINANCE — 4.1% |
|||||
| Freddie Mac(a) |
226,200 | 16,670,940 | |||
| Washington Mutual, Inc.(a) |
223,900 | 9,466,492 | |||
| 26,137,432 | |||||
123
AST HOTCHKIS AND WILEY LARGE-CAP VALUE PORTFOLIO
SCHEDULE OF INVESTMENTS (CONTINUED)
DECEMBER 31, 2004
| SHARES |
VALUE (NOTE 2) |
||||||
| TOBACCO — 4.2% |
|||||||
| Altria Group, Inc. |
440,700 | $ | 26,926,770 | ||||
| TOTAL LONG-TERM INVESTMENTS |
629,018,711 | ||||||
| PRINCIPAL AMOUNT (000) |
|||||||
| SHORT-TERM INVESTMENTS — 29.8% |
|||||||
| CERTIFICATES OF DEPOSIT — 8.8% |
|||||||
| Canadian Imperial Bank of Commerce |
|||||||
| 1.72%, 05/25/05(b) |
$ | 1,621 | 1,620,265 | ||||
| First Boston Corp. |
|||||||
| 2.36%, 01/24/05(b) |
30,328 | 30,327,744 | |||||
| Skandinaviska Enskilda Banken |
|||||||
| 2.35%, 01/28/05(b) |
5,089 | 5,088,870 | |||||
| Societe Generale |
|||||||
| 2.357%, 01/14/05(b) |
6,158 | 6,156,304 | |||||
| UBS Bank |
|||||||
| 2.315%, 01/18/05(b) |
9,366 | 9,365,924 | |||||
| Westdeutsche Landesbank |
|||||||
| 1.50%, 01/10/05(b) |
3,406 | 3,404,801 | |||||
| 55,963,908 | |||||||
| CORPORATE OBLIGATIONS — 9.8% |
|||||||
| Bank of America NA |
|||||||
| 2.30%, 01/03/05(b)(c) |
1,047 | 1,047,417 | |||||
| Bear Stearns |
|||||||
| 2.28%, 01/03/05(b)(c) |
2,657 | 2,656,602 | |||||
| 2.28%, 01/03/05(b)(c) |
10,085 | 10,085,423 | |||||
| Goldman Sachs Group, Inc. |
|||||||
| 2.33%, 01/03/05(b)(c) |
12,071 | 12,070,902 | |||||
| Merrill Lynch & Co., Inc. |
|||||||
| 2.38%, 01/03/05(b)(c) |
11,303 | 11,303,078 | |||||
| Morgan Stanley |
|||||||
| 2.33%, 01/03/05(b)(c) |
408 | 407,701 | |||||
| 2.33%, 01/03/05(b)(c) |
2,671 | 2,671,189 | |||||
| Natexis Banque NY |
|||||||
| 2.297%, 01/03/05(b)(c) |
21,381 | 21,379,158 | |||||
| Swedbank NY |
|||||||
| 2.362%, 01/18/05(b)(c) |
485 | 484,747 | |||||
| 62,106,217 | |||||||
| TIME DEPOSIT — 1.5% |
|||||||
| Bank of America NA |
|||||||
| 1.50%, 01/03/05(b) |
9,402 | 9,402,055 | |||||
| SHARES |
|||||||
| NON-REGISTERED INVESTMENT COMPANY — 9.7% |
|||||||
| BlackRock Institutional Money Market Trust(b)(j) |
62,127,414 | 62,127,414 | |||||
| TOTAL SHORT-TERM INVESTMENTS |
189,599,594 | ||||||
| TOTAL INVESTMENTS — 128.5% |
818,618,305 | ||||||
| LIABILITIES IN EXCESS OF OTHER ASSETS (28.5%) |
(181,808,686 | ) | |||||
| NET ASSETS — 100.0% |
$ | 636,809,619 | |||||
THE FOLLOWING ABBREVIATION IS USED THROUGHOUT THE SCHEDULE OF INVESTMENTS:
| ADR | American Depository Receipt |
| GBP | British Pound |
| REIT | Real Estate Investment Trust |
THE FOLLOWING ANNOTATION IS USED THROUGHOUT THE SCHEDULE OF INVESTMENTS:
| * | Non-income producing security. |
| (a) | All or a portion of securities on loan. Securities on loan have an aggregate market value of $182,140,758; cash collateral of $189,599,594 (included with liabilities) was received with which the portfolio purchased highly liquid short-term investments. |
| (b) | Represents security purchased with cash collateral for securities on loan. |
| (c) | Indicates a variable rate security. The maturity date presented for these instruments is the next date on which the rate of interest is adjusted. |
| (j) | Security available to institutional investors only. |
124
AST HOTCHKIS AND WILEY LARGE-CAP VALUE PORTFOLIO
SCHEDULE OF INVESTMENTS (CONTINUED)
DECEMBER 31, 2004
The industry classification of long-term portfolio holdings, short-term investments and liabilities in excess of other assets shown as a percentage of net assets as of December 31, 2004 were as follows:
| Insurance |
15.0 | % | |
| Electric Utilities |
8.7 | ||
| Healthcare Providers & Services |
5.9 | ||
| Diversified Financial Services |
5.1 | ||
| Multiline Retail |
5.1 | ||
| IT Services |
5.0 | ||
| Hotels, Restaurants & Leisure |
4.3 | ||
| Tobacco |
4.2 | ||
| Aerospace & Defense |
4.1 | ||
| Household Durables |
4.1 | ||
| Thrifts & Mortgage Finance |
4.1 | ||
| Software |
4.0 | ||
| Commercial Services & Supplies |
3.9 | ||
| Real Estate |
3.4 | ||
| Food Products |
3.3 | ||
| Food & Staples Retailing |
2.5 | ||
| Oil & Gas |
2.4 | ||
| Commercial Banks |
2.2 | ||
| Auto Components |
2.0 | ||
| Industrial Conglomerates |
2.0 | ||
| Leisure Equipment & Products |
1.7 | ||
| Metals & Mining |
1.7 | ||
| Paper & Forest Products |
1.2 | ||
| Machinery |
1.0 | ||
| Textile, Apparel & Luxury Goods |
1.0 | ||
| Road & Rail |
0.8 | ||
| Short-Term Investments |
29.8 | ||
| 128.5 | |||
| Liabilities in excess of other assets |
(28.5 | ) | |
| 100.0 | % | ||
See Notes to Financial Statements.
125
AST ALLIANCE/BERNSTEIN GROWTH + VALUE PORTFOLIO
SCHEDULE OF INVESTMENTS
DECEMBER 31, 2004
| SHARES |
VALUE (NOTE 2) | ||||
| LONG-TERM INVESTMENTS — 96.3% |
|||||
| COMMON STOCK |
|||||
| AEROSPACE — 0.7% |
|||||
| Boeing Co. |
10,800 | $ | 559,116 | ||
| AUTOMOTIVE PARTS — 0.8% |
|||||
| Magna International, Inc. (Class “A” Stock) |
7,700 | 635,635 | |||
| BEVERAGES — 0.6% |
|||||
| PepsiCo, Inc. |
9,600 | 501,120 | |||
| BROADCASTING — 1.0% |
|||||
| Scripps, (E.W.) Co. (Class “A” Stock) |
16,800 | 811,104 | |||
| CABLE TELEVISION — 0.8% |
|||||
| Comcast Corp. (Special Class “A” Stock)*(a) |
19,100 | 627,244 | |||
| CLOTHING & APPAREL — 0.7% |
|||||
| Jones Apparel Group, Inc. |
10,200 | 373,014 | |||
| VF Corp. |
3,600 | 199,368 | |||
| 572,382 | |||||
| COMPUTER HARDWARE — 5.0% |
|||||
| Dell, Inc.* |
65,600 | 2,764,384 | |||
| Hewlett-Packard Co. |
52,750 | 1,106,168 | |||
| 3,870,552 | |||||
| COMPUTER SERVICES & SOFTWARE — 6.4% |
|||||
| Cisco Systems, Inc.* |
37,300 | 719,890 | |||
| Electronic Arts, Inc.* |
22,100 | 1,363,128 | |||
| Microsoft Corp. |
93,700 | 2,502,727 | |||
| Symantec Corp.* |
16,000 | 412,160 | |||
| 4,997,905 | |||||
| CONGLOMERATES — 1.9% |
|||||
| Altria Group, Inc. |
11,950 | 730,145 | |||
| Textron, Inc. |
10,600 | 782,280 | |||
| 1,512,425 | |||||
| CONSUMER PRODUCTS & SERVICES — 2.5% |
|||||
| Avon Products, Inc.(a) |
22,900 | 886,230 | |||
| Kimberly-Clark Corp. |
4,425 | 291,209 | |||
| Procter & Gamble Co. |
13,400 | 738,072 | |||
| 1,915,511 | |||||
| CONTAINERS & PACKAGING — 0.6% |
|||||
| Smurfit-Stone Container Corp.*(a) |
25,600 | 478,208 | |||
| ELECTRONIC COMPONENTS & EQUIPMENT — 5.1% |
|||||
| Flextronics International Ltd.*(a) |
35,800 | 494,756 | |||
| General Electric Co. |
81,600 | 2,978,400 | |||
| Solectron Corp.* |
87,697 | 467,425 | |||
| 3,940,581 | |||||
| ENTERTAINMENT & LEISURE — 1.6% |
|||||
| Carnival Corp.(a) |
7,000 | 403,410 | |||
| Time Warner, Inc.* |
44,000 | 855,360 | |||
| 1,258,770 | |||||
| FINANCIAL — BANK & TRUST — 4.2% |
|||||
| Bank of America Corp. |
24,794 | 1,165,070 | |||
| National City Corp. |
21,700 | 814,835 | |||
| SunTrust Banks, Inc. |
7,300 | 539,324 | |||
| Wachovia Corp. |
14,650 | 770,590 | |||
| 3,289,819 | |||||
| FINANCIAL SERVICES — 11.4% |
|||||
| Citigroup, Inc. |
67,000 | 3,228,059 | |||
| Fannie Mae(a) |
11,500 | 818,915 | |||
| Freddie Mac |
7,000 | 515,900 | |||
| Goldman Sachs Group, Inc. |
3,300 | 343,332 | |||
| JP Morgan Chase & Co. |
32,500 | 1,267,825 | |||
| Lehman Brothers Holdings, Inc. |
7,200 | 629,856 | |||
| MBNA Corp. |
70,200 | 1,978,938 | |||
| 8,782,825 | |||||
| FOOD — 1.2% |
|||||
| Safeway, Inc.*(a) |
28,275 | 558,149 | |||
| Unilever NV |
6,000 | 400,260 | |||
| 958,409 | |||||
| HEALTHCARE SERVICES — 4.9% |
|||||
| Caremark Rx, Inc.*(a) |
10,500 | 414,015 | |||
| HCA, Inc.(a) |
14,600 | 583,416 | |||
| Medco Health Solutions, Inc.* |
16,300 | 678,080 | |||
| UnitedHealth Group, Inc. |
24,000 | 2,112,720 | |||
| 3,788,231 | |||||
| INDUSTRIAL PRODUCTS — 0.5% |
|||||
| Cooper Industries Ltd. (Class “A” Stock) |
6,300 | 427,707 | |||
| INSURANCE — 5.1% |
|||||
| American International Group, Inc. |
21,200 | 1,392,204 | |||
| Chubb Corp.(a) |
14,500 | 1,115,050 | |||
| MetLife, Inc. |
14,500 | 587,395 | |||
| St. Paul Cos., Inc. |
12,698 | 470,715 | |||
| Torchmark Corp. |
1,200 | 68,568 | |||
| XL Capital Ltd. (Class “A” Stock)(a) |
4,300 | 333,895 | |||
| 3,967,827 | |||||
| INTERNET SERVICES — 7.0% |
|||||
| eBay, Inc.*(a) |
16,200 | 1,883,736 | |||
| Google, Inc. (Class “A” Stock)*(a) |
2,300 | 444,130 | |||
| Juniper Networks, Inc.*(a) |
34,800 | 946,212 | |||
| Yahoo!, Inc.*(a) |
56,800 | 2,140,224 | |||
| 5,414,302 | |||||
126
AST ALLIANCE/BERNSTEIN GROWTH + VALUE PORTFOLIO
SCHEDULE OF INVESTMENTS (CONTINUED)
DECEMBER 31, 2004
| SHARES |
VALUE (NOTE 2) | |||||
| MEDICAL SUPPLIES & EQUIPMENT — 5.6% |
||||||
| Alcon, Inc. (Switzerland) |
11,000 | $ | 886,600 | |||
| Amgen, Inc.* |
29,600 | 1,898,840 | ||||
| Boston Scientific Corp.* |
12,500 | 444,375 | ||||
| St. Jude Medical, Inc.* |
9,400 | 394,142 | ||||
| Zimmer Holdings, Inc.* |
9,600 | 769,152 | ||||
| 4,393,109 | ||||||
| OIL & GAS — 5.7% |
||||||
| BP PLC [ADR] (United Kingdom) |
13,900 | 811,760 | ||||
| ChevronTexaco Corp. |
13,700 | 719,387 | ||||
| ConocoPhillips |
12,800 | 1,111,424 | ||||
| Nabors Industries Ltd.* |
14,900 | 764,221 | ||||
| Occidental Petroleum Corp. |
18,200 | 1,062,152 | ||||
| 4,468,944 | ||||||
| PAPER & FOREST PRODUCTS — 1.0% |
||||||
| International Paper Co. |
7,000 | 294,000 | ||||
| MeadWestvaco Corp. |
14,600 | 494,794 | ||||
| Neenah Paper, Inc.* |
1 | 33 | ||||
| 788,827 | ||||||
| PHARMACEUTICALS — 3.4% |
||||||
| GlaxoSmithKline PLC [ADR] (United Kingdom) |
6,200 | 293,818 | ||||
| Pfizer, Inc. |
57,700 | 1,551,553 | ||||
| Teva Pharmaceutical Industries Ltd. [ADR] (Israel)(a) |
26,300 | 785,318 | ||||
| 2,630,689 | ||||||
| RAILROADS — 3.7% |
||||||
| Burlington Northern Santa Fe Corp. |
19,000 | 898,890 | ||||
| CSX Corp. |
18,900 | 757,512 | ||||
| Norfolk Southern Corp. |
33,400 | 1,208,746 | ||||
| 2,865,148 | ||||||
| RESTAURANTS — 1.3% |
||||||
| McDonald's Corp. |
18,000 | 577,080 | ||||
| Starbucks Corp.* |
6,600 | 411,576 | ||||
| 988,656 | ||||||
| RETAIL & MERCHANDISING — 5.4% |
||||||
| Bed Bath & Beyond, Inc.*(a) |
7,000 | 278,810 | ||||
| Federated Department Stores, Inc. |
4,600 | 265,834 | ||||
| Kroger Co. (The)*(a) |
34,000 | 596,360 | ||||
| Lowe's Cos., Inc.(a) |
20,300 | 1,169,077 | ||||
| Office Depot, Inc.* |
23,300 | 404,488 | ||||
| Target Corp. |
20,400 | 1,059,372 | ||||
| Wal-Mart Stores, Inc. |
7,900 | 417,278 | ||||
| 4,191,219 | ||||||
| SEMICONDUCTORS — 1.5% |
||||||
| Broadcom Corp. (Class “A” Stock)* |
24,500 | 790,860 | ||||
| Marvell Technology Group Ltd.* |
11,100 | 393,717 | ||||
| 1,184,577 | ||||||
| TELECOMMUNICATIONS — 4.3% |
||||||
| Corning, Inc.*(a) |
74,300 | 874,511 | ||||
| Nortel Networks Corp. (Canada)* |
36,700 | 128,083 | ||||
| Qualcomm, Inc. |
29,000 | 1,229,600 | ||||
| Research in Motion Ltd. (Canada)*(a) |
4,400 | 362,648 | ||||
| Sprint Corp. |
19,100 | 474,635 | ||||
| Tellabs, Inc.* |
30,700 | 263,713 | ||||
| 3,333,190 | ||||||
| UTILITIES — 2.4% |
||||||
| American Electric Power Co., Inc.(a) |
21,600 | 741,744 | ||||
| Entergy Corp. |
9,900 | 669,141 | ||||
| Sempra Energy(a) |
12,500 | 458,500 | ||||
| 1,869,385 | ||||||
| TOTAL LONG-TERM INVESTMENTS |
75,023,417 | |||||
| PRINCIPAL AMOUNT (000) |
||||||
| SHORT-TERM INVESTMENTS — 20.9% |
||||||
| CERTIFICATES OF DEPOSIT — 4.5% |
||||||
| Banco Santander PR |
||||||
| 2.315%, 01/07/05(b)(c) |
$ | 1,688 | 1,687,929 | |||
| First Boston Corp. |
||||||
| 2.36%, 01/24/05(b) |
779 | 779,625 | ||||
| Skandinaviska Enskilda Banken |
||||||
| 2.35%, 01/28/05(b) |
482 | 481,688 | ||||
| Societe Generale |
||||||
| 2.357%, 01/14/05(b) |
564 | 563,966 | ||||
| 3,513,208 | ||||||
| COMMERCIAL PAPER — 2.7% |
||||||
| Citigroup, Inc. |
||||||
| 2.304%, 01/10/05(b) |
1,749 | 1,745,363 | ||||
| Ticonderoga Funding, LLC |
||||||
| 2.35%, 01/14/05(b) |
335 | 334,720 | ||||
| 2,080,083 | ||||||
| CORPORATE OBLIGATIONS — 8.5% |
||||||
| Goldman Sachs Group, Inc. |
||||||
| 2.33%, 01/03/05(b)(c) |
2,969 | 2,969,376 | ||||
| Merrill Lynch & Co., Inc. |
||||||
| 2.38%, 01/03/05(b)(c) |
2,409 | 2,408,753 | ||||
| Natexis Banque NY |
||||||
| 2.297%, 01/03/05(b)(c) |
1,180 | 1,179,637 | ||||
| Swedbank NY |
||||||
| 2.362%, 01/18/05(b)(c) |
53 | 53,099 | ||||
| 6,610,865 | ||||||
| TIME DEPOSIT — 0.7% |
||||||
| Bank of America NA |
||||||
| 1.50%, 01/03/05(b) |
579 | 578,634 | ||||
127
AST ALLIANCE/BERNSTEIN GROWTH + VALUE PORTFOLIO
SCHEDULE OF INVESTMENTS (CONTINUED)
DECEMBER 31, 2004
| SHARES |
VALUE (NOTE 2) |
|||||
| NON-REGISTERED INVESTMENT COMPANY — 2.5% |
||||||
| BlackRock Institutional Money Market Trust(b)(j) |
1,952,725 | $ | 1,952,725 | |||
| REGISTERED INVESTMENT COMPANIES — 2.0% |
||||||
| BlackRock Provident Institutional Funds TempCash Portfolio(j) |
777,502 | 777,502 | ||||
| BlackRock Provident Institutional Funds TempFund Portfolio(j) |
777,501 | 777,501 | ||||
| 1,555,003 | ||||||
| TOTAL SHORT TERM INVESTMENTS |
16,290,518 | |||||
| TOTAL INVESTMENTS — 117.2% |
91,313,935 | |||||
| LIABILITIES IN EXCESS OF OTHER ASSETS — (17.2%) |
(13,392,146 | ) | ||||
| NET ASSETS — 100.0% |
$ | 77,921,789 | ||||
THE FOLLOWING ABBREVIATION IS USED THROUGHOUT THE SCHEDULE OF INVESTMENTS:
| ADR | American Depository Receipt |
THE FOLLOWING ANNOTATIONS ARE USED THROUGHOUT THE SCHEDULE OF INVESTMENTS:
| * | Non-income producing security. |
| (a) | All or a portion of securities on loan. Securities on loan have an aggregate market value of $14,205,920; cash collateral of $14,735,515 (included with liabilities) was received with which the portfolio purchased highly liquid short-term investments. |
| (b) | Represents security purchased with cash collateral for securities on loan. |
| (c) | Indicates a variable rate security. The maturity date presented for these instruments is the next date on which the rate of interest is adjusted. The interest rate shown reflects the rate in effect at December 31, 2004. |
| (j) | Security available to institutional investors only. |
The industry classification of long-term portfolio holdings, short-term investments and liabilities in excess of other assets shown as a percentage of net assets as of December 31, 2004 were as follows:
| Financial Services |
11.4 | % | |
| Internet Services |
7.0 | ||
| Computer Services & Software |
6.4 | ||
| Oil & Gas |
5.7 | ||
| Medical Supplies & Equipment |
5.6 | ||
| Retail & Merchandising |
5.4 | ||
| Electronic Components & Equipment |
5.1 | ||
| Insurance |
5.1 | ||
| Computer Hardware |
5.0 | ||
| Healthcare Services |
4.9 | ||
| Telecommunications |
4.3 | ||
| Financial Bank & Trust |
4.2 | ||
| Railroads |
3.7 | ||
| Pharmaceuticals |
3.4 | ||
| Consumer Products & Services |
2.5 | ||
| Utilities |
2.4 | ||
| Conglomerates |
1.9 | ||
| Entertainment & Leisure |
1.6 | ||
| Semiconductors |
1.5 | % | |
| Restaurants |
1.3 | ||
| Food |
1.2 | ||
| Broadcasting |
1.0 | ||
| Paper & Forest Products |
1.0 | ||
| Automotive Parts |
0.8 | ||
| Cable Television |
0.8 | ||
| Aerospace |
0.7 | ||
| Clothing & Apparel |
0.7 | ||
| Beverages |
0.6 | ||
| Containers & Packaging |
0.6 | ||
| Industrial Products |
0.5 | ||
| Short-Term Investments |
20.9 | ||
| 117.2 | |||
| Liabilities in excess of other assets |
(17.2 | ) | |
| 100.0 | % | ||
See Notes to Financial Statements.
128
AST SANFORD BERNSTEIN CORE VALUE PORTFOLIO
SCHEDULE OF INVESTMENTS
DECEMBER 31, 2004
| SHARES |
VALUE (NOTE 2) | ||||
| LONG-TERM INVESTMENTS — 96.5% |
|||||
| COMMON STOCK |
|||||
| ADVERTISING — 0.5% |
|||||
| Interpublic Group of Cos., Inc. (The)*(a) |
116,500 | $ | 1,561,100 | ||
| AEROSPACE — 1.5% |
|||||
| Boeing Co. |
27,900 | 1,444,383 | |||
| General Dynamics Corp. |
6,700 | 700,820 | |||
| Goodrich Corp. |
40,800 | 1,331,712 | |||
| Northrop Grumman Corp. |
16,600 | 902,376 | |||
| 4,379,291 | |||||
| AUTOMOBILE MANUFACTURERS — 0.1% |
|||||
| General Motors Corp.(a) |
7,900 | 316,474 | |||
| AUTOMOTIVE PARTS — 2.3% |
|||||
| American Axle & Manufacturing Holdings, Inc. |
16,000 | 490,560 | |||
| Autoliv, Inc. (Germany) |
31,100 | 1,502,130 | |||
| BorgWarner, Inc. |
16,400 | 888,388 | |||
| Cooper Tire & Rubber Co.(a) |
22,100 | 476,255 | |||
| Dana Corp. |
47,700 | 826,641 | |||
| Lear Corp.(a) |
18,000 | 1,098,180 | |||
| Magna International, Inc. (Class “A” Stock) |
14,800 | 1,221,740 | |||
| 6,503,894 | |||||
| BEVERAGES — 0.8% |
|||||
| Coors, (Adolph) Co. (Class “B” Stock)(a) |
11,400 | 862,638 | |||
| PepsiCo, Inc. |
27,100 | 1,414,620 | |||
| 2,277,258 | |||||
| BUILDING MATERIALS — 1.0% |
|||||
| Martin Marietta Materials, Inc. |
14,800 | 794,168 | |||
| Masco Corp. |
20,600 | 752,518 | |||
| Vulcan Materials Co. |
23,500 | 1,283,335 | |||
| 2,830,021 | |||||
| CABLE TELEVISION — 0.9% |
|||||
| Comcast Corp. (Class “A” Stock)* |
75,000 | 2,496,000 | |||
| CHEMICALS — 1.4% |
|||||
| Dow Chemical Co. |
4,700 | 232,697 | |||
| DuPont, (E.I.) de Nemours & Co. |
60,400 | 2,962,620 | |||
| Eastman Chemical Co.(a) |
15,300 | 883,269 | |||
| 4,078,586 | |||||
| CLOTHING & APPAREL — 0.9% |
|||||
| Jones Apparel Group, Inc. |
35,000 | 1,279,950 | |||
| VF Corp. |
23,100 | 1,279,278 | |||
| 2,559,228 | |||||
| COMPUTER HARDWARE — 2.0% |
|||||
| Hewlett-Packard Co. |
196,424 | 4,119,011 | |||
| Ingram Micro, Inc. (Class “A” Stock)* |
26,500 | 551,200 | |||
| International Business Machines Corp. |
10,000 | 985,800 | |||
| 5,656,011 | |||||
| COMPUTER SERVICES & SOFTWARE — 2.2% |
|||||
| Electronic Data Systems Corp. |
81,400 | 1,880,340 | |||
| Microsoft Corp. |
130,400 | 3,482,984 | |||
| Tech Data Corp.*(a) |
18,850 | 855,790 | |||
| 6,219,114 | |||||
| CONGLOMERATES — 4.3% |
|||||
| Altria Group, Inc. |
116,800 | 7,136,480 | |||
| Honeywell International, Inc. |
59,800 | 2,117,518 | |||
| Textron, Inc. |
22,700 | 1,675,260 | |||
| Tyco International Ltd.(a) |
39,800 | 1,422,452 | |||
| 12,351,710 | |||||
| CONSUMER PRODUCTS & SERVICES — 1.8% |
|||||
| Kimberly-Clark Corp. |
25,400 | 1,671,574 | |||
| Newell Rubbermaid, Inc. |
71,700 | 1,734,423 | |||
| UST, Inc. |
38,600 | 1,857,046 | |||
| 5,263,043 | |||||
| CONTAINERS & PACKAGING — 0.8% |
|||||
| Bemis Co., Inc. |
12,800 | 372,352 | |||
| Smurfit-Stone Container Corp.* |
87,600 | 1,636,368 | |||
| Sonoco Products Co. |
6,200 | 183,830 | |||
| 2,192,550 | |||||
| ELECTRONIC COMPONENTS & EQUIPMENT — 7.3% |
|||||
| Agere Systems, Inc. (Class “A” Stock)* |
298,800 | 409,356 | |||
| Arrow Electronics, Inc.*(a) |
3,150 | 76,545 | |||
| Avnet, Inc.*(a) |
20,700 | 377,568 | |||
| Celestica, Inc. (Canada)* |
72,700 | 1,025,797 | |||
| Eastman Kodak Co.(a) |
36,300 | 1,170,675 | |||
| Flextronics International Ltd.*(a) |
67,800 | 936,996 | |||
| General Electric Co. |
375,000 | 13,687,500 | |||
| Hubbell, Inc. (Class “B” Stock) |
14,500 | 758,350 | |||
| Parker-Hannifin Corp. |
7,400 | 560,476 | |||
| Sanmina-SCI Corp.* |
69,900 | 592,053 | |||
| Solectron Corp.*(a) |
227,350 | 1,211,776 | |||
| Vishay Intertechnology, Inc.* |
6,200 | 93,124 | |||
| 20,900,216 | |||||
| ENTERTAINMENT & LEISURE — 1.8% |
|||||
| Disney, (Walt) Co. |
15,200 | 422,560 | |||
| Time Warner, Inc.* |
234,800 | 4,564,512 | |||
| Viacom, Inc. (Class “B” Stock) |
8,700 | 316,593 | |||
| 5,303,665 | |||||
129
AST SANFORD BERNSTEIN CORE VALUE PORTFOLIO
SCHEDULE OF INVESTMENTS (CONTINUED)
DECEMBER 31, 2004
| SHARES |
VALUE (NOTE 2) | ||||
| FINANCIAL — BANK & TRUST — 10.0% |
|||||
| Astoria Financial Corp. |
13,200 | $ | 527,604 | ||
| Bank of America Corp. |
199,476 | 9,373,377 | |||
| BB&T Corp.(a) |
13,200 | 555,060 | |||
| Comerica, Inc. |
31,300 | 1,909,926 | |||
| Huntington Bancshares, Inc.(a) |
70,300 | 1,742,034 | |||
| National City Corp. |
63,650 | 2,390,058 | |||
| SunTrust Banks, Inc. |
31,200 | 2,305,056 | |||
| U.S. Bancorp |
80,100 | 2,508,732 | |||
| Wachovia Corp. |
99,100 | 5,212,660 | |||
| Wells Fargo & Co.(a) |
33,700 | 2,094,455 | |||
| 28,618,962 | |||||
| FINANCIAL SERVICES — 14.1% |
|||||
| Capital One Financial Corp. |
3,100 | 261,051 | |||
| Citigroup, Inc. |
247,200 | 11,910,095 | |||
| Fannie Mae(a) |
18,700 | 1,331,627 | |||
| Freddie Mac |
49,500 | 3,648,150 | |||
| Goldman Sachs Group, Inc. |
24,600 | 2,559,384 | |||
| JP Morgan Chase & Co. |
137,400 | 5,359,974 | |||
| KeyCorp(a) |
43,475 | 1,473,803 | |||
| Lehman Brothers Holdings, Inc. |
26,400 | 2,309,472 | |||
| MBIA, Inc.(a) |
19,300 | 1,221,304 | |||
| Mellon Financial Corp.(a) |
59,300 | 1,844,823 | |||
| Merrill Lynch & Co., Inc. |
39,000 | 2,331,030 | |||
| Morgan Stanley Dean Witter & Co. |
40,000 | 2,220,800 | |||
| PNC Financial Services Group |
19,800 | 1,137,312 | |||
| Washington Mutual, Inc.(a) |
71,775 | 3,034,647 | |||
| 40,643,472 | |||||
| FOOD — 2.8% |
|||||
| Albertson’s, Inc.(a) |
65,900 | 1,573,692 | |||
| Archer-Daniels-Midland Co. |
10,200 | 227,562 | |||
| Kraft Foods, Inc. (Class “A” Stock)(a) |
38,000 | 1,353,180 | |||
| Safeway, Inc.*(a) |
88,300 | 1,743,042 | |||
| Sara Lee Corp. |
70,700 | 1,706,698 | |||
| Unilever NV |
20,800 | 1,387,568 | |||
| 7,991,742 | |||||
| HEALTHCARE SERVICES — 0.8% |
|||||
| HCA, Inc.(a) |
14,300 | 571,428 | |||
| Medco Health Solutions, Inc.* |
42,900 | 1,784,640 | |||
| 2,356,068 | |||||
| INDUSTRIAL PRODUCTS — 0.8% |
|||||
| Cooper Industries Ltd. (Class “A” Stock) |
13,900 | 943,671 | |||
| Crane Co.(a) |
8,600 | 248,024 | |||
| Ingersoll-Rand Co., Ltd. (Class “A” Stock) |
9,700 | 778,910 | |||
| SPX Corp.(a) |
8,200 | 328,492 | |||
| 2,299,097 | |||||
| INSURANCE — 6.2% |
|||||
| ACE Ltd. |
15,100 | 645,525 | |||
| Allstate Corp. (The) |
43,500 | 2,249,820 | |||
| American International Group, Inc. |
14,800 | 971,916 | |||
| Chubb Corp.(a) |
20,700 | 1,591,830 | |||
| Genworth Financial, Inc. |
53,300 | 1,439,100 | |||
| Hartford Financial Services Group, Inc. (The) |
32,000 | 2,217,920 | |||
| Manulife Financial Corp. (Canada) |
39,233 | 1,812,565 | |||
| MetLife, Inc. |
34,225 | 1,386,455 | |||
| MGIC Investment Corp.(a) |
19,300 | 1,329,963 | |||
| PartnerRe Ltd. |
6,200 | 384,028 | |||
| St. Paul Cos., Inc. |
62,440 | 2,314,650 | |||
| Torchmark Corp. |
2,225 | 127,137 | |||
| XL Capital Ltd. (Class “A” Stock)(a) |
17,800 | 1,382,170 | |||
| 17,853,079 | |||||
| MACHINERY & EQUIPMENT — 0.7% |
|||||
| Eaton Corp. |
21,600 | 1,562,976 | |||
| Stanley Works |
8,500 | 416,415 | |||
| 1,979,391 | |||||
| METALS & MINING — 1.0% |
|||||
| Alcoa, Inc. |
36,900 | 1,159,398 | |||
| United States Steel Corp. |
35,500 | 1,819,375 | |||
| 2,978,773 | |||||
| OIL & GAS — 10.1% |
|||||
| BP PLC [ADR] (United Kingdom) |
19,400 | 1,132,960 | |||
| ChevronTexaco Corp. |
110,800 | 5,818,108 | |||
| ConocoPhillips |
47,843 | 4,154,208 | |||
| Exxon Mobil Corp. |
270,000 | 13,840,199 | |||
| Marathon Oil Corp. |
53,400 | 2,008,374 | |||
| Occidental Petroleum Corp. |
37,300 | 2,176,828 | |||
| 29,130,677 | |||||
| PAPER & FOREST PRODUCTS — 2.1% |
|||||
| Georgia-Pacific Corp. |
41,625 | 1,560,105 | |||
| International Paper Co. |
35,300 | 1,482,600 | |||
| MeadWestvaco Corp. |
46,100 | 1,562,329 | |||
| Temple-Inland, Inc. |
19,300 | 1,320,120 | |||
| 5,925,154 | |||||
| PHARMACEUTICALS — 1.2% |
|||||
| AstraZeneca PLC [ADR] (United Kingdom)(a) |
23,900 | 869,721 | |||
| Merck & Co., Inc.(a) |
78,000 | 2,506,920 | |||
| 3,376,641 | |||||
| RAILROADS — 1.8% |
|||||
| Burlington Northern Santa Fe Corp. |
38,775 | 1,834,445 | |||
| CSX Corp. |
23,500 | 941,880 | |||
| Norfolk Southern Corp. |
64,450 | 2,332,446 | |||
| 5,108,771 | |||||
130
AST SANFORD BERNSTEIN CORE VALUE PORTFOLIO
SCHEDULE OF INVESTMENTS (CONTINUED)
DECEMBER 31, 2004
| SHARES |
VALUE (NOTE 2) |
||||||
| RESTAURANTS — 1.1% |
|||||||
| McDonald’s Corp. |
101,100 | $ | 3,241,266 | ||||
| RETAIL & MERCHANDISING — 3.5% |
|||||||
| Federated Department Stores, Inc. |
26,175 | 1,512,653 | |||||
| Gap, Inc.(a) |
59,700 | 1,260,864 | |||||
| Kroger Co. (The)*(a) |
118,900 | 2,085,506 | |||||
| Limited Brands, Inc. |
70,700 | 1,627,514 | |||||
| Nordstrom, Inc. |
12,900 | 602,817 | |||||
| Office Depot, Inc.* |
96,900 | 1,682,184 | |||||
| SUPERVALU, Inc.(a) |
1,625 | 56,095 | |||||
| Target Corp. |
26,100 | 1,355,373 | |||||
| 10,183,006 | |||||||
| TELECOMMUNICATIONS — 5.6% |
|||||||
| ADC Telecommunications, Inc.*(a) |
241,400 | 646,952 | |||||
| BellSouth Corp.(a) |
29,900 | 830,921 | |||||
| Corning, Inc.*(a) |
111,300 | 1,310,001 | |||||
| Nortel Networks Corp. (Canada)* |
220,800 | 770,592 | |||||
| SBC Communications, Inc.(a) |
91,900 | 2,368,263 | |||||
| Sprint Corp. |
142,950 | 3,552,308 | |||||
| Tellabs, Inc.* |
121,100 | 1,040,249 | |||||
| Verizon Communications, Inc. |
138,000 | 5,590,380 | |||||
| 16,109,666 | |||||||
| UTILITIES — 5.1% |
|||||||
| Alliant Energy Corp. |
23,900 | 683,540 | |||||
| American Electric Power Co., Inc.(a) |
52,200 | 1,792,548 | |||||
| Constellation Energy Group, Inc. |
19,500 | 852,345 | |||||
| Edison International Co. |
19,000 | 608,570 | |||||
| Entergy Corp. |
20,400 | 1,378,836 | |||||
| Exelon Corp.(a) |
46,800 | 2,062,476 | |||||
| FirstEnergy Corp. |
29,400 | 1,161,594 | |||||
| Northeast Utilities |
41,700 | 786,045 | |||||
| PPL Corp. |
26,900 | 1,433,232 | |||||
| Sempra Energy(a) |
46,100 | 1,690,948 | |||||
| Wisconsin Energy Corp. |
30,700 | 1,034,897 | |||||
| Xcel Energy, Inc.(a) |
65,100 | 1,184,820 | |||||
| 14,669,851 | |||||||
| TOTAL LONG-TERM INVESTMENTS |
277,353,777 | ||||||
| PRINCIPAL AMOUNT (000) |
|||||||
| SHORT-TERM INVESTMENTS — 19.7% |
|||||||
| CERTIFICATES OF DEPOSIT — 3.3% |
|||||||
| Banco Santander PR |
|||||||
| 2.315%, 01/07/05(b)(c) |
$ | 1,703 | 1,703,161 | ||||
| First Boston Corp. |
|||||||
| 2.36%, 01/24/05(b) |
4,839 | 4,839,178 | |||||
| Skandinaviska Enskilda Banken |
|||||||
| 2.35%, 01/28/05(b) |
1,334 | 1,334,083 | |||||
| Societe Generale |
|||||||
| 2.357%, 01/14/05(b) |
481 | 481,146 | |||||
| UBS Bank |
|||||||
| 2.315%, 01/18/05(b) |
1,201 | 1,200,650 | |||||
| 9,558,218 | |||||||
| CORPORATE OBLIGATIONS — 9.5% |
|||||||
| Bank of America NA |
|||||||
| 2.30%, 01/03/05(b)(c) |
940 | 940,013 | |||||
| Bear Stearns |
|||||||
| 2.28%, 01/03/05(b)(c) |
5,087 | 5,086,992 | |||||
| 2.28%, 01/03/05(b)(c) |
1,426 | 1,425,750 | |||||
| Goldman Sachs Group, Inc. |
|||||||
| 2.33%, 01/03/05(b)(c) |
2,985 | 2,985,186 | |||||
| Merrill Lynch & Co., Inc. |
|||||||
| 2.38%, 01/03/05(b)(c) |
9,102 | 9,102,100 | |||||
| Morgan Stanley |
|||||||
| 2.33%, 01/03/05(b)(c) |
1,726 | 1,726,381 | |||||
| Natexis Banque NY |
|||||||
| 2.297%, 01/03/05(b)(c) |
5,244 | 5,243,377 | |||||
| Swedbank NY |
|||||||
| 2.362%, 01/18/05(b)(c) |
811 | 810,502 | |||||
| 27,320,301 | |||||||
| TIME DEPOSIT — 0.7% |
|||||||
| Bank of America NA |
|||||||
| 1.50%, 01/03/05(b) |
2,004 | 2,003,648 | |||||
| SHARES |
|||||||
| NON-REGISTERED INVESTMENT COMPANY — 1.3% |
|||||||
| BlackRock Institutional Money Market Trust(b)(j) |
3,683,314 | 3,683,314 | |||||
| REGISTERED INVESTMENT COMPANIES — 4.9% |
|||||||
| BlackRock Provident Institutional Funds TempCash Portfolio(j) |
7,034,277 | 7,034,277 | |||||
| BlackRock Provident Institutional Funds TempFund Portfolio(j) |
7,034,277 | 7,034,277 | |||||
| 14,068,554 | |||||||
| TOTAL SHORT-TERM INVESTMENTS |
56,634,035 | ||||||
| TOTAL INVESTMENTS — 116.2% |
333,987,812 | ||||||
| LIABILITIES IN EXCESS OF OTHER ASSETS — (16.2%) |
(46,504,260 | ) | |||||
| NET ASSETS — 100.0% |
$ | 287,483,552 | |||||
131
AST SANFORD BERNSTEIN CORE VALUE PORTFOLIO
SCHEDULE OF INVESTMENTS (CONTINUED)
DECEMBER 31, 2004
THE FOLLOWING ABBREVIATION IS USED THROUGHOUT THE SCHEDULE OF INVESTMENTS:
| ADR | American Depository Receipt. |
THE FOLLOWING ANNOTATIONS ARE USED THROUGHOUT THE SCHEDULE OF INVESTMENTS:
| * | Non-income producing security. |
| (a) | All or a portion of securities on loan. Securities on loan have an aggregate market value of $40,931,383; cash collateral of $42,565,481 (included with liabilities) was received with which the portfolio purchased highly liquid short-term investments. |
| (b) | Represents security purchased with cash collateral for securities on loan. |
| (c) | Indicates a variable rate security. The maturity date presented for these instruments is the next date on which the rate of interest is adjusted. The interest rate shown reflects the rate in effect at December 31, 2004. |
| (j) | Security available to institutional investors only. |
The industry classification of long-term portfolio holdings, short-term investments and liabilities in excess of other assets shown as a percentage of net assets as of December 31, 2004 were as follows:
| Financial Services |
14.1 | % | |
| Oil & Gas |
10.1 | ||
| Financial — Bank & Trust |
10.0 | ||
| Electronic Components & Equipment |
7.3 | ||
| Insurance |
6.2 | ||
| Telecommunications |
5.6 | ||
| Utilities |
5.1 | ||
| Conglomerates |
4.3 | ||
| Retail & Merchandising |
3.5 | ||
| Food |
2.8 | ||
| Automotive Parts |
2.3 | ||
| Computer Services & Software |
2.2 | ||
| Paper & Forest Products |
2.1 | ||
| Computer Hardware |
2.0 | ||
| Consumer Products & Services |
1.8 | ||
| Entertainment & Leisure |
1.8 | ||
| Railroads |
1.8 | ||
| Aerospace |
1.5 | ||
| Chemicals |
1.4 | ||
| Pharmaceuticals |
1.2 | ||
| Restaurants |
1.1 | ||
| Building Materials |
1.0 | ||
| Metals & Mining |
1.0 | ||
| Cable Television |
0.9 | ||
| Clothing & Apparel |
0.9 | ||
| Beverages |
0.8 | ||
| Containers & Packaging |
0.8 | ||
| Healthcare Services |
0.8 | ||
| Industrial Products |
0.8 | ||
| Machinery & Equipment |
0.7 | ||
| Advertising |
0.5 | ||
| Automobile Manufacturers |
0.1 | ||
| Short-Term Investments |
19.7 | ||
| 116.2 | |||
| Liabilities in excess of other assets |
(16.2 | ) | |
| 100.0 | % | ||
See Notes to Financial Statements.
132
AST COHEN & STEERS REALTY PORTFOLIO
SCHEDULE OF INVESTMENTS
DECEMBER 31, 2004
| SHARES |
VALUE (NOTE 2) | |||||
| LONG-TERM INVESTMENTS — 95.9% |
||||||
| COMMON STOCK |
||||||
| APARTMENT/RESIDENTIAL — 18.9% |
||||||
| Affordable Residential Communities [REIT] |
94,200 | $ | 1,351,770 | |||
| Apartment Investment & Management Co. (Class “A” Stock) [REIT](a) |
77,200 | 2,975,288 | ||||
| Archstone-Smith Trust [REIT] |
296,500 | 11,355,950 | ||||
| Avalonbay Communities, Inc. [REIT] |
296,600 | 22,333,980 | ||||
| BRE Properties, Inc. [REIT] |
230,400 | 9,287,424 | ||||
| Equity Residential Properties Trust [REIT](a) |
391,100 | 14,149,998 | ||||
| Essex Property Trust, Inc. [REIT] |
73,700 | 6,176,060 | ||||
| GMH Communities Trust [REIT] |
76,700 | 1,081,470 | ||||
| Post Properties, Inc. [REIT] |
186,700 | 6,515,830 | ||||
| Summit Properties, Inc. [REIT] |
137,600 | 4,480,256 | ||||
| 79,708,026 | ||||||
| DIVERSIFIED — 6.8% |
||||||
| Sun Communities, Inc. [REIT] |
143,100 | 5,759,775 | ||||
| Vornado Realty Trust [REIT](a) |
303,200 | 23,082,616 | ||||
| 28,842,391 | ||||||
| HEALTH CARE — 1.4% |
||||||
| Ventas, Inc. [REIT] |
215,000 | 5,893,150 | ||||
| HOTELS & MOTELS — 7.5% |
||||||
| Hilton Hotels Corp. |
277,300 | 6,305,802 | ||||
| Host Marriott Corp. [REIT](a) |
865,100 | 14,966,230 | ||||
| Starwood Hotels & Resorts Worldwide, Inc.(a) |
183,000 | 10,687,200 | ||||
| 31,959,232 | ||||||
| INDUSTRIAL — 9.6% |
||||||
| AMB Property Corp. [REIT] |
195,900 | 7,912,401 | ||||
| Catellus Development Corp. [REIT] |
263,952 | 8,076,931 | ||||
| ProLogis [REIT] |
572,600 | 24,810,758 | ||||
| 40,800,090 | ||||||
| OFFICE — 22.0% |
||||||
| Arden Realty, Inc. [REIT] |
132,600 | 5,001,672 | ||||
| Biomed Realty Trust, Inc. [REIT] |
53,900 | 1,197,119 | ||||
| Boston Properties, Inc. [REIT](a) |
447,000 | 28,907,490 | ||||
| Brandywine Realty Trust [REIT] |
75,500 | 2,218,945 | ||||
| Brookfield Properties Corp. (Canada) |
302,800 | 11,354,842 | ||||
| CarrAmerica Realty Corp. [REIT] |
148,900 | 4,913,700 | ||||
| Equity Office Properties Trust [REIT] |
281,000 | 8,182,720 | ||||
| Highwoods Properties, Inc. [REIT] |
90,500 | 2,506,850 | ||||
| Kilroy Realty Corp. [REIT] |
108,000 | 4,617,000 | ||||
| Mack-Cali Realty Corp. [REIT] |
103,600 | 4,768,708 | ||||
| Maguire Properties, Inc. [REIT] |
154,000 | 4,228,840 | ||||
| Prentiss Properties Trust [REIT] |
97,400 | 3,720,680 | ||||
| SL Green Realty Corp. [REIT] |
176,200 | 10,668,910 | ||||
| Trizec Properties, Inc. [REIT] |
34,400 | 650,848 | ||||
| 92,938,324 | ||||||
| OFFICE/INDUSTRIAL — 2.8% |
||||||
| Liberty Property Trust [REIT](a) |
121,300 | 5,240,160 | ||||
| Reckson Associates Realty Corp. [REIT] |
202,700 | 6,650,587 | ||||
| 11,890,747 | ||||||
| REGIONAL MALL — 17.8% |
||||||
| CBL & Associates Properties, Inc. [REIT] |
86,100 | 6,573,735 | ||||
| General Growth Properties, Inc. [REIT] |
325,100 | 11,755,616 | ||||
| Macerich Co. [REIT] |
167,500 | 10,519,000 | ||||
| Mills Corp. (The) [REIT](a) |
236,600 | 15,085,616 | ||||
| Simon Property Group, Inc. [REIT](a) |
360,500 | 23,313,535 | ||||
| Taubman Centers, Inc. [REIT] |
273,000 | 8,176,350 | ||||
| 75,423,852 | ||||||
| SELF STORAGE — 4.8% |
||||||
| Public Storage, Inc. [REIT] |
195,600 | 10,904,700 | ||||
| Shurgard Storage Centers, Inc. (Class “A” Stock) [REIT] |
216,700 | 9,536,967 | ||||
| 20,441,667 | ||||||
| SHOPPING CENTERS — 4.3% |
||||||
| Developers Diversified Realty Corp. [REIT] |
117,700 | 5,222,349 | ||||
| Federal Realty Investment Trust [REIT] |
116,000 | 5,991,400 | ||||
| Pan Pacific Retail Properties, Inc. [REIT] |
65,600 | 4,113,120 | ||||
| Regency Centers Corp. [REIT] |
52,200 | 2,891,880 | ||||
| 18,218,749 | ||||||
| TOTAL LONG TERM INVESTMENTS |
406,116,228 | |||||
| PRINCIPAL AMOUNT (000) |
||||||
| SHORT-TERM INVESTMENTS — 17.2% |
||||||
| CERTIFICATE OF DEPOSIT — 0.4% |
||||||
| Canadian Imperial Bank of Commerce |
||||||
| 2.372%, 01/31/05(b)(c) |
$ | 1,881 | 1,880,905 | |||
| COMMERCIAL PAPER — 0.8% |
||||||
| Citigroup Inc. |
||||||
| 2.304%, 01/10/05(b) |
3,358 | 3,351,633 | ||||
133
AST COHEN & STEERS REALTY PORTFOLIO
SCHEDULE OF INVESTMENTS (CONTINUED)
DECEMBER 31, 2004
| PRINCIPAL AMOUNT (000) |
VALUE (NOTE 2) |
||||||
| CORPORATE OBLIGATIONS — 4.8% |
|||||||
| Bear Stearns |
|||||||
| 2.28%, 01/03/05(b)(c) |
$ | 3,148 | $ | 3,147,895 | |||
| 2.28%, 01/03/05(b)(c) |
3,442 | 3,441,989 | |||||
| Goldman Sachs Group, Inc. |
|||||||
| 2.33%, 01/03/05(b)(c) |
1,269 | 1,269,401 | |||||
| Natexis Banque NY |
|||||||
| 2.297%, 01/03/05(b)(c) |
3,750 | 3,749,589 | |||||
| Swedbank NY |
|||||||
| 2.362%, 01/18/05(b)(c) |
8,786 | 8,784,788 | |||||
| 20,393,662 | |||||||
| TIME DEPOSIT — 0.6% |
|||||||
| Bank of America NA |
|||||||
| 1.50%, 01/03/05(b) |
2,619 | 2,618,880 | |||||
| SHARES |
|||||||
| NON-REGISTERED INVESTMENT COMPANY — 7.0% |
|||||||
| BlackRock Institutional Money Market Trust(b)(j) |
29,535,952 | $ | 29,535,952 | ||||
| REGISTERED INVESTMENT COMPANIES — 3.6% |
|||||||
| BlackRock Provident Institutional Funds TempCash Portfolio(j) |
7,554,233 | 7,554,233 | |||||
| BlackRock Provident Institutional Funds TempFund Portfolio(j) |
7,554,232 | 7,554,232 | |||||
| 15,108,465 | |||||||
| TOTAL SHORT-TERM INVESTMENTS |
72,889,497 | ||||||
| TOTAL INVESTMENTS — 113.1% |
479,005,725 | ||||||
| LIABILITIES IN EXCESS OF OTHER ASSETS — (13.1%) |
(55,525,825 | ) | |||||
| NET ASSETS — 100.0% |
$ | 423,479,900 | |||||
THE FOLLOWING ABBREVIATION IS USED THROUGHOUT THE SCHEDULE OF INVESTMENTS:
| REIT | Real Estate Investment Trust |
THE FOLLOWING ANNOTATIONS ARE USED THROUGHOUT THE SCHEDULE OF INVESTMENTS:
| (a) | All or a portion of securities on loan. Securities on loan have an aggregate market value of $56,117,279; cash collateral of $57,781,032 (included with liabilities) was received with which the portfolio purchased highly liquid short-term investments. |
| (b) | Represents security purchased with cash collateral for securities on loan. |
| (c) | Indicates a variable rate security. The maturity date presented for these instruments is the next date on which the rate of interest is adjusted. |
| (j) | Security available to institutional investors only. |
The industry classification of long-term portfolio holdings, short-term investments and liabilities in excess of other assets shown as a percentage of net assets as of December 31, 2004 were as follows:
| Office |
22.0 | % | |
| Apartment/Residential |
18.9 | ||
| Regional Mall |
17.8 | ||
| Industrial |
9.6 | ||
| Hotels & Motels |
7.5 | ||
| Diversified |
6.8 | ||
| Self Storage |
4.8 | ||
| Shopping Centers |
4.3 | ||
| Office/Industrial |
2.8 | ||
| Health Care |
1.4 | ||
| Short-Term Investments |
17.2 | ||
| 113.1 | |||
| Liabilities in excess of other assets |
(13.1 | ) | |
| 100.0 | % | ||
See Notes to Financial Statements.
134
AST SANFORD BERNSTEIN MANAGED INDEX 500 PORTFOLIO
SCHEDULE OF INVESTMENTS
DECEMBER 31, 2004
| SHARES |
VALUE (NOTE 2) | ||||
| LONG-TERM INVESTMENTS — 99.5% |
|||||
| COMMON STOCK |
|||||
| ADVERTISING — 0.1% |
|||||
| Interpublic Group of Cos., Inc. (The)*(a) |
61,100 | $ | 818,740 | ||
| AEROSPACE — 1.8% |
|||||
| Boeing Co. |
71,300 | 3,691,201 | |||
| Goodrich Corp. |
28,700 | 936,768 | |||
| United Technologies Corp. |
51,100 | 5,281,185 | |||
| 9,909,154 | |||||
| AUTOMOBILE MANUFACTURERS — 0.6% |
|||||
| General Motors Corp.(a) |
81,000 | 3,244,860 | |||
| AUTOMOTIVE PARTS — 0.3% |
|||||
| Delphi Corp.(a) |
177,600 | 1,601,952 | |||
| BEVERAGES — 1.7% |
|||||
| Coca-Cola Co. |
61,700 | 2,568,571 | |||
| PepsiCo, Inc. |
135,100 | 7,052,220 | |||
| 9,620,791 | |||||
| BROADCASTING — 0.4% |
|||||
| Univision Communications, Inc. (Class “A” Stock)* |
50,000 | 1,463,500 | |||
| Westwood One, Inc.* |
28,900 | 778,277 | |||
| 2,241,777 | |||||
| BUILDING MATERIALS — 1.0% |
|||||
| American Standard Cos., Inc.* |
57,000 | 2,355,240 | |||
| Masco Corp. |
66,400 | 2,425,592 | |||
| Sherwin-Williams Co. (The) |
13,900 | 620,357 | |||
| 5,401,189 | |||||
| BUSINESS SERVICES — 0.1% |
|||||
| Fiserv, Inc.* |
19,000 | 763,610 | |||
| CABLE TELEVISION — 0.4% |
|||||
| Comcast Corp. (Class “A” Stock)* |
64,800 | 2,156,544 | |||
| CHEMICALS — 1.5% |
|||||
| Dow Chemical Co. |
24,200 | 1,198,142 | |||
| DuPont, (E.I.) de Nemours & Co. |
52,200 | 2,560,410 | |||
| Eastman Chemical Co. |
9,000 | 519,570 | |||
| FMC Corp.* |
11,300 | 545,790 | |||
| Hercules, Inc.*(a) |
44,600 | 662,310 | |||
| Lubrizol Corp. |
35,700 | 1,315,902 | |||
| PPG Industries, Inc. |
22,000 | 1,499,520 | |||
| 8,301,644 | |||||
| CLOTHING & APPAREL — 0.3% |
|||||
| VF Corp. |
34,375 | 1,903,688 | |||
| COMPUTER HARDWARE — 3.7% |
|||||
| Dell, Inc.* |
195,185 | 8,225,096 | |||
| Hewlett-Packard Co. |
239,760 | 5,027,767 | |||
| Ingram Micro, Inc. (Class “A” Stock)* |
33,200 | 690,560 | |||
| International Business Machines Corp. |
70,600 | 6,959,748 | |||
| 20,903,171 | |||||
| COMPUTER SERVICES & SOFTWARE — 6.7% |
|||||
| Cisco Systems, Inc.* |
306,400 | 5,913,520 | |||
| Electronic Arts, Inc.* |
50,000 | 3,084,000 | |||
| Electronic Data Systems Corp. |
29,300 | 676,830 | |||
| EMC Corp.* |
143,400 | 2,132,358 | |||
| Mercury Interactive Corp.*(a) |
16,900 | 769,795 | |||
| Microsoft Corp. |
600,800 | 16,047,368 | |||
| Oracle Corp.* |
322,600 | 4,426,072 | |||
| Symantec Corp.* |
110,600 | 2,849,056 | |||
| Tech Data Corp.*(a) |
33,000 | 1,498,200 | |||
| 37,397,199 | |||||
| CONGLOMERATES — 3.4% |
|||||
| 3M Co. |
13,900 | 1,140,773 | |||
| Altria Group, Inc. |
154,900 | 9,464,390 | |||
| Cendant Corp. |
93,000 | 2,174,340 | |||
| Honeywell International, Inc. |
44,900 | 1,589,909 | |||
| Textron, Inc. |
20,000 | 1,476,000 | |||
| Tyco International Ltd. |
88,100 | 3,148,694 | |||
| 18,994,106 | |||||
| CONSTRUCTION — 0.3% |
|||||
| Lennar Corp. (Class “A” Stock) |
15,700 | 889,876 | |||
| Pulte Homes, Inc. |
12,800 | 816,640 | |||
| 1,706,516 | |||||
| CONSUMER PRODUCTS & SERVICES — 4.2% |
|||||
| Avon Products, Inc. |
74,000 | 2,863,800 | |||
| Fortune Brands, Inc. |
12,100 | 933,878 | |||
| Johnson & Johnson |
101,800 | 6,456,156 | |||
| Newell Rubbermaid, Inc. |
41,400 | 1,001,466 | |||
| Procter & Gamble Co. |
189,500 | 10,437,660 | |||
| Reynolds, (R.J.) Tobacco Holdings, Inc.(a) |
26,800 | 2,106,480 | |||
| 23,799,440 | |||||
| CONTAINERS & PACKAGING — 0.1% |
|||||
| Sonoco Products Co. |
20,500 | 607,825 | |||
| ELECTRONIC COMPONENTS & EQUIPMENT — 5.3% |
|||||
| Avnet, Inc.*(a) |
28,700 | 523,488 | |||
| Eastman Kodak Co.(a) |
47,700 | 1,538,325 | |||
| Emerson Electric Co. |
14,000 | 981,400 | |||
| Flextronics International Ltd.*(a) |
31,000 | 428,420 | |||
| General Electric Co. |
641,670 | 23,420,955 | |||
| Hubbell, Inc. (Class “B” Stock) |
21,000 | 1,098,300 | |||
| Solectron Corp.*(a) |
260,000 | 1,385,800 | |||
| Vishay Intertechnology, Inc.* |
25,000 | 375,500 | |||
| 29,752,188 | |||||
135
AST SANFORD BERNSTEIN MANAGED INDEX 500 PORTFOLIO
SCHEDULE OF INVESTMENTS (CONTINUED)
DECEMBER 31, 2004
| SHARES |
VALUE (NOTE 2) | ||||
| ENTERTAINMENT & LEISURE — 3.0% |
|||||
| Carnival Corp.(a) |
30,900 | $ | 1,780,767 | ||
| Disney, (Walt) Co. |
47,100 | 1,309,380 | |||
| Harley-Davidson, Inc.(a) |
50,600 | 3,073,950 | |||
| International Game Technology Group, Inc.(a) |
59,000 | 2,028,420 | |||
| Time Warner, Inc.* |
358,000 | 6,959,520 | |||
| Viacom, Inc. (Class “B” Stock) |
50,400 | 1,834,056 | |||
| 16,986,093 | |||||
| FARMING & AGRICULTURE — 0.3% |
|||||
| Bunge Ltd.(a) |
32,300 | 1,841,423 | |||
| FINANCIAL — BANK & TRUST — 5.5% |
|||||
| Bank of America Corp. |
213,252 | 10,020,711 | |||
| Comerica, Inc. |
43,300 | 2,642,166 | |||
| Commerce Bancorp, Inc.(a) |
25,000 | 1,610,000 | |||
| Huntington Bancshares, Inc.(a) |
34,200 | 847,476 | |||
| National City Corp. |
95,400 | 3,582,270 | |||
| North Fork Bancorp, Inc. |
31,950 | 921,758 | |||
| Regions Financial Corp. |
15,176 | 540,114 | |||
| SunTrust Banks, Inc. |
45,000 | 3,324,600 | |||
| U.S. Bancorp |
71,000 | 2,223,720 | |||
| Wachovia Corp. |
62,800 | 3,303,280 | |||
| Wells Fargo & Co. |
30,800 | 1,914,220 | |||
| 30,930,315 | |||||
| FINANCIAL SERVICES — 9.6% |
|||||
| American Express Co.(a) |
61,000 | 3,438,570 | |||
| Bank of New York Co., Inc. (The) |
30,300 | 1,012,626 | |||
| Citigroup, Inc. |
342,900 | 16,520,921 | |||
| Fannie Mae |
9,500 | 676,495 | |||
| Franklin Resources, Inc. |
900 | 62,685 | |||
| Goldman Sachs Group, Inc. |
26,900 | 2,798,676 | |||
| JP Morgan Chase & Co. |
196,776 | 7,676,232 | |||
| KeyCorp(a) |
76,000 | 2,576,400 | |||
| Legg Mason, Inc. |
21,750 | 1,593,405 | |||
| Lehman Brothers Holdings, Inc.(a) |
41,300 | 3,612,924 | |||
| MBNA Corp. |
183,500 | 5,172,865 | |||
| Merrill Lynch & Co., Inc. |
59,000 | 3,526,430 | |||
| Morgan Stanley Dean Witter & Co. |
46,900 | 2,603,888 | |||
| PNC Financial Services Group |
39,100 | 2,245,904 | |||
| 53,518,021 | |||||
| FOOD — 1.3% |
|||||
| Albertson’s, Inc.(a) |
23,200 | 554,016 | |||
| Archer-Daniels-Midland Co. |
52,808 | 1,178,146 | |||
| Dean Foods Co.* |
20,800 | 685,360 | |||
| General Mills, Inc. |
63,500 | 3,156,585 | |||
| Safeway, Inc.*(a) |
86,100 | 1,699,614 | |||
| 7,273,721 | |||||
| HEALTHCARE SERVICES — 2.4% |
|||||
| Caremark Rx, Inc.*(a) |
85,700 | 3,379,151 | |||
| HCA, Inc.(a) |
24,200 | 967,032 | |||
| Health Management Associates, Inc. (Class “A” Stock)(a) |
80,000 | 1,817,600 | |||
| UnitedHealth Group, Inc. |
86,000 | 7,570,580 | |||
| 13,734,363 | |||||
| INDUSTRIAL PRODUCTS — 0.2% |
|||||
| Cooper Industries Ltd. (Class “A” Stock) |
13,900 | 943,671 | |||
| INSURANCE — 6.4% |
|||||
| ACE Ltd. |
42,500 | 1,816,875 | |||
| AFLAC, Inc. |
21,300 | 848,592 | |||
| Allstate Corp. (The) |
32,000 | 1,655,040 | |||
| American International Group, Inc. |
183,487 | 12,049,591 | |||
| Axis Capital Holdings Ltd. |
45,400 | 1,242,144 | |||
| Chubb Corp.(a) |
33,900 | 2,606,910 | |||
| CIGNA Corp. |
20,200 | 1,647,714 | |||
| Hartford Financial Services Group, Inc. (The) |
47,100 | 3,264,501 | |||
| Lincoln National Corp. |
44,800 | 2,091,264 | |||
| St. Paul Cos., Inc. |
64,695 | 2,398,244 | |||
| WellPoint, Inc.* |
35,300 | 4,059,500 | |||
| XL Capital Ltd. (Class “A” Stock)(a) |
30,500 | 2,368,325 | |||
| 36,048,700 | |||||
| INTERNET SERVICES — 3.3% |
|||||
| eBay, Inc.* |
82,800 | 9,627,984 | |||
| Juniper Networks, Inc.*(a) |
67,100 | 1,824,449 | |||
| Yahoo!, Inc.*(a) |
182,200 | 6,865,296 | |||
| 18,317,729 | |||||
| MACHINERY & EQUIPMENT — 0.4% |
|||||
| Eaton Corp. |
28,700 | 2,076,732 | |||
| MEDICAL SUPPLIES & EQUIPMENT — 4.2% |
|||||
| Abbott Laboratories |
17,700 | 825,705 | |||
| Alcon, Inc. (Switzerland) |
16,600 | 1,337,960 | |||
| Amgen, Inc.* |
132,200 | 8,480,630 | |||
| Applera Corp. — Applied Biosystems Group |
55,000 | 1,150,050 | |||
| Beckman Coulter, Inc. |
22,200 | 1,487,178 | |||
| Boston Scientific Corp.* |
124,200 | 4,415,310 | |||
| St. Jude Medical, Inc.* |
68,000 | 2,851,240 | |||
| Zimmer Holdings, Inc.* |
40,400 | 3,236,848 | |||
| 23,784,921 | |||||
| METALS & MINING — 0.9% |
|||||
| Alcan, Inc. (Canada) |
19,000 | 931,760 | |||
| Alcoa, Inc. |
29,800 | 936,316 | |||
| United States Steel Corp.(a) |
50,400 | 2,583,000 | |||
| Worthington Industries, Inc. |
29,200 | 571,736 | |||
| 5,022,812 | |||||
136
AST SANFORD BERNSTEIN MANAGED INDEX 500 PORTFOLIO
SCHEDULE OF INVESTMENTS (CONTINUED)
DECEMBER 31, 2004
| SHARES |
VALUE (NOTE 2) | ||||
| OFFICE EQUIPMENT — 0.1% |
|||||
| Pitney Bowes, Inc. |
13,000 | $ | 601,640 | ||
| OIL & GAS — 6.5% |
|||||
| Baker Hughes, Inc. |
47,400 | 2,022,558 | |||
| BP PLC [ADR] (United Kingdom) |
18,100 | 1,057,040 | |||
| ChevronTexaco Corp. |
127,876 | 6,714,769 | |||
| ConocoPhillips |
56,453 | 4,901,814 | |||
| El Paso Corp. |
79,500 | 826,800 | |||
| Exxon Mobil Corp. |
256,900 | 13,168,694 | |||
| FMC Technologies, Inc.* |
16,100 | 518,420 | |||
| Marathon Oil Corp. |
48,000 | 1,805,280 | |||
| Nabors Industries Ltd.* |
36,500 | 1,872,085 | |||
| Occidental Petroleum Corp. |
38,300 | 2,235,188 | |||
| XTO Energy, Inc. |
46,000 | 1,627,480 | |||
| 36,750,128 | |||||
| PAPER & FOREST PRODUCTS — 0.5% |
|||||
| Georgia-Pacific Corp. |
14,700 | 550,956 | |||
| International Paper Co. |
38,600 | 1,621,200 | |||
| Temple-Inland, Inc. |
9,100 | 622,440 | |||
| 2,794,596 | |||||
| PERSONAL SERVICES — 0.5% |
|||||
| Apollo Group, Inc. (Class “A” Stock)*(a) |
33,400 | 2,695,714 | |||
| PHARMACEUTICALS — 3.4% |
|||||
| Bristol-Meyers Squibb Co.(a) |
60,600 | 1,552,572 | |||
| Cephalon, Inc.* |
24,000 | 1,221,120 | |||
| Forest Laboratories, Inc.*(a) |
54,600 | 2,449,356 | |||
| Lilly, (Eli) & Co. |
6,500 | 368,875 | |||
| Merck & Co., Inc.(a) |
41,200 | 1,324,168 | |||
| Pfizer, Inc. |
461,120 | 12,399,517 | |||
| 19,315,608 | |||||
| PRINTING & PUBLISHING — 0.3% |
|||||
| Donnelley, (R.R.) & Sons Co. |
48,000 | 1,693,920 | |||
| RAILROADS — 0.7% |
|||||
| Burlington Northern Santa Fe Corp. |
15,000 | 709,650 | |||
| CSX Corp. |
47,300 | 1,895,784 | |||
| Norfolk Southern Corp. |
38,400 | 1,389,696 | |||
| 3,995,130 | |||||
| REAL ESTATE — 0.5% |
|||||
| Equity Office Properties Trust [REIT] |
44,500 | 1,295,840 | |||
| Equity Residential Properties Trust [REIT] |
35,000 | 1,266,300 | |||
| 2,562,140 | |||||
| RESTAURANTS — 1.4% |
|||||
| McDonald’s Corp. |
63,200 | 2,026,192 | |||
| Starbucks Corp.*(a) |
69,000 | 4,302,840 | |||
| Wendy’s International, Inc. |
33,000 | 1,295,580 | |||
| 7,624,612 | |||||
| RETAIL & MERCHANDISING — 7.1% |
|||||
| Bed Bath & Beyond, Inc.* |
31,400 | 1,250,662 | |||
| Federated Department Stores, Inc. |
33,900 | 1,959,081 | |||
| Home Depot, Inc. |
178,700 | 7,637,638 | |||
| Lowe’s Cos., Inc.(a) |
108,400 | 6,242,756 | |||
| May Department Stores Co.(a) |
39,500 | 1,161,300 | |||
| OfficeMax, Inc. |
21,400 | 671,532 | |||
| Rite Aid Corp.* |
183,100 | 670,146 | |||
| Saks, Inc.(a) |
30,000 | 435,300 | |||
| SUPERVALU, Inc. |
31,900 | 1,101,188 | |||
| Target Corp. |
94,300 | 4,896,999 | |||
| TJX Cos., Inc. |
100,100 | 2,515,513 | |||
| Wal-Mart Stores, Inc. |
171,200 | 9,042,784 | |||
| Williams-Sonoma, Inc.* |
51,500 | 1,804,560 | |||
| 39,389,459 | |||||
| SEMICONDUCTORS — 1.5% |
|||||
| Broadcom Corp. (Class “A” Stock)* |
36,900 | 1,191,132 | |||
| Freescale Semiconductor, Inc. (Class “B” Stock)* |
8,612 | 158,116 | |||
| Intel Corp. |
268,880 | 6,289,104 | |||
| Marvell Technology Group Ltd.* |
26,600 | 943,502 | |||
| 8,581,854 | |||||
| TELECOMMUNICATIONS — 4.3% |
|||||
| ALLTEL Corp. |
14,000 | 822,640 | |||
| BellSouth Corp. |
76,000 | 2,112,040 | |||
| Corning, Inc.* |
78,000 | 918,060 | |||
| Lucent Technologies, Inc.* |
259,000 | 973,840 | |||
| Motorola, Inc. |
78,000 | 1,341,600 | |||
| Nextel Communications, Inc. (Class “A” Stock)*(a) |
67,400 | 2,022,000 | |||
| Qualcomm, Inc. |
124,000 | 5,257,600 | |||
| SBC Communications, Inc. |
145,200 | 3,741,804 | |||
| Sprint Corp. |
64,000 | 1,590,400 | |||
| Tellabs, Inc.* |
70,000 | 601,300 | |||
| Verizon Communications, Inc. |
117,700 | 4,768,027 | |||
| 24,149,311 | |||||
| TRANSPORTATION — 1.1% |
|||||
| United Parcel Service, Inc. (Class “B” Stock)(a) |
71,600 | 6,118,936 | |||
| UTILITIES — 2.2% |
|||||
| American Electric Power Co., Inc.(a) |
61,160 | 2,100,234 | |||
| Constellation Energy Group, Inc. |
20,700 | 904,797 | |||
| DTE Energy Co.(a) |
42,000 | 1,811,460 | |||
| Entergy Corp. |
26,500 | 1,791,135 | |||
| FirstEnergy Corp. |
50,500 | 1,995,255 | |||
| FPL Group, Inc. |
5,600 | 418,600 | |||
| PPL Corp. |
15,900 | 847,152 | |||
137
AST SANFORD BERNSTEIN MANAGED INDEX 500 PORTFOLIO
SCHEDULE OF INVESTMENTS (CONTINUED)
DECEMBER 31, 2004
| SHARES |
VALUE (NOTE 2) |
||||||
| Progress Energy, Inc. |
42,500 | $ | 1,922,700 | ||||
| Sempra Energy |
22,900 | 839,972 | |||||
| 12,631,305 | |||||||
| TOTAL LONG-TERM INVESTMENTS |
558,507,248 | ||||||
| PRINCIPAL AMOUNT (000) |
|||||||
| SHORT-TERM INVESTMENTS — 10.4% |
|||||||
| CERTIFICATES OF DEPOSIT — 1.0% |
|||||||
| Canadian Imperial Bank of Commerce |
|||||||
| 1.72%, 05/25/05(b)(c) |
$ | 3,026 | 3,025,125 | ||||
| First Boston Corp. |
|||||||
| 2.36%, 01/24/05(b) |
1,263 | 1,262,630 | |||||
| Societe Generale |
|||||||
| 2.357%, 01/14/05(b) |
955 | 954,405 | |||||
| UBS Bank |
|||||||
| 2.315%, 01/18/05(b) |
105 | 105,118 | |||||
| 5,347,278 | |||||||
| COMMERCIAL PAPER |
|||||||
| Citigroup, Inc. |
|||||||
| 2.304%, 01/10/05(b) |
22 | 21,786 | |||||
| CORPORATE OBLIGATIONS — 7.4% |
|||||||
| Bear Stearns |
|||||||
| 2.28%, 01/03/05(b)(c) |
2,460 | 2,459,670 | |||||
| 2.28%, 01/03/05(b)(c) |
180 | 179,928 | |||||
| Goldman Sachs Group, Inc. |
|||||||
| 2.33%, 01/03/05(b)(c) |
8,692 | 8,691,531 | |||||
| Merrill Lynch & Co., Inc. |
|||||||
| 2.38%, 01/03/05(b)(c) |
11,625 | 11,624,810 | |||||
| Morgan Stanley |
|||||||
| 2.33%, 01/03/05(b)(c) |
3,174 | 3,174,290 | |||||
| 2.33%, 01/03/05(b)(c) |
4,655 | 4,655,074 | |||||
| Natexis Banque NY |
|||||||
| 2.297%, 01/03/05(b)(c) |
7,008 | 7,007,179 | |||||
| Sedna Finance Corporation |
|||||||
| 2.372%, 01/14/05(b)(c) |
479 | 478,899 | |||||
| Swedbank NY |
|||||||
| 2.362%, 01/18/05(b)(c) |
3,987 | 3,986,611 | |||||
| 42,257,992 | |||||||
| TIME DEPOSIT — 0.5% |
|||||||
| Bank of America NA |
|||||||
| 1.50%, 01/03/05(b) |
2,554 | 2,554,326 | |||||
| SHARES |
|||||||
| NON-REGISTERED INVESTMENT COMPANY — 1.0% |
|||||||
| BlackRock Institutional Money Market Trust(b)(j) |
5,597,143 | 5,597,143 | |||||
| REGISTERED INVESTMENT COMPANIES — 0.5% |
|||||||
| BlackRock Provident Institutional Funds TempCash Portfolio(j) |
1,370,653 | 1,370,653 | |||||
| BlackRock Provident Institutional Funds TempFund Portfolio(j) |
1,370,653 | 1,370,653 | |||||
| 2,741,306 | |||||||
| TOTAL SHORT-TERM INVESTMENTS |
58,519,831 | ||||||
| TOTAL INVESTMENTS — 109.9% |
617,027,079 | ||||||
| LIABILITIES IN EXCESS OF OTHER ASSETS — (9.9%) |
(55,361,321 | ) | |||||
| NET ASSETS — 100.0% |
$ | 561,665,758 | |||||
THE FOLLOWING ABBREVIATIONS ARE USED THROUGHOUT THE SCHEDULE OF INVESTMENTS:
| ADR | American Depository Receipt |
| REIT | Real Estate Investment Trust |
THE FOLLOWING ANNOTATIONS ARE USED THROUGHOUT THE SCHEDULE OF INVESTMENTS:
| * | Non-income producing security.\ |
| (a) | All or a portion of securities on loan. Securities on loan have an aggregate market value of $53,818,285; cash collateral of $55,778,525 (included with liabilities) was received with which the portfolio purchased highly liquid short-term investments. |
| (b) | Represents security purchased with cash collateral for securities on loan. |
| (c) | Indicates a variable rate security. The maturity date presented for these instruments is the next date on which the rate of interest is adjusted. |
| (j) | Security available to institutional investors only. |
138
AST SANFORD BERNSTEIN MANAGED INDEX 500 PORTFOLIO
SCHEDULE OF INVESTMENTS (CONTINUED)
DECEMBER 31, 2004
The industry classification of long-term portfolio holdings, short-term investments and liabilities in excess of other assets shown as a percentage of net assets as of December 31, 2004 were as follows:
| Financial Services |
9.6 | % | |
| Retail & Merchandising |
7.1 | ||
| Computer Services & Software |
6.7 | ||
| Oil & Gas |
6.5 | ||
| Insurance |
6.4 | ||
| Financial — Bank & Trust |
5.5 | ||
| Electronic Components & Equipment |
5.3 | ||
| Telecommunications |
4.3 | ||
| Consumer Products & Services |
4.2 | ||
| Medical Supplies & Equipment |
4.2 | ||
| Computer Hardware |
3.7 | ||
| Conglomerates |
3.4 | ||
| Pharmaceuticals |
3.4 | ||
| Internet Services |
3.3 | ||
| Entertainment & Leisure |
3.0 | ||
| Healthcare Services |
2.4 | ||
| Utilities |
2.2 | ||
| Aerospace |
1.8 | ||
| Beverages |
1.7 | ||
| Chemicals |
1.5 | ||
| Semiconductors |
1.5 | ||
| Restaurants |
1.4 | ||
| Food |
1.3 | ||
| Transportation |
1.1 | ||
| Building Materials |
1.0 | ||
| Metals & Mining |
0.9 | ||
| Railroads |
0.7 | ||
| Automobile Manufactures |
0.6 | ||
| Paper & Forest Products |
0.5 | ||
| Personal Services |
0.5 | ||
| Real Estate |
0.5 | ||
| Broadcasting |
0.4 | ||
| Cable Television |
0.4 | ||
| Machinery & Equipment |
0.4 | ||
| Automotive Parts |
0.3 | ||
| Clothing & Apparel |
0.3 | ||
| Construction |
0.3 | ||
| Farming & Agriculture |
0.3 | ||
| Printing & Publishing |
0.3 | ||
| Industrial Products |
0.2 | ||
| Advertising |
0.1 | ||
| Business Services |
0.1 | ||
| Containers & Packaging |
0.1 | ||
| Office Equipment |
0.1 | ||
| Short-Term Investments |
10.4 | ||
| 109.9 | |||
| Liabilities in excess of other assets |
(9.9 | ) | |
| 100.0 | % | ||
See Notes to Financial Statements.
139
AST AMERICAN CENTURY INCOME & GROWTH PORTFOLIO
SCHEDULE OF INVESTMENTS
DECEMBER 31, 2004
| SHARES |
VALUE (NOTE 2) | ||||
| LONG-TERM INVESTMENTS — 98.5% |
|||||
| COMMON STOCK — 98.0% |
|||||
| AEROSPACE — 1.1% |
|||||
| Boeing Co.(a) |
81,217 | $ | 4,204,605 | ||
| Northrop Grumman Corp. |
8,665 | 471,029 | |||
| United Technologies Corp. |
878 | 90,741 | |||
| 4,766,375 | |||||
| AIRLINES — 0.1% |
|||||
| Delta Air Lines, Inc.*(a) |
6,780 | 50,714 | |||
| Southwest Airlines Co. |
32,255 | 525,112 | |||
| 575,826 | |||||
| AUTOMOBILE MANUFACTURERS — 2.5% |
|||||
| Ford Motor Co.(a) |
788,287 | 11,540,524 | |||
| AUTOMOTIVE PARTS — 0.3% |
|||||
| Magna International, Inc. (Class “A” Stock) |
17,556 | 1,449,248 | |||
| BEVERAGES — 0.7% |
|||||
| Coca-Cola Co. |
5,888 | 245,117 | |||
| Coors, (Adolph) Co. (Class “B” Stock)(a) |
33,102 | 2,504,829 | |||
| PepsiCo, Inc. |
7,217 | 376,727 | |||
| 3,126,673 | |||||
| BROADCASTING — 0.1% |
|||||
| Clear Channel Communications, Inc.(a) |
5,377 | 180,076 | |||
| Fox Entertainment Group, Inc. (Class “A” Stock)* |
7,236 | 226,197 | |||
| 406,273 | |||||
| BUSINESS SERVICES |
|||||
| Fiserv, Inc.*(a) |
1,121 | 45,053 | |||
| CABLE TELEVISION |
|||||
| Comcast Corp. (Class “A” Stock)*(a) |
1,344 | 44,728 | |||
| EchoStar Communications Corp. (Class “A” Stock)(a) |
1,342 | 44,608 | |||
| 89,336 | |||||
| CHEMICALS — 0.2% |
|||||
| Dow Chemical Co.(a) |
7,750 | 383,703 | |||
| PPG Industries, Inc. |
5,219 | 355,727 | |||
| Praxair, Inc. |
2,235 | 98,675 | |||
| 838,105 | |||||
| COMPUTER HARDWARE — 4.9% |
|||||
| Dell, Inc.*(a) |
2,351 | 99,071 | |||
| Hewlett-Packard Co.(a) |
277,919 | 5,827,961 | |||
| Ingram Micro, Inc. (Class “A” Stock)* |
84,327 | 1,754,002 | |||
| International Business Machines Corp.(a) |
145,289 | 14,322,590 | |||
| Lexmark International, Inc.*(a) |
1,677 | 142,545 | |||
| 22,146,169 | |||||
| COMPUTER SERVICES & SOFTWARE — 3.8% |
|||||
| Cisco Systems, Inc.*(a) |
97,726 | 1,886,112 | |||
| Computer Sciences Corp.*(a) |
105,376 | 5,940,045 | |||
| Microsoft Corp. |
332,718 | 8,886,898 | |||
| Tech Data Corp.*(a) |
7,018 | 318,617 | |||
| Veritas Software Corp.* |
3,305 | 94,358 | |||
| 17,126,030 | |||||
| CONGLOMERATES — 3.2% |
|||||
| Altria Group, Inc.(a) |
76,287 | 4,661,136 | |||
| Cendant Corp.(a) |
243,035 | 5,682,158 | |||
| Tyco International Ltd.(a) |
110,950 | 3,965,353 | |||
| 14,308,647 | |||||
| CONSUMER PRODUCTS & SERVICES — 6.9% |
|||||
| American Greetings Corp. (Class “A” Stock) |
20,265 | 513,718 | |||
| Black & Decker Corp.(a) |
22,525 | 1,989,633 | |||
| Colgate-Palmolive Co. |
1,865 | 95,413 | |||
| Johnson & Johnson(a) |
238,923 | 15,152,497 | |||
| Kimberly-Clark Corp. |
52,031 | 3,424,160 | |||
| Newell Rubbermaid, Inc.(a) |
11,546 | 279,298 | |||
| Procter & Gamble Co. |
59,054 | 3,252,694 | |||
| Reynolds, (R.J.) Tobacco Holdings, Inc.(a) |
64,292 | 5,053,351 | |||
| Whirlpool Corp.(a) |
19,408 | 1,343,228 | |||
| 31,103,992 | |||||
| ELECTRONIC COMPONENTS & EQUIPMENT — 1.9% |
|||||
| Arrow Electronics, Inc.*(a) |
44,152 | 1,072,894 | |||
| Eastman Kodak Co.(a) |
143,783 | 4,637,001 | |||
| General Electric Co. |
75,903 | 2,770,460 | |||
| 8,480,355 | |||||
| ENTERTAINMENT & LEISURE — 4.4% |
|||||
| Disney, (Walt) Co.(a) |
274,060 | 7,618,868 | |||
| Harley-Davidson, Inc.(a) |
725 | 44,044 | |||
| Regal Entertainment Group (Class “A” Stock)(a) |
91,850 | 1,905,888 | |||
| Time Warner, Inc.*(a) |
449,557 | 8,739,387 | |||
| Viacom, Inc. (Class “B” Stock) |
41,684 | 1,516,881 | |||
| 19,825,068 | |||||
| FARMING & AGRICULTURE — 0.3% |
|||||
| Monsanto Co.(a) |
27,610 | 1,533,736 | |||
| FINANCIAL — BANK & TRUST — 9.7% |
|||||
| Bank of America Corp.(a) |
460,605 | 21,643,828 | |||
| Comerica, Inc. |
9,342 | 570,049 | |||
| Flagstar Bancorp, Inc.(a) |
20,990 | 474,374 | |||
| Fremont General Corp.(a) |
17,800 | 448,204 | |||
140
AST AMERICAN CENTURY INCOME & GROWTH PORTFOLIO
SCHEDULE OF INVESTMENTS (CONTINUED)
DECEMBER 31, 2004
| SHARES |
VALUE (NOTE 2) | ||||
| National City Corp. |
299,481 | $ | 11,245,511 | ||
| Wachovia Corp. |
113,081 | 5,948,061 | |||
| Wells Fargo & Co.(a) |
65,564 | 4,074,803 | |||
| 44,404,830 | |||||
| FINANCIAL SERVICES — 4.7% |
|||||
| American Express Co.(a) |
6,523 | 367,702 | |||
| Capital One Financial Corp.(a) |
50,884 | 4,284,941 | |||
| Citigroup, Inc.(a) |
82,000 | 3,950,760 | |||
| Countrywide Financial Corp. |
243,104 | 8,997,278 | |||
| Fannie Mae(a) |
22,293 | 1,587,485 | |||
| Goldman Sachs Group, Inc.(a) |
2,775 | 288,711 | |||
| Legg Mason, Inc.(a) |
2,328 | 170,549 | |||
| Lehman Brothers Holdings, Inc. |
4,172 | 364,967 | |||
| Merrill Lynch & Co., Inc.(a) |
5,754 | 343,917 | |||
| Raymond James Financial, Inc. |
25,996 | 805,356 | |||
| 21,161,666 | |||||
| FOOD — 1.8% |
|||||
| Corn Products International, Inc. |
32,522 | 1,741,878 | |||
| Pilgrim’s Pride Corp. |
31,740 | 973,783 | |||
| Sanderson Farms, Inc. |
17,036 | 737,318 | |||
| Tyson Foods, Inc. (Class “A” Stock)(a) |
255,541 | 4,701,955 | |||
| 8,154,934 | |||||
| HEALTHCARE SERVICES — 0.1% |
|||||
| Humana, Inc.* |
13,091 | 388,672 | |||
| INDUSTRIAL PRODUCTS — 0.2% |
|||||
| SPX Corp.(a) |
24,080 | 964,645 | |||
| INSURANCE — 6.4% |
|||||
| ACE Ltd.(a) |
105,438 | 4,507,475 | |||
| American Financial Group, Inc. |
23,905 | 748,466 | |||
| American International Group, Inc.(a) |
6,111 | 401,309 | |||
| AON Corp.(a) |
83,311 | 1,987,800 | |||
| Berkley, (W.R.) Corp.(a) |
51,407 | 2,424,868 | |||
| CIGNA Corp.(a) |
131,285 | 10,708,917 | |||
| Fidelity National Financial, Inc.(a) |
18,486 | 844,256 | |||
| First American Corp. |
136,304 | 4,789,723 | |||
| Hartford Financial Services Group, Inc. (The)(a) |
6,420 | 444,970 | |||
| Lincoln National Corp. |
31,750 | 1,482,090 | |||
| St. Paul Cos., Inc.(a) |
22,766 | 843,936 | |||
| 29,183,810 | |||||
| INTERNET SERVICES — 1.8% |
|||||
| CheckFree Corp.*(a) |
10,071 | 383,504 | |||
| EarthLink, Inc.*(a) |
380,350 | 4,381,631 | |||
| Sabre Holdings Corp. (Class “A” Stock)(a) |
74,997 | 1,661,934 | |||
| United Online, Inc.* |
131,651 | 1,517,936 | |||
| VeriSign, Inc.*(a) |
9,911 | 332,217 | |||
| 8,277,222 | |||||
| MACHINERY & EQUIPMENT — 0.5% |
|||||
| Caterpillar, Inc. |
2,689 | 262,204 | |||
| Cummins, Inc. |
21,636 | 1,812,881 | |||
| Eaton Corp. |
4,298 | 311,003 | |||
| 2,386,088 | |||||
| MEDICAL SUPPLIES & EQUIPMENT — 2.2% |
|||||
| Abbott Laboratories |
7,238 | 337,653 | |||
| AmerisourceBergen Corp. |
72,814 | 4,272,725 | |||
| Amgen, Inc.*(a) |
6,348 | 407,224 | |||
| Applera Corp. — Applied Biosystems Group |
88,792 | 1,856,641 | |||
| Bard, (C.R.), Inc. |
2,666 | 170,571 | |||
| Baxter International, Inc. |
5,701 | 196,913 | |||
| Becton, Dickinson & Co. |
43,153 | 2,451,090 | |||
| Genzyme Corp.* |
2,576 | 149,588 | |||
| Guidant Corp. |
1,510 | 108,871 | |||
| 9,951,276 | |||||
| METALS & MINING — 0.9% |
|||||
| Phelps Dodge Corp.(a) |
33,194 | 3,283,551 | |||
| United States Steel Corp. |
14,329 | 734,361 | |||
| 4,017,912 | |||||
| OFFICE EQUIPMENT |
|||||
| Xerox Corp.* |
7,037 | 119,699 | |||
| OIL & GAS — 8.6% |
|||||
| ChevronTexaco Corp. |
405,242 | 21,279,257 | |||
| ConocoPhillips |
40,303 | 3,499,509 | |||
| Exxon Mobil Corp. |
98,457 | 5,046,906 | |||
| Halliburton Co. |
1,358 | 53,288 | |||
| National Fuel Gas Co. |
5,234 | 148,332 | |||
| Nicor, Inc.(a) |
83,019 | 3,066,722 | |||
| Occidental Petroleum Corp. |
28,472 | 1,661,626 | |||
| Schlumberger Ltd. |
2,724 | 182,372 | |||
| Sunoco, Inc. |
54,985 | 4,492,824 | |||
| Unocal Corp. |
5,735 | 247,981 | |||
| 39,678,817 | |||||
| PAPER & FOREST PRODUCTS — 2.0% |
|||||
| Georgia-Pacific Corp.(a) |
74,049 | 2,775,357 | |||
| Louisiana-Pacific Corp.(a) |
146,264 | 3,911,099 | |||
| Weyerhaeuser Co.(a) |
38,438 | 2,583,802 | |||
| 9,270,258 | |||||
| PHARMACEUTICALS — 6.3% |
|||||
| Allergan, Inc. |
450 | 36,482 | |||
| Bristol-Meyers Squibb Co.(a) |
243,478 | 6,237,906 | |||
| Cardinal Health, Inc. |
33,704 | 1,959,888 | |||
| Gilead Sciences, Inc.* |
4,786 | 167,462 | |||
| Kos Pharmaceuticals, Inc.* |
31,435 | 1,183,213 | |||
| Lilly, (Eli) & Co. |
1,548 | 87,849 | |||
| Merck & Co., Inc.(a) |
277,197 | 8,909,112 | |||
141
AST AMERICAN CENTURY INCOME & GROWTH PORTFOLIO
SCHEDULE OF INVESTMENTS (CONTINUED)
DECEMBER 31, 2004
| SHARES |
VALUE (NOTE 2) | ||||
| Pfizer, Inc.(a) |
366,501 | $ | 9,855,212 | ||
| Wyeth |
2,909 | 123,894 | |||
| 28,561,018 | |||||
| PRINTING & PUBLISHING |
|||||
| New York Times Co. (Class “A” Stock)(a) |
899 | 36,679 | |||
| RAILROADS — 0.5% |
|||||
| Burlington Northern Santa Fe Corp. |
14,388 | 680,696 | |||
| CSX Corp. |
5,621 | 225,290 | |||
| Norfolk Southern Corp. |
16,150 | 584,469 | |||
| Union Pacific Corp.(a) |
12,541 | 843,382 | |||
| 2,333,837 | |||||
| REAL ESTATE — 2.3% |
|||||
| Apartment Investment & Management Co. (Class “A” Stock) [REIT] |
4,623 | 178,170 | |||
| CBL & Associates Properties, Inc. [REIT] |
80,529 | 6,148,389 | |||
| Colonial Properties Trust [REIT] |
25,713 | 1,009,750 | |||
| Equity Office Properties Trust [REIT] |
67,876 | 1,976,549 | |||
| Trizec Properties, Inc. [REIT] |
43,112 | 815,679 | |||
| Vornado Realty Trust [REIT] |
3,001 | 228,466 | |||
| 10,357,003 | |||||
| RESTAURANTS — 1.4% |
|||||
| McDonald’s Corp.(a) |
191,540 | 6,140,772 | |||
| RETAIL & MERCHANDISING — 4.7% |
|||||
| Barnes & Noble, Inc.* |
53,008 | 1,710,568 | |||
| Charming Shoppes, Inc.*(a) |
11,060 | 103,632 | |||
| CVS Corp.(a) |
1,514 | 68,236 | |||
| Federated Department Stores, Inc.(a) |
62,851 | 3,632,159 | |||
| Gamestop Corp. (Class “A” Stock)* |
19,835 | 444,502 | |||
| Home Depot, Inc.(a) |
7,867 | 336,236 | |||
| Kmart Holding Corp.* |
23,060 | 2,281,787 | |||
| May Department Stores Co.(a) |
202,629 | 5,957,293 | |||
| SUPERVALU, Inc.(a) |
197,314 | 6,811,280 | |||
| Target Corp.(a) |
1,865 | 96,849 | |||
| 21,442,542 | |||||
| SEMICONDUCTORS — 3.1% |
|||||
| Analog Devices, Inc. |
3,608 | 133,207 | |||
| Freescale Semiconductor, Inc. (Class “B” Stock)* |
35,316 | 648,402 | |||
| Intel Corp.(a) |
560,727 | 13,115,404 | |||
| Novellus Systems, Inc.* |
1,404 | 39,158 | |||
| Texas Instruments, Inc.(a) |
13,487 | 332,050 | |||
| 14,268,221 | |||||
| TELECOMMUNICATIONS — 5.4% |
|||||
| ALLTEL Corp. |
60,850 | 3,575,546 | |||
| Aspect Communications Corp.* |
2,995 | 33,364 | |||
| AT&T Corp.(a) |
43,228 | 823,926 | |||
| BellSouth Corp. |
142,377 | 3,956,657 | |||
| Harris Corp.(a) |
698 | 43,129 | |||
| Motorola, Inc.(a) |
319,855 | 5,501,507 | |||
| Nextel Communications, Inc. (Class “A” Stock)*(a) |
39,267 | 1,178,010 | |||
| Nortel Networks Corp. (Canada)* |
21,837 | 76,211 | |||
| SBC Communications, Inc.(a) |
127,460 | 3,284,644 | |||
| Sprint Corp.(a) |
58,241 | 1,447,289 | |||
| Verizon Communications, Inc. |
112,899 | 4,573,538 | |||
| 24,493,821 | |||||
| TRANSPORTATION — 1.1% |
|||||
| FedEx Corp.(a) |
10,293 | 1,013,758 | |||
| United Parcel Service, Inc. (Class “B” Stock)(a) |
44,463 | 3,799,808 | |||
| 4,813,566 | |||||
| UTILITIES — 3.9% |
|||||
| American Electric Power Co., Inc. |
19,886 | 682,885 | |||
| CenterPoint Energy, Inc.(a) |
163,114 | 1,843,188 | |||
| Constellation Energy Group, Inc. |
31,881 | 1,393,519 | |||
| Dominion Resources, Inc.(a) |
1,988 | 134,667 | |||
| Duke Energy Corp.(a) |
3,350 | 84,856 | |||
| Entergy Corp.(a) |
4,090 | 276,443 | |||
| Exelon Corp.(a) |
35,749 | 1,575,458 | |||
| FirstEnergy Corp. |
214,371 | 8,469,798 | |||
| FPL Group, Inc.(a) |
8,316 | 621,621 | |||
| Great Plains Energy, Inc.(a) |
23,968 | 725,751 | |||
| OGE Energy Corp. |
52,239 | 1,384,856 | |||
| TXU Corp. |
4,250 | 274,380 | |||
| UGI Corp. |
1,734 | 70,938 | |||
| 17,538,360 | |||||
| TOTAL COMMON STOCK |
445,307,058 | ||||
| PREFERRED STOCK — 0.5% |
|||||
| AUTOMOBILE MANUFACTURERS — 0.1% |
|||||
| General Motors Corp. (Class “B” Stock) 5.25%* [CVT] |
18,144 | 418,582 | |||
| FINANCIAL SERVICES — 0.2% |
|||||
| Ford Motor Co. Capital Trust II 6.50%* [CVT] |
14,767 | 779,550 | |||
142
AST AMERICAN CENTURY INCOME & GROWTH PORTFOLIO
SCHEDULE OF INVESTMENTS (CONTINUED)
DECEMBER 31, 2004
| SHARES |
VALUE (NOTE 2) |
||||||
| OFFICE EQUIPMENT — 0.2% |
|||||||
| Xerox Corp. |
|||||||
| 6.125% [CVT] |
6,311 | $ | 932,829 | ||||
| TOTAL PREFERRED STOCK |
2,130,961 | ||||||
| TOTAL LONG-TERM INVESTMENTS |
447,438,019 | ||||||
| PRINCIPAL AMOUNT (000) |
|||||||
| SHORT-TERM INVESTMENTS — 47.0% |
|||||||
| CERTIFICATES OF DEPOSIT — 10.9% |
|||||||
| Banco Santander PR |
|||||||
| 2.315%, 01/07/05(b)(c) |
$ | 168 | 168,278 | ||||
| Canadian Imperial Bank of Commerce |
|||||||
| 2.372%, 01/31/05(b)(c) |
6,558 | 6,556,684 | |||||
| 1.72%, 05/25/05(b) |
6,257 | 6,256,071 | |||||
| First Boston Corp. |
|||||||
| 2.36%, 01/24/05(b) |
20,480 | 20,479,561 | |||||
| Fortis Bank |
|||||||
| 2.055%, 06/08/05(b) |
1,550 | 1,549,367 | |||||
| Fortis Bank NY |
|||||||
| 1.775%, 06/06/05(b) |
391 | 390,781 | |||||
| Skandinaviska Enskilda Banken |
|||||||
| 2.35%, 01/28/05(b) |
12,963 | 12,962,524 | |||||
| UBS Bank |
|||||||
| 2.315%, 01/18/05(b) |
843 | 842,535 | |||||
| Westdeutsche Landesbank |
|||||||
| 1.50%, 01/10/05(b) |
179 | 178,995 | |||||
| 49,384,796 | |||||||
| COMMERCIAL PAPER — 2.1% |
|||||||
| Citigroup, Inc. |
|||||||
| 2.304%, 01/10/05(b) |
1,934 | 1,929,703 | |||||
| Ticonderoga Funding, LLC |
|||||||
| 2.35%, 01/14/05(b) |
7,530 | 7,517,784 | |||||
| 9,447,487 | |||||||
| CORPORATE OBLIGATIONS — 15.2% |
|||||||
| Bank of America NA |
|||||||
| 2.30%, 01/03/05(b)(c) |
44 | 43,859 | |||||
| Bear Stearns |
|||||||
| 2.28%, 01/03/05(b)(c) |
1,819 | 1,819,358 | |||||
| 2.28%, 01/03/05(b)(c) |
6,217 | 6,217,304 | |||||
| Goldman Sachs Group, Inc. |
|||||||
| 2.33%, 01/03/05(b)(c) |
14,095 | 14,095,129 | |||||
| Merrill Lynch & Co., Inc. |
|||||||
| 2.38%, 01/03/05(b)(c) |
15,205 | 15,204,764 | |||||
| Morgan Stanley |
|||||||
| 2.33%, 01/03/05(b)(c) |
2,835 | 2,834,958 | |||||
| 2.33%, 01/03/05(b)(c) |
304 | 303,512 | |||||
| Natexis Banque NY |
|||||||
| 2.297%, 01/03/05(b)(c) |
19,117 | 19,115,102 | |||||
| Sedna Finance Corporation |
|||||||
| 2.372%, 01/14/05(b)(c) |
5,937 | 5,936,897 | |||||
| Swedbank NY |
|||||||
| 2.362%, 01/18/05(b)(c) |
3,809 | 3,808,013 | |||||
| 69,378,896 | |||||||
| TIME DEPOSIT — 2.4% |
|||||||
| Bank of America NA |
|||||||
| 1.50%, 01/03/05(b) |
10,837 | 10,836,791 | |||||
| U.S. GOVERNMENT AGENCY OBLIGATIONS — 1.3% |
|||||||
| Federal Home Loan Banks |
|||||||
| 1.25%, 01/03/05 |
5,700 | 5,699,604 | |||||
| SHARES |
|||||||
| NON-REGISTERED INVESTMENT COMPANY — 14.9% |
|||||||
| BlackRock Institutional Money Market Trust(b)(j) |
67,543,195 | 67,543,195 | |||||
| REGISTERED INVESTMENT COMPANIES — 0.2% |
|||||||
| BlackRock Provident Institutional Funds TempCash Portfolio(j) |
445,666 | 445,666 | |||||
| BlackRock Provident Institutional Funds TempFund Portfolio(j) |
445,666 | 445,666 | |||||
| 891,332 | |||||||
| TOTAL SHORT-TERM INVESTMENTS |
213,182,101 | ||||||
| TOTAL INVESTMENTS — 145.5% |
660,620,120 | ||||||
| LIABILITIES IN EXCESS OF OTHER ASSETS — (45.5%) |
(206,708,552 | ) | |||||
| NET ASSETS — 100.0% |
$ | 453,911,568 | |||||
143
AST AMERICAN CENTURY INCOME & GROWTH PORTFOLIO
SCHEDULE OF INVESTMENTS (CONTINUED)
DECEMBER 31, 2004
THE FOLLOWING ABBREVIATIONS ARE USED THROUGHOUT THE SCHEDULE OF INVESTMENTS:
| CVT Convertible | Security |
| REIT | Real Estate Investment Trust |
THE FOLLOWING ANNOTATIONS ARE USED THROUGHOUT THE SCHEDULE OF INVESTMENTS:
| * | Non-income producing security. |
| (a) | All or a portion of securities on loan. Securities on loan have an aggregate market value of $199,475,384; cash collateral of $206,591,165 (included with liabilities) was received with which the portfolio purchased highly liquid short-term investments. |
| (b) | Represents security purchased with cash collateral for securities on loan. |
| (c) | Indicates a variable rate security. The maturity date presented for these instruments is the next date on which the rate of interest is adjusted. |
| (j) | Security available to institutional investors only. |
| Cash of $176,000 has been segregated with the custodian to cover requirements for the following open futures contracts at December 31, 2004: |
| NUMBER OF CONTRACTS |
TYPE |
EXPIRATION MONTH |
VALUE AT TRADE DATE |
VALUE AT DECEMBER 31, 2004 |
UNREALIZED APPRECIATION | ||||||||
| LONG POSITION: |
|||||||||||||
| 11 |
S&P 500 | Mar 05 | $ | 3,264,800 | $ | 3,337,675 | $ | 72,875 | |||||
The industry classification of long-term portfolio holdings, short-term investments and liabilities in excess of other assets shown as a percentage of net assets as of December 31, 2004 were as follows:
| Financial — Bank & Trust |
9.7 | % | |
| Oil & Gas |
8.6 | ||
| Consumer Products & Services |
6.9 | ||
| Insurance |
6.4 | ||
| Pharmaceuticals |
6.3 | ||
| Telecommunications |
5.4 | ||
| Computer Hardware |
4.9 | ||
| Financial Services |
4.9 | ||
| Retail & Merchandising |
4.7 | ||
| Entertainment & Leisure |
4.4 | ||
| Utilities |
3.9 | ||
| Computer Services & Software |
3.8 | ||
| Conglomerates |
3.2 | ||
| Semiconductors |
3.1 | ||
| Automobile Manufacturers |
2.6 | ||
| Real Estate |
2.3 | ||
| Medical Supplies & Equipment |
2.2 | ||
| Paper & Forest Products |
2.0 | ||
| Electronic Components & Equipment |
1.9 | ||
| Food |
1.8 | ||
| Internet Services |
1.8 | ||
| Restaurants |
1.4 | % | |
| Aerospace |
1.1 | ||
| Transportation |
1.1 | ||
| Metals & Mining |
0.9 | ||
| Beverages |
0.7 | ||
| Machinery & Equipment |
0.5 | ||
| Railroads |
0.5 | ||
| Automotive Parts |
0.3 | ||
| Farming & Agriculture |
0.3 | ||
| Chemicals |
0.2 | ||
| Industrial Products |
0.2 | ||
| Office Equipment |
0.2 | ||
| Airlines |
0.1 | ||
| Broadcasting |
0.1 | ||
| Healthcare Services |
0.1 | ||
| Short-Term Investments |
47.0 | ||
| 145.5 | |||
| Liabilities in excess of other assets |
(45.5 | ) | |
| 100.0 | % | ||
See Notes to Financial Statements.
144
AST ALLIANCE GROWTH AND INCOME PORTFOLIO
SCHEDULE OF INVESTMENTS
DECEMBER 31, 2004
| SHARES |
VALUE (NOTE 2) | ||||
| LONG TERM INVESTMENTS — 100.0% |
|||||
| COMMON STOCK AEROSPACE — 2.1% |
|||||
| General Dynamics Corp. |
73,200 | $ | 7,656,720 | ||
| Northrop Grumman Corp. |
300,000 | 16,308,000 | |||
| United Technologies Corp. |
196,500 | 20,308,275 | |||
| 44,272,995 | |||||
| BROADCASTING — 1.5% |
|||||
| Clear Channel Communications, Inc.(a) |
474,900 | 15,904,401 | |||
| Westwood One, Inc.*(a) |
648,100 | 17,453,333 | |||
| 33,357,734 | |||||
| BUILDING MATERIALS — 0.9% |
|||||
| American Standard Cos., Inc.*(a) |
457,200 | 18,891,504 | |||
| BUSINESS SERVICES — 1.0% |
|||||
| Fiserv, Inc.*(a) |
525,000 | 21,099,750 | |||
| CABLE TELEVISION — 1.9% |
|||||
| Comcast Corp. (Class “A” Stock)*(a) |
600,000 | 19,968,000 | |||
| Comcast Corp. (Special Class “A” Stock)*(a) |
625,000 | 20,525,000 | |||
| 40,493,000 | |||||
| CHEMICALS — 2.4% |
|||||
| Air Products & Chemicals, Inc. |
410,000 | 23,767,700 | |||
| DuPont, (E.I.) de Nemours & Co. |
584,200 | 28,655,010 | |||
| 52,422,710 | |||||
| COMPUTER HARDWARE — 0.8% |
|||||
| Hewlett-Packard Co. |
790,600 | 16,578,882 | |||
| COMPUTER SERVICES & SOFTWARE — 4.0% |
|||||
| Microsoft Corp. |
3,199,400 | 85,455,974 | |||
| CONGLOMERATES — 5.3% |
|||||
| 3M Co. |
247,700 | 20,328,739 | |||
| Altria Group, Inc. |
1,250,000 | 76,375,000 | |||
| Johnson Controls, Inc. |
275,000 | 17,446,000 | |||
| 114,149,739 | |||||
| CONSTRUCTION — 0.6% |
|||||
| D.R. Horton, Inc. |
199,200 | 8,029,752 | |||
| Pulte Corp. |
89,500 | 5,710,100 | |||
| 13,739,852 | |||||
| CONSUMER PRODUCTS & SERVICES — 5.2% |
|||||
| Avon Products, Inc.(a) |
1,125,000 | 43,537,500 | |||
| Fortune Brands, Inc. |
220,900 | 17,049,062 | |||
| Loews Corp. — Carolina Group |
600,000 | 17,370,000 | |||
| Procter & Gamble Co. |
600,000 | 33,048,000 | |||
| 111,004,562 | |||||
| ELECTRONIC COMPONENTS & EQUIPMENT — 4.7% |
|||||
| Emerson Electric Co.(a) |
200,000 | 14,020,000 | |||
| General Electric Co. |
2,358,400 | 86,081,600 | |||
| 100,101,600 | |||||
| ENTERTAINMENT & LEISURE — 6.6% |
|||||
| Harley-Davidson, Inc.(a) |
250,000 | 15,187,500 | |||
| Royal Caribbean Cruises Ltd.(a) |
100,000 | 5,444,000 | |||
| Time Warner, Inc.* |
1,750,000 | 34,020,000 | |||
| Viacom, Inc. (Class “B” Stock) |
2,424,600 | 88,231,194 | |||
| 142,882,694 | |||||
| FINANCIAL — BANK & TRUST — 4.7% |
|||||
| Bank of America Corp. |
1,348,700 | 63,375,413 | |||
| North Fork Bancorp, Inc. |
641,000 | 18,492,850 | |||
| Wachovia Corp. |
380,000 | 19,988,000 | |||
| 101,856,263 | |||||
| FINANCIAL SERVICES — 12.7% |
|||||
| Citigroup, Inc. |
1,994,000 | 96,070,920 | |||
| Fannie Mae(a) |
255,800 | 18,215,518 | |||
| J.P. Morgan Chase & Co. |
2,025,200 | 79,003,052 | |||
| MBNA Corp. |
883,600 | 24,908,684 | |||
| Merrill Lynch & Co., Inc. |
702,600 | 41,994,402 | |||
| Morgan Stanley Dean Witter & Co. |
282,900 | 15,706,608 | |||
| 275,899,184 | |||||
| FOOD — 0.4% |
|||||
| Dean Foods Co.* |
258,000 | 8,501,100 | |||
| HEALTHCARE SERVICES — 1.9% |
|||||
| Caremark Rx, Inc.*(a) |
383,900 | 15,137,177 | |||
| Health Management Associates, Inc. (Class “A” Stock)(a) |
406,600 | 9,237,952 | |||
| UnitedHealth Group, Inc. |
195,500 | 17,209,865 | |||
| 41,584,994 | |||||
| INDUSTRIAL PRODUCTS — 0.9% |
|||||
| Ingersoll-Rand Co., Ltd. (Class “A” Stock) |
239,800 | 19,255,940 | |||
| INSURANCE — 12.5% |
|||||
| ACE Ltd. |
1,240,800 | 53,044,200 | |||
| AFLAC, Inc. |
200,000 | 7,968,000 | |||
| Allstate Corp. (The) |
313,800 | 16,229,736 | |||
| American International Group, Inc. |
1,288,900 | 84,642,063 | |||
| Axis Capital Holdings Ltd.(a) |
800,000 | 21,888,000 | |||
| MetLife, Inc. |
397,100 | 16,086,521 | |||
| Wellpoint, Inc.* |
597,200 | 68,678,000 | |||
| 268,536,520 | |||||
| MACHINERY & EQUIPMENT — 0.1% |
|||||
| Deere & Co. |
33,900 | 2,522,160 | |||
145
AST ALLIANCE GROWTH AND INCOME PORTFOLIO
SCHEDULE OF INVESTMENTS (CONTINUED)
DECEMBER 31, 2004
| SHARES |
VALUE (NOTE 2) | |||||
| MEDICAL SUPPLIES & EQUIPMENT — 3.4% |
||||||
| Applera Corp. — Applied Biosystems Group |
445,000 | $ | 9,304,950 | |||
| Beckman Coulter, Inc. |
63,700 | 4,267,263 | ||||
| Boston Scientific Corp.* |
1,659,700 | 59,002,335 | ||||
| 72,574,548 | ||||||
| METALS & MINING — 0.7% |
||||||
| Alcoa, Inc. |
513,500 | 16,134,170 | ||||
| OIL & GAS — 11.4% |
||||||
| Baker Hughes, Inc.(a) |
456,100 | 19,461,787 | ||||
| BP PLC [ADR] (United Kingdom) |
550,000 | 32,120,000 | ||||
| ConocoPhillips |
757,200 | 65,747,676 | ||||
| EnCana Corp. (Canada) |
333,900 | 19,052,334 | ||||
| Exxon Mobil Corp. |
600,000 | 30,756,000 | ||||
| FMC Technologies, Inc.* |
268,900 | 8,658,580 | ||||
| Nabors Industries Ltd.*(a) |
347,500 | 17,823,275 | ||||
| Noble Energy, Inc.(a) |
200,000 | 12,332,000 | ||||
| Occidental Petroleum Corp. |
300,000 | 17,508,000 | ||||
| Schlumberger Ltd. |
312,600 | 20,928,570 | ||||
| 244,388,222 | ||||||
| PHARMACEUTICALS — 2.2% |
||||||
| Forest Laboratories, Inc.*(a) |
283,200 | 12,704,352 | ||||
| Pfizer, Inc. |
671,300 | 18,051,257 | ||||
| Wyeth |
369,900 | 15,754,041 | ||||
| 46,509,650 | ||||||
| RAILROADS — 3.2% |
||||||
| Burlington Northern Santa Fe Corp. |
388,700 | 18,389,397 | ||||
| Union Pacific Corp. |
750,000 | 50,437,500 | ||||
| 68,826,897 | ||||||
| RESTAURANTS — 0.5% |
||||||
| Wendy’s International, Inc. |
269,700 | 10,588,422 | ||||
| RETAIL & MERCHANDISING — 3.5% |
||||||
| Bed Bath & Beyond, Inc.*(a) |
203,400 | 8,101,422 | ||||
| Home Depot, Inc.(a) |
1,245,000 | 53,211,300 | ||||
| Lowe’s Cos., Inc.(a) |
252,400 | 14,535,716 | ||||
| 75,848,438 | ||||||
| TELECOMMUNICATIONS — 1.7% |
||||||
| BellSouth Corp.(a) |
489,300 | 13,597,647 | ||||
| Corning, Inc.*(a) |
438,100 | 5,156,437 | ||||
| Verizon Communications, Inc. |
422,100 | 17,099,271 | ||||
| 35,853,355 | ||||||
| UTILITIES — 3.2% |
||||||
| Dominion Resources, Inc.(a) |
100,000 | 6,774,000 | ||||
| Entergy Corp. |
250,000 | 16,897,500 | ||||
| Exelon Corp.(a) |
433,200 | 19,091,124 | ||||
| PPL Corp. |
325,000 | 17,316,000 | ||||
| Sempra Energy |
250,000 | 9,170,000 | ||||
| 69,248,624 | ||||||
| TOTAL LONG TERM INVESTMENTS |
2,152,579,483 | |||||
| PRINCIPAL AMOUNT (000) |
||||||
| SHORT-TERM INVESTMENTS — 11.1% |
||||||
| CERTIFICATES OF DEPOSIT — 1.5% |
||||||
| Banco Santander PR |
||||||
| 2.315%, 01/07/05(b)(c) |
$ | 17,602 | 17,601,691 | |||
| First Boston Corp. |
||||||
| 2.36%, 01/24/05(b) |
5,243 | 5,243,269 | ||||
| Skandinaviska Enskilda Banken |
||||||
| 2.35%, 01/28/05(b) |
6,535 | 6,535,240 | ||||
| UBS Bank |
||||||
| 2.315%, 01/18/05(b) |
2,789 | 2,788,544 | ||||
| 32,168,744 | ||||||
| CORPORATE OBLIGATIONS — 4.2% |
||||||
| Bear Stearns |
||||||
| 2.28%, 01/03/05(b)(c) |
20,217 | 20,217,240 | ||||
| Goldman Sachs Group, Inc. |
||||||
| 2.33%, 01/03/05(b)(c) |
2,868 | 2,867,671 | ||||
| Merrill Lynch & Co., Inc. |
||||||
| 2.38%, 01/03/05(b)(c) |
26,342 | 26,341,546 | ||||
| Morgan Stanley |
||||||
| 2.33%, 01/03/05(b)(c) |
2,120 | 2,119,821 | ||||
| Natexis Banque NY |
||||||
| 2.297%, 01/03/05(b)(c) |
31,131 | 31,127,615 | ||||
| Swedbank NY |
||||||
| 2.362%, 01/18/05(b)(c) |
7,896 | 7,894,323 | ||||
| 90,568,216 | ||||||
| TIME DEPOSIT — 0.3% |
||||||
| Bank of America NA |
||||||
| 1.50%, 01/03/05(b) |
5,496 | 5,496,388 | ||||
146
AST ALLIANCE GROWTH AND INCOME PORTFOLIO
SCHEDULE OF INVESTMENTS (CONTINUED)
DECEMBER 31, 2004
| SHARES |
VALUE (NOTE 2) |
|||||
| NON-REGISTERED INVESTMENT COMPANY — 0.4% |
||||||
| BlackRock Institutional Money Market Trust(b)(j) |
8,686,413 | $ | 8,686,413 | |||
| REGISTERED INVESTMENT COMPANIES — 4.7% |
||||||
| BlackRock Provident Institutional Funds TempCash Portfolio(j) |
50,636,983 | 50,636,983 | ||||
| BlackRock Provident Institutional Funds TempFund Portfolio(j) |
50,636,983 | 50,636,983 | ||||
| 101,273,966 | ||||||
| TOTAL SHORT TERM INVESTMENTS |
||||||
| 238,193,727 | ||||||
| TOTAL INVESTMENTS — 111.1% |
2,390,773,210 | |||||
| LIABILITIES IN EXCESS OF OTHER ASSETS — (11.1%) |
(238,567,073 | ) | ||||
| NET ASSETS — 100.0% |
$ | 2,152,206,137 | ||||
THE FOLLOWING ABBREVIATION IS USED THROUGHOUT THE SCHEDULE OF INVESTMENTS:
| ADR | American Depositary Receipt |
THE FOLLOWING ANNOTATIONS ARE USED THROUGHOUT THE SCHEDULE OF INVESTMENTS:
| * | Non-income producing security. |
| (a) | All or a portion of securities on loan. Securities on loan have an aggregate market value of $131,690,715; cash collateral of $136,919,761 (included with liabilities) was received with which the portfolio purchased highly liquid short-term investments. |
| (b) | Represents security purchased with cash collateral for securities on loan. |
| (c) | Indicates a variable rate security. The maturity date presented for these instruments is the next date on which the rate of interest is adjusted. |
| (j) | Security available to institutional investors only. |
The industry classification of long-term portfolio holdings, short-term investments and liabilities in excess of other assets shown as a percentage of net assets as of December 31, 2004 were as follows:
| Financial Services |
12.7 | % | |
| Insurance |
12.5 | ||
| Oil & Gas |
11.4 | ||
| Entertainment & Leisure |
6.6 | ||
| Conglomerates |
5.3 | ||
| Consumer Products & Services |
5.2 | ||
| Electronic Components & Equipment |
4.7 | ||
| Financial — Bank & Trust |
4.7 | ||
| Computer Services & Software |
4.0 | ||
| Retail & Merchandising |
3.5 | ||
| Medical Supplies & Equipment |
3.4 | ||
| Railroads |
3.2 | ||
| Utilities |
3.2 | ||
| Chemicals |
2.4 | ||
| Pharmaceuticals |
2.2 | ||
| Aerospace |
2.1 | ||
| Cable Television |
1.9 | ||
| Healthcare Services |
1.9 | ||
| Telecommunications |
1.7 | % | |
| Broadcasting |
1.5 | ||
| Business Services |
1.0 | ||
| Building Materials |
0.9 | ||
| Industrial Products |
0.9 | ||
| Computer Hardware |
0.8 | ||
| Metals & Mining |
0.7 | ||
| Construction |
0.6 | ||
| Restaurants |
0.5 | ||
| Food |
0.4 | ||
| Machinery & Equipment |
0.1 | ||
| Short-Term Investments |
11.1 | ||
| 111.1 | |||
| Liabilities in excess of other assets |
(11.1 | ) | |
| 100.0 | % | ||
See Notes to Financial Statements.
147
AST DEAM GLOBAL ALLOCATION PORTFOLIO
SCHEDULE OF INVESTMENTS
DECEMBER 31, 2004
| SHARES |
VALUE (NOTE 2) | ||||
| LONG-TERM INVESTMENTS — 98.4% |
|||||
| REGISTERED INVESTMENT COMPANIES |
|||||
| AST Alliance Growth Portfolio* |
5,603,060 | $ | 49,475,019 | ||
| AST DeAM Large-Cap Value Portfolio |
4,730,478 | 54,589,711 | |||
| AST DeAM Small-Cap Growth Portfolio* |
551,477 | 4,604,837 | |||
| AST DeAM Small-Cap Value Portfolio |
391,584 | 5,031,857 | |||
| AST LSV International Value Portfolio |
1,337,172 | 17,797,754 | |||
| AST PIMCO Total Return Bond Portfolio |
8,028,400 | 96,421,089 | |||
| TOTAL INVESTMENTS — 98.4% |
227,920,267 | ||||
| OTHER ASSETS IN EXCESS OF LIABILITIES — 1.6% |
3,806,891 | ||||
| NET ASSETS — 100.0% |
$ | 231,727,158 | |||
THE FOLLOWING ANNOTATION IS USED THROUGHOUT THE SCHEDULE OF INVESTMENTS:
| * | Non-income producing security. |
See Notes to Financial Statements.
148
AST AMERICAN CENTURY STRATEGIC BALANCED PORTFOLIO
SCHEDULE OF INVESTMENTS
DECEMBER 31, 2004
| SHARES |
VALUE (NOTE 2) | ||||
| LONG-TERM INVESTMENTS — 104.3% |
|||||
| COMMON STOCK — 58.7% |
|||||
| AEROSPACE — 1.0% |
|||||
| Boeing Co. |
44,792 | $ | 2,318,882 | ||
| AIRLINES — 0.1% |
|||||
| Southwest Airlines Co. |
11,604 | 188,913 | |||
| AUTOMOBILE MANUFACTURERS — 1.0% |
|||||
| Ford Motor Co.(a) |
162,595 | 2,380,391 | |||
| AUTOMOTIVE PARTS — 0.4% |
|||||
| Goodyear Tire & Rubber Co.(The)*(a) |
15,733 | 230,646 | |||
| Magna International, Inc. (Class “A” Stock) |
7,311 | 603,523 | |||
| 834,169 | |||||
| BEVERAGES — 0.7% |
|||||
| Pepsi Bottling Group, Inc. |
62,756 | 1,696,922 | |||
| BUILDING MATERIALS |
|||||
| USG Corp.*(a) |
2,161 | 87,023 | |||
| BUSINESS SERVICES — 0.8% |
|||||
| Acxiom Corp.(a) |
15,185 | 399,366 | |||
| Equifax, Inc. |
48,973 | 1,376,141 | |||
| 1,775,507 | |||||
| CHEMICALS — 0.7% |
|||||
| Georgia Gulf Corp. |
30,733 | 1,530,503 | |||
| CLOTHING & APPAREL — 0.1% |
|||||
| VF Corp. |
2,516 | 139,336 | |||
| COMPUTER HARDWARE — 2.0% |
|||||
| Dell, Inc.* |
3,819 | 160,933 | |||
| Hewlett-Packard Co. |
18,210 | 381,864 | |||
| International Business Machines Corp. |
42,389 | 4,178,707 | |||
| 4,721,504 | |||||
| COMPUTER SERVICES & SOFTWARE — 2.4% |
|||||
| Cisco Systems, Inc.* |
73,070 | 1,410,251 | |||
| Computer Sciences Corp.* |
26,750 | 1,507,898 | |||
| Microsoft Corp. |
68,052 | 1,817,669 | |||
| Oracle Corp.* |
56,306 | 772,518 | |||
| 5,508,336 | |||||
| CONGLOMERATES — 1.3% |
|||||
| Cendant Corp. |
46,082 | 1,077,397 | |||
| Tyco International Ltd.(a) |
53,436 | 1,909,803 | |||
| 2,987,200 | |||||
| CONSTRUCTION — 1.0% |
|||||
| NVR, Inc.*(a) |
3,065 | 2,358,211 | |||
| CONSUMER PRODUCTS & SERVICES — 3.6% |
|||||
| American Greetings Corp. (Class “A” Stock) |
10,626 | 269,369 | |||
| Black & Decker Corp.(a) |
14,684 | 1,297,038 | |||
| Gillette Co. |
50,627 | 2,267,077 | |||
| Johnson & Johnson(a) |
69,119 | 4,383,527 | |||
| Reynolds, (R.J.) Tobacco Holdings, Inc. |
2,630 | 206,718 | |||
| 8,423,729 | |||||
| CONTAINERS & PACKAGING |
|||||
| Silgan Holdings, Inc. |
219 | 13,350 | |||
| ELECTRONIC COMPONENTS & EQUIPMENT — 0.6% |
|||||
| Eastman Kodak Co.(a) |
29,726 | 958,663 | |||
| Parker-Hannifin Corp. |
4,751 | 359,841 | |||
| WESCO International, Inc.* |
3,080 | 91,291 | |||
| 1,409,795 | |||||
| ENTERTAINMENT & LEISURE — 2.8% |
|||||
| Disney, (Walt) Co. |
102,761 | 2,856,756 | |||
| Regal Entertainment Group (Class “A” Stock) |
19,258 | 399,604 | |||
| Time Warner, Inc.* |
152,481 | 2,964,230 | |||
| Viacom, Inc. (Class “B” Stock) |
7,226 | 262,954 | |||
| 6,483,544 | |||||
| ENVIRONMENTAL SERVICES — 0.1% |
|||||
| Republic Services, Inc. |
4,293 | 143,987 | |||
| EXCHANGE TRADED FUNDS — 1.7% |
|||||
| iShares GS $ InvesTop Corporate Bond |
36,100 | 4,026,233 | |||
| FINANCIAL — BANK & TRUST — 5.2% |
|||||
| Bank of America Corp. |
74,466 | 3,499,156 | |||
| Comerica, Inc. |
33,309 | 2,032,515 | |||
| Fremont General Corp.(a) |
8,792 | 221,383 | |||
| National City Corp. |
61,135 | 2,295,619 | |||
| U.S. Bancorp |
4,630 | 145,012 | |||
| Wachovia Corp. |
51,769 | 2,723,049 | |||
| Wells Fargo & Co.(a) |
17,831 | 1,108,197 | |||
| 12,024,931 | |||||
| FINANCIAL SERVICES — 3.6% |
|||||
| American Express Co.(a) |
48,608 | 2,740,033 | |||
| Capital One Financial Corp.(a) |
27,955 | 2,354,091 | |||
| Compucredit Corp.* |
8,569 | 234,276 | |||
| Countrywide Financial Corp. |
64,703 | 2,394,658 | |||
| Raymond James Financial, Inc. |
20,103 | 622,791 | |||
| WFS Financial, Inc.* |
3,391 | 172,195 | |||
| 8,518,044 | |||||
149
AST AMERICAN CENTURY STRATEGIC BALANCED PORTFOLIO
SCHEDULE OF INVESTMENTS (CONTINUED)
DECEMBER 31, 2004
| SHARES |
VALUE (NOTE 2) | ||||
| FOOD — 1.3% |
|||||
| Corn Products International, Inc. |
15,161 | $ | 812,023 | ||
| Pilgrim’s Pride Corp. |
38,919 | 1,194,035 | |||
| Sanderson Farms, Inc. |
5,122 | 221,680 | |||
| Tyson Foods, Inc. (Class “A” Stock)(a) |
48,029 | 883,734 | |||
| 3,111,472 | |||||
| HEALTHCARE SERVICES — 0.1% |
|||||
| Humana, Inc.* |
9,222 | 273,801 | |||
| INSURANCE — 2.9% |
|||||
| American Financial Group, Inc. |
4,276 | 133,882 | |||
| American International Group, Inc. |
10,626 | 697,809 | |||
| Berkley, (W.R.) Corp. |
36,943 | 1,742,601 | |||
| Chubb Corp. |
6,558 | 504,310 | |||
| CIGNA Corp. |
31,538 | 2,572,555 | |||
| First American Corp. |
10,874 | 382,112 | |||
| Principal Financial Group, Inc. |
8,615 | 352,698 | |||
| Safeco Corp.(a) |
5,801 | 303,044 | |||
| Selective Insurance Group, Inc. |
298 | 13,184 | |||
| 6,702,195 | |||||
| INTERNET SERVICES — 1.1% |
|||||
| EarthLink, Inc.*(a) |
163,539 | 1,883,969 | |||
| Sabre Holdings Corp. (Class “A” Stock) |
20,178 | 447,144 | |||
| United Online, Inc.* |
17,607 | 203,009 | |||
| 2,534,122 | |||||
| MACHINERY & EQUIPMENT — 0.6% |
|||||
| Cummins, Inc. |
13,329 | 1,116,836 | |||
| Hydril Co.* |
4,303 | 195,830 | |||
| Stanley Works |
3,615 | 177,099 | |||
| 1,489,765 | |||||
| MEDICAL SUPPLIES & EQUIPMENT — 1.8% |
|||||
| AmerisourceBergen Corp. |
19,059 | 1,118,382 | |||
| Amgen, Inc.* |
17,196 | 1,103,123 | |||
| Applera Corp. — Applied Biosystems Group |
2,673 | 55,892 | |||
| Becton, Dickinson & Co. |
35,502 | 2,016,515 | |||
| 4,293,912 | |||||
| METALS & MINING — 0.8% |
|||||
| Phelps Dodge Corp.(a) |
14,376 | 1,422,074 | |||
| United States Steel Corp.(a) |
9,773 | 500,866 | |||
| 1,922,940 | |||||
| OFFICE EQUIPMENT — 0.5% |
|||||
| Xerox Corp.* |
75,293 | 1,280,734 | |||
| OIL & GAS — 4.2% |
|||||
| Baker Hughes, Inc. |
4,053 | 172,942 | |||
| ChevronTexaco Corp. |
64,058 | 3,363,686 | |||
| ConocoPhillips |
3,272 | 284,108 | |||
| Exxon Mobil Corp. |
66,791 | 3,423,706 | |||
| Premcor, Inc. |
7,341 | 309,570 | |||
| Sunoco, Inc. |
25,962 | 2,121,355 | |||
| Valero Energy Corp. |
2,865 | 130,071 | |||
| 9,805,438 | |||||
| PAPER & FOREST PRODUCTS — 1.4% |
|||||
| Georgia-Pacific Corp.(a) |
3,009 | 112,777 | |||
| Louisiana-Pacific Corp.(a) |
53,345 | 1,426,446 | |||
| Potlatch Corp.(a) |
16,000 | 809,280 | |||
| Weyerhaeuser Co. |
12,268 | 824,655 | |||
| 3,173,158 | |||||
| PHARMACEUTICALS — 3.0% |
|||||
| Cardinal Health, Inc. |
16,532 | 961,336 | |||
| Kos Pharmaceuticals, Inc.* |
15,913 | 598,965 | |||
| Merck & Co., Inc.(a) |
65,925 | 2,118,830 | |||
| Pfizer, Inc. |
127,616 | 3,431,594 | |||
| 7,110,725 | |||||
| RAILROADS — 0.1% |
|||||
| Burlington Northern Santa Fe Corp. |
1,303 | 61,645 | |||
| Union Pacific Corp. |
3,331 | 224,010 | |||
| 285,655 | |||||
| RESTAURANTS — 1.2% |
|||||
| Jack in the Box, Inc.* |
2,658 | 98,000 | |||
| McDonald’s Corp. |
81,108 | 2,600,323 | |||
| 2,698,323 | |||||
| RETAIL & MERCHANDISING — 3.4% |
|||||
| 7-Eleven, Inc.* |
3,425 | 82,029 | |||
| Barnes & Noble, Inc.* |
6,672 | 215,305 | |||
| Circuit City Stores, Inc. |
1,874 | 29,309 | |||
| Costco Wholesale Corp.(a) |
24,936 | 1,207,152 | |||
| Federated Department Stores, Inc. |
28,581 | 1,651,696 | |||
| Gamestop Corp. (Class “A” Stock)* |
5,694 | 127,603 | |||
| Home Depot, Inc. |
46,555 | 1,989,760 | |||
| Kmart Holding Corp.* |
1,424 | 140,905 | |||
| Penney, (J.C.) Co., Inc. |
23,970 | 992,358 | |||
| SUPERVALU, Inc. |
45,938 | 1,585,780 | |||
| 8,021,897 | |||||
| SEMICONDUCTORS — 1.8% |
|||||
| Freescale Semiconductor, Inc. (Class “B” Stock)* |
15,193 | 278,943 | |||
| Intel Corp. |
161,310 | 3,773,042 | |||
| MEMC Electronic Materials, Inc.* |
15,737 | 208,515 | |||
| 4,260,500 | |||||
150
AST AMERICAN CENTURY STRATEGIC BALANCED PORTFOLIO
SCHEDULE OF INVESTMENTS (CONTINUED)
DECEMBER 31, 2004
| SHARES |
VALUE (NOTE 2) | |||||||
| TELECOMMUNICATIONS — 2.6% |
||||||||
| ALLTEL Corp. |
3,388 | $ | 199,079 | |||||
| AT&T Corp.(a) |
8,375 | 159,628 | ||||||
| BellSouth Corp. |
21,020 | 584,146 | ||||||
| CenturyTel, Inc. |
1,398 | 49,587 | ||||||
| Commonwealth Telephone Enterprises, Inc |
2,772 | 137,658 | ||||||
| Motorola, Inc. |
133,143 | 2,290,059 | ||||||
| Nextel Communications, Inc. (Class “A” Stock)*(a) |
11,884 | 356,520 | ||||||
| SBC Communications, Inc. |
21,079 | 543,206 | ||||||
| Sprint Corp. |
15,232 | 378,515 | ||||||
| Verizon Communications, Inc. |
34,061 | 1,379,811 | ||||||
| 6,078,209 | ||||||||
| TRANSPORTATION — 0.5% |
||||||||
| FedEx Corp. |
1,318 | 129,810 | ||||||
| United Parcel Service, Inc. (Class “B” Stock) |
11,082 | 947,068 | ||||||
| 1,076,878 | ||||||||
| UTILITIES — 2.3% |
||||||||
| Constellation Energy Group, Inc. |
28,664 | 1,252,903 | ||||||
| Exelon Corp. |
20,998 | 925,382 | ||||||
| FirstEnergy Corp. |
52,461 | 2,072,734 | ||||||
| TXU Corp.(a) |
17,534 | 1,131,995 | ||||||
| 5,383,014 | ||||||||
| TOTAL COMMON STOCK |
137,073,248 | |||||||
| PRINCIPAL AMOUNT (000) |
||||||||
| U.S. GOVERNMENT AGENCY MORTGAGE-BACKED SECURITIES — 17.9% |
||||||||
| Federal Home Loan Mortgage Corp. |
||||||||
| 4.50%, 01/01/19 |
$ | 1,494 | 1,493,040 | |||||
| 5.00%, 01/15/19 |
1,900 | 1,929,093 | ||||||
| 5.50%, 12/01/33 |
612 | 622,723 | ||||||
| 6.50%, 06/01/16 |
309 | 326,682 | ||||||
| 7.00%, 06/01/14-08/01/29 |
334 | 354,770 | ||||||
| 4,726,308 | ||||||||
| Federal National Mortgage Assoc. |
||||||||
| 3.25%, 08/15/08 |
300 | 296,296 | ||||||
| 3.75%, 05/17/07 |
3,100 | 3,106,113 | ||||||
| 4.50%, 05/01/19-06/01/19 |
951 | 949,624 | ||||||
| 5.00%, 01/15/19 |
5,255 | 5,338,754 | ||||||
| 5.50%, 12/01/16-01/15/34 |
10,661 | 10,884,010 | ||||||
| 5.75%, 02/15/08 |
200 | 213,190 | ||||||
| 6.00%, 12/01/13-09/25/32 |
8,305 | 8,593,445 | ||||||
| 6.50%, 01/01/32-12/15/35 |
4,993 | 5,237,006 | ||||||
| 6.625%, 10/15/07 |
700 | 759,098 | ||||||
| 7.00%, 05/01/11-06/01/32 |
988 | 1,048,800 | ||||||
| 7.50%, 03/01/27-09/01/30 |
144 | 154,706 | ||||||
| 36,581,042 | ||||||||
| Government National Mortgage Assoc. |
||||||||
| 6.00%, 04/15/28-05/15/28 |
97 | 101,734 | ||||||
| 6.50%, 03/15/28-04/15/28 |
86 | 90,197 | ||||||
| 7.00%, 12/15/27-05/15/31 |
248 | 263,660 | ||||||
| 7.50%, 05/15/30 |
50 | 54,051 | ||||||
| 8.00%, 03/15/27 |
11 | 11,553 | ||||||
| 8.75%, 04/15/27 |
12 | 13,640 | ||||||
| 534,835 | ||||||||
| TOTAL U.S. GOVERNMENT AGENCY MORTGAGE-BACKED SECURITIES |
41,842,185 | |||||||
| MOODY’S RATING (UNAUDITED) |
||||||||
| CORPORATE OBLIGATIONS — 10.6% |
||||||||
| AUTOMOBILE MANUFACTURERS — 0.2% |
||||||||
| DaimlerChrysler NA Holding Corp., Gtd Notes |
||||||||
| 7.30%, 01/15/12 |
A3 | 330 | 375,156 | |||||
| BEVERAGES — 0.2% |
||||||||
| Fosters Financial Corp., Notes |
||||||||
| 4.875%, 10/01/14 144A (cost $207,917; purchased 10/01/04)(g) |
Baa1 | 210 | 209,181 | |||||
| Miller Brewing Co., Notes |
||||||||
| 4.25%, 08/15/08 144A (cost $303,910; purchased 01/06/04)(g) |
Baa1 | 300 | 302,979 | |||||
| 512,160 | ||||||||
151
151
AST AMERICAN CENTURY STRATEGIC BALANCED PORTFOLIO
SCHEDULE OF INVESTMENTS (CONTINUED)
DECEMBER 31, 2004
| MOODY'S RATING |
PRINCIPAL AMOUNT |
VALUE (NOTE 2) | ||||||
| BROADCASTING — 0.3% |
||||||||
| Clear Channel Communications, Inc., Notes |
||||||||
| 4.25%, 05/15/09 |
Baa3 | $ | 160 | $ | 158,537 | |||
| Clear Channel Communications, Inc., Sr. Notes |
||||||||
| 5.00%, 03/15/12 |
Baa3 | 260 | 257,937 | |||||
| News America Holdings Co., Gtd. Notes |
||||||||
| 7.75%, 01/20/24 |
Baa3 | 150 | 178,357 | |||||
| 594,831 | ||||||||
| CABLE TELEVISION — 0.3% |
||||||||
| Comcast Corp., Gtd. Notes |
||||||||
| 5.50%, 03/15/11 |
Baa3 | 600 | 635,005 | |||||
| CSC Holdings, Inc., Sr. Notes |
||||||||
| 6.75%, 04/15/12 144A (cost $144,976; purchased 08/05/04)(g) |
B1 | 150 | 155,250 | |||||
| 790,255 | ||||||||
| COMPUTER SERVICES & SOFTWARE — 0.1% |
||||||||
| Computer Associates International, Inc. Sr. Notes |
||||||||
| 4.75%, 12/01/09 |
Ba1 | 260 | 262,187 | |||||
| CONSTRUCTION — 0.1% |
||||||||
| KB Home & Broad Home Corp. |
||||||||
| 6.375%, 08/15/11 |
Ba1 | 250 | 263,750 | |||||
| CONSUMER PRODUCTS & SERVICES — 0.2% |
||||||||
| General Electric Co., Notes |
||||||||
| 5.00%, 02/01/13 |
Aaa | 350 | 359,681 | |||||
| CONTAINERS & PACKAGING — 0.1% |
||||||||
| Ball Corp., Gtd. Notes |
||||||||
| 7.75%, 08/01/06 |
Ba3 | 250 | 263,750 | |||||
| DIVERSIFIED OPERATIONS — 0.6% |
||||||||
| Morgan Stanley Traded Custody Receipts Series 2002-2, Sub. Notes |
||||||||
| 7.719%, 03/01/32 144A (cost $1,127,294; purchased 03/15/02—08/28/02)(f)(g) |
Baa1 | 1,071 | 1,308,842 | |||||
| ENTERTAINMENT & LEISURE — 0.4% |
||||||||
| Disney, (Walt) Co., Notes |
||||||||
| 5.50%, 12/29/06 |
Baa1 | 400 | 417,262 | |||||
| Park Place Entertainment, Inc., Sr. Sub. Notes |
||||||||
| 7.875%, 12/15/05 |
Ba2 | 300 | 312,000 | |||||
| Royal Caribbean Cruises, Sr. Notes |
||||||||
| 6.875%, 12/01/13 |
Ba2 | 200 | 217,000 | |||||
| 946,262 | ||||||||
| ENVIRONMENTAL SERVICES — 0.1% |
||||||||
| Waste Management, Inc. Sr. Notes |
||||||||
| 7.00%, 07/15/28 |
Baa3 | 210 | 237,580 | |||||
| FINANCIAL — BANK & TRUST — 0.8% |
||||||||
| Bank of America Corp., Sr. Notes |
||||||||
| 4.375%, 12/01/10 |
Aa2 | 600 | 602,563 | |||||
| Citigroup, Inc., Sub. Notes |
||||||||
| 5.00%, 09/15/14 144A (cost $1,106,639; purchased 04/23/03—09/09/04)(g) |
Aa2 | 1,108 | 1,115,467 | |||||
| Washington Mutual Bank |
||||||||
| 5.50%, 01/15/13 |
A3 | 230 | 237,906 | |||||
| 1,955,936 | ||||||||
| FINANCIAL — BROKERAGE — 0.5% |
||||||||
| Credit Suisse First Boston, Inc., Notes |
||||||||
| 2.79%, 06/19/06 |
Aa3 | 300 | 301,186 | |||||
| Goldman Sachs Group, Inc., Notes |
||||||||
| 5.25%, 10/15/13 |
Aa3 | 500 | 512,445 | |||||
| Merrill Lynch & Co., Inc., Notes |
||||||||
| 2.07%, 06/12/06 |
Aa3 | 350 | 347,291 | |||||
| 1,160,922 | ||||||||
| FINANCIAL SERVICES — 2.8% |
||||||||
| American General Finance, Notes |
||||||||
| 4.50%, 11/15/07 |
A1 | 300 | 305,855 | |||||
| Deutsche Telekom International Finance BV, Gtd. Notes (Netherlands) |
||||||||
| 8.50%, 06/15/10(l) |
Baa1 | 320 | 381,665 | |||||
152
AST AMERICAN CENTURY STRATEGIC BALANCED PORTFOLIO
SCHEDULE OF INVESTMENTS (CONTINUED)
DECEMBER 31, 2004
| MOODY’S RATING |
PRINCIPAL AMOUNT |
VALUE (NOTE 2) | ||||||
| Federal Home Loan Bank, Notes |
||||||||
| 3.375%, 09/14/07 |
Aaa | $ | 2,000 | $ | 1,999,496 | |||
| Ford Motor Credit Co., Notes |
||||||||
| 7.375%, 10/28/09 |
A3 | 600 | 647,857 | |||||
| Ford Motor Credit Co., Sr. Notes |
||||||||
| 5.80%, 01/12/09 |
A3 | 275 | 281,339 | |||||
| Freddie Mac, Notes |
||||||||
| 3.75%, 08/03/07(a) |
Aaa | 2,820 | 2,824,224 | |||||
| General Electric Capital Corp., Sr. Notes |
||||||||
| 4.25%, 12/01/10 |
Aaa | 230 | 230,171 | |||||
| Morgan Stanley, Notes |
||||||||
| 4.25%, 05/15/10 |
Aa3 | 150 | 150,195 | |||||
| 6,820,802 | ||||||||
| INSURANCE — 0.3% |
||||||||
| Genworth Financial, Inc., Notes |
||||||||
| 5.75%, 06/15/14 |
A2 | 300 | 317,950 | |||||
| Monumental Global Funding II, Notes |
||||||||
| 3.85%, 03/03/08 144A (cost $350,000; purchased 02/05/03)(g) |
Aa3 | 350 | 351,170 | |||||
| 669,120 | ||||||||
| INTERNET SERVICES |
||||||||
| IAC Interactive Corp., Notes |
||||||||
| 7.00%, 01/15/13 |
Baa3 | 50 | 55,239 | |||||
| MEDICAL SUPPLIES & EQUIPMENT — 0.3% |
||||||||
| Beckman Coulter, Inc., Gtd. Notes |
||||||||
| 7.45%, 03/04/08 |
Baa3 | 400 | 441,018 | |||||
| Schering-Plough Corp., Notes |
||||||||
| 5.30%, 12/01/13 |
A3 | 150 | 157,049 | |||||
| 598,067 | ||||||||
| OIL & GAS — 0.7% |
||||||||
| Anadarko Petroleum Corp., Debs. |
||||||||
| 7.95%, 04/15/29 |
Baa1 | 250 | 319,701 | |||||
| Devon Energy Corp., Sr. Notes |
||||||||
| 2.75%, 08/01/06 |
Baa2 | 300 | 296,597 | |||||
| Enterprise Products Operation, Sr. Notes |
||||||||
| 4.625%, 10/15/09 144A (cost $272,568; purchased 10/08/04—10/15/04)(g) |
Baa3 | 270 | 269,863 | |||||
| Enterprise Products Operations, Sr. Notes |
||||||||
| 5.60%, 10/15/14 144A (cost $160,980; purchased 10/04/04)(g) |
Baa3 | 160 | 161,721 | |||||
| Kerr-McGee Corp., Gtd. Notes |
||||||||
| 6.875%, 09/15/11 |
Baa3 | 280 | 315,730 | |||||
| XTO Energy, Inc., Sr. Notes |
||||||||
| 6.25%, 04/15/13 |
Baa3 | 250 | 274,047 | |||||
| 1,637,659 | ||||||||
| RAILROADS — 0.4% |
||||||||
| Canadian National Railways Co., Bonds |
||||||||
| 6.25%, 08/01/34 |
Baa1 | 300 | 325,755 | |||||
| Norfolk Southern Corp., Bonds |
||||||||
| 7.80%, 05/15/27 |
Baa1 | 250 | 314,057 | |||||
| Norfolk Southern Corp., Notes |
||||||||
| 7.05%, 05/01/37 |
Baa1 | 300 | 352,009 | |||||
| 991,821 | ||||||||
| RESTAURANTS — 0.3% |
||||||||
| Yum! Brands, Inc., Sr. Notes |
||||||||
| 8.875%, 04/15/11 |
Ba1 | 650 | 804,090 | |||||
| RETAIL & MERCHANDISING — 0.5% |
||||||||
| CVS Corp., Notes |
||||||||
| 4.00%, 09/15/09 |
A3 | 160 | 159,417 | |||||
| May Department Stores |
||||||||
| Co., Notes |
||||||||
| 4.80%, 07/15/09 |
Baa2 | 500 | 508,918 | |||||
| Safeway, Inc., Notes |
||||||||
| 6.50%, 03/01/11 |
Baa2 | 350 | 383,804 | |||||
| 1,052,139 | ||||||||
| TELECOMMUNICATIONS — 0.7% |
||||||||
| AT&T Broadband Corp., Gtd. Notes |
||||||||
| 8.375%, 03/15/13 |
Baa3 | 48 | 59,280 | |||||
| AT&T Wireless Services, Inc., Sr. Notes |
||||||||
| 7.875%, 03/01/11 |
Baa2 | 300 | 353,545 | |||||
153
AST AMERICAN CENTURY STRATEGIC BALANCED PORTFOLIO
SCHEDULE OF INVESTMENTS (CONTINUED)
DECEMBER 31, 2004
| MOODY’S RATING |
PRINCIPAL AMOUNT |
VALUE (NOTE 2) | |||||||
| British Telecom PLC, Notes (United Kingdom) |
|||||||||
| 7.00%, 05/23/07(l) |
Baa1 | $ | 270 | $ | 289,671 | ||||
| Deutsche Telekom International Finance, Gtd. Notes (Germany) |
|||||||||
| 5.25%, 07/22/13(l) |
Baa3 | 100 | 103,037 | ||||||
| France Telecom SA, Notes (France) |
|||||||||
| 8.75%, 03/01/11(l) |
Baa3 | 100 | 119,437 | ||||||
| Nextel Communications, Sr. Notes |
|||||||||
| 5.95%, 03/15/14 |
B2 | 290 | 301,600 | ||||||
| Sprint Capital Corp., Notes |
|||||||||
| 8.375%, 03/15/12 |
Baa3 | 240 | 292,763 | ||||||
| 1,519,333 | |||||||||
| UTILITIES — 0.7% |
|||||||||
| CenterPoint Energy Resources Corp., Debs. |
|||||||||
| 6.50%, 02/01/08 |
Ba1 | 350 | 375,549 | ||||||
| Dominion Resources, Inc., Notes |
|||||||||
| 4.125%, 02/15/08 |
Baa1 | 300 | 302,282 | ||||||
| Firstenergy Corp., Notes |
|||||||||
| 6.45%, 11/15/11 |
Baa3 | 260 | 282,876 | ||||||
| Pacific Gas & Electric, First Mortgage |
|||||||||
| 6.05%, 03/01/34 |
Baa2 | 100 | 104,224 | ||||||
| Tampa Electric Co., Notes |
|||||||||
| 6.375%, 08/15/12 |
Baa1 | 300 | 330,976 | ||||||
| Virginia Electric & Power Co., Notes |
|||||||||
| 5.25%, 12/15/15 |
A3 | 300 | 305,696 | ||||||
| 1,701,603 | |||||||||
| TOTAL CORPORATE OBLIGATIONS |
24,881,185 | ||||||||
| ASSET-BACKED SECURITIES — 6.6% |
|||||||||
| ABSC NIMS Trust, Series 2004-HE5, Class A1 |
|||||||||
| 5.00%, 08/27/34 144A (cost $101,349; purchased 06/22/04)(g) |
BBB+ | (d) | 102 | 101,336 | |||||
| Accredited Mortgage Loan Trust, Series 2004-4, Class A2A |
|||||||||
| 2.567%, 01/25/35 |
Aaa | 834 | 833,825 | ||||||
| Ameriquest Finance NIM Trust, Series 2004-RN4, Class A |
|||||||||
| 4.60%, 07/25/34 |
BBB+ | (d) | 64 | 63,660 | |||||
| Ameriquest Finance NIM Trust, Series 2004-RN5, Class A |
|||||||||
| 5.193%, 06/25/34 144A (cost $68,334; purchased 06/24/04)(g) |
BBB+ | (d) | 68 | 68,194 | |||||
| Ameriquest Mortgage Securities, Inc., Series 2004-R8, Class A2 |
|||||||||
| 2.578%, 09/25/34 |
Aaa | 885 | 885,236 | ||||||
| Argent NIM Notes, Series 2004-WN9, Class A |
|||||||||
| 5.19%, 10/25/34 144A (cost $87,921; purchased 09/09/04)(g) |
BBB | (d) | 88 | 87,923 | |||||
| Argent NIM Trust, Series 2004-WN10, Class A |
|||||||||
| 4.212%, 11/25/34 144A (cost $85,988; purchased 10/19/04)(g) |
A- | (d) | 86 | 86,125 | |||||
| Argent NIM Trust, Series 2004-WN2, Class |
|||||||||
| 4.55%, 04/25/34 |
BBB | (d) | 33 | 33,464 | |||||
| Argent NIM Trust, Series 2004-WN8, Class |
|||||||||
| 4.70%, 07/25/34 |
BBB+ | (d) | 64 | 63,789 | |||||
| Asset Backed Funding Corp. NIM Trust, Series 2003-OPT1, Class Notes |
|||||||||
| 6.90%, 07/26/33 |
BBB | (d) | 19 | 18,804 | |||||
| Asset Backed Funding Corp. NIM Trust, Series 2004-OPT4, Class N1 |
|||||||||
| 4.45%, 05/26/34 |
A- | (d) | 71 | 71,201 | |||||
154
AST AMERICAN CENTURY STRATEGIC BALANCED PORTFOLIO
SCHEDULE OF INVESTMENTS (CONTINUED)
DECEMBER 31, 2004
| MOODY’S RATING |
PRINCIPAL AMOUNT |
VALUE (NOTE 2) | |||||||
| Capital One Prime Auto Receivables Trust, Series 2004-2, Class A4 |
|||||||||
| 2.462%, 03/15/10 |
Aaa | $ | 1,125 | $ | 1,126,853 | ||||
| Centex Home Equity, Series 2004-C, Class AF1 |
|||||||||
| 2.82%, 01/25/19 |
Aaa | 431 | 429,660 | ||||||
| CIT RV Trust, Series 1998-A, Class A4 |
|||||||||
| 6.09%, 02/15/12 |
Aaa | 25 | 25,394 | ||||||
| CNH Equipment Trust, Series 2004-A, Class A3A |
|||||||||
| 2.473%, 10/15/08 |
Aaa | 225 | 225,181 | ||||||
| Countrywide Asset-Backed Certificates Series 2004-11N, Class-N |
|||||||||
| 5.25%, 04/25/36 144A (cost $53,762; purchased 10/27/04)(g) |
BBB+ | (d) | 54 | 53,675 | |||||
| Countrywide Asset-Backed Certificates, Series 2004-11, Class-A1 |
|||||||||
| 2.371%, 09/25/21 |
BBB+ | (d) | 1,865 | 1,867,041 | |||||
| Countrywide Asset-Backed Certificates, Series 2004-13, Class AV1 |
|||||||||
| 2.543%, 12/25/34 |
Aaa | 820 | 820,000 | ||||||
| Countrywide Certificates, Series 2004-5N, Class N1 |
|||||||||
| 5.50%, 10/25/35 |
BBB+ | (d) | 72 | 72,145 | |||||
| Countrywide Partnership Trust Series 2004-EC1 Class 2A1 |
|||||||||
| 2.377%, 05/25/24 |
NR | 795 | 795,578 | ||||||
| Equifirst Mortgage Loan Trust Series 2004-3 Class A1 |
|||||||||
| 2.578%, 12/25/34 |
Aaa | 418 | 418,277 | ||||||
| Finance America NIM Trust, Series 2004-1, Class A |
|||||||||
| 5.25%, 06/27/34 |
BBB+ | (d) | 49 | 49,217 | |||||
| First Franklin NIM Trust, Series 2004-FF1, Class N1 |
|||||||||
| 4.50%, 09/25/05 |
BBB | (d) | 65 | 65,324 | |||||
| Ford Credit Auto Owner Trust, Series 2002-A, Class B |
|||||||||
| 4.79%, 11/15/06 |
Aa1 | 350 | 353,070 | ||||||
| Ford Credit Floorplan Master Owner Trust, Series 2004-1, Class A |
|||||||||
| 2.442%, 07/15/09 |
Aaa | 4,400 | 4,406,040 | ||||||
| Fremont NIM Trust, Series 2004-B, Class Notes |
|||||||||
| 4.703%, 05/25/34 144A (cost $54,920; purchased 05/20/04)(g) |
BBB+ | (d) | 55 | 54,726 | |||||
| GSAMP Trust, Series 2004-Min1, Class N1 |
|||||||||
| 5.50%, 09/25/34 144A (cost $89,048; purchased 09/20/04)(g) |
BBB | (d) | 89 | 88,964 | |||||
| Long Beach Asset Holdings Corp., Series 2004-5, Class Notes |
|||||||||
| 5.00%, 09/25/34 144A (cost $76,573; purchased 09/15/04)(g) |
A- | (d) | 76 | 76,289 | |||||
| Master NIM Trust, Series 2004-CI3, Class N1 |
|||||||||
| 4.45%, 02/26/34 144A (cost $21,702; purchased 05/18/04)(g) |
A | (d) | 21 | 21,020 | |||||
| Merrill Lynch Mortgage Investors, Inc., Series 2003-OP1N, Class N1 |
|||||||||
| 7.25%, 07/25/34 |
B | (d) | 29 | 29,074 | |||||
155
AST AMERICAN CENTURY STRATEGIC BALANCED PORTFOLIO
SCHEDULE OF INVESTMENTS (CONTINUED)
DECEMBER 31, 2004
| MOODY’S RATING |
PRINCIPAL AMOUNT |
VALUE (NOTE 2) | |||||||
| Morgan Stanley Capital I, Series 2004-NC2N, Class Notes |
|||||||||
| 6.25%, 12/25/33 144A (cost $26,237; purchased 03/16/04)(g) |
BBB+ | (d) | $ | 26 | $ | 26,101 | |||
| Park Place Securities, Inc., Series 2004-WHQ2, Class A3B |
|||||||||
| 2.578%, 02/25/35 |
Aaa | 1,528 | 1,528,444 | ||||||
| Residential Asset Securities Corp., Series 2004-KS2, Class MI1 |
|||||||||
| 4.71%, 03/25/34 |
Aa2 | 110 | 108,378 | ||||||
| Sail Net Interest Margin Notes, Series 2004-8A, Class A |
|||||||||
| 5.00%, 09/27/34 144A (cost $114,795; purchased 09/13/04)(g) |
A- | (d) | 115 | 114,279 | |||||
| Sail Net Interest Margin Notes, Series 2004-BNCA, Class A |
|||||||||
| 5.00%, 09/27/34 |
A- | (d) | 70 | 70,173 | |||||
| Sharps SP I LLC Net Interest Margin Trust, Series 2004—OP1N, Class NA |
|||||||||
| 5.19%, 04/25/34 144A (cost $86,827; purchased 06/09/04)(g) |
BBB | (d) | 87 | 86,608 | |||||
| WFS Financial Owner Trust, Series 2004-3, Class A1 |
|||||||||
| 1.725%, 08/17/05 |
A | (d) | 190 | 190,515 | |||||
| TOTAL ASSET-BACKED SECURITIES |
15,415,583 | ||||||||
| U.S. TREASURY OBLIGATIONS — 5.4% |
|||||||||
| U.S. Treasury Bonds |
|||||||||
| 8.00%, 11/15/21 |
1,000 | 1,373,008 | |||||||
| 6.25%, 08/15/23(a) |
2,200 | 2,576,321 | |||||||
| 6.125%, 11/15/27 |
1,200 | 1,401,892 | |||||||
| 5.375%, 02/15/31(a) |
495 | 535,412 | |||||||
| U.S. Treasury Inflationary Bonds [TIPS] |
|||||||||
| 2.00%, 07/15/14(c) |
1,100 | 1,149,732 | |||||||
| U.S. Treasury Notes |
|||||||||
| 4.00%, 06/15/09(a) |
3,080 | 3,139,554 | |||||||
| 4.375%, 08/15/12 |
1,700 | 1,741,106 | |||||||
| 4.75%, 05/15/14(a) |
400 | 416,969 | |||||||
| 4.25%, 08/15/14(a) |
240 | 240,610 | |||||||
| TOTAL U.S. TREASURY OBLIGATIONS |
12,574,604 | ||||||||
| COLLATERALIZED MORTGAGE OBLIGATIONS — 5.0% |
|||||||||
| Ameriquest Finance NIM Trust, Series 2003-N11A, Class Notes |
|||||||||
| 7.143%, 10/25/33 |
BBB+ | (d) | 19 | 18,609 | |||||
| Banc of America Commercial Mortgage, Inc., Series 2004-1, Class XP [IO] |
|||||||||
| 0.83%, 11/10/39 |
AAA | (d) | 5,857 | 175,446 | |||||
| Bear Stearns Commercial Mortgage Securities Series 2004-T16, Class-X2 |
|||||||||
| 0.81%, 08/13/46 [IO] |
AAA | (d) | 7,500 | 330,239 | |||||
| Bear Stearns Commercial Mortgage Securities, Series 2004-BA5A, Class A1 |
|||||||||
| 2.54%, 09/15/19 144A (cost $1,100,000; purchased 12/15/04)(g) |
NR | 1,100 | 1,100,000 | ||||||
| Citigroup Commercial Mortgage Trust, Series 2004-FL1, Class A1 |
|||||||||
| 2.533%, 07/15/18 |
Aaa | 3,588 | 3,594,668 | ||||||
| Commercial Mortgage Acceptance Corp., Series 1998-C2, Class X |
|||||||||
| 1.01%, 09/15/30 [IO] |
AAA | (d) | 7,387 | 274,306 | |||||
| Commercial Mortgage Pass-Through, Series 2004-HTL1, Class A1 |
|||||||||
| 2.643%, 07/15/16 |
Aaa | 850 | 851,706 | ||||||
156
AST AMERICAN CENTURY STRATEGIC BALANCED PORTFOLIO
SCHEDULE OF INVESTMENTS (CONTINUED)
DECEMBER 31, 2004
| MOODY’S RATING |
PRINCIPAL AMOUNT |
VALUE (NOTE 2) | |||||||
| Federal National Mortgage Assoc., Series 2003-52, Class KF |
|||||||||
| 2.817%, 07/25/17(c) |
Aaa | $ | 565 | $ | 566,572 | ||||
| First Franklin Mortgage Loan Asset Backed, Series 2004-Ff11 2A1 |
|||||||||
| 2.557%, 01/25/35 |
NR | 1,200 | 1,200,000 | ||||||
| GMAC Commercial Mortgage Securities, Inc., Series 2002-C2, Class A1 |
|||||||||
| 4.321%, 10/15/38 |
Aaa | 429 | 433,989 | ||||||
| LB-UBS Commercial Mortgage Trust, Series 2003-C5, Class A2 |
|||||||||
| 3.478%, 07/15/27 |
AAA | (d) | 1,100 | 1,083,349 | |||||
| Master Alternative Loans Trust, Series 2003-8, Class 4A1 |
|||||||||
| 7.00%, 12/25/33 |
Aaa | 245 | 257,208 | ||||||
| NationsLink Funding Corp., Series 1998-2, Class A1 |
|||||||||
| 6.001%, 08/20/30 |
Aaa | 61 | 61,536 | ||||||
| Washington Mutual, Series 2004-AR4, Class A6 |
|||||||||
| 3.813%, 06/25/34 |
Aaa | 850 | 837,220 | ||||||
| Washington Mutual, Series 2004-AR9, Class A7 |
|||||||||
| 4.24%, 08/25/34 |
Aaa | 950 | 951,342 | ||||||
| TOTAL COLLATERALIZED MORTGAGE OBLIGATIONS |
11,736,190 | ||||||||
| MUNICIPAL BONDS — 0.1% |
|||||||||
| ILLINOIS |
|||||||||
| Illinois State Taxable Pension |
|||||||||
| 5.10%, 06/01/33 (Cost $306,948) |
Aa3 | 300 | 288,171 | ||||||
| TOTAL LONG-TERM INVESTMENTS |
243,811,166 | ||||||||
| SHORT-TERM INVESTMENTS – 16.2% |
|||||||||
| CERTIFICATES OF DEPOSIT — 1.3% |
|||||||||
| Banco Santander PR |
|||||||||
| 2.315%, 01/07/05(b)(c) |
1,619 | 1,618,933 | |||||||
| First Boston Corp. |
|||||||||
| 2.36%, 01/24/05(b) |
306 | 306,464 | |||||||
| Skandinaviska Enskilda Banken |
|||||||||
| 2.35%, 01/28/05(b) |
739 | 738,861 | |||||||
| UBS Bank |
|||||||||
| 2.315%, 01/18/05(b) |
431 | 431,445 | |||||||
| 3,095,703 | |||||||||
| CORPORATE OBLIGATIONS — 4.4% |
|||||||||
| Bear Stearns |
|||||||||
| 2.28%, 01/03/05(b)(c) |
494 | 493,536 | |||||||
| Goldman Sachs Group, Inc. |
|||||||||
| 2.33%, 01/03/05(b)(c) |
203 | 202,985 | |||||||
| Merrill Lynch & Co., Inc. |
|||||||||
| 2.38%, 01/03/05(b)(c) |
5,057 | 5,057,402 | |||||||
| Morgan Stanley |
|||||||||
| 2.33%, 01/03/05(b)(c) |
247 | 247,311 | |||||||
| Natexis Banque NY |
|||||||||
| 2.297%, 01/03/05(b)(c) |
729 | 728,764 | |||||||
| Swedbank NY |
|||||||||
| 2.362%, 01/18/05(b)(c) |
3,560 | 3,559,297 | |||||||
| 10,289,295 | |||||||||
| TIME DEPOSIT — 2.3% |
|||||||||
| Bank of America NA |
|||||||||
| 1.50%, 01/03/05(b) |
1,123 | 1,122,926 | |||||||
| Chase Manhattan Bank(b) |
|||||||||
| 1.25%, 01/03/05 |
4,224 | 4,224,233 | |||||||
| 5,347,159 | |||||||||
| U.S. GOVERNMENT AGENCY OBLIGATIONS — 5.0% |
|||||||||
| Federal Home Loan Banks |
|||||||||
| 1.25% 01/03/05 |
11,500 | 11,499,201 | |||||||
157
AST AMERICAN CENTURY STRATEGIC BALANCED PORTFOLIO
SCHEDULE OF INVESTMENTS (CONTINUED)
DECEMBER 31, 2004
| SHARES |
VALUE |
|||||
| NON-REGISTERED INVESTMENT COMPANY — 3.2% |
||||||
| BlackRock Institutional Money Market Trust(b)(j) |
7,548,158 | $ | 7,548,158 | |||
| TOTAL SHORT-TERM INVESTMENTS |
37,779,516 | |||||
| TOTAL INVESTMENTS — 120.5% |
281,590,682 | |||||
| LIABILITIES IN EXCESS OF OTHER ASSETS — (20.5%) |
(47,896,211 | ) | ||||
| NET ASSETS — 100.0% |
$ | 233,694,471 | ||||
THE FOLLOWING ABBREVIATIONS ARE USED THROUGHOUT THE SCHEDULE OF INVESTMENTS:
| 144A | Security was purchased pursuant to Rule 144A under the Securities Act of 1933 and may not be resold subject to that rule except to qualified institutional buyers. Unless otherwise noted 144A securities are deemed to be liquid. | |
| IO | Interest Only | |
| TIPS | Treasury Inflation Protection Securities | |
THE FOLLOWING ANNOTATIONS ARE USED THROUGHOUT THE SCHEDULE OF INVESTMENTS:
| * | Non-income producing security. |
| (a) | All or a portion of securities on loan. Securities on loan have an aggregate market value of $25,489,579; cash collateral of $26,280,315 (included with liabilities) was received with which the portfolio purchased highly liquid short-term investments. |
| (b) | Represents security purchased with cash collateral for securities on loan. |
| (c) | Indicates a variable rate security. The maturity date presented for these instruments is the next date on which the rate of interest is adjusted. |
| (d) | Standard & Poors rating. |
| (f) | A TRACER (Traded Custody Receipts). Rate shown reflects the weighted average rate of the underlying securities as of December 31, 2004. |
| (g) | Indicates a security that has been deemed illiquid. The aggregate cost of illiquid securities is $5,641,740. The aggregate value, $5,839,713, represents 2.50% of net assets. |
| (j) | Security available to institutional investors only. |
| (l) | US$ Denominated Foreign Bonds. Cash of $64,000 has been segregated with the custodian to cover requirements for the following open futures contracts at December 31, 2004: |
| NUMBER OF CONTRACTS |
TYPE |
EXPIRATION MONTH |
VALUE AT TRADE DATE |
VALUE AT DECEMBER 31, 2004 |
UNREALIZED APPRECIATION | ||||||||
| LONG POSITION: | |||||||||||||
| 4 |
S&P 500 | Mar 05 | $ | 1,187,200 | $ | 1,213,700 | $ | 26,500 | |||||
158
AST AMERICAN CENTURY STRATEGIC BALANCED PORTFOLIO
SCHEDULE OF INVESTMENTS (CONTINUED)
DECEMBER 31, 2004
The industry classification of long-term portfolio holdings, short-term investments and liabilities in excess of other assets shown as a percentage of net assets as of December 31, 2004 were as follows:
| U.S. Government Agency Mortgage-Backed Securities |
17.9 | % | |
| Asset-Backed Securities |
6.6 | ||
| Financial Services |
6.4 | ||
| Financial — Bank & Trust |
6.0 | ||
| U.S. Treasury Obligations |
5.4 | ||
| Collateralized Mortgage Obligations |
5.0 | ||
| Oil & Gas |
4.9 | ||
| Retail & Merchandising |
3.9 | ||
| Consumer Products & Services |
3.8 | ||
| Telecommunications |
3.3 | ||
| Entertainment & Leisure |
3.2 | ||
| Insurance |
3.2 | ||
| Pharmaceuticals |
3.0 | ||
| Utilities |
3.0 | ||
| Computer Services & Software |
2.5 | ||
| Medical Supplies & Equipment |
2.1 | ||
| Computer Hardware |
2.0 | ||
| Semiconductors |
1.8 | ||
| Exchange Traded Funds |
1.7 | ||
| Restaurants |
1.5 | ||
| Paper & Forest Products |
1.4 | ||
| Conglomerates |
1.3 | ||
| Food |
1.3 | ||
| Automobile Manufacturers |
1.2 | ||
| Construction |
1.1 | ||
| Internet Services |
1.1 | ||
| Aerospace |
1.0 | ||
| Beverages |
0.9 | ||
| Business Services |
0.8 | ||
| Metals & Mining |
0.8 | ||
| Chemicals |
0.7 | ||
| Diversified Operations |
0.6 | ||
| Electronic Components & Equipment |
0.6 | ||
| Machinery & Equipment |
0.6 | ||
| Financial — Brokerage |
0.5 | ||
| Office Equipment |
0.5 | ||
| Railroads |
0.5 | ||
| Transportation |
0.5 | ||
| Automotive Parts |
0.4 | ||
| Broadcasting |
0.3 | ||
| Cable Television |
0.3 | ||
| Environmental Services |
0.2 | ||
| Airlines |
0.1 | ||
| Clothing & Apparel |
0.1 | ||
| Containers & Packaging |
0.1 | ||
| Healthcare Services |
0.1 | ||
| Municipal Bonds |
0.1 | ||
| Short-Term Investments |
16.2 | ||
| 120.5 | |||
| Liabilities in excess of other assets |
(20.5 | ) | |
| 100.0 | % | ||
See Notes to Financial Statements.
159
AST T. ROWE PRICE ASSET ALLOCATION PORTFOLIO
SCHEDULE OF INVESTMENTS
DECEMBER 31, 2004
| SHARES |
VALUE (NOTE 2) | ||||
| LONG-TERM INVESTMENTS — 98.3% |
|||||
| COMMON STOCK — 67.5% |
|||||
| ADVERTISING — 0.2% |
|||||
| Aegis Group PLC (United Kingdom) |
84,770 | $ | 175,770 | ||
| Getty Images, Inc.*(a) |
1,900 | 130,815 | |||
| Lamar Advertising Co.*(a) |
2,100 | 89,838 | |||
| Monster Worldwide, Inc.* |
3,200 | 107,648 | |||
| Publicis Groupe SA (France) |
6,233 | 202,062 | |||
| WPP Group PLC (United Kingdom) |
17,952 | 197,491 | |||
| WPP Group PLC [ADR] (United Kingdom) |
2,600 | 142,090 | |||
| 1,045,714 | |||||
| AEROSPACE — 0.9% |
|||||
| BAESystems PLC (United Kingdom) |
46,337 | 205,059 | |||
| Boeing Co. |
11,600 | 600,532 | |||
| European Aeronautic Defence and Space Co. (France) |
9,426 | 274,055 | |||
| General Dynamics Corp. |
4,600 | 481,160 | |||
| Goodrich Corp. |
2,000 | 65,280 | |||
| Lockheed Martin Corp. |
8,300 | 461,065 | |||
| MTC Technologies, Inc.* |
1,900 | 63,783 | |||
| Raytheon Co. |
5,800 | 225,214 | |||
| Rockwell Collins, Inc. |
10,500 | 414,120 | |||
| Triumph Group, Inc.* |
1,400 | 55,300 | |||
| United Technologies Corp. |
8,300 | 857,804 | |||
| 3,703,372 | |||||
| AIRLINES — 0.1% |
|||||
| Frontier Airlines, Inc.* |
9,200 | 104,972 | |||
| Qantas Airways Ltd. (Australia) |
22,219 | 64,619 | |||
| SkyWest, Inc. |
8,600 | 172,516 | |||
| Southwest Airlines Co. |
17,500 | 284,900 | |||
| 627,007 | |||||
| AUTOMOBILE MANUFACTURERS — 0.8% |
|||||
| General Motors Corp.(a) |
14,900 | 596,894 | |||
| Honda Motor Co. Ltd. (Japan) |
3,900 | 202,098 | |||
| Mitsubishi Corp. (Japan) |
23,000 | 297,180 | |||
| Oshkosh Truck Corp. |
3,400 | 232,492 | |||
| PACCAR, Inc. |
5,700 | 458,736 | |||
| Porsche AG (Germany) |
355 | 226,550 | |||
| PSA Peugeot Citroen SA (France) |
2,922 | 185,480 | |||
| Renault SA (France) |
3,114 | 260,523 | |||
| Toyota Motor Corp. (Japan) |
23,100 | 940,050 | |||
| 3,400,003 | |||||
| AUTOMOTIVE PARTS – 0.3% |
|||||
| Autoliv AB (Sweden) |
7,300 | 349,324 | |||
| Autoliv, Inc. (Germany) |
2,800 | 135,240 | |||
| Koito Manufacturing Co. Ltd. (Japan) |
16,000 | 144,120 | |||
| Lear Corp. |
3,700 | 225,737 | |||
| O’ Reilly Automotive, Inc.* |
3,400 | 153,170 | |||
| TRW Automotive Holdings Corp.* |
18,000 | 372,601 | |||
| 1,380,192 | |||||
| BEVERAGES — 1.3% |
|||||
| Allied Domecq PLC (United Kingdom) |
24,234 | 238,683 | |||
| Anheuser-Busch Cos., Inc. |
9,400 | 476,862 | |||
| Asahi Breweries Ltd. (Japan) |
12,000 | 148,609 | |||
| Coca-Cola Co. |
50,900 | 2,118,968 | |||
| Cott Corp. (Canada)* |
15,500 | 383,315 | |||
| Kirin Brewery Co. Ltd. (Japan) |
22,000 | 216,629 | |||
| Lion Nathan Ltd. (New Zealand) |
32,444 | 217,235 | |||
| PepsiCo, Inc. |
36,500 | 1,905,300 | |||
| 5,705,601 | |||||
| BROADCASTING — 0.6% |
|||||
| Astro All Asia Networks PLC (Malaysia)* 144A (cost $33,668; purchased 12/18/01—03/20/02)(g) |
31,200 | 44,337 | |||
| Cox Radio, Inc. (Class “A” Stock)* |
3,000 | 49,440 | |||
| Emmis Communications Corp. (Class “A” Stock)* |
3,900 | 74,841 | |||
| Fox Entertainment Group, Inc. (Class “A” Stock)* |
3,200 | 100,032 | |||
| Gestevision Telecinco SA (Spain)* |
1,258 | 25,957 | |||
| Liberty Media Corp. (Class “A” Stock)* |
85,224 | 935,760 | |||
| Liberty Media International, Inc. (Class “A” Stock)*(a) |
1,246 | 57,603 | |||
| Meredith Corp. |
2,100 | 113,820 | |||
| News Corp Inc., (Class “A” Stock) When Issued |
56,400 | 1,052,423 | |||
| Radio One, Inc. (Class “D” Stock)* |
7,900 | 127,348 | |||
| Scripps, (E.W.) Co. (Class “A” Stock) |
2,000 | 96,560 | |||
| 2,678,121 | |||||
| BUILDING MATERIALS — 0.6% |
|||||
| Aggregate Industries PLC (United Kingdom) |
94,488 | 189,571 | |||
| American Standard Cos., Inc.* |
4,300 | 177,676 | |||
| Boral Ltd. (Australia) |
84,842 | 456,909 | |||
| Bouygues SA (France) |
7,151 | 330,480 | |||
| Cemex SA de CV (Mexico) |
44,648 | 326,038 | |||
| Hughes Supply, Inc. |
2,200 | 71,170 | |||
| Lafarge SA (France) |
1,070 | 103,262 | |||
| Nobia AB (Sweden) |
10,434 | 172,712 | |||
| Pilkington PLC (United Kingdom) |
90,187 | 190,465 | |||
| RMC Group PLC (United Kingdom) |
11,905 | 194,051 | |||
160
AST T. ROWE PRICE ASSET ALLOCATION PORTFOLIO
SCHEDULE OF INVESTMENTS (CONTINUED)
DECEMBER 31, 2004
| SHARES |
VALUE (NOTE 2) | ||||
| SCP Pool Corp. |
4,012 | $ | 127,983 | ||
| Trex Co., Inc.* |
2,100 | 110,124 | |||
| 2,450,441 | |||||
| BUSINESS SERVICES — 0.7% |
|||||
| Accenture Ltd. (Class “A” Stock)* |
8,800 | 237,600 | |||
| Advisory Board Co. (The)* |
16,900 | 623,272 | |||
| ChoicePoint, Inc.* |
2,266 | 104,213 | |||
| Corporate Executive Board Co. (The) |
3,100 | 207,514 | |||
| Downer EDI Ltd. (Australia) |
25,109 | 93,101 | |||
| Fair Isaac Corp. |
3,797 | 139,274 | |||
| First Data Corp. |
16,400 | 697,656 | |||
| Fiserv, Inc.* |
4,700 | 188,893 | |||
| Forrester Research, Inc.* |
2,800 | 50,232 | |||
| Indra Sistemas SA (Spain) |
12,686 | 216,750 | |||
| Iron Mountain, Inc.*(a) |
5,125 | 156,261 | |||
| Manpower, Inc. |
5,500 | 265,650 | |||
| Robert Half International, Inc. |
3,700 | 108,891 | |||
| Wireless Facilities, Inc.* |
7,300 | 68,912 | |||
| 3,158,219 | |||||
| CABLE TELEVISION — 0.4% |
|||||
| Cable & Wireless PLC (United Kingdom) |
35,643 | 81,604 | |||
| Comcast Corp. (Class “A” Stock)* |
25,400 | 845,312 | |||
| DIRECTV Group, Inc. (The)* |
11,455 | 191,757 | |||
| EchoStar Communications Corp. (Class “A” Stock)(a) |
4,200 | 139,608 | |||
| Rogers Communications, Inc. (Class “B” Stock)*(a) |
17,600 | 460,240 | |||
| 1,718,521 | |||||
| CHEMICALS — 1.3% |
|||||
| Agrium, Inc. (Canada) |
2,700 | 45,495 | |||
| Arch Chemicals, Inc. |
4,450 | 128,071 | |||
| BASF AG (Germany) |
7,134 | 513,935 | |||
| Cabot Corp. |
8,600 | 332,648 | |||
| Degussa AG (Germany) |
8,906 | 375,028 | |||
| Dow Chemical Co.(a) |
22,700 | 1,123,877 | |||
| DuPont, (E.I.) de Nemours & Co. |
20,259 | 993,704 | |||
| Ferro Corp. |
4,400 | 102,036 | |||
| Great Lakes Chemical Corp.(a) |
1,300 | 37,037 | |||
| Kaneka Corp. (Japan) |
19,000 | 215,087 | |||
| Lyondell Chemical Co. |
4,370 | 126,380 | |||
| Minerals Technologies, Inc. |
2,400 | 160,080 | |||
| Mitsubishi Gas Chemical Co., Inc. (Japan) |
40,000 | 188,543 | |||
| Potash Corp. of Saskatchewan, Inc. (Canada) |
6,300 | 523,278 | |||
| Symyx Technologies, Inc.* |
5,300 | 159,424 | |||
| The Mosaic Co.* |
17,000 | 277,440 | |||
| Valspar Corp. |
1,200 | 60,012 | |||
| Yara International ASA (Norway)* |
2,366 | 31,154 | |||
| 5,393,229 | |||||
| CLOTHING & APPAREL — 0.2% |
|||||
| Adidas-Salomon AG (Germany) |
1,016 | 163,994 | |||
| Cintas Corp.(a) |
3,200 | 140,352 | |||
| Pacific Sunwear of California, Inc.* |
4,200 | 93,492 | |||
| World Co. Ltd. (Japan) |
3,000 | 105,397 | |||
| Yue Yuen Industrial Holdings Ltd. (Hong Kong) |
52,500 | 144,544 | |||
| 647,779 | |||||
| COMMERCIAL SERVICES |
|||||
| Jackson Hewitt Tax Service, Inc. |
1,500 | 37,875 | |||
| COMPUTER HARDWARE — 1.7% |
|||||
| Dell, Inc.* |
85,800 | 3,615,612 | |||
| Gateway, Inc.* |
12,000 | 72,120 | |||
| Hewlett-Packard Co. |
28,885 | 605,718 | |||
| Insight Enterprises, Inc.* |
4,800 | 98,496 | |||
| International Business Machines Corp. |
24,250 | 2,390,565 | |||
| Lexmark International, Inc.* |
4,300 | 365,500 | |||
| Mercury Computer Systems, Inc.* |
3,500 | 103,880 | |||
| Storage Technology Corp.* |
4,900 | 154,889 | |||
| 7,406,780 | |||||
| COMPUTER SERVICES & SOFTWARE — 3.6% |
|||||
| Activision, Inc.* |
4,300 | 86,774 | |||
| Automatic Data Processing, Inc. |
19,500 | 864,825 | |||
| Avid Technology, Inc.* |
1,900 | 117,325 | |||
| Borland Software Corp.* |
2,800 | 32,704 | |||
| CACI International, Inc. (Class “A” Stock)* |
500 | 34,065 | |||
| Cadence Design Systems, Inc.* |
3,500 | 48,335 | |||
| CDW Corp. |
8,900 | 590,515 | |||
| Cisco Systems, Inc.*(a) |
129,900 | 2,507,070 | |||
| Cognizant Technology Solutions Corp. (Class “A” Stock)* |
1,100 | 46,563 | |||
| Creative Technology Ltd. (Singapore) |
5,500 | 82,210 | |||
| DST Systems, Inc.*(a) |
2,800 | 145,936 | |||
| Electronic Arts, Inc.* |
4,300 | 265,224 | |||
| FactSet Research Systems, Inc. |
1,400 | 81,816 | |||
| Global Payments, Inc. |
1,400 | 81,956 | |||
| Henry, (Jack) & Associates, Inc. |
3,400 | 67,694 | |||
| Inforte Corp.* |
6,500 | 51,220 | |||
| Intuit, Inc.* |
10,200 | 448,902 | |||
| Logica PLC (United Kingdom) |
21,153 | 78,279 | |||
| Macrovision Corp.* |
3,100 | 79,732 | |||
| MatrixOne, Inc.* |
22,600 | 148,030 | |||
| Mercury Interactive Corp.*(a) |
2,600 | 118,430 | |||
| Microsoft Corp. |
226,100 | 6,039,130 | |||
161
AST T. ROWE PRICE ASSET ALLOCATION PORTFOLIO
SCHEDULE OF INVESTMENTS (CONTINUED)
DECEMBER 31, 2004
| SHARES |
VALUE (NOTE 2) | ||||
| NEC Soft Ltd. (Japan) |
3,900 | $ | 123,695 | ||
| NetIQ Corp.* |
17,900 | 218,559 | |||
| Oracle Corp.* |
113,500 | 1,557,220 | |||
| Red Hat, Inc.*(a) |
30,300 | 404,505 | |||
| SAP AG (Germany) |
2,130 | 380,430 | |||
| SERENA Software, Inc.* |
4,000 | 86,560 | |||
| SRA International, Inc. (Class “A” Stock)* |
1,100 | 70,620 | |||
| Tech Data Corp.*(a) |
1,600 | 72,640 | |||
| TIBCO Software, Inc.* |
6,900 | 92,046 | |||
| TRANS COSMOS, Inc. (Japan) |
4,000 | 137,016 | |||
| Trend Micro, Inc. (Japan)* |
2,500 | 134,918 | |||
| Verity, Inc.* |
16,800 | 220,416 | |||
| Websense, Inc.* |
1,900 | 96,368 | |||
| 15,611,728 | |||||
| CONGLOMERATES — 2.1% |
|||||
| Altria Group, Inc. |
50,800 | 3,103,880 | |||
| Cendant Corp.(a) |
18,600 | 434,868 | |||
| Cycle & Carriage Ltd. (Singapore) |
4,379 | 28,435 | |||
| DCC PLC (Ireland) |
9,055 | 203,082 | |||
| Guiness Peat Group PLC (New Zealand) |
71,617 | 112,252 | |||
| Honeywell International, Inc. |
35,800 | 1,267,678 | |||
| Hutchison Whampoa Ltd. (Hong Kong) |
21,400 | 200,297 | |||
| ITT Industries, Inc. |
3,400 | 287,130 | |||
| Jenoptik AG (Germany) |
8,711 | 91,882 | |||
| Mitsubishi Heavy Industries Ltd. (Japan) |
52,000 | 147,672 | |||
| Norsk Hydro ASA (Norway) |
2,389 | 188,149 | |||
| SembCorp Industries Ltd. (Singapore) |
236,000 | 234,207 | |||
| Sumitomo Corp. (Japan) |
13,000 | 112,150 | |||
| Tyco International Ltd.(a) |
75,800 | 2,709,092 | |||
| 9,120,774 | |||||
| CONSTRUCTION — 0.3% |
|||||
| Balfour Beatty PLC (United Kingdom) |
31,684 | 191,767 | |||
| D.R. Horton, Inc. |
3,771 | 152,009 | |||
| Grupo Acciona SA (Spain) |
3,551 | 314,217 | |||
| Insituform Technologies, Inc. (Class “A” Stock)* |
4,300 | 97,481 | |||
| JGC Corp. (Japan) |
12,000 | 109,730 | |||
| NCC AB (Sweden) |
16,214 | 214,710 | |||
| Technip-Coflexip SA (France) |
489 | 90,396 | |||
| Toll Brothers, Inc.* |
3,200 | 219,552 | |||
| WCI Communities, Inc.* |
2,800 | 82,320 | |||
| 1,472,182 | |||||
| CONSUMER PRODUCTS & SERVICES — 2.6% |
|||||
| Bausch & Lomb, Inc. |
900 | 58,014 | |||
| Clorox Co. |
6,056 | 356,880 | |||
| Colgate-Palmolive Co. |
11,800 | 603,688 | |||
| Dollar Thrifty Automotive Group, Inc.* |
3,500 | 105,700 | |||
| Engineered Support Systems, Inc. |
1,600 | 94,752 | |||
| Fortune Brands, Inc. |
2,700 | 208,386 | |||
| Fossil, Inc.*(a) |
4,500 | 115,380 | |||
| Gillette Co. |
20,600 | 922,468 | |||
| Hasbro, Inc. |
5,700 | 110,466 | |||
| Johnson & Johnson(a) |
56,946 | 3,611,515 | |||
| Kimberly-Clark Corp. |
8,900 | 585,709 | |||
| L'Oreal SA (France) |
1,228 | 93,223 | |||
| Lauder, (Estee) Cos., Inc. (Class “A” Stock) |
2,300 | 105,271 | |||
| Mattel, Inc. |
2,900 | 56,521 | |||
| Maytag Corp.(a) |
4,800 | 101,280 | |||
| Newell Rubbermaid, Inc. |
14,900 | 360,431 | |||
| Procter & Gamble Co. |
59,200 | 3,260,736 | |||
| Rent-A-Center, Inc.* |
1,150 | 30,475 | |||
| SEB SA (France) |
657 | 70,460 | |||
| Whirlpool Corp.(a) |
2,400 | 166,104 | |||
| 11,017,459 | |||||
| CONTAINERS & PACKAGING |
|||||
| Smurfit-Stone Container Corp.* |
4,400 | 82,192 | |||
| ELECTRONIC COMPONENTS & EQUIPMENT — 3.0% |
|||||
| Advanced Energy Industries, Inc.* |
4,500 | 41,085 | |||
| AVX Corp. |
3,200 | 40,320 | |||
| Belden CDT, Inc. |
1,150 | 26,680 | |||
| C & D Technologies, Inc. |
3,500 | 59,640 | |||
| Cyberoptics Corp.* |
1,500 | 22,305 | |||
| Digital Theater Systems, Inc.* |
8,900 | 179,157 | |||
| Fanuc Ltd. (Japan) |
3,500 | 228,847 | |||
| Flextronics International Ltd.*(a) |
16,000 | 221,120 | |||
| General Electric Co. |
237,400 | 8,665,099 | |||
| Gentex Corp.(a) |
3,000 | 111,060 | |||
| Jabil Circuit, Inc.* |
11,900 | 304,402 | |||
| Kaba Holdings AG (Switzerland) |
330 | 102,300 | |||
| Koninklijke (Royal) Philips Electronics NV (Netherlands) |
6,549 | 173,673 | |||
| Kyocera Corp. (Japan) |
1,200 | 92,398 | |||
| Littelfuse, Inc.* |
2,400 | 81,984 | |||
| NEC Corp. |
14,000 | 87,030 | |||
| Neopost SA (France) |
1,975 | 153,554 | |||
| Nikon Corp. (Japan) |
10,000 | 123,548 | |||
| Pioneer Corp. (Japan) |
8,700 | 169,806 | |||
| Plexus Corp.* |
5,500 | 71,555 | |||
| Sagem SA (France)* |
8,075 | 172,103 | |||
| Siemens AG (Germany) |
6,178 | 523,833 | |||
| Sony Corp. (Japan) |
10,000 | 386,455 | |||
| Sumitomo Electric Industries Ltd. (Japan) |
12,000 | 130,575 | |||
| TDK Corp. (Japan) |
1,900 | 140,734 | |||
| Teleflex, Inc. |
4,300 | 223,342 | |||
162
AST T. ROWE PRICE ASSET ALLOCATION PORTFOLIO
SCHEDULE OF INVESTMENTS (CONTINUED)
DECEMBER 31, 2004
| SHARES |
VALUE (NOTE 2) | ||||
| Toshiba Corp. (Japan) |
33,000 | $ | 141,700 | ||
| TTM Technologies, Inc.* |
9,800 | 115,640 | |||
| 12,789,945 | |||||
| ENTERTAINMENT & LEISURE — 1.6% |
|||||
| Brunswick Corp. |
9,200 | 455,400 | |||
| Caesars Entertainment, Inc.*(a) |
3,500 | 70,490 | |||
| Carnival Corp.(a) |
14,100 | 812,583 | |||
| Disney, (Walt) Co. |
4,092 | 113,758 | |||
| Harley-Davidson, Inc. |
2,000 | 121,500 | |||
| Heiwa Corp. (Japan) |
3,700 | 61,817 | |||
| Hilton Group PLC (United Kingdom) |
20,349 | 111,149 | |||
| International Game Technology Group, Inc. |
14,300 | 491,634 | |||
| Mandalay Resort Group |
600 | 42,258 | |||
| Marvel Enterprises, Inc.*(a) |
4,600 | 94,208 | |||
| Royal Caribbean Cruises Ltd.(a) |
6,900 | 375,636 | |||
| Station Casinos, Inc.(a) |
5,200 | 284,336 | |||
| Time Warner, Inc.* |
107,700 | 2,093,687 | |||
| Viacom, Inc. (Class“B” Stock) |
40,100 | 1,459,239 | |||
| Whitbread PLC (United Kingdom) |
10,045 | 163,251 | |||
| WMS Industries, Inc.* |
7,200 | 241,488 | |||
| 6,992,434 | |||||
| ENVIRONMENTAL SERVICES — 0.1% |
|||||
| Republic Services, Inc. |
5,200 | 174,408 | |||
| Waste Connections, Inc.* |
2,100 | 71,925 | |||
| Waste Management, Inc. |
7,159 | 214,340 | |||
| 460,673 | |||||
| FARMING & AGRICULTURE |
|||||
| Sunopta, Inc.* |
12,100 | 86,878 | |||
| FINANCIAL — BANK & TRUST — 5.5% |
|||||
| ABN AMRO Holding NV (Netherlands) |
12,832 | 339,942 | |||
| Australia & New Zealand Banking Group Ltd. (Australia) |
27,803 | 448,755 | |||
| Australia & New Zealand Banking Group Ltd. [ADR] (Australia) |
1,800 | 145,656 | |||
| Babcock & Brown Ltd. (Australia)* |
25,221 | 215,106 | |||
| Banca Intesa SpA (Italy) |
54,392 | 261,720 | |||
| Banco Santander Central Hispano SA (Spain) |
31,595 | 392,092 | |||
| Banco Santander Chile [ADR] (Chile) |
6,178 | 209,187 | |||
| Bank Austria Creditanstalt (Austria) |
4,401 | 397,807 | |||
| Bank of America Corp.(a) |
59,476 | 2,794,777 | |||
| Bank Of Ireland (Ireland) |
17,592 | 292,921 | |||
| Bank of Yokohama Ltd. (Japan)* |
37,000 | 233,259 | |||
| BankAtlantic Bancorp, Inc. (Class “A” Stock) |
9,200 | 183,080 | |||
| Barclays PLC (United Kingdom) |
81,856 | 920,931 | |||
| Barclays PLC [ADR] (United Kingdom) |
700 | 31,976 | |||
| BNP Paribas SA (France) |
8,415 | 609,650 | |||
| Bradford & Bingley PLC (United Kingdom) |
42,314 | 272,759 | |||
| City National Corp. |
1,000 | 70,650 | |||
| Comerica, Inc. |
25,400 | 1,549,908 | |||
| Commerce Bancshares, Inc. |
2,814 | 141,263 | |||
| Credito Italiano SpA (Italy) |
42,560 | 244,704 | |||
| DBS Groupo Holdings (Singapore) |
35,236 | 347,525 | |||
| Dexia (France) |
8,303 | 191,069 | |||
| East West Bancorp, Inc. |
3,300 | 138,468 | |||
| First Horizon National Corp.(a) |
3,600 | 155,196 | |||
| HBOS PLC (United Kingdom) |
28,524 | 464,393 | |||
| HSBC Holdings PLC (United Kingdom) |
19,427 | 327,849 | |||
| Joyo Bank, Ltd. (Japan) |
33,000 | 161,023 | |||
| Macquarie Bank Ltd. (Australia) |
10,597 | 386,276 | |||
| Mercantile Bankshares Corp. |
2,800 | 146,160 | |||
| National Australia Bank Ltd. (Australia) |
21,722 | 490,745 | |||
| Nordea AB (Sweden) |
54,051 | 544,951 | |||
| NSK Ltd. (Japan) |
15,000 | 75,388 | |||
| Popular, Inc. |
5,000 | 144,150 | |||
| Royal Bank of Scotland (United Kingdom) |
27,394 | 921,443 | |||
| Skandanaviska Enskilda Banken (Sweden) |
17,416 | 336,768 | |||
| Southwest Bancorporation of Texas, Inc. |
5,000 | 116,450 | |||
| State Street Corp. |
26,300 | 1,291,856 | |||
| Sumitomo Mitsui Financial Group, Inc. (Japan) |
43 | 312,628 | |||
| SunTrust Banks, Inc. |
5,800 | 428,504 | |||
| Svenska Handlesbanken (Class “A” Stock) (Sweden) |
19,749 | 514,127 | |||
| Synovus Financial Corp. |
10,600 | 302,948 | |||
| TCF Financial Corp. |
2,600 | 83,564 | |||
| Texas Regional Bancshares, Inc. (Class “A” Stock) |
4,972 | 162,485 | |||
| The 77 Bank Ltd. (Japan) |
19,000 | 133,688 | |||
| U.S. Bancorp(a) |
98,400 | 3,081,887 | |||
| UCBH Holdings, Inc. |
4,400 | 201,608 | |||
| Wachovia Corp. |
22,300 | 1,172,980 | |||
| Wells Fargo & Co. |
19,900 | 1,236,785 | |||
| Wilmington Trust Corp. |
3,500 | 126,525 | |||
| 23,753,582 | |||||
163
AST T. ROWE PRICE ASSET ALLOCATION PORTFOLIO
SCHEDULE OF INVESTMENTS (CONTINUED)
DECEMBER 31, 2004
| SHARES |
VALUE (NOTE 2) | ||||
| FINANCIAL SERVICES — 5.4% |
|||||
| Aiful Corp. (Japan) |
1,950 | $ | 214,468 | ||
| Alliance & Leicester PLC (United Kingdom) |
14,265 | 249,773 | |||
| American Express Co.(a) |
24,300 | 1,369,791 | |||
| Capital Source, Inc.*(a) |
16,800 | 431,256 | |||
| Citigroup, Inc. |
110,341 | 5,316,229 | |||
| Countrywide Financial Corp. |
6,700 | 247,967 | |||
| Credit Suisse Group (Switzerland)* |
10,775 | 452,946 | |||
| Doral Financial Corp. |
3,125 | 153,906 | |||
| Eaton Vance Corp. |
2,400 | 125,160 | |||
| Fannie Mae(a) |
13,500 | 961,335 | |||
| First Marblehead Corp.* |
1,500 | 84,375 | |||
| Franklin Resources, Inc.(a) |
5,600 | 390,040 | |||
| Freddie Mac |
9,700 | 714,890 | |||
| Goldman Sachs Group, Inc. |
9,700 | 1,009,188 | |||
| Grupo Financiero Banorte SA de C.V. (Mexico) |
104,800 | 659,995 | |||
| Hypo Real Estate Holding AG (Germany)* |
9,213 | 381,944 | |||
| IndyMac Bancorp, Inc. |
4,300 | 148,135 | |||
| ING Groep NV (Netherlands) |
12,241 | 370,375 | |||
| Investors Financial Services Corp.(a) |
15,000 | 749,700 | |||
| JP Morgan Chase & Co. |
90,068 | 3,513,553 | |||
| Legg Mason, Inc. |
5,850 | 428,571 | |||
| Lehman Brothers Holdings, Inc.(a) |
6,000 | 524,880 | |||
| MBNA Corp. |
14,500 | 408,755 | |||
| Merrill Lynch & Co., Inc. |
21,000 | 1,255,170 | |||
| Mitsubishi Tokyo Financial Group, Inc. (Japan) |
19 | 192,837 | |||
| Moody’s Corp.(a) |
2,500 | 217,125 | |||
| Morgan Stanley Dean Witter & Co. |
20,200 | 1,121,504 | |||
| Providian Financial Corp.* |
5,500 | 90,585 | |||
| Schwab, (Charles) Corp. |
39,300 | 470,028 | |||
| SLM Corp. |
15,700 | 838,223 | |||
| Waddell & Reed Financial, Inc. (Class “A” Stock) |
3,300 | 78,837 | |||
| 23,171,541 | |||||
| FINANCIAL-BROKERAGE — 0.3% |
|||||
| Ameritrade Holding Corp.* |
77,500 | 1,102,050 | |||
| FOOD — 1.1% |
|||||
| Associated British Foods PLC (United Kingdom) |
15,608 | 233,883 | |||
| Campbell Soup Co.(a) |
12,500 | 373,625 | |||
| Compass Group PLC (United Kingdom) |
10,431 | 49,315 | |||
| Dean Foods Co.* |
3,350 | 110,383 | |||
| General Mills, Inc. |
14,400 | 715,823 | |||
| Heinz, (H.J.) Co. |
3,550 | 138,415 | |||
| Hershey Foods Corp. |
4,000 | 222,160 | |||
| J. Sainsbury PLC (United Kingdom) |
26,581 | 138,044 | |||
| Kellogg Co. |
8,800 | 393,008 | |||
| Koninklijke Wessanen NV (Netherlands) |
11,125 | 142,900 | |||
| Kraft Foods, Inc. (Class “A” Stock)(a) |
4,100 | 146,001 | |||
| Nestle SA (Switzerland) |
2,138 | 559,366 | |||
| Performance Food Group Co.*(a) |
1,300 | 34,983 | |||
| SYSCO Corp. |
13,200 | 503,844 | |||
| Tesco PLC (United Kingdom) |
44,430 | 274,457 | |||
| Tootsie Roll Industries, Inc. |
2,016 | 69,814 | |||
| Unilever PLC (United Kingdom) |
44,644 | 438,417 | |||
| United Natural Foods, Inc.* |
3,400 | 105,740 | |||
| 4,650,178 | |||||
| FURNITURE |
|||||
| Mohawk Industries, Inc.*(a) |
800 | 73,000 | |||
| HEALTHCARE SERVICES — 0.9% |
|||||
| AmSurg Corp.* |
1,600 | 47,264 | |||
| Caremark Rx, Inc.* |
8,300 | 327,269 | |||
| Community Health Systems, Inc.* |
13,400 | 373,592 | |||
| Coventry Health Care, Inc.* |
2,150 | 114,122 | |||
| DaVita, Inc.* |
3,450 | 136,379 | |||
| HCA, Inc.(a) |
7,300 | 291,708 | |||
| Laboratory Corp. of America Holdings*(a) |
5,600 | 278,992 | |||
| LifePoint Hospitals, Inc.* |
1,500 | 52,230 | |||
| Medco Health Solutions, Inc.* |
3,084 | 128,294 | |||
| Omnicare, Inc. |
3,600 | 124,632 | |||
| Stericycle, Inc.* |
500 | 22,975 | |||
| Symbion, Inc.* |
3,200 | 70,656 | |||
| Triad Hospitals, Inc.* |
1,378 | 51,275 | |||
| United Surgical Partners International, Inc.* |
1,800 | 75,060 | |||
| UnitedHealth Group, Inc. |
20,900 | 1,839,827 | |||
| 3,934,275 | |||||
| HOTELS & MOTELS — 0.1% |
|||||
| Fairmont Hotels & Resorts, Inc. |
2,600 | 90,064 | |||
| Marriott International, Inc. (Class “A” Stock)(a) |
4,800 | 302,304 | |||
| 392,368 | |||||
| INDUSTRIAL PRODUCTS — 0.4% |
|||||
| Actuant Corp.* |
4,300 | 224,245 | |||
| Glory Ltd. (Japan) |
5,000 | 78,413 | |||
| Harsco Corp. |
1,600 | 89,184 | |||
| Illinois Tool Works, Inc. |
1,600 | 148,288 | |||
| Nucor Corp.(a) |
22,400 | 1,172,416 | |||
| Roper Industries, Inc. |
2,200 | 133,694 | |||
| 1,846,240 | |||||
164
AST T. ROWE PRICE ASSET ALLOCATION PORTFOLIO
SCHEDULE OF INVESTMENTS (CONTINUED)
DECEMBER 31, 2004
| SHARES |
VALUE (NOTE 2) | ||||
| INSURANCE — 3.3% |
|||||
| Aioi Insurance Co., Ltd. (Japan) |
39,000 | $ | 180,023 | ||
| Allstate Corp. (The) |
4,300 | 222,396 | |||
| American International Group, Inc. |
53,130 | 3,489,047 | |||
| Assurant, Inc. |
5,300 | 161,915 | |||
| Aviva PLC (United Kingdom) |
16,067 | 193,720 | |||
| AXA (France) |
20,751 | 512,781 | |||
| Axis Capital Holdings Ltd. |
15,600 | 426,816 | |||
| CNP Assurances (France) |
4,884 | 349,853 | |||
| Gallagher, (Arthur J.) & Co. |
2,200 | 71,500 | |||
| Genworth Financial, Inc. |
17,600 | 475,200 | |||
| Hannover Rueckversicherungs AG (Germany) |
3,267 | 127,669 | |||
| Hartford Financial Services Group, Inc. (The) |
11,600 | 803,996 | |||
| Insurance Australia Group Ltd. (Australia) |
28,415 | 143,225 | |||
| Markel Corp.* |
300 | 109,200 | |||
| Marsh & McLennan Cos., Inc. |
26,600 | 875,140 | |||
| Mercury General Corp. |
900 | 53,928 | |||
| MGIC Investment Corp.(a) |
4,700 | 323,877 | |||
| Mitsui Marine & Fire (Japan) |
19,000 | 165,024 | |||
| PMI Group, Inc. (The) |
3,200 | 133,600 | |||
| Progressive Corp. (The)(a) |
5,400 | 458,136 | |||
| Protective Life Corp. |
2,800 | 119,532 | |||
| QBE Insurance Group Ltd. (Australia) |
15,463 | 186,065 | |||
| Radian Group, Inc. |
9,200 | 489,808 | |||
| Royal & Sun Alliance Insurance Group PLC (United Kingdom) |
90,377 | 134,474 | |||
| Safeco Corp.(a) |
10,300 | 538,072 | |||
| St. Paul Cos., Inc. |
48,699 | 1,805,272 | |||
| StanCorp Financial Group, Inc. |
1,500 | 123,750 | |||
| Triad Guaranty, Inc.* |
2,700 | 163,296 | |||
| Unipol SpA (Italy) |
50,105 | 229,515 | |||
| WellChoice, Inc.* |
1,600 | 85,440 | |||
| WellPoint, Inc.* |
5,200 | 598,000 | |||
| XL Capital Ltd. (Class “A” Stock)(a) |
6,900 | 535,785 | |||
| 14,286,055 | |||||
| INTERNET SERVICES — 1.0% |
|||||
| CNET Networks, Inc.*(a) |
23,200 | 260,536 | |||
| Digital Insight Corp.* |
3,800 | 69,920 | |||
| EarthLink, Inc.*(a) |
6,800 | 78,336 | |||
| eBay, Inc.* |
12,400 | 1,441,872 | |||
| F5 Networks, Inc.* |
1,100 | 53,592 | |||
| Google, Inc. (Class “A” Stock)*(a) |
1,700 | 328,270 | |||
| IAC/InterActiveCorp*(a) |
21,900 | 604,878 | |||
| Juniper Networks, Inc.*(a) |
11,300 | 307,247 | |||
| VeriSign, Inc.* |
3,200 | 107,264 | |||
| Yahoo!, Inc.*(a) |
26,100 | 983,448 | |||
| 4,235,363 | |||||
| MACHINERY & EQUIPMENT — 0.6% |
|||||
| Briggs & Stratton Corp. |
2,000 | 83,160 | |||
| Cooper Cameron Corp.* |
1,100 | 59,191 | |||
| Danaher Corp. |
10,000 | 574,100 | |||
| Deere & Co. |
13,600 | 1,011,840 | |||
| Grant Prideco, Inc.* |
9,400 | 188,470 | |||
| Maverick Tube Corp.* |
3,800 | 115,140 | |||
| National Oilwell, Inc.*(a) |
1,200 | 42,348 | |||
| Nordson Corp. |
2,100 | 84,147 | |||
| Noritsu Koki Co. Ltd. (Japan) |
4,000 | 91,929 | |||
| Pall Corp. |
8,900 | 257,655 | |||
| 2,507,980 | |||||
| MEDICAL SUPPLIES & EQUIPMENT — 2.1% |
|||||
| Abbott Laboratories |
25,900 | 1,208,235 | |||
| AmerisourceBergen Corp. |
3,700 | 217,116 | |||
| Amgen, Inc.* |
28,600 | 1,834,690 | |||
| Bard, (C.R.), Inc. |
3,400 | 217,532 | |||
| Baxter International, Inc. |
11,200 | 386,848 | |||
| Becton, Dickinson & Co. |
4,000 | 227,200 | |||
| Biomet, Inc. |
5,400 | 234,306 | |||
| Boston Scientific Corp.* |
16,200 | 575,910 | |||
| Charles River Laboratories International, |
2,000 | 92,020 | |||
| Computer Programs and Systems, Inc. |
7,000 | 162,050 | |||
| Cytyc Corp.* |
6,200 | 170,934 | |||
| DENTSPLY International, Inc. |
2,350 | 132,070 | |||
| Digene Corp.* |
2,600 | 67,990 | |||
| Edwards Lifesciences Corp.* |
1,300 | 53,638 | |||
| Elekta AB (Sweden)* |
4,495 | 129,532 | |||
| Guidant Corp. |
5,400 | 389,340 | |||
| Inamed Corp.* |
1,000 | 63,250 | |||
| Invitrogen Corp.* |
1,462 | 98,144 | |||
| Martek Biosciences Corp.*(a) |
1,300 | 66,560 | |||
| Medtronic, Inc. |
25,200 | 1,251,684 | |||
| Merit Medical Systems, Inc.* |
3,300 | 50,424 | |||
| Patterson Cos., Inc.* |
1,800 | 78,102 | |||
| Shimadzu Corp. (Japan) |
36,000 | 217,820 | |||
| St. Jude Medical, Inc.* |
8,400 | 352,212 | |||
| STERIS Corp.* |
4,700 | 111,484 | |||
| Stryker Corp. |
8,200 | 395,650 | |||
| Techne Corp.* |
1,700 | 66,130 | |||
| Thoratec Corp.* |
1,500 | 15,630 | |||
| Zimmer Holdings, Inc.* |
4,000 | 320,480 | |||
| 9,186,981 | |||||
| METALS & MINING — 0.8% |
|||||
| Alcoa, Inc. |
19,000 | 596,981 | |||
| Anglo American PLC (United Kingdom) |
7,743 | 183,147 | |||
165
AST T. ROWE PRICE ASSET ALLOCATION PORTFOLIO
SCHEDULE OF INVESTMENTS (CONTINUED)
DECEMBER 31, 2004
| SHARES |
VALUE (NOTE 2) | ||||
| BHP Steel Ltd. (Australia) |
76,901 | $ | 497,333 | ||
| Broken Hill Proprietary Co. Ltd. (Australia) |
37,600 | 452,142 | |||
| Newmont Mining Corp. |
12,400 | 550,684 | |||
| Nippon Steel Corp. (Japan) |
151,000 | 369,874 | |||
| SKF AB (Class “B” Stock)(Sweden) |
2,937 | 130,820 | |||
| SSAB Svenskt Stal AB Series A (Sweden) |
12,828 | 308,857 | |||
| Steel Dynamics, Inc. |
4,100 | 155,308 | |||
| Voestalpine AG (Austria) |
2,771 | 215,254 | |||
| 3,460,400 | |||||
| OFFICE EQUIPMENT — 0.2% |
|||||
| Canon, Inc. (Japan) |
6,000 | 323,802 | |||
| Herman Miller, Inc. |
4,700 | 129,861 | |||
| Pitney Bowes, Inc. |
4,400 | 203,632 | |||
| 657,295 | |||||
| OIL & GAS — 5.0% |
|||||
| Anadarko Petroleum Corp. |
5,806 | 376,287 | |||
| Australia Gas & Light (Australia) |
10,811 | 116,104 | |||
| Baker Hughes, Inc.(a) |
9,300 | 396,831 | |||
| BJ Services Co. |
4,100 | 190,814 | |||
| BP PLC [ADR] (United Kingdom) |
13,100 | 765,040 | |||
| British Petroleum Co. PLC (United Kingdom) |
27,233 | 265,606 | |||
| Centrica PLC (United Kingdom) |
81,377 | 369,107 | |||
| ChevronTexaco Corp. |
45,222 | 2,374,607 | |||
| Comstock Resources, Inc.* |
4,500 | 99,225 | |||
| ConocoPhillips |
15,500 | 1,345,865 | |||
| Devon Energy Corp. |
3,400 | 132,328 | |||
| Eni SpA [ADR] (Italy)(a) |
2,500 | 314,600 | |||
| Ente Nazionale Idrocarburi SpA (Italy) |
16,651 | 416,897 | |||
| EOG Resources, Inc. |
3,800 | 271,168 | |||
| Exxon Mobil Corp. |
128,766 | 6,600,546 | |||
| FMC Technologies, Inc.* |
9,959 | 320,680 | |||
| Grey Wolf, Inc.* |
16,200 | 85,374 | |||
| Helmerich & Payne, Inc. |
1,400 | 47,656 | |||
| Inpex Corp. (Japan) |
8 | 40,363 | |||
| Murphy Oil Corp. |
7,700 | 619,465 | |||
| Nabors Industries Ltd.*(a) |
3,100 | 158,999 | |||
| National Fuel Gas Co. |
4,700 | 133,198 | |||
| Newfield Exploration Co.* |
2,400 | 141,720 | |||
| Occidental Petroleum Corp. |
3,500 | 204,260 | |||
| OMV AG (Austria) |
138 | 41,584 | |||
| Patterson-UTI Energy, Inc. |
6,600 | 128,370 | |||
| Petroleo Brasileiro SA [ADR] (Brazil) |
14,200 | 514,182 | |||
| Pioneer Natural Resources Co. |
4,400 | 154,440 | |||
| Premcor, Inc. |
1,500 | 63,255 | |||
| Schlumberger Ltd. |
16,500 | 1,104,675 | |||
| Shell Transport & Trading Co. [ADR] (United Kingdom) |
11,200 | 575,680 | |||
| Shell Transport & Trading Co. PLC (United Kingdom) |
25,438 | 216,843 | |||
| Statoil ASA (Sweden) |
28,013 | 439,391 | |||
| Toho Gas Co., Ltd. (Japan) |
70,000 | 250,024 | |||
| Tonen General Sekiyu K.K. (Japan) |
10,000 | 91,051 | |||
| Total SA (France) |
3,654 | 798,148 | |||
| Total SA [ADR] (France) |
4,300 | 472,312 | |||
| Transocean, Inc.*(a) |
12,139 | 514,572 | |||
| WGL Holdings, Inc. |
2,800 | 86,352 | |||
| Williams Cos., Inc. |
3,100 | 50,499 | |||
| Woodside Petroleum Ltd. (Australia) |
9,927 | 156,414 | |||
| 21,444,532 | |||||
| PAPER & FOREST PRODUCTS — 0.4% |
|||||
| Bowater, Inc. |
3,500 | 153,895 | |||
| International Paper Co. |
11,800 | 495,600 | |||
| MeadWestvaco Corp. |
7,900 | 267,731 | |||
| Potlatch Corp.(a) |
6,600 | 333,828 | |||
| UPM-Kymmene Oyj (Finland) |
4,257 | 94,664 | |||
| Weyerhaeuser Co.(a) |
3,500 | 235,270 | |||
| 1,580,988 | |||||
| PERSONAL SERVICES — 0.1% |
|||||
| Apollo Group, Inc. (Class “A” Stock)*(a) |
3,200 | 258,272 | |||
| Career Education Corp.* |
1,500 | 60,000 | |||
| Corinthian Colleges, Inc.*(a) |
2,300 | 43,344 | |||
| DeVry, Inc.* |
2,300 | 39,928 | |||
| Education Management Corp.* |
3,400 | 112,234 | |||
| 513,778 | |||||
| PHARMACEUTICALS — 3.6% |
|||||
| Abgenix, Inc.* |
3,500 | 36,190 | |||
| Accredo Health, Inc.* |
4,200 | 116,424 | |||
| Alkermes, Inc.*(a) |
3,800 | 53,542 | |||
| Alliance Unichem PLC (United Kingdom) |
8,252 | 119,536 | |||
| AstraZeneca PLC [ADR] (United Kingdom) |
6,400 | 232,896 | |||
| Biogen Idec, Inc.* |
7,100 | 472,931 | |||
| Bradley Pharmaceuticals, Inc.* |
2,600 | 50,440 | |||
| Cardinal Health, Inc. |
10,850 | 630,928 | |||
| Celgene Corp.*(a) |
2,400 | 63,672 | |||
| Cephalon, Inc.* |
3,628 | 184,593 | |||
| Chiron Corp.* |
3,900 | 129,987 | |||
| CSL Ltd. (Australia) |
3,027 | 69,406 | |||
| Eisai Co. Ltd. (Japan) |
4,400 | 144,706 | |||
| Elan Corp. PLC [ADR] (Ireland)* |
5,000 | 136,250 | |||
| Eon Labs, Inc.* |
1,800 | 48,600 | |||
| Forest Laboratories, Inc.*(a) |
7,200 | 322,992 | |||
166
AST T. ROWE PRICE ASSET ALLOCATION PORTFOLIO
SCHEDULE OF INVESTMENTS (CONTINUED)
DECEMBER 31, 2004
| SHARES |
VALUE (NOTE 2) | ||||
| Gehe AG (Germany) |
2,985 | $ | 242,792 | ||
| Genentech, Inc.* |
8,500 | 462,740 | |||
| Gilead Sciences, Inc.* |
12,300 | 430,377 | |||
| GlaxoSmithKline PLC (United Kingdom) |
17,171 | 402,852 | |||
| GlaxoSmithKline PLC [ADR] (United Kingdom) |
9,900 | 469,161 | |||
| Hisamitsu Pharmaceutical Co. (Japan) |
6,000 | 116,405 | |||
| Human Genome Sciences, Inc.* |
3,800 | 45,676 | |||
| Kobayashi Pharmaceutical Co. Ltd. (Japan) |
4,000 | 107,934 | |||
| Lilly, (Eli) & Co. |
24,400 | 1,384,700 | |||
| Medicis Pharmaceutical Corp. (Class “A” Stock)(a) |
2,800 | 98,308 | |||
| MedImmune, Inc.* |
7,500 | 203,325 | |||
| Merck & Co., Inc.(a) |
41,700 | 1,340,238 | |||
| Neurocrine Biosciences, Inc.* |
2,000 | 98,600 | |||
| Novartis AG (Switzerland) |
17,095 | 861,440 | |||
| Noven Pharmaceuticals, Inc.* |
4,800 | 81,888 | |||
| Novo Nordisk AS (Class “B” Stock) (Denmark) |
1,767 | 96,542 | |||
| Pfizer, Inc. |
138,185 | 3,715,795 | |||
| Priority Healthcare Corp. (Class “B” Stock)* |
1,000 | 21,770 | |||
| Sanofi-Synthelabo SA (France) |
8,285 | 662,169 | |||
| Schering-Plough Corp.(a) |
16,400 | 342,432 | |||
| Suzuken Co. Ltd. (Japan) |
2,500 | 67,093 | |||
| Takeda Chemical Industries Ltd. (Japan) |
4,500 | 226,603 | |||
| Watson Pharmaceuticals, Inc.* |
3,500 | 114,835 | |||
| Wyeth |
30,100 | 1,281,959 | |||
| 15,688,727 | |||||
| PRINTING & PUBLISHING — 0.4% |
|||||
| Dow Jones & Co., Inc. |
3,300 | 142,098 | |||
| Gannett Co., Inc. |
6,000 | 490,200 | |||
| McGraw-Hill Cos., Inc. |
3,500 | 320,390 | |||
| New York Times Co. (Class “A” Stock)(a) |
4,700 | 191,760 | |||
| Scholastic Corp.* |
3,300 | 121,968 | |||
| Singapore Press Holdings Ltd. (Singapore) |
19,750 | 55,654 | |||
| Washington Post Co. (Class “B” Stock) |
200 | 196,604 | |||
| 1,518,674 | |||||
| RAILROADS — 0.3% |
|||||
| CSX Corp. |
17,300 | 693,384 | |||
| Union Pacific Corp.(a) |
6,500 | 437,125 | |||
| 1,130,509 | |||||
| REAL ESTATE — 1.0% |
|||||
| Archstone-Smith Trust [REIT](a) |
3,800 | 145,540 | |||
| Arden Realty, Inc. [REIT] |
3,500 | 132,020 | |||
| Boston Properties, Inc. [REIT] |
2,300 | 148,741 | |||
| Camden Property Trust [REIT] |
3,000 | 153,000 | |||
| Catellus Development Corp. [REIT] |
2,078 | 63,587 | |||
| China Overseas Land & Investment Ltd. (Hong Kong) |
542,000 | 133,884 | |||
| Corio NV (Netherlands) |
2,958 | 173,290 | |||
| Duke-Weeks Realty Corp. [REIT] |
3,500 | 119,490 | |||
| EastGroup Properties, Inc. [REIT] |
2,000 | 76,640 | |||
| Equity Office Properties Trust [REIT] |
11,500 | 334,881 | |||
| Equity Residential Properties Trust [REIT](a) |
8,100 | 293,058 | |||
| General Property Trust (Australia) |
88,689 | 260,018 | |||
| Goldcrest Co. Ltd. (Japan) |
2,770 | 191,929 | |||
| LaSalle Hotel Properties [REIT] |
4,500 | 143,235 | |||
| Levitt Corp. (Class “A” Stock) |
2,075 | 63,433 | |||
| Mills Corp. (The) [REIT](a) |
2,900 | 184,904 | |||
| Mirvac Group (Australia) |
29,863 | 114,707 | |||
| Persimmon PLC (United Kingdom) |
13,927 | 184,763 | |||
| Reckson Associates Realty Corp. [REIT] |
2,400 | 78,744 | |||
| Redwood Trust, Inc. [REIT] |
1,300 | 80,717 | |||
| Regency Centers Corp. [REIT] |
3,200 | 177,280 | |||
| Simon Property Group, Inc. [REIT] |
3,500 | 226,345 | |||
| SL Green Realty Corp. [REIT] |
2,700 | 163,485 | |||
| Sun Hung Kai Properties Ltd. (Hong Kong) |
20,000 | 200,059 | |||
| Vornado Realty Trust [REIT] |
2,500 | 190,325 | |||
| Weingarten Realty, Inc. [REIT] |
3,200 | 128,320 | |||
| Wheelock and Co. Ltd. (Hong Kong) |
55,000 | 90,573 | |||
| 4,252,968 | |||||
| RESTAURANTS — 0.6% |
|||||
| CEC Entertainment, Inc.*(a) |
2,150 | 85,936 | |||
| Cheesecake Factory, Inc. (The)*(a) |
1,350 | 43,835 | |||
| McDonald’s Corp. |
21,500 | 689,289 | |||
| Mitchells & Butlers PLC (United Kingdom) |
21,849 | 142,623 | |||
| P.F. Chang’s China Bistro, Inc.*(a) |
1,000 | 56,350 | |||
| Panera Bread Co. (Class “A” Stock)*(a) |
9,800 | 395,136 | |||
| RARE Hospitality International, Inc.* |
9,300 | 296,298 | |||
| Ruby Tuesday, Inc. |
2,300 | 59,984 | |||
| Sonic Corp.* |
3,350 | 102,175 | |||
167
AST T. ROWE PRICE ASSET ALLOCATION PORTFOLIO
SCHEDULE OF INVESTMENTS (CONTINUED)
DECEMBER 31, 2004
| SHARES |
VALUE (NOTE 2) | ||||
| Starbucks Corp.*(a) |
8,800 | $ | 548,768 | ||
| Yum! Brands, Inc. |
4,700 | 221,746 | |||
| 2,642,140 | |||||
| RETAIL & MERCHANDISING — 3.9% |
|||||
| A.C. Moore Arts & Crafts, Inc.* |
4,100 | 118,121 | |||
| Amazon.com, Inc.*(a) |
1,500 | 66,435 | |||
| Best Buy Co., Inc. |
7,750 | 460,505 | |||
| Casino Guichard-Perrachon SA (France) |
3,481 | 278,215 | |||
| Charles Voegele Holding AG (Switzerland) |
1,737 | 77,906 | |||
| Chico’s FAS, Inc.*(a) |
2,700 | 122,931 | |||
| Coles Myer Ltd. (Australia) |
19,001 | 146,864 | |||
| Cost Plus, Inc.* |
3,000 | 96,390 | |||
| CVS Corp. |
9,400 | 423,658 | |||
| Dixons Group PLC (United Kingdom) |
48,887 | 142,665 | |||
| Dollar Tree Stores, Inc.*(a) |
3,300 | 94,644 | |||
| Espirit Holdings Ltd. (Hong Kong) |
19,000 | 114,889 | |||
| Family Dollar Stores, Inc.(a) |
16,700 | 521,541 | |||
| Fred's, Inc. |
3,100 | 53,940 | |||
| Hibbett Sporting Goods, Inc.* |
1,600 | 42,576 | |||
| Home Depot, Inc. |
42,600 | 1,820,723 | |||
| Hot Topic, Inc.*(a) |
24,600 | 422,874 | |||
| Kesa Electricals PLC (United Kingdom) |
11,660 | 63,241 | |||
| Kohl’s Corp.*(a) |
23,200 | 1,140,744 | |||
| Lowe’s Cos., Inc. |
15,100 | 869,609 | |||
| Matsumotokiyoshi Co. Ltd. (Japan) |
4,000 | 113,985 | |||
| Metro AG (Germany) |
10,405 | 572,650 | |||
| PETsMART, Inc. |
6,000 | 213,180 | |||
| Ross Stores, Inc. |
22,700 | 655,349 | |||
| Staples, Inc. |
7,600 | 256,196 | |||
| Target Corp. |
33,000 | 1,713,690 | |||
| TJX Cos., Inc. |
15,100 | 379,463 | |||
| Wal-Mart de Mexico SA de CV (Mexico) |
76,400 | 262,503 | |||
| Wal-Mart Stores, Inc.(a) |
77,200 | 4,077,703 | |||
| Walgreen Co. |
25,800 | 989,946 | |||
| Whole Foods Market, Inc. |
1,000 | 95,350 | |||
| Williams-Sonoma, Inc.* |
2,600 | 91,104 | |||
| York-Benimaru Co. Ltd. (Japan) |
3,600 | 111,721 | |||
| 16,611,311 | |||||
| SEMICONDUCTORS — 1.8% |
|||||
| Analog Devices, Inc. |
17,900 | 660,868 | |||
| Applied Materials, Inc.*(a) |
31,100 | 531,810 | |||
| ASM Lithography Holding NV (Netherlands)* |
10,081 | 161,828 | |||
| ATMI, Inc.* |
1,900 | 42,807 | |||
| Cymer, Inc.* |
2,400 | 70,896 | |||
| Intel Corp. |
140,200 | 3,279,278 | |||
| Intersil Corp. (Class “A” Stock)(a) |
5,600 | 93,744 | |||
| KLA-Tencor Corp.* |
6,900 | 321,402 | |||
| Linear Technology Corp. |
9,400 | 364,344 | |||
| Microchip Technology, Inc. |
2,300 | 61,318 | |||
| Mykrolis Corp.* |
3,400 | 48,178 | |||
| National Semiconductor Corp. |
32,500 | 583,375 | |||
| Novellus Systems, Inc.*(a) |
8,500 | 237,065 | |||
| Omnivision Technologies, Inc.*(a) |
2,700 | 49,545 | |||
| QLogic Corp.* |
13,800 | 506,874 | |||
| Rohm Co. Ltd. (Japan) |
500 | 51,722 | |||
| Semiconductor Manufacturing International Corp. [ADR] (China)* |
4,400 | 47,388 | |||
| Semtech Corp.* |
5,100 | 111,537 | |||
| Tessera Technologies, Inc.* |
3,000 | 111,630 | |||
| Varian Semiconductor Equipment Associates, Inc.* |
600 | 22,110 | |||
| Xilinx, Inc. |
17,000 | 504,050 | |||
| Zoran Corp.* |
4,612 | 53,407 | |||
| 7,915,176 | |||||
| TELECOMMUNICATIONS — 3.6% |
|||||
| Aeroflex, Inc.* |
3,800 | 46,056 | |||
| America Movil SA de CV (Class “L” Stock) [ADR] (Mexico) |
7,000 | 366,450 | |||
| Andrew Corp.* |
2,700 | 36,801 | |||
| Avaya, Inc.* |
2,600 | 44,720 | |||
| China Telecom Corp. Ltd. (China) |
542,000 | 198,734 | |||
| China Unicom Ltd. (Hong Kong) |
72,000 | 56,969 | |||
| Cia de Telecomunicaciones de Chile SA [ADR] |
11,500 | 129,260 | |||
| Comverse Technology, Inc.* |
4,700 | 114,915 | |||
| Corning, Inc.* |
38,000 | 447,260 | |||
| Crown Castle International Corp.* |
3,400 | 56,576 | |||
| Inter-Tel, Inc. |
2,800 | 76,664 | |||
| KDDI Corp. (Japan) |
66 | 355,538 | |||
| Koninklijke (Royal) KPN NV (Netherlands) |
32,335 | 307,220 | |||
| Lucent Technologies, Inc.*(a) |
54,000 | 203,040 | |||
| MM02 PLC (United Kingdom)* |
227,311 | 535,699 | |||
| Motorola, Inc.(a) |
44,700 | 768,840 | |||
| Netcom AB (Class “B” Stock) (Sweden) |
4,554 | 178,860 | |||
| Nextel Communications, Inc. (Class “A” Stock)*(a) |
26,100 | 783,000 | |||
| Nextel Partners, Inc. (Class “A” Stock)* |
27,700 | 541,258 | |||
| Nokia Corp. (Class “A” Stock) [ADR] (Finland)(a) |
11,200 | 175,504 | |||
| Nokia OYJ (Finland) |
9,360 | 147,836 | |||
| Plantronics, Inc. |
2,500 | 103,675 | |||
| Polycom, Inc.* |
6,100 | 142,252 | |||
168
AST T. ROWE PRICE ASSET ALLOCATION PORTFOLIO
SCHEDULE OF INVESTMENTS (CONTINUED)
DECEMBER 31, 2004
| SHARES |
VALUE (NOTE 2) | ||||
| Qualcomm, Inc. |
32,600 | $ | 1,382,240 | ||
| Research in Motion Ltd. (Canada)* |
2,700 | 222,534 | |||
| SBC Communications, Inc. |
25,100 | 646,827 | |||
| SpectraSite, Inc.* |
3,200 | 185,280 | |||
| Sprint Corp.(a) |
55,200 | 1,371,720 | |||
| Tele Danmark AS (Denmark) |
4,868 | 206,149 | |||
| Tele Norte Leste Participacoes SA [ADR] (Brazil) |
12,200 | 205,814 | |||
| Telecom Italia Mobile SpA (Italy) |
66,408 | 496,458 | |||
| Telenor ASA (Norway) |
36,129 | 328,085 | |||
| Telephone & Data Systems, Inc. |
800 | 61,560 | |||
| Telus Corp. (Canada) |
9,700 | 351,334 | |||
| Telus Corp. (Non Voting Shares) (Canada)*(a) |
28,700 | 829,430 | |||
| Thomson Multimedia (France) |
14,866 | 393,018 | |||
| Verizon Communications, Inc. |
59,784 | 2,421,849 | |||
| Vodafone Group PLC [ADR] (United Kingdom) |
24,800 | 679,024 | |||
| Western Wireless Corp. (Class “A” Stock)* |
1,400 | 41,020 | |||
| 15,639,469 | |||||
| TRANSPORTATION — 0.7% |
|||||
| Arriva PLC (United Kingdom) |
24,176 | 250,644 | |||
| Expeditors International of Washington, Inc. |
1,500 | 83,820 | |||
| Nippon Express Co. Ltd. (Japan) |
19,000 | 93,637 | |||
| Nippon Yusen Kabushiki (Japan) |
50,000 | 269,347 | |||
| Old Dominion Freight Line, Inc.* |
3,100 | 107,880 | |||
| TPG NV (Netherlands) |
5,886 | 159,851 | |||
| United Parcel Service, Inc. (Class “B” Stock) |
24,000 | 2,051,040 | |||
| UTI Worldwide, Inc. (British Virgin Islands) |
2,600 | 176,852 | |||
| 3,193,071 | |||||
| UTILITIES — 2.0% |
|||||
| Alliant Energy Corp. |
3,500 | 100,100 | |||
| American Electric Power Co., Inc.(a) |
6,400 | 219,776 | |||
| Black Hills Corp. |
2,100 | 64,428 | |||
| CMS Energy Corp.*(a) |
6,300 | 65,835 | |||
| Constellation Energy Group, Inc. |
3,600 | 157,356 | |||
| Duke Energy Corp.(a) |
35,700 | 904,282 | |||
| Dynegy, Inc.* |
20,800 | 96,096 | |||
| E.ON AG (Germany) |
8,431 | 768,496 | |||
| Edison International Co. |
9,100 | 291,473 | |||
| El Paso Electric Co.* |
10,200 | 193,188 | |||
| Electric Power Development Co., Ltd. (Japan) 144A (cost $26,709; purchased 09/27/04)(g) |
1,100 | 30,809 | |||
| Energy East Corp. |
4,800 | 128,064 | |||
| Entergy Corp. |
5,100 | 344,709 | |||
| Exelon Corp.(a) |
14,000 | 616,980 | |||
| FirstEnergy Corp. |
17,400 | 687,474 | |||
| Great Plains Energy, Inc.(a) |
5,000 | 151,400 | |||
| Hong Kong Electric Holdings Ltd. (Hong Kong) |
20,000 | 91,345 | |||
| Iberdrola SA (Spain) |
12,810 | 325,604 | |||
| NiSource, Inc. |
14,000 | 318,920 | |||
| OGE Energy Corp. |
5,800 | 153,758 | |||
| PG&E Corp.* |
12,800 | 425,984 | |||
| Pinnacle West Capital Corp. |
5,200 | 230,932 | |||
| PPL Corp. |
9,200 | 490,176 | |||
| RWE AG (Germany) |
2,961 | 163,807 | |||
| Sempra Energy(a) |
2,400 | 88,032 | |||
| Southern Co. (The)(a) |
9,300 | 311,736 | |||
| Teco Energy, Inc.(a) |
12,600 | 193,284 | |||
| Tohoku Electric Power Co., Inc. (Japan) |
12,600 | 226,252 | |||
| TXU Corp.(a) |
12,100 | 781,176 | |||
| United Utilities PLC (United Kingdom) |
15,962 | 193,066 | |||
| 8,814,538 | |||||
| TOTAL COMMON STOCK |
291,190,308 | ||||
| PREFERRED STOCK |
|||||
| CLOTHING & APPAREL |
|||||
| Anvil Holdings, Inc. 13.00% Series B (cost $26,721; purchased 12/18/01-07/30/04)(g) |
1,966 | 20,148 | |||
| HEALTHCARE SERVICES |
|||||
| Fresenius AG 2.24% (United Kingdom) |
1,709 | 159,889 | |||
| TOTAL PREFERRED STOCK |
180,037 | ||||
| MOODY’S RATING (UNAUDITED) |
PRINCIPAL AMOUNT (000) |
||||||
| CORPORATE OBLIGATIONS — 11.5% |
|||||||
| ADVERTISING — 0.1% |
|||||||
| Advanstar Communications, Inc. Sr. Sec’d. Notes |
|||||||
| 10.75%, 08/15/10 |
B3 | $ | 50 | 56,688 | |||
| Advanstar Communications, Inc., Gtd. Notes |
|||||||
| 12.00%, 02/15/11 |
Caa2 | 25 | 27,094 | ||||
| Advanstar, Inc., Gtd. Notes, Zero Coupon (until 10/15/05) |
|||||||
| 15.00%, 10/15/11 |
NR | 50 | 42,563 | ||||
169
AST T. ROWE PRICE ASSET ALLOCATION PORTFOLIO
SCHEDULE OF INVESTMENTS (CONTINUED)
DECEMBER 31, 2004
| MOODY’S RATING (UNAUDITED) |
PRINCIPAL AMOUNT (000) |
VALUE (NOTE 2) | ||||||
| R H Donnelley Finance Corp. I, Gtd. Notes |
||||||||
| 8.875%, 12/15/10 |
B1 | $ | 25 | $ | 28,000 | |||
| 10.875%, 12/15/12 |
B2 | 150 | 178,874 | |||||
| Vertis, Inc., Gtd. Notes, Series B |
||||||||
| 10.875%, 06/15/09 |
B3 | 25 | 27,250 | |||||
| Vertis, Inc., Sub. Notes |
||||||||
| 13.50%, 12/07/09 144A (cost $24,015; purchased 12/08/03)(g) |
Caa1 | 25 | 26,469 | |||||
| 386,938 | ||||||||
| AEROSPACE — 0.2% |
||||||||
| Aviall, Inc., Sr. Notes |
||||||||
| 7.625%, 07/01/11 |
B1 | 50 | 53,500 | |||||
| BE Aerospace, Inc., Sr. Notes |
||||||||
| 8.50%, 10/01/10 |
B3 | 50 | 55,250 | |||||
| BE Aerospace, Inc., Sr. Sub. Notes |
||||||||
| 8.00%, 03/01/08 |
Caa3 | 50 | 50,313 | |||||
| 8.875%, 05/01/11 Series B |
Caa3 | 75 | 78,750 | |||||
| Boeing Co., Debs. |
||||||||
| 8.75%, 08/15/21 |
A3 | 235 | 314,803 | |||||
| Gencorp, Inc., Sr. Sub. Notes |
||||||||
| 9.50%, 08/15/13 |
B2 | 100 | 112,000 | |||||
| Sequa Corp., Sr. Notes |
||||||||
| 9.00%, 08/01/09 |
B1 | 50 | 56,625 | |||||
| TD Funding Corp., Gtd. Notes |
||||||||
| 8.375%, 07/15/11 |
B3 | 25 | 26,938 | |||||
| Vought Aircraft Industries, Inc., Sr. Notes |
||||||||
| 8.00%, 07/15/11 |
B2 | 100 | 97,750 | |||||
| 845,929 | ||||||||
| AIRLINES |
||||||||
| Northwest Airlines, Inc., Gtd. Notes |
||||||||
| 9.875%, 03/15/07 |
Caa1 | 25 | 22,688 | |||||
| AUTOMOBILE MANUFACTURERS — 0.2% |
||||||||
| Daimlerchrysler NA Holdings Corp., Gtd. Notes |
||||||||
| 6.50%, 11/15/13 |
A3 | 220 | 239,020 | |||||
| Daimlerchrysler NA Holdings, Corp., Gtd. Notes |
||||||||
| 2.94%, 09/10/07(c) |
A3 | 155 | 155,627 | |||||
| General Motors Corp., Debs. |
||||||||
| 8.375%, 07/15/33 |
Baa1 | 320 | 332,465 | |||||
| Navistar International Corp., Sr. Notes |
||||||||
| 7.50%, 06/15/11 |
Ba3 | 50 | 53,875 | |||||
| 780,987 | ||||||||
| AUTOMOTIVE PARTS — 0.2% |
||||||||
| Advanced Accessory System, Sr. Notes |
||||||||
| 10.75%, 06/15/11 |
B3 | 50 | 47,750 | |||||
| Eagle-Picher Industries, Inc., Sr. Notes |
||||||||
| 9.75%, 09/01/13 |
B3 | 75 | 75,375 | |||||
| J.B. Poindexter & Co., Inc., Sr. Notes |
||||||||
| 8.75%, 03/15/14 144A (cost $77,224; purchased 03/04/04 - 09/29/04)(g) |
B1 | 75 | 80,063 | |||||
| Lear Corp., Gtd. Notes |
||||||||
| 5.75%, 08/01/14 144A (cost $79,844; purchased 07/29/04)(g) |
Baa3 | 80 | 80,906 | |||||
| Rexnord Corp., Gtd. Notes |
||||||||
| 10.125%, 12/15/12 |
B3 | 125 | 141,875 | |||||
| TRW Automotive, Inc., Sr. Notes |
||||||||
| 9.375%, 02/15/13 |
B1 | 156 | 181,739 | |||||
| TRW Automotive, Inc., Sr. Sub. Notes |
||||||||
| 11.00%, 02/15/13 |
B2 | 58 | 70,180 | |||||
| Visteon Corp., Notes |
||||||||
| 7.00%, 03/10/14 |
Ba1 | 25 | 24,000 | |||||
| 701,888 | ||||||||
| BEVERAGES — 0.1% |
||||||||
| Le-Natures, Inc., Sr. Sub. Notes |
||||||||
| 10.00%, 06/15/13 144A (cost $103,944; purchased 06/18/03—12/11/03)(g) |
B3 | 100 | 111,000 | |||||
| Miller Brewing Co., Notes |
||||||||
| 5.50%, 08/15/13 144A (cost $238,862; purchased 08/11/04—09/14/04)(g) |
Baa1 | 240 | 251,289 | |||||
| 362,289 | ||||||||
170
AST T. ROWE PRICE ASSET ALLOCATION PORTFOLIO
SCHEDULE OF INVESTMENTS (CONTINUED)
DECEMBER 31, 2004
| MOODY’S RATING (UNAUDITED) |
PRINCIPAL AMOUNT (000) |
VALUE (NOTE 2) | ||||||
| BROADCASTING — 0.1% |
||||||||
| Chancellor Media Corp., Gtd. Notes |
||||||||
| 8.00%, 11/01/08 |
Ba1 | $ | 100 | $ | 112,372 | |||
| Fisher Communications, Inc., Sr. Notes |
||||||||
| 8.625%, 09/15/14 144A (cost $51,125; purchased 09/15/04)(g) |
B2 | 50 | 54,250 | |||||
| Hearst-Argyle Television, Inc., Sr. Notes |
||||||||
| 7.00%, 01/15/18 |
Baa3 | 135 | 151,708 | |||||
| News America Inc., Bonds |
||||||||
| 6.20%, 12/15/34 144A (cost $119,047; purchased 11/30/04 - 12/15/04)(g) |
BAA3 | 120 | 122,038 | |||||
| Sinclair Broadcast Group, Inc., Gtd. Notes |
||||||||
| 8.00%, 03/15/12 |
B2 | 75 | 80,063 | |||||
| XM Satellite Radio, Inc., Sec’d. Notes |
||||||||
| 12.00%, 06/15/10 |
Caa1 | 87 | 103,204 | |||||
| 623,635 | ||||||||
| BUILDING MATERIALS — 0.2% |
||||||||
| Associated Materials, Inc., Gtd. Notes |
||||||||
| 9.75%, 04/15/12 |
B3 | 125 | 140,313 | |||||
| Associated Materials, Inc., Sr. Disc. Notes, Zero Coupon (until 03/01/09) |
||||||||
| 11.25%, 03/01/14 |
Caa1 | 100 | 72,500 | |||||
| Building Materials Corp., Sr. Notes |
||||||||
| 7.75%, 08/01/14 144A (cost $50,000; purchased 07/21/04 - 10/15/04)(g) |
B2 | 50 | 50,688 | |||||
| Masco Corp., Notes |
||||||||
| 5.875%, 07/15/12 |
Baa1 | 265 | 284,432 | |||||
| Norcraft Companies L.P., Sr. Sub. Notes |
||||||||
| 9.00%, 11/01/11 |
B3 | 75 | 81,375 | |||||
| Riverside Forest Products Ltd., Sr. Notes |
||||||||
| 7.875%, 03/01/14 |
B2 | 100 | 110,500 | |||||
| RMCC Acquisition Co., Sr. Sub. Notes |
||||||||
| 9.50%, 11/01/12 144A (cost $50,000; purchased 10/28/04)(g) |
Caa1e | 50 | 50,125 | |||||
| Texas Industries, Inc., Sr. Notes |
||||||||
| 10.25%, 06/15/11 |
B1 | 50 | 58,750 | |||||
| US Concrete, Inc., Sr. Sub. Notes |
||||||||
| 8.375%, 04/01/14 |
B3 | 75 | 81,188 | |||||
| WII Components, Inc., Sr. Notes |
||||||||
| 10.00%, 02/15/12 |
B2 | 75 | 75,375 | |||||
| 1,005,246 | ||||||||
| BUSINESS SERVICES — 0.1% |
||||||||
| Affinity Group, Inc., Sr. Sub. Notes |
||||||||
| 9.00%, 02/15/12 |
B3 | 50 | 54,375 | |||||
| Brand Intermediate Holdings, Inc., Sr. Sub. Notes |
||||||||
| 13.00%, 10/16/13 144A [PIK] (cost $58,788; purchased 07/27/04 - 08/04/04)(g) |
NR | 53 | 56,711 | |||||
| Brickman Group Ltd., Gtd. Notes, Series B |
||||||||
| 11.75%, 12/15/09 |
B2 | 50 | 58,750 | |||||
| Cie Generale de Geophysique, Sr. Notes (France) |
||||||||
| 10.625%, 11/15/07(l) |
Ba3 | 50 | 52,813 | |||||
| Crystal US Holdings, Sr. Disc. Notes, Zero Coupon (until 10/01/09) |
||||||||
| 10.50%, 10/01/14 144A (cost $31,870; purchased 10/15/04 - 11/02/04)(g) |
Caa2 | 50 | 34,500 | |||||
| IESI Corp., Gtd. Notes |
||||||||
| 10.25%, 06/15/12 |
B3 | 75 | 88,125 | |||||
| Invensys PLC, Sr. Notes (United Kingdom) |
||||||||
| 9.875%, 03/15/11 144A(l) (cost $49,641; purchased 02/27/04)(g) |
B3 | 50 | 54,000 | |||||
171
AST T. ROWE PRICE ASSET ALLOCATION PORTFOLIO
SCHEDULE OF INVESTMENTS (CONTINUED)
DECEMBER 31, 2004
| MOODY’S RATING (UNAUDITED) |
PRINCIPAL AMOUNT (000) |
VALUE (NOTE 2) | |||||||
| IPC Acquisition Corp., Gtd. Notes |
|||||||||
| 11.50%, 12/15/09 |
B3 | $ | 100 | $ | 109,999 | ||||
| US Oncology, Inc., Sr. Notes |
|||||||||
| 9.00%, 08/15/12 144A (cost $75,656; purchased 08/04/04)(g) |
B2 | 75 | 84,188 | ||||||
| Worldspan L.P./WS Financial Corp., Sr. Notes |
|||||||||
| 9.625%, 06/15/11 |
B2 | 50 | 50,000 | ||||||
| 643,461 | |||||||||
| CABLE TELEVISION — 0.2% |
|||||||||
| Cablevision Systems Corp., Sr. Notes |
|||||||||
| 8.00%, 04/15/12 144A (cost $79,010; purchased 09/14/04 - 09/15/04)(g) |
B3 | 75 | 80,438 | ||||||
| Charter Communications Holdings LLC, Sr. Notes |
|||||||||
| 8.75%, 11/15/13 |
B3 | 125 | 129,687 | ||||||
| Charter Communications Operating LLC, Sr. Notes |
|||||||||
| 8.00%, 04/30/12 144A (cost $99,385; purchased 04/20/04 - 05/06/04)(g) |
B2 | 100 | 104,500 | ||||||
| CSC Holdings, Inc., Debs., Series B |
|||||||||
| 8.125%, 08/15/09 |
B1 | 25 | 27,469 | ||||||
| CSC Holdings, Inc., Sr. Notes |
|||||||||
| 7.875%, 12/15/07 |
B1 | 25 | 26,938 | ||||||
| 8.125%, 07/15/09 |
B1 | 25 | 27,469 | ||||||
| Echostar DBS Corp., Gtd. Notes |
|||||||||
| 6.625%, 10/01/14 144A (cost $124,057; purchased 09/20/04 - 09/21/04)(g) |
Ba3 | 125 | 127,188 | ||||||
| General Cable Corp., Sr. Notes |
|||||||||
| 9.50%, 11/15/10 |
B2 | 25 | 28,375 | ||||||
| Mediacom Broadband LLC, Gtd. Notes |
|||||||||
| 11.00%, 07/15/13 |
B2 | 50 | 54,000 | ||||||
| Rogers Cable, Inc., Sec’d. Notes (Canada) |
|||||||||
| 5.50%, 03/15/14(l) |
Ba2 | 165 | 156,337 | ||||||
| Rogers Cablesystems of America, Inc., Sr. Notes, Series B (Canada) |
|||||||||
| 10.00%, 03/15/05(l) |
Ba2 | 125 | 127,343 | ||||||
| 889,744 | |||||||||
| CHEMICALS — 0.3% |
|||||||||
| Arco Chemical Co., Debentures |
|||||||||
| 9.80%, 02/01/20 |
B1 | 25 | 28,625 | ||||||
| Compass Minerals International, Inc., Sr. Disc. Notes, Zero Coupon (until 6/1/08) |
|||||||||
| 12.00%, 06/01/13 (cost $84,402; purchased 05/19/03 - 07/24/03)(g) |
B- | (d) | 125 | 101,875 | |||||
| Dow Chemical Corp., Notes |
|||||||||
| 6.125%, 02/01/11 |
A3 | 115 | 126,122 | ||||||
| Huntsman International LLC, Gtd. Notes |
|||||||||
| 9.875%, 03/01/09 |
B3 | 100 | 110,250 | ||||||
| Huntsman LLC, Gtd. Notes |
|||||||||
| 11.625%, 10/15/10 |
B2 | 100 | 118,750 | ||||||
| IMC Global, Inc., Sr. Notes |
|||||||||
| 10.875%, 08/01/13 |
B1 | 25 | 31,375 | ||||||
| Koppers Industry, Inc., Gtd. Notes |
|||||||||
| 9.875%, 10/15/13 |
B2 | 50 | 57,250 | ||||||
| Lyondell Chemical Co., Gtd. Notes |
|||||||||
| 9.50%, 12/15/08 |
B1 | 50 | 54,500 | ||||||
| MacDermid, Inc., Gtd. Notes |
|||||||||
| 9.125%, 07/15/11 |
Ba3 | 125 | 139,374 | ||||||
| Omnova Solutions, Inc., Sec’d. Notes |
|||||||||
| 11.25%, 06/01/10 |
B2 | 50 | 56,500 | ||||||
| Resolution Performance LLC, Sr. Notes |
|||||||||
| 9.50%, 04/15/10 |
B3 | 75 | 81,563 | ||||||
172
AST T. ROWE PRICE ASSET ALLOCATION PORTFOLIO
SCHEDULE OF INVESTMENTS (CONTINUED)
DECEMBER 31, 2004
| MOODY’S RATING (UNAUDITED) |
PRINCIPAL AMOUNT (000) |
VALUE (NOTE 2) | ||||||
| Rhodia SA, Sr. Notes (France) |
||||||||
| 7.625%, 06/01/10(l) |
B3 | $ | 25 | $ | 25,188 | |||
| 10.25%, 06/01/10(l)(a) |
B3 | 100 | 113,000 | |||||
| Rockwood Specialties, Inc., Sr. Sub. Notes |
||||||||
| 10.625%, 05/15/11 |
B3 | 75 | 86,625 | |||||
| 1,130,997 | ||||||||
| CLOTHING & APPAREL |
||||||||
| Dyersburg Corp., Gtd. Notes, Series B |
||||||||
| 9.75%, 09/01/07 (cost $184,978; purchased 02/04/98)(g)(i) |
NR | 175 | 0 | |||||
| COMPUTER HARDWARE |
||||||||
| International Business Machines Corp., Notes |
||||||||
| 4.25%, 09/15/09 |
A1 | 200 | 202,580 | |||||
| COMPUTER SERVICES & SOFTWARE |
||||||||
| Sungard Data Systems, Inc., Notes |
||||||||
| 3.75%, 01/15/09 |
Baa2 | 115 | 111,794 | |||||
| CONGLOMERATES |
||||||||
| Hutchison Whampoa International Ltd., Gtd. Notes |
||||||||
| 5.45%, 11/24/10 144A (cost $129,708; purchased 11/19/03)(g) |
A3 | 130 | 134,841 | |||||
| CONSTRUCTION |
||||||||
| Centex Corp., Sr. Notes |
||||||||
| 4.55%, 11/01/10 |
Baa2 | 150 | 149,435 | |||||
| CONSUMER PRODUCTS & SERVICES — 0.3% |
||||||||
| American Achievement Corp., Sr. Sub. Notes |
||||||||
| 8.25%, 04/01/12 |
B3 | 50 | 52,125 | |||||
| Bunge Ltd. Finance Corp., Co. Gtd. Notes |
||||||||
| 4.375%, 12/15/08 |
Baa3 | 205 | 206,759 | |||||
| Chattem, Inc., Sr. Sub. Notes |
||||||||
| 7.00%, 03/01/14 |
B2 | 50 | 51,750 | |||||
| Coinmach Corp., Sr. Notes |
||||||||
| 9.00%, 02/01/10 |
B2 | 54 | 56,700 | |||||
| FTD, Inc., Gtd. Notes |
||||||||
| 7.75%, 02/15/14 |
B3 | 50 | 51,750 | |||||
| Invista Co., Notes |
||||||||
| 9.25%, 05/01/12 144A (cost $128,562; purchased 04/23/04 - 10/27/04)(g) |
B1 | 125 | 140,000 | |||||
| Jostens Holdings Corp., Sr. Disc. Notes, Zero Coupon (until 12/01/08) |
||||||||
| 10.25%, 12/01/13 |
Caa2 | 175 | 125,125 | |||||
| Jostens IH Corp., Sr. Sub. Notes |
||||||||
| 7.625%, 10/01/12 144A (cost $50,000; purchased 09/23/04)(g) |
B3 | 50 | 52,250 | |||||
| Rayovac Corp., Sr. Sub. Notes |
||||||||
| 8.50%, 10/01/13 |
B3 | 25 | 27,875 | |||||
| Riddell Bell Holdings, Sr. Sub. Notes |
||||||||
| 8.375%, 10/01/12 144A (cost $25,000; purchased 09/23/04)(g) |
B3 | 25 | 26,000 | |||||
| UST, Inc., Notes |
||||||||
| 6.625%, 07/15/12 |
A3 | 260 | 290,753 | |||||
| 1,081,087 | ||||||||
| CONTAINERS & PACKAGING — 0.3% |
||||||||
| AEP Industries, Inc., Sr. Sub. Notes |
||||||||
| 9.875%, 11/15/07 |
B3 | 25 | 25,563 | |||||
| BWAY Corp., Sr. Sub. Notes |
||||||||
| 10.00%, 10/15/10 |
B3 | 50 | 52,250 | |||||
| Constar International, Inc., Sr. Sub. Notes |
||||||||
| 11.00%, 12/01/12(a) |
Caa1 | 25 | 26,063 | |||||
| Crown European Holdings SA, Sec’d. Notes |
||||||||
| 10.875%, 03/01/13 |
B2 | 175 | 207,812 | |||||
| Graham Packaging Co., Sr. Notes |
||||||||
| 8.50%, 10/15/12 144A (cost $101,406; purchased 09/29/04)(a)(g) |
Caa1 | 100 | 105,500 | |||||
173
AST T. ROWE PRICE ASSET ALLOCATION PORTFOLIO
SCHEDULE OF INVESTMENTS (CONTINUED)
DECEMBER 31, 2004
| MOODY’S RATING (UNAUDITED) |
PRINCIPAL AMOUNT (000) |
VALUE (NOTE 2) | ||||||
| Graham Packaging Co., Sub. Notes |
||||||||
| 9.875%, 10/15/14 144A (cost $102,188; purchased 09/29/04 - 10/14/04)(a)(g) |
Caa2 | $ | 100 | $ | 107,250 | |||
| Graham Packaging International, Sr. Sub. Notes |
||||||||
| 9.50%, 08/15/13 |
B3 | 25 | 28,563 | |||||
| Greif, Inc., Gtd. Notes |
||||||||
| 8.875%, 08/01/12 |
B2 | 50 | 55,875 | |||||
| Owens-Brockway Glass Containers Corp., Gtd. Notes |
||||||||
| 8.875%, 02/15/09 |
B1 | 150 | 163,687 | |||||
| 7.75%, 05/15/11 |
B1 | 25 | 27,188 | |||||
| 8.25%, 05/15/13 |
B2 | 50 | 55,250 | |||||
| Owens-Brockway Glass Containers Corp., Sec’d. Notes |
||||||||
| 8.75%, 11/15/12 |
B2 | 25 | 28,313 | |||||
| Owens-Illinois, Inc., Sr. Notes |
||||||||
| 7.35%, 05/15/08 |
B3 | 25 | 26,375 | |||||
| Plastipak Holdings, Inc., Gtd. Notes |
||||||||
| 10.75%, 09/01/11 |
B3 | 50 | 56,500 | |||||
| Pliant Corp., Sec’d. Notes, Zero Coupon (until 12/15/06) |
||||||||
| 11.125%, 06/15/09 |
B3 | 25 | 23,219 | |||||
| Sealed Air Corp., Sr. Notes |
||||||||
| 5.375%, 04/15/08 144A (cost $146,615; purchased 04/09/03 - 06/26/03)(g) |
Baa3 | 145 | 150,768 | |||||
| Silgan Holdings, Inc., Sr. Sub. Notes |
||||||||
| 6.75%, 11/15/13 |
B1 | 25 | 26,125 | |||||
| Smurfit Capital Funding PLC, Notes (Ireland) |
||||||||
| 6.75%, 11/20/05(l) |
Ba3 | 50 | 51,250 | |||||
| Smurfit-Stone Container Corp., Sr. Notes |
||||||||
| 8.375%, 07/01/12 |
B2 | 75 | 82,125 | |||||
| Stone Container Finance, Co. Gtd. (Canada) |
||||||||
| 7.375%, 07/15/14(l) |
B2 | 75 | 80,250 | |||||
| Tekni-Plex, Inc., Sec’d. Notes |
||||||||
| 8.75%, 11/15/13 144A (cost $50,438; purchased 11/12/03 - 11/13/03)(g) |
B2 | 50 | 50,000 | |||||
| 1,429,926 | ||||||||
| DIVERSIFIED MANUFACTURING OPERATIONS |
||||||||
| Borden US Finance Nova Scotia, Sec’d. Notes |
||||||||
| 9.00%, 07/15/14 144A (cost $50,250; purchased 08/04/04)(g) |
B3 | 50 | 55,750 | |||||
| ELECTRONIC COMPONENTS & EQUIPMENT — 0.2% |
||||||||
| Freescale Semiconductor Inc., Sr. Notes |
||||||||
| 6.875%, 07/15/11 |
Ba2 | 100 | 107,750 | |||||
| 7.125%, 07/15/14 |
Ba2 | 100 | 109,000 | |||||
| New ASAT Finance Ltd., Sr. Notes |
||||||||
| 9.25%, 02/01/11 144A (cost $25,000; purchased 01/16/04)(g) |
B3 | 25 | 22,813 | |||||
| Sanmina — SCI Corp., Gtd. Notes |
||||||||
| 10.375%, 01/15/10 |
Ba2 | 100 | 115,250 | |||||
| Solectron Corp., Sr. Notes |
||||||||
| 9.625%, 02/15/09 |
B1 | 125 | 138,124 | |||||
| Stats Chippac, Inc. Sr. Notes |
||||||||
| 6.75%, 11/15/11 144A (cost $25,000; purchased 11/05/04)(g) |
Ba2 | 25 | 24,875 | |||||
| Stratus Technologies, Inc., Notes |
||||||||
| 10.375%, 12/01/08 |
B3 | 125 | 113,438 | |||||
| Superior Essex Communications LLC, Sr. Notes |
||||||||
| 9.00%, 04/15/12 |
B3 | 100 | 103,500 | |||||
174
AST T. ROWE PRICE ASSET ALLOCATION PORTFOLIO
SCHEDULE OF INVESTMENTS (CONTINUED)
DECEMBER 31, 2004
| MOODY’S RATING (UNAUDITED) |
PRINCIPAL AMOUNT (000) |
VALUE (NOTE 2) | ||||||
| TNP Enterprises, Inc., Sr. Sub. Notes |
||||||||
| 10.25%, 04/01/10 |
Ba3 | $ | 50 | $ | 53,625 | |||
| UGS Corp., Sr. Sub. Notes |
||||||||
| 10.00%, 06/01/12 144A (cost $104,201; purchased 07/05/95 - 11/22/03)(g) |
B3 | 100 | 114,250 | |||||
| 902,625 | ||||||||
| ENTERTAINMENT & LEISURE — 0.5% |
||||||||
| American Casino & Entertainment Properties LLC Finance Corp. Sec’d Notes |
||||||||
| 7.85%, 02/01/12 |
B2 | 75 | 80,063 | |||||
| Ameristar Casinos, Inc., Gtd. Notes |
||||||||
| 10.75%, 02/15/09 |
B2 | 50 | 56,000 | |||||
| AMF Bowling Worldwide, Inc., Sr. Sub. Notes |
||||||||
| 10.00%, 03/01/10 |
B3 | 75 | 80,438 | |||||
| AOL Time Warner, Inc., Gtd. Bonds |
||||||||
| 7.625%, 04/15/31 |
Baa1 | 160 | 194,169 | |||||
| Argosy Gaming Co., Sr. Sub. Notes |
||||||||
| 9.00%, 09/01/11 |
B2 | 25 | 28,000 | |||||
| 7.00%, 01/15/14 |
B1 | 50 | 55,500 | |||||
| Belo Corp. |
||||||||
| 8.00%, 11/01/08 |
NR | 90 | 101,788 | |||||
| Boyd Gaming Corp., Sr. Sub. Notes |
||||||||
| 6.75%, 04/15/14 |
B1 | 325 | 342,062 | |||||
| Cinemark USA, Inc., Sr. Sub. Notes |
||||||||
| 9.00%, 02/01/13 |
B3 | 25 | 28,656 | |||||
| Cinemark, Inc., Sr. Disc. Notes, Zero Coupon (until 03/15/09) |
||||||||
| 9.75%, 03/15/14 |
Caa1 | 100 | 76,000 | |||||
| Gtech Holdings Corp., Notes |
||||||||
| 4.50%, 12/01/09 144A (cost $119,793; purchased 11/16/04)(g) |
Baa1 | 120 | 120,123 | |||||
| K2 Corp., Sr. Notes |
||||||||
| 7.375%, 07/01/14 144A (cost $76,050; purchased 06/24/04 - 06/25/04)(g) |
Ba3 | 75 | 82,500 | |||||
| LCE Acquisition Corp., Gtd. Notes |
||||||||
| 9.00%, 08/01/14 144A (cost $49,880; purchased 07/22/04 - 07/23/04)(g) |
B3 | 50 | 54,375 | |||||
| MGM Mirage, Inc., Sr. Notes |
||||||||
| 6.75%, 09/01/12 |
Ba1 | 125 | 132,187 | |||||
| MGM Mirage, Inc., Unsec’d. Notes |
||||||||
| 6.75%, 02/01/08 |
Ba1 | 25 | 26,406 | |||||
| Penn National Gaming, Inc., Gtd. Notes, Series B |
||||||||
| 11.125%, 03/01/08 |
B3 | 75 | 80,438 | |||||
| Premier Entertainment Biloxi LLC, First Mortgage |
||||||||
| 10.75%, 02/01/12 |
B3 | 50 | 54,875 | |||||
| Resorts International Hotel & Casino, Inc., Gtd. Notes |
||||||||
| 11.50%, 03/15/09 |
B2 | 25 | 29,500 | |||||
| Six Flags, Inc., Notes |
||||||||
| 8.875%, 02/01/10 |
B3 | 50 | 50,875 | |||||
| Speedway Motorsports, Inc., Sr. Sub. Notes |
||||||||
| 6.75%, 06/01/13 |
Ba2 | 50 | 52,875 | |||||
| Station Casinos, Inc., Sr. Notes |
||||||||
| 6.00%, 04/01/12 |
Ba3 | 100 | 102,375 | |||||
| Town Sports International, Inc., Gtd. Notes |
||||||||
| 9.625%, 04/15/11 |
B2 | 25 | 26,438 | |||||
| Turning Stone Casino Resort Enterprises, Sr. Notes |
||||||||
| 9.125%, 12/15/10 144A (cost $25,000; purchased 12/10/02)(g) |
B1 | 25 | 27,188 | |||||
175
AST T. ROWE PRICE ASSET ALLOCATION PORTFOLIO
SCHEDULE OF INVESTMENTS (CONTINUED)
DECEMBER 31, 2004
| MOODY'S RATING (UNAUDITED) |
PRINCIPAL AMOUNT (000) |
VALUE (NOTE 2) | ||||||
| Venetian Casino Resort LLC, Gtd. Notes |
||||||||
| 11.00%, 06/15/10 |
B3 | $ | 175 | $ | 200,593 | |||
| Warner Music Group, Sr. Sub. Notes |
||||||||
| 7.375%, 04/15/14 144A (cost $77,189; purchased 04/01/04)(g) |
B3 | 75 | 77,250 | |||||
| 2,160,674 | ||||||||
| ENVIRONMENTAL SERVICES — 0.1% |
||||||||
| Allied Waste North America Co., Gtd. Notes, Series B |
||||||||
| 8.875%, 04/01/08 |
Ba3 | 75 | 80,625 | |||||
| Allied Waste North America, Inc., Sr. Notes |
||||||||
| 7.875%, 04/15/13 |
Ba3 | 125 | 128,750 | |||||
| Casella Waste Systems, Inc., Sr. Sub. |
||||||||
| 9.75%, 02/01/13 |
B3 | 100 | 111,000 | |||||
| Synagro Technologies, Inc., Sr. Sub. Notes |
||||||||
| 9.50%, 04/01/09 |
B3 | 125 | 136,875 | |||||
| 457,250 | ||||||||
| FARMING & AGRICULTURE |
||||||||
| AGCO Corp., Gtd. Notes |
||||||||
| 9.50%, 05/01/08 |
Ba3 | 50 | 53,500 | |||||
| FINANCIAL — BANK & TRUST — 0.4% |
||||||||
| ABN AMRO Bank NV, Sub. Notes |
||||||||
| 7.125%, 06/18/07 |
A1 | 145 | 156,996 | |||||
| Bank of America Corp., Sr. Notes |
||||||||
| 4.875%, 09/15/12 |
Aa2 | 225 | 230,150 | |||||
| Bank of Nova Scotia, Sub. Debs. (Canada) |
||||||||
| 6.25%, 09/15/08(l) |
A1 | 50 | 53,679 | |||||
| BB&T Corp., Sub. Notes |
||||||||
| 6.50%, 08/01/11 |
A2 | 70 | 78,185 | |||||
| BCP Caylux Holdings Luxembourg SCA, Sr. Sub. Notes (Luxembourg) |
||||||||
| 9.625%, 06/15/14 144A (cost $184,031; purchased 06/03/04 - 09/24/04)(g)(l) |
B2 | 175 | 198,188 | |||||
| Citigroup, Inc., Sub. Notes |
||||||||
| 5.00%, 09/15/14 144A |
Aa2 | 390 | 392,627 | |||||
| International Nederland Bank NV, Sub. Notes (Netherlands) |
||||||||
| 5.125%, 05/01/15 144A (cost $252,157; purchased 02/04/04)(g)(l) |
Aa3 | 250 | 251,111 | |||||
| Northern Trust Co., Sub. Notes |
||||||||
| 4.60%, 02/01/13 |
A1 | 115 | 113,346 | |||||
| US Bank NA, Notes |
||||||||
| 2.87%, 02/01/07 |
Aa2 | 175 | 173,572 | |||||
| Wachovia Corp., Sub. Notes |
||||||||
| 6.40%, 04/01/08 |
A1 | 80 | 86,818 | |||||
| Webster Bank, Sr. Notes |
||||||||
| 5.125%, 04/15/14 |
Baa3 | 180 | 179,198 | |||||
| 1,913,870 | ||||||||
| FINANCIAL SERVICES — 1.4% |
||||||||
| Alamosa Delaware, Inc., Gtd. Notes |
||||||||
| 11.00%, 07/31/10 |
Caa1 | 74 | 87,505 | |||||
| Alamosa Delaware, Inc., Sr. Notes |
||||||||
| 8.50%, 01/31/12 |
Caa1 | 25 | 27,438 | |||||
| Arch Western Finance, Sr. Notes |
||||||||
| 6.75%, 07/01/13 |
BA3 | 50 | 51,875 | |||||
| Bank One Corp., Sub. Notes |
||||||||
| 5.25%, 01/30/13 |
A1 | 270 | 277,738 | |||||
| Capital One Bank, Sub. Notes |
||||||||
| 6.50%, 06/13/13 |
Baa3 | 125 | 136,810 | |||||
| CIT Group, Inc., Sr. Notes |
||||||||
| 2.875%, 09/29/06 |
A2 | 90 | 89,100 | |||||
| 7.75%, 04/02/12 |
A2 | 175 | 207,443 | |||||
| Couche-Tard Corp., Sr. Sub. Notes |
||||||||
| 7.50%, 12/15/13 |
Ba3 | 50 | 53,875 | |||||
| Countrywide Home Loan, Inc., Notes |
||||||||
| 4.125%, 09/15/09 |
A3 | 200 | 199,314 | |||||
| Dollar Financial Group, Gtd. Notes |
||||||||
| 9.75%, 11/15/11 |
B3 | 75 | 81,750 | |||||
176
AST T. ROWE PRICE ASSET ALLOCATION PORTFOLIO
SCHEDULE OF INVESTMENTS (CONTINUED)
DECEMBER 31, 2004
| MOODY’S RATING (UNAUDITED) |
PRINCIPAL AMOUNT (000) |
VALUE (NOTE 2) | ||||||
| Duke Capital Corp., Notes |
||||||||
| 4.302%, 05/18/06 |
Baa3 | $ | 100 | $ | 101,241 | |||
| Ford Motor Credit Co., Notes |
||||||||
| 3.24%, 02/16/05 |
A3 | 105 | 104,928 | |||||
| 5.625%, 10/01/08(a) |
A3 | 450 | 460,359 | |||||
| Franklin Resources, Inc., Notes |
||||||||
| 3.70%, 04/15/08 |
A2 | 55 | 54,912 | |||||
| General Electric Capital Corp., Notes |
||||||||
| 6.125%, 02/22/11 |
Aaa | 280 | 307,102 | |||||
| 6.00%, 06/15/12 |
Aaa | 185 | 201,962 | |||||
| General Motors Acceptance Corp., Notes |
||||||||
| 7.25%, 03/02/11 |
A3 | 230 | 241,099 | |||||
| Global Cash, Sr. Sub. Notes |
||||||||
| 8.75%, 03/15/12 |
Caa1 | 100 | 108,250 | |||||
| Goldman Sachs Group, Inc., Sub. Notes |
||||||||
| 6.345%, 02/15/34 |
A1 | 380 | 397,034 | |||||
| HBOS PLC, Sub. Notes (United Kingdom) |
||||||||
| 6.00%, 11/01/33 144A(l) (cost $168,002; purchased 10/22/03)(g) |
Aa3 | 170 | 177,680 | |||||
| Household Finance Corp., Notes |
||||||||
| 6.375%, 11/27/12 |
A1 | 125 | 138,327 | |||||
| International Lease Finance Corp., Notes |
||||||||
| 6.375%, 03/15/09 |
A1 | 185 | 200,540 | |||||
| John Deere Capital Corp., Notes |
||||||||
| 7.00%, 03/15/12 |
A3 | 190 | 219,379 | |||||
| John Hancock Global Funding II, Notes |
||||||||
| 5.625%, 06/27/06 144A (cost $239,430; purchased 06/20/01)(g) |
Aa3 | 240 | 247,440 | |||||
| MBNA America Bank NA, Notes |
||||||||
| 4.625%, 08/03/09 |
Baa1 | 190 | 193,652 | |||||
| MBNA America Bank NA, Sub. Notes |
||||||||
| 7.125%, 11/15/12 |
Baa2 | 80 | 91,140 | |||||
| Morgan Stanley, Notes |
||||||||
| 3.625%, 04/01/08 |
Aa3 | 300 | 298,584 | |||||
| Orion Power Holdings, Inc., Sr. Notes |
||||||||
| 12.00%, 05/01/10 |
B2 | 75 | 95,625 | |||||
| Pemex Project Funding Master Trust, Gtd. Notes |
||||||||
| 7.375%, 12/15/14 |
Baa1 | 125 | 139,250 | |||||
| Refco Finance Holdings LLC, Gtd. Notes |
||||||||
| 9.00%, 08/01/12 144A (cost $53,107; purchased 09/15/04 - 09/21/04)(g) |
B3 | 50 | 55,000 | |||||
| Verizon Global Funding Corp., Notes |
||||||||
| 7.75%, 12/01/30 |
A2 | 165 | 205,792 | |||||
| Wells Fargo & Co., Notes |
||||||||
| 2.59%, 03/23/07(c) |
Aa1 | 225 | 225,243 | |||||
| Williams Scotsman, Inc., Gtd. Notes |
||||||||
| 9.875%, 06/01/07 |
B3 | 25 | 25,125 | |||||
| 5,502,512 | ||||||||
| FOOD — 0.2% |
||||||||
| Agrilink Foods, Inc., Gtd. Notes |
||||||||
| 11.875%, 11/01/08 (cost $25,908; purchased 09/11/02 - 02/10/04)(g) |
B3 | 25 | 26,156 | |||||
| B&G Foods Holding Corp., Sr. Notes |
||||||||
| 8.00%, 10/01/11 |
B2 | 125 | 133,750 | |||||
| Dole Foods Co., Sr. Notes |
||||||||
| 8.875%, 03/15/11 |
B2 | 100 | 109,250 | |||||
| Kraft Foods, Inc., Notes |
||||||||
| 5.625%, 11/01/11 |
A3 | 195 | 206,786 | |||||
| McCormick & Co., Inc., Notes |
||||||||
| 6.40%, 02/01/06 |
A2 | 260 | 269,739 | |||||
| Pinnacle Foods Holding Corp., Sr. Sub. Notes |
||||||||
| 8.25%, 12/01/13 144A (cost $52,450; purchased 02/05/04 - 04/01/04)(a)(g) |
B3 | 50 | 47,875 | |||||
| 8.25%, 12/01/13 144A (cost $26,547; purchased 03/31/04)(a)(g) |
B3 | 25 | 23,938 | |||||
177
AST T. ROWE PRICE ASSET ALLOCATION PORTFOLIO
SCHEDULE OF INVESTMENTS (CONTINUED)
DECEMBER 31, 2004
| MOODY’S RATING (UNAUDITED) |
PRINCIPAL AMOUNT (000) |
VALUE (NOTE 2) | ||||||
| Wornick Co., Sec’d Notes |
||||||||
| 10.875%, 07/15/11 |
B2 | $ | 50 | $ | 54,500 | |||
| 871,994 | ||||||||
| FURNITURE |
||||||||
| Interface, Inc., Sr. Notes |
||||||||
| 10.375%, 02/01/10 |
Caa1 | 75 | 86,625 | |||||
| Sealy Mattress Co., Sr. Sub., Notes |
||||||||
| 8.25%, 06/15/14 |
Caa1 | 50 | 53,250 | |||||
| 139,875 | ||||||||
| HEALTHCARE SERVICES — 0.2% |
||||||||
| AmeriPath, Inc., Gtd. Notes |
||||||||
| 10.50%, 04/01/13 |
B3 | 50 | 53,375 | |||||
| AmerisourceBergen Corp., Sr. Notes |
||||||||
| 8.125%, 09/01/08 |
Ba3 | 75 | 83,813 | |||||
| Concentra Operating Corp., Gtd. Notes |
||||||||
| 9.50%, 08/15/10 |
B3 | 25 | 28,375 | |||||
| Concentra Operating Corp., Sr. Sub. Notes |
||||||||
| 9.125%, 06/01/12 144A (cost $74,984; purchased 05/25/04)(g) |
B3 | 75 | 85,125 | |||||
| Genesis Healthcare Corp., Notes |
||||||||
| 8.00%, 10/15/13 |
B3 | 75 | 81,750 | |||||
| Highmark, Inc., Notes |
||||||||
| 6.80%, 08/15/13 144A (cost $150,532; purchased 08/14/03 - 10/12/04)(g) |
Baa3 | 145 | 158,416 | |||||
| InSight Health Services Corp., Gtd. Notes |
||||||||
| 9.875%, 11/01/11 |
B3 | 50 | 50,750 | |||||
| Inverness Medical Innovations, Inc., Sr. Sub. Notes |
||||||||
| 8.75%, 02/15/12 144A (cost $25,000; purchased 02/05/04)(g) |
Caa1 | 25 | 26,250 | |||||
| Quintiles Transnational Corp., Notes |
||||||||
| 10.00%, 10/01/13 |
B3 | 50 | 56,250 | |||||
| Tenet Healthcare Corp., Notes |
||||||||
| 7.375%, 02/01/13(a) |
B1 | 50 | 48,750 | |||||
| Tenet Healthcare Corp., Sr. Notes |
||||||||
| 9.875%, 07/01/14 144A (cost $25,973; purchased 07/13/04)(g) |
B3 | 25 | 27,375 | |||||
| Triad Hospitals, Inc., Sr. Sub. Notes |
||||||||
| 7.00%, 11/15/13 |
B3 | 100 | 102,750 | |||||
| Vanguard Health Holdings I, Sr. Disc. Notes, Zero Coupon (until 10/01/09) |
||||||||
| 11.25%, 10/01/15 144A (cost $29,257; purchased 09/17/04)(g) |
Caa2 | 50 | 33,000 | |||||
| Vanguard Health Holdings II, Sr. Sub. Notes |
||||||||
| 9.00%, 10/01/14 144A (cost $50,000; purchased 09/17/04)(g) |
Caa1 | 50 | 53,750 | |||||
| Vicar Operating, Inc., Gtd. Notes |
||||||||
| 9.875%, 12/01/09 |
B3 | 75 | 82,500 | |||||
| 972,229 | ||||||||
| HOTELS & MOTELS — 0.1% |
||||||||
| Hammons, (John Q.) Hotels L.P., First Mortgage |
||||||||
| 8.875%, 05/15/12 |
B2 | 100 | 113,500 | |||||
| Harrahs Operating Co., Inc., Gtd. Notes |
||||||||
| 5.50%, 07/01/10 |
Baa3 | 100 | 103,635 | |||||
| Hilton Hotels Corp., Notes |
||||||||
| 7.625%, 12/01/12 |
Ba1 | 25 | 29,280 | |||||
| Host Marriott L.P., Gtd. Notes |
||||||||
| 9.50%, 01/15/07 |
Ba3 | 50 | 55,000 | |||||
| La Quinta Properties, Sr. Notes |
||||||||
| 8.875%, 03/15/11 |
Ba3 | 125 | 140,000 | |||||
| 441,415 | ||||||||
178
AST T. ROWE PRICE ASSET ALLOCATION PORTFOLIO
SCHEDULE OF INVESTMENTS (CONTINUED)
DECEMBER 31, 2004
| MOODY’S RATING (UNAUDITED) |
PRINCIPAL AMOUNT (000) |
VALUE (NOTE 2) | ||||||
| INDUSTRIAL PRODUCTS — 0.1% |
||||||||
| Brand Services, Inc., Gtd. Notes |
||||||||
| 12.00%, 10/15/12 |
B3 | $ | 75 | $ | 84,375 | |||
| Collins & Aikman Corp., Gtd. Notes |
||||||||
| 9.75%, 02/15/10 |
Caa1 | 75 | 81,000 | |||||
| Euramax International PLC, Sr. Sub. Notes |
||||||||
| 8.50%, 08/15/11 |
B2 | 25 | 26,813 | |||||
| Massey Energy Co., Sr. Notes |
||||||||
| 6.625%, 11/15/10 |
Ba3 | 75 | 78,750 | |||||
| Mobile Mini, Inc., Sr. Notes |
||||||||
| 9.50%, 07/01/13 |
B2 | 75 | 87,750 | |||||
| National Waterworks, Inc., Gtd. Notes |
||||||||
| 10.50%, 12/01/12 |
B3 | 100 | 113,000 | |||||
| Shaw Group, Inc., Unsec’d. Sr. Notes |
||||||||
| 10.75%, 03/15/10 |
Ba2 | 50 | 55,375 | |||||
| 527,063 | ||||||||
| INSURANCE — 0.5% |
||||||||
| Ace INA Holdings, Inc., Notes |
||||||||
| 5.875%, 06/15/14 |
A3 | 155 | 159,079 | |||||
| AIG SunAmerica Global Financing XII, |
||||||||
| 5.30%, 05/30/07 144A (cost $274,840; purchased 05/15/02)(g) |
Aaa | 275 | 285,871 | |||||
| Allstate Financial Global Funding LLC, |
||||||||
| 5.25%, 02/01/07 144A (cost $179,699; purchased 01/24/02 - 02/10/04)(g) |
Aa2 | 180 | 186,155 | |||||
| Fund American Cos., Inc., Notes |
||||||||
| 5.875%, 05/15/13 |
Baa2 | 195 | 198,788 | |||||
| Genworth Financial, Inc., Notes |
||||||||
| 5.75%, 06/15/14 |
A2 | 185 | 196,069 | |||||
| Metlife, Inc., Sr. Notes |
||||||||
| 6.125%, 12/01/11 |
A2 | 200 | 217,663 | |||||
| Nationwide Financial Services, Inc., Sr. Notes |
||||||||
| 5.90%, 07/01/12 |
A3 | 205 | 216,800 | |||||
| Nationwide Mutual Insurance Co., Bonds |
||||||||
| 6.60%, 04/15/34 144A (cost $104,770; purchased 03/31/04)(g) |
A2 | 105 | 105,461 | |||||
| NLV Financial Corp., Sr. Notes |
||||||||
| 7.50%, 08/15/33 144A (cost $121,251; purchased 08/20/03 - 12/03/03)(g) |
Baa3 | 120 | 128,964 | |||||
| Principal Life Global Funding I, Notes |
||||||||
| 5.125%, 10/15/13 144A (cost $183,954; purchased 06/22/04)(g) |
Aa3 | 185 | 187,875 | |||||
| Security Benefit Life Insurance Co., Notes |
||||||||
| 7.45%, 10/01/33 144A (cost $79,821; purchased 09/26/03)(g) |
Baa1 | 80 | 83,917 | |||||
| XL Capital Ltd., Gtd. Notes |
||||||||
| 6.50%, 01/15/12 |
A2 | 170 | 186,335 | |||||
| 2,152,977 | ||||||||
| MACHINERY & EQUIPMENT — 0.1% |
||||||||
| Case New Holland, Inc., Sr. Notes |
||||||||
| 9.25%, 08/01/11 144A (cost $49.399; purchased 07/29/03)(g) |
Ba3 | 50 | 55,875 | |||||
| Cummins, Inc., Sr. Notes |
||||||||
| 9.50%, 12/01/10 |
Ba2 | 25 | 28,500 | |||||
| Dresser-Rand Group, Inc., Sr. Sub. Notes |
||||||||
| 7.375%, 11/01/14 144A (cost $25,000; purchased 10/15/04)(g) |
B3 | 25 | 25,625 | |||||
| JLG Industries, Inc., Sr. Sub. Notes |
||||||||
| 8.375%, 06/15/12(a) |
B3 | 100 | 107,500 | |||||
179
AST T. ROWE PRICE ASSET ALLOCATION PORTFOLIO
SCHEDULE OF INVESTMENTS (CONTINUED)
DECEMBER 31, 2004
| MOODY’S RATING (UNAUDITED) |
PRINCIPAL AMOUNT (000) |
VALUE (NOTE 2) | ||||||
| Maax Corp., Sr. Sub. Notes (Canada) |
||||||||
| 9.75%, 06/15/12 144A (cost $76,188; purchased 05/27/04)(g)(l) |
B3 | $ | 75 | $ | 79,688 | |||
| Manitowoc Co., Inc., Sr. Notes |
||||||||
| 7.125%, 11/01/13 |
B1 | 50 | 54,375 | |||||
| Trimas Corp., Gtd. Notes |
||||||||
| 9.875%, 06/15/12 |
B3 | 100 | 106,500 | |||||
| 458,063 | ||||||||
| MEDICAL SUPPLIES & EQUIPMENT — 0.2% |
||||||||
| Fisher Scientific International, Inc., Sr. Sub. Notes |
||||||||
| 8.125%, 05/01/12 |
B2 | 65 | 72,475 | |||||
| Fresenius Medical Capital Trust II, Gtd. Notes |
||||||||
| 7.875%, 02/01/08 |
Ba2 | 250 | 271,874 | |||||
| Hospira, Inc., Notes |
||||||||
| 4.95%, 06/15/09 |
Baa3 | 190 | 194,285 | |||||
| Medquest, Inc., Gtd. Notes |
||||||||
| 11.875%, 08/15/12 |
B3 | 25 | 29,500 | |||||
| VWR International, Inc., Sr. Notes (Germany) |
||||||||
| 6.875%, 04/15/12 144A (cost $25,000; purchased 04/07/04)(g)(l) |
B2 | 25 | 26,250 | |||||
| VWR International, Inc., Sr. Sub. Notes (Germany) |
||||||||
| 8.00%, 04/15/14 144A (cost $180,579; purchased 04/29/04 - 05/19/04)(g)(l) |
B3 | 175 | 187,688 | |||||
| 782,072 | ||||||||
| METALS & MINING — 0.3% |
||||||||
| Alcan, Inc., Bonds (Canada) |
||||||||
| 6.125%, 12/15/33(l) |
Baa1 | 175 | 185,862 | |||||
| Algoma Steel, Inc., Sec’d. Notes |
||||||||
| 11.00%, 12/31/09 |
NR | 25 | 27,938 | |||||
| Allegheny Technologies, Inc., Notes |
||||||||
| 8.375%, 12/15/11 |
B2 | 75 | 83,625 | |||||
| Alpha Natural Resources, Sr. Notes |
||||||||
| 10.00%, 06/01/12 144A (cost $75,000; purchased 05/13/04)(g) |
B3 | 75 | 85,875 | |||||
| Autocam Corp., Sr. Sub. Notes |
||||||||
| 10.875%, 06/15/14 |
B3 | 50 | 49,750 | |||||
| California Steel Industries, Inc., Sr. Notes |
||||||||
| 6.125%, 03/15/14 |
Ba3 | 25 | 24,938 | |||||
| Century Aluminum Co., Sr. Notes |
||||||||
| 7.50%, 08/15/14 144A (cost $75,625; purchased 08/10/04 - 08/12/04)(g) |
B1 | 75 | 80,250 | |||||
| Compass Minerals Group, Inc., Gtd. Notes |
||||||||
| 10.00%, 08/15/11 |
B3 | 25 | 28,250 | |||||
| Foundation PA Coal Co., Sr. Notes |
||||||||
| 7.25%, 08/01/14 144A (cost $75,969; purchased 07/21/04)(g) |
B1 | 75 | 80,250 | |||||
| Freeport-McMoRan Resource Partners, Inc. L.P., Sr. Notes |
||||||||
| 7.00%, 02/15/08 |
Caa1 | 175 | 183,750 | |||||
| Gerdau Ameristeel Corp., Sr. Notes (Canada) |
||||||||
| 10.375%, 07/15/11(l) |
B2 | 125 | 147,188 | |||||
| Hawk Corp., Sr. Notes |
||||||||
| 8.75%, 11/01/14 144A (cost $50,563; purchased 10/25/04)(g) |
B2 | 50 | 51,500 | |||||
| Ipsco, Inc., Sr. Notes (Canada) |
||||||||
| 8.75%, 06/01/13(l) |
Ba3 | 25 | 28,750 | |||||
| Ispat Inland ULC, Sec’d. Notes |
||||||||
| 9.75%, 04/01/14 |
B3 | 33 | 40,920 | |||||
180
AST T. ROWE PRICE ASSET ALLOCATION PORTFOLIO
SCHEDULE OF INVESTMENTS (CONTINUED)
DECEMBER 31, 2004
| MOODY’S RATING (UNAUDITED) |
PRINCIPAL AMOUNT (000) |
VALUE (NOTE 2) | |||||||
| Jorgensen, (Earle, M.) Co., Sec’d. Notes |
|||||||||
| 9.75%, 06/01/12 |
B2 | $ | 175 | $ | 197,749 | ||||
| Neenah Corp., Sec’d. Notes |
|||||||||
| 11.00%, 09/30/10 144A (cost $27,024; purchased 10/15/03)(g) |
B2 | 25 | 27,750 | ||||||
| Russel Metals, Inc., Sr. Notes (Canada) |
|||||||||
| 6.375%, 03/01/14(l) |
Ba3 | 75 | 76,500 | ||||||
| Valmont Industries Inc., Sr. Sub. Notes |
|||||||||
| 6.875%, 05/01/14 |
B+ | (d) | 50 | 52,250 | |||||
| 1,453,095 | |||||||||
| MISCELLANEOUS |
|||||||||
| Reddy Ice Holdings, Inc., Sr. Disc. Notes, Zero Coupon (until 11/01/12) |
|||||||||
| 10.50%, 11/01/12 144A (cost $33,789; purchased 10/19/04)(g) |
Caa1 | 50 | 34,750 | ||||||
| OIL & GAS — 0.9% |
|||||||||
| Amerada Hess Corp., Bonds |
|||||||||
| 7.875%, 10/01/29 |
Ba1 | 135 | 160,208 | ||||||
| ANR Pipeline, Inc., Notes |
|||||||||
| 8.875%, 03/15/10 |
B1 | 25 | 28,125 | ||||||
| Baker Hughes, Inc., Sr. Notes |
|||||||||
| 6.875%, 01/15/29 |
A2 | 200 | 234,187 | ||||||
| Buckeye Partners L.P., Notes |
|||||||||
| 6.75%, 08/15/33 |
Baa2 | 75 | 83,027 | ||||||
| Buckeye Partners L.P., Notes |
|||||||||
| 5.30%, 10/15/14 |
Baa2 | 55 | 55,812 | ||||||
| Chesapeake Energy, 7.00%, 08/15/14 Sr. Notes |
|||||||||
| 7.00%, 08/15/14 |
Ba3 | 25 | 26,750 | ||||||
| ConocoPhillips, Gtd. Bonds |
|||||||||
| 5.90%, 10/15/32 |
A3 | 245 | 257,227 | ||||||
| Denbury Resources, Inc., Gtd. Notes |
|||||||||
| 7.50%, 04/01/13 |
B2 | 75 | 81,375 | ||||||
| Devon Financing Corp. LLC, Gtd. Notes |
|||||||||
| 7.875%, 09/30/31 |
Baa2 | 145 | 183,145 | ||||||
| Diamond Offshore Drilling, Inc., Sr. Notes |
|||||||||
| 5.15%, 09/01/14 144A (cost $125,437; purchased 09/09/04-11/15/04)(g) |
Baa2 | 125 | 126,652 | ||||||
| Duke Capital LLC, Sr. Notes |
|||||||||
| 6.25%, 02/15/13 |
Baa3 | 175 | 189,439 | ||||||
| Dynegy-Roseton Danskamme Corp., Gtd. Notes |
|||||||||
| 7.27%, 11/08/10 |
Caa2 | 50 | 50,625 | ||||||
| Encana Holdings Financial Corp., Gtd. Notes (Canada) |
|||||||||
| 5.80%, 05/01/14(l) |
Baa1 | 200 | 213,603 | ||||||
| Encore Acquisition Co., Gtd. Notes |
|||||||||
| 8.375%, 06/15/12 |
B2 | 50 | 55,875 | ||||||
| Ferrellgas Partners L.P., Sr. Notes |
|||||||||
| 8.75%, 06/15/12 |
B2 | 100 | 109,500 | ||||||
| Forest Oil Corp., Sr. Notes |
|||||||||
| 8.00%, 12/15/11 |
Ba3 | 25 | 28,688 | ||||||
| Halliburton Co., Notes |
|||||||||
| 2.86%, 01/26/05 144A (cost $190,000; purchased 05/07/04)(c)(g) |
Baa2 | 190 | 190,182 | ||||||
| Hanover Compressor Co., Sr. Notes |
|||||||||
| 9.00%, 06/01/14 |
B3 | 25 | 27,938 | ||||||
| Hanover Equipment Trust, Sec’d. Notes |
|||||||||
| 8.50%, 09/01/08 |
B2 | 25 | 27,000 | ||||||
| Hilcorp Energy I L.P., Sr. Notes |
|||||||||
| 10.50%, 09/01/10 144A (cost $75,000; purchased 08/05/03)(g) |
B3 | 75 | 85,125 | ||||||
| Kaneb Pipeline Operating Partnership L.P., Sr. Notes |
|||||||||
| 7.75%, 02/15/12 |
Ba1 | 90 | 104,232 | ||||||
| Kinder Morgan, Inc., Sr. Notes |
|||||||||
| 6.50%, 09/01/12 |
Baa2 | 180 | 198,153 | ||||||
181
AST T. ROWE PRICE ASSET ALLOCATION PORTFOLIO
SCHEDULE OF INVESTMENTS (CONTINUED)
DECEMBER 31, 2004
| MOODY’S RATING (UNAUDITED) |
PRINCIPAL AMOUNT (000) |
VALUE (NOTE 2) | ||||||
| Magnum Hunter Resources, Inc., Gtd. Notes |
||||||||
| 9.60%, 03/15/12 |
B2 | $ | 33 | $ | 37,620 | |||
| Panhandle Eastern Pipe Line Co., Sr. Notes |
||||||||
| 4.80%, 08/15/08 |
Baa3 | 70 | 71,551 | |||||
| Pemex Project Funding Master Trust, Notes |
||||||||
| 3.79%, 03/15/05 144A (cost $188,739; purchased 06/08/04)(g) |
Baa1 | 190 | 195,415 | |||||
| Petroleum Geo-Services ASA, Notes (Norway) |
||||||||
| 10.00%, 11/05/10(l) |
B1 | 75 | 85,875 | |||||
| Pioneer Natural Resource Co., Sr. Notes |
||||||||
| 5.875%, 07/15/16 |
Baa3 | 95 | 99,456 | |||||
| Plains All American Pipeline L.P., Gtd |
||||||||
| 7.75%, 10/15/12 |
Ba1 | 70 | 82,005 | |||||
| Pride International, Inc., Sr. Notes |
||||||||
| 7.375%, 07/15/14 |
Ba2 | 50 | 54,875 | |||||
| Range Resources Corp., Sr. Sub. Notes |
||||||||
| 7.375%, 07/15/13 |
B3 | 50 | 53,875 | |||||
| Swift Energy Co., Sr. Notes |
||||||||
| 7.625%, 07/15/11 |
B1 | 50 | 54,250 | |||||
| Transocean, Inc., Notes |
||||||||
| 7.50%, 04/15/31 |
Baa2 | 110 | 135,828 | |||||
| Williams Cos., Inc., Debs |
||||||||
| 7.50%, 01/15/31 |
B3 | 250 | 260,000 | |||||
| XTO Energy, Inc., Sr. Notes |
||||||||
| 6.25%, 04/15/13 |
Baa3 | 130 | 142,504 | |||||
| 3,790,122 | ||||||||
| PAPER & FOREST PRODUCTS — 0.2% |
||||||||
| Boise Cascade LLC, Sr. Sub. Notes |
||||||||
| 7.125%, 10/15/14 144A (cost $101,344; purchased 10/15/04)(g) |
B2 | 100 | 106,250 | |||||
| Celulosa Arauco Y Constitucion SA, Notes (Chile) |
||||||||
| 5.125%, 07/09/13(l) |
Baa2 | 160 | 158,781 | |||||
| Graphic Packaging International Corp., Sr. Notes |
||||||||
| 8.50%, 08/15/11 |
B2 | 25 | 27,438 | |||||
| JSG Funding PLC, Sr. Notes (Ireland) |
||||||||
| 9.625%, 10/01/12(l) |
B2 | 150 | 168,000 | |||||
| Longview Fibre Co., Sr. Sub. Notes |
||||||||
| 10.00%, 01/15/09 |
B2 | 100 | 109,750 | |||||
| MDP Acquisitions PLC, Sub. Notes (Ireland) |
||||||||
| 15.50%, 10/01/13 [PIK] (cost $28,704; purchased 10/04/04)(g) |
B3 | 25 | 29,375 | |||||
| Weyerhaeuser Co., Debs |
||||||||
| 7.375%, 03/15/32 |
Baa2 | 40 | 47,586 | |||||
| Weyerhaeuser Co., Notes |
||||||||
| 6.75%, 03/15/12 |
Baa2 | 90 | 101,561 | |||||
| 748,741 | ||||||||
| PHARMACEUTICALS — 0.2% |
||||||||
| Abbott Laboratories, Notes |
||||||||
| 5.625%, 07/01/06 |
A1 | 360 | 372,327 | |||||
| Amgen, Inc., Sr. Notes |
||||||||
| 4.00%, 11/18/09 144A (cost $124,759; purchased 01/15/04-03/31/04)(g) |
A2 | 125 | 124,749 | |||||
| Biovail Corp., Sr. Sub. Notes (Canada) |
||||||||
| 7.875%, 04/01/10(l) |
B2 | 50 | 52,000 | |||||
| GlaxoSmithKline Capital, Inc., Gtd. Notes |
||||||||
| 5.375%, 04/15/34 |
Aa2 | 125 | 124,623 | |||||
| Wyeth, Bonds |
||||||||
| 6.50%, 02/01/34 |
Baa1 | 115 | 123,107 | |||||
| 796,806 | ||||||||
182
AST T. ROWE PRICE ASSET ALLOCATION PORTFOLIO
SCHEDULE OF INVESTMENTS (CONTINUED)
DECEMBER 31, 2004
| MOODY’S RATING (UNAUDITED) |
PRINCIPAL AMOUNT (000) |
VALUE (NOTE 2) | |||||||
| PRINTING & PUBLISHING — 0.3% |
|||||||||
| Canwest Media, Inc. Sr. Sub. Notes (Canada) |
|||||||||
| 8.00%, 09/15/12 144A (cost $130,006; purchased 11/18/04)(g) |
B2 | $ | 137 | $ | 148,152 | ||||
| Canwest Media, Inc., Sr. Sub. Notes |
|||||||||
| 10.625%, 05/15/11 |
B2 | 100 | 112,750 | ||||||
| CBD Media, Inc., Gtd. Notes |
|||||||||
| 8.625%, 06/01/11 |
B3 | 50 | 53,125 | ||||||
| Dex Media East LLC, Gtd. Notes |
|||||||||
| 9.875%, 11/15/09 |
B2 | 25 | 28,594 | ||||||
| 12.125%, 11/15/12 |
B3 | 98 | 119,928 | ||||||
| Dex Media West Finance, Sr. Sub. Notes |
|||||||||
| 9.875%, 08/15/13 |
Caa1 | 73 | 84,498 | ||||||
| Dex Media West LLC, Sr. Notes |
|||||||||
| 8.50%, 08/15/10 |
B3 | 25 | 27,938 | ||||||
| Dex Media, Inc., Notes |
|||||||||
| 8.00%, 11/15/13 |
B3 | 50 | 54,375 | ||||||
| Houghton Mifflin Co., Sr. Disc. Notes, Zero Coupon (until 10/15/08) |
|||||||||
| 11.50%, 10/15/13 |
Caa1 | 100 | 74,000 | ||||||
| Houghton Mifflin Co., Sr. Sub. Notes |
|||||||||
| 9.875%, 02/01/13 |
B3 | 75 | 82,500 | ||||||
| Liberty Group Operating, Inc., Gtd. Notes |
|||||||||
| 9.375%, 02/01/08 |
Caa1 | 50 | 51,000 | ||||||
| Primedia, Inc. |
|||||||||
| 8.00%, 05/15/23 |
B | (d) | 25 | 25,844 | |||||
| Primedia, Inc., Sr. Notes |
|||||||||
| 8.875%, 05/15/11 |
B3 | 50 | 53,125 | ||||||
| Quebecor Media, Inc., Sr. Notes (Canada) |
|||||||||
| 11.125%, 07/15/11(l) |
B2 | 150 | 172,124 | ||||||
| Reader’s Digest Assoc., Sr. Notes |
|||||||||
| 6.50%, 03/01/11 |
Ba3 | 50 | 52,500 | ||||||
| Sun Media Corp., Gtd. Notes (Canada) |
|||||||||
| 7.625%, 02/15/13(l) |
Ba3 | 50 | 54,813 | ||||||
| Vertis, Inc., Sec’d. Notes |
|||||||||
| 9.75%, 04/01/09 |
B2 | 25 | 27,250 | ||||||
| 1,222,516 | |||||||||
| RAILROADS |
|||||||||
| Canadian National Railways Co., Bonds |
|||||||||
| 6.25%, 08/01/34 |
Baa1 | 195 | 211,741 | ||||||
| REAL ESTATE — 0.5% |
|||||||||
| BF Saul, Sec’d. Notes |
|||||||||
| 7.50%, 03/01/14 |
B3 | 25 | 25,875 | ||||||
| Developers Diversified Realty Corp., Notes |
|||||||||
| 3.875%, 01/30/09 |
Baa3 | 145 | 142,425 | ||||||
| EOP Operating LP, Notes |
|||||||||
| 4.65%, 10/01/10 |
Baa2 | 145 | 145,845 | ||||||
| Geo Group, Inc. (The), Sr. Notes |
|||||||||
| 8.25%, 07/15/13 |
B1 | 25 | 26,875 | ||||||
| Lennar Corp., Notes |
|||||||||
| 5.50%, 09/01/14 144A (cost $145,353; purchased 08/05/04-10/07/04)(g) |
Baa3 | 145 | 147,246 | ||||||
| LNR Property Corp., Sr. Sub. Notes |
|||||||||
| 7.625%, 07/15/13 |
Ba3 | 75 | 85,500 | ||||||
| NVR, Inc., Sr. Notes |
|||||||||
| 5.00%, 06/15/10 |
Baa3 | 150 | 150,750 | ||||||
| Omega Healthcare Investors, Inc., Sr. Notes |
|||||||||
| 7.00%, 04/01/14 [REIT] |
B1 | 50 | 51,625 | ||||||
| Pulte Homes, Inc., Gtd. Notes |
|||||||||
| 7.875%, 08/01/11 |
Baa3 | 150 | 174,240 | ||||||
| Reckson Operating Partnership L.P., Notes |
|||||||||
| 5.15%, 01/15/11 |
Ba1 | 180 | 181,789 | ||||||
| Rouse Co., Notes |
|||||||||
| 8.43%, 04/27/05 |
Baa3 | 350 | 354,852 | ||||||
| Simon Property Group L.P., Notes |
|||||||||
| 3.75%, 01/30/09 |
Baa2 | 190 | 187,163 | ||||||
| Universal City Development, Notes |
|||||||||
| 11.75%, 04/01/10 |
B2 | 150 | 177,938 | ||||||
183
AST T. ROWE PRICE ASSET ALLOCATION PORTFOLIO
SCHEDULE OF INVESTMENTS (CONTINUED)
DECEMBER 31, 2004
| MOODY’S RATING (UNAUDITED) |
PRINCIPAL AMOUNT (000) |
VALUE (NOTE 2) | ||||||
| WCI Communities, Inc., Gtd. Notes |
||||||||
| 9.125%, 05/01/12 |
Ba3 | $ | 50 | $ | 55,750 | |||
| Williams Scotsman, Inc., Sec’d. Notes |
||||||||
| 10.00%, 08/15/08 |
B2 | 50 | 55,750 | |||||
| 1,963,623 | ||||||||
| RESTAURANTS — 0.1% |
||||||||
| El Pollo Loco Inc., Sec’d. Notes |
||||||||
| 9.25%, 12/15/09 |
B2 | 50 | 52,875 | |||||
| EPL Intermediate, Inc., Sr. Disc. Notes, Zero Coupon (until 3/15/09) |
||||||||
| 12.50%, 03/15/10 |
Caa1 | 50 | 33,000 | |||||
| Perkins Family Restaurants L.P., Sr. Notes |
||||||||
| 10.125%, 12/15/07 |
B1 | 75 | 77,063 | |||||
| Yum! Brands, Inc., Sr. Notes |
||||||||
| 7.70%, 07/01/12 |
Baa3 | 185 | 219,496 | |||||
| 382,434 | ||||||||
| RETAIL & MERCHANDISING — 0.2% |
||||||||
| Adesa Corp., Sr. Sub. Notes |
||||||||
| 7.625%, 06/15/12 |
B1 | 50 | 53,000 | |||||
| Asbury Automotive Group, Inc., Gtd. Notes |
||||||||
| 9.00%, 06/15/12 |
B3 | 25 | 26,375 | |||||
| Asbury Automotive Group, Inc., Sr. Sub. Notes |
||||||||
| 8.00%, 03/15/14 |
B3 | 50 | 49,750 | |||||
| CVS Corp., Notes |
||||||||
| 4.00%, 09/15/09 |
A3 | 105 | 104,617 | |||||
| Federated Department Stores, Sr. Notes |
||||||||
| 6.625%, 04/01/11 |
Baa1 | 150 | 167,933 | |||||
| Jean Coutu Group Pjc, Inc., Sr. Notes |
||||||||
| 7.625%, 08/01/12 144A (cost $78,481; purchased 10/14/04-10/28/04)(g) |
B2 | 75 | 79,688 | |||||
| Kroger Co., Gtd. Notes |
||||||||
| 8.05%, 02/01/10 |
Baa2 | 180 | 210,924 | |||||
| May Department Stores Co. Notes |
||||||||
| 3.95%, 07/15/07 |
Baa2 | 55 | 55,126 | |||||
| Pantry, Inc., Sr. Sub. Notes |
||||||||
| 7.75%, 02/15/14 |
B3 | 50 | 53,500 | |||||
| 800,913 | ||||||||
| SEMICONDUCTORS — 0.1% |
||||||||
| AMI Semiconductor, Inc., Gtd. Notes |
||||||||
| 10.75%, 02/01/13 |
B3 | 33 | 38,940 | |||||
| Amkor Technology, Inc., Sr. Notes |
||||||||
| 9.25%, 02/15/08(a) |
B3 | 50 | 51,375 | |||||
| Fairchild Semiconductor International Corp., Sr. Sub. Notes |
||||||||
| 10.50%, 02/01/09 |
B2 | 200 | 212,000 | |||||
| 302,315 | ||||||||
| TELECOMMUNICATIONS — 1.0% |
||||||||
| America Movil SA de CV, Company Gtd. (Mexico) |
||||||||
| 5.50%, 03/01/14 |
Baa1 | 115 | 113,897 | |||||
| AT&T Broadband Corp., Gtd. Notes |
||||||||
| 8.375%, 03/15/13 |
Baa3 | 205 | 253,174 | |||||
| AT&T Corp., Sr. Notes |
||||||||
| 9.05%, 11/15/11 |
Ba1 | 125 | 144,531 | |||||
| Call-Net Enterprises, Inc., Gtd. Notes |
||||||||
| 10.625%, 12/31/08 |
Caa3 | 100 | 100,500 | |||||
| Centennial Communications Corp., Gtd. Notes |
||||||||
| 10.125%, 06/15/13 |
Caa1 | 50 | 56,375 | |||||
| Deutsche Telekom International Finance BV, Gtd. Notes (Netherlands) |
||||||||
| 8.75%, 06/15/30(l) |
Baa3 | 160 | 211,903 | |||||
| Echostar DBS Corp., Sr. Notes |
||||||||
| 9.125%, 01/15/09 |
Ba3 | 3 | 3,315 | |||||
| Eircom Funding, Sr. Sub. Notes (Ireland) |
||||||||
| 8.25%, 08/15/13(l) |
B1 | 100 | 111,000 | |||||
184
AST T. ROWE PRICE ASSET ALLOCATION PORTFOLIO
SCHEDULE OF INVESTMENTS (CONTINUED)
DECEMBER 31, 2004
| MOODY’S RATING (UNAUDITED) |
PRINCIPAL AMOUNT (000) |
VALUE (NOTE 2) | |||||||
| Fairpoint Communications, Inc., Sr. Sub. Notes |
|||||||||
| 12.50%, 05/01/10 |
Caa1 | $ | 125 | $ | 135,625 | ||||
| France Telecom SA, Notes (France) |
|||||||||
| 8.50%, 03/01/11(l) |
Baa3 | 155 | 185,128 | ||||||
| Horizon PCS, Inc., Sr. Notes |
|||||||||
| 11.375%, 07/15/12 144A (cost $76,000; purchased 07/08/04)(g) |
B3 | 75 | 84,375 | ||||||
| Inmarsat Finance PLC Co. Gtd. (United Kingdom) |
|||||||||
| 7.625%, 06/30/12 |
B2 | 25 | 26,125 | ||||||
| Insight Midwest L.P., Sr. Notes |
|||||||||
| 10.50%, 11/01/10 |
B2 | 75 | 82,500 | ||||||
| Ipcs Escrow Co., Sr. Notes |
|||||||||
| 11.50%, 05/01/12 144A (cost $52,063; purchased 07/13/04-08/10/04)(g) |
B3 | 50 | 57,000 | ||||||
| Lucent Technologies, Inc., Notes |
|||||||||
| 5.50%, 11/15/08(a) |
Caa1 | 75 | 77,438 | ||||||
| MCI, Inc., Sr. Notes |
|||||||||
| 6.688%, 05/01/09 |
B | (d) | 125 | 129,688 | |||||
| 7.735%, 05/01/14 |
B | (d) | 75 | 80,813 | |||||
| Nextel Communications, Inc., Sr. Notes |
|||||||||
| 6.875%, 10/31/13 |
B2 | 175 | 190,749 | ||||||
| 7.375%, 08/01/15 |
B2 | 150 | 165,750 | ||||||
| Nortel Networks Ltd., Notes (Canada) |
|||||||||
| 6.125%, 02/15/06(l) |
B3 | 75 | 76,688 | ||||||
| Primus Telecommunications Group, Inc., Sr. Notes |
|||||||||
| 8.00%, 01/15/14 |
B3 | 100 | 88,500 | ||||||
| Qwest Services Corp., Notes |
|||||||||
| 14.00%, 12/15/10 144A (cost $204,257; purchased 06/17/04-06/24/04)(g) |
Caa1 | 175 | 211,312 | ||||||
| Rogers Wireless, Inc., Sec’d. Notes |
|||||||||
| 9.625%, 05/01/11(l) |
Ba3 | 75 | 88,313 | ||||||
| Rogers Wireless, Inc., Sr. Sec’d. Notes (Canada) |
|||||||||
| 6.375%, 03/01/14(l) |
Ba3 | 150 | 149,250 | ||||||
| Sprint Capital Corp., Co. Gtd |
|||||||||
| 6.90%, 05/01/19 |
Baa3 | 220 | 246,687 | ||||||
| Telefonos de Mexico SA, Notes (Mexico) |
|||||||||
| 4.50%, 11/19/08(l) |
A3 | 95 | 95,871 | ||||||
| Telex Communications, Inc., Sec’d. Notes |
|||||||||
| 11.50%, 10/15/08 |
B3 | 75 | 82,125 | ||||||
| Telus Corp., Notes (Canada) |
|||||||||
| 8.00%, 06/01/11(l) |
Baa3 | 135 | 160,191 | ||||||
| Time Warner Telecom LLC, Sr. Notes |
|||||||||
| 9.75%, 07/15/08(a) |
B3 | 150 | 152,625 | ||||||
| TSI Telecommunication Services, Inc., Gtd. Notes |
|||||||||
| 12.75%, 02/01/09 |
B3 | 75 | 85,875 | ||||||
| Ubiquitel Operating Co., Sr. Notes |
|||||||||
| 9.875%, 03/01/11 |
Caa1 | 50 | 56,375 | ||||||
| United States Cellular Corp., Notes |
|||||||||
| 6.70%, 12/15/33 |
Baa1 | 110 | 114,333 | ||||||
| US Unwired, Inc., Sec’d. Notes |
|||||||||
| 10.00%, 06/15/12 |
Caa1 | 75 | 84,938 | ||||||
| Western Wireless Corp., Sr. Notes |
|||||||||
| 9.25%, 07/15/13 |
Caa1 | 125 | 136,563 | ||||||
| 4,039,532 | |||||||||
| TRANSPORTATION — 0.2% |
|||||||||
| CHC Helicopter Corp., Sr. Sub. Notes |
|||||||||
| 7.375%, 05/01/14 |
B2 | 25 | 26,500 | ||||||
| Laidlaw International, Inc., Sr. Notes |
|||||||||
| 10.75%, 06/15/11 |
B2 | 150 | 175,875 | ||||||
| Petroleum Helicopters, Inc., Gtd. Notes, Series B |
|||||||||
| 9.375%, 05/01/09 |
B1 | 75 | 82,500 | ||||||
| Travelcenters of America, Inc., Gtd. Notes |
|||||||||
| 12.75%, 05/01/09 |
B3 | 175 | 199,063 | ||||||
185
AST T. ROWE PRICE ASSET ALLOCATION PORTFOLIO
SCHEDULE OF INVESTMENTS (CONTINUED)
DECEMBER 31, 2004
| MOODY’S RATING (UNAUDITED) |
PRINCIPAL AMOUNT (000) |
VALUE (NOTE 2) | ||||||
| Union Pacific Corp., Notes |
||||||||
| 6.50%, 04/15/12 |
Baa2 | $ | 200 | $ | 223,082 | |||
| Union Tank Car Co., Notes |
||||||||
| 7.125%, 02/01/07 |
A2 | 150 | 159,648 | |||||
| 866,668 | ||||||||
| UTILITIES — 1.2% |
||||||||
| AES Corp., Sec’d. Notes |
||||||||
| 9.00%, 05/15/15 144A (cost $102,297; purchased 05/01/03-09/10/03)(g) |
B2 | 100 | 115,000 | |||||
| AES Corp., Sr. Notes |
||||||||
| 9.375%, 09/15/10 |
B3 | 75 | 87,563 | |||||
| 8.875%, 02/15/11 |
B3 | 125 | 143,438 | |||||
| 7.75%, 03/01/14 |
B3 | 25 | 27,250 | |||||
| Alabama Power Co., Sr. Notes |
||||||||
| 1.94%, 02/25/05 |
A2 | 175 | 175,214 | |||||
| Allegheny Energy Supply Co. LLC, Notes |
||||||||
| 7.80%, 03/15/11 |
B3 | 25 | 27,375 | |||||
| Appalachian Power Co., Sr. Notes, Series E |
||||||||
| 4.80%, 06/15/05 |
Baa2 | 185 | 186,585 | |||||
| Black Hills Corp., Notes |
||||||||
| 6.50%, 05/15/13 |
Baa3 | 150 | 153,980 | |||||
| Canadian Natural Resources Ltd., Notes (Canada) |
||||||||
| 7.20%, 01/15/32(l) |
Baa1 | 300 | 355,619 | |||||
| CE Electric UK Funding Co., Sr. Notes (United Kingdom) |
||||||||
| 6.995%, 12/30/07 144A(l) (cost $165,717; purchased 03/03/04)(g) |
Baa3 | 155 | 165,911 | |||||
| Centerpoint Energy, Inc., Sr. Notes Series B |
||||||||
| 5.875%, 06/01/08 |
Ba2 | 145 | 151,843 | |||||
| Chesapeake Energy Corp., Gtd. Notes |
||||||||
| 9.00%, 08/15/12 |
Ba3 | 100 | 114,750 | |||||
| Cleveland Electric Illuminating Co., Sr. |
||||||||
| 5.65%, 12/15/13 |
Baa3 | 155 | 161,034 | |||||
| CMS Energy Corp., Sr. Notes |
||||||||
| 9.875%, 10/15/07 |
B3 | 100 | 112,250 | |||||
| 8.50%, 04/15/11 |
B3 | 400 | 456,499 | |||||
| Dominion Resources, Inc., Sr. Notes |
||||||||
| 5.00%, 03/15/13 |
Baa1 | 135 | 136,056 | |||||
| Edison Mission Energy, Sr. Notes |
||||||||
| 9.875%, 04/15/11 |
B2 | 100 | 119,000 | |||||
| Exelon Generation Co. LLC, Notes |
||||||||
| 5.35%, 01/15/14 |
Baa1 | 155 | 159,218 | |||||
| Markwest Energy, Sr. Notes |
||||||||
| 6.875%, 11/01/14 144A (cost $25,000; purchased 10/19/04)(g) |
B1 | 25 | 25,500 | |||||
| NRG Energy, Inc., Sec’d. Notes |
||||||||
| 8.00%, 12/15/13 144A (cost $131,832; purchased 12/17/03-09/14/04)(g) |
B2 | 125 | 136,875 | |||||
| Pacific Gas & Electric, First Mortgage |
||||||||
| 6.05%, 03/01/34 |
Baa2 | 150 | 156,335 | |||||
| Pacific Gas & Electric, Notes |
||||||||
| 2.72%, 04/03/06(c) |
Baa2 | 60 | 60,054 | |||||
| Pinnacle West Capital Corp., Sr. Notes |
||||||||
| 6.40%, 04/01/06 |
Baa2 | 150 | 154,423 | |||||
| PPL Capital Funding, Gtd. Notes |
||||||||
| 4.33%, 03/01/09(c) |
Baa3 | 190 | 187,965 | |||||
| Progress Energy, Inc., Sr. Notes |
||||||||
| 6.75%, 03/01/06 |
Baa2 | 130 | 134,933 | |||||
| PSE&G Power LLC |
||||||||
| 8.625%, 04/15/31 |
Baa1 | 100 | 133,184 | |||||
| Public Service Co. of New Mexico, Sr. Notes |
||||||||
| 4.40%, 09/15/08 |
Baa3 | 155 | 156,428 | |||||
| Puget Sound Energy, Inc., Notes |
||||||||
| 2.37%, 07/14/06(c) |
Baa2 | 195 | 195,164 | |||||
| Sempra Energy Co., Notes |
||||||||
| 6.00%, 02/01/13 |
Baa1 | 180 | 192,419 | |||||
186
AST T. ROWE PRICE ASSET ALLOCATION PORTFOLIO
SCHEDULE OF INVESTMENTS (CONTINUED)
DECEMBER 31, 2004
| MOODY’S RATING (UNAUDITED) |
PRINCIPAL (000) |
VALUE (NOTE 2) | |||||||
| Sierra Pacific Resources, Sr. Notes |
|||||||||
| 8.625%, 03/15/14 |
B2 | $ | 175 | $ | 198,625 | ||||
| TXU Energy Co. LLC, Notes |
|||||||||
| 2.838%, 01/17/06(c) |
Baa2 | 45 | 45,137 | ||||||
| Westar Energy Inc., First Mortgage |
|||||||||
| 7.875%, 05/01/07 |
BA1 | 110 | 120,169 | ||||||
| Williams Cos., Inc., Notes |
|||||||||
| 8.75%, 03/15/32 |
B3 | 25 | 28,844 | ||||||
| WPD Holdings UK, Jr. Unsub. Notes (United Kingdom) |
|||||||||
| 6.875%, 12/15/07 144A(l) (cost $112,014; purchased 11/06/03)(g) |
Baa2 | 110 | 117,435 | ||||||
| 4,892,075 | |||||||||
| TOTAL CORPORATE OBLIGATIONS |
49,400,665 | ||||||||
| U.S. GOVERNMENT AGENCY MORTGAGE-BACKED SECURITIES — 8.5% |
|||||||||
| Federal Home Loan Mortgage Corp. |
|||||||||
| 4.50%, 11/01/18-04/01/19 |
449 | 449,467 | |||||||
| 4.579%, 09/01/32(c) |
133 | 134,610 | |||||||
| 5.00%, 12/01/08-12/01/33 |
3,811 | 3,857,703 | |||||||
| 5.50%, 12/01/33 |
185 | 187,841 | |||||||
| 6.00%, 05/01/17-01/01/35 |
2,269 | 2,349,568 | |||||||
| 6.625%, 09/15/09 |
1,000 | 1,119,480 | |||||||
| 7.00%, 11/01/30-06/01/32 |
171 | 180,528 | |||||||
| 8,279,197 | |||||||||
| Federal National Mortgage Assoc. |
|||||||||
| 4.375%, 09/15/12 |
450 | 450,915 | |||||||
| 4.50%, 05/01/18-11/01/33 |
2,983 | 2,976,339 | |||||||
| 5.00%, 03/01/18-03/01/34 |
1,721 | 1,721,337 | |||||||
| 5.50%, 04/01/18-12/01/34 |
11,853 | 12,097,723 | |||||||
| 6.00%, 05/15/08-11/01/34(a) |
3,446 | 3,590,702 | |||||||
| 6.50%, 05/01/17-12/01/32 |
2,142 | 2,258,611 | |||||||
| 7.00%, 01/01/31-04/01/32 |
18 | 19,094 | |||||||
| 23,114,721 | |||||||||
| Government National Mortgage Assoc. |
|||||||||
| 2.946%, 03/16/19 |
260 | 252,782 | |||||||
| 5.00%, 07/15/33-03/20/34 |
1,910 | 1,911,967 | |||||||
| 5.50%, 01/20/34-05/20/34 |
1,513 | 1,545,320 | |||||||
| 6.00%, 02/15/26-01/01/35 |
458 | 473,743 | |||||||
| 6.50%, 02/15/28-12/20/33 |
224 | 236,081 | |||||||
| 7.00%, 03/15/13-08/15/26 |
404 | 431,483 | |||||||
| 8.00%, 12/15/16-07/15/23 |
48 | 51,025 | |||||||
| 8.50%, 06/15/16-10/15/26 |
136 | 149,195 | |||||||
| 9.50%, 10/15/09-03/15/19 |
4 | 4,274 | |||||||
| 12.00%, 09/15/13 |
— | (p) | 188 | ||||||
| 5,056,058 | |||||||||
| TOTAL U.S. GOVERNMENT AGENCY MORTGAGE-BACKED SECURITIES |
36,449,976 | ||||||||
| U.S. TREASURY OBLIGATIONS — 6.6% |
|||||||||
| U.S. Treasury Bonds |
|||||||||
| 7.50%, 11/15/16 |
750 | 958,682 | |||||||
| 8.50%, 02/15/20 |
115 | 162,339 | |||||||
| 6.25%, 08/15/23(a) |
170 | 199,079 | |||||||
| 7.625%, 02/15/25 |
300 | 406,395 | |||||||
| 6.00%, 02/15/26 |
1,375 | 1,575,504 | |||||||
| 6.25%, 05/15/30(a) |
865 | 1,034,453 | |||||||
| 5.375%, 02/15/31(a) |
1,745 | 1,887,464 | |||||||
| U.S. Treasury Inflationary Bonds |
|||||||||
| 2.25%, 01/15/25 [TIPS] |
890 | 964,144 | |||||||
| U.S. Treasury Notes |
|||||||||
| 1.50%, 02/28/05 |
2,465 | 2,464,039 | |||||||
| 1.625%, 04/30/05 |
220 | 219,527 | |||||||
| 6.50%, 08/15/05(a) |
1,830 | 1,875,108 | |||||||
| 1.875%, 11/30/05 |
385 | 382,113 | |||||||
| 1.50%, 03/31/06 |
945 | 929,866 | |||||||
| 3.25%, 08/15/07(a) |
3,450 | 3,456,199 | |||||||
| 3.00%, 11/15/07(a) |
2,000 | 1,988,282 | |||||||
| 3.375%, 11/15/08(a) |
1,300 | 1,296,903 | |||||||
| 3.375%, 12/15/08(a) |
1,965 | 1,959,398 | |||||||
| 4.00%, 06/15/09(a) |
2,880 | 2,935,688 | |||||||
| 5.00%, 08/15/11(a) |
2,630 | 2,800,642 | |||||||
| 4.25%, 11/15/13(a) |
845 | 850,579 | |||||||
| TOTAL U.S. TREASURY OBLIGATIONS |
28,346,404 | ||||||||
187
AST T. ROWE PRICE ASSET ALLOCATION PORTFOLIO
SCHEDULE OF INVESTMENTS (CONTINUED)
DECEMBER 31, 2004
| MOODY’S RATING (UNAUDITED) |
PRINCIPAL AMOUNT (000) |
VALUE (NOTE 2) | |||||||
| COLLATERALIZED MORTGAGE OBLIGATIONS — 2.3% |
|||||||||
| Banc of America Commercial Mortgage, Inc. Series 2004-6 Class A1 |
|||||||||
| 3.801%, 12/10/42 |
AAA | (d) | $ | 105 | $ | 105,096 | |||
| Bank of America Commercial Mortgage, Inc., Series 2003-1, Class A2 |
|||||||||
| 4.648%, 09/11/36 |
AAA | (d) | 350 | 351,568 | |||||
| Bank of America Mortgage Securities Series 2004-H, Class 2A2 |
|||||||||
| 4.814%, 09/25/34 |
Aaa | 204 | 205,307 | ||||||
| Bank of America Mortgage Securities, Series 2003-L, Class 2A2 |
|||||||||
| 4.312%, 01/25/34(c) |
Aaa | 616 | 616,405 | ||||||
| Bank of America Mortgage Securities, Series 2004-A, Class 2A2 |
|||||||||
| 4.148%, 02/25/34(c) |
AAA | (d) | 351 | 345,343 | |||||
| Bank of America Mortgage Securities, Series 2004-D, Class 2A2 |
|||||||||
| 4.23%, 05/25/34(c) |
AAA | (d) | 126 | 125,347 | |||||
| Bank of America Mortgage Securities, Series 2004-I, Class 3A2 |
|||||||||
| 5.005%, 10/25/34(c) |
Aaa | 232 | 231,689 | ||||||
| Bear Stearns Commercial Mortgage Securities, Series 2004-PWR6, Class A1 |
|||||||||
| 3.668%, 11/11/41 |
Aaa | 80 | 80,066 | ||||||
| Bear Stearns Commercial Mortgage Securities, Series 2004-T14, Class A2 |
|||||||||
| 4.17%, 01/12/41 |
Aaa | 900 | 906,216 | ||||||
| Citigroup Commercial Mortgage Trust, Series 2004-C2, Class A1 |
|||||||||
| 3.787%, 10/15/41 |
Aaa | 75 | 74,906 | ||||||
| Fannie Mae, Series 2002-74, Class PJ |
|||||||||
| 5.00%, 03/25/15 |
Aaa | 575 | 587,557 | ||||||
| Fannie Mae, Series 2003-40, Class NI |
|||||||||
| 5.50%, 04/01/33 [IO] |
Aaa | 227 | 16,079 | ||||||
| Fannie Mae, Series 2003-92, Class NM |
|||||||||
| 3.50%, 04/25/13 |
Aaa | 300 | 300,161 | ||||||
| Federal Home Loan Mortgage Corp., Series 2882, Class YB |
|||||||||
| 5.00%, 10/15/27 |
Aaa | 250 | 254,528 | ||||||
| Federal Home Loan Mortgage Corp., Series 2890, Class PB |
|||||||||
| 5.00%, 11/15/27 |
Aaa | 750 | 763,584 | ||||||
| Federal National Mortgage Assoc., Series 319, Class 2 |
|||||||||
| 6.50%, 02/01/32 [IO] |
Aaa | 109 | 20,904 | ||||||
| Freddie Mac, Series 2614, Class IH |
|||||||||
| 4.50%, 05/15/16 [IO] |
Aaa | 390 | 59,781 | ||||||
| Freddie Mac, Series 2631, Class IG |
|||||||||
| 4.50%, 07/15/11 [IO] |
Aaa | 625 | 51,143 | ||||||
| Freddie Mac, Series 2631, Class PC |
|||||||||
| 4.50%, 03/15/16 |
Aaa | 750 | 762,981 | ||||||
| Freddie Mac, Series 2686, Class JG |
|||||||||
| 5.50%, 04/15/28 |
Aaa | 800 | 820,961 | ||||||
188
AST T. ROWE PRICE ASSET ALLOCATION PORTFOLIO
SCHEDULE OF INVESTMENTS (CONTINUED)
DECEMBER 31, 2004
| MOODY’S RATING (UNAUDITED) |
PRINCIPAL AMOUNT (000) |
VALUE (NOTE 2) | |||||||
| General Electric Capital Commercial Mortgage Corp., Series 2001-1, Class A2 |
|||||||||
| 6.531%, 05/15/33 |
Aaa | $ | 390 | $ | 434,195 | ||||
| GMAC Commercial Mortgage Securities, Inc., Series 2001-C2, Class A2 |
|||||||||
| 6.70%, 04/15/34 |
AAA | (d) | 375 | 420,788 | |||||
| Greenwich Capital Commercial Funding Corp., Series 2004-GG1A, Class A2 |
|||||||||
| 3.835%, 10/08/08 |
Aaa | 335 | 336,020 | ||||||
| J.P. Morgan Chase Commercial Mortgage Finance Corp., Series 2001-CIBC, Class A3 |
|||||||||
| 6.26%, 03/15/33 |
AAA | (d) | 425 | 467,360 | |||||
| J.P. Morgan Chase Commercial Mortgage Finance Corp., Series 2001-CIB2, Class A2 |
|||||||||
| 6.244%, 04/15/35 |
AAA | (d) | 325 | 347,852 | |||||
| LB-UBS Commercial Mortgage Trust, Series 2004-C2, Class A2 |
|||||||||
| 3.246%, 03/01/29 |
Aaa | 475 | 462,484 | ||||||
| LB-UBS Commercial Mortgage Trust, Series 2004-C4, Class A2 |
|||||||||
| 4.567%, 05/15/29(c) |
Aaa | 750 | 764,733 | ||||||
| Washington Mutual Mortgage, Series 2004-AR1, Class A |
|||||||||
| 4.229%, 03/25/34 |
Aaa | 207 | 205,733 | ||||||
| TOTAL COLLATERALIZED MORTGAGE OBLIGATIONS |
10,118,787 | ||||||||
| ASSET-BACKED SECURITIES — 1.0% |
|||||||||
| BankBoston Home Equity Loan Trust, Series 1998-1, Class A6 |
|||||||||
| 6.35%, 02/25/13 |
Aaa | 222 | 226,679 | ||||||
| Capital Auto Receivables Asset Trust, Series 2002-2, Class CTFS |
|||||||||
| 4.18%, 10/15/07 |
Aaa | 141 | 141,617 | ||||||
| Chase Funding Mortgage Loan Asset-Backed, Series 2002-2, Class 1M1 |
|||||||||
| 5.599%, 09/25/31 |
Aa2 | 80 | 81,566 | ||||||
| Chase Manhattan Auto Owner Trust, Series 2003-A, Class A4 |
|||||||||
| 2.06%, 12/15/09 |
Aaa | 285 | 278,035 | ||||||
| Citibank Credit Card Issuance Trust, Series 2001-C1, Class C1 |
|||||||||
| 2.68%, 01/15/10(c) |
Baa2 | 235 | 240,028 | ||||||
| Citibank Credit Card Issuance Trust, Series 2004-C1, Class-C1 |
|||||||||
| 3.053%, 07/15/13(c) |
Baa | 625 | 630,660 | ||||||
| Countrywide Asset - Backed Certificates, Series 2003-5, Class AF3 |
|||||||||
| 3.613%, 04/25/30 |
Aaa | 315 | 314,841 | ||||||
| Countrywide Home Loans, Series 2003-60, Class 2A1 |
|||||||||
| 4.986%, 02/25/34 |
Aaa | 85 | 85,725 | ||||||
| Fannie Mae Whole Loan, Series 2003-W16, Class AF3 |
|||||||||
| 2.91%, 07/25/29 |
Aaa | 230 | 229,368 | ||||||
| Hyundai Auto Receivables Trust, Series 2003-A, Class A4 |
|||||||||
| 3.02%, 10/15/10 |
Aaa | 175 | 173,138 | ||||||
189
AST T. ROWE PRICE ASSET ALLOCATION PORTFOLIO
SCHEDULE OF INVESTMENTS (CONTINUED)
DECEMBER 31, 2004
| MOODY’S RATING (UNAUDITED) |
PRINCIPAL AMOUNT (000) |
VALUE (NOTE 2) | |||||||
| Hyundai Auto Receivables Trust, Series 2003-A, Class D |
|||||||||
| 4.06%, 10/15/10 |
Baa2 | $ | 80 | $ | 80,533 | ||||
| MBNA Master Credit Card Trust, Series 2000-D, Class C |
|||||||||
| 8.40%, 09/15/09 144A (cost $314,460; purchased 07/13/04)(g) |
BBB | (d) | 300 | 329,861 | |||||
| Morgan Stanley Auto Loan Trust, Series 2004-HB1, Class C |
|||||||||
| 2.88%, 10/15/11 |
Baa2 | 122 | 121,683 | ||||||
| PECO Energy Transition Trust, Series 2001-A, Class A1 |
|||||||||
| 6.52%, 12/31/10 |
Aaa | 475 | 528,051 | ||||||
| Reliant Energy Transition Bond Co. LLC, Series 2001-1, Class A4 |
|||||||||
| 5.63%, 09/15/15 |
Aaa | 350 | 374,630 | ||||||
| World Financial Network Credit Card Master Trust, Series 2003-A, Class A2 |
|||||||||
| 2.773%, 01/18/05(c) |
Aaa | 375 | 377,441 | ||||||
| TOTAL ASSET-BACKED SECURITIES |
4,213,856 | ||||||||
| U.S. GOVERNMENT AGENCY OBLIGATIONS — 0.7% |
|
||||||||
| Federal Home Loan Bank |
|
||||||||
| 5.75%, 05/15/12 |
|
300 | 328,862 | ||||||
| Federal Home Loan Mortgage Corp. |
|
||||||||
| 2.75%, 03/15/08 |
|
350 | 342,490 | ||||||
| 5.125%, 07/15/12 |
|
565 | 594,926 | ||||||
| Federal National Mortgage Assoc. |
|
||||||||
| 7.125%, 02/15/05 |
|
160 | 160,836 | ||||||
| 3.25%, 02/15/09(a) |
|
700 | 687,042 | ||||||
| 6.00%, 05/15/11 |
|
325 | 358,040 | ||||||
| Student Loan Marketing Assoc. |
|
||||||||
| 2.30%, 01/26/09(c) |
|
225 | 225,261 | ||||||
| 3.66%, 04/01/09(c) |
|
155 | 154,673 | ||||||
| TOTAL U.S. GOVERNMENT AGENCY OBLIGATIONS |
|
2,852,130 | |||||||
| FOREIGN GOVERNMENT BONDS — 0.2% |
|||||||||
| Republic of Chile (Chile) |
|||||||||
| 5.50%, 01/15/13 |
Baa1 | 165 | 173,778 | ||||||
| Republic of South Africa (South Africa) |
|||||||||
| 6.50%, 06/02/14 |
Baa2 | 100 | 109,750 | ||||||
| United Mexican States (Mexico) |
|||||||||
| 2.752%, 01/13/09(c) |
Baa2 | 150 | 152,213 | ||||||
| 6.375%, 01/16/13 |
Baa2 | 205 | 218,837 | ||||||
| TOTAL FOREIGN GOVERNMENT BONDS |
654,578 | ||||||||
| MUNICIPAL BONDS |
|||||||||
| KANSAS |
|||||||||
| Kansas State Development Finance Authority, Revenue Bonds |
|||||||||
| 5.501%, 05/01/34 |
Aaa | 125 | 126,838 | ||||||
| OREGON |
|||||||||
| Oregon State Taxable Pension, General Obligation Unlimited |
|||||||||
| 5.892%, 06/01/27 |
Aa3 | 60 | 64,074 | ||||||
| TOTAL MUNICIPAL BONDS |
190,912 | ||||||||
|
UNITS |
|||||||||
| WARRANTS* |
|
||||||||
| ENTERTAINMENT & LEISURE |
|
||||||||
| Mikohn Gaming Corp., expiring 08/15/08 144A (cost $0; purchased 01/16/02)(g)(o) |
|
75 | 14 | ||||||
190
AST T. ROWE PRICE ASSET ALLOCATION PORTFOLIO
SCHEDULE OF INVESTMENTS (CONTINUED)
DECEMBER 31, 2004
| UNITS |
VALUE (NOTE 2) |
||||||
| RETAIL & MERCHANDISING |
|||||||
| Barneys New York, Inc., expiring 04/01/08 144A (cost $0; purchased 09/30/03)(g) |
25 | $ | 1,633 | ||||
| TRANSPORTATION |
|||||||
| Travelcenters of America, expiring 05/01/09 (cost $0; purchased 03/16/01)(g) |
525 | 2,887 | |||||
| TOTAL WARRANTS (Cost $0) |
4,534 | ||||||
| TOTAL LONG-TERM INVESTMENTS |
423,602,187 | ||||||
| PRINCIPAL (000) |
|||||||
| SHORT-TERM INVESTMENTS — 17.3% |
|||||||
| CERTIFICATES OF DEPOSIT — 3.9% |
|||||||
| Banco Santander PR |
|||||||
| 2.315%, 01/07/05(b)(c) |
$ | 156 | 155,866 | ||||
| Canadian Imperial Bank of Commerce |
|||||||
| 2.372%, 01/31/05(b)(c) |
423 | 423,155 | |||||
| First Boston Corp. |
|||||||
| 2.36%, 01/24/05(b) |
13,974 | 13,973,820 | |||||
| Skandinaviska Enskilda Banken |
|||||||
| 2.35%, 01/28/05(b) |
218 | 217,696 | |||||
| Societe Generale |
|||||||
| 2.357%, 01/14/05(b) |
446 | 445,940 | |||||
| UBS Bank |
|||||||
| 2.315%, 01/18/05(b) |
441 | 441,485 | |||||
| Westdeutsche Landesbank |
|||||||
| 1.50%, 01/10/05(b) |
1,164 | 1,164,068 | |||||
| 16,822,030 | |||||||
| COMMERCIAL PAPER — 0.1% |
|||||||
| Citigroup, Inc. |
|||||||
| 2.304%, 01/10/05(b) |
260 | 259,658 | |||||
| CORPORATE OBLIGATIONS — 4.3% |
|||||||
| Bank of America NA |
|||||||
| 2.30%, 01/03/05(b)(c) |
171 | 170,907 | |||||
| Bear Stearns |
|||||||
| 2.28%, 01/03/05(b)(c) |
616 | 616,350 | |||||
| 2.28%, 01/03/05(b)(c) |
2,892 | 2,891,899 | |||||
| Goldman Sachs Group, Inc. |
|||||||
| 2.33%, 01/03/05(b)(c) |
876 | 875,816 | |||||
| Merrill Lynch & Co., Inc. |
|||||||
| 2.38%, 01/03/05(b)(c) |
3,912 | 3,911,829 | |||||
| Morgan Stanley |
|||||||
| 2.33%, 01/03/05(b)(c) |
727 | 726,835 | |||||
| 2.33%, 01/03/05(b)(c) |
1,597 | 1,597,240 | |||||
| Natexis Banque NY |
|||||||
| 2.297%, 01/03/05(b)(c) |
5,572 | 5,571,384 | |||||
| Sedna Finance Corporation |
|||||||
| 2.372%, 01/14/05(b)(c) |
1,494 | 1,493,560 | |||||
| Swedbank NY |
|||||||
| 2.362%, 01/18/05(b)(c) |
803 | 802,402 | |||||
| 18,658,222 | |||||||
| TIME DEPOSIT — 3.1% |
|||||||
| Bank of America NA |
|||||||
| 1.50%, 01/03/05(b) |
3,741 | 3,741,055 | |||||
| Chase Manhattan Bank |
|||||||
| 1.25%, 01/03/05(b) |
9,679 | 9,678,545 | |||||
| 13,419,600 | |||||||
| SHARES |
|||||||
| NON-REGISTERED INVESTMENT COMPANY — 4.4% |
|||||||
| BlackRock Institutional Money Market Trust(b)(j) |
19,023,927 | 19,023,927 | |||||
| REGISTERED INVESTMENT COMPANIES — 1.5% |
|||||||
| BlackRock Provident Institutional Funds TempCash Portfolio(j) |
3,130,187 | 3,130,187 | |||||
| BlackRock Provident Institutional Funds TempFund Portfolio(j) |
3,130,186 | 3,130,186 | |||||
| 6,260,373 | |||||||
| TOTAL SHORT-TERM INVESTMENTS |
74,443,810 | ||||||
| TOTAL INVESTMENTS — 115.6% |
498,045,998 | ||||||
| LIABILITIES IN EXCESS OF OTHER ASSETS — (15.6%) |
(67,302,707 | ) | |||||
| NET ASSETS — 100.0% |
$ | 430,743,291 | |||||
191
AST T. ROWE PRICE ASSET ALLOCATION PORTFOLIO
SCHEDULE OF INVESTMENTS (CONTINUED)
DECEMBER 31, 2004
THE FOLLOWING ABBREVIATIONS ARE USED THROUGHOUT THE SCHEDULE OF INVESTMENTS:
| 144A | Security was purchased pursuant to Rule 144A under the Securities Act of 1933 and may not be resold subject to that rule except to qualified institutional buyers. Unless otherwise noted 144A securities are deemed to be liquid. |
| ADR | American Depository Receipt |
| IO | Interest Only |
| NR | Not Rated by Moody’s or Standard & Poor’s |
| PIK | Payment-in-kind |
| REIT | Real Estate Investment Trust |
| TIPS | Treasury Inflation Protection Securities |
| USD | United States Dollar |
THE FOLLOWING ANNOTATIONS ARE USED THROUGHOUT THE SCHEDULE OF INVESTMENTS:
| * | Non-income producing security. |
| (a) | All or a portion of securities on loan. Securities on loan have an aggregate market value of $66,213,904; cash collateral of $68,183,437 (included with liabilities) was received with which the portfolio purchased highly liquid short-term investments. |
| (b) | Represents security purchased with cash collateral for securities on loan. |
| (c) | Indicates a variable rate security. The maturity date presented for these instruments is the next date on which the rate of interest is adjusted. |
| (d) | Standard & Poor's rating. |
| (g) | Indicates a security that has been deemed illiquid. The aggregate cost of the illiquid security is $8,322,538. The aggregate value, $8,516,946, represents 1.98% of net assets. |
| (i) | Represents issuer in default on interest payments. Non-income producing security. |
| (j) | Security available to institutional investors only. |
| (l) | US$ Denominated Foreign Bonds. |
| (o) | Fair valued security. |
| (p) | Less than 1,000 par. |
The industry classification of long-term portfolio holdings, short-term investments and liabilities in excess of other assets shown as a percentage of net assets as of December 31, 2004 were as follows:
| U.S. Government Agency Mortgage-Backed Securities |
8.5 | % | |
| Financial Services |
6.8 | ||
| U.S. Treasury Obligations |
6.6 | ||
| Financial — Bank & Trust |
5.9 | ||
| Oil & Gas |
5.9 | ||
| Telecommunications |
4.6 | ||
| Retail & Merchandising |
4.1 | ||
| Pharmaceuticals |
3.8 | ||
| Insurance |
3.8 | ||
| Computer Services & Software |
3.6 | ||
| Electronic Components & Equipment |
3.2 | ||
| Utilities |
3.2 | ||
| Consumer Products & Services |
2.9 | ||
| Medical Supplies & Equipment |
2.3 | ||
| Collateralized Mortgage Obligations |
2.3 | ||
| Conglomerates |
2.1 | ||
| Entertainment & Leisure |
2.1 | ||
| Semiconductors |
1.9 | ||
| Computer Hardware |
1.7 | ||
| Chemicals |
1.6 | ||
| Real Estate |
1.5 | ||
| Beverages |
1.4 | ||
| Food |
1.3 | ||
| Aerospace |
1.1 | ||
| Healthcare Services |
1.1 | ||
| Metals & Mining |
1.1 | ||
| Automotive Manufacturers |
1.0 | ||
| Internet Services |
1.0 | ||
| Asset-Backed Securities |
1.0 | ||
| Transportation |
0.9 | ||
| Building Materials |
0.8 | % | |
| Business Services |
0.8 | ||
| Broadcasting |
0.7 | ||
| Machinery & Equipment |
0.7 | ||
| Printing & Publishing |
0.7 | ||
| Restaurants |
0.7 | ||
| U.S. Government Agency Obligations |
0.7 | ||
| Cable Television |
0.6 | ||
| Paper & Forest Products |
0.6 | ||
| Automotive Parts |
0.5 | ||
| Industrial Products |
0.5 | ||
| Advertising |
0.3 | ||
| Construction |
0.3 | ||
| Containers & Packaging |
0.3 | ||
| Financial — Brokerage |
0.3 | ||
| Railroads |
0.3 | ||
| Clothing & Apparel |
0.2 | ||
| Environmental Services |
0.2 | ||
| Hotels & Motels |
0.2 | ||
| Office Equipment |
0.2 | ||
| Foreign Government Bonds |
0.2 | ||
| Airlines |
0.1 | ||
| Personal Services |
0.1 | ||
| Short-Term Investments |
17.3 | ||
| 115.6 | |||
| Liabilities in excess of other assets |
(15.6 | ) | |
| 100.0 | % | ||
See Notes to Financial Statements.
192
AST T. ROWE PRICE GLOBAL BOND PORTFOLIO
SCHEDULE OF INVESTMENTS
DECEMBER 31, 2004
| MOODY’S RATING (UNAUDITED) |
PRINCIPAL AMOUNT (000)# |
VALUE (NOTE 2) | |||||||
| LONG-TERM INVESTMENTS — 74.5% |
|||||||||
| FOREIGN BONDS — 47.8% |
|||||||||
| AUSTRALIA — 0.2% |
|||||||||
| Eurofima, Sr. Notes |
|||||||||
| 6.50%, 08/22/11 |
Aaa | AUD | 985 | $ | 806,257 | ||||
| AUSTRIA — 2.0% |
|||||||||
| Republic of Austria, Notes |
|||||||||
| 5.25%, 01/04/11 |
Aaa | EUR | 700 | 1,057,143 | |||||
| Republic of Austria, Unsub. Notes |
|||||||||
| 4.00%, 07/15/09 |
Aaa | EUR | 4,400 | 6,230,464 | |||||
| 7,287,607 | |||||||||
| BELGIUM — 0.3% |
|||||||||
| Belgium Kingdom, Notes |
|||||||||
| 5.00%, 03/28/35 |
Aa1 | EUR | 740 | 1,119,050 | |||||
| CANADA — 2.7% |
|||||||||
| Alcan, Inc., Bonds |
|||||||||
| 6.125%, 12/15/33 |
Baa1 | 190 | 201,794 | ||||||
| Canadian Government, Bonds |
|||||||||
| 6.00%, 06/01/11 |
Aaa | CAD | 800 | 742,678 | |||||
| 5.25%, 06/01/12 |
Aaa | CAD | 1,905 | 1,704,221 | |||||
| 5.25%, 06/01/13 |
Aaa | CAD | 900 | 805,647 | |||||
| 5.00%, 06/01/14 |
Aaa | CAD | 5,200 | 4,573,085 | |||||
| 5.75%, 06/01/29 |
Aaa | CAD | 815 | 768,507 | |||||
| Canadian Natural Resources Ltd., Notes |
|||||||||
| 7.20%, 01/15/32 |
Baa1 | 195 | 231,153 | ||||||
| Canadian National Railway Co., Bonds |
|||||||||
| 6.25%, 08/01/34 |
Baa1 | 180 | 195,453 | ||||||
| Encana Holdings Finance Corp., Gtd. Notes |
|||||||||
| 5.80%, 05/01/14 |
Baa1 | 205 | 218,943 | ||||||
| Ford Credit Canada, Sr. Notes |
|||||||||
| 7.25%, 12/07/07 |
A3 | GBP | 90 | 177,616 | |||||
| Telus Corp., Notes |
|||||||||
| 8.00%, 06/01/11 |
Baa3 | 135 | 160,191 | ||||||
| 9,779,288 | |||||||||
| CHILE — 0.1% |
|||||||||
| Celulosa Arauco y Constitucion SA, Notes |
|||||||||
| 5.125%, 07/09/13 |
Baa2 | 225 | 223,286 | ||||||
| DENMARK — 1.8% |
|||||||||
| Kingdom of Denmark, Bonds |
|||||||||
| 8.00%, 03/15/06 |
Aaa | DKK | 33,350 | 6,487,623 | |||||
| FINLAND — 1.2% |
|||||||||
| Finland Government, Bonds |
|||||||||
| 5.00%, 07/04/07 |
Aaa | EUR | 3,000 | 4,310,307 | |||||
| FRANCE — 5.1% |
|||||||||
| BNP Paribas SA, Sub. Notes |
|||||||||
| 5.625%, 08/07/08 |
Aa3 | EUR | 150 | 221,161 | |||||
| 5.25%, 12/17/12 |
Aa3 | EUR | 100 | 150,110 | |||||
| Credit Lyonnais SA, Sub. Notes |
|||||||||
| 5.00%, 11/15/12 |
A1 | EUR | 300 | 430,842 | |||||
| Dexia Credit Local, Notes |
|||||||||
| 5.25%, 04/25/08 |
Aa2 | EUR | 270 | 393,365 | |||||
| France Telecom SA, Notes |
|||||||||
| 8.50%, 03/01/11 |
Baa3 | 170 | 203,043 | ||||||
| France Telecom SA, Sr. Unsub. Notes |
|||||||||
| 7.00%, 12/23/09 |
Baa3 | EUR | 435 | 684,791 | |||||
| French Government, Bonds |
|||||||||
| 5.50%, 04/25/10 |
Aaa | EUR | 3,500 | 5,313,758 | |||||
| 5.00%, 04/25/12 |
Aaa | EUR | 3,500 | 5,242,745 | |||||
| 4.75%, 10/25/12 |
Aaa | EUR | 2,155 | 3,189,388 | |||||
| 5.50%, 04/25/29 |
Aaa | EUR | 1,280 | 2,069,609 | |||||
| 5.75%, 10/25/32 |
Aaa | EUR | 330 | 555,056 | |||||
| Vivendi Environment, Sr. Notes |
|||||||||
| 5.875%, 06/27/08 |
Baa1 | EUR | 100 | 148,012 | |||||
| 18,601,880 | |||||||||
| GERMANY — 10.9% |
|||||||||
| German Government, Bonds |
|||||||||
| 5.00%, 05/20/05 |
Aaa | EUR | 4,450 | 6,109,643 | |||||
| 6.00%, 01/05/06 |
Aaa | EUR | 4,200 | 5,918,312 | |||||
| 6.00%, 07/04/07 |
Aaa | EUR | 2,800 | 4,112,129 | |||||
| 4.25%, 02/15/08 |
Aaa | EUR | 2,200 | 3,124,404 | |||||
| 4.75%, 07/04/08 |
Aaa | EUR | 5,350 | 7,733,705 | |||||
| 5.25%, 01/04/11 |
Aaa | EUR | 1,730 | 2,609,951 | |||||
| 5.00%, 01/04/12 |
Aaa | EUR | 3,000 | 4,495,001 | |||||
| 4.25%, 01/04/14 |
Aaa | EUR | 1,250 | 1,783,196 | |||||
| 5.50%, 01/04/31 |
Aaa | EUR | 2,400 | 3,893,507 | |||||
| 39,779,848 | |||||||||
193
AST T. ROWE PRICE GLOBAL BOND PORTFOLIO
SCHEDULE OF INVESTMENTS (CONTINUED)
DECEMBER 31, 2004
| MOODY’S RATING (UNAUDITED) |
PRINCIPAL (000)# |
VALUE (NOTE 2) | ||||||||
| GREECE — 0.5% |
||||||||||
| Greek Government, Bonds |
||||||||||
| 6.50%, 01/11/14 |
A+ | (d) | EUR | 1,075 | $ | 1,767,201 | ||||
| IRELAND — 0.9% |
||||||||||
| Irish Government, Bonds |
||||||||||
| 4.25%, 10/18/07 |
Aaa | EUR | 2,000 | 2,833,057 | ||||||
| Irish Life & Permanent PLC, Sub. Notes |
||||||||||
| 6.25%, 02/15/11 |
A2 | EUR | 200 | 309,626 | ||||||
| 3,142,683 | ||||||||||
| ITALY — 4.5% |
||||||||||
| Italy Treasury, Bonds |
||||||||||
| 5.00%, 10/15/07 |
Aa2 | EUR | 3,320 | 4,794,031 | ||||||
| 5.50%, 11/01/10 |
Aa2 | EUR | 1,525 | 2,322,726 | ||||||
| 5.25%, 08/01/11 |
Aa2 | EUR | 1,170 | 1,768,907 | ||||||
| 7.25%, 11/01/26 |
Aa2 | EUR | 660 | 1,273,537 | ||||||
| 6.00%, 05/01/31 |
Aa2 | EUR | 840 | 1,428,290 | ||||||
| Italy Treasury, Debs. |
||||||||||
| 6.75%, 07/01/07 |
Aa2 | EUR | 2,920 | 4,366,589 | ||||||
| UniCredito Italiano SPA, Sub. Notes |
||||||||||
| 6.10%, 02/28/12 |
Aa3 | $ | 150 | 233,208 | ||||||
| 16,187,288 | ||||||||||
| JAPAN — 7.7% |
||||||||||
| Japanese Government, Bonds |
||||||||||
| 0.60%, 09/20/09 |
A2 | JPY | 1,177,500 | 11,514,312 | ||||||
| 1.30%, 06/20/11 |
A2 | JPY | 86,700 | 870,052 | ||||||
| 1.40%, 03/20/12 |
A2 | JPY | 186,400 | 1,869,104 | ||||||
| 1.10%, 09/20/12 |
A2 | JPY | 380,000 | 3,709,192 | ||||||
| 1.00%, 12/20/12 |
A2 | JPY | 614,100 | 5,927,788 | ||||||
| 1.30%, 12/20/13 |
A2 | JPY | 81,900 | 798,918 | ||||||
| 2.00%, 06/20/22 |
A2 | JPY | 305,500 | 3,027,905 | ||||||
| 27,717,271 | ||||||||||
| MEXICO — 1.4% |
||||||||||
| America Movil SA de CV, Company Gtd. Notes |
||||||||||
| 5.50%, 03/01/14 |
Baa1 | 115 | 113,897 | |||||||
| Mexican Government, Bonds |
||||||||||
| 9.00%, 12/20/12 |
A- | (d) | MXN | 56,800 | 4,936,851 | |||||
| Telefonos de Mexico SA de CV, Notes |
||||||||||
| 4.50%, 11/19/08 |
A3 | 105 | 105,962 | |||||||
| 5,156,710 | ||||||||||
| NETHERLANDS — 2.1% |
||||||||||
| Deutsche Telekom International Finance BV, Gtd. Notes |
||||||||||
| 8.75%, 06/15/30 |
Baa2 | 185 | 245,014 | |||||||
| Deutsche Telekom International Finance BV, Gtd. Notes |
||||||||||
| 7.50%, 05/29/07 |
Baa3 | EUR | 390 | 585,115 | ||||||
| E.ON International Finance BV, Gtd. Notes |
||||||||||
| 5.75%, 05/29/09 |
A1 | EUR | 200 | 300,165 | ||||||
| ING Bank NV, Sub. Notes |
||||||||||
| 5.125%, 05/01/15 144A (cost $111,769; purchased 05/06/03)(g) |
Aa3 | 110 | 110,489 | |||||||
| Netherlands Government, Bonds |
||||||||||
| 5.75%, 02/15/07 |
Aaa | EUR | 660 | 955,468 | ||||||
| 5.00%, 07/15/12 |
Aaa | EUR | 1,205 | 1,810,617 | ||||||
| 4.25%, 07/15/13 |
Aaa | EUR | 2,220 | 3,172,406 | ||||||
| Telecom Italia Fin NV |
||||||||||
| 5.875%, 01/24/08 |
Baa2 | EUR | 250 | 366,381 | ||||||
| 7,545,655 | ||||||||||
| SPAIN — 0.8% |
||||||||||
| Spanish Government, Bonds |
||||||||||
| 6.00%, 01/31/29 |
Aaa | EUR | 1,130 | 1,938,284 | ||||||
| 5.75%, 07/30/32 |
Aaa | EUR | 560 | 939,816 | ||||||
| 2,878,100 | ||||||||||
| SWEDEN — 0.3% |
||||||||||
| Swedish Government, Bonds |
||||||||||
| 5.00%, 01/28/09 |
Aaa | SEK | 7,400 | 1,192,050 | ||||||
| UNITED KINGDOM — 5.3% |
||||||||||
| Abbey National PLC, Sub. Notes |
||||||||||
| 4.625%, 02/11/11 |
A1 | EUR | 200 | 288,172 | ||||||
| HBOS PLC, Sub. Bonds |
||||||||||
| 6.00%, 11/01/33 144A(cost $177,884; purchased 10/22/03)(g) |
Aa3 | 180 | 188,132 | |||||||
| HBOS Treasury Services PLC, Gtd. Notes |
||||||||||
| 4.75%, 02/06/07 |
Aa2 | EUR | 300 | 424,908 | ||||||
194
AST T. ROWE PRICE GLOBAL BOND PORTFOLIO
SCHEDULE OF INVESTMENTS (CONTINUED)
DECEMBER 31, 2004
| MOODY’S RATING (UNAUDITED) |
PRINCIPAL |
VALUE (NOTE 2) | |||||||||
| Imperial Tobacco Finance, Gtd. Notes |
|||||||||||
| 6.375%, 09/27/06 |
Baa3 | EUR | 250 | $ | 359,926 | ||||||
| Merrill Lynch & Co., Sr. Unsub. Notes |
|||||||||||
| 7.375%, 12/17/07 |
Aa3 | GBP | 90 | 184,030 | |||||||
| Monumental Global Funding, Sec’d. Notes |
|||||||||||
| 5.75%, 03/20/07 |
Aa3 | GBP | 120 | 234,149 | |||||||
| NGG Finance PLC, Gtd. Notes |
|||||||||||
| 5.25%, 08/23/06 |
Baa1 | EUR | 200 | 282,759 | |||||||
| Rio Tinto Finance PLC, Gtd. Notes |
|||||||||||
| 5.125%, 05/10/07 |
Aa3 | EUR | 200 | 285,626 | |||||||
| Union Bank of Switzerland London, Sub. Notes |
|||||||||||
| 8.00%, 01/08/07 |
Aa3 | GBP | 207 | 421,101 | |||||||
| United Kingdom Treasury, Bonds GBP |
|||||||||||
| 5.75%, 12/07/09 |
Aaa | GBP | 4,525 | 9,169,523 | |||||||
| 5.00%, 03/07/12 |
AAA | (d) | GBP | 950 | 1,878,629 | ||||||
| 4.25%, 06/07/32 |
Aaa | GBP | 2,620 | 4,895,908 | |||||||
| United Utilities Water PLC, Gtd. Notes |
|||||||||||
| 6.625%, 11/08/07 |
A2 | EUR | 200 | 298,749 | |||||||
| WPD Holdings UK, Jr. Unsub. Notes |
|||||||||||
| 6.875%, 12/15/07 144A (cost $122,197; purchased 11/06/03)(g) |
Baa2 | $ | 120 | 128,111 | |||||||
| 19,039,723 | |||||||||||
| TOTAL FOREIGN BONDS |
173,021,827 | ||||||||||
| U.S. GOVERNMENT AGENCY MORTGAGE-BACKED SECURITIES — 7.8% |
|
||||||||||
| FEDERAL HOME LOAN MORTGAGE CORP. |
|||||||||||
| 4.50%, 07/15/11 - 05/01/19 |
1,138 | 1,042,152 | |||||||||
| 4.571%, 09/01/32 |
188 | 189,592 | |||||||||
| 5.00%, 12/01/08 - 12/01/33 |
2,338 | 2,347,796 | |||||||||
| 6.00%, 05/01/17 - 10/01/32 |
584 | 606,224 | |||||||||
| 7.00%, 10/10/30 - 11/01/30 |
69 | 73,590 | |||||||||
| 4,259,354 | |||||||||||
| FEDERAL NATIONAL MORTGAGE ASSOC. |
|||||||||||
| 2.91%, 07/25/29 |
275 | 274,244 | |||||||||
| 4.50%, 05/01/18 |
466 | 465,253 | |||||||||
| 5.00%, 03/01/18 - 04/01/34 |
4,238 | 4,243,813 | |||||||||
| 5.50%, 04/01/17 - 12/01/34 |
7,537 | 7,714,349 | |||||||||
| 6.00%, 05/01/33 - 11/01/34 |
3,515 | 3,637,840 | |||||||||
| 6.50%, 09/01/10 - 12/01/32 |
2,244 | 2,359,652 | |||||||||
| 7.00%, 12/01/29 - 01/01/31 |
116 | 123,229 | |||||||||
| 18,818,380 | |||||||||||
| GOVERNMENT NATIONAL MORTGAGE ASSOC. |
|||||||||||
| 5.00%, 07/15/33 - 02/20/34 |
1,996 | 1,997,541 | |||||||||
| 5.50%, 01/20/34 |
357 | 364,885 | |||||||||
| 5.50%, 01/01/34 [TBA] |
822 | 838,954 | |||||||||
| 6.00%, 01/01/33 |
275 | 284,969 | |||||||||
| 6.50%, 05/15/16 - 12/20/33 |
973 | 1,035,670 | |||||||||
| 7.00%, 03/15/13 - 12/15/13 |
270 | 288,037 | |||||||||
| 7.50%, 09/15/30 - 11/15/32 |
275 | 295,618 | |||||||||
| 5,105,674 | |||||||||||
| TOTAL U.S. GOVERNMENT AGENCY MORTGAGE-BACKED SECURITIES |
28,183,408 | ||||||||||
| CORPORATE OBLIGATIONS — 6.0% |
|||||||||||
| AEROSPACE |
|||||||||||
| Boeing Co., Debs. |
|||||||||||
| 8.75%, 08/15/21 |
A3 | 125 | 167,449 | ||||||||
| AUTOMOBILE MANUFACTURERS — 0.2% |
|||||||||||
| DaimlerChrysler NA Holding Corp., Gtd. Notes |
|||||||||||
| 2.94%, 09/10/07 |
A3 | 150 | 150,607 | ||||||||
| Daimlerchrysler NA Holding Corp., Notes |
|||||||||||
| 6.50%, 11/15/13 |
A3 | 235 | 255,317 | ||||||||
| General Motors Corp., Debs. |
|||||||||||
| 8.375%, 07/15/33 |
Baa1 | 275 | 285,712 | ||||||||
| 691,636 | |||||||||||
195
AST T. ROWE PRICE GLOBAL BOND PORTFOLIO
SCHEDULE OF INVESTMENTS (CONTINUED)
DECEMBER 31, 2004
| MOODY’S RATING (UNAUDITED) |
PRINCIPAL AMOUNT (000)# |
VALUE (NOTE 2) | ||||||
| AUTOMOTIVE PARTS |
||||||||
| Lear Corp., Gtd. Notes |
||||||||
| 5.75%, 08/01/14 144A(cost $74,853; purchased 07/29/04)(g) |
Baa3 | $ | 75 | $ | 75,849 | |||
| BROADCASTING — 0.1% |
||||||||
| Chancellor Media Corp., Gtd. Notes |
||||||||
| 8.00%, 11/01/08 |
Ba1 | 100 | 112,372 | |||||
| Hearst-Argyle Television, Inc., Sr. Notes |
||||||||
| 7.00%, 01/15/18 |
Baa3 | 180 | 202,278 | |||||
| News America Inc., Bonds |
||||||||
| 6.20%, 12/15/34 144A(cost $109,126; Purchased 11/30/04)(g) |
Baa3 | 110 | 111,868 | |||||
| 426,518 | ||||||||
| BUILDING MATERIALS — 0.1% |
||||||||
| Masco Corp., Notes |
||||||||
| 5.875%, 07/15/12 |
Baa1 | 245 | 262,967 | |||||
| CHEMICALS |
||||||||
| Dow Chemical Co., Notes |
||||||||
| 6.125%, 02/01/11 |
A3 | 150 | 164,507 | |||||
| COMPUTER HARDWARE — 0.1% |
||||||||
| International Business Machines Corp., Notes |
||||||||
| 4.25%, 09/15/09 |
A1 | 230 | 232,967 | |||||
| COMPUTER SERVICES & SOFTWARE |
||||||||
| Sungard Data Systems, Inc., Notes |
||||||||
| 3.75%, 01/15/09 |
Baa2 | 110 | 106,933 | |||||
| CONSTRUCTION |
||||||||
| Centex Corp., Sr. Notes |
||||||||
| 4.55%, 11/01/10 |
Baa2 | 140 | 139,472 | |||||
| CONSUMER PRODUCTS & SERVICES — 0.1% |
||||||||
| Bunge Limited Finance Corp., Gtd. Notes |
||||||||
| 4.375%, 12/15/08 |
Baa3 | 205 | 206,759 | |||||
| UST, Inc., Notes |
||||||||
| 6.625%, 07/15/12 |
A3 | 190 | 212,473 | |||||
| 419,232 | ||||||||
| CONTAINERS & PACKAGING — 0.1% |
||||||||
| Sealed Air Corp., Sr. Notes |
||||||||
| 5.375%, 04/15/08 144A(cost $217,231; purchased 04/09/03 - 06/26/03)(g) |
Baa3 | 215 | 223,555 | |||||
| ENTERTAINMENT & LEISURE — 0.1% |
||||||||
| AOL Time Warner, Inc., Gtd. Bonds |
||||||||
| 7.625%, 04/15/31 |
Baa1 | 210 | 254,848 | |||||
| Belo Corp. |
||||||||
| 8.00%, 11/01/08 |
Baa3 | 80 | 90,478 | |||||
| Gtech Holdings Corp., Notes |
||||||||
| 4.50%, 12/01/09 144A(cost $119,805; purchased 11/16/04)(g) |
Baa1 | 120 | 120,123 | |||||
| 465,449 | ||||||||
| FINANCIAL — BANK & TRUST — 0.4% |
||||||||
| ABN AMRO Bank NV, Sub. Notes |
||||||||
| 7.125%, 06/18/07 |
A1 | 215 | 232,787 | |||||
| Bank of America Corp., Sr. Notes |
||||||||
| 6.125%, 12/16/10 |
Aa2 | GBP | 215 | 435,997 | ||||
| Bank One Corp., Sub. Notes |
||||||||
| 5.25%, 01/30/13 |
A1 | 285 | 293,168 | |||||
| BB&T Corp., Sub. Notes |
||||||||
| 6.50%, 08/01/11 |
A2 | 90 | 100,523 | |||||
| Northern Trust Co., Sub. Notes |
||||||||
| 4.60%, 02/01/13 |
A1 | 155 | 152,770 | |||||
| US Bank NA, Notes |
||||||||
| 2.87%, 02/01/07 |
Aa2 | 140 | 138,857 | |||||
| Webster Bank, Sr. Notes |
||||||||
| 5.125%, 04/15/14 |
Baa3 | 205 | 204,087 | |||||
| 1,558,189 | ||||||||
| FINANCIAL SERVICES — 1.7% |
||||||||
| Capital One Bank, Sub. Notes |
||||||||
| 6.50%, 06/13/13 |
Baa3 | 125 | 136,810 | |||||
| CIT Group, Inc., Sr. Notes |
||||||||
| 7.75%, 04/02/12 |
A2 | 235 | 278,566 | |||||
| Countrywide Home Loan, Inc., Notes |
||||||||
| 4.125%, 09/15/09 |
A3 | 185 | 184,365 | |||||
196
AST T. ROWE PRICE GLOBAL BOND PORTFOLIO
SCHEDULE OF INVESTMENTS (CONTINUED)
DECEMBER 31, 2004
| MOODY’S |
PRINCIPAL AMOUNT (000)# |
VALUE (NOTE 2) | ||||||
| Duke Capital Corp., Notes |
||||||||
| 4.302%, 05/18/06 |
Baa3 | $ | 100 | $ | 101,241 | |||
| Ford Motor Credit Co., Notes |
||||||||
| 3.24%, 11/16/06 |
A3 | 100 | 99,931 | |||||
| 5.625%, 10/01/08 |
A3 | 450 | 460,359 | |||||
| Franklin Resources, Inc., Notes |
||||||||
| 3.70%, 04/15/08 |
A2 | 80 | 79,872 | |||||
| General Electric Capital Corp., Notes |
||||||||
| 6.125%, 02/22/11 |
Aaa | 145 | 159,036 | |||||
| General Electric Capital Corp., Sr. Unsub. Notes |
||||||||
| 5.125%, 06/20/07 |
Aaa | EUR | 425 | 609,751 | ||||
| General Electric Capital Corp., Unsub. Notes |
||||||||
| 6.00%, 06/15/12 |
Aaa | 240 | 262,004 | |||||
| General Motors Acceptance Corp., Notes |
||||||||
| 7.25%, 03/02/11 |
A3 | 250 | 262,065 | |||||
| General Motors Acceptance Corp., Notes |
||||||||
| 6.00%, 07/03/08 |
A3 | EUR | 190 | 268,279 | ||||
| Goldman Sachs Group, Inc., Sub. Bonds |
||||||||
| 6.345%, 02/15/34 |
A1 | 395 | 412,707 | |||||
| Household Finance Corp., Unsub. Notes |
||||||||
| 5.125%, 06/24/09 |
A1 | EUR | 100 | 146,243 | ||||
| International Lease Finance Corp., Notes |
||||||||
| 6.375%, 03/15/09 |
A1 | 170 | 184,280 | |||||
| John Deere Capital Corp., Notes |
||||||||
| 7.00%, 03/15/12 |
A3 | 280 | 323,295 | |||||
| John Hancock Global Funding Ltd., Sec’d. Notes |
||||||||
| 3.875%, 02/08/06 |
AA | EUR | 200 | 275,289 | ||||
| JPMorgan Chase & Co., Notes |
||||||||
| 3.875%, 12/03/08 |
A1 | EUR | 250 | 349,377 | ||||
| MBNA America Bank NA, Notes |
||||||||
| 4.625%, 08/03/09 |
Baa1 | 175 | 178,364 | |||||
| MBNA America Bank NA, Sub. Notes |
||||||||
| 7.125%, 11/15/12 |
Baa2 | 80 | 91,140 | |||||
| Morgan Stanley, Notes |
||||||||
| 3.625%, 04/01/08 |
Aa3 | $ | 170 | 169,198 | ||||
| Morgan Stanley, Sr. Notes |
||||||||
| 4.375%, 03/01/10 |
Aa3 | EUR | 200 | 284,157 | ||||
| Verizon Global Funding Corp., Notes |
||||||||
| 7.75%, 12/01/30 |
A2 | 245 | 305,571 | |||||
| Wells Fargo & Co., Notes |
||||||||
| 2.59%, 03/23/07(c) |
Aa1 | 235 | 235,253 | |||||
| 5,857,153 | ||||||||
| FOOD — 0.1% |
||||||||
| McCormick & Co., Inc., Notes |
||||||||
| 6.40%, 02/01/06 |
A2 | 310 | 321,612 | |||||
| FOREST PRODUCTS |
||||||||
| Weyerhaeuser Co., Debs. |
||||||||
| 7.375%, 03/15/32 |
Baa2 | 45 | 53,535 | |||||
| HEALTHCARE SERVICES |
||||||||
| Highmark, Inc., Notes |
||||||||
| 6.80%, 08/15/13 144A(cost $137,863; purchased 08/14/03- 10/12/04)(g) |
Baa3 | 135 | 147,491 | |||||
| HOTELS & MOTELS |
||||||||
| Harrahs Operating Co., Inc., Gtd. Notes |
||||||||
| 5.50%, 07/01/10 |
Baa3 | 90 | 93,271 | |||||
| INSURANCE — 0.4% |
||||||||
| Ace INA Holdings, Inc., Notes |
||||||||
| 5.875%, 06/15/14 |
A3 | 155 | 159,079 | |||||
| Allstate Financial Global Funding LLC, |
||||||||
| 5.25%, 02/01/07 144A(cost $264,556; purchased 01/24/02)(g) |
Aa2 | 265 | 274,062 | |||||
| Fund American Cos., Inc., Notes |
||||||||
| 5.875%, 05/15/13 |
Baa2 | 200 | 203,885 | |||||
| Genworth Financial, Inc., Notes |
||||||||
| 5.75%, 06/15/14 |
A2 | 185 | 196,069 | |||||
| Nationwide Financial Services, Inc., Sr. Notes |
||||||||
| 5.90%, 07/01/12 |
A3 | 200 | 211,513 | |||||
197
AST T. ROWE PRICE GLOBAL BOND PORTFOLIO
SCHEDULE OF INVESTMENTS (CONTINUED)
DECEMBER 31, 2004
| MOODY’S RATING (UNAUDITED) |
PRINCIPAL AMOUNT (000)# |
VALUE (NOTE 2) | ||||||
| Nationwide Mutual Insurance Co., Bonds |
||||||||
| 6.60%, 04/15/34 144A(cost $114,748; purchased 03/31/04)(g) |
A2 | $ | 115 | $ | 115,505 | |||
| NLV Financial Corp., Sr. Notes |
||||||||
| 7.50%, 08/15/33 144A(cost $146,368; purchased 08/20/03-12/03/03)(g) |
Baa3 | 145 | 155,831 | |||||
| Security Benefit Life Insurance Co., Notes |
||||||||
| 7.45%, 10/01/33 144A(cost $94,788; purchased 09/26/03)(g) |
Baa1 | 95 | 99,651 | |||||
| XL Capital Ltd., Gtd. Notes |
||||||||
| 6.50%, 01/15/12 |
A2 | 170 | 186,335 | |||||
| 1,601,930 | ||||||||
| MEDICAL SUPPLIES & EQUIPMENT — 0.1% |
||||||||
| Hospira, Inc., Notes |
||||||||
| 4.95%, 06/15/09 144A |
Baa3 | 195 | 199,398 | |||||
| OIL & GAS — 0.9% |
||||||||
| Amerada Hess Corp., Bonds |
||||||||
| 7.875%, 10/01/29 |
Ba1 | 135 | 160,208 | |||||
| Baker Hughes, Inc., Sr. Notes |
||||||||
| 6.875%, 01/15/29 |
A2 | 300 | 351,281 | |||||
| Buckeye Partners L.P., Notes |
||||||||
| 6.75%, 08/15/33 |
Baa2 | 95 | 105,168 | |||||
| Buckeye Partners, Notes |
||||||||
| 5.30%, 10/15/14 |
Baa2 | 50 | 50,739 | |||||
| ConocoPhillips, Gtd. Bonds |
||||||||
| 5.90%, 10/15/32 |
A3 | 180 | 188,983 | |||||
| Devon Financing Corp. ULC, Gtd. Bonds |
||||||||
| 7.875%, 09/30/31 |
Baa2 | 210 | 265,245 | |||||
| Diamond Offshore Drilling, Inc., Sr. Notes |
||||||||
| 5.15%, 09/01/14 144A(cost $115,402; purchased 11/30/04)(g) |
Baa2 | 115 | 116,520 | |||||
| Duke Capital LLC, Sr. Notes |
||||||||
| 6.25%, 02/15/13 |
Baa3 | 190 | 205,677 | |||||
| Halliburton Co., Notes |
||||||||
| 2.85%, 01/26/07 144A(cost $198,811; purchased 05/07/04)(g) |
Baa2 | 200 | 200,191 | |||||
| Kaneb Pipe Line Operating Partnership L.P., Sr. Notes |
||||||||
| 7.75%, 02/15/12 |
Ba1 | 145 | 167,929 | |||||
| Kinder Morgan, Inc., Sr. Notes |
||||||||
| 6.50%, 09/01/12 |
Baa2 | 235 | 258,699 | |||||
| Panhandle Eastern Pipe Line Co., Sr. Notes |
||||||||
| 4.80%, 08/15/08 |
Baa3 | 90 | 91,994 | |||||
| Pemex Project Funding Master Trust, Gtd. Bonds |
||||||||
| 7.375%, 12/15/14 |
Baa1 | 130 | 144,820 | |||||
| Pemex Project Funding Master Trust, Notes |
||||||||
| 3.79%, 06/15/10 144A(cost $193,707; purchased 06/08/04)(g) |
Baa1 | 195 | 200,558 | |||||
| Pioneer Natural Resource Co., Sr. Notes |
||||||||
| 5.875%, 07/15/16 |
Baa3 | 90 | 94,221 | |||||
| Plains All American Pipeline L.P., Gtd. |
||||||||
| 7.75%, 10/15/12 |
Ba1 | 75 | 87,862 | |||||
| Transocean, Inc., Notes |
||||||||
| 7.50%, 04/15/31 |
Baa2 | 130 | 160,524 | |||||
| XTO Energy, Inc., Sr. Notes |
||||||||
| 6.25%, 04/15/13 |
Baa3 | 130 | 142,504 | |||||
| 2,993,123 | ||||||||
| PAPER & FOREST PRODUCTS |
||||||||
| Weyerhaeuser Co., Notes |
||||||||
| 6.75%, 03/15/12 |
Baa2 | 105 | 118,488 | |||||
198
AST T. ROWE PRICE GLOBAL BOND PORTFOLIO
SCHEDULE OF INVESTMENTS (CONTINUED)
DECEMBER 31, 2004
| MOODY’S RATING (UNAUDITED) |
PRINCIPAL AMOUNT (000)# |
VALUE (NOTE 2) | ||||||
| PHARMACEUTICALS — 0.1% |
||||||||
| Amgen, Inc., Sr. Notes |
||||||||
| 4.00%, 11/18/09 144A(cost $109,788; purchased 11/15/04- 12/14/04)(g) |
A2 | $ | 110 | $ | 109,779 | |||
| GlaxoSmithKline Capital, Inc., Gtd. Notes |
||||||||
| 5.375%, 04/15/34 |
Aa2 | 140 | 139,578 | |||||
| Wyeth, Inc., Bonds |
||||||||
| 6.50%, 02/01/34 |
Baa1 | 115 | 123,107 | |||||
| 372,464 | ||||||||
| REAL ESTATE — 0.3% |
||||||||
| Developers Diversified Realty Corp., Notes |
||||||||
| 3.875%, 01/30/09 |
Baa3 | 145 | 142,425 | |||||
| EOP Operating L.P., Notes |
||||||||
| 4.65%, 10/01/10 |
Baa2 | 135 | 135,786 | |||||
| Lennar Corp., Notes |
||||||||
| 5.50%, 09/01/14 144A(cost $130,323; purchased 08/05/04- 10/07/04)(g) |
Baa3 | 130 | 132,014 | |||||
| NVR, Inc. |
||||||||
| 5.00%, 06/15/10 |
Baa3 | 140 | 140,700 | |||||
| Pulte Homes, Inc., Gtd. Notes |
||||||||
| 7.875%, 08/01/11 |
Baa3 | 165 | 191,663 | |||||
| Reckson Operating Partnership L.P., Notes |
||||||||
| 5.15%, 01/15/11 |
Ba1 | 180 | 181,789 | |||||
| Simon Property Group L.P., Notes |
||||||||
| 3.75%, 01/30/09 |
Baa2 | 190 | 187,164 | |||||
| 1,111,541 | ||||||||
| RETAIL & MERCHANDISING — 0.1% |
||||||||
| CVS Corp., Notes |
||||||||
| 4.00%, 09/15/09 |
A3 | 95 | 94,654 | |||||
| Federated Department Stores, Inc., Sr. Notes |
||||||||
| 6.625%, 04/01/11 |
Baa1 | 145 | 162,335 | |||||
| Kroger Co., Gtd. Notes |
||||||||
| 8.05%, 02/01/10 |
Baa1 | 170 | 199,207 | |||||
| May Department Stores Co. Notes |
||||||||
| 3.95%, 07/15/07 |
Baa2 | 50 | 50,114 | |||||
| 506,310 | ||||||||
| TELECOMMUNICATIONS — 0.2% |
||||||||
| AT&T Broadband Corp., Gtd. Notes |
||||||||
| 8.375%, 03/15/13 |
Baa3 | 200 | 247,000 | |||||
| Sprint Capital Corp., Gtd. Notes |
||||||||
| 6.90%, 05/01/19 |
Baa3 | 210 | 235,475 | |||||
| United States Cellular Corp., Notes |
||||||||
| 6.70%, 12/15/33 |
Baa1 | 115 | 119,530 | |||||
| 602,005 | ||||||||
| UTILITIES — 0.9% |
||||||||
| Alabama Power Co., Sr. Notes |
A2 | 165 | 165,202 | |||||
| 1.94%, 02/25/05 |
||||||||
| Appalachian Power Co., Sr. Notes |
||||||||
| 4.80%, 06/15/05 |
Baa2 | 225 | 226,928 | |||||
| Black Hills Corp., Notes |
||||||||
| 6.50%, 05/15/13 |
Baa3 | 230 | 236,103 | |||||
| Centerpoint Energy, Inc., Sr. Notes Series B |
||||||||
| 5.875%, 06/01/08 |
Ba2 | 130 | 136,135 | |||||
| Cleveland Electric Illuminating Co., Sr. |
||||||||
| 5.65%, 12/15/13 |
Baa3 | 190 | 197,397 | |||||
| Dominion Resources, Inc., Sr. Notes |
||||||||
| 5.00%, 03/15/13 |
Baa1 | 130 | 131,017 | |||||
| Exelon Generation Co. LLC, Notes |
||||||||
| 5.35%, 01/15/14 |
Baa1 | 170 | 174,626 | |||||
| Pacific Gas and Electric Co., First Mortgage Notes |
||||||||
| 2.72%, 04/03/06(c) |
Baa2 | 60 | 60,054 | |||||
| 6.05%, 03/01/34 |
Baa2 | 150 | 156,335 | |||||
| Pinnacle West Capital Corp., Sr. Notes |
||||||||
| 6.40%, 04/01/06 |
Baa2 | 190 | 195,602 | |||||
| PPL Capital Funding, Gtd. Notes |
||||||||
| 4.33%, 03/01/09 |
Baa3 | 195 | 192,911 | |||||
| Progress Energy, Inc., Sr. Notes |
||||||||
| 6.75%, 03/01/06 |
Baa2 | 115 | 119,364 | |||||
| PSE&G Power LLC, Gtd. Bonds |
||||||||
| 8.625%, 04/15/31 |
Baa1 | 110 | 146,503 | |||||
199
AST T. ROWE PRICE GLOBAL BOND PORTFOLIO
SCHEDULE OF INVESTMENTS (CONTINUED)
DECEMBER 31, 2004
| MOODY’S RATING (UNAUDITED) |
PRINCIPAL AMOUNT (000)# |
VALUE (NOTE 2) | |||||||
| Public Service Co. of New Mexico, Sr. Notes |
|||||||||
| 4.40%, 09/15/08 |
Baa3 | $ | 185 | $ | 186,704 | ||||
| Puget Sound Energy, Inc., Notes |
|||||||||
| 2.37%, 01/15/05 |
Baa2 | 180 | 180,151 | ||||||
| Sempra Energy Co., Notes |
|||||||||
| 6.00%, 02/01/13 |
Baa1 | 240 | 256,558 | ||||||
| TXU Energy Co., Notes |
|||||||||
| 2.838%, 01/17/06 |
Baa2 | 43 | 43,131 | ||||||
| Westar Energy Inc., First Mortgage Notes |
|||||||||
| 7.875%, 05/01/07 |
Ba1 | 100 | 109,245 | ||||||
| 2,913,966 | |||||||||
| TOTAL CORPORATE OBLIGATIONS |
21,827,010 | ||||||||
| U.S. TREASURY OBLIGATIONS — 5.8% |
|||||||||
| U.S. Treasury Bonds |
|||||||||
| 7.50%, 11/15/16 |
580 | 741,381 | |||||||
| 8.50%, 02/15/20 |
150 | 211,746 | |||||||
| 6.25%, 08/15/23 |
260 | 304,474 | |||||||
| 6.00%, 02/15/26 |
970 | 1,111,446 | |||||||
| 6.50%, 11/15/26 |
615 | 747,346 | |||||||
| 6.25%, 05/15/30 |
525 | 627,847 | |||||||
| 5.375%, 02/15/31 |
1,255 | 1,357,459 | |||||||
| U.S. Treasury Inflationary Bonds |
|||||||||
| 2.25%, 01/15/25 TIPS |
860 | 931,645 | |||||||
| U.S. Treasury Notes |
|||||||||
| 1.50%, 02/28/05 |
3,645 | 3,643,578 | |||||||
| 1.625%, 04/30/05 |
395 | 394,152 | |||||||
| 6.50%, 08/15/05 |
250 | 256,162 | |||||||
| 1.875%, 11/30/05 |
665 | 660,013 | |||||||
| 3.50%, 11/15/06 |
840 | 847,351 | |||||||
| 3.375%, 11/15/08 |
1,265 | 1,261,987 | |||||||
| 3.375%, 12/15/08(k) |
1,655 | 1,650,282 | |||||||
| 4.00%, 06/15/09 |
4,325 | 4,408,629 | |||||||
| 5.00%, 08/15/11 |
725 | 772,040 | |||||||
| 4.25%, 11/15/13 |
1,035 | 1,041,833 | |||||||
| 4.75%, 05/15/14 |
145 | 151,151 | |||||||
| TOTAL U.S. TREASURY OBLIGATIONS |
21,120,522 | ||||||||
| COLLATERALIZED MORTGAGE OBLIGATIONS — 2.8% |
|||||||||
| Banc of America Commercial Mortgage, Inc. Series 2004-6 Cl-A1 |
|||||||||
| 3.801%, 12/10/42 |
AAA | (d) | 95 | 95,086 | |||||
| Bank of America Commercial Mortgage, Inc., Series 2003-1, Class A2 |
|||||||||
| 4.648%, 09/11/36 |
AAA | (d) | 500 | 502,240 | |||||
| Bank of America Mortgage Securities, Series 2003-L, Class 2A2 |
|||||||||
| 4.311%, 01/25/34 |
Aaa | 688 | 688,923 | ||||||
| Bank of America Mortgage Securities, Series 2004-A, Class 2A2 |
|||||||||
| 4.147%, 02/25/34 |
AAA | (d) | 351 | 345,343 | |||||
| Bank of America Mortgage Securities, Series 2004-D, Class 2A2 |
|||||||||
| 4.222%, 05/25/34 |
AAA | (d) | 139 | 138,874 | |||||
| Bank of America Mortgage Securities, Series 2004-H, Class 2A2 |
|||||||||
| 4.814%, 09/25/34 |
Aaa | 191 | 191,918 | ||||||
| Bank of America Mortgage Securities, Series 2004-I, Class 3A2 |
|||||||||
| 5.005%, 10/25/34 |
AAA | (d) | 185 | 185,352 | |||||
| Bear Stearns Commercial Mortgage Securities, Series 2002-Top8, Class A2 |
|||||||||
| 4.83%, 08/15/38 |
AAA | (d) | 935 | 947,809 | |||||
| Bear Stearns Commercial Mortgage Securities, Series 2004-Pwr6, Class A1 |
|||||||||
| 3.688%, 11/11/41 |
AAA | (d) | 75 | 75,062 | |||||
200
AST T. ROWE PRICE GLOBAL BOND PORTFOLIO
SCHEDULE OF INVESTMENTS (CONTINUED)
DECEMBER 31, 2004
| MOODY’S RATING (UNAUDITED) |
PRINCIPAL AMOUNT (000)# |
VALUE (NOTE 2) | |||||||
| Citigroup Commercial Mortgage Trust, Series 2004-C2, Class A1 |
|||||||||
| 3. 787%, 10/15/41 |
Aaa | $ | 70 | $ | 69,913 | ||||
| CS First Boston Mortgage Securities Corp., Series 2004-C5, Class A4 |
|||||||||
| 4.829%, 11/15/37 |
Aaa | 475 | 472,409 | ||||||
| DLJ Commercial Mortgage Corp., Series 1999-CG2, Class A1B |
|||||||||
| 7.30%, 06/10/32 |
Aaa | 450 | 506,386 | ||||||
| Fannie Mae REMIC Trust Series, 2003-92, Class NM |
|||||||||
| 3.50%, 04/25/13 |
Aaa | 300 | 300,161 | ||||||
| Fannie Mae REMIC Trust, Series 2002-74, Class PJ |
|||||||||
| 5.00%, 03/25/15 |
Aaa | 700 | 715,287 | ||||||
| Fannie Mae Strip, Series 319, Class 2 |
|||||||||
| 6.50%, 02/01/32 IO |
Aaa | 69 | 13,265 | ||||||
| Fannie Mae, Series 2003-40, Class NI |
|||||||||
| 5.50%, 04/01/33 IO |
Aaa | 343 | 24,264 | ||||||
| Freddie Mac, Series 2614, Class IH |
|||||||||
| 4.50%, 05/15/16 IO |
Aaa | 303 | 46,445 | ||||||
| Freddie Mac, Series 2627, Class IE |
|||||||||
| 4.50%, 04/15/18 IO |
Aaa | 156 | 18,486 | ||||||
| Freddie Mac, Series 2631, Class KI |
|||||||||
| 4.50%, 01/15/15 IO |
Aaa | 540 | 44,579 | ||||||
| Freddie Mac, Series 2631, Class LI |
|||||||||
| 4.50%, 06/15/11 IO |
Aaa | 248 | 13,580 | ||||||
| Freddie Mac, Series 2631, Class PC |
|||||||||
| 4.50%, 03/15/16 |
Aaa | 1,000 | 1,017,306 | ||||||
| Freddie Mac, Series 2686, Class JG |
|||||||||
| 5.50%, 04/15/28 |
Aaa | 925 | 949,237 | ||||||
| Freddie Mac., Series 2882, Class Yb |
|||||||||
| 5.00%, 10/15/27 |
Aaa | 225 | 229,075 | ||||||
| Freddie Mac., Series 2890, Class Pb |
|||||||||
| 5.00%, 11/15/27 |
Aaa | 700 | 712,678 | ||||||
| General Electric Capital Commercial Mortgage Corp., Series 2001-1, Class A2 |
|||||||||
| 6.531%, 05/15/33 |
Aaa | 550 | 612,327 | ||||||
| Government National Mortgage Assoc., Series 2004-23, Class B |
|||||||||
| 2.946%, 03/16/19 |
Aaa | 240 | 233,337 | ||||||
| GS Mortgage Securities Corp., Series 2004-GG2, Class A2 |
|||||||||
| 4.293%, 08/01/38 |
Aaa | 140 | 141,730 | ||||||
| JP Morgan Chase Commercial Mortgage Finance Corp., Series 2001-CIB2, Class A2 |
|||||||||
| 6.244%, 04/15/35 |
AAA | (d) | 225 | 240,820 | |||||
| JP Morgan Chase Commercial Mortgage Finance Corp., Series 2001-CIBC, Class A3 |
|||||||||
| 6.26%, 03/15/33 |
AAA | (d) | 440 | 483,855 | |||||
| Washington Mutual Mortgage Securities Corp., Series 2004-AR1, Class A |
|||||||||
| 4.229%, 03/25/34 |
Aaa | 207 | 205,733 | ||||||
| TOTAL COLLATERALIZED MORTGAGE OBLIGATIONS |
10,221,480 | ||||||||
| ASSET-BACKED SECURITIES — 1.8% |
|||||||||
| BankBoston Home Equity Loan Trust, Series 1998-1, Class A6 |
|||||||||
| 6.35%, 02/25/13 |
Aaa | 244 | 249,346 | ||||||
| Capital Auto Receivables Asset Trust, Series 2002-2, Class CTFS |
|||||||||
| 4.18%, 10/15/07 |
Aaa | 76 | 76,255 | ||||||
| Chase Funding Mortgage Loan Asset-Backed, Series 2002-2, Class 1M1 |
|||||||||
| 5.599%, 09/25/31 |
Aa2 | 60 | 61,175 | ||||||
201
AST T. ROWE PRICE GLOBAL BOND PORTFOLIO
SCHEDULE OF INVESTMENTS (CONTINUED)
DECEMBER 31, 2004
| MOODY’S RATING (UNAUDITED) |
PRINCIPAL AMOUNT (000)# |
VALUE (NOTE 2) | |||||||
| Chase Funding Mortgage Loan Asset-Backed, Series 2003-1, Class 1A6 |
|||||||||
| 4.458%, 03/25/14 |
Aaa | $ | 500 | $ | 500,785 | ||||
| Chase Manhattan Auto Owner Trust, Series 2001-B, Class CTFS |
|||||||||
| 3.75%, 05/15/08 |
A1 | 75 | 75,601 | ||||||
| Chase Manhattan Auto Owner Trust, Series 2003-A, Class A4 |
|||||||||
| 2.06%, 12/15/09 |
Aaa | 455 | 443,880 | ||||||
| Citibank Credit Card Issuance Trust, Series 2000-A3, Class A3 |
|||||||||
| 6.875%, 11/15/09 |
Aaa | 825 | 898,376 | ||||||
| Citibank Credit Card Issuance Trust, Series 2001-A1, Class A1 |
|||||||||
| 6.90%, 10/15/07 |
Aaa | 150 | 154,576 | ||||||
| Citibank Credit Card Issuance Trust, Series 2001-C1, Class C1 |
|||||||||
| 3.15%, 01/15/10(c) |
Baa2 | 250 | 255,349 | ||||||
| 3.053%, 07/15/13 |
Baa2 | 300 | 302,716 | ||||||
| Countrywide Asset-Backed Certificates, Series 2003-5, Class AF3 |
|||||||||
| 3.613%, 04/25/30 |
Aaa | 340 | 339,829 | ||||||
| Countrywide Home Loans, Series 2003-60, Class 2A1 |
|||||||||
| 4.986%, 02/25/34 |
Aaa | 94 | 94,298 | ||||||
| Greenwich Capital Commercial Funding Corp., Series 2004 - GG1A, Class A2 |
|||||||||
| 3.835%, 10/08/08 |
Aaa | 375 | 376,142 | ||||||
| Harley-Davidson Motorcycle Trust, Series 2001-1, Class B |
|||||||||
| 5.29%, 01/15/09 |
A2 | 66 | 66,314 | ||||||
| Hyundai Auto Receivables Trust, Series 2003-A, Class A4 |
|||||||||
| 3.02%, 10/15/10 |
Aaa | 200 | 197,872 | ||||||
| Hyundai Auto Receivables Trust, Series 2003-A, Class D |
|||||||||
| 4.06%, 10/15/10 |
Baa2 | 90 | 90,600 | ||||||
| MBNA Master Credit Card Trust, Series 2000-D, Class C |
|||||||||
| 8.40%, 09/15/09 144A (cost $690,017; purchased 05/16/02 - 12/06/02)(g) |
BBB | (d) | 650 | 714,700 | |||||
| Morgan Stanley Auto Loan Trust, Series 2004-HB1, Class C |
|||||||||
| 2.88%, 10/15/11 |
Baa2 | 130 | 129,795 | ||||||
| PECO Energy Transition Trust, Series 2001-A, Class A1 |
|||||||||
| 6.52%, 12/31/10 |
Aaa | 475 | 528,051 | ||||||
| Reliant Energy Transition Bond Co. LLC, Series 2001-1, Class A4 |
|||||||||
| 5.63%, 09/15/15 |
Aaa | 275 | 294,352 | ||||||
| World Financial Network Credit Card Master Trust, Series 2003-A, Class A2 |
|||||||||
| 2.773%, 05/15/12(c) |
Aaa | 500 | 503,254 | ||||||
| TOTAL ASSET-BACKED SECURITIES |
6,353,266 | ||||||||
| U.S. GOVERNMENT AGENCY OBLIGATIONS — 1.7% |
|||||||||
| Federal Home Loan Bank |
|||||||||
| 5.75%, 05/15/12 |
675 | 739,938 | |||||||
| Federal Home Loan Mortgage Corp. |
|||||||||
| 2.75%, 03/15/08 |
2,100 | 2,054,942 | |||||||
202
AST T. ROWE PRICE GLOBAL BOND PORTFOLIO
SCHEDULE OF INVESTMENTS (CONTINUED)
DECEMBER 31, 2004
| MOODY’S RATING (UNAUDITED) |
PRINCIPAL AMOUNT (000)# |
VALUE (NOTE 2) | |||||||
| Federal National Mortgage Assoc. |
|||||||||
| 3.25%, 08/15/08 |
$ | 1,850 | $ | 1,827,158 | |||||
| 6.00%, 05/15/11 |
485 | 534,307 | |||||||
| 4.375%, 09/15/12 |
450 | 450,915 | |||||||
| Student Loan Marketing Assoc. |
|||||||||
| 2.30%, 01/26/09(c) |
240 | 240,278 | |||||||
| 3.78%, 04/01/09(c) |
155 | 154,673 | |||||||
| TOTAL U.S. GOVERNMENT AGENCY OBLIGATIONS |
6,002,211 | ||||||||
| MUNICIPAL BONDS — 0.6% |
|||||||||
| CALIFORNIA — 0.1% |
|||||||||
| California State Economic Recovery Series B |
|||||||||
| 5.00%, 07/01/23 |
Aa3 | 90 | 95,508 | ||||||
| 5.00%, 07/01/23 |
Aa3 | 95 | 102,723 | ||||||
| California State Variable Purpose GO |
|||||||||
| 5.25%, 04/01/34 |
Baa1 | 105 | 109,200 | ||||||
| 307,431 | |||||||||
| KANSAS |
|||||||||
| Kansas State Development Finance Authority, Revenue Bonds |
|||||||||
| 5.501%, 05/01/34 |
Aaa | 125 | 126,838 | ||||||
| MASSACHUSETTS — 0.1% |
|||||||||
| Massachusetts State Bonds, Series B |
|||||||||
| 5.25%, 08/01/15 |
AAA | (d) | 370 | 417,719 | |||||
| NEW YORK — 0.1% |
|||||||||
| New York State Urban Development Corp. Series A |
|||||||||
| 5.25%, 01/01/09 |
Aa- | (d) | 200 | 217,584 | |||||
| NORTH CAROLINA — 0.2% |
|||||||||
| North Carolina State Public Impt. Series A |
|||||||||
| 5.25%, 03/01/13 |
Aa1 | 645 | 733,771 | ||||||
| PUERTO RICO — 0.1% |
|||||||||
| Puerto Rico Public Finance Corp. Series A |
|||||||||
| 5.25%, 08/01/29 |
Aaa | 395 | 437,703 | ||||||
| TOTAL MUNICIPAL BONDS |
2,241,046 | ||||||||
| SOVEREIGN ISSUES — 0.2% |
|||||||||
| CHILE — 0.1% |
|||||||||
| Republic of Chile, Bonds |
|||||||||
| 5.50%, 01/15/13 |
Baa1 | 225 | 236,970 | ||||||
| MEXICO — 0.1% |
|||||||||
| United Mexican States, Notes |
|||||||||
| 2.752%, 01/13/09(c) |
Baa2 | 140 | 142,065 | ||||||
| 6.375%, 01/16/13 |
Baa2 | 260 | 277,550 | ||||||
| 419,615 | |||||||||
| SOUTH AFRICA |
|||||||||
| Republic of South Africa, Notes |
|||||||||
| 6.50%, 06/02/14 |
Baa2 | 100 | 109,750 | ||||||
| TOTAL SOVEREIGN ISSUES |
766,335 | ||||||||
| UNITS |
|||||||||
| WARRANTS |
|||||||||
| Central Bank of Nigeria, expiring on 11/15/20 (Nigeria) (cost $0; purchased 09/15/98)(g)(o) |
250 | 0 | |||||||
| Republic of Venezuela, expiring on 04/15/20 (Venezuela) (cost $0; Purchased 01/12/99)(g)(o) |
1,250 | 0 | |||||||
| Travelcenters of America, expiring on 05/01/09 (cost $0; purchased 02/07/01)(g) |
750 | 4,125 | |||||||
| TOTAL WARRANTS |
4,125 | ||||||||
| TOTAL INVESTMENTS — 74.5% |
269,741,230 | ||||||||
| OTHER ASSETS IN EXCESS OF LIABILITIES — 25.5% |
92,275,742 | ||||||||
| NET ASSETS — 100.0% |
$ | 362,016,972 | |||||||
203
AST T. ROWE PRICE GLOBAL BOND PORTFOLIO
SCHEDULE OF INVESTMENTS (CONTINUED)
DECEMBER 31, 2004
THE FOLLOWING ABBREVIATIONS ARE USED THROUGHOUT THE SCHEDULE OF INVESTMENTS:
| 144A | Security was purchased pursuant to Rule 144A under the Securities Act of 1933 and may not be resold subject to that rule except to qualified institutional buyers. Unless otherwise noted 144A securities are deemed to be liquid. | |
| ARS | Argentine Peso | |
| AUD | Australian Dollar | |
| CAD | Canadian Dollar | |
| CNY | Chinese Yuan | |
| DKK | Danish Krone | |
| EUR | Euro | |
| GBP | British Pound | |
| IO | Interest Only | |
| JPY | Japanese Yen | |
| KRW | Korean Won | |
| MXN | Mexican Peso | |
| NOK | Norwegian Krone | |
| PLZ | Polish Zloty | |
| RUB | Russian Rouble | |
| SEK | Swedish Krona | |
| SGD | Singapore Dollar | |
| TRL | Turkish Lira | |
| TBA | Security purchased on a forward commitment basis | |
| TIPS | Treasury Inflation Protection Securities | |
| THE FOLLOWING ANNOTATIONS ARE USED THROUGHOUT THE SCHEDULE OF INVESTMENTS: | ||
| # | Principal amount is shown in U.S. dollars unless otherwise stated. | |
| (c) | Indicates a variable rate security. The maturity date presented for these instruments is the next date on which the rate of interest is adjusted. | |
| (d) | Standard & Poor’s rating. | |
| (g) | Indicates a security that has been deemed illiquid. The aggregate cost of illiquid securities is $3,129,235. The aggregate value, $3,228,554, represents 0.89% of net assets. | |
| (k) | Securities with an aggregate market value of $55,840 have been segregated with the custodian to cover margin requirements for the following open futures contracts at December 31, 2004: | |
| NUMBER OF CONTRACTS |
TYPE |
EXPIRATION MONTH |
VALUE AT TRADE DATE |
VALUE AT DECEMBER 31, |
UNREALIZED DEPRECIATION |
|||||||||
| SHORT POSITIONS: | ||||||||||||||
| U.S. Treasury 5 Year Note | ||||||||||||||
| 69 | Mar 05 | $ | 7,534,664 | $ | 7,557,656 | $ | (22,992 | ) | ||||||
| U.S. Treasury 10 Year Note | ||||||||||||||
| 92 | Mar 05 | 10,262,148 | 10,298,250 | (36,102 | ) | |||||||||
| $ | (59,094 | ) | ||||||||||||
| (o) | Fair valued security. |
204
AST T. ROWE PRICE GLOBAL BOND PORTFOLIO
SCHEDULE OF INVESTMENTS (CONTINUED)
DECEMBER 31, 2004
Foreign currency exchange contracts outstanding at December 31, 2004:
PURCHASE CONTRACTS
| SETTLEMENT MONTH |
TYPE |
CONTRACTS TO RECEIVE |
IN EXCHANGE FOR |
CONTRACTS AT VALUE |
UNREALIZED APPRECIATION (DEPRECIATION) |
|||||||||
| May 05 | Buy ARS | 3,922,512 | $ | 1,292,000 | $ | 1,319,600 | $ | 27,600 | ||||||
| Feb 05 | Buy AUD | 757,004 | 580,282 | 589,054 | 8,772 | |||||||||
| Feb 05 | Buy CAD | 4,507,916 | 3,681,465 | 3,751,982 | 70,517 | |||||||||
| Jul 05 | Buy CNY | 19,479,348 | 2,380,000 | 2,353,573 | (26,427 | ) | ||||||||
| Feb 05 | Buy EUR | 6,742,711 | 8,881,558 | 9,138,674 | 257,116 | |||||||||
| Feb 05 | Buy GBP | 198,016 | 380,000 | 377,999 | (2,001 | ) | ||||||||
| Feb 05 | Buy JPY | 4,166,916,744 | 39,837,213 | 40,782,448 | 945,235 | |||||||||
| Feb 05 | Buy KRW | 3,000,959,155 | 2,736,553 | 2,898,626 | 162,073 | |||||||||
| Feb 05 | Buy MXN | 36,376,725 | 3,149,919 | 3,233,789 | 83,870 | |||||||||
| Feb 05 | Buy NOK | 2,025,000 | 325,097 | 333,229 | 8,132 | |||||||||
| Feb 05 | Buy PLZ | 8,723,348 | 2,623,563 | 2,877,556 | 253,993 | |||||||||
| May 05 | Buy RUB | 73,045,500 | 2,562,997 | 2,635,116 | 72,119 | |||||||||
| Feb 05 | Buy SEK | 57,552,029 | 8,337,582 | 8,649,500 | 311,918 | |||||||||
| Feb 05 | Buy SGD | 466,675 | 283,590 | 286,231 | 2,641 | |||||||||
| Feb 05 | Buy TRL | 1,951,488,000,000 | 1,232,000 | 1,408,323 | 176,323 | |||||||||
| Mar 05 | Buy TRL | 2,022,107,300,000 | 1,387,000 | 1,439,663 | 52,663 | |||||||||
| Jun 05 | Buy TRL | 2,108,422,250,000 | 1,397,000 | 1,439,841 | 42,841 | |||||||||
| $ | 81,067,819 | $ | 83,515,204 | $ | 2,447,385 | |||||||||
|
SALE CONTRACTS
|
| |||||||||||||
| SETTLEMENT MONTH |
TYPE |
CONTRACTS TO DELIVER |
IN EXCHANGE FOR |
CONTRACTS AT VALUE |
UNREALIZED APPRECIATION (DEPRECIATION) |
|||||||||
| Feb 05 | Sell CAD | 8,381,548 | $ | 6,896,292 | $ | 6,976,043 | $ | (79,751 | ) | |||||
| Jul 05 | Sell CNY | 19,479,348 | 2,414,784 | 2,353,573 | 61,211 | |||||||||
| Feb 05 | Sell DKK | 27,854,061 | 4,864,063 | 5,075,653 | (211,590 | ) | ||||||||
| Feb 05 | Sell EUR | 23,582,459 | 30,774,338 | 31,962,275 | (1,187,937 | ) | ||||||||
| Feb 05 | Sell GBP | 2,397,919 | 4,415,673 | 4,577,475 | (161,802 | ) | ||||||||
| Feb 05 | Sell JPY | 1,319,911,006 | 12,593,360 | 12,918,233 | (324,873 | ) | ||||||||
| Feb 05 | Sell MXN | 31,083,489 | 2,724,470 | 2,763,235 | (38,765 | ) | ||||||||
| Feb 05 | Sell PLZ | 8,723,348 | 2,657,558 | 2,877,556 | (219,998 | ) | ||||||||
| Feb 05 | Sell RUB | 73,045,500 | 2,602,260 | 2,635,116 | (32,856 | ) | ||||||||
| Mar 05 | Sell TRL | 1,951,488,000,000 | 1,325,739 | 1,408,323 | (82,583 | ) | ||||||||
| $ | 71,268,537 | $ | 73,547,482 | $ | (2,278,944 | ) | ||||||||
205
AST T. ROWE PRICE GLOBAL BOND PORTFOLIO
SCHEDULE OF INVESTMENTS (CONTINUED)
DECEMBER 31, 2004
The industry classification of long-term portfolio holdings, short-term investments and liabilities in excess of other assets shown as a percentage of net assets as of December 31, 2004 were as follows:
| Foreign Bonds | 47.8 | % | |
| U.S. Government Agency Mortgage-Backed Securities | 7.8 | ||
| U.S. Treasury Obligations | 5.8 | ||
| Collateralized Mortgage Obligations | 2.8 | ||
| Asset-Backed Securities | 1.8 | ||
| Financial Services | 1.7 | ||
| U.S. Government Agency Obligations | 1.7 | ||
| Oil & Gas | 0.9 | ||
| Utilities | 0.9 | ||
| Municipal Bonds | 0.6 | ||
| Financial — Bank & Trust | 0.4 | ||
| Insurance | 0.4 | ||
| Real Estate | 0.3 | ||
| Automobile Manufacturers | 0.2 | ||
| Sovereign Issues | 0.2 | ||
| Telecommunications | 0.2 | ||
| Broadcasting | 0.1 | ||
| Building Materials | 0.1 | ||
| Computer Hardware | 0.1 | ||
| Consumer Products & Services | 0.1 | ||
| Containers & Packaging | 0.1 | ||
| Entertainment & Leisure | 0.1 | ||
| Food | 0.1 | ||
| Medical Supplies & Equipment | 0.1 | ||
| Pharmaceuticals | 0.1 | ||
| Retail & Merchandising | 0.1 | ||
| 74.5 | |||
| Liabilities in excess of other assets | 25.5 | ||
| 100.0 | % | ||
See Notes to Financial Statements.
206
AST GOLDMAN SACHS HIGH YIELD PORTFOLIO
SCHEDULE OF INVESTMENTS
DECEMBER 31, 2004
| MOODY’S RATING (UNAUDITED) |
PRINCIPAL AMOUNT (000) |
VALUE (NOTE 2) | ||||||
| LONG-TERM INVESTMENTS — 95.0% |
||||||||
| CORPORATE OBLIGATIONS — 94.4% |
||||||||
| AEROSPACE — 1.6% |
||||||||
| Argo-Tech Corp., Sr. Notes |
||||||||
| 9.25%, 06/01/11 |
B3 | $ | 2,000 | $ | 2,205,000 | |||
| BE Aerospace, Inc., Sr. Sub. Notes |
||||||||
| 8.00%, 03/01/08 |
Caa3 | 625 | 628,906 | |||||
| 8.875%, 05/01/11 |
Caa3 | 1,000 | 1,050,000 | |||||
| K & F Acquisition, Inc., Sr. Sub. Notes |
||||||||
| 7.75%, 11/15/14 144A |
Caa1 | 3,000 | 3,112,500 | |||||
| Sequa Corp., Sr. Notes |
||||||||
| 9.00%, 08/01/09 |
B1 | 1,750 | 1,981,875 | |||||
| Standard Aero Holdings, Inc., Sr. Sub. Notes |
||||||||
| 8.25%, 09/01/14 144A |
Caa1 | 1,250 | 1,356,250 | |||||
| TransDigm, Inc., Gtd. Notes |
||||||||
| 8.375%, 07/15/11 |
B3 | 2,000 | 2,155,000 | |||||
| Vought Aircraft Industry, Sr. Notes |
||||||||
| 8.00%, 07/15/11 |
B2 | 500 | 488,750 | |||||
| 12,978,281 | ||||||||
| AIRLINES — 0.2% |
||||||||
| Continental Airlines, Inc., Notes |
||||||||
| 8.00%, 12/15/05 |
Caa2 | 1,000 | 980,000 | |||||
| Northwest Airlines, Inc., Gtd. Notes |
||||||||
| 10.00%, 02/01/09 |
Caa1 | 1,000 | 847,500 | |||||
| 1,827,500 | ||||||||
| AUTOMOTIVE PARTS — 2.9% |
||||||||
| Accuride Corp., Sr. Sub. Notes, Series B |
||||||||
| 9.25%, 02/01/08 |
Caa1 | 800 | 816,000 | |||||
| Advanced Accessory System, Sr. Notes |
||||||||
| 10.75%, 06/15/11 |
B3 | 2,250 | 2,148,750 | |||||
| Affinia Group, Inc., Sr. Sub. Notes |
||||||||
| 9.00%, 11/30/14 144A |
Caa1 | 1,500 | 1,571,250 | |||||
| Allied Holdings, Inc., Gtd. Notes, Series B |
||||||||
| 8.625%, 10/01/07 |
Caa1 | 1,000 | 806,250 | |||||
| Collins & Aikman Products, Sr. Sub. Notes |
||||||||
| 12.875%, 08/24/12 144A |
B3 | 250 | 217,188 | |||||
| Dana Corp., Notes |
||||||||
| 9.00%, 08/15/11 |
Ba3 | 550 | 679,454 | |||||
| Delco Remy International, Inc., Sr. Sub. Notes |
||||||||
| 9.375%, 04/15/12 |
B3 | 2,250 | 2,317,500 | |||||
| Foamex L.P., Gtd. Notes |
||||||||
| 9.875%, 06/15/07 |
Caa2 | 325 | 268,125 | |||||
| 10.75%, 04/01/09 |
B3 | 1,525 | 1,498,313 | |||||
| Goodyear Tire & Rubber Co., Notes |
||||||||
| 7.857%, 08/15/11 |
B2 | 3,000 | 3,059,999 | |||||
| Schefenaccker AG, Sr. Sub. Notes (Netherlands) |
||||||||
| 9.50%, 02/11/14 |
B2 | EUR | 1,000 | 1,165,557 | ||||
| Stoneridge, Inc., Gtd. Notes |
||||||||
| 11.50%, 05/01/12 |
B2 | 750 | 875,625 | |||||
| Tenneco Automotive, Inc., Sr. Sub. Notes |
||||||||
| 8.625%, 11/15/14 144A(cost $500,000; purchased 11/09/04)(g) |
B3 | 500 | 522,500 | |||||
| TRW Automotive, Inc., Sr. Sub. Notes |
||||||||
| 11.00%, 02/15/13 |
B2 | 3,721 | 4,502,409 | |||||
| United Components, Inc., Sr. Sub. Notes |
||||||||
| 9.375%, 06/15/13 |
B3 | 1,750 | 1,907,500 | |||||
| 22,356,420 | ||||||||
| BUILDING MATERIALS — 3.4% |
||||||||
| ACIH, Inc., Sr. Disc. Notes, Zero Coupon (until 12/15/07) |
||||||||
| 11.50%, 12/15/05 144A(cost $628,461; purchased 12/21/04)(g) |
Caa3 | 875 | 636,563 | |||||
207
AST GOLDMAN SACHS HIGH YIELD PORTFOLIO
SCHEDULE OF INVESTMENTS (CONTINUED)
DECEMBER 31, 2004
| MOODY’S |
PRINCIPAL (000) |
VALUE (NOTE 2) | ||||||
| Associated Materials, Inc., Gtd. Notes |
||||||||
| 9.75%, 04/15/12 |
B3 | $ | 1,125 | $ | 1,262,813 | |||
| Associated Materials, Inc., Sr. Disc. Notes, Zero Coupon (until 03/01/09) |
||||||||
| 11.25%, 03/01/14 |
Caa2 | 2,650 | 1,921,250 | |||||
| Culligan Finance Corp. BV, Sr. Notes (Netherlands) |
||||||||
| 8.00%, 10/01/14 144A(cost $1,395,131; purchased 09/21/04)(g) |
B3 | EUR | 1,125 | 1,613,259 | ||||
| 8.00%, 10/01/14 144A(cost $155,028; purchased 09/21/04)(g) |
B3 | EUR | 125 | 179,251 | ||||
| Erico International Corp., Sr. Sub. Notes |
||||||||
| 8.875%, 03/01/12 |
B3 | 1,875 | 1,978,125 | |||||
| FIMEP SA, Sr. Notes (France) |
||||||||
| 10.50%, 02/15/13(l) |
B1 | 3,500 | 4,165,000 | |||||
| Goodman Global Holdings, Sr. Sub. Notes |
||||||||
| 7.875%, 12/15/12 144A(cost $625,000; purchased 12/15/04)(g) |
Caa1 | 625 | 621,875 | |||||
| Grohe Holding GMBH, Sr. Notes (Germany) |
||||||||
| 8.625%, 10/01/14 |
B3 | EUR | 5,000 | 7,339,949 | ||||
| Norcraft Cos. LLC, Sr. Sub. Notes |
||||||||
| 9.00%, 11/01/11 |
B3 | 1,350 | 1,464,750 | |||||
| Norcraft Holdings, Sr. Disc. Notes, Zero Coupon (until 09/01/08) |
||||||||
| 9.75%, 09/01/12 |
Caa1 | 750 | 566,250 | |||||
| Nortek, Inc., Sr. Sub. Notes |
||||||||
| 8.50%, 09/01/14 144A |
B3 | $ | 2,000 | 2,100,000 | ||||
| Sanitec International SA, Sr. Notes (Luxembourg) |
||||||||
| 9.00%, 05/15/12 |
B3 | EUR | 2,000 | 3,044,719 | ||||
| 26,893,804 | ||||||||
| CAPITAL GOODS — OTHERS — 0.7% |
||||||||
| Altra Industrial Motion, Sec’d. Notes |
||||||||
| 9.00%, 12/01/11 144A (cost $883,750; purchased 11/22/04-12/21/04)(g) |
B3 | 875 | 892,500 | |||||
| Columbus Mckinnon Corp., Sec’d. Notes |
||||||||
| 10.00%, 08/01/10 |
B3 | 425 | 480,250 | |||||
| Mueller Group, Inc., Sr. Sub. Notes. |
||||||||
| 10.00%, 05/01/12 |
Caa1 | 1,525 | 1,669,875 | |||||
| Rexnord Corp., Gtd. Notes |
||||||||
| 10.125%, 12/15/12 |
B3 | 2,700 | 3,064,500 | |||||
| 6,107,125 | ||||||||
| CHEMICALS — 9.0% |
||||||||
| Avecia Group, Gtd. Notes (United Kingdom) |
||||||||
| 11.00%, 07/01/09(l) |
Caa3 | 750 | 776,250 | |||||
| BCP Caylux Holdings LUX SCA, Sr. Sub. Notes (Luxembourg) |
||||||||
| 9.625%, 06/15/14 144A(l) |
B2 | 4,000 | 4,530,000 | |||||
| Borden US Financial/ Nova Scotia, Sec’d. Notes |
||||||||
| 9.00%, 07/15/14 144A |
B3 | 1,000 | 1,115,000 | |||||
| Compass Minerals Group, Inc., Gtd. Notes |
||||||||
| 10.00%, 08/15/11 |
B3 | 1,625 | 1,836,250 | |||||
208
AST GOLDMAN SACHS HIGH YIELD PORTFOLIO
SCHEDULE OF INVESTMENTS (CONTINUED)
DECEMBER 31, 2004
| MOODY’S RATING (UNAUDITED) |
PRINCIPAL AMOUNT (000) |
VALUE (NOTE 2) | |||||||
| Compass Minerals International, Inc., Sr. Disc. Notes, Zero Coupon (until 06/01/08) |
|||||||||
| 12.00%, 06/01/13 |
B- | (d) | $ | 3,950 | $ | 3,219,250 | |||
| Compass Minerals International, Inc., Sr. Notes, Zero Coupon (until 12/15/07) |
|||||||||
| 12.75%, 12/15/12 |
B- | (d) | 1,900 | 1,634,000 | |||||
| Crompton Corp., Sr. Notes |
|||||||||
| 9.875%, 08/01/12 144A |
B1 | 875 | 1,006,250 | ||||||
| Crystal US Holdings, Sr. Disc. Notes, Zero Coupon (until 10/01/09) |
|||||||||
| 10.50%, 10/01/14 144A (cost $2,515,994; purchased 10/05/04 - 10/28/04)(g) |
Caa2 | 4,000 | 2,760,000 | ||||||
| Dynea International Oy Co., Gtd. Notes (Finland) |
|||||||||
| 12.25%, 08/15/10 |
Caa2 | EUR | 1,875 | 2,625,051 | |||||
| Equistar Chemical L.P., Gtd. Notes |
|||||||||
| 10.125%, 09/01/08 |
B2 | 2,100 | 2,430,750 | ||||||
| FMC Corp., Sec’d. Notes |
|||||||||
| 10.25%, 11/01/09 |
Ba2 | 1,000 | 1,152,500 | ||||||
| FMC Corp., Sr. Sub. Notes |
|||||||||
| 7.75%, 07/01/11 |
Ba2 | 275 | 292,188 | ||||||
| HMP Equity Holdings Corp., Sr. Disc. Notes, 05/15/08 |
CCC+ | (d) | 2,000 | 1,332,500 | |||||
| Huntsman Advanced Materials, Inc., Sec’d. Notes |
|||||||||
| 11.00%, 07/15/10 144A |
B2 | 1,975 | 2,360,125 | ||||||
| Huntsman ICI Chemicals LLC, Gtd. Notes |
|||||||||
| 10.125%, 07/01/09 |
B2 | 2,383 | 2,520,023 | ||||||
| Huntsman International LLC, Sr. Sub. Notes (Luxembourg) |
|||||||||
| 10.125%, 07/01/09 |
Caa1 | EUR $ | 2,000 | 2,888,406 | |||||
| Huntsman LLC Co., Gtd. Notes |
|||||||||
| 11.625%, 10/15/10 |
B2 | 1,500 | 1,781,250 | ||||||
| Invista Co., Notes |
|||||||||
| 9.25%, 05/01/12 144A |
B1 | 3,500 | 3,920,000 | ||||||
| Kranton Polymers LLC, Sr. Sub. Notes |
|||||||||
| 8.125%, 01/15/14 144A |
B3 | 2,500 | 2,618,750 | ||||||
| LBC Luxembourg Holdings SA, Gtd. Notes (Luxembourg) |
|||||||||
| 11.00%, 05/15/14 |
Caa1 | EUR | 1,375 | 2,074,555 | |||||
| Lyondell Chemical Co., Gtd. Notes |
|||||||||
| 9.50%, 12/15/08 |
B1 | 3,000 | 3,270,000 | ||||||
| 10.875%, 05/01/09 |
B3 | 2,500 | 2,656,250 | ||||||
| Lyondell Chemical Co., Sec’d. Notes |
|||||||||
| 9.875%, 05/01/07 |
B1 | 298 | 313,645 | ||||||
| Rhodia SA, Sr. Notes (France) |
|||||||||
| 7.625%, 06/01/10(l) |
B3 | 550 | 554,125 | ||||||
| 10.25%, 06/01/10(l) |
B3 | 1,750 | 1,977,500 | ||||||
| Rhodia SA, Sr. Sub. Notes (France) |
|||||||||
| 8.875%, 06/01/11(l) |
Caa1 | 2,000 | 2,025,000 | ||||||
| 9.25%, 06/01/11(l) |
Caa1 | 4,250 | 5,935,673 | ||||||
| Rockwood Specialties, Inc., Sr. Sub. Notes |
|||||||||
| 10.625%, 05/15/11 |
B3 | 2,375 | 2,743,125 | ||||||
| 7.625%, 11/15/14 144A (cost $5,322,991; purchased 11/05/04-12/13/04)(g) |
B3 | 4,000 | 5,606,904 | ||||||
209
AST GOLDMAN SACHS HIGH YIELD PORTFOLIO
SCHEDULE OF INVESTMENTS (CONTINUED)
DECEMBER 31, 2004
| MOODY’S RATING (UNAUDITED) |
PRINCIPAL AMOUNT (000) |
VALUE (NOTE 2) | ||||||
| United Agricultural Products Holding Corp., Sr. Disc. Notes, Zero Coupon (until 01/15/08) |
||||||||
| 10.75%, 07/15/12 144A |
B3 | $ | 3,250 | $ | 2,567,500 | |||
| United Agricultural Products Holding Corp., Sr. Notes |
||||||||
| 8.25%, 12/15/11 144A |
B3 | 655 | 705,763 | |||||
| 71,228,583 | ||||||||
| CONGLOMERATES — 2.8% |
||||||||
| Amsted Industries, Inc., Sr. Notes |
||||||||
| 10.25%, 10/15/11 144A |
B3 | 1,500 | 1,702,500 | |||||
| Blount, Inc., Sr. Sub. Notes |
||||||||
| 8.875%, 08/01/12 |
Caa1 | 1,375 | 1,498,750 | |||||
| Bombardier, Inc., Notes (Canada) |
||||||||
| 6.75%, 05/01/12 144A(l) |
Ba2 | 5,000 | 4,612,500 | |||||
| Eagle Picher Industries, Inc., Sr. Notes |
||||||||
| 9.75%, 09/01/13 |
B3 | 2,000 | 2,010,000 | |||||
| Invensys PLC, Sr. Notes (United Kingdom) |
||||||||
| 9.875%, 03/15/11 144A(l) |
B3 | 3,000 | 3,240,000 | |||||
| Mark IV Industries, Inc., Sr. Sub. Notes |
||||||||
| 7.50%, 09/01/07 |
Caa1 | 2,750 | 2,695,000 | |||||
| Noma Luxembourg SA, Sr. Notes (Luxembourg) |
||||||||
| 9.75%, 07/15/11 |
B3 | EUR | 1,500 | 2,039,140 | ||||
| Park-Ohio Industries, Inc., Sr. Sub. Notes |
||||||||
| 8.375%, 11/15/14 144A |
Caa1 | 1,500 | 1,507,500 | |||||
| Polypore, Inc., Sr. Disc. Notes, Zero Coupon (until 10/01/08) |
||||||||
| 10.50%, 10/01/12 144A (cost $802,918; Purchased 12/02/04-12/20/04)(g) |
Caa2 | $ | 1,250 | 806,250 | ||||
| Polypore, Inc., Sr. Sub. Notes |
||||||||
| 8.75%, 05/15/12 |
Caa1 | 1,000 | 1,050,000 | |||||
| 8.75%, 05/15/12 |
Caa1 | 750 | 1,062,763 | |||||
| 22,224,403 | ||||||||
| CONSUMER CYCLICAL — SERVICES — 1.4% |
||||||||
| Brand Services, Inc., Gtd. Notes |
||||||||
| 12.00%, 10/15/12 |
B3 | 1,625 | 1,828,125 | |||||
| Brickman Group Ltd., Gtd. Notes, Series B |
||||||||
| 11.75%, 12/15/09 |
B2 | 2,000 | 2,350,000 | |||||
| Interline Brands, Inc., Sr. Sub. Notes |
||||||||
| 11.50%, 05/15/11 |
Caa1 | 1,750 | 1,977,500 | |||||
| United Rentals NA, Inc., Sr. Notes |
||||||||
| 7.75%, 11/15/13 |
B2 | 4,000 | 3,940,000 | |||||
| Williams Scotsman, Inc., Gtd. Notes |
||||||||
| 9.875%, 06/01/07 |
B3 | 1,250 | 1,256,250 | |||||
| 11,351,875 | ||||||||
| CONSUMER PRODUCTS — 6.0% |
||||||||
| Aearo Co., Sr. Sub. Notes |
||||||||
| 8.25%, 04/15/12 |
B3 | 1,125 | 1,164,375 | |||||
| Alltrista Corp., Gtd. Notes |
||||||||
| 9.75%, 05/01/12 |
B2 | 1,500 | 1,672,500 | |||||
| Ames True Temper, Inc., Sr. Sub. Notes |
||||||||
| 10.00%, 07/15/12 |
Caa1 | 1,500 | 1,545,000 | |||||
| Bombardier Recreational, Sr. Sub. Notes (Canada) |
||||||||
| 8.375%, 12/15/13(l) |
B3 | 1,000 | 1,072,500 | |||||
| Briggs & Stratton Corp., Gtd. Notes |
||||||||
| 8.875%, 03/15/11 |
Ba1 | 2,125 | 2,565,938 | |||||
210
AST GOLDMAN SACHS HIGH YIELD PORTFOLIO
SCHEDULE OF INVESTMENTS (CONTINUED)
DECEMBER 31, 2004
| MOODY’S RATING (UNAUDITED) |
PRINCIPAL (000) |
VALUE (NOTE 2) | ||||||
| Chattem, Inc., Sr. Sub. Notes |
||||||||
| 7.00%, 03/01/14 |
B2 | $ | 1,500 | $ | 1,552,500 | |||
| FTD, Inc., Gtd. Notes |
||||||||
| 7.75%, 02/15/14 |
B3 | 1,950 | 2,018,250 | |||||
| Johnsondiversey Holdings, Inc., Disc. Notes, Zero Coupon (until 05/15/07) |
||||||||
| 10.67%, 05/15/13 |
B3 | 1,625 | 1,413,750 | |||||
| Jostens Holding Corp., Sr. Disc. Notes, Zero Coupon (until 12/01/08) |
||||||||
| 10.25%, 12/01/13 |
Caa2 | 4,500 | 3,217,499 | |||||
| Jostens IH Corp., Sr. Sub. Notes |
||||||||
| 7.625%, 10/01/12 144A |
B3 | 2,625 | 2,743,125 | |||||
| Leiner Health Products, Sr. Sub. Notes |
||||||||
| 11.00%, 06/01/12 |
B3 | 750 | 823,125 | |||||
| Norcross Safety Products, Sr. Sub. Notes |
||||||||
| 9.875%, 08/15/11 |
B3 | 1,500 | 1,665,000 | |||||
| NSP Holdings Capital Corp., Sr. Notes |
||||||||
| 11.75%, 01/01/12 144A(cost $500,000; purchased 12/16/04)(g) |
Caa1 | 500 | 507,500 | |||||
| Playtex Products, Inc., Gtd. Notes |
||||||||
| 9.375%, 06/01/11 |
Caa1 | 2,875 | 3,083,438 | |||||
| Prestige Brands, Inc., Sr. Sub. Notes |
||||||||
| 9.25%, 04/15/12 144A |
Caa1 | 1,625 | 1,734,688 | |||||
| Rayovac Corp., Sr. Sub. Notes |
||||||||
| 8.50%, 10/01/13 |
B3 | 1,625 | 1,811,875 | |||||
| Reddy Ice Group, Inc., Sr. Sub. Notes |
||||||||
| 8.875%, 08/01/11 |
B3 | 2,150 | 2,332,750 | |||||
| Safilo Capital International SA, Sr. Notes (Luxembourg) |
||||||||
| 9.625%, 05/15/13 |
Caa2 | EUR | 5,500 | 7,681,459 | ||||
| Sealy Mattress Co., Sr. Sub. Notes |
||||||||
| 8.25%, 06/15/14 |
Caa1 | $ | 1,750 | 1,863,750 | ||||
| Simmons Co., Sr. Disc. Notes, Zero Coupon (until 01/01/10) |
||||||||
| 9.625%, 12/15/14 144A (cost $848,153; purchased 12/10/04)(g) |
Caa2 | 1,375 | 845,625 | |||||
| Sleepmaster LLC, Gtd. Notes |
||||||||
| 11.00%, 05/15/09(i) (cost $896,931; purchased 11/15/02)(g) |
NR | 1,000 | 272,500 | |||||
| Solo Cup Co., Sr. Sub. Notes |
||||||||
| 8.50%, 02/15/14 |
B3 | 1,500 | 1,567,500 | |||||
| True Temper Sports, Inc., Sr. Sub. Notes |
||||||||
| 8.375%, 09/15/11 |
B3 | 425 | 397,375 | |||||
| United Industries Corp., Gtd. Notes, Series D |
||||||||
| 9.875%, 04/01/09 |
B3 | 2,575 | 2,706,969 | |||||
| WH Holdings Ltd., Sr. Notes |
||||||||
| 9.50%, 04/01/11 |
B3 | 2,000 | 2,210,000 | |||||
| 48,468,991 | ||||||||
| DEFENSE — 0.9% |
||||||||
| Alliant Techsystems, Inc., Gtd. Notes |
||||||||
| 8.50%, 05/15/11 |
B2 | 2,000 | 2,200,000 | |||||
| Communications & Power Industry, Sr. Sub. Notes |
||||||||
| 8.00%, 02/01/12 |
B3 | 1,500 | 1,597,500 | |||||
| DRS Technologies, Inc., Sr. Sub. Notes |
||||||||
| 6.875%, 11/01/13 |
B2 | 1,300 | 1,365,000 | |||||
| L-3 Communications Corp., Gtd. Notes |
||||||||
| 6.125%, 07/15/13 |
Ba3 | 2,000 | 2,075,000 | |||||
| 7,237,500 | ||||||||
211
AST GOLDMAN SACHS HIGH YIELD PORTFOLIO
SCHEDULE OF INVESTMENTS (CONTINUED)
DECEMBER 31, 2004
| MOODY’S RATING (UNAUDITED) |
PRINCIPAL (000) |
VALUE (NOTE 2) | |||||||
| ELECTRIC — 3.6% |
|||||||||
| AES Corp., Sr. Notes |
|||||||||
| 9.50%, 06/01/09 |
B2 | $ | 1,000 | $ | 1,142,500 | ||||
| Allegheny Energy Supply Co. LLC, Notes |
|||||||||
| 8.25%, 04/15/12 144A |
B3 | 2,000 | 2,245,000 | ||||||
| Caithness Coso Funding Corp., Sec’d. Notes |
|||||||||
| 9.05%, 12/15/09 |
Ba2 | 2,447 | 2,703,837 | ||||||
| Calpine Canada Energy Finance Corp., Gtd. Notes (Canada) |
|||||||||
| 8.50%, 05/01/08(l) |
Caa1 | 4,225 | 3,485,625 | ||||||
| Calpine Corp., Sec’d. Notes |
|||||||||
| 8.75%, 07/15/13 144A |
B | (d) | 1,000 | 830,000 | |||||
| Calpine Corp., Sr. Notes |
|||||||||
| 8.50%, 02/15/11 |
Caa1 | 1,900 | 1,458,250 | ||||||
| CMS Energy Corp., Sr. Notes |
|||||||||
| 8.90%, 07/15/08 |
B3 | 1,250 | 1,385,938 | ||||||
| 8.50%, 04/15/11 |
B3 | 1,000 | 1,141,250 | ||||||
| Dynegy Holdings, Inc., Sec’d. Notes |
|||||||||
| 10.125%, 07/15/13 144A |
B3 | 1,500 | 1,725,000 | ||||||
| Dynegy Holdings, Inc., Sr. Notes |
|||||||||
| 8.75%, 02/15/12 |
Caa2 | 2,000 | 2,105,000 | ||||||
| Midwest Generation LLC, Notes |
|||||||||
| 8.75%, 05/01/34 |
B1 | 5,500 | 6,269,999 | ||||||
| NRG Energy, Inc., Sec’d. Notes |
|||||||||
| 8.00%, 12/15/13 144A |
B2 | 2,250 | 2,463,750 | ||||||
| Reliant Resource, Inc., Sec’d. Notes |
|||||||||
| 9.25%, 07/15/10 |
B1 | 1,000 | 1,120,000 | ||||||
| 9.50%, 07/15/13 |
B1 | 750 | 855,938 | ||||||
| 28,932,087 | |||||||||
| ENERGY — 1.9% |
|||||||||
| El Paso Production Holding Co., Gtd. Notes |
|||||||||
| 7.75%, 06/01/13 |
B3 | 3,275 | 3,446,938 | ||||||
| Evergreen Resources, Inc., Sr. Sub. Notes |
|||||||||
| 5.875%, 03/15/12 |
Ba3 | 350 | 366,110 | ||||||
| Foundation PA Coal Co., Sr. Notes |
|||||||||
| 7.25%, 08/01/14 144A |
B1 | 1,750 | 1,872,500 | ||||||
| Inergy L.P. Finance, Sr. Notes |
|||||||||
| 6.875%, 12/15/14 144A (cost $1,000,835; purchased 12/17/04)(g) |
B1 | 1,000 | 1,010,000 | ||||||
| Key Energy Services, Inc., Sr. Notes |
|||||||||
| 6.375%, 05/01/13 |
Ba2 | 1,000 | 1,022,500 | ||||||
| Pride International, Inc., Sr. Notes |
|||||||||
| 7.375%, 07/15/14 |
Ba2 | 1,500 | 1,646,250 | ||||||
| Magnum Hunter Resources, Inc., Gtd. Notes |
|||||||||
| 9.60%, 03/15/12 |
B2 | 715 | 815,100 | ||||||
| Swift Energy Co., Sr. Sub. Notes |
|||||||||
| 9.375%, 05/01/12 |
B3 | 2,675 | 3,009,375 | ||||||
| Tesoro Petroleum Corp., Gtd. Notes, Series B |
|||||||||
| 9.625%, 11/01/08 |
B3 | 2,275 | 2,491,125 | ||||||
| 15,679,898 | |||||||||
| ENTERTAINMENT — 1.7% |
|||||||||
| AMC Entertainment, Inc., Sr. Sub. Notes |
|||||||||
| 9.875%, 02/01/12 |
Caa1 | 1,625 | 1,779,375 | ||||||
| Six Flags, Inc., Sr. Notes |
|||||||||
| 9.75%, 04/15/13 |
B2 | 1,875 | 1,912,500 | ||||||
| Universal City Development Partners Ltd., Sr. Notes |
|||||||||
| 11.75%, 04/01/10 |
B2 | 4,000 | 4,745,000 | ||||||
212
AST GOLDMAN SACHS HIGH YIELD PORTFOLIO
SCHEDULE OF INVESTMENTS (CONTINUED)
DECEMBER 31, 2004
| MOODY’S RATING (UNAUDITED) |
PRINCIPAL AMOUNT (000) |
VALUE (NOTE 2) | ||||||
| Warner Music Group, Sr. Sub. Notes |
||||||||
| 7.375%, 04/15/14 144A |
B3 | $ | 2,000 | $ | 2,060,000 | |||
| WMG Holdings Corp., Sr. Disc. Notes, Zero Coupon (until 12/15/09) |
Caa2 | 3,500 | 2,253,125 | |||||
| 9.50%, 06/15/05 144A (cost $2,238,841; purchased 12/17/04–12/23/04)(g) |
||||||||
| WMG Holdings Corp., Sr. Notes |
||||||||
| 6.905%, 03/15/05 144A(c) (cost $1,010,000; purchased 12/23/04)(g) |
Caa2 | 1,000 | 1,012,500 | |||||
| 13,762,500 | ||||||||
| ENVIRONMENTAL — 0.9% |
||||||||
| Allied Waste North America Co., Gtd. Notes, Series B |
||||||||
| 9.25%, 09/01/12 |
Ba3 | 4,000 | 4,350,000 | |||||
| Allied Waste North America, Sec’d. Notes |
||||||||
| 6.125%, 02/15/14 |
Ba3 | 2,000 | 1,890,000 | |||||
| Waste Services, Inc., Sr. Sub. Notes |
||||||||
| 9.50%, 04/15/14 144A (cost $1,017,500; purchased 05/04/04)(g) |
Caa1 | 1,000 | 1,000,000 | |||||
| 7,240,000 | ||||||||
| FINANCE — 0.5% |
||||||||
| Refco Finance Holdings LLC, Sr. Sub. Notes |
||||||||
| 9.00%, 08/01/12 144A |
B3 | 4,000 | 4,400,000 | |||||
| FOOD — 4.7% |
||||||||
| American Seafood Group LLC, Gtd. Notes |
||||||||
| 10.125%, 04/15/10 |
B3 | 3,225 | 3,466,875 | |||||
| Del Monte Corp., Gtd. Notes, Series B |
||||||||
| 9.25%, 05/15/11 |
B2 | 2,625 | 2,887,500 | |||||
| Dole Foods Co., Inc., Gtd. Notes |
||||||||
| 7.25%, 06/15/10 |
B2 | 1,000 | 1,032,500 | |||||
| Dole Foods Co., Inc., Sr. Notes |
||||||||
| 8.625%, 05/01/09 |
B2 | 4,000 | 4,370,000 | |||||
| Dominos, Inc., Sr. Sub. Notes |
||||||||
| 8.25%, 07/01/11 |
B3 | 602 | 660,695 | |||||
| Eagle Family Foods, Inc., Gtd. Notes, Series B |
||||||||
| 8.75%, 01/15/08 |
Caa2 | 2,200 | 1,705,000 | |||||
| Land O Lakes, Inc., Sec’d. Notes |
||||||||
| 9.00%, 12/15/10 |
B2 | 750 | 825,000 | |||||
| Land O’ Lakes, Inc., Sr. Notes |
||||||||
| 8.75%, 11/15/11 |
B3 | 2,250 | 2,250,000 | |||||
| Landry’s Restaurants, Inc., Sr. Notes |
||||||||
| 7.50%, 12/15/14 144A (cost $3,124,688; purchased 12/15/04- 12/20/04)(g) |
B2 | 3,125 | 3,117,188 | |||||
| Michael Foods, Sr. Sub. Notes |
||||||||
| 8.00%, 11/15/13 |
B3 | 1,450 | 1,537,000 | |||||
| National Beef Packaging Co., Sr. Notes |
||||||||
| 10.50%, 08/01/11 |
B2 | 1,025 | 1,081,375 | |||||
| Pilgrim’s Pride Corp., Gtd. Notes |
||||||||
| 9.625%, 09/15/11 |
B1 | 2,200 | 2,486,000 | |||||
| Pilgrim’s Pride Corp., Sr. Sub. Notes |
||||||||
| 9.25%, 11/15/13 |
B2 | 2,250 | 2,531,250 | |||||
| Pinnacle Foods Holding Corp., Sr. Sub. Notes |
||||||||
| 8.25%, 12/01/13 144A (cost $919,581; purchased 11/09/04)(g) |
B3 | 1,000 | 957,500 | |||||
| 8.25%, 12/01/13 144A |
B3 | 1,000 | 957,500 | |||||
213
AST GOLDMAN SACHS HIGH YIELD PORTFOLIO
SCHEDULE OF INVESTMENTS (CONTINUED)
DECEMBER 31, 2004
| MOODY’S RATING (UNAUDITED) |
PRINCIPAL AMOUNT (000) |
VALUE (NOTE 2) | ||||||
| Smithfield Foods, Inc., Sr. Notes |
||||||||
| 8.00%, 10/15/09 |
Ba2 | $ | 1,600 | $ | 1,780,000 | |||
| 7.75%, 05/15/13 |
Ba2 | 1,000 | 1,117,500 | |||||
| Swift & Co., Gtd. Notes |
||||||||
| 10.125%, 10/01/09 |
B1 | 1,250 | 1,400,000 | |||||
| Swift & Co., Sr. Sub. Notes |
||||||||
| 12.50%, 01/01/10 |
B2 | 1,950 | 2,213,250 | |||||
| United Biscuits, Co., Gtd. Notes (United Kingdom) |
||||||||
| 10.625%, 04/15/11 |
B1 | EUR | 750 | 1,090,798 | ||||
| 37,466,931 | ||||||||
| GAMING — 6.2% |
||||||||
| Boyd Gaming Corp., Sr. Sub. Notes |
||||||||
| 8.75%, 04/15/12 |
B1 | 3,000 | 3,352,500 | |||||
| Global Cash Account/Finance Corp., Sr. Sub. Notes |
||||||||
| 8.75%, 03/15/12 |
Caa1 | 950 | 1,028,375 | |||||
| Herbst Gaming, Inc., Sr. Sub. Notes |
||||||||
| 7.00%, 11/15/14 144A (cost $1,513,350; purchased 11/05/04)(g) |
B3 | 1,500 | 1,526,250 | |||||
| Isle of Capri Casinos, Inc., Gtd. Notes |
||||||||
| 9.00%, 03/15/12 |
B2 | 1,400 | 1,550,500 | |||||
| Isle of Capri Casinos, Inc., Sr. Sub. Notes |
||||||||
| 7.00%, 03/01/14 |
B2 | 675 | 691,875 | |||||
| Mandalay Resort Group, Sr. Notes |
||||||||
| 9.50%, 08/01/08 |
Ba2 | 1,500 | 1,721,250 | |||||
| Mandalay Resort Group, Sr. Sub. Notes |
||||||||
| 10.25%, 08/01/07 |
Ba3 | 425 | 482,375 | |||||
| 9.375%, 02/15/10 |
Ba3 | 4,550 | 5,323,500 | |||||
| MGM Grand, Inc., Gtd. Notes |
||||||||
| 8.375%, 02/01/11 |
Ba2 | 5,900 | 6,681,749 | |||||
| MGM Mirage, Inc., Sr. Notes |
||||||||
| 5.875%, 02/27/14 |
Ba1 | $ | 3,000 | 2,962,500 | ||||
| Mohegan Tribal Gaming Authority, Sr. Sub. Notes |
||||||||
| 8.00%, 04/01/12 |
Ba3 | 1,100 | 1,199,000 | |||||
| MTR Gaming Group, Inc., Gtd. Notes, Series B |
||||||||
| 9.75%, 04/01/10 |
B2 | 2,350 | 2,596,750 | |||||
| Park Place Entertainment Corp., Sr. Sub. Notes |
||||||||
| 7.875%, 03/15/10 |
Ba2 | 4,000 | 4,525,000 | |||||
| Penn National Gaming, Inc., Gtd. Notes, Series B |
||||||||
| 11.125%, 03/01/08 |
B2 | 1,850 | 1,984,125 | |||||
| Pinnacle Entertainment, Inc., Sr. Sub. Notes |
||||||||
| 8.25%, 03/15/12 |
Caa1 | 1,000 | 1,067,500 | |||||
| River Rock Entertainment, Sr. Notes |
||||||||
| 9.75%, 11/01/11 |
B2 | 950 | 1,069,938 | |||||
| Seneca Gaming Corp., Sr. Notes |
||||||||
| 7.25%, 05/01/12 |
B2 | 750 | 793,125 | |||||
| Station Casinos, Inc., Sr. Sub. Notes |
||||||||
| 6.875%, 03/01/16 |
B1 | 2,250 | 2,354,063 | |||||
| Sun International Hotels Ltd., Gtd. Notes |
||||||||
| 8.875%, 08/15/11 |
B2 | 2,750 | 3,018,125 | |||||
| Venetian Casino/LV Sands, Gtd. Notes |
||||||||
| 11.00%, 06/15/10 |
B2 | 2,000 | 2,292,500 | |||||
| Wynn Las Vegas, LLC Corp., First Mortgage |
||||||||
| 6.625%, 12/01/14 144A |
B2 | 4,000 | 3,980,000 | |||||
| 50,201,000 | ||||||||
214
AST GOLDMAN SACHS HIGH YIELD PORTFOLIO
SCHEDULE OF INVESTMENTS (CONTINUED)
DECEMBER 31, 2004
| MOODY’S RATING (UNAUDITED) |
PRINCIPAL AMOUNT (000) |
VALUE (NOTE 2) | ||||||
| HEALTH CARE — 3.4% |
||||||||
| Alliance Imaging, Sr. Sub. Notes |
||||||||
| 7.25%, 12/15/12 144A (cost $1,002,020; purchased 12/09/04)(g) |
B3 | $ | 1,000 | $ | 1,022,500 | |||
| AmeriPath, Inc., Gtd. Notes |
||||||||
| 10.50%, 04/01/13 |
Caa1 | 2,375 | 2,535,313 | |||||
| CDRV Investors, Inc., Sr. Disc. Notes, Zero Coupon (until 01/01/10) |
||||||||
| 9.625%, 01/01/15 144A (cost $2,782,114; purchased 12/08/04)(g) |
Caa2 | 4,500 | 2,818,125 | |||||
| Concentra Operating Corp., Gtd. Notes |
||||||||
| 9.50%, 08/15/10 |
B3 | 600 | 681,000 | |||||
| Fisher Scientific International, Inc., Sr. Sub. Notes |
||||||||
| 8.00%, 09/01/13 |
B2 | 4,200 | 4,788,000 | |||||
| Medical Device Manufacturing, Inc., Sr. Sub. Debs. |
||||||||
| 10.00%, 07/15/12 144A |
Caa1 | 1,500 | 1,623,750 | |||||
| Nyco Holdings, Sr. Notes (Denmark) |
||||||||
| 11.50%, 03/31/13 |
B3 | EUR | 750 | 1,208,033 | ||||
| Quintiles Transnational Corp., Sr. Sub. |
||||||||
| 10.00%, 10/01/13 |
B3 | 2,000 | 2,250,000 | |||||
| Sybron Dental Specialties, Inc., Gtd. Notes |
||||||||
| 8.125%, 06/15/12 |
B2 | 1,625 | 1,779,375 | |||||
| Tenet Healthcare Corp., Notes |
||||||||
| 7.375%, 02/01/13 |
B1 | 1,750 | 1,706,250 | |||||
| Tenet Healthcare Corp., Sr. Notes |
||||||||
| 9.875%, 07/01/14 144A |
B3 | 1,500 | 1,642,500 | |||||
| US Oncology, Inc., Sr. Notes |
||||||||
| 9.00%, 08/15/12 144A |
B2 | $ | 1,750 | 1,964,375 | ||||
| Vanguard Health Holdings II, Sr. Sub. Notes |
||||||||
| 9.00%, 10/01/14 144A |
Caa1 | 1,500 | 1,612,500 | |||||
| VWR International, Inc., Sr. Sub. Notes (Germany) |
||||||||
| 8.00%, 04/15/14 144A(l) (cost $1,256,250; purchased 04/07/04-06/02/04)(g) |
B3 | 1,250 | 1,340,625 | |||||
| 26,972,346 | ||||||||
| LODGING — 1.3% |
||||||||
| Cornell Cos., Inc., Sr. Notes |
||||||||
| 10.75%, 07/01/12 |
B3 | 1,000 | 1,075,000 | |||||
| Gaylord Entertainment Co., Sr. Notes |
||||||||
| 6.75%, 11/15/14 144A |
B3 | 1,000 | 1,010,000 | |||||
| HMH Properties, Inc., Gtd. Notes, Series B |
||||||||
| 7.875%, 08/01/08 |
Ba3 | 928 | 958,160 | |||||
| Host Marriott L.P., Sr. Notes |
||||||||
| 7.00%, 08/15/12 144A |
Ba3 | 1,500 | 1,593,750 | |||||
| Starwood Hotels & Resorts Worldwide, Inc., Gtd. Notes |
||||||||
| 7.375%, 05/01/07 |
Ba1 | 4,125 | 4,418,906 | |||||
| 7.875%, 05/01/12 |
Ba1 | 1,500 | 1,721,250 | |||||
| 10,777,066 | ||||||||
215
AST GOLDMAN SACHS HIGH YIELD PORTFOLIO
SCHEDULE OF INVESTMENTS (CONTINUED)
DECEMBER 31, 2004
| MOODY’S RATING (UNAUDITED) |
PRINCIPAL AMOUNT (000) |
VALUE (NOTE 2) | ||||||
| MEDIA — BROADCAST TOWERS — 0.7% |
||||||||
| American Tower Corp., Sr. Notes |
||||||||
| 7.125%, 10/15/12 144A (cost $506,250; purchased 11/29/04)(g) |
Caa1 | $ | 500 | $ | 513,750 | |||
| 7.50%, 05/01/12 |
Caa1 | 2,000 | 2,110,000 | |||||
| Crown Castle International Corp., Sr. Notes |
||||||||
| 7.50%, 12/01/13 |
B3 | 3,000 | 3,240,000 | |||||
| 5,863,750 | ||||||||
| MEDIA — BROADCASTING & RADIO — 0.7% |
||||||||
| Sinclair Broadcasting Group, Inc., Gtd. |
||||||||
| 8.00%, 03/15/12 |
B2 | 3,650 | 3,896,375 | |||||
| XM Satellite Radio, Inc., Sec’d. Notes, Zero Coupon (until 12/31/05) |
||||||||
| 14.00%, 12/31/09 |
Caa1 | 1,782 | 1,826,977 | |||||
| 5,723,352 | ||||||||
| MEDIA — CABLE — 5.3% |
||||||||
| Adelphia Communications Corp., Sr. Notes |
||||||||
| 10.25%, 06/15/11 (cost $2,500,000; purchased 07/14/04-12/23/04)(g)(i) |
NR | 2,500 | 2,543,750 | |||||
| Cablevision Systems Corp. Holdings, Inc., Sr. Notes |
||||||||
| 7.875%, 12/15/07 |
B1 | 2,000 | 2,155,000 | |||||
| 8.125%, 07/15/09 |
B1 | 2,200 | 2,417,250 | |||||
| Cablevision Systems Corp., Sr. Notes |
||||||||
| 8.00%, 04/15/12 144A |
B3 | 3,000 | 3,217,500 | |||||
| Charter Communications Holdings LLC, Sr. Disc. Notes, Zero Coupon (until 05/15/06) |
||||||||
| 11.75%, 05/15/11 |
Ca | 4,950 | 3,663,000 | |||||
| Charter Communications Holdings LLC, Sr. Notes |
||||||||
| 10.25%, 09/15/10 |
Caa1 | 3,750 | 3,993,750 | |||||
| 10.00%, 05/15/11 |
Ca | 7,000 | 6,019,999 | |||||
| CSC Holdings, Inc., Sr. Sub. Notes |
||||||||
| 10.50%, 05/15/16 |
B2 | 425 | 484,500 | |||||
| Ono Finance PLC, Gtd. Notes (United Kingdom) |
||||||||
| 10.50%, 05/15/14 |
Caa2 | EUR | 2,000 | 3,119,478 | ||||
| 10.50%, 05/15/14 |
Caa2 | EUR | 1,500 | 2,339,609 | ||||
| Rogers Cablesystems Ltd., Gtd. Notes |
||||||||
| 11.00%, 12/01/15 |
Ba3 | 750 | 840,000 | |||||
| Tele Columbus AG & Co., Sr. Notes (Germany) |
||||||||
| 9.375%, 04/15/12 |
B3 | EUR | 1,250 | 1,805,254 | ||||
| Tele Columbus AG & Co., Sr. Sub. Notes (Germany) |
||||||||
| 9.375%, 04/15/12 |
B3 | EUR | 1,500 | 2,166,304 | ||||
| Telenet Communication NV, Sr. Notes (Belgium) |
||||||||
| 9.00%, 12/15/13 |
B3 | EUR | 3,750 | 5,708,849 | ||||
| Telenet Group Holdings NV, Disc. Notes, Zero Coupon (until 12/15/08) (Belgium) |
||||||||
| 11.50%, 06/15/14 144A(l) |
Caa2 | 3,250 | 2,486,250 | |||||
| 42,960,493 | ||||||||
216
AST GOLDMAN SACHS HIGH YIELD PORTFOLIO
SCHEDULE OF INVESTMENTS (CONTINUED)
DECEMBER 31, 2004
| MOODY’S RATING (UNAUDITED) |
PRINCIPAL AMOUNT (000) |
VALUE (NOTE 2) | |||||||
| MEDIA — NON CABLE — 1.2% |
|||||||||
| DIRECTV Holdings LLC, Sr. Notes |
|||||||||
| 8.375%, 03/15/13 |
B1 | $ | 3,000 | $ | 3,378,750 | ||||
| Echostar DBS Corp., Sr. Notes |
|||||||||
| 5.75%, 10/01/08 |
Ba3 | 2,000 | 2,035,000 | ||||||
| Lamar Media Corp., Gtd. Notes |
|||||||||
| 7.25%, 01/01/13 |
Ba3 | 1,525 | 1,654,625 | ||||||
| PanAmSat Corp., Sr. Notes |
|||||||||
| 9.00%, 08/15/14 144A |
B1 | 2,500 | 2,803,125 | ||||||
| 9,871,500 | |||||||||
| METALS — 2.0% |
|||||||||
| AK Steel Corp., Gtd. Notes |
|||||||||
| 7.75%, 06/15/12 |
B3 | 3,000 | 3,105,000 | ||||||
| Almatis Holding BV, Sr. Notes (Netherland) |
|||||||||
| 9.00%, 07/15/12 |
B3 | EUR | 500 | 762,337 | |||||
| Euramax International PLC, Sr. Sub. Notes |
|||||||||
| 8.50%, 08/15/11 |
B2 | 3,000 | 3,217,500 | ||||||
| Neenah Corp., Sec’d. Notes |
|||||||||
| 11.00%, 09/30/10 144A |
B2 | 2,000 | 2,220,000 | ||||||
| OM Group, Inc., Gtd. Notes |
|||||||||
| 9.25%, 12/15/11 |
Caa1 | 2,250 | 2,407,500 | ||||||
| Ryerson Tull, Inc., Notes |
|||||||||
| 9.125%, 07/15/06 |
B1 | 1,900 | 1,947,500 | ||||||
| United States Steel Corp., Sr. Notes |
|||||||||
| 9.75%, 05/15/10 |
B1 | 1,956 | 2,239,620 | ||||||
| 15,899,457 | |||||||||
| PACKAGING — 4.6% |
|||||||||
| Clondalkin Industries BV, Sr. Notes (Netherlands) |
|||||||||
| 8.00%, 03/15/14 |
B3 | EUR | 1,500 | 2,171,401 | |||||
| Consolidated Container Co., Gtd. Notes |
|||||||||
| 10.125%, 07/15/09 |
Caa2 | 1,500 | 1,477,500 | ||||||
| Constar International, Inc., Sr. Sub. Notes |
|||||||||
| 11.00%, 12/01/12 |
Caa1 | $ | 1,000 | 1,042,500 | |||||
| Crown European Holdings SA, Sec’d. Notes (France) |
|||||||||
| 9.50%, 03/01/11(l) |
B1 | 3,000 | 3,435,000 | ||||||
| Crown European Holdings SA, Sec’d. Notes (France) |
|||||||||
| 10.25%, 03/01/11 |
B+ | (d) | EUR | 1,500 | 2,385,483 | ||||
| Graham Packaging Co. Sub. Notes |
|||||||||
| 9.875%, 10/15/14 144A |
Caa2 | 6,500 | 6,971,250 | ||||||
| Graham Packaging International Corp., Sr. Sub. Notes |
|||||||||
| 9.50%, 08/15/13 |
B3 | 3,500 | 3,998,750 | ||||||
| Huntsman Packaging Corp., Gtd. Notes |
|||||||||
| 13.00%, 06/01/10 |
Caa2 | 2,800 | 2,744,000 | ||||||
| Impress Group BV, Sr. Notes (Netherland) |
|||||||||
| 10.50%, 05/25/07 |
B2 | EUR | 1,600 | 2,346,520 | |||||
| Owens-Brockway Glass Container, Inc., Gtd. Notes |
|||||||||
| 8.875%, 02/15/09 |
B2 | 1,150 | 1,254,938 | ||||||
| 8.25%, 05/15/13 |
B3 | 4,500 | 4,972,500 | ||||||
| Owens-Illinois, Inc., Sr. Notes |
|||||||||
| 8.10%, 05/15/07 |
Caa1 | 2,000 | 2,140,000 | ||||||
| Pliant Corp., Sec’d. Notes |
|||||||||
| 11.125%, 09/01/09 |
B3 | 500 | 547,500 | ||||||
| Portola Packaging, Inc., Sr. Notes |
|||||||||
| 8.25%, 02/01/12 |
Caa1 | 500 | 397,500 | ||||||
| Russell Stanley Holdings, Inc., Sr. Sub. Notes |
|||||||||
| 9.00%, 11/30/08 [PIK] 144A (cost $967,227; purchased 02/05/99-11/30/04)(g)(o) |
NR | 341 | 0 | ||||||
217
AST GOLDMAN SACHS HIGH YIELD PORTFOLIO
SCHEDULE OF INVESTMENTS (CONTINUED)
DECEMBER 31, 2004
| MOODY’S RATING (UNAUDITED) |
PRINCIPAL AMOUNT (000) |
VALUE (NOTE 2) | ||||||
| Tekni-Plex, Inc., Gtd. Notes |
||||||||
| 12.75%, 06/15/10 |
B3 | $ | 625 | $ | 596,875 | |||
| Tekni-Plex, Inc., Sec’d. Notes |
||||||||
| 8.75%, 11/15/13 144A (cost $741,330; purchased 11/15/04-12/01/04)(g) |
B2 | 750 | 750,000 | |||||
| 37,231,717 | ||||||||
| PAPER — 2.9% |
||||||||
| Ainsworth Lumber Ltd., Sr. Notes (Canada) |
||||||||
| 7.25%, 10/01/12(l) 144A |
B2 | 1,000 | 1,022,500 | |||||
| Boise Cascade LLC., Sr. Notes |
||||||||
| 7.125%, 10/15/14 144A |
B2 | 1,000 | 1,062,500 | |||||
| Georgia-Pacific Corp., Gtd. Notes |
||||||||
| 9.375%, 02/01/13 |
Ba2 | 7,000 | 8,189,999 | |||||
| Jefferson Smurfit Corp., Gtd. Notes |
||||||||
| 7.50%, 06/01/13 |
B2 | 1,200 | 1,287,000 | |||||
| Jefferson Smurfit Corp., Sr. Notes (Ireland) |
||||||||
| 9.625%, 10/01/12(l) |
B3 | 1,750 | 1,960,000 | |||||
| Jefferson Smurfit Corp., Sub. Notes (Ireland) |
||||||||
| 15.50%, 10/01/13 [PIK](l) |
Caa1 | 2,105 | 2,473,862 | |||||
| JSG Funding PLC, Sr. Notes (Ireland) |
||||||||
| 10.125%, 10/01/12 |
B3 | EUR | 1,000 | 1,549,545 | ||||
| Riverside Forest Products Ltd., Sr. Notes |
||||||||
| 7.875%, 03/01/14 |
B2 | 975 | 1,077,375 | |||||
| Stone Container Finance, Gtd. Notes |
||||||||
| 7.375%, 07/15/14 |
B2 | 500 | 535,000 | |||||
| Stone Container Corp., Sr. Notes |
||||||||
| 9.75%, 02/01/11 |
B2 | $ | 1,500 | 1,650,000 | ||||
| Tembec Industries, Inc., Gtd. Notes |
||||||||
| 8.50%, 02/01/11(l) |
Ba3 | 2,500 | 2,525,000 | |||||
| 23,332,781 | ||||||||
| PIPELINES — 4.0% |
||||||||
| El Paso Corp., Notes |
||||||||
| 7.875%, 06/15/12 |
Caa1 | 6,500 | 6,833,124 | |||||
| El Paso Corp., Sr. Notes |
||||||||
| 6.95%, 12/15/07 |
Caa1 | 1,000 | 1,052,500 | |||||
| 8.05%, 10/15/30 |
Caa1 | 1,575 | 1,531,688 | |||||
| 7.80%, 08/01/31 |
Caa1 | 5,000 | 4,824,999 | |||||
| Pacific Energy Partners L.P., Sr. Notes |
||||||||
| 7.125%, 06/15/14 |
Ba2 | 1,750 | 1,872,500 | |||||
| Southern Natural Gas Co., Notes |
||||||||
| 8.00%, 03/01/32 |
B1 | 750 | 822,188 | |||||
| Tennessee Gas Pipeline Co., Bonds |
||||||||
| 8.375%, 06/15/32 |
B1 | 1,575 | 1,783,688 | |||||
| Tennessee Gas Pipeline Co., Debs. |
||||||||
| 7.50%, 04/01/17 |
B1 | 1,750 | 1,938,125 | |||||
| Transcontinental Gas Pipe Co., Sr. Notes, Series B |
||||||||
| 8.875%, 07/15/12 |
B1 | 1,875 | 2,289,844 | |||||
| Williams Cos., Inc., Notes |
||||||||
| 8.125%, 03/15/12 |
B3 | 2,000 | 2,320,000 | |||||
| 7.625%, 07/15/19 |
B3 | 4,000 | 4,420,000 | |||||
| 7.875%, 09/01/21 |
B3 | 2,000 | 2,240,000 | |||||
| 31,928,656 | ||||||||
| PUBLISHING — 6.9% |
||||||||
| Advanstar Communications, Inc., Gtd. Notes |
||||||||
| 12.00%, 02/15/11 |
Caa2 | 2,000 | 2,167,500 | |||||
| Advanstar Communications, Inc., Sec’d. Notes |
||||||||
| 10.75%, 08/15/10 |
B3 | 425 | 481,844 | |||||
218
AST GOLDMAN SACHS HIGH YIELD PORTFOLIO
SCHEDULE OF INVESTMENTS (CONTINUED)
DECEMBER 31, 2004
| MOODY’S RATING (UNAUDITED) |
PRINCIPAL AMOUNT (000) |
VALUE (NOTE 2) | |||||||
| Advanstar, Inc., Gtd. Notes, Zero Coupon (until 10/15/05) |
|||||||||
| 15.00%, 10/15/11 (cost $919,806; purchased 02/14/01-12/12/03)(g) |
NR | $ | 1,000 | $ | 851,250 | ||||
| Advertising Direct Solutions, Sr. Notes |
|||||||||
| 9.25%, 11/15/12 144A (cost $1,411,711; purchased 10/28/04)(g) |
Caa1 | 1,375 | 1,450,625 | ||||||
| American Media Operations, Inc., Gtd. Notes, Series B |
|||||||||
| 10.25%, 05/01/09 |
B2 | 1,650 | 1,746,938 | ||||||
| Dex Media East LLC, Gtd. Notes |
|||||||||
| 12.125%, 11/15/12 |
Caa1 | 2,437 | 2,982,279 | ||||||
| Dex Media West Finance, Sr. Sub. Notes |
|||||||||
| 9.875%, 08/15/13 |
Caa1 | 4,395 | 5,087,213 | ||||||
| Dex Media, Inc., Disc. Notes, Zero Coupon (until 11/15/08) |
|||||||||
| 9.00%, 11/15/13 |
B3 | 7,500 | 5,915,624 | ||||||
| Houghton Mifflin Co., Sr. Disc. Notes, Zero Coupon (until 10/15/08) |
|||||||||
| 11.50%, 10/15/13 |
Caa1 | 1,325 | 980,500 | ||||||
| Houghton Mifflin Co., Sr. Sub. Notes |
|||||||||
| 9.875%, 02/01/13 |
B3 | 1,000 | 1,100,000 | ||||||
| Lighthouse International Co. SA, Sr. Notes (Luxembourg) |
|||||||||
| 8.00%, 04/30/14 |
B3 | EUR | 3,500 | 4,923,882 | |||||
| 8.00%, 04/30/14 |
B3 | EUR | 5,500 | 7,737,528 | |||||
| Quebecor Media, Inc., Sr. Disc. Notes, Zero Coupon (until 07/15/06) |
|||||||||
| 13.75%, 07/15/11 |
B2 | $ | 1,700 | 1,691,500 | |||||
| Quebecor Media, Inc., Sr. Notes |
|||||||||
| 11.125%, 07/15/11 |
B2 | 2,475 | 2,840,063 | ||||||
| Vertis, Inc., Gtd. Notes, Series B |
|||||||||
| 10.875%, 06/15/09 |
B3 | 1,750 | 1,907,500 | ||||||
| Vertis, Inc., Sec’d. Notes |
|||||||||
| 9.75%, 04/01/09 |
B2 | 750 | 817,500 | ||||||
| Yell Finance BV, Sr. Disc. Notes, Zero Coupon (until 08/01/06) (Netherlands) |
|||||||||
| 13.50%, 08/01/11(l) |
B1 | 1,360 | 1,343,000 | ||||||
| Yell Finance BV, Sr. Notes (Netherlands) |
|||||||||
| 10.75%, 08/01/11(l) |
B1 | 1,137 | 1,318,920 | ||||||
| Ziff Davis Media, Inc., Gtd. Notes, Series B |
|||||||||
| 12.00%, 08/12/09 [PIK] |
CC | (d) | 414 | 444,553 | |||||
| WDAC Subsidiary Corp., Sr. Notes |
|||||||||
| 8.375%, 12/01/14 144A |
B2 | 1,000 | 991,250 | ||||||
| 8.50%, 12/01/14 144A |
Caa1 | EUR | 6,500 | 8,790,947 | |||||
| 55,570,416 | |||||||||
| REAL ESTATE |
|||||||||
| CB Richard Ellis Service, Sr. Notes |
|||||||||
| 9.75%, 05/15/10 |
B1 | 439 | 502,655 | ||||||
219
AST GOLDMAN SACHS HIGH YIELD PORTFOLIO
SCHEDULE OF INVESTMENTS (CONTINUED)
DECEMBER 31, 2004
| MOODY’S RATING (UNAUDITED) |
PRINCIPAL AMOUNT (000) |
VALUE (NOTE 2) | ||||||
| RETAILERS — 0.9% |
||||||||
| General Nutrition Center, Sr. Sub. Notes |
||||||||
| 8.50%, 12/01/10 |
B3 | $ | 1,225 | $ | 1,163,750 | |||
| PCA International, Inc., Sr. Notes |
||||||||
| 11.875%, 08/01/09 |
B3 | 1,200 | 1,062,000 | |||||
| Penney, (J.C.) Co., Inc., Notes |
||||||||
| 9.00%, 08/01/12 |
Ba3 | 3,000 | 3,712,500 | |||||
| Victoria Acquisition III BV, Sr. Notes (Netherlands) |
||||||||
| 7.875%, 10/01/14 144A |
B3 | EUR | 1,000 | 1,372,842 | ||||
| 7,311,092 | ||||||||
| RETAILERS — FOOD & DRUG — 1.1% |
||||||||
| Brake Brothers Finance PLC, Sr. Notes (United Kingdom) |
||||||||
| 12.00%, 12/15/11 |
B3 | GBP | 1,000 | 2,227,086 | ||||
| Couche-Tard Corp., Sr. Sub. Notes |
||||||||
| 7.50%, 12/15/13 |
Ba3 | 1,500 | 1,616,250 | |||||
| Jean Coutu Group (PJC), Inc., Sr. Sub. Notes (Canada) |
||||||||
| 8.50%, 08/01/14 144A(l) |
B3 | 1,750 | 1,802,500 | |||||
| Rite Aid Corp., Sec’d. Notes |
||||||||
| 8.125%, 05/01/10 |
B2 | 1,500 | 1,593,750 | |||||
| 6.875%, 08/15/13 |
Caa1 | 2,025 | 1,832,625 | |||||
| 9,072,211 | ||||||||
| TECHNOLOGY — 3.0% |
||||||||
| Activant Solutions, Sr. Notes |
||||||||
| 10.50%, 06/15/11 |
B2 | 2,025 | 2,187,000 | |||||
| AMI Semiconductor, Inc., Gtd. Notes |
||||||||
| 10.75%, 02/01/13 |
B3 | 1,500 | 1,770,000 | |||||
| Amkor Technology, Inc., Notes |
||||||||
| 5.00%, 03/15/07 |
B3 | 375 | 355,313 | |||||
| 9.25%, 02/15/08 |
B3 | 1,250 | 1,284,375 | |||||
| Flextronics International Ltd., Sr. Sub. Notes |
||||||||
| 6.25%, 11/15/14 144A |
Ba2 | $ | 750 | 746,250 | ||||
| Lucent Technologies, Debs. |
||||||||
| 6.45%, 03/15/29 |
Caa1 | 2,250 | 2,047,500 | |||||
| Lucent Technologies, Inc., Notes |
||||||||
| 5.50%, 11/15/08 |
Caa1 | 1,000 | 1,032,500 | |||||
| Nortel Networks Ltd., Notes (Canada) |
||||||||
| 6.125%, 02/15/06(l) |
B3 | 1,000 | 1,022,500 | |||||
| Riverdeep Group Ltd., Sr. Notes (Ireland) |
||||||||
| 9.25%, 04/15/11 |
B3 | EUR | 750 | 1,100,992 | ||||
| Telex Communications, Inc., Secd. Notes |
||||||||
| 11.50%, 10/15/08 |
B3 | 800 | 876,000 | |||||
| TSI Telecommunication Services, Inc., Gtd. Notes |
||||||||
| 12.75%, 02/01/09 |
B3 | 1,250 | 1,431,250 | |||||
| Worldspan L.P., Sr. Notes |
||||||||
| 9.625%, 06/15/11 |
B2 | 3,000 | 3,000,000 | |||||
| Xerox Corp., Gtd. Notes |
||||||||
| 9.75%, 01/15/09 |
B1 | 5,000 | 5,900,000 | |||||
| Xerox Corp., Sr. Notes |
||||||||
| 7.625%, 06/15/13 |
B1 | 1,250 | 1,378,125 | |||||
| 24,131,805 | ||||||||
| TELECOMMUNICATIONS — 2.7% |
||||||||
| Alaska Communications Systems Holdings, Inc., Gtd. Notes |
||||||||
| 9.875%, 08/15/11 |
B2 | 1,525 | 1,647,000 | |||||
| Cincinnati Bell, Inc., Gtd. Notes |
||||||||
| 7.25%, 07/15/13 |
B2 | 1,000 | 1,032,500 | |||||
| Cincinnati Bell, Inc., Sr. Sub. Notes |
||||||||
| 8.375%, 01/15/14 |
B3 | 3,000 | 3,052,500 | |||||
220
AST GOLDMAN SACHS HIGH YIELD PORTFOLIO
SCHEDULE OF INVESTMENTS (CONTINUED)
DECEMBER 31, 2004
| MOODY’S RATING (UNAUDITED) |
PRINCIPAL AMOUNT (000) |
VALUE (NOTE 2) | ||||||
| Citizens Communications, Sr. Notes |
||||||||
| 6.25%, 01/15/13 |
Ba3 | $ | 1,000 | $ | 1,012,500 | |||
| Eircom Funding, Sr. Sub. Notes (Ireland) |
||||||||
| 8.25%, 08/15/13(l) |
B1 | 1,000 | 1,110,000 | |||||
| Inmarsat Finance II Ltd, Gtd. Notes, Zero Coupon (until 11/15/08) |
||||||||
| 10.375%, 11/15/12 144A |
Caa1 | 2,000 | 1,450,000 | |||||
| Inmarsat Finance PLC, Gtd. (United Kingdom) |
||||||||
| 7.625%, 06/30/12(l) |
B2 | 1,000 | 1,045,000 | |||||
| Qwest Capital Funding Co., Gtd. Notes |
||||||||
| 7.90%, 08/15/10 |
Caa2 | 1,000 | 1,015,000 | |||||
| Qwest Corp., Notes |
||||||||
| 9.125%, 03/15/12 144A |
Ba3 | 3,000 | 3,480,000 | |||||
| Qwest Services Corp., Notes |
||||||||
| 14.00%, 12/15/10 144A |
Caa1 | 5,750 | 6,943,125 | |||||
| 21,787,625 | ||||||||
| TELECOMMUNICATIONS — CELLULAR — 3.6% |
||||||||
| Alamosa Delaware, Inc., Gtd. Notes, Zero Coupon (until 7/31/05) |
||||||||
| 12.00%, 07/31/09 |
Caa1 | 750 | 817,500 | |||||
| Alamosa Delaware, Inc., Notes |
||||||||
| 8.50%, 01/31/12 |
Caa1 | 2,000 | 2,195,000 | |||||
| American Cellular Corp., Sr. Notes, Series B |
||||||||
| 10.00%, 08/01/11 |
B3 | 1,750 | 1,509,375 | |||||
| Centennial Cellular Operating Co., Gtd. Notes |
||||||||
| 10.125%, 06/15/13 |
Caa1 | 1,500 | 1,691,250 | |||||
| Horizon PCS, Inc., Sr. Notes |
||||||||
| 11.375%, 07/15/12 144A |
B3 | 500 | 562,500 | |||||
| Nextel Communications, Inc., Sr. Notes |
||||||||
| 7.375%, 08/01/15 |
B2 | 6,750 | 7,458,750 | |||||
| Nextel Communications, Sr. Notes |
||||||||
| 5.95%, 03/15/14 |
B2 | 2,500 | 2,600,000 | |||||
| Nextel Partners, Inc., Sr. Notes |
||||||||
| 12.50%, 11/15/09 |
Caa1 | 838 | 953,225 | |||||
| 8.125%, 07/01/11 |
Caa1 | 2,000 | 2,230,000 | |||||
| Oskar Mobil AS, Sec’d. Notes (Czech Republic) |
||||||||
| 7.50%, 10/15/11 144A |
B1 | EUR | 750 | 1,118,832 | ||||
| Rogers Wireless, Inc., Sr. Sec’d. Notes |
||||||||
| 6.375%, 03/01/14 |
Ba3 | 1,875 | 1,865,625 | |||||
| Rogers Wireless Communications, Inc., Sec’d. Notes |
||||||||
| 7.50%, 03/15/15 144A |
Ba3 | 1,000 | 1,060,000 | |||||
| Rogers Wireless Communications, Inc., Sr. Sub. Notes |
||||||||
| 8.00%, 12/15/12 144A |
B2 | 500 | 531,250 | |||||
| Triton PCS, Inc., Gtd. Notes |
||||||||
| 8.75%, 11/15/11 |
B3 | 1,000 | 795,000 | |||||
| 8.50%, 06/01/13 |
B2 | 1,750 | 1,697,500 | |||||
| US Unwired, Inc., Sec’d. Notes |
||||||||
| 10.00%, 06/15/12 |
Caa1 | 1,750 | 1,981,875 | |||||
| 29,067,682 | ||||||||
| TEXTILE — 1.0% |
||||||||
| Collins & Aikman Corp., Gtd. Notes |
||||||||
| 9.75%, 02/15/10 |
B2 | 1,375 | 1,485,000 | |||||
| Phillips Van Heusen Corp., Sr. Notes |
||||||||
| 8.125%, 05/01/13 |
B2 | 1,000 | 1,090,000 | |||||
| Propex Fabrics, Inc., Sr. Notes |
||||||||
| 10.00%, 12/01/12 144A (cost $1,750,000; purchased 11/23/04)(g) |
Caa1 | 1,750 | 1,824,375 | |||||
221
AST GOLDMAN SACHS HIGH YIELD PORTFOLIO
SCHEDULE OF INVESTMENTS (CONTINUED)
DECEMBER 31, 2004
| MOODY’S RATING (UNAUDITED) |
PRINCIPAL AMOUNT (000) |
VALUE (NOTE 2) | ||||||
| Russell Corp., Gtd. Notes |
||||||||
| 9.25%, 05/01/10 |
B1 | $ | 1,050 | $ | 1,131,375 | |||
| Warnaco Group, Inc., Sr. Notes |
||||||||
| 8.875%, 06/15/13 |
B2 | 2,000 | 2,210,000 | |||||
| 7,740,750 | ||||||||
| TRANSPORTATION — 0.7% |
||||||||
| Petroleum Helicopters, Inc., Gtd. Notes, Series B |
||||||||
| 9.375%, 05/01/09 |
B1 | 2,425 | 2,667,500 | |||||
| Stena AB, Sr. Notes (Sweden) |
||||||||
| 9.625%, 12/01/12(l) |
Ba3 | 1,500 | 1,702,500 | |||||
| 7.50%, 11/01/13(l) |
Ba3 | 1,000 | 1,052,500 | |||||
| 5,422,500 | ||||||||
| TOTAL CORPORATE OBLIGATIONS |
759,524,752 | |||||||
| SHARES |
||||||||
| COMMON STOCK CHEMICALS |
||||||||
| General Chemicals Industry Products* (cost $854,314; purchased 01/27/00 - 11/07/02)(g)(o) |
386 | 107,621 | ||||||
| PACKAGING |
||||||||
| Russell Stanley Holdings, Inc.* (cost $523,314; purchased 02/05/99-03/30/99)(g)(o) |
39,000 | 0 | ||||||
| TOTAL COMMON STOCK |
107,621 | |||||||
| PREFERRED STOCK — 0.5% |
||||||||
| PUBLISHING — 0.5% |
||||||||
| Primedia, Inc., Series D, 10.00% |
8,475 | 851,738 | ||||||
| Primedia, Inc., Series F, 9.20% |
17,250 | 1,664,625 | ||||||
| Primedia, Inc., Series H, 8.625% |
13,100 | 1,205,200 | ||||||
| Ziff Davis Media, Inc., Series E, 10.00% |
108 | 7,479 | ||||||
| 3,729,042 | ||||||||
| SHARES |
||||||||
| RETAILERS |
||||||||
| General Nutrition Center, Series A, 12.00% [PIK]* |
1,000 | 97,250 | ||||||
| TOTAL PREFERRED STOCK |
3,826,292 | |||||||
| UNITS |
||||||||
| RIGHTS* |
||||||||
| CAPITAL GOODS — OTHERS |
||||||||
| Simonds Industries, Inc. (cost $340,716; purchased 03/08/01)(g) |
10,428 | 104,280 | ||||||
| CONSUMER PRODUCTS |
||||||||
| Sleepmaster, Inc.(o) |
1,055 | 0 | ||||||
| TOTAL RIGHTS |
104,280 | |||||||
| WARRANTS* — 0.1% |
||||||||
| CHEMICALS |
||||||||
| General Chemical Industry Product, Inc., Series A, expiring 04/30/11 (cost $0; purchased 01/27/00-11/07/02)(g)(o) |
223 | 0 | ||||||
| General Chemical Industry Product, Inc., Series B, expiring 04/30/11 (cost $0; purchased 01/27/00-11/07/02)(g)(o) |
165 | 0 | ||||||
| ENTERTAINMENT |
||||||||
| AMF Bowling Worldwide, Inc., Series B, expiring 03/09/09 (cost $761,617; purchased 01/08/97-04/06/99)(g)(o) |
10,136 | 0 | ||||||
| MEDIA — BROADCASTING & RADIO |
||||||||
| XM Satellite Radio, Inc., expiring 03/15/10 144A (cost $354,375; purchased 08/31/00)(g) |
2,000 | 172,000 | ||||||
| METALS — 0.1% |
||||||||
| ACP Holding Corp., expiring 10/07/13 144A (cost $0; purchased 09/26/03)(g) |
321,453 | 570,579 | ||||||
| PACKAGING |
||||||||
| Pliant Corp., expiring 06/01/10 144A (cost $0; purchased 09/29/00)(g) |
1,000 | 10 | ||||||
| PAPER |
||||||||
| MDP Acquisitions PLC, expiring 10/01/13 (Ireland) 144A (cost $0; purchased 09/23/02)(g) |
900 | 25,650 | ||||||
222
AST GOLDMAN SACHS HIGH YIELD PORTFOLIO
SCHEDULE OF INVESTMENTS (CONTINUED)
DECEMBER 31, 2004
| UNITS |
VALUE (NOTE 2) | ||||||
| PUBLISHING |
|||||||
| Advanstar Holdings Corp., expiring 10/15/11 144A (cost $0; purchased 10/09/01)(g) |
1,100 | $ | 22 | ||||
| Ziff Davis Media, Inc., expiring 08/12/12 (cost $198; purchased 07/18/00)(g) |
19,800 | 11,880 | |||||
| 11,902 | |||||||
| TOTAL WARRANTS |
780,141 | ||||||
| TOTAL LONG-TERM INVESTMENTS |
764,343,086 | ||||||
| SHARES |
|||||||
| SHORT-TERM INVESTMENTS — 2.9% |
|||||||
| REGISTERED INVESTMENT COMPANIES |
|||||||
| BlackRock Provident Institutional Funds TempCash Portfolio(j) |
11,654,208 | 11,654,208 | |||||
| BlackRock Provident Institutional Funds TempFund Portfolio(j) |
11,654,207 | 11,654,207 | |||||
| TOTAL SHORT-TERM INVESTMENTS |
23,308,415 | ||||||
| TOTAL INVESTMENTS — 97.9% |
787,651,501 | ||||||
| OTHER ASSETS IN EXCESS OF LIABILITIES — 2.1% |
16,937,614 | ||||||
| NET ASSETS — 100.0% |
$ | 804,589,115 | |||||
THE FOLLOWING ABBREVIATIONS ARE USED THROUGHOUT THE SCHEDULE OF INVESTMENTS:
| 144A | Security was purchased pursuant to Rule 144A under the Securities Act of 1933 and may not be resold subject to that rule except to qualified institutional buyers. Unless otherwise noted 144A securities are deemed to be liquid. |
| EUR | Euro |
| GBP | British Pound |
| PIK | Payment-in-kind |
THE FOLLOWING ANNOTATIONS ARE USED THROUGHOUT THE SCHEDULE OF INVESTMENTS:
| * | Non-income producing security. |
| (c) | Indicates a variable rate security. The maturity date presented for these instruments is the next date on which the rate of interest is adjusted. |
| (d) | Standard & Poor’s rating. |
| (g) | Indicates a security that has been deemed illiquid. The aggregate of cost of illiquid securities is $42,570,394. The aggregate value, $40,248,332 represents 5.00% of net assets. |
| (i) | Represents issuer in default on interest payments. Non-income producing security. |
| (j) | Security available to institutional investors only. |
| (l) | US$ Denominated Foreign Bonds. |
| (o) | Fair valued security. |
223
AST GOLDMAN SACHS HIGH YIELD PORTFOLIO
SCHEDULE OF INVESTMENTS (CONTINUED)
DECEMBER 31, 2004
Foreign currency exchange contracts outstanding at December 31, 2004:
PURCHASE CONTRACTS
| SETTLEMENT MONTH |
TYPE |
CONTRACTS TO DELIVER |
IN EXCHANGE FOR |
CONTRACTS AT VALUE |
UNREALIZED APPRECIATION |
|||||||||
| Feb 05 |
Buy EUR | 3,465,288 | $ | 4,617,584 | $ | 4,696,144 | $ | 78,560 | ||||||
| SALE CONTRACTS | ||||||||||||||
| SETTLEMENT MONTH |
TYPE |
CONTRACTS TO DELIVER |
IN EXCHANGE FOR |
CONTRACTS AT VALUE |
UNREALIZED DEPRECIATION |
|||||||||
| Feb 05 |
Sell EUR | 72,190,120 | $ | 94,088,493 | $ | 97,831,606 | $ | (3,743,113 | ) | |||||
| Feb 05 |
Sell GBP | 857,875 | 1,580,897 | 1,638,445 | (57,548 | ) | ||||||||
| $ | 95,669,390 | $ | 99,470,051 | $ | (3,800,661 | ) | ||||||||
224
AST GOLDMAN SACHS HIGH YIELD PORTFOLIO
SCHEDULE OF INVESTMENTS (CONTINUED)
DECEMBER 31, 2004
The industry classification of long-term portfolio holdings, short-term investments and other assets in excess of liabilities shown as a percentage of net assets as of December 31, 2004 were as follows:
| Chemicals |
9.0 | % | |
| Publishing |
7.4 | ||
| Gaming |
6.2 | ||
| Consumer Products |
6.0 | ||
| Media — Cable |
5.3 | ||
| Food |
4.6 | ||
| Packaging |
4.6 | ||
| Pipelines |
4.0 | ||
| Electric |
3.6 | ||
| Telecommunications — Cellular |
3.6 | ||
| Automotive Parts |
3.3 | ||
| Building Materials |
3.3 | ||
| Health Care |
3.3 | ||
| Technology |
3.0 | ||
| Paper |
2.9 | ||
| Conglomerates |
2.7 | ||
| Telecommunications |
2.7 | ||
| Metals |
2.1 | ||
| Energy |
1.9 | ||
| Entertainment |
1.7 | ||
| Aerospace |
1.6 | ||
| Consumer Cyclical — Services |
1.4 | ||
| Lodging |
1.3 | ||
| Media — Non Cable |
1.2 | ||
| Retailers — Food & Drug |
1.1 | ||
| Textile |
1.0 | ||
| Defense |
0.9 | ||
| Environmental |
0.9 | ||
| Retailers |
0.9 | ||
| Capital Goods — Others |
0.7 | ||
| Media — Broadcast & Radio |
0.7 | ||
| Media — Broadcast Towers |
0.7 | ||
| Transportation |
0.7 | ||
| Finance |
0.5 | ||
| Airlines |
0.2 | ||
| Short-Term Investments |
2.9 | ||
| 97.9 | |||
| Liabilities in excess of other assets |
2.1 | ||
| 100.0 | % | ||
See Notes to Financial Statements.
225
AST LORD ABBETT BOND-DEBENTURE PORTFOLIO
SCHEDULE OF INVESTMENTS
DECEMBER 31, 2004
| MOODY’S RATING (UNAUDITED) |
PRINCIPAL AMOUNT (000) |
VALUE (NOTE 2) | |||||||
| LONG-TERM INVESTMENTS — 108.4% |
|||||||||
| CONVERTIBLE BONDS — 19.4% |
|||||||||
| AEROSPACE/DEFENSE — 1.3% |
|||||||||
| Alliant Techsystems, Inc. |
|||||||||
| 2.75%, 02/15/24(a) |
B2 | $ | 2,500 | $ | 2,659,375 | ||||
| Lockheed Martin Corp. |
|||||||||
| 2.04%, 08/15/33(c) |
Baa2 | 3,000 | 3,118,560 | ||||||
| 5,777,935 | |||||||||
| BUILDING & CONSTRUCTION — 0.8% |
|||||||||
| Fluor Corp. |
|||||||||
| 1.50%, 02/15/24(a) |
A3 | 3,000 | 3,435,000 | ||||||
| COMPUTER HARDWARE — 0.3% |
|||||||||
| ASML Holding N.V. (Netherlands) |
|||||||||
| 5.75%, 10/15/06(l) |
B2 | 1,000 | 1,137,500 | ||||||
| DIVERSIFIED CAPITAL GOODS — 0.4% |
|||||||||
| Tyco International Group SA (Luxembourg) |
|||||||||
| 2.75%, 01/15/18(l) |
Baa3 | 1,000 | 1,590,000 | ||||||
| ELECTRONICS — 0.6% |
|||||||||
| FLIR Systems, Inc. |
|||||||||
| 3.00%, 06/01/23 |
B+ | (d) | 600 | 978,000 | |||||
| RF Micro Devices, Inc. |
|||||||||
| 1.50%, 07/01/10 |
B- | (d) | 1,500 | 1,717,500 | |||||
| 2,695,500 | |||||||||
| ENERGY — EXPLORATION & PRODUCTION — 0.4% |
|||||||||
| Quicksilver Resources, Inc. |
|||||||||
| 1.875%, 11/01/24 144A |
NR | 1,500 | 1,606,875 | ||||||
| FOOD — WHOLESALE — 1.0% |
|||||||||
| Bunge Ltd. Finance Corp. |
|||||||||
| 3.75%, 11/15/22 |
Baa3 | 1,500 | 2,705,625 | ||||||
| Nestle Holding, Inc. (Switzerland) |
|||||||||
| 3.00%, 05/09/05(l) |
AAA | (d) | 1,500 | 1,695,000 | |||||
| 4,400,625 | |||||||||
| GAMING — 0.5% |
|||||||||
| International Game Technology, Zero Coupon |
|||||||||
| 0.00%, 01/29/33 |
Baa2 | 3,000 | 2,306,250 | ||||||
| HEALTH SERVICES — 3.6% |
|||||||||
| Advanced Medical Optics |
|||||||||
| 2.50%, 07/15/24(a) |
B3 | 1,100 | 1,201,750 | ||||||
| Fisher Scientific International, Inc. |
|||||||||
| 2.50%, 10/01/23(a) |
Ba2 | 3,000 | 4,477,499 | ||||||
| Lifepoint Hospital Holdings, Inc. |
|||||||||
| 4.50%, 06/01/09 |
B3 | 2,750 | 2,760,312 | ||||||
| Medtronic, Inc. |
|||||||||
| 1.25%, 09/15/21 |
A1 | 2,500 | 2,540,625 | ||||||
| SFBC International, Inc. |
|||||||||
| 2.25%, 08/15/24 144A |
B- | (d) | 2,000 | 2,457,500 | |||||
| Universal Health Services, Inc. |
|||||||||
| 0.426%, 06/23/20 |
Baa3 | 2,750 | 1,598,438 | ||||||
| 15,036,124 | |||||||||
| HEALTHCARE SERVICES — 0.3% |
|||||||||
| Invitrogen Corp. |
|||||||||
| 1.50%, 02/15/24(a) |
NR | 1,500 | 1,413,750 | ||||||
| HOTELS — 1.0% |
|||||||||
| Fairmont Hotels & Resorts, Inc. (Canada) |
|||||||||
| 3.75%, 12/01/23(l) |
NR | 4,000 | 4,530,000 | ||||||
| HOUSEHOLD & LEISURE PRODUCTS — 0.4% |
|||||||||
| Costco Wholesale Corp., Zero Coupon |
|||||||||
| 0.00%, 08/19/17 |
A3 | 1,500 | 1,653,750 | ||||||
| MACHINERY — 0.5% |
|||||||||
| Agco Corp. |
|||||||||
| 1.75%, 12/31/33 |
B1 | 1,750 | 2,056,250 | ||||||
| MEDIA — BROADCASTING — 0.2% |
|||||||||
| Sinclair Broadcast Group, Inc., |
|||||||||
| 4.875%, (until 01/15/2011) 2.00%, 07/15/18 |
B3 | 1,000 | 963,750 | ||||||
| MEDIA — DIVERSIFIED — 1.4% |
|||||||||
| Disney, (Walt) Co. |
|||||||||
| 2.125%, 04/15/23 |
Baa1 | 2,500 | 2,793,750 | ||||||
| Liberty Media Corp. |
|||||||||
| 3.25%, 03/15/31(a) |
Baa3 | 3,500 | 3,451,875 | ||||||
| 6,245,625 | |||||||||
| MEDIA — SERVICES — 0.5% |
|||||||||
| Lamar Advertising Co. |
|||||||||
| 2.875%, 12/31/10(a) |
B2 | 2,000 | 2,217,500 | ||||||
226
AST LORD ABBETT BOND-DEBENTURE PORTFOLIO
SCHEDULE OF INVESTMENTS (CONTINUED)
DECEMBER 31, 2004
| MOODY’S RATING (UNAUDITED) |
PRINCIPAL AMOUNT (000) |
VALUE (NOTE 2) | |||||||
| METALS & MINING EXCLUDING STEEL — 0.7% |
|||||||||
| Placer Dome, Inc. |
|||||||||
| 2.75%, 10/15/23(a) |
Baa2 | $ | 2,500 | $ | 3,078,125 | ||||
| OIL FIELD EQUIPMENT & SERVICES — 0.8% |
|||||||||
| Schlumberger Ltd. |
|||||||||
| 1.50%, 06/01/23 |
A1 | 3,000 | 3,300,000 | ||||||
| PHARMACEUTICALS — 1.8% |
|||||||||
| Allergan, Inc., Zero Coupon |
|||||||||
| 0.00%, 11/06/22(a) |
A3 | 1,500 | 1,473,750 | ||||||
| Amylin Pharmaceuticals, Inc. |
|||||||||
| 2.50%, 04/15/11 |
NR | 1,000 | 1,035,000 | ||||||
| Teva Pharmaceuticals Financial |
|||||||||
| 0.375%, 11/15/22 |
BBB | (d) | 1,150 | 1,676,125 | |||||
| 0.50%, 02/01/24 |
BBB | (d) | 585 | 598,894 | |||||
| Watson Pharmaceutical, Inc. |
|||||||||
| 1.75%, 03/15/23 |
Ba1 | 3,000 | 3,105,000 | ||||||
| 7,888,769 | |||||||||
| SOFTWARE/SERVICES — 2.0% |
|||||||||
| DSTSystems, Inc. |
|||||||||
| 4.125%, 08/15/23(a) |
NR | 3,000 | 3,922,500 | ||||||
| EMC Corp. |
|||||||||
| 4.50%, 04/01/07(a) |
BBB | (d) | 1,250 | 1,412,500 | |||||
| Manugistics Group, Inc. |
|||||||||
| 5.00%, 11/01/07 |
NR | 1,250 | 1,153,125 | ||||||
| Mentor Graphics Corp. |
|||||||||
| 6.875%, 06/15/07 |
NR | 1,750 | 1,848,438 | ||||||
| 8,336,563 | |||||||||
| SUPPORT-SERVICES — 0.3% |
|||||||||
| Armor Holdings, Inc., 2.00%, (until 11/01/11) |
|||||||||
| 0.00%, 11/01/24 |
B1 | 1,000 | 1,141,250 | ||||||
| TELECOM — WIRELESS — 0.2% |
|||||||||
| Nextel Communications, Inc. |
|||||||||
| 5.25%, 01/15/10 |
Ba3 | 1,000 | 1,028,750 | ||||||
| TELECOMMUNICATIONS EQUIPMENT — 0.4% |
|||||||||
| LSI Logic Corp. |
|||||||||
| 4.00%, 05/15/10(a) |
B | (d) | 2,000 | 1,887,500 | |||||
| TOTAL CONVERTIBLE BONDS |
83,727,391 | ||||||||
| CORPORATE OBLIGATIONS — 77.6% |
|||||||||
| AEROSPACE/DEFENSE — 1.9% |
|||||||||
| DRS Technologies, Inc., Sr. Sub. Notes |
|||||||||
| 6.875%, 11/01/13 |
B2 | 1,500 | 1,575,000 | ||||||
| Esterline Technologies Corp., Sr. Sub. Notes |
|||||||||
| 7.75%, 06/15/13 |
B1 | 500 | 548,750 | ||||||
| L-3 Communications Corp., Sr. Sub. Notes |
|||||||||
| 6.125%, 01/15/14 |
Ba3 | 1,500 | 1,552,500 | ||||||
| Raytheon Co., Notes |
|||||||||
| 4.85%, 01/15/11 |
Baa3 | 3,000 | 3,077,805 | ||||||
| Titan Corp., Gtd. Notes |
|||||||||
| 8.00%, 05/15/11 |
B2 | 1,500 | 1,605,000 | ||||||
| 8,359,055 | |||||||||
| APPAREL & TEXTILE — 0.5% |
|||||||||
| Invista, Notes |
|||||||||
| 9.25%, 05/01/12 144A |
B1 | 1,750 | 1,960,000 | ||||||
| AUTO LOANS — 0.4% |
|||||||||
| Ford Motor Credit Corp., Notes |
|||||||||
| 7.25%, 10/25/11 |
A3 | 1,500 | 1,610,807 | ||||||
| AUTOMOTIVE PARTS & EQUIPMENT — 1.6% |
|||||||||
| Affinia Group, Inc., Sr. Sub. Notes |
|||||||||
| 9.00%, 11/30/14 144A |
Caa1 | 700 | 733,250 | ||||||
| Cooper Standard Automotive Corp., Notes |
|||||||||
| 8.375%, 12/15/14 144A |
B3 | 1,275 | 1,278,188 | ||||||
| Cummins, Inc., Sr. Notes |
|||||||||
| 9.50%, 12/01/10 |
Ba2 | 750 | 855,000 | ||||||
| Delco Remy International, Inc., Gtd. Notes |
|||||||||
| 11.00%, 05/01/09(a) |
B3 | 1,175 | 1,257,250 | ||||||
| Eagle-Picher Industries, Inc., Sr. Notes |
|||||||||
| 9.75%, 09/01/13 |
B3 | 1,625 | 1,633,125 | ||||||
227
AST LORD ABBETT BOND-DEBENTURE PORTFOLIO
SCHEDULE OF INVESTMENTS (CONTINUED)
DECEMBER 31, 2004
| MOODY’S RATING (UNAUDITED) |
PRINCIPAL AMOUNT (000) |
VALUE (NOTE 2) | ||||||
| Stanadyne Corp., Sr. Sub. Notes |
||||||||
| 10.00%, 08/15/14 144A |
Caa1 | $ | 500 | $ | 542,500 | |||
| Tenneco Automotive, Inc., Sr. Sub. Notes |
||||||||
| 8.625%, 11/15/14 144A |
B3 | 500 | 522,500 | |||||
| 6,821,813 | ||||||||
| BANKING — 0.1% |
||||||||
| Wachovia Corp., Sub. Notes |
||||||||
| 6.605%, 10/01/25 |
A1 | 325 | 361,367 | |||||
| BEVERAGES — 0.3% |
||||||||
| Le-Natures, Inc., Sr. Sub. Notes (9.50% until 12/20/03) |
||||||||
| 10.00%, 06/15/13 144A |
Caa1 | 1,000 | 1,110,000 | |||||
| BUILDING & CONSTRUCTION — 1.1% |
||||||||
| Beazer Homes USA, Inc., Sr. Notes |
||||||||
| 6.50%, 11/15/13 |
Ba1 | 1,000 | 1,017,500 | |||||
| D.R. Horton, Inc., Sr. Notes |
||||||||
| 6.875%, 05/01/13 |
Ba1 | 1,000 | 1,087,500 | |||||
| Schuler Homes, Inc., Gtd. Notes |
||||||||
| 9.375%, 07/15/09 |
Ba1 | 500 | 540,000 | |||||
| Shaw Group, Inc. (The), Unsec’d. Sr. Notes |
||||||||
| 10.75%, 03/15/10(a) |
Ba3 | 1,000 | 1,107,500 | |||||
| William Lyon Homes, Inc., Gtd. Notes |
||||||||
| 10.75%, 04/01/13 |
B2 | 750 | 846,563 | |||||
| 4,599,063 | ||||||||
| BUILDING MATERIALS — 0.7% |
||||||||
| Ainsworth Lumber Ltd, Sr. Notes (Canada) |
||||||||
| 7.25%, 10/01/12(l) 144A |
B2 | 2,000 | 2,045,000 | |||||
| Jacuzzi Brands, Inc., Sec’d. Notes |
||||||||
| 9.625%, 07/01/10 |
B3 | 1,000 | 1,115,000 | |||||
| 3,160,000 | ||||||||
| CHEMICALS — 3.9% |
||||||||
| Airgas, Inc., Sr. Sub. Notes |
||||||||
| 6.25%, 07/15/14 |
Ba2 | 1,600 | 1,640,000 | |||||
| Crompton Corp., Sr. Notes |
||||||||
| 9.875%, 08/01/12 144A |
B1 | 1,875 | 2,156,250 | |||||
| Hercules, Inc., Gtd. Notes |
||||||||
| 6.75%, 10/15/29 |
Ba3 | 2,250 | 2,334,374 | |||||
| Huntsman International Holdings, Sr. Disc. Notes, Zero Coupon |
||||||||
| 0.00%, 12/31/09 |
Caa2 | 1,700 | 960,500 | |||||
| Huntsman LLC, Gtd. Notes (11.50% until 11/19/04) |
||||||||
| 11.75%, 07/15/12 144A |
B3 | 1,000 | 1,187,500 | |||||
| IMC Global, Inc., Gtd. Notes, Series |
||||||||
| 11.25%, 06/01/11 |
B1 | 700 | 812,000 | |||||
| Lyondell Chemical Co., Sec’d. Notes, Series A |
||||||||
| 9.625%, 05/01/07 |
B1 | 750 | 828,750 | |||||
| Nalco Co., Sr. Sub. Notes |
||||||||
| 8.875%, 11/15/13(a) |
Caa1 | 2,000 | 2,204,999 | |||||
| Nova Chemicals Ltd., Sr. Notes |
||||||||
| 6.50%, 01/15/12 |
Ba2 | 850 | 905,250 | |||||
| Rhodia SA, Sr. Sub. Notes (France) |
||||||||
| 8.875%, 06/01/11(a)(l) |
Caa1 | 1,475 | 1,493,438 | |||||
| Rockwood Specialties Group, Sub. Notes |
||||||||
| 7.50%, 11/15/14 144A |
B3 | 1,525 | 1,589,813 | |||||
| Terra Capital, Inc., Sec’d. Notes |
||||||||
| 11.50%, 06/01/10 |
Caa1 | 650 | 744,250 | |||||
| 16,857,124 | ||||||||
| CONSUMER PRODUCTS — 2.3% |
||||||||
| Aearo Co., Sr. Sub. Notes |
||||||||
| 8.25%, 04/15/12 |
B3 | 675 | 698,625 | |||||
228
AST LORD ABBETT BOND-DEBENTURE PORTFOLIO
SCHEDULE OF INVESTMENTS (CONTINUED)
DECEMBER 31, 2004
| MOODY’S RATING (UNAUDITED) |
PRINCIPAL AMOUNT (000) |
VALUE (NOTE 2) | |||||||
| Church & Dwight Co., Inc., Sr. Sub. Notes |
|||||||||
| 6.00%, 12/15/12 144A |
Ba3 | $ | 250 | $ | 255,625 | ||||
| Elizabeth Arden, Inc., Gtd. Notes |
|||||||||
| 7.75%, 01/15/14 |
B2 | 3,000 | 3,195,000 | ||||||
| Playtex Products, Inc., Gtd. Notes |
|||||||||
| 9.375%, 06/01/11(a) |
Caa2 | 2,250 | 2,413,125 | ||||||
| Rayovac Corp., Sr. Sub. Notes |
|||||||||
| 8.50%, 10/01/13 |
B3 | 3,000 | 3,345,000 | ||||||
| 9,907,375 | |||||||||
| DIVERSIFIED CAPITAL GOODS — 1.3% |
|||||||||
| J.B. Poindexter & Co., Inc., Sr. Notes |
|||||||||
| 8.75%, 03/15/14 144A |
B1 | 1,500 | 1,601,250 | ||||||
| Park-Ohio Industries, Inc., Sr. Sub. Notes |
|||||||||
| 8.375%, 11/15/14 144A |
Caa1 | 1,000 | 1,005,000 | ||||||
| Sensus Metering Systems, Sr. Sub. Notes |
|||||||||
| 8.625%, 12/15/13 |
Caa1 | 2,000 | 2,060,000 | ||||||
| Trinity Industries, Inc., Sr. Notes |
|||||||||
| 6.50%, 03/15/14 |
Ba3 | 1,000 | 1,005,000 | ||||||
| 5,671,250 | |||||||||
| ELECTRIC — GENERATION — 3.5% |
|||||||||
| AES Corp., Sr. Notes |
|||||||||
| 7.75%, 03/01/14 |
B2 | 2,000 | 2,180,000 | ||||||
| Calpine Corp., Sec’d. Notes |
|||||||||
| 8.50%, 07/15/10 144A(a) |
B | (d) | 3,000 | 2,587,500 | |||||
| Calpine Generating Co., Sec’d. Notes |
|||||||||
| 11.50%, 04/01/11 |
B3 | 500 | 477,500 | ||||||
| Dynegy Holdings, Inc., Sec’d. Notes |
|||||||||
| 9.875%, 07/15/10 144A |
B3 | 1,000 | 1,122,500 | ||||||
| Dynegy Holdings, Inc., Sr. Notes |
|||||||||
| 6.875%, 04/01/11(a) |
Caa2 | 3,500 | 3,386,249 | ||||||
| NRG Energy, Inc., Sec’d. Notes |
|||||||||
| 8.00%, 12/15/13 144A |
B1 | 2,200 | 2,409,000 | ||||||
| Reliant Energy, Inc., Sec’d. Notes |
|||||||||
| 6.75%, 12/15/14 |
B1 | 1,225 | 1,223,469 | ||||||
| Reliant Resource, Inc., Sec’d. Notes |
|||||||||
| 9.50%, 07/15/13 |
B1 | 1,000 | 1,141,250 | ||||||
| Texas Genco LLC Financing, Sr. Notes |
|||||||||
| 6.875%, 12/15/14 144A |
B1 | 575 | 597,281 | ||||||
| 15,124,749 | |||||||||
| ELECTRIC — INTEGRATED — 2.6% |
|||||||||
| Duke Energy Corp., Sr. Notes, Series B |
|||||||||
| 5.375%, 01/01/09 |
Baa1 | 2,500 | 2,622,562 | ||||||
| Midwest Generation LLC, Sec’d. Notes |
|||||||||
| 8.75%, 05/01/34 |
B1 | 1,500 | 1,710,000 | ||||||
| Mission Energy Holding Co., Sec’d. Notes |
|||||||||
| 13.50%, 07/15/08 |
B3 | 750 | 939,375 | ||||||
| Nevada Power Co., General Finance Mortgage |
|||||||||
| 5.875%, 01/15/15 144A |
Ba2 | 1,200 | 1,215,000 | ||||||
| Northwestern Corp., Sec’d. Notes |
|||||||||
| 5.875%, 11/01/14 144A |
Ba1 | 150 | 154,196 | ||||||
| PPL Energy Supply LLC, Sr. Notes |
|||||||||
| 6.40%, 11/01/11 |
Baa2 | 500 | 550,551 | ||||||
| Teco Energy, Inc., Sr. Notes |
|||||||||
| 7.50%, 06/15/10 |
Ba2 | 1,300 | 1,443,000 | ||||||
| Virginia Electric & Power Co., Notes |
|||||||||
| 4.50%, 12/15/10 |
A3 | 2,400 | 2,420,500 | ||||||
| 7.00%, 01/01/24 |
|||||||||
| A2 | 300 | 306,860 | |||||||
| 11,362,044 | |||||||||
| ELECTRONICS — 0.9% |
|||||||||
| Amkor Technology, Inc., Sr. Notes |
|||||||||
| 7.125%, 03/15/11(a) |
B3 | 1,000 | 945,000 | ||||||
229
AST LORD ABBETT BOND-DEBENTURE PORTFOLIO
SCHEDULE OF INVESTMENTS (CONTINUED)
DECEMBER 31, 2004
| MOODY’S RATING (UNAUDITED) |
PRINCIPAL AMOUNT (000) |
VALUE (NOTE 2) | ||||||
| Communications & Power Industries Holding Corp., Sr. Sub. Notes |
||||||||
| 8.00%, 02/01/12 |
B3 | $ | 1,000 | $ | 1,065,000 | |||
| Freescale Semiconductor, Inc., Sr. Notes |
||||||||
| 7.125%, 07/15/14 |
Ba2 | 800 | 872,000 | |||||
| Sanmina — SCI Corp., Gtd. Notes |
||||||||
| 10.375%, 01/15/10 |
Ba2 | 1,000 | 1,152,500 | |||||
| 4,034,500 | ||||||||
| ENERGY — EXPLORATION & PRODUCTION — 2.4% |
||||||||
| Chesapeake Energy Corp., Sr. Notes |
||||||||
| 7.00%, 08/15/14 |
Ba3 | 1,700 | 1,819,000 | |||||
| 6.375%, 06/15/15 144A |
Ba3 | 500 | 516,250 | |||||
| Exco Resources, Inc., Gtd. Notes |
||||||||
| 7.25%, 01/15/11 |
B2 | 3,000 | 3,224,999 | |||||
| Forest Oil Corp., Sr. Notes |
||||||||
| 8.00%, 06/15/08 |
Ba3 | 350 | 388,063 | |||||
| Harvest Operations Corp., Sr. Notes |
||||||||
| 7.875%, 10/15/11 144A |
B3 | 1,000 | 1,012,500 | |||||
| Houston Exploration Co., Sr. Sub. Notes |
||||||||
| 7.00%, 06/15/13 |
B2 | 1,000 | 1,065,000 | |||||
| KCS Energy, Inc., Sr. Notes |
||||||||
| 7.125%, 04/01/12 |
B3 | 1,000 | 1,055,000 | |||||
| Range Resources Corp., Sr. Sub. Notes |
||||||||
| 7.375%, 07/15/13 |
B3 | 1,025 | 1,104,438 | |||||
| 10,185,250 | ||||||||
| ENVIRONMENTAL — 1.0% |
||||||||
| Allied Waste North America, Inc., Sec’d. Notes |
||||||||
| 6.125%, 02/15/14(a) |
B2 | 1,750 | 1,653,750 | |||||
| Allied Waste North America, Inc., Sr. Notes |
||||||||
| 7.875%, 04/15/13 |
B2 | 2,750 | 2,832,500 | |||||
| 4,486,250 | ||||||||
| FOOD & DRUG RETAILERS — 1.8% |
||||||||
| Ingles Markets, Inc., Gtd. Notes |
||||||||
| 8.875%, 12/01/11 |
Ba3 | 1,000 | 1,075,000 | |||||
| Jean Coutu Group PJC, Inc., Sr. Sub. Notes (Canada) |
||||||||
| 8.50%, 08/01/14 144A(a)(l) |
B3 | 825 | 849,750 | |||||
| Rite Aid Corp., Debs. |
||||||||
| 7.70%, 02/15/27 |
Caa1 | 2,500 | 2,068,750 | |||||
| Rite Aid Corp., Sec’d. Notes |
||||||||
| 8.125%, 05/01/10 |
B2 | 2,000 | 2,125,000 | |||||
| Stater Brothers Holdings, Inc., Sr. Notes |
||||||||
| 8.125%, 06/15/12 |
B1 | 1,500 | 1,593,750 | |||||
| 7,712,250 | ||||||||
| FOOD — WHOLESALE — 2.2% |
||||||||
| Chiquita Brands International, Inc., Sr. Notes |
||||||||
| 7.50%, 11/01/14 144A |
B2 | 2,500 | 2,543,750 | |||||
| Dole Foods Co., Debs. (7.875% until 03/28/03) |
||||||||
| 8.75%, 07/15/13 |
B2 | 2,000 | 2,245,000 | |||||
| Land O’ Lakes, Inc., Sr. Notes |
||||||||
| 8.75%, 11/15/11(a) |
B3 | 1,500 | 1,500,000 | |||||
| Michael Foods, Sr. Sub. Notes |
||||||||
| 8.00%, 11/15/13 |
B3 | 1,500 | 1,590,000 | |||||
| Pinnacle Foods Holding Corp., Sr. Sub. Notes |
||||||||
| 8.25%, 12/01/13 144A(a) |
B3 | 1,525 | 1,460,188 | |||||
| 9,338,938 | ||||||||
| FORESTRY/PAPER — 3.1% |
||||||||
| Boise Cascade LLC, Sr. Sub. Notes |
||||||||
| 7.125%, 10/15/14 144A |
B2 | 600 | 637,500 | |||||
| Bowater, Inc., Notes |
||||||||
| 6.50%, 06/15/13 |
Ba3 | 2,500 | 2,512,855 | |||||
| Buckeye Technologies, Inc., Sr. Sub. Notes |
||||||||
| 8.00%, 10/15/10 |
Caa1 | 2,500 | 2,512,500 | |||||
230
AST LORD ABBETT BOND-DEBENTURE PORTFOLIO
SCHEDULE OF INVESTMENTS (CONTINUED)
DECEMBER 31, 2004
| MOODY'S RATING (UNAUDITED) |
PRINCIPAL AMOUNT (000) |
VALUE (NOTE 2) | ||||||
| Jefferson Smurfit Corp., Gtd. Notes |
||||||||
| 8.25%, 10/01/12 |
B2 | $ | 1,000 | $ | 1,095,000 | |||
| JSG Funding PLC, Sr. Notes (Ireland) |
||||||||
| 9.625%, 10/01/12(l) |
B3 | 750 | 840,000 | |||||
| Longview Fibre Co., Sr. Sub. Notes |
||||||||
| 10.00%, 01/15/09 |
B2 | 500 | 548,750 | |||||
| Norske Skog Corp., Sr. Notes (Canada) |
||||||||
| 7.375%, 03/01/14(l) |
Ba3 | 2,000 | 2,095,000 | |||||
| Tembec Industries, Inc., Gtd. Notes (Canada) |
||||||||
| 8.625%, 06/30/09 |
Ba3 | 1,000 | 1,010,000 | |||||
| 7.75%, 03/15/12 |
Ba3 | 2,000 | 1,945,000 | |||||
| 13,196,605 | ||||||||
| GAMING — 5.0% |
||||||||
| Boyd Gaming Corp., Sr. Sub. Notes |
||||||||
| 8.75%, 04/15/12 |
B1 | 1,500 | 1,676,250 | |||||
| Hard Rock Hotel, Inc., Notes |
||||||||
| 8.875%, 06/01/13 |
B3 | 1,840 | 2,042,400 | |||||
| Isle of Capri Casinos, Inc., Gtd. Notes |
||||||||
| 9.00%, 03/15/12 |
B2 | 1,250 | 1,384,375 | |||||
| Isle of Capri Casinos, Inc., Sr. Sub. Notes |
||||||||
| 7.00%, 03/01/14 |
B2 | 1,800 | 1,845,000 | |||||
| Mandalay Resort Group, Sr. Sub. Notes |
||||||||
| 9.375%, 02/15/10 |
Ba3 | 600 | 702,000 | |||||
| MGM Mirage, Inc., Sr. Notes |
||||||||
| 6.75%, 09/01/12 |
Ba1 | 1,700 | 1,797,750 | |||||
| Park Place Entertainment Corp., Sr. Notes |
||||||||
| 7.50%, 09/01/09 |
Ba1 | 350 | 391,125 | |||||
| Park Place Entertainment Corp., Sr. Sub. Notes |
||||||||
| 9.375%, 02/15/07 |
Ba2 | 1,000 | 1,105,000 | |||||
| Penn National Gaming, Inc., Sr. Sub. Notes |
||||||||
| 6.875%, 12/01/11 |
B2 | 1,250 | 1,306,250 | |||||
| Premier Entertainment Biloxi/Finance, First Mortgage |
||||||||
| 10.75%, 02/01/12 |
B3 | 575 | 631,063 | |||||
| River Rock Entertainment, Sr. Notes |
||||||||
| 9.75%, 11/01/11 |
B2 | 2,005 | 2,258,130 | |||||
| Scientific Games Corp., Sr. Sub Notes |
||||||||
| 6.25%, 12/15/12 144A(a) |
B1 | 1,225 | 1,252,563 | |||||
| Seneca Gaming Corp., Sr. Notes |
||||||||
| 7.25%, 05/01/12 |
B2 | 500 | 528,750 | |||||
| Station Casinos, Inc., Sr. Sub. Notes |
||||||||
| 6.50%, 02/01/14 |
B1 | 2,000 | 2,064,999 | |||||
| Turning Stone Casino Resort Enterprise, Sr. Notes |
||||||||
| 9.125%, 12/15/10 144A |
B1 | 500 | 543,750 | |||||
| Venetian Casino Resort LLC, Gtd. Notes |
||||||||
| 11.00%, 06/15/10 |
B2 | 500 | 573,125 | |||||
| Wynn Las Vegas LLC Corp., First Mortgage Notes |
||||||||
| 6.625%, 12/01/14 144A |
B2 | 1,500 | 1,492,500 | |||||
| 21,595,030 | ||||||||
| GAS DISTRIBUTION — 2.4% |
||||||||
| El Paso Corp., Sr. Notes |
||||||||
| 7.00%, 05/15/11(a) |
Caa1 | 1,500 | 1,524,375 | |||||
| 7.75%, 01/15/32(a) |
Caa1 | 1,000 | 962,500 | |||||
| Ferrellgas Partners L.P., Sr. Notes |
||||||||
| 6.75%, 05/01/14 |
Ba3 | 2,000 | 2,065,000 | |||||
| Markwest Energy, Sr. Notes |
||||||||
| 6.875%, 11/01/14 144A |
B1 | 1,500 | 1,530,000 | |||||
231
AST LORD ABBETT BOND-DEBENTURE PORTFOLIO
SCHEDULE OF INVESTMENTS (CONTINUED)
DECEMBER 31, 2004
| MOODY’S RATING (UNAUDITED) |
PRINCIPAL AMOUNT (000) |
VALUE (NOTE 2) | ||||||
| Northwest Pipeline Corp., Gtd. Notes |
||||||||
| 8.125%, 03/01/10 |
Ba2 | $ | 500 | $ | 555,625 | |||
| Sonat, Inc., Notes |
||||||||
| 7.625%, 07/15/11 |
Caa1 | 1,000 | 1,040,000 | |||||
| Suburban Propane Partners L.P., Sr. Notes |
||||||||
| 6.875%, 12/15/13 |
B1 | 1,500 | 1,537,500 | |||||
| Williams Cos., Inc., Notes |
||||||||
| 7.875%, 09/01/21 |
B1 | 1,000 | 1,120,000 | |||||
| 10,335,000 | ||||||||
| HEALTH SERVICES — 6.1% |
||||||||
| Alliance Imaging, Sr. Sub. Notes |
||||||||
| 7.25%, 12/15/12 144A(a) |
B3 | 1,500 | 1,533,750 | |||||
| AmeriPath, Inc., Gtd. Notes |
||||||||
| 10.50%, 04/01/13 |
Caa1 | 2,000 | 2,135,000 | |||||
| Ardent Health Services LLC, Sr. Sub. Notes |
||||||||
| 10.00%, 08/15/13 |
B3 | 1,750 | 1,846,250 | |||||
| Beverly Enterprises, Inc., Sr. Sub. Notes |
||||||||
| 7.875%, 06/15/14 144A |
B2 | 1,500 | 1,616,250 | |||||
| Bio-Rad Laboratories, Inc., Sr. Sub Notes |
||||||||
| 6.125%, 12/15/14 144A |
Ba3 | 1,000 | 1,012,500 | |||||
| Hanger Orthopedic Group, Inc., Gtd. Notes |
||||||||
| 10.375%, 02/15/09(a) |
B3 | 1,000 | 1,037,500 | |||||
| HCA, Inc., Notes |
||||||||
| 6.375%, 01/15/15 |
Ba2 | 1,500 | 1,508,838 | |||||
| HEALTHSOUTH Corp., Sr. Notes |
||||||||
| 8.375%, 10/01/11(a) |
NR | 1,910 | 1,991,175 | |||||
| Medex, Inc., Sr. Sub. Notes |
||||||||
| 8.875%, 05/15/13 |
B3 | 2,000 | 2,339,999 | |||||
| National Mentor, Inc., Sr. Sub. Notes |
||||||||
| 9.625%, 12/01/12 144A |
B3 | 575 | 613,813 | |||||
| National Nephrology Associates, Inc., Sr. Sub. Notes |
||||||||
| 9.00%, 11/01/11 144A |
B1 | 335 | 389,438 | |||||
| Pacificare Health Systems, Inc., Gtd. Notes |
||||||||
| 10.75%, 06/01/09 |
Ba3 | 640 | 742,400 | |||||
| PerkinElmer, Inc., Gtd. Notes |
||||||||
| 8.875%, 01/15/13 |
Ba3 | 1,500 | 1,717,500 | |||||
| Tenet Healthcare Corp., Notes |
||||||||
| 7.375%, 02/01/13(a) |
B3 | 1,500 | 1,462,500 | |||||
| Tenet Healthcare Corp., Sr. Notes |
||||||||
| 9.875%, 07/01/14 144A |
B3 | 2,000 | 2,189,999 | |||||
| Triad Hospitals, Inc., Sr. Sub. Notes |
||||||||
| 7.00%, 11/15/13 |
B3 | 1,500 | 1,541,250 | |||||
| UnitedHealth Group, Inc., Notes |
||||||||
| 4.875%, 04/01/13 |
A3 | 1,500 | 1,515,099 | |||||
| Vanguard Health Holdings II, Sr. Sub. Notes |
||||||||
| 9.00%, 10/01/14 144A |
Caa1 | 775 | 833,125 | |||||
| 26,026,386 | ||||||||
| HOTELS — 1.0% |
||||||||
| Felcor Lodging L.P., Gtd. Notes |
||||||||
| (8.50% until 06/20/03) |
||||||||
| 9.00%, 06/01/11 |
B1 | 700 | 796,250 | |||||
| Host Marriott L.P., Gtd. Notes |
||||||||
| 9.25%, 10/01/07 |
Ba3 | 1,000 | 1,120,000 | |||||
| Host Marriott L.P., Sr. Notes |
||||||||
| 7.00%, 08/15/12 144A |
Ba3 | 2,350 | 2,496,875 | |||||
| 4,413,125 | ||||||||
| HOUSEHOLD & LEISURE PRODUCTS — 0.3% |
||||||||
| Fedders North America, Inc., Sr. Notes |
||||||||
| 9.875%, 03/01/14 |
Caa1 | 1,750 | 1,435,000 | |||||
232
AST LORD ABBETT BOND-DEBENTURE PORTFOLIO
SCHEDULE OF INVESTMENTS (CONTINUED)
DECEMBER 31, 2004
| MOODY’S RATING (UNAUDITED) |
PRINCIPAL AMOUNT (000) |
VALUE (NOTE 2) | ||||||
| LEISURE — 1.2% |
||||||||
| Gaylord Entertainment Co., Sr. Notes |
||||||||
| 8.00%, 11/15/13 |
B3 | $ | 3,000 | $ | 3,255,000 | |||
| 6.75%, 11/15/14 144A(a) |
B3 | 1,000 | 1,010,000 | |||||
| Six Flags, Inc., Sr. Notes |
||||||||
| 9.50%, 02/01/09(a) |
Caa1 | 1,000 | 1,045,000 | |||||
| 5,310,000 | ||||||||
| MACHINERY — 0.9% |
||||||||
| AGCO Corp., Gtd. Notes |
||||||||
| 9.50%, 05/01/08 |
Ba3 | 1,000 | 1,070,000 | |||||
| JLG Industries, Inc., Gtd. Notes |
||||||||
| 8.25%, 05/01/08 |
B2 | 600 | 651,000 | |||||
| Manitowoc Co., Inc., Sr. Notes |
||||||||
| 7.125%, 11/01/13(a) |
B1 | 2,015 | 2,191,313 | |||||
| 3,912,313 | ||||||||
| MEDIA — BROADCASTING — 2.2% |
||||||||
| Allbritton Communications, Sr. Sub. Notes |
||||||||
| 7.75%, 12/15/12 |
B3 | 2,200 | 2,288,000 | |||||
| Clear Channel Communications, Inc., Sr. Notes |
||||||||
| 4.625%, 01/15/08 |
Baa3 | 2,500 | 2,540,403 | |||||
| Emmis Operating Co., Sr. Sub. Notes |
||||||||
| 6.875%, 05/15/12 |
B2 | 1,500 | 1,576,875 | |||||
| Paxson Communications Corp., Gtd. Notes |
||||||||
| 10.75%, 07/15/08(a) |
Caa1 | 2,000 | 2,110,000 | |||||
| Sinclair Broadcast Group, Inc., Gtd. Notes |
||||||||
| 8.75%, 12/15/11 |
B2 | 1,000 | 1,093,750 | |||||
| 9,609,028 | ||||||||
| MEDIA — CABLE — 4.1% |
||||||||
| Charter Communications Holdings II, Sr. Notes |
||||||||
| 10.25%, 09/15/10 |
Caa1 | 2,000 | 2,130,000 | |||||
| Charter Communications Holdings LLC, Sr. Notes |
||||||||
| 10.00%, 04/01/09 |
Ca | 3,500 | 3,167,499 | |||||
| CSC Holdings, Inc., Debs., Series B |
||||||||
| 8.125%, 08/15/09 |
B1 | 1,500 | 1,648,125 | |||||
| DIRECTV Holdings LLC, Sr. Notes |
||||||||
| 8.375%, 03/15/13 |
B1 | 1,250 | 1,407,813 | |||||
| Echostar DBS Corp., Sr. Notes |
||||||||
| 6.375%, 10/01/11 |
Ba3 | 1,500 | 1,541,250 | |||||
| Insight Communications Co., Inc., Sr. Disc. Notes, Zero Coupon (until 02/15/06) |
||||||||
| 12.25%, 02/15/11(a) |
Caa2 | 4,000 | 3,909,999 | |||||
| Mediacom LLC Capital Corp., Sr. Notes |
||||||||
| 9.50%, 01/15/13(a) |
B3 | 1,625 | 1,639,219 | |||||
| Mediacom LLC Capital Corp., Sr. Notes, Series B |
||||||||
| 8.50%, 04/15/08(a) |
B3 | 2,175 | 2,229,375 | |||||
| 17,673,280 | ||||||||
| MEDIA — DIVERSIFIED — 0.4% |
||||||||
| Block Communications, Inc., Gtd. Notes |
||||||||
| 9.25%, 04/15/09 |
B2 | 1,550 | 1,697,250 | |||||
| MEDIA — SERVICES — 0.8% |
||||||||
| Interpublic Group of Cos., Inc., Notes |
||||||||
| 7.25%, 08/15/11 |
Baa3 | 500 | 545,311 | |||||
| 6.25%, 11/15/14 |
Baa3 | 640 | 650,790 | |||||
| Warner Music Group, Sr. Sub. Notes |
||||||||
| 7.375%, 04/15/14 144A |
B3 | 2,000 | 2,060,000 | |||||
| 3,256,101 | ||||||||
| METALS & MINING EXCLUDING STEEL — 0.3% |
||||||||
| Peabody Energy Corp., Sr. Notes |
||||||||
| 5.875%, 04/15/16 |
Ba3 | 1,500 | 1,500,000 | |||||
233
AST LORD ABBETT BOND-DEBENTURE PORTFOLIO
SCHEDULE OF INVESTMENTS (CONTINUED)
DECEMBER 31, 2004
| MOODY’S RATING (UNAUDITED) |
PRINCIPAL AMOUNT (000) |
VALUE (NOTE 2) | ||||||
| NON-ELECTRIC UTILITIES — 0.9% |
||||||||
| Semco Energy, Inc., Sr. Notes |
||||||||
| 7.125%, 05/15/08 |
Ba2 | $ | 1,750 | $ | 1,881,726 | |||
| 7.75%, 05/15/13 |
Ba2 | 2,000 | 2,206,250 | |||||
| 4,087,976 | ||||||||
| NON-FOOD & DRUG RETAILERS — 1.5% |
||||||||
| Couche-Tard Corp., Sr. Sub. Notes |
||||||||
| 7.50%, 12/15/13 |
Ba3 | 1,450 | 1,562,375 | |||||
| Penny, (J.C.) Co., Inc., Notes |
||||||||
| 6.875%, 10/15/15 |
Ba2 | 1,000 | 1,087,500 | |||||
| Saks, Inc., Gtd. Notes |
||||||||
| 9.875%, 10/01/11 |
Ba3 | 1,000 | 1,190,000 | |||||
| 7.375%, 02/15/19 |
Ba3 | 2,600 | 2,587,000 | |||||
| 6,426,875 | ||||||||
| OIL FIELD EQUIPMENT & SERVICES — 1.5% |
||||||||
| Hanover Compressor Co., Sr. Notes |
||||||||
| 8.625%, 12/15/10 |
B3 | 1,000 | 1,097,500 | |||||
| Key Energy Services, Inc., Gtd. Notes |
||||||||
| 8.375%, 03/01/08 |
B1 | 500 | 526,250 | |||||
| Key Energy Services, Inc., Sr. Notes |
||||||||
| 6.375%, 05/01/13 |
B1 | 2,500 | 2,556,250 | |||||
| McDermott, (J.Ray) SA, Sec’d. Notes |
||||||||
| 11.00%, 12/15/13 144A |
Caa1 | 1,000 | 1,120,000 | |||||
| Pride International, Inc., Sr. Notes |
||||||||
| 7.375%, 07/15/14 |
Ba2 | 1,000 | 1,097,500 | |||||
| 6,397,500 | ||||||||
| PACKAGING — 3.6% |
||||||||
| AEP Industries, Inc., Sr. Sub. Notes |
||||||||
| 9.875%, 11/15/07 |
B3 | 1,000 | 1,022,500 | |||||
| BWAY Corp., Sr. Sub. Notes |
||||||||
| 10.00%, 10/15/10(c) |
B3 | 1,000 | 1,045,000 | |||||
| Constar International, Inc., Sr. Sub. Notes |
||||||||
| 11.00%, 12/01/12(a) |
Caa1 | 1,925 | 2,006,813 | |||||
| Crown Cork & Seal Co., Inc., Debs. |
||||||||
| 7.375%, 12/15/26(a) |
B3 | 3,500 | 3,307,499 | |||||
| Graham Packing Co., Sr. Notes |
||||||||
| 8.50%, 10/15/12 144A(a) |
Caa1 | 1,600 | 1,688,000 | |||||
| Owens-Brockway Glass Containers Corp., Gtd. Notes |
||||||||
| 8.875%, 02/15/09 |
B1 | 2,500 | 2,728,125 | |||||
| 7.75%, 05/15/11 |
B1 | 1,500 | 1,631,250 | |||||
| Portola Packaging, Inc., Sr. Notes |
||||||||
| 8.25%, 02/01/12 |
Caa1 | 550 | 437,250 | |||||
| Solo Cup Co., Sr. Sub. Notes |
||||||||
| 8.50%, 02/15/14 |
B3 | 1,000 | 1,045,000 | |||||
| Stone Container Finance, Gtd. Notes (Canada) |
||||||||
| 7.375%, 07/15/14(l) |
B2 | 550 | 588,500 | |||||
| 15,499,937 | ||||||||
| PHARMACEUTICALS – 1.1% |
||||||||
| Alpharma, Inc., Sr. Notes |
||||||||
| 8.625%, 05/01/11 144A |
B3 | 1,500 | 1,575,000 | |||||
| Biovail Corp., Sr. Sub. Notes (Canada) |
||||||||
| 7.875%, 04/01/10(a)(l) |
B2 | 2,500 | 2,600,000 | |||||
| Elan Finance PLC, Sr. Notes (Brazil) |
||||||||
| 7.75%, 11/15/11(l) 144A |
B3 | 425 | 454,750 | |||||
| 4,629,750 | ||||||||
| PRINTING & PUBLISHING — 1.6% |
||||||||
| Dex Media, Inc., Notes |
||||||||
| 8.00%, 11/15/13(a) |
B3 | 3,000 | 3,262,500 | |||||
| Houghton Mifflin Co., Sr. Notes |
||||||||
| 8.25%, 02/01/11 |
B3 | 2,500 | 2,675,000 | |||||
| Primedia, Inc., Sr. Notes |
||||||||
| 8.875%, 05/15/11 |
B3 | 850 | 903,125 | |||||
| 6,840,625 | ||||||||
| RESTAURANTS — 0.7% |
||||||||
| Denny’s Corp., Inc., Sr. Notes |
||||||||
| 10.00%, 10/01/12 144A(a) |
Caa1 | 1,250 | 1,351,563 | |||||
234
AST LORD ABBETT BOND-DEBENTURE PORTFOLIO
SCHEDULE OF INVESTMENTS (CONTINUED)
DECEMBER 31, 2004
| MOODY’S RATING (UNAUDITED) |
PRINCIPAL AMOUNT (000) |
VALUE (NOTE 2) | ||||||
| Friendly Ice Cream Corp., Sr. Notes |
||||||||
| 8.375%, 06/15/12(a) |
B2 | $ | 1,900 | $ | 1,873,875 | |||
| 3,225,438 | ||||||||
| SOFTWARE/SERVICES — 0.6% |
||||||||
| Electronic Data Systems Corp., Notes, Series B |
||||||||
| 6.50%, 08/01/13 |
Ba1 | 2,500 | 2,644,073 | |||||
| SUPPORT-SERVICES — 2.0% |
||||||||
| Iron Mountain, Inc., Gtd. Notes |
||||||||
| 7.75%, 01/15/15 |
Caa1 | 2,500 | 2,550,000 | |||||
| 6.625%, 01/01/16 |
Caa1 | 4,000 | 3,750,000 | |||||
| JohnsonDiversey, Inc., Gtd. Notes, Series B |
||||||||
| 9.625%, 05/15/12 |
B2 | 750 | 841,875 | |||||
| United Rentals NA, Inc., Sr. Sub. Notes |
||||||||
| 7.75%, 11/15/13(a) |
B2 | 1,500 | 1,477,500 | |||||
| 8,619,375 | ||||||||
| TELECOM — FIXED LINE — 0.3% |
||||||||
| Level 3 Financing, Inc., Sr. Notes |
||||||||
| 10.75%, 10/15/11 144A(a) |
Caa1 | 1,600 | 1,456,000 | |||||
| TELECOM — INTEGRATED/SERVICES — 2.3% |
||||||||
| Cincinnati Bell, Inc., Sr. Sub. Notes |
||||||||
| 8.375%, 01/15/14(a) |
B3 | 2,500 | 2,543,750 | |||||
| MCI, Inc., Sr. Notes |
||||||||
| 7.69%, 05/01/09 |
B2 | 970 | 1,006,375 | |||||
| 8.74%, 05/01/14 |
B2 | 831 | 895,403 | |||||
| Qwest Capital Funding Co., Gtd. Notes |
||||||||
| 7.90%, 08/15/10(a) |
Caa2 | 3,750 | 3,806,250 | |||||
| Qwest Services Corp., Notes |
||||||||
| 14.00%, 12/15/10 144A |
Caa1 | 1,500 | 1,811,250 | |||||
| 10,063,028 | ||||||||
| TELECOM — WIRELESS — 2.6% |
||||||||
| Airgate PCS, Inc., Sec’d. Notes |
||||||||
| 9.375%, 09/01/09 |
Caa1 | 1,250 | 1,353,125 | |||||
| 5.85%, 10/15/11(c) 144A |
B2 | 500 | 516,250 | |||||
| Centennial Communications Corp., Gtd. Notes |
||||||||
| 10.125%, 06/15/13 |
Caa1 | 2,000 | 2,255,000 | |||||
| Dobson Communications Corp., Sr. Notes |
||||||||
| 10.875%, 07/01/10(a) |
Ca | 500 | 390,000 | |||||
| 8.875%, 10/01/13(a) |
Ca | 775 | 548,313 | |||||
| Nextel Communications, Inc., Sr. Notes |
||||||||
| 7.375%, 08/01/15 |
Ba3 | 1,000 | 1,105,000 | |||||
| Nextel Partners, Inc., Sr. Notes |
||||||||
| 8.125%, 07/01/11 |
B3 | 1,400 | 1,561,000 | |||||
| Rodgers Wireles Communications, Inc., Sec’d. Notes (Canada) |
||||||||
| 7.25%, 12/15/12 144A(l) |
Ba3 | 400 | 426,000 | |||||
| Rural Cellular Corp., Sr. Notes |
||||||||
| 9.875%, 02/01/10(a) |
Caa1 | 1,500 | 1,533,750 | |||||
| Rural Cellular Corp., Sr. Sub. Notes |
||||||||
| 9.75%, 01/15/10 |
Caa2 | 300 | 273,000 | |||||
| Ubiquitel Operating Co., Sr. Notes |
||||||||
| 9.875%, 03/01/11 144A(a) |
Caa1 | 550 | 620,125 | |||||
| Western Wireless Corp., Sr. Notes |
||||||||
| 9.25%, 07/15/13(a) |
Caa1 | 550 | 600,875 | |||||
| 11,182,438 | ||||||||
| TELECOMMUNICATIONS EQUIPMENT — 0.3% |
||||||||
| Lucent Technologies, Debs. |
||||||||
| 6.45%, 03/15/29 |
B2 | 1,500 | 1,365,000 | |||||
| THEATERS & ENTERTAINMENT — 1.1% |
||||||||
| AMC Entertainment, Inc., Sr. Sub. Notes |
||||||||
| 8.00%, 03/01/14 |
B3 | 2,500 | 2,500,000 | |||||
| Carmike Cinemas, Inc., Sr. Sub. Notes |
||||||||
| 7.50%, 02/15/14 |
Caa1 | 550 | 565,813 | |||||
235
AST LORD ABBETT BOND-DEBENTURE PORTFOLIO
SCHEDULE OF INVESTMENTS (CONTINUED)
DECEMBER 31, 2004
| MOODY’S RATING (UNAUDITED) |
PRINCIPAL AMOUNT (000) |
VALUE (NOTE 2) | ||||||
| Cinemark USA, Inc., Sr. Sub. Notes |
||||||||
| 9.00%, 02/01/13 |
B3 | $ | 500 | $ | 573,125 | |||
| Loews Cineplex, Sr. Sub. Notes |
||||||||
| 9.00%, 08/01/14 144A |
B3 | 1,200 | 1,305,000 | |||||
| 4,943,938 | ||||||||
| TRANSPORTATION EXCLUDING AIR/RAIL — 1.2% |
||||||||
| CHC Helicopter Corp., Sr. Sub. Notes |
||||||||
| 7.375%, 05/01/14 |
B2 | 2,000 | 2,120,000 | |||||
| Hornbeck Offshore Services, Inc., Sr. Notes |
||||||||
| 6.125%, 12/01/14 144A |
Ba3 | 1,180 | 1,191,800 | |||||
| Offshore Logistics, Inc., Gtd. Notes |
||||||||
| 6.125%, 06/15/13 |
Ba2 | 1,825 | 1,861,500 | |||||
| Stena AB, Sr. Notes (Sweden) |
||||||||
| 7.00%, 12/01/16 144A(l) |
Ba3 | 150 | 149,250 | |||||
| 5,322,550 | ||||||||
| TOTAL CORPORATE OBLIGATIONS |
335,325,456 | |||||||
| SHARES |
||||||||
| COMMON STOCK — 0.7% |
||||||||
| AEROSPACE/DEFENSE — 0.4% |
||||||||
| Northrop Grumman Corp. |
30,000 | 1,630,800 | ||||||
| TELECOMMUNICATIONS EQUIPMENT — 0.3% |
||||||||
| Avaya, Inc.* |
84,248 | 1,449,066 | ||||||
| TOTAL COMMON STOCK |
3,079,866 | |||||||
| PREFERRED STOCK — 4.5% |
||||||||
| AGENCY — 0.1% |
||||||||
| Fannie Mae 5.375% [CVT] |
6 | 636,000 | ||||||
| AUTOMOTIVE — 0.3% |
||||||||
| Ford Motor Co. Capital Trust II 6.50%[CVT] |
25,000 | 1,319,750 | ||||||
| BEVERAGES — 0.2% |
||||||||
| Constellation Brands, Inc. 5.75% [CVT] |
20,000 | 752,400 | ||||||
| ELECTRIC — DISTR/TRANS — 0.5% |
||||||||
| FPL Group, Inc. 8.00% [CVT] |
35,000 | 2,108,400 | ||||||
| ENERGY — EXPLORATION & PRODUCTION — 0.5% |
||||||||
| Chesapeake Energy Corp. 4.125% [CVT] |
2,000 | 2,327,500 | ||||||
| FOOD & DRUG RETAILERS — 0.4% |
||||||||
| Albertson’s, Inc. 7.25% [CVT] |
65,000 | 1,651,000 | ||||||
| FORESTRY/PAPER — 0.3% |
||||||||
| Temple-Inland, Inc. 7.50% [CVT] |
25,000 | 1,407,500 | ||||||
| HEALTH SERVICES — 0.3% |
||||||||
| Omnicare, Inc. 4.00% [CVT] |
25,000 | 1,379,000 | ||||||
| INTEGRATED ENERGY — 0.5% |
||||||||
| Williams Cos., Inc. 5.50% [CVT] |
25,000 | 2,100,000 | ||||||
| MEDIA — BROADCASTING — 0.3% |
||||||||
| Sinclair Broadcast Group, Inc. 6.00% [CVT] |
30,000 | 1,304,700 | ||||||
| PHARMACEUTICALS — 0.3% |
||||||||
| Schering Plough Corp. 6.00% [CVT] |
23,000 | 1,290,300 | ||||||
| PRINTING & PUBLISHING — 0.8% |
||||||||
| Interpublic Group of Cos., Inc. Series A 5.375% [CVT] |
60,000 | 2,940,000 | ||||||
| TOTAL PREFERRED STOCK |
19,216,550 | |||||||
236
AST LORD ABBETT BOND-DEBENTURE PORTFOLIO
SCHEDULE OF INVESTMENTS (CONTINUED)
DECEMBER 31, 2004
| PRINCIPAL AMOUNT (000) |
VALUE (NOTE 2) |
||||||
| U.S. GOVERNMENT AGENCY MORTGAGE-BACKED |
|||||||
| SECURITIES — 5.2% |
|||||||
| Federal Home Loan Mortgage Corp. |
|||||||
| 6.00%, 04/01/33 |
$ | 4,679 | $ | 4,841,194 | |||
| Federal National Mortgage Assoc |
|||||||
| 5.50%, 04/01/33 – 07/01/33 |
7,612 | 7,736,444 | |||||
| 6.00%, 05/01/33 – 08/01/34 |
9,359 | 9,689,976 | |||||
| 17,426,420 | |||||||
| TOTAL U.S. GOVERNMENT AGENCY MORTGAGE-BACKED SECURITIES |
22,267,614 | ||||||
| U.S. TREASURY — 1.0% |
|||||||
| U.S. Treasury Notes |
|||||||
| 5.00%, 02/15/11(a) (Cost $4,270,651) |
4,000 | 4,256,408 | |||||
| TOTAL LONG-TERM INVESTMENTS |
467,873,285 | ||||||
| SHORT-TERM INVESTMENTS — 24.7% |
|||||||
| CORPORATE OBLIGATIONS — 2.0% |
|||||||
| Natexis Banque NY |
|||||||
| 2.297%, 01/03/05(b)(c) |
8,599 | 8,598,046 | |||||
| TIME DEPOSITS — 1.5% |
|||||||
| Bank of America NA |
|||||||
| 1.50%, 01/03/05(b) |
4,816 | 4,815,507 | |||||
| Chase Manhattan Bank |
|||||||
| 2.25%, 01/03/05(b) |
1,828 | 1,828,164 | |||||
| 6,643,671 | |||||||
| SHARES |
|||||||
| NON-REGISTERED INVESTMENT COMPANY — 16.6% |
|||||||
| BlackRock Institutional Money Market Trust(b)(j) |
71,290,398 | 71,290,398 | |||||
| REGISTERED INVESTMENT COMPANIES — 4.6% |
|||||||
| BlackRock Provident Institutional Funds TempCash Portfolio(j) |
9,988,637 | 9,988,637 | |||||
| BlackRock Provident Institutional Funds TempFund Portfolio(j) |
9,988,637 | 9,988,637 | |||||
| 19,977,274 | |||||||
| TOTAL SHORT-TERM INVESTMENTS |
106,509,389 | ||||||
| TOTAL INVESTMENTS — 133.1% |
574,382,674 | ||||||
| LIABILITIES IN EXCESS OF OTHER ASSETS — (33.1%) |
(142,869,848 | ) | |||||
| NET ASSETS — 100.0% |
$ | 431,512,826 | |||||
THE FOLLOWING ABBREVIATIONS ARE USED THROUGHOUT THE SCHEDULE OF INVESTMENTS:
| 144A |
Security was purchased pursuant to Rule 144A under the securities Act of 1933 and may not be resold subject to that rule except to qualified institutional buyers. | |
| CVT |
Convertible Security | |
| NR |
Not Rated by Moody’s or Standard & Poor’s |
THE FOLLOWING ANNOTATIONS ARE USED THROUGHOUT THE SCHEDULE OF INVESTMENTS:
| (a) | All or a portion of securities on loan. Securities on loan have an aggregate market value of $84,570,979; cash collateral of $86,532,115 (included with liabilities) was received with which the portfolio purchased highly liquid short-term investments. |
| (b) | Represents security purchased with cash collateral for securities on loan. |
| (c) | Indicates a variable rate security. The maturity date presented for these instruments is the next date on which the rate of interest is adjusted. |
| (d) | Standard & Poor’s rating. |
| (j) | Security available to institutional investors only. |
| (l) | US$ Denominated Foreign Bonds. |
237
AST LORD ABBETT BOND-DEBENTURE PORTFOLIO
SCHEDULE OF INVESTMENTS (CONTINUED)
DECEMBER 31, 2004
The industry classification of long-term portfolio holdings, short-term investments and liabilities in excess of other assets shown as a percentage of net assets as of December 31, 2004 were as follows:
| Healthcare Services |
6.7 | % | |
| Gaming |
5.5 | ||
| U.S. Government Agency Mortgage-Backed Securities |
5.2 | ||
| Media — Cable |
4.1 | ||
| Chemicals |
3.9 | ||
| Health Services |
3.6 | ||
| Packaging |
3.6 | ||
| Electric — Generation |
3.5 | ||
| Forestry/Paper |
3.4 | ||
| Energy — Exploration & Production |
3.3 | ||
| Aerospace/Defense |
3.2 | ||
| Food — Wholesale |
3.2 | ||
| Pharmaceuticals |
3.2 | ||
| Telecom — Wireless |
2.8 | ||
| Media — Broadcasting |
2.7 | ||
| Electric — Integrated |
2.6 | ||
| Software/Services |
2.6 | ||
| Printing & Publishing |
2.4 | ||
| Gas Distribution |
2.4 | ||
| Consumer Products |
2.3 | ||
| Oil Field Equipment & Services |
2.3 | ||
| Support — Services |
2.3 | ||
| Telecom — Integrated/Services |
2.3 | ||
| Food & Drug Retailers |
2.2 | ||
| Hotels |
2.0 | ||
| Building & Construction |
1.9 | ||
| Media — Diversified |
1.8 | ||
| Diversified Capital Goods |
1.7 | ||
| Automotive Parts & Equipment |
1.6 | ||
| Electronics |
1.5 | ||
| Non-Food & Drug Retailers |
1.5 | ||
| Machinery |
1.4 | % | |
| Media — Services |
1.3 | ||
| Leisure |
1.2 | ||
| Transportation Excluding Air/Rail |
1.2 | ||
| Theaters & Entertainment |
1.1 | ||
| Environmental |
1.0 | ||
| Metals & Mining Excluding Steel |
1.0 | ||
| Telecommunications Equipment |
1.0 | ||
| U.S. Treasury Obligations |
1.0 | ||
| Non-Electric Utilities |
0.9 | ||
| Building Materials |
0.7 | ||
| Household & leisure Products |
0.7 | ||
| Restaurants |
0.7 | ||
| Apparel & Textile |
0.5 | ||
| Beverages |
0.5 | ||
| Electric — Distr/Trans |
0.5 | ||
| Integrated Energy |
0.5 | ||
| Aerospace |
0.4 | ||
| Auto Loans |
0.4 | ||
| Automotive |
0.3 | ||
| Computer Hardware |
0.3 | ||
| Telecom — Fixed Line |
0.3 | ||
| Agency |
0.1 | ||
| Banking |
0.1 | ||
| Short-Term Investments |
24.7 | ||
| 133.1 | |||
| Liabilities in excess of other assets |
(33.1 | ) | |
| 100.0 | % | ||
See Notes to Financial Statements.
238
AST PIMCO TOTAL RETURN BOND PORTFOLIO
SCHEDULE OF INVESTMENTS
DECEMBER 31, 2004
| MOODY’S RATING (UNAUDITED) |
PRINCIPAL AMOUNT (000) |
VALUE (NOTE 2) | |||||||
| LONG-TERM INVESTMENTS — 58.9% |
|||||||||
| ASSET-BACKED SECURITIES — 4.7% |
|||||||||
| Bear Stearns Asset Backed Securities, Inc., Series 2001-A, Class AIII |
|||||||||
| 2.723%, 02/15/31(c) |
Aaa | $ | 787 | $ | 788,439 | ||||
| CCCA LLC, Series 2000 |
|||||||||
| 7.80%, 10/15/08 144A (cost $1,060,272; purchased 0521/02-02/12/03)(g) |
AAA | (d) | 1,000 | 1,082,794 | |||||
| CDC Mortgage Capital Trust, Series 2002-HE2, Class A |
|||||||||
| 2.708%, 01/25/33(c) |
Aaa | 1,418 | 1,419,227 | ||||||
| Citibank Omni-S Master Trust, Series 2002-1, Class A |
|||||||||
| 2.502%, 02/18/09(c) |
Aaa | 20,700 | 20,711,101 | ||||||
| Citibank Omni-S Master Trust, Series 2002-4, Class A |
|||||||||
| 2.533%, 08/18/09(c) |
Aaa | 23,000 | 23,031,639 | ||||||
| Contimortgage Home Equity Loan Trust, Series 1997-5, Class A8 |
|||||||||
| 2.703%, 03/15/24(c) |
Aaa | 345 | 346,812 | ||||||
| Countrywide Asset-Backed Certificates, Series 2004-7, Class 2AV1 |
|||||||||
| 2.567%, 12/25/22 |
Aaa | 14,121 | 14,129,946 | ||||||
| EMC Mortgage Loan Trust, Series 2001-A, Class A |
|||||||||
| 2.788%, 05/25/40 144A(c) |
Aaa | 10,867 | 10,887,273 | ||||||
| Equity One ABS, Inc., Series 2004-2, Class AF1 |
|||||||||
| 2.527%, 07/25/34(c) |
Aaa | 13,120 | 13,128,521 | ||||||
| Fremont Home Loan Trust, Series 2004-2, Class 2A1 |
|||||||||
| 2.567%, 07/25/34(c) |
Aaa | 5,196 | 5,199,238 | ||||||
| Home Equity Mortgage Trust, Series 2004-4, Class A2 |
|||||||||
| 2.567%, 12/25/34 |
Aaa | 9,570 | 9,578,120 | ||||||
| Nelnet Student Loan Trust, Series 2004-4, Class A1 |
|||||||||
| 2.017%, 01/25/05(c) |
Aaa | 6,900 | 6,901,001 | ||||||
| Novastar NIM Trust, Series 2004-N1, Class Notes |
|||||||||
| 4.458%, 02/25/34 144A |
A- | (d) | 259 | 259,358 | |||||
| Wells Fargo Home Equity Trust, Series 2004-2, Class A-31 |
|||||||||
| 2.578%, 06/25/19(c) |
Aaa | 2,215 | 2,217,099 | ||||||
| TOTAL ASSET-BACKED SECURITIES |
109,680,568 | ||||||||
| COLLATERALIZED MORTGAGE OBLIGATIONS — 4.0% |
|||||||||
| Bank of America Mortgage Securities, Series 2004-1, Class 5A1 |
|||||||||
| 6.50%, 09/25/33 |
AAA | (d) | 1,321 | 1,343,460 | |||||
| Bear Stearns Trust, |
|||||||||
| Series 2002-11, Class A-1 5.638%, 02/25/33 [ARM](c) |
Aaa | 950 | 949,272 | ||||||
| Series 2002-11, Class A-2 5.325%, 01/25/33 [ARM](c) |
Aaa | 2,630 | 2,665,396 | ||||||
239
AST PIMCO TOTAL RETURN BOND PORTFOLIO
SCHEDULE OF INVESTMENTS (CONTINUED)
DECEMBER 31, 2004
| MOODY'S RATING (UNAUDITED) |
PRINCIPAL AMOUNT (000) |
VALUE (NOTE 2) | ||||||
| Series 2002-9, Class 2A 5.261%, 10/25/32 [ARM](c) |
Aaa | $ | 416 | $ | 417,107 | |||
| Fannie Mae Whole Loan, |
||||||||
| Series 2003-W1, Class 1A1 6.50%, 12/25/42 |
Aaa | 2,640 | 2,750,596 | |||||
| Series 2004-W2, Class 2A2 7.00%, 02/25/44 |
Aaa | 826 | 874,608 | |||||
| Series 2004-W2, Class 5A 7.50%, 03/25/44 |
Aaa | 838 | 897,967 | |||||
| Series 1993-70, Class Z 6.90%, 05/25/23 |
Aaa | 220 | 227,408 | |||||
| Fannie Mae, |
||||||||
| Series 2002-55, Class KY 4.75%, 04/25/28 |
Aaa | 72 | 71,778 | |||||
| Series 2002-56, Class MC 5.50%, 09/25/17 |
Aaa | 476 | 490,266 | |||||
| Series 2003-122, Class TU 4.00%, 05/25/16 |
Aaa | 770 | 777,996 | |||||
| Series 2003-25, Class KP 5.00%, 04/25/33 |
Aaa | 20,745 | 20,619,863 | |||||
| Series 2003-33, Class PU 4.50%, 05/25/33 |
Aaa | 687 | 687,241 | |||||
| Series 2003-63, Class A2 2.34%, 07/25/44 |
Aaa | 315 | 314,424 | |||||
| Freddie Mac, |
||||||||
| Series 2064, Class ZA 6.50%, 05/15/28 |
Aaa | 5,648 | 5,884,034 | |||||
| Series 2145, Class MZ 6.50%, 04/15/29 |
Aaa | 14,262 | 14,870,593 | |||||
| Series 2378, Class PE 5.50%, 11/15/16 |
Aaa | 665 | 692,675 | |||||
| Series 2504, Class L 5.50%, 03/15/15 |
Aaa | 42 | 41,689 | |||||
| Series 2513, Class QK 5.00%, 08/15/28 |
Aaa | 146 | 146,335 | |||||
| Series 2649, Class QA 3.50%, 03/15/10 |
Aaa | 1,179 | 1,183,052 | |||||
| Series 2662, Class DG 5.00%, 10/15/22 |
Aaa | 1,300 | 1,295,455 | |||||
| Series 2694, Class QH 4.50%, 03/15/32 |
Aaa | 1,265 | 1,219,359 | |||||
| Series 2721, Class PE 5.00%, 01/15/23 |
Aaa | 525 | 519,673 | |||||
| Series 2724, Class PT 3.75%, 05/15/16 |
Aaa | 578 | 579,316 | |||||
| Series 2728, Class TC 4.00%, 02/15/23 |
Aaa | 1,060 | 1,059,686 | |||||
| Series 2734, Class PG 5.00%, 07/15/32 |
Aaa | 909 | 904,283 | |||||
| Series 2737, Class XG 4.00%, 11/15/22 |
Aaa | 530 | 529,843 | |||||
| Series 2737, Class YD 5.00%, 08/15/32 |
Aaa | 600 | 597,332 | |||||
| Series 2750, Class NB 4.00%, 12/15/22 |
Aaa | 1,426 | 1,425,003 | |||||
| Series 2759, Class AU 3.50%, 05/15/19 |
Aaa | 610 | 608,702 | |||||
| Series 2786, Class PA 3.50%, 10/15/10 |
Aaa | 595 | 596,835 | |||||
| GS Mortgage Securities Corp. II, |
||||||||
| Series 2001-1285, Class A2 6.526%, 08/15/18 144A |
Aa1 | 2,000 | 2,229,191 | |||||
| GSR Mortgage Loan Trust, Series 2004-7, Class 1A1 |
||||||||
| 3.464%, 06/01/34 |
Aaa | 16,618 | 16,396,695 | |||||
| Indymac Trust, Series 2001-H2, Class A2 |
||||||||
| 6.598%, 01/25/32 [ARM](c) |
Aaa | 197 | 197,607 | |||||
240
AST PIMCO TOTAL RETURN BOND PORTFOLIO
SCHEDULE OF INVESTMENTS (CONTINUED)
DECEMBER 31, 2004
| MOODY'S RATING (UNAUDITED) |
PRINCIPAL AMOUNT (000) |
VALUE (NOTE 2) | |||||||
| Nationslink Funding Corp., Series 1999-SL, Class A4 |
|||||||||
| 6.654%, 11/10/30 |
Aaa | $ | 349 | $ | 357,644 | ||||
| Prime Mortgage Trust, Series 2004-CL1, Class 1A2 |
|||||||||
| 2.58%, 02/25/34(c) |
AAA | (d) | 2,712 | 2,717,787 | |||||
| Prime Mortgage Trust, Series 2004-CL1, Class 2A2 |
|||||||||
| 2.58%, 02/25/19(c) |
AAA | (d) | 689 | 690,002 | |||||
| Residential Funding Mortgage Securities, Series 2002-SA2, Class A1 |
|||||||||
| 5.586%, 09/25/32(c) |
Aaa | 507 | 505,921 | ||||||
| Rothschild, (L.F.) Mortgage Trust, Series 2, Class Z |
|||||||||
| 9.95%, 08/01/17 |
AAA | (d) | 196 | 207,876 | |||||
| Structured Asset Securities Corp., Series 2002-1A, Class 4A |
|||||||||
| 6.112%, 02/25/32(c) |
Aaa | 276 | 275,989 | ||||||
| Washington Mutual, |
|||||||||
| Series 2002-AR11, Class A1 5.145%, 10/25/32(c) |
Aaa | 2,155 | 2,185,293 | ||||||
| Series 2004-CB1, Class 4A 6.00%, 06/25/34 |
Aaa | 753 | 773,368 | ||||||
| TOTAL COLLATERALIZED MORTGAGE OBLIGATIONS |
91,778,620 | ||||||||
| CORPORATE OBLIGATIONS — 4.2% |
|||||||||
| AIRLINES — 0.2% |
|||||||||
| United Air Lines, Inc., Equipment Trust, |
|||||||||
| Series 91C 10.36%, 11/13/12 144A (cost $8,052,231; purchased 01/03/96)(g)(i) |
NR | 6,925 | 3,358,625 | ||||||
| Series 91E 10.36%, 11/27/12 144A (cost $582,741; purchased 01/03/96)(g)(i) |
NR | 500 | 242,500 | ||||||
| United Air Lines, Inc., Pass-Thru Cert., Series 91A2 |
|||||||||
| 10.02%, 03/22/14 144A (cost $1,00,630; purchased 03/01/95)(g)(i) |
NR | 1,000 | 385,495 | ||||||
| 3,986,620 | |||||||||
| AUTOMOBILE MANUFACTURERS — 0.3% |
|||||||||
| Daimlerchrysler NA Holding Corp., Notes |
|||||||||
| 2.96%, 05/24/06 |
A3 | 5,900 | 5,931,388 | ||||||
| CONGLOMERATES — 0.1% |
|||||||||
| Altria Group, Inc., Debs. |
|||||||||
| 7.75%, 01/15/27 |
Baa2 | 1,700 | 1,913,348 | ||||||
| ENTERTAINMENT & LEISURE |
|||||||||
| Time Warner, Inc., Notes |
|||||||||
| 8.11%, 08/15/06 |
Baa1 | 510 | 547,246 | ||||||
| FINANCIAL SERVICES — 2.0% |
|||||||||
| Duke Capital Corp., Notes |
|||||||||
| 4.302%, 05/18/06 |
Baa3 | 595 | 602,382 | ||||||
| Ford Motor Credit Co., Notes |
|||||||||
| 2.51%, 01/18/05 |
A3 | 4,500 | 4,497,480 | ||||||
| 7.60%, 08/01/05 |
A3 | 6,200 | 6,345,581 | ||||||
| 6.875%, 02/01/06 |
A3 | 431 | 444,131 | ||||||
| Ford Motor Credit Co., Sr. Notes |
|||||||||
| 5.80%, 01/12/09 |
A3 | 860 | 879,823 | ||||||
241
AST PIMCO TOTAL RETURN BOND PORTFOLIO
SCHEDULE OF INVESTMENTS (CONTINUED)
DECEMBER 31, 2004
| MOODY'S RATING (UNAUDITED) |
PRINCIPAL AMOUNT (000) |
VALUE (NOTE 2) | |||||||
| General Motors Acceptance Corp., Notes |
|||||||||
| 7.50%, 07/15/05 |
Baa1 | $ | 11,400 | $ | 11,636,344 | ||||
| 6.75%, 01/15/06 |
A3 | 1,475 | 1,513,546 | ||||||
| 6.125%, 09/15/06 |
A3 | 780 | 799,962 | ||||||
| 4.375%, 12/10/07 |
A3 | 380 | 374,901 | ||||||
| 6.875%, 09/15/11 |
A3 | 510 | 523,341 | ||||||
| Pemex Project Funding Master Trust, Gtd. Notes |
|||||||||
| 8.50%, 02/15/08 |
Baa1 | 490 | 553,700 | ||||||
| 8.00%, 11/15/11 |
Baa1 | 2,700 | 3,114,450 | ||||||
| 8.625%, 02/01/22 |
Baa1 | 2,300 | 2,681,800 | ||||||
| Phoenix Quake Ltd., Notes |
|||||||||
| 4.05%, 07/03/08 144A (cost $1,200,000; purchased 06/18/03)(c)(g) |
Baa3 | 1,200 | 1,241,832 | ||||||
| Phoenix Quake Wind Ltd., Notes |
|||||||||
| 4.05%, 07/03/08 144A(c) (cost $1,200,000; purchased 06/18/03)(g) |
Baa3 | 1,200 | 1,241,832 | ||||||
| 5.10%, 07/03/08 144A(c) |
Ba1 | 550 | 456,786 | ||||||
| Qwest Capital Funding Corp., Gtd. Notes |
|||||||||
| 7.25%, 02/15/11 |
Caa2 | 153 | 150,705 | ||||||
| Sr. Wind Ltd., Notes, Series A1 |
|||||||||
| 7.51%, 02/10/05 144A(c) (cost $4,000,000; purchased 04/30/01)(g) |
BB+ | (d) | 4,000 | 4,030,560 | |||||
| Sr. Wind Ltd., Notes, Series A2 |
|||||||||
| 8.01%, 02/10/05 144A (cost $2,000,000; purchased 04/30/01)(c)(g) |
BB+ | (d) | 2,000 | 2,022,200 | |||||
| UFJ Finance Aruba AEC, Gtd. Notes |
|||||||||
| 6.75%, 07/15/13 |
Baa1 | 2,900 | 3,236,989 | ||||||
| Verizon Global Funding Corp., Notes |
|||||||||
| 7.25%, 12/01/10 |
A2 | 900 | 1,032,377 | ||||||
| 47,380,722 | |||||||||
| OIL & GAS — 0.6% |
|||||||||
| El Paso Corp., Sr. Notes |
|||||||||
| 7.75%, 01/15/32 |
Caa1 | 14,940 | 14,379,750 | ||||||
| TELECOMMUNICATIONS — 0.8% |
|||||||||
| France Telecom SA, Notes (France) |
|||||||||
| 8.20%, 03/01/06(c)(l) |
Baa2 | 5,000 | 5,251,280 | ||||||
| GTE Hawaiian Telephone, Debs. |
|||||||||
| 7.375%, 09/01/06 |
Aaa | 585 | 620,436 | ||||||
| Qwest Corp., Debs. |
|||||||||
| 7.20%, 11/10/26 |
Ba3 | 8,950 | 8,636,750 | ||||||
| 8.875%, 06/01/31 |
Ba3 | 500 | 525,000 | ||||||
| Sprint Capital Corp., Gtd. Notes |
|||||||||
| 6.00%, 01/15/07 |
Baa3 | 3,500 | 3,664,833 | ||||||
| 18,698,299 | |||||||||
| UTILITIES — 0.2% |
|||||||||
| AEP Texas Central Co., Notes |
|||||||||
| 3.54%, 02/15/05(c) |
Baa2 | 1,600 | 1,599,987 | ||||||
| Appalachian Power Co., Sr. Notes, Series E |
|||||||||
| 4.80%, 06/15/05 |
Baa2 | 1,585 | 1,598,582 | ||||||
| Cleveland Electric Co., Notes |
|||||||||
| 7.13%, 07/01/07 |
Aaa | 1,570 | 1,696,332 | ||||||
| 4,894,901 | |||||||||
| TOTAL CORPORATE OBLIGATIONS |
97,732,274 | ||||||||
| FOREIGN GOVERNMENT BONDS — 3.1% |
|||||||||
| Republic of Brazil (Brazil) |
|||||||||
| 3.063%, 04/15/06 [BRB](c) |
B2 | 1,687 | 1,691,322 | ||||||
| 11.50%, 03/12/08 |
B2 | 7,000 | 8,249,500 | ||||||
| 3.125%, 04/15/09 |
B2 | 106 | 105,087 | ||||||
| 3.125%, 04/15/09 [BRB](c) |
B2 | 937 | 930,024 | ||||||
242
AST PIMCO TOTAL RETURN BOND PORTFOLIO
SCHEDULE OF INVESTMENTS (CONTINUED)
DECEMBER 31, 2004
| MOODY'S RATING (UNAUDITED) |
PRINCIPAL AMOUNT (000) |
VALUE (NOTE 2) | ||||||
| 8.299%, 06/29/09 |
B1 | $ | 100 | $ | 117,875 | |||
| 11.00%, 01/11/12 |
B2 | 7,080 | 8,630,520 | |||||
| Republic of Panama (Panama) |
||||||||
| 9.375%, 01/16/23 |
Ba1 | 4,400 | 5,104,000 | |||||
| 8.875%, 09/30/27 |
Ba1 | 400 | 442,000 | |||||
| Republic of Peru (Peru) |
||||||||
| 9.125%, 01/15/08 |
Ba3 | 3,000 | 3,427,500 | |||||
| 9.125%, 02/21/12 |
Ba3 | 6,500 | 7,596,875 | |||||
| 9.125%, 02/21/12 |
Ba3 | 1,375 | 1,608,750 | |||||
| 9.875%, 02/06/15 |
Ba3 | 2,500 | 3,075,000 | |||||
| 4.50%, 03/07/17 |
Ba3 | 4,000 | 3,720,200 | |||||
| Republic of South Africa (South Africa) |
||||||||
| 9.125%, 05/19/09 |
Baa2 | 800 | 950,000 | |||||
| Russian Federation (Russia) 5.00%, |
||||||||
| 03/31/30(c) |
Baa3 | 13,800 | 14,288,521 | |||||
| United Mexican States (Mexico) |
||||||||
| 9.875%, 02/01/10 |
Baa2 | 600 | 738,900 | |||||
| 8.375%, 01/14/11 |
Baa2 | 2,800 | 3,295,600 | |||||
| 6.375%, 01/16/13 |
Baa2 | 2,490 | 2,658,075 | |||||
| 8.125%, 12/30/19 |
Baa2 | 200 | 235,200 | |||||
| 8.30%, 08/15/31 |
Baa2 | 5,100 | 5,989,950 | |||||
| TOTAL FOREIGN GOVERNMENT BONDS |
72,854,899 | |||||||
| MUNICIPAL BONDS — 1.5% |
||||||||
| CALIFORNIA — 0.2% |
||||||||
| Golden State Tobacco Securitization Corp. Series 2003-A-1 |
||||||||
| 6.25%, 06/01/33 |
A3 | 5,300 | 5,313,356 | |||||
| ILLINOIS — 0.1% |
||||||||
| Chicago Illinois Refunding — Emergency Telephone System |
||||||||
| 5.25%, 01/01/13 |
Aaa | 2,000 | 2,240,600 | |||||
| Illinois State Taxable — Pension General Obligation Bond |
||||||||
| 4.95%, 06/01/23 |
Aa3 | 570 | 555,197 | |||||
| 2,795,797 | ||||||||
| MARYLAND — 0.3% |
||||||||
| Prince George’s Country Maryland General Obligation Bond Series B |
||||||||
| 5.00%, 10/01/13 |
Aa2 | 5,570 | 6,180,806 | |||||
| NEVADA — 0.3% |
||||||||
| Las Vegas Water Authority (MBIA Insured) Series B |
||||||||
| 5.00%, 06/01/25 |
Aaa | 3,840 | 3,992,294 | |||||
| 5.00%, 06/01/27 |
Aaa | 2,200 | 2,265,032 | |||||
| 6,257,326 | ||||||||
| NEW JERSEY — 0.1% |
||||||||
| City of Trenton General Obligation Bond |
||||||||
| 4.80%, 04/01/14 |
Aaa | 990 | 989,931 | |||||
| Jersey City Municipal Utilities Authority Water Revenue Bond Series A |
||||||||
| 4.81%, 05/15/14 |
Aaa | 1,000 | 993,250 | |||||
| 1,983,181 | ||||||||
| NEW MEXICO |
||||||||
| Jicarilla New Mexico Apache Nation Revenue Bonds |
||||||||
| 3.85%, 12/01/08 |
NR | 435 | 431,255 | |||||
| NEW YORK — 0.1% |
||||||||
| New York City Transitional Financial Authority Series E |
||||||||
| 5.00%, 02/01/28 |
Aa2 | 1,200 | 1,230,396 | |||||
| OREGON |
||||||||
| Portland Oregon River District Urban Renewal and Redevelopment Revenue Bonds Series B |
||||||||
| 3.35%, 06/15/10 |
Aaa | 1,020 | 965,308 | |||||
| WISCONSIN — 0.4% |
||||||||
| Badger Tobacco Asset Securitization Corp. |
||||||||
| 6.00%, 06/01/17 |
Baa3 | 10,100 | 10,111,312 | |||||
| Wisconsin State General Revenue Bond |
||||||||
| 5.70%, 05/01/26 |
Aaa | 510 | 531,527 | |||||
| 10,642,839 | ||||||||
| TOTAL MUNICIPAL BONDS |
35,800,264 | |||||||
243
AST PIMCO TOTAL RETURN BOND PORTFOLIO
SCHEDULE OF INVESTMENTS (CONTINUED)
DECEMBER 31, 2004
| PRINCIPAL AMOUNT (000) |
VALUE (NOTE 2) | |||||
| U.S. GOVERNMENT AGENCY |
||||||
| MORTGAGE-BACKED SECURITIES — 21.5% |
||||||
| Federal Home Loan Mortgage Corp. |
||||||
| 5.00%, 10/01/18-05/01/34 |
$ | 8,687 | $ | 8,813,142 | ||
| 5.50%, 01/01/34 |
3,630 | 3,691,564 | ||||
| 6.00%, 02/01/16-02/01/33 |
9,465 | 9,832,530 | ||||
| 8.25%, 08/01/17 |
20 | 22,217 | ||||
| 22,359,453 | ||||||
| Federal National Mortgage Assoc. |
||||||
| 3.705%, 08/01/29(c) |
299 | 300,867 | ||||
| 3.974%, 05/01/36(c) |
17,259 | 17,467,579 | ||||
| 4.094%, 01/01/24(c) |
15 | 15,177 | ||||
| 4.297%, 11/01/35(c) |
5,354 | 5,444,520 | ||||
| 4.50%, 09/01/18-09/01/33 |
1,931 | 1,918,594 | ||||
| 4.537%, 01/01/28(c) |
225 | 227,473 | ||||
| 5.00%, 10/01/08-01/13/35 |
275,050 | 277,609,959 | ||||
| 5.50%, 08/01/16-01/13/35 |
107,145 | 109,826,743 | ||||
| 6.00%, 08/01/13-01/01/34 |
28,128 | 29,495,470 | ||||
| 6.375%, 01/01/09 |
1,831 | 1,967,193 | ||||
| 6.50%, 09/01/16-11/01/33 |
1,544 | 1,633,112 | ||||
| 445,906,687 | ||||||
| Government National Mortgage Assoc. |
||||||
| 2.75%, 01/20/32-02/20/32(c) |
11,049 | 10,833,212 | ||||
| 3.375%, 03/20/17-05/20/30(c) |
4,966 | 4,944,524 | ||||
| 3.50%, 07/20/30(c) |
2,920 | 2,908,186 | ||||
| 3.75%, 08/20/23-09/20/24(c) |
1,219 | 1,230,471 | ||||
| 4.00%, 10/20/29-11/20/29(c) |
5,030 | 5,087,953 | ||||
| 4.625%, 10/20/23-12/20/26(c) |
1,875 | 1,916,404 | ||||
| 6.00%, 01/15/34 |
192 | 199,332 | ||||
| 7.00%, 02/15/24 |
19 | 19,862 | ||||
| 27,139,944 | ||||||
| TOTAL U.S. GOVERNMENT AGENCY MORTGAGE-BACKED SECURITIES |
495,406,084 | |||||
| U.S. GOVERNMENT AGENCY OBLIGATIONS — 1.8% |
||||||
| Small Business Administration |
||||||
| 7.449%, 08/01/10 |
1,616 | 1,745,587 | ||||
| 6.344%, 08/01/11 |
12,427 | 13,096,309 | ||||
| 4.915%, 09/10/13 |
13,600 | 13,728,091 | ||||
| 5.13%, 09/01/23 |
1,622 | 1,661,705 | ||||
| 5.52%, 06/01/24 |
10,396 | 10,834,731 | ||||
| TOTAL U.S. GOVERNMENT AGENCY OBLIGATIONS |
41,066,423 | |||||
| U.S. TREASURY OBLIGATIONS — 17.6% |
||||||
| U.S. Treasury Bonds |
||||||
| 8.875%, 02/15/19 |
2,900 | 4,172,943 | ||||
| U.S. Treasury Inflationary Bonds [TIPS] |
||||||
| 3.375%, 01/15/07(k) |
2,300 | 2,935,998 | ||||
| 3.625%, 01/15/08 |
3,300 | 4,248,758 | ||||
| 3.875%, 01/15/09 |
61,200 | 79,868,672 | ||||
| 4.25%, 01/15/10 |
8,100 | 10,663,878 | ||||
| 0.875%, 04/15/10 |
33,900 | 33,839,438 | ||||
| 3.50%, 01/15/11 |
104,400 | 130,087,673 | ||||
| 3.375%, 01/15/12(c) |
2,400 | 2,937,900 | ||||
| 3.00%, 07/15/12 |
24,500 | 29,035,857 | ||||
| 1.875%, 07/15/13 |
400 | 427,815 | ||||
| U.S. Treasury Notes |
||||||
| 2.50%, 09/30/06 |
9,300 | 9,222,624 | ||||
| 3.50%, 11/15/09 |
1,500 | 1,493,439 | ||||
| 3.50%, 12/15/09 |
100,500 | 100,044,635 | ||||
| TOTAL U.S. TREASURY OBLIGATIONS |
408,979,630 | |||||
| NUMBER OF CONTRACTS |
||||||
| OPTIONS CALL OPTIONS |
||||||
| U.S. Treasury Note Futures, Strike Price 115, Expires 02/18/05* |
530 | 28,984 | ||||
| U.S. Treasury Note Futures, Strike Price 116, Expires 02/18/05* |
240 | 8,250 | ||||
| TOTAL OPTIONS |
37,234 | |||||
| SHARES |
||||||
| PREFERRED STOCK — 0.4% |
||||||
| FINANCIAL SERVICES |
||||||
| Fannie Mae, 7.00% |
174,800 | 9,952,675 | ||||
244
AST PIMCO TOTAL RETURN BOND PORTFOLIO
SCHEDULE OF INVESTMENTS (CONTINUED)
DECEMBER 31, 2004
| UNITS |
VALUE (NOTE 2) | |||||
| RIGHTS* — 0.1% |
||||||
| United Mexican States Value Recovery Rights |
||||||
| Series C (Mexico) |
49,719 | $ | 708,496 | |||
| Series D (Mexico) |
49,629 | 1,191,096 | ||||
| Series E (Mexico) |
35,410 | 757,774 | ||||
| TOTAL RIGHTS |
2,657,366 | |||||
| TOTAL LONG-TERM INVESTMENTS |
1,365,946,037 | |||||
| PRINCIPAL AMOUNT (000) |
||||||
| SHORT-TERM INVESTMENTS — 59.4% |
||||||
| BANK LOAN — 0.3% |
||||||
| Morgan Stanley |
||||||
| 2.65%, 08/19/05 144A (cost $6,300,000; purchased 06/28/04)(g) |
$ | 6,300 | 6,274,252 | |||
| CERTIFICATES OF DEPOSIT — 7.1% |
||||||
| Bank of America |
||||||
| 1.995%, 01/18/05 |
200 | 200,000 | ||||
| 2.03%, 02/04/05 |
1,700 | 1,700,000 | ||||
| 2.36%, 03/14/05 |
44,800 | 44,799,678 | ||||
| 2.44%, 03/23/05 |
500 | 499,998 | ||||
| 2.44%, 03/28/05 |
11,700 | 11,699,981 | ||||
| Citibank NA |
||||||
| 2.465%, 03/29/05 |
50,000 | 49,999,958 | ||||
| 2.465%, 03/29/05 |
9,000 | 8,999,993 | ||||
| HSBC Bank |
||||||
| 2.41%, 04/01/05 |
46,400 | 46,399,436 | ||||
| Wells Fargo |
||||||
| 2.065%, 01/11/05 |
600 | 600,000 | ||||
| 164,899,044 | ||||||
| COMMERCIAL PAPER — 7.3% |
||||||
| Bank of Ireland |
||||||
| 1.96%, 01/27/05 144A (cost $39,344,227; purchased 09/27/04)(h) |
39,400 | 39,345,900 | ||||
| Ford Motor Co. |
||||||
| 2.52%, 04/07/05 |
11,400 | 11,322,594 | ||||
| General Motors Acceptance Corp. |
||||||
| 2.404%, 03/22/05 |
3,800 | 3,779,446 | ||||
| 2.495%, 04/05/05 |
2,500 | 2,483,540 | ||||
| 2.535%, 04/05/05 |
2,300 | 2,284,614 | ||||
| HBOS Treasury Services |
||||||
| 1.955%, 01/25/05 |
43,200 | 43,146,668 | ||||
| 1.96%, 01/25/05 |
1,800 | 1,797,772 | ||||
| UBS Finance, Inc. |
||||||
| 2.20%, 01/03/05 |
50,000 | 49,993,889 | ||||
| 2.20%, 01/03/05 |
14,900 | 14,898,179 | ||||
| 169,052,602 | ||||||
| SHARES |
||||||
| REGISTERED INVESTMENT COMPANIES — 1.2% |
||||||
| BlackRock Provident Institutional Funds TempCash Portfolio(j) |
14,048,660 | 14,048,660 | ||||
| BlackRock Provident Institutional Funds TempFund Portfolio(j) |
14,048,659 | 14,048,659 | ||||
| 28,097,319 | ||||||
| PRINCIPAL AMOUNT (000) |
||||||
| U.S. GOVERNMENT AGENCY OBLIGATIONS — 43.0% |
||||||
| Federal Home Loan Bank |
||||||
| 1.00%, 01/03/05(n) |
$ | 20,800 | 20,798,844 | |||
| 1.00%, 01/03/05(n) |
20,800 | 20,798,844 | ||||
| 1.00%, 01/03/05(n) |
50,000 | 49,997,222 | ||||
| 1.00%, 01/03/05(n) |
50,000 | 49,997,223 | ||||
| 1.00%, 01/03/05(n) |
50,000 | 49,997,223 | ||||
| 1.00%, 01/03/05(n) |
50,000 | 49,997,223 | ||||
| 1.00%, 01/03/05(n) |
50,000 | 49,997,222 | ||||
| 1.00%, 01/03/05(n) |
8,700 | 8,699,517 | ||||
| 1.00%, 01/03/05(n) |
50,000 | 49,997,222 | ||||
| 1.00%, 01/03/05(n) |
50,000 | 49,997,223 | ||||
| 1.05%, 01/03/05(n) |
14,900 | 14,899,131 | ||||
| 1.05%, 01/03/05(n) |
50,000 | 49,997,083 | ||||
| 1.95%, 01/14/05(n) |
22,900 | 22,885,339 | ||||
| 1.95%, 01/14/05(n) |
17,200 | 17,188,989 | ||||
| 1.95%, 01/14/05(n) |
22,900 | 22,885,339 | ||||
| Federal Home Loan Mortgage Corp. |
||||||
| 1.98%, 01/18/05(n) |
22,900 | 22,879,819 | ||||
| 1.985%, 01/25/05(n) |
6,800 | 6,791,086 | ||||
| 1.985%, 01/25/05(n) |
23,000 | 22,969,851 | ||||
| 1.985%, 01/25/05(n) |
23,000 | 22,969,851 | ||||
| 2.19%, 02/15/05(n) |
23,100 | 23,038,567 | ||||
| 2.19%, 02/15/05(n) |
23,100 | 23,038,567 | ||||
| 2.19%, 02/15/05(n) |
13,100 | 13,065,161 | ||||
| 2.11%, 03/01/05(n) |
23,000 | 22,912,054 | ||||
| 2.30%, 03/01/05(n) |
22,200 | 22,117,808 | ||||
| 2.13%, 03/07/05(n) |
8,000 | 7,968,760 | ||||
| 2.20%, 03/08/05(n) |
23,000 | 22,905,828 | ||||
245
AST PIMCO TOTAL RETURN BOND PORTFOLIO
SCHEDULE OF INVESTMENTS (CONTINUED)
DECEMBER 31, 2004
| PRINCIPAL AMOUNT (000) |
VALUE (NOTE 2) |
||||||
| 2.315%, 03/08/05(n) |
$ | 1,900 | $ | 1,891,814 | |||
| 2.22%, 03/11/05(n) |
21,100 | 21,008,918 | |||||
| 2.26%, 03/14/05(n) |
900 | 895,876 | |||||
| Federal National Mortgage Assoc |
|||||||
| 2.20%, 01/24/05(n) |
23,100 | 23,069,350 | |||||
| 2.20%, 01/26/05(n) |
9,000 | 8,986,696 | |||||
| 2.285%, 02/23/05(n) |
1,600 | 1,594,463 | |||||
| 2.305%, 03/02/05(n) |
22,200 | 22,113,294 | |||||
| 2.31%, 03/02/05(n) |
22,000 | 21,913,888 | |||||
| 2.335%, 03/09/05(n) |
23,400 | 23,296,793 | |||||
| 2.34%, 03/09/05(n) |
8,800 | 8,761,104 | |||||
| 2.34%, 03/09/05(n) |
8,700 | 8,661,546 | |||||
| 2.345%, 03/09/05(n) |
14,400 | 14,336,216 | |||||
| 2.35%, 03/09/05(n) |
23,500 | 23,395,686 | |||||
| 2.395%, 03/16/05(n) |
23,500 | 23,382,745 | |||||
| 2.40%, 03/16/05(n) |
23,500 | 23,382,500 | |||||
| 2.39%, 04/15/05(n) |
23,400 | 23,236,882 | |||||
| 2.485%, 05/25/05(n) |
9,000 | 8,909,919 | |||||
| 997,628,686 | |||||||
| U.S. TREASURY BILLS — 0.5% |
|||||||
| U.S. Treasury Bills |
|||||||
| 2.00%, 03/17/05(n)(k) |
710 | 707,002 | |||||
| 2.145%, 03/17/05(n)(k) |
2,130 | 2,121,003 | |||||
| 2.195%, 03/17/05(n) |
500 | 497,683 | |||||
| 2.205%, 03/17/05(n)(k) |
1,420 | 1,414,002 | |||||
| 2.205%, 03/17/05(n) |
2,860 | 2,847,919 | |||||
| 2.21%, 03/17/05(n)(k) |
3,500 | 3,485,216 | |||||
| 11,072,825 | |||||||
| TOTAL SHORT-TERM INVESTMENTS |
1,377,024,728 | ||||||
| TOTAL INVESTMENTS, BEFORE OUTSTANDING OPTIONS WRITTEN — 118.3% |
2,742,970,765 | ||||||
| NUMBER OF CONTRACTS/ SWAP NOTIONAL AMOUNT $(000) |
|||||||
| OUTSTANDING OPTIONS WRITTEN — (0.2)% |
|||||||
| CALL OPTIONS — (0.2%) |
|||||||
| Swap 3-Month LIBOR & Fixed, Strike Price |
|||||||
| 5.50%, Expires 01/07/05* |
24,500 | (1,753,220 | ) | ||||
| Swap 3-Month LIBOR & Fixed, Strike Price |
|||||||
| 6.00%, Expires 06/09/05* |
38,300 | (3,471,857 | ) | ||||
| U.S. Treasury Note Futures, Strike Price 114, Expires 02/18/05* |
1,629 | (381,797 | ) | ||||
| (5,606,874 | ) | ||||||
| PUT OPTIONS |
|||||||
| 3-Month Euro-Euribor Interest Futures Strike Price 94.25, Expires 06/15/05* |
134 | 0 | |||||
| Eurodollar Futures, Strike Price 97.75, Expires 06/13/05* |
319 | (184,280 | ) | ||||
| Swap 3-Month LIBOR & Fixed, Strike Price |
|||||||
| 6.70%, Expires 06/09/05* |
22,300 | (1,249 | ) | ||||
| Swap 3-Month LIBOR & Fixed, Strike Price |
|||||||
| 7.00%, Expires 01/07/05* |
24,500 | 0 | |||||
| U.S. Treasury Note Futures, Strike Price 108, Expires 02/18/05* |
1,137 | (106,594 | ) | ||||
| (292,123 | ) | ||||||
| TOTAL OUTSTANDING OPTIONS WRITTEN |
(5,898,997 | ) | |||||
| TOTAL INVESTMENTS, NET OF OUTSTANDING OPTIONS WRITTEN — 118.1% |
2,737,071,768 | ||||||
| OTHER LIABILITIES IN EXCESS OF OTHER ASSETS — (18.1%) |
(418,848,319 | ) | |||||
| NET ASSETS — 100.0% |
$ | 2,318,223,449 | |||||
THE FOLLOWING ABBREVIATIONS ARE USED THROUGHOUT THE SCHEDULE OF INVESTMENTS:
| 144A |
Security was purchased pursuant to Rule 144A under the Securities Act of 1933 and may not be resold subject to that rule except to qualified institutional buyers. Unless otherwise noted 144A securities are deemed to be liquid. | |
| ARM |
Adjustable Rate Mortgage Security | |
| BRB |
Brady Bond | |
| BRL |
Brazilian Real | |
| CLP |
Chilean Peso | |
| EUR |
Euro |
246
AST PIMCO TOTAL RETURN BOND PORTFOLIO
SCHEDULE OF INVESTMENTS (CONTINUED)
DECEMBER 31, 2004
| GBP |
British Pound | |
| HKD |
Hong Kong Dollar | |
| INR |
Indonesian Rupiah | |
| JPY |
Japanese Yen | |
| KRW |
Korean Won | |
| MXN |
Mexican Peso | |
| PEN |
Peruvian Sol | |
| PLZ |
Polish Zloty | |
| RUB |
Russian Rouble | |
| SGD |
Singapore Dollar | |
| SKK |
Slovak Koruna | |
| TIPS |
Treasury Inflation Protection Securities | |
| TWD |
Taiwan Dollar |
THE FOLLOWING ANNOTATIONS ARE USED THROUGHOUT THE SCHEDULE OF INVESTMENTS:
| * | Non-income producing security. |
| (c) | Indicates a variable rate security. The maturity date presented for these instruments is the next date on which the rate of interest is adjusted. |
| (d) | Standard & Poor’s rating. |
| (g) | Indicates a security that has been deemed illiquid. The aggregate cost of illiquid securities is $26,955,013. The aggregate value, $24,361,073 represents 1.05% of net assets. |
| (h) | Security is a 144A security restricted as to resale and generally is sold only to institutional investors who agree that they are purchasing the security for investment and not with a view to public distribution. At the end of the current reporting period, the aggregate cost of such securities was $39,344,227. The aggregate market value of $39,345,900, is approximately 1.70% of net assets. These securities have been deemed to be liquid under procedures established by the Board of Trustees. |
| (i) | Represents issuer in default on interest payments. Non-income producing security. |
| (j) | Security available to institutional investors only. |
| (k) | Securities with an aggregate market value of $10,663,221 have been segregated with the custodian to cover margin requirements for the following open futures contracts at December 31, 2004: |
| NUMBER OF CONTRACTS |
TYPE |
EXPIRATION MONTH |
VALUE AT TRADE DATE |
VALUE AT DECEMBER 31, 2004 |
UNREALIZED APPRECIATION (DEPRECIATION) |
|||||||||
| LONG POSITIONS: | ||||||||||||||
| 1,638 | Euro-Bund | Mar 05 | $ | 264,516,739 | $ | 264,034,824 | $ | (481,915 | ) | |||||
| 554 | Euro Dollar | Jun 05 | 134,167,250 | 134,102,625 | (64,625 | ) | ||||||||
| 2,345 | Euro Dollar | Sep 05 | 569,293,000 | 566,376,125 | (2,916,875 | ) | ||||||||
| 1,063 | Euro Dollar | Dec 05 | 256,446,975 | 256,289,300 | (157,675 | ) | ||||||||
| 25 | Japanese Government 10 Year Bond | Mar 05 | 33,677,383 | 33,756,221 | 78,838 | |||||||||
| 3,250 | U.S. Treasury 10 Year Note | Mar 05 | 362,894,500 | 363,796,875 | 902,375 | |||||||||
| 143 | U.S. Treasury 15 Year Bond | Mar 05 | 15,790,172 | 16,087,500 | 297,328 | |||||||||
| $ | (2,342,549 | ) | ||||||||||||
| (l) | US$ Denominated Foreign Bonds. |
| (n) | Rates shown are the effective yields at purchase date. |
247
AST PIMCO TOTAL RETURN BOND PORTFOLIO
SCHEDULE OF INVESTMENTS (CONTINUED)
DECEMBER 31, 2004
Foreign currency exchange contracts outstanding at December 31, 2004:
PURCHASE CONTRACTS
| SETTLEMENT MONTH |
TYPE |
CONTRACTS TO RECEIVE |
IN EXCHANGE FOR |
CONTRACTS AT VALUE |
UNREALIZED APPRECIATION (DEPRECIATION) | ||||||||||
| Jan 05 |
Buy | BRL | 1,303,830 | $ | 436,355 | $ | 490,900 | $ | 54,545 | ||||||
| Feb 05 |
Buy | BRL | 1,361,634 | 473,447 | 512,663 | 39,216 | |||||||||
| Mar 05 |
Buy | BRL | 1,500,000 | 522,375 | 564,759 | 42,384 | |||||||||
| Feb 05 |
Buy | CLP | 385,171,053 | 645,402 | 693,038 | 47,636 | |||||||||
| Mar 05 |
Buy | CLP | 303,010,000 | 511,172 | 545,206 | 34,034 | |||||||||
| Jan 05 |
Buy | EUR | 10,010,000 | 13,389,765 | 13,600,981 | 211,216 | |||||||||
| Jan 05 |
Buy | GBP | 1,093,000 | 2,094,604 | 2,095,891 | 1,287 | |||||||||
| Jan 05 |
Buy | HKD | 3,512,275 | 452,502 | 452,539 | 37 | |||||||||
| Mar 05 |
Buy | INR | 34,232,000 | 777,467 | 787,483 | 10,016 | |||||||||
| Jan 05 |
Buy | JPY | 4,255,061,000 | 39,805,830 | 41,583,860 | 1,778,030 | |||||||||
| Jan 05 |
Buy | KRW | 523,611,000 | 456,653 | 505,756 | 49,103 | |||||||||
| Feb 05 |
Buy | KRW | 533,341,000 | 498,072 | 515,154 | 17,082 | |||||||||
| Mar 05 |
Buy | KRW | 590,000,000 | 554,845 | 569,881 | 15,036 | |||||||||
| Feb 05 |
Buy | MXN | 4,869,827 | 422,141 | 432,213 | 10,072 | |||||||||
| Mar 05 |
Buy | MXN | 5,606,000 | 492,099 | 495,654 | 3,555 | |||||||||
| Feb 05 |
Buy | PEN | 1,567,673 | 472,444 | 478,095 | 5,651 | |||||||||
| Mar 05 |
Buy | PEN | 1,740,000 | 526,874 | 530,650 | 3,776 | |||||||||
| Feb 05 |
Buy | PLZ | 3,324,488 | 1,043,284 | 1,096,204 | 52,920 | |||||||||
| Jan 05 |
Buy | RUB | 12,981,636 | 452,953 | 468,313 | 15,360 | |||||||||
| Feb 05 |
Buy | RUB | 13,057,580 | 458,241 | 471,052 | 12,811 | |||||||||
| Mar 05 |
Buy | RUB | 15,239,000 | 544,931 | 549,747 | 4,816 | |||||||||
| Jan 05 |
Buy | SGD | 761,437 | 455,650 | 466,712 | 11,062 | |||||||||
| Feb 05 |
Buy | SGD | 774,318 | 471,254 | 475,003 | 3,749 | |||||||||
| Mar 05 |
Buy | SGD | 853,000 | 520,011 | 523,687 | 3,676 | |||||||||
| Feb 05 |
Buy | SKK | 14,838,569 | 494,536 | 518,305 | 23,769 | |||||||||
| Mar 05 |
Buy | SKK | 16,715,000 | 578,693 | 583,716 | 5,023 | |||||||||
| Feb 05 |
Buy | TWD | 15,168,502 | 468,307 | 478,651 | 10,344 | |||||||||
| Mar 05 |
Buy | TWD | 16,605,000 | 514,404 | 523,981 | 9,577 | |||||||||
| $ | 68,534,311 | $ | 71,010,094 | $ | 2,475,783 | ||||||||||
SALE CONTRACTS
| SETTLEMENT MONTH |
TYPE |
CONTRACTS TO DELIVER |
IN EXCHANGE FOR |
CONTRACTS AT VALUE |
UNREALIZED APPRECIATION (DEPRECIATION) |
|||||||||||
| Jan 05 |
Sell | EUR | 17,800,000 | $ | 23,896,396 | $ | 24,184,832 | $ | (288,436 | ) | ||||||
| Jan 05 |
Sell | GBP | 203,000 | 394,977 | 389,740 | 5,237 | ||||||||||
| Jan 05 |
Sell | JPY | 797,734,000 | 7,775,370 | 7,785,006 | (9,636 | ) | |||||||||
| $ | 32,066,743 | $ | 32,359,578 | $ | (292,835 | ) | ||||||||||
Interest rate swap agreements outstanding at December 31, 2004:
| DESCRIPTION |
EXPIRATION MONTH |
NOTIONAL AMOUNT (000) |
UNREALIZED APPRECIATION (DEPRECIATION) |
||||||
| Receive variable rate payments on the Lehman Commercial Mortgage Backed Securities Index and pay fixed rate payment of 1.49% for the initial calculation period and variable rate payments thereafter on the one month LIBOR-BBA floating rate. (cost $0; purchased 09/15/04)(g)(2) |
Apr 05 | $ | 4,200 | $ | 17,689 | ||||
| Receive fixed rate payments of 4.00% and pay variable rate payments on the three month LIBOR-BBA floating rate. (cost $541,780; purchased 12/06/04)(g)(6) |
Jun 07 | 89,200 | (71,021 | ) | |||||
| Receive fixed rate payments of 4.00% and pay variable rate payments on the three month LIBOR-BBA floating rate.(8) |
Jun 10 | 104,900 | 326,241 | ||||||
| Receive fixed rate payments of 4.00% and pay variable rate payments on the three month LIBOR-BBA floating rate.(1) |
Jun 10 | 221,300 | (329,328 | ) | |||||
| Receive fixed rate payments of 5.00% And pay variable rate payments on the three month LIBOR-BBA floating rate.(3) |
Dec 14 | 3,600 | (108,360 | ) | |||||
| Receive variable rate payments on the three month LIBOR-BBA floating rate and pay fixed rate payments of 5.00%.(9) |
Jun 15 | 41,000 | 219,359 | ||||||
| Receive variable rate payments on the three month LIBOR-BBA floating rate and pay fixed rate payments of 5.00%.(6) |
Jun 15 | 107,500 | 150,141 | ||||||
248
AST PIMCO TOTAL RETURN BOND PORTFOLIO
SCHEDULE OF INVESTMENTS (CONTINUED)
DECEMBER 31, 2004
| DESCRIPTION |
EXPIRATION MONTH |
NOTIONAL AMOUNT (000) |
UNREALIZED APPRECIATION (DEPRECIATION) |
|||||||
| Receive fixed rate payments of 6.00% and pay variable rate payments on the six month LIBOR-BBA floating rate. (cost ($12,806); purchased 02/12/02)(g)(3) |
Mar 17 | EUR | 11,200 | 675,733 | ||||||
| Receive fixed rate payments of 6.00% and pay variable rate payments on the six month LIBOR-BBA floating rate. (cost $51,787; purchased 05/15/02)(g)(7) |
Mar 32 | EUR | 5,300 | 403,473 | ||||||
| Receive fixed rate payments of 6.00% and pay variable rate payments on the six month LIBOR-BBA floating rate. (cost $2,816; purchased 03/25/02)(g)(4) |
Mar 32 | EUR | 6,600 | 564,111 | ||||||
| Receive fixed rate payments of 6.00% and pay variable rate payments on the six month EUR-EURIBOR floating rate. (cost $218,789; purchased 11/08/04)(g)(5) |
Jun 34 | EUR | 2,800 | 133,625 | ||||||
| Receive fixed rate payments of 6.00% and pay variable rate payments on the six month LIBOR-BBA floating rate. (cost $756,773; purchased 07/02/2004)(g)(4) |
Jun 34 | EUR | 15,400 | 1,187,593 | ||||||
| Receive variable rate payments on the six month LIBOR-BBA floating rate and pay fixed rate payments of 5.00%.(3) |
Mar 17 | GBP | 6,500 | (110,518 | ) | |||||
| Receive variable rate payments on the six month LIBOR-BBA floating rate and pay fixed rate payments of 5.00%.(4) |
Mar 32 | GBP | 3,600 | (139,676 | ) | |||||
| Receive variable rate payments on the six month LIBOR-BBA floating rate and pay fixed rate payments of 5.00%.(7) |
Mar 32 | GBP | 3,100 | (142,754 | ) | |||||
| Receive variable rate payments on the six month LIBOR-BBA floating rate and pay fixed rate payments of 5.00%.(6) |
Jun 34 | GBP | 3,400 | (27,896 | ) | |||||
| Receive variable rate payments on the six month LIBOR-BBA floating rate and pay fixed rate payments of 5.00%.(1) |
Jun 34 | GBP | 3,600 | (147,564 | ) | |||||
| Receive variable rate payments on the six month LIBOR-BBA floating rate and pay fixed rate payments of 5.00%.(7) |
Jun 34 | GBP | 4,300 | (203,732 | ) | |||||
| Receive fixed rate payments on the six month LIBOR-BBA floating rate and pay fixed rate payments of 2.00%.(6) |
Jun 12 | JPY | 1,050,000 | (463,943 | ) | |||||
| Receive fixed rate payments on the six month LIBOR-BBA floating rate and pay fixed rate payments of 2.00%.(7) |
Jun 12 | JPY | 1,625,000 | (770,649 | ) | |||||
| Receive variable rate payments on the six month LIBOR-BBA floating rate and pay fixed rate payments of 2.00%.(3) |
Jun 12 | JPY | 130,000 | (60,898 | ) | |||||
| Receive variable rate payments on the six month LIBOR-BBA floating rate and pay fixed rate payments of 2.00%.(3) |
Jun 12 | JPY | 387,100 | (147,639 | ) | |||||
| $ | 953,987 | |||||||||
Broker/Counterparty:
| (1) | Barclays Bank PLC |
| (2) | Citigroup |
| (3) | Goldman Sachs |
| (4) | J.P. Morgan Chase & Co. |
| (5) | Merrill Lynch |
| (6) | Morgan Stanley |
| (7) | UBS — Warburg |
| (8) | RBS Greenwich Capital |
| (9) | Lehman Brothers Specialty Financing, Inc. |
249
AST PIMCO TOTAL RETURN BOND PORTFOLIO
SCHEDULE OF INVESTMENTS (CONTINUED)
DECEMBER 31, 2004
Credit default swap agreements outstanding at December 31, 2004:
| DESCRIPTION |
EXPIRATION MONTH |
NOTIONAL AMOUNT (000) |
UNREALIZED APPRECIATION | |||||
| Receive a fixed rate equal to 1.10% and the Portfolio will pay to the counterparty at par in the event of default of Republic of Panama 8.875% due 09/30/27. (cost $0; purchased 06/07/04)(g)(6) |
Jun 05 | $ | 1,200 | $ | 3,375 | |||
| Receive a fixed rate equal to 1.80% and the Portfolio will pay to the counterparty at par in the event of default of Republic of Panama 9.375% due 04/01/29. (cost $0; purchased 05/30/03)(g)(6) |
Jun 05 | 500 | 3,044 | |||||
| Receive a fixed rate equal to 0.98% and the Portfolio will pay to the counterparty at par in the event of default of Russian Federation 5.0% due 03/31/30. (cost $0; purchased 08/03/04)(g)(4) |
Aug 05 | 3,300 | 4,223 | |||||
| $ | 10,642 | |||||||
Broker/Counterparty
| (4) | J.P. Morgan Chase & Co. |
| (6) | Morgan Stanley |
The industry classification of long-term portfolio holdings, short-term investments and liabilities in excess of other assets shown as a percentage of net assets as of December 31, 2004 were as follows:
| U.S. Government Agency Mortgage-Backed Securities |
21.5 | % | |
| U.S. Treasury Obligations |
17.6 | ||
| Asset-Backed Securities |
4.7 | ||
| Collateralized Mortgage Obligations |
4.0 | ||
| Foreign Government Bonds |
3.1 | ||
| Financial Services |
2.4 | ||
| U.S. Government Agency Obligations |
1.8 | ||
| Municipal Bonds |
1.5 | ||
| Telecommunications |
0.8 | ||
| Oil & Gas |
0.6 | ||
| Automobile Manufacturers |
0.3 | ||
| Airlines |
0.2 | ||
| Utilities |
0.2 | ||
| Conglomerates |
0.1 | ||
| Rights |
0.1 | ||
| Options Written |
(0.2 | ) | |
| Short-Term Investments |
59.4 | ||
| 118.1 | |||
| Liabilities in excess of other assets |
(18.1 | ) | |
| 100.0 | % | ||
See Notes to Financial Statements.
250
AST PIMCO LIMITED MATURITY BOND PORTFOLIO
SCHEDULE OF INVESTMENTS
DECEMBER 31, 2004
| MOODY'S RATING (UNAUDITED) |
PRINCIPAL AMOUNT (000) |
VALUE (NOTE 2) | ||||||
| LONG-TERM INVESTMENTS — 32.8% |
||||||||
| ASSET-BACKED SECURITIES — 3.8% |
||||||||
| Advanta Mortgage Loan Trust, Series 1994-4, Class A |
||||||||
| 2.793%, 11/25/29(c) |
Aaa | $ | 1,795 | $ | 1,795,525 | |||
| Ameriquest Mortgage Securities, Inc., Series 2002-4, Class A2 |
||||||||
| 2.857%, 01/25/05(c) |
Aaa | 106 | 105,880 | |||||
| Argent Securities, Inc., Series 2004-W11, Class A2 |
||||||||
| 2.598%, 11/25/34(c) |
Aaa | 4,004 | 4,006,788 | |||||
| Bear Stearns Asset Backed Securities, Inc., Series 2003-3, Class A1 |
||||||||
| 2.618%, 01/25/05 |
Aaa | 1,454 | 1,455,873 | |||||
| Bear Stearns Asset Backed Securities, Inc., Series 2004-HE9, Class 1A1 |
||||||||
| 2.361%, 01/25/05(c) |
Aaa | 3,387 | 3,390,411 | |||||
| Capital Auto Receivables Asset Trust, Series 2002-5, Class A4 |
||||||||
| 2.92%, 04/15/08 |
Aaa | 1,446 | 1,444,299 | |||||
| Chase Credit Card Master Trust, Series 2002-2, Class A |
||||||||
| 2.453%, 07/16/07(c) |
Aaa | 4,300 | 4,303,307 | |||||
| Chase Funding Loan Acquisition Trust, Series 2001-C2, Class IIA1 |
||||||||
| 2.658%, 07/25/30(c) |
Aaa | 315 | 314,835 | |||||
| Series 2003-C1, Class 2A2 |
||||||||
| 2.748%, 01/25/05(c) |
Aaa | 199 | 199,645 | |||||
| Citibank Omni-S Master Trust, Series 2002-5, Class A |
||||||||
| 2.783%, 11/17/09 |
Aaa | 4,300 | 4,305,698 | |||||
| Credit Suisse First Boston Mortgage Securities Corp., Series 2001-HE30, Class A2 |
||||||||
| 2.768%, 07/25/32 |
Aaa | 352 | 353,155 | |||||
| Series 2002-HE1, Class |
||||||||
| 2.551%, 08/25/32(c) |
Aaa | 296 | 296,886 | |||||
| First Franklin Mortgage Loan, Series 2003-FF5, Class A2 |
||||||||
| 2.82%, 03/25/34(c) |
Aaa | 1,178 | 1,174,193 | |||||
| Master Asset Backed Securities Trust, Series 2004 - WMC1, Class A4 |
||||||||
| 2.28%, 02/25/34(c) |
Aaa | 284 | 284,256 | |||||
| Merrill Lynch Mortgage Investors, Inc., Series 2004 - WMC4, Class A2B1 |
||||||||
| 2.558%, 01/25/05(c) |
Aaa | 1,821 | 1,822,269 | |||||
| Morgan Stanley ABS Capital, Series 2004-HE9, Class-A3A |
||||||||
| 2.567%, 01/25/05(c) |
Aaa | 4,237 | 4,235,946 | |||||
| Nelnet Student Loan Trust, Series 2004-4, Class A1 |
||||||||
| 1.92%, 01/25/05(c) |
Aaa | 2,600 | 2,600,377 | |||||
| Novaster Home Equity Loan, Series 2001-2, Class A2 |
||||||||
| 2.511%, 09/25/31(c) |
Aaa | 412 | 412,536 | |||||
251
AST PIMCO LIMITED MATURITY BOND PORTFOLIO
SCHEDULE OF INVESTMENTS (CONTINUED)
DECEMBER 31, 2004
| MOODY'S RATING (UNAUDITED) |
PRINCIPAL AMOUNT (000) |
VALUE (NOTE 2) | |||||||
| Park Place Securities, Inc., Series 2004-MCW1, Class A3 |
|||||||||
| 2.618%, 10/25/34(c) |
Aaa | $ | 1,214 | $ | 1,215,132 | ||||
| Renaissance Home Equity Loan Trust, Series 2004-3, Class AV2A |
|||||||||
| 2.777%, 01/25/05(c) |
Aaa | 2,138 | 2,139,733 | ||||||
| Residential Asset Mortgage Products, Inc., Series 2003-RS11, Class AIIB |
|||||||||
| 2.748%, 01/25/05(c) |
Aaa | 1,601 | 1,602,291 | ||||||
| Series 2004-RS9, Class AII1 |
|||||||||
| 2.578%, 01/25/05(c) |
Aaa | 4,110 | 4,112,756 | ||||||
| Residential Asset Securities Corp., Series 2001-KS3, Class AII |
|||||||||
| 2.648%, 01/25/05(c) |
Aaa | 359 | 359,296 | ||||||
| SVO Timeshare Mortgage Corp., Series 2001-AA, Class A |
|||||||||
| 5.47%, 10/20/13 144A |
Aaa | 1,909 | 1,941,485 | ||||||
| Wells Fargo Home Equity Trust, Series 2004-2, Class AI1A |
|||||||||
| 2.587%, 02/25/18(c) |
Aaa | 3,247 | 3,249,627 | ||||||
| TOTAL ASSET-BACKED SECURITIES |
47,122,199 | ||||||||
| COLLATERALIZED MORTGAGE OBLIGATIONS — 5.7% |
|||||||||
| Bank of America Mortgage Securities, Series 2002-K, Class 2A1 |
|||||||||
| 5.597%, 10/20/32(c) |
AAA | (d) | 2,210 | $ | 2,242,119 | ||||
| Bear Stearns Adjustable Rate Mortgage Trust, Series 2003-8, Class 2A1 |
|||||||||
| 4.905%, 01/25/34(c) |
Aaa | 3,323 | 3,318,641 | ||||||
| Bear Stearns Alt-A Trust, Series 2003-7, Class IIA1 |
|||||||||
| 2.697%, 02/25/34(c) |
Aaa | 1,260 | 1,260,563 | ||||||
| Bear Stearns Trust, Series 2002-2, Class |
|||||||||
| 6.936%, 06/25/31 [ARM](c) |
Aaa | 241 | 254,148 | ||||||
| Countrywide Alternative Loan Trust, Series 2003-J3, Class 2A1 |
|||||||||
| 6.25%, 12/25/33 |
AAA | (d) | 1,724 | 1,766,829 | |||||
| Countrywide Home Loans Series 2004-25 Cl-2A1 |
|||||||||
| 2.71%, 02/25/35(c) |
Aaa | 4,200 | 4,201,970 | ||||||
| Series 2003-R4, Class 1A1B |
|||||||||
| 4.879%, 07/25/19 144A |
Aaa | 545 | 545,693 | ||||||
| Series 2003-R4, Class 2A |
|||||||||
| 6.50%, 01/25/34 144A |
Aaa | 1,425 | 1,478,392 | ||||||
| Credit Suisse First Boston USA, Inc., Series 2002, Class P-3A |
|||||||||
| 2.695%, 09/27/32 144A |
Aaa | 5,552 | 5,509,483 | ||||||
252
AST PIMCO LIMITED MATURITY BOND PORTFOLIO
SCHEDULE OF INVESTMENTS (CONTINUED)
DECEMBER 31, 2004
| MOODY'S RATING (UNAUDITED) |
PRINCIPAL AMOUNT (000) |
VALUE (NOTE 2) | ||||||
| Series 2003-8, Class 5A1 |
||||||||
| 6.50%, 04/25/33(c) |
Aaa | $ | 775 | $ | 789,294 | |||
| Fannie Mae, Series 1988-22, Class A |
||||||||
| 3.21%, 08/25/18(c) |
Aaa | 17 | 17,436 | |||||
| Series 1996-39, Class H |
||||||||
| 8.00%, 11/25/23 |
Aaa | 198 | 206,048 | |||||
| Series 2002-76, Class PD |
||||||||
| 5.00%, 08/25/22 |
Aaa | 633 | 633,384 | |||||
| Series 2003-54, Class TH |
||||||||
| 3.50%, 05/25/09 |
Aaa | 2,249 | 2,254,183 | |||||
| Series 2004-41, Class PB |
||||||||
| 3.50%, 04/25/17 |
Aaa | 2,071 | 2,067,852 | |||||
| FHLMC Structured Pass Through Securities, Series T-57, Class 1A1 |
||||||||
| 6.50%, 07/25/43 |
Aaa | 7,219 | 7,552,573 | |||||
| Series T-59, Class 1A2 |
||||||||
| 7.00%, 10/25/43 |
Aaa | 4,016 | 4,254,925 | |||||
| First Republic Mortgage Loan Trust, Series 2002-FRB1, Class A |
||||||||
| 2.703%, 08/15/32(c) |
Aaa | 10,326 | 10,332,107 | |||||
| Freddie Mac, Series 2538, Class CA |
||||||||
| 5.00%, 04/15/16 |
Aaa | 3,606 | 3,662,588 | |||||
| Government National Mortgage Assoc., Series 1998-15, Class C |
||||||||
| 6.50%, 06/20/28 |
Aaa | 4,873 | 5,083,627 | |||||
| GSR Mortgage Loan Trust, Series 2004-7, Class 1A1 |
||||||||
| 3.46%, 06/25/34 |
Aaa | 1,456 | 1,436,824 | |||||
| Merrill Lynch Mortgage Investors, Inc., Series 1995-C2, Class B |
||||||||
| 6.925%, 06/15/21(c) |
Aaa | 329 | 336,674 | |||||
| Residential Funding Mortgage Securities, Series 2002-SA2, Class A1 |
||||||||
| 5.586%, 09/25/32(c) |
Aaa | 974 | 972,925 | |||||
| Saco I, Inc., Series 2004-2, Class A2 |
||||||||
| 2.607%, 01/25/05(c) 144A |
Aaa | 2,072 | 2,051,066 | |||||
| Structured Asset Securities Corp., Series 2001-13, Class 2A |
||||||||
| 7.00%, 10/25/16 |
Aaa | 505 | 508,615 | |||||
| Series 2004-S1, Class A1 |
||||||||
| 2.547%, 01/25/05(c) |
Aaa | 1,467 | 1,467,864 | |||||
| Travelers Mortgage Securities Corp., Series 1984-1, Class Z2 |
||||||||
| 12.00%, 03/01/14 |
Aaa | 410 | 414,904 | |||||
| Washington Mutual, Series 2002-AR11, Class A1 |
||||||||
| 5.145%, 10/25/32(c) |
Aaa | 2,155 | 2,185,293 | |||||
| Series 2002-AR2, Class A |
||||||||
| 3.181%, 01/25/05(c) |
Aaa | 769 | 770,378 | |||||
| Series 2003-R1, Class A1 |
||||||||
| 2.451%, 01/25/05(c) |
Aaa | 2,882 | 2,880,341 | |||||
| TOTAL COLLATERALIZED MORTGAGE OBLIGATIONS |
70,456,739 | |||||||
253
AST PIMCO LIMITED MATURITY BOND PORTFOLIO
SCHEDULE OF INVESTMENTS (CONTINUED)
DECEMBER 31, 2004
| MOODY'S RATING (UNAUDITED) |
PRINCIPAL AMOUNT (000) |
VALUE (NOTE 2) | ||||||
| CORPORATE OBLIGATIONS — 9.3% |
||||||||
| AIRLINES — 0.2% |
||||||||
| United Air Lines, Inc., Pass-Thru Cert., Series 01-1 |
||||||||
| 6.831%, 09/01/08 144A (cost $1,800,000; purchased 08/10/01)(g)(i) |
NR | $ | 1,800 | $ | 84,060 | |||
| 6.932%, 09/01/11 144A (cost $1,100,000; purchased 08/10/01)(g)(i) |
NR | 1,100 | 335,972 | |||||
| United Air Lines, Inc., Pass-Thru Cert., Series 97A |
||||||||
| 2.02%, 03/02/05(c) |
NR | 2,992 | 2,553,062 | |||||
| 2,973,094 | ||||||||
| AUTOMOBILE MANUFACTURERS — 0.4% |
||||||||
| DaimlerChrysler NA Holding Co., Notes |
||||||||
| 7.40%, 01/20/05 |
A3 | 4,960 | 4,969,126 | |||||
| AUTOMOTIVE PARTS — 0.1% |
BAA3 | |||||||
| Lear Corp., Gtd. Notes |
||||||||
| 7.96%, 05/15/05 |
Baa3 | 800 | 812,848 | |||||
| CABLE TELEVISION — 0.4% |
||||||||
| Continental Cablevision, Inc., Sr. Notes |
||||||||
| 8.875%, 09/15/05 |
Baa3 | 400 | 415,695 | |||||
| Cox Communications, Inc., Notes |
||||||||
| 3.04%, 03/14/05(c)144A |
Baa3 | 3,250 | 3,258,287 | |||||
| Rogers Cablesystems of America, Inc., Sr. Notes, Series B (Canada) |
||||||||
| 10.00%, 03/15/05(l) |
Ba2 | 880 | 896,500 | |||||
| 4,570,482 | ||||||||
| CONGLOMERATES — 0.4% |
||||||||
| Tyco International Group, Gtd. Notes (Luxembourg) |
||||||||
| 6.375%, 06/15/05(l) |
Baa3 | 4,670 | 4,738,654 | |||||
| ELECTRONIC COMPONENTS & EQUIPMENT — 0.2% |
||||||||
| PP&L Capital Funding, Sr. Notes |
||||||||
| 7.75%, 04/15/05 |
Baa3 | 3,000 | 3,036,111 | |||||
| ENTERTAINMENT & LEISURE — 0.3% |
||||||||
| Time Warner, Inc., Notes |
||||||||
| 7.75%, 06/15/05 |
Baa1 | 3,600 | 3,668,188 | |||||
| FINANCIAL — BANK & TRUST — 0.2% |
||||||||
| Household Finance Corp., Notes |
||||||||
| 6.70%, 01/19/05 |
A1 | 2,300 | 2,365,980 | |||||
| FINANCIAL SERVICES — 1.8% |
||||||||
| Chrysler Financial Co. LLC, Sr. Notes |
||||||||
| 2.26%, 01/27/05 |
A3 | 1,000 | 996,999 | |||||
| Duke Capital LLC, Sr. Notes, Series A |
||||||||
| 6.25%, 07/15/05 |
Baa3 | 1,500 | 1,525,050 | |||||
| Ford Motor Credit Co., Notes |
||||||||
| 7.60%, 08/01/05 |
A3 | 5,700 | 5,833,842 | |||||
| 6.875%, 02/01/06 |
A3 | 4,000 | 4,121,864 | |||||
| General Motors Accept Corp., Notes |
||||||||
| 3.185%, 02/18/05(c) |
A3 | 5,100 | 5,078,437 | |||||
| Nisource Finance Corp., Notes |
||||||||
| 2.909%, 11/23/09 |
Baa3 | 4,300 | 4,299,845 | |||||
| 21,856,037 | ||||||||
| FOOD — 0.1% |
||||||||
| Nabisco, Inc., Notes |
||||||||
| 6.375%, 02/01/05 |
A3 | 1,710 | 1,713,251 | |||||
| HEALTHCARE SERVICES — 0.2% |
||||||||
| HCA, Inc., Notes |
||||||||
| 6.91%, 06/15/05 |
Ba1 | 2,000 | 2,029,528 | |||||
254
AST PIMCO LIMITED MATURITY BOND PORTFOLIO
SCHEDULE OF INVESTMENTS (CONTINUED)
DECEMBER 31, 2004
| MOODY'S RATING (UNAUDITED) |
PRINCIPAL AMOUNT (000) |
VALUE (NOTE 2) | ||||||
| HOTELS & MOTELS — 0.4% |
||||||||
| MGM Grand, Inc., Notes |
||||||||
| 6.95%, 02/01/05 |
Ba1 | $ | 2,400 | $ | 2,406,000 | |||
| Park Place Entertainment, Sr. Notes |
||||||||
| 8.50%, 11/15/06 |
Ba1 | 1,760 | 1,914,000 | |||||
| 4,320,000 | ||||||||
| OIL & GAS — 0.6% |
||||||||
| Centerpoint Energy, Notes |
||||||||
| 8.125%, 07/15/05 |
Ba1 | 1,950 | 2,001,622 | |||||
| Enterprise Products Operations, Gtd. Notes |
||||||||
| 8.25%, 03/15/05 |
Baa3 | 1,000 | 1,008,844 | |||||
| Kerr-McGee Corp., Gtd. Notes |
||||||||
| 5.375%, 04/15/05 |
Baa3 | 2,000 | 2,013,000 | |||||
| Pioneer Natural Resources, Sr. Notes |
||||||||
| 8.875%, 04/15/05 |
Ba1 | 2,420 | 2,457,382 | |||||
| 7,480,848 | ||||||||
| PAPER & FOREST PRODUCTS — 0.2% |
||||||||
| Georgia-Pacific Corp., Notes |
||||||||
| 7.50%, 05/15/06 |
Ba3 | 2,350 | 2,473,375 | |||||
| RETAIL & MERCHANDISING — 0.1% |
||||||||
| Delhaize America, Inc., Gtd. Notes |
||||||||
| 7.375%, 04/15/06 |
Ba1 | 740 | 780,683 | |||||
| TELECOMMUNICATIONS — 1.8% |
||||||||
| British Telecom PLC, Notes (United Kingdom) |
||||||||
| 7.875%, 06/15/05(l) |
Baa1 | 8,400 | 8,763,107 | |||||
| Deutsche Telekom International Finance Corp., Gtd. Notes (Germany) |
||||||||
| 8.25%, 06/15/05(l) |
Baa2 | 5,000 | 5,117,085 | |||||
| France Telecom SA, Notes (France) |
||||||||
| 8.20%, 03/01/06(c)(l) |
Baa2 | 2,500 | 2,625,640 | |||||
| Qwest Corp., Notes |
||||||||
| 6.625%, 09/15/05 |
Ba3 | 800 | 820,000 | |||||
| SBC Communications, Inc., Notes |
||||||||
| 4.206%, 06/05/21 144A |
A1 | 4,470 | 4,496,167 | |||||
| Sprint Capital Corp., Gtd. Notes |
||||||||
| 7.90%, 03/15/05 |
Baa3 | 2,170 | 2,193,590 | |||||
| 24,015,589 | ||||||||
| UTILITIES — 1.9% |
||||||||
| AEP Texas Central Co., Notes |
||||||||
| 3.54%, 02/15/05(c) |
Baa2 | 10,000 | 9,999,920 | |||||
| Dominion Resources, Inc., Sr. Notes, Class B |
||||||||
| 7.625%, 07/15/05 |
Baa1 | 3,000 | 3,071,625 | |||||
| Duke Energy Corp., Sr. Notes |
||||||||
| 2.89%, 03/08/05(c) |
Baa1 | 500 | 501,086 | |||||
| GPU, Inc., Notes, Series A |
||||||||
| 7.70%, 12/01/05 |
Baa3 | 500 | 518,083 | |||||
| Niagara Mohawk Power Corp., Notes |
||||||||
| 7.75%, 05/15/06 |
Baa2 | 4,590 | 4,862,724 | |||||
| Ohio Edison Co., Notes |
||||||||
| 5.647%, 06/15/09 144A |
Baa2 | 500 | 516,782 | |||||
| Ohio Edison Co., Sr. Notes |
||||||||
| 4.00%, 05/01/08 |
Baa2 | 1,205 | 1,205,615 | |||||
| Pacific Gas & Electric, Notes |
||||||||
| 2.72%, 04/03/06(c) |
Baa2 | 2,351 | 2,353,104 | |||||
| 23,028,939 | ||||||||
| TOTAL CORPORATE OBLIGATIONS (Cost $116,554,165) |
114,832,733 | |||||||
255
AST PIMCO LIMITED MATURITY BOND PORTFOLIO
SCHEDULE OF INVESTMENTS (CONTINUED)
DECEMBER 31, 2004
| MOODY'S RATING (UNAUDITED) |
PRINCIPAL AMOUNT (000) |
VALUE (NOTE 2) | ||||||
| FOREIGN GOVERNMENT BONDS — 2.2% |
||||||||
| Republic of Brazil (Brazil) |
B1 | |||||||
| 8.299%, 03/29/05 |
B1 | $ | 1,000 | $ | 1,178,750 | |||
| 3.125%, 04/15/05 [BRB](c) |
B2 | 150 | 144,644 | |||||
| 3.125%, 04/15/06 [BRB](c) |
B2 | 2,736 | 2,742,684 | |||||
| 3.125%, 04/15/09 [BRB](c) |
B2 | 1,487 | 1,478,942 | |||||
| 12.00%, 04/15/10 |
B2 | 700 | 868,000 | |||||
| 11.00%, 01/11/12 |
B2 | 2,000 | 2,438,000 | |||||
| 8.00%, 04/15/14 [BRB] |
B2 | 2,195 | 2,260,220 | |||||
| Republic of Panama (Panama) |
||||||||
| 9.625%, 02/08/11 |
Ba1 | 3,000 | 3,555,000 | |||||
| 9.375%, 07/23/12 |
Ba1 | 1,000 | 1,190,000 | |||||
| 8.875%, 09/30/27 |
Ba1 | 900 | 994,500 | |||||
| Republic of Peru (Peru) |
||||||||
| 9.125%, 01/15/08 |
Ba3 | 1,200 | 1,371,000 | |||||
| 9.125%, 02/21/12 |
Ba3 | 875 | 1,023,750 | |||||
| 9.125%, 02/21/12 |
Ba3 | 500 | 585,000 | |||||
| 9.875%, 02/06/15 |
Ba3 | 1,000 | 1,230,000 | |||||
| 5.00%, 03/07/17 |
Ba3 | 484 | 464,664 | |||||
| Republic of South Africa (South Africa) |
||||||||
| 9.125%, 05/19/09 |
Baa2 | 2,650 | 3,146,875 | |||||
| Russian Federation (Russia) |
||||||||
| 8.25%, 03/31/10 |
Baa3 | 1,250 | 1,389,750 | |||||
| United Mexican States (Mexico) |
||||||||
| 11.375%, 09/15/16 |
Baa2 | 150 | 221,775 | |||||
| 8.125%, 12/30/19 |
Baa2 | 850 | 999,600 | |||||
| TOTAL FOREIGN GOVERNMENT BONDS |
27,283,154 | |||||||
| SHARES |
||||||||
| PREFERRED STOCK — 0.6% |
||||||||
| FINANCIAL SERVICES |
||||||||
| Fannie Mae, 7.00% |
124,400 | 7,083,025 | ||||||
| RIGHTS* — 0.0% |
||||||||
| United Mexican States Value Recovery Rights Series C (Mexico) 0.00% |
5,500 | 78,375 | ||||||
| Series D (Mexico) 0.00% |
5,500 | 132,000 | ||||||
| Series E (Mexico) 0.00% |
5,500 | 117,700 | ||||||
| TOTAL RIGHTS |
328,075 | |||||||
| PRINCIPAL AMOUNT (000) |
||||||||
| U.S. GOVERNMENT AGENCY MORTGAGE-BACKED SECURITIES — 3.8% |
||||||||
| Federal Home Loan Mortgage Corp. |
||||||||
| 4.064%, 12/01/26 |
$ | 100 | 103,184 | |||||
| 6.00%, 08/01/29-04/01/33 |
11,147 | 11,535,262 | ||||||
| 8.50%, 01/01/25-01/01/25 |
648 | 714,010 | ||||||
| 12,352,456 | ||||||||
| Federal National Mortgage Assoc. |
||||||||
| 2.184%, 02/11/05(c) |
10,000 | 9,997,639 | ||||||
| 2.333%, 01/28/05(c) |
8,200 | 8,200,253 | ||||||
| 3.239%, 01/01/25(c) |
28 | 28,192 | ||||||
| 4.135%, 05/01/25(c) |
215 | 214,096 | ||||||
| 4.936%, 03/01/17(c) |
643 | 655,216 | ||||||
| 5.00%, 09/01/18 |
3,518 | 3,578,616 | ||||||
| 5.50%, 01/13/35[TBA] |
200 | 203,062 | ||||||
| 6.00%, 04/01/12-11/01/17 |
4,873 | 5,111,217 | ||||||
| 27,988,291 | ||||||||
| Government National Mortgage Assoc. |
||||||||
| 3.375%, 05/20/24-06/20/26(c) |
890 | 885,892 | ||||||
| 3.75%, 07/20/17-07/20/24(c) |
187 | 188,817 | ||||||
| 4.00%, 11/20/29(c) |
885 | 895,153 | ||||||
| 6.50%, 04/15/26-06/15/29 |
470 | 495,470 | ||||||
| 7.00%, 01/15/24-08/15/25 |
152 | 163,087 | ||||||
| 8.00%, 06/20/30-01/20/32 |
2,788 | 3,015,675 | ||||||
| 8.50%, 10/15/29-01/15/31 |
714 | 780,443 | ||||||
| 6,424,537 | ||||||||
| TOTAL U.S. GOVERNMENT AGENCY MORTGAGE-BACKED SECURITIES |
46,765,284 | |||||||
256
AST PIMCO LIMITED MATURITY BOND PORTFOLIO
SCHEDULE OF INVESTMENTS (CONTINUED)
DECEMBER 31, 2004
| SHARES |
VALUE (NOTE 2) | |||||
| U.S. GOVERNMENT AGENCY OBLIGATIONS — 0.0% |
||||||
| Small Business Investment Cos., Series 1997-P10B, Class 1 |
||||||
| 7.31%, 05/10/07 (Cost $574,682) |
575 | $ | 608,343 | |||
| U.S. TREASURY OBLIGATIONS — 7.4% |
||||||
| U.S. Treasury Notes |
||||||
| 3.50%, 12/15/09 (Cost $91,097,142) |
91,400 | 90,985,867 | ||||
| TOTAL LONG-TERM INVESTMENTS |
405,465,419 | |||||
| SHORT-TERM INVESTMENTS — 40.0% |
||||||
| CERTIFICATES OF DEPOSIT — 3.3% |
||||||
| Bank of America |
||||||
| 2.30%, 03/16/05 |
20,800 | 20,799,728 | ||||
| UBS Bank AG |
||||||
| 1.93%, 07/05/05 |
20,000 | 19,997,258 | ||||
| 40,796,986 | ||||||
| COMMERCIAL PAPER — 6.5% |
||||||
| CDC Corp. |
||||||
| 2.02%, 02/07/05 144A (cost $23,551,003; purchased 10/13/04)(h) |
23,600 | 23,552,880 | ||||
| 2.07%, 02/23/05 144A (cost $897,257; purchased 10/27/04)(h) |
900 | 897,179 | ||||
| Fortis Funding |
3,500 | 3,491,537 | ||||
| 1.93%, 01/25/05 144A (cost $3,495,497; purchased 09/24/04)(h) |
||||||
| General Electric Capital Corp. |
||||||
| 2.32%, 02/24/05 |
12,000 | 11,940,702 | ||||
| 2.34%, 03/01/05 |
100 | 99,444 | ||||
| 2.42%, 03/14/05 |
8,600 | 8,548,548 | ||||
| 2.42%, 03/15/05 |
3,700 | 3,677,615 | ||||
| General Motors Acceptance Corp. |
||||||
| 2.495%, 04/05/05 |
3,760 | 3,735,244 | ||||
| Rabobank USA |
||||||
| 2.17%, 01/03/05 |
22,200 | 22,197,324 | ||||
| Skandi Ensk Bank |
||||||
| 2.04%, 01/27/05 144A (cost $1,597,643; purchased 10/27/04)(h) |
1,600 | 1,597,713 | ||||
| 79,738,186 | ||||||
| PRINCIPAL AMOUNT (000) |
||||||
| U.S. GOVERNMENT AGENCY OBLIGATIONS — 29.4% |
||||||
| Federal Home Loan Bank |
||||||
| 1.00%, 01/03/05(n) |
$ | 24,300 | 24,298,650 | |||
| 1.05%, 01/03/05(n) |
22,200 | 22,198,705 | ||||
| 1.958%, 01/05/05(n) |
18,900 | 18,900,000 | ||||
| 1.96%, 01/14/05(n) |
3,900 | 3,897,503 | ||||
| 1.97%, 01/19/05(n) |
14,500 | 14,486,304 | ||||
| 1.985%, 01/21/05(n) |
17,200 | 17,181,723 | ||||
| 2.10%, 01/25/05(n) |
13,600 | 13,601,210 | ||||
| 2.295%, 03/02/05(n) |
2,500 | 2,490,675 | ||||
| Federal Home Loan Mortgage Corp. |
||||||
| 1.94%, 01/04/05(n) |
8,600 | 8,599,519 | ||||
| 1.955%, 01/11/05(n) |
23,300 | 23,289,307 | ||||
| 1.98%, 01/18/05(n) |
8,600 | 8,592,421 | ||||
| 1.985%, 01/25/05(n) |
8,600 | 8,588,727 | ||||
| 1.985%, 01/25/05(n) |
6,400 | 6,391,611 | ||||
| 2.06%, 02/01/05(n) |
15,400 | 15,372,772 | ||||
| 2.11%, 03/01/05(n) |
3,200 | 3,187,764 | ||||
| 2.13%, 03/07/05(n) |
2,100 | 2,091,493 | ||||
| 2.20%, 03/08/05(n) |
5,600 | 5,576,950 | ||||
| Federal National Mortgage Assoc. |
||||||
| 1.25%, 01/03/05(n) |
36,500 | 36,497,464 | ||||
| 1.65%, 01/03/05(n) |
24,300 | 24,297,773 | ||||
| 1.96%, 01/03/05(n) |
20,000 | 20,000,000 | ||||
| 2.20%, 01/24/05(n) |
3,200 | 3,195,996 | ||||
| 2.20%, 01/26/05(n) |
8,300 | 8,288,520 | ||||
| 2.26%, 02/23/05(n) |
3,200 | 3,189,550 | ||||
| 2.303%, 03/02/05(n) |
6,100 | 6,077,247 | ||||
| 2.305%, 03/02/05(n) |
8,100 | 8,069,787 | ||||
| 2.305%, 03/02/05(n) |
8,100 | 8,069,787 | ||||
| 2.34%, 03/09/05(n) |
6,000 | 5,974,920 | ||||
| 2.34%, 03/09/05(n) |
4,700 | 4,680,354 | ||||
| 2.34%, 03/09/05(n) |
8,200 | 8,165,724 | ||||
| 2.36%, 03/09/05(n) |
100 | 99,582 | ||||
| 2.39%, 03/16/05(n) |
8,100 | 8,062,497 | ||||
| 2.395%, 03/16/05(n) |
8,100 | 8,062,497 | ||||
| 2.40%, 03/16/05(n) |
1,300 | 1,293,981 | ||||
| 2.39%, 04/15/05(n) |
8,200 | 8,143,896 | ||||
| 360,914,909 | ||||||
| U.S. TREASURY BILLS — 0.3% |
||||||
| U.S. Treasury Bills |
||||||
| 2.18%, 03/03/05(n)(k) |
3,000 | 2,989,872 | ||||
| 2.21%, 03/17/05(n) |
600 | 597,466 | ||||
| 3,587,338 | ||||||
257
AST PIMCO LIMITED MATURITY BOND PORTFOLIO
SCHEDULE OF INVESTMENTS (CONTINUED)
DECEMBER 31, 2004
| SHARES |
VALUE (NOTE 2) |
||||||
| REGISTERED INVESTMENT COMPANIES — 0.5% |
|||||||
| BlackRock Provident Institutional Funds TempCash Portfolio(j) |
3,344,463 | $ | 3,344,463 | ||||
| BlackRock Provident Institutional Funds TempFund Portfolio(j) |
3,344,462 | 3,344,462 | |||||
| 6,688,925 | |||||||
| TOTAL SHORT-TERM INVESTMENTS |
491,726,344 | ||||||
| TOTAL INVESTMENTS, BEFORE OUTSTANDING WRITTEN OPTIONS — 72.8% |
897,191,763 | ||||||
| SWAP NOTIONAL AMOUNT ($000) |
|||||||
| WRITTEN OPTIONS — 0.0% |
|||||||
| CALL OPTION |
|||||||
| Swap 3-Month LIBOR, Strike Price |
$ | 50,700 | (760 | ) | |||
| 4.00%, Expires 01/07/05* |
|||||||
| PUT OPTION |
|||||||
| Swap 3-Month LIBOR, Strike Price |
50,700 | (1 | ) | ||||
| 7.00%, Expires 01/07/05* |
|||||||
| TOTAL WRITTEN OPTIONS |
(761 | ) | |||||
| TOTAL INVESTMENTS, NET OF OUTSTANDING OPTIONS WRITTEN — 72.8% |
897,191,002 | ||||||
| OTHER ASSETS IN EXCESS OF LIABILITIES — 27.2% |
335,629,075 | ||||||
| NET ASSETS — 100.0% |
$ | 1,232,820,077 | |||||
THE FOLLOWING ABBREVIATIONS ARE USED THROUGHOUT THE SCHEDULE OF INVESTMENTS:
| 144A | Security was purchased pursuant to Rule 144A under the Securities Act of 1933 and may not be resold subject to that rule except to qualified institutional buyers. Unless otherwise noted 144A securities are deemed to be liquid. |
| ARM | Adjustable Rate Mortgage Security |
| BRB | Brady Bond |
| EUR | Euro |
| GBP | British Pound |
| JPY | Japanese Yen |
| NR | Not Rated by Moody’s or Standard & Poor’s |
| SEK | Swedish Krona |
| TBA | Security purchased on a forward commitment basis |
THE FOLLOWING ANNOTATIONS ARE USED THROUGHOUT THE SCHEDULE OF INVESTMENTS:
| * | Non-income producing security. |
| (c) | Indicates a variable rate security. The maturity date presented for these instruments is the next date on which the rate of interest is adjusted. |
| (d) | Standard & Poor’s rating. |
| (g) | Indicates a security that has been deemed illiquid. The aggregate cost of illiquid securities is $4,010,498. The aggregate value, $2,795,900, represents 0.21% of net assets. |
| (h) | Security is a 144A security restricted as to resale and generally is sold only to institutional investors who agree that they are purchasing the security for investment and not with a view to public distribution (does not include 144A securities — see footnote above). At the end of the current reporting period, the aggregate cost of such securities was $29,541,400. The aggregate market value of $29,539,309 is approximately 2.40% of net assets. These securities have been deemed to be liquid under procedures established by the Board of Trustees. |
| (i) | Represents issuer in default on interest payments. Non-income producing security. |
| (j) | Security available to institutional investors only. |
258
AST PIMCO LIMITED MATURITY BOND PORTFOLIO
SCHEDULE OF INVESTMENTS (CONTINUED)
DECEMBER 31, 2004
| (k) | Securities with an aggregate market value of $2,989,872 have been segregated with the custodian to cover margin requirements for the following open futures contracts at December 31, 2004: |
| NUMBER OF CONTRACTS |
TYPE |
EXPIRATION MONTH |
VALUE AT TRADE DATE |
VALUE AT DECEMBER 31, 2004 |
UNREALIZED DEPRECIATION |
|||||||||
| LONG POSITIONS: |
||||||||||||||
| 874 |
Euro Dollar | Dec 05 | $ | 210,851,275 | $ | 210,721,400 | $ | (129,875 | ) | |||||
| (l) | US$ Denominated Foreign Bonds. |
| (n) | Rates shown are the effective yields at purchase date. |
Interest rate swap agreements outstanding at December 31, 2004:
| DESCRIPTION |
EXPIRATION MONTH |
NOTIONAL AMOUNT (000) |
UNREALIZED APPRECIATION (DEPRECIATION) |
||||||
| Receive variable rate payments on the six month LIBOR-BBA floating rate and pay fixed rate payments of 4.00%. (cost $1,023,426; purchased on 12/13/04)(g)(1) |
Jun 07 | 160,000 | (179,015 | ) | |||||
| Receive variable rate payments on the six month EURO-EURIBOR floating rate and pay fixed rate payments of 4.00%. (cost $13,738; purchased on 09/15/04)(g)(2) |
Jun 10 | EUR | 2,700 | 98,595 | |||||
| Receive variable rate payments on the six month LIBOR-BBA floating rate and pay fixed rate payments of 4.25%.(g)(3) |
Mar 05 | GBP | 96,500 | (284,425 | ) | ||||
| Receive variable rate payments on the three month STIBOR floating rate and pay fixed rate payments of 4.50%. (cost ($73,334); purchased on 06/02/04)(g)(2) |
Jun 08 | SEK | 254,000 | 1,344,190 | |||||
| $ | 979,345 | ||||||||
Brokers/Counterparties
| (1) | Barclays Bank PLC |
| (2) | Merrill Lynch |
| (3) | Morgan Stanley |
Credit default swap agreement outstanding at December 31, 2004:
| DESCRIPTION |
EXPIRATION MONTH |
NOTIONAL AMOUNT (000) |
UNREALIZED APPRECIATION | |||||
| Receive a fixed rate equal to 1.00% and the Portfolio will pay to the counterparty at par in the event of default of Russian Federation 5.00% due 03/31/30. (cost $0; purchased 03/11/04)(g)(5) |
Mar 05 | $ | 3,200 | $ | 1,600 | |||
Broker/Counterparty
| (5) | J.P. Morgan Chase & Co. |
Foreign currency exchange contracts outstanding at December 31, 2004:
PURCHASE CONTRACTS
| SETTLEMENT MONTH |
TYPE |
CONTRACTS TO RECEIVE |
IN EXCHANGE |
CONTRACTS AT VALUE |
UNREALIZED APPRECIATION | ||||||||
| Jan 05 |
Buy EUR | 501,000 | $ | 664,028 | $ | 680,708 | $ | 16,680 | |||||
| Jan 05 |
Buy JPY | 951,956,000 | 8,905,489 | 9,303,276 | 397,787 | ||||||||
| $ | 9,569,517 | $ | 9,983,984 | $ | 414,467 | ||||||||
259
AST PIMCO LIMITED MATURITY BOND PORTFOLIO
SCHEDULE OF INVESTMENTS (CONTINUED)
DECEMBER 31, 2004
SALE CONTRACTS
| SETTLEMENT MONTH |
TYPE |
CONTRACTS TO DELIVER |
IN EXCHANGE FOR |
CONTRACTS AT VALUE |
UNREALIZED DEPRECIATION |
|||||||||||
| Jan 05 |
Sell | JPY | 549,104,000 | $ | 5,360,413 | $ | 5,366,284 | $ | (5,871 | ) | ||||||
| Jan 05 |
Sell | SEK | 8,343,000 | 1,249,195 | 1,255,455 | (6,260 | ) | |||||||||
| $ | 6,609,608 | $ | 6,621,739 | $ | (12,131 | ) | ||||||||||
The industry classification of long-term portfolio holdings, short-term investments and liabilities in excess of other assets shown as a percentage of net assets as of December 31, 2004 were as follows:
| U.S. Treasury Obligations |
7.4 | % | |
| Collateralized Mortgage Obligations |
5.7 | ||
| U.S. Government Agency Mortgage-Backed Securities |
3.8 | ||
| Asset-Backed Securities |
3.8 | ||
| Financial Services |
2.4 | ||
| Foreign Government Bonds |
2.2 | ||
| Utilities |
1.9 | ||
| Telecommunications |
1.8 | ||
| Oil & Gas |
0.6 | ||
| Automobile Manufacturers |
0.4 | ||
| Cable Television |
0.4 | ||
| Conglomerates |
0.4 | ||
| Hotels & Motels |
0.4 | ||
| Entertainment & Leisure |
0.3 | ||
| Airlines |
0.2 | ||
| Electronic Components & Equipment |
0.2 | ||
| Financial — Bank & Trust |
0.2 | ||
| Healthcare Services |
0.2 | ||
| Paper & Forest Products |
0.2 | ||
| Automotive Parts |
0.1 | ||
| Food |
0.1 | ||
| Retail & Merchandising |
0.1 | ||
| Short-Term Investments |
40.0 | ||
| 72.8 | |||
| Other assets in excess of liabilities |
27.2 | ||
| 100.0 | % | ||
See Notes to Financial Statements.
260
AST MONEY MARKET PORTFOLIO
SCHEDULE OF INVESTMENTS
DECEMBER 31, 2004
| PRINCIPAL AMOUNT (000) |
VALUE (NOTE 2) | |||||
| COMMERCIAL PAPER — 44.2% |
||||||
| Banco Bilbao Vizcayza Argentaria Puerto Rico |
||||||
| 2.25%, 01/03/05 (cost $38,245,219; purchased 12/31/04)(h) |
$ | 38,250 | $ | 38,245,219 | ||
| Bank of Ireland |
||||||
| 2.445%, 03/23/05 144A (cost $45,746,943; purchased 12/21/04)(h) |
46,000 | 45,746,943 | ||||
| Irish Life & Permanent Corp. |
||||||
| 2.55%, 06/02/05 144A (cost $44,713,347; purchased 12/07/04)(h) |
45,200 | 44,713,347 | ||||
| Nationwide Building Society |
||||||
| 2.31%, 02/07/05 144A (cost $44,693,637; purchased 12/06/04)(h) |
44,800 | 44,693,637 | ||||
| Network Rail Corp. Finance PLC |
||||||
| 1.99%, 01/10/05 144A (cost $45,977,115; purchased 10/07/04)(h) |
46,000 | 45,977,115 | ||||
| San Paolo |
||||||
| 2.30%, 01/06/05 |
38,250 | 38,237,781 | ||||
| Santander Century Hispanic Financial |
||||||
| 2.09%, 03/24/05 |
60,000 | 59,714,367 | ||||
| Spintab AB |
||||||
| 2.28%, 02/01/05 |
42,000 | 41,917,540 | ||||
| Stadshypotek Delaware |
||||||
| 2.32%, 02/08/05 144A (cost $49,877,556; purchased 12/08/04)(h) |
50,000 | 49,877,556 | ||||
| Swedish National Housing Finance |
||||||
| 2.38%, 03/08/05 144A (cost $49,781,833; purchased 12/08/04)(h) |
50,000 | 49,781,833 | ||||
| UBS Finance Delaware, Inc. |
||||||
| 2.38%, 01/05/05 |
40,250 | 40,239,356 | ||||
| Unicredit Delaware, Inc. |
||||||
| 2.39%, 03/08/05 |
28,000 | 27,877,313 | ||||
| Washington Gas Light Co. |
||||||
| 2.30%, 01/03/05 |
12,500 | 12,498,403 | ||||
| Westpac Capital Corp. |
||||||
| 2.06%, 02/22/05 |
61,700 | 61,516,408 | ||||
| TOTAL COMMERCIAL PAPER |
601,036,818 | |||||
| EURO TIME DEPOSITS — 14.6% |
||||||
| Branch Banking & Trust |
||||||
| 2.125%, 01/03/05 |
38,250 | 38,250,000 | ||||
| Chase Manhattan Bank USA NA |
||||||
| 2.125%, 01/03/05 |
43,100 | 43,100,000 | ||||
| Ixis Corp. & Investment Bank |
||||||
| 2.40%, 01/04/05 |
40,250 | 40,250,000 | ||||
| Key Bank NA Cayman Island |
||||||
| 2.125%, 01/03/05 |
38,250 | 38,250,000 | ||||
| National City Bank of Indiana |
||||||
| 2.188%, 01/03/05 |
38,250 | 38,250,000 | ||||
| TOTAL EURO TIME DEPOSITS |
198,100,000 | |||||
| CORPORATE OBLIGATIONS — 22.0% |
||||||
| 3M Co. |
||||||
| 5.674%, 12/12/05 144A |
9,000 | 9,234,189 | ||||
| American General Finance |
||||||
| 2.402%, 01/06/06 144A(c) |
5,000 | 5,000,000 | ||||
| American Honda Finance Corp. |
||||||
| 2.46%, 03/20/05 144A(c) |
58,500 | 58,500,000 | ||||
| Bank of America Corp. |
||||||
| 7.875%, 05/16/05 |
12,000 | 12,265,305 | ||||
| General Electric Capital Corp. |
||||||
| 6.80%, 11/01/05 |
25,700 | 26,594,106 | ||||
| HBOS Treasury Services PLC |
||||||
| 2.09%, 01/12/05 144A(c) |
18,000 | 18,009,223 | ||||
| Lehman Brothers Holdings, Inc. |
||||||
| 7.75%, 01/15/05 |
18,000 | 18,042,840 | ||||
| 2.19%, 01/22/05(c) |
41,000 | 41,026,910 | ||||
| Nationwide Building Society |
||||||
| 2.36%, 12/14/05 144A(c) |
5,000 | 5,000,000 | ||||
| Northern Rock PLC |
||||||
| 2.023%, 01/13/05 144A(c) |
46,000 | 45,999,178 | ||||
| U.S. Bank NA |
||||||
| 2.038%, 01/23/05(c) |
42,000 | 41,997,067 | ||||
| Wal-Mart Stores |
||||||
| 5.006%, 06/01/05 |
18,000 | 18,216,770 | ||||
| TOTAL CORPORATE OBLIGATIONS |
299,885,588 | |||||
| CERTIFICATES OF DEPOSIT — 9.2% |
||||||
| Discover Bank |
||||||
| 2.55%, 10/27/05 |
23,000 | 22,997,174 | ||||
| Lloyds TSB Bank PLC |
||||||
| 2.00%, 01/25/05(c) |
60,000 | 59,972,723 | ||||
| Natexis Banque Populair Corp. |
||||||
| 2.342%, 01/18/05(c) |
42,000 | 41,988,160 | ||||
| TOTAL CERTIFICATES OF DEPOSIT |
124,958,057 | |||||
| U.S. GOVERNMENT AGENCY OBLIGATIONS — 4.9% |
||||||
| Federal National Mortgage Assoc. |
||||||
| 1.87%, 03/02/05 (Cost $66,791,183) |
67,000 | 66,791,183 | ||||
261
AST MONEY MARKET PORTFOLIO
SCHEDULE OF INVESTMENTS (CONTINUED)
DECEMBER 31, 2004
| PRINCIPAL AMOUNT (000) |
VALUE (NOTE 2) | |||||
| YANKEE CERTIFICATES OF DEPOSIT — 3.3% |
||||||
| Nordea Bank Finland NY |
||||||
| 2.37%, 03/07/05 (Cost $45,200,000) |
$ | 45,200 | $ | 45,200,000 | ||
| SOVEREIGN ISSUES — 1.5% |
||||||
| CANADA Ontario (Province of) |
||||||
| 7.00%, 08/04/05 (Cost $19,788,077) |
19,266 | 19,788,077 | ||||
| TOTAL INVESTMENTS — 99.7% |
1,355,759,723 | |||||
| OTHER ASSETS IN EXCESS OF LIABILITIES — 0.3% |
3,428,096 | |||||
| NET ASSETS — 100.0% |
$ | 1,359,187,819 | ||||
THE FOLLOWING ABBREVIATIONS ARE USED THROUGHOUT THE SCHEDULE OF INVESTMENTS:
| 144A | Security was purchased pursuant to Rule 144A under the Securities Act of 1933 and may not be resold subject to that rule except to qualified institutional buyers. Unless otherwise noted 144A securities are deemed to be liquid. |
THE FOLLOWING ANNOTATIONS ARE USED THROUGHOUT THE SCHEDULE OF INVESTMENTS:
| + | The cost of securities for federal income tax purposes is substantially the same as for financial reporting purposes. |
| (c) | Indicates a variable rate security. The maturity date presented for these instruments is the next date on which the rate of interest is adjusted. |
| (h) | Security is restricted as to resale and generally is sold only to institutional investors who agree that they are purchasing the paper for investment and not with a view to public distribution (does not include 144A securities — see footnote above). At the end of the current reporting period, the aggregate cost of such securities was $319,035,650. The aggregate market value of $319,035,650 is approximately 23.47% of net assets. These securities have been deemed to be liquid under procedures established by the Board of Trustees. |
The following is a breakdown of the money market portfolio by industry classification, as of December 31, 2004. Percentages are based on net assets.
| INDUSTRY |
|||
| Financial Services |
31.2 | % | |
| Bank |
24.2 | ||
| Euro Time Deposits |
14.6 | ||
| Certificates of Deposits |
9.2 | ||
| U.S. Government |
8.5 | ||
| Industrial |
6.3 | ||
| Yankee Certificates of Deposits |
3.3 | ||
| Sovereign Issue |
1.5 | ||
| Utilities — Gas |
0.9 | ||
| 99.7 | |||
| Liabilities in Excess of Other Assets |
0.3 | ||
| 100.0% | |||
See Notes to Financial Statements.
262
(This page intentionally left blank)
263
AMERICAN SKANDIA TRUST
STATEMENTS OF ASSETS AND LIABILITIES
DECEMBER 31, 2004
| PORTFOLIO |
||||||||||||||||||||
| AST JPMORGAN |
AST WILLIAM BLAIR |
AST LSV |
AST MFS GLOBAL |
AST STATE STREET |
||||||||||||||||
| ASSETS |
||||||||||||||||||||
| Investments at value(A), including securities on loan(D) |
$ | 342,549,280 | $ | 1,328,712,716 | $ | 187,848,720 | $ | 166,279,723 | $ | 276,981,968 | ||||||||||
| Cash |
5,021,230 | 58,171,579 | 5,604,843 | 169,781 | — | |||||||||||||||
| Foreign currency at value(B) |
7,750 | 18,761,465 | 14 | — | — | |||||||||||||||
| Swap contracts, outstanding |
— | — | — | — | — | |||||||||||||||
| Receivable for: |
||||||||||||||||||||
| Securities sold |
150,836 | 8,840,424 | — | 31,708 | 25,022 | |||||||||||||||
| Dividends and interest |
789,324 | 1,359,265 | 346,075 | 215,055 | 14,340 | |||||||||||||||
| Fund shares sold |
31,534,146 | 1,423 | 2,028 | 295 | 235 | |||||||||||||||
| Futures variation margin |
— | — | 571,879 | — | — | |||||||||||||||
| Unrealized appreciation on swap agreements |
— | — | — | — | — | |||||||||||||||
| Unrealized appreciation on foreign currency forward contracts |
— | — | — | 273 | — | |||||||||||||||
| Prepaid expenses |
5,572 | 21,780 | 3,093 | 2,116 | 4,688 | |||||||||||||||
| TOTAL ASSETS |
380,058,138 | 1,415,868,652 | 194,376,652 | 166,698,951 | 277,026,253 | |||||||||||||||
| LIABILITIES |
||||||||||||||||||||
| Payable to custodian |
— | — | — | — | 117,020 | |||||||||||||||
| Written options outstanding, at value(C) |
— | — | — | — | — | |||||||||||||||
| Swap contracts, outstanding |
— | — | — | — | — | |||||||||||||||
| Unrealized depreciation on swap agreements |
— | — | — | — | — | |||||||||||||||
| Unrealized depreciation on foreign currency forward contracts |
— | — | — | — | — | |||||||||||||||
| Payable to broker for collateral for securities on loan |
— | — | — | — | 47,475,710 | |||||||||||||||
| Payable for: |
||||||||||||||||||||
| Securities purchased |
— | 5,060,461 | — | 119,821 | 1,379,054 | |||||||||||||||
| Fund shares redeemed |
236,628 | 67,242,072 | 542,464 | 145,727 | 1,761,421 | |||||||||||||||
| Futures variation margin |
— | — | — | — | — | |||||||||||||||
| Advisory fees |
183,075 | 331,873 | 94,699 | 62,982 | 93,404 | |||||||||||||||
| Shareholder servicing fees |
1,904 | 7,707 | 1,053 | 908 | 1,258 | |||||||||||||||
| Deferred trustees’ fees |
7,559 | 18,941 | 3,028 | 877 | 7,944 | |||||||||||||||
| Accrued expenses and other liabilities |
68,571 | 173,822 | 68,489 | 50,011 | 59,001 | |||||||||||||||
| Withholding tax |
— | 154,973 | — | — | — | |||||||||||||||
| Dividends and distributions |
— | — | — | — | — | |||||||||||||||
| TOTAL LIABILITIES |
497,737 | 72,989,849 | 709,733 | 380,326 | 50,894,812 | |||||||||||||||
| NET ASSETS |
$ | 379,560,401 | $ | 1,342,878,803 | $ | 193,666,919 | $ | 166,318,625 | $ | 226,131,441 | ||||||||||
| COMPONENTS OF NET ASSETS |
||||||||||||||||||||
| Common stock, at $.001 par value |
$ | 20,730 | $ | 111,820 | $ | 14,551 | $ | 13,739 | $ | 16,070 | ||||||||||
| Paid-in capital in excess of par |
441,741,178 | 1,369,105,350 | 306,277,590 | 139,308,773 | 390,157,501 | |||||||||||||||
| 441,761,908 | 1,369,217,170 | 306,292,141 | 139,322,512 | 390,173,571 | ||||||||||||||||
| Undistributed net investment income (loss) |
4,429,643 | (855,659 | ) | 2,748,715 | 460,456 | (7,944 | ) | |||||||||||||
| Accumulated net realized gain (loss) on investments |
(120,558,851 | ) | (291,935,762 | ) | (125,802,247 | ) | (3,277,315 | ) | (193,303,096 | ) | ||||||||||
| Accumulated unrealized appreciation (depreciation) on investments and foreign currencies |
53,927,701 | 266,453,054 | 10,428,310 | 29,812,972 | 29,268,910 | |||||||||||||||
| NET ASSETS, DECEMBER 31, 2004 |
$ | 379,560,401 | $ | 1,342,878,803 | $ | 193,666,919 | $ | 166,318,625 | $ | 226,131,441 | ||||||||||
| Shares of common stock outstanding |
20,730,243 | 111,820,186 | 14,550,972 | 13,739,208 | 16,070,296 | |||||||||||||||
| Net asset value, offering and redemption price per share |
$ | 18.31 | $ | 12.01 | $ | 13.31 | $ | 12.11 | $ | 14.07 | ||||||||||
| (A) Investments at cost |
$ | 288,659,155 | $ | 1,063,402,327 | $ | 177,436,454 | $ | 136,473,819 | $ | 247,713,058 | ||||||||||
| (B) Foreign currency at cost |
$ | 7,537 | $ | 17,589,899 | $ | 14 | $ | — | $ | — | ||||||||||
| (C) Premiums received for written options |
$ | — | $ | — | $ | — | $ | — | $ | — | ||||||||||
| (D) Securities on loan at value |
$ | — | $ | — | $ | — | $ | — | $ | 45,829,298 | ||||||||||
264
| PORTFOLIO | ||||||||||||||||||||||||||||
| AST DEAM SMALL-CAP |
AST FEDERATED AGGRESSIVE GROWTH |
AST SACHS |
AST SMALL-CAP |
AST DEAM |
AST MID-CAP |
AST MID-CAP |
AST MID-CAP | |||||||||||||||||||||
| ASSETS |
||||||||||||||||||||||||||||
| Investments at value(A), including securities on loan(D) |
$ | 390,852,326 | $ | 385,989,636 | $ | 349,842,603 | $ | 1,015,377,311 | $ | 114,943,362 | $ | 375,113,670 | $ | 461,449,380 | $ | 1,712,759,069 | ||||||||||||
| Cash |
4,379,684 | — | 8,383,678 | 34,898,209 | 6,874,565 | 9,208,795 | — | — | ||||||||||||||||||||
| Foreign currency at value(B) |
— | — | — | — | — | — | — | — | ||||||||||||||||||||
| Swap contracts, outstanding |
— | — | — | — | — | — | — | — | ||||||||||||||||||||
| Receivable for: |
||||||||||||||||||||||||||||
| Securities sold |
— | 2,997,224 | 285,985 | 6,645,785 | — | — | — | 438,256 | ||||||||||||||||||||
| Dividends and interest |
70,620 | 22,431 | 371,912 | 1,354,589 | 128,047 | 54,266 | 78,542 | 779,750 | ||||||||||||||||||||
| Fund shares sold |
1,192 | 1,776 | 63,759 | 7,407 | 380,371 | 1,839 | 2,601 | 2,598 | ||||||||||||||||||||
| Futures variation margin |
3,375 | — | — | — | 4,725 | — | — | — | ||||||||||||||||||||
| Unrealized appreciation on swap agreements |
— | — | — | — | — | — | — | — | ||||||||||||||||||||
| Unrealized appreciation on foreign currency forward contracts |
— | — | — | — | — | — | — | — | ||||||||||||||||||||
| Prepaid expenses |
6,329 | 4,717 | 5,755 | 15,322 | 1,214 | 4,865 | 6,660 | 20,564 | ||||||||||||||||||||
| TOTAL ASSETS |
395,313,526 | 389,015,784 | 358,953,692 | 1,058,298,623 | 122,332,284 | 384,383,435 | 461,537,183 | 1,714,000,237 | ||||||||||||||||||||
| LIABILITIES |
||||||||||||||||||||||||||||
| Payable to custodian |
— | — | — | — | — | — | — | — | ||||||||||||||||||||
| Written options outstanding, at value(C) |
— | — | — | — | — | — | — | — | ||||||||||||||||||||
| Swap contracts, outstanding |
— | — | — | — | — | — | — | — | ||||||||||||||||||||
| Unrealized depreciation on swap agreements |
— | — | — | — | — | — | — | — | ||||||||||||||||||||
| Unrealized depreciation on foreign currency forward contracts |
— | — | — | — | — | — | — | — | ||||||||||||||||||||
| Payable to broker for collateral for securities on loan |
52,272,180 | — | 35,142,626 | 81,239,062 | 10,439,764 | 89,897,252 | 59,779,562 | 370,221,741 | ||||||||||||||||||||
| Payable for: |
||||||||||||||||||||||||||||
| Securities purchased |
— | 8,475,725 | 129,638 | 4,565,765 | — | 5,809,191 | — | 2,192,630 | ||||||||||||||||||||
| Fund shares redeemed |
2,069,270 | 32,598,460 | 357,232 | 49,883,787 | 321 | 11,810,340 | 995,542 | 31,215,315 | ||||||||||||||||||||
| Futures variation margin |
— | — | — | — | — | — | — | — | ||||||||||||||||||||
| Advisory fees |
92,047 | 151,432 | 143,679 | 359,242 | 34,365 | 72,123 | 139,495 | 458,991 | ||||||||||||||||||||
| Shareholder servicing fees |
1,880 | 2,069 | 1,771 | 5,046 | 608 | 1,575 | 2,267 | 7,314 | ||||||||||||||||||||
| Deferred trustees’ fees |
8,521 | 549 | 5,294 | 7,958 | 135 | 999 | 7,191 | 14,213 | ||||||||||||||||||||
| Accrued expenses and other liabilities |
60,991 | 54,152 | 68,523 | 102,764 | 37,991 | 50,852 | 60,231 | 103,769 | ||||||||||||||||||||
| Withholding tax |
— | — | — | — | — | — | — | — | ||||||||||||||||||||
| Dividends and distributions |
— | — | — | — | — | — | — | — | ||||||||||||||||||||
| TOTAL LIABILITIES |
54,504,889 | 41,282,387 | 35,848,763 | 136,163,624 | 10,513,184 | 107,642,332 | 60,984,288 | 404,213,973 | ||||||||||||||||||||
| NET ASSETS |
$ | 340,808,637 | $ | 347,733,397 | $ | 323,104,929 | $ | 922,134,999 | $ | 111,819,100 | $ | 276,741,103 | $ | 400,552,895 | $ | 1,309,786,264 | ||||||||||||
| COMPONENTS OF NET ASSETS |
||||||||||||||||||||||||||||
| Common stock, at $.001 par value |
$ | 40,820 | $ | 33,420 | $ | 15,061 | $ | 50,438 | $ | 8,702 | $ | 62,754 | $ | 28,145 | $ | 61,501 | ||||||||||||
| Paid-in capital in excess of par |
553,382,309 | 251,967,734 | 199,918,459 | 664,690,614 | 92,255,482 | 303,993,786 | 667,978,054 | 901,585,415 | ||||||||||||||||||||
| 553,423,129 | 252,001,154 | 199,933,520 | 664,741,052 | 92,264,184 | 304,056,540 | 668,006,199 | 901,646,916 | |||||||||||||||||||||
| Undistributed net investment income (loss) |
(8,521 | ) | (773,698 | ) | 945,479 | 758,238 | 161,322 | (1,000 | ) | (7,191 | ) | 1,866,876 | ||||||||||||||||
| Accumulated net realized gain (loss) on investments |
(261,499,900 | ) | 28,837,822 | 49,098,239 | 212,498,884 | 9,189,985 | (69,212,516 | ) | (374,218,782 | ) | 183,845,590 | |||||||||||||||||
| Accumulated unrealized appreciation (depreciation) on investments and foreign currencies |
48,893,929 | 67,668,119 | 73,127,691 | 44,136,825 | 10,203,609 | 41,898,079 | 106,772,669 | 222,426,882 | ||||||||||||||||||||
| NET ASSETS, DECEMBER 31, 2004 |
$ | 340,808,637 | $ | 347,733,397 | $ | 323,104,929 | $ | 922,134,999 | $ | 111,819,100 | $ | 276,741,103 | $ | 400,552,895 | $ | 1,309,786,264 | ||||||||||||
| Shares of common stock outstanding |
40,819,704 | 33,419,561 | 15,060,961 | 50,437,840 | 8,701,625 | 62,754,082 | 28,144,563 | 61,501,009 | ||||||||||||||||||||
| Net asset value, offering and redemption price per share |
$ | 8.35 | $ | 10.41 | $ | 21.45 | $ | 18.28 | $ | 12.85 | $ | 4.41 | $ | 14.23 | $ | 21.30 | ||||||||||||
| (A) Investments at cost |
$ | 342,129,957 | $ | 318,321,517 | $ | 276,714,912 | $ | 971,240,486 | $ | 104,935,624 | $ | 333,215,591 | $ | 354,676,711 | $ | 1,490,332,187 | ||||||||||||
| (B) Foreign currency at cost |
$ | — | $ | — | $ | — | $ | — | $ | — | $ | — | $ | — | $ | — | ||||||||||||
| (C) Premiums received for written options |
$ | — | $ | — | $ | — | $ | — | $ | — | $ | — | $ | — | $ | — | ||||||||||||
| (D) Securities on loan at value |
$ | 50,307,165 | $ | — | $ | 33,533,789 | $ | 77,030,483 | $ | 10,034,977 | $ | 86,696,831 | $ | 57,914,924 | $ | 359,332,590 | ||||||||||||
See Notes to Financial Statements.
265
AMERICAN SKANDIA TRUST
STATEMENTS OF ASSETS AND LIABILITIES
DECEMBER 31, 2004
| PORTFOLIO |
|||||||||||||||||||
| AST ALGER ALL-CAP |
AST GABELLI |
AST T. ROWE PRICE |
AST ALLIANCE GROWTH |
AST MFS GROWTH |
|||||||||||||||
| ASSETS |
|||||||||||||||||||
| Investments at value(A), including securities on loan(D) |
$ | 388,951,114 | $ | 230,252,190 | $ | 272,859,746 | $ | 292,479,267 | $ | 616,324,370 | |||||||||
| Cash |
— | — | — | — | 175 | ||||||||||||||
| Foreign currency at value(B) |
— | — | — | — | — | ||||||||||||||
| Swap contracts, outstanding |
— | — | — | — | — | ||||||||||||||
| Receivable for: |
|||||||||||||||||||
| Securities sold |
2,141,350 | 15,967 | 67,600 | 4,139,247 | 7,954,887 | ||||||||||||||
| Dividends and interest |
143,310 | 204,250 | 285,406 | 116,279 | 345,297 | ||||||||||||||
| Fund shares sold |
118,912 | 1,236 | 38,048 | 616 | 262 | ||||||||||||||
| Futures variation margin |
— | — | — | — | — | ||||||||||||||
| Unrealized appreciation on swap agreements |
— | — | — | — | — | ||||||||||||||
| Unrealized appreciation on foreign currency forward contracts |
— | — | — | — | — | ||||||||||||||
| Prepaid expenses |
6,882 | 3,421 | 3,022 | 5,000 | 10,344 | ||||||||||||||
| TOTAL ASSETS |
391,361,568 | 230,477,064 | 273,253,822 | 296,740,409 | 624,635,335 | ||||||||||||||
| LIABILITIES |
|||||||||||||||||||
| Payable to custodian |
— | — | — | — | — | ||||||||||||||
| Written options outstanding, at value(C) |
— | — | — | — | — | ||||||||||||||
| Swap contracts, outstanding |
— | — | — | — | — | ||||||||||||||
| Unrealized depreciation on swap agreements |
— | — | — | — | — | ||||||||||||||
| Unrealized depreciation on foreign currency forward contracts |
— | — | — | — | — | ||||||||||||||
| Payable to broker for collateral for securities on loan |
54,356,970 | 34,623,492 | 35,002,660 | 33,745,696 | 51,760,156 | ||||||||||||||
| Payable for: |
|||||||||||||||||||
| Securities purchased |
688,164 | — | — | 4,048,856 | 5,020,273 | ||||||||||||||
| Fund shares redeemed |
1,698,706 | 356,010 | 177 | 653,152 | 32,649,780 | ||||||||||||||
| Futures variation margin |
— | — | — | — | — | ||||||||||||||
| Advisory fees |
123,013 | 70,080 | 103,893 | 94,196 | 191,679 | ||||||||||||||
| Shareholder servicing fees |
1,838 | 1,062 | 1,299 | 1,419 | 3,110 | ||||||||||||||
| Deferred trustees’ fees |
6,968 | 1,710 | 2,715 | 5,590 | 9,444 | ||||||||||||||
| Accrued expenses and other liabilities |
55,442 | 42,554 | 53,781 | 56,123 | 76,697 | ||||||||||||||
| Withholding tax |
— | — | — | — | — | ||||||||||||||
| Dividends and distributions |
— | — | — | — | — | ||||||||||||||
| TOTAL LIABILITIES |
56,931,101 | 35,094,908 | 35,164,525 | 38,605,032 | 89,711,139 | ||||||||||||||
| NET ASSETS |
$ | 334,430,467 | $ | 195,382,156 | $ | 238,089,297 | $ | 258,135,377 | $ | 534,924,196 | |||||||||
| COMPONENTS OF NET ASSETS |
|||||||||||||||||||
| Common stock, at $.001 par value |
$ | 62,175 | $ | 16,243 | $ | 10,521 | $ | 29,233 | $ | 66,238 | |||||||||
| Paid-in capital in excess of par |
685,661,858 | 178,454,249 | 167,620,103 | 493,670,704 | 924,360,482 | ||||||||||||||
| 685,724,033 | 178,470,492 | 167,630,624 | 493,699,937 | 924,426,720 | |||||||||||||||
| Undistributed net investment income (loss) |
(6,968 | ) | 738,826 | 691,301 | (5,590 | ) | 50,323 | ||||||||||||
| Accumulated net realized gain (loss) on investments |
(392,436,254 | ) | (27,210,786 | ) | 18,028,625 | (269,987,695 | ) | (443,186,683 | ) | ||||||||||
| Accumulated unrealized appreciation (depreciation) on investments |
41,149,656 | 43,383,624 | 51,738,747 | 34,428,725 | 53,633,836 | ||||||||||||||
| NET ASSETS, DECEMBER 31, 2004 |
$ | 334,430,467 | $ | 195,382,156 | $ | 238,089,297 | $ | 258,135,377 | $ | 534,924,196 | |||||||||
| Shares of common stock outstanding |
62,174,732 | 16,243,032 | 10,520,692 | 29,232,752 | 66,237,986 | ||||||||||||||
| Net asset value, offering and redemption price per share |
$ | 5.38 | $ | 12.03 | $ | 22.63 | $ | 8.83 | $ | 8.08 | |||||||||
| (A) Investments at cost |
$ | 347,801,458 | $ | 186,868,732 | $ | 221,121,000 | $ | 258,050,542 | $ | 562,693,595 | |||||||||
| (B) Foreign currency at cost |
$ | — | $ | — | $ | — | $ | — | $ | — | |||||||||
| (C) Premiums received for written options |
$ | — | $ | — | $ | — | $ | — | $ | — | |||||||||
| (D) Securities on loan at value |
$ | 51,878,979 | $ | 33,207,455 | $ | 34,032,616 | $ | 32,523,825 | $ | 49,940,121 | |||||||||
266
| PORTFOLIO |
|||||||||||||||||||||||||||||
| AST MARSICO |
AST GOLDMAN |
AST DEAM |
AST HOTCHKIS & WILEY LARGE-CAP VALUE |
AST ALLIANCE/ BERNSTEIN GROWTH + VALUE |
AST SANFORD BERNSTEIN CORE VALUE |
AST COHEN & |
AST SANFORD |
||||||||||||||||||||||
| ASSETS |
|||||||||||||||||||||||||||||
| Investments at value(A), including securities on loan(D) |
$ | 2,724,282,584 | $ | 1,127,576,884 | $ | 223,246,128 | $ | 818,618,305 | $ | 91,313,935 | $ | 333,987,812 | $ | 479,005,725 | $ | 617,027,079 | |||||||||||||
| Cash |
— | 13,129,756 | 5,963,441 | 10,637,418 | — | — | — | — | |||||||||||||||||||||
| Foreign currency at value(B) |
— | — | — | — | — | — | — | — | |||||||||||||||||||||
| Swap contracts, outstanding |
— | — | — | — | — | — | — | — | |||||||||||||||||||||
| Receivable for: |
|||||||||||||||||||||||||||||
| Securities sold |
1,081,276 | — | 1,775,725 | 4,376,424 | 2,096,667 | 198,375 | 12,870 | — | |||||||||||||||||||||
| Dividends and interest |
1,545,067 | 873,088 | 240,446 | 987,239 | 82,405 | 554,383 | 2,229,223 | 718,716 | |||||||||||||||||||||
| Fund shares sold |
5,107 | 6,268 | 186,589 | 4,372 | 29,125 | 6,865 | 210,512 | 7,534 | |||||||||||||||||||||
| Futures variation margin |
— | — | — | — | — | — | — | — | |||||||||||||||||||||
| Unrealized appreciation on swap agreements |
— | — | — | — | — | — | — | — | |||||||||||||||||||||
| Unrealized appreciation on foreign currency forward contracts |
— | — | — | — | — | — | — | — | |||||||||||||||||||||
| Prepaid expenses |
34,166 | 19,025 | 2,704 | 10,540 | 1,275 | 4,127 | 5,150 | 10,980 | |||||||||||||||||||||
| TOTAL ASSETS |
2,726,948,200 | 1,141,605,021 | 231,415,033 | 834,634,298 | 93,523,407 | 334,751,562 | 481,463,480 | 617,764,309 | |||||||||||||||||||||
| LIABILITIES |
|||||||||||||||||||||||||||||
| Payable to custodian |
— | — | — | — | — | — | — | — | |||||||||||||||||||||
| Written options outstanding, at value(C) |
— | — | — | — | — | — | — | — | |||||||||||||||||||||
| Swap contracts, outstanding |
— | — | — | — | — | — | — | — | |||||||||||||||||||||
| Unrealized depreciation on swap agreements |
— | — | — | — | — | — | — | — | |||||||||||||||||||||
| Unrealized depreciation on foreign currency forward contracts |
— | — | — | — | — | — | — | — | |||||||||||||||||||||
| Payable to broker for collateral for securities on loan |
329,069,063 | 165,485,959 | 39,460,439 | 189,599,594 | 14,735,515 | 42,565,481 | 57,781,032 | 55,778,525 | |||||||||||||||||||||
| Payable for: |
|||||||||||||||||||||||||||||
| Securities purchased |
20,217,805 | — | — | 4,375,052 | 798,833 | 4,578,029 | 16,533 | — | |||||||||||||||||||||
| Fund shares redeemed |
81,660,945 | 6,954,199 | 59 | 3,585,533 | 361 | 1,367 | 6,892 | 181,016 | |||||||||||||||||||||
| Futures variation margin |
— | — | 6,750 | — | — | — | — | — | |||||||||||||||||||||
| Advisory fees |
821,019 | 249,167 | 37,675 | 174,295 | 28,142 | 67,261 | 114,113 | 70,349 | |||||||||||||||||||||
| Shareholder servicing fees |
13,029 | 5,524 | 1,047 | 3,535 | 426 | 1,568 | 2,425 | 3,087 | |||||||||||||||||||||
| Deferred trustees’ fees |
22,587 | 42,540 | 1,294 | 14,662 | 436 | 1,795 | 2,739 | 9,337 | |||||||||||||||||||||
| Accrued expenses and other liabilities |
124,066 | 89,939 | 42,803 | 72,008 | 37,905 | 52,509 | 59,846 | 56,237 | |||||||||||||||||||||
| Withholding tax |
— | — | — | — | — | — | — | — | |||||||||||||||||||||
| Dividends and distributions |
— | — | — | — | — | — | — | — | |||||||||||||||||||||
| TOTAL LIABILITIES |
431,928,514 | 172,827,328 | 39,550,067 | 197,824,679 | 15,601,618 | 47,268,010 | 57,983,580 | 56,098,551 | |||||||||||||||||||||
| NET ASSETS |
$ | 2,295,019,686 | $ | 968,777,693 | $ | 191,864,966 | $ | 636,809,619 | $ | 77,921,789 | $ | 287,483,552 | $ | 423,479,900 | $ | 561,665,758 | |||||||||||||
| COMPONENTS OF NET ASSETS |
|||||||||||||||||||||||||||||
| Common stock, at $.001 par value |
$ | 128,501 | $ | 44,800 | $ | 16,621 | $ | 38,214 | $ | 7,824 | $ | 23,468 | $ | 24,670 | $ | 46,916 | |||||||||||||
| Paid-in capital in excess of par |
1,954,053,477 | 1,755,442,838 | 170,370,359 | 608,417,454 | 69,841,285 | 228,606,618 | 269,231,833 | 639,067,894 | |||||||||||||||||||||
| 1,954,181,978 | 1,755,487,638 | 170,386,980 | 608,455,668 | 69,849,109 | 228,630,086 | 269,256,503 | 639,114,810 | ||||||||||||||||||||||
| Undistributed net investment income (loss) |
(22,586) | 4,402,631 | 1,866,747 | 5,764,961 | 455,649 | 3,380,904 | 5,935,924 | 6,886,856 | |||||||||||||||||||||
| Accumulated net realized gain (loss) on investments |
(288,395,691) | (922,748,333 | ) | (1,869,901 | ) | (54,366,215 | ) | (3,801,166 | ) | 5,335,860 | 32,952,991 | (156,516,831 | ) | ||||||||||||||||
| Accumulated unrealized appreciation (depreciation) on investments |
629,255,985 | 131,635,758 | 21,481,140 | 76,955,205 | 11,418,197 | 50,136,702 | 115,334,482 | 72,180,923 | |||||||||||||||||||||
| NET ASSETS, DECEMBER 31, 2004 |
$ | 2,295,019,686 | $ | 968,777,693 | $ | 191,864,966 | $ | 636,809,619 | $ | 77,921,789 | $ | 287,483,552 | $ | 423,479,900 | $ | 561,665,758 | |||||||||||||
| Shares of common stock outstanding |
128,500,514 | 44,799,540 | 16,621,079 | 38,213,907 | 7,823,763 | 23,467,627 | 24,669,798 | 46,915,834 | |||||||||||||||||||||
| Net asset value, offering and redemption price per share |
$ | 17.86 | $ | 21.62 | $ | 11.54 | $ | 16.66 | $ | 9.96 | $ | 12.25 | $ | 17.17 | $ | 11.97 | |||||||||||||
| (A) Investments at cost |
$ | 2,095,026,598 | $ | 995,941,126 | $ | 201,905,551 | $ | 741,663,100 | $ | 79,895,738 | $ | 283,851,110 | $ | 363,671,243 | $ | 544,846,156 | |||||||||||||
| (B) Foreign currency at cost |
$ | — | $ | — | $ | — | $ | — | $ | — | $ | — | $ | — | $ | — | |||||||||||||
| (C) Premiums received for written options |
$ | — | $ | — | $ | — | $ | — | $ | — | $ | — | $ | — | $ | — | |||||||||||||
| (D) Securities on loan at value |
$ | 318,667,131 | $ | 160,709,768 | $ | 38,144,442 | $ | 182,140,758 | $ | 14,205,920 | $ | 40,931,383 | $ | 56,117,279 | $ | 53,818,285 | |||||||||||||
See Notes to Financial Statements.
267
AMERICAN SKANDIA TRUST
STATEMENTS OF ASSETS AND LIABILITIES
DECEMBER 31, 2004
| PORTFOLIO | |||||||||||||||||||
| AST AMERICAN CENTURY INCOME & GROWTH |
AST ALLIANCE AND INCOME |
AST DEAM |
AST AMERICAN CENTURY STRATEGIC BALANCED |
AST T. ROWE ASSET | |||||||||||||||
| ASSETS |
|||||||||||||||||||
| Investments at value(A), including securities on loan(D) |
$ | 660,620,120 | $ | 2,390,773,210 | $ | 227,920,267 | $ | 281,590,682 | $ | 498,045,998 | |||||||||
| Cash |
176,000 | 36,631 | 2,699,799 | 855,570 | 112 | ||||||||||||||
| Foreign currency at value(B) |
— | — | — | — | — | ||||||||||||||
| Swap contracts, outstanding |
— | — | — | — | — | ||||||||||||||
| Receivable for: |
|||||||||||||||||||
| Securities sold |
— | 1,654,920 | — | 1,292,807 | 1,445,984 | ||||||||||||||
| Dividends and interest |
691,877 | 3,164,070 | 2,429 | 834,963 | 1,879,021 | ||||||||||||||
| Fund shares sold |
562 | 1,723 | 1,130,767 | 1,273,158 | 1,432,071 | ||||||||||||||
| Futures variation margin |
— | — | — | — | — | ||||||||||||||
| Unrealized appreciation on swap agreements |
— | — | — | — | — | ||||||||||||||
| Unrealized appreciation on foreign currency forward contracts |
— | — | — | — | — | ||||||||||||||
| Prepaid expenses |
8,276 | 35,496 | 5,536 | 4,162 | 6,953 | ||||||||||||||
| TOTAL ASSETS |
661,496,835 | 2,395,666,050 | 231,758,798 | 285,851,342 | 502,810,139 | ||||||||||||||
| LIABILITIES |
|||||||||||||||||||
| Payable to custodian |
— | — | — | — | — | ||||||||||||||
| Written options outstanding, at value(C) |
— | — | — | — | — | ||||||||||||||
| Swap contracts, outstanding |
— | — | — | — | — | ||||||||||||||
| Unrealized depreciation on swap agreements |
— | — | — | — | — | ||||||||||||||
| Unrealized depreciation on foreign currency forward contracts |
— | — | — | — | — | ||||||||||||||
| Payable to broker for collateral for securities on loan |
206,591,165 | 136,919,761 | — | 26,280,315 | 68,183,437 | ||||||||||||||
| Payable for: |
|||||||||||||||||||
| Securities purchased |
— | 17,295,280 | — | 25,712,025 | 3,345,263 | ||||||||||||||
| Fund shares redeemed |
754,365 | 88,514,847 | 182 | 51 | 305,722 | ||||||||||||||
| Futures variation margin |
2,750 | — | — | 1,000 | — | ||||||||||||||
| Advisory fees |
146,173 | 549,079 | 10,456 | 79,028 | 108,849 | ||||||||||||||
| Shareholder servicing fees |
2,482 | 12,306 | — | 1,269 | 2,367 | ||||||||||||||
| Deferred trustees’ fees |
7,058 | 24,865 | 6,805 | 3,443 | 5,080 | ||||||||||||||
| Accrued expenses and other liabilities |
81,274 | 143,775 | 14,197 | 79,740 | 116,130 | ||||||||||||||
| Withholding tax |
— | — | — | — | — | ||||||||||||||
| Dividends and distributions |
— | — | — | — | — | ||||||||||||||
| TOTAL LIABILITIES |
207,585,267 | 243,459,913 | 31,640 | 52,156,871 | 72,066,848 | ||||||||||||||
| NET ASSETS |
$ | 453,911,568 | $ | 2,152,206,137 | $ | 231,727,158 | $ | 233,694,471 | $ | 430,743,291 | |||||||||
| COMPONENTS OF NET ASSETS |
|||||||||||||||||||
| Common stock, at $.001 par value |
$ | 34,120 | $ | 110,281 | $ | 19,057 | $ | 16,819 | $ | 25,628 | |||||||||
| Paid-in capital in excess of par |
511,096,365 | 2,068,941,800 | 298,011,559 | 221,412,435 | 364,233,836 | ||||||||||||||
| 511,130,485 | 2,069,052,081 | 298,030,616 | 221,429,254 | 364,259,464 | |||||||||||||||
| Undistributed net investment income (loss) |
7,177,404 | 26,786,245 | 7,418,160 | 3,655,598 | 7,758,351 | ||||||||||||||
| Accumulated net realized gain (loss) on investments |
(103,952,399 | ) | (274,914,232 | ) | (91,998,248 | ) | (9,331,664 | ) | 2,216,615 | ||||||||||
| Accumulated unrealized appreciation (depreciation) on investments |
39,556,078 | 331,282,043 | 18,276,630 | 17,941,283 | 56,508,861 | ||||||||||||||
| NET ASSETS, DECEMBER 31, 2004 |
$ | 453,911,568 | $ | 2,152,206,137 | $ | 231,727,158 | $ | 233,694,471 | $ | 430,743,291 | |||||||||
| Shares of Common Stock Outstanding |
34,119,503 | 110,281,042 | 19,057,449 | 16,818,969 | 25,627,769 | ||||||||||||||
| Net Asset Value, Offering and Redemption Price Per Share |
$ | 13.30 | $ | 19.52 | $ | 12.16 | $ | 13.89 | $ | 16.81 | |||||||||
| (A) Investments at Cost |
$ | 621,137,876 | $ | 2,059,491,167 | $ | 209,643,638 | $ | 263,675,931 | $ | 441,542,232 | |||||||||
| (B) Foreign Currency at Cost |
$ | — | $ | — | $ | — | $ | — | $ | — | |||||||||
| (C) Premiums Received for Written Options |
$ | — | $ | — | $ | — | $ | — | $ | — | |||||||||
| (D) Securities on Loan at Value |
$ | 199,475,384 | $ | 131,690,715 | $ | — | $ | 25,489,579 | $ | 66,213,904 | |||||||||
268
| PORTFOLIO |
||||||||||||||||||||
| AST T. ROWE |
AST GOLDMAN SACHS HIGH YIELD |
AST LORD ABBETT |
AST PIMCO TOTAL BOND |
AST PIMCO |
AST MONEY |
|||||||||||||||
| ASSETS |
||||||||||||||||||||
| Investments at value(A), including securities on loan(D) |
$ | 269,741,230 | $ | 787,651,501 | $ | 574,382,674 | $ | 2,742,970,765 | $ | 897,191,763 | $ | 1,355,759,723 | ||||||||
| Cash |
13,242,949 | — | — | 70,225 | 34,536 | — | ||||||||||||||
| Foreign currency at value(B) |
410,642 | 292,144 | — | 8,111,932 | 71,304 | — | ||||||||||||||
| Swap contracts, outstanding |
— | — | — | — | 963,831 | — | ||||||||||||||
| Receivable for: |
||||||||||||||||||||
| Securities sold |
301,358 | — | — | — | — | — | ||||||||||||||
| Dividends and interest |
4,522,845 | 14,626,367 | 7,044,192 | 10,914,593 | 2,780,189 | 3,327,868 | ||||||||||||||
| Fund shares sold |
78,324,628 | 6,558,528 | 1,003 | — | 422,213,537 | 3,596,582 | ||||||||||||||
| Futures variation margin |
224,845 | — | — | 2,300,366 | 76,475 | — | ||||||||||||||
| Unrealized appreciation on swap agreements |
— | — | — | 3,688,607 | 1,444,385 | — | ||||||||||||||
| Unrealized appreciation on foreign currency forward contracts |
2,537,024 | 78,560 | — | 2,481,020 | 414,467 | — | ||||||||||||||
| Prepaid expenses |
4,234 | 19,051 | 6,681 | 39,574 | 15,698 | 32,852 | ||||||||||||||
| TOTAL ASSETS |
369,309,755 | 809,226,151 | 581,434,550 | 2,770,577,082 | 1,325,206,185 | 1,362,717,025 | ||||||||||||||
| LIABILITIES |
||||||||||||||||||||
| Payable to custodian |
— | — | — | — | — | 2,821,867 | ||||||||||||||
| Written options outstanding, at value(C) |
— | — | — | 5,898,997 | 761 | — | ||||||||||||||
| Swap contracts, outstanding |
— | — | — | 5,470,624 | — | — | ||||||||||||||
| Unrealized depreciation on swap agreements |
— | — | — | 2,723,978 | 463,440 | — | ||||||||||||||
| Unrealized depreciation on foreign currency forward contracts |
2,368,583 | 3,800,661 | — | 298,072 | 12,131 | — | ||||||||||||||
| Payable to broker for collateral for securities on loan |
— | — | 86,532,115 | — | — | — | ||||||||||||||
| Payable for: |
||||||||||||||||||||
| Securities purchased |
4,761,976 | 500,000 | — | 395,309,966 | 91,599,199 | — | ||||||||||||||
| Fund shares redeemed |
66 | 14,352 | 63,193,808 | 41,849,413 | 5,406 | 408,350 | ||||||||||||||
| Futures variation margin |
— | — | — | — | — | — | ||||||||||||||
| Advisory fees |
99,948 | 220,822 | 125,649 | 543,653 | 187,169 | 92,743 | ||||||||||||||
| Shareholder servicing fees |
1,541 | 4,355 | 2,696 | 12,871 | 4,429 | 7,207 | ||||||||||||||
| Deferred trustees’ fees |
3,002 | 10,293 | 1,822 | 34,163 | 14,567 | 45,047 | ||||||||||||||
| Accrued expenses and other liabilities |
57,667 | 86,553 | 65,634 | 211,896 | 99,006 | 153,992 | ||||||||||||||
| Withholding tax |
— | — | — | — | — | — | ||||||||||||||
| Dividends and distributions |
— | — | — | — | — | — | ||||||||||||||
| TOTAL LIABILITIES
|
7,292,783 | 4,637,036 | 149,921,724 | 452,353,633 | 92,386,108 | 3,529,206 | ||||||||||||||
| NET ASSETS
|
$ | 362,016,972 | $ | 804,589,115 | $ | 431,512,826 | $ | 2,318,223,449 | $ | 1,232,820,077 | $ | 1,359,187,819 | ||||||||
| COMPONENTS OF NET ASSETS |
||||||||||||||||||||
| Common stock, at $.001 par value |
$ | 29,773 | $ | 89,925 | $ | 36,461 | $ | 192,996 | $ | 110,871 | $ | 1,359,298 | ||||||||
| Paid-in capital in excess of par |
324,218,646 | 910,799,118 | 386,205,532 | 2,183,359,358 | 1,204,636,123 | 1,357,913,397 | ||||||||||||||
| 324,248,419 | 910,889,043 | 386,241,993 | 2,183,552,354 | 1,204,746,994 | 1,359,272,695 | |||||||||||||||
| Undistributed net investment income (loss) |
9,098,990 | 48,592,328 | 20,445,329 | 63,743,320 | 17,102,941 | (45,047 | ) | |||||||||||||
| Accumulated net realized gain (loss) on investments |
510,796 | (202,046,042 | ) | 5,390,631 | 56,031,960 | 5,372,511 | (39,829 | ) | ||||||||||||
| Accumulated unrealized appreciation (depreciation) on investments |
28,158,767 | 47,153,786 | 19,434,873 | 14,895,815 | 5,597,631 | — | ||||||||||||||
| NET ASSETS, DECEMBER 31, 2004 |
$ | 362,016,972 | $ | 804,589,115 | $ | 431,512,826 | $ | 2,318,223,449 | $ | 1,232,820,077 | $ | 1,359,187,819 | ||||||||
| Shares of Common Stock Outstanding |
29,772,652 | 89,925,435 | 36,460,770 | 192,996,086 | 110,871,320 | 1,359,297,837 | ||||||||||||||
| Net Asset Value, Offering and Redemption Price Per Share |
$ | 12.16 | $ | 8.95 | $ | 11.83 | $ | 12.01 | $ | 11.12 | $ | 1.00 | ||||||||
| (A) Investments at Cost |
$ | 241,946,580 | $ | 736,842,327 | $ | 554,947,801 | $ | 2,727,545,094 | $ | 893,776,825 | $ | 1,355,759,723 | ||||||||
| (B) Foreign Currency at Cost |
$ | 408,078 | $ | 290,873 | $ | — | $ | 7,881,162 | $ | 70,334 | $ | — | ||||||||
| (C) Premiums Received for Written Options |
$ | — | $ | — | $ | — | $ | 4,233,189 | $ | 929,078 | $ | — | ||||||||
| (D) Securities on Loan at Value |
$ | — | $ | — | $ | 84,570,979 | $ | — | $ | — | $ | — | ||||||||
See Notes to Financial Statements.
269
AMERICAN SKANDIA TRUST
STATEMENTS OF OPERATIONS
YEAR ENDED DECEMBER 31, 2004
| PORTFOLIO |
||||||||||||||||||||
| AST JPMORGAN |
AST WILLIAM BLAIR |
AST LSV |
AST MFS |
AST STATE STREET |
||||||||||||||||
| INVESTMENT INCOME: |
||||||||||||||||||||
| Interest |
$ | 47,395 | $ | 674,622 | $ | 92,802 | $ | 63,201 | $ | 53,366 | ||||||||||
| Dividends |
8,879,391 | 15,390,808 | 4,353,206 | 2,289,855 | 597,593 | |||||||||||||||
| Income from securities loaned, net |
— | — | — | — | 47,911 | |||||||||||||||
| Foreign taxes withheld |
(1,010,973 | ) | (1,455,331 | ) | (479,944 | ) | (195,582 | ) | (83 | ) | ||||||||||
| Total Income |
7,915,813 | 14,610,099 | 3,966,064 | 2,157,474 | 698,787 | |||||||||||||||
| EXPENSES: |
||||||||||||||||||||
| Advisory fees |
2,838,631 | 10,224,182 | 1,719,328 | 1,222,784 | 2,331,618 | |||||||||||||||
| Distribution fees |
4,172 | 358,671 | — | — | 58,056 | |||||||||||||||
| Shareholder servicing fees and expenses |
321,000 | 1,022,000 | 172,000 | 122,000 | 259,000 | |||||||||||||||
| Administration and accounting fees |
272,000 | 448,000 | 172,000 | 122,000 | 235,000 | |||||||||||||||
| Custodian fees and expenses |
104,000 | 613,000 | 174,000 | 101,000 | 62,000 | |||||||||||||||
| Audit and legal fees |
37,000 | 61,000 | 45,000 | 47,000 | 29,000 | |||||||||||||||
| Trustees’ fees |
16,000 | 19,000 | 14,000 | 11,000 | 16,000 | |||||||||||||||
| Printing expense |
— | 45,000 | — | — | — | |||||||||||||||
| Interest expense |
699 | — | 2,233 | 269 | 1,990 | |||||||||||||||
| Miscellaneous |
38,217 | 60,785 | 62,823 | 25,934 | 23,097 | |||||||||||||||
| Total Expenses |
3,631,719 | 12,851,638 | 2,361,384 | 1,651,987 | 3,015,761 | |||||||||||||||
| Less: Advisory fee waivers and expense reimbursements |
— | (1,063,560 | ) | (257,899 | ) | — | — | |||||||||||||
| Less: Fees paid indirectly |
(4,172 | ) | (358,671 | ) | — | — | (58,056 | ) | ||||||||||||
| Net Expenses |
3,627,547 | 11,429,407 | 2,103,485 | 1,651,987 | 2,957,705 | |||||||||||||||
| Net Investment Income (Loss) |
4,288,266 | 3,180,692 | 1,862,579 | 505,487 | (2,258,918 | ) | ||||||||||||||
| REALIZED AND UNREALIZED GAIN (LOSS) ON INVESTMENTS |
||||||||||||||||||||
| Net Realized Gain (Loss) on: |
||||||||||||||||||||
| Investments |
69,166,468 | 74,963,193 | 40,393,669 | 8,807,104 | 31,564,967 | |||||||||||||||
| Futures |
— | — | 1,280,777 | — | — | |||||||||||||||
| Options written |
— | — | — | — | — | |||||||||||||||
| Swap agreements |
— | — | — | — | — | |||||||||||||||
| Foreign currencies |
148,942 | (631,562 | ) | (334,992 | ) | (34,310 | ) | — | ||||||||||||
| 69,315,410 | 74,331,631 | 41,339,454 | 8,772,794 | 31,564,967 | ||||||||||||||||
| Net change in unrealized appreciation (depreciation) on: |
||||||||||||||||||||
| Investments |
(21,899,406 | ) | 107,021,135 | (9,077,450 | ) | 13,521,171 | (50,716,500 | ) | ||||||||||||
| Futures |
— | — | (310,397 | ) | — | — | ||||||||||||||
| Options written |
— | — | — | — | — | |||||||||||||||
| Swap Agreements |
— | — | — | — | — | |||||||||||||||
| Foreign currencies |
(29,277 | ) | 1,430,135 | (270,348 | ) | (1,013 | ) | — | ||||||||||||
| (21,928,683 | ) | 108,451,270 | (9,658,195 | ) | 13,520,158 | (50,716,500 | ) | |||||||||||||
| Net gain (loss) on investments and foreign currencies |
47,386,727 | 182,782,901 | 31,681,259 | 22,292,952 | (19,151,533 | ) | ||||||||||||||
| Net Increase (Decrease) in Net Assets Resulting from Operations |
$ | 51,674,993 | $ | 185,963,593 | $ | 33,543,838 | $ | 22,798,439 | $ | (21,410,451 | ) | |||||||||
270
| PORTFOLIO |
||||||||||||||||||||||||||||||||
| AST DEAM |
AST FEDERATED AGGRESSIVE GROWTH |
AST GOLDMAN SACHS SMALL-CAP VALUE |
AST SMALL-CAP |
AST DEAM |
AST MID-CAP |
AST NEUBERGER BERMAN MID-CAP GROWTH |
AST NEUBERGER BERMAN MID-CAP VALUE |
|||||||||||||||||||||||||
| INVESTMENT INCOME: |
||||||||||||||||||||||||||||||||
| Interest |
$ | 60,276 | $ | 196,843 | $ | 41,654 | $ | 494,204 | $ | 75,597 | $ | 48,926 | $ | 12,083 | $ | 86,736 | ||||||||||||||||
| Dividends |
1,107,711 | 588,812 | 5,144,985 | 9,608,749 | 1,052,743 | 1,263,754 | 1,328,494 | 13,386,686 | ||||||||||||||||||||||||
| Income from securities loaned, net |
104,459 | — | 87,081 | 142,678 | 8,638 | 51,549 | 79,025 | 227,651 | ||||||||||||||||||||||||
| Foreign taxes withheld |
(4,564 | ) | (6,102 | ) | (4,910 | ) | (9,480 | ) | (261 | ) | — | (5,500 | ) | (21,004 | ) | |||||||||||||||||
| Total Income |
1,267,882 | 779,553 | 5,268,810 | 10,236,151 | 1,136,717 | 1,364,229 | 1,414,102 | 13,680,069 | ||||||||||||||||||||||||
| EXPENSES: |
||||||||||||||||||||||||||||||||
| Advisory fees |
3,329,908 | 2,428,067 | 3,007,975 | 7,517,906 | 672,828 | 2,114,611 | 3,227,666 | 10,054,756 | ||||||||||||||||||||||||
| Distribution fees |
— | — | 95,799 | — | — | 156,867 | 158,715 | 566,800 | ||||||||||||||||||||||||
| Shareholder servicing fees and expenses |
351,000 | 256,000 | 317,000 | 835,000 | 71,000 | 211,000 | 359,000 | 1,130,000 | ||||||||||||||||||||||||
| Administration and accounting fees |
289,000 | 233,000 | 270,000 | 445,000 | 71,000 | 205,000 | 295,000 | 468,000 | ||||||||||||||||||||||||
| Custodian fees and expenses |
63,000 | 47,000 | 95,000 | 98,000 | 26,000 | 34,000 | 47,000 | 130,000 | ||||||||||||||||||||||||
| Audit and legal fees |
29,000 | 35,000 | 30,000 | 18,000 | 39,000 | 36,000 | 31,000 | 12,000 | ||||||||||||||||||||||||
| Trustees’ fees |
15,000 | 12,000 | 15,000 | 22,000 | 12,000 | 12,000 | 18,000 | 27,000 | ||||||||||||||||||||||||
| Printing expense |
— | — | — | — | — | — | — | — | ||||||||||||||||||||||||
| Interest expense |
1,063 | 4,410 | — | — | — | 307 | 2,433 | 317 | ||||||||||||||||||||||||
| Miscellaneous |
27,725 | 19,613 | 25,116 | 47,986 | 14,669 | 15,650 | 20,993 | 41,658 | ||||||||||||||||||||||||
| Total Expenses |
4,105,696 | 3,035,090 | 3,855,890 | 8,983,892 | 906,497 | 2,785,435 | 4,159,807 | 12,430,531 | ||||||||||||||||||||||||
| Less: Advisory fee waivers and expense reimbursements |
(525,711 | ) | — | — | — | (106,033 | ) | (251,551 | ) | (41,862 | ) | (64,751 | ) | |||||||||||||||||||
| Less: Fees paid indirectly |
— | — | (95,799 | ) | — | — | (156,867 | ) | (158,715 | ) | (566,800 | ) | ||||||||||||||||||||
| Net Expenses |
3,579,985 | 3,035,090 | 3,760,091 | 8,983,892 | 800,464 | 2,377,017 | 3,959,230 | 11,798,980 | ||||||||||||||||||||||||
| Net Investment Income (Loss) |
(2,312,103) | (2,255,537 | ) | 1,508,719 | 1,252,259 | 336,253 | (1,012,788 | ) | (2,545,128 | ) | 1,881,089 | |||||||||||||||||||||
| REALIZED AND UNREALIZED GAIN (LOSS) ON INVESTMENTS |
||||||||||||||||||||||||||||||||
| Net Realized Gain (Loss) on: |
||||||||||||||||||||||||||||||||
| Investments |
38,163,293 | 31,714,359 | 50,503,621 | 221,204,501 | 7,619,038 | 15,765,813 | 20,087,966 | 186,401,919 | ||||||||||||||||||||||||
| Futures |
693,861 | — | — | — | 1,477,718 | — | — | — | ||||||||||||||||||||||||
| Options written |
— | — | — | — | — | — | — | — | ||||||||||||||||||||||||
| Swap agreements |
— | — | — | — | — | — | — | — | ||||||||||||||||||||||||
| Foreign currencies |
— | (29,005 | ) | — | — | — | — | — | — | |||||||||||||||||||||||
| 38,857,154 | 31,685,354 | 50,503,621 | 221,204,501 | 9,096,756 | 15,765,813 | 20,087,966 | 186,401,919 | |||||||||||||||||||||||||
| Net change in unrealized appreciation (depreciation) on: |
||||||||||||||||||||||||||||||||
| Investments |
(9,467,901 | ) | 30,229,268 | 5,052,697 | (91,399,533 | ) | 5,889,540 | 21,394,926 | 36,796,535 | 51,114,048 | ||||||||||||||||||||||
| Futures |
140,316 | — | — | — | 95,670 | — | — | — | ||||||||||||||||||||||||
| Options written |
— | — | — | — | — | — | — | — | ||||||||||||||||||||||||
| Swap Agreements |
— | — | — | — | — | — | — | — | ||||||||||||||||||||||||
| Foreign currencies |
— | — | — | — | — | — | — | — | ||||||||||||||||||||||||
| (9,327,585) | 30,229,268 | 5,052,697 | (91,399,533 | ) | 5,985,210 | 21,394,926 | 36,796,535 | 51,114,048 | ||||||||||||||||||||||||
| Net gain (loss) on investments and foreign currencies |
29,529,569 | 61,914,622 | 55,556,318 | 129,804,968 | 15,081,966 | 37,160,739 | 56,884,501 | 237,515,967 | ||||||||||||||||||||||||
| Net Increase (Decrease) in Net Assets Resulting from Operations |
$ | 27,217,466 | $ | 59,659,085 | $ | 57,065,037 | $ | 131,057,227 | $ | 15,418,219 | $ | 36,147,951 | $ | 54,339,373 | $ | 239,397,056 | ||||||||||||||||
See Notes to Financial Statements.
271
AMERICAN SKANDIA TRUST
STATEMENTS OF OPERATIONS
YEAR ENDED DECEMBER 31, 2004
| PORTFOLIO |
||||||||||||||||||||
| AST ALGER ALL-CAP |
AST GABELLI ALL-CAP VALUE |
AST T. ROWE |
AST ALLIANCE GROWTH |
AST MFS |
||||||||||||||||
| INVESTMENT INCOME: |
||||||||||||||||||||
| Interest |
$ | 49,019 | $ | 2,045 | $ | 53,699 | $ | 1,287 | $ | 266,848 | ||||||||||
| Dividends |
2,777,968 | 2,985,762 | 3,058,994 | 2,642,547 | 5,750,459 | |||||||||||||||
| Income from securities loaned, net |
158,577 | 38,472 | 37,681 | 19,711 | 68,837 | |||||||||||||||
| Foreign taxes withheld |
(20,046 | ) | (32,443 | ) | (108,866 | ) | (51,272 | ) | (28,057 | ) | ||||||||||
| Total Income |
2,965,518 | 2,993,836 | 3,041,508 | 2,612,273 | 6,058,087 | |||||||||||||||
| EXPENSES: |
||||||||||||||||||||
| Advisory fees |
3,430,092 | 1,774,598 | 1,652,904 | 2,255,999 | 5,053,539 | |||||||||||||||
| Distribution fees |
769,690 | — | 13,851 | 90,818 | 62,209 | |||||||||||||||
| Shareholder servicing fees and expenses |
361,000 | 187,000 | 184,000 | 251,000 | 562,000 | |||||||||||||||
| Administration and accounting fees |
295,000 | 187,000 | 181,000 | 230,000 | 364,000 | |||||||||||||||
| Custodian fees and expenses |
45,000 | 30,000 | 52,000 | 39,000 | 97,000 | |||||||||||||||
| Audit and legal fees |
26,000 | 34,000 | 37,000 | 37,000 | 22,000 | |||||||||||||||
| Trustees’ fees |
17,000 | 12,000 | 12,000 | 14,000 | 21,000 | |||||||||||||||
| Printing expense |
— | — | — | — | — | |||||||||||||||
| Interest expense |
9,701 | 3,154 | 4,835 | 5,190 | 510 | |||||||||||||||
| Miscellaneous |
21,878 | 25,230 | 18,181 | 20,459 | 31,103 | |||||||||||||||
| Total Expenses |
4,975,361 | 2,252,982 | 2,155,771 | 2,943,466 | 6,213,361 | |||||||||||||||
| Less: Advisory fee waivers and expense reimbursements |
— | — | — | (75,125 | ) | (159,291 | ) | |||||||||||||
| Less: Fees paid indirectly |
(769,690 | ) | — | (13,851 | ) | (90,818 | ) | (62,209 | ) | |||||||||||
| Net Expenses |
4,205,671 | 2,252,982 | 2,141,920 | 2,777,523 | 5,991,861 | |||||||||||||||
| Net Investment Income (Loss) |
(1,240,153 | ) | 740,854 | 899,588 | (165,250 | ) | 66,226 | |||||||||||||
| REALIZED AND UNREALIZED GAIN (LOSS) ON INVESTMENTS |
||||||||||||||||||||
| Net Realized Gain (Loss) on: |
||||||||||||||||||||
| Investments |
45,226,925 | 4,590,022 | 22,678,036 | 6,464,542 | 40,791,942 | |||||||||||||||
| Futures |
— | — | — | — | — | |||||||||||||||
| Options written |
— | — | — | — | — | |||||||||||||||
| Swap agreements |
— | — | — | — | — | |||||||||||||||
| Foreign currencies |
— | (313 | ) | (61,475 | ) | — | 5,266 | |||||||||||||
| 45,226,925 | 4,589,709 | 22,616,561 | 6,464,542 | 40,797,208 | ||||||||||||||||
| Net change in unrealized appreciation (depreciation) on: |
||||||||||||||||||||
| Investments |
(19,019,358 | ) | 20,232,463 | 27,061,108 | 7,640,416 | 15,175,689 | ||||||||||||||
| Futures |
— | — | — | — | — | |||||||||||||||
| Options written |
— | — | — | — | — | |||||||||||||||
| Swap agreements |
— | — | — | — | — | |||||||||||||||
| Foreign currencies |
— | (128 | ) | — | — | 881 | ||||||||||||||
| (19,019,358 | ) | 20,232,335 | 27,061,108 | 7,640,416 | 15,176,570 | |||||||||||||||
| Net gain (loss) on investments and foreign currencies |
26,207,567 | 24,822,044 | 49,677,669 | 14,104,958 | 55,973,778 | |||||||||||||||
| Net Increase (Decrease) in Net Assets Resulting from Operations |
$ | 24,967,414 | $ | 25,562,898 | $ | 50,577,257 | $ | 13,939,708 | $ | 56,040,004 | ||||||||||
272
| PORTFOLIO |
||||||||||||||||||||||||||||||||
| AST MARSICO |
AST GOLDMAN |
AST DEAM |
AST HOTCHKIS & WILEY |
AST ALLIANCE/ BERNSTEIN |
AST SANFORD BERNSTEIN CORE VALUE |
AST COHEN & |
AST SANFORD BERNSTEIN MANAGED INDEX 500 |
|||||||||||||||||||||||||
| INVESTMENT INCOME: |
||||||||||||||||||||||||||||||||
| Interest |
$ | 133,488 | $ | 34,650 | $ | 68,268 | $ | 967,848 | $ | 48 | $ | 99 | $ | 4,614 | $ | 512 | ||||||||||||||||
| Dividends |
18,788,855 | 14,536,267 | 3,371,237 | 10,596,562 | 1,287,498 | 5,627,296 | 14,813,926 | 11,092,793 | ||||||||||||||||||||||||
| Income from securities loaned, net |
333,381 | 130,179 | 17,567 | 21,365 | 13,406 | 32,229 | 27,435 | 43,970 | ||||||||||||||||||||||||
| Foreign taxes withheld |
(57,054) | — | — | — | (6,532 | ) | (14,220 | ) | (29,513 | ) | (4,186 | ) | ||||||||||||||||||||
| Total Income |
19,198,670 | 14,701,096 | 3,457,072 | 11,585,775 | 1,294,420 | 5,645,404 | 14,816,462 | 11,133,089 | ||||||||||||||||||||||||
| EXPENSES: |
||||||||||||||||||||||||||||||||
| Advisory fees |
17,125,762 | 9,213,248 | 1,316,848 | 4,457,421 | 618,479 | 1,715,705 | 3,221,036 | 3,289,927 | ||||||||||||||||||||||||
| Distribution fees |
560,317 | 391,133 | — | — | — | 120,110 | 31,673 | 242,565 | ||||||||||||||||||||||||
| Shareholder servicing fees and expenses |
1,903,000 | 1,024,000 | 155,000 | 594,000 | 69,000 | 229,000 | 322,000 | 548,000 | ||||||||||||||||||||||||
| Administration and accounting fees |
545,000 | 455,000 | 155,000 | 373,000 | 69,000 | 217,000 | 273,000 | 181,000 | ||||||||||||||||||||||||
| Custodian fees and expenses |
165,000 | 91,000 | 31,000 | 64,000 | 15,000 | 28,000 | 41,000 | 65,000 | ||||||||||||||||||||||||
| Audit and legal fees |
9,000 | 30,000 | 35,000 | 18,000 | 41,000 | 36,000 | 33,000 | 24,000 | ||||||||||||||||||||||||
| Trustees’ fees |
36,000 | 31,000 | 13,000 | 22,000 | 12,000 | 14,000 | 16,000 | 19,000 | ||||||||||||||||||||||||
| Printing expense |
— | 67,000 | — | — | — | — | — | — | ||||||||||||||||||||||||
| Interest expense |
— | 2,225 | — | 2,044 | — | 2,703 | 3,464 | 10,742 | ||||||||||||||||||||||||
| Miscellaneous |
67,495 | 50,315 | 16,011 | 33,478 | 13,855 | 20,298 | 19,864 | 49,141 | ||||||||||||||||||||||||
| Total Expenses |
20,411,574 | 11,354,921 | 1,721,859 | 5,563,943 | 838,334 | 2,382,816 | 3,961,037 | 4,429,375 | ||||||||||||||||||||||||
| Less: Advisory fee waivers and expense reimbursements |
(510,113) | (707,863 | ) | (188,118 | ) | (195,269 | ) | — | — | (356,672 | ) | — | ||||||||||||||||||||
| Less: Fees paid indirectly |
(560,317) | (391,133 | ) | — | — | — | (120,110 | ) | (31,673 | ) | (242,565 | ) | ||||||||||||||||||||
| Net Expenses |
19,341,144 | 10,255,925 | 1,533,741 | 5,368,674 | 838,334 | 2,262,706 | 3,572,692 | 4,186,810 | ||||||||||||||||||||||||
| Net Investment Income (Loss) |
(142,474 | ) | 4,445,171 | 1,923,331 | 6,217,101 | 456,086 | 3,382,698 | 11,243,770 | 6,946,279 | |||||||||||||||||||||||
| REALIZED AND UNREALIZED GAIN (LOSS) ON INVESTMENTS |
||||||||||||||||||||||||||||||||
| Net Realized Gain (Loss) on: |
||||||||||||||||||||||||||||||||
| Investments |
61,602,018 | 42,580,023 | 19,453,943 | 48,115,688 | 1,877,289 | 7,698,383 | 25,274,404 | 6,382,969 | ||||||||||||||||||||||||
| Futures |
— | — | 650,129 | — | — | — | — | — | ||||||||||||||||||||||||
| Options written |
— | — | — | — | — | — | — | — | ||||||||||||||||||||||||
| Swap agreements |
— | — | — | — | — | — | — | — | ||||||||||||||||||||||||
| Foreign currencies |
(327,163) | — | — | — | — | — | (509 | ) | — | |||||||||||||||||||||||
| 61,274,855 | 42,580,023 | 20,104,072 | 48,115,688 | 1,877,289 | 7,698,383 | 25,273,895 | 6,382,969 | |||||||||||||||||||||||||
| Net change in unrealized appreciation (depreciation) on: |
||||||||||||||||||||||||||||||||
| Investments |
245,076,470 | (17,509,798 | ) | 5,836,908 | 31,554,521 | 4,406,550 | 19,408,283 | 68,830,737 | 34,494,253 | |||||||||||||||||||||||
| Futures |
— | — | (68,633 | ) | — | — | — | — | — | |||||||||||||||||||||||
| Options written |
— | — | — | — | — | — | — | — | ||||||||||||||||||||||||
| Swap agreements |
— | — | — | — | — | — | — | — | ||||||||||||||||||||||||
| Foreign currencies |
261,312 | — | — | — | — | — | — | — | ||||||||||||||||||||||||
| 245,337,782 | (17,509,798 | ) | 5,768,275 | 31,554,521 | 4,406,550 | 19,408,283 | 68,830,737 | 34,494,253 | ||||||||||||||||||||||||
| Net gain (loss) on investments and foreign currencies |
306,612,637 | 25,070,225 | 25,872,347 | 79,670,209 | 6,283,839 | 27,106,666 | 94,104,632 | 40,877,222 | ||||||||||||||||||||||||
| Net Increase (Decrease) in Net Assets Resulting from Operations |
$306,470,163 | $ | 29,515,396 | $ | 27,795,678 | $ | 85,887,310 | $ | 6,739,925 | $ | 30,489,364 | $ | 105,348,402 | $ | 47,823,501 | |||||||||||||||||
See Notes to Financial Statements.
273
AMERICAN SKANDIA TRUST
STATEMENTS OF OPERATIONS
YEAR ENDED DECEMBER 31, 2004
| PORTFOLIO |
|||||||||||||||||||
| AST AMERICAN CENTURY INCOME & GROWTH |
AST ALLIANCE GROWTH AND INCOME |
AST DEAM |
AST AMERICAN CENTURY STRATEGIC BALANCED |
AST T. ROWE |
|||||||||||||||
| INVESTMENT INCOME: |
|||||||||||||||||||
| Interest |
$ | 62,619 | $ | 79,129 | $ | 31,202 | $ | 3,388,316 | $ | 6,102,818 | |||||||||
| Dividends |
10,938,329 | 43,768,424 | 5,498,190 | 2,692,370 | 5,615,841 | ||||||||||||||
| Income from securities loaned, net |
138,591 | 120,578 | — | 45,904 | 43,542 | ||||||||||||||
| Foreign taxes withheld |
(976 | ) | (70,669 | ) | — | (70 | ) | (177,275 | ) | ||||||||||
| Total Income |
11,138,563 | 43,897,462 | 5,529,392 | 6,126,520 | 11,584,926 | ||||||||||||||
| EXPENSES: |
|||||||||||||||||||
| Advisory fees |
2,933,112 | 14,754,011 | 244,392 | 1,967,485 | 3,276,291 | ||||||||||||||
| Distribution fees |
— | 661,107 | — | — | — | ||||||||||||||
| Shareholder servicing fees and expenses |
391,000 | 1,967,000 | — | 231,000 | 385,000 | ||||||||||||||
| Administration and accounting fees |
309,000 | 552,000 | 43,000 | 219,000 | 310,000 | ||||||||||||||
| Custodian fees and expenses |
100,000 | 180,000 | 12,000 | 85,000 | 155,000 | ||||||||||||||
| Audit and legal fees |
65,000 | 8,000 | 34,000 | 50,000 | 33,000 | ||||||||||||||
| Trustees’ fees |
15,000 | 39,000 | 14,000 | 15,000 | 17,000 | ||||||||||||||
| Printing expense |
21,000 | — | — | — | — | ||||||||||||||
| Interest expense |
1,619 | 1,474 | — | — | — | ||||||||||||||
| Miscellaneous |
30,290 | 68,467 | 5,172 | 31,181 | 139,256 | ||||||||||||||
| Total Expenses |
3,866,021 | 18,231,059 | 352,564 | 2,598,666 | 4,315,547 | ||||||||||||||
| Less: Advisory fee waivers and expense reimbursements |
— | (483,601 | ) | — | (79,495 | ) | (184,576 | ) | |||||||||||
| Less: Fees paid indirectly |
— | (661,107 | ) | — | — | — | |||||||||||||
| Net Expenses |
3,866,021 | 17,086,351 | 352,564 | 2,519,171 | 4,130,971 | ||||||||||||||
| Net Investment Income (Loss) |
7,272,542 | 26,811,111 | 5,176,828 | 3,607,349 | 7,453,955 | ||||||||||||||
| REALIZED AND UNREALIZED GAIN (LOSS) ON INVESTMENTS |
|||||||||||||||||||
| Net Realized Gain (Loss) on: |
|||||||||||||||||||
| Investments |
42,396,806 | 61,723,758 | 15,804,533 | 18,263,719 | 20,449,650 | ||||||||||||||
| Futures |
249,186 | — | — | 93,082 | — | ||||||||||||||
| Options written |
— | — | — | — | — | ||||||||||||||
| Swap agreements |
— | — | — | — | — | ||||||||||||||
| Foreign currencies |
2,741 | — | — | 4,887 | 27,447 | ||||||||||||||
| 42,648,733 | 61,723,758 | 15,804,533 | 18,361,688 | 20,477,097 | |||||||||||||||
| Net change in unrealized appreciation (depreciation) on: |
|||||||||||||||||||
| Investments |
269,259 | 125,226,936 | 3,909,800 | (2,253,275 | ) | 14,214,375 | |||||||||||||
| Futures |
5,750 | — | — | (52,337 | ) | — | |||||||||||||
| Options written |
— | — | — | — | — | ||||||||||||||
| Swap agreements |
— | — | — | — | — | ||||||||||||||
| Foreign currencies |
959 | — | — | 31 | (5,904 | ) | |||||||||||||
| 275,968 | 125,226,936 | 3,909,800 | (2,305,581 | ) | 14,208,471 | ||||||||||||||
| Net gain (loss) on investments and foreign currencies |
42,924,701 | 186,950,694 | 19,714,333 | 16,056,107 | 34,685,568 | ||||||||||||||
| Net Increase (Decrease) in Net Assets Resulting from Operations |
$ | 50,197,243 | $ | 213,761,805 | $ | 24,891,161 | $ | 19,663,456 | $ | 42,139,523 | |||||||||
274
| PORTFOLIO |
|||||||||||||||||||||||
| AST T. ROWE PRICE GLOBAL BOND |
AST GOLDMAN SACHS HIGH YIELD |
AST LORD ABBETT BOND– DEBENTURE |
AST PIMCO |
AST PIMCO |
AST MONEY |
||||||||||||||||||
| INVESTMENT INCOME: |
|||||||||||||||||||||||
| Interest |
$ | 8,983,044 | $ | 58,216,767 | $ | 22,917,958 | $ | 61,856,172 | $ | 22,037,430 | $ | 27,766,931 | |||||||||||
| Dividends |
— | 748,105 | 1,055,511 | 1,302,974 | 206,406 | 2,598 | |||||||||||||||||
| Income from securities loaned, net |
— | — | 162,976 | — | — | — | |||||||||||||||||
| Foreign taxes withheld |
— | — | — | — | — | — | |||||||||||||||||
| Total Income |
8,983,044 | 58,964,872 | 24,136,445 | 63,159,146 | 22,243,836 | 27,769,529 | |||||||||||||||||
| EXPENSES: |
|||||||||||||||||||||||
| Advisory fees |
1,967,449 | 5,470,793 | 3,156,878 | 14,364,170 | 5,924,396 | 9,976,603 | |||||||||||||||||
| Distribution fees |
— | — | — | — | — | — | |||||||||||||||||
| Shareholder servicing fees and expenses |
246,000 | 729,000 | 395,000 | 2,210,000 | 912,000 | 1,996,000 | |||||||||||||||||
| Administration and accounting fees |
228,000 | 401,000 | 311,000 | 576,000 | 437,000 | 277,000 | |||||||||||||||||
| Custodian fees and expenses |
71,000 | 88,000 | 54,000 | 277,000 | 122,000 | 195,000 | |||||||||||||||||
| Audit and legal fees |
49,000 | 22,000 | 35,000 | 40,000 | 14,000 | 5,000 | |||||||||||||||||
| Trustees’ fees |
14,000 | 26,000 | 16,000 | 50,000 | 27,000 | 50,000 | |||||||||||||||||
| Printing expense |
— | — | — | 102,000 | — | — | |||||||||||||||||
| Interest expense |
— | 26,227 | 1,200 | 2,521 | — | — | |||||||||||||||||
| Miscellaneous |
67,409 | 52,333 | 43,414 | 176,807 | 64,341 | 73,200 | |||||||||||||||||
| Total Expenses |
2,642,858 | 6,815,353 | 4,012,492 | 17,798,498 | 7,500,737 | 12,572,803 | |||||||||||||||||
| Less: Advisory fee waivers and expense reimbursements |
— | — | (195,038 | ) | (605,091 | ) | (254,510 | ) | (997,652 | ) | |||||||||||||
| Less: Fees paid indirectly |
— | — | — | — | — | — | |||||||||||||||||
| Net Expenses |
2,642,858 | 6,815,353 | 3,817,454 | 17,193,407 | 7,246,227 | 11,575,151 | |||||||||||||||||
| Net Investment Income (Loss) |
6,340,186 | 52,149,519 | 20,318,991 | 45,965,739 | 14,997,609 | 16,194,378 | |||||||||||||||||
| REALIZED AND UNREALIZED GAIN (LOSS) ON INVESTMENTS |
|||||||||||||||||||||||
| Net Realized Gain (Loss) on: |
|||||||||||||||||||||||
| Investments |
299,757 | 6,703,319 | 5,617,774 | 20,629,058 | 6,048,149 | (39,829 | ) | ||||||||||||||||
| Futures |
146,739 | — | — | 41,502,214 | 3,084,009 | — | |||||||||||||||||
| Options written |
— | — | — | 4,887,090 | 59,319 | — | |||||||||||||||||
| Swap agreements |
— | — | — | 11,959,274 | (564,528 | ) | — | ||||||||||||||||
| Foreign currencies |
2,726,062 | (3,546,862 | ) | — | 3,503,223 | 227,190 | — | ||||||||||||||||
| 3,172,558 | 3,156,457 | 5,617,774 | 82,480,859 | 8,854,139 | (39,829 | ) | |||||||||||||||||
| Net change in unrealized appreciation (depreciation) on: |
|||||||||||||||||||||||
| Investments |
10,610,344 | 24,934,941 | 4,618,109 | (11,842,844 | ) | (8,031,818 | ) | — | |||||||||||||||
| Futures |
(29,681) | — | — | (11,042,749 | ) | (1,307,581 | ) | — | |||||||||||||||
| Options written |
— | — | — | (1,980,227 | ) | 831,580 | — | ||||||||||||||||
| Swap agreements |
— | — | — | 330,587 | 1,766,290 | — | |||||||||||||||||
| Foreign currencies |
632,886 | (3,655,388 | ) | — | 2,656,902 | 408,149 | — | ||||||||||||||||
| 11,273,550 | 21,279,553 | 4,618,109 | (21,905,331 | ) | (6,333,380 | ) | — | ||||||||||||||||
| Net gain (loss) on investments and foreign currencies |
14,446,108 | 24,436,010 | 10,235,883 | 60,575,528 | 2,520,759 | (39,829 | ) | ||||||||||||||||
| Net Increase (Decrease) in Net Assets Resulting from Operations |
$ | 20,786,294 | $ | 76,585,529 | $ | 30,554,874 | $ | 106,541,267 | $ | 17,518,368 | $ | 16,154,549 | |||||||||||
See Notes to Financial Statements.
275
AMERICAN SKANDIA TRUST
STATEMENTS OF CHANGES IN NET ASSETS
| PORTFOLIO |
||||||||||||||||
| AST JPMORGAN INTERNATIONAL EQUITY |
AST WILLIAM BLAIR INTERNATIONAL GROWTH |
|||||||||||||||
| YEAR ENDED DECEMBER 31, 2004 |
YEAR ENDED DECEMBER 31, 2003 |
YEAR ENDED DECEMBER 31, 2004 |
YEAR ENDED DECEMBER 31, 2003 |
|||||||||||||
| OPERATIONS |
||||||||||||||||
| Net investment income (loss) |
$ | 4,288,266 | $ | 3,597,767 | $ | 3,180,692 | $ | 1,711,134 | ||||||||
| Net realized gain (loss) on investments and foreign currencies |
69,315,410 | (8,430,018 | ) | 74,331,631 | 12,024,056 | |||||||||||
| Net change in unrealized appreciation (depreciation) on investments and foreign currencies |
(21,928,683 | ) | 103,596,542 | 108,451,270 | 119,096,652 | |||||||||||
| Net Increase (Decrease) in Net Assets Resulting from Operations |
51,674,993 | 98,764,291 | 185,963,593 | 132,831,842 | ||||||||||||
| DIVIDENDS AND DISTRIBUTIONS |
||||||||||||||||
| Dividends from net investment income |
(3,597,872 | ) | (2,687,610 | ) | (7,604,485 | ) | — | |||||||||
| Distributions from net realized gains |
— | — | — | — | ||||||||||||
| Total Dividends and Distributions |
(3,597,872 | ) | (2,687,610 | ) | (7,604,485 | ) | — | |||||||||
| FUND SHARE TRANSACTIONS |
||||||||||||||||
| Net proceeds from shares sold(b) |
66,608,802 | 265,111,169 | 719,145,204 | 332,531,656 | ||||||||||||
| Net asset value of shares issued in reinvestment of dividends and distributions |
3,597,872 | 2,687,610 | 7,604,485 | — | ||||||||||||
| Cost of shares redeemed |
(77,762,221 | ) | (341,028,716 | ) | (203,778,980 | ) | (142,646,114 | ) | ||||||||
| Increase (Decrease) in Net Assets from Fund Share Transactions |
(7,555,547 | ) | (73,229,937 | ) | 522,970,709 | 189,885,542 | ||||||||||
| Net Increase (Decrease) in Net Assets |
40,521,574 | 22,846,744 | 701,329,817 | 322,717,384 | ||||||||||||
| NET ASSETS |
||||||||||||||||
| Beginning of Year |
339,038,827 | 316,192,083 | 641,548,986 | 318,831,602 | ||||||||||||
| End of Year(a) |
$ | 379,560,401 | $ | 339,038,827 | $ | 1,342,878,803 | $ | 641,548,986 | ||||||||
| (a) Includes Undistributed Net Investment Income of: |
$ | 4,429,643 | $ | 3,590,307 | $ | — | $ | 1,090,742 | ||||||||
| (b) Includes Value of Shares Issued in Merger |
$ | — | $ | — | $ | 371,141,306 | $ | — | ||||||||
| SHARES ISSUED AND REDEEMED |
||||||||||||||||
| Shares sold |
3,877,910 | 20,500,466 | 28,858,342 | 35,495,958 | ||||||||||||
| Shares issued in reinvestment of dividends and distributions |
229,018 | 236,170 | 722,172 | — | ||||||||||||
| Shares issued in merger |
— | — | 35,850,785 | — | ||||||||||||
| Shares redeemed |
(4,820,971 | ) | (25,177,543 | ) | (15,035,523 | ) | (16,833,929 | ) | ||||||||
| Net Increase (Decrease) in Shares Outstanding |
(714,043 | ) | (4,440,907 | ) | 50,395,776 | 18,662,029 | ||||||||||
See Notes to Financial Statements.
276
| PORTFOLIO |
||||||||||||||||||||||||
| AST LSV INTERNATIONAL VALUE |
AST MFS GLOBAL EQUITY |
AST STATE STREET RESEARCH SMALL- |
||||||||||||||||||||||
| YEAR ENDED DECEMBER 31, 2004 |
YEAR ENDED DECEMBER 31, 2003 |
YEAR ENDED DECEMBER 31, 2004 |
YEAR ENDED DECEMBER 31, 2003 |
YEAR ENDED DECEMBER 31, 2004 |
YEAR ENDED DECEMBER 31, 2003 |
|||||||||||||||||||
| OPERATIONS |
||||||||||||||||||||||||
| Net investment income (loss) |
$1,862,579 | $ | 1,726,606 | $ | 505,487 | $ | 239,532 | $ | (2,258,918 | ) | $ | (1,824,690 | ) | |||||||||||
| Net realized gain (loss) on investments and foreign currencies |
41,339,454 | 6,044,625 | 8,772,794 | (734,192 | ) | 31,564,967 | 18,185,601 | |||||||||||||||||
| Net change in unrealized appreciation (depreciation) on investments and foreign currencies |
(9,658,195) | 35,350,874 | 13,520,158 | 19,986,060 | (50,716,500 | ) | 85,575,566 | |||||||||||||||||
| Net Increase (Decrease) in Net Assets Resulting from Operations |
33,543,838 | 43,122,105 | 22,798,439 | 19,491,400 | (21,410,451 | ) | 101,936,477 | |||||||||||||||||
| DIVIDENDS AND DISTRIBUTIONS |
||||||||||||||||||||||||
| Dividends from net investment income |
(2,339,322) | (787,176 | ) | (221,874 | ) | (121,731 | ) | — | — | |||||||||||||||
| Distributions from net realized gains |
— | — | — | — | — | — | ||||||||||||||||||
| Total Dividends and Distributions |
(2,339,322 | ) | (787,176 | ) | (221,874 | ) | (121,731 | ) | — | — | ||||||||||||||
| FUND SHARE TRANSACTIONS |
||||||||||||||||||||||||
| Net proceeds from shares sold(b) |
52,122,908 | 144,252,913 | 65,618,377 | 47,812,795 | 30,829,098 | 315,265,468 | ||||||||||||||||||
| Net asset value of shares issued in reinvestment of dividends and distributions |
2,339,322 | 787,176 | 221,874 | 121,731 | — | — | ||||||||||||||||||
| Cost of shares redeemed |
(64,059,074 | ) | (144,319,525 | ) | (25,036,294 | ) | (24,533,163 | ) | (121,477,890 | ) | (333,037,514 | ) | ||||||||||||
| Increase (Decrease) in Net Assets from Fund Share Transactions |
(9,596,844 | ) | 720,564 | 40,803,957 | 23,401,363 | (90,648,792 | ) | (17,772,046 | ) | |||||||||||||||
| Net Increase (Decrease) in Net Assets |
21,607,672 | 43,055,493 | 63,380,522 | 42,771,032 | (112,059,243 | ) | 84,164,431 | |||||||||||||||||
| NET ASSETS |
||||||||||||||||||||||||
| Beginning of Year |
172,059,247 | 129,003,754 | 102,938,103 | 60,167,071 | 338,190,684 | 254,026,253 | ||||||||||||||||||
| End of Year(a) |
$ | 193,666,919 | $ | 172,059,247 | $ | 166,318,625 | $ | 102,938,103 | $ | 226,131,441 | $ | 338,190,684 | ||||||||||||
| (a) Includes Undistributed Net Investment Income of: |
$ | 2,748,715 | $ | 2,173,635 | $ | 460,456 | $ | 211,153 | $ | — | $ | — | ||||||||||||
| (b) Includes Value of Shares Issued in Merger |
$ | — | $ | — | $ | — | $ | — | $ | — | $ | — | ||||||||||||
| SHARES ISSUED AND REDEEMED |
||||||||||||||||||||||||
| Shares sold |
4,474,755 | 16,124,899 | 6,051,804 | 5,416,991 | 2,072,826 | 25,415,423 | ||||||||||||||||||
| Shares issued in reinvestment of dividends and distributions |
208,496 | 103,168 | 21,334 | 16,361 | — | — | ||||||||||||||||||
| Shares issued in merger |
— | — | — | — | — | — | ||||||||||||||||||
| Shares redeemed |
(5,562,873 | ) | (16,185,413 | ) | (2,371,855 | ) | (2,841,031 | ) | (8,368,356 | ) | (27,462,413 | ) | ||||||||||||
| Net Increase (Decrease) in Shares Outstanding |
(879,622) | 42,654 | 3,701,283 | 2,592,321 | (6,295,530 | ) | (2,046,990 | ) | ||||||||||||||||
277
AMERICAN SKANDIA TRUST
STATEMENTS OF CHANGES IN NET ASSETS
FOR THE YEAR ENDED DECEMBER 31, 2004
| PORTFOLIO |
||||||||||||||||
| AST DEAM SMALL-CAP GROWTH |
AST FEDERATED AGGRESSIVE GROWTH |
|||||||||||||||
| YEAR ENDED DECEMBER 31, 2004 |
YEAR ENDED DECEMBER 31, 2003 |
YEAR ENDED DECEMBER 31, 2004 |
YEAR ENDED DECEMBER 31, 2003 |
|||||||||||||
| OPERATIONS |
||||||||||||||||
| Net investment income (loss) |
$ | (2,312,103 | ) | $ | (650,051 | ) | $ | (2,255,537 | ) | $ | (990,021 | ) | ||||
| Net realized gain (loss) on investments and foreign currencies |
38,857,154 | 51,185,190 | 31,685,354 | 13,170,761 | ||||||||||||
| Net change in unrealized appreciation (depreciation) on investments and foreign currencies |
(9,327,585 | ) | 79,918,938 | 30,229,268 | 40,158,594 | |||||||||||
| Net Increase (Decrease) in Net Assets Resulting from Operations |
27,217,466 | 130,454,077 | 59,659,085 | 52,339,334 | ||||||||||||
| DIVIDENDS AND DISTRIBUTIONS |
||||||||||||||||
| Dividends from net investment income |
— | — | — | — | ||||||||||||
| Distributions from net realized gains |
— | — | (4,045,919 | ) | — | |||||||||||
| Total Dividends and Distributions |
— | — | (4,045,919 | ) | — | |||||||||||
| FUND SHARE TRANSACTIONS |
||||||||||||||||
| Net proceeds from shares sold(b) |
28,814,141 | 168,312,065 | 182,870,868 | 223,259,628 | ||||||||||||
| Net asset value of shares issued in reinvestment of dividends and distributions |
— | — | 4,045,919 | — | ||||||||||||
| Cost of shares redeemed |
(118,652,777 | ) | (188,633,759 | ) | (82,361,753 | ) | (127,105,498 | ) | ||||||||
| Increase (Decrease) in Net Assets from Fund Share Transactions |
(89,838,636 | ) | (20,321,694 | ) | 104,555,034 | 96,154,130 | ||||||||||
| Net Increase (Decrease) in Net Assets |
(62,621,170 | ) | 110,132,383 | 160,168,200 | 148,493,464 | |||||||||||
| NET ASSETS |
||||||||||||||||
| Beginning of Year |
403,429,807 | 293,297,424 | 187,565,197 | 39,071,733 | ||||||||||||
| End of Year(a) |
$ | 340,808,637 | $ | 403,429,807 | $ | 347,733,397 | $ | 187,565,197 | ||||||||
| (a) Includes Undistributed Net Investment Income of: |
$ | — | $ | 132,924 | $ | — | $ | — | ||||||||
| (b) Includes Value of Shares Issued in Merger |
$ | — | $ | — | $ | — | $ | — | ||||||||
| SHARES ISSUED AND REDEEMED |
||||||||||||||||
| Shares sold |
3,733,903 | 27,138,716 | 20,069,092 | 32,404,016 | ||||||||||||
| Shares issued in reinvestment of dividends and Distributions |
— | — | 462,920 | — | ||||||||||||
| Shares issued in merger |
— | — | — | — | ||||||||||||
| Shares redeemed |
(15,790,806 | ) | (31,038,640 | ) | (8,887,584 | ) | (18,312,306 | ) | ||||||||
| Net Increase (Decrease) in Shares Outstanding |
(12,056,903 | ) | (3,899,924 | ) | 11,644,428 | 14,091,710 | ||||||||||
See Notes to Financial Statements.
278
| PORTFOLIO |
||||||||||||||||||||||||
| AST GOLDMAN SACHS SMALL-CAP VALUE |
AST SMALL-CAP VALUE |
AST DEAM SMALL-CAP VALUE |
||||||||||||||||||||||
| YEAR ENDED DECEMBER 31, 2004 |
YEAR ENDED DECEMBER 31, 2003 |
YEAR ENDED DECEMBER 31, 2004 |
YEAR ENDED DECEMBER 31, 2003 |
YEAR ENDED DECEMBER 31, 2004 |
YEAR ENDED DECEMBER 31, 2003 |
|||||||||||||||||||
| OPERATIONS |
||||||||||||||||||||||||
| Net investment income (loss) |
$ | 1,508,719 | $ | 1,217,697 | $ | 1,252,259 | $ | 197,511 | $ | 336,253 | $ | 152,092 | ||||||||||||
| Net realized gain (loss) on investments and foreign currencies |
50,503,621 | 14,463,894 | 221,204,501 | 6,055,694 | 9,096,756 | 4,965,824 | ||||||||||||||||||
| Net change in unrealized appreciation (depreciation) on investments and foreign currencies |
5,052,697 | 87,538,179 | (91,399,533 | ) | 170,461,501 | 5,985,210 | 4,356,184 | |||||||||||||||||
| Net Increase (Decrease) in Net Assets Resulting from Operations |
57,065,037 | 103,219,770 | 131,057,227 | 176,714,706 | 15,418,219 | 9,474,100 | ||||||||||||||||||
| DIVIDENDS AND DISTRIBUTIONS |
||||||||||||||||||||||||
| Dividends from net investment income |
(696,491 | ) | (2,448,006 | ) | (42,814 | ) | (998,184 | ) | (121,670 | ) | (20,010 | ) | ||||||||||||
| Distributions from net realized gains |
(4,161,394 | ) | — | — | — | (2,928,706 | ) | — | ||||||||||||||||
| Total Dividends and Distributions |
(4,857,885 | ) | (2,448,006 | ) | (42,814 | ) | (998,184 | ) | (3,050,376 | ) | (20,010 | ) | ||||||||||||
| FUND SHARE TRANSACTIONS |
||||||||||||||||||||||||
| Net proceeds from shares sold(b) |
10,011,757 | 24,078,465 | 179,244,384 | 296,681,802 | 70,772,927 | 66,691,597 | ||||||||||||||||||
| Net asset value of shares issued in reinvestment of dividends and distributions |
4,857,885 | 2,448,006 | 42,814 | 998,184 | 3,050,376 | 20,010 | ||||||||||||||||||
| Cost of shares redeemed |
(87,413,873 | ) | (98,957,367 | ) | (162,582,637 | ) | (200,050,371 | ) | (26,352,092 | ) | (37,604,247 | ) | ||||||||||||
| Increase (Decrease) in Net Assets from Fund Share Transactions |
(72,544,231) | (72,430,896 | ) | 16,704,561 | 97,629,615 | 47,471,211 | 29,107,360 | |||||||||||||||||
| Net Increase (Decrease) in Net Assets |
(20,337,079) | 28,340,868 | 147,718,974 | 273,346,137 | 59,839,054 | 38,561,450 | ||||||||||||||||||
| NET ASSETS |
||||||||||||||||||||||||
| Beginning of Year |
343,442,008 | 315,101,140 | 774,416,025 | 501,069,888 | 51,980,046 | 13,418,596 | ||||||||||||||||||
| End of Year(a) |
$323,104,929 | $ | 343,442,008 | $ | 922,134,999 | $ | 774,416,025 | $ | 111,819,100 | $ | 51,980,046 | |||||||||||||
| (a) Includes Undistributed Net Investment Income of: |
$945,479 | $ | 1,233,112 | $ | 758,238 | $ | 490,083 | $ | 161,322 | $ | 148,516 | |||||||||||||
| (b) Includes Value of Shares Issued in Merger |
$ — | $ | — | $ | — | $ | — | $ | — | $ | — | |||||||||||||
| SHARES ISSUED AND REDEEMED |
||||||||||||||||||||||||
| Shares sold |
519,968 | 1,549,548 | 10,827,345 | 22,211,822 | 6,113,740 | 6,932,419 | ||||||||||||||||||
| Shares issued in reinvestment of dividends and Distributions |
268,540 | 199,837 | 2,690 | 90,825 | 279,851 | 2,741 | ||||||||||||||||||
| Shares issued in merger |
||||||||||||||||||||||||
| Shares redeemed |
— | — | — | — | — | — | ||||||||||||||||||
| Net Increase (Decrease) in Shares Outstanding |
(4,684,602) | (7,104,738 | ) | (9,705,838 | ) | (16,207,684 | ) | (2,374,562 | ) | (3,983,864 | ) | |||||||||||||
279
AMERICAN SKANDIA TRUST
STATEMENTS OF CHANGES IN NET ASSETS
FOR THE YEAR ENDED DECEMBER 31, 2004
| PORTFOLIO |
||||||||||||||||
| AST GOLDMAN SACHS MID-CAP GROWTH |
AST NEUBERGER BERMAN MID-CAP GROWTH |
|||||||||||||||
| YEAR ENDED DECEMBER 31, 2004 |
YEAR ENDED DECEMBER 31, 2003 |
YEAR ENDED DECEMBER 31, 2004 |
YEAR ENDED DECEMBER 31, 2003 |
|||||||||||||
| OPERATIONS: |
||||||||||||||||
| Net investment income (loss) |
$ | (1,012,788 | ) | $ | (507,024 | ) | $ | (2,545,128 | ) | $ | (2,582,570 | ) | ||||
| Net realized gain (loss) on investments and foreign currencies |
15,765,813 | 5,796,922 | 20,087,966 | 21,580,775 | ||||||||||||
| Net change in unrealized appreciation (depreciation) on investments and foreign currencies |
21,394,926 | 21,374,255 | 36,796,535 | 62,914,518 | ||||||||||||
| Net Increase (Decrease) in Net Assets Resulting from Operations |
36,147,951 | 26,664,153 | 54,339,373 | 81,912,723 | ||||||||||||
| DIVIDENDS AND DISTRIBUTIONS: |
||||||||||||||||
| Dividends from net investment income |
— | — | — | — | ||||||||||||
| Distributions from net realized gains |
— | — | — | — | ||||||||||||
| Total Dividends and Distributions |
— | — | — | — | ||||||||||||
| FUND SHARE TRANSACTIONS |
||||||||||||||||
| Net proceeds from shares sold(b) |
111,638,653 | 87,872,685 | 63,034,623 | 223,429,606 | ||||||||||||
| Net asset value of shares issued in reinvestment of dividends and distributions |
— | — | — | — | ||||||||||||
| Cost of shares redeemed |
(31,594,068 | ) | (15,361,738 | ) | (76,831,248 | ) | (232,790,046 | ) | ||||||||
| Increase (Decrease) in Net Assets from Fund Share Transactions |
80,044,585 | 72,510,947 | (13,796,625 | ) | (9,360,440 | ) | ||||||||||
| Net Increase (Decrease) in Net Assets |
116,192,536 | 99,175,100 | 40,542,748 | 72,552,283 | ||||||||||||
| NET ASSETS |
||||||||||||||||
| Beginning of Year |
160,548,567 | 61,373,467 | 360,010,147 | 287,457,864 | ||||||||||||
| End of Year(a) |
$ | 276,741,103 | $ | 160,548,567 | $ | 400,552,895 | $ | 360,010,147 | ||||||||
| (a) Includes Undistributed Net Investment Income of: |
$ | — | $ | — | $ | — | $ | — | ||||||||
| (b) Includes Value of Shares Issued in Merger |
$ | — | $ | — | $ | — | $ | — | ||||||||
| SHARES ISSUED AND REDEEMED |
||||||||||||||||
| Shares sold |
28,236,277 | 26,125,346 | 4,873,186 | 21,029,402 | ||||||||||||
| Shares issued in reinvestment of dividends and distributions |
— | — | — | — | ||||||||||||
| Shares issued in merger |
— | — | — | — | ||||||||||||
| Shares redeemed |
(7,842,533 | ) | (5,080,380 | ) | (6,098,875 | ) | (22,258,356 | ) | ||||||||
| Net Increase (Decrease) in Shares Outstanding |
20,393,744 | 21,044,966 | (1,225,689 | ) | (1,228,954 | ) | ||||||||||
See Notes to Financial Statements.
280
| PORTFOLIO |
||||||||||||||||||||||||
| AST NEUBERGER BERMAN MID-CAP VALUE |
AST ALGER ALL-CAP GROWTH |
AST GABELLI ALL-CAP VALUE |
||||||||||||||||||||||
| YEAR ENDED DECEMBER 31, 2004 |
YEAR ENDED DECEMBER 31, 2003 |
YEAR ENDED DECEMBER 31, 2004 |
YEAR ENDED DECEMBER 31, 2003 |
YEAR ENDED DECEMBER 31, 2004 |
YEAR ENDED DECEMBER 31, 2003 |
|||||||||||||||||||
| OPERATIONS: |
||||||||||||||||||||||||
| Net investment income (loss) |
$ | 1,881,089 | $ | 1,182,774 | $ | (1,240,153 | ) | $ | (1,955,251 | ) | $ | 740,854 | $ | 513,629 | ||||||||||
| Net realized gain (loss) on investments and foreign currencies |
186,401,919 | 49,678,777 | 45,226,925 | 32,943,906 | 4,589,709 | (5,064,919 | ) | |||||||||||||||||
| Net change in unrealized appreciation (depreciation) on investments and foreign currencies |
51,114,048 | 206,833,309 | (19,019,358 | ) | 76,563,619 | 20,232,335 | 43,074,019 | |||||||||||||||||
| Net Increase (Decrease) in Net Assets Resulting from Operations |
239,397,056 | 257,694,860 | 24,967,414 | 107,552,274 | 25,562,898 | 38,522,729 | ||||||||||||||||||
| DIVIDENDS AND DISTRIBUTIONS: |
||||||||||||||||||||||||
| Dividends from net investment income |
(1,190,224 | ) | (1,718,079 | ) | — | — | (512,677 | ) | (880,134 | ) | ||||||||||||||
| Distributions from net realized gains |
(26,886,646 | ) | — | — | — | — | — | |||||||||||||||||
| Total Dividends and Distributions |
(28,076,870 | ) | (1,718,079 | ) | — | — | (512,677 | ) | (880,134 | ) | ||||||||||||||
| FUND SHARE TRANSACTIONS |
||||||||||||||||||||||||
| Net proceeds from shares sold(b) |
187,485,189 | 177,071,018 | 46,585,861 | 149,224,395 | 49,786,781 | 175,383,709 | ||||||||||||||||||
| Net asset value of shares issued in reinvestment of dividends and distributions |
28,076,870 | 1,718,079 | — | — | 512,677 | 880,134 | ||||||||||||||||||
| Cost of shares redeemed |
(144,470,285 | ) | (168,365,058 | ) | (139,627,353 | ) | (177,557,709 | ) | (61,841,238 | ) | (145,589,930 | ) | ||||||||||||
| Increase (Decrease) in Net Assets from Fund Share Transactions |
71,091,774 | 10,424,039 | (93,041,492 | ) | (28,333,314 | ) | (11,541,780 | ) | 30,673,913 | |||||||||||||||
| Net Increase (Decrease) in Net Assets |
282,411,960 | 266,400,820 | (68,074,078 | ) | 79,218,960 | 13,508,441 | 68,316,508 | |||||||||||||||||
| NET ASSETS |
||||||||||||||||||||||||
| Beginning of Year |
1,027,374,304 | 760,973,484 | 402,504,545 | 323,285,585 | 181,873,715 | 113,557,207 | ||||||||||||||||||
| End of Year(a) |
$ | 1,309,786,264 | $ | 1,027,374,304 | $ | 334,430,467 | $ | 402,504,545 | $ | 195,382,156 | $ | 181,873,715 | ||||||||||||
| (a) Includes Undistributed Net Investment Income of: |
$ | 1,866,876 | $ | 1,176,011 | $ | — | $ | — | $ | 738,826 | $ | 510,962 | ||||||||||||
| (b) Includes Value of Shares Issued in Merger |
$ | — | $ | — | $ | — | $ | — | $ | — | $ | — | ||||||||||||
| SHARES ISSUED AND REDEEMED |
||||||||||||||||||||||||
| Shares sold |
9,960,559 | 11,610,879 | 9,180,722 | 35,493,768 | 4,546,658 | 19,789,079 | ||||||||||||||||||
| Shares issued in reinvestment of dividends and distributions |
1,570,294 | 136,366 | — | — | 48,549 | 118,938 | ||||||||||||||||||
| Shares issued in merger |
$ | — | $ | — | $ | — | $ | — | $ | — | $ | — | ||||||||||||
| Shares redeemed |
(7,735,737 | ) | (12,191,352 | ) | (28,179,863 | ) | (42,691,556 | ) | (5,746,999 | ) | (17,129,623 | ) | ||||||||||||
| Net Increase (Decrease) in Shares Outstanding |
3,795,116 | (444,107 | ) | (18,999,141 | ) | (7,197,788 | ) | (1,151,792 | ) | 2,778,394 | ||||||||||||||
241
AMERICAN SKANDIA TRUST
STATEMENTS OF CHANGES IN NET ASSETS
FOR THE YEAR ENDED DECEMBER 31, 2004
| PORTFOLIO |
||||||||||||||||
| AST T. ROWE PRICE NATURAL RESOURCES |
AST ALLIANCE GROWTH |
|||||||||||||||
| YEAR ENDED DECEMBER 31, 2004 |
YEAR ENDED DECEMBER 31, 2003 |
YEAR ENDED DECEMBER 31, 2004 |
YEAR ENDED DECEMBER 31, 2003 |
|||||||||||||
| OPERATIONS: |
||||||||||||||||
| Net investment income (loss) |
$ | 899,588 | $ | 867,608 | $ | (165,250 | ) | $ | (326,953 | ) | ||||||
| Net realized gain (loss) on investments and foreign currencies |
22,616,561 | 380,603 | 6,464,542 | (17,957,900 | ) | |||||||||||
| Net change in unrealized appreciation (depreciation) on investments and foreign currencies |
27,061,108 | 32,880,858 | 7,640,416 | 68,385,477 | ||||||||||||
| Net Increase (Decrease) in Net Assets Resulting from Operations |
50,577,257 | 34,129,069 | 13,939,708 | 50,100,624 | ||||||||||||
| DIVIDENDS AND DISTRIBUTIONS: |
||||||||||||||||
| Dividends from net investment income |
(1,843,388 | ) | (1,610,638 | ) | — | — | ||||||||||
| Distributions from net realized gains |
— | (2,249,299 | ) | — | — | |||||||||||
| Total Dividends and Distributions |
(1,843,388 | ) | (3,859,937 | ) | — | — | ||||||||||
| FUND SHARE TRANSACTIONS |
||||||||||||||||
| Net proceeds from shares sold(b) |
91,830,070 | 63,090,052 | 81,916,908 | 82,964,366 | ||||||||||||
| Net asset value of shares issued in reinvestment of dividends and distributions |
1,843,388 | 3,859,937 | — | — | ||||||||||||
| Cost of shares redeemed |
(75,178,286 | ) | (49,044,554 | ) | (74,777,073 | ) | (136,498,812 | ) | ||||||||
| Increase (Decrease) in Net Assets from Fund Share Transactions |
18,495,172 | 17,905,435 | 7,139,835 | (53,534,446 | ) | |||||||||||
| Net Increase (Decrease) in Net Assets |
67,229,041 | 48,174,567 | 21,079,543 | (3,433,822 | ) | |||||||||||
| NET ASSETS |
||||||||||||||||
| Beginning of Year |
170,860,256 | 122,685,689 | 237,055,834 | 240,489,656 | ||||||||||||
| End of Year(a) |
$ | 238,089,297 | $ | 170,860,256 | $ | 258,135,377 | $ | 237,055,834 | ||||||||
| (a) Includes Undistributed Net Investment Income of: |
$ | 691,301 | $ | 1,878,344 | $ | — | $ | — | ||||||||
| (b) Includes Value of Shares Issued in Merger |
$ | — | $ | — | $ | — | $ | — | ||||||||
| SHARES ISSUED AND REDEEMED |
||||||||||||||||
| Shares sold |
4,711,892 | 4,117,098 | 9,853,712 | 11,735,266 | ||||||||||||
| Shares issued in reinvestment of dividends and Distributions |
105,578 | 305,133 | — | — | ||||||||||||
| Shares issued in merger |
— | — | — | — | ||||||||||||
| Shares redeemed |
(4,089,071 | ) | (3,675,349 | ) | (9,014,318 | ) | (18,959,206 | ) | ||||||||
| Net Increase (Decrease) in Shares Outstanding |
728,399 | 746,882 | 839,394 | (7,223,940 | ) | |||||||||||
See Notes to Financial Statements.
282
| PORTFOLIO |
|||||||||||||||||||||||
| AST MFS GROWTH |
AST MARSICO CAPITAL GROWTH |
AST GOLDMAN SACHS CONCENTRATED GROWTH |
|||||||||||||||||||||
| YEAR ENDED DECEMBER 31, 2004 |
YEAR ENDED DECEMBER 31, 2003 |
YEAR ENDED DECEMBER 31, 2004 |
YEAR ENDED DECEMBER 31, 2003 |
YEAR ENDED DECEMBER 31, 2004 |
YEAR ENDED DECEMBER 31, 2003 |
||||||||||||||||||
| OPERATIONS: |
|||||||||||||||||||||||
| Net investment income (loss) |
$66,226 | $ | (1,082,134 | ) | $ | (142,474 | ) | $ | (2,677,864 | ) | $ | 4,445,171 | $ | (2,943,541 | ) | ||||||||
| Net realized gain (loss) on investments and foreign currencies |
40,797,208 | 60,316,628 | 61,274,855 | 12,823,587 | 42,580,023 | (16,368,661 | ) | ||||||||||||||||
| Net change in unrealized appreciation (depreciation) on investments and foreign currencies |
15,176,570 | 52,297,178 | 245,337,782 | 345,910,557 | (17,509,798 | ) | 267,349,182 | ||||||||||||||||
| Net Increase (Decrease) in Net Assets Resulting from Operations |
56,040,004 | 111,531,672 | 306,470,163 | 356,056,280 | 29,515,396 | 248,036,980 | |||||||||||||||||
| DIVIDENDS AND DISTRIBUTIONS: |
|||||||||||||||||||||||
| Dividends from net investment income |
— | — | — | — | — | (3,836,920 | ) | ||||||||||||||||
| Distributions from net realized gains |
— | — | — | — | — | (3,836,920 | ) | ||||||||||||||||
| Total Dividends and Distributions |
— | — | — | — | — | 3,836,920 | |||||||||||||||||
| FUND SHARE TRANSACTIONS |
|||||||||||||||||||||||
| Net proceeds from shares sold(b) |
29,685,612 | 90,882,329 | 480,032,518 | 585,870,757 | 73,692,664 | 185,939,240 | |||||||||||||||||
| Net asset value of shares issued in reinvestment of dividends and distributions |
— | — | — | — | — | 3,836,920 | |||||||||||||||||
| Cost of shares redeemed |
(144,108,452) | (135,191,566 | ) | (202,064,369 | ) | (312,446,929 | ) | (285,630,024 | ) | (430,389,058 | ) | ||||||||||||
| Increase (Decrease) in Net Assets from Fund Share Transactions |
(114,422,840) | (44,309,237 | ) | 277,968,149 | 273,423,828 | (211,937,360 | ) | (240,612,898 | ) | ||||||||||||||
| Net Increase (Decrease) in Net Assets |
(58,382,836) | 67,222,435 | 584,438,312 | 629,480,108 | (182,421,964 | ) | 3,587,162 | ||||||||||||||||
| NET ASSETS |
|||||||||||||||||||||||
| Beginning of Year |
593,307,032 | 526,084,597 | 1,710,581,374 | 1,081,101,266 | 1,151,199,657 | 1,147,612,495 | |||||||||||||||||
| End of Year(a) |
$534,924,196 | $ | 593,307,032 | $ | 2,295,019,686 | $ | 1,710,581,374 | $ | 968,777,693 | $ | 1,151,199,657 | ||||||||||||
| (a) Includes Undistributed Net Investment Income of: |
$50,323 | $ | — | $ | — | $ | — | $ | 4,402,631 | $ | — | ||||||||||||
| (b) Includes Value of Shares Issued in Merger |
$ | — | $ | — | $ | — | $ | — | $ | 42,536,344 | $ | — | |||||||||||
| SHARES ISSUED AND REDEEMED |
|||||||||||||||||||||||
| Shares sold |
3,969,455 | 13,930,579 | 30,104,296 | 43,295,979 | 1,535,694 | 10,352,347 | |||||||||||||||||
| Shares issued in reinvestment of dividends and Distributions |
— | — | — | — | — | 246,749 | |||||||||||||||||
| Shares issued in merger |
— | — | — | — | 2,089,499 | — | |||||||||||||||||
| Shares redeemed |
(19,022,477) | (21,235,914 | ) | (12,388,470 | ) | (24,718,870 | ) | (14,035,812 | ) | (24,061,450 | ) | ||||||||||||
| Net Increase (Decrease) in Shares Outstanding |
(15,053,022) | (7,305,335 | ) | 17,715,826 | 18,577,109 | (10,410,619 | ) | (13,462,354 | ) | ||||||||||||||
283
AMERICAN SKANDIA TRUST
STATEMENTS OF CHANGES IN NET ASSETS
FOR THE YEAR ENDED DECEMBER 31, 2004
| PORTFOLIO |
||||||||||||||||
| AST DEAM LARGE-CAP VALUE |
AST HOTCHKIS & WILEY LARGE-CAP VALUE |
|||||||||||||||
| YEAR ENDED DECEMBER 31, 2004 |
YEAR ENDED DECEMBER 31, 2003 |
YEAR ENDED DECEMBER 31, 2004 |
YEAR ENDED DECEMBER 31, 2003 |
|||||||||||||
| OPERATIONS: |
||||||||||||||||
| Net investment income (loss) |
$ | 1,923,331 | $ | 1,261,229 | $ | 6,217,101 | $ | 9,253,490 | ||||||||
| Net realized gain (loss) on investments and foreign currencies |
20,104,072 | 2,619,192 | 48,115,688 | 23,922,416 | ||||||||||||
| Net change in unrealized appreciation (depreciation) on investments and foreign currencies |
5,768,275 | 22,762,597 | 31,554,521 | 77,110,024 | ||||||||||||
| Net Increase (Decrease) in Net Assets Resulting from Operations |
27,795,678 | 26,643,018 | 85,887,310 | 110,285,930 | ||||||||||||
| DIVIDENDS AND DISTRIBUTIONS: |
||||||||||||||||
| Dividends from net investment income |
(1,225,279 | ) | (898,632 | ) | (9,262,013 | ) | (15,175,707 | ) | ||||||||
| Distributions from net realized gains |
— | — | — | — | ||||||||||||
| Total Dividends and Distributions |
(1,225,279 | ) | (898,632 | ) | (9,262,013 | ) | (15,175,707 | ) | ||||||||
| FUND SHARE TRANSACTIONS |
||||||||||||||||
| Net proceeds from shares sold(b) |
68,697,775 | 31,355,971 | 52,611,206 | 105,728,038 | ||||||||||||
| Net asset value of shares issued in reinvestment of dividends and distributions |
1,225,273 | 898,632 | 9,262,013 | 15,175,707 | ||||||||||||
| Cost of shares redeemed |
(38,449,494 | ) | (34,172,073 | ) | (141,800,738 | ) | (236,435,297 | ) | ||||||||
| Increase (Decrease) in Net Assets from Fund Share Transactions |
31,473,554 | (1,917,470 | ) | (79,927,519 | ) | (115,531,552 | ) | |||||||||
| Net Increase (Decrease) in Net Assets |
58,043,953 | 23,826,916 | (3,302,222 | ) | (20,421,329 | ) | ||||||||||
| NET ASSETS |
||||||||||||||||
| Beginning of Year |
133,821,013 | 109,994,097 | 640,111,841 | 660,533,170 | ||||||||||||
| End of Year(a) |
$ | 191,864,966 | $ | 133,821,013 | $ | 636,809,619 | $ | 640,111,841 | ||||||||
| (a) Includes Undistributed Net Investment Income of: |
$ | 1,866,747 | $ | 1,235,341 | $ | 5,764,961 | $ | 9,247,336 | ||||||||
| (b) Includes Value of Shares Issued in Merger |
$ | — | $ | — | $ | — | $ | — | ||||||||
| SHARES ISSUED AND REDEEMED |
||||||||||||||||
| Shares sold |
6,638,607 | 3,646,802 | 3,609,679 | 8,213,537 | ||||||||||||
| Shares issued in reinvestment of dividends and Distributions |
122,283 | 121,765 | 650,422 | 1,294,857 | ||||||||||||
| Shares issued in merger |
— | — | — | — | ||||||||||||
| Shares redeemed |
(3,723,950 | ) | (4,200,036 | ) | (9,720,869 | ) | (18,447,824 | ) | ||||||||
| Net Increase (Decrease) in Shares Outstanding |
3,036,940 | (431,469 | ) | (5,460,768 | ) | (8,939,430 | ) | |||||||||
284
| PORTFOLIO |
|||||||||||||||||||||||
| AST ALLIANCE/BERNSTEIN GROWTH + VALUE |
AST SANFORD BERNSTEIN CORE VALUE |
AST COHEN & STEERS REALTY |
|||||||||||||||||||||
| YEAR ENDED DECEMBER 31, 2004 |
YEAR ENDED DECEMBER 31, 2003 |
YEAR ENDED DECEMBER 31, 2004 |
YEAR ENDED DECEMBER 31, 2003 |
YEAR ENDED DECEMBER 31, 2004 |
YEAR ENDED DECEMBER 31, 2003 |
||||||||||||||||||
| OPERATIONS: |
|||||||||||||||||||||||
| Net investment income (loss) |
$ | 456,086 | $ | 229,423 | $ | 3,382,698 | $ | 2,999,662 | $ | 11,243,770 | $ | 11,594,978 | |||||||||||
| Net realized gain (loss) on investments and foreign currencies |
1,877,289 | (859,322 | ) | 7,698,383 | 5,741,748 | 25,273,895 | 4,076,614 | ||||||||||||||||
| Net change in unrealized appreciation (depreciation) on investments and foreign currencies |
4,406,550 | 11,294,315 | 19,408,283 | 41,119,213 | 68,830,737 | 53,524,346 | |||||||||||||||||
| Net Increase (Decrease) in Net Assets Resulting from Operations |
6,739,925 | 10,664,416 | 30,489,364 | 49,860,623 | 105,348,402 | 69,195,938 | |||||||||||||||||
| DIVIDENDS AND DISTRIBUTIONS: |
|||||||||||||||||||||||
| Dividends from net investment income |
(229,760) | (201,627 | ) | (3,001,313 | ) | (1,344,832 | ) | (7,684,744 | ) | (6,935,947 | ) | ||||||||||||
| Distributions from net realized gains |
— | — | (5,245,992 | ) | — | (4,721,132 | ) | (4,037,564 | ) | ||||||||||||||
| Total Dividends and Distributions |
(229,760) | (201,627 | ) | (8,247,305 | ) | (1,344,832 | ) | (12,405,876 | ) | (10,973,511 | ) | ||||||||||||
| FUND SHARE TRANSACTIONS |
|||||||||||||||||||||||
| Net proceeds from shares sold(b) |
20,326,548 | 49,406,446 | 114,497,710 | 171,733,899 | 121,458,367 | 125,402,990 | |||||||||||||||||
| Net asset value of shares issued in reinvestment of dividends and distributions |
229,760 | 201,627 | 8,247,305 | 1,344,832 | 12,405,876 | 10,973,511 | |||||||||||||||||
| Cost of shares redeemed |
(12,981,600) | (28,298,575 | ) | (50,050,864 | ) | (228,223,123 | ) | (92,828,844 | ) | (82,617,074 | ) | ||||||||||||
| Increase (Decrease) in Net Assets from Fund Share Transactions |
7,574,708 | 21,309,498 | 72,694,151 | (55,144,392 | ) | 41,035,399 | 53,759,427 | ||||||||||||||||
| Net Increase (Decrease) in Net Assets |
14,084,873 | 31,772,287 | 94,936,210 | (6,628,601 | ) | 133,977,925 | 111,981,854 | ||||||||||||||||
| NET ASSETS |
|||||||||||||||||||||||
| Beginning of Year |
63,836,916 | 32,064,629 | 192,547,342 | 199,175,943 | 289,501,975 | 177,520,121 | |||||||||||||||||
| End of Year(a) |
$ | 77,921,789 | $ | 63,836,916 | $ | 287,483,552 | $ | 192,547,342 | $ | 423,479,900 | $ | 289,501,975 | |||||||||||
| (a) Includes Undistributed Net Investment Income of: |
$ | 455,649 | $ | 229,323 | $ | 3,380,904 | $ | 2,999,519 | $ | 5,935,924 | $ | 12,322,596 | |||||||||||
| (b) Includes Value of Shares Issued in Merger |
$ | — | $ | — | $ | — | $ | — | $ | — | $ | — | |||||||||||
| SHARES ISSUED AND REDEEMED |
|||||||||||||||||||||||
| Shares sold |
2,180,350 | 6,108,916 | 10,046,608 | 18,419,257 | 8,515,874 | 11,467,639 | |||||||||||||||||
| Shares issued in reinvestment of dividends and distributions |
25,416 | 29,221 | 757,329 | 162,814 | 902,902 | 1,194,070 | |||||||||||||||||
| Shares issued in merger |
|||||||||||||||||||||||
| Shares redeemed |
(1,412,752) | (3,530,277 | ) | (4,578,037 | ) | (24,050,334 | ) | (7,171,624 | ) | (7,906,893 | ) | ||||||||||||
| Net Increase (Decrease) in Shares Outstanding |
793,014 | 2,607,860 | 6,225,900 | (5,468,263 | ) | 2,247,152 | 4,754,816 | ||||||||||||||||
See Notes to Financial Statements.
285
AMERICAN SKANDIA TRUST
STATEMENTS OF CHANGES IN NET ASSETS
FOR THE YEAR ENDED DECEMBER 31, 2004
| PORTFOLIO |
||||||||||||||||
| AST SANFORD BERNSTEIN MANAGED INDEX 500 |
AST AMERICAN CENTURY INCOME & GROWTH |
|||||||||||||||
| YEAR ENDED DECEMBER 31, 2004 |
YEAR ENDED DECEMBER 31, 2003 |
YEAR ENDED DECEMBER 31, 2004 |
YEAR ENDED DECEMBER 31, 2003 |
|||||||||||||
| OPERATIONS: |
||||||||||||||||
| Net investment income (loss) |
$ | 6,946,279 | $ | 4,712,777 | $ | 7,272,542 | $ | 3,739,754 | ||||||||
| Net realized gain (loss) on investments and foreign currencies |
6,382,969 | (22,904,344 | ) | 42,648,733 | (14,708,272 | ) | ||||||||||
| Net change in unrealized appreciation (depreciation) on investments and foreign currencies |
34,494,253 | 129,067,539 | 275,968 | 74,483,016 | ||||||||||||
| Net Increase (Decrease) in Net Assets Resulting from Operations |
47,823,501 | 110,875,972 | 50,197,243 | 63,514,498 | ||||||||||||
| DIVIDENDS AND DISTRIBUTIONS: |
||||||||||||||||
| Dividends from net investment income |
(4,631,826 | ) | (5,460,558 | ) | (3,630,621 | ) | (3,198,975 | ) | ||||||||
| Distributions from net realized gains |
— | — | — | — | ||||||||||||
| Total Dividends and Distributions |
(4,631,826 | ) | (5,460,558 | ) | (3,630,621 | ) | (3,198,975 | ) | ||||||||
| FUND SHARE TRANSACTIONS |
||||||||||||||||
| Net proceeds from shares sold(b) |
167,380,415 | 356,927,914 | 175,729,951 | 89,193,923 | ||||||||||||
| Net asset value of shares issued in reinvestment of dividends and distributions |
4,631,826 | 5,460,558 | 3,630,621 | 3,198,975 | ||||||||||||
| Cost of shares redeemed |
(195,030,248 | ) | (367,481,124 | ) | (77,825,976 | ) | (106,020,156 | ) | ||||||||
| Increase (Decrease) in Net Assets from Fund Share Transactions |
(23,018,007 | ) | (5,092,652 | ) | 101,534,596 | (13,627,258 | ) | |||||||||
| Net Increase (Decrease) in Net Assets |
20,173,668 | 100,322,762 | 148,101,218 | 46,688,265 | ||||||||||||
| NET ASSETS |
||||||||||||||||
| Beginning of Year |
541,492,090 | 441,169,328 | 305,810,350 | 259,122,085 | ||||||||||||
| End of Year(a) |
$ | 561,665,758 | $ | 541,492,090 | $ | 453,911,568 | $ | 305,810,350 | ||||||||
| (a) Includes undistributed net investment income of: |
$ | 6,949,361 | $ | 4,634,908 | $ | 7,177,404 | $ | 3,639,612 | ||||||||
| (b) Includes Value of shares issued in merger |
$ | — | $ | — | $ | 108,397,180 | $ | — | ||||||||
| SHARES ISSUED AND REDEEMED |
||||||||||||||||
| Shares sold |
14,970,341 | 37,789,818 | 5,525,672 | 8,664,497 | ||||||||||||
| Shares issued in reinvestment of dividends and distributions |
424,551 | 661,084 | 306,640 | 361,876 | ||||||||||||
| Shares issued in merger |
— | — | 9,098,089 | — | ||||||||||||
| Shares redeemed |
(17,787,384 | ) | (39,584,221 | ) | (6,392,267 | ) | (10,968,072 | ) | ||||||||
| Net Increase (Decrease) in Shares Outstanding |
(2,392,492 | ) | (1,133,319 | ) | 8,538,134 | (1,941,699 | ) | |||||||||
286
| PORTFOLIO |
||||||||||||||||||||||||
| AST ALLIANCE GROWTH AND INCOME |
AST DEAM GLOBAL ALLOCATION |
AST AMERICAN CENTURY STRATEGIC BALANCED |
||||||||||||||||||||||
| YEAR ENDED DECEMBER 31, 2004 |
YEAR ENDED DECEMBER 31, 2003 |
YEAR ENDED DECEMBER 31, 2004 |
YEAR ENDED DECEMBER 31, 2003 |
YEAR ENDED DECEMBER 31, 2004 |
YEAR ENDED DECEMBER 31, 2003 |
|||||||||||||||||||
| OPERATIONS: |
||||||||||||||||||||||||
| Net investment income (loss) |
$ | 26,811,111 | $ | 13,703,539 | $ | 5,176,828 | $ | 2,865,266 | $ | 3,607,349 | $ | 3,138,699 | ||||||||||||
| Net realized gain (loss) on investments and foreign currencies |
61,723,758 | 6,271,686 | 15,804,533 | (7,921,590 | ) | 18,361,688 | 1,714,993 | |||||||||||||||||
| Net change in unrealized appreciation (depreciation) on investments and foreign currencies |
125,226,936 | 360,635,846 | 3,909,800 | 51,799,545 | (2,305,581 | ) | 29,832,013 | |||||||||||||||||
| Net Increase (Decrease) in Net Assets Resulting from Operations |
213,761,805 | 380,611,071 | 24,891,161 | 46,743,221 | 19,663,456 | 34,685,705 | ||||||||||||||||||
| DIVIDENDS AND DISTRIBUTIONS: |
||||||||||||||||||||||||
| Dividends from net investment income |
(13,715,428) | (15,225,927 | ) | (2,868,023 | ) | (3,336,217 | ) | (3,257,861 | ) | (4,190,899 | ) | |||||||||||||
| Distributions from net realized gains |
— | — | — | — | — | — | ||||||||||||||||||
| Total Dividends and Distributions |
(13,715,428) | (15,225,927 | ) | (2,868,023 | ) | (3,336,217 | ) | (3,257,861 | ) | (4,190,899 | ) | |||||||||||||
| FUND SHARE TRANSACTIONS |
||||||||||||||||||||||||
| Net proceeds from shares sold(b) |
337,350,352 | 593,298,760 | 4,188,371 | 8,946,825 | 29,157,046 | 76,199,419 | ||||||||||||||||||
| Net asset value of shares issued in reinvestment of dividends and distributions |
13,715,428 | 15,225,927 | 2,868,023 | 3,336,217 | 3,257,861 | 4,190,899 | ||||||||||||||||||
| Cost of shares redeemed |
(235,435,244 | ) | (307,078,572 | ) | (62,160,128 | ) | (75,244,539 | ) | (50,944,326 | ) | (54,434,994 | ) | ||||||||||||
| Increase (Decrease) in Net Assets from Fund Share Transactions |
115,630,536 | 301,446,115 | (55,103,734 | ) | (62,961,497 | ) | (18,529,419 | ) | 25,955,324 | |||||||||||||||
| Net Increase (Decrease) in Net Assets |
315,676,913 | 666,831,259 | (33,080,596 | ) | (19,554,493 | ) | (2,123,824 | ) | 56,450,130 | |||||||||||||||
| NET ASSETS |
||||||||||||||||||||||||
| Beginning of Year |
1,836,529,224 | 1,169,697,965 | 264,807,754 | 284,362,247 | 235,818,295 | 179,368,165 | ||||||||||||||||||
| End of Year(a) |
$ | 2,152,206,137 | $ | 1,836,529,224 | $ | 231,727,158 | $ | 264,807,754 | $ | 233,694,471 | $ | 235,818,295 | ||||||||||||
| (a) Includes undistributed net investment income of: |
$ | 26,786,245 | $ | 13,690,562 | $ | 7,418,160 | $ | 2,859,857 | $ | 3,655,598 | $ | 3,254,418 | ||||||||||||
| (b) Includes Value of shares issued in merger |
$ | — | $ | — | $ | — | $ | — | $ | — | $ | — | ||||||||||||
| SHARES ISSUED AND REDEEMED |
||||||||||||||||||||||||
| Shares sold |
18,587,095 | 38,000,229 | 364,495 | 920,270 | 2,222,427 | 6,454,629 | ||||||||||||||||||
| Shares issued in reinvestment of dividends and distributions |
771,830 | 1,185,818 | 256,303 | 369,458 | 251,962 | 392,407 | ||||||||||||||||||
| Shares issued in merger |
— | — | — | — | — | — | ||||||||||||||||||
| Shares redeemed |
(12,801,079 | ) | (21,657,584 | ) | (5,479,553 | ) | (7,687,978 | ) | (3,905,055 | ) | (4,698,189 | ) | ||||||||||||
| Net Increase (Decrease) in Shares Outstanding |
6,557,846 | 17,528,463 | (4,858,755 | ) | (6,398,250 | ) | (1,430,666 | ) | 2,148,847 | |||||||||||||||
See Notes to Financial Statements.
287
AMERICAN SKANDIA TRUST
STATEMENTS OF CHANGES IN NET ASSETS
FOR THE YEAR ENDED DECEMBER 31, 2004
| PORTFOLIO |
||||||||||||||||
| AST T. ROWE PRICE ASSET ALLOCATION |
AST T. ROWE PRICE GLOBAL BOND |
|||||||||||||||
| YEAR ENDED DECEMBER 31, 2004 |
YEAR ENDED DECEMBER 31, 2003 |
YEAR ENDED DECEMBER 31, 2004 |
YEAR ENDED DECEMBER 31, 2003 |
|||||||||||||
| OPERATIONS: |
||||||||||||||||
| Net investment income (loss) |
$ | 7,453,955 | $ | 5,424,142 | $ | 6,340,186 | $ | 5,620,309 | ||||||||
| Net realized gain (loss) on investments and foreign currencies |
20,477,097 | (2,775,356 | ) | 3,172,558 | 13,484,118 | |||||||||||
| Net change in unrealized appreciation (depreciation) on investments and foreign currencies |
14,208,471 | 61,791,721 | 11,273,550 | 6,225,980 | ||||||||||||
| Net Increase (Decrease) in Net Assets Resulting from Operations |
42,139,523 | 64,440,507 | 20,786,294 | 25,330,407 | ||||||||||||
| DIVIDENDS AND DISTRIBUTIONS: |
||||||||||||||||
| Dividends from net investment income |
(5,760,759 | ) | (7,112,841 | ) | (14,361,174 | ) | (7,341,835 | ) | ||||||||
| Distributions from net realized gains |
— | — | (4,039,501 | ) | (393,861 | ) | ||||||||||
| Total Dividends and Distributions |
(5,760,759 | ) | (7,112,841 | ) | (18,400,675 | ) | (7,735,696 | ) | ||||||||
| FUND SHARE TRANSACTIONS |
||||||||||||||||
| Net proceeds from shares sold(b) |
65,060,701 | 64,071,924 | 154,138,660 | 149,353,234 | ||||||||||||
| Net asset value of shares issued in reinvestment of dividends and distributions |
5,760,759 | 7,112,841 | 18,400,675 | 7,735,696 | ||||||||||||
| Cost of shares redeemed |
(36,609,042 | ) | (37,479,431 | ) | (42,537,993 | ) | (154,647,282 | ) | ||||||||
| Increase (Decrease) in Net Assets from Fund Share Transactions |
34,212,418 | 33,705,334 | 130,001,342 | 2,441,648 | ||||||||||||
| Net Increase (Decrease) in Net Assets |
70,591,182 | 91,033,000 | 132,386,961 | 20,036,359 | ||||||||||||
| NET ASSETS |
||||||||||||||||
| Beginning of Year |
360,152,109 | 269,119,109 | 229,630,011 | 209,593,652 | ||||||||||||
| End of Year(a) |
$ | 430,743,291 | $ | 360,152,109 | $ | 362,016,972 | $ | 229,630,011 | ||||||||
| (a) Includes undistributed net investment income of: |
$ | 7,758,351 | $ | 5,501,091 | $ | 9,098,990 | $ | 14,585,175 | ||||||||
| (b) Includes Value of shares issued in merger |
$ | — | $ | — | $ | — | — | |||||||||
| SHARES ISSUED AND REDEEMED |
||||||||||||||||
| Shares sold |
4,155,151 | 4,550,475 | 12,950,265 | 13,142,102 | ||||||||||||
| Shares issued in reinvestment of dividends and distributions |
374,562 | 589,300 | 1,625,501 | 703,886 | ||||||||||||
| Shares issued in merger |
— | — | — | — | ||||||||||||
| Shares redeemed |
(2,351,005 | ) | (2,819,253 | ) | (3,775,219 | ) | (13,760,980 | ) | ||||||||
| Net Increase (Decrease) in Shares Outstanding |
2,178,708 | 2,320,522 | 10,800,547 | 85,008 | ||||||||||||
288
| PORTFOLIO |
||||||||||||||||||||||||
| AST GOLDMAN SACHS HIGH YIELD |
AST LORD ABBETT BOND-DEBENTURE |
AST PIMCO TOTAL RETURN BOND |
||||||||||||||||||||||
| YEAR ENDED DECEMBER 31, 2004 |
YEAR ENDED DECEMBER 31, 2003 |
YEAR ENDED DECEMBER 31, 2004 |
YEAR ENDED DECEMBER 31, 2003 |
YEAR ENDED DECEMBER 31, 2004 |
YEAR ENDED DECEMBER 31, 2003 |
|||||||||||||||||||
| OPERATIONS: |
||||||||||||||||||||||||
| Net investment income (loss) |
$ | 52,149,519 | $ | 58,033,720 | $ | 20,318,991 | $ | 12,592,832 | $ | 45,965,739 | $ | 64,377,650 | ||||||||||||
| Net realized gain (loss) on investments and foreign currencies |
3,156,457 | (19,650,074 | ) | 5,617,774 | 5,070,483 | 82,480,859 | 43,742,046 | |||||||||||||||||
| Net change in unrealized appreciation (depreciation) on investments and foreign currencies |
21,279,553 | 108,667,975 | 4,618,109 | 16,561,547 | (21,905,331 | ) | 5,637,237 | |||||||||||||||||
| Net Increase (Decrease) in Net Assets Resulting from Operations |
76,585,529 | 147,051,621 | 30,554,874 | 34,224,862 | 106,541,267 | 113,756,933 | ||||||||||||||||||
| DIVIDENDS AND DISTRIBUTIONS: |
||||||||||||||||||||||||
| Dividends from net investment income |
(58,039,833 | ) | (48,256,122 | ) | (12,614,602 | ) | (6,806,378 | ) | (85,249,707 | ) | (81,937,642 | ) | ||||||||||||
| Distributions from net realized gains |
— | — | (1,277,546 | ) | — | (15,173,281 | ) | (84,016,359 | ) | |||||||||||||||
| Total Dividends and Distributions |
(58,039,833 | ) | (48,256,122 | ) | (13,892,148 | ) | (6,806,378 | ) | (100,422,988 | ) | (165,954,001 | ) | ||||||||||||
| FUND SHARE TRANSACTIONS |
||||||||||||||||||||||||
| Net proceeds from shares sold(b) |
444,975,172 | 877,747,441 | 217,843,768 | 290,840,802 | 451,098,235 | 614,483,072 | ||||||||||||||||||
| Net asset value of shares issued in reinvestment of dividends and distributions |
58,039,833 | 48,256,122 | 13,892,148 | 6,806,378 | 100,422,988 | 165,954,001 | ||||||||||||||||||
| Cost of shares redeemed |
(585,482,945) | (732,728,601 | ) | (163,298,095 | ) | (143,591,943 | ) | (347,328,191 | ) | (875,375,595 | ) | |||||||||||||
| Increase (Decrease) in Net Assets from Fund Share Transactions |
(82,467,940 | ) | 193,274,962 | 68,437,821 | 154,055,237 | 204,193,032 | (94,938,522 | ) | ||||||||||||||||
| Net Increase (Decrease) in Net Assets |
(63,922,244 | ) | 292,070,461 | 85,100,547 | 181,473,721 | 210,311,311 | (147,135,590 | ) | ||||||||||||||||
| NET ASSETS |
||||||||||||||||||||||||
| Beginning of Year |
868,511,359 | 576,440,898 | 346,412,279 | 164,938,558 | 2,107,912,138 | 2,255,047,728 | ||||||||||||||||||
| End of Year(a) |
$ | 804,589,115 | $ | 868,511,359 | $ | 431,512,826 | $ | 346,412,279 | $ | 2,318,223,449 | $ | 2,107,912,138 | ||||||||||||
| (a) Includes undistributed net investment income of: |
$ | 48,592,328 | $ | 58,029,504 | $ | 20,445,329 | $ | 12,612,780 | $ | 63,743,320 | $ | 85,294,834 | ||||||||||||
| (b) Includes Value of shares issued in merger |
$ | — | $ | — | $ | — | $ | — | $ | 112,868,287 | $ | — | ||||||||||||
| SHARES ISSUED AND REDEEMED |
||||||||||||||||||||||||
| Shares sold |
52,363,464 | 109,361,578 | 19,174,087 | 26,854,491 | 28,503,530 | 51,497,661 | ||||||||||||||||||
| Shares issued in reinvestment of dividends and distributions |
7,112,725 | 6,556,538 | 1,250,420 | 698,090 | 8,532,118 | 14,355,889 | ||||||||||||||||||
| Shares issued in merger |
— | — | — | — | 9,825,426 | — | ||||||||||||||||||
| Shares redeemed |
(68,634,777 | ) | (89,910,309 | ) | (14,256,032 | ) | (13,634,182 | ) | (29,613,934 | ) | (74,286,875 | ) | ||||||||||||
| Net Increase (Decrease) in Shares Outstanding |
(9,158,588) | 26,007,807 | 6,168,475 | 13,918,399 | 17,247,140 | (8,433,325 | ) | |||||||||||||||||
See Notes to Financial Statements.
289
AMERICAN SKANDIA TRUST
STATEMENTS OF CHANGES IN NET ASSETS
FOR THE YEAR ENDED DECEMBER 31, 2004
| PORTFOLIO |
||||||||||||||||
| AST PIMCO LIMITED MATURITY BOND |
AST MONEY MARKET |
|||||||||||||||
| YEAR ENDED DECEMBER 31, 2004 |
YEAR ENDED DECEMBER 31, 2003 |
YEAR ENDED DECEMBER 31, 2004 |
YEAR ENDED DECEMBER 31, 2003 |
|||||||||||||
| OPERATIONS: |
||||||||||||||||
| Net investment income (loss) |
$ | 14,997,609 | $ | 22,396,135 | $ | 16,194,378 | $ | 15,784,301 | ||||||||
| Net realized gain (loss) on investments and foreign currencies |
8,854,139 | 20,971,015 | (39,829 | ) | 514 | |||||||||||
| Net change in unrealized appreciation (depreciation) on investments and foreign currencies |
(6,333,380 | ) | (7,068,932 | ) | — | — | ||||||||||
| Net Increase (Decrease) in Net Assets Resulting from Operations |
17,518,368 | 36,298,218 | 16,154,549 | 15,784,815 | ||||||||||||
| DIVIDENDS AND DISTRIBUTIONS: |
||||||||||||||||
| Dividends from net investment income |
(29,754,321 | ) | (23,900,815 | ) | (16,221,849 | ) | (15,784,301 | ) | ||||||||
| Distributions from net realized gains |
(11,277,977 | ) | (14,225,392 | ) | — | (1,531 | ) | |||||||||
| Total Dividends and Distributions |
(41,032,298 | ) | (38,126,207 | ) | (16,221,849 | ) | (15,785,832 | ) | ||||||||
| FUND SHARE TRANSACTIONS |
||||||||||||||||
| Net proceeds from shares sold(b) |
588,058,113 | 524,100,846 | 6,476,121,235 | 5,378,146,107 | ||||||||||||
| Net asset value of shares issued in reinvestment of dividends and distributions |
41,032,298 | 38,126,207 | 16,221,849 | 15,785,832 | ||||||||||||
| Cost of shares redeemed |
(378,680,783 | ) | (613,317,888 | ) | (6,895,204,565 | ) | (6,376,530,695 | ) | ||||||||
| Increase (Decrease) in Net Assets from Fund Share Transactions |
250,409,628 | (51,090,835 | ) | (402,861,481 | ) | (982,598,756 | ) | |||||||||
| Net Increase (Decrease) in Net Assets |
226,895,698 | (52,918,824 | ) | (402,928,781 | ) | (982,599,773 | ) | |||||||||
| NET ASSETS |
||||||||||||||||
| Beginning of Year |
1,005,924,379 | 1,058,843,203 | 1,762,116,600 | 2,744,716,373 | ||||||||||||
| End of Year(a) |
$ | 1,232,820,077 | $ | 1,005,924,379 | $ | 1,359,187,819 | $ | 1,762,116,600 | ||||||||
| (a) Includes undistributed net investment income of: |
$ | 17,102,941 | $ | 29,739,752 | $ | — | $ | — | ||||||||
| (b) Includes Value of shares issued in Merger |
$ | — | $ | — | $ | — | $ | — | ||||||||
| SHARES ISSUED AND REDEEMED |
||||||||||||||||
| Shares sold |
52,844,163 | 46,460,972 | 6,476,121,230 | 5,378,147,673 | ||||||||||||
| Shares issued in reinvestment of dividends and Distributions |
3,726,815 | 3,431,701 | 16,221,851 | 15,784,266 | ||||||||||||
| Shares issued in merger |
— | — | — | — | ||||||||||||
| Shares redeemed |
(34,149,061 | ) | (54,611,298 | ) | (6,895,204,565 | ) | (6,376,530,695 | ) | ||||||||
| Net Increase (Decrease) in Shares Outstanding |
22,421,917 | (4,718,625 | ) | (402,861,484 | ) | (982,598,756 | ) | |||||||||
290
AMERICAN SKANDIA TRUST
NOTES TO FINANCIAL STATEMENTS
DECEMBER 31, 2004
1. ORGANIZATION
American Skandia Trust (the “Trust”) a Massachusetts business trust, organized on October 31, 1998, is an open-end management investment company, registered under the Investment Company Act of 1940, as amended. The Trust is composed of thirty-seven Portfolios (“Portfolio” or “Portfolios”), each with a separate series of capital stock.
Purchases of shares of the Portfolios may be made only by separate accounts of participating insurance companies for the purpose of investing assets attributable to variable annuity contracts and variable life insurance policies (“Contractholders”), or by qualified plans. The separate accounts of the participating insurance companies place orders to purchase and redeem shares of the Trust based on, among other things, the amount of premium payments to be invested and the amount of surrender and transfer requests to be effected on that day under the variable annuity contracts and variable life insurance policies.
The Portfolios of the Trust have the following investments objectives:
AST JPMorgan International Equity Portfolio (“JPMorgan International Equity”), formerly known as AST Strong International Equity Fund: Capital growth by investing primarily in equity securities of foreign companies.
AST William Blair International Growth Portfolio (“William Blair International Growth”): Long-term capital growth by investing primarily in equity securities of foreign companies.
AST LSV International Value Portfolio (“LSV International Value”), formerly known as AST DeAM International Equity Portfolio: Capital growth by investing primarily in equity securities of foreign companies represented in the MSCI EAFE Index.
AST MFS Global Equity Portfolio (“MFS Global Equity”): Capital growth by investing primarily in common stocks and related securities of U.S. and foreign issuers.
AST State Street Research Small-Cap Growth Portfolio (“State Street Research Small-Cap Growth”), formerly known as AST PBHG Small-Cap Growth Portfolio: Capital growth by investing in common stocks of small capitalization companies.
AST DeAM Small-Cap Growth Portfolio (“DeAM Small-Cap Growth”): Maximize capital growth by investing primarily in equity securities of small capitalization companies included in the Russell 2000 Growth Index.
AST Federated Aggressive Growth Portfolio (“Federated Aggressive Growth”): Capital growth by investing primarily in stocks of small companies that are traded on national securities exchanges, Nasdaq stock exchange and the over-the-counter-market.
AST Goldman Sachs Small-Cap Value Portfolio (“Goldman Sachs Small-Cap Value”): Long-term capital growth by investing primarily in equity securities of small capitalization companies that are believed to be undervalued.
AST Small-Cap Value Portfolio (“Small-Cap Value”), formerly known as Gabelli Small-Cap Value Portfolio: Long-term capital growth by investing primarily in stocks and equity-related securities of small capitalization companies that appear to be undervalued.
291
AMERICAN SKANDIA TRUST
NOTES TO FINANCIAL STATEMENTS (CONTINUED)
DECEMBER 31, 2004
AST DeAM Small-Cap Value Portfolio (“DeAM Small-Cap Value”): Maximum capital growth by investing primarily in equity securities of small capitalization companies included in the Russell 2000 Value Index.
AST Goldman Sachs Mid-Cap Growth Portfolio (“Goldman Sachs Mid-Cap Growth”): Long-term capital growth by investing primarily in equity securities of medium-sized companies.
AST Neuberger Berman Mid-Cap Growth Portfolio (“Neuberger Berman Mid-Cap Growth”): Capital growth by investing primarily in common stocks of medium capitalization companies.
AST Neuberger Berman Mid-Cap Value Portfolio (“Neuberger Berman Mid-Cap Value”): Capital growth by investing primarily in common stocks of medium capitalization companies.
AST Alger All-Cap Growth Portfolio (“Alger All-Cap Growth”): Long-term capital growth by investing in common and preferred stocks.
AST Gabelli All-Cap Value Portfolio (“Gabelli All-Cap Value”): Capital growth by investing in readily marketable equity securities.
AST T. Rowe Price Natural Resources Portfolio (“T. Rowe Price Natural Resources”): Long-term capital growth by investing primarily in common stocks of companies that own or develop natural resources and other basic commodities.
AST Alliance Growth Portfolio (“Alliance Growth”): Long-term capital growth by investing predominantly in the equity securities of a limited number of large, high-quality U.S. companies.
AST MFS Growth Portfolio (“MFS Growth”): Long-term capital growth and future income by investing primarily in common stocks and related securities.
AST Marsico Capital Growth Portfolio (“Marsico Capital Growth”): Capital growth by investing primarily in common stocks with the majority of the portfolio’s assets in large capitalization stocks.
AST Goldman Sachs Concentrated Growth Portfolio (“Goldman Sachs Concentrated Growth”): Capital growth by investing primarily in equity securities.
AST DeAM Large-Cap Value Portfolio (“DeAM Large-Cap Value”): Maximum capital growth by investing in equity securities of large capitalization companies included in the Russell 1000 Value Index.
AST Hotchkis & Wiley Large-Cap Value Portfolio (“Hotchkis & Wiley Large-Cap Value”), formerly known as AST INVESCO Capital Income Portfolio: Capital growth and current income by investing primarily in dividend-paying common and preferred stocks, and to a lesser extent in fixed income securities.
AST Alliance/Bernstein Growth + Value Portfolio (“Alliance/Bernstein Growth + Value”): Capital growth by investing approximately 50% of assets in growth stocks of large companies and 50% of assets in value stocks of large companies.
AST Sanford Bernstein Core Value Portfolio (“Sanford Bernstein Core Value”): Long-term capital growth by investing primarily in common stocks of large capitalization companies that appear to be undervalued.
292
AMERICAN SKANDIA TRUST
NOTES TO FINANCIAL STATEMENTS (CONTINUED)
DECEMBER 31, 2004
AST Cohen & Steers Realty Portfolio (“Cohen & Steers Realty”): Maximize total return by investing primarily in equity securities of real estate companies.
AST Sanford Bernstein Managed Index 500 Portfolio (“Sanford Bernstein Managed Index 500”): Outperform the S&P 500 Stock Index by investing primarily in common stocks included in the S&P 500.
AST American Century Income & Growth Portfolio (“American Century Income & Growth”): Capital growth and, secondarily, current income by investing primarily in stocks of large U.S. companies selected through quantitative investment techniques.
AST Alliance Growth and Income Portfolio (“Alliance Growth and Income”): Long-term capital growth and income by investing primarily in common stocks that are believed to be selling at reasonable valuations in relation to their fundamental business prospects.
AST DeAM Global Allocation Portfolio (“DeAM Global Allocation”): A high level of total return by investing primarily in a diversified portfolio of mutual funds.
AST American Century Strategic Balanced Portfolio (“American Century Strategic Balanced”): Capital growth by investing approximately 60% of its assets in equity securities and the remainder in bonds and other fixed income securities.
AST T. Rowe Price Asset Allocation Portfolio (“T. Rowe Price Asset Allocation”): A high level of total return by investing primarily in a diversified portfolio of equity and fixed income securities.
AST T. Rowe Price Global Bond Portfolio (“T. Rowe Price Global Bond”): High current income and capital growth by investing primarily in high-quality foreign and U.S. dollar-denominated bonds.
AST Goldman Sachs High Yield Portfolio (“Goldman Sachs High Yield”), formerly known as AST Federated High Yield Portfolio: High current income by investing primarily in lower quality fixed income securities rated BBB and below.
AST Lord Abbett Bond-Debenture Portfolio (“Lord Abbett Bond-Debenture”): High current income and the opportunity for capital appreciation to produce a high total return by investing primarily in high yield and investment grade debt securities, securities convertible into common stock and preferred stock.
AST PIMCO Total Return Bond Portfolio (“PIMCO Total Return Bond”): Maximize total return, consistent with preservation of capital by investing primarily in higher-quality fixed income securities of varying maturities, so that the portfolio’s expected average duration will be from three to six years.
AST PIMCO Limited Maturity Bond Portfolio (“PIMCO Limited Maturity Bond”): Maximize total return, consistent with preservation of capital by investing primarily in higher-quality fixed income securities of varying maturities, so that the portfolio’s expected average duration will be from one to three years.
AST Money Market Portfolio (“Money Market”): Maximize current income and maintain high levels of liquidity by investing in high-quality, short-term, U.S. dollar-denominated instruments.
293
AMERICAN SKANDIA TRUST
NOTES TO FINANCIAL STATEMENTS (CONTINUED)
DECEMBER 31, 2004
2. SIGNIFICANT ACCOUNTING POLICIES
The following accounting policies are in conformity with accounting principles generally accepted in the United States of America. Such policies are consistently followed by the Trust and the Portfolios in the preparation of their financial statements.
Security Valuation
Securities listed on a securities exchange are valued at the last sale price on such exchange on the day of valuation or, if there was no sale on such day, at the mean between the last reported bid and ask prices, or at the last bid price on such day in the absence of an asked price. Securities traded via Nasdaq are valued at the official closing price provided by Nasdaq. Securities that are actively traded in the over-the-counter market, including listed securities for which the primary market is believed by the co-managers, in consultation with the subadviser(s) to be over-the-counter, are valued at market value using prices provided by an independent pricing agent or principal market maker. Options on securities and indices traded on an exchange are valued at the last sale price as of the close of trading on the applicable exchange or, if there was no sale, at the mean between the most recently quoted bid and asked prices on such exchange, or at the last bid price in the absence of an asked price. Futures contracts and options thereon traded on a commodities exchange or board of trade are valued at the last sale price at the close of trading on such exchange or board of trade or, if there was no sale on the applicable commodities exchange or board of trade on such day, at the mean between the most recently quoted bid and asked prices on such exchange or board of trade or at the last bid price in the absence of an asked price. Prices may be obtained from independent pricing services which use information provided by market makers or estimates of market values obtained from yield data relating to investments or securities with similar characteristics. Securities for which market quotations are not readily available, or whose values have been effected by events occurring after the close of the security’s foreign market and before the Portfolio’s normal pricing time, are valued at fair value in accordance with the Board of Trustees’ approved fair valuation procedures. Using fair value to price securities may result in a value that is different from a security’s most recent closing price and from the price used by other mutual funds to calculate their net asset values.
Investments in mutual funds are valued at their net asset value as of the close of the New York Stock Exchange on the date of valuation. Money Market uses amortized cost to value short-term securities. The amortized cost method involves valuing a security at its cost on the date of purchase and, thereafter, assuming a constant amortization to maturity of the difference between the principle amount due at maturity and cost. Short-term securities that are held in the other Portfolios which mature in more than 60 days are valued at current market quotations and those short-term securities which mature in 60 days or less are valued at amortized cost which approximates market value.
Restricted and Illiquid Securities
Subject to guidelines adopted by the Board of Trustees of the Trust, each Portfolio may invest up to 15% of its net assets in illiquid securities (except for the AST Money Market Portfolio, which is limited to 10% of net assets, and the AST Alliance/Bernstein Growth + Value Portfolio, the AST Sanford Bernstein Core Value Portfolio and the AST Sanford Bernstein Managed Index 500 Portfolio, which is limited to 5% of its net assets). Illiquid securities are those that, because of the absence of a readily available market or due to legal or contractual restrictions on resale, cannot be
294
AMERICAN SKANDIA TRUST
NOTES TO FINANCIAL STATEMENTS (CONTINUED)
DECEMBER 31, 2004
sold within seven days in the ordinary course of business at approximately the amount at which the Portfolio has valued the investment. Therefore, a Portfolio may find it difficult to sell illiquid securities at the time considered most advantageous by its Sub-advisor and may incur expenses that would not be incurred in the sale of securities that were freely marketable. Certain securities that would otherwise be considered illiquid because of legal restrictions on resale to the general public may be traded among qualified institutional buyers under Rule 144A of the Securities Act of 1933. These Rule 144A securities, as well as commercial paper that is sold in private placements under Section 4(2) of the Securities Act, may be deemed liquid by the Portfolio’s Sub-advisor under the guidelines adopted by the Board of Trustees of the Trust. However, the liquidity of a Portfolio’s investments in Rule 144A securities could be impaired if trading does not develop or declines.
Foreign Currency Translation
Portfolio securities and other assets and liabilities denominated in foreign currencies are translated each business day into U.S. dollars based at the current rates of exchange. Purchases and sales of Portfolio securities and income and expenses are translated into U.S. dollars on the respective dates of such transactions. The Portfolios do not isolate that portion of the results of operations resulting from changes in foreign exchange rates on investments from the fluctuations arising from changes in market prices of securities held. Such fluctuations are included with net realized and unrealized gain or loss from investments.
Net realized foreign exchange gains and losses include gains and losses from sales and maturities of foreign currencies, gains and losses realized between the trade and settlement dates of foreign securities transactions, and the difference between the amount of net investment income accrued on foreign securities and the U.S. dollar amount actually received. Net unrealized foreign exchange gains and losses include gains and losses from changes in the value of assets and liabilities other than Portfolio securities, resulting from changes in exchange rates.
Forward Currency Contracts
A forward currency contract is a commitment to purchase or sell a foreign currency at a future date at a negotiated forward rate. Certain Portfolios, as defined in the prospectus, enter into forward currency contracts in order to hedge their exposure to changes in foreign currency exchange rates on their foreign portfolio holdings or on specific receivables and payables denominated in a foreign currency. The contracts are valued daily at forward exchange rates and any unrealized gain or loss is included in net unrealized appreciation or depreciation on investments. Gain or loss is realized on the settlement date of the contract equal to the difference between the settlement value of the original and negotiated forward contracts. This gain or loss, if any, is included in net realized gain or loss on foreign currency transactions. Risks may arise upon entering into these contracts from the potential inability of the counterparties to meet the terms of their contracts.
Options
The Portfolios (except for Money Market) may either purchase or write options in order to hedge against adverse market movements or fluctuations in value caused by changes in prevailing interest rates or foreign currency exchange rates with respect to securities or financial instruments which the Portfolio currently owns or intends to purchase. The
295
AMERICAN SKANDIA TRUST
NOTES TO FINANCIAL STATEMENTS (CONTINUED)
DECEMBER 31, 2004
Portfolio’s principal reason for writing options is to realize, through receipt of premiums, a greater current return than would be realized on the underlying security alone. When the Portfolio purchases an option, it pays a premium and an amount equal to that premium is recorded as an asset. When the Portfolio writes an option, it receives a premium and an amount equal to that premium is recorded as a liability. The asset or liability is adjusted daily to reflect the current market value of the option.
If an option expires unexercised, the Portfolio realizes a gain or loss to the extent of the premium received or paid. If an option is exercised, the premium received or paid is recorded as an adjustment to the proceeds from the sale or the cost basis of the purchase. The difference between the premium and the amount received or paid on effecting a closing purchase or sale transaction is also treated as a realized gain or loss. Gain or loss on purchased options is included in net realized gain or loss on investment transactions. Gain or loss on written options is presented separately as net realized gain or loss on written options transactions.
The Portfolio, as writer of an option, may have no control over whether the underlying securities or financial instruments may be sold (called) or purchased (put). As a result, the Portfolio bears the market risk of an unfavorable change in the price of the security or financial instrument underlying the written option. The Portfolio, as purchaser of an over-the-counter option, bears the risk of the potential inability of the counterparties to meet the terms of their contracts.
When a Portfolio writes an option on a swap contract, an amount equal to any premium received by the Portfolio is recorded as a liability and is subsequently adjusted to the current market value of the written option on the swap. If a call option on a swap is exercised, the Portfolio becomes obligated to pay a fixed interest rate (noted as the strike price) and receive a variable interest rate on a notional amount. If a put option on a swap is exercised, the Portfolio becomes obligated to pay a variable interest rate and receive a fixed interest rate (noted as the strike price) on a notional amount. Premiums received from writing options on swaps that expire or are exercised are treated as realized gains upon the expiration or exercise of such options on swaps. The risk associated with writing put and call options on swaps is that the Portfolio will be obligated to be party to a swap agreement if an option on a swap is exercised.
Financial Futures Contracts
A financial futures contract is an agreement to purchase (long) or sell (short) an agreed amount of securities at a set price for delivery on a future date. Upon entering into a financial futures contract, the Portfolio is required to pledge to the broker an amount of cash and/or other assets equal to a certain percentage of the contract amount. This amount is known as the “initial margin.” Subsequent payments known as “variation margin,” are made or received by the Portfolio each day, depending on the daily fluctuations in the value of the underlying security. Such variation margin is recorded for financial statement purposes on a daily basis as unrealized gain or loss. When the contract expires or is closed, the gain or loss is realized and is presented in the Statement of Operations as net realized gain or loss on financial futures contracts. The use of futures transactions as a hedge involves the risk of imperfect correlation in movements in the price of futures contracts, interest rates and underlying hedged assets.
296
AMERICAN SKANDIA TRUST
NOTES TO FINANCIAL STATEMENTS (CONTINUED)
DECEMBER 31, 2004
Short Sales
Certain portfolios of the Trust may make short sales of securities as a method of hedging potential price declines in similar securities owned. The Portfolio may sell a security it does not own in anticipation of a decline in the market value of that security (short sale). When the Portfolio makes a short sale, it will borrow the security sold short and deliver it to the broker-dealer through which it made the short sale as collateral for its obligation to deliver the security upon conclusion of the sale. The Portfolio may have to pay a fee to borrow the particular security and may be obligated to return any interest or dividends received on such borrowed securities. The fee may be referred to as the “initial margin.” Subsequent payments known as “variation margin,” are made or received by the Portfolio each day, depending on the daily fluctuations in the value of the security sold short. Such variation margin is recorded for financial statement purposes on a daily basis as unrealized gain or loss. A gain, limited to the price at which the Portfolio sold the security short, or a loss, unlimited as to dollar amount, will be recognized upon the termination of a short sale if the market price at termination is less than or greater than the proceeds originally received, respectively, and is presented in the Statements of Operations as net realized gain or loss on short sales.
Repurchase Agreements
In connection with transactions in repurchase agreements with United States financial institutions, it is each Portfolio’s policy that its custodian or designated subcustodians under triparty repurchase agreements, as the case may be, take possession of the underlying collateral securities, the value of which exceeds the principal amount of the repurchase transactions, including accrued interest. To the extent that any repurchase transaction exceeds one business day, the value of the collateral is marked-to-market on a daily basis to ensure the adequacy of the collateral. If the seller defaults and the value of the collateral declines or, if bankruptcy proceedings are commenced with respect to the seller of the security, realization of the collateral by the Portfolio may be delayed or limited.
Swap Agreements
The Portfolios may enter into swap agreements. A swap is an agreement to exchange the return generated by one instrument for the return generated by another instrument. The Portfolios may enter into interest rate, forward swap spread lock and credit default swap agreements to manage its exposure to interest rates and credit risk. Interest rate swap agreements involve the exchange by the Portfolio with another party of their respective commitments to pay or receive interest. Forward spread lock swap agreements involve commitments to pay or receive a settlement amount calculated as the difference between the swap spread and a fixed spread, multiplied by the notional amount times the duration of the swap. The swap spread is the difference between the benchmark swap rate (market rate) and the specific Treasury rate. In a credit default swap, one party makes a stream of payments to another party in exchange for the right to receive a specified return in the event of a default by a third party, typically corporate issues or sovereign issues of an emerging country, on its obligation. Dividends and interest on the securities in the swap are included in the value of the exchange. The swaps are valued daily at current market value and any unrealized gain or loss is included in the net unrealized appreciation or depreciation on investments. Gain or loss is realized on the termination date of the swap and is equal to the difference between the Portfolio’s basis in the swap and the proceeds of the closing transaction, including fees. During the period that the swap agreement is open, the Portfolio may be subject to risk from the potential inability of the counterparty to meet the terms of the agreement.
297
AMERICAN SKANDIA TRUST
NOTES TO FINANCIAL STATEMENTS (CONTINUED)
DECEMBER 31, 2004
Risks
Forward currency contracts, written options, financial futures contracts, and swap agreements involve elements of both market and credit risk in excess of the amounts reflected on the Statements of Assets and Liabilities. Lower rated or unrated (i.e., high yield) securities are more likely to react to developments affecting market risk (general market liquidity) and credit risk (an issuer’s inability to meet principal and interest payments on its obligations) than are more highly rated securities, which react primarily to movements in the general level of interest rates. The ability of issuers of debt securities held by the Fund to meet their obligations may be affected by economic developments in a specific industry or region.
Delayed Delivery Transactions
Certain Portfolios may purchase or sell securities on a when-issued or delayed delivery basis. These transactions involve a commitment by the Portfolio to purchase or sell securities for a predetermined price or yield, with payment and delivery taking place beyond the customary settlement period. When delayed delivery purchases are outstanding, the Portfolio will set aside and maintain until the settlement date in a segregated account, liquid assets in an amount sufficient to meet the purchase price. When purchasing a security on a delayed delivery basis, the Portfolio assumes the rights and risks of ownership of the security, including the risk of price and yield fluctuations, and takes such fluctuations into account when determining its net asset value. The Portfolio may dispose of or renegotiate a delayed delivery transaction after it is entered into, and may sell when-issued securities before they are delivered, which may result in a capital gain or loss. When the Portfolio has sold a security on a delayed delivery basis, the Portfolio does not participate in future gains and losses with respect to the security.
Security Loans
The Portfolios may lend their portfolio securities to broker-dealers. Security loans are limited to 33 1/3% of the total assets of the respective portfolio. The loans are secured by collateral at least equal at all times to the market value of the securities loaned. Loans are subject to termination at the option of the borrower or the Portfolios. Upon termination of the loan, the borrower will return to the lender securities identical to the loaned securities. Should the borrower of the securities fail financially, the Portfolios have the right to repurchase the securities using the collateral in the open market. The Portfolios recognize income, net of any rebate and securities lending agent fees, for lending its securities in the form of fees or interest on the investment of any cash received as collateral. The Portfolios also continue to receive interest and dividends or amounts equivalent thereto, on the securities loaned and recognize any unrealized gain or loss in the market price of the securities loaned that may occur during the term of the loan.
Securities Transactions and Net Investment Income
Securities transactions are recorded on the trade date. Realized and unrealized gains or losses from security and currency transactions are calculated on the identified cost basis. Dividend income is recorded on the ex-dividend date. Interest income, including amortization of premium and accretion of discount on debt securities, as required, is recorded on the accrual basis. Expenses are recorded on the accrual basis. The Trust’s expenses are allocated to the respective Portfolios on the basis of relative net assets except for expenses that are charged directly at the portfolio level.
298
AMERICAN SKANDIA TRUST
NOTES TO FINANCIAL STATEMENTS (CONTINUED)
DECEMBER 31, 2004
Taxes
For federal income tax purposes, each Portfolio in the Trust is treated as a separate taxpaying entity. It is each Portfolio’s policy to continue to meet the requirements of the Internal Revenue Code applicable to regulated investment companies and to distribute all of its taxable net investment income and capital gains, if any, to shareholders. Therefore, no federal income tax provision is required. Withholding taxes on foreign dividends, interest and capital gains are recorded net of reclaimable amounts, at the time the related income is earned.
Dividends and Distributions
Dividends, if any, from net investment income are declared and paid at least annually by all Portfolios other than Money Market. In the case of Money Market, dividends are declared daily and paid monthly. Distributions to shareholders are recorded on the ex-dividend date. Net realized gains from investment transactions, if any, are distributed at least annually. These dividends and distributions are determined in accordance with federal income tax regulations and may differ from accounting principles generally accepted in the United States of America. Permanent book/tax differences relating to income and gains are reclassified amongst undistributed net investment income, accumulated net realized gain or loss and paid in capital in excess of par, as appropriate.
Estimates
The preparation of financial statements requires management to make estimates and assumptions that affect the reported amounts and disclosures in the financial statements. Actual results could differ from those estimates.
3. AGREEMENTS AND OTHER TRANSACTIONS WITH AFFILIATES
The Portfolios have entered into investment management agreements with American Skandia Investment Services, Inc. and Prudential Investments LLC the co-managers (together the “Investment Manager”) which provide that the Investment Manager will furnish each Portfolio with investment advice and investment management and administrative services. The Investment Manager has engaged the following firms as Sub-advisers for their respective Portfolios:
Alliance Capital Management L.P. for Alliance Growth and Income and Alliance Growth;
Alliance Capital Management, L.P. and Sanford C. Bernstein & Co., LLC co-manager Alliance/Bernstein Growth + Value;
American Century Investment Management, Inc. for American Century Income & Growth and American Century Strategic Balanced;
Cohen & Steers Capital Management, Inc. for Cohen & Steers Realty;
Deutsche Asset Management, Inc. for DeAM Global Allocation, DeAM Small-Cap Growth, DeAM Large-Cap Value and DeAM Small-Cap Value;
299
AMERICAN SKANDIA TRUST
NOTES TO FINANCIAL STATEMENTS (CONTINUED)
DECEMBER 31, 2004
Federated Investment Counseling for Federated Aggressive Growth;
Fred Alger Management, Inc. for Alger All-Cap Growth;
GAMCO Investors, Inc. for Gabelli All-Cap Value;
Goldman Sachs Asset Management for Goldman Sachs Concentrated Growth, Goldman Sachs Small-Cap Value Goldman Sachs Mid-Cap Growth and Goldman Sachs High Yield (replaced Federated Investment Counseling on May 1, 2004);
Hotchkis and Wiley Capital Management, LLC for Hotchkis & Wiley Large-Cap Value (replaced INVESCO Funds Group, Inc. on May 1, 2004);
Integrity Asset Management for a portion of Small-Cap Value (formerly Gabelli Small-Cap Value);
J.P. Morgan Investment Management, Inc. for JPMorgan International Equity (replaced Strong Capital Management, Inc. on February 23, 2004) and a portion of Small-Cap Value (formerly Gabelli Small-Cap Value);
Lee Munder Investments, Ltd. for a portion of Small-Cap Value (formerly Gabelli Small-Cap Value);
Lord Abbett & Co. for Lord Abbett Bond-Debenture;
LSV Asset Management for LSV International Value (replaced Deutsche Asset Management, Inc. on November 19, 2004);
Marsico Capital Management, LLC for Marsico Capital Growth;
Massachusetts Financial Services Company for MFS Global Equity and MFS Growth;
Neuberger Berman Management, Inc. for Neuberger Berman Mid-Cap Value and Neuberger Berman Mid-Cap Growth;
Pacific Investment Management Company LLC for PIMCO Total Return Bond and PIMCO Limited Maturity Bond;
Sanford C. Bernstein & Co., LLC for Sanford Bernstein Managed Index 500 and Sanford Bernstein Core Value;
State Street Research Group for State Street Research Small Cap Growth (replaced Pilgram Baxter & Associates, Ltd. on May 1, 2004);
T. Rowe Price Associates, Inc. for T. Rowe Price Asset Allocation and T. Rowe Price Natural Resources;
T. Rowe Price International, Inc. for T. Rowe Price Global Bond;
Wells Fargo Capital Management, Inc. for Money Market; and
William Blair & Company, LLC for William Blair International Growth.
Advisory Fees and Expense Limitations
The Investment Manager receives a fee, computed daily and paid monthly, based on an annual rate of the value of each Portfolio’s average daily net assets. The Investment Manager pays each Sub-adviser a fee as compensation for advisory
300
AMERICAN SKANDIA TRUST
NOTES TO FINANCIAL STATEMENTS (CONTINUED)
DECEMBER 31, 2004
services provided to the Portfolios. All amounts paid or payable to the Portfolios by the Investment Manager, under the agreement, are reflected in the Statements of Operations.
| ADVISORY FEES |
EFFECTIVE ADVISORY FEES NET OF WAIVER |
EXPENSE LIMITATIONS |
|||||||
| JPMorgan International Equity |
1.00 | % | 0.8851 | % | 1.75 | % | |||
| William Blair International Growth |
1.00 | % | 0.8960 | % | 1.75 | % | |||
| LSV International Value |
1.00 | % | 0.8500 | % | 1.50 | % | |||
| MFS Global Equity |
1.00 | % | 1.0000 | % | 1.75 | % | |||
| State Street Research Small-Cap Growth |
0.90 | % | 0.9000 | % | 1.30 | % | |||
| DeAM Small-Cap Growth |
0.95 | % | 0.8001 | % | 1.35 | % | |||
| Federated Aggressive Growth |
0.95 | % | 0.9500 | % | 1.35 | % | |||
| Goldman Sachs Small-Cap Value |
0.95 | % | 0.9500 | % | 1.35 | % | |||
| Small-Cap Value |
0.90 | % | 0.9000 | % | 1.30 | % | |||
| DeAM Small-Cap Value |
0.95 | % | 0.8000 | % | 1.15 | % | |||
| Goldman Sachs Mid-Cap Growth |
1.00 | % | 0.8810 | % | 1.35 | % | |||
| Neuberger Berman Mid-Cap Growth |
0.90 | % | 0.8883 | % | 1.25 | % | |||
| Neuberger Berman Mid-Cap Value |
0.90 | % | 0.8845 | % | 1.25 | % | |||
| Alger All-Cap Growth |
0.95 | % | 0.9500 | % | 1.45 | % | |||
| Gabelli All-Cap Value |
0.95 | % | 0.9500 | % | 1.45 | % | |||
| T. Rowe Price Natural Resources |
0.90 | % | 0.9000 | % | 1.35 | % | |||
| Alliance Growth |
0.90 | % | 0.8700 | % | 1.45 | % | |||
| MFS Growth |
0.90 | % | 0.8716 | % | 1.35 | % | |||
| Marsico Capital Growth |
0.90 | % | 0.8732 | % | 1.35 | % | |||
| Goldman Sachs Concentrated Growth |
0.90 | % | 0.8309 | % | 1.35 | % | |||
| DeAM Large-Cap Value |
0.85 | % | 0.7500 | % | 0.99 | % | |||
| Hotchkis & Wiley Large-Cap Value |
0.75 | % | 0.7171 | % | 1.20 | % | |||
| Alliance/Bernstein Growth + Value |
0.90 | % | 0.9000 | % | 1.35 | % | |||
| Sanford Bernstein Core Value |
0.75 | % | 0.7500 | % | 1.25 | % | |||
| Cohen & Steers Realty |
1.00 | % | 0.8893 | % | 1.45 | % | |||
| Sanford Bernstein Managed Index 500 |
0.60 | % | 0.6000 | % | 0.80 | % | |||
| American Century Income & Growth |
0.75 | % | 0.7500 | % | 1.25 | % | |||
| Alliance Growth and Income |
0.75 | % | 0.7254 | % | 1.25 | % | |||
| DeAM Global Allocation |
0.10 | % | 0.1000 | % | 0.35 | % | |||
| American Century Strategic Balanced |
0.85 | % | 0.8157 | % | 1.25 | % | |||
| T. Rowe Price Asset Allocation |
0.85 | % | 0.8021 | % | 1.25 | % | |||
| T. Rowe Price Global Bond |
0.80 | % | 0.8000 | % | 1.75 | % | |||
| Goldman Sachs High Yield |
0.75 | % | 0.7500 | % | 1.15 | % | |||
| Lord Abbett Bond-Debenture |
0.80 | % | 0.7506 | % | 1.20 | % | |||
| PIMCO Total Return Bond |
0.65 | % | 0.6226 | % | 1.05 | % | |||
| PIMCO Limited Maturity Bond |
0.65 | % | 0.6221 | % | 1.05 | % | |||
| Money Market |
0.50 | % | 0.4500 | % | 0.65 | % |
301
AMERICAN SKANDIA TRUST
NOTES TO FINANCIAL STATEMENTS (CONTINUED)
DECEMBER 31, 2004
The advisory fee for JPMorgan International Equity reduces to a rate of 0.85% for average daily net assets in excess of $75 million, and Neuberger Berman Mid-Cap Growth, Neuberger Berman Mid-Cap Value and Alliance Growth reduce to a rate of 0.85% for average daily net assets in excess of $1 billion. Effective June 1, 2004, the Investment Manager has voluntarily agreed to reduce the advisory fee for Neuberger Berman Mid-Cap Value to a rate of 0.80% for average daily net assets in excess of $1 billion, and reduce Alger All-Cap Growth and Gabelli All-Cap Value to a rate of 0.90% for average daily net assets in excess of $500 million.
During the year ended December 31, 2004, the Investment Manager has voluntarily agreed to waive a portion of its advisory fees equal to an annual rate of 0.05% of the average daily net assets in excess of $1 billion of each of the portfolios other than the waivers disclosed below:
| YEAR ENDED DECEMBER 31, 2004 (% OF THE AVERAGE DAILY NET ASSETS) |
||||||
| UP TO $1 BILLION |
OVER $1 BILLION |
|||||
| William Blair International Growth |
0.10 | % | 0.15 | % | ||
| LSV International Value |
0.15 | % | 0.20 | % | ||
| DeAM Small-Cap Growth |
0.15 | % | 0.20 | % | ||
| DeAM Small-Cap Value |
0.15 | % | 0.15 | % | ||
| Goldman Sachs Concentrated Growth |
0.07 | % | 0.05 | % | ||
| DeAM Large-Cap Value |
0.10 | % | 0.10 | % | ||
| Money Market |
0.05 | % | 0.05 | % | ||
| JANUARY 1 THROUGH MAY 31, 2004 (% OF THE AVERAGE DAILY NET ASSETS) |
JUNE 1 THROUGH DECEMBER 31, 2004 (% OF THE AVERAGE DAILY NET ASSETS) |
|||||||
| UP TO $1 BILLION |
OVER $1 BILLION |
|||||||
| Goldman Sachs Mid-Cap Growth |
0.10% | 0.13 | % | 0.18 | % | |||
| Neuberger Berman Mid-Cap Growth |
0.05% over $1 billion | 0.02 | % | 0.07 | % | |||
| Alliance Growth |
0.05% over $1 billion | 0.05 | % | 0.10 | % | |||
| MFS Growth |
0.05% over $1 billion | 0.05 | % | 0.10 | % | |||
| Marsico Capital Growth |
0.05% over $1 billion | 0.03 | % | 0.03 | % | |||
| Cohen & Steers Realty |
0.05% over $1 billion | 0.18 | % | 0.23 | % | |||
| American Century Strategic Balanced |
0.05% over $1 billion | 0.06 | % | 0.11 | % | |||
| T. Rowe Price Asset Allocation |
0.05% over $1 billion | 0.08 | % | 0.13 | % | |||
| Lord Abbett Bond-Debenture |
0.05% over $1 billion | 0.08 | % | 0.13 | % | |||
| PIMCO Limited Maturity Bond |
0.05% over $1 billion | 0.05 | % | 0.10 | % | |||
| JANUARY 1 THROUGH APRIL 30, 2004 (% OF THE AVERAGE DAILY NET ASSETS) |
MAY 1 THROUGH DECEMBER 31, 2004 (% OF THE AVERAGE DAILY NET ASSETS) | |||||
| UP TO $1 BILLION |
OVER $1 BILLION | |||||
| Hotchkis & Wiley Large Cap Value |
0.05% over $1 billion | 0.05% | 0.10% | |||
302
AMERICAN SKANDIA TRUST
NOTES TO FINANCIAL STATEMENTS (CONTINUED)
DECEMBER 31, 2004
Until November 18, 2004, the Trust utilized a Distribution Plan (the “Plan”) under Rule 12b-1 of the Investment Company Act of 1940. The Plan permitted American Skandia Marketing, Incorporated (“ASMI”) to receive brokerage commissions in connection with purchases and sales of securities by the Portfolios, and to use these commissions to promote the sale of variable contracts, the premiums for which were invested in shares of the Trust. Under the Plan, securities transactions for a Portfolio were directed to certain brokers for execution (“clearing brokers”) who agreed to pay part of the brokerage commissions received on these transactions to ASMI for “introducing” transactions to the clearing broker. In turn, ASMI used the brokerage commissions received as an introducing broker to pay various distribution-related expenses, such as advertising, printing of sales materials, and payments to dealers. The Distribution Plan was terminated by the Board of Trustees of the Trust effective November 18, 2004.
Commissions received by ASMI under the Plan are reflected in the cost of securities purchased and the proceeds from the sale of securities. These commissions are shown in the Statements of Operations as “Distribution Fees” and a corresponding reduction “Fees Paid Indirectly”. Net expenses of the Portfolios are unaffected by these commissions. For the year ended December 31, 2004, commissions received by ASMI totaled $4,342,553.
The Trust excluding DeAM Global Allocation Portfolio has entered into an agreement with American Skandia Life Assurance Corporation (“ASLAC”) pursuant to which it pays ASLAC a shareholder servicing fee at an annual rate of 0.10% of each Portfolio’s average daily net assets. Certain officers and Trustees of the Trust are officers or directors of the Investment Manager. The Trust pays no compensation directly to its officers or interested Trustees. The Investment Manager also pays for occupancy and certain clerical and administrative expenses. The Trust bears all other costs and expenses.
4. PORTFOLIO SECURITIES TRANSACTIONS
The aggregate cost of purchases and the proceeds from the sales of securities (excluding government securities and short-term issues) for the year ended December 31, 2004 were as follows:
| COST OF PURCHASES |
PROCEEDS FROM SALES | |||||
| JPMorgan International Equity |
$ | 287,670,192 | $ | 330,036,585 | ||
| William Blair International Growth |
1,147,836,084 | 870,683,402 | ||||
| LSV International Value |
401,281,604 | 402,757,543 | ||||
| MFS Global Equity |
95,247,414 | 56,832,049 | ||||
| State Street Research Small-Cap Growth |
604,875,815 | 684,504,218 | ||||
| DeAM Small-Cap Growth |
498,629,904 | 586,179,978 | ||||
| Federated Aggressive Growth |
307,101,176 | 193,630,600 | ||||
| Goldman Sachs Small-Cap Value |
191,292,846 | 269,726,361 | ||||
| Small-Cap Value |
1,071,107,970 | 966,398,046 | ||||
| DeAM Small-Cap Value |
184,040,906 | 135,680,787 | ||||
303
AMERICAN SKANDIA TRUST
NOTES TO FINANCIAL STATEMENTS (CONTINUED)
DECEMBER 31, 2004
| COST OF PURCHASES |
PROCEEDS FROM SALES | |||||
| Goldman Sachs Mid-Cap Growth |
$ | 205,709,122 | $ | 111,925,073 | ||
| Neuberger Berman Mid-Cap Growth |
317,448,449 | 339,728,368 | ||||
| Neuberger Berman Mid-Cap Value |
824,069,454 | 758,864,005 | ||||
| Alger All-Cap Growth |
614,473,458 | 708,240,645 | ||||
| Gabelli All-Cap Value |
48,263,964 | 47,148,470 | ||||
| T. Rowe Price Natural Resources |
128,369,784 | 114,141,305 | ||||
| Alliance Growth |
245,868,543 | 237,860,493 | ||||
| MFS Growth |
1,092,783,712 | 1,177,040,435 | ||||
| Marsico Capital Growth |
1,692,095,554 | 1,310,779,145 | ||||
| Goldman Sachs Concentrated Growth |
179,653,845 | 427,290,563 | ||||
| DeAM Large-Cap Value |
308,851,204 | 274,818,323 | ||||
| Hotchkis & Wiley Large-Cap Value |
742,855,192 | 827,017,709 | ||||
| Alliance/Bernstein Growth + Value |
31,104,359 | 24,980,550 | ||||
| Sanford Bernstein Core Value |
138,456,803 | 73,967,958 | ||||
| Cohen & Steers Realty |
132,397,521 | 100,269,637 | ||||
| Sanford Bernstein Managed Index 500 |
223,016,652 | 240,935,747 | ||||
| American Century Income & Growth |
376,770,341 | 378,844,602 | ||||
| Alliance Growth and Income |
1,183,947,179 | 955,353,868 | ||||
| DeAM Global Allocation |
224,545,461 | 278,760,244 | ||||
| American Century Strategic Balanced |
208,225,599 | 198,960,161 | ||||
| T. Rowe Price Asset Allocation |
179,771,413 | 143,877,287 | ||||
| T. Rowe Price Global Bond |
133,920,429 | 94,885,473 | ||||
| Goldman Sachs High Yield |
464,174,453 | 573,737,370 | ||||
| Lord Abbett Bond-Debenture |
324,756,130 | 155,312,218 | ||||
| PIMCO Total Return Bond |
250,121,965 | 263,513,570 | ||||
| PIMCO Limited Maturity Bond |
166,944,986 | 136,976,138 | ||||
304
AMERICAN SKANDIA TRUST
NOTES TO FINANCIAL STATEMENTS (CONTINUED)
DECEMBER 31, 2004
Written options transactions, during the year ended December 31, 2004, were as follows:
| PIMCO TOTAL RETURN BOND |
PIMCO LIMITED MATURITY |
|||||||||||||
| NUMBER OF CONTRACTS/ SWAP NOTIONAL AMOUNT $(000) |
PREMIUM |
NUMBER OF CONTRACTS/ SWAP NOTIONAL AMOUNT $(000) |
PREMIUM |
|||||||||||
| Balance at beginning of period |
257,792 | $ | 8,096,548 | 101,400 | $ | 929,078 | ||||||||
| Written options |
8,615 | 4,416,339 | 112 | 59,080 | ||||||||||
| Written swap options |
11,400 | 60,486 | — | — | ||||||||||
| Expired options |
(71,874 | ) | (5,427,581 | ) | (112 | ) | (59,080 | ) | ||||||
| Expired swap options |
(52,200 | ) | (1,467,072 | ) | — | — | ||||||||
| Closed options |
(84 | ) | (76,623 | ) | — | — | ||||||||
| Closed swap options |
(40,830 | ) | (1,368,908 | ) | — | — | ||||||||
| Balance at end of period |
112,819 | $ | 4,233,189 | 101,400 | $ | 929,078 | ||||||||
At December 31, 2004, PIMCO Total Return Bond and PIMCO Limited Maturity had sufficient cash and/or securities at least equal to the value of written options.
5. TAX AND DISTRIBUTION INFORMATION
Each Portfolio intends to qualify as a regulated investment company under the Internal Revenue Code and to distribute all of its taxable income, including any net realized gains on investments, to shareholders. Accordingly, no provision for federal income or excise tax has been made.
Income and capital gains of the Portfolios are determined in accordance with both tax regulations and accounting principles generally accepted in the United States of America. Such determinations may result in temporary and permanent differences between tax basis earnings and earnings reported for financial statement purposes. Temporary differences that result in over-distributions for financial statement purposes are classified as distributions in excess of net investment income or accumulated net realized gains or loss. Permanent differences in the recognition of earnings are reclassified between undistributed net investment income and accumulated net realized gain or loss or to additional paid-in capital, as appropriate. Distributions in excess of tax-basis earnings are recorded as a return of capital.
Distributions to shareholders, which are determined in accordance with federal income tax regulations, which may differ from generally accepted accounting principles, are recorded on the ex-dividend date. In order to present undistributed net investment income and accumulated net realized capital gains or losses on the Statements of Assets and Liabilities that more closely represent their tax character, certain adjustments have been made to undistributed net
305
AMERICAN SKANDIA TRUST
NOTES TO FINANCIAL STATEMENTS (CONTINUED)
DECEMBER 31, 2004
investment income, accumulated net realized gain or loss on investments and paid-in capital. For the year ended December 31, 2004 the adjustments were as follows:
| PORTFOLIO |
UNDISTRIBUTED NET INVESTMENT INCOME |
ACCUMULATED NET REALIZED GAIN OR LOSS |
PAIN-IN CAPITAL |
|||||||||
| JPMorgan International Equity(c) |
$ | 148,942 | $ | (148,942 | ) | $ | — | |||||
| William Blair International Growth(c)(g)(i)(j)(k)(l)(m) |
2,477,392 | (103,260,917 | ) | 100,783,525 | ||||||||
| LSV International Value(c)(g)(i) |
1,051,823 | (1,319,461 | ) | 267,638 | ||||||||
| MFS Global Equity(c) |
(34,310 | ) | 34,310 | — | ||||||||
| State Street Research Small-Cap Growth(a)(h) |
2,251,759 | 23,570 | (2,275,329 | ) | ||||||||
| DeAM Small-Cap Growth(a)(h) |
2,170,658 | 181,017 | (2,351,675 | ) | ||||||||
| Federated Aggressive Growth(a)(c)(g)(h) |
1,609,280 | (1,609,280 | ) | — | ||||||||
| Goldman Sachs Small-Cap Value(h)(i) |
(1,099,861 | ) | 1,346,605 | (246,744 | ) | |||||||
| Small-Cap Value(h) |
(941,290 | ) | 941,290 | — | ||||||||
| DeAM Small-Cap Value(h)(i) |
(201,777 | ) | 201,560 | 217 | ||||||||
| Goldman Sachs Mid-Cap Growth(a) |
1,012,788 | — | (1,012,788 | ) | ||||||||
| Neuberger Berman Mid-Cap Growth(a)(i) |
2,545,129 | — | (2,545,129 | ) | ||||||||
| Alger All-Cap Growth(a) |
1,240,153 | — | (1,240,153 | ) | ||||||||
| Gabelli All-Cap Value(c) |
(313 | ) | 313 | — | ||||||||
| T. Rowe Price Natural Resources(c)(h) |
(243,243 | ) | 243,243 | — | ||||||||
| Alliance Growth(a) |
165,250 | — | (165,250 | ) | ||||||||
| MFS Growth(c) |
5,266 | (5,266 | ) | — | ||||||||
| Marsico Capital Growth(a)(c)(i) |
532,346 | 327,163 | (859,509 | ) | ||||||||
| Goldman Sachs Concentrated Growth(k)(l) |
(770 | ) | (213,736 | ) | 214,506 | |||||||
| DeAM Large-Cap Value(h) |
(66,645 | ) | 66,645 | — | ||||||||
| Hotchkis & Wiley Large-Cap Value(c)(h) |
(437,463 | ) | 437,463 | — | ||||||||
| Cohen & Steers Realty(c)(h) |
(9,945,701 | ) | 9,945,701 | — | ||||||||
| Sanford Bernstein Managed Index 500(h) |
(62,505 | ) | 62,505 | — | ||||||||
| American Century Income & Growth(c)(h)(j)(k)(l) |
(104,129 | ) | (33,258,688 | ) | 33,362,817 | |||||||
| DeAM Global Allocation(i)(n) |
2,249,498 | (2,248,145 | ) | (1,353 | ) | |||||||
| American Century Strategic Balanced(c)(d) |
51,692 | (51,692 | ) | — | ||||||||
| T. Rowe Price Asset Allocation(c)(d)(g)(h)(i) |
564,064 | (564,201 | ) | 137 | ||||||||
| T. Rowe Price Global Bond(c)(d)(i) |
2,534,803 | (2,761,805 | ) | 227,002 | ||||||||
306
AMERICAN SKANDIA TRUST
NOTES TO FINANCIAL STATEMENTS (CONTINUED)
DECEMBER 31, 2004
| PORTFOLIO |
UNDISTRIBUTED NET INVESTMENT INCOME |
ACCUMULATED NET REALIZED GAIN OR LOSS |
PAIN-IN CAPITAL |
||||||
| Goldman Sachs High Yield(c) |
(3,546,862 | ) | 3,546,862 | — | |||||
| Lord Abbett Bond-Debenture(d) |
128,160 | (128,160 | ) | — | |||||
| PIMCO Total Return Bond(c)(d)(f)(k)(l) |
17,732,454 | (17,977,403 | ) | 244,949 | |||||
| PIMCO Limited Maturity Bond(c)(d)(f)(i) |
2,119,901 | (2,185,355 | ) | 65,454 | |||||
| Money Market(b) |
1,347 | — | (1,347 | ) |
| (a) | Reclassification of tax operating loss. |
| (b) | Reclassification of overdistribution of ordinary income. |
| (c) | Reclassification of net foreign currency exchange gain or loss. |
| (d) | Reclassification of paydown gain and loss. |
| (e) | Reclassification of bifurcation on the sale of foreign bonds. |
| (f) | Reclassification of swap income. |
| (g) | Reclassification of book to tax differences on Passive Foreign Investment Companies. |
| (h) | Reclassification of book to tax differences on Real Estate Investment Trusts. |
| (i) | Reclassification due to other adjustments. |
| (j) | Reclassification of capital loss carryover from merger. |
| (k) | Reclassification of deferred directors compensation from merger. |
| (l) | Reclassification of disallowed wash sales from merger. |
| (m) | Reclassification of Passive Foreign Investment Company mark-to-market from merger. |
| (n) | Reclassification of short-term capital gains to ordinary income. |
For the year ended December 31, 2004, the tax character of the dividends paid, as reflected in the Statements of Changes in Net Assets were:
| PORTFOLIO |
ORDINARY INCOME |
LONG-TERM CAPITAL GAIN |
TOTAL DISTRIBUTIONS | ||||||
| JPMorgan International Equity |
$ | 3,597,872 | $ | — | $ | 3,597,872 | |||
| William Blair International Growth |
7,604,485 | — | 7,604,485 | ||||||
| LSV International Value |
2,339,322 | — | 2,339,322 | ||||||
| MFS Global Equity |
221,874 | — | 221,874 | ||||||
| Federated Aggressive Growth |
4,045,919 | — | 4,045,919 | ||||||
| Goldman Sachs Small-Cap Value |
696,491 | 4,161,394 | 4,857,885 | ||||||
| Small-Cap Value |
42,814 | — | 42,814 | ||||||
| DeAM Small-Cap Value |
1,486,307 | 1,564,069 | 3,050,376 | ||||||
307
AMERICAN SKANDIA TRUST
NOTES TO FINANCIAL STATEMENTS (CONTINUED)
DECEMBER 31, 2004
| PORTFOLIO |
ORDINARY INCOME |
LONG-TERM CAPITAL GAIN |
TOTAL DISTRIBUTIONS | |||
| Neuberger Berman Mid-Cap Value |
1,190,224 | 26,886,646 | 28,076,870 | |||
| Gabelli All-Cap Value |
512,677 | — | 512,677 | |||
| T. Rowe Price Natural Resources |
1,843,388 | — | 1,843,388 | |||
| DeAM Large-Cap Value |
1,225,279 | — | 1,225,279 | |||
| Hotchkis & Wiley Large-Cap Value |
9,262,013 | — | 9,262,013 | |||
| Alliance/Bernstein Growth + Value |
229,760 | — | 229,760 | |||
| Sanford Bernstein Core Value |
8,247,305 | — | 8,247,305 | |||
| Cohen & Steers Realty |
7,684,744 | 4,721,132 | 12,405,876 | |||
| Sanford Bernstein Managed Index 500 |
4,631,826 | — | 4,631,826 | |||
| American Century Income & Growth |
3,630,621 | — | 3,630,621 | |||
| Alliance Growth and Income |
13,715,428 | — | 13,715,428 | |||
| DeAM Global Allocation |
2,868,023 | — | 2,868,023 | |||
| American Century Strategic Balanced |
3,257,861 | — | 3,257,861 | |||
| T. Rowe Price Asset Allocation |
5,760,759 | — | 5,760,759 | |||
| T. Rowe Price Global Bond |
16,891,538 | 1,509,137 | 18,400,675 | |||
| Goldman Sachs High Yield |
58,039,833 | — | 58,039,833 | |||
| Lord Abbett Bond-Debenture |
13,892,148 | — | 13,892,148 | |||
| PIMCO Total Return Bond |
85,249,707 | 15,173,281 | 100,422,988 | |||
| PIMCO Limited Maturity Bond |
35,683,588 | 5,348,710 | 41,032,298 | |||
| Money Market |
16,221,849 | — | 16,221,849 |
For the year ended December 31, 2003, the tax character of the dividends paid, as reflected in the Statements of Changes in Net Assets were:
| PORTFOLIO |
ORDINARY INCOME |
LONG-TERM CAPITAL GAIN |
TOTAL DISTRIBUTIONS | ||||||
| JPMorgan International Equity |
$ | 2,687,610 | $ | — | $ | 2,687,610 | |||
| LSV International Value |
787,176 | — | 787,176 | ||||||
| MFS Global Equity |
121,731 | — | 121,731 | ||||||
| Goldman Sachs Small-Cap Value |
2,448,006 | — | 2,448,006 | ||||||
| Small-Cap Value |
998,184 | — | 998,184 | ||||||
| DeAM Small-Cap Value |
20,010 | — | 20,010 | ||||||
| Neuberger Berman Mid-Cap Value |
1,718,079 | — | 1,718,079 | ||||||
308
AMERICAN SKANDIA TRUST
NOTES TO FINANCIAL STATEMENTS (CONTINUED)
DECEMBER 31, 2004
| PORTFOLIO |
ORDINARY INCOME |
LONG-TERM CAPITAL GAIN |
TOTAL DISTRIBUTIONS | |||
| Gabelli All-Cap Value |
880,134 | — | 880,134 | |||
| T. Rowe Price Natural Resources |
1,610,638 | 2,249,299 | 3,859,937 | |||
| Goldman Sachs Concentrated Growth |
3,836,920 | — | 3,836,920 | |||
| DeAM Large-Cap Value |
898,632 | — | 898,632 | |||
| Hotchkis & Wiley Large-Cap Value |
15,175,707 | — | 15,175,707 | |||
| Alliance/Bernstein Growth + Value |
201,627 | — | 201,627 | |||
| Sanford Bernstein Core Value |
1,344,832 | — | 1,344,832 | |||
| Cohen & Steers Realty |
6,935,947 | 4,037,564 | 10,973,511 | |||
| Sanford Bernstein Managed Index 500 |
5,460,558 | — | 5,460,558 | |||
| American Century Income & Growth |
3,198,975 | — | 3,198,975 | |||
| Alliance Growth and Income |
15,225,927 | — | 15,225,927 | |||
| DeAM Global Allocation |
3,336,217 | — | 3,336,217 | |||
| American Century Strategic Balanced |
4,190,899 | — | 4,190,899 | |||
| T. Rowe Price Asset Allocation |
7,112,841 | — | 7,112,841 | |||
| T. Rowe Price Global Bond |
7,341,835 | 393,861 | 7,735,696 | |||
| Goldman Sachs High Yield |
48,256,122 | — | 48,256,122 | |||
| Lord Abbett Bond-Debenture |
6,806,378 | — | 6,806,378 | |||
| PIMCO Total Return Bond |
125,943,541 | 40,010,460 | 165,954,001 | |||
| PIMCO Limited Maturity Bond |
33,374,842 | 4,751,365 | 38,126,207 | |||
| Money Market |
15,785,832 | — | 15,785,832 |
The tax character of distributable earnings at December 31, 2004 was:
| PORTFOLIO |
UNDISTRIBUTED ORDINARY INCOME |
UNDISTRIBUTED LONG-TERM CAPITAL GAIN | ||||
| JP Morgan International Equity |
$ | 4,437,202 | $ | — | ||
| William Blair International Growth |
14,181,104 | — | ||||
| LSV International Value |
2,852,382 | — | ||||
| MFS Global Equity |
461,319 | — | ||||
| Federated Aggressive Growth |
18,518,250 | 11,034,745 | ||||
| Goldman Sachs Small-Cap Value |
10,502,160 | 41,411,910 | ||||
| Small-Cap Value |
17,304,347 | 196,537,368 | ||||
309
AMERICAN SKANDIA TRUST
NOTES TO FINANCIAL STATEMENTS (CONTINUED)
DECEMBER 31, 2004
| PORTFOLIO |
UNDISTRIBUTED ORDINARY INCOME |
UNDISTRIBUTED LONG-TERM CAPITAL GAIN | ||
| DeAM Small-Cap Value |
6,820,040 | 2,685,750 | ||
| Neuberger Berman Mid-Cap Value |
71,192,660 | 117,238,620 | ||
| Gabelli All-Cap Value |
746,664 | — | ||
| T. Rowe Price Natural Resources |
1,741,601 | 19,787,244 | ||
| MFS Growth |
59,767 | — | ||
| Goldman Sachs Concentrated Growth |
4,445,171 | — | ||
| DeAM Large-Cap Value |
1,868,041 | — | ||
| Hotchkis & Wiley Large-Cap Value |
5,779,623 | — | ||
| Alliance/Bernstein Growth + Value |
456,085 | — | ||
| Sanford Bernstein Core Value |
5,096,098 | 5,160,571 | ||
| Cohen & Steers Realty |
7,423,269 | 27,914,051 | ||
| Sanford Bernstein Managed Index 500 |
6,896,193 | — | ||
| American Century Income & Growth |
7,184,462 | — | ||
| Alliance Growth and Income |
26,811,111 | — | ||
| DeAM Global Allocation |
7,424,965 | — | ||
| American Century Strategic Balanced |
3,659,041 | — | ||
| T. Rowe Price Asset Allocation |
8,879,620 | 2,605,257 | ||
| T. Rowe Price Global Bond |
14,171,304 | 271,889 | ||
| Goldman Sachs High Yield |
49,411,104 | — | ||
| Lord Abbett Bond-Debenture |
22,671,957 | 3,192,803 | ||
| PIMCO Total Return Bond |
93,816,996 | 29,905,832 | ||
| PIMCO Limited Maturity Bond |
18,086,112 | 6,894,871 |
These amounts differ from undistributed net investment income on the Statement of Assets and Liabilities primarily due to timing differences. Such timing differences include tax adjustments on Real Estate Investment Trusts, Passive Foreign Investment Companies, foreign exchange contracts, deferred compensation and deferred losses on wash sales and straddles.
310
AMERICAN SKANDIA TRUST
NOTES TO FINANCIAL STATEMENTS (CONTINUED)
DECEMBER 31, 2004
At December 31, 2004, the following Portfolios had, for federal income tax purposes, capital loss carryforwards available to offset future net realized capital gains:
| EXPIRATION DECEMBER 31, | |||||||||||||||||||||
| PORTFOLIO |
TOTAL(A) |
2007 |
2008 |
2009 |
2010 |
2011 |
2012 | ||||||||||||||
| JPMorgan International Equity |
$ | 120,488,699 | $ | — | $ | — | $ | 33,661,765 | $ | 76,213,067 | $ | 10,613,867 | $ | — | |||||||
| William Blair International Growth |
290,071,424 | 32,777,655 | 31,207,105 | 49,141,273 | 132,003,291 | 44,942,100 | — | ||||||||||||||
| LSV International Value |
125,352,964 | — | 3,643,047 | 107,473,503 | 14,236,414 | — | — | ||||||||||||||
| MFS Global Equity |
2,683,552 | — | — | — | — | 2,683,552 | — | ||||||||||||||
| State Street Research Small-Cap Growth |
190,750,738 | — | — | 124,469,583 | 66,281,155 | — | — | ||||||||||||||
| DeAM Small-Cap Growth |
260,044,582 | — | — | 176,759,403 | 83,285,179 | — | — | ||||||||||||||
| Goldman Sachs Mid-Cap Growth |
68,597,283 | — | — | 42,654,750 | 25,942,533 | — | — | ||||||||||||||
| Neuberger Berman Mid- Cap Growth |
373,728,413 | — | — | 250,206,155 | 122,095,636 | 1,426,622 | — | ||||||||||||||
| Alger All-Cap Growth |
392,409,864 | — | 12,145,781 | 208,714,661 | 171,549,422 | — | — | ||||||||||||||
| Gabelli All-Cap Value |
23,634,292 | — | — | — | 18,685,440 | 4,948,852 | — | ||||||||||||||
| Alliance Growth |
263,976,123 | — | — | 134,760,953 | 95,931,726 | 31,458,198 | 1,825,246 | ||||||||||||||
| MFS Growth |
426,177,505 | — | — | 227,753,394 | 198,424,111 | — | — | ||||||||||||||
| Marsico Capital Growth |
286,152,317 | — | — | 151,632,671 | 134,519,646 | — | — | ||||||||||||||
| Goldman Sachs |
|||||||||||||||||||||
| Concentrated Growth |
911,061,881 | — | 113,078,776 | 465,068,305 | 179,588,458 | 153,326,342 | — | ||||||||||||||
| DeAM Large-Cap Value |
1,328,484 | — | — | — | — | 1,328,484 | — | ||||||||||||||
| Hotchkis & Wiley |
|||||||||||||||||||||
| Large-Cap Value |
54,378,701 | — | — | — | 54,378,701 | — | — | ||||||||||||||
| Alliance/Bernstein |
|||||||||||||||||||||
| Growth + Value |
3,705,536 | — | — | — | 2,514,238 | 1,191,298 | — | ||||||||||||||
| Sanford Bernstein |
|||||||||||||||||||||
| Managed Index 500 |
154,475,129 | — | — | 54,895,895 | 69,268,601 | 30,310,633 | — | ||||||||||||||
| American Century |
|||||||||||||||||||||
| Income & Growth |
84,973,518 | — | 6,181,763 | 27,940,814 | 34,446,133 | 16,404,808 | — | ||||||||||||||
| Alliance Growth and Income |
263,266,046 | — | — | — | 201,742,522 | 61,523,524 | — | ||||||||||||||
311
AMERICAN SKANDIA TRUST
NOTES TO FINANCIAL STATEMENTS (CONTINUED)
DECEMBER 31, 2004
| EXPIRATION DECEMBER 31, | ||||||||||||||
| PORTFOLIO |
TOTAL(A) |
2007 |
2008 |
2009 |
2010 |
2011 |
2012 | |||||||
| DeAM Global Allocation |
90,862,127 | — | 2,111,164 | 35,338,513 | 48,177,607 | 5,234,843 | — | |||||||
| American Century Strategic Balanced |
6,643,762 | — | — | — | 4,057,905 | 2,585,857 | — | |||||||
| Goldman Sachs High Yield |
202,014,666 | — | 15,283,720 | 61,793,618 | 87,452,429 | 37,484,899 | — | |||||||
| Money Market |
26,493 | — | — | — | — | — | 26,493 | |||||||
| (a) | It is uncertain whether the Fund will be able to realize the full benefit prior to the expiration date. |
The following Portfolios expect to elect to treat post-October losses incurred in the period November 1, 2004 through December 31, 2004 as having occurred on January 1, 2005.
| POST OCTOBER LOSSES | ||||||
| PORTFOLIO |
CURRENCY |
CAPITAL | ||||
| Federated Aggressive Growth |
$ | 30,048 | $ | — | ||
| Gabelli All-Cap Value |
602 | — | ||||
| T. Rowe Price Natural Resources |
5,238 | — | ||||
| Alliance Growth |
— | 253,026 | ||||
| Cohen & Steers Realty |
948 | — | ||||
| Goldman Sachs High Yield |
4,530,584 | — | ||||
| PIMCO Total Return Bond |
— | 3,484,365 | ||||
| PIMCO Limited Maturity Bond |
— | 2,218,503 | ||||
| Money Market |
— | 13,335 | ||||
At December 31, 2004, the cost and unrealized appreciation or depreciation in value of the investments for federal income tax purposes, were as follows:
| PORTFOLIO |
TAX BASIS |
GROSS UNREALIZED APPRECIATION |
GROSS UNREALIZED (DEPRECIATION) |
NET UNREALIZED APPRECIATION (DEPRECIATION) |
OTHER TEMPORARY DIFFERENCES |
||||||||||||
| JPMorgan International |
|||||||||||||||||
| Equity |
$ | 288,729,307 | $ | 59,003,726 | $ | (5,183,753 | ) | $ | 53,819,973 | $ | (7,559 | ) | |||||
| William Blair International |
|||||||||||||||||
| Growth |
1,080,284,487 | 249,564,880 | (1,136,651 | ) | 248,428,229 | (18,941 | ) | ||||||||||
| LSV International Value |
177,986,375 | 11,404,599 | (1,542,254 | ) | 9,862,345 | (3,028 | ) | ||||||||||
| MFS Global Equity |
137,067,582 | 30,242,184 | (1,030,043 | ) | 29,212,141 | (877 | ) | ||||||||||
312
AMERICAN SKANDIA TRUST
NOTES TO FINANCIAL STATEMENTS (CONTINUED)
DECEMBER 31, 2004
| PORTFOLIO |
TAX BASIS |
GROSS UNREALIZED APPRECIATION |
GROSS UNREALIZED (DEPRECIATION) |
NET UNREALIZED APPRECIATION (DEPRECIATION) |
OTHER TEMPORARY DIFFERENCES |
|||||||
| State Street Research Small-Cap Growth |
250,265,416 | 30,232,448 | (3,515,896 | ) | 26,716,552 | (7,944 | ) | |||||
| DeAM Small-Cap Growth |
343,413,715 | 58,758,179 | (11,319,568 | ) | 47,438,611 | (180,081 | ) | |||||
| Federated Aggressive Growth |
319,779,791 | 76,730,748 | (10,520,903 | ) | 66,209,845 | (30,596 | ) | |||||
| Goldman Sachs Small-Cap Value |
278,579,970 | 78,144,948 | (6,882,315 | ) | 71,262,633 | (5,294 | ) | |||||
| Small-Cap Value |
971,817,120 | 55,200,510 | (11,640,319 | ) | 43,560,191 | (7,958 | ) | |||||
| DeAM Small-Cap Value |
104,894,101 | 10,654,579 | (605,318 | ) | 10,049,261 | (196,006 | ) | |||||
| Goldman Sachs Mid-Cap Growth |
333,830,823 | 45,494,212 | (4,211,365 | ) | 41,282,847 | (999 | ) | |||||
| Neuberger Berman Mid-Cap Growth |
355,167,080 | 108,305,277 | (2,022,977 | ) | 106,282,300 | (7,191 | ) | |||||
| Neuberger Berman Mid-Cap Value |
1,493,036,788 | 224,160,076 | (4,437,795 | ) | 219,722,281 | (14,213 | ) | |||||
| Alger All-Cap Growth |
347,827,849 | 44,448,397 | (3,325,131 | ) | 41,123,266 | (6,968 | ) | |||||
| Gabelli All-Cap Value |
190,450,752 | 45,622,649 | (5,821,211 | ) | 39,801,438 | (2,312 | ) | |||||
| T. Rowe Price Natural Resources |
223,921,965 | 49,170,991 | (233,210 | ) | 48,937,781 | (7,953 | ) | |||||
| Alliance Growth |
263,809,088 | 34,695,514 | (6,025,335 | ) | 28,670,179 | (258,616 | ) | |||||
| MFS Growth |
579,702,770 | 49,935,399 | (13,313,799 | ) | 36,621,600 | (9,444 | ) | |||||
| Marsico Capital Growth |
2,097,269,972 | 629,734,923 | (2,722,311 | ) | 627,012,612 | (22,587 | ) | |||||
| Goldman Sachs Concentrated Growth |
1,007,627,578 | 180,133,555 | (60,184,249 | ) | 119,949,306 | (42,540 | ) | |||||
| DeAM Large-Cap Value |
202,306,404 | 21,839,921 | (900,197 | ) | 20,939,724 | (141,857 | ) | |||||
| Hotchkis & Wiley Large-Cap Value |
741,650,613 | 81,928,100 | (4,960,408 | ) | 76,967,692 | (14,662 | ) | |||||
| Alliance/Bernstein Growth + Value |
79,991,368 | 12,895,703 | (1,573,136 | ) | 11,322,567 | (436 | ) | |||||
| Sanford Bernstein Core Value |
285,389,219 | 51,199,217 | (2,600,624 | ) | 48,598,593 | (1,795 | ) | |||||
| Cohen & Steers Realty |
360,115,961 | 119,004,440 | (114,676 | ) | 118,889,764 | (3,687 | ) | |||||
| Sanford Bernstein Managed Index 500 |
546,887,858 | 97,876,285 | (27,737,064 | ) | 70,139,221 | (9,337 | ) | |||||
| American Century Income & Growth |
640,043,883 | 46,300,106 | (25,723,869 | ) | 20,576,237 | (79,933 | ) | |||||
| Alliance Growth and Income |
2,071,139,354 | 343,112,690 | (23,478,834 | ) | 319,633,856 | (24,865 | ) |
313
AMERICAN SKANDIA TRUST
NOTES TO FINANCIAL STATEMENTS (CONTINUED)
DECEMBER 31, 2004
| PORTFOLIO |
TAX BASIS |
GROSS UNREALIZED APPRECIATION |
GROSS UNREALIZED (DEPRECIATION) |
NET UNREALIZED APPRECIATION (DEPRECIATION) |
OTHER TEMPORARY DIFFERENCES |
|||||||
| DeAM Global Allocation |
210,779,758 | 17,140,509 | — | 17,140,509 | (6,805 | ) | ||||||
| American Century Strategic Balanced |
266,337,334 | 18,541,779 | (3,288,431 | ) | 15,253,348 | (29,942 | ) | |||||
| T. Rowe Price Asset Allocation |
443,047,062 | 62,346,170 | (7,347,234 | ) | 54,998,936 | (5,080 | ) | |||||
| T. Rowe Price Global Bond |
246,872,390 | 23,236,959 | (368,119 | ) | 22,868,840 | 92,403 | ||||||
| Goldman Sachs High Yield |
736,873,706 | 58,978,062 | (8,200,267 | ) | 50,777,795 | (818,776 | ) | |||||
| Lord Abbett Bond-Debenture |
554,974,778 | 22,337,456 | (2,929,560 | ) | 19,407,896 | (1,822 | ) | |||||
| PIMCO Total Return Bond |
2,727,549,700 | 24,212,695 | (8,791,630 | ) | 15,421,065 | (3,942,943 | ) | |||||
| PIMCO Limited Maturity Bond |
893,776,824 | 6,781,099 | (3,366,160 | ) | 3,414,939 | (2,505,531 | ) | |||||
| Money Market |
1,355,759,723 | — | — | — | (58,382 | ) |
The differences between book and tax basis of investments are primarily attributable to deferred losses on wash sales and straddles, as well as tax adjustments on investments in Passive Foreign Investment Companies, Real Estate Investments Trusts, foreign exchange contracts, and other temporary differences.
6. LINE OF CREDIT
The Portfolios and other affiliated funds participated in a $200 million unsecured, committed line of credit, provided by a syndication of banks, under a line of credit agreement. Borrowings may be made for temporary or emergency purposes, including the meeting of redemption requests that otherwise might require the untimely disposition of securities. Any borrowings must be repaid within 30 days of their receipt. Interest is charged to each Portfolio, based on its borrowings, at a premium above the Federal Funds Rate. In addition, a commitment fee, equal to an annual rate of 0.09% of the average daily unused portion of the line of credit, is allocated among the participants at the end of each quarter. The expiration date of the line of credit was April 30, 2004. On May 1, 2004, a new line of credit of $250 million was provided by PNC Bank and the expiration date of the new credit agreement was October 29, 2004. Effective October 29, 2004, a new line of credit was increased to $500 million, and the commitment fee is reduced to 0.075%. The expiration date of the new credit agreement is October 28, 2005. The following Portfolios utilized the line of credit during the year ended December 31, 2004.
| PORTFOLIO |
AVERAGE ADVANCES OUTSTANDING DURING THE PERIOD |
AVERAGE INTEREST RATE |
NUMBER OF DAYS ADVANCES OUTSTANDING DURING THE PERIOD |
OUTSTANDING BORROWINGS AT DECEMBER 31, 2004 | ||||||
| JPMorgan International Equity |
$ | 2,287,500 | 1.543 | % | 8 | — | ||||
| LSV International Value |
5,300,000 | 2.504 | % | 6 | — | |||||
| MFS Global Equity |
2,066,667 | 1.563 | % | 3 | — | |||||
| State Street Research Small-Cap Growth |
3,463,636 | 1.889 | % | 11 | — | |||||
314
AMERICAN SKANDIA TRUST
NOTES TO FINANCIAL STATEMENTS (CONTINUED)
DECEMBER 31, 2004
| PORTFOLIO |
AVERAGE ADVANCES OUTSTANDING DURING THE PERIOD |
AVERAGE INTEREST RATE |
NUMBER OF DAYS ADVANCES OUTSTANDING DURING THE PERIOD |
OUTSTANDING BORROWINGS AT DECEMBER 31, 2004 | ||||||
| DeAM Small-Cap Growth |
$ | 3,585,714 | 1.524 | % | 7 | — | ||||
| Federated Aggressive Growth |
3,506,897 | 1.526 | % | 29 | — | |||||
| Goldman Sachs Mid-Cap Growth |
1,116,667 | 1.649 | % | 6 | — | |||||
| Neuberger Berman Mid-Cap Growth |
2,525,926 | 1.515 | % | 27 | — | |||||
| Neuberger Berman Mid-Cap Value |
3,800,000 | 1.500 | % | 2 | — | |||||
| Alger All-Cap Growth |
4,183,673 | 1.704 | % | 49 | — | |||||
| Gabelli All-Cap Value |
1,996,774 | 1.834 | % | 31 | — | |||||
| T. Rowe Price Natural Resources |
3,681,481 | 1.751 | % | 27 | — | |||||
| Alliance Growth |
1,290,411 | 1.983 | % | 73 | — | |||||
| MFS Growth |
3,000,000 | 1.563 | % | 3 | — | |||||
| Goldman Sachs Concentrated Growth |
2,702,778 | 1.643 | % | 18 | — | |||||
| Hotchkis & Wiley Large-Cap Value |
2,159,091 | 1.549 | % | 22 | — | |||||
| Sanford Bernstein Core Value |
3,550,000 | 1.523 | % | 18 | — | |||||
| Cohen & Steers Realty |
5,453,333 | 1.516 | % | 15 | — | |||||
| Sanford Bernstein Managed Index 500 |
4,923,684 | 1.810 | % | 38 | — | |||||
| American Century Income & Growth |
2,807,692 | 1.610 | % | 13 | — | |||||
| Alliance Growth and Income |
7,020,000 | 1.512 | % | 5 | — | |||||
| Goldman Sachs High Yield |
15,984,615 | 1.515 | % | 39 | — | |||||
| Lord Abbett Bond-Debenture |
4,800,000 | 1.500 | % | 6 | — | |||||
| PIMCO Total Return Bond |
46,000,000 | 2.000 | % | 1 | — | |||||
7. REORGANIZATION
On November 19, 2003, the Board of Trustees of the Trust approved an Agreement and Plan of Reorganization (the "Plan") which provides for the transfer of all the assets of the following portfolios for shares of the acquiring portfolios and the assumption of the liabilities of the portfolios.
Shareholders approved the Plan at a meeting on April 27, 2004 and the reorganization took place on May 1, 2004.
315
AMERICAN SKANDIA TRUST
NOTES TO FINANCIAL STATEMENTS (CONTINUED)
DECEMBER 31, 2004
The acquisition was accomplished by a tax-free exchange of the following shares:
| MERGED FUNDS |
SHARES |
ACQUIRING FUNDS |
SHARES |
VALUE | |||||
| AST American Century International Growth |
30,735,036 | AST William Blair International Growth |
35,850,785 | $ | 371,141,306 | ||||
| AST DeAM Large-Cap Growth |
4,193,423 | AST Goldman Sachs Concentrated Growth |
2,089,499 | 42,536,344 | |||||
| AST MFS Growth with Income |
13,118,199 | AST American Century Income & Growth |
9,098,089 | 108,397,180 | |||||
| AST DeAM Bond |
11,602,687 | AST PIMCO Total Return Bond |
9,825,426 | 112,868,287 | |||||
The aggregate net assets and unrealized appreciation of the Merged and Acquiring Funds immediately before the acquisitions and the future utilization of the acquired capital loss carryforwards from the merged funds were as follows:
| MERGED FUNDS |
TOTAL NET ASSETS |
UNREALIZED APPRECIATION/ (DEPRECIATION) |
CAPITAL LOSS CARRYFORWARDS* | |||||||
| AST American Century International Growth |
$ | 371,141,306 | $ | 38,629,432 | $ | 273,879,330 | ||||
| AST DeAM Large-Cap Growth |
42,536,344 | 748,131 | — | |||||||
| AST MFS Growth with Income |
108,397,180 | 4,953,701 | 28,897,863 | |||||||
| AST DeAM Bond |
112,868,287 | (833,488 | ) | — | ||||||
| ACQUIRING FUNDS |
|||
| AST William Blair International Growth |
$ | 747,572,780 | |
| AST Goldman Sachs Concentrated Growth |
1,029,307,448 | ||
| AST American Century Income & Growth |
308,408,872 | ||
| AST PIMCO Total Return Bond |
2,097,077,107 | ||
| * | The future utilization of the acquired capital loss carry forwards may be limited under certain conditions defined in the Internal Revenue Code of 1986, as amended. |
8. OWNERSHIP
As of December 31, 2004, more than 99% of each Portfolio was owned of record by American Skandia Life Assurance Corporation (“ASLAC”) on behalf of the owners of the variable insurance products issued by ASLAC.
316
(This page intentionally left blank)
317
AMERICAN SKANDIA TRUST
FINANCIAL HIGHLIGHTS
PER SHARE DATA (FOR A SHARE OUTSTANDING THROUGHOUT EACH PERIOD)
| INCREASE (DECREASE) FROM INVESTMENT OPERATIONS |
|||||||||||||||||
| PORTFOLIO |
PERIOD ENDED |
NET ASSET VALUE BEGINNING OF PERIOD |
NET INVESTMENT INCOME (LOSS) |
NET REALIZED & UNREALIZED GAIN (LOSS) |
TOTAL FROM INVESTMENT OPERATIONS |
||||||||||||
| AST JPMorgan International Equity |
12/31/04 12/31/03 12/31/02 12/31/01 12/31/00 |
$ |
15.81 12.22 15.07 22.03 34.23 |
$ |
0.22 0.14 0.10 0.08 0.22 |
|
$ |
2.46 3.56 (2.87 (4.75 (8.09 |
) ) ) |
$ |
2.68 3.70 (2.77 (4.67 (7.87 |
) ) ) | |||||
| AST William Blair International Growth |
12/31/04 12/31/03 12/31/02 12/31/01 12/31/00 |
$ |
10.44 7.46 10.39 18.72 25.10 |
$ |
0.06 0.06 0.11 0.12 (0.04 |
) |
$ |
1.62 3.04 (2.71 (3.73 (6.03 |
) ) ) |
$ |
1.68 2.98 (2.60 (3.61 (6.07 |
) ) ) | |||||
| AST LSV International Value |
12/31/04 12/31/03 12/31/02 12/31/01 12/31/00 |
$ |
11.15 8.38 10.10 14.91 24.63 |
$ |
0.13 0.11 0.06 (0.01 (0.07 |
) ) |
$ |
2.19 2.71 (1.78 (4.80 (5.10 |
) ) ) |
$ |
2.32 2.82 (1.72 (4.81 (5.17 |
) ) ) | |||||
| AST MFS Global Equity |
12/31/04 12/31/03 12/31/02 12/31/01 12/31/00 |
$ |
10.25 8.08 9.21 10.23 11.03 |
$ |
0.04 0.02 0.02 — 0.01 |
|
$ |
1.84 2.17 (1.15 (1.02 (0.79 |
) ) ) |
$ |
1.88 2.19 (1.13 (1.02 (0.78 |
) ) ) | |||||
| AST State Street Research Small-Cap Growth |
12/31/04 12/31/03 12/31/02 12/31/01 12/31/00 |
$ |
15.12 10.41 15.87 20.30 42.61 |
$ |
(0.14 (0.09 (0.13 (0.07 (0.22 |
) ) ) ) ) |
$ |
(0.91 4.80 (5.33 (1.27 (18.08 |
) ) ) ) |
$ |
(1.05 4.71 (5.46 (1.34 (18.30 |
) ) ) ) | |||||
| LESS DISTRIBUTIONS |
||||||||||||
| PORTFOLIO |
FROM NET INVESTMENT INCOME |
FROM NET REALIZED GAINS |
TOTAL DISTRIBUTIONS |
|||||||||
| AST JPMorgan International Equity |
$ |
(0.18 (0.11 (0.08 (0.03 (0.07 |
) ) ) ) ) |
$ |
— — — (2.26 (4.26 |
) ) |
$ |
(0.18 (0.11 (0.08 (2.29 (4.33 |
) ) ) ) ) | |||
| AST William Blair International Growth |
$ |
(0.11 — (0.33 (0.82 (0.13 |
) ) ) ) |
$ |
— — — (3.90 (0.18 |
) ) |
$ |
(0.11 — (0.33 (4.72 (0.31 |
) ) ) ) | |||
| AST LSV International Value |
$ |
(0.16 (0.05 — — — |
) ) |
$ |
— — — — (4.55 |
) |
$ |
(0.16 (0.05 — — (4.55 |
) ) ) | |||
| AST MFS Global Equity |
$ |
(0.02 (0.02 — — (0.01 |
) ) ) |
$ |
— — — — (0.01 |
) |
$ |
(0.02 (0.02 — — (0.02 |
) ) ) | |||
| AST State Street Research Small-Cap Growth |
$ |
— — — — — |
|
$ |
— — — (3.09 (4.01 |
) ) |
$ |
— — — (3.09 (4.01 |
) ) | |||
| (1) | Annualized for periods less than one year. |
| (2) | Commenced operations on January 3, 2000. |
| (3) | Commenced operations on May 1, 2000. |
| (4) | Commenced operations on October 23, 2000. |
| (5) | Commenced operations on May 1, 2001. |
| (6) | Commenced operations on May 1, 2002. |
| * | Includes commissions received by American Skandia Marketing, Inc. under the Portfolio’s Distribution Plan, as described in Note 3 to the Financial Statements. |
| ** | These annual total returns do not consider the effect of sales load or insurance contract charges. |
| + | Amount represents less than $.005 per share. |
See Notes to Financial Statements.
318
| SUPPLEMENTAL DATA |
RATIOS OF EXPENSES TO AVERAGE NET ASSETS(1)* |
||||||||||||||||||
| NET ASSET VALUE END OF PERIOD |
TOTAL RETURN** |
NET ASSETS AT (IN 000'S) |
PORTFOLIO TURNOVER RATE |
AFTER ADVISORY AND EXPENSE |
BEFORE ADVISORY AND EXPENSE |
RATIO OF NET INVESTMENT INCOME (LOSS) TO AVERAGE NET ASSETS(1) |
|||||||||||||
| $ |
18.31 15.81 12.22 15.07 22.03 |
17.11 30.60 (18.42 (22.75 (26.53 |
% % )% )% )% |
$ |
379,560 339,039 316,192 444,271 637,131 |
91 50 50 162 86 |
% % % % % |
1.13 1.14 1.21 1.09 1.16 |
% % % % % |
1.13 1.14 1.21 1.14 1.16 |
% % % % % |
1.34 1.02 0.84 0.45 0.63 |
% % % % % | ||||||
| $ |
12.01 10.44 7.46 10.39 18.72 |
16.15 39.95 (25.67 (23.55 (24.62 |
% % )% )% )% |
$ |
1,342,879 641,549 318,832 587,377 1,094,019 |
94 88 94 74 75 |
% % % % % |
1.15 1.24 1.32 1.24 1.18 |
% % % % % |
1.26 1.34 1.32 1.24 1.19 |
% % % % % |
0.31 0.46 0.41 0.64 (0.02 |
% % % % )% | ||||||
| $ |
13.31 11.15 8.38 10.10 14.91 |
21.04 33.91 (17.03 (32.21 (30.28 |
% % )% )% )% |
$ |
193,667 172,059 129,004 154,991 276,037 |
242 138 354 712 514 |
% % % % % |
1.22 1.12 1.34 1.66 1.34 |
% % % % % |
1.37 1.27 1.44 1.60 1.38 |
% % % % % |
1.08 1.22 0.59 (0.07 (0.44 |
% % % )% )% | ||||||
| $ |
12.11 10.25 8.08 9.21 10.23 |
18.39 27.14 (12.26 (9.97 (7.19 |
% % )% )% )% |
$ |
166,319 102,938 60,167 55,882 29,514 |
48 54 74 89 100 |
% % % % % |
1.35 1.40 1.41 1.50 1.56 |
% % % % % |
1.35 1.40 1.41 1.40 1.87 |
% % % % % |
0.41 0.32 0.25 0.02 0.08 |
% % % % % | ||||||
| $ |
14.07 15.12 10.41 15.87 20.30 |
(6.94 45.24 (34.41 (6.47 (48.16 |
)% % )% )% )% |
$ |
226,131 338,191 254,026 494,900 592,038 |
237 107 123 136 85 |
% % % % % |
1.16 1.20 1.23 1.16 1.07 |
% % % % % |
1.16 1.20 1.23 1.16 1.07 |
% % % % % |
(0.87 (0.65 (0.74 (0.51 (0.54 |
)% )% )% )% )% | ||||||
319
AMERICAN SKANDIA TRUST
FINANCIAL HIGHLIGHTS
PER SHARE DATA (FOR A SHARE OUTSTANDING THROUGHOUT EACH PERIOD)
| INCREASE (DECREASE) FROM INVESTMENT OPERATIONS |
||||||||||||||||||
| PORTFOLIO |
PERIOD ENDED |
NET ASSET VALUE BEGINNING OF PERIOD |
NET INVESTMENT INCOME (LOSS) |
NET REALIZED & UNREALIZED GAIN (LOSS) |
TOTAL FROM INVESTMENT OPERATIONS |
|||||||||||||
| AST DeAM Small-Cap Growth |
12/31/04 12/31/03 12/31/02 12/31/01 12/31/00 |
|
$ |
7.63 5.17 7.03 11.72 15.59 |
$ |
(0.06 (0.01 (0.01 (0.05 (0.08 |
) ) ) ) ) |
$ |
0.78 2.47 (1.85 (2.95 (2.90 |
) ) ) |
$ |
0.72 2.46 (1.86 (3.00 (2.98 |
) ) ) | |||||
| AST Federated Aggressive Growth |
12/31/04 12/31/03 12/31/02 12/31/01 12/31/00 |
(4) |
$ |
8.61 5.09 7.22 9.10 10.00 |
$ |
(0.07 (0.05 (0.04 (0.03 0.01 |
) ) ) ) |
$ |
2.03 3.57 (2.05 (1.85 (0.91 |
) ) ) |
$ |
1.96 3.52 (2.09 (1.88 (0.90 |
) ) ) | |||||
| AST Goldman Sachs Small-Cap Value |
12/31/04 12/31/03 12/31/02 12/31/01 12/31/00 |
|
$ |
18.12 12.96 15.55 14.55 10.87 |
$ |
0.11 0.08 0.11 0.08 0.01 |
|
$ |
3.50 5.19 (1.21 1.34 3.67 |
) |
$ |
3.61 5.27 (1.10 1.42 3.68 |
) | |||||
| AST Small-Cap Value |
12/31/04 12/31/03 12/31/02 12/31/01 12/31/00 |
|
$ |
15.70 11.59 13.07 13.02 11.39 |
$ |
0.02 0.01 0.03 0.04 0.10 |
|
$ |
2.56 4.13 (1.23 0.84 2.23 |
) |
$ |
2.58 4.14 (1.20 0.88 2.33 |
) | |||||
| AST DeAM Small-Cap Value |
12/31/04 12/31/03 12/31/02 |
(6) |
$ |
11.10 7.75 10.00 |
$ |
0.03 0.03 0.02 |
|
$ |
2.31 3.33 (2.27 |
) |
$ |
2.34 3.36 (2.25 |
) | |||||
| AST Goldman Sachs Mid-Cap Growth |
12/31/04 12/31/03 12/31/02 12/31/01 12/31/00 |
(3) |
$ |
3.79 2.88 3.97 6.64 10.00 |
$ |
(0.02 (0.01 (0.02 (0.03 0.01 |
) ) ) ) |
$ |
0.64 0.92 (1.07 (2.64 (3.37 |
) ) ) |
$ |
0.62 0.91 (1.09 (2.67 (3.36 |
) ) ) | |||||
| LESS DISTRIBUTIONS |
||||||||||||
| PORTFOLIO |
FROM NET INVESTMENT INCOME |
FROM NET REALIZED GAINS |
TOTAL DISTRIBUTIONS |
|||||||||
| AST DeAM Small-Cap Growth |
$ |
— — — — — |
|
$ |
— — — (1.69 (0.89 |
) ) |
$ |
— — — (1.69 (0.89 |
) ) | |||
| AST Federated Aggressive Growth |
$ |
— — — — — |
+ |
$ |
(0.16 — (0.04 — — |
) ) |
$ |
(0.16 — (0.04 — — |
) ) + | |||
| AST Goldman Sachs Small-Cap Value |
$ |
(0.04 (0.11 (0.06 — — |
) ) ) |
$ |
(0.24 — (1.43 (0.42 — |
) ) ) |
$ |
(0.28 (0.11 (1.49 (0.42 — |
) ) ) ) | |||
| AST Small-Cap Value |
$ |
— (0.03 (0.06 (0.07 (0.07 |
) ) ) ) |
$ |
— — (0.22 (0.76 (0.63 |
) ) ) |
$ |
— (0.03 (0.28 (0.83 (0.70 |
) ) ) ) | |||
| AST DeAM Small-Cap Value |
$ |
(0.02 (0.01 — |
) ) |
$ |
(0.57 — — |
) |
$ |
(0.59 (0.01 — |
) ) | |||
| AST Goldman Sachs Mid-Cap Growth |
$ |
— — — — — |
+ |
$ |
— — — — — |
|
$ |
— — — — — |
+ | |||
| (1) | Annualized for periods less than one year. |
| (2) | Commenced operations on January 3, 2000. |
| (3) | Commenced operations on May 1, 2000. |
| (4) | Commenced operations on October 23, 2000. |
| (5) | Commenced operations on May 1, 2001. |
| (6) | Commenced operations on May 1, 2002. |
| * | Includes commissions received by American Skandia Marketing, Inc. under the Portfolio's Distribution Plan, as described in Note 3 to the Financial Statements. |
| ** | These annual total returns do not consider the effect of sales load or insurance contract charges. |
| + | Amount represents less than $.005 per share. |
See Notes to Financial Statements.
320
| SUPPLEMENTAL DATA |
RATIOS OF EXPENSES TO AVERAGE NET ASSETS(1)* |
||||||||||||||||||
| NET ASSET VALUE END OF PERIOD |
TOTAL RETURN** |
NET ASSETS AT END OF PERIOD (IN 000'S) |
PORTFOLIO TURNOVER RATE |
AFTER ADVISORY AND EXPENSE |
BEFORE ADVISORY AND EXPENSE |
RATIO OF NET INVESTMENT INCOME (LOSS) TO AVERAGE NET ASSETS(1) |
|||||||||||||
| $ |
8.35 7.63 5.17 7.03 11.72 |
9.44 47.58 (26.46 (28.43 (20.95 |
% % )% )% )% |
$ |
340,809 403,430 293,297 537,324 791,839 |
145 185 132 196 136 |
% % % % % |
1.02 1.02 1.00 1.16 1.11 |
% % % % % |
1.17 1.17 1.15 1.17 1.13 |
% % % % % |
(0.66 (0.19 (0.12 (0.64 (0.67 |
)% )% )% )% )% | ||||||
| $ |
10.41 8.61 5.09 7.22 9.10 |
23.07 69.16 (29.19 (20.61 (9.00 |
% % )% )% )% |
$ |
347,733 187,565 39,072 49,489 1,938 |
81 96 250 244 49 |
% % % % % |
1.19 1.22 1.35 1.35 1.35 |
% % % % % |
1.19 1.22 1.38 1.78 7.22 |
% % % % % |
(0.88 (0.99 (1.02 (0.84 2.67 |
)% )% )% )% % | ||||||
| $ |
21.45 18.12 12.96 15.55 14.55 |
20.18 41.08 (7.93 9.91 33.85 |
% % )% % % |
$ |
323,105 343,442 315,101 432,511 227,759 |
61 67 129 159 67 |
% % % % % |
1.22 1.26 1.27 1.18 1.15 |
% % % % % |
1.22 1.26 1.27 1.18 1.15 |
% % % % % |
0.48 0.40 0.62 0.69 (0.13 |
% % % % )% | ||||||
| $ |
18.28 15.70 11.59 13.07 13.02 |
16.44 35.78 (9.38 6.98 21.86 |
% % )% % % |
$ |
922,135 774,416 501,070 538,479 333,586 |
124 26 24 59 88 |
% % % % % |
1.08 1.10 1.10 1.08 1.12 |
% % % % % |
1.08 1.10 1.10 1.08 1.12 |
% % % % % |
0.15 0.04 0.20 0.54 0.87 |
% % % % % | ||||||
| $ |
12.85 11.10 7.75 |
22.11 43.46 (22.50 |
% % )% |
$ |
111,819 51,980 13,419 |
215 193 122 |
% % % |
1.13 1.15 1.15 |
% % % |
1.28 1.36 1.48 |
% % % |
0.47 0.62 0.43 |
% % % | ||||||
| $ |
4.41 3.79 2.88 3.97 6.64 |
16.36 31.60 (27.46 (40.17 (33.60 |
% % )% )% )% |
$ |
276,741 160,549 61,373 71,039 65,098 |
54 59 162 203 55 |
% % % % % |
1.20 1.31 1.31 1.34 1.28 |
% % % % % |
1.32 1.41 1.33 1.34 1.28 |
% % % % % |
(0.48 (0.54 (0.65 (0.63 0.18 |
)% )% )% )% % | ||||||
321
AMERICAN SKANDIA TRUST
FINANCIAL HIGHLIGHTS
PER SHARE DATA (FOR A SHARE OUTSTANDING THROUGHOUT EACH PERIOD)
| INCREASE (DECREASE) FROM INVESTMENT OPERATIONS | ||||||||||||||
| PORTFOLIO |
PERIOD ENDED |
NET ASSET VALUE BEGINNING OF PERIOD |
NET (LOSS) |
NET REALIZED & UNREALIZED |
TOTAL FROM INVESTMENT OPERATIONS | |||||||||
| AST Neuberger Berman Mid-Cap Growth |
12/31/04 12/31/03 12/31/02 12/31/01 12/31/00 |
$ |
12.26 9.39 13.65 21.63 24.03 |
$ |
(0.09) (0.09) (0.13) (0.06) (0.04) |
$ |
2.06 2.96 (4.13) (5.02) (1.74) |
$ |
1.97 2.87 (4.26) (5.08) (1.78) | |||||
| AST Neuberger Berman Mid-Cap Value |
12/31/04 12/31/03 12/31/02 12/31/01 12/31/00 |
$ |
17.80 13.09 15.41 16.85 13.32 |
$ |
0.03 0.02 0.03 0.08 0.02 |
$ |
3.94 4.72 (1.56) (0.60) 3.60 |
$ |
3.97 4.74 (1.53) (0.52) 3.62 | |||||
| AST Alger All-Cap Growth |
12/31/04 12/31/03 12/31/02 12/31/01 12/31/00(2) |
$ |
4.96 3.66 5.70 6.84 10.00 |
$ |
(0.02) (0.02) (0.04) (0.02) — |
$ |
0.44 1.32 (2.00) (1.12) (3.16) |
$ |
0.42 1.30 (2.04) (1.14) (3.16) | |||||
| AST Gabelli All-Cap Value |
12/31/04 12/31/03 12/31/02 12/31/01 12/31/00(4) |
$ |
10.46 7.77 9.86 10.09 10.00 |
$ |
0.04 0.04 0.06 0.04 0.03 |
$ |
1.56 2.72 (2.09) (0.25) 0.06 |
$ |
1.60 2.76 (2.03) (0.21) 0.09 | |||||
| AST T. Rowe Price Natural Resources |
12/31/04 12/31/03 12/31/02 12/31/01 12/31/00 |
$ |
17.45 13.56 15.12 16.50 13.16 |
$ |
0.10 0.12 0.07 0.15 0.17 |
$ |
5.28 4.25 (0.85) (0.04) 3.31 |
$ |
5.38 4.37 (0.78) 0.11 3.48 | |||||
| AST Alliance Growth |
12/31/04 12/31/03 12/31/02 12/31/01 12/31/00 |
$ |
8.35 6.75 9.78 15.15 18.95 |
$ |
(0.01) (0.01) (0.03) (0.02) — |
$ |
0.49 1.61 (3.00) (1.93) (2.24) |
$ |
0.48 1.60 (3.03) (1.95) (2.24) | |||||
| LESS DISTRIBUTIONS | ||||||||||||||
| PORTFOLIO |
FROM NET INVESTMENT INCOME |
FROM NET REALIZED GAINS |
TOTAL DISTRIBUTIONS | |||||||||||
| AST Neuberger Berman Mid-Cap Growth |
$ |
— — — — — |
$ |
— — — (2.90) (0.62) |
$ |
— — — (2.90) (0.62) | ||||||||
| AST Neuberger Berman Mid-Cap Value |
$ |
(0.02) (0.03) (0.08) (0.02) (0.04) |
$ |
(0.45) — (0.71) (0.90) (0.05) |
$ |
(0.47) (0.03) (0.79) (0.92) (0.09) | ||||||||
| AST Alger All-Cap Growth |
$ |
— — — — — |
$ |
— — — — — |
$ |
— — — — — | ||||||||
| AST Gabelli All-Cap Value |
$ |
(0.03) (0.07) (0.06) (0.01) — |
$ |
— — — (0.01) — |
$ |
(0.03) (0.07) (0.06) (0.02) — | ||||||||
| AST T. Rowe Price Natural Resources |
$ |
(0.20) (0.20) (0.24) (0.20) (0.14) |
$ |
— (0.28) (0.54) (1.29) — |
$ |
(0.20) (0.48) (0.78) (1.49) (0.14) | ||||||||
| AST Alliance Growth |
$ |
— — — — — |
$ |
— — — (3.42) (1.56) |
$ |
— — — (3.42) (1.56) | ||||||||
| (1) | Annualized for periods less than one year. |
| (2) | Commenced operations on January 3, 2000. |
| (3) | Commenced operations on May 1, 2000. |
| (4) | Commenced operations on October 23, 2000. |
| (5) | Commenced operations on May 1, 2001. |
| (6) | Commenced operations on May 1, 2002. |
| * | Includes commissions received by American Skandia Marketing, Inc. under the Portfolio's Distribution Plan, as described in Note 3 to the Financial Statements. |
| ** | These annual total returns do not consider the effect of sales load or insurance contract charges. |
| + | Amount represents less than $.005 per share. |
See Notes to Financial Statements.
322
| SUPPLEMENTAL DATA |
RATIOS OF EXPENSES TO AVERAGE NET ASSETS(1)* |
||||||||||||||||||
| NET ASSET VALUE END OF PERIOD |
TOTAL RETURN** |
NET ASSETS AT END OF PERIOD (IN 000'S) |
PORTFOLIO TURNOVER RATE |
AFTER ADVISORY AND EXPENSE |
BEFORE ADVISORY AND EXPENSE |
RATIO OF NET INVESTMENT INCOME (LOSS) TO AVERAGE NET ASSETS |
|||||||||||||
| $ |
14.23 12.26 9.39 13.65 21.63 |
16.07 30.56 (31.21 (25.79 (8.07 |
% % )% )% )% |
$ |
400,553 360,010 287,458 518,580 719,405 |
90 150 104 117 121 |
% % % % % |
1.15 1.17 1.16 1.12 1.09 |
% % % % % |
1.16 1.17 1.16 1.12 1.09 |
% % % % % |
(0.71 (0.83 (0.84 (0.60 (0.55 |
)% )% )% )% )% | ||||||
| $ |
21.30 17.80 13.09 15.41 16.85 |
22.84 36.32 (10.56 (3.03 27.49 |
% % )% )% % |
$ |
1,309,786 1,027,374 760,973 1,003,034 978,649 |
68 70 92 221 220 |
% % % % % |
1.09 1.15 1.16 1.22 1.24 |
% % % % % |
1.05 1.15 1.16 1.22 1.24 |
% % % % % |
0.17 0.15 0.20 0.55 0.19 |
% % % % % | ||||||
| $ |
5.38 4.96 3.66 5.70 6.84 |
8.47 35.52 (35.79 (16.67 (31.60 |
% % )% )% )% |
$ |
334,430 402,505 323,286 743,059 205,079 |
175 159 182 150 123 |
% % % % % |
1.38 1.40 1.29 1.20 1.24 |
% % % % % |
1.38 1.40 1.29 1.20 1.24 |
% % % % % |
(0.34 (0.53 (0.67 (0.37 (0.05 |
)% )% )% )% )% | ||||||
| $ |
12.03 10.46 7.77 9.86 10.09 |
15.32 35.85 (20.71 (2.18 0.90 |
% % )% )% % |
$ |
195,382 181,874 113,557 158,886 14,165 |
27 30 28 68 31 |
% % % % % |
1.21 1.20 1.19 1.20 1.45 |
% % % % % |
1.21 1.20 1.19 1.20 1.59 |
% % % % % |
0.40 0.41 0.63 0.89 2.71 |
% % % % % | ||||||
| $ |
22.63 17.45 13.56 15.12 16.50 |
31.19 33.52 (5.53 0.70 26.79 |
% % )% % % |
$ |
238,089 170,860 122,686 135,550 134,644 |
63 43 56 36 96 |
% % % % % |
1.17 1.17 1.16 1.08 1.14 |
% % % % % |
1.17 1.17 1.16 1.11 1.20 |
% % % % % |
0.49 0.77 0.54 0.85 1.13 |
% % % % % | ||||||
| $ |
8.83 8.35 6.75 9.78 15.15 |
5.75 23.70 (30.98 (14.72 (13.74 |
% % )% )% )% |
$ |
258,135 237,056 240,490 452,984 467,362 |
95 63 59 106 135 |
% % % % % |
1.14 1.16 1.13 1.13 1.16 |
% % % % % |
1.17 1.16 1.13 1.13 1.16 |
% % % % % |
(0.07 (0.14 (0.31 (0.22 (0.46 |
)% )% )% )% )% | ||||||
323
AMERICAN SKANDIA TRUST
FINANCIAL HIGHLIGHTS
PER SHARE DATA (FOR A SHARE OUTSTANDING THROUGHOUT EACH PERIOD)
| INCREASE (DECREASE) FROM INVESTMENT OPERATIONS |
||||||||||||||||||
| PORTFOLIO |
PERIOD ENDED |
NET ASSET VALUE BEGINNING OF PERIOD |
NET INVESTMENT INCOME (LOSS) |
NET REALIZED & UNREALIZED |
TOTAL FROM INVESTMENT OPERATIONS |
|||||||||||||
| AST MFS Growth |
12/31/04 12/31/03 12/31/02 12/31/01 12/31/00 |
|
$ |
7.30 5.94 8.27 10.56 11.30 |
$ |
— (0.01 (0.02 (0.01 0.01 |
) ) ) |
$ |
0.78 1.37 (2.31 (2.28 (0.75 |
) ) ) |
$ |
0.78 1.36 (2.33 (2.29 (0.74 |
) ) ) | |||||
| AST Marsico Capital Growth |
12/31/04 12/31/03 12/31/02 12/31/01 12/31/00 |
|
$ |
15.44 11.72 13.88 18.10 21.63 |
$ |
— (0.02 (0.04 (0.04 (0.01 |
+ ) ) ) ) |
$ |
2.42 3.74 (2.12 (3.84 (3.00 |
) ) ) |
$ |
2.42 3.72 (2.16 (3.88 (3.01 |
) ) ) | |||||
| AST Goldman Sachs Concentrated Growth |
12/31/04 12/31/03 12/31/02 12/31/01 12/31/00 |
|
$ |
20.85 16.71 23.97 35.08 55.21 |
$ |
0.10 (0.05 0.06 0.13 (0.06 |
) ) |
$ |
0.67 4.25 (7.18 (11.24 (15.55 |
) ) ) |
$ |
0.77 4.20 (7.12 (11.11 (15.61 |
) ) ) | |||||
| AST DeAM Large-Cap Value |
12/31/04 12/31/03 12/31/02 12/31/01 12/31/00 |
(4) |
$ |
9.85 7.85 9.30 9.85 10.00 |
$ |
0.11 0.09 0.06 0.01 0.03 |
|
$ |
1.67 1.98 (1.48 (0.55 (0.18 |
) ) ) |
$ |
1.78 2.07 (1.42 (0.54 (0.15 |
) ) ) | |||||
| AST Hotchkis & Wiley Large-Cap Value |
12/31/04 12/31/03 12/31/02 12/31/01 12/31/00 |
|
$ |
14.66 12.55 15.59 17.59 18.65 |
$ |
0.18 0.24 0.30 0.34 0.38 |
|
$ |
2.05 2.18 (2.96 (1.82 0.32 |
) ) |
$ |
2.23 2.42 (2.66 (1.48 0.70 |
) ) | |||||
| LESS DISTRIBUTIONS |
||||||||||||||||||
| PORTFOLIO |
FROM NET INVESTMENT |
FROM NET REALIZED GAINS |
TOTAL DISTRIBUTIONS |
|||||||||||||||
| AST MFS Growth |
$ |
— — — — — |
|
$ |
— — — — — |
|
$ |
— — — — — |
| |||||||||
| AST Marsico Capital Growth |
$ |
— — — — — |
|
$ |
— — — (0.34 (0.52 |
) ) |
$ |
— — — (0.34 (0.52 |
) ) | |||||||||
| AST Goldman Sachs Concentrated Growth |
$ |
— (0.06 (0.14 — (0.07 |
) ) ) |
$ |
— — — — (4.45 |
) |
$ |
— (0.06 (0.14 — (4.52 |
) ) ) | |||||||||
| AST DeAM Large-Cap Value |
$ |
(0.09 (0.07 (0.03 (0.01 — |
) ) ) ) |
$ |
— — — — — |
|
$ |
(0.09 (0.07 (0.03 (0.01 — |
) ) ) ) | |||||||||
| AST Hotchkis & Wiley Large-Cap Value |
$ |
(0.23 (0.31 (0.38 (0.36 (0.36 |
) ) ) ) ) |
$ |
— — — (0.16 (1.40 |
) ) |
$ |
(0.23 (0.31 (0.38 (0.52 (1.76 |
) ) ) ) ) | |||||||||
| (1) | Annualized for periods less than one year. |
| (2) | Commenced operations on January 3, 2000. |
| (3) | Commenced operations on May 1, 2000. |
| (4) | Commenced operations on October 23, 2000. |
| (5) | Commenced operations on May 1, 2001. |
| (6) | Commenced operations on May 1, 2002. |
| * | Includes commissions received by American Skandia Marketing, Inc. under the Portfolio’s Distribution Plan, as described in Note 3 to the Financial Statements. |
| ** | These annual total returns do not consider the effect of sales load or insurance contract charges. |
| + | Amount represents less than $.005 per share. |
See Notes to Financial Statements.
324
| SUPPLEMENTAL DATA |
RATIOS OF EXPENSES TO AVERAGE NET ASSETS(1)* |
||||||||||||||||||
| NET ASSET VALUE END OF PERIOD |
TOTAL RETURN** |
NET ASSETS AT END OF PERIOD (IN 000’S) |
PORTFOLIO TURNOVER RATE |
AFTER ADVISORY AND EXPENSE |
BEFORE ADVISORY AND EXPENSE |
RATIO OF NET INVESTMENT INCOME (LOSS) TO AVERAGE NET ASSETS |
|||||||||||||
| $ |
8.08 7.30 5.94 8.27 10.56 |
10.69 22.90 (28.17 (21.68 (6.53 |
% % )% )% )% |
$ |
534,924 593,307 526,085 974,397 82,051 |
201 262 198 210 243 |
% % % % % |
1.08 1.25 1.18 1.11 1.24 |
% % % % % |
1.11 1.25 1.18 1.11 1.24 |
% % % % % |
0.01 (0.20 (0.28 (0.12 0.08 |
% )% )% )% % | ||||||
| $ |
17.86 15.44 11.72 13.88 18.10 |
15.67 31.74 (15.56 (21.71 (14.25 |
% % )% )% )% |
$ |
2,295,020 1,710,581 1,081,101 1,252,427 1,770,849 |
72 82 109 111 118 |
% % % % % |
1.05 1.10 1.09 1.06 1.04 |
% % % % % |
1.07 1.11 1.10 1.08 1.06 |
% % % % % |
(0.01 (0.21 (0.29 (0.25 (0.09 |
)% )% )% )% )% | ||||||
| $ |
21.62 20.85 16.71 23.97 35.08 |
3.69 25.25 (29.84 (31.67 (30.97 |
% % )% )% )% |
$ |
968,778 1,151,200 1,147,612 2,452,732 4,262,410 |
18 21 109 46 34 |
% % % % % |
1.04 1.06 1.06 1.04 1.00 |
% % % % % |
1.11 1.13 1.09 1.07 1.04 |
% % % % % |
0.43 (0.26 0.23 0.45 (0.13 |
% )% % % )% | ||||||
| $ |
11.54 9.85 7.85 9.30 9.85 |
18.17 26.59 (15.30 (5.53 (1.50 |
% % )% )% )% |
$ |
191,865 133,821 109,994 45,357 6,351 |
189 161 202 134 1 |
% % % % % |
0.99 0.99 1.07 1.35 1.35 |
% % % % % |
1.11 1.09 1.15 1.35 2.41 |
% % % % % |
1.24 1.13 0.96 0.51 3.39 |
% % % % % | ||||||
| $ |
16.66 14.66 12.55 15.59 17.59 |
15.45 19.94 (17.49 (8.59 4.74 |
% % )% )% % |
$ |
636,810 640,112 660,533 1,029,069 1,173,070 |
127 100 32 26 55 |
% % % % % |
0.90 0.98 0.95 0.91 0.94 |
% % % % % |
0.94 0.98 0.95 0.92 0.95 |
% % % % % |
1.05 1.50 1.80 2.17 2.25 |
% % % % % | ||||||
325
AMERICAN SKANDIA TRUST
FINANCIAL HIGHLIGHTS
PER SHARE DATA (FOR A SHARE OUTSTANDING THROUGHOUT EACH PERIOD)
| INCREASE (DECREASE) FROM INVESTMENT OPERATIONS |
|||||||||||||||||
| PORTFOLIO |
PERIOD ENDED |
NET ASSET VALUE BEGINNING OF PERIOD |
NET INVESTMENT INCOME (LOSS) |
NET REALIZED & UNREALIZED |
TOTAL FROM INVESTMENT OPERATIONS |
||||||||||||
| AST Alliance/Bernstein Growth + Value |
12/31/04 12/31/03 12/31/02 12/31/01 |
(5) |
$ |
9.08 7.25 9.71 10.00 |
$ |
0.06 0.03 0.06 0.01 |
$ |
0.85 1.85 (2.47 (0.30 |
) ) |
$ |
0.91 1.88 (2.41 (0.29 |
) ) | |||||
| AST Sanford Bernstein Core Value |
12/31/04 12/31/03 12/31/02 12/31/01 |
(5) |
$ |
11.17 8.77 10.14 10.00 |
$ |
0.12 0.18 0.09 0.04 |
$ |
1.38 2.28 (1.43 0.10 |
) |
$ |
1.50 2.46 (1.34 0.14 |
) | |||||
| AST Cohen & Steers Realty |
12/31/04 12/31/03 12/31/02 12/31/01 12/31/00 |
|
$ |
12.91 10.05 10.11 10.18 8.36 |
$ |
0.41 0.49 0.49 0.50 0.32 |
$ |
4.36 3.02 (0.22 (0.23 1.78 |
) ) |
$ |
4.77 3.51 0.27 0.27 2.10 |
| |||||
| AST Sanford Bernstein Managed Index 500 |
12/31/04 12/31/03 12/31/02 12/31/01 12/31/00 |
|
$ |
10.98 8.75 11.14 12.63 14.96 |
$ |
0.15 0.11 0.11 0.11 0.10 |
$ |
0.94 2.24 (2.39 (1.36 (1.40 |
) ) ) |
$ |
1.09 2.35 (2.28 (1.25 (1.30 |
) ) ) | |||||
| AST American Century Income & Growth |
12/31/04 12/31/03 12/31/02 12/31/01 12/31/00 |
|
$ |
11.95 9.41 11.84 13.02 15.65 |
$ |
0.21 0.15 0.12 0.10 0.07 |
$ |
1.28 2.51 (2.45 (1.19 (1.74 |
) ) ) |
$ |
1.49 2.66 (2.33 (1.09 (1.67 |
) ) ) | |||||
| AST Alliance Growth and Income |
12/31/04 12/31/03 12/31/02 12/31/01 12/31/00 |
|
$ |
17.71 13.57 18.70 21.38 23.50 |
$ |
0.24 0.14 0.18 0.12 0.19 |
$ |
1.70 4.19 (4.35 (0.15 0.57 |
) ) |
$ |
1.94 4.33 (4.17 (0.03 0.76 |
) ) | |||||
|
LESS DISTRIBUTIONS |
||||||||||||
| PORTFOLIO |
FROM NET INVESTMENT |
FROM NET REALIZED GAINS |
TOTAL DISTRIBUTIONS |
|||||||||
| AST Alliance/Bernstein Growth + Value |
$ |
(0.03 (0.05 (0.01 — |
) ) ) |
$ |
— — (0.04 — |
) |
$ |
(0.03 (0.05 (0.05 — |
) ) ) | |||
| AST Sanford Bernstein Core Value |
$ |
(0.15 (0.06 (0.03 — |
) ) ) |
$ |
(0.27 — — — |
) |
$ |
(0.42 (0.06 (0.03 — |
) ) ) | |||
| AST Cohen & Steers Realty |
$ |
(0.32 (0.41 (0.33 (0.34 (0.28 |
) ) ) ) ) |
$ |
(0.19 (0.24 — — — |
) ) |
$ |
(0.51 (0.65 (0.33 (0.34 (0.28 |
) ) ) ) ) | |||
| AST Sanford Bernstein Managed Index 500 |
$ |
(0.10 (0.12 (0.11 (0.11 (0.08 |
) ) ) ) ) |
$ |
— — — (0.13 (0.95 |
) ) |
$ |
(0.10 (0.12 (0.11 (0.24 (1.03 |
) ) ) ) ) | |||
| AST American Century Income & Growth |
$ |
(0.14 (0.12 (0.10 (0.09 (0.08 |
) ) ) ) ) |
$ |
— — — — (0.88 |
) |
$ |
(0.14 (0.12 (0.10 (0.09 (0.96 |
) ) ) ) ) | |||
| AST Alliance Growth and Income |
$ |
(0.13 (0.19 (0.13 (0.19 (0.23 |
) ) ) ) ) |
$ |
— — (0.83 (2.46 (2.65 |
) ) ) |
$ |
(0.13 (0.19 (0.96 (2.65 (2.88 |
) ) ) ) ) | |||
| (1) | Annualized for periods less than one year. |
| (2) | Commenced operations on January 3, 2000. |
| (3) | Commenced operations on May 1, 2000. |
| (4) | Commenced operations on October 23, 2000. |
| (5) | Commenced operations on May 1, 2001. |
| (6) | Commenced operations on May 1, 2002. |
| * | Includes commissions received by American Skandia Marketing, Inc. under the Portfolio’s Distribution Plan, as described in Note 3 to the Financial Statements. |
| ** | These annual total returns do not consider the effect of sales load or insurance contract charges. |
| + | Amount represents less than $.005 per share. |
See Notes to Financial Statements.
326
| SUPPLEMENTAL DATA |
RATIOS OF EXPENSES TO AVERAGE NET ASSETS(1)* |
||||||||||||||||||
| NET ASSET VALUE END OF PERIOD |
TOTAL RETURN** |
NET ASSETS AT END OF PERIOD (IN 000’S) |
PORTFOLIO TURNOVER RATE |
AFTER ADVISORY AND EXPENSE |
BEFORE ADVISORY AND EXPENSE |
RATIO OF NET INVESTMENT INCOME (LOSS) TO AVERAGE NET ASSETS |
|||||||||||||
| $ |
9.96 9.08 7.25 9.71 |
10.07 26.10 (25.00 (2.80 |
% % )% )% |
$ |
77,922 63,837 32,065 34,007 |
37 25 43 95 |
% % % % |
1.22 1.15 1.15 1.35 |
% % % % |
1.22 1.15 1.15 1.45 |
% % % % |
0.66 0.50 0.60 0.46 |
% % % % | ||||||
| $ |
12.25 11.17 8.77 10.14 |
13.92 28.31 (13.24 1.40 |
% % )% % |
$ |
287,484 192,547 199,176 44,100 |
33 90 28 25 |
% % % % |
1.04 1.14 1.00 1.15 |
% % % % |
1.04 1.14 1.00 1.15 |
% % % % |
1.48 1.55 1.63 1.36 |
% % % % | ||||||
| $ |
17.17 12.91 10.05 10.11 10.18 |
37.95 37.43 2.65 2.85 26.19 |
% % % % % |
$ |
423,480 289,502 177,520 139,631 132,486 |
32 34 60 59 59 |
% % % % % |
1.12 1.24 1.26 1.21 1.28 |
% % % % % |
1.23 1.24 1.26 1.21 1.28 |
% % % % % |
3.49 5.43 5.11 5.01 5.21 |
% % % % % | ||||||
| $ |
11.97 10.98 8.75 11.14 12.63 |
9.98 27.32 (20.64 (10.01 (8.82 |
% % )% )% )% |
$ |
561,666 541,492 441,169 623,363 704,897 |
41 45 36 54 84 |
% % % % % |
0.81 0.84 0.84 0.77 0.78 |
% % % % % |
0.81 0.84 0.84 0.78 0.78 |
% % % % % |
1.27 1.03 1.04 0.95 0.84 |
% % % % % | ||||||
| $ |
13.30 11.95 9.41 11.84 13.02 |
12.59 28.78 (19.81 (8.44 (10.77 |
% % )% )% )% |
$ |
453,912 305,810 259,122 374,739 487,880 |
99 81 83 55 61 |
% % % % % |
0.99 0.99 0.98 0.94 0.94 |
% % % % % |
0.99 0.99 0.98 0.94 0.94 |
% % % % % |
1.86 1.46 1.04 0.76 0.68 |
% % % % % | ||||||
| $ |
19.52 17.71 13.57 18.70 21.38 |
11.01 32.43 (23.28 (0.48 5.52 |
% % )% )% % |
$ |
2,152,206 1,836,529 1,169,698 1,875,230 1,595,755 |
50 62 79 103 144 |
% % % % % |
0.90 0.97 0.96 0.94 1.05 |
% % % % % |
0.93 0.99 0.98 0.96 1.06 |
% % % % % |
1.36 1.01 0.99 0.74 0.96 |
% % % % % | ||||||
327
AMERICAN SKANDIA TRUST
FINANCIAL HIGHLIGHTS (CONTINUED)
PER SHARE DATA (FOR A SHARE OUTSTANDING THROUGHOUT EACH PERIOD)
| INCREASE (DECREASE) FROM INVESTMENT OPERATIONS |
||||||||||||||||
| PORTFOLIO |
PERIOD ENDED |
NET ASSET VALUE BEGINNING OF PERIOD |
NET INVESTMENT INCOME (LOSS) |
NET REALIZED & UNREALIZED GAIN (LOSS) |
TOTAL FROM INVESTMENT OPERATIONS |
|||||||||||
| AST DeAM Global Allocation |
12/31/04 12/31/03 12/31/02 12/31/01 12/31/00 |
$ |
11.07 9.38 11.46 13.30 15.24 |
$ |
0.28 0.12 0.11 0.34 0.34 |
$ |
0.94 1.69 (1.84 (1.87 (0.89 |
) ) ) |
$ |
1.22 1.81 (1.73 (1.53 (0.55 |
) ) ) | |||||
| AST American Century Strategic Balanced |
12/31/04 12/31/03 12/31/02 12/31/01 12/31/00 |
$ |
12.92 11.14 12.62 13.70 15.30 |
$ |
0.21 0.18 0.26 0.27 0.32 |
$ |
0.94 1.87 (1.47 (0.78 (0.81 |
) ) ) |
$ |
1.15 2.05 (1.21 (0.51 (0.49 |
) ) ) | |||||
| AST T. Rowe Price Asset Allocation |
12/31/04 12/31/03 12/31/02 12/31/01 12/31/00 |
$ |
15.36 12.74 15.05 18.12 18.86 |
$ |
0.29 0.24 0.34 0.41 0.52 |
$ |
1.40 2.73 (1.76 (1.21 (0.63 |
) ) ) |
$ |
1.69 2.97 (1.42 (0.80 (0.11 |
) ) ) | |||||
| AST T. Rowe Price Global Bond |
12/31/04 12/31/03 12/31/02 12/31/01 12/31/00 |
$ |
12.10 11.10 9.65 9.40 9.60 |
$ |
0.17 0.27 0.05 0.56 0.48 |
$ |
0.81 1.12 1.40 (0.31 (0.53 |
) ) |
$ |
0.98 1.39 1.45 0.25 (0.05 |
) | |||||
| AST Goldman Sachs High Yield |
12/31/04 12/31/03 12/31/02 12/31/01 12/31/00 |
$ |
8.77 7.89 8.86 9.71 11.92 |
$ |
0.70 0.62 0.69 0.74 1.18 |
$ |
0.19 0.95 (0.70 (0.66 (2.23 |
) ) ) |
$ |
0.89 1.57 (0.01 0.08 (1.05 |
) ) | |||||
|
LESS DISTRIBUTIONS |
||||||||||||
| PORTFOLIO |
FROM NET INVESTMENT |
FROM NET REALIZED GAINS |
TOTAL DISTRIBUTIONS |
|||||||||
| AST DeAM Global Allocation |
$ |
(0.13 (0.12 (0.35 (0.31 (0.32 |
) ) ) ) ) |
$ |
— — — — (1.07 |
) |
$ |
(0.13 (0.12 (0.35 (0.31 (1.39 |
) ) ) ) ) | |||
| AST American Century Strategic Balanced |
$ |
(0.18 (0.27 (0.27 (0.25 (0.23 |
) ) ) ) ) |
$ |
— — — (0.32 (0.88 |
) ) |
$ |
(0.18 (0.27 (0.27 (0.57 (1.11 |
) ) ) ) ) | |||
| AST T. Rowe Price Asset Allocation |
$ |
(0.24 (0.35 (0.39 (0.52 (0.45 |
) ) ) ) ) |
$ |
— — (0.50 (1.75 (0.18 |
) ) ) |
$ |
(0.24 (0.35 (0.89 (2.27 (0.63 |
) ) ) ) ) | |||
| AST T. Rowe Price Global Bond |
$ |
(0.72 (0.37 — — (0.15 |
) ) ) |
$ |
(0.20 (0.02 — — — |
) ) |
$ |
(0.92 (0.39 — — (0.15 |
) ) ) | |||
| AST Goldman Sachs High Yield |
$ |
(0.71 (0.69 (0.96 (0.93 (1.16 |
) ) ) ) ) |
$ |
— — — — — |
|
$ |
(0.71 (0.69 (0.96 (0.93 (1.16 |
) ) ) ) ) | |||
| (1) | Annualized for periods less than one year. |
| (2) | Commenced operations on January 3, 2000. |
| (3) | Commenced operations on May 1, 2000. |
| (4) | Commenced operations on October 23, 2000. |
| (5) | Commenced operations on May 1, 2001. |
| (6) | Commenced operations on May 1, 2002. |
| * | Includes commissions received by American Skandia Marketing, Inc. under the Portfolio’s Distribution Plan, as described in Note 3 to the Financial Statements. |
| ** | These annual total returns do not consider the effect of sales load or insurance contract charges. |
| + | Amount represents less than $.005 per share. |
See Notes to Financial Statements.
328
| SUPPLEMENTAL DATA |
RATIOS OF EXPENSES TO AVERAGE NET ASSETS(1)* |
||||||||||||||||||
| NET ASSETS VALUE END OF PERIOD |
TOTAL RETURN** |
NET ASSETS AT END OF PERIOD (IN 000'S) |
PORTFOLIO TURNOVER RATE |
AFTER ADVISORY AND EXPENSE |
BEFORE ADVISORY AND EXPENSE |
RATIO OF NET INVESTMENT INCOME (LOSS) TO AVERAGE NET ASSETS |
|||||||||||||
| $ |
12.16 11.07 9.38 11.46 13.30 |
11.09 19.53 (15.43 (11.73 (4.36 |
% % )% )% )% |
$ |
231,727 264,808 284,362 481,159 622,641 |
93 18 160 77 60 |
% % % % % |
0.14 0.14 0.47 0.89 0.95 |
% % % % % |
0.14 0.14 0.47 0.95 0.95 |
% % % % % |
2.12 1.08 0.91 2.68 2.70 |
% % % % % | ||||||
| $ |
13.89 12.92 11.14 12.62 13.70 |
8.99 18.87 (9.74 (3.80 (3.11 |
% % )% )% )% |
$ |
233,694 235,818 179,368 210,722 217,483 |
218 145 126 124 125 |
% % % % % |
1.09 1.11 1.10 1.08 1.10 |
% % % % % |
1.12 1.11 1.10 1.08 1.10 |
% % % % % |
1.56 1.57 2.16 2.19 2.33 |
% % % % % | ||||||
| $ |
16.81 15.36 12.74 15.05 18.12 |
11.17 24.02 (9.89 (4.79 (0.48 |
% % )% )% )% |
$ |
430,743 360,152 269,119 332,791 395,375 |
83 94 107 103 43 |
% % % % % |
1.07 1.12 1.11 1.10 1.08 |
% % % % % |
1.12 1.12 1.11 1.10 1.08 |
% % % % % |
1.93 1.84 2.37 2.46 2.64 |
% % % % % | ||||||
| $ |
12.16 12.10 11.10 9.65 9.40 |
8.64 12.86 15.03 2.66 (0.45 |
% % % % )% |
$ |
362,017 229,630 209,594 108,014 122,200 |
111 196 323 187 171 |
% % % % % |
1.07 1.06 1.06 0.87 1.12 |
% % % % % |
1.07 1.06 1.06 1.08 1.12 |
% % % % % |
2.58 2.57 3.13 4.83 4.35 |
% % % % % | ||||||
| $ |
8.95 8.77 7.89 8.86 9.71 |
11.08 21.59 0.04 0.14 (9.69 |
% % % % )% |
$ |
804,589 868,511 576,441 525,821 497,882 |
66 65 41 48 20 |
% % % % % |
0.93 0.93 0.94 0.95 0.96 |
% % % % % |
0.93 0.93 0.94 0.95 0.96 |
% % % % % |
7.15 7.56 9.02 10.22 10.36 |
% % % % % | ||||||
329
AMERICAN SKANDIA TRUST
FINANCIAL HIGHLIGHTS (CONTINUED)
PER SHARE DATA (FOR A SHARE OUTSTANDING THROUGHOUT EACH PERIOD)
| INCREASE (DECREASE) FROM INVESTMENT OPERATIONS |
||||||||||||||||||
| PORTFOLIO |
PERIOD ENDED |
NET ASSET VALUE BEGINNING OF PERIOD |
NET INVESTMENT INCOME (LOSS) |
NET REALIZED & UNREALIZED GAIN (LOSS) |
TOTAL FROM INVESTMENT OPERATIONS |
|||||||||||||
| AST Lord Abbett Bond-Debenture |
12/31/04 12/31/03 12/31/02 12/31/01 12/31/00 |
(4) |
$ |
11.44 10.07 10.45 10.15 10.00 |
$ |
0.53 0.44 0.42 0.39 0.02 |
|
$ |
0.29 1.37 (0.39 (0.08 0.13 |
) ) |
$ |
0.82 1.81 0.03 0.31 0.15 |
| |||||
| AST PIMCO Total Return Bond |
12/31/04 12/31/03 12/31/02 12/31/01 12/31/00 |
|
$ |
11.99 12.24 11.93 11.60 10.99 |
$ |
0.23 0.35 0.39 0.56 0.65 |
|
$ |
0.36 0.27 0.66 0.42 0.56 |
|
$ |
0.59 0.62 1.05 0.98 1.21 |
| |||||
| AST PIMCO Limited Maturity Bond |
12/31/04 12/31/03 12/31/02 12/31/01 12/31/00 |
|
$ |
11.37 11.36 11.30 11.07 10.84 |
$ |
0.17 0.22 0.24 0.50 0.68 |
|
$ |
0.06 0.14 0.43 0.36 0.17 |
|
$ |
0.23 0.36 0.67 0.86 0.85 |
| |||||
| AST Money Market |
12/31/04 12/31/03 12/31/02 12/31/01 12/31/00 |
|
$ |
1.00 1.00 1.00 1.00 1.00 |
$ |
0.01 — 0.01 0.04 0.06 |
+ |
$ |
— — — — — |
|
$ |
0.01 — 0.01 0.04 0.06 |
+ | |||||
| LESS DISTRIBUTIONS |
||||||||||||||||||
| PORTFOLIO |
FROM NET INVESTMENT |
FROM NET REALIZED GAINS |
TOTAL DISTRIBUTIONS |
|||||||||||||||
| AST Lord Abbett Bond-Debenture |
$ |
(0.39 (0.44 (0.41 (0.01 — |
) ) ) ) |
$ |
(0.04 — — — — |
) |
$ |
(0.43 (0.44 (0.41 (0.01 — |
) ) ) ) | |||||||||
| AST PIMCO Total Return Bond |
$ |
(0.48 (0.43 (0.52 (0.65 (0.60 |
) ) ) ) ) |
$ |
(0.09 (0.44 (0.22 — — |
) ) ) |
$ |
(0.57 (0.87 (0.74 (0.65 (0.60 |
) ) ) ) ) | |||||||||
| AST PIMCO Limited Maturity Bond |
$ |
(0.35 (0.22 (0.47 (0.63 (0.62 |
) ) ) ) ) |
$ |
(0.13 (0.13 (0.14 — — |
) ) ) |
$ |
(0.48 (0.35 (0.61 (0.63 (0.62 |
) ) ) ) ) | |||||||||
| AST Money Market |
$ |
(0.01 — (0.01 (0.04 (0.06 |
) + ) ) ) |
$ |
— — — — — |
+ + + + |
$ |
(0.01 — (0.01 (0.04 (0.06 |
) + ) ) ) | |||||||||
| (1) | Annualized for periods less than one year. |
| (2) | Commenced operations on January 3, 2000. |
| (3) | Commenced operations on May 1, 2000. |
| (4) | Commenced operations on October 23, 2000. |
| (5) | Commenced operations on May 1, 2001. |
| (6) | Commenced operations on May 1, 2002. |
| * | Includes commissions received by American Skandia Marketing, Inc. under the Portfolio's Distribution Plan, as described in Note 3 to the Financial Statements. |
| ** | These annual total returns do not consider the effect of sales load or insurance contract charges. |
| + | Amount represents less than $.005 per share. |
See Notes to Financial Statements.
330
| . | SUPPLEMENTAL DATA |
RATIOS OF EXPENSES TO AVERAGE NET ASSETS(1)* |
|||||||||||||||||
| NET ASSET VALUE END OF PERIOD |
TOTAL RETURN** |
NET ASSETS AT END OF PERIOD (IN 000'S) |
PORTFOLIO TURNOVER RATE |
AFTER ADVISORY AND EXPENSE |
BEFORE ADVISORY AND EXPENSE |
RATIO OF NET INVESTMENT INCOME (LOSS) TO AVERAGE NET ASSETS |
|||||||||||||
| $ |
11.83 11.44 10.07 10.45 10.15 |
7.42 18.74 0.41 3.04 1.50 |
% % % % % |
$ |
431,513 346,412 164,939 62,456 6,783 |
49 84 43 102 9 |
% % % % % |
0.97 1.04 1.04 1.10 1.20 |
% % % % % |
1.02 1.04 1.04 1.10 3.07 |
% % % % % |
5.15 6.31 7.16 7.23 4.39 |
% % % % % | ||||||
| $ |
12.01 11.99 12.24 11.93 11.60 |
4.96 5.32 9.22 8.87 11.57 |
% % % % % |
$ |
2,318,223 2,107,944 2,255,048 1,638,346 1,258,218 |
253 222 229 343 365 |
% % % % % |
0.78 0.78 0.78 0.79 0.82 |
% % % % % |
0.81 0.80 0.80 0.81 0.82 |
% % % % % |
2.08 2.85 3.90 5.02 6.14 |
% % % % % | ||||||
| $ |
11.12 11.37 11.36 11.30 11.07 |
2.07 3.28 6.21 7.97 8.43 |
% % % % % |
$ |
1,232,820 1,005,924 1,058,843 611,197 417,842 |
103 208 271 445 171 |
% % % % % |
0.79 0.82 0.83 0.83 0.87 |
% % % % % |
0.82 0.82 0.83 0.83 0.87 |
% % % % % |
1.65 1.74 2.87 5.10 6.14 |
% % % % % | ||||||
| $ |
1.00 1.00 1.00 1.00 1.00 |
0.84 0.63 1.29 3.77 6.07 |
% % % % % |
$ |
1,359,188 1,762,117 2,744,716 2,652,093 2,244,193 |
N/A N/A N/A N/A N/A |
|
0.58 0.59 0.58 0.59 0.60 |
% % % % % |
0.63 0.64 0.63 0.64 0.65 |
% % % % % |
0.81 0.63 1.27 3.60 5.93 |
% % % % % | ||||||
331
REPORT OF INDEPENDENT REGISTERED PUBLIC ACCOUNTING FIRM
The Board of Trustees and Shareholders of
American Skandia Trust:
We have audited the accompanying statements of assets and liabilities of the American Skandia Trust (comprised of AST Alger All-Cap Growth Portfolio, AST Alliance Growth and Income Portfolio, AST Alliance Growth Portfolio, AST Alliance/Bernstein Growth + Value Portfolio, AST American Century Income & Growth Portfolio, AST American Century Strategic Balanced Portfolio, AST Cohen & Steers Realty Portfolio, AST DeAM Global Allocation Portfolio, AST LSV International Value Portfolio, AST DeAM Large-Cap Value Portfolio, AST DeAM Small-Cap Value Portfolio, AST DeAM Small-Cap Growth Portfolio, AST Federated Aggressive Growth Portfolio, AST Goldman Sachs High Yield Portfolio, AST Gabelli All-Cap Value Portfolio, AST Small-Cap Value Portfolio, AST Goldman Sachs Concentrated Growth Portfolio, AST Goldman Sachs Mid-Cap Growth Portfolio, AST Goldman Sachs Small-Cap Value Portfolio, AST Hotchkis & Wiley Large-Cap Value Portfolio, AST Lord Abbett Bond-Debenture Portfolio, AST Marsico Capital Growth Portfolio, AST MFS Global Equity Portfolio, AST MFS Growth Portfolio, AST Money Market Portfolio, AST Neuberger Berman Mid-Cap Growth Portfolio, AST Neuberger Berman Mid-Cap Value Portfolio, AST State Street Research Small-Cap Growth Portfolio, AST PIMCO Limited Maturity Bond Portfolio, AST PIMCO Total Return Bond Portfolio, AST Sanford Bernstein Core Value Portfolio, AST Sanford Bernstein Managed Index 500 Portfolio, AST JPMorgan International Equity Portfolio, AST T. Rowe Price Asset Allocation Portfolio, AST T. Rowe Price Global Bond Portfolio, AST T. Rowe Price Natural Resources Portfolio, and AST William Blair International Growth Portfolio, collectively, the "Funds"), including the schedules of investments, as of December 31, 2004, and the related statements of operations for the year then ended, and the statements of changes in net assets and the financial highlights for each of the years in the two-year period then ended. These financial statements and financial highlights are the responsibility of the Funds' management. Our responsibility is to express an opinion on these financial statements and financial highlights based on our audits. The financial highlights for the periods presented through December 31, 2002 were audited by other auditors, whose report dated February 14, 2003, expressed an unqualified opinion thereon.
We conducted our audits in accordance with the standards of the Public Company Accounting Oversight Board (United States). Those standards require that we plan and perform the audits to obtain reasonable assurance about whether the financial statements and financial highlights are free of material misstatement. An audit includes examining, on a test basis, evidence supporting the amounts and disclosures in the financial statements. Our procedures included confirmation of securities owned as of December 31, 2004, by correspondence with custodians and brokers or by other appropriate auditing procedures where replies from brokers were not received. An audit also includes assessing the accounting principles used and significant estimates made by management, as well as evaluating the overall financial statement presentation. We believe that our audits provide a reasonable basis for our opinion.
In our opinion, the financial statements and financial highlights referred to above present fairly, in all material respects, the financial position of the Funds constituting the American Skandia Trust as of December 31, 2004, and the results of its operations for the year then ended, and the changes in its net assets and the financial highlights for each of the years in the two-year period then ended, in conformity with U.S. generally accepted accounting principles.
KPMG LLP
New York, New York
February 9, 2005
332
TAX INFORMATION (UNAUDITED)
For the year ended December 31, 2004, the tax character of the dividends paid was:
| PORTFOLIO |
ORDINARY INCOME |
LONG-TERM CAPITAL GAIN |
TOTAL DIVIDENDS PAID | ||||||
| JPMorgan International Equity |
$ | 3,597,872 | $ | — | $ | 3,597,872 | |||
| William Blair International Growth |
7,604,485 | — | 7,604,485 | ||||||
| LSV International Value |
2,339,322 | — | 2,339,322 | ||||||
| MFS Global Equity |
221,874 | — | 221,874 | ||||||
| Federated Aggressive Growth |
4,045,919 | — | 4,045,919 | ||||||
| Goldman Sachs Small-Cap Value |
696,491 | 4,161,394 | 4,857,885 | ||||||
| Small-Cap Value |
42,814 | — | 42,814 | ||||||
| DeAM Small-Cap Value |
1,486,307 | 1,564,069 | 3,050,376 | ||||||
| Neuberger Berman Mid-Cap Value |
1,190,224 | 26,886,646 | 28,076,870 | ||||||
| Gabelli All-Cap Value |
512,677 | — | 512,677 | ||||||
| T. Rowe Price Natural Resources |
1,843,388 | — | 1,843,388 | ||||||
| DeAM Large-Cap Value |
1,225,279 | — | 1,225,279 | ||||||
| Hotchkis & Wiley Large-Cap Value |
9,262,013 | — | 9,262,013 | ||||||
| Alliance/Bernstein Growth + Value |
229,760 | — | 229,760 | ||||||
| Sanford Bernstein Core Value |
8,247,305 | — | 8,247,305 | ||||||
| Cohen & Steers Realty |
7,684,744 | 4,721,132 | 12,405,876 | ||||||
| Sanford Bernstein Managed Index 500 |
4,631,826 | — | 4,631,826 | ||||||
| American Century Income & Growth |
3,630,621 | — | 3,630,621 | ||||||
| Alliance Growth and Income |
13,715,428 | — | 13,715,428 | ||||||
| DeAM Global Allocation |
2,868,023 | — | 2,868,023 | ||||||
| American Century Strategic Balanced |
3,257,861 | — | 3,257,861 | ||||||
| T. Rowe Price Asset Allocation |
5,760,759 | — | 5,760,759 | ||||||
| T. Rowe Price Global Bond |
16,891,538 | 1,509,137 | 18,400,675 | ||||||
| Goldman Sachs High Yield |
58,039,833 | — | 58,039,833 | ||||||
| Lord Abbett Bond-Debenture |
13,892,148 | — | 13,892,148 | ||||||
| PIMCO Total Return Bond |
85,249,707 | 15,173,281 | 100,422,988 | ||||||
| PIMCO Limited Maturity Bond |
35,683,588 | 5,348,710 | 41,032,298 | ||||||
| Money Market |
16,221,849 | — | 16,221,849 | ||||||
333
Pursuant to Section 854 of the Internal Revenue Code, the following percentages of distributions from ordinary income for the year ended December 31, 2004 have been designated as being eligible for the dividends received deduction available to corporate shareholders:
| CORPORATE DIVIDEND RECEIVED DEDUCTION |
|||
| Goldman Sachs Small-Cap Value |
100 | % | |
| Small-Cap Value |
100 | % | |
| DeAM Small-Cap Value |
23 | % | |
| Neuberger Berman Mid-Cap Value |
100 | % | |
| Gabelli All-Cap Value |
100 | % | |
| T. Rowe Price Natural Resources |
37 | % | |
| DeAM Large-Cap Value |
100 | % | |
| Hotchkis & Wiley Large-Cap Value |
100 | % | |
| Alliance/Bernstein Growth + Value |
100 | % | |
| Sanford Bernstein Core Value |
57 | % | |
| Sanford Bernstein Managed Index 500 |
100 | % | |
| American Century Income & Growth |
100 | % | |
| Alliance Growth and Income |
100 | % | |
| American Century Strategic Balanced |
63 | % | |
| T. Rowe Price Asset Allocation |
21 | % | |
| Lord Abbett Bond-Debenture |
5 | % |
Pursuant to Section 853 of the Internal Revenue Code, the following foreign taxes paid and foreign source income have been designated as being paid in connection with dividends distributed from investment company taxable income for the year ended December 31, 2004:
| FOREIGN TAXES |
FOREIGN SOURCE INCOME | |||
| JPMorgan International Equity |
1,010,973 | 5,448,181 | ||
| MFS Global Equity |
195,582 | 656,903 | ||
| LSV International Value |
479,944 | 3,332,326 | ||
| William Blair International Growth |
1,455,331 | 15,636,435 |
In addition, JP Morgan International Equity designates $853,782 of foreign taxes and $4,451,648 of foreign source income from 2003 investment company taxable income, which was distributed to shareholders in 2004.
334
MANAGEMENT OF THE FUND
(Unaudited)
Information pertaining to the Directors of the Fund is set forth below. Directors who are not deemed to be “interested persons” of the Fund as defined in the Investment Company Act are referred to as “Independent Directors.” Directors who are deemed to be “interested persons” of the Fund are referred to as “Interested Directors.” “Fund Complex” consists of the Fund and any other investment companies managed by PI.
| Name, Address**, and Birthdate |
Position with Fund* Term of Office*** Length of Time Served |
Number of Portfolios In Fund Complex Overseen by Director |
Other Directorships Held by the Director**** | |||
| Saul K. Fenster, Ph.D. (3/22/33) | Director, Since 2003 | 74 | Member (since 2000), Board of Directors of IDT Corporation | |||
| Principal Occupations During Past 5 Years – Currently President Emeritus of New Jersey Institute of Technology (since 2002); formerly President (1978-2002) of New Jersey Institute of Technology; Commissioner (1998-2002) of the Middle States Association Commission on Higher Education; Commissioner (1985-2002) of the New Jersey Commission on Science and Technology; Director (since 1998) of Society of Manufacturing Engineering Education Foundation, Director (since 1995) of Prosperity New Jersey; formerly a director or trustee of Liberty Science Center, Research and Development Council of New Jersey, New Jersey State Chamber of Commerce, and National Action Council for Minorities in Engineering. | ||||||
| Delayne Dedrick Gold (7/15/38) | Director, Since 2003 | 74 | — | |||
| Principal Occupations During Past 5 Years – Marketing Consultant (1982-present); formerly Senior Vice President and Member of the Board of Directors, Prudential Bache Securities, Inc. | ||||||
| Julian A. Lerner (11/12/24) | Director Emeritus, Since 2003 | 74 | — | |||
| Principal Occupations During Past 5 Years – Senior Vice President and Portfolio Manager (1986-1995); AIM Charter Fund and AIM Summit Fund. | ||||||
| W. Scott McDonald, Jr. (4/19/37) | Vice Chairman and Director, Since 2003 | 74 | — | |||
| Principal Occupations During Past 5 Years – Of Counsel (since 2004); formerly Management Consultant (1997-2004) at Kaludis Consulting Group, Inc. (company serving higher education); formerly principal (1995-1997), Scott McDonald & Associates, Chief Operating Officer (1991-1995), Fairleigh Dickinson University, Executive Vice President and Chief Operating Officer (1975-1991), Drew University, interim President (1988-1990), Drew University and former Director of School, College and University Underwriters, Ltd. | ||||||
| Thomas T. Mooney (11/11/41) | Chairman and Director, Since 2003 | 74 | Director (since 1988) of The High Yield Plus Fund, Inc. | |||
| Principal Occupations During Past 5 Years – Chief Executive Officer, the Rochester Business Alliance, formerly President of the Greater Rochester Metro Chamber of Commerce, Rochester City Manager; formerly Deputy Monroe County Executive; Director of Blue Cross of Rochester and Executive Service Corps of Rochester; Director of the Rochester Individual Practice Association; Director of Rural Metro Ambulance Rochester (since 2003); Vice President and Director of Hi-tech of Rochester. | ||||||
| Thomas M. O’Brien (12/5/50) | Director, Since 1992 | 74 | Director (December 1996-May 2000) of North Fork Bancorporation, Inc.; Director (since May 2000) of Atlantic Bank of New York. | |||
| Principal Occupations During Past 5 Years – President and Chief Executive Officer (since May 2000) of Atlantic Bank of New York; Vice Chairman (January 1997-April 2000) of North Fork Bank; President and Chief Executive Officer (December 1984-December 1996) of North Side Savings Bank. | ||||||
| Name, Address**, and Birthdate |
Position with Fund* Term of Office*** Length of Time Served |
Number of Portfolios In Fund Complex Overseen by Director |
Other Directorships Held by the Director**** | |||
| John A. Pileski (9/2/39) | Director, Since 2001 | 74 | Director (since April 2001) of New York Community Bank. | |||
| Principal Occupations During Past 5 Years – Retired since June 2000; Tax Partner (July 1974-June 2000) of KPMG, LLP. | ||||||
| F. Don Schwartz (8/14/35) | Director, Since 1992 | 74 | — | |||
| Principal Occupations During Past 5 Years – Management Consultant (since April 1985). | ||||||
| Interested Directors | ||||||
| Name, Address**, and Birthdate |
Position with Fund* Term of Office*** Length of Time Served |
Number of Portfolios In Fund Complex Overseen by Director |
Other Directorships Held by the Director**** | |||
| *David R. Odenath (3/8/57) | President and Director Since 2003 | 74 | — | |||
| Principal Occupations During Past 5 Years – President of Prudential Annuities (since August 2002); Executive Vice President (since May 2003) of American Skandia Investment Services, Inc; Chief Executive Officer and Director (since May 2003) of American Skandia Life Assurance Corporation, American Skandia Information Services and Technology Corporation and Skandia U.S. Inc.; President, Chief Executive Officer and Director (since May 2003) of American Skandia Marketing, Inc.; Formerly President, Chief Executive Officer, Chief Operating Officer and Officer-In-Charge (1999-2003) of PI; Senior Vice President (since June 1999) of Prudential; formerly Senior Vice President (August 1993-May 1999) of PaineWebber Group, Inc. | ||||||
| *Robert F. Gunia (12/15/46) | Vice President and Director since 2003 | 167 | Vice President and Director (since May 1989) and Treasurer (since 1999) of The Asia Pacific Fund, Inc. | |||
| Principal Occupations During Past 5 Years – Chief Administrative Officer (since June 1999) of Prudential Investments LLC (PI); Executive Vice President and Treasurer (since January 1996) of PI; President (since April 1999) of Prudential Investment Management Services LLC (PIMS); Corporate Vice President (since September 1997) of The Prudential Insurance Company of America (Prudential); Director, Executive Vice President and Chief Administrative Officer (since May 2003) of American Skandia Investment Services, Inc, American Skandia Advisory Services, Inc., and American Skandia Fund Services, Inc.; Executive Vice President (since March 1999) and Treasurer (since May 2000) of Prudential Mutual Fund Services LLC; formerly Senior Vice President (March 1987-May 1999) of Prudential Securities Incorporated (Prudential Securities). | ||||||
| Officers | ||||
| Name, Address**, and Birthdate |
Position with Fund* Term of Office*** Length of Time Served |
Principal Occupations During Past 5 Years | ||
| Grace C. Torres (6/28/59) | Treasurer and Principal Financial and Accounting Officer Since 2003 | Senior Vice President (since January 2000) of PI; Senior Vice President and Assistant Treasurer (since May 2003) of American Skandia Investment Services, Inc. and American Skandia Advisory Services, Inc.; formerly First Vice President (December 1996-January 2000) of PI and First Vice President (March 1993-1999) of Prudential Securities. | ||
| Jonathan D. Shain (8/9/58) | Assistant Secretary Since 2003 | Vice President and Corporate Counsel (since August 1998) of Prudential Insurance; Vice President and Assistant Secretary (since May 2003) of American Skandia Investment Services, Inc. and American Skandia Fund Services, Inc.; formerly Attorney with Fleet Bank, N.A. (January 1997-July 1998). | ||
| Officers | ||||
| Name, Address**, and Birthdate |
Position with Fund* Term of Office*** Length of Time Served |
Principal Occupations During Past 5 Years | ||
| William V. Healey (7/28/53) | Chief Legal Officer Since 2004 | Vice President and Associate General Counsel (since 1998) of Prudential; Executive Vice President and Chief Legal Officer (since February 1999) of Prudential Investments LLC; Senior Vice President, Chief Legal Officer and Secretary (since December 1998) of Prudential Investment Management Services LLC; Executive Vice President and Chief Legal Officer (since February 1999) of Prudential Mutual Fund Services LLC; Vice President and Secretary (since October 1998) of Prudential Investment Management, Inc.; Executive Vice President and Chief Legal Officer (since May 2003) of American Skandia Investment Services, Inc., American Skandia Fund Services, Inc. and American Skandia Advisory Services, Inc.; Director (June 1999-June 2002 and June 2003-present) of ICI Mutual Insurance Company; prior to August 1998, Associate General Counsel of the Dreyfus Corporation (Dreyfus), a subsidiary of Mellon Bank, N.A. (Mellon Bank), and an officer and/or director of various affiliates of Mellon Bank and Dreyfus; Assistant Secretary (since June 2004) of The Asia Pacific Fund, Inc. | ||
| Edward P. Macdonald (7/4/67) | Assistant Secretary Since 2003 | Vice President and Assistant Secretary (since May 2003) of American Skandia Investment Services, Inc.; Chief Counsel, Investment Management of American Skandia, Inc. (ASI) (since July 2002); Senior Counsel, Securities of ASI (September 2000-June 2002); Counsel of ASI (December 1999-August 2000); Senior Associate of Counsel of ASI (April 1999-December 1999); Branch Chief, Senior Counsel and Attorney at the U.S. Securities and Exchange Commission (October 1994-April 1999). | ||
| Lee D. Augsburger (6/7/59) | Chief Compliance Officer Since 2004 | Vice President and Chief Compliance Officer (since May 2003) of PI; Vice President and Chief Compliance Officer (since October 2000) of Prudential Investment Management, Inc.; formerly Vice President and Chief Legal Officer-Annuities (August 1999-October 2000) of Prudential Insurance Company of America; Vice President and Corporate Counsel (November 1997-August 1999) of Prudential Insurance Company of America. | ||
| Maryanne Ryan (10/12/64) | Anti-Money Laundering Compliance Officer Since 2002 |
Vice President, Prudential (since November 1998), First Vice President Prudential Securities (March 1997-May 1998); Anti-Money Laundering Compliance Officer (since 2003) of American Skandia Investment Services, Inc., American Skandia Advisory Services, Inc. and American Skandia Marketing, Inc. | ||
| Helene Gurian (10/25/53) | Acting Anti-Money Laundering Compliance Officer Since 2004 |
Vice President, Prudential (since July 1997). Vice President, Compliance (July 1997-January 2001); Vice President, Compliance and Risk Officer, Retail Distribution (January 2001-May 2002); Vice President, Corporate Investigations (May 2002-present) responsible for supervision of Prudential's fraud investigations, anti-money laundering program and high technology investigation unit. | ||
* “Interested” Director, as defined in the Investment Company Act, by reason of employment with the Manager (as defined below), and/or the Distributor (as defined below).
** Unless otherwise noted, the address of the Directors and Officers is c/o: Prudential Investments LLC, Gateway Center Three, 100 Mulberry Street, Newark, New Jersey 07102.
*** There is no set term of office for Directors and Officers. The Independent Directors have adopted a retirement policy, which calls for the retirement of Directors on December 31 of the year in which they reach the age of 75. The table shows how long they have served as Director and/or Officer.
**** This column includes only directorships of companies required to register, or file reports with the SEC under the Securities Exchange Act of 1934 (i.e., “public companies”) or other investment companies registered under the Investment Company Act.
| American Skandia Life |
PRESORTED STD | |
| Assurance Corporation |
U.S. POSTAGE PAID | |
| Tower One Corporate Drive |
LOUISVILLE KY | |
| Shelton, CT 06484 |
PERMIT 1051 |
Annuities are sold by prospectus, which contains complete information on risk factors, fees and surrender charges, as well as conditions, limitations and terms for keeping it in force that may apply. Your licensed financial professional can provide you with costs and complete details. Annuities are issued by American Skandia Life Assurance Corporation (“American Skandia”) and distributed by American Skandia Marketing Incorporated.
American Skandia is solely responsible for its respective financial conditions and contractual obligations. Guarantees are based on the claims-paying ability of the issuing company. Both companies are located at One Corporate Drive, P.O. Box 883, Shelton, Ct 06484. All are Prudential Financial companies.
B1-1204
Item 2 – Code of Ethics – – See Exhibit (a)
As of the end of the period covered by this report, the registrant has adopted a code of ethics (the “Section 406 Standards for Investment Companies – Ethical Standards for Principal Executive and Financial Officers”) that applies to the registrant’s Principal Executive Officer and Principal Financial Officer; the registrant’s Principal Financial Officer also serves as the Principal Accounting Officer.
The registrant hereby undertakes to provide any person, without charge, upon request, a copy of the code of ethics. To request a copy of the code of ethics, contact the registrant 973-802-6469, and ask for a copy of the Section 406 Standards for Investment Companies - Ethical Standards for Principal Executive and Financial Officers.
Item 3 – Audit Committee Financial Expert –
The registrant’s Board has determined that Mr. John A. Pileski, member of the Board’s Audit Committee is an “audit committee financial expert,” and that he is “independent,” for purposes of this Item.
Item 4 – Principal Accountant Fees and Services –
(a) Audit Fees
For the fiscal years ended December 31, 2004 and December 31, 2003, KPMG LLP (“KPMG”), the Registrant’s principal accountant, billed the Registrant $598,600 and $667,000, respectively, for professional services rendered for the audit of the Registrant’s annual financial statements or services that are normally provided in connection with statutory and regulatory filings.
(b) Audit-Related Fees
None.
(c) Tax Fees
None.
(d) All Other Fees
None.
(e) (1) Audit Committee Pre-Approval Policies and Procedures
THE PRUDENTIAL MUTUAL FUNDS
AUDIT COMMITTEE POLICY
on
Pre-Approval of Services Provided by the Independent Accountants
The Audit Committee of each Prudential Mutual Fund is charged with the responsibility to monitor the independence of the Fund’s independent accountants. As part of this responsibility, the Audit Committee must pre-approve any independent accounting firm’s engagement to render audit and/or permissible non-audit services, as required by law. In evaluating a proposed engagement of the independent accountants, the Audit Committee will assess the effect that the engagement might reasonably be expected to have on the accountant’s independence. The Committee’s evaluation will be based on:
| • | a review of the nature of the professional services expected to be provided, |
| • | a review of the safeguards put into place by the accounting firm to safeguard independence, and |
| • | periodic meetings with the accounting firm. |
Policy for Audit and Non-Audit Services Provided to the Funds
On an annual basis, the scope of audits for each Fund, audit fees and expenses, and audit-related and non-audit services (and fees proposed in respect thereof) proposed to be performed by the Fund’s independent accountants will be presented by the Treasurer and the independent accountants to the Audit Committee for review and, as appropriate, approval prior to the initiation of such services. Such presentation shall be accompanied by confirmation by both the Treasurer and the independent accountants that the proposed services will not adversely affect the independence of the independent accountants. Proposed services shall be described in sufficient detail to enable the Audit Committee to assess the appropriateness of such services and fees, and the compatibility of the provision of such services with the auditor’s independence. The Committee shall receive periodic reports on the progress of the audit and other services which are approved by the Committee or by the Committee Chair pursuant to authority delegated in this Policy.
The categories of services enumerated under “Audit Services”, “Audit-related Services”, and “Tax Services” are intended to provide guidance to the Treasurer and the independent accountants as to those categories of services which the Committee believes are generally consistent with the independence of the independent accountants and which the Committee (or the Committee Chair) would expect upon the presentation of specific proposals to pre-approve. The enumerated categories are not intended as an exclusive list of audit, audit-related or tax services which the Committee (or the Committee Chair) would consider for pre-approval.
Audit Services
The following categories of audit services are considered to be consistent with the role of the Fund’s independent accountants:
| • | Annual Fund financial statement audits |
| • | Seed audits (related to new product filings, as required) |
| • | SEC and regulatory filings and consents |
Audit-related Services
The following categories of audit-related services are considered to be consistent with the role of the Fund’s independent accountants:
| • | Accounting consultations |
| • | Fund merger support services |
| • | Agreed Upon Procedure Reports |
| • | Attestation Reports |
| • | Other Internal Control Reports |
Individual audit-related services that fall within one of these categories and are not presented to the Audit Committee as part of the annual pre-approval process will be subject to pre-approval by the Committee Chair (or any other Committee member on whom this responsibility has been delegated) so long as the estimated fee for those services does not exceed $50,000.
Tax Services
The following categories of tax services are considered to be consistent with the role of the Fund’s independent accountants:
| • | Tax compliance services related to the filing or amendment of the following: |
| • | Federal, state and local income tax compliance; and, |
| • | Sales and use tax compliance |
| • | Timely RIC qualification reviews |
| • | Tax distribution analysis and planning |
| • | Tax authority examination services |
| • | Tax appeals support services |
| • | Accounting methods studies |
| • | Fund merger support services |
| • | Tax consulting services and related projects |
Individual tax services that fall within one of these categories and are not presented to the Audit Committee as part of the annual pre-approval process will be subject to pre-approval by the Committee Chair (or any other Committee member on whom this responsibility has been delegated) so long as the estimated fee for those services does not exceed $50,000.
Other Non-audit Services
Certain non-audit services that the independent accountants are legally permitted to render will be subject to pre-approval by the Committee or by one or more Committee members to whom the Committee has delegated this authority and who will report to the full Committee any pre-approval decisions made pursuant to this Policy. Non-audit services presented for pre-approval
pursuant to this paragraph will be accompanied by a confirmation from both the Treasurer and the independent accountants that the proposed services will not adversely affect the independence of the independent accountants.
Proscribed Services
The Fund’s independent accountants will not render services in the following categories of non-audit services:
| • | Bookkeeping or other services related to the accounting records or financial statements of the Fund |
| • | Financial information systems design and implementation |
| • | Appraisal or valuation services, fairness opinions, or contribution-in-kind reports |
| • | Actuarial services |
| • | Internal audit outsourcing services |
| • | Management functions or human resources |
| • | Broker or dealer, investment adviser, or investment banking services |
| • | Legal services and expert services unrelated to the audit |
| • | Any other service that the Public Company Accounting Oversight Board determines, by regulation, is impermissible. |
Pre-approval of Non-Audit Services Provided to Other Entities Within the Prudential Fund Complex
Certain non-audit services provided to Prudential Investments LLC or any of its affiliates that also provide ongoing services to the Prudential Mutual Funds will be subject to pre-approval by the Audit Committee. The only non-audit services provided to these entities that will require pre-approval are those related directly to the operations and financial reporting of the Funds. Individual projects that are not presented to the Audit Committee as part of the annual pre-approval process, will be subject to pre-approval by the Committee Chair (or any other Committee member on whom this responsibility has been delegated) so long as the estimated fee for those services does not exceed $50,000. Services presented for pre-approval pursuant to this paragraph will be accompanied by a confirmation from both the Treasurer and the independent accountants that the proposed services will not adversely affect the independence of the independent accountants.
Although the Audit Committee will not pre-approve all services provided to Prudential Investments LLC and its affiliates, the Committee will receive an annual report from the Fund’s independent accounting firm showing the aggregate fees for all services provided to Prudential Investments and its affiliates.
(e) (2) Percentage of services referred to in 4(b)- (4)(d) that were approved by the audit committee –
Not applicable.
| (f) | Percentage of hours expended attributable to work performed by other than full time employees of principal accountant if greater than 50%. |
Not applicable.
(g) Non-Audit Fees
Not applicable to Registrant. The aggregate non-audit fees billed by KPMG for services rendered to the registrant’s investment adviser and any entity controlling, controlled by, or under common control with the investment adviser that provides ongoing services to the registrant for the last fiscal year 2004 was $33,500. There were no non-audit fees billed by KPMG for services rendered to the registrant’s investment adviser and any entity controlling, controlled by, or under common control with the investment adviser that provides ongoing services to the registrant for the fiscal year 2003.
(h) Principal Accountants Independence
Not applicable as KPMG has not provided non-audit services to the registrant’s investment adviser and any entity controlling, controlled by, or under common control with the investment adviser that provides ongoing services to the registrant that were not pre-approved pursuant to Rule 2-01(c)(7)(ii) of Regulation S-X.
Item 5 – Audit Committee of Listed Registrants – Not applicable.
Item 6 – Schedule of Investments – The schedule is included as part of the report to shareholders filed under Item 1 of this Form.
Item 7 – Disclosure of Proxy Voting Policies and Procedures for Closed-End Management Investment Companies – Not applicable.
Item 8 – Portfolio Managers of Closed-End Management Investment Companies – Not applicable.
Item 9 – Purchases of Equity Securities by Closed-End Management Investment Company and Affiliated Purchasers – Not applicable.
Item 10 – Submission of Matters to a Vote of Security Holders:
On August 30, 2004, the Board of Trustees adopted the following nominations and communications policy:
Governance Committee: The Governance Committee of the Board of Trustees is responsible for nominating directors and making recommendations to the Board concerning Board composition, committee structure and governance, trustee education, and governance practices. The Board has determined that each member of the Governance Committee is not an “interested person” as defined in the Investment Company Act of 1940.
The Governance Committee Charter is available on the Trust’s website at www.americanskandia.prudential.com.
Selection of Trustee Nominees: The Governance Committee is responsible for considering trustee nominees at such times as it considers electing new trustees to the Board. The Governance Committee may consider recommendations by business and personal contacts of current Board members and by executive search firms which the Committee may engage from time to time and will also consider shareholder recommendations. The Governance Committee has not established specific, minimum qualifications that it believes must be met by a trustee nominee. In evaluating trustee nominees, the Governance Committee considers, among other things, an individual’s background, skills, and experience; whether the individual is an “interested person” as defined in the Investment Company Act of 1940; and whether the individual is would be deemed an “audit committee financial expert” within the meaning of applicable SEC rules. The Governance Committee also considers whether the individual’s background, skills, and experience will complement the background, skills, and experience of other nominees and will contribute to the diversity of the Board. There are no differences in the manner in which the Governance Committee evaluates nominees for trustee based on whether the nominee is recommended by a shareholder.
A shareholder who wishes to recommend a trustee nominee should submit his or her recommendation in writing to the Chair of the Board (Mr. Thomas T. Mooney) or the Chair of the Governance Committee (Mr. Saul K. Fenster, Ph.D.), in either case c/o American Skandia Trust, P.O. Box 13964, Philadelphia, PA 19176. At a minimum, the recommendation should include:
| • | the name, address, and business, educational, and/or other pertinent background of the person being recommended; |
| • | a statement concerning whether the person is an “interested person” as defined in the Investment Company Act of 1940; |
| • | any other information that the Trust would be required to include in a proxy statement concerning the person if he or she was nominated; |
| • | the name and address of the person submitting the recommendation, together with the number of Trust shares held by such person and the period for which the shares have been held. |
The recommendation also can include any additional information which the person submitting it believes would assist the Governance Committee in evaluating the recommendation.
Shareholders should note that a person who owns securities issued by Prudential Financial, Inc. (the parent company of the Trust’s investment adviser) would be deemed an “interested person” under the Investment Company Act of 1940. In addition, certain other relationships with Prudential Financial, Inc. or its subsidiaries, with registered broker-dealers, or with the Trust’s outside legal counsel may cause a person to be deemed an “interested person.”
Before the Governance Committee decides to nominate an individual as a trustee, Committee members and other trustees customarily interview the individual in person. In addition, the individual customarily is asked to complete a detailed questionnaire which is designed to elicit information which must be disclosed under SEC and stock exchange rules and to determine whether the individual is subject to any statutory disqualification from serving as a trustee of a registered investment company.
Shareholder Communications with Trustees: Shareholders of the Trust can communicate directly with the Board of Trustees by writing to the Chair of the Board, c/o American Skandia Trust, P.O. Box 13964, Philadelphia, PA 19176. Shareholders can communicate directly with an individual trustee by writing to that trustee at, American Skandia Trust, P.O. Box 13964, Philadelphia, PA 19176. Such communications to the Board or individual trustees are not screened before being delivered to the addressee.
Item 11 – Controls and Procedures
| (a) | It is the conclusion of the registrant’s principal executive officer and principal financial officer that the effectiveness of the registrant’s current disclosure controls and procedures (such disclosure controls and procedures having been evaluated within 90 days of the date of this filing) provide reasonable assurance that the information required to be disclosed by the registrant has been recorded, processed, summarized and reported within the time period specified in the Commission’s rules and forms and that the information required to be disclosed by the registrant has been accumulated and communicated to the registrant’s principal executive officer and principal financial officer in order to allow timely decisions regarding required disclosure. |
| (b) | There have been no significant changes in the registrant’s internal controls or in other factors that could significantly affect these controls subsequent to the date of their evaluation, including any corrective actions with regard to significant deficiencies and material weaknesses. |
Item 12 – Exhibits
| (a) | Code of Ethics – Attached hereto |
| (b) | Certifications pursuant to Section 302 and 906 of the Sarbanes-Oxley Act – Attached hereto |
SIGNATURES
Pursuant to the requirements of the Securities Exchange Act of 1934 and the Investment Company Act of 1940, the registrant has duly caused this report to be signed on its behalf by the undersigned, thereunto duly authorized.
| (Registrant) American Skandia Trust | ||
| By (Signature and Title)* |
/s/ Jonathan D. Shain | |
| Jonathan D. Shain | ||
| Assistant Secretary | ||
| Date February 18, 2005 | ||
Pursuant to the requirements of the Securities Exchange Act of 1934 and the Investment Company Act of 1940, this report has been signed below by the following persons on behalf of the registrant and in the capacities and on the dates indicated.
| By (Signature and Title)* |
/s/ David R. Odenath | |
| David R. Odenath | ||
| President and Principal Executive Officer | ||
| Date February 18, 2005 | ||
| By (Signature and Title)* |
/s/ Grace C. Torres | |
| Grace C. Torres | ||
| Treasurer and Principal Financial Officer | ||
| Date February 18, 2005 | ||
| * | Print the name and title of each signing officer under his or her signature. |