Table of Contents
UNITED STATES
SECURITIES AND EXCHANGE COMMISSION
Washington, D.C. 20549
FORM N-CSR
CERTIFIED SHAREHOLDER REPORT OF REGISTERED
MANAGEMENT INVESTMENT COMPANIES
Investment Company Act file number: 811-5186
American Skandia Trust
(Exact name of registrant as specified in charter)
| Gateway Center 3, 100 Mulberry Street, Newark, New Jersey |
07102 | |
| (Address of principal executive offices) | (Zip code) |
Marguerite E. H. Morrison
Gateway Center 3,
100 Mulberry Street,
Newark, New Jersey 07102
(Name and address of agent for service)
Registrant’s telephone number, including area code: 973-367-7525
Date of fiscal year end: 12/31/03
Date of reporting period: 12/31/03
Table of Contents
Item 1—Reports to Stockholders—[ INSERT REPORT ]
Table of Contents
AMERICAN SKANDIA LIFE ASSURANCE CORPORATION
VARIABLE ACCOUNT B
VARIABLE ACCOUNT F
Financial Statements
For the Year Ended
December 31, 2003
This report has been prepared to provide information to owners of American Skandia Life Assurance Corporation’s Annuities. Investors should consider the contract and the underlying portfolios’ investment objectives, risks, and charges and expenses carefully before investing. The contract’s prospectus and the underlying portfolios prospectus contain information relating to investment objectives, risks, and charges and expenses as well as other important information. Contact your financial professional for the prospectuses together with the applicable prospectuses for the American Skandia Trust, Gartmore Variable Investment Trust, Wells Fargo Equity Value, Wells Fargo Equity Income, INVESCO Variable Investment Funds, Prudential Series Fund SP Jennison International Growth Portfolio and First Trust 10 Uncommon Values. You should read the prospectuses carefully before investing or sending money.
Past performance does not guarantee future results. The investment return and principal value of an investment will fluctuate so that an investor’s shares, when redeemed, may be worth more or less than their original cost. Current performance may be lower or higher than the performance data quoted.

IFS-2004-A087705
Table of Contents
AMERICAN SKANDIA TRUST
Annual Report
December 31, 2003
Table of Contents
|
|
American Skandia, Inc. One Corporate Drive P.O. Box 883 Shelton, CT 06484-0883 Telephone: (203) 926-1888 |
January 30, 2004
Dear Contract Owner,
The past year presented a welcome change for equity investors. Several years of corporate belt-tightening paid off in a swift upswing in profits when economic growth picked up. Stock prices rose in anticipation of further profitability improvements in 2004. The gradual economic acceleration raised no fears of inflation or industrial bottlenecks, so interest rates stayed low. As a result, bondholders also had a good year.
The year 2003 was noteworthy for Prudential Financial. We successfully joined American Skandia and Prudential Annuities to create a strong, innovative organization. More clients are entrusting their retirement savings to us, and our market share continues to grow. As of September 30, we ranked sixth in advisor-sold variable annuity sales.
Despite this good news, the industry faces a number of challenges. Market timing and late trading have been the subject of attention by the regulators and investment management industry. Please be assured that Prudential Financial takes these issues very seriously. We are committed to protecting the interests of our contract holders.
Thank you for your confidence in our products. We look forward to continuing to serve your investment needs.
Sincerely,

David R. Odenath, Jr.
President,
Prudential Annuities
Annuities are sold by prospectus, which contains complete information on risk factors, fees and surrender charges, as well as conditions, limitations and terms for keeping it in force that may apply. Your licensed financial professional can provide you with costs and complete details. Annuities are issued by American Skandia Life Assurance Corporation (“American Skandia”) and distributed by American Skandia Marketing, Incorporated. American Skandia is solely responsible for its respective financial condition and contractual obligations. Guarantees are based on the claims-paying ability of the issuing company. Both companies are located at One Corporate Drive, P.O. Box 883, Shelton, CT 06484. All are Prudential Financial Companies.
Table of Contents
| I. American Skandia Trust |
||
| Performance Information and Commentary |
1 | |
| Schedules of Investments: |
||
| 45 | ||
| 47 | ||
| 49 | ||
| 53 | ||
| 58 | ||
| 61 | ||
| 65 | ||
| 70 | ||
| 74 | ||
| 79 | ||
| 87 | ||
| 91 | ||
| 94 | ||
| 97 | ||
| 100 | ||
| 103 | ||
| 109 | ||
| 112 | ||
| 115 | ||
| 119 | ||
| 122 | ||
| 124 | ||
| 128 | ||
| 132 | ||
| 135 | ||
| 139 | ||
| 141 | ||
| 146 | ||
| 151 | ||
| 154 | ||
| 158 | ||
| 162 | ||
| 163 | ||
| 171 | ||
| 198 | ||
| 209 | ||
| 222 | ||
| 231 | ||
| 235 | ||
| 244 | ||
| 250 | ||
| 252 | ||
| II. Gartmore Variable Investment Trust-GVIT Developing Markets |
||
| III. Wells Fargo Equity Value |
||
| IV. Wells Fargo Equity Income |
||
| V. INVESCO Variable Investments Funds, Inc. |
||
| VI. Prudential Series Fund SP Jennison International Growth Portfolio |
||
| VII. First Defined-10 Uncommon Values |
||
Table of Contents
Performance Information and Commentary
The following pages present information on the investment performance of each Portfolio, which had been in operation for six months or more at December 31, 2003, including comparisons with relevant market indexes. Commentary by each Portfolio’s sub-advisor regarding its performance and relevant market conditions is also provided.
Explanations of Market Indexes
Balanced Blended Index — The Balanced Blended Index is calculated by weighting the S&P 500 Index at 60% and the Lehman Brothers Aggregate Bond Index at 40%. The Lehman Brothers Aggregate Bond Index is an unmanaged index comprised of more than 5,000 government and corporate bonds.
Blended Index — The Blended Index is calculated by weighting the Russell 3000 Index at 50%, the Lehman Brothers Aggregate Bond Index at 40% and the MSCI EAFE Index at 10%. The Russell 3000 Index is an unmanaged capitalization-weighted index which is comprised of 3,000 of the largest capitalized U.S. domiciled companies whose common stock is traded in the U.S. on the New York Stock Exchange, American Stock Exchange and over-the-counter market.
LB Aggregate Index — The Lehman Brothers Aggregate Bond Index is an unmanaged capitalization-weighted measure of treasury issues, agency issues, corporate bond issues and mortgage securities.
LB Global Aggregate Index — The Lehman Brothers Global Aggregate Bond Index is an unmanaged measure of the global investment grade bond markets and is composed of the U.S. Aggregate Index, Pan European Aggregate Index, Asian-Pacific Aggregate Index and treasury obligations of Australia, Canada and New Zealand.
ML 1-3 Year Index — The Merrill Lynch 1-3 Year Treasury Index is an unmanaged index of treasury issues with maturities ranging from 1-2.99 years.
ML U.S. High Yield Master II Index — The Merrill Lynch U.S. High Yield Master II Index is an unmanaged index of publicly traded non-convertible U.S. bonds rated below investment grade.
MSCI EAFE Index — The Morgan Stanley Capital International Europe, Australasia, Far East Index is an unmanaged capitalization-weighted index generally accepted as a benchmark for major overseas markets.
MSCI World Index — The Morgan Stanley Capital International World Index is an unmanaged capitalization-weighted index which includes the equity markets of Australia, Austria, Belgium, Canada, Denmark, Finland, France, Germany, Hong Kong, Ireland, Italy, Japan, Malaysia, Netherlands, New Zealand, Norway, Singapore, Spain, Sweden, Switzerland, United Kingdom and United States.
NAREIT Index — The NAREIT Equity REIT Index is an unmanaged capitalization-weighted index comprised of all tax-qualifed Real Estate Investment Trusts listed on the New York Stock Exchange, American Stock Exchange and Nasdaq National Market System.
Russell 2000 Index — The Russell 2000 Index is an unmanaged capitalization-weighted index which is comprised of 2,000 of the smallest capitalized U.S. domiciled companies whose common stock is traded in the U.S. on the New York Stock Exchange, American Stock Exchange and over-the-counter market.
1
Table of Contents
Performance Information and Commentary (Continued)
Russell 2000 Growth Index is a market cap-weighted index that measures the performance of those Russell 2000 companies with higher price-to-book ratios and higher forecasted growth values.
SB Extended Market Index — The Salomon Brothers Extended Market Index is an unmanaged capitalization-weighted index of the smallest 20%, based on market capitalization, of all institutionally available non-U.S. stocks.
S&P 500 Index — The Standard & Poor’s 500 Index is an unmanaged capitalization-weighted measure of 500 widely held common stocks listed on the New York Stock Exchange, American Stock Exchange, and over-the-counter market.
S&P MidCap 400 Index is a widely accepted, unmanaged total return index measuring the performance of the mid-size company segment of the U.S. stock market.
All index returns assume reinvestment of dividends and, unlike Portfolio returns, do not reflect any fees or expenses. It is not possible to invest directly in an index.
2
Table of Contents
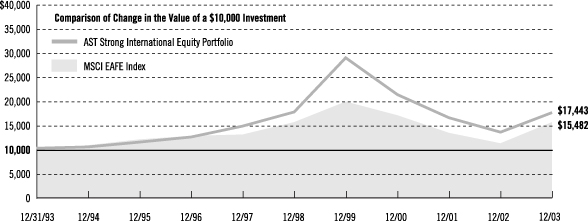
AST Strong International Equity Portfolio
The AST Strong International Equity Portfolio had a total return of 30.60% for the year ended December 31, 2003, compared with a return of 38.59% for the unmanaged MSCI EAFE Index.
All major international equity markets and all global economic sectors enjoyed double-digit gains in U.S. dollars in 2003. Performance was best among emerging markets, where falling interest rates, attractive valuations, and accelerating growth prospects sparked investor sentiment. The Portfolio’s investments in Brazil and Mexico, in particular, were beneficiaries of this trend. Asian markets also posted strong returns, particularly in the second half of the year. The Portfolio’s holdings in the region were focused on beneficiaries of China’s rapid expansion and its positive influence on regional trade and development, as well as corporate restructuring efforts in Japan. The European markets had less dramatic performance in local currencies, reflecting the struggling regional economy. Germany was a notable exception, rebounding more than Europe as a whole, just as it had fallen more in previous years. We increased the Portfolio’s allocation to Germany with an emphasis on companies we believe are poised for a significant earnings recovery in spite of the strong euro.
The strength of key currencies compared to the U.S. dollar was a major factor in the Portfolio’s results. Its balance of currency exposures contributed to the below-benchmark return. Moreover, our international equity investment process emphasizes large-capitalization companies that demonstrate high-quality attributes, including solid balance sheets, consistent growth in earnings, and proven business development strategies. In 2003, however, the greatest returns came to stocks of small-capitalization companies or firms with highly leveraged balance sheets, a history of poor acquisition strategies, and volatile earnings results. Therefore, the Portfolio did not participate fully in the market’s dramatic recovery.
| 1 Year |
5 Year |
10 Year |
||||||||
| AVERAGE ANNUAL TOTAL RETURNS |
30.60 | % | – | 0.14 | % | 5.72 | % | |||
Past performance does not guarantee future results. The investment return and principal value of an investment will fluctuate so that an investor’s shares, when redeemed, may be worth more or less than their original cost. Current performance may be lower or higher than the performance data quoted.
For a complete list of holdings, please refer to the Schedule of Investments section of this report.
The portfolio invests in foreign securities that are subject to the risk of currency fluctuation and the impact of social, political, and economic changes.
3
Table of Contents
AST William Blair International Growth Portfolio
For the year ended December 31, 2003, the AST William Blair International Growth Portfolio had a total return of 39.95%, compared with a return of 38.59% for the unmanaged MSCI EAFE Index.
After bottoming in March, global markets rallied strongly through year-end as economic activity accelerated and the threats of conflict and SARS receded. Global market returns were broadly driven by economic growth prospects: Asian markets, led by China’s boom, performed best, followed by the United States, while Europe lagged significantly. Substantial appreciation of European currencies, the Japanese yen, and even stronger gains by the Australian and Canadian dollars against the U.S. dollar helped the Portfolio’s return. The Portfolio benefited from an allocation favoring the Pacific Rim markets. Japan, Australia, Hong Kong, and other Asian markets were its best-performing areas. Absolute and relative returns also stood out in Canada and Latin America, albeit with smaller portfolio allocations. In terms of economic sectors, technology and consumer cyclicals (including retailing and consumer electronics) were the best contributors. A wide range of holdings benefited from consumer technology purchases of wireless telecommunications devices, digital cameras, flat-panel displays and televisions, notebook computers, and computer printers.
The Portfolio’s best-performing stocks included Research In Motion, producer of the Blackberry wireless device, which made significant progress in solidifying its leadership with new products and distribution deals. Techtronic Industries continued to gain share in the tool market with its Ryobi and Ridgid brands. Christian Dior benefited from strong design momentum and a solid brand portfolio. Nitto Denko, which manufactures largely technology-related materials and chemicals, was another strong performer.

| 1 Year |
5 Year |
Since Inception |
|||||||
| AVERAGE ANNUAL TOTAL RETURNS |
39.95 | % | 1.86 | % | 6.09 | % |
Past performance does not guarantee future results. The investment return and principal value of an investment will fluctuate so that an investor’s shares, when redeemed, may be worth more or less than their original cost. Current performance may be lower or higher than the performance data quoted.
The portfolio invests in foreign securities that are subject to the risk of currency fluctuation and the impact of social, political, and economic changes.
For a complete list of holdings, please refer to the Schedule of Investments section of this report.
4
Table of Contents
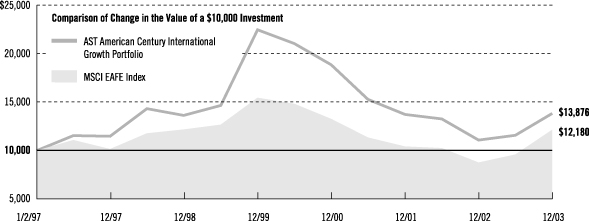
AST American Century International Growth Portfolio
The AST American Century International Growth Portfolio had a total return of 25.01% for the year ended December 31, 2003, compared to a return of 38.59% for the unmanaged MSCI EAFE Index.
The Portfolio’s financial holdings posted the largest contribution to its return, but also detracted most from its performance relative to the MSCI EAFE Index. Bank holdings, which represented the Portfolio’s heaviest average industry-level weighting, drove its gains. For example, France’s Societe Generale, a top-10 holding at the end of the period, made the largest contribution of the bank positions. However, the Portfolio’s lack of Japanese banks proved especially damaging to its relative performance. Japan has some of the world’s largest banks (in terms of assets), but many of them carry billions of dollars in bad debt. The Portfolio was underweight in many of those companies, and its lighter position detracted from its relative performance when the share prices of Japanese banks advanced during the last six months of the year.
Gains in telecommunications came as improving business conditions lifted the stocks of companies that provide mobile-phone service. France Telecom and Vodafone Group were the Portfolio’s top contributors in the group. The Portfolio’s technology stake also advanced, led by holdings in the electrical equipment and semiconductor industries.
Only the industrials sector detracted from the Portfolio’s absolute returns, with the industrial parts industry declining most.
| 1 Year |
5 Year |
Since Inception |
|||||||
| AVERAGE ANNUAL TOTAL RETURNS |
25.01 | % | 0.29 | % | 4.79 | % |
Past performance does not guarantee future results. The investment return and principal value of an investment will fluctuate so that an investor’s shares, when redeemed, may be worth more or less than their original cost. Current performance may be lower or higher than the performance data quoted.
The portfolio invests in foreign securities that are subject to the risk of currency fluctuation and the impact of social, political, and economic changes.
For a complete list of holdings, please refer to the Schedule of Investments section of this report.
5
Table of Contents
AST DeAM International Equity Portfolio
For the year ended December 31, 2003, the AST DeAM International Equity Portfolio had a total return of 33.91%, compared with a return of 38.59% for the unmanaged MSCI EAFE Index and a return of –6.89% for the unmanaged Salomon Brothers Extended Market Index.
The reporting period was one of the strongest 12 months ever for international markets, which performed significantly better than U.S. equities, as measured by the Russell 1000 Index (29.89%). Although the increasing likelihood of war in Iraq threatened to derail gains made early in the year, markets began to rally again in anticipation of a shorter war than had been previously expected. Some central banks moved to increase interest rates, which is usually a reaction to an expected economic acceleration. Together with productivity increases, this led investors to assume that the global recession was ending and to bid share prices higher.
The Portfolio had positive returns in all countries except Luxembourg (a single position). It had average returns above 30% in both the United Kingdom and Japan, its two largest country exposures. In Japan, markets responded favorably to a stabilizing economy and recent economic reforms. The Portfolio’s highest-returning industry exposure was its software stocks. However, the financial sector is by far the largest in the international markets and also in the Portfolio. As a result, bank holdings, taken together, made the largest contribution to the Portfolio’s return.
The largest factors in the Portfolio’s underperformance of the MSCI EAFE Index was its stock selection in the capital goods industry group and in Japan. Its strongest relative performance was in automobiles and components and in Switzerland.

| 1 Year |
5 Year |
Since Inception |
|||||||
| AVERAGE ANNUAL TOTAL RETURNS |
33.91 | % | –0.08 | % | 3.21 | % |
Past performance does not guarantee future results. The investment return and principal value of an investment will fluctuate so that an investor’s shares, when redeemed, may be worth more or less than their original cost. Current performance may be lower or higher than the performance data quoted. Part of the historical performance of the Portfolio is due to purchases of securities sold in Initial Public Offerings (“IPOs”). There is no guarantee that the Portfolio’s investments in IPOs, if any, will continue to have a similar impact on the Portfolio’s performance.
The portfolio invests in foreign securities that are subject to the risk of currency fluctuation and the impact of social, political, and economic changes.
For a complete list of holdings, please refer to the Schedule of Investments section of this report.
6
Table of Contents
AST MFS Global Equity Portfolio
For the year ended December 31, 2003, the AST MFS Global Equity Portfolio had a total return of 27.14%, compared with a return of 33.11% for the unmanaged MSCI World Index.
A global equity rally dominated returns in 2003, enhanced for U.S. investors in overseas stock markets by the decline of the dollar relative to other currencies. Despite a high absolute return, the Portfolio trailed its benchmark. Syngenta and Akzo Nobel were significant detractors. Swiss agricultural chemical firm Syngenta’s earnings were hurt by pricing competition, higher pension fund costs, and a rising euro that lowered the euro value of U.S. sales. Akzo Nobel, a Netherlands-based chemical and pharmaceutical firm, experienced problems with its drug business, and we sold the Portfolio’s position. Positions in industrial gas companies, such as British firm BOC Group and American firm Praxair, generally underperformed the overall market.
French information technology consulting firm Cap Gemini Ernst & Young, was one of the Portfolio’s top-performing individual holdings. We sold the stock when it reached our target price. Retailing and utilities and communications were the Portfolio’s strongest-performing sectors over the period. Strong consumer spending helped our holding in U.K. fashion retailer Next. In the United States, our position in Home Depot benefited from a booming housing market. In utilities and communications, Spanish electric utility Iberdrola, Spanish telecommunications firm Telefonica, and Japanese cellular provider KDDI were strong performers. Iberdrola stock rose as demand for electricity increased while the company continued to lower its cost of production. Telefonica stock benefited from an improving Spanish economy. KDDI did well as the company increased its market share and became more profitable. In the financial services area, Australian insurer QBE Insurance Group, contributed strongly to portfolio performance. The firm, which is the largest corporate member of the Lloyd’s of London syndicate, benefited from improving policy prices over the past couple of years.

| 1 Year |
Since Inception |
|||||
| AVERAGE ANNUAL TOTAL RETURNS |
27.14 | % | 0.69 | % |
Past performance does not guarantee future results. The investment return and principal value of an investment will fluctuate so that an investor’s shares, when redeemed, may be worth more or less than their original cost. Current performance may be lower or higher than the performance data quoted.
The portfolio invests in foreign securities that are subject to the risk of currency fluctuation and the impact of social, political, and economic changes.
For a complete list of holdings, please refer to the Schedule of Investments section of this report.
7
Table of Contents
AST PBHG Small-Cap Growth Portfolio
For the year ended December 31, 2003, the AST PBHG Small-Cap Growth Portfolio had a total return of 45.24%, compared with a return of 47.25% for the unmanaged Russell 2000 Index. Small-cap growth stocks outperformed their value counterparts, as the unmanaged Russell 2000 Growth Index returned 48.54%.
The Portfolio is managed in two parts to manage risk while increasing exposure where we think the opportunities are greatest. A portion of the Portfolio’s assets are managed in an aggressive growth style, where, in 2003, we maintained considerably greater exposure to technology than the Russell 2000 Growth Index. This paid off in several substantial gains. One of the largest contributors to performance was SanDisk Corporation. There continues to be burgeoning demand and very firm pricing for its flash memory devices for consumer electronics. Other strong technology holdings included Omnivision Technologies and Foundry Networks. The performance of the aggressive portion of the Portfolio was hurt by a few healthcare positions, such as Accredo Health and Surmodics, Inc. In 2003, we sold positions in PEC Solutions, Immucor, and Tradestation due to earnings disappointments.
The balance of the Portfolio is managed in a growth-at-a reasonable-price (GARP) style. Its relative performance was hurt by a lack of exposure to the richly valued biotechnology industry. Several new drug approvals spurred strong stock performances. The GARP holdings were also hurt by energy positions. Nonetheless, we continued to increase our weighting to this sector as we believe valuations remain attractive and industry supply fundamentals strong. Some individual positions detracted from the Portfolio’s return, including Atlantic Coast Airlines, a regional carrier that lost its relationship with United Airlines. The stock has since been sold. Some stock selections in the consumer cyclical sector also performed poorly during the period. On the positive side, holdings in asset management benefited from an improving stock market, while some bank holdings also posted strong results.

| 1 Year |
5 Year |
Since Inception |
|||||||
| AVERAGE ANNUAL TOTAL RETURNS |
45.24 | % | 2.25 | % | 7.79 | % |
Past performance does not guarantee future results. The investment return and principal value of an investment will fluctuate so that an investor’s shares, when redeemed, may be worth more or less than their original cost. Current performance may be lower or higher than the performance data quoted.
Investing in small- and medium-size companies may cause the portfolio to be subject to significant price fluctuation and above average risks.
For a complete list of holdings, please refer to the Schedule of Investments section of this report.
8
Table of Contents
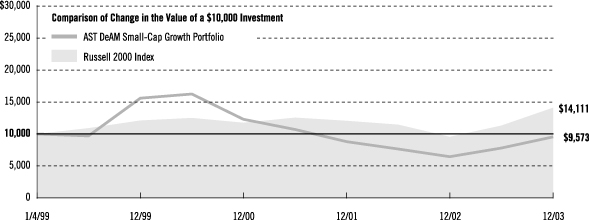
AST DeAM Small-Cap Growth Portfolio
For the year ended December 31, 2003, the AST DeAM Small-Cap Growth Portfolio had a total return of 47.58%, in line with the unmanaged Russell 2000 Index, which returned 47.25%.
Small-cap stocks significantly outperformed large-cap stocks in 2003, although both asset classes posted very strong gains. Performance was mixed over the course of the year as the war in Iraq threatened to derail gains in the market. However, strong economic news and indications from the Federal Reserve that interest rates would remain low fueled the markets.
Stock selection within every industry group in the Portfolio contributed to its performance. Stock selection in technology hardware and equipment made the largest contribution to the Portfolio’s performance. Within that group, a position in Western Digital Corp. made the largest individual contribution to absolute performance. The smallest contribution was made in the insurance industry group, where Proassurance was by far the largest single detractor. The portfolio currently does not hold Proassurance. Overall, the largest individual contribution to both absolute and relative performance was a position in Patina Oil & Gas Co., which returned 94.84% during the year. As of the end of December, 1.25% of the Portfolio’s assets were invested in Patina.
Relative to the Russell 2000 Index stock selection, healthcare equipment and services produced the largest contribution to relative performance, while stock selection in real estate detracted the most from relative performance.
| 1 Year |
Since Inception |
|||||
| AVERAGE ANNUAL TOTAL RETURNS |
47.58 | % | –0.87 | % |
Past performance does not guarantee future results. The investment return and principal value of an investment will fluctuate so that an investor’s shares, when redeemed, may be worth more or less than their original cost. Current performance may be lower or higher than the performance data quoted.
Investing in small- and medium-size companies may cause the portfolio to be subject to significant price fluctuation and above average risks.
For a complete list of holdings, please refer to the Schedule of Investments section of this report.
9
Table of Contents
AST Federated Aggressive Growth Portfolio
For the year ended December 31, 2003, the AST Federated Aggressive Growth Portfolio had a total return of 69.16%, outperforming the return of 47.25% for the unmanaged Russell 2000 Index and the 48.54% gain of the unmanaged Russell 2000 Growth Index.
Small-cap growth stocks had strong performance during 2003 due to investors’ anticipation of a recovering economy and the end of a three-year bear market in equities. Strong security selection in the information technology sector was a primary driver of the Portfolio’s performance. In fact, 12 of the 25 largest contributions to its return were from technology holdings. Positions in Nic Inc., Magma Design Automation, Ecollege, Valueclick, Online Resources, Genus, Lexar Media, Utstarcom, and Arm Holdings rose more than 100% in 2003.
Strong security selection in the consumer discretionary sector also contributed to the Portfolio’s outperformance of the Russell 2000 Growth Index. Positions in this sector included 5 of the top 25 contributing stocks. Gains above 50% by Advance Auto Parts, Central European Media, Monro Muffler & Brake, Carmax, and Sky Perfect Communications contributed strongly to returns.
With our bottom-up fundamental security selection process, we continue to find attractive small-cap investment opportunities—companies that are dominant competitors and that have strengthening fundamentals for both near-term and long-term growth in sales and earnings. We believe that such strong growth companies, if purchased at reasonable prices, will provide investors with superior returns over the long term.

| 1 Year |
Since Inception |
|||||
| AVERAGE ANNUAL TOTAL RETURNS |
69.16 | % | –4.38 | % |
Past performance does not guarantee future results. The investment return and principal value of an investment will fluctuate so that an investor’s shares, when redeemed, may be worth more or less than their original cost. Current performance may be lower or higher than the performance data quoted.
Investing in small- and medium-size companies may cause the portfolio to be subject to significant price fluctuation and above average risks.
For a complete list of holdings, please refer to the Schedule of Investments section of this report.
10
Table of Contents
AST Goldman Sachs Small-Cap Value Portfolio
For the year ended December 31, 2003, the AST Goldman Sachs Small-Cap Value Portfolio had a total return of 41.08%, trailing the return of 47.25% for the unmanaged Russell 2000 Index. During the year small-cap value stocks underperformed small-cap growth.
The first quarter of 2003 was volatile, as investors dealt with conflicting economic reports and the start of the war in Iraq. Most major corporations remained fiscally restrained in anticipation of the continued low demand environment. In the second, third and fourth quarters, the U.S. equity market rallied sharply due to easing geopolitical concerns, a marked shift in investor sentiment, and an improved economic backdrop. While the gains were broad based, the largest returns were found in both highly speculative and smaller-cap areas. Investors seemed optimistic that an improving economy would further stimulate demand for U.S. products and services. During the year, the Portfolio’s holdings in industrials and basic materials generated the best results from a sector standpoint. Examples of strong performers in the industrial area included Wabash (1.8% of the Portfolio), GrafTech (1.0%), and Hughes Supply (1.2%). Within Basic Materials, the Portfolio benefited substantially from its investments in Commercial Metals (1.2%) and Caraustar Industries (1.4%). Commercial Metals is well positioned due to its diversified profit mix (the company has exposure to both steel and scrap steel) and its ability to create greater cash flow stability in very cyclical industries. The largest detractors from performance included Tropical Sportswear (0.1%), Too Inc. (0.3%), also retailers, which suffered due to the necessity for heavy markdowns in order to clear spring merchandise.

| 1 Year |
5 Year |
Since Inception |
|||||||
| AVERAGE ANNUAL TOTAL RETURNS |
41.08 | % | 15.77 | % | 12.97 | % |
Past performance does not guarantee future results. The investment return and principal value of an investment will fluctuate so that an investor’s shares, when redeemed, may be worth more or less than their original cost. Current performance may be lower or higher than the performance data quoted.
Investing in small- and medium-size companies may cause the portfolio to be subject to significant price fluctuation and above average risks.
For a complete list of holdings, please refer to the Schedule of Investments section of this report.
11
Table of Contents
AST Gabelli Small-Cap Value Portfolio
For the year ended December 31, 2003, the AST Gabelli Small-Cap Value Portfolio had a total return of 35.78%, compared with a return of 47.25% for the unmanaged Russell 2000 Index and 46.03% for the unmanaged Russell 2000 Value Index.
The end of large-scale fighting in Iraq, the fiscal stimulus package, low interest rates, and low inflation combined to bring about economic recovery. Earnings began to exceed expectations and investors drove stock prices up through the end of the year. Small-capitalization stocks had outperformed large caps throughout the recent three-year bear market, and continued to do so during 2003. More than 10% of our holdings enjoyed share-price increases in excess of 100%. Six of these were small wireless telecommunication service providers, which rose an average of 376%. We expect consolidation in this industry to lift the prices of some acquisition targets.
Another theme that has born fruit is the aging population in the United States. As baby boomers live longer and grow older, we expect more money to be spent on dental supplies and services, and on orthopedics, including joint replacements. Our nine holdings in these areas rose an average of 98%. Our significant weightings in both the industrial, and broadcast and cable sectors, served us well. Expectations of a pick up in merger and acquisition activity drove prices up, particularly among the smaller firms. In the absence of inflation, larger firms can find it difficult to raise prices and try to “buy sales and earnings” instead.
Our traditional underweighting in technology and financials tempered our results somewhat, but was partially offset by our overallocation to the consumer discretionary and industrial sectors.

| 1 Year |
5 Year |
Since Inception |
|||||||
| AVERAGE ANNUAL TOTAL RETURNS |
35.78 | % | 10.04 | % | 9.27 | % |
Past performance does not guarantee future results. The investment return and principal value of an investment will fluctuate so that an investor’s shares, when redeemed, may be worth more or less than their original cost. Current performance may be lower or higher than the performance data quoted.
Investing in small- and medium-size companies may cause the portfolio to be subject to significant price fluctuation and above average risks.
For a complete list of holdings, please refer to the Schedule of Investments section of this report.
12
Table of Contents
AST DeAM Small-Cap Value Portfolio
For the year ended December 31, 2003, the AST DeAM Small-Cap Value Portfolio had a total return of 43.46%, compared with a return of 47.25% for the unmanaged Russell 2000 Index.
Small-cap stocks significantly outperformed large-cap stocks in 2003, although both asset classes posted very strong gains. Although value stocks trailed growth stocks slightly among small caps, returns of both were quite high. Performance was mixed over the course of the year as the war in Iraq threatened to derail gains in the market. However, strong economic news and indications from the Federal Reserve that interest rates would remain low fueled the markets.
The Portfolio’s bank holdings produced the largest contribution to its return, adding more than six percentage points. Bank stocks have a large weight in the Portfolio (and the Russell 2000 Index), and our holdings returned 46.55% for the period. Selection among technology hardware and equipment stocks also led to significant positive performance. The Portfolio’s holdings of these stocks returned 89.62% for the year and contributed almost five percentage points of return. Automobiles and components was the only industry group in which the Portfolio’s holdings detracted from its absolute return.
In terms of performance relative to the broad Russell 2000 Index, stock selection in the bank industry added most. Flagstar Bankcorp returned over 100% for the year, and the Portfolio, on average, held an overweight in the stock. As of the end of the year, it still held a small position. The Portfolio’s holdings in pharmaceuticals and biotechnology detracted most from its relative performance. For example, it did not hold ImClone, which rebounded sharply after a steep fall in 2002.

| 1 Year |
Since Inception |
|||||
| AVERAGE ANNUAL TOTAL RETURNS |
43.46 | % | 6.56 | % |
Past performance does not guarantee future results. The investment return and principal value of an investment will fluctuate so that an investor’s shares, when redeemed, may be worth more or less than their original cost. Current performance may be lower or higher than the performance data quoted.
Investing in small-size companies may cause the portfolio to be subject to significant price fluctuation and above average risks.
For a complete list of holdings, please refer to the Schedule of Investments section of this report.
13
Table of Contents
AST Goldman Sachs Mid-Cap Growth Portfolio
For the year ended December 31, 2003, the AST Goldman Sachs Mid-Cap Growth Portfolio had a total return of 31.60%, underperforming the unmanaged S&P MidCap 400 Index, which returned 35.62%.
The first quarter of 2003 was volatile, as investors dealt with conflicting economic reports and the start of the war in Iraq. Most major corporations remained fiscally restrained in anticipation of the continued low demand environment. In the second, third, and fourth quarters, the U.S. equity market rallied sharply due to easing geopolitical concerns, a marked shift in investor sentiment, and an improved economic backdrop.
While the gains were broad based, the largest returns were found in both highly speculative and smaller-cap areas. Investors seem optimistic that an improving economy will further stimulate demand for U.S. products and services. During the year, strong stock selection in the media and consumer discretionary sectors added to returns while weak stock selection and underweights in technology and healthcare detracted from performance. Media companies have suffered during the period from geopolitical and economic turmoil, but have recently shown signs of recovery. Echostar Communications (1.7% of the Portfolio), Cablevision Systems Corp. (1.4%), and Univision Communications (1.8%) were among the top contributors since inception. Performance in healthcare and technology suffered because we did not own many of the more aggressive, speculative stocks that have suffered the most over the last few years, but led the most recent rally. Intuit (0.9%) was one of the biggest detractors in the period due to a disappointing tax season and missed earnings targets.

| 1 Year |
Since Inception |
|||||
| AVERAGE ANNUAL TOTAL RETURNS |
31.60 | % | –23.23 | % |
Past performance does not guarantee future results. The investment return and principal value of an investment will fluctuate so that an investor’s shares, when redeemed, may be worth more or less than their original cost. Current performance may be lower or higher than the performance data quoted.
Investing in medium-size companies may cause the portfolio to be subject to significant price fluctuation and above average risks.
For a complete list of holdings, please refer to the Schedule of Investments section of this report.
14
Table of Contents
AST Neuberger Berman Mid-Cap Growth Portfolio
The AST Neuberger Berman Mid-Cap Growth Portfolio had a total return of 30.56% for the year ended December 31, 2003, underperforming the 36.14% gain of the unmanaged S&P Midcap 400 Index and the 42.71% rise of the unmanaged Russell Mid-Cap Index.
The Portfolio’s industrial, telecommunications, and energy holdings made the largest contributions to its return in 2003. Although one of the weaker performing sectors in terms of absolute return, the Portfolio’s energy positions improved its performance as compared with the Russell Midcap Growth Index because we focused on companies such as Murphy Oil and XTO Energy that either had the ability to increase their reserves or that were involved in oil and gas production. An underweight in the consumer staples sector, which was among the market’s weaker sectors, also contributed to relative performance.
The Portfolio’s overweight in information technology, one of the strongest performing sectors, added to its relative performance, and three of the five largest contributions to its return were from stocks in the technology sector. However, overall stock selection within the sector hurt the Portfolio’s relative performance. The Portfolio held stocks of technology firms that we believed would have performed well if technology spending hadn’t improved significantly. When the market moved sharply upward in April and May, the defensive nature of these technology holdings led them to fall behind. This was the largest factor in the Portfolio’s underperformance. In May, we began repositioning the Portfolio in response.

| 1 Year |
5 Year |
Since Inception |
||||||||
| AVERAGE ANNUAL TOTAL RETURNS |
30.56 | % | – | 1.49 | % | 7.13 | % | |||
Past performance does not guarantee future results. The investment return and principal value of an investment will fluctuate so that an investor’s shares, when redeemed, may be worth more or less than their original cost. Current performance may be lower or higher than the performance data quoted.
Investing in small- and medium-size companies may cause the portfolio to be subject to significant price fluctuation and above average risks.
For a complete list of holdings, please refer to the Schedule of Investments section of this report.
15
Table of Contents
AST Neuberger Berman Mid-Cap Value Portfolio
The AST Neuberger Berman Mid-Cap Value Portfolio had a total return of 36.32% for the year ended December 31, 2003, compared to a return of 35.62% for the unmanaged S&P MidCap 400 Index. Mid-cap value stocks outperformed their growth counterparts, with the unmanaged Russell Midcap Value Index returning 38.07%.
The Portfolio’s holdings in the consumer discretionary and financial sectors made the largest absolute contributions to its return, but sizable contributions also came from its holdings in the healthcare, energy, industrial, and information technology sectors.
In comparison to the Russell Midcap Value Index, its performance was helped by strong stock selection in the consumer discretionary and energy sectors, but its holdings in the healthcare and financial sectors, as well as a substantial underweighting in technology, led to its underperformance of the Index. We drastically reduced the Portfolio’s technology weighting in May, when we sold several holdings as they approached our valuation targets. Since then, we have simply been unable to find many quality companies at valuations not already reflecting highly optimistic assumptions about earnings growth.
In the financials sector, some of the Portfolio’s regional bank positions produced solid returns, but not as high as those of more credit- and capital-markets sensitive companies. However, we have confidence in regional banks and continue to own, in our opinion, some of the best-managed. We think they have more predictable earnings streams, more transparent balance sheets, and lower P/E ratios than capital-market and credit-sensitive financial stocks. Our insurance holdings also detracted from relative performance, despite excellent business fundamentals. They have displayed strong earnings and premium growth, favorable pricing, and high profitability. Our healthcare holdings also did well but lagged the healthcare sector of the Russell Midcap Value Index.

| 1 Year |
5 Year |
10 Year |
|||||||
| AVERAGE ANNUAL TOTAL RETURNS |
36.32 | % | 9.76 | % | 9.92 | % |
Past performance does not guarantee future results. The investment return and principal value of an investment will fluctuate so that an investor’s shares, when redeemed, may be worth more or less than their original cost. Current performance may be lower or higher than the performance data quoted.
Investing In small- and medium-size companies may cause the portfolio to be subject to significant price fluctuation and above average risks.
For a complete list of holdings, please refer to the Schedule of Investments section of this report.
16
Table of Contents
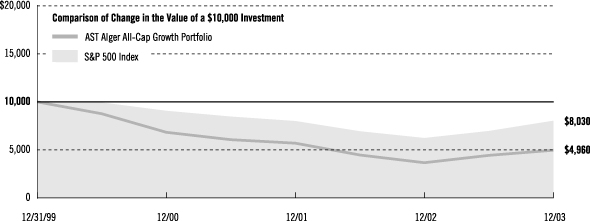
AST Alger All-Cap Growth Portfolio
For the year ended December 31, 2003, the AST Alger All-Cap Growth Portfolio had a total return of 35.52%, significantly outperforming the 28.67% gain of the unmanaged S&P 500 Index.
The Portfolio outperformed its S&P 500 benchmark in 2003 because of our solid security selection in the healthcare and financials sectors and an overweighting in the strong information technology (IT) sector. At the stock level, eBay Inc., Yahoo! Inc., and Broadcom Corp. contributed most positively to Portfolio performance throughout 2003. We have long been proponents of ebay because of its huge market opportunity and truly unique and highly scaleable business model. In regards to Yahoo!, we felt that its new “Pay-for-Performance” pricing plan for advertising would prove to be very attractive and drive significant increases in its revenues. Broadcom has been benefiting from increased broadband access spending in Asia and North America. As for stocks that had a negative impact on the Portfolio, positions in Biogen Inc., Advanced Fibre Communications Inc., and Brocade Communications Systems Inc. detracted most from Portfolio value during the year.
Currently, the Portfolio is well positioned, with IT and healthcare representing the top two sectors. Our bullish outlook in the technology sector is rooted in the belief that tech corporate profits are recovering and IT spending is beginning to pick up. In addition, the technology sector has cut costs and increased its leverage substantially over the past few years. Within healthcare, we are especially excited about prospects within pharmaceuticals and biotechnology. We are expecting 30 new drug approvals in 2004 from an extremely accommodative U.S. Food and Drug Administration.
| 1 Year |
Since Inception |
|||||
| AVERAGE ANNUAL TOTAL RETURNS |
35.52 | % | –16.08 | % |
Past performance does not guarantee future results. The investment return and principal value of an investment will fluctuate so that an investor’s shares, when redeemed, may be worth more or less than their original cost. Current performance may be lower or higher than the performance data quoted.
Investing in small- and medium-size companies may cause the portfolio to be subject to significant price fluctuation and above average risks.
For a complete list of holdings, please refer to the Schedule of Investments section of this report.
17
Table of Contents
AST Gabelli All-Cap Value Portfolio
For the year ended December 31, 2003, the AST Gabelli All-Cap Value Portfolio had a total return of 35.85%, compared with a return of 28.67% for the unmanaged S&P 500 Index.
Many positions contributed to the Portfolio’s strong return in 2003. Cablevision (+40%) focused on reducing the debt on its balance sheet and is nearly at the point where it could realistically contemplate paying a dividend. Its management is committed to focus on the company’s core cable business. At Time Warner (+37%), new chairman Richard Parsons eliminated more than $6 billion of debt and refocused the company.
Mergers and acquisition activity has picked up again, and the Portfolio’s return benefited from some of these deals, including the purchase of SPS Technologies (+122%) by Precision Cast Parts. It also gained from the hostile bid for Dana Corporation (+56%) by ArvinMeritor. While ArvinMeritor ultimately dropped its bid, Dana took steps to recognize its underlying value by selling its aftermarket operation. Dana has transformed itself into an attractive purchase for investors who want a company solely exposed to the market for original equipment manufacturing (OEM) parts.
In 2003, Chemed (+30%) changed its name to Roto Rooter and bought the portion of Vitas Healthcare that it didn’t own. Roto Rooter plans to divest Vitas in a public offering as soon as possible. Young Broadcasting (+52%), which owns 11 television stations, is expected to benefit when the limit on the number of television stations under one owner is loosened, allowing Young to sell its San Francisco station.

| 1 Year |
Since Inception |
|||||
| AVERAGE ANNUAL TOTAL RETURNS |
35.85 | % | 1.94 | % |
Past performance does not guarantee future results. The investment return and principal value of an investment will fluctuate so that an investor’s shares, when redeemed, may be worth more or less than their original cost. Current performance may be lower or higher than the performance data quoted.
Investing in small- and medium-size companies may cause the portfolio to be subject to significant price fluctuation and above average risks.
For a complete list of holdings, please refer to the Schedule of Investments section of this report.
18
Table of Contents
AST T. Rowe Price Natural Resources Portfolio
The AST T. Rowe Price Natural Resources Portfolio had a total return of 33.52% for the year ended December 31, 2003, significantly outperforming the broad-based unmanaged S&P 500 Index, which returned 28.67%.
U.S. stocks rose in 2003, and several major indexes finished the year at their highest levels in nearly two years. The global recovery, and especially the strong growth in China, increased demand throughout the year, driving commodity prices higher. The Portfolio’s overweights in the precious, non-ferrous, and diversified metals sectors were the top contributors to its relative performance. An underweight in the weaker oil and gas drilling sector also contributed to relative results.
The best-performing industries in the Portfolio in terms of absolute return were commodity-linked investments, especially precious metals holdings. Metals stocks were top contributors as higher commodity prices and a weaker dollar allowed companies with U.S. operations to improve their positions. Our top contributor, Phelps Dodge, rose more than 140% for the year on rising copper prices. Inco and Norilsk Nickel rose sharply as nickel prices surged. Fertilizer maker Agrium was another top contributor, benefiting from increased demand for ammonia in China. We eliminated some poor performers from the Portfolio, including Great Lakes Chemicals and El Paso.
In our view, the combination of the Federal Reserve’s accommodative interest-rate policy and government tax cuts should allow for continued economic expansion, although at the price of rising inflation. We expect resource demand to be boosted by the growth of emerging economies and the recovery of the developed world.

| 1 Year |
5 Year |
Since Inception |
|||||||
| AVERAGE ANNUAL TOTAL RETURNS |
33.52 | % | 15.58 | % | 12.30 | % |
Past performance does not guarantee future results. The investment return and principal value of an investment will fluctuate so that an investor’s shares, when redeemed, may be worth more or less than their original cost. Current performance may be lower or higher than the performance data quoted.
The portfolio may invest in foreign securities that are subject to the risk of currency fluctuation and the impact of social, political, and economic changes. The portfolio focuses its investments in one sector, thereby increasing its vulnerability to any single economic, political or regulatory development.
For a complete list of holdings, please refer to the Schedule of Investments section of this report.
19
Table of Contents
AST Alliance Growth Portfolio
For the year ended December 31, 2003, the AST Alliance Growth Portfolio had a total return of 23.70%, underperforming the return of 28.67% for the unmanaged S&P 500 Index and 29.75% for the unmanaged Russell 1000 Growth Index.
The Portfolio’s performance relative to the Russell 1000 Growth Index was positively affected by favorable stock selection and an underweight position in the healthcare sector. Amgen, Boston Scientific, Pfizer*, UnitedHealth Group, and Wyeth* all were notable outperformers in this sector. The Portfolio’s consumer staples holdings were among the market’s poorest-performing sectors and its underweight in the sector served relative performance well. Unfavorable stock selection detracted from performance in both the producer durables and utilities sectors.
In the technology sector, lower-quality stocks with uncertain earnings surged during 2003. The Portfolio’s positions, which focused on high-quality growth stocks, lagged the technology stocks in the Russell 1000 Growth Index. An underweight in technology also detracted from relative performance. Peoplesoft* and EMC positions were among those most responsible for underperformance in this sector. Strong performance, particularly from Citigroup, MBNA, and Progressive, drove strong stock selection in the financials sector, which more than offset the negative impact from overweighting this relatively weak sector. An overweight in the consumer discretionary sector and unfavorable stock selection, particularly a position Kohl’s, detracted from relative performance.

| 1 Year |
5 Year |
Since Inception |
||||||||
| AVERAGE ANNUAL TOTAL RETURNS |
23.70 | % | – | 3.40 | % | 4.01 | % | |||
Past performance does not guarantee future results. The investment return and principal value of an investment will fluctuate so that an investor’s shares, when redeemed, may be worth more or less than their original cost. Current performance may be lower or higher than the performance data quoted.
* Position no longer held at period end.
For a complete list of holdings, please refer to the Schedule of Investments section of this report.
20
Table of Contents
AST MFS Growth Portfolio
For the year ended December 31, 2003, the AST MFS Growth Portfolio had a total return of 22.90%, underperforming the return for the unmanaged S&P 500 Index of 28.67% and the unmanaged Russell 1000 Growth Index, which rose 29.75%.
Although the Portfolio had a good absolute return in a strong year for growth stocks, it trailed the S&P 500 Index and also the Russell 1000 Growth Index primarily because of its positioning in the technology, industrial goods and services, and business services areas. An underweighting and selection in technology stocks in general, and in semiconductor firms in particular, hurt results relative to its style target. In industrial goods and services, positions in Northrop Grumman and Automatic Data Processing disappointed. We sold both during the period. Retailer Kohl’s was also a significant performance detractor after reporting disappointing sales and earnings. We felt this setback was temporary.
The healthcare sector was among the Portfolio’s strongest. We avoided or underweighted a number of large-cap pharmaceutical stocks because we felt their medium-term growth prospects would be limited by patent expirations on key products as well as a dearth of new drugs in the development pipeline. Instead, we trained our sights on biotechnology concerns such as Genentech and Amgen that we believed would offer stronger sustainable growth. Positioning in consumer staples concerns also contributed to performance. Our holding in Avon products benefited from strong cosmetics sales in Latin America and Europe. Colgate-Palmolive stock also contributed to relative results.

| 1 Year |
Since Inception |
|||||
| AVERAGE ANNUAL TOTAL RETURNS |
22.90 | % | –7.21 | % |
Past performance does not guarantee future results. The investment return and principal value of an investment will fluctuate so that an investor’s shares, when redeemed, may be worth more or less than their original cost. Current performance may be lower or higher than the performance data quoted.
The portfolio invests in foreign securities that are subject to the risk of currency fluctuation and the impact of social, political, and economic changes.
For a complete list of holdings, please refer to the Schedule of Investments section of this report.
21
Table of Contents
AST Marsico Capital Growth Portfolio
The AST Marsico Capital Growth Portfolio had a total return of 31.74% for the year ended December 31, 2003, outperforming the return of 28.67% for the unmanaged S&P 500 Index.
Large capitalization companies, as measured by the performance of the S&P 500 Index, rose by about 12% in the fourth quarter, and by nearly 29% for the full year. Every economic sector in the S&P 500 Index had a positive return last year.
There were a variety of contributing factors to the Portfolio’s relative outperformance as compared with the S&P 500 Index. In particular, the Portfolio benefited from investments in the healthcare and consumer discretionary sectors. Pharmaceuticals and biotechnology (e.g., Genentech +139% and Unitedhealth +39%) and consumer durables (e.g., Lennar Corp., +105%) positions were the most significant industry-level holdings that affected performance positively.
The Portfolio’s primary “blemish” in terms of absolute performance last year was maintaining a generally underweight position in the information technology sector (particularly the semiconductor and tech hardware industries). Specific investments in the industrials sector also detracted from performance (e.g., General Dynamics –34% prior to being sold and Lockheed Martin –19%).
As of December 31, 2003, the Portfolio’s economic sector allocations emphasized healthcare, information technology, industrials, and financials.

| 1 Year |
5 Year |
Since Inception |
|||||||
| AVERAGE ANNUAL TOTAL RETURNS |
31.74 | % | 2.65 | % | 8.32 | % |
Past performance does not guarantee future results. The investment return and principal value of an investment will fluctuate so that an investor’s shares, when redeemed, may be worth more or less than their original cost. Current performance may be lower or higher than the performance data quoted.
For a complete list of holdings, please refer to the Schedule of Investments section of this report.
22
Table of Contents
AST Goldman Sachs Concentrated Growth Portfolio
For the year ended December 31, 2003, the AST Goldman Sachs Concentrated Growth Portfolio had a total return of 25.25%, compared with a return of 28.67% for the unmanaged S&P 500 Index.
The first quarter of 2003 was volatile, as investors dealt with conflicting economic reports and the start of the war in Iraq. Most major corporations remained fiscally restrained in anticipation of the continued low demand environment. In the second, third, and fourth quarters, the U.S. equity market rallied sharply due to easing geopolitical concerns, a marked shift in investor sentiment, and an improved economic backdrop. While the gains were broad based, the largest returns were found in both highly speculative and smaller-cap areas. Investors seem optimistic that an improving economy will further stimulate demand for U.S. products and services. During the year, the Portfolio benefited from strength in the consumer discretionary sector. Notable performers included Cendant Corp. (4.9% of the Portfolio) and Starwood Hotels and Resorts Worldwide, Inc. (0.6%). Cendant’s stock price steadily climbed during 2003, as investors grew more comfortable with the prospects for the travel and leisure industry. The Portfolio was also helped by an underweight in the healthcare sector. Concerns about Medicare Drug Benefit legislation, patent expiration, and drug re-importation weighed on the group. Freddie Mac (3.7%) and Fannie Mae (3.8%), two holdings in finance, were notably weak. In the case of Freddie Mac, it was a difficult period, as investors were concerned that the investigation into its earnings restatement would ultimately impair its franchise value. Abrupt management changes at the senior level also disconcerted investors. However, many of these issues were subsequently resolved and Freddie Mac stock rallied at the end of the year.

| 1 Year |
5 Year |
10 Year |
|||||||
| AVERAGE ANNUAL TOTAL RETURNS |
25.25 | % | –8.47 | % | 8.93 | % |
Past performance does not guarantee future results. The investment return and principal value of an investment will fluctuate so that an investor’s shares, when redeemed, may be worth more or less than their original cost. Current performance may be lower or higher than the performance data quoted.
For a complete list of holdings, please refer to the Schedule of Investments section of this report.
The portfolio is non-diversified and involves greater risks because a loss resulting from a particular security will have a greater impact on the portfolio’s overall performance.
23
Table of Contents
AST DeAM Large Cap Growth Portfolio
For the year ended December 31, 2003, the AST DeAM Large Cap Growth Portfolio had a total return of 32.24%, compared with a return of 28.67% for the unmanaged S&P 500 Index and 29.75% for the Russell 1000 Growth Index.
The large-cap growth universe, as measured by the Russell 1000 Growth Index, returned slightly more than the S&P 500 Index over the Portfolio’s reporting period. Small-cap stocks significantly outperformed large-cap stocks, although both asset classes posted very strong gains. Performance was mixed over the course of the year as the war in Iraq threatened to derail gains in the market. However, strong economic news and indications from the Federal Reserve that interest rates would remain low fueled the markets.
By far the largest contribution to absolute performance came from the technology hardware and equipment industry group. The Portfolio’s holdings in this group returned 73.95% for the year. Its retailing positions also had a strong year. The Portfolio’s materials holdings were the weakest group. Although they fell in value, the Portfolio’s relatively small weighting in the group caused the overall detraction from performance to be minor.
Large contributions to the Portfolio’s outperformance of the Russell 1000 Growth Index came from its holdings of retailing, commercial services and supplies, and healthcare and equipment stocks. Materials, again, was the largest detractor from relative performance, underperforming the Russell 1000 Growth Index slightly.

| 1 Year |
Since Inception |
|||||
| AVERAGE ANNUAL TOTAL RETURNS |
32.24 | % | 1.40 | % |
Past performance does not guarantee future results. The investment return and principal value of an investment will fluctuate so that an investor’s shares, when redeemed, may be worth more or less than their original cost. Current performance may be lower or higher than the performance data quoted.
For a complete list of holdings, please refer to the Schedule of Investments section of this report.
24
Table of Contents
AST DeAM Large-Cap Value Portfolio
The AST DeAM Large-Cap Value Portfolio had a total return of 26.59% for the year ended December 31, 2003, compared with a return of 28.67% for the unmanaged S&P 500 Index.
DeAm seeks to maintain a portfolio of equity securities that approximates the market risk of the stocks in the Russell 1000 Value Index, but outperforms that index through active stock selection. The large-cap value universe as measured by the Russell 1000 Value Index returned 30.01% beating the S&P 500 Index. Large value stocks outperformed large growth stocks and stocks of the smaller companies that are included in the Russell Index, but not the S&P 500 Index which significantly outperformed stocks of larger companies. However, performance was mixed over the course of the year as the war in Iraq threatened to derail gains in the market. Eventually, strong economic news and indications from the Federal Reserve that interest rates would remain low fueled the markets.
Relative to the Russell 1000 Value Index, stock selection was poor in many industry groups. Materials holdings were the largest detractors. The Portfolio’s software and services stocks performed particularly poor, but the impact was minor because less than a percentage point of the Portfolio’s assets were in this group, on average. The Portfolio’s automobiles and components holdings made the largest gains during the year, returning 107.55% and beating the comparable stocks in the Russell Index. They were the largest contributor to performance relative to that value-stock target. However, stock selection in the diversified financials group contributed most to the Portfolio’s absolute performance because not only did we have strong stock selection in that group, it also was relatively large.

| 1 Year |
Since Inception |
|||||
| AVERAGE ANNUAL TOTAL RETURNS |
26.59 | % | –0.07 | % |
Past performance does not guarantee future results. The investment return and principal value of an investment will fluctuate so that an investor’s shares, when redeemed, may be worth more or less than their original cost. Current performance may be lower or higher than the performance data quoted.
For a complete list of holdings, please refer to the Schedule of Investments section of this report.
25
Table of Contents
AST Alliance/Bernstein Growth & Value Portfolio
For the year ended December 31, 2003, the AST Alliance/Bernstein Growth & Value Portfolio had a total return of 26.10%, compared with a return for the unmanaged S&P 500 Index of 28.67%.
Relative to the S&P 500 Index, the Portfolio was overweighted in the financial services sector and underweighted in consumer staples, telecommunications, and capital equipment during the year. The overweight in financial services, in addition to the underweights in consumer staples and telecommunications, benefited performance. The underweight in capital equipment hurt performance. While positive stock selection in the energy, technology, capital equipment, and consumer staples sectors enhanced the Portfolio’s return, stock selection in the financial services, industrial commodities, and telecommunications sectors dampened performance. The largest contributors to positive relative performance during the year were our investments in Nortel Networks, Corning, Intel, Georgia Pacific, and ConocoPhillips. Large detractors from performance included Kohl’s, Viacom, Nokia, Dell, and Qwest Communications.

| 1 Year |
Since Inception |
|||||
| AVERAGE ANNUAL TOTAL RETURNS |
26.10 | % | –3.11 | % |
Past performance does not guarantee future results. The investment return and principal value of an investment will fluctuate so that an investor’s shares, when redeemed, may be worth more or less than their original cost. Current performance may be lower or higher than the performance data quoted.
For a complete list of holdings, please refer to the Schedule of Investments section of this report.
26
Table of Contents
AST Sanford Bernstein Core Value Portfolio
For the year ended December 31, 2003, the AST Sanford Bernstein Core Value Portfolio had a total return of 28.31%, in line with the 28.67% gain of the unmanaged S&P 500 Index and slightly below the 30.03% rise of the Russell 1000 Value Index.
Cyclical stocks led the substantial market gains, with technology stocks particularly strong on signs of a revival in capital spending. Nortel Networks, Corning, Sanmina*, and Avaya* rose an astounding 163%, 215%, 181%, and 428%, respectively. As the strong economy prompted more people toward home ownership, the Portfolio’s holdings in home builders outperformed; Centex, Pulte, and KB Home* rose 118%, 96%, and 70%, respectively.
Stock selection in the consumer growth sector had the largest negative impact on the Portfolio’s performance relative to the Russell 1000 Value Index. Several of its pharmaceutical positions, including Schering Plough*, Merck, Wyeth, and Pfizer, underperformed due to investor concerns about weak product pipelines, patent expirations, and pricing pressures. On top of these industry pressures, Wyeth was dragged down by news that it had added reserves to its “fen-phen” (diet drug) settlement trust. Though our positions in these stocks hurt performance, we continue to view them as attractive value opportunities and are confident in their long-term outlook due to continuing growth in prescriptions, both as the population ages and as new pharmaceuticals are under development.

| 1 Year |
Since Inception |
|||||
| AVERAGE ANNUAL TOTAL RETURNS |
28.31 | % | 4.64 | % |
Past performance does not guarantee future results. The investment return and principal value of an investment will fluctuate so that an investor’s shares, when redeemed, may be worth more or less than their original cost. Current performance may be lower or higher than the performance data quoted.
* Position no longer held at period end.
For a complete list of holdings, please refer to the Schedule of Investments section of this report.
27
Table of Contents
AST Cohen & Steers Realty Portfolio
For the year ended December 31, 2003, the AST Cohen & Steers Realty Portfolio had a total return of 37.43%, compared to the unmanaged NAREIT Equity REIT Index’s total return of 37.13% and the broad-based, unmanaged S&P 500 Index’s total return of 28.67%.
Exceeding even the most optimistic expectations, 2003 was the best year for REITs since 1991. REITs gained wider acceptance as their low correlation with other asset classes offered a welcomed diversification opportunity to investors. In addition, the economy vindicated investor expectations for improving fundamentals. While almost all REIT’s share prices rose in 2003, the healthcare sector gained most, followed by the regional mall sector. As was the case in the past several years, underperformers for the year were apartment and office building owners.
The Portfolio benefited from its overweight in malls and our shift from underweight to overweight in hotels. Stock selection in general was strong, particularly in the office, industrial, and healthcare sectors. The largest contributions to the Portfolio’s performance relative to its benchmark came from overweights in Vornado Realty and Rouse and positions in Brookfield Properties and Starwood Hotel & Resorts. Detractors from relative performance included underweights in shopping centers and healthcare facilities and overweights in office and industrial buildings. Individual detractors included overweights in Crescent Real Estate, AvalonBay Communities, and Sun Communities.
In light of the return of business and consumer confidence, surging profitability, ongoing fiscal stimulus and still-accommodative monetary policy, we believe the U.S. economy will remain robust and experience strong job growth. In our view, while REITs are no longer as undervalued as they were, the conditions to sustain strength and growth in this asset class are in place.

| 1 Year |
5 Year |
Since Inception |
|||||||
| AVERAGE ANNUAL TOTAL RETURNS |
37.43 | % | 13.37 | % | 7.85 | % |
Past performance does not guarantee future results. The investment return and principal value of an investment will fluctuate so that an investor’s shares, when redeemed, may be worth more or less than their original cost. Current performance may be lower or higher than the performance data quoted.
The portfolio focuses its investments in one sector, thereby increasing its vulnerability to any single economic, political or regulatory development.
For a complete list of holdings, please refer to the Schedule of Investments section of this report.
28
Table of Contents
AST Sanford Bernstein Managed Index 500 Portfolio
For the year ended December 31, 2003, the AST Sanford Bernstein Managed Index 500 Portfolio had a total return of 27.32%, compared with the unmanaged S&P 500 Index, which returned 28.67%.
Stock selection in the consumer cyclical sector was the largest detractor from the Portfolio’s returns as compared with the S&P 500 Index. Retailers Wal-Mart, Kohl’s, and Home Depot underperformed the sector average, while Yahoo!, a Portfolio underweight, rose 175% over the year. The largest positive contribution to the Portfolio’s performance was our stock selection in the capital equipment sector. The majority of the Portfolio’s holdings posted double-digits gains. Positions in Paccar, BF Goodrich, and Cummins Engine were up 90%, 69%, and 80% respectively. We also selected well in the finance sector, with positions in FleetBoston, Capital One, and Humana up 88%, 107%, and 128% respectively. The five largest individual contributions to performance came from Altria, Corning, Sanmina, Merck, and Cisco Systems. The five largest detractors were Wal-Mart, Kohl’s, Federal Home Loan, JP Morgan Chase, and Medimmune.
Overall, the Fund’s sector weightings were generally close to those of the S&P 500 Index during the year. The most positive impact came from our underweight in the telecommunications sector. Most of the underperformance by sector was due, in fact, to a small allocation to cash that hurt in a rising equity market.

| 1 Year |
5 Year |
Since Inception |
|||||||
| AVERAGE ANNUAL TOTAL RETURNS |
27.32 | % | 0.10 | % | 4.28 | % |
Past performance does not guarantee future results. The investment return and principal value of an investment will fluctuate so that an investor’s shares, when redeemed, may be worth more or less than their original cost. Current performance may be lower or higher than the performance data quoted.
For a complete list of holdings, please refer to the Schedule of Investments section of this report.
29
Table of Contents
AST American Century Income & Growth Portfolio
For the year ended December 31, 2003, the AST American Century Income & Growth Portfolio had a total return of 28.78%, in line with the 28.67% gain of the unmanaged S&P 500 Index.
The S&P 500 staged an impressive rally in 2003 after stumbling in the first quarter. Low interest rates and inflation, solid corporate profits, and the onset of business spending and hiring were nearly ideal conditions for equity investors. Financials, technology, and consumer cyclicals accounted for the majority of the S&P 500 Index’s positive return, but every economic sector in the index posted gains for the year.
The Portfolio’s risk evaluation and sector weightings are positioned relative to the S&P 500. As a result, the same sectors that drove the index higher—financials, technology, consumer cyclicals, and energy—also accounted for more than two-thirds of the Portfolio’s absolute return. As with the S&P 500 Index, the Portfolio’s absolute performance was positive in all economic sectors.
Stock selection improved performance relative to the S&P 500 benchmark the most in the consumer cyclical and energy sectors. However, the Portfolio’s consumer services and technology stocks gained less than the benchmark’s components in those sectors. In addition, the Portfolio was slightly overweighted in telecommunication services, a sector that lagged, detracting from performance.

| 1 Year |
5 Year |
Since Inception |
|||||||
| AVERAGE ANNUAL TOTAL RETURNS |
28.78 | % | 0.74 | % | 5.19 | % |
Past performance does not guarantee future results. The investment return and principal value of an investment will fluctuate so that an investor’s shares, when redeemed, may be worth more or less than their original cost. Current performance may be lower or higher than the performance data quoted.
For a complete list of holdings, please refer to the Schedule of Investments section of this report.
30
Table of Contents
AST Alliance Growth and Income Portfolio
For the year ended December 31, 2003, the AST Alliance Growth and Income Portfolio had a total return of 32.43% compared with a return of 28.67% for the unmanaged S&P 500 Index.
The performance of the AST Alliance Growth and Income Portfolio in 2003 was better than the S&P 500 Index. In addition, it beat the somewhat larger gain (30.03%) of the Russell 1000 Value Index, which represents the Portfolio’s target large-cap value stock universe. Relative to the Russell 1000 Value Index, the Portfolio was overweighted primarily in the healthcare and technology sectors and underweighted in the utilities sector during the year. The technology overweight and the utilities underweight were beneficial to performance. However, good stock selection within the healthcare sector couldn’t offset the impact of the Portfolio’s overweight in the sector. The largest contributors to positive relative performance during the year were our investments in Juniper Networks, Veritas Software, Marvell Technology, J. P. Morgan, and Altera Corp. Large detractors from performance included HCA Healthcare, Colgate Palmolive, Pfizer, Union Pacific, and Kerr McGee Corp.

| 1 Year |
5 Year |
10 Year |
|||||||
| AVERAGE ANNUAL TOTAL RETURNS |
32.43 | % | 4.37 | % | 10.43 | % |
Past performance does not guarantee future results. The investment return and principal value of an investment will fluctuate so that an investor’s shares, when redeemed, may be worth more or less than their original cost. Current performance may be lower or higher than the performance data quoted.
For a complete list of holdings, please refer to the Schedule of Investments section of this report.
31
Table of Contents
AST MFS Growth with Income Portfolio
For the year ended December 31, 2003, the AST MFS Growth with Income Portfolio had a total return of 21.71%, compared with a 28.67% return for the unmanaged S&P 500 Index.
The primary detractor to the portfolio’s relative performance was poor stock selection in technology, financial, and leisure sectors. We avoided eBay and Yahoo!, missing the gains of the Internet industry, and underweighted Intel. We also underweighted banks and credit companies, which outperformed the S&P 500 Index. Absolute performance was hurt most by a position in Fannie Mae. Investors were concerned about potential regulatory and political changes. The Portfolio’s insurance stocks, including The Hartford Group, Travelers Insurance, XL Capital, MetLife, and UnumProvident,* declined after they had to increase their reserves. Media firm Viacom and several print and publishing holdings, including the New York Times, Tribune, and Reed Elsevier, suffered when local ad revenues did not pick up as much as expected.
Relative performance benefited from the Portfolio’s underweight in the food and beverage industry and position in Altria (formerly Phillip Morris), which continued to rebound from earlier concerns about litigation and competitive pressures. Healthcare holdings Genentech* and Guidant were strong contributors to returns. Genentech’s stock price rose on unexpectedly positive testing data for a colorectal cancer drug and approval of several new drugs. Guidant exceeded investors’ income expectations. Technology holdings Analog Devices, Cisco, and VERITAS had solid results. Analog Devices reported better-than-expected earnings and rallied with the rest of the semiconductor industry. Prospects of a pick up in telecommunication services business and Cisco Systems’ continued gains in the business enterprise market pushed its stock price higher. Signs of improving balance sheet strength led to strong performance for data storage software company VERITAS.

| 1 Year |
Since Inception |
|||||
| AVERAGE ANNUAL TOTAL RETURNS |
21.71 | % | –3.79 | % |
Past performance does not guarantee future results. The investment return and principal value of an investment will fluctuate so that an investor’s shares, when redeemed, may be worth more or less than their original cost. Current performance may be lower or higher than the performance data quoted.
The portfolio invests in foreign securities that are subject to the risk of currency fluctuation and the impact of social, political, and economic changes.
* Position no longer held at period end.
For a complete list of holdings, please refer to the Schedule of Investments section of this report.
32
Table of Contents
AST INVESCO Capital Income Portfolio
For the year ended December 31, 2003, the AST INVESCO Capital Income Portfolio had a total return of 19.94%, compared with a return of 28.67% for the unmanaged S&P 500 Index.
In the first half of 2003, as the country focused on conflict in Iraq, the domestic equity markets managed slight gains, and the U.S. economy grew at a sluggish pace. By the second half of the year, however, major combat operations ended, economic growth gathered momentum, and the equity markets experienced a broad-based rally. GDP growth in the first quarter was a paltry 1.4%, but growth accelerated significantly to 8.2% by the third quarter. Fourth quarter growth is estimated between 4%-5% and GDP growth for the year should come in near 4.5%. During the first half of 2003, investors focused on lower-quality technology companies. However, during much of the third quarter and into the fourth quarter, they began to refocus on quality and earnings.
The Portfolio underperformed the S&P 500 Index primarily because of its fixed income holdings. Stocks outperformed bonds by a large margin in 2003. In addition, the Portfolio’s underweight in consumer discretionary stocks as compared with the S&P 500 was the largest drag on the relative performance of its equity holdings. Many stocks in the sector rallied on investor expectations that it would benefit from the economic recovery. A number of the Portfolio’s holdings in the healthcare sector also detracted from performance. However, the Portfolio’s strong stock selection in the consumer discretionary sector provided a lift to its return. In addition, its technology and financial services stocks turned in strong performances during the fourth quarter. Positions in the economically sensitive industrials and materials sectors benefited as investors continued to gain confidence in the economic recovery. The Portfolio also benefited from a significant position in the strong-performing information technology sector, which continued to recover from its multiyear bear market and gain traction from the economic recovery.

| 1 Year |
5 Year |
Since Inception |
|||||||
| AVERAGE ANNUAL TOTAL RETURNS |
19.94 | % | 1.15 | % | 8.20 | % |
Past performance does not guarantee future results. The investment return and principal value of an investment will fluctuate so that an investor’s shares, when redeemed, may be worth more or less than their original cost. Current performance may be lower or higher than the performance data quoted.
For a complete list of holdings, please refer to the Schedule of Investments section of this report.
33
Table of Contents
AST DeAM Global Asset Allocation Portfolio
For the year ended December 31, 2003, the AST DeAM Global Allocation Portfolio had a total return of 19.53%. That compared to a return of 20.50% for the unmanaged blended benchmark index (50% Russell 3000 Index/40% LB Aggregate Index/10% MSCI EAFE Index).
During a tumultuous year in which geopolitical crisis and the hopes of economic recovery were realized, the financial markets made a strong comeback after three difficult years. Despite good absolute returns for asset allocation funds, they trailed the equity markets. The bulk of the Portfolio’s absolute performance resulted from the strength of the second and fourth quarters in the equity markets when investors’ response to the perceived reduction of risk was at its peak. However, the Portfolio’s relative performance was strongest in the first and third quarters. Although our fixed income strategy performed well during the year, our international equity strategy trailed its benchmark.
Throughout the year, the Portfolio’s asset allocation was more heavily weighted in equities than its neutral position, with a decided international bias toward the end of the year. This equity overweight and underweight in bonds hurt during the first half of the year, but helped later. As a result, the overall impact of our asset allocation was neglible. The very strong move toward lower-quality issues in the equity rally hurt both our equity and fixed income strategies, which emphasize securities that are inexpensively priced for their balance sheet strength and estimated earnings potential.

| 1 Year |
5 Year |
10 Year |
|||||||
| AVERAGE ANNUAL TOTAL RETURNS |
19.53 | % | 0.62 | % | 6.51 | % |
Past performance does not guarantee future results. The investment return and principal value of an investment will fluctuate so that an investor’s shares, when redeemed, may be worth more or less than their original cost. Current performance may be lower or higher than the performance data quoted.
For a complete list of holdings, please refer to the Schedule of Investments section of this report.
34
Table of Contents
AST American Century Strategic Balanced Portfolio
For the year ended December 31, 2003, the AST American Century Strategic Balanced Portfolio had a total return of 18.87%, compared with a return of 18.76% for the unmanaged Balanced Blended benchmark index (60% S&P 500 Index, 40% Lehman Brothers Aggregate Bond Index).
Returns for balanced portfolios in 2003 were typically the highest since 1999. For the first calendar year since then, the S&P 500 (+28.68%) outperformed the Lehman Brothers U.S. Aggregate Index (+4.10%). In fact, it was first positive calendar year for the S&P 500 in the four-year period. In that climate, the Portfolio’s stock and bond portfolios returned approximately 31% and 4% respectively.
U.S. stocks generally outperformed investment grade U.S. bonds because of a surge in economic activity. Economic growth (GDP) accelerated, starting at a 3.1% annualized rate in the second quarter of 2003, then spiking to 8.2% in the third quarter. The spike was due in part to monetary stimulus provided by the Federal Reserve in the form of low short-term interest rates and fiscal stimulus provided by government spending and tax cuts.
The Portfolio’s equity sleeve outperformance was due primarily to effective stock selection in consumer cyclicals. The Portfolio’s bond portfolio slightly underperformed its bond benchmark. The bonds were affected most by a relatively short duration compared with their benchmark; shorter-duration diversified portfolios generally underperformed in 2003.

| 1 Year |
5 Year |
Since Inception |
|||||||
| AVERAGE ANNUAL TOTAL RETURNS |
18.87 | % | 2.47 | % | 6.50 | % |
Past performance does not guarantee future results. The investment return and principal value of an investment will fluctuate so that an investor’s shares, when redeemed, may be worth more or less than their original cost. Current performance may be lower or higher than the performance data quoted.
For a complete list of holdings, please refer to the Schedule of Investments section of this report.
35
Table of Contents
AST T. Rowe Price Asset Allocation Portfolio
The AST T. Rowe Price Asset Allocation Portfolio had a total return of 24.02% for the year ended December 31, 2003, compared to a return of 18.76%, for the unmanaged Balanced Blended Index (60% S&P 500 Index, 40% Lehman Brothers Government/Credit Index).
U.S. stocks rose in 2003. Small-cap stocks strongly outpaced large-cap shares. U.S. bonds produced positive returns, but they were subdued relative to bond returns in recent years. High yield bonds surged, enjoying their best year in a decade as the economy and stock market improved and as fixed income investors seeking higher yields embraced riskier assets. Non-U.S. stocks strongly outpaced their domestic counterparts, thanks in part to the U.S. dollar’s protracted weakness versus major foreign currencies.
Over the past 12 months, the Portfolio has benefited from a general overweighting in equities and from an overweighting in international equities, in particular. We also overweighted high yield bonds, which outperformed other fixed income sectors as investors searched for higher yields.
While we can’t be sure that the equity markets will outperform over the near term, we believe that given the prospects for a recovering economy the longer-term outlook for the asset class is favorable. In line with this outlook, we are continuing to overweight equities and the more economically sensitive sectors of the fixed income market, such as high yield bonds.

| 1 Year |
5 Year |
Since Inception |
|||||||
| AVERAGE ANNUAL TOTAL RETURNS |
24.02 | % | 3.15 | % | 8.56 | % |
Past performance does not guarantee future results. The investment return and principal value of an investment will fluctuate so that an investor’s shares, when redeemed, may be worth more or less than their original cost. Current performance may be lower or higher than the performance data quoted.
The portfolio invests in lower-rated securities commonly known as “junk” bonds which are subject to greater credit and market risks.
For a complete list of holdings, please refer to the Schedule of Investments section of this report.
36
Table of Contents
AST T. Rowe Price Global Bond Portfolio
For the year ended December 31, 2003, the AST T. Rowe Price Global Bond Portfolio had a total return of 12.86%, outperforming the 12.51% gain of the unmanaged Lehman Brothers Global Aggregate Index.
Stronger economic data, low interest rates, and an expanding U.S. fiscal deficit led the U.S. Treasury market to underperform other developed markets in 2003. Much of the sell-off in government bonds occurred in the second half of the year as geopolitical uncertainty and fears of deflation subsided. Importantly, the period was marked by the decline in the U.S. dollar, which fell 20% against the euro in 2003 and weakened more than 10% against the Japanese yen.
European government bonds with shorter-dated maturities outperformed globally aided by Europe’s weaker economic fundamentals compared with the United States and the strength of the euro. Japanese government bonds recouped intra-period losses, owing to the Bank of Japan’s commitment to maintaining a zero interest policy, the strength of the Japanese yen, and positive supply-demand factors.
The Portfolio’s strong absolute returns and relative performance against the Index were helped by a weak U.S. dollar and a powerful rally in high yield corporate bonds and emerging-market bonds in 2003. Currency exposure was a key contributor to the Portfolio’s relative returns, particularly its overweight position in the Canadian dollar versus the U.S. dollar. On a country and duration basis, the main contributor to the Portfolio’s relative performance was its underweight position in Japanese government bonds, which sold off dramatically during the summer. Over the period, we also shortened the Portfolio’s duration in the European government bond market from an overweight exposure.

| 1 Year |
5 Year |
Since Inception |
|||||||
| AVERAGE ANNUAL TOTAL RETURNS |
12.86 | % | 3.99 | % | 4.54 | % |
Past performance does not guarantee future results. The investment return and principal value of an investment will fluctuate so that an investor’s shares, when redeemed, may be worth more or less than their original cost. Current performance may be lower or higher than the performance data quoted.
The portfolio may invest in foreign securities that are subject to the risk of currency fluctuation and the impact of social, political, and economic changes. The portfolio may invest in lower-rated securities commonly known as “junk” bonds which are subject to greater credit and market risks. The portfolio may invest in asset backed securities which are subject to prepayment and extension risks.
For a complete list of holdings, please refer to the Schedule of Investments section of this report.
37
Table of Contents
AST Federated High Yield Portfolio
For the year ended December 31, 2003, the AST Federated High Yield Portfolio had a total return of 21.59%, compared with a 28.15% gain for the unmanaged Merrill Lynch US High Yield Master II Index.
In the U.S. fixed income market, high yield corporate bonds significantly outperformed high-quality bonds in 2003. High yield bonds began the year from an extremely oversold position. At that time, investors were still in a defensive posture due to economic and geopolitical uncertainty. Despite the conflict in the Middle East, most indicators continued to show robust economic growth over the course of the year. In addition, increased corporate earnings led to improved credit quality for the underlying market over the past several quarters. The distressed end of the high yield market was the area with the strongest performance in 2003.
The Portfolio underperformed the Index in 2003 largely because it was positioned less aggressively than the Index in the lower credit quality sector. The Portfolio was also hurt by intra-period cash flows into and out of the Portfolio. From an industry sector perspective, the Portfolio’s relative overweight positions in the consumer noncyclical and gaming sectors and its underweight positions in the more speculative sectors hurt relative performance. Among the specific holdings that underperformed during the period were General Chemical Industries (chemicals), New World Pasta (food and beverage), and Levi Strauss & Co. (textiles). Conversely, among the Portfolio’s holdings that significantly outperformed the market were Charter Communications (media/cable), Alamosa PCS Holdings (wireless), and Nextel Communications (wireless).

| 1 Year |
5 Year |
Since Inception |
|||||||
| AVERAGE ANNUAL TOTAL RETURNS |
21.59 | % | 2.33 | % | 5.59 | % |
Past performance does not guarantee future results. The investment return and principal value of an investment will fluctuate so that an investor’s shares, when redeemed, may be worth more or less than their original cost. Current performance may be lower or higher than the performance data quoted.
The portfolio invests in lower-rated securities commonly known as “junk” bonds which are subject to greater credit and market risks.
For a complete list of holdings, please refer to the Schedule of Investments section of this report.
38
Table of Contents
AST Lord Abbett Bond-Debenture Portfolio
The AST Lord Abbett Bond-Debenture Portfolio had a total return of 18.74% for the year ended 2003, compared to a return of 28.15% for the unmanaged Merrill Lynch US High Yield Master II Index.
Throughout the year, the pattern that was evident in all sectors of the high yield corporate bond market was that lower-rated credits outperformed higher-rated credits. In the convertible securities market, the speculative grade issues outperformed investment grade issues as well. Even in the high grade portion of the market, the highest yielding investment grade companies led that sector’s advance. The Portfolio underperformed in 2003 because of its limited exposure to the highest yielding securities. We believe these securities generally offered a poor risk/return profile over the long term.
During the year, the Portfolio benefited partly because investors were willing to take on more risk as credit quality improved. On the other hand, investors’ search for yield drove spreads tighter during 2003, making it more challenging for the Portfolio to find value opportunities. We believe the strong macroeconomic environment with broad improvements in credit fundamentals allowed for strength in the Portfolio’s high yield and convertible securities holdings throughout the year.
Note: The views of Lord, Abbett & Co. LLC and the Portfolio’s holdings described in this report are as of December 31, 2003; these views and the holdings may have changed subsequent to this date. Information provided in this report should not be considered a recommendation to purchase or sell securities. The Portfolio is not insured by the FDIC, is not a deposit or other obligation of, or guaranteed by banks, and is subject to investment risks including loss of principal amount invested. For a more detailed discussion of the risks associated with the Portfolio, see the Portfolio’s Prospectus.

| 1 Year |
Since Inception |
|||||
| AVERAGE ANNUAL TOTAL RETURNS |
18.74 | % | 7.16 | % |
Past performance does not guarantee future results. The investment return and principal value of an investment will fluctuate so that an investor’s shares, when redeemed, may be worth more or less than their original cost. Current performance may be lower or higher than the performance data quoted.
The portfolio may invest in lower-rated securities commonly known as “junk” bonds which are subject to greater credit and market risks. The portfolio may invest in mortgage backed securities which are subject to prepayment and extension risks. The portfolio may invest 20% of its assets in equity securities.
For a complete list of holdings, please refer to the Schedule of Investments section of this report.
39
Table of Contents
AST DeAM Bond Portfolio
From the year ended December 31, 2003, the AST DeAM Bond Portfolio had a total return of 3.81%, compared with a return for the unmanaged Lehman Brothers Aggregate Index of 4.10%.
The Portfolio had a substantially overweight exposure to the asset backed securities sector compared to the Index. Asset backed securities outperformed as yield spreads in all major asset backed sub-sectors tightened relative to interest rate swaps, the benchmark for asset backed securities. In turn, interest rate swap spreads tightened versus U.S. Treasury securities. The Portfolio remained significantly overweighted in asset backed securities at year-end.
As for mortgage-related securities, we maintained the Portfolio’s overweight exposure to commercial mortgage backed securities, primarily the highest quality, multi-family bonds backed by agencies. Our conservative approach to managing the Portfolio’s securities backed by residential mortgages was particularly effective during the summer when the sector experienced heightened volatility. In addition, we increased the Portfolio’s exposure to mortgage pass through securities when they were relatively inexpensive, which helped the Portfolio’s performance later in the year.
Turning to the corporate bond market, the utility, telecommunications, and auto sectors that performed poorly in 2002 led the relative performance race in 2003. Our decision to selectively increase the Portfolio’s holdings of bonds in the BBB ratings category, particularly among issuers in the sectors cited above, contributed significantly to the Portfolio’s performance in 2003.

| 1 Year |
Since Inception |
|||||
| AVERAGE ANNUAL TOTAL RETURNS |
3.81 | % | 6.92 | % |
Past performance does not guarantee future results. The investment return and principal value of an investment will fluctuate so that an investor’s shares, when redeemed, may be worth more or less than their original cost. Current performance may be lower or higher than the performance data quoted.
The portfolio may invest in asset backed securities which are subject to prepayment and extension risks.
For a complete list of holdings, please refer to the Schedule of Investments section of this report.
40
Table of Contents
AST Pimco Total Return Bond Portfolio
For the year ended December 31, 2003, the AST PIMCO Total Return Bond Portfolio had a total return of 5.32%, as compared to the unmanaged Lehman Brothers Aggregate Bond Index, which returned 4.10%.
Bonds gained ground in 2003 despite volatile interest rates. The Portfolio outperformed its benchmark, driven by favorable security selection. Allocations to U.S. Treasury inflation-protected securities (TIPS) and municipal bonds helped returns as these less volatile assets outperformed amid rising rates. Emerging-market bonds strongly boosted returns as credit fundamentals within the asset class continued to improve. Conversely, an underweight in corporate bonds was negative as profits and margins improved. A mortgage underweight in the fourth quarter detracted from returns as lower volatility caused this area of the market to perform well.
We believe the global economic recovery will be sustained in 2004 as China joins the United States as an engine for growth. Given our outlook, we’ll take a defensive posture with the Portfolio. In particular, we anticipate underweighting fully priced mortgages and corporate bonds in favor of more compelling sectors and strategies. We will target a below-index duration to protect relative returns against the risk of upward pressure on interest rates. We plan to emphasize TIPS, which hedge against inflation risk and are less volatile than bonds when rates rise. We will continue to hold high yielding emerging-market bonds, which we feel will continue to enhance results due to their improving fundamentals.

| 1 Year |
5 Year |
Since Inception |
|||||||
| AVERAGE ANNUAL TOTAL RETURNS |
5.32 | % | 6.68 | % | 7.14 | % |
Past performance does not guarantee future results. The investment return and principal value of an investment will fluctuate so that an investor’s shares, when redeemed, may be worth more or less than their original cost. Current performance may be lower or higher than the performance data quoted.
The portfolio invests in lower-rated securities commonly known as “junk” bonds which are subject to greater credit and market risks.
For a complete list of holdings, please refer to the Schedule of Investments section of this report.
41
Table of Contents
AST Pimco Limited Maturity Bond Portfolio
For the year ended December 31, 2003, the AST PIMCO Limited Maturity Bond Portfolio had a total return of 3.28%, as compared to the unmanaged Merrill Lynch 1-3 Year Treasury Index return of 1.90%.
Bonds gained ground in 2003 despite volatile interest rates, led by higher yielding corporate bonds and emerging market securities. The Portfolio’s outperformance was driven by active management across a wide spectrum of securities, including select mortgages and corporates, Eurozone issues, and emerging markets—all of which added value amid volatile markets in 2003. A corporate allocation was positive as profits and margins improved in the sector. Emerging-market bonds boosted returns as credit fundamentals continued to improve. A mortgage emphasis was positive as mortgage bonds outperformed Treasury bonds on a duration-adjusted basis. A broader than index yield curve structure was negative as intermediate yields increased modestly.
We believe the global economic recovery will be sustained in 2004 as China joins the United States as an engine for growth. Given our outlook, we’ll take a defensive posture with the Portfolio. In particular, we anticipate underweighting fully priced mortgages and corporate bonds in favor of more compelling sectors and strategies. We will target a below-index duration to protect relative returns against the risk of upward pressure on interest rates. We will continue to hold high yielding emerging-market bonds, which we feel will continue to enhance results due to their improving fundamentals.
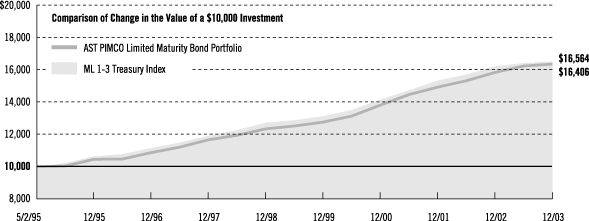
| 1 Year |
5 Year |
Since Inception |
|||||||
| AVERAGE ANNUAL TOTAL RETURNS |
3.28 | % | 5.83 | % | 5.88 | % |
Past performance does not guarantee future results. The investment return and principal value of an investment will fluctuate so that an investor’s shares, when redeemed, may be worth more or less than their original cost. Current performance may be lower or higher than the performance data quoted.
For a complete list of holdings, please refer to the Schedule of Investments section of this report.
42
Table of Contents
AST Money Market Portfolio
For the year ended December 31, 2003, the AST Money Market Portfolio returned 0.63%, compared with a return of 0.64% for the Lipper VP Money Market Funds Average.
The year was challenging as the United States became involved in a war in Iraq, deflation threatened the U.S. economy, and the job market remained weak even as economic growth accelerated in the second half of 2003. Nevertheless, the one-year London Interbank Offered Rate (LIBOR) ended the year right where it began at 1.45%.
The Portfolio was helped by our decision to rein in its average maturity until the third and fourth quarters of 2003, when the slope of the short yield curve steepened. The yield curve became steeper as yields on securities maturing in a year rose more than yields on securities maturing in one month. Despite the fragile credit environment, the Portfolio also benefited from our ability to avoid exposure to money market securities with problems stemming from their credit quality or structure.
In the first half of the year, as some of the Portfolio’s higher yielding investments matured, their proceeds were reinvested in money market securities with lower yields. In the second half of the year, the Portfolio’s ability to take advantage of the modest increase in money market yields was hampered by a decline in its assets. We believe the Portfolio’s assets fell as investors took advantage of the rally in the stock market. Shrinking assets could continue to detrimentally affect performance as we maintain increased liquidity to cover outflows and have less to reinvest should interest rates continue to rise.
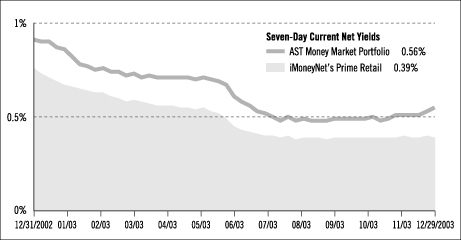
| 1 Year |
5 Year |
10 Year |
|||||||
| AVERAGE ANNUAL TOTAL RETURNS |
0.63 | % | 3.25 | % | 4.08 | % | |||
| Money Market 7-day current net yield |
0.56 | % |
Past performance does not guarantee future results. The investment return and principal value of an investment will fluctuate so that an investor’s shares, when redeemed, may be worth more or less than their original cost. Current performance may be lower or higher than the performance data quoted. The yield quotation more closely reflects the current earnings of the AST Money Market Portfolio than the total return.
An investment in the American Skandia Trust Money Market Portfolio is neither insured nor guaranteed by the Federal Deposit Insurance Corporation or any other government agency. Although the Portfolio seeks to preserve the value of your investment at $1.00 per share, it is possible to lose money by investing in the Portfolio.
For a complete list of holdings, please refer to the Schedule of Investments section of this report.
43
Table of Contents
[THIS PAGE INTENTIONALLY LEFT BLANK]
44
Table of Contents
AST Strong International Equity Portfolio
Schedule of Investments
December 31, 2003
| Shares |
Value | ||||
| LONG-TERM INVESTMENTS — 99.6% |
|||||
| COMMON STOCK |
|||||
| Australia — 1.7% |
|||||
| BHP Billiton Ltd. |
540,700 | $ | 4,966,082 | ||
| Bluescope Steel Ltd. |
213,820 | 902,174 | |||
| 5,868,256 | |||||
| Belgium — 1.0% |
|||||
| Fortis |
165,500 | 3,327,535 | |||
| Bermuda — 0.6% |
|||||
| Jardine Matheson Holdings Ltd. |
236,100 | 2,124,900 | |||
| Brazil — 1.5% |
|||||
| Companhia Vale do Rio Doce [ADR] |
88,000 | 5,148,000 | |||
| Canada — 2.9% |
|||||
| Bank of Nova Scotia |
60,000 | 3,055,136 | |||
| EnCana Corp. |
167,760 | 6,620,825 | |||
| 9,675,961 | |||||
| Finland — 0.9% |
|||||
| UPM-Kymmene Oyj |
164,000 | 3,127,750 | |||
| France — 12.3% |
|||||
| Accor SA |
96,200 | 4,356,181 | |||
| Altran Technologies SA* |
370,166 | 4,776,486 | |||
| Aventis SA |
68,100 | 4,501,060 | |||
| BNP Paribas SA |
60,600 | 3,815,782 | |||
| Essilor International SA |
92,500 | 4,783,678 | |||
| Groupe Danone SA |
46,000 | 7,508,073 | |||
| L’Oreal SA |
94,300 | 7,731,457 | |||
| Total SA |
22,100 | 4,108,905 | |||
| 41,581,622 | |||||
| Germany — 7.7% |
|||||
| DaimlerChrysler AG |
87,700 | 4,092,962 | |||
| Deutsche Bank AG |
52,000 | 4,309,284 | |||
| E.ON AG |
70,500 | 4,600,996 | |||
| Puma AG Rudolf Dassler Sport |
26,100 | 4,608,981 | |||
| Schering AG |
67,000 | 3,393,100 | |||
| Siemens AG |
65,500 | 5,246,279 | |||
| 26,251,602 | |||||
| Hong Kong — 4.1% |
|||||
| HSBC Holdings PLC |
251,000 | 3,960,469 | |||
| Hutchison Whampoa Ltd. |
649,700 | 4,790,989 | |||
| Swire Pacific Ltd. (Class “A” Stock) |
810,000 | 4,997,553 | |||
| 13,749,011 | |||||
| Ireland — 2.5% |
|||||
| Bank of Ireland |
414,800 | 5,661,120 | |||
| Ryanair Holdings PLC [ADR]* |
57,500 | 2,911,800 | |||
| 8,572,920 | |||||
| Shares |
Value | ||||
| Italy — 4.7% |
|||||
| Eni SPA |
424,950 | $ | 8,018,733 | ||
| Telecom Italia SPA* |
1,422,861 | 4,217,613 | |||
| UniCredito Italiano SPA |
715,000 | 3,859,990 | |||
| 16,096,336 | |||||
| Japan — 17.7% |
|||||
| Canon, Inc. |
151,000 | 7,030,792 | |||
| Disco Corp. |
63,000 | 3,568,256 | |||
| East Japan Railway Co. |
720 | 3,392,741 | |||
| Hankyu Department Stores, Inc. |
312,000 | 2,090,286 | |||
| Hitachi Ltd. |
904,000 | 5,449,137 | |||
| House Foods Corp. |
253,400 | 2,868,099 | |||
| Komatsu Ltd. |
1,158,000 | 7,347,579 | |||
| Lawson, Inc. |
96,000 | 3,278,529 | |||
| Mitsubishi Heavy Industries Ltd. |
1,160,000 | 3,225,530 | |||
| Nintendo Co. Ltd. |
37,000 | 3,452,459 | |||
| Nippon Telegraph and Telephone Corp. |
1,000 | 4,824,111 | |||
| The Daimaru, Inc. |
379,000 | 2,104,180 | |||
| Tokyo Gas Co. Ltd. |
1,410,000 | 5,025,847 | |||
| Toyota Motor Corp. |
180,500 | 6,096,949 | |||
| 59,754,495 | |||||
| Korea — 1.2% |
|||||
| Samsung Electronics Co. Ltd. [GDR]* |
21,000 | 3,974,401 | |||
| Mexico — 1.7% |
|||||
| America Movil (Class “L” Stock) [ADR] |
83,826 | 2,291,803 | |||
| Wal-Mart de Mexico SA de CV |
1,316,000 | 3,519,170 | |||
| 5,810,973 | |||||
| Netherlands — 5.1% |
|||||
| ING Groep NV |
254,000 | 5,923,890 | |||
| Koninklijke (Royal) Philips Electronics NV NY Reg. |
131,200 | 3,816,608 | |||
| Royal Dutch Petroleum Co. NY Reg. |
67,300 | 3,525,847 | |||
| STMicroelectronics NV |
151,600 | 4,111,251 | |||
| 17,377,596 | |||||
| Singapore — 3.3% |
|||||
| DBS Group Holdings Ltd. |
622,200 | 5,385,585 | |||
| Flextronics International Ltd.* |
285,000 | 4,229,400 | |||
| Singapore Technologies Engineering Ltd. |
1,350,000 | 1,621,622 | |||
| 11,236,607 | |||||
| South Africa — 1.4% |
|||||
| Gold Fields Ltd. [ADR] |
350,500 | 4,885,970 | |||
45
Table of Contents
AST Strong International Equity Portfolio
Schedule of Investments
December 31, 2003
| Shares |
Value | ||||
| Spain — 2.6% |
|||||
| Banco Santander Central Hispano SA |
386,400 | $ | 4,576,559 | ||
| Telefonica SA |
299,838 | 4,402,263 | |||
| 8,978,822 | |||||
| Sweden — 3.6% |
|||||
| Autoliv, Inc. |
217,900 | 8,267,438 | |||
| Sandvik AB |
111,000 | 3,825,831 | |||
| 12,093,269 | |||||
| Switzerland — 5.2% |
|||||
| Nestle SA |
20,400 | 5,096,907 | |||
| Novartis AG [ADR] |
112,000 | 5,139,681 | |||
| UBS AG |
54,600 | 3,739,333 | |||
| Zurich Financial Services AG |
24,500 | 3,526,177 | |||
| 17,502,098 | |||||
| United Kingdom — 17.9% |
|||||
| Anglo American PLC |
417,000 | 9,010,205 | |||
| Boots Group PLC |
216,900 | 2,683,051 | |||
| BP PLC |
626,000 | 5,076,493 | |||
| Diageo PLC |
371,800 | 4,892,018 | |||
| Exel PLC |
201,100 | 2,658,605 | |||
| GlaxoSmithKline PLC [ADR] |
74,000 | 3,449,880 | |||
| HSBC Holdings PLC |
112,000 | 1,760,369 | |||
| Lloyds TSB Group PLC |
416,000 | 3,336,281 | |||
| Reed Elsevier PLC |
391,000 | 3,270,524 | |||
| Royal Bank of Scotland Group PLC |
190,000 | 5,598,539 | |||
| Tesco PLC |
1,754,000 | 8,093,187 | |||
| United Utilities PLC |
291,000 | 2,581,237 | |||
| Vodafone Group PLC |
3,267,000 | 8,100,098 | |||
| 60,510,487 | |||||
| Total Long-Term Investments |
|||||
| (Cost $261,859,080) |
337,648,611 | ||||
| Total Investments — 99.6% |
|||||
| (Cost $261,859,080; Note 5) |
337,648,611 | ||||
| Other Assets in Excess of |
1,390,216 | ||||
| Net Assets — 100.0% |
$ | 339,038,827 | |||
The industry classification of portfolio holdings and other assets in excess of liabilities shown as a percentage of net assets as of December 31, 2003 was as follows:
| Industry |
|||
| Financial - Bank & Trust |
14.3 | % | |
| Oil & Gas |
9.5 | ||
| Telecommunications |
7.0 | ||
| Food |
6.9 | ||
| Metals & Mining |
5.9 | ||
| Electronic Components & Equipment |
5.2 | ||
| Pharmaceuticals |
4.9 | ||
| Machinery & Equipment |
4.4 | ||
| Retail & Merchandising |
4.0 | ||
| Semiconductors |
3.7 | ||
| Conglomerates |
3.5 | ||
| Automobile Manufacturers |
3.0 | ||
| Insurance |
2.8 | ||
| Automobile Parts |
2.4 | ||
| Consumer Products & Services |
2.3 | ||
| Office Equipment |
2.1 | ||
| Utilities |
2.1 | ||
| Business Services |
1.9 | ||
| Transportation |
1.8 | ||
| Construction |
1.5 | ||
| Beverages |
1.4 | ||
| Clothing & Apparel |
1.4 | ||
| Medical Supplies & Equipment |
1.4 | ||
| Hotels & Motels |
1.3 | ||
| Financial Services |
1.1 | ||
| Entertainment & Leisure |
1.0 | ||
| Printing & Publishing |
1.0 | ||
| Airlines |
0.9 | ||
| Paper & Forest Products |
0.9 | ||
| 99.6 | |||
| Other assets in excess of liabilities |
0.4 | ||
| 100.0 | % | ||
The following abbreviations are used in portfolio descriptions:
| ADR | American Depositary Receipt |
| GDR | Global Depositary Receipt |
| symbol |
description | |
| * |
Non-income producing security. |
See Notes to Financial Statements.
46
Table of Contents
AST William Blair International Growth Portfolio
Schedule of Investments
December 31, 2003
| Shares |
Value | ||||
| LONG-TERM INVESTMENTS — 77.9% |
|||||
| COMMON STOCK |
|||||
| Australia — 1.8% |
|||||
| Macquarie Bank Ltd. |
183,000 | $ | 4,903,054 | ||
| Toll Holdings Ltd. |
755,800 | 4,698,018 | |||
| Virgin Blue Holdings Ltd.* |
1,057,600 | 1,896,497 | |||
| 11,497,569 | |||||
| Austria — 1.3% |
|||||
| Erste Bank der Oesterreichischen Sparkassen AG |
65,900 | 8,143,571 | |||
| Brazil — 0.8% |
|||||
| Companhia de Bebidas das Americas |
18,900,000 | 4,841,282 | |||
| Canada — 5.3% |
|||||
| Manulife Financial Corp. |
375,100 | 12,263,861 | |||
| Petro-Canada |
204,400 | 10,108,883 | |||
| Precision Drilling Corp.* |
59,200 | 2,599,807 | |||
| Research in Motion Ltd.* |
86,100 | 5,777,978 | |||
| Shoppers Drug Mart Corp.* |
147,100 | 3,311,386 | |||
| 34,061,915 | |||||
| Exchange-Traded Fund — 5.2% |
|||||
| iShares MSCI EAFE Index Fund |
242,700 | 33,130,977 | |||
| France — 2.9% |
|||||
| Dassault Systemes SA |
108,800 | 4,962,422 | |||
| Dior (Christian) SA |
175,600 | 10,638,329 | |||
| Klepierre |
51,800 | 3,116,625 | |||
| 18,717,376 | |||||
| Germany — 4.5% |
|||||
| Bayerische Motoren Werke AG |
219,100 | 10,156,313 | |||
| Puma AG Rudolf Dassler Sport |
27,900 | 4,926,842 | |||
| SAP AG |
82,800 | 13,906,180 | |||
| 28,989,335 | |||||
| Greece — 1.0% |
|||||
| Coca-Cola Hellenic Bottling Co. SA |
304,000 | 6,334,612 | |||
| Hong Kong — 3.2% |
|||||
| Esprit Holdings Ltd. |
927,000 | 3,086,577 | |||
| Huaneng Power International, Inc. |
2,498,000 | 4,327,644 | |||
| Li & Fung Ltd. |
3,616,000 | 6,194,652 | |||
| Techtronic Industries Co. Ltd. |
2,506,080 | 6,956,312 | |||
| 20,565,185 | |||||
| India — 1.3% |
|||||
| HDFC Bank Ltd. |
332,500 | 2,672,025 | |||
| Infosys Technologies Ltd. |
47,609 | 5,805,637 | |||
| 8,477,662 | |||||
| Indonesia — 0.3% |
|||||
| PT Unilever Indonesia Tbk |
4,759,500 | 2,048,464 | |||
| Shares |
Value | ||||
| Ireland — 1.8% |
|||||
| Anglo Irish Bank Corp. PLC |
329,112 | $ | 5,193,228 | ||
| Ryanair Holdings PLC [ADR]* |
131,800 | 6,674,352 | |||
| 11,867,580 | |||||
| Israel — 0.8% |
|||||
| Teva Pharmaceutical Industries Ltd. [ADR] |
87,900 | 4,984,809 | |||
| Italy — 1.6% |
|||||
| Banco Popolare di Verona e Novara Scrl |
388,200 | 6,571,195 | |||
| Merloni Elettrodomestici SPA |
199,800 | 3,767,672 | |||
| 10,338,867 | |||||
| Japan — 18.5% |
|||||
| Askul Corp. |
104,800 | 5,143,678 | |||
| Canon, Inc. |
216,800 | 10,094,541 | |||
| Fanuc Ltd. |
128,600 | 7,703,760 | |||
| Hino Motors Ltd. |
894,000 | 6,373,201 | |||
| Hoya Corp. |
82,800 | 7,602,426 | |||
| Keyence Corp. |
52,700 | 11,108,455 | |||
| NEC Electronics Corp. |
32,929 | 2,408,914 | |||
| Nissan Motor Co. Ltd. |
718,700 | 8,208,349 | |||
| Nitto Denko Corp. |
136,000 | 7,233,368 | |||
| Nomura Holdings, Inc. |
779,000 | 13,265,607 | |||
| Oracle Corp. |
68,000 | 3,521,508 | |||
| Pioneer Corp. |
177,800 | 4,910,777 | |||
| Sharp Corp. |
431,800 | 6,813,229 | |||
| SMC Corp. |
86,700 | 10,791,994 | |||
| Sumitomo Trust & Banking Co. Ltd. |
2,175,000 | 12,785,762 | |||
| 117,965,569 | |||||
| Korea — 2.1% |
|||||
| Kookmin Bank* |
109,600 | 4,107,125 | |||
| Samsung Electronics Co. Ltd. |
25,390 | 9,610,483 | |||
| 13,717,608 | |||||
| Mexico — 1.7% |
|||||
| America Movil SA de CV |
2,816,300 | 3,874,613 | |||
| Grupo Financiero BBVA Bancomer |
3,144,900 | 2,686,693 | |||
| Wal-Mart de Mexico SA de CV |
1,584,500 | 4,237,178 | |||
| 10,798,484 | |||||
| Singapore — 0.6% |
|||||
| Venture Corp. Ltd. |
334,900 | 3,943,944 | |||
| Spain — 1.6% |
|||||
| Banco Popular Espanol SA |
114,900 | 6,855,159 | |||
| Grupo Ferrovial SA |
103,000 | 3,609,157 | |||
| 10,464,316 | |||||
| Sweden — 0.4% |
|||||
| Atlas Copco AB (Class “A” Stock) |
67,400 | 2,412,061 | |||
47
Table of Contents
AST William Blair International Growth Portfolio
Schedule of Investments
December 31, 2003
| Shares |
Value | ||||
| Switzerland — 4.4% |
|||||
| Adecco SA |
169,900 | $ | 10,921,407 | ||
| Logitech International SA* |
69,000 | 2,984,839 | |||
| UBS AG |
211,370 | 14,475,876 | |||
| 28,382,122 | |||||
| Taiwan — 2.3% |
|||||
| Hon Hai Precision Industry Co. Ltd. |
1,684,000 | 6,621,914 | |||
| MediaTek, Inc. |
391,000 | 3,673,903 | |||
| Quanta Computer, Inc. |
1,837,300 | 4,518,838 | |||
| 14,814,655 | |||||
| Thailand — 0.4% |
|||||
| Bangkok Bank Public Co. Ltd.* |
553,000 | 1,521,282 | |||
| 299,500 | 869,266 | ||||
| 2,390,548 | |||||
| United Kingdom — 14.1% |
|||||
| 3i Group PLC |
542,800 | 6,000,233 | |||
| Acambis PLC* |
407,000 | 2,224,034 | |||
| BG Group PLC |
2,607,600 | 13,385,533 | |||
| BHP Billiton PLC |
593,400 | 5,183,924 | |||
| British Sky Broadcasting |
982,300 | 12,362,058 | |||
| Capita Group PLC |
835,800 | 3,635,800 | |||
| HBOS PLC |
868,905 | 11,253,876 | |||
| Man Group PLC |
245,200 | 6,413,011 | |||
| Reckitt Benckiser PLC |
331,600 | 7,503,310 | |||
| Standard Chartered PLC |
680,500 | 11,237,916 | |||
| Tesco PLC |
2,505,200 | 11,559,322 | |||
| 90,759,017 | |||||
| Total Investments — 77.9% |
|||||
| (Cost $379,987,706; Note 5) |
499,647,528 | ||||
| Other Assets in Excess of |
141,901,458 | ||||
| Net Assets — 100.0% |
$ | 641,548,986 | |||
The industry classification of portfolio holdings and other assets in excess of liabilities shown as a percentage of net assets as of December 31, 2003 was as follows:
| Industry |
|||
| Financial - Bank & Trust |
11.2 | % | |
| Business Services |
7.1 | ||
| Electronic Components & Equipment |
6.7 | ||
| Financial Services |
6.5 | ||
| Exchange-Traded Fund |
5.2 | ||
| Oil & Gas |
4.1 | ||
| Automobile Manufacturers |
3.9 | ||
| Computer Services & Software |
3.6 | ||
| Computer Hardware |
3.1 | ||
| Consumer Products & Services |
3.1 | ||
| Machinery & Equipment |
3.1 | ||
| Retail & Merchandising |
2.0 | ||
| Broadcasting |
1.9 | ||
| Insurance |
1.9 | ||
| Food |
1.8 | ||
| Beverages |
1.7 | ||
| Semiconductors |
1.7 | ||
| Office Equipment |
1.6 | ||
| Airlines |
1.3 | ||
| Medical Supplies & Equipment |
1.2 | ||
| Pharmaceuticals |
1.1 | ||
| Clothing & Apparel |
0.8 | ||
| Metals & Mining |
0.8 | ||
| Transportation |
0.7 | ||
| Utilities |
0.7 | ||
| Telecommunications |
0.6 | ||
| Real Estate |
0.5 | ||
| 77.9 | |||
| Other assets in excess of liabilities |
22.1 | ||
| 100.0 | % | ||
The following abbreviation is used in portfolio descriptions:
| ADR | American Depositary Receipt |
| symbol |
description | |
| * |
Non-income producing security. |
See Notes to Financial Statements.
48
Table of Contents
AST American Century International Growth Portfolio
Schedule of Investments
December 31, 2003
| Shares |
Value | ||||
| LONG-TERM INVESTMENTS — 99.7% |
|||||
| COMMON STOCK — 99.0% |
|||||
| Australia — 2.0% |
|||||
| BHP Billiton Ltd. |
409,484 | $ | 3,760,923 | ||
| Commonwealth Bank of Australia* |
163,890 | 3,636,567 | |||
| 7,397,490 | |||||
| Austria — 1.0% |
|||||
| Erste Bank der Oesterreichischen Sparkassen AG |
31,190 | 3,854,294 | |||
| Brazil — 0.1% |
|||||
| Tele Norte Leste Participacoes SA [ADR] |
30,423 | 469,427 | |||
| Denmark — 0.4% |
|||||
| A P Moller - Maersk A/S |
214 | 1,544,328 | |||
| Finland — 0.8% |
|||||
| Nokia Corp. [ADR] |
175,470 | 2,982,990 | |||
| France — 14.6% |
|||||
| Accor SA |
100,444 | 4,548,360 | |||
| Axa SA |
206,860 | 4,427,869 | |||
| Credit Agricole SA |
311,180 | 7,430,168 | |||
| France Telecom SA* |
179,282 | 5,124,281 | |||
| Groupe Danone SA |
25,250 | 4,121,279 | |||
| LVMH Moet Hennessy Louis |
62,238 | 4,529,683 | |||
| Publicis Groupe |
49,467 | 1,603,559 | |||
| Renault SA |
38,150 | 2,632,196 | |||
| Societe Generale (Class “A” Stock) |
85,020 | 7,506,811 | |||
| Total SA |
41,750 | 7,762,299 | |||
| Vinci SA |
15,910 | 1,317,472 | |||
| Vivendi Universal SA* |
78,320 | 1,903,666 | |||
| Wanadoo* |
274,675 | 2,252,002 | |||
| 55,159,645 | |||||
| Germany — 9.9% |
|||||
| BASF AG |
23,330 | 1,311,871 | |||
| Commerzbank AG* |
105,200 | 2,063,396 | |||
| Deutsche Boerse AG |
46,770 | 2,557,366 | |||
| Deutsche Telekom AG* |
271,955 | 4,977,380 | |||
| E.ON AG |
38,761 | 2,529,634 | |||
| Linde AG |
34,210 | 1,842,542 | |||
| Metro AG |
87,373 | 3,851,774 | |||
| Puma AG Rudolf Dassler Sport |
12,310 | 2,173,814 | |||
| SAP AG |
31,200 | 5,240,010 | |||
| Siemens AG |
94,490 | 7,568,258 | |||
| T-Online International AG* |
270,121 | 3,509,392 | |||
| 37,625,437 | |||||
| Greece — 0.7% |
|||||
| Alpha Bank AE |
42,240 | 1,277,643 | |||
| Public Power Corp. |
48,230 | 1,192,366 | |||
| 2,470,009 | |||||
| Shares |
Value | ||||
| Hong Kong — 3.5% |
|||||
| Cheung Kong Holdings Ltd. |
228,000 | $ | 1,813,463 | ||
| China Life Insurance Co. Ltd. |
2,104,000 | 1,720,903 | |||
| CNOOC Ltd. |
667,000 | 1,305,889 | |||
| Huaneng Power International, Inc. |
1,476,000 | 2,557,087 | |||
| PetroChina Co. Ltd. |
2,535,000 | 1,453,031 | |||
| Sinopec Shanghai Petrochemical Co. Ltd. (Class “H” Stock) |
6,582,000 | 2,924,918 | |||
| Sun Hung Kai Properties Ltd. |
182,000 | 1,506,196 | |||
| 13,281,487 | |||||
| Hungary — 0.5% |
|||||
| Gedeon Richter Rt. |
6,380 | 755,295 | |||
| OTP Bank Rt.* |
81,580 | 1,052,117 | |||
| 1,807,412 | |||||
| India — 0.3% |
|||||
| Reliance Industries Ltd.* |
75,700 | 950,709 | |||
| Ireland — 2.6% |
|||||
| Anglo Irish Bank Corp. PLC |
182,980 | 2,887,336 | |||
| CRH PLC |
162,564 | 3,336,171 | |||
| Depfa Bank PLC |
14,820 | 1,871,193 | |||
| Ryanair Holdings PLC [ADR]* |
36,080 | 1,827,091 | |||
| 9,921,791 | |||||
| Israel — 1.1% |
|||||
| Teva Pharmaceutical Industries Ltd. [ADR] |
75,947 | 4,306,954 | |||
| Italy — 1.5% |
|||||
| Banca Intesa SPA |
751,810 | 2,939,721 | |||
| Banco Popolare di Verona e |
162,200 | 2,745,616 | |||
| 5,685,337 | |||||
| Japan — 18.6% |
|||||
| Bank of Yokohama Ltd. (The) |
343,000 | 1,593,860 | |||
| Canon, Inc. |
34,000 | 1,583,092 | |||
| Chugai Pharmaceutical Co. Ltd. |
146,998 | 2,113,688 | |||
| Denso Corp. |
136,900 | 2,695,335 | |||
| Dentsu, Inc. |
234 | 1,179,061 | |||
| Fanuc Ltd. |
79,800 | 4,780,405 | |||
| Fast Retailing Co. Ltd. |
24,500 | 1,488,243 | |||
| Hoya Corp. |
41,600 | 3,819,576 | |||
| JSR Corp |
68,000 | 1,519,642 | |||
| KDDI Corp. |
540 | 3,093,776 | |||
| Keyence Corp. |
12,000 | 2,529,439 | |||
| Marui Co. Ltd. |
255,900 | 3,223,523 | |||
| Matsushita Electric Industrial Co. Ltd. |
66,000 | 912,681 | |||
| Mitsubishi Corp. |
643,000 | 6,815,789 | |||
| NEC Corp. |
529,000 | 3,894,569 | |||
| Nissan Motor Co. Ltd. |
536,000 | 6,121,713 | |||
| Nitto Denko Corp. |
32,100 | 1,707,287 | |||
| NOK Corp. |
37,000 | 1,346,459 | |||
49
Table of Contents
AST American Century International Growth Portfolio
Schedule of Investments
December 31, 2003
| Shares |
Value | ||||
| Orix Corp. |
34,300 | $ | 2,835,663 | ||
| Seiko Epson Corp. |
16,900 | 788,467 | |||
| Sharp Corp. |
234,000 | 3,692,209 | |||
| Sumitomo Mitsui Financial |
870 | 4,635,346 | |||
| Tokyo Electron Ltd. |
24,900 | 1,891,257 | |||
| Tokyu Corp. |
425,000 | 2,181,114 | |||
| Toray Industries, Inc. |
200,000 | 836,055 | |||
| Toyota Motor Corp. |
22,000 | 743,118 | |||
| Yahoo! Japan Corp.* |
162 | 2,176,729 | |||
| 70,198,096 | |||||
| Korea — 1.3% |
|||||
| Samsung Electronics Co. Ltd. |
13,330 | 5,045,598 | |||
| Mexico — 0.6% |
|||||
| America Movil (Class “L” Stock) [ADR] |
86,800 | 2,373,112 | |||
| Netherlands — 2.6% |
|||||
| Aegon NV |
90,940 | 1,345,517 | |||
| ING Groep NV |
198,960 | 4,640,225 | |||
| Koninklijke (Royal) Philips Electronics NV NY Reg. |
131,009 | 3,811,052 | |||
| 9,796,794 | |||||
| Norway — 0.5% |
|||||
| Telenor ASA |
289,630 | 1,893,775 | |||
| Russia — 0.5% |
|||||
| Mobile Telesystems [ADR] |
23,848 | 1,974,614 | |||
| South Africa — 0.3% |
|||||
| MTN Group Ltd.* |
293,980 | 1,252,993 | |||
| Spain — 1.4% |
|||||
| Actividades de Construccion y |
21,807 | 1,064,494 | |||
| Telefonica SA |
283,380 | 4,160,625 | |||
| 5,225,119 | |||||
| Sweden — 3.1% |
|||||
| Atlas Copco AB (Class “A” Stock) |
69,560 | 2,489,361 | |||
| Ericsson, (L.M.) Telefonaktiebolaget |
1,085,710 | 1,946,501 | |||
| Foreningsparbanken AB |
69,697 | 1,370,634 | |||
| Tele2 AB (Class “B” Stock)* |
46,249 | 2,468,225 | |||
| Volvo AB (Class “B” Stock) |
114,460 | 3,499,673 | |||
| 11,774,394 | |||||
| Switzerland — 9.9% |
|||||
| ABB Ltd.* |
495,278 | 2,510,930 | |||
| Adecco SA |
78,205 | 5,027,126 | |||
| Clariant AG* |
96,556 | 1,424,821 | |||
| Compagnie Financiere Richemont AG (Class “A” Stock) |
74,370 | 1,785,962 | |||
| Credit Suisse Group |
229,400 | 8,393,248 | |||
| Julius Baer Holdings Ltd. |
5,190 | 1,749,933 | |||
| Shares |
Value | ||||
| Roche Holding AG |
65,501 | $ | 6,607,034 | ||
| Swiss Life Holding* |
26,043 | 4,780,078 | |||
| UBS AG |
56,120 | 3,843,432 | |||
| Zurich Financial Services AG |
9,370 | 1,348,583 | |||
| 37,471,147 | |||||
| Taiwan — 0.8% |
|||||
| Acer, Inc. |
496,000 | 737,791 | |||
| China Steel Corp.* |
71,351 | 1,185,333 | |||
| Taiwan Semiconductor Manufacturing Co. Ltd.* |
606,800 | 1,134,957 | |||
| 3,058,081 | |||||
| United Kingdom — 20.4% |
|||||
| Abbey National PLC |
335,487 | 3,189,051 | |||
| Alliance & Leicester PLC |
162,789 | 2,587,792 | |||
| AstraZeneca PLC |
51,030 | 2,448,227 | |||
| BP PLC |
1,064,590 | 8,633,203 | |||
| British Sky Broadcasting Group PLC* |
304,250 | 3,828,928 | |||
| Cadbury Schweppes PLC |
235,100 | 1,726,603 | |||
| Exel PLC |
192,600 | 2,546,233 | |||
| GlaxoSmithKline PLC |
297,300 | 6,812,338 | |||
| Hays PLC |
1,153,720 | 2,478,409 | |||
| HBOS PLC |
123,890 | 1,604,597 | |||
| HSBC Holdings PLC |
353,800 | 5,560,881 | |||
| Man Group PLC |
119,545 | 3,126,604 | |||
| Marks & Spencer Group PLC |
182,500 | 944,174 | |||
| mmO2 PLC* |
1,632,376 | 2,250,102 | |||
| Next PLC |
121,410 | 2,440,762 | |||
| Reckitt Benckiser PLC |
250,725 | 5,673,303 | |||
| Rio Tinto PLC |
91,010 | 2,513,890 | |||
| Smith & Nephew PLC |
176,100 | 1,479,295 | |||
| Tesco PLC |
628,120 | 2,898,228 | |||
| United Business Media PLC |
229,110 | 2,009,701 | |||
| Vodafone Group PLC |
3,136,283 | 7,776,002 | |||
| WPP Group PLC |
438,309 | 4,303,763 | |||
| 76,832,086 | |||||
| Total Common Stock |
|||||
| (Cost $310,886,261) |
374,353,119 | ||||
| PREFERRED STOCK — 0.7% |
|||||
| Germany |
|||||
| Porsche AG |
4,470 | 2,652,907 | |||
| Total Long-Term Investments |
|||||
| (Cost $313,014,034) |
377,006,026 | ||||
| SHORT-TERM INVESTMENTS — 0.6% |
|||||
| United States |
|||||
| Registered Investment Company |
|||||
| J.P. Morgan Prime II Money Market Fund |
44,156 | 44,156 | |||
50
Table of Contents
AST American Century International Growth Portfolio
Schedule of Investments
December 31, 2003
| Par (000) |
Value |
||||||
| U.S. Government Agency Obligation — 0.6% |
|||||||
| Federal Home Loan Bank |
$ | 2,300 | $ | 2,299,955 | |||
| Total Short-Term Investments |
|||||||
| (Cost $2,344,111) |
2,344,111 | ||||||
| Total Investments — 100.3% |
|||||||
| (Cost $315,358,145; Note 5) |
379,350,137 | ||||||
| Liabilities in Excess of Other |
(1,022,699 | ) | |||||
| Net Assets — 100.0% |
$ | 378,327,438 | |||||
The industry classification of portfolio holdings and liabilities in excess of other assets shown as a percentage of net assets as of December 31, 2003 was as follows:
| Industry |
|||
| Financial - Bank & Trust |
18.0 | % | |
| Telecommunications |
11.3 | ||
| Electronic Components & Equipment |
6.5 | ||
| Pharmaceuticals |
6.1 | ||
| Oil & Gas |
5.3 | ||
| Business Services |
5.2 | ||
| Insurance |
4.8 | ||
| Automobile Manufacturers |
4.1 | ||
| Financial Services |
3.3 | ||
| Food |
3.3 | ||
| Semiconductors |
2.8 |
Foreign currency exchange contracts outstanding at December 31, 2003:
| Industry |
|||
| Retail & Merchandising |
2.6 | % | |
| Conglomerates |
2.2 | ||
| Internet Services |
2.1 | ||
| Advertising |
1.9 | ||
| Chemicals |
1.9 | ||
| Transportation |
1.7 | ||
| Utilities |
1.7 | ||
| Consumer Products & Services |
1.5 | ||
| Computer Services & Software |
1.4 | ||
| Medical Supplies & Equipment |
1.4 | ||
| Building Materials |
1.3 | ||
| Hotels & Motels |
1.2 | ||
| Automotive Parts |
1.1 | ||
| Broadcasting |
1.0 | ||
| Metals & Mining |
1.0 | ||
| Printing & Publishing |
1.0 | ||
| Real Estate |
0.9 | ||
| Clothing & Apparel |
0.8 | ||
| Machinery & Equipment |
0.7 | ||
| Office Equipment |
0.6 | ||
| Short-term investments |
0.6 | ||
| Airlines |
0.5 | ||
| Construction |
0.3 | ||
| Computer Hardware |
0.2 | ||
| 100.3 | |||
| Liabilities in excess of other assets |
(0.3 | ) | |
| 100.0 | % | ||
| Settlement Month |
Purchase Contracts |
Contracts to Receive |
In For |
Contracts at Value |
Unrealized (Depreciation) |
|||||||||
| 01/04 |
Buy AUD | 328,620 | $ | 245,545 | $ | 247,598 | $ | 2,053 | ||||||
| 01/04 |
Buy CHF | 357,226 | 287,625 | 288,843 | 1,218 | |||||||||
| 01/04 |
Buy EUR | 122,717 | 153,151 | 154,790 | 1,639 | |||||||||
| 01/04 |
Buy GBP | 308,666 | 547,389 | 552,562 | 5,173 | |||||||||
| 01/04 |
Buy JPY | 131,261,220 | 1,226,167 | 1,224,794 | (1,373 | ) | ||||||||
| $ | 2,459,877 | $ | 2,468,587 | $ | 8,710 | |||||||||
| Settlement Month |
Sale Contracts |
Contracts to Receive |
In For |
Contracts at Value |
Unrealized (Depreciation) |
|||||||||
| 01/04 |
Sell EUR | 389,205 | $ | 488,024 | $ | 490,924 | $ | (2,900 | ) | |||||
| 01/04 |
Sell GBP | 287,588 | 512,667 | 514,983 | (2,316 | ) | ||||||||
| 01/04 |
Sell JPY | 66,172,392 | 617,966 | 617,453 | 513 | |||||||||
| $ | 1,618,657 | $ | 1,623,360 | $ | (4,703 | ) | ||||||||
51
Table of Contents
AST American Century International Growth Portfolio
Schedule of Investments
December 31, 2003
The following abbreviations are used in portfolio descriptions:
| ADR | American Depositary Receipt |
| AUD | Australian Dollar |
| CHF | Swiss Franc |
| EUR | Euro Dollar |
| GBP | British Pound |
| JPY | Japanese Yen |
| symbol |
description | |
| * |
Non-income producing security. | |
| (n) |
Rates shown are the effective yields at purchase date. |
See Notes to Financial Statements.
52
Table of Contents
AST DeAM International Equity Portfolio
Schedule of Investments
December 31, 2003
| Shares |
Value | ||||
| LONG-TERM INVESTMENTS — 91.7% |
|||||
| COMMON STOCK |
|||||
| Australia — 4.9% |
|||||
| Amcor Ltd. |
32,188 | $ | 200,322 | ||
| AMP Ltd. |
41,113 | 155,192 | |||
| Australia & New Zealand Banking |
44,927 | 598,472 | |||
| BHP Billiton Ltd. |
92,130 | 846,172 | |||
| Coles Myer Ltd. |
33,636 | 191,593 | |||
| Commonwealth Bank of Australia* |
29,073 | 645,103 | |||
| Foster’s Group Ltd. |
88,332 | 299,491 | |||
| General Property Trust |
84,294 | 189,899 | |||
| HHG PLC* |
30,889 | 22,342 | |||
| Insurance Australia Group Ltd. |
67,129 | 214,958 | |||
| John Fairfax Holdings Ltd. |
97,681 | 259,064 | |||
| Macquarie Bank Ltd. |
8,910 | 238,722 | |||
| National Australia Bank Ltd. |
35,743 | 806,569 | |||
| News Corp. Ltd. |
74,132 | 669,698 | |||
| QBE Insurance Group Ltd. |
20,599 | 164,515 | |||
| Rinker Group Ltd.* |
34,328 | 169,412 | |||
| Rio Tinto Ltd. |
9,607 | 269,268 | |||
| Stockland |
61,674 | 242,564 | |||
| Suncorp-Metway Ltd. |
19,092 | 178,228 | |||
| Telstra Corp. Ltd. |
56,211 | 204,137 | |||
| Wesfarmers Ltd. |
11,597 | 231,463 | |||
| Westfield Trust |
84,535 | 226,746 | |||
| Westpac Banking Corp. Ltd. |
53,144 | 640,260 | |||
| WMC Ltd. |
30,731 | 152,123 | |||
| WMC Resources Ltd.* |
35,564 | 150,860 | |||
| Woodside Petroleum Ltd. |
15,266 | 170,232 | |||
| Woolworths Ltd. |
25,929 | 230,527 | |||
| 8,367,932 | |||||
| Austria — 0.9% |
|||||
| Erste Bank der Oesterreichischen Sparkassen AG |
11,510 | 1,422,345 | |||
| OMV AG |
1,050 | 156,387 | |||
| 1,578,732 | |||||
| Belgium — 2.7% |
|||||
| Almanij NV |
12,270 | 623,405 | |||
| Colruyt NV |
7,450 | 717,936 | |||
| Delhaize Group |
10,130 | 521,066 | |||
| Dexia |
62,000 | 1,068,265 | |||
| Fortis |
8,430 | 169,493 | |||
| S.A. D’Ieteren NV |
1,090 | 223,554 | |||
| Umicore |
20,010 | 1,404,588 | |||
| 4,728,307 | |||||
| Denmark — 0.5% |
|||||
| Danske Bank AS |
11,903 | 279,269 | |||
| Topdanmark AS* |
10,528 | 563,571 | |||
| 842,840 | |||||
| Shares |
Value | ||||
| Finland — 2.4% |
|||||
| Fortum OYJ |
101,840 | $ | 1,050,771 | ||
| Nokia OYJ |
180,980 | 3,129,712 | |||
| 4,180,483 | |||||
| France — 6.0% |
|||||
| Alcatel SA* |
4,920 | 63,362 | |||
| Aventis SA |
4,380 | 289,495 | |||
| Axa SA |
60,580 | 1,296,724 | |||
| BNP Paribas SA |
27,770 | 1,748,585 | |||
| Carrefour SA |
1,730 | 94,967 | |||
| Compagnie de Saint-Gobain |
700 | 34,267 | |||
| Eramet SLN |
1,250 | 60,703 | |||
| France Telecom SA* |
39,240 | 1,121,567 | |||
| Groupe Danone SA |
1,020 | 166,483 | |||
| LVMH Moet Hennessy Louis |
1,600 | 116,448 | |||
| Renault SA |
12,660 | 873,489 | |||
| Societe Generale (Class “A” Stock) |
3,860 | 340,817 | |||
| Suez SA |
2,770 | 55,659 | |||
| Total SA |
15,600 | 2,900,403 | |||
| Vinci SA |
11,940 | 988,725 | |||
| Vivendi Universal SA* |
7,990 | 194,207 | |||
| 10,345,901 | |||||
| Germany — 3.0% |
|||||
| Bayer AG |
4,270 | 125,062 | |||
| Deutsche Post AG |
32,610 | 672,520 | |||
| Deutsche Telekom AG* |
87,140 | 1,594,855 | |||
| E.ON AG |
3,510 | 229,071 | |||
| RWE AG |
23,570 | 932,632 | |||
| SAP AG |
8,570 | 1,439,323 | |||
| Schwarz Pharma AG |
4,090 | 110,969 | |||
| 5,104,432 | |||||
| Hong Kong — 1.5% |
|||||
| Bank of East Asia Ltd. |
66,200 | 203,368 | |||
| BOC Hong Kong Holdings Ltd. |
77,000 | 144,804 | |||
| Cheung Kong Holdings Ltd. |
45,300 | 360,306 | |||
| CLP Ltd. |
53,600 | 255,449 | |||
| Hang Seng Bank Ltd. |
20,300 | 266,706 | |||
| Hong Kong & China Gas Co. Ltd. |
125,000 | 190,794 | |||
| Hong Kong Electric Holdings Ltd. |
38,000 | 150,265 | |||
| Hutchison Whampoa Ltd. |
64,100 | 472,684 | |||
| Sun Hung Kai Properties Ltd. |
32,900 | 272,274 | |||
| Swire Pacific Ltd. (Class “A” Stock) |
30,800 | 190,030 | |||
| 2,506,680 | |||||
| Ireland — 0.1% |
|||||
| Grafton Group PLC |
33,760 | 232,930 | |||
| Italy — 3.5% |
|||||
| Assicurazioni Generali SPA |
2,150 | 56,950 | |||
| Banca Intesa SPA |
271,970 | 1,063,455 | |||
| Buzzi Unicem SPA |
25,930 | 305,809 | |||
| Enel SPA |
121,360 | 825,089 | |||
53
Table of Contents
AST DeAM International Equity Portfolio
Schedule of Investments
December 31, 2003
| Shares |
Value | ||||
| Eni SPA |
73,190 | $ | 1,381,082 | ||
| Impregilo SPA |
159,100 | 102,347 | |||
| Mediaset SPA |
85,330 | 1,013,886 | |||
| Merloni Elettrodomestici SPA |
5,940 | 112,012 | |||
| Parmalat Finanziaria SPA(cost $1,180,360; purchased 11/25/03)(g) |
448,250 | 62,194 | |||
| San Paolo-IMI SPA |
59,080 | 770,544 | |||
| Telecom Italia Mobile SPA |
36,280 | 197,234 | |||
| UniCredito Italiano SPA |
28,390 | 153,266 | |||
| 6,043,868 | |||||
| Japan — 19.6% |
|||||
| Acom Co. Ltd. |
2,690 | 121,987 | |||
| Advantest Corp. |
2,000 | 158,626 | |||
| Aeon Co. Ltd. |
5,600 | 187,590 | |||
| Ajinomoto Co., Inc. |
15,000 | 172,576 | |||
| Asahi Glass Co. Ltd. |
21,800 | 179,005 | |||
| Asahi Kasei Corp. |
37,000 | 200,933 | |||
| Bank of Yokohama Ltd. (The) |
26,000 | 120,817 | |||
| Bridgestone Corp. |
15,000 | 201,689 | |||
| Canon, Inc. |
18,200 | 847,420 | |||
| Central Japan Railway Co. |
28 | 241,933 | |||
| Chubu Electric Power Co., Inc. |
17,300 | 360,787 | |||
| Chugai Pharmaceutical Co. Ltd. |
9,700 | 139,477 | |||
| Dai Nippon Printing Co. Ltd. |
22,000 | 308,948 | |||
| Daiwa House Industry Co. Ltd. |
18,000 | 191,471 | |||
| Daiwa Securities Group, Inc. |
41,000 | 278,893 | |||
| Denso Corp. |
14,000 | 275,637 | |||
| East Japan Railway Co. |
73 | 343,986 | |||
| Eisai Co. Ltd. |
5,500 | 148,316 | |||
| Fanuc Ltd. |
3,400 | 203,676 | |||
| Fuji Photo Film Co. Ltd. |
10,700 | 345,451 | |||
| Fujisawa Pharmaceutical Co. Ltd. |
6,400 | 136,456 | |||
| Fujitsu Ltd. |
49,000 | 288,961 | |||
| Hitachi Ltd. |
84,200 | 507,541 | |||
| Honda Motor Co. Ltd. |
17,400 | 772,828 | |||
| Hoya Corp. |
3,400 | 312,177 | |||
| Ito-Yokado Co. Ltd. |
9,000 | 283,008 | |||
| Itochu Corp. |
44,000 | 145,339 | |||
| Japan Tobacco, Inc. |
17 | 124,522 | |||
| JFE Holdings, Inc. |
12,200 | 332,976 | |||
| Kansai Electric Power Co. |
22,900 | 401,290 | |||
| Kao Corp. |
14,000 | 284,781 | |||
| Keihin Electric Express Railway |
37,100 | 217,747 | |||
| Keyence Corp. |
900 | 189,708 | |||
| Kinki Nippon Railway Co. Ltd. |
43,900 | 131,901 | |||
| Kirin Brewery Co. Ltd. |
21,300 | 181,657 | |||
| Komatsu Ltd. |
33,200 | 210,656 | |||
| Konica Minolta Holdings, Inc. |
12,000 | 161,351 | |||
| Kubota Corp. |
49,000 | 202,090 | |||
| Kyocera Corp. |
3,300 | 219,856 | |||
| Kyushu Electric Power Co., Inc. |
15,000 | 257,955 | |||
| Marui Co. Ltd. |
10,600 | 133,526 | |||
| Shares |
Value | ||||
| Matsushita Electric Industrial Co. Ltd. |
48,000 | $ | 663,768 | ||
| Matsushita Electric Works Ltd. |
19,000 | 170,729 | |||
| Millea Holdings, Inc. |
36 | 470,281 | |||
| Mitsubishi Chemical Corp. |
55,000 | 143,184 | |||
| Mitsubishi Corp. |
30,000 | 317,999 | |||
| Mitsubishi Electric Corp.* |
53,900 | 223,808 | |||
| Mitsubishi Estate Co. Ltd. |
36,000 | 341,290 | |||
| Mitsubishi Heavy Industries Ltd. |
84,000 | 233,573 | |||
| Mitsubishi Tokyo Financial Group, Inc. |
94 | 733,265 | |||
| Mitsui & Co. Ltd. |
41,000 | 330,158 | |||
| Mitsui Fudosan Co. Ltd. |
21,000 | 189,680 | |||
| Mitsui OSK Lines Ltd. |
33,000 | 161,043 | |||
| Mitsui Sumitomo Insurance Co. Ltd. |
32,000 | 262,760 | |||
| Mizuho Financial Group, Inc. |
140 | 424,559 | |||
| Murata Manufacturing Co. Ltd. |
5,300 | 286,339 | |||
| NEC Corp. |
38,400 | 282,706 | |||
| Nikko Cordial Corp. |
40,000 | 222,824 | |||
| Nintendo Co. Ltd. |
2,400 | 223,943 | |||
| Nippon Express Co. Ltd. |
30,000 | 141,644 | |||
| Nippon Mitsubishi Oil Corp. |
32,900 | 167,616 | |||
| Nippon Steel Corp. |
152,000 | 326,211 | |||
| Nippon Telegraph and Telephone Corp. |
124 | 598,190 | |||
| Nippon Unipac Holding |
29 | 149,641 | |||
| Nissan Motor Co. Ltd. |
57,200 | 653,287 | |||
| Nitto Denko Corp. |
4,400 | 234,021 | |||
| Nomura Holdings, Inc. |
43,000 | 732,248 | |||
| NTT Data Corp. |
40 | 151,162 | |||
| NTT DoCoMo, Inc. |
394 | 893,366 | |||
| Oji Paper Co. Ltd. |
25,000 | 161,426 | |||
| Olympus Optical Co. Ltd. |
6,000 | 130,167 | |||
| Omron Corp. |
6,400 | 129,887 | |||
| Oriental Land Co. |
1,900 | 117,188 | |||
| Orix Corp. |
2,300 | 190,146 | |||
| Osaka Gas Co. Ltd. |
67,000 | 181,301 | |||
| Pioneer Corp. |
4,200 | 116,003 | |||
| Promise Co. Ltd. |
3,100 | 135,084 | |||
| Resona Holdings, Inc. |
129,000 | 162,499 | |||
| Ricoh Co. Ltd. |
17,000 | 335,495 | |||
| Rohm Co. Ltd. |
2,500 | 292,992 | |||
| Sankyo Co. Ltd. |
9,600 | 180,498 | |||
| Sanyo Electric Co. Ltd. |
39,400 | 205,879 | |||
| Secom Co. Ltd. |
6,300 | 235,140 | |||
| Sekisui House Ltd. |
16,000 | 165,270 | |||
| Seven-Eleven Japan Co. Ltd. |
8,900 | 269,898 | |||
| Sharp Corp. |
24,000 | 378,688 | |||
| Shin-Etsu Chemical Co. Ltd. |
9,700 | 396,436 | |||
| Shionogi & Co. Ltd. |
8,000 | 148,997 | |||
| Shiseido Co. Ltd. |
12,000 | 145,899 | |||
| SMC Corp. |
2,000 | 248,950 | |||
| SoftBank Corp. |
5,200 | 159,149 | |||
| Sompo Japan Insurance, Inc. |
21,000 | 172,632 | |||
| Sony Corp. |
19,100 | 661,202 | |||
| Sumitomo Chemical Co. Ltd. |
33,000 | 136,102 | |||
| Sumitomo Corp. |
26,000 | 193,842 | |||
54
Table of Contents
AST DeAM International Equity Portfolio
Schedule of Investments
December 31, 2003
| Shares |
Value | ||||
| Sumitomo Electric Industries Ltd. |
20,400 | $ | 182,357 | ||
| Sumitomo Mitsui Financial Group, Inc. |
88 | 468,863 | |||
| Sumitomo Trust & Banking Co. Ltd. |
28,000 | 164,598 | |||
| Taisho Pharmaceutical Co. Ltd. |
7,300 | 130,510 | |||
| Takeda Chemical Industries Ltd. |
18,700 | 741,579 | |||
| TDK Corp. |
3,000 | 216,105 | |||
| The Shizouka Bank Ltd. |
18,200 | 134,500 | |||
| Tobu Railway Co. Ltd. |
50,000 | 178,688 | |||
| Tohoku Electric Power Co., Inc. |
13,600 | 225,503 | |||
| Tokyo Electric Power Co., Inc. |
26,100 | 572,315 | |||
| Tokyo Electron Ltd. |
3,900 | 296,221 | |||
| Tokyo Gas Co. Ltd. |
75,200 | 268,045 | |||
| Tokyu Corp. |
33,000 | 169,357 | |||
| Toppan Printing Co. Ltd. |
20,700 | 215,363 | |||
| Toray Industries, Inc. |
50,000 | 209,014 | |||
| Toshiba Corp. |
75,300 | 285,265 | |||
| Tostem Inax Holding Corp. |
9,000 | 173,836 | |||
| Toto Ltd. |
16,900 | 143,186 | |||
| Toyota Industries Corp. |
8,800 | 186,806 | |||
| Toyota Motor Corp. |
59,000 | 1,992,908 | |||
| UFJ Holdings, Inc. |
82 | 394,047 | |||
| Yamanouchi Pharmaceutical Co. Ltd. |
7,400 | 229,934 | |||
| Yamato Transport Co. Ltd. |
14,000 | 164,860 | |||
| 33,649,469 | |||||
| Netherlands — 6.0% |
|||||
| ABN AMRO Holding NV |
59,410 | 1,390,080 | |||
| ING Groep NV |
90,430 | 2,109,046 | |||
| Koninklijke (Royal) KPN NV* |
174,270 | 1,345,273 | |||
| Koninklijke (Royal) Philips Electronics NV |
18,070 | 527,649 | |||
| Oce NV |
56,800 | 870,484 | |||
| Royal Dutch Petroleum Co. |
34,880 | 1,839,031 | |||
| STMicroelectronics NV |
7,470 | 202,579 | |||
| Stork NV |
45,260 | 896,294 | |||
| Unilever NV |
7,880 | 515,361 | |||
| VNU NV |
21,090 | 666,378 | |||
| 10,362,175 | |||||
| New Zealand — 0.1% |
|||||
| Telecom Corp. of New Zealand Ltd. |
50,142 | 176,785 | |||
| Norway — 0.7% |
|||||
| Norsk Hydro ASA |
13,040 | 804,611 | |||
| Telenor ASA |
68,000 | 444,625 | |||
| 1,249,236 | |||||
| Singapore — 0.6% |
|||||
| DBS Group Holdings Ltd. |
34,700 | 300,353 | |||
| Oversea-Chinese Banking Corp. Ltd. |
31,600 | 225,143 | |||
| Singapore Press Holdings Ltd. |
11,000 | 122,417 | |||
| Singapore Telecommunications Ltd. |
174,300 | 201,159 | |||
| United Overseas Bank Ltd. |
31,600 | 245,610 | |||
| 1,094,682 | |||||
| Shares |
Value | ||||
| Spain — 5.6% |
|||||
| Amadeus Global Travel Distribution SA (Class “A” Stock) |
22,530 | $ | 146,354 | ||
| Banco Bilbao Vizcaya Argentaria SA |
26,400 | 364,632 | |||
| Banco Santander Central Hispano SA |
67,900 | 804,214 | |||
| Corporacion Mapfre SA |
81,290 | 1,151,472 | |||
| Endesa SA |
45,750 | 880,030 | |||
| Repsol YPF SA |
96,960 | 1,890,769 | |||
| Telefonica SA |
205,740 | 3,020,703 | |||
| Union Fenosa SA |
72,770 | 1,366,732 | |||
| 9,624,906 | |||||
| Sweden — 0.9% |
|||||
| Atlas Copco AB (Class “B” Stock) |
49,380 | 1,609,330 | |||
| Switzerland — 8.6% |
|||||
| Clariant AG* |
35,864 | 529,224 | |||
| Credit Suisse Group |
69,155 | 2,530,232 | |||
| Nestle SA |
9,662 | 2,414,035 | |||
| Novartis AG |
40,419 | 1,835,073 | |||
| Roche Holding AG |
22,545 | 2,274,096 | |||
| Serono SA Cl-B |
1,202 | 857,218 | |||
| Swiss Life Holding* |
5,633 | 1,033,912 | |||
| Swisscom AG |
1,204 | 397,196 | |||
| UBS AG |
21,219 | 1,453,203 | |||
| Vontobel Holding AG |
5,183 | 118,391 | |||
| Zurich Financial Services AG |
8,851 | 1,273,886 | |||
| 14,716,466 | |||||
| United Kingdom — 24.1% |
|||||
| Arriva PLC |
45,980 | 312,784 | |||
| AstraZeneca PLC |
50,580 | 2,426,638 | |||
| Avis Europe PLC |
152,600 | 259,519 | |||
| Balfour Beatty PLC |
149,550 | 584,964 | |||
| Barclays PLC |
221,840 | 1,978,693 | |||
| BG Group PLC |
23,550 | 120,889 | |||
| BHP Billiton PLC |
18,210 | 159,082 | |||
| Big Food Group PLC |
136,290 | 386,099 | |||
| BP PLC |
444,290 | 3,602,931 | |||
| British American Tobacco PLC |
97,050 | 1,337,758 | |||
| British Sky Broadcasting Group PLC* |
4,550 | 57,261 | |||
| BT Group PLC |
49,100 | 165,466 | |||
| Close Brothers Group PLC |
43,490 | 571,448 | |||
| Compass Group PLC |
7,570 | 51,496 | |||
| Diageo PLC |
88,490 | 1,164,321 | |||
| GlaxoSmithKline PLC |
165,000 | 3,780,812 | |||
| GUS PLC |
109,140 | 1,511,247 | |||
| Hanson PLC |
140,950 | 1,035,154 | |||
| HBOS PLC |
61,100 | 791,354 | |||
| HSBC Holdings PLC |
212,290 | 3,336,686 | |||
| IMI PLC |
55,030 | 332,233 | |||
| Imperial Tobacco Group PLC |
1,420 | 27,962 | |||
| InterContinental Hotels Group PLC |
120,970 | 1,145,578 | |||
55
Table of Contents
AST DeAM International Equity Portfolio
Schedule of Investments
December 31, 2003
| Shares |
Value | |||||
| Investec PLC |
8,360 | $ | 164,174 | |||
| Lloyds TSB Group PLC |
55,440 | 444,624 | ||||
| Misys PLC |
324,080 | 1,228,477 | ||||
| National Express Group PLC |
123,057 | 1,345,981 | ||||
| Pilkington PLC |
216,210 | 370,600 | ||||
| Reckitt Benckiser PLC |
32,700 | 739,922 | ||||
| Reed Elsevier PLC |
90,180 | 754,312 | ||||
| Rentokil Initial PLC |
256,150 | 871,243 | ||||
| Rexam PLC |
167,870 | 1,285,448 | ||||
| Rio Tinto PLC |
12,270 | 338,924 | ||||
| Royal Bank of Scotland Group PLC |
70,440 | 2,075,585 | ||||
| SABMiller PLC |
125,620 | 1,302,053 | ||||
| Scottish Power PLC |
64,820 | 431,952 | ||||
| Shell Transport & Trading Co. PLC |
108,150 | 804,431 | ||||
| Unilever PLC |
114,300 | 1,065,533 | ||||
| Vodafone Group PLC |
1,234,730 | 3,061,351 | ||||
| Total Common Stock ($138,350,416) |
41,424,985 | |||||
| Rights* |
||||||
| AMP Ltd. |
29,808 | 0 | ||||
| Total Long-Term Investments |
||||||
| (Cost $138,350,416) |
157,840,139 | |||||
| Par (000) |
||||||
| SHORT-TERM INVESTMENT — 0.4% |
||||||
| U.S. Treasury Obligations |
||||||
| U.S. Treasury Bills |
||||||
| 0.93%, 01/29/04(k)(n) |
||||||
| (Cost $699,494) |
$ | 700 | 699,487 | |||
| Total Investments — 92.1% |
||||||
| (Cost $139,049,910; Note 5) |
158,539,626 | |||||
| Other Assets in Excess of |
13,519,621 | |||||
| Net Assets — 100.0% |
$ | 172,059,247 | ||||
The industry classification of portfolio holdings and other assets in excess of liabilities shown as a percentage of net assets as of December 31, 2003 was as follows:
| Industry |
|||
| Financial - Bank & Trust |
16.4 | % | |
| Telecommunications |
9.7 | ||
| Oil & Gas |
9.0 | ||
| Pharmaceuticals |
7.8 | ||
| Insurance |
5.2 | ||
| Utilities |
3.9 | ||
| Food |
3.7 | ||
| Electronic Components & Equipment |
3.2 | ||
| Automobile Manufacturers |
2.7 | ||
| Transportation |
2.5 | ||
| Financial Services |
2.4 | ||
| Metals & Mining |
2.4 | ||
| Building Materials |
2.1 | ||
| Machinery & Equipment |
2.0 | ||
| Beverages |
1.7 | ||
| Computer Services & Software |
1.6 | ||
| Retail & Merchandising |
1.6 | ||
| Construction |
1.2 | ||
| Office Equipment |
1.2 | ||
| Business Services |
1.1 | ||
| Real Estate |
1.1 | ||
| Chemicals |
1.0 | ||
| Conglomerates |
1.0 | ||
| Printing & Publishing |
1.0 | ||
| Farming & Agriculture |
0.9 | ||
| Consumer Products & Services |
0.8 | ||
| Consumer Products & Services |
0.8 | ||
| Containers & Packaging |
0.8 | ||
| Hotels & Motels |
0.7 | ||
| Broadcasting |
0.5 | ||
| Semiconductors |
0.5 | ||
| Short-term investments |
0.4 | ||
| Computer Hardware |
0.3 | ||
| Entertainment & Leisure |
0.2 | ||
| Medical Supplies & Equipment |
0.2 | ||
| Paper & Forest Products |
0.2 | ||
| Automotive Parts |
0.1 | ||
| Clothing & Apparel |
0.1 | ||
| Internet Services |
0.1 | ||
| 92.1 | |||
| Other assets in excess of liabilities |
7.9 | ||
| 100.0 | % | ||
56
Table of Contents
AST DeAM International Equity Portfolio
Schedule of Investments
December 31, 2003
Foreign currency exchange contracts outstanding at December 31, 2003:
| Settlement Month |
Purchase Contracts |
Contracts to Receive |
In Exchange For |
Contracts at Value |
Unrealized Appreciation |
|||||||||
| 03/04 |
Buy EUR | 6,418,636 | $ | 7,857,733 | $ | 8,051,347 | $ | 193,614 | ||||||
| 03/04 |
Buy GBP | 2,235,647 | 3,885,003 | 3,963,051 | 78,048 | |||||||||
| 03/04 |
Buy JPY | 358,478,394 | 3,337,244 | 3,345,936 | 8,692 | |||||||||
| $ | 15,079,980 | $ | 15,360,334 | $ | 280,354 | |||||||||
| Settlement Month |
Sale Contracts |
Contracts to Deliver |
In Exchange |
Contracts at Value |
Unrealized Depreciation |
|||||||||
| 03/04 |
Sell EUR | 327,391 | $ | 402,000 | $ | 410,670 | $ | (8,670 | ) | |||||
| 03/04 |
Sell GBP | 113,296 | 197,000 | 200,835 | (3,835 | ) | ||||||||
| 03/04 |
Sell JPY | 18,664,806 | 174,000 | 174,212 | (212 | ) | ||||||||
| $ | 773,000 | $ | 785,717 | $ | (12,717 | ) | ||||||||
The following abbreviations are used in portfolio descriptions:
| EUR | Euro Dollar |
| GBP | British Pound |
| JPY | Japanese Yen |
| symbol |
description | |
| * |
Non-income producing security. | |
| (g) |
Indicates a security that has been deemed illiquid. The aggregate cost of the illiquid security is $1,180,360. The aggregate value of $62,194 represents 0.04% of net assets. | |
| (k) |
Securities with an aggregate market value of $699,487 have been segregated with the custodian to cover margin requirements for the following open futures contracts at December 31, 2003: | |
| Description | Expiration Month |
Number of Contracts |
Contracts at Trade Date Value |
Contracts at Current Value |
Unrealized Appreciation | ||||||||||
| Long Positions: |
|||||||||||||||
| DJ Euro STOXX 50 Index |
03/04 | 153 | $ | 5,267,474 | $ | 5,324,508 | $ | 57,034 | |||||||
| FTSE 100 Index |
03/04 | 50 | 3,925,881 | 3,997,870 | 71,989 | ||||||||||
| S&P ASX 200 Index |
03/04 | 19 | 1,163,705 | 1,182,821 | 19,116 | ||||||||||
| TOPIX Index |
03/04 | 33 | 3,055,527 | 3,217,785 | 162,258 | ||||||||||
| $ | 310,397 | ||||||||||||||
| (n) |
Rates shown are the effective yields at purchase date. | |
See Notes to Financial Statements.
57
Table of Contents
AST MFS Global Equity Portfolio
Schedule of Investments
December 31, 2003
| Shares |
Value | ||||
| LONG-TERM INVESTMENTS — 96.1% |
|||||
| COMMON STOCK |
|||||
| Australia — 2.3% |
|||||
| News Corp. Ltd. |
103,765 | $ | 937,398 | ||
| QBE Insurance Group Ltd. |
183,758 | 1,467,594 | |||
| 2,404,992 | |||||
| Austria — 0.7% |
|||||
| Erste Bank der Oesterreichischen Sparkassen AG |
5,850 | 722,912 | |||
| Canada — 2.5% |
|||||
| BCE, Inc. |
39,439 | 882,017 | |||
| Canadian National Railway Co. |
10,901 | 689,815 | |||
| Canadian Natural Resources Ltd. |
11,180 | 565,554 | |||
| Talisman Energy, Inc. |
7,930 | 451,162 | |||
| 2,588,548 | |||||
| France — 10.8% |
|||||
| Axa SA |
55,820 | 1,194,835 | |||
| Carrefour SA |
15,840 | 869,522 | |||
| France Telecom SA* |
37,790 | 1,080,123 | |||
| L’Air Liquide SA |
13,671 | 2,414,152 | |||
| L’Oreal SA |
4,760 | 390,262 | |||
| Sanofi-Synthelabo SA |
34,260 | 2,579,872 | |||
| Schneider Electric SA |
8,303 | 543,549 | |||
| Total SA |
10,170 | 1,890,840 | |||
| 10,963,155 | |||||
| Germany — 1.5% |
|||||
| Bayerische Motoren Werke AG |
18,210 | 844,119 | |||
| Schering AG |
14,350 | 726,731 | |||
| 1,570,850 | |||||
| Hong Kong — 0.6% |
|||||
| Esprit Holdings Ltd. |
177,000 | 589,346 | |||
| Ireland — 0.8% |
|||||
| Irish Life & Permanent PLC |
50,660 | 817,921 | |||
| Italy — 0.6% |
|||||
| Riunione Adriatica di Sicurta SPA |
36,200 | 616,423 | |||
| Japan — 8.8% |
|||||
| Bridgestone Corp. |
55,000 | 739,526 | |||
| Canon, Inc. |
28,000 | 1,303,723 | |||
| Chugai Pharmaceutical Co. Ltd. |
71,000 | 1,020,911 | |||
| Citizen Watch Co. Ltd. |
54,000 | 496,314 | |||
| Honda Motor Co. Ltd. |
28,000 | 1,243,632 | |||
| Japan Telecom Holdings Co. Ltd. |
170 | 455,258 | |||
| KDDI Corp. |
257 | 1,472,408 | |||
| Seiko Epson Corp. |
12,800 | 597,182 | |||
| Tokyo Broadcasting System, Inc. |
29,800 | 474,653 | |||
| Tokyo Gas Co. Ltd. |
147,000 | 523,971 | |||
| Yamaha Corp. |
39,400 | 773,883 | |||
| 9,101,461 | |||||
| Shares |
Value | ||||
| Korea — 2.0% |
|||||
| Samsung Electronics Co. Ltd. |
2,890 | $ | 1,093,907 | ||
| Samsung SDI Co. Ltd. |
8,020 | 945,707 | |||
| 2,039,614 | |||||
| Netherlands — 2.2% |
|||||
| Reed Elsevier NV |
120,840 | 1,501,354 | |||
| STMicroelectronics NV |
29,600 | 802,725 | |||
| 2,304,079 | |||||
| Norway — 0.9% |
|||||
| DnB Holding ASA |
145,426 | 970,556 | |||
| Singapore — 2.4% |
|||||
| DBS Group Holdings Ltd. |
103,500 | 895,866 | |||
| Singapore Telecommunications Ltd. |
849,000 | 979,827 | |||
| United Overseas Bank Ltd. |
81,000 | 629,571 | |||
| 2,505,264 | |||||
| Spain — 2.4% |
|||||
| Iberdrola SA |
49,640 | 981,154 | |||
| Telefonica SA |
103,896 | 1,525,415 | |||
| 2,506,569 | |||||
| Sweden — 1.3% |
|||||
| Hennes & Mauritz AB (Class “B” Stock) |
58,380 | 1,387,431 | |||
| Switzerland — 8.0% |
|||||
| Credit Suisse Group |
29,320 | 1,072,755 | |||
| Nestle SA |
4,927 | 1,231,003 | |||
| Novartis AG |
47,710 | 2,166,094 | |||
| Roche Holding AG |
13,520 | 1,363,752 | |||
| Syngenta AG |
7,916 | 533,174 | |||
| Synthes-Stratec, Inc. |
480 | 475,052 | |||
| UBS AG |
20,190 | 1,382,731 | |||
| 8,224,561 | |||||
| United Kingdom — 16.1% |
|||||
| AstraZeneca PLC |
27,380 | 1,313,589 | |||
| BG Group PLC |
104,490 | 536,376 | |||
| BOC Group PLC |
78,820 | 1,204,290 | |||
| BP PLC |
142,420 | 1,154,943 | |||
| British Sky Broadcasting Group PLC* |
53,980 | 679,328 | |||
| Capital Radio PLC |
23,830 | 199,646 | |||
| Diageo PLC |
128,086 | 1,685,312 | |||
| GlaxoSmithKline PLC |
39,990 | 916,332 | |||
| Granada Compass PLC |
446,480 | 975,109 | |||
| Kingfisher PLC |
214,474 | 1,069,279 | |||
| Next PLC |
47,560 | 956,121 | |||
| Reckitt Benckiser PLC |
133,850 | 3,028,703 | |||
| Royal Bank of Scotland Group PLC |
26,427 | 778,698 | |||
| Vodafone Group PLC |
449,584 | 1,114,684 | |||
| William Hill PLC |
109,260 | 835,181 | |||
| 16,447,591 | |||||
58
Table of Contents
AST MFS Global Equity Portfolio
Schedule of Investments
December 31, 2003
| Shares |
Value | ||||
| United States — 32.2% |
|||||
| Accenture Ltd. (Class “A” Stock)* |
37,820 | $ | 995,423 | ||
| Ace Ltd. |
26,890 | 1,113,784 | |||
| AdvancePCS, Inc.* |
15,860 | 835,188 | |||
| Air Products & Chemicals, Inc. |
19,280 | 1,018,562 | |||
| Alberto-Culver Co. (Class “B” Stock) |
7,510 | 473,731 | |||
| American Express Co. |
26,800 | 1,292,564 | |||
| AmerisourceBergen Corp. (Class “A” Stock) |
14,650 | 822,598 | |||
| Applera Corporation — Applied Biosystems Group |
10,420 | 215,798 | |||
| Aramark Corp. |
32,070 | 879,359 | |||
| Bank of America Corp. |
12,400 | 997,333 | |||
| Burlington Northern Santa Fe Corp. |
23,640 | 764,754 | |||
| Citigroup, Inc. |
31,230 | 1,515,904 | |||
| ConocoPhilips |
11,138 | 730,319 | |||
| FedEx Corp. |
6,720 | 453,600 | |||
| Fisher Scientific International, Inc.* |
17,130 | 708,668 | |||
| Genzyme Corp.* |
8,300 | 409,522 | |||
| The Home Depot, Inc. |
26,730 | 948,648 | |||
| International Business Machines Corp. |
9,940 | 921,239 | |||
| The J.M. Smucker Co. |
10,610 | 480,527 | |||
| Johnson & Johnson |
32,310 | 1,669,134 | |||
| Lincare Holdings, Inc.* |
18,030 | 541,441 | |||
| Microsoft Corp. |
33,960 | 935,258 | |||
| Networks Associates, Inc.* |
33,920 | 510,157 | |||
| Nike, Inc. (Class “B” Stock) |
13,700 | 937,902 | |||
| Noble Drilling Corp.* |
14,400 | 515,232 | |||
| OTP Bank* [GDR] |
21,950 | 566,167 | |||
| PepsiCo, Inc. |
27,600 | 1,286,712 | |||
| Praxair, Inc. |
40,100 | 1,531,820 | |||
| SouthTrust Corp. |
25,280 | 827,414 | |||
| Symantec Corp.* |
15,000 | 519,750 | |||
| Thermo Electron Corp.* |
50,880 | 1,282,176 | |||
| Time Warner, Inc.* |
105,780 | 1,902,982 | |||
| TJX Companies, Inc. |
59,030 | 1,301,611 | |||
| Union Pacific Corp. |
11,170 | 776,092 | |||
| Verizon Communications, Inc. |
23,850 | 836,658 | |||
| Viacom, Inc. (Class “B” Stock) |
24,800 | 1,100,624 | |||
| Waters Corp.* |
15,000 | 497,400 | |||
| 43,939,279 | |||||
| Total Long-Term Investments |
|||||
| (Cost $82,592,591) |
98,877,324 | ||||
| Par (000) |
Value |
||||||
| SHORT-TERM INVESTMENTS — 4.0% |
|||||||
| U.S. Government Agency Obligation |
|||||||
| Federal Home Loan Bank |
|||||||
| (Cost $4,139,914) |
$ | 4,140 | $ | 4,139,914 | |||
| Total Investments — 100.1% |
|||||||
| (Cost $86,732,505; Note 5) |
103,017,238 | ||||||
| Liabilities in Excess of |
(79,135 | ) | |||||
| Net Assets — 100.0% |
$ | 102,938,103 | |||||
The industry classification of portfolio holdings and liabilities in excess of other assets shown as a percentage of net assets as of December 31, 2003 was as follows:
| Industry |
|||
| Pharmaceuticals |
11.2 | % | |
| Telecommunications |
8.1 | ||
| Financial - Bank & Trust |
7.2 | ||
| Chemicals |
6.5 | ||
| Oil & Gas |
6.2 | ||
| Financial Services |
4.8 | ||
| Insurance |
4.3 | ||
| Medical Supplies & Equipment |
4.1 | ||
| Short-term investments |
4.0 | ||
| Consumer Products & Services |
3.8 | ||
| Retail & Merchandising |
3.8 | ||
| Broadcasting |
3.2 | ||
| Beverages |
2.9 | ||
| Automobile Manufacturers |
2.7 | ||
| Electrical Components & Equipment |
2.7 | ||
| Entertainment & Leisure |
2.6 | ||
| Printing & Publishing |
2.6 | ||
| Food |
2.5 | ||
| Business Services |
2.4 | ||
| Retail & Merchandising |
2.2 | ||
| Office Equipment |
1.8 | ||
| Machinery & Equipment |
1.7 | ||
| Railroads |
1.5 | ||
| Transportation |
1.1 | ||
| Internet Services |
1.0 | ||
| Utilities |
1.0 | ||
| Clothing & Apparel |
0.9 | ||
| Computer Hardware |
0.9 | ||
| Computer Services & Software |
0.9 | ||
| Semiconductors |
0.8 | ||
| Healthcare Services |
0.5 | ||
| Science & Technology |
0.2 | ||
| 100.1 | |||
| Liabilities in excess of other assets |
(0.1 | ) | |
| 100.0 | % | ||
59
Table of Contents
AST MFS Global Equity Portfolio
Schedule of Investments
December 31, 2003
Foreign currency exchange contracts outstanding at December 31, 2003:
| Settlement Month |
Sale Contracts |
Contracts to Deliver |
In Exchange For |
Contracts at Value |
Unrealized Appreciation | ||||||||
| 01/04 |
Sell JPY | 2,416,755 | $ | 22,590 | $ | 22,551 | $ | 39 | |||||
The following abbreviations are used in portfolio descriptions:
| JPY | Japanese Yen |
| GDR | Global Depositary Receipt |
| symbol |
description | |
| * |
Non-income producing security. | |
| (n) |
Rates shown are the effective yields at purchase date. |
See Notes to Financial Statements.
60
Table of Contents
AST PBHG Small-Cap Growth Portfolio
Schedule of Investments
December 31, 2003
| Shares |
Value | ||||
| LONG-TERM INVESTMENTS — 95.8% |
|||||
| COMMON STOCK |
|||||
| Advertising — 0.5% |
|||||
| ADVO, Inc. |
51,450 | $ | 1,634,052 | ||
| Aquantive, Inc.* |
15,200 | 155,800 | |||
| 1,789,852 | |||||
| Airlines — 0.2% |
|||||
| SkyWest, Inc. |
42,400 | 768,288 | |||
| Broadcasting — 5.1% |
|||||
| Cumulus Media, Inc. (Class “A” Stock)* |
82,700 | 1,819,400 | |||
| Emmis Communications Corp. (Class “A” Stock)* |
133,100 | 3,600,355 | |||
| Entravision Communications Corp. |
149,400 | 1,658,340 | |||
| Gray Television, Inc. |
82,000 | 1,239,840 | |||
| Lin TV Corp. (Class “A” Stock)* |
33,900 | 874,959 | |||
| Radio One, Inc. (Class “A” Stock)* |
103,100 | 2,015,605 | |||
| Sinclair Broadcast Group, Inc.* |
240,600 | 3,589,752 | |||
| Spanish Broadcasting Systems, Inc. |
247,200 | 2,595,600 | |||
| 17,393,851 | |||||
| Business Services — 5.4% |
|||||
| Advisory Board Co.* |
45,800 | 1,598,878 | |||
| Arbitron, Inc.* |
60,200 | 2,511,544 | |||
| Charles River Associates, Inc.* |
30,200 | 966,098 | |||
| Gevity HR, Inc. |
60,100 | 1,336,624 | |||
| Icon PLC [ADR]* |
53,500 | 2,332,600 | |||
| Medical Staffing Network Holdings, Inc.* |
172,200 | 1,885,590 | |||
| Metrologic Instruments, Inc.* |
85,200 | 2,300,400 | |||
| National Processing, Inc.* |
43,600 | 1,026,780 | |||
| Navigant Consulting, Inc.* |
66,200 | 1,248,532 | |||
| Parametric Technology Corp.* |
229,100 | 902,654 | |||
| Portfolio Recovery Associates, Inc.* |
39,000 | 1,035,450 | |||
| SM&A* |
51,800 | 606,060 | |||
| Wireless Facilities, Inc.* |
30,400 | 451,744 | |||
| 18,202,954 | |||||
| Chemicals — 0.9% |
|||||
| Olin Corp.(a) |
151,200 | 3,033,072 | |||
| Clothing & Apparel — 2.0% |
|||||
| Deckers Outdoor Corp.* |
32,100 | 658,050 | |||
| K-Swiss, Inc. (Class “A” Stock) |
63,600 | 1,530,216 | |||
| Mothers Work, Inc.* |
41,400 | 1,010,160 | |||
| Quiksilver, Inc.* |
48,000 | 851,040 | |||
| Too, Inc.* |
167,400 | 2,825,712 | |||
| 6,875,178 | |||||
| Computer Hardware — 2.7% |
|||||
| Bell Microproducts, Inc.* |
155,900 | 1,412,454 | |||
| Cray, Inc.* |
96,800 | 961,224 | |||
| Shares |
Value | ||||
| Insight Enterprises, Inc.* |
49,000 | $ | 921,200 | ||
| Lexar Media, Inc.* |
113,400 | 1,976,562 | |||
| Merge Technologies, Inc.* |
70,000 | 1,234,800 | |||
| SanDisk Corp.*(a) |
43,200 | 2,641,248 | |||
| 9,147,488 | |||||
| Computer Services & Software — 10.3% |
|||||
| Altiris, Inc.*(a) |
56,400 | 2,057,472 | |||
| Ascential Software Corp.* |
33,200 | 860,876 | |||
| At Road, Inc.* |
37,200 | 494,760 | |||
| Avid Technology, Inc.*(a) |
40,400 | 1,939,200 | |||
| BARRA, Inc. |
45,700 | 1,621,893 | |||
| Cerner Corp.*(a) |
41,600 | 1,574,560 | |||
| Cognizant Technology Solutions Corp.* |
83,500 | 3,810,940 | |||
| Dot Hill Systems Corp.* |
89,800 | 1,360,470 | |||
| eResearch Technology, Inc.*(a) |
91,800 | 2,333,556 | |||
| Extreme Networks, Inc.* |
140,700 | 1,014,447 | |||
| FileNET Corp.* |
70,200 | 1,901,016 | |||
| Manhattan Associates, Inc.*(a) |
58,500 | 1,616,940 | |||
| MicroStrategy, Inc. (Class “A” Stock)* |
30,700 | 1,611,136 | |||
| Mobius Management Systems, Inc.* |
45,700 | 578,105 | |||
| Neoware Systems, Inc.* |
67,200 | 920,640 | |||
| NetIQ Corp.* |
64,900 | 859,925 | |||
| OPNET Technologies, Inc.* |
39,700 | 653,462 | |||
| Quality Systems, Inc.* |
20,600 | 918,554 | |||
| Quest Software, Inc.*(a) |
133,900 | 1,901,380 | |||
| SafeNet, Inc.* |
54,500 | 1,676,965 | |||
| ScanSource, Inc.* |
36,300 | 1,656,006 | |||
| SupportSoft, Inc.* |
122,800 | 1,614,820 | |||
| Trident Microsystems, Inc.* |
98,900 | 1,722,838 | |||
| 34,699,961 | |||||
| Conglomerates — 1.2% |
|||||
| Brink’s Co. (The) |
174,400 | 3,943,184 | |||
| Consumer Products & Services — 1.6% |
|||||
| Aaron Rents, Inc. (Class “B” Stock) |
73,200 | 1,473,516 | |||
| Coinstar, Inc.* |
95,200 | 1,719,312 | |||
| Integrated Alarm Services Group, Inc.* |
259,000 | 2,201,500 | |||
| 5,394,328 | |||||
| Electronic Components & Equipment — 4.9% |
|||||
| Benchmark Electronics, Inc.* |
37,800 | 1,315,818 | |||
| DSP Group, Inc.* |
116,100 | 2,892,051 | |||
| EDO Corp. |
70,700 | 1,742,755 | |||
| Faro Technologies, Inc.* |
54,800 | 1,368,904 | |||
| GrafTech International Ltd.* |
90,900 | 1,227,150 | |||
| KVH Industries, Inc.* |
24,200 | 664,774 | |||
| Merix Corp.* |
39,600 | 971,388 | |||
| Moog, Inc. (Class “A” Stock)* |
36,300 | 1,793,220 | |||
| Park Electrochemical Corp. |
59,000 | 1,562,910 | |||
| Teledyne Technologies, Inc.* |
69,700 | 1,313,845 | |||
| Veeco Instruments, Inc.*(a) |
62,700 | 1,768,140 | |||
| 16,620,955 | |||||
61
Table of Contents
AST PBHG Small-Cap Growth Portfolio
Schedule of Investments
December 31, 2003
| Shares |
Value | ||||
| Environmental Services — 0.4% |
|||||
| Republic Services, Inc. |
57,300 | $ | 1,468,599 | ||
| Equipment Services — 0.5% |
|||||
| TTM Technologies, Inc.* |
90,200 | 1,522,576 | |||
| Farming & Agriculture — 0.2% |
|||||
| Sunopta, Inc.* |
74,600 | 688,558 | |||
| Financial - Bank & Trust — 2.6% |
|||||
| Bank Mutual Corp. |
122,746 | 1,398,077 | |||
| Brookline Bancorp, Inc.(a) |
136,880 | 2,099,739 | |||
| Franklin Bank Corp.* |
6,500 | 123,500 | |||
| Greater Bay Bancorp(a) |
65,900 | 1,876,832 | |||
| Jefferson Bancshares, Inc. |
43,200 | 595,728 | |||
| Provident Financial Services, Inc. |
53,000 | 1,001,700 | |||
| UMB Financial Corp. |
36,574 | 1,738,728 | |||
| 8,834,304 | |||||
| Financial Services — 1.5% |
|||||
| Affiliated Managers Group, Inc.*(a) |
17,400 | 1,210,866 | |||
| Friedman, Billings, Ramsey Group, |
105,400 | 2,432,632 | |||
| PrivateBancorp, Inc. |
29,900 | 1,361,048 | |||
| 5,004,546 | |||||
| Healthcare Services — 5.0% |
|||||
| American Healthways, Inc.*(a) |
119,400 | 2,850,078 | |||
| AMERIGROUP Corp.* |
17,800 | 759,170 | |||
| Apria Healthcare Group, Inc.*(a) |
89,300 | 2,542,371 | |||
| Centene Corp.* |
26,100 | 731,061 | |||
| Coventry Health Care, Inc.* |
36,300 | 2,340,987 | |||
| Hooper Holmes, Inc. |
129,100 | 797,838 | |||
| IMPAC Medical Systems, Inc.* |
36,100 | 922,716 | |||
| LifePoint Hospitals, Inc.*(a) |
44,500 | 1,310,525 | |||
| Matria Healthcare, Inc.* |
44,000 | 929,720 | |||
| Odyssey Healthcare, Inc.* |
127,675 | 3,735,771 | |||
| 16,920,237 | |||||
| Industrial Products — 0.6% |
|||||
| Ceradyne, Inc.* |
61,300 | 2,087,878 | |||
| Insurance — 2.7% |
|||||
| Allmerica Financial Corp.*(a) |
77,400 | 2,381,598 | |||
| American Medical Security Group, Inc.* |
42,600 | 955,092 | |||
| HCC Insurance Holdings, Inc.(a) |
43,515 | 1,383,777 | |||
| Odyssey Re Holdings Corp.(a) |
59,300 | 1,337,215 | |||
| Platinum Underwriters Holdings Ltd. (Bermuda)* |
56,900 | 1,707,000 | |||
| StanCorp Financial Group, Inc. |
21,400 | 1,345,632 | |||
| 9,110,314 | |||||
| Internet Services — 3.1% |
|||||
| Advanced Digital Information Corp.* |
90,400 | 1,265,600 | |||
| Digital Insight Corp.* |
49,000 | 1,220,100 | |||
| Digital River, Inc.* |
52,600 | 1,162,460 | |||
| Shares |
Value | ||||
| eCollege.com, Inc.* |
57,000 | $ | 1,052,220 | ||
| F5 Networks, Inc.* |
55,900 | 1,403,090 | |||
| Macromedia, Inc.* |
66,300 | 1,182,792 | |||
| Netflix, Inc.*(a) |
36,500 | 1,996,185 | |||
| Packeteer, Inc.* |
61,300 | 1,040,874 | |||
| 10,323,321 | |||||
| Machinery & Equipment — 1.9% |
|||||
| Global Power Equipment Group, Inc.* |
141,300 | 943,884 | |||
| Grant Prideco, Inc.*(a) |
155,800 | 2,028,516 | |||
| JLG Industries, Inc. |
103,500 | 1,576,305 | |||
| Lone Star Technologies, Inc.* |
45,100 | 720,698 | |||
| Rofin-Sinar Technologies, Inc.* |
36,700 | 1,268,352 | |||
| 6,537,755 | |||||
| Medical Supplies & Equipment — 7.3% |
|||||
| Advanced Neuromodulation Systems, Inc.* |
30,500 | 1,402,390 | |||
| Align Technology, Inc.* |
72,500 | 1,197,700 | |||
| Closure Medical Corp.* |
40,600 | 1,377,558 | |||
| Cytyc Corp.* |
137,800 | 1,896,128 | |||
| Digene Corp.* |
56,300 | 2,257,630 | |||
| Gen-Probe, Inc.* |
95,000 | 3,464,650 | |||
| ICU Medical, Inc.*(a) |
73,200 | 2,509,296 | |||
| Inamed Corp.*(a) |
33,900 | 1,629,234 | |||
| Integra LifeSciences Holdings Corp.* |
62,200 | 1,780,786 | |||
| Kensey Nash Corp.* |
45,900 | 1,067,175 | |||
| Kyphon, Inc.* |
35,500 | 881,465 | |||
| Martek Biosciences Corp.*(a) |
32,300 | 2,098,531 | |||
| Synovis Life Technologies, Inc.* |
42,800 | 870,552 | |||
| Thoratec Corp.* |
45,400 | 590,654 | |||
| Wright Medical Group, Inc.* |
51,000 | 1,552,440 | |||
| 24,576,189 | |||||
| Metals & Mining — 0.5% |
|||||
| CONSOL Energy, Inc.(a) |
63,900 | 1,655,010 | |||
| Oil & Gas — 4.9% |
|||||
| AGL Resources, Inc. |
50,400 | 1,466,640 | |||
| Atwood Oceanics, Inc.* |
61,000 | 1,948,340 | |||
| Cal Dive International, Inc.* |
45,000 | 1,084,950 | |||
| Core Laboratories NV* |
117,200 | 1,956,068 | |||
| Frontier Oil Corp. |
76,900 | 1,324,218 | |||
| Pride International, Inc.*(a) |
148,100 | 2,760,584 | |||
| Stone Energy Corp.* |
30,600 | 1,298,970 | |||
| Tom Brown, Inc.* |
69,800 | 2,251,050 | |||
| Universal Compression Holdings, Inc.* |
54,500 | 1,425,720 | |||
| Vintage Petroleum, Inc. |
90,900 | 1,093,527 | |||
| 16,610,067 | |||||
| Personal Services — 1.7% |
|||||
| Career Education Corp.*(a) |
70,382 | 2,820,206 | |||
| University of Phoenix Online* |
40,233 | 2,773,261 | |||
| 5,593,467 | |||||
62
Table of Contents
AST PBHG Small-Cap Growth Portfolio
Schedule of Investments
December 31, 2003
| Shares |
Value | ||||
| Pharmaceuticals — 4.4% |
|||||
| Accredo Health, Inc.*(a) |
106,800 | $ | 3,375,948 | ||
| Covance, Inc.*(a) |
111,500 | 2,988,200 | |||
| Eon Labs, Inc.* |
40,300 | 2,053,285 | |||
| Kos Pharmaceuticals, Inc.*(a) |
33,400 | 1,437,536 | |||
| Medicis Pharmaceutical Corp. (Class “A” Stock)(a) |
20,700 | 1,475,910 | |||
| SFBC International, Inc.* |
30,700 | 815,392 | |||
| Taro Pharmaceuticals Industries Ltd.* |
40,500 | 2,612,250 | |||
| 14,758,521 | |||||
| Printing & Publishing — 1.3% |
|||||
| Applied Films Corp.* |
32,300 | 1,066,546 | |||
| Journal Register Co.* |
105,900 | 2,192,130 | |||
| Scholastic Corp.* |
38,100 | 1,296,924 | |||
| 4,555,600 | |||||
| Real Estate — 1.7% |
|||||
| Boston Properties, Inc. [REIT] |
14,600 | 703,574 | |||
| Brandywine Realty Trust [REIT] |
35,400 | 947,658 | |||
| Jones Lang Lasalle, Inc. [REIT]* |
68,200 | 1,413,786 | |||
| MeriStar Hospitality Corp. [REIT]* |
423,600 | 2,757,636 | |||
| 5,822,654 | |||||
| Restaurants — 2.0% |
|||||
| Krispy Kreme Doughnuts, Inc.*(a) |
78,100 | 2,858,460 | |||
| P.F. Chang’s China Bistro, Inc.*(a) |
74,200 | 3,775,296 | |||
| 6,633,756 | |||||
| Retail & Merchandising — 7.1% |
|||||
| Barnes & Noble, Inc.*(a) |
27,500 | 903,375 | |||
| Charming Shoppes, Inc.* |
165,200 | 892,080 | |||
| Cost Plus, Inc.* |
20,700 | 848,700 | |||
| Dick’s Sporting Goods, Inc.* |
19,900 | 968,334 | |||
| Dillard’s, Inc. (Class “A” Stock) |
133,400 | 2,195,764 | |||
| Emulex Corp.*(a) |
69,100 | 1,843,588 | |||
| Jos. A. Bank Clothiers, Inc.* |
39,800 | 1,380,662 | |||
| Kenneth Cole Productions, Inc. (Class “A” Stock) |
51,000 | 1,499,400 | |||
| Linens ‘n Things, Inc.*(a) |
92,700 | 2,788,416 | |||
| Select Comfort Corp.* |
59,400 | 1,470,744 | |||
| The Wet Seal, Inc.* |
75,600 | 747,684 | |||
| Tractor Supply Co.* |
106,200 | 4,130,118 | |||
| Urban Outfitters, Inc.* |
121,600 | 4,505,280 | |||
| 24,174,145 | |||||
| Semiconductors — 7.6% |
|||||
| Actel Corp.* |
30,500 | 735,050 | |||
| Brooks Automation, Inc.* |
55,400 | 1,339,018 | |||
| Cymer, Inc.*(a) |
36,600 | 1,690,554 | |||
| ESS Technology, Inc.* |
91,200 | 1,551,312 | |||
| Formfactor, Inc.* |
53,300 | 1,055,340 | |||
| GlobespanVirata, Inc.*(a) |
210,000 | 1,234,800 | |||
| Integrated Device Technology, Inc.* |
139,500 | 2,395,215 | |||
| LTX Corp.* |
101,600 | 1,527,048 | |||
| Marvell Technology Group Ltd.* |
50,100 | 1,900,293 | |||
| Shares |
Value | |||||
| Mattson Technology, Inc.* |
97,700 | $ | 1,193,894 | |||
| MKS Instruments, Inc.* |
82,300 | 2,386,700 | ||||
| Omnivision Technologies, Inc.* |
75,500 | 4,171,375 | ||||
| Power Integrations, Inc.*(a) |
59,100 | 1,977,486 | ||||
| Silicon Laboratories, Inc.* |
62,600 | 2,705,572 | ||||
| 25,863,657 | ||||||
| Telecommunications — 2.8% |
||||||
| ADTRAN, Inc. |
38,200 | 1,184,200 | ||||
| Boston Communications Group, Inc.* |
68,700 | 638,223 | ||||
| Carrier Access Corp.* |
73,200 | 916,464 | ||||
| Foundry Networks, Inc.*(a) |
150,000 | 4,104,000 | ||||
| Insight Communications Co., Inc.* |
182,100 | 1,877,451 | ||||
| Powerwave Technologies, Inc.*(a) |
92,700 | 709,155 | ||||
| 9,429,493 | ||||||
| Utilities — 1.2% |
||||||
| Massey Energy Co. |
73,200 | 1,522,560 | ||||
| MGE Energy, Inc. |
19,900 | 627,049 | ||||
| Philadelphia Suburban Corp. |
51,000 | 1,127,100 | ||||
| UGI Corp. |
19,850 | 672,915 | ||||
| 3,949,624 | ||||||
| Total Long-Term Investments |
||||||
| (Cost $244,003,972) |
323,989,382 | |||||
| Par (000) |
||||||
| SHORT-TERM INVESTMENTS — 18.7% |
||||||
| Commercial Paper — 0.8% |
||||||
| Amsterdam Funding Corp. |
||||||
| 1.10%, 01/05/04(b) |
$ | 68 | 68,039 | |||
| Concord Minutemen Capital Co. |
||||||
| 1.13%, 02/12/04(b) |
1,296 | 1,292,055 | ||||
| General Electric Capital Corp. |
||||||
| 1.11%, 02/05/04(b) |
101 | 100,910 | ||||
| Lexington Parker Capital Co. |
||||||
| 1.10%, 01/12/04(b) |
307 | 306,093 | ||||
| Monumental Global Funding |
||||||
| 1.141%, 01/29/04 [FRN](b)(c) |
32 | 32,432 | ||||
| Tulip Funding Corp. |
||||||
| 1.10%, 01/21/04(b) |
844 | 843,244 | ||||
| 2,642,773 | ||||||
| Corporate Obligations — 8.6% |
||||||
| American Express Centurian |
||||||
| 1.131%, 01/29/04 [FRN](b)(c) |
4,116 | 4,115,661 | ||||
| Bear Stearns Co., Inc. |
||||||
| 1.12%, 01/02/04 [FRN](b)(c) |
5,603 | 5,603,062 | ||||
| Canadian Imperial Bank of Commerce |
||||||
| 1.111%, 01/29/04 [FRN](b)(c) |
1,516 | 1,515,414 | ||||
| General Electric Capital Corp. |
||||||
| 1.13%, 01/02/04 [FRN](b)(c) |
1,002 | 1,002,465 | ||||
| Goldman Sachs Group, Inc. |
||||||
| 1.14%, 01/06/04 [FRN](b)(c) |
1,190 | 1,189,588 | ||||
63
Table of Contents
AST PBHG Small-Cap Growth Portfolio
Schedule of Investments
December 31, 2003
| Par (000) |
Value | |||||
| Merrill Lynch & Co., Inc. |
||||||
| 1.13%, 01/02/04(b) |
$ | 460 | $ | 460,452 | ||
| 1.13%, 01/02/04 [FRN](b)(c) |
1,085 | 1,085,352 | ||||
| Morgan Stanley |
||||||
| 1.03%, 01/02/04 [FRN](b)(c) |
2,418 | 2,417,856 | ||||
| 1.08%, 01/02/04 [FRN](b)(c) |
4,776 | 4,775,694 | ||||
| Natexis Banques Populaires |
||||||
| 1.035%, 01/02/04 [FRN](b)(c) |
1,502 | 1,502,223 | ||||
| 1.10%, 01/02/04 [FRN](b)(c) |
799 | 799,272 | ||||
| Societe Generale |
||||||
| 1.08%, 01/02/04 [FRN](b)(c) |
3,208 | 3,207,840 | ||||
| Westdeutsche Landesbank |
||||||
| 1.111%, 01/23/04 [FRN](b)(c) |
1,112 | 1,111,730 | ||||
| 1.111%, 01/29/04 [FRN](b)(c) |
23 | 22,593 | ||||
| 28,809,202 | ||||||
| Shares |
||||||
| Non-Registered Investment Company — 5.5% |
||||||
| BlackRock Institutional Money Market Trust(b)(j) |
18,721,811 | 18,721,811 | ||||
| Registered Investment Company — 2.7% |
||||||
| BlackRock Provident Institutional Funds TempFund Portfolio |
9,255,479 | 9,255,479 | ||||
| Par (000) |
Value |
||||||
| Repurchase Agreement — 0.6% |
|||||||
| Merrill Lynch & Co., Inc. |
|||||||
| 1.00%, dated 12/31/03, to be repurchased on 01/02/04, repurchase price $1,918,657 (Collateralized by Federal Home Loan Mortgage Corp. 5.50% maturing 12/01/33, Federal National Mortgage Assoc. 4.00% - 6.00% maturing 11/01/17 to 11/01/33 and Government National Mortgage Assoc. 1.47% maturing 01/16/04 [FRN](c), par value $2,353,979, market value including accrued interest $1,976,143)(b) |
$ | 1,919 | $ | 1,918,551 | |||
| Time Deposits — 0.5% |
|||||||
| Chase Manhattan Bank |
|||||||
| 0.875%, 01/02/04(b) |
960 | 960,018 | |||||
| UBS Bank |
|||||||
| 0.938%, 01/02/04(b) |
771 | 770,856 | |||||
| 1,730,874 | |||||||
| Total Short-Term Investments |
|||||||
| (Cost $63,078,690) |
63,078,690 | ||||||
| Total Investments — 114.5% |
|||||||
| (Cost $307,082,662; Note 5) |
387,068,072 | ||||||
| Liabilities in Excess of |
(48,877,388 | ) | |||||
| Net Assets — 100.0% |
$ | 338,190,684 | |||||
The following abbreviations are used in portfolio descriptions:
| ADR | American Depositary Receipt |
| FRN | Floating Rate Note |
| REIT | Real Estate Investment Trust |
| symbol |
description | |
| * |
Non-income producing security. | |
| (a) |
Portion of securities on loan with an aggregate market value of $51,196,558; cash collateral $53,823,211 was received with which the portfolio purchased securities. | |
| (b) |
Represents security purchased with cash collateral for securities on loan. | |
| (c) |
Indicates a variable rate security. The maturity date presented for these instruments is the latter of the next date on which the security can be redeemed at par or the next date on which the rate of interest is adjusted. The interest rate shown reflects the rate in effect at December 31, 2003. | |
| (j) |
Security available to institutional investors only. | |
See Notes to Financial Statements.
64
Table of Contents
AST DeAM Small-Cap Growth Portfolio
Schedule of Investments
December 31, 2003
| Shares |
Value | ||||
| LONG-TERM INVESTMENTS — 98.4% | |||||
| COMMON STOCK |
|||||
| Advertising — 0.2% |
|||||
| ADVO, Inc. |
31,400 | $ | 997,264 | ||
| Aerospace — 1.0% |
|||||
| Titan Corp. (The)* |
165,400 | 3,607,374 | |||
| United Industrial Corp. |
18,700 | 337,535 | |||
| 3,944,909 | |||||
| Airlines — 1.8% |
|||||
| AirTran Holdings, Inc.* |
276,100 | 3,285,590 | |||
| America West Holdings Corp. |
133,100 | 1,650,440 | |||
| ExpressJet Holdings, Inc.* |
74,400 | 1,116,000 | |||
| Mesa Air Group, Inc.*(a) |
109,500 | 1,370,940 | |||
| 7,422,970 | |||||
| Automobile Manufacturers — 1.2% |
|||||
| Oshkosh Truck Corp. |
96,400 | 4,919,292 | |||
| Broadcasting |
|||||
| Cumulus Media, Inc. |
3,686 | 81,092 | |||
| Building & Real Estate — 0.4% |
|||||
| Champion Enterprises, Inc.* |
212,400 | 1,486,800 | |||
| Building Materials — 0.1% |
|||||
| Simpson Manufacturing Co., Inc.* |
6,400 | 325,504 | |||
| Business Services — 4.2% |
|||||
| Ariba, Inc.* |
118,400 | 355,200 | |||
| Dionex Corp.* |
39,300 | 1,808,586 | |||
| Exult, Inc.* |
344,400 | 2,452,128 | |||
| FreeMarkets, Inc.* |
81,700 | 546,573 | |||
| FTI Consulting, Inc.*(a) |
73,250 | 1,711,853 | |||
| Gevity HR, Inc. |
122,600 | 2,726,624 | |||
| Informatica Corp.* |
110,700 | 1,140,210 | |||
| Itron, Inc.* |
50,100 | 919,836 | |||
| John H. Harland Co. |
42,500 | 1,160,250 | |||
| Pegasus Solutions, Inc.* |
60,200 | 630,294 | |||
| Per-Se Technologies, Inc.* |
57,900 | 883,554 | |||
| Pre-Paid Legal Services, Inc.*(a) |
48,300 | 1,261,596 | |||
| Right Management Consultants, Inc.* |
79,150 | 1,476,939 | |||
| 17,073,643 | |||||
| Chemicals — 2.4% |
|||||
| Georgia Gulf Corp.(a) |
139,450 | 4,027,316 | |||
| Hercules, Inc.* |
280,000 | 3,416,000 | |||
| MacDermid, Inc. |
63,000 | 2,157,120 | |||
| 9,600,436 | |||||
| Clothing & Apparel — 1.8% |
|||||
| J. Jill Group, Inc.* |
43,300 | 550,343 | |||
| Pacific Sunwear of California, Inc.*(a) |
221,650 | 4,681,248 | |||
| Quiksilver, Inc.* |
103,600 | 1,836,828 | |||
| 7,068,419 | |||||
| Shares |
Value | ||||
| Computer Hardware — 2.9% |
|||||
| Hutchinson Technology, Inc.*(a) |
96,600 | $ | 2,969,484 | ||
| Komag, Inc.* |
104,100 | 1,522,983 | |||
| Lexar Media, Inc.* |
149,400 | 2,604,042 | |||
| Mercury Computer Systems, Inc.* |
45,100 | 1,122,990 | |||
| Silicon Storage Technology, Inc.* |
192,000 | 2,112,000 | |||
| Synaptics, Inc.* |
103,700 | 1,553,426 | |||
| 11,884,925 | |||||
| Computer Services & Software — 10.3% |
|||||
| Ansys, Inc.* |
26,700 | 1,059,990 | |||
| Avid Technology, Inc.*(a) |
38,400 | 1,843,200 | |||
| CACI International, Inc. |
35,300 | 1,716,286 | |||
| Concur Technologies, Inc.* |
99,500 | 963,160 | |||
| Echelon Corp.* |
103,600 | 1,154,104 | |||
| Epicor Software Corp.* |
200,800 | 2,562,207 | |||
| FileNET Corp.* |
23,100 | 625,548 | |||
| Group 1 Software, Inc.* |
79,500 | 1,400,790 | |||
| IDX Systems Corp.* |
49,300 | 1,322,226 | |||
| Intergraph Corp.* |
98,100 | 2,346,552 | |||
| Keane, Inc.* |
66,800 | 977,952 | |||
| Kronos, Inc.* |
64,350 | 2,548,904 | |||
| Macrovision Corp.* |
63,200 | 1,427,688 | |||
| MatrixOne, Inc.* |
143,100 | 881,496 | |||
| Micromuse, Inc.* |
195,300 | 1,347,570 | |||
| Micros Systems, Inc.* |
11,000 | 476,960 | |||
| MicroStrategy, Inc. (Class “A” Stock)* |
12,300 | 645,504 | |||
| MRO Software, Inc.* |
39,800 | 535,708 | |||
| Netegrity, Inc.* |
54,100 | 557,771 | |||
| Omnicell, Inc.* |
89,500 | 1,449,900 | |||
| Overland Storage, Inc.* |
32,800 | 616,640 | |||
| Portal Software, Inc.* |
82,620 | 556,033 | |||
| Progress Software Corp.* |
91,700 | 1,876,182 | |||
| Rainbow Technologies, Inc.* |
115,400 | 1,299,404 | |||
| Stratasys, Inc.* |
76,200 | 2,077,212 | |||
| Sybase, Inc.* |
124,800 | 2,568,383 | |||
| TIBCO Software, Inc.* |
163,400 | 1,106,218 | |||
| Tradestation Group, Inc.* |
217,500 | 1,927,050 | |||
| Transaction Systems Architects, Inc. |
111,100 | 2,514,193 | |||
| Websense, Inc.* |
47,400 | 1,385,976 | |||
| 41,770,807 | |||||
| Consumer Products & Services — 1.7% |
|||||
| Engineered Support Systems, Inc. |
80,575 | 4,436,459 | |||
| NBTY, Inc.* |
54,500 | 1,463,870 | |||
| Rollins, Inc. |
36,550 | 824,203 | |||
| 6,724,532 | |||||
| Containers & Packaging — 0.4% |
|||||
| Silgan Holdings, Inc.* |
35,300 | 1,503,427 | |||
65
Table of Contents
AST DeAM Small-Cap Growth Portfolio
Schedule of Investments
December 31, 2003
| Shares |
Value | ||||
| Electronic Components & Equipment — 4.9% |
|||||
| Benchmark Electronics, Inc.* |
110,550 | $ | 3,848,246 | ||
| Checkpoint Systems, Inc.* |
168,300 | 3,182,553 | |||
| Daktronics, Inc.* |
96,000 | 2,415,360 | |||
| DSP Group, Inc.* |
39,800 | 991,418 | |||
| General Cable Corp.* |
131,700 | 1,073,355 | |||
| Landauer, Inc. |
8,400 | 342,552 | |||
| Littelfuse, Inc.* |
10,300 | 296,846 | |||
| Planar Systems, Inc.* |
126,700 | 3,081,344 | |||
| Teledyne Technologies, Inc.* |
105,700 | 1,992,445 | |||
| Varian, Inc.* |
58,600 | 2,445,378 | |||
| 19,669,497 | |||||
| Entertainment & Leisure — 1.4% |
|||||
| Ameristar Casinos, Inc.* |
124,800 | 3,053,856 | |||
| Isle of Capri Casinos, Inc.* |
117,400 | 2,520,578 | |||
| 5,574,434 | |||||
| Environmental Services — 0.2% |
|||||
| Tetra Tech, Inc.* |
37,500 | 932,250 | |||
| Farming & Agriculture — 0.3% |
|||||
| Delta & Pine Land Co. |
46,800 | 1,188,720 | |||
| Financial - Bank & Trust — 5.0% |
|||||
| East West Bancorp, Inc. |
50,100 | 2,689,368 | |||
| Flagstar Bancorp, Inc.(a) |
182,100 | 3,900,582 | |||
| Independent Bank Corp. |
35,367 | 1,003,008 | |||
| Pacific Capital Bancorp |
34,400 | 1,266,608 | |||
| R&G Financial Corp. (Class “B” Stock) |
88,200 | 3,510,360 | |||
| Republic Bancorp, Inc. |
149,798 | 2,020,775 | |||
| Texas Regional Bancshares, Inc. |
40,920 | 1,514,040 | |||
| UCBH Holdings, Inc. |
86,700 | 3,378,699 | |||
| Wintrust Financial Corp. |
16,900 | 762,190 | |||
| 20,045,630 | |||||
| Financial Services — 2.8% |
|||||
| Dime Community Bancshares |
53,700 | 1,651,812 | |||
| New Century Financial Corp.(a) |
75,800 | 3,006,986 | |||
| Novastar Financial, Inc.(a) |
19,000 | 816,240 | |||
| W Holding Co., Inc. |
137,090 | 2,551,245 | |||
| Westcorp, Inc. |
63,000 | 2,302,650 | |||
| World Acceptance Corp.* |
50,000 | 995,500 | |||
| 11,324,433 | |||||
| Healthcare Services — 3.8% |
|||||
| AMERIGROUP Corp.* |
74,800 | 3,190,220 | |||
| Beverly Enterprises, Inc.*(a) |
314,100 | 2,698,119 | |||
| PAREXEL International Corp.* |
92,500 | 1,504,050 | |||
| Select Medical Corp. |
263,800 | 4,294,664 | |||
| United Surgical Partners International, Inc.* |
25,800 | 863,784 | |||
| VCA Antech, Inc.* |
94,600 | 2,930,708 | |||
| 15,481,545 | |||||
| Shares |
Value | ||||
| Hotels & Motels — 0.5% |
|||||
| Choice Hotels International, Inc. |
54,400 | $ | 1,917,600 | ||
| Industrial Products — 0.4% |
|||||
| Ceradyne, Inc.* |
43,300 | 1,474,798 | |||
| Internet Services — 6.5% |
|||||
| Advanced Digital Information Corp.* |
246,600 | 3,452,400 | |||
| Akamai Technologies, Inc.* |
93,300 | 1,002,975 | |||
| Ask Jeeves, Inc.* |
83,100 | 1,505,772 | |||
| CNET Networks, Inc.* |
115,300 | 786,346 | |||
| Digital Insight Corp.* |
58,800 | 1,464,120 | |||
| Digital River, Inc.* |
14,000 | 309,400 | |||
| EarthLink, Inc.* |
188,300 | 1,883,000 | |||
| eCollege.com, Inc.* |
151,600 | 2,798,536 | |||
| eSPEED, Inc. (Class “A” Stock)* |
60,600 | 1,418,646 | |||
| F5 Networks, Inc.* |
50,800 | 1,275,080 | |||
| FindWhat.com* |
232,100 | 4,351,874 | |||
| J2 Global Communications, Inc.* |
20,600 | 510,262 | |||
| NetBank, Inc. |
74,900 | 999,915 | |||
| Openwave Systems, Inc.* |
54,700 | 601,700 | |||
| Packeteer, Inc.* |
61,400 | 1,042,572 | |||
| Priceline.com, Inc.* |
43,083 | 771,186 | |||
| Secure Computing Corp.* |
32,900 | 589,239 | |||
| United Online, Inc.*(a) |
30,750 | 516,293 | |||
| WebEx Communications, Inc.* |
54,400 | 1,093,440 | |||
| 26,372,756 | |||||
| Machinery & Equipment — 1.1% |
|||||
| Nordson Corp. |
43,600 | 1,505,508 | |||
| Toro Co. |
63,600 | 2,951,040 | |||
| 4,456,548 | |||||
| Medical Supplies & Equipment — 10.3% |
|||||
| Advanced Medical Optics, Inc.* |
51,800 | 1,017,870 | |||
| ALARIS Medical Systems, Inc.* |
107,300 | 1,632,033 | |||
| BioReliance Corp.* |
31,100 | 1,487,202 | |||
| Cytyc Corp.* |
86,900 | 1,195,744 | |||
| Digene Corp.* |
69,900 | 2,802,990 | |||
| Enzo Biochem, Inc.* |
107,610 | 1,927,295 | |||
| Gen-Probe, Inc.* |
80,200 | 2,924,894 | |||
| Inamed Corp.*(a) |
37,200 | 1,787,832 | |||
| Integra LifeSciences Holdings Corp.* |
107,200 | 3,069,136 | |||
| Intermagnetics General Corp.* |
22,100 | 489,736 | |||
| Kyphon, Inc.* |
79,700 | 1,978,951 | |||
| Martek Biosciences Corp.*(a) |
64,300 | 4,177,571 | |||
| Merit Medical Systems, Inc.* |
159,421 | 3,548,719 | |||
| Molecular Devices Corp.* |
26,900 | 510,831 | |||
| OraSure Technologies, Inc.* |
61,300 | 487,948 | |||
| Quidel Corp.* |
69,000 | 746,580 | |||
| Regeneration Technologies, Inc.* |
157,800 | 1,729,488 | |||
| SurModics, Inc.*(a) |
66,800 | 1,596,520 | |||
| Sybron Dental Specialties, Inc.* |
89,100 | 2,503,710 | |||
| Synovis Life Technologies, Inc.* |
59,800 | 1,216,332 | |||
| Ventana Medical Systems, Inc.* |
53,000 | 2,088,200 | |||
66
Table of Contents
AST DeAM Small-Cap Growth Portfolio
Schedule of Investments
December 31, 2003
| Shares |
Value | ||||
| Vital Images, Inc.* |
29,400 | $ | 524,496 | ||
| Wilson Greatbatch Technologies, Inc.*(a) |
49,200 | 2,079,684 | |||
| 41,523,762 | |||||
| Metals & Mining — 0.7% |
|||||
| Hecla Mining Co.* |
349,700 | 2,899,013 | |||
| Office Equipment — 0.7% |
|||||
| United Stationers, Inc.* |
64,900 | 2,655,708 | |||
| Oil & Gas — 4.5% |
|||||
| Evergreen Resources, Inc.*(a) |
99,500 | 3,234,745 | |||
| KCS Energy, Inc.* |
103,200 | 1,088,760 | |||
| Oceaneering International, Inc.* |
65,200 | 1,825,600 | |||
| Patina Oil & Gas Corp. |
101,625 | 4,978,609 | |||
| Remington Oil & Gas Corp.* |
110,200 | 2,169,838 | |||
| Southwestern Energy Co.* |
70,400 | 1,682,560 | |||
| St. Mary Land & Exploration Co. |
55,300 | 1,576,050 | |||
| Unit Corp.* |
61,400 | 1,445,970 | |||
| 18,002,132 | |||||
| Personal Services — 1.2% |
|||||
| Strayer Education, Inc. |
9,800 | 1,066,534 | |||
| Sylvan Learning Systems, Inc.* |
136,800 | 3,938,472 | |||
| 5,005,006 | |||||
| Pharmaceuticals — 6.3% |
|||||
| aaiPharma, Inc.*(a) |
106,400 | 2,672,768 | |||
| Bradley Pharmaceuticals, Inc.* |
103,000 | 2,619,290 | |||
| Cell Therapeutics, Inc.*(a) |
46,800 | 407,160 | |||
| Enzon Pharmaceuticals, Inc.* |
251,500 | 3,018,000 | |||
| Esperion Therapeutics, Inc.*(a) |
33,500 | 1,159,435 | |||
| Inveresk Research Group, Inc.* |
26,900 | 665,237 | |||
| K-V Pharmaceutical Co. (Class “A” Stock)* |
39,050 | 995,775 | |||
| Kos Pharmaceuticals, Inc.*(a) |
61,000 | 2,625,440 | |||
| MGI Pharma, Inc.* |
30,700 | 1,263,305 | |||
| Onyx Pharmaceuticals, Inc.* |
59,700 | 1,685,331 | |||
| Perrigo Co. |
141,800 | 2,229,096 | |||
| Progenics Pharmaceuticals, Inc.* |
13,100 | 247,066 | |||
| SciClone Pharmaceuticals, Inc.* |
108,700 | 736,986 | |||
| Serologicals Corp.* |
132,200 | 2,458,920 | |||
| SFBC International, Inc.* |
71,700 | 1,904,352 | |||
| United Therapeutics Corp.* |
38,000 | 872,100 | |||
| 25,560,261 | |||||
| Real Estate — 1.4% |
|||||
| Alexandria Real Estate Equities, Inc. [REIT] |
18,000 | 1,042,200 | |||
| CoStar Group, Inc.* |
24,800 | 1,033,664 | |||
| Essex Property Trust, Inc. [REIT] |
23,500 | 1,509,170 | |||
| IMPAC Mortgage Holdings, Inc. [REIT] |
48,600 | 885,006 | |||
| Shares |
Value | ||||
| Washington Real Estate Investment Trust [REIT] |
34,200 | $ | 998,640 | ||
| 5,468,680 | |||||
| Restaurants — 1.9% |
|||||
| California Pizza Kitchen, Inc.* |
28,200 | 567,666 | |||
| P.F. Chang’s China Bistro, Inc.*(a) |
83,900 | 4,268,832 | |||
| Panera Bread Co. (Class “A” Stock)* |
67,100 | 2,652,463 | |||
| 7,488,961 | |||||
| Retail & Merchandising — 6.0% |
|||||
| 7-Eleven, Inc.* |
174,600 | 2,802,330 | |||
| Aeropostale, Inc.* |
58,500 | 1,604,070 | |||
| Hibbett Sporting Goods, Inc.* |
14,700 | 438,060 | |||
| Hollywood Entertainment Corp.* |
221,400 | 3,044,250 | |||
| Hot Topic, Inc.* |
132,500 | 3,903,450 | |||
| Movie Gallery, Inc. |
176,800 | 3,302,624 | |||
| PETCO Animal Supplies, Inc.* |
157,800 | 4,805,010 | |||
| Tuesday Morning Corp.* |
67,100 | 2,029,775 | |||
| Yankee Candle Co., Inc.* |
78,300 | 2,139,939 | |||
| 24,069,508 | |||||
| Semiconductors — 4.1% |
|||||
| Chippac, Inc. (Class “A” Stock) |
257,200 | 1,952,148 | |||
| Kopin Corp.* |
46,100 | 309,331 | |||
| Lattice Semiconductor Corp.* |
76,900 | 744,392 | |||
| LTX Corp.* |
73,200 | 1,100,196 | |||
| Mattson Technology, Inc.* |
143,900 | 1,758,458 | |||
| Micrel, Inc.* |
40,700 | 634,106 | |||
| Microsemi Corp.* |
102,300 | 2,514,534 | |||
| MKS Instruments, Inc.* |
52,500 | 1,522,500 | |||
| Mykrolis Corp.* |
50,700 | 815,256 | |||
| Photronics, Inc.* |
127,600 | 2,541,792 | |||
| Power Integrations, Inc.*(a) |
18,400 | 615,664 | |||
| Vitesse Semiconductor Corp.* |
166,300 | 976,181 | |||
| White Electronic Designs Corp.* |
131,400 | 1,156,320 | |||
| 16,640,878 | |||||
| Telecommunications — 5.7% |
|||||
| Aspect Communications Corp.* |
132,100 | 2,081,896 | |||
| Boston Communications Group, Inc.* |
103,100 | 957,799 | |||
| Comtech Telecommunications Corp.* |
115,100 | 3,322,937 | |||
| Golden Telecom, Inc.* |
22,200 | 616,050 | |||
| Intervoice, Inc.* |
94,500 | 1,121,715 | |||
| Intrado, Inc.* |
31,900 | 700,205 | |||
| Plantronics, Inc.* |
65,800 | 2,148,370 | |||
| RF Micro Devices, Inc.* |
373,200 | 3,750,660 | |||
| Sonus Networks, Inc.* |
179,300 | 1,355,508 | |||
| SpectraLink Corp. |
77,700 | 1,489,509 | |||
| TALK America Holdings, Inc.* |
149,100 | 1,717,632 | |||
| ViaSat, Inc.* |
51,500 | 985,710 | |||
| Westell Technologies, Inc. (Class “A” Stock)* |
443,100 | 2,795,961 | |||
| 23,043,952 | |||||
67
Table of Contents
AST DeAM Small-Cap Growth Portfolio
Schedule of Investments
December 31, 2003
| Shares |
Value | |||||
| Transportation — 0.3% |
||||||
| Knight Transportation, Inc.* |
47,000 | $ | 1,205,550 | |||
| Total Long-Term Investments |
||||||
| (Cost $338,615,419) |
396,805,642 | |||||
| Par (000) |
||||||
| SHORT-TERM INVESTMENTS — 9.2% |
||||||
| Commercial Paper — 0.5% |
||||||
| Concord Minutemen Capital Co. |
||||||
| 1.13%, 02/12/04(b) |
$ | 1,244 | 1,240,824 | |||
| Silver Tower U.S. Funding |
||||||
| 1.13%, 02/02/04(b) |
911 | 908,824 | ||||
| 2,149,648 | ||||||
| Corporate Obligations — 3.6% |
||||||
| American Express Centurian |
||||||
| 1.131%, 01/29/04 [FRN](b)(c) |
2,271 | 2,271,353 | ||||
| Bear Stearns Co., Inc. |
||||||
| 1.12%, 01/02/04 [FRN](b)(c) |
1,569 | 1,569,282 | ||||
| Canadian Imperial Bank of Commerce |
||||||
| 1.111%, 01/29/04 [FRN](b)(c) |
1,230 | 1,229,784 | ||||
| Merrill Lynch & Co., Inc. |
||||||
| 1.13%, 01/02/04 [FRN](b)(c) |
4,673 | 4,672,962 | ||||
| 1.13%, 01/02/04(b) |
454 | 453,528 | ||||
| Morgan Stanley |
||||||
| 1.03%, 01/02/04 [FRN](b)(c) |
239 | 239,478 | ||||
| 1.08%, 01/02/04 [FRN](b)(c) |
486 | 485,703 | ||||
| Natexis Banques Populaires |
||||||
| 1.10%, 01/02/04 [FRN](b)(c) |
2,668 | 2,667,570 | ||||
| Societe Generale |
||||||
| 1.08%, 01/02/04 [FRN](b)(c) |
1,067 | 1,066,338 | ||||
| 14,655,998 | ||||||
| Shares |
||||||
| Non-Registered Investment Company — 4.2% |
||||||
| BlackRock Institutional Money Market Trust(b)(j) |
16,480,413 | 16,480,413 | ||||
| Par (000) |
Value |
||||||
| Repurchase Agreements — 0.5% |
|||||||
| Merrill Lynch & Co., Inc. |
|||||||
| 1.00%, dated 12/31/03, to be repurchased on 01/02/04, repurchase price $1,889,807 (Collateralized by Federal Home Loan Mortgage Corp. 5.50% maturing 12/01/33, Federal National Mortgage Assoc. 4.00% - 6.00% maturing 11/01/17 to 11/01/33 and Government National Mortgage Assoc. 1.47% maturing 01/16/04 [FRN](c), par value $2,318,583, market value including accrued interest $1,946,428)(b) |
$ | 1,890 | $ | 1,889,702 | |||
| Time Deposits — 0.2% |
|||||||
| Chase Manhattan Bank |
|||||||
| 0.875%, 01/02/04(b) |
690 | 689,892 | |||||
| UBS Bank |
|||||||
| 0.938%, 01/02/04(b) |
309 | 309,220 | |||||
| 999,112 | |||||||
| U.S. Treasury Obligation — 0.2% |
|||||||
| U.S. Treasury Bills |
|||||||
| 0.93%, 01/29/04(k)(n) |
1,000 | 999,324 | |||||
| Total Short-Term Investments |
| ||||||
| (Cost $37,174,150) |
37,174,197 | ||||||
| Total Investments — 107.6% |
|||||||
| (Cost $375,789,569; Note 5) |
433,979,839 | ||||||
| Liabilities in Excess of Other |
(30,550,032 | ) | |||||
| Net Assets — 100.0% |
$ | 403,429,807 | |||||
68
Table of Contents
AST DeAM Small-Cap Growth Portfolio
Schedule of Investments
December 31, 2003
The following abbreviations are used in portfolio descriptions:
| FRN | Floating Rate Note |
| REIT | Real Estate Investment Trust |
| symbol |
description | |
| * |
Non-income producing security. | |
| (a) |
Portion of securities on loan with an aggregate market value of $34,443,314; cash collateral $36,174,873 was received with which the portfolio purchased securities. | |
| (b) |
Represents security purchased with cash collateral for securities on loan. | |
| (c) |
Indicates a variable rate security. The maturity date presented for these instruments is the latter of the next date on which the security can be redeemed at par or the next date on which the rate of interest is adjusted. The interest rate shown reflects the rate in effect at December 31, 2003. | |
| (j) |
Security available to institutional investors only. | |
| (k) |
Securities with an aggregate market value of $999,324 have been segregated with the custodian to cover margin requirements for the following open futures contracts at December 31, 2003: | |
| Description | Expiration Month |
Number of Contracts |
Contracts at Trade Date Value |
Contracts at Current Value |
Unrealized Appreciation | ||||||||
| Long Positions: |
|||||||||||||
| Russell 2000 |
03/04 | 26 | $ | 7,212,200 | $ | 7,243,600 | $ | 31,400 | |||||
| (n) |
Rates shown are the effective yields at purchase date. | |
See Notes to Financial Statements.
69
Table of Contents
AST Federated Aggressive Growth Portfolio
Schedule of Investments
December 31, 2003
| Shares |
Value | ||||
| LONG-TERM INVESTMENTS — 97.8% |
|||||
| COMMON STOCK |
|||||
| Advertising — 1.0% |
|||||
| Getty Images, Inc.* |
11,200 | $ | 561,456 | ||
| Lamar Advertising Co.* |
17,500 | 653,100 | |||
| Valueclick, Inc.* |
76,440 | 694,075 | |||
| 1,908,631 | |||||
| Aerospace — 0.4% |
|||||
| DRS Technologies, Inc.* |
24,211 | 672,582 | |||
| Airlines |
|||||
| Ryanair Holdings PLC [ADR]* |
142 | 7,191 | |||
| Automotive Parts — 4.5% |
|||||
| Advance Auto Parts, Inc.* |
80,236 | 6,531,211 | |||
| Monro Muffler Brake, Inc.* |
95,431 | 1,909,574 | |||
| 8,440,785 | |||||
| Broadcasting — 1.3% |
|||||
| Entercom Communications Corp.* |
9,680 | 512,653 | |||
| Sky Perfect Communications, Inc. (Japan)* |
1,456 | 1,711,822 | |||
| Spanish Broadcasting Systems, Inc. |
21,600 | 226,800 | |||
| 2,451,275 | |||||
| Building Materials — 0.3% |
|||||
| Cemex SA de CV [ADR] |
2,100 | 55,230 | |||
| Simpson Manufacturing Co., Inc.* |
8,160 | 415,018 | |||
| 470,248 | |||||
| Business Services — 5.3% |
|||||
| Arbitron, Inc.* |
11,400 | 475,608 | |||
| Ctrip.Com International Ltd. [ADR]* |
32,700 | 1,112,127 | |||
| Exponent, Inc.* |
30,035 | 642,749 | |||
| Exult, Inc.* |
119,080 | 847,850 | |||
| Fair Isaac Corp. |
11,232 | 552,165 | |||
| Indus International, Inc.* |
286,000 | 858,000 | |||
| Informatica Corp.* |
118,695 | 1,222,559 | |||
| Kroll, Inc.* |
19,970 | 519,220 | |||
| Marimba, Inc.* |
8,300 | 45,650 | |||
| Monster Worldwide, Inc.* |
63,960 | 1,404,561 | |||
| NuCo2, Inc.* |
37,600 | 476,392 | |||
| Pegasus Solutions, Inc.* |
25,600 | 268,032 | |||
| SM&A* |
24,900 | 291,330 | |||
| Tech Data Corp.* |
23,608 | 937,002 | |||
| Visual Networks, Inc.* |
160,580 | 359,699 | |||
| 10,012,944 | |||||
| Cable Television — 4.1% |
|||||
| Central European Media Enterprises Ltd. (Class “A” Stock)* |
442,888 | 7,692,965 | |||
| Chemicals — 0.4% |
|||||
| Cabot Microelectronics Corp.* |
16,770 | 821,730 | |||
| Shares |
Value | ||||
| Computer Hardware — 3.8% |
|||||
| Cray, Inc.* |
43,520 | $ | 432,154 | ||
| Komag, Inc.* |
34,900 | 510,587 | |||
| Lexar Media, Inc.* |
27,100 | 472,353 | |||
| Maxtor Corp.* |
87,400 | 970,140 | |||
| SanDisk Corp.* |
7,840 | 479,338 | |||
| Seagate Technology |
108,070 | 2,042,523 | |||
| Synaptics, Inc.* |
148,834 | 2,229,533 | |||
| 7,136,628 | |||||
| Computer Services & Software — 6.0% |
|||||
| Altiris, Inc.* |
22,568 | 823,281 | |||
| At Road, Inc.* |
13,250 | 176,225 | |||
| Avid Technology, Inc.* |
4,000 | 192,000 | |||
| BARRA, Inc. |
5,600 | 198,744 | |||
| BindView Development Corp.* |
144,500 | 544,765 | |||
| Business Objects SA [ADR]* |
38,480 | 1,334,102 | |||
| Cognos, Inc. (Canada)* |
6,978 | 213,666 | |||
| DigitalNet Holdings, Inc.* |
18,400 | 358,800 | |||
| EMC Corp.* |
33,114 | 427,833 | |||
| FactSet Research Systems, Inc. |
4,960 | 189,522 | |||
| FileNET Corp.* |
19,656 | 532,284 | |||
| Hummingbird Ltd. (Canada)* |
19,800 | 426,690 | |||
| Magma Design Automation, Inc.* |
64,740 | 1,511,032 | |||
| Manhattan Associates, Inc.* |
7,930 | 219,185 | |||
| MicroStrategy, Inc. (Class “A” Stock)* |
3,450 | 181,056 | |||
| Netegrity, Inc.* |
55,640 | 573,648 | |||
| Niku Corp.* |
23,300 | 198,050 | |||
| OpenTV Corp.* |
99,100 | 331,985 | |||
| PEC Solutions, Inc.* |
10,400 | 176,280 | |||
| Pervasive Software, Inc.* |
107,744 | 781,144 | |||
| SafeNet, Inc.* |
41,800 | 1,286,186 | |||
| Siebel Systems, Inc.* |
35,300 | 489,611 | |||
| 11,166,089 | |||||
| Consumer Products & Services — 2.3% |
|||||
| 1-800-Flowers.Com, Inc.* |
48,900 | 540,834 | |||
| Concorde Career Colleges, Inc.* |
16,600 | 414,502 | |||
| Dollar Thrifty Automotive Group, Inc.* |
34,610 | 897,783 | |||
| eDiets.Com, Inc. (Class “A” Stock)* |
51,300 | 316,008 | |||
| Elizabeth Arden, Inc.* |
37,800 | 752,976 | |||
| NBTY, Inc.* |
49,700 | 1,334,942 | |||
| 4,257,045 | |||||
| Electronic Components & Equipment — 2.5% |
|||||
| American Power Conversion Corp. |
31,167 | 762,033 | |||
| Avnet, Inc.* |
7,600 | 164,616 | |||
| CEVA, Inc.* |
146,978 | 1,528,571 | |||
| M-Systems Flash Disk Pioneers Ltd. (Israel)* |
45,200 | 781,056 | |||
| Vicor Corp.* |
84,656 | 965,925 | |||
| Wolfson Microelectronics PLC (United Kingdom)* |
87,500 | 501,244 | |||
| 4,703,445 | |||||
70
Table of Contents
AST Federated Aggressive Growth Portfolio
Schedule of Investments
December 31, 2003
| Shares |
Value | ||||
| Entertainment & Leisure — 3.5% |
|||||
| Ambassadors Group, Inc. |
10,100 | $ | 237,249 | ||
| Dover Downs Gaming & Entertainment, Inc. |
12,120 | 114,655 | |||
| International Speedway Corp. |
29,328 | 1,309,788 | |||
| Speedway Motorsports, Inc. |
31,700 | 916,764 | |||
| Winnebago Industries, Inc. |
58,700 | 4,035,626 | |||
| 6,614,082 | |||||
| Environmental Services — 0.1% |
|||||
| Allied Waste Industries, Inc.* |
15,500 | 215,140 | |||
| Financial Services — 3.3% |
|||||
| Affiliated Managers Group, Inc.* |
15,458 | 1,075,722 | |||
| Bankrate, Inc.* |
46,900 | 580,622 | |||
| Federal Agricultural Mortgage Corp.* |
24,138 | 771,450 | |||
| IndyMac Bancorp, Inc. |
12,180 | 362,842 | |||
| Providian Financial Corp.* |
242,256 | 2,819,861 | |||
| SFGC Co., Ltd. (Japan) |
5,200 | 666,679 | |||
| 6,277,176 | |||||
| Food — 0.7% |
|||||
| Dean Foods Co.* |
4,125 | 135,589 | |||
| Volume Services America Holdings, Inc. |
55,000 | 915,750 | |||
| Whole Foods Market, Inc. |
5,200 | 349,076 | |||
| 1,400,415 | |||||
| Healthcare Services — 3.4% |
|||||
| Community Health Systems, Inc.* |
18,600 | 494,388 | |||
| LifePoint Hospitals, Inc.* |
37,981 | 1,118,541 | |||
| Medarex, Inc.* |
115,700 | 720,811 | |||
| National Dentex Corp.* |
14,590 | 350,160 | |||
| Province Healthcare Co.* |
32,032 | 512,512 | |||
| Select Medical Corp. |
27,000 | 439,560 | |||
| Sequenom, Inc.* |
40,600 | 129,108 | |||
| TLC Vision Corp. (Canada)* |
85,100 | 564,213 | |||
| United Surgical Partners International, Inc.* |
29,890 | 1,000,717 | |||
| VCA Antech, Inc.* |
34,750 | 1,076,555 | |||
| 6,406,565 | |||||
| Hotels & Motels — 1.4% |
|||||
| Orient-Express Hotels Ltd. |
59,093 | 970,898 | |||
| Prime Hospitality Corp.* |
163,342 | 1,666,088 | |||
| 2,636,986 | |||||
| Industrial Products — 0.2% |
|||||
| Steel Dynamics, Inc.* |
13,060 | 306,779 | |||
| Insurance — 2.5% |
|||||
| Axis Capital Holdings Ltd.* |
17,012 | 498,111 | |||
| Endurance Specialty Holdings Ltd. |
7,700 | 258,335 | |||
| Philadelphia Consolidated |
34,024 | 1,661,392 | |||
| RTW, Inc.* |
50,730 | 326,701 | |||
| Shares |
Value | ||||
| WellChoice, Inc.* |
55,740 | $ | 1,923,030 | ||
| 4,667,569 | |||||
| Internet Services — 3.8% |
|||||
| Advanced Digital Information Corp.* |
15,050 | 210,700 | |||
| Digital Impact, Inc.* |
342,550 | 986,544 | |||
| eCollege.com, Inc.* |
15,166 | 279,964 | |||
| Mediagrif Interactive Technologies, Inc. (Canada)* |
168,400 | 1,391,768 | |||
| Netopia, Inc.* |
50,700 | 739,206 | |||
| NIC, Inc.* |
207,792 | 1,668,570 | |||
| Online Resources Corp.* |
216,959 | 1,433,882 | |||
| Online Resources Corp. (Germany)*144A |
61,000 | 400,160 | |||
| 7,110,794 | |||||
| Machinery & Equipment — 0.1% |
|||||
| Graco, Inc. |
5,690 | 228,169 | |||
| Medical Supplies & Equipment — 6.7% |
|||||
| Aspect Medical Systems, Inc.* |
68,960 | 786,834 | |||
| Cambridge Heart, Inc.* |
340,600 | 306,540 | |||
| Cytyc Corp.* |
120,848 | 1,662,868 | |||
| DJ Orthopedics, Inc.* |
36,214 | 970,535 | |||
| Dyax Corp.* |
331,244 | 2,722,826 | |||
| Endologix, Inc.* |
131,100 | 520,467 | |||
| Illumina, Inc.* |
27,800 | 195,990 | |||
| Inamed Corp.* |
17,530 | 842,492 | |||
| Invitrogen Corp.* |
7,000 | 490,000 | |||
| Kyphon, Inc.* |
54,674 | 1,357,555 | |||
| OraSure Technologies, Inc.* |
14,000 | 111,440 | |||
| Orthofix International NV* |
33,134 | 1,622,903 | |||
| Therasense, Inc.* |
37,440 | 760,032 | |||
| Zoll Medical Corp.* |
3,700 | 131,276 | |||
| 12,481,758 | |||||
| Metals & Mining — 0.9% |
|||||
| Glamis Gold Ltd. (Canada)* |
39,900 | 683,088 | |||
| Golden Star Resources Ltd. (Canada)* |
32,100 | 223,737 | |||
| Hecla Mining Co.* |
34,200 | 283,518 | |||
| Pan American Silver Corp. (Canada)* |
11,100 | 158,730 | |||
| Placer Dome, Inc. |
16,400 | 293,724 | |||
| 1,642,797 | |||||
| Oil & Gas — 1.0% |
|||||
| Anadarko Petroleum Corp. |
18,000 | 918,180 | |||
| Encore Acquisition Co.* |
20,400 | 502,860 | |||
| Oceaneering International, Inc.* |
16,520 | 462,560 | |||
| 1,883,600 | |||||
| Personal Services — 0.1% |
|||||
| Universal Technical Institute, Inc.* |
6,900 | 207,000 | |||
| Pharmaceuticals — 8.5% |
|||||
| Acusphere, Inc.* |
117,000 | 1,027,260 | |||
| Alexion Pharmaceuticals, Inc.* |
118,604 | 2,018,641 | |||
| Atrix Laboratories, Inc.* |
43,310 | 1,041,172 | |||
71
Table of Contents
AST Federated Aggressive Growth Portfolio
Schedule of Investments
December 31, 2003
| Shares |
Value | ||||
| Avigen, Inc.* |
63,800 | $ | 375,144 | ||
| Biovail Corp. (Canada)* |
10,000 | 214,900 | |||
| Corixa Corp.* |
20,000 | 120,800 | |||
| CV Therapeutics, Inc.* |
27,976 | 410,128 | |||
| DOV Pharmaceutical, Inc.* |
42,920 | 578,132 | |||
| Dr. Reddy’s Laboratories Ltd. [ADR] |
11,360 | 359,544 | |||
| Encysive Pharmaceuticals, Inc.* |
25,000 | 223,750 | |||
| Eon Labs, Inc.* |
10,180 | 518,671 | |||
| Exelixis, Inc.* |
28,990 | 205,249 | |||
| I-Flow Corp.* |
25,300 | 351,923 | |||
| ILEX Oncology, Inc.* |
34,700 | 737,375 | |||
| InterMune, Inc.* |
9,530 | 220,715 | |||
| King Pharmaceuticals, Inc.* |
56,280 | 858,833 | |||
| MIM Corp.* |
34,010 | 239,090 | |||
| Neurochem, Inc. (Canada)* |
63,100 | 1,487,898 | |||
| Onyx Pharmaceuticals, Inc.* |
35,150 | 992,285 | |||
| Point Therapeutics, Inc.*144A (cost $700,000; purchased 9/26/03)(g)(o) |
350,000 | 1,055,250 | |||
| Ranbaxy Laboratories-Sp [GDR] |
12,500 | 300,876 | |||
| Shire Pharmaceuticals Group PLC [ADR]* |
24,024 | 697,897 | |||
| Telik, Inc.* |
73,642 | 1,694,502 | |||
| Vicuron Pharmaceuticals, Inc.* |
13,200 | 246,180 | |||
| 15,976,215 | |||||
| Printing & Publishing — 0.2% |
|||||
| Journal Communications, Inc. (Class “A” Stock) |
25,000 | 463,250 | |||
| Real Estate — 4.5% |
|||||
| Agree Realty Corp. [REIT] |
5,200 | 147,056 | |||
| American Financial Realty Trust [REIT] |
10,000 | 170,500 | |||
| Coachmen Industries, Inc. |
120,200 | 2,176,822 | |||
| CoStar Group, Inc.* |
37,357 | 1,557,040 | |||
| First Potomac Realty Trust [REIT]* |
75,000 | 1,405,500 | |||
| Wetherspoon (J.D.) PLC (United Kingdom) |
608,816 | 3,040,756 | |||
| 8,497,674 | |||||
| Restaurants — 2.9% |
|||||
| Bob Evans Farms, Inc. |
5,620 | 182,425 | |||
| Outback Steakhouse, Inc. |
21,400 | 946,094 | |||
| Ruby Tuesday, Inc. |
16,700 | 475,783 | |||
| The Cheesecake Factory, Inc.* |
85,428 | 3,761,395 | |||
| 5,365,697 | |||||
| Retail & Merchandising — 3.7% |
|||||
| A.C. Moore Arts & Crafts, Inc.* |
18,800 | 362,088 | |||
| CarMax, Inc.* |
25,955 | 802,788 | |||
| Cost Plus, Inc.* |
6,100 | 250,100 | |||
| Dick’s Sporting Goods, Inc.* |
10,577 | 514,677 | |||
| Dollar Tree Stores, Inc.* |
36,300 | 1,091,178 | |||
| Family Dollar Stores, Inc. |
8,910 | 319,691 | |||
| LKQ Corp.* |
12,700 | 227,965 | |||
| Shares |
Value | ||||
| PETCO Animal Supplies, Inc.* |
10,000 | $ | 304,500 | ||
| PETsMART, Inc. |
71,850 | 1,710,030 | |||
| Shoe Carnival, Inc.* |
7,700 | 137,060 | |||
| Talbots, Inc. (The) |
37,960 | 1,168,409 | |||
| 6,888,486 | |||||
| Semiconductors — 8.2% |
|||||
| Amkor Technology, Inc.* |
20,600 | 375,126 | |||
| ARM Holdings PLC [ADR]* |
252,476 | 1,742,084 | |||
| Asyst Technologies, Inc.* |
48,500 | 841,475 | |||
| ATI Technologies, Inc. (Canada)* |
85,970 | 1,299,866 | |||
| August Technology Corp.* |
39,000 | 723,450 | |||
| Cirrus Logic, Inc.* |
63,200 | 484,744 | |||
| Conexant Systems, Inc.* |
88,200 | 438,354 | |||
| Cree, Inc.* |
74,360 | 1,315,428 | |||
| ESS Technology, Inc.* |
13,600 | 231,336 | |||
| Genus, Inc.* |
346,000 | 2,076,000 | |||
| GlobespanVirata, Inc.* |
106,782 | 627,878 | |||
| Integrated Device Technology, Inc.* |
94,100 | 1,615,697 | |||
| Kopin Corp.* |
15,700 | 105,347 | |||
| Metron Technology NV* |
178,400 | 767,120 | |||
| MKS Instruments, Inc.* |
9,800 | 284,200 | |||
| TriQuint Semiconductor, Inc.* |
46,600 | 329,462 | |||
| Ultratech Stepper, Inc.* |
22,900 | 672,573 | |||
| Vitesse Semiconductor Corp.* |
95,742 | 562,006 | |||
| Xicor, Inc.* |
79,400 | 900,396 | |||
| 15,392,542 | |||||
| Telecommunications — 4.1% |
|||||
| Foundry Networks, Inc.* |
35,464 | 970,295 | |||
| Hungarian Telephone & Cable Co.* |
10,100 | 99,586 | |||
| Intrado, Inc.* |
39,437 | 865,642 | |||
| L-3 Communications Holdings, Inc.* |
8,370 | 429,883 | |||
| RADVision Ltd. (Israel)* |
174,410 | 1,990,018 | |||
| TALK America Holdings, Inc.* |
157,300 | 1,812,096 | |||
| UTStarcom, Inc.* |
25,380 | 940,837 | |||
| Western Wireless Corp. (Class “A” Stock)* |
24,600 | 451,656 | |||
| Wireless Matrix Corp. (Canada)* |
51,200 | 64,978 | |||
| 7,624,991 | |||||
| Transportation — 6.0% |
|||||
| ABX Air, Inc.* |
892,880 | 3,839,384 | |||
| EGL, Inc.* |
91,000 | 1,597,960 | |||
| Expeditors International of Washington, Inc. |
51,896 | 1,954,403 | |||
| Forward Air Corp.* |
26,800 | 737,000 | |||
| Quality Distribution, Inc.* |
107,600 | 2,103,580 | |||
| UTI Worldwide, Inc. |
25,345 | 961,336 | |||
| 11,193,663 | |||||
| Utilities — 0.1% |
|||||
| Consolidated Water Co. Ltd. |
7,200 | 144,360 | |||
| Total Common Stock |
|||||
| (Cost $145,951,252) |
183,367,266 | ||||
72
Table of Contents
AST Federated Aggressive Growth Portfolio
Schedule of Investments
December 31, 2003
| Shares |
Value | ||||
| PREFERRED STOCK |
|||||
| Telecommunications |
|||||
| Crown Castle International Corp., 6.25%* |
|||||
| (Cost $68,513) |
2,100 | $ | 91,350 | ||
| WARRANT* |
|||||
| Pharmaceuticals |
|||||
| Point Therapeutics, expiring on 09/24/2008 |
|||||
| (Cost $0) |
175,000 | 0 | |||
| Total Long-Term Investments |
|||||
| (Cost $146,019,765) |
183,458,616 | ||||
| Par (000) |
Value | |||||
| SHORT-TERM INVESTMENT — 1.8% |
||||||
| Repurchase Agreement |
||||||
| Greenwich Capital Markets, Inc. |
||||||
| 0.70%, maturing 12/31/03, to be repurchased on 01/02/04, repurchase price $3,444,134 (Collateralized by U.S. Treasury Bills, 2.875%(n), maturing 06/30/04, par value $3,484,000, market value including accrued interest $3,515,574) (Cost $3,444,000) |
$ | 3,444 | $ | 3,444,000 | ||
| Total Investments — 100.4% |
||||||
| (Cost $149,463,765; Note 5) |
186,902,616 | |||||
| Liabilities in Excess of |
662,581 | |||||
| Net Assets — 100.0% |
$ | 187,565,197 | ||||
The following abbreviations are used in portfolio descriptions:
| 144A | Security was purchased pursuant to Rule 144A under the securities Act of 1933 and may not be resold subject to that rule except to qualified institutional buyers. Unless otherwise noted 144A securities are deemed to be liquid. |
| ADR | American Depositary Receipt |
| GDR | Global Depositary Receipt |
| REIT | Real Estate Investment Trust |
| symbol |
description | |
| * |
Non-income producing security. | |
| (g) |
Indicates a security that has been deemed illiquid. The aggregate cost of the illiquid security is $700,000. The aggregate value, $1,055,250 represents 0.56% of net assets. | |
| (n) |
Rates shown are the effective yields at purchase date. | |
| (o) |
Indicates a fair valued security. | |
See Notes to Financial Statements.
73
Table of Contents
AST Goldman Sachs Small-Cap Value Portfolio
Schedule of Investments
December 31, 2003
| Shares |
Value | ||||
| LONG-TERM INVESTMENTS — 98.3% |
|||||
| COMMON STOCK |
|||||
| Advertising — 0.8% |
|||||
| ADVO, Inc. |
46,784 | $ | 1,485,860 | ||
| Getty Images, Inc.* |
3,500 | 175,455 | |||
| Lamar Advertising Co.*(a) |
28,974 | 1,081,310 | |||
| 2,742,625 | |||||
| Aerospace — 2.2% |
|||||
| DRS Technologies, Inc.* |
11,032 | 306,469 | |||
| Ducommun, Inc.* |
99,350 | 2,220,473 | |||
| MTC Technologies, Inc.* |
123,353 | 3,974,433 | |||
| Rockwell Collins, Inc. |
31,128 | 934,774 | |||
| 7,436,149 | |||||
| Airlines — 0.3% |
|||||
| AirTran Holdings, Inc.* |
98,483 | 1,171,948 | |||
| Automobile Manufacturers — 0.3% |
|||||
| Monaco Coach Corp.* |
36,936 | 879,077 | |||
| Automotive Parts — 3.6% |
|||||
| American Axle & Manufacturing Holdings, Inc.*(a) |
67,750 | 2,738,455 | |||
| ArvinMeritor, Inc. |
66,326 | 1,599,783 | |||
| Lear Corp. |
12,149 | 745,098 | |||
| Superior Industries International, Inc. |
19,932 | 867,441 | |||
| Wabash National Corp.* |
212,553 | 6,227,803 | |||
| 12,178,580 | |||||
| Beverages — 0.1% |
|||||
| Pepsi Bottling Group, Inc.(a) |
12,200 | 294,996 | |||
| Broadcasting — 0.7% |
|||||
| Belo Corp. (Class “A” Stock) |
23,762 | 673,415 | |||
| Regent Communications, Inc.* |
212,375 | 1,348,581 | |||
| Saga Communications, Inc. (Class “A” Stock)* |
27,881 | 516,635 | |||
| 2,538,631 | |||||
| Building Materials — 2.7% |
|||||
| American Standard Companies, Inc.* |
9,733 | 980,113 | |||
| ElkCorp |
41,171 | 1,099,266 | |||
| Hughes Supply, Inc. |
83,019 | 4,119,402 | |||
| Lennox International, Inc. |
49,360 | 824,312 | |||
| Texas Industries, Inc. |
18,146 | 671,402 | |||
| Universal Forest Products, Inc. |
46,214 | 1,487,167 | |||
| 9,181,662 | |||||
| Business Services — 1.2% |
|||||
| John H. Harland Co. |
20,201 | 551,487 | |||
| Medical Staffing Network Holdings, Inc.* |
157,952 | 1,729,575 | |||
| PRG-Schultz International, Inc.*(a) |
271,360 | 1,329,664 | |||
| Tech Data Corp.* |
16,300 | 646,947 | |||
| 4,257,673 | |||||
| Shares |
Value | ||||
| Chemicals — 3.3% |
|||||
| Agrium, Inc. (Canada) |
168,697 | $ | 2,776,753 | ||
| Albemarle Corp. |
67,392 | 2,019,738 | |||
| Cytec Industries, Inc.* |
19,098 | 733,172 | |||
| Minerals Technologies, Inc. |
24,418 | 1,446,767 | |||
| Monsanto Co. |
24,600 | 707,988 | |||
| Praxair, Inc. |
22,200 | 848,040 | |||
| Sensient Technologies Corp.(a) |
111,564 | 2,205,620 | |||
| TETRA Technologies, Inc.* |
31,536 | 764,433 | |||
| 11,502,511 | |||||
| Clothing & Apparel — 1.4% |
|||||
| K-Swiss, Inc. (Class “A” Stock) |
33,586 | 808,079 | |||
| Kellwood Co. |
54,562 | 2,237,042 | |||
| OshKosh B’Gosh, Inc. (Class “A” Stock) |
19,224 | 412,547 | |||
| Too, Inc.* |
64,524 | 1,089,165 | |||
| Tropical Sportswear International Corp.* |
179,209 | 390,676 | |||
| 4,937,509 | |||||
| Computer Hardware — 1.7% |
|||||
| Hutchinson Technology, Inc.*(a) |
110,718 | 3,403,472 | |||
| Imation Corp. |
24,949 | 876,957 | |||
| Integrated Circuit Systems, Inc.* |
20,400 | 581,196 | |||
| Komag, Inc.* |
52,626 | 769,918 | |||
| Storage Technology Corp.* |
8,700 | 224,025 | |||
| 5,855,568 | |||||
| Computer Services & Software — 2.9% |
|||||
| Activision, Inc.* |
58,600 | 1,066,520 | |||
| Anteon International Corp.* |
12,200 | 439,810 | |||
| CDW Corp. |
13,800 | 797,088 | |||
| Enterasys Networks, Inc.* |
154,114 | 577,928 | |||
| Extreme Networks, Inc.* |
146,504 | 1,056,294 | |||
| GTSI Corp.* |
10,889 | 150,824 | |||
| NetIQ Corp.* |
205,185 | 2,718,700 | |||
| OPNET Technologies, Inc.* |
56,573 | 931,192 | |||
| ScanSource, Inc.* |
42,721 | 1,948,932 | |||
| Symantec Corp.*(a) |
11,768 | 407,761 | |||
| 10,095,049 | |||||
| Conglomerates — 0.3% |
|||||
| ITT Industries, Inc. |
6,300 | 467,523 | |||
| Johnson Controls, Inc. |
4,257 | 494,323 | |||
| 961,846 | |||||
| Construction — 1.4% |
|||||
| Beazer Homes USA, Inc. |
15,630 | 1,526,426 | |||
| Standard Pacific Corp. |
54,117 | 2,627,380 | |||
| WCI Communities, Inc.* |
25,584 | 527,286 | |||
| 4,681,092 | |||||
| Consumer Products & Services — 4.0% |
|||||
| Aaron Rents, Inc. (Class “B” Stock) |
91,990 | 1,851,759 | |||
| Clorox Co. |
8,600 | 417,616 | |||
74
Table of Contents
AST Goldman Sachs Small-Cap Value Portfolio
Schedule of Investments
December 31, 2003
| Shares |
Value | ||||
| Concord Camera Corp.* |
153,311 | $ | 1,418,127 | ||
| Elizabeth Arden, Inc.* |
119,472 | 2,379,882 | |||
| Estee Lauder Companies, Inc. (Class “A” Stock) |
12,475 | 489,769 | |||
| Fossil, Inc.* |
69,684 | 1,951,849 | |||
| Helen of Troy Ltd.* |
26,289 | 608,590 | |||
| Jarden Corp.* |
112,482 | 3,075,257 | |||
| Oneida Ltd.*(a) |
115,111 | 678,004 | |||
| Rayovac Corp.* |
13,327 | 279,201 | |||
| UST, Inc. |
17,903 | 638,958 | |||
| 13,789,012 | |||||
| Containers & Packaging — 0.4% |
|||||
| Packaging Corp. of America |
27,925 | 610,440 | |||
| Sealed Air Corp.* |
8,700 | 471,018 | |||
| Sonoco Products Co. |
14,066 | 346,305 | |||
| 1,427,763 | |||||
| Electronic Components & Equipment — 3.8% |
|||||
| Artisan Components, Inc.* |
48,016 | 984,328 | |||
| Baldor Electric Co. |
26,086 | 596,065 | |||
| EDO Corp. |
52,251 | 1,287,987 | |||
| Fargo Electronics, Inc.* |
119,030 | 1,514,062 | |||
| FLIR Systems, Inc.*(a) |
27,785 | 1,014,153 | |||
| Franklin Electric Co., Inc. |
21,309 | 1,288,981 | |||
| GrafTech International Ltd.* |
254,954 | 3,441,879 | |||
| LoJack Corp.* |
15,418 | 124,269 | |||
| OpticNet, Inc.* |
20,300 | 0 | |||
| Rockwell Automation, Inc. |
16,200 | 576,720 | |||
| Symbol Technologies, Inc. |
23,500 | 396,915 | |||
| Varian, Inc.* |
31,352 | 1,308,319 | |||
| Zebra Technologies Corp. (Class “A” Stock)* |
9,225 | 612,263 | |||
| 13,145,941 | |||||
| Entertainment & Leisure — 1.2% |
|||||
| Argosy Gaming Co.* |
54,605 | 1,419,184 | |||
| Harrah’s Entertainment, Inc. |
12,844 | 639,246 | |||
| Station Casinos, Inc. |
72,235 | 2,212,558 | |||
| 4,270,988 | |||||
| Environmental Services — 0.8% |
|||||
| Republic Services, Inc. |
29,446 | 754,701 | |||
| TRC Companies, Inc.* |
33,374 | 702,856 | |||
| Waste Connections, Inc.* |
34,472 | 1,302,008 | |||
| 2,759,565 | |||||
| Financial - Bank & Trust — 12.8% |
|||||
| Accredited Home Lenders Holding Co.* |
52,323 | 1,601,084 | |||
| Alabama National Bancorp |
12,710 | 667,911 | |||
| Banknorth Group, Inc. |
31,691 | 1,030,908 | |||
| BankUnited Financial Corp.* |
84,108 | 2,169,145 | |||
| Berkshire Hills Bancorp, Inc. |
25,551 | 924,946 | |||
| Brookline Bancorp, Inc.(a) |
112,548 | 1,726,486 | |||
| Shares |
Value | ||||
| Capital Corp of the West* |
6,981 | $ | 276,727 | ||
| Cardinal Financial Corp.* |
73,195 | 606,055 | |||
| Citizens Banking Corp. |
96,814 | 3,167,754 | |||
| City National Corp. |
17,800 | 1,105,736 | |||
| Community First Bankshares, Inc. |
57,768 | 1,671,806 | |||
| Corus Bankshares, Inc. |
36,438 | 1,149,983 | |||
| Fidelity Bankshares, Inc. |
40,623 | 1,275,562 | |||
| First Community Bancorp |
39,907 | 1,442,239 | |||
| First Niagara Financial Group, Inc. |
164,278 | 2,449,385 | |||
| First Oak Brook Bancshares, Inc. |
22,493 | 675,015 | |||
| Greater Bay Bancorp(a) |
125,024 | 3,560,683 | |||
| IBERIABANK Corp. |
29,817 | 1,759,203 | |||
| Interchange Financial Services Corp. |
10,666 | 269,850 | |||
| Irwin Financial Corp. |
51,868 | 1,628,655 | |||
| M&T Bank Corp. |
12,363 | 1,215,283 | |||
| Main Street Banks, Inc. |
44,227 | 1,172,016 | |||
| Mercantile Bankshares Corp. |
9,900 | 451,242 | |||
| New York Community Bancorp, Inc.(a) |
23,300 | 886,565 | |||
| North Fork Bancorp, Inc.(a) |
19,300 | 781,071 | |||
| PFF Bancorp, Inc. |
80,458 | 2,919,016 | |||
| Republic Bancorp, Inc. |
148,505 | 2,003,332 | |||
| Southcoast Financial Corp.* |
18,928 | 397,488 | |||
| SouthTrust Corp. |
28,604 | 936,209 | |||
| Sterling Bancorp |
22,317 | 636,035 | |||
| Sun Bancorp, Inc.* |
13,405 | 353,892 | |||
| United Community Banks, Inc. |
33,906 | 1,115,507 | |||
| Western Sierra Bancorp* |
1,403 | 65,941 | |||
| Wintrust Financial Corp. |
30,963 | 1,396,431 | |||
| 43,489,161 | |||||
| Financial Services — 3.4% |
|||||
| Affiliated Managers Group, Inc.*(a) |
26,151 | 1,819,848 | |||
| AMBAC Financial Group, Inc. |
4,100 | 284,499 | |||
| Bear Stearns Companies, Inc.(a) |
6,522 | 521,434 | |||
| CIT Group, Inc. |
23,200 | 834,040 | |||
| Countrywide Financial Corp.(a) |
12,556 | 952,373 | |||
| Financial Federal Corp.* |
64,177 | 1,960,607 | |||
| IndyMac Bancorp, Inc. |
74,781 | 2,227,726 | |||
| LaBranche & Co., Inc.*(a) |
142,333 | 1,661,026 | |||
| Sky Financial Group, Inc. |
54,830 | 1,422,290 | |||
| 11,683,843 | |||||
| Food — 0.4% |
|||||
| American Italian Pasta Co. (Class “A” Stock)(a) |
24,563 | 1,029,190 | |||
| Hain Celestial Group, Inc.* |
13,795 | 320,182 | |||
| 1,349,372 | |||||
| Healthcare Services — 0.8% |
|||||
| NDCHealth Corp.(a) |
39,811 | 1,019,958 | |||
| United Surgical Partners International, Inc.* |
51,068 | 1,709,756 | |||
| 2,729,714 | |||||
75
Table of Contents
AST Goldman Sachs Small-Cap Value Portfolio
Schedule of Investments
December 31, 2003
| Shares |
Value | ||||
| Hotels & Motels — 0.1% |
|||||
| Hilton Hotels Corp. |
29,707 | $ | 508,881 | ||
| Industrial Products — 3.6% |
|||||
| Actuant Corp.* |
63,318 | 2,292,112 | |||
| Carlisle Companies, Inc. |
7,600 | 462,536 | |||
| Harsco Corp. |
55,946 | 2,451,553 | |||
| Lydall, Inc.* |
194,554 | 1,982,505 | |||
| Maverick Tube Corp.* |
105,402 | 2,028,989 | |||
| Mueller Industries, Inc.* |
71,026 | 2,440,453 | |||
| Nucor Corp.(a) |
10,349 | 579,544 | |||
| 12,237,692 | |||||
| Insurance — 5.4% |
|||||
| Aetna, Inc. |
9,503 | 642,213 | |||
| AmerUs Group Co.(a) |
39,591 | 1,384,497 | |||
| Axis Capital Holdings Ltd.* |
10,000 | 292,800 | |||
| Donegal Group, Inc. |
27,302 | 601,190 | |||
| Horace Mann Educators Corp. |
55,029 | 768,755 | |||
| Hub International Ltd. (Canada) |
61,597 | 1,032,366 | |||
| Navigators Group, Inc.* |
32,353 | 998,737 | |||
| NYMAGIC, Inc. |
27,609 | 757,039 | |||
| PartnerRe Ltd. |
16,723 | 970,770 | |||
| ProAssurance Corp.* |
43,951 | 1,413,025 | |||
| PXRE Corp. |
51,001 | 1,202,094 | |||
| RenaissanceRe Holdings Ltd.(a) |
23,705 | 1,162,730 | |||
| RLI Corp. |
58,143 | 2,178,036 | |||
| St. Paul Companies, Inc.(a) |
8,100 | 321,165 | |||
| StanCorp Financial Group, Inc. |
25,745 | 1,618,846 | |||
| Torchmark Corp. |
13,300 | 605,682 | |||
| U.S.I. Holdings Corp.* |
74,743 | 975,396 | |||
| UnumProvident Corp. |
21,100 | 332,747 | |||
| Willis Group Holdings Ltd. (United Kingdom)* |
33,089 | 1,127,342 | |||
| 18,385,430 | |||||
| Internet Services — 2.4% |
|||||
| Ask Jeeves, Inc.* |
7,918 | 143,474 | |||
| GTECH Holdings Corp.(a) |
32,777 | 1,622,134 | |||
| Lionbridge Technologies, Inc.* |
460,315 | 4,423,627 | |||
| NetBank, Inc. |
41,013 | 547,524 | |||
| SeeBeyond Technology Corp.* |
193,298 | 829,248 | |||
| United Online, Inc.*(a) |
32,424 | 544,399 | |||
| 8,110,406 | |||||
| Machinery & Equipment — 1.3% |
|||||
| Eaton Corp. |
9,200 | 993,416 | |||
| Hydril Co.* |
28,141 | 673,414 | |||
| Stanley Works |
8,600 | 325,682 | |||
| Terex Corp.* |
81,246 | 2,313,886 | |||
| 4,306,398 | |||||
| Medical Supplies & Equipment — 1.0% |
|||||
| AmerisourceBergen Corp. |
12,400 | 696,260 | |||
| Charles River Laboratories International, Inc.* |
14,500 | 497,785 | |||
| Shares |
Value | ||||
| Lifeline Systems, Inc.* |
14,694 | $ | 279,186 | ||
| Radiologix, Inc.* |
273,944 | 928,670 | |||
| Sybron Dental Specialties, Inc.* |
39,846 | 1,119,673 | |||
| 3,521,574 | |||||
| Metals & Mining — 1.5% |
|||||
| Commercial Metals Co. |
131,666 | 4,002,646 | |||
| Precision Castparts Corp. |
11,000 | 499,510 | |||
| Schnitzer Steel Industries, Inc. |
10,451 | 632,286 | |||
| 5,134,442 | |||||
| Oil & Gas — 5.6% |
|||||
| AGL Resources, Inc. |
34,431 | 1,001,942 | |||
| Evergreen Resources, Inc.*(a) |
114,673 | 3,728,019 | |||
| Frontier Oil Corp. |
66,873 | 1,151,553 | |||
| Murphy Oil Corp.(a) |
6,700 | 437,577 | |||
| Northwest Natural Gas Co. |
86,243 | 2,651,972 | |||
| Patina Oil & Gas Corp. |
80,287 | 3,933,261 | |||
| Piedmont Natural Gas Co., Inc.(a) |
14,063 | 611,178 | |||
| Range Resources Corp. |
163,847 | 1,548,354 | |||
| Sunoco, Inc.(a) |
16,300 | 833,745 | |||
| WGL Holdings, Inc. |
40,406 | 1,122,883 | |||
| Williams Companies, Inc. |
117,400 | 1,152,868 | |||
| XTO Energy, Inc.(a) |
39,800 | 1,126,340 | |||
| 19,299,692 | |||||
| Paper & Forest Products — 1.6% |
|||||
| Caraustar Industries, Inc.* |
359,709 | 4,963,985 | |||
| Plum Creek Timber Co., Inc. |
13,118 | 399,443 | |||
| Wausau-Mosinee Paper Corp. |
21,864 | 295,601 | |||
| 5,659,029 | |||||
| Pharmaceuticals — 1.9% |
|||||
| Covance, Inc.*(a) |
94,621 | 2,535,842 | |||
| Kos Pharmaceuticals, Inc.*(a) |
37,996 | 1,635,348 | |||
| MedImmune, Inc.* |
12,900 | 327,660 | |||
| Priority Healthcare Corp. |
45,324 | 1,092,762 | |||
| United Therapeutics Corp.* |
40,280 | 924,426 | |||
| 6,516,038 | |||||
| Printing & Publishing — 0.4% |
|||||
| Journal Register Co.* |
69,223 | 1,432,916 | |||
| Real Estate — 8.2% |
|||||
| Agree Realty Corp. [REIT] |
20,146 | 569,729 | |||
| Avalonbay Communities, Inc. [REIT] |
12,920 | 617,576 | |||
| Brandywine Realty Trust [REIT] |
40,983 | 1,097,115 | |||
| Capital Automotive [REIT] |
26,634 | 852,288 | |||
| Commercial Net Lease Realty, Inc. [REIT] |
108,929 | 1,938,936 | |||
| Correctional Properties Trust [REIT] |
90,750 | 2,613,600 | |||
| Entertainment Properties Trust [REIT] |
51,681 | 1,793,848 | |||
| Gables Residential Trust [REIT] |
16,361 | 568,381 | |||
| Healthcare Realty Trust, Inc. [REIT] |
35,264 | 1,260,688 | |||
76
Table of Contents
AST Goldman Sachs Small-Cap Value Portfolio
Schedule of Investments
December 31, 2003
| Shares |
Value | ||||
| Highwoods Properties, Inc. [REIT] |
11,600 | $ | 294,640 | ||
| iStar Financial, Inc. [REIT] |
36,303 | 1,412,187 | |||
| LaSalle Hotel Properties [REIT] |
32,375 | 600,556 | |||
| Lexington Corp. Properties Trust [REIT] |
83,994 | 1,695,839 | |||
| Liberty Property Trust [REIT] |
12,582 | 489,440 | |||
| MFA Mortgage Investments, Inc. [REIT] |
86,789 | 846,193 | |||
| Parkway Properties, Inc. [REIT] |
52,320 | 2,176,512 | |||
| Post Properties, Inc. [REIT] |
22,719 | 634,314 | |||
| Prentiss Properties Trust [REIT] |
97,202 | 3,206,693 | |||
| Public Storage, Inc. [REIT] |
7,800 | 338,442 | |||
| RAIT Investment Trust [REIT] |
83,495 | 2,137,472 | |||
| Summit Properties, Inc. [REIT] |
123,480 | 2,965,989 | |||
| 28,110,438 | |||||
| Restaurants — 1.0% |
|||||
| BUCA, Inc.* |
175,769 | 1,196,988 | |||
| California Pizza Kitchen, Inc.* |
30,534 | 614,649 | |||
| Total Entertainment Restaurant Corp.* |
76,740 | 927,019 | |||
| Yum! Brands, Inc.* |
17,200 | 591,680 | |||
| 3,330,336 | |||||
| Retail & Merchandising — 5.3% |
|||||
| Abercrombie & Fitch Co.* |
8,400 | 207,564 | |||
| AnnTaylor Stores Corp.*(a) |
129,563 | 5,052,956 | |||
| Brookstone, Inc.* |
76,830 | 1,637,247 | |||
| Charlotte Russe Holding, Inc.* |
50,930 | 705,890 | |||
| Federated Department Stores, Inc.(a) |
21,520 | 1,014,238 | |||
| Gymboree Corp.* |
105,575 | 1,819,057 | |||
| Limited Brands(a) |
16,900 | 304,707 | |||
| Linens ‘n Things, Inc.* |
47,370 | 1,424,890 | |||
| Michaels Stores, Inc. |
11,000 | 486,200 | |||
| Penney (J.C.) Co., Inc. |
33,600 | 883,008 | |||
| Ross Stores, Inc. |
19,600 | 518,028 | |||
| School Specialty, Inc.* |
41,507 | 1,411,653 | |||
| TJX Companies, Inc.(a) |
29,800 | 657,090 | |||
| Tuesday Morning Corp.* |
32,342 | 978,346 | |||
| Zale Corp.* |
21,133 | 1,124,276 | |||
| 18,225,150 | |||||
| Semiconductors — 0.6% |
|||||
| Actel Corp.* |
9,486 | 228,613 | |||
| Power Integrations, Inc.*(a) |
41,897 | 1,401,874 | |||
| Tessera Technologies, Inc.* |
29,598 | 556,738 | |||
| 2,187,225 | |||||
| Telecommunications — 1.5% |
|||||
| CenturyTel, Inc.(a) |
17,000 | 554,540 | |||
| Ditech Communications Corp.* |
66,450 | 1,269,195 | |||
| Tellabs, Inc.* |
62,400 | 526,032 | |||
| West Corp.* |
126,083 | 2,928,908 | |||
| 5,278,675 | |||||
| Shares |
Value | |||||
| Transportation — 2.4% |
||||||
| Heartland Express, Inc. |
47,769 | $ | 1,155,532 | |||
| Landstar System, Inc.* |
79,356 | 3,018,702 | ||||
| OMI Corp.* |
269,315 | 2,404,983 | ||||
| SCS Transportation, Inc.* |
67,503 | 1,186,703 | ||||
| Yellow Roadway Corp.* |
8,600 | 311,062 | ||||
| 8,076,982 | ||||||
| Utilities — 4.0% |
||||||
| Atmos Energy Corp. |
30,449 | 739,911 | ||||
| Avista Corp. |
36,406 | 659,677 | ||||
| Central Vermont Public Service Corp. |
11,932 | 280,402 | ||||
| CH Energy Group, Inc. |
11,791 | 552,998 | ||||
| Cinergy Corp.(a) |
7,100 | 275,551 | ||||
| El Paso Electric Co.* |
148,267 | 1,979,363 | ||||
| Empire District Electric Co. |
20,334 | 445,925 | ||||
| Energen Corp. |
16,399 | 672,851 | ||||
| Energy East Corp. |
59,495 | 1,332,688 | ||||
| Entergy Corp. |
13,389 | 764,914 | ||||
| FirstEnergy Corp. |
27,087 | 953,462 | ||||
| FPL Group, Inc. |
5,467 | 357,651 | ||||
| MGE Energy, Inc. |
1,213 | 38,222 | ||||
| PG&E Corp.*(a) |
16,500 | 458,205 | ||||
| Pinnacle West Capital Corp. |
9,400 | 376,188 | ||||
| PNM Resources, Inc. |
60,879 | 1,710,700 | ||||
| PPL Corp.(a) |
17,244 | 754,425 | ||||
| Puget Energy, Inc. |
12,600 | 299,502 | ||||
| SCANA Corp. |
7,800 | 267,150 | ||||
| South Jersey Industries, Inc. |
16,460 | 666,630 | ||||
| Wisconsin Energy Corp. |
9,300 | 311,085 | ||||
| 13,897,500 | ||||||
| Total Long-Term Investments |
||||||
| (Cost $269,504,084) |
337,579,079 | |||||
| Par (000) |
||||||
| SHORT-TERM INVESTMENTS — 13.2% |
||||||
| Commercial Paper — 1.3% |
||||||
| Amsterdam Funding Corp. |
||||||
| 1.10%, 01/05/04(b) |
$ | 907 | 906,221 | |||
| Cancara Asset Securitisation Ltd. |
||||||
| 1.11%, 01/12/04(b) |
738 | 737,521 | ||||
| General Electric Capital Corp. |
||||||
| 1.11%, 02/05/04(b) |
547 | 545,077 | ||||
| Lexington Parker Capital Co. |
||||||
| 1.10%, 01/12/04(b) |
475 | 473,631 | ||||
| Tannehill Capital Co. |
||||||
| 1.10%, 01/08/04(b) |
329 | 328,592 | ||||
| 1.11%, 01/13/04(b) |
379 | 378,487 | ||||
| Tulip Funding Corp. |
||||||
| 1.10%, 01/21/04(b) |
1,214 | 1,213,320 | ||||
| 4,582,849 | ||||||
77
Table of Contents
AST Goldman Sachs Small-Cap Value Portfolio
Schedule of Investments
December 31, 2003
| Par (000) |
Value | |||||
| Corporate Obligations — 5.4% |
||||||
| American Express Centurian |
||||||
| 1.131%, 01/29/04 [FRN](b)(c) |
$ | 1,128 | $ | 1,128,181 | ||
| Bear Stearns Co., Inc. |
||||||
| 1.12%, 01/02/04 [FRN](b)(c) |
841 | 840,910 | ||||
| 1.12%, 01/02/04 [FRN](b)(c) |
969 | 969,484 | ||||
| General Electric Capital Corp. |
||||||
| 1.13%, 01/02/04 [FRN](b)(c) |
311 | 311,305 | ||||
| Merrill Lynch & Co., Inc. |
||||||
| 1.13%, 01/02/04 [FRN](b)(c) |
1,435 | 1,434,560 | ||||
| 1.13%, 01/02/04(b) |
446 | 446,084 | ||||
| Morgan Stanley |
||||||
| 1.03%, 01/02/04 [FRN](b)(c) |
316 | 315,580 | ||||
| 1.08%, 01/02/04 [FRN](b)(c) |
3,772 | 3,771,891 | ||||
| Natexis Banques Populaires |
||||||
| 1.035%, 01/02/04 [FRN](b)(c) |
4,661 | 4,661,296 | ||||
| 1.10%, 01/02/04 [FRN](b)(c) |
3,585 | 3,584,083 | ||||
| Westdeutsche Landesbank |
||||||
| 1.13%, 01/09/04 [FRN](b)(c) |
933 | 932,458 | ||||
| 1.111%, 01/29/04 [FRN](b)(c) |
200 | 199,463 | ||||
| 18,595,295 | ||||||
| Shares |
||||||
| Non-Registered Investment Company — 5.6% |
||||||
| BlackRock Institutional Money Market Trust(b)(j) |
18,980,640 | 18,980,640 | ||||
| Par (000) |
Value |
||||||
| Repurchase Agreement — 0.5% |
|||||||
| Merrill Lynch & Co., Inc. |
|||||||
| 1.00%, dated 12/31/03, to be repurchased on 01/02/04, repurchase price $1,858,785 (Collateralized by Federal Home Loan Mortgage Corp. 5.50% maturing 12/01/33, Federal National Mortgage Assoc. 4.00% - 6.00% maturing 11/01/17 to 11/01/33 and Government National Mortgage Assoc. 1.47% maturing 01/16/04 [FRN](c), par value $2,280,522, market value including accrued interest $1,914,477)(b) |
$ | 1,859 | $ | 1,858,682 | |||
| Time Deposits — 0.4% |
|||||||
| Chase Manhattan Bank |
|||||||
| 0.875%, 01/02/04(b) |
1,108 | 1,108,426 | |||||
| UBS Bank |
|||||||
| 0.938%, 01/02/04(b) |
384 | 383,843 | |||||
| 1,492,269 | |||||||
| Total Short-Term Investments |
|||||||
| (Cost $45,509,735) |
45,509,735 | ||||||
| Total Investments — 111.5% |
|||||||
| (Cost $315,013,819; Note 5) |
383,088,814 | ||||||
| Liabilities in Excess of |
(39,646,806 | ) | |||||
| Net Assets — 100.0% |
$ | 343,442,008 | |||||
The following abbreviations are used in portfolio descriptions:
| FRN | Floating Rate Note |
| REIT | Real Estate Investment Trust |
| symbol |
description | |
| * |
Non-income producing security. | |
| (a) |
Portion of securities on loan with an aggregate market value of $43,590,588; cash collateral $45,509,735 was received with which the portfolio purchased securities. | |
| (b) |
Represents security purchased with cash collateral for securities on loan. | |
| (c) |
Indicates a variable rate security. The maturity date presented for these instruments is the latter of the next date on which the security can be redeemed at par or the next date on which the rate of interest is adjusted. The interest rate shown reflects the rate in effect at December 31, 2003. | |
| (j) |
Security available to institutional investors only. | |
See Notes to Financial Statements.
78
Table of Contents
AST Gabelli Small-Cap Value Portfolio
Schedule of Investments
December 31, 2003
| Shares |
Value | ||||
| LONG-TERM INVESTMENTS — 90.4% |
|||||
| COMMON STOCK — 90.2% |
|||||
| Advertising — 0.3% |
|||||
| Interep National Radio Sales, Inc.* |
62,000 | $ | 84,320 | ||
| Penton Media, Inc.* |
310,000 | 421,600 | |||
| ValueVision Media, Inc.* |
91,510 | 1,528,217 | |||
| 2,034,137 | |||||
| Aerospace — 2.7% |
|||||
| Alliant Techsystems, Inc.* |
54,360 | 3,139,834 | |||
| Curtiss-Wright Corp. (Class “B” Stock) |
100,000 | 4,490,000 | |||
| Embraer Aircraft Corp. [ADR] |
30,000 | 1,050,900 | |||
| Fairchild Corp. (Class “A” Stock)* |
510,100 | 2,570,904 | |||
| Herley Industries, Inc.* |
40,000 | 828,000 | |||
| Sequa Corp. (Class “A” Stock)* |
29,600 | 1,450,400 | |||
| Sequa Corp. (Class “B” Stock)* |
7,000 | 349,300 | |||
| Titan Corp. (The)* |
310,000 | 6,761,100 | |||
| 20,640,438 | |||||
| Airlines — 0.2% |
|||||
| Midwest Express Holdings, Inc.* |
310,000 | 1,305,100 | |||
| Automobile Manufacturers — 0.8% |
|||||
| Monaco Coach Corp.* |
83,000 | 1,975,400 | |||
| Navistar International Corp.*(a) |
80,000 | 3,831,200 | |||
| Oshkosh Truck Corp. |
600 | 30,618 | |||
| Thor Industries, Inc. |
4,000 | 224,880 | |||
| 6,062,098 | |||||
| Automotive Parts — 2.5% |
|||||
| American Axle & Manufacturing Holdings, Inc.*(a) |
32,390 | 1,309,204 | |||
| BorgWarner, Inc. |
32,000 | 2,722,240 | |||
| Cooper Tire & Rubber Co. |
60,000 | 1,282,800 | |||
| Dana Corp. |
207,500 | 3,807,625 | |||
| Federal-Mogul Corp.*(a) |
100,000 | 22,500 | |||
| Midas, Inc.* |
116,900 | 1,671,670 | |||
| Myers Industries, Inc. |
310,000 | 3,757,200 | |||
| Raytech Corp.* |
40,000 | 132,800 | |||
| Standard Motor Products, Inc. |
160,100 | 1,945,215 | |||
| TBC Corp.* |
109,720 | 2,831,873 | |||
| Transpro, Inc.* |
40,000 | 167,600 | |||
| 19,650,727 | |||||
| Beverages — 1.0% |
|||||
| Boston Beer Co., Inc. (Class “A” Stock)* |
78,000 | 1,414,920 | |||
| Mondavi, (Robert) Corp. (Class “A” Stock)* |
30,000 | 1,165,200 | |||
| PepsiAmericas, Inc. |
310,280 | 5,311,994 | |||
| 7,892,114 | |||||
| Broadcasting — 7.4% |
|||||
| Beasley Broadcast Group, Inc.* |
250,000 | 4,107,500 | |||
| Crown Media Holdings, Inc.* |
270,000 | 2,232,900 | |||
| Fisher Communications, Inc.* |
88,000 | 4,488,000 | |||
| Shares |
Value | ||||
| Granite Broadcasting Corp.* |
300,000 | $ | 495,000 | ||
| Gray Television, Inc. |
328,000 | 4,959,360 | |||
| Gray Television, Inc. (Class “A” Stock) |
5,000 | 75,850 | |||
| Liberty Corp. (The) |
35,000 | 1,581,650 | |||
| Lin TV Corp. (Class “A” Stock)* |
200,000 | 5,162,000 | |||
| Media General, Inc. (Class “A” Stock) |
144,000 | 9,374,399 | |||
| Nexstar Broadcasting Group, Inc. |
1,000 | 13,710 | |||
| Paxson Communications Corp.* |
520,000 | 2,002,000 | |||
| Saga Communications, Inc. (Class “A” Stock)* |
100,000 | 1,853,000 | |||
| Salem Communications Corp. (Class “A” Stock)* |
80,000 | 2,169,600 | |||
| SBS Broadcasting SA* |
45,300 | 1,476,780 | |||
| Scripps (E.W.) Co. (Class “A” Stock) |
47,000 | 4,424,580 | |||
| Sinclair Broadcast Group, Inc.* |
440,000 | 6,564,800 | |||
| Spanish Broadcasting Systems, Inc. |
40,000 | 420,000 | |||
| UnitedGlobalCom, Inc. (Class “A” Stock)*(a) |
270,000 | 2,289,600 | |||
| Young Broadcasting, Inc. |
223,000 | 4,468,920 | |||
| 58,159,649 | |||||
| Building Materials — 2.7% |
|||||
| Apogee Enterprises, Inc. |
203,290 | 2,307,342 | |||
| Florida Rock Industries, Inc. |
4,000 | 219,400 | |||
| Gibraltar Steel Corp. |
95,000 | 2,389,250 | |||
| Hughes Supply, Inc. |
1,000 | 49,620 | |||
| Modine Manufacturing Co. |
237,000 | 6,394,260 | |||
| Skyline Corp. |
63,000 | 2,196,810 | |||
| Texas Industries, Inc. |
66,860 | 2,473,820 | |||
| Thomas Industries, Inc. |
145,000 | 5,025,700 | |||
| Walter Industries, Inc. |
10,000 | 133,500 | |||
| 21,189,702 | |||||
| Business Services — 0.9% |
|||||
| Acxiom Corp.* |
57,770 | 1,072,789 | |||
| BearingPoint, Inc.* |
40,000 | 403,600 | |||
| Edgewater Technology, Inc.* |
420,000 | 2,041,200 | |||
| GP Strategies Corp.* |
50,000 | 400,000 | |||
| Insurance Auto Auctions, Inc.* |
141,540 | 1,847,097 | |||
| Kroll, Inc.* |
11,000 | 286,000 | |||
| New England Business Service, Inc. |
19,000 | 560,500 | |||
| StarTek, Inc. |
16,000 | 652,640 | |||
| UniFirst Corp. |
2,000 | 47,420 | |||
| 7,311,246 | |||||
| Cable Television — 1.3% |
|||||
| Cablevision Systems New York Group |
390,000 | 9,122,100 | |||
| Rogers Communications, Inc. |
50,000 | 825,000 | |||
| 9,947,100 | |||||
79
Table of Contents
AST Gabelli Small-Cap Value Portfolio
Schedule of Investments
December 31, 2003
| Shares |
Value | ||||
| Chemicals — 4.5% |
|||||
| Airgas, Inc. |
2,000 | $ | 42,960 | ||
| Albemarle Corp. |
110,000 | 3,296,700 | |||
| Arch Chemicals, Inc. |
140,000 | 3,592,400 | |||
| Cytec Industries, Inc.* |
49,945 | 1,917,389 | |||
| Ethyl Corp.* |
40,000 | 874,800 | |||
| Ferro Corp. |
200,000 | 5,441,999 | |||
| Fuller (H.B.) Co. |
41,600 | 1,237,184 | |||
| Great Lakes Chemical Corp.(a) |
145,000 | 3,942,550 | |||
| Hercules, Inc.* |
440,000 | 5,368,000 | |||
| MacDermid, Inc. |
68,000 | 2,328,320 | |||
| Omnova Solutions, Inc.* |
180,000 | 864,000 | |||
| Penford Corp. |
31,150 | 427,690 | |||
| Schulman (A.), Inc. |
52,000 | 1,108,640 | |||
| Sensient Technologies Corp.(a) |
180,000 | 3,558,600 | |||
| TETRA Technologies, Inc.* |
50,000 | 1,212,000 | |||
| 35,213,232 | |||||
| Clothing & Apparel — 0.4% |
|||||
| Hartmarx Corp.* |
375,000 | 1,563,750 | |||
| Unifi, Inc.* |
15,000 | 96,750 | |||
| Wolverine World Wide, Inc. |
65,000 | 1,324,700 | |||
| 2,985,200 | |||||
| Computer Services & Software — 0.8% |
|||||
| Agilysys, Inc. |
30,000 | 334,500 | |||
| Analysts International Corp.* |
12,000 | 40,440 | |||
| Baldwin Technology Co., Inc. (Class “A” Stock)* |
170,900 | 393,070 | |||
| Intergraph Corp.* |
94,313 | 2,255,966 | |||
| Keane, Inc.*(a) |
15,000 | 219,600 | |||
| PLATO Learning, Inc.* |
82,430 | 869,637 | |||
| Progress Software Corp.* |
20,000 | 409,200 | |||
| SPSS, Inc.* |
25,000 | 447,000 | |||
| Tyler Technologies, Inc.* |
85,000 | 818,550 | |||
| Xanser Corp.* |
200,000 | 474,000 | |||
| 6,261,963 | |||||
| Conglomerates — 0.7% |
|||||
| Brink’s Co. (The) |
115,470 | 2,610,777 | |||
| Cendant Corp.*(a) |
50,000 | 1,113,500 | |||
| Griffon Corp.* |
55,130 | 1,116,934 | |||
| Park Ohio Holdings Corp.* |
80,000 | 592,000 | |||
| 5,433,211 | |||||
| Construction — 0.3% |
|||||
| Fleetwood Enterprises, Inc.*(a) |
185,000 | 1,898,100 | |||
| Insituform Technologies, Inc. (Class “A” Stock)* |
29,000 | 478,500 | |||
| KB Home |
1,000 | 72,520 | |||
| 2,449,120 | |||||
| Consumer Products & Services — 5.4% |
|||||
| Aaron Rents, Inc. (Class “A” Stock) |
76,500 | 1,414,485 | |||
| Aaron Rents, Inc. (Class “B” Stock) |
165,000 | 3,321,450 | |||
| Alberto-Culver Co. (Class “B” Stock) |
35,890 | 2,263,941 | |||
| Shares |
Value | ||||
| ANC Rental Corp.*(a) |
20,000 | $ | 2 | ||
| Aviall, Inc.* |
160,000 | 2,481,600 | |||
| Bowlin Travel Centers, Inc.* |
8,500 | 17,000 | |||
| Church and Dwight Co., Inc. |
82,420 | 3,263,832 | |||
| CNS, Inc. |
105,600 | 1,446,720 | |||
| Concorde Career Colleges, Inc.* |
50,360 | 1,257,489 | |||
| Culp, Inc.* |
35,000 | 381,500 | |||
| Dial Corp. (The) |
50,000 | 1,423,500 | |||
| Dollar Thrifty Automotive Group, Inc.* |
26,690 | 692,339 | |||
| Eagle Supply Group, Inc.* |
60,000 | 157,200 | |||
| Elizabeth Arden, Inc.* |
45,000 | 896,400 | |||
| Energizer Holdings, Inc.* |
65,000 | 2,441,400 | |||
| Fedders Corp. |
360,000 | 2,592,000 | |||
| Fortune Brands, Inc. |
2,000 | 142,980 | |||
| GC Companies, Inc.* |
103,000 | 36,050 | |||
| Jarden Corp.* |
36,825 | 1,006,796 | |||
| National Presto Industries, Inc. |
25,200 | 910,980 | |||
| Oil-Dri Corp. of America |
113,700 | 1,808,967 | |||
| Revlon, Inc. (Class “A” Stock)*(a) |
13,401 | 30,018 | |||
| Rollins, Inc. |
280,000 | 6,314,000 | |||
| Roto-Rooter Inc. |
120,000 | 5,532,000 | |||
| Scotts Co. (The) (Class “A” Stock)*(a) |
5,000 | 295,800 | |||
| WD-40 Co. |
22,000 | 777,920 | |||
| Weider Nutrition International, Inc.* |
242,100 | 1,077,345 | |||
| 41,983,714 | |||||
| Containers & Packaging — 1.0% |
|||||
| Crown Holdings, Inc.* |
90,000 | 815,400 | |||
| Greif, Inc. (Class “A” Stock) |
100,000 | 3,551,000 | |||
| Greif, Inc. (Class “B” Stock) |
5,200 | 185,900 | |||
| Packaging Dynamics Corp. |
100,000 | 1,028,000 | |||
| Pactiv Corp.* |
80,000 | 1,912,000 | |||
| 7,492,300 | |||||
| Electronic Components & Equipment — 5.5% |
|||||
| Agere Systems, Inc. (Class “A” Stock)* |
200,000 | 610,000 | |||
| Agere Systems, Inc. (Class “B” Stock)* |
100,000 | 290,000 | |||
| AMETEK, Inc. |
33,000 | 1,592,580 | |||
| Baldor Electric Co. |
159,000 | 3,633,150 | |||
| C & D Technologies, Inc. |
15,000 | 287,550 | |||
| Capstone Turbine Corp.* |
60,000 | 111,600 | |||
| CTS Corp. |
330,000 | 3,795,000 | |||
| Electro Rental Corp. |
180,000 | 2,401,200 | |||
| ESCO Technologies, Inc.* |
1,500 | 65,475 | |||
| Fargo Electronics, Inc.* |
22,000 | 279,840 | |||
| FLIR Systems, Inc.*(a) |
4,000 | 146,000 | |||
| Franklin Electric Co., Inc. |
27,000 | 1,633,230 | |||
| GrafTech International Ltd.* |
41,800 | 564,300 | |||
| Katy Industries, Inc.* |
132,100 | 754,291 | |||
| Lamson & Sessions Co.* |
220,500 | 1,272,285 | |||
| Landauer, Inc. |
48,000 | 1,957,440 | |||
| Lecroy Corp.* |
11,000 | 198,110 | |||
| Littelfuse, Inc.* |
145,000 | 4,178,900 | |||
| Magnetek, Inc.* |
165,000 | 1,087,350 | |||
80
Table of Contents
AST Gabelli Small-Cap Value Portfolio
Schedule of Investments
December 31, 2003
| Shares |
Value | ||||
| Methode Electronics, Inc. (Class “A” Stock) |
83,000 | $ | 1,015,090 | ||
| Park Electrochemical Corp. |
25,000 | 662,250 | |||
| Parker-Hannifin Corp. |
7,000 | 416,500 | |||
| Pentair, Inc. |
73,920 | 3,378,144 | |||
| SL Industries, Inc.* |
9,000 | 72,180 | |||
| Thomas & Betts Corp.(a) |
500,000 | 11,444,999 | |||
| Woodward Governor Co. |
30,000 | 1,704,900 | |||
| 43,552,364 | |||||
| Entertainment & Leisure — 3.4% |
|||||
| Brunswick Corp.(a) |
89,130 | 2,837,008 | |||
| Canterbury Park Holding Corp. |
16,000 | 270,400 | |||
| Churchill Downs, Inc. |
25,000 | 905,025 | |||
| Dover Downs Gaming & Entertainment, Inc. |
130,000 | 1,229,800 | |||
| Dover Motorsports, Inc. |
200,000 | 700,000 | |||
| Gaylord Entertainment Co. |
261,347 | 7,801,208 | |||
| Gemstar-TV Guide International, Inc.* |
345,000 | 1,742,250 | |||
| Magna Entertainment Corp.*(a) |
275,000 | 1,394,250 | |||
| Park Place Entertainment Corp.* |
20,000 | 216,600 | |||
| Pinnacle Entertainment, Inc.* |
108,400 | 1,010,288 | |||
| Six Flags, Inc.* |
370,000 | 2,782,400 | |||
| Topps Co., Inc. (The) |
293,120 | 3,007,411 | |||
| Vail Resorts, Inc.* |
48,530 | 825,010 | |||
| World Wrestling Entertainment, Inc. |
130,000 | 1,703,000 | |||
| 26,424,650 | |||||
| Environmental Services — 1.2% |
|||||
| Allied Waste Industries, Inc.*(a) |
230,000 | 3,192,400 | |||
| Catalytica Energy Systems, Inc.* |
35,000 | 122,465 | |||
| CUNO, Inc.* |
5,000 | 225,150 | |||
| Met-Pro Corp. |
5,333 | 86,128 | |||
| Newpark Resources, Inc.* |
180,000 | 862,200 | |||
| Republic Services, Inc. |
100,000 | 2,563,000 | |||
| Waste Connections, Inc.* |
40,000 | 1,510,800 | |||
| Waste Management, Inc. |
20,000 | 592,000 | |||
| 9,154,143 | |||||
| Equipment Services — 0.3% |
|||||
| Gerber Scientific, Inc.* |
175,000 | 1,393,000 | |||
| Industrial Distribution Group, Inc.* |
175,000 | 973,000 | |||
| Strattec Security Corp.* |
2,000 | 121,820 | |||
| 2,487,820 | |||||
| Farming & Agriculture — 0.1% |
|||||
| Delta & Pine Land Co. |
25,210 | 640,334 | |||
| Financial - Bank & Trust — 1.7% |
|||||
| Community First Bankshares, Inc. |
90,000 | 2,604,600 | |||
| Crazy Woman Creek Bancorp, Inc. |
9,500 | 192,375 | |||
| First Republic Bank |
60,000 | 2,148,000 | |||
| Hibernia Corp. (Class “A” Stock) |
50,000 | 1,175,500 | |||
| Silicon Valley Bancshares* |
83,000 | 2,993,810 | |||
| Shares |
Value | ||||
| Southwest Bancorporation of Texas, Inc. |
30,000 | $ | 1,165,500 | ||
| TCF Financial Corp. |
56,950 | 2,924,383 | |||
| 13,204,168 | |||||
| Financial Services — 0.7% |
|||||
| BKF Capital Group, Inc.* |
100,000 | 2,468,000 | |||
| CIT Group, Inc. |
56,000 | 2,013,200 | |||
| Countrywide Financial Corp.(a) |
8,000 | 606,800 | |||
| Interactive Data Corp.* |
12,000 | 198,720 | |||
| Waddell & Reed Financial, Inc. (Class “A” Stock) |
10,000 | 234,600 | |||
| 5,521,320 | |||||
| Food — 4.6% |
|||||
| Corn Products International, Inc. |
166,000 | 5,718,700 | |||
| Del Monte Foods Co.* |
629,603 | 6,547,871 | |||
| Flowers Foods, Inc. |
331,400 | 8,550,120 | |||
| Hain Celestial Group, Inc.* |
60,000 | 1,392,600 | |||
| Ingles Markets, Inc. (Class “A” Stock) |
111,000 | 1,139,970 | |||
| International Multifoods Corp.* |
300,000 | 5,400,000 | |||
| Interstate Bakeries Corp. |
40,000 | 569,200 | |||
| John B. Sanfillippo & Sons, Inc.* |
3,000 | 153,120 | |||
| Performance Food Group Co.*(a) |
20,000 | 723,400 | |||
| Ralcorp Holdings, Inc.* |
40,000 | 1,254,400 | |||
| Smucker (J.M.) Co. (The)(a) |
35,000 | 1,585,150 | |||
| Suprema Specialties, Inc.* (cost $12,750; purchased 11/18/01)(g) |
1,000 | 0 | |||
| Twinlab Corp.* |
310,000 | 6,975 | |||
| Weis Markets, Inc. |
72,500 | 2,631,750 | |||
| 35,673,256 | |||||
| Furniture — 0.2% |
|||||
| La-Z-Boy, Inc. |
32,700 | 686,046 | |||
| Stanley Furniture Co., Inc. |
25,000 | 787,500 | |||
| 1,473,546 | |||||
| Healthcare Services — 0.4% |
|||||
| Laboratory Corp. of America Holdings*(a) |
52,720 | 1,948,004 | |||
| Odyssey Healthcare, Inc.* |
4,500 | 131,670 | |||
| Orthodontic Centers of America, Inc.*(a) |
79,800 | 642,390 | |||
| VitalWorks Inc.* |
64,000 | 282,880 | |||
| 3,004,944 | |||||
| Hotels & Motels — 1.1% |
|||||
| Aztar Corp.* |
120,000 | 2,700,000 | |||
| Boca Resorts, Inc. (Class “A” Stock)* |
140,000 | 2,094,400 | |||
| Kerzner International Ltd.* |
25,000 | 974,000 | |||
| La Quinta Corp.* |
350,000 | 2,243,500 | |||
| Trump Hotels & Casino Resorts, Inc.* |
25,000 | 54,000 | |||
| Wyndham International, Inc. (Class “A” Stock)* |
220,000 | 147,400 | |||
| 8,213,300 | |||||
81
Table of Contents
AST Gabelli Small-Cap Value Portfolio
Schedule of Investments
December 31, 2003
| Shares |
Value | ||||
| Industrial Products — 3.3% |
|||||
| Acuity Brands, Inc. |
50,000 | $ | 1,290,000 | ||
| Carlisle Companies, Inc. |
30,190 | 1,837,363 | |||
| Core Molding Technologies, Inc.* |
200,200 | 584,584 | |||
| Crane Co.(a) |
160,000 | 4,918,400 | |||
| Donaldson Co., Inc. |
45,000 | 2,662,200 | |||
| Eastern Co. (The) |
30,000 | 469,200 | |||
| Kaman Corp. (Class “A” Stock) |
291,000 | 3,704,430 | |||
| Roper Industries, Inc. |
45,000 | 2,216,700 | |||
| Standex International Corp. |
20,000 | 560,000 | |||
| TransTechnology Corp.* |
40,000 | 266,000 | |||
| Tredegar Corp. |
57,000 | 885,210 | |||
| Watts Water Technologies, Inc. |
270,000 | 5,994,000 | |||
| 25,388,087 | |||||
| Insurance — 1.6% |
|||||
| Alleghany Corp.* |
8,000 | 1,780,000 | |||
| Argonaut Group, Inc.* |
58,000 | 901,320 | |||
| CNA Financial Corp.* |
290,000 | 2,757,900 | |||
| Everest Reinsurance Group Ltd. |
15,000 | 1,269,000 | |||
| MONY Group, Inc. (The)*(a) |
60,000 | 1,877,400 | |||
| Phoenix Companies, Inc. (The) |
3,500 | 42,140 | |||
| PMI Group, Inc. (The)(a) |
15,000 | 558,450 | |||
| Presidential Life Corp. |
29,000 | 381,640 | |||
| ProAssurance Corp.*(a) |
46,000 | 1,478,900 | |||
| Triad Guaranty, Inc.* |
1,000 | 50,350 | |||
| UnumProvident Corp.(a) |
60,000 | 946,200 | |||
| 12,043,300 | |||||
| Internet Services — 0.2% |
|||||
| J Net Enterprises, Inc.* |
185,000 | 259,000 | |||
| Stellent, Inc.* |
129,900 | 1,278,216 | |||
| 1,537,216 | |||||
| Machinery & Equipment — 4.5% |
|||||
| AGCO Corp.* |
110,000 | 2,215,400 | |||
| Alamo Group, Inc. |
12,000 | 183,120 | |||
| Albany International Corp. (Class “A” Stock) |
60,150 | 2,039,085 | |||
| Carbo Ceramics, Inc. |
39,000 | 1,998,750 | |||
| CLARCOR, Inc. |
140,000 | 6,174,000 | |||
| Flowserve Corp.* |
137,000 | 2,860,560 | |||
| Gardner Denver, Inc.* |
4,000 | 95,480 | |||
| Gencorp, Inc. |
490,000 | 5,277,300 | |||
| Graco, Inc. |
42,000 | 1,684,200 | |||
| IDEX Corp. |
70,000 | 2,911,300 | |||
| Lone Star Technologies, Inc.* |
35,000 | 559,300 | |||
| Smith (A.O.) Corp. |
40,000 | 1,402,000 | |||
| Tennant Co. |
107,800 | 4,667,740 | |||
| Thermo Electron Corp.* |
100,000 | 2,520,000 | |||
| 34,588,235 | |||||
| Shares |
Value | ||||
| Medical Supplies & Equipment — 3.8% |
|||||
| Apogent Technologies, Inc.* |
177,350 | $ | 4,086,144 | ||
| Cytyc Corp.* |
114,410 | 1,574,282 | |||
| DENTSPLY International, Inc. |
9,000 | 406,530 | |||
| Exactech, Inc.* |
54,100 | 797,975 | |||
| Henry Schein, Inc.* |
12,000 | 810,960 | |||
| ICU Medical, Inc.* |
2,000 | 68,560 | |||
| Inamed Corp.* |
55,000 | 2,643,300 | |||
| Interpore International, Inc.* |
25,000 | 325,000 | |||
| Inverness Medical Innovations, Inc.* |
30,000 | 653,400 | |||
| Invitrogen Corp.*(a) |
35,000 | 2,450,000 | |||
| NWH, Inc. |
10,300 | 211,356 | |||
| Ocular Sciences, Inc.* |
18,000 | 516,780 | |||
| Orthofix International NV* |
4,000 | 195,920 | |||
| Owens & Minor, Inc. |
167,500 | 3,669,925 | |||
| Patterson Dental Co.* |
6,000 | 384,960 | |||
| Schick Technologies, Inc.* |
50,000 | 370,000 | |||
| Sola International, Inc.* |
67,500 | 1,269,000 | |||
| SurModics, Inc.* |
27,940 | 667,766 | |||
| Sybron Dental Specialties, Inc.* |
245,000 | 6,884,500 | |||
| Techne Corp.* |
23,630 | 892,741 | |||
| Young Innovations, Inc. |
5,000 | 180,000 | |||
| 29,059,099 | |||||
| Metals & Mining — 2.3% |
|||||
| Ampco-Pittsburgh Corp. |
17,000 | 232,390 | |||
| Barrick Gold Corp. |
190,000 | 4,314,900 | |||
| Circor International, Inc. |
25,000 | 602,500 | |||
| Kinross Gold Corp.* |
19,500 | 155,805 | |||
| Layne Christensen Co.* |
50,000 | 587,500 | |||
| Material Sciences Corp. |
376,750 | 3,808,943 | |||
| Newmont Mining Corp. |
48,000 | 2,333,280 | |||
| Precision Castparts Corp.(a) |
100,093 | 4,545,223 | |||
| WHX Corp.*(a) |
30,000 | 80,100 | |||
| Worthington Industries, Inc. |
55,000 | 991,650 | |||
| 17,652,291 | |||||
| Office Equipment — 0.7% |
|||||
| Danka Business Systems PLC [ADR]*(a) |
131,920 | 580,448 | |||
| Hon Industries, Inc. |
47,730 | 2,067,664 | |||
| Imagistics International, Inc.* |
10,000 | 375,000 | |||
| McGrath Rentcorp |
45,000 | 1,226,250 | |||
| Nashua Corp.* |
113,600 | 965,600 | |||
| 5,214,962 | |||||
| Oil & Gas — 3.0% |
|||||
| Callon Petroleum Co.* |
59,000 | 611,830 | |||
| Devon Energy Corp.(a) |
30,000 | 1,717,800 | |||
| EOG Resources, Inc. |
46,500 | 2,146,905 | |||
| Equitable Resources, Inc. |
55,000 | 2,360,600 | |||
| Forest Oil Corp.*(a) |
110,000 | 3,142,700 | |||
| Key Energy Services, Inc.* |
121,210 | 1,249,675 | |||
| Kinder Morgan, Inc. |
42,000 | 2,482,200 | |||
| Nicor, Inc. |
4,000 | 136,160 | |||
82
Table of Contents
AST Gabelli Small-Cap Value Portfolio
Schedule of Investments
December 31, 2003
| Shares |
Value | ||||
| Northwest Natural Gas Co. |
14,600 | $ | 448,950 | ||
| Penn Virginia Corp. |
12,000 | 667,800 | |||
| Rowan Companies, Inc.*(a) |
83,000 | 1,923,110 | |||
| Semco Energy, Inc. |
150,000 | 735,000 | |||
| Southwestern Energy Co.* |
26,000 | 621,400 | |||
| W-H Energy Services, Inc.* |
15,000 | 243,000 | |||
| XTO Energy, Inc.(a) |
160,000 | 4,528,000 | |||
| 23,015,130 | |||||
| Paper & Forest Products — 0.3% |
|||||
| Boise Cascade Corp. |
34,300 | 1,127,098 | |||
| CSS Industries, Inc. |
13,000 | 403,130 | |||
| Wausau-Mosinee Paper Corp. |
80,000 | 1,081,600 | |||
| 2,611,828 | |||||
| Personal Services — 0.6% |
|||||
| Matthews International Corp. (Class “A” Stock) |
160,000 | 4,734,400 | |||
| Pharmaceuticals — 0.1% |
|||||
| Bone Care International, Inc.* |
45,000 | 573,300 | |||
| Corixa Corp.* |
38,000 | 229,520 | |||
| Priority Healthcare Corp. (Class “B” Stock)*(a) |
10,000 | 241,100 | |||
| 1,043,920 | |||||
| Printing & Publishing — 3.2% |
|||||
| Bowne & Co., Inc. |
121,270 | 1,644,421 | |||
| Hollinger International, Inc.(a) |
254,050 | 3,968,261 | |||
| Journal Communications, Inc. |
3,140 | 58,184 | |||
| Journal Register Co.* |
200,000 | 4,140,000 | |||
| Lee Enterprises, Inc. |
63,000 | 2,749,950 | |||
| Martha Stewart Living Omnimedia, Inc.* |
15,000 | 147,750 | |||
| McClatchy Co. |
12,000 | 825,600 | |||
| Nelson (Thomas), Inc. |
72,000 | 1,391,760 | |||
| PRIMEDIA, Inc.* |
750,000 | 2,122,500 | |||
| Pulitzer, Inc. |
120,000 | 6,480,000 | |||
| Scholastic Corp.* |
35,270 | 1,200,591 | |||
| 24,729,017 | |||||
| Real Estate — 0.5% |
|||||
| Glenborough Realty Trust, Inc. [REIT] |
40,000 | 798,000 | |||
| Griffin Land & Nurseries, Inc.* |
46,000 | 653,706 | |||
| Innkeepers USA Trust [REIT] |
100,000 | 837,000 | |||
| Sun Communities, Inc. [REIT] |
32,000 | 1,238,400 | |||
| 3,527,106 | |||||
| Registered Investment Company — 0.1% |
|||||
| First Financial Fund, Inc.** |
26,000 | 459,680 | |||
| Restaurants — 1.5% |
|||||
| Darden Restaurants, Inc.(a) |
67,460 | 1,419,358 | |||
| RARE Hospitality International, Inc.* |
12,000 | 293,280 | |||
| Ruby Tuesday, Inc. |
10,000 | 284,900 | |||
| Steak ‘n Shake Co. (The)* |
240,000 | 4,284,000 | |||
| Shares |
Value | ||||
| Triarc Companies, Inc. (Class “A” Stock) |
129,310 | $ | 1,528,444 | ||
| Triarc Companies, Inc. (Class “B” Stock) |
281,320 | 3,032,630 | |||
| Wendy’s International, Inc. |
16,000 | 627,840 | |||
| 11,470,452 | |||||
| Retail & Merchandising — 1.7% |
|||||
| Big 5 Sporting Goods Corp.* |
9,000 | 188,550 | |||
| Bon-Ton Stores, Inc. |
45,000 | 499,500 | |||
| Coldwater Creek, Inc.* |
1,500 | 16,500 | |||
| Cole National Corp.* |
95,192 | 1,903,840 | |||
| Fred’s, Inc. |
30,000 | 929,400 | |||
| Hancock Fabrics, Inc. |
5,000 | 72,400 | |||
| Neiman Marcus Group, Inc. (Class “A” Stock)* |
60,000 | 3,220,199 | |||
| Office Depot, Inc.*(a) |
109,950 | 1,837,265 | |||
| Payless ShoeSource, Inc.* |
31,690 | 424,646 | |||
| School Specialty, Inc.* |
3,000 | 102,030 | |||
| Sports Authority, Inc. (The)* |
51,254 | 1,968,154 | |||
| United Auto Group, Inc. |
52,000 | 1,627,600 | |||
| 12,790,084 | |||||
| Semiconductors — 0.6% |
|||||
| Axcelis Technologies, Inc.* |
296,000 | 3,025,120 | |||
| MKS Instruments, Inc.* |
20,000 | 580,000 | |||
| Mykrolis Corp.* |
61,500 | 988,920 | |||
| 4,594,040 | |||||
| Telecommunications — 3.6% |
|||||
| Acme Communications, Inc.* |
200,000 | 1,758,000 | |||
| Andrew Corp.* |
40,000 | 460,400 | |||
| AO VimpelCom [ADR]* |
44,000 | 3,234,000 | |||
| Centennial Communications, Inc.* |
70,000 | 368,200 | |||
| Cincinnati Bell, Inc.*(a) |
600,000 | 3,030,000 | |||
| Citizens Communications Co.* |
270,000 | 3,353,400 | |||
| Commonwealth Telephone Enterprises, Inc.* |
155,000 | 5,851,250 | |||
| D & E Communications, Inc. |
100,000 | 1,451,000 | |||
| General Communication, Inc.* |
90,000 | 783,000 | |||
| Leap Wireless International, Inc.*(a) |
50,000 | 1,650 | |||
| Nextel Communications, Inc. (Class “A” Stock)* |
25,000 | 701,500 | |||
| Nextel Partners, Inc. (Class “A” Stock)*(a) |
30,000 | 403,500 | |||
| Pegasus Communications Corp.*(a) |
30,000 | 842,400 | |||
| Plantronics, Inc.* |
5,000 | 163,250 | |||
| Rogers Wireless Communications, Inc. |
67,500 | 1,444,500 | |||
| Rural Cellular Corp.* |
104,000 | 826,800 | |||
| Sycamore Networks, Inc.* |
352,000 | 1,844,480 | |||
| Triton PCS Holdings, Inc.* |
18,000 | 100,440 | |||
| Western Wireless Corp. (Class “A” Stock)* |
70,000 | 1,285,200 | |||
| 27,902,970 | |||||
83
Table of Contents
AST Gabelli Small-Cap Value Portfolio
Schedule of Investments
December 31, 2003
| Shares |
Value | ||||
| Transportation — 0.6% |
|||||
| GATX Corp. |
95,000 | $ | 2,658,100 | ||
| Hub Group, Inc. (Class “A” Stock)* |
30,000 | 646,200 | |||
| Landstar System, Inc.* |
2,000 | 76,080 | |||
| Ryder System, Inc. |
30,000 | 1,024,500 | |||
| 4,404,880 | |||||
| Utilities — 5.9% |
|||||
| AES Corp.* |
113,500 | 1,071,440 | |||
| Allegheny Energy, Inc.*(a) |
200,000 | 2,552,000 | |||
| Allete, Inc. |
106,360 | 3,254,616 | |||
| Alliant Energy Corp.(a) |
45,000 | 1,120,500 | |||
| American States Water Co. |
5,000 | 125,000 | |||
| Aquila, Inc.* |
630,000 | 2,135,700 | |||
| Artesian Resources Corp. (Class “A” Stock) |
450 | 12,537 | |||
| Atmos Energy Corp. |
31,000 | 753,300 | |||
| Avista Corp. |
40,000 | 724,800 | |||
| Baycorp Holdings Ltd.* |
1,000 | 13,060 | |||
| BIW Ltd. |
1,000 | 19,100 | |||
| California Water Service Group |
5,000 | 137,000 | |||
| Cascade Natural Gas Corp. |
15,000 | 316,350 | |||
| Central Vermont Public Service Corp. |
58,000 | 1,363,000 | |||
| CH Energy Group, Inc. |
50,100 | 2,349,690 | |||
| Chesapeake Utilities Corp. |
6,000 | 156,300 | |||
| Cleco Corp.(a) |
76,000 | 1,366,480 | |||
| CMS Energy Corp.*(a) |
100,000 | 852,000 | |||
| Connecticut Water Service, Inc. |
5,650 | 156,223 | |||
| Consolidated Water Co. Ltd. |
2,500 | 50,125 | |||
| Delta Natural Gas Co., Inc. |
5,000 | 119,300 | |||
| Duquesne Light Holdings, Inc.(a) |
200,000 | 3,668,000 | |||
| El Paso Electric Co.* |
280,000 | 3,737,999 | |||
| Empire District Electric Co. |
20,000 | 438,600 | |||
| Energy West, Inc.* |
11,480 | 68,306 | |||
| EnergySouth, Inc. |
1,200 | 42,000 | |||
| Green Mountain Power Corp. |
1,000 | 23,600 | |||
| Ionics, Inc.* |
50,150 | 1,597,278 | |||
| Laclede Group, Inc. (The) |
10,000 | 285,500 | |||
| Maine & Maritimes Corp. |
15,000 | 525,150 | |||
| MGE Energy, Inc. |
8,000 | 252,080 | |||
| Middlesex Water Co. |
7,866 | 159,680 | |||
| New Jersey Resources Corp. |
5,000 | 192,550 | |||
| NUI Corp. |
35,000 | 564,200 | |||
| Otter Tail Power Co. |
15,000 | 400,950 | |||
| Pennichuck Corp. |
1,001 | 28,292 | |||
| RGC Resources, Inc. |
2,000 | 45,700 | |||
| SJW Corp. |
26,000 | 2,320,500 | |||
| South Jersey Industries, Inc. |
8,500 | 344,250 | |||
| Southern Union Co.* |
68,000 | 1,251,200 | |||
| Southwest Gas Corp. |
70,000 | 1,571,500 | |||
| Southwest Water Co. |
10,185 | 163,469 | |||
| TXU Corp.(a) |
30,000 | 711,600 | |||
| UIL Holdings Corp. |
17,000 | 766,700 | |||
| Unisource Energy Corp. |
40,000 | 986,400 | |||
| Shares |
Value | |||||
| Unitil Corp. |
10,000 | $ | 258,000 | |||
| Westar Energy, Inc. |
345,000 | 6,986,249 | ||||
| York Water Co. |
2,904 | 52,795 | ||||
| 46,091,069 | ||||||
| Total Common Stock |
||||||
| (Cost $562,768,292) |
698,218,662 | |||||
| PREFERRED STOCK — 0.2% |
||||||
| Aerospace — 0.1% |
||||||
| Sequa Corp., $5 [CVT]* |
9,000 | 800,775 | ||||
| Broadcasting — 0.1% |
||||||
| News Corp. Ltd. [ADR], 6.25% |
35,000 | 1,058,750 | ||||
| Total Preferred Stock |
||||||
| (Cost $1,798,733) |
1,859,525 | |||||
| RIGHTS* |
||||||
| Consumer Products & Services |
||||||
| Fedders Corp. |
||||||
| (Cost $0) |
360,000 | 21,600 | ||||
| Units |
||||||
| WARRANTS* |
||||||
| Aerospace |
||||||
| Orbital Science Corp., expiring 08/31/04 |
||||||
| (Cost $0) |
482 | 3,596 | ||||
| Total Long-Term Investments |
||||||
| (Cost $564,567,025) |
700,103,383 | |||||
| Par (000) |
||||||
| SHORT-TERM INVESTMENTS — 12.0% |
||||||
| Certificate of Deposit — 0.1% |
||||||
| Svenska Handelsbank, Inc. |
||||||
| 1.39%, 10/27/04(b) |
$ | 1,016 | 1,015,614 | |||
| Commercial Paper — 1.2% |
||||||
| Cancara Asset Securitisation Ltd. |
||||||
| 1.11%, 01/12/04(b) |
730 | 729,071 | ||||
| Concord Minutemen Capital Co. |
||||||
| 1.11%, 01/09/04(b) |
957 | 954,977 | ||||
| 1.13%, 02/12/04(b) |
231 | 229,936 | ||||
| Fairway Finance Corp. |
||||||
| 1.10%, 01/12/04(b) |
927 | 924,442 | ||||
| General Electric Capital Corp. |
||||||
| 1.11%, 02/05/04(b) |
104 | 104,084 | ||||
| Lexington Parker Capital Co. |
||||||
| 1.10%, 01/12/04(b) |
1,777 | 1,773,220 | ||||
| Monumental Global Funding |
||||||
| 1.141%, 01/29/04 [FRN](b)(c) |
1,358 | 1,361,165 | ||||
| Tulip Funding Corp. |
||||||
| 1.10%, 01/21/04(b) |
3,330 | 3,326,542 | ||||
| 9,403,437 | ||||||
84
Table of Contents
AST Gabelli Small-Cap Value Portfolio
Schedule of Investments
December 31, 2003
| Par (000) |
Value | |||||
| Corporate Obligations — 3.8% |
||||||
| Bear Stearns Co., Inc. |
||||||
| 1.12%, 01/02/04 [FRN](b)(c) |
$ | 6,047 | $ | 6,047,224 | ||
| Canadian Imperial Bank of Commerce |
||||||
| 1.111%, 01/29/04 [FRN](b)(c) |
906 | 906,354 | ||||
| Goldman Sachs Group, Inc. |
||||||
| 1.14%, 01/06/04 [FRN](b)(c) |
5,444 | 5,444,059 | ||||
| Merrill Lynch & Co., Inc. |
||||||
| 1.13%, 01/02/04(b) |
1,132 | 1,131,825 | ||||
| 1.13%, 01/02/04 [FRN](b)(c) |
1,490 | 1,489,960 | ||||
| Morgan Stanley |
||||||
| 1.08%, 01/02/04 [FRN](b)(c) |
4,791 | 4,791,273 | ||||
| Natexis Banques Populaires |
||||||
| 1.10%, 01/02/04 [FRN](b)(c) |
2,057 | 2,056,499 | ||||
| Societe Generale |
||||||
| 1.08%, 01/02/04 [FRN](b)(c) |
1,168 | 1,168,194 | ||||
| Westdeutsche Landesbank |
||||||
| 1.13%, 01/09/04 [FRN](b)(c) |
6,479 | 6,478,206 | ||||
| 1.111%, 01/23/04 [FRN](b)(c) |
176 | 176,423 | ||||
| 29,690,017 | ||||||
| Shares |
||||||
| Non-Registered Investment Company — 4.8% |
||||||
| BlackRock Institutional Money Market Trust(b)(j) |
36,755,219 | 36,755,219 | ||||
| Par (000) |
Value |
||||||
| Repurchase Agreement — 0.6% |
|||||||
| Merrill Lynch & Co., Inc. |
|||||||
| 1.00%, dated 12/31/03, to be repurchased on 01/02/04, repurchase price $4,716,201 (Collateralized by Federal Home Loan Mortgage Corp. 5.50% maturing 12/01/33, Federal National Mortgage Assoc. 4.00% - 6.00% maturing 11/01/17 to 11/01/33 and Government National Mortgage Assoc. 1.47% maturing 01/16/04 [FRN](c), par value $5,786,254, market value including accrued interest $4,857,505)(b) |
$ | 4,716 | $ | 4,715,939 | |||
| Time Deposits — 0.2% |
|||||||
| Chase Manhattan Bank |
|||||||
| 0.875%, 01/02/04(b) |
1,220 | 1,219,745 | |||||
| UBS Bank |
|||||||
| 0.938%, 01/02/04(b) |
433 | 433,412 | |||||
| 1,653,157 | |||||||
| U.S. Treasury Obligation — 1.3% |
|||||||
| U.S. Treasury Bills |
|||||||
| 0.86%, 01/15/04(a)(n) |
|||||||
| (Cost $9,996,656) |
10,000 | 9,996,656 | |||||
| Total Short-Term Investments |
|||||||
| (Cost $93,230,039) |
93,230,039 | ||||||
| Total Investments — 102.4% |
|||||||
| (Cost $657,797,064; Note 5) |
793,333,422 | ||||||
| Liabilities in Excess of |
(18,917,397 | ) | |||||
| Net Assets — 100.0% |
$ | 774,416,025 | |||||
85
Table of Contents
AST Gabelli Small-Cap Value Portfolio
Schedule of Investments
December 31, 2003
The following abbreviations are used in portfolio descriptions:
| ADR | American Depositary Receipt |
| CVT | Convertible Security |
| FRN | Floating Rate Note |
| REIT | Real Estate Investment Trust |
| symbol |
description | |
| * |
Non-income producing security. | |
| ** |
Closed-end Fund | |
| (a) |
Portion of securities on loan with an aggregate market value of $78,987,815; cash collateral $83,233,383 was received with which the portfolio purchased securities. | |
| (b) |
Represents security purchased with cash collateral for securities on loan. | |
| (c) |
Indicates a variable rate security. The maturity date presented for these instruments is the latter of the next date on which the security can be redeemed at par or the next date on which the rate of interest is adjusted. The interest rate shown reflects the rate in effect at December 31, 2003. | |
| (g) |
Indicates a security that has been deemed illiquid. The aggregate cost of the illiquid security is $12,750. The aggregate value, $0 represents 0.00% of net assets. | |
| (j) |
Security available to institutional investors only. | |
| (n) |
Rates shown are the effective yields at purchase date. | |
See Notes to Financial Statements.
86
Table of Contents
AST DeAM Small-Cap Value Portfolio
Schedule of Investments
December 31, 2003
| Shares |
Value | ||||
| LONG-TERM INVESTMENTS — 80.6% |
|||||
| COMMON STOCK |
|||||
| Advertising — 0.9% |
|||||
| ADVO, Inc. |
14,350 | $ | 455,756 | ||
| Airlines — 2.3% |
|||||
| Alaska Air Group, Inc.* |
16,300 | 444,827 | |||
| Atlantic Coast Airlines Holdings, Inc.* |
30,800 | 304,920 | |||
| SkyWest, Inc. |
25,400 | 460,248 | |||
| 1,209,995 | |||||
| Automotive Parts — 1.6% |
|||||
| Pep Boys - Manny, Moe & Jack, Inc. |
20,200 | 461,974 | |||
| Superior Industries International, Inc. |
2,600 | 113,152 | |||
| Tenneco Automotive, Inc.* |
34,700 | 232,143 | |||
| 807,269 | |||||
| Building Materials — 0.8% |
|||||
| Centex Construction Products, Inc. |
6,800 | 409,836 | |||
| Business Services — 3.7% |
|||||
| American Management Systems, Inc.* |
18,500 | 278,795 | |||
| Cornell Companies, Inc.* |
31,200 | 425,880 | |||
| MPS Group, Inc.* |
41,700 | 389,895 | |||
| Quanta Services, Inc.* |
33,400 | 243,820 | |||
| Safeguard Scientifics, Inc.* |
19,100 | 77,164 | |||
| SOURCECORP, Inc.* |
19,500 | 499,785 | |||
| 1,915,339 | |||||
| Chemicals — 2.9% |
|||||
| FMC Corp.* |
14,300 | 488,059 | |||
| Georgia Gulf Corp. |
16,800 | 485,184 | |||
| Hercules, Inc.* |
42,700 | 520,940 | |||
| 1,494,183 | |||||
| Clothing & Apparel — 0.8% |
|||||
| Phillips-Van Heusen Corp. |
8,200 | 145,468 | |||
| Stride Rite Corp. |
25,700 | 292,466 | |||
| 437,934 | |||||
| Computer Hardware — 0.4% |
|||||
| SBS Technologies, Inc.* |
14,600 | 214,766 | |||
| Computer Services & Software — 2.4% |
|||||
| E.piphany, Inc.* |
15,200 | 109,592 | |||
| JDA Software Group, Inc.* |
17,500 | 288,925 | |||
| MTS Systems Corp. |
17,600 | 338,448 | |||
| Sybase, Inc.* |
14,900 | 306,642 | |||
| Sykes Enterprises, Inc.* |
25,200 | 215,712 | |||
| 1,259,319 | |||||
| Construction — 0.6% |
|||||
| Granite Construction, Inc. |
13,100 | 307,719 | |||
| WCI Communities, Inc.* |
1,400 | 28,854 | |||
| 336,573 | |||||
| Consumer Products & Services — 2.7% |
|||||
| Dollar Thrifty Automotive Group, Inc.* |
20,200 | 523,988 | |||
| Shares |
Value | ||||
| Jacuzzi Brands, Inc.* |
24,000 | $ | 170,160 | ||
| K2, Inc.* |
28,800 | 438,048 | |||
| Steven Madden, Ltd.* |
14,000 | 285,600 | |||
| 1,417,796 | |||||
| Electronic Components & Equipment — 2.8% |
|||||
| Benchmark Electronics, Inc.* |
11,650 | 405,537 | |||
| KEMET Corp.* |
35,900 | 491,471 | |||
| Park Electrochemical Corp. |
10,400 | 275,496 | |||
| Zygo Corp.* |
15,800 | 260,542 | |||
| 1,433,046 | |||||
| Entertainment & Leisure — 3.3% |
|||||
| AMC Entertainment, Inc.* |
22,900 | 348,309 | |||
| Bally Total Fitness Holding Corp.* |
53,600 | 375,200 | |||
| Callaway Golf Co. |
21,800 | 367,330 | |||
| Handleman Co. |
15,600 | 320,268 | |||
| Vail Resorts, Inc.* |
19,300 | 328,100 | |||
| 1,739,207 | |||||
| Equipment Services — 0.6% |
|||||
| United Rentals, Inc.* |
16,000 | 308,160 | |||
| Farming & Agriculture — 0.9% |
|||||
| Delta & Pine Land Co. |
17,900 | 454,660 | |||
| Financial - Bank & Trust — 9.0% |
|||||
| BankUnited Financial Corp.* |
3,600 | 92,844 | |||
| Capital City Bank Group, Inc. |
1,900 | 87,381 | |||
| Community Bank Systems, Inc. |
4,200 | 205,800 | |||
| Community Trust Bancorp, Inc. |
1,760 | 53,152 | |||
| Corus Bankshares, Inc. |
8,000 | 252,480 | |||
| First Charter Corp. |
14,200 | 277,610 | |||
| First Federal Capital Corp. |
1,500 | 33,780 | |||
| First Indiana Corp. |
3,600 | 67,500 | |||
| Hudson River Bancorp, Inc. |
4,400 | 171,732 | |||
| IBERIABANK Corp. |
2,200 | 129,800 | |||
| Irwin Financial Corp. |
2,700 | 84,780 | |||
| MB Financial, Inc. |
6,300 | 229,320 | |||
| Mid-State Bancshares |
5,200 | 132,288 | |||
| NBT Bancorp, Inc. |
6,300 | 135,072 | |||
| Pacific Capital Bancorp |
7,900 | 290,878 | |||
| Provident Bancshares Corp. |
19,900 | 585,856 | |||
| Provident Financial Services, Inc. |
3,000 | 56,700 | |||
| R&G Financial Corp. (Class “B” Stock) |
6,100 | 242,780 | |||
| Simmons First National Corp. |
3,200 | 89,280 | |||
| South Financial Group, Inc. |
11,700 | 325,962 | |||
| Sterling Financial Corp.* |
8,340 | 285,478 | |||
| Susquehanna Bancshares, Inc. |
8,600 | 215,086 | |||
| UMB Financial Corp. |
7,100 | 337,534 | |||
| Umpqua Holdings Corp. |
3,700 | 76,923 | |||
| Washington Trust Bancorp, Inc. |
2,100 | 55,020 | |||
| Waypoint Financial Corp. |
5,565 | 120,705 | |||
| Wesbanco, Inc. |
1,400 | 38,766 | |||
| 4,674,507 | |||||
87
Table of Contents
AST DeAM Small-Cap Value Portfolio
Schedule of Investments
December 31, 2003
| Shares |
Value | ||||
| Financial Services — 3.4% |
|||||
| Capstead Mortgage Corp.(a) |
3,800 | $ | 63,764 | ||
| FirstFed America Bancorp, Inc. |
19,000 | 494,570 | |||
| Firstfed Financial Corp.* |
6,500 | 282,750 | |||
| ITLA Capital Corp.* |
4,300 | 215,430 | |||
| National Health Investors, Inc. |
1,300 | 32,344 | |||
| Saxon Capital, Inc.* |
9,800 | 205,310 | |||
| Westcorp, Inc. |
12,500 | 456,875 | |||
| 1,751,043 | |||||
| Food — 1.5% |
|||||
| Flowers Foods, Inc. |
20,800 | 536,640 | |||
| Ralcorp Holdings, Inc.* |
8,200 | 257,152 | |||
| 793,792 | |||||
| Furniture — 0.8% |
|||||
| Haverty Furniture Co., Inc. |
20,700 | 411,102 | |||
| Healthcare Services — 2.0% |
|||||
| deCODE Genetics, Inc.* |
18,500 | 151,515 | |||
| Kindred Healthcare, Inc.* |
9,400 | 488,612 | |||
| US Oncology, Inc.* |
38,700 | 416,412 | |||
| 1,056,539 | |||||
| Hotels & Motels — 0.9% |
|||||
| Choice Hotels International, Inc. |
12,600 | 444,150 | |||
| Industrial Products — 1.8% |
|||||
| AMCOL International Corp. |
26,900 | 546,070 | |||
| Standex International Corp. |
3,600 | 100,800 | |||
| Tredegar Corp. |
17,800 | 276,434 | |||
| 923,304 | |||||
| Insurance — 3.1% |
|||||
| LandAmerica Financial Group, Inc. |
12,100 | 632,346 | |||
| Philadelphia Consolidated Holdings Corp.* |
9,200 | 449,236 | |||
| Stewart Information Services Corp. |
12,000 | 486,600 | |||
| United Fire & Casualty Co. |
1,600 | 64,576 | |||
| 1,632,758 | |||||
| Internet Services — 0.4% |
|||||
| EarthLink, Inc.* |
5,500 | 55,000 | |||
| Infospace, Inc.* |
1,500 | 34,575 | |||
| NetBank, Inc. |
4,300 | 57,405 | |||
| Stellent, Inc.* |
3,900 | 38,376 | |||
| 185,356 | |||||
| Machinery & Equipment — 4.2% |
|||||
| Briggs & Stratton Corp. |
10,100 | 680,740 | |||
| Flowserve Corp.* |
20,800 | 434,304 | |||
| Stewart & Stevenson Services, Inc. |
7,600 | 106,780 | |||
| Terex Corp.*(a) |
20,900 | 595,232 | |||
| Toro Co. |
8,300 | 385,120 | |||
| 2,202,176 | |||||
| Shares |
Value | ||||
| Medical Supplies & Equipment — 1.5% |
|||||
| Cambrex Corp. |
13,800 | $ | 348,588 | ||
| Sybron Dental Specialties, Inc.* |
15,600 | 438,360 | |||
| 786,948 | |||||
| Metals & Mining — 1.3% |
|||||
| Century Aluminum Co.* |
18,100 | 344,081 | |||
| Hecla Mining Co.* |
37,500 | 310,875 | |||
| 654,956 | |||||
| Office Equipment — 0.8% |
|||||
| United Stationers, Inc.*(a) |
9,700 | 396,924 | |||
| Oil & Gas — 4.2% |
|||||
| Denbury Resources, Inc.* |
12,600 | 175,266 | |||
| Houston Exploration Co.* |
14,900 | 544,148 | |||
| Nuevo Energy Co.* |
21,200 | 512,404 | |||
| Patina Oil & Gas Corp. |
8,700 | 426,213 | |||
| Spinnaker Exploration Co.* |
4,200 | 135,534 | |||
| Tesoro Petroleum Corp.* |
27,400 | 399,218 | |||
| 2,192,783 | |||||
| Paper & Forest Products — 1.1% |
|||||
| Louisiana-Pacific Corp.*(a) |
26,700 | 477,396 | |||
| Rock-Tenn Co. (Class “A” Stock) |
5,900 | 101,834 | |||
| 579,230 | |||||
| Pharmaceuticals — 1.0% |
|||||
| Alpharma, Inc. (Class “A” Stock) |
14,000 | 281,400 | |||
| Perrigo Co. |
16,100 | 253,092 | |||
| 534,492 | |||||
| Printing & Publishing — 0.6% |
|||||
| Consolidated Graphics, Inc.* |
9,800 | 309,484 | |||
| Real Estate — 7.8% |
|||||
| Alexandria Real Estate Equities, Inc. [REIT] |
2,600 | 150,540 | |||
| Anthracite Capital, Inc. [REIT] |
3,400 | 37,638 | |||
| Anworth Mortgage Asset Corp. [REIT] |
2,600 | 36,218 | |||
| Brandywine Realty Trust [REIT] |
5,000 | 133,850 | |||
| Capital Automotive [REIT] |
3,100 | 99,200 | |||
| Colonial Properties Trust [REIT] |
1,000 | 39,600 | |||
| Commercial Net Lease Realty, Inc. [REIT] |
8,500 | 151,300 | |||
| Corporate Office Properties Trust [REIT] |
1,800 | 37,800 | |||
| EastGroup Properties, Inc. [REIT] |
1,000 | 32,380 | |||
| Essex Property Trust, Inc. [REIT] |
1,100 | 70,642 | |||
| First Industrial Realty Trust, Inc. [REIT] |
3,200 | 108,000 | |||
| Gables Residential Trust [REIT] |
4,100 | 142,434 | |||
| Glimcher Realty Trust [REIT] |
1,000 | 22,380 | |||
| Great Lakes, Inc. [REIT] |
2,600 | 40,820 | |||
| Health Care, Inc. [REIT] |
4,100 | 147,600 | |||
| Heritage Property Investment Trust [REIT] |
1,100 | 31,295 | |||
| Highwoods Properties, Inc. [REIT] |
7,400 | 187,960 | |||
| Home Properties of New York, Inc. [REIT] |
2,400 | 96,936 | |||
| IMPAC Mortgage Holdings, Inc. [REIT] |
8,100 | 147,501 | |||
| Jones Lang Lasalle, Inc. [REIT]* |
6,400 | 132,672 | |||
88
Table of Contents
AST DeAM Small-Cap Value Portfolio
Schedule of Investments
December 31, 2003
| Shares |
Value | ||||
| Keystone Property Trust [REIT] |
6,000 | $ | 132,540 | ||
| Kilroy Realty Corp. [REIT] |
5,000 | 163,750 | |||
| Lexington Corp. Properties Trust [REIT] |
1,900 | 38,361 | |||
| Manufactured Home Communities, Inc. [REIT] |
2,500 | 94,125 | |||
| MFA Mortgage Investments, Inc. [REIT] |
3,500 | 34,125 | |||
| Mid-America Apartment Communities, Inc. [REIT] |
1,000 | 33,580 | |||
| Nationwide Health Properties, Inc. [REIT] |
8,800 | 172,040 | |||
| Newcastle Investment Corp. [REIT] |
1,500 | 40,650 | |||
| Parkway Properties, Inc. [REIT] |
600 | 24,960 | |||
| Post Properties, Inc. [REIT] |
5,200 | 145,184 | |||
| Prentiss Properties Trust [REIT] |
2,800 | 92,372 | |||
| PS Business Parks, Inc. [REIT] |
800 | 33,008 | |||
| RAIT Investment Trust [REIT] |
4,500 | 115,200 | |||
| Reckson Associates Realty Corp. [REIT](a) |
8,100 | 196,830 | |||
| Redwood Trust, Inc. [REIT] |
1,600 | 81,360 | |||
| Senior Housing Properties Trust [REIT] |
5,000 | 86,150 | |||
| SL Green Realty Corp. [REIT] |
4,300 | 176,515 | |||
| Sovran Self Storage, Inc. [REIT] |
1,900 | 70,585 | |||
| Summit Properties, Inc. [REIT] |
5,100 | 122,502 | |||
| Sun Communities, Inc. [REIT] |
2,800 | 108,360 | |||
| Ventas, Inc. [REIT] |
6,300 | 138,600 | |||
| Washington Real Estate Investment Trust [REIT] |
4,000 | 116,800 | |||
| 4,064,363 | |||||
| Retail & Merchandising — 1.7% |
|||||
| Charming Shoppes, Inc.* |
79,400 | 428,760 | |||
| Stage Stores, Inc.* |
16,000 | 446,400 | |||
| 875,160 | |||||
| Telecommunications — 2.2% |
|||||
| Cincinnati Bell, Inc.*(a) |
57,900 | 292,395 | |||
| Dobson Communications Corp.*(a) |
28,700 | 188,559 | |||
| Primus Telecommunications Group, Inc.* |
29,100 | 296,238 | |||
| Unova, Inc.* |
16,600 | 380,970 | |||
| 1,158,162 | |||||
| Transportation — 0.9% |
|||||
| RailAmerica, Inc.* |
15,000 | 177,000 | |||
| USF Corp. |
9,000 | 307,710 | |||
| 484,710 | |||||
| Utilities — 3.7% |
|||||
| Avista Corp. |
28,700 | 520,044 | |||
| Energen Corp. |
11,100 | 455,433 | |||
| PNM Resources, Inc. |
22,800 | 640,680 | |||
| Southern Union Co.* |
16,390 | 301,576 | |||
| 1,917,733 | |||||
| Total Long-Term Investments |
|||||
| (Cost $37,805,305) |
41,923,511 | ||||
| Par (000) |
Value | |||||
| SHORT-TERM INVESTMENTS — 5.0% |
||||||
| Commercial Paper — 0.9% |
||||||
| Tannehill Capital Co. |
||||||
| 1.10%, 01/08/04(b) |
$ | 467 | $ | 466,025 | ||
| Corporate Obligations — 1.5% |
||||||
| General Electric Capital Corp. |
||||||
| 1.13%, 01/02/04 [FRN](b)(c) |
463 | 463,791 | ||||
| Merrill Lynch & Co., Inc. |
||||||
| 1.13%, 01/02/04(b) |
11 | 11,293 | ||||
| Natexis Banques Populaires |
||||||
| 1.10%, 01/02/04 [FRN](b)(c) |
229 | 228,496 | ||||
| Westdeutsche Landesbank |
||||||
| 1.111%, 01/29/04 [FRN](b)(c) |
99 | 99,132 | ||||
| 802,712 | ||||||
| Shares |
||||||
| Non-Registered Investment Company — 0.7% |
||||||
| BlackRock Institutional Money Market Trust(b)(j) |
366,733 | 366,733 | ||||
| Par (000) |
||||||
| Repurchase Agreement — 0.1% |
||||||
| Merrill Lynch & Co., Inc. |
||||||
| 1.00%, dated 12/31/03, to be repurchased on 01/02/04, repurchase price $47,057 (Collateralized by Federal Home Loan Mortgage Corp. 5.50% maturing 12/01/33, Federal National Mortgage Assoc. 4.00% - 6.00% maturing 11/01/17 to 11/01/33 and Government National Mortgage Assoc. 1.47% maturing 01/16/04 [FRN](c), par value $57,734, market value including accrued interest $48,467)(b) |
$ | 47 | 47,054 | |||
| Time Deposit — 0.1% |
||||||
| Chase Manhattan Bank |
||||||
| 0.875%, 01/02/04(b) |
75 | 74,756 | ||||
| U.S. Treasury Obligations — 1.7% |
||||||
| U.S. Treasury Bills |
||||||
| 0.88%, 01/29/04(k)(n) |
65 | 64,955 | ||||
| 0.90%, 01/29/04(k)(n) |
60 | 59,957 | ||||
| 0.93%, 01/29/04(k)(n) |
700 | 699,487 | ||||
| 824,399 | ||||||
| Total Short-Term Investments |
||||||
| (Cost $2,581,687) |
2,581,679 | |||||
| Total Investments — 85.6% |
||||||
| (Cost $40,386,992; Note 5) |
44,505,190 | |||||
| Other Assets less Liabilities — 14.4% |
7,474,856 | |||||
| Net Assets — 100.0% |
$ | 51,980,046 | ||||
89
Table of Contents
AST DeAM Small-Cap Value Portfolio
Schedule of Investments
December 31, 2003
The following abbreviations are used in portfolio descriptions:
| FRN | Floating Rate Note |
| REIT | Real Estate Investment Trust |
| symbol |
description |
|||
| * |
Non-income producing security. | |||
| (a) |
Portion of securities on loan with an aggregate market value of $1,628,862; cash collateral $1,757,280 was received with which the portfolio purchased securites. | |||
| (b) |
Represents security purchased with cash collateral for securities on loan. | |||
| (c) |
Indicates a variable rate security. The maturity date presented for these instruments is the latter of the next date on which the security can be redeemed at par or the next date on which the rate of interest is adjusted. The interest rate shown reflects the rate in effect at December 31, 2003. | |||
| (j) |
Security available to institutional investors only. | |||
| (k) |
Securities with an aggregate market value of $824,399 have been segregated with the custodian to cover margin requirements for the following open futures contracts at December 31, 2003: | |||
| Description | Expiration Month |
Number of Contracts |
Contracts at Trade Date Value |
Contracts at Current Value |
Unrealized Appreciation | ||||||||
| Long Position: |
|||||||||||||
| Russell 2000 |
03/04 | 36 | $ | 9,929,183 | $ | 10,029,600 | $ | 100,417 | |||||
| (n) |
Rates shown are the effective yields at purchase date. | |||
See Notes to Financial Statements.
90
Table of Contents
AST Goldman Sachs Mid-Cap Growth Portfolio
Schedule of Investments
December 31, 2003
| Shares |
Value | ||||
| LONG-TERM INVESTMENTS — 96.1% |
|||||
| COMMON STOCK |
|||||
| Advertising — 1.9% |
|||||
| Lamar Advertising Co.*(a) |
82,750 | $ | 3,088,230 | ||
| Aerospace — 1.3% |
|||||
| Alliant Techsystems, Inc.* |
36,325 | 2,098,132 | |||
| Broadcasting — 10.2% |
|||||
| Citadel Broadcasting Co.* |
116,079 | 2,596,687 | |||
| Entercom Communications Corp.* |
42,525 | 2,252,124 | |||
| Entravision Communications Corp. |
220,000 | 2,442,000 | |||
| Scripps, (E.W.) Co. (Class “A” Stock) |
33,080 | 3,114,150 | |||
| Univision Communications, Inc. |
71,500 | 2,837,835 | |||
| Westwood One, Inc.* |
88,275 | 3,019,888 | |||
| 16,262,684 | |||||
| Building Materials — 1.8% |
|||||
| American Standard Companies, Inc.* |
28,750 | 2,895,125 | |||
| Business Services — 3.8% |
|||||
| ARAMARK Corp. (Class “B” Stock) |
138,075 | 3,786,016 | |||
| Iron Mountain, Inc.*(a) |
60,077 | 2,375,445 | |||
| 6,161,461 | |||||
| Cable Television — 4.0% |
|||||
| Cablevision Systems New York Group (Class “A” Stock)*(a) |
97,875 | 2,289,296 | |||
| EchoStar Communications Corp. |
79,250 | 2,694,500 | |||
| Lodgenet Entertainment Corp.* |
74,350 | 1,359,118 | |||
| 6,342,914 | |||||
| Clothing & Apparel — 1.8% |
|||||
| Reebok International Ltd.(a) |
73,875 | 2,904,765 | |||
| Computer Services & Software — 9.2% |
|||||
| Avocent Corp.* |
73,925 | 2,699,740 | |||
| BARRA, Inc. |
69,200 | 2,455,908 | |||
| Cognos, Inc. (Canada)* |
45,975 | 1,407,755 | |||
| Electronic Arts, Inc.*(a) |
20,850 | 996,213 | |||
| Intuit, Inc.* |
27,950 | 1,478,835 | |||
| Manhattan Associates, Inc.*(a) |
26,294 | 726,766 | |||
| SunGard Data Systems, Inc.* |
108,700 | 3,012,076 | |||
| Symantec Corp.*(a) |
55,650 | 1,928,273 | |||
| 14,705,566 | |||||
| Conglomerates — 1.1% |
|||||
| Brink’s Co. (The) |
78,450 | 1,773,755 | |||
| Consumer Products & Services — 3.1% |
|||||
| Energizer Holdings, Inc.* |
20,700 | 777,492 | |||
| Mattel, Inc. |
108,100 | 2,083,087 | |||
| UST, Inc. |
60,825 | 2,170,844 | |||
| 5,031,423 | |||||
| Shares |
Value | ||||
| Electronic Components & Equipment — 6.1% |
|||||
| Amphenol Corp.* |
45,500 | $ | 2,908,815 | ||
| Gentex Corp.(a) |
64,950 | 2,868,192 | |||
| Harman International Industries, Inc. |
53,750 | 3,976,425 | |||
| 9,753,432 | |||||
| Entertainment & Leisure — 2.6% |
|||||
| Harrah’s Entertainment, Inc. |
43,075 | 2,143,843 | |||
| Metro-Goldwyn-Mayer, Inc.*(a) |
115,623 | 1,975,997 | |||
| 4,119,840 | |||||
| Equipment Services — 1.5% |
|||||
| Millipore Corp.*(a) |
56,510 | 2,432,756 | |||
| Financial - Bank & Trust — 1.6% |
|||||
| M&T Bank Corp. |
9,825 | 965,798 | |||
| National Commerce Financial Corp. |
55,950 | 1,526,316 | |||
| 2,492,114 | |||||
| Financial Services — 3.4% |
|||||
| Ambac Financial Group, Inc. |
35,850 | 2,487,631 | |||
| Moody’s Corp. |
36,425 | 2,205,534 | |||
| Nelnet, Inc. (Class “A” Stock)*(a) |
35,300 | 790,720 | |||
| 5,483,885 | |||||
| Furniture — 1.9% |
|||||
| Ethan Allen Interiors, Inc.(a) |
72,825 | 3,049,911 | |||
| Healthcare Services — 2.9% |
|||||
| Caremark Rx, Inc.*(a) |
96,575 | 2,446,244 | |||
| Hooper Holmes, Inc. |
352,025 | 2,175,515 | |||
| 4,621,759 | |||||
| Hotels & Motels — 0.8% |
|||||
| Marriott International, Inc. (Class “A” Stock)(a) |
27,775 | 1,283,205 | |||
| Industrial Products — 1.4% |
|||||
| Grainger (W.W.), Inc.(a) |
47,925 | 2,271,166 | |||
| Insurance — 2.0% |
|||||
| RenaissanceRe Holdings Ltd.(a) |
35,200 | 1,726,560 | |||
| Willis Group Holdings Ltd. (United Kingdom)* |
45,825 | 1,561,258 | |||
| 3,287,818 | |||||
| Internet Services — 3.5% |
|||||
| Checkfree Corp.*(a) |
109,275 | 3,021,453 | |||
| ProQuest Co.* |
51,250 | 1,509,313 | |||
| Sabre Holdings Corp. |
51,098 | 1,103,206 | |||
| 5,633,972 | |||||
| Medical Supplies & Equipment — 4.6% |
|||||
| Apogent Technologies, Inc.* |
118,850 | 2,738,304 | |||
| Charles River Laboratories International, Inc.*(a) |
106,575 | 3,658,720 | |||
| St. Jude Medical, Inc.* |
16,500 | 1,012,275 | |||
| 7,409,299 | |||||
91
Table of Contents
AST Goldman Sachs Mid-Cap Growth Portfolio
Schedule of Investments
December 31, 2003
| Shares |
Value | ||||
| Office Equipment — 1.3% |
|||||
| Pitney Bowes, Inc. |
52,250 | $ | 2,122,395 | ||
| Oil & Gas — 4.0% |
|||||
| Energy Partners Ltd.* |
54,525 | 757,898 | |||
| Nabors Industries Ltd.*(a) |
35,825 | 1,486,738 | |||
| Pogo Producing Co. |
35,550 | 1,717,065 | |||
| Smith International, Inc.*(a) |
58,750 | 2,439,299 | |||
| 6,401,000 | |||||
| Personal Services — 1.1% |
|||||
| ITT Educational Services, Inc.* |
36,325 | 1,706,185 | |||
| Pharmaceuticals — 4.3% |
|||||
| Allergan, Inc.(a) |
11,725 | 900,597 | |||
| Biogen Idec, Inc.*(a) |
43,550 | 1,601,769 | |||
| Covance, Inc.*(a) |
81,375 | 2,180,850 | |||
| MedImmune, Inc.* |
84,850 | 2,155,190 | |||
| 6,838,406 | |||||
| Retail & Merchandising — 8.9% |
|||||
| 99 Cents Only Stores*(a) |
61,600 | 1,677,368 | |||
| Chico’s FAS, Inc.*(a) |
64,875 | 2,397,131 | |||
| Dollar Tree Stores, Inc.* |
79,125 | 2,378,498 | |||
| Family Dollar Stores, Inc. |
27,100 | 972,348 | |||
| PETCO Animal Supplies, Inc.* |
109,970 | 3,348,586 | |||
| TJX Companies, Inc. |
93,950 | 2,071,598 | |||
| Williams-Sonoma, Inc.*(a) |
43,075 | 1,497,718 | |||
| 14,343,247 | |||||
| Semiconductors — 4.4% |
|||||
| KLA-Tencor Corp.*(a) |
42,025 | 2,465,607 | |||
| Microchip Technology, Inc.(a) |
74,550 | 2,486,988 | |||
| Tessera Technologies, Inc.* |
29,700 | 558,657 | |||
| Xilinx, Inc.*(a) |
41,700 | 1,615,458 | |||
| 7,126,710 | |||||
| Telecommunications — 0.7% |
|||||
| Crown Castle International Corp.*(a) |
106,675 | 1,176,625 | |||
| Transportation — 0.9% |
|||||
| C.H. Robinson Worldwide, Inc. |
38,350 | 1,453,849 | |||
| Total Long-Term Investments |
|||||
| (Cost $133,768,476) |
154,271,629 | ||||
| Par (000) |
Value | |||||
| SHORT-TERM INVESTMENTS — 25.4% |
||||||
| Commercial Paper — 6.3% |
||||||
| Amsterdam Funding Corp. |
||||||
| 1.10%, 01/05/04(b) |
$ | 372 | $ | 372,040 | ||
| Cancara Asset Securitisation Ltd. |
||||||
| 1.11%, 01/12/04(b) |
5,019 | 5,015,100 | ||||
| Monumental Global Funding |
||||||
| 1.141%, 01/29/04 [FRN](b)(c) |
824 | 825,888 | ||||
| Silver Tower U.S. Funding |
||||||
| 1.13%, 02/02/04(b) |
782 | 779,379 | ||||
| Tannehill Capital Co. |
||||||
| 1.11%, 01/13/04(b) |
3,113 | 3,106,919 | ||||
| Tulip Funding Corp. |
||||||
| 1.10%, 01/21/04(b) |
53 | 52,868 | ||||
| 10,152,194 | ||||||
| Corporate Obligations — 10.7% |
||||||
| American Express Centurian |
||||||
| 1.144%, 01/22/04 [FRN](b)(c) |
583 | 582,718 | ||||
| 1.131%, 01/29/04 [FRN](b)(c) |
803 | 802,617 | ||||
| Bear Stearns Co., Inc. |
||||||
| 1.12%, 01/02/04 [FRN](b)(c) |
4,083 | 4,082,546 | ||||
| General Electric Capital Corp. |
||||||
| 1.13%, 01/02/04 [FRN](b)(c) |
270 | 270,636 | ||||
| Merrill Lynch & Co., Inc. |
||||||
| 1.13%, 01/02/04(b) |
275 | 274,520 | ||||
| 1.13%, 01/02/04 [FRN](b)(c) |
1,239 | 1,239,027 | ||||
| Morgan Stanley |
||||||
| 1.03%, 01/02/04 [FRN](b)(c) |
309 | 308,553 | ||||
| 1.08%, 01/02/04 [FRN](b)(c) |
3,980 | 3,979,661 | ||||
| Natexis Banques Populaires |
||||||
| 1.035%, 01/02/04 [FRN](b)(c) |
62 | 62,157 | ||||
| 1.10%, 01/02/04 [FRN](b)(c) |
1,966 | 1,965,966 | ||||
| Westdeutsche Landesbank |
||||||
| 1.13%, 01/09/04 [FRN](b)(c) |
2,609 | 2,608,905 | ||||
| 1.111%, 01/23/04 [FRN](b)(c) |
61 | 61,311 | ||||
| 1.111%, 01/29/04 [FRN](b)(c) |
964 | 963,574 | ||||
| 17,202,191 | ||||||
92
Table of Contents
AST Goldman Sachs Mid-Cap Growth Portfolio
Schedule of Investments
December 31, 2003
| Shares |
Value | |||||
| Non-Registered Investment Company — 6.7% |
||||||
| BlackRock Institutional Money Market Trust(b)(j) |
10,677,315 | $ | 10,677,315 | |||
| Par (000) |
||||||
| Repurchase Agreement — 0.7% |
||||||
| Merrill Lynch & Co., Inc. |
||||||
| 1.00%, dated 12/31/03, to be repurchased on 01/02/04, repurchase price $1,143,895 (Collateralized by Federal Home Loan Mortgage Corp. 5.50% maturing 12/01/33, Federal National Mortgage Assoc. 4.00% - 6.00% maturing 11/01/17 to 11/01/33 and Government National Mortgage Assoc. 1.47% maturing 01/16/04 [FRN](c), par value $1,403,432, market value including accrued interest $1,178,168)(b) |
$ | 1,144 | 1,143,832 | |||
| Par (000) |
Value |
||||||
| Time Deposits — 1.0% |
|||||||
| Chase Manhattan Bank |
|||||||
| 0.875%, 01/02/04(b) |
$ | 767 | $ | 766,663 | |||
| UBS Bank |
|||||||
| 0.938%, 01/02/04(b) |
895 | 894,747 | |||||
| 1,661,410 | |||||||
| Total Short-Term Investments |
|||||||
| (Cost $40,836,942) |
40,836,942 | ||||||
| Total Investments — 121.5% |
|||||||
| (Cost $174,605,418; Note 5) |
195,108,571 | ||||||
| Liabilities in Excess of |
(34,560,004 | ) | |||||
| Net Assets — 100.0% |
$ | 160,548,567 | |||||
| The following abbreviation is used in portfolio descriptions: | ||||
| FRN | Floating Rate Note | |||
| symbol |
description |
|||
| * |
Non-income producing security. | |||
| (a) |
Portion of securities on loan with an aggregate market value of $39,257,216; cash collateral $40,836,942 was received with which the portfolio purchased securities. | |||
| (b) |
Represents security purchased with cash collateral for securities on loan. | |||
| (c) |
Indicates a variable rate security. The maturity date presented for these instruments is the latter of the next date on which the security can be redeemed at par or the next date on which the rate of interest is adjusted. The interest rate shown reflects the rate in effect at December 31, 2003. | |||
| (j) |
Security available to institutional investors only. | |||
See Notes to Financial Statements.
93
Table of Contents
AST Neuberger Berman Mid-Cap Growth Portfolio
Schedule of Investments
December 31, 2003
| Shares |
Value | ||||
| LONG-TERM INVESTMENTS — 97.6% | |||||
| COMMON STOCK |
|||||
| Advertising — 0.6% |
|||||
| Getty Images, Inc.* |
41,500 | $ | 2,080,395 | ||
| Broadcasting — 2.8% |
|||||
| Scripps (E.W.) Co. (Class “A” Stock) |
56,100 | 5,281,254 | |||
| Univision Communications, Inc. |
117,300 | 4,655,637 | |||
| 9,936,891 | |||||
| Business Services — 2.4% |
|||||
| Alliance Data Systems Corp.* |
187,500 | 5,190,000 | |||
| Corporate Executive Board Co.*(a) |
74,630 | 3,482,982 | |||
| 8,672,982 | |||||
| Clothing & Apparel — 2.0% |
|||||
| Coach, Inc.* |
188,000 | 7,097,000 | |||
| Computer Hardware — 1.1% |
|||||
| SanDisk Corp.*(a) |
65,000 | 3,974,100 | |||
| Computer Services & Software — 7.5% |
|||||
| Adobe Systems, Inc.(a) |
45,000 | 1,768,500 | |||
| Affiliated Computer Services, Inc. |
35,000 | 1,906,100 | |||
| Cognos, Inc. (Canada)* |
55,500 | 1,699,410 | |||
| Electronic Arts, Inc.* |
41,900 | 2,001,982 | |||
| Mercury Interactive Corp.*(a) |
111,500 | 5,423,360 | |||
| PeopleSoft, Inc.*(a) |
168,000 | 3,830,400 | |||
| Symantec Corp.*(a) |
161,000 | 5,578,650 | |||
| Unisys Corp.*(a) |
12,500 | 185,625 | |||
| Veritas Software Corp.*(a) |
125,200 | 4,652,432 | |||
| 27,046,459 | |||||
| Construction — 0.5% |
|||||
| Centex Corp. |
17,500 | 1,883,875 | |||
| Containers & Packaging — 1.8% |
|||||
| Packaging Corp. of America |
90,000 | 1,967,400 | |||
| Pactiv Corp.* |
186,500 | 4,457,350 | |||
| 6,424,750 | |||||
| Electronic Components & Equipment — 8.4% |
|||||
| Agilent Technologies, Inc.*(a) |
70,000 | 2,046,800 | |||
| Gentex Corp.(a) |
89,500 | 3,952,320 | |||
| Harman International Industries, Inc. |
73,000 | 5,400,540 | |||
| Jabil Circuit, Inc.* |
65,000 | 1,839,500 | |||
| Molex, Inc.(a) |
142,500 | 4,971,825 | |||
| Parker-Hannifin Corp. |
52,000 | 3,094,000 | |||
| Zebra Technologies Corp. (Class “A” Stock)*(a) |
132,750 | 8,810,618 | |||
| 30,115,603 | |||||
| Shares |
Value | ||||
| Entertainment & Leisure — 3.7% |
|||||
| International Game Technology(a) |
135,000 | $ | 4,819,500 | ||
| Mandalay Resort Group |
104,000 | 4,650,880 | |||
| Royal Caribbean Cruises Ltd.(a) |
114,000 | 3,966,060 | |||
| 13,436,440 | |||||
| Equipment Services — 0.9% |
|||||
| United Rentals, Inc.* |
170,000 | 3,274,200 | |||
| Exchange - Traded Funds — 0.7% |
|||||
| iShares Russell 2000 Growth Index Fund(a) |
45,000 | 2,666,250 | |||
| Financial - Bank & Trust — 1.0% |
|||||
| New York Community Bancorp, Inc. |
93,600 | 3,561,480 | |||
| Financial Services — 5.3% |
|||||
| Capital One Financial Corp.(a) |
88,500 | 5,424,165 | |||
| Franklin Resources, Inc. |
88,500 | 4,607,310 | |||
| Investors Financial Services Corp.(a) |
141,000 | 5,415,810 | |||
| Moody’s Corp. |
62,100 | 3,760,155 | |||
| 19,207,440 | |||||
| Food — 1.1% |
|||||
| Whole Foods Market, Inc.(a) |
60,500 | 4,061,365 | |||
| Healthcare Services — 2.5% |
|||||
| Caremark Rx, Inc.*(a) |
210,500 | 5,331,965 | |||
| Stericycle, Inc.* |
75,800 | 3,539,860 | |||
| 8,871,825 | |||||
| Industrial Products — 3.6% |
|||||
| Donaldson Co., Inc. |
49,500 | 2,928,420 | |||
| Fastenal Co.(a) |
115,000 | 5,743,100 | |||
| SPX Corp.*(a) |
72,500 | 4,263,725 | |||
| 12,935,245 | |||||
| Insurance — 0.4% |
|||||
| China Life Insurance Co. [ADR]*(a) |
42,400 | 1,397,928 | |||
| Internet Services — 1.9% |
|||||
| Amazon.com, Inc.*(a) |
51,500 | 2,710,960 | |||
| Juniper Networks, Inc.*(a) |
222,000 | 4,146,960 | |||
| 6,857,920 | |||||
| Machinery & Equipment — 2.1% |
|||||
| Danaher Corp.(a) |
63,500 | 5,826,125 | |||
| Eaton Corp. |
17,500 | 1,889,650 | |||
| 7,715,775 | |||||
| Medical Supplies & Equipment — 9.4% |
|||||
| Bard (C.R.), Inc. |
44,500 | 3,615,625 | |||
| Genzyme Corp.*(a) |
85,000 | 4,193,900 | |||
| Henry Schein, Inc.* |
76,500 | 5,169,870 | |||
| Inamed Corp.* |
48,750 | 2,342,925 | |||
| Invitrogen Corp.*(a) |
43,500 | 3,045,000 | |||
| Varian Medical Systems, Inc.* |
91,000 | 6,288,100 | |||
94
Table of Contents
AST Neuberger Berman Mid-Cap Growth Portfolio
Schedule of Investments
December 31, 2003
| Shares |
Value | ||||
| VISX, Inc.* |
189,000 | $ | 4,375,350 | ||
| Zimmer Holdings, Inc.* |
70,000 | 4,928,000 | |||
| 33,958,770 | |||||
| Metals & Mining — 0.6% |
|||||
| Freeport-McMoRan Copper & Gold, Inc. (Class “B” Stock)(a) |
49,000 | 2,064,370 | |||
| Oil & Gas — 2.9% |
|||||
| Kinder Morgan, Inc. |
32,000 | 1,891,200 | |||
| Murphy Oil Corp. |
59,500 | 3,885,945 | |||
| XTO Energy, Inc.(a) |
170,400 | 4,822,320 | |||
| 10,599,465 | |||||
| Personal Services — 0.9% |
|||||
| Education Management Corp.* |
108,000 | 3,352,320 | |||
| Pharmaceuticals — 7.6% |
|||||
| Allergan, Inc.(a) |
60,500 | 4,647,005 | |||
| Celgene Corp.*(a) |
65,500 | 2,948,810 | |||
| Chiron Corp.*(a) |
84,000 | 4,787,160 | |||
| Gilead Sciences, Inc.*(a) |
85,000 | 4,941,900 | |||
| NPS Pharmaceuticals, Inc.* |
102,800 | 3,160,072 | |||
| Teva Pharmaceutical Industries Ltd. [ADR](a) |
76,500 | 4,338,315 | |||
| Watson Pharmaceuticals, Inc.*(a) |
57,500 | 2,645,000 | |||
| 27,468,262 | |||||
| Retail & Merchandising — 10.2% |
|||||
| CarMax, Inc.* |
77,500 | 2,397,075 | |||
| Michaels Stores, Inc.(a) |
117,500 | 5,193,500 | |||
| Nordstrom, Inc. |
106,500 | 3,652,950 | |||
| PETsMART, Inc. |
104,000 | 2,475,200 | |||
| Ross Stores, Inc. |
195,000 | 5,153,850 | |||
| Staples, Inc.* |
143,500 | 3,917,550 | |||
| Tiffany & Co.(a) |
110,000 | 4,972,000 | |||
| Tuesday Morning Corp.* |
100,000 | 3,025,000 | |||
| Williams-Sonoma, Inc.*(a) |
156,500 | 5,441,504 | |||
| 36,228,629 | |||||
| Semiconductors — 9.9% |
|||||
| ASML Holding NV.*(a) |
194,000 | 3,889,700 | |||
| Broadcom Corp. (Class “A” Stock)*(a) |
73,500 | 2,505,615 | |||
| Fairchild Semiconductor International, Inc.* |
140,000 | 3,495,800 | |||
| Intersil Corp. (Class “A” Stock) |
154,500 | 3,839,325 | |||
| KLA-Tencor Corp.*(a) |
62,000 | 3,637,540 | |||
| Lam Research Corp.*(a) |
74,000 | 2,390,200 | |||
| Microchip Technology, Inc. |
181,000 | 6,038,160 | |||
| National Semiconductor Corp.*(a) |
63,500 | 2,502,535 | |||
| QLogic Corp.*(a) |
70,500 | 3,637,800 | |||
| Silicon Laboratories, Inc.* |
77,500 | 3,349,550 | |||
| 35,286,225 | |||||
| Shares |
Value | |||||
| Telecommunications — 3.6% |
||||||
| Corning, Inc.* |
239,000 | $ | 2,492,770 | |||
| Nextel Partners, Inc. (Class “A” Stock)*(a) |
509,500 | 6,852,775 | ||||
| UTStarcom, Inc.*(a) |
101,500 | 3,762,605 | ||||
| 13,108,150 | ||||||
| Transportation — 2.2% |
||||||
| J.B. Hunt Transport Services, Inc.* |
201,000 | 5,429,010 | ||||
| Swift Transportation Co., Inc.* |
123,500 | 2,595,970 | ||||
| 8,024,980 | ||||||
| Total Long-Term Investments |
||||||
| (Cost $281,332,961) |
351,309,094 | |||||
| Par (000) |
||||||
| SHORT-TERM INVESTMENTS — 45.2% |
||||||
| Certificate of Deposit |
||||||
| Svenska Handelsbank, Inc. |
||||||
| 1.39%, 10/27/04(b) |
$ | 7 | 6,850 | |||
| Commercial Paper — 7.6% |
||||||
| Amsterdam Funding Corp. |
||||||
| 1.10%, 01/05/04(b) |
7,808 | 7,800,629 | ||||
| Cancara Asset Securitisation Ltd. |
||||||
| 1.11%, 01/12/04(b) |
7,041 | 7,035,083 | ||||
| Concord Minutemen Capital Co. |
||||||
| 1.13%, 02/09/04(b) |
1,414 | 1,410,552 | ||||
| 1.13%, 02/12/04(b) |
1,494 | 1,490,412 | ||||
| Lexington Parker Capital Co. |
||||||
| 1.10%, 01/12/04(b) |
75 | 74,601 | ||||
| Monumental Global Funding |
||||||
| 1.141%, 01/29/04 [FRN](b)(c) |
3,059 | 3,066,307 | ||||
| Tannehill Capital Co. |
||||||
| 1.10%, 01/08/04(b) |
3,700 | 3,690,206 | ||||
| 1.11%, 01/13/04(b) |
29 | 29,304 | ||||
| Tulip Funding Corp. |
||||||
| 1.10%, 01/21/04(b) |
2,664 | 2,661,501 | ||||
| 27,258,595 | ||||||
| Corporate Obligations — 16.9% |
||||||
| American Express Centurian |
||||||
| 1.144%, 01/22/04 [FRN](b)(c) |
2,408 | 2,407,648 | ||||
| 1.131%, 01/29/04 [FRN](b)(c) |
5,568 | 5,568,432 | ||||
| Bear Stearns Co., Inc. |
||||||
| 1.12%, 01/02/04 [FRN](b)(c) |
5,328 | 5,328,188 | ||||
| Canadian Imperial Bank of Commerce |
||||||
| 1.111%, 01/29/04 [FRN](b)(c) |
4,859 | 4,858,553 | ||||
| General Electric Capital Corp. |
||||||
| 1.13%, 01/02/04 [FRN](b)(c) |
3,215 | 3,217,738 | ||||
| Goldman Sachs Group, Inc. |
||||||
| 1.14%, 01/06/04 [FRN](b)(c) |
1,527 | 1,526,852 | ||||
95
Table of Contents
AST Neuberger Berman Mid-Cap Growth Portfolio
Schedule of Investments
December 31, 2003
| Par (000) |
Value | |||||
| Merrill Lynch & Co., Inc. |
||||||
| 1.13%, 01/02/04(b) |
$ | 1,581 | $ | 1,580,555 | ||
| 1.13%, 01/02/04 [FRN](b)(c) |
7,028 | 7,028,408 | ||||
| Morgan Stanley |
||||||
| 1.03%, 01/02/04 [FRN](b)(c) |
1,227 | 1,226,619 | ||||
| 1.08%, 01/02/04 [FRN](b)(c) |
7,121 | 7,120,725 | ||||
| Natexis Banques Populaires |
||||||
| 1.035%, 01/02/04 [FRN](b)(c) |
4,560 | 4,560,145 | ||||
| 1.10%, 01/02/04 [FRN](b)(c) |
7,765 | 7,763,458 | ||||
| Societe Generale |
||||||
| 1.08%, 01/02/04 [FRN](b)(c) |
6,891 | 6,890,054 | ||||
| Westdeutsche Landesbank |
||||||
| 1.13%, 01/09/04 [FRN](b)(c) |
168 | 167,483 | ||||
| 1.111%, 01/29/04 [FRN](b)(c) |
1,635 | 1,634,446 | ||||
| 60,879,304 | ||||||
| Shares |
||||||
| Non-Registered Investment Company — 15.0% |
||||||
| BlackRock Institutional Money Market Trust(b)(j) |
53,908,723 | 53,908,723 | ||||
| Registered Investment Companies — 2.5% |
||||||
| BlackRock Provident Institutional Funds TempCash Portfolio |
4,573,468 | 4,573,468 | ||||
| BlackRock Provident Institutional Funds TempFund Portfolio |
4,573,467 | 4,573,467 | ||||
| 9,146,935 | ||||||
| Par (000) |
Value |
||||||
| Repurchase Agreement — 1.8% |
|||||||
| Merrill Lynch & Co., Inc. |
|||||||
| 1.00%, dated 12/31/03, to be repurchased on 01/02/04, repurchase price $6,586,011 (Collateralized by Federal Home Loan Mortgage Corp. 5.50% maturing 12/01/33, Federal National Mortgage Assoc. 4.00% - 6.00% maturing 11/01/17 to 11/01/33 and Government National Mortgage Assoc. 1.47% maturing 01/16/04 [FRN](c), par value $8,080,303, market value including accrued interest $6,783,338)(b) |
$ | 6,586 | $ | 6,585,645 | |||
| Time Deposits — 1.4% |
|||||||
| Chase Manhattan Bank |
|||||||
| 0.875%, 01/02/04(b) |
3,969 | 3,968,906 | |||||
| UBS Bank |
|||||||
| 0.938%, 01/02/04(b) |
1,104 | 1,104,078 | |||||
| 5,072,984 | |||||||
| Total Short-Term Investments |
|||||||
| (Cost $162,859,036) |
162,859,036 | ||||||
| Total Investments — 142.8% |
|||||||
| (Cost $444,191,997; Note 5) |
514,168,130 | ||||||
| Liabilities in Excess of |
(154,157,983 | ) | |||||
| Net Assets — 100.0% |
$ | 360,010,147 | |||||
The following abbreviations are used in portfolio descriptions:
| ADR | American Depositary Receipt |
| FRN | Floating Rate Note |
| symbol |
description | |
| * |
Non-income producing security. | |
| (a) |
Portion of securities on loan with an aggregate market value of $148,818,301; cash collateral $153,712,101 was received with which the portfolio purchased securities. | |
| (b) |
Represents security purchased with cash collateral for securities on loan. | |
| (c) |
Indicates a variable rate security. The maturity date presented for these instruments is the latter of the next date on which the security can be redeemed at par or the next date on which the rate of interest is adjusted. The interest rate shown reflects the rate in effect at December 31, 2003. | |
| (j) |
Security not available to non-institutional buyers. | |
See Notes to Financial Statements.
96
Table of Contents
AST Neuberger Berman Mid-Cap Value Portfolio
Schedule of Investments
December 31, 2003
| Shares |
Value | ||||
| LONG-TERM INVESTMENTS — 97.6% |
|||||
| COMMON STOCK |
|||||
| Automotive Parts — 4.1% |
|||||
| BorgWarner, Inc. |
220,900 | $ | 18,791,963 | ||
| Lear Corp. |
383,200 | 23,501,656 | |||
| 42,293,619 | |||||
| Beverages — 2.6% |
|||||
| Constellation Brands, Inc. (Class “A” Stock)* |
796,500 | 26,228,745 | |||
| Building Materials — 1.0% |
|||||
| American Standard Companies, Inc.* |
100,400 | 10,110,280 | |||
| Business Services — 3.6% |
|||||
| Manpower, Inc.(a) |
507,900 | 23,911,932 | |||
| Viad Corp. |
519,300 | 12,982,500 | |||
| 36,894,432 | |||||
| Clothing & Apparel — 5.3% |
|||||
| Liz Claiborne, Inc. |
509,000 | 18,049,140 | |||
| Reebok International Ltd.(a) |
326,600 | 12,841,912 | |||
| VF Corp. |
543,700 | 23,509,588 | |||
| 54,400,640 | |||||
| Computer Services & Software — 1.7% |
|||||
| Computer Associates International, Inc.(a) |
646,700 | 17,680,778 | |||
| Conglomerates — 1.3% |
|||||
| Johnson Controls, Inc. |
111,400 | 12,935,768 | |||
| Consumer Products & Services — 0.9% |
|||||
| Regis Corp. |
231,600 | 9,152,832 | |||
| Entertainment & Leisure — 1.0% |
|||||
| Brunswick Corp.(a) |
325,400 | 10,357,482 | |||
| Financial - Bank & Trust — 10.8% |
|||||
| Charter One Financial, Inc. |
687,300 | 23,746,215 | |||
| First Tennessee National Corp. |
559,100 | 24,656,310 | |||
| GreenPoint Financial Corp. |
588,200 | 20,775,224 | |||
| North Fork Bancorp, Inc.(a) |
401,800 | 16,260,846 | |||
| SouthTrust Corp. |
311,700 | 10,201,941 | |||
| TCF Financial Corp. |
295,600 | 15,179,060 | |||
| 110,819,596 | |||||
| Financial Services — 7.6% |
|||||
| Ambac Financial Group, Inc. |
299,650 | 20,792,714 | |||
| Bear Stearns Companies, Inc. |
230,600 | 18,436,470 | |||
| CIT Group, Inc. |
287,300 | 10,328,435 | |||
| Federated Investors, Inc. (Class “B” Stock) |
269,400 | 7,909,584 | |||
| IndyMac Bancorp, Inc.(a) |
707,800 | 21,085,362 | |||
| 78,552,565 | |||||
| Shares |
Value | ||||
| Food — 3.0% |
|||||
| Del Monte Foods Co.* |
1,435,200 | $ | 14,926,080 | ||
| Fresh Del Monte Produce, Inc.*(a) |
650,100 | 15,491,883 | |||
| 30,417,963 | |||||
| Healthcare Services — 13.8% |
|||||
| Anthem, Inc.*(a) |
251,900 | 18,892,500 | |||
| DaVita, Inc.* |
396,100 | 15,447,900 | |||
| Laboratory Corp. of America Holdings*(a) |
388,200 | 14,343,990 | |||
| Omnicare, Inc.(a) |
385,000 | 15,550,150 | |||
| Oxford Health Plans, Inc.(a) |
558,000 | 24,273,000 | |||
| Quest Diagnostics, Inc.(a) |
168,200 | 12,297,102 | |||
| Triad Hospitals, Inc.* |
763,700 | 25,408,298 | |||
| Universal Health Services, Inc. |
300,400 | 16,137,488 | |||
| 142,350,428 | |||||
| Industrial Products — 3.5% |
|||||
| Mohawk Industries, Inc.*(a) |
213,200 | 15,039,128 | |||
| SPX Corp.*(a) |
347,500 | 20,436,475 | |||
| 35,475,603 | |||||
| Insurance — 12.7% |
|||||
| Loews Corp. |
316,000 | 15,626,200 | |||
| PartnerRe Ltd. |
315,100 | 18,291,555 | |||
| PMI Group, Inc. (The)(a) |
518,000 | 19,285,140 | |||
| Radian Group, Inc.(a) |
488,000 | 23,790,000 | |||
| RenaissanceRe Holdings Ltd.(a) |
491,100 | 24,088,455 | |||
| WellChoice, Inc.* |
446,000 | 15,387,000 | |||
| XL Capital Ltd. (Class “A” Stock)(a) |
184,800 | 14,331,240 | |||
| 130,799,590 | |||||
| Oil & Gas — 12.1% |
|||||
| Apache Corp.(a) |
65,907 | 5,345,058 | |||
| EOG Resources, Inc. |
369,800 | 17,073,666 | |||
| Equitable Resources, Inc. |
287,100 | 12,322,332 | |||
| Murphy Oil Corp. |
83,200 | 5,433,792 | |||
| Pioneer Natural Resources Co.* |
660,000 | 21,073,800 | |||
| Sunoco, Inc.(a) |
432,500 | 22,122,375 | |||
| Talisman Energy, Inc. (Canada) |
346,700 | 19,623,220 | |||
| XTO Energy, Inc.(a) |
752,666 | 21,300,448 | |||
| 124,294,691 | |||||
| Railroads — 1.0% |
|||||
| Canadian National Railway Co. (Canada) |
167,200 | 10,580,416 | |||
| Restaurants — 1.5% |
|||||
| Darden Restaurants, Inc.(a) |
756,000 | 15,906,240 | |||
97
Table of Contents
AST Neuberger Berman Mid-Cap Value Portfolio
Schedule of Investments
December 31, 2003
| Shares |
Value | |||||
| Retail & Merchandising — 5.0% |
||||||
| Foot Locker, Inc. |
756,600 | $ | 17,742,270 | |||
| May Department Stores Co. (The)(a) |
126,000 | 3,662,820 | ||||
| Office Depot, Inc.*(a) |
303,600 | 5,073,156 | ||||
| Payless ShoeSource, Inc.* |
603,800 | 8,090,920 | ||||
| Pier 1 Imports, Inc. |
746,300 | 16,314,118 | ||||
| 50,883,284 | ||||||
| Transportation — 3.3% |
||||||
| CNF, Inc. |
453,200 | 15,363,480 | ||||
| Teekay Shipping Corp. |
323,200 | 18,432,096 | ||||
| 33,795,576 | ||||||
| Utilities — 1.8% |
||||||
| Pepco Holdings, Inc.(a) |
264,500 | 5,168,330 | ||||
| PPL Corp.(a) |
302,500 | 13,234,375 | ||||
| 18,402,705 | ||||||
| Total Long-Term Investments |
||||||
| (Cost $831,020,399) |
1,002,333,233 | |||||
| Par (000) |
||||||
| SHORT-TERM INVESTMENTS — 21.7% |
||||||
| Certificate of Deposit |
||||||
| Svenska Handelsbank, Inc. |
$ | 0 | 63 | |||
| Commercial Paper — 0.1% |
||||||
| Cancara Asset Securitisation Ltd. 1.11%, 01/12/04(b) |
428 | 428,089 | ||||
| Monumental Global Funding |
363 | 363,633 | ||||
| 791,722 | ||||||
| Corporate Obligations — 5.8% |
||||||
| American Express Centurian |
||||||
| 1.144%, 01/22/04 [FRN](b)(c) |
4,916 | 4,916,241 | ||||
| 1.131%, 01/29/04 [FRN](b)(c) |
1,147 | 1,146,895 | ||||
| Bear Stearns Co., Inc. |
4,237 | 4,236,913 | ||||
| General Electric Capital Corp. 1.13%, 01/02/04 [FRN](b)(c) |
6,433 | 6,438,603 | ||||
| Merrill Lynch & Co., Inc. |
||||||
| 1.13%, 01/02/04(b) |
3,485 | 3,485,412 | ||||
| 1.13%, 01/02/04 [FRN](b)(c) |
6,860 | 6,859,502 | ||||
| Morgan Stanley |
||||||
| 1.03%, 01/02/04 [FRN](b)(c) |
4,866 | 4,865,714 | ||||
| 1.08%, 01/02/04 [FRN](b)(c) |
4,845 | 4,845,221 | ||||
| Natexis Banques Populaires |
||||||
| 1.035%, 01/02/04 [FRN](b)(c) |
2,266 | 2,265,653 | ||||
| 1.10%, 01/02/04 [FRN](b)(c) |
10,618 | 10,615,450 | ||||
| Par (000) |
Value |
||||||
| Societe Generale |
$ | 6,828 | $ | 6,826,986 | |||
| Westdeutsche Landesbank |
|||||||
| 1.13%, 01/09/04 [FRN](b)(c) |
3,190 | 3,189,377 | |||||
| 1.111%, 01/29/04 [FRN](b)(c) |
4 | 3,689 | |||||
| 59,695,656 | |||||||
| Shares |
|||||||
| Non-Registered Investment Company — 11.6% |
|||||||
| BlackRock Institutional Money Market Trust(b)(j) |
119,272,335 | 119,272,335 | |||||
| Registered Investment Company — 2.5% |
|||||||
| BlackRock Provident Institutional Funds TempCash Portfolio |
25,568,936 | 25,568,936 | |||||
| Par (000) |
|||||||
| Repurchase Agreement — 1.4% |
|||||||
| Merrill Lynch & Co., Inc. |
|||||||
| 1.00%, dated 12/31/03, to be repurchased on 01/02/04, repurchase price $14,523,357 (Collateralized by Federal Home Loan Mortgage Corp. 5.50% maturing 12/01/33, Federal National Mortgage Assoc. 4.00% - 6.00% maturing 11/01/17 to 11/01/33 and Government National Mortgage Assoc. 1.47% maturing 01/16/04 [FRN](c), par value $17,818,543, market value including accrued interest $14,958,498)(b) |
$ | 14,523 | 14,522,550 | ||||
| Time Deposits — 0.3% |
|||||||
| Chase Manhattan Bank |
2,579 | 2,579,497 | |||||
| UBS Bank |
465 | 464,697 | |||||
| 3,044,194 | |||||||
| Total Short-Term Investments |
|||||||
| (Cost $222,895,456) |
222,895,456 | ||||||
| Total Investments — 119.3% |
|||||||
| (Cost $1,053,915,855; Note 5) |
1,225,228,689 | ||||||
| Liabilities in Excess of |
(197,854,385 | ) | |||||
| Net Assets — 100.0% |
$ | 1,027,374,304 | |||||
98
Table of Contents
AST Neuberger Berman Mid-Cap Value Portfolio
Schedule of Investments
December 31, 2003
The following abbreviation is used in portfolio descriptions:
| FRN | Floating Rate Note |
| symbol |
description | |
| * |
Non-income producing security. | |
| (a) |
Portion of securities on loan with an aggregate market value of $190,549,938; cash collateral $197,326,520 was received with which the portfolio purchased securities. | |
| (b) |
Represents security purchased with cash collateral for securities on loan. | |
| (c) |
Indicates a variable rate security. The maturity date presented for these instruments is the latter of the next date on which the security can be redeemed at par or the next date on which the rate of interest is adjusted. The interest rate shown reflects the rate in effect at December 31, 2003. | |
| (j) |
Security available to institutional investors only. | |
See Notes to Financial Statements.
99
Table of Contents
AST Alger All-Cap Growth Portfolio
Schedule of Investments
December 31, 2003
| Shares |
Value | ||||
| LONG-TERM INVESTMENTS — 98.6% |
|||||
| COMMON STOCK |
|||||
| Biotechnology — 7.1% |
|||||
| Amgen, Inc.* |
88,800 | $ | 5,487,840 | ||
| Genentech, Inc.*(a) |
164,600 | 15,401,622 | |||
| Invitrogen Corp.*(a) |
57,800 | 4,046,000 | |||
| QLT, Inc.* |
195,200 | 3,679,520 | |||
| 28,614,982 | |||||
| Business Services — 0.7% |
|||||
| Monster Worldwide, Inc.* |
136,500 | 2,997,540 | |||
| Clothing & Apparel — 0.4% |
|||||
| Pacific Sunwear of California, Inc.*(a) |
69,800 | 1,474,176 | |||
| Commercial Services & Supplies — 0.5% |
|||||
| SpectraSite, Inc.* |
62,100 | 2,157,975 | |||
| Computer Services & Software — 12.2% |
|||||
| Activision, Inc.* |
272,400 | 4,957,680 | |||
| Brocade Communications Systems, Inc.*(a) |
1,091,000 | 6,305,980 | |||
| Cisco Systems, Inc.* |
402,300 | 9,771,867 | |||
| Novell, Inc.* |
435,000 | 4,576,200 | |||
| Oracle Corp.* |
349,300 | 4,610,760 | |||
| PeopleSoft, Inc.*(a) |
608,400 | 13,871,520 | |||
| Veritas Software Corp.*(a) |
138,500 | 5,146,660 | |||
| 49,240,667 | |||||
| Entertainment & Leisure — 5.7% |
|||||
| Disney (Walt) Co. |
343,900 | 8,023,187 | |||
| International Game Technology(a) |
124,000 | 4,426,800 | |||
| Royal Caribbean Cruises Ltd.(a) |
31,300 | 1,088,927 | |||
| Time Warner, Inc.*(a) |
524,200 | 9,430,358 | |||
| 22,969,272 | |||||
| Financial - Bank & Trust — 3.0% |
|||||
| Bank of New York Co., Inc. |
196,200 | 6,498,144 | |||
| U.S. Bancorp |
190,300 | 5,667,134 | |||
| 12,165,278 | |||||
| Financial Services — 5.8% |
|||||
| Capital One Financial Corp.(a) |
117,500 | 7,201,575 | |||
| Citigroup, Inc. |
227,400 | 11,037,996 | |||
| Morgan Stanley Dean Witter & Co. |
87,300 | 5,052,051 | |||
| 23,291,622 | |||||
| Healthcare Services — 4.5% |
|||||
| Health Management Associates, Inc. (Class “A” Stock)(a) |
193,100 | 4,634,400 | |||
| Medco Health Solutions, Inc.* |
156,300 | 5,312,637 | |||
| Quest Diagnostics, Inc.(a) |
112,300 | 8,210,253 | |||
| 18,157,290 | |||||
| Insurance — 1.0% |
|||||
| MGIC Investment Corp. |
71,400 | 4,065,516 | |||
| Shares |
Value | ||||
| Internet Services — 9.7% |
|||||
| eBay, Inc.*(a) |
279,000 | $ | 18,020,610 | ||
| United Online, Inc.*(a) |
200,600 | 3,368,074 | |||
| Yahoo!, Inc.*(a) |
388,900 | 17,566,613 | |||
| 38,955,297 | |||||
| Machinery & Equipment — 5.2% |
|||||
| Broadcom Corp. (Class “A” Stock)*(a) |
388,500 | 13,243,965 | |||
| Caterpillar, Inc. |
92,000 | 7,637,840 | |||
| 20,881,805 | |||||
| Medical Supplies & Equipment — 6.1% |
|||||
| Boston Scientific Corp.*(a) |
367,400 | 13,505,624 | |||
| Guidant Corp. |
74,000 | 4,454,800 | |||
| Varian Medical Systems, Inc.* |
34,200 | 2,363,220 | |||
| Zimmer Holdings, Inc.* |
61,700 | 4,343,680 | |||
| 24,667,324 | |||||
| Oil & Gas — 1.2% |
|||||
| Halliburton Co. |
180,200 | 4,685,200 | |||
| Personal Services — 0.9% |
|||||
| Apollo Group, Inc. (Class “A” Stock)*(a) |
50,950 | 3,464,600 | |||
| Pharmaceuticals — 7.2% |
|||||
| Allergan, Inc.(a) |
28,300 | 2,173,723 | |||
| Millennium Pharmaceuticals, Inc.* |
355,900 | 6,644,653 | |||
| Pfizer, Inc. |
385,440 | 13,617,595 | |||
| Teva Pharmaceutical Industries Ltd. [ADR](a) |
114,900 | 6,515,979 | |||
| 28,951,950 | |||||
| Retail & Merchandising — 6.1% |
|||||
| Bed Bath & Beyond, Inc.* |
121,000 | 5,245,350 | |||
| Gap, Inc.(a) |
327,100 | 7,591,991 | |||
| Home Depot, Inc. |
328,000 | 11,640,720 | |||
| 24,478,061 | |||||
| Semiconductors — 12.8% |
|||||
| Applied Materials, Inc.* |
380,500 | 8,542,225 | |||
| Intel Corp. |
202,700 | 6,526,940 | |||
| Intersil Corp. (Class “A” Stock) |
270,700 | 6,726,895 | |||
| Kulicke & Soffa Industries, Inc.* |
428,100 | 6,156,078 | |||
| Micron Technology, Inc.*(a) |
434,300 | 5,850,021 | |||
| National Semiconductor Corp.*(a) |
169,200 | 6,668,172 | |||
| Novellus Systems, Inc.* |
97,200 | 4,087,260 | |||
| Texas Instruments, Inc. |
239,500 | 7,036,510 | |||
| 51,594,101 | |||||
| Telecommunications — 8.5% |
|||||
| Advanced Fibre Communications, Inc.*(a) |
440,100 | 8,868,015 | |||
| CIENA Corp.*(a) |
982,000 | 6,520,480 | |||
| Comverse Technology, Inc.*(a) |
343,300 | 6,038,647 | |||
100
Table of Contents
AST Alger All-Cap Growth Portfolio
Schedule of Investments
December 31, 2003
| Shares |
Value | |||||
| Corning, Inc.* |
767,600 | $ | 8,006,068 | |||
| Nextel Communications, Inc. (Class “A” Stock)*(a) |
167,200 | 4,691,632 | ||||
| 34,124,842 | ||||||
| TOTAL LONG-TERM INVESTMENTS |
||||||
| (Cost $336,768,484) |
396,937,498 | |||||
| Par (000) |
||||||
| SHORT-TERM INVESTMENTS — 33.6% |
||||||
| Certificate of Deposit |
||||||
| Svenska Handelsbank, Inc. |
||||||
| 1.39%, 10/27/04(b) |
$ | 186 | 186,012 | |||
| Commercial Paper — 6.1% |
||||||
| Cancara Asset Securitisation Ltd. |
||||||
| 1.11%, 01/12/04(b) |
7,181 | 7,174,677 | ||||
| Concord Minutemen Capital Co. |
||||||
| 1.11%, 01/09/04(b) |
2,718 | 2,710,394 | ||||
| 1.13%, 02/09/04(b) |
8,299 | 8,276,159 | ||||
| General Electric Capital Corp. |
||||||
| 1.11%, 02/05/04(b) |
4,147 | 4,135,098 | ||||
| Lexington Parker Capital Co. |
||||||
| 1.10%, 01/12/04(b) |
1,897 | 1,893,716 | ||||
| Monumental Global Funding |
||||||
| 1.141%, 01/29/04 [FRN](b)(c) |
294 | 295,042 | ||||
| Tannehill Capital Co. |
||||||
| 1.10%, 01/08/04(b) |
135 | 134,215 | ||||
| 24,619,301 | ||||||
| Corporate Obligations — 19.0% |
||||||
| American Express Centurian |
||||||
| 1.144%, 01/22/04 [FRN](b)(c) |
378 | 378,215 | ||||
| 1.131%, 01/29/04 [FRN](b)(c) |
1,458 | 1,458,011 | ||||
| Bear Stearns Co., Inc. |
||||||
| 1.12%, 01/02/04 [FRN](b)(c) |
12,338 | 12,337,764 | ||||
| General Electric Capital Corp. |
||||||
| 1.13%, 01/02/04 [FRN](b)(c) |
7,439 | 7,445,668 | ||||
| Goldman Sachs Group, Inc. |
||||||
| 1.14%, 01/06/04 [FRN](b)(c) |
1,849 | 1,848,870 | ||||
| Merrill Lynch & Co., Inc. |
||||||
| 1.13%, 01/02/04 [FRN](b)(c) |
7 | 7,130 | ||||
| 1.13%, 01/02/04(b) |
674 | 673,575 | ||||
| Morgan Stanley |
||||||
| 1.03%, 01/02/04 [FRN](b)(c) |
9,473 | 9,472,845 | ||||
| 1.08%, 01/02/04 [FRN](b)(c) |
5,278 | 5,278,004 | ||||
| Natexis Banques Populaires |
||||||
| 1.035%, 01/02/04 [FRN](b)(c) |
12,291 | 12,291,363 | ||||
| 1.10%, 01/02/04 [FRN](b)(c) |
9,389 | 9,386,180 | ||||
| Societe Generale |
||||||
| 1.08%, 01/02/04 [FRN](b)(c) |
2,394 | 2,393,025 | ||||
| Westdeutsche Landesbank |
||||||
| 1.13%, 01/09/04 [FRN](b)(c) |
5,957 | 5,956,802 | ||||
| Par (000) |
Value |
||||||
| 1.111%, 01/23/04 [FRN](b)(c) |
$ | 976 | $ | 975,658 | |||
| 1.111%, 01/29/04 [FRN](b)(c) |
6,363 | 6,361,752 | |||||
| 76,264,862 | |||||||
| Shares |
|||||||
| Non-Registered Investment Company — 5.7% |
|||||||
| BlackRock Institutional Money Market Trust(b)(j) |
22,869,786 | 22,869,786 | |||||
| Registered Investment Companies — 0.7% |
|||||||
| BlackRock Provident Institutional Funds TempCash Portfolio |
1,436,060 | 1,436,060 | |||||
| BlackRock Provident Institutional Funds TempFund Portfolio |
1,436,059 | 1,436,059 | |||||
| 2,872,119 | |||||||
| Par (000) |
|||||||
| Repurchase Agreement — 0.7% |
|||||||
| Merrill Lynch & Co., Inc. |
|||||||
| 1.00%, dated 12/31/03, to be repurchased on 01/02/04, repurchase price $2,806,719 (Collateralized by Federal Home Loan Mortgage Corp. 5.50% maturing 12/01/33, Federal National Mortgage Assoc. 4.00% - 6.00% maturing 11/01/17 to 11/01/33 and Government National Mortgage Assoc. 1.47% maturing 01/16/04 [FRN](c), par value $3,443,532, market value including accrued interest $2,890,812)(b) |
$ | 2,807 | 2,806,563 | ||||
| Time Deposits — 1.4% |
|||||||
| Chase Manhattan Bank |
|||||||
| 0.875%, 01/02/04(b) |
4,087 | 4,087,052 | |||||
| UBS Bank |
|||||||
| 0.938%, 01/02/04(b) |
1,578 | 1,577,992 | |||||
| 5,665,044 | |||||||
| Total Short-Term Investments |
|||||||
| (Cost $135,283,687) |
135,283,687 | ||||||
| Total Investments — 132.2% |
|||||||
| (Cost $472,052,171; Note 5) |
532,221,185 | ||||||
| Liabilities in Excess of |
(129,716,640 | ) | |||||
| Net Assets — 100.0% |
$ | 402,504,545 | |||||
101
Table of Contents
AST Alger All-Cap Growth Portfolio
Schedule of Investments
December 31, 2003
The following abbreviations are used in portfolio descriptions:
| ADR | American Depositary Receipt |
| FRN | Floating Rate Note |
| symbol |
description | |
| * |
Non-income producing security. | |
| (a) |
Portion of securities on loan with an aggregate market value of $127,443,711; cash collateral $132,411,568 was received with which the portfolio purchased securities. | |
| (b) |
Represents security purchased with cash collateral for securities on loan. | |
| (c) |
Indicates a variable rate security. The maturity date presented for these instruments is the latter of the next date on which the security can be redeemed at par or the next date on which the rate of interest is adjusted. The interest rate shown reflects the rate in effect at December 31, 2003. | |
| (j) |
Security available to institutional investors only. | |
See Notes to Financial Statements.
102
Table of Contents
AST Gabelli All-Cap Value Portfolio
Schedule of Investments
December 31, 2003
| Shares |
Value | ||||
| LONG-TERM INVESTMENTS — 91.0% |
|||||
| COMMON STOCK — 90.8% |
|||||
| Aerospace — 1.1% |
|||||
| Curtiss-Wright Corp. (Class “B” Stock) |
1,400 | $ | 62,860 | ||
| General Dynamics Corp. |
2,000 | 180,780 | |||
| Lockheed Martin Corp. |
2,500 | 128,500 | |||
| Northrop Grumman Corp.(a) |
10,700 | 1,022,920 | |||
| Raytheon Co. |
4,000 | 120,160 | |||
| Sequa Corp. (Class “A” Stock)* |
11,000 | 539,000 | |||
| 2,054,220 | |||||
| Automobile Manufacturers — 2.5% |
|||||
| DaimlerChrysler AG*(a) |
43,000 | 1,987,460 | |||
| Ford Motor Co.(a) |
1,000 | 16,000 | |||
| General Motors Corp.(a) |
6,000 | 320,400 | |||
| Monaco Coach Corp.* |
10,000 | 238,000 | |||
| Navistar International Corp.*(a) |
35,000 | 1,676,150 | |||
| PACCAR, Inc. |
3,000 | 255,360 | |||
| 4,493,370 | |||||
| Automotive Parts — 3.7% |
|||||
| AutoNation, Inc.*(a) |
75,000 | 1,377,750 | |||
| BorgWarner, Inc. |
12,000 | 1,020,840 | |||
| Dana Corp. |
140,000 | 2,569,000 | |||
| Exide Technologies*(a) |
20,000 | 500 | |||
| Federal-Mogul Corp.*(a) |
8,000 | 1,800 | |||
| Genuine Parts Co. |
40,000 | 1,328,000 | |||
| Midas, Inc.* |
5,000 | 71,500 | |||
| Myers Industries, Inc. |
29,000 | 351,480 | |||
| Superior Industries International, Inc. |
2,000 | 87,040 | |||
| 6,807,910 | |||||
| Beverages — 1.8% |
|||||
| Coca-Cola Co. |
10,000 | 507,500 | |||
| Coca-Cola Enterprises, Inc. |
30,000 | 656,100 | |||
| Coca-Cola Hellenic Bottling Co. SA [ADR] |
1,500 | 31,620 | |||
| Fomento Economico Mexicano SA de CV [ADR] |
35,000 | 1,290,800 | |||
| PepsiAmericas, Inc. |
40,000 | 684,800 | |||
| Pernod Ricard SA (France) |
200 | 22,238 | |||
| 3,193,058 | |||||
| Broadcasting — 7.6% |
|||||
| Beasley Broadcast Group, Inc.* |
7,500 | 123,225 | |||
| Belo Corp. (Class “A” Stock) |
20,000 | 566,800 | |||
| Crown Media Holdings, Inc.* |
60,000 | 496,200 | |||
| Fox Entertainment Group, Inc. |
35,000 | 1,020,250 | |||
| Gray Television, Inc. |
20,000 | 302,400 | |||
| Grupo Televisa SA [ADR] |
22,000 | 876,920 | |||
| Liberty Corp. (The) |
5,000 | 225,950 | |||
| Liberty Media Corp. (Class “A” Stock)*(a) |
275,533 | 3,276,087 | |||
| Shares |
Value | ||||
| Liberty Media Corp. (Class “B” Stock)* |
500 | $ | 6,900 | ||
| Lin TV Corp. (Class “A” Stock)* |
17,000 | 438,770 | |||
| Media General, Inc. (Class “A” Stock) |
16,500 | 1,074,150 | |||
| Mediaset SPA (Italy) |
4,000 | 47,528 | |||
| Meredith Corp. |
6,000 | 292,860 | |||
| News Corp. Ltd. [ADR](a) |
2,000 | 72,200 | |||
| NRJ Group (France) |
1,000 | 21,317 | |||
| Paxson Communications Corp.* |
81,000 | 311,850 | |||
| Publishing & Broadcasting Ltd. (Australia) |
7,000 | 66,032 | |||
| Scripps, (E.W.) Co. (Class “A” Stock) |
28,000 | 2,635,920 | |||
| UnitedGlobalCom, Inc. (Class “A” Stock)*(a) |
170,216 | 1,443,432 | |||
| Young Broadcasting, Inc. (Class “A” Stock)* |
27,000 | 541,080 | |||
| 13,839,871 | |||||
| Building Materials — 0.2% |
|||||
| Bouygues SA (France) |
750 | 26,224 | |||
| CRH PLC (Ireland) |
3,000 | 61,567 | |||
| Thomas Industries, Inc. |
10,000 | 346,599 | |||
| 434,390 | |||||
| Business Services |
|||||
| Amadeus Global Travel Distribution SA (Spain) |
3,500 | 22,736 | |||
| SGS Societe Generale De Surveillance Holding SA (Switzerland) |
50 | 31,372 | |||
| 54,108 | |||||
| Cable Television — 1.9% |
|||||
| Cablevision Systems New York Group (Class “A” Stock)* |
100,000 | 2,339,000 | |||
| Comcast Corp. (Class “A” Stock)* |
18,000 | 591,660 | |||
| Hughes Electronics Corp.* |
32,929 | 544,969 | |||
| PrimaCom AG [ADR]* |
14,400 | 6,912 | |||
| 3,482,541 | |||||
| Chemicals — 1.8% |
|||||
| Albemarle Corp. |
13,000 | 389,610 | |||
| Great Lakes Chemical Corp.(a) |
40,000 | 1,087,600 | |||
| Hercules, Inc.* |
80,000 | 976,000 | |||
| Sensient Technologies Corp.(a) |
45,000 | 889,650 | |||
| Shin-Etsu Chemical Co. Ltd. (Japan) |
500 | 20,435 | |||
| 3,363,295 | |||||
| Clothing & Apparel |
|||||
| Dior (Christian) SA (France) |
730 | 44,225 | |||
| Swatch Group AG (Switzerland) |
300 | 36,022 | |||
| 80,247 | |||||
| Computer Hardware — 0.3% |
|||||
| Hewlett-Packard Co. |
20,365 | 467,784 | |||
| Computer Services & Software — 0.6% |
|||||
| EMC Corp.* |
14,000 | 180,880 | |||
103
Table of Contents
AST Gabelli All-Cap Value Portfolio
Schedule of Investments
December 31, 2003
| Shares |
Value | ||||
| NIWS Co., Ltd. (Japan) |
8 | $ | 17,915 | ||
| PeopleSoft, Inc.*(a) |
40,000 | 912,000 | |||
| 1,110,795 | |||||
| Conglomerates — 3.2% |
|||||
| Cendant Corp.*(a) |
68,800 | 1,532,176 | |||
| Honeywell International, Inc. |
99,000 | 3,309,570 | |||
| ITT Industries, Inc. |
12,000 | 890,520 | |||
| 5,732,266 | |||||
| Construction — 0.5% |
|||||
| Fleetwood Enterprises, Inc.* |
90,000 | 923,400 | |||
| Sekisui House Ltd. (Japan) |
2,000 | 20,659 | |||
| Technip-Coflexip SA (France) |
200 | 21,645 | |||
| 965,704 | |||||
| Consumer Products & Services — 2.7% |
|||||
| Altadis SA (Spain) |
2,000 | 56,761 | |||
| Boots Group PLC (United Kingdom) |
2,500 | 30,925 | |||
| Church and Dwight Co., Inc. |
15,000 | 594,000 | |||
| Energizer Holdings, Inc.* |
44,000 | 1,652,640 | |||
| Gallaher Group PLC [ADR] |
700 | 29,778 | |||
| Gillette Co. |
10,000 | 367,300 | |||
| Mattel, Inc. |
15,000 | 289,050 | |||
| Procter & Gamble Co. |
13,000 | 1,298,440 | |||
| Rayovac Corp.* |
25,000 | 523,750 | |||
| 4,842,644 | |||||
| Containers & Packaging — 0.1% |
|||||
| Greif, Inc. (Class “A” Stock) |
4,000 | 142,040 | |||
| Electronic Components & Equipment — 2.2% |
|||||
| Agere Systems, Inc. (Class “B” Stock)* |
50,000 | 145,000 | |||
| AMETEK, Inc. |
10,000 | 482,600 | |||
| CTS Corp. |
30,000 | 345,000 | |||
| Eastman Kodak Co.(a) |
15,000 | 385,050 | |||
| General Electric Co.(a) |
40,000 | 1,239,200 | |||
| Magnetek, Inc.* |
22,000 | 144,980 | |||
| Molex, Inc. |
20,000 | 587,200 | |||
| Nintendo Co., Ltd. (Japan) |
300 | 27,993 | |||
| Thomas & Betts Corp.(a) |
30,000 | 686,700 | |||
| Tokyo Electron Ltd. (Japan) |
400 | 30,382 | |||
| 4,074,105 | |||||
| Entertainment & Leisure — 4.9% |
|||||
| Disney (Walt) Co. |
85,000 | 1,983,050 | |||
| Dover Downs Gaming & Entertainment, Inc. |
16,000 | 151,360 | |||
| Dover Motorsports, Inc. |
25,000 | 87,500 | |||
| Gaylord Entertainment Co. (Class “A” Stock)* |
18,000 | 537,300 | |||
| Gemstar-TV Guide International, Inc.* |
100,000 | 505,000 | |||
| Greek Organization of Football Prognostics (Greece) |
1,600 | 23,007 | |||
| Hilton Group PLC (United Kingdom) |
10,000 | 40,234 | |||
| MGM MIRAGE* |
15,000 | 564,150 | |||
| Shares |
Value | ||||
| Pixar, Inc.* |
100 | $ | 6,929 | ||
| Time Warner, Inc.*(a) |
160,000 | 2,878,400 | |||
| Viacom, Inc. |
16,000 | 708,320 | |||
| Vivendi Universal SA [ADR]* |
47,000 | 1,141,160 | |||
| World Wrestling Entertainment, Inc. |
23,500 | 307,850 | |||
| 8,934,260 | |||||
| Environmental Services — 0.6% |
|||||
| Trojan Technologies, Inc. [Canada]* |
30,000 | 170,700 | |||
| Waste Management, Inc. |
30,000 | 888,000 | |||
| 1,058,700 | |||||
| Financial - Bank & Trust — 2.6% |
|||||
| Bank of Ireland [ADR] |
1,000 | 54,940 | |||
| Bank of New York Co., Inc.(a) |
23,000 | 761,760 | |||
| Deutsche Bank AG [ADR]*(a) |
14,000 | 1,150,940 | |||
| PNC Financial Services Group |
15,000 | 820,950 | |||
| UBS AG [ADR]* |
1,000 | 67,990 | |||
| Wilmington Trust Corp. |
50,000 | 1,800,000 | |||
| 4,656,580 | |||||
| Financial Services — 5.6% |
|||||
| American Express Co.(a) |
90,000 | 4,340,700 | |||
| BKF Capital Group, Inc.* |
7,000 | 172,760 | |||
| Countrywide Financial Corp.(a) |
5,333 | 404,508 | |||
| Eaton Vance Corp. |
10,000 | 366,400 | |||
| Fannie Mae |
6,000 | 450,360 | |||
| Freddie Mac |
4,800 | 279,936 | |||
| Irish Life & Permanent PLC (Ireland) |
2,000 | 31,862 | |||
| J.P. Morgan Chase & Co. |
12,000 | 440,760 | |||
| Lehman Brothers Holdings, Inc.(a) |
4,000 | 308,880 | |||
| Merrill Lynch & Co., Inc. |
15,000 | 879,750 | |||
| Nikko Securities Co. Ltd. (Japan) |
7,000 | 38,994 | |||
| Price (T. Rowe) Group, Inc.(a) |
40,000 | 1,896,400 | |||
| Schwab, (Charles) Corp. |
18,000 | 213,120 | |||
| Washington Mutual, Inc. |
7,000 | 280,840 | |||
| 10,105,270 | |||||
| Food — 6.3% |
|||||
| Albertson’s, Inc.(a) |
25,000 | 566,250 | |||
| Archer-Daniels-Midland Co. |
180,000 | 2,739,600 | |||
| Del Monte Foods Co.* |
10,000 | 104,000 | |||
| Diageo PLC [ADR] |
26,000 | 1,374,360 | |||
| Flowers Foods, Inc. |
60,000 | 1,548,000 | |||
| General Mills, Inc.(a) |
20,000 | 906,000 | |||
| Heinz (H.J.) Co. |
30,000 | 1,092,900 | |||
| Kellogg Co. |
15,000 | 571,200 | |||
| Safeway, Inc.* |
60,000 | 1,314,600 | |||
| Smucker (J.M.) Co. (The)(a) |
340 | 15,399 | |||
| Weis Markets, Inc. |
17,000 | 617,100 | |||
| Wrigley (Wm., Jr.) Co. |
11,000 | 618,310 | |||
| 11,467,719 | |||||
| Healthcare Services — 0.1% |
|||||
| Tenet Healthcare Corp.* |
8,000 | 128,400 | |||
104
Table of Contents
AST Gabelli All-Cap Value Portfolio
Schedule of Investments
December 31, 2003
| Shares |
Value | ||||
| Hotels & Motels — 0.1% |
|||||
| Hilton Hotels Corp. |
15,000 | $ | 256,950 | ||
| Industrial Products — 1.8% |
|||||
| Cooper Industries Ltd. (Class “A” Stock) |
40,000 | 2,317,200 | |||
| Crane Co.(a) |
30,000 | 922,200 | |||
| 3,239,400 | |||||
| Insurance — 1.2% |
|||||
| Alleghany Corp.* |
2,040 | 453,900 | |||
| Argonaut Group, Inc.* |
14,000 | 217,560 | |||
| Hartford Financial Services Group, Inc. (The) |
5,000 | 295,150 | |||
| Leucadia National Corp. |
5,000 | 230,500 | |||
| MONY Group, Inc. (The)*(a) |
10,000 | 312,900 | |||
| Riunione Adriatica di Sicurta SPA (Italy) |
1,300 | 22,137 | |||
| UnumProvident Corp.(a) |
21,000 | 331,170 | |||
| White Mountain Insurance Group* |
600 | 275,970 | |||
| 2,139,287 | |||||
| Internet Services — 0.2% |
|||||
| Checkfree Corp.* |
3,000 | 82,950 | |||
| eBay, Inc.*(a) |
200 | 12,918 | |||
| InterActiveCorp.*(a) |
6,000 | 203,580 | |||
| 299,448 | |||||
| Machinery & Equipment — 2.4% |
|||||
| AGCO Corp.* |
40,000 | 805,600 | |||
| Deere & Co. |
20,000 | 1,301,000 | |||
| Flowserve Corp.* |
10,000 | 208,800 | |||
| Gencorp, Inc. |
55,000 | 592,350 | |||
| Thermo Electron Corp.* |
60,000 | 1,512,000 | |||
| 4,419,750 | |||||
| Medical Supplies & Equipment — 2.2% |
|||||
| Apogent Technologies, Inc.* |
11,000 | 253,440 | |||
| Aventis SA [ADR] |
500 | 33,130 | |||
| Baxter International, Inc. |
6,000 | 183,120 | |||
| Bio-Rad Laboratories, Inc.* |
3,000 | 173,010 | |||
| DENTSPLY International, Inc. |
3,000 | 135,510 | |||
| Henry Schein, Inc.* |
10,000 | 675,800 | |||
| ICU Medical, Inc.* |
4,000 | 137,120 | |||
| Inamed Corp.* |
15,000 | 720,900 | |||
| Invitrogen Corp.*(a) |
7,000 | 490,000 | |||
| Nakanishi, Inc. (Japan) |
1,000 | 43,342 | |||
| Owens & Minor, Inc. |
15,000 | 328,650 | |||
| Patterson Dental Co.* |
1,500 | 96,240 | |||
| Sybron Dental Specialties, Inc.* |
27,000 | 758,701 | |||
| Synthes-Stratec, Inc. (Switzerland) |
35 | 34,639 | |||
| 4,063,602 | |||||
| Metals & Mining — 0.8% |
|||||
| Alcoa, Inc.(a) |
7,000 | 266,000 | |||
| Harmony Gold Mining Co. [ADR] |
5,000 | 81,150 | |||
| Shares |
Value | ||||
| Newmont Mining Corp. |
6,000 | $ | 291,660 | ||
| Precision Castparts Corp.(a) |
17,636 | 800,851 | |||
| 1,439,661 | |||||
| Oil & Gas — 4.7% |
|||||
| Baker Hughes, Inc. |
16,200 | 520,992 | |||
| Burlington Resources, Inc. |
30,000 | 1,661,399 | |||
| ConocoPhillips |
19,594 | 1,284,779 | |||
| Devon Energy Corp.(a) |
18,000 | 1,030,680 | |||
| El Paso Corp. |
62,000 | 507,780 | |||
| Eni SPA [ADR] |
550 | 52,239 | |||
| ENSCO International, Inc. |
5,000 | 135,850 | |||
| Equitable Resources, Inc. |
6,000 | 257,520 | |||
| Halliburton Co.(a) |
4,000 | 104,000 | |||
| Kerr-McGee Corp. |
20,000 | 929,800 | |||
| National Fuel Gas Co. |
38,000 | 928,720 | |||
| ONEOK, Inc.(a) |
30,000 | 662,400 | |||
| Questar Corp. |
10,000 | 351,500 | |||
| Total SA [ADR] |
750 | 69,383 | |||
| 8,497,042 | |||||
| Paper & Forest Products — 0.3% |
|||||
| International Paper Co. |
6,000 | 258,660 | |||
| MeadWestvaco Corp. |
8,000 | 238,000 | |||
| 496,660 | |||||
| Pharmaceuticals — 2.0% |
|||||
| AstraZeneca PLC [ADR](a) |
1,000 | 48,380 | |||
| Bristol-Myers Squibb Co.(a) |
40,000 | 1,144,000 | |||
| GlaxoSmithKline PLC [ADR] |
1,750 | 81,585 | |||
| Merck & Co., Inc. |
8,000 | 369,600 | |||
| Novartis AG [ADR] |
1,500 | 68,835 | |||
| Pfizer, Inc. |
47,000 | 1,660,509 | |||
| Roche Holding AG (Switzerland) |
600 | 60,522 | |||
| Sanofi-Sythelabo SA [ADR] |
1,500 | 56,625 | |||
| Takeda Chemical Industries Ltd. (Japan) |
700 | 27,760 | |||
| Wyeth |
4,000 | 169,800 | |||
| 3,687,616 | |||||
| Printing & Publishing — 5.0% |
|||||
| Journal Register Co.* |
10,000 | 207,000 | |||
| Knight-Ridder, Inc. |
14,000 | 1,083,180 | |||
| McGraw-Hill Companies, Inc. |
5,000 | 349,600 | |||
| New York Times Co. (Class “A” Stock) |
30,000 | 1,433,700 | |||
| Pearson PLC (ADR) |
2,300 | 25,783 | |||
| PRIMEDIA, Inc.* |
50,000 | 141,500 | |||
| Pulitzer, Inc. |
25,000 | 1,350,000 | |||
| Readers Digest Association, Inc.(a) |
20,894 | 306,306 | |||
| Tribune Co.(a) |
55,000 | 2,838,000 | |||
| Washington Post Co. (Class “B” Stock) |
1,700 | 1,345,380 | |||
| 9,080,449 | |||||
| Real Estate |
|||||
| Cheung Kong Holdings Ltd. |
3,000 | 23,861 | |||
105
Table of Contents
AST Gabelli All-Cap Value Portfolio
Schedule of Investments
December 31, 2003
| Shares |
Value | ||||
| Retail & Merchandising — 0.6% |
|||||
| Big 5 Sporting Goods Corp.* |
3,000 | $ | 62,850 | ||
| Blockbuster, Inc. (Class “A” Stock)(a) |
2,000 | 35,900 | |||
| Compagnie Financiere Richemont AG (Switzerland) |
2,700 | 64,839 | |||
| Matsumotokiyoshi Co., LTD (Japan)* |
400 | 8,976 | |||
| Matsumotokiyoshi Co., LTD (Japan)* WI |
400 | 8,976 | |||
| Neiman Marcus Group, Inc. (Class “A” Stock)* |
17,000 | 912,391 | |||
| 1,093,932 | |||||
| Semiconductors — 0.7% |
|||||
| Rohm Co. Ltd. (Japan) |
300 | 35,159 | |||
| Texas Instruments, Inc. |
45,000 | 1,322,100 | |||
| 1,357,259 | |||||
| Telecommunications — 10.6% |
|||||
| AT&T Corp.(a) |
25,000 | 507,500 | |||
| BCE, Inc. |
25,000 | 559,000 | |||
| BT Group PLC [ADR] |
15,000 | 513,300 | |||
| Cable & Wireless Communications PLC [ADR] |
25,000 | 175,250 | |||
| CenturyTel, Inc.(a) |
80,000 | 2,609,599 | |||
| Cincinnati Bell, Inc.*(a) |
130,000 | 656,500 | |||
| Commonwealth Telephone Enterprises, Inc.*(a) |
14,490 | 546,998 | |||
| Corning, Inc.* |
140,000 | 1,460,200 | |||
| France Telecom SA [ADR] |
1,000 | 28,590 | |||
| IDT Corp.* |
200 | 4,430 | |||
| IDT Corp. (Class “B” Stock)* |
200 | 4,626 | |||
| Ito-Yokado Co. Ltd. (Japan) |
1,000 | 31,445 | |||
| KDDI Corp. (Japan) |
6 | 34,375 | |||
| Lucent Technologies, Inc.* |
186,000 | 528,240 | |||
| MMO2 PLC [ADR]* |
60,000 | 819,600 | |||
| Motorola, Inc. |
145,000 | 2,040,150 | |||
| Nextel Communications, Inc. (Class “A” Stock)* |
25,000 | 701,500 | |||
| Nextel Partners, Inc. (Class “A” Stock)*(a) |
25,000 | 336,250 | |||
| Nortel Networks Corp.* |
70,000 | 296,100 | |||
| Price Communications Corp.* |
38,000 | 521,740 | |||
| Qualcomm, Inc. |
2,000 | 107,860 | |||
| Qwest Communications International, Inc.* |
260,000 | 1,123,200 | |||
| Sprint Corp.(a) |
65,000 | 1,067,300 | |||
| Sprint Corp. (PCS Group)*(a) |
140,000 | 786,800 | |||
| Telecom Italia SPA (Italy)* |
15,000 | 44,463 | |||
| Telefonica Moviles, SA (Spain) |
2,500 | 26,110 | |||
| Telephone & Data Systems, Inc. |
19,000 | 1,188,450 | |||
| United States Cellular Corp.* |
35,000 | 1,242,500 | |||
| Verizon Communications, Inc. |
25,000 | 877,000 | |||
| Vodafone Group PLC [ADR](a) |
2,000 | 50,080 | |||
| Western Wireless Corp. (Class “A” Stock)* |
12,000 | 220,320 | |||
| 19,109,476 | |||||
| Shares |
Value | |||||
| Utilities — 7.9% |
||||||
| AES Corp.* |
127,500 | $ | 1,203,600 | |||
| Allegheny Energy, Inc.*(a) |
60,000 | 765,600 | ||||
| Aquila, Inc.* |
125,000 | 423,750 | ||||
| CH Energy Group, Inc. |
7,000 | 328,300 | ||||
| Cinergy Corp.(a) |
42,000 | 1,630,019 | ||||
| Cleco Corp. |
10,000 | 179,800 | ||||
| Constellation Energy Group, Inc. |
30,000 | 1,174,800 | ||||
| DPL, Inc. |
28,000 | 584,640 | ||||
| Duke Energy Corp.(a) |
12,000 | 245,400 | ||||
| Duquesne Light Holdings, Inc.(a) |
48,000 | 880,320 | ||||
| El Paso Electric Co.* |
38,100 | 508,635 | ||||
| FirstEnergy Corp. |
10,000 | 352,000 | ||||
| Great Plains Energy, Inc. |
40,000 | 1,272,800 | ||||
| Mirant Corp.*(a) |
200,000 | 78,000 | ||||
| NiSource, Inc. |
10,000 | 219,400 | ||||
| Northeast Utilities(a) |
75,000 | 1,512,750 | ||||
| NUI Corp. |
5,000 | 80,600 | ||||
| PPL Corp.(a) |
2,000 | 87,500 | ||||
| Public Service Enterprise Group, Inc.(a) |
8,200 | 359,160 | ||||
| Sierra Pacific Resources*(a) |
30,000 | 220,200 | ||||
| Teco Energy, Inc.(a) |
38,000 | 547,580 | ||||
| UIL Holdings Corp. |
3,000 | 135,300 | ||||
| Unisource Energy Corp. |
10,000 | 246,600 | ||||
| Wisconsin Energy Corp. |
20,000 | 669,000 | ||||
| Xcel Energy, Inc.(a) |
32,000 | 543,360 | ||||
| 14,249,114 | ||||||
| Total Common Stock |
||||||
| (Cost $141,788,324) |
164,942,784 | |||||
| PREFERRED STOCK — 0.2% |
||||||
| Broadcasting |
||||||
| News Corp. Ltd. [ADR] |
||||||
| (Cost $447,655) |
14,684 | 444,190 | ||||
| Total Long-Term Investments |
||||||
| (Cost $142,235,979) |
165,386,974 | |||||
| Par (000) |
||||||
| SHORT-TERM INVESTMENTS — 32.3% |
||||||
| Certificate of Deposit — 0.3% |
||||||
| Svenska Handelsbank, Inc. |
||||||
| 1.39%, 10/27/04(b) |
$ | 579 | 579,432 | |||
| Commercial Paper — 4.7% |
||||||
| Cancara Asset Securitisation Ltd. |
||||||
| 1.11%, 01/12/04(b) |
350 | 349,475 | ||||
| Concord Minutemen Capital Co. |
||||||
| 1.13%, 02/12/04(b) |
342 | 341,031 | ||||
| Crown Point Capital Co. |
||||||
| 1.11%, 01/16/04(b) |
86 | 85,689 | ||||
| General Electric Capital Corp. |
||||||
| 1.11%, 02/05/04(b) |
688 | 686,485 | ||||
106
Table of Contents
AST Gabelli All-Cap Value Portfolio
Schedule of Investments
December 31, 2003
| Par (000) |
Value | |||||
| Lexington Parker Capital Co. |
||||||
| 1.10%, 01/12/04(b) |
$ | 1,302 | $ | 1,299,633 | ||
| Monumental Global Funding |
||||||
| 1.141%, 01/29/04 [FRN](b)(c) |
1,891 | 1,895,691 | ||||
| Silver Tower U.S. Funding |
||||||
| 1.13%, 02/02/04(b) |
2,864 | 2,856,064 | ||||
| Tannehill Capital Co. |
||||||
| 1.11%, 01/13/04(b) |
293 | 292,856 | ||||
| Tulip Funding Corp. |
||||||
| 1.10%, 01/21/04(b) |
804 | 803,593 | ||||
| 8,610,517 | ||||||
| Corporate Obligations — 9.6% |
||||||
| American Express Centurian |
||||||
| 1.118%, 01/22/04 [FRN](b)(c) |
307 | 307,066 | ||||
| 1.144%, 01/22/04 [FRN](b)(c) |
14 | 14,398 | ||||
| 1.131%, 01/29/04 [FRN](b)(c) |
1,203 | 1,202,504 | ||||
| Bear Stearns Co., Inc. |
||||||
| 1.12%, 01/02/04 [FRN](b)(c) |
3,915 | 3,914,602 | ||||
| Canadian Imperial Bank of Commerce |
||||||
| 1.111%, 01/29/04 [FRN](b)(c) |
1,001 | 1,001,261 | ||||
| Goldman Sachs Group, Inc. |
||||||
| 1.14%, 01/06/04 [FRN](b)(c) |
1,597 | 1,597,407 | ||||
| Merrill Lynch & Co., Inc. |
||||||
| 1.13%, 01/02/04(b) |
390 | 389,603 | ||||
| 1.13%, 01/02/04 [FRN](b)(c) |
2,182 | 2,181,260 | ||||
| Morgan Stanley |
||||||
| 1.03%, 01/02/04 [FRN](b)(c) |
1,140 | 1,140,058 | ||||
| 1.08%, 01/02/04 [FRN](b)(c) |
1,897 | 1,896,555 | ||||
| Natexis Banques Populaires |
||||||
| 1.035%, 01/02/04 [FRN](b)(c) |
730 | 729,832 | ||||
| 1.10%, 01/02/04 [FRN](b)(c) |
2,556 | 2,555,753 | ||||
| Westdeutsche Landesbank |
||||||
| 1.13%, 01/09/04 [FRN](b)(c) |
145 | 144,579 | ||||
| 1.111%, 01/23/04 [FRN](b)(c) |
66 | 66,216 | ||||
| 1.111%, 01/29/04 [FRN](b)(c) |
303 | 302,469 | ||||
| 17,443,563 | ||||||
| Shares |
||||||
| Non-Registered Investment Company — 7.7% |
||||||
| BlackRock Institutional Money Market Trust(b)(j) |
14,082,195 | 14,082,195 | ||||
| Registered Investment Companies — 8.3% |
||||||
| BlackRock Provident Institutional Funds TempCash Portfolio |
7,538,660 | 7,538,660 | ||||
| BlackRock Provident Institutional Funds TempFund Portfolio |
7,538,658 | 7,538,658 | ||||
| 15,077,318 | ||||||
| Par (000) |
Value |
||||||
| Repurchase Agreement — 0.9% |
|||||||
| Merrill Lynch & Co., Inc. |
|||||||
| 1.00%, dated 12/31/03, to be repurchased on 01/02/04, repurchase price $1,623,438 (Collateralized by Federal Home Loan Mortgage Corp. 5.50% maturing 12/01/33, Federal National Mortgage Assoc. 4.00% - 6.00% maturing 11/01/17 to 11/01/33 and Government National Mortgage Assoc. 1.47% maturing 01/16/04 [FRN](c), par value $1,991,778, market value including accrued interest $1,672,079)(b) |
$ | 1,623 | $ | 1,623,348 | |||
| Time Deposits — 0.8% |
|||||||
| Chase Manhattan Bank |
|||||||
| 0.875%, 01/02/04(b) |
959 | 959,416 | |||||
| UBS Bank |
|||||||
| 0.938%, 01/02/04(b) |
415 | 415,396 | |||||
| 1,374,812 | |||||||
| Total Short-Term Investments |
|||||||
| (Cost $58,791,185) |
58,791,185 | ||||||
| Total Investments — 123.3% |
|||||||
| (Cost $201,027,164; Note 5) |
224,178,159 | ||||||
| Liabilities in Excess of |
(42,304,444 | ) | |||||
| Net Assets — 100.0% |
$ | 181,873,715 | |||||
107
Table of Contents
AST Gabelli All-Cap Value Portfolio
Schedule of Investments
December 31, 2003
The following abbreviations are used in portfolio descriptions:
| ADR | American Depositary Receipt |
| FRN | Floating Rate Note |
| symbol |
description | |
| * |
Non-income producing security. | |
| (a) |
Portion of securities on loan with an aggregate market value of $41,967,791; cash collateral $43,713,867 was received with which the portfolio purchased securities. | |
| (b) |
Represents security purchased with cash collateral for securities on loan. | |
| (c) |
Indicates a variable rate security. The maturity date presented for these instruments is the latter of the next date on which the security can be redeemed at par or the next date on which the rate of interest is adjusted. The interest rate shown reflects the rate in effect at December 31, 2003. | |
| (j) |
Security available to institutional investors only. | |
See Notes to Financial Statements.
108
Table of Contents
AST T. Rowe Price Natural Resources Portfolio
Schedule of Investments
December 31, 2003
| Shares |
Value | ||||
| LONG-TERM INVESTMENTS — 97.2% |
|||||
| COMMON STOCK — 96.4% |
|||||
| Building & Real Estate — 4.7% |
|||||
| AMB Property Corp. [REIT] |
34,800 | $ | 1,144,224 | ||
| Archstone Smith Trust [REIT] |
31,000 | 867,380 | |||
| Boston Properties, Inc. [REIT] |
16,700 | 804,773 | |||
| Camden Property Trust [REIT] |
24,000 | 1,063,200 | |||
| Catellus Development Corp. |
56,085 | 1,352,770 | |||
| Duke-Weeks Realty Corp. [REIT] |
38,630 | 1,197,530 | |||
| Rouse Co. [REIT] |
35,500 | 1,668,500 | |||
| 8,098,377 | |||||
| Building Materials — 1.4% |
|||||
| Carpenter Technology Corp. |
36,500 | 1,079,305 | |||
| Walter Industries, Inc. |
94,400 | 1,260,240 | |||
| 2,339,545 | |||||
| Chemicals — 9.6% |
|||||
| Agrium, Inc. (Canada) |
336,100 | 5,532,206 | |||
| Dow Chemical Co. |
60,100 | 2,498,357 | |||
| Hercules, Inc.* |
150,900 | 1,840,980 | |||
| IMC Global, Inc.*(a) |
132,300 | 1,313,739 | |||
| Octel Corp. |
36,975 | 728,038 | |||
| Potash Corp. of Saskatchewan, Inc. (Canada)(a) |
51,700 | 4,471,016 | |||
| 16,384,336 | |||||
| Containers & Packaging — 2.0% |
|||||
| Packaging Corp. of America |
71,700 | 1,567,362 | |||
| Smurfit-Stone Container Corp.*(a) |
96,962 | 1,800,584 | |||
| 3,367,946 | |||||
| Diversified Metals — 4.0% |
|||||
| Companhia Vale Do Rio Doce (Class “A” Stock) [ADR] |
24,000 | 1,236,240 | |||
| Companhia Vale Do Rio Doce [ADR] |
5,000 | 292,500 | |||
| Inco Ltd. (Canada)* |
61,700 | 2,456,894 | |||
| Nucor Corp.(a) |
49,700 | 2,783,200 | |||
| 6,768,834 | |||||
| Energy Services — 2.2% |
|||||
| Massey Energy Co. |
38,600 | 802,880 | |||
| Peabody Energy Corp. |
27,500 | 1,147,025 | |||
| W-H Energy Services, Inc.* |
114,900 | 1,861,380 | |||
| 3,811,285 | |||||
| Exploration & Production — 9.1% |
|||||
| Devon Energy Corp.(a) |
79,957 | 4,578,338 | |||
| Encore Acquisition Co.* |
46,400 | 1,143,760 | |||
| Shares |
Value | ||||
| Forest Oil Corp.* |
54,380 | $ | 1,553,637 | ||
| Global Industries Ltd.* |
117,700 | 606,155 | |||
| Kerr-McGee Corp. |
28,800 | 1,338,912 | |||
| Layne Christensen Co.* |
79,700 | 936,475 | |||
| Murphy Oil Corp.(a) |
77,500 | 5,061,524 | |||
| Tom Brown, Inc.* |
9,400 | 303,150 | |||
| 15,521,951 | |||||
| Farming & Agriculture — 0.8% |
|||||
| Delta and Pine Land Co. |
50,900 | 1,292,860 | |||
| Gas Transmission & Distribution — 1.0% |
|||||
| Gazprom [ADR] 144A (cost $1,291,335; purchased 06/24/03 - 07/03/03)(g) |
67,000 | 1,735,300 | |||
| Integrated Petroleum — 18.7% |
|||||
| Amerada Hess Corp. |
54,300 | 2,887,131 | |||
| Baker Hughes, Inc. |
98,900 | 3,180,624 | |||
| BP PLC [ADR](a) |
82,300 | 4,061,505 | |||
| ChevronTexaco Corp. |
23,028 | 1,989,389 | |||
| ENI Co. SPA [ADR](a) |
18,000 | 1,709,640 | |||
| Exxon Mobil Corp. |
106,000 | 4,346,000 | |||
| Lukoil Holding [ADR] |
6,900 | 641,700 | |||
| Marathon Oil Corp. |
105,600 | 3,494,304 | |||
| Royal Dutch Petroleum Co. . |
83,800 | 4,390,282 | |||
| Total Fina SA [ADR] |
51,700 | 4,782,767 | |||
| Yukos [ADR] |
12,127 | 516,610 | |||
| 31,999,952 | |||||
| Machinery & Equipment — 4.4% |
|||||
| Cooper Cameron Corp.*(a) |
50,500 | 2,353,300 | |||
| Deere & Co. |
18,900 | 1,229,445 | |||
| Grant Prideco, Inc.*(a) |
42,400 | 552,048 | |||
| Hydril Co.* |
96,900 | 2,318,817 | |||
| Joy Global, Inc. |
42,500 | 1,111,375 | |||
| 7,564,985 | |||||
| Metals & Mining — 11.9% |
|||||
| Alcoa, Inc.(a) |
107,184 | 4,072,992 | |||
| Arch Coal, Inc.(a) |
89,400 | 2,786,598 | |||
| BHP Billiton Ltd. (Australia) |
137,400 | 1,261,956 | |||
| International Steel Group, Inc.*(a) |
58,700 | 2,286,365 | |||
| JSC MMC Norilsk Nickel [ADR] |
27,300 | 1,778,595 | |||
| Newmont Mining Corp.(a) |
78,826 | 3,831,732 | |||
| Noranda, Inc. (Canada) |
98,450 | 1,561,417 | |||
| Teck Corp. [CVT] |
161,100 | 2,733,867 | |||
| 20,313,522 | |||||
| Non-Ferrous Metals — 1.3% |
|||||
| Phelps Dodge Corp.*(a) |
28,800 | 2,191,392 | |||
109
Table of Contents
AST T. Rowe Price Natural Resources Portfolio
Schedule of Investments
December 31, 2003
| Shares |
Value | ||||
| Oil & Gas — 8.4% |
|||||
| Diamond Offshore Drilling, Inc.(a) |
124,900 | $ | 2,561,699 | ||
| Helmerich & Payne, Inc. |
27,800 | 776,454 | |||
| Nabors Industries, Inc.*(a) |
30,500 | 1,265,750 | |||
| Premcor, Inc.* |
49,100 | 1,276,600 | |||
| Schlumberger Ltd.(a) |
68,400 | 3,742,848 | |||
| Seacor Smit, Inc.* |
19,850 | 834,296 | |||
| Tidewater, Inc. |
38,600 | 1,153,368 | |||
| Transocean, Inc.*(a) |
116,600 | 2,799,566 | |||
| 14,410,581 | |||||
| Paper & Forest Products — 4.6% |
|||||
| Bowater, Inc.(a) |
51,700 | 2,394,227 | |||
| International Paper Co. |
12,400 | 534,564 | |||
| Kimberly-Clark Corp. |
18,200 | 1,075,438 | |||
| Longview Fibre Co.* |
40,300 | 497,705 | |||
| MeadWestvaco Corp. |
29,600 | 880,600 | |||
| Potlatch Corp. |
69,500 | 2,416,515 | |||
| 7,799,049 | |||||
| Petroleum Exploration & Production — 11.0% |
|||||
| BG Group PLC (United Kingdom) |
433,600 | 2,225,789 | |||
| BJ Services Co.* |
62,600 | 2,247,340 | |||
| Canadian Natural Resources Ltd. (Canada)(a) |
20,500 | 1,034,020 | |||
| Cimarex Energy Co.* |
11,973 | 319,559 | |||
| ConocoPhillips |
19,939 | 1,307,400 | |||
| EOG Resources, Inc. |
12,300 | 567,891 | |||
| FMC Technologies, Inc.* |
102,800 | 2,395,240 | |||
| Noble Corp.* |
48,000 | 1,717,440 | |||
| Noble Energy, Inc. |
13,100 | 582,033 | |||
| Smith International, Inc.* |
22,700 | 942,504 | |||
| Ultra Petroleum Corp.* |
74,600 | 1,836,652 | |||
| Unocal Corp. |
44,400 | 1,635,252 | |||
| Westport Resources Corp.* |
38,300 | 1,143,638 | |||
| XTO Energy, Inc.(a) |
27,966 | 791,438 | |||
| 18,746,196 | |||||
| Precious Metals — 0.9% |
|||||
| Meridian Gold Inc* |
109,000 | 1,592,490 | |||
| Transportation — 0.4% |
|||||
| Norfolk Southern Corp. |
31,600 | 747,340 | |||
| Total Common Stock |
|||||
| (Cost $140,116,806) |
164,685,941 | ||||
| Moody’s Rating (Unaudited) |
Par (000) |
Value | ||||||
| CORPORATE OBLIGATION — 0.8% |
||||||||
| Metals & Mining |
||||||||
| Teck Cominco Ltd. |
||||||||
| (Cost $1,180,737) |
Ba1 | $ | 1,336 | $ | 1,289,240 | |||
| Total Long-Term Investments |
||||||||
| (Cost $141,297,543) |
165,975,181 | |||||||
| SHORT-TERM INVESTMENTS — 22.9% |
||||||||
| Commercial Paper — 5.2% |
||||||||
| Cancarra AB |
2,780 | 2,778,045 | ||||||
| Concord Minutemen Capital Co. |
68 | 68,015 | ||||||
| Fairway Finance Corp. |
1,126 | 1,122,522 | ||||||
| Greyhawk Funding LLC |
620 | 619,906 | ||
| Lexington Parker Capital Co. |
1,021 | 1,018,640 | ||
| Silver Tower U.S. Funding |
1,038 | 1,035,492 | ||
| Tannehill Capital Co. |
||||
| 1.10%, 01/08/04(b) |
2,180 | 2,174,289 | ||
| 8,816,909 | ||||
| Corporate Obligations — 5.8% |
||||
| General Electric Capital Corp. |
||||
| 1.13%, 01/02/04 [FRN](b)(c) |
13 | 12,902 | ||
| Goldman Sachs Group, Inc. |
||||
| 1.14%, 01/06/04 [FRN](b)(c) |
2,055 | 2,055,192 | ||
| Merrill Lynch & Co., Inc. |
||||
| 1.13%, 01/02/04(b) |
175 | 174,517 | ||
| 1.13%, 01/02/04 [FRN](b)(c) |
562 | 562,280 | ||
| Morgan Stanley |
||||
| 1.03%, 01/02/04 [FRN](b)(c) |
2,881 | 2,880,630 | ||
| 1.08%, 01/02/04 [FRN](b)(c) |
721 | 720,987 | ||
| Natexis Banques Populaires |
||||
| 1.10%, 01/02/04 [FRN](b)(c) |
998 | 997,331 | ||
| Westdeutsche Landesbank |
||||
| 1.13%, 01/09/04 [FRN](b)(c) |
748 | 747,600 | ||
| 1.111%, 01/23/04 [FRN](b)(c) |
1,849 | 1,848,404 | ||
| 9,999,843 | ||||
110
Table of Contents
AST T. Rowe Price Natural Resources Portfolio
Schedule of Investments
December 31, 2003
| Shares |
Value | |||||
| Non-Registered Investment Company — 5.8% |
||||||
| BlackRock Institutional Money Market Trust(b) |
9,874,323 | $ | 9,874,323 | |||
| Registered Investment Company — 5.2% |
||||||
| BlackRock Provident Institutional Funds TempCash Portfolio |
8,928,021 | 8,928,021 | ||||
| Par (000) |
||||||
| Repurchase Agreement — 0.4% |
||||||
| Merrill Lynch & Co., Inc. |
||||||
| 1.00%, dated 12/31/03, to be repurchased on 01/02/04, repurchase price $727,196 (Collateralized by Federal Home Loan Mortgage Corp. 5.50% maturing 12/01/33, Federal National Mortgage Assoc. 4.00%-6.00% maturing 11/01/17 to 11/01/33 and Government National Mortgage Assoc. 1.47% maturing 01/16/04 [FRN](c), par value $892,188) market value including accrued interest $748,984)(b) |
$ | 727 | 727,155 | |||
| Par (000) |
Value |
||||||
| Time Deposits — 0.5% |
|||||||
| Chase Manhattan Bank |
|||||||
| 0.875%, 01/02/04(b) |
$ | 430 | $ | 430,018 | |||
| UBS Bank |
|||||||
| 0.938%, 01/02/04(b) |
430 | 430,334 | |||||
| 860,352 | |||||||
| Total Short-Term Investments |
|||||||
| (Cost $39,206,603) |
39,206,603 | ||||||
| Total Investments — 120.1% |
|||||||
| (Cost $180,504,146; Note 5) |
205,181,784 | ||||||
| Liabilities in Excess of |
(34,321,528 | ) | |||||
| Net Assets — 100.0% |
$ | 170,860,256 | |||||
The following abbreviations are used in portfolio descriptions:
| 144A | Security was purchased pursuant to Rule 144A under the securities Act of 1933 and may not be resold subject to that rule except to qualified institutional buyers. Unless otherwise noted 144A securities are deemed to be liquid. |
| ADR | American Depositary Receipt |
| CVT | Convertible Security |
| FRN | Floating Rate Note |
| REIT | Real Estate Investment Trust |
| symbol |
description | |
| * |
Non-income producing security. | |
| (a) |
Portion of securities on loan with an aggregate market value of $28,343,578; cash collateral $29,658,676 was received with which the portfolio purchased securities. | |
| (b) |
Represents security purchased with cash collateral for securities on loan. | |
| (c) |
Indicates a variable rate security. The maturity date presented for these instruments is the latter of the next date on which the security can be redeemed at par or the next date on which the rate of interest is adjusted. The interest rate shown reflects the rate in effect at December 31, 2003. | |
| (g) |
Indicates a security that has been deemed illiquid. The aggregate cost of the illiquid securities is $1,911,241. The aggregate value, $2,355,206 represents 1.38% of net assets. | |
| (h) |
Indicates a restricted security; the aggregate cost of the restricted security is $619,906. The aggregate value, $619,906 is approximately 0.36% of net assets. | |
| (j) |
Security available to institutional investors only. | |
See Notes to Financial Statements.
111
Table of Contents
Schedule of Investments
December 31, 2003
| Shares |
Value | ||||
| LONG-TERM INVESTMENTS — 99.8% |
|||||
| COMMON STOCK |
|||||
| Broadcasting — 2.8% |
|||||
| Clear Channel Communications, Inc. |
81,200 | $ | 3,802,596 | ||
| Liberty Media Corp. (Class “A” Stock)* |
101,400 | 1,205,646 | |||
| Scripps (E.W.) Co. (Class “A” Stock) |
16,900 | 1,590,966 | |||
| 6,599,208 | |||||
| Cable Television — 2.4% |
|||||
| Comcast Corp. (Special Class “A” Stock)*(a) |
182,200 | 5,699,216 | |||
| Computer Hardware — 3.5% |
|||||
| Dell, Inc.* |
244,900 | 8,316,804 | |||
| Computer Services & Software — 15.0% |
|||||
| Cisco Systems, Inc.* |
366,000 | 8,890,140 | |||
| Electronic Arts, Inc.*(a) |
83,800 | 4,003,964 | |||
| EMC Corp.* |
240,000 | 3,100,800 | |||
| Microsoft Corp. |
507,200 | 13,968,288 | |||
| Symantec Corp.*(a) |
60,200 | 2,085,930 | |||
| Veritas Software Corp.*(a) |
95,800 | 3,559,928 | |||
| 35,609,050 | |||||
| Consumer Products & Services — 2.8% |
|||||
| Avon Products, Inc. |
49,900 | 3,367,751 | |||
| Procter & Gamble Co. |
33,300 | 3,326,004 | |||
| 6,693,755 | |||||
| Electronic Components & Equipment — 4.3% |
|||||
| General Electric Co. |
326,700 | 10,121,166 | |||
| Entertainment & Leisure — 4.7% |
|||||
| Time Warner, Inc.*(a) |
103,800 | 1,867,362 | |||
| Viacom, Inc. (Class “B” Stock) |
208,500 | 9,253,230 | |||
| 11,120,592 | |||||
| Financial - Bank & Trust — 0.5% |
|||||
| Bank One Corp. |
27,700 | 1,262,843 | |||
| Financial Services — 14.1% |
|||||
| Citigroup, Inc. |
215,300 | 10,450,662 | |||
| Fannie Mae |
41,200 | 3,092,472 | |||
| Franklin Resources, Inc. |
9,500 | 494,570 | |||
| Goldman Sachs Group, Inc. |
12,500 | 1,234,125 | |||
| J.P. Morgan Chase & Co. |
34,400 | 1,263,512 | |||
| Lehman Brothers Holdings, Inc. |
31,500 | 2,432,430 | |||
| MBNA Corp. |
286,500 | 7,119,525 | |||
| Merrill Lynch & Co., Inc. |
42,300 | 2,480,895 | |||
| Morgan Stanley Dean Witter & Co. |
82,100 | 4,751,127 | |||
| 33,319,318 | |||||
| Healthcare Services — 2.4% |
|||||
| UnitedHealth Group, Inc.(a) |
98,500 | 5,730,730 | |||
| Shares |
Value | ||||
| Insurance — 7.1% |
|||||
| ACE Ltd. |
45,900 | $ | 1,901,178 | ||
| American International Group, Inc. |
144,400 | 9,570,832 | |||
| Progressive Corp. (The) |
63,600 | 5,316,324 | |||
| 16,788,334 | |||||
| Internet Services — 4.0% |
|||||
| eBay, Inc.*(a) |
73,700 | 4,760,283 | |||
| Yahoo!, Inc.*(a) |
102,600 | 4,634,442 | |||
| 9,394,725 | |||||
| Medical Supplies & Equipment — 6.9% |
|||||
| Alcon, Inc. (Switzerland) |
17,900 | 1,083,666 | |||
| Amgen, Inc.* |
100,100 | 6,186,180 | |||
| Boston Scientific Corp.* |
55,000 | 2,021,800 | |||
| Medtronic, Inc. |
130,100 | 6,324,161 | |||
| Zimmer Holdings, Inc.* |
12,200 | 858,880 | |||
| 16,474,687 | |||||
| Pharmaceuticals — 5.4% |
|||||
| Forest Laboratories, Inc.* |
11,800 | 729,240 | |||
| Gilead Sciences, Inc.*(a) |
22,400 | 1,302,336 | |||
| Pfizer, Inc. |
303,800 | 10,733,254 | |||
| 12,764,830 | |||||
| Retail & Merchandising — 10.9% |
|||||
| Bed Bath & Beyond, Inc.* |
50,500 | 2,189,175 | |||
| Family Dollar Stores, Inc. |
9,500 | 340,860 | |||
| Kohl’s Corp.* |
24,200 | 1,087,548 | |||
| Lowe’s Companies, Inc. |
115,200 | 6,380,928 | |||
| Target Corp. |
93,600 | 3,594,240 | |||
| Wal-Mart Stores, Inc. |
169,300 | 8,981,365 | |||
| Walgreen Co.(a) |
90,500 | 3,292,390 | |||
| 25,866,506 | |||||
| Semiconductors — 12.0% |
|||||
| Applied Materials, Inc.*(a) |
182,000 | 4,085,900 | |||
| Broadcom Corp. (Class “A” Stock)*(a) |
54,100 | 1,844,269 | |||
| Intel Corp. |
351,300 | 11,311,860 | |||
| Marvell Technology Group Ltd.* |
54,700 | 2,074,771 | |||
| Maxim Integrated Products, Inc. |
80,300 | 3,998,940 | |||
| Taiwan Semiconductor Manufacturing Co. Ltd. [ADR]* |
334,524 | 3,425,526 | |||
| Texas Instruments, Inc. |
59,500 | 1,748,110 | |||
| 28,489,376 | |||||
| Telecommunications — 1.0% |
|||||
| Nokia Corp. (Class “A” Stock) [ADR](a) |
138,500 | 2,354,500 | |||
| Total Long-Term Investments |
|||||
| (Cost $209,817,330) |
236,605,640 | ||||
112
Table of Contents
AST Alliance Growth Portfolio
Schedule of Investments
December 31, 2003
| Par (000) |
Value | |||||
| SHORT-TERM INVESTMENTS — 12.6% |
||||||
| Commercial Paper — 4.3% |
||||||
| Cancara Asset Securitisation Ltd. |
||||||
| 1.11%, 01/12/04(b) |
$ | 3,435 | $ | 3,431,739 | ||
| General Electric Capital Corp. |
||||||
| 1.11%, 02/05/04(b) |
3,288 | 3,278,409 | ||||
| Monumental Global Funding |
||||||
| 1.141%, 01/29/04 [FRN](b)(c) |
116 | 116,780 | ||||
| Silver Tower U.S. Funding |
||||||
| 1.13%, 02/02/04(b) |
1,450 | 1,446,091 | ||||
| Tulip Funding Corp. |
||||||
| 1.10%, 01/21/04(b) |
1,907 | 1,905,278 | ||||
| 10,178,297 | ||||||
| Corporate Obligations — 6.5% |
||||||
| American Express Centurian |
||||||
| 1.118%, 01/22/04 [FRN](b)(c) |
998 | 998,158 | ||||
| Bear Stearns Co., Inc. |
||||||
| 1.12%, 01/02/04 [FRN](b)(c) |
2,087 | 2,087,144 | ||||
| Goldman Sachs Group, Inc. |
||||||
| 1.14%, 01/06/04 [FRN](b)(c) |
4,656 | 4,656,366 | ||||
| Merrill Lynch & Co., Inc. |
||||||
| 1.13%, 01/02/04 [FRN](b)(c) |
1,032 | 1,031,715 | ||||
| 1.13%, 01/02/04(b) |
71 | 70,678 | ||||
| Morgan Stanley |
||||||
| 1.08%, 01/02/04 [FRN](b)(c) |
1,094 | 1,093,742 | ||||
| Natexis Banques Populaires |
||||||
| 1.035%, 01/02/04 [FRN](b)(c) |
3,061 | 3,061,003 | ||||
| Societe Generale |
||||||
| 1.08%, 01/02/04 [FRN](b)(c) |
1,294 | 1,293,996 | ||||
| Westdeutsche Landesbank |
||||||
| 1.13%, 01/09/04 [FRN](b)(c) |
1,203 | 1,202,385 | ||||
| 15,495,187 | ||||||
| Shares |
Value |
||||||
| Non-Registered Investment Company — 1.0% |
|||||||
| BlackRock Institutional Money Market Trust(b)(j) |
2,300,125 | $ | 2,300,125 | ||||
| Par (000) |
|||||||
| Repurchase Agreement — 0.1% |
|||||||
| Merrill Lynch & Co., Inc. |
|||||||
| 1.00%, dated 12/31/03, to be repurchased on 01/02/04, repurchase price $294,509 (Collateralized by Federal Home Loan Mortgage Corp. 5.50% maturing 12/01/33, Federal National Mortgage Assoc. 4.00% - 6.00% maturing 11/01/17 to 11/01/33 and Government National Mortgage Assoc. 1.47% maturing 01/16/04 [FRN](c), par value $361,330, market value including accrued interest $303,333)(b) |
$ | 294 | 294,493 | ||||
| Time Deposits — 0.7% |
|||||||
| Chase Manhattan Bank |
|||||||
| 0.875%, 01/02/04(b) |
860 | 860,220 | |||||
| UBS Bank |
|||||||
| 0.938%, 01/02/04(b) |
799 | 798,867 | |||||
| 1,659,087 | |||||||
| Total Short-Term Investments |
|||||||
| (Cost $29,927,189) |
29,927,189 | ||||||
| Total Investments — 112.4% |
|||||||
| (Cost $239,744,519; Note 5) |
266,532,829 | ||||||
| Liabilities in Excess of |
(29,476,995 | ) | |||||
| Net Assets — 100.0% |
$ | 237,055,834 | |||||
113
Table of Contents
AST Alliance Growth Portfolio
Schedule of Investments
December 31, 2003
The following abbreviations are used in portfolio descriptions:
| ADR | American Depositary Receipt |
| FRN | Floating Rate Note |
| symbol |
description | |
| * |
Non-income producing security. | |
| (a) |
Portion of securities on loan with an aggregate market value of $29,127,070; cash collateral $29,927,189 was received with which the portfolio purchased securities. | |
| (b) |
Represents security purchased with cash collateral for securities on loan. | |
| (c) |
Indicates a variable rate security. The maturity date presented for these instruments is the latter of the next date on which the security can be redeemed at par or the next date on which the rate of interest is adjusted. The interest rate shown reflects the rate in effect at December 31, 2003. | |
| (j) |
Security available to institutional investors only. | |
See Notes to Financial Statements.
114
Table of Contents
Schedule of Investments
December 31, 2003
| Shares |
Value | ||||
| LONG-TERM INVESTMENTS — 97.6% |
|||||
| COMMON STOCK |
|||||
| Airlines — 1.2% |
|||||
| JetBlue Airways Corp.* |
45,750 | $ | 1,213,290 | ||
| Southwest Airlines Co. |
355,500 | 5,737,770 | |||
| 6,951,060 | |||||
| Automobile Manufacturers — 0.3% |
|||||
| Bayerische Motoren Werke AG (Germany) |
34,000 | 1,576,060 | |||
| Beverages — 1.2% |
|||||
| Anheuser-Busch Companies, Inc. |
28,600 | 1,506,648 | |||
| PepsiCo, Inc. |
119,500 | 5,571,090 | |||
| 7,077,738 | |||||
| Broadcasting — 2.6% |
|||||
| Clear Channel Communications, Inc. |
169,860 | 7,954,544 | |||
| Liberty Media Corp. (Class “A” Stock)* |
300,400 | 3,571,756 | |||
| News Corp. Ltd. [ADR](a) |
108,300 | 3,909,630 | |||
| 15,435,930 | |||||
| Business Services — 1.5% |
|||||
| Accenture Ltd. (Class “A” Stock)* |
114,800 | 3,021,536 | |||
| First Data Corp.(a) |
37,900 | 1,557,311 | |||
| Fiserv, Inc.* |
115,400 | 4,559,454 | |||
| 9,138,301 | |||||
| Cable Television — 2.7% |
|||||
| Comcast Corp. (Class “A” Stock)* |
225,552 | 7,413,894 | |||
| EchoStar Communications Corp. |
246,300 | 8,374,200 | |||
| 15,788,094 | |||||
| Chemicals — 0.5% |
|||||
| Air Products & Chemicals, Inc. |
52,300 | 2,763,009 | |||
| Clothing & Apparel — 1.8% |
|||||
| Coach, Inc.* |
86,900 | 3,280,475 | |||
| Nike, Inc. (Class “B” Stock)(a) |
108,000 | 7,393,680 | |||
| 10,674,155 | |||||
| Computer Hardware — 3.4% |
|||||
| Apple Computer, Inc.* |
76,900 | 1,643,353 | |||
| Dell, Inc.* |
373,320 | 12,677,947 | |||
| International Business Machines Corp. |
65,300 | 6,052,004 | |||
| 20,373,304 | |||||
| Computer Services & Software — 13.3% |
|||||
| Affiliated Computer Services, Inc. |
69,800 | 3,801,308 | |||
| Amdocs Ltd.* |
91,800 | 2,063,664 | |||
| Cadence Design Systems, Inc.*(a) |
177,800 | 3,196,844 | |||
| Cisco Systems, Inc.* |
826,780 | 20,082,486 | |||
| EMC Corp.* |
116,300 | 1,502,596 | |||
| Intuit, Inc.*(a) |
60,500 | 3,201,055 | |||
| Shares |
Value | ||||
| Mercury Interactive Corp.*(a) |
48,500 | $ | 2,359,040 | ||
| Microsoft Corp. |
877,080 | 24,154,783 | |||
| Oracle Corp.* |
468,930 | 6,189,876 | |||
| Symantec Corp.*(a) |
231,300 | 8,014,545 | |||
| Veritas Software Corp.*(a) |
127,611 | 4,742,025 | |||
| 79,308,222 | |||||
| Conglomerates — 4.3% |
|||||
| 3M Co. |
88,060 | 7,487,742 | |||
| Altria Group, Inc. |
55,400 | 3,014,868 | |||
| Tyco International Ltd.(a) |
564,700 | 14,964,550 | |||
| 25,467,160 | |||||
| Consumer Products & Services — 5.0% |
|||||
| Avon Products, Inc. |
68,600 | 4,629,814 | |||
| Clorox Co. |
50,400 | 2,447,424 | |||
| Colgate-Palmolive Co. |
101,000 | 5,055,050 | |||
| Johnson & Johnson |
254,958 | 13,171,130 | |||
| Procter & Gamble Co. |
45,400 | 4,534,552 | |||
| 29,837,970 | |||||
| Electronic Components & Equipment — 2.6% |
|||||
| General Electric Co. |
443,550 | 13,741,179 | |||
| Rockwell Automation, Inc. |
42,600 | 1,516,560 | |||
| Zebra Technologies Corp. (Class “A” Stock)* |
5,400 | 358,398 | |||
| 15,616,137 | |||||
| Entertainment & Leisure — 5.1% |
|||||
| Carnival Corp.(a) |
167,700 | 6,662,721 | |||
| Harley-Davidson, Inc.(a) |
76,300 | 3,626,539 | |||
| International Game Technology(a) |
61,000 | 2,177,700 | |||
| Time Warner, Inc.*(a) |
597,300 | 10,745,427 | |||
| Viacom, Inc. (Class “B” Stock) |
155,391 | 6,896,253 | |||
| 30,108,640 | |||||
| Financial - Bank & Trust — 0.8% |
|||||
| Bank of New York Co., Inc.(a) |
140,400 | 4,650,048 | |||
| Financial Services — 8.1% |
|||||
| American Express Co. |
178,909 | 8,628,781 | |||
| Citigroup, Inc.(a) |
218,945 | 10,627,590 | |||
| Fannie Mae |
95,100 | 7,138,206 | |||
| MBNA Corp. |
248,900 | 6,185,165 | |||
| Merrill Lynch & Co., Inc. |
26,200 | 1,536,630 | |||
| Morgan Stanley |
123,800 | 7,164,306 | |||
| Schwab (Charles) Corp. |
151,600 | 1,794,944 | |||
| SLM Corp. |
133,800 | 5,041,584 | |||
| 48,117,206 | |||||
| Food — 0.1% |
|||||
| Sysco Corp. |
15,900 | 591,957 | |||
| Healthcare Services — 1.2% |
|||||
| Caremark Rx, Inc.*(a) |
178,200 | 4,513,806 | |||
| HCA, Inc.(a) |
55,900 | 2,401,464 | |||
| 6,915,270 | |||||
115
Table of Contents
AST MFS Growth Portfolio
Schedule of Investments
December 31, 2003
| Shares |
Value | ||||
| Hotels & Motels — 0.1% |
|||||
| Hilton Hotels Corp. |
34,600 | $ | 592,698 | ||
| Industrial Products — 0.5% |
|||||
| Illinois Tool Works, Inc.(a) |
36,200 | 3,037,542 | |||
| Insurance — 2.1% |
|||||
| American International Group, Inc. |
192,000 | 12,725,760 | |||
| Internet Services — 2.6% |
|||||
| eBay, Inc.*(a) |
115,500 | 7,460,145 | |||
| InterActiveCorp.*(a) |
196,700 | 6,674,031 | |||
| Yahoo!, Inc.*(a) |
34,800 | 1,571,916 | |||
| 15,706,092 | |||||
| Machinery & Equipment — 1.0% |
|||||
| Danaher Corp.(a) |
49,400 | 4,532,450 | |||
| Eaton Corp. |
14,100 | 1,522,518 | |||
| 6,054,968 | |||||
| Medical Supplies & Equipment — 7.9% |
|||||
| Abbott Laboratories |
125,300 | 5,838,980 | |||
| Alcon, Inc. (Switzerland) |
40,500 | 2,451,870 | |||
| Amgen, Inc.* |
81,600 | 5,042,880 | |||
| Bard (C.R.), Inc. |
44,700 | 3,631,875 | |||
| Baxter International, Inc. |
98,400 | 3,003,168 | |||
| Biomet, Inc.(a) |
120,300 | 4,380,123 | |||
| Genzyme Corp.*(a) |
108,700 | 5,363,258 | |||
| Guidant Corp. |
107,300 | 6,459,460 | |||
| Invitrogen Corp.*(a) |
21,800 | 1,526,000 | |||
| Medtronic, Inc. |
97,000 | 4,715,170 | |||
| Zimmer Holdings, Inc.* |
65,000 | 4,576,000 | |||
| 46,988,784 | |||||
| Metals & Mining — 0.3% |
|||||
| BHP Billiton Ltd. |
106,000 | 1,935,560 | |||
| Oil & Gas — 0.7% |
|||||
| BJ Services Co.* |
52,700 | 1,891,930 | |||
| Smith International, Inc.* |
49,900 | 2,071,848 | |||
| 3,963,778 | |||||
| Personal Services — 1.0% |
|||||
| Apollo Group, Inc. (Class “A” Stock)*(a) |
44,100 | 2,998,800 | |||
| Career Education Corp.* |
66,700 | 2,672,669 | |||
| 5,671,469 | |||||
| Pharmaceuticals — 7.6% |
|||||
| Allergan, Inc.(a) |
27,400 | 2,104,594 | |||
| Cardinal Health, Inc.(a) |
106,500 | 6,513,540 | |||
| Forest Laboratories, Inc.*(a) |
52,500 | 3,244,500 | |||
| Genentech, Inc.*(a) |
9,500 | 888,915 | |||
| Gilead Sciences, Inc.*(a) |
125,800 | 7,314,012 | |||
| Pfizer, Inc. |
486,002 | 17,170,451 | |||
| Roche Holding AG (Switzerland) |
17,200 | 1,734,950 | |||
| Watson Pharmaceuticals, Inc.*(a) |
31,200 | 1,435,200 | |||
| Wyeth |
109,600 | 4,652,520 | |||
| 45,058,682 | |||||
| Shares |
Value | |||||
| Restaurants — 0.3% |
||||||
| Outback Steakhouse, Inc. |
35,000 | $ | 1,547,350 | |||
| Retail & Merchandising — 7.4% |
||||||
| Best Buy Co., Inc.(a) |
59,300 | 3,097,832 | ||||
| CarMax, Inc.* |
35,400 | 1,094,922 | ||||
| Home Depot, Inc. |
86,000 | 3,052,140 | ||||
| Kohl’s Corp.*(a) |
166,300 | 7,473,522 | ||||
| Lowe’s Companies, Inc. |
37,800 | 2,093,742 | ||||
| Staples, Inc.* |
107,600 | 2,937,480 | ||||
| Target Corp. |
268,900 | 10,325,760 | ||||
| TJX Companies, Inc.(a) |
140,300 | 3,093,615 | ||||
| Wal-Mart Stores, Inc. |
115,500 | 6,127,275 | ||||
| Walgreen Co.(a) |
118,800 | 4,321,944 | ||||
| 43,618,232 | ||||||
| Semiconductors — 6.9% |
||||||
| Analog Devices, Inc. |
148,700 | 6,788,155 | ||||
| Intel Corp. |
458,100 | 14,750,820 | ||||
| Marvell Technology Group Ltd.* |
62,000 | 2,351,660 | ||||
| Microchip Technology, Inc. |
91,700 | 3,059,112 | ||||
| Novellus Systems, Inc.* |
37,000 | 1,555,850 | ||||
| Taiwan Semiconductor Manufacturing Co. Ltd. [ADR]*(a) |
301,780 | 3,090,227 | ||||
| Texas Instruments, Inc. |
211,100 | 6,202,118 | ||||
| Xilinx, Inc.*(a) |
79,500 | 3,079,830 | ||||
| 40,877,772 | ||||||
| Telecommunications — 2.9% |
||||||
| AT&T Wireless Services, Inc.*(a) |
295,000 | 2,357,050 | ||||
| Corning, Inc.* |
236,500 | 2,466,695 | ||||
| Nextel Communications, Inc. |
156,200 | 4,382,972 | ||||
| NTL, Inc.* |
36,400 | 2,538,900 | ||||
| Qualcomm, Inc. |
47,700 | 2,572,461 | ||||
| Vodafone Group PLC (United Kingdom) |
1,270,200 | 3,149,294 | ||||
| 17,467,372 | ||||||
| Transportation — 0.6% |
||||||
| FedEx Corp.(a) |
51,600 | 3,483,000 | ||||
| Total Common Stock |
||||||
| (Cost $540,664,233) |
579,119,320 | |||||
| Units |
||||||
| Rights* |
||||||
| Seagate Technology, Inc. |
||||||
| (Cost $0) |
15,300 | 0 | ||||
| Total Long-Term Investments |
||||||
| (Cost $540,664,233) |
579,119,320 | |||||
| Par (000) |
||||||
| SHORT-TERM INVESTMENTS — 17.2% |
||||||
| Commercial Paper — 5.7% |
||||||
| Amsterdam Funding Corp. |
||||||
| 1.10%, 01/05/04(b) |
$ | 131 | 130,400 | |||
| Cancara Asset Securitisation Ltd. |
||||||
| 1.11%, 01/12/04(b) |
8,634 | 8,626,300 | ||||
116
Table of Contents
AST MFS Growth Portfolio
Schedule of Investments
December 31, 2003
| Par (000) |
Value | |||||
| Concord Minutemen Capital Co. |
||||||
| 1.11%, 01/09/04(b) |
$ | 3,446 | $ | 3,437,258 | ||
| 1.13%, 02/09/04(b) |
2,323 | 2,316,599 | ||||
| Crown Point Capital Co. |
||||||
| 1.11%, 01/16/04(b) |
6,976 | 6,958,513 | ||||
| Fairway Finance Corp. |
||||||
| 1.10%, 01/12/04(b) |
1,290 | 1,286,623 | ||||
| General Electric Capital Corp. |
||||||
| 1.11%, 02/05/04(b) |
428 | 426,513 | ||||
| Lexington Parker Capital Co. |
||||||
| 1.10%, 01/12/04(b) |
1,472 | 1,469,014 | ||||
| Monumental Global Funding |
||||||
| 1.141%, 01/29/04 [FRN](b)(c) |
3,792 | 3,801,603 | ||||
| Silver Tower U.S. Funding |
||||||
| 1.13%, 02/02/04(b) |
3,795 | 3,784,593 | ||||
| Tannehill Capital Co. |
||||||
| 1.11%, 01/13/04(b) |
993 | 990,666 | ||||
| Tulip Funding Corp. |
||||||
| 1.10%, 01/21/04(b) |
297 | 296,970 | ||||
| 33,525,052 | ||||||
| Corporate Obligations — 7.9% |
||||||
| American Express Centurian |
||||||
| 1.118%, 01/22/04 [FRN](b)(c) |
34 | 34,205 | ||||
| 1.131%, 01/29/04 [FRN](b)(c) |
1,143 | 1,142,734 | ||||
| Bear Stearns Co., Inc. |
||||||
| 1.12%, 01/02/04 [FRN](b)(c) |
13,732 | 13,732,704 | ||||
| Canadian Imperial Bank of Commerce |
||||||
| 1.111%, 01/29/04 [FRN](b)(c) |
299 | 299,296 | ||||
| Goldman Sachs Group, Inc. |
||||||
| 1.14%, 01/06/04 [FRN](b)(c) |
5,542 | 5,541,886 | ||||
| Merrill Lynch & Co., Inc. |
||||||
| 1.13%, 01/02/04(b) |
415 | 414,511 | ||||
| 1.13%, 01/02/04 [FRN](b)(c) |
3,438 | 3,437,176 | ||||
| Morgan Stanley |
||||||
| 1.03%, 01/02/04 [FRN](b)(c) |
3,927 | 3,926,763 | ||||
| 1.08%, 01/02/04 [FRN](b)(c) |
638 | 638,466 | ||||
| Natexis Banques Populaires |
||||||
| 1.035%, 01/02/04 [FRN](b)(c) |
2,202 | 2,202,042 | ||||
| 1.10%, 01/02/04 [FRN](b)(c) |
8,722 | 8,719,827 | ||||
| Societe Generale |
||||||
| 1.08%, 01/02/04 [FRN](b)(c) |
4,081 | 4,080,421 | ||||
| Westdeutsche Landesbank |
||||||
| 1.13%, 01/09/04 [FRN](b)(c) |
2,986 | 2,985,559 | ||||
| 1.111%, 01/23/04 [FRN](b)(c) |
75 | 74,935 | ||||
| 47,230,525 | ||||||
| Shares |
Value |
||||||
| Non-Registered Investment Company — 2.6% |
|||||||
| BlackRock Institutional Money Market Trust(b)(j) |
15,591,600 | $ | 15,591,600 | ||||
| Par (000) |
|||||||
| Repurchase Agreement — 0.3% |
|||||||
| Merrill Lynch & Co., Inc. |
|||||||
| 1.00%, dated 12/31/03, to be repurchased on 01/02/04, repurchase price $1,727,223 (Collateralized by Federal Home Loan Mortgage Corp. 5.50% maturing 12/01/33, Federal National Mortgage Assoc. 4.00% - 6.00% maturing 11/01/17 to 11/01/33 and Government National Mortgage Assoc. 1.47% maturing 01/16/04 [FRN](c), par value $2,119,111, market value including accrued interest $1,778,973)(b) |
$ | 1,727 | 1,727,127 | ||||
| Time Deposits — 0.7% |
|||||||
| Chase Manhattan Bank |
|||||||
| 0.875%, 01/02/04(b) |
2,408 | 2,407,630 | |||||
| UBS Bank |
|||||||
| 0.938%, 01/02/04(b) |
1,651 | 1,651,413 | |||||
| 4,059,043 | |||||||
| Total Short-Term Investments |
|||||||
| (Cost $102,133,347) |
102,133,347 | ||||||
| Total Investments — 114.8% |
|||||||
| (Cost $642,797,580; Note 5) |
681,252,667 | ||||||
| Liabilities in Excess of |
(87,945,635 | ) | |||||
| Net Assets — 100.0% |
$ | 593,307,032 | |||||
117
Table of Contents
AST MFS Growth Portfolio
Schedule of Investments
December 31, 2003
The following abbreviations are used in portfolio descriptions:
| ADR | American Depositary Receipt |
| FRN | Floating Rate Note |
| symbol |
description | |
| * |
Non-income producing security. | |
| (a) |
Portion of securities on loan with an aggregate market value of $99,035,560; cash collateral $102,133,347 was received with which the portfolio purchased securities. | |
| (b) |
Represents security purchased with cash collateral for securities on loan. | |
| (c) |
Indicates a variable rate security. The maturity date presented for these instruments is the latter of the next date on which the security can be redeemed at par or the next date on which the rate of interest is adjusted. The interest rate shown reflects the rate in effect at December 31, 2003. | |
| (j) |
Security available to institutional investors only. | |
See Notes to Financial Statements.
118
Table of Contents
AST Marsico Capital Growth Portfolio
Schedule of Investments
December 31, 2003
| Shares |
Value | ||||
| LONG-TERM INVESTMENTS — 93.9% |
|||||
| COMMON STOCK |
|||||
| Aerospace — 1.3% |
|||||
| Lockheed Martin Corp.(a) |
420,219 | $ | 21,599,257 | ||
| Airlines — 1.4% |
|||||
| Ryanair Holdings PLC [ADR]*(a) |
464,750 | 23,534,940 | |||
| Automobile Manufacturers — 1.1% |
|||||
| Bayerische Motoren Werke AG (Germany) |
403,887 | 18,722,058 | |||
| Beverages — 0.6% |
|||||
| Anheuser-Busch Companies, Inc. |
205,563 | 10,829,059 | |||
| Clothing & Apparel — 0.6% |
|||||
| Nike, Inc. (Class “B” Stock) |
140,244 | 9,601,104 | |||
| Computer Hardware — 2.8% |
|||||
| Dell, Inc.*(a) |
1,435,303 | 48,742,890 | |||
| Computer Services & Software — 9.0% |
|||||
| Cisco Systems, Inc.* |
3,043,875 | 73,935,723 | |||
| Electronic Arts, Inc.*(a) |
1,086,118 | 51,894,718 | |||
| EMC Corp.*(a) |
2,151,556 | 27,798,104 | |||
| 153,628,545 | |||||
| Conglomerates — 1.9% |
|||||
| Honeywell International, Inc. |
745,737 | 24,929,988 | |||
| Tyco International Ltd. |
268,980 | 7,127,970 | |||
| 32,057,958 | |||||
| Construction — 3.3% |
|||||
| Lennar Corp. (Class “A” Stock)(a) |
331,684 | 31,841,664 | |||
| Lennar Corp. (Class “B” Stock) |
31,625 | 2,890,525 | |||
| MDC Holdings, Inc.(a) |
348,381 | 22,470,575 | |||
| 57,202,764 | |||||
| Consumer Products & Services — 2.3% |
|||||
| Procter & Gamble Co. |
387,294 | 38,682,925 | |||
| Electronic Components & Equipment — 2.1% |
|||||
| General Electric Co. |
1,134,203 | 35,137,609 | |||
| Entertainment & Leisure — 2.9% |
|||||
| Disney (Walt) Co. |
279,826 | 6,528,341 | |||
| Harley-Davidson, Inc.(a) |
110,370 | 5,245,886 | |||
| Wynn Resorts Ltd.*(a) |
1,356,552 | 37,997,021 | |||
| 49,771,248 | |||||
| Financial Services — 15.4% |
|||||
| Citigroup, Inc. |
1,689,164 | 81,992,020 | |||
| Countrywide Financial Corp.(a) |
244,832 | 18,570,507 | |||
| Fannie Mae |
538,661 | 40,431,895 | |||
| Merrill Lynch & Co., Inc.(a) |
883,059 | 51,791,410 | |||
| SLM Corp. |
1,870,288 | 70,472,452 | |||
| 263,258,284 | |||||
| Shares |
Value | |||||
| Healthcare Services — 9.0% |
||||||
| Caremark Rx, Inc.*(a) |
1,817,203 | $ | 46,029,752 | |||
| Quest Diagnostics, Inc.(a) |
304,040 | 22,228,364 | ||||
| UnitedHealth Group, Inc.(a) |
1,477,462 | 85,958,740 | ||||
| 154,216,856 | ||||||
| Hotels & Motels — 1.6% |
||||||
| Four Seasons Hotels, Inc. (Canada)(a) |
545,714 | 27,913,271 | ||||
| Machinery & Equipment — 4.0% |
||||||
| Caterpillar, Inc.(a) |
833,040 | 69,158,981 | ||||
| Medical Supplies & Equipment — 7.8% |
||||||
| Amgen, Inc.* |
531,524 | 32,848,183 | ||||
| Boston Scientific Corp.* |
1,651,198 | 60,698,038 | ||||
| Zimmer Holdings, Inc.*(a) |
564,877 | 39,767,341 | ||||
| 133,313,562 | ||||||
| Pharmaceuticals — 6.4% |
||||||
| Genentech, Inc.*(a) |
885,305 | 82,837,989 | ||||
| Lilly (Eli) & Co. |
384,816 | 27,064,109 | ||||
| 109,902,098 | ||||||
| Retail & Merchandising — 4.9% |
||||||
| Lowe’s Companies, Inc. |
534,586 | 29,610,719 | ||||
| Tiffany & Co.(a) |
1,200,729 | 54,272,950 | ||||
| 83,883,669 | ||||||
| Semiconductors — 8.1% |
||||||
| Intel Corp. |
3,168,503 | 102,025,796 | ||||
| Maxim Integrated Products, Inc. |
745,682 | 37,134,964 | ||||
| 139,160,760 | ||||||
| Telecommunications — 4.7% |
||||||
| Nextel Communications, Inc. |
1,282,264 | 35,980,328 | ||||
| Qualcomm, Inc. |
809,221 | 43,641,288 | ||||
| 79,621,616 | ||||||
| Transportation — 2.7% |
||||||
| FedEx Corp. |
689,827 | 46,563,323 | ||||
| Total Long-Term Investments |
||||||
| (Cost $1,222,323,262) |
1,606,502,777 | |||||
| Par (000) |
||||||
| SHORT-TERM INVESTMENTS — 28.2% |
||||||
| Certificate of Deposit — 0.4% |
||||||
| Svenska Handelsbank, Inc. |
||||||
| 1.39%, 10/27/04(b) |
$ | 6,269 | 6,268,141 | |||
| Commercial Paper — 2.5% |
||||||
| Amsterdam Funding Corp. |
||||||
| 1.10%, 01/05/04(b) |
4,444 | 4,439,753 | ||||
119
Table of Contents
AST Marsico Capital Growth Portfolio
Schedule of Investments
December 31, 2003
| Par (000) |
Value | |||||
| Cancara Asset Securitisation Ltd. |
||||||
| 1.11%, 01/12/04(b) |
$ | 2,251 | $ | 2,249,089 | ||
| Concord Minutemen Capital Co. |
||||||
| 1.11%, 01/12/04(b) |
1,410 | 1,407,832 | ||||
| 1.13%, 02/09/04(b) |
3,329 | 3,320,145 | ||||
| 1.13%, 02/12/04(b) |
2,897 | 2,888,735 | ||||
| Fairway Finance Corp. |
||||||
| 1.10%, 01/12/04(b) |
10,318 | 10,288,586 | ||||
| Lexington Parker Capital Co. |
||||||
| 1.10%, 01/12/04(b) |
9,370 | 9,352,256 | ||||
| Monumental Global Funding |
||||||
| 1.141%, 01/29/04 [FRN](b)(c) |
7,657 | 7,676,080 | ||||
| Tulip Funding Corp. |
||||||
| 1.10%, 01/21/04(b) |
1,356 | 1,354,302 | ||||
| 42,976,778 | ||||||
| Corporate Obligations — 12.3% |
||||||
| American Express Centurian |
||||||
| 1.118%, 01/22/04 [FRN](b)(c) |
6,334 | 6,334,106 | ||||
| 1.144%, 01/22/04 [FRN](b)(c) |
13,710 | 13,710,069 | ||||
| 1.131%, 01/29/04 [FRN](b)(c) |
13,601 | 13,601,195 | ||||
| Bear Stearns Co., Inc. |
||||||
| 1.12%, 01/02/04 [FRN](b)(c) |
33,584 | 33,584,396 | ||||
| 1.12%, 01/02/04 [FRN](b)(c) |
10,294 | 10,294,402 | ||||
| Canadian Imperial Bank of Commerce |
||||||
| 1.111%, 01/29/04 [FRN](b)(c) |
644 | 644,358 | ||||
| Goldman Sachs Group, Inc. |
||||||
| 1.14%, 01/06/04 [FRN](b)(c) |
17,027 | 17,026,778 | ||||
| Merrill Lynch & Co., Inc. |
||||||
| 1.13%, 01/02/04 [FRN](b)(c) |
40,497 | 40,497,183 | ||||
| 1.13%, 01/02/04(b) |
2,856 | 2,856,231 | ||||
| Morgan Stanley |
||||||
| 1.03%, 01/02/04 [FRN](b)(c) |
1,943 | 1,943,307 | ||||
| 1.08%, 01/02/04 [FRN](b)(c) |
5,874 | 5,873,631 | ||||
| Natexis Banques Populaires |
||||||
| 1.035%, 01/02/04 [FRN](b)(c) |
290 | 289,693 | ||||
| 1.10%, 01/02/04 [FRN](b)(c) |
40,366 | 40,355,335 | ||||
| Societe Generale |
||||||
| 1.08%, 01/02/04 [FRN](b)(c) |
19,968 | 19,963,841 | ||||
| Westdeutsche Landesbank |
||||||
| 1.13%, 01/09/04 [FRN](b)(c) |
4,596 | 4,595,046 | ||||
| 211,569,571 | ||||||
| Shares |
||||||
| Non-Registered Investment Company — 5.7% |
||||||
| BlackRock Institutional Money Market Trust(b)(j) |
97,344,054 | 97,344,054 | ||||
| Shares |
Value |
||||||
| Registered Investment Companies — 0.0% |
|||||||
| BlackRock Provident Institutional Funds TempCash Portfolio |
13,534 | $ | 13,534 | ||||
| BlackRock Provident Institutional Funds TempFund Portfolio |
13,534 | 13,534 | |||||
| 27,068 | |||||||
| Par (000) |
|||||||
| Repurchase Agreement — 0.7% |
|||||||
| Merrill Lynch & Co., Inc. |
|||||||
| 1.00%, dated 12/31/03, to be repurchased on 01/02/04, repurchase price $11,901,623 (Collateralized by Federal Home Loan Mortgage Corp. 5.50% maturing 12/01/33, Federal National Mortgage Assoc. 4.00% - 6.00% maturing 11/01/17 to 11/01/33 and Government National Mortgage Assoc. 1.47% maturing 01/16/04 [FRN](c), par value $14,601,967, market value including accrued interest $12,258,213)(b) |
$ | 11,901 | 11,900,962 | ||||
| Time Deposits — 0.9% |
|||||||
| Chase Manhattan Bank |
|||||||
| 0.875%, 01/02/04(b) |
9,159 | 9,159,368 | |||||
| UBS Bank |
|||||||
| 0.938%, 01/02/04(b) |
5,425 | 5,425,398 | |||||
| 14,584,766 | |||||||
| U.S. Government Agency Obligations — 5.7% |
|||||||
| Federal Home Loan Banks |
|||||||
| 0.60%, 01/02/04(n) |
50,000 | 49,999,167 | |||||
| 0.60%, 01/02/04(n) |
48,300 | 48,299,195 | |||||
| 98,298,362 | |||||||
| Total Short-Term Investments |
|||||||
| (Cost $482,969,702) |
482,969,702 | ||||||
| Total Investments — 122.1% |
|||||||
| (Cost $1,705,292,964; Note 5) |
2,089,472,479 | ||||||
| Liabilities in Excess of |
(378,891,105 | ) | |||||
| Net Assets — 100.0% |
$ | 1,710,581,374 | |||||
120
Table of Contents
AST Marsico Capital Growth Portfolio
Schedule of Investments
December 31, 2003
Foreign currency exchange contracts outstanding at December 31, 2003:
| Settlement Month |
Sale Contracts |
Contracts to Deliver |
In Exchange For |
Contracts at Value |
Unrealized Depreciation |
|||||||||
| 03/04 |
Sell EUR | 14,026,200 | $ | 17,327,046 | $ | 17,595,019 | $ | (267,973 | ) | |||||
The following abbreviations are used in portfolio descriptions:
| ADR | American Depositary Receipt |
| EUR | Euro Dollar |
| FRN | Floating Rate Note |
| symbol |
description | |
| * |
Non-income producing security. | |
| (a) |
Portion of securities on loan with an aggregate market value of $371,136,740; cash collateral $384,644,273 was received with which the portfolio purchased securities. | |
| (b) |
Represents security purchased with cash collateral for securities on loan. | |
| (c) |
Indicates a variable rate security. The maturity date presented for these instruments is the latter of the next date on which the security can be redeemed at par or the next date on which the rate of interest is adjusted. The interest rate shown reflects the rate in effect at December 31, 2003. | |
| (j) |
Security available to institutional investors only. | |
| (n) |
Rates shown are the effective yields at purchase date. | |
See Notes to Financial Statements.
121
Table of Contents
AST Goldman Sachs Concentrated Growth Portfolio
Schedule of Investments
December 31, 2003
| Shares |
Value | ||||
| LONG-TERM INVESTMENTS — 99.4% |
|||||
| COMMON STOCK |
|||||
| Beverages — 4.3% |
|||||
| PepsiCo, Inc. |
1,067,400 | $ | 49,762,188 | ||
| Broadcasting — 16.9% |
|||||
| Clear Channel Communications, Inc. |
1,104,600 | 51,728,417 | |||
| Entravision Communications Corp. (Class “A” Stock)* |
781,200 | 8,671,320 | |||
| Liberty Media Corp. (Class “A” Stock)*(a) |
2,732,210 | 32,485,977 | |||
| Scripps, (E.W.) Co. (Class “A” Stock) |
114,404 | 10,769,993 | |||
| Univision Communications, Inc. |
1,883,000 | 74,736,269 | |||
| Westwood One, Inc.*(a) |
472,700 | 16,171,067 | |||
| 194,563,043 | |||||
| Business Services — 4.3% |
|||||
| First Data Corp.(a) |
1,212,800 | 49,833,952 | |||
| Cable Television — 7.0% |
|||||
| Cablevision Systems New York Group (Class “A” Stock)*(a) |
2,091,609 | 48,922,735 | |||
| EchoStar Communications Corp. (Class “A” Stock)* |
931,625 | 31,675,250 | |||
| 80,597,985 | |||||
| Computer Hardware — 3.2% |
|||||
| Dell, Inc.*(a) |
1,079,600 | 36,663,216 | |||
| Computer Services & Software — 9.0% |
|||||
| Cisco Systems, Inc.* |
1,542,400 | 37,464,896 | |||
| Intuit, Inc.*(a) |
211,026 | 11,165,386 | |||
| Microsoft Corp. |
1,997,394 | 55,008,230 | |||
| 103,638,512 | |||||
| Conglomerates — 4.9% |
|||||
| Cendant Corp.*(a) |
2,536,215 | 56,481,508 | |||
| Entertainment & Leisure — 12.8% |
|||||
| Harrah’s Entertainment, Inc. |
838,800 | 41,747,076 | |||
| Metro-Goldwyn-Mayer, Inc.*(a) |
640,303 | 10,942,778 | |||
| Time Warner, Inc.*(a) |
1,002,424 | 18,033,608 | |||
| Viacom, Inc. (Class “B” Stock) |
1,715,350 | 76,127,233 | |||
| 146,850,695 | |||||
| Financial Services — 12.2% |
|||||
| Fannie Mae |
580,216 | 43,551,013 | |||
| Freddie Mac |
738,700 | 43,080,984 | |||
| Moody’s Corp. |
194,858 | 11,798,652 | |||
| Schwab (Charles) Corp. |
3,534,500 | 41,848,480 | |||
| 140,279,129 | |||||
| Food — 1.7% |
|||||
| Wrigley (Wm., Jr.) Co. |
356,300 | 20,027,623 | |||
| Shares |
Value | |||||
| Healthcare Services — 0.2% |
||||||
| Caremark Rx, Inc.*(a) |
90,000 | $ | 2,279,700 | |||
| Hotels & Motels — 0.6% |
||||||
| Starwood Hotels & Resorts Worldwide, Inc. |
198,773 | 7,149,865 | ||||
| Internet Services — 2.0% |
||||||
| eBay, Inc.*(a) |
140,020 | 9,043,892 | ||||
| Sabre Holdings Corp. |
656,450 | 14,172,755 | ||||
| 23,216,647 | ||||||
| Pharmaceuticals — 7.7% |
||||||
| Lilly (Eli) & Co. |
258,160 | 18,156,393 | ||||
| Pfizer, Inc. |
1,142,200 | 40,353,926 | ||||
| Wyeth |
711,300 | 30,194,685 | ||||
| 88,705,004 | ||||||
| Printing & Publishing — 1.5% |
||||||
| McGraw-Hill Companies, Inc. |
248,305 | 17,361,486 | ||||
| Retail & Merchandising — 2.8% |
||||||
| Dollar Tree Stores, Inc.* |
170,275 | 5,118,467 | ||||
| Family Dollar Stores, Inc. |
591,700 | 21,230,196 | ||||
| Wal-Mart Stores, Inc. |
120,000 | 6,366,000 | ||||
| 32,714,663 | ||||||
| Semiconductors — 4.5% |
||||||
| Intel Corp.(a) |
1,149,200 | 37,004,240 | ||||
| Texas Instruments, Inc. |
497,600 | 14,619,488 | ||||
| 51,623,728 | ||||||
| Telecommunications — 3.8% |
||||||
| Crown Castle International Corp.*(a) |
502,130 | 5,538,494 | ||||
| Qualcomm, Inc.(a) |
703,890 | 37,960,788 | ||||
| 43,499,282 | ||||||
| Total Long-Term Investments |
||||||
| (Cost $996,850,801) |
1,145,248,226 | |||||
| Par (000) |
||||||
| SHORT-TERM INVESTMENTS — 17.8% |
||||||
| Commercial Paper — 6.2% |
||||||
| Cancara Asset Securitisation Ltd. |
||||||
| 1.11%, 01/12/04(b) |
$ | 10,153 | 10,144,265 | |||
| Crown Point Capital Co. |
||||||
| 1.11%, 01/16/04(b) |
449 | 448,093 | ||||
| General Electric Capital Corp. |
||||||
| 1.11%, 02/05/04(b) |
12,927 | 12,891,317 | ||||
| Monumental Global Funding |
||||||
| 1.141%, 01/29/04 [FRN](b)(c) |
6,360 | 6,375,512 | ||||
| Silver Tower U.S. Funding |
||||||
| 1.13%, 02/02/04(b) |
3,347 | 3,337,431 | ||||
| Tannehill Capital Co. |
||||||
| 1.11%, 01/13/04(b) |
32,661 | 32,600,816 | ||||
122
Table of Contents
AST Goldman Sachs Concentrated Growth Portfolio
Schedule of Investments
December 31, 2003
| Par (000) |
Value | |||||
| Tulip Funding Corp. |
||||||
| 1.10%, 01/21/04(b) |
$ | 4,453 | $ | 4,449,370 | ||
| 70,246,804 | ||||||
| Corporate Obligations — 6.1% |
||||||
| Bear Stearns Co., Inc. |
||||||
| 1.12%, 01/02/04 [FRN](b)(c) |
16,414 | 16,413,416 | ||||
| Canadian Imperial Bank of Commerce |
||||||
| 1.111%, 01/29/04 [FRN](b)(c) |
1,765 | 1,764,536 | ||||
| Merrill Lynch & Co., Inc. |
||||||
| 1.13%, 01/02/04 [FRN](b)(c) |
9,512 | 9,512,500 | ||||
| 1.13%, 01/02/04(b) |
1,396 | 1,395,879 | ||||
| Morgan Stanley |
||||||
| 1.08%, 01/02/04 [FRN](b)(c) |
4,609 | 4,609,383 | ||||
| Natexis Banques Populaires |
||||||
| 1.035%, 01/02/04 [FRN](b)(c) |
20,887 | 20,887,052 | ||||
| 1.10%, 01/02/04 [FRN](b)(c) |
9,940 | 9,937,386 | ||||
| Westdeutsche Landesbank |
||||||
| 1.13%, 01/09/04 [FRN](b)(c) |
3,025 | 3,025,064 | ||||
| 1.111%, 01/23/04 [FRN](b)(c) |
2,385 | 2,384,305 | ||||
| 69,929,521 | ||||||
| Shares |
||||||
| Non-Registered Investment Company — 4.1% |
||||||
| BlackRock Institutional Money Market Trust(b)(j) |
47,644,968 | 47,644,968 | ||||
| Par (000) |
Value |
||||||
| Repurchase Agreement — 0.5% |
|||||||
| Merrill Lynch & Co., Inc. |
|||||||
| 1.00%, dated 12/31/03, to be repurchased on 01/02/04, repurchase price $5,816,485 (Collateralized by Federal Home Loan Mortgage Corp. 5.50% maturing 12/01/33, Federal National Mortgage Assoc. 4.00% - 6.00% maturing 11/01/17 to 11/01/33 and Government National Mortgage Assoc. 1.47% maturing 01/16/04 [FRN](c), par value $7,136,180, market value including accrued interest $5,990,756)(b) |
$ | 5,816 | $ | 5,816,162 | |||
| Time Deposits — 0.9% |
|||||||
| Chase Manhattan Bank |
|||||||
| 0.875%, 01/02/04(b) |
3,783 | 3,782,949 | |||||
| UBS Bank |
|||||||
| 0.938%, 01/02/04(b) |
6,968 | 6,968,185 | |||||
| 10,751,134 | |||||||
| Total Short-Term Investments |
|||||||
| (Cost $204,388,589) |
204,388,589 | ||||||
| Total Investments — 117.2% |
|||||||
| (Cost $1,201,239,390; Note 5) |
1,349,636,815 | ||||||
| Liabilities in Excess of |
(198,437,158 | ) | |||||
| Net Assets — 100.0% |
$ | 1,151,199,657 | |||||
| The following abbreviation is used in portfolio descriptions: | ||
| FRN |
Floating Rate Note | |
| symbol |
description | |
| * |
Non-income producing security. | |
| (a) |
Portion of securities on loan with an aggregate market value of $198,291,158; cash collateral $204,388,590 was received with which the portfolio purchased securities. | |
| (b) |
Represents security purchased with cash collateral for securities on loan. | |
| (c) |
Indicates a variable rate security. The maturity date presented for these instruments is the latter of the next date on which the security can be deemed at par or the next date on which the rate of interest is adjusted. The interest rate shown reflects the rate in effect at December 31, 2003. | |
| (j) |
Security available to institutional investors only. | |
See Notes to Financial Statements.
123
Table of Contents
AST DeAM Large-Cap Growth Portfolio
Schedule of Investments
December 31, 2003
| Shares |
Value | ||||
| LONG-TERM INVESTMENTS — 91.9% |
|||||
| COMMON STOCK — 91.7% |
|||||
| Advertising — 0.3% |
|||||
| Omnicom Group, Inc. |
3,600 | $ | 314,388 | ||
| Aerospace — 1.8% |
|||||
| Boeing Co. |
21,700 | 914,438 | |||
| United Defense Industries, Inc.* |
10,200 | 325,176 | |||
| United Technologies Corp. |
5,300 | 502,281 | |||
| 1,741,895 | |||||
| Automotive Parts — 1.3% |
|||||
| Advance Auto Parts, Inc.* |
5,000 | 407,000 | |||
| Autoliv, Inc. |
21,700 | 817,005 | |||
| 1,224,005 | |||||
| Beverages — 4.8% |
|||||
| Anheuser-Busch Companies, Inc. |
38,800 | 2,043,984 | |||
| Coca-Cola Co. |
13,400 | 680,050 | |||
| PepsiCo, Inc. |
41,100 | 1,916,082 | |||
| 4,640,116 | |||||
| Broadcasting — 0.3% |
|||||
| Clear Channel Communications, Inc. |
7,100 | 332,493 | |||
| Business Services — 0.8% |
|||||
| Alliance Data Systems Corp.* |
2,900 | 80,272 | |||
| Convergys Corp.* |
18,600 | 324,756 | |||
| D&B Corp.* |
2,800 | 141,988 | |||
| Total System Services, Inc.(a) |
4,200 | 130,746 | |||
| Viad Corp. |
3,500 | 87,500 | |||
| 765,262 | |||||
| Cable Television — 1.3% |
|||||
| Comcast Corp. (Class “A” Stock)* |
15,500 | 509,485 | |||
| Cox Communications, Inc. (Class “A” Stock)*(a) |
1,200 | 41,340 | |||
| Hughes Electronics Corp.* |
44,535 | 737,054 | |||
| 1,287,879 | |||||
| Clothing & Apparel — 1.1% |
|||||
| Coach, Inc.* |
5,600 | 211,400 | |||
| NIKE, Inc. (Class “B” Stock)(a) |
13,000 | 889,980 | |||
| 1,101,380 | |||||
| Computer Hardware — 2.7% |
|||||
| Dell, Inc.*(a) |
11,800 | 400,728 | |||
| International Business Machines Corp.(a) |
18,000 | 1,668,240 | |||
| SanDisk Corp.*(a) |
10,000 | 611,400 | |||
| 2,680,368 | |||||
| Computer Services & Software — 9.0% |
|||||
| BMC Software, Inc.*(a) |
54,500 | 1,016,425 | |||
| Cisco Systems, Inc.*(a) |
86,100 | 2,091,369 | |||
| EMC Corp.*(a) |
53,400 | 689,928 | |||
| Shares |
Value | ||||
| Microsoft Corp. |
157,400 | $ | 4,334,796 | ||
| Oracle Corp.* |
32,800 | 432,960 | |||
| Veritas Software Corp.* |
6,900 | 256,404 | |||
| 8,821,882 | |||||
| Conglomerates — 2.6% |
|||||
| 3M Co.(a) |
29,500 | 2,508,385 | |||
| Construction |
|||||
| NVR, Inc.* |
100 | 46,600 | |||
| Consumer Products & Services — 3.9% |
|||||
| Johnson & Johnson |
34,900 | 1,802,934 | |||
| Procter & Gamble Co. |
18,800 | 1,877,744 | |||
| Whirlpool Corp.(a) |
1,900 | 138,035 | |||
| 3,818,713 | |||||
| Containers & Packaging — 0.2% |
|||||
| Sealed Air Corp.* |
4,200 | 227,388 | |||
| Electronic Components & Equipment — 4.3% |
|||||
| General Electric Co.(a) |
126,200 | 3,909,676 | |||
| Sanmina-SCI Corp.* |
22,300 | 281,203 | |||
| 4,190,879 | |||||
| Entertainment & Leisure — 0.4% |
|||||
| Marvel Enterprises, Inc.*(a) |
12,300 | 358,053 | |||
| Financial - Bank & Trust — 0.5% |
|||||
| New York Community Bancorp, Inc.(a) |
12,766 | 485,746 | |||
| Financial Services — 3.9% |
|||||
| American Express Co.(a) |
22,000 | 1,061,060 | |||
| Fannie Mae(a) |
6,400 | 480,384 | |||
| Lehman Brothers Holdings, Inc. |
4,100 | 316,602 | |||
| MBNA Corp. |
17,000 | 422,450 | |||
| Moody’s Corp. |
4,900 | 296,695 | |||
| Schwab (Charles) Corp. |
17,200 | 203,648 | |||
| SLM Corp. |
27,300 | 1,028,664 | |||
| 3,809,503 | |||||
| Food — 1.1% |
|||||
| Sysco Corp. |
27,600 | 1,027,548 | |||
| Healthcare Services — 4.7% |
|||||
| Coventry Health Care, Inc.* |
4,500 | 290,205 | |||
| DaVita, Inc.* |
6,100 | 237,900 | |||
| First Health Group Corp.* |
50,000 | 973,000 | |||
| Health Net, Inc.*(a) |
10,800 | 353,160 | |||
| IMS Health, Inc.(a) |
4,900 | 121,814 | |||
| Manor Care, Inc. |
12,400 | 428,668 | |||
| UnitedHealth Group, Inc.(a) |
37,200 | 2,164,296 | |||
| 4,569,043 | |||||
| Industrial Products — 0.5% |
|||||
| Donaldson Co., Inc. |
8,200 | 485,112 | |||
124
Table of Contents
AST DeAM Large-Cap Growth Portfolio
Schedule of Investments
December 31, 2003
| Shares |
Value | ||||
| Insurance — 2.2% |
|||||
| American International Group, Inc. |
5,000 | $ | 331,400 | ||
| Berkley (W.R) Corp. |
34,650 | 1,211,018 | |||
| The Progressive Corp. |
7,400 | 618,566 | |||
| 2,160,984 | |||||
| Internet Services — 2.4% |
|||||
| Amazon.com, Inc.*(a) |
400 | 21,056 | |||
| eBay, Inc.*(a) |
9,800 | 632,982 | |||
| InterActiveCorp.*(a) |
33,300 | 1,129,869 | |||
| Yahoo!, Inc.*(a) |
12,800 | 578,176 | |||
| 2,362,083 | |||||
| Medical Supplies & Equipment — 7.1% |
|||||
| Abbott Laboratories |
25,500 | 1,188,300 | |||
| Amgen, Inc.* |
40,700 | 2,515,260 | |||
| Charles River Laboratories International, Inc.* |
4,700 | 161,351 | |||
| Guidant Corp. |
20,500 | 1,234,100 | |||
| IDEXX Laboratories, Inc.* |
26,000 | 1,203,280 | |||
| Respironics, Inc.* |
9,200 | 414,828 | |||
| St. Jude Medical, Inc.* |
3,300 | 202,455 | |||
| 6,919,574 | |||||
| Office Equipment — 0.5% |
|||||
| Hon Industries, Inc. |
1,400 | 60,648 | |||
| Xerox Corp.*(a) |
27,700 | 382,260 | |||
| 442,908 | |||||
| Oil & Gas — 1.9% |
|||||
| Chesapeake Energy Corp.(a) |
46,900 | 636,902 | |||
| EOG Resources, Inc. |
8,300 | 383,211 | |||
| Newfield Exploration Co.* |
14,400 | 641,376 | |||
| XTO Energy, Inc.(a) |
5,600 | 158,480 | |||
| 1,819,969 | |||||
| Personal Services — 0.4% |
|||||
| University of Phoenix Online* |
6,000 | 413,580 | |||
| Pharmaceuticals — 8.9% |
|||||
| Endo Pharmaceuticals Holdings, Inc.* |
26,400 | 508,464 | |||
| Genentech, Inc.*(a) |
11,700 | 1,094,769 | |||
| Gilead Sciences, Inc.* |
19,200 | 1,116,288 | |||
| Merck & Co., Inc. |
35,300 | 1,630,860 | |||
| Mylan Laboratories, Inc. |
46,050 | 1,163,223 | |||
| Pfizer, Inc. |
87,100 | 3,077,243 | |||
| Watson Pharmaceuticals, Inc.*(a) |
3,300 | 151,800 | |||
| 8,742,647 | |||||
| Printing & Publishing — 1.4% |
|||||
| McGraw-Hill Companies, Inc. |
19,600 | 1,370,432 | |||
| Restaurants — 1.9% |
|||||
| Brinker International, Inc.* |
17,300 | 573,668 | |||
| CBRL Group, Inc. |
12,300 | 470,598 | |||
| Starbucks Corp.*(a) |
24,600 | 813,276 | |||
| 1,857,542 | |||||
| Shares |
Value | |||||
| Retail & Merchandising — 6.7% |
||||||
| Blockbuster, Inc. (Class “A” Stock)(a) |
16,600 | $ | 297,970 | |||
| Chico’s FAS, Inc.*(a) |
27,900 | 1,030,905 | ||||
| Claire’s Stores, Inc. |
55,200 | 1,039,968 | ||||
| Home Depot, Inc.(a) |
10,900 | 386,841 | ||||
| Lowe’s Companies, Inc. |
17,200 | 952,708 | ||||
| RadioShack Corp.(a) |
12,600 | 386,568 | ||||
| Staples, Inc.* |
26,800 | 731,640 | ||||
| Talbots, Inc. (The) |
6,900 | 212,382 | ||||
| TJX Companies, Inc.(a) |
6,300 | 138,915 | ||||
| Wal-Mart Stores, Inc. |
25,000 | 1,326,250 | ||||
| 6,504,147 | ||||||
| Semiconductors — 8.9% |
||||||
| Cree, Inc.*(a) |
19,200 | 339,648 | ||||
| Intel Corp. |
135,600 | 4,366,320 | ||||
| International Rectifier Corp.* |
13,500 | 667,035 | ||||
| MEMC Electronic Materials, Inc.* |
39,200 | 377,104 | ||||
| Silicon Laboratories, Inc.* |
10,800 | 466,776 | ||||
| Texas Instruments, Inc. |
55,500 | 1,630,590 | ||||
| Xilinx, Inc.*(a) |
21,300 | 825,162 | ||||
| 8,672,635 | ||||||
| Telecommunications — 3.3% |
||||||
| AT&T Wireless Services, Inc.* |
87,400 | 698,326 | ||||
| Foundry Networks, Inc.* |
7,300 | 199,728 | ||||
| Nextel Communications, Inc. (Class “A” Stock)*(a) |
30,500 | 855,830 | ||||
| UK, Inc. |
27,100 | 1,461,503 | ||||
| 3,215,387 | ||||||
| Transportation — 0.6% |
||||||
| FedEx Corp.(a) |
3,500 | 236,250 | ||||
| Swift Transportation Co., Inc.* |
10,800 | 227,016 | ||||
| Werner Enterprises, Inc. |
4,325 | 84,294 | ||||
| 547,560 | ||||||
| Total Common Stock |
||||||
| (Cost $80,643,638) |
89,466,086 | |||||
| PREFERRED STOCK — 0.2% |
||||||
| Broadcasting |
||||||
| News Corp. Ltd. [ADR] |
||||||
| (Cost $144,947) |
4,981 | 150,675 | ||||
| Total Long-Term Investments |
||||||
| (Cost $80,788,585) |
89,616,761 | |||||
| Par (000) |
||||||
| SHORT-TERM INVESTMENTS — 18.5% |
||||||
| Commercial Paper — 4.8% |
||||||
| Cancara Asset Securitisation Ltd. |
||||||
| 1.11%, 01/12/04(b) |
$ | 618 | 617,605 | |||
| Concord Minutemen Capital Co. |
||||||
| 1.13%, 02/09/04(b) |
162 | 161,277 | ||||
125
Table of Contents
AST DeAM Large-Cap Growth Portfolio
Schedule of Investments
December 31, 2003
| Par (000) |
Value | |||||
| Crown Point Capital Co. |
||||||
| 1.11%, 01/16/04(b) |
$ | 14 | $ | 13,700 | ||
| General Electric Capital Corp. |
||||||
| 1.11%, 02/05/04(b) |
2,247 | 2,240,911 | ||||
| Monumental Global Funding |
||||||
| 1.141%, 01/29/04 [FRN](b)(c) |
1,649 | 1,653,469 | ||||
| 4,686,962 | ||||||
| Corporate Obligations — 10.0% |
||||||
| Bear Stearns Co., Inc. |
||||||
| 1.12%, 01/02/04 [FRN](b)(c) |
855 | 854,875 | ||||
| Canadian Imperial Bank of Commerce |
||||||
| 1.111%, 01/29/04 [FRN](b)(c) |
235 | 235,303 | ||||
| General Electric Capital Corp. |
||||||
| 1.13%, 01/02/04 [FRN](b)(c) |
224 | 224,627 | ||||
| Goldman Sachs Group, Inc. |
||||||
| 1.14%, 01/06/04 [FRN](b)(c) |
446 | 445,938 | ||||
| Merrill Lynch & Co., Inc. |
||||||
| 1.13%, 01/02/04 [FRN](b)(c) |
2,195 | 2,195,734 | ||||
| 1.13%, 01/02/04(b) |
62 | 62,145 | ||||
| Morgan Stanley |
||||||
| 1.03%, 01/02/04 [FRN](b)(c) |
605 | 605,410 | ||||
| 1.08%, 01/02/04 [FRN](b)(c) |
2,657 | 2,657,400 | ||||
| Natexis Banques Populaires |
||||||
| 1.035%, 01/02/04 [FRN](b)(c) |
1,009 | 1,009,446 | ||||
| 1.10%, 01/02/04 [FRN](b)(c) |
656 | 656,068 | ||||
| Westdeutsche Landesbank |
||||||
| 1.13%, 01/09/04 [FRN](b)(c) |
908 | 908,379 | ||||
| 9,855,325 | ||||||
| Shares |
||||||
| Non-Registered Investment Company — 2.1% |
||||||
| BlackRock Institutional Money Market Trust(b)(j) |
2,018,107 | 2,018,107 | ||||
| Par (000) |
Value |
||||||
| Repurchase Agreement — 0.3% |
|||||||
| Merrill Lynch & Co., Inc. |
|||||||
| 1.00%, dated 12/31/03, to be repurchased on 01/02/04, repurchase price $258,951 (Collateralized by Federal Home Loan Mortgage Corp. 5.50% maturing 12/01/33, Federal National Mortgage Assoc. 4.00% - 6.00% maturing 11/01/17 to 11/01/33 and Government National Mortgage Assoc. 1.47% maturing 01/16/04 [FRN](c), par value $317,704, market value including accrued interest $266,709)(b) |
$ | 259 | $ | 258,937 | |||
| Time Deposits — 0.8% |
|||||||
| Chase Manhattan Bank |
|||||||
| 0.875%, 01/02/04(b) |
251 | 251,345 | |||||
| UBS Bank |
|||||||
| 0.938%, 01/02/04(b) |
497 | 497,153 | |||||
| 748,498 | |||||||
| U.S. Treasury Obligations — 0.5% |
|||||||
| U.S. Treasury Bills |
|||||||
| 0.82%, 01/29/04(k)(n) |
50 | 49,968 | |||||
| 0.84%, 01/29/04(k)(n) |
45 | 44,970 | |||||
| 0.87%, 01/29/04(k)(n) |
50 | 49,966 | |||||
| 0.89%, 01/29/04(k)(n) |
10 | 9,993 | |||||
| 0.93%, 01/29/04(k)(n) |
300 | 299,781 | |||||
| 454,678 | |||||||
| Total Short-Term Investments |
|||||||
| (Cost $18,022,510) |
18,022,507 | ||||||
| Total Investments — 110.4% |
|||||||
| (Cost $98,811,095; Note 5) |
107,639,268 | ||||||
| Liabilities in Excess of |
(10,168,711 | ) | |||||
| Net Assets — 100.0% |
$ | 97,470,557 | |||||
126
Table of Contents
AST DeAM Large-Cap Growth Portfolio
Schedule of Investments
December 31, 2003
The following abbreviations are used in portfolio descriptions:
| ADR | American Depositary Receipt |
| FRN | Floating Rate Note |
| symbol |
description | |
| * | Non-income producing security. | |
| (a) | Portion of securities on loan with an aggregate market value of $17,070,056; cash collateral $17,567,829 was received with which the portfolio purchased securities. | |
| (b) | Represents security purchased with cash collateral for securities on loan. | |
| (c) | Indicates a variable rate security. The maturity date presented for these instruments is the latter of the next date on which the security can be redeemed at par or the next date on which the rate of interest is adjusted. The interest rate shown reflects the rate in effect at December 31, 2003. | |
| (j) | Security available to institutional investors only. | |
| (k) | Securities with an aggregate market value of $439,688 have been segregated with the custodian to cover margin requirements for the following open futures contracts at December 31, 2003: |
| Description | Expiration Month |
Number of Contracts |
Contracts at Trade Date Value |
Contracts at Current Value |
Unrealized Appreciation | ||||||||
| Long Positions: |
|||||||||||||
| S&P 500 |
03/04 | 28 | $ | 7,590,638 | $ | 7,774,200 | $ | 183,562 | |||||
| (n) | Rates shown are the effective yields at purchase date. |
See Notes to Financial Statements.
127
Table of Contents
AST DeAM Large-Cap Value Portfolio
Schedule of Investments
December 31, 2003
| Shares |
Value | ||||
| LONG-TERM INVESTMENTS — 92.5% |
|||||
| COMMON STOCK — 92.3% |
|||||
| Aerospace — 1.2% |
|||||
| Goodrich Corp. |
41,400 | $ | 1,229,166 | ||
| Lockheed Martin Corp. |
6,100 | 313,540 | |||
| 1,542,706 | |||||
| Automotive Parts — 2.1% |
|||||
| American Axle & Manufacturing Holdings, Inc.*(a) |
28,100 | 1,135,802 | |||
| Autoliv, Inc. |
23,800 | 896,070 | |||
| Delphi Corp. |
79,000 | 806,590 | |||
| 2,838,462 | |||||
| Beverages — 1.6% |
|||||
| PepsiAmericas, Inc. |
6,600 | 112,992 | |||
| PepsiCo, Inc. |
42,700 | 1,990,674 | |||
| 2,103,666 | |||||
| Cable Television — 3.9% |
|||||
| Comcast Corp. (Class “A” Stock)* |
71,300 | 2,343,631 | |||
| Cox Communications, Inc. (Class “A” Stock)*(a) |
49,500 | 1,705,275 | |||
| Hughes Electronics Corp.* |
73,101 | 1,209,822 | |||
| 5,258,728 | |||||
| Chemicals — 2.7% |
|||||
| Dow Chemical Co. |
8,100 | 336,717 | |||
| Engelhard Corp. |
56,900 | 1,704,155 | |||
| Monsanto Co. |
52,900 | 1,522,462 | |||
| 3,563,334 | |||||
| Computer Hardware — 2.5% |
|||||
| Hewlett-Packard Co. |
27,200 | 624,784 | |||
| International Business Machines Corp. |
29,800 | 2,761,864 | |||
| 3,386,648 | |||||
| Conglomerates — 1.2% |
|||||
| Altria Group, Inc.(a) |
12,800 | 696,576 | |||
| Honeywell International, Inc. |
27,500 | 919,325 | |||
| 1,615,901 | |||||
| Construction — 0.6% |
|||||
| MDC Holdings, Inc. |
4,800 | 309,600 | |||
| The Ryland Group, Inc. |
3,100 | 274,784 | |||
| Toll Brothers, Inc.*(a) |
7,000 | 278,320 | |||
| 862,704 | |||||
| Consumer Products & Services — 3.1% |
|||||
| Clorox Co. |
3,500 | 169,960 | |||
| Gillette Co. |
12,300 | 451,779 | |||
| Hasbro, Inc. |
38,900 | 827,792 | |||
| Procter & Gamble Co. |
12,000 | 1,198,560 | |||
| Whirlpool Corp.(a) |
21,500 | 1,561,975 | |||
| 4,210,066 | |||||
| Shares |
Value | ||||
| Containers & Packaging — 0.2% |
|||||
| Owens-Illinois, Inc.* |
26,500 | $ | 315,085 | ||
| Electronic Components & Equipment — 2.1% |
|||||
| Avnet, Inc.* |
12,300 | 266,418 | |||
| Eastman Kodak Co.(a) |
73,000 | 1,873,910 | |||
| Sanmina-SCI Corp.* |
51,500 | 649,415 | |||
| 2,789,743 | |||||
| Entertainment & Leisure — 1.0% |
|||||
| Time Warner, Inc.*(a) |
74,100 | 1,333,059 | |||
| Financial - Bank & Trust — 12.8% |
|||||
| Bank of America Corp.(a) |
54,600 | 4,391,477 | |||
| FleetBoston Financial Corp. |
23,000 | 1,003,950 | |||
| Golden West Financial Corp. |
16,400 | 1,692,316 | |||
| Independence Community Bank Corp. |
9,000 | 323,730 | |||
| National City Corp. |
39,100 | 1,327,054 | |||
| New York Community Bancorp, Inc.(a) |
21,500 | 818,075 | |||
| U.S. Bancorp |
99,900 | 2,975,022 | |||
| Wachovia Corp. |
60,000 | 2,795,400 | |||
| Wells Fargo & Co. |
19,600 | 1,154,244 | |||
| Zions Bancorporation |
8,400 | 515,172 | |||
| 16,996,440 | |||||
| Financial Services — 10.6% |
|||||
| CIT Group, Inc. |
39,300 | 1,412,835 | |||
| Citigroup, Inc.(a) |
117,475 | 5,702,237 | |||
| Countrywide Financial Corp.(a) |
18,933 | 1,436,068 | |||
| Franklin Resources, Inc. |
6,400 | 333,184 | |||
| J.P. Morgan Chase & Co. |
76,900 | 2,824,537 | |||
| John Hancock Financial Services, Inc. |
9,300 | 348,750 | |||
| Lehman Brothers Holdings, Inc.(a) |
13,100 | 1,011,582 | |||
| MBIA, Inc. |
4,900 | 290,227 | |||
| Washington Mutual, Inc. |
18,400 | 738,208 | |||
| 14,097,628 | |||||
| Food — 1.2% |
|||||
| Dean Foods Co.* |
42,000 | 1,380,540 | |||
| Safeway, Inc.* |
10,100 | 221,291 | |||
| 1,601,831 | |||||
| Healthcare Services — 1.7% |
|||||
| Health Net, Inc.*(a) |
31,300 | 1,023,510 | |||
| Humana, Inc.* |
55,600 | 1,270,460 | |||
| 2,293,970 | |||||
| Insurance — 4.4% |
|||||
| Berkley (W.R) Corp. |
51,150 | 1,787,692 | |||
| Fidelity National Financial, Inc. |
20,925 | 811,472 | |||
| First American Corp. |
20,000 | 595,400 | |||
| Markel Corp.* |
2,300 | 583,073 | |||
| Mercury General Corp. |
5,700 | 265,335 | |||
| Nationwide Financial Services, Inc. |
3,100 | 102,486 | |||
| Principal Financial Group, Inc. |
53,400 | 1,765,938 | |||
| 5,911,396 | |||||
128
Table of Contents
AST DeAM Large-Cap Value Portfolio
Schedule of Investments
December 31, 2003
| Shares |
Value | ||||
| Machinery & Equipment — 2.6% |
|||||
| Caterpillar, Inc. |
13,500 | $ | 1,120,770 | ||
| Eaton Corp. |
22,300 | 2,407,954 | |||
| 3,528,724 | |||||
| Medical Supplies & Equipment — 0.6% |
|||||
| PerkinElmer, Inc. |
43,900 | 749,373 | |||
| Metals & Mining — 1.8% |
|||||
| Alcoa, Inc.(a) |
61,900 | 2,352,200 | |||
| Office Equipment — 1.0% |
|||||
| Hon Industries, Inc. |
2,000 | 86,640 | |||
| Xerox Corp.*(a) |
94,300 | 1,301,340 | |||
| 1,387,980 | |||||
| Oil & Gas — 10.3% |
|||||
| Amerada Hess Corp. |
7,000 | 372,190 | |||
| ChevronTexaco Corp. |
3,700 | 319,643 | |||
| ConocoPhillips |
19,400 | 1,272,058 | |||
| Exxon Mobil Corp. |
112,600 | 4,616,600 | |||
| Marathon Oil Corp. |
44,700 | 1,479,123 | |||
| Occidental Petroleum Corp. |
58,200 | 2,458,368 | |||
| Pioneer Natural Resources Co.* |
23,400 | 747,162 | |||
| Pogo Producing Co. |
19,100 | 922,530 | |||
| Unocal Corp. |
45,100 | 1,661,033 | |||
| 13,848,707 | |||||
| Paper & Forest Products — 0.3% |
|||||
| Rayonier, Inc. |
9,600 | 398,496 | |||
| Pharmaceuticals — 3.0% |
|||||
| King Pharmaceuticals, Inc.* |
2,600 | 39,676 | |||
| Merck & Co., Inc. |
37,800 | 1,746,360 | |||
| Valeant Pharmaceuticals International(a) |
35,700 | 897,855 | |||
| Watson Pharmaceuticals, Inc.*(a) |
28,400 | 1,306,400 | |||
| 3,990,291 | |||||
| Printing & Publishing — 0.7% |
|||||
| McGraw-Hill Companies, Inc. |
13,215 | 923,993 | |||
| Real Estate — 1.7% |
|||||
| Apartment Investment & Management Co. (Class “A” Stock) [REIT] |
5,900 | 203,550 | |||
| Avalonbay Communities, Inc. [REIT] |
900 | 43,020 | |||
| Equity Office Properties Trust [REIT] |
17,100 | 489,915 | |||
| Equity Residential Properties Trust [REIT] |
17,900 | 528,229 | |||
| Federal Realty Investment Trust [REIT] |
2,100 | 80,619 | |||
| Mills Corp. (The) [REIT] |
2,700 | 118,800 | |||
| Pan Pacific Retail Properties, Inc. [REIT] |
1,900 | 90,535 | |||
| Simon Property Group, Inc. [REIT] |
7,900 | 366,086 | |||
| Vornado Realty Trust [REIT] |
6,200 | 339,450 | |||
| 2,260,204 | |||||
| Restaurants — 0.6% |
|||||
| McDonald’s Corp. |
31,600 | 784,628 | |||
| Shares |
Value | ||||
| Retail & Merchandising — 1.8% |
|||||
| Federated Department Stores, Inc.(a) |
30,900 | $ | 1,456,317 | ||
| May Department Stores Co. (The)(a) |
19,300 | 561,051 | |||
| Saks, Inc.* |
25,300 | 380,512 | |||
| 2,397,880 | |||||
| Semiconductors — 1.2% |
|||||
| Fairchild Semiconductor International, Inc.* |
29,300 | 731,621 | |||
| International Rectifier Corp.* |
17,600 | 869,616 | |||
| 1,601,237 | |||||
| Telecommunications — 6.5% |
|||||
| AT&T Corp.(a) |
37,100 | 753,130 | |||
| AT&T Wireless Services, Inc.* |
142,900 | 1,141,771 | |||
| BellSouth Corp. |
62,300 | 1,763,090 | |||
| CenturyTel, Inc. |
5,900 | 192,458 | |||
| SBC Communications, Inc. |
27,100 | 706,497 | |||
| Sprint Corp.(a) |
74,300 | 1,220,006 | |||
| Verizon Communications, Inc.(a) |
84,500 | 2,964,260 | |||
| 8,741,212 | |||||
| Transportation — 2.4% |
|||||
| FedEx Corp.(a) |
22,800 | 1,539,000 | |||
| Ryder System, Inc. |
49,900 | 1,704,085 | |||
| 3,243,085 | |||||
| Utilities — 4.9% |
|||||
| CenterPoint Energy, Inc. |
40,400 | 391,476 | |||
| Edison International Co.(a) |
60,400 | 1,324,572 | |||
| Entergy Corp. |
37,900 | 2,165,227 | |||
| Exelon Corp. |
38,000 | 2,521,680 | |||
| Northeast Utilities |
6,100 | 123,037 | |||
| 6,525,992 | |||||
| Total Common Stock |
|||||
| (Cost $107,948,243) |
123,455,369 | ||||
| PREFERRED STOCK — 0.2% |
|||||
| Broadcasting |
|||||
| News Corp. Ltd. [ADR] |
|||||
| (Cost $237,922) |
8,176 | 247,324 | |||
| Moody’s (Unaudited) |
Par (000) |
||||||
| CORPORATE OBLIGATION |
|||||||
| Retail & Merchandising |
|||||||
| Ames Department Stores, Inc., |
|||||||
| 10.00%, 04/15/06 (cost $13,156; purchased 11/17/00 - 1/30/01)(g)(i) |
|||||||
| (Cost $13,156) |
NR | $ | 40 | 300 | |||
| Total Long-Term Investments |
|||||||
| (Cost $108,199,321) |
123,702,993 | ||||||
129
Table of Contents
AST DeAM Large-Cap Value Portfolio
Schedule of Investments
December 31, 2003
| Par (000) |
Value | |||||
| SHORT-TERM INVESTMENTS — 23.5% | ||||||
| Certificate of Deposit — 1.2% |
||||||
| Westdeutsche Landesbank |
$ | 1,561 | $ | 1,560,556 | ||
| Commercial Paper — 2.9% |
||||||
| Cancara Asset Securitisation Ltd. |
||||||
| 1.11%, 01/12/04(b) |
874 | 873,734 | ||||
| Concord Minutemen Capital Co. |
||||||
| 1.13%, 02/09/04(b) |
2,071 | 2,065,435 | ||||
| Crown Point Capital Co. |
||||||
| 1.11%, 01/16/04(b) |
6 | 5,578 | ||||
| Lexington Parker Capital Co. |
||||||
| 1.10%, 01/12/04(b) |
168 | 168,054 | ||||
| Silver Tower U.S. Funding |
||||||
| 1.13%, 02/02/04(b) |
785 | 782,624 | ||||
| Tannehill Capital Co. |
||||||
| 1.10%, 01/08/04(b) |
34 | 34,261 | ||||
| 3,929,686 | ||||||
| Corporate Obligations — 15.6% |
||||||
| American Express Centurian |
||||||
| 1.118%, 01/22/04 [FRN](b)(c) |
1,006 | 1,005,640 | ||||
| Bear Stearns Co., Inc. |
||||||
| 1.12%, 01/02/04 [FRN](b)(c) |
5,068 | 5,067,702 | ||||
| General Electric Capital Corp. |
||||||
| 1.13%, 01/02/04 [FRN](b)(c) |
566 | 566,916 | ||||
| Merrill Lynch & Co., Inc. |
||||||
| 1.13%, 01/02/04 [FRN](b)(c) |
3,055 | 3,054,902 | ||||
| 1.13%, 01/02/04(b) |
67 | 67,291 | ||||
| Morgan Stanley |
||||||
| 1.03%, 01/02/04 [FRN](b)(c) |
4,494 | 4,494,001 | ||||
| 1.08%, 01/02/04 [FRN](b)(c) |
526 | 525,839 | ||||
| Natexis Banques Populaires |
||||||
| 1.035%, 01/02/04 [FRN](b)(c) |
1,413 | 1,413,093 | ||||
| 1.10%, 01/02/04 [FRN](b)(c) |
3,410 | 3,409,154 | ||||
| Westdeutsche Landesbank |
||||||
| 1.13%, 01/09/04 [FRN](b)(c) |
1,233 | 1,232,384 | ||||
| 20,836,922 | ||||||
| Shares |
||||||
| Non-Registered Investment Company — 2.3% |
||||||
| BlackRock Institutional Money Market Trust(b)(j) |
3,118,213 | $ | 3,118,213 | |||
| Par (000) |
Value |
||||||
| Repurchase Agreement — 0.2% |
|||||||
| Merrill Lynch & Co., Inc. |
|||||||
| 1.00%, dated 12/31/03, to be repurchased on 01/02/04, repurchase price $280,395 (Collateralized by Federal Home Loan Mortgage Corp. 5.50% maturing 12/01/33, Federal National Mortgage Assoc. 4.00% - 6.00% maturing 11/01/17 to 11/01/33 and Government National Mortgage Assoc. 1.47% maturing 01/16/04 [FRN](c), par value $344,014, market value including accrued interest $288,796)(b) |
$ | 280 | $ | 280,379 | |||
| Time Deposits — 0.9% |
|||||||
| Chase Manhattan Bank |
|||||||
| 0.875%, 01/02/04(b) |
940 | 939,916 | |||||
| UBS Bank |
|||||||
| 0.938%, 01/02/04(b) |
280 | 279,978 | |||||
| 1,219,894 | |||||||
| U.S. Treasury Obligations — 0.4% |
|||||||
| U.S. Treasury Bills |
|||||||
| 0.82%, 01/29/04(k)(n) |
35 | 34,978 | |||||
| 0.84%, 01/29/04(k)(n) |
100 | 99,934 | |||||
| 0.87%, 01/29/04(k)(n) |
70 | 69,952 | |||||
| 0.88%, 01/29/04(k)(n) |
15 | 14,990 | |||||
| 0.89%, 01/29/04(k)(n) |
40 | 39,972 | |||||
| 0.93%, 01/29/04(k)(n) |
300 | 299,781 | |||||
| 559,607 | |||||||
| Total Short-Term Investments |
|||||||
| (Cost $31,505,260) |
31,505,257 | ||||||
| Total Investments — 116.0% |
|||||||
| (Cost $139,704,581; Note 5) |
155,208,250 | ||||||
| Liabilities in Excess of |
(21,387,237 | ) | |||||
| Net Assets — 100.0% |
$ | 133,821,013 | |||||
130
Table of Contents
AST DeAM Large-Cap Value Portfolio
Schedule of Investments
December 31, 2003
The following abbreviations are used in portfolio descriptions:
| ADR | American Depositary Receipt |
| FRN | Floating Rate Note |
| REIT | Real Estate Investment Trust |
| symbol |
description | |
| * |
Non-income producing security. | |
| (a) |
Portion of securities on loan with an aggregate market value of $29,927,181; cash collateral $30,945,650 was received with which the portfolio purchased securities. | |
| (b) |
Represents security purchased with cash collateral for securities on loan. | |
| (c) |
Indicates a variable rate security. The maturity date presented for these instruments is the latter of the next date on which the security can be redeemed at par or the next date on which the rate of interest is adjusted. The interest rate shown reflects the rate in effect at December 31, 2003. | |
| (g) |
Indicates a security that has been deemed illiquid. The aggregate cost of the illiquid security is $13,156. The aggregate value, $300 represents 0.00% of net assets. | |
| (i) |
Represents issuer in default on interest payments, Non-income producing security. | |
| (j) |
Security available to institutional investors only. | |
| (k) |
Securities with an aggregate market value of $509,640 have been segregated with the custodian to cover margin requirements for the following open futures contracts at December 31, 2003: | |
| Description | Expiration Month |
Number of Contracts |
Contracts at Trade Date Value |
Contracts at Current Value |
Unrealized Appreciation | ||||||||
| Long Positions: |
|||||||||||||
| S&P 500 |
03/04 | 34 | $ | 9,230,700 | $ | 9,440,100 | $ | 209,400 | |||||
| (n) |
Rates shown are the effective yields at purchase date. | |
See Notes to Financial Statements.
131
Table of Contents
AST Alliance/Bernstein Growth + Value Portfolio
Schedule of Investments
December 31, 2003
| Shares |
Value | ||||
| LONG-TERM INVESTMENTS — 98.1% |
|||||
| COMMON STOCK |
|||||
| Automotive Parts — 1.2% |
|||||
| Genuine Parts Co. |
5,000 | $ | 166,000 | ||
| Magna International, Inc. (Class “A” Stock) |
7,700 | 616,385 | |||
| 782,385 | |||||
| Beverages — 0.7% |
|||||
| PepsiCo, Inc. |
9,600 | 447,552 | |||
| Cable Television — 2.7% |
|||||
| Comcast Corp. (Special Class “A” Stock)*(a) |
55,000 | 1,720,400 | |||
| Chemicals — 0.9% |
|||||
| DuPont (E.I.) de Nemours & Co. |
11,900 | 546,091 | |||
| Clothing & Apparel — 1.4% |
|||||
| VF Corp. |
20,150 | 871,286 | |||
| Computer Hardware — 4.8% |
|||||
| Dell, Inc.* |
54,700 | 1,857,612 | |||
| Hewlett-Packard Co. |
52,750 | 1,211,668 | |||
| 3,069,280 | |||||
| Computer Services & Software — 7.6% |
|||||
| Cisco Systems, Inc.*(a) |
53,300 | 1,294,657 | |||
| Electronic Arts, Inc.*(a) |
22,100 | 1,055,938 | |||
| Microsoft Corp.(a) |
67,000 | 1,845,180 | |||
| Veritas Software Corp.*(a) |
17,700 | 657,732 | |||
| 4,853,507 | |||||
| Conglomerates — 1.5% |
|||||
| Altria Group, Inc.(a) |
6,150 | 334,683 | |||
| Textron, Inc. |
10,600 | 604,836 | |||
| 939,519 | |||||
| Consumer Products & Services — 1.9% |
|||||
| Johnson & Johnson |
5,300 | 273,798 | |||
| Procter & Gamble Co. |
5,200 | 519,376 | |||
| Whirlpool Corp.(a) |
5,700 | 414,105 | |||
| 1,207,279 | |||||
| Containers & Packaging — 0.7% |
|||||
| Smurfit-Stone Container Corp.*(a) |
25,600 | 475,392 | |||
| Electronic Components & Equipment — 4.4% |
|||||
| Flextronics International Ltd.* |
35,800 | 531,272 | |||
| General Electric Co.(a) |
61,800 | 1,914,564 | |||
| Solectron Corp.*(a) |
62,697 | 370,539 | |||
| 2,816,375 | |||||
| Entertainment & Leisure — 2.4% |
|||||
| Viacom, Inc. (Class “B” Stock) |
34,400 | 1,526,672 | |||
| Financial - Bank & Trust — 6.1% |
|||||
| Bank of America Corp.(a) |
14,200 | 1,142,106 | |||
| FleetBoston Financial Corp. |
9,000 | 392,850 | |||
| Shares |
Value | ||||
| Golden West Financial Corp. |
3,500 | $ | 361,165 | ||
| National City Corp. |
39,100 | 1,327,054 | |||
| Wachovia Corp. |
14,650 | 682,544 | |||
| 3,905,719 | |||||
| Financial Services — 13.4% |
|||||
| Citigroup, Inc.(a) |
51,500 | 2,499,809 | |||
| Fannie Mae |
23,900 | 1,793,934 | |||
| Goldman Sachs Group, Inc.(a) |
12,500 | 1,234,125 | |||
| Lehman Brothers Holdings, Inc. |
7,200 | 555,984 | |||
| MBNA Corp. |
70,200 | 1,744,470 | |||
| Merrill Lynch & Co., Inc.(a) |
4,900 | 287,385 | |||
| Washington Mutual, Inc. |
12,025 | 482,443 | |||
| 8,598,150 | |||||
| Food — 1.3% |
|||||
| Kroger Co. (The)* |
11,500 | 212,865 | |||
| Safeway, Inc.* |
28,275 | 619,505 | |||
| 832,370 | |||||
| Healthcare Services — 2.2% |
|||||
| UnitedHealth Group, Inc.(a) |
24,000 | 1,396,320 | |||
| Industrial Products — 0.5% |
|||||
| Cooper Industries Ltd. (Class “A” Stock) |
5,400 | 312,822 | |||
| Insurance — 8.3% |
|||||
| American International Group, Inc. |
21,200 | 1,405,135 | |||
| Chubb Corp.(a) |
14,500 | 987,450 | |||
| Jefferson-Pilot Corp.(a) |
12,900 | 653,385 | |||
| MetLife, Inc. |
33,400 | 1,124,578 | |||
| The Progressive Corp. |
7,500 | 626,925 | |||
| Torchmark Corp. |
1,200 | 54,648 | |||
| Travelers Property Casualty Corp. |
29,300 | 491,654 | |||
| 5,343,775 | |||||
| Internet Services — 2.1% |
|||||
| eBay, Inc.*(a) |
16,200 | 1,046,358 | |||
| Yahoo!, Inc.*(a) |
6,700 | 302,639 | |||
| 1,348,997 | |||||
| Medical Supplies & Equipment — 3.7% |
|||||
| Amgen, Inc.* |
22,700 | 1,402,860 | |||
| Medtronic, Inc. |
19,200 | 933,312 | |||
| 2,336,172 | |||||
| Oil & Gas — 3.1% |
|||||
| ConocoPhillips(a) |
17,700 | 1,160,589 | |||
| Occidental Petroleum Corp. |
13,400 | 566,016 | |||
| Valero Energy Corp. |
5,000 | 231,700 | |||
| 1,958,305 | |||||
| Paper & Forest Products — 2.0% |
|||||
| Georgia-Pacific Corp.(a) |
27,650 | 848,026 | |||
| MeadWestvaco Corp. |
14,600 | 434,350 | |||
| 1,282,376 | |||||
132
Table of Contents
AST Alliance/Bernstein Growth + Value Portfolio
Schedule of Investments
December 31, 2003
| Shares |
Value | ||||
| Pharmaceuticals — 4.2% |
|||||
| GlaxoSmithKline PLC [ADR] |
12,300 | $ | 573,426 | ||
| Pfizer, Inc. |
47,200 | 1,667,576 | |||
| Wyeth |
9,700 | 411,765 | |||
| 2,652,767 | |||||
| Railroads — 3.5% |
|||||
| Burlington Northern Santa Fe Corp. |
19,000 | 614,650 | |||
| CSX Corp. |
18,900 | 679,266 | |||
| Norfolk Southern Corp. |
38,600 | 912,890 | |||
| 2,206,806 | |||||
| Retail & Merchandising — 8.3% |
|||||
| Bed Bath & Beyond, Inc.* |
7,000 | 303,450 | |||
| Federated Department Stores, Inc.(a) |
4,600 | 216,798 | |||
| Kohl’s Corp.*(a) |
7,100 | 319,074 | |||
| Lowe’s Companies, Inc. |
20,300 | 1,124,417 | |||
| May Department Stores Co. (The)(a) |
20,250 | 588,668 | |||
| Sears, Roebuck and Co. |
8,100 | 368,469 | |||
| Wal-Mart Stores, Inc. |
33,900 | 1,798,395 | |||
| Walgreen Co. |
15,600 | 567,528 | |||
| 5,286,799 | |||||
| Semiconductors — 2.7% |
|||||
| Intel Corp.(a) |
44,000 | 1,416,800 | |||
| Maxim Integrated Products, Inc. |
5,800 | 288,840 | |||
| 1,705,640 | |||||
| Telecommunications — 3.5% |
|||||
| Corning, Inc.* |
44,300 | 462,049 | |||
| Nortel Networks Corp.* |
142,800 | 604,044 | |||
| Qwest Communications International, Inc.* |
76,500 | 330,480 | |||
| Sprint Corp.(a) |
22,000 | 361,240 | |||
| Sprint Corp. (PCS Group)*(a) |
41,000 | 230,420 | |||
| Tellabs, Inc.* |
30,700 | 258,801 | |||
| 2,247,034 | |||||
| Utilities — 3.0% |
|||||
| American Electric Power Co., Inc. |
21,600 | 659,016 | |||
| Entergy Corp. |
9,900 | 565,587 | |||
| PPL Corp.(a) |
7,900 | 345,625 | |||
| Sempra Energy(a) |
12,500 | 375,750 | |||
| 1,945,978 | |||||
| Total Long-Term Investments |
|||||
| (Cost $55,604,121) |
62,615,768 | ||||
| Par (000) |
Value | |||||
| SHORT-TERM INVESTMENTS — 30.6% |
||||||
| Commercial Paper — 6.0% |
||||||
| Cancara Asset Securitisation Ltd. |
||||||
| 1.11%, 01/12/04(b) |
$ | 814,193 | $ | 813,490 | ||
| Crown Point Capital Co. |
||||||
| 1.11%, 01/16/04(b) |
207,182 | 206,677 | ||||
| General Electric Capital Corp. |
||||||
| 1.11%, 02/05/04(b) |
1,433,683 | 1,429,705 | ||||
| Monumental Global Funding |
||||||
| 1.141%, 01/29/04 [FRN](b)(c) |
93,525 | 93,758 | ||||
| Tannehill Capital Co. |
||||||
| 1.10%, 01/08/04(b) |
1,308,889 | 1,305,289 | ||||
| 3,848,919 | ||||||
| Corporate Obligations — 18.8% |
||||||
| American Express Centurian |
||||||
| 1.118%, 01/22/04 [FRN](b)(c) |
1,355,754 | 1,355,754 | ||||
| Bear Stearns Co., Inc. |
||||||
| 1.12%, 01/02/04 [FRN](b)(c) |
533,168 | 533,168 | ||||
| 1.12%, 01/02/04 [FRN](b)(c) |
156,864 | 156,864 | ||||
| General Electric Capital Corp. |
||||||
| 1.13%, 01/02/04 [FRN](b)(c) |
7,672 | 7,680 | ||||
| Goldman Sachs Group, Inc. |
||||||
| 1.14%, 01/06/04 [FRN](b)(c) |
632,844 | 632,844 | ||||
| Merrill Lynch & Co., Inc. |
||||||
| 1.13%, 01/02/04(b) |
52,643 | 52,643 | ||||
| 1.13%, 01/02/04 [FRN](b)(c) |
1,298,523 | 1,298,523 | ||||
| 1.13%, 01/02/04 [FRN](b)(c) |
1,797,171 | 1,797,171 | ||||
| Morgan Stanley |
||||||
| 1.03%, 01/02/04 [FRN](b)(c) |
560,303 | 560,303 | ||||
| 1.03%, 01/02/04 [FRN](b)(c) |
1,486,990 | 1,486,990 | ||||
| 1.08%, 01/02/04 [FRN](b)(c) |
2,384,146 | 2,384,145 | ||||
| Natexis Banques Populaires |
||||||
| 1.035%, 01/02/04 [FRN](b)(c) |
774,070 | 774,070 | ||||
| 1.10%, 01/02/04 [FRN](b)(c) |
918,111 | 917,879 | ||||
| 11,958,034 | ||||||
| Shares |
||||||
| Non-Registered Investment Company — 2.7% |
||||||
| BlackRock Institutional Money Market Trust(b)(j) |
1,709,550 | 1,709,550 | ||||
| Registered Investment Companies — 1.6% |
||||||
| BlackRock Provident Institutional Funds TempCash Portfolio |
497,498 | 497,498 | ||||
| BlackRock Provident Institutional Funds TempFund Portfolio |
497,498 | 497,498 | ||||
| 994,996 | ||||||
133
Table of Contents
AST Alliance/Bernstein Growth + Value Portfolio
Schedule of Investments
December 31, 2003
| Par (000) |
Value | |||||
| Repurchase Agreement — 0.3% |
||||||
| Merrill Lynch & Co., Inc. |
||||||
| 1.00%, dated 12/31/03, to be repurchased on 01/02/04, repurchase price $219,359 (Collateralized by Federal Home Loan Mortgage Corp. 5.50% maturing 12/01/33, Federal National Mortgage Assoc. 4.00% - 6.00% maturing 11/01/17 to 11/01/33 and Government National Mortgage Assoc. 1.47% maturing 01/16/04 [FRN](c), par value $269,129, market value including accrued interest $225,931)(b) |
$ | 219 | $ | 219,347 | ||
| Par (000) |
Value |
||||||
| Time Deposits — 1.2% |
|||||||
| Chase Manhattan Bank |
$ | 350,061 | $ | 350,061 | |||
| UBS Bank |
436,591 | 436,591 | |||||
| 786,652 | |||||||
| Total Short-Term Investments |
|||||||
| (Cost $19,517,498) |
19,517,498 | ||||||
| Total Investments — 128.7% |
|||||||
| (Cost $75,121,619; Note 5) |
82,133,266 | ||||||
| Liabilities in Excess of |
(18,296,350 | ) | |||||
| Net Assets — 100.0% |
$ | 63,836,916 | |||||
The following abbreviations are used in portfolio descriptions:
| ADR | American Depositary Receipt |
| FRN | Floating Rate Note |
| symbol |
description | |
| * |
Non-income producing security. | |
| (a) |
Portion of securities on loan with an aggregate market value $17,996,855; cash collateral $18,522,502 was received with which the portfolio purchased securities. | |
| (b) |
Represents security purchased with cash collateral for securities on loan. | |
| (c) |
Indicates a variable rate security. The maturity date presented for these instruments is the latter of the next date on which the security can be redeemed at par or the next date on which the rate of interest is adjusted. The interest rate shown reflects the rate in effect at December 31, 2003. | |
| (j) |
Security available to institutional investors only. | |
See Notes to Financial Statements.
134
Table of Contents
AST Sanford Bernstein Core Value Portfolio
Schedule of Investments
December 31, 2003
| Shares |
Value | ||||
| LONG-TERM INVESTMENTS — 96.5% |
|||||
| COMMON STOCK |
|||||
| Aerospace — 0.5% |
|||||
| Goodrich Corp. |
33,400 | $ | 991,646 | ||
| Automobile Manufacturers — 1.2% |
|||||
| General Motors Corp.(a) |
34,300 | 1,831,620 | |||
| PACCAR, Inc. |
6,100 | 519,232 | |||
| 2,350,852 | |||||
| Automotive Parts — 3.7% |
|||||
| American Axle & Manufacturing Holdings, Inc.*(a) |
16,000 | 646,720 | |||
| Autoliv, Inc. |
31,100 | 1,170,915 | |||
| AutoNation, Inc.* |
57,300 | 1,052,601 | |||
| BorgWarner, Inc. |
7,700 | 655,039 | |||
| Cooper Tire & Rubber Co. |
22,100 | 472,498 | |||
| Dana Corp. |
31,300 | 574,355 | |||
| Delphi Corp. |
31,400 | 320,594 | |||
| Genuine Parts Co. |
7,500 | 249,000 | |||
| Lear Corp. |
18,000 | 1,103,940 | |||
| Magna International, Inc. |
11,800 | 944,590 | |||
| 7,190,252 | |||||
| Building Materials — 1.0% |
|||||
| Martin Marietta Materials, Inc. |
14,800 | 695,156 | |||
| Masco Corp. |
20,600 | 564,646 | |||
| Sherwin-Williams Co. (The) |
19,350 | 672,219 | |||
| 1,932,021 | |||||
| Business Services — 0.4% |
|||||
| Tech Data Corp.* |
18,850 | 748,157 | |||
| Cable Television — 1.2% |
|||||
| Comcast Corp. (Class “A” Stock)* |
70,424 | 2,314,837 | |||
| Chemicals — 1.6% |
|||||
| Ashland, Inc. |
22,900 | 1,008,974 | |||
| Dow Chemical Co. |
4,700 | 195,379 | |||
| DuPont (E.I.) de Nemours & Co. |
14,000 | 642,460 | |||
| Lubrizol Corp. |
1,745 | 56,747 | |||
| Monsanto Co. |
43,200 | 1,243,296 | |||
| 3,146,856 | |||||
| Clothing & Apparel — 1.2% |
|||||
| Liz Claiborne, Inc. |
16,900 | 599,274 | |||
| Reebok International Ltd.(a) |
17,900 | 703,828 | |||
| VF Corp. |
23,100 | 998,844 | |||
| 2,301,946 | |||||
| Computer Hardware — 2.6% |
|||||
| Hewlett-Packard Co. |
150,524 | 3,457,536 | |||
| International Business Machines Corp. |
16,400 | 1,519,952 | |||
| 4,977,488 | |||||
| Shares |
Value | ||||
| Computer Services & Software — 0.9% |
|||||
| Electronic Data Systems Corp. |
49,700 | $ | 1,219,638 | ||
| Ingram Micro, Inc. (Class “A” Stock)* |
26,500 | 421,350 | |||
| 1,640,988 | |||||
| Conglomerates — 3.4% |
|||||
| Altria Group, Inc.(a) |
72,200 | 3,929,124 | |||
| Cendant Corp.*(a) |
26,000 | 579,020 | |||
| Textron, Inc. |
18,600 | 1,061,316 | |||
| Tyco International Ltd.(a) |
39,800 | 1,054,700 | |||
| 6,624,160 | |||||
| Construction — 1.0% |
|||||
| Centex Corp.(a) |
5,300 | 570,545 | |||
| D.R. Horton, Inc. |
3,900 | 168,714 | |||
| Pulte Corp. |
13,500 | 1,263,870 | |||
| 2,003,129 | |||||
| Consumer Products & Services — 1.4% |
|||||
| Procter & Gamble Co. |
6,500 | 649,220 | |||
| UST, Inc. |
27,800 | 992,182 | |||
| Whirlpool Corp.(a) |
15,125 | 1,098,831 | |||
| 2,740,233 | |||||
| Containers & Packaging — 0.1% |
|||||
| Smurfit-Stone Container Corp.*(a) |
13,875 | 257,659 | |||
| Electronic Components & Equipment — 2.0% |
|||||
| Arrow Electronics, Inc.* |
1,750 | 40,495 | |||
| Avnet, Inc.* |
3,400 | 73,644 | |||
| Flextronics International Ltd.* |
67,800 | 1,006,152 | |||
| Hubbell, Inc. (Class “B” Stock) |
14,500 | 639,450 | |||
| Rockwell Automation, Inc. |
5,800 | 206,480 | |||
| Sanmina-SCI Corp.* |
69,900 | 881,439 | |||
| Solectron Corp.*(a) |
155,950 | 921,665 | |||
| Vishay Intertechnology, Inc.*(a) |
6,200 | 141,980 | |||
| 3,911,305 | |||||
| Entertainment & Leisure — 1.2% |
|||||
| Disney (Walt) Co. |
11,900 | 277,627 | |||
| Time Warner, Inc.*(a) |
90,500 | 1,628,095 | |||
| Viacom, Inc. (Class “B” Stock) |
8,700 | 386,106 | |||
| 2,291,828 | |||||
| Financial - Bank & Trust — 13.1% |
|||||
| AmSouth Bancorp |
36,225 | 887,513 | |||
| Astoria Financial Corp.(a) |
13,200 | 491,040 | |||
| Bank of America Corp.(a) |
58,550 | 4,709,176 | |||
| Bank One Corp. |
49,100 | 2,238,469 | |||
| Comerica, Inc. |
20,900 | 1,171,654 | |||
| FleetBoston Financial Corp. |
56,975 | 2,486,959 | |||
| Golden West Financial Corp. |
14,000 | 1,444,660 | |||
| Huntington Bancshares, Inc. |
38,500 | 866,250 | |||
| National City Corp. |
44,650 | 1,515,421 | |||
| PNC Financial Services Group |
19,800 | 1,083,654 | |||
| Regions Financial Corp. |
28,925 | 1,076,010 | |||
| SunTrust Banks, Inc. |
10,200 | 729,300 | |||
135
Table of Contents
AST Sanford Bernstein Core Value Portfolio
Schedule of Investments
December 31, 2003
| Shares |
Value | ||||
| U.S. Bancorp |
59,400 | $ | 1,768,932 | ||
| Wachovia Corp. |
60,300 | 2,809,376 | |||
| Wells Fargo & Co. |
33,700 | 1,984,593 | |||
| 25,263,007 | |||||
| Financial Services — 14.6% |
|||||
| Bear Stearns Companies, Inc.(a) |
15,700 | 1,255,215 | |||
| Citigroup, Inc.(a) |
187,330 | 9,092,997 | |||
| Countrywide Financial Corp.(a) |
9,866 | 748,336 | |||
| Fannie Mae |
11,100 | 833,166 | |||
| Freddie Mac |
28,700 | 1,673,784 | |||
| Goldman Sachs Group, Inc.(a) |
18,500 | 1,826,505 | |||
| J.P. Morgan Chase & Co. |
59,400 | 2,181,762 | |||
| John Hancock Financial Services, Inc. |
33,100 | 1,241,250 | |||
| KeyCorp |
43,475 | 1,274,687 | |||
| Lehman Brothers Holdings, Inc.(a) |
20,500 | 1,583,010 | |||
| MBIA, Inc. |
19,300 | 1,143,139 | |||
| Merrill Lynch & Co., Inc. |
22,500 | 1,319,625 | |||
| Morgan Stanley Dean Witter & Co.(a) |
33,000 | 1,909,710 | |||
| Washington Mutual, Inc. |
48,775 | 1,956,853 | |||
| 28,040,039 | |||||
| Food — 1.6% |
|||||
| Archer-Daniels-Midland Co. |
10,200 | 155,244 | |||
| Kroger Co. (The)* |
59,700 | 1,105,047 | |||
| Safeway, Inc.* |
61,100 | 1,338,701 | |||
| Sara Lee Corp. |
16,500 | 358,215 | |||
| SUPERVALU, Inc. |
1,625 | 46,459 | |||
| 3,003,666 | |||||
| Industrial Products — 0.6% |
|||||
| Cooper Industries Ltd. |
13,900 | 805,227 | |||
| Crane Co. |
8,600 | 264,364 | |||
| 1,069,591 | |||||
| Insurance — 7.3% |
|||||
| ACE Ltd. |
15,100 | 625,442 | |||
| Aetna, Inc. |
8,175 | 552,467 | |||
| Allstate Corp. (The) |
43,500 | 1,871,369 | |||
| American International Group, Inc. |
22,400 | 1,484,672 | |||
| Chubb Corp.(a) |
20,700 | 1,409,670 | |||
| Hartford Financial Services Group, Inc. (The) |
24,000 | 1,416,720 | |||
| Jefferson-Pilot Corp. |
22,300 | 1,129,495 | |||
| MetLife, Inc. |
34,225 | 1,152,356 | |||
| MGIC Investment Corp. |
19,300 | 1,098,942 | |||
| PartnerRe Ltd. |
7,200 | 417,960 | |||
| RenaissanceRe Holdings Ltd. |
6,300 | 309,015 | |||
| St. Paul Companies, Inc.(a) |
27,300 | 1,082,445 | |||
| Torchmark Corp. |
2,225 | 101,327 | |||
| Travelers Property Casualty Corp. |
54,527 | 914,963 | |||
| Travelers Property Casualty Corp. |
7,864 | 133,452 | |||
| Shares |
Value | ||||
| XL Capital Ltd. (Class “A” Stock)(a) |
3,400 | $ | 263,670 | ||
| 13,963,965 | |||||
| Machinery & Equipment — 1.1% |
|||||
| Caterpillar, Inc. |
11,300 | 938,126 | |||
| Eaton Corp. |
10,800 | 1,166,184 | |||
| 2,104,310 | |||||
| Medical Supplies & Equipment — 0.5% |
|||||
| Guidant Corp. |
16,200 | 975,240 | |||
| Metals & Mining — 1.1% |
|||||
| Alcan, Inc. |
20,600 | 967,170 | |||
| Alcoa, Inc.(a) |
27,900 | 1,060,200 | |||
| 2,027,370 | |||||
| Oil & Gas — 9.5% |
|||||
| BP PLC [ADR] |
19,400 | 957,390 | |||
| ChevronTexaco Corp. |
27,000 | 2,332,530 | |||
| ConocoPhillips(a) |
38,843 | 2,546,936 | |||
| Exxon Mobil Corp. |
202,700 | 8,310,699 | |||
| Marathon Oil Corp. |
42,400 | 1,403,016 | |||
| Occidental Petroleum Corp. |
37,300 | 1,575,552 | |||
| Valero Energy Corp. |
22,700 | 1,051,918 | |||
| Williams Companies, Inc. |
17,600 | 172,832 | |||
| 18,350,873 | |||||
| Paper & Forest Products — 1.6% |
|||||
| Georgia-Pacific Corp.(a) |
41,625 | 1,276,639 | |||
| MeadWestvaco Corp. |
31,900 | 949,025 | |||
| Temple-Inland, Inc. |
13,500 | 846,045 | |||
| 3,071,709 | |||||
| Pharmaceuticals — 3.2% |
|||||
| Bristol-Myers Squibb Co.(a) |
40,000 | 1,144,000 | |||
| GlaxoSmithKline PLC [ADR] |
17,300 | 806,526 | |||
| Merck & Co., Inc. |
52,400 | 2,420,880 | |||
| Pfizer, Inc. |
26,500 | 936,245 | |||
| Wyeth |
19,700 | 836,265 | |||
| 6,143,916 | |||||
| Railroads — 1.9% |
|||||
| Burlington Northern Santa Fe Corp. |
38,775 | 1,254,371 | |||
| CSX Corp. |
23,500 | 844,590 | |||
| Norfolk Southern Corp. |
64,450 | 1,524,243 | |||
| 3,623,204 | |||||
| Restaurants — 0.9% |
|||||
| McDonald’s Corp. |
69,100 | 1,715,753 | |||
| Retail & Merchandising — 1.7% |
|||||
| Federated Department Stores, Inc.(a) |
26,175 | 1,233,628 | |||
| Foot Locker, Inc.(a) |
1,400 | 32,830 | |||
| May Department Stores Co. (The)(a) |
38,625 | 1,122,829 | |||
| Office Depot, Inc.*(a) |
57,400 | 959,154 | |||
| 3,348,441 | |||||
136
Table of Contents
AST Sanford Bernstein Core Value Portfolio
Schedule of Investments
December 31, 2003
| Shares |
Value | |||||
| Telecommunications — 6.6% |
||||||
| ADC Telecommunications, Inc.* |
173,800 | $ | 516,186 | |||
| BellSouth Corp. |
29,900 | 846,170 | ||||
| Corning, Inc.* |
135,400 | 1,412,222 | ||||
| JDS Uniphase Corp.* |
97,400 | 355,510 | ||||
| Lucent Technologies, Inc.* |
136,600 | 387,944 | ||||
| Nortel Networks Corp.* |
336,000 | 1,421,280 | ||||
| Qwest Communications International, Inc.* |
168,100 | 726,192 | ||||
| SBC Communications, Inc. |
74,600 | 1,944,822 | ||||
| Sprint Corp.(a) |
81,800 | 1,343,156 | ||||
| Sprint Corp. (PCS Group)*(a) |
134,700 | 757,014 | ||||
| Tellabs, Inc.* |
71,700 | 604,431 | ||||
| Verizon Communications, Inc. |
68,000 | 2,385,440 | ||||
| 12,700,367 | ||||||
| Utilities — 7.8% |
||||||
| Alliant Energy Corp.(a) |
23,900 | 595,110 | ||||
| American Electric Power Co., Inc. |
44,300 | 1,351,593 | ||||
| Cinergy Corp.(a) |
22,400 | 869,344 | ||||
| Constellation Energy Group, Inc. |
19,500 | 763,620 | ||||
| Edison International Co. |
53,900 | 1,182,027 | ||||
| Entergy Corp. |
20,400 | 1,165,452 | ||||
| Exelon Corp. |
23,400 | 1,552,824 | ||||
| FirstEnergy Corp. |
29,400 | 1,034,880 | ||||
| Northeast Utilities(a) |
41,700 | 841,089 | ||||
| PG&E Corp.*(a) |
12,800 | 355,456 | ||||
| PPL Corp.(a) |
26,900 | 1,176,875 | ||||
| Sempra Energy(a) |
38,700 | 1,163,322 | ||||
| TXU Corp.(a) |
31,600 | 749,552 | ||||
| Wisconsin Energy Corp. |
30,700 | 1,026,915 | ||||
| Xcel Energy, Inc.(a) |
65,100 | 1,105,398 | ||||
| 14,933,457 | ||||||
| Total Long-Term Investments |
||||||
| (Cost $155,029,847) |
185,758,265 | |||||
| Par (000) |
||||||
| SHORT-TERM INVESTMENTS — 29.7% |
||||||
| Certificate of Deposit — 2.1% |
||||||
| Svenska Handelsbank, Inc. |
$ | 441 | 440,608 | |||
| Westdeutsche Landesbank |
3,665 | 3,663,911 | ||||
| 4,104,519 | ||||||
| Commercial Paper — 5.1% |
||||||
| Cancara Asset Securitisation Ltd. |
2,472 | 2,469,609 | ||||
| Crown Point Capital Co. |
568 | 567,089 | ||||
| Fairway Finance Corp. |
832 | 829,999 | ||||
| Par (000) |
Value | |||||
| General Electric Capital Corp. |
$ | 66 | $ | 65,837 | ||
| Lexington Parker Capital Co. |
733 | 731,696 | ||||
| Monumental Global Funding |
721 | 722,316 | ||||
| Silver Tower U.S. Funding |
96 | 96,159 | ||||
| Tannehill Capital Co. |
4,084 | 4,072,341 | ||||
| Tulip Funding Corp. |
284 | 283,456 | ||||
| 9,838,502 | ||||||
| Corporate Obligations — 11.9% |
||||||
| American Express Centurian |
||||||
| 1.118%, 01/22/04 [FRN](b)(c) |
1,574 | 1,573,712 | ||||
| 1.144%, 01/22/04 [FRN](b)(c) |
171 | 171,428 | ||||
| Bear Stearns Co., Inc. |
||||||
| 1.12%, 01/02/04 [FRN](b)(c) |
929 | 929,402 | ||||
| Canadian Imperial Bank of Commerce |
||||||
| 1.111%, 01/29/04 [FRN](b)(c) |
822 | 821,886 | ||||
| Goldman Sachs Group, Inc. |
||||||
| 1.14%, 01/06/04 [FRN](b)(c) |
1,647 | 1,647,449 | ||||
| Merrill Lynch & Co., Inc. |
||||||
| 1.13%, 01/02/04(b) |
187 | 187,182 | ||||
| 1.13%, 01/02/04 [FRN](b)(c) |
5,500 | 5,500,291 | ||||
| Morgan Stanley |
||||||
| 1.03%, 01/02/04 [FRN](b)(c) |
5,414 | 5,414,437 | ||||
| 1.08%, 01/02/04 [FRN](b)(c) |
2,288 | 2,288,483 | ||||
| Natexis Banques Populaires |
||||||
| 1.035%, 01/02/04 [FRN](b)(c) |
1,197 | 1,197,014 | ||||
| 1.10%, 01/02/04 [FRN](b)(c) |
2,524 | 2,523,498 | ||||
| Westdeutsche Landesbank |
||||||
| 1.111%, 01/23/04 [FRN](b)(c) |
52 | 51,674 | ||||
| 1.111%, 01/29/04 [FRN](b)(c) |
510 | 509,955 | ||||
| 22,816,411 | ||||||
| Shares |
||||||
| Non-Registered Investment Company — 3.5% |
||||||
| BlackRock Institutional Money Market Trust(b)(j) |
6,758,284 | 6,758,284 | ||||
| Registered Investment Companies — 5.7% |
||||||
| BlackRock Provident Institutional Funds TempCash Portfolio |
5,519,645 | 5,519,645 | ||||
| BlackRock Provident Institutional Funds TempFund Portfolio |
5,519,645 | 5,519,645 | ||||
| 11,039,290 | ||||||
137
Table of Contents
AST Sanford Bernstein Core Value Portfolio
Schedule of Investments
December 31, 2003
| Par (000) |
Value | |||||
| Repurchase Agreement — 0.4% |
||||||
| Merrill Lynch & Co., Inc. |
||||||
| 1.00%, dated 12/31/03, to be repurchased on 01/02/04, repurchase price $779,967 (Collateralized by Federal Home Loan Mortgage Corp. 5.50% maturing 12/01/33, Federal National Mortgage Assoc. 4.00% - 6.00% maturing 11/01/17 to 11/01/33 and Government National Mortgage Assoc. 1.47% maturing 01/16/04 [FRN](c), par value $956,933, market value including accrued interest $803,336)(b) |
$ | 780 | $ | 779,924 | ||
| Par (000) |
Value |
||||||
| Time Deposits — 1.0% |
|||||||
| Chase Manhattan Bank |
|||||||
| 0.875%, 01/02/04(b) |
$ | 1,491 | $ | 1,491,077 | |||
| UBS Bank |
|||||||
| 0.938%, 01/02/04(b) |
437 | 437,381 | |||||
| 1,928,458 | |||||||
| Total Short-Term Investments |
|||||||
| (Cost $57,265,388) |
57,265,388 | ||||||
| Total Investments — 126.2% |
|||||||
| (Cost $212,295,235; Note 5) |
243,023,653 | ||||||
| Liabilities in Excess of |
(50,476,311 | ) | |||||
| Net Assets — 100.0% |
$ | 192,547,342 | |||||
The following abbreviations are used in portfolio descriptions:
| ADR | American Depositary Receipt |
| FRN | Floating Rate Note |
| symbol |
description | |
| * |
Non-income producing security. | |
| (a) |
Portion of securities on loan with an aggregate market value of $44,692,673; cash collateral $46,226,098 was received with which the portfolio purchased securities. | |
| (b) |
Represents security purchased with cash collateral for securities on loan. | |
| (c) |
Indicates a variable rate security. The maturity date presented for these instruments is the latter of the next date on which the security can be redeemed at par or the next date on which the rate of interest is adjusted. The interest rate shown reflects the rate in effect at December 31, 2003. | |
| (j) |
Security available to institutional investors only. | |
See Notes to Financial Statements.
138
Table of Contents
AST Cohen & Steers Realty Portfolio
Schedule of Investments
December 31, 2003
| Shares |
Value | ||||
| LONG-TERM INVESTMENTS — 96.7% |
|||||
| COMMON STOCK |
|||||
| Apartment/Residential — 12.8% |
|||||
| Apartment Investment & Management Co. (Class “A” Stock) [REIT] |
80,300 | $ | 2,770,350 | ||
| Avalonbay Communities, Inc. [REIT] |
290,200 | 13,871,560 | |||
| BRE Properties, Inc. [REIT] |
160,300 | 5,354,020 | |||
| Equity Residential Properties Trust [REIT] |
175,900 | 5,190,809 | |||
| Essex Property Trust, Inc. [REIT] |
79,100 | 5,079,802 | |||
| Summit Properties, Inc. [REIT] |
176,900 | 4,249,138 | |||
| United Dominion Realty Trust, Inc. [REIT] |
23,500 | 451,200 | |||
| 36,966,879 | |||||
| Building & Real Estate — 7.4% |
|||||
| Catellus Development Corp. |
403,052 | 9,721,614 | |||
| Federal Realty Investment Trust [REIT] |
178,900 | 6,867,971 | |||
| Post Properties, Inc. [REIT] |
174,600 | 4,874,832 | |||
| 21,464,417 | |||||
| Diversified — 4.0% |
|||||
| Brookfield Properties Corp. (Canada) |
296,900 | 8,569,836 | |||
| Crescent Real Estate Equities Co. [REIT] |
173,300 | 2,968,629 | |||
| 11,538,465 | |||||
| Hotels & Motels — 8.7% |
|||||
| Hilton Hotels Corp.(a) |
266,700 | 4,568,571 | |||
| Host Marriott Corp. [REIT]*(a) |
849,600 | 10,467,072 | |||
| Starwood Hotels & Resorts Worldwide, Inc. |
280,100 | 10,075,197 | |||
| 25,110,840 | |||||
| Industrial — 6.2% |
|||||
| AMB Property Corp. [REIT] |
123,000 | 4,044,240 | |||
| ProLogis [REIT] |
430,300 | 13,808,327 | |||
| 17,852,567 | |||||
| Office — 14.4% |
|||||
| Arden Realty, Inc. [REIT] |
191,200 | 5,801,008 | |||
| CarrAmerica Realty Corp. [REIT] |
134,600 | 4,008,388 | |||
| Equity Office Properties Trust [REIT] |
286,100 | 8,196,765 | |||
| Mack-Cali Realty Corp. [REIT] |
85,700 | 3,566,834 | |||
| Maguire Properties, Inc. |
164,600 | 3,999,780 | |||
| Vornado Realty Trust [REIT] |
294,700 | 16,134,825 | |||
| 41,707,600 | |||||
| Shares |
Value | |||||
| Office/Industrial — 13.3% |
||||||
| Boston Properties, Inc. [REIT] |
410,300 | $ | 19,772,357 | |||
| Kilroy Realty Corp. [REIT] |
129,100 | 4,228,025 | ||||
| Liberty Property Trust [REIT] |
49,500 | 1,925,550 | ||||
| Prentiss Properties Trust [REIT] |
97,400 | 3,213,226 | ||||
| Reckson Associates Realty Corp. [REIT](a) |
186,600 | 4,534,380 | ||||
| SL Green Realty Corp. [REIT] |
117,500 | 4,823,375 | ||||
| 38,496,913 | ||||||
| Real Estate — 9.9% |
||||||
| Archstone-Smith Trust [REIT] |
353,600 | 9,893,728 | ||||
| Mills Corp. [REIT] |
155,000 | 6,820,000 | ||||
| Pan Pacific Retail Properties, Inc. [REIT] |
52,800 | 2,515,920 | ||||
| Sun Communities, Inc. [REIT] |
129,000 | 4,992,300 | ||||
| Ventas, Inc. [REIT] |
196,800 | 4,329,600 | ||||
| 28,551,548 | ||||||
| Regional Mall — 17.4% |
||||||
| CBL & Associates Properties, Inc. [REIT] |
74,100 | 4,186,650 | ||||
| Developers Diversified Realty Corp. [REIT] |
125,000 | 4,196,250 | ||||
| General Growth Properties, Inc. [REIT](a) |
201,300 | 5,586,075 | ||||
| Macerich Co. [REIT] |
159,000 | 7,075,500 | ||||
| Regency Centers Corp. [REIT] |
33,800 | 1,346,930 | ||||
| Rouse Co. [REIT] |
245,600 | 11,543,200 | ||||
| Simon Property Group, Inc. [REIT] |
251,600 | 11,659,144 | ||||
| Taubman Centers, Inc. [REIT] |
246,400 | 5,075,840 | ||||
| 50,669,589 | ||||||
| Self Storage — 2.6% |
||||||
| Public Storage, Inc. [REIT] |
118,400 | 5,137,376 | ||||
| Shurgard Storage Centers, Inc. (Class “A” Stock) [REIT] |
63,400 | 2,387,010 | ||||
| 7,524,386 | ||||||
| Total Long-Term Investments |
||||||
| (Cost $233,379,459) |
279,883,204 | |||||
| Par (000) |
||||||
| SHORT-TERM INVESTMENTS — 8.0% |
||||||
| Commercial Paper — 2.2% |
||||||
| Cancarra AB |
||||||
| 1.11%, 01/12/04(b) |
$ | 1,603 | 1,602,038 | |||
| Tannehill Capital Co. |
||||||
| 1.10%, 01/08/04(b) |
4,886 | 4,872,188 | ||||
| 6,474,226 | ||||||
139
Table of Contents
AST Cohen & Steers Realty Portfolio
Schedule of Investments
December 31, 2003
| Par (000) |
Value | |||||
| Corporate Obligations — 2.6% |
||||||
| American Express Centurian |
||||||
| 1.131%, 01/29/04 [FRN](b)(c) |
$ | 3,176 | $ | 3,176,007 | ||
| Merrill Lynch & Co., Inc. |
||||||
| 1.13%, 01/02/04 [FRN](b)(c) |
1,034 | 1,033,872 | ||||
| Westdeutsche Landesbank |
||||||
| 1.111%, 01/29/04 [FRN](b)(c) |
3,255 | 3,254,307 | ||||
| 7,464,186 | ||||||
| Shares |
||||||
| Registered Investment Companies — 3.0% |
||||||
| BlackRock Provident Institutional Funds TempCash Portfolio |
4,371,201 | 4,371,201 | ||||
| BlackRock Provident Institutional Funds TempFund Portfolio |
4,371,201 | 4,371,201 | ||||
| 8,742,402 | ||||||
| Par (000) |
Value |
||||||
| Time Deposits — 0.2% |
|||||||
| Chase Manhattan Bank |
|||||||
| 0.875%, 01/02/04(b) |
$ | 337 | $ | 336,834 | |||
| UBS Bank |
|||||||
| 0.938%, 01/02/04(b) |
295 | 295,354 | |||||
| 632,188 | |||||||
| Total Short-Term Investments |
|||||||
| (Cost $23,313,002) |
23,313,002 | ||||||
| Total Investments — 104.7% |
|||||||
| (Cost $256,692,461; Note 5) |
303,196,206 | ||||||
| Liabilities in Excess of |
(13,694,231 | ) | |||||
| Net Assets — 100.0% |
$ | 289,501,975 | |||||
The following abbreviations are used in portfolio descriptions:
| FRN | Floating Rate Note |
| REIT | Real Estate Investment Trust |
| symbol |
description | |
| * |
Non-income producing security. | |
| (a) |
Portion of securities on loan with an aggregate market value of $13,951,746; cash collateral $14,570,600 was received with which the portfolio purchased securities. | |
| (b) |
Represents security purchased with cash collateral for securities on loan. | |
| (c) |
Indicates a variable rate security. The maturity date presented for these instruments is the latter of the next date on which the security can be redeemed at par or the next date on which the rate of interest is adjusted. The interest rate shown reflects the rate in effect at December 31, 2003. | |
See Notes to Financial Statements.
140
Table of Contents
AST Sanford Bernstein Managed Index 500 Portfolio
Schedule of Investments
December 31, 2003
| Shares |
Value | ||||
| LONG-TERM INVESTMENTS — 99.0% |
|||||
| COMMON STOCK — 99.0% |
|||||
| Advertising — 0.2% |
|||||
| Interpublic Group of Companies, Inc. |
56,000 | $ | 869,663 | ||
| Aerospace — 1.0% |
|||||
| Goodrich Corp. |
49,000 | 1,454,810 | |||
| Northrop Grumman Corp.(a) |
2,678 | 256,017 | |||
| United Technologies Corp. |
37,000 | 3,506,490 | |||
| 5,217,317 | |||||
| Airlines — 0.4% |
|||||
| Southwest Airlines Co. |
122,000 | 1,969,080 | |||
| Automobile Manufacturers — 0.9% |
|||||
| Ford Motor Co.(a) |
130,000 | 2,080,000 | |||
| General Motors Corp.(a) |
54,000 | 2,883,600 | |||
| 4,963,600 | |||||
| Automotive Parts — 0.2% |
|||||
| Dana Corp. |
56,600 | 1,038,610 | |||
| Beverages — 1.5% |
|||||
| Anheuser-Busch Companies, Inc. |
103,000 | 5,426,040 | |||
| Coca-Cola Co. |
46,500 | 2,359,875 | |||
| PepsiCo, Inc. |
12,100 | 564,102 | |||
| 8,350,017 | |||||
| Broadcasting — 0.2% |
|||||
| Westwood One, Inc.* |
28,900 | 988,669 | |||
| Building Materials — 1.0% |
|||||
| American Standard Companies, Inc.* |
19,000 | 1,913,300 | |||
| Masco Corp. |
94,000 | 2,576,540 | |||
| Sherwin-Williams Co. (The) |
33,600 | 1,167,264 | |||
| 5,657,104 | |||||
| Business Services — 0.2% |
|||||
| Fiserv, Inc.*(a) |
33,000 | 1,303,830 | |||
| Cable Television — 1.4% |
|||||
| Comcast Corp. (Class “A” Stock)* |
132,281 | 4,348,076 | |||
| Comcast Corp. (Special Class “A” Stock)*(a) |
105,000 | 3,284,400 | |||
| 7,632,476 | |||||
| Chemicals — 1.6% |
|||||
| Ashland, Inc. |
25,000 | 1,101,500 | |||
| Dow Chemical Co. |
24,200 | 1,005,994 | |||
| DuPont (E.I.) de Nemours & Co. |
52,200 | 2,395,458 | |||
| Eastman Chemical Co.(a) |
36,000 | 1,423,080 | |||
| Lubrizol Corp. |
35,700 | 1,160,964 | |||
| PPG Industries, Inc. |
22,000 | 1,408,440 | |||
| 8,495,436 | |||||
| Clothing & Apparel — 0.2% |
|||||
| VF Corp. |
22,375 | 967,495 | |||
| Shares |
Value | ||||
| Computer Hardware — 3.4% |
|||||
| Dell, Inc.* |
194,600 | $ | 6,608,616 | ||
| Hewlett-Packard Co. |
225,660 | 5,183,410 | |||
| International Business Machines Corp. |
70,900 | 6,571,012 | |||
| 18,363,038 | |||||
| Computer Services & Software — 8.3% |
|||||
| Affiliated Computer Services, Inc. |
25,000 | 1,361,500 | |||
| Cisco Systems, Inc.* |
550,100 | 13,361,929 | |||
| Electronic Arts, Inc.*(a) |
50,000 | 2,389,000 | |||
| Electronic Data Systems Corp.(a) |
48,000 | 1,177,920 | |||
| EMC Corp.* |
70,000 | 904,400 | |||
| Mercury Interactive Corp.*(a) |
29,900 | 1,454,336 | |||
| Microsoft Corp. |
632,300 | 17,413,542 | |||
| Oracle Corp.* |
133,600 | 1,763,520 | |||
| Symantec Corp.*(a) |
68,000 | 2,356,200 | |||
| Veritas Software Corp.*(a) |
76,000 | 2,824,160 | |||
| 45,006,507 | |||||
| Conglomerates — 3.2% |
|||||
| 3M Co. |
7,400 | 629,222 | |||
| Altria Group, Inc. |
188,600 | 10,263,612 | |||
| Cendant Corp.*(a) |
107,100 | 2,385,117 | |||
| Honeywell International, Inc. |
27,900 | 932,697 | |||
| Textron, Inc. |
20,000 | 1,141,200 | |||
| Tyco International Ltd.(a) |
68,000 | 1,802,000 | |||
| 17,153,848 | |||||
| Consumer Products & Services — 4.3% |
|||||
| Avon Products, Inc. |
18,500 | 1,248,565 | |||
| Colgate-Palmolive Co. |
68,600 | 3,433,430 | |||
| Johnson & Johnson |
210,000 | 10,848,600 | |||
| Procter & Gamble Co. |
72,000 | 7,191,360 | |||
| Whirlpool Corp. |
7,000 | 508,550 | |||
| 23,230,505 | |||||
| Electronic Components & Equipment — 4.2% |
|||||
| Eastman Kodak Co.(a) |
21,100 | 541,637 | |||
| Emerson Electric Co.(a) |
14,000 | 906,500 | |||
| General Electric Co. |
577,270 | 17,883,825 | |||
| Sanmina-SCI Corp.* |
92,600 | 1,167,686 | |||
| Solectron Corp.*(a) |
260,000 | 1,536,600 | |||
| Vishay Intertechnology, Inc.*(a) |
25,000 | 572,500 | |||
| 22,608,748 | |||||
| Entertainment & Leisure — 1.5% |
|||||
| Carnival Corp.(a) |
63,800 | 2,534,774 | |||
| Disney (Walt) Co. |
54,900 | 1,280,817 | |||
| Harley-Davidson, Inc.(a) |
37,000 | 1,758,610 | |||
| Time Warner, Inc.* |
32,200 | 579,278 | |||
| Viacom, Inc. (Class “B” Stock) |
50,400 | 2,236,752 | |||
| 8,390,231 | |||||
141
Table of Contents
AST Sanford Bernstein Managed Index 500 Portfolio
Schedule of Investments
December 31, 2003
| Shares |
Value | ||||
| Financial - Bank & Trust — 5.6% |
|||||
| Bank of America Corp.(a) |
89,900 | $ | 7,230,657 | ||
| Bank One Corp. |
74,200 | 3,382,778 | |||
| Comerica, Inc. |
35,800 | 2,006,948 | |||
| Commerce Bancorp, Inc. |
25,000 | 1,317,000 | |||
| FleetBoston Financial Corp. |
119,442 | 5,213,643 | |||
| National City Corp. |
44,700 | 1,517,118 | |||
| PNC Financial Services Group |
34,300 | 1,877,239 | |||
| Regions Financial Corp. |
18,000 | 669,600 | |||
| SunTrust Banks, Inc. |
10,000 | 715,000 | |||
| U.S. Bancorp |
71,000 | 2,114,380 | |||
| Wachovia Corp. |
74,100 | 3,452,319 | |||
| Wells Fargo & Co. |
18,600 | 1,095,354 | |||
| 30,592,036 | |||||
| Financial Services — 9.5% |
|||||
| Citigroup, Inc. |
354,600 | 17,212,284 | |||
| Fannie Mae |
107,400 | 8,061,444 | |||
| Goldman Sachs Group, Inc. |
33,000 | 3,258,090 | |||
| J.P. Morgan Chase & Co. |
125,480 | 4,608,880 | |||
| John Hancock Financial Services, Inc. |
51,500 | 1,931,250 | |||
| KeyCorp |
76,000 | 2,228,320 | |||
| Lehman Brothers Holdings, Inc.(a) |
6,500 | 501,930 | |||
| MBNA Corp. |
183,500 | 4,559,975 | |||
| Merrill Lynch & Co., Inc. |
42,000 | 2,463,300 | |||
| Morgan Stanley Dean Witter & Co.(a) |
78,800 | 4,560,156 | |||
| SLM Corp. |
69,600 | 2,622,528 | |||
| 52,008,157 | |||||
| Food — 1.8% |
|||||
| Albertson’s, Inc.(a) |
53,200 | 1,204,980 | |||
| Archer-Daniels-Midland Co. |
88,808 | 1,351,658 | |||
| Campbell Soup Co.(a) |
79,200 | 2,122,560 | |||
| Dean Foods Co.* |
36,000 | 1,183,320 | |||
| General Mills, Inc.(a) |
54,500 | 2,468,850 | |||
| Safeway, Inc.* |
16,500 | 361,515 | |||
| SUPERVALU, Inc. |
31,900 | 912,021 | |||
| 9,604,904 | |||||
| Healthcare Services — 2.3% |
|||||
| Caremark Rx, Inc.*(a) |
47,500 | 1,203,175 | |||
| HCA, Inc.(a) |
33,000 | 1,417,680 | |||
| Health Management Associates, Inc. |
80,000 | 1,920,000 | |||
| UnitedHealth Group, Inc.(a) |
86,000 | 5,003,480 | |||
| WellPoint Health Networks, Inc.* |
28,000 | 2,715,720 | |||
| 12,260,055 | |||||
| Industrial Products — 0.6% |
|||||
| Cooper Industries Ltd. (Class “A” Stock) |
23,000 | 1,332,390 | |||
| Crane Co. |
32,000 | 983,680 | |||
| Ingersoll-Rand Co.* |
11,000 | 746,680 | |||
| 3,062,750 | |||||
| Shares |
Value | ||||
| Insurance — 5.3% |
|||||
| ACE Ltd. |
53,000 | $ | 2,195,260 | ||
| Allstate Corp. (The) |
32,000 | 1,376,640 | |||
| American International Group, Inc. |
187,987 | 12,459,778 | |||
| AON Corp.(a) |
31,200 | 746,928 | |||
| Chubb Corp. |
25,900 | 1,763,790 | |||
| CIGNA Corp. |
15,500 | 891,250 | |||
| Hartford Financial Services Group, Inc. (The) |
10,100 | 595,700 | |||
| MetLife, Inc. |
25,900 | 872,053 | |||
| St. Paul Companies, Inc. |
22,000 | 872,300 | |||
| The Progressive Corp. |
35,900 | 3,000,881 | |||
| Travelers Property Casualty Corp. |
148,513 | 2,520,266 | |||
| XL Capital Ltd. (Class “A” Stock) |
19,000 | 1,473,450 | |||
| 28,768,296 | |||||
| Internet Services — 1.6% |
|||||
| eBay, Inc.*(a) |
81,000 | 5,231,790 | |||
| Yahoo!, Inc.*(a) |
79,600 | 3,595,532 | |||
| 8,827,322 | |||||
| Machinery & Equipment — 1.0% |
|||||
| Caterpillar, Inc. |
8,000 | 664,160 | |||
| Danaher Corp.(a) |
28,600 | 2,624,050 | |||
| Eaton Corp. |
19,000 | 2,051,620 | |||
| 5,339,830 | |||||
| Medical Supplies & Equipment — 4.3% |
|||||
| Amgen, Inc.* |
130,300 | 8,052,540 | |||
| Applera Corp. - Applied Biosystems Group(a) |
25,000 | 517,750 | |||
| Guidant Corp. |
50,800 | 3,058,160 | |||
| Medtronic, Inc. |
140,100 | 6,810,261 | |||
| St. Jude Medical, Inc.* |
34,000 | 2,085,900 | |||
| Zimmer Holdings, Inc.* |
40,400 | 2,844,160 | |||
| 23,368,771 | |||||
| Metals & Mining — 0.5% |
|||||
| Alcan, Inc.(a) |
19,000 | 892,050 | |||
| Alcoa, Inc. |
17,400 | 661,200 | |||
| Worthington Industries, Inc. |
65,200 | 1,175,556 | |||
| 2,728,806 | |||||
| Office Equipment — 0.2% |
|||||
| Pitney Bowes, Inc. |
13,000 | 528,060 | |||
| Xerox Corp.*(a) |
25,000 | 345,000 | |||
| 873,060 | |||||
| Oil & Gas — 4.2% |
|||||
| Apache Corp.(a) |
23,000 | 1,865,300 | |||
| ChevronTexaco Corp. |
54,238 | 4,685,621 | |||
| ConocoPhillips |
41,153 | 2,698,402 | |||
| El Paso Corp.(a) |
170,000 | 1,392,300 | |||
142
Table of Contents
AST Sanford Bernstein Managed Index 500 Portfolio
Schedule of Investments
December 31, 2003
| Shares |
Value | ||||
| Evergreen Resources, Inc.* |
43,000 | $ | 1,397,930 | ||
| Exxon Mobil Corp. |
240,400 | 9,856,400 | |||
| Marathon Oil Corp. |
31,000 | 1,025,790 | |||
| 22,921,743 | |||||
| Paper & Forest Products — 0.9% |
|||||
| Georgia-Pacific Corp.(a) |
69,000 | 2,116,230 | |||
| International Paper Co. |
37,000 | 1,595,070 | |||
| MeadWestvaco Corp. |
30,000 | 892,500 | |||
| 4,603,800 | |||||
| Pharmaceuticals — 6.6% |
|||||
| Allergan, Inc.(a) |
6,000 | 460,860 | |||
| Barr Laboratories, Inc.*(a) |
20,000 | 1,539,000 | |||
| Bristol-Myers Squibb Co. |
53,800 | 1,538,680 | |||
| Cephalon, Inc.*(a) |
24,000 | 1,161,840 | |||
| Forest Laboratories, Inc.* |
42,800 | 2,645,040 | |||
| Gilead Sciences, Inc.*(a) |
25,000 | 1,453,500 | |||
| MedImmune, Inc.* |
49,000 | 1,244,600 | |||
| Merck & Co., Inc. |
44,200 | 2,042,040 | |||
| Pfizer, Inc. |
532,620 | 18,817,465 | |||
| Wyeth |
115,700 | 4,911,465 | |||
| 35,814,490 | |||||
| Printing & Publishing — 0.7% |
|||||
| Donnelley (R.R.) & Sons Co.(a) |
48,000 | 1,447,200 | |||
| Tribune Co.(a) |
49,700 | 2,564,520 | |||
| 4,011,720 | |||||
| Railroads — 0.4% |
|||||
| Burlington Northern Santa Fe Corp. |
15,000 | 485,250 | |||
| CSX Corp. |
28,100 | 1,009,914 | |||
| Norfolk Southern Corp. |
38,400 | 908,160 | |||
| 2,403,324 | |||||
| Real Estate — 0.6% |
|||||
| Equity Office Properties Trust [REIT] |
70,000 | 2,005,500 | |||
| Equity Residential Properties Trust [REIT] |
35,000 | 1,032,850 | |||
| 3,038,350 | |||||
| Restaurants |
|||||
| McDonald’s Corp. |
5,000 | 123,896 | |||
| Retail & Merchandising — 7.2% |
|||||
| Bed Bath & Beyond, Inc.* |
56,000 | 2,427,600 | |||
| Family Dollar Stores, Inc. |
35,000 | 1,255,800 | |||
| Federated Department Stores, Inc. |
33,900 | 1,597,707 | |||
| Home Depot, Inc. |
197,000 | 6,991,530 | |||
| Lowe’s Companies, Inc. |
100,000 | 5,539,000 | |||
| May Department Stores Co. (The)(a) |
39,500 | 1,148,265 | |||
| Ross Stores, Inc. |
44,000 | 1,162,920 | |||
| Sears, Roebuck and Co.(a) |
33,900 | 1,542,111 | |||
| TJX Companies, Inc.(a) |
80,100 | 1,766,205 | |||
| Wal-Mart Stores, Inc. |
295,900 | 15,697,495 | |||
| 39,128,633 | |||||
| Shares |
Value | ||||
| Semiconductors — 4.9% |
|||||
| Altera Corp.* |
95,000 | $ | 2,156,500 | ||
| Applied Materials, Inc.*(a) |
134,000 | 3,008,300 | |||
| Broadcom Corp. (Class “A” Stock)*(a) |
58,000 | 1,977,220 | |||
| Intel Corp. |
375,080 | 12,077,576 | |||
| Linear Technology Corp. |
53,000 | 2,229,710 | |||
| Marvell Technology Group Ltd.* |
29,300 | 1,111,349 | |||
| Maxim Integrated Products, Inc. |
50,000 | 2,490,000 | |||
| Texas Instruments, Inc. |
42,000 | 1,233,960 | |||
| 26,284,615 | |||||
| Telecommunications — 4.3% |
|||||
| ALLTEL Corp. |
14,000 | 652,120 | |||
| AT&T Corp.(a) |
30,340 | 615,902 | |||
| AT&T Wireless Services, Inc.* |
120,000 | 958,800 | |||
| BellSouth Corp. |
76,000 | 2,150,800 | |||
| Corning, Inc.* |
129,200 | 1,347,556 | |||
| Lucent Technologies, Inc.* |
400,000 | 1,136,000 | |||
| Motorola, Inc. |
78,000 | 1,097,460 | |||
| Nextel Communications, Inc. (Class “A” Stock)*(a) |
47,000 | 1,318,820 | |||
| Qualcomm, Inc. |
71,000 | 3,829,030 | |||
| SBC Communications, Inc. |
145,200 | 3,785,364 | |||
| Sprint Corp. |
90,000 | 1,477,800 | |||
| Verizon Communications, Inc. |
135,200 | 4,742,816 | |||
| 23,112,468 | |||||
| Utilities — 2.8% |
|||||
| American Electric Power Co., Inc. |
85,160 | 2,598,232 | |||
| CenterPoint Energy, Inc. |
42,900 | 414,603 | |||
| Constellation Energy Group, Inc. |
36,000 | 1,409,760 | |||
| DTE Energy Co. |
42,000 | 1,654,800 | |||
| Entergy Corp. |
35,000 | 1,999,550 | |||
| FirstEnergy Corp. |
63,000 | 2,217,600 | |||
| FPL Group, Inc. |
5,600 | 366,352 | |||
| Pinnacle West Capital Corp. |
22,150 | 886,443 | |||
| PPL Corp.(a) |
60,000 | 2,624,999 | |||
| TXU Corp.(a) |
37,200 | 882,384 | |||
| Xcel Energy, Inc.(a) |
6,700 | 113,766 | |||
| 15,168,489 | |||||
| Total Common Stock |
|||||
| (Cost $498,565,020) |
536,251,689 | ||||
| Units |
|||||
| RIGHTS* |
|||||
| Semiconductors |
|||||
| Seagate Technology, Inc. |
|||||
| (Cost $0) |
33,800 | 0 | |||
| Total Long-Term Investments |
|||||
| (Cost $498,565,020) |
536,251,689 | ||||
143
Table of Contents
AST Sanford Bernstein Managed Index 500 Portfolio
Schedule of Investments
December 31, 2003
| Par (000) |
Value | |||||
| SHORT-TERM INVESTMENTS — 14.8% |
||||||
| Certificate of Deposit |
||||||
| Svenska Handelsbank, Inc. |
||||||
| 1.39%, 10/27/04(b) |
$ | 79 | $ | 79,433 | ||
| Commercial Paper — 2.7% |
||||||
| Amsterdam Funding Corp. |
1,086 | 1,084,805 | ||||
| Cancara Asset Securitisation Ltd. |
1,818 | 1,816,907 | ||||
| Concord Minutemen Capital Co. |
||||||
| 1.11%, 01/09/04(b) |
838 | 835,428 | ||||
| 1.13%, 02/09/04(b) |
49 | 48,689 | ||||
| Fairway Finance Corp. |
||||||
| 1.10%, 01/12/04(b) |
2,574 | 2,566,738 | ||||
| General Electric Capital Corp. |
||||||
| 1.11%, 02/05/04(b) |
4,634 | 4,621,572 | ||||
| Monumental Global Funding |
||||||
| 1.141%, 01/29/04 [FRN](b)(c) |
2,203 | 2,208,617 | ||||
| Silver Tower U.S. Funding |
||||||
| 1.13%, 02/02/04(b) |
1,224 | 1,220,161 | ||||
| Tulip Funding Corp. |
||||||
| 1.10%, 01/21/04(b) |
359 | 358,382 | ||||
| 14,761,299 | ||||||
| Corporate Obligations — 7.5% |
||||||
| American Express Centurian |
||||||
| 1.118%, 01/22/04 [FRN](b)(c) |
1,591 | 1,591,153 | ||||
| 1.131%, 01/29/04 [FRN](b)(c) |
670 | 669,561 | ||||
| Bear Stearns Co., Inc. |
||||||
| 1.12%, 01/02/04 [FRN](b)(c) |
10,437 | 10,437,505 | ||||
| Canadian Imperial Bank of Commerce |
||||||
| 1.111%, 01/29/04 [FRN](b)(c) |
1,663 | 1,663,183 | ||||
| Goldman Sachs Group, Inc. |
||||||
| 1.14%, 01/06/04 [FRN](b)(c) |
2,640 | 2,639,830 | ||||
| Merrill Lynch & Co., Inc. |
||||||
| 1.13%, 01/02/04(b) |
396 | 395,849 | ||||
| 1.13%, 01/02/04 [FRN](b)(c) |
5,103 | 5,102,330 | ||||
| Morgan Stanley |
||||||
| 1.03%, 01/02/04 [FRN](b)(c) |
4,102 | 4,102,201 | ||||
| 1.08%, 01/02/04 [FRN](b)(c) |
3,700 | 3,699,813 | ||||
| Natexis Banques Populaires |
||||||
| 1.035%, 01/02/04 [FRN](b)(c) |
2,145 | 2,145,264 | ||||
| 1.10%, 01/02/04 [FRN](b)(c) |
3,408 | 3,407,419 | ||||
| Societe Generale |
546 | 545,922 | ||||
| Westdeutsche Landesbank |
||||||
| 1.13%, 01/09/04 [FRN](b)(c) |
274 | 274,320 | ||||
| 1.111%, 01/23/04 [FRN](b)(c) |
2,089 | 2,088,819 | ||||
| 1.111%, 01/29/04 [FRN](b)(c) |
1,380 | 1,379,983 | ||||
| 40,143,152 | ||||||
| Shares |
Value |
||||||
| Non-Registered Investment Company — 2.5% |
|||||||
| BlackRock Institutional Money Market Trust(b)(j) |
13,674,833 | $ | 13,674,833 | ||||
| Registered Investment Companies — 1.2% |
|||||||
| BlackRock Provident Institutional Funds TempCash Portfolio |
3,316,264 | 3,316,264 | |||||
| BlackRock Provident Institutional Funds TempFund Portfolio |
3,316,263 | 3,316,263 | |||||
| 6,632,527 | |||||||
| Par (000) |
|||||||
| Repurchase Agreement — 0.3% |
|||||||
| Merrill Lynch & Co., Inc. |
|||||||
| 1.00%, dated 12/31/03, to be repurchased on 01/02/04, repurchase price $1,649,462 (Collateralized by Federal Home Loan Mortgage Corp. 5.50% maturing 12/01/33, Federal National Mortgage Assoc. 4.00% - 6.00% maturing 11/01/17 to 11/01/33 and Government National Mortgage Assoc. 1.47% maturing 01/16/04 [FRN](c), par value $2,023,707, market value including accrued interest $1,698,883)(b) |
$ | 1,649 | 1,649,371 | ||||
| Time Deposits — 0.6% |
|||||||
| Chase Manhattan Bank |
1,564 | 1,564,039 | |||||
| UBS Bank |
1,495 | 1,495,480 | |||||
| 3,059,519 | |||||||
| Total Short-Term Investments |
|||||||
| (Cost $80,000,134) |
80,000,134 | ||||||
| Total Investments — 113.8% |
|||||||
| (Cost $578,565,154; Note 5) |
616,251,823 | ||||||
| Liabilities in Excess of |
(74,759,733 | ) | |||||
| Net Assets — 100.0% |
$ | 541,492,090 | |||||
144
Table of Contents
AST Sanford Bernstein Managed Index 500 Portfolio
Schedule of Investments
December 31, 2003
The following abbreviations are used in portfolio descriptions:
| FRN | Floating Rate Note |
| REIT | Real Estate Investment Trust |
| symbol |
description | |
| * |
Non-income producing security. | |
| (a) |
Portion of securities on loan with an aggregate market value of $71,119,383; cash collateral $73,367,607 was received with which the portfolio purchased securities. | |
| (b) |
Represents security purchased with cash collateral for securities on loan. | |
| (c) |
Indicates a variable rate security. The maturity date presented for these instruments is the latter of the next date on which the security can be redeemed at par or the next date on which the rate of interest is adjusted. The interest rate shown reflects the rate in effect at December 31, 2003. | |
| (j) |
Security available to institutional investors only. | |
See Notes to Financial Statements.
145
Table of Contents
AST American Century Income & Growth Portfolio
Schedule of Investments
December 31, 2003
| Shares |
Value | ||||
| LONG-TERM INVESTMENTS — 98.3% |
|||||
| COMMON STOCK — 97.8% |
|||||
| Aerospace — 0.1% |
|||||
| United Technologies Corp. |
3,900 | $ | 369,603 | ||
| Airlines — 0.2% |
|||||
| Delta Air Lines, Inc.*(a) |
9,000 | 106,290 | |||
| Southwest Airlines Co. |
22,900 | 369,606 | |||
| 475,896 | |||||
| Automobile Manufacturers — 2.4% |
|||||
| Ford Motor Co.(a) |
451,800 | 7,228,800 | |||
| General Motors Corp.(a) |
2,100 | 112,140 | |||
| 7,340,940 | |||||
| Automotive Parts — 0.1% |
|||||
| Advance Auto Parts, Inc.* |
700 | 56,980 | |||
| American Axle & Manufacturing Holdings, Inc.*(a) |
4,400 | 177,848 | |||
| 234,828 | |||||
| Beverages — 0.3% |
|||||
| Coors (Adolph) Co. (Class “B” Stock) |
17,600 | 987,360 | |||
| PepsiCo, Inc. |
600 | 27,972 | |||
| 1,015,332 | |||||
| Broadcasting — 0.1% |
|||||
| Fox Entertainment Group, Inc. (Class “A” Stock)* |
9,100 | 265,265 | |||
| Building Materials — 0.7% |
|||||
| Sherwin-Williams Co. (The) |
62,202 | 2,160,897 | |||
| Business Services — 0.8% |
|||||
| Convergys Corp.* |
61,800 | 1,079,028 | |||
| Viad Corp. |
52,600 | 1,315,000 | |||
| 2,394,028 | |||||
| Chemicals — 1.7% |
|||||
| Engelhard Corp. |
3,100 | 92,845 | |||
| Monsanto Co. |
173,400 | 4,990,452 | |||
| 5,083,297 | |||||
| Computer Hardware — 3.3% |
|||||
| Dell, Inc.*(a) |
23,000 | 781,080 | |||
| Hewlett-Packard Co. |
172,324 | 3,958,282 | |||
| International Business Machines Corp.(a) |
44,357 | 4,111,007 | |||
| Storage Technology Corp.* |
9,500 | 244,625 | |||
| Western Digital Corp.* |
75,000 | 884,250 | |||
| 9,979,244 | |||||
| Computer Services & Software — 4.6% |
|||||
| Cisco Systems, Inc.*(a) |
119,003 | 2,890,583 | |||
| Computer Associates International, Inc. |
3,000 | 82,020 | |||
| Computer Sciences Corp.* |
30,415 | 1,345,255 | |||
| Electronic Arts, Inc.*(a) |
1,900 | 90,782 | |||
| Electronic Data Systems Corp.(a) |
24,756 | 607,512 | |||
| Shares |
Value | ||||
| Microsoft Corp.(a) |
286,372 | $ | 7,886,685 | ||
| Oracle Corp.* |
75,700 | 999,240 | |||
| Take-Two Interactive Software, Inc.*(a) |
10,900 | 314,029 | |||
| 14,216,106 | |||||
| Conglomerates — 2.5% |
|||||
| Altria Group, Inc.(a) |
96,100 | 5,229,762 | |||
| Cendant Corp.*(a) |
41,300 | 919,751 | |||
| Honeywell International, Inc. |
3,200 | 106,976 | |||
| Tyco International Ltd.(a) |
51,185 | 1,356,403 | |||
| 7,612,892 | |||||
| Construction — 0.6% |
|||||
| KB Home |
18,100 | 1,312,612 | |||
| NVR, Inc.*(a) |
1,344 | 626,304 | |||
| 1,938,916 | |||||
| Consumer Products & Services — 5.7% |
|||||
| Black & Decker Corp. |
4,400 | 217,008 | |||
| Fortune Brands, Inc. |
32,716 | 2,338,867 | |||
| Johnson & Johnson |
82,298 | 4,251,515 | |||
| Procter & Gamble Co. |
70,644 | 7,055,922 | |||
| Rent-A-Center, Inc.*(a) |
46,250 | 1,381,950 | |||
| Reynolds (R.J.) Tobacco Holdings, Inc.(a) |
18,000 | 1,046,700 | |||
| Whirlpool Corp.(a) |
16,600 | 1,205,990 | |||
| 17,497,952 | |||||
| Containers & Packaging — 0.2% |
|||||
| Bemis Co., Inc. |
13,400 | 670,000 | |||
| Electronic Components & Equipment — 4.6% |
|||||
| Arrow Electronics, Inc.*(a) |
45,758 | 1,058,840 | |||
| Avnet, Inc.* |
95,453 | 2,067,512 | |||
| Benchmark Electronics, Inc.* |
21,350 | 743,194 | |||
| Eastman Kodak Co.(a) |
153,780 | 3,947,533 | |||
| General Electric Co. |
156,983 | 4,863,333 | |||
| Sanmina-SCI Corp.*(a) |
102,200 | 1,288,742 | |||
| 13,969,154 | |||||
| Entertainment & Leisure — 4.1% |
|||||
| Disney (Walt) Co. |
129,400 | 3,018,902 | |||
| Harrah’s Entertainment, Inc. |
10,100 | 502,677 | |||
| Regal Entertainment Group (Class “A” Stock) |
69,600 | 1,428,192 | |||
| Time Warner, Inc.*(a) |
298,643 | 5,372,588 | |||
| Viacom, Inc. (Class “B” Stock)(a) |
48,143 | 2,136,586 | |||
| 12,458,945 | |||||
| Financial - Bank & Trust — 8.5% |
|||||
| Bank of America Corp.(a) |
164,241 | 13,209,905 | |||
| Bank One Corp. |
14,100 | 642,819 | |||
| First Tennessee National Corp. |
17,923 | 790,404 | |||
| Flagstar Bancorp, Inc. |
13,400 | 287,028 | |||
| FleetBoston Financial Corp. |
41,100 | 1,794,015 | |||
146
Table of Contents
AST American Century Income & Growth Portfolio
Schedule of Investments
December 31, 2003
| Shares |
Value | ||||
| PNC Financial Services Group |
30,100 | $ | 1,647,373 | ||
| UnionBanCal Corp. |
37,200 | 2,140,488 | |||
| Wachovia Corp. |
59,019 | 2,749,695 | |||
| Wells Fargo & Co. |
46,200 | 2,720,718 | |||
| 25,982,445 | |||||
| Financial Services — 7.4% |
|||||
| Citigroup, Inc.(a) |
218,301 | 10,596,332 | |||
| Fannie Mae |
45,939 | 3,448,182 | |||
| H&R Block, Inc.(a) |
15,844 | 877,282 | |||
| Lehman Brothers Holdings, Inc.(a) |
2,400 | 185,328 | |||
| MBNA Corp. |
14,800 | 367,780 | |||
| Merrill Lynch & Co., Inc.(a) |
44,548 | 2,612,740 | |||
| Morgan Stanley Dean Witter & Co.(a) |
34,036 | 1,969,663 | |||
| Washington Mutual, Inc.(a) |
65,600 | 2,631,872 | |||
| 22,689,179 | |||||
| Food — 2.2% |
|||||
| Archer-Daniels-Midland Co. |
67,600 | 1,028,872 | |||
| ConAgra Foods, Inc. |
52,600 | 1,388,114 | |||
| Sara Lee Corp. |
9,500 | 206,245 | |||
| SUPERVALU, Inc. |
91,500 | 2,615,985 | |||
| Tyson Foods, Inc. (Class “A” Stock) |
106,100 | 1,404,764 | |||
| 6,643,980 | |||||
| Healthcare Services — 0.9% |
|||||
| Health Net, Inc.* |
51,900 | 1,697,130 | |||
| Humana, Inc.* |
42,927 | 980,882 | |||
| 2,678,012 | |||||
| Industrial Products — 0.3% |
|||||
| Carlisle Companies, Inc. |
8,554 | 520,596 | |||
| RPM International, Inc. |
20,400 | 335,784 | |||
| 856,380 | |||||
| Insurance — 5.9% |
|||||
| ACE Ltd. |
69,000 | 2,857,980 | |||
| Allstate Corp. (The) |
43,039 | 1,851,538 | |||
| AmerUs Group Co.(a) |
47,400 | 1,657,578 | |||
| Berkley (W.R) Corp. |
63,850 | 2,231,558 | |||
| Fidelity National Financial, Inc. |
110,441 | 4,282,901 | |||
| First American Corp. |
98,200 | 2,923,414 | |||
| Principal Financial Group, Inc. |
27,100 | 896,197 | |||
| Protective Life Corp. |
37,400 | 1,265,616 | |||
| 17,966,782 | |||||
| Internet Services — 0.9% |
|||||
| Checkfree Corp.*(a) |
8,486 | 234,638 | |||
| EarthLink, Inc.* |
57,800 | 578,000 | |||
| Netflix, Inc.*(a) |
7,100 | 388,299 | |||
| United Online, Inc.*(a) |
25,200 | 423,108 | |||
| VeriSign, Inc.*(a) |
69,400 | 1,131,220 | |||
| 2,755,265 | |||||
| Shares |
Value | ||||
| Machinery & Equipment — 0.2% |
|||||
| Briggs & Stratton Corp. |
3,000 | $ | 202,200 | ||
| Eaton Corp. |
2,900 | 313,142 | |||
| 515,342 | |||||
| Medical Supplies & Equipment — 1.9% |
|||||
| Abbott Laboratories(a) |
16,827 | 784,138 | |||
| Amgen, Inc.*(a) |
50,940 | 3,148,092 | |||
| Fisher Scientific International, Inc.*(a) |
8,700 | 359,919 | |||
| Invitrogen Corp.*(a) |
1,100 | 77,000 | |||
| McKesson Corp. |
46,300 | 1,489,008 | |||
| 5,858,157 | |||||
| Office Equipment — 0.4% |
|||||
| IKON Office Solutions, Inc. |
19,500 | 231,270 | |||
| United Stationers, Inc.*(a) |
24,600 | 1,006,632 | |||
| Xerox Corp.*(a) |
9,300 | 128,340 | |||
| 1,366,242 | |||||
| Oil & Gas — 8.7% |
|||||
| Amerada Hess Corp. |
1,800 | 95,706 | |||
| ChevronTexaco Corp. |
89,600 | 7,740,544 | |||
| ConocoPhillips |
30,460 | 1,997,262 | |||
| Exxon Mobil Corp. |
45,285 | 1,856,685 | |||
| Marathon Oil Corp. |
205,500 | 6,799,995 | |||
| Occidental Petroleum Corp. |
33,986 | 1,435,569 | |||
| ONEOK, Inc.(a) |
53,933 | 1,190,841 | |||
| Schlumberger Ltd. |
9,800 | 536,256 | |||
| Sunoco, Inc.(a) |
100,600 | 5,145,690 | |||
| 26,798,548 | |||||
| Paper & Forest Products — 0.6% |
|||||
| Georgia-Pacific Corp. |
6,000 | 184,020 | |||
| Louisiana-Pacific Corp.*(a) |
21,700 | 387,996 | |||
| Rayonier, Inc. |
23,626 | 980,715 | |||
| Weyerhaeuser Co. |
5,100 | 326,400 | |||
| 1,879,131 | |||||
| Pharmaceuticals — 6.4% |
|||||
| Bristol-Myers Squibb Co. |
157,400 | 4,501,640 | |||
| Endo Pharmaceuticals Holdings, Inc.* |
12,900 | 248,454 | |||
| King Pharmaceuticals, Inc.* |
64,400 | 982,744 | |||
| Kos Pharmaceuticals, Inc.*(a) |
4,200 | 180,768 | |||
| Merck & Co., Inc. |
130,299 | 6,019,814 | |||
| Pfizer, Inc. |
182,901 | 6,461,892 | |||
| Pharmaceutical Resources, Inc.* |
2,200 | 143,330 | |||
| Valeant Pharmaceuticals International(a) |
13,900 | 349,585 | |||
| Wyeth |
13,700 | 581,565 | |||
| 19,469,792 | |||||
147
Table of Contents
AST American Century Income & Growth Portfolio
Schedule of Investments
December 31, 2003
| Shares |
Value | ||||
| Railroads — 0.4% |
|||||
| Burlington Northern Santa Fe Corp. |
10,000 | $ | 323,500 | ||
| CSX Corp. |
5,000 | 179,700 | |||
| Norfolk Southern Corp. |
10,100 | 238,865 | |||
| Union Pacific Corp. |
7,000 | 486,360 | |||
| 1,228,425 | |||||
| Real Estate — 0.8% |
|||||
| CBL & Associates Properties, Inc. [REIT] |
11,600 | 655,400 | |||
| Equity Office Properties Trust [REIT](a) |
48,300 | 1,383,795 | |||
| General Growth Properties, Inc. [REIT](a) |
12,800 | 355,200 | |||
| Simon Property Group, Inc. [REIT] |
3,300 | 152,922 | |||
| 2,547,317 | |||||
| Retail & Merchandising — 5.2% |
|||||
| Barnes & Noble, Inc.*(a) |
28,000 | 919,800 | |||
| Blockbuster, Inc. (Class “A” Stock)(a) |
46,311 | 831,282 | |||
| Claire’s Stores, Inc. |
14,000 | 263,760 | |||
| Federated Department Stores, Inc. |
167,300 | 7,884,849 | |||
| Gap, Inc.(a) |
27,300 | 633,633 | |||
| Home Depot, Inc. |
5,834 | 207,049 | |||
| May Department Stores Co. (The)(a) |
118,000 | 3,430,260 | |||
| RadioShack Corp.(a) |
6,300 | 193,284 | |||
| Sears, Roebuck and Co.(a) |
31,600 | 1,437,484 | |||
| 15,801,401 | |||||
| Semiconductors — 4.0% |
|||||
| Intel Corp.(a) |
365,742 | 11,776,892 | |||
| Texas Instruments, Inc. |
20,300 | 596,414 | |||
| 12,373,306 | |||||
| Telecommunications — 5.7% |
|||||
| ALLTEL Corp. |
42,978 | 2,001,915 | |||
| AT&T Corp.(a) |
27,589 | 560,057 | |||
| BellSouth Corp. |
105,900 | 2,996,969 | |||
| Motorola, Inc. |
13,700 | 192,759 | |||
| Nextel Communications, Inc. (Class “A” Stock)*(a) |
94,100 | 2,640,446 | |||
| PanAmSat Corp.* |
42,200 | 909,832 | |||
| Qualcomm, Inc. |
7,500 | 404,475 | |||
| SBC Communications, Inc. |
93,800 | 2,445,366 | |||
| Scientific-Atlanta, Inc. |
9,559 | 260,961 | |||
| Sprint Corp.(a) |
132,468 | 2,175,125 | |||
| Verizon Communications, Inc.(a) |
80,965 | 2,840,252 | |||
| 17,428,157 | |||||
| Transportation — 0.9% |
|||||
| FedEx Corp. |
8,400 | 567,000 | |||
| United Parcel Service, Inc. (Class “B” Stock)(a) |
30,606 | 2,281,677 | |||
| 2,848,677 | |||||
| Shares |
Value | |||||
| Utilities — 4.5% |
||||||
| Duquesne Light Holdings, Inc. |
2,000 | $ | 36,680 | |||
| Edison International Co.(a) |
204,600 | 4,486,879 | ||||
| Exelon Corp. |
50,912 | 3,378,520 | ||||
| Great Plains Energy, Inc. |
54,700 | 1,740,554 | ||||
| OGE Energy Corp. |
9,600 | 232,224 | ||||
| PG&E Corp.*(a) |
11,200 | 311,024 | ||||
| Sempra Energy |
21,054 | 632,883 | ||||
| TXU Corp.(a) |
72,700 | 1,724,444 | ||||
| UGI Corp. |
19,000 | 644,100 | ||||
| Westar Energy, Inc. |
35,700 | 722,925 | ||||
| 13,910,233 | ||||||
| Total Common Stock |
||||||
| (Cost $265,223,101) |
299,280,066 | |||||
| PREFERRED STOCK — 0.5% |
||||||
| Automobile Manufacturers — 0.1% |
||||||
| General Motors Corp. (Class “B” Stock), 5.25% [CVT] |
11,500 | 309,005 | ||||
| Financial Services — 0.2% |
||||||
| Ford Motor Co. Capital Trust II, 6.50%* [CVT] |
9,800 | 547,330 | ||||
| Office Equipment — 0.2% |
||||||
| Xerox Corp., 6.125%* [CVT] |
4,200 | 544,950 | ||||
| Total Preferred Stock |
||||||
| (Cost $1,198,965) |
1,401,285 | |||||
| Total Long-Term Investments |
||||||
| (Cost $266,422,066) |
300,681,351 | |||||
| Par (000) |
||||||
| SHORT-TERM INVESTMENTS — 36.3% |
||||||
| Certificate of Deposit — 0.2% |
||||||
| Svenska Handelsbank, Inc. |
||||||
| 1.39%, 10/27/04 (b) |
$ | 546 | 545,614 | |||
| Commercial Paper — 15.8% |
||||||
| Amsterdam Funding Corp. |
||||||
| 1.10%, 01/05/04(b) |
312 | 311,571 | ||||
| Cancara Asset Securitisation Ltd. |
||||||
| 1.11%, 01/12/04(b) |
1,970 | 1,967,890 | ||||
| Concord Minutemen Capital Co. |
||||||
| 1.11%, 01/12/04(b) |
5,747 | 5,734,277 | ||||
| 1.13%, 02/09/04(b) |
4,894 | 4,881,167 | ||||
| 1.13%, 02/12/04(b) |
1,154 | 1,150,917 | ||||
| Crown Point Capital Co. |
||||||
| 1.11%, 01/09/04(b) |
3,874 | 3,867,751 | ||||
| 1.11%, 01/16/04(b) |
11,180 | 11,153,125 | ||||
| Fairway Finance Corp. |
||||||
| 1.11%, 02/05/04(b) |
11,401 | 11,369,647 | ||||
| Lexington Parker Capital Co. |
||||||
| 1.10%, 01/12/04(b) |
1,010 | 1,008,430 | ||||
148
Table of Contents
AST American Century Income & Growth Portfolio
Schedule of Investments
December 31, 2003
| Par (000) |
Value | |||||
| Monumental Global Funding |
||||||
| 1.141%, 01/29/04 [FRN](b)(c) |
$ | 739 | $ | 741,016 | ||
| Silver Tower U.S. Funding |
||||||
| 1.13%, 02/02/04(b) |
2,985 | 2,976,795 | ||||
| Tannehill Capital Co. |
||||||
| 1.10%, 01/08/04(b) |
1,501 | 1,496,578 | ||||
| 1.11%, 01/13/04(b) |
1,945 | 1,941,894 | ||||
| 48,601,058 | ||||||
| Corporate Obligations — 11.4% |
||||||
| American Express Centurian |
||||||
| 1.131%, 01/29/04 [FRN](b)(c) |
230 | 229,652 | ||||
| Bear Stearns Co., Inc. |
||||||
| 1.12%, 01/02/04 [FRN](b)(c) |
412 | 412,005 | ||||
| Canadian Imperial Bank of Commerce |
||||||
| 1.111%, 01/29/04 [FRN](b)(c) |
234 | 234,328 | ||||
| General Electric Capital Corp. |
||||||
| 1.13%, 01/02/04 [FRN](b)(c) |
6,552 | 6,558,672 | ||||
| Goldman Sachs Group, Inc. |
||||||
| 1.14%, 01/06/04 [FRN](b)(c) |
198 | 197,764 | ||||
| Merrill Lynch & Co., Inc. |
||||||
| 1.13%, 01/02/04 [FRN](b)(c) |
299 | 299,166 | ||||
| 1.13%, 01/02/04 [FRN](b)(c) |
2,091 | 2,091,017 | ||||
| Morgan Stanley |
||||||
| 1.03%, 01/02/04 [FRN](b)(c) |
840 | 840,030 | ||||
| 1.08%, 01/02/04 [FRN](b)(c) |
6,342 | 6,341,807 | ||||
| Natexis Banques Populaires |
||||||
| 1.035%, 01/02/04 [FRN](b)(c) |
6,513 | 6,513,377 | ||||
| 1.10%, 01/02/04 [FRN](b)(c) |
3,545 | 3,544,032 | ||||
| Societe Generale |
||||||
| 1.08%, 01/02/04 [FRN](b)(c) |
6,190 | 6,188,937 | ||||
| Westdeutsche Landesbank |
||||||
| 1.13%, 01/09/04 [FRN](b)(c) |
33 | 33,305 | ||||
| 1.111%, 01/23/04 [FRN](b)(c) |
354 | 353,956 | ||||
| 1.111%, 01/29/04 [FRN](b)(c) |
906 | 906,023 | ||||
| 34,744,071 | ||||||
| Shares |
Value |
||||||
| Non-Registered Investment Company — 4.6% |
|||||||
| BlackRock Institutional Money Market Trust(b)(j) |
14,139,086 | $ | 14,139,086 | ||||
| Par (000) |
|||||||
| Repurchase Agreement — 0.4% |
|||||||
| Merrill Lynch & Co., Inc. |
$ | 1,247 | $ | 1,246,526 | |||
| Time Deposits — 2.1% |
|||||||
| Chase Manhattan Bank |
|||||||
| 0.875%, 01/02/04(b) |
4,340 | 4,340,252 | |||||
| UBS Bank |
|||||||
| 0.938%, 01/12/04(b) |
1,975 | 1,975,313 | |||||
| 6,315,565 | |||||||
| U.S. Government Agency Obligation — 1.8% |
|||||||
| Federal Home Loan Bank |
|||||||
| 0.70%, 01/02/04(n) |
5,500 | 5,499,893 | |||||
| Total Short-Term Investments |
|||||||
| (Cost $111,091,813) |
111,091,813 | ||||||
| Total Investments — 134.6% |
|||||||
| (Cost $377,513,879; Note 5) |
411,773,164 | ||||||
| Liabilities in Excess of |
(105,962,814 | ) | |||||
| Net Assets — 100.0% |
$ | 305,810,350 | |||||
The following abbreviations are used in portfolio descriptions:
| CVT | Convertible Security |
| FRN | Floating Rate Note |
| REIT | Real Estate Investment Trust |
149
Table of Contents
AST American Century Income & Growth Portfolio
Schedule of Investments
December 31, 2003
| symbol |
description | |
| * |
Non-income producing security. | |
| (a) |
Portion of securities on loan with an aggregate market value of $101,700,129; cash collateral $105,591,921 was received with which the portfolio purchased securities. | |
| (b) |
Represents security purchased with cash collateral for securities on loan. | |
| (c) |
Indicates a variable rate security. The maturity date presented for these instruments is the latter of the next date on which the security can be redeemed at par or the next date on which the rate of interest is adjusted. The interest rate shown reflects the rate in effect at December 31, 2003. | |
| (j) |
Security not available to non-institutional buyers. | |
| (m) |
Cash of $160,000 has been segregated with the custodian to cover requirements for the following open futures contracts at December 31, 2003: | |
| Description | Expiration Month |
Number of Contracts |
Contracts at Trade Date Value |
Contracts at Current Value |
Unrealized Appreciation | ||||||||
| Long Positions: |
|||||||||||||
| S&P 500 |
03/04 | 10 | $ | 2,709,375 | $ | 2,776,500 | $ | 67,125 | |||||
| (n) |
Rates shown are the effective yields at purchase date. | |
See Notes to Financial Statements.
150
Table of Contents
AST Alliance Growth and Income Portfolio
Schedule of Investments
December 31, 2003
| Shares |
Value | ||||
| LONG-TERM INVESTMENTS — 94.6% |
|||||
| COMMON STOCK |
|||||
| Aerospace — 1.6% |
|||||
| Northrop Grumman Corp.(a) |
150,000 | $ | 14,340,000 | ||
| United Technologies Corp. |
150,000 | 14,215,500 | |||
| 28,555,500 | |||||
| Beverages — 1.6% |
|||||
| Anheuser-Busch Companies, Inc. |
550,000 | 28,974,000 | |||
| Broadcasting — 1.9% |
|||||
| Clear Channel Communications, Inc. |
375,000 | 17,561,250 | |||
| Westwood One, Inc.* |
510,000 | 17,447,100 | |||
| 35,008,350 | |||||
| Building Materials — 1.0% |
|||||
| American Standard Companies, Inc.* |
175,000 | 17,622,500 | |||
| Business Services — 1.7% |
|||||
| First Data Corp.(a) |
750,000 | 30,817,500 | |||
| Cable Television — 2.8% |
|||||
| Comcast Corp. (Class “A” Stock)* |
1,040,000 | 34,184,800 | |||
| Comcast Corp. (Special Class “A” Stock)*(a) |
555,000 | 17,360,400 | |||
| 51,545,200 | |||||
| Chemicals — 0.1% |
|||||
| Ashland, Inc. |
60,000 | 2,643,600 | |||
| Computer Hardware — 0.4% |
|||||
| Hewlett-Packard Co. |
350,000 | 8,039,500 | |||
| Computer Services & Software — 1.9% |
|||||
| Microsoft Corp. |
1,250,000 | 34,425,000 | |||
| Conglomerates — 3.0% |
|||||
| Altria Group, Inc.(a) |
750,000 | 40,815,000 | |||
| Johnson Controls, Inc. |
125,000 | 14,515,000 | |||
| 55,330,000 | |||||
| Consumer Products & Services — 6.4% |
|||||
| Avon Products, Inc. |
300,000 | 20,247,000 | |||
| Colgate-Palmolive Co. |
515,000 | 25,775,750 | |||
| International Flavors & Fragrances, Inc. |
142,300 | 4,969,116 | |||
| Johnson & Johnson |
325,000 | 16,789,500 | |||
| Loews Corp. - Carolina Group |
700,000 | 17,668,000 | |||
| Procter & Gamble Co. |
320,000 | 31,961,600 | |||
| 117,410,966 | |||||
| Entertainment & Leisure — 6.3% |
|||||
| Carnival Corp.(a) |
225,000 | 8,939,250 | |||
| Harley-Davidson, Inc.(a) |
600,000 | 28,518,000 | |||
| Royal Caribbean Cruises Ltd.(a) |
100,000 | 3,479,000 | |||
| Time Warner, Inc.*(a) |
1,000,000 | 17,990,000 | |||
| Viacom, Inc. (Class “B” Stock) |
1,275,000 | 56,584,500 | |||
| 115,510,750 | |||||
| Shares |
Value | ||||
| Financial - Bank & Trust — 6.9% |
|||||
| Bank of America Corp.(a) |
750,000 | $ | 60,322,500 | ||
| Bank One Corp. |
1,350,000 | 61,546,500 | |||
| Commerce Bancorp, Inc.(a) |
100,000 | 5,268,000 | |||
| 127,137,000 | |||||
| Financial Services — 12.5% |
|||||
| Citigroup, Inc.(a) |
1,650,000 | 80,091,000 | |||
| Fannie Mae |
425,000 | 31,900,500 | |||
| J.P. Morgan Chase & Co. |
1,400,000 | 51,422,000 | |||
| MBNA Corp. |
1,075,000 | 26,713,750 | |||
| Merrill Lynch & Co., Inc. |
215,000 | 12,609,750 | |||
| Morgan Stanley Dean Witter & Co. |
470,000 | 27,198,900 | |||
| 229,935,900 | |||||
| Food — 0.7% |
|||||
| Dean Foods Co.* |
400,000 | 13,148,000 | |||
| Healthcare Services — 6.8% |
|||||
| Anthem, Inc.*(a) |
400,000 | 30,000,000 | |||
| HCA, Inc.(a) |
750,000 | 32,220,000 | |||
| Health Management Associates, Inc. (Class “A” Stock)(a) |
432,400 | 10,377,600 | |||
| Tenet Healthcare Corp.* |
1,000,000 | 16,050,000 | |||
| WellPoint Health Networks, Inc.* |
375,000 | 36,371,250 | |||
| 125,018,850 | |||||
| Insurance — 7.9% |
|||||
| ACE Ltd. |
750,000 | 31,065,000 | |||
| Allstate Corp. (The) |
500,000 | 21,510,000 | |||
| American International Group, Inc. |
1,100,000 | 72,908,000 | |||
| Axis Capital Holdings Ltd.* |
123,300 | 3,610,224 | |||
| MetLife, Inc. |
450,000 | 15,151,500 | |||
| 144,244,724 | |||||
| Internet Services — 0.3% |
|||||
| Juniper Networks, Inc.*(a) |
300,000 | 5,604,000 | |||
| Medical Supplies & Equipment — 1.1% |
|||||
| Alcon, Inc. (Switzerland) |
185,000 | 11,199,900 | |||
| Applera Corp. - Applied Biosystems Group(a) |
457,200 | 9,468,612 | |||
| 20,668,512 | |||||
| Metals & Mining — 0.4% |
|||||
| Alcoa, Inc.(a) |
175,000 | 6,650,000 | |||
| Oil & Gas — 10.9% |
|||||
| Baker Hughes, Inc. |
408,300 | 13,130,928 | |||
| BP PLC [ADR] |
600,000 | 29,610,000 | |||
| ConocoPhillips |
665,000 | 43,604,050 | |||
| Devon Energy Corp.(a) |
250,000 | 14,315,000 | |||
| Exxon Mobil Corp. |
400,000 | 16,400,000 | |||
| Kerr-McGee Corp. |
600,000 | 27,894,000 | |||
| Nabors Industries Ltd.*(a) |
400,000 | 16,600,000 | |||
| Noble Corp.* |
297,400 | 10,640,972 | |||
| Noble Energy, Inc. |
175,000 | 7,775,250 | |||
151
Table of Contents
AST Alliance Growth and Income Portfolio
Schedule of Investments
December 31, 2003
| Shares |
Value | |||||
| Occidental Petroleum Corp. |
300,000 | $ | 12,672,000 | |||
| Weatherford International Ltd.* |
221,600 | 7,977,600 | ||||
| 200,619,800 | ||||||
| Pharmaceuticals — 5.8% |
||||||
| Cephalon, Inc.*(a) |
100,000 | 4,841,000 | ||||
| MedImmune, Inc.*(a) |
575,000 | 14,605,000 | ||||
| Pfizer, Inc. |
1,500,000 | 52,995,000 | ||||
| Wyeth |
800,000 | 33,960,000 | ||||
| 106,401,000 | ||||||
| Railroads — 5.3% |
||||||
| Burlington Northern Santa Fe Corp. |
1,050,000 | 33,967,500 | ||||
| Union Pacific Corp. |
920,000 | 63,921,600 | ||||
| 97,889,100 | ||||||
| Retail & Merchandising — 1.2% |
||||||
| Home Depot, Inc. |
600,000 | 21,294,000 | ||||
| Telecommunications — 4.2% |
||||||
| BellSouth Corp. |
550,000 | 15,565,000 | ||||
| SBC Communications, Inc. |
600,000 | 15,642,000 | ||||
| Sprint Corp.(a) |
1,000,000 | 16,420,000 | ||||
| Verizon Communications, Inc. |
850,000 | 29,818,000 | ||||
| 77,445,000 | ||||||
| Utilities — 1.9% |
||||||
| Edison International Co. |
74,100 | 1,625,013 | ||||
| Entergy Corp. |
250,000 | 14,282,500 | ||||
| Exelon Corp. |
75,000 | 4,977,000 | ||||
| PPL Corp.(a) |
325,000 | 14,218,750 | ||||
| 35,103,263 | ||||||
| Total Long-Term Investments |
||||||
| (Cost $1,530,986,908) |
1,737,042,015 | |||||
| Par (000) |
||||||
| SHORT-TERM INVESTMENTS — 20.3% |
||||||
| Certificates of Deposit — 1.3% |
||||||
| Svenska Handelsbank, Inc. |
||||||
| 1.39%, 10/27/04(b) |
$ | 3,721 | 3,720,353 | |||
| Westdeutsche Landesbank |
||||||
| 1.50%, 01/10/04(b) |
20,394 | 20,388,442 | ||||
| 24,108,795 | ||||||
| Commercial Paper — 3.0% |
||||||
| Amsterdam Funding Corp. |
||||||
| 1.10%, 01/05/04(b) |
3,386 | 3,382,960 | ||||
| Cancara Asset Securitisation Ltd. |
||||||
| 1.11%, 01/12/04(b) |
1,132 | 1,130,803 | ||||
| Concord Minutemen Capital Co. |
||||||
| 1.11%, 01/12/04(b) |
6,170 | 6,158,990 | ||||
| Crown Point Capital Co. |
||||||
| 1.11%, 01/16/04(b) |
67 | 66,935 | ||||
| Par (000) |
Value | |||||
| Fairway Finance Corp. |
||||||
| 1.10%, 01/12/04(b) |
$ | 1,296 | $ | 1,292,196 | ||
| General Electric Capital Corp. |
||||||
| 1.11%, 02/05/04(b) |
62 | 61,489 | ||||
| Lexington Parker Capital Co. |
||||||
| 1.10%, 01/12/04(b) |
3,930 | 3,922,090 | ||||
| Monumental Global Funding |
||||||
| 1.141%, 01/29/04 [FRN](b)(c) |
1,173 | 1,176,153 | ||||
| Silver Tower U.S. Funding |
||||||
| 1.13%, 02/02/04(b) |
4,952 | 4,937,922 | ||||
| Tannehill Capital Co. |
||||||
| 1.10%, 01/08/04(b) |
32,950 | 32,859,670 | ||||
| 54,989,208 | ||||||
| Corporate Obligations — 6.8% |
||||||
| American Express Centurian |
||||||
| 1.118%, 01/22/04 [FRN](b)(c) |
22,263 | 22,263,349 | ||||
| Bear Stearns Co., Inc. |
||||||
| 1.12%, 01/02/04 [FRN](b)(c) |
18,940 | 18,939,736 | ||||
| General Electric Capital Corp. |
||||||
| 1.13%, 01/02/04 [FRN](b)(c) |
1,815 | 1,817,200 | ||||
| Goldman Sachs Group, Inc. |
||||||
| 1.14%, 01/06/04 [FRN](b)(c) |
7,291 | 7,290,637 | ||||
| Merrill Lynch & Co., Inc. |
||||||
| 1.13%, 01/02/04(b) |
1,714 | 1,714,493 | ||||
| 1.13%, 01/02/04 [FRN](b)(c) |
2,974 | 2,974,322 | ||||
| Morgan Stanley |
||||||
| 1.03%, 01/02/04 [FRN](b)(c) |
10,012 | 10,012,289 | ||||
| 1.08%, 01/02/04 [FRN](b)(c) |
13,285 | 13,285,581 | ||||
| Natexis Banques Populaires |
||||||
| 1.035%, 01/02/04 [FRN](b)(c) |
8,988 | 8,987,626 | ||||
| 1.10%, 01/13/04 [FRN](b)(c) |
13,266 | 13,262,362 | ||||
| Societe Generale |
||||||
| 1.08%, 01/02/04 [FRN](b)(c) |
11,877 | 11,874,154 | ||||
| Westdeutsche Landesbank |
||||||
| 1.13%, 01/09/04 [FRN](b)(c) |
3,204 | 3,203,326 | ||||
| 1.111%, 01/29/04 [FRN](b)(c) |
8,980 | 8,977,792 | ||||
| 124,602,867 | ||||||
| Shares |
||||||
| Non-Registered Investment Company — 3.2% |
||||||
| BlackRock Institutional Money Market Trust(b)(j) |
59,511,605 | 59,511,605 | ||||
| Registered Investment Companies — 4.9% |
||||||
| BlackRock Provident Institutional Funds TempCash Portfolio |
44,896,925 | 44,896,925 | ||||
| BlackRock Provident Institutional Funds TempFund Portfolio |
44,896,925 | 44,896,925 | ||||
| 89,793,850 | ||||||
152
Table of Contents
AST Alliance Growth and Income Portfolio
Schedule of Investments
December 31, 2003
| Par (000) |
Value | |||||
| Repurchase Agreement — 0.4% |
||||||
| Merrill Lynch & Co., Inc. |
||||||
| 1.00%, dated 12/31/03, to be repurchased on 01/02/04, repurchase price $7,144,116 (Collateralized by Federal Home Loan Mortgage Corp. 5.50% maturing 12/01/33, Federal National Mortgage Assoc. 4.00% - 6.00% maturing 11/01/17 to 11/01/33 and Government National Mortgage Assoc. 1.47% maturing 01/16/04 [FRN](c), par value $8,765,036, market value including accrued interest $7,358,165)(b) |
$ | 7,144 | $ | 7,143,720 | ||
| Par (000) |
Value |
||||||
| Time Deposits — 0.7% |
|||||||
| Chase Manhattan Bank |
|||||||
| 0.875%, 01/02/04(b) |
$ | 10,565 | $ | 10,565,405 | |||
| UBS Bank |
|||||||
| 0.938%, 01/02/04(b) |
2,424 | 2,424,026 | |||||
| 12,989,431 | |||||||
| Total Short-Term Investments |
|||||||
| (Cost $373,139,476) |
373,139,476 | ||||||
| Total Investments — 114.9% |
|||||||
| (Cost $1,904,126,384; Note 5) |
2,110,181,491 | ||||||
| Liabilities in Excess of |
(273,652,267 | ) | |||||
| Net Assets — 100.0% |
$ | 1,836,529,224 | |||||
The following abbreviations are used in portfolio descriptions:
| ADR | American Depositary Receipt |
| FRN | Floating Rate Note |
| symbol |
description | |
| * |
Non-income producing security. | |
| (a) |
Portions of securities on loan with an aggregate market value of $275,666,382; cash collateral $283,345,627 was received with which the portfolio purchased securities. | |
| (b) |
Represents security purchased with cash collateral for securities on loan. | |
| (c) |
Indicates a variable rate security. The maturity date presented for these instruments is the latter of the next date on which the security can be redeemed at par or the next date on which the rate of interest is adjusted. The interest rate shown reflects the rate in effect at December 31, 2003. | |
| (j) |
Security available to institutional investors only. | |
See Notes to Financial Statements.
153
Table of Contents
AST MFS Growth with Income Portfolio
Schedule of Investments
December 31, 2003
| Shares |
Value | ||||
| LONG-TERM INVESTMENTS — 97.3% |
|||||
| COMMON STOCK |
|||||
| Aerospace — 0.7% |
|||||
| Lockheed Martin Corp.(a) |
13,040 | $ | 670,256 | ||
| United Technologies Corp. |
1,500 | 142,155 | |||
| 812,411 | |||||
| Airlines — 0.2% |
|||||
| Southwest Airlines Co. |
13,300 | 214,662 | |||
| Automobile Manufacturers — 1.0% |
|||||
| Bayerische Motoren Werke AG (Germany) |
15,260 | 707,373 | |||
| Porsche AG (Germany) |
611 | 362,623 | |||
| 1,069,996 | |||||
| Automotive Parts — 0.2% |
|||||
| Magna International, Inc. (Class “A” Stock) |
3,030 | 242,552 | |||
| Beverages — 1.8% |
|||||
| Anheuser-Busch Companies, Inc. |
9,300 | 489,924 | |||
| PepsiCo, Inc. |
32,346 | 1,507,971 | |||
| 1,997,895 | |||||
| Broadcasting — 1.2% |
|||||
| Clear Channel Communications, Inc. |
27,630 | 1,293,913 | |||
| Building Materials — 0.3% |
|||||
| American Standard Companies, Inc.* |
3,020 | 304,114 | |||
| Business Services — 0.8% |
|||||
| Accenture Ltd. (Class “A” Stock)*(a) |
18,800 | 494,816 | |||
| ARAMARK Corp. (Class “B” Stock) |
14,040 | 384,977 | |||
| 879,793 | |||||
| Cable Television — 1.4% |
|||||
| Comcast Corp. (Class “A” Stock)* |
37,603 | 1,236,011 | |||
| EchoStar Communications Corp. |
8,850 | 300,900 | |||
| 1,536,911 | |||||
| Chemicals — 2.7% |
|||||
| Air Products & Chemicals, Inc. |
8,110 | 428,451 | |||
| Dow Chemical Co. |
15,700 | 652,649 | |||
| Monsanto Co. |
1,600 | 46,048 | |||
| PPG Industries, Inc.(a) |
11,310 | 724,066 | |||
| Praxair, Inc. |
29,080 | 1,110,857 | |||
| 2,962,071 | |||||
| Computer Hardware — 3.4% |
|||||
| Dell, Inc.* |
6,800 | 230,928 | |||
| Hewlett-Packard Co. |
47,261 | 1,085,585 | |||
| International Business Machines Corp. |
25,400 | 2,354,072 | |||
| 3,670,585 | |||||
| Computer Services & Software — 6.7% |
|||||
| Amdocs Ltd.* |
6,800 | 152,864 | |||
| Shares |
Value | ||||
| Cisco Systems, Inc.* |
114,770 | $ | 2,787,763 | ||
| Microsoft Corp. |
149,200 | 4,108,968 | |||
| Veritas Software Corp.*(a) |
7,170 | 266,437 | |||
| 7,316,032 | |||||
| Conglomerates — 3.0% |
|||||
| Altria Group, Inc.(a) |
38,100 | 2,073,402 | |||
| Tyco International Ltd.(a) |
47,270 | 1,252,655 | |||
| 3,326,057 | |||||
| Consumer Products & Services — 6.3% |
|||||
| Colgate-Palmolive Co. |
7,800 | 390,390 | |||
| Johnson & Johnson |
51,450 | 2,657,907 | |||
| Kimberly-Clark Corp. |
9,090 | 537,128 | |||
| Newell Rubbermaid, Inc.(a) |
30,200 | 687,654 | |||
| Procter & Gamble Co. |
18,420 | 1,839,790 | |||
| Reckitt Benckiser PLC |
32,910 | 744,674 | |||
| 6,857,543 | |||||
| Electronic Components & Equipment — 3.9% |
|||||
| Emerson Electric Co.(a) |
8,800 | 569,800 | |||
| General Electric Co. |
103,180 | 3,196,516 | |||
| Rockwell Automation, Inc. |
7,610 | 270,916 | |||
| STMicroelectronics NV NY Reg. |
9,080 | 245,251 | |||
| 4,282,483 | |||||
| Entertainment & Leisure — 3.6% |
|||||
| Disney (Walt) Co. |
12,800 | 298,624 | |||
| Harley-Davidson, Inc.(a) |
4,100 | 194,873 | |||
| Time Warner, Inc.*(a) |
76,780 | 1,381,272 | |||
| Viacom, Inc. (Class “B” Stock) |
47,064 | 2,088,701 | |||
| 3,963,470 | |||||
| Financial - Bank & Trust — 7.4% |
|||||
| Bank of America Corp.(a) |
22,890 | 1,841,043 | |||
| Bank of New York Co., Inc.(a) |
8,500 | 281,520 | |||
| Bank One Corp. |
17,670 | 805,575 | |||
| Golden West Financial Corp. |
5,000 | 515,950 | |||
| State Street Corp. |
7,000 | 364,560 | |||
| SunTrust Banks, Inc. |
6,310 | 451,165 | |||
| U.S. Bancorp |
35,210 | 1,048,554 | |||
| Wells Fargo & Co. |
45,180 | 2,660,649 | |||
| 7,969,016 | |||||
| Financial Services — 9.4% |
|||||
| American Express Co. |
20,300 | 979,069 | |||
| Citigroup, Inc.(a) |
76,880 | 3,731,754 | |||
| Fannie Mae |
30,440 | 2,284,826 | |||
| Goldman Sachs Group, Inc.(a) |
3,470 | 342,593 | |||
| Lehman Brothers Holdings, Inc.(a) |
5,810 | 448,648 | |||
| MBNA Corp. |
16,730 | 415,741 | |||
| Mellon Financial Corp. |
11,830 | 379,861 | |||
| Merrill Lynch & Co., Inc. |
27,910 | 1,636,922 | |||
| 10,219,414 | |||||
154
Table of Contents
AST MFS Growth with Income Portfolio
Schedule of Investments
December 31, 2003
| Shares |
Value | ||||
| Food — 0.4% |
|||||
| Archer-Daniels-Midland Co. |
15,640 | $ | 238,041 | ||
| Safeway, Inc.* |
9,700 | 212,527 | |||
| 450,568 | |||||
| Healthcare Services — 1.1% |
|||||
| HCA, Inc.(a) |
3,900 | 167,544 | |||
| Tenet Healthcare Corp.* |
64,430 | 1,034,102 | |||
| 1,201,646 | |||||
| Hotels & Motels — 0.2% |
|||||
| Starwood Hotels & Resorts Worldwide, Inc. |
5,400 | 194,238 | |||
| Industrial Products — 0.7% |
|||||
| Grainger (W.W.), Inc.(a) |
8,100 | 383,859 | |||
| Illinois Tool Works, Inc.(a) |
5,170 | 433,815 | |||
| 817,674 | |||||
| Insurance — 3.2% |
|||||
| American International Group, Inc. |
18,025 | 1,194,696 | |||
| Chubb Corp.(a) |
9,270 | 631,287 | |||
| Hartford Financial Services Group, Inc. (The) |
6,330 | 373,660 | |||
| Marsh & McLennan Companies, Inc. |
7,890 | 377,852 | |||
| MetLife, Inc. |
11,600 | 390,572 | |||
| Travelers Property Casualty Corp. |
1 | 17 | |||
| XL Capital Ltd. (Class “A” Stock)(a) |
7,310 | 566,891 | |||
| 3,534,975 | |||||
| Internet Services — 0.1% |
|||||
| InterActiveCorp.*(a) |
4,760 | 161,507 | |||
| Machinery & Equipment — 0.7% |
|||||
| Danaher Corp.(a) |
3,000 | 275,250 | |||
| Eaton Corp. |
4,100 | 442,718 | |||
| 717,968 | |||||
| Medical Supplies & Equipment — 4.4% |
|||||
| Abbott Laboratories |
18,920 | 881,672 | |||
| AmerisourceBergen Corp. |
19,390 | 1,088,749 | |||
| Applera Corp. - Applied Biosystems Group(a) |
3,200 | 66,272 | |||
| Bard (C.R.), Inc. |
3,170 | 257,563 | |||
| Baxter International, Inc. |
26,270 | 801,760 | |||
| Genzyme Corp.*(a) |
10,300 | 508,202 | |||
| Guidant Corp. |
19,630 | 1,181,725 | |||
| 4,785,943 | |||||
| Metals & Mining — 0.3% |
|||||
| BHP Billiton PLC (United Kingdom) |
34,200 | 298,770 | |||
| Office Equipment — 0.4% |
|||||
| Xerox Corp.* |
32,800 | 452,640 | |||
| Oil & Gas — 6.6% |
|||||
| BP PLC [ADR] |
4,489 | 221,532 | |||
| Encana Corp. |
4,050 | 159,732 | |||
| Shares |
Value | ||||
| Encana Corp. (Canada) |
8,140 | $ | 321,254 | ||
| Exxon Mobil Corp. |
72,554 | 2,974,714 | |||
| Halliburton Co.(a) |
26,450 | 687,700 | |||
| Noble Corp.* |
8,140 | 291,249 | |||
| Schlumberger Ltd.(a) |
15,260 | 835,027 | |||
| Total SA [ADR] |
6,100 | 564,311 | |||
| Transocean, Inc. |
12,910 | 309,969 | |||
| Unocal Corp. |
24,400 | 898,652 | |||
| 7,264,140 | |||||
| Pharmaceuticals — 6.9% |
|||||
| AstraZeneca Group PLC |
14,190 | 680,783 | |||
| Cardinal Health, Inc. |
5,400 | 330,264 | |||
| Gilead Sciences, Inc.*(a) |
8,600 | 500,004 | |||
| Novartis AG (Switzerland) |
30,350 | 1,377,927 | |||
| Pfizer, Inc. |
35,692 | 1,260,998 | |||
| Roche Holding AG (Switzerland) |
8,450 | 852,345 | |||
| Sanofi-Synthelabo SA (France) |
5 | 377 | |||
| Schering-Plough Corp. |
54,340 | 944,973 | |||
| Wyeth |
36,840 | 1,563,857 | |||
| 7,511,528 | |||||
| Printing & Publishing — 1.7% |
|||||
| Gannett Co., Inc. |
5,050 | 450,258 | |||
| New York Times Co. (Class “A” Stock) |
28,670 | 1,370,139 | |||
| 1,820,397 | |||||
| Railroads — 1.5% |
|||||
| Canadian National Railway Co. (Canada) |
11,002 | 696,207 | |||
| Union Pacific Corp. |
14,130 | 981,752 | |||
| 1,677,959 | |||||
| Restaurants — 0.3% |
|||||
| McDonald’s Corp. |
13,940 | 346,130 | |||
| Retail & Merchandising — 6.0% |
|||||
| CVS Corp. |
16,310 | 589,117 | |||
| Home Depot, Inc. |
42,290 | 1,500,872 | |||
| Kohl’s Corp.*(a) |
13,660 | 613,880 | |||
| May Department Stores Co. (The) |
19,900 | 578,493 | |||
| Target Corp. |
28,400 | 1,090,560 | |||
| TJX Companies, Inc.(a) |
38,650 | 852,233 | |||
| Wal-Mart Stores, Inc. |
26,090 | 1,384,075 | |||
| 6,609,230 | |||||
| Semiconductors — 2.4% |
|||||
| Analog Devices, Inc. |
18,270 | 834,026 | |||
| Intel Corp. |
45,640 | 1,469,608 | |||
| Texas Instruments, Inc. |
10,600 | 311,428 | |||
| 2,615,062 | |||||
| Telecommunications — 2.7% |
|||||
| AT&T Wireless Services, Inc.*(a) |
60,200 | 480,998 | |||
| KPN NV (Netherlands)* |
25,200 | 194,531 | |||
| Nokia Corp. (Class “A” Stock) [ADR](a) |
13,280 | 225,760 | |||
155
Table of Contents
AST MFS Growth with Income Portfolio
Schedule of Investments
December 31, 2003
| Shares |
Value | |||||
| SBC Communications, Inc. |
24,500 | $ | 638,715 | |||
| Sprint Corp. (PCS Group)*(a) |
46,520 | 261,442 | ||||
| Verizon Communications, Inc. |
32,020 | 1,123,262 | ||||
| 2,924,708 | ||||||
| Transportation — 1.3% |
||||||
| FedEx Corp.(a) |
11,790 | 795,825 | ||||
| United Parcel Service, Inc. |
9,020 | 672,441 | ||||
| 1,468,266 | ||||||
| Utilities — 2.4% |
||||||
| Dominion Resources, Inc. |
14,830 | 946,599 | ||||
| Entergy Corp. |
2,100 | 119,973 | ||||
| Exelon Corp. |
14,860 | 986,110 | ||||
| FirstEnergy Corp. |
7,500 | 264,000 | ||||
| PPL Corp.(a) |
6,100 | 266,875 | ||||
| 2,583,557 | ||||||
| Total Long-Term Investments |
||||||
| (Cost $95,383,806) |
106,355,824 | |||||
| Par (000) |
||||||
| SHORT-TERM INVESTMENTS — 23.5% |
||||||
| Commercial Paper — 4.2% |
||||||
| Cancara Asset Securitisation Ltd. |
||||||
| 1.11%, 01/12/04(b) |
$ | 533 | 532,203 | |||
| Crown Point Capital Co. |
||||||
| 1.11%, 01/16/04(b) |
266 | 264,942 | ||||
| General Electric Capital Corp. |
||||||
| 1.11%, 02/05/04(b) |
782 | 779,842 | ||||
| Monumental Global Funding |
||||||
| 1.141%, 01/29/04 [FRN](b)(c) |
276 | 276,494 | ||||
| Silver Tower U.S. Funding |
||||||
| 1.13%, 02/02/04(b) |
552 | 549,960 | ||||
| Tannehill Capital Co. |
||||||
| 1.10%, 01/08/04(b) |
1,654 | 1,649,439 | ||||
| 1.11%, 01/13/04(b) |
556 | 555,409 | ||||
| 4,608,289 | ||||||
| Corporate Obligations — 9.6% |
||||||
| American Express Centurian |
||||||
| 1.118%, 01/22/04 [FRN](b)(c) |
474 | 473,668 | ||||
| General Electric Capital Corp. |
||||||
| 1.13%, 01/02/04 [FRN](b)(c) |
53 | 53,373 | ||||
| Goldman Sachs Group, Inc. |
||||||
| 1.14%, 01/06/04 [FRN](b)(c) |
301 | 300,601 | ||||
| Merrill Lynch & Co., Inc. |
||||||
| 1.13%, 01/02/04(b) |
75 | 75,073 | ||||
| 1.13%, 01/02/04 [FRN](b)(c) |
2,558 | 2,558,383 | ||||
| Morgan Stanley |
||||||
| 1.03%, 01/02/04 [FRN](b)(c) |
2,711 | 2,710,882 | ||||
| 1.03%, 01/02/04 [FRN](b)(c) |
1,635 | 1,634,961 | ||||
| 1.08%, 01/02/04 [FRN](b)(c) |
161 | 160,873 | ||||
| Par (000) |
Value |
||||||
| Natexis Banques Populaires |
|||||||
| 1.035%, 01/02/04 [FRN](b)(c) |
$ | 257 | $ | 256,711 | |||
| 1.10%, 01/02/04 [FRN](b)(c) |
1,734 | 1,733,475 | |||||
| Societe Generale |
497 | 496,802 | |||||
| 10,454,802 | |||||||
| Shares |
|||||||
| Non-Registered Investment Company — 2.2% |
|||||||
| BlackRock Institutional Money Market Trust(b)(j) |
2,437,939 | 2,437,939 | |||||
| Registered Investment Companies |
|||||||
| BlackRock Provident Institutional Funds TempCash Portfolio |
116 | 116 | |||||
| BlackRock Provident Institutional Funds TempFund Portfolio |
116 | 116 | |||||
| 232 | |||||||
| Par (000) |
|||||||
| Repurchase Agreement — 0.3% |
|||||||
| Merrill Lynch & Co., Inc. |
|||||||
| 1.00%, dated 12/31/03, to be repurchased on 01/02/04, repurchase price $312,821 (Collateralized by Federal Home Loan Mortgage Corp. 5.50% maturing 12/01/33, Federal National Mortgage Assoc. 4.00% - 6.00% maturing 11/01/17 to 11/01/33 and Government National Mortgage Assoc. 1.47% maturing 01/16/04 [FRN](c), par value $383,797, market value including accrued interest $322,194)(b) |
$ | 313 | 312,804 | ||||
| Time Deposits — 0.9% |
|||||||
| Chase Manhatten Bank |
663 | 663,205 | |||||
| UBS Bank |
337 | 337,022 | |||||
| 1,000,227 | |||||||
| U.S. Government Agency Obligation — 6.3% |
|||||||
| Federal Home Loan Banks |
6,863 | 6,862,857 | |||||
| Total Short-Term Investments |
|||||||
| (Cost $25,677,150) |
25,677,150 | ||||||
| Total Investments — 120.8% |
|||||||
| (Cost $121,060,956; Note 5) |
132,032,974 | ||||||
| Liabilities in Excess of |
(22,694,075 | ) | |||||
| Net Assets — 100.0% |
$ | 109,338,899 | |||||
156
Table of Contents
AST MFS Growth with Income Portfolio
Schedule of Investments
December 31, 2003
Foreign currency exchange contracts outstanding at December 31, 2003:
| Settlement Month |
Purchase Contracts |
Contracts to Deliver |
In Exchange For |
Contracts at Value |
Unrealized Appreciation | ||||||||
| 01/04 |
Buy CND | 36,400 | $ | 28,148 | $ | 28,168 | $ | 20 | |||||
| 01/04 |
Buy CHF | 161,143 | 129,759 | 130,295 | 536 | ||||||||
| 01/04 |
Buy GBP | 62,511 | 111,158 | 111,905 | 747 | ||||||||
| $ | 269,065 | $ | 270,368 | $ | 1,303 | ||||||||
The following abbreviations are used in portfolio descriptions:
| ADR | American Depositary Receipt |
| CHF | Swiss Franc |
| CND | Canadian Dollar |
| FRN | Floating Rate Note |
| GBP | British Pound |
| symbol |
description | |
| * | Non-income producing security. | |
| (a) | Portion of securities on loan with an aggregate market value of $18,213,225; cash collateral $18,814,061 was received with which the portfolio purchased securities. | |
| (b) | Represents security purchased with cash collateral for securities on loan. | |
| (c) | Indicates a variable rate security. The maturity date presented for these instruments is the latter of the next date on which the security can be redeemed at par or the next date on which the rate of interest is adjusted. The interest rate shown reflects the rate in effect at December 31, 2003. | |
| (j) | Security available to institutional investors only. | |
See Notes to Financial Statements.
157
Table of Contents
AST INVESCO Capital Income Portfolio
Schedule of Investments
December 31, 2003
| Shares |
Value | ||||
| LONG-TERM INVESTMENTS — 99.4% |
|||||
| COMMON STOCK — 88.5% |
|||||
| Aerospace — 1.0% |
|||||
| United Technologies Corp. |
69,700 | $ | 6,605,469 | ||
| Beverages — 1.8% |
|||||
| PepsiCo, Inc. |
253,000 | 11,794,860 | |||
| Building Materials — 1.7% |
|||||
| Masco Corp.(a) |
395,400 | 10,837,914 | |||
| Chemicals — 6.4% |
|||||
| Air Products & Chemicals, Inc. |
160,600 | 8,484,498 | |||
| DuPont (E.I.) de Nemours & Co. |
167,000 | 7,663,630 | |||
| Eastman Chemical Co.(a) |
158,900 | 6,281,317 | |||
| PPG Industries, Inc.(a) |
95,700 | 6,126,714 | |||
| Praxair, Inc. |
317,800 | 12,139,960 | |||
| 40,696,119 | |||||
| Computer Hardware — 1.8% |
|||||
| Dell, Inc.* |
332,500 | 11,291,700 | |||
| Computer Services & Software — 8.0% |
|||||
| Cisco Systems, Inc.* |
823,900 | 20,012,531 | |||
| EMC Corp.*(a) |
230,300 | 2,975,476 | |||
| Microsoft Corp. |
775,200 | 21,349,008 | |||
| Oracle Corp.* |
535,200 | 7,064,640 | |||
| 51,401,655 | |||||
| Conglomerates — 1.4% |
|||||
| Honeywell International, Inc. |
274,100 | 9,163,163 | |||
| Consumer Products & Services — 3.9% |
|||||
| Johnson & Johnson |
313,000 | 16,169,580 | |||
| Procter & Gamble Co. |
86,000 | 8,589,680 | |||
| 24,759,260 | |||||
| Electronic Components & Equipment — 5.6% |
|||||
| Emerson Electric Co.(a) |
90,800 | 5,879,300 | |||
| General Electric Co. |
652,000 | 20,198,960 | |||
| Jabil Circuit, Inc.* |
345,400 | 9,774,820 | |||
| 35,853,080 | |||||
| Entertainment & Leisure — 0.7% |
|||||
| Viacom, Inc. (Class “B” Stock) |
105,400 | 4,677,652 | |||
| Financial - Bank & Trust — 4.6% |
|||||
| Bank of America Corp. |
152,500 | 12,265,575 | |||
| Bank of New York Co., Inc. |
257,900 | 8,541,648 | |||
| State Street Corp. |
167,000 | 8,697,360 | |||
| 29,504,583 | |||||
| Financial Services — 12.1% |
|||||
| Citigroup, Inc.(a) |
402,200 | 19,522,789 | |||
| Fannie Mae |
251,400 | 18,870,084 | |||
| Freddie Mac |
129,700 | 7,564,104 | |||
| Goldman Sachs Group, Inc.(a) |
131,400 | 12,973,122 | |||
| MBNA Corp. |
357,100 | 8,873,935 | |||
| Shares |
Value | ||||
| Morgan Stanley Dean Witter & Co. |
176,800 | $ | 10,231,416 | ||
| 78,035,450 | |||||
| Industrial Products — 2.3% |
|||||
| Ingersoll-Rand Co.* |
214,100 | 14,533,108 | |||
| Insurance — 6.5% |
|||||
| Allstate Corp. (The) |
129,700 | 5,579,694 | |||
| American International Group, Inc. |
189,800 | 12,579,944 | |||
| MGIC Investment Corp. |
50,300 | 2,864,082 | |||
| PMI Group, Inc. (The) |
238,400 | 8,875,632 | |||
| Radian Group, Inc. |
235,200 | 11,466,000 | |||
| 41,365,352 | |||||
| Internet Services — 0.6% |
|||||
| eBay, Inc.*(a) |
56,700 | 3,662,253 | |||
| Machinery & Equipment — 2.4% |
|||||
| Deere & Co. |
100,600 | 6,544,030 | |||
| Eaton Corp. |
81,130 | 8,760,417 | |||
| 15,304,447 | |||||
| Medical Supplies & Equipment — 1.7% |
|||||
| Medtronic, Inc. |
227,100 | 11,039,331 | |||
| Metals & Mining — 1.5% |
|||||
| Phelps Dodge Corp.*(a) |
123,300 | 9,381,897 | |||
| Oil & Gas — 2.6% |
|||||
| Exxon Mobil Corp. |
402,200 | 16,490,200 | |||
| Paper & Forest Products — 2.6% |
|||||
| International Paper Co. |
225,400 | 9,716,994 | |||
| Weyerhaeuser Co. |
110,300 | 7,059,200 | |||
| 16,776,194 | |||||
| Pharmaceuticals — 5.3% |
|||||
| Pfizer, Inc. |
664,920 | 23,491,624 | |||
| Wyeth |
240,000 | 10,188,000 | |||
| 33,679,624 | |||||
| Retail & Merchandising — 8.0% |
|||||
| Bed Bath & Beyond, Inc.* |
90,800 | 3,936,180 | |||
| Home Depot, Inc. |
210,800 | 7,481,292 | |||
| Target Corp. |
262,700 | 10,087,680 | |||
| Wal-Mart Stores, Inc. |
313,000 | 16,604,650 | |||
| Walgreen Co.(a) |
364,900 | 13,275,062 | |||
| 51,384,864 | |||||
| Semiconductors — 4.5% |
|||||
| Altera Corp.* |
314,600 | 7,141,420 | |||
| Intel Corp. |
525,500 | 16,921,100 | |||
| Maxim Integrated Products, Inc. |
100,600 | 5,009,880 | |||
| 29,072,400 | |||||
| Telecommunications — 1.5% |
|||||
| Qualcomm, Inc. |
175,200 | 9,448,536 | |||
| Total Common Stock |
|||||
| (Cost $522,262,848) |
566,759,111 | ||||
158
Table of Contents
AST INVESCO Capital Income Portfolio
Schedule of Investments
December 31, 2003
| Moody’s Rating |
Par (000) |
Value | ||||||
| U.S. GOVERNMENT AGENCY OBLIGATIONS — 5.9% | ||||||||
| Federal Home Loan Mortgage Corp. |
||||||||
| 4.00%, 12/15/11 |
$ | 2,000 | $ | 2,048,533 | ||||
| 4.25%, 06/15/05 |
8,000 | 8,306,936 | ||||||
| 6.25%, 07/15/32 |
1,500 | 1,636,925 | ||||||
| 11,992,394 | ||||||||
| Federal National Mortgage Assoc. |
||||||||
| 4.465%, 12/01/33 |
370 | 375,666 | ||||||
| 4.619%, 12/01/03 |
885 | 904,067 | ||||||
| 4.783%, 11/25/33 |
255 | 262,411 | ||||||
| 5.19%, 11/01/33 |
390 | 401,554 | ||||||
| 5.50%, 09/01/33 |
10,486 | 10,630,694 | ||||||
| 7.00%, 07/15/05 |
12,300 | 13,292,818 | ||||||
| 25,867,210 | ||||||||
| Total U.S. Government Agency Obligations |
||||||||
| (Cost $37,683,613) |
37,859,604 | |||||||
| CORPORATE OBLIGATIONS — 3.7% |
||||||||
| Automobile Manufacturers — 0.1% |
||||||||
| Ford Motor Co., Notes |
||||||||
| 7.45%, 07/16/31 |
Baa1 | 405 | 410,461 | |||||
| General Motors Corp., Debs. |
||||||||
| 8.25%, 07/15/23 |
Baa1 | 140 | 159,365 | |||||
| Sr. Notes |
||||||||
| 7.125%, 07/15/13(a) |
Baa1 | 215 | 233,094 | |||||
| 802,920 | ||||||||
| Broadcasting |
||||||||
| Clear Channel Communications, Notes |
||||||||
| 3.125%, 02/01/07 |
Baa3 | 110 | 110,367 | |||||
| Cable Television — 0.2% |
||||||||
| Comcast Cable Communications, Inc., |
||||||||
| 6.75%, 01/30/11 |
Baa3 | 1,230 | 1,371,241 | |||||
| Financial Services — 1.5% |
||||||||
| CIT Group, Inc., Sr. Notes |
||||||||
| 5.75%, 09/25/07 |
A2 | 525 | 566,948 | |||||
| General Motors Acceptance Corp., Notes |
||||||||
| 6.875%, 09/15/11 |
A3 | 585 | 631,066 | |||||
| Goldman Sachs Group, Inc., Notes |
||||||||
| 4.75%, 07/15/13 |
Aa3 | 1,200 | 1,171,695 | |||||
| Household Finance Co., Notes |
||||||||
| 6.75%, 05/15/11 |
A1 | 1,000 | 1,127,399 | |||||
| J.P. Morgan Chase & Co., |
||||||||
| 6.75%, 02/01/11 |
A2 | 1,000 | 1,129,198 | |||||
| Moody’s Rating |
Par (000) |
Value | ||||||
| Lehman Brothers Holdings, Notes |
||||||||
| 3.50%, 08/07/08 |
A1 | $ | 1,000 | $ | 994,793 | |||
| MBNA Corp., Notes |
||||||||
| 6.125%, 03/01/13 |
Baa2 | 600 | 645,395 | |||||
| Morgan Stanley, Notes |
||||||||
| 5.30%, 03/01/13 |
Aa3 | 1,000 | 1,023,349 | |||||
| Pemex Project Funding Master Trust, Gtd. Notes |
||||||||
| 8.00%, 11/15/11 |
Baa1 | 425 | 477,063 | |||||
| PNC Funding Corp., Bonds |
||||||||
| 5.25%, 11/15/15 |
A3 | 600 | 595,892 | |||||
| Washington Mutual, Inc., Notes |
||||||||
| 4.00%, 01/15/09 |
A3 | 665 | 666,907 | |||||
| 6.875%, 06/15/11 |
A3 | 800 | 908,521 | |||||
| 9,938,226 | ||||||||
| Food — 0.1% |
||||||||
| Kraft Foods, Inc., Notes |
||||||||
| 5.25%, 10/01/13 |
A3 | 520 | 525,680 | |||||
| Oil & Gas — 0.1% |
||||||||
| Duke Energy Field Services Corp., Notes |
||||||||
| 8.125%, 08/16/30 |
Baa2 | 450 | 551,771 | |||||
| Paper & Forest Products — 0.2% |
||||||||
| Weyerhaeuser Co., Notes |
||||||||
| 6.75%, 03/15/12 |
Baa2 | 970 | 1,059,892 | |||||
| Real Estate — 0.2% |
||||||||
| Simon Property Group L.P., Notes |
||||||||
| 6.35%, 08/28/12 |
Baa2 | 1,000 | 1,088,491 | |||||
| Restaurants — 0.1% |
||||||||
| Tricon Global Restaurants, Inc., Sr. Notes |
||||||||
| 8.875%, 04/15/11 |
Ba1 | 270 | 328,725 | |||||
| Telecommunications — 0.4% |
||||||||
| Deutsche Telekom International Finance BV, Gtd. Notes (Netherlands) |
||||||||
| 8.75%, 06/15/30(l) |
Baa3 | 700 | 897,394 | |||||
| France Telecom SA, |
||||||||
| 9.75%, 03/01/31(l) |
Baa3 | 75 | 99,993 | |||||
| Sprint Capital Corp., |
||||||||
| 8.75%, 03/15/32 |
Baa3 | 800 | 948,410 | |||||
| Telecom Italia Capital, |
||||||||
| 5.25%, 11/15/13 144A(l) |
Baa2 | 930 | 933,987 | |||||
| 2,879,784 | ||||||||
159
Table of Contents
AST INVESCO Capital Income Portfolio
Schedule of Investments
December 31, 2003
| Moody’s Rating |
Par (000) |
Value | ||||||
| Utilities — 0.8% |
||||||||
| Columbus Southern Power |
||||||||
| 5.50%, 03/01/13 |
A3 | $ | 1,000 | $ | 1,037,409 | |||
| Jersey Central Power & Light Co., 1st Mortgage |
||||||||
| 7.98%, 02/16/23 |
A2 | 1,500 | 1,558,411 | |||||
| Penn Power Co., 1st Mortgage |
||||||||
| 8.50%, 07/15/22 |
Baa1 | 1,000 | 1,040,318 | |||||
| PPL Energy Supply LLC, |
||||||||
| 6.40%, 11/01/11 |
Baa2 | 215 | 235,240 | |||||
| PSE&G Power Co., |
||||||||
| 7.75%, 04/15/11 |
Baa1 | 850 | 1,002,924 | |||||
| 4,874,302 | ||||||||
| Total Corporate Obligations |
||||||||
| (Cost $22,932,111) |
23,531,399 | |||||||
| ASSET BACKED SECURITIES — 0.4% |
||||||||
| Accredited Mortgage Loan Trust Series 2003-3 Class A3 |
||||||||
| 1.50%, 11/25/03 |
Aaa | 796 | 797,552 | |||||
| Chase Funding Mortgage Loan Trust Series 2003-6 Class 2A2 |
||||||||
| 1.41%, 11/25/03 |
Aaa | 800 | 803,327 | |||||
| Citifinancial Mortgage Securities, Inc. Series 2003-4 Class AV1 |
||||||||
| 1.42%, 11/25/03 |
Aaa | 793 | 792,558 | |||||
| Vanerbilt Mortgage Finance Series 2002-B Class A4 |
||||||||
| 5.84%, 12/01/03 |
Aaa | 225 | 220,620 | |||||
| (Cost $2,615,328) |
2,614,057 | |||||||
| U.S. TREASURY OBLIGATION — 0.4% |
||||||||
| U.S. Treasury Notes |
||||||||
| 6.00%, 02/15/26 |
||||||||
| (Cost $2,198,765) |
2,025 | 2,246,247 | ||||||
| COLLATERALIZED MORTGAGE OBLIGATIONS — 0.2% | ||||||||
| MLCC Mortgage Investors, Inc. Series 2003-G Class A1 |
||||||||
| 1.49%, 01/25/29 |
Aaa | 798 | 797,546 | |||||
| Structured Asset Securities Corp. Series 2004-1AC Class A1 |
||||||||
| 1.00%, 01/25/34 |
Aaa | 620 | 637,534 | |||||
| (Cost $1,434,015) |
1,435,080 | |||||||
| Moody’s Rating |
Par (000) |
Value | ||||||
| SOVEREIGN ISSUE — 0.2% |
||||||||
| Mexico |
||||||||
| United Mexican States |
||||||||
| 7.50%, 01/14/12 |
||||||||
| (Cost $983,973) |
Baa2 | $ | 900 | $ | 1,017,450 | |||
| CONVERTIBLE BOND — 0.1% |
||||||||
| Ford Motor Credit Corp. |
||||||||
| 7.25%, 10/25/11(a) |
||||||||
| (Cost $456,690) |
A3 | 465 | 505,079 | |||||
| Total Long-Term Investments |
||||||||
| (Cost $590,567,343) |
635,968,027 | |||||||
| SHORT-TERM INVESTMENTS — 5.3% |
||||||||
| Commercial Paper — 0.9% |
||||||||
| Concord Minutemen Capital Co. |
||||||||
| 1.10%, 02/10/04(b) |
517 | 515,683 | ||||||
| General Electric Capital Corp. |
||||||||
| 1.11%, 02/05/04(b) |
165 | 164,780 | ||||||
| Tannehill Capital Co. |
||||||||
| 1.10%, 01/08/04(b) |
4,778 | 4,764,816 | ||||||
| 5,445,279 | ||||||||
| Corporate Obligations — 1.8% |
||||||||
| Bear Stearns Co., Inc. |
||||||||
| 1.12%, 01/02/04 [FRN](b)(c) |
4,509 | 4,509,414 | ||||||
| Canadian Imperial Bank of Commerce |
||||||||
| 1.111%, 01/29/04 [FRN](b)(c) |
1,893 | 1,892,694 | ||||||
| Merrill Lynch & Co., Inc. |
||||||||
| 1.13%, 01/02/04 [FRN](b)(c) |
4,426 | 4,425,561 | ||||||
| 1.13%, 01/02/04(b) |
15 | 14,939 | ||||||
| Morgan Stanley |
||||||||
| 1.03%, 01/02/04 [FRN](b)(c) |
687 | 686,947 | ||||||
| Natexis Banques Populaires |
||||||||
| 1.035%, 01/02/04 [FRN](b)(c) |
504 | 503,584 | ||||||
| 12,033,139 | ||||||||
160
Table of Contents
AST INVESCO Capital Income Portfolio
Schedule of Investments
December 31, 2003
| Shares |
Value |
|||||
| Non-Registered Investment Company — 1.8% |
||||||
| BlackRock Institutional Money Market Trust(b)(j) |
11,399,535 | $ | 11,399,535 | |||
| Registered Investment Company — 0.7% |
||||||
| BlackRock Provident Institutional Funds TempCash Portfolio |
4,341,417 | 4,341,417 | ||||
| Par (000) |
||||||
| Repurchase Agreement |
||||||
| Merrill Lynch & Co., Inc. |
||||||
| 1.00%, dated 12/31/03, to be repurchased on 01/02/04, repurchase price $62,249 (Collateralized by Federal Home Loan Mortgage Corp. 5.5% maturing 12/01/33, Federal National Mortgage Assoc. 4.0% - 6.0% maturing 11/01/17 to 11/01/33 and Government National Mortgage Assoc. 1.47% maturing 01/16/04 [FRN](c), par value $76,373, market value including accrued interest $64,115)(b) |
$ 62 | 62,246 | ||||
| Time Deposits — 0.1% |
||||||
| Chase Manhattan Bank |
||||||
| 0.875%, 01/02/04(b) |
520 | 519,857 | ||||
| UBS Bank |
||||||
| 0.938%, 01/02/04(b) |
388 | 388,199 | ||||
| 908,056 | ||||||
| Total Short-Term Investments |
||||||
| (Cost $34,189,672) |
34,189,672 | |||||
| Total Investments — 104.7% |
||||||
| (Cost $624,757,015; Note 5) |
670,157,699 | |||||
| Liabilities in Excess of |
(30,045,858 | ) | ||||
| Net Assets — 100.0% |
$ | 640,111,841 | ||||
The following abbreviation is used in portfolio descriptions:
| FRN | Floating Rate Note |
| symbol |
description | |
| * | Non-income producing security. | |
| (a) | Portion of securities on loan with an aggregate market value of $29,117,630; cash collateral $29,848,255 was received with which the portfolio purchased securities. | |
| (b) | Represents security purchased with cash collateral for securities on loan. | |
| (c) | Indicates a variable rate security. The maturity date presented for these instruments is the latter of the next date on which the security can be redeemed at par or the next date on which the rate of interest is adjusted. The interest rate shown reflects the rate in effect at December 31, 2003. | |
| (j) | Security not available to non-institutional buyers. | |
| (l) | US$ Denominated Foreign Bonds. |
See Notes to Financial Statements.
The following abbreviation is used in portfolio descriptions:
144A Security was purchased pursuant to Rule 144A under the Securities Act of 1933 and may not be resold subject to that rule except to qualified institutional buyers. Unless otherwise noted 144A securities are deemed to be liquid.
161
Table of Contents
AST DeAM Global Allocation Portfolio
Schedule of Investments
December 31, 2003
| Shares |
Value | ||||
| LONG-TERM INVESTMENTS — 99.1% |
|||||
| REGISTERED INVESTMENT COMPANIES |
|||||
| AST DeAM Bond Portfolio |
9,061,593 | $ | 95,690,421 | ||
| AST DeAM International Equity Portfolio* |
2,768,726 | 30,871,298 | |||
| AST DeAM Large-Cap Growth Portfolio* |
6,182,877 | 63,250,829 | |||
| AST DeAM Large-Cap Value Portfolio |
6,340,454 | 62,453,467 | |||
| Shares |
Value | ||||
| AST DeAM Small-Cap Growth Portfolio* |
661,575 | $ | 5,047,813 | ||
| AST DeAM Small-Cap Value Portfolio |
461,174 | 5,119,033 | |||
| Total Investments — 99.1% |
|||||
| (Cost $248,066,031; Note 5) |
262,432,861 | ||||
| Other Assets in Excess of Liabilities — 0.9% |
2,374,893 | ||||
| Net Assets — 100.0% |
$ | 264,807,754 | |||
| symbol |
description | |
| * | Non-income producing security. |
See Notes to Financial Statements.
162
Table of Contents
AST American Century Strategic Balanced Portfolio
Schedule of Investments
December 31, 2003
| Shares |
Value | ||||
| LONG-TERM INVESTMENTS — 97.4% |
|||||
| COMMON STOCK — 59.9% |
|||||
| Aerospace — 0.3% |
|||||
| United Defense Industries, Inc.* |
22,283 | $ | 710,382 | ||
| Airlines — 0.1% |
|||||
| Southwest Airlines Co. |
14,549 | 234,821 | |||
| Automobile Manufacturers — 1.2% |
|||||
| Ford Motor Co.(a) |
183,292 | 2,932,672 | |||
| Automotive Parts — 0.5% |
|||||
| Advance Auto Parts, Inc.* |
8,092 | 658,688 | |||
| American Axle & Manufacturing Holdings, Inc.*(a) |
11,442 | 462,486 | |||
| 1,121,174 | |||||
| Beverages — 0.4% |
|||||
| Coors (Adolph) Co. (Class “B” Stock) |
4,007 | 224,793 | |||
| PepsiAmericas, Inc. |
5,509 | 94,314 | |||
| PepsiCo, Inc. |
12,651 | 589,789 | |||
| 908,896 | |||||
| Broadcasting — 0.4% |
|||||
| Fox Entertainment Group, Inc. |
33,213 | 968,159 | |||
| Building Materials — 0.4% |
|||||
| Sherwin-Williams Co. (The) |
24,052 | 835,566 | |||
| Business Services — 0.6% |
|||||
| Convergys Corp.* |
34,730 | 606,386 | |||
| Viad Corp. |
31,790 | 794,750 | |||
| 1,401,136 | |||||
| Chemicals — 1.1% |
|||||
| Engelhard Corp. |
7,361 | 220,462 | |||
| Monsanto Co. |
46,145 | 1,328,053 | |||
| Sigma-Aldrich Corp.(a) |
18,069 | 1,033,185 | |||
| 2,581,700 | |||||
| Computer Hardware — 1.8% |
|||||
| Dell, Inc.* |
19,310 | 655,768 | |||
| Hewlett-Packard Co. |
25,783 | 592,236 | |||
| International Business Machines Corp. |
27,434 | 2,542,582 | |||
| Western Digital Corp.* |
46,148 | 544,085 | |||
| 4,334,671 | |||||
| Computer Services & Software — 3.1% |
|||||
| Cisco Systems, Inc.* |
82,564 | 2,005,480 | |||
| Computer Sciences Corp.* |
8,356 | 369,586 | |||
| Microsoft Corp. |
172,936 | 4,762,657 | |||
| Oracle Corp.* |
10,149 | 133,967 | |||
| 7,271,690 | |||||
| Conglomerates — 1.4% |
|||||
| Altria Group, Inc.(a) |
27,474 | 1,495,134 | |||
| Cendant Corp.*(a) |
47,173 | 1,050,543 | |||
| Shares |
Value | ||||
| Tyco International Ltd.(a) |
31,389 | $ | 831,809 | ||
| 3,377,486 | |||||
| Construction — 0.9% |
|||||
| KB Home |
15,437 | 1,119,491 | |||
| NVR, Inc.*(a) |
2,306 | 1,074,596 | |||
| 2,194,087 | |||||
| Consumer Products & Services — 4.9% |
|||||
| Black & Decker Corp.(a) |
21,662 | 1,068,370 | |||
| Energizer Holdings, Inc.* |
12,443 | 467,359 | |||
| Gillette Co. |
56,842 | 2,087,807 | |||
| Hasbro, Inc. |
38,743 | 824,451 | |||
| Johnson & Johnson |
38,977 | 2,013,552 | |||
| Procter & Gamble Co. |
31,399 | 3,136,133 | |||
| Rent-A-Center, Inc.*(a) |
37,014 | 1,105,978 | |||
| Reynolds (R.J.) Tobacco Holdings, Inc. |
19,387 | 1,127,354 | |||
| 11,831,004 | |||||
| Electronic Components & Equipment — 1.6% |
|||||
| Avnet, Inc.* |
54,766 | 1,186,232 | |||
| Benchmark Electronics, Inc.* |
12,498 | 435,055 | |||
| Eastman Kodak Co.(a) |
32,669 | 838,613 | |||
| General Electric Co. |
20,617 | 638,715 | |||
| Sanmina-SCI Corp.* |
53,221 | 671,117 | |||
| 3,769,732 | |||||
| Entertainment & Leisure — 2.3% |
|||||
| Disney (Walt) Co. |
40,798 | 951,817 | |||
| Regal Entertainment Group |
22,980 | 471,550 | |||
| Time Warner, Inc.*(a) |
164,008 | 2,950,504 | |||
| Viacom, Inc. (Class “B” Stock) |
22,256 | 987,721 | |||
| 5,361,592 | |||||
| Exchange Traded Funds — 0.8% |
|||||
| iShares GS $ InvesTop Corporate Bond Fund |
17,500 | 1,934,975 | |||
| Financial - Bank & Trust — 3.9% |
|||||
| Bank of America Corp.(a) |
49,123 | 3,950,963 | |||
| PNC Financial Services Group |
5,015 | 274,471 | |||
| UnionBanCal Corp. |
9,064 | 521,543 | |||
| Wachovia Corp. |
61,176 | 2,850,190 | |||
| Wells Fargo & Co. |
15,791 | 929,932 | |||
| Zions Bancorporation |
10,516 | 644,946 | |||
| 9,172,045 | |||||
| Financial - Brokerage — 0.1% |
|||||
| Legg Mason, Inc. |
1,795 | 138,538 | |||
| Financial Services — 5.1% |
|||||
| American Express Co. |
14,048 | 677,535 | |||
| Citigroup, Inc.(a) |
71,996 | 3,494,687 | |||
163
Table of Contents
AST American Century Strategic Balanced Portfolio
Schedule of Investments
December 31, 2003
| Shares |
Value | ||||
| Fannie Mae |
13,785 | $ | 1,034,702 | ||
| H&R Block, Inc.(a) |
25,108 | 1,390,230 | |||
| Lehman Brothers Holdings, Inc. |
21,332 | 1,647,257 | |||
| MBNA Corp. |
73,135 | 1,817,405 | |||
| Merrill Lynch & Co., Inc. |
4,440 | 260,406 | |||
| New Century Financial Corp. |
5,019 | 199,104 | |||
| Washington Mutual, Inc. |
40,703 | 1,633,004 | |||
| 12,154,330 | |||||
| Food — 1.2% |
|||||
| Archer-Daniels-Midland Co. |
2,020 | 30,744 | |||
| SUPERVALU, Inc. |
55,803 | 1,595,408 | |||
| Tyson Foods, Inc. (Class “A” Stock) |
97,251 | 1,287,603 | |||
| 2,913,755 | |||||
| Healthcare Services — 0.7% |
|||||
| Health Net, Inc.*(a) |
45,074 | 1,473,920 | |||
| Humana, Inc.* |
12,212 | 279,044 | |||
| 1,752,964 | |||||
| Industrial Products |
|||||
| Carlisle Companies, Inc. |
1,134 | 69,015 | |||
| Insurance — 3.6% |
|||||
| ACE Ltd. |
1,255 | 51,982 | |||
| Allstate Corp. (The) |
1,271 | 54,678 | |||
| American International Group, Inc. |
3,804 | 252,129 | |||
| Berkley (W.R) Corp. |
35,277 | 1,232,931 | |||
| Fidelity National Financial, Inc. |
61,840 | 2,398,156 | |||
| First American Corp. |
57,196 | 1,702,725 | |||
| Odyssey Re Holdings Corp.(a) |
12,187 | 274,817 | |||
| Principal Financial Group, Inc. |
49,835 | 1,648,043 | |||
| Protective Life Corp. |
22,424 | 758,828 | |||
| 8,374,289 | |||||
| Internet Services — 0.2% |
|||||
| EarthLink, Inc.* |
23,818 | 238,180 | |||
| United Online, Inc.*(a) |
8,621 | 144,747 | |||
| 382,927 | |||||
| Machinery & Equipment — 0.1% |
|||||
| Briggs & Stratton Corp. |
2,493 | 168,028 | |||
| Medical Supplies & Equipment — 1.7% |
|||||
| Abbott Laboratories |
3,993 | 186,074 | |||
| ALARIS Medical Systems, Inc.* |
2,072 | 31,515 | |||
| Amgen, Inc.* |
34,914 | 2,157,686 | |||
| Beckman Coulter, Inc. |
17,035 | 865,889 | |||
| Becton, Dickinson & Co. |
117 | 4,813 | |||
| Dade Behring Holdings, Inc.* |
2,333 | 83,381 | |||
| Guidant Corp. |
10,195 | 613,739 | |||
| IDEXX Laboratories, Inc.* |
326 | 15,087 | |||
| McKesson Corp. |
501 | 16,112 | |||
| 3,974,296 | |||||
| Office Equipment — 0.6% |
|||||
| United Stationers, Inc.* |
35,044 | 1,434,000 | |||
| Shares |
Value | ||||
| Oil & Gas — 4.1% |
|||||
| ChevronTexaco Corp. |
30,549 | $ | 2,639,128 | ||
| Devon Energy Corp. |
884 | 50,618 | |||
| Exxon Mobil Corp. |
42,136 | 1,727,576 | |||
| Marathon Oil Corp. |
44,901 | 1,485,774 | |||
| Schlumberger Ltd.(a) |
32,631 | 1,785,568 | |||
| Sunoco, Inc.(a) |
36,851 | 1,884,929 | |||
| 9,573,593 | |||||
| Paper & Forest Products — 0.6% |
|||||
| Georgia-Pacific Corp. |
2,470 | 75,755 | |||
| Louisiana-Pacific Corp.*(a) |
54,027 | 966,003 | |||
| Weyerhaeuser Co. |
6,137 | 392,768 | |||
| 1,434,526 | |||||
| Pharmaceuticals — 3.2% |
|||||
| Endo Pharmaceuticals Holdings, Inc.* |
38,806 | 747,404 | |||
| King Pharmaceuticals, Inc.* |
30,000 | 457,800 | |||
| Kos Pharmaceuticals, Inc.* |
1,612 | 69,380 | |||
| Merck & Co., Inc. |
8,659 | 400,046 | |||
| Mylan Laboratories, Inc. |
24,476 | 618,264 | |||
| Pfizer, Inc. |
113,693 | 4,016,773 | |||
| Pharmaceutical Resources, Inc.* |
4,405 | 286,986 | |||
| Valeant Pharmaceuticals International(a) |
16,905 | 425,161 | |||
| Wyeth |
10,061 | 427,089 | |||
| 7,448,903 | |||||
| Railroads — 0.1% |
|||||
| Union Pacific Corp. |
3,335 | 231,716 | |||
| Real Estate — 0.1% |
|||||
| General Growth Properties, Inc. [REIT] |
6,600 | 183,150 | |||
| Restaurants — 0.4% |
|||||
| CBRL Group, Inc. |
849 | 32,483 | |||
| McDonald’s Corp. |
32,168 | 798,731 | |||
| 831,214 | |||||
| Retail & Merchandising — 4.2% |
|||||
| Barnes & Noble, Inc.*(a) |
22,519 | 739,749 | |||
| Blockbuster, Inc. (Class “A” Stock)(a) |
55,629 | 998,541 | |||
| Claire’s Stores, Inc. |
14,032 | 264,363 | |||
| Federated Department Stores, Inc. |
58,894 | 2,775,675 | |||
| Gap, Inc.(a) |
48,126 | 1,117,005 | |||
| May Department Stores Co. (The) |
19,974 | 580,644 | |||
| RadioShack Corp.(a) |
21,937 | 673,027 | |||
| Saks, Inc.* |
16,068 | 241,663 | |||
| Sears, Roebuck and Co.(a) |
17,529 | 797,394 | |||
| Staples, Inc.* |
26,273 | 717,253 | |||
| Wal-Mart Stores, Inc. |
17,323 | 918,985 | |||
| 9,824,299 | |||||
| Semiconductors — 2.5% |
|||||
| Intel Corp. |
170,290 | 5,483,338 | |||
| Texas Instruments, Inc. |
17,593 | 516,882 | |||
| 6,000,220 | |||||
164
Table of Contents
AST American Century Strategic Balanced Portfolio
Schedule of Investments
December 31, 2003
| Shares |
Value | ||||
| Telecommunications — 2.9% |
|||||
| ALLTEL Corp. |
16,513 | $ | 769,176 | ||
| AT&T Corp.(a) |
6,434 | 130,610 | |||
| BellSouth Corp. |
40,391 | 1,143,065 | |||
| CenturyTel, Inc.(a) |
2,911 | 94,957 | |||
| Nextel Communications, Inc. |
69,992 | 1,963,976 | |||
| PanAmSat Corp.* |
21,190 | 456,856 | |||
| Scientific-Atlanta, Inc. |
9,858 | 269,123 | |||
| Sprint Corp.(a) |
71,909 | 1,180,746 | |||
| Verizon Communications, Inc. |
25,111 | 880,894 | |||
| 6,889,403 | |||||
| Transportation — 0.5% |
|||||
| FedEx Corp.(a) |
1,300 | 87,750 | |||
| United Parcel Service, Inc. (Class “B” Stock)(a) |
13,493 | 1,005,903 | |||
| 1,093,653 | |||||
| Utilities — 2.3% |
|||||
| Edison International Co. |
98,700 | 2,164,490 | |||
| Exelon Corp. |
23,462 | 1,556,938 | |||
| Great Plains Energy, Inc. |
8,693 | 276,611 | |||
| PG&E Corp.* |
1,236 | 34,324 | |||
| TXU Corp.(a) |
61,173 | 1,451,024 | |||
| UGI Corp. |
1,245 | 42,206 | |||
| 5,525,593 | |||||
| Total Common Stock |
|||||
| (Cost $122,567,002) |
141,340,200 | ||||
| Par (000) |
|||||||
| U.S. GOVERNMENT AGENCY OBLIGATIONS — 14.6% | |||||||
| Federal Home Loan Bank |
|||||||
| 1.875%, 06/15/06(a) |
$ | 3,000 | 2,973,704 | ||||
| Federal Home Loan Mortgage Corp. |
|||||||
| 5.25%, 01/15/06 |
2,200 | 2,341,315 | |||||
| 5.50%, 12/01/33 |
670 | 678,646 | |||||
| 6.50%, 06/01/16 |
532 | 563,281 | |||||
| 7.00%, 06/01/14 - 08/01/29 |
520 | 555,109 | |||||
| 4,138,351 | |||||||
| Federal National Mortgage Assoc. |
|||||||
| 1.51%, 07/25/17 [FRB](c) |
685 | 686,251 | |||||
| 3.25%, 08/15/08 |
300 | 297,930 | |||||
| 5.50%, 02/15/06 - 08/01/33(a) |
10,394 | 10,649,657 | |||||
| 6.00%, 12/01/13 - 09/25/32 |
9,404 | 9,730,537 | |||||
| 6.50%, 01/01/32 - 08/01/32 |
814 | 852,289 | |||||
| 6.625%, 10/15/07 |
700 | 789,994 | |||||
| Moody’s (Unaudited) |
Par (000) |
Value | ||||||
| 7.00%, 05/01/11 - 01/15/34 |
$ | 2,688 | $ | 2,849,640 | ||||
| 7.50%, 03/01/27 - 09/01/30 |
249 | 266,953 | ||||||
| 26,123,251 | ||||||||
| Government National Mortgage Assoc. |
||||||||
| 6.00%, 04/15/28 - 05/15/28 |
206 | 214,244 | ||||||
| 6.50%, 03/15/28 - 04/15/28 |
169 | 178,909 | ||||||
| 7.00%, 12/15/27 - 05/15/31 |
539 | 575,829 | ||||||
| 7.50%, 05/15/30 |
151 | 162,347 | ||||||
| 8.00%, 03/15/27 |
11 | 11,746 | ||||||
| 8.75%, 01/15/27 - 04/15/27 |
28 | 31,222 | ||||||
| 1,174,297 | ||||||||
| Total U.S. Government Agency Obligations |
||||||||
| (Cost $34,010,704) |
34,409,603 | |||||||
| U.S. TREASURY OBLIGATIONS — 10.0% |
||||||||
| U.S. Treasury Bonds |
||||||||
| 5.50%, 08/15/28 |
1,300 | 1,354,490 | ||||||
| 5.375%, 02/15/31(a) |
1,255 | 1,309,172 | ||||||
| 2,663,662 | ||||||||
| U.S. Treasury Notes |
||||||||
| 1.625%, 03/31/05(a) |
6,300 | 6,323,631 | ||||||
| 2.375%, 08/15/06(a) |
3,000 | 3,017,112 | ||||||
| 3.00%, 02/15/08(a) |
4,400 | 4,421,828 | ||||||
| 3.375%, 11/15/08(a) |
1,400 | 1,411,540 | ||||||
| 4.25%, 08/15/13(a) |
5,850 | 5,859,144 | ||||||
| 21,033,255 | ||||||||
| Total U.S. Treasury Obligations |
||||||||
| (Cost $23,614,806) |
23,696,917 | |||||||
| CORPORATE OBLIGATIONS — 9.9% |
||||||||
| Automobile Manufacturers — 0.3% |
||||||||
| General Motors Corp., Notes |
||||||||
| 7.20%, 01/15/11(a) |
Baa1 | 675 | 743,185 | |||||
| Broadcasting — 0.3% |
||||||||
| Liberty Media Corp., Sr. Notes |
||||||||
| 2.67%, 09/17/06 [VR] (c) |
Baa3 | 450 | 455,247 | |||||
| News America Holdings Co., Gtd. Notes |
||||||||
| 7.75%, 01/20/24 |
Baa3 | 150 | 176,284 | |||||
| 631,531 | ||||||||
| Cable Television — 0.4% |
||||||||
| Comcast Cable Communications Corp., Notes |
||||||||
| 8.375%, 05/01/07 |
Baa3 | 350 | 406,142 | |||||
| Comcast Corp., Gtd. Notes |
||||||||
| 5.50%, 03/15/11 |
Baa3 | 200 | 208,254 | |||||
| Cox Communications, Inc., Notes |
||||||||
| 6.75%, 03/15/11 |
Baa2 | 250 | 283,639 | |||||
| 898,035 | ||||||||
165
Table of Contents
AST American Century Strategic Balanced Portfolio
Schedule of Investments
December 31, 2003
| Moody’s Rating (Unaudited) |
Par (000) |
Value | ||||||
| Chemicals — 0.2% |
||||||||
| Crompton Corp., Sr. Notes |
||||||||
| 8.50%, 03/15/05 |
Ba2 | $ | 450 | $ | 472,500 | |||
| Consumer Products & Services — 0.2% |
||||||||
| Dial Corp. (The), Sr. Notes |
||||||||
| 7.00%, 08/15/06 |
Baa3 | 400 | 442,931 | |||||
| Containers & Packaging — 0.1% |
||||||||
| Ball Corp., Gtd. Notes |
||||||||
| 7.75%, 08/01/06 |
Ba3 | 250 | 270,000 | |||||
| Diversified — 1.4% |
||||||||
| Lehman Brothers Targeted Return Index Securities Trust Series 10-2002, Sec’d Notes [TRAINS] |
||||||||
| 6.829%, 01/15/12 144A(cost $1,355,575; purchased 05/23/02 -08/14/02)(e)(g) |
A3 | 1,278 | 1,449,214 | |||||
| Series L-2002, Sec’d Notes [TRAINS] |
||||||||
| 7.754%, 11/15/31 144A(cost $607,681; purchased 04/14/03)(e)(g) |
Baa1 | 504 | 604,164 | |||||
| Morgan Stanley Traded Custody Receipts Series 2002-2, Notes [TRACERS] |
||||||||
| 7.282%, 03/01/32 144A(cost $1,183,080; purchased 03/15/02 -08/28/02)(f)(g) |
Baa1 | 1,122 | 1,312,614 | |||||
| 3,365,992 | ||||||||
| Entertainment & Leisure — 0.3% |
||||||||
| Disney (Walt) Co., Notes |
||||||||
| 5.50%, 12/29/06 |
Baa1 | 400 | 429,230 | |||||
| Park Place Entertainment, Inc., Sr. Sub. Notes |
||||||||
| 7.875%, 12/15/05 |
Ba2 | 300 | 322,125 | |||||
| 751,355 | ||||||||
| Environmental Services — 0.2% |
||||||||
| Waste Management, Inc., Notes |
||||||||
| 7.00%, 10/15/06 |
Baa3 | 400 | 441,273 | |||||
| Financial - Bank & Trust — 0.6% |
||||||||
| Bank of America Corp., |
||||||||
| Sub. Notes |
||||||||
| 4.75%, 08/15/13(a) |
Aa3 | 400 | 393,585 | |||||
| Sr. Notes |
||||||||
| 4.375%, 12/01/10 |
Aa2 | 600 | 602,402 | |||||
| U.S. Bancorp, Sr. Notes |
||||||||
| 2.75%, 03/30/06 |
Aa3 | 400 | 405,145 | |||||
| 1,401,132 | ||||||||
| Moody’s Rating (Unaudited) |
Par (000) |
Value | ||||||
| Financial - Brokerage — 0.5% |
||||||||
| Credit Suisse First Boston, Inc., Notes |
||||||||
| 1.45%, 06/19/06 [FRN](c) |
Aa3 | $ | 300 | $ | 300,713 | |||
| Goldman Sachs Group, Inc., Notes |
||||||||
| 5.25%, 10/15/13 |
Aa3 | 250 | 252,881 | |||||
| Merrill Lynch & Co., Inc., Notes |
||||||||
| 2.07%, 06/12/06 |
Aa3 | 350 | 348,160 | |||||
| 3.70%, 04/21/08 |
Aa3 | 350 | 352,631 | |||||
| 1,254,385 | ||||||||
| Financial Services — 2.5% |
||||||||
| American General Finance, Notes |
||||||||
| 4.50%, 11/15/07 |
A1 | 300 | 313,274 | |||||
| American International Group, Inc., Notes |
||||||||
| 4.25%, 05/15/13 144A(cost $298,580; purchased 05/08/03)(g) |
AAA(d) | 300 | 285,093 | |||||
| Citigroup, Inc., Sub. Notes |
||||||||
| 7.25%, 10/01/10 |
Aa2 | 600 | 700,286 | |||||
| Deutsche Telekom International Finance BV, Gtd. Notes (Netherlands) |
||||||||
| 8.50%, 06/15/10(l) |
Baa3 | 250 | 302,743 | |||||
| Diageo Capital PLC, Notes (United Kingdom) |
||||||||
| 3.375%, 03/20/08(a)(l) |
A2 | 350 | 348,053 | |||||
| Ford Motor Credit Co., Notes |
||||||||
| 1.351%, 04/28/05 [FRN](c) |
A3 | 600 | 594,564 | |||||
| 1.62%, 06/30/05 [FRN](c) |
A3 | 250 | 248,127 | |||||
| 6.875%, 02/01/06 |
A3 | 600 | 640,695 | |||||
| 5.625%, 10/01/08 |
A3 | 200 | 206,480 | |||||
| 7.00%, 10/01/13 |
A3 | 200 | 211,309 | |||||
| Sr. Notes |
||||||||
| 5.80%, 01/12/09 |
A3 | 275 | 283,516 | |||||
| General Electric Capital Corp., Sr. Notes |
||||||||
| 4.25%, 12/01/10 |
Aaa | 230 | 229,201 | |||||
| General Motors Acceptance Corp., Notes |
||||||||
| 3.18%, 03/04/05 [FRN](c) |
A3 | 400 | 406,377 | |||||
| Morgan Stanley, Notes |
||||||||
| 4.25%, 05/15/10 |
Aa3 | 400 | 399,989 | |||||
| Pemex Project Funding Master Trust, Gtd. Notes |
||||||||
| 7.375%, 12/15/14 |
Baa1 | 300 | 321,750 | |||||
| Wells Fargo & Co., Sub. Notes |
||||||||
| 4.95%, 10/16/13 |
Aa2 | 300 | 299,958 | |||||
| 5,791,415 | ||||||||
166
Table of Contents
AST American Century Strategic Balanced Portfolio
Schedule of Investments
December 31, 2003
| Moody’s (Unaudited) |
Par (000) |
Value | ||||||
| Food — 0.1% |
||||||||
| Cadbury Schweppes US Finance LLC, Notes |
||||||||
| 5.125%, 10/01/13 144A(cost $298,516; purchased 10/08/03)(g) |
Baa2 | $ | 300 | $ | 298,612 | |||
| Insurance — 0.1% |
||||||||
| Monumental Global Funding II, Notes |
||||||||
| 3.85%, 03/03/08 144A |
Aa3 | 350 | 353,466 | |||||
| Medical Supplies & Equipment — 0.3% |
||||||||
| Beckman Coulter, Inc., Gtd. Notes |
||||||||
| 7.45%, 03/04/08 |
Baa3 | 400 | 453,124 | |||||
| Schering-Plough Corp., Notes |
||||||||
| 5.30%, 12/01/13 |
A3 | 150 | 152,969 | |||||
| 606,093 | ||||||||
| Oil & Gas — 0.1% |
||||||||
| Anadarko Petroleum Corp., Debs. |
||||||||
| 7.95%, 04/15/29 |
Baa1 | 250 | 308,991 | |||||
| Paper & Forest Products — 0.1% |
||||||||
| Abitibi-Consolidated, Inc., Gtd. Notes |
||||||||
| 7.875%, 08/01/09 |
Ba1 | 200 | 216,577 | |||||
| Restaurants — 0.3% |
||||||||
| Tricon Global Restaurants, Inc., Sr. Notes |
||||||||
| 8.875%, 04/15/11 |
Ba1 | 650 | 791,375 | |||||
| Retail & Merchandising — 0.4% |
||||||||
| Delhaize America, Inc., Gtd. Notes |
||||||||
| 7.375%, 04/15/06 |
Ba1 | 300 | 324,000 | |||||
| Safeway, Inc., Notes |
||||||||
| 6.15%, 03/01/06 |
Baa2 | 350 | 374,686 | |||||
| Toys “R” Us, Inc., Notes |
||||||||
| 7.375%, 10/15/18 |
Baa3 | 150 | 150,229 | |||||
| 848,915 | ||||||||
| Telecommunications — 0.7% |
||||||||
| AT&T Broadband Corp., Gtd. Notes |
||||||||
| 8.375%, 03/15/13 |
Baa3 | 48 | 58,848 | |||||
| AT&T Corp., Notes |
||||||||
| 6.00%, 03/15/09 |
Baa2 | 5 | 5,396 | |||||
| AT&T Wireless Services, Inc., Sr. Notes |
||||||||
| 7.875%, 03/01/11 |
Baa2 | 100 | 115,422 | |||||
| Moody’s (Unaudited) |
Par (000) |
Value | |||||||
| British Telecom PLC, Notes (United Kingdom) |
|||||||||
| 7.00%, 05/23/07(l) |
Baa1 | $ | 270 | $ | 301,446 | ||||
| EchoStar DBS Corp., Sr. Notes |
|||||||||
| 9.375%, 02/01/09 |
Ba3 | 500 | 529,375 | ||||||
| Verizon New England, Inc., Notes |
|||||||||
| 4.75%, 10/01/13 |
Aa3 | 300 | 291,259 | ||||||
| Vodafone Group PLC, Notes (United Kingdom) |
|||||||||
| 5.00%, 12/16/13(l) |
A2 | 300 | 299,456 | ||||||
| 1,601,202 | |||||||||
| Utilities — 0.8% |
|||||||||
| CenterPoint Energy Resources Corp., Debs. |
|||||||||
| 6.50%, 02/01/08 |
Ba1 | 100 | 107,223 | ||||||
| Dominion Resources, Inc., Notes |
|||||||||
| 4.125%, 02/15/08 |
Baa1 | 300 | 306,013 | ||||||
| Progress Energy, Inc., Sr. Notes |
|||||||||
| 7.10%, 03/01/11 |
Baa2 | 300 | 338,565 | ||||||
| Sempra Energy Co., Notes |
|||||||||
| 6.00%, 02/01/13 |
Baa1 | 150 | 159,643 | ||||||
| Tampa Electric Co., Notes |
|||||||||
| 6.375%, 08/15/12 |
Baa1 | 300 | 322,792 | ||||||
| Virginia Electric & Power Co., Notes |
|||||||||
| 5.25%, 12/15/15 |
A3 | 300 | 301,692 | ||||||
| Sr. Notes |
|||||||||
| 5.75%, 03/31/06 |
A3 | 250 | 267,815 | ||||||
| 1,803,743 | |||||||||
| Total Corporate Obligations |
|||||||||
| (Cost $22,400,488) |
23,292,708 | ||||||||
| ASSET BACKED SECURITIES — 1.5% |
|||||||||
| AQ Finance NIM Trust |
|||||||||
| 7.143%, 10/25/33 |
BBB+ | (d) | 74 | 74,704 | |||||
| Argent Securities, Inc. |
|||||||||
| 3.991%, 09/25/30 |
Aaa | 550 | 561,691 | ||||||
| Asset Backed Funding Corp. NIM Trust Series 2003-OPT1 |
|||||||||
| 7.00%, 07/26/33 |
BBB+ | (d) | 77 | 77,599 | |||||
| Bayview Financial Acquisition Trust Series 1998-B Class M1 [FRB] |
|||||||||
| 2.51%, 06/25/36 144A |
Aa2 | 189 | 188,632 | ||||||
167
Table of Contents
AST American Century Strategic Balanced Portfolio
Schedule of Investments
December 31, 2003
| Moody’s (Unaudited) |
Par (000) |
Value | |||||||
| Bayview Financial Acquisition Trust |
|
||||||||
| Series 2002-DA Class M1 |
|||||||||
| 1.97%, 08/25/32 144A(cost $177,356; purchased 09/19/03)(g) |
Aa2 | $ | 177 | $ | 177,867 | ||||
| Chase Funding Mortgage Loan Asset-Backed Series 2001-1 |
|||||||||
| 2.071%, 12/25/30(c) |
A2 | 200 | 200,791 | ||||||
| CIT RV Trust Series 1998-A Class A4 |
|||||||||
| 6.09%, 02/15/12 |
Aaa | 122 | 123,639 | ||||||
| Ford Credit Auto Owner Trust Series 2002-A Class B |
|||||||||
| 4.79%, 11/15/06 |
A1 | 350 | 361,148 | ||||||
| Household Mortgage Loan Trust |
|||||||||
| Series 2002-HC1 Class M [FRB] |
|||||||||
| 1.77%, 05/20/32(c) |
Aa2 | 303 | 303,722 | ||||||
| Series 2003-HC2 Class M |
|||||||||
| 1.72%, 06/20/33 |
Aa2 | 316 | 317,950 | ||||||
| Long Beach Mortgage Loan Trust Series 2001-2 Class M2 |
|||||||||
| 2.07%, 07/25/31 |
A2 | 420 | 415,398 | ||||||
| Morgan Stanley ABS Capital I Series 2003-NC9N |
|||||||||
| 7.60%, 07/25/33 144A(cost $69,688; purchased 10/29/03)(g) |
NR | 70 | 69,688 | ||||||
| Residential Asset Mortgage Products, Inc. Series 2001-RS2 Class MII1 [FRB] |
|||||||||
| 1.67%, 06/25/31(c) |
Aa2 | 200 | 200,523 | ||||||
| Series 2003-RZ4 Class A4 |
|||||||||
| 4.04%, 12/25/30 |
Aaa | 500 | 499,197 | ||||||
| Total Asset Backed Securities (Cost $3,544,137) |
3,572,549 | ||||||||
| COLLATERALIZED MORTGAGE OBLIGATIONS — 0.8% |
|||||||||
| Chase Mortgage Finance Corp. Series 2001-S3 Class A1 |
|||||||||
| 6.50%, 07/25/16 |
Aaa | 63 | 63,332 | ||||||
| Commercial Mortgage Acceptance Corp. Series 1998-C2 Class X |
|||||||||
| 1.47%, 09/15/30 |
AAA | (d) | 7,905 | 356,171 | |||||
| Credit-Based Asset Servicing and Securitization Series 2001-CB2 Class A2F |
|||||||||
| 5.974%, 03/25/19 |
Aaa | 18 | 17,947 | ||||||
| GMAC Commercial Mortgage Securities, Inc. Series 2002-C2 Class A1 |
|||||||||
| 4.321%, 10/15/38 |
Aaa | 522 | 539,848 | ||||||
| Moody’s (Unaudited) |
Par (000) |
Value | |||||||
| Master Alternative Loans Trust Series 2003-8 Class 4A1 |
|||||||||
| 7.00%, 12/25/33 |
AAA | (d) | $ | 623 | $ | 654,033 | |||
| Morgan Stanley Capital I Series 1998-WF1 Class A1 |
|||||||||
| 6.25%, 03/15/30 |
AAA | (d) | 38 | 38,984 | |||||
| NationsLink Funding Corp. Series 1998-2 Class A1 |
|||||||||
| 6.00%, 08/20/30 |
Aaa | 119 | 125,912 | ||||||
| Total Collateralized Mortgage Obligations |
|||||||||
| (Cost $1,745,045) |
1,796,227 | ||||||||
| MUNICIPAL BONDS — 0.4% |
|
||||||||
| Illinois — 0.2% |
|||||||||
| Illinois State |
|||||||||
| 5.10%, 06/01/33 |
Aa3 | 600 | 551,682 | ||||||
| New Jersey — 0.2% |
|||||||||
| New Jersery State Turnpike |
|||||||||
| 4.252%, 01/01/16 |
Aaa | 400 | 382,304 | ||||||
| Total Municipal Bonds |
|||||||||
| (Cost $1,007,059) |
933,986 | ||||||||
| SOVEREIGN ISSUES — 0.3% |
|
||||||||
| Canada |
|||||||||
| Province of Ontario |
|||||||||
| 3.50%, 09/17/07(a) |
|||||||||
| (Cost $696,942) |
Aa2 | 700 | 712,018 | ||||||
| Total Long-Term Investments |
|||||||||
| (Cost $209,586,183) |
229,754,208 | ||||||||
| SHORT-TERM INVESTMENTS — 31.1% |
|||||||||
| Commercial Paper — 1.9% |
|||||||||
| Cancara Asset Securitisation Ltd. |
|||||||||
| 1.11%, 01/12/04(b) |
355 | 354,566 | |||||||
| Concord Minutemen Capital Co. |
|||||||||
| 1.11%, 01/12/04(b) |
1,049 | 1,046,904 | |||||||
| 1.13%, 02/09/04(b) |
443 | 442,246 | |||||||
| General Electric Capital Corp. |
|||||||||
| 1.11%, 02/05/04(b) |
1,829 | 1,824,363 | |||||||
| Tannehill Capital Co. |
|||||||||
| 1.10%, 01/08/04(b) |
845 | 842,330 | |||||||
| 1.11%, 01/13/04(b) |
63 | 62,874 | |||||||
| 4,573,283 | |||||||||
| Corporate Obligations — 7.2% |
|||||||||
| Bear Stearns Co., Inc. |
|||||||||
| 1.12%, 01/02/04 [FRN](b)(c) |
2,867 | 2,867,073 | |||||||
| Goldman Sachs Group, Inc. |
|||||||||
| 1.14%, 01/06/04 [FRN](b)(c) |
545 | 545,465 | |||||||
168
Table of Contents
AST American Century Strategic Balanced Portfolio
Schedule of Investments
December 31, 2003
| Par (000) |
Value | |||||
| Merrill Lynch & Co., Inc. |
||||||
| 1.13%, 01/02/04(b) |
$ | 806 | $ | 805,907 | ||
| 1.13%, 01/02/04 [FRN](b)(c) |
1,744 | 1,743,505 | ||||
| Morgan Stanley |
||||||
| 1.03%, 01/02/04 [FRN](b)(c) |
3,159 | 3,158,989 | ||||
| 1.08%, 01/02/04 [FRN](b)(c) |
205 | 204,543 | ||||
| Natexis Banques Populaires |
||||||
| 1.035%, 01/02/04 [FRN](b)(c) |
1,341 | 1,340,949 | ||||
| 1.10%, 01/02/04 [FRN](b)(c) |
4,018 | 4,016,553 | ||||
| Westdeutsche Landesbank |
||||||
| 1.13%, 01/09/04 [FRN](b)(c) |
2,249 | 2,248,623 | ||||
| 16,931,607 | ||||||
| Shares |
||||||
| Non-Registered Investment Company — 11.6% |
||||||
| BlackRock Institutional Money Market Trust(b)(j) |
27,020,659 | 27,020,659 | ||||
| Par (000) |
||||||
| Repurchase Agreement — 1.4% |
||||||
| Merrill Lynch & Co., Inc. |
||||||
| 1.00%, dated 12/31/03, to be repurchased on 1/02/04, repurchase price $3,358,134 (Collateralized by Federal Home Loan Mortgage Corp. 5.50% maturing 12/01/33, Federal National Mortgage Assoc. 4.00% - 6.00% maturing 11/01/17 to 11/01/33 and Government National Mortgage Assoc. 1.47% maturing 01/16/04 [FRN](c), par value $4,120,057, market value including accrued interest $3,458,748)(b) |
$ | 3,358 | 3,357,947 | |||
| Par (000) |
Value |
||||||
| Time Deposits — 0.5% |
|||||||
| Chase Manhattan Bank |
|||||||
| 0.875%, 01/02/04 (b) |
$ | 692 | $ | 692,364 | |||
| UBS Bank |
|||||||
| 0.938%, 01/02/04 (b) |
544 | 543,722 | |||||
| 1,236,086 | |||||||
| U.S. Government Agency Obligation — 8.5% |
|||||||
| Federal Home Loan Bank |
|||||||
| 0.70%, 01/02/04(n) |
20,106 | 20,105,609 | |||||
| Total Short-Term Investments |
|||||||
| (Cost $73,225,191) |
73,225,191 | ||||||
| Total Investments — 128.5% |
|||||||
| (Cost $282,811,374; Note 5) |
302,979,399 | ||||||
| Liabilities in Excess of |
(67,161,104 | ) | |||||
| Net Assets — 100.0% |
$ | 235,818,295 | |||||
The following abbreviations are used in portfolio descriptions:
| 144A | Security was purchased pursuant to Rule 144A under the securities Act of 1933 and may not be resold subject to that rule except to qualified institutional buyers. Unless otherwise noted 144A securities are deemed to be liquid. |
| FRB | Floating Rate Bond |
| FRN | Floating Rate Note |
| IO | Interest Only |
| REIT | Real Estate Investment Trust |
| VR | Variable Rate Bond |
| symbol |
description | |
| * | Non-income producing security. | |
| (a) | Portion of securities on loan with an aggregate market value $51,499,664; cash collateral $53,119,582 was received with which the portfolio purchased securities. | |
| (b) | Represents security purchased with cash collateral for securities on loan. |
169
Table of Contents
AST American Century Strategic Balanced Portfolio
Schedule of Investments
December 31, 2003
| symbol |
description | |
| (c) | Indicates a variable rate security. The maturity date presented for these instruments is the latter of the next date on which the security can be redeemed at par or the next date on which the rate of interest is adjusted. The interest rate shown reflects the rate in effect at December 31, 2003. | |
| (d) | Standard & Poor’s rating. | |
| (e) | A TRAIN (Targeted Return Index Securities Trust) is a trust established pursuant to a series trust agreement. Each registered holder of certificates issued by the TRAIN is a beneficial owner of a fractional undivided interest in the TRAIN and is entitled to receive a pro rata share of interest and other amounts or property distributed. Rate shown reflects the weighted average rate of the underlying securities as of December 31, 2003. | |
| (f) | A TRACER (Traded Custody Receipts) are custody receipts that evidence direct ownership of a basket of securities consisting initially of $1,000 principal amount of each of 25 debt securities (underlying securities). Holders of TRACERS will be entitled to receive distributions of interest, principal and other payments on each underlying security following the receipt by the Custodian of payment from the issuer of the underlying security. | |
| (g) | Indicates a security that has been deemed illiquid. The aggregate cost of illiquid securities is $4,530,828. The aggregate value, $4,808,943 represents 2.04% of net assets. | |
| (j) | Security available to institutional investors only. | |
| (l) | US$ Denominated Foreign Bonds. | |
| (m) | Cash of $144,000 has been segregated with the custodian to cover requirements for the following open futures contracts at December 31, 2003: |
| Description | Expiration Month |
Number of Contracts |
Contracts at Trade Date Value |
Contracts at Current Value |
Unrealized Appreciation | ||||||||
| Long Positions: |
|||||||||||||
| S&P 500 |
03/04 | 7 | $ | 1,864,713 | $ | 1,943,550 | $ | 78,837 | |||||
| (n) | Rates shown are the effective yields at purchase date. |
See Notes to Financial Statements.
170
Table of Contents
AST T. Rowe Price Asset Allocation Portfolio
Schedule of Investments
December 31, 2003
| Shares |
Value | ||||
| LONG-TERM INVESTMENTS — 97.9% |
|||||
| COMMON STOCK — 64.6% |
|||||
| Advertising — 0.1% |
|||||
| Lamar Advertising Co.*(a) |
1,200 | $ | 44,784 | ||
| Publicis Groupe SA (France) |
5,322 | 172,522 | |||
| WPP Group PLC [ADR] |
2,800 | 137,620 | |||
| 354,926 | |||||
| Aerospace — 0.7% |
|||||
| Boeing Co. |
13,800 | 581,532 | |||
| European Aeronautic Defence and Space Co. (France) |
9,750 | 231,821 | |||
| General Dynamics Corp. |
1,400 | 126,546 | |||
| Herley Industries, Inc.* |
2,000 | 41,400 | |||
| Lockheed Martin Corp.(a) |
6,200 | 318,680 | |||
| MTC Technologies, Inc.* |
2,000 | 64,440 | |||
| Northrop Grumman Corp. |
2,900 | 277,240 | |||
| Raytheon Co. |
5,800 | 174,232 | |||
| Rockwell Collins, Inc. |
2,400 | 72,072 | |||
| Triumph Group, Inc.* |
1,500 | 54,600 | |||
| United Technologies Corp. |
7,400 | 701,298 | |||
| 2,643,861 | |||||
| Airlines — 0.1% |
|||||
| Atlantic Coast Airlines Holdings, Inc.* |
2,000 | 19,800 | |||
| Delta Air Lines, Inc.*(a) |
10,000 | 118,100 | |||
| Frontier Airlines, Inc.* |
13,000 | 185,380 | |||
| Qantas Airways Ltd. (Australia) |
32,969 | 81,725 | |||
| SkyWest, Inc. |
6,000 | 108,720 | |||
| 513,725 | |||||
| Automobile Manufacturers — 1.0% |
|||||
| Fuji Heavy Industries Ltd. (Japan) |
26,000 | 126,155 | |||
| General Motors Corp.(a) |
16,800 | 897,119 | |||
| Honda Motor Co. Ltd. (Japan) |
4,900 | 217,636 | |||
| Mitsubishi Corp. (Japan) |
26,000 | 275,600 | |||
| Navistar International Corp.*(a) |
3,000 | 143,670 | |||
| Oshkosh Truck Corp. |
9,900 | 505,197 | |||
| Porsche AG (Germany) |
450 | 267,071 | |||
| PSA Peugeot Citroen SA (France) |
3,708 | 188,955 | |||
| Toyota Motor Corp. (Japan) |
23,900 | 807,297 | |||
| Volkswagen AG (Germany) |
5,903 | 328,730 | |||
| 3,757,430 | |||||
| Automotive Parts — 0.3% |
|||||
| Autoliv AB (Sweden) |
9,100 | 345,267 | |||
| Autoliv, Inc. |
3,500 | 131,775 | |||
| Denso Corp. (Japan) |
9,600 | 189,008 | |||
| Genuine Parts Co. |
5,100 | 169,320 | |||
| Koito Manufacturing Co. Ltd. (Japan) |
15,000 | 90,977 | |||
| O’ Reilly Automotive, Inc.* |
4,900 | 187,964 | |||
| 1,114,311 | |||||
| Shares |
Value | ||||
| Beverages — 1.5% |
|||||
| Allied Domecq PLC (United Kingdom) |
31,004 | $ | 239,214 | ||
| Anheuser-Busch Companies, Inc. |
11,000 | 579,480 | |||
| Boston Beer Co., Inc. |
1,700 | 30,838 | |||
| Coca-Cola Co. |
40,300 | 2,045,226 | |||
| Cott Corp. (Canada)* |
11,300 | 316,513 | |||
| Davide Campari-Milano SPA (Italy) |
2,600 | 126,261 | |||
| Kirin Brewery Co. Ltd. (Japan) |
28,000 | 238,798 | |||
| Lion Nathan Ltd. (New Zealand) |
46,393 | 207,733 | |||
| PepsiCo, Inc. |
29,600 | 1,379,952 | |||
| Remy Cointreau SA (France) |
3,963 | 129,967 | |||
| 5,293,982 | |||||
| Broadcasting — 0.7% |
|||||
| Astro All Asia Networks PLC |
|||||
| (Malaysia)* 144A |
46,200 | 53,738 | |||
| British Sky Broadcasting PLC |
18,283 | 230,088 | |||
| Clear Channel Communications, Inc. |
18,500 | 866,356 | |||
| Cox Radio, Inc. (Class “A” Stock)* |
3,200 | 80,736 | |||
| Emmis Communications Corp. |
800 | 21,640 | |||
| Fuji Television Network, Inc. (Japan) |
26 | 140,711 | |||
| Liberty Media Corp. |
26,624 | 316,559 | |||
| Meredith Corp. |
2,100 | 102,501 | |||
| News Corp. Ltd. (Australia) |
16,483 | 148,905 | |||
| News Corp. Ltd. [ADR](a) |
4,200 | 151,620 | |||
| Radio One, Inc. (Class “D” Stock)* |
4,200 | 81,060 | |||
| Scripps (E.W.) Co. (Class “A” Stock) |
1,000 | 94,140 | |||
| Univision Communications, Inc. |
5,760 | 228,614 | |||
| Westwood One, Inc.* |
2,400 | 82,104 | |||
| 2,598,772 | |||||
| Building & Real Estate — 0.1% |
|||||
| United Dominion Realty Trust [REIT] |
9,600 | 184,320 | |||
| Building Materials — 0.6% |
|||||
| Aggregate Industries PLC |
121,878 | 186,545 | |||
| American Standard Companies, Inc.* |
1,800 | 181,260 | |||
| Boral Ltd. (Australia) |
120,484 | 461,155 | |||
| Cemex SA de CV (Mexico) |
51,951 | 271,607 | |||
| Central Glass Co. Ltd. (Japan) |
15,900 | 100,293 | |||
| Heidelberger Zement AG (Germany)* |
1,840 | 77,773 | |||
| Italcement SPA (Italy) |
7,736 | 96,505 | |||
| Masco Corp. |
7,000 | 191,870 | |||
| Pilkington PLC (United Kingdom) |
113,525 | 194,590 | |||
| RMC Group PLC (United Kingdom) |
14,925 | 186,359 | |||
| SCP Pool Corp.* |
5,075 | 165,851 | |||
| 2,113,808 | |||||
171
Table of Contents
AST T. Rowe Price Asset Allocation Portfolio
Schedule of Investments
December 31, 2003
| Shares |
Value | ||||
| Business Services — 1.0% |
|||||
| Accenture Ltd. (Class “A” Stock)*(a) |
6,700 | $ | 176,344 | ||
| Advisory Board Co.* |
2,000 | 69,820 | |||
| BearingPoint, Inc.* |
23,700 | 239,133 | |||
| ChoicePoint, Inc.* |
5,066 | 192,964 | |||
| Corporate Executive Board Co.* |
4,000 | 186,680 | |||
| Exult, Inc.* |
64,300 | 457,816 | |||
| Fair Isaac Corp. |
2,665 | 131,011 | |||
| First Data Corp.(a) |
12,100 | 497,190 | |||
| Fiserv, Inc.* |
4,400 | 173,844 | |||
| Forrester Research, Inc.* |
3,000 | 53,610 | |||
| Indra Sistemas SA (Spain) |
16,116 | 206,735 | |||
| InterCept Group, Inc.* |
1,400 | 15,806 | |||
| Iron Mountain, Inc.*(a) |
2,950 | 116,643 | |||
| Kamigumi Co. Ltd. (Japan) |
24,000 | 169,749 | |||
| Manpower, Inc. |
3,400 | 160,072 | |||
| Paychex, Inc. |
11,800 | 438,960 | |||
| Robert Half International, Inc.* |
3,700 | 86,358 | |||
| Tech Data Corp.* |
2,800 | 111,132 | |||
| 3,483,867 | |||||
| Cable Television — 0.3% |
|||||
| Cable & Wireless PLC |
86,091 | 205,745 | |||
| Comcast Corp. (Class “A” Stock)* |
5,221 | 171,614 | |||
| Cox Communications, Inc. |
2,473 | 85,195 | |||
| EchoStar Communications Corp. |
16,100 | 547,401 | |||
| Hughes Electronics Corp.* |
9,055 | 149,860 | |||
| 1,159,815 | |||||
| Capital Goods |
|||||
| Saurer AG (Switzerland)* |
1,904 | 84,520 | |||
| Chemicals — 1.2% |
|||||
| Agrium, Inc. (Canada) |
15,500 | 255,130 | |||
| Arch Chemicals, Inc. |
4,150 | 106,489 | |||
| BASF AG (Germany) |
7,504 | 421,958 | |||
| Cabot Corp. |
8,200 | 261,088 | |||
| Cabot Microelectronics Corp.* |
849 | 41,601 | |||
| Degussa AG (Germany) |
11,248 | 393,283 | |||
| Dow Chemical Co. |
23,500 | 976,895 | |||
| DuPont (E.I.) de Nemours & Co. |
6,959 | 319,349 | |||
| Great Lakes Chemical Corp.(a) |
1,300 | 35,347 | |||
| IMC Global, Inc.* |
40,000 | 397,200 | |||
| Kaneka Corp. (Japan) |
40,000 | 298,591 | |||
| Millennium Chemicals, Inc.*(a) |
12,600 | 159,768 | |||
| Minerals Technologies, Inc. |
900 | 53,325 | |||
| Mitsubishi Gas Chemical Co., Inc. (Japan) |
29,000 | 98,768 | |||
| Potash Corp. of Saskatchewan, Inc. (Canada) |
4,100 | 354,568 | |||
| Symyx Technologies, Inc.* |
5,700 | 117,135 | |||
| Shares |
Value | ||||
| Valspar Corp. |
1,300 | $ | 64,246 | ||
| Waters Corp.* |
3,200 | 106,112 | |||
| 4,460,853 | |||||
| Clothing & Apparel — 0.2% |
|||||
| Adidas-Salomon AG (Germany) |
1,316 | 149,893 | |||
| Coach, Inc.* |
4,400 | 166,100 | |||
| Sanyo Shokai Ltd. (Japan) |
13,000 | 84,184 | |||
| Too, Inc.* |
5,300 | 89,464 | |||
| Yue Yuen Industrial Holdings Ltd. |
76,000 | 209,001 | |||
| 698,642 | |||||
| Computer Hardware — 1.7% |
|||||
| Dell, Inc.* |
57,200 | 1,942,512 | |||
| Hewlett-Packard Co. |
62,685 | 1,439,874 | |||
| Insight Enterprises, Inc.* |
5,100 | 95,880 | |||
| International Business Machines Corp. |
19,150 | 1,774,822 | |||
| Itochu Techno-Science Corp. (Japan) |
6,600 | 205,692 | |||
| Lexmark International, Inc.* |
6,000 | 471,840 | |||
| Mercury Computer Systems, Inc.* |
7,900 | 196,710 | |||
| Storage Technology Corp.* |
6,100 | 157,075 | |||
| 6,284,405 | |||||
| Computer Services & Software — 3.8% |
|||||
| Adobe Systems, Inc.(a) |
11,800 | 463,740 | |||
| Aeroflex, Inc.* |
4,000 | 46,760 | |||
| Affiliated Computer Services, Inc. |
1,300 | 70,798 | |||
| Barra, Inc. |
2,000 | 70,980 | |||
| Black Box Corp. |
1,000 | 46,070 | |||
| Borland Software Corp.* |
3,000 | 29,190 | |||
| Brocade Communications Systems, Inc.* |
4,700 | 27,166 | |||
| Cadence Design Systems, Inc.* |
14,600 | 262,508 | |||
| CDW Corp. |
5,400 | 311,904 | |||
| Ceridan Corp.* |
3,100 | 64,914 | |||
| Cisco Systems, Inc.* |
122,200 | 2,968,237 | |||
| Creative Technology Ltd. (Singapore) |
7,500 | 79,050 | |||
| DST Systems, Inc.*(a) |
13,800 | 576,288 | |||
| FactSet Research Systems, Inc.(a) |
2,000 | 76,420 | |||
| Global Payments, Inc. |
1,500 | 70,680 | |||
| Henry (Jack) & Associates, Inc. |
3,600 | 74,088 | |||
| Intuit, Inc.*(a) |
8,400 | 444,444 | |||
| Logica PLC (United Kingdom) |
26,186 | 120,123 | |||
| Macrovision Corp.* |
6,700 | 151,353 | |||
| Mercury Interactive Corp.*(a) |
5,700 | 277,248 | |||
| Microsoft Corp. |
173,300 | 4,772,681 | |||
| NEC Soft Ltd. (Japan) |
3,900 | 103,168 | |||
| Oracle Corp.* |
69,400 | 916,080 | |||
| Pinnacle Systems, Inc.* |
5,100 | 43,503 | |||
| SAP AG (Germany) |
3,001 | 504,015 | |||
| Serena Software, Inc.*(a) |
4,300 | 78,905 | |||
| Siebel Systems, Inc.*(a) |
12,400 | 171,988 | |||
172
Table of Contents
AST T. Rowe Price Asset Allocation Portfolio
Schedule of Investments
December 31, 2003
| Shares |
Value | ||||
| SRA International, Inc.* |
1,200 | $ | 51,720 | ||
| Symantec Corp.*(a) |
4,400 | 152,460 | |||
| Thiel Logistik AG (Germany)* |
6,546 | 35,587 | |||
| TIBCO Software, Inc.* |
7,400 | 50,098 | |||
| Trend Micro, Inc. (Japan)* |
3,000 | 80,480 | |||
| Veritas Software Corp.*(a) |
8,000 | 297,280 | |||
| Websense, Inc.* |
2,000 | 58,480 | |||
| 13,548,406 | |||||
| Conglomerates — 1.8% |
|||||
| 3M Co. |
3,000 | 255,090 | |||
| Altria Group, Inc. |
40,900 | 2,225,778 | |||
| Cycle & Carriage Ltd. (Singapore) |
8,379 | 28,616 | |||
| Davis Service Group PLC |
35,063 | 236,323 | |||
| DCC PLC (Ireland) |
11,544 | 157,551 | |||
| Honeywell International, Inc. |
25,900 | 865,837 | |||
| Hutchison Whampoa Ltd. (Hong Kong) |
57,400 | 423,277 | |||
| ITT Industries, Inc. |
1,400 | 103,894 | |||
| Jenoptik AG (Germany) |
11,459 | 125,748 | |||
| Mitsubishi Heavy Industries Ltd. (Japan) |
67,000 | 186,302 | |||
| Norsk Hydro ASA (Norway) |
2,979 | 183,814 | |||
| SembCorp Industries Ltd. (Singapore) |
328,000 | 243,349 | |||
| Sumitomo Corp. (Japan) |
25,000 | 186,386 | |||
| Tyco International Ltd.(a) |
54,100 | 1,433,650 | |||
| 6,655,615 | |||||
| Construction — 0.3% |
|||||
| Balfour Beatty PLC (United Kingdom) |
13,998 | 54,753 | |||
| Beazer Homes USA, Inc. |
400 | 39,064 | |||
| D.R. Horton, Inc. |
2,714 | 117,408 | |||
| Eiffage SA (France) |
921 | 109,316 | |||
| Grupo Acciona SA (Spain) |
4,222 | 256,953 | |||
| Insituform Technologies, Inc. |
2,400 | 39,600 | |||
| JGC Corp. (Japan) |
15,000 | 156,480 | |||
| Toll Brothers, Inc.*(a) |
3,400 | 135,184 | |||
| 908,758 | |||||
| Consumer Products & Services — 2.4% |
|||||
| Bausch & Lomb, Inc. |
4,300 | 223,170 | |||
| Black & Decker Corp.(a) |
1,500 | 73,980 | |||
| Clorox Co. |
6,056 | 294,079 | |||
| Colgate-Palmolive Co. |
7,700 | 385,385 | |||
| Dollar Thrifty Automotive Group, Inc.* |
3,700 | 95,978 | |||
| Fancl Corp. (Japan) |
1,700 | 48,222 | |||
| Fortune Brands, Inc. |
5,000 | 357,450 | |||
| Gillette Co. |
13,700 | 503,201 | |||
| Hasbro, Inc. |
14,700 | 312,816 | |||
| Jakks Pacific, Inc.* |
4,500 | 59,220 | |||
| Johnson & Johnson |
40,046 | 2,068,777 | |||
| Kao Corp. (Japan) |
6,900 | 140,356 | |||
| Kimberly-Clark Corp. |
7,200 | 425,448 | |||
| L’Oreal SA (France) |
1,599 | 131,099 | |||
| Shares |
Value | ||||
| Lancaster Colony Corp. |
1,950 | $ | 88,062 | ||
| Newell Rubbermaid, Inc.(a) |
23,000 | 523,710 | |||
| Olympus Optical Co. Ltd. (Japan) |
2,000 | 43,389 | |||
| Orkla ASA (Class “A” Stock) (Norway) |
4,580 | 102,576 | |||
| Procter & Gamble Co. |
25,100 | 2,506,989 | |||
| Rent-A-Center, Inc.*(a) |
1,250 | 37,350 | |||
| SEB SA (France) |
792 | 98,900 | |||
| ServiceMaster Co.(a) |
3,800 | 44,270 | |||
| 8,564,427 | |||||
| Containers & Packaging — 0.1% |
|||||
| Smurfit-Stone Container Corp.*(a) |
3,100 | 57,567 | |||
| Toyo Seikan Kaisha, Ltd. (Japan) |
10,000 | 139,778 | |||
| 197,345 | |||||
| Electronic Components & Equipment — 2.3% |
|||||
| Agere Systems, Inc. (Class “B” Stock)* |
5,000 | 14,500 | |||
| AVX Corp. |
3,400 | 56,508 | |||
| C & D Technologies, Inc. |
2,700 | 51,759 | |||
| Cable Design Techologies Corp.* |
2,500 | 22,475 | |||
| Fanuc Ltd. (Japan) |
4,400 | 263,581 | |||
| General Electric Co. |
149,700 | 4,637,707 | |||
| Gentex Corp.(a) |
3,200 | 141,312 | |||
| Hosiden Corp. (Japan) |
9,000 | 102,622 | |||
| Jabil Circuit, Inc.* |
5,500 | 155,650 | |||
| Konica Minolta Holdings, Inc. (Japan) |
9,000 | 121,013 | |||
| Kyocera Corp. (Japan) |
1,600 | 106,597 | |||
| Littelfuse, Inc.* |
2,600 | 74,932 | |||
| Mitsumi Electric Co. Ltd. (Japan) |
9,100 | 100,196 | |||
| NEC Electronics Corp. (Japan)144A* (cost $42,883; purchased 07/14/03)(g) |
1,200 | 87,786 | |||
| Neopost SA (France) |
2,209 | 111,453 | |||
| Pioneer Corp. (Japan) |
11,100 | 306,578 | |||
| Plexus Corp.* |
10,000 | 171,700 | |||
| Rambus, Inc.* |
5,300 | 162,710 | |||
| Sagem SA (France) |
2,077 | 222,517 | |||
| Siemens AG (Germany) |
7,020 | 562,274 | |||
| Sony Corp. (Japan) |
7,000 | 242,325 | |||
| Sumitomo Electric Industries Ltd. (Japan) |
15,000 | 134,086 | |||
| TDK Corp. (Japan) |
2,800 | 201,698 | |||
| Technitrol, Inc.* |
1,500 | 31,110 | |||
| Ultimate Electronics, Inc.* |
4,600 | 35,098 | |||
| 8,118,187 | |||||
| Entertainment & Leisure — 1.2% |
|||||
| Alliance Gaming Corp.* |
1,000 | 24,650 | |||
| Brunswick Corp. |
6,500 | 206,895 | |||
| Carnival Corp.(a) |
13,900 | 552,247 | |||
| Disney (Walt) Co. |
35,892 | 837,360 | |||
| International Game Technology(a) |
8,200 | 292,740 | |||
| Mandalay Resort Group |
1,900 | 84,968 | |||
| Multimedia Games, Inc.* |
3,300 | 135,630 | |||
| Park Place Entertainment Corp.* |
8,000 | 86,640 | |||
| Station Casinos, Inc. |
2,700 | 82,701 | |||
173
Table of Contents
AST T. Rowe Price Asset Allocation Portfolio
Schedule of Investments
December 31, 2003
| Shares |
Value | ||||
| Time Warner, Inc.* |
47,700 | $ | 858,123 | ||
| Viacom, Inc. (Class “B” Stock) |
20,300 | 900,915 | |||
| Whitbread PLC (United Kingdom) |
18,993 | 244,463 | |||
| Wynn Resorts Ltd.*(a) |
2,400 | 67,224 | |||
| 4,374,556 | |||||
| Environmental Services — 0.2% |
|||||
| Waste Connections, Inc.* |
2,100 | 79,317 | |||
| Waste Management, Inc. |
17,559 | 519,746 | |||
| 599,063 | |||||
| Farming & Agriculture |
|||||
| Sunopta, Inc.* |
4,400 | 40,612 | |||
| Financial - Bank & Trust — 6.0% |
|||||
| ABN AMRO Holding NV (Netherlands) |
8,324 | 194,766 | |||
| Anglo Irish Bank Corp. (Ireland) |
31,073 | 490,317 | |||
| Australia & New Zealand Banking Group Ltd. (Australia) |
39,739 | 529,362 | |||
| Australia & New Zealand Banking Group Ltd. [ADR] |
2,500 | 167,125 | |||
| Banc Nazionale del Lavoro (Italy)* |
74,483 | 178,034 | |||
| Banca Intesa SPA (Italy) |
66,352 | 259,449 | |||
| Banco Santander Central Hispano SA (Spain) |
39,691 | 470,104 | |||
| Banco Santander Chile [ADR] |
17,878 | 425,139 | |||
| Bank of America Corp.(a) |
19,760 | 1,589,297 | |||
| Bank of Yokohama Ltd. (Japan) |
55,000 | 255,575 | |||
| BankAtlantic Bancorp, Inc. |
8,700 | 165,300 | |||
| Banknorth Group, Inc. |
3,900 | 126,867 | |||
| Barclays PLC (United Kingdom) |
103,287 | 921,264 | |||
| BNP Paribas SA (France) |
9,818 | 618,207 | |||
| BPI-SGPS SA (Portugal) |
36,459 | 134,284 | |||
| Bradford & Bingley PLC |
50,940 | 278,131 | |||
| Charter One Financial, Inc. |
3,500 | 120,925 | |||
| Comerica, Inc. |
25,700 | 1,440,742 | |||
| Commerce Bancshares, Inc. |
2,880 | 141,178 | |||
| Community First Bankshares, Inc. |
4,700 | 136,018 | |||
| Compass Bancshares, Inc. |
4,000 | 157,240 | |||
| Credito Italiano SPA (Italy) |
54,436 | 293,877 | |||
| DBS Groupo Holdings (Singapore) |
17,236 | 149,190 | |||
| Deutsche Bank AG (Germany) |
4,476 | 370,930 | |||
| Dexia (France) |
10,638 | 182,891 | |||
| East West Bancorp, Inc. |
2,800 | 150,304 | |||
| First Tennessee National Corp. |
2,400 | 105,840 | |||
| FleetBoston Financial Corp. |
9,056 | 395,294 | |||
| HBOS PLC (United Kingdom) |
34,021 | 440,633 | |||
| HSBC Holdings PLC |
28,143 | 442,340 | |||
| Jyske Bank SA (Denmark)* |
3,290 | 173,887 | |||
| M&T Bank Corp. |
1,500 | 147,450 | |||
| Macquarie Bank Ltd. (Australia) |
10,899 | 292,013 | |||
| Shares |
Value | ||||
| Mercantile Bankshares Corp. |
3,700 | $ | 168,646 | ||
| National Austrailia Bank Ltd. (Australia) |
28,434 | 641,636 | |||
| National Commerce Financial Corp. |
4,100 | 111,848 | |||
| Nordea AB (Sweden) |
75,152 | 564,008 | |||
| Popular, Inc. |
1,600 | 71,904 | |||
| Royal Bank of Scotland |
23,532 | 693,394 | |||
| Skandianaviska Enskilda Banken (Sweden) |
22,205 | 327,120 | |||
| Southwest Bancorporation of Texas, Inc. |
2,700 | 104,895 | |||
| State Street Corp. |
9,600 | 499,968 | |||
| Sumitomo Mitsui Financial Group, Inc. (Japan) |
51 | 271,727 | |||
| Svenska Handlesbanken (Class “A” Stock) (Sweden) |
19,454 | 397,445 | |||
| Synovus Financial Corp. |
5,300 | 153,276 | |||
| TCF Financial Corp. |
2,100 | 107,835 | |||
| Texas Regional Bancshares, Inc. |
4,015 | 148,555 | |||
| The 77 Bank Ltd. (Japan) |
25,000 | 140,898 | |||
| U.S. Bancorp |
68,600 | 2,042,908 | |||
| UCBH Holdings, Inc. |
5,500 | 214,335 | |||
| Wachovia Corp. |
36,400 | 1,695,876 | |||
| Wells Fargo & Co. |
13,000 | 765,570 | |||
| Wilmington Trust Corp. |
3,700 | 133,200 | |||
| 21,199,017 | |||||
| Financial — Brokerage |
|||||
| Legg Mason, Inc.(a) |
2,100 | 162,078 | |||
| Financial Services — 4.8% |
|||||
| Aiful Corp. (Japan) |
2,400 | 175,572 | |||
| Alliance & Leicester PLC |
27,121 | 431,132 | |||
| American Express Co. |
24,400 | 1,176,812 | |||
| Citigroup, Inc. |
85,641 | 4,157,013 | |||
| Concord EFS, Inc.* |
5,500 | 81,620 | |||
| Credit Suisse Group (Switzerland) |
10,050 | 367,708 | |||
| Doral Financial Corp. |
2,625 | 84,735 | |||
| Eaton Vance Corp. |
8,300 | 304,112 | |||
| Fannie Mae |
14,000 | 1,050,840 | |||
| First Marblehead Corp.* |
1,100 | 24,068 | |||
| Franklin Resources, Inc. |
3,500 | 182,210 | |||
| Freddie Mac |
13,200 | 769,824 | |||
| Goldman Sachs Group, Inc.(a) |
9,500 | 937,935 | |||
| Grupo Financiero Banorte S.A. de C.V. (Mexico) |
74,200 | 257,519 | |||
| IndyMac Bancorp, Inc. |
2,400 | 71,496 | |||
| ING Groep NV (Netherlands) |
13,509 | 315,062 | |||
| Investment Technology Group, Inc.* |
2,250 | 36,338 | |||
| Investors Financial Services Corp.(a) |
7,300 | 280,393 | |||
| J.P. Morgan Chase & Co. |
52,188 | 1,916,864 | |||
| Janus Capital Group, Inc. |
10,300 | 169,023 | |||
| Lehman Brothers Holdings, Inc. |
5,100 | 393,822 | |||
| MBNA Corp. |
14,100 | 350,385 | |||
174
Table of Contents
AST T. Rowe Price Asset Allocation Portfolio
Schedule of Investments
December 31, 2003
| Shares |
Value | ||||
| Mellon Financial Corp. |
10,300 | $ | 330,733 | ||
| Merrill Lynch & Co., Inc. |
15,400 | 903,210 | |||
| Moody’s Corp. |
2,500 | 151,375 | |||
| Morgan Stanley Dean Witter & Co.(a) |
18,300 | 1,059,021 | |||
| National Financial Partners Corp. |
4,800 | 132,240 | |||
| Nomura Securities Co. Ltd. (Japan) |
13,000 | 221,377 | |||
| Schwab (Charles) Corp. |
23,800 | 281,792 | |||
| SLM Corp. |
8,800 | 331,584 | |||
| Waddell & Reed Financial, Inc. |
7,200 | 168,912 | |||
| 17,114,727 | |||||
| Food — 1.0% |
|||||
| Associated British Foods PLC |
19,807 | 207,073 | |||
| Campbell Soup Co.(a) |
8,900 | 238,520 | |||
| Compass Group PLC (United Kingdom) |
36,901 | 251,023 | |||
| CSM NV (Netherlands) |
6,268 | 137,093 | |||
| Dean Foods Co.* |
1,950 | 64,097 | |||
| General Mills, Inc.(a) |
9,400 | 425,820 | |||
| Heinz (H.J.) Co. |
3,550 | 129,327 | |||
| Horizon Organic Holding Corp.* |
2,000 | 47,900 | |||
| Kraft Foods, Inc. (Class “A” Stock) |
3,500 | 112,770 | |||
| Nestle SA (Switzerland) |
1,715 | 428,489 | |||
| Performance Food Group Co.*(a) |
1,400 | 50,638 | |||
| Sainsbury (J.) PLC (United Kingdom) |
78,400 | 438,939 | |||
| Sysco Corp. |
10,500 | 390,915 | |||
| Tootsie Roll Industries, Inc. |
2,055 | 73,980 | |||
| Unilever PLC (United Kingdom) |
55,064 | 513,319 | |||
| United Natural Foods, Inc.* |
700 | 25,137 | |||
| Whole Foods Market, Inc.*(a) |
1,100 | 73,843 | |||
| Wrigley (Wm., Jr.) Co. |
2,000 | 112,420 | |||
| Yamazaki Baking Co. Ltd. (Japan) |
7,000 | 58,067 | |||
| 3,779,370 | |||||
| Furniture |
|||||
| La-Z-Boy, Inc. |
3,700 | 77,626 | |||
| Healthcare Services — 0.8% |
|||||
| Anthem, Inc.*(a) |
2,400 | 180,000 | |||
| Caremark Rx, Inc.*(a) |
4,300 | 108,919 | |||
| Community Health Systems, Inc.* |
3,000 | 79,740 | |||
| Coventry Health Care, Inc.* |
1,500 | 96,735 | |||
| DaVita, Inc.* |
2,500 | 97,500 | |||
| First Health Group Corp.* |
5,400 | 105,084 | |||
| HCA, Inc.(a) |
9,500 | 408,120 | |||
| Laboratory Corp. of America Holdings* |
10,700 | 395,365 | |||
| LifePoint Hospitals, Inc.*(a) |
3,000 | 88,350 | |||
| Medco Health Solutions, Inc.* |
2,484 | 84,431 | |||
| Omnicare, Inc. |
6,600 | 266,574 | |||
| Triad Hospitals, Inc.* |
1,478 | 49,173 | |||
| United Surgical Partners International, Inc.* |
3,600 | 120,528 | |||
| UnitedHealth Group, Inc.(a) |
15,800 | 919,244 | |||
| 2,999,763 | |||||
| Shares |
Value | ||||
| Hotels & Motels |
|||||
| Fairmont Hotels & Resorts, Inc. |
2,600 | $ | 70,564 | ||
| Industrial Products — 0.6% |
|||||
| Actuant Corp.* |
10,400 | 376,480 | |||
| Draka Holdings (Netherlands)* |
3,654 | 71,900 | |||
| Harsco Corp. |
1,700 | 74,494 | |||
| Illinois Tool Works, Inc. |
6,600 | 553,806 | |||
| Maverick Tube Corp.* |
4,000 | 77,000 | |||
| Mohawk Industries, Inc.*(a) |
500 | 35,270 | |||
| Nucor Corp.(a) |
13,300 | 744,800 | |||
| Steel Dynamics, Inc.* |
7,300 | 171,477 | |||
| 2,105,227 | |||||
| Insurance — 3.2% |
|||||
| Allianz AG (Germany) |
2,524 | 318,620 | |||
| American International Group, Inc. |
40,130 | 2,659,817 | |||
| Aviva PLC (United Kingdom) |
25,690 | 225,462 | |||
| AXA Asia Pacific Holdings (Australia) |
110,154 | 237,367 | |||
| China Life Insurance Co. [ADR]*(a) |
10,100 | 332,997 | |||
| CNP Assurances (France) |
6,579 | 342,559 | |||
| Gallagher (Arthur J.) & Co. |
1,600 | 51,984 | |||
| Hannover Rueckversicherungs AG (Germany) |
3,844 | 134,404 | |||
| Hartford Financial Services Group, Inc. (The) |
6,600 | 389,598 | |||
| Horace Mann Educators Corp. |
3,000 | 41,910 | |||
| Marsh & McLennan Companies, Inc. |
10,400 | 498,056 | |||
| Max Re Capital Ltd. |
4,900 | 109,956 | |||
| Mercury General Corp. |
1,000 | 46,550 | |||
| Mitsui Marine & Fire (Japan) |
42,000 | 344,873 | |||
| Ohio Casualty Corp.* |
10,700 | 185,752 | |||
| PICC Property and Casualty Co. Ltd. (Hong Kong)* 144A (cost $2,810; purchased 10/31/03)(g) |
12,000 | 5,371 | |||
| PMI Group, Inc. (The) |
3,400 | 126,582 | |||
| Principal Financial Group, Inc. |
9,600 | 317,472 | |||
| Protective Life Corp. |
4,600 | 155,664 | |||
| Prudential PLC (United Kingdom) |
24,899 | 210,497 | |||
| QBE Insurance Group Ltd. (Australia) |
38,083 | 304,152 | |||
| Radian Group, Inc.(a) |
9,300 | 453,375 | |||
| Riunione Adriatica di Sicurta SPA (Italy) |
16,436 | 279,876 | |||
| Safeco Corp. |
29,200 | 1,136,756 | |||
| Scottish Annuity & Life Holdings Ltd. |
3,600 | 74,808 | |||
| St. Paul Companies, Inc. |
9,600 | 380,640 | |||
| StanCorp Financial Group, Inc. |
1,600 | 100,608 | |||
| Travelers Property Casualty Corp. |
107,400 | 1,822,578 | |||
| Triad Guaranty, Inc.* |
3,600 | 181,260 | |||
| UnumProvident Corp. |
8,600 | 135,622 | |||
| WellChoice, Inc.* |
1,900 | 65,550 | |||
| 11,670,716 | |||||
175
Table of Contents
AST T. Rowe Price Asset Allocation Portfolio
Schedule of Investments
December 31, 2003
| Shares |
Value | ||||
| Internet Services — 0.6% |
|||||
| Digital Insight Corp.* |
4,100 | $ | 102,090 | ||
| EarthLink, Inc.* |
10,600 | 106,000 | |||
| InterActiveCorp.*(a) |
12,700 | 430,911 | |||
| Networks Associates, Inc.* |
14,800 | 222,592 | |||
| Priceline.com, Inc.* |
8,600 | 153,940 | |||
| VeriSign, Inc.* |
22,200 | 361,860 | |||
| Yahoo!, Inc.*(a) |
16,300 | 736,271 | |||
| 2,113,664 | |||||
| Machinery & Equipment — 0.4% |
|||||
| Cooper Cameron Corp.*(a) |
1,200 | 55,920 | |||
| Danaher Corp.(a) |
3,700 | 339,475 | |||
| Deere & Co. |
5,900 | 383,795 | |||
| Eaton Corp. |
1,900 | 205,162 | |||
| Grant Prideco, Inc.* |
9,400 | 122,388 | |||
| Nordson Corp. |
2,200 | 75,966 | |||
| Pall Corp. |
5,800 | 155,614 | |||
| Singulus Technologies AG (Germany)* |
4,961 | 104,501 | |||
| Stanley Works |
2,700 | 102,249 | |||
| Tecumseh Products Co. |
1,400 | 67,802 | |||
| 1,612,872 | |||||
| Medical Supplies & Equipment — 1.9% |
|||||
| Abbott Laboratories |
24,200 | 1,127,720 | |||
| AmerisourceBergen Corp. |
1,600 | 89,840 | |||
| Amgen, Inc.* |
23,400 | 1,446,120 | |||
| Apogent Technologies, Inc.* |
3,700 | 85,248 | |||
| Bard (C.R.), Inc. |
1,500 | 121,875 | |||
| Baxter International, Inc. |
8,200 | 250,264 | |||
| Boston Scientific Corp.* |
18,000 | 661,680 | |||
| Charles River Laboratories International, Inc.* |
1,100 | 37,763 | |||
| Computer Programs and Systems, Inc. |
7,500 | 150,900 | |||
| Cytyc Corp.* |
7,600 | 104,576 | |||
| DENTSPLY International, Inc. |
2,550 | 115,184 | |||
| Digene Corp.* |
1,000 | 40,100 | |||
| Elekta AB (Sweden)* |
5,863 | 110,003 | |||
| Guidant Corp. |
4,500 | 270,900 | |||
| Invitrogen Corp.*(a) |
1,562 | 109,340 | |||
| Medtronic, Inc. |
19,100 | 928,451 | |||
| Patterson Dental Co.* |
1,000 | 64,160 | |||
| Shimadzu Corp. (Japan) |
42,000 | 173,612 | |||
| St. Jude Medical, Inc.* |
4,200 | 257,670 | |||
| STERIS Corp.* |
5,000 | 113,000 | |||
| Stryker Corp.(a) |
3,600 | 306,036 | |||
| Techne Corp.* |
1,800 | 68,004 | |||
| Zimmer Holdings, Inc.* |
3,000 | 211,200 | |||
| 6,843,646 | |||||
| Metals & Mining — 0.9% |
|||||
| Alcoa, Inc.(a) |
15,200 | 577,600 | |||
| Anglo American PLC (United Kingdom) |
8,984 | 194,119 | |||
| Shares |
Value | ||||
| BHP Steel Ltd. (Australia) |
109,702 | $ | 462,867 | ||
| Broken Hill Proprietary Co. Ltd. (Australia) |
16,800 | 154,300 | |||
| Gerdau SA [ADR] |
28,210 | 570,406 | |||
| Newmont Mining Corp. |
6,900 | 335,409 | |||
| Nippon Steel Corp. (Japan) |
146,000 | 313,334 | |||
| SKF AB (Sweden) |
4,921 | 190,129 | |||
| SSAB Svenskt Stal AB Series A (Sweden) |
13,586 | 242,631 | |||
| Voestalpine AG (Austria) |
3,319 | 135,222 | |||
| 3,176,017 | |||||
| Office Equipment — 0.2% |
|||||
| Buhrmann NV (Netherlands)* |
10,384 | 90,506 | |||
| Canon, Inc. (Japan) |
8,000 | 372,493 | |||
| Herman Miller, Inc. |
4,800 | 116,496 | |||
| 579,495 | |||||
| Oil & Gas — 4.2% |
|||||
| Amerada Hess Corp. |
4,300 | 228,631 | |||
| Anadarko Petroleum Corp. |
4,006 | 204,346 | |||
| Australia Gas & Light (Australia) |
26,153 | 221,287 | |||
| Baker Hughes, Inc. |
6,300 | 202,608 | |||
| BP PLC [ADR] |
9,800 | 483,630 | |||
| British Petroleum Co. PLC |
34,736 | 281,689 | |||
| Centrica PLC (United Kingdom) |
96,020 | 362,690 | |||
| ChevronTexaco Corp. |
14,961 | 1,292,481 | |||
| Compania Espanola de Petroleos SA (Spain) |
12,885 | 446,944 | |||
| Devon Energy Corp.(a) |
2,400 | 137,424 | |||
| Eni SPA [ADR](a) |
3,100 | 294,438 | |||
| ENSCO International, Inc. |
1,000 | 27,170 | |||
| Ente Nazionale Idrocarburi SPA (Italy) |
8,914 | 168,206 | |||
| EOG Resources, Inc. |
1,600 | 73,872 | |||
| Exxon Mobil Corp. |
111,266 | 4,561,905 | |||
| FMC Technologies, Inc.* |
11,659 | 271,655 | |||
| Grey Wolf, Inc.* |
22,600 | 84,524 | |||
| Helmerich & Payne, Inc. |
1,500 | 41,895 | |||
| Marathon Oil Corp. |
4,300 | 142,287 | |||
| Murphy Oil Corp. |
6,100 | 398,391 | |||
| National Fuel Gas Co. |
3,400 | 83,096 | |||
| Newfield Exploration Co.* |
2,600 | 115,804 | |||
| Occidental Petroleum Corp. |
2,300 | 97,152 | |||
| OMV AG (Austria) |
198 | 29,490 | |||
| Patterson-UTI Energy, Inc.* |
3,500 | 115,220 | |||
| Petroleo Brasileiro SA [ADR] |
11,700 | 311,922 | |||
| Pioneer Natural Resources Co.* |
4,700 | 150,071 | |||
| Schlumberger Ltd. |
12,100 | 662,112 | |||
| Shell Transport & Trading Co. [ADR] |
20,100 | 905,103 | |||
| Shell Transport & Trading Co. PLC (United Kingdom) |
43,786 | 325,685 | |||
| Smedvig ASA (Class “A” Stock) (Norway) |
4,672 | 35,464 | |||
176
Table of Contents
AST T. Rowe Price Asset Allocation Portfolio
Schedule of Investments
December 31, 2003
| Shares |
Value | ||||
| Statoil ASA (Sweden) |
35,546 | $ | 399,390 | ||
| Tokyo Gas Co. Ltd. (Japan) |
29,000 | 103,368 | |||
| Tom Brown, Inc.* |
3,800 | 122,550 | |||
| Tonen General Sekiyu K.K. (Japan) |
10,000 | 82,766 | |||
| Total SA [ADR] |
4,300 | 397,793 | |||
| TotalFinaElf SA (France) |
4,599 | 855,061 | |||
| Transocean, Inc.*(a) |
10,039 | 241,036 | |||
| Valero Energy Corp. |
1,500 | 69,510 | |||
| WGL Holdings, Inc. |
3,000 | 83,370 | |||
| Woodside Petroleum Ltd. (Australia) |
14,327 | 159,761 | |||
| 15,271,797 | |||||
| Paper & Forest Products — 0.4% |
|||||
| Bowater, Inc.(a) |
3,600 | 166,716 | |||
| International Paper Co. |
9,500 | 409,545 | |||
| MeadWestvaco Corp. |
7,900 | 235,025 | |||
| Paperlinx (Australia) |
47,240 | 177,253 | |||
| Potlatch Corp. |
7,600 | 264,252 | |||
| Weyerhaeuser Co. |
3,500 | 224,000 | |||
| 1,476,791 | |||||
| Personal Services — 0.2% |
|||||
| Apollo Group, Inc. |
3,200 | 217,600 | |||
| Career Education Corp.* |
1,600 | 64,112 | |||
| Corinthian Colleges, Inc.* |
1,200 | 66,672 | |||
| DeVry, Inc.* |
3,100 | 77,903 | |||
| Education Management Corp.*(a) |
3,600 | 111,744 | |||
| University of Phoenix Online* |
2,833 | 195,279 | |||
| 733,310 | |||||
| Pharmaceuticals — 4.5% |
|||||
| Abgenix, Inc.* |
3,700 | 46,102 | |||
| Accredo Health, Inc.* |
4,500 | 142,245 | |||
| Advance Paradigm, Inc.* |
1,700 | 89,522 | |||
| Alkermes, Inc.* |
4,100 | 55,350 | |||
| Alliance Unichem PLC |
21,129 | 196,308 | |||
| AstraZeneca Group PLC |
2,393 | 114,807 | |||
| AstraZeneca PLC [ADR](a) |
10,100 | 488,638 | |||
| Aventis SA (France) |
4,009 | 264,974 | |||
| Barr Laboratories, Inc.* |
400 | 30,780 | |||
| Biogen Idec, Inc.*(a) |
4,700 | 172,866 | |||
| Cardinal Health, Inc.(a) |
7,250 | 443,410 | |||
| Celgene Corp.*(a) |
2,000 | 90,040 | |||
| Celltech Group PLC (United Kingdom)* |
18,719 | 126,668 | |||
| Cephalon, Inc.* |
3,328 | 161,108 | |||
| CSL Ltd. (Australia) |
4,441 | 59,727 | |||
| Eisai Co. Ltd. (Japan) |
5,700 | 153,709 | |||
| Eon Labs, Inc.* |
1,000 | 50,950 | |||
| Forest Laboratories, Inc.*(a) |
13,700 | 846,660 | |||
| Galen Holdings PLC (United Kingdom) |
16,447 | 209,485 | |||
| Gehe AG (Germany) |
3,826 | 185,557 | |||
| Genentech, Inc.*(a) |
5,300 | 495,921 | |||
| Shares |
Value | ||||
| Gilead Sciences, Inc.*(a) |
6,400 | $ | 372,096 | ||
| Glaxosmithkline PLC |
20,837 | 477,459 | |||
| GlaxoSmithKline PLC [ADR] |
1,400 | 65,268 | |||
| Hisamitsu Pharmaceutical Co. (Japan) |
7,000 | 82,691 | |||
| Human Genome Sciences, Inc.* |
4,100 | 54,325 | |||
| ICOS Corp.* |
1,800 | 74,304 | |||
| Lilly (Eli) & Co. |
18,700 | 1,315,171 | |||
| Medicis Pharmaceutical Corp. |
1,200 | 85,560 | |||
| MedImmune, Inc.*(a) |
7,500 | 190,500 | |||
| Merck & Co., Inc. |
29,700 | 1,372,140 | |||
| Mylan Laboratories, Inc. |
3,450 | 87,147 | |||
| Neurocrine Biosciences, Inc.* |
2,100 | 114,534 | |||
| Novartis AG (Switzerland) |
15,944 | 723,878 | |||
| Noven Pharmaceuticals, Inc.* |
5,100 | 77,571 | |||
| Novo Nordisk AS (Class “B” Stock) (Denmark) |
2,266 | 92,319 | |||
| Pfizer, Inc. |
119,685 | 4,228,470 | |||
| Priority Healthcare Corp. |
1,500 | 36,165 | |||
| Sanofi-Synthelabo SA (France) |
7,052 | 531,035 | |||
| Schering-Plough Corp. |
9,800 | 170,422 | |||
| Schwarz Pharma AG (Germany) |
9,977 | 270,693 | |||
| Suzuken Co. Ltd. (Japan) |
2,100 | 68,191 | |||
| Takeda Chemical Industries Ltd. (Japan) |
5,700 | 226,043 | |||
| Watson Pharmaceuticals, Inc.* |
1,700 | 78,200 | |||
| Wyeth |
21,200 | 899,940 | |||
| 16,118,949 | |||||
| Printing & Publishing — 0.4% |
|||||
| Dow Jones & Co., Inc. |
2,600 | 129,610 | |||
| Gannett Co., Inc. |
4,800 | 427,968 | |||
| Knight-Ridder, Inc. |
3,300 | 255,321 | |||
| McGraw-Hill Companies, Inc. |
1,700 | 118,864 | |||
| New York Times Co. (Class “A” Stock) |
3,100 | 148,149 | |||
| Pulitzer, Inc. |
1,200 | 64,800 | |||
| Scholastic Corp.* |
5,000 | 170,200 | |||
| Singapore Press Holdings Ltd. (Singapore) |
7,000 | 77,901 | |||
| 1,392,813 | |||||
| Railroads — 0.2% |
|||||
| Burlington Northern Santa Fe Corp. |
9,200 | 297,620 | |||
| CSX Corp. |
6,500 | 233,610 | |||
| Union Pacific Corp. |
4,200 | 291,816 | |||
| 823,046 | |||||
| Real Estate — 0.8% |
|||||
| Archstone-Smith Trust [REIT] |
3,000 | 83,940 | |||
| Arden Realty, Inc. [REIT] |
3,700 | 112,258 | |||
| Boston Properties, Inc. [REIT] |
2,400 | 115,656 | |||
| Camden Property Trust [REIT] |
3,200 | 141,760 | |||
| Catellus Development Corp. |
2,178 | 52,533 | |||
177
Table of Contents
AST T. Rowe Price Asset Allocation Portfolio
Schedule of Investments
December 31, 2003
| Shares |
Value | ||||
| Corio NV (Netherlands) |
3,741 | $ | 144,865 | ||
| Duke-Weeks Realty Corp. [REIT] |
3,700 | 114,700 | |||
| EastGroup Properties, Inc. [REIT] |
2,400 | 77,712 | |||
| General Property Trust (Australia) |
127,155 | 286,456 | |||
| Goldcrest Co. Ltd. (Japan) |
1,900 | 90,417 | |||
| LaSalle Hotel Properties [REIT] |
4,800 | 89,040 | |||
| Mills Corp. (The) [REIT] |
600 | 26,400 | |||
| Mitsui Fudosan Co. Ltd. (Japan) |
12,000 | 108,389 | |||
| Persimmon PLC (United Kingdom) |
16,568 | 159,271 | |||
| Reckson Associates Realty Corp. [REIT] |
2,600 | 63,180 | |||
| Regency Centers Corp. [REIT] |
3,400 | 135,490 | |||
| Rouse Co. [REIT] |
2,900 | 136,300 | |||
| Simon Property Group, Inc. [REIT] |
2,700 | 125,118 | |||
| SL Green Realty Corp. [REIT] |
3,900 | 160,095 | |||
| Sun Hung Kai Properties Ltd. |
29,000 | 239,998 | |||
| Vornado Realty Trust [REIT] |
2,700 | 147,825 | |||
| Wereldhave NV (Netherlands) |
1,899 | 142,162 | |||
| Westfield Trust (Australia) |
80,347 | 215,513 | |||
| Wheelock and Co. Ltd. (Hong Kong) |
69,000 | 83,099 | |||
| 3,052,177 | |||||
| Restaurants — 0.3% |
|||||
| CEC Entertainment, Inc.* |
1,900 | 90,041 | |||
| Darden Restaurants, Inc.(a) |
2,850 | 59,964 | |||
| McDonald’s Corp. |
14,700 | 365,001 | |||
| Mitchells & Butlers PLC |
27,963 | 112,631 | |||
| P.F. Chang’s China Bistro, Inc.*(a) |
1,100 | 55,968 | |||
| Ruby Tuesday, Inc. |
2,400 | 68,376 | |||
| Sonic Corp.* |
1,600 | 48,992 | |||
| Starbucks Corp.* |
6,400 | 211,584 | |||
| The Cheesecake Factory, Inc.*(a) |
1,000 | 44,030 | |||
| Wendy’s International, Inc. |
2,400 | 94,176 | |||
| 1,150,763 | |||||
| Retail & Merchandising — 3.5% |
|||||
| A.C. Moore Arts & Crafts, Inc.* |
4,400 | 84,744 | |||
| AnnTaylor Stores Corp.* |
8,300 | 323,700 | |||
| Bed Bath & Beyond, Inc.* |
3,500 | 151,725 | |||
| Best Buy Co., Inc.(a) |
6,350 | 331,724 | |||
| Carrefour SA (France) |
3,020 | 165,780 | |||
| Casino Guichard-Perrachon SA (France) |
1,860 | 180,885 | |||
| Charles Voegele Holding AG (Switzerland)* |
2,184 | 139,331 | |||
| Christopher & Banks Corp. |
10,975 | 214,342 | |||
| Coles Myer Ltd. (Australia) |
27,467 | 156,454 | |||
| Cost Plus, Inc.* |
2,600 | 106,600 | |||
| CVS Corp. |
7,800 | 281,736 | |||
| Dixons Group PLC (United Kingdom) |
62,090 | 154,500 | |||
| Dollar Tree Stores, Inc.* |
11,600 | 348,696 | |||
| Espirit Holdings Ltd. (Hong Kong) |
27,500 | 91,565 | |||
| Family Dollar Stores, Inc. |
7,700 | 276,276 | |||
| Shares |
Value | ||||
| Home Depot, Inc. |
41,700 | $ | 1,479,933 | ||
| Kesa Electricals PLC (United Kingdom) |
5,697 | 26,236 | |||
| Kohl’s Corp.*(a) |
7,300 | 328,062 | |||
| Lowe’s Companies, Inc. |
6,000 | 332,340 | |||
| Mauri Co. Ltd. (Japan) |
13,900 | 175,096 | |||
| Metro AG (Germany) |
6,742 | 297,216 | |||
| Michaels Stores, Inc. |
3,500 | 154,700 | |||
| Pier 1 Imports, Inc. |
5,600 | 122,416 | |||
| Ross Stores, Inc. |
29,400 | 777,042 | |||
| Staples, Inc.* |
7,600 | 207,480 | |||
| Target Corp. |
39,000 | 1,497,600 | |||
| Toys ‘R’ Us, Inc.* |
3,600 | 45,504 | |||
| Tweeter Home Entertainment Group, Inc.* |
3,000 | 28,350 | |||
| Valora Holding AG (Switzerland) |
410 | 102,106 | |||
| Wal-Mart de Mexico SA (Class “V” Stock) (Mexico) |
123,300 | 351,447 | |||
| Wal-Mart Stores, Inc. |
55,600 | 2,949,580 | |||
| Walgreen Co.(a) |
17,700 | 643,926 | |||
| Williams-Sonoma, Inc.*(a) |
2,800 | 97,356 | |||
| 12,624,448 | |||||
| Semiconductors — 1.9% |
|||||
| AMIS Holdings, Inc.* |
6,600 | 120,648 | |||
| Analog Devices, Inc. |
9,200 | 419,980 | |||
| Applied Materials, Inc.*(a) |
32,600 | 731,870 | |||
| ATMI, Inc.* |
3,300 | 76,362 | |||
| Cymer, Inc.*(a) |
2,600 | 120,094 | |||
| Intel Corp. |
57,500 | 1,851,500 | |||
| Intersil Corp. (Class “A” Stock) |
11,200 | 278,320 | |||
| KLA-Tencor Corp.*(a) |
4,000 | 234,680 | |||
| Linear Technology Corp. |
7,500 | 315,525 | |||
| Maxim Integrated Products, Inc. |
11,000 | 547,800 | |||
| Microchip Technology, Inc.(a) |
6,000 | 200,160 | |||
| Mykrolis Corp.* |
3,600 | 57,888 | |||
| Novellus Systems, Inc.* |
5,400 | 227,070 | |||
| QLogic Corp.*(a) |
4,900 | 252,840 | |||
| Rohm Co. Ltd. (Japan) |
600 | 70,318 | |||
| Semtech Corp.* |
5,400 | 122,742 | |||
| Tessera Technologies, Inc.* |
3,200 | 60,192 | |||
| Texas Instruments, Inc. |
23,900 | 702,182 | |||
| Varian Semiconductor Equipment Associates, Inc.* |
600 | 26,214 | |||
| Xilinx, Inc.*(a) |
10,000 | 387,400 | |||
| Zoran Corp.* |
3,112 | 54,118 | |||
| 6,857,903 | |||||
| Telecommunications — 3.7% |
|||||
| Advanced Fibre Communications, Inc.*(a) |
1,700 | 34,255 | |||
| America Movil SA de CV, |
11,300 | 308,942 | |||
| BellSouth Corp. |
13,000 | 367,900 | |||
| Carso Global Telecom (Mexico)* |
202,900 | 284,202 | |||
178
Table of Contents
AST T. Rowe Price Asset Allocation Portfolio
Schedule of Investments
December 31, 2003
| Shares |
Value | ||||
| Catapult Communications Corp.* |
5,300 | $ | 76,850 | ||
| Centillium Commuications, Inc.* |
10,500 | 59,115 | |||
| China Unicom Ltd. (Hong Kong)* |
106,000 | 98,988 | |||
| Commonwealth Telephone Enterprises, Inc.* |
3,500 | 132,125 | |||
| Comverse Technology, Inc.* |
4,700 | 82,673 | |||
| Corning, Inc.* |
23,200 | 241,976 | |||
| Crown Castle International Corp.*(a) |
15,600 | 172,068 | |||
| Debitel AG (Germany) |
4,668 | 55,936 | |||
| Inter-Tel, Inc. |
800 | 19,984 | |||
| KDDI Corp. (Japan) |
84 | 481,254 | |||
| KPN NV (Netherlands)* |
50,105 | 386,784 | |||
| MM02 PLC (United Kingdom)* |
286,440 | 394,835 | |||
| Motorola, Inc. |
35,200 | 495,264 | |||
| Netcom AB (Class “B” Stock) (Sweden)* |
5,841 | 311,723 | |||
| Nextel Communications, Inc. |
33,200 | 931,592 | |||
| Nextel Partners, Inc. |
25,000 | 336,250 | |||
| NII Holdings, Inc. |
3,100 | 231,353 | |||
| Nokia Corp. (Class “A” Stock) [ADR](a) |
14,400 | 244,800 | |||
| Nokia OYJ (Finland) |
10,881 | 188,167 | |||
| NTL, Inc.* |
4,900 | 341,775 | |||
| Plantronics, Inc.* |
3,000 | 97,950 | |||
| Polycom, Inc.* |
9,000 | 175,680 | |||
| Powerwave Technologies, Inc.*(a) |
4,500 | 34,425 | |||
| Qualcomm, Inc. |
10,800 | 582,444 | |||
| Qwest Communications International, Inc.* |
38,700 | 167,184 | |||
| Research in Motion Ltd.* |
5,400 | 360,882 | |||
| Rogers Wireless Communications, Inc. (Class “B” Stock)* |
3,700 | 79,180 | |||
| SBC Communications, Inc. |
31,700 | 826,419 | |||
| SK Telecom Co. Ltd. [ADR](a) |
5,910 | 110,222 | |||
| Smartone Telecommunications |
73,000 | 74,753 | |||
| Tele Danmark AS (Denmark) |
8,831 | 318,644 | |||
| Telecom Italia Mobile SPA (Italy) |
84,195 | 457,720 | |||
| Telecom Italia SPA (Italy)* |
99,822 | 295,890 | |||
| Telefonos de Mexico SA (Class “L” Stock) [ADR] |
7,900 | 260,937 | |||
| Telenor ASA (Norway) |
45,699 | 298,807 | |||
| Telephone & Data Systems, Inc. |
800 | 50,040 | |||
| Thomson Multimedia (France) |
20,562 | 437,539 | |||
| Verizon Communications, Inc. |
31,284 | 1,097,442 | |||
| Vodafone Group PLC [ADR](a) |
36,400 | 911,456 | |||
| Western Wireless Corp. |
20,500 | 376,380 | |||
| 13,292,805 | |||||
| Shares |
Value | ||||
| Transportation — 0.7% |
|||||
| Arriva PLC |
31,008 | $ | 210,935 | ||
| Covenant Transportation, Inc.* |
4,900 | 93,149 | |||
| Expeditors International of Washington, Inc. |
1,100 | 41,426 | |||
| FedEx Corp.(a) |
4,700 | 317,250 | |||
| Forward Air Corp.* |
1,500 | 41,250 | |||
| Macquarie Infrastructure (Australia) |
30,128 | 77,180 | |||
| Nippon Express Co. Ltd. (Japan) |
25,000 | 118,037 | |||
| United Parcel Service, Inc. |
19,000 | 1,416,449 | |||
| UTI Worldwide, Inc. |
3,000 | 113,790 | |||
| 2,429,466 | |||||
| Utilities — 1.8% |
|||||
| Alliant Energy Corp.(a) |
3,700 | 92,130 | |||
| American Electric Power Co., Inc. |
2,600 | 79,326 | |||
| CenterPoint Energy, Inc. |
11,800 | 114,342 | |||
| Constellation Energy Group, Inc. |
3,600 | 140,976 | |||
| Duke Energy Corp.(a) |
17,200 | 351,740 | |||
| E.ON AG (Germany) |
10,616 | 692,825 | |||
| Edison International Co. |
9,100 | 199,563 | |||
| El Paso Electric Co.* |
10,200 | 136,170 | |||
| Energy East Corp. |
5,100 | 114,240 | |||
| Entergy Corp. |
3,300 | 188,529 | |||
| Exelon Corp. |
3,900 | 258,804 | |||
| FirstEnergy Corp. |
17,400 | 612,480 | |||
| Great Plains Energy, Inc. |
4,000 | 127,280 | |||
| Hong Kong Electric Holdings Ltd. |
27,500 | 108,745 | |||
| Iberdrola SA (Spain) |
20,000 | 395,308 | |||
| MVV Energie AG (Germany) |
2,624 | 50,971 | |||
| NiSource, Inc. |
6,100 | 133,834 | |||
| OGE Energy Corp. |
4,600 | 111,274 | |||
| PG&E Corp.*(a) |
15,400 | 427,658 | |||
| Pinnacle West Capital Corp. |
5,200 | 208,104 | |||
| PPL Corp.(a) |
5,600 | 245,000 | |||
| Severn Trent PLC (United Kingdom) |
13,223 | 177,298 | |||
| Teco Energy, Inc.(a) |
4,300 | 61,963 | |||
| The Southern Co. |
5,900 | 178,475 | |||
| Tohoku Electric Power Co., Inc. (Japan) |
15,200 | 252,033 | |||
| Tokyo Electric Power Co. (Japan) |
7,000 | 153,494 | |||
| TXU Corp.(a) |
24,500 | 581,140 | |||
| Xcel Energy, Inc.(a) |
8,600 | 146,028 | |||
| 6,339,730 | |||||
| Total Common Stock |
|||||
| (Cost $193,643,184) |
232,822,986 | ||||
179
Table of Contents
AST T. Rowe Price Asset Allocation Portfolio
Schedule of Investments
December 31, 2003
| Par (000) |
Value | |||||
| U.S. GOVERNMENT AGENCY OBLIGATIONS — 9.3% | ||||||
| Federal Home Loan Bank |
||||||
| 5.75%, 05/15/12 |
$ | 300 | $ | 327,294 | ||
| Federal Home Loan Mortgage Corp. |
||||||
| 4.50%, 07/15/11 - 05/15/16 [IO] |
1,765 | 891,806 | ||||
| 4.641%, 11/01/02 [VR](c) |
214 | 219,585 | ||||
| 5.00%, 12/01/08 - 01/14/34 |
2,589 | 2,610,548 | ||||
| 5.50%, 04/15/28 |
800 | 823,762 | ||||
| 6.00%, [TBA] |
1,900 | 1,963,532 | ||||
| 6.25%, 07/15/32 |
400 | 436,513 | ||||
| 7.00%, 11/01/30 - 06/01/32 |
360 | 380,751 | ||||
| 7,326,497 | ||||||
| Federal National Mortgage Assoc. |
||||||
| 2.91%, 07/25/29 |
230 | 229,584 | ||||
| 3.25%, 11/15/07 - 08/15/08 |
1,160 | 1,161,895 | ||||
| 4.50%, 05/01/18 - 11/01/33 |
875 | 871,471 | ||||
| 5.00%, 03/25/15 |
575 | 590,036 | ||||
| 5.125%, 01/02/14 |
155 | 155,841 | ||||
| 5.50%, 12/01/16 -01/01/34 |
11,852 | 11,864,938 | ||||
| 6.00%, 05/15/08 -01/01/34 |
4,164 | 4,373,921 | ||||
| 6.50%, 05/01/17 -12/01/32 |
1,897 | 1,831,925 | ||||
| 7.00%, 01/01/31 -04/01/32 |
46 | 48,268 | ||||
| 7.125%, 02/15/05 |
160 | 170,160 | ||||
| 21,298,039 | ||||||
| Government National Mortgage Assoc. |
||||||
| 4.00%, 09/15/18 - 10/15/18 |
772 | 754,734 | ||||
| 5.00%, 09/20/33 |
794 | 785,862 | ||||
| 5.50%, [TBA] |
1,200 | 1,217,438 | ||||
| 6.00%, 02/15/26 - 05/15/26 |
201 | 209,517 | ||||
| 6.50%, 01/15/28 - 09/20/32 |
472 | 497,519 | ||||
| 7.00%, 03/15/13 - 08/15/26 |
622 | 667,510 | ||||
| 8.00%, 12/15/16 - 07/15/23 |
60 | 66,219 | ||||
| 8.50%, 06/15/16 - 10/15/26 |
178 | 194,629 | ||||
| 10.00%, 11/15/09 |
1 | 1,276 | ||||
| 10.50%, 08/15/15 |
2 | 2,158 | ||||
| 11.50%, 06/15/10 |
3 | 3,898 | ||||
| 12.00%, 09/15/13 |
† | 206 | ||||
| 4,406,794 | ||||||
| Tennessee Valley Authority |
||||||
| 6.875%, 12/15/43 |
40 | 41,725 | ||||
| (Cost $33,078,080) |
33,400,349 | |||||
| U.S. TREASURY OBLIGATIONS — 8.2% | ||||||
| U.S. Treasury Bonds |
||||||
| 7.50%, 11/15/16 |
940 | 1,197,032 | ||||
| 7.125%, 02/15/23 |
805 | 1,004,961 | ||||
| 6.25%, 08/15/23 -05/15/30(a) |
1,460 | 1,673,363 | ||||
| 7.625%, 02/15/25 |
300 | 396,293 | ||||
| 5.375%, 02/15/31(a) |
345 | 359,892 | ||||
| 4,631,541 | ||||||
| Par (000) |
Value | |||||
| U.S. Treasury Inflationary Notes [TIPS] |
||||||
| 1.875%, 07/15/13(a)(c) |
$ | 1,205 | $ | 1,205,417 | ||
| U.S. Treasury Notes |
||||||
| 5.875%, 11/15/04(a) |
5,720 | 5,951,037 | ||||
| 6.50%, 08/15/05 |
5,545 | 5,983,837 | ||||
| 1.875%, 11/30/05(a) |
2,600 | 2,605,689 | ||||
| 3.50%, 11/15/06 |
75 | 77,546 | ||||
| 3.25%, 08/15/07 -08/15/08(a) |
3,465 | 3,494,382 | ||||
| 4.75%, 11/15/08(a) |
2,565 | 2,746,756 | ||||
| 4.375%, 08/15/12(a) |
110 | 112,217 | ||||
| 3.875%, 02/15/13(a) |
930 | 910,674 | ||||
| 4.25%, 08/15/13 -11/15/13(a) |
215 | 215,066 | ||||
| 6.00%, 02/15/26 |
1,335 | 1,480,859 | ||||
| 23,578,063 | ||||||
| (Cost $29,164,578) |
29,415,021 | |||||
| Moody’s (Unaudited) |
||||||
| ASSET BACKED SECURITIES — 1.7% |
||||||
| BankBoston Home Equity Loan Trust Series 1998-1 Class A6 |
||||||
| 6.35%, 02/25/13 |
Aaa | 312 | 326,443 | |||
| Capital Auto Receivables Asset Trust Series 2002-2 Class CTFS |
||||||
| 4.18%, 10/15/07 |
Aaa | 355 | 362,569 | |||
| Chase Funding Mortgage Loan Asset-Backed Series 2002-1 Class 1A3 |
||||||
| 5.039%, 12/25/23 [VR](c) |
Aaa | 550 | 553,829 | |||
| Chase Funding Mortgage Loan Asset-Backed Series 2002-2 Class 1M1 |
||||||
| 5.599%, 09/25/31 |
Aa2 | 80 | 83,280 | |||
| Chase Funding Mortgage Loan Asset-Backed Series 2003-3 Class 1M1 |
||||||
| 4.537%, 09/25/32 |
Aa2 | 150 | 142,799 | |||
| Chase Manhattan Auto Owner Trust Series 2003-A Class A4 |
||||||
| 2.06%, 12/15/09 |
Aaa | 285 | 279,422 | |||
| Citibank Credit Card Issuance |
||||||
| 7.45%, 09/15/07 |
Baa2 | 600 | 649,244 | |||
| Citibank Credit Card Issuance Trust Series 2001-C1 Class C1 |
||||||
| 2.23%, 01/15/10 [VR](c) |
Baa2 | 235 | 238,879 | |||
180
Table of Contents
AST T. Rowe Price Asset Allocation Portfolio
Schedule of Investments
December 31, 2003
| Moody’s (Unaudited) |
Par (000) |
Value | ||||||
| Citibank Credit Card Issuance Trust Series 2002-C1 |
||||||||
| 2.16%, 02/09/09 [VR](c) |
Baa2 | $ | 225 | $ | 227,779 | |||
| Countrywide Asset-Backed Certificates Series 2003-5 Class AF3 |
||||||||
| 3.613%, 04/25/30 |
Aaa | 315 | 317,964 | |||||
| Harley-Davidson Motorcycle Trust Series 2003-3 Class B |
||||||||
| 2.28%, 05/15/11 |
A2 | 266 | 266,807 | |||||
| Hyundai Auto Receivables Trust Series 2003-A Class A4 |
||||||||
| 3.02%, 10/15/10 |
Aaa | 175 | 174,920 | |||||
| Hyundai Auto Receivables Trust Series 2003-A Class D |
||||||||
| 4.06%, 10/15/10 |
Baa2 | 80 | 80,011 | |||||
| John Deere Owner Trust Series 2001-A Class A4 |
||||||||
| 3.78%, 09/15/08 |
Aaa | 900 | 917,528 | |||||
| MBNA Credit Card Master Note Trust Series 2001-C2 |
||||||||
| 2.313%, 12/15/10 [VR] 144A |
Baa2 | 550 | 560,543 | |||||
| MBNA Master Credit Card Trust Series 2000-D Class C |
||||||||
| 8.40%, 09/15/09 144A |
BBB(d) | 300 | 342,151 | |||||
| Reliant Energy Transition Bond Co. LLC Series 2001-1 Class A4 |
||||||||
| 5.63%, 09/15/15 |
Aaa | 350 | 372,787 | |||||
| World Financial Network Credit Card Master Trust Series 2003-A Class A2 |
||||||||
| 1.49%, 08/14/03 [VR](c) |
Aaa | 375 | 377,338 | |||||
| (Cost $6,138,124) |
6,274,293 | |||||||
| COLLATERALIZED MORTGAGE OBLIGATIONS — 1.5% |
||||||||
| Bank of America Commercial Mortgage, Inc. Series, 2003-1 Class A2 |
||||||||
| 4.648%, 09/11/36 |
AAA(d) | 350 | 348,198 | |||||
| Bank of America Mortgage Securities, Series 2003-L |
||||||||
| 4.377%, 01/25/34 |
Aaa | 850 | 848,141 | |||||
| Moody’s (Unaudited) |
Par (000) |
Value | ||||||
| Countrywide Asset-Backed Certificates, Series 2003-60 Class 1A2 |
||||||||
| 5.067%, 02/25/34 |
Aaa | $ | 150 | $ | 152,672 | |||
| General Electric Capital Commercial Mortgage Corp., Series 2001-1 Class A2 |
||||||||
| 6.531%, 05/15/33 |
Aaa | 390 | 437,622 | |||||
| GMAC Commercial Mortgage Securities, Inc., Series 2001-C2 Class A2 |
||||||||
| 6.70%, 04/15/34 |
AAA(d) | 375 | 424,432 | |||||
| J.P. Morgan Chase Commercial Mortgage Finance Corp., Series 2001-CIB2 Class A2 |
||||||||
| 6.244%, 04/15/35 |
AAA(d) | 325 | 357,483 | |||||
| J.P. Morgan Chase Commercial Mortgage Finance Corp., Series 2001-CIBC Class A3 |
||||||||
| 6.26%, 03/15/33 |
AAA(d) | 1,425 | 1,572,519 | |||||
| J.P. Morgan Commercial Mortgage Finance Corp., Series 1999-PSL1 Class A2 |
||||||||
| 7.108%, 02/15/32 |
AAA(d) | 310 | 353,484 | |||||
| Salomon Brothers Mortgage Securities VII, Series 2001-C1 Class A2 |
||||||||
| 6.226%, 12/18/35 |
Aaa | 550 | 603,853 | |||||
| Summit Mortgage Trust, Series 2002-1 Class A2 |
||||||||
| 6.227%, 06/28/16 [VR] 144A |
NA | 163 | 163,163 | |||||
| (Cost $5,066,363) |
5,261,567 | |||||||
| Shares |
||||
| PREFERRED STOCK — 0.4% |
||||
| Broadcasting — 0.2% |
||||
| News Corp. Ltd. [ADR], 6.25% |
11,212 | 339,163 | ||
| Cable Television — 0.2% |
||||
| Cablevision Systems Corp. 11.125% Series M |
4,125 | 434,156 | ||
| Chemicals |
||||
| Hercules Trust II, 6.5% [CVT] |
150 | 118,500 | ||
| Clothing & Apparel |
||||
| Anvil Holdings, Inc., Series B 13.00%* |
1,966 | 28,011 | ||
| Hugo Boss (Germany) |
6,240 | 125,540 | ||
| 153,551 | ||||
181
Table of Contents
AST T. Rowe Price Asset Allocation Portfolio
Schedule of Investments
December 31, 2003
| Shares |
Value | ||||
| Healthcare Services |
|||||
| Fresenius AG (United Kingdom) |
2,211 | $ | 154,642 | ||
| Telecommunications |
|||||
| Alamosa Holdings, Inc., 7.5%, |
75 | 25,969 | |||
| Utilities |
|||||
| CMS Energy Corp., 4.5%*[CVT] 144A (cost $40,928; purchased 12/01/03 - 12/02/03)(g) |
800 | 44,900 | |||
| Total Preferred Stock |
|||||
| (Cost $1,080,778) |
1,270,881 | ||||
| Moody’s Rating (Unaudited) |
Par (000) |
||||||
| SOVEREIGN ISSUES — 0.1% |
|||||||
| Chile |
|||||||
| Republic of Chile |
|||||||
| 5.50%, 01/15/13 |
Baa1 | $ | 165 | 170,115 | |||
| Mexico — 0.1% |
|||||||
| United Mexican States |
|||||||
| 6.375%, 01/16/13 |
Baa2 | 205 | 213,200 | ||||
| Total Sovereign Issues |
|||||||
| (Cost $365,554) |
383,315 | ||||||
| MUNICIPAL BONDS |
|||||||
| Oregon |
|||||||
| Oregon State Taxable Pension |
|||||||
| 5.892%, 06/01/27 |
|||||||
| (Cost $60,000) |
Aa3 | 60 | 62,433 | ||||
| CONVERTIBLE BONDS |
|||||||
| Sanmina - SCI Corp. |
|||||||
| 10.375%, 01/15/10 |
|||||||
| (Cost $50,000) |
Ba2 | 50 | 58,750 | ||||
| Units |
Value | |||
| WARRANTS* |
||||
| Entertainment & Leisure |
||||
| Mikohn Gaming Corp., expiring 08/15/08 144A (cost $0; purchased 01/16/02)(g) |
75 | 0 | ||
| Retail & Merchandising |
||||
| Barneys New York, Inc., expiring 04/01/08 (cost $0; purchased 09/30/03)(g) |
25 | 513 | ||
| Travelcenters of America Units, expiring 05/01/09 |
525 | 2,887 | ||
| Total Warrants |
||||
| (Cost $0) |
3,400 | |||
| Moody’s (Unaudited) |
Par (000) |
Value | ||||||
| CORPORATE OBLIGATIONS — 12.1% |
||||||||
| Advertising — 0.1% |
||||||||
| Advanstar Communications, Inc., Gtd. Notes |
||||||||
| 12.00%, 02/15/11 |
Caa2 | $ | 25 | $ | 26,438 | |||
| Advanstar Communications, Inc., Sec’d. Notes |
||||||||
| 10.75%, 08/15/10 144A |
B3 | 25 | 27,188 | |||||
| R H Donnelley Finance Corp. I, Gtd. Notes |
||||||||
| 8.875%, 12/15/10 |
B1 | 25 | 28,250 | |||||
| 10.875%, 12/15/12 |
B2 | 150 | 178,874 | |||||
| Vertis, Inc., Gtd. Notes, |
||||||||
| 10.875%, 06/15/09 |
B3 | 50 | 53,500 | |||||
| Sec’d. Notes |
||||||||
| 9.75%, 04/01/09 |
B2 | 25 | 27,281 | |||||
| Vertis, Inc., Sub. Notes |
||||||||
| 13.50%, 12/07/09 144A |
Caa1 | 50 | 49,250 | |||||
| 390,781 | ||||||||
| Aerospace — 0.2% |
||||||||
| Aviall, Inc., Sr. Notes |
||||||||
| 7.625%, 07/01/11 |
B1 | 50 | 52,375 | |||||
| BE Aerospace, Inc., Sr. Notes |
||||||||
| 8.50%, 10/01/10 144A |
B3 | 50 | 53,875 | |||||
| Boeing Co., Debs. |
||||||||
| 8.75%, 08/15/21 |
A3 | 85 | 108,288 | |||||
| Gencorp, Inc., Sr. Sub. Notes |
||||||||
| 9.50%, 08/15/13 144A |
B2 | 150 | 156,750 | |||||
| Sequa Corp., Sr. Notes |
||||||||
| 9.00%, 08/01/09 |
B1 | 50 | 55,375 | |||||
| TD Funding Corp., Gtd. Notes |
||||||||
| 8.375%, 07/15/11 |
B3 | 25 | 26,719 | |||||
| Vought Aircraft Industry, Inc., |
||||||||
| 8.00%, 07/15/11 144A |
B2 | 125 | 128,125 | |||||
| 581,507 | ||||||||
| Airlines |
||||||||
| Northwest Airlines, Inc., |
||||||||
| 9.875%, 03/15/07 |
Caa1 | 25 | 22,875 | |||||
182
Table of Contents
AST T. Rowe Price Asset Allocation Portfolio
Schedule of Investments
December 31, 2003
| Moody’s (Unaudited) |
Par (000) |
Value | ||||||
| Automobile Manufacturers — 0.2% |
||||||||
| Daimlerchrysler NA Holding Corp., Notes |
||||||||
| 6.50%, 11/15/13 |
A3 | $ | 310 | $ | 327,153 | |||
| General Motors Corp., Debs |
||||||||
| 8.375%, 07/15/33 |
Baa1 | 200 | 228,472 | |||||
| 555,625 | ||||||||
| Automotive Parts — 0.2% |
||||||||
| Accuride Corp., Sr. Sub. Notes, Series B |
||||||||
| 9.25%, 02/01/08 |
Caa1 | 25 | 25,875 | |||||
| Dana Corp., Notes |
||||||||
| 9.00%, 08/15/11 |
Ba3 | 50 | 60,500 | |||||
| 7.00%, 03/01/29 |
Ba3 | 25 | 24,875 | |||||
| Dura Operating Corp., Gtd. Notes, Series D |
||||||||
| 9.00%, 05/01/09(a) |
B2 | 75 | 75,375 | |||||
| Eagle-Picher Industries, Inc., |
||||||||
| 9.75%, 09/01/13 144A |
B3 | 75 | 82,125 | |||||
| Intermet Corp., Gtd. Notes |
||||||||
| 9.75%, 06/15/09 |
B2 | 25 | 25,750 | |||||
| Rexnord Corp., Gtd. Notes |
||||||||
| 10.125%, 12/15/12 |
B3 | 100 | 110,500 | |||||
| TRW Automotive, Inc., |
||||||||
| 9.375%, 02/15/13 |
B1 | 125 | 143,438 | |||||
| Sr. Sub. Notes |
||||||||
| 11.00%, 02/15/13 |
B2 | 50 | 59,375 | |||||
| 607,813 | ||||||||
| Beverages — 0.1% |
||||||||
| Bottling Group LLC, Gtd. Notes |
||||||||
| 4.625%, 11/15/12 |
A3 | 160 | 159,416 | |||||
| Coca-Cola Enterprises, Notes |
||||||||
| 6.125%, 08/15/11 |
A2 | 160 | 177,215 | |||||
| Le-Natures, Inc., Sr. Sub. Notes |
||||||||
| 9.00%, 06/15/13 144A |
B3 | 125 | 131,250 | |||||
| 467,881 | ||||||||
| Broadcasting — 0.4% |
||||||||
| Clear Channel Communications, Inc., Sr. Notes |
||||||||
| 4.625%, 01/15/08 |
Baa3 | 145 | 149,725 | |||||
| Granite Broadcasting Corp., |
||||||||
| 9.75%, 12/01/10 144A |
B3 | 25 | 25,063 | |||||
| Moody’s (Unaudited) |
Par (000) |
Value | ||||||
| Hearst-Argyle Television, Inc., |
||||||||
| 7.00%, 01/15/18 |
Baa3 | $ | 135 | $ | 149,235 | |||
| Liberty Media Corp., Sr. Notes |
||||||||
| 2.67%, 09/17/06 [VR] (c) |
Baa3 | 80 | 80,933 | |||||
| News America, Inc., Gtd. Notes |
||||||||
| 6.55%, 03/15/33 |
Baa3 | 185 | 192,819 | |||||
| Pegasus Satellite Communications, Inc., Sr. Disc. Notes, |
||||||||
| Zero Coupon |
||||||||
| 13.50%, 03/01/07 |
C | 50 | 42,563 | |||||
| Sr. Notes |
||||||||
| 11.25%, 01/15/10 144A |
Ca | 150 | 138,750 | |||||
| Sinclair Broadcast Group, Inc., Gtd. Notes |
||||||||
| 8.00%, 03/15/12 |
B2 | 75 | 81,375 | |||||
| Univision Communications, Inc., Sr. Notes |
||||||||
| 2.875%, 10/15/06 |
Baa3 | 95 | 94,736 | |||||
| Vivendi Universal SA, Sr. Notes, (France) |
||||||||
| 9.25%, 04/15/10 144A |
B1 | 125 | 148,125 | |||||
| XM Satellite Radio, Inc., |
||||||||
| 12.00%, 06/15/10 |
Caa1 | 50 | 56,875 | |||||
| Sec’d. Notes, |
||||||||
| 14.00%, 12/31/09 |
Caa1 | 125 | 112,500 | |||||
| 1,272,699 | ||||||||
| Building Materials — 0.2% |
||||||||
| American Builders & Contractors Supply Co., Inc., Gtd. Notes, Series B |
||||||||
| 10.625%, 05/15/07 |
B3 | 150 | 156,000 | |||||
| Associated Materials, Inc., |
||||||||
| 9.75%, 04/15/12 |
B3 | 125 | 137,500 | |||||
| Koppers, Inc., Gtd. Notes |
||||||||
| 9.875%, 10/15/13 144A |
B2 | 50 | 55,500 | |||||
| Masco Corp., Notes |
||||||||
| 5.875%, 07/15/12 |
Baa1 | 265 | 282,380 | |||||
| Nortek, Inc., Sr. Sub. Notes, |
||||||||
| 9.875%, 06/15/11 |
B3 | 75 | 83,063 | |||||
183
Table of Contents
AST T. Rowe Price Asset Allocation Portfolio
Schedule of Investments
December 31, 2003
| Moody’s (Unaudited) |
Par (000) |
Value | ||||||
| Texas Industries, Inc., Sr. Notes |
||||||||
| 10.25%, 06/15/11 |
B1 | $ | 50 | $ | 56,750 | |||
| 771,193 | ||||||||
| Business Services — 0.2% |
||||||||
| Brickman Group Ltd., Gtd. Notes, Series B |
||||||||
| 11.75%, 12/15/09 |
B2 | 50 | 58,500 | |||||
| Cie Generale de Geophysique, |
||||||||
| 10.625%, 11/15/07(l) |
Ba3 | 50 | 53,250 | |||||
| Couche-Tard Corp., Sr. Sub. Notes |
||||||||
| 7.50%, 12/15/13 144A |
Ba3 | 25 | 26,438 | |||||
| IESI Corp., Gtd. Notes |
||||||||
| 10.25%, 06/15/12 |
B3 | 50 | 55,813 | |||||
| IPC Acquisition Corp., Gtd. Notes |
||||||||
| 11.50%, 12/15/09 |
B3 | 100 | 109,500 | |||||
| J.P. Morgan Chase & Co., |
||||||||
| 5.75%, 01/02/13 |
A2 | 180 | 190,141 | |||||
| Worldspan L.P./ WS Financial Corp., Sr. Notes |
||||||||
| 9.625%, 06/15/11 144A |
B2 | 50 | 51,625 | |||||
| 545,267 | ||||||||
| Cable Television — 0.4% |
||||||||
| Charter Communications Holdings LLC, Sr. Notes |
||||||||
| 10.00%, 04/01/09(a) |
Ca | 25 | 22,375 | |||||
| 10.25%, 09/15/10 144A |
Caa1 | 100 | 105,250 | |||||
| 11.125%, 01/15/11 |
Ca | 125 | 115,000 | |||||
| 8.75%, 11/15/13 144A |
B3 | 125 | 127,813 | |||||
| Comcast Corp., Gtd. Notes |
||||||||
| 5.85%, 01/15/10 |
Baa3 | 350 | 374,269 | |||||
| Cox Communications, Inc., Notes |
||||||||
| 7.875%, 08/15/09 |
Baa2 | 150 | 177,436 | |||||
| CSC Holdings, Inc., |
||||||||
| 8.125%, 08/15/09 |
B1 | 25 | 26,938 | |||||
| Sr. Notes |
||||||||
| 7.875%, 12/15/07 |
B1 | 25 | 26,438 | |||||
| 8.125%, 07/15/09 |
B1 | 25 | 26,938 | |||||
| 7.625%, 04/01/11 |
B1 | 50 | 52,875 | |||||
| Moody’s (Unaudited) |
Par (000) |
Value | ||||||
| General Cable Corp., Sr. Notes |
||||||||
| 9.50%, 11/15/10 144A |
B2 | $ | 100 | $ | 107,250 | |||
| Mediacom Broadband LLC, Gtd. Notes |
||||||||
| 11.00%, 07/15/13 |
B2 | 75 | 84,563 | |||||
| Rogers Cablesystems of America, Inc., Sr. Notes, Series B (Canada) |
||||||||
| 10.00%, 03/15/05(l) |
Ba2 | 125 | 134,687 | |||||
| 1,381,832 | ||||||||
| Chemicals — 0.4% |
||||||||
| Avecia Group, Gtd. Notes |
||||||||
| 11.00%, 07/01/09(a)(l) |
Caa3 | 125 | 113,125 | |||||
| Chevron Phillips Chemical Co., Notes |
||||||||
| 5.375%, 06/15/07 |
Baa1 | 140 | 149,170 | |||||
| Dow Chemical Corp., Notes |
||||||||
| 6.125%, 02/01/11 |
A3 | 115 | 123,917 | |||||
| Equistar Chemical, Sr. Notes |
||||||||
| 10.625%, 05/01/11 |
B2 | 25 | 27,625 | |||||
| Huntsman Advanced Materials LLC, Sec’d. Notes |
||||||||
| 11.00%, 07/15/10 144A |
B2 | 50 | 55,500 | |||||
| Huntsman ICI Chemicals LLC, Gtd. Notes |
||||||||
| 10.125%, 07/01/09 |
Caa1 | 25 | 26,000 | |||||
| Huntsman International LLC, |
||||||||
| 9.875%, 03/01/09 |
B3 | 100 | 110,000 | |||||
| Kronos International, Inc., |
||||||||
| 8.875%, 06/30/09 (EUR) |
B2 | 50 | 68,744 | |||||
| Lyondell Chemical Co., |
||||||||
| 9.50%, 12/15/08 |
B1 | 75 | 79,500 | |||||
| MacDermid, Inc., Gtd. Notes |
||||||||
| 9.125%, 07/15/11 |
Ba3 | 125 | 140,625 | |||||
| Nalco Co., Sr. Notes |
||||||||
| 7.75%, 11/15/11 144A |
B2 | 25 | 26,875 | |||||
| Noveon, Inc., Sr. Sub. Notes |
||||||||
| 13.00%, 08/31/11 |
NR | 107 | 113,423 | |||||
184
Table of Contents
AST T. Rowe Price Asset Allocation Portfolio
Schedule of Investments
December 31, 2003
| Moody’s (Unaudited) |
Par (000) |
Value | ||||||
| Resolution Perfomance LLC, |
||||||||
| 9.50%, 04/15/10 |
B3 | $ | 50 | $ | 51,375 | |||
| Rhodia SA, Sr. Notes (France) |
||||||||
| 7.625%, 06/01/10 144A |
B3 | 25 | 24,125 | |||||
| 8.875%, 06/01/11 144A |
B3 | 100 | 92,500 | |||||
| Rockwood Specialties, Inc., Sr. Sub. Notes |
||||||||
| 10.625%, 05/15/11 144A |
B3 | 75 | 84,000 | |||||
| Salt Holdings Corp., Inc., |
||||||||
| Zero Coupon (until 06/01/08) |
||||||||
| 12.00%, 06/01/13 144A |
B-(d) | 125 | 86,875 | |||||
| 1,373,379 | ||||||||
| Clothing & Apparel |
||||||||
| Avondale Mills, Inc., |
||||||||
| 10.25%, 07/01/13 |
B3 | 75 | 47,625 | |||||
| Dyersburg Corp., Gtd. Notes, |
||||||||
| 9.75%, 09/01/07(i) |
NR | 175 | 18 | |||||
| J. Crew Intermediate LLC, |
||||||||
| 16.00%, 05/15/08 |
CCC(d) | 50 | 40,000 | |||||
| 87,643 | ||||||||
| Computer Hardware — 0.1% |
||||||||
| International Business Machines Corp., Notes |
||||||||
| 4.25%, 09/15/09 |
A1 | 200 | 205,430 | |||||
| Conglomerates |
||||||||
| Hutchison Whampoa International Ltd., Gtd. Notes |
||||||||
| 5.45%, 11/24/10 144A |
A3 | 130 | 132,085 | |||||
| Consumer Products & Services — 0.3% |
||||||||
| American Achievement Corp., Gtd. Notes |
||||||||
| 11.625%, 01/01/07 |
B1 | 50 | 56,250 | |||||
| American Safety Razor Co., |
||||||||
| 9.875%, 08/01/05 |
B3 | 50 | 49,750 | |||||
| Moody’s (Unaudited) |
Par (000) |
Value | ||||||
| Bally Total Fitness Holding Corp., Sr. Notes |
||||||||
| 10.50%, 07/15/11 144A |
B2 | $ | 50 | $ | 50,500 | |||
| Bunge Limited Finance Corp., Notes |
||||||||
| 4.375%, 12/15/08 144A |
Baa3 | 140 | 140,982 | |||||
| Chattem, Inc., Gtd. Notes, Series B |
||||||||
| 8.875%, 04/01/08 |
B2 | 50 | 51,625 | |||||
| Coinmach Corp., Sr. Notes |
||||||||
| 9.00%, 02/01/10 |
B2 | 75 | 81,750 | |||||
| Jostens Holdings Corp., |
||||||||
| Zero Coupon |
Caa2 | 100 | 64,000 | |||||
| Jostens, Inc., Sr. Sub. Notes |
||||||||
| 12.75%, 05/01/10 |
B3 | 100 | 115,500 | |||||
| Rayovac Corp., Sr. Sub. Notes |
||||||||
| 8.50%, 10/01/13 |
B3 | 25 | 26,188 | |||||
| Salton, Inc., Sr. Sub. Notes |
||||||||
| 12.25%, 04/15/08 |
B3 | 50 | 53,500 | |||||
| UST, Inc., Notes |
||||||||
| 6.625%, 07/15/12 |
A3 | 260 | 289,698 | |||||
| 979,743 | ||||||||
| Containers & Packaging — 0.3% |
||||||||
| AEP Industries, Inc., |
||||||||
| 9.875%, 11/15/07 |
B3 | 25 | 25,250 | |||||
| Bway Corp., Sr. Sub. Notes |
||||||||
| 10.00%, 10/15/10 |
B3 | 75 | 82,125 | |||||
| Constar International, Inc., |
||||||||
| 11.00%, 12/01/12 |
Caa1 | 25 | 21,250 | |||||
| Crown European Holdings SA, Sec’d. Notes |
||||||||
| 10.875%, 03/01/13 |
B2 | 175 | 206,718 | |||||
| Greif, Inc., Gtd. Notes |
||||||||
| 8.875%, 08/01/12 |
B2 | 50 | 55,250 | |||||
| Owens-Brockway Glass Containers Corp., Gtd. Notes |
||||||||
| 8.875%, 02/15/09 |
B1 | 125 | 137,187 | |||||
| 7.75%, 05/15/11 |
B1 | 25 | 26,938 | |||||
| 8.25%, 05/15/13 |
B1 | 50 | 53,875 | |||||
| Owens-Illinois, Inc., Sr. Notes |
||||||||
| 7.35%, 05/15/08 |
B3 | 25 | 25,813 | |||||
185
Table of Contents
AST T. Rowe Price Asset Allocation Portfolio
Schedule of Investments
December 31, 2003
| Moody’s (Unaudited) |
Par (000) |
Value | ||||||
| Plastipak Holdings, Inc., |
||||||||
| 10.75%, 09/01/11 |
B3 | $ | 50 | $ | 55,750 | |||
| Sealed Air Corp., Sr. Notes |
||||||||
| 5.375%, 04/15/08 144A |
Baa3 | 145 | 153,249 | |||||
| Silgan Holdings, Inc., |
||||||||
| 6.75%, 11/15/13 144A |
B1 | 25 | 25,188 | |||||
| Smurfit Capital Funding PLC, Notes (Ireland) |
||||||||
| 6.75%, 11/20/05(l) |
Ba3 | 50 | 52,000 | |||||
| Smurfit-Stone Container Corp., |
||||||||
| 8.375%, 07/01/12 |
B2 | 25 | 27,250 | |||||
| Tekni-Plex, Inc., Sec’d. Notes |
||||||||
| 8.75%, 11/15/13 144A |
B2 | 75 | 78,563 | |||||
| 1,026,406 | ||||||||
| Electronic Components & Equipment — 0.1% |
||||||||
| Amkor Technologies, Inc., |
||||||||
| 7.75%, 05/15/13(a) |
B1 | 50 | 53,875 | |||||
| Chippac International Ltd., |
||||||||
| 12.75%, 08/01/09 |
B3 | 50 | 55,375 | |||||
| Stratus Technologies, Inc., |
||||||||
| 10.375%, 12/01/08 144A |
B3 | 50 | 53,313 | |||||
| TNP Enterprises, Inc., Notes |
||||||||
| 14.50%, 04/01/11 [PIK] |
B1 | 25 | 27,188 | |||||
| TNP Enterprises, Inc., |
||||||||
| 10.25%, 04/01/10 |
Ba3 | 50 | 54,750 | |||||
| 244,501 | ||||||||
| Entertainment & Leisure — 0.4% |
||||||||
| Ameristar Casinos, Inc., Gtd. Notes |
||||||||
| 10.75%, 02/15/09 |
B2 | 50 | 57,750 | |||||
| AMF Bowling Worldwide, Inc., |
||||||||
| 13.00%, 02/28/08 |
B3 | 50 | 56,750 | |||||
| AOL Time Warner, Inc., |
||||||||
| 7.625%, 04/15/31 |
Baa1 | 160 | 185,291 | |||||
| Argosy Gaming Co., Gtd. Notes |
||||||||
| 10.75%, 06/01/09 |
B2 | 100 | 108,500 | |||||
| Moody’s (Unaudited) |
Par (000) |
Value | ||||||
| Coast Hotels & Casinos, Inc., |
||||||||
| 9.50%, 04/01/09 |
B2 | $ | 25 | $ | 26,500 | |||
| Hockey Co., Notes (Canada) |
||||||||
| 11.25%, 04/15/09(l) |
B2 | 50 | 57,313 | |||||
| IMAX Corp., Gtd. Notes (Canada) |
||||||||
| 9.625%, 12/01/10 144A |
B3 | 25 | 26,406 | |||||
| Majestic Star Casino LLC, |
||||||||
| 9.50%, 10/15/10 144A |
B2 | 75 | 77,250 | |||||
| Old Evangeline Downs LLC, |
||||||||
| 13.00%, 03/01/10 |
B-(d) | 50 | 53,625 | |||||
| Penn National Gaming, Inc., |
||||||||
| 11.125%, 03/01/08 |
B3 | 75 | 84,844 | |||||
| Resorts International Hotel & Casino, Inc., Gtd. Notes |
||||||||
| 11.50%, 03/15/09 |
B2 | 25 | 27,313 | |||||
| Six Flags, Inc., Sr. Notes |
||||||||
| 9.50%, 02/01/09 |
B2 | 75 | 78,938 | |||||
| 9.75%, 04/15/13 |
B2 | 75 | 79,125 | |||||
| 9.625%, 06/01/14 144A |
B2 | 25 | 26,250 | |||||
| Speedway Motorsports, Inc., |
||||||||
| 6.75%, 06/01/13 |
Ba2 | 50 | 51,750 | |||||
| Station Casinos, Inc., |
||||||||
| 9.875%, 07/01/10 |
B1 | 75 | 82,875 | |||||
| Town Sports International, Inc., Gtd. Notes |
||||||||
| 9.625%, 04/15/11 |
B2 | 25 | 26,875 | |||||
| Trump Casino Holdings LLC, |
||||||||
| 11.625%, 03/15/10(a) |
B3 | 25 | 24,063 | |||||
| Turning Stone Casino Resort Enterprise, Sr. Notes |
||||||||
| 9.125%, 12/15/10 144A |
B1 | 25 | 27,313 | |||||
| Venetian Casino Resort LLC, |
||||||||
| 11.00%, 06/15/10 |
B3 | 100 | 116,499 | |||||
| Viacom, Inc., Gtd. Notes |
||||||||
| 5.625%, 08/15/12 |
A3 | 110 | 117,249 | |||||
| 1,392,479 | ||||||||
186
Table of Contents
AST T. Rowe Price Asset Allocation Portfolio
Schedule of Investments
December 31, 2003
| Moody’s (Unaudited) |
Par (000) |
Value | ||||||
| Environmental Services — 0.1% |
||||||||
| Allied Waste North America, Inc., Sr. Notes |
||||||||
| 7.875%, 04/15/13 |
Ba3 | $ | 75 | $ | 81,563 | |||
| Casella Waste Systems, Inc., |
||||||||
| 9.75%, 02/01/13 |
B3 | 100 | 112,500 | |||||
| Synagro Technologies, Inc., |
||||||||
| 9.50%, 04/01/09 |
B3 | 125 | 137,187 | |||||
| 331,250 | ||||||||
| Farming & Agriculture — 0.1% |
||||||||
| AGCO Corp., Gtd. Notes |
||||||||
| 9.50%, 05/01/08 |
Ba3 | 50 | 54,875 | |||||
| Dimon, Inc., Gtd. Notes |
||||||||
| 9.625%, 10/15/11 |
Ba3 | 150 | 168,375 | |||||
| 223,250 | ||||||||
| Financial - Bank & Trust — 0.3% |
||||||||
| ABN AMRO Bank NV, |
||||||||
| 7.125%, 06/18/07 |
A1 | 145 | 163,707 | |||||
| Bank of America Corp., Sr. Notes |
||||||||
| 4.875%, 09/15/12 |
Aa2 | 225 | 226,550 | |||||
| Bank of Nova Scotia, Sub. Debs. (Canada) |
||||||||
| 6.25%, 09/15/08(l) |
A1 | 50 | 55,046 | |||||
| BB&T Corp., Sub. Notes |
||||||||
| 6.50%, 08/01/11 |
A2 | 70 | 78,682 | |||||
| Capital One Bank, Notes |
||||||||
| 4.25%, 12/01/08 |
Baa2 | 180 | 179,416 | |||||
| Countrywide Home Loans, Inc., Gtd. Notes |
||||||||
| 5.50%, 02/01/07 |
A3 | 135 | 144,754 | |||||
| Northern Trust Co., Sub. Notes |
||||||||
| 4.60%, 02/01/13 |
A1 | 115 | 111,723 | |||||
| US Bank NA, Notes |
||||||||
| 2.85%, 11/15/06 |
Aa2 | 175 | 175,967 | |||||
| Wachovia Corp., Sub. Notes |
||||||||
| 6.40%, 04/01/08 |
A1 | 80 | 88,300 | |||||
| 1,224,145 | ||||||||
| Financial Services — 1.4% |
||||||||
| Alamosa Delaware, Inc., |
||||||||
| 11.00%, 07/31/10 |
Caa1 | 74 | 80,660 | |||||
| Arch Western Finance, Sr. Notes |
||||||||
| 6.75%, 07/01/13 144A |
Ba2 | 50 | 51,500 | |||||
| ASAT Finance LLC, Gtd. Notes |
||||||||
| 12.50%, 11/01/06 |
B3 | 146 | 155,939 | |||||
| Moody’s (Unaudited) |
Par (000) |
Value | ||||||
| Bank One Corp., Sub. Notes |
||||||||
| 5.25%, 01/30/13 |
A1 | $ | 270 | $ | 277,486 | |||
| Bear Stearns Co., Inc., Notes |
||||||||
| 4.00%, 01/31/08 |
A1 | 230 | 234,481 | |||||
| BHP Finance USA Ltd., |
||||||||
| 4.80%, 04/15/13(l) |
A2 | 135 | 135,595 | |||||
| CIT Group, Inc., Sr. Notes |
||||||||
| 2.875%, 09/29/06 |
A2 | 90 | 90,298 | |||||
| 7.75%, 04/02/12 |
A2 | 175 | 207,076 | |||||
| Citigroup, Inc., Sub. Notes |
||||||||
| 5.625%, 08/27/12 |
Aa2 | 240 | 253,788 | |||||
| Dollar Financial Group, Gtd. Notes |
||||||||
| 9.75%, 11/15/11 144A |
B3 | 50 | 52,000 | |||||
| Equinox Holdings Ltd., |
||||||||
| 9.00%, 12/15/09 144A |
B3 | 50 | 52,250 | |||||
| Ford Motor Credit Co., Notes |
||||||||
| 6.50%, 01/25/07 |
A3 | 380 | 405,065 | |||||
| Franklin Resources, Inc., Notes |
||||||||
| 3.70%, 04/15/08 |
A2 | 55 | 54,755 | |||||
| General Electric Capital Corp., Notes |
||||||||
| 3.50%, 05/01/08 |
Aaa | 185 | 185,372 | |||||
| 6.00%, 06/15/12 |
Aaa | 360 | 391,054 | |||||
| General Motors Acceptance Corp., Notes |
||||||||
| 7.25%, 03/02/11 |
A3 | 230 | 252,690 | |||||
| Goldman Sachs Group, Inc., Notes |
||||||||
| 4.125%, 01/15/08 |
Aa3 | 220 | 225,775 | |||||
| 6.125%, 02/15/33 |
Aa3 | 75 | 75,785 | |||||
| HBOS PLC, Sub. Notes |
||||||||
| 6.00%, 11/01/33 144A |
Aa3 | 170 | 169,701 | |||||
| Household Finance Corp., Notes |
||||||||
| 5.75%, 01/30/07 |
A1 | 70 | 75,731 | |||||
| 6.375%, 11/27/12 |
A1 | 55 | 60,441 | |||||
| International Lease Finance Corp., Notes |
||||||||
| 6.375%, 03/15/09 |
A1 | 275 | 303,284 | |||||
| John Deere Capital Corp., Notes |
||||||||
| 7.00%, 03/15/12 |
A3 | 190 | 219,227 | |||||
| John Hancock Global Funding II, Notes |
||||||||
| 5.625%, 06/27/06 144A |
Aa3 | 240 | 257,069 | |||||
187
Table of Contents
AST T. Rowe Price Asset Allocation Portfolio
Schedule of Investments
December 31, 2003
| Moody’s (Unaudited) |
Par (000) |
Value | ||||||
| Lehman Brothers Holdings, Inc., Notes |
||||||||
| 4.00%, 01/22/08 |
A1 | $ | 115 | $ | 117,403 | |||
| Morgan Stanley, Notes |
||||||||
| 3.625%, 04/01/08 |
Aa3 | 105 | 105,251 | |||||
| Orion Power Holdings, Inc., |
||||||||
| 12.00%, 05/01/10 |
B2 | 75 | 91,500 | |||||
| Pemex Project Funding Master Trust, Gtd. Notes |
||||||||
| 7.375%, 12/15/14 |
Baa1 | 215 | 230,588 | |||||
| PHH Corp., Notes |
||||||||
| 7.125%, 03/01/13 |
Baa1 | 140 | 157,107 | |||||
| SLM Corp., Notes |
||||||||
| 4.00%, 01/15/09 |
A2 | 225 | 226,802 | |||||
| Union Planters Corp., Notes |
||||||||
| 4.375%, 12/01/10 |
A2 | 120 | 119,683 | |||||
| Verizon Global Funding Corp., Notes |
||||||||
| 7.75%, 12/01/30 A2 |
A2 | 165 | 194,546 | |||||
| Williams Scotsman, Inc., |
||||||||
| 9.875%, 06/01/07 |
B3 | 25 | 25,438 | |||||
| 5,535,340 | ||||||||
| Food — 0.3% |
||||||||
| Agrilink Foods, Inc., Gtd. Notes |
||||||||
| 11.875%, 11/01/08 |
B3 | 25 | 26,500 | |||||
| B&G Foods, Inc., |
||||||||
| 9.625%, 08/01/07 |
B3 | 75 | 78,000 | |||||
| Dole Foods Co., Sr. Notes |
||||||||
| 8.875%, 03/15/11 |
B2 | 100 | 109,750 | |||||
| Luigino’s, Inc., Sr. Sub. Notes |
||||||||
| 10.00%, 02/01/06 |
B3 | 100 | 103,000 | |||||
| McCormick & Co., Inc., Notes |
||||||||
| 6.40%, 02/01/06 |
A2 | 260 | 281,615 | |||||
| Pantry, Inc., Gtd. Notes |
||||||||
| 10.25%, 10/15/07 |
B3 | 75 | 78,000 | |||||
| Pinnacle Foods Holding Corp., |
||||||||
| 8.25%, 12/01/13 144A |
B3 | 100 | 104,000 | |||||
| PSF Group Holdings, Inc., |
||||||||
| 9.25%, 06/15/11 |
B1 | 50 | 50,750 | |||||
| United Agricultural Products, |
||||||||
| 8.25%, 12/15/11 144A |
B3 | 100 | 103,250 | |||||
| 934,865 | ||||||||
| Moody’s (Unaudited) |
Par (000) |
Value | ||||||
| Furniture |
||||||||
| Interface, Inc., Sr. Notes |
||||||||
| 10.375%, 02/01/10 |
Caa1 | $ | 75 | $ | 79,688 | |||
| Norcraft Companies L.P., |
||||||||
| 9.00%, 11/01/11 144A |
B3 | 75 | 80,625 | |||||
| 160,313 | ||||||||
| Healthcare Services — 0.2% |
||||||||
| AmeriPath, Inc., Gtd. Notes |
||||||||
| 10.50%, 04/01/13 |
B3 | 50 | 54,250 | |||||
| Concentra Operating Corp., |
||||||||
| 13.00%, 08/15/09 |
B3 | 75 | 84,000 | |||||
| 9.50%, 08/15/10 |
B3 | 25 | 27,125 | |||||
| Genesis Healthcare Corp., |
||||||||
| 8.00%, 10/15/13 144A |
B3 | 75 | 78,563 | |||||
| Highmark, Inc., Notes |
||||||||
| 6.80%, 08/15/13 144A |
Baa3 | 80 | 87,069 | |||||
| InSight Health Services Corp., Gtd. Notes |
||||||||
| 9.875%, 11/01/11(a) |
B3 | 50 | 53,750 | |||||
| Quintiles Transnational Corp., |
||||||||
| 10.00%, 10/01/13 144A |
B3 | 50 | 54,250 | |||||
| Tenet Healthcare Corp., |
||||||||
| Notes |
B1 | 75 | 75,750 | |||||
| Sr. Notes |
||||||||
| 6.50%, 06/01/12 |
B1 | 25 | 24,094 | |||||
| Vicar Operating, Inc., Gtd. Notes |
||||||||
| 9.875%, 12/01/09 |
B3 | 75 | 83,625 | |||||
| 622,476 | ||||||||
| Hotels & Motels — 0.2% |
||||||||
| Courtyard by Marriott II Ltd., |
||||||||
| 10.75%, 02/01/08 |
B2 | 215 | 217,150 | |||||
| Extended Stay America, |
||||||||
| 9.875%, 06/15/11 |
B2 | 25 | 28,125 | |||||
| Hammons, (John Q.) Hotels L.P., First Mortgage Notes |
||||||||
| 8.875%, 05/15/12 |
B2 | 100 | 110,750 | |||||
| Hilton Hotels Corp., Notes |
||||||||
| 7.625%, 12/01/12 |
Ba1 | 25 | 28,125 | |||||
188
Table of Contents
AST T. Rowe Price Asset Allocation Portfolio
Schedule of Investments
December 31, 2003
| Moody’s (Unaudited) |
Par (000) |
Value | ||||||
| Host Marriott L.P., Gtd. Notes |
||||||||
| 9.50%, 01/15/07 |
Ba3 | $ | 50 | $ | 55,875 | |||
| La Quinta Properties, Sr. Notes |
||||||||
| 8.875%, 03/15/11 |
Ba3 | 125 | 138,906 | |||||
| 578,931 | ||||||||
| Industrial Products — 0.3% |
||||||||
| Actuant Corp., Gtd. Notes |
||||||||
| 13.00%, 05/01/09 |
B2 | 179 | 233,595 | |||||
| Brand Services, Inc., Gtd. Notes |
||||||||
| 12.00%, 10/15/12 |
B3 | 75 | 87,000 | |||||
| Euramax International PLC, |
||||||||
| 8.50%, 08/15/11 144A |
B2 | 25 | 26,750 | |||||
| Four M Corp., Sr. Notes, Series B |
||||||||
| 12.00%, 06/01/06 |
B3 | 125 | 125,000 | |||||
| Massey Energy Co., Sr. Notes |
||||||||
| 6.625%, 11/15/10 144A |
Ba3 | 75 | 77,250 | |||||
| Mobile Mini, Inc., Sr. Notes |
||||||||
| 9.50%, 07/01/13 |
B2 | 75 | 82,875 | |||||
| National Waterworks, Inc., |
||||||||
| 10.50%, 12/01/12 |
B3 | 100 | 112,250 | |||||
| Shaw Group, Inc., Sr. Notes |
||||||||
| 10.75%, 03/15/10 144A |
Ba2 | 75 | 79,875 | |||||
| Steel Dynamics, Inc., Gtd. Notes |
||||||||
| 9.50%, 03/15/09 |
B1 | 125 | 139,375 | |||||
| 963,970 | ||||||||
| Insurance — 0.5% |
||||||||
| AIG SunAmerica Global Financing XII, Notes |
||||||||
| 5.30%, 05/30/07 144A |
Aaa | 275 | 294,853 | |||||
| Allstate Financial Global Funding LLC, Notes |
||||||||
| 5.25%, 02/01/07 144A |
Aa2 | 180 | 193,616 | |||||
| Fund American Companies, Inc., Notes |
||||||||
| 5.875%, 05/15/13 |
Baa2 | 70 | 70,975 | |||||
| Marsh & McLennan Companies, Inc., Notes |
||||||||
| 3.625%, 02/15/08 |
A2 | 80 | 80,358 | |||||
| Metlife, Inc., Sr. Notes |
||||||||
| 6.125%, 12/01/11 |
A2 | 200 | 218,464 | |||||
| Moody’s Rating (Unaudited) |
Par (000) |
Value | ||||||
| Nationwide Financial Services, Inc., Sr. Notes |
||||||||
| 5.90%, 07/01/12 |
A3 | $ | 325 | $ | 339,767 | |||
| NLV Financial Corp., Sr. Notes |
||||||||
| 7.50%, 08/15/33 144A |
Baa3 | 120 | 124,996 | |||||
| Principal Life Global Funding I, Notes |
||||||||
| 5.125%, 10/15/13 144A |
Aa3 | 185 | 185,833 | |||||
| Security Benefit Life Insurance Co., Notes |
||||||||
| 7.45%, 10/01/33 144A |
Baa1 | 80 | 81,908 | |||||
| XL Capital Ltd., Gtd. Notes |
||||||||
| 6.50%, 01/15/12 |
A2 | 240 | 263,105 | |||||
| 1,853,875 | ||||||||
| Machinery & Equipment — 0.1% |
||||||||
| Case New Holland, Inc., Sr. Notes |
||||||||
| 9.25%, 08/01/11 144A |
Ba3 | 50 | 56,250 | |||||
| Cummins, Inc., Sr. Notes |
||||||||
| 9.50%, 12/01/10 144A |
Ba2 | 25 | 28,875 | |||||
| Manitowoc Co., Inc. (The), |
||||||||
| 7.125%, 11/01/13 |
B1 | 50 | 51,938 | |||||
| Trimas Corp., Gtd. Notes |
||||||||
| 9.875%, 06/15/12 |
B3 | 100 | 104,750 | |||||
| 241,813 | ||||||||
| Medical Supplies & Equipment — 0.1% |
||||||||
| Fisher Scientific International, Inc., Sr. Sub. Notes |
||||||||
| 8.125%, 05/01/12 |
B2 | 65 | 70,038 | |||||
| Fresenius Medical Capital Trust II, Gtd. Notes |
||||||||
| 7.875%, 02/01/08 |
Ba2 | 250 | 268,125 | |||||
| 338,163 | ||||||||
| Metals & Mining — 0.3% |
||||||||
| Alcan, Inc., Bonds (Canada) |
||||||||
| 6.125%, 12/15/33(l) |
Baa1 | 175 | 176,670 | |||||
| Allegheny Technologies, Inc., Notes |
||||||||
| 8.375%, 12/15/11 |
B2 | 25 | 24,625 | |||||
| Century Aluminum Co., Notes |
||||||||
| 11.75%, 04/15/08 |
B1 | 100 | 112,000 | |||||
189
Table of Contents
AST T. Rowe Price Asset Allocation Portfolio
Schedule of Investments
December 31, 2003
| Moody’s Rating (Unaudited) |
Par (000) |
Value | ||||||
| Compass Minerals Group, Inc., Gtd. Notes |
||||||||
| 10.00%, 08/15/11 |
B3 | $ | 25 | $ | 28,125 | |||
| Falconbridge Ltd., Notes (Canada) |
||||||||
| 7.35%, 06/05/12(l) |
Baa3 | 185 | 209,351 | |||||
| Freeport-McMoRan Resource Partners, Inc. L.P., Sr. Notes |
||||||||
| 7.00%, 02/15/08 |
Caa1 | 150 | 96,750 | |||||
| Gerdau Ameristeel Corp., |
||||||||
| 10.375%, 07/15/11 144A |
B2 | 125 | 138,750 | |||||
| Ipsco, Inc., Sr. Notes (Canada) |
||||||||
| 8.75%, 06/01/13(l) |
Ba3 | 25 | 27,813 | |||||
| Jorgensen, (Earle, M.) Co., |
||||||||
| 9.75%, 06/01/12 |
B2 | 175 | 195,125 | |||||
| Neenah Corp., Sec’d. Notes |
||||||||
| 11.00%, 09/30/10 144A |
B2 | 25 | 27,625 | |||||
| Sr. Sub. Notes |
||||||||
| 13.00%, 09/30/13 144A |
CCC+(d) | 50 | 51,125 | |||||
| 1,087,959 | ||||||||
| Oil & Gas — 0.7% |
||||||||
| AmeriGas Partners L.P., Sr. Notes |
||||||||
| 8.875%, 05/20/11 |
B2 | 175 | 193,375 | |||||
| ANR Pipeline, Inc., Notes |
||||||||
| 8.875%, 03/15/10 |
B1 | 25 | 28,219 | |||||
| Baker Hughes, Inc., Sr. Notes |
||||||||
| 6.875%, 01/15/29 |
A2 | 200 | 227,190 | |||||
| Buckeye Partners L.P., Notes |
||||||||
| 6.75%, 08/15/33 |
Baa2 | 75 | 78,924 | |||||
| ConocoPhillips, Gtd. Notes |
||||||||
| 5.90%, 10/15/32 |
A3 | 150 | 150,918 | |||||
| Devon Financing Corp., |
||||||||
| 6.875%, 09/30/11(a) |
Baa2 | 145 | 164,670 | |||||
| Dynegy Holdings, Inc.,. |
||||||||
| 7.625%, 10/15/26 |
Caa2 | 25 | 21,719 | |||||
| Sr. Notes |
||||||||
| 8.75%, 02/15/12(a) |
Caa2 | 25 | 25,250 | |||||
| El Paso Corp., Sr. Notes |
||||||||
| 8.05%, 10/15/30 |
Caa1 | 25 | 21,875 | |||||
| 7.80%, 08/01/31 |
Caa1 | 50 | 42,813 | |||||
| 7.75%, 01/15/32 |
Caa1 | 150 | 128,625 | |||||
| Encore Acquisition Co., |
||||||||
| 8.375%, 06/15/12 |
B2 | 50 | 54,375 | |||||
| Moody’s Rating (Unaudited) |
Par (000) |
Value | ||||||
| Hanover Equipment Trust, |
||||||||
| 8.50%, 09/01/08 |
B2 | $ | 25 | $ | 26,625 | |||
| Hilcorp Energy I L.P., Sr. Notes |
||||||||
| 10.50%, 09/01/10 144A |
B3 | 75 | 82,500 | |||||
| Kaneb Pipe Line Operating Partnership L.P., Sr. Notes |
||||||||
| 7.75%, 02/15/12 |
Ba1 | 90 | 103,141 | |||||
| Kinder Morgan, Inc., Sr. Notes |
||||||||
| 6.50%, 09/01/12 |
Baa2 | 180 | 198,962 | |||||
| Magnum Hunter Resources, Inc., Gtd. Notes |
||||||||
| 9.60%, 03/15/12 |
B2 | 50 | 57,000 | |||||
| Occidental Petroleum Corp., Notes |
||||||||
| 4.25%, 03/15/10 |
Baa1 | 75 | 75,572 | |||||
| Panhandle Eastern Pipe Line Co., Notes |
||||||||
| 4.80%, 08/15/08 144A |
Baa3 | 70 | 72,199 | |||||
| Petroleum Geo-Services ASA, Notes (Norway) |
||||||||
| 10.00%, 11/05/10(l) |
NR | 75 | 80,625 | |||||
| Pride Petroleum Services, Inc., |
||||||||
| 9.375%, 05/01/07 |
Ba2 | 67 | 69,178 | |||||
| PSE&G Energy Holdings, Inc., |
||||||||
| 8.50%, 06/15/11 |
Ba3 | 75 | 83,531 | |||||
| Southern Natural Gas Co., Notes |
||||||||
| 8.875%, 03/15/10 |
B1 | 50 | 56,438 | |||||
| Tom Brown, Inc., Notes |
||||||||
| 7.25%, 09/15/13 |
Ba3 | 25 | 26,563 | |||||
| Transocean, Inc., Notes |
||||||||
| 7.50%, 04/15/31 |
Baa2 | 110 | 126,363 | |||||
| Westport Resources Corp., |
||||||||
| 8.25%, 11/01/11 |
Ba3 | 25 | 27,625 | |||||
| Williams Companies, Inc., Debs. |
||||||||
| 7.50%, 01/15/31 |
B3 | 250 | 254,374 | |||||
| 2,478,649 | ||||||||
| Paper & Forest Products — 0.3% |
||||||||
| Ainsworth Lumber, (Canada) Sec’d. Notes |
||||||||
| 13.875%, 07/15/07(l) |
B3 | 125 | 144,375 | |||||
| Sr. Notes |
||||||||
| 12.50%, 07/15/07(l) |
B3 | 25 | 29,500 | |||||
| Boise Cascade Co., Sr. Notes |
||||||||
| 7.00%, 11/01/13 |
Ba2 | 25 | 26,281 | |||||
190
Table of Contents
AST T. Rowe Price Asset Allocation Portfolio
Schedule of Investments
December 31, 2003
| Moody’s Rating (Unaudited) |
Par (000) |
Value | ||||||
| Celulosa Arauco y Constitucion SA, |
||||||||
| 5.125%, 07/09/13(l) |
Baa2 | $ | 160 | $ | 156,877 | |||
| Georgia-Pacific Corp., |
||||||||
| 9.875%, 11/01/21 |
Ba3 | 50 | 52,500 | |||||
| Gtd. Notes |
||||||||
| 9.375%, 02/01/13 |
Ba2 | 100 | 115,500 | |||||
| Graphic Packaging International Corp., Gtd. Notes |
||||||||
| 8.50%, 08/15/11 144A |
B2 | 25 | 27,500 | |||||
| JSG Funding PLC, Sr. Notes (Ireland) |
||||||||
| 9.625%, 10/01/12(l) |
B2 | 50 | 56,250 | |||||
| Longview Fibre Co., |
||||||||
| 10.00%, 01/15/09 |
B2 | 100 | 110,250 | |||||
| Potlatch Corp., Gtd. Notes |
||||||||
| 10.00%, 07/15/11 |
Ba1 | 25 | 28,000 | |||||
| SCA Coordination Center NV, Gtd. Notes (Belgium) |
||||||||
| 4.50%, 07/15/15 144A |
A3 | 120 | 112,457 | |||||
| Weyerhaeuser Co., Notes |
||||||||
| 6.75%, 03/15/12 |
Baa2 | 180 | 196,681 | |||||
| 1,056,171 | ||||||||
| Pharmaceuticals — 0.1% |
||||||||
| Abbott Laboratories, Notes |
||||||||
| 5.625%, 07/01/06 |
A1 | 210 | 226,646 | |||||
| Alpharma, Inc., Sr. Notes |
||||||||
| 8.625%, 05/01/11 144A |
B3 | 25 | 25,500 | |||||
| Biovail Corp. (Canada) |
||||||||
| 7.875%, 04/01/10(l) |
B2 | 50 | 51,250 | |||||
| 303,396 | ||||||||
| Printing & Publishing — 0.3% |
||||||||
| Canwest Media, Inc., |
||||||||
| 10.625%, 05/15/11 |
B2 | 100 | 114,750 | |||||
| CBD Media, Sr. Sub. Notes |
||||||||
| 8.625%, 06/01/11 144A |
B3 | 50 | 55,000 | |||||
| Dex Media East LLC, Gtd. Notes |
||||||||
| 9.875%, 11/15/09 |
B2 | 25 | 28,625 | |||||
| 12.125%, 11/15/12 |
B3 | 150 | 185,999 | |||||
| Moody’s Rating (Unaudited) |
Par (000) |
Value | ||||||
| Dex Media West LLC, Sr. Notes |
||||||||
| 8.50%, 08/15/10 144A |
B2 | $ | 25 | $ | 27,969 | |||
| Dex Media West, Sr. Sub. Notes |
||||||||
| 9.875%, 08/15/13 144A |
B3 | 75 | 87,563 | |||||
| Dex Media, Inc., |
||||||||
| 9.00%, 11/15/13 144A |
Caa1 | 100 | 70,750 | |||||
| Notes |
||||||||
| 8.00%, 11/15/13 144A |
Caa1 | 25 | 26,563 | |||||
| Hollinger International Publishing, Sr. Notes |
||||||||
| 9.00%, 12/15/10 |
B2 | 100 | 106,750 | |||||
| Hollinger Participation Trust, |
||||||||
| 12.125%, 11/15/10 [PIK] 144A |
B3 | 75 | 89,438 | |||||
| Houghton Mifflin Co., |
||||||||
| 9.875%, 02/01/13 |
B3 | 75 | 82,875 | |||||
| Liberty Group Operating, Inc., Gtd. Notes |
||||||||
| 9.375%, 02/01/08 |
Caa1 | 50 | 50,750 | |||||
| Primedia, Inc., Sr. Notes |
||||||||
| 8.875%, 05/15/11 |
B3 | 25 | 26,438 | |||||
| 8.00%, 05/15/23 144A |
B3 | 25 | 25,625 | |||||
| Quebecor Media, Inc., Sr. Notes |
||||||||
| 11.125%, 07/15/11 |
B2 | 150 | 174,374 | |||||
| Sun Media Corp., Gtd. Notes |
||||||||
| 7.625%, 02/15/13 |
Ba3 | 50 | 53,750 | |||||
| Transwestern Publishing Co., |
||||||||
| 9.625%, 11/15/07 |
B2 | 25 | 26,000 | |||||
| 1,233,219 | ||||||||
| Railroads |
||||||||
| Canadian National Railway Co., Notes (Canada) |
||||||||
| 4.40%, 03/15/13(l) |
Baa1 | 130 | 125,293 | |||||
| Real Estate — 0.2% |
||||||||
| LNR Property Corp., |
||||||||
| 7.625%, 07/15/13 |
Ba3 | 100 | 105,500 | |||||
191
Table of Contents
AST T. Rowe Price Asset Allocation Portfolio
Schedule of Investments
December 31, 2003
| Moody’s Rating (Unaudited) |
Par (000) |
Value | ||||||
| Pulte Homes, Inc., Gtd. Notes |
||||||||
| 7.875%, 08/01/11 |
Baa3 | $ | 150 | $ | 177,053 | |||
| Rouse Co., Notes |
||||||||
| 8.43%, 04/27/05 |
Baa3 | 350 | 375,442 | |||||
| Universal City Development Partners L.P., Sr. Notes |
||||||||
| 11.75%, 04/01/10 144A |
B2 | 50 | 59,000 | |||||
| Wackenhut Corrections Corp., |
||||||||
| 8.25%, 07/15/13 144A |
B1 | 25 | 26,625 | |||||
| WCI Communities, Inc., |
||||||||
| 9.125%, 05/01/12 |
Ba3 | 25 | 27,625 | |||||
| Williams Scotsman, Inc., |
||||||||
| 10.00%, 08/15/08 |
B2 | 50 | 55,063 | |||||
| 826,308 | ||||||||
| Restaurants |
||||||||
| O’Charley’s, Inc., Sr. Sub. Notes |
||||||||
| 9.00%, 11/01/13 144A |
Ba3 | 50 | 50,500 | |||||
| Perkins Family Restuarants L.P., Sr. Notes |
||||||||
| 10.125%, 12/15/07(a) |
B1 | 75 | 76,875 | |||||
| 127,375 | ||||||||
| Retail & Merchandising — 0.2% |
||||||||
| Asbury Automotive Group, Inc., Sr. Sub. Notes |
||||||||
| 8.00%, 03/15/14 144A |
B3 | 50 | 50,500 | |||||
| AutoZone, Inc., Sr. Notes |
||||||||
| 4.75%, 11/15/10 |
Baa2 | 135 | 135,697 | |||||
| Barneys New York, Inc., |
||||||||
| 9.00%, 04/01/08 |
B3 | 25 | 23,875 | |||||
| Commemorative Brands, Inc., |
||||||||
| 11.00%, 01/15/07 |
Caa1 | 50 | 51,250 | |||||
| Fred Meyer, Inc., Gtd. Notes |
||||||||
| 7.45%, 03/01/08 |
Baa3 | 170 | 193,793 | |||||
| Office Depot, Inc., Notes |
||||||||
| 6.25%, 08/15/13 |
Baa3 | 160 | 168,303 | |||||
| 623,418 | ||||||||
| Moody’s Rating (Unaudited) |
Par (000) |
Value | ||||||
| Semiconductors — 0.1% |
||||||||
| AMI Semiconductor, Inc., |
||||||||
| 10.75%, 02/01/13 |
B3 | $ | 33 | $ | 39,435 | |||
| Fairchild Semiconductor International Corp., |
||||||||
| 10.50%, 02/01/09 |
B2 | 200 | 224,000 | |||||
| On Semiconductor Corp., |
||||||||
| 13.00%, 05/15/08 |
Caa1 | 75 | 87,563 | |||||
| 12.00%, 03/15/10 |
B3 | 50 | 59,875 | |||||
| 410,873 | ||||||||
| Telecommunications — 1.1% |
||||||||
| ACC Escrow Corp., Sr. Notes |
||||||||
| 10.00%, 08/01/11 144A |
B2 | 75 | 83,625 | |||||
| Alaska Communications Systems Holdings, Inc., Sr. Notes |
||||||||
| 9.875%, 08/15/11 144A |
B2 | 75 | 79,125 | |||||
| AT&T Wireless Services, Inc., |
||||||||
| 7.875%, 03/01/11 |
Baa2 | 120 | 138,506 | |||||
| 8.75%, 03/01/31 |
Baa2 | 120 | 148,583 | |||||
| Avaya, Inc., Sec’d. Notes |
||||||||
| 11.125%, 04/01/09 |
B2 | 50 | 58,750 | |||||
| British Telecom PLC, Notes United Kingdom) |
||||||||
| 8.375%, 12/15/10(l) |
Baa1 | 135 | 164,546 | |||||
| Centennial Communications Corp., Gtd. Notes |
||||||||
| 10.125%, 06/15/13 |
Caa1 | 50 | 55,250 | |||||
| Cincinnati Bell, Inc., |
||||||||
| 8.375%, 01/15/14 144A |
B3 | 50 | 54,250 | |||||
| Citizens Communications Co., |
||||||||
| 9.00%, 08/15/31 |
Baa2 | 95 | 111,223 | |||||
| Deutsche Telekom International Finance, Gtd. Notes (Germany) |
||||||||
| 5.25%, 07/22/13(l) |
Baa3 | 150 | 151,872 | |||||
| DIRECTV Holdings LLC, |
||||||||
| 8.375%, 03/15/13 |
B1 | 50 | 58,250 | |||||
192
Table of Contents
AST T. Rowe Price Asset Allocation Portfolio
Schedule of Investments
December 31, 2003
| Moody’s Rating (Unaudited) |
Par (000) |
Value | ||||||
| Dobson Communications Corp., Sr. Notes |
||||||||
| 10.875%, 07/01/10(a) |
B3 | $ | 100 | $ | 109,500 | |||
| 8.875%, 10/01/13 144A |
B3 | 75 | 76,313 | |||||
| Echostar DBS Corp., Sr. Notes |
||||||||
| 10.375%, 10/01/07 |
Ba3 | 50 | 55,188 | |||||
| 9.125%, 01/15/09 |
3 | 3,371 | ||||||
| Eircom Funding, Sr. Sub. Notes (Ireland) |
||||||||
| 8.25%, 08/15/13(l) |
B1 | 25 | 27,813 | |||||
| France Telecom SA, Notes (France) |
||||||||
| 9.25%, 03/01/11(l) |
Baa3 | 75 | 90,229 | |||||
| Insight Midwest L.P., Sr. Notes |
||||||||
| 10.50%, 11/01/10 |
B2 | 100 | 109,250 | |||||
| INTELSAT Ltd., Notes |
||||||||
| 5.25%, 11/01/08 144A |
Baa3 | 75 | 77,261 | |||||
| LCI International, Inc., Sr. Notes |
||||||||
| 7.25%, 06/15/07 |
Caa1 | 50 | 48,250 | |||||
| Lucent Technologies, Inc., Notes |
||||||||
| 5.50%, 11/15/08 |
Caa1 | 75 | 70,125 | |||||
| Motorola, Inc., Notes |
||||||||
| 6.75%, 02/01/06(a) |
Baa3 | 100 | 107,791 | |||||
| Nextel Communications, Inc., Notes |
||||||||
| 6.00%, 06/01/11 |
B2 | 50 | 62,250 | |||||
| Sr. Notes |
||||||||
| 9.375%, 11/15/09 |
B2 | 25 | 27,313 | |||||
| 9.50%, 02/01/11 |
B2 | 50 | 56,750 | |||||
| 6.875%, 10/31/13 |
B2 | 100 | 105,500 | |||||
| 7.375%, 08/01/15 |
B2 | 150 | 161,999 | |||||
| Nextel Partners, Inc., Sr. Notes |
||||||||
| 11.00%, 03/15/10 |
Caa1 | 25 | 27,813 | |||||
| 8.125%, 07/01/11 |
Caa1 | 75 | 80,250 | |||||
| Nortel Networks Corp., Notes (Canada) |
||||||||
| 6.875%, 09/01/23(l) |
B3 | 100 | 95,500 | |||||
| Nortel Networks Ltd., Notes (Canada) |
||||||||
| 6.125%, 02/15/06(l) |
B3 | 25 | 25,438 | |||||
| Qwest Corp., Notes |
||||||||
| 8.875%, 03/15/12 144A |
Ba3 | 75 | 86,250 | |||||
| Qwest Services Corp., Notes |
||||||||
| 13.50%, 12/15/10 144A |
CCC+(d) | 175 | 213,499 | |||||
| Moody’s Rating (Unaudited) |
Par (000) |
Value | ||||||
| Rogers Cantel, Inc., |
||||||||
| 9.375%, 06/01/08 |
Ba3 | $ | 25 | $ | 26,281 | |||
| Sr. Sub. Notes (Canada) |
||||||||
| 8.80%, 10/01/07(l) |
B2 | 25 | 25,813 | |||||
| Rogers Wireless, Inc., |
||||||||
| 9.625%, 05/01/11 |
Ba3 | 50 | 59,625 | |||||
| Sprint Capital Corp., Gtd. Notes |
||||||||
| 6.375%, 05/01/09 |
Baa3 | 350 | 374,563 | |||||
| Telefonos de Mexico SA, Notes (Mexico) |
||||||||
| 4.50%, 11/19/08 144A |
A3 | 95 | 95,619 | |||||
| Telex Communications, Inc., Sec’d. Notes |
||||||||
| 11.50%, 10/15/08 144A |
B3 | 25 | 26,688 | |||||
| TSI Telecommunication Services, Inc., Gtd. Notes |
||||||||
| 12.75%, 02/01/09 |
B3 | 50 | 55,125 | |||||
| U.S. Unwired, Inc., Gtd. Notes, Zero Coupon (until 11/01/04) |
||||||||
| 13.375%, 11/01/09 |
Caa2 | 75 | 54,750 | |||||
| United States Cellular Corp., Notes |
||||||||
| 6.70%, 12/15/33 |
Baa1 | 110 | 110,391 | |||||
| Verizon Florida, Inc., Debs. |
||||||||
| 6.125%, 01/15/13 |
A1 | 115 | 123,328 | |||||
| Verizon Virginia, Inc., Debs. |
||||||||
| 4.625%, 03/15/13 |
Aa3 | 105 | 101,421 | |||||
| Western Wireless Corp., Sr. Notes |
||||||||
| 9.25%, 07/15/13 |
Caa1 | 125 | 132,500 | |||||
| 4,007,737 | ||||||||
| Transportation — 0.2% |
||||||||
| Hertz Corp., Notes |
||||||||
| 4.70%, 10/02/06 |
Baa2 | 80 | 81,460 | |||||
| Petroleum Helicopters, Inc., |
||||||||
| 9.375%, 05/01/09 |
B1 | 75 | 79,875 | |||||
| Travelcenters of America, Inc., Gtd. Notes |
||||||||
| 12.75%, 05/01/09 |
B3 | 175 | 202,125 | |||||
| Union Pacific Corp., Notes |
||||||||
| 6.50%, 04/15/12 |
Baa2 | 200 | 222,480 | |||||
| Union Tank Car Co., Notes |
||||||||
| 7.125%, 02/01/07 |
A2 | 150 | 167,002 | |||||
| 752,942 | ||||||||
193
Table of Contents
AST T. Rowe Price Asset Allocation Portfolio
Schedule of Investments
December 31, 2003
| Moody’s Rating (Unaudited) |
Par (000) |
Value | ||||||
| Utilities — 1.4% |
||||||||
| AES Corp., Sec’d. Notes |
||||||||
| 9.00%, 05/15/15 144A |
B2 | $ | 100 | $ | 113,500 | |||
| AES Corp., Sr. Notes |
||||||||
| 9.375%, 09/15/10(a) |
B3 | 75 | 83,531 | |||||
| 8.875%, 02/15/11 |
B3 | 125 | 136,875 | |||||
| Allegheny Energy Supply Co. LLC, Notes |
||||||||
| 7.80%, 03/15/11 |
B3 | 125 | 116,563 | |||||
| 8.75%, 04/15/12 144A |
B3 | 50 | 47,375 | |||||
| American Electric Power Co., Inc., Sr. Notes |
||||||||
| 5.375%, 03/15/10 |
Baa3 | 105 | 110,187 | |||||
| Appalachian Power Co., Sr. Notes |
||||||||
| 4.80%, 06/15/05 |
Baa2 | 185 | 192,595 | |||||
| Aquila, Inc., Sr. Notes |
||||||||
| 14.875%, 07/01/12 |
Caa1 | 25 | 33,625 | |||||
| Black Hills Corp., Notes |
||||||||
| 6.50%, 05/15/13 |
Baa3 | 150 | 152,307 | |||||
| Calpine Corp., Sec’d. Notes |
||||||||
| 8.50%, 07/15/10 144A |
B(d) | 50 | 49,000 | |||||
| 9.875%, 12/01/11 144A |
B(d) | 50 | 51,625 | |||||
| Canadian Natural Resources Ltd., Notes (Canada) |
||||||||
| 7.20%, 01/15/32(l) |
Baa1 | 300 | 348,456 | |||||
| CE Electric UK Funding Co., |
||||||||
| 6.853%, 12/30/04 144A |
Baa3 | 185 | 191,076 | |||||
| CenterPoint Energy Resources Corp., Debs. |
||||||||
| 6.50%, 02/01/08 |
Ba1 | 61 | 65,406 | |||||
| Chesapeake Energy Corp., |
||||||||
| 9.00%, 08/15/12 |
Ba3 | 100 | 115,500 | |||||
| CMS Energy Corp., Sr. Notes |
||||||||
| 9.875%, 10/15/07 |
B3 | 100 | 112,000 | |||||
| 8.50%, 04/15/11 |
B3 | 25 | 27,125 | |||||
| Duke Capital Corp., Sr. Notes |
||||||||
| 7.50%, 10/01/09(a) |
Baa3 | 175 | 200,359 | |||||
| Moody’s Rating (Unaudited) |
Par (000) |
Value | ||||||
| Dynegy Holdings, Inc., |
||||||||
| 10.125%, 07/15/13 144A |
B3 | $ | 125 | $ | 144,375 | |||
| Edison Mission Energy, Sr. Notes |
||||||||
| 9.875%, 04/15/11 |
B2 | 100 | 104,500 | |||||
| Entergy Gulf States, Inc., |
||||||||
| 5.20%, 12/03/07 |
Baa3 | 160 | 164,848 | |||||
| Entergy Louisiana, Inc., |
||||||||
| 6.50%, 03/01/08 |
Aaa | 475 | 484,663 | |||||
| Exelon Generation Co. LLC, Notes |
||||||||
| 5.35%, 01/15/14 144A |
Baa1 | 155 | 154,724 | |||||
| FirstEnergy Corp., Notes |
||||||||
| 5.50%, 11/15/06 |
Baa2 | 175 | 181,416 | |||||
| Florida Power & Light Co., |
||||||||
| 5.95%, 10/01/33 |
Aa3 | 125 | 128,487 | |||||
| Illinois Power Corp., |
||||||||
| 11.50%, 12/15/10 |
B3 | 75 | 91,125 | |||||
| North American Energy Partners, Inc., Sr. Notes |
||||||||
| 8.75%, 12/01/11 144A |
B2 | 75 | 79,125 | |||||
| NRG Energy, Inc., Sec’d. Notes |
||||||||
| 8.00%, 12/15/13 144A |
B2 | 75 | 79,219 | |||||
| Ohio Edison Co., Sr. Notes |
||||||||
| 4.00%, 05/01/08 144A |
Baa2 | 175 | 171,311 | |||||
| Pepco Holdings, Inc., Notes |
||||||||
| 3.75%, 02/15/06 |
Baa2 | 150 | 152,899 | |||||
| Pinnacle West Capital Corp., |
||||||||
| 6.40%, 04/01/06 |
Baa2 | 150 | 160,991 | |||||
| Public Service Co. of New Mexico, Sr. Notes |
||||||||
| 4.40%, 09/15/08 |
Baa3 | 155 | 157,124 | |||||
| Public Service Electric & Gas Co., First Mortgage Notes |
||||||||
| 7.00%, 09/01/24 |
A3 | 300 | 307,360 | |||||
194
Table of Contents
AST T. Rowe Price Asset Allocation Portfolio
Schedule of Investments
December 31, 2003
| Moody’s Rating (Unaudited) |
Par (000) |
Value | ||||||
| Reliant Resources, Inc., |
||||||||
| 9.50%, 07/15/13 144A |
B1 | $ | 125 | $ | 134,375 | |||
| Sempra Energy Co., Notes |
||||||||
| 6.00%, 02/01/13 |
Baa1 | 180 | 191,571 | |||||
| South Point Energy Center LLC, Gtd. Notes |
||||||||
| 9.825%, 05/30/19 144A |
B2 | 125 | 115,625 | |||||
| Suburban Propane Partners L.P., Sr. Notes |
||||||||
| 6.875%, 12/15/13 144A |
B1 | 25 | 25,375 | |||||
| TXU Energy Co., Sr. Notes |
||||||||
| 7.00%, 03/15/13 |
Baa2 | 70 | 77,580 | |||||
| Utilicorp Canada Finance Corp., Gtd. Notes (Canada) |
||||||||
| 7.75%, 06/15/11(l) |
Caa1 | 50 | 48,625 | |||||
| Williams Companies, Inc., Notes |
||||||||
| 8.75%, 03/15/32 |
B3 | 25 | 28,375 | |||||
| WPD Holdings UK, Jr. Unsub. Notes (United Kingdom) |
||||||||
| 6.875%, 12/15/07 144A |
Baa2 | 110 | 112,575 | |||||
| 5,470,561 | ||||||||
| Total Corporate Obligations |
||||||||
| (Cost $41,541,199) |
43,524,243 | |||||||
| Total Long-Term Investments |
||||||||
| (Cost $310,187,860) |
352,477,250 | |||||||
| SHORT-TERM INVESTMENTS — 17.3% |
||||
| Certificate of Deposit — 0.2% |
||||
| Svenska Handelsbank, Inc. |
||||
| 1.39%, 10/27/04(b) |
543 | 543,182 | ||
| Commercial Paper — 1.2% |
||||
| Cancara Asset Securitisation Ltd. |
||||
| 1.11%, 01/12/04(b) |
1,162 | 1,161,069 | ||
| Concord Minutemen Capital Co. |
||||
| 1.10%, 02/10/04(b) |
376 | 374,851 | ||
| 1.13%, 02/12/04(b) |
83 | 83,261 | ||
| Fairway Finance Corp. |
||||
| 1.10%, 01/12/04(b) |
173 | 172,696 | ||
| General Electric Capital Corp. |
||||
| 1.11%, 02/05/04(b) |
261 | 260,464 |
| Par (000) |
Value | |||||
| Lexington Parker Capital Co. |
||||||
| 1.10%, 01/12/04(b) |
$ | 116 | $ | 115,579 | ||
| Monumental Global Funding |
||||||
| 1.141%, 01/29/04 [FRN](b)(c) |
57 | 57,179 | ||||
| Silver Tower U.S. Funding |
||||||
| 1.13%, 02/02/04(b) |
1,113 | 1,109,626 | ||||
| Tannehill Capital Co. |
||||||
| 1.11%, 01/13/04(b) |
540 | 538,527 | ||||
| Tulip Funding Corp. |
||||||
| 1.10%, 01/21/04(b) |
444 | 443,298 | ||||
| 4,316,550 | ||||||
| Corporate Obligations — 4.8% |
||||||
| American Express Centurian |
||||||
| 1.118%, 01/22/04 [FRN](b)(c) |
462 | 461,570 | ||||
| 1.144%, 01/22/04 [FRN](b)(c) |
224 | 224,392 | ||||
| 1.131%, 01/29/04 [FRN](b)(c) |
237 | 237,498 | ||||
| Bear Stearns Co., Inc. |
||||||
| 1.12%, 01/02/04 [FRN](b)(c) |
2,342 | 2,342,107 | ||||
| Canadian Imperial Bank of Commerce |
||||||
| 1.111%, 01/29/04 [FRN](b)(c) |
87 | 87,149 | ||||
| General Electric Capital Corp. |
||||||
| 1.13%, 01/02/04 [FRN](b)(c) |
79 | 78,887 | ||||
| Goldman Sachs Group, Inc. |
||||||
| 1.14%, 01/06/04 [FRN](b)(c) |
1,331 | 1,330,767 | ||||
| Merrill Lynch & Co., Inc. |
||||||
| 1.13%, 01/02/04(b) |
503 | 503,327 | ||||
| 1.13%, 01/02/04 [FRN](b)(c) |
3,856 | 3,855,913 | ||||
| Morgan Stanley |
||||||
| 1.03%, 01/02/04 [FRN](b)(c) |
2,061 | 2,060,717 | ||||
| 1.08%, 01/02/04 [FRN](b)(c) |
1,316 | 1,315,938 | ||||
| Natexis Banques Populaires |
||||||
| 1.035%, 01/02/04 [FRN](b)(c) |
962 | 961,984 | ||||
| 1.10%, 01/02/04 [FRN](b)(c) |
1,911 | 1,910,578 | ||||
| Societe Generale |
||||||
| 1.08%, 01/02/04 [FRN](b)(c) |
495 | 494,919 | ||||
| Westdeutsche Landesbank |
||||||
| 1.13%, 01/09/04 [FRN](b)(c) |
1,381 | 1,381,344 | ||||
| 1.111%, 01/23/04 [FRN](b)(c) |
87 | 86,668 | ||||
| 1.111%, 01/29/04 [FRN](b)(c) |
128 | 128,223 | ||||
| 17,461,981 | ||||||
| Shares |
||||||
| Non-Registered Investment Company — 4.8% |
||||||
| BlackRock Institutional Money Market Trust(b)(j) |
17,327,902 | 17,327,902 | ||||
| Registered Investment Companies — 5.4% |
||||||
| BlackRock Provident Institutional Funds TempCash Portfolio |
9,707,655 | 9,707,655 | ||||
| BlackRock Provident Institutional Funds TempFund Portfolio |
9,707,654 | 9,707,654 | ||||
| 19,415,309 | ||||||
195
Table of Contents
AST T. Rowe Price Asset Allocation Portfolio
Schedule of Investments
December 31, 2003
| Par (000) |
Value | |||||
| Repurchase Agreement — 0.6% |
||||||
| Merrill Lynch & Co., Inc. |
||||||
| 1.00%, dated 12/31/03, to be repurchased on 01/02/04, repurchase price $ 2,097,311 (Collateralized by Federal Home Loan Mortgage Corp. 5.50% maturing 12/01/33, Federal National Mortgage Assoc. 4.00% - 6.00% maturing 11/01/17 to 11/01/33 and Government National Mortgage Assoc. 1.47% maturing 01/16/04 [FRN] (c), par value $2,573,167, market value including accrued interest $2,160,149)(b) |
$ | 2,097 | $ | 2,097,194 | ||
| Par (000) |
Value |
||||||
| Time Deposits — 0.3% |
|||||||
| Chase Manhattan Bank |
|||||||
| 0.875%, 01/02/04(b) |
$ | 723 | $ | 722,705 | |||
| UBS Bank |
|||||||
| 0.938%, 01/02/04(b) |
521 | 521,456 | |||||
| 1,244,161 | |||||||
| Total Short-Term Investments |
|||||||
| (Cost $62,406,279) |
62,406,279 | ||||||
| Total Investments — 115.2% |
|||||||
| (Cost $372,594,139; Note 5) |
414,883,517 | ||||||
| Liabilities in Excess of |
(54,731,408 | ) | |||||
| Net Assets — 100.0% |
$ | 360,152,109 | |||||
The following abbreviations are used in portfolio descriptions:
| 144A | Security was purchased pursuant to Rule 144A under the securities Act of 1933 and may not be resold subject to that rule except to qualified institutional buyers. Unless otherwise noted 144A securities are deemed to be liquid. |
| ADR | American Depositary Receipt |
| CVT | Convertible Security |
| EUR | Euro Dollar |
| FRN | Floating Rate Note |
| IO | Interest Only |
| NR | Not Rated by Moody’s or Standard & Poor’s. |
| PIK | Payment-in-kind |
| REIT | Real Estate Investment Trust |
| TBA | Securities purchased on a forward commitment basis |
| TIPS | Treasury Inflation Protestion Securities |
| VR | Variable Rate Bond |
| symbol |
description | |
| * |
Non-income producing security. | |
| † |
Less than $500 par. | |
| (a) |
Portion of securities on loan with an aggregate market value of $41,770,328; cash collateral $42,990,970 was received with which the portfolio purchased securities. | |
| (b) |
Represents security purchased with cash collateral for securities on loan. | |
| (c) |
Indicates a variable rate security. The maturity date presented for these instruments is the latter of the next date on which the security can be redeemed at par or the next date on which the rate of interest is adjusted. The interest rate shown reflects the rate in effect at December 31, 2003. | |
| (d) |
Standard & Poor’s rating. |
196
Table of Contents
AST T. Rowe Price Asset Allocation Portfolio
Schedule of Investments
December 31, 2003
| symbol |
description | |
| (g) |
Indicates a security that has been deemed illiquid. The aggregate cost of illiquid securities is $9,232,709. The aggregate value, $9,703,785 represents 2.69% of net assets. | |
| (i) |
Represents issuer in default on interest payments. Non-income producing security. | |
| (j) |
Security available to institutional investors only. | |
| (l) |
US$ Denominated Foreign Bonds. |
Definitions of abbreviations and annotations are included following the Schedules of Investments.
See Notes to Financial Statements.
197
Table of Contents
AST T. Rowe Price Global Bond Portfolio
Schedule of Investments
December 31, 2003
| Moody’s Rating (Unaudited) |
Par (000) |
Value | |||||
| LONG-TERM INVESTMENTS — 92.8% |
|||||||
| FOREIGN BONDS — 51.1% |
|||||||
| Australia — 0.3% |
|||||||
| BHP Finance USA Ltd., |
|||||||
| 4.80%, 04/15/13 |
A2 | USD210 | $ | 210,926 | |||
| New South Wales Treasury Corp., Gtd. Notes |
|||||||
| 6.00%, 05/01/12 |
AAA(d) | AUD495 | 379,512 | ||||
| 590,438 | |||||||
| Austria — 4.3% |
|||||||
| Republic of Austria, |
|||||||
| 4.00%, 07/15/09 |
Aaa | ATS7,585 | 9,710,704 | ||||
| Telekom Finanzmanagement GmbH, Gtd. Notes |
|||||||
| 5.00%, 07/22/13 |
Baa2 | 75 | 94,877 | ||||
| 9,805,581 | |||||||
| Belgium — 0.1% |
|||||||
| SCA Coordination Center NV, Gtd. Notes |
|||||||
| 4.50%, 07/15/15 144A |
NR | USD165 | 154,629 | ||||
| Canada — 2.8% |
|||||||
| Alcan, Inc., Bonds |
|||||||
| 6.125%,12/15/33 |
Baa1 | 190 | 191,814 | ||||
| Canadian Government, Bonds |
|||||||
| 5.25%,06/01/12 |
Aaa | CAD2,680 | 2,175,150 | ||||
| 5.25%, 06/01/13 |
Aaa | 3,910 | 3,128,121 | ||||
| Canadian National Railway Co., Notes |
|||||||
| 4.40%, 03/15/13 |
Baa1 | USD205 | 197,577 | ||||
| Canadian Natural Resources Ltd., Notes |
|||||||
| 7.20%, 01/15/32 |
Baa1 | 285 | 331,033 | ||||
| Falconbridge Ltd., Notes |
|||||||
| 7.35%, 06/05/12 |
Baa3 | 240 | 271,591 | ||||
| Ford Credit Canada, |
|||||||
| 7.25%, 12/07/07 |
A3 | CAD90 | 165,709 | ||||
| 6,460,995 | |||||||
| Moody’s Rating (Unaudited) |
Par (000) |
Value | |||||
| Chile — 0.1% |
|||||||
| Celulosa Arauco y Constitucion SA, Notes |
|||||||
| 5.125%, 07/09/13 |
Baa2 | USD225 | $ | 220,608 | |||
| Denmark — 1.1% |
|||||||
| Danske Bank AS, Sub. Notes |
|||||||
| 4.25%, 06/20/16 [VR] (c) |
Aa3 | USD150 | 181,811 | ||||
| Kingdom of Denmark, Bonds |
|||||||
| 8.00%, 03/15/06 |
Aaa | DKK12,360 | 2,316,471 | ||||
| TDC AS, Unsub. Notes |
|||||||
| 5.875%, 04/24/06 |
Baa1 | 100 | 133,508 | ||||
| 2,631,790 | |||||||
| Finland — 1.7% |
|||||||
| Finland Government, Bonds |
|||||||
| 5.00%, 07/04/07 |
Aaa | FIM3,000 | 4,004,860 | ||||
| France — 5.0% |
|||||||
| BNP Paribas SA, Sub. Notes |
|||||||
| 5.625%, 08/07/08 |
Aa3 | EUR150 | 201,991 | ||||
| 5.25%, 12/17/12 |
Aa3 | 100 | 131,937 | ||||
| Credit Lyonnais SA, |
|||||||
| 5.00%, 11/15/12 |
A1 | 300 | 394,854 | ||||
| Crown Euro Holdings SA, Sec’d. Notes |
|||||||
| 9.50%, 03/01/11 |
B1 | USD200 | 227,500 | ||||
| Dexia Credit Local, Notes |
|||||||
| 5.25%, 04/25/08 |
Aa2 | EUR270 | 362,214 | ||||
| France Telecom SA, |
|||||||
| 9.25%, 03/01/11 |
Baa3 | USD90 | 108,274 | ||||
| Sr. Unsub. Notes |
|||||||
| 7.00%, 12/23/09 |
Baa3 | EUR435 | 622,045 | ||||
| French Government, |
|||||||
| 5.00%, 04/25/12 |
Aaa | 2,750 | 3,674,836 | ||||
| 5.50%, 04/25/29 |
Aaa | 1,280 | 1,749,175 | ||||
| Notes |
|||||||
| 5.75%, 10/25/32 |
Aaa | 1,210 | 1,712,948 | ||||
| French Treasury Notes, |
|||||||
| 3.00%, 07/12/08 |
AAA(d) | 1,620 | 2,003,303 | ||||
| Vivendi Environment, |
|||||||
| 5.875%, 06/27/08 |
Baa1 | 300 | 405,303 | ||||
| 11,594,380 | |||||||
198
Table of Contents
AST T. Rowe Price Global Bond Portfolio
Schedule of Investments
December 31, 2003
| Moody’s (Unaudited) |
Par (000) |
Value | |||||
| Germany — 9.8% |
|||||||
| German Government, Bonds |
|||||||
| 4.125%, 08/27/04 |
Aaa | EUR600 | $ | 766,540 | |||
| 5.00%, 05/20/05 |
Aaa | 4,450 | 5,807,998 | ||||
| 6.00%, 01/05/06 |
Aaa | 4,200 | 5,636,799 | ||||
| 4.00%, 02/16/07 |
Aaa | 2,800 | 3,634,455 | ||||
| 4.25%, 02/15/08 |
Aaa | 300 | 390,515 | ||||
| 4.50%, 07/04/09 |
Aaa | 2,200 | 2,885,521 | ||||
| 5.00%, 01/04/12 |
Aaa | 1,750 | 2,338,040 | ||||
| 5.50%, 01/04/31 |
Aaa | 820 | 1,122,045 | ||||
| 22,581,913 | |||||||
| Greece — 1.2% |
|||||||
| Greek Government, Bonds |
|||||||
| 4.60%, 05/20/13 |
A1 | 965 | 1,237,561 | ||||
| 6.50%, 01/11/14 |
NA | 1,075 | 1,576,520 | ||||
| 2,814,081 | |||||||
| Ireland — 1.3% |
|||||||
| Irish Government, Bonds |
|||||||
| 4.25%, 10/18/07 |
Aaa | IEP2,000 | 2,609,339 | ||||
| Irish Life & Permanent PLC, Sub. Notes |
|||||||
| 6.25%, 02/15/11 |
A2 | 200 | 276,882 | ||||
| 2,886,221 | |||||||
| Italy — 5.1% |
|||||||
| Italy Treasury, |
|||||||
| 5.00%, 10/15/07 |
Aa2 | EUR3,320 | 4,442,476 | ||||
| 5.25%, 08/01/11 |
Aa2 | 1,170 | 1,585,344 | ||||
| 7.25%, 11/01/26 |
Aa2 | 660 | 1,089,055 | ||||
| 6.00%, 05/01/31 |
Aa2 | 240 | 344,580 | ||||
| Debs. |
|||||||
| 6.75%, 07/01/07 |
Aa2 | 2,920 | 4,109,009 | ||||
| UniCredito Italiano SPA, Sub. Notes |
|||||||
| 6.10%, 02/28/12 |
Aa3 | 150 | 208,197 | ||||
| 11,778,661 | |||||||
| Japan — 5.7% |
|||||||
| Japanese Government, Bonds |
|||||||
| 0.90%, 12/22/08 |
A2 | UPY241,000 | 2,285,434 | ||||
| 1.80%, 09/21/09 |
A2 | 308,000 | 3,045,967 | ||||
| 1.30%, 06/20/11 |
A2 | 162,000 | 1,538,537 | ||||
| 1.00%, 12/20/12 |
A2 | 527,100 | 4,809,005 | ||||
| 2.00%, 06/20/22 |
A2 | 143,400 | 1,389,306 | ||||
| 13,068,249 | |||||||
| Moody’s (Unaudited) |
Par (000) |
Value | |||||
| Mexico |
|||||||
| Telefonos de Mexico SA de CV, Notes |
|||||||
| 4.50%, 11/19/08 144A |
A3 | USD105 | $ | 105,685 | |||
| Netherlands — 3.2% |
|||||||
| Deutsche Telekom International Finance BV, Gtd. Notes |
|||||||
| 7.50%, 05/29/07 |
Baa3 | EUR390 | 550,737 | ||||
| 5.25%, 07/22/13 |
Baa3 | 200 | 202,496 | ||||
| E.ON International Finance BV, Gtd. Notes |
|||||||
| 5.75%, 05/29/09 |
A1 | 200 | 273,696 | ||||
| ING Bank NV, Sub. Notes |
|||||||
| 5.50%, 01/04/12 |
Aa3 | 400 | 536,883 | ||||
| 5.125%, 05/01/15 144A |
Aa3 | USD110 | 109,868 | ||||
| Koninlijke KPN NV, |
|||||||
| 4.75%, 11/05/08 |
Baa2 | EUR100 | 129,856 | ||||
| Netherlands Government, Bonds |
|||||||
| 5.75%, 02/15/07 |
Aaa | 660 | 897,906 | ||||
| 5.00%, 07/15/12 |
Aaa | 1,205 | 1,610,724 | ||||
| 4.25%, 07/15/13 |
Aaa | 1,720 | 2,163,949 | ||||
| Olivetti Finance NV, |
|||||||
| 6.50%, 04/24/07 |
Baa2 | 225 | 307,163 | ||||
| 7.25%, 04/24/12 |
Baa2 | 125 | 181,844 | ||||
| RWE Finance BV, |
|||||||
| 5.50%, 10/26/07 |
A1 | 200 | 268,846 | ||||
| 7,233,968 | |||||||
| Poland — 2.4% |
|||||||
| Polish Government, Bonds |
|||||||
| 5.75%, 06/24/08 |
A2 | PLZ21,300 | 5,490,755 | ||||
| Russia — 0.5% |
|||||||
| Russian Ministry of Finance, Debs. |
|||||||
| 3.00%, 05/14/11 |
Ba1 | USD1,370 | 1,078,787 | ||||
199
Table of Contents
AST T. Rowe Price Global Bond Portfolio
Schedule of Investments
December 31, 2003
| Moody’s (Unaudited) |
Par (000) |
Value | |||||
| Spain — 1.1% |
|||||||
| Spanish Government, Bonds |
|||||||
| 6.00%, 01/31/29 |
Aaa | EUR1,130 | $ | 1,648,530 | |||
| 5.75%, 07/30/32 |
Aaa | 560 | 792,047 | ||||
| 2,440,577 | |||||||
| Sweden — 0.5% |
|||||||
| Swedish Government, Bonds |
|||||||
| 5.00%, 01/28/09 |
Aaa | SEK7,400 | 1,068,518 | ||||
| United Kingdom — 4.9% |
|||||||
| Abbey National PLC, |
|||||||
| 4.625%, 02/11/11 |
A1 | GBP200 | 256,509 | ||||
| AIG SunAmerica Institutional Funding III Ltd., Sec’d. Notes |
|||||||
| 5.50%, 03/07/11 |
Aaa | 315 | 426,644 | ||||
| British Telecom PLC, Notes |
|||||||
| 8.375%, 12/15/10 |
Baa1 | USD205 | 249,867 | ||||
| Coca-Cola HBC Finance PLC, Gtd. Notes |
|||||||
| 5.25%, 06/27/06 |
A3 | GBP200 | 264,469 | ||||
| HBOS PLC, Sub. Notes |
|||||||
| 6.00%, 11/01/33 144A |
Aa3 | USD180 | 179,684 | ||||
| HBOS Treasury Services PLC, Gtd. Notes |
|||||||
| 4.75%, 02/06/07 |
Aa2 | GBP300 | 394,933 | ||||
| Imperial Tobacco Finance, Gtd. Notes |
|||||||
| 6.375%, 09/27/06 |
Baa3 | 250 | 337,513 | ||||
| Monumental Global Funding, Sec’d. Notes |
|||||||
| 5.75%, 03/20/07 |
Aa3 | 120 | 217,311 | ||||
| NGG Finance PLC, Gtd. Notes |
|||||||
| 5.25%, 08/23/06 |
Baa1 | 200 | 264,192 | ||||
| Rio Tinto Finance PLC, |
|||||||
| 5.125%, 05/10/07 |
Aa3 | 200 | 265,658 | ||||
| Royal Bank of Scotland PLC, Sub. Notes |
|||||||
| 6.00%, 05/10/13 |
AA2 | 240 | 333,264 | ||||
| Union Bank of Switzerland London, Sub. Notes |
|||||||
| 8.00%, 01/08/07 |
Aa3 | 207 | 401,930 | ||||
| United Kingdom Treasury, Bonds |
|||||||
| 5.75%, 12/07/09 |
Aaa | 465 | 879,368 | ||||
| 5.00%, 03/07/12 |
AAA(d) | 950 | 1,729,018 | ||||
| 4.25%, 06/07/32 |
Aaa | 2,080 | 3,475,296 | ||||
| Moody’s (Unaudited) |
Par (000) |
Value | |||||
| United Kingdom, Bonds |
|||||||
| 8.50%, 12/07/05 |
Aaa | GBP575 | $ | 1,109,517 | |||
| United Utilities Water PLC, Gtd. Notes |
|||||||
| 6.625%, 11/08/07 |
A2 | 200 | 278,672 | ||||
| WPD Holdings UK, |
|||||||
| 6.875%, 12/15/07 144A |
Baa2 | USD120 | 122,809 | ||||
| WPP Group PLC, |
|||||||
| 5.125%, 06/18/04 |
Baa2 | GBP135 | 172,289 | ||||
| 11,358,943 | |||||||
| Total Foreign Bonds |
|||||||
| (Cost $102,226,852) |
117,369,639 | ||||||
| U.S. GOVERNMENT AGENCY OBLIGATIONS — 14.8% | |||||||
| Federal Home Loan Bank |
|||||||
| 5.75%, 05/15/12 |
USD900 | 981,881 | |||||
| Federal Home Loan Mortgage Corp. |
|||||||
| Zero Coupon, 06/15/11 - 04/15/18 [IO] |
1,581 | 190,453 | |||||
| 4.50%, 03/15/16 |
1,000 | 996,110 | |||||
| 4.641%, 09/01/32 |
302 | 309,277 | |||||
| 5.00%, 12/01/08 - 01/01/34 |
2,654 | 2,660,980 | |||||
| 5.50%, 04/15/28 |
925 | 952,475 | |||||
| 6.00%, [TBA] |
1,650 | 1,705,173 | |||||
| 6.25%, 07/15/32 |
445 | 485,621 | |||||
| 7.00%, 10/10/30 - 11/01/30 |
159 | 168,015 | |||||
| 7,468,104 | |||||||
| Federal National Mortgage Assoc. |
|||||||
| Zero Coupon, 02/01/32 - 04/01/33 [IO] |
520 | 72,832 | |||||
| 2.91%, 07/25/29 |
275 | 274,503 | |||||
| 3.25%, 08/15/08 |
1,850 | 1,837,233 | |||||
| 4.50%, 05/01/18 |
550 | 551,433 | |||||
| 5.00%, 03/25/15 |
700 | 718,305 | |||||
| 5.125%, 01/02/14 |
170 | 170,922 | |||||
| 5.50%, 06/01/17 - 12/01/33 |
8,487 | 8,718,009 | |||||
| 6.00%, 05/15/11 - 01/01/34 |
4,672 | 4,866,792 | |||||
| 6.50%, 09/01/10 - 12/01/32 |
2,107 | 2,213,469 | |||||
| 7.00%, 12/01/29 - 01/01/31 |
265 | 281,430 | |||||
| 19,704,928 | |||||||
200
Table of Contents
AST T. Rowe Price Global Bond Portfolio
Schedule of Investments
December 31, 2003
| Moody’s Rating (Unaudited) |
Par (000) |
Value | |||||
| Government National Mortgage Assoc. |
|||||||
| 4.00%, 10/15/18 |
USD1,016 | $ | 993,840 | ||||
| 5.50%, 10/15/17 - 01/01/34 |
1,778 | 1,818,108 | |||||
| 6.50%, 05/15/16 - 09/20/32 |
1,588 | 1,688,669 | |||||
| 7.00%, 03/15/13 - 12/15/13 |
412 | 442,434 | |||||
| 7.50%, 09/15/30 - 11/15/32 |
581 | 623,892 | |||||
| 5,566,943 | |||||||
| Student Loan Marketing Assoc. |
|||||||
| 4.00%, 01/15/09 |
240 | 241,922 | |||||
| (Cost $33,666,688) |
33,963,778 | ||||||
| CORPORATE OBLIGATIONS — 12.4% |
|||||||
| Aerospace — 0.1% |
|||||||
| Boeing Co., Debs. |
|||||||
| 8.75%, 08/15/21 |
A2 | 125 | 159,247 | ||||
| Automobile Manufacturers — 0.3% |
|||||||
| DaimlerChrysler NA Holding Corp., Notes |
|||||||
| 6.50%, 11/15/13 |
A3 | 335 | 353,537 | ||||
| General Motors Corp., Debs. |
|||||||
| 8.375%, 07/15/33 |
Baa1 | 275 | 314,149 | ||||
| 667,686 | |||||||
| Automotive Parts — 0.2% |
|||||||
| Rexnord Corp., Gtd. Notes |
|||||||
| 10.125%, 12/15/12 |
B3 | 200 | 221,000 | ||||
| TRW Automotive, Inc., Sr. Notes |
|||||||
| 9.375%, 02/15/13 |
B1 | 200 | 229,500 | ||||
| 450,500 | |||||||
| Beverages — 0.2% |
|||||||
| Anheuser-Busch Companies, Inc., Bonds |
|||||||
| 4.375%, 01/15/13 |
A1 | 280 | 273,064 | ||||
| Bottling Group LLC, Gtd. Notes |
|||||||
| 4.625%, 11/15/12 |
A3 | 200 | 199,271 | ||||
| 472,335 | |||||||
| Broadcasting — 0.4% |
|||||||
| Clear Channel Communications, Inc., Sr. Notes |
|||||||
| 4.625%, 01/15/08 |
Baa3 | 200 | 206,518 | ||||
| Hearst-Argyle Television, Inc., Sr. Notes |
|||||||
| 7.00%, 01/15/18 |
Baa3 | 180 | 198,980 | ||||
| Liberty Media Corp., Sr. Notes |
|||||||
| 2.64%, 09/17/06 [FRN](c) |
Baa3 | 95 | 96,108 | ||||
| Moody’s Rating (Unaudited) |
Par (000) |
Value | |||||
| News America, Inc., Gtd. Notes |
|||||||
| 6.55%, 03/15/33 |
Baa3 | USD280 | $ | 291,834 | |||
| Univision Communications, Inc., Sr. Notes |
|||||||
| 2.875%, 10/15/06 |
Baa3 | 110 | 109,695 | ||||
| 903,135 | |||||||
| Building Materials — 0.1% |
|||||||
| Masco Corp., Notes |
|||||||
| 5.875%, 07/15/12 |
Baa1 | 245 | 261,068 | ||||
| Cable Television — 0.3% |
|||||||
| Comcast Corp., Gtd. Notes |
|||||||
| 5.85%, 01/15/10 |
Baa3 | 415 | 443,777 | ||||
| Cox Communications, Inc., Notes |
|||||||
| 7.875%, 08/15/09 |
Baa2 | 225 | 266,156 | ||||
| 709,933 | |||||||
| Chemicals — 0.3% |
|||||||
| Chevron Phillips Chemical Co., Notes |
|||||||
| 5.375%, 06/15/07 |
Baa1 | 205 | 218,429 | ||||
| Dow Chemical Co., Notes |
|||||||
| 6.125%, 02/01/11 |
A3 | 150 | 161,631 | ||||
| Ethyl Corp., Gtd. Notes |
|||||||
| 8.875%, 05/01/10 |
B2 | 200 | 215,000 | ||||
| 595,060 | |||||||
| Computer Hardware — 0.1% |
|||||||
| International Business Machines Corp., Notes |
|||||||
| 4.25%, 09/15/09 |
A1 | 230 | 236,245 | ||||
| Consumer Products & Services — 0.1% |
|||||||
| UST, Inc., Notes |
|||||||
| 6.625%, 07/15/12 |
A3 | 190 | 211,703 | ||||
| Containers & Packaging — 0.2% |
|||||||
| Owens-Brockway Glass Containers Corp., Gtd. Notes |
|||||||
| 8.25%, 05/15/13 |
B2 | 200 | 215,500 | ||||
| Sealed Air Corp., Sr. Notes |
|||||||
| 5.375%, 04/15/08 144A (cost $217,849; purchased |
Baa3 | 215 | 227,233 | ||||
| 442,733 | |||||||
| Entertainment & Leisure — 0.3% |
|||||||
| AOL Time Warner, Inc., Gtd. Notes |
|||||||
| 7.625%, 04/15/31 |
Baa1 | 210 | 243,195 | ||||
| Town Sports International, Inc., Gtd. Notes |
|||||||
| 9.625%, 04/15/11 |
B2 | 75 | 80,625 | ||||
| Viacom, Inc., Gtd. Notes |
|||||||
| 5.625%, 08/15/12 |
A3 | 120 | 127,909 | ||||
| 5.50%, 05/15/33 |
A3 | 190 | 177,562 | ||||
| 629,291 | |||||||
201
Table of Contents
AST T. Rowe Price Global Bond Portfolio
Schedule of Investments
December 31, 2003
| Moody’s Rating (Unaudited) |
Par (000) |
Value | |||||
| Financial - Bank & Trust — 0.7% |
|||||||
| ABN AMRO Bank NV, Sub. Notes |
|||||||
| 7.125%, 06/18/07 |
A1 | USD215 | $ | 242,738 | |||
| Bank of America Corp., Sr. Notes |
|||||||
| 6.125%, 12/16/10 |
Aa2 | 215 | 405,382 | ||||
| BB&T Corp., Sub. Notes |
|||||||
| 6.50%, 08/01/11 |
A2 | 90 | 101,163 | ||||
| Capital One Bank, Notes |
|||||||
| 4.25%, 12/01/08 |
Baa2 | 195 | 194,368 | ||||
| Northern Trust Co., Sub. Notes |
|||||||
| 4.60%, 02/01/13 |
A1 | 155 | 150,583 | ||||
| Suntrust Banks, Inc., Sub. Notes |
|||||||
| 6.375%, 04/01/11 |
Aa3 | 200 | 224,237 | ||||
| Wachovia Corp., Sub. Notes |
|||||||
| 6.40%, 04/01/08 |
A1 | 230 | 253,863 | ||||
| 1,572,334 | |||||||
| Financial Services — 3.6% |
|||||||
| Bank One Corp., Sub. Notes |
|||||||
| 5.25%, 01/30/13 |
A1 | 285 | 292,902 | ||||
| Bear Stearns Co., Inc., Notes |
|||||||
| 4.00%, 01/31/08 |
A1 | 260 | 265,066 | ||||
| Bunge Limited Finance Corp., Notes |
|||||||
| 4.375%, 12/15/08 144A (cost $150,069; purchased 12/10/03)(g) |
Baa3 | 150 | 151,052 | ||||
| CIT Group, Inc., Sr. Notes |
|||||||
| 2.875%, 09/29/06 |
A2 | 100 | 100,331 | ||||
| 7.75%, 04/02/12 |
A2 | 235 | 278,074 | ||||
| Citigroup, Inc., Sub. Notes |
|||||||
| 5.625%, 08/27/12 |
Aa2 | 400 | 422,981 | ||||
| Countrywide Home Loans, Inc., Gtd. Notes |
|||||||
| 5.50%, 02/01/07 |
A3 | 200 | 214,451 | ||||
| Duke Capital Corp., Sr. Notes |
|||||||
| 7.50%, 10/01/09 |
Baa3 | 190 | 217,532 | ||||
| Ford Motor Credit Co., Notes |
|||||||
| 6.50%, 01/25/07 |
A3 | 520 | 554,300 | ||||
| Franklin Resources, Inc., Notes |
|||||||
| 3.70%, 04/15/08 |
A2 | 80 | 79,644 | ||||
| General Electric Capital Corp., Notes |
|||||||
| 3.50%, 05/01/08 |
Aaa | 270 | 270,543 | ||||
| Sr. Unsub. Notes |
|||||||
| 5.125%, 06/20/07 |
Aaa | 425 | 566,487 | ||||
| Unsub. Notes |
|||||||
| 6.00%, 06/15/12 |
Aaa | 470 | 510,543 | ||||
| General Motors Acceptance Corp., Notes |
|||||||
| 6.00%, 07/03/08 |
A3 | 190 | 252,109 | ||||
| 7.25%, 03/02/11 |
A3 | 250 | 274,663 | ||||
| Unsub. Notes |
|||||||
| 6.125%, 03/15/07 |
A3 | 200 | 265,930 | ||||
| Moody’s Rating (Unaudited) |
Par (000) |
Value | |||||
| Goldman Sachs Group, Inc., Notes |
|||||||
| 4.125%, 01/15/08 |
Aa3 | USD390 | $ | 400,237 | |||
| 4.25%, 08/04/10 |
Aa3 | 100 | 125,140 | ||||
| 6.125%, 02/15/33 |
Aa3 | 115 | 116,204 | ||||
| Household Finance Corp., |
|||||||
| 5.75%, 01/30/07 |
A1 | 200 | 216,373 | ||||
| 6.375%, 11/27/12 |
A1 | 75 | 82,420 | ||||
| Unsub. Notes |
|||||||
| 5.125%, 06/24/09 |
A1 | 100 | 132,071 | ||||
| International Lease Finance Corp., Notes |
|||||||
| 6.375%, 03/15/09 |
A1 | 275 | 303,284 | ||||
| J.P. Morgan Chase & Co., Sub. Notes |
|||||||
| 5.75%, 01/02/13 |
A2 | 235 | 248,240 | ||||
| John Deere Capital Corp., Notes |
|||||||
| 7.00%, 03/15/12 |
A3 | 280 | 323,071 | ||||
| John Hancock Global Funding Ltd., Sec’d. Notes |
|||||||
| 3.875%, 02/08/06 |
AA(d) | 200 | 255,487 | ||||
| Lehman Brothers Holdings, Inc., Notes |
|||||||
| 4.00%, 01/22/08 |
A1 | 130 | 132,716 | ||||
| Morgan Stanley, Notes |
|||||||
| 3.625%, 04/01/08 |
Aa3 | 170 | 170,406 | ||||
| Sr. Notes |
|||||||
| 4.375%, 03/01/10 |
Aa3 | 200 | 254,374 | ||||
| National Rural Utilities Cooperative Finance Corp., Collateral Trust |
|||||||
| 3.00%, 02/15/06 |
A1 | 270 | 273,511 | ||||
| PHH Corp., Notes |
|||||||
| 7.125%, 03/01/13 |
Baa1 | 150 | 168,329 | ||||
| State Street Corp., Sub. Notes |
|||||||
| 7.65%, 06/15/10 |
A1 | 170 | 203,565 | ||||
| Union Planters Corp., Notes |
|||||||
| 4.375%, 12/01/10 |
A2 | 130 | 129,657 | ||||
| Verizon Global Funding Corp., Notes |
|||||||
| 7.75%, 12/01/30 |
A2 | 245 | 288,872 | ||||
| 8,540,565 | |||||||
| Financial — Brokerage —0.1% |
|||||||
| Merrill Lynch & Co., Sr. Unsub. Notes |
|||||||
| 7.375%, 12/17/07 |
Aa3 | 90 | 173,800 | ||||
| Food — 0.3% |
|||||||
| ConAgra Foods, Inc., Notes |
|||||||
| 7.50%, 09/15/05 |
Baa1 | 260 | 282,592 | ||||
| McCormick & Co., Inc., Notes |
|||||||
| 6.40%, 02/01/06 |
A2 | 310 | 335,771 | ||||
| 618,363 | |||||||
202
Table of Contents
AST T. Rowe Price Global Bond Portfolio
Schedule of Investments
December 31, 2003
| Moody’s Rating (Unaudited) |
Par (000) |
Value | |||||
| Healthcare Services |
|||||||
| Highmark, Inc., Notes |
|||||||
| 6.80%, 08/15/13 144A (cost $99,779; purchased 8/14/03)(g) |
Baa3 | USD100 | $ | 108,837 | |||
| Industrial Products — 0.2% |
|||||||
| Collins & Aikman Floor Coverings, Gtd. Notes |
|||||||
| 9.75%, 02/15/10 |
B2 | 165 | 177,375 | ||||
| National Waterworks, Inc., Gtd. Notes |
|||||||
| 10.50%, 12/01/12 |
B3 | 150 | 168,375 | ||||
| 345,750 | |||||||
| Insurance — 0.9% |
|||||||
| AIG SunAmerica Global Financing XII, Notes |
|||||||
| 5.30%, 05/30/07 144A (cost $361,217; purchased |
Aaa | 355 | 380,628 | ||||
| Allstate Financial Global Funding LLC, Notes |
|||||||
| 5.25%, 02/01/07 144A (cost $264,360; purchased 1/24/02)(g) |
Aa2 | 265 | 285,046 | ||||
| Fund American Companies, Inc., Notes |
|||||||
| 5.875%, 05/15/13 |
Baa2 | 105 | 106,463 | ||||
| Marsh & McLennan Companies, Inc., Bonds |
|||||||
| 3.625%, 02/15/08 |
A2 | 90 | 90,403 | ||||
| Metlife, Inc., Sr. Notes |
|||||||
| 6.125%, 12/01/11 |
A2 | 300 | 327,696 | ||||
| Nationwide Financial Services, Inc., Sr. Notes |
|||||||
| 5.90%, 07/01/12 |
A3 | 200 | 209,087 | ||||
| NLV Financial Corp., Sr. Notes |
|||||||
| 7.50%, 08/15/33 144A (cost $146,376; purchased |
Baa3 | 145 | 151,036 | ||||
| Security Benefit Life Insurance Co., Notes |
|||||||
| 7.45%, 10/01/33 144A (cost $94,786; purchased 9/26/03)(g) |
Baa1 | 95 | 97,266 | ||||
| XL Capital Ltd., Gtd. Notes |
|||||||
| 6.50%, 01/15/12 |
A1 | 290 | 317,919 | ||||
| 1,965,544 | |||||||
| Medical Supplies & Equipment — 0.1% |
|||||||
| Abbott Laboratories, Notes |
|||||||
| 5.625%, 07/01/06 |
A1 | 305 | 329,176 | ||||
| Moody’s Rating (Unaudited) |
Par (000) |
Value | |||||
| Oil & Gas — 1.0% |
|||||||
| Baker Hughes, Inc., Sr. Notes |
|||||||
| 6.875%, 01/15/29 |
A2 | USD300 | $ | 340,786 | |||
| Buckeye Partners L.P., Notes |
|||||||
| 6.75%, 08/15/33 |
Baa2 | 95 | 99,971 | ||||
| ConocoPhillips, Gtd. Notes |
|||||||
| 5.90%, 10/15/32 |
A3 | 180 | 181,102 | ||||
| Devon Financing Corp., Gtd. Notes |
|||||||
| 6.875%, 09/30/11 |
Baa2 | 210 | 238,487 | ||||
| Kaneb Pipe Line Operating Partnership L.P., Sr. Notes |
|||||||
| 7.75%, 02/15/12 |
Ba1 | 145 | 166,171 | ||||
| Kinder Morgan, Inc., Sr. Notes |
|||||||
| 6.50%, 09/01/12 |
Baa2 | 235 | 259,757 | ||||
| Occidental Petroleum Corp., Notes |
|||||||
| 4.25%, 03/15/10 |
Baa1 | 110 | 110,839 | ||||
| Panhandle Eastern Pipe Line Co., Notes |
|||||||
| 4.80%, 08/15/08 144A (cost $89,673; purchased 8/13/03)(g) |
Baa3 | 90 | 92,827 | ||||
| Pemex Project Funding Master Trust, Gtd. Notes |
|||||||
| 7.375%, 12/15/14 |
Baa1 | 400 | 429,001 | ||||
| Praxair, Inc., Notes |
|||||||
| 6.90%, 11/01/06 |
A3 | 240 | 267,613 | ||||
| Transocean, Inc., Notes |
|||||||
| 7.50%, 04/15/31 |
Baa2 | 130 | 149,338 | ||||
| 2,335,892 | |||||||
| Paper & Forest Products —0.1% |
|||||||
| Weyerhaeuser Co., Notes |
|||||||
| 6.75%, 03/15/12 |
Baa2 | 210 | 229,461 | ||||
| Pharmaceuticals |
|||||||
| Alpharma, Inc., Sr. Notes |
|||||||
| 8.625%, 05/01/11 144A (cost $50,000; purchased 4/16/03)(g) |
B3 | 50 | 51,000 | ||||
| Printing & Publishing — 0.1% |
|||||||
| Houghton Mifflin Co., Sr. Sub. Notes |
|||||||
| 9.875%, 02/01/13 |
B3 | 100 | 110,500 | ||||
| Reed Elsevier Capital, Gtd. Notes |
|||||||
| 5.75%, 07/31/08 |
A3 | 165 | 223,465 | ||||
| 333,965 | |||||||
| Railroads — 0.1% |
|||||||
| Union Pacific Corp., Notes |
|||||||
| 6.50%, 04/15/12 |
Baa2 | 225 | 250,290 | ||||
| Real Estate — 0.1% |
|||||||
| Pulte Homes, Inc., Gtd. Notes |
|||||||
| 7.875%, 08/01/11 |
Baa3 | 165 | 194,758 | ||||
203
Table of Contents
AST T. Rowe Price Global Bond Portfolio
Schedule of Investments
December 31, 2003
| Moody’s Rating (Unaudited) |
Par (000) |
Value | |||||
| WCI Communities, Inc., |
|||||||
| 9.125%, 05/01/12 |
Ba3 | USD25 | $ | 27,625 | |||
| 222,383 | |||||||
| Retail & Merchandising —0.3% |
|||||||
| AutoZone, Inc., Sr. Notes |
|||||||
| 4.75%, 11/15/10 |
Baa2 | 150 | 150,774 | ||||
| Fred Meyer, Inc., Gtd. Notes |
|||||||
| 7.45%, 03/01/08 |
Baa3 | 205 | 233,693 | ||||
| Office Depot, Inc., Notes |
|||||||
| 6.25%, 08/15/13 |
Baa3 | 185 | 194,600 | ||||
| 579,067 | |||||||
| Telecommunications — 0.7% |
|||||||
| AT&T Wireless Services, Inc., |
|||||||
| 7.875%, 03/01/11 |
Baa2 | 170 | 196,217 | ||||
| 8.75%, 03/01/31 |
Baa2 | 170 | 210,493 | ||||
| Citizens Communications Co., |
|||||||
| 9.00%, 08/15/31 |
Baa2 | 110 | 128,784 | ||||
| INTELSAT Ltd., Notes |
|||||||
| 5.25%, 11/01/08 144A (cost $79,981; purchased 10/31/03)(g) |
Baa3 | 80 | 82,412 | ||||
| Motorola, Inc., Notes |
|||||||
| 6.75%, 02/01/06 |
Baa3 | 120 | 129,350 | ||||
| Sprint Capital Corp., Gtd. Notes |
|||||||
| 6.375%, 05/01/09 |
Baa3 | 400 | 428,073 | ||||
| United States Cellular Corp., Notes |
|||||||
| 6.70%, 12/15/33 |
Baa1 | 115 | 115,408 | ||||
| Verizon Florida, Inc., Debs. |
|||||||
| 6.125%, 01/15/13 |
A1 | 95 | 101,880 | ||||
| Verizon Virginia, Inc., Debs. |
|||||||
| 4.625%, 03/15/13 |
Aa3 | 165 | 159,376 | ||||
| 1,551,993 | |||||||
| Transportation |
|||||||
| Hertz Corp., Sec’d. Notes |
|||||||
| 4.70%, 10/02/06 |
BBB-(d) | 95 | 96,734 | ||||
| Utilities — 1.5% |
|||||||
| AES Corp, Sec’d. Notes |
|||||||
| 8.75%, 05/15/13 144A (cost $200,000; purchased 5/01/03)(g) |
B2 | 200 | 224,500 | ||||
| American Electric Power Co., Inc., Sr. Notes |
|||||||
| 5.375%, 03/15/10 |
Baa3 | 170 | 178,398 | ||||
| Appalachian Power Co., Sr. Notes |
|||||||
| 4.80%, 06/15/05 |
Baa2 | 225 | 234,238 | ||||
| Black Hills Corp., Notes |
|||||||
| 6.50%, 05/15/13 |
Baa3 | 230 | 233,537 | ||||
| Moody’s Rating (Unaudited) |
Par (000) |
Value | |||||
| Centerpoint Energy Resources Corp., Debs. |
|||||||
| 6.50%, 02/01/08 |
Ba1 | USD35 | $ | 37,528 | |||
| CMS Energy Corp., Sr. Notes |
|||||||
| 9.875%, 10/15/07 |
B3 | 200 | 224,000 | ||||
| Consolidated Edison Co. of New York, Debs. |
|||||||
| 8.125%, 05/01/10 |
A1 | 200 | 243,262 | ||||
| Entergy Gulf States, Inc., |
|||||||
| 5.20%, 12/03/07 |
Baa3 | 200 | 206,060 | ||||
| Exelon Generation Co. LLC, Notes |
|||||||
| 5.35%, 01/15/14 144A (cost $169,941; purchased 12/16/03)(g) |
Baa1 | 170 | 169,697 | ||||
| FirstEnergy Corp., Notes |
|||||||
| 5.50%, 11/15/06 |
Baa2 | 190 | 196,966 | ||||
| Florida Power & Light Co., |
|||||||
| 5.95%, 10/01/33 |
Aa3 | 145 | 149,045 | ||||
| Ohio Edison Co., Sr. Notes |
|||||||
| 4.00%, 05/01/08 144A (cost $204,275; purchased 10/01/03)(g) |
Baa2 | 205 | 200,679 | ||||
| Pepco Holdings, Inc., Notes |
|||||||
| 3.75%, 02/15/06 |
Baa2 | 200 | 203,866 | ||||
| Pinnacle West Capital Corp., |
|||||||
| 6.40%, 04/01/06 |
Baa2 | 190 | 203,922 | ||||
| Public Service Co. of New Mexico, Sr. Notes |
|||||||
| 4.40%, 09/15/08 |
Baa3 | 185 | 187,535 | ||||
| Sempra Energy Co., Notes |
|||||||
| 6.00%, 02/01/13 |
Baa1 | 240 | 255,428 | ||||
| TXU Energy Co., Sr. Notes |
|||||||
| 7.00%, 03/15/13 |
Baa2 | 110 | 121,911 | ||||
| Virginia Electric & Power Co., Sr. Notes |
|||||||
| 5.375%, 02/01/07 |
A3 | 250 | 266,839 | ||||
| 3,537,411 | |||||||
| Total Corporate Obligations |
|||||||
| (Cost $26,986,612) |
28,581,501 | ||||||
| U.S. TREASURY OBLIGATIONS — 7.7% |
|||||||
| U.S. Treasury Bonds |
|||||||
| 7.50%, 11/15/16 |
30 | 38,203 | |||||
| 6.25%, 08/15/23 - 05/15/30 |
1,485 | 1,698,889 | |||||
| 6.00%, 02/15/26 |
970 | 1,075,980 | |||||
| 6.50%, 11/15/26 |
265 | 311,831 | |||||
| 5.375%, 02/15/31 |
580 | 605,036 | |||||
| 3,729,939 | |||||||
204
Table of Contents
AST T. Rowe Price Global Bond Portfolio
Schedule of Investments
December 31, 2003
| Moody’s (Unaudited) |
Par (000) |
Value | |||||
| U.S. Treasury Inflationary Bonds |
|||||||
| 1.875%, 07/15/13 |
USD1,440 | $ | 1,440,498 | ||||
| U.S. Treasury Notes |
|||||||
| 2.125%, 08/31/04(k) |
990 | 997,078 | |||||
| 5.875%, 11/15/04 |
4,330 | 4,504,892 | |||||
| 6.50%, 08/15/05 |
1,730 | 1,866,914 | |||||
| 3.50%, 11/15/06 |
960 | 992,588 | |||||
| 4.75%, 11/15/08 |
2,085 | 2,232,743 | |||||
| 4.375%, 08/15/12 |
75 | 76,512 | |||||
| 3.875%, 02/15/13 |
530 | 518,986 | |||||
| 4.25%, 11/15/13 |
1,350 | 1,348,946 | |||||
| 12,538,659 | |||||||
| Total U.S. Treasury Obligations |
|||||||
| (Cost $17,784,753) |
17,709,096 | ||||||
| ASSET BACKED SECURITIES — 3.6% |
|||||||
| BankBoston Home Equity Loan Trust, Series 1998-1 Class A6 |
|||||||
| 6.35%, 02/25/13 |
Aaa | 343 | 359,087 | ||||
| Capital Auto Receivables Asset Trust, Series 2002-2 Class CTFS |
|||||||
| 4.18%, 10/15/07 |
Aaa | 191 | 195,230 | ||||
| Chase Funding Mortgage Loan Asset-Backed, Series 2002-1 Class 1A3 |
|||||||
| 5.039%, 12/25/23 [VR](c) |
Aaa | 300 | 302,088 | ||||
| Series 2002-2 Class 1M1 |
|||||||
| 5.599%, 09/25/31 |
Aa2 | 60 | 62,460 | ||||
| Chase Funding Mortgage Loan Asset-Backed, Series 2002-3 Class 1A6 |
|||||||
| 4.707%, 08/25/13 |
Aaa | 250 | 256,205 | ||||
| Series 2003-1 Class 1A6 |
|||||||
| 4.458%, 03/25/14 |
Aaa | 600 | 598,950 | ||||
| Series 2003-3 Class 1M1 |
|||||||
| 4.537%, 09/25/32 |
Aa2 | 225 | 214,198 | ||||
| Chase Manhattan Auto Owner Trust, Series 2001-B Class CTFS |
|||||||
| 3.75%, 05/15/08 |
A1 | 160 | 162,173 | ||||
| Series 2003-A Class A4 |
|||||||
| 2.06%, 12/15/09 |
Aaa | 455 | 446,096 | ||||
| Citibank Credit Card Issuance Trust, Series 2000-A3 Class A3 |
|||||||
| 6.875%, 11/15/09 |
Aaa | 825 | 939,946 | ||||
| Series 2000-C1 Class C1 |
|||||||
| 7.45%, 09/15/07 |
Baa2 | 300 | 324,622 | ||||
| Series 2001-A1 Class A1 |
|||||||
| 6.90%, 10/15/07 |
Aaa | 150 | 162,613 | ||||
| Moody’s (Unaudited) |
Par (000) |
Value | |||||
| Series 2001-C1 Class C1 |
|||||||
| 2.23%, 01/15/10 [FRN](c) |
Baa2 | USD250 | $ | 254,126 | |||
| Series 2002-C1 Class C1 |
|||||||
| 2.16%, 02/09/09 [FRN](c) |
Baa2 | 475 | 480,867 | ||||
| Countrywide Asset-Backed Certificates, Series 2003-5 |
|||||||
| 3.613%, 04/25/30 |
Aaa | 340 | 343,200 | ||||
| Series 2003-60 Class 1A2 |
|||||||
| 5.067%, 02/25/34 |
Aaa | 165 | 167,939 | ||||
| Harley-Davidson Motorcycle Trust, Series 2001-1 Class B |
|||||||
| 5.29%, 01/15/09 |
A2 | 120 | 123,871 | ||||
| Series 2002-2 Class B |
|||||||
| 2.84%, 06/15/10 |
A2 | 297 | 300,636 | ||||
| Series 2003-2 Class B |
|||||||
| 1.89%, 02/15/11 144A (cost $325,825; purchased 5/13/03)(g) |
A1 | 326 | 325,158 | ||||
| Series 2003-3 Class B |
|||||||
| 2.28%, 05/15/11 |
A2 | 111 | 111,169 | ||||
| Hyundai Auto Receivables Trust, Series 2003-A Class A4 |
|||||||
| 3.02%, 10/15/10 |
Aaa | 200 | 199,909 | ||||
| Series 2003-A Class D |
|||||||
| 4.06%, 10/15/10 |
Baa2 | 90 | 90,013 | ||||
| MBNA Credit Card Master Note Trust, Series 2001-C2 Class C2 |
|||||||
| 2.27%, 12/15/10 |
Baa2 | 265 | 270,080 | ||||
| MBNA Master Credit Card Trust, Series 2000-D Class C |
|||||||
| 8.40%, 09/15/09 144A |
BBB(d) | 650 | 741,327 | ||||
| Reliant Energy Transition Bond Co. LLC, Series 2001-1 Class A4 |
|||||||
| 5.63%, 09/15/15 |
Aaa | 275 | 292,904 | ||||
| World Financial Network Credit Card Master Trust, |
|||||||
| 1.49%, 05/15/12 [FRN] |
Aaa | 500 | 503,118 | ||||
| Total Asset Backed Securities |
|||||||
| (Cost $8,104,379) |
8,227,985 | ||||||
205
Table of Contents
AST T. Rowe Price Global Bond Portfolio
Schedule of Investments
December 31, 2003
| Moody’s (Unaudited) |
Par (000) |
Value | |||||
| COLLATERALIZED MORTGAGE OBLIGATIONS — 2.9% | |||||||
| Bank of America Commercial Mortgage, Inc., Series 2003-1 Class A2 |
|||||||
| 4.648%, 09/11/36 |
Aaa | USD500 | $ | 497,425 | |||
| Bank of America Mortgage Securities, Series 2003-L Class 2A2 |
|||||||
| 4.368%, 01/25/34 |
Aaa | 950 | 947,922 | ||||
| Bear Stearns Commercial Mortgage Securities, Series 2002-Top8 Class A2 |
|||||||
| 4.83%, 08/15/38 |
AAA(d) | 935 | 945,336 | ||||
| DLJ Commercial Mortgage Corp., Series 1999-CG2 Class A1B |
|||||||
| 7.30%, 06/10/32 |
Aaa | 450 | 521,086 | ||||
| General Electric Capital Commercial Mortgage Corp., Series 2001-1 Class A2 |
|||||||
| 6.531%, 05/15/33 |
Aaa | 550 | 617,159 | ||||
| J.P. Morgan Chase Commercial Mortgage Finance Corp., Series 2001-CIB2 Class A2 |
|||||||
| 6.244%, 04/15/35 |
AAA(d) | 225 | 247,488 | ||||
| Series 2001-CIBC Class A3 |
|||||||
| 6.26%, 03/15/33 |
AAA(d) | 650 | 717,290 | ||||
| J.P. Morgan Commercial Mortgage Finance Corp., Series 1999-C7 Class A2 |
|||||||
| 6.507%, 10/15/35 |
AAA(d) | 550 | 613,440 | ||||
| Series 1999-PSL1 Class A2 |
|||||||
| 7.108%, 02/15/32 [VR](c) |
AAA(d) | 895 | 1,020,545 | ||||
| Salomon Brothers Mortgage Securities VII, Series 2001-C1 Class A2 |
|||||||
| 6.226%, 12/18/35 |
Aaa | 300 | 329,374 | ||||
| symbol |
description | |
| * |
Non-income producing security. | |
| (c) |
Indicates a variable rate security. The maturity date presented for these instruments is the latter of the next date on which the security can be redeemed at par or the next date on which the rate of interest is adjusted. The interest rate shown reflects the rate in effect at December 31, 2003. | |
| (d) |
Standard & Poor’s rating. | |
| (g) |
Indicates a security that has been deemed illiquid. The aggregate cost of the illiquid securities is $4,254,120. The aggregate value, $4,374,987 represents 1.91% of net assets. |
| Moody’s (Unaudited) |
Par (000) |
Value | |||||
| Summit Mortgage Trust, Series 2002-1 Class A2 |
|||||||
| 6.227%, 06/28/16 [VR] 144A (c) (cost $145,853; purchased 5/28/02)(g) |
NR | USD144 | $ | 143,532 | |||
| Total Collateralized Mortgage Obligations |
|||||||
| (Cost $6,589,081) |
6,600,597 | ||||||
| SOVEREIGN ISSUES — 0.3% |
|||||||
| Chile — 0.2% |
|||||||
| Republic of Chile |
|||||||
| 5.50%, 01/15/13 |
Baa1 | 320 | 329,920 | ||||
| Mexico — 0.1% |
|||||||
| United Mexican States |
|||||||
| 6.375%, 01/16/13 |
Baa2 | 260 | 270,400 | ||||
| Total Sovereign Issues |
|||||||
| (Cost $574,370) |
600,320 | ||||||
| Units |
|||||
| WARRANTS* |
|||||
| Central Bank of Nigeria (Nigeria), |
250 | 0 | |||
| Republic of Venezuela (Venezuela), expiring 04/15/2020 |
1,250 | 0 | |||
| TravelCenters of America, expiring 05/01/2009 |
750 | 4,125 | |||
| (Cost $0) |
4,125 | ||||
| Total Long-Term Investments — 92.8% |
|||||
| (Cost $195,932,735; Note 5) |
213,057,041 | ||||
| Other Assets in Excess of Liabilities — 7.2% |
16,572,970 | ||||
| Net Assets — 100.0% |
$ | 229,630,011 | |||
206
Table of Contents
AST T. Rowe Price Global Bond Portfolio
Schedule of Investments
December 31, 2003
| symbol |
description | |
| (k) |
Securities with an aggregate market value of $43,307 have been segregated with the custodian to cover margin requirements for the following open future contracts at December 31, 2003: |
| Description | Expiration Month |
Notional Amount (000) |
Contracts at Trade Date Value |
Contracts at Current Value |
Unrealized Appreciation (Depreciation) |
||||||||
| Long Positions: |
|||||||||||||
| U.S. Treasury Bonds |
03/04 | $ | 500 | 538,203 | 546,563 | $ | 8,360 | ||||||
| Short Positions: |
|||||||||||||
| U.S. Treasury 5 Year Notes |
03/04 | 9,600 | 10,685,907 | 10,716,000 | (30,093 | ) | |||||||
| U.S. Treasury 10 Year Notes |
03/04 | 8,600 | 9,647,164 | 9,654,844 | (7,680 | ) | |||||||
| (37,773 | ) | ||||||||||||
| $ | (29,413 | ) | |||||||||||
Foreign currency exchange contracts outstanding at December 31, 2003:
| Settlement Month |
Purchase Contracts |
Contracts to Receive |
In Exchange For |
Contracts at Value |
Unrealized (Depreciation) |
|||||||||
| 02/04 |
Buy CAD | 4,792,153 | $ | 3,685,000 | $ | 3,693,401 | $ | 8,401 | ||||||
| 02/04 |
Buy CNY | 18,339,451 | 2,232,000 | 2,215,793 | (16,207 | ) | ||||||||
| 04/04 |
Buy CNY | 16,198,420 | 1,960,000 | 1,957,111 | (2,889 | ) | ||||||||
| 05/04 |
Buy CNY | 20,939,451 | 2,555,836 | 2,529,928 | (25,908 | ) | ||||||||
| 09/04 |
Buy CNY | 16,198,420 | 2,002,153 | 1,957,111 | (45,042 | ) | ||||||||
| 02/04 |
Buy EUR | 3,345,606 | 4,079,690 | 4,199,153 | 119,463 | |||||||||
| 02/04 |
Buy GBP | 740,364 | 1,248,254 | 1,314,778 | 66,524 | |||||||||
| 02/04 |
Buy JPY | 3,571,776,428 | 33,041,471 | 33,316,275 | 274,804 | |||||||||
| 01/04 |
Buy KOR | 2,488,625,000 | 2,150,000 | 2,088,649 | (61,351 | ) | ||||||||
| 02/04 |
Buy NOK | 2,025,000 | 292,503 | 302,806 | 10,303 | |||||||||
| 02/04 |
Buy SEK | 894,640 | 116,931 | 123,794 | 6,863 | |||||||||
| 02/04 |
Buy THB | 72,325,000 | 2,121,279 | 2,130,339 | 9,060 | |||||||||
| $ | 55,485,117 | $ | 55,829,138 | $ | 344,021 | |||||||||
| Settlement Month |
Sell Contracts |
Contracts to Receive |
In Exchange For |
Contracts at Value |
Unrealized Appreciation (Depreciation) |
|||||||||
| 02/04 |
Sell CAD | 6,678,210 | $ | 5,087,954 | $ | 5,147,020 | $ | (59,066 | ) | |||||
| 02/04 |
Sell CNY | 18,339,451 | 2,229,504 | 2,215,793 | 13,711 | |||||||||
| 04/04 |
Sell CNY | 16,198,420 | 1,985,222 | 1,957,111 | 28,111 | |||||||||
| 05/04 |
Sell CNY | 20,939,451 | 2,594,021 | 2,529,928 | 64,093 | |||||||||
| 09/04 |
Sell CNY | 16,198,420 | 2,030,641 | 1,957,111 | 73,530 | |||||||||
| 02/04 |
Sell DKK | 6,938,918 | 1,100,368 | 1,169,597 | (69,229 | ) | ||||||||
| 02/04 |
Sell EUR | 9,385,611 | 11,253,906 | 11,780,115 | (526,209 | ) | ||||||||
| 02/04 |
Sell GBP | 238,012 | 409,000 | 422,675 | (13,675 | ) | ||||||||
| 02/04 |
Sell PLZ | 20,801,154 | 5,251,698 | 5,545,280 | (293,582 | ) | ||||||||
| $ | 31,942,314 | $ | 32,724,630 | ($ | 782,316 | ) | ||||||||
207
Table of Contents
AST T. Rowe Price Global Bond Portfolio
Schedule of Investments
December 31, 2003
The following abbreviations are used in portfolio descriptions:
| 144A | Security was purchased pursuant to Rule 144A under the securities Act of 1933 and may not be resold subject to that rule except to qualified institutional buyers. Unless otherwise noted 144A securities are deemed to be liquid. |
| ATS | Austrian Shilling |
| AUD | Australian Dollar |
| CAD | Canadian Dollar |
| CNY | Chinese Yuan |
| DKK | Danish Krone |
| EUR | Euro Dollar |
| FIM | Finnish Murkka |
| FRN | Floating Rate Note |
| GBP | British Pound |
| IEP | Irish Punt |
| IO | Interest Only |
| JPY | Japanese Yen |
| KOR | Korean Won |
| NOK | Norwegian Krone |
| PLZ | Polish Zloty |
| SEK | Swedish Krona |
| TBA | Securities purchased on a forward commitment basis |
| THB | Thai Baht |
| USD | United States Dollar |
| VR | Variable Rate Bond |
See Notes to Financial Statements.
208
Table of Contents
AST Federated High Yield Portfolio
Schedule of Investments
December 31, 2003
| Moody’s Rating (Unaudited) |
Par (000) |
Value | ||||||
| LONG-TERM INVESTMENTS — 96.8% |
||||||||
| CORPORATE OBLIGATIONS — 95.8% |
||||||||
| Aerospace / Defense — 1.3% |
||||||||
| Alliant Techsystems, Inc., |
B2 | $ | 2,200 | $ | 2,431,000 | |||
| DRS Technologies, Inc., |
B2 | 1,300 | 1,339,000 | |||||
| Gencorp, Inc., Sr. Sub. Notes 9.50%, 08/15/13 144A |
B2 | 1,050 | 1,097,250 | |||||
| Hexcel Corp., Gtd. Notes 9.875%, 10/01/08 |
B3 | 1,150 | 1,293,750 | |||||
| Hexcel Corp., Sr. Sub. Notes 9.75%, 01/15/09 |
Caa2 | 2,825 | 2,973,313 | |||||
| TD Funding Corp., |
B3 | 1,850 | 1,977,188 | |||||
| 11,111,501 | ||||||||
| Automotive — 4.4% |
||||||||
| Accuride Corp., |
Caa1 | 800 | 828,000 | |||||
| Advanced Accessory System, Sr. Notes |
B2 | 2,225 | 2,475,313 | |||||
| American Axle & Manufacturing, Inc., |
Ba1 | 3,600 | 3,811,500 | |||||
| Arvin Industries, Inc., |
Baa3 | 1,400 | 1,471,750 | |||||
| Arvin Industries, Inc.,Notes 7.125%, 03/15/09 |
Baa3 | 775 | 822,469 | |||||
| ArvinMeritor, Inc., Notes |
Baa3 | 1,275 | 1,463,063 | |||||
| Dana Corp., Notes |
Ba3 | 550 | 665,500 | |||||
| General Motors Corp., |
Baa1 | 3,350 | 3,631,936 | |||||
| General Motors Corp., Debs 8.375%, 07/15/33 |
Baa1 | 3,525 | 4,026,819 | |||||
| Lear Corp., Gtd. Notes, |
Ba1 | 3,500 | 4,121,249 | |||||
| Rexnord Corp., Gtd. Notes 10.125%, 12/15/12 |
B3 | 2,700 | 2,983,500 | |||||
| Stoneridge, Inc., Gtd. Notes 11.50%, 05/01/12 |
B2 | 3,175 | 3,758,407 | |||||
| Moody’s Rating (Unaudited) |
Par (000) |
Value | ||||||
| TRW Automotive, Inc., |
B2 | $ | 5,725 | $ | 6,798,437 | |||
| United Components, Inc., |
B3 | 1,475 | 1,611,438 | |||||
| 38,469,381 | ||||||||
| Building Materials — 1.9% |
||||||||
| Associated Materials, Inc., |
B3 | 1,125 | 1,237,500 | |||||
| Collins & Aikman Corp., |
B2 | 1,375 | 1,478,125 | |||||
| Euramax International PLC, |
B2 | 3,400 | 3,638,000 | |||||
| FIMEP SA, Sr. Notes, (France) |
B1 | 1,275 | 1,487,606 | |||||
| MMI Products, Inc., |
Caa2 | 3,125 | 2,562,500 | |||||
| NCI Building Systems, Inc., |
B2 | 2,050 | 2,167,875 | |||||
| Norcraft Companies L.P., |
B3 | 1,350 | 1,451,250 | |||||
| Nortek Holdings, Inc., |
Caa1 | 3,400 | 2,482,000 | |||||
| 16,504,856 | ||||||||
| Chemicals — 4.0% |
||||||||
| Compass Minerals International, Sr. Notes, Zero Coupon (until 12/15/07) |
NR | 1,900 | 1,510,500 | |||||
| Compass Minerals International, |
NR | 3,950 | 2,745,250 | |||||
| Equistar Chemical Funding Corp., Gtd. Notes |
B2 | 3,025 | 3,342,624 | |||||
| FMC Corp., Sr. Sub. Notes 7.75%, 07/01/11 |
Ba2 | 275 | 280,500 | |||||
209
Table of Contents
AST Federated High Yield Portfolio
Schedule of Investments
December 31, 2003
| Moody’s Rating (Unaudited) |
Par (000) |
Value | ||||||
| FMC Corp., Sec’d. Notes 10.25%, 11/01/09 |
Ba2 | $ | 1,600 | $ | 1,880,000 | |||
| General Chemical Industry Products, Inc., |
NR | 1,075 | 196,188 | |||||
| Huntsman Advanced Materials LLC, |
B2 | 1,100 | 1,221,000 | |||||
| Huntsman ICI Chemicals LLC, Gtd. Notes |
Caa1 | 4,600 | 4,783,999 | |||||
| Koppers, Inc., Gtd. Notes |
B2 | 1,575 | 1,748,250 | |||||
| Kraton Polymers LLC, |
B3 | 575 | 602,313 | |||||
| Lyondell Chemical Co., Gtd. Notes 9.50%, 12/15/08 |
B1 | 2,850 | 3,021,000 | |||||
| Lyondell Chemical Co., |
B3 | 2,775 | 2,872,125 | |||||
| Lyondell Chemical Co., |
B1 | 2,050 | 2,173,000 | |||||
| Nalco Co., Sr. Notes |
B2 | 725 | 779,375 | |||||
| Nalco Co., Sr. Sub. Notes |
Caa1 | 1,500 | 1,612,500 | |||||
| Rhodia SA, Sr. Notes (France) 7.625%, 06/01/10 144A(l) |
B2 | 550 | 530,750 | |||||
| Rhodia SA, Sr. Notes (France) 8.875%, 06/01/11 144A(l) |
B3 | 1,275 | 1,179,375 | |||||
| Texas Petrochemical Corp., |
NR | 2,125 | 690,625 | |||||
| Union Carbide Chemical & Plastic Corp., Gtd. Notes |
B1 | 2,250 | 2,168,438 | |||||
| Moody’s Rating (Unaudited) |
Par (000) |
Value | ||||||
| Union Carbide Chemical & Plastic Corp., Debs. |
B1 | $ | 250 | $ | 229,688 | |||
| Union Carbide Corp., Debs. 6.79%, 06/01/05 |
B1 | 1,375 | 1,338,906 | |||||
| 34,906,406 | ||||||||
| Construction Machinery — 2.1% |
||||||||
| AGCO Corp., Gtd. Notes |
Ba3 | 2,300 | 2,524,250 | |||||
| Case Corp., Notes |
Ba3 | 2,500 | 2,618,750 | |||||
| Case New Holland, Inc., |
Ba3 | 3,875 | 4,359,375 | |||||
| Clark Materials Handling Corp., Gtd. Notes, Series D |
NR | 2,625 | 263 | |||||
| Columbus McKinnon Corp., Gtd. Notes |
Caa1 | 2,925 | 2,749,500 | |||||
| Columbus McKinnon Corp., Sec’d. Notes |
B3 | 425 | 453,688 | |||||
| Great Lakes Dredge & Dock, Sr. Sub. Notes |
B3 | 750 | 774,375 | |||||
| United Rentals, Inc., Gtd. Notes 10.75%, 04/15/08 |
B1 | 4,550 | 5,141,499 | |||||
| 18,621,700 | ||||||||
| Consumer Products — 4.9% |
||||||||
| Alltrista Corp., Gtd. Notes 9.75%, 05/01/12 |
B2 | 3,225 | 3,571,688 | |||||
| American Achievement Corp., Gtd. Notes |
B1 | 2,900 | 3,262,500 | |||||
| American Greetings Corp., |
Ba3 | 4,000 | 4,639,999 | |||||
| American Safety Razor Co., |
B3 | 650 | 646,750 | |||||
| Amscan Holdings, Inc., |
B3 | 1,800 | 1,813,500 | |||||
210
Table of Contents
AST Federated High Yield Portfolio
Schedule of Investments
December 31, 2003
| Moody’s Rating (Unaudited) |
Par (000) |
Value | ||||||
| Armkel Finance, Inc., |
B2 | $ | 1,275 | $ | 1,410,469 | |||
| Bombardier Recreational, |
B3 | 575 | 600,875 | |||||
| Chattem, Inc., Gtd. Notes, Series B |
B2 | 3,400 | 3,510,500 | |||||
| Commemorative Brands, Inc., Sr. Sub. Notes |
Caa1 | 1,000 | 1,025,000 | |||||
| Diamond Brands Operating, Inc., Debs. |
NR | 1,500 | 150 | |||||
| ICON Health & Fitness, Inc., Gtd. Notes |
B3 | 1,450 | 1,616,750 | |||||
| Jostens Holdings Corp., |
Caa2 | 4,500 | 2,880,000 | |||||
| Jostens, Inc., Sr. Sub. Notes 12.75%, 05/01/10 |
B3 | 1,900 | 2,194,500 | |||||
| Playtex Products, Inc., |
Caa1 | 2,900 | 2,929,000 | |||||
| Sealy Mattress Co., |
B3 | 1,200 | 1,254,000 | |||||
| Sealy Mattress Co., |
B3 | 2,700 | 2,814,750 | |||||
| Simmons Co., Sr. Sub. Notes 7.875%, 01/15/14 144A |
Caa1 | 575 | 583,625 | |||||
| Sleepmaster LLC, Gtd. Notes 11.00%, 05/15/09 |
C | 1,000 | 277,500 | |||||
| Tempur-Pedic, Inc., |
B3 | 950 | 1,065,188 | |||||
| Moody’s Rating (Unaudited) |
Par (000) |
Value | ||||||
| True Temper Sports, Inc., |
B3 | $ | 1,950 | $ | 2,076,750 | |||
| United Industries Corp., |
B3 | 3,875 | 4,078,437 | |||||
| 42,251,931 | ||||||||
| Diversified Manufacturing — 1.8% |
||||||||
| Tyco International Group, Gtd. Notes, (Luxembourg) |
Ba2 | 12,750 | 13,638,420 | |||||
| Simonds Industries, Inc., Notes 10.00%, 10/01/08 |
NR | 158 | 157,500 | |||||
| Amsted Industries, Inc., |
B3 | 1,500 | 1,665,000 | |||||
| 15,460,920 | ||||||||
| Energy — 4.1% |
||||||||
| CITGO Petroleum Corp., |
Ba3 | 2,700 | 3,172,500 | |||||
| Compton Petroleum Corp., |
B2 | 2,025 | 2,222,438 | |||||
| Continental Resources, Inc., |
Caa1 | 3,075 | 3,105,750 | |||||
| Lone Star Technologies, Inc., Gtd. Notes |
B2 | 3,025 | 3,009,875 | |||||
| Magnum Hunter Resources, Inc., Gtd. Notes |
B2 | 1,100 | 1,254,000 | |||||
| Pogo Producing Co., |
Ba3 | 4,100 | 4,381,875 | |||||
| Semco Energy, Inc., |
Ba2 | 950 | 993,938 | |||||
| Tennessee Gas Pipeline Co., Bonds |
B1 | 1,575 | 1,677,375 | |||||
| Tesoro Petroleum Corp., |
B3 | 700 | 729,750 | |||||
211
Table of Contents
AST Federated High Yield Portfolio
Schedule of Investments
December 31, 2003
| Moody’s Rating (Unaudited) |
Par (000) |
Value | ||||||
| Tesoro Petroleum Corp., |
B3 | $ | 2,275 | $ | 2,434,250 | |||
| Tesoro Petroleum Corp., |
Ba3 | 975 | 1,050,563 | |||||
| Transcontinental Gas Pipe Line Corp., Notes, Series B |
B1 | 150 | 162,375 | |||||
| Transcontinental Gas Pipe Line Corp., Notes, Series B |
B1 | 1,875 | 2,259,375 | |||||
| Williams Companies, Inc., Notes |
B3 | 4,525 | 4,756,905 | |||||
| Williams Companies, Inc., Notes |
B3 | 2,300 | 2,432,250 | |||||
| Williams Companies, Inc., |
B3 | 1,600 | 1,820,000 | |||||
| 35,463,219 | ||||||||
| Entertainment — 3.1% |
||||||||
| AMC Entertainment, Inc., |
Caa1 | 1,225 | 1,274,000 | |||||
| AMC Entertainment, Inc., |
Caa1 | 2,675 | 2,982,625 | |||||
| AMF Bowling Worldwide, Inc., Sr. Sub. Notes |
B3 | 1,625 | 1,844,375 | |||||
| Intrawest Corp., |
B1 | 1,975 | 2,197,188 | |||||
| Regal Cinemas, Inc., |
B2 | 3,525 | 4,000,875 | |||||
| Six Flags, Inc., Sr. Notes |
B2 | 374 | 394,103 | |||||
| Six Flags, Inc., Sr. Notes |
B2 | 2,050 | 2,162,750 | |||||
| Universal City Development Partners L.P., Sr. Notes |
B2 | 5,125 | 6,047,500 | |||||
| Vivendi Universal SA, |
B1 | 2,725 | 2,895,313 | |||||
| Moody’s Rating (Unaudited) |
Par (000) |
Value | ||||||
| Vivendi Universal SA, |
B1 | $ | 3,000 | $ | 3,555,000 | |||
| 27,353,729 | ||||||||
| Environmental — 1.6% |
||||||||
| Allied Waste North America Co., Gtd. Notes, Series B |
Ba3 | 2,300 | 2,426,500 | |||||
| Allied Waste North America Co., Gtd. Notes, Series B |
Ba3 | 5,100 | 5,686,500 | |||||
| Allied Waste North America Co., Gtd. Notes, Series B 7.875%, 01/01/09 |
Ba3 | 3,850 | 4,004,000 | |||||
| Sensus Metering Systems, |
Caa1 | 1,375 | 1,416,250 | |||||
| 13,533,250 | ||||||||
| Financial Institutions — 0.3% |
||||||||
| CBRE Escrow, Inc., Sr. Notes |
B1 | 675 | 752,625 | |||||
| Dollar Financial Group, |
B3 | 2,000 | 2,080,000 | |||||
| 2,832,625 | ||||||||
| Food & Beverage — 5.8% |
||||||||
| Agrilink Foods, Inc., |
B3 | 937 | 993,220 | |||||
| American Seafood Group LLC, Gtd. Notes |
B3 | 3,225 | 3,853,875 | |||||
| B&G Foods, Inc., |
B3 | 1,675 | 1,742,000 | |||||
| Constellation Brands, Inc., |
Ba2 | 1,625 | 1,836,250 | |||||
| Constellation Brands, Inc., |
Ba3 | 1,900 | 2,113,750 | |||||
| Cott Beverages, Inc., |
B2 | 2,000 | 2,175,000 | |||||
| Del Monte Corp., |
B2 | 1,700 | 1,882,750 | |||||
212
Table of Contents
AST Federated High Yield Portfolio
Schedule of Investments
December 31, 2003
| Moody’s Rating (Unaudited) |
Par (000) |
Value | ||||||
| Del Monte Foods Corp., |
B2 | $ | 3,625 | $ | 4,023,749 | |||
| Dole Foods Co., Inc., |
B2 | 600 | 624,000 | |||||
| Dole Foods Co., Inc., |
B2 | 5,100 | 5,622,749 | |||||
| Domino’s, Inc., |
B3 | 825 | 895,125 | |||||
| Eagle Family Foods, Inc., |
Caa2 | 2,200 | 1,617,000 | |||||
| Land O’ Lakes, Inc., |
B3 | 3,175 | 2,809,875 | |||||
| Michael Foods, Inc., |
B3 | 1,450 | 1,515,250 | |||||
| National Beef Packaging Co., |
B2 | 1,300 | 1,345,500 | |||||
| New World Pasta Co., |
NR | 1,825 | 479,063 | |||||
| Pilgrim’s Pride Corp., |
B1 | 2,200 | 2,431,000 | |||||
| PPC Escrow Corp., |
B2 | 2,925 | 3,056,625 | |||||
| Reddy Ice Group, Inc., |
B3 | 2,150 | 2,295,125 | |||||
| Smithfield Foods, Inc., |
Ba2 | 1,600 | 1,688,000 | |||||
| Smithfield Foods, Inc., |
Ba2 | 3,050 | 3,187,250 | |||||
| Smithfield Foods, Inc., |
Ba3 | 1,300 | 1,319,500 | |||||
| Swift & Co., Gtd. Notes |
B1 | 1,350 | 1,441,125 | |||||
| Swift & Co., Sr. Sub. Notes |
B2 | 950 | 1,009,375 | |||||
| Moody’s Rating (Unaudited) |
Par (000) |
Value | ||||||
| United Agricultural Products, |
B3 | $ | 725 | $ | 748,563 | |||
| 50,705,719 | ||||||||
| Gaming — 7.4% |
||||||||
| Boyd Gaming Corp., |
B1 | 3,325 | 3,657,500 | |||||
| Cinemark USA, Inc., |
B3 | 1,350 | 1,525,500 | |||||
| Coast Hotels & Casinos, Inc., Gtd. Notes |
B2 | 2,275 | 2,411,500 | |||||
| Harrah’s Operating Co., Inc., Gtd. Notes |
Ba1 | 1,500 | 1,642,500 | |||||
| Isle of Capri Casinos, Inc., |
B2 | 1,475 | 1,556,125 | |||||
| Isle of Capri Casinos, Inc., |
B2 | 1,400 | 1,564,500 | |||||
| Majestic Star Casino LLC, |
B2 | 1,825 | 1,879,750 | |||||
| Mandalay Resort Group, |
Ba2 | 1,500 | 1,758,750 | |||||
| Mandalay Resort Group, |
Ba3 | 4,675 | 5,422,999 | |||||
| Mandalay Resort Group, |
Ba3 | 1,300 | 1,517,750 | |||||
| MGM Grand, Inc., Gtd. Notes |
Ba2 | 2,125 | 2,443,750 | |||||
| MGM Grand, Inc., Gtd. Notes |
Ba1 | 3,000 | 3,097,500 | |||||
| MGM Grand, Inc., Gtd. Notes |
Ba2 | 5,700 | 6,497,999 | |||||
| Mohegan Tribal Gaming Co., |
Ba3 | 700 | 724,500 | |||||
| Mohegan Tribal Gaming Co., |
Ba3 | 1,100 | 1,204,500 | |||||
| Mohegan Tribal Gaming Co., |
Ba3 | 2,375 | 2,576,875 | |||||
213
Table of Contents
AST Federated High Yield Portfolio
Schedule of Investments
December 31, 2003
| Moody’s Rating (Unaudited) |
Par (000) |
Value | ||||||
| Park Place Entertainment Corp., Sr. Sub. Notes |
Ba2 | $ | 6,575 | $ | 7,314,687 | |||
| Park Place Entertainment Corp., Sr. Sub. Notes |
Ba2 | 1,100 | 1,243,000 | |||||
| Penn National Gaming, Inc., |
B3 | 1,850 | 2,021,125 | |||||
| Penn National Gaming, Inc., |
B3 | 2,000 | 2,262,500 | |||||
| Poster Financial Group, |
B2 | 600 | 637,500 | |||||
| River Rock Entertainment, |
B2 | 950 | 1,024,813 | |||||
| Sun International Ltd., |
B2 | 2,750 | 3,011,250 | |||||
| Venetian Casino Resort LLC, Gtd. Notes |
B3 | 3,600 | 4,194,000 | |||||
| Wynn Las Vegas LLC, |
B3 | 2,500 | 2,931,250 | |||||
| 64,122,123 | ||||||||
| Healthcare — 1.6% |
||||||||
| Alaris Medical, Inc., |
B3 | 1,275 | 1,322,813 | |||||
| Fisher Scientific International, Inc., Sr. Sub. Notes |
B2 | 3,200 | 3,456,000 | |||||
| Fisher Scientific International, Inc., Sr. Sub. Notes |
B2 | 1,000 | 1,080,000 | |||||
| Hanger Orthopedic Group, Inc., Gtd. Notes 10.375%, 02/15/09 |
B2 | 1,250 | 1,425,000 | |||||
| Kinetic Concepts, Inc., |
B3 | 725 | 761,250 | |||||
| Sybron Dental Specialties, Inc., Gtd. Notes |
B2 | 1,625 | 1,775,313 | |||||
| Moody’s Rating (Unaudited) |
Par (000) |
Value | ||||||
| Universal Hospital Services, Inc., Sr. Notes |
B3 | $ | 3,750 | $ | 3,937,499 | |||
| 13,757,875 | ||||||||
| Healthcare Services — 3.1% |
||||||||
| AmeriPath, Inc., Gtd. Notes 10.50%, 04/01/13 |
B3 | 3,075 | 3,336,375 | |||||
| Ardent Health Services LLC, |
B3 | 1,200 | 1,314,000 | |||||
| Concentra Operating Corp., |
B3 | 600 | 651,000 | |||||
| HCA, Inc., Sr. Notes |
Ba1 | 5,475 | 6,170,873 | |||||
| HCA, Inc., Notes |
Ba1 | 3,500 | 3,704,330 | |||||
| HCA, Inc., Notes |
Ba1 | 600 | 612,924 | |||||
| HCA, Inc., Notes |
Ba1 | 1,600 | 1,899,136 | |||||
| Hudson Respiratory Care, Inc., Sr. Sub. Notes 9.125%, 04/15/08 |
Ca | 1,125 | 973,125 | |||||
| Magellan Health Services, Inc., Sr. Notes |
NR | 1,225 | 1,292,375 | |||||
| Manor Care, Inc., Gtd. Notes |
Ba1 | 2,700 | 3,044,412 | |||||
| Vanguard Health Systems, Inc., Gtd. Notes |
B3 | 3,500 | 3,823,750 | |||||
| 26,822,300 | ||||||||
| Industrial — Other — 2.8% |
||||||||
| Brand Services, Inc., |
B3 | 2,450 | 2,842,000 | |||||
| Briggs & Stratton Corp., |
Ba1 | 2,125 | 2,502,188 | |||||
| Cabot Safety Corp., |
B3 | 2,150 | 2,198,375 | |||||
| Continental Global Group, Inc., Sr. Notes, Series B |
C | 600 | 123,000 | |||||
214
Table of Contents
AST Federated High Yield Portfolio
Schedule of Investments
December 31, 2003
| Moody’s Rating (Unaudited) |
Par (000) |
Value | ||||||
| Eagle-Picher Industries, Inc., Sr. Notes |
B3 | $ | 3,475 | $ | 3,805,125 | |||
| Foamex L.P. Capital Corp., Gtd. Notes |
Caa2 | 325 | 264,875 | |||||
| Foamex L.P. Capital Corp., Gtd. Notes |
B3 | 1,025 | 978,875 | |||||
| General Cable Corp., |
B2 | 550 | 589,875 | |||||
| Hines Nurseries, Inc., |
B3 | 1,650 | 1,806,750 | |||||
| Interline Brands, Inc., |
Caa1 | 2,650 | 2,934,875 | |||||
| Neenah Corp., Sec’d. Notes |
B2 | 2,308 | 2,550,340 | |||||
| Neenah Corp., Sr. Sub. Notes |
NR | 1,924 | 1,967,044 | |||||
| Norcross Safety Products LLC, |
B3 | 1,300 | 1,443,000 | |||||
| 24,006,322 | ||||||||
| Lodging — 3.1% |
||||||||
| Courtyard by Marriott II Ltd., Sr. Notes, Series B |
B2 | 1,175 | 1,186,750 | |||||
| Felcor Lodging L.P., |
B1 | 675 | 732,375 | |||||
| Florida Panthers Holdings, Inc., Gtd. Notes |
B2 | 3,025 | 3,236,750 | |||||
| Hilton Hotels Corp., Notes |
Ba1 | 2,525 | 2,818,531 | |||||
| Hilton Hotels Corp., Notes |
Ba1 | 2,300 | 2,656,500 | |||||
| HMH Properties, Inc., |
Ba3 | 3,650 | 3,809,688 | |||||
| HMH Properties, Inc., |
Ba3 | 970 | 1,018,500 | |||||
| Moody’s Rating (Unaudited) |
Par (000) |
Value | ||||||
| MTR Gaming Group, |
B2 | $ | 2,350 | $ | 2,526,250 | |||
| Royal Caribbean Cruises Ltd., |
Ba2 | 2,050 | 2,244,750 | |||||
| Starwood Hotels & Resorts Worldwide, Inc., Notes |
Ba1 | 575 | 608,063 | |||||
| Starwood Hotels & Resorts Worldwide, Inc., |
Ba1 | 4,125 | 4,465,312 | |||||
| Starwood Hotels & Resorts Worldwide, Inc., |
Ba1 | 1,500 | 1,687,500 | |||||
| 26,990,969 | ||||||||
| Media — Cable — 2.4% |
||||||||
| Charter Communications Holdings LLC, |
Ca | 5,050 | 3,383,500 | |||||
| Charter Communications Holdings LLC, Sr. Notes |
Caa1 | 3,650 | 3,841,625 | |||||
| Charter Communications Holdings LLC, Sr. Notes |
Ca | 3,000 | 2,625,000 | |||||
| CSC Holdings, Inc., Sr. Notes |
B1 | 3,075 | 3,251,813 | |||||
| CSC Holdings, Inc., Sr. Notes |
B1 | 5,800 | 6,249,499 | |||||
| CSC Holdings, Inc., |
B2 | 425 | 487,688 | |||||
| Rogers Cablesystems Ltd., |
Ba3 | 750 | 873,750 | |||||
| 20,712,875 | ||||||||
| Media — Non Cable — 8.8% |
||||||||
| Advanstar Communications, Inc., Gtd. Notes |
Caa2 | 3,450 | 3,648,375 | |||||
| Advanstar Communications, Inc., Sec’d. Notes |
B3 | 425 | 462,188 | |||||
215
Table of Contents
AST Federated High Yield Portfolio
Schedule of Investments
December 31, 2003
| Moody’s Rating (Unaudited) |
Par (000) |
Value | ||||||
| Advanstar, Inc., Gtd. Notes, |
NR | $ | 1,675 | $ | 1,310,688 | |||
| American Media Operations, Inc., Gtd. Notes, Series B |
B2 | 2,575 | 2,768,125 | |||||
| Block Communications, Inc., Gtd. Notes |
B2 | 2,475 | 2,666,813 | |||||
| Dex Media East LLC, |
B3 | 4,925 | 6,106,999 | |||||
| Dex Media West, |
B3 | 4,500 | 5,253,750 | |||||
| Dex Media, Inc., Disc. Notes, Zero Coupon |
Caa1 | 1,750 | 1,238,125 | |||||
| Dex Media, Inc., Notes |
Caa1 | 875 | 929,688 | |||||
| DIRECTV Holdings LLC, |
B1 | 5,000 | 5,825,000 | |||||
| Echostar DBS Corp. |
Ba3 | 2,000 | 2,032,500 | |||||
| Echostar DBS Corp., |
Ba3 | 5,750 | 6,346,562 | |||||
| Lamar Media Corp., |
Ba3 | 1,525 | 1,647,000 | |||||
| LodgeNet Entertainment Corp., Sr. Sub. Notes |
B3 | 2,100 | 2,310,000 | |||||
| Muzak Finance LLC, Sr. Notes |
B3 | 1,650 | 1,757,250 | |||||
| Panamsat Corp., Gtd. Notes |
Ba3 | 4,675 | 5,189,250 | |||||
| Quebecor Media, Inc., Sr. Disc. Notes, Zero Coupon (until 07/15/06) |
B2 | 1,700 | 1,513,000 | |||||
| Quebecor Media, Inc., Sr. Notes |
B2 | 2,475 | 2,877,188 | |||||
| Moody’s Rating (Unaudited) |
Par (000) |
Value | ||||||
| R.H. Donnelley Corp., |
B2 | $ | 2,850 | $ | 3,398,625 | |||
| Sinclair Broadcast Group, Inc., Gtd. Notes |
B2 | 1,275 | 1,421,625 | |||||
| Sinclair Broadcast Group, Inc., Gtd. Notes |
B2 | 3,650 | 3,960,249 | |||||
| Vertis, Inc., Gtd. Notes, Series B |
B3 | 5,200 | 5,563,999 | |||||
| Vertis, Inc., Sec’d Notes |
B2 | 750 | 817,500 | |||||
| XM Satellite Radio, Inc., Sec’d. Notes |
Caa1 | 2,075 | 2,360,313 | |||||
| XM Satellite Radio, Inc., Sec’d. Notes, Zero Coupon (until 12/31/05) |
Caa1 | 2,312 | 2,081,048 | |||||
| Yell Finance BV, Sr. Disc. Notes, Zero Coupon (until 08/01/06) (Netherlands) |
B2 | 1,360 | 1,258,000 | |||||
| Yell Finance BV, Sr. Notes (Netherlands) |
B2 | 1,137 | 1,341,660 | |||||
| Ziff Davis Media, Inc., Gtd. Notes, Series B |
NR | 388 | 361,118 | |||||
| 76,446,638 | ||||||||
| Metals & Mining — 1.1% |
||||||||
| California Steel Industries, Inc., Sr. Notes |
Ba3 | 525 | 556,500 | |||||
| Commonwealth Industries, Inc., Sr. Sub. Notes |
B3 | 725 | 743,125 | |||||
| Compass Minerals Group, Inc., Gtd. Notes |
B3 | 1,625 | 1,828,125 | |||||
| Imco Recycling, Inc., |
B3 | 1,975 | 2,054,000 | |||||
| Republic Technologies, Inc., Gtd. Notes |
NR | 1,700 | 25,500 | |||||
216
Table of Contents
AST Federated High Yield Portfolio
Schedule of Investments
December 31, 2003
| Moody’s Rating (Unaudited) |
Par (000) |
Value | ||||||
| Ryerson Tull, Inc., Notes |
B1 | $ | 1,900 | $ | 1,919,000 | |||
| United States Steel Corp., Sr. Notes |
B1 | 2,325 | 2,650,500 | |||||
| 9,776,750 | ||||||||
| Packaging — 3.9% |
||||||||
| Berry Plastics Corp., |
B3 | 1,600 | 1,850,000 | |||||
| Berry Plastics Corp., |
B3 | 1,100 | 1,271,875 | |||||
| Graham Packaging Co., |
Caa1 | 1,325 | 1,179,250 | |||||
| Graham Packaging Co., |
Caa1 | 2,525 | 2,600,750 | |||||
| Graham Packaging Co., Inc., Sr. Sub. Notes |
Caa1 | 800 | 824,000 | |||||
| Graham Packaging Co., Inc., Sr. Disc. Notes, Series B |
Caa2 | 500 | 517,500 | |||||
| Graphic Packaging International Corp., Sr. Sub. Notes |
B3 | 400 | 444,000 | |||||
| Greif, Inc., Gtd. Notes |
B2 | 1,600 | 1,768,000 | |||||
| Huntsman Packaging Corp., Gtd. Notes |
Caa1 | 2,100 | 1,942,500 | |||||
| Jefferson Smurfit Corp., |
B2 | 1,500 | 1,627,500 | |||||
| Jefferson Smurfit Corp., |
B2 | 1,200 | 1,260,000 | |||||
| Owens-Brockway Glass Containers Corp., Gtd. Notes |
B1 | 1,150 | 1,262,125 | |||||
| Owens-Brockway Glass Containers Corp., Gtd. Notes |
B1 | 4,500 | 4,848,750 | |||||
| Moody’s Rating (Unaudited) |
Par (000) |
Value | ||||||
| Owens-Illinois, Inc., |
B3 | $ | 2,000 | $ | 2,115,000 | |||
| Owens-Illinois, Inc., |
B3 | 2,050 | 2,116,625 | |||||
| Plastipak Holdings, Inc., Gtd. Notes |
B3 | 1,100 | 1,226,500 | |||||
| Pliant Corp., Sec’d. Notes |
B3 | 500 | 543,750 | |||||
| Pliant Corp., Sr. Sub Notes |
Caa1 | 1,675 | 1,549,375 | |||||
| Russell-Stanley Holdings, Inc. Sr. Sub. Notes |
NR | 312 | 3,897 | |||||
| Tekni-Plex, Inc., Gtd. Notes |
B3 | 4,350 | 4,785,000 | |||||
| 33,736,397 | ||||||||
| Paper — 2.8% |
||||||||
| Boise Cascade Co., Sr. Notes |
Ba2 | 275 | 288,478 | |||||
| Boise Cascade Co., Sr. Notes |
Ba2 | 525 | 551,906 | |||||
| Georgia-Pacific Corp., |
Ba2 | 8,850 | 10,221,750 | |||||
| Georgia-Pacific Corp., Notes |
Ba3 | 2,000 | 2,125,000 | |||||
| Georgia-Pacific Corp., Notes |
Ba3 | 2,000 | 2,220,000 | |||||
| JSG Funding PLC, Sr. Notes (Ireland) |
B2 | 3,600 | 4,050,000 | |||||
| MDP Acquisitions PLC, |
B3 | 1,447 | 1,684,394 | |||||
| Stone Container Corp., |
B2 | 1,500 | 1,665,000 | |||||
| Tembec Industries, Inc., Gtd. Notes (Canada) |
Baa3 | 1,425 | 1,482,000 | |||||
| 24,288,528 | ||||||||
| Restaurants — 0.7% |
||||||||
| Advantica Restaurant Group, Inc., Sr. Notes |
Ca | 1,750 | 1,225,000 | |||||
217
Table of Contents
AST Federated High Yield Portfolio
Schedule of Investments
December 31, 2003
| Moody’s Rating (Unaudited) |
Par (000) |
Value | ||||||
| Buffets, Inc., Sr. Sub. Notes |
B3 | $ | 1,225 | $ | 1,329,125 | |||
| Carrols Corp., Gtd. Notes |
B3 | 3,375 | 3,459,375 | |||||
| 6,013,500 | ||||||||
| Retailers — 3.5% |
||||||||
| Buhrmann U.S., Inc., |
B2 | 4,750 | 5,343,750 | |||||
| Community Distributors, Inc., Gtd. Notes, Series B |
NR | 500 | 431,250 | |||||
| Couche-Tard Corp., |
Ba3 | 1,675 | 1,771,313 | |||||
| General Nutrition Center, |
B3 | 1,225 | 1,261,750 | |||||
| Michaels Stores, Inc., |
Ba1 | 1,075 | 1,187,875 | |||||
| Mothers Work, Inc., Gtd. Notes |
B3 | 1,575 | 1,740,375 | |||||
| PCA Finance Corp., |
B3 | 3,000 | 3,284,999 | |||||
| Penney (J.C.) Co., Inc., Notes |
Ba3 | 5,368 | 6,441,600 | |||||
| Rite Aid Corp., Notes |
B2 | 2,400 | 2,592,000 | |||||
| Rite Aid Corp., Sec’d. Notes |
Caa2 | 4,025 | 3,884,125 | |||||
| United Auto Group, Inc., |
B3 | 2,300 | 2,558,750 | |||||
| 30,497,787 | ||||||||
| Services — 0.6% |
||||||||
| Brickman Group Ltd., |
B2 | 2,475 | 2,895,749 | |||||
| Sitel Corp., Gtd. Notes |
Caa2 | 2,175 | 2,153,250 | |||||
| 5,048,999 | ||||||||
| Technology — 2.8% |
||||||||
| Activant Solutions, Sr. Notes |
B2 | 2,025 | 2,202,188 | |||||
| Moody’s Rating (Unaudited) |
Par (000) |
Value | ||||||
| AMI Semiconductor, Inc., |
B3 | $ | 1,365 | $ | 1,631,175 | |||
| Danka Business Systems, |
B2 | 1,750 | 1,736,875 | |||||
| Ingram Micro, Inc., |
Ba2 | 3,025 | 3,357,750 | |||||
| Seagate Technology HDD Holdings, Gtd. Notes |
Ba2 | 1,000 | 1,085,000 | |||||
| Telex Communications, Inc., Sec’d. Notes |
B3 | 800 | 854,000 | |||||
| Unisys Corp., Sr. Notes |
Ba1 | 2,500 | 2,700,000 | |||||
| Viasystems, Inc., |
Caa2 | 750 | 802,500 | |||||
| Xerox Corp., Gtd. Notes |
B1 | 5,450 | 6,417,375 | |||||
| Xerox Corp., Sr. Notes |
B1 | 3,250 | 3,526,250 | |||||
| 24,313,113 | ||||||||
| Textile — 1.8% |
||||||||
| Broder Brothers Co., |
B3 | 1,425 | 1,417,875 | |||||
| Dyersburg Corp., |
NR | 1,725 | 173 | |||||
| GFSI, Inc., Sr. Sub. Notes, Series B |
B3 | 2,175 | 2,011,875 | |||||
| Levi Strauss & Co., |
Ca | 2,325 | 1,522,875 | |||||
| Levi Strauss & Co., |
Ca | 1,150 | 753,250 | |||||
| Phillips Van-Heusen, |
B2 | 1,925 | 2,050,125 | |||||
218
Table of Contents
AST Federated High Yield Portfolio
Schedule of Investments
December 31, 2003
| Moody’s Rating (Unaudited) |
Par (000) |
Value | ||||||
| Russell Corp., Gtd. Notes |
B1 | $ | 1,975 | $ | 2,054,000 | |||
| Warnaco, Inc., Sr. Notes |
B2 | 4,450 | 4,605,749 | |||||
| William Carter Co., |
B3 | 1,445 | 1,665,363 | |||||
| 16,081,285 | ||||||||
| Tobacco — 0.6% |
||||||||
| Commonwealth Brands, Inc., Sec’d. Notes |
B3 | 2,150 | 2,354,250 | |||||
| Dimon, Inc., Gtd. Notes |
Ba3 | 725 | 813,813 | |||||
| Dimon, Inc., Sr. Notes |
Ba3 | 1,650 | 1,674,750 | |||||
| 4,842,813 | ||||||||
| Transportation — 1.4% |
||||||||
| Allied Holdings, Inc., |
Caa1 | 2,900 | 2,791,250 | |||||
| Holt Group, Inc., Gtd. Notes 9.75%, 01/15/06 |
C | 1,350 | 45,563 | |||||
| NationsRent, Inc., |
B2 | 1,875 | 2,025,000 | |||||
| Petroleum Helicopters, Inc., Gtd. Notes, Series B |
B1 | 2,425 | 2,582,625 | |||||
| Stena AB, Sr. Notes (Sweden) |
Ba3 | 2,800 | 3,164,000 | |||||
| Stena AB, Sr. Notes, (Sweden) |
Ba3 | 1,500 | 1,519,155 | |||||
| 12,127,593 | ||||||||
| Utilities — 3.1% |
||||||||
| Calpine Canada Energy, |
Caa1 | 2,725 | 2,173,188 | |||||
| Calpine Corp., Sr. Notes 8.50%, 02/15/11 |
Caa1 | 2,700 | 2,139,750 | |||||
| CMS Energy Corp., Sr. Notes 8.90%, 07/15/08 |
B3 | 1,250 | 1,365,625 | |||||
| Moody’s Rating (Unaudited) |
Par (000) |
Value | ||||||
| CMS Energy Corp., Sr. Notes 7.50%, 01/15/09 |
B3 | $ | 4,050 | $ | 4,252,500 | |||
| CMS Energy Corp., Sr. Notes 8.50%, 04/15/11 |
B3 | 1,000 | 1,085,000 | |||||
| Illinois Power Corp., First Mortgage Notes |
B3 | 3,700 | 4,495,500 | |||||
| NRG Energy, Inc., Sec’d. Notes |
B2 | 2,250 | 2,376,563 | |||||
| PG&E Corp., Sec’d. Notes 6.875%, 07/15/08 144A |
NR | 1,250 | 1,352,563 | |||||
| PSEG Energy Holdings, Inc., Sr. Notes |
Ba3 | 3,975 | 4,685,530 | |||||
| Reliant Resources, Inc., Sec’d. Notes |
B1 | 1,450 | 1,558,750 | |||||
| Reliant Resources, Inc., Sec’d. Notes |
B1 | 1,775 | 1,908,125 | |||||
| 27,393,094 | ||||||||
| Utility – Natural Gas — 2.7% |
||||||||
| ANR Pipeline, Inc., Notes 8.875%, 03/15/10 |
B1 | 500 | 564,375 | |||||
| Caithness Coso Fund Corp., Sec’d. Notes |
Ba2 | 2,792 | 3,043,088 | |||||
| El Paso Corp., Sr. Notes 6.95%, 12/15/07 |
Caa1 | 2,175 | 2,088,000 | |||||
| El Paso Corp., Sr. Notes 6.75%, 05/15/09 |
Caa1 | 2,100 | 2,010,750 | |||||
| El Paso Corp., Sr. Notes 8.05%, 10/15/30 |
Caa1 | 3,450 | 3,018,750 | |||||
| El Paso Corp., Sr. Notes 7.80%, 08/01/31 |
Caa1 | 6,475 | 5,544,218 | |||||
| El Paso Production Holding Corp., Gtd. Notes |
B2 | 3,275 | 3,270,906 | |||||
| Swift Energy Co., |
B3 | 2,675 | 2,929,125 | |||||
| Tennessee Gas Pipeline, Debs. 7.50%, 04/01/17 |
B1 | 1,000 | 1,028,750 | |||||
| 23,497,962 | ||||||||
| Wireless Communications — 6.3% |
||||||||
| ACC Escrow Corp., Sr. Notes 10.00%, 08/01/11 144A |
B2 | 3,000 | 3,345,000 | |||||
| Alaska Communications Systems Holdings, Inc., Gtd. Notes |
B3 | 1,250 | 1,256,250 | |||||
219
Table of Contents
AST Federated High Yield Portfolio
Schedule of Investments
December 31, 2003
| Moody’s Rating (Unaudited) |
Par (000) |
Value | |||||||
| Alaska Communications Systems Holdings, Inc., Sr. Notes |
B2 | $ | 1,525 | $ | 1,608,875 | ||||
| Cincinnati Bell, Inc., |
B2 | 2,825 | 3,015,123 | ||||||
| Cincinnati Bell, Inc., |
B3 | 2,175 | 2,359,875 | ||||||
| Eircom Funding, |
B1 | 1,275 | 1,418,438 | ||||||
| Nextel Communications, Inc., Sr. Notes |
B2 | 9,400 | 10,269,499 | ||||||
| Nextel Partners, Inc., |
Caa1 | 838 | 980,460 | ||||||
| Nextel Partners, Inc., |
Caa1 | 725 | 806,563 | ||||||
| Nextel Partners, Inc., |
Caa1 | 1,425 | 1,585,313 | ||||||
| Qwest Corp., Notes |
Ba3 | 7,550 | 8,682,499 | ||||||
| Qwest Services Corp., Notes 13.50%, 12/15/10 144A |
CCC+ | (d) | 12,350 | 15,066,999 | |||||
| Rogers Cantel, Inc., |
B2 | 2,500 | 2,581,250 | ||||||
| Triton PCS, Inc., Gtd. Notes 8.50%, 06/01/13 |
B2 | 1,750 | 1,890,000 | ||||||
| 54,866,144 | |||||||||
| Total Corporate Obligations |
|||||||||
| (Cost $792,946,163) |
832,558,304 | ||||||||
| Shares |
Value | ||||
| PREFERRED STOCK — 0.7% |
|||||
| Healthcare Services |
|||||
| River Holding Corp., Series B, |
9,262 | $ | 93 | ||
| Media – Non Cable — 0.4% |
|||||
| Primedia, Inc., |
|||||
| Series D, 10.00%, |
8,475 | 834,788 | |||
| Series F, 9.20% |
17,250 | 1,647,374 | |||
| Series H, 8.625% |
13,100 | 1,211,750 | |||
| Ziff Davis Media, Inc., |
|||||
| Series E, 10.00%* |
108 | 2,403 | |||
| 3,696,315 | |||||
| Retailers — 0.3% |
|||||
| General Nutrition Center, |
2,400 | 2,406,000 | |||
| Wireless Communications McLeodUSA, Inc., Series A, 2.50% [CVT]* |
24,880 | 189,586 | |||
| Total Preferred Stock |
|||||
| (Cost $12,047,972 ) |
6,291,994 | ||||
| COMMON STOCK — 0.2% |
|||||
| Packaging |
|||||
| Russell-Stanley Holdings, Inc.* |
39,000 | 39,000 | |||
| Entertainment |
|||||
| AMF Bowling Worldwide, Inc.* |
4,409 | 106,477 | |||
| Diversified Manufacturing |
|||||
| Simonds Industries, Inc.* |
10,428 | 261,639 | |||
| Metals & Mining — 0.1% |
|||||
| ACP Holding Corp.*144A |
731,028 | 438,617 | |||
| Royal Oak Mines, Inc.* |
66,164 | 298 | |||
| 438,915 | |||||
| Media — Cable — 0.1% |
|||||
| NTL, Inc.* |
6,490 | 452,677 | |||
| Viatel Holding Ltd. (United Kingdom)* |
13,205 | 32,682 | |||
| 485,359 | |||||
| Total Common Stock |
|||||
| (Cost $6,944,603) |
1,331,390 | ||||
220
Table of Contents
AST Federated High Yield Portfolio
Schedule of Investments
December 31, 2003
| Units |
Value | |||||
| WARRANTS* — 0.1% |
||||||
| Media — Non Cable |
||||||
| Advanstar Holdings Corp., |
1,100 | $ | 11 | |||
| Packaging |
||||||
| Pliant Corp., expiring 06/01/10 |
1,000 | 10 | ||||
| Entertainment |
||||||
| AMF Bowling Worldwide, Inc., Series A, expiring 03/09/09 |
10,375 | 29,828 | ||||
| AMF Bowling Worldwide, Inc., Series B, expiring 03/09/09 |
10,136 | 2,585 | ||||
| 32,413 | ||||||
| Metals & Mining — 0.1% |
||||||
| ACP Holding Corp., |
658,733 | 329,366 | ||||
| Paper |
||||||
| MDP Acquisitions PLC, |
900 | 5,850 | ||||
| Media — Non Cable |
||||||
| Ziff Davis Holdings, Inc., |
19,800 | 198 | ||||
| Wireless Communications |
||||||
| McLeodUSA, Inc., expiring 04/16/07 |
55,131 | 28,117 | ||||
| XM Satellite Radio Holdings, Inc., expiring 03/15/10 |
2,000 | 42,500 | ||||
| 70,617 | ||||||
| Total Warrants |
||||||
| (Cost $2,807,182) |
438,465 | |||||
| RIGHTS* |
||||||
| Media — Cable |
||||||
| NTL, Inc. (Cost $20) |
1 | 20 | ||||
| Total Long-Term Investments |
840,620,173 | |||||
| Par (000) |
||||||
| SHORT-TERM INVESTMENT — 1.6% |
||||||
| Repurchase Agreement — 1.5% |
||||||
| Greenwich Capital Markets, Inc. |
||||||
| 0.70%, dated 12/31/03, to be repurchased on 01/02/04, repurchase price $13,846,538 (Collateralized by U.S. Treasury Bills, 2.875%,(n) maturing 6/30/04, par value $14,007,000, market value including accrued interest $14,133,938) |
$ | 13,846 | 13,846,000 | |||
| Shares |
Value | ||||
| Registered Investment Companies — 0.1% |
|||||
| BlackRock Provident Institutional Funds TempCash Portfolio |
221,250 | $ | 221,250 | ||
| BlackRock Provident Institutional Funds TempFund Portfolio |
221,250 | 221,250 | |||
| 442,500 | |||||
| Total Short-Term Investments |
14,288,500 | ||||
| Total Investments — 98.4% |
|||||
| (Cost $829,034,440; Note 5) |
854,908,673 | ||||
| Other Assets in Excess of |
13,602,686 | ||||
| Net Assets — 100.0% |
$ | 868,511,359 | |||
The following abbreviations are is used in portfolio descriptions:
| 144A | Security was purchased pursuant to Rule 144A under the securities Act of 1933 and may not be resold subject to that rule except to qualified institutional buyers. Unless otherwise noted 144A securities are deemed to be liquid. |
| CVT | Convertible Security |
| FRN | Floating Rate Note |
| PIK | Payment in Kind Security |
| symbol |
description | |
| * | Non-income producing security. | |
| (c) | Indicates a variable rate security. The maturity date presented for these instruments is the latter of the next date on which the security can be redeemed at par or the next date on which the rate of interest is adjusted. The interest rate shown reflects the rate in effect at December 31, 2003. | |
| (d) | Standard & Poor’s rating. | |
| (g) | Indicates a security that has been deemed illiquid. The aggregate cost of the illiquid securities is $15,337,104. The aggregate value, $3,748,690 represents 0.43% of net assets. | |
| (i) | Represents issuer in default on interest payments, Non-income producing security. | |
| (l) | US$ Denominated Foreign Bonds. | |
| (n) | Rates shown are the effective yields at purchase date. | |
| (o) | Indicates a fair valued security. |
See Notes to Financial Statements.
221
Table of Contents
AST Lord Abbett Bond - Debenture Portfolio
Schedule of Investments
December 31, 2003
| Moody’s (Unaudited) |
Par (000) |
Value | ||||||
| LONG-TERM INVESTMENTS — 76.9% |
||||||||
| CORPORATE OBLIGATIONS — 57.6% |
||||||||
| Aerospace/Defense — 1.2% |
||||||||
| Alliant Techsystems, Inc., |
||||||||
| 8.50%, 05/15/11 |
B2 | $ | 250 | $ | 276,250 | |||
| DRS Technologies, Inc., |
||||||||
| 6.875%, 11/01/13 144A |
B2 | 1,000 | 1,030,000 | |||||
| Esterline Technologies Corp., |
||||||||
| 7.75%, 06/15/13 144A |
B1 | 500 | 540,000 | |||||
| Raytheon Co., Notes |
||||||||
| 4.85%, 01/15/11 |
Baa3 | 1,500 | 1,504,199 | |||||
| Titan Corp., Gtd. Notes |
||||||||
| 8.00%, 05/15/11 144A |
B2 | 750 | 855,000 | |||||
| 4,205,449 | ||||||||
| Airlines — 0.3% |
||||||||
| American Airlines, Inc., Bonds |
||||||||
| 8.608%, 04/01/11 |
Baa3 | 700 | 637,891 | |||||
| Delta Air Lines, Inc., Pass-Thru Cert., Series 01-1 |
||||||||
| 7.711%, 09/18/11 |
Baa3 | 500 | 443,329 | |||||
| 1,081,220 | ||||||||
| Apparel & Textile — 0.1% |
||||||||
| Tommy Hilfiger USA, Inc., |
||||||||
| 6.85%, 06/01/08 |
Ba1 | 500 | 503,750 | |||||
| Automotive — 0.1% |
||||||||
| General Motors Corp., |
||||||||
| 7.125%, 07/15/13(a) |
Baa1 | 275 | 298,144 | |||||
| Automobile Parts & Equipment — 1.7% |
||||||||
| Collins & Aikman Products Corp., Gtd. Notes |
||||||||
| 10.75%, 12/31/11 |
B2 | 500 | 493,750 | |||||
| Cummins, Inc., Sr. Notes |
||||||||
| 9.50%, 12/01/10 144A |
Ba2 | 750 | 866,250 | |||||
| Dana Corp., Notes |
||||||||
| 10.125%, 03/15/10 |
Ba3 | 750 | 877,500 | |||||
| Delco Remy International, Inc., Gtd. Notes |
||||||||
| 11.00%, 05/01/09(a) |
B3 | 1,175 | 1,222,000 | |||||
| Dura Operating Corp., |
||||||||
| 9.00%, 05/01/09(a) |
B2 | 850 | 854,250 | |||||
| Moody’s (Unaudited) |
Par (000) |
Value | ||||||
| Goodyear Tire & Rubber Co., Notes |
||||||||
| 7.857%, 08/15/11(a) |
B2 | $ | 1,000 | $ | 877,500 | |||
| Tenneco Automotive, Inc., |
||||||||
| 10.25%, 07/15/13 |
B2 | 565 | 645,513 | |||||
| 5,836,763 | ||||||||
| Banking — 0.1% |
||||||||
| Wachovia Corp., Sub. Notes |
||||||||
| 6.605%, 10/01/05 |
A1 | 325 | 358,190 | |||||
| Beverages — 0.6% |
||||||||
| Le-Natures, Inc., |
||||||||
| 9.00%, 06/15/13 144A |
B3 | 2,000 | 2,100,000 | |||||
| Building & Construction — 0.9% |
||||||||
| Beazer Homes USA, Inc., |
||||||||
| 8.375%, 04/15/12 |
Ba2 | 500 | 553,750 | |||||
| Sr. Notes |
||||||||
| 6.50%, 11/15/13 144A(a) |
Ba2 | 500 | 501,875 | |||||
| D.R. Horton, Inc., Sr. Notes |
||||||||
| 6.875%, 05/01/13 |
Ba1 | 500 | 535,000 | |||||
| Schuler Homes, Inc., |
||||||||
| 9.375%, 07/15/09 |
Ba1 | 500 | 565,000 | |||||
| William Lyon Homes, Inc. |
||||||||
| 10.75%, 04/01/13 |
B3 | 750 | 856,875 | |||||
| 3,012,500 | ||||||||
| Building Material — 0.5% |
||||||||
| Fedders North America, Inc., Gtd. Notes |
||||||||
| 9.375%, 08/15/07 |
Caa1 | 400 | 404,000 | |||||
| Interface, Inc., Sr. Sub. Notes, Series B |
||||||||
| 9.50%, 11/15/05(a) |
Caa3 | 500 | 487,500 | |||||
| Jacuzzi Brands, Inc., |
||||||||
| 9.625%, 07/01/10 144A |
B3 | 750 | 828,750 | |||||
| 1,720,250 | ||||||||
| Chemicals — 1.3% |
||||||||
| Airgas, Inc., Gtd. Notes |
||||||||
| 9.125%, 10/01/11 |
Ba2 | 350 | 394,625 | |||||
| IMC Global, Inc., Gtd. Notes, Series B |
||||||||
| 11.25%, 06/01/11 |
B1 | 700 | 773,500 | |||||
| Koppers, Inc., Gtd. Notes |
||||||||
| 9.875%, 10/15/13 144A |
B2 | 450 | 499,500 | |||||
222
Table of Contents
AST Lord Abbett Bond - Debenture Portfolio
Schedule of Investments
December 31, 2003
| Moody’s (Unaudited) |
Par (000) |
Value | ||||||
| Kranton Polymers LLC, |
||||||||
| 8.125%, 01/15/14 144A |
B3 | $ | 45 | $ | 47,138 | |||
| Lyondell Chemical Co., |
||||||||
| 9.625%, 05/01/07 |
B1 | 750 | 795,000 | |||||
| Rhodia SA, Sr. Notes (France) |
||||||||
| 8.875%, 06/01/11 144A(a)(l) |
Caa1 | 1,500 | 1,387,500 | |||||
| Terra Capital, Inc., Sec’d Notes |
||||||||
| 11.50%, 06/01/10 |
Caa1 | 700 | 735,000 | |||||
| 4,632,263 | ||||||||
| Computer Hardware — 0.5% |
||||||||
| ASML Holding N.V. (Netherlands) |
||||||||
| 5.75%, 10/15/06(I) |
B3 | 1,000 | 1,315,000 | |||||
| Seagate Technology HDD Holdings, Gtd. Notes |
||||||||
| 8.00%, 05/15/09 |
Ba2 | 500 | 542,500 | |||||
| 1,857,500 | ||||||||
| Consumer Products — 1.0% |
||||||||
| Bombardier Recreational, |
||||||||
| 8.375%, 12/15/13 144A(1) |
B3 | 500 | 522,500 | |||||
| JohnsonDiversey, Inc., |
||||||||
| 9.625%, 05/15/12 |
B2 | 750 | 840,000 | |||||
| Rayovac Corp., |
||||||||
| 8.50%, 10/01/13 |
B3 | 2,000 | 2,095,000 | |||||
| 3,457,500 | ||||||||
| Diversified Capital Goods — 1.0% |
||||||||
| Blount, Inc., Gtd. Notes |
||||||||
| 13.00%, 08/01/09 |
Caa2 | 550 | 595,375 | |||||
| Eagle-Picher Industries, Inc., |
||||||||
| 9.75%, 09/01/13 144A |
B3 | 500 | 547,500 | |||||
| Sensus Metering Systems, |
||||||||
| 8.625%, 12/15/13 144A |
Caa1 | 500 | 515,000 | |||||
| Stena AB, Sr. Notes, (Sweden) |
||||||||
| 7.50%, 11/01/13 144A(l) |
Ba3 | 765 | 774,769 | |||||
| Moody’s (Unaudited) |
Par (000) |
Value | ||||||
| Tyco International Group SA, |
||||||||
| 6.00%, 11/15/13 144A(l) |
Ba2 | $ | 925 | $ | 957,375 | |||
| 3,390,019 | ||||||||
| Electric Generation — 1.3% |
||||||||
| Calpine Corp., Sec’d. Notes |
||||||||
| 8.50%, 07/15/10 144A |
B(d) | 2,750 | 2,695,000 | |||||
| Sr. Notes |
||||||||
| 7.875%, 04/01/08(a) |
Caa1 | 500 | 392,500 | |||||
| Dynegy Holdings, Inc., |
||||||||
| 9.875%, 07/15/10 144A |
B3 | 500 | 565,000 | |||||
| NRG Energy, Inc., |
||||||||
| 8.00%, 12/15/13 144A |
B2 | 425 | 448,906 | |||||
| Reliant Resources, Inc., |
||||||||
| 9.50%, 07/15/13 144A(a) |
B1 | 560 | 602,000 | |||||
| 4,703,406 | ||||||||
| Electric — Integrated — 1.9% |
||||||||
| Duke Energy Corp., |
||||||||
| 5.375%, 01/01/09 |
Baa1 | 1,500 | 1,583,715 | |||||
| PPL Energy Supply LLC, |
||||||||
| 6.40%, 11/01/11 |
Baa2 | 500 | 547,070 | |||||
| Teco Energy, Inc., Sr. Notes |
||||||||
| 7.50%, 06/15/10 |
Ba1 | 2,000 | 2,150,000 | |||||
| Virginia Electric & Power Co., Notes |
||||||||
| 4.50%, 12/15/10 |
A3 | 2,000 | 2,019,554 | |||||
| 7.00%, 01/01/24 |
A2 | 300 | 309,155 | |||||
| 6,609,494 | ||||||||
| Electronics — 0.7% |
||||||||
| Micron Technology, Inc. |
||||||||
| 2.50%, 02/01/10 [CVT] |
B2 | 1,000 | 1,327,500 | |||||
| STMicroelectronics N.V. (Netherlands) |
||||||||
| Zero Coupon, 07/05/13 [CVT](l) |
A3 | 1,000 | 1,071,017 | |||||
| 2,398,517 | ||||||||
| Energy Exploration —1.1% |
||||||||
| El Paso Production Holding Corp., Gtd. Notes |
||||||||
| 7.75%, 06/01/13 144A |
B2 | 1,250 | 1,248,438 | |||||
| Houston Exploration Co., |
||||||||
| 7.00%, 06/15/13 144A |
B2 | 250 | 259,375 | |||||
223
Table of Contents
AST Lord Abbett Bond - Debenture Portfolio
Schedule of Investments
December 31, 2003
| Moody’s (Unaudited) |
Par (000) |
Value | ||||||
| Magnum Hunter Resources, Inc., Gtd. Notes |
||||||||
| 9.60%, 03/15/12 |
B2 | $ | 1,000 | $ | 1,140,000 | |||
| Range Resources Corp., |
||||||||
| 7.375%, 07/15/13 |
B3 | 1,000 | 1,005,000 | |||||
| 3,652,813 | ||||||||
| Energy Production —0.5% |
||||||||
| Forest Oil Corp., Sr. Notes |
||||||||
| 8.00%, 06/15/08 |
Ba3 | 350 | 383,250 | |||||
| Hanover Compressor Co., |
||||||||
| 8.625%, 12/15/10(a) |
B3 | 1,395 | 1,429,875 | |||||
| 1,813,125 | ||||||||
| Environmental Services — 1.0% |
||||||||
| Allied Waste North America, Inc., Sr. Notes |
||||||||
| 7.875%, 04/15/13 |
Ba3 | 2,500 | 2,718,750 | |||||
| Nalco Co., Sr. Sub. Notes |
||||||||
| 8.875%, 11/15/13 144A |
Caa1 | 825 | 886,875 | |||||
| 3,605,625 | ||||||||
| Financial Services — 0.3% |
||||||||
| Alamosa Delaware, Inc., |
||||||||
| 11.00%, 07/31/10 |
Caa1 | 1,000 | 1,090,000 | |||||
| Food & Drug Retailers —1.4% |
||||||||
| Ingles Markets, Inc., Gtd. Notes |
||||||||
| 8.875%, 12/01/11 |
Ba3 | 1,400 | 1,414,000 | |||||
| Rite Aid Corp., Notes |
||||||||
| 8.125%, 05/01/10 |
B2 | 2,000 | 2,159,999 | |||||
| Roundy’s, Inc., |
||||||||
| 8.875%, 06/15/12 |
B2 | 750 | 804,375 | |||||
| Stater Brothers Holdings, Inc., Sr. Notes |
||||||||
| 10.75%, 08/15/06 |
B2 | 500 | 529,375 | |||||
| 4,907,749 | ||||||||
| Food - Wholesale — 2.3% |
||||||||
| B&G Foods, Inc., Gtd. Notes, Series D |
||||||||
| 9.625%, 08/01/07 |
B3 | 2,000 | 2,080,000 | |||||
| Corn Products International, Inc., Sr. Notes |
||||||||
| 8.45%, 08/15/09 |
Ba1 | 500 | 561,250 | |||||
| Dean Foods Co., Sr. Notes |
||||||||
| 6.625%, 05/15/09 |
Ba2 | 1,250 | 1,318,750 | |||||
| Moody’s (Unaudited) |
Par (000) |
Value | ||||||
| Dole Foods Co., Debs. |
||||||||
| 7.875%, 07/15/13 |
B2 | $ | 1,000 | $ | 1,107,500 | |||
| Land O’ Lakes, Inc., |
||||||||
| 9.00%, 12/15/10 144A |
B2 | 400 | 405,000 | |||||
| Sr. Notes |
||||||||
| 8.75%, 11/15/11(a) |
B3 | 400 | 354,000 | |||||
| Michael Foods, Inc., |
||||||||
| 8.00%, 11/15/13 144A |
B3 | 1,500 | 1,567,500 | |||||
| Pinnacle Foods Holding Corp., Sr. Sub. Notes |
||||||||
| 8.25%, 12/01/13 144A |
B3 | 475 | 494,000 | |||||
| 7,888,000 | ||||||||
| Forestry/Paper — 2.2% |
||||||||
| Boise Cascade Co., Sr. Notes |
||||||||
| 6.50%, 11/01/10 |
Ba2 | 800 | 839,208 | |||||
| Buckeye Technologies, Inc., |
||||||||
| 8.00%, 10/15/10 |
Caa1 | 1,250 | 1,231,250 | |||||
| Georgia-Pacific Corp., Debs. |
||||||||
| 8.25%, 03/01/23 |
Ba3 | 1,100 | 1,122,000 | |||||
| Jefferson Smurfit Corp., |
||||||||
| 8.25%, 10/01/12 |
B2 | 1,000 | 1,085,000 | |||||
| JSG Funding PLC, Sr. Notes (Ireland) |
||||||||
| 9.625%, 10/01/12(l) |
B2 | 750 | 843,750 | |||||
| Longview Fibre Co., |
||||||||
| 10.00%, 01/15/09 |
B2 | 500 | 551,250 | |||||
| Millar Western Forest Products Ltd., Sr. Notes |
||||||||
| 7.75%, 11/15/13 144A |
B3 | 590 | 615,075 | |||||
| Tembec Industries, Inc., |
||||||||
| 7.75%, 03/15/12(l) |
Ba3 | 1,500 | 1,500,000 | |||||
| 7,787,533 | ||||||||
| Gaming — 3.7% |
||||||||
| Aztar Corp., Sr. Sub. Notes |
||||||||
| 8.875%, 05/15/07 |
Ba3 | 1,500 | 1,573,125 | |||||
| Boyd Gaming Corp., |
||||||||
| 8.75%, 04/15/12 |
B1 | 1,500 | 1,650,000 | |||||
| Hard Rock Hotel, Inc., Notes |
||||||||
| 8.875%, 06/01/13 144A |
B3 | 1,340 | 1,433,800 | |||||
| Isle of Capri Casinos, Inc., |
||||||||
| 9.00%, 03/15/12 |
B2 | 1,250 | 1,396,875 | |||||
| Mandalay Resort Group, |
||||||||
| 9.375%, 02/15/10(a) |
Ba3 | 600 | 700,500 | |||||
224
Table of Contents
AST Lord Abbett Bond - Debenture Portfolio
Schedule of Investments
December 31, 2003
| Moody’s (Unaudited) |
Par (000) |
Value | ||||||
| Mohegan Tribal Gaming Co., |
||||||||
| 6.375%, 07/15/09 |
Ba3 | $ | 1,000 | $ | 1,035,000 | |||
| Park Place Entertainment Corp., Sr. Notes |
||||||||
| 7.50%, 09/01/09 |
Ba1 | 350 | 386,750 | |||||
| Sr. Sub. Notes |
||||||||
| 9.375%, 02/15/07 |
Ba2 | 1,000 | 1,137,500 | |||||
| Penn National Gaming, Inc., |
||||||||
| 6.875%, 12/01/11 144A |
B3 | 750 | 746,250 | |||||
| River Rock Entertainment, |
||||||||
| 9.75%, 11/01/11 144A |
B2 | 755 | 814,456 | |||||
| Turning Stone Casino Resort Enterprise, Sr. Notes |
||||||||
| 9.125%, 12/15/10 144A |
B1 | 500 | 546,250 | |||||
| Venetian Casino Resort LLC, Gtd. Notes |
||||||||
| 11.00%, 06/15/10 |
B3 | 500 | 582,500 | |||||
| 12,003,006 | ||||||||
| Gas Distribution — 2.0% |
||||||||
| Northwest Pipeline Corp., |
||||||||
| 8.125%, 03/01/10 |
B1 | 500 | 557,500 | |||||
| PSE&G Energy Holdings, Inc., Sr. Notes |
||||||||
| 8.50%, 06/15/11 |
Ba3 | 500 | 556,875 | |||||
| Semco Energy, Inc., Sr. Notes |
||||||||
| 7.125%, 05/15/08 144A |
Ba2 | 800 | 837,000 | |||||
| 7.75%, 05/15/13 |
Ba2 | 1,855 | 1,940,793 | |||||
| Sonat, Inc., Notes |
||||||||
| 6.875%, 06/01/05(a) |
Caa1 | 750 | 742,500 | |||||
| 7.625%, 07/15/11(a) |
Caa1 | 1,000 | 931,250 | |||||
| Suburban Propane Partners L.P., Sr. Notes |
||||||||
| 6.875%, 12/15/13 144A |
B1 | 850 | 862,750 | |||||
| Williams Companies, Inc., |
||||||||
| 8.625%, 06/01/10(a) |
B3 | 500 | 568,750 | |||||
| 6,997,418 | ||||||||
| Health Services — 4.0% |
||||||||
| Abgenix |
||||||||
| 3.50%, 03/15/07 |
NR | 1,000 | 933,750 | |||||
| AmeriPath, Inc., Gtd. Notes |
||||||||
| 10.50%, 04/01/13 |
B3 | 1,500 | 1,627,500 | |||||
| Hanger Orthopedic Group, Inc., Gtd. Notes |
||||||||
| 10.375%, 02/15/09 |
B2 | 500 | 570,000 | |||||
| Moody’s (Unaudited) |
Par (000) |
Value | ||||||
| HEALTHSOUTH Corp., |
||||||||
| 8.375%, 10/01/11 |
NR | $ | 760 | $ | 722,000 | |||
| Iasis Healthcare Corp., |
||||||||
| 8.50%, 10/15/09 |
B3 | 1,400 | 1,466,500 | |||||
| Mariner Health Care, Inc., |
||||||||
| 8.25%, 12/15/13 144A |
B3 | 375 | 380,625 | |||||
| Medex, Inc., Sr. Sub. Notes |
||||||||
| 8.875%, 05/15/13 144A |
B3 | 2,000 | 2,160,000 | |||||
| National Nephrology Associates, Inc., |
||||||||
| 9.00%, 11/01/11 144A |
B3 | 335 | 352,588 | |||||
| Pacificare Health Systems, Inc., Gtd. Notes |
||||||||
| 10.75%, 06/01/09 |
B1 | 640 | 758,400 | |||||
| Prime Medical Services, Inc., |
||||||||
| 8.75%, 04/01/08 |
B3 | 750 | 727,500 | |||||
| Rotech Healthcare, Inc., |
||||||||
| 9.50%, 04/01/12 |
B2 | 750 | 787,500 | |||||
| Tenet Healthcare Corp., Notes |
||||||||
| 7.375%, 02/01/13(a) |
B1 | 1,000 | 1,010,000 | |||||
| Triad Hospitals, Inc., |
||||||||
| 8.75%, 05/01/09 |
B1 | 530 | 575,050 | |||||
| Sr. Sub. Notes |
||||||||
| 7.00%, 11/15/13 144A |
B3 | 750 | 759,375 | |||||
| UnitedHealth Group, Inc., Notes |
||||||||
| 4.875%, 04/01/13 |
A3 | 1,000 | 1,008,815 | |||||
| 13,839,603 | ||||||||
| Hotels — 1.8% |
||||||||
| Felcor Lodging L.P., Gtd. Notes |
||||||||
| 9.00%, 06/01/11 |
B1 | 700 | 766,500 | |||||
| Gaylord Entertainment Co., |
||||||||
| 8.00%, 11/15/13 144A |
B3 | 2,050 | 2,173,000 | |||||
| Hilton Hotels Corp., Notes |
||||||||
| 8.25%, 02/15/11 |
Ba1 | 1,000 | 1,155,000 | |||||
| HMH Properties, Inc., Gtd. Notes |
||||||||
| 7.875%, 08/01/08 Series B |
Ba3 | 1,000 | 1,043,750 | |||||
| Host Marriott L.P. |
||||||||
| 9.25%, 10/01/07 [REIT] |
Ba3 | 1,000 | 1,122,500 | |||||
| 6,260,750 | ||||||||
225
Table of Contents
AST Lord Abbett Bond - Debenture Portfolio
Schedule of Investments
December 31, 2003
| Moody’s (Unaudited) |
Par (000) |
Value | ||||||
| Household & Leisure Products — 0.5% |
||||||||
| Costco Wholesale Corp., |
||||||||
| Zero Coupon, 08/19/17 |
A3 | $ | 1,000 | $ | 851,250 | |||
| Remington Arms Co., Inc., |
||||||||
| Notes 10.50%, 02/01/11 |
B2 | 750 | 802,500 | |||||
| 1,653,750 | ||||||||
| Leisure — 0.2% |
||||||||
| Six Flags, Inc., Sr. Notes |
||||||||
| 9.50%, 02/01/09 |
B3 | 750 | 789,375 | |||||
| Machinery — 0.4% |
||||||||
| JLG Industries, Inc., Gtd. Notes |
||||||||
| 8.25%, 05/01/08 |
B2 | 600 | 654,750 | |||||
| Manitowoc Co., Inc. (The), |
||||||||
| 7.125%, 11/01/13 |
B1 | 665 | 690,769 | |||||
| 1,345,519 | ||||||||
| Media - Broadcasting — 2.2% |
||||||||
| Allbritton Communications, |
||||||||
| 7.75%, 12/15/12 |
B3 | 2,050 | 2,137,125 | |||||
| Clear Channel Communications, Inc., Sr. Notes |
||||||||
| 4.625%, 01/15/08 |
Baa3 | 2,000 | 2,065,176 | |||||
| Paxson Communications Corp., Gtd. Notes |
||||||||
| 10.75%, 07/15/08 |
Caa1 | 1,500 | 1,644,375 | |||||
| Sinclair Broadcast Group, Inc., Gtd. Notes |
||||||||
| 8.75%, 12/15/11 |
B2 | 1,000 | 1,115,000 | |||||
| TV Azteca SA de CV, Sr. Notes, Series B (Mexico) |
||||||||
| 10.50%, 02/15/07(l) |
B1 | 575 | 590,813 | |||||
| 7,552,489 | ||||||||
| Media - Cable — 4.7% |
||||||||
| Charter Communications Holdings LLC, Sr. Notes |
||||||||
| 10.00%, 04/01/09(a) |
Ca | 3,300 | 2,953,500 | |||||
| Comcast Corp., Gtd. Notes |
||||||||
| 5.85%, 01/15/10 |
Baa3 | 2,800 | 2,994,160 | |||||
| Comcast U.K. Cable Corp., Debs. (Bermuda) |
||||||||
| 11.20%, 11/15/07(l) |
Caa2 | 1,225 | 1,243,375 | |||||
| CSC Holdings, Inc., Debs., |
||||||||
| 8.125%, 08/15/09 |
B1 | 1,500 | 1,616,250 | |||||
| DIRECTV Holdings LLC, |
||||||||
| 8.375%, 03/15/13 |
B1 | 1,250 | 1,456,250 | |||||
| Moody’s (Unaudited) |
Par (000) |
Value | ||||||
| EchoStar DBS Corp., Sr. Notes |
||||||||
| 6.375%, 10/01/11 144A |
Ba3 | $ | 1,500 | $ | 1,545,000 | |||
| Insight Communications Co., Inc., Zero Coupon (until 02/15/06) 12.25%, |
||||||||
| 02/15/11 |
Caa2 | 2,750 | 2,364,999 | |||||
| Mediacom LLC, Sr. Notes, |
||||||||
| 8.50%, 04/15/08(a) |
B2 | 2,000 | 2,050,000 | |||||
| 16,223,534 | ||||||||
| Media - Diversified — 0.5% |
||||||||
| Block Communications, Inc., Gtd. Notes |
||||||||
| 9.25%, 04/15/09 |
B2 | 1,550 | 1,670,125 | |||||
| Media Services — 0.2% |
||||||||
| Interpublic Group of Companies, Inc., Notes |
||||||||
| 7.25%, 08/15/11 |
Baa3 | 500 | 547,500 | |||||
| Metals & Mining — 0.2% |
||||||||
| Century Aluminum Co., Notes |
||||||||
| 11.75%, 04/15/08 |
B1 | 500 | 560,000 | |||||
| Non-Food & Drug Retailers — 1.2% |
||||||||
| Couche-Tard Corp., Sr. Sub. Notes |
||||||||
| 7.50%, 12/15/13 144A |
Ba3 | 240 | 253,800 | |||||
| Penny, (J.C.) Co., Inc. |
||||||||
| 8.00%, 03/01/10 |
Ba3 | 250 | 287,813 | |||||
| 6.875%, 10/15/15 |
Ba3 | 1,000 | 1,056,250 | |||||
| 7.95%, 04/01/17 |
Ba3 | 1,275 | 1,455,094 | |||||
| Saks, Inc. |
||||||||
| 9.875%, 10/01/11 |
B1 | 1,000 | 1,195,000 | |||||
| 4,247,957 | ||||||||
| Oil Field Equipment Services — 0.2% |
||||||||
| Key Energy Services, Inc., |
||||||||
| 8.375%, 03/01/08 |
Ba2 | 500 | 537,500 | |||||
| Sr. Notes |
||||||||
| 6.375%, 05/01/13 |
Ba2 | 175 | 178,500 | |||||
| 716,000 | ||||||||
| Packaging — 1.7% |
||||||||
| Bway Corp., Sr. Sub. Notes |
||||||||
| 10.00%, 10/15/10 |
B3 | 1,000 | 1,095,000 | |||||
| Crown Cork & Seal Co., Inc., Debs. |
||||||||
| 7.375%, 12/15/26 |
B3 | 1,575 | 1,431,281 | |||||
226
Table of Contents
AST Lord Abbett Bond - Debenture Portfolio
Schedule of Investments
December 31, 2003
| Moody’s (Unaudited) |
Par (000) |
Value | ||||||
| Graham Packaging Co., Inc., |
||||||||
| 10.75%, 01/15/09 |
Caa2 | $ | 150 | $ | 155,250 | |||
| Owens-Brockway Glass Containers Corp., Gtd. Notes |
||||||||
| 8.875%, 02/15/09 |
B1 | 1,750 | 1,920,625 | |||||
| Plastipak Holdings, Inc., |
||||||||
| 10.75%, 09/01/11 |
B3 | 500 | 557,500 | |||||
| Portola Packaging, Inc., |
||||||||
| 10.75%, 10/01/05 |
B2 | 500 | 503,750 | |||||
| Tekni-Plex, Inc., Sec’d. Notes |
||||||||
| 8.75%, 11/15/13 144A |
B2 | 175 | 183,313 | |||||
| 5,846,719 | ||||||||
| Pharmaceuticals — 2.8% |
||||||||
| Allergan, Inc. |
||||||||
| Zero Coupon, 11/06/22 [CVT] |
A3 | 1,000 | 957,500 | |||||
| Alpharma, Inc., Sr. Notes |
||||||||
| 8.625%, 05/01/11 144A |
B3 | 2,000 | 2,040,000 | |||||
| Amgen, Inc. |
||||||||
| Zero Coupon, 03/01/32 [CVT] |
A2 | 1,000 | 758,750 | |||||
| Biovail Corp. (Canada) |
||||||||
| 7.875%, 04/01/10(l) |
B2 | 2,500 | 2,562,500 | |||||
| Cell Therapeutics, Inc. |
||||||||
| 5.75%, 06/15/08 |
NR | 88 | 90,860 | |||||
| Cephalon, Inc. |
||||||||
| 2.50%, 12/15/06 [CVT] |
B-(d) | 500 | 479,375 | |||||
| PerkinElmer, Inc., Gtd. Notes |
||||||||
| 8.875%, 01/15/13(a) |
Ba3 | 1,500 | 1,725,000 | |||||
| Teva Pharmaceuticals Financial |
||||||||
| 0.375%, 11/18/07 |
BBB-(d) | 810 | 1,127,925 | |||||
| 9,741,910 | ||||||||
| Printing & Publishing — 1.7% |
||||||||
| Dex Media West, |
||||||||
| 9.875%, 08/15/13 144A |
B3 | 600 | 700,500 | |||||
| Dex Media, Inc., Notes |
||||||||
| 8.00%, 11/15/13 144A |
Caa1 | 1,250 | 1,328,125 | |||||
| Houghton Mifflin Co. |
||||||||
| 8.25%, 02/01/11 144A |
B2 | 1,900 | 2,042,500 | |||||
| Primedia, Inc., Sr. Notes |
||||||||
| 8.875%, 05/15/11 |
B3 | 1,600 | 1,692,000 | |||||
| Von Hoffman Corp. |
||||||||
| 10.25%, 03/15/09 144A |
B2 | 100 | 107,000 | |||||
| 5,870,125 | ||||||||
| Moody’s (Unaudited) |
Par (000) |
Value | ||||||
| Services & Software — 1.3% |
||||||||
| Electronic Data Systems Corp., Notes, Series B |
||||||||
| 6.00%, 08/01/13(a) |
Baa3 | $ | 2,000 | $ | 1,969,504 | |||
| Mentor Graphics Corp. |
||||||||
| 6.875%, 06/15/07 |
NR | 1,750 | 1,870,313 | |||||
| Unisys Corp., Sr. Notes |
||||||||
| 8.125%, 06/01/06 |
Ba1 | 750 | 813,750 | |||||
| 4,653,567 | ||||||||
| Steel Producers & Products — 0.1% |
||||||||
| Armco, Inc., Sr. Notes |
||||||||
| 9.00%, 09/15/07 |
B3 | 400 | 357,000 | |||||
| Support Services — 0.9% |
||||||||
| Iron Mountain, Inc., |
||||||||
| 7.75%, 01/15/15 |
B2 | 1,500 | 1,578,750 | |||||
| 6.625%, 01/01/16 |
B2 | 1,500 | 1,466,250 | |||||
| 3,045,000 | ||||||||
| Telecommunications — 4.6% |
||||||||
| Centennial Communications Corp., Gtd. Notes |
||||||||
| 10.125%, 06/15/13 |
Caa1 | 1,500 | 1,657,500 | |||||
| Cincinnati Bell, Inc., |
||||||||
| 8.375%, 01/15/14 144A |
B3 | 850 | 922,250 | |||||
| Corning, Inc. |
||||||||
| 7.00%, 03/15/07 |
Ba2 | 750 | 753,750 | |||||
| 3.50%, 11/01/08 [CVT] |
Ba2 | 1,600 | 1,990,000 | |||||
| Dobson Communications Corp., Sr. Notes |
||||||||
| 10.875%, 07/01/10(a) |
B3 | 500 | 547,500 | |||||
| 8.875%, 10/01/13 144A(a) |
B3 | 850 | 864,875 | |||||
| Eircom Funding, |
||||||||
| 8.25%, 08/15/13(l) |
B1 | 250 | 278,125 | |||||
| Level 3 Financing, Inc., |
||||||||
| 10.75%, 10/15/11 144A |
Caa2 | 700 | 743,750 | |||||
| Nextel Communications, Inc. Notes |
||||||||
| 5.25%, 01/15/10 |
B2 | 1,000 | 1,020,000 | |||||
| Sr. Notes |
||||||||
| 9.50%, 02/01/11 |
B2 | 1,000 | 1,135,000 | |||||
| 7.375%, 08/01/15 |
B2 | 300 | 324,000 | |||||
| Nextel Partners, Inc., |
||||||||
| 8.125%, 07/01/11(a) |
Caa1 | 350 | 374,500 | |||||
| Qwest Services Corp., Notes |
||||||||
| 13.50%, 12/15/10 144A |
CCC+(d) | 1,500 | 1,830,000 | |||||
227
Table of Contents
AST Lord Abbett Bond - Debenture Portfolio
Schedule of Investments
December 31, 2003
| Moody’s (Unaudited) |
Par (000) |
Value | ||||||
| Rural Cellular Corp. |
||||||||
| 9.75%, 01/15/10 |
Caa2 | $ | 300 | $ | 294,750 | |||
| 9.875%, 02/01/10 |
Caa1 | 1,500 | 1,605,000 | |||||
| Western Wireless Corp., |
||||||||
| 9.25%, 07/15/13 |
Caa1 | 550 | 583,000 | |||||
| Worldcom, Inc. |
||||||||
| 6.50%, 04/15/10(a)(i) |
NR | 1,500 | 1,215,000 | |||||
| 16,139,000 | ||||||||
| Transportation — 0.5% |
||||||||
| Avis Group Holdings, Inc., Notes |
||||||||
| 11.00%, 05/01/09 |
Baa3 | 500 | 541,305 | |||||
| Great Lakes Dredge & Dock, |
||||||||
| 7.75%, 12/15/13 144A |
B3 | 450 | 464,625 | |||||
| Offshore Logistics, Inc., Notes |
||||||||
| 6.125%, 06/15/13 |
Ba2 | 750 | 738,750 | |||||
| 1,744,680 | ||||||||
| Theaters & Entertainment — 0.2% |
||||||||
| AMC Entertainment, Inc., |
||||||||
| 9.50%, 03/15/09 |
Caa1 | 250 | 260,000 | |||||
| Cinemark USA, Inc., |
||||||||
| 9.00%, 02/01/13 |
B3 | 500 | 565,000 | |||||
| Total Corporate Obligations |
825,000 | |||||||
| (Cost $188,940,233) |
199,539,837 | |||||||
| CONVERTIBLE BONDS — 12.7% |
||||||||
| Beverly Enterprises, Inc. |
||||||||
| 2.75%, 11/01/10 [CVT] |
B2 | 1,000 | 1,415,000 | |||||
| Bunge Limited Finance Corp. |
||||||||
| 3.75%, 11/15/07 |
Baa3 | 1,000 | 1,171,250 | |||||
| Disney (Walt) Co. |
||||||||
| 2.125%, 04/15/08 [CVT] |
Baa1 | 2,000 | 2,127,500 | |||||
| Documentum, Inc. |
||||||||
| 4.50%, 04/01/07 |
BBB(d) | 2,000 | 2,392,499 | |||||
| Eastman Kodak Co. |
||||||||
| 3.375%, 10/15/10 [CVT] 144A |
Baa3 | 200 | 223,000 | |||||
| EDO Corp. |
||||||||
| 5.25%, 04/15/07 |
NR | 500 | 560,625 | |||||
| Fairmont Hotels & Resorts, Inc. (Canada) |
||||||||
| 3.75%, 01/20/09 144A [CVT](l) |
NR | 1,500 | 1,580,625 | |||||
| First Data Corp. |
||||||||
| 2.00%, 03/01/04 [CVT](a) |
A1 | 1,500 | 1,631,250 | |||||
| Moody’s (Unaudited) |
Par (000) |
Value | ||||||
| Fisher Scientific International, Inc. |
||||||||
| 2.50%, 10/01/10 144A [CVT] |
B1 | $ | 2,000 | $ | 2,277,500 | |||
| FLIR Systems, Inc. |
||||||||
| 3.00%, 06/01/10 144A |
NR | 1,500 | 1,657,500 | |||||
| Ford Motor Credit Corp. |
||||||||
| 7.25%, 10/25/11(a) |
A3 | 1,500 | 1,629,288 | |||||
| General Mills, Inc. |
||||||||
| Zero Coupon, 10/28/22 |
Baa2 | 850 | 599,250 | |||||
| Kerr-McGee Corp. |
||||||||
| 5.25%, 02/15/10 |
Ba1 | 1,100 | 1,164,625 | |||||
| L-3 Communications |
||||||||
| 4.00%, 09/15/11 [CVT] |
Ba3 | 1,500 | 1,648,125 | |||||
| Lamar Advertising Co. |
||||||||
| 2.875%, 12/31/10 |
B2 | 1,750 | 1,802,500 | |||||
| Liberty Media Corp. |
||||||||
| 3.25%, 03/15/31 |
Baa3 | 2,250 | 2,336,265 | |||||
| Lifepoint Hospital Holdings, Inc. |
||||||||
| 4.50%, 06/01/09 |
B3 | 1,500 | 1,513,125 | |||||
| LSI Logic Corp. |
||||||||
| 4.00%, 05/15/10 [CVT] |
NR | 2,000 | 2,232,500 | |||||
| Manugistics Group, Inc. |
||||||||
| 5.00%, 11/01/07 |
NR | 850 | 787,313 | |||||
| Maxtor Corp. |
||||||||
| 6.80%, 04/30/10(a) |
B2 | 260 | 372,775 | |||||
| Medtronic, Inc. |
||||||||
| 1.25%, 09/15/04 [CVT] |
A1 | 1,500 | 1,543,125 | |||||
| Nestle Holding, Inc. (Switzerland)(l) |
||||||||
| 3.00%, 05/09/05 |
NR | 1,500 | 1,725,000 | |||||
| Parker Drilling Co. |
||||||||
| 5.50%, 08/01/04(a) |
Caa1 | 440 | 441,650 | |||||
| Placer Dome, Inc. |
||||||||
| 2.75%, 10/15/13 [CVT] 144A |
Baa2 | 1,500 | 1,801,875 | |||||
| RF Micro Devices, Inc. |
||||||||
| 1.50%, 07/01/10 |
B-(d) | 1,000 | 1,517,500 | |||||
| Sanmina - SCI Corp. |
||||||||
| 10.375%, 01/15/10 |
Ba2 | 1,000 | 1,175,000 | |||||
| Sinclair Broadcast Group, Inc. |
||||||||
| 4.875%, 01/15/11 144A |
B3 | 1,000 | 1,103,750 | |||||
| Teradyne, Inc. |
||||||||
| 3.75%, 10/15/06 |
NR | 1,000 | 1,155,000 | |||||
| Tyco International Group SA (Luxembourg) |
||||||||
| 2.75%, 01/15/08(l) |
Ba2 | 1,250 | 1,601,563 | |||||
| Universal Health Services, Inc. |
||||||||
| 0.426%, 06/23/06 [CVT] |
Baa3 | 3,500 | 2,323,125 | |||||
228
Table of Contents
AST Lord Abbett Bond - Debenture Portfolio
Schedule of Investments
December 31, 2003
| Moody’s (Unaudited) |
Par (000) |
Value | ||||||
| Wind River Systems, Inc. |
||||||||
| 3.75%, 12/15/06 |
CCC+(d) | $ | 600 | $ | 562,500 | |||
| Total Convertible Bonds | ||||||||
| (Cost $41,460,580) |
44,072,603 | |||||||
| Shares |
||||
| PREFERRED STOCK — 3.7% |
||||
| Broadcasting — 0.4% |
||||
| Sinclair Broadcast Group, Inc., 6.00%[CVT] |
25,000 | 1,233,750 | ||
| Business Services — 0.1% |
||||
| Interpublic Group of Companies, Inc., 5.375%*[CVT] |
5,200 | 298,220 | ||
| Electronic Components & Equipment — 0.3% |
||||
| Electronic Data Systems Corp., 7.625%[CVT] |
7,000 | 160,510 | ||
| Motorola, Inc., |
20,000 | 868,600 | ||
| 1,029,110 | ||||
| Entertainment & Leisure — 0.1% |
||||
| Six Flags, Inc., |
8,000 | 183,200 | ||
| Financial Services — 0.1% |
||||
| Doral Financial Corp., |
1,320 | 334,468 | ||
| Insurance — 0.4% |
||||
| Anthem, Inc., 6.00%[CVT] |
14,000 | 1,235,220 | ||
| Lumber & Wood Products — 0.3% |
||||
| Temple-Inland, Inc., 7.50%[CVT] |
20,000 | 1,162,400 | ||
| Metals & Mining — 0.5% |
||||
| Phelps Dodge Corp., 6.75%[CVT] |
10,500 | 1,776,600 | ||
| Oil & Gas — 0.1% |
||||
| Kerr-McGee Corp., 5.50%[CVT] |
10,000 | 499,000 | ||
| Pharmaceuticals — 0.4% |
||||
| Omnicare, Inc., 4.00%[CVT] |
20,000 | 1,275,000 | ||
| Telecommunications — 0.1% |
||||
| Alamosa Holdings, Inc., 7.5%, Series B*[CVT] |
800 | 277,000 | ||
| Sprint Corp. 7.125%[CVT] |
20,000 | 142,000 | ||
| 419,000 | ||||
| Utilities — 0.9% |
||||
| Dominion Resources, Inc., 9.50%[CVT] |
25,000 | 1,431,250 | ||
| FPL Group, Inc., 8.00%[CVT] |
35,000 | 1,977,150 | ||
| 3,408,400 | ||||
| Total Preferred Stock |
||||
| (Cost $11,191,949) |
12,854,368 | |||
| Par (000) |
Value | |||||
| U.S. GOVERNMENT AGENCY OBLIGATIONS — 2.9% | ||||||
| Federal Home Loan Mortgage Corp. |
||||||
| 3.50%, 09/15/07 |
$ | 5,000 | $ | 5,090,741 | ||
| Federal National Mortgage Assoc. |
||||||
| 5.50%, 07/01/33 |
3,717 | 3,768,941 | ||||
| 7.00%, 11/01/31 - 03/01/32 |
994 | 1,052,501 | ||||
| 4,821,442 | ||||||
| Total U.S. Government Agency Obligations |
||||||
| (Cost $9,882,669) |
9,912,183 | |||||
| Shares |
||||||
| COMMON STOCK |
||||||
| Computer Hardware |
||||||
| McDATA Corp. |
110 | 1,048 | ||||
| Computer Services & Software |
||||||
| EMC Corp.*(a) |
3,000 | 38,760 | ||||
| Total Common Stock |
||||||
| (Cost $126,604) |
39,808 | |||||
| Total Long Term Investments | ||||||
| (Cost $251,602,035) |
266,418,799 | |||||
| Par (000) |
||||||
| SHORT-TERM INVESTMENTS — 18.6% | ||||||
| Commercial Paper — 0.5% |
||||||
| Concord Minutemen Capital Co. |
||||||
| 1.10%, 02/10/04(b) |
$ | 1,668 | 1,663,494 | |||
| General Electric Capital Corp. |
||||||
| 1.11%, 02/05/04(b) |
35 | 35,060 | ||||
| 1,698,554 | ||||||
| Corporate Obligations — 1.6% |
||||||
| Merrill Lynch & Co., Inc. |
||||||
| 1.13%, 01/02/04(b) |
527 | 527,165 | ||||
| Natexis Banques Populaires |
||||||
| 1.035%, 01/02/04 [FRN](b)(c) |
5,176 | 5,175,928 | ||||
| 5,703,093 | ||||||
| Non-Registered Investment Company — 4.9% | ||||||
| Shares |
||||||
| BlackRock Institutional Money Market Trust(b)(j) |
17,119,296 | 17,119,296 | ||||
229
Table of Contents
AST Lord Abbett Bond - Debenture Portfolio
Schedule of Investments
December 31,2003
| Par (000) |
Value | |||||
| Registered Investment Companies — 10.9% |
||||||
| BlackRock Provident Institutional Funds |
||||||
| TempCash Portfolio |
$ | 18,665,672 | $ | 18,665,672 | ||
| BlackRock Provident Institutional Funds |
||||||
| TempFund Portfolio |
18,665,672 | 18,665,672 | ||||
| 37,331,344 | ||||||
| Repurchase Agreement — 0.6% |
||||||
| Merrill Lynch & Co., Inc. |
||||||
| 1.00%, dated 12/31/03, to be repurchased on 01/02/04, repurchase price $2,196,642 (Collateralized by Federal Home Loan Mortgage Corp. 5.50% maturing 12/01/33,
Federal National Mortgage Assoc. 4.00% - 6.00% maturing 11/01/17 to 11/01/33 and Government National Mortgage Assoc. 1.47% maturing 01/16/04 [FRN](c), par value $2,695,035, market value including accrued interest |
2,197 | 2,196,519 | ||||
| Time Deposits — 0.1% |
||||||
| Chase Manhattan Bank |
||||||
| 0.875%, 01/02/04(b) |
371 | 370,578 | ||||
| UBS Bank |
||||||
| 0.938%, 01/02/04(b) |
4 | 3,940 | ||||
| 374,518 | ||||||
| Total Short-Term Investments |
||||||
| (Cost $64,423,324) |
64,423,324 | |||||
| Total Investments — 95.5% |
||||||
| (Cost $316,025,359; Note 5) |
330,842,123 | |||||
| Other Assets in Excess of |
15,570,157 | |||||
| Net Assets — 100.0% |
$ | 346,412,280 | ||||
The following abbreviations are used in portfolio descriptions:
| 144A | Security was purchased pursuant to Rule 144A under the securities Act of 1933 and may not be resold subject to that rule except to qualified institutional buyers. |
| CVT | Convertible Security |
| FRN | Floating Rate Note |
| NR | Not Rated |
| REIT | Real Estate Investment Trust |
| symbol |
description | |
| * |
Non-income producing security. | |
| (a) |
Portion of securities on loan with an aggregate market value of $26,473,438; cash collateral $27,091,980 was received with which the portfolio purchased securities. | |
| (b) |
Represents security purchased with cash collateral for securities on loan. | |
| (c) |
Indicates a variable rate security. The maturity date presented for these instruments is the latter of the next date on which the security can be redeemed at par or the next date on which the rate of interest is adjusted. The interest rate shown reflects the rate in effect at December 31, 2003. | |
| (d) |
Standard & Poor’s rating. | |
| (i) |
Represents issuer in default on interest payments, Non-income producing security. | |
| (j) |
Security available to institutional investors only. | |
| (l) |
US$ Denominated Foreign Bonds. |
See Notes to Financial Statements.
230
Table of Contents
Schedule of Investments
December 31, 2003
| Moody’s Rating |
Par (000) |
Value | ||||||
| LONG-TERM INVESTMENTS — 97.4% |
||||||||
| U.S. GOVERNMENT AGENCY OBLIGATIONS — 37.7% | ||||||||
| Federal Home Loan Mortgage Corp. |
||||||||
| 2.875%, 12/15/06 |
$ | 1,245 | $ | 1,254,808 | ||||
| 3.50%, 03/15/10 |
1,280 | 1,302,926 | ||||||
| 3.75%, 05/15/16 |
578 | 583,084 | ||||||
| 4.29%, 07/25/36 |
590 | 603,493 | ||||||
| 4.50%, 03/15/32 |
1,265 | 1,194,726 | ||||||
| 4.688%, 07/25/22 |
680 | 694,464 | ||||||
| 5.00%, 10/15/22 - 01/15/33 |
2,675 | 2,618,312 | ||||||
| 5.50%, 11/15/16 |
665 | 694,175 | ||||||
| 6.00%, 10/01/33 |
178 | 183,632 | ||||||
| 6.50%, 11/15/29 - 02/15/30 |
92 | 92,319 | ||||||
| 7.00%, 09/25/43 |
607 | 652,297 | ||||||
| 7.50%, 07/25/32 |
505 | 553,803 | ||||||
| 10,428,039 | ||||||||
| Federal National Mortgage Assoc. |
||||||||
| 2.34%, 07/25/44 |
420 | 416,870 | ||||||
| 3.056%, 07/25/37 |
705 | 707,170 | ||||||
| 4.00%, 05/25/16 |
770 | 776,041 | ||||||
| 4.50%, 01/15/33 - 05/25/33 |
2,357 | 2,326,607 | ||||||
| 4.732%, 08/25/33 |
610 | 629,500 | ||||||
| 5.00%, 01/25/18 - 08/01/23 |
1,054 | 1,068,657 | ||||||
| 5.50%, 09/25/17 - 10/01/33 |
10,996 | 11,188,850 | ||||||
| 6.00%, 10/25/16 - 12/01/33 |
5,630 | 5,855,223 | ||||||
| 6.03%, 07/01/08 |
1,481 | 1,608,005 | ||||||
| 6.061%, 05/01/12 |
1,935 | 2,124,332 | ||||||
| 6.375%, 01/01/09 |
1,859 | 2,047,200 | ||||||
| 6.50%, 09/01/16 - 11/01/33 |
2,571 | 2,713,600 | ||||||
| 7.00%, 07/25/42 |
481 | 519,702 | ||||||
| 7.50%, 05/25/42 -06/25/42 |
1,011 | 1,104,997 | ||||||
| 33,086,754 | ||||||||
| Government National Mortgage Assoc. 6.00%, 10/15/33 |
241 | 250,383 | ||||||
| Total U.S. Government Agency Obligations | ||||||||
| (Cost $43,232,279) |
43,765,176 | |||||||
| CORPORATE OBLIGATIONS — 29.9% |
||||||||
| Aerospace — 0.9% |
||||||||
| BAE Systems Asset Trust, Pass-Thru Cert. |
||||||||
| 7.156%, 12/15/11 144A |
Baa1 | 539 | 588,403 | |||||
| 6.664%, 09/15/13 144A |
Aaa | 414 | 458,275 | |||||
| 1,046,678 | ||||||||
| Broadcasting — 0.3% |
||||||||
| Liberty Media Corp., Notes |
Baa3 | 370 | 372,136 | |||||
| Moody’s Rating |
Par (000) |
Value | ||||||
| Cable Television — 1.0% |
||||||||
| Comcast Corp., Gtd. Notes |
Baa3 | $ | 875 | $ | 955,542 | |||
| TCI Communications, Inc., |
Baa3 | 205 | 222,688 | |||||
| 1,178,230 | ||||||||
| Construction — 0.8% |
||||||||
| Sociedad Concesionaria Autopista Central, |
||||||||
| 6.223%, 12/15/26 144A(l) |
Baa3 | 975 | 980,969 | |||||
| Entertainment & Leisure — 0.5% |
||||||||
| Time Warner, Inc., Notes |
||||||||
| 8.11%, 08/15/06 |
Baa1 | 510 | 577,749 | |||||
| Financial - Bank & Trust — 5.2% |
||||||||
| OneAmerica Financial Partners, Bonds |
||||||||
| 7.00%, 10/15/33 144A |
Baa2 | 495 | 491,540 | |||||
| PF Export Receivables Master Trust, Pass-Thru Cert., |
||||||||
| 3.748%, 06/01/13 144A |
Aaa | 1,390 | 1,355,702 | |||||
| PLC Trust 2003-1, Sec’d. Notes |
||||||||
| 2.709%, 03/31/06 144A |
AAA(d) | 800 | 800,000 | |||||
| Rabobank Capital Funding II, Bonds |
||||||||
| 5.26%, 12/29/49 144A |
Aa2 | 1,705 | 1,711,305 | |||||
| SLM Corp., Notes |
||||||||
| 5.625%, 08/01/33 |
A2 | 805 | 766,331 | |||||
| Westpac Capital Trust III, |
||||||||
| 5.819%, 12/29/49 144A |
A2 | 870 | 902,315 | |||||
| 6,027,193 | ||||||||
| Financial Services — 6.2% |
||||||||
| American International Group, Inc., Notes |
||||||||
| 4.25%, 05/15/13 144A |
AAA(d) | 115 | 109,286 | |||||
| ASIF Global Financing XIX, Sec’d. Notes |
||||||||
| 4.90%, 01/17/13 144A |
Aaa | 1,460 | 1,453,675 | |||||
| Citigroup, Inc., |
||||||||
| 3.50%, 02/01/08 |
Aa1 | 745 | 748,496 | |||||
| Sub. Notes |
||||||||
| 6.00%, 10/31/33 |
Aa2 | 695 | 697,335 | |||||
| Ford Motor Credit Co., |
||||||||
| 6.875%, 02/01/06 |
A3 | 76 | 81,155 | |||||
| Sr. Notes |
||||||||
| 5.80%, 01/12/09 |
A3 | 810 | 835,083 | |||||
231
Table of Contents
AST DeAM Bond Portfolio
Schedule of Investments
December 31, 2003
| Moody’s Rating (Unaudited) |
Par (000) |
Value | ||||||
| General Motors Acceptance Corp., Notes |
||||||||
| 4.375%, 12/10/07 |
A3 | $ | 380 | $ | 384,250 | |||
| 6.875%, 09/15/11 |
A3 | 510 | 550,160 | |||||
| Household Financial Corp., Notes |
||||||||
| 6.50%, 01/24/06 |
A1 | 1,015 | 1,098,229 | |||||
| Verizon Global Funding Corp., Notes |
||||||||
| 7.25%, 12/01/10 |
A2 | 900 | 1,037,969 | |||||
| 7.75%, 12/01/30 |
A2 | 110 | 129,698 | |||||
| 7,125,336 | ||||||||
| Insurance — 2.6% |
||||||||
| American General Institute Capital Trust Co., Gtd. Notes |
||||||||
| 8.125%, 03/15/46 144A |
Aa1 | 600 | 768,481 | |||||
| Gtd. Notes, Series A |
||||||||
| 7.57%, 12/01/45 144A |
Aa1 | 320 | 382,317 | |||||
| Health Care Services Corp., Notes |
||||||||
| 7.75%, 06/15/11 144A |
Baa1 | 1,110 | 1,301,197 | |||||
| QBE Insurance Group Ltd., Bonds (Australia) |
||||||||
| 5.647%, 07/01/23 144A(l) |
Baa1 | 575 | 549,155 | |||||
| 3,001,150 | ||||||||
| Metals & Mining — 1.5% |
||||||||
| Alcan, Inc., Bonds (Canada) |
||||||||
| 6.125%, 12/15/33(l) |
Baa1 | 715 | 721,825 | |||||
| WMC Finance USA, Gtd. Notes (Australia) |
||||||||
| 5.125%, 05/15/13(l) |
Baa2 | 1,000 | 987,658 | |||||
| 1,709,483 | ||||||||
| Oil & Gas — 0.4% |
||||||||
| Pemex Project Funding Master Trust, Gtd. Notes |
||||||||
| 9.125%, 10/13/10 |
Baa1 | 390 | 465,075 | |||||
| Paper & Forest Products — 1.0% |
||||||||
| Sappi Papier Holding AG, |
||||||||
| 7.50%, 06/15/32 144A(l) |
Baa2 | 620 | 699,705 | |||||
| Weyerhaeuser Co., Debs. |
||||||||
| 7.375%, 03/15/32 |
Baa2 | 400 | 436,273 | |||||
| 1,135,978 | ||||||||
| Telecommunications — 1.9% |
||||||||
| France Telecom SA, Notes (France) |
||||||||
| 9.00%, 03/01/11(l) |
Baa3 | 385 | 463,173 | |||||
| GTE Hawaiian Telephone, Debs. |
||||||||
| 7.375%, 09/01/06 |
Aaa | 1,585 | 1,772,791 | |||||
| 2,235,964 | ||||||||
| Moody’s Rating (Unaudited) |
Par (000) |
Value | ||||||
| Utilities — 7.6% |
||||||||
| Appalachian Power Co., |
||||||||
| 4.80%, 06/15/05 |
Baa2 | $ | 1,585 | $ | 1,650,074 | |||
| Cleveland Electric Co. (Toledo), Notes |
||||||||
| 7.13%, 07/01/07 |
Aaa | 1,570 | 1,765,677 | |||||
| Consumers Energy, Notes |
||||||||
| 4.00%, 05/15/10 144A |
Baa3 | 1,000 | 968,946 | |||||
| Indiana Michigan Power, |
||||||||
| 6.375%, 11/01/12 |
Baa2 | 820 | 888,198 | |||||
| Pacificorp Australia LLC, Bonds (Australia) |
||||||||
| 6.15%, 01/15/08 144A(l) |
Aaa | 1,150 | 1,250,197 | |||||
| SP Powerassets Ltd., Notes (Singapore) |
||||||||
| 5.00%, 10/22/13 144A(l) |
Aa1 | 460 | 463,511 | |||||
| Xcel Energy, Inc., Sr. Notes |
||||||||
| 7.00%, 12/01/10 |
Baa3 | 1,540 | 1,748,710 | |||||
| 8,735,313 | ||||||||
| Total Corporate Obligations |
||||||||
| (Cost $33,889,931) |
34,591,254 | |||||||
| ASSET BACKED SECURITIES — 12.5% |
||||||||
| Advanta Mortgage Loan Trust, Series 2000-2 Class A6 |
||||||||
| 7.72%, 03/25/15 |
Aaa | 744 | 803,495 | |||||
| Americredit Automobile Receivables Trust, Series 2001-C Class A4 |
||||||||
| 5.01%, 07/14/08 |
Aaa | 1,610 | 1,660,931 | |||||
| CCCA LLC |
||||||||
| 7.80%, 10/15/08 144A |
AAA(d) | 1,000 | 1,094,070 | |||||
| Conseco Finance, Series 2002-C Class AF3 |
||||||||
| 4.58%, 08/15/33 |
Aaa | 1,391 | 1,409,863 | |||||
| Green Tree Financial Corp., Series 1993-4 Class A5 |
||||||||
| 7.05%, 01/15/19 |
Aaa | 593 | 622,855 | |||||
| Household Automotive Trust, Series 2002-3 Class A4 |
||||||||
| 3.44%, 05/18/09 |
Aaa | 1,455 | 1,476,941 | |||||
| MMCA Automobile Trust, Series 2002-2 Class A4 |
||||||||
| 4.30%, 03/15/10 |
Aa3 | 1,395 | 1,411,456 | |||||
| Series 2002-3 Class B |
||||||||
| 3.86%, 08/17/09 |
A2 | 1,401 | 1,392,065 | |||||
| Vanderbilt Acquisition Loan Trust, Series 2002-1 Class A2 |
||||||||
| 4.77%, 10/07/18 |
Aaa | 1,620 | 1,660,245 | |||||
232
Table of Contents
AST DeAM Bond Portfolio
Schedule of Investments
December 31, 2003
| Moody’s Rating (Unaudited) |
Par (000) |
Value | ||||||
| WFS Financial Owner Trust, Series 2002-2 Class A4 |
||||||||
| 4.50%, 02/20/10 |
Aaa | $ | 1,640 | $ | 1,698,466 | |||
| Series 2003-3 |
||||||||
| 3.25%, 05/20/11 |
Aaa | 1,230 | 1,236,248 | |||||
| Total Asset Backed Securities |
||||||||
| (Cost $14,266,535) |
14,466,635 | |||||||
| U.S. TREASURY OBLIGATIONS — 10.4% |
||||||||
| U.S. Treasury Notes |
||||||||
| 1.625%, 04/30/05 |
4,448 | 4,462,772 | ||||||
| 6.125%, 08/15/07(a) |
1,820 | 2,037,477 | ||||||
| 5.00%, 08/15/11(a) |
1,265 | 1,354,143 | ||||||
| 6.00%, 02/15/26 |
3,793 | 4,207,416 | ||||||
| (Cost $12,015,540) |
12,061,808 | |||||||
| MUNICIPAL BONDS — 3.8% |
||||||||
| Illinois — 0.5% |
||||||||
| Illinois State |
||||||||
| 4.95%, 06/01/23 |
Aa3 | 570 | 538,057 | |||||
| New Jersey — 1.7% |
||||||||
| City of Trenton |
||||||||
| 4.80%, 04/01/14 |
Aaa | 990 | 983,605 | |||||
| Jersey City, New Jersey Utilities Authority |
||||||||
| 4.81%, 05/15/14 |
Aaa | 1,000 | 987,109 | |||||
| 1,970,714 | ||||||||
| New Mexico — 0.4% |
||||||||
| Jicarilla New Mexico Apache Nation |
||||||||
| 3.85%, 12/01/08 |
NR | 435 | 434,026 | |||||
| Oregon — 0.8% |
||||||||
| Portland, Oregon River District 3.35%, 06/15/10 |
Aaa | 1,020 | 968,174 | |||||
| Wisconsin — 0.4% |
||||||||
| Wisconsin State General Revenue 5.70%, 05/01/26 |
Aaa | 510 | 518,441 | |||||
| Total Municipal Bonds |
||||||||
| (Cost $4,519,136) |
4,429,412 | |||||||
| COLLATERALIZED MORTGAGE OBLIGATIONS — 2.9% | ||||||||
| GSMPS Mortgage Loan Trust, Series 1998-5 Class A 7.50%, 06/19/27 144A |
NR | 536 | 576,111 | |||||
| Master Asset Securitization Trust, Series 2003-6 Class 8A1 5.50%, 07/25/33 |
AAA(d) | 1,076 | 1,100,366 | |||||
| NYC Mortgage Loan Trust, Series 1996 Class A3 6.75%, 09/25/19 144A |
Aaa | 270 | 298,476 | |||||
| Moody’s Rating (Unaudited) |
Par (000) |
Value | ||||||
| Residential Asset Securitization Trust, Series 2000-A3 Class A4 7.879%, 05/25/30 |
AAA(d) | $ | 51 | $ | 51,355 | |||
| Wells Fargo Mortgage Backed Securities, Series 2003-6 Class 1A1 5.00%, 06/25/18 |
Aaa | 1,344 | 1,373,536 | |||||
| Total Collateralized Mortgage Obligations |
||||||||
| (Cost $3,409,688) |
3,399,844 | |||||||
| SOVEREIGN ISSUES — 0.2% |
||||||||
| United Mexican States 7.50%, 04/08/33 |
Baa2 | 174 | 180,525 | |||||
| (Cost $178,359) |
||||||||
| Total Long-Term Investments |
||||||||
| (Cost $111,511,468) |
112,894,654 | |||||||
| SHORT-TERM INVESTMENTS — 6.7% |
||||||||
| Corporate Obligations — 1.0% |
||||||||
| Merrill Lynch & Co., Inc. 1.13%, 01/02/04(b) |
179 | 179,073 | ||||||
| Natexis Banques Populaires 1.035%, 01/02/04 [FRN](b)(c) |
928 | 927,960 | ||||||
| 1,107,033 | ||||||||
| Shares |
||||||
| Non-Registered Investment Company — 5.0% |
||||||
| BlackRock Institutional Money Market Trust(b)(j) |
5,815,276 | 5,815,275 | ||||
| Par (000) |
|||||||
| Repurchase Agreement — 0.6% |
|||||||
| Merrill Lynch & Co., Inc. |
$ | 746 | 746,139 | ||||
| Time Deposit — 0.1% |
|||||||
| Chase Manhattan Bank 0.875%, 01/02/04(b) |
61 | 60,790 | |||||
| Total Short-Term Investments |
|||||||
| (Cost $7,729,237) |
7,729,237 | ||||||
| Total Investments — 104.1% |
|||||||
| (Cost $119,240,705; Note 5) |
120,623,891 | ||||||
| Liabilities in Excess of Other Assets — (4.1%) |
(4,742,175 | ) | |||||
| Net Assets — 100.0% |
$ | 115,881,716 | |||||
233
Table of Contents
Schedule of Investments
December 31, 2003
234
The following abbreviations are used in portfolio descriptions:
| 144A | Security was purchased pursuant to Rule 144A under the securities Act of 1933 and may not be resold subject to that rule except to qualified institutional buyers. Unless otherwise noted 144A securities are deemed to be liquid. |
| FRN | Floating Rate Note |
| NR | Not Rated |
| symbol |
description | |
| (a) | Portion of securities on loan with an aggregate market value of $7,585,975; cash collateral $7,729,338 was received with which the portfolio purchased securities. | |
| (b) | Represents security purchased with cash collateral for securities on loan. | |
| (c) | Indicates a variable rate security. The maturity date presented for these instruments is the latter of the next date on which the security can be redeemed at par or the next date on which the rate of interest is adjusted. The interest rate shown reflects the rate in effect at December 31, 2003. | |
| (d) | Standard & Poor’s rating. | |
| (j) | Security not available to non-institutional buyers. | |
| (l) | US$ Denominated Foreign Bonds |
See Notes to Financial Statements.
Table of Contents
AST PIMCO Total Return Bond Portfolio
Schedule of Investments
December 31, 2003
| Par (000) |
Value | |||||||
| LONG-TERM INVESTMENTS — 57.4% |
||||||||
| U.S. GOVERNMENT AGENCY OBLIGATIONS — 24.4% | ||||||||
| Federal Home Loan Mortgage Corp. |
$ | 85 | $ | 85,353 | ||||
| 5.00%, 09/15/16 - 11/01/18 |
11,647 | 11,899,874 | ||||||
| 5.50%, 03/15/15 |
487 | 495,094 | ||||||
| 6.00%, 02/01/16 -04/01/33 |
13,829 | 14,375,988 | ||||||
| 6.50%, 05/15/28 -08/01/32 |
28,501 | 30,104,092 | ||||||
| 8.25%, 08/01/17 |
47 | 51,138 | ||||||
| 57,011,539 | ||||||||
| Federal National Mortgage Assoc. |
19 | 19,666 | ||||||
| 3.747%, 08/01/29 [ARM](c) |
391 | 393,956 | ||||||
| 4.042%, 05/01/36 [VR](c) |
22,756 | 23,139,817 | ||||||
| 4.336%, 11/01/35 [ARM](c) |
6,934 | 7,052,149 | ||||||
| 4.533%, 01/01/28 [VR](c) |
300 | 303,600 | ||||||
| 5.00%, 10/01/08 - 04/25/33 |
97,361 | 99,404,838 | ||||||
| 5.50%, 08/01/16 - 03/01/18 |
78,286 | 81,238,297 | ||||||
| 6.00%, 08/01/13 - 01/14/34 |
181,209 | 188,821,207 | ||||||
| 6.25%, 05/25/08 [IO](cost $2,490; purchased 05/16/94)(g) |
68 | 1,314 | ||||||
| 6.50%, 12/25/42 |
4,021 | 4,273,689 | ||||||
| 6.90%, 05/25/23 |
311 | 327,240 | ||||||
| 404,975,773 | ||||||||
| Government National Mortgage Assoc. 3.25%, 04/20/30 - 05/20/30 [VR](c) |
664 | 662,318 | ||||||
| 3.50%, 07/20/30 - 02/20/32 [VR](c) |
20,628 | 20,701,976 | ||||||
| 4.375%, 03/20/17 - 02/20/27 [VR](c) |
6,522 | 6,649,344 | ||||||
| 4.75%, 08/20/23 - 09/20/24 [VR](c) |
1,759 | 1,788,902 | ||||||
| 5.00%, 10/20/29 - 11/20/29 [VR](c) |
7,495 | 7,650,980 | ||||||
| 5.625%, 10/20/23 - 12/20/26 [VR](c) |
3,023 | 3,070,476 | ||||||
| 6.00%, 04/01/16 |
236 | 247,939 | ||||||
| 6.50%, 09/20/28 |
10,541 | 10,960,610 | ||||||
| 7.00%, 02/15/24 |
64 | 69,044 | ||||||
| 51,801,589 | ||||||||
| (Cost $505,800,112) |
513,788,901 | |||||||
| Par (000) |
Value | |||||||
| U.S. TREASURY OBLIGATIONS — 9.2% |
||||||||
| U.S. Treasury Inflationary Bonds [TIPS] |
||||||||
| 3.375%, 01/15/07(c)(k) |
$ | 6,900 | $ | 8,730,433 | ||||
| 3.375%, 01/15/12(c)(k) |
7,800 | 9,096,063 | ||||||
| 3.875%, 01/15/09(c) |
50,500 | 64,345,513 | ||||||
| 3.875%, 04/15/29(c) |
42,150 | 61,470,879 | ||||||
| 4.25%, 01/15/10(c) |
3,300 | 4,219,721 | ||||||
| 3.00%, 07/15/12(c) |
38,100 | 42,748,404 | ||||||
| 190,611,013 | ||||||||
| U.S. Treasury Inflationary Notes [TIPS] |
2,600 | 2,600,900 | ||||||
| (Cost $184,591,369) |
193,211,913 | |||||||
| Moody’s Rating |
||||||||
| CORPORATE OBLIGATIONS — 8.1% |
||||||||
| Airlines — 0.5% |
||||||||
| American Airlines, Inc., Pass-Thru Cert., Series 94A5 |
||||||||
| 10.19%, 05/26/16 144A(cost $250,000; purchased 05/14/94)(g) |
B3 | 250 | 190,836 | |||||
| Continental Airlines, Inc., |
||||||||
| 7.256%, 03/15/20 |
Baa3 | 1,203 | 1,223,408 | |||||
| Pass-Thru Cert., Series 991C |
||||||||
| 6.954%, 08/02/09 |
B2 | 6,180 | 5,376,620 | |||||
| United Air Lines, Inc., |
||||||||
| 10.36%, 11/13/12 144A(cost $8,052,232; purchased 01/03/96)(g)(i) |
Ca | 6,925 | 3,116,250 | |||||
| Series 91E |
||||||||
| 10.36%, 11/27/12 144A(cost $582,741; purchased 01/03/96)(g)(i) |
Ca | 500 | 225,000 | |||||
| United Air Lines, Inc., Pass-Thru Cert., Series 91A2 |
||||||||
| 10.02%, 03/22/14 144A (cost $1,000,630; purchased 03/01/95)(g)(i) |
Ca | 1,000 | 302,105 | |||||
| 10,434,219 | ||||||||
| Automobile Manufacturers — 0.1% |
||||||||
| General Motors Corp., Bonds |
||||||||
| 8.375%, 07/05/33 |
Baa1 | 1,100 | 1,627,277 | |||||
235
Table of Contents
AST PIMCO Total Return Bond Portfolio
Schedule of Investments
December 31, 2003
| Moody’s Rating |
Par (000) |
Value | ||||||
| Business Services — 0.1% |
||||||||
| Trinom Ltd., Sec’d. Notes |
||||||||
| 5.17%, 06/18/04 144A [FRN](cost $1,400,000; purchased 06/08/01)(c)(g) |
Ba1 | $ | 1,400 | $ | 1,409,114 | |||
| Conglomerates — 0.1% |
||||||||
| Altria Group, Inc., Debs. |
||||||||
| 7.75%, 01/15/27 |
Baa2 | 1,700 | 1,839,347 | |||||
| Financial Services — 3.0% |
||||||||
| CIT Group, Inc., Sr. Notes |
||||||||
| 7.125%, 10/15/04 |
A2 | 7,000 | 7,302,890 | |||||
| Gemstone Investor Ltd., |
||||||||
| 7.71%, 10/31/04 144A |
Caa1 | 3,600 | 3,654,000 | |||||
| General Motors Acceptance Corp., Notes |
||||||||
| 2.02%, 03/22/04 [FRN](c) |
A3 | 17,000 | 17,023,613 | |||||
| 1.969%, 05/04/04 [FRN](c) |
A3 | 8,100 | 8,114,353 | |||||
| 6.85%, 06/17/04 |
A3 | 2,000 | 2,047,342 | |||||
| 1.52%, 07/21/04 [FRN](c) |
A3 | 5,150 | 5,151,545 | |||||
| LG&E Capital Corp., Notes |
||||||||
| 6.205%, 05/03/04 144A(cost $5,000,000; purchased 05/04/99)(g) |
A3 | 5,000 | 5,061,095 | |||||
| Pemex Project Funding Master Trust, Gtd. Notes |
||||||||
| 8.00%, 11/15/11 |
Baa1 | 2,700 | 3,030,750 | |||||
| 8.625%, 02/01/22 |
Baa1 | 2,300 | 2,558,750 | |||||
| Phoenix Quake Ltd., Notes |
||||||||
| 3.60%, 07/03/08 144A [FRN](cost $1,200,000; purchased 06/18/03)(c)(g) |
Baa3 | 1,200 | 1,215,276 | |||||
| 3.60%, 07/03/08 144A [FRN](cost $1,200,000; purchased 06/18/03)(c)(g) |
Baa3 | 1,200 | 1,212,768 | |||||
| 4.65%, 07/03/08 144A [FRN](c) |
Ba1 | 550 | 544,777 | |||||
| Qwest Capital Funding Corp., Gtd. Notes |
||||||||
| 7.25%, 02/15/11 |
Caa2 | 153 | 151,470 | |||||
| Sr. Wind Ltd., Notes, |
||||||||
| 6.42%, 05/18/05 144A [FRN](cost $4,000,000; purchased 04/30/01)(c)(g) |
BB+(d) | 4,000 | 4,013,760 | |||||
| Moody’s Rating |
Par (000) |
Value | |||||||
| Notes, Series A2 |
|||||||||
| 6.92%, 05/18/05 144A [FRN](cost $2,000,000; purchased 04/30/01)(c)(g) |
BB+(d) | $ | 2,000 | $ | 2,059,360 | ||||
| UFJ Finance Aruba AEC, Gtd. Notes |
|||||||||
| 6.75%, 07/15/13 |
Baa1 | 2,900 | 3,098,311 | ||||||
| 66,240,060 | |||||||||
| Oil & Gas — 1.7% |
|||||||||
| El Paso Corp., Sr. Notes |
Caa1 | 21,700 | 18,607,750 | ||||||
| Kerr McGee Corp., Notes |
BBB | (d) | 1,300 | 1,297,942 | |||||
| Williams Companies, Inc., Notes, Series A |
B3 | 15,000 | 15,600,000 | ||||||
| 35,505,692 | |||||||||
| Telecommunications — 2.4% |
|
||||||||
| AT&T Corp., Sr. Notes |
Baa2 | 5,000 | 5,862,995 | ||||||
| France Telecom SA, |
Baa3 | 6,900 | 9,199,356 | ||||||
| Notes, (France) 8.70%, 03/01/06(l) |
Baa3 | 5,000 | 5,588,310 | ||||||
| Qwest Corp., |
Caa2 | 900 | 904,500 | ||||||
| 7.20%, 11/10/26 |
Ba3 | 13,250 | 13,117,500 | ||||||
| 8.875%, 06/01/31 |
Ba3 | 500 | 527,500 | ||||||
| Notes 8.875%, 03/15/12 144A |
Ba3 | 600 | 690,000 | ||||||
| Sprint Capital Corp., |
Baa3 | 7,700 | 8,230,792 | ||||||
| 6.375%, 05/01/09 |
Baa3 | 5,000 | 5,350,910 | ||||||
| Notes 8.375%, 03/15/12 |
Baa3 | 300 | 351,047 | ||||||
| 49,822,910 | |||||||||
| Utilities — 0.2% |
|||||||||
| AEP Texas Central Co., Notes |
Baa2 | 1,600 | 1,602,112 | ||||||
| National Rural Utilities Co., Notes |
A2 | 2,000 | 2,006,118 | ||||||
236
Table of Contents
AST PIMCO Total Return Bond Portfolio
Schedule of Investments
December 31, 2003
| Moody’s Rating |
Par (000) |
Value | ||||||
| Pacific Gas & Electric Co., |
Ba2 | $ | 1,100 | $ | 1,106,875 | |||
| 4,715,105 | ||||||||
| Total Corporate Obligations |
||||||||
| (Cost $172,702,105) |
171,593,724 | |||||||
| COLLATERALIZED MORTGAGE |
||||||||
| Bear Stearns Trust, |
||||||||
| Series 2002-8 Class 3A |
||||||||
| 6.082%, 08/25/32 [ARM, VR](c) |
Aaa | 284 | 286,202 | |||||
| Series 2002-9 Class 2A |
||||||||
| 5.301%, 10/25/32 [ARM, VR](c) |
Aaa | 878 | 892,342 | |||||
| Series 2002-11 Class A-1 |
||||||||
| 5.652%, 02/25/33 [ARM](c) |
Aaa | 1,659 | 1,671,626 | |||||
| Series 2002-11 Class A-2 |
||||||||
| 5.382%, 01/25/33 [ARM](c) |
Aaa | 6,301 | 6,395,404 | |||||
| CMC Securities Corp. III, Series 1998-1 Class A19 |
||||||||
| 6.75%, 05/25/28 [ARM](c) |
Aaa | 1,486 | 1,485,059 | |||||
| G-Wing Ltd., Series 2001-WH1A Class B |
||||||||
| 3.82%, 11/06/11 144A [FRN](cost $5,415,338; purchased 05/10/01)(c)(g) |
BBB(d) | 5,415 | 5,363,134 | |||||
| GEM Trust, Series 1999-1 Class 1A3 |
||||||||
| 6.625%, 04/25/29 |
AAA(d) | 3,307 | 3,305,469 | |||||
| GS Mortgage Securities Corp. II, Series 2001-1285 |
||||||||
| 6.526%, 08/15/18 144A |
Aaa | 2,000 | 2,168,897 | |||||
| Indymac Trust, Series 2001-H2 Class A2 |
||||||||
| 6.576%, 01/25/32 [ARM](c) |
Aaa | 618 | 639,259 | |||||
| Merrill Lynch Mortgage Investors, Inc., Series 1998-C3 Class A1 |
||||||||
| 5.65%, 12/15/30 |
Aaa | 1,815 | 1,864,068 | |||||
| Nationslink Funding Corp., Series 1999-SL Class A4 |
||||||||
| 6.654%, 11/10/30 |
Aaa | 500 | 530,109 | |||||
| Moody’s Rating |
Par (000) |
Value | ||||||
| PHH Mortgage Services Corp., Series 1997-6 Class A4 |
||||||||
| 7.157%, 11/18/27 144A [FRN](c) |
NR | $ | 2,017 | $ | 2,094,809 | |||
| Residential Asset Securitization Trust, Series 2001-A1 Class A5 |
||||||||
| 5.587%, 07/25/31 |
Aaa | 20,808 | 21,096,465 | |||||
| Residential Funding Mortgage Securities I, Series 1998-S30 Class A6 |
||||||||
| 6.50%, 12/25/28 |
AAA(d) | 11,813 | 11,807,687 | |||||
| Series 1999-16 Class A4 |
||||||||
| 6.75%, 07/25/29 |
AAA(d) | 4,798 | 4,807,090 | |||||
| Series 2002-SA2 Class A1 |
||||||||
| 5.599%, 09/25/32 [VR](c) |
Aaa | 1,511 | 1,550,282 | |||||
| Rothschild, (L.F.) Mortgage Trust, Series 2 Class 2 |
||||||||
| 9.95%, 08/01/17 |
AAA(d) | 280 | 307,827 | |||||
| Salomon Brothers Mortgage Securities, Series 1999-3 Class A |
||||||||
| 1.521%, 05/25/29 [FRB](c) |
AAA(d) | 87 | 87,202 | |||||
| Small Business Administration, |
||||||||
| 4.875%, 09/10/13 |
NR | 13,600 | 13,597,041 | |||||
| Series 2000-P10B Class 1 |
||||||||
| 7.449%, 08/01/10 |
NR | 2,489 | 2,707,809 | |||||
| Series 2001-P10B Class A 6.344%, 08/01/11 |
NR | 14,502 | 15,247,868 | |||||
| Series 2003-20I Class 1 5.13%, 09/01/23 |
NR | 1,700 | 1,722,609 | |||||
| Structured Asset Mortgage Investments, Inc., Series 1992-2 Class 1A3 |
AAA (d) | 7,419 | 7,428,102 | |||||
| Structured Asset Securities Corp., Series 2001-15A Class 2A1 |
Aaa | 852 | 885,337 | |||||
| Series 2002-1A Class 4A 6.127%, 02/25/32 [VR](c) |
Aaa | 672 | 693,050 | |||||
| Washington Mutual, Series 2002-AR11 Class A1 |
Aaa | 4,818 | 4,935,717 | |||||
| (Cost $111,544,907) |
113,570,464 | |||||||
| MUNICIPAL BONDS — 4.2% |
||||||||
| California — 0.7% |
||||||||
| California State Revenue Anticipation Warrants Cl-A |
MIG1 | 6,100 | 6,112,383 | |||||
237
Table of Contents
AST PIMCO Total Return Bond Portfolio
Schedule of Investments
December 31, 2003
| Moody’s Rating (Unaudited) |
Par (000) |
Value | ||||||
| Golden State Tobacco Securitization Corp. Series 2003-A-1 |
Baa2 | $ | 5,300 | $ | 5,093,300 | |||
| Ventura County California Community College District Series A |
Aaa | 3,355 | 3,457,831 | |||||
| 14,663,514 | ||||||||
| Illinois — 0.1% |
||||||||
| Chicago Illinois Refunding-Emergency Telephone System |
Aaa | 2,000 | 2,264,560 | |||||
| Michigan |
||||||||
| Michigan Higher Education Student Loan Authority Revenue Bond Series |
Aaa | 600 | 600,000 | |||||
| Minnesota |
||||||||
| Northstar Gurantee Income Dividend, Minnesota Student Loan Revenue Bonds Series A-3 |
Aaa | 500 | 500,000 | |||||
| Nevada — 0.6% |
||||||||
| Las Vegas Water Authority (MBIA Insured) Series B |
Aaa | 3,840 | 3,951,014 | |||||
| 5.00%, 06/01/26 |
Aaa | 7,000 | 7,171,500 | |||||
| 5.00%, 06/01/27 |
Aaa | 2,200 | 2,252,294 | |||||
| 13,374,808 | ||||||||
| New York — 1.3% |
||||||||
| New York City Municipal Financial Authority Water & Sewer System Series E |
Aa2 | 12,800 | 13,070,080 | |||||
| New York City Transitional Financial Authority Series E |
Aa2 | 1,200 | 1,228,080 | |||||
| 5.00%, 02/01/33 |
Aa2 | 11,700 | 11,939,031 | |||||
| 26,237,191 | ||||||||
| Moody’s Rating (Unaudited) |
Par (000) |
Value | ||||||
| Texas — 0.4% |
||||||||
| Brazos Texas Higher Education Authority Student Loan Revenue Bond Series A-13 |
Aaa | $ | 1,800 | $ | 1,800,000 | |||
| Lower Colorado River Authority Texas |
Aaa | 5,000 | 5,098,950 | |||||
| University of Texas Revenue Bond Series B |
Aaa | 1,600 | 1,634,208 | |||||
| 8,533,158 | ||||||||
| Washington — 0.3% |
||||||||
| Energy Northwest Washington Electric Series A |
Aa1 | 3,300 | 3,757,413 | |||||
| 5.50%, 07/01/14 |
Aa1 | 2,600 | 2,962,440 | |||||
| 6,719,853 | ||||||||
| Wisconsin — 0.8% |
||||||||
| Badger Tobacco Asset Securitization Corp. |
Baa2 | 10,100 | 9,651,964 | |||||
| Wisconsin State General Revenue Bond |
Aaa | 6,600 | 6,600,000 | |||||
| 16,251,964 | ||||||||
| Total Municipal Bonds |
||||||||
| (Cost $88,886,098) |
89,145,048 | |||||||
| SOVEREIGN ISSUES — 4.0% |
||||||||
| Brazil — 1.6% |
||||||||
| Republic of Brazil |
B2 | 2,972 | 2,942,821 | |||||
| 11.50%, 03/12/08 |
B2 | 7,000 | 8,155,000 | |||||
| 2.063%, 04/15/09 |
B2 | 129 | 123,062 | |||||
| 2.063%, 04/15/09 [BRB, FRN](c) |
B2 | 887 | 843,003 | |||||
| 11.00%, 01/11/12 |
B2 | 7,080 | 8,248,199 | |||||
| 8.00%, 04/15/14 [BRB](c) |
B2 | 7,216 | 7,120,609 | |||||
| 11.00%, 08/17/40 |
B2 | 6,000 | 6,630,000 | |||||
| 34,062,694 | ||||||||
| Mexico — 1.0% |
||||||||
| United Mexican States |
Baa2 | 600 | 759,000 | |||||
| 8.375%, 01/14/11 |
Baa2 | 2,800 | 3,332,000 | |||||
| 6.375%, 01/16/13 |
Baa2 | 2,490 | 2,589,600 | |||||
| 11.375%, 09/15/16 |
Baa2 | 200 | 284,000 | |||||
| 8.00%, 09/24/22 |
Baa2 | 6,700 | 7,346,550 | |||||
| 8.30%, 08/15/31 |
Baa2 | 5,900 | 6,667,000 | |||||
| 20,978,150 | ||||||||
238
Table of Contents
AST PIMCO Total Return Bond Portfolio
Schedule of Investments
December 31, 2003
| Moody’s Rating (Unaudited) |
Par (000) |
Value | ||||||
| Panama — 0.4% |
||||||||
| Republic of Panama |
Ba1 | $ | 4,124 | $ | 3,605,907 | |||
| 9.375%, 01/16/23 |
Ba1 | 4,400 | 4,818,000 | |||||
| 8.875%, 09/30/27 |
Ba1 | 400 | 422,000 | |||||
| 8,845,907 | ||||||||
| Peru — 0.9% |
||||||||
| Republic of Peru |
Ba3 | 3,000 | 3,540,000 | |||||
| 9.125%, 02/21/12 |
Ba3 | 7,875 | 8,820,000 | |||||
| 9.875%, 02/06/15 |
Ba3 | 2,500 | 2,912,500 | |||||
| 4.50%, 03/07/17 |
Ba3 | 4,000 | 3,560,000 | |||||
| 18,832,500 | ||||||||
| South Africa — 0.1% |
||||||||
| Republic of South Africa |
Baa2 | 800 | 966,000 | |||||
| 7.375%, 04/25/12 |
Baa2 | 200 | 225,500 | |||||
| 1,191,500 | ||||||||
| Total Sovereign Issues |
||||||||
| (Cost $73,566,236) |
83,910,751 | |||||||
| ASSET BACKED SECURITIES — 2.1% |
||||||||
| Bayview Financial Acquisition Trust, Series 2001-AA Class A |
Aaa | 1,230 | 1,231,615 | |||||
| Series 2001-BA Class A 1.421%, 07/25/31 144A [FRB](c) |
Aaa | 7,208 | 7,195,490 | |||||
| Bear Stearns Asset Backed Securities, Inc., Series 2001-A Class AII |
Aaa | 1,281 | 1,283,310 | |||||
| CDC Mortgage Capital Trust, Series 2002-HE2 Class A |
Aaa | 9,794 | 9,791,096 | |||||
| Conseco Finance Home Loan Trust, Series 1999-G Class M1 |
Aa2 | 5,553 | 5,615,734 | |||||
| Contimortgage Home Equity Loan Trust, Series 1997-5 Class A8 |
Aaa | 562 | 562,143 | |||||
| Moody’s Rating (Unaudited) |
Par (000) |
Value | ||||||
| EMC Mortgage Loan Trust, Series 2001-A Class A |
Aaa | $ | 17,628 | $ | 17,633,169 | |||
| (Cost $43,252,279) |
43,312,557 | |||||||
| Units |
||||||||
| RIGHTS* |
||||||||
| United Mexican States Value Recovery (Mexico) |
49,719 | 497,190 | ||||||
| Series C |
49,719 | 99,438 | ||||||
| Series D |
33,910 | 67,820 | ||||||
| Series E |
33,910 | 42,388 | ||||||
| Total Rights (Cost $658,994) |
706,836 | |||||||
| Total Long-Term Investments | |||||
| (cost $1,181,002,100) |
1,209,240,194 | ||||
| Par (000) |
|||||
| SHORT-TERM INVESTMENTS — 43.4% |
|||||
| Commercial Paper — 13.1% |
|||||
| Danske Corp. |
$ | 16,600 | 16,589,996 | ||
| 1.09%, 03/03/04 |
7,900 | 7,878,233 | |||
| 1.07%, 03/22/04 |
22,800 | 22,744,431 | |||
| General Electric Capital Corp. |
4,400 | 4,388,585 | |||
| 1.10%, 03/15/04 |
1,200 | 1,196,187 | |||
| HBOS Treasury Services |
900 | 898,820 | |||
| 1.10%, 04/16/04 |
23,400 | 23,323,495 | |||
| 1.105%, 04/22/04 |
8,400 | 8,370,865 | |||
| Lloyds TSB Bank |
4,200 | 4,196,185 | |||
| RABO Bank |
47,900 | 47,858,571 | |||
| Royal Bank of Scotland |
56,100 | 56,023,578 | |||
239
Table of Contents
AST PIMCO Total Return Bond Portfolio
Schedule of Investments
December 31, 2003
| Par (000) |
Value | |||||
| UBS Finance LLC, Inc. |
$ | 7,400 | $ | 7,381,880 | ||
| 1.075%, 02/25/04 |
1,200 | 1,195,796 | ||||
| 1.09%, 03/02/04 144A |
44,000 | 43,849,459 | ||||
| 1.095%, 04/01/04 |
30,000 | 29,890,500 | ||||
| Westpac Trust |
1,400 | 1,395,765 | ||||
| 277,182,346 | ||||||
| Shares |
||||||
| Registered Investment Companies — 1.1% |
||||||
| BlackRock Provident Institutional Funds TempCash Portfolio |
11,867,405 | 11,867,405 | ||||
| BlackRock Provident Institutional Funds TempFund Portfolio |
11,867,404 | 11,867,404 | ||||
| 23,734,809 | ||||||
| Par (000) |
||||||
| U.S. Government Agency Obligations — 21.1% |
||||||
| Federal Home Loan Mortgage Corp. |
||||||
| 1.08%, 01/29/04 |
$ | 18,600 | 18,585,913 | |||
| 1.07%, 02/02/04 |
50,000 | 49,955,643 | ||||
| 1.07%, 02/11/04 |
3,000 | 2,996,634 | ||||
| 1.08%, 02/12/04 |
48,400 | 48,307,170 | ||||
| 1.09%, 03/01/04 |
40,000 | 39,926,122 | ||||
| Federal National Mortgage Assoc. |
||||||
| 1.075%, 01/28/04 |
60,000 | 59,956,239 | ||||
| 1.00%, 02/04/04 |
14,900 | 14,885,928 | ||||
| 1.075%, 02/18/04 |
20,000 | 19,973,891 | ||||
| 1.075%, 03/03/04 |
32,500 | 32,438,859 | ||||
| 1.055%, 03/10/04 |
60,100 | 59,976,712 | ||||
| 1.06%, 03/10/04 |
31,300 | 31,235,487 | ||||
| 1.065%, 03/10/04 |
11,100 | 11,077,014 | ||||
| 1.04%, 03/12/04 |
800 | 798,336 | ||||
| 1.045%, 03/17/04 |
2,600 | 2,594,189 | ||||
| 1.05%, 03/24/04 |
2,300 | 2,294,919 | ||||
| 1.09%, 03/24/04 |
9,000 | 8,980,119 | ||||
| 1.03%, 03/31/04 |
31,600 | 31,517,726 | ||||
| 1.075%, 04/01/04 |
7,800 | 7,778,572 | ||||
| 443,279,473 | ||||||
| Par (000) |
Value |
||||||
| U.S. Treasury Obligations — 8.1% |
|||||||
| U.S. Treasury Bills |
|||||||
| 0.885%, 03/18/04(k)(n) |
$ | 12,505 | $ | 12,483,004 | |||
| 0.985%, 04/15/04(n) |
71,800 | 71,617,485 | |||||
| 0.995%, 04/15/04(n) |
22,700 | 22,642,297 | |||||
| 1.02%, 04/29/04(n) |
64,600 | 64,411,948 | |||||
| 171,154,734 | |||||||
| Number of Contracts |
|||||||
| OUTSTANDING PUT OPTIONS PURCHASED* |
|||||||
| Eurodollar Futures, Strike Price 96.50, |
8,000 | 5,000 | |||||
| Eurodollar Futures, Strike Price 97.00, |
2,500 | 3,125 | |||||
| (Cost $12,063) |
8,125 | ||||||
| Total Put Options |
|||||||
| Total Short-Term Investments |
|||||||
| (Cost $915,496,515) |
915,359,487 | ||||||
| Total Investments, Before Outstanding |
|||||||
| (Cost $2,096,498,615; Note 5) |
2,124,599,681 | ||||||
| Par (000) |
|||||||
| SHORT SALE — (0.5)% |
|||||||
| Federal National Mortgage Assoc. |
|||||||
| 6.00%, 01/20/19 |
|||||||
| (Proceeds received $11,537,187) |
$ | 11,000 | (11,536,250 | ) | |||
| OUTSTANDING OPTIONS WRITTEN— (0.4)% |
|
Number of Contracts/ Swap Notional Amount $(000) |
|||||
| Call Options — (0.3)% |
|||||||
| Eurodollar Futures, Strike Price 98.50, Expires 03/15/04 |
38 | (27,312 | ) | ||||
| Swap 3-Month LIBOR & Fixed, Strike Price 3.25, Expires 03/03/04 |
40,500 | (77,274 | ) | ||||
240
Table of Contents
AST PIMCO Total Return Bond Portfolio
Schedule of Investments
December 31, 2003
| Number of Contracts/Swap Notional Amount $(000) |
Value |
|||||
| Swap 3-Month LIBOR & Fixed, Strike Price 4.00, Expires 03/03/04 |
24,700 | $ | (25,418 | ) | ||
| Swap 3-Month LIBOR & Fixed, Strike Price 5.20, Expires 11/02/04 |
31,400 | (1,520,796 | ) | |||
| Swap 3-Month LIBOR & Fixed, Strike Price 5.50, Expires 01/07/05 |
24,500 | (1,430,800 | ) | |||
| Swap 3-Month LIBOR & Fixed, Strike Price 6.00, Expires 06/09/05 |
38,300 | (2,830,255 | ) | |||
| Swap 3-Month LIBOR & Fixed, Strike Price 6.00, Expires 10/19/04 |
9,400 | (810,167 | ) | |||
| U.S. Treasury Note Futures, Strike Price 113, Expire 02/21/04 |
262 | (307,031 | ) | |||
| (7,029,053 | ) | |||||
| Put Options — (0.1)% |
||||||
| 3-Month Euro-Euribor Interest Futures Strike Price 97.00, Expires 12/13/04 |
86 | (52,882 | ) | |||
| 3-Month Euro-Euribor Interest Futures Strike Price 97.50, Expires 03/15/04 |
130 | (2,050 | ) | |||
| Eurodollar Futures, Strike Price 97.25, Expires 03/15/04 |
19 | (120 | ) | |||
| Number of Contracts/Swap Notional Amount $(000) |
Value |
|||||
| Eurodollar Futures, Strike Price 97.75, Expires 03/15/04 |
121 | $ | (1,512 | ) | ||
| Eurodollar Futures, Strike Price 98.00, Expires 06/14/04 |
545 | (54,500 | ) | |||
| Swap 3-Month LIBOR & Fixed, Strike Price 6.00, Expires 10/19/04 |
9,400 | (76,619 | ) | |||
| Swap 3-Month LIBOR & Fixed, Strike Price 6.70, Expires 06/09/05 |
22,330 | (267,845 | ) | |||
| Swap 3-Month LIBOR & Fixed, Strike Price 6.70, Expires 11/02/04 |
31,400 | (131,817 | ) | |||
| Swap 3-Month LIBOR & Fixed, Strike Price 7.00, Expires 01/07/05 |
24,500 | (115,689 | ) | |||
| U.S. Treasury Note Futures, Strike Price 108, Expire 02/21/04 |
161 | (50,312 | ) | |||
| (753,346 | ) | |||||
| Total Written Options |
||||||
| (Premium received $8,096,548) |
(7,782,399 | ) | ||||
| Total Investments, Net of Outstanding Short Sale and Options Written—99.9% |
||||||
| (Cost $2,076,864,880) |
2,105,281,032 | |||||
| Other Assets in Excess of |
2,631,106 | |||||
| Net Assets — 100.0% |
$ | 2,107,912,138 | ||||
Interest rate swap agreements outstanding at December 31, 2003:
| Description | Expiration Month |
Notional Amount (000) |
Unrealized Appreciation (Depreciation) |
||||||||
| Receive fixed rate payments of 4.00% and pay variable rate payments on the three month LIBOR-BBA floating rate.(1) |
06/09 | $ | 111,600 | $ | 449,971 | ||||||
| Receive fixed rate payments of 4.00% and pay variable rate payments on the six month LIBOR-BBA floating rate. (cost $255,444 purchased on 12/16/03)(g)(1) |
03/07 | EUR | 48,100 | 22,187 | |||||||
| Receive fixed rate payments of 4.00% and pay variable rate payments on the six month LIBOR-BBA floating rate.(2) |
12/07 | EUR | 50,200 | (117,378 | ) | ||||||
| Receive fixed rate payments of 6.00% and pay variable rate payments on the six month LIBOR-BBA floating rate. (cost ($4,768) purchased on 03/15/02)(g)(2) |
03/17 | EUR | 2,000 | 35,646 | |||||||
| Receive fixed rate payments of 6.00% and pay variable rate payments on the six month LIBOR-BBA floating rate. (cost ($22,063) purchased 02/12/02)(g)(1) |
03/17 | EUR | 15,000 | 253,647 | |||||||
| Receive fixed rate payments of 6.00% and pay variable rate payments on the six month LIBOR-BBA floating rate. (cost $62,540 purchased 05/15/02)(g)(3) |
03/32 | EUR | 5,300 | 35,478 | |||||||
| Receive fixed rate payments of 6.00% and pay variable rate payments on the six month LIBOR-BBA floating rate. (cost $41,291 purchased 03/15/02)(g)(2) |
03/32 | EUR | 6,600 | 80,769 | |||||||
| Receive variable rate payments on the six month LIBOR-BBA floating rate and pay fixed rate payments of 5.00%. (cost $17,837 purchased 03/15/02)(g)(2) |
03/17 | GBP | 1,200 | (16,196 | ) | ||||||
241
Table of Contents
AST PIMCO Total Return Bond Portfolio
Schedule of Investments
December 31, 2003
| Description | Expiration Month |
Notional Amount (000) |
Unrealized Appreciation (Depreciation) |
|||||||
| Receive variable rate payments on the six month LIBOR-BBA floating rate and pay fixed rate payments of 5.00%. (cost $38,858 purchased 03/14/02)(g)(3) |
03/17 | GBP | 2,500 | $ | (35,438 | ) | ||||
| Receive variable rate payments on the six month LIBOR-BBA floating rate and pay fixed rate payments of 5.00%. (cost $68,356 purchased 02/12/02)(g)(1) |
03/17 | GBP | 6,800 | (59,055 | ) | |||||
| Receive variable rate payments on the six month LIBOR-BBA floating rate and pay fixed rate payments of 5.00%.(2) |
03/32 | GBP | 3,600 | 12,754 | ||||||
| Receive variable rate payments on the six month LIBOR-BBA floating rate and pay fixed rate payments of 5.00%.(3) |
03/32 | GBP | 3,100 | (17,125 | ) | |||||
| $ | 645,260 | |||||||||
Broker/Counterparty
(1) Goldman Sachs
(2) J.P. Morgan Chase & Co.
(3) UBS - Warburg
(4) Morgan Stanley
Credit default swap agreements outstanding at December 31, 2003:
| Description | Expiration Month |
Notional Amount (000) |
Unrealized Appreciation | |||||
| Receive a fixed rate equal to 0.50% and the Portfolio will pay to the counterparty at par in the event of default of Republic of Brazil 14.50% due 10/15/09 (cost $0 purchased 12/08/03)(g)(3) |
03/04 | $ | 1,200 | $ | 451 | |||
| Receive a fixed rate equal to 1.80% and the Portfolio will pay to the counterparty at par in the event of default of Republic of Panama 9.375% due 04/01/29. (cost $0 purchased 05/30/03)(g)(4) |
06/05 | 500 | 6,694 | |||||
| Receive a fixed rate equal to 1.75% and the Portfolio will pay to the counterparty at par in the event of default of Republic of Peru 9.125% due 02/21/12. (cost $0 purchased 05/30/03)(g)(4) |
06/04 | 1,300 | 8,637 | |||||
| $ | 15,782 | |||||||
Foreign currency exchange contracts outstanding at December 31, 2003:
| Settlement Month |
Purchase Contracts |
Contracts to Receive |
In Exchange For |
Contracts at Value |
Unrealized Appreciation | ||||||||
| 01/04 |
Buy GBP | 1,070,000 | $ | 1,848,120 | $ | 1,907,525 | $ | 59,405 | |||||
| 01/04 |
Buy JPY | 523,234,000 | 4,855,054 | 4,880,103 | 25,049 | ||||||||
| $ | 6,703,174 | $ | 6,787,628 | $ | 84,454 | ||||||||
| Settlement Month |
Sale Contracts |
Contracts to Deliver |
In Exchange For |
Contracts at Value |
Unrealized Depreciation |
|||||||||
| 01/04 |
Sell EUR | 4,140,000 | $ | 4,988,994 | $ | 5,221,999 | $ | (233,005 | ) | |||||
242
Table of Contents
AST PIMCO Total Return Bond Portfolio
Schedule of Investments
December 31, 2003
The following abbreviations are used in portfolio descriptions:
| 144A | Security was purchased pursuant to Rule 144A under the securities Act of 1933 and may not be resold subject to that rule except to qualified institutional buyers. Unless otherwise noted 144A securities are deemed to be liquid. |
| ARM | Adjustable Rate Mortgage Security |
| BRB | Brady Bond |
| EUR | Euro Dollar |
| FRB | Floating Rate Bond |
| FRN | Floating Rate Note |
| GBP | British Pound |
| IO | Interest Only |
| JPY | Japanese Yen |
| NR | Not Rated |
| TIPS | Treasury Inflation Protection Securities |
| VR | Variable Rate Bond |
| symbol |
description | |
| * |
Non-income producing security. | |
| (c) |
Indicates a variable rate security. The maturity date presented for these instruments is the latter of the next date on which the security can be redeemed at par or the next date on which the rate of interest is adjusted. The interest rate shown reflects the rate in effect at December 31, 2003. | |
| (d) |
Standard & Poor’s rating. | |
| (g) |
Indicates a security that has been deemed illiquid. The aggregate cost of illiquid securities is $49,288,884. The aggregate value, $43,700,370 represents 2.07% of net assets. | |
| (i) |
Represents issuer in default on interest payments, Non-income producing security. | |
| (k) |
Securities with an aggregate market value of $15,102,134 have been segregated with the custodian to cover margin requirements for the following open futures contracts at December 31, 2003: |
| Description | Expiration Month |
Notional Amount (000) |
Contracts at Trade Date Value |
Contracts at Current Value |
Unrealized Appreciation (Depreciation) |
||||||||||||
| Long Positions: |
|||||||||||||||||
| U.S. Treasury 5 Year Notes |
03/04 | $ | 154,100 | $ | 169,818,641 | $ | 172,014,125 | $ | 2,195,484 | ||||||||
| U.S. Treasury 10 Year Notes |
03/04 | 112,300 | 358,476,711 | 364,077,422 | 5,600,711 | ||||||||||||
| 3 Month Euro-Bobl |
03/04 | EUR | 46,600 | 64,912,748 | 64,968,441 | 55,693 | |||||||||||
| Euro Dollar |
06/04 | EUR | 3,750 | 3,672,000 | 3,696,375 | 24,375 | |||||||||||
| Euro Dollar |
09/04 | EUR | 83,250 | 81,237,819 | 81,788,963 | 551,144 | |||||||||||
| Euro Dollar |
12/04 | EUR | 76,000 | 74,169,819 | 74,358,400 | 188,581 | |||||||||||
| Euro Dollar |
03/05 | EUR | 53,000 | 51,515,796 | 51,637,900 | 122,104 | |||||||||||
| Euro Dollar |
06/05 | EUR | 47,500 | 45,996,406 | 46,079,750 | 83,344 | |||||||||||
| Euro Dollar |
09/05 | EUR | 20,750 | 20,048,650 | 20,053,838 | 5,188 | |||||||||||
| Euro Dollar |
12/05 | EUR | 25,750 | 24,799,825 | 24,807,550 | 7,725 | |||||||||||
| Euro Dollar |
03/08 | EUR | 15,250 | 14,460,050 | 14,435,650 | (24,400 | ) | ||||||||||
| Euro Dollar |
06/08 | EUR | 15,250 | 14,443,275 | 14,418,875 | (24,400 | ) | ||||||||||
| Euro Dollar |
09/08 | EUR | 15,250 | 14,426,881 | 14,402,863 | (24,018 | ) | ||||||||||
| Euro Dollar |
12/08 | EUR | 15,250 | 14,410,106 | 14,388,375 | (21,731 | ) | ||||||||||
| Euro Euribor Interest Rate |
12/04 | EUR | 107,000 | 130,843,338 | 131,320,636 | 477,298 | |||||||||||
| Euro Euribor Interest Rate |
03/05 | EUR | 62,500 | 76,303,563 | 76,512,834 | 209,271 | |||||||||||
| Euro Euribor Interest Rate |
06/05 | EUR | 15,000 | 18,299,577 | 18,315,780 | 16,203 | |||||||||||
| Euro Euribor Interest Rate |
09/05 | EUR | 15,000 | 18,261,325 | 18,274,155 | 12,830 | |||||||||||
| Euro Euribor Interest Rate |
12/05 | EUR | 15,000 | 18,225,947 | 18,238,206 | 12,259 | |||||||||||
| 9,467,661 | |||||||||||||||||
| Short Position: |
|||||||||||||||||
| U.S. Treasury Bonds |
03/04 | 57,600 | 62,196,539 | 62,964,000 | (767,461 | ) | |||||||||||
| $ | 8,700,200 | ||||||||||||||||
| (l) |
US$ Denominated Foreign Bonds. | |
| (m) |
Rates shown are the effective yields at purchase date. | |
| See Notes to Financial Statements. | ||
243
Table of Contents
AST PIMCO Limited Maturity Bond Portfolio
Schedule of Investments
December 31, 2003
| Moody’s (Unaudited) |
Par (000) |
Value | ||||||
| LONG-TERM INVESTMENTS — 40.0% |
||||||||
| CORPORATE OBLIGATIONS — 16.1% |
||||||||
| Airlines — 0.3% |
||||||||
| United Air Lines, Inc., |
||||||||
| 6.831%, 09/01/08 |
Ca | $ | 1,800 | $ | 310,404 | |||
| 6.932%, 09/01/11 |
B3 | 1,100 | 387,197 | |||||
| Pass-Thru Cert., Series 97A 1.392%, 03/02/04 [FRN](c) |
NR | 3,413 | 2,785,828 | |||||
| 3,483,429 | ||||||||
| Business Services — 0.2% |
||||||||
| Trinom Ltd., Sec’d Notes |
||||||||
| 5.17%, 06/18/04 144A [FRN] (cost $2,000,000; purchased 06/08/01)(c)(g) |
Ba1 | 2,000 | 2,013,020 | |||||
| Entertainment & Leisure — 0.9% |
||||||||
| Disney (Walt) Co., Notes |
||||||||
| 4.50%, 09/15/04 |
Baa1 | 5,500 | 5,620,290 | |||||
| Time Warner, Inc., Notes |
||||||||
| 7.75%, 06/15/05 |
Baa1 | 3,600 | 3,886,157 | |||||
| 9,506,447 | ||||||||
| Financial — Bank & Trust — 2.2% |
||||||||
| Bank of America Corp., Notes |
||||||||
| 4.75%, 10/15/06 |
Aa2 | 5,500 | 5,810,272 | |||||
| Golden West Financial Corp., Sr. Notes |
||||||||
| 5.50%, 08/08/06 |
A1 | 5,000 | 5,399,085 | |||||
| Household Bank, Notes |
||||||||
| 1.357%, 02/27/04 [FRN](c) |
NR | 2,500 | 2,500,618 | |||||
| Household Finance Corp., Notes |
||||||||
| 6.70%, 01/21/04 |
A1 | 2,300 | 2,485,633 | |||||
| Wachovia Corp., Notes |
||||||||
| 4.95%, 11/01/06 |
Aa3 | 6,000 | 6,374,519 | |||||
| 22,570,127 | ||||||||
| Financial Services — 4.3% |
||||||||
| Finova Group, Inc., Notes |
||||||||
| 7.50%, 11/15/09 |
NR | 300 | 181,500 | |||||
| Ford Motor Credit Co., Notes |
||||||||
| 7.60%, 08/01/05 |
A3 | 5,700 | 6,094,508 | |||||
| 6.875%, 02/01/06 |
A3 | 4,000 | 4,271,300 | |||||
| General Motors Acceptance Corp., Notes |
||||||||
| 1.88%, 01/20/04 [FRN](c) |
A3 | 11,700 | 11,703,078 | |||||
| Heller Financial, Inc., Notes |
||||||||
| 6.375%, 03/15/06 |
Aaa | 6,400 | 6,984,992 | |||||
| Moody’s (Unaudited) |
Par (000) |
Value | ||||||
| Morgan Stanley, Notes |
||||||||
| 3.625%, 04/01/08 |
Aa3 | $ | 6,600 | $ | 6,615,767 | |||
| Pemex Project Funding Master Trust, Gtd. Notes |
||||||||
| 7.375%, 12/15/14 |
Baa1 | 4,000 | 4,290,000 | |||||
| 8.625%, 02/01/22 |
Baa1 | 3,000 | 3,337,500 | |||||
| 43,478,645 | ||||||||
| Insurance — 1.8% |
||||||||
| Marsh & McLennan Co., Inc., Sr. Notes |
||||||||
| 6.625%, 06/15/04 |
A2 | 8,000 | 8,185,120 | |||||
| Travelers Property Casualty Corp., Sr. Notes |
||||||||
| 3.75%, 03/15/08 |
A2 | 10,000 | 10,053,160 | |||||
| 18,238,280 | ||||||||
| Oil & Gas — 0.3% |
||||||||
| Pioneer Natural Resources, Sr. Notes |
||||||||
| 8.875%, 04/15/05 |
Ba1 | 2,420 | 2,590,792 | |||||
| Restaurants — 0.3% |
||||||||
| Yum! Brands, Inc., Sr. Notes |
||||||||
| 7.45%, 05/15/05 |
Ba1 | 2,500 | 2,678,125 | |||||
| Telecommunications — 3.4% |
||||||||
| British Telecom PLC, Notes (United Kingdom) |
||||||||
| 7.875%, 12/15/05(l) |
Baa1 | 8,400 | 9,261,975 | |||||
| Deutsche Telekom International Finance Corp., Gtd. Notes (Germany) |
||||||||
| 8.25%, 06/15/05(l) |
Baa3 | 5,000 | 5,426,015 | |||||
| France Telecom SA, Notes (France) |
||||||||
| 8.45%, 03/01/06 [VR](c)(l) |
Baa3 | 2,500 | 2,781,225 | |||||
| 9.00%, 03/01/11(l) |
Baa3 | 2,900 | 3,488,836 | |||||
| Sprint Capital Corp., Gtd. Notes |
||||||||
| 7.90%, 03/15/05 |
Baa3 | 2,170 | 2,312,430 | |||||
| 6.00%, 01/15/07 |
Baa3 | 5,000 | 5,344,670 | |||||
| Verizon Wireless, Inc., Notes |
||||||||
| 5.375%, 12/15/06 |
A3 | 5,000 | 5,339,875 | |||||
| 33,955,026 | ||||||||
| Utilities — 2.4% |
||||||||
| AEP Texas Central Co., Notes |
||||||||
| 2.43%, 02/15/05 [FRN](c) |
Baa2 | 10,000 | 10,013,200 | |||||
| Edison International, Inc., Notes |
||||||||
| 6.875%, 09/15/04 |
Ba2 | 3,000 | 3,097,500 | |||||
| Niagara Mohawk Power Corp., Notes |
||||||||
| 7.75%, 05/15/06 |
Baa2 | 4,590 | 5,128,145 | |||||
244
Table of Contents
AST PIMCO Limited Maturity Bond Portfolio
Schedule of Investments
December 31, 2003
| Moody’s (Unaudited) |
Par (000) |
Value | ||||||
| TXU Corp., Sr. Notes |
||||||||
| 6.375%, 06/15/06 |
Ba1 | $ | 167 | $ | 177,438 | |||
| TXU Energy Co., Sr. Notes |
||||||||
| 6.125%, 03/15/08 |
Baa2 | 5,000 | 5,357,115 | |||||
| 23,773,398 | ||||||||
| Total Corporate Obligations |
||||||||
| (Cost $157,820,498) |
162,287,289 | |||||||
| U.S. GOVERNMENT AGENCY OBLIGATIONS — 9.8% | ||||||||
| Federal Home Loan Mortgage Corp. |
||||||||
| 5.00%, 04/15/16 |
5,074 | 5,199,557 | ||||||
| 5.25%, 04/15/26 |
688 | 692,764 | ||||||
| 6.00%, 04/15/28 - 04/01/33 |
22,890 | 23,549,255 | ||||||
| 6.50%, 09/25/22 - 07/25/43 |
17,892 | 18,583,558 | ||||||
| 6.569%, 12/01/26 |
113 | 117,110 | ||||||
| 8.50%, 01/01/25 |
1,040 | 1,135,484 | ||||||
| 49,277,728 | ||||||||
| Federal Housing Authority |
||||||||
| 7.46%, 08/25/23 |
1,388 | 1,435,731 | ||||||
| Federal National Mortgage Assoc. |
||||||||
| 1.541%, 11/25/32 |
6,734 | 6,748,991 | ||||||
| 3.008%, 01/01/25(c) [VR] |
38 | 39,262 | ||||||
| 3.159%, 08/25/18(c) [FRN] |
26 | 25,389 | ||||||
| 4.761%, 03/01/17(c) [VR] |
949 | 968,623 | ||||||
| 5.00%, 05/01/18 - 11/01/18 |
4,441 | 4,536,116 | ||||||
| 5.04%, 05/01/25 [VR](c) |
289 | 299,459 | ||||||
| 6.00%, 04/01/12 - 11/01/17 |
8,430 | 8,854,075 | ||||||
| 7.00%, 07/25/08 |
2,072 | 2,175,272 | ||||||
| 8.00%, 11/25/23 |
318 | 337,241 | ||||||
| 23,984,428 | ||||||||
| Government National Mortgage Assoc. |
||||||||
| 4.375%, 05/20/24 - 06/20/26 [VR](c) |
1,331 | 1,357,271 | ||||||
| 4.75%, 07/20/17 - 07/20/24 [VR](c) |
236 | 240,572 | ||||||
| 5.00%, 11/20/29 [VR](c) |
1,323 | 1,350,766 | ||||||
| 6.50%, 04/15/26 - 05/15/32 |
11,466 | 12,073,638 | ||||||
| 7.00%, 01/15/24 - 08/15/25 |
257 | 274,260 | ||||||
| 8.00%, 06/20/30 - 01/20/32 |
5,757 | 6,223,082 | ||||||
| Moody’s (Unaudited) |
Par (000) |
Value | |||||||
| 8.50%, 10/15/29 - 01/15/31 |
$ | 1,787 | $ | 1,945,088 | |||||
| 23,464,677 | |||||||||
| Total U.S. Government Agency Obligations |
|||||||||
| (Cost $97,027,124) |
98,162,564 | ||||||||
| COLLATERALIZED MORTGAGE OBLIGATIONS — 8.4% |
|
||||||||
| Bank of America Mortgage Securities, Series 2002-K Class 2A1 |
|||||||||
| 5.737%, 10/20/32 [VR](c) |
AAA(d) | 4,705 | 4,870,876 | ||||||
| Bear Stearns Adjustable Rate Mortgage Trust, Series 2003-8 Class 2A1 |
|||||||||
| 4.948%, 01/25/34 [VR](c) |
Aaa | 5,494 | 5,522,344 | ||||||
| Bear Stearns Alt-A Trust, Series 2003-7 Class IIA1 |
|||||||||
| 1.419%, 12/30/03 [VR](c) |
Aaa | 3,500 | 3,495,282 | ||||||
| Bear Stearns Trust, Series 2002-2 Class IIIA |
|||||||||
| 6.761%, 06/25/31 [ARM](c) |
Aaa | 636 | 664,916 | ||||||
| Countrywide Alternative Loan Trust, Series 2003-J3 Class 2A1 |
|||||||||
| 6.25%, 12/25/33 |
AAA(d) | 3,858 | 3,961,245 | ||||||
| Countrywide Home Loans, Series 1999-3 Class A2 |
|||||||||
| 6.05%, 04/25/29 |
AAA(d) | 2,256 | 2,257,420 | ||||||
| Series 1999-9 Class A1 |
|||||||||
| 6.50%, 08/25/29 |
AAA(d) | 2,151 | 2,242,011 | ||||||
| Series 2003-R4 Class 2A |
|||||||||
| 6.50%, 01/25/34 144A |
Aaa | 2,015 | 2,131,589 | ||||||
| Credit Suisse First Boston USA, Inc., Series 2002 Class P-3A |
|||||||||
| 1.724%, 09/27/32 144A (cost $8,622,002; purchased 09/24/02)(g) |
NR | 8,622 | 8,574,176 | ||||||
| First Republic Mortgage Loan Trust, Series |
|||||||||
| 1.462%, 08/15/32 |
Aaa | 22,692 | 22,564,674 | ||||||
| GSmps Mortgage Loan Trust, 2003-3 Class A1 |
|||||||||
| 7.00%, 06/25/43 144A |
AAA | (d) | 3,991 | 4,233,543 | |||||
| Mellon Residential Funding Corp., Series 1998-2 Class A14 |
|||||||||
| 6.75%, 01/25/13 |
AAA | (d) | 35 | 35,191 | |||||
245
Table of Contents
AST PIMCO Limited Maturity Bond Portfolio
Schedule of Investments
December 31, 2003
| Moody’s (Unaudited) |
Par (000) |
Value | ||||||
| Merrill Lynch Mortgage Investors, Inc., Series |
||||||||
| 6.891%, 06/15/21 [VR] (c) |
Aaa | $ | 365 | $ | 390,034 | |||
| Residential Funding Mortgage Securities I, Series |
||||||||
| 5.599%, 09/25/32 [VR](c) |
Aaa | 2,906 | 2,981,311 | |||||
| Salomon Brothers Mortgage Securities VII, Series |
||||||||
| 7.15%, 03/25/25 144A |
Aaa | 8,842 | 9,312,435 | |||||
| Small Business Investment Companies, Series |
||||||||
| 7.31%, 05/10/07 |
NR | 888 | 962,076 | |||||
| Structured Asset Securities Corp., Series 2001-13 |
||||||||
| 7.00%, 10/25/16 |
Aaa | 1,774 | 1,807,399 | |||||
| Travelers Mortgage Securities Corp., Series 1984-1 |
||||||||
| 12.00%, 03/01/14 |
Aaa | 586 | 594,544 | |||||
| United Mortgage Securities Corp., Series 1994-1 |
||||||||
| 3.964%, 06/25/32 |
Aaa | 3,135 | 3,149,595 | |||||
| Washington Mutual, Series |
||||||||
| 5.162%, 10/25/32 [VR](c) |
Aaa | 4,818 | 4,935,717 | |||||
| Total Collateralized Mortgage Obligations |
||||||||
| (Cost $84,549,705) |
84,686,378 | |||||||
| SOVEREIGN ISSUES — 4.1% |
||||||||
| Brazil — 1.1% |
||||||||
| Republic of Brazil |
||||||||
| 2.00%, 04/15/06 [BRB, FRN](c) |
B2 | 4,560 | 4,515,230 | |||||
| 12.00%, 04/15/10 |
B2 | 700 | 843,500 | |||||
| 11.00%, 01/11/12 |
B2 | 2,000 | 2,330,000 | |||||
| 8.00%, 04/15/14 [BRB] |
B2 | 3,411 | 3,365,885 | |||||
| 11,054,615 | ||||||||
| Mexico — 0.1% |
||||||||
| United Mexican States |
||||||||
| 11.375%, 09/15/16 |
Baa2 | 1,000 | 1,420,000 | |||||
| Panama — 1.1% |
||||||||
| Republic of Panama |
||||||||
| 9.625%, 02/08/11 |
Ba1 | 3,000 | 3,480,000 | |||||
| 9.375%, 07/23/12 |
Ba1 | 1,000 | 1,145,000 | |||||
| 9.375%, 01/16/23 |
Ba1 | 3,619 | 3,962,805 | |||||
| 8.875%, 09/30/27 |
Ba1 | 2,500 | 2,637,500 | |||||
| 11,225,305 | ||||||||
| Moody’s (Unaudited) |
Par (000) |
Value | |||||||
| Peru — 1.5% |
|||||||||
| Republic of Peru |
|||||||||
| 9.125%, 01/15/08 |
Ba3 | $ | 1,200 | $ | 1,416,000 | ||||
| 9.125%, 02/21/12 |
Ba3 | 10,375 | 11,620,000 | ||||||
| 9.875%, 02/06/15 |
Ba3 | 1,000 | 1,165,000 | ||||||
| 5.00%, 03/07/17 |
Ba3 | 517 | 480,810 | ||||||
| 14,681,810 | |||||||||
| South Africa — 0.3% |
|||||||||
| Republic of South Africa |
|||||||||
| 9.125%, 05/19/09 |
Baa2 | 2,650 | 3,199,875 | ||||||
| Total Sovereign Issues |
|||||||||
| (Cost $36,123,901) |
41,581,605 | ||||||||
| ASSET BACKED SECURITIES — 1.4% |
|||||||||
| Advanta Mortgage Loan Trust, Series 1994-4 |
|||||||||
| 1.516%, 11/25/29 [VR](c) |
Aaa | 2,742 | 2,738,697 | ||||||
| Brazos Student Loan Finance Corp., Series 2001-B |
|||||||||
| 1.21%, 10/31/35 [VR](c) |
Aaa | 2,200 | 2,198,324 | ||||||
| First Franklin Mortgage Loan, Series 2003-Ff5 Class A2 |
|||||||||
| 2.718%, 03/25/34 |
Aaa | 1,680 | 1,678,917 | ||||||
| Green Tree Financial Corp., Series 1999-5 Class A3 |
|||||||||
| 6.97%, 04/01/31 |
BBB- | (d) | 1,183 | 1,191,325 | |||||
| Novaster Home Equity Loan, Series 2001-2 Class A2 |
|||||||||
| 1.471%, 09/25/31 [FRB](c) |
Aaa | 845 | 846,185 | ||||||
| Residential Asset Mortgage Products, Inc., Series 2003-Rs11 Class AIIB |
|||||||||
| 1.47%, 12/25/33 [VR](c) |
Aaa | 2,500 | 2,497,998 | ||||||
| SVO Timeshare Mortgage Corp., Series 2001-AA Class A |
|||||||||
| 5.47%, 10/20/13 144A (cost $2,951,826; purchased 06/20/01)(g) |
Aaa | 2,956 | 3,067,825 | ||||||
| Total Asset Backed Securities |
|||||||||
| (Cost $14,105,884) |
14,219,271 | ||||||||
| MUNICIPAL BONDS — 0.3% |
|
||||||||
| Missouri |
|||||||||
| Missouri Higher Education Lending Authority |
|||||||||
| Student Loan |
|||||||||
| 1.19%, 12/17/03 |
|||||||||
| (Cost $2,900,000) |
Aaa | 2,900 | 2,900,000 | ||||||
246
Table of Contents
AST PIMCO Limited Maturity Bond Portfolio
Schedule of Investments
December 31, 2003
| Units |
Value | |||||||
| Rights* |
||||||||
| United Mexican States Value Recovery (Mexico) |
||||||||
| Series B |
5,500 | $ | 55,000 | |||||
| Series C |
5,500 | 11,000 | ||||||
| Series D |
5,500 | 11,000 | ||||||
| Series E |
5,500 | 6,875 | ||||||
| Total Rights |
||||||||
| (Cost $0) |
83,875 | |||||||
| Total Long-Term Investments |
||||||||
| (Cost $392,527,112) |
403,920,982 | |||||||
| Par (000) |
||||||||
| SHORT-TERM INVESTMENTS — 50.4% |
||||||||
| Certificate of Deposit — 2.1% |
||||||||
| Citibank NA |
||||||||
| 1.095%, 02/19/04 |
$ | 21,000 | 20,999,971 | |||||
| Commercial Paper — 10.3% |
||||||||
| ABN AMRO NA Finance, Inc. |
||||||||
| 1.07%, 01/26/04 |
9,100 | 9,093,289 | ||||||
| 1.075%, 02/03/04 |
16,100 | 16,076,411 | ||||||
| Danske Corp. |
||||||||
| 1.08%, 01/07/04 |
20,000 | 19,996,400 | ||||||
| 1.08%, 01/21/04 |
1,800 | 1,798,921 | ||||||
| General Electric Capital Corp. |
||||||||
| 1.09%, 01/15/04 |
300 | 299,876 | ||||||
| HBOS Treasury Services |
||||||||
| 1.105%, 01/23/04 |
600 | 599,594 | ||||||
| Rabobank USA Financial Corp. |
||||||||
| 1.05%, 01/13/04 |
14,000 | 13,995,433 | ||||||
| Royal Bank of Scotland |
||||||||
| 1.08%, 02/03/04 |
7,500 | 7,492,680 | ||||||
| Shell Finance Plc |
||||||||
| 1.07%, 02/06/04 |
20,000 | 19,978,154 | ||||||
| UBS Finance LLC, Inc. |
||||||||
| 1.075%, 02/25/04 |
10,100 | 10,082,871 | ||||||
| 1.07%, 04/05/04 |
4,400 | 4,387,445 | ||||||
| 103,801,074 | ||||||||
| Shares |
||||||||
| Registered Investment Companies — 0.1% |
||||||||
| BlackRock Provident Institutional Funds TempCash Portfolio |
251,491 | 251,491 | ||||||
| BlackRock Provident Institutional Funds TempFund Portfolio |
251,490 | 251,490 | ||||||
| 502,981 | ||||||||
| Par (000) |
Value |
||||||||
| U.S. Government Agency Obligations — 17.4% |
|||||||||
| Federal Home Loan Bank |
|||||||||
| 1.05%, 01/14/04(n) |
$ | 7,200 | $ | 7,197,350 | |||||
| 1.05%, 01/14/04(n) |
4,100 | 4,098,491 | |||||||
| 1.05%, 01/14/04(n) |
47,000 | 46,982,698 | |||||||
| Federal Home Loan Mortgage Corp. |
|||||||||
| 1.08%, 02/12/04(n) |
23,200 | 23,173,318 | |||||||
| 1.085%, 03/01/04(n) |
20,000 | 19,968,200 | |||||||
| 1.09%, 03/01/04(n) |
25,900 | 25,852,164 | |||||||
| Federal National Mortgage Assoc. |
|||||||||
| 1.08%, 02/18/04(n) |
26,400 | 26,365,536 | |||||||
| 1.135%, 02/18/04(n) |
9,100 | 9,088,120 | |||||||
| 1.08%, 02/23/04(n) |
3,500 | 3,494,355 | |||||||
| 1.03%, 03/31/04(n) |
4,700 | 4,687,763 | |||||||
| 1.075%, 04/01/04(n) |
4,500 | 4,487,638 | |||||||
| 175,395,633 | |||||||||
| U.S. Treasury Obligations — 20.5% |
|||||||||
| U.S. Treasury Bills |
|||||||||
| 0.91%, 03/04/04(k)(n) |
3,420 | 3,415,171 | |||||||
| 0.84%,03/18/04(k)(n) |
600 | 598,945 | |||||||
| 0.985%, 04/15/04(n) |
11,500 | 11,466,647 | |||||||
| 0.985%, 04/15/04(n) |
11,500 | 11,466,647 | |||||||
| 0.985%, 04/15/04(n) |
15,700 | 15,654,463 | |||||||
| 0.995%, 04/15/04(n) |
11,500 | 11,466,308 | |||||||
| 1.02%, 04/29/04(n) |
32,800 | 32,688,480 | |||||||
| 1.02%, 04/29/04(n) |
1,600 | 1,594,560 | |||||||
| 1.025%, 05/06/04(n) |
23,700 | 23,614,333 | |||||||
| 1.04%, 05/13/04(n) |
42,500 | 42,361,918 | |||||||
| 1.031%, 06/03/04(n) |
50,000 | 49,805,149 | |||||||
| 1.031%, 06/03/04(n) |
1,000 | 996,103 | |||||||
| 205,128,724 | |||||||||
| Total Short-Term Investments |
|||||||||
| (Cost $505,775,496) |
505,828,383 | ||||||||
| Total Investments, Before |
|||||||||
| (Cost $898,302,608) |
909,749,365 | ||||||||
| Swap Notional Amount $(000) |
|||||||||
| WRITTEN OPTIONS — (0.1)% |
|||||||||
| Call Option – (0.1)% |
|||||||||
| Swap 3-Month LIBOR, Strike Price 4.00, Expires 01/07/05 |
50,700 | (592,936 | ) | ||||||
247
Table of Contents
AST PIMCO Limited Maturity Bond Portfolio
Schedule of Investments
December 31, 2003
| Swap Notional Amount $(000) |
Value |
|||||||
| Put Option |
||||||||
| Swap 3-Month LIBOR, Strike Price 7.00, Expires 01/07/05 |
50,700 | $ | (239,406 | ) | ||||
| Total Written Options |
||||||||
| (Premiums received $929,078) |
(832,342 | ) | ||||||
| Total Investments, Net of Outstanding |
||||||||
| (Cost $897,373,531) |
908,917,023 | |||||||
| Other Assets in Excess of |
97,007,356 | |||||||
| Net Assets — 100.0% |
$ | 1,005,924,379 | ||||||
Foreign currency exchange contracts outstanding at December 31, 2003:
| Settlement Month |
Sale Contracts |
Contracts to Deliver |
In Exchange For |
Contracts at Value |
Unrealized Depreciation |
|||||||||
| 01/04 |
Sell EUR | 1,428,570 | $ | 1,769,436 | $ | 1,801,930 | ($ | 32,494 | ) | |||||
The following abbreviations are used in portfolio descriptions:
| 144A | Security was purchased pursuant to Rule 144A under the securities Act of 1933 and may not be resold subject to that rule except to qualified institutional buyers. Unless otherwise noted 144A securities are deemed to be liquid. |
| ARM | Adjustable Rate Mortgage Security |
| BRB | Brady Bond |
| EUR | Euro Dollar |
| FRB | Floating Rate Bond |
| FRN | Floating Rate Note |
| GBP | British Pound |
| NR | Not Rated |
| VR | Variable Rate Bond |
| symbol |
description | |
| (c) |
Indicates a variable rate security. The maturity date presented for these instruments is the latter of the next date on which the security can be redeemed at par or the next date on which the rate of interest is adjusted. The interest rate shown reflects the rate in effect at December 31, 2003. | |
| (d) |
Standard & Poor’s rating | |
| (g) |
Indicates a security that has been deemed illiquid. The aggregate cost of illiquid securities is $13,573,828. The aggregate value, $13,655,021 represents 1.37% of net assets. |
248
Table of Contents
AST PIMCO Limited Maturity Bond Portfolio
Schedule of Investments
December 31, 2003
| (k) | Securities with an aggregate market value of $4,014,116 have been segregated with the custodian to cover margin requirements for the following open futures contracts at December 31, 2003: |
| Description | Expiration Month |
Notional Amount (000) |
Contracts at Trade Date Value |
Contracts at Current Value |
Unrealized Appreciation/ (Depreciation) |
|||||||||||
| Long Positions: |
||||||||||||||||
| 3 Month Euro-Bobl |
03/04 | EUR | 38,700 | $ | 53,976,310 | $ | 53,954,478 | $ | (21,832 | ) | ||||||
| 3 Month Eurodollar |
12/04 | EUR | 141,500 | 137,244,063 | 138,443,600 | 1,199,537 | ||||||||||
| $ | 1,177,705 | |||||||||||||||
(l) US$ Denominated Foreign Bonds.
(n) Rates shown are the effective yields at purchase date.
Interest rate swap agreements outstanding at December 31, 2003:
| Description | Expiration Month |
Contracts/ Notional |
Unrealized Appreciation (Depreciation) |
||||||||
| Receive fixed rate payments of 4.00% and pay variable rate payments on the six month LIBOR-BBA floating rate.(cost $19,934 purchased 03/17/03)(g)(1) |
03/07 | EUR | $ | 16,000 | $ | 72,417 | |||||
| Receive fixed rate payments of 4.25% and pay variable rate payments on the six month LIBOR-BBA floating rate.(2) |
03/05 | GBP | 96,500 | (857,762 | ) | ||||||
| $ | (785,345 | ) | |||||||||
Brokers/Counterparties
(1) UBS - Warburg
(2) Morgan Stanley
See Notes to Financial Statements.
249
Table of Contents
Schedule of Investments
December 31, 2003
| Par (000) |
Value | |||||
| CORPORATE OBLIGATIONS — 22.6% |
||||||
| Special Purpose Insurance Vehicle - 2.5% |
||||||
| John Hancock Global Funding II |
||||||
| 1.27%, 09/13/04 [FRN] 144A(c) |
$ | 44,000 | $ | 44,037,696 | ||
| Financial — Bank & Trust — 4.5% |
||||||
| HBOS Treasury Services PLC |
||||||
| 1.17%, 01/22/04 |
23,000 | 23,000,162 | ||||
| 1.18%, 01/23/04 |
10,000 | 10,000,135 | ||||
| J.P. Morgan Chase & Co. |
||||||
| 1.305%, 02/05/04 [FRN](c) |
12,500 | 12,501,978 | ||||
| Marshall & IIsley Bank 5.252%, 12/15/04 |
22,500 | 23,299,196 | ||||
| Northern Rock PLC |
||||||
| 1.27%, 03/18/04 [FRN] 144A(c) |
23,000 | 23,004,735 | ||||
| Suntrust Bank |
||||||
| 1.25%, 04/12/04 [FRN](c) |
57,000 | 57,024,970 | ||||
| 148,831,176 | ||||||
| Financial Services — 7.4% |
||||||
| American Express Centurion Bank |
||||||
| 1.111%, 05/24/04 |
25,000 | 25,000,000 | ||||
| American Honda Finance |
||||||
| 1.14%, 05/12/04 [FRN] 144A(c) |
52,000 | 52,000,001 | ||||
| Caterpillar Financial Services Corp. |
||||||
| 1.34%, 03/05/04 [FRN](c) |
25,000 | 25,008,787 | ||||
| 1.31%, 04/02/04 [FRN](c) |
28,000 | 28,012,134 | ||||
| 130,020,922 | ||||||
| Financial — Brokerage — 4.2% |
||||||
| Bear Stearns Co., Inc. |
||||||
| 1.77%, 05/24/04 [FRN](c) |
75,000 | 75,184,316 | ||||
| Total Corporate Obligations |
||||||
| (Cost $398,074,110 ) |
398,074,110 | |||||
| U.S. GOVERNMENT AGENCY OBLIGATIONS — 15.0% | ||||||
| Federal Home Loan Bank |
||||||
| 0.70%, 01/02/04 |
27,150 | 27,149,472 | ||||
| 1.09%, 02/06/04 - 02/06/04 |
99,800 | 99,691,218 | ||||
| 126,840,690 | ||||||
| Federal Home Loan Mortgage Corp. |
||||||
| 1.12%, 01/29/04 |
80,000 | 79,930,311 | ||||
| 3.25%, 01/15/04 |
36,320 | 36,348,235 | ||||
| 116,278,546 | ||||||
| Federal National Mortgage Assoc. |
||||||
| 1.28%, 01/02/04 |
22,000 | 21,999,218 | ||||
| (Cost $265,118,454) |
265,118,454 | |||||
| Par (000) |
Value | |||||
| CERTIFICATES OF DEPOSIT — 15.5% |
||||||
| Bank of Scotland NY |
||||||
| 1.13%, 03/31/04 |
$ | 62,000 | $ | 62,004,394 | ||
| BNP Paribas NY |
||||||
| 1.39%, 08/27/04 |
62,000 | 62,027,347 | ||||
| Discover Bank |
||||||
| 1.095%, 01/20/04 |
53,000 | 53,000,000 | ||||
| Royal Bank of Canada NY |
||||||
| 1.078%, 09/03/04 |
71,000 | 70,981,413 | ||||
| SwedBank |
||||||
| 1.413%, 11/03/04 |
25,000 | 24,998,424 | ||||
| (Cost $273,011,578) |
273,011,578 | |||||
| TIME DEPOSIT — 4.7% |
||||||
| Societe Generale |
||||||
| 0.875%, 01/02/04 |
||||||
| (Cost $83,000,000) |
83,000 | 83,000,000 | ||||
| ASSET BACKED SECURITIES — 3.4% | ||||||
| WFS Financial Owner Trust |
||||||
| 1.127%, 08/20/04 |
41,626 | 41,625,757 | ||||
| Whole Auto Loan Trust |
||||||
| 1.10%, 09/15/04 |
18,093 | 18,093,156 | ||||
| (Cost $59,718,913) |
59,718,913 | |||||
| REGISTERED INVESTMENT COMPANIES | ||||||
| Shares |
||||||
| BlackRock Provident Institutional Funds |
||||||
| TempCash Portfolio |
19,178 | 19,178 | ||||
| BlackRock Provident Institutional Funds |
||||||
| TempFund Portfolio |
19,177 | 19,177 | ||||
| (Cost $38,355) |
38,355 | |||||
| Par (000) |
||||||
| COMMERCIAL PAPER — 33.6% |
||||||
| Financial — Bank & Trust — 10.0% |
||||||
| Bradford & Bingley PLC |
||||||
| 1.15%, 01/07/05 144A |
$ | 28,000 | 28,000,000 | |||
| HSBC Bank of Canada |
||||||
| 1.22%, 02/04/04 144A |
34,000 | 33,960,824 | ||||
| Nationwide Building Society |
||||||
| 1.10%, 03/08/04 |
64,000 | 63,868,978 | ||||
| Spintab AB |
||||||
| 1.10%, 03/10/04 |
50,000 | 49,894,583 | ||||
| 175,724,385 | ||||||
250
Table of Contents
AST Money Market Portfolio
Schedule of Investments
December 31, 2003
| Par (000) |
Value | |||||
| Financial Services — 23.6% |
||||||
| KBC Financial Products International |
||||||
| 1.10%, 02/19/04 144A |
$ | 67,500 | $ | 67,398,938 | ||
| KFW International Finance |
||||||
| 1.12%, 02/02/04 144A |
50,604 | 50,553,621 | ||||
| National Bank of New Zealand International |
||||||
| 1.18%, 05/05/04 144A |
61,500 | 61,248,021 | ||||
| Network Rail Finance PLC |
||||||
| 1.10%, 02/17/04 144A |
35,000 | 34,949,736 | ||||
| 1.11%, 04/02/04 144A |
29,250 | 29,167,028 | ||||
| Par (000) |
Value | |||||
| Stadshypotek Delaware, Inc. |
||||||
| 1.12%, 03/12/04 144A |
$ | 65,000 | $ | 64,856,422 | ||
| Swedish National Housing Finance Corp. |
||||||
| 1.10%, 03/10/04 144A |
44,000 | 43,907,233 | ||||
| Toyota Motors Credit Corp. |
||||||
| 1.08%, 03/15/04 144A |
22,250 | 22,200,605 | ||||
| 1.08%, 03/19/04 144A |
42,000 | 41,901,720 | ||||
| 416,183,324 | ||||||
| Total Commercial Paper |
||||||
| (Cost $591,907,709) |
591,907,709 | |||||
| Total Investments — 94.8% |
||||||
| (Cost $1,670,869,119) |
1,670,869,119 | |||||
| Other Assets in Excess of |
91,247,481 | |||||
| Net Assets — 100.0% |
$ | 1,762,116,600 | ||||
The following abbreviations are used in portfolio descriptions:
| 144A | Security was purchased pursuant to Rule 144A under the securities Act of 1933 and may not be resold subject to that rule except to qualified institutional buyers. Unless otherwise noted 144A securities are deemed to be liquid. |
| FRN | Floating Rate Note |
| symbol |
description | |
| (c) |
Indicates a variable rate security. The maturity date presented for these instruments is the latter of the next date on which the security can be redeemed at par or the next date on which the rate of interest is adjusted. The interest rate shown reflects the rate in effect at December 31, 2003. | |
| (h) |
Indicates a restricted security; the aggregate cost and value, $478,144,148 is approximately 27.13% of net assets. |
See Notes to Financial Statements.
251
Table of Contents
Statements of Assets and Liabilities
December 31, 2003
(Amounts in thousands, except per share amounts)
| Portfolio | ||||||||||||||||||||||||
| AST Strong International Equity |
AST William Blair International Growth |
AST American Century International Growth |
AST DeAM International Equity |
AST Global Equity |
AST PBHG Small-Cap Growth |
|||||||||||||||||||
| Assets |
||||||||||||||||||||||||
| Investments in securities at value(A) including securities loaned at value(D) |
$ | 337,649 | $ | 499,648 | $ | 379,350 | $ | 158,540 | $ | 103,017 | $ | 387,068 | ||||||||||||
| Cash |
1,763 | 168,121 | — | 10,839 | — | — | ||||||||||||||||||
| Foreign currency at value(B) |
— | 1,091 | 398 | — | — | — | ||||||||||||||||||
| Unrealized appreciation on foreign currency exchange contracts |
— | — | 11 | 280 | — | — | ||||||||||||||||||
| Unrealized appreciation on swap agreements |
— | — | — | — | — | — | ||||||||||||||||||
| Receivable for: |
||||||||||||||||||||||||
| Securities sold |
118 | 66,441 | 4,539 | — | 41 | 4,746 | ||||||||||||||||||
| Dividends and interest |
859 | 549 | 797 | 215 | 162 | 176 | ||||||||||||||||||
| Fund shares sold |
1 | 5,684 | 2 | 76 | 163 | 485 | ||||||||||||||||||
| Futures variation margin |
— | — | — | 2,218 | — | — | ||||||||||||||||||
| Other assets |
5 | 4 | 4 | 2 | 1 | 4 | ||||||||||||||||||
| Total Assets |
340,395 | 741,538 | 385,101 | 172,170 | 103,384 | 392,479 | ||||||||||||||||||
| Liabilities |
||||||||||||||||||||||||
| Payable to custodian |
— | — | — | — | 60 | — | ||||||||||||||||||
| Unrealized depreciation on foreign currency exchange contracts |
— | — | 7 | 13 | — | — | ||||||||||||||||||
| Written options outstanding, at value(C) |
— | — | — | — | — | — | ||||||||||||||||||
| Investments sold short, at value(E) |
— | — | — | — | — | — | ||||||||||||||||||
| Unrealized depreciation on swap agreements |
— | — | — | — | — | — | ||||||||||||||||||
| Payable from Loans |
1,000 | — | — | — | — | — | ||||||||||||||||||
| Payable on return of securities lent |
— | — | — | — | — | 53,823 | ||||||||||||||||||
| Payable for: |
||||||||||||||||||||||||
| Securities purchased |
— | 99,391 | 6,257 | — | 294 | 144 | ||||||||||||||||||
| Fund shares redeemed |
105 | — | 233 | — | 15 | 114 | ||||||||||||||||||
| Futures variation margin |
— | — | — | — | — | — | ||||||||||||||||||
| Advisory fees |
168 | 145 | 151 | 47 | 39 | 143 | ||||||||||||||||||
| Shareholder servicing fees |
5 | 8 | 5 | 2 | 2 | 5 | ||||||||||||||||||
| Deferred directors compensation |
8 | 11 | 8 | 3 | 1 | 8 | ||||||||||||||||||
| Accrued expenses and other liabilities |
70 | 81 | 113 | 46 | 35 | 51 | ||||||||||||||||||
| Accrued foreign cap gain tax |
— | 353 | — | — | — | — | ||||||||||||||||||
| Dividends and Distributions |
— | — | — | — | — | — | ||||||||||||||||||
| Total Liabilities |
1,356 | 99,989 | 6,774 | 111 | 446 | 54,288 | ||||||||||||||||||
| Net Assets |
$ | 339,039 | $ | 641,549 | $ | 378,327 | $ | 172,059 | $ | 102,938 | $ | 338,191 | ||||||||||||
| Components of Net Assets |
||||||||||||||||||||||||
| Shares of beneficial interest (unlimited number of shares authorized, $.001 par value per share) |
$ | 21 | $ | 61 | $ | 32 | $ | 15 | $ | 10 | $ | 22 | ||||||||||||
| Additional paid-in capital |
449,296 | 784,031 | 603,949 | 315,606 | 98,509 | 483,075 | ||||||||||||||||||
| Undistributed net investment income (loss) |
3,591 | 1,091 | (285 | ) | 2,173 | 212 | (1 | ) | ||||||||||||||||
| Accumulated net realized gain (loss) on investments |
(189,726 | ) | (263,006 | ) | (289,477 | ) | (165,821 | ) | (12,085 | ) | (224,891 | ) | ||||||||||||
| Accumulated net unrealized appreciation on investments |
75,857 | 119,372 | 64,108 | 20,086 | 16,292 | 79,986 | ||||||||||||||||||
| Net Assets, December 31, 2003 |
$ | 339,039 | $ | 641,549 | $ | 378,327 | $ | 172,059 | $ | 102,938 | $ | 338,191 | ||||||||||||
| Shares of common stock outstanding |
21,444 | 61,424 | 31,507 | 15,431 | 10,038 | 22,366 | ||||||||||||||||||
| Net asset value, offering and redemption price per share |
$ | 15.81 | $ | 10.44 | $ | 12.01 | $ | 11.15 | $ | 10.25 | $ | 15.12 | ||||||||||||
| (A) Investments at cost |
$ | 261,859 | $ | 379,988 | $ | 315,358 | $ | 139,050 | $ | 86,733 | $ | 307,082 | ||||||||||||
| (B) Foreign currency at cost |
$ | — | $ | 1,088 | $ | 398 | $ | — | $ | — | $ | — | ||||||||||||
| (C) Premiums Received for Written Options |
$ | — | $ | — | $ | — | $ | — | $ | — | $ | — | ||||||||||||
| (D) Securities Loaned at Value |
$ | — | $ | — | $ | — | $ | — | $ | — | $ | 51,197 | ||||||||||||
| (E) Proceeds received for investments sold short |
$ | — | $ | — | $ | — | $ | — | $ | — | $ | — | ||||||||||||
See Notes to Financial Statements.
252
Table of Contents
| Portfolio | |||||||||||||||||||||||||||
| AST DeAM |
AST Federated Aggressive Growth |
AST Goldman Sachs Small-Cap Value |
AST Gabelli |
AST DeAM Small-Cap Value |
AST Mid-Cap |
AST Mid-Cap |
AST Mid-Cap | ||||||||||||||||||||
| $ | 433,980 | $ | 186,903 | $ | 383,089 | $ | 793,333 | $ | 44,505 | $ | 195,109 | $ | 514,168 | $ | 1,225,229 | ||||||||||||
| 6,664 | — | 2,346 | 66,887 | 9,402 | 7,976 | — | — | ||||||||||||||||||||
| — | — | — | — | — | — | — | — | ||||||||||||||||||||
| — | — | — | — | — | — | — | — | ||||||||||||||||||||
| — | — | — | — | — | — | — | — | ||||||||||||||||||||
| — | 4,458 | 4,961 | 676 | — | — | — | 4,492 | ||||||||||||||||||||
| 123 | 17 | 333 | 486 | 53 | 97 | 62 | 690 | ||||||||||||||||||||
| — | 224 | 2 | 411 | — | 1,476 | 313 | 2 | ||||||||||||||||||||
| — | — | — | — | — | — | — | — | ||||||||||||||||||||
| 4 | 2 | 3 | 8 | — | 1 | 4 | 10 | ||||||||||||||||||||
| 440,771 | 191,604 | 390,734 | 861,801 | 53,960 | 204,659 | 514,547 | 1,230,423 | ||||||||||||||||||||
| — | — | — | — | — | — | — | — | ||||||||||||||||||||
| — | — | — | — | — | — | — | — | ||||||||||||||||||||
| — | — | — | — | — | — | — | — | ||||||||||||||||||||
| — | — | — | — | — | — | — | — | ||||||||||||||||||||
| — | — | — | — | — | — | — | — | ||||||||||||||||||||
| — | — | — | — | — | — | — | — | ||||||||||||||||||||
| 36,175 | — | 45,510 | 83,233 | 1,757 | 40,837 | 153,712 | 197,327 | ||||||||||||||||||||
| — | 3,930 | 840 | 1,656 | — | 3,206 | 226 | 4,368 | ||||||||||||||||||||
| 903 | — | 731 | 2,127 | 87 | — | 418 | 878 | ||||||||||||||||||||
| 88 | — | — | — | 114 | — | — | — | ||||||||||||||||||||
| 111 | 79 | 154 | 276 | 12 | 40 | 127 | 360 | ||||||||||||||||||||
| 6 | 3 | 5 | 11 | 1 | 2 | 5 | 14 | ||||||||||||||||||||
| 9 | 1 | 5 | 8 | — | 1 | 7 | 14 | ||||||||||||||||||||
| 49 | 26 | 47 | 74 | 9 | 24 | 42 | 88 | ||||||||||||||||||||
| — | — | — | — | — | — | — | — | ||||||||||||||||||||
| — | — | — | — | — | — | — | — | ||||||||||||||||||||
| 37,341 | 4,039 | 47,292 | 87,385 | 1,980 | 44,110 | 154,537 | 203,049 | ||||||||||||||||||||
| $ | 403,430 | $ | 187,565 | $ | 343,442 | $ | 774,416 | $ | 51,980 | $ | 160,549 | $ | 360,010 | $ | 1,027,374 | ||||||||||||
| $ | 53 | $ | 22 | $ | 19 | $ | 49 | $ | 5 | $ | 42 | $ | 29 | $ | 58 | ||||||||||||
| 645,560 | 147,424 | 272,705 | 647,987 | 44,788 | 224,983 | 684,319 | 830,497 | ||||||||||||||||||||
| 133 | (127 | ) | 1,233 | 491 | 148 | (1 | ) | (7 | ) | 1,176 | |||||||||||||||||
| (300,538 | ) | 2,807 | 1,410 | (9,647 | ) | 2,821 | (84,978 | ) | (394,307 | ) | 24,330 | ||||||||||||||||
| 58,222 | 37,439 | 68,075 | 135,536 | 4,218 | 20,503 | 69,976 | 171,313 | ||||||||||||||||||||
| $ | 403,430 | $ | 187,565 | $ | 343,442 | $ | 774,416 | $ | 51,980 | $ | 160,549 | $ | 360,010 | $ | 1,027,374 | ||||||||||||
| 52,877 | 21,775 | 18,957 | 49,314 | 4,683 | 42,360 | 29,370 | 57,706 | ||||||||||||||||||||
| $ | 7.63 | $ | 8.61 | $ | 18.12 | $ | 15.70 | $ | 11.10 | $ | 3.79 | $ | 12.26 | $ | 17.80 | ||||||||||||
| $ | 375,790 | $ | 149,464 | $ | 315,014 | $ | 657,797 | $ | 40,387 | $ | 174,605 | $ | 444,192 | $ | 1,053,916 | ||||||||||||
| $ | — | $ | — | $ | — | $ | — | $ | — | $ | — | $ | — | $ | — | ||||||||||||
| $ | — | $ | — | $ | — | $ | — | $ | — | $ | — | $ | — | $ | — | ||||||||||||
| $ | 34,443 | $ | — | $ | 43,591 | $ | 78,988 | $ | 1,629 | $ | 39,257 | $ | 148,818 | $ | 190,550 | ||||||||||||
| $ | — | $ | — | $ | — | $ | — | $ | — | $ | — | $ | — | $ | — | ||||||||||||
253
Table of Contents
American Skandia Trust
Statements of Assets and Liabilities (CONTINUED)
December 31, 2003
(Amounts in thousands, except per share amounts)
| Portfolio | ||||||||||||||||||||||||
| AST Alger All-Cap |
AST Gabelli |
AST T.Rowe Price Natural Resources |
AST Alliance |
AST MFS Growth |
AST Marsico |
|||||||||||||||||||
| Assets |
||||||||||||||||||||||||
| Investments in securities at value(A) |
||||||||||||||||||||||||
| including securities loaned at value(D) |
$ | 532,221 | $ | 224,178 | $ | 205,182 | $ | 266,533 | $ | 681,253 | $ | 2,089,472 | ||||||||||||
| Cash |
— | — | 3,048 | — | — | — | ||||||||||||||||||
| Foreign currency at value(B) |
— | — | — | — | — | — | ||||||||||||||||||
| Unrealized appreciation on foreign currency exchange contracts |
— | — | — | — | — | — | ||||||||||||||||||
| Unrealized appreciation on swap agreements |
— | — | — | — | — | — | ||||||||||||||||||
| Receivable for: |
||||||||||||||||||||||||
| Securities sold |
4,730 | — | — | 3,298 | 27,378 | — | ||||||||||||||||||
| Dividends and interest |
143 | 215 | 237 | 162 | 399 | 656 | ||||||||||||||||||
| Fund shares sold |
— | 1,288 | 140 | — | — | 6,115 | ||||||||||||||||||
| Futures variation margin |
— | — | — | — | — | — | ||||||||||||||||||
| Other assets |
5 | 2 | 1 | 3 | 6 | 17 | ||||||||||||||||||
| Total Assets |
537,099 | 225,683 | 208,608 | 269,996 | 709,036 | 2,096,260 | ||||||||||||||||||
| Liabilities |
||||||||||||||||||||||||
| Payable to custodian |
— | — | — | 4 | 362 | — | ||||||||||||||||||
| Unrealized depreciation on foreign currency exchange contracts |
— | — | — | — | — | 268 | ||||||||||||||||||
| Written options outstanding, at value(C) |
— | — | — | — | — | — | ||||||||||||||||||
| Investments sold short, at value(E) |
— | — | — | — | — | — | ||||||||||||||||||
| Unrealized depreciation on swap agreements |
— | — | — | — | — | — | ||||||||||||||||||
| Payable from Loans |
— | — | — | — | 3,000 | — | ||||||||||||||||||
| Payable on return of securities lent |
132,412 | 43,714 | 29,659 | 29,927 | 102,133 | 384,644 | ||||||||||||||||||
| Payable for: |
||||||||||||||||||||||||
| Securities purchased |
1,576 | — | 7,997 | 2,851 | 9,508 | — | ||||||||||||||||||
| Fund shares redeemed |
397 | 2 | — | 34 | 450 | — | ||||||||||||||||||
| Futures variation margin |
— | — | — | — | — | — | ||||||||||||||||||
| Advisory fees |
147 | 62 | 64 | 85 | 192 | 597 | ||||||||||||||||||
| Shareholder servicing fees |
6 | 3 | 2 | 3 | 8 | 23 | ||||||||||||||||||
| Deferred directors compensation |
7 | 2 | 3 | 6 | 9 | 23 | ||||||||||||||||||
| Accrued expenses and other liabilities |
49 | 26 | 23 | 30 | 67 | 124 | ||||||||||||||||||
| Accrued foreign cap gain tax |
— | — | — | — | — | — | ||||||||||||||||||
| Dividends and Distributions |
— | — | — | — | — | — | ||||||||||||||||||
| Total Liabilities |
134,594 | 43,809 | 37,748 | 32,940 | 115,729 | 385,679 | ||||||||||||||||||
| Net Assets |
$ | 402,505 | $ | 181,874 | $ | 170,860 | $ | 237,056 | $ | 593,307 | $ | 1,710,581 | ||||||||||||
| Components of Net Assets |
||||||||||||||||||||||||
| Shares of beneficial interest (unlimited number of shares authorized, $.001 par value per share) |
$ | 81 | $ | 17 | $ | 10 | $ | 28 | $ | 81 | $ | 111 | ||||||||||||
| Additional paid-in capital |
779,925 | 189,995 | 149,125 | 486,697 | 1,038,769 | 1,676,962 | ||||||||||||||||||
| Undistributed net investment income (loss) |
(7 | ) | 511 | 1,878 | (5 | ) | (21 | ) | (413 | ) | ||||||||||||||
| Accumulated net realized gain (loss) on investments |
(437,663 | ) | (31,801 | ) | (4,831 | ) | (276,452 | ) | (483,979 | ) | (349,997 | ) | ||||||||||||
| Accumulated net unrealized appreciation on investments |
60,169 | 23,152 | 24,678 | 26,788 | 38,457 | 383,918 | ||||||||||||||||||
| Net Assets, December 31, 2003 |
$ | 402,505 | $ | 181,874 | $ | 170,860 | $ | 237,056 | $ | 593,307 | $ | 1,710,581 | ||||||||||||
| Shares of common stock outstanding |
81,174 | 17,395 | 9,792 | 28,393 | 81,291 | 110,785 | ||||||||||||||||||
| Net asset value, offering and redemption price per share |
$ | 4.96 | $ | 10.46 | $ | 17.45 | $ | 8.35 | $ | 7.30 | $ | 15.44 | ||||||||||||
| (A) Investments at cost |
$ | 472,052 | $ | 201,027 | $ | 180,504 | $ | 239,745 | $ | 642,798 | $ | 1,705,293 | ||||||||||||
| (B) Foreign currency at cost |
$ | — | $ | — | $ | — | $ | — | $ | — | $ | — | ||||||||||||
| (C) Premiums Received for Written Options |
$ | — | $ | — | $ | — | $ | — | $ | — | $ | — | ||||||||||||
| (D) Securities Loaned at Value |
$ | 127,444 | $ | 41,968 | $ | 28,344 | $ | 29,127 | $ | 99,036 | $ | 371,137 | ||||||||||||
| (E) Proceeds received for investments sold short |
$ | — | $ | — | $ | — | $ | — | $ | — | $ | — | ||||||||||||
See Notes to Financial Statements.
254
Table of Contents
| Portfolio | ||||||||||||||||||||||||||||
| AST Goldman |
AST DeAM |
AST DeAM |
AST Alliance/ Bernstein Growth + Value |
AST Sanford Bernstein Core Value |
AST Cohen & |
AST Sanford |
AST American Century Income & Growth |
|||||||||||||||||||||
| $ | 1,349,637 | $ | 107,639 | $ | 155,208 | $ | 82,133 | $ | 243,024 | $ | 303,196 | $ | 616,252 | $ | 411,773 | |||||||||||||
| 7,149 | 7,583 | 9,232 | — | — | — | — | 58 | |||||||||||||||||||||
| — | — | — | — | — | — | — | — | |||||||||||||||||||||
| — | — | — | — | — | — | — | — | |||||||||||||||||||||
| — | — | — | — | — | — | — | — | |||||||||||||||||||||
| — | — | — | 33 | — | — | 1,749 | — | |||||||||||||||||||||
| 644 | 68 | 141 | 73 | 314 | 1,849 | 699 | 468 | |||||||||||||||||||||
| 4 | — | 208 | 194 | 152 | — | 37 | — | |||||||||||||||||||||
| — | 20 | 25 | — | — | — | — | 7 | |||||||||||||||||||||
| 15 | 1 | 2 | 1 | 2 | 4 | 6 | 3 | |||||||||||||||||||||
| 1,357,449 | 115,311 | 164,816 | 82,434 | 243,492 | 305,049 | 618,743 | 412,309 | |||||||||||||||||||||
| — | — | — | — | — | — | — | — | |||||||||||||||||||||
| — | — | — | — | — | — | — | — | |||||||||||||||||||||
| — | — | — | — | — | — | — | — | |||||||||||||||||||||
| — | — | — | — | — | — | — | — | |||||||||||||||||||||
| — | — | — | — | — | — | — | — | |||||||||||||||||||||
| — | — | — | — | — | — | — | — | |||||||||||||||||||||
| 204,389 | 17,568 | 30,946 | 18,523 | 46,226 | 14,571 | 73,368 | 105,592 | |||||||||||||||||||||
| — | — | — | 41 | 4,575 | 34 | 2,802 | — | |||||||||||||||||||||
| 1,403 | 240 | — | — | 69 | 816 | 952 | 761 | |||||||||||||||||||||
| — | — | — | — | — | — | — | — | |||||||||||||||||||||
| 297 | 16 | 28 | 23 | 43 | 84 | 72 | 98 | |||||||||||||||||||||
| 16 | 1 | 2 | 1 | 3 | 4 | 7 | 4 | |||||||||||||||||||||
| 42 | 1 | 1 | — | 2 | 3 | 9 | 6 | |||||||||||||||||||||
| 102 | 14 | 18 | 9 | 27 | 35 | 41 | 38 | |||||||||||||||||||||
| — | — | — | — | — | — | — | — | |||||||||||||||||||||
| — | — | — | — | — | — | — | — | |||||||||||||||||||||
| 206,249 | 17,840 | 30,995 | 18,597 | 50,945 | 15,547 | 77,251 | 106,499 | |||||||||||||||||||||
| $ | 1,151,200 | $ | 97,471 | $ | 133,821 | $ | 63,837 | $ | 192,547 | $ | 289,502 | $ | 541,492 | $ | 305,810 | |||||||||||||
| $ | 55 | $ | 10 | $ | 14 | $ | 7 | $ | 17 | $ | 22 | $ | 49 | $ | 26 | |||||||||||||
| 1,967,904 | 98,366 | 138,900 | 62,267 | 155,919 | 228,199 | 662,084 | 381,161 | |||||||||||||||||||||
| (42 | ) | (1 | ) | 1,235 | 229 | 3,000 | 12,322 | 4,634 | 3,640 | |||||||||||||||||||
| (965,114 | ) | (9,916 | ) | (22,041 | ) | (5,678 | ) | 2,883 | 2,455 | (162,962 | ) | (113,343 | ) | |||||||||||||||
| 148,397 | 9,012 | 15,713 | 7,012 | 30,728 | 46,504 | 37,687 | 34,326 | |||||||||||||||||||||
| $ | 1,151,200 | $ | 97,471 | $ | 133,821 | $ | 63,837 | $ | 192,547 | $ | 289,502 | $ | 541,492 | $ | 305,810 | |||||||||||||
| 55,210 | 9,528 | 13,585 | 7,031 | 17,242 | 22,423 | 49,308 | 25,581 | |||||||||||||||||||||
| $ | 20.85 | $ | 10.23 | $ | 9.85 | $ | 9.08 | $ | 11.17 | $ | 12.91 | $ | 10.98 | $ | 11.95 | |||||||||||||
| $ | 1,201,239 | $ | 98,811 | $ | 139,705 | $ | 75,122 | $ | 212,295 | $ | 256,692 | $ | 578,565 | $ | 377,514 | |||||||||||||
| $ | — | $ | — | $ | — | $ | — | $ | — | $ | — | $ | — | $ | — | |||||||||||||
| $ | — | $ | — | $ | — | $ | — | $ | — | $ | — | $ | — | $ | — | |||||||||||||
| $ | 198,291 | $ | 17,070 | $ | 29,927 | $ | 17,997 | $ | 44,693 | $ | 13,952 | $ | 71,119 | $ | 101,700 | |||||||||||||
| $ | — | $ | — | $ | — | $ | — | $ | — | $ | — | $ | — | $ | — | |||||||||||||
255
Table of Contents
American Skandia Trust
Statements of Assets and Liabilities (CONTINUED)
December 31, 2003
(Amounts in thousands, except per share amounts)
| Portfolio | ||||||||||||||||||||||||
| AST Alliance Income |
AST MFS Income |
AST INVESCO Capital Income |
AST DeAM |
AST American Century Strategic Balanced |
AST Asset |
|||||||||||||||||||
| Assets |
||||||||||||||||||||||||
| Investments in securities at value(A) |
||||||||||||||||||||||||
| Including Securities Loaned at Value(D) |
$ | 2,110,181 | $ | 132,033 | $ | 670,158 | $ | 262,433 | $ | 302,979 | $ | 414,884 | ||||||||||||
| Cash |
— | — | — | 2,587 | 207 | 19 | ||||||||||||||||||
| Foreign currency at value(B) |
— | — | — | — | — | — | ||||||||||||||||||
| Unrealized appreciation on foreign currency exchange contracts |
— | 1 | — | — | — | — | ||||||||||||||||||
| Unrealized appreciation on swap agreements |
— | — | — | — | — | — | ||||||||||||||||||
| Receivable for: |
||||||||||||||||||||||||
| Securities sold |
1,786 | 78 | 1,074 | — | 2,535 | 196 | ||||||||||||||||||
| Dividends and interest |
2,401 | 148 | 1,490 | 1 | 973 | 1,805 | ||||||||||||||||||
| Fund shares sold |
6,841 | — | 1 | — | — | 162 | ||||||||||||||||||
| Futures variation margin |
— | — | — | — | 5 | — | ||||||||||||||||||
| Other assets |
18 | 1 | 7 | 2 | 3 | 4 | ||||||||||||||||||
| Total Assets |
2,121,227 | 132,261 | 672,730 | 265,023 | 306,702 | 417,070 | ||||||||||||||||||
| Liabilities |
||||||||||||||||||||||||
| Payable to custodian |
— | — | — | — | — | — | ||||||||||||||||||
| Unrealized depreciation on foreign currency exchange contracts |
— | — | — | — | — | — | ||||||||||||||||||
| Written options outstanding, at value(C) |
— | — | — | — | — | — | ||||||||||||||||||
| Investments sold short, at value(E) |
— | — | — | — | — | — | ||||||||||||||||||
| Unrealized depreciation on swap agreements |
— | — | — | — | — | — | ||||||||||||||||||
| Payable from Loans |
— | — | — | — | — | — | ||||||||||||||||||
| Payable on return of securities lent |
283,346 | 18,814 | 29,848 | — | 53,120 | 42,991 | ||||||||||||||||||
| Payable for: |
||||||||||||||||||||||||
| Securities purchased |
729 | 3,147 | 1,947 | — | 17,091 | 13,753 | ||||||||||||||||||
| Fund shares redeemed |
— | 901 | 530 | 181 | 546 | — | ||||||||||||||||||
| Futures variation margin |
— | — | — | — | — | — | ||||||||||||||||||
| Advisory fees |
448 | 35 | 200 | 12 | 81 | 93 | ||||||||||||||||||
| Shareholder servicing fees |
25 | 2 | 9 | — | 3 | 5 | ||||||||||||||||||
| Deferred directors compensation |
25 | 1 | 15 | 7 | 3 | 5 | ||||||||||||||||||
| Accrued expenses and other liabilities |
125 | 22 | 69 | 15 | 40 | 71 | ||||||||||||||||||
| Accrued foreign cap gain tax |
— | — | — | — | — | — | ||||||||||||||||||
| Dividends and Distributions |
— | — | — | — | — | — | ||||||||||||||||||
| Total Liabilities |
284,698 | 22,922 | 32,618 | 215 | 70,884 | 56,918 | ||||||||||||||||||
| Net Assets |
$ | 1,836,529 | $ | 109,339 | $ | 640,112 | $ | 264,808 | $ | 235,818 | $ | 360,152 | ||||||||||||
| Components of Net Assets |
||||||||||||||||||||||||
| Shares of beneficial interest (unlimited number of shares authorized, $.001 par value per share) |
$ | 104 | $ | 13 | $ | 44 | $ | 24 | $ | 18 | $ | 23 | ||||||||||||
| Additional paid-in capital |
1,953,317 | 135,654 | 688,339 | 353,112 | 239,941 | 330,024 | ||||||||||||||||||
| Undistributed net investment income (loss) |
13,691 | 401 | 9,247 | 2,860 | 3,254 | 5,501 | ||||||||||||||||||
| Accumulated net realized gain (loss) on investments |
(336,638 | ) | (37,704 | ) | (102,919 | ) | (105,555 | ) | (27,642 | ) | (17,696 | ) | ||||||||||||
| Accumulated net unrealized appreciation on investments |
206,055 | 10,975 | 45,401 | 14,367 | 20,247 | 42,300 | ||||||||||||||||||
| Net Assets, December 31, 2003 |
$ | 1,836,529 | $ | 109,339 | $ | 640,112 | $ | 264,808 | $ | 235,818 | $ | 360,152 | ||||||||||||
| Shares of common stock outstanding |
103,723 | 12,996 | 43,675 | 23,916 | 18,250 | 23,449 | ||||||||||||||||||
| Net asset value, offering and redemption price per share |
$ | 17.71 | $ | 8.41 | $ | 14.66 | $ | 11.07 | $ | 12.92 | $ | 15.36 | ||||||||||||
| (A) Investments at cost |
$ | 1,904,126 | $ | 121,061 | $ | 624,757 | $ | 248,066 | $ | 282,811 | $ | 372,594 | ||||||||||||
| (B) Foreign currency at cost |
$ | — | $ | — | $ | — | $ | — | $ | — | $ | — | ||||||||||||
| (C) Premiums Received for Written Options |
$ | — | $ | — | $ | — | $ | — | $ | — | $ | — | ||||||||||||
| (D) Securities Loaned at Value |
$ | 275,666 | $ | 18,213 | $ | 29,118 | $ | — | $ | 51,500 | $ | 41,770 | ||||||||||||
| (E) Proceeds received for investments sold short |
— | — | — | — | — | — | ||||||||||||||||||
See Notes to Financial Statements.
256
Table of Contents
| Portfolio | |||||||||||||||||||||
| AST T. Rowe |
AST Federated High Yield |
AST Lord |
AST DeAM |
AST PIMCO Total Return Bond |
AST PIMCO Bond |
AST Money Market |
|||||||||||||||
| $ | 213,057 | $ | 854,909 | $ | 330,842 | $ | 120,624 | $ | 2,124,599 | $ | 909,749 | $ | 1,670,869 | ||||||||
| 18,853 | — | 67,771 | 11,088 | — | 4,178 | — | |||||||||||||||
| 417 | — | — | — | 4,369 | 1,637 | — | |||||||||||||||
| 675 | — | — | — | 84 | — | — | |||||||||||||||
| — | — | — | — | 906 | 73 | — | |||||||||||||||
| 4,558 | — | — | 303 | 11,537 | 102,143 | — | |||||||||||||||
| 3,795 | 17,936 | 3,835 | 896 | 10,829 | 4,143 | 1,908 | |||||||||||||||
| 699 | 36 | 1,216 | 3 | 2,271 | 136 | 89,654 | |||||||||||||||
| 364 | — | — | — | 685 | — | — | |||||||||||||||
| 3 | 10 | 3 | 2 | 30 | 15 | 35 | |||||||||||||||
| 242,421 | 872,891 | 403,667 | 132,916 | 2,155,310 | 1,022,074 | 1,762,466 | |||||||||||||||
| — | — | — | — | — | — | — | |||||||||||||||
| 1,113 | — | — | — | 233 | 32 | — | |||||||||||||||
| — | — | — | — | 7,782 | 832 | — | |||||||||||||||
| — | — | — | — | 11,536 | — | — | |||||||||||||||
| — | — | — | — | 245 | 858 | — | |||||||||||||||
| — | — | — | — | — | — | — | |||||||||||||||
| — | — | 27,092 | 7,729 | — | — | — | |||||||||||||||
| 11,536 | — | 30,064 | 9,253 | 25,679 | 13,447 | — | |||||||||||||||
| — | 4,098 | — | — | 1,197 | 614 | — | |||||||||||||||
| — | — | — | — | — | — | — | |||||||||||||||
| 80 | 173 | 59 | 29 | 484 | 236 | 140 | |||||||||||||||
| 3 | 13 | 4 | 2 | 29 | 14 | 23 | |||||||||||||||
| 3 | 11 | 2 | 1 | 33 | 15 | 45 | |||||||||||||||
| 56 | 85 | 34 | 20 | 180 | 102 | 140 | |||||||||||||||
| — | — | — | — | — | — | — | |||||||||||||||
| — | — | — | — | — | — | 1 | |||||||||||||||
| 12,791 | 4,380 | 57,255 | 17,034 | 47,398 | 16,150 | 349 | |||||||||||||||
| $ | 229,630 | $ | 868,511 | $ | 346,412 | $ | 115,882 | $ | 2,107,912 | $ | 1,005,924 | $ | 1,762,117 | ||||||||
| $ | 19 | $ | 99 | $ | 30 | $ | 11 | $ | 176 | $ | 88 | $ | 1,762 | ||||||||
| 194,001 | 993,258 | 317,774 | 107,570 | 1,978,105 | 954,184 | 1,760,373 | |||||||||||||||
| 14,586 | 58,029 | 12,612 | 4,310 | 85,295 | 29,739 | (18 | ) | ||||||||||||||
| 4,139 | (208,749 | ) | 1,179 | 2,608 | 6,701 | 9,982 | — | ||||||||||||||
| 16,885 | 25,874 | 14,817 | 1,383 | 37,635 | 11,931 | — | |||||||||||||||
| $ | 229,630 | $ | 868,511 | $ | 346,412 | $ | 115,882 | $ | 2,107,912 | $ | 1,005,924 | $ | 1,762,117 | ||||||||
| 18,972 | 99,083 | 30,292 | 10,973 | 175,749 | 88,449 | 1,762,159 | |||||||||||||||
| $ | 12.10 | $ | 8.77 | $ | 11.44 | $ | 10.56 | $ | 11.99 | $ | 11.37 | $ | 1.00 | ||||||||
| $ | 195,933 | $ | 829,034 | $ | 316,025 | $ | 119,241 | $ | 2,096,499 | $ | 898,303 | $ | 1,670,869 | ||||||||
| $ | 410 | $ | — | $ | — | $ | — | $ | 4,220 | $ | 1,609 | $ | — | ||||||||
| $ | — | $ | — | $ | — | $ | — | $ | 8,097 | $ | 929 | $ | — | ||||||||
| $ | — | $ | — | $ | 26,473 | $ | 7,586 | $ | — | $ | — | $ | — | ||||||||
| $ | — | $ | — | $ | — | $ | — | $ | 11,537 | $ | — | $ | — | ||||||||
257
Table of Contents
American Skandia Trust
Statements of OPERATIONS
For the Year Ended December 31, 2003
(Amounts in thousands)
| Portfolio | ||||||||||||||||||||||||
| AST Strong International Equity |
AST William Blair International Growth |
AST American Century International Growth |
AST DeAM International Equity |
AST MFS Global Equity |
AST PBHG Small-Cap Growth |
|||||||||||||||||||
| Investment Income |
||||||||||||||||||||||||
| Interest |
$ | 188 | $ | 236 | $ | — | $ | 78 | $ | 28 | $ | 6 | ||||||||||||
| Dividends |
8,190 | 6,347 | 7,579 | 3,586 | 1,356 | 1,222 | ||||||||||||||||||
| Security Lending |
— | — | — | — | — | 144 | ||||||||||||||||||
| Foreign taxes withheld |
(853 | ) | (678 | ) | (883 | ) | (350 | ) | (108 | ) | (2 | ) | ||||||||||||
| Total Investment Income |
7,525 | 5,905 | 6,696 | 3,314 | 1,276 | 1,370 | ||||||||||||||||||
| Expenses |
||||||||||||||||||||||||
| Investment advisory fees |
3,098 | 3,710 | 3,456 | 1,414 | 741 | 2,545 | ||||||||||||||||||
| Shareholder servicing fees |
351 | 371 | 345 | 141 | 74 | 283 | ||||||||||||||||||
| Administration and accounting fees |
290 | 297 | 287 | 141 | 100 | 250 | ||||||||||||||||||
| Custodian fees |
133 | 127 | 341 | 49 | 97 | 73 | ||||||||||||||||||
| Distribution fees |
72 | 401 | — | — | — | 203 | ||||||||||||||||||
| Audit and legal fees |
22 | 22 | 21 | 8 | 5 | 16 | ||||||||||||||||||
| Trustees’ fees |
12 | 13 | 14 | 8 | 6 | 10 | ||||||||||||||||||
| Interest expenses |
— | 4 | 6 | — | — | 2 | ||||||||||||||||||
| Miscellaneous expenses |
20 | 21 | 25 | 39 | 13 | 16 | ||||||||||||||||||
| Total Expenses |
3,998 | 4,966 | 4,495 | 1,800 | 1,036 | 3,398 | ||||||||||||||||||
| Less: Advisory fee waivers and expense reimbursements |
— | (371 | ) | — | (212 | ) | — | — | ||||||||||||||||
| Less: Fees paid indirectly |
(72 | ) | (401 | ) | — | — | — | (203 | ) | |||||||||||||||
| Net Expenses |
3,926 | 4,194 | 4,495 | 1,588 | 1,036 | 3,195 | ||||||||||||||||||
| Net Investment Income (Loss) |
3,599 | 1,711 | 2,201 | 1,726 | 240 | (1,825 | ) | |||||||||||||||||
| Realized and Unrealized Gain (Loss) on Investments |
||||||||||||||||||||||||
| Net realized gain (loss) on: |
||||||||||||||||||||||||
| Securities transactions |
(8,428 | ) | 12,696 | 11,823 | 5,216 | (708 | ) | 18,186 | ||||||||||||||||
| Foreign currency transactions |
(3 | ) | (671 | ) | (228 | ) | 1,091 | (26 | ) | — | ||||||||||||||
| Futures transactions |
— | — | — | (262 | ) | — | — | |||||||||||||||||
| Written option transactions |
— | — | — | — | — | — | ||||||||||||||||||
| Swap agreement transactions |
— | — | — | — | — | — | ||||||||||||||||||
| Net realized gain (loss) |
(8,431 | ) | 12,025 | 11,595 | 6,045 | (734 | ) | 18,186 | ||||||||||||||||
| Net change in unrealized appreciation (depreciation) on: |
||||||||||||||||||||||||
| Securities |
103,580 | 119,463 | 65,348 | 34,740 | 19,982 | 85,576 | ||||||||||||||||||
| Futures contracts |
— | — | — | 527 | — | — | ||||||||||||||||||
| Written option contracts |
— | — | — | — | — | — | ||||||||||||||||||
| Swap Agreements |
— | — | — | — | — | — | ||||||||||||||||||
| Foreign currencies translation |
17 | (14 | ) | 24 | 84 | 3 | — | |||||||||||||||||
| Unrealized foreign cap gain tax on appreciated securities |
— | (353 | ) | — | — | — | — | |||||||||||||||||
| Net change in unrealized appreciation (depreciation) |
103,597 | 119,096 | 65,372 | 35,351 | 19,985 | 85,576 | ||||||||||||||||||
| Net gain on investments |
95,166 | 131,121 | 76,967 | 41,396 | 19,251 | 103,762 | ||||||||||||||||||
| Net Increase in Net Assets Resulting from Operations |
$ | 98,765 | $ | 132,832 | $ | 79,168 | $ | 43,122 | $ | 19,491 | $ | 101,937 | ||||||||||||
See Notes to Financial Statements.
258
Table of Contents
| Portfolio | ||||||||||||||||||||||||||||||
| AST DeAM Small-Cap Growth |
AST Federated Aggressive Growth |
AST Goldman Sachs Small-Cap Value |
AST Gabelli Small-Cap Value |
AST DeAM Small-Cap Value |
AST Goldman Sachs Mid-Cap Growth |
AST Neuberger Berman Mid-Cap Growth |
AST Neuberger Berman Mid-Cap Value |
|||||||||||||||||||||||
| $ | 56 | $ | 53 | $ | 26 | $ | 179 | $ | 30 | $ | 13 | $ | 1 | $ | 38 | |||||||||||||||
| 2,541 | 184 | 4,696 | 6,053 | 402 | 516 | 789 | 9,736 | |||||||||||||||||||||||
| 206 | — | 54 | 93 | 2 | 35 | 89 | 122 | |||||||||||||||||||||||
| (7 | ) | (3 | ) | (7 | ) | (10 | ) | — | — | (9 | ) | (47 | ) | |||||||||||||||||
| 2,796 | 234 | 4,769 | 6,315 | 434 | 564 | 870 | 9,849 | |||||||||||||||||||||||
| 3,215 | 950 | 2,869 | 5,024 | 233 | 933 | 2,809 | 7,270 | |||||||||||||||||||||||
| 339 | 100 | 302 | 558 | 24 | 93 | 312 | 808 | |||||||||||||||||||||||
| 283 | 100 | 261 | 361 | 39 | 93 | 267 | 416 | |||||||||||||||||||||||
| 68 | 45 | 74 | 87 | 22 | 29 | 30 | 81 | |||||||||||||||||||||||
| — | — | 257 | 5 | — | 148 | 193 | 635 | |||||||||||||||||||||||
| 17 | 7 | 15 | 34 | 2 | 6 | 20 | 52 | |||||||||||||||||||||||
| 15 | 5 | 12 | 18 | 4 | 6 | 11 | 25 | |||||||||||||||||||||||
| — | 5 | — | 6 | — | — | — | — | |||||||||||||||||||||||
| 18 | 12 | 18 | 29 | 10 | 4 | 4 | 15 | |||||||||||||||||||||||
| 3,955 | 1,224 | 3,808 | 6,122 | 334 | 1,312 | 3,646 | 9,302 | |||||||||||||||||||||||
| (508 | ) | — | — | — | (52 | ) | (93 | ) | — | — | ||||||||||||||||||||
| — | — | (257 | ) | (5 | ) | — | (148 | ) | (193 | ) | (635 | ) | ||||||||||||||||||
| 3,447 | 1,224 | 3,551 | 6,117 | 282 | 1,071 | 3,453 | 8,667 | |||||||||||||||||||||||
| (651 | ) | (990 | ) | 1,218 | 198 | 152 | (507 | ) | (2,583 | ) | 1,182 | |||||||||||||||||||
| 48,068 | 13,182 | 14,465 | 6,056 | 2,806 | 5,797 | 21,579 | 49,679 | |||||||||||||||||||||||
| — | (12 | ) | — | — | — | — | — | — | ||||||||||||||||||||||
| 3,117 | — | — | — | 2,160 | — | — | — | |||||||||||||||||||||||
| — | — | — | — | — | — | — | — | |||||||||||||||||||||||
| — | — | — | — | — | — | — | — | |||||||||||||||||||||||
| 51,185 | 13,170 | 14,465 | 6,056 | 4,966 | 5,797 | 21,579 | 49,679 | |||||||||||||||||||||||
| 79,832 | 40,159 | 87,538 | 170,461 | 4,199 | 21,374 | 62,915 | 206,834 | |||||||||||||||||||||||
| 88 | — | — | — | 157 | — | — | — | |||||||||||||||||||||||
| — | — | — | — | — | — | — | — | |||||||||||||||||||||||
| — | — | — | — | — | — | — | — | |||||||||||||||||||||||
| — | — | — | — | — | — | — | — | |||||||||||||||||||||||
| — | — | — | — | — | — | — | — | |||||||||||||||||||||||
| 79,920 | 40,159 | 87,538 | 170,461 | 4,356 | 21,374 | 62,915 | 206,834 | |||||||||||||||||||||||
| 131,105 | 53,329 | 102,003 | 176,517 | 9,322 | 27,171 | 84,494 | 256,513 | |||||||||||||||||||||||
| $ | 130,454 | $ | 52,339 | $ | 103,221 | $ | 176,715 | $ | 9,474 | $ | 26,664 | $ | 81,911 | $ | 257,695 | |||||||||||||||
259
Table of Contents
American Skandia Trust
Statements of OPERATIONS (CONTINUED)
For the Year Ended December 31, 2003
(Amounts in thousands)
| Portfolio | ||||||||||||||||||||||||
AST Alger All-Cap Growth |
AST Gabelli All-Cap Value |
AST T. Rowe Price Natural Resources |
AST Alliance Growth |
AST MFS Growth |
AST Marsico Capital Growth |
|||||||||||||||||||
| Investment Income |
||||||||||||||||||||||||
| Interest |
$ | 96 | $ | 10 | $ | 110 | $ | — | $ | 167 | $ | 1,064 | ||||||||||||
| Dividends |
2,115 | 1,995 | 2,123 | 2,281 | 4,810 | 9,697 | ||||||||||||||||||
| Security Lending |
68 | 34 | 23 | 27 | 62 | 246 | ||||||||||||||||||
| Foreign taxes withheld |
(14 | ) | (11 | ) | (93 | ) | (22 | ) | (41 | ) | (123 | ) | ||||||||||||
| Total Investment Income |
2,265 | 2,028 | 2,163 | 2,286 | 4,998 | 10,884 | ||||||||||||||||||
| Expenses |
||||||||||||||||||||||||
| Investment advisory fees |
3,483 | 1,205 | 1,014 | 2,095 | 4,944 | 11,626 | ||||||||||||||||||
| Shareholder servicing fees |
367 | 127 | 113 | 233 | 549 | 1,292 | ||||||||||||||||||
| Administration and accounting fees |
299 | 127 | 113 | 220 | 361 | 484 | ||||||||||||||||||
| Custodian fees |
33 | 22 | 32 | 30 | 154 | 151 | ||||||||||||||||||
| Distribution fees |
901 | 6 | 18 | 97 | 773 | 599 | ||||||||||||||||||
| Audit and legal fees |
19 | 7 | 6 | 12 | 29 | 83 | ||||||||||||||||||
| Trustees’ fees |
13 | 6 | 7 | 10 | 19 | 37 | ||||||||||||||||||
| Interest expenses |
3 | 5 | 1 | 3 | — | 11 | ||||||||||||||||||
| Miscellaneous expenses |
3 | 16 | 9 | 10 | 24 | 26 | ||||||||||||||||||
| Total Expenses |
5,121 | 1,521 | 1,313 | 2,710 | 6,853 | 14,309 | ||||||||||||||||||
| Less: Advisory fee waivers and expense reimbursements |
— | — | — | — | — | (147 | ) | |||||||||||||||||
| Less: Fees paid indirectly |
(901 | ) | (6 | ) | (18 | ) | (97 | ) | (773 | ) | (599 | ) | ||||||||||||
| Net Expenses |
4,220 | 1,515 | 1,295 | 2,613 | 6,080 | 13,563 | ||||||||||||||||||
| Net Investment Income (Loss) |
(1,955 | ) | 513 | 868 | (327 | ) | (1,082 | ) | (2,679 | ) | ||||||||||||||
| Realized and Unrealized Gain (Loss) on Investments |
||||||||||||||||||||||||
| Net realized gain (loss) on: |
||||||||||||||||||||||||
| Securities transactions |
32,944 | (5,063 | ) | 393 | (17,958 | ) | 60,324 | 13,330 | ||||||||||||||||
| Foreign currency transactions |
— | (2 | ) | (13 | ) | — | (7 | ) | (506 | ) | ||||||||||||||
| Futures transactions |
— | — | — | — | — | — | ||||||||||||||||||
| Written option transactions |
— | — | — | — | — | — | ||||||||||||||||||
| Swap agreement transactions |
— | — | — | — | — | — | ||||||||||||||||||
| Net realized gain (loss) |
32,944 | (5,065 | ) | 380 | (17,958 | ) | 60,317 | 12,824 | ||||||||||||||||
| Net change in unrealized appreciation (depreciation) on: |
||||||||||||||||||||||||
| Securities |
76,563 | 43,075 | 32,881 | 68,385 | 52,295 | 346,172 | ||||||||||||||||||
| Futures contracts |
— | — | — | — | — | — | ||||||||||||||||||
| Written option contracts |
— | — | — | — | — | — | ||||||||||||||||||
| Swap Agreements |
— | — | — | — | — | — | ||||||||||||||||||
| Foreign currencies translation |
— | — | — | — | 2 | (261 | ) | |||||||||||||||||
| Unrealized foreign cap gain tax on appreciated securities |
— | — | — | — | — | — | ||||||||||||||||||
| Net change in unrealized appreciation (depreciation) |
76,563 | 43,075 | 32,881 | 68,385 | 52,297 | 345,911 | ||||||||||||||||||
| Net gain on investments |
109,507 | 38,010 | 33,261 | 50,427 | 112,614 | 358,735 | ||||||||||||||||||
| Net Increase in Net Assets Resulting from |
$ | 107,552 | $ | 38,523 | $ | 34,129 | $ | 50,100 | $ | 111,532 | $ | 356,056 | ||||||||||||
See Notes to Financial Statements.
260
Table of Contents
| Portfolio | ||||||||||||||||||||||||||||||
| AST Goldman Sachs Concentrated Growth |
AST DeAM Large-Cap Growth |
AST DeAM Large-Cap Value |
AST Alliance/ Bernstein Growth + Value |
AST Sanford Bernstein Core Value |
AST Cohen & Steers Realty |
AST Sanford Bernstein Managed Index 500 |
AST American Century Income & Growth |
|||||||||||||||||||||||
| $ | 41 | $ | 19 | $ | 24 | $ | — | $ | — | $ | — | $ | — | $ | 36 | |||||||||||||||
| 8,097 | 719 | 2,323 | 744 | 4,881 | 14,210 | 8,201 | 6,188 | |||||||||||||||||||||||
| 184 | 19 | 19 | 11 | 36 | 24 | 48 | 46 | |||||||||||||||||||||||
| — | — | — | (1 | ) | (3 | ) | (24 | ) | (2 | ) | — | |||||||||||||||||||
| 8,322 | 757 | 2,366 | 754 | 4,914 | 14,210 | 8,247 | 6,270 | |||||||||||||||||||||||
| 10,103 | 677 | 949 | 411 | 1,450 | 2,135 | 2,736 | 1,916 | |||||||||||||||||||||||
| 1,123 | 80 | 112 | 46 | 193 | 214 | 456 | 256 | |||||||||||||||||||||||
| 467 | 80 | 112 | 47 | 187 | 204 | 167 | 233 | |||||||||||||||||||||||
| 152 | 22 | 23 | 7 | 29 | 35 | 80 | 77 | |||||||||||||||||||||||
| 641 | — | — | — | 294 | 27 | 281 | — | |||||||||||||||||||||||
| 66 | 4 | 6 | 3 | 10 | 12 | 28 | 15 | |||||||||||||||||||||||
| 36 | 6 | 6 | 5 | 9 | 8 | 15 | 10 | |||||||||||||||||||||||
| 26 | — | — | — | 24 | — | 10 | 8 | |||||||||||||||||||||||
| 53 | 8 | 9 | 6 | 12 | 7 | 42 | 15 | |||||||||||||||||||||||
| 12,667 | 877 | 1,217 | 525 | 2,208 | 2,642 | 3,815 | 2,530 | |||||||||||||||||||||||
| (761 | ) | (88 | ) | (112 | ) | — | — | — | — | — | ||||||||||||||||||||
| (641 | ) | — | — | — | (294 | ) | (27 | ) | (281 | ) | — | |||||||||||||||||||
| 11,265 | 789 | 1,105 | 525 | 1,914 | 2,615 | 3,534 | 2,530 | |||||||||||||||||||||||
| (2,943 | ) | (32 | ) | 1,261 | 229 | 3,000 | 11,595 | 4,713 | 3,740 | |||||||||||||||||||||
| (16,368 | ) | 4,448 | 1,892 | (859 | ) | 5,741 | 4,077 | (22,904 | ) | (14,942 | ) | |||||||||||||||||||
| — | — | — | — | — | — | — | — | |||||||||||||||||||||||
| — | 701 | 727 | — | — | — | — | 232 | |||||||||||||||||||||||
| — | — | — | — | — | — | — | — | |||||||||||||||||||||||
| — | — | — | — | — | — | — | — | |||||||||||||||||||||||
| (16,368 | ) | 5,149 | 2,619 | (859 | ) | 5,741 | 4,077 | (22,904 | ) | (14,710 | ) | |||||||||||||||||||
| 267,349 | 16,909 | 22,471 | 11,295 | 41,119 | 53,525 | 129,068 | 74,364 | |||||||||||||||||||||||
| — | 235 | 292 | — | — | — | — | 119 | |||||||||||||||||||||||
| — | — | — | — | — | — | — | — | |||||||||||||||||||||||
| — | — | — | — | — | — | — | — | |||||||||||||||||||||||
| — | — | — | — | — | — | — | — | |||||||||||||||||||||||
| — | — | — | — | — | — | — | — | |||||||||||||||||||||||
| 267,349 | 17,144 | 22,763 | 11,295 | 41,119 | 53,525 | 129,068 | 74,483 | |||||||||||||||||||||||
| 250,981 | 22,293 | 25,382 | 10,436 | 46,860 | 57,602 | 106,164 | 59,773 | |||||||||||||||||||||||
| $ | 248,038 | $ | 22,261 | $ | 26,643 | $ | 10,665 | $ | 49,860 | $ | 69,197 | $ | 110,877 | $ | 63,513 | |||||||||||||||
261
Table of Contents
American Skandia Trust
Statements of Operations (CONTINUED)
For the Year Ended December 31, 2003
(Amounts in thousands)
| Portfolio | |||||||||||||||||||||||
| AST Alliance Growth and Income |
AST MFS Growth with Income |
AST INVESCO Capital Income |
AST DeAM Global Allocation |
AST American Century Strategic Balanced |
AST T. Rowe Price Asset Allocation |
||||||||||||||||||
| Investment Income |
|||||||||||||||||||||||
| Interest |
$ | 6 | $ | 28 | $ | 5,046 | $ | 14 | $ | 3,227 | $ | 4,756 | |||||||||||
| Dividends |
25,835 | 1,429 | 9,998 | 3,216 | 2,084 | 4,071 | |||||||||||||||||
| Security Lending |
137 | 12 | 58 | — | 45 | 36 | |||||||||||||||||
| Foreign taxes withheld |
(121 | ) | (13 | ) | (71 | ) | — | — | (147 | ) | |||||||||||||
| Total Investment Income |
25,857 | 1,456 | 15,031 | 3,230 | 5,356 | 8,716 | |||||||||||||||||
| Expenses |
|||||||||||||||||||||||
| Investment advisory fees |
10,173 | 795 | 4,631 | 266 | 1,696 | 2,500 | |||||||||||||||||
| Shareholder servicing fees |
1,356 | 88 | 617 | — | 200 | 294 | |||||||||||||||||
| Administration and accounting fees |
490 | 88 | 378 | 46 | 196 | 257 | |||||||||||||||||
| Custodian fees |
147 | 55 | 73 | 17 | 74 | 108 | |||||||||||||||||
| Distribution fees |
1,030 | — | 257 | — | — | — | |||||||||||||||||
| Audit and legal fees |
84 | 5 | 35 | 15 | 12 | 18 | |||||||||||||||||
| Trustees’ fees |
40 | 6 | 21 | 11 | 8 | 11 | |||||||||||||||||
| Interest expenses |
12 | 1 | 2 | — | — | — | |||||||||||||||||
| Miscellaneous expenses |
28 | 11 | 20 | 10 | 32 | 104 | |||||||||||||||||
| Total Expenses |
13,360 | 1,049 | 6,034 | 365 | 2,218 | 3,292 | |||||||||||||||||
| Less: Advisory fee waivers and expense reimbursements |
(178 | ) | — | — | — | — | — | ||||||||||||||||
| Less: Fees paid indirectly |
(1,030 | ) | — | (257 | ) | — | — | — | |||||||||||||||
| Net Expenses |
12,152 | 1,049 | 5,777 | 365 | 2,218 | 3,292 | |||||||||||||||||
| Net Investment Income (Loss) |
13,705 | 407 | 9,254 | 2,865 | 3,138 | 5,424 | |||||||||||||||||
| Realized and Unrealized Gain (Loss) on Investments |
|||||||||||||||||||||||
| Net realized gain (loss) on: |
|||||||||||||||||||||||
| Securities transactions |
6,271 | (1,284 | ) | 23,922 | (7,922 | ) | 1,301 | (2,752 | ) | ||||||||||||||
| Foreign currency transactions |
— | (5 | ) | — | — | 51 | (23 | ) | |||||||||||||||
| Futures transactions |
— | — | — | — | 363 | — | |||||||||||||||||
| Written option transactions |
— | — | — | — | — | — | |||||||||||||||||
| Swap agreement transactions |
— | — | — | — | — | — | |||||||||||||||||
| Net realized gain (loss) |
6,271 | (1,289 | ) | 23,922 | (7,922 | ) | 1,715 | (2,775 | ) | ||||||||||||||
| Net change in unrealized appreciation (depreciation) on: |
|||||||||||||||||||||||
| Securities |
360,636 | 18,512 | 77,110 | 51,800 | 29,732 | 61,788 | |||||||||||||||||
| Futures contracts |
— | — | — | — | 100 | — | |||||||||||||||||
| Written option contracts |
— | — | — | — | — | — | |||||||||||||||||
| Swap Agreements |
— | — | — | — | — | — | |||||||||||||||||
| Foreign currencies translation |
— | 3 | — | — | — | 3 | |||||||||||||||||
| Unrealized foreign cap gain tax on appreciated securities |
— | — | — | — | — | — | |||||||||||||||||
| Net change in unrealized appreciation (depreciation) |
360,636 | 18,515 | 77,110 | 51,800 | 29,832 | 61,791 | |||||||||||||||||
| Net gain on investments |
366,907 | 17,226 | 101,032 | 43,878 | 31,547 | 59,016 | |||||||||||||||||
| Net Increase in Net Assets Resulting from |
$ | 380,612 | $ | 17,633 | $ | 110,286 | $ | 46,743 | $ | 34,685 | $ | 64,440 | |||||||||||
See Notes to Financial Statements.
262
Table of Contents
| Portfolio | |||||||||||||||||||||||||
| AST T. Rowe Price Global Bond |
AST Federated High Yield |
AST Lord Abbett Bond- Debenture |
AST DeAM Bond |
AST PIMCO Total Return Bond |
AST PIMCO Limited Maturity Bond |
AST Money Market |
|||||||||||||||||||
| $ | 7,929 | $ | 64,298 | $ | 13,951 | $ | 4,990 | $ | 81,569 | $ | 31,404 | $ | 30,359 | ||||||||||||
| 2 | 902 | 678 | — | 297 | 149 | 3 | |||||||||||||||||||
| — | — | 47 | 7 | — | — | — | |||||||||||||||||||
| (4 | ) | — | — | — | — | — | — | ||||||||||||||||||
| 7,927 | 65,200 | 14,676 | 4,997 | 81,866 | 31,553 | 30,362 | |||||||||||||||||||
| 1,748 | 5,757 | 1,596 | 1,079 | 14,633 | 7,267 | 12,457 | |||||||||||||||||||
| 218 | 768 | 200 | 127 | 2,251 | 1,118 | 2,491 | |||||||||||||||||||
| 211 | 408 | 196 | 127 | 580 | 467 | 302 | |||||||||||||||||||
| 55 | 95 | 30 | 23 | 339 | 157 | 293 | |||||||||||||||||||
| — | — | — | — | — | — | — | |||||||||||||||||||
| 13 | 48 | 12 | 7 | 139 | 65 | 133 | |||||||||||||||||||
| 10 | 25 | 9 | 7 | 70 | 35 | 78 | |||||||||||||||||||
| 1 | 21 | 11 | — | — | 2 | — | |||||||||||||||||||
| 50 | 46 | 31 | 21 | 102 | 47 | 70 | |||||||||||||||||||
| 2,306 | 7,168 | 2,085 | 1,391 | 18,114 | 9,158 | 15,824 | |||||||||||||||||||
| — | — | — | (190 | ) | (626 | ) | — | (1,246 | ) | ||||||||||||||||
| — | — | — | — | — | — | — | |||||||||||||||||||
| 2,306 | 7,168 | 2,085 | 1,201 | 17,488 | 9,158 | 14,578 | |||||||||||||||||||
| 5,621 | 58,032 | 12,591 | 3,796 | 64,378 | 22,395 | 15,784 | |||||||||||||||||||
| 4,782 | (19,649 | ) | 5,071 | 3,125 | 29,224 | 12,319 | 1 | ||||||||||||||||||
| 9,046 | — | — | — | 2,807 | 1,712 | — | |||||||||||||||||||
| (339 | ) | — | — | — | 11,947 | 6,527 | — | ||||||||||||||||||
| (5 | ) | — | — | — | 8,053 | — | — | ||||||||||||||||||
| — | — | — | — | (8,289 | ) | 414 | — | ||||||||||||||||||
| 13,484 | (19,649 | ) | 5,071 | 3,125 | 43,742 | 20,972 | 1 | ||||||||||||||||||
| 6,628 | 108,668 | 16,562 | (2,046 | ) | 5,836 | (3,884 | ) | — | |||||||||||||||||
| 166 | — | — | — | (6,348 | ) | (2,319 | ) | — | |||||||||||||||||
| 30 | — | — | — | 3,126 | 97 | — | |||||||||||||||||||
| — | — | — | — | 3,154 | (1,262 | ) | — | ||||||||||||||||||
| (598 | ) | — | — | — | (130 | ) | 299 | — | |||||||||||||||||
| — | — | — | — | — | — | — | |||||||||||||||||||
| 6,226 | 108,668 | 16,562 | (2,046 | ) | 5,638 | (7,069 | ) | — | |||||||||||||||||
| 19,710 | 89,019 | 21,633 | 1,079 | 49,380 | 13,903 | 1 | |||||||||||||||||||
| $ | 25,331 | $ | 147,051 | $ | 34,224 | $ | 4,875 | $ | 113,758 | $ | 36,298 | $ | 15,785 | ||||||||||||
263
Table of Contents
American Skandia Trust
Statements of Changes in Net Assets
(Amounts in thousands)
| Portfolio | ||||||||||||||||
| AST Strong International Equity |
AST William Blair International Growth |
|||||||||||||||
| Year Ended December 31, 2003 |
Year Ended December 31, 2002 |
Year Ended December 31, 2003 |
Year Ended December 31, 2002 |
|||||||||||||
| From Operations |
||||||||||||||||
| Net investment income (loss) |
$ | 3,599 | $ | 3,158 | $ | 1,711 | $ | 1,776 | ||||||||
| Net realized gain (loss) on investments |
(8,431 | ) | (46,656 | ) | 12,025 | (162,815 | ) | |||||||||
| Net change in unrealized appreciation (depreciation) on investments |
103,597 | (29,826 | ) | 119,096 | 32,074 | |||||||||||
| Net Increase (Decrease) in Net Assets from Operations |
98,765 | (73,324 | ) | 132,832 | (128,965 | ) | ||||||||||
| Dividends and Distributions to Shareholders |
||||||||||||||||
| Dividends to shareholders from net investment income |
(2,688 | ) | (2,561 | ) | — | (18,118 | ) | |||||||||
| Distributions to shareholders from capital gains |
— | — | — | — | ||||||||||||
| Return of capital |
— | — | — | — | ||||||||||||
| Total Dividends and Distributions to Shareholders |
(2,688 | ) | (2,561 | ) | — | (18,118 | ) | |||||||||
| Capital Share Transactions |
||||||||||||||||
| Proceeds from shares sold |
265,111 | 439,655 | 332,531 | 32,772 | ||||||||||||
| Net asset value of shares issued in reinvestment of dividends and distributions |
2,688 | 2,561 | — | 18,118 | ||||||||||||
| Net asset value of shares issued in merger |
— | — | — | — | ||||||||||||
| Cost of shares redeemed |
(341,029 | ) | (494,410 | ) | (142,646 | ) | (172,352 | ) | ||||||||
| Increase (Decrease) in Net Assets from Capital Share Transactions |
(73,230 | ) | (52,194 | ) | 189,885 | (121,462 | ) | |||||||||
| Total Increase (Decrease) in Net Assets |
22,847 | (128,079 | ) | 322,717 | (268,545 | ) | ||||||||||
| Net Assets |
||||||||||||||||
| Beginning of Year |
316,192 | 444,271 | 318,832 | 587,377 | ||||||||||||
| End of Year(a) |
$ | 339,039 | $ | 316,192 | $ | 641,549 | $ | 318,832 | ||||||||
| (a) Includes Undistributed Net Investment Income of: |
$ | 3,591 | $ | — | $ | 1,091 | $ | 12,879 | ||||||||
| Shares Issued and Redeemed |
||||||||||||||||
| Shares sold |
20,500 | 32,826 | 35,496 | 4,092 | ||||||||||||
| Shares issued in reinvestment of dividends and distributions |
236 | 184 | — | 1,925 | ||||||||||||
| Shares issued in merger |
— | — | — | — | ||||||||||||
| Shares redeemed |
(25,177 | ) | (36,613 | ) | (16,834 | ) | (19,775 | ) | ||||||||
| Net Increase (Decrease) in Shares Outstanding |
(4,441 | ) | (3,603 | ) | 18,662 | (13,758 | ) | |||||||||
See Notes to Financial Statements.
264
Table of Contents
| Portfolio | ||||||||||||||||||||||
| AST American Century International Growth |
AST DeAM International Equity |
AST MFS Global Equity |
||||||||||||||||||||
| Year Ended December 31, 2003 |
Year Ended December 31, 2002 |
Year Ended December 31, 2003 |
Year Ended December 31, 2002 |
Year Ended December 31, 2003 |
Year Ended December 31, 2002 |
|||||||||||||||||
| $ | 2,201 | $ | 3,374 | $ | 1,726 | $ | 875 | $ | 240 | $ | 155 | |||||||||||
| 11,595 | (93,520 | ) | 6,045 | (15,170 | ) | (734 | ) | (5,759 | ) | |||||||||||||
| 65,372 | (6,360 | ) | 35,351 | (14,799 | ) | 19,985 | (3,827 | ) | ||||||||||||||
| 79,168 | (96,506 | ) | 43,122 | (29,094 | ) | 19,491 | (9,431 | ) | ||||||||||||||
| (5,697 | ) | — | (787 | ) | — | (122 | ) | (7 | ) | |||||||||||||
| — | — | — | — | — | — | |||||||||||||||||
| (474 | ) | — | — | — | — | — | ||||||||||||||||
| (6,171 | ) | — | (787 | ) | — | (122 | ) | (7 | ) | |||||||||||||
| 414,217 | 578,484 | 144,253 | 150,379 | 47,813 | 62,221 | |||||||||||||||||
| 6,171 | — | 787 | — | 122 | 7 | |||||||||||||||||
| — | 4,251 | — | — | — | — | |||||||||||||||||
| (489,056 | ) | (630,357 | ) | (144,320 | ) | (147,272 | ) | (24,533 | ) | (48,505 | ) | |||||||||||
| (68,668 | ) | (47,622 | ) | 720 | 3,107 | 23,402 | 13,723 | |||||||||||||||
| 4,329 | (144,128 | ) | 43,055 | (25,987 | ) | 42,771 | 4,285 | |||||||||||||||
| 373,998 | 518,126 | 129,004 | 154,991 | 60,167 | 55,882 | |||||||||||||||||
| $ | 378,327 | $ | 373,998 | $ | 172,059 | $ | 129,004 | $ | 102,938 | $ | 60,167 | |||||||||||
| $ | — | $ | 2,725 | $ | 2,441 | $ | 40 | $ | 212 | $ | 120 | |||||||||||
| 41,898 | 53,404 | 16,125 | 15,649 | 5,417 | 7,272 | |||||||||||||||||
| 700 | — | 103 | — | 16 | 1 | |||||||||||||||||
| — | 350 | — | — | — | — | |||||||||||||||||
| (49,262 | ) | (58,170 | ) | (16,185 | ) | (15,602 | ) | (2,841 | ) | (5,897 | ) | |||||||||||
| (6,664 | ) | (4,416 | ) | 43 | 47 | 2,592 | 1,376 | |||||||||||||||
265
Table of Contents
American Skandia Trust
Statements of Changes in Net Assets (CONTINUED)
(Amounts in thousands)
| Portfolio | ||||||||||||||||
| AST PBHG Small-Cap Growth |
AST DeAM Small-Cap Growth |
|||||||||||||||
| Year Ended December 31, 2003 |
Year Ended December 31, 2002 |
Year Ended December 31, 2003 |
Year Ended December 31, 2002 |
|||||||||||||
| From Operations |
||||||||||||||||
| Net investment income (loss) |
$ | (1,825 | ) | $ | (2,583 | ) | $ | (651 | ) | $ | (486 | ) | ||||
| Net realized gain (loss) on investments |
18,186 | (81,726 | ) | 51,185 | (101,504 | ) | ||||||||||
| Net change in unrealized appreciation (depreciation) on investments |
85,576 | (69,335 | ) | 79,920 | (33,577 | ) | ||||||||||
| Net Increase (Decrease) in Net Assets from Operations |
101,937 | (153,644 | ) | 130,454 | (135,567 | ) | ||||||||||
| Dividends and Distributions to Shareholders |
||||||||||||||||
| Dividends to shareholders from net investment income |
— | — | — | — | ||||||||||||
| Distributions to shareholders from capital gains |
— | — | — | — | ||||||||||||
| Total Dividends and Distributions to Shareholders |
— | — | — | — | ||||||||||||
| Capital Share Transactions |
||||||||||||||||
| Proceeds from shares sold |
315,266 | 644,310 | 168,312 | 896,258 | ||||||||||||
| Net asset value of shares issued in reinvestment of dividends and distributions |
— | — | — | — | ||||||||||||
| Net asset value of shares issued in merger |
— | — | — | — | ||||||||||||
| Cost of shares redeemed |
(333,038 | ) | (731,540 | ) | (188,633 | ) | (1,004,718 | ) | ||||||||
| Increase (Decrease) in Net Assets from Capital Share Transactions |
(17,772 | ) | (87,230 | ) | (20,321 | ) | (108,460 | ) | ||||||||
| Total Increase (Decrease) in Net Assets |
84,165 | (240,874 | ) | 110,133 | (244,027 | ) | ||||||||||
| Net Assets |
||||||||||||||||
| Beginning of Year |
254,026 | 494,900 | 293,297 | 537,324 | ||||||||||||
| End of Year(a) |
$ | 338,191 | $ | 254,026 | $ | 403,430 | $ | 293,297 | ||||||||
| (a) Includes Undistributed Net Investment Income of: |
$ | — | $ | — | $ | 133 | $ | — | ||||||||
| Shares Issued and Redeemed |
||||||||||||||||
| Shares sold |
25,415 | 52,000 | 27,139 | 139,297 | ||||||||||||
| Shares issued in reinvestment of dividends and distributions |
— | — | — | — | ||||||||||||
| Shares issued in merger |
— | — | — | — | ||||||||||||
| Shares redeemed |
(27,462 | ) | (58,780 | ) | (31,039 | ) | (158,925 | ) | ||||||||
| Net Increase (Decrease) in Shares Outstanding |
(2,047 | ) | (6,780 | ) | (3,900 | ) | (19,628 | ) | ||||||||
See Notes to Financial Statements.
266
Table of Contents
| Portfolio | ||||||||||||||||||||||
| AST Federated Aggressive Growth |
AST Goldman Sachs Small-Cap Value |
AST Gabelli Small-Cap Value |
||||||||||||||||||||
| Year Ended December 31, 2003 |
Year Ended December 31, 2002 |
Year Ended December 31, 2003 |
Year Ended December 31, 2002 |
Year Ended December 31, 2003 |
Year Ended December 31, 2002 |
|||||||||||||||||
| $ | (990 | ) | $ | (282 | ) | $ | 1,218 | $ | 2,938 | $ | 198 | $ | 1,050 | |||||||||
| 13,170 | (5,855 | ) | 14,465 | (10,779 | ) | 6,056 | (13,488 | ) | ||||||||||||||
| 40,159 | (5,430 | ) | 87,538 | (41,829 | ) | 170,461 | (42,426 | ) | ||||||||||||||
| 52,339 | (11,567 | ) | 103,221 | (49,670 | ) | 176,715 | (54,864 | ) | ||||||||||||||
| — | — | (2,448 | ) | (1,944 | ) | (998 | ) | (2,310 | ) | |||||||||||||
| — | (234 | ) | — | (43,887 | ) | — | (8,534 | ) | ||||||||||||||
| — | (234 | ) | (2,448 | ) | (45,831 | ) | (998 | ) | (10,844 | ) | ||||||||||||
| 223,260 | 94,763 | 24,078 | 450,476 | 296,682 | 628,656 | |||||||||||||||||
| — | 234 | 2,448 | 45,831 | 998 | 10,844 | |||||||||||||||||
| — | — | — | — | — | — | |||||||||||||||||
| (127,106 | ) | (93,613 | ) | (98,958 | ) | (518,216 | ) | (200,051 | ) | (611,201 | ) | |||||||||||
| 96,154 | 1,384 | (72,432 | ) | (21,909 | ) | 97,629 | 28,299 | |||||||||||||||
| 148,493 | (10,417 | ) | 28,341 | (117,410 | ) | 273,346 | (37,409 | ) | ||||||||||||||
| 39,072 | 49,489 | 315,101 | 432,511 | 501,070 | 538,479 | |||||||||||||||||
| $ | 187,565 | $ | 39,072 | $ | 343,442 | $ | 315,101 | $ | 774,416 | $ | 501,070 | |||||||||||
| $ | — | $ | — | $ | 1,233 | $ | 2,725 | $ | 491 | $ | 1,420 | |||||||||||
| 32,404 | 15,801 | 1,550 | 29,753 | 22,212 | 50,486 | |||||||||||||||||
| — | 37 | 200 | 3,216 | 91 | 857 | |||||||||||||||||
| — | — | — | — | — | — | |||||||||||||||||
| (18,312 | ) | (15,010 | ) | (7,105 | ) | (36,463 | ) | (16,208 | ) | (49,318 | ) | |||||||||||
| 14,092 | 828 | (5,355 | ) | (3,494 | ) | 6,095 | 2,025 | |||||||||||||||
267
Table of Contents
American Skandia Trust
Statements of Changes in Net Assets (CONTINUED)
(Amounts in thousands)
| Portfolio | ||||||||||||||||
| AST DeAM Small-Cap Value(2) |
AST Goldman Sachs Mid-Cap Growth |
|||||||||||||||
| Year Ended December 31, 2003 |
Year Ended December 31, 2002 |
Year Ended December 31, 2003 |
Year Ended December 31, |
|||||||||||||
| From Operations |
||||||||||||||||
| Net investment income (loss) |
$ | 152 | $ | 27 | $ | (507 | ) | $ | (387 | ) | ||||||
| Net realized gain (loss) on investments |
4,966 | (2,156 | ) | 5,797 | (24,937 | ) | ||||||||||
| Net change in unrealized appreciation (depreciation) on investments |
4,356 | (138 | ) | 21,374 | 3,843 | |||||||||||
| Net Increase (Decrease) in Net Assets from Operations |
9,474 | (2,267 | ) | 26,664 | (21,481 | ) | ||||||||||
| Dividends and Distributions to Shareholders |
||||||||||||||||
| Dividends to shareholders from net investment income |
(20 | ) | — | — | — | |||||||||||
| Distributions to shareholders from capital gains |
— | — | — | — | ||||||||||||
| Total Dividends and Distributions to Shareholders |
(20 | ) | — | — | — | |||||||||||
| Capital Share Transactions |
||||||||||||||||
| Proceeds from shares sold |
66,691 | 38,578 | 87,874 | 61,224 | ||||||||||||
| Net asset value of shares issued in reinvestment of dividends and distributions |
20 | — | — | — | ||||||||||||
| Net asset value of shares issued in merger |
— | — | — | — | ||||||||||||
| Cost of shares redeemed |
(37,604 | ) | (22,892 | ) | (15,362 | ) | (49,409 | ) | ||||||||
| Increase (Decrease) in Net Assets from Capital Share Transactions |
29,107 | 15,686 | 72,512 | 11,815 | ||||||||||||
| Total Increase (Decrease) in Net Assets |
38,561 | 13,419 | 99,176 | (9,666 | ) | |||||||||||
| Net Assets |
||||||||||||||||
| Beginning of Year |
13,419 | — | 61,373 | 71,039 | ||||||||||||
| End of Year(a) |
$ | 51,980 | $ | 13,419 | $ | 160,549 | $ | 61,373 | ||||||||
| (a) Includes Undistributed Net Investment Income of: |
$ | 148 | $ | 25 | $ | — | $ | — | ||||||||
| Shares Issued and Redeemed |
||||||||||||||||
| Shares sold |
6,932 | 4,512 | 26,125 | 18,370 | ||||||||||||
| Shares issued in reinvestment of dividends and distributions |
3 | — | — | — | ||||||||||||
| Shares issued in merger |
— | — | — | — | ||||||||||||
| Shares redeemed |
(3,983 | ) | (2,781 | ) | (5,080 | ) | (14,928 | ) | ||||||||
| Net Increase (Decrease) in Shares Outstanding |
2,952 | 1,731 | 21,045 | 3,442 | ||||||||||||
(2) Commenced operations on May 1, 2002.
See Notes to Financial Statements.
268
Table of Contents
| Portfolio | ||||||||||||||||||||||
| AST Neuberger Berman Mid-Cap Growth |
AST Neuberger Berman Mid-Cap Value |
AST Alger All-Cap Growth |
||||||||||||||||||||
| Year Ended December 31, |
Year Ended December 31, 2002 |
Year Ended December 31, 2003 |
Year Ended December 31, 2002 |
Year Ended December 31, 2003 |
Year Ended December 31, 2002 |
|||||||||||||||||
| $ | (2,583 | ) | $ | (3,218 | ) | $ | 1,182 | $ | 1,894 | $ | (1,955 | ) | $ | (3,411 | ) | |||||||
| 21,579 | (138,989 | ) | 49,679 | (19,244 | ) | 32,944 | (172,189 | ) | ||||||||||||||
| 62,915 | (10,992 | ) | 206,834 | (95,009 | ) | 76,563 | (55,589 | ) | ||||||||||||||
| 81,911 | (153,199 | ) | 257,695 | (112,359 | ) | 107,552 | (231,189 | ) | ||||||||||||||
| — | — | (1,718 | ) | (4,849 | ) | — | — | |||||||||||||||
| — | — | — | (45,689 | ) | — | — | ||||||||||||||||
| — | — | (1,718 | ) | (50,538 | ) | — | — | |||||||||||||||
| 223,431 | 552,946 | 177,071 | 531,525 | 149,225 | 94,410 | |||||||||||||||||
| — | — | 1,718 | 50,538 | — | — | |||||||||||||||||
| — | — | — | — | — | — | |||||||||||||||||
| (232,790 | ) | (630,869 | ) | (168,365 | ) | (661,227 | ) | (177,558 | ) | (282,994 | ) | |||||||||||
| (9,359 | ) | (77,923 | ) | 10,424 | (79,164 | ) | (28,333 | ) | (188,584 | ) | ||||||||||||
| 72,552 | (231,122 | ) | 266,401 | (242,061 | ) | 79,219 | (419,773 | ) | ||||||||||||||
| 287,458 | 518,580 | 760,973 | 1,003,034 | 323,286 | 743,059 | |||||||||||||||||
| $ | 360,010 | $ | 287,458 | $ | 1,027,374 | $ | 760,973 | $ | 402,505 | $ | 323,286 | |||||||||||
| $ | — | $ | — | $ | 1,176 | $ | 1,176 | $ | — | $ | — | |||||||||||
| 21,029 | 48,835 | 11,611 | 36,590 | 35,494 | 20,702 | |||||||||||||||||
| — | — | 136 | 3,399 | — | — | |||||||||||||||||
| — | — | — | — | — | — | |||||||||||||||||
| (22,258 | ) | (56,239 | ) | (12,191 | ) | (46,925 | ) | (42,692 | ) | (62,769 | ) | |||||||||||
| (1,229 | ) | (7,404 | ) | (444 | ) | (6,936 | ) | (7,198 | ) | (42,067 | ) | |||||||||||
269
Table of Contents
American Skandia Trust
Statements of Changes in Net Assets (CONTINUED)
(Amounts in thousands)
| Portfolio | ||||||||||||||||
| AST Gabelli All-Cap Value(3) |
AST T. Rowe Price Natural Resources |
|||||||||||||||
| Year Ended December 31, 2003 |
Year Ended December 31, 2002 |
Year Ended December 31, 2003 |
Year Ended December 31, 2002 |
|||||||||||||
| From Operations |
||||||||||||||||
| Net investment income (loss) |
$ | 513 | $ | 880 | $ | 868 | $ | 796 | ||||||||
| Net realized gain (loss) on investments |
(5,065 | ) | (21,890 | ) | 380 | 1,512 | ||||||||||
| Net change in unrealized appreciation (depreciation) on investments |
43,075 | (16,645 | ) | 32,881 | (14,607 | ) | ||||||||||
| Net Increase (Decrease) in Net Assets from Operations |
38,523 | (37,655 | ) | 34,129 | (12,299 | ) | ||||||||||
| Dividends and Distributions to Shareholders |
||||||||||||||||
| Dividends to shareholders from net investment income |
(880 | ) | (977 | ) | (1,611 | ) | (2,339 | ) | ||||||||
| Distributions to shareholders from capital gains |
— | — | (2,249 | ) | (5,243 | ) | ||||||||||
| Total Dividends and Distributions to Shareholders |
(880 | ) | (977 | ) | (3,860 | ) | (7,582 | ) | ||||||||
| Capital Share Transactions |
||||||||||||||||
| Proceeds from shares sold |
175,384 | 105,599 | 63,090 | 156,021 | ||||||||||||
| Net asset value of shares issued in reinvestment of dividends and distributions |
880 | 977 | 3,860 | 7,582 | ||||||||||||
| Net asset value of shares issued in merger |
— | 4,155 | — | — | ||||||||||||
| Cost of shares redeemed |
(145,590 | ) | (117,428 | ) | (49,045 | ) | (156,586 | ) | ||||||||
| Increase (Decrease) in Net Assets from Capital Share Transactions |
30,674 | (6,697 | ) | 17,905 | 7,017 | |||||||||||
| Total Increase (Decrease) in Net Assets |
68,317 | (45,329 | ) | 48,174 | (12,864 | ) | ||||||||||
| Net Assets |
||||||||||||||||
| Beginning of Year |
113,557 | 158,886 | 122,686 | 135,550 | ||||||||||||
| End of Year(a) |
$ | 181,874 | $ | 113,557 | $ | 170,860 | $ | 122,686 | ||||||||
| (a) Includes Undistributed Net Investment Income of: |
$ | 511 | $ | 880 | $ | 1,878 | $ | 359 | ||||||||
| Shares Issued and Redeemed |
||||||||||||||||
| Shares sold |
19,789 | 12,017 | 4,117 | 10,655 | ||||||||||||
| Shares issued in reinvestment of dividends and distributions |
119 | 103 | 305 | 516 | ||||||||||||
| Shares issued in merger |
— | 426 | — | — | ||||||||||||
| Shares redeemed |
(17,129 | ) | (14,039 | ) | (3,675 | ) | (11,091 | ) | ||||||||
| Net Increase (Decrease) in Shares Outstanding |
2,779 | (1,493 | ) | 747 | 80 | |||||||||||
(3) Acquired AST Kinetics Internet on May 3, 2002.
See Notes to Financial Statements.
270
Table of Contents
| Portfolio | ||||||||||||||||||||||
| AST Alliance Growth |
AST MFS Growth |
AST Marsico Capital Growth |
||||||||||||||||||||
| Year Ended December 31, 2003 |
Year Ended December 31, 2002 |
Year Ended December 31, 2003 |
Year Ended December 31, 2002 |
Year Ended December 31, 2003 |
Year Ended December 31, 2002 |
|||||||||||||||||
| $ | (327 | ) | $ | (1,059 | ) | $ | (1,082 | ) | $ | (2,033 | ) | $ | (2,679 | ) | $ | (3,450 | ) | |||||
| (17,958 | ) | (98,412 | ) | 60,317 | (191,140 | ) | 12,824 | (105,228 | ) | |||||||||||||
| 68,385 | (36,148 | ) | 52,297 | (58,810 | ) | 345,911 | (92,282 | ) | ||||||||||||||
| 50,100 | (135,619 | ) | 111,532 | (251,983 | ) | 356,056 | (200,960 | ) | ||||||||||||||
| — | — | — | — | — | — | |||||||||||||||||
| — | — | — | — | — | — | |||||||||||||||||
| — | — | — | — | — | — | |||||||||||||||||
| 82,965 | 241,193 | 90,882 | 237,845 | 585,871 | 856,350 | |||||||||||||||||
| — | — | — | — | — | — | |||||||||||||||||
| — | — | — | — | — | — | |||||||||||||||||
| (136,499 | ) | (318,068 | ) | (135,192 | ) | (434,174 | ) | (312,447 | ) | (826,716 | ) | |||||||||||
| (53,534 | ) | (76,875 | ) | (44,310 | ) | (196,329 | ) | 273,424 | 29,634 | |||||||||||||
| (3,434 | ) | (212,494 | ) | 67,222 | (448,312 | ) | 629,480 | (171,326 | ) | |||||||||||||
| 240,490 | 452,984 | 526,085 | 974,397 | 1,081,101 | 1,252,427 | |||||||||||||||||
| $ | 237,056 | $ | 240,490 | $ | 593,307 | $ | 526,085 | $ | 1,710,581 | $ | 1,081,101 | |||||||||||
| $ | — | $ | — | $ | — | $ | — | $ | — | $ | — | |||||||||||
| 11,735 | 30,274 | 13,931 | 33,492 | 43,296 | 63,902 | |||||||||||||||||
| — | — | — | — | — | — | |||||||||||||||||
| — | — | — | — | — | — | |||||||||||||||||
| (18,959 | ) | (40,983 | ) | (21,236 | ) | (62,727 | ) | (24,719 | ) | (61,914 | ) | |||||||||||
| (7,224 | ) | (10,709 | ) | (7,305 | ) | (29,235 | ) | 18,577 | 1,988 | |||||||||||||
271
Table of Contents
American Skandia Trust
Statements of Changes in Net Assets (CONTINUED)
(Amounts in thousands)
| Portfolio | ||||||||||||||||
| AST Goldman Sachs Concentrated Growth |
AST DeAM Large-Cap Growth(2) |
|||||||||||||||
| Year Ended December 31, |
Year Ended December 31, |
Year Ended December 31, 2003 |
Year Ended December 31, |
|||||||||||||
| From Operations |
||||||||||||||||
| Net investment income (loss) |
$ | (2,943 | ) | $ | 3,828 | $ | (32 | ) | $ | 36 | ||||||
| Net realized gain (loss) on investments |
(16,368 | ) | (327,562 | ) | 5,149 | (15,065 | ) | |||||||||
| Net change in unrealized appreciation (depreciation) on investments |
267,349 | (338,158 | ) | 17,144 | (8,132 | ) | ||||||||||
| Net Increase (Decrease) in Net Assets from Operations |
248,038 | (661,892 | ) | 22,261 | (23,161 | ) | ||||||||||
| Dividends and Distributions to Shareholders |
||||||||||||||||
| Dividends to shareholders from net investment income |
(3,837 | ) | (13,673 | ) | (36 | ) | — | |||||||||
| Distributions to shareholders from capital gains |
— | — | — | — | ||||||||||||
| Total Dividends and Distributions to Shareholders |
(3,837 | ) | (13,673 | ) | (36 | ) | — | |||||||||
| Capital Share Transactions |
||||||||||||||||
| Proceeds from shares sold |
185,939 | 332,030 | 31,765 | 111,209 | ||||||||||||
| Net asset value of shares issued in reinvestment of dividends and distributions |
3,837 | 13,673 | 36 | — | ||||||||||||
| Net asset value of shares issued in merger |
— | — | — | — | ||||||||||||
| Cost of shares redeemed |
(430,389 | ) | (975,258 | ) | (33,229 | ) | (11,374 | ) | ||||||||
| Increase (Decrease) in Net Assets from Capital Share Transactions |
(240,613 | ) | (629,555 | ) | (1,428 | ) | 99,835 | |||||||||
| Total Increase (Decrease) in Net Assets |
3,588 | (1,305,120 | ) | 20,797 | 76,674 | |||||||||||
| Net Assets |
||||||||||||||||
| Beginning of Year |
1,147,612 | 2,452,732 | 76,674 | — | ||||||||||||
| End of Year(a) |
$ | 1,151,200 | $ | 1,147,612 | $ | 97,471 | $ | 76,674 | ||||||||
| (a) Includes Undistributed Net Investment Income of: |
$ | — | $ | 3,486 | $ | — | $ | 36 | ||||||||
| Shares Issued and Redeemed |
||||||||||||||||
| Shares sold |
10,352 | 17,052 | 3,491 | 11,311 | ||||||||||||
| Shares issued in reinvestment of dividends and distributions |
247 | 636 | 5 | — | ||||||||||||
| Shares issued in merger |
— | — | — | — | ||||||||||||
| Shares redeemed |
(24,061 | ) | (51,343 | ) | (3,874 | ) | (1,405 | ) | ||||||||
| Net Increase (Decrease) in Shares Outstanding |
(13,462 | ) | (33,655 | ) | (378 | ) | 9,906 | |||||||||
(2) Commenced operations on May 1, 2002.
See Notes to Financial Statements.
272
Table of Contents
| Portfolio | ||||||||||||||||||||||
| AST DeAM Large-Cap Value |
AST Alliance/Bernstein Growth + Value |
AST Sanford Bernstein Core Value |
||||||||||||||||||||
| Year Ended December 31, 2003 |
Year Ended December 31, 2002 |
Year Ended December 31, 2003 |
Year Ended December 31, 2002 |
Year Ended December 31, 2003 |
Year Ended December 31, 2002 |
|||||||||||||||||
| $ | 1,261 | $ | 921 | $ | 229 | $ | 202 | $ | 3,000 | $ | 1,345 | |||||||||||
| 2,619 | (20,465 | ) | (859 | ) | (4,288 | ) | 5,741 | (2,326 | ) | |||||||||||||
| 22,763 | (7,711 | ) | 11,295 | (6,160 | ) | 41,119 | (11,566 | ) | ||||||||||||||
| 26,643 | (27,255 | ) | 10,665 | (10,246 | ) | 49,860 | (12,547 | ) | ||||||||||||||
| (899 | ) | (162 | ) | (202 | ) | (39 | ) | (1,345 | ) | (154 | ) | |||||||||||
| — | — | — | (160 | ) | — | — | ||||||||||||||||
| (899 | ) | (162 | ) | (202 | ) | (199 | ) | (1,345 | ) | (154 | ) | |||||||||||
| 31,356 | 162,049 | 49,406 | 36,054 | 171,734 | 231,272 | |||||||||||||||||
| 899 | 162 | 202 | 199 | 1,345 | 154 | |||||||||||||||||
| — | — | — | — | — | — | |||||||||||||||||
| (34,172 | ) | (70,157 | ) | (28,299 | ) | (27,750 | ) | (228,223 | ) | (63,649 | ) | |||||||||||
| (1,917 | ) | 92,054 | 21,309 | 8,503 | (55,144 | ) | 167,777 | |||||||||||||||
| 23,827 | 64,637 | 31,772 | (1,942 | ) | (6,629 | ) | 155,076 | |||||||||||||||
| 109,994 | 45,357 | 32,065 | 34,007 | 199,176 | 44,100 | |||||||||||||||||
| $ | 133,821 | $ | 109,994 | $ | 63,837 | $ | 32,065 | $ | 192,547 | $ | 199,176 | |||||||||||
| $ | 1,235 | $ | 905 | $ | 229 | $ | 202 | $ | 3,000 | $ | 1,345 | |||||||||||
| 3,647 | 17,259 | 6,109 | 4,380 | 18,419 | 25,297 | |||||||||||||||||
| 121 | 17 | 29 | 22 | 163 | 15 | |||||||||||||||||
| — | — | — | — | — | — | |||||||||||||||||
| (4,200 | ) | (8,135 | ) | (3,530 | ) | (3,480 | ) | (24,050 | ) | (6,950 | ) | |||||||||||
| (432 | ) | 9,141 | 2,608 | 922 | (5,468 | ) | 18,362 | |||||||||||||||
273
Table of Contents
American Skandia Trust
Statements of Changes in Net Assets (CONTINUED)
(Amounts in thousands)
| Portfolio | ||||||||||||||||
| AST Cohen & Steers Realty |
AST Sanford Bernstein Managed Index 500 |
|||||||||||||||
| Year Ended December 31, |
Year Ended December 31, |
Year Ended December 31, 2003 |
Year Ended December 31, 2002 |
|||||||||||||
| From Operations |
||||||||||||||||
| Net investment income (loss) |
$ | 11,595 | $ | 9,569 | $ | 4,713 | $ | 5,477 | ||||||||
| Net realized gain (loss) on investments |
4,077 | 1,585 | (22,904 | ) | (68,866 | ) | ||||||||||
| Net change in unrealized appreciation (depreciation) on investments |
53,525 | (13,242 | ) | 129,068 | (68,076 | ) | ||||||||||
| Net Increase (Decrease) in Net Assets from Operations |
69,197 | (2,088 | ) | 110,877 | (131,465 | ) | ||||||||||
| Dividends and Distributions to Shareholders |
||||||||||||||||
| Dividends to shareholders from net investment income |
(6,936 | ) | (4,940 | ) | (5,460 | ) | (5,999 | ) | ||||||||
| Distributions to shareholders from capital gains |
(4,038 | ) | — | — | — | |||||||||||
| Total Dividends and Distributions to Shareholders |
(10,974 | ) | (4,940 | ) | (5,460 | ) | (5,999 | ) | ||||||||
| Capital Share Transactions |
||||||||||||||||
| Proceeds from shares sold |
125,403 | 203,643 | 356,927 | 479,306 | ||||||||||||
| Net asset value of shares issued in reinvestment of dividends and distributions |
10,974 | 4,940 | 5,460 | 5,999 | ||||||||||||
| Net asset value of shares issued in merger |
— | — | — | — | ||||||||||||
| Cost of shares redeemed |
(82,618 | ) | (163,666 | ) | (367,481 | ) | (530,035 | ) | ||||||||
| Increase (Decrease) in Net Assets from Capital Share Transactions |
53,759 | 44,917 | (5,094 | ) | (44,730 | ) | ||||||||||
| Total Increase (Decrease) in Net Assets |
111,982 | 37,889 | 100,323 | (182,194 | ) | |||||||||||
| Net Assets |
||||||||||||||||
| Beginning of Year |
177,520 | 139,631 | 441,169 | 623,363 | ||||||||||||
| End of Year(a) |
$ | 289,502 | $ | 177,520 | $ | 541,492 | $ | 441,169 | ||||||||
| (a) Includes Undistributed Net Investment Income of: |
$ | 12,322 | $ | 10,001 | $ | 4,634 | $ | 5,462 | ||||||||
| Shares Issued and Redeemed |
||||||||||||||||
| Shares sold |
11,468 | 19,473 | 37,790 | 49,475 | ||||||||||||
| Shares issued in reinvestment of dividends and distributions |
1,194 | 495 | 661 | 559 | ||||||||||||
| Shares issued in merger |
— | — | — | — | ||||||||||||
| Shares redeemed |
(7,907 | ) | (16,108 | ) | (39,585 | ) | (55,566 | ) | ||||||||
| Net Increase (Decrease) in Shares Outstanding |
4,755 | 3,860 | (1,134 | ) | (5,532 | ) | ||||||||||
See Notes to Financial Statements.
274
Table of Contents
| Portfolio | ||||||||||||||||||||||
| AST American Century Income & Growth |
AST Alliance Growth and Income |
AST MFS Growth with Income |
||||||||||||||||||||
| Year Ended December 31, 2003 |
Year Ended December 31, 2002 |
Year Ended December 31, 2003 |
Year Ended December 31, 2002 |
Year Ended December 31, 2003 |
Year Ended December 31, 2002 |
|||||||||||||||||
| $ | 3,740 | $ | 3,261 | $ | 13,705 | $ | 15,218 | $ | 407 | $ | 336 | |||||||||||
| (14,710 | ) | (46,649 | ) | 6,271 | (272,116 | ) | (1,289 | ) | (17,282 | ) | ||||||||||||
| 74,483 | (30,667 | ) | 360,636 | (177,457 | ) | 18,515 | (7,982 | ) | ||||||||||||||
| 63,513 | (74,055 | ) | 380,612 | (434,355 | ) | 17,633 | (24,928 | ) | ||||||||||||||
| (3,199 | ) | (3,169 | ) | (15,226 | ) | (13,117 | ) | (325 | ) | (421 | ) | |||||||||||
| — | — | — | (83,418 | ) | — | — | ||||||||||||||||
| (3,199 | ) | (3,169 | ) | (15,226 | ) | (96,535 | ) | (325 | ) | (421 | ) | |||||||||||
| 89,195 | 154,389 | 593,298 | 366,063 | 25,986 | 80,221 | |||||||||||||||||
| 3,199 | 3,169 | 15,226 | 96,535 | 325 | 421 | |||||||||||||||||
| — | — | — | — | — | — | |||||||||||||||||
| (106,020 | ) | (195,951 | ) | (307,079 | ) | (637,240 | ) | (21,823 | ) | (76,464 | ) | |||||||||||
| (13,626 | ) | (38,393 | ) | 301,445 | (174,642 | ) | 4,488 | 4,178 | ||||||||||||||
| 46,688 | (115,617 | ) | 666,831 | (705,532 | ) | 21,796 | (21,171 | ) | ||||||||||||||
| 259,122 | 374,739 | 1,169,698 | 1,875,230 | 87,543 | 108,714 | |||||||||||||||||
| $ | 305,810 | $ | 259,122 | $ | 1,836,529 | $ | 1,169,698 | $ | 109,339 | $ | 87,543 | |||||||||||
| $ | 3,640 | $ | 3,210 | $ | 13,691 | $ | 15,212 | $ | 401 | $ | 329 | |||||||||||
| 8,664 | 15,113 | 38,000 | 23,119 | 3,404 | 10,627 | |||||||||||||||||
| 362 | 278 | 1,186 | 5,716 | 49 | 49 | |||||||||||||||||
| — | — | — | — | — | — | |||||||||||||||||
| (10,968 | ) | (19,524 | ) | (21,658 | ) | (42,917 | ) | (3,069 | ) | (10,289 | ) | |||||||||||
| (1,942 | ) | (4,133 | ) | 17,528 | (14,082 | ) | 384 | 387 | ||||||||||||||
275
Table of Contents
American Skandia Trust
Statements of Changes in Net Assets (CONTINUED)
(Amounts in thousands)
| Portfolio | ||||||||||||||||
| AST INVESCO Capital Income |
AST DeAM Global Allocation |
|||||||||||||||
| Year Ended December 31, 2003 |
Year Ended December 31, 2002 |
Year Ended December 31, 2003 |
Year Ended December 31, 2002 |
|||||||||||||
| From Operations |
||||||||||||||||
| Net investment income (loss) |
$ | 9,254 | $ | 15,172 | $ | 2,865 | $ | 3,437 | ||||||||
| Net realized gain (loss) on investments |
23,922 | (87,292 | ) | (7,922 | ) | (44,273 | ) | |||||||||
| Net change in unrealized appreciation (depreciation) on investments |
77,110 | (96,725 | ) | 51,800 | (27,927 | ) | ||||||||||
| Net Increase (Decrease) in Net Assets from Operations |
110,286 | (168,845 | ) | 46,743 | (68,763 | ) | ||||||||||
| Dividends and Distributions to Shareholders |
||||||||||||||||
| Dividends to shareholders from net investment income |
(15,176 | ) | (24,256 | ) | (3,336 | ) | (14,493 | ) | ||||||||
| Distributions to shareholders from capital gains |
— | — | — | — | ||||||||||||
| Total Dividends and Distributions to Shareholders |
(15,176 | ) | (24,256 | ) | (3,336 | ) | (14,493 | ) | ||||||||
| Capital Share Transactions |
||||||||||||||||
| Proceeds from shares sold |
105,728 | 259,526 | 8,947 | 35,694 | ||||||||||||
| Net asset value of shares issued in reinvestment of dividends and distributions |
15,176 | 24,256 | 3,336 | 14,493 | ||||||||||||
| Net asset value of shares issued in merger |
— | — | — | — | ||||||||||||
| Cost of shares redeemed |
(236,435 | ) | (459,217 | ) | (75,244 | ) | (163,728 | ) | ||||||||
| Increase (Decrease) in Net Assets from Capital Share Transactions |
(115,531 | ) | (175,435 | ) | (62,961 | ) | (113,541 | ) | ||||||||
| Total Increase (Decrease) in Net Assets |
(20,421 | ) | (368,536 | ) | (19,554 | ) | (196,797 | ) | ||||||||
| Net Assets |
||||||||||||||||
| Beginning of Year |
660,533 | 1,029,069 | 284,362 | 481,159 | ||||||||||||
| End of Year(a) |
$ | 640,112 | $ | 660,533 | $ | 264,808 | $ | 284,362 | ||||||||
| (a) Includes Undistributed Net Investment Income of: |
$ | 9,247 | $ | 15,087 | $ | 2,860 | $ | 2,248 | ||||||||
| Shares Issued and Redeemed |
||||||||||||||||
| Shares sold |
8,214 | 18,388 | 920 | 3,428 | ||||||||||||
| Shares issued in reinvestment of dividends and distributions |
1,295 | 1,614 | 370 | 1,358 | ||||||||||||
| Shares issued in merger |
— | — | — | — | ||||||||||||
| Shares redeemed |
(18,448 | ) | (33,390 | ) | (7,688 | ) | (16,469 | ) | ||||||||
| Net Increase (Decrease) in Shares Outstanding |
(8,939 | ) | (13,388 | ) | (6,398 | ) | (11,683 | ) | ||||||||
See Notes to Financial Statements.
276
Table of Contents
| Portfolio | ||||||||||||||||||||||
| AST American Century Strategic Balanced |
AST T. Rowe Price Asset Allocation |
AST T. Rowe Price Global Bond |
||||||||||||||||||||
| Year Ended December 31, 2003 |
Year Ended December 31, 2002 |
Year Ended December 31, 2003 |
Year Ended December 31, 2002 |
Year Ended December 31, 2003 |
Year Ended December 31, 2002 |
|||||||||||||||||
| $ | 3,138 | $ | 4,190 | $ | 5,424 | $ | 7,055 | $ | 5,621 | $ | 4,607 | |||||||||||
| 1,715 | (20,149 | ) | (2,775 | ) | (13,328 | ) | 13,484 | 4,819 | ||||||||||||||
| 29,832 | (6,290 | ) | 61,791 | (26,318 | ) | 6,226 | 11,526 | |||||||||||||||
| 34,685 | (22,249 | ) | 64,440 | (32,591 | ) | 25,331 | 20,952 | |||||||||||||||
| (4,191 | ) | (4,499 | ) | (7,113 | ) | (8,650 | ) | (7,342 | ) | — | ||||||||||||
| — | — | — | (11,079 | ) | (394 | ) | — | |||||||||||||||
| (4,191 | ) | (4,499 | ) | (7,113 | ) | (19,729 | ) | (7,736 | ) | — | ||||||||||||
| 76,200 | 65,841 | 64,072 | 39,238 | 149,353 | 218,466 | |||||||||||||||||
| 4,191 | 4,499 | 7,113 | 19,729 | 7,736 | — | |||||||||||||||||
| — | — | — | — | — | — | |||||||||||||||||
| (54,435 | ) | (74,946 | ) | (37,479 | ) | (70,319 | ) | (154,648 | ) | (137,838 | ) | |||||||||||
| 25,956 | (4,606 | ) | 33,706 | (11,352 | ) | 2,441 | 80,628 | |||||||||||||||
| 56,450 | (31,354 | ) | 91,033 | (63,672 | ) | 20,036 | 101,580 | |||||||||||||||
| 179,368 | 210,722 | 269,119 | 332,791 | 209,594 | 108,014 | |||||||||||||||||
| $ | 235,818 | $ | 179,368 | $ | 360,152 | $ | 269,119 | $ | 229,630 | $ | 209,594 | |||||||||||
| $ | 3,254 | $ | 4,109 | $ | 5,501 | $ | 7,277 | $ | 14,768 | $ | 12,450 | |||||||||||
| 6,455 | 5,746 | 4,550 | 2,937 | 13,142 | 21,071 | |||||||||||||||||
| 392 | 373 | 589 | 1,421 | 704 | — | |||||||||||||||||
| — | — | — | — | — | — | |||||||||||||||||
| (4,698 | ) | (6,712 | ) | (2,819 | ) | (5,340 | ) | (13,761 | ) | (13,374 | ) | |||||||||||
| 2,149 | (593 | ) | 2,320 | (982 | ) | 85 | 7,697 | |||||||||||||||
277
Table of Contents
American Skandia Trust
Statements of Changes in Net Assets (continued)
(Amounts in thousands)
| Portfolio | ||||||||||||||||
| AST Federated High Yield |
AST Lord Abbett Bond-Debenture |
|||||||||||||||
| Year Ended December 31, 2003 |
Year Ended December 31, 2002 |
Year Ended December 31, 2003 |
Year Ended December 31, 2002 |
|||||||||||||
| From Operations |
||||||||||||||||
| Net investment income (loss) |
$ | 58,032 | $ | 48,254 | $ | 12,591 | $ | 6,806 | ||||||||
| Net realized gain (loss) on investments |
(19,649 | ) | (90,040 | ) | 5,071 | (3,033 | ) | |||||||||
| Net change in unrealized appreciation (depreciation) on investments |
108,668 | 47,287 | 16,562 | (773 | ) | |||||||||||
| Net Increase (Decrease) in Net Assets from Operations |
147,051 | 5,501 | 34,224 | 3,000 | ||||||||||||
| Dividends and Distributions to Shareholders |
||||||||||||||||
| Dividends to shareholders from net investment income |
(48,256 | ) | (55,266 | ) | (6,806 | ) | (2,416 | ) | ||||||||
| Distributions to shareholders from capital gains |
— | — | — | — | ||||||||||||
| Total Dividends and Distributions to Shareholders |
(48,256 | ) | (55,266 | ) | (6,806 | ) | (2,416 | ) | ||||||||
| Capital Share Transactions |
||||||||||||||||
| Proceeds from shares sold |
877,748 | 511,974 | 290,841 | 154,778 | ||||||||||||
| Net asset value of shares issued in reinvestment of dividends and distributions |
48,256 | 55,266 | 6,806 | 2,416 | ||||||||||||
| Net asset value of shares issued in merger |
— | — | — | — | ||||||||||||
| Cost of shares redeemed |
(732,729 | ) | (466,855 | ) | (143,592 | ) | (55,295 | ) | ||||||||
| Increase (Decrease) in Net Assets from Capital Share Transactions |
193,275 | 100,385 | 154,055 | 101,899 | ||||||||||||
| Total Increase (Decrease) in Net Assets |
292,070 | 50,620 | 181,473 | 102,483 | ||||||||||||
| Net Assets |
||||||||||||||||
| Beginning of Year |
576,441 | 525,821 | 164,939 | 62,456 | ||||||||||||
| End of Year(a) |
$ | 868,511 | $ | 576,441 | $ | 346,412 | $ | 164,939 | ||||||||
| (a) Includes Undistributed Net Investment Income of: |
$ | 58,029 | $ | 48,253 | $ | 12,612 | $ | 6,807 | ||||||||
| Shares Issued and Redeemed |
||||||||||||||||
| Shares sold |
109,361 | 64,786 | 26,854 | 15,722 | ||||||||||||
| Shares issued in reinvestment of dividends and distributions |
6,557 | 7,031 | 698 | 246 | ||||||||||||
| Shares issued in merger |
— | — | — | — | ||||||||||||
| Shares redeemed |
(89,910 | ) | (58,095 | ) | (13,634 | ) | (5,572 | ) | ||||||||
| Net Increase (Decrease) in Shares Outstanding |
26,008 | 13,722 | 13,918 | 10,396 | ||||||||||||
(2) Commenced operations on May 1, 2002.
See Notes to Financial Statements.
278
Table of Contents
| Portfolio | ||||||||||||||||||||||
| AST DeAM Bond(2) |
AST PIMCO Total Return Bond |
AST PIMCO Limited Maturity Bond |
||||||||||||||||||||
| Year Ended December 31, 2003 |
Year Ended December 31, 2002 |
Year Ended December 31, |
Year Ended December 31, |
Year Ended December 31, |
Year Ended December 31, 2002 |
|||||||||||||||||
| $ | 3,796 | $ | 3,194 | $ | 64,378 | $ | 76,593 | $ | 22,395 | $ | 24,002 | |||||||||||
| 3,125 | 4,025 | 43,742 | 84,928 | 20,972 | 13,375 | |||||||||||||||||
| (2,046 | ) | 3,429 | 5,638 | 15,060 | (7,069 | ) | 13,777 | |||||||||||||||
| 4,875 | 10,648 | 113,758 | 176,581 | 36,298 | 51,154 | |||||||||||||||||
| (3,194 | ) | — | (81,938 | ) | (75,526 | ) | (23,901 | ) | (26,976 | ) | ||||||||||||
| (4,028 | ) | — | (84,016 | ) | (32,366 | ) | (14,225 | ) | (8,081 | ) | ||||||||||||
| (7,222 | ) | — | (165,954 | ) | (107,892 | ) | (38,126 | ) | (35,057 | ) | ||||||||||||
| 43,632 | 204,175 | 614,483 | 1,114,509 | 524,101 | 764,837 | |||||||||||||||||
| 7,222 | — | 165,954 | 107,892 | 38,126 | 35,057 | |||||||||||||||||
| — | — | — | — | — | — | |||||||||||||||||
| (64,361 | ) | (83,087 | ) | (875,377 | ) | (674,388 | ) | (613,318 | ) | (368,345 | ) | |||||||||||
| (13,507 | ) | 121,088 | (94,940 | ) | 548,013 | (51,091 | ) | 431,549 | ||||||||||||||
| (15,854 | ) | 131,736 | (147,136 | ) | 616,702 | (52,919 | ) | 447,646 | ||||||||||||||
| 131,736 | — | 2,255,048 | 1,638,346 | 1,058,843 | 611,197 | |||||||||||||||||
| $ | 115,882 | $ | 131,736 | $ | 2,107,912 | $ | 2,255,048 | $ | 1,005,924 | $ | 1,058,843 | |||||||||||
| $ | 4,310 | $ | 3,194 | $ | 85,392 | $ | 78,694 | $ | 32,678 | $ | 23,254 | |||||||||||
| 4,169 | 20,226 | 51,498 | 95,111 | 46,461 | 68,971 | |||||||||||||||||
| 703 | — | 14,356 | 9,423 | 3,432 | 3,234 | |||||||||||||||||
| — | — | — | — | — | — | |||||||||||||||||
| (6,132 | ) | (7,993 | ) | (74,287 | ) | (57,738 | ) | (54,612 | ) | (33,140 | ) | |||||||||||
| (1,260 | ) | 12,233 | (8,433 | ) | 46,796 | (4,719 | ) | 39,065 | ||||||||||||||
279
Table of Contents
American Skandia Trust
Statements of Changes in Net Assets (CONTINUED)
(Amounts in thousands)
| Portfolio | ||||||||
| AST Money Market |
||||||||
| Year Ended 2003 |
Year Ended 2002 |
|||||||
| From Operations |
||||||||
| Net investment income (loss) |
$ | 15,784 | $ | 35,888 | ||||
| Net realized gain (loss) on investments |
1 | 2 | ||||||
| Net change in unrealized appreciation (depreciation) on investments |
— | — | ||||||
| Net Increase (Decrease) in Net Assets from Operations |
15,785 | 35,890 | ||||||
| Dividends and Distributions to Shareholders |
||||||||
| Dividends to shareholders from net investment income |
(15,784 | ) | (35,888 | ) | ||||
| Distributions to shareholders from capital gains |
(2 | ) | (352 | ) | ||||
| Total Dividends and Distributions to Shareholders |
(15,786 | ) | (36,240 | ) | ||||
| Capital Share Transactions |
||||||||
| Proceeds from shares sold |
5,378,148 | 9,251,249 | ||||||
| Net asset value of shares issued in reinvestment of dividends and distributions |
15,784 | 36,240 | ||||||
| Net asset value of shares issued in merger |
— | — | ||||||
| Cost of shares redeemed |
(6,376,530 | ) | (9,194,516 | ) | ||||
| Increase (Decrease) in Net Assets from Capital Share Transactions |
(982,598 | ) | 92,973 | |||||
| Total Increase (Decrease) in Net Assets |
(982,599 | ) | 92,623 | |||||
| Net Assets |
||||||||
| Beginning of Year |
2,744,716 | 2,652,093 | ||||||
| End of Year(a) |
$ | 1,762,117 | $ | 2,744,716 | ||||
| (a) Includes Undistributed Net Investment Income of: |
$ | — | $ | — | ||||
| Shares Issued and Redeemed |
||||||||
| Shares sold |
5,378,148 | 9,251,252 | ||||||
| Shares issued in reinvestment of dividends and distributions |
15,784 | 36,240 | ||||||
| Shares issued in merger |
— | — | ||||||
| Shares redeemed |
(6,376,530 | ) | (9,194,516 | ) | ||||
| Net Increase (Decrease) in Shares Outstanding |
(982,598 | ) | 92,976 | |||||
See Notes to Financial Statements.
280
Table of Contents
[THIS PAGE INTENTIONALLY LEFT BLANK]
Table of Contents
American Skandia Trust
Financial Highlights
Per Share Data (for a share outstanding throughout each period)
| Increase (Decrease) from Investment Operations |
Less Distributions |
|||||||||||||||||||||||||||||
| Portfolio |
Period Ended |
Net Asset Value Beginning of Period |
Net Investment Income (Loss) |
Net Realized & Unrealized Gain (Loss) |
Total from Investment Operations |
From Net Investment Income |
From Net Realized Gains |
Total Distributions |
||||||||||||||||||||||
| AST Strong |
12/31/03 | $ | 12.22 | $ | 0.14 | $ | 3.56 | $ | 3.70 | $ | (0.11 | ) | $ | — | $ | (0.11 | ) | |||||||||||||
| International Equity |
12/31/02 | 15.07 | 0.10 | (2.87 | ) | (2.77 | ) | (0.08 | ) | — | (0.08 | ) | ||||||||||||||||||
| 12/31/01 | 22.03 | 0.08 | (4.75 | ) | (4.67 | ) | (0.03 | ) | (2.26 | ) | (2.29 | ) | ||||||||||||||||||
| 12/31/00 | 34.23 | 0.22 | (8.09 | ) | (7.87 | ) | (0.07 | ) | (4.26 | ) | (4.33 | ) | ||||||||||||||||||
| 12/31/99 | 22.67 | 0.05 | 13.36 | 13.41 | — | (1.85 | ) | (1.85 | ) | |||||||||||||||||||||
| AST William Blair |
12/31/03 | $ | 7.46 | $ | 0.06 | $ | 3.04 | $ | 2.98 | $ | — | $ | — | $ | — | |||||||||||||||
| International Growth |
12/31/02 | 10.39 | 0.11 | (2.71 | ) | (2.60 | ) | (0.33 | ) | — | (0.33 | ) | ||||||||||||||||||
| 12/31/01 | 18.72 | 0.12 | (3.73 | ) | (3.61 | ) | (0.82 | ) | (3.90 | ) | (4.72 | ) | ||||||||||||||||||
| 12/31/00 | 25.10 | (0.04 | ) | (6.03 | ) | (6.07 | ) | (0.13 | ) | (0.18 | ) | (0.31 | ) | |||||||||||||||||
| 12/31/99 | 13.74 | (0.03 | ) | 11.39 | 11.36 | — | — | — | ||||||||||||||||||||||
| AST American Century |
12/31/03 | $ | 9.80 | $ | 0.07 | $ | 2.32 | $ | 2.39 | $ | (0.18 | ) | $ | — | $ | (0.18 | ) | |||||||||||||
| International Growth(9)(10) |
12/31/02 | 12.17 | 0.09 | (2.46 | ) | (2.37 | ) | — | — | — | ||||||||||||||||||||
| 12/31/01 | 18.16 | 0.13 | (4.83 | ) | (4.70 | ) | (0.08 | ) | (1.21 | ) | (1.29 | ) | ||||||||||||||||||
| 12/31/00 | 22.40 | 0.03 | (3.45 | ) | (3.42 | ) | — | (0.82 | ) | (0.82 | ) | |||||||||||||||||||
| 12/31/99 | 13.66 | (0.04 | ) | 8.88 | 8.84 | — | (0.10 | ) | (0.10 | ) | ||||||||||||||||||||
| AST DeAM |
12/31/03 | $ | 8.38 | $ | 0.11 | $ | 2.71 | $ | 2.82 | $ | (0.05 | ) | $ | — | $ | (0.05 | ) | |||||||||||||
| International Equity |
12/31/02 | 10.10 | 0.06 | (1.78 | ) | (1.72 | ) | — | — | — | ||||||||||||||||||||
| 12/31/01 | 14.91 | (0.01 | ) | (4.80 | ) | (4.81 | ) | — | — | — | ||||||||||||||||||||
| 12/31/00 | 24.63 | (0.07 | ) | (5.10 | ) | (5.17 | ) | — | (4.55 | ) | (4.55 | ) | ||||||||||||||||||
| 12/31/99 | 13.04 | (0.07 | ) | 11.72 | 11.65 | (0.03 | ) | (0.03 | ) | (0.06 | ) | |||||||||||||||||||
| AST MFS |
12/31/03 | $ | 8.08 | $ | 0.02 | $ | 2.17 | $ | 2.19 | $ | (0.02 | ) | $ | — | $ | (0.02 | ) | |||||||||||||
| Global Equity |
12/31/02 | 9.21 | 0.02 | (1.15 | ) | (1.13 | ) | — | — | — | ||||||||||||||||||||
| 12/31/01 | 10.23 | — | (1.02 | ) | (1.02 | ) | — | — | — | |||||||||||||||||||||
| 12/31/00 | 11.03 | 0.01 | (0.79 | ) | (0.78 | ) | (0.01 | ) | (0.01 | ) | (0.02 | ) | ||||||||||||||||||
| 12/31/99 | (3) | 10.00 | 0.01 | 1.02 | 1.03 | — | — | — | ||||||||||||||||||||||
| AST PBHG |
12/31/03 | $ | 10.41 | $ | (0.09 | ) | $ | 4.80 | $ | 4.71 | $ | — | $ | — | $ | — | ||||||||||||||
| Small-Cap Growth |
12/31/02 | 15.87 | (0.13 | ) | (5.33 | ) | (5.46 | ) | — | — | — | |||||||||||||||||||
| 12/31/01 | 20.30 | (0.07 | ) | (1.27 | ) | (1.34 | ) | — | (3.09 | ) | (3.09 | ) | ||||||||||||||||||
| 12/31/00 | 42.61 | (0.22 | ) | (18.08 | ) | (18.30 | ) | — | (4.01 | ) | (4.01 | ) | ||||||||||||||||||
| 12/31/99 | 17.61 | (0.03 | ) | 25.03 | 25.00 | — | — | — | ||||||||||||||||||||||
See Notes to Financial Statements.
282
Table of Contents
| Supplemental Data |
Ratios of Expenses to Average Net Assets(1)* |
||||||||||||||||||
| Net Asset of Period |
Total Return |
Net Assets (in 000’s) |
Portfolio Turnover Rate |
After Advisory and Expense |
Before Advisory and Expense |
Ratio of Net Investment Income (Loss) to Average Net Assets(1) |
|||||||||||||
| $ | 15.81 | 30.60 | % | $ | 339,039 | 50 | % | 1.14 | % | 1.14 | % | 1.02 | % | ||||||
| 12.22 | (18.42 | %) | 316,192 | 50 | % | 1.21 | % | 1.21 | % | 0.84 | % | ||||||||
| 15.07 | (22.75 | %) | 444,271 | 162 | % | 1.09 | % | 1.14 | % | 0.45 | % | ||||||||
| 22.03 | (26.53 | %) | 637,131 | 86 | % | 1.16 | % | 1.16 | % | 0.63 | % | ||||||||
| 34.23 | 64.13 | % | 770,512 | 159 | % | 1.18 | % | 1.18 | % | 0.18 | % | ||||||||
| $ | 10.44 | 39.95 | % | $ | 641,549 | 88 | % | 1.24 | % | 1.34 | % | 0.46 | % | ||||||
| 7.46 | (25.67 | %) | 318,832 | 94 | % | 1.32 | % | 1.32 | % | 0.41 | % | ||||||||
| 10.39 | (23.55 | %) | 587,377 | 74 | % | 1.24 | % | 1.24 | % | 0.64 | % | ||||||||
| 18.72 | (24.62 | %) | 1,094,019 | 75 | % | 1.18 | % | 1.19 | % | (0.02 | %) | ||||||||
| 25.10 | 82.68 | % | 1,551,045 | 76 | % | 1.23 | % | 1.23 | % | (0.18 | %) | ||||||||
| $ | 12.01 | 25.01 | % | $ | 378,327 | 185 | % | 1.30 | % | 1.30 | % | 0.64 | % | ||||||
| 9.80 | (19.47 | %) | 373,998 | 236 | % | 1.25 | % | 1.25 | % | 0.73 | % | ||||||||
| 12.17 | (27.27 | %) | 518,126 | 176 | % | 1.28 | % | 1.28 | % | 0.56 | % | ||||||||
| 18.16 | (16.10 | %) | 332,504 | 126 | % | 1.27 | % | 1.27 | % | (0.04 | %) | ||||||||
| 22.40 | 65.20 | % | 154,226 | 112 | % | 1.50 | % | 1.50 | % | (0.32 | %) | ||||||||
| $ | 11.15 | 33.91 | % | $ | 172,059 | 138 | % | 1.12 | % | 1.27 | % | 1.22 | % | ||||||
| 8.38 | (17.03 | %) | 129,004 | 354 | % | 1.34 | % | 1.44 | % | 0.59 | % | ||||||||
| 10.10 | (32.21 | %) | 154,991 | 712 | % | 1.66 | % | 1.60 | % | (0.07 | %) | ||||||||
| 14.91 | (30.28 | %) | 276,037 | 514 | % | 1.34 | % | 1.38 | % | (0.44 | %) | ||||||||
| 24.63 | 89.71 | % | 217,397 | 309 | % | 1.29 | % | 1.29 | % | (0.54 | %) | ||||||||
| $ | 10.25 | 27.14 | % | $ | 102,938 | 54 | % | 1.40 | % | 1.40 | % | 0.32 | % | ||||||
| 8.08 | (12.26 | %) | 60,167 | 74 | % | 1.41 | % | 1.41 | % | 0.25 | % | ||||||||
| 9.21 | (9.97 | %) | 55,882 | 89 | % | 1.50 | % | 1.40 | % | 0.02 | % | ||||||||
| 10.23 | (7.19 | %) | 29,514 | 100 | % | 1.56 | % | 1.87 | % | 0.08 | % | ||||||||
| 11.03 | 10.40 | % | 1,291 | 142 | % | 1.75 | % | 2.11 | % | 0.75 | % | ||||||||
| $ | 15.12 | 45.24 | % | $ | 338,191 | 107 | % | 1.20 | % | 1.20 | % | (0.65 | %) | ||||||
| 10.41 | (34.41 | %) | 254,026 | 123 | % | 1.23 | % | 1.23 | % | (0.74 | %) | ||||||||
| 15.87 | (6.47 | %) | 494,900 | 136 | % | 1.16 | % | 1.16 | % | (0.51 | %) | ||||||||
| 20.30 | (48.16 | %) | 592,038 | 85 | % | 1.07 | % | 1.07 | % | (0.54 | %) | ||||||||
| 42.61 | 141.96 | % | 1,443,211 | 116 | % | 1.08 | % | 1.08 | % | (0.46 | %) | ||||||||
283
Table of Contents
American Skandia Trust
Financial Highlights (continued)
Per Share Data (for a share outstanding throughout each period)
| Increase (Decrease) from Investment Operations |
Less Distributions |
|||||||||||||||||||||||||||||
| Portfolio |
Period Ended |
Net Asset Value Beginning of Period |
Net Investment Income (Loss) |
Net Realized & Unrealized Gain (Loss) |
Total from Investment Operations |
From Net Investment Income |
From Net Realized Gains |
Total Distributions |
||||||||||||||||||||||
| AST DeAM |
12/31/03 | $ | 5.17 | $ | (0.01 | ) | $ | 2.47 | $ | 2.46 | $ | — | $ | — | $ | — | ||||||||||||||
| Small-Cap Growth |
12/31/02 | 7.03 | (0.01 | ) | (1.85 | ) | (1.86 | ) | — | — | — | |||||||||||||||||||
| 12/31/01 | 11.72 | (0.05 | ) | (2.95 | ) | (3.00 | ) | — | (1.69 | ) | (1.69 | ) | ||||||||||||||||||
| 12/31/00 | 15.59 | (0.08 | ) | (2.90 | ) | (2.98 | ) | — | (0.89 | ) | (0.89 | ) | ||||||||||||||||||
| 12/31/99 | (2) | 10.00 | (0.05 | ) | 5.64 | 5.59 | — | — | — | |||||||||||||||||||||
| AST Federated |
12/31/03 | $ | 5.09 | $ | (0.05 | ) | $ | 3.57 | $ | 3.52 | $ | — | $ | — | $ | — | ||||||||||||||
| Aggressive Growth |
12/31/02 | 7.22 | (0.04 | ) | (2.05 | ) | (2.09 | ) | — | (0.04 | ) | (0.04 | ) | |||||||||||||||||
| 12/31/01 | 9.10 | (0.03 | ) | (1.85 | ) | (1.88 | ) | — | † | — | — | † | ||||||||||||||||||
| 12/31/00 | (6) | 10.00 | 0.01 | (0.91 | ) | (0.90 | ) | — | — | — | ||||||||||||||||||||
| AST Goldman Sachs |
12/31/03 | $ | 12.96 | $ | 0.08 | $ | 5.19 | $ | 5.27 | $ | (0.11 | ) | $ | — | $ | (0.11 | ) | |||||||||||||
| Small-Cap Value |
12/31/02 | 15.55 | 0.11 | (1.21 | ) | (1.10 | ) | (0.06 | ) | (1.43 | ) | (1.49 | ) | |||||||||||||||||
| 12/31/01 | 14.55 | 0.08 | 1.34 | 1.42 | — | (0.42 | ) | (0.42 | ) | |||||||||||||||||||||
| 12/31/00 | 10.87 | 0.01 | 3.67 | 3.68 | — | — | — | |||||||||||||||||||||||
| 12/31/99 | 9.99 | (0.03 | ) | 0.91 | 0.88 | — | — | — | ||||||||||||||||||||||
| AST Gabelli |
12/31/03 | $ | 11.59 | $ | 0.01 | $ | 4.13 | $ | 4.14 | $ | (0.03 | ) | $ | — | $ | (0.03 | ) | |||||||||||||
| Small-Cap Value |
12/31/02 | 13.07 | 0.03 | (1.23 | ) | (1.20 | ) | (0.06 | ) | (0.22 | ) | (0.28 | ) | |||||||||||||||||
| 12/31/01 | 13.02 | 0.04 | 0.84 | 0.88 | (0.07 | ) | (0.76 | ) | (0.83 | ) | ||||||||||||||||||||
| 12/31/00 | 11.39 | 0.10 | 2.23 | 2.33 | (0.07 | ) | (0.63 | ) | (0.70 | ) | ||||||||||||||||||||
| 12/31/99 | 11.44 | 0.08 | (0.03 | ) | 0.05 | (0.10 | ) | — | (0.10 | ) | ||||||||||||||||||||
| AST DeAM |
12/31/03 | $ | 7.75 | $ | 0.03 | $ | 3.33 | $ | 3.36 | $ | (0.01 | ) | $ | — | $ | (0.01 | ) | |||||||||||||
| Small-Cap Value |
12/31/02 | (8) | 10.00 | 0.02 | (2.27 | ) | (2.25 | ) | — | — | — | |||||||||||||||||||
| AST Goldman Sachs |
12/31/03 | $ | 2.88 | $ | (0.01 | ) | $ | 0.92 | $ | 0.91 | $ | — | $ | — | $ | — | ||||||||||||||
| Mid-Cap Growth |
12/31/02 | 3.97 | (0.02 | ) | (1.07 | ) | (1.09 | ) | — | — | — | |||||||||||||||||||
| 12/31/01 | 6.64 | (0.03 | ) | (2.64 | ) | (2.67 | ) | — | † | — | — | † | ||||||||||||||||||
| 12/31/00 | (5) | 10.00 | 0.01 | (3.37 | ) | (3.36 | ) | — | — | — | ||||||||||||||||||||
See Notes to Financial Statements.
284
Table of Contents
| Supplemental Data |
Ratios of Expenses to Average Net Assets(1)* |
||||||||||||||||||
| Net Asset of Period |
Total Return |
Net Assets (in 000’s) |
Portfolio Turnover Rate |
After Advisory and Expense |
Before Advisory and Expense |
Ratio of Net Investment Income (Loss) to Average Net Assets(1) |
|||||||||||||
| $ | 7.63 | 47.58 | % | $ | 403,430 | 185 | % | 1.02 | % | 1.17 | % | (0.19 | %) | ||||||
| 5.17 | (26.46 | %) | 293,297 | 132 | % | 1.00 | % | 1.15 | % | (0.12 | %) | ||||||||
| 7.03 | (28.43 | %) | 537,324 | 196 | % | 1.16 | % | 1.17 | % | (0.64 | %) | ||||||||
| 11.72 | (20.95 | %) | 791,839 | 136 | % | 1.11 | % | 1.13 | % | (0.67 | %) | ||||||||
| 15.59 | 55.90 | % | 841,984 | 133 | % | 1.14 | % | 1.14 | % | (0.67 | %) | ||||||||
| $ | 8.61 | 69.16 | % | $ | 187,565 | 96 | % | 1.22 | % | 1.22 | % | (0.99 | %) | ||||||
| 5.09 | (29.19 | %) | 39,072 | 250 | % | 1.35 | % | 1.38 | % | (1.02 | %) | ||||||||
| 7.22 | (20.61 | %) | 49,489 | 244 | % | 1.35 | % | 1.78 | % | (0.84 | %) | ||||||||
| 9.10 | (9.00 | %) | 1,938 | 49 | % | 1.35 | % | 7.22 | % | 2.67 | % | ||||||||
| $ | 18.12 | 41.08 | % | $ | 343,442 | 67 | % | 1.26 | % | 1.26 | % | 0.40 | % | ||||||
| 12.96 | (7.93 | %) | 315,101 | 129 | % | 1.27 | % | 1.27 | % | 0.62 | % | ||||||||
| 15.55 | 9.91 | % | 432,511 | 159 | % | 1.18 | % | 1.18 | % | 0.69 | % | ||||||||
| 14.55 | 33.85 | % | 227,759 | 67 | % | 1.15 | % | 1.15 | % | (0.13 | %) | ||||||||
| 10.87 | 8.81 | % | 74,192 | 85 | % | 1.24 | % | 1.24 | % | (0.36 | %) | ||||||||
| $ | 15.70 | 35.78 | % | $ | 774,416 | 26 | % | 1.10 | % | 1.10 | % | 0.04 | % | ||||||
| 11.59 | (9.38 | %) | 501,070 | 24 | % | 1.10 | % | 1.10 | % | 0.20 | % | ||||||||
| 13.07 | 6.98 | % | 538,479 | 59 | % | 1.08 | % | 1.08 | % | 0.54 | % | ||||||||
| 13.02 | 21.86 | % | 333,586 | 88 | % | 1.12 | % | 1.12 | % | 0.87 | % | ||||||||
| 11.39 | 0.58 | % | 261,493 | 26 | % | 1.11 | % | 1.11 | % | 0.64 | % | ||||||||
| $ | 11.10 | 43.46 | % | $ | 51,980 | 193 | % | 1.15 | % | 1.36 | % | 0.62 | % | ||||||
| 7.75 | (22.50 | %) | 13,419 | 122 | % | 1.15 | % | 1.48 | % | 0.43 | % | ||||||||
| $ | 3.79 | 31.60 | % | $ | 160,549 | 59 | % | 1.31 | % | 1.41 | % | (0.54 | %) | ||||||
| 2.88 | (27.46 | %) | 61,373 | 162 | % | 1.31 | % | 1.33 | % | (0.65 | %) | ||||||||
| 3.97 | (40.17 | %) | 71,039 | 203 | % | 1.34 | % | 1.34 | % | (0.63 | %) | ||||||||
| 6.64 | (33.60 | %) | 65,098 | 55 | % | 1.28 | % | 1.28 | % | 0.18 | % | ||||||||
285
Table of Contents
American Skandia Trust
Financial Highlights (continued)
Per Share Data (for a share outstanding throughout each period)
| Increase (Decrease) from Investment Operations |
Less Distributions |
|||||||||||||||||||||||||||||
| Portfolio |
Period Ended |
Net Asset Value Beginning of Period |
Net Investment Income (Loss) |
Net Realized & Unrealized Gain (Loss) |
Total from Investment Operations |
From Net Investment Income |
From Net Realized Gains |
Total Distributions |
||||||||||||||||||||||
| AST Neuberger Berman |
12/31/03 | $ | 9.39 | $ | (0.09 | ) | $ | 2.96 | $ | 2.87 | $ | — | $ | — | $ | — | ||||||||||||||
| Mid-Cap Growth |
12/31/02 | 13.65 | (0.13 | ) | (4.13 | ) | (4.26 | ) | — | — | — | |||||||||||||||||||
| 12/31/01 | 21.63 | (0.06 | ) | (5.02 | ) | (5.08 | ) | — | (2.90 | ) | (2.90 | ) | ||||||||||||||||||
| 12/31/00 | 24.03 | (0.04 | ) | (1.74 | ) | (1.78 | ) | — | (0.62 | ) | (0.62 | ) | ||||||||||||||||||
| 12/31/99 | 17.26 | (0.11 | ) | 8.21 | 8.10 | — | (1.33 | ) | (1.33 | ) | ||||||||||||||||||||
| AST Neuberger Berman |
12/31/03 | $ | 13.09 | $ | 0.02 | $ | 4.72 | $ | 4.74 | $ | (0.03 | ) | $ | — | $ | (0.03 | ) | |||||||||||||
| Mid-Cap Value |
12/31/02 | 15.41 | 0.03 | (1.56 | ) | (1.53 | ) | (0.08 | ) | (0.71 | ) | (0.79 | ) | |||||||||||||||||
| 12/31/01 | 16.85 | 0.08 | (0.60 | ) | (0.52 | ) | (0.02 | ) | (0.90 | ) | (0.92 | ) | ||||||||||||||||||
| 12/31/00 | 13.32 | 0.02 | 3.60 | 3.62 | (0.04 | ) | (0.05 | ) | (0.09 | ) | ||||||||||||||||||||
| 12/31/99 | 13.16 | 0.10 | 0.60 | 0.70 | (0.24 | ) | (0.30 | ) | (0.54 | ) | ||||||||||||||||||||
| AST Alger |
12/31/03 | $ | 3.66 | $ | (0.02 | ) | $ | 1.32 | $ | 1.30 | $ | — | $ | — | $ | — | ||||||||||||||
| All-Cap Growth(12) |
12/31/02 | 5.70 | (0.04 | ) | (2.00 | ) | (2.04 | ) | — | — | — | |||||||||||||||||||
| 12/31/01 | 6.84 | (0.02 | ) | (1.12 | ) | (1.14 | ) | — | — | — | ||||||||||||||||||||
| 12/31/00 | (4) | 10.00 | — | (3.16 | ) | (3.16 | ) | — | — | — | ||||||||||||||||||||
| AST Gabelli |
12/31/03 | $ | 7.77 | $ | 0.04 | $ | 2.72 | $ | 2.76 | $ | (0.07 | ) | $ | — | $ | (0.07 | ) | |||||||||||||
| All-Cap Value(13) |
12/31/02 | 9.86 | 0.06 | (2.09 | ) | (2.03 | ) | (0.06 | ) | — | (0.06 | ) | ||||||||||||||||||
| 12/31/01 | 10.09 | 0.04 | (0.25 | ) | (0.21 | ) | (0.01 | ) | (0.01 | ) | (0.02 | ) | ||||||||||||||||||
| 12/31/00 | (6) | 10.00 | 0.03 | 0.06 | 0.09 | — | — | — | ||||||||||||||||||||||
| AST T. Rowe Price |
12/31/03 | $ | 13.56 | $ | 0.12 | $ | 4.25 | $ | 4.37 | $ | (0.20 | ) | $ | (0.28 | ) | $ | (0.48 | ) | ||||||||||||
| Natural Resources |
12/31/02 | 15.12 | 0.07 | (0.85 | ) | (0.78 | ) | (0.24 | ) | (0.54 | ) | (0.78 | ) | |||||||||||||||||
| 12/31/01 | 16.50 | 0.15 | (0.04 | ) | 0.11 | (0.20 | ) | (1.29 | ) | (1.49 | ) | |||||||||||||||||||
| 12/31/00 | 13.16 | 0.17 | 3.31 | 3.48 | (0.14 | ) | — | (0.14 | ) | |||||||||||||||||||||
| 12/31/99 | 11.97 | 0.14 | 2.67 | 2.81 | (0.18 | ) | (1.44 | ) | (1.62 | ) | ||||||||||||||||||||
| AST Alliance Growth |
12/31/03 | $ | 6.75 | $ | (0.01 | ) | $ | 1.61 | $ | 1.60 | $ | — | $ | — | $ | — | ||||||||||||||
| 12/31/02 | 9.78 | (0.03 | ) | (3.00 | ) | (3.03 | ) | — | — | — | ||||||||||||||||||||
| 12/31/01 | 15.15 | (0.02 | ) | (1.93 | ) | (1.95 | ) | — | (3.42 | ) | (3.42 | ) | ||||||||||||||||||
| 12/31/00 | 18.95 | — | (2.24 | ) | (2.24 | ) | — | (1.56 | ) | (1.56 | ) | |||||||||||||||||||
| 12/31/99 | 16.07 | (0.07 | ) | 4.85 | 4.78 | — | (1.90 | ) | (1.90 | ) | ||||||||||||||||||||
See Notes to Financial Statements.
286
Table of Contents
| Supplemental Data |
Ratios of Expenses to Average Net Assets(1)* |
||||||||||||||||||
| Net Asset of Period |
Total Return |
Net Assets (in 000’s) |
Portfolio Turnover Rate |
After Advisory and Expense |
Before Advisory and Expense |
Ratio of Net Investment Income (Loss) to Average Net Assets(1) |
|||||||||||||
| $ | 12.26 | 30.56 | % | $ | 360,010 | 150 | % | 1.17 | % | 1.17 | % | (0.83 | %) | ||||||
| 9.39 | (31.21 | %) | 287,458 | 104 | % | 1.16 | % | 1.16 | % | (0.84 | %) | ||||||||
| 13.65 | (25.79 | %) | 518,580 | 117 | % | 1.12 | % | 1.12 | % | (0.60 | %) | ||||||||
| 21.63 | (8.07 | %) | 719,405 | 121 | % | 1.09 | % | 1.09 | % | (0.55 | %) | ||||||||
| 24.03 | 51.37 | % | 394,325 | 148 | % | 1.13 | % | 1.13 | % | (0.71 | %) | ||||||||
| $ | 17.80 | 36.32 | % | $ | 1,027,374 | 70 | % | 1.15 | % | 1.15 | % | 0.15 | % | ||||||
| 13.09 | (10.56 | %) | 760,973 | 92 | % | 1.16 | % | 1.16 | % | 0.20 | % | ||||||||
| 15.41 | (3.03 | %) | 1,003,034 | 221 | % | 1.22 | % | 1.22 | % | 0.55 | % | ||||||||
| 16.85 | 27.49 | % | 978,649 | 220 | % | 1.24 | % | 1.24 | % | 0.19 | % | ||||||||
| 13.32 | 5.67 | % | 664,383 | 176 | % | 1.13 | % | 1.13 | % | 0.39 | % | ||||||||
| $ | 4.96 | 35.52 | % | $ | 402,505 | 159 | % | 1.40 | % | 1.40 | % | (0.53 | %) | ||||||
| 3.66 | (35.79 | %) | 323,286 | 182 | % | 1.29 | % | 1.29 | % | (0.67 | %) | ||||||||
| 5.70 | (16.67 | %) | 743,059 | 150 | % | 1.20 | % | 1.20 | % | (0.37 | %) | ||||||||
| 6.84 | (31.60 | %) | 205,079 | 123 | % | 1.24 | % | 1.24 | % | (0.05 | %) | ||||||||
| $ | 10.46 | 35.85 | % | $ | 181,874 | 30 | % | 1.20 | % | 1.20 | % | 0.41 | % | ||||||
| 7.77 | (20.71 | %) | 113,557 | 28 | % | 1.19 | % | 1.19 | % | 0.63 | % | ||||||||
| 9.86 | (2.18 | %) | 158,886 | 68 | % | 1.20 | % | 1.20 | % | 0.89 | % | ||||||||
| 10.09 | 0.90 | % | 14,165 | 31 | % | 1.45 | % | 1.59 | % | 2.71 | % | ||||||||
| $ | 17.45 | 33.52 | % | $ | 170,860 | 43 | % | 1.17 | % | 1.17 | % | 0.77 | % | ||||||
| 13.56 | (5.53 | %) | 122,686 | 56 | % | 1.16 | % | 1.16 | % | 0.54 | % | ||||||||
| 15.12 | 0.70 | % | 135,550 | 36 | % | 1.08 | % | 1.11 | % | 0.85 | % | ||||||||
| 16.50 | 26.79 | % | 134,644 | 96 | % | 1.14 | % | 1.20 | % | 1.13 | % | ||||||||
| 13.16 | 28.11 | % | 102,225 | 72 | % | 1.16 | % | 1.16 | % | 1.11 | % | ||||||||
| $ | 8.35 | 23.70 | % | $ | 237,056 | 63 | % | 1.16 | % | 1.16 | % | (0.14 | %) | ||||||
| 6.75 | (30.98 | %) | 240,490 | 59 | % | 1.13 | % | 1.13 | % | (0.31 | %) | ||||||||
| 9.78 | (14.72 | %) | 452,984 | 106 | % | 1.13 | % | 1.13 | % | (0.22 | %) | ||||||||
| 15.15 | (13.74 | %) | 467,362 | 135 | % | 1.16 | % | 1.16 | % | (0.46 | %) | ||||||||
| 18.95 | 33.91 | % | 364,454 | 316 | % | 1.11 | % | 1.11 | % | (0.50 | %) | ||||||||
287
Table of Contents
American Skandia Trust
Financial Highlights (continued)
Per Share Data (for a share outstanding throughout each period)
| Increase (Decrease) from Investment Operations |
Less Distributions |
|||||||||||||||||||||||||||||
| Portfolio |
Period Ended |
Net Asset Value Beginning of Period |
Net Investment Income (Loss) |
Net Realized & Unrealized Gain (Loss) |
Total from Investment Operations |
From Net Investment Income |
From Net Realized Gains |
Total Distributions |
||||||||||||||||||||||
| AST MFS |
12/31/03 | $ | 5.94 | $ | (0.01 | ) | $ | 1.37 | $ | 1.36 | $ | — | $ | — | $ | — | ||||||||||||||
| Growth(11) |
12/31/02 | 8.27 | (0.02 | ) | (2.31 | ) | (2.33 | ) | — | — | — | |||||||||||||||||||
| 12/31/01 | 10.56 | (0.01 | ) | (2.28 | ) | (2.29 | ) | — | † | — | — | |||||||||||||||||||
| 12/31/00 | 11.30 | 0.01 | (0.75 | ) | (0.74 | ) | — | — | — | |||||||||||||||||||||
| 12/31/99 | (3) | 10.00 | 0.01 | 1.29 | 1.30 | — | — | — | ||||||||||||||||||||||
| AST Marsico |
12/31/03 | $ | 11.72 | $ | (0.02 | ) | $ | 3.74 | $ | 3.72 | $ | — | $ | — | $ | — | ||||||||||||||
| Capital Growth |
12/31/02 | 13.88 | (0.04 | ) | (2.12 | ) | (2.16 | ) | — | — | — | |||||||||||||||||||
| 12/31/01 | 18.10 | (0.04 | ) | (3.84 | ) | (3.88 | ) | — | (0.34 | ) | (0.34 | ) | ||||||||||||||||||
| 12/31/00 | 21.63 | (0.01 | ) | (3.00 | ) | (3.01 | ) | — | (0.52 | ) | (0.52 | ) | ||||||||||||||||||
| 12/31/99 | 14.20 | (0.03 | ) | 7.48 | 7.45 | (0.01 | ) | (0.01 | ) | (0.02 | ) | |||||||||||||||||||
| AST Goldman Sachs |
12/31/03 | $ | 16.71 | $ | (0.05 | ) | $ | 4.25 | $ | 4.20 | $ | (0.06 | ) | $ | — | $ | (0.06 | ) | ||||||||||||
| Concentrated Growth |
12/31/02 | 23.97 | 0.06 | (7.18 | ) | (7.12 | ) | (0.14 | ) | — | (0.14 | ) | ||||||||||||||||||
| 12/31/01 | 35.08 | 0.13 | (11.24 | ) | (11.11 | ) | — | — | — | |||||||||||||||||||||
| 12/31/00 | 55.21 | (0.06 | ) | (15.55 | ) | (15.61 | ) | (0.07 | ) | (4.45 | ) | (4.52 | ) | |||||||||||||||||
| 12/31/99 | 37.00 | 0.05 | 19.65 | 19.70 | — | (1.49 | ) | (1.49 | ) | |||||||||||||||||||||
| AST DeAM |
12/31/03 | $ | 7.74 | $ | — | $ | 2.49 | $ | 2.49 | $ | — | $ | — | $ | — | |||||||||||||||
| Large-Cap Growth |
12/31/02 | (8) | 10.00 | — | † | (2.26 | ) | (2.26 | ) | — | — | — | ||||||||||||||||||
| AST DeAM |
12/31/03 | $ | 7.85 | $ | 0.09 | $ | 1.98 | $ | 2.07 | $ | (0.07 | ) | $ | — | $ | (0.07 | ) | |||||||||||||
| Large-Cap Value |
12/31/02 | 9.30 | 0.06 | (1.48 | ) | (1.42 | ) | (0.03 | ) | — | (0.03 | ) | ||||||||||||||||||
| 12/31/01 | 9.85 | 0.01 | (0.55 | ) | (0.54 | ) | (0.01 | ) | — | (0.01 | ) | |||||||||||||||||||
| 12/31/00 | (6) | 10.00 | 0.03 | (0.18 | ) | (0.15 | ) | — | — | — | ||||||||||||||||||||
| AST Alliance/Bernstein |
12/31/03 | $ | 7.25 | $ | 0.03 | $ | 1.85 | $ | 1.88 | $ | (0.05 | ) | $ | — | $ | (0.05 | ) | |||||||||||||
| Growth + Value |
12/31/02 | 9.71 | 0.06 | (2.47 | ) | (2.41 | ) | (0.01 | ) | (0.04 | ) | (0.05 | ) | |||||||||||||||||
| 12/31/01 | (7) | 10.00 | 0.01 | (0.30 | ) | (0.29 | ) | — | — | — | ||||||||||||||||||||
See Notes to Financial Statements.
288
Table of Contents
| Supplemental Data |
Ratios of Expenses to Average Net Assets(1)* |
||||||||||||||||||
| Net Asset Value End of Period |
Total Return |
Net Assets (in 000’s) |
Portfolio Turnover Rate |
After Advisory and Expense |
Before Advisory and Expense |
Ratio of Net Investment Income (Loss) to Average Net Assets(1) |
|||||||||||||
| $ | 7.30 | 22.90 | % | $ | 593,307 | 262 | % | 1.25 | % | 1.25 | % | (0.20 | )% | ||||||
| 5.94 | (28.17 | )% | 526,085 | 198 | % | 1.18 | % | 1.18 | % | (0.28 | )% | ||||||||
| 8.27 | (21.68 | )% | 974,397 | 210 | % | 1.11 | % | 1.11 | % | (0.12 | )% | ||||||||
| 10.56 | (6.53 | )% | 82,051 | 243 | % | 1.24 | % | 1.24 | % | 0.08 | % | ||||||||
| 11.30 | 13.00 | % | 4,868 | 60 | % | 1.35 | % | 1.35 | % | 0.76 | % | ||||||||
| $ | 15.44 | 31.74 | % | $ | 1,710,581 | 82 | % | 1.10 | % | 1.11 | % | (0.21 | )% | ||||||
| 11.72 | (15.56 | )% | 1,081,101 | 109 | % | 1.09 | % | 1.10 | % | (0.29 | )% | ||||||||
| 13.88 | (21.71 | )% | 1,252,427 | 111 | % | 1.06 | % | 1.08 | % | (0.25 | )% | ||||||||
| 18.10 | (14.25 | )% | 1,770,849 | 118 | % | 1.04 | % | 1.06 | % | (0.09 | )% | ||||||||
| 21.63 | 52.58 | % | 1,723,736 | 115 | % | 1.08 | % | 1.08 | % | (0.25 | )% | ||||||||
| $ | 20.85 | 25.25 | % | $ | 1,151,200 | 21 | % | 1.06 | % | 1.13 | % | (0.26 | )% | ||||||
| 16.71 | (29.84 | )% | 1,147,612 | 109 | % | 1.06 | % | 1.09 | % | 0.23 | % | ||||||||
| 23.97 | (31.67 | )% | 2,452,732 | 46 | % | 1.04 | % | 1.07 | % | 0.45 | % | ||||||||
| 35.08 | (30.97 | )% | 4,262,410 | 34 | % | 1.00 | % | 1.04 | % | (0.13 | )% | ||||||||
| 55.21 | 55.01 | % | 5,923,778 | 35 | % | 1.00 | % | 1.04 | % | 0.12 | % | ||||||||
| $ | 10.23 | 32.24 | % | $ | 97,471 | 151 | % | 0.99 | % | 1.10 | % | (0.04 | )% | ||||||
| 7.74 | (22.60 | )% | 76,674 | 101 | % | 0.98 | % | 1.08 | % | 0.07 | % | ||||||||
| $ | 9.85 | 26.59 | % | $ | 133,821 | 161 | % | 0.99 | % | 1.09 | % | 1.13 | % | ||||||
| 7.85 | (15.30 | )% | 109,994 | 202 | % | 1.07 | % | 1.15 | % | 0.96 | % | ||||||||
| 9.30 | (5.53 | )% | 45,357 | 134 | % | 1.35 | % | 1.35 | % | 0.51 | % | ||||||||
| 9.85 | (1.50 | )% | 6,351 | 1 | % | 1.35 | % | 2.41 | % | 3.39 | % | ||||||||
| $ | 9.08 | 26.10 | % | $ | 63,837 | 25 | % | 1.15 | % | 1.15 | % | 0.50 | % | ||||||
| 7.25 | (25.00 | )% | 32,065 | 43 | % | 1.15 | % | 1.15 | % | 0.60 | % | ||||||||
| 9.71 | (2.80 | )% | 34,007 | 95 | % | 1.35 | % | 1.45 | % | 0.46 | % | ||||||||
289
Table of Contents
American Skandia Trust
Financial Highlights (continued)
Per Share Data (for a share outstanding throughout each period)
| Increase (Decrease) from Investment Operations |
Less Distributions |
||||||||||||||||||||||||||||
| Portfolio |
Period Ended |
Net Asset Value Beginning of Period |
Net Investment Income (Loss) |
Net Realized & Unrealized Gain (Loss) |
Total from Investment Operations |
From Net Investment Income |
From Net Realized Gains |
Total Distributions |
|||||||||||||||||||||
| AST Sanford Bernstein |
12/31/03 | $ | 8.77 | $ | 0.18 | $ | 2.28 | $ | 2.46 | $ | (0.06 | ) | $ | — | $ | (0.06 | ) | ||||||||||||
| Core Value |
12/31/02 | 10.14 | 0.09 | (1.43 | ) | (1.34 | ) | (0.03 | ) | — | (0.03 | ) | |||||||||||||||||
| 12/31/01 | (7) | 10.00 | 0.04 | 0.10 | 0.14 | — | — | — | |||||||||||||||||||||
| AST Cohen & Steers Realty |
12/31/03 | $ | 10.05 | $ | 0.49 | $ | 3.02 | $ | 3.51 | $ | (0.41 | ) | $ | (0.24 | ) | $ | (0.65 | ) | |||||||||||
| 12/31/02 | 10.11 | 0.49 | (0.22 | ) | 0.27 | (0.33 | ) | — | (0.33 | ) | |||||||||||||||||||
| 12/31/01 | 10.18 | 0.50 | (0.23 | ) | 0.27 | (0.34 | ) | — | (0.34 | ) | |||||||||||||||||||
| 12/31/00 | 8.36 | 0.32 | 1.78 | 2.10 | (0.28 | ) | — | (0.28 | ) | ||||||||||||||||||||
| 12/31/99 | 8.41 | 0.33 | (0.15 | ) | 0.18 | (0.23 | ) | — | (0.23 | ) | |||||||||||||||||||
| AST Sanford Bernstein |
12/31/03 | $ | 8.75 | $ | 0.11 | $ | 2.24 | $ | 2.35 | $ | (0.12 | ) | $ | — | $ | (0.12 | ) | ||||||||||||
| Managed Index 500 |
12/31/02 | 11.14 | 0.11 | (2.39 | ) | (2.28 | ) | (0.11 | ) | — | (0.11 | ) | |||||||||||||||||
| 12/31/01 | 12.63 | 0.11 | (1.36 | ) | (1.25 | ) | (0.11 | ) | (0.13 | ) | (0.24 | ) | |||||||||||||||||
| 12/31/00 | 14.96 | 0.10 | (1.40 | ) | (1.30 | ) | (0.08 | ) | (0.95 | ) | (1.03 | ) | |||||||||||||||||
| 12/31/99 | 12.78 | 0.08 | 2.56 | 2.64 | (0.06 | ) | (0.40 | ) | (0.46 | ) | |||||||||||||||||||
| AST American Century |
12/31/03 | $ | 9.41 | $ | 0.15 | $ | 2.51 | $ | 2.66 | $ | (0.12 | ) | $ | — | $ | (0.12 | ) | ||||||||||||
| Income & Growth |
12/31/02 | 11.84 | 0.12 | (2.45 | ) | (2.33 | ) | (0.10 | ) | — | (0.10 | ) | |||||||||||||||||
| 12/31/01 | 13.02 | 0.10 | (1.19 | ) | (1.09 | ) | (0.09 | ) | — | (0.09 | ) | ||||||||||||||||||
| 12/31/00 | 15.65 | 0.07 | (1.74 | ) | (1.67 | ) | (0.08 | ) | (0.88 | ) | (0.96 | ) | |||||||||||||||||
| 12/31/99 | 13.47 | 0.09 | 2.84 | 2.93 | (0.11 | ) | (0.64 | ) | (0.75 | ) | |||||||||||||||||||
| AST Alliance |
12/31/03 | $ | 13.57 | $ | 0.14 | $ | 4.19 | $ | 4.33 | $ | (0.19 | ) | $ | — | $ | (0.19 | ) | ||||||||||||
| Growth and Income |
12/31/02 | 18.70 | 0.18 | (4.35 | ) | (4.17 | ) | (0.13 | ) | (0.83 | ) | (0.96 | ) | ||||||||||||||||
| 12/31/01 | 21.38 | 0.12 | (0.15 | ) | (0.03 | ) | (0.19 | ) | (2.46 | ) | (2.65 | ) | |||||||||||||||||
| 12/31/00 | 23.50 | 0.19 | 0.57 | 0.76 | (0.23 | ) | (2.65 | ) | (2.88 | ) | |||||||||||||||||||
| 12/31/99 | 21.68 | 0.23 | 3.04 | 3.27 | (0.25 | ) | (1.20 | ) | (1.45 | ) | |||||||||||||||||||
| AST MFS |
12/31/03 | $ | 6.94 | $ | 0.03 | $ | 1.47 | $ | 1.50 | $ | (0.03 | ) | $ | — | $ | (0.03 | ) | ||||||||||||
| Growth with Income |
12/31/02 | 8.89 | 0.03 | (1.95 | ) | (1.92 | ) | (0.03 | ) | — | (0.03 | ) | |||||||||||||||||
| 12/31/01 | 10.53 | 0.03 | (1.66 | ) | (1.63 | ) | (0.01 | ) | — | (0.01 | ) | ||||||||||||||||||
| 12/31/00 | 10.52 | 0.03 | (0.01 | ) | 0.02 | (0.01 | ) | — | (0.01 | ) | |||||||||||||||||||
| 12/31/99 | (3) | 10.00 | 0.01 | 0.51 | 0.52 | — | — | — | |||||||||||||||||||||
See Notes to Financial Statements.
290
Table of Contents
| Supplemental Data |
Ratios of Expenses to Average Net Assets(1)* |
||||||||||||||||||
| Net Asset of Period |
Total Return |
Net Assets at End of (in 000’s) |
Portfolio Turnover Rate |
After Advisory and Expense |
Before Advisory and Expense |
Ratio of Net Investment Income (Loss) to Average Net Assets(1) |
|||||||||||||
| $ | 11.17 | 28.31 | % | $ | 192,547 | 90 | % | 1.14 | % | 1.14 | % | 1.55 | % | ||||||
| 8.77 | (13.24 | %) | 199,176 | 28 | % | 1.00 | % | 1.00 | % | 1.63 | % | ||||||||
| 10.14 | 1.40 | % | 44,100 | 25 | % | 1.15 | % | 1.15 | % | 1.36 | % | ||||||||
| $ | 12.91 | 37.43 | % | $ | 289,502 | 34 | % | 1.24 | % | 1.24 | % | 5.43 | % | ||||||
| 10.05 | 2.65 | % | 177,520 | 60 | % | 1.26 | % | 1.26 | % | 5.11 | % | ||||||||
| 10.11 | 2.85 | % | 139,631 | 59 | % | 1.21 | % | 1.21 | % | 5.01 | % | ||||||||
| 10.18 | 26.19 | % | 132,486 | 59 | % | 1.28 | % | 1.28 | % | 5.21 | % | ||||||||
| 8.36 | 2.26 | % | 56,697 | 51 | % | 1.27 | % | 1.27 | % | 4.95 | % | ||||||||
| $ | 10.98 | 27.32 | % | $ | 541,492 | 45 | % | 0.84 | % | 0.84 | % | 1.03 | % | ||||||
| 8.75 | (20.64 | %) | 441,169 | 36 | % | 0.84 | % | 0.84 | % | 1.04 | % | ||||||||
| 11.14 | (10.01 | %) | 623,363 | 54 | % | 0.77 | % | 0.78 | % | 0.95 | % | ||||||||
| 12.63 | (8.82 | %) | 704,897 | 84 | % | 0.78 | % | 0.78 | % | 0.84 | % | ||||||||
| 14.96 | 21.23 | % | 633,567 | 101 | % | 0.79 | % | 0.77 | % | 0.74 | % | ||||||||
| $ | 11.95 | 28.78 | % | $ | 305,810 | 81 | % | 0.99 | % | 0.99 | % | 1.46 | % | ||||||
| 9.41 | (19.81 | %) | 259,122 | 83 | % | 0.98 | % | 0.98 | % | 1.04 | % | ||||||||
| 11.84 | (8.44 | %) | 374,739 | 55 | % | 0.94 | % | 0.94 | % | 0.76 | % | ||||||||
| 13.02 | (10.77 | %) | 487,880 | 61 | % | 0.94 | % | 0.94 | % | 0.68 | % | ||||||||
| 15.65 | 22.98 | % | 360,630 | 125 | % | 0.98 | % | 0.98 | % | 0.86 | % | ||||||||
| $ | 17.71 | 32.43 | % | $ | 1,836,529 | 62 | % | 0.97 | % | 0.99 | % | 1.01 | % | ||||||
| 13.57 | (23.28 | %) | 1,169,698 | 79 | % | 0.96 | % | 0.98 | % | 0.99 | % | ||||||||
| 18.70 | (0.48 | %) | 1,875,230 | 103 | % | 0.94 | % | 0.96 | % | 0.74 | % | ||||||||
| 21.38 | 5.52 | % | 1,595,755 | 144 | % | 1.05 | % | 1.06 | % | 0.96 | % | ||||||||
| 23.50 | 16.09 | % | 1,498,306 | 69 | % | 0.92 | % | 0.94 | % | 1.09 | % | ||||||||
| $ | 8.41 | 21.71 | % | $ | 109,339 | 95 | % | 1.19 | % | 1.19 | % | 0.46 | % | ||||||
| 6.94 | (21.62 | %) | 87,543 | 82 | % | 1.19 | % | 1.19 | % | 0.35 | % | ||||||||
| 8.89 | (15.46 | %) | 108,714 | 99 | % | 1.11 | % | 1.11 | % | 0.42 | % | ||||||||
| 10.53 | 0.19 | % | 77,618 | 62 | % | 1.23 | % | 1.26 | % | 0.34 | % | ||||||||
| 10.52 | 5.20 | % | 8,757 | 6 | % | 1.23 | % | 1.23 | % | 1.45 | % | ||||||||
291
Table of Contents
American Skandia Trust
Financial Highlights (continued)
Per Share Data (for a share outstanding throughout each period)
| Increase (Decrease) from Investment Operations |
Less Distributions |
|||||||||||||||||||||||||||
| Portfolio |
Period Ended |
Net Asset Value Beginning of Period |
Net Investment Income (Loss) |
Net Realized & Unrealized Gain (Loss) |
Total from Investment Operations |
From Net Investment Income |
From Net Realized Gains |
Total Distributions |
||||||||||||||||||||
| AST INVESCO |
12/31/03 | $ | 12.55 | $ | 0.24 | $ | 2.18 | $ | 2.42 | $ | (0.31 | ) | $ | — | $ | (0.31 | ) | |||||||||||
| Capital Income |
12/31/02 | 15.59 | 0.30 | (2.96 | ) | (2.66 | ) | (0.38 | ) | — | (0.38 | ) | ||||||||||||||||
| 12/31/01 | 17.59 | 0.34 | (1.82 | ) | (1.48 | ) | (0.36 | ) | (0.16 | ) | (0.52 | ) | ||||||||||||||||
| 12/31/00 | 18.65 | 0.38 | 0.32 | 0.70 | (0.36 | ) | (1.40 | ) | (1.76 | ) | ||||||||||||||||||
| 12/31/99 | 17.50 | 0.36 | 1.61 | 1.97 | (0.32 | ) | (0.50 | ) | (0.82 | ) | ||||||||||||||||||
| AST DeAM |
12/31/03 | $ | 9.38 | $ | 0.12 | $ | 1.69 | $ | 1.81 | $ | (0.12 | ) | $ | — | $ | (0.12 | ) | |||||||||||
| Global Allocation |
12/31/02 | 11.46 | 0.11 | (1.84 | ) | (1.73 | ) | (0.35 | ) | — | (0.35 | ) | ||||||||||||||||
| 12/31/01 | 13.30 | 0.34 | (1.87 | ) | (1.53 | ) | (0.31 | ) | — | (0.31 | ) | |||||||||||||||||
| 12/31/00 | 15.24 | 0.34 | (0.89 | ) | (0.55 | ) | (0.32 | ) | (1.07 | ) | (1.39 | ) | ||||||||||||||||
| 12/31/99 | 14.13 | 0.32 | 2.30 | 2.62 | (0.35 | ) | (1.16 | ) | (1.51 | ) | ||||||||||||||||||
| AST American Century |
12/31/03 | $ | 11.14 | $ | 0.18 | $ | 1.87 | $ | 2.05 | $ | (0.27 | ) | $ | — | $ | (0.27 | ) | |||||||||||
| Strategic Balanced |
12/31/02 | 12.62 | 0.26 | (1.47 | ) | (1.21 | ) | (0.27 | ) | — | (0.27 | ) | ||||||||||||||||
| 12/31/01 | 13.70 | 0.27 | (0.78 | ) | (0.51 | ) | (0.25 | ) | (0.32 | ) | (0.57 | ) | ||||||||||||||||
| 12/31/00 | 15.30 | 0.32 | (0.81 | ) | (0.49 | ) | (0.23 | ) | (0.88 | ) | (1.11 | ) | ||||||||||||||||
| 12/31/99 | 13.66 | 0.20 | 1.56 | 1.76 | (0.12 | ) | — | (0.12 | ) | |||||||||||||||||||
| AST T. Rowe Price |
12/31/03 | $ | 12.74 | $ | 0.24 | $ | 2.73 | $ | 2.97 | $ | (0.35 | ) | $ | — | $ | (0.35 | ) | |||||||||||
| Asset Allocation |
12/31/02 | 15.05 | 0.34 | (1.76 | ) | (1.42 | ) | (0.39 | ) | (0.50 | ) | (0.89 | ) | |||||||||||||||
| 12/31/01 | 18.12 | 0.41 | (1.21 | ) | (0.80 | ) | (0.52 | ) | (1.75 | ) | (2.27 | ) | ||||||||||||||||
| 12/31/00 | 18.86 | 0.52 | (0.63 | ) | (0.11 | ) | (0.45 | ) | (0.18 | ) | (0.63 | ) | ||||||||||||||||
| 12/31/99 | 17.47 | 0.44 | 1.32 | 1.76 | (0.36 | ) | (0.01 | ) | (0.37 | ) | ||||||||||||||||||
| AST T. Rowe Price |
12/31/03 | $ | 11.10 | $ | 0.27 | $ | 1.12 | $ | 1.39 | $ | (0.37 | ) | $ | (0.02 | ) | $ | (0.39 | ) | ||||||||||
| Global Bond |
12/31/02 | 9.65 | 0.05 | 1.40 | 1.45 | — | — | — | ||||||||||||||||||||
| 12/31/01 | 9.40 | 0.56 | (0.31 | ) | 0.25 | — | — | — | ||||||||||||||||||||
| 12/31/00 | 9.60 | 0.48 | (0.53 | ) | (0.05 | ) | (0.15 | ) | — | (0.15 | ) | |||||||||||||||||
| 12/31/99 | 11.46 | 0.33 | (1.25 | ) | (0.92 | ) | (0.71 | ) | (0.23 | ) | (0.94 | ) | ||||||||||||||||
| AST Federated High Yield |
12/31/03 | $ | 7.89 | $ | 0.62 | $ | 0.95 | $ | 1.57 | $ | (0.69 | ) | $ | — | $ | (0.69 | ) | |||||||||||
| 12/31/02 | 8.86 | 0.69 | (0.70 | ) | (0.01 | ) | (0.96 | ) | — | (0.96 | ) | |||||||||||||||||
| 12/31/01 | 9.71 | 0.74 | (0.66 | ) | 0.08 | (0.93 | ) | — | (0.93 | ) | ||||||||||||||||||
| 12/31/00 | 11.92 | 1.18 | (2.23 | ) | (1.05 | ) | (1.16 | ) | — | (1.16 | ) | |||||||||||||||||
| 12/31/99 | 12.65 | 1.03 | (0.77 | ) | 0.26 | (0.91 | ) | (0.08 | ) | (0.99 | ) | |||||||||||||||||
See Notes to Financial Statements.
292
Table of Contents
| Supplemental Data |
Ratios of Expenses to Average Net Assets(1)* |
||||||||||||||||||
| Net Asset Value End of Period |
Total Return |
Net Assets at End of Period (in 000’s) |
Portfolio Turnover Rate |
After Advisory Fee Waiver and Expense Reimbursement |
Before Advisory Fee Waiver and Expense Reimbursement |
Ratio of Net Investment Income (Loss) to Average Net Assets(1) |
|||||||||||||
| $ | 14.66 | 19.94 | % | $ | 640,112 | 100 | % | 0.98 | % | 0.98 | % | 1.50 | % | ||||||
| 12.55 | (17.49 | %) | 660,533 | 32 | % | 0.95 | % | 0.95 | % | 1.80 | % | ||||||||
| 15.59 | (8.59 | %) | 1,029,069 | 26 | % | 0.91 | % | 0.92 | % | 2.17 | % | ||||||||
| 17.59 | 4.74 | % | 1,173,070 | 55 | % | 0.94 | % | 0.95 | % | 2.25 | % | ||||||||
| 18.65 | 11.74 | % | 1,048,064 | 76 | % | 0.93 | % | 0.93 | % | 2.10 | % | ||||||||
| $ | 11.07 | 19.53 | % | $ | 264,808 | 18 | % | 0.14 | % | 0.14 | % | 1.08 | % | ||||||
| 9.38 | (15.43 | %) | 284,362 | 160 | % | 0.47 | % | 0.47 | % | 0.91 | % | ||||||||
| 11.46 | (11.73 | %) | 481,159 | 77 | % | 0.89 | % | 0.95 | % | 2.68 | % | ||||||||
| 13.30 | (4.36 | %) | 622,641 | 60 | % | 0.95 | % | 0.95 | % | 2.70 | % | ||||||||
| 15.24 | 20.85 | % | 499,571 | 154 | % | 1.00 | % | 1.00 | % | 2.37 | % | ||||||||
| $ | 12.92 | 18.87 | % | $ | 235,818 | 145 | % | 1.11 | % | 1.11 | % | 1.57 | % | ||||||
| 11.14 | (9.74 | %) | 179,368 | 126 | % | 1.10 | % | 1.10 | % | 2.16 | % | ||||||||
| 12.62 | (3.80 | %) | 210,722 | 124 | % | 1.08 | % | 1.08 | % | 2.19 | % | ||||||||
| 13.70 | (3.11 | %) | 217,483 | 125 | % | 1.10 | % | 1.10 | % | 2.33 | % | ||||||||
| 15.30 | 12.97 | % | 216,748 | 104 | % | 1.10 | % | 1.10 | % | 1.93 | % | ||||||||
| $ | 15.36 | 24.02 | % | $ | 360,152 | 94 | % | 1.12 | % | 1.12 | % | 1.84 | % | ||||||
| 12.74 | (9.89 | %) | 269,119 | 107 | % | 1.11 | % | 1.11 | % | 2.37 | % | ||||||||
| 15.05 | (4.79 | %) | 332,791 | 103 | % | 1.10 | % | 1.10 | % | 2.46 | % | ||||||||
| 18.12 | (0.48 | %) | 395,375 | 43 | % | 1.08 | % | 1.08 | % | 2.64 | % | ||||||||
| 18.86 | 10.28 | % | 447,542 | 17 | % | 1.07 | % | 1.07 | % | 2.65 | % | ||||||||
| $ | 12.10 | 12.86 | % | $ | 229,630 | 196 | % | 1.06 | % | 1.06 | % | 2.57 | % | ||||||
| 11.10 | 15.03 | % | 209,594 | 323 | % | 1.06 | % | 1.06 | % | 3.13 | % | ||||||||
| 9.65 | 2.66 | % | 108,014 | 187 | % | 0.87 | % | 1.08 | % | 4.83 | % | ||||||||
| 9.40 | (0.45 | %) | 122,200 | 171 | % | 1.12 | % | 1.12 | % | 4.35 | % | ||||||||
| 9.60 | (8.33 | %) | 138,144 | 106 | % | 1.11 | % | 1.11 | % | 3.51 | % | ||||||||
| $ | 8.77 | 21.59 | % | $ | 868,511 | 65 | % | 0.93 | % | 0.93 | % | 7.56 | % | ||||||
| 7.89 | 0.04 | % | 576,441 | 41 | % | 0.94 | % | 0.94 | % | 9.02 | % | ||||||||
| 8.86 | 0.14 | % | 525,821 | 48 | % | 0.95 | % | 0.95 | % | 10.22 | % | ||||||||
| 9.71 | (9.69 | %) | 497,882 | 20 | % | 0.96 | % | 0.96 | % | 10.36 | % | ||||||||
| 11.92 | 2.00 | % | 623,788 | 39 | % | 0.94 | % | 0.94 | % | 9.09 | % | ||||||||
293
Table of Contents
American Skandia Trust
Financial Highlights (continued)
Per Share Data (for a share outstanding throughout each period)
| Increase (Decrease) from Investment Operations |
Less Distributions |
|||||||||||||||||||||||||||||
| Portfolio |
Period Ended |
Net Asset Value Beginning of Period |
Net Investment Income (Loss) |
Net Realized & Unrealized Gain (Loss) |
Total from Investment Operations |
From Net Investment Income |
From Net Realized Gains |
Total Distributions |
||||||||||||||||||||||
| AST Lord Abbett |
12/31/03 | $ | 10.07 | $ | 0.44 | $ | 1.37 | $ | 1.81 | $ | (0.44 | ) | $ | — | $ | (0.44 | ) | |||||||||||||
| Bond-Debenture |
12/31/02 | 10.45 | 0.42 | (0.39 | ) | 0.03 | (0.41 | ) | — | (0.41 | ) | |||||||||||||||||||
| 12/31/01 | 10.15 | 0.39 | (0.08 | ) | 0.31 | (0.01 | ) | — | (0.01 | ) | ||||||||||||||||||||
| 12/31/00 | (6) | 10.00 | 0.02 | 0.13 | 0.15 | — | — | — | ||||||||||||||||||||||
| AST DeAM Bond |
12/31/03 | $ | 10.77 | $ | 0.35 | $ | 0.05 | $ | 0.40 | $ | (0.27 | ) | $ | (0.34 | ) | $ | (0.61 | ) | ||||||||||||
| 12/31/02 | (8) | 10.00 | 0.26 | 0.51 | 0.77 | — | — | — | ||||||||||||||||||||||
| AST PIMCO Total |
12/31/03 | $ | 12.24 | $ | 0.35 | $ | 0.27 | $ | 0.62 | $ | (0.43 | ) | $ | (0.44 | ) | $ | (0.87 | ) | ||||||||||||
| Return Bond |
12/31/02 | 11.93 | 0.39 | 0.66 | 1.05 | (0.52 | ) | (0.22 | ) | (0.74 | ) | |||||||||||||||||||
| 12/31/01 | 11.60 | 0.56 | 0.42 | 0.98 | (0.65 | ) | — | (0.65 | ) | |||||||||||||||||||||
| 12/31/00 | 10.99 | 0.65 | 0.56 | 1.21 | (0.60 | ) | — | (0.60 | ) | |||||||||||||||||||||
| 12/31/99 | 12.02 | 0.58 | (0.71 | ) | (0.13 | ) | (0.52 | ) | (0.38 | ) | (0.90 | ) | ||||||||||||||||||
| AST PIMCO Limited |
12/31/03 | $ | 11.36 | $ | 0.22 | $ | 0.14 | $ | 0.36 | $ | (0.22 | ) | $ | (0.13 | ) | $ | (0.35 | ) | ||||||||||||
| Maturity Bond |
12/31/02 | 11.30 | 0.24 | 0.43 | 0.67 | (0.47 | ) | (0.14 | ) | (0.61 | ) | |||||||||||||||||||
| 12/31/01 | 11.07 | 0.50 | 0.36 | 0.86 | (0.63 | ) | — | (0.63 | ) | |||||||||||||||||||||
| 12/31/00 | 10.84 | 0.68 | 0.17 | 0.85 | (0.62 | ) | — | (0.62 | ) | |||||||||||||||||||||
| 12/31/99 | 11.08 | 0.59 | (0.22 | ) | 0.37 | (0.61 | ) | — | (0.61 | ) | ||||||||||||||||||||
| AST Money Market |
12/31/03 | $ | 1.00 | $ | — | † | $ | — | $ | — | † | $ | — | † | $ | — | † | $ | — | † | ||||||||||
| 12/31/02 | 1.00 | 0.01 | — | 0.01 | (0.01 | ) | — | † | (0.01 | ) | ||||||||||||||||||||
| 12/31/01 | 1.00 | 0.04 | — | 0.04 | (0.04 | ) | — | † | (0.04 | ) | ||||||||||||||||||||
| 12/31/00 | 1.00 | 0.06 | — | 0.06 | (0.06 | ) | — | † | (0.06 | ) | ||||||||||||||||||||
| 12/31/99 | 1.00 | 0.04 | — | 0.04 | (0.04 | ) | — | † | (0.04 | ) | ||||||||||||||||||||
| (1) | Annualized for periods less than one year. |
| (2) | Commenced operations on January 4, 1999. |
| (3) | Commenced operations on October 18, 1999. |
| (4) | Commenced operations on January 3, 2000. |
| (5) | Commenced operations on May 1, 2000. |
| (6) | Commenced operations on October 23, 2001. |
| (7) | Commenced operations on May 1, 2001. |
| (8) | Commenced operations on May 1, 2002. |
| (9) | Merged with AST American Century International Growth on December 19, 2003. |
| (10) | Merged with AST Scudder Japan on May 3, 2002. |
| (11) | Merged with AST Alger Growth on February 16, 2001. |
| (12) | Merged with AST Alger Mid-Cap Growth on February 16, 2001. |
| (13) | Merged with AST Kinetics Internet on May 3, 2002. |
| * | Includes commissions received by American Skandia Marketing, Inc. under the Portfolio’s Distribution Plan, as described in Note 3 of the Financial Statements, for the years ended December 31, 1999, 2000, 2001, 2002 and 2003. |
| † | Amount represents less than a penny per share. |
See Notes to Financial Statements.
294
Table of Contents
| Supplemental Data |
Ratios of Expenses to Average Net Assets (1)* |
||||||||||||||||||
| Net Asset Value End of Period |
Total Return |
Net Assets at End of Period (in 000’s) |
Portfolio Turnover Rate |
After Advisory Fee Waiver and Expense Reimbursement |
Before Advisory Fee Waiver and Expense Reimbursement |
Ratio of Net Investment Income (Loss) to Average Net Assets(1) |
|||||||||||||
| $ | 11.44 | 18.74 | % | $ | 346,412 | 84 | % | 1.04 | % | 1.04 | % | 6.31 | % | ||||||
| 10.07 | 0.41 | % | 164,939 | 43 | % | 1.04 | % | 1.04 | % | 7.16 | % | ||||||||
| 10.45 | 3.04 | % | 62,456 | 102 | % | 1.10 | % | 1.10 | % | 7.23 | % | ||||||||
| 10.15 | 1.50 | % | 6,783 | 9 | % | 1.20 | % | 3.07 | % | 4.39 | % | ||||||||
| $ | 10.56 | 3.81 | % | $ | 115,882 | 305 | % | 0.95 | % | 1.10 | % | 2.99 | % | ||||||
| 10.77 | 7.70 | % | 131,736 | 240 | % | 0.93 | % | 1.08 | % | 3.71 | % | ||||||||
| $ | 11.99 | 5.32 | % | $ | 2,107,944 | 222 | % | 0.78 | % | 0.80 | % | 2.85 | % | ||||||
| 12.24 | 9.22 | % | 2,255,048 | 229 | % | 0.78 | % | 0.80 | % | 3.90 | % | ||||||||
| 11.93 | 8.87 | % | 1,638,346 | 343 | % | 0.79 | % | 0.81 | % | 5.02 | % | ||||||||
| 11.60 | 11.57 | % | 1,258,218 | 365 | % | 0.82 | % | 0.82 | % | 6.14 | % | ||||||||
| 10.99 | (1.09 | %) | 1,005,763 | 227 | % | 0.82 | % | 0.82 | % | 5.46 | % | ||||||||
| $ | 11.37 | 3.28 | % | $ | 1,005,924 | 208 | % | 0.82 | % | 0.82 | % | 1.74 | % | ||||||
| 11.36 | 6.21 | % | 1,058,843 | 271 | % | 0.83 | % | 0.83 | % | 2.87 | % | ||||||||
| 11.30 | 7.97 | % | 611,197 | 445 | % | 0.83 | % | 0.83 | % | 5.10 | % | ||||||||
| 11.07 | 8.43 | % | 417,842 | 171 | % | 0.87 | % | 0.87 | % | 6.14 | % | ||||||||
| 10.84 | 3.37 | % | 406,604 | 178 | % | 0.86 | % | 0.86 | % | 5.51 | % | ||||||||
| $ | 1.00 | 0.63 | % | $ | 1,762,117 | N/A | 0.59 | % | 0.64 | % | 0.63 | % | |||||||
| 1.00 | 1.29 | % | 2,744,716 | N/A | 0.58 | % | 0.63 | % | 1.27 | % | |||||||||
| 1.00 | 3.77 | % | 2,652,093 | N/A | 0.59 | % | 0.64 | % | 3.60 | % | |||||||||
| 1.00 | 6.07 | % | 2,244,193 | N/A | 0.60 | % | 0.65 | % | 5.93 | % | |||||||||
| 1.00 | 4.60 | % | 2,409,157 | N/A | 0.60 | % | 0.65 | % | 4.52 | % | |||||||||
295
Table of Contents
American Skandia Trust
Notes To Financial Statements
December 31, 2003
1. ORGANIZATION
American Skandia Trust (the “Trust”) is an open-end management investment company, registered under the Investment Company Act of 1940, as amended. The Trust was organized on October 31, 1988 as a Massachusetts business trust. The Trust operates as a series company and, at December 31, 2003, issued 41 classes of shares of beneficial interest (collectively the “Portfolios”).
The Portfolios of the Trust have the following investments objectives:
AST Strong International Equity Portfolio (“Strong International Equity”): Capital growth by investing primarily in equity securities of foreign companies.
AST William Blair International Growth Portfolio (“William Blair International Growth”): Long-term capital growth by investing primarily in equity securities of foreign companies.
AST American Century International Growth Portfolio (“American Century International Growth”): Capital growth by investing primarily in equity securities of foreign companies.
AST DeAM International Equity Portfolio (“DeAM International Equity”): Capital growth by investing primarily in equity securities of foreign companies represented in the MSCI EAFE Index.
AST MFS Global Equity Portfolio (“MFS Global Equity”): Capital growth by investing primarily in common stocks and related securities of U.S. and foreign issuers.
AST PBHG Small-Cap Growth Portfolio (“PBHG Small-Cap Growth”): Capital growth by investing in common stocks of small capitalization companies.
AST DeAM Small-Cap Growth Portfolio (“DeAM Small-Cap Growth”): Maximize capital growth by investing primarily in equity securities of small capitalization companies included in the Russell 2000 Growth Index.
AST Federated Aggressive Growth Portfolio (“Federated Aggressive Growth”): Capital growth by investing primarily in stocks of small companies that are traded on national securities exchanges, Nasdaq stock exchange and the over-the-counter-market.
AST Goldman Sachs Small-Cap Value Portfolio (“Goldman Sachs Small-Cap Value”): Long-term capital growth by investing primarily in equity securities of small capitalization companies that are believed to be undervalued.
AST Gabelli Small-Cap Value Portfolio (“Gabelli Small-Cap Value”): Long-term capital growth by investing primarily in stocks and equity-related securities of small capitalization companies that appear to be undervalued.
AST DeAM Small-Cap Value Portfolio (“DeAM Small-Cap Value”): Maximum capital growth by investing primarily in equity securities of small capitalization companies included in the Russell 2000 Value Index.
AST Goldman Sachs Mid-Cap Growth Portfolio (“Goldman Sachs Mid-Cap Growth”): Long-term capital growth by investing primarily in equity securities of medium-sized companies.
AST Neuberger Berman Mid-Cap Growth Portfolio (“Neuberger Berman Mid-Cap Growth”): Capital growth by investing primarily in common stocks of medium capitalization companies.
296
Table of Contents
AST Neuberger Berman Mid-Cap Value Portfolio (“Neuberger Berman Mid-Cap Value”): Capital growth by investing primarily in common stocks of medium capitalization companies.
AST Alger All-Cap Growth Portfolio (“Alger All-Cap Growth”): Long-term capital growth by investing in common and preferred stocks.
AST Gabelli All-Cap Value Portfolio (“Gabelli All-Cap Value”): Capital growth by investing in readily marketable equity securities.
AST T. Rowe Price Natural Resources Portfolio (“T. Rowe Price Natural Resources”): Long-term capital growth by investing primarily in common stocks of companies that own or develop natural resources and other basic commodities.
AST Alliance Growth Portfolio (“Alliance Growth”): Long-term capital growth by investing predominantly in the equity securities of a limited number of large, high-quality U.S. companies.
AST MFS Growth Portfolio (“MFS Growth”): Long-term capital growth and future income by investing primarily in common stocks and related securities.
AST Marsico Capital Growth Portfolio (“Marsico Capital Growth”): Capital growth by investing primarily in common stocks, with the majority of the portfolio’s assets in large capitalization stocks.
AST Goldman Sachs Concentrated Growth Portfolio (“Goldman Sachs Concentrated Growth”): Capital growth by investing primarily in equity securities.
AST DeAM Large-Cap Growth Portfolio (“DeAM Large-Cap Growth”): Maximum capital growth by investing primarily in equity securities of large capitalization companies included in the Russell 10000 Growth Index.
AST DeAM Large-Cap Value Portfolio (“DeAM Large-Cap Value”): Maximum capital growth by investing in equity securities of large capitalization companies included in the Russell 1000 Value Index.
AST Alliance/Bernstein Growth + Value Portfolio (“Alliance/Bernstein Growth + Value”): Capital growth by investing approximately 50% of assets in growth stocks of large companies and 50% of assets in value stocks of large companies.
AST Sanford Bernstein Core Value Portfolio (“Sanford Bernstein Core Value”): Long-term capital growth by investing primarily in common stocks of large capitalization companies that appear to be undervalued.
AST Cohen & Steers Realty Portfolio (“Cohen & Steers Realty”): Maximize total return by investing primarily in equity securities of real estate companies.
AST Sanford Bernstein Managed Index 500 Portfolio (“Sanford Bernstein Managed Index 500”): Outperform the S&P 500 Stock Index by investing primarily in common stocks included in the S&P 500.
AST American Century Income & Growth Portfolio (“American Century Income & Growth”): Capital growth and, secondarily, current income by investing primarily in stocks of large U.S. companies selected through quantitative investment techniques.
297
Table of Contents
American Skandia Trust
Notes To Financial Statements (continued)
December 31, 2003
AST Alliance Growth and Income Portfolio (“Alliance Growth and Income”): Long-term capital growth and income by investing primarily in common stocks that are believed to be selling at reasonable valuations in relation to their fundamental business prospects.
AST MFS Growth with Income Portfolio (“MFS Growth with Income”): Long-term growth of capital with a secondary objective to seek reasonable current income by investing primarily in common stocks and related securities.
AST INVESCO Capital Income Portfolio (“INVESCO Capital Income”): Capital growth and current income by investing primarily in dividend-paying common and preferred stocks, and to a lesser extent in fixed income securities.
AST DeAM Global Allocation Portfolio (“DeAM Global Allocation”): A high level of total return by investing primarily in a diversified portfolio of mutual funds.
AST American Century Strategic Balanced Portfolio (“American Century Strategic Balanced”): Capital growth by investing approximately 60% of its assets in equity securities and the remainder in bonds and other fixed income securities.
AST T. Rowe Price Asset Allocation Portfolio (“T. Rowe Price Asset Allocation”): A high level of total return by investing primarily in a diversified portfolio of equity and fixed income securities.
AST T. Rowe Price Global Bond Portfolio (“T. Rowe Price Global Bond”): High current income and capital growth by investing primarily in high-quality foreign and U.S. dollar-denominated bonds.
AST Federated High Yield Portfolio (“Federated High Yield”): High current income by investing primarily in lower-quality fixed income securities rated BBB and below. Lower rated or unrated (i.e., high yield) securities are more likely to react to developments affecting market risk (general market liquidity) and credit risk (an issuer’s inability to meet principal and interest payments on its obligations) than are more highly rated securities, which react primarily to movements in the general level of interest rates. The ability of issuers of debt securities held by the Fund to meet their obligations may be affected by economic developments in a specific industry or region.
AST Lord Abbett Bond-Debenture Portfolio (“Lord Abbett Bond-Debenture”): High current income and the opportunity for capital appreciation to produce a high total return by investing primarily in high yield and investment grade debt securities, securities convertible into common stock and preferred stock.
AST DeAM Bond Portfolio (“DeAM Bond”): High current income by investing primarily in a wide range of intermediate-term, higher-quality fixed income securities.
AST PIMCO Total Return Bond Portfolio (“PIMCO Total Return Bond”): Maximize total return, consistent with preservation of capital by investing primarily in higher-quality fixed income securities of varying maturities, so that the portfolio’s expected average duration will be from three to six years.
AST PIMCO Limited Maturity Bond Portfolio (“PIMCO Limited Maturity Bond”): Maximize total return, consistent with preservation of capital by investing primarily in higher-quality fixed income securities of varying maturities, so that the portfolio’s expected average duration will be from one to three years.
298
Table of Contents
AST Money Market Portfolio (“Money Market”): Maximize current income and maintain high levels of liquidity by investing in high-quality, short-term, U.S. dollar-denominated instruments.
On May 1, 2003, Skandia Insurance Company Ltd. (publ), the ultimate parent of the Trust’s investment manager, announced that it reached a definitive agreement with Prudential Financial, Inc. the parent of Prudential Investments LLC to sell American Skandia, Inc. and its subsidiaries including American Skandia Investment Services, Incorporated the Trust’s investment manager. Upon completion of this transaction American Skandia Investment Services, Incorporated and Prudential Investments LLC became co-managers of the Trust.
2. SIGNIFICANT ACCOUNTING POLICIES
The following accounting policies are in conformity with accounting principles generally accepted in the United States of America. Such policies are consistently followed by the Trust and the Portfolios in the preparation of their financial statements. The preparation of financial statements requires management to make estimates and assumptions that affect the reported amounts and disclosures in the financial statements. Actual results could differ from those estimates.
Security Valuation
Securities listed on a securities exchange are normally valued at the last sale price on such exchange on the day of valuation or, if there was no sale on such day, at the mean between the last reported bid and ask prices, or at the last bid price on such day in the absence of an asked price. Securities traded via Nasdaq are valued at the official closing price provided by Nasdaq. Securities that are actively traded in the over-the-counter market, including listed securities for which the primary market is believed by the co-managers, in consultation with the subadviser(s); to be over-the-counter, are valued by an independent pricing agent or principal market maker. Options on securities and indices traded on an exchange are valued at the mean between the most recently quoted bid and asked prices on such exchange. Futures contracts and options thereon traded on a commodities exchange or board of trade are valued at the last sale price at the close of trading on such exchange or board of trade or, if there was no sale on the applicable commodities exchange or board of trade on such day, at the mean between the most recently quoted bid and asked prices on such exchange or board of trade or at the last bid price in the absence of an asked price. Securities for which market quotations are not readily available, or whose values have been affected by events occurring after the close of the security’s foreign market and before the Portfolio’s normal pricing time, are valued at fair value in accordance with procedures approved by the Board of Trustees. Investments in mutual funds are valued at their net asset value as of the close of the New York Stock Exchange on the date of the valuation.
Money Market uses amortized cost to value short-term securities. Short-term securities that are held in the other Portfolios which mature in more than 60 days are valued at current market quotations and those short-term securities which mature in 60 days or less are valued at amortized cost which approximates market value.
Restricted Securities
The Portfolios may hold up to 15% of their net assets in illiquid securities, including those which are restricted as to disposition under securities law (“restricted securities”). Certain issues of restricted securities held by the Portfolios at December 31, 2003 include registration rights, under which the Portfolios may demand registration by the issuer,
299
Table of Contents
American Skandia Trust
Notes To Financial Statements (continued)
December 31, 2003
of which the Portfolio may bear the cost of such registration. Restricted securities, sometimes referred to as private placements, are valued pursuant to the valuation procedures noted above.
Foreign Currency Translation
Portfolio securities and other assets and liabilities denominated in foreign currencies are translated each business day into U.S. dollars based on the current rates of exchange. Purchases and sales of Portfolio securities and income and expenses are translated into U.S. dollars on the respective dates of such transactions.
The Portfolios do not isolate that portion of the results of operations resulting from changes in foreign exchange rates on investments from the fluctuations arising from changes in market prices of securities held. Such fluctuations are included with net realized and unrealized gain or loss from investments.
Net realized foreign exchange gains and losses include gains and losses from sales and maturities of foreign currencies, gains and losses realized between the trade and settlement dates of foreign securities transactions, and the difference between the amount of net investment income accrued on foreign securities and the U.S. dollar amount actually received. Net unrealized foreign exchange gains and losses include gains and losses from changes in the value of assets and liabilities other than Portfolio securities, resulting from changes in exchange rates.
Forward Currency Contracts
A forward currency contract is a commitment to purchase or sell a foreign currency at a future date at a negotiated forward rate. Certain Portfolios, as defined in the prospectus, enter into forward currency contracts in order to hedge their exposure to changes in foreign currency exchange rates on their foreign portfolio holdings or on specific receivables and payables denominated in a foreign currency. The contracts are valued daily at forward exchange rates and any unrealized gain or loss is included in net unrealized appreciation or depreciation on investments. Gain or loss is realized on the settlement date of the contract equal to the difference between the settlement value of the original and renegotiated forward contracts. This gain or loss, if any, is included in net realized gain or loss on foreign currency transactions. Risks may arise upon entering into these contracts from the potential inability of the counterparties to meet the terms of their contracts.
Options
The Portfolios (except for Money Market) may either purchase or write options in order to hedge against adverse market movements or fluctuations in value caused by changes in prevailing interest rates with respect to securities or financial instruments which the Portfolio currently owns or intends to purchase. The Portfolio’s principal reason for writing options is to realize, through receipt of premiums, a greater current return than would be realized on the underlying security alone. When the Portfolio purchases an option, it pays a premium and an amount equal to that premium is recorded as an asset. When the Portfolio writes an option, it receives a premium and an amount equal to that premium is recorded as a liability. The asset or liability is adjusted daily to reflect the current market value of the option.
If an option expires unexercised, the Portfolio realizes a gain or loss to the extent of the premium received or paid. If an option is exercised, the premium received or paid is recorded as an adjustment to the proceeds from the sale or the
300
Table of Contents
cost of the purchase. The difference between the premium and the amount received or paid on effecting a closing purchase or sale transaction is also treated as a realized gain or loss. Gain or loss on purchased options is included in net realized gain or loss on investment transactions. Gain or loss on written options is presented separately as net realized gain or loss on written option transactions.
The Portfolio, as writer of an option, may have no control over whether the underlying securities or financial instruments may be sold (called) or purchased (put). As a result, the Portfolio bears the market risk of an unfavorable change in the price of the security or financial instrument underlying the written option. The Portfolio, as purchaser of an option, bears the risk of the potential inability of the counterparties to meet the terms of their contracts.
When a Portfolio writes an option on a swap, an amount equal to any premium received by the Portfolio is recorded as a liability and is subsequently adjusted to the current market value of the written option on the swap. If a call option on a swap is exercised, the Portfolio becomes obligated to pay a fixed interest rate (noted as the strike price) and receive a variable interest rate on a notional amount. If a put option on a swap is exercised, the Portfolio becomes obligated to pay a variable interest rate and receive a fixed interest rate (noted as the strike price) on a notional amount. Premiums received from writing options on swaps that expire or are exercised are treated as realized gains upon the expiration or exercise of such options on swaps. The risk associated with writing put and call options on swaps is that the Portfolio will be obligated to be party to a swap agreement if an option on a swap is exercised.
Financial Futures Contracts
A financial futures contract is an agreement to purchase (long) or sell (short) an agreed amount of securities at a set price for delivery on a future date. Upon entering into a financial futures contract, the Portfolio is required to pledge to the broker an amount of cash and/or other assets equal to a certain percentage of the contract amount. This amount is known as the “initial margin.” Subsequent payments known as “variation margin,” are made or received by the Portfolio each day, depending on the daily fluctuations in the value of the underlying security. Such variation margin is recorded for financial statement purposes on a daily basis as unrealized gain or loss. When the contract expires or is closed, the gain or loss is realized and is presented in the Statement of Operations as net realized gain or loss on financial futures contracts. The use of futures transactions involves the risk of imperfect correlation in movements in the price of futures contracts, interest rates and underlying hedged assets.
Short Sales
Certain portfolios of the Trust may make short sales of securities as a method of hedging potential price declines in similar securities owned. The Portfolio may sell a security it does not own in anticipation of a decline in the market value of that security (short sale). When the Portfolio makes a short sale, it will borrow the security sold short and deliver it to the broker-dealer through which it made the short sale as collateral for its obligation to deliver the security upon conclusion of the sale. The Portfolio may have to pay a fee to borrow the particular security and may be obligated to return any interest or dividends received on such borrowed securities. The fee may be referred to as the “initial margin.” Subsequent payments known as “variation margin,” are made or received by the Portfolio each day, depending on the daily fluctuations in the value of the security sold short. Such variation margin is recorded for financial statement purposes on a daily basis as unrealized gain (loss). A gain, limited to the price at which the Portfolio sold the security short, or a loss, unlimited as to dollar amount, will be recognized upon the termination of
301
Table of Contents
American Skandia Trust
Notes To Financial Statements (continued)
December 31, 2003
a short sale if the market price at termination is less than or greater than the proceeds originally received, respectively, and is presented in the Statements of Operations as net realized gain or loss on short sales.
Repurchase Agreements
In connection with transactions in repurchase agreements with United States financial institutions, it is the Portfolio’s policy that its custodian or designated subcustodians under triparty repurchase agreements, as the case may be, take possession of the underlying collateral securities, the value of which exceeds the principal amount of the repurchase transactions, including accrued interest. To the extent that any repurchase transaction exceeds one business day, the value of the collateral is marked-to-market on a daily basis to ensure the adequacy of the collateral. If the seller defaults and the value of the collateral declines or, if bankruptcy proceedings are commenced with respect to the seller of the security, realization of the collateral by the Portfolio may be delayed or limited.
Swap Agreements
The Portfolios may enter into swap agreements. A swap is an agreement to exchange the return generated by one instrument for the return generated by another instrument. The Portfolios may enter into interest rate, forward swap spread lock and credit default swap agreements to manage its exposure to interest rates and credit risk. Interest rate swap agreements involve the exchange by the Portfolio with another party of their respective commitments to pay or receive interest. Forward spread lock swap agreements involve commitments to pay or receive a settlement amount calculated as the difference between the swap spread and a fixed spread, multiplied by the notional amount times the duration of the swap. The swap spread is the difference between the benchmark swap rate (market rate) and the specific Treasury rate. In a credit default swap, one party makes a stream of payments to another party in exchange for the right to receive a specified return in the event of a default by a third party, typically corporate issues or sovereign issues of an emerging country, on its obligation. Dividends and interest on the securities in the swap are included in the value of the exchange. The swaps are valued daily at current market value and any unrealized gain or loss is included in the net unrealized appreciation or depreciation on investments. Gain or loss is realized on the termination date of the swap and is equal to the difference between the Portfolio’s basis in the swap and the proceeds of the closing transaction, including fees. During the period that the swap agreement is open, the Portfolio may be subject to risk from the potential inability of the counterparty to meet the terms of the agreement.
Forward currency contracts, written options, financial futures contracts, and swap agreements involve elements of both market and credit risk in excess of the amounts reflected on the Statements of Assets and Liabilities.
Delayed Delivery Transactions
Certain Portfolios may purchase or sell securities on a when-issued or delayed delivery basis. These transactions involve a commitment by the Portfolio to purchase or sell securities for a predetermined price or yield, with payment and delivery taking place beyond the customary settlement period. When delayed delivery purchases are outstanding, the Portfolio will set aside and maintain until the settlement date in a segregated account, liquid assets in an amount sufficient to meet the purchase price. When purchasing a security on a delayed delivery basis, the Portfolio assumes the rights and risks of ownership of the security, including the risk of price and yield fluctuations, and takes such
302
Table of Contents
fluctuations into account when determining its net asset value. The Portfolio may dispose of or renegotiate a delayed delivery transaction after it is entered into, and may sell when-issued securities before they are delivered, which may result in a capital gain or loss. When the Portfolio has sold a security on a delayed delivery basis, the Portfolio does not participate in future gains and losses with respect to the security.
Security Loans
The Portfolios may lend their portfolio securities to broker-dealers. Security loans are limited to 33 1/3% of the total assets of the respective portfolio. The loans are secured by collateral at least equal at all times to the market value of the securities loaned. Loans are subject to termination at the option of the borrower or the Portfolios. Upon termination of the loan, the borrower will return to the lender securities identical to the loaned securities. Should the borrower of the securities fail financially, the Portfolios have the right to repurchase the securities using the collateral in the open market. The Portfolios recognize income, net of any rebate and securities lending agent fees, for lending its securities in the form of fees or interest on the investment of any cash received as collateral. The Portfolios also continue to receive interest and dividends or amounts equivalent thereto, on the securities loaned and recognize any unrealized gain or loss in the market price of the securities loaned that may occur during the term of the loan.
Investment Transactions and Investment Income
Securities transactions are accounted for on the trade date. Realized gains and losses from securities sold are recognized on the specific identification basis. Dividend income is recorded on the ex-dividend date and interest income is recorded on the accrual basis. The Portfolio amortizes premiums and discounts on portfolio securities as adjustments to interest income. Expenses are recorded on the accrual basis.
Taxes
For federal income tax purposes, each Portfolio in the Trust is treated as a separate taxpaying entity. It is each Portfolio’s policy to continue to meet the requirements of the Internal Revenue Code applicable to regulated investment companies and to distribute all of its taxable net income and capital gains, if any, to shareholders. Therefore, no federal income tax provision is required.
Withholding taxes on foreign dividends, interest and capital gains are recorded net of reclaimable amounts, at the time the related income is earned.
Distributions to Shareholders
Dividends, if any, from net investment income are declared and paid at least annually by all Portfolios other than Money Market. In the case of Money Market, dividends are declared daily and paid monthly. Distributions to shareholders, which are determined in accordance with federal income tax regulations, which may differ from generally accepted accounting principles, are recorded on the ex-dividend date. Net realized gains from investment transactions, if any, are distributed at least annually. These dividends and distributions are determined in accordance with federal income tax regulations and may differ from accounting principles generally accepted in the United States of America.
303
Table of Contents
American Skandia Trust
Notes To Financial Statements (continued)
December 31, 2003
Estimates
The preparation of financial statements requires management to make estimates and assumptions that affect the reported amounts and disclosures in the financial statements. Actual results could differ from those estimates.
3. AGREEMENTS AND OTHER TRANSACTIONS WITH AFFILIATES
The Portfolios have entered into investment management agreements with American Skandia Investment Services, Inc. and Prudential Investments LLC the co-managers (together the “Investment Manager”) which provide that the Investment Manager will furnish each Portfolio with investment advice and investment management and administrative services. The Investment Manager has engaged the following firms as Sub-advisers for their respective Portfolios:
Alliance Capital Management L.P. for Alliance Growth and Income and Alliance Growth;
Alliance Capital Management, L.P. and Sanford C. Bernstein & Co., LLC co-manager Alliance/Bernstein Growth + Value;
American Century Investment Management, Inc. for American Century Income & Growth, American Century Strategic Balanced and American Century International Growth;
Cohen & Steers Capital Management, Inc. for Cohen & Steers Realty;
Deutsche Asset Management, Inc. for DeAM Global Allocation, DeAM International Equity, DeAM Small-Cap Growth, DeAM Large-Cap Value, DeAM Bond, DeAM Large-Cap Growth and DeAM Small-Cap Value;
Federated Investment Counseling for Federated High Yield and Federated Aggressive Growth;
Fred Alger Management, Inc. for Alger All-Cap Growth;
GAMCO Investors, Inc. for Gabelli Small-Cap Value and Gabelli All-Cap Value;
Goldman Sachs Asset Management for Goldman Sachs Concentrated Growth, Goldman Sachs Small-Cap Value and Goldman Sachs Mid-Cap Growth;
INVESCO Funds Group, Inc. for INVESCO Capital Income;
Lord Abbett & Co. for Lord Abbett Bond-Debenture;
Marsico Capital Management, LLC for Marsico Capital Growth;
Massachusetts Financial Services Company for MFS Global Equity, MFS Growth, and MFS Growth with Income;
Neuberger Berman Management, Inc. for Neuberger Berman Mid-Cap Value and Neuberger Berman Mid-Cap Growth;
Pacific Investment Management Company LLC for PIMCO Total Return Bond and PIMCO Limited Maturity Bond;
Pilgrim Baxter & Associates, Ltd. for PBHG Small-Cap Growth;
Sanford C. Bernstein & Co., LLC for Sanford Bernstein Managed Index 500 and Sanford Bernstein Core Value;
Strong Capital Management, Inc. for Strong International Equity;
304
Table of Contents
T. Rowe Price Associates, Inc. for T. Rowe Price Asset Allocation and T. Rowe Price Natural Resources; T. Rowe Price International, Inc. for T. Rowe Price Global Bond;
Wells Fargo Capital Management, Inc. for Money Market;
and William Blair & Company, LLC for William Blair International Growth
Advisory Fees and Expense Limitations
The Investment Manager receives a fee, computed daily and paid monthly, based on an annual rate of the value of each Portfolio’s average daily net assets. The Investment Manager pays each Sub-adviser a fee as compensation for advisory services provided to the Portfolios. All amounts paid or payable to the Portfolios by the Investment Manager, under the agreement, are reflected in the Statements of Operations.
| Advisory Fees |
Expense Limitations |
|||||
| Strong International Equity |
1.00 | % | 1.75 | % | ||
| William Blair International Growth |
1.00 | % | 1.75 | % | ||
| American Century International Growth |
1.00 | % | 1.75 | % | ||
| DeAM International Equity |
1.00 | % | 1.50 | % | ||
| MFS Global Equity |
1.00 | % | 1.75 | % | ||
| PBHG Small-Cap Growth |
0.90 | % | 1.30 | % | ||
| DeAM Small-Cap Growth |
0.95 | % | 1.35 | % | ||
| Federated Aggressive Growth |
0.95 | % | 1.35 | % | ||
| Goldman Sachs Small-Cap Value |
0.95 | % | 1.35 | % | ||
| Gabelli Small-Cap Value |
0.90 | % | 1.30 | % | ||
| DeAM Small-Cap Value |
0.95 | % | 1.15 | % | ||
| Goldman Sachs Mid-Cap Growth |
1.00 | % | 1.35 | % | ||
| Neuberger Berman Mid-Cap Growth |
0.90 | % | 1.25 | % | ||
| Neuberger Berman Mid-Cap Value |
0.90 | % | 1.25 | % | ||
| Alger All-Cap Growth |
0.95 | % | 1.45 | % | ||
| Gabelli All-Cap Value |
0.95 | % | 1.45 | % | ||
| T. Rowe Price Natural Resources |
0.90 | % | 1.35 | % | ||
| Alliance Growth |
0.90 | % | 1.45 | % | ||
| MFS Growth |
0.90 | % | 1.35 | % | ||
| Marsico Capital Growth |
0.90 | % | 1.35 | % | ||
| Goldman Sachs Concentrated Growth |
0.90 | % | 1.35 | % | ||
| DeAM Large-Cap Growth |
0.85 | % | 0.99 | % | ||
| DeAM Large-Cap Value |
0.85 | % | 0.99 | % | ||
| Alliance/Bernstein Growth + Value |
0.90 | % | 1.35 | % | ||
| Sanford Bernstein Core Value |
0.75 | % | 1.25 | % | ||
| Cohen & Steers Realty |
1.00 | % | 1.45 | % | ||
| Sanford Bernstein Managed Index 500 |
0.60 | % | 0.80 | % | ||
| American Century Income & Growth |
0.75 | % | 1.25 | % |
305
Table of Contents
American Skandia Trust
Notes To Financial Statements (continued)
December 31, 2003
| Advisory Fees |
Expense Limitations |
|||||
| Alliance Growth and Income |
0.75 | % | 1.25 | % | ||
| MFS Growth with Income |
0.90 | % | 1.35 | % | ||
| INVESCO Capital Income |
0.75 | % | 1.20 | % | ||
| DeAM Global Allocation |
0.10 | % | 0.35 | % | ||
| American Century Strategic Balanced |
0.85 | % | 1.25 | % | ||
| T. Rowe Price Asset Allocation |
0.85 | % | 1.25 | % | ||
| T. Rowe Price Global Bond |
0.80 | % | 1.75 | % | ||
| Federated High Yield |
0.75 | % | 1.15 | % | ||
| Lord Abbett Bond-Debenture |
0.80 | % | 1.20 | % | ||
| DeAM Bond |
0.85 | % | 0.99 | % | ||
| PIMCO Total Return Bond |
0.65 | % | 1.05 | % | ||
| PIMCO Limited Maturity Bond |
0.65 | % | 1.05 | % | ||
| Money Market |
0.50 | % | 0.65 | % |
The advisory fee for Strong International Equity reduces to a rate of 0.85% for average daily net assets in excess of $75 million, and Neuberger Berman Mid-Cap Value, Neuberger Berman Mid-Cap Growth and Alliance Growth reduces to a rate of 0.85% for average daily net assets in excess of $1 billion. During the year ended December 31, 2003, the Investment Manager has voluntarily waived advisory fees from, the Money Market equal to 0.05% of the average net assets, and 0.05% of the average daily net assets in excess of $1 billion from Alliance Growth and Income, PIMCO Total Return Bond, INVESCO Capital Income and Marsico Capital Growth. Also, Goldman Sachs Concentrated Growth has voluntarily waived advisory fees equal to 0.07% on all assets less than $1 billion and 0.05% on all assets greater than $1 billion. The Investment Manager has voluntarily waived advisory fees for the year ended December 31, 2003, for: DeAM Large-Cap Value, DeAM Large-Cap Growth, Goldman Sachs Mid-Cap Growth and William Blair International Growth equal to 0.10% of the average net assets; and DeAM International Equity, DeAM Bond, DeAM Small-Cap Growth and DeAM Small-Cap Value, equal to 0.15% of the average net assets.
The Trust has adopted a Distribution Plan (the “Plan”) under Rule 12b-1 of the Investment Company Act of 1940. The Plan permits American Skandia Marketing, Incorporated (“ASMI”) to receive brokerage commissions in connection with purchases and sales of securities by the Portfolios, and to use these commissions to promote the sale of variable contracts, the premiums for which are invested in shares of the Trust. Under the Plan, securities transactions for a Portfolio may be directed to certain brokers for execution (“clearing brokers”) who have agreed to pay part of the brokerage commissions received on these transactions to ASMI for “introducing” transactions to the clearing broker. In turn, ASMI uses the brokerage commissions received as an introducing broker to pay various distribution-related expenses, such as advertising, printing of sales materials, and payments to dealers.
Commissions received by ASMI under the Plan are reflected in the cost of securities purchased and the proceeds from the sale of securities. These commissions are shown in the Statements of Operations as “Distribution Fees” and a corresponding reduction “Fees Paid Indirectly”. Net expenses of the Portfolios are unaffected by these commissions. For the year ended December 31, 2003, commissions received by ASMI totaled $8,091,627.
306
Table of Contents
The Trust excluding DeAM Global Allocation Portfolio has entered into an agreement with American Skandia Life Assurance Corporation (“ASLAC”) pursuant to which it pays ASLAC a shareholder servicing fee at an annual rate of 0.10% of each Portfolio’s average daily net assets.
Certain officers and Trustees of the Trust are officers or directors of the Investment Manager. The Trust pays no compensation directly to its officers or interested Trustees. The Investment Manager also pays for occupancy and certain clerical and administrative expenses. The Trust bears all other costs and expenses.
4. PORTFOLIO SECURITIES TRANSACTIONS
The aggregate cost of purchases and the proceeds from the sales of securities (excluding government securities and short-term issues) for the year ended December 31, 2003 were as follows:
| Cost of Purchases |
Proceeds from Sales | |||||
| Strong International Equity |
$ | 161,451,933 | $ | 220,550,114 | ||
| William Blair International Growth |
403,422,440 | 305,592,621 | ||||
| American Century International Growth |
632,044,205 | 718,444,005 | ||||
| DeAM International Equity |
180,489,449 | 181,807,676 | ||||
| MFS Global Equity |
59,765,236 | 38,803,953 | ||||
| PBHG Small-Cap Growth |
289,855,047 | 316,332,734 | ||||
| DeAM Small-Cap Growth |
605,674,176 | 622,523,199 | ||||
| Federated Aggressive Growth |
199,848,034 | 92,006,563 | ||||
| Goldman Sachs Small-Cap Value |
196,421,533 | 268,191,035 | ||||
| Gabelli Small-Cap Value |
200,199,634 | 132,649,296 | ||||
| DeAM Small-Cap Value |
61,216,106 | 35,697,784 | ||||
| Goldman Sachs Mid-Cap Growth |
121,598,818 | 54,661,241 | ||||
| Neuberger Berman Mid-Cap Growth |
454,851,703 | 464,975,328 | ||||
| Neuberger Berman Mid-Cap Value |
556,840,586 | 542,551,822 | ||||
| Alger All-Cap Growth |
565,833,912 | 597,249,090 | ||||
| Gabelli All-Cap Value |
57,069,746 | 33,525,492 | ||||
| T. Rowe Price Natural Resources |
62,563,058 | 48,816,099 | ||||
| Alliance Growth |
143,923,865 | 194,684,705 | ||||
| MFS Growth |
1,385,815,617 | 1,423,339,037 | ||||
| Marsico Capital Growth |
1,184,542,918 | 1,011,921,672 | ||||
| Goldman Sachs Concentrated Growth |
236,165,471 | 488,413,269 | ||||
| DeAM Large-Cap Growth |
114,892,316 | 119,905,519 | ||||
| DeAM Large-Cap Value |
171,570,182 | 177,766,860 | ||||
| Alliance/Bernstein Growth + Value |
31,246,637 | 10,775,873 | ||||
| Sanford Bernstein Core Value |
158,935,290 | 206,251,025 | ||||
| Cohen & Steers Realty |
118,133,172 | 69,705,975 | ||||
| Sanford Bernstein Managed Index 500 |
203,761,172 | 219,327,024 | ||||
| American Century Income & Growth |
205,636,902 | 223,996,556 | ||||
307
Table of Contents
American Skandia Trust
Notes To Financial Statements (continued)
December 31, 2003
| Cost of Purchases |
Proceeds from Sales | |||||
| Alliance Growth and Income |
$ | 1,025,984,115 | $ | 824,935,283 | ||
| MFS Growth with Income |
84,963,568 | 81,441,407 | ||||
| INVESCO Capital Income |
553,372,645 | 648,737,280 | ||||
| DeAM Global Allocation |
46,268,679 | 109,067,857 | ||||
| American Century Strategic Balanced |
158,090,830 | 165,296,288 | ||||
| T. Rowe Price Asset Allocation |
130,705,634 | 121,028,082 | ||||
| T. Rowe Price Global Bond |
155,238,746 | 114,881,336 | ||||
| Federated High Yield |
680,421,357 | 462,357,429 | ||||
| Lord Abbett Bond-Debenture |
247,287,807 | 157,853,469 | ||||
| DeAM Bond |
100,244,621 | 86,496,672 | ||||
| PIMCO Total Return Bond |
1,178,957,582 | 1,197,643,265 | ||||
| PIMCO Limited Maturity Bond |
182,690,466 | 116,491,731 | ||||
Written options transactions, during the year ended December 31, 2003, were as follows:
| PIMCO Total Return Bond |
PIMCO Limited Maturity | |||||||||||
| Number of Contracts/ Swap Notional Amount $(000) |
Premium |
Number of Contracts |
Premium | |||||||||
| Balance at beginning of year |
308,308 | $ | 10,670,168 | — | $ | — | ||||||
| Written options |
10,535 | 6,758,646 | 101,400 | 929,078 | ||||||||
| Written swap options |
95,300 | 1,335,222 | — | — | ||||||||
| Expired options |
(17,198 | ) | (9,281,433 | ) | — | — | ||||||
| Expired swap options |
(78,000 | ) | (803,058 | ) | — | — | ||||||
| Closed options |
(153 | ) | (152,766 | ) | — | — | ||||||
| Closed swap options |
(61,000 | ) | (430,242 | ) | — | — | ||||||
| Balance at end of year |
257,792 | $ | 8,096,548 | 101,400 | $ | 929,078 | ||||||
At December 31, 2003, PIMCO Total Return Bond and PIMCO Limited Maturity had sufficient cash and/or securities at least equal to the value of written options.
5. TAX AND DISTRIBUTION INFORMATION
Each Portfolio intends to qualify as a regulated investment company under the Internal Revenue Code and to distribute all of its taxable income, including any net realized gains on investments, to shareholders. Accordingly, no provision for federal income or excise tax has been made.
Income and capital gains of the Portfolios are determined in accordance with both tax regulations and accounting principles generally accepted in the United States of America. Such determinations may result in temporary and permanent differences between tax basis earnings and earnings reported for financial statement purposes. Temporary differences that result in over-distributions for financial statement purposes are classified as distributions in excess of net investment income or accumulated net realized gains or loss. Permanent differences in the recognition of
308
Table of Contents
earnings are reclassified between undistributed net investment income and accumulated net realized gain or loss or to additional paid-in capital, as appropriate. Distributions in excess of tax-basis earnings are recorded as a return of capital.
In order to present undistributed net investment income and accumulated net realized capital gains or losses on the Statements of Assets and Liabilities that more closely represent their tax character, certain adjustments have been made to undistributed net investment income and accumulated net realized gain or loss on investments. For the year ended December 31, 2003 the adjustments were as follows:
| Portfolio |
Undistributed Net Investment Income |
Accumulated Net Realized Gain or Loss |
Paid-In Capital |
|||||||||
| Strong International Equity (a)(i) |
$ | 4,329,712 | $ | (4,329,712 | ) | $ | — | |||||
| William Blair International Growth (a)(b)(i) |
(13,499,429 | ) | 13,309,822 | 189,607 | ||||||||
| American Century International Growth (a)(i) |
961,577 | (1,442,025 | ) | 480,448 | ||||||||
| DeAM International Equity (a)(b)(i) |
1,194,831 | (1,194,831 | ) | — | ||||||||
| MFS Global Equity (a) |
(26,835 | ) | 26,835 | — | ||||||||
| PBHG Small-Cap Growth (c)(i) |
4,366,843 | (2,510,144 | ) | (1,856,699 | ) | |||||||
| DeAM Small-Cap Growth (d)(c)(i) |
1,429,548 | (723,570 | ) | (705,978 | ) | |||||||
| Federated Aggressive Growth (a)(c) |
862,698 | (862,698 | ) | — | ||||||||
| Goldman Sachs Small-Cap Value (d)(i) |
(261,903 | ) | 261,903 | — | ||||||||
| Gabelli Small-Cap Value (d)(i) |
(129,398 | ) | 129,398 | — | ||||||||
| DeAM Small-Cap Value (d) |
(8,512 | ) | 8,512 | — | ||||||||
| Goldman Sachs Mid-Cap Growth (c) |
506,402 | — | (506,402 | ) | ||||||||
| Neuberger Berman Mid-Cap Growth (c)(i) |
7,189,862 | (4,610,167 | ) | (2,579,695 | ) | |||||||
| Neuberger Berman Mid-Cap Value (i) |
(135,025 | ) | 135,025 | |||||||||
| Alger All-Cap Growth (c) |
1,951,877 | — | (1,951,877 | ) | ||||||||
| Gabelli All-Cap Value (a) |
(2,049 | ) | 2,049 | — | ||||||||
| T. Rowe Price Natural Resources (a)(b)(d)(i) |
2,262,295 | (2,262,295 | ) | — | ||||||||
| Alliance Growth (c)(i) |
323,556 | 1,059 | (324,615 | ) | ||||||||
| MFS Growth (a)(c)(i) |
1,066,340 | 9,402 | (1,075,742 | ) | ||||||||
| Marsico Capital Growth (a)(c)(i) |
4,857,940 | (2,074,481 | ) | (2,783,459 | ) | |||||||
| Goldman Sachs Concentrated Growth (c)(i) |
3,252,438 | (320,308 | ) | (2,932,130 | ) | |||||||
| DeAM Large-Cap Growth (c) |
30,849 | — | (30,849 | ) | ||||||||
| DeAM Large-Cap Value (d) |
(32,065 | ) | 32,065 | — | ||||||||
| Cohen & Steers Realty (a)(d)(e)(i) |
(2,337,563 | ) | 2,337,563 | — | ||||||||
| Sanford Bernstein Managed Index 500 (d) |
(79,540 | ) | 79,540 | — | ||||||||
| American Century Income & Growth (i) |
(111,081 | ) | 18,085 | 92,996 | ||||||||
| Alliance Growth and Income (i) |
— | 598 | (598 | ) | ||||||||
| MFS Growth with Income (a)(i) |
(9,966 | ) | 9,966 | — | ||||||||
| INVESCO Capital Income (h)(i) |
82,442 | (82,442 | ) | — | ||||||||
| DeAM Global Allocation (i) |
1,082,688 | (1,082,688 | ) | — | ||||||||
| American Century Strategic Balanced (a)(h)(i) |
198,038 | (198,038 | ) | — | ||||||||
| T. Rowe Price Asset Allocation (a)(b)(d)(h)(i) |
(86,765 | ) | 86,765 | — | ||||||||
| T. Rowe Price Global Bond (a)(h)(i) |
3,856,449 | (3,856,449 | ) | — | ||||||||
309
Table of Contents
American Skandia Trust
Notes To Financial Statements (continued)
December 31, 2003
| Portfolio |
Undistributed Net Investment Income |
Accumulated Net Realized Gain or Loss |
Paid-In Capital | ||||||||
| Lord Abbett Bond-Debenture (h) |
$ | 20,160 | $ | (20,160 | ) | $ | — | ||||
| DeAM Bond (h) |
514,185 | (514,185 | ) | — | |||||||
| Money Market Portfolio (h) |
(18,923 | ) | (514 | ) | 19,437 | ||||||
| PIMCO Total Return Bond (a)(h)(i)(j) |
24,160,731 | (24,160,731 | ) | — | |||||||
| PIMCO Limited Maturity Bond (a)(h)(j) |
7,990,662 | (7,990,662 | ) | — | |||||||
(a) Reclassification of net foreign currency gains or losses.
(b) Reclassification of book to tax differences due to the sale of passive foreign investment companies.
(c) Reclassification of tax operating loss.
(d) Reclassification of REIT distribution.
(e) Reclassification of book to tax differences due to the sale of REIT.
(f) Reclassification of bifurcation on sale of foreign bond.
(g) Reclassification of premium amortization.
(h) Due to other adjustments.
(i) Reclassification of paydowns.
(j) Reclassification of swap interest payments.
For the year ended December 31, 2003, the tax character of the dividends paid, as reflected in the Statements of Changes in Net Assets were:
| Portfolio |
Ordinary Income |
Long-Term Capital Gain |
Return of Capital |
Total Distributions | ||||||||
| Strong International Equity |
$ | 2,687,610 | $ | — | $ | — | $ | 2,687,610 | ||||
| William Blair International Growth |
— | — | — | — | ||||||||
| American Century International Growth |
5,697,702 | — | 474,188 | 6,171,890 | ||||||||
| DeAM International Equity |
787,176 | — | — | 787,176 | ||||||||
| MFS Global Equity |
121,731 | — | — | 121,731 | ||||||||
| PBHG Small-Cap Growth |
— | — | — | — | ||||||||
| DeAM Small-Cap Growth |
— | — | — | — | ||||||||
| Goldman Sachs Small-Cap Value |
2,448,006 | — | — | 2,448,006 | ||||||||
| Gabelli Small-Cap Value |
998,184 | — | — | 998,184 | ||||||||
| DeAM Small-Cap Value |
20,010 | — | — | 20,010 | ||||||||
| Neuberger Berman Mid-Cap Value |
1,718,079 | — | — | 1,718,079 | ||||||||
| Gabelli All-Cap Value |
880,134 | — | — | 880,134 | ||||||||
| T. Rowe Price Natural Resources |
1,610,638 | 2,249,299 | — | 3,859,937 | ||||||||
| Goldman Sachs Concentrated Growth |
3,836,920 | — | — | 3,836,920 | ||||||||
| DeAM Large-Cap Growth |
36,105 | — | — | 36,105 | ||||||||
| DeAM Large-Cap Value |
898,632 | — | — | 898,632 | ||||||||
| Alliance/Bernstein Growth + Value |
201,627 | — | — | 201,627 | ||||||||
| Sanford Bernstein Core Value |
1,344,832 | — | — | 1,344,832 | ||||||||
| Cohen & Steers Realty |
6,935,947 | 4,037,564 | — | 10,973,511 | ||||||||
| Sanford Bernstein Managed Index 500 |
5,460,558 | — | — | 5,460,558 | ||||||||
| American Century Income & Growth |
3,198,975 | — | — | 3,198,975 | ||||||||
310
Table of Contents
| Portfolio |
Ordinary Income |
Long-Term Capital Gain |
Return of Capital |
Total Distributions | ||||||||
| Alliance Growth and Income |
$ | 15,225,927 | $ | — | $ | — | $ | 15,225,927 | ||||
| MFS Growth with Income |
325,327 | — | — | 325,327 | ||||||||
| INVESCO Capital Income |
15,175,707 | — | — | 15,175,707 | ||||||||
| DeAM Global Allocation |
3,336,217 | — | — | 3,336,217 | ||||||||
| American Century Strategic Balanced |
4,190,899 | — | — | 4,190,899 | ||||||||
| T. Rowe Price Asset Allocation |
7,112,841 | — | — | 7,112,841 | ||||||||
| T. Rowe Price Global Bond |
7,341,835 | 393,861 | — | 7,735,696 | ||||||||
| Federated High Yield |
48,256,122 | — | — | 48,256,122 | ||||||||
| Lord Abbett Bond-Debenture |
6,806,378 | — | — | 6,806,378 | ||||||||
| DeAM Bond |
7,221,807 | — | — | 7,221,807 | ||||||||
| PIMCO Total Return Bond |
125,943,541 | 40,010,460 | — | 165,954,001 | ||||||||
| PIMCO Limited Maturity Bond |
33,374,842 | 4,751,365 | — | 38,126,207 | ||||||||
| Money Market |
15,785,832 | — | — | 15,785,832 | ||||||||
For the year ended December 31, 2002, the tax character of the dividends paid, as reflected in the Statements of Changes in Net Assets were:
| Portfolio |
Ordinary Income |
Long-Term Capital Gain |
Total Distributions | ||||||
| Strong International Equity |
$ | 2,560,668 | $ | — | $ | 2,560,668 | |||
| William Blair International Growth |
18,118,140 | — | 18,118,140 | ||||||
| MFS Global Equity |
6,556 | — | 6,556 | ||||||
| Federated Aggressive Growth |
233,692 | — | 233,692 | ||||||
| Goldman Sachs Small-Cap Value |
27,258,170 | 18,572,388 | 45,830,558 | ||||||
| Gabelli Small-Cap Value |
7,016,045 | 3,857,653 | 10,873,698 | ||||||
| Neuberger Berman Mid-Cap Value |
30,970,516 | 19,567,222 | 50,537,738 | ||||||
| Gabelli All-Cap Value |
976,757 | — | 976,757 | ||||||
| T. Rowe Price Natural Resources |
6,092,777 | 1,489,130 | 7,581,907 | ||||||
| Goldman Sachs Concentrated Growth |
13,672,817 | — | 13,672,817 | ||||||
| DeAM Large-Cap Value |
162,043 | — | 162,043 | ||||||
| Alliance/Bernstein Growth + Value |
199,375 | — | 199,375 | ||||||
| Sanford Bernstein Core Value |
154,357 | — | 154,357 | ||||||
| Cohen & Steers Realty |
4,940,078 | — | 4,940,078 | ||||||
| Sanford Bernstein Managed Index 500 |
5,998,962 | — | 5,998,962 | ||||||
| American Century Income & Growth |
3,169,121 | — | 3,169,121 | ||||||
| Alliance Growth and Income |
61,586,458 | 34,948,202 | 96,534,660 | ||||||
| MFS Growth with Income |
420,906 | — | 420,906 | ||||||
| INVESCO Capital Income |
24,256,471 | — | 24,256,471 | ||||||
| DeAM Global Allocation |
14,492,971 | — | 14,492,971 | ||||||
| American Century Strategic Balanced |
4,499,131 | — | 4,499,131 | ||||||
| T. Rowe Price Asset Allocation |
8,649,475 | 11,079,330 | 19,728,805 | ||||||
311
Table of Contents
American Skandia Trust
Notes To Financial Statements (continued)
December 31, 2003
| Portfolio |
Ordinary Income |
Long-Term Capital Gain |
Total Distributions | ||||||
| Federated High Yield |
$ | 55,265,646 | $ | — | $ | 55,265,646 | |||
| Lord Abbett Bond-Debenture |
2,416,133 | — | 2,416,133 | ||||||
| PIMCO Total Return Bond |
95,609,796 | 12,282,200 | 107,891,996 | ||||||
| PIMCO Limited Maturity Bond |
35,056,557 | — | 35,056,557 | ||||||
| Money Market |
36,239,903 | — | 36,239,903 | ||||||
The tax character of distributable earnings at December 31, 2003 was:
| Portfolio |
Ordinary Income |
Long-Term Capital Gain | ||||
| Strong International Equity |
$ | 3,597,866 | $ | — | ||
| William Blair International Growth |
7,604,485 | — | ||||
| American Century International Growth |
— | — | ||||
| DeAM International Equity |
2,339,322 | — | ||||
| MFS Global Equity |
221,874 | — | ||||
| PBHG Small-Cap Growth |
— | — | ||||
| DeAM Small-Cap Growth |
— | — | ||||
| Federated Aggressive Growth |
4,045,919 | — | ||||
| Goldman Sachs Small-Cap Value |
696,491 | 4,161,394 | ||||
| Gabelli Small-Cap Value |
42,814 | — | ||||
| DeAM Small-Cap Value |
1,486,307 | 1,564,069 | ||||
| Goldman Sachs Mid-Cap Growth |
— | — | ||||
| Neuberger Berman Mid-Cap Growth |
— | — | ||||
| Neuberger Berman Mid-Cap Value |
1,190,224 | 26,886,646 | ||||
| Alger All-Cap Growth |
— | — | ||||
| Gabelli All-Cap Value |
512,672 | — | ||||
| T. Rowe Price Natural Resources |
1,843,388 | — | ||||
| Alliance Growth |
— | — | ||||
| MFS Growth |
— | — | ||||
| Marsico Capital Growth |
— | — | ||||
| Goldman Sachs Concentrated Growth |
— | — | ||||
| DeAM Large-Cap Growth |
— | — | ||||
| DeAM Large-Cap Value |
1,225,279 | — | ||||
| Alliance/Bernstein Growth + Value |
229,760 | — | ||||
| Sanford Bernstein Core Value |
8,247,305 | — | ||||
| Cohen & Steers Realty |
7,684,744 | 4,721,132 | ||||
| Sanford Bernstein Managed Index 500 |
4,631,826 | — | ||||
| American Century Income & Growth |
3,630,621 | — | ||||
| Alliance Growth and Income |
13,715,428 | — | ||||
| MFS Growth with Income |
403,670 | — | ||||
| INVESCO Capital Income |
9,261,999 | — | ||||
312
Table of Contents
| Portfolio |
Ordinary Income |
Long-Term Capital Gain | ||||
| DeAM Global Allocation |
$ | 2,868,023 | $ | — | ||
| American Century Strategic Balanced |
3,257,861 | — | ||||
| T. Rowe Price Asset Allocation |
5,760,759 | — | ||||
| T. Rowe Price Global Bond |
16,891,538 | 1,509,137 | ||||
| Federated High Yield |
58,039,797 | — | ||||
| Lord Abbett Bond-Debenture |
13,892,148 | — | ||||
| DeAM Bond |
6,587,781 | 681,514 | ||||
| PIMCO Total Return Bond |
85,249,707 | 15,173,281 | ||||
| PIMCO Limited Maturity Bond |
35,683,588 | 5,348,709 | ||||
| Money Market |
27,469 | — | ||||
These amounts differ from undistributed net investment income on the Statements of Assets and Liabilities primarily due to timing differences.
At December 31, 2003, the following Portfolios had, for federal income tax purposes, capital loss carryforwards available to offset future net realized capital gains:
| Expiration December 31, | |||||||||||||||
| Portfolio |
Total |
2008 |
2009 |
2010 |
2011 | ||||||||||
| Strong International Equity |
$ | 187,634,414 | $ | — | $ | 100,807,480 | $ | 76,213,067 | $ | 10,613,867 | |||||
| William Blair International Growth |
262,834,328 | — | 93,897,621 | 123,994,607 | 44,942,100 | ||||||||||
| American Century International Growth |
288,132,693 | 79,504,524 | 104,641,134 | 95,978,351 | 8,008,684 | ||||||||||
| DeAM International Equity |
165,358,319 | 43,648,402 | 107,473,503 | 14,236,414 | — | ||||||||||
| MFS Global Equity |
11,078,864 | 102,871 | 2,025,569 | 6,125,096 | 2,825,328 | ||||||||||
| PBHG Small-Cap Growth |
223,311,073 | — | 157,029,918 | 66,281,155 | — | ||||||||||
| DeAM Small-Cap Growth |
300,230,534 | — | 216,945,355 | 83,285,179 | — | ||||||||||
| Federated Aggressive Growth |
— | — | — | — | — | ||||||||||
| Goldman Sachs Small-Cap Value |
— | — | — | — | — | ||||||||||
| Gabelli Small-Cap Value |
3,742,822 | — | — | 3,742,822 | — | ||||||||||
| DeAM Small-Cap Value |
— | — | — | — | — | ||||||||||
| Goldman Sachs Mid-Cap Growth |
84,438,560 | — | 58,496,027 | 25,942,533 | — | ||||||||||
| Neuberger Berman Mid-Cap Growth |
393,730,075 | — | 270,207,817 | 122,095,636 | 1,426,622 | ||||||||||
| Neuberger Berman Mid-Cap Value |
— | — | — | — | — | ||||||||||
| Alger All-Cap Growth |
436,369,084 | 56,105,001 | 208,714,661 | 171,549,422 | — | ||||||||||
| Gabelli All-Cap Value |
28,106,272 | — | 1,815,571 | 21,341,849 | 4,948,852 | ||||||||||
| T. Rowe Price Natural Resources |
2,789,355 | — | — | — | 2,789,355 | ||||||||||
| Alliance Growth |
262,150,877 | — | 134,760,953 | 95,931,726 | 31,458,198 | ||||||||||
| MFS Growth |
458,347,610 | — | 259,923,499 | 198,424,111 | — | ||||||||||
| Marsico Capital Growth |
344,302,754 | — | 209,783,108 | 134,519,646 | — | ||||||||||
| Goldman Sachs Concentrated Growth |
954,099,195 | 156,116,090 | 465,068,305 | 179,588,458 | 153,326,342 | ||||||||||
| DeAM Large-Cap Growth |
9,151,713 | — | — | 9,151,713 | — | ||||||||||
313
Table of Contents
American Skandia Trust
Notes To Financial Statements (continued)
December 31, 2003
| Expiration December 31, | |||||||||||||||
| Portfolio |
Total |
2008 |
2009 |
2010 |
2011 | ||||||||||
| DeAM Large-Cap Value |
$ | 21,532,998 | $ | — | $ | 3,927,079 | $ | 15,949,510 | $ | ,656,409 | |||||
| Alliance/Bernstein Growth + Value |
5,284,212 | — | — | 4,092,914 | 1,191,298 | ||||||||||
| Sanford Bernstein Core Value |
— | — | — | — | — | ||||||||||
| Cohen & Steers Realty |
— | — | — | — | — | ||||||||||
| Sanford Bernstein Managed Index 500 |
159,385,659 | — | 59,806,425 | 69,268,601 | 30,310,633 | ||||||||||
| American Century Income & Growth |
88,982,431 | 9,602,532 | 33,041,332 | 29,933,758 | 16,404,809 | ||||||||||
| Alliance Growth and Income |
316,348,367 | 254,824,843 | 61,523,524 | ||||||||||||
| MFS Growth with Income (a) |
31,736,461 | 303,576 | 11,842,307 | 15,076,348 | 4,512,375 | ||||||||||
| INVESCO Capital Income |
102,862,892 | — | 16,409,726 | 86,453,166 | — | ||||||||||
| DeAM Global Allocation |
102,070,572 | 13,319,609 | 35,338,513 | 48,177,607 | 5,234,843 | ||||||||||
| American Century Strategic Balanced |
23,087,262 | — | 6,031,874 | 14,469,531 | 2,585,857 | ||||||||||
| T. Rowe Price Asset Allocation |
16,301,159 | — | — | 11,926,235 | 4,374,924 | ||||||||||
| Federated High Yield (b) |
208,313,692 | 17,797,821 | 61,793,618 | 87,452,429 | 37,484,899 | ||||||||||
(a) MFS Growth with Income had additional capital loss carryforwards of $1,855 expiring in 2007.
(b) Federated High Yield had additional capital loss carryforwards of $3,784,925 expiring in 2007.
The following Portfolios elected to treat post-October losses incurred in the period November 1, 2003 through December 31, 2003 as having occurred in the following fiscal year:
| Post October Losses | ||||||
| Portfolio |
Currency |
Capital | ||||
| William Blair International |
$ | 88,218 | $ | — | ||
| American Century International |
95,519 | — | ||||
| MFS Global Equity |
9,817 | — | ||||
| Federated Aggressive Growth |
126 | — | ||||
| Alger All-Cap Growth |
— | 1,294,094 | ||||
| Alliance Growth |
— | 1,178,467 | ||||
| MFS Growth |
11,725 | — | ||||
| Marsico Capital Growth |
— | 389,872 | ||||
| Alliance/Bernstein Growth + Value |
— | 152,682 | ||||
| Sanford Bernstein Core Value |
— | 16,153 | ||||
| Sanford Bernstein Managed Index 500 |
— | 514.201 | ||||
| American Century Income & Growth |
— | 883,892 | ||||
| MFS Growth with Income |
— | 367,628 | ||||
| T. Rowe Price Global Bond |
97,518 | — | ||||
314
Table of Contents
At December 31, 2003, the cost and unrealized appreciation or depreciation in value of the investments for federal income tax purposes, were as follows:
| Portfolio |
Tax Basis |
Gross Unrealized Appreciation |
Gross Unrealized (Depreciation) |
Other Temporary Differences |
Net Unrealized Appreciation (Depreciation) | |||||||||||
| Strong International Equity |
$ | 263,949,985 | $ | 74,889,125 | $ | (1,190,500 | ) | $ | 7,559 | $ | 73,698,625 | |||||
| William Blair International Growth |
386,574,536 | 113,761,043 | (688,051 | ) | 10,843 | 113,072,992 | ||||||||||
| American Century International Growth |
316,883,579 | 63,210,753 | (744,195 | ) | 8,099 | 62,466,558 | ||||||||||
| DeAM International Equity |
139,676,490 | 21,357,050 | (2,493,914 | ) | 3,028 | 18,863,136 | ||||||||||
| MFS Global Equity |
87,738,098 | 15,715,155 | (436,015 | ) | 877 | 15,279,140 | ||||||||||
| PBHG Small-Cap Growth |
308,656,062 | 81,739,007 | (3,326,996 | ) | 7,944 | 78,412,011 | ||||||||||
| DeAM Small-Cap Growth |
375,955,658 | 67,381,489 | (9,357,308 | ) | 8,521 | 58,024,181 | ||||||||||
| Federated Aggressive Growth |
150,828,784 | 39,639,798 | (3,565,966 | ) | 548 | 36,073,832 | ||||||||||
| Goldman Sachs Small-Cap Value |
316,977,146 | 74,313,255 | (8,201,587 | ) | 252,037 | 66,111,668 | ||||||||||
| Gabelli Small-Cap Value |
663,245,922 | 154,782,982 | (24,695,482 | ) | 7,958 | 130,087,500 | ||||||||||
| DeAM Small-Cap Value |
40,468,342 | 4,334,171 | (297,323 | ) | 135 | 4,036,848 | ||||||||||
| Goldman Sachs Mid-Cap Growth |
175,145,186 | 20,726,775 | (763,390 | ) | 1,000 | 19,963,385 | ||||||||||
| Neuberger Berman Mid-Cap Growth |
444,768,670 | 71,486,385 | (2,086,925 | ) | 7,191 | 69,399,460 | ||||||||||
| Neuberger Berman Mid-Cap Value |
1,056,472,183 | 175,595,838 | (6,839,332 | ) | 14,213 | 168,756,506 | ||||||||||
| Alger All-Cap Growth |
472,052,171 | 65,581,591 | (5,412,577 | ) | 6,968 | 60,169,014 | ||||||||||
| Gabelli All-Cap Value |
204,721,699 | 24,840,274 | (5,383,814 | ) | 1,710 | 19,456,460 | ||||||||||
| T. Rowe Price Natural Resources |
182,508,277 | 28,265,942 | (5,592,435 | ) | 2,715 | 22,673,507 | ||||||||||
| Alliance Growth |
252,867,412 | 18,927,122 | (5,261,705 | ) | 5,590 | 13,665,417 | ||||||||||
| MFS Growth |
668,428,593 | 21,689,579 | (8,865,505 | ) | 9,444 | 12,824,074 | ||||||||||
| Marsico Capital Growth |
1,710,987,919 | 380,799,540 | (2,314,980 | ) | 22,587 | 378,484,560 | ||||||||||
| Goldman Sachs Concentrated Growth |
1,212,254,816 | 175,751,421 | (38,369,421 | ) | 41,770 | 137,382,000 | ||||||||||
| DeAM Large-Cap Growth |
99,392,056 | 9,612,352 | (1,365,140 | ) | 770 | 8,247,212 | ||||||||||
| DeAM Large-Cap Value |
140,200,845 | 16,538,503 | (1,531,098 | ) | 1,294 | 15,007,405 | ||||||||||
| Alliance/Bernstein Growth & Value |
75,363,179 | 8,053,023 | (1,282,936 | ) | 436 | 6,770,087 | ||||||||||
| Sanford Bernstein Core Value |
214,641,602 | 29,488,868 | (1,106,816 | ) | 1,795 | 28,382,052 | ||||||||||
| Cohen & Steers Realty |
254,185,132 | 50,076,373 | (1,065,299 | ) | 2,739 | 49,011,074 | ||||||||||
| Sanford Bernstein Managed Index 500 |
581,615,179 | 65,114,964 | (30,478,320 | ) | 9,337 | 34,636,644 | ||||||||||
| American Century Income & Growth |
401,004,679 | 33,732,776 | (22,964,291 | ) | 5,688 | 10,768,485 | ||||||||||
| Alliance Growth and Income |
1,924,416,007 | 213,351,244 | (27,585,760 | ) | 24,865 | 185,765,484 | ||||||||||
| MFS Growth with Income |
126,662,657 | 6,660,038 | (1,289,721 | ) | 1,370 | 5,370,317 | ||||||||||
| INVESCO Capital Income |
624,813,490 | 49,432,012 | (4,087,803 | ) | 14,662 | 45,344,209 | ||||||||||
| DeAm Global Allocation |
251,550,093 | 10,882,768 | — | 6,805 | 10,882,768 | |||||||||||
| American Century Strategic Balanced |
287,365,773 | 18,326,680 | (2,713,054 | ) | 3,443 | 15,613,626 | ||||||||||
| T. Rowe Price Asset Allocation |
374,243,988 | 47,816,211 | (7,176,682 | ) | 4,940 | 40,639,529 | ||||||||||
| T. Rowe Price Global Bond |
195,506,988 | 17,550,053 | — | 4,184 | 17,550,053 | |||||||||||
| Federated High Yield |
829,470,111 | 60,132,041 | (34,693,479 | ) | 10,293 | 25,438,562 | ||||||||||
| Lord Abbett Bond-Debenture |
316,124,341 | 15,745,755 | (1,027,973 | ) | 1,822 | 14,717,782 | ||||||||||
| DeAm Bond |
119,590,649 | 1,485,564 | (452,322 | ) | 1,340 | 1,033,242 | ||||||||||
| PIMCO Total Return Bond |
2,085,258,426 | 32,432,092 | (12,409,486 | ) | 32,823 | 20,022,606 | ||||||||||
| PIMCO Limited Maturity Bond |
898,669,804 | 13,813,000 | (3,565,781 | ) | 14,568 | 10,247,219 | ||||||||||
315
Table of Contents
American Skandia Trust
Notes To Financial Statements (continued)
December 31, 2003
The differences between book basis and tax basis of investments are primarily attributable to deferred losses on wash sales and mark to market on passive foreign investment companies.
6. LINE OF CREDIT
The Portfolios and other affiliated funds participate in a $200 million unsecured, committed line of credit, provided by a syndication of banks, under a line of credit agreement. Borrowings may be made for temporary or emergency purposes, including the meeting of redemption requests that otherwise might require the untimely disposition of securities. Any borrowings must be repaid within 30 days of their receipt. Interest is charged to each Portfolio, based on its borrowings, at a premium above the Federal Funds Rate. In addition, a commitment fee, equal to an annual rate of 0.09% of the average daily unused portion of the line of credit, is allocated among the participants at the end of each quarter. For the year ended December 31, 2003, there were twenty-four Portfolios borrowing under the agreement, by the Trust.
| Portfolio |
Average Advances Outstanding During the Period |
Average Interest Rate |
Number of Days Advances Outstanding During the period |
Outstanding Borrowings at December 31, 2003 | |||||||
| Strong International Equity |
$ | 1,625,000 | 1.481 | % | 4 | $ | 1,000,000 | ||||
| William Blair International Growth |
11,250,000 | 1.555 | % | 8 | — | ||||||
| American Century International Growth |
5,340,000 | 1.683 | % | 25 | — | ||||||
| PBHG Small-Cap Growth |
2,058,824 | 1.814 | % | 17 | — | ||||||
| Federated Aggressive Growth |
3,828,571 | 1.596 | % | 28 | — | ||||||
| Gabelli Small-Cap Value |
6,611,111 | 1.780 | % | 18 | — | ||||||
| Alger All-Cap Growth |
2,789,286 | 1.609 | % | 28 | — | ||||||
| Gabelli All-Cap Value |
2,666,667 | 1.781 | % | 39 | — | ||||||
| T. Rowe Price Natural Resources |
2,500,000 | 1.779 | % | 6 | — | ||||||
| Alliance Growth |
4,320,000 | 1.731 | % | 15 | — | ||||||
| MFS Growth |
2,750,000 | 1.523 | % | 4 | 3,000,000 | ||||||
| Marsico Capital Growth |
6,741,935 | 1.792 | % | 31 | — | ||||||
| Goldman Sachs Concentrated Growth |
10,675,472 | 1.679 | % | 53 | — | ||||||
| Alliance/Bernstein Growth + Value |
1,000,000 | 1.820 | % | 8 | — | ||||||
| Sanford Bernstein Core Value |
38,785,714 | 1.616 | % | 14 | — | ||||||
| Sanford Bernstein Managed Index 500 |
6,454,839 | 1.731 | % | 31 | — | ||||||
| American Century Income & Growth |
8,421,053 | 1.752 | % | 19 | — | ||||||
| Alliance Growth and Income |
8,464,286 | 1.772 | % | 28 | — | ||||||
| MFS Growth with Income |
4,000,000 | 1.766 | % | 4 | — | ||||||
| INVESCO Capital Income |
3,666,667 | 1.646 | % | 9 | — | ||||||
| American Century Strategic Balanced |
2,000,000 | 1.875 | % | 3 | — | ||||||
| T. Rowe Price Global Bond |
7,000,000 | 1.750 | % | 2 | — | ||||||
| Federated High Yield |
30,437,500 | 1.545 | % | 16 | — | ||||||
| Lord Abbett Bond-Debenture |
5,761,905 | 1.686 | % | 42 | — | ||||||
316
Table of Contents
7. SUBSEQUENT EVENTS
On January 8, 2004, the Board of Trustees of the Trust approved JP Morgan Fleming Asset Management USA, Inc. to replace Strong Capital Management, Inc. as the sub-adviser on the AST Strong International Equity Portfolio. Upon transition, the Portfolio’s name will change to AST JP Morgan International Equity Portfolio. The transition is expected to take place on or about February 23, 2004.
On November 19, 2003, the Board of Trustees of the Trust approved an Agreement and Plan of Reorganization (the “Plan”) which provides for the transfer of all assets of the following portfolios for shares of the acquiring portfolios and the assumption of the liabilities of the portfolios. These portfolio reorganizations are still subject to shareholder approval.
| Portfolio |
Acquiring Portfolio | |
| American Century International Growth |
William Blair International Growth | |
| DeAM Bond |
PIMCO Total Return Bond | |
| DeAM Large-Cap Growth |
Goldman Sachs Concentrated Growth | |
| MFS Growth with Income |
American Century Income & Growth |
8. CHANGE IN INDEPENDENT AUDITORS
Deloitte & Touche LLP was previously the independent auditors for the Trust. The decision to change the independent auditors was approved by the Audit Committee and by the Board of Trustees in a meeting held on September 4, 2003, resulting in KPMG LLP’s appointment as independent auditors of the Trust.
The reports on the financial statements of the Trust audited by Deloitte & Touche LLP for the years ended December 31, 2002 and 2001 did not contain an adverse opinion or disclaimer of opinion, and were not qualified or modified as to uncertainty, audit scope or accounting principles. There were no disagreements between the Trust and Deloitte & Touche LLP on any matter of accounting principles or practices, financial statement disclosure, or auditing scope or procedures.
317
Table of Contents
Independent Auditors’ Report
The Board of Trustees and Shareholders of
American Skandia Trust:
We have audited the accompanying statements of assets and liabilities of the American Skandia Trust (comprised of AST Alger All-Cap Growth Portfolio, AST Alliance Growth & Income Portfolio, AST Alliance Growth Portfolio, AST Alliance/Bernstein Growth & Value Portfolio, AST American Century Income & Growth Portfolio, AST American Century International Growth Portfolio, AST American Century Strategic Balanced Portfolio, AST Cohen & Steers Realty Portfolio, AST DeAM Bond Portfolio, AST DeAM Global Allocation Portfolio, AST DeAM International Equity Portfolio, AST DeAM Large-Cap Growth Portfolio, AST DeAM Large-Cap Value Portfolio, AST DeAM Small-Cap Value Portfolio, AST DeAM Small-Cap Growth Portfolio, AST Federated Aggressive Growth Portfolio, AST Federated High Yield Portfolio, AST Gabelli All-Cap Value Portfolio, AST Gabelli Small-Cap Value Portfolio, AST Goldman Sachs Concentrated Growth Portfolio, AST Goldman Sachs Mid-Cap Growth Portfolio, AST Goldman Sachs Small-Cap Value Portfolio, AST INVESCO Capital Income Portfolio, AST Lord Abbett Bond-Debenture Portfolio, AST Marsico Capital Growth Portfolio, AST MFS Global Equity Portfolio, AST MFS Growth Portfolio, AST MFS Growth with Income Portfolio, AST Money Market Portfolio, AST Neuberger Berman Mid-Cap Growth Portfolio, AST Neuberger Berman Mid-Cap Value Portfolio, AST PBHG Small-Cap Growth Portfolio, AST PIMCO Limited Maturity Bond Portfolio, AST PIMCO Total Return Bond Portfolio, AST Sanford Bernstein Core Value Portfolio, AST Sanford Bernstein Managed Index 500 Portfolio, AST Strong International Equity Portfolio, AST T. Rowe Price Asset Allocation Portfolio, AST T. Rowe Price Global Bond Portfolio, AST T. Rowe Price Natural Resources Portfolio, and AST William Blair International Growth Portfolio) (collectively “the Funds”), including the schedules of investments, as of December 31, 2003, and the related statements of operations, the statements of changes in net assets, and the financial highlights for the year then ended. These financial statements and financial highlights are the responsibility of the Funds’ management. Our responsibility is to express an opinion on these financial statements and financial highlights based on our audits. The statements of changes in net assets and the financial highlights for the periods presented through December 31, 2002, were audited by other auditors, whose report dated, February 14, 2003, expressed an unqualified opinion thereon.
We conducted our audits in accordance with auditing standards generally accepted in the United States of America. Those standards require that we plan and perform the audits to obtain reasonable assurance about whether the financial statements and financial highlights are free of material misstatement. An audit includes examining, on a test basis, evidence supporting the amounts and disclosures in the financial statements. Our procedures included confirmation of securities owned as of December 31, 2003, by correspondence with custodians and brokers. An audit also includes assessing the accounting principles used and significant estimates made by management, as well as evaluating the overall financial statement presentation. We believe that our audits provide a reasonable basis for our opinion.
In our opinion, the financial statements and financial highlights referred to above present fairly, in all material respects, the financial position of the Funds constituting the American Skandia Trust, as of December 31, 2003, and the results of their operations, the changes in their net assets, and the financial highlights for the year then ended, in conformity with accounting principles generally accepted in the United States of America.

New York, New York
February 11, 2004
318
Table of Contents
Tax Information (Unaudited)
Detailed below are the percentages of ordinary income dividends paid in the fiscal year ended December 31, 2003 qualifying for the corporate dividends received deduction:
| Portfolio |
Corporate Dividend Received Deduction |
||
| Goldman Sachs Small-Cap Value |
100 | % | |
| Gabelli Small-Cap Value |
100 | % | |
| DeAM Small-Cap Value |
23 | % | |
| Neuberger Berman Mid-Cap Value |
100 | % | |
| Gabelli All-Cap Value |
100 | % | |
| T. Rowe Price Natural Resources |
37 | % | |
| Goldman Sachs Concentrated Growth |
100 | % | |
| DeAM Large-Cap Growth |
100 | % | |
| DeAM Large-Cap Value |
100 | % | |
| Alliance/Bernstein Growth + Value |
100 | % | |
| Sanford Bernstein Core Value |
57 | % | |
| Cohen & Steers Realty |
100 | % | |
| Sanford Bernstein Managed Index 500 |
100 | % | |
| American Century Income & Growth |
100 | % | |
| Alliance Growth and Income |
100 | % | |
| MFS Growth with Income |
100 | % | |
| INVESCO Capital Income |
100 | % | |
| American Century Strategic Balanced |
63 | % | |
| T. Rowe Price Asset Allocation |
21 | % | |
| Lord Abbett Bond-Debenture |
5 | % |
319
Table of Contents
MANAGEMENT OF THE TRUST
Information pertaining to the Trustees of the Trust is set forth below. Trustees who are not deemed to be “interested persons” of the Trust as defined in the Investment Company Act are referred to as “Independent Trustees.” Trustees who are deemed to be “interested persons” of the Trust are referred to as “Interested Trustees.” “Fund Complex” consists of the Trust and any other investment companies managed by Prudential Investments LLC.
Independent Trustees
| Name, Address** and Age |
Position |
Term of |
Principal Occupations |
Number of Portfolios in Fund Complex Overseen by Trustee |
Other | |||||
| Saul K. Fenster, Ph.D. (71) |
Trustee | Since 2003 | President Emeritus of New Jersey Institute of Technology (since 2002); formerly President (1978-2002) of New Jersey Institute of Technology; Commissioner (1998-2002) of the Middle States Association Commission on Higher Education; Commissioner (1985-2002) of the New Jersey Commission on Science and Technology; Director (since 1998) Society of Manufacturing Engineering Education Foundation, Director (since 1995) of Prosperity New Jersey; formerly a director or trustee of Liberty Science Center, Research and Development Council of New Jersey, New Jersey State Chamber of Commerce, and National Action Council for Minorities in Engineering. | 78 | Member (since 2000), Board of Directors of IDT Corporation. | |||||
| Delayne Dedrick Gold (64) |
Trustee | Since 2003 | Marketing Consultant (1982-present); formerly Senior Vice President and Member of the Board of Directors, Prudential Bache Securities, Inc. | 89 | ||||||
| Julian A. Lerner (79) |
Trustee Emeritus | Since 1996 | Senior Vice President and Portfolio Manager (1986-1995); AIM Charter Fund and AIM Summit Fund. | 41 | ||||||
| W. Scott McDonald, Jr. (67) |
Trustee | Since 2003 | Management Consultant (since 1997) at Kaludis Consulting Group, Inc. (company serving higher education); Formerly, principal (1995-1997), Scott McDonald & Associates, Chief Operating Officer (1991-1995), Fairleigh Dickinson University, Executive Vice President and Chief Operating Officer (1975-1991), Drew University, interim President (1988-1990), Drew University and former Director of School, College and University Underwriters Ltd. | 78 | ||||||
320
Table of Contents
| Name, Address** and Age |
Position |
Term of |
Principal Occupations |
Number of Portfolios in Fund Complex Overseen by Trustee |
Other | |||||
| Thomas T. Mooney (62) |
Trustee | Since 2003 | Chief Executive Officer, the Rochester Business Alliance, formerly President of the Greater Rochester Metro Chamber of Commerce, Rochester City Manager; formerly Deputy Monroe County Executive; Director of Blue Cross of Rochester and Executive Service Corps of Rochester; Director of the Rochester Individual Practice Association; Director of Rural Metro Ambulance Rochester (since 2003). | 81 | Director (since 1988) of The High Yield Plus Fund, Inc. | |||||
| Thomas M. O’Brien (53) |
Trustee | Since 1992 | President and Chief Executive Officer (since May 2000) of Atlantic Bank of New York; Vice Chairman (January 1997-April 2000) of North Fork Bank; President and Chief Executive Officer (December 1984-December 1996) of North Side Savings Bank. | 77 | Director (December 1996-May 2000) of North Fork Bank; Director (since May 2000) of Atlantic Bank of New York. | |||||
| John A. Pileski (64) |
Trustee | Since 2001 | Retired since June 2000; Tax Partner (July 1974-June 2000) of KPMG, LLP. | 77 | Director (since April 2001) of New York Community Bank; Director (since January 1997) of Director of Queens Museum of Art; Director (since May 1980) of Surf Club of Quogue, Inc. | |||||
| F. Don Schwartz (68) |
Trustee | Since 1992 | Management Consultant (since April 1985). | 77 | — | |||||
| Louis A. Weil, III (63) |
Trustee | Since 2003 | Formerly Chairman (January 1999-July 2000), President and Chief Executive Officer (January 1996-July 2000) and Director (since September 1991) of Central Newspapers, Inc.; formerly Chairman of the Board (January 1996-July 2000), Publisher and Chief Executive Officer (August 1991-December 1995) of Phoenix Newspapers, Inc. | 81 | — | |||||
321
Table of Contents
| Interested Trustees | ||||||||||
| Name, Address** and Age |
Position |
Term of and Length of |
Principal Occupations |
Number of Portfolios in Fund Complex Overseen by Trustee |
Other | |||||
| *David R. Odenath, Jr. (47) |
Chairman and Trustee | Since 2003 | President of Prudential Annuities (since August 2002); Executive Vice President (since May 2003) of American Skandia Investment Services, Inc; Chief Executive Officer and Director (since May 2003) of American Skandia Life Assurance Corporation, American Skandia Information Services and Technology Corporation and Skandia U.S. Inc.; President, Chief Executive Officer and Director (since May 2003) of American Skandia Marketing, Inc.; Formerly President, Chief Executive Officer, Chief Operating Officer and Officer-In-Charge (1999-2003) of PI; Senior Vice President (since June 1999) of Prudential; formerly Senior Vice President (August 1993-May 1999) of PaineWebber Group, Inc. | 115 | — | |||||
| *Robert F. Gunia (57) |
Vice President and Trustee | Since 2003 | Chief Administrative Officer (since June 1999) of Prudential Investments LLC (PI); Executive Vice President and Treasurer (since January 1996) of PI; President (since April 1999) of Prudential Investment Management Services LLC (PIMS); Corporate Vice President (since September 1997) of The Prudential Insurance Company of America (Prudential); Director, Executive Vice President and Chief Administrative Officer (since May 2003) of American Skandia Investment Services, Inc, American Skandia Advisory Services, Inc., and American Skandia Fund Services, Inc.; President (since April 1999) of Prudential Investment Management Services LLC; Executive Vice President (since March 1999) and Treasurer (since May 2000) of Prudential Mutual Fund Services LLC; formerly Senior Vice President (March 1987-May 1999) of Prudential Securities Incorporated (Prudential Securities). | 112 | Vice President and Director (since May 1989) and Treasurer (since 1999) of The Asia Pacific Fund, Inc. | |||||
322
Table of Contents
Information pertaining to the Officers of the Trust who are not also Trustees is set forth below.
Officers
| Name, Address** and Age |
Position |
Term of |
Principal Occupations |
|||||||
| Grace C. Torres (44) |
Treasurer and Principal Financial and Accounting Officer | Since 2003 | Senior Vice President (since January 2000) of PI; Senior Vice President and Assistant Treasurer (since May 2003) of American Skandia Investment Services, Inc. and American Skandia Advisory Services, Inc.; formerly First Vice President (December 1996-January 2000) of PI and First Vice President (March 1993-1999) of Prudential Securities. | |||||||
| Jonathan D. Shain (45) |
Secretary | Since 2003 | Vice President and Corporate Counsel (since August 1998) of Prudential; Vice President and Assistant Secretary (since May 2003) of American Skandia Investment Services, Inc. and American Skandia Fund Services, Inc.; formerly Attorney with Fleet Bank, N.A. (January 1997-July 1998). | |||||||
| Edward P. Macdonald (36) |
Assistant Secretary | Since 2000 | Vice President and Assistant Secretary (since May 2003) of American Skandia Investment Services, Inc.; Chief Counsel, Investment Management of American Skandia, Inc. (ASI) (since July 2002); Senior Counsel, Securities of ASI (September 2000-June 2002); Counsel of ASI (December 1999-August 2000); Senior Associate of Counsel of ASI (April 1999-December 1999); Branch Chief, Senior Counsel and Attorney at the U.S. Securities and Exchange Commission (October 1994-April 1999). | |||||||
| Marguerite E. H. Morrison (48) |
Chief Legal Officer and Assistant Secretary | Since 2003 | Vice President and Chief Legal Officer-Mutual Funds and Unit Investment Trusts (since August 2000) of Prudential; Senior Vice President and Secretary (since April 2003) of PI; Senior Vice President and Secretary (since May 2003) of American Skandia Investment Services, Inc., American Skandia Advisory Services, Inc., and American Skandia Fund Services, Inc.; Vice President and Assistant Secretary of PIMS (since October 2001), previously Senior Vice President and Assistant Secretary (February 2001-April 2003) of PI, Vice President and Associate General Counsel (December 1996-February 2001) of PI. | |||||||
323
Table of Contents
| Name, Address** and |
Position |
Term of |
Principal Occupations |
|||||||
| Maryanne Ryan (40) |
Anti-Money Laundering Compliance Officer | Since 2003 | Vice President, Prudential (since November 1998), First Vice President Prudential Securities (March 1997-May 1998); Anti-Money Laundering Compliance Officer (since 2003) of American Skandia Investment Services, Inc., American Skandia Advisory Services, Inc. and American Skandia Marketing, Inc. |
| * | “Interested” Trustee, as defined in the Investment Company Act, by reason of employment with the Manager (as defined below), and/or the Distributor (as defined below). |
| ** | Unless otherwise noted, the address of the Trustees and Officers is c/o: Prudential Investments LLC, Gateway Center Three, 100 Mulberry Street, Newark, New Jersey 07102. |
| *** | There is no set term of office for Trustees and Officers. The Independent Trustees have adopted a retirement policy, which calls for the retirement of Trustees on December 31 of the year in which they reach the age of 75. The table shows how long they have served as Trustee and/or Officer. |
| **** | This column includes only directorships of companies required to register, or file reports with the SEC under the Securities Exchange Act of 1934 (i.e., “public companies”) or other investment companies registered under the Investment Company Act. |
324
Table of Contents
American Skandia Life
Assurance Corporation
Tower One Corporate Drive
Shelton, CT 06484
PRESORTED STD
U.S. POSTAGE PAID
LOUISVILLE KY
PERMIT 1051
Annuities are sold by prospectus, which contains complete information on risk factors, fees and surrender charges, as well as conditions, limitations, and terms for keeping it in force that may apply. Please read the prospectus carefully before you invest or send money. Annuities are issued by American Skandia Life Assurance Corporation (“American Skandia”) and distributed by American Skandia Marketing Incorporated.
American Skandia is solely responsible for its respective financial condition and contractual obligations. Guarantees are based on the claims-paying ability of the issuing company. Both companies are located at One Corporate Drive, PO Box 883, Shelton, CT 06484. All are Prudential Financial companies.
B1-1203
Table of Contents
Item 2—Code of Ethics—See Exhibit (a)
As of the end of the period covered by this report, the registrant has adopted a code of ethics (the “Section 406 Standards for Investment Companies—Ethical Standards for Principal Executive and Financial Officers”) that applies to the registrant’s Principal Executive Officer and Principal Financial Officer; the registrant’s Principal Financial Officer also serves as the Principal Accounting Officer.
The registrant hereby undertakes to provide any person, without charge, upon request, a copy of the code of ethics. To request a copy of the code of ethics, contact the registrant 973-367-7525, and ask for a copy of the Section 406 Standards for Investment Companies—Ethical Standards for Principal Executive and Financial Officers.
Item 3—Audit Committee Financial Expert—
The registrant’s Board has determined that Mr. John A. Pileski, member of the Board’s Audit Committee is an “audit committee financial expert,” and that he is “independent,” for purposes of this Item.
Item 4—Principal Accountant Fees and Services—
Form N-CSR, Item 4. Principal Accountant Fees and Services
| (a) | Audit Fees |
For the fiscal year ended December 31, 2003 KPMG LLP, the Registrant’s principal accountant, billed the Registrant $667,000 (for professional services rendered for the audit of the Registrant’s annual financial statements or services that are normally provided in connection with statutory and regulatory filings. KPMG did not serve as the Registrant’s principal accountant during fiscal year 2002, so no information is provided for FY2002.
| (b) | Audit-Related Fees |
None.
| (c) | Tax Fees |
None.
| (d) | All Other Fees |
None.
Table of Contents
(e)(1) Audit Committee Pre-Approval Policies and Procedures
THE PRUDENTIAL MUTUAL FUNDS
AUDIT COMMITTEE POLICY
on
Pre-Approval of Services Provided by the Independent Accountants
The Audit Committee of each Prudential Mutual Fund is charged with the responsibility to monitor the independence of the Fund’s independent accountants. As part of this responsibility, the Audit Committee must pre-approve any independent accounting firm’s engagement to render audit and/or permissible non-audit services, as required by law. In evaluating a proposed engagement of the independent accountants, the Audit Committee will assess the effect that the engagement might reasonably be expected to have on the accountant’s independence. The Committee’s evaluation will be based on:
| • | a review of the nature of the professional services expected to be provided, |
| • | a review of the safeguards put into place by the accounting firm to safeguard independence, and |
| • | periodic meetings with the accounting firm. |
Policy for Audit and Non-Audit Services Provided to the Funds
On an annual basis, the scope of audits for each Fund, audit fees and expenses, and audit-related and non-audit services (and fees proposed in respect thereof) proposed to be performed by the Fund’s independent accountants will be presented by the Treasurer and the independent accountants to the Audit Committee for review and, as appropriate, approval prior to the initiation of such services. Such presentation shall be accompanied by confirmation by both the Treasurer and the independent accountants that the proposed services will not adversely affect the independence of the independent accountants. Proposed services shall be described in sufficient detail to enable the Audit Committee to assess the appropriateness of such services and fees, and the compatibility of the provision of such services with the auditor’s independence. The Committee shall receive periodic reports on the progress of the audit and other services which are approved by the Committee or by the Committee Chair pursuant to authority delegated in this Policy.
The categories of services enumerated under “Audit Services”, “Audit-related Services”, and “Tax Services” are intended to provide guidance to the Treasurer and the independent accountants as to those categories of services which the Committee believes are generally consistent with the independence of the independent accountants and which the Committee (or the Committee Chair) would expect upon the presentation of specific proposals to pre-approve.
Table of Contents
The enumerated categories are not intended as an exclusive list of audit, audit-related or tax services which the Committee (or the Committee Chair) would consider for pre-approval.
Audit Services
The following categories of audit services are considered to be consistent with the role of the Fund’s independent accountants
| Ø | Annual Fund financial statement audits |
| Ø | Seed audits (related to new product filings, as required) |
| Ø | SEC and regulatory filings and consents |
Audit-related Services
The following categories of audit-related services are considered to be consistent with the role of the Fund’s independent accountants:
| Ø | Accounting consultations |
| Ø | Fund merger support services |
| Ø | Agreed Upon Procedure Reports |
| Ø | Attestation Reports |
| Ø | Other Internal Control Reports |
Individual audit-related services that fall within one of these categories and are not presented to the Audit Committee as part of the annual pre-approval process will be subject to pre-approval by the Committee Chair (or any other Committee member on whom this responsibility has been delegated) so long as the estimated fee for those services does not exceed $50,000.
Tax Services
The following categories of tax services are considered to be consistent with the role of the Fund’s independent accountants:
| Ø | Tax compliance services related to the filing or amendment of the following: |
| n | Federal, state and local income tax compliance; and, |
| n | Sales and use tax compliance |
| Ø | Timely RIC qualification reviews |
| Ø | Tax distribution analysis and planning |
| Ø | Tax authority examination services |
| Ø | Tax appeals support services |
| Ø | Accounting methods studies |
| Ø | Fund merger support services |
| Ø | Tax consulting services and related projects |
Individual tax services that fall within one of these categories and are not presented to the Audit Committee as part of the annual pre-approval process will be subject to pre-approval by the
Table of Contents
Committee Chair (or any other Committee member on whom this responsibility has been delegated) so long as the estimated fee for those services does not exceed $50,000.
Other Non-audit Services
Certain non-audit services that the independent accountants are legally permitted to render will be subject to pre-approval by the Committee or by one or more Committee members to whom the Committee has delegated this authority and who will report to the full Committee any pre-approval decisions made pursuant to this Policy. Non-audit services presented for pre-approval pursuant to this paragraph will be accompanied by a confirmation from both the Treasurer and the independent accountants that the proposed services will not adversely affect the independence of the independent accountants.
Proscribed Services
The Fund’s independent accountants will not render services in the following categories of non-audit services:
| Ø | Bookkeeping or other services related to the accounting records or financial statements of the Fund |
| Ø | Financial information systems design and implementation |
| Ø | Appraisal or valuation services, fairness opinions, or contribution-in-kind reports |
| Ø | Actuarial services |
| Ø | Internal audit outsourcing services |
| Ø | Management functions or human resources |
| Ø | Broker or dealer, investment adviser, or investment banking services |
| Ø | Legal services and expert services unrelated to the audit |
| Ø | Any other service that the Public Company Accounting Oversight Board determines, by regulation, is impermissible. |
Pre-approval of Non-Audit Services Provided to Other Entities Within the Prudential Fund Complex
Certain non-audit services provided to Prudential Investments LLC or any of its affiliates that also provide ongoing services to the Prudential Mutual Funds will be subject to pre-approval by the Audit Committee. The only non-audit services provided to these entities that will require pre-approval are those related directly to the operations and financial reporting of the Funds. Individual projects that are not presented to the Audit Committee as part of the annual pre-approval process, will be subject to pre-approval by the Committee Chair (or any other Committee member on whom this responsibility has been delegated) so long as the estimated fee for those services does not exceed $50,000. Services presented for pre-approval pursuant to this paragraph will be accompanied by a confirmation from both the Treasurer and the independent accountants that the proposed services will not adversely affect the independence of the independent accountants.
Table of Contents
Although the Audit Committee will not pre-approve all services provided to Prudential Investments LLC and its affiliates, the Committee will receive an annual report from the Fund’s independent accounting firm showing the aggregate fees for all services provided to Prudential Investments and its affiliates.
(e)-(2) Percentage of services referred to in 4(b)- (4)(d) that were approved by the audit committee—Not applicable.
| (f) | Percentage of hours expended attributable to work performed by other than full time employees of principal accountant if greater than 50%. |
Not applicable.
| (g) | Non-Audit Fees |
N/A to Registrant and to the registrant’s investment adviser and any entity controlling, controlled by, or under common control with the investment adviser that provides ongoing services to the registrant.
(h) Principal Accountants Independence
Not applicable as KPMG has not provided non-audit services to the registrant’s investment adviser and any entity controlling, controlled by, or under common control with the investment adviser that provides ongoing services to the registrant that were not pre-approved pursuant to Rule 2-01(c)(7)(ii) of Regulation S-X.
Item 5—Reserved
Item 6—Reserved
Item 7—Disclosure of Proxy Voting Policies and Procedures for Closed-End Management Investment Companies—Not required in
this filing
Item 8—Reserved
Item 9—Controls and Procedures
| (a) | It is the conclusion of the registrant’s principal executive officer and principal financial officer that the effectiveness of the registrant’s current disclosure controls and procedures (such disclosure controls and procedures having been evaluated within 90 days of the date of this filing) provide reasonable assurance that the information required to be disclosed by the registrant has been recorded, processed, summarized and reported within the time period specified in the Commission’s rules and forms and that the information required to be disclosed by the registrant has been accumulated and communicated to the registrant’s principal executive officer and principal financial officer in order to allow timely decisions regarding required disclosure. |
| (b) | There have been no significant changes in the registrant’s internal controls or in other factors that could significantly affect these controls subsequent to the date of their |
Table of Contents
evaluation, including any corrective actions with regard to significant deficiencies and material weaknesses.
Item 10—Exhibits
| (a) | Code of Ethics—attached hereto |
| (b) | Certifications pursuant to Section 302 and 906 of the Sarbanes-Oxley Act—Attached hereto |
Table of Contents
SIGNATURES
Pursuant to the requirements of the Securities Exchange Act of 1934 and the Investment Company Act of 1940, the registrant has duly caused this report to be signed on its behalf by the undersigned, thereunto duly authorized.
| (Registrant) | American Skandia Trust | |
| By (Signature and Title)* | /s/ Marguerite E. H. Morrison | |
| Marguerite E. H. Morrison Secretary | ||
| Date | February 12, 2004 | |
Pursuant to the requirements of the Securities Exchange Act of 1934 and the Investment Company Act of 1940, this report has been signed below by the following persons on behalf of the registrant and in the capacities and on the dates indicated.
| By (Signature and Title)* | /s/ David R. Odenath | |
| David R. Odenath President and Principal Executive Officer | ||
| Date | February 12, 2004 | |
| By (Signature and Title)* | /s/ Grace C. Torres | |
| Grace C. Torres Treasurer and Principal Financial Officer | ||
| Date | February 12, 2004 | |
* Print the name and title of each signing officer under his or her signature.