SECURITIES AND EXCHANGE COMMISSION
Washington, D.C. 20549
FORM 10-K
|
x
|
ANNUAL REPORT PURSUANT TO SECTION 13 OR 15(d) OF THE SECURITIES EXCHANGE ACT OF 1934
|
For the fiscal year ended December 31, 2012
or
|
¨
|
TRANSITION REPORT PURSUANT TO SECTION 13 OR 15(d) OF THE SECURITIES EXCHANGE ACT OF 1934
|
For the transition period from to
Commission file number 001-12019
QUAKER CHEMICAL CORPORATION
(Exact name of Registrant as specified in its charter)
|
A Pennsylvania Corporation
|
No. 23-0993790
|
|
|
(State or other jurisdiction of incorporation or organization)
|
(I.R.S. Employer Identification No.)
|
|
One Quaker Park, 901 E. Hector Street,
Conshohocken, Pennsylvania
|
19428-2380
|
|
|
(Address of principal executive offices)
|
(Zip Code)
|
Registrant’s telephone number, including area code: (610) 832-4000
Securities registered pursuant to Section 12(b) of the Act:
|
Title of each class
|
Name of each Exchange on which registered
|
|||
|
Common Stock, $1.00 par value
|
New York Stock Exchange
|
Securities registered pursuant to Section 12(g) of the Act:
None
Indicate by check mark if the Registrant is a well-known seasoned issuer, as defined in Rule 405 of the Securities Act. Yes ¨ No x
Indicate by check mark if the Registrant is not required to file reports pursuant to Section 13 or Section 15(d) of the Act. Yes ¨ No x
Indicate by check mark whether the Registrant (1) has filed all reports required to be filed by Section 13 or 15(d) of the Securities Exchange Act of 1934 during the preceding 12 months and (2) has been subject to such filing requirements for the past 90 days. Yes x No ¨
Indicate by check mark whether the Registrant has submitted electronically and posted on its corporate Web site, if any, every Interactive Data File required to be submitted and posted pursuant to Rule 405 of Regulation S-T during the preceding 12 months (or for such shorter period that the Registrant was required to submit and post such files) Yes x No ¨
Indicate by check mark if disclosure of delinquent filers pursuant to Item 405 of Regulation S-K is not contained herein, and will not be contained, to the best of Registrant’s knowledge, in definitive proxy or information statements incorporated by reference in Part III of this Form 10-K or any amendment to this Form 10-K. ¨
Indicate by check mark whether the Registrant is a large accelerated filer, an accelerated filer, a non-accelerated filer, or a smaller reporting company. See the definitions of “large accelerated filer,” “accelerated filer” and “smaller reporting company” in Rule 12b-2 of the Exchange Act. (Check one):
|
Large accelerated filer ¨
|
Accelerated filer x
|
|
|
Non-accelerated filer ¨
(Do not check if smaller reporting company)
|
Smaller reporting company ¨
|
|
Indicate by check mark whether the Registrant is a shell company (as defined in Rule 12b-2 of the Act). Yes ¨ No x
State the aggregate market value of voting and non-voting common equity held by non-affiliates of the Registrant. (The aggregate market value is computed by reference to the last reported sale on the New York Stock Exchange on June 30, 2012): $593,424,846
Indicate the number of shares outstanding of each of the Registrant’s classes of common stock as of the latest practicable date: 13,096,116 shares of Common Stock, $1.00 Par Value, as of February 28, 2013.
DOCUMENTS INCORPORATED BY REFERENCE
Portions of the Registrant’s definitive Proxy Statement relating to the Annual Meeting of Shareholders to be held on May 8, 2013 are incorporated by reference into Part III.
PART I
As used in this Report, the terms “Quaker,” the “Company,” “we” and “our” refer to Quaker Chemical Corporation, its subsidiaries, and associated companies, unless the context otherwise requires.
General Description
Quaker develops, produces, and markets a broad range of formulated chemical specialty products for various heavy industrial and manufacturing applications and, in addition, offers and markets chemical management services (“CMS”). Quaker’s principal products and services include: (i) rolling lubricants (used by manufacturers of steel in the hot and cold rolling of steel and by manufacturers of aluminum in the hot rolling of aluminum); (ii) corrosion preventives (used by steel and metalworking customers to protect metal during manufacture, storage, and shipment); (iii) metal finishing compounds (used to prepare metal surfaces for special treatments such as galvanizing and tin plating and to prepare metal for further processing); (iv) machining and grinding compounds (used by metalworking customers in cutting, shaping, and grinding metal parts which require special treatment to enable them to tolerate the manufacturing process, achieve closer tolerance, and improve tool life); (v) forming compounds (used to facilitate the drawing and extrusion of metal products); (vi) hydraulic fluids (used by steel, metalworking, and other customers to operate hydraulically activated equipment); (vii) technology for the removal of hydrogen sulfide in various industrial applications; (viii) chemical milling maskants for the aerospace industry and temporary and permanent coatings for metal and concrete products; (ix) construction products, such as flexible sealants and protective coatings, for various applications; (x) specialty greases; (xi) die casting lubricants and (xii) programs to provide chemical management services. Individual product lines representing more than 10% of consolidated revenues for any of the past three years are as follows:
|
2012
|
2011
|
2010
|
|||||||||
|
Rolling Lubricants
|
20.7
|
%
|
22.0
|
%
|
21.2
|
%
|
|||||
|
Machining and grinding compounds
|
17.6
|
%
|
18.8
|
%
|
20.3
|
%
|
|||||
|
Hydraulic fluids
|
13.5
|
%
|
12.9
|
%
|
13.7
|
%
|
|||||
|
Corrosion preventives
|
12.4
|
%
|
11.5
|
%
|
11.5
|
%
|
A substantial portion of Quaker’s sales worldwide are made directly through its own employees and its CMS programs with the balance being handled through distributors and agents. Quaker employees visit the plants of customers regularly and, through training and experience, identify production needs which can be resolved or alleviated either by adapting Quaker’s existing products or by applying new formulations developed in Quaker’s laboratories. Quaker makes little use of advertising but relies heavily upon its reputation in the markets which it serves. Generally, separate manufacturing facilities of a single customer are served by different personnel. As part of the Company’s chemical management services, certain third-party product sales to customers are managed by the Company. Where the Company acts as principal, revenues are recognized on a gross reporting basis at the selling price negotiated with the customers. Where the Company acts as an agent, such revenue is recorded using net reporting as service revenues at the amount of the administrative fee earned by the Company for ordering the goods. Third-party products transferred under arrangements resulting in net reporting totaled $39.3 million, $50.9 million and $56.5 million for 2012, 2011 and 2010, respectively. The Company recognizes revenue in accordance with the terms of the underlying agreements, when title and risk of loss have been transferred, when collectability is reasonably assured, and when pricing is fixed or determinable. This generally occurs for product sales when products are shipped to customers or, for consignment-type arrangements, upon usage by the customer and, for services, when they are performed. License fees and royalties are included in other income when recognized in accordance with agreed-upon terms, when performance obligations are satisfied, when the amount is fixed or determinable, and when collectability is reasonably assured.
In July 2012, the Company acquired NP Coil Dexter Industries, S.r.l., for approximately $2.7 million. NP Coil Dexter is a European manufacturer and supplier of metal surface treatment products. In July 2011, the Company acquired the remaining 60% ownership interest in Tecniquimia Mexicana, S.A. de C.V., its Mexican affiliate, for approximately $10.5 million. The acquisition of Tecniquimia allowed the Company to further capitalize on the growing Mexican market. Also, in October 2011, the Company acquired G.W. Smith & Sons, Inc. for approximately $14.5 million. G.W. Smith is a manufacturer and distributor of high quality die casting lubricants and metalworking fluids.
Competition
The chemical specialty industry comprises a number of companies of similar size as well as companies larger and smaller than Quaker. Quaker cannot readily determine its precise position in every industry it serves. Based on information available to Quaker, however, it is estimated that Quaker holds a leading global position (among a group in excess of 25 other suppliers) in the market for process fluids to produce sheet steel. It is also believed that Quaker holds significant global positions in the markets for process fluids in portions of the automotive and industrial markets. The offerings of many of our competitors differ from Quaker, with some who offer a broad portfolio of fluids including general lubricants to those who have a more specialized product range and all of whom provide different levels of technical services to individual customers. Competition in the industry is based primarily on the ability to provide products that meet the needs of the customer and render technical services and laboratory assistance to customers and, to a lesser extent, on price.
1
Major Customers and Markets
In 2012, Quaker’s five largest customers (each composed of multiple subsidiaries or divisions with semi-autonomous purchasing authority) accounted for approximately 19% of its consolidated net sales with the largest customer (Arcelor-Mittal Group) accounting for approximately 9% of consolidated net sales. A significant portion of Quaker’s revenues are realized from the sale of process fluids and services to manufacturers of steel, automobiles, appliances, and durable goods, and, therefore, Quaker is subject to the same business cycles as those experienced by these manufacturers and their customers. Furthermore, steel customers typically have limited manufacturing locations as compared to metalworking customers and generally use higher volumes of products at a single location. Accordingly, the loss or closure of a steel mill or other major customer site can have a material adverse effect on Quaker’s business.
Raw Materials
Quaker uses over 1,000 raw materials, including mineral oils and derivatives, animal fats and derivatives, vegetable oils and derivatives, ethylene derivatives, solvents, surface active agents, chlorinated paraffinic compounds, and a wide variety of other organic and inorganic compounds. In 2012, three raw material groups (mineral oils and derivatives, animal fats and derivatives, and vegetable oils and derivatives) each accounted for as much as 10% of the total cost of Quaker’s raw material purchases. The price of mineral oil can be affected by the price of crude oil and refining capacity. In addition, animal fat and vegetable oil prices are impacted by increased biodiesel consumption. Accordingly, significant fluctuations in the price of crude oil can have a material effect upon the Company’s business. Many of the raw materials used by Quaker are “commodity” chemicals, and, therefore, Quaker’s earnings can be affected by market changes in raw material prices. Reference is made to the disclosure contained in Item 7A of this Report.
Patents and Trademarks
Quaker has a limited number of patents and patent applications, including patents issued, applied for, or acquired in the United States and in various foreign countries, some of which may prove to be material to its business. Principal reliance is placed upon Quaker’s proprietary formulae and the application of its skills and experience to meet customer needs. Quaker’s products are identified by trademarks that are registered throughout its marketing area.
Quaker’s research and development laboratories are directed primarily toward applied research and development since the nature of Quaker’s business requires continual modification and improvement of formulations to provide chemical specialties to satisfy customer requirements. Quaker maintains quality control laboratory facilities in each of its manufacturing locations. In addition, Quaker maintains facilities in Conshohocken, Pennsylvania, Santa Fe Springs, California, Batavia, New York, Uithoorn, The Netherlands, Rio De Janiero, Brazil and Qingpu, China that are devoted primarily to applied research and development.
Research and development costs are expensed as incurred. Research and development expenses during 2012, 2011 and 2010 were $20.0 million, $18.8 million and $15.7 million, respectively.
Most of Quaker’s subsidiaries and associated companies also have laboratory facilities. Although not as complete as the Conshohocken, Santa Fe Springs, Batavia, Uithoorn, Rio De Janiero or Qingpu laboratories, these facilities are generally sufficient for the requirements of the customers being served. If problems are encountered which cannot be resolved by local laboratories, such problems may be referred to the laboratory staff in Conshohocken or Uithoorn.
Regulatory Matters
In order to facilitate compliance with applicable Federal, state, and local statutes and regulations relating to occupational health and safety and protection of the environment, the Company has an ongoing program of site assessment for the purpose of identifying capital expenditures or other actions that may be necessary to comply with such requirements. The program includes periodic inspections of each facility by Quaker and/or independent experts, as well as ongoing inspections and training by on-site personnel. Such inspections address operational matters, record keeping, reporting requirements and capital improvements. Capital expenditures directed solely or primarily to regulatory compliance amounted to approximately $1.0 million, $1.0 million and $0.7 million in 2012, 2011 and 2010, respectively. In 2013, the Company expects to incur approximately $1.4 million for capital expenditures directed primarily to regulatory compliance.
Number of Employees
On December 31, 2012, Quaker’s consolidated companies had 1,711 full-time employees of whom 546 were employed by the parent company and its U.S. subsidiaries and 1,165 were employed by its non-U.S. subsidiaries. Associated companies of Quaker (in which it owns less than 50% and has significant influence) employed 65 people on December 31, 2012.
2
Product Classification
The Company organizes its segments by the nature of the product sold. The Company’s reportable segments are as follows:
|
·
|
Metalworking process chemicals — generally includes industrial process fluids for various heavy industrial and manufacturing applications.
|
|
·
|
Coatings — generally includes temporary and permanent coatings for metal and concrete products and chemical milling maskants.
|
|
·
|
Other chemical products—other various chemical products.
|
Incorporated by reference is the segment information contained in Note 15 of Notes to Consolidated Financial Statements included in Item 8 of this Report.
Non-U.S. Activities
Since significant revenues and earnings are generated by non-U.S. operations, Quaker’s financial results are affected by currency fluctuations, particularly between the U.S. Dollar, the E.U. Euro, the Brazilian Real, and the Chinese Renminbi, and the impact of those currency fluctuations on the underlying economies. Incorporated by reference is (i) the foreign exchange risk information contained in Item 7A of this Report, (ii) the geographic information in Note 15 of Notes to Consolidated Financial Statements included in Item 8 of this Report and (iii) information regarding risks attendant to foreign operations included in Item 1A of this Report.
Quaker on the Internet
Financial results, news and other information about Quaker can be accessed from the Company’s Web site at http://www.quakerchem.com. This site includes important information on products and services, financial reports, news releases, and career opportunities. The Company’s periodic and current reports on Forms 10-K, 10-Q and 8-K, including exhibits and supplemental schedules filed therewith, and amendments to those reports, filed with the Securities and Exchange Commission (“SEC”) are available on the Company’s Web site, free of charge, as soon as reasonably practicable after they are electronically filed with or furnished to the SEC. Information contained on, or that may be accessed through, the Company’s Web site is not incorporated by reference in this Report and, accordingly, you should not consider that information part of this Report.
Factors that May Affect Our Future Results
(Cautionary Statements under the Private Securities Litigation Reform Act of 1995)
Certain information included in this Report and other materials filed or to be filed by Quaker with the SEC (as well as information included in oral statements or other written statements made or to be made by us) contain or may contain forward-looking statements within the meaning of Section 27A of the Securities Act of 1933, as amended, and Section 21E of the Securities Exchange Act of 1934, as amended. These statements can be identified by the fact that they do not relate strictly to historical or current facts. We have based these forward-looking statements on our current expectations about future events. These forward-looking statements include statements with respect to our beliefs, plans, objectives, goals, expectations, anticipations, intentions, financial condition, results of operations, future performance, and business, including:
|
|
•
|
statements relating to our business strategy;
|
|
•
|
our current and future results and plans; and
|
|
•
|
statements that include the words “may,” “could,” “should,” “would,” “believe,” “expect,” “anticipate,” “estimate,” “intend,” “plan” or similar expressions.
|
Such statements include information relating to current and future business activities, operational matters, capital spending, and financing sources. From time to time, oral or written forward-looking statements are also included in Quaker’s periodic reports on Forms 10-K, 10-Q and 8-K, press releases, and other materials released to, or statements made to, the public.
Any or all of the forward-looking statements in this Report, in Quaker’s Annual Report to Shareholders for 2012, and in any other public statements we make may turn out to be wrong. This can occur as a result of inaccurate assumptions or as a consequence of known or unknown risks and uncertainties. Many factors will be important in determining our future performance. Consequently, actual results may differ materially from those that might be anticipated from our forward-looking statements.
We undertake no obligation to publicly update any forward-looking statements, whether as a result of new information, future events or otherwise. However, any further disclosures made on related subjects in Quaker’s subsequent reports on Forms 10-K, 10-Q and 8-K should be consulted. These forward-looking statements are subject to risks, uncertainties and assumptions about us and our operations that are subject to change based on various important factors, some of which are beyond our control. A major risk is that the demand for the Company’s products and services is largely derived from the demand for its customers’ products, which subjects
3
the Company to uncertainties related to downturns in a customer’s business and unanticipated customer production shutdowns. Other major risks and uncertainties include, but are not limited to, significant increases in raw material costs, worldwide economic and political conditions, foreign currency fluctuations, terrorist attacks and other acts of violence, each of which is discussed in greater detail in Item 1A of this Report. Furthermore, the Company is subject to the same business cycles as those experienced by steel, automobile, aircraft, appliance, and durable goods manufacturers. These risks, uncertainties, and possible inaccurate assumptions relevant to our business could cause our actual results to differ materially from expected and historical results. Other factors beyond those discussed in this Report could also adversely affect us. Therefore, we caution you not to place undue reliance on our forward-looking statements. This discussion is provided as permitted by the Private Securities Litigation Reform Act of 1995.
Changes to the industries and markets that Quaker serves could have a material adverse effect on the Company’s liquidity, financial position and results of operations.
The chemical specialty industry comprises a number of companies of similar size as well as companies larger and smaller than Quaker. It is estimated that Quaker holds a leading and significant global position in the markets for process fluids to produce sheet steel and significant global positions in portions of the automotive and industrial markets. The industry is highly competitive, and a number of companies with significant financial resources and/or customer relationships compete with us to provide similar products and services. Our competitors may be positioned to offer more favorable pricing and service terms, resulting in reduced profitability and loss of market share for us. Historically, competition in the industry has been based primarily on the ability to provide products that meet the needs of the customer and render technical services and laboratory assistance to the customer and, to a lesser extent, on price. Factors critical to the Company’s business include successfully differentiating the Company’s offering from its competition, operating efficiently and profitably as a globally integrated whole, and increasing market share and customer penetration through internally developed business programs and strategic acquisitions.
The business environment in which the Company operates remains uncertain. The Company is subject to the same business cycles as those experienced by steel, automobile, aircraft, appliance, and durable goods manufacturers. A major risk is that the Company’s demand is largely derived from the demand for its customers’ products, which subjects the Company to uncertainties related to downturns in our customers’ business and unanticipated customer production shutdowns or curtailments. The Company has limited ability to adjust its cost level contemporaneously with changes in sales and gross margins. Thus, a significant downturn in sales or gross margins due to weak end-user markets, loss of a significant customer, and/or rising raw material costs could have a material adverse effect on the Company’s liquidity, financial position, and results of operations.
Our business depends on attracting and retaining qualified management personnel.
The unanticipated departure of any key member of our management team could have an adverse effect on our business. Given the relative size of the Company and the breadth of its global operations, there are a limited number of qualified management personnel to assume the responsibilities of management level employees should there be management turnover. In addition, because of the specialized and technical nature of our business, our future performance is dependent on the continued service of, and our ability to attract and retain, qualified management, commercial and technical personnel. Competition for such personnel is intense, and we may be unable to continue to attract or retain such personnel. In an effort to mitigate such risks, the Company utilizes retention bonuses, offers competitive pay and maintains continued succession planning, but there can be no assurance that these mitigating factors will be adequate to attract or retain qualified management personnel.
Inability to obtain sufficient price increases or contract concessions to offset increases in the costs of raw material could have a material adverse effect on the Company’s liquidity, financial position and results of operations. Price increases implemented could result in the loss of sales.
Quaker uses over 1,000 raw materials, including mineral oils and derivatives, animal fats and derivatives, vegetable oils and derivatives, ethylene derivatives, solvents, surface active agents, chlorinated paraffinic compounds, and a wide variety of other organic and inorganic compounds. In 2012, three raw material groups (mineral oils and derivatives, animal fats and derivatives, and vegetable oils and derivatives) each accounted for as much as 10% of the total cost of Quaker’s raw material purchases. The price of mineral oil can be affected by the price of crude oil and refining capacity. In addition, many of the raw materials used by Quaker are “commodity” chemicals. Accordingly, Quaker’s earnings can be affected by market changes in raw material prices.
Over the past three years, Quaker has experienced significant volatility in its raw material costs, particularly crude oil derivatives. In addition, refining capacity has also been constrained by various factors, which further contributed to volatile raw material costs and negatively impacted margins. Animal fat and vegetable oil prices have been impacted by increased biodiesel consumption. In response, the Company has aggressively pursued price increases to offset the increased raw material costs. Although the Company has been successful in recovering a substantial amount of the raw material cost increases while retaining customers, there can be no assurance that the Company can continue to recover raw material costs or retain customers in the future. As a result of the Company’s pricing actions, customers may become more likely to consider competitors’ products, some of which may be available at a lower cost. Significant loss of customers could result in a material adverse effect on the Company’s results of operations.
4
Availability of raw materials, including sourcing from some single suppliers and some suppliers in volatile economic environments, could have a material adverse effect on the Company’s liquidity, financial position and results of operations.
The chemical specialty industry can experience some tightness of supply of certain raw materials. In addition, in some cases, we choose to source from a single supplier and/or suppliers in economies that have experienced instability. Any significant disruption in supply could affect our ability to obtain raw materials, which could have a material adverse effect on our liquidity, financial position and results of operations. In addition, the Company’s raw materials are subject to various regulatory laws, and a change in the ability to legally use such raw materials may impact Quaker’s liquidity, financial position and results of operations.
Loss of a significant manufacturing facility may materially and adversely affect the Company’s liquidity, financial position and results of operations.
Quaker has multiple manufacturing facilities throughout the world. In certain countries such as Brazil and China, there is only one such facility. If one of the Company’s facilities was damaged to such extent that production was halted for an extended period, the Company may not be able to timely supply affected customers. This could result in a loss of sales over an extended period or permanently. The Company does take steps to mitigate against this risk including contingency planning and procuring property and casualty insurance (including business interruption insurance). Nevertheless, the loss of sales in any one region over any extended period of time could have a significant material adverse effect on Quaker’s liquidity, financial position and results of operations.
Bankruptcy of a significant customer could have a material adverse effect on our liquidity, financial position and results of operations.
A significant portion of Quaker’s revenues is derived from sales to customers in the steel and automotive industries, including some of our larger customers, where a number of bankruptcies have occurred in the past and companies have experienced financial difficulties. As part of the bankruptcy process, the Company’s pre-petition receivables may not be realized, customer manufacturing sites may be closed or contracts voided. The bankruptcy of a major customer could have a material adverse effect on the Company’s liquidity, financial position, and results of operations. Steel customers typically have limited manufacturing locations as compared to metalworking customers and generally use higher volumes of products at a single location. The loss or closure of a steel mill or other major site of a significant customer could have a material adverse effect on Quaker’s business.
During 2012, our five largest customers (each composed of multiple subsidiaries or divisions with semi-autonomous purchasing authority) together accounted for approximately 19% of our consolidated net sales, with the largest customer (Arcelor-Mittal Group) accounting for approximately 9% of consolidated net sales.
Failure to comply with any material provision of our credit facility or other debt agreements could have a material adverse effect on our liquidity, financial position and results of operations.
The Company maintains a $175.0 million unsecured credit facility (the “Credit Facility”) with a group of lenders, which can be increased to $225.0 million at the Company’s option if lenders agree to increase their commitments and the Company satisfies certain conditions. The Credit Facility, which matures in 2014, provides the availability of revolving credit borrowings. In general, the borrowings under the Credit Facility bear interest at either a base rate or LIBOR rate plus a margin based on the Company’s consolidated leverage ratio.
The Credit Facility contains limitations on capital expenditures, investments, acquisitions and liens, as well as default provisions customary for facilities of its type. While these covenants and restrictions are not currently considered to be overly restrictive, they could become more difficult to comply with as our business or financial conditions change. In addition, deterioration in the Company’s results of operations or financial position could significantly increase borrowing costs.
Quaker is exposed to market rate risk for changes in interest rates, due to the variable interest rate applied to the Company’s borrowings under its Credit Facility. Accordingly, if interest rates rise significantly, the cost of debt to Quaker will increase, perhaps significantly, depending on the extent of Quaker’s borrowings under the Credit Facility. At December 31, 2012, the Company had $12.2 million outstanding under its credit facilities. The Company had, in previous years, entered into interest rate swaps in order to fix a portion of its variable rate debt and mitigate the risks associated with higher interest rates, which matured during 2012.
Failure to generate taxable income could have a material adverse effect on our financial position and results of operations.
At December 31, 2012, the Company had net U.S. deferred tax assets totaling $13.9 million, excluding deferred tax assets relating to additional minimum pension liabilities. In addition, at that date, the Company had $12.6 million in operating loss carryforwards primarily related to certain of its foreign operations. The Company records valuation allowances when necessary to reduce its deferred tax assets to the amount that is more likely than not to be realized. The Company considers future taxable income and ongoing prudent and feasible tax planning strategies in assessing the need for a valuation allowance. However, in the event the Company were to determine that it would not be able to realize all or part of its net deferred tax assets in the future, an adjustment to the deferred tax asset would be a non-cash charge to income in the period such determination was made, which could have a material adverse effect on the Company’s financial statements. The Company continues to closely monitor this situation as it relates to its net deferred tax assets and the assessment of valuation allowances.
5
Environmental laws and regulations and pending legal proceedings may materially and adversely affect the Company’s liquidity, financial position and results of operations.
The Company is a party to proceedings, cases, and requests for information from, and negotiations with, various claimants and Federal and state agencies relating to various matters, including environmental matters. An adverse result in one or more matters could materially and adversely affect the Company’s liquidity, financial position and results of operations. Incorporated herein by reference is the information concerning pending asbestos-related litigation against an inactive subsidiary and amounts accrued associated with certain environmental non-capital remediation costs in Note 20 of Notes to Consolidated Financial Statements which appears in Item 8 of this Report.
Climate change and greenhouse gas restrictions may materially affect the Company’s liquidity, financial position and results of operations.
The Company is subject to various regulations regarding its emission of greenhouse gases in its manufacturing facilities. In addition, a number of countries have adopted, or are considering the adoption of regulatory frameworks to reduce greenhouse gas emissions. These include adoption of cap and trade regimes, carbon taxes, increased efficiency standards and incentives or mandates for renewable energy. These requirements could make our products more expensive and reduce demand for our products. Current and pending greenhouse gas regulations may also increase our compliance costs.
We might not be able to timely develop, manufacture and gain market acceptance of new and enhanced products required to maintain or expand our business.
We believe that our continued success depends on our ability to continuously develop and manufacture new products and product enhancements on a timely and cost-effective basis, in response to customers’ demands for higher performance process chemicals, coatings and other chemical products. Our competitors may develop new products or enhancements to their products that offer performance, features and lower prices that may render our products less competitive or obsolete and, as a consequence, we may lose business and/or significant market share. The development and commercialization of new products require significant expenditures over an extended period of time, and some products that we seek to develop may never become profitable. In addition, we may not be able to develop and introduce products incorporating new technologies in a timely manner that will satisfy our customers’ future needs or achieve market acceptance.
An inability to capitalize on prior or future acquisitions may adversely affect the Company’s liquidity, financial position and results of operations.
Quaker has completed several acquisitions in the past and may continue to seek acquisitions to grow business. Success of the acquisitions depends on the Company’s ability to:
|
•
|
successfully execute the integration or consolidation of the acquired operations into existing businesses,
|
|
|
•
|
develop or modify the financial reporting and information systems of the acquired entity to ensure overall financial integrity and adequacy of internal control procedures,
|
|
|
•
|
identify and take advantage of cost reduction opportunities, and
|
|
|
•
|
further penetrate existing markets with the product capabilities acquired.
|
The Company may fail to derive significant benefits from such transactions, which could have a material adverse affect on liquidity, financial position and results of operations. Also, if the Company fails to achieve sufficient financial performance from an acquisition, certain long-lived assets, such as property, plant and equipment and goodwill and other intangible assets, could become impaired and result in the recognition of an impairment loss.
The scope of our international operations subjects the Company to risks, including risks from changes in trade regulations, currency fluctuations, and political and economic instability.
Since significant revenues and earnings are generated by non-U.S. operations, Quaker’s financial results are affected by currency fluctuations, particularly between the U.S. Dollar, the E.U. Euro, the Brazilian Real, and the Chinese Renminbi, and the impact of those currency fluctuations on the underlying economies. During the past three years, sales by non-U.S. subsidiaries accounted for approximately 60% to 65% of our annual consolidated net sales. All of these operations use the local currency as their functional currency. The Company generally does not use financial instruments that expose it to significant risk involving foreign currency transactions; however, the size of non-U.S. activities has a significant impact on reported operating results and attendant net assets. Therefore, as exchange rates vary, Quaker’s results can be materially affected. Incorporated by reference is the foreign exchange risk information contained in Item 7A of this Report and the geographic information in Note 15 of Notes to Consolidated Financial Statements included in Item 8 of this Report.
6
The Company often sources inventory among its worldwide operations. This practice can give rise to foreign exchange risk resulting from the varying cost of inventory to the receiving location, as well as from the revaluation of intercompany balances. The Company mitigates this risk through local sourcing efforts.
Additional risks associated with the Company’s international operations include, but are not limited to, the following:
|
|
•
|
changes in economic conditions from country to country, similar to the recent instability in certain European economies,
|
|
|
|
•
|
changes in a country’s political condition, such as the current political unrest in the Middle East,
|
|
|
•
|
trade protection measures,
|
||
|
|
•
|
longer payment cycles,
|
|
|
|
•
|
licensing and other legal requirements,
|
|
|
|
•
|
restrictions on the repatriation of our assets, including cash,
|
|
|
|
•
|
the difficulties of staffing and managing dispersed international operations,
|
|
|
|
•
|
less protective foreign intellectual property laws,
|
|
|
|
•
|
legal systems that may be less developed and predictable than those in the United States, and
|
|
|
•
|
local tax issues.
|
The breadth of Quaker’s international operations subjects the Company to various local non-income taxes, including value-added-taxes (“VAT”). With VAT, the Company essentially operates as an agent for various jurisdictions by collecting VAT from customers and remitting those amounts to the taxing authorities on the goods it sells. The laws and regulations regarding VAT can be complex and vary widely among countries as well as among individual states within a given country for the same products, making full compliance difficult. As VAT is often charged as a percentage of the selling price of the goods sold, the amounts involved can be material. Should there be non-compliance by the Company, it may need to remit funds to the tax authorities prior to collecting the appropriate amounts from customers or jurisdictions which may have been incorrectly paid. In addition, the Company may choose for commercial reasons not to seek repayment from certain customers. This could have a material adverse affect on the Company’s liquidity, financial position and results of operations. See Note 20 of Notes to Consolidated Financial Statements, included in Item 8 of this Report, which is incorporated herein by this reference, for further discussion.
Terrorist attacks, other acts of violence or war, natural disasters, cybersecurity incidents or other uncommon global events may affect the markets in which we operate and our profitability.
Terrorist attacks, other acts of violence or war, natural disasters, cybersecurity incidents or other uncommon global events may negatively affect our operations. There can be no assurance that there will not be further terrorist attacks against the U.S. or other locations where we do business. Also, other uncommon global events, such as earthquakes, fires and tsunami, cannot be predicted. Terrorist attacks, other acts of violence or armed conflicts, and natural disasters may directly impact our physical facilities or those of our suppliers or customers. Additional terrorist attacks or natural disasters may disrupt the global insurance and reinsurance industries with the result that we may not be able to obtain insurance at historical terms and levels for all of our facilities. Furthermore, any of these events may make travel and the transportation of our supplies and products more difficult and more expensive and ultimately affect the sales of our products. Failure to effectively prevent, detect and recover from breaches in the Company’s cybersecurity infrastructure could also negatively impact the Company’s results of operation through the loss of Company assets, business disruptions or other adverse consequences resulting from other misuses of the Company’s information technology. The consequences of terrorist attacks, other acts of violence or armed conflicts, natural disasters, cybersecurity incidents or other uncommon global events can be unpredictable, and we may not be able to foresee events, such as these, that could have an adverse effect on our business.
|
Item 1B.
|
Unresolved Staff Comments.
|
None.
Quaker’s corporate headquarters and a laboratory facility are located in Conshohocken, Pennsylvania. Quaker’s other principal facilities are located in Detroit, Michigan; Middletown, Ohio; Santa Fe Springs, California; Batavia, New York; Dayton, Ohio; Monterrey, N.L., Mexico; Uithoorn, The Netherlands; Santa Perpetua de Mogoda, Spain; Rio de Janeiro, Brazil; Tradate, Italy; Gorgonzola, Italy and Qingpu, China. All of the properties, except Santa Fe Springs, California, are used by the metalworking process chemicals segment. The Santa Fe Springs, California property is used by the coatings segment. With the exception of the Conshohocken, Santa Fe Springs and Gorgonzola sites, which are leased, all of these principal facilities are owned by Quaker and, as of December 31, 2012, were mortgage free. Quaker also leases sales, laboratory, manufacturing, and warehouse facilities in other locations.
7
Quaker’s principal facilities (excluding Conshohocken) consist of various manufacturing, administrative, warehouse, and laboratory buildings. Substantially all of the buildings (including Conshohocken) are of fire-resistant construction and are equipped with sprinkler systems. All facilities are primarily of masonry and/or steel construction and are adequate and suitable for Quaker’s present operations. The Company has a program to identify needed capital improvements that are implemented as management considers necessary or desirable. Most locations have various numbers of raw material storage tanks ranging from 2 to 58 at each location with a capacity ranging from 1,000 to 82,000 gallons and processing or manufacturing vessels ranging in capacity from 7 to 16,000 gallons.
Each of Quaker’s non-U.S. associated companies (in which it owns a less than 50% interest and has significant influence) owns or leases a plant and/or sales facilities in various locations, with the exception of Primex, Ltd.
The Company is a party to proceedings, cases, and requests for information from, and negotiations with, various claimants and Federal and state agencies relating to various matters, including environmental matters. For information concerning pending asbestos-related litigation against an inactive subsidiary, amounts accrued associated with certain environmental non-capital remediation costs and the Company’s value-added-tax dispute settlements, reference is made to Note 20 of Notes to Consolidated Financial Statements, included in Item 8 of this Report, which is incorporated herein by this reference. The Company is a party to other litigation which management currently believes will not have a material adverse effect on the Company’s results of operations, cash flow or financial condition.
|
Item 4.
|
Mine Safety Disclosures.
|
Not Applicable
8
Set forth below is information regarding the executive officers of the Company, each of whom (with the exception of Ms. Loebl) has been employed by the Company for more than five years, including the respective positions and offices with the Company held by each over the respected periods indicated. Each of the executive officers, with the exception of Mr. Hill, is elected annually to a one-year term. Mr. Hill is considered an executive officer in his capacity as principal accounting officer for purposes of this item.
|
Name, Age, and Present
Position with the Company
|
|
Business Experience During Past Five
Years and Period Served as an Officer
|
|
|
Michael F. Barry, 54
Chairman of the Board, Chief Executive Officer
and President and Director
|
|
Mr. Barry, who has been employed by the Company since 1998, has served as Chairman of the Board since May 13, 2009, in addition to his position as Chief Executive Officer and President held since October 2008. He served as Senior Vice President and Managing Director – North America from January 2006 to October 2008. He served as Senior Vice President and Global Industry Leader – Metalworking and Coatings from July 2005 through December 2005. He served as Vice President and Global Industry Leader – Industrial Metalworking and Coatings from January 2004 through June 2005 and Vice President and Chief Financial Officer from 1998 to August 2004.
|
|
|
Margaret M. Loebl, 53
Vice President, Chief Financial Officer
and Treasurer
|
|
Ms. Loebl joined the Company on June 29, 2012 as Vice President, Chief Financial Officer and Treasurer. Prior to joining the Company, Ms. Loebl, from August 2011 to December 2011, provided senior executive-level financial consulting services in Paris, France, for Constellium, a leader in the manufacturing of high-quality aluminum products and solutions. Prior to joining Constellium, she served from October 2008 through December 2010 as Corporate Vice President, Chief Financial Officer and Treasurer of TechTeam Global, Inc., a provider of information technology and business process outsourcing services. Ms. Loebl served as an Executive in Residence at the University of Illinois in support of the University’s Finance Academy from August 2007 to December 2008. From November 2002 through August 2007, Ms. Loebl served as Group Vice President, Finance at Archer Daniels Midland Company, a leading agricultural processor.
|
|
|
D. Jeffry Benoliel, 54
Vice President – Global Metalworking and Fluid
Power and Corporate Secretary
|
|
Mr. Benoliel, who has been employed by the Company since 1995, has served as Vice-President – Global Metalworking and Fluid Power and Corporate Secretary since June 2011 and until March 15, 2012 also held the position of General Counsel. He served as Vice President-Global Strategy, General Counsel and Corporate Secretary from October 2008 until June 2011 and as Vice President, Secretary and General Counsel from 2001 through September 2008.
|
|
|
Joseph A. Berquist, 41
Vice President and Managing
Director – North America
|
Mr. Berquist, who has been employed by the Company since 1997, has served as Vice President and Managing Director – North America since April 2010. He served as Senior Director, North America Commercial from October 2008 through March 2010 and as Industry Business Director - Metalworking/Fluid Power from July 2006 through September 2008.
|
||
|
Ronald S. Ettinger, 60
Vice President – Human Resources
|
Mr. Ettinger, who has been employed by the Company since 2002, has served as Vice President-Human Resources since December 2011. He served as Director-Global Human Resources from August 2005 to November 2011.
|
||
9
|
Name, Age, and Present
Position with the Company
|
|
Business Experience During Past Five
Years and Period Served as an Officer
|
|
|
George H. Hill, 38
Global Controller
|
Mr. Hill, who has been employed by the Company since 2002, has served in his current position since April 2007.
|
||
|
Dieter Laininger, 50
Vice President and Managing
Director – South America
and Global Primary Metals
|
Mr. Laininger, who has been employed by the Company since 1991, was appointed Vice President and Managing Director – South America, effective January 16, 2013, in addition to his position as Vice President-Global Primary Metals, to which he was appointed effective June 2011. He served as Industry Business Manager for Steel and Metalworking – EMEA from March 2001 through July 2011.
|
||
|
Joseph F. Matrange, 71
Vice President – Global Coatings
|
Mr. Matrange, who has been employed by the Company since 2001, has served as Vice President – Global Coatings since October 2008. He has also served as President of AC Products, Inc., a California subsidiary, since October 2000, and Epmar Corporation, a California subsidiary, since April 2002.
|
||
|
Jan F. Nieman, 52
Vice President and Managing
Director – Asia/Pacific
|
|
Mr. Nieman, who has been employed by the Company since 1992, has served in his current position since February 2005.
|
|
|
Wilbert Platzer, 51
Vice President and Managing
Director – Europe
|
|
Mr. Platzer, who has been employed by the Company since 1995, has served in his current position since January 2006.
|
|
10
PART II
|
Market for Registrant’s Common Equity, Related Stockholder Matters and Issuer Purchases of Equity Securities.
|
The Company’s common stock is listed on the New York Stock Exchange (“NYSE”) under the trading symbol KWR. The following table sets forth, for the calendar quarters during the past two most recent fiscal years, the range of high and low sales prices for the common stock as reported on the NYSE composite tape (amounts rounded to the nearest penny), and the quarterly dividends declared and paid:
|
Price Range
|
Dividends
|
Dividends
|
||||||||||||||||||||||
|
2012
|
2011
|
Declared
|
Paid
|
|||||||||||||||||||||
|
High
|
Low
|
High
|
Low
|
2012
|
2011
|
2012
|
2011
|
|||||||||||||||||
|
First quarter
|
$ | 48.15 | $ | 35.82 | $ | 44.39 | $ | 35.00 | $ | 0.24 | $ | 0.235 | $ | 0.24 | $ | 0.235 | ||||||||
|
Second quarter
|
46.59 | 37.86 | 46.02 | 38.57 | 0.245 | 0.24 | 0.24 | 0.235 | ||||||||||||||||
|
Third quarter
|
50.55 | 40.21 | 44.98 | 25.31 | 0.245 | 0.24 | 0.245 | 0.24 | ||||||||||||||||
|
Fourth quarter
|
54.00 | 45.07 | 40.87 | 24.11 | 0.245 | 0.24 | 0.245 | 0.24 | ||||||||||||||||
There are no restrictions that currently materially limit the Company’s ability to pay dividends or that the Company believes are likely to materially limit the future payment of dividends. If a default under the Company’s primary credit facility were to occur and continue, the payment of dividends would be prohibited. Reference is made to the “Liquidity and Capital Resources” disclosure contained in Item 7 of this Report.
As of January 17, 2013, there were 1,003 shareholders of record of the Company’s common stock, its only outstanding class of equity securities.
Every holder of Quaker common stock is entitled to one vote or ten votes for each share held of record on any record date depending on how long each share has been held. As of January 17, 2013, 13,095,923 shares of Quaker common stock were issued and outstanding. Based on the information available to the Company on January 17, 2013, as of that date the holders of 770,844 shares of Quaker common stock would have been entitled to cast ten votes for each share, or approximately 38% of the total votes that would have been entitled to be cast as of that record date and the holders of 12,325,079 shares of Quaker common stock would have been entitled to cast one vote for each share, or approximately 62% of the total votes that would have been entitled to be cast as of that date. The number of shares that are indicated as entitled to one vote includes those shares presumed to be entitled to only one vote. Because the holders of these shares may rebut this presumption, the total number of votes entitled to be cast as of January 17, 2013 could be more than 20,033,519.
Reference is made to the information in Item 12 of this Report under the caption “Equity Compensation Plans,” which is incorporated herein by this reference.
The following table sets forth information concerning shares of the Company’s common stock acquired by the Company during the fourth quarter of the fiscal year covered by this Report, all of which were acquired from employees in payment of the exercise price of employee stock options exercised during the period:
|
Issuer Purchases of Equity Securities
|
|||||||
|
(c)
|
(d)
|
||||||
|
Total Number of
|
Maximum Number
|
||||||
|
(a)
|
(b)
|
Shares Purchased
|
of Shares that May
|
||||
|
Total Number
|
Average
|
as part of Publicly
|
Yet Be Purchased
|
||||
|
of Shares
|
Price Paid
|
Announced Plans
|
Under the Plans
|
||||
|
Period
|
Purchased (1)
|
per Share (2)
|
or Programs (3)
|
or Programs (3)
|
|||
|
October 1 - October 31
|
—
|
$
|
—
|
—
|
252,600
|
||
|
November 1 - November 30
|
5,378
|
51.38
|
—
|
252,600
|
|||
|
December 1 - December 31
|
—
|
—
|
—
|
252,600
|
|||
|
Total
|
5,378
|
$
|
51.38
|
—
|
252,600
|
||
|
(1)
|
All of the 5,378 shares acquired by the Company during the period covered by this report were acquired from employees upon their surrender of previously owned shares in payment of the exercise price of employee stock options or, also, for the payment of taxes related to the exercise of employee stock options.
|
11
|
(2)
|
The price paid per share, in each case, represents either a) the average of the high and low price of the Company’s common stock on the date of exercise; or b) the closing price of the Company’s common stock on date of exercise, in each case as specified by the plan pursuant to which the applicable option was granted.
|
|
(3)
|
On February 15, 1995, the Board of Directors of the Company authorized a share repurchase program authorizing the repurchase of up to 500,000 shares of Quaker common stock, and, on January 26, 2005, the Board authorized the repurchase of up to an additional 225,000 shares. Under the 1995 action of the Board, 27,600 shares may yet be purchased. Under the 2005 action of the Board, none of the shares authorized has been purchased and, accordingly, all of those shares may yet be purchased. Neither of the share repurchase authorizations has an expiration date.
|
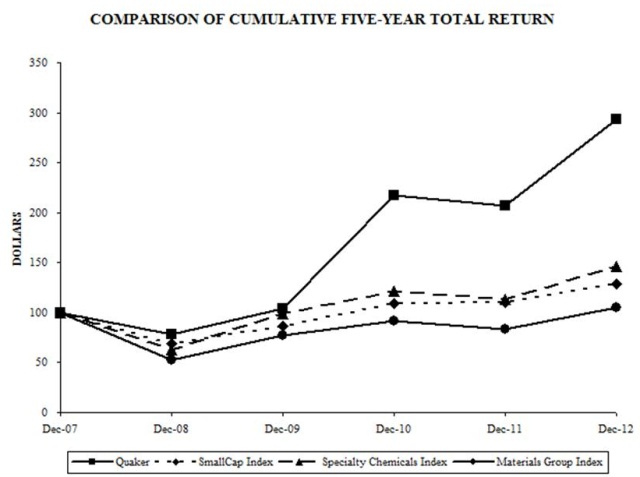
The following graph compares the cumulative total return (assuming reinvestment of dividends) from December 31, 2007 to December 31, 2012 for (i) Quaker’s common stock, (ii) the S&P SmallCap 600 Index (the “SmallCap Index”), (iii) the S&P 600 Specialty Chemicals Index (the “Specialty Chemicals Index”), and (iv) the S&P 600 Materials Group Index (the “Materials Group Index”). We are replacing the Specialty Chemicals Index with the Materials Group Index in subsequent years, because the Materials Group Index is used as a market metric to determine the cash portion of the payouts earned under the Company’s Long-Term Performance Incentive Plan. The graph assumes the investment of $100 on December 31, 2007 in each of Quaker’s common stock, the stocks comprising the SmallCap Index, the stocks comprising the Specialty Chemicals Index, and the stocks comprising the Materials Group Index.
|
12/31/2007
|
12/31/2008
|
12/31/2009
|
12/31/2010
|
12/31/2011
|
12/31/2012
|
|||||||||||||||||||
|
Quaker
|
$ | 100.00 | $ | 77.75 | $ | 103.92 | $ | 216.94 | $ | 207.40 | $ | 293.34 | ||||||||||||
|
SmallCap Index
|
100.00 | 68.93 | 86.55 | 109.32 | 110.43 | 128.46 | ||||||||||||||||||
|
Specialty Chemicals Index
|
100.00 | 62.81 | 98.39 | 121.63 | 113.69 | 146.36 | ||||||||||||||||||
|
Materials Group Index
|
100.00 | 52.15 | 77.28 | 91.40 | 83.85 | 105.06 | ||||||||||||||||||
12
The following table sets forth selected financial data for the Company and its consolidated subsidiaries:
|
Year Ended December 31,
|
||||||||||||||||||||
|
2012 (2)
|
2011 (3)
|
2010 (4)
|
2009 (5)
|
2008 (6)
|
||||||||||||||||
|
(re-cast)
|
(re-cast)
|
(re-cast)
|
(re-cast)
|
|||||||||||||||||
|
Summary of Operations (1):
|
||||||||||||||||||||
|
Net sales
|
$ | 708,226 | $ | 683,231 | $ | 544,063 | $ | 451,490 | $ | 581,641 | ||||||||||
|
Income before taxes and equity in net income of associated companies
|
62,948 | 59,377 | 46,213 | 23,692 | 16,629 | |||||||||||||||
|
Net income attribuatable to Quaker Chemical Corporation
|
47,405 | 45,892 | 32,120 | 16,058 | 9,833 | |||||||||||||||
|
Per share:
|
||||||||||||||||||||
|
Net income attributable to Quaker Chemical Corporation
|
||||||||||||||||||||
|
Common Shareholders - basic
|
$ | 3.64 | $ | 3.71 | $ | 2.85 | $ | 1.46 | $ | 0.93 | ||||||||||
|
Net income attributable to Quaker Chemical Corporation
|
||||||||||||||||||||
|
Common Shareholders - diluted
|
$ | 3.63 | $ | 3.66 | $ | 2.80 | $ | 1.45 | $ | 0.93 | ||||||||||
|
Dividends declared
|
0.975 | 0.955 | 0.935 | 0.92 | 0.92 | |||||||||||||||
|
Dividends paid
|
0.97 | 0.95 | 0.93 | 0.92 | 0.905 | |||||||||||||||
|
Financial Position
|
||||||||||||||||||||
|
Working capital
|
$ | 170,018 | $ | 152,900 | $ | 114,291 | $ | 98,994 | $ | 116,962 | ||||||||||
|
Total assets
|
536,634 | 511,152 | 452,868 | 398,183 | 387,957 | |||||||||||||||
|
Long-term debt
|
30,000 | 46,701 | 73,855 | 63,685 | 84,236 | |||||||||||||||
|
Total equity
|
289,676 | 261,357 | 190,537 | 159,186 | 132,393 | |||||||||||||||
Following amounts in thousands
| (1 | ) |
The selected financial data for the years 2008 through 2011 has been re-cast in order to retrospectively apply the equity method of accounting for the Company’s investment in Primex, a captive insurance company. For further information, see the Change in Accounting Method section included in Item 7 of this Report and Note 4 of Notes to Consolidated Financial Statements, included in Item 8 of this Report.
|
| (2 | ) |
The results of operations for 2012 include an increase to other income of $1,737 related to a change in the fair value of a contingent consideration liability; an increase to other income of $1,033 related to a change in the fair value of an acquisition-related liability; and a $2,216 tax benefit from the derecognition of various uncertain tax positions due to the expiration of applicable statutes of limitations; partially offset by a pre-tax charge of $1,254 related to the bankruptcy of certain customers in the U.S.; a pre-tax charge of $609 related to CFO transition costs; and certain uncommon charges of $1,936, pre-tax, that largely consist of severance and related items and costs associated with the launch of the Company's new revitalized Brand.
|
| (3 | ) |
The results of operations for 2011 include an increase to other income of $2,718 related to the revaluation of the Company’s previously held ownership interest in Tecniquimia Mexicana S.A de C.V. to its fair value; an increase to other income of $595 related to a change in the fair value of a contingent consideration liability; and a $1,972 tax benefit from the derecognition of various uncertain tax positions due to the expiration of applicable statutes of limitations.
|
| (4 | ) |
The results of operations for 2010 include a pre-tax final charge of $1,317 related to the retirement of the Company’s former Chief Executive Officer in 2008; a net pre-tax charge of $4,132 related to a non-income tax contingency; a $322 charge related to a currency devaluation at the Company’s 50% owned affiliate in Venezuela; and a $564 charge related to an out-of-period adjustment at the Company’s 40% owned affiliate in Mexico; partially offset by a $2,441 tax benefit from the derecognition of various uncertain tax positions due to the expiration of applicable statutes of limitations and resolution of tax audits for certain tax years.
|
| (5 | ) |
The results of operations for 2009 include a pre-tax charge for restructuring and related activities of $2,289; a pre-tax charge of $2,443 related to the retirement of the Company’s former Chief Executive Officer in 2008; partially offset by a gain of $1,193 on the disposition of land in Europe and a $583 tax benefit from the derecognition of various uncertain tax positions due to the expiration of applicable statutes of limitations and resolution of tax audits for certain tax years.
|
| (6 | ) |
The results of operations for 2008 include a pre-tax charge for restructuring and related activities of $2,916; and a pre-tax charge of $3,505 for the incremental charges related to the retirement of the Company’s Chief Executive Officer; partially offset by a net arbitration award of $956 related to litigation with one of the former owners of the Company’s Italian subsidiary; a tax refund of $460 relating to the Company’s increased investment in China; and a $1,508 tax benefit from the derecognition of various uncertain tax positions due to the expiration of applicable statutes of limitations and resolution of tax audits for certain tax years.
|
13
|
Item 7.
|
Management’s Discussion and Analysis of Financial Condition and Results of Operations.
|
Executive Summary
Quaker Chemical Corporation is a leading global provider of process fluids, chemical specialties, and technical expertise to a wide range of industries, including steel, aluminum, automotive, mining, aerospace, tube and pipe, cans, and others. For nearly 100 years, Quaker has helped customers around the world achieve production efficiency, improve product quality, and lower costs through a combination of innovative technology, process knowledge, and customized services. Headquartered in Conshohocken, Pennsylvania USA, Quaker serves businesses worldwide with a network of dedicated and experienced professionals whose mission is to make a difference.
The Company’s 2012 record revenue of $708.2 million grew 4% compared to 2011 on an increase in product volumes, including acquisitions, of 5%, and an increase in price and selling mix of 3%, which were partially offset by a decrease from foreign exchange rate translation of approximately $26.8, million or 4%. Gross profit increased $16.1 million, or 7%, from 2011 with gross margin improving to 33.7% from 32.6% for 2011, reflecting some stabilization in raw material costs experienced primarily at the end of 2012, allowing margins to return to more acceptable levels. Selling, general and administrative expenses (“SG&A”) increased $10.7 million, or 7%, from 2011 primarily due to acquisitions and higher selling, inflationary and other costs on increased business activity, which were partially offset by decreases due to foreign exchange rate translation and lower incentive compensation. Included in SG&A for 2012 were charges of $0.06 per diluted share for certain customer bankruptcies in the U.S., $0.03 per diluted share related to CFO transition costs and certain other charges of $0.11 per diluted share that largely consist of severance and related items and costs associated with the launch of the Company's new revitalized Brand. As a result, SG&A, as a percentage of sales, increased slightly to 24.8% from 24.1% in 2011. In addition, changes in foreign exchange rates negatively impacted the 2012 net income by approximately $1.7 million, or $0.13 per diluted share.
During 2012, the Company’s results reflect certain uncommon items. There was an increase in other income of $1.7 million, or $0.09 per diluted share, due to a change in the fair value of a contingent consideration liability and, also, a separate increase in other income of approximately $1.0 million due to a change in the fair value of an acquisition-related liability. The effective tax rate for 2012 includes approximately $2.2 million, or approximately $0.17 per diluted share, of benefit from the derecognition of several uncertain tax positions due to the expiration of applicable statutes of limitations and resolution of tax audits for certain tax years. In 2011, the Company completed an equity offering of approximately 1.3 million shares, raising approximately $48.1 million of net cash proceeds, which caused an approximate $0.11 dilutive effect on the 2012 earnings per diluted share.
The full year 2011 results also include other atypical items. An increase, similar to the one noted above, was recognized in other income due to a change in the fair value of the contingent consideration liability of $0.6 million, or $0.03 per diluted share, and, also, there was an increase of $2.7 million, or $0.22 per diluted share, to other income resulting from the revaluation of the Company’s previously held ownership interest in its Mexican affiliate to its fair value, which was related to the Company’s 2011 purchase of the remaining ownership interest in this entity. The effective tax rate for 2011 includes approximately $2.0 million, or approximately $0.16 per diluted share, of benefit from the derecognition of several uncertain tax positions due to the expiration of applicable statutes of limitations and resolution of tax audits for certain tax years.
The results for 2011 and 2010 have been re-cast in order to retrospectively apply the equity method of accounting for the Company’s investment in Primex, a captive insurance company. The results for 2012 also reflect the Company’s equity earnings attributable to its investment in Primex. As a result, the Company's earnings per diluted share wre $3.63 for the full year 2012 compared to $3.66 for the full year 2011, which incluude earnings per diluted share from Primex of $0.14 and $0.19 in 2012 and 2011, respectively. For further information, see the Change in Accounting Method section below, and Note 4 of Notes to Consolidated Financial Statements included in Item 8, of this Report.
For 2012, net cash provided by operating activities was a record $62.9 million. Net cash provided by operating activities increased approximately $43.2 million from 2011, primarily led by improved working capital management and higher net income.
For the Company, 2012 was a record year in terms of revenue, net income, and net operating cash flow. The Company achieved such levels despite a challenging global environment, including a strengthening dollar and weaker demand experienced in several geographical areas, by continuing to grow through additional new business and recent acquisitions. The Company’s shareholder appreciation increased approximately 41% in 2012 as we continued with both dividend and share price appreciation. Also, the Company’s balance sheet and cash flow generation remains very strong, as its cash position exceeded its debt at December 31, 2012, which provides financial flexibility for the Company to be able to invest in strategic growth opportunities, such as the recent NP Coil Dexter Industries S.r.l acquisition. This was the Company’s fifth acquisition in the last two years, as the Company continues to add new adjacent product lines which can be leveraged on a global platform. Further, the Company launched a new revitalized Brand during 2012, which the Company believes will build on its 94-year history and take the Company to the next level. Going into 2013, the Company will continue to face challenging economic environments in various parts of the world, especially Europe. In addition, the Company will likely experience higher raw material costs from current levels due to increasing crude oil pricing. However, the Company also expects a continued recovery in North America and China, as well as growth due to its strategic initiatives and further leverage from its acquisitions. In summary, the Company remains confident in its future and expects 2013 to be another good year for Quaker.
14
Change in Accounting Method
In 1986, the market for general liability insurance became highly volatile and there was limited product liability insurance for chemical companies to purchase. In response, the Company joined together with fifteen other chemical companies, each putting forward $0.5 million as capital, to form a captive insurance company, Primex, Ltd. (“Primex”). Primex was incorporated in Barbados and operates under the provisions of the Exempt Insurance Act of 1983, and provides excess liability insurance coverage only to its shareholders who are in chemical and chemical related manufacturing industries. Primex utilizes leading service providers for insurance, actuarial, accounting and legal services.
Since 1986, many of the original investors have exited Primex, either through acquisitions or divestitures. To date, companies that have ceased to purchase insurance from Primex have sold their shares back to Primex. Each current shareholder has one representative on Primex’s board of directors, each with an equal vote on operational and financial matters. As a result of one of those shareholders exiting Primex in 2012, the Company reassessed its ability to significantly influence the operating and financial policies of Primex. Based on its ownership percentage and other factors, the Company determined that during 2012 the Company obtained the ability to significantly influence Primex and, as a result, needed to change its method of accounting for Primex from the cost method to the equity method. In accordance with the guidance of the Financial Accounting Standards Board (“FASB”), the equity method of accounting must be applied on a retrospective basis, and all periods presented must be recast to reflect the change in the method of accounting.
Consequently, the Company has recast its Consolidated Balance Sheet as of December 31, 2011, the Consolidated Statements of Income, Other Comprehensive Income and Cash Flows for the years ending December 31, 2010 and December 31, 2011 and the Consolidated Statement of Changes in Equity for the years ended December 31, 2009, December 31, 2010 and December 31, 2011 and the Notes to the Consolidated Financial Statements included in Item 8 of this report. In addition, the Selected Financial Data for the years ended December 31, 2008, December 31, 2009, December 31, 2010 and December 31, 2011 included in Item 6 of this Report and Management’s Discussion and Analysis for the years ended December 31, 2010 and December 31, 2011 included in Item 7 of this Report have been updated to reflect the change in method of accounting.
The change in method of accounting results in an increase of previously reported net income and earnings per share for the years ending December 31, 2011 and December 31, 2010 of $2.3 million, or $0.19 per diluted share, and $0.3 million, or $0.03 per diluted share, respectively.
The following table sets forth the impact, by line item on each financial statement, of the retrospective application of the change in method of accounting (amounts in thousands, except per share data):
|
Consolidated Statement of Income
|
2011
|
2010
|
||||||
|
Equity in net income of associated companies
|
$ | 2,323 | $ | 313 | ||||
|
Net income attributable to Quaker Chemical Corporation
|
$ | 2,323 | $ | 313 | ||||
|
Net income attributable to Quaker Chemical Corporation Common Shareholders - Diluted
|
$ | 0.19 | $ | 0.03 | ||||
|
Consolidated Balance Sheet
|
||||||||
|
Investments in associated companies
|
$ | 6,131 | $ | 3,938 | ||||
|
Other assets
|
(500 | ) | (500 | ) | ||||
|
Total assets
|
$ | 5,631 | $ | 3,438 | ||||
|
Retained earnings
|
$ | 4,778 | $ | 2,455 | ||||
|
Accumulated other comprehensive loss
|
853 | 983 | ||||||
|
Total equity
|
$ | 5,631 | $ | 3,438 | ||||
For further information, see Note 4 of the Notes to Consolidated Financial Statements included in Item 8 of this Report.
The Company determined that the ability to significantly influence the operating and financial policies of Primex was obtained during the first quarter of 2012. The Company did not amend and restate any of its Quarterly Reports on Form 10-Q for 2012 because the errors identified were not deemed to be material to any individual period.
15
Critical Accounting Policies and Estimates
Quaker’s discussion and analysis of its financial condition and results of operations are based upon Quaker’s consolidated financial statements, which have been prepared in accordance with accounting principles generally accepted in the United States. The preparation of these financial statements requires Quaker to make estimates and judgments that affect the reported amounts of assets, liabilities, revenues and expenses, and related disclosure of contingent assets and liabilities. On an ongoing basis, Quaker evaluates its estimates, including those related to customer sales incentives, product returns, bad debts, inventories, property, plant and equipment, investments, goodwill, intangible assets, income taxes, financing operations, restructuring, incentive compensation plans (including equity-based compensation), pensions and other postretirement benefits, and contingencies and litigation. Quaker bases its estimates on historical experience and on various other assumptions that are believed to be reasonable under the circumstances, the results of which form the basis for making judgments about the carrying values of assets and liabilities that are not readily apparent from other sources. Actual results may differ from these estimates under different assumptions or conditions.
Quaker believes the following critical accounting policies describe the more significant judgments and estimates used in the preparation of its consolidated financial statements:
1. Accounts receivable and inventory reserves and exposures—Quaker establishes allowances for doubtful accounts for estimated losses resulting from the inability of its customers to make required payments. If the financial condition of Quaker’s customers were to deteriorate, resulting in an impairment of their ability to make payments, additional allowances may be required. As part of its terms of trade, Quaker may custom manufacture products for certain large customers and/or may ship product on a consignment basis. Further, a significant portion of Quaker’s revenues is derived from sales to customers in the U.S. steel and automotive industries, where a number of bankruptcies have occurred during recent years and companies have experienced financial difficulties. When a bankruptcy occurs, Quaker must judge the amount of proceeds, if any, that may ultimately be received through the bankruptcy or liquidation process. These matters may increase the Company’s exposure, should a bankruptcy occur, and may require a write down or a disposal of certain inventory due to its estimated obsolescence or limited marketability. Reserves for customers filing for bankruptcy protection are generally established at 75-100% of the amount outstanding at the bankruptcy filing date, dependent on the Company’s evaluation of likely proceeds from the bankruptcy process. Large and/or financially distressed customers are generally reserved for on a specific review basis, while a general reserve is maintained for other customers based on historical experience. The Company’s consolidated allowance for doubtful accounts was $6.4 million and $4.6 million at December 31, 2012 and December 31, 2011, respectively. Further, the Company recorded provisions for doubtful accounts of $2.1 million, $0.9 million and $0.9 million in 2012, 2011 and 2010, respectively. An increase of 10% to the recorded provisions would have decreased the Company’s pre-tax earnings by approximately $0.2 million, $0.1 million and $0.1 million in 2012, 2011 and 2010, respectively.
2. Environmental and litigation reserves—Accruals for environmental and litigation matters are recorded when it is probable that a liability has been incurred and the amount of the liability can be reasonably estimated. Accrued liabilities are exclusive of claims against third parties and are not discounted. Environmental costs and remediation costs are capitalized if the costs extend the life, increase the capacity or improve the safety or efficiency of the property from the date acquired or constructed, and/or mitigate or prevent contamination in the future. Estimates for accruals for environmental matters are based on a variety of potential technical solutions, governmental regulations and other factors, and are subject to a large range of potential costs for remediation and other actions. A considerable amount of judgment is required in determining the most likely estimate within the range of total costs, and the factors determining this judgment may vary over time. Similarly, reserves for litigation and similar matters are based on a range of potential outcomes and require considerable judgment in determining the most probable outcome. If no amount within the range is considered more probable than any other amount, the Company accrues the lowest amount in that range in accordance with generally accepted accounting principles. See Note 20 of Notes to Consolidated Financial Statements which appears in Item 8 of this Report.
3. Realizability of equity investments—Quaker holds equity investments in various foreign companies, whereby it has the ability to influence, but not control, the operations of the entity and its future results. Quaker records an impairment charge to an investment when it believes a decline in value that is other than temporary has occurred. Future adverse changes in market conditions, poor operating results of underlying investments, devaluation of foreign currencies or other events or circumstances could result in losses or an inability to recover the carrying value of the investments. These indicators may result in an impairment charge in the future. The carrying amount of the Company’s equity investments at December 31, 2012 was $16.6 million, which comprised four investments of $8.8 million, or a 32.3% interest, in Primex, Ltd (Barbados), $5.9 million, or a 50% interest, in Nippon Quaker Chemical, Ltd. (Japan), $1.7 million, or a 50% interest, in Kelko Quaker Chemical, S.A. (Venezuela) and $0.2 million, or a 50% interest, in Kelko Quaker Chemical, S.A. (Panama), respectively. See Note 4 of Notes to Consolidated Financial Statements which appears in Item 8 of this Report.
4. Tax exposures, valuation allowances and uncertain tax positions—Quaker records expenses and liabilities for taxes based on estimates of amounts that will be ultimately determined to be deductible in tax returns filed in various jurisdictions. The filed tax returns are subject to audit, which often occur several years subsequent to the date of the financial statements. Disputes or disagreements may arise during audits over the timing or validity of certain items or deductions, which may not be resolved for extended periods of time. Quaker applies the provisions of FASB’s guidance regarding uncertain tax positions. The guidance applies to all income tax positions taken on previously filed tax returns or expected to be taken on a future tax return. The FASB’s guidance regarding accounting for uncertainty in income taxes prescribes the recognition threshold and measurement attributes for financial statement recognition and measurement of tax positions taken or expected to be taken on a tax return. The guidance further requires
16
the determination of whether the benefits of tax positions will be more likely than not sustained upon audit based upon the technical merits of the tax position. For tax positions that are determined to be more likely than not sustained upon audit, a company recognizes the largest amount of benefit that is greater than 50% likely of being realized upon ultimate settlement in the financial statements. For tax positions that are not determined to be more likely than not sustained upon audit, a company does not recognize any portion of the benefit in the financial statements. Additionally, the guidance provides for derecognition, classification, penalties and interest, accounting in interim periods, disclosure and transition. The guidance also requires that the amount of interest expense and income to be recognized related to uncertain tax positions be computed by applying the applicable statutory rate of interest to the difference between the tax position recognized, including timing differences, and the amount previously taken or expected to be taken in a tax return. The Company’s continuing practice is to recognize interest and/or penalties related to income tax matters in income tax expense. Quaker also records valuation allowances when necessary to reduce its deferred tax assets to the amount that is more likely than not to be realized. While Quaker has considered future taxable income and employs prudent and feasible tax planning strategies in assessing the need for a valuation allowance, in the event Quaker were to determine that it would be able to realize its deferred tax assets in the future in excess of its net recorded amount, an adjustment to the deferred tax asset would increase income in the period such determination was made. Likewise, should Quaker determine that it would not be able to realize all or part of its net deferred tax assets in the future, an adjustment to the deferred tax asset would be charged to income in the period such determination was made. Both determinations could have a material adverse impact on the Company’s financial statements. U.S. income taxes have not been provided on the undistributed earnings of non-U.S. subsidiaries since it is the Company’s intention to continue to reinvest these earnings in those foreign subsidiaries for working capital needs and growth initiatives. U.S. and foreign income taxes that would be payable if such earnings were distributed may be lower than the amount computed at the U.S. statutory rate due to the availability of foreign tax credits.
5. Restructuring liabilities— Restructuring charges may consist of charges for employee severance, rationalization of manufacturing facilities and other items. To account for such charges, the Company applies FASB’s guidance regarding exit or disposal cost obligations. This guidance requires that a liability for a cost associated with an exit or disposal activity be recognized when the liability is incurred.
6. Goodwill and other intangible assets— The Company records goodwill and intangible assets at fair value as of the acquisition date and amortizes definite-lived intangible assets on a straight-line basis over the useful lives of the intangible assets based on third-party valuations of the assets. Goodwill and intangible assets, which have indefinite lives, are not amortized and are required to be assessed at least annually for impairment. The Company compares the assets’ fair value to their carrying value, primarily based on future discounted cash flows, in order to determine if an impairment charge is warranted. The estimates of future cash flows involve considerable management judgment and are based upon assumptions about expected future operating performance. Assumptions used in these forecasts are consistent with internal planning. The actual cash flows could differ from management’s estimates due to changes in business conditions, operating performance, and economic conditions. The Company completed its annual impairment assessment as of the end of the third quarter 2012, and no impairment charge was warranted. The Company’s consolidated goodwill and indefinite-lived intangible assets at December 31, 2012 and December 31, 2011 were $60.3 million and $59.3 million, respectively. The Company’s assumption of weighted average cost of capital (“WACC”) and estimated future net operating profit after tax (“NOPAT”) are particularly important in determining whether an impairment charge has been incurred. The Company currently uses a WACC of 12% and, at September 30, 2012, this assumption would have had to increase by more than 11.26 percentage points before any of the Company’s reporting units would fail step one of the impairment analysis. Further, at September 30, 2012, the Company’s estimate of future NOPAT would have had to decrease by more than 48.4% before any of the Company’s reporting units would be considered potentially impaired. As a result, the estimated fair value of each of the Company’s reporting units substantially exceeds their carrying value.
7. Postretirement benefits—The Company provides certain pension and other postretirement benefits to employees and retirees. Independent actuaries, in accordance with accounting principles generally accepted in the United States, perform the required valuations to determine benefit expense and, if necessary, non-cash charges to equity for additional minimum pension liabilities. Critical assumptions used in the actuarial valuation include the weighted average discount rate, rates of increase in compensation levels, and expected long-term rates of return on assets. If different assumptions were used, additional pension expense or charges to equity might be required. The Company’s U.S. pension plan year-end is November 30, and the measurement date is December 31. The following table highlights the potential impact on the Company’s pre-tax earnings, due to changes in assumptions with respect to the Company’s pension plans, based on assets and liabilities at December 31, 2012:
|
1/2 Percentage Point Increase
|
1/2 Percentage Point Decrease
|
||||||||||||||||||||
|
Foreign
|
Domestic
|
Total
|
Foreign
|
Domestic
|
Total
|
||||||||||||||||
|
(Dollars in millions)
|
|||||||||||||||||||||
|
Discount rate
|
$ | (0.5 | ) | $ | (0.1 | ) | $ | (0.6 | ) | $ | 0.5 | $ | 0.1 | $ | 0.6 | ||||||
|
Expected rate of return on plan assets
|
(0.3 | ) | (0.2 | ) | (0.5 | ) | 0.3 | 0.2 | 0.5 | ||||||||||||
17
Recently Issued Accounting Standards
The FASB updated its guidance in July 2012 regarding indefinite-lived intangible asset impairment testing. The updated guidance permits a Company to first assess qualitative factors to determine whether it is more likely than not that the fair value of the indefinite-lived intangible asset is less than its carrying value. If the Company determines that the fair value is more likely than not above its carrying value, no further impairment testing is required. However, if the Company concludes otherwise, then the first step of the traditional two-step impairment test is required to be performed. The guidance is effective for annual and interim fiscal periods beginning after September 15, 2012, with early adoption permitted if an entity’s financial statements have not been issued as of the date of the entity’s interim or annual impairment test. The Company elected to test its indefinite-lived intangible assets for impairment under the traditional two-step method during the current year but is currently evaluating the effect of this guidance for future applicability.
The FASB updated its guidance in December 2011 regarding disclosures pertaining to the netting and offsetting of derivatives and financial instruments on an entity’s Consolidated Balance Sheet. Disclosures required under the updated guidance include presenting gross amounts of assets and liabilities related to financial instruments that may have been historically offset on the Consolidated Balance Sheet. The guidance is effective for annual and interim fiscal periods beginning on or after January 1, 2013. The Company is currently evaluating the effect of this guidance.
Quaker’s cash and cash equivalents increased to $32.5 million at December 31, 2012 from $16.9 million at December 31, 2011. The $15.6 million increase was primarily the result of a record amount of cash provided by operating activities of $62.9 million, net of cash used in investing activities of $16.7 million and cash used in financing activities of $30.6 million.
Net cash flows provided by operating activities were $62.9 million in 2012, compared to $19.7 million provided by operating activities in 2011. The $43.2 million increase in operating cash flow was primarily driven by improved working capital levels and higher net income. The largest contributors to the improved working capital levels were changes in accounts receivable and inventory. The increase in the Company’s working capital investment in 2011 was largely due to increasing sales volumes and raw material costs, which in turn necessitated higher selling prices to restore the Company’s margins to more historically acceptable levels. In 2012, the Company was able to leverage consistent working capital levels compared to 2011, despite record sales volumes.
Net cash flows used in investing activities decreased $18.7 million from $35.4 million in 2011 to $16.7 million in 2012, which was primarily driven by lower payments for acquisitions. In 2012, the Company acquired NP Coil Dexter Industries, S.r.l. for approximately $2.7 million and settled hold-back of consideration liabilities assumed in the acquisitions of Tecniquimia Mexicana, S.A. de C.V. and G.W. Smith and Sons, Inc. for approximately $3.0 million. In 2011, the Company acquired G.W. Smith & Sons, Inc. for approximately $14.5 million and acquired the remaining 60% ownership interest in Tecniquimia Mexicana, S.A. de C.V. for approximately $10.5 million. This decrease in cash paid for acquisitions from 2011 was partially offset by higher investments in property plant and equipment during 2012, as the Company continued to invest in the expansion of its Asia/Pacific facilities and in its information technology infrastructure. Also, changes in the Company’s restricted cash, as discussed below, affected the investing cash flow comparisons.
In the first quarter of 2007, an inactive subsidiary of the Company reached a settlement agreement and release with one of its insurance carriers for $20.0 million. The proceeds of the settlement are restricted and can only be used to pay claims and costs of defense associated with this subsidiary’s asbestos litigation. The payments were structured to be received over a four-year period with annual installments of $5.0 million, the final installment of which was received in the first quarter of 2010. During the third quarter of 2007, the same inactive subsidiary and one of its insurance carriers entered into a Claim Handling and Funding Agreement, under which the carrier will pay 27% of the defense and indemnity costs incurred by or on behalf of the subsidiary in connection with asbestos bodily injury claims for a minimum of five years beginning July 1, 2007. The agreement continues until terminated and can only be terminated by either party by providing the other party with a minimum of two years prior written notice. As of December 31, 2012, no notice of termination has been given under this agreement.
Net cash flows used by financing activities were $30.6 million in 2012 compared with $9.1 million provided by financing activities in 2011. The Company’s second quarter 2011 offering of approximately 1.3 million shares of its common stock resulted in net cash proceeds of approximately $48.1 million, which were used to repay a portion of the outstanding borrowings on the Company’s revolving credit line in 2011. In 2012, the Company was able to fund its investing and financing activities through strong net operating cash flow and, also, repay a further portion of its revolving credit line. During 2012, the Company recorded $2.0 million of excess tax benefits related to stock options exercises in capital in excess of par on its Condensed Consolidated Balance Sheet and as a cash flow from financing activities in its Condensed Consolidated Statement of Cash Flows, compared to approximately $0.1 million of these benefits recorded in 2011. Higher dividend payments, primarily due to the Company’s prior year equity offering, and a change in stock option exercise and other activity also affected the financing cash flow comparisons.
The Company completed its annual goodwill impairment assessment as of the end of the third quarter of 2012 and the estimated fair value of each of the Company’s reporting units substantially exceeded their carrying value, so no impairment charge was warranted.
18
The Company’s primary credit line is a $175.0 million syndicated multicurrency credit agreement with Bank of America, N.A. (administrative agent) and certain other major financial institutions, which expires in June 2014. At the Company’s option, the principal amount available can be increased to $225.0 million if the lenders agree to increase their commitments and the Company satisfies certain conditions. At December 31, 2012 and December 31, 2011, the Company had approximately $12.2 million and $28.5 million, respectively, outstanding under this facility. The Company’s access to this credit is largely dependent on its consolidated leverage ratio covenant, which cannot exceed 3.50 to 1. At December 31, 2012 and December 31, 2011, the Company’s consolidated leverage ratio was below 1.0 to 1. Under this covenant and the borrowing capacity available on the Company’s primary credit line, approximately $160.0 million of additional borrowings could have been borrowed as of December 31, 2012. The Company had previously entered into interest rate swaps with a combined notional value of $15.0 million to fix the interest rate on that amount of its variable rate debt, which matured during the third quarter of 2012.
The Company filed a shelf registration statement on Form S-3 with the Securities and Exchange Commission (the “SEC”) in 2009. The registration statement was declared effective on January 29, 2010 and permitted the Company to offer and sell, from time to time and in one or more public offerings, up to $100.0 million aggregate dollar amount of its securities, including shares of preferred stock (either separately or represented by depositary shares), common stock, debt securities and warrants to purchase our debt or equity securities, as well as units that include any of these securities, on terms, in each case, established at the time of the offering. This registration statement provided the Company with the ability to issue registered debt or equity securities on an accelerated basis. During 2011, the Company sold approximately 1.3 million shares of common stock for gross proceeds of approximately $51.2 million utilizing this shelf registration. In early 2013, this shelf registration expired.
At December 31, 2012, the Company’s gross liability for uncertain tax positions, including interest and penalties, was $16.3 million. The Company cannot determine a reliable estimate of the timing of cash flows by period related to its uncertain tax position liability. However, should the entire liability be paid, the amount of the payment may be reduced by up to $10.8 million as a result of offsetting benefits in other tax jurisdictions.
As of December 31, 2012, the Company held an equity investment in Primex, a captive insurance company, which is accounted for under the equity method of accounting. Subsequent to December 31, 2012, the Company received its first dividend distribution of approximately $2.0 million from Primex Ltd., which will be accounted for as a reduction to the Company’s investment balance in this associated company. For further information, see the Change in Accounting Method section above and Note 4 of Notes to Consolidated Financial Statements included in Item 8 of this Report.
The Company believes it is capable of supporting its operating requirements, including pension plan contributions, payments of dividends to shareholders, possible acquisitions and other business opportunities, capital expenditures and possible resolution of contingencies, through internally generated funds supplemented with debt or equity as needed.
The following table summarizes the Company’s contractual obligations at December 31, 2012, and the effect such obligations are expected to have on its liquidity and cash flows in future periods. Pension and other postretirement plan contributions beyond 2012 are not determinable since the amount of any contribution is heavily dependent on the future economic environment and investment returns on pension trust assets. The timing of payments related to other long-term liabilities, which consist primarily of deferred compensation agreements, also cannot be readily determined due to their uncertainty. Interest obligations on the Company’s short and long-term debt are included and assume the debt levels will be outstanding for the entire respective period and apply the interest rates in effect at December 31, 2012. The contingent acquisition consideration is included based on management’s estimate of the probability of the earnout being ultimately met/paid and the discount rate in effect at the time of acquisition:
|
Payments due by period
|
||||||||||||||||||||||||||||
|
2018 and
|
||||||||||||||||||||||||||||
|
Contractual Obligations (Amounts in millions)
|
Total
|
2013
|
2014
|
2015
|
2016
|
2017
|
Beyond
|
|||||||||||||||||||||
|
Short-term debt
|
$ | 0.867 | $ | 0.867 | $ | — | $ | — | $ | — | $ | — | $ | — | ||||||||||||||
|
Long-term debt
|
40.917 | 1.680 | 13.633 | 1.277 | 1.241 | 1.230 | 21.856 | |||||||||||||||||||||
|
Capital lease obligations
|
0.660 | 0.291 | 0.147 | 0.099 | 0.065 | 0.058 | — | |||||||||||||||||||||
|
Non-cancelable operating leases
|
16.811 | 4.927 | 4.003 | 3.472 | 2.941 | 1.466 | 0.002 | |||||||||||||||||||||
|
Purchase obligations
|
8.459 | 7.193 | 1.266 | — | — | — | — | |||||||||||||||||||||
|
Pension and other postretirement plan
|
||||||||||||||||||||||||||||
|
contributions
|
7.329 | 7.329 | — | — | — | — | — | |||||||||||||||||||||
|
Contingent acquisition consideration
|
5.149 | — | 5.149 | — | — | — | — | |||||||||||||||||||||
|
Other long-term liabilities (See Note 19 of Notes
|
||||||||||||||||||||||||||||
|
to Consolidated Financial Statements)
|
5.034 | — | — | — | — | — | 5.034 | |||||||||||||||||||||
|
Total contractual cash obligations
|
$ | 85.226 | $ | 22.287 | $ | 24.198 | $ | 4.848 | $ | 4.247 | $ | 2.754 | $ | 26.892 | ||||||||||||||
19
Operations
CMS Discussion
The Company currently has numerous CMS contracts around the world. Under its traditional CMS approach, the Company effectively acts as an agent, and the revenues and costs from these sales are reported on a net sales or “pass-through” basis. Under an alternative structure for certain contracts, the contracts are structured differently in that the Company’s revenue received from the customer is a fee for products and services provided to the customer, which are indirectly related to the actual costs incurred. Profit is dependent on how well the Company controls product costs and achieves product conversions from other third-party suppliers’ products to its own products. As a result, under the alternative structure, the Company recognizes in reported revenue the gross revenue received from the CMS site customer and in cost of goods sold the third-party product purchases, which substantially offset each other until the Company achieves significant product conversions. This may result in a decrease in reported gross margin as a percentage of sales.
The Company has maintained a mix of CMS contracts with both the traditional product pass-through structure and the alternative structure, including fixed price contracts that cover all services and products. Since the global economic downturn and its impact on the automotive sector, the Company has experienced shifts in customer requirements and business circumstances, but the Company’s offerings continue to include both approaches to CMS.
Net sales for 2012 were $708.2 million, an increase of 4% from $683.2 million in 2011. Product volumes, including acquisitions, increased revenues by approximately 5% and selling and price mix increased revenues by approximately 3%, while foreign exchange rate translation decreased revenues by approximately $26.8 million, or 4%.
Gross profit increased by approximately $16.1 million, or 7%, from 2011, with gross margin improving to 33.7% from 32.6%, for 2011, reflecting some stabilization in raw material costs experienced primarily at the end of 2012, allowing margins to return to more acceptable levels.
SG&A increased by approximately $10.7 million, or 7%, compared to 2011, primarily related to acquisitions and higher selling, inflationary and other costs on increased business activity, which were partially offset by decreases due to foreign exchange rate translation and lower incentive compensation. Also, SG&A for 2012 includes charges of $0.06 per diluted share for certain customer bankruptcies in the U.S., $0.03 per diluted share related to CFO transition costs and certain uncommon charges of $0.11 per diluted share that largely consists of severance and related items and costs associated with the launch of the Company's new revitalized Brand. As a result, SG&A, as a percentage of sales, slightly increased to 24.8% from 24.1% in 2011.
The decrease in interest expense was primarily due to lower average borrowings and lower interest rates in 2012 as compared to 2011, and the decrease in interest income from 2011 to 2012 was primarily caused by lower cash levels invested in higher interest rate jurisdictions.
Other income for 2012 included increases due to changes in the fair value of a contingent consideration liability of $1.7 million, or $0.09 per diluted share, and a separate acquisition-related liability of $1.0 million, or $0.08 per diluted share, noted above. Other income for 2011 included a lower increase related to the adjustment of the contingent consideration liability of $0.6 million, or $0.03 per diluted share, noted above, and, also, other income for 2011 increased $2.7 million, or $0.22 per diluted share, related to the revaluation of the Company’s previously held ownership interest in its Mexican affiliate to its fair value, which was related to the Company’s 2011 purchase of the remaining ownership interest in this entity. In addition, the Company experienced higher foreign exchange losses in 2012 and, also, received lower third party license fees in 2012, primarily as a result of the prior year purchase of the remaining ownership interest in the Company’s Mexican affiliate.
The Company’s 2012 and 2011 effective tax rates of 24.7% and 24.0%, respectively, reflect decreases in reserves for uncertain tax positions due to the expiration of applicable statutes of limitations for certain tax years of approximately $0.17 and $0.16 per diluted share, respectively. The Company has experienced and expects to further experience volatility in its effective tax rates due to the varying timing of tax audits and the expiration of applicable statutes of limitations as they relate to uncertain tax positions, among other factors. At the end of 2012, the Company had net U.S. deferred tax assets totaling $13.9 million, excluding deferred tax assets relating to additional minimum pension liabilities. The Company records valuation allowances when necessary to reduce its deferred tax assets to the amount that is more likely than not to be realized. The Company considers future taxable income and ongoing prudent and feasible tax planning strategies in assessing the need for a valuation allowance. However, in the event the Company were to determine that it would not be able to realize all or part of its net deferred tax assets in the future, an adjustment to the deferred tax assets would be a non-cash charge to income in the period such determination was made, which could have a material adverse impact on the Company’s financial statements. The uncertain global economic environment has been negatively impacting profitability in certain taxing jurisdictions. The Company continues to closely monitor this situation as it relates to its net deferred tax assets and the assessment of valuation allowances. The Company is continuing to evaluate alternatives that could positively impact taxable income in these jurisdictions. During 2012, the Company recorded $2.0 million of excess tax benefits in capital in excess of par on its Consolidated Balance Sheet and in its Consolidated Statement of Cash Flows, related to stock option exercises.
20
The decrease in equity in net income of associated companies was caused by lower income from the Company’s equity investment in a captive insurance company, partially offset by improved performance over the majority of the Company’s equity affiliates in 2012 as compared to 2011, in particular in our Japanese affiliate.
Earnings per diluted share for 2012 of $3.63 reflect an approximate $0.11 per share dilutive effect as a result of the Company’s equity offering in May of 2011. Changes in foreign exchange rates negatively impacted the 2012 net income by approximately $1.7 million or $0.13 per diluted share.
Segment Reviews—Comparison of 2012 with 2011
Metalworking Process Chemicals:
Metalworking Process Chemicals generally consists of industrial process fluids for various heavy industrial and manufacturing applications. This segment represented approximately 93% of the Company’s net sales in 2012, which were up approximately $20.5 million, or 3%, compared to 2011. Net sales for this reportable segment increased approximately 4% from acquisition activity and approximately 3% from increases in volume and price and selling mix primarily in North America and Asia/Pacific, which were partially offset by decreases due to foreign currency translation of approximately 4%. The foreign currency translation impacts were primarily driven by the average E.U. Euro to U.S. Dollar exchange rate being 1.29 in 2012 compared to 1.39 in 2011 and the average Brazilian Real to U.S. Dollar exchange rate being 0.51 in 2012 compared to 0.60 in 2011. The 2012 operating income for this reportable segment increased approximately $5.9 million from 2011, primarily driven by the sales increases noted above and improved margins, reflecting some stabilization in raw material costs experienced primarily at the end of 2012, allowing margins to improve to more acceptable levels.
Coatings:
The Company’s coatings segment, which represented approximately 6% of the Company’s net sales in 2012, generally contains products that provide temporary and permanent coatings for metal and concrete products and chemical milling maskants. Net sales for this reportable segment in 2012 were up approximately $3.6 million, or 9%, compared to 2011, which was primarily due to increased sales of chemical milling maskants to the aerospace industry. The 2012 operating income for this reportable segment increased approximately $1.4 million from 2011, consistent with the sales increase noted above.
Other Chemical Products:
Other Chemical Products, which represented approximately 1% of the Company’s net sales in 2012, generally consists of sulfur removal products for industrial gas streams sold by the Company’s Q2 Technologies joint venture. For 2012, net sales and operating income for this reportable segment increased approximately $0.9 million and approximately $0.2 million, respectively, compared to 2011, due to increased activity in the oil and gas market.
Comparison of 2011 with 2010
Net sales for 2011 were approximately $683.2 million, an increase of $139.2 million, or 26%, from 2010. Product volumes were approximately 13% higher, including acquisitions. Selling prices and mix increased revenues by approximately 10%, as the Company increased prices to help offset higher raw material costs. Foreign exchange rates increased revenues by approximately 3%.
Gross profit increased by approximately $29.9 million, or 15%, compared to 2010, largely as a result of increased volumes. Gross margin decreased from 35.4% in 2010 to 32.6%, as the increases in raw material costs that began in the second half of 2010 continued to escalate throughout 2011. Price increases were implemented during 2011 to help recover margins, but the significant raw material cost increase was only partially offset as the Company typically experiences a lag effect in recovering its margins.
SG&A increased approximately $25.5 million, or 18%, compared to 2010. Higher selling, inflationary and other costs as a result of increased business activity and investment in growth, acquisition-related activity and foreign exchange rate translation accounted for the majority of the increase while overall incentive compensation costs were lower. SG&A as a percentage of sales decreased from 25.6% in 2010 to 24.1% in 2011.
Included in the 2010 results is a non-income tax contingency charge of approximately $4.1 million, or approximately $0.26 per diluted share. See Note 20 to Consolidated Financial Statements in Item 8 of this Report. Also included in the 2010 results was a final charge related to the Company’s former CEO’s supplemental retirement plan of approximately $1.3 million, or approximately $0.08 per diluted share.
Other income for 2011 increased $0.6 million, or $0.03 per diluted share, due to a change in the fair value of a contingent consideration liability, noted above, and, also, increased $2.7 million, or approximately $0.22 per diluted share, related to the revaluation of the Company’s previously held ownership interest in its Mexican equity affiliate to its fair value related to the July 2011 purchase of the remaining interest in this entity. Partially offsetting these increases to other income were foreign exchange rate losses versus gains in 2010.
Interest expense decreased due to lower average borrowings, primarily caused by the repayment of outstanding borrowings from the proceeds of the second quarter 2011 equity offering.
21
The Company’s effective tax rate for 2011 was 24.0% compared to 27.3% in 2010. The 2011 effective tax rate includes a benefit of approximately $0.16 per diluted share, while 2010 includes a benefit of approximately $0.21 per diluted share, due to the expiration of applicable statutes of limitations for uncertain tax positions. The 2011 effective tax rate was impacted by a changing mix of income from higher rate jurisdictions to lower rate jurisdictions. In addition, the fair value adjustment related to the Company’s purchase of the remaining 60% ownership interest in its Mexican equity affiliate was not taxable. The Company has experienced, and expects to experience, further volatility in its quarterly effective tax rates due to the varying timing of tax audits and the expiration of applicable statutes of limitations as they relate to uncertain tax positions.
Equity in net income of associated companies in 2011 includes higher income from the Company’s equity investment in a captive insurance company of $2.3 million compared to $0.3 million in 2010. Also, equity in net income of associated companies in 2010 reflects an equity affiliate charge of approximately $0.05 per diluted share, related to an out-of-period adjustment, as well as a $0.03 per diluted share charge related to the first quarter 2010 devaluation of the Venezuelan Bolivar Fuerte. See 4 of Notes to Consolidated Financial Statements in Item 8 of this Report.
Segment Reviews—Comparison of 2011 with 2010
Metalworking Process Chemicals:
Metalworking Process Chemicals consists of industrial process fluids for various heavy industrial and manufacturing applications. This segment represented approximately 94% of the Company’s net sales in 2011, which were up approximately $130.0 million, or 25%, compared to 2010. Net sales for this reportable segment increased approximately 8% from acquisition activity, approximately 3% from foreign currency translation, approximately 5% from increases in volume, and approximately 9% from price and selling mix across the Company’s North American, Asia Pacific and European regions, as price increases were implemented in this segment during 2011 to help recover rising raw material costs. The foreign currency translation impacts were primarily driven by the average E.U. Euro to U.S. Dollar exchange rate being 1.39 in 2011 compared to 1.33 in 2010 and the average U.S. Dollar to Brazilian Real exchange rate being 0.60 in 2011 compared to 0.57 in 2010. The 2011 operating income for this reportable segment increased approximately $11.7 million over 2010, reflecting the Company’s acquisition activity and the volume and sales price increases noted above, which were partially offset by higher raw material costs and higher SG&A on increased business activity.
Coatings:
The Company’s coatings segment, which represented approximately 6% of the Company’s net sales in 2011, contains products that provide temporary and permanent coatings for metal and concrete products and chemical milling maskants. Net sales for this reportable segment were up approximately $8.2 million, or 26% for 2011 compared with the prior year, primarily due to increased sales in chemical milling maskants sold to the aerospace industry. The 2011 operating income for this reportable segment was up approximately $2.2 million, consistent with the volume increases noted above.
Other Chemical Products:
Other Chemical Products, which represented less than 1% of the Company’s net sales in 2011, consists of sulfur removal products for industrial gas streams sold by the Company’s Q2 Technologies joint venture. For 2011, net sales and operating income for this reportable segment were up approximately $1.0 million and $0.2 million, respectively, which was caused by increased activity in the oil and gas market in 2011 as compared to 2010.
The Company is involved in environmental clean-up activities in connection with an existing plant location and former waste disposal sites. In April of 1992, the Company identified certain soil and groundwater contamination at AC Products, Inc. (“ACP”), a wholly owned subsidiary. In voluntary coordination with the Santa Ana California Regional Water Quality Board (“SACRWQB”), ACP is remediating the contamination. Effective October 17, 2007, ACP agreed to operate the two existing groundwater treatment systems associated with the extraction wells P-2 and P-3 so as to hydraulically contain groundwater contamination emanating from ACP’s site until such time as the concentrations of contaminants are below the current Federal maximum contaminant level for four consecutive quarterly sampling events. On September 11, 2012, ACP received a letter from the SACRWQB advising that no further action is required to remediate the soil contamination on site. At December 31, 2012, the Company believes that the remaining potential-known liabilities associated with the ACP contamination, namely estimated future cost of the water remediation program, is approximately $0.7 million to $1.2 million, for which the Company has sufficient reserves. Notwithstanding the foregoing, the Company cannot be certain that liabilities in the form of remediation expenses and damages will not be incurred in excess of the amount reserved. See Note 20 of Notes to Consolidated Financial Statements which appears in Item 8 of this Report.
22
General
The Company generally does not use financial instruments that expose it to significant risk involving foreign currency transactions; however, the size of non-U.S. activities has a significant impact on reported operating results and the attendant net assets. During the past three years, sales by non-U.S. subsidiaries accounted for approximately 60% to 65% of our consolidated net annual sales. See Note 15 of Notes to Consolidated Financial Statements which appears in Item 8 of this Report and the Foreign Exchange Risk section in Item 7A of this Report.
Factors that May Affect Our Future Results
(Cautionary Statements Under the Private Securities Litigation Reform Act of 1995)
Certain information included in this Report and other materials filed or to be filed by Quaker with the SEC (as well as information included in oral statements or other written statements made or to be made by us) contain or may contain forward-looking statements within the meaning of Section 27A of the Securities Act of 1933, as amended, and Section 21E of the Securities Exchange Act of 1934, as amended. These statements can be identified by the fact that they do not relate strictly to historical or current facts. We have based these forward-looking statements on our current expectations about future events. These forward-looking statements include statements with respect to our beliefs, plans, objectives, goals, expectations, anticipations, intentions, financial condition, results of operations, future performance, and business, including:
|
|
•
|
statements relating to our business strategy;
|
|
|
|
•
|
our current and future results and plans; and
|
|
|
|
•
|
statements that include the words “may,” “could,” “should,” “would,” “believe,” “expect,” “anticipate,” “estimate,” “intend,” “plan” or similar expressions.
|
Such statements include information relating to current and future business activities, operational matters, capital spending, and financing sources. From time to time, oral or written forward-looking statements are also included in Quaker’s periodic reports on Forms 10-Q and 8-K, press releases and other materials released to, or statements made to, the public.
Any or all of the forward-looking statements in this Report, in Quaker’s Annual Report to Shareholders for 2012 and in any other public statements we make may turn out to be wrong. This can occur as a result of inaccurate assumptions or as a consequence of known or unknown risks and uncertainties. Many factors discussed in this Report will be important in determining our future performance. Consequently, actual results may differ materially from those that might be anticipated from our forward-looking statements.
We undertake no obligation to publicly update any forward-looking statements, whether as a result of new information, future events or otherwise. However, any further disclosures made on related subjects in Quaker’s subsequent reports on Forms 10-K, 10-Q and 8-K should be consulted. These forward-looking statements are subject to risks, uncertainties and assumptions about us and our operations that are subject to change based on various important factors, some of which are beyond our control. A major risk is that the Company’s demand is largely derived from the demand for its customers’ products, which subjects the Company to uncertainties related to downturns in a customer’s business and unanticipated customer production shutdowns. Other major risks and uncertainties include, but are not limited to, significant increases in raw material costs, worldwide economic and political conditions, foreign currency fluctuations, and terrorist attacks and other acts of violence, each of which is discussed in greater detail in Item 1A of this Report. Furthermore, the Company is subject to the same business cycles as those experienced by steel, automobile, aircraft, appliance, and durable goods manufacturers. These risks, uncertainties, and possible inaccurate assumptions relevant to our business could cause our actual results to differ materially from expected and historical results. Other factors beyond those discussed in this Report could also adversely affect us. Therefore, we caution you not to place undue reliance on our forward-looking statements. This discussion is provided as permitted by the Private Securities Litigation Reform Act of 1995.
23
Quaker is exposed to the impact of interest rates, foreign currency fluctuations, changes in commodity prices, and credit risk.
Interest Rate Risk. Quaker’s exposure to market rate risk for changes in interest rates relates primarily to its short and long-term debt. Most of Quaker’s debt is negotiated at market rates. Accordingly, if interest rates rise significantly, the cost of debt to Quaker will increase. This can have an adverse effect on Quaker, depending on the extent of Quaker’s borrowings. As of December 31, 2012, Quaker had approximately $12.2 million in borrowings under its credit facility at a weighted average borrowing rate of approximately 1.96% (LIBOR plus a spread). If interest rates had changed by 10%, the Company’s interest expense would have correspondingly increased or decreased approximately $0.1 million. The Company previously used derivative financial instruments primarily for the purposes of hedging exposures to fluctuations in interest rates. Specifically, the Company had previously entered into interest rate swaps in order to fix a portion of its variable rate debt. The swaps had a combined notional value of $15.0 million and a fair value of $(0.4) million at December 31, 2011, but matured during 2012. The Company does not enter into derivative contracts for trading or speculative purposes. See the information included under the caption “Derivatives” in Note 1, and the information in Note 3, of Notes to Consolidated Financial Statements which appears in Item 8 of this Report and is incorporated herein by reference.
Foreign Exchange Risk. A significant portion of Quaker’s revenues and earnings is generated by its foreign operations. These foreign operations also represent a significant portion of Quaker’s assets and liabilities. All such operations use the local currency as their functional currency. Accordingly, Quaker’s financial results are affected by risks typical of global business such as currency fluctuations, particularly between the U.S. Dollar, the Brazilian Real, the Chinese Renminbi and the E.U. Euro. As exchange rates vary, Quaker’s results can be materially affected. If the Brazilian Real, the E.U. Euro and the Chinese Renminbi had each changed by 10% against the U.S. Dollar, the Company’s 2012 revenues and pre-tax earnings would have correspondingly increased or decreased approximately $31.2 million and $3.7 million, respectively.
The Company generally does not use financial instruments that expose it to significant risk involving foreign currency transactions; however, the size of non-U.S. activities has a significant impact on reported operating results and the attendant net assets. During the past three years, sales by non-U.S. subsidiaries accounted for approximately 60% to 65% of consolidated net annual sales.
In addition, the Company often sources inventory among its worldwide operations. This practice can give rise to foreign exchange risk resulting from the varying cost of inventory to the receiving location, as well as from the revaluation of intercompany balances. The Company mitigates this risk through local sourcing efforts.
Commodity Price Risk. Many of the raw materials used by Quaker are commodity chemicals, and, therefore, Quaker’s earnings can be materially affected by market changes in raw material prices. In certain cases, Quaker has entered into fixed-price purchase contracts having a term of up to two years. These contracts provide protection to Quaker if the price for the contracted raw materials rises, however, in certain limited circumstances, Quaker will not realize the benefit if such prices decline. If the Company’s gross margin had changed by one percentage point, the Company’s 2012 pretax earnings would have correspondingly increased or decreased by approximately $7.1 million.
Credit Risk. Quaker establishes allowances for doubtful accounts for estimated losses resulting from the inability of its customers to make required payments. If the financial condition of Quaker’s customers were to deteriorate, resulting in an impairment of their ability to make payments, additional allowances may be required. Downturns in the overall economic climate may also exacerbate specific customer financial issues. A significant portion of Quaker’s revenues is derived from sales to customers in the U.S. steel and automotive industries, including some of our larger customers, where a number of bankruptcies occurred during recent years and companies have experienced financial difficulty. When a bankruptcy occurs, Quaker must judge the amount of proceeds, if any, that may ultimately be received through the bankruptcy or liquidation process. In addition, as part of its terms of trade, Quaker may custom manufacture products for certain large customers and/or may ship product on a consignment basis. These practices may increase the Company’s exposure should a bankruptcy occur, and may require a write-down or disposal of certain inventory due to its estimated obsolescence or limited marketability. Customer returns of products or disputes may also result in similar issues related to the realizability of recorded accounts receivable or returned inventory. The Company recorded provisions for doubtful accounts of $2.1 million, $0.9 million and $0.9 million in 2012, 2011 and 2010, respectively. A change of 10% to the recorded provisions would have increased or decreased the Company’s pre-tax earnings by approximately $0.2 million, $0.1 million and $0.1 million in 2012, 2011 and 2010, respectively.
24
|
Item 8.
|
Financial Statements and Supplementary Data.
|
INDEX TO CONSOLIDATED FINANCIAL STATEMENTS
|
|
Page
|
|
|
Financial Statements:
|
|
|
|
|
26
|
|
|
|
27
|
|
|
28
|
||
|
|
29
|
|
|
|
30
|
|
|
|
31
|
|
|
32
|
To the Shareholders and Board of Directors
of Quaker Chemical Corporation:
In our opinion, the accompanying consolidated balance sheets and the related consolidated statements of income, comprehensive income, changes in equity, and cash flows present fairly, in all material respects, the financial position of Quaker Chemical Corporation and its subsidiaries at December 31, 2012 and December 31, 2011, and the results of their operations and their cash flows for each of the three years in the period ended December 31, 2012 in conformity with accounting principles generally accepted in the United States of America. Also in our opinion, the Company maintained, in all material respects, effective internal control over financial reporting as of December 31, 2012, based on criteria established in Internal Control - Integrated Framework issued by the Committee of Sponsoring Organizations of the Treadway Commission (COSO). The Company's management is responsible for these financial statements, for maintaining effective internal control over financial reporting and for its assessment of the effectiveness of internal control over financial reporting, included in Management's Report on Internal Control over Financial Reporting appearing under Item 9A. Our responsibility is to express opinions on these financial statements and on the Company's internal control over financial reporting based on our integrated audits. We conducted our audits in accordance with the standards of the Public Company Accounting Oversight Board (United States). Those standards require that we plan and perform the audits to obtain reasonable assurance about whether the financial statements are free of material misstatement and whether effective internal control over financial reporting was maintained in all material respects. Our audits of the financial statements included examining, on a test basis, evidence supporting the amounts and disclosures in the financial statements, assessing the accounting principles used and significant estimates made by management, and evaluating the overall financial statement presentation. Our audit of internal control over financial reporting included obtaining an understanding of internal control over financial reporting, assessing the risk that a material weakness exists, and testing and evaluating the design and operating effectiveness of internal control based on the assessed risk. Our audits also included performing such other procedures as we considered necessary in the circumstances. We believe that our audits provide a reasonable basis for our opinions.
A company’s internal control over financial reporting is a process designed to provide reasonable assurance regarding the reliability of financial reporting and the preparation of financial statements for external purposes in accordance with generally accepted accounting principles. A company’s internal control over financial reporting includes those policies and procedures that (i) pertain to the maintenance of records that, in reasonable detail, accurately and fairly reflect the transactions and dispositions of the assets of the company; (ii) provide reasonable assurance that transactions are recorded as necessary to permit preparation of financial statements in accordance with generally accepted accounting principles, and that receipts and expenditures of the company are being made only in accordance with authorizations of management and directors of the company; and (iii) provide reasonable assurance regarding prevention or timely detection of unauthorized acquisition, use, or disposition of the company’s assets that could have a material effect on the financial statements.
Because of its inherent limitations, internal control over financial reporting may not prevent or detect misstatements. Also, projections of any evaluation of effectiveness to future periods are subject to the risk that controls may become inadequate because of changes in conditions, or that the degree of compliance with the policies or procedures may deteriorate.
As described in Management's Report on Internal Control over Financial Reporting appearing under Item 9A, management has excluded NP Coil Dexter Industries, S.r.l. from its assessment of internal control over financial reporting as of December 31, 2012 because this entity was acquired by the Company in purchase business combinations on July 2, 2012. We have also excluded NP Coil Dexter Industries, S.r.l. from our audit of internal control over financial reporting. This entity represents total assets and total revenues of 2% and less than 1%, respectively, of the related consolidated financial statement amounts as of and for the year ended December 31, 2012.
As discussed in Note 4 to the consolidated financial statements, the Company changed its accounting method for one of its long term investments.
/s/ PricewaterhouseCoopers LLP
Philadelphia, PA
March 6, 2013
CONSOLIDATED STATEMENT OF INCOME
|
Year Ended December 31,
|
||||||||||||
|
2012
|
2011
|
2010
|
||||||||||
|
(re-cast)
|
(re-cast)
|
|||||||||||
|
(In thousands, except per share amounts)
|
||||||||||||
|
Net sales
|
$ | 708,226 | $ | 683,231 | $ | 544,063 | ||||||
|
Costs and expenses
|
||||||||||||
|
Cost of goods sold
|
469,515 | 460,581 | 351,274 | |||||||||
|
Selling, general and administrative expenses
|
175,487 | 164,738 | 139,209 | |||||||||
|
Non-income tax contingency charge
|
— | — | 4,132 | |||||||||
|
CEO transition costs
|
— | — | 1,317 | |||||||||
| 645,002 | 625,319 | 495,932 | ||||||||||
|
Operating income
|
63,224 | 57,912 | 48,131 | |||||||||
|
Other income, net
|
3,415 | 5,050 | 2,106 | |||||||||
|
Interest expense
|
(4,283 | ) | (4,666 | ) | (5,225 | ) | ||||||
|
Interest income
|
592 | 1,081 | 1,201 | |||||||||
|
Income before taxes and equity in net income of associated companies
|
62,948 | 59,377 | 46,213 | |||||||||
|
Taxes on income before equity in net income of associated companies
|
15,575 | 14,256 | 12,616 | |||||||||
|
Income before equity in net income of associated companies
|
47,373 | 45,121 | 33,597 | |||||||||
|
Equity in net income of associated companies
|
2,867 | 3,102 | 807 | |||||||||
|
Net income
|
50,240 | 48,223 | 34,404 | |||||||||
|
Less: Net income attributable to noncontrolling interest
|
2,835 | 2,331 | 2,284 | |||||||||
|
Net income attributable to Quaker Chemical Corporation
|
$ | 47,405 | $ | 45,892 | $ | 32,120 | ||||||
|
Earnings per common share data:
|
||||||||||||
|
Net income attributable to Quaker Chemical Corporation Common Shareholders – basic
|
$ | 3.64 | $ | 3.71 | $ | 2.85 | ||||||
|
Net income attributable to Quaker Chemical Corporation Common Shareholders – diluted
|
$ | 3.63 | $ | 3.66 | $ | 2.80 | ||||||
The accompanying notes are an integral part of these consolidated financial statements.
CONSOLIDATED STATEMENT OF COMPREHENSIVE INCOME
|
Year Ended December 31,
|
||||||||||||
|
2012
|
2011
|
2010
|
||||||||||
|
(re-cast)
|
(re-cast)
|
|||||||||||
|
(In thousands)
|
||||||||||||
|
Net income
|
$ | 50,240 | $ | 48,223 | $ | 34,404 | ||||||
|
Other comprehensive loss, net of tax
|
||||||||||||
|
Currency translation adjustments
|
(2,111 | ) | (9,155 | ) | 805 | |||||||
|
Defined benefit retirement plans
|
||||||||||||
|
Net loss arising during the period, other
|
(13,980 | ) | (9,698 | ) | (6,267 | ) | ||||||
|
Amortization of actuarial loss
|
1,852 | 1,230 | 1,832 | |||||||||
|
Amortization of prior service cost
|
76 | 77 | 91 | |||||||||
|
Amortization of initial net asset
|
— | — | (3 | ) | ||||||||
|
Current period change in fair value of derivatives
|
272 | 395 | 708 | |||||||||
|
Unrealized gain (loss) on available-for-sale securities
|
866 | (138 | ) | 248 | ||||||||
|
Other comprehensive loss
|
(13,025 | ) | (17,289 | ) | (2,586 | ) | ||||||
|
Comprehensive income
|
37,215 | 30,934 | 31,818 | |||||||||
|
Less: comprehensive income attributable to noncontrolling interest
|
(2,698 | ) | (1,256 | ) | (2,761 | ) | ||||||
|
Comprehensive income attributable to Quaker Chemical Corporation
|
$ | 34,517 | $ | 29,678 | $ | 29,057 | ||||||
The accompanying notes are an integral part of these condensed consolidated financial statements.
CONSOLIDATED BALANCE SHEET
|
December 31,
|
||||||||
|
2012
|
2011
|
|||||||
|
(re-cast)
|
||||||||
|
(In thousands, except par value
and share amounts)
|
||||||||
|
ASSETS
|
||||||||
|
Current assets
|
||||||||
|
Cash and cash equivalents
|
$
|
32,547
|
$
|
16,909
|
||||
|
Accounts receivable, net
|
|
154,197
|
150,676
|
|||||
|
Inventories
|
|
72,471
|
74,758
|
|||||
|
Current deferred tax assets
|
|
6,401
|
6,338
|
|||||
|
Prepaid expenses and other current assets
|
|
12,194
|
10,868
|
|||||
|
Total current assets
|
|
277,810
|
|
|
259,549
|
|||
|
Property, plant and equipment, net
|
|
85,112
|
82,916
|
|||||
|
Goodwill
|
|
59,169
|
58,152
|
|||||
|
Other intangible assets, net
|
|
32,809
|
31,783
|
|||||
|
Investments in associated companies
|
|
16,603
|
14,073
|
|||||
|
Non-current deferred tax assets
|
|
30,673
|
29,823
|
|||||
|
Other assets
|
|
34,458
|
34,856
|
|||||
|
Total assets
|
$
|
536,634
|
|
$
|
511,152
|
|||
|
|
|
|
|
|||||
|
LIABILITIES AND EQUITY
|
|
|
|
|||||
|
Current liabilities
|
|
|
|
|||||
|
Short-term borrowings and current portion of long-term debt
|
$
|
1,468
|
|
$
|
636
|
|||
|
Accounts payable
|
|
67,586
|
|
|
65,026
|
|||
|
Dividends payable
|
3,208
|
3,099
|
||||||
|
Accrued compensation
|
|
16,842
|
|
|
16,987
|
|||
|
Accrued pension and postretirement benefits
|
2,188
|
2,038
|
||||||
|
Current deferred tax liabilities
|
253
|
238
|
||||||
|
Other current liabilities
|
|
16,247
|
|
|
18,625
|
|||
|
Total current liabilities
|
|
107,792
|
|
|
106,649
|
|||
|
Long-term debt
|
|
30,000
|
|
|
46,701
|
|||
|
Non-current deferred tax liabilities
|
6,383
|
7,094
|
||||||
|
Accrued pension and postretirement benefits
|
|
49,916
|
|
|
34,533
|
|||
|
Other non-current liabilities
|
|
52,867
|
|
|
54,818
|
|||
|
Total liabilities
|
|
246,958
|
|
|
249,795
|
|||
|
Equity
|
|
|
|
|||||
|
Common stock $1 par value; authorized 30,000,000 shares; issued and outstanding
|
|
|
|
|||||
|
2012 – 13,094,901 shares; 2011 – 12,911,508 shares
|
13,095
|
12,912
|
||||||
|
Capital in excess of par value
|
|
94,470
|
|
|
89,725
|
|||
|
Retained earnings
|
|
215,390
|
|
|
180,710
|
|||
|
Accumulated other comprehensive loss
|
|
(41,855)
|
|
(28,967)
|
||||
|
Total Quaker shareholders’ equity
|
|
281,100
|
|
|
254,380
|
|||
|
Noncontrolling interest
|
8,576
|
6,977
|
||||||
|
Total equity
|
289,676
|
261,357
|
||||||
|
Total liabilities and equity
|
$
|
536,634
|
|
$
|
511,152
|
|||
The accompanying notes are an integral part of these consolidated financial statements.
CONSOLIDATED STATEMENT OF CASH FLOWS
|
Year Ended December 31,
|
||||||||||||
|
2012
|
2011
|
2010
|
||||||||||
|
(re-cast)
|
(re-cast)
|
|||||||||||
|
(In thousands)
|
||||||||||||
|
Cash flows from operating activities
|
|
|
|
|||||||||
|
Net income
|
$ | 50,240 | $ | 48,223 | $ | 34,404 | ||||||
|
Adjustments to reconcile net income to net cash provided by operating activities:
|
||||||||||||
|
Depreciation
|
12,252 | 11,455 | 9,867 | |||||||||
|
Amortization
|
3,106 | 2,338 | 988 | |||||||||
|
Equity in undistributed earnings of associated companies, net of dividends
|
(2,350 | ) | (2,365 | ) | (294 | ) | ||||||
|
Deferred income taxes
|
2,354 | 2,431 | 1,849 | |||||||||
|
Uncertain tax positions (non-deferred portion)
|
(1,407 | ) | 3,673 | (1,130 | ) | |||||||
|
Acquisition-related fair value adjustments
|
(1,909 | ) | (2,624 | ) | — | |||||||
|
Deferred compensation and other, net
|
(156 | ) | 566 | (628 | ) | |||||||
|
Stock-based compensation
|
3,807 | 3,513 | 3,096 | |||||||||
|
(Gain) loss on disposal of property, plant and equipment
|
(108 | ) | (86 | ) | 32 | |||||||
|
Insurance settlement realized
|
(1,391 | ) | (1,840 | ) | (1,640 | ) | ||||||
|
Pension and other postretirement benefits
|
(1,427 | ) | (4,239 | ) | (2,636 | ) | ||||||
|
Increase (decrease) in cash from changes in current assets and current liabilities, net of acquisitions:
|
||||||||||||
|
Accounts receivable
|
779 | (31,558 | ) | (4,469 | ) | |||||||
|
Inventories
|
3,228 | (9,281 | ) | (7,153 | ) | |||||||
|
Prepaid expenses and other current assets
|
504 | (2,505 | ) | (814 | ) | |||||||
|
Accounts payable and accrued liabilities
|
(2,562 | ) | 4,442 | 5,511 | ||||||||
|
Estimated taxes on income
|
(2,067 | ) | (2,477 | ) | 564 | |||||||
|
Net cash provided by operating activities
|
62,893 | 19,666 | 37,547 | |||||||||
|
Cash flows from investing activities
|
||||||||||||
|
Capital expenditures
|
(12,735 | ) | (12,117 | ) | (9,354 | ) | ||||||
|
Payments related to acquisitions, net of cash acquired
|
(5,635 | ) | (25,477 | ) | (35,909 | ) | ||||||
|
Proceeds from disposition of assets
|
245 | 393 | 229 | |||||||||
|
Insurance settlement received and interest earned
|
69 | 80 | 5,122 | |||||||||
|
Change in restricted cash, net
|
1,322 | 1,760 | (1,124 | ) | ||||||||
|
Net cash used in investing activities
|
(16,734 | ) | (35,361 | ) | (41,036 | ) | ||||||
|
Cash flows from financing activities
|
||||||||||||
|
Net decrease in short-term borrowings
|
(315 | ) | (254 | ) | (1,456 | ) | ||||||
|
Proceeds from long-term debt
|
— | — | 9,841 | |||||||||
|
Repayment of long-term debt
|
(17,632 | ) | (27,364 | ) | (636 | ) | ||||||
|
Dividends paid
|
(12,616 | ) | (11,586 | ) | (10,449 | ) | ||||||
|
Stock options exercised, other
|
(924 | ) | 1,105 | 5,500 | ||||||||
|
Excess tax benefit related to stock option exercises
|
2,045 | 109 | 2,558 | |||||||||
|
Proceeds from sale of common stock, net of related expenses
|
— | 48,143 | — | |||||||||
|
Distributions to noncontrolling shareholders
|
(1,099 | ) | (1,000 | ) | (1,021 | ) | ||||||
|
Net cash (used in) provided by financing activities
|
(30,541 | ) | 9,153 | 4,337 | ||||||||
|
Effect of exchange rate changes on cash
|
20 | (2,315 | ) | (133 | ) | |||||||
|
Net increase (decrease) in cash and cash equivalents
|
15,638 | (8,857 | ) | 715 | ||||||||
|
Cash and cash equivalents at beginning of period
|
16,909 | 25,766 | 25,051 | |||||||||
|
Cash and cash equivalents at end of period
|
$ | 32,547 | $ | 16,909 | $ | 25,766 | ||||||
|
Supplemental cash flow disclosures:
|
||||||||||||
|
Cash paid during the year for:
|
||||||||||||
|
Income taxes
|
$ | 13,190 | $ | 9,110 | $ | 7,799 | ||||||
|
Interest
|
2,809 | 3,298 | 4,884 | |||||||||
|
Non-cash activities:
|
||||||||||||
|
Restricted insurance receivable (See also Note 18 of Notes to Consolidated Financial Statements)
|
$ | — | $ | — | $ | 5,000 | ||||||
|
Property, plant and equipment acquired by capital lease
|
— | — | 848 | |||||||||
The accompanying notes are an integral part of these consolidated financial statements.
CONSOLIDATED STATEMENT OF CHANGES IN EQUITY
|
Accumulated
|
||||||||||||||||||||||||
|
Capital in
|
other
|
Non-
|
||||||||||||||||||||||
|
Common
|
excess of
|
Retained
|
comprehensive
|
controlling
|
||||||||||||||||||||
|
stock
|
par value
|
earnings
|
loss
|
interest
|
Total
|
|||||||||||||||||||
|
Balance at December 31, 2009 (re-cast)
|
$ | 11,086 | $ | 27,527 | $ | 125,282 | $ | (9,690 | ) | $ | 4,981 | $ | 159,186 | |||||||||||
|
Net income (re-cast)
|
— | — | 32,120 | — | 2,284 | 34,404 | ||||||||||||||||||
|
Currency translation adjustments
|
— | — | — | 328 | 477 | 805 | ||||||||||||||||||
|
Defined benefit retirement plans:
|
||||||||||||||||||||||||
|
Net loss arising during the period, other
|
— | — | — | (6,267 | ) | — | (6,267 | ) | ||||||||||||||||
|
Amortization of actuarial loss
|
— | — | — | 1,832 | — | 1,832 | ||||||||||||||||||
|
Amortization of prior service cost
|
— | — | — | 91 | — | 91 | ||||||||||||||||||
|
Amortization of initial net asset
|
— | — | — | (3 | ) | — | (3 | ) | ||||||||||||||||
|
Current period changes in fair value of derivatives
|
— | — | — | 708 | — | 708 | ||||||||||||||||||
|
Unrealized gain on available-for-sale securities (re-cast)
|
— | — | — | 248 | — | 248 | ||||||||||||||||||
|
Dividends ($0.935 per share)
|
— | — | (10,600 | ) | — | — | (10,600 | ) | ||||||||||||||||
|
Dividends paid to noncontrolling interests
|
— | — | — | — | (1,021 | ) | (1,021 | ) | ||||||||||||||||
|
Shares issued upon exercise of stock options and other
|
297 | 4,965 | — | — | — | 5,262 | ||||||||||||||||||
|
Shares issued for employee stock purchase plan
|
10 | 228 | — | — | — | 238 | ||||||||||||||||||
|
Equity based compensation plans
|
99 | 2,997 | — | — | — | 3,096 | ||||||||||||||||||
|
Excess tax benefit from stock option exercises
|
— | 2,558 | — | — | — | 2,558 | ||||||||||||||||||
|
Balance at December 31, 2010 (re-cast)
|
11,492 | 38,275 | 146,802 | (12,753 | ) | 6,721 | 190,537 | |||||||||||||||||
|
Net income (re-cast)
|
— | — | 45,892 | — | 2,331 | 48,223 | ||||||||||||||||||
|
Currency translation adjustments
|
— | — | — | (8,080 | ) | (1,075 | ) | (9,155 | ) | |||||||||||||||
|
Defined benefit retirement plans:
|
||||||||||||||||||||||||
|
Net loss arising during the period, other
|
— | — | — | (9,698 | ) | — | (9,698 | ) | ||||||||||||||||
|
Amortization of actuarial loss
|
— | — | — | 1,230 | — | 1,230 | ||||||||||||||||||
|
Amortization of prior service cost
|
— | — | — | 77 | — | 77 | ||||||||||||||||||
|
Current period changes in fair value of derivatives
|
— | — | — | 395 | — | 395 | ||||||||||||||||||
|
Unrealized loss on available-for-sale securities (re-cast)
|
— | — | — | (138 | ) | — | (138 | ) | ||||||||||||||||
|
Dividends ($0.95 per share)
|
— | — | (11,984 | ) | — | — | (11,984 | ) | ||||||||||||||||
|
Dividends paid to noncontrolling interests
|
— | — | — | — | (1,000 | ) | (1,000 | ) | ||||||||||||||||
|
Stock offering, net of related expenses
|
1,265 | 46,878 | — | — | — | 48,143 | ||||||||||||||||||
|
Shares issued upon exercise of stock options and other
|
47 | 811 | — | — | — | 858 | ||||||||||||||||||
|
Shares issued for employee stock purchase plan
|
8 | 239 | — | — | — | 247 | ||||||||||||||||||
|
Equity based compensation plans
|
100 | 3,413 | — | — | — | 3,513 | ||||||||||||||||||
|
Excess tax benefit from stock option exercises
|
— | 109 | — | — | — | 109 | ||||||||||||||||||
|
Balance at December 31, 2011 (re-cast)
|
12,912 | 89,725 | 180,710 | (28,967 | ) | 6,977 | 261,357 | |||||||||||||||||
|
Net income
|
— | — | 47,405 | — | 2,835 | 50,240 | ||||||||||||||||||
|
Currency translation adjustments
|
— | — | — | (1,974 | ) | (137 | ) | (2,111 | ) | |||||||||||||||
|
Defined benefit retirement plans:
|
||||||||||||||||||||||||
|
Net loss arising during the period, other
|
— | — | — | (13,980 | ) | — | (13,980 | ) | ||||||||||||||||
|
Amortization of actuarial loss
|
— | — | — | 1,852 | — | 1,852 | ||||||||||||||||||
|
Amortization of prior service cost
|
— | — | — | 76 | — | 76 | ||||||||||||||||||
|
Current period changes in fair value of derivatives
|
— | — | — | 272 | — | 272 | ||||||||||||||||||
|
Unrealized gain on available-for-sale securities
|
— | — | — | 866 | — | 866 | ||||||||||||||||||
|
Dividends ($0.975 per share)
|
— | — | (12,725 | ) | — | — | (12,725 | ) | ||||||||||||||||
|
Dividends paid to noncontrolling interests
|
— | — | — | — | (1,099 | ) | (1,099 | ) | ||||||||||||||||
|
Shares issued upon exercise of stock options and other
|
102 | (1,296 | ) | — | — | — | (1,194 | ) | ||||||||||||||||
|
Shares issued for employee stock purchase plan
|
7 | 263 | — | — | — | 270 | ||||||||||||||||||
|
Equity based compensation plans
|
74 | 3,733 | — | — | — | 3,807 | ||||||||||||||||||
|
Excess tax benefit from stock option exercises
|
— | 2,045 | — | — | — | 2,045 | ||||||||||||||||||
|
Balance at December 31, 2012
|
$ | 13,095 | $ | 94,470 | $ | 215,390 | $ | (41,855 | ) | $ | 8,576 | $ | 289,676 | |||||||||||
The accompanying notes are an integral part of these consolidated financial statements.
31
NOTES TO CONSOLIDATED FINANCIAL STATEMENTS
(Dollars in thousands except per share amounts)
Note 1 – Significant Accounting Policies
Principles of consolidation: All majority-owned subsidiaries are included in the Company’s consolidated financial statements, with appropriate elimination of intercompany balances and transactions. Investments in associated companies (less than majority-owned and in which the Company has significant influence) are accounted for under the equity method. The Company’s share of net income or losses in these investments in associated companies is included in the Consolidated Statement of Income. The Company periodically reviews these investments for impairments and, if necessary, would adjust these investments to their fair value when a decline in market value or other impairment indicators are deemed to be other than temporary. As described in Note 4 of Notes to Consolidated Financial Statements, during 2012 the Company acquired an increased ownership percentage in Primex, Ltd. (“Primex”), a captive insurance company. Due to the increased ownership percentage and other factors, the Company changed its method of accounting for its investment in Primex from the cost method to the equity method of accounting. As a result, the Company recast its Consolidated Balance Sheet as of December 31, 2011, the Consolidated Statements of Income, Other Comprehensive Income and Cash Flows for the years ending December 31, 2010 and December 31, 2011 and the Consolidated Statement of Changes in Equity for the years ending December 31, 2009, December 31, 2010 and December 31, 2011 and the Notes to Consolidated Financial Statements to reflect the change in method of accounting. See also Note 4 to Notes to Consolidated Financial Statements.
The Financial Accounting Standards Board’s (“FASB’s”) guidance regarding the consolidation of certain Variable Interest Entities (“VIEs”) generally requires that assets, liabilities and results of the activities of a VIE be consolidated into the financial statements of the enterprise that is considered the primary beneficiary. The consolidated financial statements include the accounts of the Company and all of its subsidiaries in which a controlling interest is maintained and would include any VIEs if the Company was the primary beneficiary pursuant to the provisions of the applicable guidance.
Translation of foreign currency: Assets and liabilities of non-U.S. subsidiaries and associated companies are translated into U.S. Dollars at the respective rates of exchange prevailing at the end of the year. Income and expense accounts are translated at average exchange rates prevailing during the year. Translation adjustments resulting from this process are recorded directly in equity as accumulated other comprehensive income (loss) and will be included as income or expense only upon sale or liquidation of the underlying investment. All non-U.S. subsidiaries use their local currency as their functional currency.
Cash and cash equivalents: The Company considers all highly liquid investments with original maturities of three months or less to be cash equivalents.
Inventories: Inventories are valued at the lower of cost or market value, and are valued using the first-in, first-out (“FIFO”) method. See also Note 6 of Notes to Consolidated Financial Statements.
Long-lived assets: Property, plant and equipment are stated at cost. Depreciation is computed using the straight-line method on an individual asset basis over the following estimated useful lives: buildings and improvements, 10 to 45 years; and machinery and equipment, 1 to 15 years. The carrying value of long-lived assets is periodically evaluated whenever changes in circumstances or current events indicate the carrying amount of such assets may not be recoverable. An estimate of undiscounted cash flows produced by the asset, or the appropriate group of assets, is compared with the carrying value to determine whether impairment exists. If necessary, the Company recognizes an impairment loss for the difference between the carrying amount of the assets and their estimated fair value. Fair value is based on current and anticipated future undiscounted cash flows. Upon sale or other dispositions of long-lived assets, the applicable amounts of asset cost and accumulated depreciation are removed from the accounts and the net amount, less proceeds from disposals, is recorded in income. Expenditures for renewals or improvements that increase the estimated useful life or capacity of the assets are capitalized, whereas expenditures for repairs and maintenance are expensed when incurred.
Capitalized software: The Company capitalizes certain costs incurred in connection with developing or obtaining software for internal use. In connection with the upgrade and implementations of the Company’s global transaction and consolidation systems, approximately $2,395 and $2,800 of net costs were capitalized at December 31, 2012 and December 31, 2011, respectively. These costs are amortized over a period of three to five years once the assets are ready for their intended use.
Goodwill and other intangible assets: The Company records goodwill, definite-lived intangible assets and indefinite-lived intangible assets at fair value at acquisition. Goodwill and indefinite-lived intangible assets are not amortized, but tested for impairment at least annually. These tests will be performed more frequently if triggering events indicate potential impairment. Definite-lived intangible assets are amortized over their estimated useful lives, generally for periods ranging from 5 to 20 years. The Company continually evaluates the reasonableness of the useful lives of these assets. See Note 17 of Notes to Consolidated Financial Statements.
32
QUAKER CHEMICAL CORPORATION
NOTES TO CONSOLIDATED FINANCIAL STATEMENTS - Continued
(Dollars in thousands except per share amounts)
Revenue recognition: The Company recognizes revenue in accordance with the terms of the underlying agreements, when title and risk of loss have been transferred, when collectability is reasonably assured, and when pricing is fixed or determinable. This generally occurs when products are shipped to customers or, for consignment-type arrangements, upon usage by the customer and when services are performed. License fees and royalties are included in other income when recognized in accordance with their agreed-upon terms, when performance obligations are satisfied, when the amount is fixed or determinable, and when collectability is reasonably assured. As part of the Company’s chemical management services, certain third-party product sales to customers are managed by the Company. Where the Company acts as a principal, revenues are recognized on a gross reporting basis at the selling price negotiated with customers. Where the Company acts as an agent, such revenue is recorded using net reporting as service revenue at the amount of the administrative fee earned by the Company for ordering the goods. Third-party products transferred under arrangements resulting in net reporting totaled $39,299, $50,893 and $56,528 for 2012, 2011 and 2010, respectively.
Accounts receivable and allowance for doubtful accounts: Trade accounts receivable are recorded at the invoiced amount and generally do not bear interest. The allowance for doubtful accounts is the Company’s best estimate of the amount of probable credit losses with its existing accounts receivable. Reserves for customers filing for bankruptcy protection are generally established at 75-100% of the amount owed at the filing date, dependent on the Company’s evaluation of likely proceeds from the bankruptcy process. Large and/or financially distressed customers are generally reserved for on a specific review basis while a general reserve is established for other customers based on historical experience. The Company performs a formal review of its allowance for doubtful accounts quarterly. Account balances are charged off against the allowance when the Company feels it is probable the receivable will not be recovered. The Company does not have any off-balance-sheet credit exposure related to its customers. During 2012, the Company’s five largest customers accounted for approximately 19% of its consolidated net sales with the largest customer (Arcelor-Mittal Group) accounting for approximately 9% of consolidated net sales.
During 2012, the Company recorded charges of $1,254 to its allowance for doubtful accounts and selling, general and administrative expenses due to the bankruptcies of two U.S. customers. See Note 5 of Notes to Consolidated Financial Statements.
Research and development costs: Research and development costs are expensed as incurred. Research and development expenses are included in selling, general and administrative expenses and were $19,993, $18,812 and $15,690 in 2012, 2011 and 2010, respectively.
Concentration of credit risk: Financial instruments, which potentially subject the Company to a concentration of credit risk, principally consist of cash equivalents, short-term investments and trade receivables. The Company invests temporary and excess funds in money market securities and financial instruments having maturities typically within 90 days. The Company has not experienced losses from the aforementioned investments.
Environmental liabilities and expenditures: Accruals for environmental matters are recorded when it is probable that a liability has been incurred and the amount of the liability can be reasonably estimated. If there is a range of estimated liability and no amount in that range is considered more probable than another, then the Company records the lowest amount in the range in accordance with generally accepted accounting principles. Accrued liabilities are exclusive of claims against third parties and are not discounted. Environmental costs and remediation costs are capitalized if the costs extend the life, increase the capacity or improve safety or efficiency of the property from the date acquired or constructed, and/or mitigate or prevent contamination in the future.
Asset retirement obligations: The Company follows the FASB’s guidance regarding asset retirement obligations, which addresses the accounting and reporting for obligations associated with the retirement of tangible long-lived assets and the associated retirement costs. Also, the Company follows the FASB’s guidance for conditional asset retirement obligations (“CARO”), which relates to legal obligations to perform an asset retirement activity in which the timing and (or) method of settlement are conditional on a future event that may or may not be within the control of the entity. In accordance with this guidance, the Company records a liability when there is enough information regarding the timing of the CARO to perform a probability-weighted discounted cash flow analysis. See Note 9 of Notes to Consolidated Financial Statements.
33
QUAKER CHEMICAL CORPORATION
NOTES TO CONSOLIDATED FINANCIAL STATEMENTS - Continued
(Dollars in thousands except per share amounts)
Pension and other postretirement benefits: The Company maintains various noncontributory retirement plans, the largest of which is in the U.S., covering substantially all of its employees in the U.S. and certain other countries. The plans of the Company’s subsidiaries in The Netherlands, the United Kingdom and Mexico are subject to the provisions of FASB’s guidance regarding employers’ accounting for pension plans. The plans of the remaining non-U.S. subsidiaries are, for the most part, either fully insured or integrated with the local governments’ plans and are not subject to the provisions of the guidance. The guidance requires that employers recognize on a prospective basis the funded status of their defined benefit pension and other postretirement plans on their consolidated balance sheet, and, also, recognize as a component of other comprehensive income, net of tax, the gains or losses and prior service costs or credits that arise during the period but are not recognized as components of net periodic benefit cost. The Company’s U.S. pension plan year ends on November 30 and the measurement date is December 31. The measurement date for the Company’s other postretirement benefits plan is December 31. See Note 11 of Notes to Consolidated Financial Statements.
Comprehensive income (loss): The Company presents other comprehensive loss in its Statement of Comprehensive Income. The components of accumulated other comprehensive loss at December 31, 2012 include: accumulated foreign currency translation adjustments of $3,336, minimum pension liability of ($46,914), unrealized holding gains on available-for-sale securities of $1,723. The components of accumulated other comprehensive loss at December 31, 2011 include: accumulated foreign currency translation adjustments of $4,709, minimum pension liability of ($34,260), unrealized holding gains on available-for-sale securities of $857, and the fair value of derivative instruments of ($272).
The items in other comprehensive loss in the Statement of Consolidated Comprehensive Income are net of tax benefits related to defined benefit retirement plans of $4,310, $2,223 and $1,342 for 2012, 2011 and 2010, respectively. Additionally, the items in other comprehensive loss in the Statement of Consolidated Comprehensive Income are net of tax benefits related to changes in the fair value of derivatives of $146, $213 and $381 for 2012, 2011 and 2010, respectively. Also, the items in other comprehensive loss in the Statement of Comprehensive Income are net of tax benefits (expense) related to changes in unrealized holding gains (losses) on available-for-sale securities of $446, ($71) and $128 for 2012, 2011 and 2010, respectively.
Income taxes and uncertain tax positions: The provision for income taxes is determined using the asset and liability approach of accounting for income taxes. Under this approach, deferred taxes represent the future tax consequences expected to occur when the reported amounts of assets and liabilities are recovered or paid. The provision for income taxes represents income taxes paid or payable for the current year and the change in deferred taxes during the year. Deferred taxes result from differences between the financial and tax bases of the Company’s assets and liabilities and are adjusted for changes in tax rates and tax laws when changes are enacted. Valuation allowances are recorded to reduce deferred tax assets when it is more likely than not that a tax benefit will not be realized. The FASB’s guidance regarding accounting for uncertainty in income taxes prescribes the recognition threshold and measurement attributes for financial statement recognition and measurement of tax positions taken or expected to be taken on a tax return. The guidance further requires the determination of whether the benefits of tax positions will be more likely than not sustained upon audit based upon the technical merits of the tax position. For tax positions that are determined to be more likely than not sustained upon audit, a company recognizes the largest amount of benefit that is greater than 50% likely of being realized upon ultimate settlement in the financial statements. For tax positions that are not determined to be more likely than not sustained upon audit, a company does not recognize any portion of the benefit in the financial statements. Additionally, the guidance provides for derecognition, classification, penalties and interest, accounting in interim periods, disclosure and transition. The guidance also requires that the amount of interest expense and income to be recognized related to uncertain tax positions be computed by applying the applicable statutory rate of interest to the difference between the tax position recognized, including timing differences, and the amount previously taken or expected to be taken in a tax return. The Company’s continuing practice is to recognize interest and/or penalties related to income tax matters in income tax expense. See Note 10 of Notes to Consolidated Financial Statements.
Derivatives: The Company is exposed to the impact of changes in interest rates, foreign currency fluctuations, changes in commodity prices and credit risk. The Company does not use derivative instruments to mitigate the risks associated with foreign currency fluctuations, changes in commodity prices or credit risk, but has used derivative financial instruments primarily for purposes of hedging exposures to fluctuations in interest rates. The Company recognizes all derivatives on its balance sheet at fair value. For derivative instruments designated as cash flow hedges, the effective portion of any hedge is reported in Accumulated Other Comprehensive Income (Loss) until it is cleared to earnings during the same period in which the hedged item affects earnings. The Company uses no derivative instruments designated as fair value hedges. The Company does not enter into derivative contracts for trading or speculative purposes. See Note 3 of Notes to Consolidated Financial Statements.
34
QUAKER CHEMICAL CORPORATION
NOTES TO CONSOLIDATED FINANCIAL STATEMENTS - Continued
(Dollars in thousands except per share amounts)
Fair value measurements: The Company utilizes the FASB’s guidance regarding fair value measurements, which establishes a common definition for fair value to be applied to guidance requiring use of fair value, establishes a framework for measuring fair value and expands disclosure about such fair value measurements. Specifically, the guidance utilizes a fair value hierarchy that prioritizes the inputs to valuation techniques used to measure fair value into three broad levels. The following is a brief description of those three levels:
|
•
|
Level 1: Observable inputs such as quoted prices (unadjusted) in active markets for identical assets or liabilities.
|
|
|
•
|
Level 2: Inputs other than quoted prices that are observable for the asset or liability, either directly or indirectly. These include quoted prices for similar assets or liabilities in active markets and quoted prices for identical or similar assets or liabilities in markets that are not active.
|
|
|
•
|
Level 3: Unobservable inputs that reflect the reporting entity's own assumptions.
|
Stock-based compensation: The Company applies the FASB’s guidance regarding share-based payments, which requires the recognition of the fair value of stock compensation in net income. The Company elected the modified prospective method in adopting the guidance. Under this method, the provisions of the guidance apply to all awards granted or modified after the date of adoption. In addition, the unrecognized expense of awards not yet vested at the date of adoption is recognized in net income in the periods after the date of adoption using the same valuation method (e.g. Black-Scholes) and assumptions determined under the original provisions of the guidance as disclosed in the Company’s previous filings.
The Company has a long-term incentive program (“LTIP”) for key employees which provides for the granting of options to purchase stock at prices not less than market value on the date of the grant. Most options become exercisable between one and three years after the date of the grant for a period of time determined by the Company, but not to exceed seven years from the date of grant. Common stock awards issued under the LTIP program are subject only to time vesting over a three to five-year period. In addition, as part of the Company’s Global Annual Incentive Plan (“GAIP”), nonvested shares may be issued to key employees, which generally vest over a two to five-year period.
Based on historical experience, the Company has assumed a forfeiture rate of 13% on the nonvested stock. The Company will record additional expense if the actual forfeiture rate is lower than estimated, and will record a recovery of prior expense if the actual forfeiture is higher than estimated. See Note 13 of Notes to Consolidated Financial Statements.
Earnings per share: The Company follows FASB’s guidance regarding the calculation of earnings per share (“EPS”) for nonvested stock awards with rights to non-forfeitable dividends. The guidance requires nonvested stock awards with rights to non-forfeitable dividends to be included as part of the basic weighted average share calculation under the two-class method. See Note 14 of Notes to Consolidated Financial Statements.
Segments: The Company organizes its segments by the nature of the product sold. The Company’s reportable segments are as follows:
|
•
|
Metalworking process chemicals—generally includes industrial process fluids for various heavy industrial and manufacturing applications.
|
|
|
•
|
Coatings—generally includes temporary and permanent coatings for metal and concrete products and chemical milling maskants.
|
|
|
•
|
Other chemical products—other various chemical products.
|
Segment data includes direct segment costs, as well as general operating costs. Any inter-segment transactions are immaterial for each period presented. See Note 15 of Notes to Consolidated Financial Statements.
35
QUAKER CHEMICAL CORPORATION
NOTES TO CONSOLIDATED FINANCIAL STATEMENTS - Continued
(Dollars in thousands except per share amounts)
Recently issued accounting standards:
The FASB updated its guidance in July 2012 regarding indefinite-lived intangible asset impairment testing. The updated guidance permits a Company to first assess qualitative factors to determine whether it is more likely than not that the fair value of the indefinite-lived intangible asset is less than its carrying value. If the Company determines that the fair value is more likely than not above its carrying value, no further impairment testing is required. However, if the Company concludes otherwise, then the first step of the traditional two-step impairment test is required to be performed. The guidance is effective for annual and interim fiscal periods beginning after September 15, 2012, with early adoption permitted if an entity’s financial statements have not been issued as of the date of the entity’s interim or annual impairment test. The Company elected to test its indefinite-lived intangible assets for impairment under the traditional two-step method during the current year but is currently evaluating the effect of this guidance for future applicability.
The FASB updated its guidance in December 2011 regarding disclosures pertaining to the netting and offsetting of derivatives and financial instruments on an entity’s Consolidated Balance Sheet. Disclosures required under the updated guidance include presenting gross amounts of assets and liabilities related to financial instruments that may have been historically offset on the Consolidated Balance Sheet. The guidance is effective for annual and interim fiscal periods beginning on or after January 1, 2013. The Company is currently evaluating the effect of this guidance.
Reclassifications: During 2012, the Company adopted the FASB’s guidance regarding presentation of comprehensive income. The guidance requires that comprehensive income be presented with the Consolidated Statement of Income or as a separate statement immediately following the Consolidated Statement of Income, and can no longer be presented as part of the Consolidated Statement of Changes in Equity. The Company adopted the guidance using the two statement approach. The guidance required retrospective application, so the prior periods’ presentation of comprehensive income has been conformed to the current year presentation. In addition, certain other information has been reclassified to conform to the current year presentation.
Accounting estimates: The preparation of financial statements in conformity with generally accepted accounting principles requires management to make estimates and assumptions that affect the reported amounts of assets, liabilities and disclosure of contingencies at the date of the financial statements and the reported amounts of net sales and expenses during the reporting period. Actual results could differ from such estimates.
The Company values company-owned life insurance policies, various deferred compensation assets and liabilities, acquisition-related consideration and an obligation related to a non-competition agreement and previously valued its interest rate swaps at fair value. The Company’s assets and liabilities subject to fair value measurement are as follows (in thousands):
|
Fair Value Measurements at December 31, 2012
|
||||||||||||||||
|
Fair Value
|
Using Fair Value Hierarchy
|
|||||||||||||||
|
as of
|
||||||||||||||||
|
Assets
|
December 31, 2012
|
Level 1
|
Level 2
|
Level 3
|
||||||||||||
|
Company-owned life insurance
|
$ | 1,653 | $ | — | $ | 1,653 | $ | — | ||||||||
|
Company-owned life insurance - Deferred compensation assets
|
437 | — | 437 | — | ||||||||||||
|
Other deferred compensation assets
|
||||||||||||||||
|
Large capitalization registered investment companies
|
62 | 62 | — | — | ||||||||||||
|
Mid capitalization registered investment companies
|
6 | 6 | — | — | ||||||||||||
|
Small capitalization registered investment companies
|
9 | 9 | — | — | ||||||||||||
|
International developed and emerging markets registered investment
|
||||||||||||||||
|
companies
|
37 | 37 | — | — | ||||||||||||
|
Fixed income registered investment companies
|
8 | 8 | — | — | ||||||||||||
|
Total
|
$ | 2,212 | $ | 122 | $ | 2,090 | $ | — | ||||||||
36
QUAKER CHEMICAL CORPORATION
NOTES TO CONSOLIDATED FINANCIAL STATEMENTS - Continued
(Dollars in thousands except per share amounts)
|
Fair Value Measurements at December 31, 2012
|
||||||||||||||||
|
Fair Value
|
Using Fair Value Hierarchy
|
|||||||||||||||
|
as of
|
||||||||||||||||
|
Liabilities
|
December 31, 2012
|
Level 1
|
Level 2
|
Level 3
|
||||||||||||
|
Deferred compensation liabilities
|
||||||||||||||||
|
Large capitalization registered investment companies
|
$ | 336 | $ | 336 | $ | — | $ | — | ||||||||
|
Mid capitalization registered investment companies
|
88 | 88 | — | — | ||||||||||||
|
Small capitalization registered investment companies
|
72 | 72 | — | — | ||||||||||||
|
International developed and emerging markets registered investment
|
||||||||||||||||
|
companies
|
187 | 187 | — | — | ||||||||||||
|
Fixed income registered investment companies
|
48 | 48 | — | — | ||||||||||||
|
Fixed general account
|
173 | — | 173 | — | ||||||||||||
|
Acquisition-related consideration
|
4,901 | — | — | 4,901 | ||||||||||||
|
Total
|
$ | 5,805 | $ | 731 | $ | 173 | $ | 4,901 | ||||||||
|
Fair Value Measurements at December 31, 2011
|
||||||||||||||||
|
Fair Value
|
Using Fair Value Hierarchy
|
|||||||||||||||
|
as of
|
||||||||||||||||
|
Assets
|
December 31, 2011
|
Level 1
|
Level 2
|
Level 3
|
||||||||||||
|
Company-owned life insurance
|
$ | 1,508 | $ | — | $ | 1,508 | $ | — | ||||||||
|
Company-owned life insurance - Deferred compensation assets
|
487 | — | 487 | — | ||||||||||||
|
Other deferred compensation assets
|
||||||||||||||||
|
Large capitalization registered investment companies
|
64 | 64 | — | — | ||||||||||||
|
Mid capitalization registered investment companies
|
4 | 4 | — | — | ||||||||||||
|
Small capitalization registered investment companies
|
7 | 7 | — | — | ||||||||||||
|
International developed and emerging markets registered investment
|
||||||||||||||||
|
companies
|
32 | 32 | — | — | ||||||||||||
|
Fixed income registered investment companies
|
8 | 8 | — | — | ||||||||||||
|
Total
|
$ | 2,110 | $ | 115 | $ | 1,995 | $ | — | ||||||||
37
QUAKER CHEMICAL CORPORATION
NOTES TO CONSOLIDATED FINANCIAL STATEMENTS - Continued
(Dollars in thousands except per share amounts)
|
Fair Value Measurements at December 31, 2011
|
||||||||||||||||
|
Fair Value
|
Using Fair Value Hierarchy
|
|||||||||||||||
|
as of
|
||||||||||||||||
|
Liabilities
|
December 31, 2011
|
Level 1
|
Level 2
|
Level 3
|
||||||||||||
|
Deferred compensation liabilities
|
||||||||||||||||
|
Large capitalization registered investment companies
|
$ | 318 | $ | 318 | $ | — | $ | — | ||||||||
|
Mid capitalization registered investment companies
|
83 | 83 | — | — | ||||||||||||
|
Small capitalization registered investment companies
|
68 | 68 | — | — | ||||||||||||
|
International developed and emerging markets registered investment
|
||||||||||||||||
|
companies
|
168 | 168 | — | — | ||||||||||||
|
Fixed income registered investment companies
|
50 | 50 | — | — | ||||||||||||
|
Fixed general account
|
177 | — | 177 | — | ||||||||||||
|
Interest rate derivatives
|
418 | — | 418 | — | ||||||||||||
|
Acquisition-related consideration
|
8,898 | — | — | 8,898 | ||||||||||||
|
Total
|
$ | 10,180 | $ | 687 | $ | 595 | $ | 8,898 | ||||||||
The fair values of Company-owned life insurance (“COLI”) and COLI deferred compensation assets are based on quotes for like instruments with similar credit ratings and terms. The fair values of other deferred compensation assets and liabilities are based on quoted prices in active markets. The fair values of interest rate derivatives were based on quoted market prices from various banks for similar instruments. The fair value of the Summit earnout is based on unobservable inputs and is classified as Level 3. Significant inputs and assumptions are management’s estimate of the probability of the earnout ultimately being met/paid and the discount rate used to present value the liability. The fair value of the G.W. Smith, Tecniquimia and NP Coil Dexter holdbacks and the obligation related to a non-competition agreement are also based on unobservable inputs and are classified as Level 3. The significant input or assumption for both the obligation related to the non-competition agreement and the holdbacks is management’s estimate of the discount rate used to present value the liabilities. Significant changes in any Level 3 input or assumption in isolation would result in increases or decreases to the fair value measurements for the holdbacks, the earnout and the obligation related to the non-competition agreement.
Changes in the fair value of the Level 3 liabilities during the year ended December 31, 2012 were as follows:
|
Non-competition
|
||||||||||||||||||||||||
|
Earnout
|
Hold-back
|
Agreement
|
Hold-back
|
Hold-back
|
||||||||||||||||||||
|
Summit
|
Tecniquimia
|
Obligation
|
GW Smith
|
NP Coil Dexter
|
Total
|
|||||||||||||||||||
|
Balance at December 31, 2011
|
$ | 5,444 | $ | 1,877 | $ | 675 | $ | 902 | $ | — | $ | 8,898 | ||||||||||||
|
Acquisitions
|
— | — | — | — | 927 | 927 | ||||||||||||||||||
|
Interest accretion
|
790 | 123 | 42 | 98 | 71 | 1,124 | ||||||||||||||||||
|
Change in fair value estimate
|
(1,737 | ) | — | — | — | (1,033 | ) | (2,770 | ) | |||||||||||||||
|
Payments
|
— | (2,000 | ) | (313 | ) | (1,000 | ) | — | (3,313 | ) | ||||||||||||||
|
Currency exchange adjustment
|
— | — | — | — | 35 | 35 | ||||||||||||||||||
|
Balance at December 31, 2012
|
$ | 4,497 | $ | — | $ | 404 | $ | — | $ | — | $ | 4,901 | ||||||||||||
Quantitative information about the Company’s Level 3 fair value measurements at December 31, 2012 were as follows:
|
Fair value at December 31, 2012
|
Valuation technique
|
Unobservable input
|
Input value
|
||||||
|
Summit earnout
|
4,497
|
Discounted cash flow
|
Discount rate
|
14.5%
|
|||||
|
Non-competition agreement obligation
|
404
|
Discounted cash flow
|
Discount rate
|
14.0%
|
38
QUAKER CHEMICAL CORPORATION
NOTES TO CONSOLIDATED FINANCIAL STATEMENTS - Continued
(Dollars in thousands except per share amounts)
The fair value of the Summit earnout is based on the weighted average probability of the outcome of different payout scenarios. As of December 31, 2012, the probabilities applied to the payout scenarios ranged from 20% to 50%, depending on the Company’s estimate of the likelihood of each payout scenario.
Note 3 – Hedging Activities
The Company utilized interest rate swaps to mitigate the impact of changes in interest rates by converting a portion of the Company’s variable interest rate debt to fixed interest rate debt. The interest rate swaps had a combined notional amount of $15,000 as of December 31, 2011, which matured during the third quarter of 2012. Information about the Company’s interest rate derivatives is as follows:
|
Fair Value
|
|||||||||
|
Consolidated Balance Sheet
|
December 31, | ||||||||
|
Location
|
2012
|
2011
|
|||||||
|
Derivatives designated as cash flow hedges:
|
|||||||||
|
Interest rate swaps
|
Other current liabilities
|
$ | — | $ | 418 | ||||
| $ | — | $ | 418 | ||||||
|
Cash Flow Hedges
|
||||||||||||
|
Interest Rate Swaps
|
||||||||||||
|
For the Years Ended December 31,
|
||||||||||||
|
2012
|
2011
|
2010
|
||||||||||
|
Amount of Gain Recognized in
|
||||||||||||
|
Accumulated OCI on Derivative (Effective Portion)
|
$ | 272 | $ | 395 | $ | 708 | ||||||
|
Amount and Location of Loss Reclassified from
|
||||||||||||
|
Accumulated OCI into Income (Effective Portion)
|
Interest Expense
|
$ | (392 | ) | $ | (660 | ) | $ | (1,590 | ) | ||
|
Amount and Location of Loss Recognized in Income on Derivative
|
||||||||||||
|
(Ineffective Portion and Amount Excluded from Effectiveness Testing)
|
Other Income
|
$ | — | $ | — | $ | — | |||||
Note 4 – Investments in Associated Companies
As of December 31, 2012, the Company held a 50% investment in and had significant influence over Kelko Quaker Chemical, S.A. (Venezuela), Nippon Quaker Chemical, Ltd. (Japan) and Kelko Quaker Chemical S.A. (Panama) and held a 32% investment in and had significant influence over Primex, Ltd. (Barbados).
In 1986, the market for general liability insurance became highly volatile and there was limited product liability insurance for chemical companies to purchase. In response, the Company joined together with fifteen other chemical companies, each putting forward $0.5 million as capital, to form a captive insurance company, Primex, Ltd. (“Primex”). Primex was incorporated in Barbados and operates under the provisions of the Exempt Insurance Act of 1983, and provides excess liability insurance coverage only to its shareholders who are in chemical and chemical related manufacturing industries. Primex utilizes leading service providers for insurance, actuarial, accounting and legal services.
Since 1986, many of the original investors have exited Primex, either through acquisitions or divestitures. To date, companies that have ceased to purchase insurance from Primex have sold their shares back to Primex. Each current shareholder has one representative on Primex’s board of directors, each having an equal vote on operational and financial matters. As a result of one of those shareholders exiting from Primex in 2012, the Company reassessed its ability to significantly influence the operating and financial policies of Primex. Based on its ownership percentage and other factors, the Company determined that during 2012 the Company obtained the ability to significantly influence Primex and, as a result, needed to change its method of accounting for Primex from the cost method to the equity method. In accordance with the guidance of the FASB, the equity method of accounting must be applied on a retrospective basis, and all periods presented must be recast to reflect the change in the method of accounting.
39
QUAKER CHEMICAL CORPORATION
NOTES TO CONSOLIDATED FINANCIAL STATEMENTS - Continued
(Dollars in thousands except per share amounts)
Consequently, the Company has recast its Consolidated Balance Sheet as of December 31, 2011, the Consolidated Statements of Income, Other Comprehensive Income and Cash Flows for the years ending December 31, 2010 and December 31, 2011 and the Consolidated Statement of Changes in Equity for the years ending December 31, 2009, December 31, 2010 and December 31, 2011 and the Notes to Consolidated Financial Statements.
The change in the method of accounting results in an increase of previously reported net income and earnings per share for the years ending December 31, 2011 and December 31, 2010 of $2,323, or $0.19 per diluted share, and $313, or $0.03 per diluted share, respectively.
The following table sets forth the impact, by line item of the retrospective application of the change in method of accounting (amounts in thousands, except per share data):
|
Income Statement:
|
2011
|
2010
|
||||||
|
Equity in net income of associated companies
|
$ | 2,323 | $ | 313 | ||||
|
Net income attributable to Quaker Chemical Corporation
|
$ | 2,323 | $ | 313 | ||||
|
Net income attributable to Quaker Chemical Corporation Common Shareholders - Diluted
|
$ | 0.19 | $ | 0.03 | ||||
|
Balance Sheet:
|
||||||||
|
Investments in associated companies
|
$ | 6,131 | $ | 3,938 | ||||
|
Other assets
|
(500 | ) | (500 | ) | ||||
|
Total assets
|
$ | 5,631 | $ | 3,438 | ||||
|
Retained earnings
|
$ | 4,778 | $ | 2,455 | ||||
|
Accumulated other comprehensive loss
|
853 | 983 | ||||||
|
Total equity
|
$ | 5,631 | $ | 3,438 | ||||
For further information, see Note 21 of the Notes to Consolidated Financial Statements.
In 2011, the Company purchased the remaining 60% ownership interest in Tecniquimia Mexicana, S.A. de C.V., the Company’s Mexican equity affiliate. As a result of the purchase, the Company only included six months of the affiliate’s 2011 results in its investments in associated companies, with the remaining six months after acquisition being reflected as a wholly owned subsidiary in the Company’s Consolidated Financial Statements.
Effective January 1, 2010, Venezuela’s economy was considered to be highly inflationary under U.S. generally accepted accounting principles, as it had experienced a rate of general inflation in excess of 100% over the latest three-year period, based upon the blended Consumer Price Index and National Consumer Price Index. Accordingly, all gains and losses resulting from the remeasurement of the Company’s Venezuelan 50% owned equity affiliate (Kelko Quaker Chemical, S.A.) were required to be recorded directly to the Consolidated Statement of Income. On January 8, 2010, the Venezuelan government announced the devaluation of the Bolivar Fuerte and the establishment of a two-tier exchange structure. The Company recorded a charge in the first quarter of 2010 of approximately $0.03 per diluted share to reflect the devaluation. On February 9, 2013, the Venezuelan Government announced a further devaluation of the Bolivar Fuerte. Accordingly, the Company currently estimates that it will record a charge of approximately $0.03 per diluted share during the first quarter of 2013.
During the fourth quarter of 2010, the Company identified errors in reserves for pension and certain other items at its Tecniquimia Mexicana, S.A. de C.V. affiliate. The affiliate adjusted for these items in the fourth quarter of 2010, which had the effect of reducing equity in net income of associated companies and net income by $564 in the fourth quarter and year-to-date periods of 2010. The Company believes this adjustment was not material to its Consolidated Financial Statements for the years ended December 31, 2007, December 31, 2008, December 31, 2009 or December 31, 2010 and, therefore, did not restate any prior period amounts.
40
QUAKER CHEMICAL CORPORATION
NOTES TO CONSOLIDATED FINANCIAL STATEMENTS - Continued
(Dollars in thousands except per share amounts)
Summarized financial information of Kelko Quaker Chemical, S.A. (Venezuela), Nippon Quaker Chemical, Ltd. (Japan) and Kelko Quaker Chemical S.A. (Panama), in the aggregate, is as follows:
|
December 31,
|
||||||||
|
2012
|
2011
|
|||||||
|
Current Assets
|
$ | 28,602 | $ | 32,998 | ||||
|
Noncurrent Assets
|
2,402 | 845 | ||||||
|
Current Liabilities
|
15,158 | 17,793 | ||||||
|
Noncurrent Liabilities
|
248 | 359 | ||||||
|
Year Ended December 31,
|
||||||||||||
|
2012
|
2011
|
2010
|
||||||||||
|
Net Sales
|
$ | 55,963 | $ | 66,925 | $ | 65,592 | ||||||
|
Gross Margin
|
18,480 | 22,092 | 24,810 | |||||||||
|
Operating Income
|
4,224 | 4,769 | 5,211 | |||||||||
|
Net Income
|
2,118 | 1,696 | 1,071 | |||||||||
Summarized financial information of Primex, Ltd. is as follows:
|
December 31,
|
||||||||
|
2012
|
2011
|
|||||||
|
Total Assets
|
$ | 130,816 | $ | 131,172 | ||||
|
Total Liabilities
|
97,754 | 104,310 | ||||||
|
Year Ended December 31,
|
||||||||||||
|
2012
|
2011
|
2010
|
||||||||||
|
Revenue
|
$ | 8,473 | $ | 11,523 | $ | 3,317 | ||||||
|
Income Before Income Taxes
|
8,901 | 14,837 | 2,178 | |||||||||
|
Net Income
|
6,031 | 9,941 | 1,596 | |||||||||
Subsequent to December 31, 2012, the company received its first dividend distribution from Primex, Ltd. of approximately $2,000, which will be accounted for as a reduction of the Company’s investment balance in this associated company.
Note 5 – Accounts Receivable and Allowance for Doubtful Accounts
At December 31, 2012 and December 31, 2011, the Company had gross trade accounts receivable totaling $160,596 and $155,245 with trade accounts receivable greater than 90 days past due of $9,401 and $6,112, respectively. The following are changes in the allowance for doubtful accounts during the years ended December 31, 2012, December 31, 2011 and December 31, 2010:
|
Exchange
|
||||||||||||||||||||
|
Charged
|
Rate
|
|||||||||||||||||||
|
Balance at
|
to Costs
|
Write-Offs
|
Changes
|
Balance
|
||||||||||||||||
|
Beginning
|
and
|
Charged to
|
And Other
|
at End
|
||||||||||||||||
|
of Period
|
Expenses
|
Allowance
|
Adjustments
|
of Period
|
||||||||||||||||
|
ALLOWANCE FOR DOUBTFUL ACCOUNTS
|
||||||||||||||||||||
|
Year ended December 31, 2012
|
$ | 4,569 | $ | 2,072 | $ | (737 | ) | $ | 495 | $ | 6,399 | |||||||||
|
Year ended December 31, 2011
|
$ | 4,278 | $ | 855 | $ | (607 | ) | $ | 43 | $ | 4,569 | |||||||||
|
Year ended December 31, 2010
|
$ | 4,002 | $ | 860 | $ | (538 | ) | $ | (46 | ) | $ | 4,278 | ||||||||
Included in exchange rate changes and other adjustments are allowance for doubtful accounts of $416, $146 and $0 acquired in 2012, 2011 and 2010 business acquisitions.
41
QUAKER CHEMICAL CORPORATION
NOTES TO CONSOLIDATED FINANCIAL STATEMENTS - Continued
(Dollars in thousands except per share amounts)
Note 6 – Inventories
Total inventories comprise:
|
December 31,
|
||||||||
|
2012
|
2011
|
|||||||
|
Raw materials and supplies
|
$ | 40,417 | $ | 41,771 | ||||
|
Work in process and finished goods
|
32,054 | 32,987 | ||||||
| $ | 72,471 | $ | 74,758 | |||||
Note 7 – Other Current Liabilities
Other current liabilities comprise:
|
December 31,
|
||||||||
|
2012
|
2011
|
|||||||
|
Non-income taxes
|
$ | 6,364 | $ | 5,683 | ||||
|
Present value of acquisition-related liabilities
|
— | 2,779 | ||||||
|
Professional fees
|
2,083 | 2,279 | ||||||
|
Selling expenses
|
2,205 | 1,858 | ||||||
|
Legal
|
1,018 | 1,420 | ||||||
|
Freight
|
1,120 | 1,212 | ||||||
|
Current portion of interest rate swaps
|
— | 418 | ||||||
|
Other
|
3,457 | 2,976 | ||||||
|
Total
|
$ | 16,247 | $ | 18,625 | ||||
During 2012, the Company settled the acquisition-related liabilities assumed in the 2011 purchases of Tecniquimia Mexicana, S.A. de C.V. and G.W. Smith and Sons, Inc. for approximately $2,000 and $1,000, respectively. See also Notes 2 and 16 for more information. In addition, the Company’s interest rate swaps matured in 2012. See also Note 3 for more information.
Note 8 – Property, Plant and Equipment
Property, plant and equipment comprise:
|
December 31,
|
||||||||
|
2012
|
2011
|
|||||||
|
Land
|
$ | 8,346 | $ | 8,198 | ||||
|
Building and improvements
|
72,292 | 71,029 | ||||||
|
Machinery and equipment
|
134,754 | 130,939 | ||||||
|
Construction in progress
|
9,785 | 4,529 | ||||||
| 225,177 | 214,695 | |||||||
|
Less accumulated depreciation
|
(140,065 | ) | (131,779 | ) | ||||
| $ | 85,112 | $ | 82,916 | |||||
The Company leases certain equipment under capital leases in Europe, South America and the U.S. Gross property, plant and equipment includes $1,275 and $1,297 of capital leases with $569 and $766 of accumulated depreciation at December 31, 2012 and December 31, 2011, respectively.
42
QUAKER CHEMICAL CORPORATION
NOTES TO CONSOLIDATED FINANCIAL STATEMENTS - Continued
(Dollars in thousands except per share amounts)
The following is a schedule by years of future minimum lease payments:
|
For the year ended December 31,
|
||||
|
2013
|
$ | 291 | ||
|
2014
|
147 | |||
|
2015
|
99 | |||
|
2016
|
65 | |||
|
2017
|
58 | |||
|
2018 and beyond
|
— | |||
|
Total net minimum lease payments
|
660 | |||
|
Less amount representing interest
|
(48 | ) | ||
|
Present value of net minimum lease payments
|
$ | 612 | ||
Note 9 – Asset Retirement Obligations
The Company’s conditional asset retirement obligation (“CARO”) consist primarily of asbestos contained in certain manufacturing facilities and decommissioning costs related to aboveground storage tanks, and the Company had $348 and $334 accrued for such CAROs at December 31, 2012 and December 31, 2011, respectively. During 2012 and 2011, the Company accrued interest of $14 on this liability, which is included in other non-current liabilities on the Company’s Consolidated Balance Sheet.
Note 10 – Taxes on Income and Uncertain Tax Positions
Taxes (benefit) on income consist of the following:
|
Year Ended December 31,
|
||||||||||||
|
2012
|
2011
|
2010
|
||||||||||
|
Current:
|
||||||||||||
|
Federal
|
$ | 3,318 | $ | 3,485 | $ | 1,429 | ||||||
|
State
|
(69 | ) | 385 | 195 | ||||||||
|
Foreign
|
9,972 | 7,955 | 9,143 | |||||||||
| 13,221 | 11,825 | 10,767 | ||||||||||
|
Deferred:
|
||||||||||||
|
Federal
|
4,409 | 2,022 | 1,204 | |||||||||
|
State
|
(794 | ) | — | — | ||||||||
|
Foreign
|
(1,261 | ) | 409 | 645 | ||||||||
|
Total
|
$ | 15,575 | $ | 14,256 | $ | 12,616 | ||||||
The components of earnings before income taxes were as follows:
|
Year Ended December 31,
|
||||||||||||
|
2012
|
2011
|
2010
|
||||||||||
|
Domestic
|
$ | 26,520 | $ | 24,071 | $ | 9,482 | ||||||
|
Foreign
|
36,428 | 35,306 | 36,731 | |||||||||
|
Total
|
$ | 62,948 | $ | 59,377 | $ | 46,213 | ||||||
43
QUAKER CHEMICAL CORPORATION
NOTES TO CONSOLIDATED FINANCIAL STATEMENTS - Continued
(Dollars in thousands except per share amounts)
Total deferred tax assets and liabilities are composed of the following at December 31:
|
2012
|
2011
|
|||||||||||||||
|
Current
|
Non-current
|
Current
|
Non-current
|
|||||||||||||
|
Retirement benefits
|
$ | 614 | $ | 14,397 | $ | 808 | $ | 9,907 | ||||||||
|
Allowance for doubtful accounts
|
1,984 | — | 755 | — | ||||||||||||
|
Insurance and litigation reserves
|
580 | 260 | 683 | 424 | ||||||||||||
|
Postretirement benefits
|
— | 2,543 | — | 2,259 | ||||||||||||
|
Supplemental retirement benefits
|
— | 2,501 | 69 | 2,303 | ||||||||||||
|
Performance incentives
|
3,002 | 520 | 3,139 | 383 | ||||||||||||
|
Equity-based compensation
|
349 | 395 | 239 | 449 | ||||||||||||
|
Alternative minimum tax carryforward
|
— | — | — | 447 | ||||||||||||
|
Insurance settlement
|
10 | 9,425 | 26 | 9,698 | ||||||||||||
|
Operating loss carryforward
|
— | 9,425 | — | 3,010 | ||||||||||||
|
Uncertain tax positions
|
— | 7,700 | — | 7,911 | ||||||||||||
|
Interest rate swaps and other
|
679 | 1,039 | 786 | 216 | ||||||||||||
| 7,218 | 48,205 | 6,505 | 37,007 | |||||||||||||
|
Valuation allowance
|
(710 | ) | (7,148 | ) | — | (1,377 | ) | |||||||||
|
Total deferred income tax assets, net
|
$ | 6,508 | $ | 41,057 | $ | 6,505 | $ | 35,630 | ||||||||
|
Depreciation
|
— | 5,069 | — | 3,123 | ||||||||||||
|
Europe pension and other
|
— | 2,552 | — | 2,481 | ||||||||||||
|
Amortization and other
|
360 | 9,146 | 405 | 7,297 | ||||||||||||
|
Total deferred income tax liabilities
|
$ | 360 | $ | 16,767 | $ | 405 | $ | 12,901 | ||||||||
Following are the changes in the Company’s deferred tax asset valuation allowance for the years ended December 31, 2012, December 31, 2011 and December 31, 2010:
|
Effect of
|
||||||||||||||||||||
|
Balance at
|
Additional
|
Allowance
|
Exchange
|
Balance
|
||||||||||||||||
|
Beginning
|
Valuation
|
Utilization
|
Rate
|
at End
|
||||||||||||||||
|
of Period
|
Allowance
|
and Other
|
Changes
|
of Period
|
||||||||||||||||
|
VALUATION ALLOWANCE
|
||||||||||||||||||||
|
Year ended December 31, 2012
|
$ | 1,377 | $ | 6,594 | $ | (34 | ) | $ | (79 | ) | $ | 7,858 | ||||||||
|
Year ended December 31, 2011
|
$ | 4,923 | $ | 348 | $ | (3,753 | ) | $ | (141 | ) | $ | 1,377 | ||||||||
|
Year ended December 31, 2010
|
$ | 5,666 | $ | 38 | $ | (769 | ) | $ | (12 | ) | $ | 4,923 | ||||||||
The Company’s net deferred tax assets and liabilities are classified in the Consolidated Balance Sheet as follows:
|
2012
|
2011
|
|||||||
|
Current deferred tax assets
|
$ | 6,401 | $ | 6,338 | ||||
|
Non-current deferred tax assets
|
30,673 | 29,823 | ||||||
|
Current deferred tax liabilities
|
253 | 238 | ||||||
|
Non-current deferred tax liabilities
|
6,383 | 7,094 | ||||||
|
Net deferred tax asset
|
$ | 30,438 | $ | 28,829 | ||||
44
QUAKER CHEMICAL CORPORATION
NOTES TO CONSOLIDATED FINANCIAL STATEMENTS - Continued
(Dollars in thousands except per share amounts)
The following is a reconciliation of income taxes at the Federal statutory rate with income taxes recorded by the Company for the years ended December 31, 2012, December 31, 2011 and December 31, 2010:
|
2012
|
2011
|
2010
|
||||||||||
|
Income tax provision at the Federal statutory tax rate
|
$ | 22,032 | $ | 20,782 | $ | 16,175 | ||||||
|
Differences in tax rates on foreign earnings and
|
||||||||||||
|
remittances
|
(3,207 | ) | (3,692 | ) | (2,546 | ) | ||||||
|
Foreign dividends
|
815 | 735 | 15,645 | |||||||||
|
Excess foreign tax credit utilization
|
(2,237 | ) | (2,493 | ) | (15,198 | ) | ||||||
|
Research and development activities credit utilization
|
— | (1,348 | ) | — | ||||||||
|
Uncertain tax positions
|
(1,196 | ) | 701 | (1,130 | ) | |||||||
|
Domestic production activities deduction
|
(402 | ) | — | (932 | ) | |||||||
|
State income tax provisions, net
|
(45 | ) | 250 | 127 | ||||||||
|
Non-deductible entertainment and business meals
|
||||||||||||
|
expense
|
200 | 166 | 152 | |||||||||
|
Non-taxable gain on acquisition
|
— | (951 | ) | — | ||||||||
|
Miscellaneous items, net
|
(385 | ) | 106 | 323 | ||||||||
|
Taxes on income
|
$ | 15,575 | $ | 14,256 | $ | 12,616 | ||||||
At December 31, 2012, the Company domestically had a net deferred tax asset of $13,907. In addition, the Company has foreign tax loss carryforwards of $12,553 of which $23 expires in 2014, $352 expires in 2015, $68 expires in 2016, $344 expires in 2017, $247 expires in 2018, $291 expires in 2019, $102 expires in 2020, $245 expires in 2021, $258 expires in 2022 and $183 expires in 2023; the remaining foreign tax losses have no expiration dates. A partial valuation allowance has been established with respect to the tax benefit of these losses for $1,443.
U.S. income taxes have not been provided on the undistributed earnings of non-U.S. subsidiaries because it is the Company’s intention to continue to reinvest these earnings in those subsidiaries to support growth initiatives. U.S. and foreign income taxes that would be payable if such earnings were distributed may be lower than the amount computed at the U.S. statutory rate due to the availability of tax credits. The amount of such undistributed earnings at December 31, 2012 was approximately $150,000. Any income tax liability which might result from ultimate remittance of these earnings is expected to be substantially offset by foreign tax credits.
As of December 31, 2012, the Company’s cumulative liability for gross unrecognized tax benefits was $12,410. The Company had accrued $1,630 for cumulative penalties and $2,288 for cumulative interest at December 31, 2012. As of December 31, 2011, the Company’s cumulative liability for gross unrecognized tax benefits was $12,719. The Company had accrued $1,298 for cumulative penalties and $2,268 for cumulative interest at December 31, 2011.
The Company continues to recognize interest and penalties associated with uncertain tax positions as a component of taxes on income before equity in net income of associated companies in its Consolidated Statement of Income. The Company has recognized $301 for penalties and ($26) for interest (net of expirations and settlements) on its Consolidated Statement of Income for the twelve-month period ended December 31, 2012. The Company recognized $502 for penalties and $529 for interest (net of expirations and settlements) on its Consolidated Statement of Income for the twelve-month period ended December 31, 2011. The Company recognized ($12) for penalties and $80 for interest (net of expirations and settlements) on its Consolidated Statement of Income for the twelve-month period ended December 31, 2010.
The Company estimates that during the year ending December 31, 2013, it will reduce its cumulative liability for gross unrecognized tax benefits by approximately $2,300 to $2,400 due to the expiration of the statute of limitations with regard to certain tax positions. This estimated reduction in the cumulative liability for unrecognized tax benefits does not consider any increase in liability for unrecognized tax benefits with regard to existing tax positions or any increase in cumulative liability for unrecognized tax benefits with regard to new tax positions for the year ending December 31, 2013.
The Company and its subsidiaries are subject to U.S. Federal income tax, as well as the income tax of various state and foreign tax jurisdictions. Tax years that remain subject to examination by major tax jurisdictions include The Netherlands from 2006, United Kingdom from 2007, Brazil and Spain from 2008, the United States from 2009, China and Italy from 2010, and various domestic state tax jurisdictions from 1993.
45
QUAKER CHEMICAL CORPORATION
NOTES TO CONSOLIDATED FINANCIAL STATEMENTS - Continued
(Dollars in thousands except per share amounts)
A reconciliation of the beginning and ending amounts of unrecognized tax benefits for the years ended December 31, 2012, December 31, 2011 and December 31, 2010, respectively, is as follows:
|
2012
|
2011
|
2010
|
||||||||||
|
Unrecognized tax benefits at January 1
|
$ | 12,719 | $ | 10,464 | $ | 10,686 | ||||||
|
Increase in unrecognized tax benefits taken in prior periods
|
— | 1,597 | — | |||||||||
|
(Decrease) in unrecognized tax benefits taken in prior periods
|
(411 | ) | — | — | ||||||||
|
Increase in unrecognized tax benefits taken in current period
|
1,733 | 2,623 | 2,249 | |||||||||
|
(Decrease) in unrecognized tax benefits due to lapse of statute of limitations
|
(1,837 | ) | (1,578 | ) | (1,828 | ) | ||||||
|
Increase (decrease) due to foreign exchange rates
|
206 | (387 | ) | (643 | ) | |||||||
|
Unrecognized tax benefits at December 31
|
$ | 12,410 | $ | 12,719 | $ | 10,464 | ||||||
The amount of unrecognized tax benefits above that, if recognized, would impact the Company’s tax expense and effective tax rate is $1,652, $2,966 and $3,427 in 2012, 2011 and 2010, respectively.
46
QUAKER CHEMICAL CORPORATION
NOTES TO CONSOLIDATED FINANCIAL STATEMENTS - Continued
(Dollars in thousands except per share amounts)
Note 11 – Pension and Other Postretirement Benefits
The following table shows the Company’s plans’ funded status reconciled with amounts reported in the consolidated balance sheet as of December 31, 2012 and December 31, 2011:
|
Other
|
||||||||||||||||||||||||||||||||
|
Pension Benefits
|
Postretirement Benefits
|
|||||||||||||||||||||||||||||||
|
2012
|
2011
|
2012
|
2011
|
|||||||||||||||||||||||||||||
|
Foreign
|
Domestic
|
Total
|
Foreign
|
Domestic
|
Total
|
Domestic
|
Domestic
|
|||||||||||||||||||||||||
|
Change in benefit obligation
|
||||||||||||||||||||||||||||||||
|
Benefit obligation at beginning of year
|
$ | 61,581 | $ | 66,226 | $ | 127,807 | $ | 53,250 | $ | 63,125 | $ | 116,375 | $ | 7,202 | $ | 7,815 | ||||||||||||||||
|
Service cost
|
2,004 | 460 | 2,464 | 1,890 | 400 | 2,290 | 46 | 16 | ||||||||||||||||||||||||
|
Interest cost
|
3,020 | 2,803 | 5,823 | 3,037 | 3,145 | 6,182 | 283 | 331 | ||||||||||||||||||||||||
|
Employee contributions
|
101 | — | 101 | 104 | — | 104 | — | — | ||||||||||||||||||||||||
|
Benefits paid
|
(1,973 | ) | (4,668 | ) | (6,641 | ) | (1,734 | ) | (4,423 | ) | (6,157 | ) | (728 | ) | (793 | ) | ||||||||||||||||
|
Plan expenses and premiums paid
|
(331 | ) | (225 | ) | (556 | ) | (272 | ) | (200 | ) | (472 | ) | — | — | ||||||||||||||||||
|
Actuarial loss (gain)
|
14,874 | 5,811 | 20,685 | 4,799 | 4,179 | 8,978 | 514 | (167 | ) | |||||||||||||||||||||||
|
Translation difference and other
|
2,004 | — | 2,004 | 507 | — | 507 | — | — | ||||||||||||||||||||||||
|
Benefit obligation at end of year
|
$ | 81,280 | $ | 70,407 | $ | 151,687 | $ | 61,581 | $ | 66,226 | $ | 127,807 | $ | 7,317 | $ | 7,202 | ||||||||||||||||
|
Change in plan assets
|
||||||||||||||||||||||||||||||||
|
Fair value of plan assets at beginning of
|
||||||||||||||||||||||||||||||||
|
year
|
$ | 54,968 | $ | 43,470 | $ | 98,438 | $ | 52,873 | $ | 43,103 | $ | 95,976 | $ | — | $ | — | ||||||||||||||||
|
Actual return on plan assets
|
2,972 | 4,466 | 7,438 | 1,984 | 178 | 2,162 | — | — | ||||||||||||||||||||||||
|
Employer contributions
|
3,842 | 2,948 | 6,790 | 3,504 | 4,812 | 8,316 | 728 | 793 | ||||||||||||||||||||||||
|
Employee contributions
|
101 | — | 101 | 104 | — | 104 | — | — | ||||||||||||||||||||||||
|
Benefits paid
|
(1,973 | ) | (4,668 | ) | (6,641 | ) | (1,734 | ) | (4,423 | ) | (6,157 | ) | (728 | ) | (793 | ) | ||||||||||||||||
|
Plan expenses and premiums paid
|
(331 | ) | (225 | ) | (556 | ) | (272 | ) | (200 | ) | (472 | ) | — | — | ||||||||||||||||||
|
Translation difference
|
1,330 | — | 1,330 | (1,491 | ) | — | (1,491 | ) | — | — | ||||||||||||||||||||||
|
Fair value of plan assets at end of year
|
$ | 60,909 | $ | 45,991 | $ | 106,900 | $ | 54,968 | $ | 43,470 | $ | 98,438 | $ | — | $ | — | ||||||||||||||||
|
Net amount recognized
|
$ | (20,371 | ) | $ | (24,416 | ) | $ | (44,787 | ) | $ | (6,613 | ) | $ | (22,756 | ) | $ | (29,369 | ) | $ | (7,317 | ) | $ | (7,202 | ) | ||||||||
|
Amounts recognized in the balance sheet
|
||||||||||||||||||||||||||||||||
|
consist of:
|
||||||||||||||||||||||||||||||||
|
Current liabilities
|
$ | (892 | ) | $ | (577 | ) | $ | (1,469 | ) | $ | (706 | ) | $ | (585 | ) | $ | (1,291 | ) | $ | (719 | ) | $ | (747 | ) | ||||||||
|
Non-current liabilities
|
(19,479 | ) | (23,839 | ) | (43,318 | ) | (5,907 | ) | (22,171 | ) | (28,078 | ) | (6,598 | ) | (6,455 | ) | ||||||||||||||||
|
Net amount recognized
|
$ | (20,371 | ) | $ | (24,416 | ) | $ | (44,787 | ) | $ | (6,613 | ) | $ | (22,756 | ) | $ | (29,369 | ) | $ | (7,317 | ) | $ | (7,202 | ) | ||||||||
|
Amounts not yet reflected in net periodic
|
||||||||||||||||||||||||||||||||
|
benefit costs and included in
|
||||||||||||||||||||||||||||||||
|
accumulated other comprehensive
|
||||||||||||||||||||||||||||||||
|
loss:
|
||||||||||||||||||||||||||||||||
|
Prior service cost
|
$ | (62 | ) | $ | (460 | ) | $ | (522 | ) | $ | (90 | ) | $ | (542 | ) | $ | (632 | ) | $ | — | $ | — | ||||||||||
|
Accumulated loss
|
(29,227 | ) | (35,929 | ) | (65,156 | ) | (15,112 | ) | (33,160 | ) | (48,272 | ) | (2,107 | ) | (1,709 | ) | ||||||||||||||||
|
Accumulated other comprehensive
|
||||||||||||||||||||||||||||||||
|
loss (AOCI)
|
(29,289 | ) | (36,389 | ) | (65,678 | ) | (15,202 | ) | (33,702 | ) | (48,904 | ) | (2,107 | ) | (1,709 | ) | ||||||||||||||||
|
Cumulative employer contributions
|
||||||||||||||||||||||||||||||||
|
in excess of net period benefit cost
|
8,918 | 11,973 | 20,891 | 8,589 | 10,946 | 19,535 | (5,210 | ) | (5,493 | ) | ||||||||||||||||||||||
|
Net amount recognized
|
$ | (20,371 | ) | $ | (24,416 | ) | $ | (44,787 | ) | $ | (6,613 | ) | $ | (22,756 | ) | $ | (29,369 | ) | $ | (7,317 | ) | $ | (7,202 | ) | ||||||||
The accumulated benefit obligation for all defined benefit pension plans was $145,836 ($69,951 Domestic and $75,885 Foreign) and $123,889 ($65,820 Domestic and $58,069 Foreign) at December 31, 2012 and December 31, 2011, respectively.
47
QUAKER CHEMICAL CORPORATION
NOTES TO CONSOLIDATED FINANCIAL STATEMENTS - Continued
(Dollars in thousands except per share amounts)
Information for pension plans with an accumulated benefit obligation in excess of plan assets:
|
2012
|
2011
|
|||||||||||||||||||||||
|
Foreign
|
Domestic
|
Total
|
Foreign
|
Domestic
|
Total
|
|||||||||||||||||||
|
Projected benefit obligation
|
$ | 81,280 | $ | 70,407 | $ | 151,687 | $ | 14,672 | $ | 66,226 | $ | 80,898 | ||||||||||||
|
Accumulated benefit obligation
|
75,885 | 69,951 | 145,836 | 13,630 | 65,820 | 79,450 | ||||||||||||||||||
|
Fair value of plan assets
|
60,909 | 45,991 | 106,900 | 8,172 | 43,470 | 51,642 | ||||||||||||||||||
Information for pension plans with a projected benefit obligation in excess of plan assets:
|
2012
|
2011
|
|||||||||||||||||||||||
|
Foreign
|
Domestic
|
Total
|
Foreign
|
Domestic
|
Total
|
|||||||||||||||||||
|
Projected benefit obligation
|
$ | 81,280 | $ | 70,407 | $ | 151,687 | $ | 61,581 | $ | 66,226 | $ | 127,807 | ||||||||||||
|
Fair value of plan assets
|
60,909 | 45,991 | 106,900 | 54,968 | 43,470 | 98,438 | ||||||||||||||||||
Components of net periodic benefit costs – pension plans:
|
2012
|
2011
|
|||||||||||||||||||||||
|
Foreign
|
Domestic
|
Total
|
Foreign
|
Domestic
|
Total
|
|||||||||||||||||||
|
Service cost
|
$ | 2,004 | $ | 460 | $ | 2,464 | $ | 1,890 | $ | 400 | $ | 2,290 | ||||||||||||
|
Interest cost
|
3,020 | 2,803 | 5,823 | 3,037 | 3,145 | 6,182 | ||||||||||||||||||
|
Expected return on plan assets
|
(1,995 | ) | (3,481 | ) | (5,476 | ) | (2,349 | ) | (3,592 | ) | (5,941 | ) | ||||||||||||
|
Other, amortization, net
|
620 | 2,139 | 2,759 | 265 | 1,636 | 1,901 | ||||||||||||||||||
|
Net periodic benefit cost
|
$ | 3,649 | $ | 1,921 | $ | 5,570 | $ | 2,843 | $ | 1,589 | $ | 4,432 | ||||||||||||
|
2010
|
||||||||||||
|
Foreign
|
Domestic
|
Total
|
||||||||||
|
Service cost
|
$ | 1,606 | $ | 368 | $ | 1,974 | ||||||
|
Interest cost
|
2,587 | 3,385 | 5,972 | |||||||||
|
Expected return on plan assets
|
(2,135 | ) | (3,307 | ) | (5,442 | ) | ||||||
|
Settlement charge
|
— | 1,317 | 1,317 | |||||||||
|
Curtailment charge
|
— | 19 | 19 | |||||||||
|
Other, amortization, net
|
36 | 1,516 | 1,552 | |||||||||
|
Net periodic benefit cost
|
$ | 2,094 | $ | 3,298 | $ | 5,392 | ||||||
48
QUAKER CHEMICAL CORPORATION
NOTES TO CONSOLIDATED FINANCIAL STATEMENTS - Continued
(Dollars in thousands except per share amounts)
Other changes recognized in other comprehensive income:
|
2012
|
2011
|
|||||||||||||||||||||||
|
Foreign
|
Domestic
|
Total
|
Foreign
|
Domestic
|
Total
|
|||||||||||||||||||
|
Net loss arising during the period
|
$ | 13,897 | $ | 4,826 | $ | 18,723 | $ | 5,164 | $ | 7,593 | $ | 12,757 | ||||||||||||
|
Recognition of amortization in net periodic
|
||||||||||||||||||||||||
|
benefit cost
|
||||||||||||||||||||||||
|
Prior service cost
|
(30 | ) | (82 | ) | (112 | ) | (32 | ) | (82 | ) | (114 | ) | ||||||||||||
|
Actuarial loss
|
(590 | ) | (2,057 | ) | (2,647 | ) | (234 | ) | (1,554 | ) | (1,788 | ) | ||||||||||||
|
Effect of exchange rates on amounts included in
|
||||||||||||||||||||||||
|
AOCI
|
809 | — | 809 | (793 | ) | — | (793 | ) | ||||||||||||||||
|
Total recognized in other comprehensive income
|
14,086 | 2,687 | 16,773 | 4,105 | 5,957 | 10,062 | ||||||||||||||||||
|
Total recognized in net periodic benefit cost and
|
||||||||||||||||||||||||
|
other comprehensive loss
|
$ | 17,735 | $ | 4,608 | $ | 22,343 | $ | 6,948 | $ | 7,546 | $ | 14,494 | ||||||||||||
|
2010
|
||||||||||||
|
Foreign
|
Domestic
|
Total
|
||||||||||
|
Net loss arising during period
|
$ | 4,100 | $ | 3,204 | $ | 7,304 | ||||||
|
Recognition of amortization in net periodic benefit cost
|
||||||||||||
|
Transition asset
|
4 | — | 4 | |||||||||
|
Prior service cost
|
(30 | ) | (104 | ) | (134 | ) | ||||||
|
Actuarial loss
|
(10 | ) | (2,747 | ) | (2,757 | ) | ||||||
|
Effect of exchange rates on amounts included in AOCI
|
(259 | ) | — | (259 | ) | |||||||
|
Total recognized in other comprehensive loss
|
3,805 | 353 | 4,158 | |||||||||
|
Total recognized in net periodic benefit cost and other
|
||||||||||||
|
comprehensive loss
|
$ | 5,899 | $ | 3,651 | $ | 9,550 | ||||||
Components of net periodic benefit costs – other postretirement plan:
|
2012
|
2011
|
2010
|
||||||||||
|
Service cost
|
$ | 46 | $ | 16 | $ | 16 | ||||||
|
Interest cost and other
|
398 | 331 | 462 | |||||||||
|
Net periodic benefit costs
|
$ | 444 | $ | 347 | $ | 478 | ||||||
Other changes recognized in other comprehensive income – other post retirement benefit plans:
|
2012
|
2011
|
2010
|
||||||||||
|
Net loss (gain) arising during period
|
$ | 514 | $ | (167 | ) | $ | 747 | |||||
|
Amortization of actuarial loss in net periodic benefit costs
|
(116 | ) | (75 | ) | (62 | ) | ||||||
|
Total recognized in other comprehensive loss (income)
|
398 | (242 | ) | 685 | ||||||||
|
Total recognized in net periodic benefit cost and other
|
||||||||||||
|
comprehensive loss
|
$ | 842 | $ | 105 | $ | 1,163 | ||||||
49
QUAKER CHEMICAL CORPORATION
NOTES TO CONSOLIDATED FINANCIAL STATEMENTS - Continued
(Dollars in thousands except per share amounts)
Estimated amounts that will be amortized from accumulated other comprehensive loss over the next fiscal year:
|
Pension Plans
|
Other Postretirement
|
|||||||||||||||
|
Foreign
|
Domestic
|
Total
|
Benefits
|
|||||||||||||
|
Actuarial loss
|
$ | 1,474 | $ | 2,488 | $ | 3,962 | $ | 186 | ||||||||
|
Prior service cost
|
30 | 82 | 112 | — | ||||||||||||
| $ | 1,504 | $ | 2,570 | $ | 4,074 | $ | 186 | |||||||||
Weighted-average assumptions used to determine benefit obligations at December 31, 2012 and December 31, 2011:
|
Other Postretirement
|
||||||||||||
|
Pension Benefits
|
Benefits
|
|||||||||||
|
2012
|
2011
|
2012
|
2011
|
|||||||||
|
U.S. Plans:
|
||||||||||||
|
Discount rate
|
3.52%
|
4.41%
|
3.20%
|
4.15%
|
||||||||
|
Rate of compensation increase
|
3.40%
|
3.40%
|
N/A
|
N/A
|
||||||||
|
Foreign Plans:
|
||||||||||||
|
Discount rate
|
3.94%
|
4.99%
|
N/A
|
N/A
|
||||||||
|
Rate of compensation increase
|
3.60%
|
3.58%
|
N/A
|
N/A
|
||||||||
Weighted-average assumptions used to determine net periodic benefit costs for the years ended December 31, 2012 and December 31, 2011:
|
Other Postretirement
|
||||||||||||
|
Pension Benefits
|
Benefits
|
|||||||||||
|
2012
|
2011
|
2012
|
2011
|
|||||||||
|
U.S. Plans:
|
||||||||||||
|
Discount rate
|
4.41%
|
5.20%
|
4.15%
|
4.80%
|
||||||||
|
Expected long-term return on plan assets
|
8.25%
|
8.25%
|
N/A
|
N/A
|
||||||||
|
Rate of compensation increase
|
3.40%
|
3.40%
|
N/A
|
N/A
|
||||||||
|
Foreign Plans:
|
||||||||||||
|
Discount rate
|
4.99%
|
5.49%
|
N/A
|
N/A
|
||||||||
|
Expected long-term return on plan assets
|
3.51%
|
4.11%
|
N/A
|
N/A
|
||||||||
|
Rate of compensation increase
|
3.58%
|
3.66%
|
N/A
|
N/A
|
||||||||
The long-term rates of return on assets were selected from within the reasonable range of rates determined by (a) historical real returns for the asset classes covered by the investment policy and (b) projections of inflation over the long-term period during which benefits are payable to plan participants.
50
QUAKER CHEMICAL CORPORATION
NOTES TO CONSOLIDATED FINANCIAL STATEMENTS - Continued
(Dollars in thousands except per share amounts)
Assumed health care cost trend rates at December 31, 2012 and December 31, 2011:
|
2012
|
2011
|
||||
|
Health care cost trend rate for next year
|
7.30%
|
7.50%
|
|||
|
Rate to which the cost trend rate is assumed to decline
|
|||||
|
(the ultimate trend rate)
|
4.50%
|
4.50%
|
|||
|
Year that the rate reaches the ultimate trend rate
|
2027
|
2027
|
|||
Assumed health care cost trend rates have a significant effect on the amounts reported for the health care plans. A one-percentage-point change in assumed health care cost trend rates would have the following effects:
|
1% point
|
1% point
|
|||||||
|
Increase
|
Decrease
|
|||||||
|
Effect on total service and interest cost
|
$ | 29 | $ | (25 | ) | |||
|
Effect on postretirement benefit obligations
|
634 | (554 | ) | |||||
Plan Assets and Fair Value
The Company’s pension plan target asset allocation and the weighted-average asset allocations at December 31, 2012 and December 31, 2011 by asset category were as follows:
|
Target
|
2012
|
2011
|
|||||||||
|
Asset Category
|
|||||||||||
|
U.S. Plans
|
|||||||||||
|
Equity securities
|
61%
|
58%
|
52%
|
||||||||
|
Debt securities
|
32%
|
40%
|
39%
|
||||||||
|
Other
|
7%
|
2%
|
9%
|
||||||||
|
Total
|
100%
|
100%
|
100%
|
||||||||
|
Foreign Plans
|
|||||||||||
|
Equity securities and other
|
18%
|
17%
|
17%
|
||||||||
|
Debt securities
|
82%
|
83%
|
83%
|
||||||||
|
Total
|
100%
|
100%
|
100%
|
||||||||
As of December 31, 2012 and December 31, 2011, “Other” consisted principally of cash and cash equivalents (approximately 2% and 9% of plan assets, respectively).
The Company’s pension investment policy is designed to ensure that pension assets are invested in a manner consistent with meeting the future benefit obligations of the pension plans and maintaining compliance with various laws and regulations including the Employee Retirement Income Security Act of 1974 (ERISA).
The Company establishes strategic asset allocation percentage targets and appropriate benchmarks for significant asset classes with the aim of achieving a prudent balance between return and risk. The Company’s investment horizon is generally long term, and, accordingly, the target asset allocations encompass a long-term perspective of capital markets, expected risk and return and perceived future economic conditions while also considering the profile of plan liabilities. To the extent feasible, the short-term investment portfolio is managed to immunize the short-term obligations, the intermediate portfolio duration is immunized to reduce the risk of volatility in intermediate plan distributions and the total return portfolio is expected to maximize the long-term real growth of plan assets. The critical investment principles of diversification, assessment of risk and targeting the optimal expected returns for given levels of risk are applied. The Company’s investment guidelines prohibit use of securities such as letter stock and other unregistered securities, commodities or commodity contracts, short sales, margin transactions, private placements (unless specifically addressed by addendum), or any derivatives, options or futures for the purpose of portfolio leveraging.
51
QUAKER CHEMICAL CORPORATION
NOTES TO CONSOLIDATED FINANCIAL STATEMENTS - Continued
(Dollars in thousands except per share amounts)
The target asset allocation is reviewed periodically and is determined based on a long-term projection of capital market outcomes, inflation rates, fixed income yields, returns, volatilities and correlation relationships. The interaction between plan assets and benefit obligations is periodically studied to assist in establishing such strategic asset allocation targets. Asset performance is monitored with an overall expectation that plan assets will meet or exceed benchmark performance over rolling five-year periods. The Company’s pension committee, as authorized by the Company’s Board of Directors, has discretion to manage the assets within established asset allocation ranges approved by senior management of the Company. As of December 31, 2012, the plan’s investments were in compliance with all approved ranges of asset allocations.
The following is a description of the valuation methodologies used for the investments measured at fair value, including the general classification of such instruments pursuant to the valuation hierarchy:
Cash and Cash Equivalents
Cash and cash equivalents consist of cash and money market funds and are classified as a Level 1 investment.
Registered Investment Companies
The shares of registered investment companies, which represent the net asset values of shares held by the Plan, are valued at quoted market prices in an exchange and active market and are classified as Level 1 investments.
Common Stock
Common stock is valued at quoted market prices in an exchange and active market and is classified as a Level 1 investment.
Corporate Bonds
Corporate bonds are valued at quoted market prices in an exchange and active market and are classified as a Level 1 investment.
U.S. and Foreign Government Bonds
U.S. and foreign government bonds are valued at quoted market prices in an exchange and active market and are classified as a Level 1 investment.
Pooled Separate Accounts
Pooled separate accounts consist of insurance annuity contracts and are valued based on the reported unit value at year end. Units of the pooled separate accounts are not traded in an active exchange or market; however, valuation is based on the underlying investments of the units and is classified as a Level 2 investment.
Diversified Equity Securities of Registered Investment Companies
Investment in diversified equity securities of registered investment companies is based upon the quoted redemption value of shares in the fund owned by the plan at year end. The shares of the fund are not available in an exchange or active market; however, the fair value is determined based on the underlying investments in the fund as traded in an exchange and active market and is classified as a Level 2 investment.
Fixed Income Securities of Registered Investment Companies
Investment in fixed income securities of registered investment companies is based upon the quoted redemption value of shares in the fund owned by the plan at year end. The shares of the fund are not available in an exchange or active market; however, the fair value is determined based on the underlying investments in the fund as traded in an exchange and active market and is classified as a Level 2 investment.
52
QUAKER CHEMICAL CORPORATION
NOTES TO CONSOLIDATED FINANCIAL STATEMENTS - Continued
(Dollars in thousands except per share amounts)
Insurance Contract
Investment in the foreign pension plan insurance contract is valued at reported cash surrender value of the contract at year end. Cash surrender value is determined based on unobservable inputs, which are contractually determined, regarding returns, fees, and the present value of the future cash flows of the contract. The contract is classified as a Level 3 investment.
Real Estate
The foreign pension plan’s investment in real estate consists of an investment in a property fund. The fund’s underlying investments consist of real property, which are valued using unobservable inputs. The property fund is classified as a Level 3 investment.
As of December 31, 2012 and December 31, 2011, the U.S. and foreign plans’ investments measured at fair value on a recurring basis were as follows:
|
Fair Value Measurements at December 31, 2012
|
||||||||||||||||
|
Fair Value as of
|
Using Fair Value Hierarchy
|
|||||||||||||||
|
U.S. Pension Assets
|
December 31, 2012
|
Level 1
|
Level 2
|
Level 3
|
||||||||||||
|
Cash and cash equivalents
|
$ | 905 | $ | 905 | $ | — | $ | — | ||||||||
|
Large capitalization common stock
|
12,195 | 12,195 | — | — | ||||||||||||
|
Large capitalization registered investment companies
|
6,551 | 6,551 | — | — | ||||||||||||
|
Small capitalization common stock
|
539 | 539 | — | — | ||||||||||||
|
Small capitalization registered investment companies
|
1,910 | 1,910 | — | — | ||||||||||||
|
International developed and emerging markets registered
|
||||||||||||||||
|
investment companies
|
3,107 | 3,107 | — | — | ||||||||||||
|
International developed and emerging markets common stock
|
2,527 | 2,527 | — | — | ||||||||||||
|
Fixed income corporate securities
|
10,297 | 10,297 | — | — | ||||||||||||
|
Fixed income registered investment companies
|
6,483 | 6,483 | — | — | ||||||||||||
|
U.S. and foreign government fixed income securities
|
12 | 12 | — | — | ||||||||||||
|
Pooled separate accounts
|
1,465 | — | 1,465 | — | ||||||||||||
|
Total U.S. pension plan assets
|
$ | 45,991 | $ | 44,526 | $ | 1,465 | $ | — | ||||||||
|
Foreign Pension Assets
|
||||||||||||||||
|
Cash and cash equivalents
|
$ | 96 | $ | 96 | $ | — | $ | — | ||||||||
|
Insurance contract (underlying notional investments in
|
||||||||||||||||
|
debt and equity securities)
|
51,146 | — | — | 51,146 | ||||||||||||
|
Diversified equity securities - registered investment companies
|
5,072 | — | 5,072 | — | ||||||||||||
|
Fixed income registered investment companies
|
4,207 | — | 4,207 | — | ||||||||||||
|
Real estate registered investment companies
|
388 | — | — | 388 | ||||||||||||
|
Total foreign pension assets
|
$ | 60,909 | $ | 96 | $ | 9,279 | $ | 51,534 | ||||||||
|
Total pension assets at fair value
|
$ | 106,900 | $ | 44,622 | $ | 10,744 | $ | 51,534 | ||||||||
53
QUAKER CHEMICAL CORPORATION
NOTES TO CONSOLIDATED FINANCIAL STATEMENTS - Continued
(Dollars in thousands except per share amounts)
|
Fair Value Measurements at December 31, 2011
|
||||||||||||||||
|
Fair Value as of
|
Using Fair Value Hierarchy
|
|||||||||||||||
|
U.S. Pension Assets
|
December 31, 2011
|
Level 1
|
Level 2
|
Level 3
|
||||||||||||
|
Cash and cash equivalents
|
$ | 4,066 | $ | 4,066 | $ | — | $ | — | ||||||||
|
Large capitalization common stock
|
11,260 | 11,260 | — | — | ||||||||||||
|
Large capitalization registered investment companies
|
5,629 | 5,629 | — | — | ||||||||||||
|
Small capitalization common stock
|
389 | 389 | — | — | ||||||||||||
|
Small capitalization registered investment companies
|
1,641 | 1,641 | — | — | ||||||||||||
|
International developed and emerging markets registered
|
||||||||||||||||
|
investment companies
|
3,848 | 3,848 | — | — | ||||||||||||
|
Fixed income corporate securities
|
9,480 | 9,480 | — | — | ||||||||||||
|
Fixed income registered investment companies
|
5,743 | 5,743 | — | — | ||||||||||||
|
Pooled separate accounts
|
1,414 | — | 1,414 | — | ||||||||||||
|
Total U.S. pension plan assets
|
$ | 43,470 | $ | 42,056 | $ | 1,414 | $ | — | ||||||||
|
Foreign Pension Assets
|
||||||||||||||||
|
Cash and cash equivalents
|
$ | 203 | $ | 203 | $ | — | $ | — | ||||||||
|
Insurance contract (underlying notional investments in
|
||||||||||||||||
|
debt and equity securities)
|
46,797 | — | — | 46,797 | ||||||||||||
|
Diversified equity securities - registered investment companies
|
4,130 | — | 4,130 | — | ||||||||||||
|
Fixed income registered investment companies
|
3,475 | — | 3,475 | — | ||||||||||||
|
Real estate registered investment companies
|
363 | — | — | 363 | ||||||||||||
|
Total foreign pension assets
|
$ | 54,968 | $ | 203 | $ | 7,605 | $ | 47,160 | ||||||||
|
Total pension assets at fair value
|
$ | 98,438 | $ | 42,259 | $ | 9,019 | $ | 47,160 | ||||||||
Changes in the fair value of the U.S. and foreign plans’ Level 3 investments during the years ended December 31, 2012 and December 31, 2011 were as follows:
|
Insurance
|
Real Estate
|
|||||||||||
|
Contract
|
Fund
|
Total
|
||||||||||
|
Balance at December 31, 2010
|
$ | 45,334 | $ | 339 | $ | 45,673 | ||||||
|
Purchases
|
2,592 | — | 2,592 | |||||||||
|
Settlements
|
(1,376 | ) | — | (1,376 | ) | |||||||
|
Unrealized gains
|
1,738 | 24 | 1,762 | |||||||||
|
Currency translation adjustment
|
(1,491 | ) | — | (1,491 | ) | |||||||
|
Balance at December 31, 2011
|
46,797 | 363 | 47,160 | |||||||||
|
Purchases
|
2,997 | — | 2,997 | |||||||||
|
Settlements
|
(1,466 | ) | — | (1,466 | ) | |||||||
|
Unrealized gains
|
1,854 | 10 | 1,864 | |||||||||
|
Currency translation adjustment
|
964 | 15 | 979 | |||||||||
|
Balance at December 31, 2012
|
$ | 51,146 | $ | 388 | $ | 51,534 | ||||||
U.S. pension assets include Company common stock in the amounts of $539 (1% of total U.S. plan assets) and $389 (1% of total U.S. plan assets) at December 31, 2012 and December 31, 2011, respectively.
54
QUAKER CHEMICAL CORPORATION
NOTES TO CONSOLIDATED FINANCIAL STATEMENTS - Continued
(Dollars in thousands except per share amounts)
Cash Flows
Contributions
The Company expects to make minimum cash contributions of $6,610 to its pension plans ($2,111 Domestic and $4,499 Foreign) and $719 to its other postretirement benefit plan in 2013.
Estimated Future Benefit Payments
The following benefit payments, which reflect expected future service, as appropriate, are expected to be paid:
|
Other
|
||||||||||||||||
|
Pension Benefits
|
Postretirement
|
|||||||||||||||
|
Foreign
|
Domestic
|
Total
|
Benefits
|
|||||||||||||
|
2013
|
$ | 2,419 | $ | 4,885 | $ | 7,304 | $ | 719 | ||||||||
|
2014
|
2,248 | 4,780 | 7,028 | 697 | ||||||||||||
|
2015
|
1,767 | 4,442 | 6,209 | 634 | ||||||||||||
|
2016
|
2,265 | 4,468 | 6,733 | 611 | ||||||||||||
|
2017
|
2,224 | 4,311 | 6,535 | 594 | ||||||||||||
|
2018 and beyond
|
16,028 | 21,308 | 37,336 | 2,527 | ||||||||||||
The Company maintains a plan under which supplemental retirement benefits are provided to certain officers. Benefits payable under the plan are based on a combination of years of service and existing postretirement benefits. Included in total pension costs are charges of $700, $628 and $2,042 in 2012, 2011 and 2010, respectively, representing the annual accrued benefits under this plan. Included in the 2010 charges are settlement charges of $1,317 in connection with the retirement of the Company’s former CEO.
Defined Contribution Plan
The Company has a 401(k) plan with an employer match covering substantially all domestic employees. The plan allows for and the Company has paid a nonelective contribution on behalf of participants who have completed one year of service equal to 3% of the eligible participants’ compensation in the form of Company common stock. Total Company contributions were $1,703, $1,624 and $2,197 for 2012, 2011 and 2010, respectively.
Note 12 – Debt
Debt is comprised of the following:
|
December 31,
|
||||||||
|
2012
|
2011
|
|||||||
|
Industrial development authority monthly 5.60% fixed rate demand bond maturing 2018
|
$ | 5,000 | $ | 5,000 | ||||
|
Industrial development authority monthly 5.26% fixed rate demand bond maturing 2028
|
10,000 | 10,000 | ||||||
|
Credit facilities (1.96% weighted average borrowing rate at December 31, 2012)
|
12,200 | 28,500 | ||||||
|
Ohio Department of Development term loan (see below)
|
2,754 | 3,076 | ||||||
|
Other debt obligations (including capital leases)
|
1,514 | 761 | ||||||
| 31,468 | 47,337 | |||||||
|
Short-term debt
|
(867 | ) | — | |||||
|
Current portion of long-term debt
|
(601 | ) | (636 | ) | ||||
| $ | 30,000 | $ | 46,701 | |||||
55
QUAKER CHEMICAL CORPORATION
NOTES TO CONSOLIDATED FINANCIAL STATEMENTS - Continued
(Dollars in thousands except per share amounts)
During the next five years, payments on the Company’s debt, including capital lease maturities, are due as follows:
|
2013
|
$ | 1,468 | ||
|
2014
|
12,667 | |||
|
2015
|
425 | |||
|
2016
|
398 | |||
|
2017
|
395 | |||
|
2018 and beyond
|
$ | 16,115 |
The Company’s primary credit facility is a syndicated multicurrency credit agreement with Bank of America, N.A., as administrative agent, swing line lender and letter of credit issuer, and certain other financial institutions as lenders. The Company’s maximum principal amount for revolving credit borrowings is $175,000, which can be increased to $225,000 at the Company’s option if the lenders agree to increase their commitments and the Company satisfies certain conditions. The maturity date of the Company’s credit line is June 2014.
In May 2008, the Company entered into a financing agreement to issue a $10,000 Industrial Development Revenue Bond (“IDRB”) to finance the expansion of the Company’s Middletown, Ohio manufacturing facility. Proceeds from the bond issuance were restricted and could only be used only for capital expenditures related to the expansion. Of the $10,000 received from the bond issuance, all had been expended as of December 31, 2010.
In addition to the IDRB, the Company’s Middletown, Ohio expansion project was also financed by a low interest rate $3,500 loan from the Ohio Department of Development. Principal repayment on this loan began in September 2010 with its final maturity being in 2021. The current interest rate of 1% will rise to 2% beginning January 1, 2014 and to 3% beginning January 1, 2019 until final maturity.
The provisions of the agreements require that the Company maintain certain financial ratios and covenants, all of which the Company was in compliance with as of December 31, 2012 and December 31, 2011. At December 31, 2012 and December 31, 2011, the Company had approximately $12,200 and $28,500 outstanding on these credit lines at a weighted average borrowing rate of 1.96% and 2.06% (LIBOR plus a spread), respectively. The Company had entered into interest rate swaps in order to fix a portion of its variable rate debt and mitigate the risks associated with higher interest rates. The combined notional value of the swaps was $15,000 at December 31, 2011. The Company’s swaps matured in 2012.
At December 31, 2012 and December 31, 2011, the amounts at which the Company’s debt is recorded are not materially different from their fair market value.
Note 13 – Equity and Stock-Based Compensation
The Company has 30,000,000 shares of common stock authorized, with a par value of $1, and 13,094,901 shares issued as of December 31, 2012.
Holders of record of the Company’s common stock for a period of less than 36 consecutive calendar months or less are entitled to 1 vote per share of common stock. Holders of record of the Company’s common stock for a period greater than 36 consecutive calendar months are entitled to 10 votes per share of common stock.
The Company is authorized to issue 10,000,000 shares of preferred stock, $1 par value, subject to approval by the Board of Directors. The Board of Directors may designate one or more series of preferred stock and the number of shares, rights, preferences, and limitations of each series. As of December 31, 2012, no preferred stock has been issued.
The Company filed a shelf registration statement on Form S-3 with the Securities and Exchange Commission (the “SEC”) in 2009. The registration statement was declared effective on January 29, 2010 and permitted the Company to offer and sell from time to time in one or more public offerings up to $100 million aggregate dollar amount of its securities, including shares of preferred stock (either separately or represented by depositary shares), common stock, debt securities and warrants to purchase the Company’s debt or equity securities, as well as units that include any of these securities, on terms, in each case, established at the time of the offering. The registration statement provided the Company with the ability to issue registered debt or equity securities on an accelerated basis. The Company sold 1,265,000 shares of its common stock during the second quarter of 2011. The Company received gross proceeds of $51,233. The Company used the proceeds to repay a portion of its revolving credit line during the second quarter of 2011. In early 2013, this shelf registration expired.
56
QUAKER CHEMICAL CORPORATION
NOTES TO CONSOLIDATED FINANCIAL STATEMENTS - Continued
(Dollars in thousands except per share amounts)
The Company recognized share-based compensation expense in selling, general and administrative expenses in its Consolidated Statement of Income for the years ended December 31, 2012, December 31, 2011 and December 31, 2010, which was comprised of the following:
|
December 31,
|
||||||||||||
|
2012
|
2011
|
2010
|
||||||||||
|
Stock options
|
$ | 542 | $ | 482 | $ | 404 | ||||||
|
Nonvested stock awards and restricted stock units
|
1,504 | 1,430 | 1,096 | |||||||||
|
Employee stock purchase plan
|
48 | 44 | 42 | |||||||||
|
Non-elective and elective 401(k) matching contribution in stock
|
1,653 | 1,497 | 1,424 | |||||||||
|
Director stock ownership plan
|
60 | 60 | 130 | |||||||||
|
Total share-based compensation expense
|
$ | 3,807 | $ | 3,513 | $ | 3,096 | ||||||
As of December 31, 2012 and December 31, 2011, the Company recorded $2,045 and $109, respectively, of excess tax benefits in capital in excess of par value on its Consolidated Balance Sheets related to stock option exercises. During 2010, the Company recorded $2,558 of excess tax benefits in capital in excess of par value on its Consolidated Balance Sheet related to stock option exercises, which occurred over the then current and prior years. In previous years, the Company’s taxable income in affected jurisdictions was not sufficient to recognize these benefits, while the Company’s full-year 2010 taxable income was sufficient to recognize these benefits. For 2012, 2011 and 2010, the Company recognized these benefits as a cash inflow from financing activities in its Consolidated Statement of Cash Flows, which represents the Company’s estimate of cash savings during 2012, 2011 and 2010.
Stock option activity under all plans is as follows:
|
2012
|
2011
|
|||||||||||
|
Weighted
|
Weighted
|
Weighted
|
Weighted
|
|||||||||
|
Average
|
Average
|
Average
|
Average
|
|||||||||
|
Exercise
|
Remaining
|
Exercise
|
Remaining
|
|||||||||
|
Number of
|
Price
|
Contractual
|
Number of
|
Price
|
Contractual
|
|||||||
|
Shares
|
per Share
|
Term (years)
|
Shares
|
per Share
|
Term (years)
|
|||||||
|
Options outstanding at January 1,
|
253,342
|
$
|
16.43
|
303,444
|
$
|
14.19
|
||||||
|
Options granted
|
40,157
|
38.57
|
36,835
|
37.37
|
||||||||
|
Options exercised
|
(177,574)
|
11.87
|
(75,919)
|
18.02
|
||||||||
|
Options forfeited
|
(8,470)
|
29.32
|
(11,018)
|
13.67
|
||||||||
|
Options outstanding at December 31,
|
107,455
|
$
|
31.23
|
5.1
|
253,342
|
$
|
16.43
|
4.7
|
||||
|
Options exercisable at December 31,
|
17,360
|
$
|
28.81
|
4.4
|
98,239
|
$
|
11.83
|
4.3
|
||||
The total intrinsic value of options exercised during 2012 was approximately $5,875. Intrinsic value is calculated as the difference between the current market price of the underlying security and the strike price of a related option. As of December 31, 2012, the total intrinsic value of options outstanding was $2,362 and the total intrinsic value of exercisable options was approximately $424.
57
QUAKER CHEMICAL CORPORATION
NOTES TO CONSOLIDATED FINANCIAL STATEMENTS - Continued
(Dollars in thousands except per share amounts)
A summary of the Company’s outstanding stock options at December 31, 2012 is as follows:
|
Number
|
Weighted
|
Weighted
|
Number
|
Weighted
|
|||||||||
|
Outstanding
|
Average
|
Average
|
Exercisable
|
Average
|
|||||||||
|
Range of
|
at
|
Contractual
|
Exercise
|
at
|
Exercise
|
||||||||
|
Exercise Prices
|
12/31/2012
|
Life
|
Price
|
12/31/2012
|
Price
|
||||||||
|
$
|
—
|
-
|
$
|
10.00
|
—
|
—
|
$
|
—
|
—
|
$
|
—
|
||
|
$
|
10.01
|
-
|
$
|
20.00
|
38,139
|
4.0
|
18.85
|
8,073
|
18.97
|
||||
|
$
|
20.01
|
-
|
$
|
30.00
|
—
|
—
|
—
|
—
|
—
|
||||
|
$
|
30.01
|
-
|
$
|
40.00
|
67,124
|
5.7
|
37.77
|
9,287
|
37.37
|
||||
|
$
|
40.01
|
-
|
$
|
50.00
|
2,192
|
6.5
|
46.21
|
—
|
—
|
||||
|
107,455
|
5.1
|
31.23
|
17,360
|
28.81
|
|||||||||
As of December 31, 2012, unrecognized compensation expense related to options granted in 2010 was $16, for options granted during 2011 was $184 and for options granted in 2012 was $463.
During the first quarter of 2012, the Company granted stock options under its LTIP plan that are subject only to time vesting over a three-year period. In connection with a transition of key employees in the Company during the second quarter of 2012, stock options were granted under the Company’s LTIP plan that are also subject only to time vesting over a three-year period. For the purposes of determining the fair value of stock option awards, the Company uses the Black-Scholes option pricing model and the assumptions set forth in the table below:
|
June 30,
|
March 31,
|
Year Ended December 31,
|
|||||||||||||
|
2012
|
2012
|
2011
|
2010
|
2009
|
|||||||||||
|
Stock option awards
|
2,192
|
37,965
|
36,835
|
110,939
|
165,990
|
||||||||||
|
Dividend yield
|
2.69
|
%
|
3.09
|
%
|
5.00
|
%
|
5.10
|
%
|
3.90
|
%
|
|||||
|
Expected volatility
|
69.09
|
%
|
69.90
|
%
|
62.13
|
%
|
53.72
|
%
|
44.22
|
%
|
|||||
|
Risk-free interest rate
|
0.58
|
%
|
0.61
|
%
|
1.99
|
%
|
2.85
|
%
|
2.09
|
%
|
|||||
|
Expected term (years)
|
4.0
|
4.0
|
5.0
|
6.0
|
6.0
|
||||||||||
These awards are being amortized on a straight-line basis over the respective vesting period of each award. The compensation expense recorded on each award during 2012, 2011 and 2010, respectively, is as follows:
|
Year Ended December 31,
|
||||||||||||
|
2012
|
2011
|
2010
|
||||||||||
|
2012 Stock option awards
|
$ | 167 | $ | — | $ | — | ||||||
|
2011 Stock option awards
|
$ | 164 | $ | 139 | $ | — | ||||||
|
2010 Stock option awards
|
$ | 193 | $ | 224 | $ | 209 | ||||||
|
2009 Stock option awards
|
$ | 18 | $ | 113 | $ | 112 | ||||||
58
QUAKER CHEMICAL CORPORATION
NOTES TO CONSOLIDATED FINANCIAL STATEMENTS - Continued
(Dollars in thousands except per share amounts)
Nonvested shares granted under the Company’s LTIP plan are shown below:
|
Weighted
|
|||||
|
Average Grant
|
|||||
|
Number of
|
Date Fair Value
|
||||
|
Shares
|
(per share)
|
||||
|
Nonvested awards, December 31, 2011
|
169,863
|
$
|
20.66
|
||
|
Granted
|
42,754
|
$
|
39.43
|
||
|
Vested
|
(83,019)
|
$
|
12.99
|
||
|
Forfeited
|
(6,654)
|
$
|
27.67
|
||
|
Nonvested awards, December 31, 2012
|
122,944
|
$
|
31.98
|
||
The fair value of the nonvested stock is based on the trading price of the Company’s common stock on the date of grant. The Company adjusts the grant date fair value for expected forfeitures based on historical experience for similar awards. As of December 31, 2012, unrecognized compensation expense related to these awards was $1,691, to be recognized over a weighted average remaining period of 1.80 years.
In 2012, the Company granted restricted stock units under the Company’s LTIP plan. Nonvested restricted stock units granted under the Company’s LTIP plan are shown below:
|
Weighted
|
|||||
|
Average Grant
|
|||||
|
Number of
|
Date Fair Value
|
||||
|
Units
|
(per unit)
|
||||
|
Nonvested awards, December 31, 2011
|
—
|
$
|
—
|
||
|
Granted
|
2,100
|
$
|
38.13
|
||
|
Vested
|
—
|
$
|
—
|
||
|
Forfeited
|
—
|
$
|
—
|
||
|
Nonvested awards, December 31, 2012
|
2,100
|
$
|
38.13
|
||
The fair value of the nonvested restricted stock units is based on the trading price of the Company’s common stock on the date of grant. As of December 31, 2012, unrecognized compensation expense related to these awards was $51, to be recognized over a weighted average remaining period of 2.25 years.
Nonvested shares granted under the Company’s GAIP plan are shown below:
|
Weighted
|
|||||
|
Average Grant
|
|||||
|
Number of
|
Date Fair Value
|
||||
|
Shares
|
(per share)
|
||||
|
Nonvested awards, December 31, 2011
|
62,250
|
$
|
7.72
|
||
|
Granted
|
—
|
$
|
—
|
||
|
Vested
|
(59,850)
|
$
|
7.72
|
||
|
Forfeited
|
(2,400)
|
$
|
7.72
|
||
|
Nonvested awards, December 31, 2012
|
—
|
$
|
—
|
||
As of December 31, 2012, these shares were fully vested and all related compensation expense was recognized.
59
QUAKER CHEMICAL CORPORATION
NOTES TO CONSOLIDATED FINANCIAL STATEMENTS - Continued
(Dollars in thousands except per share amounts)
Employee Stock Purchase Plan
In 2000, the Board adopted an Employee Stock Purchase Plan (“ESPP”) whereby employees may purchase Company stock through a payroll deduction plan. Purchases are made from the plan and credited to each participant’s account at the end of each month, the “Investment Date.” The purchase price of the stock is 85% of the fair market value on the Investment Date. The plan is compensatory and the 15% discount is expensed on the Investment Date. All employees, including officers, are eligible to participate in this plan. A participant may withdraw all uninvested payment balances credited to a participant’s account at any time. An employee whose stock ownership of the Company exceeds five percent of the outstanding common stock is not eligible to participate in this plan.
2003 Director Stock Ownership Plan
In March 2003, the Company’s Board of Directors approved a stock ownership plan for each member of the Company’s Board to encourage the Directors to increase their investment in the Company. The Plan was effective on the date it was approved and remains in effect for a term of ten years or until it is earlier terminated by the Board. The maximum number of shares of Common Stock which may be issued under the Plan is 75,000, subject to certain conditions that the Compensation/Management Development Committee (the “Committee”) may elect to adjust the number of shares. As of December 31, 2012, the Committee has not made any elections to adjust the shares under this plan. Each Director is eligible to receive an annual retainer for services rendered as a member of the Board of Directors. Currently, each Director who owns less than 7,500 shares of Company Common Stock is required to receive 75% of the annual retainer in Common Stock and 25% of the annual retainer in cash. Each Director who owns 7,500 or more shares of Company Common Stock may elect to receive payment of a percentage (up to 100%) of their annual retainer in shares of common stock. Currently, the annual retainer is $40. The number of shares issued in payment of the fees is calculated based on an amount equal to the average of the closing prices per share of Common Stock as reported on the composite tape of the New York Stock Exchange for the two trading days immediately preceding the retainer payment date. The retainer payment date is June 1.
Note 14 – Earnings Per Share
The following table summarizes EPS calculations for the years ended December 31, 2012, December 31, 2011 and December 31, 2010:
|
December 31,
|
||||||||||||
|
2012
|
2011
|
2010
|
||||||||||
|
(re-cast)
|
(re-cast)
|
|||||||||||
|
Basic earnings per common share
|
|
|
||||||||||
|
Net income attributable to Quaker Chemical Corporation
|
$ | 47,405 | $ | 45,892 | $ | 32,120 | ||||||
|
Less: income allocated to participating securities
|
(526 | ) | (825 | ) | (660 | ) | ||||||
|
Net income available to common shareholders
|
$ | 46,879 | $ | 45,067 | $ | 31,460 | ||||||
|
Basic weighted average common shares outstanding
|
12,871,703 | 12,159,958 | 11,039,410 | |||||||||
|
Basic earnings per common share
|
$ | 3.64 | $ | 3.71 | $ | 2.85 | ||||||
|
Diluted earnings per common share
|
||||||||||||
|
Net income attributable to Quaker Chemical Corporation
|
$ | 47,405 | $ | 45,892 | $ | 32,120 | ||||||
|
Less: income allocated to participating securities
|
(524 | ) | (817 | ) | (652 | ) | ||||||
|
Net income available to common shareholders
|
$ | 46,881 | $ | 45,075 | $ | 31,468 | ||||||
|
Basic weighted average common shares outstanding
|
12,871,703 | 12,159,958 | 11,039,410 | |||||||||
|
Effect of dilutive securities
|
58,798 | 158,215 | 202,551 | |||||||||
|
Diluted weighted average common shares outstanding
|
12,930,501 | 12,318,173 | 11,241,961 | |||||||||
|
Diluted earnings per common share
|
$ | 3.63 | $ | 3.66 | $ | 2.80 | ||||||
The following number of stock options are not included in diluted earnings per share since the effect would have been anti-dilutive: 4,417 in 2012, 11,683 in 2011 and 0 in 2010.
60
QUAKER CHEMICAL CORPORATION
NOTES TO CONSOLIDATED FINANCIAL STATEMENTS - Continued
(Dollars in thousands except per share amounts)
The following table presents information about the reported segments for the years ended December 31, 2012, December 31, 2011 and December 31, 2010:
|
Metalworking
|
Other
|
|||||||||||||||
|
Process
|
Chemical
|
|||||||||||||||
|
Chemicals
|
Coatings
|
Products
|
Total
|
|||||||||||||
|
2012
|
|
|
|
|||||||||||||
|
Net sales
|
$ | 661,794 | $ | 42,763 | $ | 3,669 | $ | 708,226 | ||||||||
|
Operating income for reportable segments
|
116,013 | 10,654 | 304 | 126,971 | ||||||||||||
|
Depreciation
|
10,834 | 700 | 60 | 11,594 | ||||||||||||
|
Segment assets
|
514,513 | 21,406 | 715 | 536,634 | ||||||||||||
|
Expenditures for long-lived assets
|
12,291 | 444 | — | 12,735 | ||||||||||||
|
2011
|
||||||||||||||||
|
Net sales
|
$ | 641,325 | $ | 39,182 | $ | 2,724 | $ | 683,231 | ||||||||
|
Operating income for reportable segments
|
110,118 | 9,275 | 112 | 119,505 | ||||||||||||
|
Depreciation
|
10,222 | 624 | 43 | 10,889 | ||||||||||||
|
Segment assets (re-cast)
|
489,615 | 20,644 | 893 | 511,152 | ||||||||||||
|
Expenditures for long-lived assets
|
11,706 | 411 | — | 12,117 | ||||||||||||
|
2010
|
||||||||||||||||
|
Net sales
|
$ | 511,305 | $ | 30,999 | $ | 1,759 | $ | 544,063 | ||||||||
|
Operating income (loss) for reportable segments
|
98,427 | 7,093 | (77 | ) | 105,443 | |||||||||||
|
Depreciation
|
9,150 | 555 | 31 | 9,736 | ||||||||||||
|
Segment assets (re-cast)
|
433,821 | 18,201 | 846 | 452,868 | ||||||||||||
|
Expenditures for long-lived assets
|
8,983 | 370 | 1 | 9,354 | ||||||||||||
Operating income is comprised of revenue less related costs and expenses. Non-operating items primarily consist of general corporate expenses identified as not being a cost of operation, interest expense, interest income, and license fees from non-consolidated affiliates.
A reconciliation of total segment operating income to total consolidated income before taxes and equity in net income of associated companies for the years ended December 31, 2012, December 31, 2011 and December 31, 2010 is as follows:
|
2012
|
2011
|
2010
|
||||||||||
|
Total operating income for reportable segments
|
$ | 126,971 | $ | 119,505 | $ | 105,443 | ||||||
|
Non-income tax contingency charge
|
— | — | (4,132 | ) | ||||||||
|
CEO transition charges
|
— | — | (1,317 | ) | ||||||||
|
Non-operating charges
|
(59,983 | ) | (58,689 | ) | (50,744 | ) | ||||||
|
Depreciation of corporate assets and amortization
|
(3,764 | ) | (2,904 | ) | (1,119 | ) | ||||||
|
Consolidated operating income
|
63,224 | 57,912 | 48,131 | |||||||||
|
Interest expense
|
(4,283 | ) | (4,666 | ) | (5,225 | ) | ||||||
|
Interest income
|
592 | 1,081 | 1,201 | |||||||||
|
Other income, net
|
3,415 | 5,050 | 2,106 | |||||||||
|
Consolidated income before taxes and equity in net
|
||||||||||||
|
income of associated companies
|
$ | 62,948 | $ | 59,377 | $ | 46,213 | ||||||
Net sales are attributed to geographic region based on the location of the originating seller.
61
QUAKER CHEMICAL CORPORATION
NOTES TO CONSOLIDATED FINANCIAL STATEMENTS - Continued
(Dollars in thousands except per share amounts)
Net sales and long-lived assets by geographic area as of and for the years ended December 31, 2012, December 31, 2011 and December 31, 2010 are as follows:
|
2012
|
2011
|
2010
|
|||||||||
|
Net sales
|
|||||||||||
|
North America
|
$ | 310,127 | $ | 268,519 | $ | 190,623 | |||||
|
Europe
|
169,323 | 178,695 | 148,426 | ||||||||
|
Asia/Pacific
|
157,062 | 151,468 | 125,189 | ||||||||
|
South America
|
66,238 | 79,181 | 75,169 | ||||||||
|
South Africa
|
5,476 | 5,368 | 4,656 | ||||||||
|
Consolidated
|
$ | 708,226 | $ | 683,231 | $ | 544,063 | |||||
| 2012 | 2011 | 2010 | |||||||||
| (re-cast) | (re-cast) | ||||||||||
|
Long-lived assets
|
|||||||||||
|
North America
|
$ | 88,857 | $ | 90,800 | $ | 85,821 | |||||
|
Europe
|
22,299 | 19,215 | 24,793 | ||||||||
|
Asia/Pacific
|
19,720 | 15,225 | 14,099 | ||||||||
|
South America
|
5,276 | 6,577 | 6,998 | ||||||||
|
South Africa
|
21 | 28 | 41 | ||||||||
|
Consolidated
|
$ | 136,173 | $ | 131,845 | $ | 131,752 | |||||
Note 16 – Business Acquisitions
In July 2012, the Company acquired NP Coil Dexter Industries, S.r.l. for approximately $2,748, including short-term debt and long-term debt of approximately $1,186 and $854, respectively. NP Coil Dexter is a European manufacturer and supplier of metal surface treatment products. The Company allocated $3,825 of intangible assets, comprised of trademarks and formulations, to be amortized over 10 years; two customer lists to be amortized over 8 and 4 years, respectively; and a non-competition agreement to be amortized over 5 years. In addition, the Company recorded $1,786 of goodwill, none of which will be tax deductible and was assigned to the metalworking process chemical segment. Liabilities assumed include a hold-back of consideration to be paid to the former shareholders at eighteen months from the acquisition date. During the fourth quarter of 2012, the Company recorded an increase to other income of approximately $1,033 on its Consolidated Statement of Income related to a change in the fair value of this hold-back of consideration liability.
In October 2011, the Company acquired G.W. Smith & Sons, Inc. for approximately $14,518. G.W Smith manufactures and distributes high quality die casting lubricants, and also distributes metalworking fluids. The Company allocated $6,260 of intangible assets, comprised of trade names and formulations, to be amortized over 15 years; a trademark to be amortized over 5 years; a non-competition agreement to be amortized over 5 years; and customer lists to be amortized over 16 years. In addition, the Company recorded $1,120 of goodwill, all of which will be tax deductible and was assigned to the metalworking process chemical segment. Liabilities assumed include a hold-back of consideration to be paid to the former shareholder at one year from the acquisition date, which was settled during 2012 with a payment of approximately $1,000 to G.W. Smith’s former shareholder.
In July 2011, the Company acquired the remaining 60% ownership interest in Tecniquimia Mexicana, S.A. de C.V., the Company’s Mexican equity affiliate, for approximately $10,500. As part of the acquisition, the Company recorded a one-time increase to other income of approximately $2,718 to revalue the previously held ownership interest in Tecniquimia to its fair value. The acquisition of Tecniquimia allowed the Company to further capitalize on the growing Mexican market. The Company allocated $3,556 of intangible assets, comprised of trade names and trademarks, to be amortized over 5 years; and customer lists, to be amortized over 20 years. In addition, the Company recorded $6,773 of goodwill, none of which will be tax deductible, and was assigned to the metalworking process chemicals segment. Liabilities assumed included a hold-back of consideration to be paid to the former shareholders at one year from the purchase date, which was settled during 2012 with a payment of approximately $2,000 to Tecniquimia’s former shareholders.
In December 2010, the Company completed the acquisition of Summit Lubricants, Inc., which manufactures and distributes specialty greases and lubricants, for approximately $29,116, which was subject to certain post closing adjustments. During 2011, the Company paid an additional $717 to finalize the post closing adjustments and recorded non-cash adjustments to fixed assets and goodwill to finalize its
62
QUAKER CHEMICAL CORPORATION
NOTES TO CONSOLIDATED FINANCIAL STATEMENTS - Continued
(Dollars in thousands except per share amounts)
valuation of the assets acquired and liabilities assumed at the acquisition date. The Company allocated $17,100 to intangible assets, comprised of formulations, to be amortized over 15 years; customer lists, to be amortized over 20 years; a non-competition agreement, to be amortized over 5 years; and a trademark, which was assigned an indefinite life. In addition, the Company recorded $3,423 of goodwill, all of which will be tax deductible, and was assigned to the metalworking process chemicals segment. Liabilities assumed include an earnout to be paid to the former shareholders if certain earnings targets are met by the end of 2013. During 2012 and 2011, the Company recorded increases to other income of approximately $1,737 and $595, respectively, on its Consolidated Statement of Income related to changes in the fair value of the contingent consideration liability during each respective year.
The following tables show the allocation of the purchase price of the assets and liabilities acquired during 2012 and 2011. The pro-forma results of operations have not been provided because the effects were not material:
| NP Coil Dexter | ||||
|
2012 Acquisitions
|
Industries, S.r.l. | |||
|
Current assets
|
$ | 5,536 | ||
|
Fixed assets
|
1,211 | |||
|
Intangibles
|
3,825 | |||
|
Goodwill
|
1,786 | |||
|
Other long-term assets
|
783 | |||
|
Total assets purchased
|
13,141 | |||
|
Short-term debt
|
(1,186 | ) | ||
|
Other current liabilities
|
(6,168 | ) | ||
|
Long-term debt
|
(854 | ) | ||
|
Other long-term liabilities
|
(1,258 | ) | ||
|
Present value of hold-back
|
(927 | ) | ||
|
Total liabilities assumed
|
(10,393 | ) | ||
|
Cash paid for an acquisition
|
$ | 2,748 | ||
|
Quaker
|
GW Smith
|
|||||||||
|
2011 Acquisitions
|
Tecniquimia
|
& Sons, Inc.
|
Total
|
|||||||
|
Current assets
|
$ | 8,946 | $ | 6,138 | $ | 15,084 | ||||
|
Fixed assets
|
4,308 | 2,869 | 7,177 | |||||||
|
Intangibles
|
3,556 | 6,260 | 9,816 | |||||||
|
Goodwill
|
6,773 | 1,120 | 7,893 | |||||||
|
Other long-term assets
|
1,355 | 1 | 1,356 | |||||||
|
Total assets purchased
|
24,938 | 16,388 | 41,326 | |||||||
|
Current liabilities
|
(2,224 | ) | (1,001 | ) | (3,225 | ) | ||||
|
Long-term liabilities
|
(6,869 | ) | — | (6,869 | ) | |||||
|
Present value of hold-back
|
(1,754 | ) | (869 | ) | (2,623 | ) | ||||
|
Total liabilities assumed
|
(10,847 | ) | (1,870 | ) | (12,717 | ) | ||||
|
Additional minimum pension liability
|
987 | — | 987 | |||||||
|
Total equity assumed
|
987 | — | 987 | |||||||
|
Fair value of previously held equity interest
|
(4,578 | ) | — | (4,578 | ) | |||||
|
Cash paid for acquisitions
|
$ | 10,500 | $ | 14,518 | $ | 25,018 | ||||
Included in the 2012 acquisition of NP Coil Dexter was approximately $113 of cash acquired and in the 2011 acquisitions of Tecniquimia Mexicana, S.A. de C.V. and G.W. Smith and Sons, Inc. cash acquired was approximately $236 and $22, respectively.
Certain pro forma and other disclosures may not have been provided as of December 31, 2012 for the 2012 and 2011 acquisitions, because the effects were not material.
63
QUAKER CHEMICAL CORPORATION
NOTES TO CONSOLIDATED FINANCIAL STATEMENTS - Continued
(Dollars in thousands except per share amounts)
Note 17 – Goodwill and Other Intangible Assets
The Company completed its annual impairment assessment as of the end of the third quarter of 2012 and no impairment charge was warranted. The Company has recorded no impairment charges in the past. Changes in the carrying amount of goodwill for the years ended December 31, 2012 and December 31, 2011 were as follows:
|
Metalworking
|
||||||||||||
|
Process
|
||||||||||||
|
Chemicals
|
Coatings
|
Total
|
||||||||||
|
Balance as of December 31, 2010
|
$ | 44,677 | $ | 8,081 | $ | 52,758 | ||||||
|
Goodwill additions
|
8,229 | — | 8,229 | |||||||||
|
Currency translation adjustments and other
|
(2,835 | ) | — | (2,835 | ) | |||||||
|
Balance as of December 31, 2011
|
$ | 50,071 | $ | 8,081 | $ | 58,152 | ||||||
|
Goodwill additions
|
1,786 | — | 1,786 | |||||||||
|
Currency translation adjustments and other
|
(769 | ) | — | (769 | ) | |||||||
|
Balance as of December 31, 2012
|
$ | 51,088 | $ | 8,081 | $ | 59,169 | ||||||
Gross carrying amounts and accumulated amortization for definite-lived intangible assets as of December 31, 2012 and December 31, 2011 were as follows:
|
Gross Carrying
|
Accumulated
|
|||||||||||||||
|
Amount
|
Amortization
|
|||||||||||||||
|
2012
|
2011
|
2012
|
2011
|
|||||||||||||
|
Amortized intangible assets
|
|
|
|
|
||||||||||||
|
Customer lists and rights to sell
|
$ | 32,356 | $ | 30,435 | $ | 8,192 | $ | 6,386 | ||||||||
|
Trademarks and patents
|
6,760 | 4,685 | 2,548 | 1,991 | ||||||||||||
|
Formulations and product technology
|
5,278 | 5,278 | 3,423 | 3,090 | ||||||||||||
|
Other
|
5,467 | 5,309 | 3,989 | 3,557 | ||||||||||||
|
Total
|
$ | 49,861 | $ | 45,707 | $ | 18,152 | $ | 15,024 | ||||||||
The Company recorded $3,106, $2,338 and $988 of amortization expense in 2012, 2011 and 2010, respectively. Estimated annual aggregate amortization expense for the subsequent five years is as follows:
|
For the year ended December 31, 2013
|
$ | 3,167 | ||
|
For the year ended December 31, 2014
|
$ | 2,938 | ||
|
For the year ended December 31, 2015
|
$ | 2,938 | ||
|
For the year ended December 31, 2016
|
$ | 2,464 | ||
|
For the year ended December 31, 2017
|
$ | 2,016 |
The Company has two indefinite-lived intangible assets totaling $1,100 for trademarks at December 31, 2012 and December 31, 2011.
64
QUAKER CHEMICAL CORPORATION
NOTES TO CONSOLIDATED FINANCIAL STATEMENTS - Continued
(Dollars in thousands except per share amounts)
Note 18 – Other Assets
Other assets comprise:
|
December 31,
|
||||||||
|
2012
|
2011
|
|||||||
|
(re-cast)
|
||||||||
|
Restricted insurance settlement
|
$ | 26,398 | $ | 27,720 | ||||
|
Deferred compensation assets
|
915 | 945 | ||||||
|
Supplemental retirement income program
|
1,653 | 1,508 | ||||||
|
Uncertain tax positions
|
3,058 | 1,842 | ||||||
|
Other
|
2,434 | 2,841 | ||||||
|
Total
|
$ | 34,458 | $ | 34,856 | ||||
Previously, an inactive subsidiary of the Company executed separate settlement and release agreements with two of its insurance carriers for $35,000, of which $26,398 remains. Part of the agreements were payable in four annual installments of $5,000, the final of which was received in the first quarter of 2010. The proceeds of both settlements are restricted and can only be used to pay claims and costs of defense associated with the subsidiary’s asbestos litigation. The proceeds of the settlement and release agreements have been deposited into interest bearing accounts which earned approximately $69 and $80 in 2012 and 2011, respectively, offset by $1,391 and $1,840 of payments in 2012 and 2011, respectively. Due to the restricted nature of the proceeds, a corresponding deferred credit was established in “Other non-current liabilities” for an equal and offsetting amount, and will remain until the restrictions lapse or the funds are exhausted via payments of claims and costs of defense. See Notes 19 and 20 of Notes to Consolidated Financial Statements.
Note 19 – Other Non-Current Liabilities
Other non-current liabilities comprise:
|
December 31,
|
||||||||
|
2012
|
2011
|
|||||||
|
Restricted insurance settlement
|
$ | 26,398 | $ | 27,720 | ||||
|
Uncertain tax positions (includes interest and penalties)
|
16,328 | 16,285 | ||||||
|
Environmental reserves
|
456 | 934 | ||||||
|
Acquisition-related consideration
|
4,651 | 5,869 | ||||||
|
Other (primarily deferred and long-term compensation)
|
5,034 | 4,010 | ||||||
|
Total
|
$ | 52,867 | $ | 54,818 | ||||
See also Notes 18 and 20 of Notes to Consolidated Financial Statements.
Note 20 – Commitments and Contingencies
In April of 1992, the Company identified certain soil and groundwater contamination at AC Products, Inc. (“ACP”), a wholly owned subsidiary. In voluntary coordination with the Santa Ana California Regional Water Quality Board (“SACRWQB”), ACP has been remediating the contamination, the principal contaminant of which is perchloroethylene (“PERC”). On or about December 18, 2004, the Orange County Water District (“OCWD”) filed a civil complaint in Superior Court in Orange County, California against ACP and other parties potentially responsible for groundwater contamination. OCWD was seeking to recover compensatory and other damages related to the investigation and remediation of the contamination in the groundwater. Effective October 17, 2007, ACP and OCWD settled all claims related to this litigation. Pursuant to the settlement agreement with OCWD, ACP agreed to pay $2,000. In addition to the $2,000 payment, ACP agreed to operate the two existing groundwater treatment systems associated with its extraction wells P-2 and P-3 so as to
65
QUAKER CHEMICAL CORPORATION
NOTES TO CONSOLIDATED FINANCIAL STATEMENTS - Continued
(Dollars in thousands except per share amounts)
hydraulically contain groundwater contamination emanating from ACP’s site until such time as the concentrations of PERC are below the current Federal maximum contaminant level for four consecutive quarterly sampling events. On September 11, 2012, ACP received a letter from the SACRWQB advising that no further action is required to remediate the soil contamination on site. As of December 31, 2012, the Company believes that the range of potential-known liabilities associated with the ACP water remediation program is approximately $700 to $1,200, for which the Company has sufficient reserves.
The low and high ends of the range are based on the length of operation of the two extraction wells as determined by groundwater modeling with planned higher maintenance costs in later years if a longer treatment period is required. Costs of operation include the operation and maintenance of the extraction wells, groundwater monitoring and program management. The duration of the well operation was estimated based on historical trends in concentrations in the monitoring wells within the proximity of the applicable extraction wells. Also factored into the model was the impact of water injected into the underground aquifer from a planned water treatment system to be installed by OCWD adjacent to P-2. Based on the modeling, it is estimated that P-2 will operate for another one and one-half to three years and P-3 will operate for another half a year. Operation and maintenance costs were based on historical expenditures and estimated inflation. As mentioned above, a significantly higher maintenance expense was factored into the range if the system operates for the longer period.
The Company believes, although there can be no assurance regarding the outcome of other unrelated environmental matters, that it has made adequate accruals for costs associated with other environmental problems of which it is aware. Approximately $230 and $493 was accrued at December 31, 2012 and December 31, 2011, respectively, to provide for such anticipated future environmental assessments and remediation costs.
An inactive subsidiary of the Company that was acquired in 1978 sold certain products containing asbestos, primarily on an installed basis, and is among the defendants in numerous lawsuits alleging injury due to exposure to asbestos. The subsidiary discontinued operations in 1991 and has no remaining assets other than the proceeds from insurance settlements received. To date, the overwhelming majority of these claims have been disposed of without payment and there have been no adverse judgments against the subsidiary. Based on a continued analysis of the existing and anticipated future claims against this subsidiary, it is currently projected that the subsidiary’s total liability over the next 50 years for these claims is approximately $3,300 (excluding costs of defense). Although the Company has also been named as a defendant in certain of these cases, no claims have been actively pursued against the Company, and the Company has not contributed to the defense or settlement of any of these cases pursued against the subsidiary. These cases were handled by the subsidiary’s primary and excess insurers who had agreed in 1997 to pay all defense costs and be responsible for all damages assessed against the subsidiary arising out of existing and future asbestos claims up to the aggregate limits of the policies. A significant portion of this primary insurance coverage was provided by an insurer that is now insolvent, and the other primary insurers have asserted that the aggregate limits of their policies have been exhausted. The subsidiary challenged the applicability of these limits to the claims being brought against the subsidiary. In response, two of the three carriers entered into separate settlement and release agreements with the subsidiary in late 2005 and early 2007 for $15,000 and $20,000, respectively. The proceeds of both settlements are restricted and can only be used to pay claims and costs of defense associated with the subsidiary’s asbestos litigation. During the third quarter of 2007, the subsidiary and the remaining primary insurance carrier entered into a Claim Handling and Funding Agreement, under which the carrier will pay 27% of defense and indemnity costs incurred by or on behalf of the subsidiary in connection with asbestos bodily injury claims for a minimum of five years beginning July 1, 2007. The agreement continues until terminated and can only be terminated by either party by providing the other party with a minimum of two years prior written notice. As of December 31, 2012, no notice of termination has been given under this agreement. At the end of the term of the agreement, the subsidiary may choose to again pursue its claim against this insurer regarding the application of the policy limits. The Company also believes that, if the coverage issues under the primary policies with the remaining carrier are resolved adversely to the subsidiary and all settlement proceeds were used, the subsidiary may have limited additional coverage from a state guarantee fund established following the insolvency of one of the subsidiary’s primary insurers. Nevertheless, liabilities in respect of claims may exceed the assets and coverage available to the subsidiary.
If the subsidiary’s assets and insurance coverage were to be exhausted, claimants of the subsidiary may actively pursue claims against the Company because of the parent-subsidiary relationship. Although asbestos litigation is particularly difficult to predict, especially with respect to claims that are currently not being actively pursued against the Company, the Company does not believe that such claims would have merit or that the Company would be held to have liability for any unsatisfied obligations of the subsidiary as a result of such claims. After evaluating the nature of the claims filed against the subsidiary and the small number of such claims that have resulted in any payment, the potential availability of additional insurance coverage at the subsidiary level, the additional availability of the Company’s own insurance and the Company’s strong defenses to claims that it should be held responsible for the subsidiary’s obligations because of the parent-subsidiary relationship, the Company believes it is not probable that the Company will incur any material losses. All of the asbestos cases pursued against the Company challenging the parent-subsidiary relationship are in the early stages of litigation. The Company has been successful to date having claims naming it dismissed during initial proceedings. Since the Company may be in this early stage of litigation for some time, it is not possible to estimate additional losses or range of loss, if any.
66
QUAKER CHEMICAL CORPORATION
NOTES TO CONSOLIDATED FINANCIAL STATEMENTS - Continued
(Dollars in thousands except per share amounts)
As initially disclosed in the Company’s second quarter 2010 Form 10-Q, one of the Company’s subsidiaries may have paid certain value-added-taxes (“VAT”) incorrectly and, in certain cases, may not have collected sufficient VAT from certain customers. The VAT rules and regulations at issue are complex, vary among the jurisdictions and can be contradictory, in particular as to how they relate to the subsidiary’s products and to sales between jurisdictions.
Since its inception, the subsidiary had been consistent in its VAT collection and remittance practices and had never been contacted by any tax authority relative to VAT. Now the subsidiary has determined that for certain products, a portion of the VAT was incorrectly paid and that the total VAT due exceeds the amount originally collected and remitted by the subsidiary. In 2010, three jurisdictions contacted the subsidiary and, since then, the subsidiary has either participated in an amnesty program or entered into a settlement whereby it paid a reduced portion of the amounts owed in resolution of those jurisdictions’ claims. The subsidiary has modified its VAT invoicing and payment procedures to eliminate or mitigate future exposure.
In analyzing the subsidiary’s exposure, it is difficult to estimate both the probability and the amount of any potential liabilities due to a number of factors, including: the decrease in exposure over time due to applicable statutes of limitations and actions taken by the subsidiary, the joint liability of customers and suppliers for a portion of the VAT, the availability of a VAT refund for VAT incorrectly paid through an administrative process, any amounts which may have been or will be paid by customers, as well as the timing and structure of any tax amnesties or settlements. In addition, interest and penalties on any VAT due can be a multiple of the base tax. The subsidiary may contest any tax assessment administratively and/or judicially for an extended period of time, but may ultimately resolve its disputes through participation in tax amnesty programs, which are a common practice for settling tax disputes in the jurisdictions in question and which have historically occurred on a regular basis, resulting in significant reductions of interest and penalties. Also, the timing of payments and refunds of VAT may not be contemporaneous, and, if additional VAT is owed, it may not be fully recoverable from customers. As a result, this matter has the potential to have a material adverse impact on the Company’s financial position, liquidity and capital resources and the results of operations.
In 2010, the Company recorded a net charge of $4,132, which consisted of a net $3,901 charge related to two tax dispute settlements entered into by the subsidiary, as well as a net $231 charge representing management’s best estimate based on the information available to it, including the factors noted above, of the amount that ultimately may be paid related to the other jurisdiction that has made inquiries. At December 31, 2012 and December 31, 2011, the Company had no accrual for remaining payments to be made under tax dispute settlements entered into by the subsidiary, as the respective accruals noted above were paid.
The charges taken by the Company in 2010 assume a successful recovery of the VAT incorrectly paid, as well as reductions in interest and penalties from anticipated future amnesty programs or settlements. On a similar basis, if all other potentially impacted jurisdictions were to initiate audits and issue assessments, the remaining exposure, net of refunds, could be from $0 to $12,000 with one jurisdiction representing approximately 82 percent of this additional exposure, assuming the continued availability of future amnesty programs or settlements to reduce the interest and penalties. If there are future assessments but no such future amnesty programs or settlements, the potential exposure could be higher.
The Company is party to other litigation which management currently believes will not have a material adverse effect on the Company’s results of operations, cash flows or financial condition.
The Company leases certain manufacturing and office facilities and equipment under non-cancelable operating leases with various terms from 1 to 7 years expiring in 2019. Rent expense for 2012, 2011 and 2010 was $5,189, $5,282, and $5,112, respectively. The Company’s minimum rental commitments under non-cancelable operating leases at December 31, 2012 for future years were approximately:
|
2013
|
$ | 4,927 | ||
|
2014
|
$ | 4,003 | ||
|
2015
|
$ | 3,472 | ||
|
2016
|
$ | 2,941 | ||
|
2017
|
$ | 1,466 | ||
|
2018 and beyond
|
$ | 2 |
67
QUAKER CHEMICAL CORPORATION
NOTES TO CONSOLIDATED FINANCIAL STATEMENTS - Continued
(Dollars in thousands except per share amounts)
Note 21 – Quarterly Results (unaudited)
|
First (1)
|
Second (2)
|
Third (3)
|
Fourth (4)
|
|||||||||
|
2012
|
(re-cast)
|
(re-cast)
|
(re-cast)
|
|||||||||
|
Net sales
|
$ | 177,638 | $ | 176,797 | $ | 180,923 | $ | 172,868 | ||||
|
Gross profit
|
59,795 | 60,636 | 59,126 | 59,154 | ||||||||
|
Operating income
|
16,702 | 16,983 | 15,863 | 13,676 | ||||||||
|
Net income attributable to Quaker Chemical Corporation
|
12,365 | 11,108 | 10,925 | 13,007 | ||||||||
|
Net income attributable to Quaker Chemical Corporation
|
||||||||||||
|
Common Shareholders - Basic
|
$ | 0.96 | $ | 0.86 | $ | 0.84 | $ | 0.99 | ||||
|
Net income attributable to Quaker Chemical Corporation
|
||||||||||||
|
Common Shareholders - Diluted
|
$ | 0.95 | $ | 0.85 | $ | 0.83 | $ | 0.99 | ||||
|
First (1)
|
Second (2)
|
Third (3)
|
Fourth (4)
|
|||||||||
|
2011
|
(re-cast)
|
(re-cast)
|
(re-cast)
|
(re-cast)
|
||||||||
|
Net sales
|
$ | 159,865 | $ | 167,792 | $ | 182,313 | $ | 173,261 | ||||
|
Gross profit
|
52,734 | 53,766 | 59,486 | 56,664 | ||||||||
|
Operating income
|
14,100 | 14,941 | 17,504 | 11,367 | ||||||||
|
Net income attributable to Quaker Chemical Corporation
|
11,026 | 10,554 | 13,942 | 10,370 | ||||||||
|
Net income attributable to Quaker Chemical Corporation
|
||||||||||||
|
Common Shareholders - Basic
|
$ | 0.96 | $ | 0.86 | $ | 1.09 | $ | 0.80 | ||||
|
Net income attributable to Quaker Chemical Corporation
|
||||||||||||
|
Common Shareholders - Diluted
|
$ | 0.94 | $ | 0.85 | $ | 1.07 | $ | 0.80 | ||||
|
(1)
|
Net income attributable to Quaker Chemical Corporation includes tax benefits of approximately $0.12 and $0.11 per diluted share in the first quarters of 2012 and 2011, respectively, resulting from the derecognition of several uncertain tax positions due to the expiration of applicable statutes of limitation.
|
|
(2)
|
Net income attributable to Quaker Chemical Corporation includes charges of approximately $0.06 per diluted share in the second quarter of 2012 due to certain customer bankruptcies in the U.S. and approximately $0.03 per diluted share related to CFO transition costs.
|
|
(3)
|
Net income attributable to Quaker Chemical Corporation includes tax benefits of approximately $0.03 per diluted share in both the third quarters of 2012 and 2011 resulting from the derecognition of several uncertain tax positions due to the expiration of applicable statutes of limitation. Net income attributable to Quaker Chemical Corporation also includes certain uncommon charges of $0.05 per diluted share largely consisting of severance and other related costs and costs associated with the launch of the Company's new revitalized Brand. Net income attributable to Quaker Chemical Corporation in the third quarter of 2011 includes earnings per diluted share of $0.22 representing the revaluation of the Company’s previously held ownership interest in its Mexican equity affiliate to its fair value related to the purchase of the remaining ownership interest in this affiliate.
|
|
(4)
|
Net income attributable to Quaker Chemical Corporation includes tax benefits of approximately $0.02 per diluted common share in both the fourth quarters of 2012 and 2011 resulting from the derecognition of several uncertain tax positions due to the expiration of applicable statutes of limitation. Net income attributable to Quaker Chemical Corporation also includes earnings per diluted share of $0.09 and $0.03 in the fourth quarters of 2012 and 2011, respectively, related to changes in the fair value of a contingent consideration liability during each respective period. In addition, net income attributable to Quaker Chemical Corporation for the fourth quarter of 2012 includes earnings per diluted share of $0.08 related to a separate change in the fair value of an acquisition-related liability. Net income attributable to Quaker Chemical Corporation for the fourth quarter of 2012 also includes certain uncommon charges of $0.06 per diluted share largely consisting of severance and other related costs and costs associated with the launch of the Company's new revitalized Brand.
|
68
QUAKER CHEMICAL CORPORATION
NOTES TO CONSOLIDATED FINANCIAL STATEMENTS - Continued
(Dollars in thousands except per share amounts)
During 2012, the Company's ownership percentage in Primex, Ltd., a captive insurance company, increased following the exit of one of its shareholders. Due to the increased ownership percentage and other factors, the Company changed its method of accounting for its investment in Primex from the cost method to the equity method of accounting. In accordance with FASB’s guidance, the equity method of accounting must be applied on a retrospective basis. As a result, the Company has recast its Condensed Financial Statements for the three months ended March 31, 2012 and March 31, 2011, June 30, 2012 and June 30, 2011, September 30, 2012 and September 30, 2011 and December 31, 2011. The Company did not amend and restate any of its quarterly reports on Form 10-Q for 2012, because the errors identified were not deemed material to any individual period.
The following tables set forth the impact, by line item per financial statement, of the retrospective application of the change in method of accounting (amounts in thousands, except per share data):
|
Three Months Ended
|
||||||||||||
|
Condensed Consolidated Statement of Income
|
March 31, 2012
|
June 30, 2012
|
September 30, 2012
|
|||||||||
|
Equity in net income of associated companies
|
$ | 419 | $ | 568 | $ | 439 | ||||||
|
Net income attributable to Quaker Chemical Corporation
|
$ | 419 | $ | 568 | $ | 439 | ||||||
|
Net income attributable to Quaker Chemical Corporation Common Shareholders - Diluted
|
$ | 0.04 | $ | 0.04 | $ | 0.03 | ||||||
|
Condensed Consolidated Balance Sheet
|
March 31, 2012
|
June 30, 2012
|
September 30, 2012
|
|||||||||
|
Investments in associated companies
|
$ | 7,620 | $ | 7,819 | $ | 8,685 | ||||||
|
Other assets
|
(500 | ) | (500 | ) | (500 | ) | ||||||
|
Total assets
|
$ | 7,120 | $ | 7,319 | $ | 8,185 | ||||||
|
Retained earnings
|
$ | 5,197 | $ | 5,765 | $ | 6,204 | ||||||
|
Accumulated other comprehensive loss
|
1,923 | 1,554 | 1,981 | |||||||||
|
Total equity
|
$ | 7,120 | $ | 7,319 | $ | 8,185 | ||||||
|
Three Months Ended
|
||||||||||||
|
Condensed Consolidated Statement of Income
|
March 31, 2011
|
June 30, 2011
|
September 30, 2011
|
December 31, 2011
|
||||||||
|
Equity in net income of associated companies
|
$ | 426 | $ | 713 | $ | 584 | $ | 600 | ||||
|
Net income attributable to Quaker Chemical Corporation
|
$ | 426 | $ | 713 | $ | 584 | $ | 600 | ||||
|
Net income attributable to Quaker Chemical Corporation Common Shareholders - Diluted
|
$ | 0.03 | $ | 0.06 | $ | 0.04 | $ | 0.05 | ||||
|
Condensed Consolidated Balance Sheet
|
March 31, 2011
|
June 30, 2011
|
September 30, 2011
|
December 31, 2011
|
||||||||
|
Investments in associated companies
|
$ | 4,486 | $ | 5,248 | $ | 4,919 | $ | 6,131 | ||||
|
Other assets
|
(500 | ) | (500 | ) | (500 | ) | (500 | ) | ||||
|
Total assets
|
$ | 3,986 | $ | 4,748 | $ | 4,419 | $ | 5,631 | ||||
|
Retained earnings
|
$ | 2,881 | $ | 3,594 | $ | 4,178 | $ | 4,778 | ||||
|
Accumulated other comprehensive loss
|
1,105 | 1,154 | 241 | 853 | ||||||||
|
Total equity
|
$ | 3,986 | $ | 4,748 | $ | 4,419 | $ | 5,631 | ||||
69
|
Item 9.
|
Changes in and Disagreements With Accountants on Accounting and Financial Disclosure.
|
Not Applicable.
Conclusion regarding the Effectiveness of Disclosure Controls and Procedures
As required by Rule 13a-15(b) under the Securities Exchange Act of 1934, as amended (the “Exchange Act”), our management, including our principal executive officer and principal financial officer, has evaluated the effectiveness of our disclosure controls and procedures as of the end of the period covered by this report. Based on that evaluation, our principal executive officer and our principal financial officer have concluded that as of the end of the period covered by this report our disclosure controls and procedures (as defined in Rule 13a-15(e) under the Exchange Act) were effective.
Management’s Report on Internal Control over Financial Reporting
The management of Quaker is responsible for establishing and maintaining adequate internal control over financial reporting as such term is defined in Rule 13a-15(f) promulgated under the Exchange Act. Internal control over financial reporting is a process designed to provide reasonable assurance regarding the reliability of financial reporting and the preparation of financial statements for external purposes in accordance with generally accepted accounting principles.
Because of its inherent limitations, internal control over financial reporting may not prevent or detect misstatements. Also, projections of any evaluation of effectiveness to future periods are subject to the risk that controls may become inadequate because of changes in conditions or that the degree of compliance with the policies or procedures may deteriorate.
Our management, with the participation of our principal executive officer and principal financial officer, assessed the effectiveness of the Company’s internal control over financial reporting as of December 31, 2012. In making this assessment, our management used the criteria set forth by the Committee of Sponsoring Organizations of the Treadway Commission (“COSO”) in Internal Control—Integrated Framework. Based on its assessment, Quaker’s management has concluded that as of December 31, 2012, the Company’s internal control over financial reporting is effective based on those criteria.
Management has excluded NP Coil Dexter Industries, S.r.l. from our assessment of internal control over financial reporting as of December 31, 2012 because this entity was acquired by the Company in a purchase business combination on July 2, 2012. This entity is a wholly owned subsidiary, whose total assets and total revenues represent approximately 2% and less than 1%, respectively, of the related consolidated financial statement amounts as of and for the year ended December 31, 2012.
The effectiveness of the Company’s internal control over financial reporting as of December 31, 2012 has been audited by PricewaterhouseCoopers LLP, an independent registered public accounting firm, as stated in their report which is included in “Item 8. Financial Statements and Supplementary Data.”
Changes in Internal Controls Over Financial Reporting
As required by Rule 13a-15(d) under the Exchange Act, our management, including our principal executive officer and principal financial officer, has evaluated our internal control over financial reporting to determine whether any changes to our internal control over financial reporting occurred during the fourth quarter of the year ended December 31, 2012 that have materially affected, or are reasonably likely to materially affect, our internal control over financial reporting. Based on that evaluation, no such changes to our internal control over financial reporting occurred during the fourth quarter of the year ended December 31, 2012.
|
Item 9B.
|
Other Information.
|
None.
70
PART III
Incorporated by reference is (i) the information beginning immediately following the caption “Proposal 1—Election of Directors and Nominee Biographies” in the Registrant’s definitive Proxy Statement relating to the Annual Meeting of Shareholders to be held May 8, 2013 to be filed with the SEC no later than 120 days after the close of its fiscal year ended December 31, 2012 (the “2013 Proxy Statement”) to, but not including, the caption “Corporate Governance,” (ii) the information appearing in Item 4(a) of this Report, (iii) the information in the 2013 Proxy Statement beginning with and including the sub-caption, “Section 16(a) Beneficial Ownership Reporting Compliance” to, but not including, the caption “Certain Relationships and Related Transactions,” and (iv) the information in the 2013 Proxy Statement beginning with and including the sub-caption “Code of Conduct” to, but not including, the caption “Compensation Committee Interlocks and Insider Participation.”
|
Item 11.
|
Executive Compensation.
|
Incorporated by reference is the information in the 2013 Proxy Statement (i) beginning with and including the caption “Compensation Committee Interlocks and Insider Participation” to, but not including, the caption “Proposal 2 – Approval of the 2013 Director Stock Ownership Plan,” and (ii) beginning with and including the caption, “Executive Compensation” to, but not including, the caption “Stock Ownership of Certain Beneficial Owners and Management.”
|
Item 12.
|
Security Ownership of Certain Beneficial Owners and Management and Related Stockholder Matters.
|
Incorporated by reference is the information in the 2013 Proxy Statement beginning immediately following the caption “Stock Ownership of Certain Beneficial Owners and Management” to, but not including, the sub-caption “Section 16(a) Beneficial Ownership Reporting Compliance.”
Equity Compensation Plans
The following table sets forth certain information relating to the Company’s equity compensation plans as of December 31, 2012. Each number of securities reflected in the table is a reference to shares of Quaker common stock.
| Equity Compensation Plan Information | |||||||||||
|
Number of securities
|
|||||||||||
|
Number of securities
|
remaining available for
|
||||||||||
|
to be issued upon
|
Weighted-average
|
future issuance under
|
|||||||||
|
exercise of
|
exercise price of
|
equity compensation plans
|
|||||||||
|
outstanding options,
|
outstanding options,
|
(excluding securities
|
|||||||||
|
Plan Category
|
warrants and rights
|
warrants and rights
|
reflected in column (a))
|
||||||||
|
(a)
|
(b)
|
(c)
|
|||||||||
|
Equity compensation plans approved
|
|||||||||||
|
by security holders
|
107,455 | $ | 31.23 | 869,352 | (1 | ) | |||||
|
Equity compensation plans not approved
|
|||||||||||
|
by security holders
|
— | — | — | ||||||||
|
Total
|
107,455 | $ | 31.23 | 869,352 | |||||||
|
(1)
|
As of December 31, 2012, 304,900 of these shares were available for issuance as restricted stock awards under the Company’s 2001 Global Annual Incentive Plan, 44,160 shares were available for issuance upon the exercise of stock options and/or as restricted stock awards under the Company’s 2006 Long-Term Performance Incentive Plan, 494,694 shares were available for issuance upon the exercise of stock options and/or as restricted stock awards under the Company’s 2011 Long-Term Performance Incentive Plan, and 25,598 shares were available for issuance under the 2003 Director Stock Ownership Plan.
|
71
|
Item 13.
|
Certain Relationships and Related Transactions, and Director Independence.
|
Incorporated by reference is the information in the 2013 Proxy Statement beginning immediately following the sub-caption “Certain Relationships and Related Transactions” to, but not including, the caption “Proposal 3—Ratification of Appointment of Independent Registered Public Accounting Firm,” and the additional information in the 2013 Proxy Statement beginning with and including the sub-caption “Director Independence” to, but not including, the sub-caption “Governance Committee Procedures for Selecting Director Nominees.”
|
Item 14.
|
Principal Accountant Fees and Services.
|
Incorporated by reference is the information in the 2013 Proxy Statement beginning with and including the sub-caption “Audit Fees” to, but not including, the statement recommending a vote for ratification of the appointment of PricewaterhouseCoopers LLP as the Company’s independent registered public accounting firm for the year ending December 31, 2013.
72
PART IV
|
Item 15.
|
Exhibits and Financial Statement Schedules.
|
(a) Exhibits and Financial Statement Schedules
|
1.
|
Financial Statements and Supplementary Data.
|
|
|
Page
|
|
|
Financial Statements:
|
|
|
|
|
27
|
|
|
|
28
|
|
|
29
|
||
|
|
30
|
|
|
|
31
|
|
|
|
32
|
|
|
|
33
|
|
2.
|
Financial Statement Schedules
|
All schedules are omitted because they are not applicable or the required information is shown in the financial statements or notes thereto. Financial statements of 50% or less owned companies have been omitted because none of the companies meets the criteria requiring inclusion of such statements.
| 3(i) — |
Amended and Restated Articles of Incorporation dated July 16, 1990. Incorporated by reference to Exhibit 3(a) as filed by Registrant with Form 10-K for the year 1996.
|
||
|
3(ii) —
|
By-laws (as amended effective October 4, 2008). Incorporated by reference to Exhibit 10.1 as filed by Registrant with Form 10-Q for the quarter ended September 30, 2008.
|
||
| 10.1 — |
Deferred Compensation Plan as adopted by the Registrant dated December 17, 1999, effective July 1, 1997. Incorporated by reference to Exhibit 10(ff) as filed by Registrant with Form 10-K for the year 1999.*
|
||
| 10.2 — |
Supplemental Retirement Income Program adopted by the Registrant on November 6, 1984, as amended November 8, 1989. Incorporated by reference to Exhibit 10(gg) as filed by Registrant with Form 10-K for the year 1999.*
|
||
| 10.3 — |
2001 Global Annual Incentive Plan as approved May 9, 2001, effective January 1, 2001. Incorporated by reference to Exhibit 10(hh) as filed by Registrant with Form 10-K for the year 2001.*
|
||
| 10.4 — |
2003 Director Stock Ownership Plan as approved May 14, 2003. Incorporated by reference to Exhibit 10(ww) as filed by the Registrant with Form 10-K for the year 2003.*
|
||
| 10.5 — |
Credit Agreement between Registrant and Bank of America, N.A. and ABN AMRO Bank, N.V. and Banc of America Securities, in the amount of $100,000,000, dated October 14, 2005. Incorporated by reference to Exhibit 10(jjj) as filed by the Registrant with Form 10-Q for the quarter ended September 30, 2005.
|
||
| 10.6 — |
Settlement Agreement and Release between Registrant, an inactive subsidiary of the Registrant, and Hartford Accident and Indemnity Company dated December 12, 2005. Incorporated by reference to Exhibit 10(nnn) as filed by the Registrant with Form 10-K for the year 2005.
|
||
| 10.7 — |
Amendment to Registrant’s Deferred Compensation Plan for key officers dated December 20, 2005. Incorporated by reference to Exhibit 10 as filed by Registrant with Form 8-K filed on December 22, 2005.*
|
||
| 10.8 — |
2001 Global Annual Incentive Plan, as amended and restated. Incorporated by reference to Appendix D to the Registrant’s definitive proxy statement filed on March 31, 2006.*
|
||
73
| 10.9 — |
2006 Long-Term Performance Incentive Plan. Incorporated by reference to Appendix E to the Registrant’s definitive proxy statement filed on March 31, 2006.*
|
||
| 10.10 — |
Form of Stock Option Agreement provided for associates under the Registrant’s 2006 Long-Term Performance Incentive Plan. Incorporated by reference to Exhibit 10.3 as filed by Registrant with Form 8-K filed on May 12, 2006.*
|
||
| 10.11 — |
Form of Restricted Stock Award Agreement for executive officers and other employees under Registrant’s 2006 Long-Term Performance Incentive Plan. Incorporated by reference to Exhibit 10 as filed by Registrant with Form 8-K filed on June 27, 2006.*
|
||
| 10.12 — |
Employment Agreement by and between L. Willem Platzer and Quaker Chemical B.V., a Netherlands corporation and a subsidiary of Registrant, dated August 21, 2006. Incorporated by reference to Exhibit 10 as filed by the Registrant with Form 8-K filed on August 22, 2006.*
|
||
| 10.13 — |
First Amendment to Syndicated Multicurrency Credit Agreement between Registrant and Bank of America, N.A. and certain other financial institutions dated October 6, 2006. Incorporated by reference to Exhibit 10.30 as filed by the Registrant with Form 10-K for the year ended 2008.
|
||
| 10.14 — |
2006 Long-Term Performance Incentive Plan (amended and restated effective November 8, 2006). Incorporated by reference to Exhibit 10(www) as filed by the Registrant with Form 10-K for the year ended 2006.*
|
||
| 10.15 — |
Financing Agreement by and among Montgomery County Industrial Development Authority and Registrant and Brown Brothers Harriman & Co. dated February 1, 2007. Incorporated by reference to Exhibit 10(yyy) as filed by the Registrant with Form 10-K for the year ended 2006.
|
||
| 10.16 — |
Settlement Agreement and Release between Registrant, an inactive subsidiary of Registrant and Federal Insurance Company dated March 26, 2007. Incorporated by reference to Exhibit 10(zzz) as filed by the Registrant with Form 10-Q for the quarter ended March 31, 2007.
|
||
| 10.17 — |
Change in Control Agreement by and between Registrant and L. Willem Platzer dated April 2, 2007, effective January 1, 2007. Incorporated by reference to Exhibit 10(aaaa) as filed by the Registrant with Form 10-Q for the quarter ended March 31, 2007.*
|
||
| 10.18 — |
Change in Control Agreement by and between Registrant and Jan F. Nieman dated June 27, 2007, effective January 1, 2007. Incorporated by reference to Exhibit 10 (cccc) as filed by the Registrant with Form 10-Q for the quarter ended June 30, 2007.*
|
||
| 10.19 — |
Memorandum of Employment dated June 28, 2007 between Registrant and Mark A. Featherstone, effective April 9, 2007. Incorporated by reference to Exhibit 10 as filed by the Registrant with Form 8-K filed on July 2, 2007.*
|
||
| 10.20 — |
Amendment No.1 to the Registrant’s Director Stock Ownership Plan (as amended March 7, 2007) approved on July 25, 2007. Incorporated by reference to Exhibit 10.37 as filed by the Registrant with Form 10-K for the year ended 2008.*
|
||
| 10.21 — |
Second Amendment to Syndicated Multicurrency Credit Agreement between Registrant and Bank of America, N.A. and certain other financial institutions dated August 13, 2007. Incorporated by reference to Exhibit 10(eeee) as filed by the Registrant with Form 10-Q for the quarter ended September 30, 2007.
|
||
| 10.22 — |
Claim Handling and Funding Agreement between SB Decking, Inc., an inactive subsidiary of Registrant, and Employers Insurance Company of Wausau dated September 25, 2007. Incorporated by reference to Exhibit 10(ffff) as filed by the Registrant with Form 10-Q for the quarter ended September 30, 2007.
|
||
| 10.23 — |
Settlement Agreement and Mutual Release entered into between AC Products, Inc., wholly owned subsidiary of Registrant, and Orange County Water District, effective November 8, 2007. Incorporated by reference to Exhibit 10.47 as filed by the Registrant with Form 10-K for the year ended 2007.
|
74
| 10.24 — |
Financing Agreement by and among Butler County Port Authority and Registrant and Brown Brothers Harriman & Co. dated May 15, 2008. Incorporated by reference to Exhibit 10.1 as filed by the Registrant with Form 10-Q for the quarter ended June 30, 2008.
|
||
| 10.25 — |
Engineering, Procurement and Construction Contract by and between Registrant and FMC Technologies, Inc., effective May 14, 2008. Incorporated by reference to Exhibit 10.2 as filed by the Registrant with Form 10-Q for the quarter ended June 30, 2008.
|
||
| 10.26 — |
Employment, Transition and Consulting Agreement by and between Registrant and Ronald J. Naples dated May 22, 2008, effective May 7, 2008. Incorporated by reference to Exhibit 10.3 as filed by the Registrant with Form 10-Q for the quarter ended June 30, 2008. *
|
||
| 10.27 — |
Employment Agreeement by and between Registrant and Michael F. Barry dated July 1, 2008. Incorporated by reference to Exhibit 10.5 as filed by the Registrant with Form 10-Q for the quarter ended June 30, 2008. *
|
||
| 10.28 — |
Change in Control Agreement by and between Registrant and Michael F. Barry dated July 1, 2008. Incorporated by reference to Exhibit 10.6 as filed by the Registrant with Form 10-Q for the quarter ended June 30, 2008. *
|
||
| 10.29 — |
Butler County Port Authority Industrial Development Revenue Bond dated May 15, 2008. Incorporated by reference to Exhibit 10.7 as filed by the Registrant with Form 10-Q for the quarter ended June 30, 2008.
|
||
| 10.30 — |
Expatriate Agreement by and between Jan F. Nieman and Quaker Chemical Limited (Hong Kong) and Quaker Chemical B.V., both subsidiaries of Registrant, dated June 3, 2003, effective August 1, 2003 and Amended Expatriate Agreement by and between Jan F. Nieman and Quaker Chemical (China) Co. Ltd., Quaker Chemical Limited (Hong Kong) and Quaker Chemical B.V., all subsidiaries of Registrant, dated July 27, 2008, effective August 1, 2008. Incorporated by reference to Exhibit 10.37 as filed by the Registrant with Form 10-K for the year ended December 31, 2009.*
|
||
| 10.31 — |
Memorandum of Employment by and between Registrant and Joseph F. Matrange dated September 30, 2008. Incorporated by reference to Exhibit 10.48 as filed by the Registrant with Form 10-K for the year ended 2008. *
|
||
| 10.32 — |
Memorandum of Employment by and between Registrant and D. Jeffry Benoliel dated October 1, 2008. Incorporated by reference to Exhibit 10.49 as filed by the Registrant with Form 10-K for the year ended 2008. *
|
||
| 10.33 — |
Amendment to Memorandum of Employment by and between Mark A. Featherstone and Registrant dated November 19, 2008, effective January 1, 2008. Incorporated by reference to Exhibit 10.52 as filed by the Registrant with Form 10-K for the year ended 2008. *
|
||
| 10.34 — |
Change in Control Agreement by and between Registrant and Mark A. Featherstone dated November 19, 2008, effective January 1, 2008. Incorporated by reference to Exhibit 10.53 as filed by the Registrant with Form 10-K for the year ended 2008. *
|
||
| 10.35 — |
Change in Control Agreement by and between Registrant and D. Jeffry Benoliel dated November 19, 2008, effective January 1, 2008. Incorporated by reference to Exhibit 10.54 as filed by the Registrant with Form 10-K for the year ended 2008. *
|
||
| 10.36 — |
Change in Control Agreement by and between Registrant and Joseph F. Matrange dated November 19, 2008, effective October 1, 2008. Incorporated by reference to Exhibit 10.55 as filed by the Registrant with Form 10-K for the year ended 2008. *
|
||
| 10.37 — |
Change in Control Agreement by and between Registrant and Ronald S. Ettinger dated November 19, 2008, effective October 1, 2008. Incorporated by reference to Exhibit 10.56 as filed by the Registrant with Form 10-K for the year ended 2008. *
|
||
| 10.38 — |
Change in Control Agreement by and between Registrant and George H. Hill dated November 19, 2008, effective October 1, 2008. Incorporated by reference to Exhibit 10.57 as filed by the Registrant with Form 10-K for the year ended 2008. *
|
75
| 10.39 — |
Supplemental Retirement Income Program (as amended and restated effective January 1, 2008), approved November 19, 2008. Incorporated by reference to Exhibit 10.58 as filed by the Registrant with Form 10-K for the year ended 2008. *
|
||
| 10.40 — |
Amendment No. 1 to the 2001 Global Annual Incentive Plan (as amended and restated effective January 1, 2006), approved November 19, 2008. Incorporated by reference to Exhibit 10.60 as filed by the Registrant with Form 10-K for the year ended 2008. *
|
||
| 10.41 — |
Amendment No. 1 to the 2006 Long-Term Performance Incentive Plan (as amended and restated effective November 8, 2006), approved November 19, 2008. Incorporated by reference to Exhibit 10.61 as filed by the Registrant with Form 10-K for the year ended 2008. *
|
||
| 10.42 — |
Third Amendment to Syndicated Multicurrency Credit Agreement between Registrant and Bank of America, N.A. and certain other financial institutions dated February 13, 2009, effective February 17, 2009. Incorporated by reference to Exhibit 10.62 as filed by the Registrant with Form 10-K for the year ended 2008.
|
||
| 10.43 — |
Amendment No. 2 to the Quaker Chemical Corporation 2003 Director Stock Ownership Plan (As Amended March 7, 2007). Incorporated by reference to Exhibit 10.1 as filed by the Registrant with Form 10-Q for the quarter ended March 31, 2009. *
|
||
| 10.44 — |
Amended Expatriate Agreement by and between Jan F. Nieman and Quaker Chemical (China) Ltd., Quaker Chemical Limited (Hong Kong) and Quaker Chemical B.V., all subsidiaries of Registrant, dated April 6, 2010, Effective March 1, 2010. Incorporated by reference to Exhibit 10.1 as filed by the Registrant with Form 10-Q for the quarter ended March 31, 2010. *
|
||
| 10.45 — |
Employment Agreement by and between Registrant and Joseph Berquist dated April 1, 2010. Incorporated by reference to Exhibit 10.2 as filed by the Registrant with Form 10-Q for the quarter ended March 31, 2010. *
|
||
| 10.46 — |
Change in Control Agreement by and between Registrant and Joseph Berquist dated April 1, 2010. Incorporated by reference to Exhibit 10.3 as filed by the Registrant with Form 10-Q for the quarter ended March 31, 2010. *
|
||
| 10.47 — |
Fourth Amendment to Syndicated Multicurrency Credit Agreement between Registrant and Bank of America, N.A. and certain other financial institutions dated June 21, 2010. Incorporated by reference to Exhibit 10.1 as filed by the Registrant with Form 10-Q for the quarter ended June 30, 2010.
|
||
| 10.48 — |
Stock Purchase Agreement by and among Registrant, Summit Lubricants Inc., Ronald Krol, Brian Caputi, Dale M. Perry and Anthony Musilli, dated December 31, 2010. Incorporated by reference to Exhibit 10.54 as filed by the Registrant with Form 10-K for the year ended 2010.
|
||
| 10.49 — |
Amendment No. 3 to the Quaker Chemical Corporation 2003 Director Stock Ownership Plan (As Amended January 26, 2011). Incorporated by reference to Exhibit 10.55 as filed by the Registrant with Form 10-K for the year ended 2010.*
|
||
| 10.50 — |
Employment Agreement by and between Carlos Claro and Quaker Chemical Industria e Comercio Ltda., a Brazilian corporation and a subsidiary of the Registrant, dated January 5, 2011. Incorporated by reference to Exhibit 10.56 as filed by the Registrant with Form 10-K for the year ended 2010.*
|
||
| 10.51 — |
Employment Agreement by and between Dieter Laininger and Quaker Chemical B.V., a subsidiary of the registrant, dated June 1, 2011, effective June 15, 2011. Incorporated by reference to Exhibit 10.1 as filed by the Registrant with Form 10-Q for the quarter ended June 30, 2011. *
|
||
| 10.52 — |
Change in Control Agreement by and between Registrant and Dieter Laininger dated May 31, 2011, effective June 15, 2011. Incorporated by reference to Exhibit 10.1 as filed by the Registrant with Form 10-Q for the quarter ended June 30, 2011. *
|
||
| 10.53 — |
Global Annual and Incentive Plan (as amended and restated effective May 11, 2011). Incorporated by reference to Appendix B to the Registrant’s definitive proxy statement filed on March 31, 2011. *
|
||
| 10.54 — |
2011 Long-Term Performance Incentive Plan. Incorporated by reference to Appendix C to the Registrant’s definitive proxy statement filed on March 31, 2011. *
|
76
| 10.55 — |
Form of Restricted Stock Unit Agreement for executive officers and other employees under Registrant’s 2011 Long-Term Performance Incentive Plan. Incorporated by reference to Exhibit 10.1 as filed by the Registrant with Form 10-Q for the quarter ended March 31, 2012.*
|
||
| 10.56 — |
Memorandum of Employment by and between Registrant and Margaret M. Loebl, dated May 22, 2012, effective June 29, 2012. Incorporated by reference to Exhibit 10.1 as filed by the Registrant with Form 10-Q for the quarter ended June 30, 2012.*
|
||
| 10.57 — |
Change in Control Agreement by and between Registrant and Margaret M. Loebl, dated May 22, 2012, effective June 29, 2012. Incorporated by reference to Exhibit 10.2 as filed by the Registrant with Form 10-Q for the quarter ended June 30, 2012.*
|
||
| 10.58 — |
Amendment to Employment Agreement by and between Jan Nieman and Quaker Chemical Limited (Hong Kong) and Quaker Chemical, B.V., both subsidiaries of Registrant, dated August 2, 2012. Incorporated by reference to Exhibit 10.1 as filed by the Registrant with Form 10-Q for the quarter ended September 30, 2012.*
|
||
| 10.59 — | |||
| 21 — | |||
| 23 — | |||
| 31.1 — | |||
| 31.2 — | |||
| 32.1 — | |||
| 32.2 — |
|
101.INS —
|
XBRL Instance Document **
|
|
101.SCH —
|
XBRL Extension Schema Document **
|
| 101.CAL — |
XBRL Calculation Linkbase Document **
|
| 101.DEF — |
XBRL Definition Linkbase Document **
|
| 101.LAB — | XBRL Label Linkbase Document ** |
|
|
|
|
101.PRE —
|
XBRL Presentation Linkbase Document **
|
|
*
|
This exhibit is a management contract or compensation plan or arrangement required to be filed as an exhibit to this Report.
|
|
**
|
Pursuant to Rule 406T of Regulation S-T, these interactive data files are deemed not filed or part of a registration statement or prospectus for purposes of Sections 11 or 12 of the Securities Act of 1933 and are deemed not filed for purposes of Section 18 of the Securities Exchange Act of 1934 and otherwise are not subject to liability under these Sections.
|
(b) Exhibits required by Regulation 601 S-K
See (a) 3 of this Item 15.
(c) Financial Statement Schedules
See (a) 2 of this Item 15.
77
Pursuant to the requirements of Section 13 or 15(d) of the Securities Exchange Act of 1934, the Registrant has duly caused this Report to be signed on its behalf by the undersigned, thereunto duly authorized.
|
QUAKER CHEMICAL CORPORATION
|
||
|
Registrant
|
||
|
By:
|
/s/ MICHAEL F. BARRY
|
|
|
Michael F. Barry
Chairman of the Board, Chief Executive Officer and President
|
||
Date: March 6, 2013
Pursuant to the requirements of the Securities Exchange Act of 1934, this Report has been signed below by the following persons on behalf of the Registrant and in the capacities and on the dates indicated.
|
Signatures
|
Capacity |
Date
|
|||||
|
/s/ MICHAEL F. BARRY
|
Principal Executive Officer and
|
March 6, 2013
|
|||||
|
Michael F. Barry
|
Director
|
||||||
|
Chairman of the Board, Chief Executive Officer and President
|
|||||||
|
/s/ MARGARET M. LOEBL
|
Principal Financial Officer
|
March 6, 2013
|
|||||
|
Margaret M. Loebl
|
|||||||
|
Vice President, Chief Financial Officer and Treasurer
|
|||||||
|
/s/ GEORGE H. HILL
|
Principal Accounting Officer
|
March 6, 2013
|
|||||
|
George H. Hill
|
|||||||
|
Global Controller
|
|||||||
|
/s/ JOSEPH B. ANDERSON, JR.
|
Director
|
March 6, 2013
|
|||||
|
Joseph B. Anderson, Jr
|
|||||||
|
/s/ PATRICIA C. BARRON
|
Director
|
March 6, 2013
|
|||||
|
Patricia C. Barron
|
|||||||
|
/s/ DONALD R. CALDWELL
|
Director
|
March 6, 2013
|
|||||
|
Donald R. Caldwell
|
|||||||
|
/s/ ROBERT E. CHAPPELL
|
Director
|
March 6, 2013
|
|||||
|
Robert E. Chappell
|
|||||||
|
/s/ WILLIAM R. COOK
|
Director
|
March 6, 2013
|
|||||
|
William R. Cook
|
|||||||
|
/s/ EDWIN J. DELATTRE
|
Director
|
March 6, 2013
|
|||||
|
Edwin J. Delattre
|
|||||||
|
/s/ MARK A. DOUGLAS
|
Director
|
March 6, 2013
|
|||||
|
Mark A. Douglas
|
|||||||
|
/s/ JEFFRY D. FRISBY
|
Director
|
March 6, 2013
|
|||||
|
Jeffry D. Frisby
|
|||||||
|
/s/ ROBERT H. ROCK
|
Director
|
March 6, 2013
|
|||||
|
Robert H. Rock
|
|||||||
78