Table of Contents
Registration No. 333-152409
Washington, D.C. 20549
POST EFFECTIVE AMENDMENT NO. 13 [X]
AMENDMENT NO. 27 [X]
Boston, MA 02116
U.S. INSURANCE LAW
200 BERKELEY ST.
[X] on April 29, 2019 pursuant to paragraph (b) of Rule 485
[ ] 60 days after filing pursuant to paragraph (a) (1) of Rule 485
Table of Contents
(“John Hancock USA”)
| • | Starting on the next page is a Table of Contents for this prospectus. |
| • | The section after the Table of Contents is called “Summary of Benefits and Risks.” It contains a summary of the benefits available under the policy and of the principal risks of purchasing the policy. You should read this section before reading any other section of this prospectus. |
| • | Behind the Summary of Benefits and Risks section is a section called “Fee Tables” that describes the fees and expenses you will pay when buying, owning and surrendering the policy. |
| • | Behind the Fee Tables section is a section called “Detailed Information.” This section gives more details about the policy. It may repeat certain information contained in the Summary of Benefits and Risks section in order to put the more detailed information in proper context. |
| • | Finally, on the back cover of this prospectus is information concerning the Statement of Additional Information (the “SAI”) and how the SAI, audited financial statements for John Hancock USA and the Separate Account, personalized illustrations and other information can be obtained. |
| • | Option 1 - The death benefit will equal the greater of (1) the Total Face Amount plus any amount payable under a supplementary benefit rider, or (2) the minimum death benefit (as described under “The minimum death benefit” provision in the “Detailed Information” section of this prospectus). |
| • | Option 2 - The death benefit will equal the greater of (1) the Total Face Amount plus any amount payable under a supplementary benefit rider, plus the policy value on the date of death, or (2) the minimum death benefit. |
| • | the amount you invested, |
| • | plus any gain or minus any loss of the investment experience of the variable investment accounts you’ve chosen, |
| • | minus all charges we deduct, and |
| • | minus all withdrawals you have made. |
| Transaction Fees | ||
| Charge | When Charge is Deducted | Amount Deducted |
| Deferred premium charge | Upon making a premium payment (charge deducted monthly over a ten year period beginning in the policy year following the premium payment)(1) | 0.13% monthly for ten policy years for each premium payment |
| Transfer fee | Upon each transfer into or out of an investment account beyond an annual limit of not less than twelve | $25.00 (2) |
| Replacement fee(3) | Upon a policy replacement or section 1035 exchange for the first ten policy years | |
| Maximum charge | $37.69 per $1,000 of Total Face Amount | |
| Minimum charge | $3.37 per $1,000 of Total Face Amount | |
| Charge for representative insured person | $12.60 per $1,000 of Total Face Amount | |
| Surrender fee(4) | Upon a withdrawal or surrender of the policy (if such surrender is not subject to a Replacement fee) during the first 7 policy years | |
| Maximum charge | $14.63 per $1,000 of Total Face Amount | |
| Minimum charge | $1.05 per $1,000 of Total Face Amount | |
| Charge for representative insured person | $2.88 per $1,000 of Total Face Amount | |
| Periodic Charges Other Than Fund Operating Expenses | ||
| Charge | When Charge is Deducted | Amount Deducted |
| Cost of insurance charge(1) | Monthly | |
| Maximum charge | $83.33 per $1,000 of NAR | |
| Minimum charge | $0.04 per $1,000 of NAR | |
| Charge for representative insured person | $0.22 per $1,000 of NAR | |
| Base Face Amount charge(2) | Monthly | |
| Maximum charge | $2.44 per $1,000 of Base Face Amount | |
| Minimum charge | $0.09 per $1,000 of Base Face Amount | |
| Charge for representative insured person | $0.24 per $1,000 of Base Face Amount | |
| Administrative charge | Monthly | $15.00 |
| Asset-based risk charge(3) | Monthly | 0.14% of policy value |
| Policy loan interest rate(4) | Accrues
daily Payable annually |
3.75% |
| Rider Charges | ||
| Charge | When Charge is Deducted | Amount Deducted |
| Accelerated Benefit Rider(1) | At exercise of benefit | $150 |
| Overloan Protection Rider(2) | At exercise of benefit | |
| Maximum charge | 8.00% | |
| Minimum charge | 0.04% | |
| Return of Premium Death Benefit Rider(3) | Monthly | |
| Maximum charge | $83.33 per $1,000 of NAR | |
| Minimum charge | $0.04 per $1,000 per NAR | |
| Charge for representative insured person | $0.22 per $1,000 of NAR | |
| Long-Term Care Rider(4) | Monthly | |
| Maximum charge | $3.34 per $1,000 of NAR | |
| Minimum charge | $0.01 per $1,000 of NAR | |
| Charge for representative insured person | $0.08 per $1,000 of NAR | |
| Total Annual Portfolio Operating Expenses | Minimum | Maximum |
| Range of expenses, including management fees, distribution and/or service (12b-1) fees, and other expenses1 | 0.42% | 1.87% |
| Portfolio | Subadviser | Investment Objective |
| 500 Index | John Hancock Asset Management, a division of Manulife Asset Management (North America) Limited | To approximate the aggregate total return of a broad-based U.S. domestic equity market index. |
| Active Bond | John Hancock Asset Management, a division of Manulife Asset Management (US) LLC | To seek to provide income and capital appreciation. |
| American Asset Allocation | Capital Research and Management Company (Adviser to the American Funds Insurance Series) | To seek to provide high total return (including income and capital gains) consistent with preservation of capital over the long-term. |
| American Global Growth | Capital Research and Management Company (Adviser to the American Funds Insurance Series) | To seek to provide long-term growth of capital. |
| American Growth | Capital Research and Management Company (Adviser to the American Funds Insurance Series) | To seek to provide growth of capital. |
| American Growth–Income | Capital Research and Management Company (Adviser to the American Funds Insurance Series) | To seek to provide growth of capital and income. |
| American International | Capital Research and Management Company (Adviser to the American Funds Insurance Series) | To seek to provide long-term growth of capital. |
| Blue Chip Growth | T. Rowe Price Associates, Inc. | To seek to provide long-term growth of capital. Current income is a secondary objective. |
| Capital Appreciation | Jennison Associates LLC | To seek to provide long-term growth of capital. |
| Capital Appreciation Value | T. Rowe Price Associates, Inc. | To seek to provide long-term capital appreciation. |
| Core Bond | Wells Capital Management, Incorporated | To seek to provide total return consisting of income and capital appreciation. |
| Emerging Markets Value | Dimensional Fund Advisors LP | To seek to provide long-term capital appreciation. |
| Equity Income | T. Rowe Price Associates, Inc. | To seek to provide substantial dividend income and also long-term growth of capital. |
| Financial Industries | John Hancock Asset Management, a division of Manulife Asset Management (US) LLC | To seek to provide growth of capital. |
| Fundamental All Cap Core | John Hancock Asset Management, a division of Manulife Asset Management (US) LLC | To seek to provide long-term growth of capital. |
| Fundamental Large Cap Value | John Hancock Asset Management, a division of Manulife Asset Management (US) LLC | To seek to provide long-term capital appreciation. |
| Global | Templeton Global Advisors Limited | To seek to provide long-term capital appreciation. |
| Global Bond | Pacific Investment Management Company LLC | To seek to provide maximum total return, consistent with preservation of capital and prudent investment management. |
| Health Sciences | T. Rowe Price Associates, Inc. | To seek to provide long-term capital appreciation. |
| High Yield | Western Asset Management Company | To seek to provide an above-average total return over a market cycle of 3 to 5 years, consistent with reasonable risk. |
| International Equity Index | SSGA Funds Management, Inc. | To seek to track the performance of a broad-based equity index of foreign companies primarily in developed countries and, to a lesser extent, in emerging markets. |
| International Growth Stock | Invesco Advisers, Inc. | To seek to provide long-term growth of capital. |
| International Small Company | Dimensional Fund Advisors LP | To seek to provide long-term capital appreciation. |
| Portfolio | Subadviser | Investment Objective |
| International Value | Templeton Investment Counsel, LLC | To seek to provide long-term growth of capital. |
| Investment Quality Bond | Wellington Management Company LLP | To seek to provide a high level of current income consistent with the maintenance of principal and liquidity. |
| Lifestyle Balanced | John Hancock Asset Management, a division of Manulife Asset Management (US) LLC; and John Hancock Asset Management, a division of Manulife Asset Management (North America) Limited | To seek to provide a high level of current income and growth of capital, with a greater emphasis on growth of capital. |
| Lifestyle Conservative | John Hancock Asset Management, a division of Manulife Asset Management (US) LLC; and John Hancock Asset Management, a division of Manulife Asset Management (North America) Limited | To seek to provide a high level of current income with some consideration given to growth of capital. |
| Lifestyle Growth | John Hancock Asset Management, a division of Manulife Asset Management (US) LLC; and John Hancock Asset Management, a division of Manulife Asset Management (North America) Limited | To seek to provide long-term growth of capital. Current income is also a consideration. |
| Lifestyle Moderate | John Hancock Asset Management, a division of Manulife Asset Management (US) LLC; and John Hancock Asset Management, a division of Manulife Asset Management (North America) Limited | To seek to provide a balance between a high level of current income and growth of capital, with a greater emphasis on income. |
| Managed Volatility Aggressive | John Hancock Asset Management, a division of Manulife Asset Management (US) LLC; and John Hancock Asset Management, a division of Manulife Asset Management (North America) Limited | To seek to provide long-term growth of capital while seeking to both manage the volatility of return and limit the magnitude of portfolio losses. |
| Managed Volatility Balanced | John Hancock Asset Management, a division of Manulife Asset Management (US) LLC; and John Hancock Asset Management, a division of Manulife Asset Management (North America) Limited | To seek to provide growth of capital and current income while seeking to both manage the volatility of return and limit the magnitude of portfolio losses. |
| Managed Volatility Conservative | John Hancock Asset Management, a division of Manulife Asset Management (US) LLC; and John Hancock Asset Management, a division of Manulife Asset Management (North America) Limited | To seek to provide current income and growth of capital while seeking to both manage the volatility of return and limit the magnitude of portfolio losses. |
| Managed Volatility Growth | John Hancock Asset Management, a division of Manulife Asset Management (US) LLC; and John Hancock Asset Management, a division of Manulife Asset Management (North America) Limited | To seek to provide long-term growth of capital while seeking to both manage the volatility of return and limit the magnitude of portfolio losses. |
| Portfolio | Subadviser | Investment Objective |
| Managed Volatility Moderate | John Hancock Asset Management, a division of Manulife Asset Management (US) LLC; and John Hancock Asset Management, a division of Manulife Asset Management (North America) Limited | To seek to provide current income and growth of capital while seeking to both manage the volatility of return and limit the magnitude of portfolio losses. |
| Mid Cap Index | John Hancock Asset Management, a division of Manulife Asset Management (North America) Limited | To seek to approximate the aggregate total return of a medium-capitalization U.S. domestic equity market index. |
| Mid Cap Stock | Wellington Management Company, LLP | To seek to provide long-term growth of capital. |
| Mid Value | T. Rowe Price Associates, Inc. | To seek to provide long-term capital appreciation. |
| Money Market | John Hancock Asset Management, a division of Manulife Asset Management (US) LLC | To seek to obtain maximum current income consistent with preservation of principal and liquidity. Certain market conditions may cause the return of the portfolio to become low or possibly negative. |
| PIMCO VIT All Asset (a series of PIMCO Variable Insurance Trust) (only Class M is available) | Pacific Investment Management Company LLC | To seek to provide maximum real return, consistent with preservation of real capital and prudent investment management. |
| Real Estate Securities | Deutsche Investment Management Americas Inc. | To seek to provide a combination of long-term capital appreciation and current income. |
| Science & Technology | Allianz Global Investors U.S. LLC; and T. Rowe Price Associates, Inc. | To seek to provide long-term growth of capital. Current income is incidental to the portfolio’s objective. |
| Select Bond | John Hancock Asset Management, a division of Manulife Asset Management (US) LLC | To seek to provide income and capital appreciation. |
| Short Term Government Income | John Hancock Asset Management, a division of Manulife Asset Management (US) LLC | To seek to provide a high level of current income consistent with preservation of capital. Maintaining a stable share price is a secondary goal. |
| Small Cap Index | John Hancock Asset Management, a division of Manulife Asset Management (North America) Limited | To seek to approximate the aggregate total return of a small-capitalization U.S. domestic equity market index. |
| Small Cap Opportunities | Dimensional Fund Advisors LP; and GW&K Investment Management, LLC | To seek to provide long-term capital appreciation. |
| Small Cap Stock | Wellington Management Company LLP | To seek to provide long-term capital appreciation. |
| Small Cap Value | Wellington Management Company LLP | To seek to provide long-term capital appreciation. |
| Small Company Value | T. Rowe Price Associates, Inc. | To seek to provide long-term growth of capital. |
| Strategic Income Opportunities | John Hancock Asset Management, a division of Manulife Asset Management (US) LLC | To seek to provide a high level of current income. |
| Total Bond Market | John Hancock Asset Management, a division of Manulife Asset Management (US) LLC | To seek to track the performance of the Bloomberg Barclays U.S. Aggregate Bond Index.* |
| Total Stock Market Index | John Hancock Asset Management, a division of Manulife Asset Management (North America) Limited | To seek to approximate the aggregate total return of a broad U.S. domestic equity market index. |
| Ultra Short Term Bond | John Hancock Asset Management, a division of Manulife Asset Management (US) LLC | To seek to provide a high level of current income consistent with the maintenance of liquidity and the preservation of capital. |
| Utilities | Massachusetts Financial Services Company | To seek to provide capital growth and current income (income above that available from the portfolio invested entirely in equity securities). |
| • | Option 1 - The death benefit will equal the greater of (1) the Total Face Amount plus any amount payable under a supplementary benefit rider, or (2) the minimum death benefit (as described below). |
| • | Option 2 - The death benefit will equal the greater of (1) the Total Face Amount plus any amount payable under a supplementary benefit rider, plus the policy value on the date of death, or (2) the minimum death benefit. |
| • | As shown in the Fee Tables, there is a charge per $1000 of Base Face Amount. This means for the same amount of Total Face Amount, your Base Face Amount charges deducted from policy value will be higher if you elect greater proportions of Base Face Amount at issue versus Supplemental Face Amount. |
| • | However, if you elect greater proportions of Supplemental Face Amount coverage at issue, the guaranteed limit upon the asset-based risk charge we provide will be higher. As shown in the Fee Tables, the “maximum” guaranteed charge of 0.14% of policy value is for a policy with 90% Supplemental Face Amount at issue. A policy with 50% Supplemental Face Amount at issue would have a guaranteed charge of 0.09%; whereas a policy with 100% Base Face Amount at issue would have a guaranteed charge of 0.03%. Please see the Fee Tables for a description of the guaranteed and current asset-based risk charges in all policy years. The asset-based risk charge percentages assessed on a current basis may be the same for both Base Face Amount and Supplemental Face Amount. |
| • | Also, after the insured person reaches or would have reached age 121, any Supplemental Face Amount will terminate. If your priority is to maximize the death benefit when the insured person reaches or would have reached age 121, then you may wish to maximize the proportion of the Base Face Amount. |
| Attained Age | Applicable Factor | |
|
40 and
under |
250% | |
|
45 |
215% | |
|
50 |
185% | |
|
55 |
150% | |
|
60 |
130% | |
|
65 |
120% | |
|
70 |
115% | |
|
75 |
105% | |
|
90 |
105% | |
|
95 and
above |
100% |
| • | the remaining Total Face Amount will be at least $100,000, |
| • | the remaining Base Face Amount will be at least $50,000, and |
| • | the remaining Total Face Amount will at least equal the minimum required by the tax laws to maintain the policy’s life insurance status. |
| • | within 18 months after the policy's Issue Date, or |
| • | within 60 days after the later of the effective date of a material change in the investment objectives of any investment account or the date you are notified of the change. |
| • | We first determine the net cash surrender value of your policy. |
| • | We then subtract an amount equal to the monthly deductions then being deducted from policy value times the number of full policy months until the next policy anniversary. |
| • | We then multiply the resulting amount by the difference between the effective annual rate then being charged on loans and the effective annual rate then being credited on the loan account. |
| • | We then subtract the third item above from the second item above. |
| • | The same proportionate part of the loan as was borrowed from any fixed account will be repaid to that fixed account. |
| • | The remainder of the repayment will be allocated among the accounts in the same way a new premium payment would be allocated (unless otherwise specified by you). |
| • | Deferred premium charge - At the end of each policy year, we calculate a deferred premium charge on the basis of the total of the premiums paid during that policy year, multiplied by a rate not to exceed 0.13% (15% on a cumulative basis). The premium charge is then assessed monthly over ten policy years in 120 equal monthly amounts. |
| • | Administrative charge - A monthly charge to help cover our administrative costs. This is a flat dollar charge of $15. |
| • | Base Face Amount charge - A monthly charge to primarily help cover sales costs. To determine the charge we multiply the amount of Base Face Amount at issue by a rate that varies by duration (policy year) and by the insured person's sex, risk classification, and issue age. We reserve the right to increase the rate and the charge period (see Fee Table). |
| • | Cost of insurance charge - A monthly charge for the cost of insurance. To determine the charge, we multiply the net amount of insurance for which we are then at risk by a cost of insurance rate. The rate is derived from an actuarial table. The table in your policy will show the maximum cost of insurance rates. The cost of insurance rates that we currently apply are generally less than the maximum rates. The current rates will never be more than the maximum rates shown in the policy. The cost of insurance we use will depend on age of the insured person at issue, the insurance risk characteristics and (usually) sex of the insured person, and the length of time the policy has been in effect. Regardless of the table used, cost of insurance rates generally increase each year that you own your policy, as the insured person’s age increases. (The insured person’s “age” on any date is his or her age on the birthday nearest that date.) For death benefit Option 1, the net amount at risk is equal to the greater of zero, or the result of (a) minus (b) where: |
| • | Replacement fee - A Replacement fee is imposed for the first ten policy years if you surrender your policy in connection with the purchase of a replacement policy, including a replacement intended to qualify as a tax free exchange under section 1035 of the Internal Revenue Code. The fee is a percentage of the premiums we receive in the first policy year that do not exceed the Replacement Fee Calculation Limit stated in your policy. The percentage applied is dependent upon the policy year during which replacement occurs and grades down proportionately at the beginning of each policy month until it reaches zero. The Replacement Fee Calculation Limit varies by issue age, sex and the amount of Base Face Amount and Supplemental Face Amount elected at issue. |
| • | Surrender fee - Effective July 27, 2010, we will automatically issue the Surrender Fee Endorsement with all policies described in this prospectus that we determine according to our underwriting standards present a heightened risk of early termination. These standards will be (i) designed to identify cases that expose us to potential increased costs resulting from early surrenders or withdrawals, (ii) will be uniformly applied and reasonable, and (iii) will not unfairly discriminate against any purchaser. For example, we will take into account factors such as the nature of the purchaser (individual or corporate), the size and business type of any corporate purchaser, and the purposes for which the insurance is being purchased. |
| • | Asset-based risk charge - A monthly charge to help cover sales, administrative and other costs. The charge is a percentage of that portion of your policy value allocated to investment accounts. This charge does not apply to the current fixed account. |
| • | Supplementary benefits charges - A charge for any supplementary insurance benefits added to the policy by means of a rider. |
| • | Loan interest rate - We will charge interest on any amount you borrow from your policy. The interest charged on any loan is an effective annual rate of 3.75% in the first ten policy years and 3.00% thereafter. However, we reserve the right to increase the percentage after the tenth policy year to as much as 3.25%. (see “Policy loans”). |
| • | Transfer fee - We currently do not impose a fee upon transfers of policy value among the investment accounts, but reserve the right to impose a fee of up to $25 for any transfer beyond an annual limit (which will not be less than 12) to compensate us for the costs of processing these transfers (see “Market timing and disruptive trading risks”). |
| • | We will stop any monthly deduction charges. |
| • | We will stop accepting any premium payments. |
| • | We will no longer process withdrawals. |
| • | We will continue to credit interest to a fixed account. |
| • | We will not allow any new loans and loan interest will continue to be charged if there is an outstanding loan. |
| • | Any Supplemental Face Amount will terminate (see “Base Face Amount vs. Supplemental Face Amount”). |
| • | Overloan Protection Rider - This rider will prevent your policy from lapsing on any date if policy debt exceeds the death benefit. The benefit is subject to a number of eligibility requirements relating to, among other things, the number of years the policy has been in force, the attained age of the life insured, the death benefit option elected and the tax status of the policy. |
| • | Return of Premium Death Benefit Rider - You may elect to have your policy issued with an optional Return of Premium Death Benefit Rider. This rider provides an additional death benefit payable upon the death of the insured person. The Return of Premium Death Benefit has an initial value equal to your initial premium times the “Percentage of Premium” you select (which may range between 0% and 100%). We show the Percentage of Premium you select in the Policy Specifications page. If you elected increases to your Supplemental Face Amount, you may not elect this rider. This benefit is only available to you if you elect death benefit Option 1. |
| • | Accelerated Benefit Rider - This rider provides for acceleration of payment of a portion of the death benefit should the insured person become terminally ill and have a life expectancy of one year or less. You must meet the following conditions before we pay the benefit. |
| • | You must provide written evidence satisfactory to us that the life insured is terminally ill and has a life expectancy of one year or less. |
| • | We must have a signed consent of any irrevocable beneficiary and any assignee. |
| • | You must claim the benefit voluntarily. We will not pay the benefit if you are claiming it to satisfy creditors or for government benefits. |
| • | Long-Term Care Rider - This rider provides for periodic advance payments to you of a portion of the death benefit if the insured person becomes “chronically ill” so that such person: (1) is unable to perform at least two activities of daily living without substantial human assistance or has a severe cognitive impairment; and (2) is receiving certain qualified services described in the rider. The decision to add this rider must be made at issuance of the policy. If you elect this rider, you will also have an option to apply to have a portion of the policy's death benefit advanced to you in |
| the event of terminal illness. In addition, there is a significant risk that ownership of a policy with this rider by anyone other than the insured will cause adverse tax consequences (see “Tax considerations”). |
| • | The policy is delivered to and received by the applicant. |
| • | The Minimum Initial Premium is received by us. |
| • | The insured person is living and there has been no deterioration in the insurability of the insured person since the date of the application. |
| • | Changes necessary to comply with or obtain or continue exemptions under the Federal securities laws |
| • | Combining or removing fixed accounts or variable investment accounts |
| • | Changes in the form of organization of any separate account |
| • | Determine when and how much you invest in the variable investment accounts and any fixed account |
| • | Borrow or withdraw amounts you have in the variable investment account and any fixed account |
| • | Change the beneficiary who will receive the death benefit |
| • | Change the amount of insurance |
| • | Turn in (i.e., “surrender”) the policy for the full amount of its net cash surrender value |
| • | Choose the form in which we will pay out the death benefit or other proceeds |
| • | John Hancock USA at either of the addresses shown on the back cover of this prospectus, or |
| • | the John Hancock USA representative who delivered the policy to you. |
| • | loans |
| • | surrenders or withdrawals |
| • | change of death benefit option |
| • | increase or decrease in Face Amount |
| • | change of beneficiary |
| • | election of payment option for policy proceeds |
| • | tax withholding elections |
| • | election of telephone/internet transaction privilege |
| • | transfers of policy value among the variable investment accounts and any fixed account |
| • | change of allocation among the variable investment accounts and any fixed account for new premium payments |
| • | First, all withdrawals from such a policy are treated as ordinary income subject to tax up to the amount equal to the excess (if any) of the policy value immediately before the withdrawal over the investment in the policy at such time. If |
| you own any other modified endowment contracts issued to you in the same calendar year by the same insurance company or its affiliates, their values will be combined with the value of the policy from which you take the withdrawal for purposes of determining how much of the withdrawal is taxable as ordinary income. |
| • | Second, loans taken from or secured by such a policy and assignments or pledges of any part of its value are treated as partial withdrawals from the policy and taxed accordingly. Past-due loan interest that is added to the loan amount is treated as an additional loan. |
| • | Third, a 10% additional penalty tax is imposed on the portion of any distribution (including distributions on surrender) from, or loan taken from or secured by, such a policy that is included in income except where the distribution or loan: |
| • | is made on or after the date on which the policy owner attains age 59½; |
| • | is attributable to the policy owner becoming disabled; or |
| • | is part of a series of substantially equal periodic payments for the life (or life expectancy) of the policy owner or the joint lives (or joint life expectancies) of the policy owner and the policy owner’s beneficiary. |
| JOHN HANCOCK USA SERVICE OFFICE | |
| Overnight Express Delivery | Mail Delivery |
| Life
Post Issue - Specialty Products John Hancock Insurance Company 30 Dan Road, Suite #55979 Canton, MA 02021 |
Life
Post Issue - Specialty Products John Hancock Insurance Company PO Box 55979 Boston, MA 02205 |
| Phone: | Fax: |
| 1-800-521-1234 | 1-617-572-1571 |
Table of Contents
dated April 29, 2019
(Name of Registrant)
(“John Hancock USA”)
(Name of Depositor)
| Contents of this SAI | Page No. |
|
|
2 |
|
|
2 |
|
|
2 |
|
|
2 |
|
|
2 |
|
|
3 |
|
|
3 |
|
Financial Statements of Registrant and Depositor
|
F-1 |
| • | Fixed dollar payments: The amount of these payments varies widely. JH Distributors may, for example, make one or more payments in connection with a firm’s conferences, seminars or training programs, seminars for the public, advertising and sales campaigns regarding the policies, to assist a firm in connection with its systems, operations and marketing expenses, or for other activities of a selling firm or wholesaler. JH Distributors may make these payments upon the initiation of a relationship with a firm, and at any time thereafter. |
| • | Payments based upon sales: These payments are based upon a percentage of the total amount of money received, or anticipated to be received, for sales through a firm of some or all of the insurance products that we and/or our affiliates offer. JH Distributors makes these payments on a periodic basis. |
| • | Payments based upon “assets under management”: These payments are based upon a percentage of the policy value of some or all of our (and/or our affiliates’) insurance products that were sold through the firm. JH Distributors makes these payments on a periodic basis. |
Table of Contents
AUDITED STATUTORY-BASIS FINANCIAL STATEMENTS
John Hancock Life Insurance Company (U.S.A.)
For the Years Ended December 31, 2018, 2017 and 2016
With Report of Independent Auditors
Table of Contents
AUDITED STATUTORY-BASIS FINANCIAL STATEMENTS
JOHN HANCOCK LIFE INSURANCE COMPANY (U.S.A.)
Years Ended December 31, 2018, 2017 and 2016
| F-1 | ||||
| F-3 | ||||
| F-5 | ||||
| Statements of Changes in Capital and Surplus—Statutory-Basis |
F-6 | |||
| F-7 | ||||
| F-8 | ||||
Table of Contents
Report of Independent Auditors
The Board of Directors and Stockholder
John Hancock Life Insurance Company (U.S.A.)
We have audited the accompanying statutory-basis financial statements of John Hancock Life Insurance Company (U.S.A.) (the Company), which comprise the balance sheets as of December 31, 2018 and 2017, and the related statements of operations, changes in capital and surplus and cash flow for each of the three years in the period ended December 31, 2018, and the related notes to the financial statements.
Management’s Responsibility for the Financial Statements
Management is responsible for the preparation and fair presentation of these financial statements in conformity with accounting practices prescribed or permitted by the Michigan Department of Insurance and Financial Services. Management also is responsible for the design, implementation and maintenance of internal control relevant to the preparation and fair presentation of financial statements that are free of material misstatement, whether due to fraud or error.
Auditor’s Responsibility
Our responsibility is to express an opinion on these financial statements based on our audits. We conducted our audits in accordance with auditing standards generally accepted in the United States. Those standards require that we plan and perform the audit to obtain reasonable assurance about whether the financial statements are free of material misstatement.
An audit involves performing procedures to obtain audit evidence about the amounts and disclosures in the financial statements. The procedures selected depend on the auditor’s judgment, including the assessment of the risks of material misstatement of the financial statements, whether due to fraud or error. In making those risk assessments, the auditor considers internal control relevant to the entity’s preparation and fair presentation of the financial statements in order to design audit procedures that are appropriate in the circumstances, but not for the purpose of expressing an opinion on the effectiveness of the entity’s internal control. Accordingly, we express no such opinion. An audit also includes evaluating the appropriateness of accounting policies used and the reasonableness of significant accounting estimates made by management, as well as evaluating the overall presentation of the financial statements.
We believe that the audit evidence we have obtained is sufficient and appropriate to provide a basis for our audit opinions.
Basis for Adverse Opinion on U.S. Generally Accepted Accounting Principles
As described in Note 2 to the statutory-basis financial statements, the Company prepared these financial statements using accounting practices prescribed or permitted by the Michigan Department of Insurance and Financial Services, which is a basis of accounting other than U.S. generally accepted accounting principles. The effects on the financial statements of the variances between these statutory accounting practices and U.S. generally accepted accounting principles, although not reasonably determinable, are presumed to be material.
Adverse Opinion on U.S. Generally Accepted Accounting Principles
In our opinion, because of the significance of the matter described in the Basis for Adverse Opinion on U.S. Generally Accepted Accounting Principles paragraph, the statutory-basis financial statements referred to above do not present fairly, in conformity with U.S. generally accepted accounting principles, the financial position of the Company at December 31, 2018 and 2017, or the results of its operations or its cash flows for each of the three years in the period ended December 31, 2018.
F-1
Table of Contents
Opinion on Statutory-Basis of Accounting
In our opinion, the statutory-basis financial statements referred to above present fairly, in all material respects, the financial position of the Company at December 31, 2018 and 2017, and the results of its operations and its cash flows for each of the three years in the period ended December 31, 2018, on the basis of accounting described in Note 2.
/s/ Ernst & Young LLP
Boston, Massachusetts
April 3, 2019
F-2
Table of Contents
JOHN HANCOCK LIFE INSURANCE COMPANY (U.S.A.)
BALANCE SHEETS—STATUTORY BASIS
| December 31, | ||||||||
| 2018 | 2017 | |||||||
|
|
|
|||||||
| (in millions) | ||||||||
| Admitted assets |
||||||||
| Cash and invested assets: |
||||||||
| Bonds |
$ | 44,556 | $ | 47,970 | ||||
| Stocks: |
||||||||
| Preferred stocks |
14 | 11 | ||||||
| Common stocks |
918 | 1,354 | ||||||
| Investments in affiliates |
2,913 | 2,560 | ||||||
| Mortgage loans on real estate |
12,085 | 11,900 | ||||||
| Real estate: |
||||||||
| Company occupied |
162 | 286 | ||||||
| Investment properties |
3,851 | 5,436 | ||||||
| Cash, cash equivalents and short-term investments |
2,988 | 4,131 | ||||||
| Policy loans |
2,788 | 2,726 | ||||||
| Derivatives |
8,511 | 9,637 | ||||||
| Receivable for securities |
1 | 16 | ||||||
| Other invested assets |
9,728 | 9,269 | ||||||
|
|
|
|
|
|||||
| Total cash and invested assets |
88,515 | 95,296 | ||||||
| Investment income due and accrued |
583 | 705 | ||||||
| Premiums due |
65 | 65 | ||||||
| Amounts recoverable from reinsurers |
232 | 163 | ||||||
| Net deferred tax asset |
- | 13 | ||||||
| Funds held by or deposited with reinsured companies |
3,188 | 3,321 | ||||||
| Other reinsurance receivable |
575 | 181 | ||||||
| Amounts due from affiliates |
244 | 477 | ||||||
| Other assets |
2,423 | 1,435 | ||||||
| Assets held in separate accounts |
124,131 | 141,167 | ||||||
|
|
|
|
|
|||||
| Total admitted assets |
$ | 219,956 | $ | 242,823 | ||||
|
|
|
|
|
|||||
The accompanying notes are an integral part of these statutory-basis financial statements.
F-3
Table of Contents
JOHN HANCOCK LIFE INSURANCE COMPANY (U.S.A.)
BALANCE SHEETS—STATUTORY BASIS – (CONTINUED)
| December 31, | ||||||||
| 2018 | 2017 | |||||||
|
|
|
|||||||
| (in millions) | ||||||||
| Liabilities and capital and surplus |
||||||||
| Liabilities: |
||||||||
| Policy and contract obligations: |
||||||||
| Policy reserves |
$ | 64,047 | $ | 69,132 | ||||
| Policyholders’ and beneficiaries funds |
2,395 | 2,683 | ||||||
| Consumer notes |
154 | 197 | ||||||
| Dividends payable to policyholders |
393 | 408 | ||||||
| Policy benefits in process of payment |
445 | 450 | ||||||
| Other amount payable on reinsurance |
845 | 534 | ||||||
| Other policy obligations |
46 | 46 | ||||||
|
|
|
|
|
|||||
| Total policy and contract obligations |
68,325 | 73,450 | ||||||
| Payable to parent and affiliates |
1,309 | 1,645 | ||||||
| Transfers to (from) separate account, net |
(311 | ) | (365 | ) | ||||
| Asset valuation reserve |
1,981 | 2,106 | ||||||
| Reinsurance in unauthorized companies |
1 | 4 | ||||||
| Funds withheld from unauthorized reinsurers |
336 | 66 | ||||||
| Interest maintenance reserve |
1,373 | 2,038 | ||||||
| Current federal income taxes payable |
- | 104 | ||||||
| Net deferred tax liability |
77 | |
- |
| ||||
| Derivatives |
3,719 | 4,129 | ||||||
| Payables for collateral on derivatives |
1,559 | 1,973 | ||||||
| Payables for securities |
29 | 177 | ||||||
| Funds held under coinsurance |
7,376 | 7,239 | ||||||
| Other general account obligations |
1,181 | 981 | ||||||
| Obligations related to separate accounts |
124,131 | 141,167 | ||||||
|
|
|
|
|
|||||
| Total liabilities |
211,086 | 234,714 | ||||||
| Capital and surplus: |
||||||||
| Preferred stock (par value $1; 50,000,000 shares authorized; 100,000 shares issued and outstanding at December 31, 2018 and 2017) |
- | - | ||||||
| Common stock (par value $1; 50,000,000 shares authorized; 4,728,940 shares issued and outstanding at December 31, 2018 and 2017, respectively) |
5 | 5 | ||||||
| Paid-in surplus |
3,219 | 3,219 | ||||||
| Surplus notes |
585 | 585 | ||||||
| Unassigned surplus |
5,061 | 4,300 | ||||||
|
|
|
|
|
|||||
| Total capital and surplus |
8,870 | 8,109 | ||||||
|
|
|
|
|
|||||
| Total liabilities and capital and surplus |
$ | 219,956 | $ | 242,823 | ||||
|
|
|
|
|
|||||
The accompanying notes are an integral part of these statutory-basis financial statements.
F-4
Table of Contents
JOHN HANCOCK LIFE INSURANCE COMPANY (U.S.A.)
STATEMENTS OF OPERATIONS—STATUTORY-BASIS
| Years Ended December 31, | ||||||||||||
| 2018 | 2017 | 2016 | ||||||||||
|
|
|
|||||||||||
| (in millions) | ||||||||||||
| Premiums and other revenues: |
||||||||||||
| Life, long-term care and annuity premiums, net |
$ | 5,816 | $ | 18,286 | $ | 13,227 | ||||||
| Consideration for supplementary contracts with life contingencies |
132 | 176 | 201 | |||||||||
| Net investment income |
4,665 | 4,426 | 4,308 | |||||||||
| Amortization of interest maintenance reserve |
179 | 195 | 191 | |||||||||
| Commissions and expense allowance on reinsurance ceded |
468 | 1,963 | 629 | |||||||||
| Reserve adjustment on reinsurance ceded |
(7,820 | ) | (12,621 | ) | (7,297 | ) | ||||||
| Separate account administrative and contract fees |
1,786 | 1,772 | 1,697 | |||||||||
| Other revenue |
193 | 347 | 434 | |||||||||
|
|
|
|
|
|
|
|||||||
| Total premiums and other revenues |
5,419 | 14,544 | 13,390 | |||||||||
| Benefits paid or provided: |
||||||||||||
| Death, surrender and other contract benefits, net |
12,322 | 12,693 | 10,220 | |||||||||
| Annuity benefits |
1,735 | 1,788 | 1,622 | |||||||||
| Disability and long-term care benefits |
801 | 738 | 664 | |||||||||
| Interest and adjustments on policy or deposit-type funds |
(52 | ) | (318 | ) | 94 | |||||||
| Payments on supplementary contracts with life contingencies |
203 | 199 | 191 | |||||||||
| Increase (decrease) in life and long-term care reserves |
(5,078 | ) | 1,979 | 1,784 | ||||||||
|
|
|
|
|
|
|
|||||||
| Total benefits paid or provided |
9,931 | 17,079 | 14,575 | |||||||||
| Insurance expenses and other deductions: |
||||||||||||
| Commissions and expense allowance on reinsurance assumed |
1,078 | 1,091 | 1,049 | |||||||||
| General expenses |
1,186 | 1,039 | 943 | |||||||||
| Insurance taxes, licenses and fees |
167 | 138 | 171 | |||||||||
| Net transfers to (from) separate accounts |
(7,616 | ) | (8,706 | ) | (5,581 | ) | ||||||
| Investment income ceded |
1,052 | 878 | 1,240 | |||||||||
| Other deductions |
(459 | ) | 153 | 21 | ||||||||
|
|
|
|
|
|
|
|||||||
| Total insurance expenses and other deductions |
(4,592 | ) | (5,407 | ) | (2,157 | ) | ||||||
| Income (loss) from operations before dividends to policyholders, federal income taxes and net realized capital gains (losses) |
80 | 2,872 | 972 | |||||||||
| Dividends to policyholders |
111 | 124 | 131 | |||||||||
|
|
|
|
|
|
|
|||||||
| Income (loss) from operations before federal income taxes and net realized capital gains (losses) |
(31 | ) | 2,748 | 841 | ||||||||
| Federal income tax expense (benefit) |
(725 | ) | 446 | (121 | ) | |||||||
|
|
|
|
|
|
|
|||||||
| Income (loss) from operations before net realized capital gains (losses) |
694 | 2,302 | 962 | |||||||||
| Net realized capital gains (losses) |
340 | (403 | ) | (933 | ) | |||||||
|
|
|
|
|
|
|
|||||||
| Net income (loss) |
$ | 1,034 | $ | 1,899 | $ | 29 | ||||||
|
|
|
|
|
|
|
|||||||
The accompanying notes are an integral part of these statutory-basis financial statements.
F-5
Table of Contents
JOHN HANCOCK LIFE INSURANCE COMPANY (U.S.A.)
STATEMENTS OF CHANGES IN CAPITAL AND SURPLUS—STATUTORY-BASIS
| Preferred and Common Stock |
Paid-in Surplus |
Surplus Notes |
Unassigned Surplus (Deficit) |
Total Capital and Surplus |
||||||||||||||||
|
|
|
|||||||||||||||||||
| (in millions) | ||||||||||||||||||||
| Balances at January 1, 2016 |
$ | 5 | $ | 3,196 | $ | 990 | $ | 1,253 | $ | 5,444 | ||||||||||
| Net income (loss) |
29 | 29 | ||||||||||||||||||
| Change in net unrealized capital gains (losses) |
569 | 569 | ||||||||||||||||||
| Change in net deferred income tax |
810 | 810 | ||||||||||||||||||
| Decrease (increase) in non-admitted assets |
(38 | ) | (38 | ) | ||||||||||||||||
| Decrease (increase) in asset valuation reserves |
(262 | ) | (262 | ) | ||||||||||||||||
| Change in surplus as a result of reinsurance |
(125 | ) | (125 | ) | ||||||||||||||||
| Surplus note redemptions |
(405 | ) | (405 | ) | ||||||||||||||||
| Other adjustments, net |
- | 132 | 132 | |||||||||||||||||
|
|
|
|||||||||||||||||||
| Balances at December 31, 2016 |
5 | 3,196 | 585 | 2,368 | 6,154 | |||||||||||||||
| Net income (loss) |
1,899 | 1,899 | ||||||||||||||||||
| Change in net unrealized capital gains (losses) |
1,394 | 1,394 | ||||||||||||||||||
| Change in net deferred income tax |
(726 | ) | (726 | ) | ||||||||||||||||
| Decrease (increase) in non-admitted assets |
191 | 191 | ||||||||||||||||||
| Change in liability for reinsurance in unauthorized reinsurance |
(1 | ) | (1 | ) | ||||||||||||||||
| Capital contribution from parent |
- | 23 | 23 | |||||||||||||||||
| Dividend paid to parent |
(900 | ) | (900 | ) | ||||||||||||||||
| Change in surplus as a result of reinsurance |
80 | 80 | ||||||||||||||||||
| Other adjustments, net |
- | (5 | ) | (5 | ) | |||||||||||||||
|
|
|
|||||||||||||||||||
| Balances at December 31, 2017 |
5 | 3,219 | 585 | 4,300 | 8,109 | |||||||||||||||
| Net income (loss) |
1,034 | 1,034 | ||||||||||||||||||
| Change in net unrealized capital gains (losses) |
(220 | ) | (220 | ) | ||||||||||||||||
| Change in net deferred income tax |
(17 | ) | (17 | ) | ||||||||||||||||
| Decrease (increase) in non-admitted assets |
43 | 43 | ||||||||||||||||||
| Change in liability for reinsurance in unauthorized reinsurance |
3 | 3 | ||||||||||||||||||
| Decrease (increase) in asset valuation reserves |
125 | 125 | ||||||||||||||||||
| Dividend paid to parent |
(600 | ) | (600 | ) | ||||||||||||||||
| Change in surplus as a result of reinsurance |
380 | 380 | ||||||||||||||||||
| Other adjustments, net |
- | 13 | 13 | |||||||||||||||||
|
|
|
|||||||||||||||||||
| Balances at December 31, 2018 |
$ | 5 | $ | 3,219 | $ | 585 | $ | 5,061 | $ | 8,870 | ||||||||||
|
|
|
|||||||||||||||||||
The accompanying notes are an integral part of these statutory-basis financial statements.
F-6
Table of Contents
JOHN HANCOCK LIFE INSURANCE COMPANY (U.S.A.)
STATEMENTS OF CASH FLOW—STATUTORY-BASIS
| Years Ended December 31, | ||||||||||||
| 2018 | 2017 | 2016 | ||||||||||
|
|
|
|||||||||||
| (in millions) | ||||||||||||
| Operations |
||||||||||||
| Premiums and other considerations collected, net of reinsurance |
$ | 13,901 | $ | 18,819 | $ | 13,411 | ||||||
| Net investment income received |
4,828 | 4,603 | 4,415 | |||||||||
| Separate account fees |
1,786 | 1,772 | 1,697 | |||||||||
| Commissions and expenses allowance on reinsurance ceded |
468 | 1,963 | 629 | |||||||||
| Miscellaneous income |
668 | 374 | 595 | |||||||||
| Benefits and losses paid |
(22,601 | ) | (28,091 | ) | (21,060 | ) | ||||||
| Net transfers from (to) separate accounts |
7,670 | 8,763 | 5,699 | |||||||||
| Commissions and expenses (paid) recovered |
(3,763 | ) | (3,040 | ) | (2,873 | ) | ||||||
| Dividends paid to policyholders |
(126 | ) | (138 | ) | (137 | ) | ||||||
| Federal and foreign income and capital gain taxes (paid) recovered |
(617 | ) | (846 | ) | 200 | |||||||
|
|
|
|||||||||||
| Net cash provided by (used in) operating activities |
2,214 | 4,179 | 2,576 | |||||||||
| Investment activities |
||||||||||||
| Proceeds from sales, maturities, or repayments of investments: |
||||||||||||
| Bonds |
22,532 | 19,287 | 20,934 | |||||||||
| Stocks |
566 | 317 | 239 | |||||||||
| Mortgage loans on real estate |
880 | 885 | 1,283 | |||||||||
| Real estate |
2,507 | 986 | 1,295 | |||||||||
| Other invested assets |
2,066 | 624 | 485 | |||||||||
| Net gains (losses) on cash, cash equivalents and short term investments |
(4 | ) | 4 | (2 | ) | |||||||
|
|
|
|||||||||||
| Total investment proceeds |
28,547 | 22,103 | 24,234 | |||||||||
| Cost of investments acquired: |
||||||||||||
| Bonds |
25,992 | 21,195 | 21,880 | |||||||||
| Stocks |
114 | 459 | 652 | |||||||||
| Mortgage loans on real estate |
1,975 | 1,179 | 2,440 | |||||||||
| Real estate |
213 | 415 | 446 | |||||||||
| Other invested assets |
2,530 | 1,680 | 1,429 | |||||||||
| Derivatives |
12 | 46 | 1,420 | |||||||||
|
|
|
|||||||||||
| Total cost of investments acquired |
30,836 | 24,974 | 28,267 | |||||||||
| Net increase (decrease) in receivable/payable for securities and collateral on derivatives |
(547 | ) | 217 | 266 | ||||||||
| Net (increase) decrease in policy loans |
(62 | ) | (4 | ) | 932 | |||||||
|
|
|
|||||||||||
| Net cash provided by (used in) investment activities |
(2,898 | ) | (2,658 | ) | (2,835 | ) | ||||||
| Financing and miscellaneous activities |
||||||||||||
| Surplus notes |
- | - | (405 | ) | ||||||||
| Borrowed funds |
(42 | ) | (164 | ) | (64 | ) | ||||||
| Net deposits (withdrawals) on deposit-type contracts |
(288 | ) | (34 | ) | 93 | |||||||
| Dividend paid to Parent |
(600 | ) | (900 | ) | - | |||||||
| Other cash provided (applied) |
471 | (171 | ) | (14 | ) | |||||||
|
|
|
|||||||||||
| Net cash provided by (used in) financing and miscellaneous activities |
(459 | ) | (1,269 | ) | (390 | ) | ||||||
| Net increase (decrease) in cash, cash equivalents and short-term investments |
(1,143 | ) | 252 | (649 | ) | |||||||
| Cash, cash equivalents and short-term investments at beginning of year |
4,131 | 3,879 | 4,528 | |||||||||
|
|
|
|||||||||||
| Cash, cash equivalents and short-term investments at end of year |
$ | 2,988 | $ | 4,131 | $ | 3,879 | ||||||
|
|
|
|||||||||||
| Non-cash activities during the year: |
||||||||||||
| Premium and other operating activity related to reinsurance transactions, net |
$ | 7,873 | $ | 33 | $ | 650 | ||||||
| Transfer of invested assets related to reinsurance transactions and other affiliate transactions, net |
(7,873 | ) | 16 | (650 | ) | |||||||
| Financing and miscellaneous activities related to reinsurance transactions and transfer with affiliates, net |
- | (49 | ) | - | ||||||||
The accompanying notes are an integral part of these statutory-basis financial statements.
F-7
Table of Contents
JOHN HANCOCK LIFE INSURANCE COMPANY (U.S.A.)
NOTES TO STATUTORY-BASIS FINANCIAL STATEMENTS
1. Organization and Nature of Operations
John Hancock Life Insurance Company (U.S.A.) (“JHUSA” or the “Company”) is a wholly-owned subsidiary of The Manufacturers Investment Corporation (“MIC”). MIC is a wholly-owned subsidiary of John Hancock Financial Corporation (“JHFC”), which is an indirect, wholly-owned subsidiary of The Manufacturers Life Insurance Company (“MLI”). MLI, in turn, is a wholly-owned subsidiary of Manulife Financial Corporation (“MFC”), a Canadian-based, publicly traded financial services holding company.
The Company is licensed to conduct insurance business in 49 states, the District of Columbia, Guam, Puerto Rico and the U.S. Virgin Islands, and provides a wide range of financial protection and wealth management products and services to both individual and institutional customers located primarily in the United States. Through its insurance operations, the Company offers a variety of individual life insurance and individual and group long-term care insurance products that are distributed through multiple distribution channels, including insurance agents, brokers, banks, financial planners, and direct marketing. The Company also offers mutual fund products and services which include a variety of retirement products to retirement plans. The Company distributes these products through multiple distribution channels, including insurance agents and affiliated brokers, securities brokerage firms, financial planners, pension plan sponsors, pension plan consultants, and banks. Effective December 2, 2016, the Company discontinued new sales of its individual long-term care product. Effective March 31, 2018, the Company discontinued new sales of its corporate and bank-owned life insurance products.
The Company is also registered as a foreign reinsurer in several jurisdictions outside of the United States as part of its International Group Program that offers pooling services and reinsurance coverage for group employee contracts issued by its network partners to local companies, which are subsidiaries, branches or affiliates of multinational corporations.
Pursuant to a distribution agreement with the Company, John Hancock Distributors LLC (“JHD”), a registered broker-dealer and a wholly-owned subsidiary of the Company, acts as the principal underwriter of variable life contracts and other products issued by the Company.
The Company has two wholly-owned life insurance subsidiaries, John Hancock Life Insurance Company of New York (“JHNY”) and John Hancock Life & Health Insurance Company (“JHLH”) and a wholly-owned captive insurance subsidiary, Manulife (Michigan) Reassurance Company (“MMRC”).
In 2017, following receipt of regulatory approval, JHLH executed a Plan and Agreement of Merger with John Hancock Insurance Company of Vermont (“JHVT”), also a wholly-owned subsidiary of JHUSA. Effective as of October 1, 2017, JHVT merged with and into JHLH. Prior to the JHLH/JHVT merger, JHUSA issued one common share to its parent MIC in exchange for 100% ownership of JHVT and became the common parent of both JHLH and JHVT. As a result of the merger, JHVT ceased to exist and the companies’ property and obligations became the property and obligations of JHLH.
2. Significant Accounting Policies
Use of Estimates
The preparation of financial statements requires management to make estimates and assumptions that affect amounts reported in the financial statements and accompanying notes. Such estimates and assumptions could change in the future as more information becomes known and may impact the amounts reported and disclosed herein.
Basis of Presentation
These financial statements have been prepared in conformity with accounting practices prescribed or permitted by the Michigan Department of Insurance and Financial Services (the “Insurance Department”). The National Association of Insurance Commissioners’ (“NAIC”) Accounting Practices and Procedures Manual (“NAIC SAP”) has been adopted as a component of practices prescribed or permitted by the State of Michigan. The Michigan Director of the Department of Insurance and Financial Services (the “Director”) has the authority to prescribe or permit other specific practices that deviate from prescribed practices. NAIC SAP practices differ from accounting principles generally accepted in the United States (“GAAP”) as described below.
F-8
Table of Contents
JOHN HANCOCK LIFE INSURANCE COMPANY (U.S.A.)
NOTES TO STATUTORY-BASIS FINANCIAL STATEMENTS – (CONTINUED)
2. Significant Accounting Policies - (continued)
Investments: Investments in bonds not backed by other loans are principally stated at amortized cost using the constant yield (interest) method. Bonds can also be stated at the lesser of amortized cost or fair value based on their NAIC designated rating. Non-redeemable preferred stocks, which have characteristics of equity securities, are reported at cost or lower of cost or market value as determined by the Securities Valuation Office of the NAIC (“SVO”) rating, and the related net unrealized capital gains (losses) are reported in unassigned surplus along with any adjustment for federal income taxes. Redeemable preferred stocks, which have characteristics of debt securities and are rated as medium quality or better, are reported at cost or amortized cost. All other redeemable preferred stocks are reported at the lower of cost, amortized cost, or fair value.
For bonds other than loan-backed and structured securities, the Company has a process in place to identify securities that could potentially have an impairment that is other-than-temporary. The Company recognizes other-than-temporary impairment losses on bonds with unrealized losses when the entity does not have the intent and ability to hold the security for a period of time sufficient to allow for any anticipated recovery in value. Declines in value due to credit difficulties are also considered to be other-than-temporarily impaired when the Company does not have the intent and ability to hold the security for a period of time sufficient to allow for any anticipated recovery in value. The entire difference between amortized cost and fair value on such bonds with credit difficulties is recognized as an impairment loss in income.
Loan-backed and structured securities (i.e., collateralized mortgage obligations) are adjusted for the effects of changes in prepayment assumptions on the related accretion of discounts or amortization of premiums of such securities using either the retrospective or prospective methods. The retrospective adjustment method is used to value all such securities, except principal-only and interest-only securities and such securities with NAIC designations of 3-6, which are valued using the prospective method. If it is determined that a decline in fair value is other-than-temporary, the cost basis of the security is written down to the present value of estimated future cash flows using the original effective interest rate inherent in the security.
Common stocks are primarily reported at fair value based on quoted market prices and the related net unrealized capital gains (losses) are reported in unassigned surplus, net of any adjustment for federal income taxes. There are no restrictions on common and preferred stocks.
Insurance subsidiaries are reported at their underlying audited statutory equity. Non-insurance subsidiaries, which have significant ongoing operations other than for the benefit of the Company and its affiliates, are reported based on the underlying audited GAAP equity. Non-insurance subsidiaries, which have no significant ongoing operations other than for the benefit of the Company and its affiliates, are reported based on the underlying audited GAAP equity, including the admitted portion of goodwill. Dividends from subsidiaries are included in net investment income. The remaining net change in the subsidiaries’ equity is included in the change in net unrealized capital gains (losses).
Realized capital gains (losses) on sales of securities are recognized using the first in, first out (“FIFO”) method. The cost basis of bonds, common and preferred stocks, and other invested assets is adjusted for impairments in value deemed to be other-than-temporary and such adjustments are reported as a component of net realized capital gains (losses).
Mortgage loans on real estate are reported at unpaid principal balances, less an allowance for impairments. Valuation allowances, if necessary, are established for mortgage loans on real estate based on the difference between the net value of the collateral, determined as the fair value of the collateral less estimated costs to obtain and sell, and the recorded investment in the mortgage loan. The initial valuation allowance and subsequent changes in the allowance for mortgage loans are charged or credited directly to unassigned surplus. A mortgage loan is considered to be impaired when, based on current information and events, it is probable that the Company will be unable to collect all principal and interest amounts due according to the contractual terms of the mortgage agreement. When management determines foreclosure is probable and the impairment is other-than-temporary, the mortgage loan is written down and a realized loss is recognized.
Real estate occupied by the Company and real estate held for the production of income are reported at depreciated cost, net of related obligations. Real estate that the Company has the intent to sell is reported at the lower of depreciated cost or fair value, net of related obligations. Depreciation is calculated on a straight-line basis over the estimated useful lives of the properties. Investment income and operating expenses include rent for the Company’s occupancy of Company owned properties.
F-9
Table of Contents
JOHN HANCOCK LIFE INSURANCE COMPANY (U.S.A.)
NOTES TO STATUTORY-BASIS FINANCIAL STATEMENTS – (CONTINUED)
2. Significant Accounting Policies - (continued)
Cash equivalents are short-term highly liquid investments with original maturities of three months or less and are principally stated at amortized cost. Short-term investments include investments with maturities of one year or less and greater than three months at the date of acquisition and are principally stated at amortized cost.
Policy loans are reported at unpaid principal balances.
Derivative instruments that meet the criteria to qualify for hedge accounting are accounted for in a manner consistent with the item hedged (i.e., amortized cost or fair value with the related net unrealized capital gains (losses) reported in unassigned surplus along with any adjustment for federal income taxes). Derivative instruments that are entered into for other than hedging purposes or that do not meet the criteria to qualify for hedge accounting are accounted for at fair value, and the related changes in fair value are recognized as net unrealized capital gains (losses) reported in unassigned surplus, net of any adjustments for federal income taxes. Embedded derivatives are not accounted for separately from the host contract.
Other invested assets consist of ownership interests in partnerships and limited liability companies (“LLCs”) which are carried based on the underlying audited GAAP equity, with the exception of affordable housing tax credit properties, which are carried at amortized cost. The related net unrealized capital gains (losses) are reported in unassigned surplus, net of any adjustments for federal income taxes. The Company records its share of income using the most recent financial information available, which is generally on a three month lag. Depending on the timing of receipt of the audited financial statements of these other invested assets, the investee level financial data may be up to one year in arrears.
Interest Maintenance and Asset Valuation Reserves: Under a formula prescribed by the NAIC, the Company defers the portion of realized capital gains (losses) on sales of fixed income investments, principally bonds and mortgage loans, and interest-related hedging activities that are attributable to changes in the general level of interest rates and amortizes those deferrals over the remaining period to maturity based on groupings of individual securities sold in five-year bands. That net deferral is reported as the interest maintenance reserve (“IMR”) in the accompanying Balance Sheets. Realized capital gains (losses) are reported in income, net of federal income tax and transferred to the IMR. The asset valuation reserve (“AVR”) provides a valuation allowance for invested assets. The AVR is determined by an NAIC prescribed formula with changes reflected directly in unassigned surplus.
Subsidiaries: The accounts and operations of the Company’s subsidiaries are not consolidated with the accounts and operations of the Company.
Goodwill: Goodwill is admitted subject to an aggregate limitation of 10% of the capital and surplus in the most recently filed quarterly statement, excluding electronic data processing (“EDP”) equipment, operating system software, net deferred tax assets, and net positive goodwill. Goodwill is amortized over the period the Company benefits economically, not to exceed 10 years. Goodwill held by non-insurance subsidiaries is assessed in accordance with GAAP, subject to certain limitations for holding companies and foreign insurance subsidiaries. Goodwill is reported in other invested assets in the Balance Sheets.
Separate Accounts: Separate account assets and liabilities reported in the accompanying Balance Sheets represent funds that are separately administered, principally for annuity contracts and variable life insurance policies, and for which the contract holder, rather than the Company, bears the investment risk. Separate account obligations are intended to be satisfied from separate account assets and not from assets of the general account. Separate accounts are generally reported at fair value. The operations of the separate accounts are not included in the Statements of Operations; however, income earned on amounts initially invested by the Company in the formation of new separate accounts is included in other revenue. Fees charged to contract holders, principally mortality, policy administration, and surrender charges are included in separate account administrative and contract fees. The assets in the separate accounts are not pledged to others as collateral or otherwise restricted. For the years ended December 31, 2018, 2017 and 2016, there were no gains (losses) on transfers of assets from the general account to the separate account.
Nonadmitted Assets: Certain assets designated as nonadmitted, principally other invested assets, furniture and equipment, prepaid expenses, and other assets not specifically identified as an admitted asset within the NAIC SAP are excluded from the accompanying Balance Sheets and are charged directly to unassigned surplus.
Policy Acquisition Costs: The costs of acquiring and renewing business are expensed when incurred.
F-10
Table of Contents
JOHN HANCOCK LIFE INSURANCE COMPANY (U.S.A.)
NOTES TO STATUTORY-BASIS FINANCIAL STATEMENTS – (CONTINUED)
2. Significant Accounting Policies - (continued)
Policy Reserves: Reserves for life, long-term care, annuity, and deposit-type contracts are developed by actuarial methods and are determined based on interest rates, mortality tables and valuation methods prescribed by the NAIC that will provide, in the aggregate, reserves that are greater than or equal to the maximum of guaranteed policy cash values or the amounts required by the Insurance Department.
| • | The Company waives deduction of deferred fractional premiums on the death of lives insured and annuity contract holders and returns any premium beyond the date of death. Surrender values on policies do not exceed the corresponding benefit reserves. At December 31, 2018 and 2017, the Company held reserves of $1,212 million and $1,281 million, respectively, on insurance in-force for which gross premiums were less than net premiums according to the standard of valuation set by the State of Michigan. |
| • | Reserves for individual life insurance policies are maintained using the 1941, 1958, 1980, 2001 and 2017 Commissioner’s Standard Ordinary Mortality Tables and using principally the Commissioner’s Reserve Valuation Method. Policies using the principles-based reserving method use assumptions as outlined in the Company’s PBR Actuarial Report. |
| • | Annuity and supplementary contracts with life contingency reserves are based principally on modifications of the 1937 Standard Annuity Table, the Group Annuity Mortality Tables for 1951, 1971, 1983, and 1994, the 1971 and 1983 Individual Annuity Mortality Tables, the A-2000 Individual Annuity Mortality Table, and the 2012 Individual Annuity Mortality Table. |
| • | Liabilities related to policyholder funds left on deposit with the Company are generally equal to fund balances. |
| • | Long-term care reserves are generally calculated using the one-year preliminary term method based on various mortality, morbidity, and lapse tables. |
| • | For life insurance, the calendar year exact method is used to calculate the reserve at December 31, 2018 and 2017. Reserves at December 31, 2018 and 2017 are calculated based on the rated age. For certain policies with substandard table ratings, substandard multiple extras are applied via the Lotter method. |
| • | For long-term care, the interpolated reserve method is used to adjust the calculated terminal reserve, and in addition an unearned premium reserve is held. |
| • | Tabular interest, tabular less actual reserve released, and tabular costs have been determined by formula. Tabular interest on funds not involving life contingencies is calculated as one percent of the product of such valuation rate of interest times the mean of the amount of funds subject to such valuation rate of interest held at the beginning and end of the valuation year. |
| • | From time to time, the Company finds it appropriate to modify certain required policy reserves because of changes in actuarial assumptions. Reserve modifications resulting from such determinations are recorded directly to unassigned surplus. |
| • | Reserves for variable deferred annuity contracts are calculated in accordance with NAIC Actuarial Guideline 43. The reserve is based on the worst present value of accumulated losses from the perspective of the Company. The liability is evaluated under both a standard scenario and stochastic scenario, and the Company holds the higher of the standard or stochastic values. |
Reinsurance: Reinsurance ceded contracts do not relieve the Company from its obligations to policyholders. The Company remains liable to its policyholders for the portion reinsured to the extent that any reinsurer does not meet its obligations for reinsurance ceded to it under the reinsurance agreements. Failure of the reinsurers to honor their obligations could result in losses to the Company; consequently, estimates are established for amounts deemed or estimated to be uncollectible. To minimize its exposure to significant losses from reinsurance insolvencies, the Company evaluates the financial condition of its reinsurers and monitors concentration of credit risk arising from similar characteristics of the insurer.
Premiums, commissions, expense reimbursements, benefits, and reserves related to reinsured business are accounted for on bases consistent with those used in accounting for the original policies issued and the terms of the reinsurance contracts.
F-11
Table of Contents
JOHN HANCOCK LIFE INSURANCE COMPANY (U.S.A.)
NOTES TO STATUTORY-BASIS FINANCIAL STATEMENTS – (CONTINUED)
2. Significant Accounting Policies - (continued)
Premiums ceded to other companies have been reported as a reduction of premium income. Amounts applicable to reinsurance ceded for future policy benefits, unearned premium reserves, and claim liabilities have been reported as reductions of these items.
The Company records a liability for unsecured policy reserves ceded to reinsurers not authorized in the State of Michigan to assume such business. Changes to those amounts are credited or charged directly to unassigned surplus. Policy and contract liabilities ceded to reinsurers have been reported as reductions of the related reserves. Commissions and expense allowances allowed by reinsurers on business ceded are reported as income when received. Investment income ceded includes separate account fee income, net investment income and realized investment and other gains (losses), which was ceded to the affiliated reinsurers. NAIC SAP prescribes that no gain be recognized upon inception of a reinsurance treaty. The initial gain is recorded directly to unassigned surplus and released into income over the life of the treaty.
Federal Income Taxes: Total federal income taxes are based upon the Company’s best estimate of its current and deferred tax assets or liabilities. Current tax expense is reported in the Statements of Operations as federal income tax expense if resulting from operations and within net realized capital gains (losses) if resulting from capital transactions. Changes in the balances of deferred taxes, which provide for book versus tax temporary differences, are subject to limitations and are reported within various lines within surplus. The provision for federal and foreign income taxes incurred in the Statements of Operations is different from that which would be obtained by applying the statutory federal income tax rate to income before income tax (including realized capital gains). For additional information, see the Federal Income Taxes Note for reconciliation of effective tax rate.
Participating Insurance and Policyholder Dividends: Participating business represented approximately 16% and 14% of the Company’s aggregate reserve for life contracts at December 31, 2018 and 2017, respectively. The amount of policyholders’ dividends to be paid is approved annually by the Company’s Board of Directors. Policyholder dividends are recognized when declared rather than over the term of the related policies. The determination of the amount of policyholders’ dividends is complex and varies by policy type. In general, the aggregate amount of policyholders’ dividends is calculated based upon actual interest, mortality, morbidity, persistency, and expense experience for the year, as well as management’s judgment as to the appropriate level of statutory surplus to be retained by the Company. John Hancock Life Insurance Company (“JHLICO”) was a predecessor company that was merged into JHUSA on December 31, 2009. For additional information on the closed blocks, see the Reinsurance and Closed Block Note.
Surplus Notes: Surplus notes are reported in capital and surplus, and the interest expense is not accrued unless approved for payment by the Insurance Department.
Statements of Cash Flow: Cash, cash equivalents and short-term investments in the Statements of Cash Flow represent movements of cash and highly liquid debt investments with initial maturities of one year or less.
Premiums and Benefits: Premiums for whole, term, and universal life, long-term care, annuity policies, and group annuity contracts with any mortality and morbidity risk are recognized as revenue when due. Revenues for universal life and annuity policies with mortality or morbidity risk, except for term certain supplementary contracts, consist of the entire premium received. Premiums received for variable universal life, as well as annuity policies and group annuity contracts without mortality or morbidity risk are recorded using deposit accounting and are credited directly to an appropriate policy reserve account, without recognizing premium revenue. Benefits incurred represent the total of death benefits paid, annuity benefits paid and the change in policy reserves.
Policy and Contract Claims: Policy and contract claims are determined on an individual-case basis for reported losses. Estimates of incurred but not reported losses are developed on the basis of past experience.
Guaranty Fund Assessments: Guaranty fund assessments are accrued when the Company receives knowledge of an insurance insolvency.
Variances Between NAIC SAP and GAAP: The more significant variances from GAAP are: (a) bonds would generally be reported at fair value; (b) changes in the fair value of derivative financial instruments would generally be reported as revenue unless deemed an effective hedge; (c) embedded derivatives would be bifurcated from the underlying contract or security and accounted for separately at fair value; (d) income recognition on partnerships and LLCs, which are accounted for under the equity method, would not be limited to the amount of cash distribution; (e) majority-owned noninsurance subsidiaries,
F-12
Table of Contents
JOHN HANCOCK LIFE INSURANCE COMPANY (U.S.A.)
NOTES TO STATUTORY-BASIS FINANCIAL STATEMENTS – (CONTINUED)
2. Significant Accounting Policies - (continued)
variable interest entities where the Company is the primary beneficiary, and certain other controlled entities would be consolidated; (f) changes in the balances of deferred income taxes would generally be included in net income; (g) market value adjusted (“MVA”) annuity products would be reported in the general account of the Company; (h) all assets, subject to valuation allowances, would be recognized; (i) reserves would generally be based upon the net level premium method or the estimated gross margin method with estimates of future mortality, morbidity, persistency and interest; (j) reinsurance ceded, unearned ceded premium and unpaid ceded claims would be reported as an asset; (k) AVR and the IMR would not be recorded; (l) changes to the mortgage loan valuation allowance would be reported in income; (m) surplus notes would be reported as liabilities; (n) premiums received in excess of policy charges for universal life and annuity policies would not be recognized as premium revenue and benefits would represent the excess of benefits paid over the policy account value and interest credited to the account values; (o) certain acquisition costs, such as commissions and other variable costs, directly related to acquiring new business are charged to current operations as incurred, would generally be capitalized and amortized based on profit emergence over the expected life of the policies or over the premium payment period; and (p) changes in unrealized capital gains (losses) and foreign currency translations would be presented as other comprehensive income.
The effects of the foregoing variances from GAAP on the accompanying statutory-basis financial statements have not been determined, but are presumed to be material.
3. Permitted Statutory Accounting Practices
The financial statements of the Company are presented in conformity with accounting practices prescribed or permitted by the Insurance Department.
For determining the Company’s solvency under the State of Michigan’s insurance laws and regulations, the Insurance Department recognizes only statutory accounting practices prescribed or permitted by the State of Michigan for determining and reporting the financial condition and results of operations of the Company. NAIC SAP has been adopted as a component of practices prescribed or permitted by the State of Michigan. The Director has the authority to prescribe or permit other specific practices that deviate from prescribed practices.
As of December 31, 2018 and 2017, the Director had not prescribed or permitted the Company to use any accounting practices that would result in the Company’s income or financial position to deviate from NAIC SAP.
4. Accounting Changes
Accounting changes adopted to conform to the provisions of NAIC SAP are reported as changes in accounting principles. The cumulative effect of changes in accounting principles is reported as an adjustment to unassigned surplus in the period of the change in accounting principle. The cumulative effect is the difference between the amount of unassigned surplus at the beginning of the year and the amount of unassigned surplus that would have been reported at that date if the new accounting principle had been applied retrospectively.
John Hancock Subsidiaries, LLC (“JHS”) is a wholly-owned subsidiary of the Company. During 2017, the Company reclassified its investment in JHS of $1.3 billion from Stocks - Investments in affiliates to Other invested assets. This reclassification was the result of a change in accounting principle and did not have a material impact on the Company’s financial position, results of operations, and financial statement disclosures.
Adoption of New Accounting Standards
Effective January 1, 2018, the NAIC made substantive revisions to Statement of Statutory Accounting Principles (“SSAP”) No. 100, Fair Value Measurements. The revised guidance allows the use of net asset value as a practical expedient for fair value when 1) specifically allowed in a SSAP or 2) when specific conditions exist. The guidance did not have a material impact on the Company’s financial position, results of operations and financial statement disclosures.
Effective January 1, 2018, the NAIC made substantive revisions to SSAP No. 86, Accounting for Derivative Instruments and Hedging, Income Generation, and Replication (Synthetic Asset) Transactions to adopt ASU 2017-04 Settlement of Valuation Margin. The revised guidance requires the recognition of changes in variation margin as unrealized gains/losses until the derivative contract has matured, terminated and/or expired. The guidance applies to both over-the-counter (“OTC”) derivatives and (“ETF”) exchange-traded futures, regardless of whether the counterparty or exchange considers the variation
F-13
Table of Contents
JOHN HANCOCK LIFE INSURANCE COMPANY (U.S.A.)
NOTES TO STATUTORY-BASIS FINANCIAL STATEMENTS – (CONTINUED)
4. Accounting Changes - (continued)
margin payment to be collateral or a legal settlement. The guidance did not have a material impact on the Company’s financial position, results of operations and financial statement disclosures.
In June 2017, the NAIC adopted revisions to SSAP No. 37, Mortgage Loans. The revision requires an age analysis of mortgage loans disclosure, aggregated by type, with identification of mortgage loans in which the entity is a participant or co-lender in a mortgage loan agreement, capturing: 1) recorded investment of current mortgage loans, 2) recorded investment of mortgage loans classified as 30-59 days, 60-89 days, 90-179 days, and 180 days and greater past due; 3) recorded investment of mortgage loans 90 days and 180 days past due still accruing interest; 4) interest accrued for mortgage loans 90 days and 180 days past due; and 5) recorded investment and number of mortgage loans where interest has been reduced, by percent reduced. The guidance did not have a material impact on the Company’s financial position, results of operations, and financial statement disclosures.
In March 2015, the NAIC adopted revisions to SSAP No. 1, Disclosure of Accounting Policies, Risks and Uncertainties and Other Disclosures (“SSAP 1”) regarding management’s assessment of an entity’s ability to continue as a going concern. The pronouncement requires management to assess the entity’s ability to continue as a going concern, and provide footnote disclosures when conditions give rise to substantial doubt about an entity’s ability to continue as a going concern within one year from the financial statement issuance date. The new guidance was effective December 31, 2016. The guidance did not have a material impact on the Company’s financial position, results of operations, and financial statement disclosures.
Future Adoption of New Accounting Standards
In August, 2016, the NAIC adopted substantive revisions to SSAP No. 51 – Life Contracts in order to allow principle-based reserving (“PBR”) for life insurance contracts as specified in the Valuation Manual. Current statutory accounting guidance refers to existing model laws for reserving guidance which are primarily based on formulaic methodology. Also, in June 2016, the NAIC adopted updates to Appendix A-820: Minimum Life and Annuity Reserve Standards as part of the PBR project, which incorporate relevant aspects of the 2009 revisions to the Standard Valuation Law (Model #820) into Appendix A-820. The effective date was January 1, 2017 but companies are allowed to defer adoption for three years until January 1, 2020. The Company has adopted PBR for certain products launched in 2018 and will finish implementation prior to January 1, 2020. Adoption will be on a prospective basis for policies issued on or after the adoption date, therefore, we expect no impact to surplus upon adoption.
In March 2017, the NAIC made substantive revisions to SSAP No. 69 – Statement of Cash Flow to adopt ASU 2016-15 Statement of Cash Flows: Classification of Certain Cash Receipts and Cash Payments as issued by the FASB, without modifications. The revisions clarified the classification of eight specific cash flow issues with the objective of reducing diversity in practice. The amendment is to be applied retrospectively, effective for fiscal years beginning after December 15, 2018 and interim periods within those years. Early adoption is permitted. The Company will adopt the amendment in 2019 and is currently assessing the impact of these revisions on its financial statements.
In August 2017, the NAIC adopted non-substantive revisions to SSAP No. 69 – Statement of Cash Flow to adopt ASU 2016-18 Statement of Cash Flows: Restricted Cash as issued by the FASB. The revision clarifies that restricted cash and cash equivalents shall not be reported as operating, investing or financing activities, but shall be reported with cash and cash equivalents when reconciling beginning and ending amounts on the cash flow statement. A consequential change was incorporated in SSAP No. 1 – Accounting Policies, Risks & Uncertainties and Other Disclosures to ensure information on restricted cash, cash equivalents and short-term investments is reported in the restricted asset disclosure. The revision is effective December 31, 2019, to be adopted retrospectively to allow for comparative cash flow statements. Early adoption is permitted. The Company will adopt the amendment in 2019 and is currently assessing the impact of these revisions on its financial statements.
In November 2018, the NAIC made non-substantive revisions to SSAP No. 86, Derivatives to incorporate hedge documentation and assessment efficiencies from ASU 2017-12 Targeted Improvements to Accounting for Hedging Activities as issued by FASB. The revisions will allow companies to perform subsequent assessments of hedge effectiveness qualitatively if certain conditions are met, allow companies more time to perform the initial quantitative hedge effectiveness assessment and clarify that companies may apply the “criterial terms match” method for a group of forecasted transactions if they meet the requirements. The revisions are effective beginning January 1, 2019 and early adoption is permitted. The Company will adopt the amendment in 2019 and is currently assessing the impact of these revisions on its financial statements.
F-14
Table of Contents
JOHN HANCOCK LIFE INSURANCE COMPANY (U.S.A.)
NOTES TO STATUTORY-BASIS FINANCIAL STATEMENTS – (CONTINUED)
4. Accounting Changes - (continued)
Reconciliation Between Audited Financial Statements and NAIC Annual Statements
There were no differences in net income (loss) or capital and surplus between the audited financial statements and the NAIC statements as filed as of and for the years ended December 31, 2018, 2017 and 2016.
5. Investments
Bonds
The carrying value and fair value of the Company’s investments in bonds are summarized as follows:
| Carrying Value |
Gross Unrealized Gains |
Gross Unrealized Losses |
Fair Value |
|||||||||||||
|
|
|
|||||||||||||||
| (in millions) | ||||||||||||||||
| December 31, 2018: |
||||||||||||||||
| U.S. government and agencies |
$ | 3,052 | $ | 123 | $ | (16 | ) | $ | 3,159 | |||||||
| States and political subdivisions |
2,272 | 297 | (13 | ) | 2,556 | |||||||||||
| Foreign governments |
2,370 | 54 | (12 | ) | 2,412 | |||||||||||
| Corporate bonds |
31,188 | 1,749 | (832 | ) | 32,105 | |||||||||||
| Mortgage-backed and asset-backed securities |
5,674 | 249 | (106 | ) | 5,817 | |||||||||||
|
|
|
|||||||||||||||
| Total bonds |
$ | 44,556 | $ | 2,472 | $ | (979 | ) | $ | 46,049 | |||||||
|
|
|
|||||||||||||||
| December 31, 2017: |
||||||||||||||||
| U.S. government and agencies |
$ | 5,382 | $ | 153 | $ | (78 | ) | $ | 5,457 | |||||||
| States and political subdivisions |
2,713 | 548 | (3 | ) | 3,258 | |||||||||||
| Foreign governments |
2,467 | 87 | (17 | ) | 2,537 | |||||||||||
| Corporate bonds |
31,028 | 3,455 | (77 | ) | 34,406 | |||||||||||
| Mortgage-backed and asset-backed securities |
6,380 | 430 | (28 | ) | 6,782 | |||||||||||
|
|
|
|||||||||||||||
| Total bonds |
$ | 47,970 | $ | 4,673 | $ | (203 | ) | $ | 52,440 | |||||||
|
|
|
|||||||||||||||
A summary of the carrying value and fair value of the Company’s investments in bonds at December 31, 2018, by contractual maturity, is as follows:
| Carrying Value |
Fair Value |
|||||||
|
|
|
|||||||
| (in millions) | ||||||||
| Due in one year or less |
$ | 930 | $ | 932 | ||||
| Due after one year through five years |
4,914 | 4,923 | ||||||
| Due after five years through ten years |
7,546 | 7,628 | ||||||
| Due after ten years |
25,492 | 26,749 | ||||||
| Mortgage-backed and asset-backed securities |
5,674 | 5,817 | ||||||
|
|
|
|||||||
| Total |
$ | 44,556 | $ | 46,049 | ||||
|
|
|
|||||||
The expected maturities in the foregoing table may differ from the contractual maturities because certain borrowers have the right to call or prepay obligations with or without call or prepayment penalties.
F-15
Table of Contents
JOHN HANCOCK LIFE INSURANCE COMPANY (U.S.A.)
NOTES TO STATUTORY-BASIS FINANCIAL STATEMENTS – (CONTINUED)
5. Investments - (continued)
The Company maintains assets which are pledged as collateral in connection with various agreements and transactions. Additionally, the Company holds assets on deposit with government authorities as required by state law. The following table summarizes the carrying value or fair value, as applicable, of the pledged or deposited assets:
| December 31, | ||||||||
| 2018 | 2017 | |||||||
|
|
|
|||||||
| (in millions) | ||||||||
| At fair value: |
||||||||
| Bonds and cash pledged in support of over-the-counter derivative instruments |
$ | 265 | $ | 135 | ||||
| Bonds and cash pledged in support of exchange-traded futures |
362 | 364 | ||||||
| Bonds and cash pledged in support of cleared interest rate swaps |
337 | 192 | ||||||
|
|
|
|||||||
| Total fair value |
$ | 964 | $ | 691 | ||||
|
|
|
|||||||
| At carrying value: |
||||||||
| Bonds on deposit with government authorities |
$ | 14 | $ | 16 | ||||
| Mortgage loans pledged in support of real estate |
- | 2 | ||||||
| Bonds held in trust |
93 | 93 | ||||||
| Pledged collateral under reinsurance agreements |
2,508 | 4,187 | ||||||
|
|
|
|||||||
| Total carrying value |
$ | 2,615 | $ | 4,298 | ||||
|
|
|
|||||||
At December 31, 2018 and 2017, the Company held below investment grade corporate bonds of $2,856 million and $2,238 million, with an aggregate fair value of $2,830 million and $2,412 million, respectively. The Company performs periodic evaluations of the relative credit standing of the issuers of these bonds.
The Company has a process in place to identify securities that could potentially have an impairment that is other-than-temporary. This process involves monitoring market events that could impact issuers’ credit ratings, business climate, management changes, litigation and government actions, and other similar factors. This process also involves monitoring late payments, downgrades by rating agencies, key financial ratios, financial statements, revenue forecasts, and cash flow projections as indicators of credit issues.
At the end of each quarter, the MFC Loan Review Committee reviews all securities where there is evidence of impairment or a significant unrealized loss at the Balance Sheet date. Impairment is considered to have occurred, based on management’s judgment, when it is deemed probable that the Company will not be able to collect all amounts due according to the debt security’s contractual terms. The analysis focuses on each company’s or project’s ability to service its debts in a timely fashion and the length of time the security has been trading below amortized cost. The results of this analysis are reviewed by the Transaction and Portfolio Review Committee at MFC. This committee includes MFC’s Chief Financial Officer, Chief Investment Officer, Chief Risk Officer, Chief Credit Officer, and other senior management. This quarterly process includes a fresh assessment of the credit quality of each investment in the entire fixed maturity security portfolio.
The Company considers relevant facts and circumstances in evaluating whether the impairment of a security is other-than-temporary. Relevant facts and circumstances considered include (1) the length of time the fair value has been below cost; (2) the financial position of the issuer, including the current and future impact of any specific events; and (3) the Company’s ability and intent to hold the security to maturity or until it recovers in value. To the extent the Company determines that a security, other than loan-backed and structured securities, is deemed to be other-than-temporarily impaired, the difference between book value and fair value would be charged to income. For loan-backed and structured securities in an unrealized loss position, where the Company does not intend to sell or is not likely to be required to sell the security, the Company calculates an other-than-temporary impairment loss by subtracting the net present value of the projected future cash flows of the security from the amortized cost of the security. The net present value is calculated by discounting the Company’s best estimate of projected future cash flows at the effective interest rate implicit in the debt security prior to impairment. The projection of future cash flows is subject to the same analysis the Company applies to its overall impairment evaluation process, as noted above, which incorporates security specific information such as late payments, downgrades by rating agencies, key financial ratios, financial statements, and fundamentals of the industry and geographic area in which the issuer operates, as well as overall macroeconomic conditions. The cash flow estimates, including prepayment assumptions, are based on data from third-party data sources or internal estimates, and are driven by assumptions regarding the underlying collateral, including default rates, recoveries, and changes in value.
F-16
Table of Contents
JOHN HANCOCK LIFE INSURANCE COMPANY (U.S.A.)
NOTES TO STATUTORY-BASIS FINANCIAL STATEMENTS – (CONTINUED)
5. Investments - (continued)
There are a number of significant risks and uncertainties inherent in the process of monitoring impairments and determining if impairment is other-than-temporary. These risks and uncertainties include (1) the risk that the Company’s assessment of an issuer’s ability to meet all of its contractual obligations will change based on changes in the credit characteristics of that issuer; (2) the risk that the economic outlook will be worse than expected or have more of an impact on the issuer than anticipated; (3) the risk that fraudulent information could be provided to the Company’s investment professionals who determine the fair value estimates and other-than-temporary impairments; and (4) the risk that new information obtained by the Company or changes in other facts and circumstances lead the Company to change its intent to hold the security to maturity or until it recovers in value. Any of these situations could result in a charge to income in a future period.
The following tables disclose the impact of Other-Than-Temporary Impairments (OTTI) on Carrying Values (CV), including the Net Present Value (NPV) of Projected Cash Flows (CF) less than Book Value (BV) by CUSIP for loan-backed and structured securities:
Year Ended December 31, 2018
| CUSIP# |
CV Before OTTI |
NPV of Projected CFs |
Credit OTTI Recognized in Loss |
CV After OTTI |
Fair Value |
|||||||||||||||
|
|
|
|||||||||||||||||||
| $ | - | $ | - | $ | - | $ | - | $ | - | |||||||||||
| - | - | - | - | - | ||||||||||||||||
| - | - | - | - | - | ||||||||||||||||
|
|
|
|||||||||||||||||||
| Total |
$ | - | $ | - | $ | - | $ | - | $ | - | ||||||||||
|
|
|
|||||||||||||||||||
Year Ended December 31, 2017
| CUSIP# |
CV Before OTTI |
NPV of Projected CFs |
Credit OTTI Recognized in Loss |
CV After OTTI |
Fair Value |
|||||||||||||||
|
|
|
|||||||||||||||||||
| 671451CZ0 |
$ | 2 | $ | - | $ | 2 | $ | - | $ | - | ||||||||||
| - | - | - | - | - | ||||||||||||||||
| - | - | - | - | - | ||||||||||||||||
|
|
|
|||||||||||||||||||
| Total |
$ | 2 | $ | - | $ | 2 | $ | - | $ | - | ||||||||||
|
|
|
|||||||||||||||||||
When a decline in fair value is other-than-temporary, an impairment loss is recognized as a realized loss equal to the entire difference between the bond’s carrying value or amortized cost and its fair value.
F-17
Table of Contents
JOHN HANCOCK LIFE INSURANCE COMPANY (U.S.A.)
NOTES TO STATUTORY-BASIS FINANCIAL STATEMENTS – (CONTINUED)
5. Investments - (continued)
The following table shows gross unrealized losses and fair values of bonds, aggregated by investment category and length of time that individual securities have been in a continuous unrealized loss position:
| Less than 12 months | 12 months or more | Total | ||||||||||||||||||||||
| Fair Value | Gross Unrealized Losses |
Fair Value |
Gross Unrealized Losses |
Fair Value | Gross Unrealized Losses |
|||||||||||||||||||
| (in millions) | ||||||||||||||||||||||||
| December 31, 2018: |
||||||||||||||||||||||||
| U.S. government and agencies |
$ | 384 | $ | (2 | ) | $ | 205 | $ | (14 | ) | $ | 589 | $ | (16 | ) | |||||||||
| States and political subdivisions |
199 | (5 | ) | 113 | (8 | ) | 312 | (13 | ) | |||||||||||||||
| Foreign governments |
10 | - | 75 | (12 | ) | 85 | (12 | ) | ||||||||||||||||
| Corporate bonds |
14,077 | (583 | ) | 3,429 | (249 | ) | 17,506 | (832 | ) | |||||||||||||||
| Mortgage-backed and asset-backed securities |
1,769 | (51 | ) | 967 | (55 | ) | 2,736 | (106 | ) | |||||||||||||||
| Total |
$ | 16,439 | $ | (641 | ) | $ | 4,789 | $ | (338 | ) | $ | 21,228 | $ | (979 | ) | |||||||||
| Less than 12 months | 12 months or more | Total | ||||||||||||||||||||||
| Fair Value | Gross Unrealized Losses |
Fair Value |
Gross Unrealized Losses |
Fair Value | Gross Unrealized Losses |
|||||||||||||||||||
| (in millions) | ||||||||||||||||||||||||
| December 31, 2017: |
||||||||||||||||||||||||
| U.S. government and agencies |
$ | 2,805 | $ | (18 | ) | $ | 1,137 | $ | (60 | ) | $ | 3,942 | $ | (78 | ) | |||||||||
| States and political subdivisions |
45 | - | 62 | (3 | ) | 107 | (3 | ) | ||||||||||||||||
| Foreign governments |
27 | - | 43 | (17 | ) | 70 | (17 | ) | ||||||||||||||||
| Corporate bonds |
2,028 | (14 | ) | 2,534 | (63 | ) | 4,562 | (77 | ) | |||||||||||||||
| Mortgage-backed and asset-backed securities |
540 | (3 | ) | 772 | (25 | ) | 1,312 | (28 | ) | |||||||||||||||
| Total |
$ | 5,445 | $ | (35 | ) | $ | 4,548 | $ | (168 | ) | $ | 9,993 | $ | (203 | ) | |||||||||
At December 31, 2018 and 2017, there were 1,383 and 483 bonds that had a gross unrealized loss, of which the single largest unrealized loss was $43 million and $40 million, respectively. The Company anticipates that these bonds will perform in accordance with their contractual terms and the Company currently has the ability and intent to hold these bonds until they recover or mature. Unrealized losses can be created by rising interest rates or by rising credit concerns and hence widening credit spreads. Credit concerns are apt to play a larger role in the unrealized loss on below investment grade securities. Unrealized losses on investment grade securities principally relate to changes in interest rates or changes in credit spreads since the securities were acquired. Credit rating agencies’ statistics indicate that investment grade securities have been found to be less likely to develop credit concerns.
For the years ended December 31, 2018, 2017 and 2016, realized capital losses include $72 million, $3 million, and $61 million related to bonds that have experienced an other-than-temporary decline in value and were comprised of 21, 4, and 8 securities, respectively.
The total recorded investment in restructured corporate bonds at December 31, 2018, 2017 and 2016 was $0 million, $3 million, and $16 million, respectively. There were 1, 1, and 2 restructured corporate bonds for which an impairment was recognized during 2018, 2017 and 2016, respectively. The Company accrues interest income on impaired securities to the
F-18
Table of Contents
JOHN HANCOCK LIFE INSURANCE COMPANY (U.S.A.)
NOTES TO STATUTORY-BASIS FINANCIAL STATEMENTS – (CONTINUED)
5. Investments - (continued)
extent deemed collectible and the loan continues to perform under its original or restructured contractual terms. Interest income on non-performing loans generally is recognized on a cash basis.
The sales of investments in bonds resulted in the following:
| Years Ended December 31, | ||||||||||||
| 2018 | 2017 | 2016 | ||||||||||
|
|
|
|||||||||||
| (in millions) | ||||||||||||
| Proceeds |
$ | 28,102 | $ | 17,663 | $ | 20,018 | ||||||
| Realized gross gains |
729 | 557 | 524 | |||||||||
| Realized gross losses |
(407 | ) | (33 | ) | (112 | ) | ||||||
The Company had no nonadmitted accrued investment income from bonds (unaffiliated) at December 31, 2018 and 2017.
Affiliate Transactions
In 2018, the Company sold certain bonds to an affiliate, Manulife Reinsurance Bermuda Limited (“MRBL”). These bonds had a book value of $449 million and fair value of $501 million. The Company recognized $52 million in pre-tax realized gains before transfer to the IMR.
In 2018, the Company sold certain bonds to an affiliate, JHNY. These bonds had a book value of $293 million and fair value of $313 million. The Company recognized $20 million in pre-tax realized gains before transfer to the IMR.
In 2018, the Company sold certain bonds and stocks to an affiliate, John Hancock Funding Company LLC, (“JHFLLC”). These bonds and stocks had a book value of $53 million and fair value of $53 million. The Company did not recognize any pre-tax realized gains before transfer to the IMR.
In 2018, the Company acquired at fair value, certain bonds from an affiliate, JHNY, for $647 million.
In 2018, the Company acquired at fair value, certain bonds from an affiliate, JHLH, for $48 million.
In 2017, the Company sold certain private placements to an affiliate, The Manufacturers Life Insurance Company Bermuda Branch (“MLI Bermuda”). These private placements had a book value of $208 million and fair value of $226 million. The Company recognized $18 million in pre-tax realized gains before transfer to the IMR.
In 2017, the Company sold certain bonds to an affiliate, MRBL. These bonds had a book value of $204 million and fair value of $227 million. The Company recognized $23 million in pre-tax realized gains before transfer to the IMR.
In 2017, the Company sold certain bonds to an affiliate, JHLH. These bonds had a book value of $263 million and fair value of $304 million. The Company recognized $41 million in pre-tax realized gains before transfer to the IMR.
In 2017, the Company sold certain bonds to an affiliate, John Hancock Reassurance Company Limited (“JHRECO”). These bonds had a book value of $172 million and fair value of $200 million. The Company recognized $28 million in pre-tax realized gains before transfer to the IMR.
In 2017, the Company sold certain bonds to its indirect parent, MLI. These bonds had a book value of $448 million and fair value of $521 million. The Company recognized $73 million in pre-tax realized gains before transfer to the IMR.
In 2017, the Company sold certain bonds to an affiliate, Manulife Securities Ltd Partner (“MSLP”). These bonds had a book value of $412 million and fair value of $435 million. The Company recognized $23 million in pre-tax realized gains before transfer to the IMR.
In 2017, the Company acquired at fair value, certain bonds from an affiliate, JHLH, for $177 million.
F-19
Table of Contents
JOHN HANCOCK LIFE INSURANCE COMPANY (U.S.A.)
NOTES TO STATUTORY-BASIS FINANCIAL STATEMENTS – (CONTINUED)
5. Investments - (continued)
In 2017, the Company acquired at fair value, certain bonds from an affiliate, MRBL, for $100 million.
In 2016, the Company transferred certain bonds to an affiliate, JHRECO, in lieu of a reinsurance cash settlement. These bonds had a book value of $676 million and fair value of $751 million. The Company recognized $75 million in pre-tax realized gains before transfer to the IMR.
In 2016, the Company sold certain bonds to an affiliate, Manulife Financial Singapore (“MLS”). These bonds had a book value of $93 million and fair value of $100 million. The Company recognized $7 million in pre-tax realized gains before transfer to the IMR.
In 2016, the Company sold certain bonds to an affiliate, Manubank (“MB”). These bonds had a book value of $12 million and fair value of $12 million. The Company did not recognize any pre-tax realized gains or losses before transfer to the IMR.
In 2016, the Company sold certain bonds to an affiliate Manulife International Ltd (“MIL”). These bonds had a book value of $67 million and fair value of $75 million. The Company recognized $8 million in pre-tax realized gains before transfer to the IMR.
In 2016, the Company sold certain bonds to an affiliate MLRL. These bonds had a book value of $25 million and fair value of $29 million. The Company recognized $4 million in pre-tax realized gains before transfer to the IMR.
In 2016, the Company sold certain bonds to an affiliate Manulife Reinsurance Ltd Partner (“MRLP”). These bonds had a book value of $211 million and fair value of $221 million. The Company recognized $10 million in pre-tax realized gains before transfer to the IMR.
In 2016, the Company received, at fair value, certain bonds from an affiliate, JHNY in lieu of reinsurance cash settlement, for $26 million.
In 2016, the Company acquired, at fair value, certain bonds from an affiliate, JHNY, for $343 million.
In 2016, the Company acquired, at fair value, certain bonds from an affiliate, MIL, for $60 million.
In 2016, the Company acquired, at fair value, certain bonds from an affiliate, MLRL, for $29 million.
In 2016, the Company acquired, at fair value, certain bonds from an affiliate, MLS, for $21 million.
In 2016, the Company acquired, at fair value, certain bonds from an affiliate, JHLH, for $140 million.
F-20
Table of Contents
JOHN HANCOCK LIFE INSURANCE COMPANY (U.S.A.)
NOTES TO STATUTORY-BASIS FINANCIAL STATEMENTS – (CONTINUED)
5. Investments - (continued)
Preferred and Common Stocks
Cost and fair value of the Company’s investments in preferred and common stocks are summarized as follow:
| Cost | Gross Unrealized Gains |
Gross Unrealized Losses |
Fair Value | |||||||||||||
|
|
|
|||||||||||||||
| (in millions) | ||||||||||||||||
| December 31, 2018: |
||||||||||||||||
| Preferred stocks: |
||||||||||||||||
| Nonaffiliated |
$ | 14 | $ | 1 | $ | - | $ | 15 | ||||||||
| Affiliates |
- | - | - | - | ||||||||||||
| Common stocks: |
||||||||||||||||
| Nonaffiliated |
791 | 157 | (30 | ) | 918 | |||||||||||
| Affiliates* |
1,589 | 1,324 | - | 2,913 | ||||||||||||
|
|
|
|||||||||||||||
| Total stocks |
$ | 2,394 | $ | 1,482 | $ | (30) | $ | 3,846 | ||||||||
|
|
|
|||||||||||||||
| Cost | Gross Unrealized Gains |
Gross Unrealized Losses |
Fair Value | |||||||||||||
|
|
|
|||||||||||||||
| (in millions) | ||||||||||||||||
| December 31, 2017: |
||||||||||||||||
| Preferred stocks: |
||||||||||||||||
| Nonaffiliated |
$ | 11 | $ | 3 | $ | - | $ | 14 | ||||||||
| Affiliates |
- | - | - | - | ||||||||||||
| Common stocks: |
||||||||||||||||
| Nonaffiliated |
1,131 | 235 | (12 | ) | 1,354 | |||||||||||
| Affiliates* |
1,589 | 971 | - | 2,560 | ||||||||||||
|
|
|
|||||||||||||||
| Total stocks |
$ | 2,731 | $ | 1,209 | $ | (12) | $ | 3,928 | ||||||||
|
|
|
|||||||||||||||
| *Affiliates - fair value represents the carrying value |
| |||||||||||||||
At December 31, 2018 and 2017, there were 309 and 136 nonaffiliated equity securities that had a gross unrealized loss excluding securities that have been written down to zero. The single largest unrealized loss was $3 million and $3 million at December 31, 2018 and 2017, respectively. The Company anticipates that these equity securities will recover in value in the near term.
The Company has a process in place to identify equity securities that could potentially have an impairment that is other-than-temporary. The Company considers relevant facts and circumstances in evaluating whether the impairment of a security is other-than-temporary. Relevant facts and circumstances include (1) the length of time the fair value has been below cost; (2) the financial position of the issuer; and (3) the Company’s ability and intent to hold the security until it recovers. To the extent the Company determines that a security is deemed to be other-than-temporarily impaired, the difference between book value and fair value would be charged to income.
For the years ended December 31, 2018, 2017 and 2016, realized capital losses include $11 million, $2 million, and $24 million related to preferred and common stocks that have experienced an other-than-temporary decline in value and were comprised of 95, 81, and 108 securities, respectively. These are primarily made up of impairments on public and private common stocks.
F-21
Table of Contents
JOHN HANCOCK LIFE INSURANCE COMPANY (U.S.A.)
NOTES TO STATUTORY-BASIS FINANCIAL STATEMENTS – (CONTINUED)
5. Investments - (continued)
Affiliate Transactions
In 2018, the Company sold certain common stocks to an affiliate, MRBL. These stocks had a book value of $264 million and fair value of $306 million. The Company recognized $42 million in pre-tax realized gains.
In 2017, the Company acquired at fair value, certain common stocks from an affiliate, JHLH, for $43 million.
Mortgage Loans on Real Estate
At December 31, 2018 and 2017, the mortgage loan portfolio was diversified by geographic region and specific collateral property type as displayed below. The Company controls credit risk through credit approvals, limits, and monitoring procedures.
December 31, 2018:
| Property Type | Carrying Value |
Geographic Concentration |
Carrying Value |
|||||||
|
|
|
|||||||||
| (in millions) | (in millions) | |||||||||
| Apartments |
$ | 2,828 | East North Central | $ | 1,523 | |||||
| Industrial |
1,020 | East South Central | 253 | |||||||
| Office buildings |
3,241 | Middle Atlantic | 1,936 | |||||||
| Retail |
3,406 | Mountain | 516 | |||||||
| Agricultural |
133 | New England | 642 | |||||||
| Agribusiness |
247 | Pacific | 3,823 | |||||||
| Mixed use |
7 | South Atlantic | 2,367 | |||||||
| Other |
1,226 | West North Central | 336 | |||||||
| Allowance |
(23 | ) | West South Central | 709 | ||||||
| Canada / Other | 3 | |||||||||
| Allowance | (23 | ) | ||||||||
|
|
|
|
|
|||||||
| Total mortgage loans on real estate |
$ | 12,085 | Total mortgage loans on real estate | $ | 12,085 | |||||
|
|
|
|
|
|||||||
December 31, 2017:
| Property Type | Carrying Value |
Geographic Concentration |
Carrying Value |
|||||||
|
|
|
|||||||||
| (in millions) | (in millions) | |||||||||
| Apartments |
$ | 2,560 | East North Central | $ | 1,574 | |||||
| Industrial |
907 | East South Central | 187 | |||||||
| Office buildings |
3,168 | Middle Atlantic | 1,868 | |||||||
| Retail |
3,652 | Mountain | 527 | |||||||
| Agricultural |
139 | New England | 579 | |||||||
| Agribusiness |
303 | Pacific | 3,604 | |||||||
| Mixed use |
22 | South Atlantic | 2,449 | |||||||
| Other |
1,163 | West North Central | 384 | |||||||
| Allowance |
(14 | ) | West South Central | 660 | ||||||
| Canada / Other | 82 | |||||||||
| Allowance | (14 | ) | ||||||||
|
|
|
|
|
|||||||
| Total mortgage loans on real estate |
$ | 11,900 | Total mortgage loans on real estate | $ | 11,900 | |||||
|
|
|
|
|
|||||||
The aggregate mortgages outstanding to any one borrower do not exceed $425 million.
During 2018, the respective maximum and minimum lending rates for mortgage loans issued were 0.00% and 0.00% for agricultural loans and 8.30% and 3.26% for commercial loans. The Company issued no purchase money mortgages in 2018 and 2017. At the issuance of a loan, the percentage of any one loan to value of security, exclusive of insured, guaranteed, or
F-22
Table of Contents
JOHN HANCOCK LIFE INSURANCE COMPANY (U.S.A.)
NOTES TO STATUTORY-BASIS FINANCIAL STATEMENTS – (CONTINUED)
5. Investments - (continued)
purchase money mortgages does not exceed 75%. Impaired mortgage loans without an allowance for credit losses were $0 million, $0 million, and $0 million at December 31, 2018, 2017 and 2016, respectively. The average recorded investment in impaired loans was $56 million, $31 million, and $25 million at December 31, 2018, 2017 and 2016, respectively. The Company recognized $4 million, $0 million, and $1 million of interest income during the period the loans were impaired for the years ended December 31, 2018, 2017 and 2016, respectively.
The following table shows the age analysis of mortgage loans aggregated by type:
| Farm | Residential | Commercial | Mezzanine | Total | ||||||||||||||||
|
|
|
|||||||||||||||||||
| (in millions) | ||||||||||||||||||||
| December 31, 2018: |
| |||||||||||||||||||
| Recorded Investment |
||||||||||||||||||||
| Current |
$ | 380 | $ | - | $ | 11,707 | $ | 21 | $ | 12,108 | ||||||||||
| 30 - 59 Days Past Due |
- | - | - | - | - | |||||||||||||||
| 60 - 89 Days Past Due |
- | - | - | - | - | |||||||||||||||
| 90 - 179 Days Past Due |
- | - | - | - | - | |||||||||||||||
| 180 + Days Past Due |
- | - | - | - | - | |||||||||||||||
| December 31, 2017: |
||||||||||||||||||||
| Recorded Investment |
||||||||||||||||||||
| Current |
$ | 442 | $ | - | $ | 11,472 | $ | - | $ | 11,914 | ||||||||||
| 30 - 59 Days Past Due |
- | - | - | - | - | |||||||||||||||
| 60 - 89 Days Past Due |
- | - | - | - | - | |||||||||||||||
| 90 - 179 Days Past Due |
- | - | - | - | - | |||||||||||||||
| 180 + Days Past Due |
- | - | - | - | - | |||||||||||||||
The Company had no recorded investment of mortgage loans 90 to 179 days or 180 days or greater past due still accruing interest or where interest has been reduced in 2018 and 2017. The Company was not a participant or co-lender in a mortgage loan agreement in 2018 and 2017.
Generally, the terms of the restructured mortgage loans call for the Company to receive some form or combination of an equity participation in the underlying collateral, excess cash flows or an effective yield at the maturity of the loans sufficient to meet the original terms of the loans. There are no contractual commitments made to extend credit to debtors owning receivables whose terms have been modified in troubled debt restructurings. The Company accrues interest income on impaired loans to the extent deemed collectible and the loan continues to perform under its original or restructured contractual terms. Interest income on non-performing loans generally is recognized on a cash basis.
For mortgage loans, the Company evaluates credit quality through regular monitoring of credit related exposures, considering both qualitative and quantitative factors in assigning an internal risk rating (“IRR”). These ratings are updated at least annually.
The carrying value of mortgage loans by IRR was as follows:
| December 31, | ||||||||
| 2018 | 2017 | |||||||
|
|
|
|||||||
| (in millions) | ||||||||
| AAA |
$ | 279 | $ | 250 | ||||
| AA |
2,814 | 2,842 | ||||||
| A |
5,505 | 5,585 | ||||||
| BBB |
3,370 | 3,095 | ||||||
| BB |
61 | 98 | ||||||
| B and lower and unrated |
56 | 30 | ||||||
|
|
|
|||||||
| Total |
$ | 12,085 | $ | 11,900 | ||||
|
|
|
|||||||
F-23
Table of Contents
JOHN HANCOCK LIFE INSURANCE COMPANY (U.S.A.)
NOTES TO STATUTORY-BASIS FINANCIAL STATEMENTS – (CONTINUED)
5. Investments - (continued)
Affiliate Transactions
In 2018, the Company sold certain mortgages to an affiliate, JHLH. These mortgages had a book value of $8 million and fair value of $8 million at the date of the transaction. The Company recognized $0 million in pre-tax realized losses before transfer to the IMR.
In 2018, the Company acquired, at fair value, certain mortgages from an affiliate, JHNY, for $105 million.
In 2018, the Company acquired, at fair value, certain mortgages from an affiliate, JHLH, for $29 million.
In 2017, the Company transferred two mortgages to an affiliate, Clarendon Real Estate, LLC (“CRE LLC”). The mortgages had a book value of $7 million and fair value of $7 million at the date of the transaction. The Company did not recognize any pre-tax realized gains or losses before transfer to the IMR.
Real Estate
The composition of the Company’s investment in real estate is summarized as follows:
| December 31, | ||||||||
| 2018 | 2017 | |||||||
|
|
|
|||||||
| (in millions) | ||||||||
| Properties occupied by the company |
$ | 236 | $ | 396 | ||||
| Properties held for the production of income |
4,730 | 6,086 | ||||||
| Properties held for sale |
- | - | ||||||
| Less accumulated depreciation |
(953 | ) | (760 | ) | ||||
|
|
|
|||||||
| Total |
$ | 4,013 | $ | 5,722 | ||||
|
|
|
|||||||
The Company recorded $0 million, $0 million, and $38 million of impairments on real estate investments during the years ended December 31, 2018, 2017 and 2016, respectively.
Affiliate Transactions
In 2018, the Company entered into a joint venture arrangement with the University of California Board of Regents (“UC”). As part of this arrangement, the Company sold six U.S. commercial real estate properties and one other invested asset with the characteristics of real estate to Broadway Green LLC, Broadway Wacker LLC and Broadway Congress LLC, all joint venture entities formed by UC. The Company provides management services to these joint ventures and owns 10% of their equity. The real estate properties had a book value of $728 million and fair value of $985 million which resulted in pre-tax realized gains to operations of $231 million (after 10% deferral of realized gain).
In 2017, the Company entered into an arrangement to sell four real estate properties to Hancock U.S Real Estate Fund, LP. These properties had a book value of $325 million and fair value of $471 million, resulting in pre-tax realized gains of $135 million and a deferred gain of $10 million. As part of this arrangement, the Company also committed approximately $44 million for an 11.7% equity interest in the fund.
On May 20, 2016, the Company entered into an arrangement to sell three real estate properties to Manulife U.S. Real Estate Investment Trust (“REIT”) for $777 million. These properties had a book value of $524 million and fair value of $769 million. Approximately 62% of the $245 million gain from operations was ceded to an affiliate reinsurer. The Company recognized an after-tax gain, after reinsurance of $60 million.
F-24
Table of Contents
JOHN HANCOCK LIFE INSURANCE COMPANY (U.S.A.)
NOTES TO STATUTORY-BASIS FINANCIAL STATEMENTS – (CONTINUED)
5. Investments - (continued)
Other Invested Assets
The Company had no investments in partnerships or LLCs that exceed 10% of its admitted assets at December 31, 2018 and 2017.
Other invested assets primarily consist of investments in partnerships and LLCs. The Company recorded $39 million, $0 million, and $99 million of impairments on partnerships and LLCs during the years ended December 31, 2018, 2017 and 2016, respectively. These impairments are based on significant judgement by the Company in determining whether the objective evidence of other-than-temporary impairment exists. The Company considers relevant facts and circumstances in evaluating whether the impairment of an other invested asset is other-than-temporary. Relevant facts and circumstances include (1) the length of time the fair value has been below cost; (2) the financial position of the investee; (3) the Company’s ability and intent to hold the other invested asset until it recovers. To the extent the Company determines that an other invested asset is deemed to be other-than-temporarily impaired, the difference between book and fair value would be charged to income.
Affiliate Transactions
In 2018, the Company entered into an agreement to launch John Hancock Infrastructure Fund, LP (the “Fund”), a closed-end pooled fund that will offer investors the opportunity to invest alongside the Company in a targeted infrastructure strategy focused primarily on U.S investments. The fund was seeded with the partial sale of 9 assets owned by the Company. The assets sold had a book value of $1,045 million and fair value of $1,094 million which resulted in a gain to operations of $49 million.
In 2018, the Company acquired at fair value, certain other invested assets from an affiliate, JHNY, for $4 million.
In 2018, the Company acquired at fair value, certain other invested assets from an affiliate, JHLH, for $9 million.
In 2018, the Company acquired at fair value, certain other invested assets from an affiliate, John Hancock Partnership Holdings I (“JHPH I”), for $39 million.
In 2018, the Company acquired at fair value, certain other invested assets from an affiliate, John Hancock Partnership Holdings II (“JHPH II”), for $39 million.
In 2018, the Company acquired at fair value, certain other invested assets from an affiliate, JHFLLC, for $6 million.
Other
The subprime lending sector, also referred to as B-paper, near-prime, or second chance lending, is the sector of the mortgage lending industry which lends to borrowers who do not qualify for prime market interest rates because of poor or insufficient credit history.
For purposes of this disclosure, subprime exposure is defined as the potential for financial loss through direct investment, indirect investment, or underwriting risk associated with risk from the subprime lending sector. For purposes of this note, subprime exposure is not limited solely to the risk associated with holding direct mortgage loans, but also includes any indirect risk through investments in asset-backed or structured securities, hedge funds, common stock, subsidiaries and affiliates, and insurance product issuance.
Although it can be difficult to determine the indirect risk exposures, it should be noted that not only does it include expected losses, it also includes the potential for losses that could occur due to significantly depressed fair value of the related assets in an illiquid market.
The Company had no direct exposure through investments in subprime mortgage loans as of December 31, 2018 or 2017.
Management considers several factors when classifying a structured finance or residential mortgage-backed security holding as “subprime” or placing a security in the highest risk category. These factors include the transaction’s weighted average
F-25
Table of Contents
JOHN HANCOCK LIFE INSURANCE COMPANY (U.S.A.)
NOTES TO STATUTORY-BASIS FINANCIAL STATEMENTS – (CONTINUED)
5. Investments - (continued)
FICO or credit score, loan-to-value ratio (LTV), geographic composition, lien position, loan purpose, and loan documentation.
The Company has entered into certain repurchase agreements with an aggregate carrying value of $0 million and $0 million as of December 31, 2018 and 2017, respectively. For such agreements, the Company agrees to a specified term, price, and interest rate through the date of the repurchase.
The Company established a facility with an affiliate, MRBL whereby cash collateral can be received under a repurchase agreement program. There was no repurchase agreement activity in 2018 and 2017.
For securities lending transactions, the Company’s policy is to require a minimum of 102% of the fair value of securities loaned to be maintained as collateral. Positions are marked to market and adjusted on a daily basis to ensure the 102% margin requirement is maintained. There were no securities on loan as of December 31, 2018 or 2017.
F-26
Table of Contents
JOHN HANCOCK LIFE INSURANCE COMPANY (U.S.A.)
NOTES TO STATUTORY-BASIS FINANCIAL STATEMENTS – (CONTINUED)
5. Investments - (continued)
Net Investment Income and Net Realized and Other Gains (Losses)
Major categories of the Company’s net investment income are summarized as follows:
| 2018 | 2017 | 2016 | ||||||||||
|
|
|
|||||||||||
| (in millions) | ||||||||||||
| Income: |
||||||||||||
| Bonds |
$ | 2,279 | $ | 2,146 | $ | 2,232 | ||||||
| Preferred stocks |
- | - | - | |||||||||
| Common stocks |
126 | 23 | 225 | |||||||||
| Mortgage loans on real estate |
594 | 610 | 609 | |||||||||
| Real estate |
638 | 704 | 762 | |||||||||
| Policy loans |
175 | 176 | 167 | |||||||||
| Cash, cash equivalents and short-term investments |
38 | 33 | 18 | |||||||||
| Other invested assets |
1,069 | 1,014 | 506 | |||||||||
| Derivatives |
427 | 483 | 594 | |||||||||
| Other income |
(21 | ) | 12 | 30 | ||||||||
|
|
|
|||||||||||
| Total investment income |
5,325 | 5,201 | 5,143 | |||||||||
| Expenses |
||||||||||||
| Investment expenses |
(424 | ) | (509 | ) | (529 | ) | ||||||
| Investment taxes, licenses and fees, excluding federal income taxes |
(76 | ) | (93 | ) | (94 | ) | ||||||
| Investment interest expense |
(48 | ) | (50 | ) | (82 | ) | ||||||
| Depreciation on real estate and other invested assets |
(112 | ) | (123 | ) | (130 | ) | ||||||
|
|
|
|||||||||||
| Total investment expenses |
(660 | ) | (775 | ) | (835 | ) | ||||||
|
|
|
|||||||||||
| Net investment income |
$ | 4,665 | $ | 4,426 | $ | 4,308 | ||||||
|
|
|
|||||||||||
Realized capital gains (losses) and amounts transferred to the IMR are as follows:
| 2018 | 2017 | 2016 | ||||||||||
|
|
|
|||||||||||
| (in millions) | ||||||||||||
| Realized capital gains (losses) |
$ | 730 | $ | 722 | $ | (494 | ) | |||||
| Less amount transferred to the IMR (net of related tax benefit (expense) of $2 in 2018, $(475) in 2017, and $31 in 2016) |
(6 | ) | 882 | (57 | ) | |||||||
|
|
|
|||||||||||
| Realized capital gains (losses) before tax |
736 | (160 | ) | (437 | ) | |||||||
| Less federal income taxes on realized capital gains (losses) before effect of transfer to the IMR |
396 | 243 | 496 | |||||||||
|
|
|
|||||||||||
| Net realized capital gains (losses) |
$ | 340 | $ | (403 | ) | $ | (933 | ) | ||||
|
|
|
|||||||||||
6. Derivatives
Derivatives are financial contracts, the value of which is derived from underlying interest rates, foreign exchange rates, credit, equity price movements, indices or other market risks arising from on-balance sheet financial instruments and selected anticipated transactions. The Company uses derivatives including swaps, forward and futures agreements, floors, and options to manage current and anticipated exposures to changes in interest rates, foreign exchange rates, credit and equity market prices.
F-27
Table of Contents
JOHN HANCOCK LIFE INSURANCE COMPANY (U.S.A.)
NOTES TO STATUTORY-BASIS FINANCIAL STATEMENTS – (CONTINUED)
6. Derivatives - (continued)
Over-the-counter (“OTC”) bilateral swaps are contractual agreements between the Company and a counterparty to exchange a series of cash flows based upon rates applied to a notional amount. For interest rate swaps, counterparties generally exchange fixed or floating interest rate payments based on a notional value in a single currency. Cross currency swaps involve the exchange of principal amounts between parties as well as the exchange of interest payments in one currency for the receipt of interest payments in another currency. Total return swaps are contracts that involve the exchange of payments based on changes in the values of a reference asset, including any returns such as interest earned on these assets, in return for amounts based on reference rates specified in the contract.
Cleared OTC interest rate swaps are contractual agreements between the Company and a counterparty whereby the transaction must be cleared through a central clearing house, and subject to mandatory margin and reporting requirements.
Forward and futures agreements are contractual obligations to buy or sell a financial instrument or foreign currency on a predetermined future date at a specified price. Forward contracts are OTC contracts negotiated between counterparties, whereas futures agreements are contracts with standard amounts and settlement dates that are traded on regulated exchanges.
Interest rate floors are contracts with counterparties which require payment of a premium for the right to receive payments when the market interest rate on specified future dates falls below the agreed upon strike price. Interest rate treasury lock contracts are customized agreements securing current interest rates on Treasury securities for payment on a future date.
Options are contractual agreements whereby the holder has the right, but not the obligation, to buy (call option) or sell (put option) a security, exchange rate, interest rate, or other financial instrument at a predetermined price/rate within a specified time.
Swaptions are contractual agreements whereby the holder has the right, but not obligation, to enter into a given swap agreement on a specified future date.
Types of Derivatives and Derivative Strategies
Interest Rate Contracts. The Company uses interest rate futures contracts, OTC interest rate swap agreements, cleared interest rate swap agreements, swaptions, and interest rate treasury locks as part of its overall strategies of managing the duration of assets and liabilities or the average life of certain asset portfolios to specified targets. Interest rate swap agreements are contracts with counterparties to exchange interest rate payments of a differing character (i.e., fixed-rate payments exchanged for variable-rate payments) based on an underlying principal balance (notional principal). The net differential to be paid or received on interest rate swap agreements is accrued and recognized as a component of net investment income.
The Company uses interest rate swap agreements in effective cash flow and fair value hedge accounting relationships. These derivatives hedge the variable cash flows associated with certain floating-rate bonds, as well as, future fixed income asset acquisitions, which will support the Company’s long-term care and life insurance businesses. These derivatives reduce the impact of future interest rate changes on the cost of acquiring adequate assets to support the investment income assumptions used in pricing these products. For its fair value hedging relationships, the Company uses interest rate swap agreements and interest rate treasury locks to hedge the risk of changes in fair value of existing fixed rate assets and liabilities arising from changes in benchmark interest rates.
Inflation swaps are used to reduce inflation risk generated from inflation-indexed liabilities. Inflation swaps are classified within interest rate swaps for disclosure purposes. The Company utilizes inflation swaps in effective hedge accounting relationships and other hedging relationships.
The Company uses exchange-traded interest rate futures primarily to hedge mismatches between the duration of assets in a portfolio and the duration of liabilities supported by those assets, to hedge against changes in value of securities the Company owns or anticipates acquiring, and to hedge against changes in interest rates on anticipated liability issuances by replicating U.S. Treasury or swap curve performance. The Company utilizes exchange-traded interest rate futures in other hedging relationships.
F-28
Table of Contents
JOHN HANCOCK LIFE INSURANCE COMPANY (U.S.A.)
NOTES TO STATUTORY-BASIS FINANCIAL STATEMENTS – (CONTINUED)
6. Derivatives - (continued)
The Company also uses interest rate floors and swaptions primarily to protect against interest rate exposure arising from mismatches between assets and liabilities (duration mismatches). The Company utilizes interest rate floors in other hedging relationships.
Foreign Currency Contracts. Foreign currency derivatives, including foreign currency swaps, foreign currency forwards, and foreign currency futures are used by the Company to reduce the risk from fluctuations in foreign currency exchange rates associated with its assets and liabilities denominated in foreign currencies.
Cross currency rate swap agreements are used to manage the Company’s exposure to foreign exchange rate fluctuations, interest rate fluctuations, or both, on foreign currency financial instruments. Cross currency rate swap agreements are contracts to exchange the currencies of two different countries at the same rate of exchange at specified future dates. The net differential to be paid or received on cross currency rate swap agreements is accrued and recognized as a component of net investment income.
Under foreign currency forwards, the Company agrees with other parties to deliver a specified amount of an identified currency at a specified future date. Typically, the price is agreed upon at the time of the contract and payment for such a contract is made at the specified future date. The maturities of these forwards correspond with the future periods in which the foreign currency transactions are expected to occur. The Company utilizes currency forwards in effective hedge accounting relationships and other hedging relationships.
Foreign currency futures are contractual obligations to buy or sell a foreign currency on a predetermined future date at a specified price. These contracts are standardized contracts traded on an exchange. The Company utilizes foreign exchange futures in other hedging relationships.
Equity Market Contracts. Total return swaps are contracts that involve the exchange of payments based on changes in the value of a reference asset, including any returns such as interest earned on these assets, in exchange for amounts based on reference rates specified in the contract. The Company utilizes total return swaps in effective hedge accounting relationships and other hedging relationships.
Equity index options are contractual agreements whereby the holder has the right, but not the obligation, to buy (call option) or sell (put option) an underlying equity market index on or before a specified future date at a specified price. The Company utilizes equity index options in other hedging relationships.
Equity index futures contracts are contractual obligations to buy or sell a specified amount of an underlying equity index at an agreed contract price on a specified date. Equity index futures are contracts with standard amounts and settlement dates that are traded on regulated exchanges. The Company utilizes equity index futures in other hedging relationships.
Credit Contracts. The Company manages credit risk through the issuance of credit default swaps (“CDS”). A CDS is a derivative instrument representing an agreement between two parties to exchange the credit risk of a single specified entity or an index based on the credit risk of a group of entities (all commonly referred to as the “reference entity” or a portfolio of “reference entities”), in return for a periodic premium. CDS contracts typically have a five-year term.
Replication Synthetic Assets. Replication synthetic asset transactions (“RSATs”) are derivative transactions made in combination with a cash instrument in order to reproduce the investment characteristic of an otherwise permissible investment. The Company uses interest rate swaps and credit default swaps in these transactions when direct investments are either too expensive to acquire or otherwise unavailable in the market. Such derivatives can only be RSATs and not hedging vehicles.
F-29
Table of Contents
JOHN HANCOCK LIFE INSURANCE COMPANY (U.S.A.)
NOTES TO STATUTORY-BASIS FINANCIAL STATEMENTS – (CONTINUED)
6. Derivatives - (continued)
The table below provides a summary of the gross notional amount and fair value of derivatives contracts for all derivatives in effective hedge accounting relationships, other hedging relationships, and RSATs:
| December 31, 2018 | ||||||||||||||||||||||
| Notional Amount |
Carrying Value Assets |
Carrying Value Liabilities |
Fair Value Assets |
Fair Value Liabilities |
||||||||||||||||||
|
|
|
|||||||||||||||||||||
| (in millions) | ||||||||||||||||||||||
| Effective Hedge Accounting Relationships |
||||||||||||||||||||||
| Fair value hedges |
Interest rate swaps |
$ | 1,919 | $ | - | $ | - | $ | 259 | $ | 98 | |||||||||||
| Foreign currency swaps |
17 | - | 3 | - | 5 | |||||||||||||||||
| Cash flow hedges |
Interest rate swaps |
6,987 | - | - | 484 | 362 | ||||||||||||||||
| Foreign currency swaps |
421 | 61 | - | 55 | - | |||||||||||||||||
| Foreign currency forwards |
66 | - | - | - | 7 | |||||||||||||||||
| Interest rate treasury locks |
1,351 | - | - | 27 | 12 | |||||||||||||||||
| Equity total return swaps |
32 | - | - | - | 6 | |||||||||||||||||
|
|
|
|||||||||||||||||||||
| Total Derivatives in Effective Hedge Accounting Relationships |
$ | 10,793 | $ | 61 | $ | 3 | $ | 825 | $ | 490 | ||||||||||||
|
|
|
|||||||||||||||||||||
| Other Hedging Relationships |
||||||||||||||||||||||
| Interest rate swaps |
$ | 137,873 | $ | 7,336 | $ | 3,287 | $ | 7,336 | $ | 3,287 | ||||||||||||
| Interest rate treasury locks |
11,980 | 277 | 77 | 277 | 77 | |||||||||||||||||
| Interest rate options |
8,574 | 230 | - | 230 | - | |||||||||||||||||
| Interest rate futures |
7,977 | - | - | - | - | |||||||||||||||||
| Foreign currency swaps |
1,439 | 341 | 269 | 341 | 269 | |||||||||||||||||
| Foreign currency forwards |
718 | 19 | 14 | 19 | 14 | |||||||||||||||||
| Foreign currency futures |
1,040 | - | - | - | - | |||||||||||||||||
| Equity total return swaps |
394 | 11 | 10 | 11 | 10 | |||||||||||||||||
| Equity index options |
4,818 | 236 | 59 | 236 | 59 | |||||||||||||||||
| Equity index futures |
4,178 | - | - | - | - | |||||||||||||||||
| Credit default swaps |
- | - | - | - | - | |||||||||||||||||
|
|
|
|||||||||||||||||||||
| Total Derivatives in Other Hedging Relationships |
$ | 178,991 | $ | 8,450 | $ | 3,716 | $ | 8,450 | $ | 3,716 | ||||||||||||
|
|
|
|||||||||||||||||||||
| Replication Synthetic Asset Transactions |
||||||||||||||||||||||
| Interest rate swaps |
$ | 3,135 | $ | - | $ | - | $ | 19 | $ | 188 | ||||||||||||
| Credit default swaps |
- | - | - | - | - | |||||||||||||||||
|
|
|
|||||||||||||||||||||
| Total Derivatives in Replication Synthetic Asset Transactions |
$ | 3,135 | $ | - | $ | - | $ | 19 | $ | 188 | ||||||||||||
|
|
|
|||||||||||||||||||||
| Total Derivatives |
$ | 192,919 | $ | 8,511 | $ | 3,719 | $ | 9,294 | $ | 4,394 | ||||||||||||
|
|
|
|||||||||||||||||||||
F-30
Table of Contents
JOHN HANCOCK LIFE INSURANCE COMPANY (U.S.A.)
NOTES TO STATUTORY-BASIS FINANCIAL STATEMENTS – (CONTINUED)
6. Derivatives - (continued)
| December 31, 2017 | ||||||||||||||||||||||
|
|
|
|||||||||||||||||||||
| Notional Amount |
Carrying Value Assets |
Carrying Value Liabilities |
Fair Value Assets |
Fair Value Liabilities |
||||||||||||||||||
|
|
|
|||||||||||||||||||||
| (in millions) | ||||||||||||||||||||||
| Effective Hedge Accounting Relationships |
||||||||||||||||||||||
| Fair value hedges |
Interest rate swaps |
$ | 1,870 | $ | - | $ | 2 | $ | 308 | $ | 128 | |||||||||||
| Foreign currency swaps |
45 | - | 9 | - | 15 | |||||||||||||||||
| Cash flow hedges |
Interest rate swaps |
8,116 | - | - | 896 | 283 | ||||||||||||||||
| Foreign currency swaps |
1,549 | 78 | 45 | 295 | 268 | |||||||||||||||||
| Foreign currency forwards |
132 | - | - | - | 3 | |||||||||||||||||
| Interest rate treasury locks |
880 | - | - | 58 | - | |||||||||||||||||
| Equity total return swaps |
36 | - | - | 9 | - | |||||||||||||||||
|
|
|
|||||||||||||||||||||
| Total Derivatives in Effective Hedge Accounting Relationships |
$ | 12,628 | $ | 78 | $ | 56 | $ | 1,566 | $ | 697 | ||||||||||||
|
|
|
|||||||||||||||||||||
| Other Hedging Relationships |
||||||||||||||||||||||
| Interest rate swaps |
$ | 121,799 | $ | 8,284 | $ | 4,041 | $ | 8,284 | $ | 4,041 | ||||||||||||
| Interest rate treasury locks |
10,728 | 630 | 13 | 630 | 13 | |||||||||||||||||
| Interest rate options |
8,014 | 247 | - | 247 | - | |||||||||||||||||
| Interest rate futures |
7,453 | - | - | - | - | |||||||||||||||||
| Foreign currency swaps |
322 | 57 | 13 | 57 | 13 | |||||||||||||||||
| Foreign currency forwards |
535 | 2 | 5 | 2 | 5 | |||||||||||||||||
| Foreign currency futures |
991 | - | - | - | - | |||||||||||||||||
| Equity total return swaps |
100 | 20 | - | 20 | - | |||||||||||||||||
| Equity index options |
4,113 | 319 | 1 | 319 | 1 | |||||||||||||||||
| Equity index futures |
5,372 | - | - | - | - | |||||||||||||||||
| Credit default swaps |
- | - | - | - | - | |||||||||||||||||
|
|
|
|||||||||||||||||||||
| Total Derivatives in Other Hedging Relationships |
$ | 159,427 | $ | 9,559 | $ | 4,073 | $ | 9,559 | $ | 4,073 | ||||||||||||
|
|
|
|||||||||||||||||||||
| Replication Synthetic Asset Transactions |
||||||||||||||||||||||
| Interest rate swaps |
$ | 3,135 | $ | - | $ | - | $ | 98 | $ | 102 | ||||||||||||
| Credit default swaps |
30 | - | - | - | - | |||||||||||||||||
|
|
|
|||||||||||||||||||||
| Total Derivatives in Replication Synthetic Asset Transactions |
$ | 3,165 | $ | - | $ | - | $ | 98 | $ | 102 | ||||||||||||
|
|
|
|||||||||||||||||||||
| Total Derivatives |
$ | 175,220 | $ | 9,637 | $ | 4,129 | $ | 11,223 | $ | 4,872 | ||||||||||||
|
|
|
|||||||||||||||||||||
Hedging Relationships
The Company generally does not enter into derivative contracts for speculative purposes. In certain circumstances, these hedges also meet the requirements for hedge accounting and are reported in a manner consistent with the hedged asset or liability. For the years ended December 31, 2018, 2017 and 2016, respectively, the Company recorded unrealized gains (losses) of $231 million, $402 million, and $436 million, respectively, related to derivatives that no longer qualify for hedge accounting.
Fair Value Hedges. The Company uses interest rate swaps to manage its exposure to changes in fair value of fixed-rate financial instruments caused by changes in interest rates. The Company also uses cross currency swaps to manage its exposure to foreign exchange rate fluctuations and interest rate fluctuations.
Cash Flow Hedges. The Company uses interest rate swaps and interest rate treasury locks to hedge the variability in cash flows from variable rate financial instruments and forecasted transactions. The Company also uses cross currency swaps and forward agreements to hedge currency exposure on foreign currency financial instruments and foreign currency denominated
F-31
Table of Contents
JOHN HANCOCK LIFE INSURANCE COMPANY (U.S.A.)
NOTES TO STATUTORY-BASIS FINANCIAL STATEMENTS – (CONTINUED)
6. Derivatives - (continued)
expenses, respectively. Total return swaps are used to hedge the variability in cash flows associated with certain stock-based compensation awards. Inflation swaps are used to reduce inflation risk generated from inflation-indexed liabilities.
For the year ended December 31, 2018, all of the Company’s hedged forecast transactions qualified as cash flow hedges and no cash flow hedges were discontinued because it was probable that the original forecasted transactions would occur by the end of the originally specified time period documented at inception of the hedging relationship.
The maximum time frame for which variable cash flows are hedged is 28 years.
Derivatives Not Designated as Hedging Instruments or RSAT Relationships. The Company enters into interest rate swap agreements, cancelable interest rate swap agreements, and interest rate futures contracts to manage interest rate risk, total return swap agreements to manage equity risk, and CDS to manage credit risk. The Company also uses interest rate treasury locks and interest rate floor agreements to manage exposure to interest rates without designating the derivatives as hedging instruments. Interest rate floor agreements hedge the interest rate risk associated with minimum interest rate guarantees in certain life insurance and annuity businesses.
The Company offers certain variable annuity products with a guaranteed minimum withdrawal benefit (“GMWB”) and guaranteed minimum death benefit (“GMDB”). These guarantees are effectively an embedded option on the basket of mutual funds offered to contract holders. The Company manages a hedging program to reduce its exposure to certain contracts with the GMWB and GMDB guarantees. This dynamic hedging program uses interest rate swap agreements, equity index futures (including but not limited to the Dow Jones Industrial, Standard & Poor’s 500, Russell 2000, and Dow Jones Euro Stoxx 50 indices), currency futures, total return swaps, equity index options, swaptions and U.S. Treasury futures to match the sensitivities of the GMWB and GMDB liabilities to the market risk factors.
The Company also has a macro equity risk hedging program using equity futures and interest rate swaps, as well as equity index options. This program is designed to reduce the Company’s overall exposure to public equity markets arising from several sources including, but not limited to, variable annuity guarantees not dynamically hedged, separate account fees not associated with guarantees, and Company equity holdings.
The Company uses foreign currency swaps and foreign currency forwards to reduce the risk from fluctuations in foreign currency exchange rates associated with its assets and liabilities denominated in foreign currencies.
F-32
Table of Contents
JOHN HANCOCK LIFE INSURANCE COMPANY (U.S.A.)
NOTES TO STATUTORY-BASIS FINANCIAL STATEMENTS – (CONTINUED)
6. Derivatives - (continued)
For the years ended December 31, 2018, 2017 and 2016 net gains and losses related to derivatives in other hedging relationships were recognized by the Company, and the components were recorded in net unrealized and net realized gains (losses) as follows:
| Years ended December 31, | ||||||||||||
| 2018 | 2017 | 2016 | ||||||||||
|
|
|
|||||||||||
| (in millions) | ||||||||||||
| Other Hedging Relationships |
||||||||||||
| Net unrealized capital gain (loss): |
||||||||||||
| Interest rate swaps |
$ | (193 | ) | $ | (805 | ) | $ | 773 | ||||
| Interest rate treasury locks |
(417 | ) | 841 | (435 | ) | |||||||
| Interest rate options |
(35 | ) | (73 | ) | (8 | ) | ||||||
| Interest rate futures |
212 | - | - | |||||||||
| Foreign currency swaps |
- | 6 | (31 | ) | ||||||||
| Foreign currency forwards |
6 | (11 | ) | - | ||||||||
| Foreign currency futures |
(11 | ) | - | - | ||||||||
| Equity total return swaps |
9 | 3 | (4 | ) | ||||||||
| Equity index options |
(133 | ) | 102 | 68 | ||||||||
| Equity index futures |
121 | - | - | |||||||||
| Credit default swaps |
- | - | - | |||||||||
| Commodity futures |
- | - | - | |||||||||
|
|
|
|||||||||||
| Total net unrealized capital gain (loss) |
$ | (441 | ) | $ | 63 | $ | 363 | |||||
|
|
|
|||||||||||
| Net realized capital gain (loss): |
||||||||||||
| Interest rate swaps |
$ | (225 | ) | $ | 874 | $ | (490 | ) | ||||
| Interest rate treasury locks |
43 | 34 | 342 | |||||||||
| Interest rate options |
(5 | ) | (3 | ) | - | |||||||
| Interest rate futures |
(411 | ) | 273 | (23 | ) | |||||||
| Foreign currency swaps |
4 | 4 | 3 | |||||||||
| Foreign currency forwards |
(16 | ) | 16 | 24 | ||||||||
| Foreign currency futures |
61 | (111 | ) | 94 | ||||||||
| Equity total return swaps |
(2 | ) | (9 | ) | (9 | ) | ||||||
| Equity index options |
49 | 22 | (98 | ) | ||||||||
| Equity index futures |
157 | (1,104) | (1,007 | ) | ||||||||
| Credit default swaps |
- | - | - | |||||||||
| Commodity futures |
- | - | - | |||||||||
|
|
|
|||||||||||
| Total net realized capital gain (loss) |
$ | (345 | ) | $ | (4 | ) | $ | (1,164 | ) | |||
|
|
|
|||||||||||
| Total gain (loss) from derivatives in other hedging relationships |
$ | (786 | ) | $ | 59 | $ | (801 | ) | ||||
|
|
|
|||||||||||
The table above does not include unrealized gains (losses) of ($28) million, $9 million, $11 million and realized gains (losses) of $12 million, $12 million and $6 million for the years ended December 31, 2018, 2017 and 2016, respectively. These gains (losses) represent a portion of equity total return swaps used to hedge restricted share units, but that are no longer in an effective accounting hedge relationship. The gains (losses) are recorded in the General Insurance Expenses line in the Statement of Operations.
The Company also deferred net realized gains (losses) of ($229) million, $872 million, and ($526) million (including ($226) million, $874 million, and ($490) million of gains (losses) for derivatives in other hedging relationships, respectively) related to interest rates for the years ended December 31, 2018, 2017 and 2016, respectively. Deferred net realized gains and losses are reported in IMR and amortized over the remaining period to expiration date.
F-33
Table of Contents
JOHN HANCOCK LIFE INSURANCE COMPANY (U.S.A.)
NOTES TO STATUTORY-BASIS FINANCIAL STATEMENTS – (CONTINUED)
6. Derivatives - (continued)
Credit Default Swaps
The Company replicates exposure to specific issuers by selling credit protection via CDS in order to complement its cash bond investing. The Company does not employ leverage in its CDS program and therefore, does not write CDS protection in excess of its government bond holdings.
The following table provides details of the CDS protection sold by type of contract and external agency rating for the underlying reference security, as of December 31, 2018 and 2017, respectively
| December 31, 2018 | December 31, 2017 | |||||||||||||||||||||||
|
|
|
|||||||||||||||||||||||
| Notional Amount2 |
Fair Value |
Weighted average maturity (in years)3 |
Notional Amount2 |
Fair Value |
Weighted average maturity (in years)3 |
|||||||||||||||||||
|
|
|
|||||||||||||||||||||||
| (in millions) | ||||||||||||||||||||||||
| Single name CDS1 |
||||||||||||||||||||||||
| Corporate debt |
||||||||||||||||||||||||
| AAA |
$ | - | $ | - | - | $ | 10 | $ | - | 1 | ||||||||||||||
| AA |
- | - | - | 10 | - | - | ||||||||||||||||||
| A |
- | - | - | 10 | - | 1 | ||||||||||||||||||
| BBB |
- | - | - | - | - | - | ||||||||||||||||||
|
|
|
|
|
|||||||||||||||||||||
| Total CDS protection sold |
$ | - | $ | - | $ | 30 | $ | - | ||||||||||||||||
|
|
|
|
|
|||||||||||||||||||||
| 1 | The rating agency designations are based on S&P where available followed by Moody’s, Dominion Bond Rating Services (DBRS), and Fitch. If no rating is available from a rating agency, then an internally developed rating is used. |
| 2 | Notional amount represents the maximum future payments the Company would have to pay its counterparties assuming a default of the underlying credit and zero recovery on the underlying issuer obligation. |
| 3 | The weighted average maturity of the CDS is weighted based on notional amounts. |
The Company holds no purchased credit protection at December 31, 2018 and 2017. The average credit rating of the counterparties guaranteeing the underlying credits is A and the weighted average maturity is 0 years.
Credit Risk
The Company’s exposure to loss on derivatives is limited to the amount of any net gains that may have accrued with a particular counterparty. Gross derivative counterparty exposure is measured as the total fair value (including accrued interest) of all outstanding contracts in a gain position excluding any offsetting contracts in negative positions and the impact of collateral on hand. The Company may be exposed to credit-related losses in the event of nonperformance by counterparties to the derivative financial instruments. The current credit exposure of the Company’s derivative contracts is limited to the fair value in excess of the collateral held at the reporting date.
The Company manages its credit risk by entering into transactions with creditworthy counterparties, obtaining collateral where appropriate, and entering into master netting agreements that provide for a netting of payments and receipts with a single counterparty. The Company enters into credit support annexes with its OTC derivative dealers in order to manage its credit exposure to those counterparties. As part of the terms and conditions of those agreements, the pledging and accepting of collateral in connection with the Company’s derivative usage is required. As of December 31, 2018 and 2017, the Company accepted collateral consisting of cash of $1,559 million and $1,973 million, and various securities with a fair value of $3,280 million and $4,360 million, respectively, which is held in separate custodial accounts and not reflected within these financial statements. In addition, the Company has pledged collateral to support both the OTC derivative instruments, exchange traded futures and cleared interest rate swap transactions. For further details regarding pledged collateral see the Investments Note.
Under U.S. regulations, certain interest rate swap agreements and credit default swap agreements are required to be cleared through central clearing houses. These transactions are contractual agreements that require initial and variation margin
F-34
Table of Contents
JOHN HANCOCK LIFE INSURANCE COMPANY (U.S.A.)
NOTES TO STATUTORY-BASIS FINANCIAL STATEMENTS – (CONTINUED)
6. Derivatives - (continued)
collateral postings and are settled on a daily basis through a clearing house. As such, they reduce the credit risk exposure in the event of default by a counterparty.
Financing Premiums
The following table presents the Company’s aggregate, non-discounted total premium cost for derivative contracts with financing premiums and the premium cost due in each of the following four years, and thereafter.
| Fiscal Year |
Derivative Premium Payments Due |
|||
| (in millions) | ||||
| 2018 |
$ | - | ||
| 2019 |
66 | |||
| 2020 |
- | |||
| 2021 |
- | |||
| Thereafter |
- | |||
|
|
|
|||
| Total Future Settled Premiums |
$ | 66 | ||
|
|
|
|||
| Undiscounted Future Premium Commitments |
Derivative Fair
Value With Premium Commitments |
Derivative Fair
Value Excluding Impact of Future Settled Premiums |
||||||||||
| (in millions) | ||||||||||||
| Prior Year |
$ | 40 | $ | 32 | $ | 71 | ||||||
| Current Year |
$ | 66 | $ | (48 | ) | $ | 17 | |||||
Transactions with Affiliates
The Company has entered into a currency swap agreement with JHFC which was recorded at fair value. JHFC utilizes the currency swap to hedge currency exposure on foreign currency financial instruments. The Company has also entered into currency swap agreements with external counterparties which offset the currency swap agreement with JHFC. As of December 31, 2018 and 2017, the currency swap agreements with JHFC and the external counterparties had offsetting fair values of $266 million and $261 million, respectively.
The Company has entered into equity total return swap agreements with MLI which are recorded at fair value. JHUSA utilizes the equity total return swaps to hedge equity exposure on restricted share units (“RSU”). As of December 31, 2018 and 2017, the equity total return swap agreements with MLI had a fair value of ($14) million and $30 million.
In 2017, the Company repositioned interest rate swaps supporting affiliate reinsurance with John Hancock Reassurance Company Limited. The transaction resulted in a pre-tax gain of $24 million and a post-tax increase to surplus of $16 million, net of amounts transferred to the interest maintenance reserve (IMR) and ceded to the affiliate reinsurer.
7. Fair Value
The following is a description of the valuation techniques used to measure fair value and the general classification of these instruments pursuant to the fair value hierarchy:
| • | Financial Instruments Measured at Fair Value and Reported in the Balance Sheet after Initial Recognition – This category includes assets and liabilities measured at fair value. Financial instruments in this category include bonds and preferred stocks carried at the lower of cost or fair value due to their SVO quality rating, common stocks, derivatives, and separate account assets. |
| • | Other Financial Instruments Not Reported at Fair Value After Initial Recognition – This category includes assets and liabilities as follows: |
F-35
Table of Contents
JOHN HANCOCK LIFE INSURANCE COMPANY (U.S.A.)
NOTES TO STATUTORY-BASIS FINANCIAL STATEMENTS – (CONTINUED)
7. Fair Value - (continued)
Bonds – For bonds, including corporate debt, U.S. Treasury, commercial and residential mortgage-backed securities, asset-backed securities, collateralized debt obligations, issuances by foreign governments, and obligations of state and political subdivisions, fair values are based on quoted market prices when available. When market prices are not available, fair value is generally estimated using discounted cash flow analyses, incorporating current market inputs for similar financial instruments with comparable terms and credit quality (matrix pricing). The significant inputs into these models include, but are not limited to, yield curves, credit risks and spreads, measures of volatility, and prepayment speeds.
Mortgage Loans on Real Estate – The fair value of unimpaired mortgage loans is estimated using discounted cash flows and takes into account the contractual maturities and discount rates, which were based on current market rates for similar maturity ranges and adjusted for risk due to the property type. The fair value of impaired mortgage loans is based on the net of the collateral less estimated cost to obtain and sell. Fair value of commercial mortgages is derived through an internal valuation methodology using both observable and unobservable inputs. Unobservable inputs include credit assumptions and liquidity spread adjustments. Fair value of fixed-rate residential mortgages is determined using the discounted cash flow method. Inputs used for valuation are primarily comprised of prevailing interest rates and prepayment rates, if applicable. Fair value of variable-rate residential mortgages is assumed to be their carrying value.
Cash, Cash Equivalents and Short-Term Investments – The carrying values for cash, cash equivalents, and short-term investments approximate their fair value due to the short-term maturities of these instruments.
Policy Loans – These loans are carried at unpaid principal balances, which approximate their fair values.
Policy Reserves – Policy reserves consist of guaranteed investment contracts. The fair values associated with these financial instruments are determined by projecting cash flows and discounting the cash flows at current corporate rates, defined as U.S. Treasury rates plus MFC’s corporate spread. The fair value attributable to credit risk represents the present value of the spread.
Policyholders’ and Beneficiaries Funds – Includes term certain contracts and supplementary contracts without life contingencies. The fair values associated with the term certain contracts and supplementary contracts without life contingencies are determined by projecting cash flows and discounting the cash flows at current corporate rates, defined as U.S. Treasury rates plus MFC’s corporate spread. The fair value attributable to credit risk represents the present value of the spread. Effective December 31, 2016, fair value disclosure is no longer required for those balances that can be withdrawn by the policyholder at any time without prior notice or penalty. The fair value is the amount estimated to be payable to the policyholder as of the reporting date which is generally the carrying value and provides no additional disclosure value.
Consumer Notes – The fair value of consumer notes is determined by projecting cash flows and using a spread assumption associated with the specific risks in the Signature Note contracts. The spread is calculated by taking the difference between the contractual crediting rate and the yield curve as of the issue date of each Signature Note. The calculated spread is added to the yield curve as of each future valuation date to determine the fair value of the Signature Notes.
Financial Instruments Measured at Fair Value and Reported in the Balance Sheet after Initial Recognition
Valuation Hierarchy
The Company categorizes its fair value measurements according to a three-level hierarchy. The hierarchy prioritizes the inputs used by the Company’s valuation techniques. A level is assigned to each fair value measurement based on the lowest level input significant to the fair value measurement in its entirety. The three levels of the fair value hierarchy are defined as follows:
| • | Level 1 – Fair value measurements that reflect unadjusted, quoted prices in active markets for identical assets and liabilities that the Company has the ability to access at the measurement date reflecting market transactions. Level 1 assets primarily include exchange traded equity securities and certain separate account assets. |
F-36
Table of Contents
JOHN HANCOCK LIFE INSURANCE COMPANY (U.S.A.)
NOTES TO STATUTORY-BASIS FINANCIAL STATEMENTS – (CONTINUED)
7. Fair Value - (continued)
| • | Level 2 – Fair value measurements using inputs other than quoted prices included within Level 1 that are observable for the asset or liability, either directly or indirectly. These include quoted prices for similar assets and liabilities in active markets, quoted prices for identical or similar assets and liabilities in inactive markets, inputs that are observable that are not prices (such as interest rates, credit risks, etc.), and inputs that are derived from or corroborated by observable market data. Most bonds are classified within Level 2. Also, included in the Level 2 category are certain separate account assets and derivative assets and liabilities. |
| • | Level 3 – Fair value measurements using significant nonmarket observable inputs. These include valuations for assets and liabilities that are derived using data, some or all of which is not market observable data, including assumptions about risk. Level 3 securities include impaired bonds and less liquid securities, such as structured asset-backed securities, commercial mortgage-backed securities, and other securities that have little or no price transparency. |
Determination of Fair Value
Fair value is defined as the price that would be received to sell an asset or paid to transfer a liability in an orderly transaction (not a forced liquidation or distress sale) between market participants at the measurement date, that is, an exit value.
When available, quoted market prices are used to determine fair value. If quoted market prices are not available, fair value is typically based upon alternative valuation techniques such as discounted cash flows, matrix pricing, consensus pricing services and other techniques. Broker quotes are generally used when external public vendor prices are not available.
The Company has a process in place that includes a review of price movements relative to the market, a comparison of prices between vendors, and a comparison to internal matrix pricing which uses predominately external observable data. Judgement is applied in adjusting external observable data for items including liquidity and credit factors.
The following is a description of the valuation techniques used to measure fair value and the general classification of these instruments pursuant to the fair value hierarchy:
Bonds
Refer to the previous page for the determination of fair value of bonds. Generally, impaired bonds with a NAIC designation rating of 6 whose cost is greater than its fair value are reported at fair value and are classified within Level 3.
Preferred Stocks
Preferred stocks with active markets are classified within Level 1, as fair values are based on quoted market prices. Preferred stocks not traded in active markets are classified within Level 3.
Common Stocks
Common stocks with active markets are classified within Level 1, as fair values are based on quoted market prices. Common stocks not traded in active markets are classified within Level 3.
Derivatives
The fair value of derivatives is determined through the use of quoted market prices for exchange-traded derivatives or through the use of pricing models for OTC derivatives. The pricing models used are based on market standard valuation methodologies, and the inputs to these models are consistent with what a market participant would use when pricing the instruments. Derivative valuations can be affected by changes in interest rates, currency exchange rates, financial indices, credit spreads, default risk (including the counterparties to the contract), and volatility. The Company’s derivatives are generally classified within Level 2 given the significant inputs to the pricing models for most OTC derivatives are observable or can be corroborated by observable market data. Inputs that are observable generally include interest rates, foreign currency exchange rates, and interest rate curves. However, certain OTC derivatives may rely on inputs that are significant to the fair value, that are unobservable in the market or cannot be derived principally from or corroborated by observable market data and would be classified within Level 3. Inputs that are unobservable generally include broker quotes, volatilities, and inputs that are outside of the observable portion of the interest rate curve or other relevant market measures. These unobservable inputs may involve significant management judgment or estimation.
Even though unobservable, these inputs are based on assumptions deemed appropriate given the circumstances and consistent with what market participants would use when pricing such instruments. The credit risk of both the counterparty and the
F-37
Table of Contents
JOHN HANCOCK LIFE INSURANCE COMPANY (U.S.A.)
NOTES TO STATUTORY-BASIS FINANCIAL STATEMENTS – (CONTINUED)
7. Fair Value - (continued)
Company are considered in determining the fair value for all OTC derivatives after taking into account the effects of netting agreements and collateral arrangements.
Separate Account Assets and Liabilities
For separate accounts structured as a non-unitized fund, the fair value of separate account assets is based on the fair value of the underlying assets owned by the separate account. For separate accounts structured as a unitized fund, the fair value of the separate account assets is based on the fair value of the underlying funds owned by the separate account. Assets owned by the Company’s separate accounts primarily include: investments in mutual funds, bonds, common stock, short-term investments, real estate, and cash and cash equivalents. Investment performance related to separate account assets is fully offset by corresponding amounts credited to contract holders whose interest in the separate account assets is recorded by the Company as separate account liabilities. Separate account liabilities are set equal to the fair value of separate account assets.
The fair value of fund investments is based upon quoted market prices or reported net asset value (“NAV”). Fund investments that are traded in an active market and have a NAV that the Company can access at the measurement date are classified within Level 1. Level 2 assets consist primarily of bonds which are valued using matrix pricing with independent pricing data.
Separate account assets classified as Level 3 consist primarily of fixed maturity and equity investments in private companies, which own timber and agriculture and carry them at fair value. The values of the timber and agriculture investments are estimated using generally accepted valuation techniques. A comprehensive appraisal is performed shortly after initial purchase and at two or three-year intervals thereafter. Appraisal updates are conducted according to client contracts, generally at one-year or six-month intervals. In the quarters in which an investment is not independently appraised or its valuation updated, the market value is reviewed by management. The valuation of an investment is adjusted only if there has been a significant change in economic circumstances related to the investment since acquisition or the most recent independent valuation and upon the independent appraiser’s review and concurrence with management. Further, these valuations are prepared giving consideration to the income, cost, and sales comparison approaches of estimating asset value. The significant unobservable inputs used in the fair value measurement of the Company’s timberland investments are harvest volumes, timber prices, operating costs and discount rates. Significant changes to any one of these inputs in isolation could result in a significant change to fair value measurement. Holding other factors constant, an increase to either harvest volumes or timber prices would tend to increase the fair value of a timberland investment, while an increase in operating costs or discount rate would have the opposite effect. These investments are classified as Level 3 by the companies owning them, and therefore the equity investments in these companies are considered to be Level 3 by the Company.
F-38
Table of Contents
JOHN HANCOCK LIFE INSURANCE COMPANY (U.S.A.)
NOTES TO STATUTORY-BASIS FINANCIAL STATEMENTS – (CONTINUED)
7. Fair Value - (continued)
The following table presents the Company’s assets and liabilities that are measured and reported at fair value in the Balance Sheets after initial recognition by fair value hierarchy level:
| December 31, 2018 | ||||||||||||||||||||||||
| Carrying Value |
Total Fair Value |
Level 1 | Level 2 | Level 3 | Net Asset Value (NAV) |
|||||||||||||||||||
|
|
|
|||||||||||||||||||||||
| (in millions) | ||||||||||||||||||||||||
| Assets: |
||||||||||||||||||||||||
| Bond with NAIC 6 rating: |
||||||||||||||||||||||||
| Industrial and misc |
$ | 31 | $ | 31 | $ | - | $ | 25 | $ | 6 | $ | - | ||||||||||||
| Loan-backed and structured securities |
- | - | - | - | - | - | ||||||||||||||||||
|
|
|
|||||||||||||||||||||||
| Total bonds with NAIC 6 rating |
31 | 31 | - | 25 | 6 | - | ||||||||||||||||||
| Preferred stocks: |
||||||||||||||||||||||||
| Industrial and misc |
3 | 3 | - | - | 3 | - | ||||||||||||||||||
|
|
|
|||||||||||||||||||||||
| Total preferred stocks |
3 | 3 | - | - | 3 | - | ||||||||||||||||||
| Common stocks: |
||||||||||||||||||||||||
| Industrial and misc |
918 | 918 | 807 | - | 111 | - | ||||||||||||||||||
|
|
|
|||||||||||||||||||||||
| Total common stocks |
918 | 918 | 807 | - | 111 | - | ||||||||||||||||||
| Derivatives: |
||||||||||||||||||||||||
| Interest rate swaps |
7,336 | 7,336 | - | 7,336 | - | - | ||||||||||||||||||
| Interest rate treasury locks |
277 | 277 | - | 12 | 265 | - | ||||||||||||||||||
| Interest rate options |
230 | 230 | - | 91 | 139 | - | ||||||||||||||||||
| Interest rate futures |
- | - | - | - | - | - | ||||||||||||||||||
| Foreign currency swaps |
341 | 341 | - | 341 | - | - | ||||||||||||||||||
| Foreign currency forwards |
19 | 19 | - | 19 | - | - | ||||||||||||||||||
| Foreign currency futures |
- | - | - | - | - | - | ||||||||||||||||||
| Equity total return swaps |
11 | 11 | - | - | 11 | - | ||||||||||||||||||
| Equity index options |
236 | 236 | - | 236 | - | - | ||||||||||||||||||
| Equity index futures |
- | - | - | - | - | - | ||||||||||||||||||
| Credit default swaps |
- | - | - | - | - | - | ||||||||||||||||||
|
|
|
|||||||||||||||||||||||
| Total derivatives |
8,450 | 8,450 | - | 8,035 | 415 | - | ||||||||||||||||||
| Assets held in separate accounts |
124,131 | 124,131 | 119,774 | 2,553 | 1,804 | - | ||||||||||||||||||
|
|
|
|||||||||||||||||||||||
| Total assets |
$ | 133,533 | $ | 133,533 | $ | 120,581 | $ | 10,613 | $ | 2,339 | $ | - | ||||||||||||
|
|
|
|||||||||||||||||||||||
| Liabilities: |
||||||||||||||||||||||||
| Derivatives: |
||||||||||||||||||||||||
| Interest rate swaps |
$ | 3,287 | $ | 3,287 | $ | - | $ | 3,232 | $ | 55 | $ | - | ||||||||||||
| Interest rate treasury locks |
77 | 77 | - | 17 | 60 | - | ||||||||||||||||||
| Interest rate options |
- | - | - | - | - | - | ||||||||||||||||||
| Interest rate futures |
- | - | - | - | - | - | ||||||||||||||||||
| Foreign currency swaps |
269 | 269 | - | 269 | - | - | ||||||||||||||||||
| Foreign currency forwards |
14 | 14 | - | 14 | - | - | ||||||||||||||||||
| Foreign currency futures |
- | - | - | - | - | - | ||||||||||||||||||
| Equity total return swaps |
10 | 10 | - | - | 10 | - | ||||||||||||||||||
| Equity index options |
59 | 59 | - | 59 | - | - | ||||||||||||||||||
| Equity index futures |
- | - | - | - | - | - | ||||||||||||||||||
| Credit default swaps |
- | - | - | - | - | - | ||||||||||||||||||
|
|
|
|||||||||||||||||||||||
| Total derivatives |
3,716 | 3,716 | - | 3,591 | 125 | - | ||||||||||||||||||
| Liabilities held in separate accounts |
124,131 | 124,131 | 119,774 | 2,553 | 1,804 | - | ||||||||||||||||||
|
|
|
|||||||||||||||||||||||
| Total liabilities |
$ | 127,847 | $ | 127,847 | $ | 119,774 | $ | 6,144 | $ | 1,929 | $ | - | ||||||||||||
|
|
|
|||||||||||||||||||||||
F-39
Table of Contents
JOHN HANCOCK LIFE INSURANCE COMPANY (U.S.A.)
NOTES TO STATUTORY-BASIS FINANCIAL STATEMENTS – (CONTINUED)
7. Fair Value - (continued)
| December 31, 2017 | ||||||||||||||||||||||||
| Carrying Value |
Total Fair Value |
Level 1 | Level 2 | Level 3 | Net Asset Value (NAV) |
|||||||||||||||||||
|
|
|
|||||||||||||||||||||||
| (in millions) | ||||||||||||||||||||||||
| Assets: |
||||||||||||||||||||||||
| Bond with NAIC 6 rating: |
||||||||||||||||||||||||
| Industrial and misc |
$ | 22 | $ | 22 | $ | - | $ | 12 | $ | 10 | $ | - | ||||||||||||
| Loan-backed and structured securities |
6 | 6 | - | - | 6 | - | ||||||||||||||||||
|
|
|
|||||||||||||||||||||||
| Total bonds with NAIC 6 rating |
28 | 28 | - | 12 | 16 | - | ||||||||||||||||||
| Preferred stocks: |
||||||||||||||||||||||||
| Industrial and misc |
- | - | - | - | - | - | ||||||||||||||||||
|
|
|
|||||||||||||||||||||||
| Total preferred stocks |
- | - | - | - | - | - | ||||||||||||||||||
| Common stocks: |
||||||||||||||||||||||||
| Industrial and misc |
1,354 | 1,354 | 1,220 | - | 134 | - | ||||||||||||||||||
|
|
|
|||||||||||||||||||||||
| Total common stocks |
1,354 | 1,354 | 1,220 | - | 134 | - | ||||||||||||||||||
| Derivatives: |
||||||||||||||||||||||||
| Interest rate swaps |
8,284 | 8,284 | - | 8,284 | - | - | ||||||||||||||||||
| Interest rate treasury locks |
630 | 630 | - | 61 | 569 | - | ||||||||||||||||||
| Interest rate options |
247 | 247 | - | 67 | 180 | - | ||||||||||||||||||
| Interest rate futures |
- | - | - | - | - | - | ||||||||||||||||||
| Foreign currency swaps |
57 | 57 | - | 57 | - | - | ||||||||||||||||||
| Foreign currency forwards |
2 | 2 | - | 2 | - | - | ||||||||||||||||||
| Foreign currency futures |
- | - | - | - | - | - | ||||||||||||||||||
| Equity total return swaps |
20 | 20 | - | - | 20 | - | ||||||||||||||||||
| Equity index options |
319 | 319 | - | 319 | - | - | ||||||||||||||||||
| Equity index futures |
- | - | - | - | - | - | ||||||||||||||||||
| Credit default swaps |
- | - | - | - | - | - | ||||||||||||||||||
|
|
|
|||||||||||||||||||||||
| Total derivatives |
9,559 | 9,559 | - | 8,790 | 769 | - | ||||||||||||||||||
| Assets held in separate accounts |
141,167 | 141,167 | 136,373 | 2,950 | 1,844 | - | ||||||||||||||||||
|
|
|
|||||||||||||||||||||||
| Total assets |
$ | 152,108 | $ | 152,108 | $ | 137,593 | $ | 11,752 | $ | 2,763 | $ | - | ||||||||||||
|
|
|
|||||||||||||||||||||||
| Liabilities: |
||||||||||||||||||||||||
| Derivatives: |
||||||||||||||||||||||||
| Interest rate swaps |
$ | 4,041 | $ | 4,041 | $ | - | $ | 4,001 | $ | 40 | $ | - | ||||||||||||
| Interest rate treasury locks |
13 | 13 | - | 12 | 1 | - | ||||||||||||||||||
| Interest rate options |
- | - | - | - | - | - | ||||||||||||||||||
| Interest rate futures |
- | - | - | - | - | - | ||||||||||||||||||
| Foreign currency swaps |
13 | 13 | - | 13 | - | - | ||||||||||||||||||
| Foreign currency forwards |
5 | 5 | - | 5 | - | - | ||||||||||||||||||
| Foreign currency futures |
- | - | - | - | - | - | ||||||||||||||||||
| Equity total return swaps |
- | - | - | - | - | - | ||||||||||||||||||
| Equity index options |
1 | 1 | - | 1 | - | - | ||||||||||||||||||
| Equity index futures |
- | - | - | - | - | - | ||||||||||||||||||
| Credit default swaps |
- | - | - | - | - | - | ||||||||||||||||||
|
|
|
|||||||||||||||||||||||
| Total derivatives |
4,073 | 4,073 | - | 4,032 | 41 | - | ||||||||||||||||||
| Liabilities held in separate accounts |
141,167 | 141,167 | 136,373 | 2,950 | 1,844 | - | ||||||||||||||||||
|
|
|
|||||||||||||||||||||||
| Total liabilities |
$ | 145,240 | $ | 145,240 | $ | 136,373 | $ | 6,982 | $ | 1,885 | $ | - | ||||||||||||
|
|
|
|||||||||||||||||||||||
F-40
Table of Contents
JOHN HANCOCK LIFE INSURANCE COMPANY (U.S.A.)
NOTES TO STATUTORY-BASIS FINANCIAL STATEMENTS – (CONTINUED)
7. Fair Value - (continued)
The table below presents the carrying amounts and fair value by fair value hierarchy level for certain assets and liabilities that are not reported at fair value in the Balance Sheets:
| December 31, 2018 | ||||||||||||||||||||
| Carrying Value |
Total Fair Value |
Level 1 | Level 2 | Level 3 | ||||||||||||||||
|
|
|
|||||||||||||||||||
| (in millions) | ||||||||||||||||||||
| Assets: |
||||||||||||||||||||
| Bonds (1) |
$ | 44,525 | $ | 43,579 | $ | - | $ | 40,875 | $ | 2,704 | ||||||||||
| Preferred stocks |
11 | 12 | - | - | 12 | |||||||||||||||
| Mortgage loans on real estate |
12,085 | 12,199 | - | - | 12,199 | |||||||||||||||
| Cash, cash equivalents and short term investments |
2,988 | 2,988 | 2,381 | 607 | - | |||||||||||||||
| Policy loans |
2,788 | 2,788 | - | 2,788 | - | |||||||||||||||
| Derivatives in effective hedge accounting and RSAT relationships |
61 | 844 | - | 816 | 28 | |||||||||||||||
|
|
|
|||||||||||||||||||
| Total assets |
$ | 62,458 | $ | 62,410 | $ | 2,381 | $ | 45,086 | $ | 14,943 | ||||||||||
|
|
|
|||||||||||||||||||
| Liabilities: |
||||||||||||||||||||
| Consumer notes |
$ | 154 | $ | 176 | $ | - | $ | - | $ | 176 | ||||||||||
| Borrowed money |
- | - | - | - | - | |||||||||||||||
| Policy reserves |
1,322 | 1,306 | - | - | 1,306 | |||||||||||||||
| Policyholders’ and beneficiaries funds |
796 | 961 | - | 961 | - | |||||||||||||||
| Derivatives in effective hedge accounting and RSAT relationships |
3 | 678 | - | 438 | 240 | |||||||||||||||
|
|
|
|||||||||||||||||||
| Total liabilities |
$ | 2,275 | $ | 3,121 | $ | - | $ | 1,399 | $ | 1,722 | ||||||||||
|
|
|
|||||||||||||||||||
| December 31, 2017 | ||||||||||||||||||||
| Carrying Value |
Total Fair Value |
Level 1 | Level 2 | Level 3 | ||||||||||||||||
|
|
|
|||||||||||||||||||
| (in millions) | ||||||||||||||||||||
| Assets: |
||||||||||||||||||||
| Bonds (1) |
$ | 47,942 | $ | 49,997 | $ | - | $ | 47,017 | $ | 2,980 | ||||||||||
| Preferred stocks |
11 | 14 | - | - | 14 | |||||||||||||||
| Mortgage loans on real estate |
11,900 | 12,759 | - | - | 12,759 | |||||||||||||||
| Cash, cash equivalents and short term investments |
4,131 | 4,131 | 3,065 | 1,066 | - | |||||||||||||||
| Policy loans |
2,726 | 2,726 | - | 2,726 | - | |||||||||||||||
| Derivatives in effective hedge accounting and RSAT relationships |
78 | 1,664 | - | 1,596 | 68 | |||||||||||||||
|
|
|
|||||||||||||||||||
| Total assets |
$ | 66,788 | $ | 71,291 | $ | 3,065 | $ | 52,405 | $ | 15,821 | ||||||||||
|
|
|
|||||||||||||||||||
| Liabilities: |
||||||||||||||||||||
| Consumer notes |
$ | 197 | $ | 226 | $ | - | $ | - | $ | 226 | ||||||||||
| Borrowed money |
- | - | - | - | - | |||||||||||||||
| Policy reserves |
1,364 | 1,354 | - | - | 1,354 | |||||||||||||||
| Policyholders’ and beneficiaries funds |
937 | 1,136 | - | 1,136 | - | |||||||||||||||
| Derivatives in effective hedge accounting and RSAT relationships |
56 | 799 | - | 618 | 181 | |||||||||||||||
|
|
|
|||||||||||||||||||
| Total liabilities |
$ | 2,554 | $ | 3,515 | $ | - | $ | 1,754 | $ | 1,761 | ||||||||||
|
|
|
|||||||||||||||||||
| (1) | Bonds are carried at amortized cost unless they have NAIC designation rating of 6. Fair value of bonds exclude leveraged leases of $2,439 million and $2,415 million at December 31, 2018 and 2017, respectively. The Company calculates the carrying value by accruing income at its expected internal rate of return. |
F-41
Table of Contents
JOHN HANCOCK LIFE INSURANCE COMPANY (U.S.A.)
NOTES TO STATUTORY-BASIS FINANCIAL STATEMENTS – (CONTINUED)
7. Fair Value - (continued)
Transfers of Level 1 and Level 2 Assets and Liabilities
The Company’s policy is to record transfers of assets and liabilities between Level 1 and Level 2 at their fair values as of the end of each reporting period, consistent with the date of the determination of fair value. Assets are transferred out of Level 1 when they are no longer transacted with sufficient frequency and volume in an active market. During the years ended December 31, 2018 and 2017, the Company did not have any transfers from Level 1 to Level 2. Conversely, assets are transferred from Level 2 to Level 1 when transaction volume and frequency are indicative of an active market. The Company did not transfer assets from Level 2 to Level 1 during the years ended December 31, 2018 and 2017.
F-42
Table of Contents
JOHN HANCOCK LIFE INSURANCE COMPANY (U.S.A.)
NOTES TO STATUTORY-BASIS FINANCIAL STATEMENTS – (CONTINUED)
7. Fair Value - (continued)
Level 3 Financial Instruments
The changes in Level 3 financial instruments measured and reported at fair value for the years ended December 31, 2018, 2017 and 2016, are summarized as follows:
| Balance at |
Net realized/unrealized gains (losses) included in: |
Amounts to separate |
Purchases |
Issuances |
Sales |
Settlements |
Transfers | Balance at 2018 |
||||||||||||||||||||||||||||||||||||
| Net income (1) |
Surplus | Into Level 3 (3) |
Out of Level 3 (3) |
|||||||||||||||||||||||||||||||||||||||||
|
|
|
|||||||||||||||||||||||||||||||||||||||||||
| (in millions) | ||||||||||||||||||||||||||||||||||||||||||||
| Bonds with NAIC 6 rating: |
||||||||||||||||||||||||||||||||||||||||||||
| Impaired corporate bonds |
$ | 10 | $ | - | $ | - | $ | - | $ | - | $ | - | $ | (1 | ) | $ | - | $ | - | $ | (3 | ) | $ | 6 | ||||||||||||||||||||
| Impaired mortgage-backed and asset-backed securities |
6 | 1 | - | - | - | - | (7 | ) | - | - | - | - | ||||||||||||||||||||||||||||||||
|
|
|
|||||||||||||||||||||||||||||||||||||||||||
| Total bonds with NAIC 6 rating |
16 | 1 | - | - | - | - | (8 | ) | - | - | (3 | ) | 6 | |||||||||||||||||||||||||||||||
| Preferred stocks: |
||||||||||||||||||||||||||||||||||||||||||||
| Industrial and misc |
- | - | - | - | 3 | - | - | - | - | - | 3 | |||||||||||||||||||||||||||||||||
|
|
|
|||||||||||||||||||||||||||||||||||||||||||
| Total preferred stocks |
- | - | - | - | 3 | - | - | - | - | - | 3 | |||||||||||||||||||||||||||||||||
| Common stocks: |
||||||||||||||||||||||||||||||||||||||||||||
| Industrial and misc |
134 | 44 | 3 | - | 4 | - | (76 | ) | - | 2 | - | 111 | ||||||||||||||||||||||||||||||||
|
|
|
|||||||||||||||||||||||||||||||||||||||||||
| Total common stocks |
134 | 44 | 3 | - | 4 | - | (76 | ) | - | 2 | - | 111 | ||||||||||||||||||||||||||||||||
| Net derivatives |
728 | - | (389 | ) | - | 8 | - | - | (46 | ) | - | (11 | ) | 290 | ||||||||||||||||||||||||||||||
| Separate account assets/liabilities |
1,844 | 133 | - | - | 42 | - | (209 | ) | - | 3 | (9 | ) | 1,804 | |||||||||||||||||||||||||||||||
|
|
|
|||||||||||||||||||||||||||||||||||||||||||
| Total |
$ | 2,722 | $ | 178 | $ | (386 | ) | $ | - | $ | 57 | $ | - | $ | (293 | ) | $ | (46 | ) | $ | 5 | $ | (23 | ) | $ | 2,214 | ||||||||||||||||||
|
|
|
|||||||||||||||||||||||||||||||||||||||||||
F-43
Table of Contents
JOHN HANCOCK LIFE INSURANCE COMPANY (U.S.A.)
NOTES TO STATUTORY-BASIS FINANCIAL STATEMENTS – (CONTINUED)
7. Fair Value - (continued)
| Balance at |
Net realized/unrealized gains (losses) included in: |
Amounts to |
Purchases |
Issuances |
Sales |
Settlements |
Transfers | Balance at |
||||||||||||||||||||||||||||||||||||
| Net income (1) |
Surplus | Into Level 3 (3) |
Out of Level 3 (3) |
|||||||||||||||||||||||||||||||||||||||||
|
|
|
|||||||||||||||||||||||||||||||||||||||||||
| (in millions) | ||||||||||||||||||||||||||||||||||||||||||||
| Bonds with NAIC 6 rating: |
||||||||||||||||||||||||||||||||||||||||||||
| Impaired corporate bonds |
$ | 17 | $ | (1 | ) | $ | 1 | $ | - | $ | 3 | $ | - | $ | (7 | ) | $ | - | $ | - | $ | (3 | ) | $ | 10 | |||||||||||||||||||
| Impaired mortgage-backed and asset-backed securities |
7 | 1 | - | - | - | - | (2 | ) | - | - | - | 6 | ||||||||||||||||||||||||||||||||
|
|
|
|||||||||||||||||||||||||||||||||||||||||||
| Total bonds with NAIC 6 rating |
24 | - | 1 | - | 3 | - | (9 | ) | - | - | (3 | ) | 16 | |||||||||||||||||||||||||||||||
| Preferred stocks: |
||||||||||||||||||||||||||||||||||||||||||||
| Industrial and misc |
- | - | - | - | - | - | - | - | - | - | - | |||||||||||||||||||||||||||||||||
|
|
|
|||||||||||||||||||||||||||||||||||||||||||
| Total preferred stocks |
- | - | - | - | - | - | - | - | - | - | - | |||||||||||||||||||||||||||||||||
| Common stocks: |
||||||||||||||||||||||||||||||||||||||||||||
| Industrial and misc |
169 | 49 | (24 | ) | - | 8 | - | (68 | ) | - | - | - | 134 | |||||||||||||||||||||||||||||||
|
|
|
|||||||||||||||||||||||||||||||||||||||||||
| Total common stocks |
169 | 49 | (24 | ) | - | 8 | - | (68 | ) | - | - | - | 134 | |||||||||||||||||||||||||||||||
| Net derivatives |
86 | - | 758 | - | 16 | - | - | (59 | ) | - | (73 | ) | 728 | |||||||||||||||||||||||||||||||
| Separate account assets/liabilities |
1,896 | 83 | - | - | 34 | - | (164 | ) | - | 6 | (11 | ) | 1,844 | |||||||||||||||||||||||||||||||
|
|
|
|||||||||||||||||||||||||||||||||||||||||||
| Total |
$ | 2,175 | $ | 132 | $ | 735 | $ | - | $ | 61 | $ | - | $ | (241 | ) | $ | (59 | ) | $ | 6 | $ | (87 | ) | $ | 2,722 | |||||||||||||||||||
|
|
|
|||||||||||||||||||||||||||||||||||||||||||
F-44
Table of Contents
JOHN HANCOCK LIFE INSURANCE COMPANY (U.S.A.)
NOTES TO STATUTORY-BASIS FINANCIAL STATEMENTS – (CONTINUED)
7. Fair Value - (continued)
| Balance at |
Net realized/unrealized gains (losses) included in: |
Amounts |
Purchases |
Issuances |
Sales |
Settlements |
Transfers | Balance at |
||||||||||||||||||||||||||||||||||||
| Net income (1) |
Surplus | Into Level 3 (3) |
Out of Level 3 (3) |
|||||||||||||||||||||||||||||||||||||||||
|
|
|
|||||||||||||||||||||||||||||||||||||||||||
| (in millions) | ||||||||||||||||||||||||||||||||||||||||||||
| Bonds with NAIC 6 rating: |
||||||||||||||||||||||||||||||||||||||||||||
| Impaired corporate bonds |
$ | 29 | $ | 1 | $ | (1 | ) | $ | - | $ | 1 | $ | - | $ | (17 | ) | $ | - | $ | 4 | $ | - | $ | 17 | ||||||||||||||||||||
| Impaired mortgage-backed and asset-backed securities |
7 | 1 | - | - | - | - | (1 | ) | - | - | - | 7 | ||||||||||||||||||||||||||||||||
|
|
|
|||||||||||||||||||||||||||||||||||||||||||
| Total bonds with NAIC 6 rating |
36 | 2 | (1 | ) | - | 1 | - | (18 | ) | - | 4 | - | 24 | |||||||||||||||||||||||||||||||
| Preferred stocks: |
||||||||||||||||||||||||||||||||||||||||||||
| Industrial and misc |
- | - | - | - | - | - | - | - | - | - | - | |||||||||||||||||||||||||||||||||
|
|
|
|||||||||||||||||||||||||||||||||||||||||||
| Total preferred stocks |
- | - | - | - | - | - | - | - | - | - | - | |||||||||||||||||||||||||||||||||
| Common stocks: |
||||||||||||||||||||||||||||||||||||||||||||
| Industrial and misc |
110 | (1 | ) | 37 | - | 25 | - | (2 | ) | - | - | - | 169 | |||||||||||||||||||||||||||||||
|
|
|
|||||||||||||||||||||||||||||||||||||||||||
| Total common stocks |
110 | (1 | ) | 37 | - | 25 | - | (2 | ) | - | - | - | 169 | |||||||||||||||||||||||||||||||
| Net derivatives |
388 | - | (407 | ) | - | 152 | - | - | - | - | (47 | ) | 86 | |||||||||||||||||||||||||||||||
| Separate account assets/liabilities |
1,965 | 84 | - | - | 46 | - | (234 | ) | - | 11 | 24 | 1,896 | ||||||||||||||||||||||||||||||||
|
|
|
|||||||||||||||||||||||||||||||||||||||||||
| Total |
$ | 2,499 | $ | 85 | $ | (371 | ) | $ | - | $ | 224 | $ | - | $ | (254 | ) | $ | - | $ | 15 | $ | (23 | ) | $ | 2,175 | |||||||||||||||||||
|
|
|
|||||||||||||||||||||||||||||||||||||||||||
| (1) | This amount is included in net realized capital gains (losses) on the Statements of Operations. |
| (2) | Changes in the fair value of separate account assets are credited directly to separate account liabilities in accordance with NAIC SAP and are not reflected in income. |
| (3) | For financial instruments that are transferred into and/or out of Level 3, the Company uses the fair value of the instruments at the beginning of the reporting period. |
F-45
Table of Contents
JOHN HANCOCK LIFE INSURANCE COMPANY (U.S.A.)
NOTES TO STATUTORY-BASIS FINANCIAL STATEMENTS – (CONTINUED)
7. Fair Value - (continued)
The transfers into Level 3 primarily result from securities that were impaired during the year or securities where a lack of observable market data (versus the previous year) resulted in reclassifying instruments into Level 3. The transfers out of Level 3 primarily result from observable market data becoming available for that instrument, thus eliminating the need to extrapolate market data beyond observable points. Additionally, securities carried at fair value at the beginning of the period but carried at amortized cost at the end of the period due to rating change or change in fair value relative to amortized cost, are included in transfers out of Level 3. Conversely, any securities carried at amortized cost at the beginning of the period and carried at fair value at the end of the year due to SVO rating change or change in fair value relative to amortized cost, are included into transfers into Level 3.
8. Reinsurance
Certain premiums and benefits are assumed from or ceded to affiliate and other insurance companies under various reinsurance agreements. The Company entered into these reinsurance agreements to shift underlying risk on certain of its products, and to improve cash flow and statutory capital. The ceded reinsurance agreements provide the Company with increased capacity to write larger risks and maintain its exposure to loss within its capital resources.
Total reinsurance amounts included in the Company’s accompanying statutory-basis financial statements were as follows:
| Years ended December 31, | ||||||||||||
| 2018 | 2017 | 2016 | ||||||||||
|
|
|
|||||||||||
| (in millions) | ||||||||||||
| Premiums earned |
||||||||||||
| Direct |
$ | 20,067 | $ | 20,392 | $ | 19,809 | ||||||
| Assumed |
603 | 605 | 872 | |||||||||
| Ceded |
(14,854 | ) | (2,711 | ) | (7,454 | ) | ||||||
|
|
|
|||||||||||
| Net |
$ | 5,816 | $ | 18,286 | $ | 13,227 | ||||||
|
|
|
|||||||||||
| Benefits to policyholders ceded |
$ | (15,881 | ) | $ | (16,741 | ) | $ | (15,271 | ) | |||
Reserve amounts ceded to reinsurers not authorized in the State of Michigan are mostly covered by funds withheld assets, letters of credit or trust agreements. Amounts payable or recoverable for reinsurance on policy and contract liabilities are not subject to periodic or maximum limits. At December 31, 2018, any material recoveries were collateralized or settled by the assuming company.
Neither the Company nor any of its related parties control, directly or indirectly, any external reinsurers with whom the Company conducts business. No policies issued by the Company have been reinsured with a foreign company, which is controlled, either directly or indirectly, by a party not primarily engaged in the business of insurance. The Company does not have any reinsurance agreements in effect under which the reinsurer may unilaterally cancel the agreement. At December 31, 2018, there were no reinsurance agreements in effect such that the amount of losses paid or accrued through the statement date may result in a payment to the reinsurer of amounts which, in aggregate and allowing for offset of mutual credits from other reinsurance agreements with the same reinsurer, exceed the total direct premium collected under the reinsured policies.
As of December 31, 2018, if all reinsurance agreements were cancelled the estimated aggregate reduction in unassigned surplus is $5,586 million.
F-46
Table of Contents
JOHN HANCOCK LIFE INSURANCE COMPANY (U.S.A.)
NOTES TO STATUTORY-BASIS FINANCIAL STATEMENTS – (CONTINUED)
8. Reinsurance - (continued)
Non-Affiliated Reinsurance
The table below consists of the impact of the New York Life (“NYL”) Agreements:
| Years ended December 31, | ||||||||||||
| 2018 | 2017 | 2016 | ||||||||||
|
|
|
|||||||||||
| (in millions) | ||||||||||||
| Premiums ceded |
$ | (219 | ) | $ | (224 | ) | $ | (264 | ) | |||
| Premiums assumed |
88 | 91 | 106 | |||||||||
| Benefits ceded |
(594 | ) | (636 | ) | (615 | ) | ||||||
| Benefits assumed |
238 | 254 | 246 | |||||||||
| Other reinsurance receivable (payable) |
- | (1 | ) | (2 | ) | |||||||
| Funds held by or deposited with reinsured companies |
3,183 | 3,316 | 3,483 | |||||||||
The JHLICO closed block was established upon the demutualization of JHLICO for those designated participating policies that were in-force on February 1, 2000.
Effective July 1, 2015, the Company entered into coinsurance reinsurance agreements with NYL to cede 100% quota share (“QS”) of the Company’s JHLICO Closed Block policies (“NYL 100% Coinsurance”). In addition, NYL agreed to retrocede 40% QS of the same policy risks back to the Company under a coinsurance funds withheld (“FWH”) agreement (“NYL 40% FWH Retrocession”). Collectively, these agreements are known as the NYL Agreements. The NYL 100% Coinsurance keeps the assets supporting the JHLICO Closed Block together in NYL, and the NYL 40% FWH Retrocession adjusts the net reinsurance to NYL to 60% of the JHLICO Closed Block policies at risk.
In conjunction with the NYL Agreements, the existing 100% coinsurance FWH agreement which retrocedes the JHLICO Closed Block New York business back to the Company from JHNY was recaptured. In addition, the 90% modified coinsurance FWH treaty with MRBL was also recaptured. The recaptures were necessary to complete the NYL Agreements, because the policies under these agreements are the same policies at risk under the NYL Agreements.
The table below consists of the impact of the 2018 Reinsurance Group of America (“RGA”) Agreement:
| Year ended December 31, |
||||
| 2018 | ||||
|
|
|
|||
| (in millions) | ||||
| Premiums ceded, net |
$ | (2,790 | ) | |
| Benefits ceded, net |
(134 | ) | ||
| Other reinsurance receivable |
24 | |||
| Other amounts payable on reinsurance |
- | |||
Effective July 1, 2018, the Company entered into a coinsurance agreement with RGA to cede 100% quota share (“QS”) of a significant block of individual payout annuities. The transaction was structured such that the Company transferred the policy liabilities of $2,520 million and related invested assets of $2,829 million. The Company incurred a pre-tax loss of $72 million net of realized capital gains, including a ceding commission paid of $33 million, and a decrease of $43 million to statutory surplus. Under the terms of the agreement, the Company will maintain responsibility for servicing the policies.
F-47
Table of Contents
JOHN HANCOCK LIFE INSURANCE COMPANY (U.S.A.)
NOTES TO STATUTORY-BASIS FINANCIAL STATEMENTS – (CONTINUED)
8. Reinsurance - (continued)
The table below consists of the impact of the 2012 RGA Agreement:
| Years ended December 31, | ||||||||||||
| 2018 | 2017 | 2016 | ||||||||||
|
|
|
|||||||||||
| (in millions) | ||||||||||||
| Premiums ceded, net |
$ | (2 | ) | $ | (3 | ) | $ | (392 | ) | |||
| Benefits ceded, net |
(407 | ) | (418 | ) | (467 | ) | ||||||
| Other reinsurance receivable |
72 | 68 | 73 | |||||||||
| Other amounts payable on reinsurance |
- | - | - | |||||||||
Effective April 1, 2012, the Company entered into a coinsurance agreement with RGA to cede its fixed deferred annuities at 90% quota share (“QS”). Subsequently, the treaty increased to 100% QS effective February 29, 2016. The transaction was structured such that the Company transferred the actuarial liabilities and related invested assets. Under the terms of the agreement, the Company will maintain responsibility for servicing the policies.
The table below consists of the impact of the Jackson National Life Insurance Company (“Jackson’) Agreement:
| Year ended December 31, |
||||
| 2018 | ||||
|
|
|
|||
| (in millions) | ||||
| Premiums ceded, net |
$ | (5,317 | ) | |
| Benefits ceded, net |
(134 | ) | ||
| Funds held by or deposited with reinsured companies |
- | |||
| Other reinsurance receivable |
20 | |||
| Other amounts payable on reinsurance |
- | |||
Effective October 1, 2018, the Company entered into 100% quota share coinsurance agreement with Jackson, a wholly-owned subsidiary of Prudential plc, to reinsure a block of legacy group pay-out annuities. The transaction was structured such that the Company transferred the policy liabilities of $4,292 million and related invested assets of $5,400 million. The Company incurred a pre-tax loss of $914 million net of realized capital gains, including a ceding commission paid of $222 million, and a decrease of $699 million to statutory surplus. Under the terms of the agreement, the Company will maintain responsibility for servicing the policies.
F-48
Table of Contents
JOHN HANCOCK LIFE INSURANCE COMPANY (U.S.A.)
NOTES TO STATUTORY-BASIS FINANCIAL STATEMENTS – (CONTINUED)
8. Reinsurance - (continued)
Affiliated Reinsurance
The table and commentary below consist of the impact of the reinsurance agreements with an affiliate, JHNY:
| Years ended December 31, | ||||||||||||
| 2018 | 2017 | 2016 | ||||||||||
|
|
|
|||||||||||
| (in millions) | ||||||||||||
| Premiums ceded, net |
$ | (167 | ) | $ | (177 | ) | $ | (183 | ) | |||
| Benefits ceded, net |
(408 | ) | (424 | ) | (427 | ) | ||||||
| Funds held by or deposited with reinsured companies |
- | - | - | |||||||||
| Other reinsurance receivable |
39 | 46 | 41 | |||||||||
| Other amounts payable on reinsurance |
5 | 4 | 9 | |||||||||
| Treaty settlement received (paid)* |
208 | 227 | 246 | |||||||||
| * | Treaty settlement consisted primarily of ceded investment income, ceded benefit payments and ceded statutory reserves. |
On January 1, 2010, the assets supporting the policyholders who reside in the state of New York (“NY business”) were transferred to JHNY from the Company. The transfer included participating traditional life insurance, variable universal life insurance, universal life insurance, fixed deferred and immediate annuities, participating pension contracts, and variable annuities. The NY business was transferred using assumption reinsurance, modified coinsurance and coinsurance with cut-through provisions.
The NY business related to participating traditional life insurance policies was transferred from JHUSA to JHNY under a coinsurance agreement and was immediately retroceded back to JHUSA using a coinsurance FWH agreement. JHNY retained the invested assets supporting this block of business. As previously noted, the coinsurance FWH agreement was recaptured effective July 1, 2015. The NY business related to variable universal life was reinsured through coinsurance and modified coinsurance. The NY business related to universal life was transferred from the Company to JHNY under coinsurance agreements.
The NY business related to a majority of the fixed deferred annuity business was transferred from the Company to JHNY under an assumption reinsurance agreement. The NY business related to variable annuities and some participating pension contracts where assets were held in separate accounts were reinsured through modified coinsurance. The NY business related to fixed deferred and immediate annuities and participating pension contracts was transferred from the Company to JHNY under a coinsurance agreement.
F-49
Table of Contents
JOHN HANCOCK LIFE INSURANCE COMPANY (U.S.A.)
NOTES TO STATUTORY-BASIS FINANCIAL STATEMENTS – (CONTINUED)
8. Reinsurance - (continued)
The table and commentary below consist of the impact of the reinsurance agreements with an affiliate, JHRECO:
| Years ended December 31, | ||||||||||||
| 2018 | 2017 | 2016 | ||||||||||
|
|
|
|||||||||||
| (in millions) | ||||||||||||
| Premiums ceded |
$ | (501 | ) | $ | (256 | ) | $ | (517 | ) | |||
| Premiums ceded, impact of treaty recaptured |
- | 3,718 | - | |||||||||
| Benefits ceded |
(573 | ) | (782 | ) | (836 | ) | ||||||
| Other reinsurance receivable |
13 | 2 | - | |||||||||
| Other amounts payable on reinsurance |
- | - | 24 | |||||||||
| Funds withheld from reinsured companies |
7,131 | 7,048 | - | |||||||||
| Funds withheld from unauthorized reinsurers |
- | - | 7,236 | |||||||||
| Treaty settlement received (paid)* |
20 | (8 | ) | (594 | ) | |||||||
| * | Treaty settlement consisted primarily of ceded investment income, ceded benefit payments and ceded statutory reserves. |
The Company also reinsures a portion of the risk related to certain annuity policies. The reinsurance agreement is written on a modified coinsurance basis where the assets supporting the reinsured policies remain invested with the Company. On October 1, 2017, the Company recaptured the payout annuity policies with JHRECO. The recapture resulted in pre-tax income of $708 million and an increase in surplus, net of tax, of $460 million.
The Company reinsures a large portion of the Long-Term Care (“LTC”) risk under a single accounting and capital regime, which helps to manage JHUSA’s overall risk profile and reduce strain on statutory surplus. JHUSA’s indirect parent company, MFC, is regulated on a global basis by the Canadian insurance regulator, The Office of the Superintendent of Financial Institution (“OSFI”), and reports its results on a consolidated International Financial Reporting Standards (“IFRS”) basis. As such, the agreement has no impact on the parent company financial results.
JHRECO does not retrocede any risks to a third party or affiliates. The risks assumed by JHRECO are solely the responsibility of JHRECO, but they are also retained within the parent company group. Reserve credits taken were $9,038 million and $8,644 million at December 31, 2018 and 2017, respectively. On December 31, 2017, JHRECO changed its domiciliary jurisdiction from Bermuda to the state of Michigan. As a result of the re-domestication of JHRECO, collateral was no longer required as of December 31, 2017. Total amount of funds withheld (including capital) on behalf of the captive reinsurer that back the long-term care liabilities was $7,131 million and $7,048 million at December 31, 2018 and 2017, respectively.
F-50
Table of Contents
JOHN HANCOCK LIFE INSURANCE COMPANY (U.S.A.)
NOTES TO STATUTORY-BASIS FINANCIAL STATEMENTS – (CONTINUED)
8. Reinsurance - (continued)
The available and required capital in the table below represent JHRECO’s capital position on a NAIC basis at December 31, 2018 and 2017.
| Years ended December 31, | ||||||||
| 2018 | 2017 | |||||||
|
|
|
|||||||
| (in millions) | ||||||||
| Available Capital |
$ | 2,085 | $ | 1,884 | ||||
| Required Capital |
$ | 323 | $ | 262 | ||||
| RBC Ratio |
646 | % | 718 | % | ||||
JHUSA’s Authorized Control Level (“ACL”) Risk Based capital impact on recapture of the LTC reinsurance agreement at December 31, 2018 and 2017 is as follows:
| Available Capital |
Required Capital |
RBC Ratio |
||||||||||
|
|
|
|||||||||||
| (in millions) | ||||||||||||
| As reported at December 31, 2018 |
$ | 11,404 | $ | 1,425 | 800 | % | ||||||
| Impact of JHRECO LTC Recapture |
470 | 232 | -83 | % | ||||||||
|
|
|
|||||||||||
| Capital Gross of JHRECO LTC Cession |
$ | 11,874 | $ | 1,657 | 717 | % | ||||||
|
|
|
|||||||||||
| Available Capital |
Required Capital |
RBC Ratio |
||||||||||
|
|
|
|||||||||||
| (in millions) | ||||||||||||
| As reported at December 31, 2017 |
$ | 10,761 | $ | 1,266 | 850 | % | ||||||
| Impact of JHRECO LTC Recapture |
854 | 189 | -52 | % | ||||||||
|
|
|
|||||||||||
| Capital Gross of JHRECO LTC Cession |
$ | 11,615 | $ | 1,455 | 798 | % | ||||||
|
|
|
|||||||||||
The table and commentary below consist of the impact of the reinsurance agreements with an affiliate, MRBL:
| Years ended December 31, | ||||||||||||
| 2018 | 2017 | 2016 | ||||||||||
|
|
|
|||||||||||
| (in millions) | ||||||||||||
| Premiums ceded |
$ | (3,763 | ) | $ | (3,320 | ) | $ | (3,978 | ) | |||
| Benefits ceded |
(10,700 | ) | (11,653 | ) | (10,494 | ) | ||||||
| Other reinsurance receivable |
185 | 25 | - | |||||||||
| Other amounts payable on reinsurance |
660 | 389 | 605 | |||||||||
| Funds withheld from unauthorized reinsurers |
7 | - | 227 | |||||||||
| Treaty settlement received (paid)* |
178 | 480 | (142 | ) | ||||||||
| * | Treaty settlement consisted primarily of ceded investment income related to non-qualifying hedging strategies and changes in the modified coinsurance and coinsurance reserves. |
F-51
Table of Contents
JOHN HANCOCK LIFE INSURANCE COMPANY (U.S.A.)
NOTES TO STATUTORY-BASIS FINANCIAL STATEMENTS – (CONTINUED)
8. Reinsurance - (continued)
The Company reinsures 87% of certain group annuity contracts in-force with MRBL. The reinsurance agreement covers all contracts, excluding the guaranteed benefit rider.
The Company reinsures 90% of a significant block of variable annuity contracts in-force with MRBL. All substantial risks, including all guaranteed benefits (GMDB, Guaranteed Minimum Income Benefit (“GMIB”), and GMWB), related to certain specified policies not already reinsured to third parties, are reinsured under the agreement. The base contracts are reinsured on a modified coinsurance basis, while the guaranteed benefit reinsurance coverage is apportioned in accordance with the reinsurance agreement provisions between modified coinsurance and coinsurance FWH. The assets supporting the reinsured policies remain invested with the Company. Since the inception of the treaty in 2008, several amendments have been enacted to refine certain aspects of the treaty. The net MRBL reinsurance recoverable includes the impact of ongoing reinsurance cash flows and is accounted for over the life of the underlying reinsured policies using assumptions consistent with those used to account for the underlying policies with changes to ceded reserves and cost of reinsurance recognized as a component of benefits to policyholders on the Statements of Operations.
The Company’s indirect parent company, MFC, is regulated on a global basis by the Canadian insurance regulator, OSFI, and reports on a consolidated IFRS basis. The Company utilizes a dynamic hedging program to manage risks on an economic basis. The IFRS accounting for these derivatives aligns with MFC’s market-based reserving regime. The US statutory accounting and reserving framework does not provide appropriate alignment of economic risk management strategies (hedging) and associated reserve methodologies. The treaty with MRBL provides a mechanism to allow management of the majority of the variable annuity risk under a single consolidated reserve and capital regime, rather than managing the block simultaneously under two very diverse frameworks.
As a coinsurance / modified coinsurance treaty, MRBL holds $1,989 million and $1,873 million as a coinsurance reserve and JHUSA holds $420 million and $109 million as a modified coinsurance reserve at December 31, 2018 and 2017, respectively. The IFRS reserves that MRBL holds for variable annuities are similar in concept to AG43. The calculations are a real-world stochastic calculation at CTE(70), based on the guaranteed benefits and fees in isolation rather than the whole contract, including the cash flows generated from the dynamic hedging program and including margins for adverse deviation. The real-world stochastic scenarios are subject to Canadian Institute of Actuaries equity and bond fund return calibration criteria. Reserve credits taken were $7 million and $0 million at December 31, 2018 and 2017, respectively, and there is no supporting collateral.
MRBL does not retrocede any risks to a third party. The risks assumed by MRBL are solely the responsibility of MRBL, but they are also retained within MFC. This transaction has no impact on MFC’s financial statements as it reports its risks on a consolidated basis.
On September 30, 2018, the Company entered into a combination coinsurance and modified coinsurance agreement with MRBL to cede 95% of certain single life and survivorship variable universal life products. The transactions included the transfer from JHUSA of $662 million of policy liabilities. The transactions resulted in a pre-tax gain of $500 million, including a ceding commission received of $500 million, and an increase in surplus of $395 million net of tax, which was deferred and will be amortized over a period of approximately 20 years.
F-52
Table of Contents
JOHN HANCOCK LIFE INSURANCE COMPANY (U.S.A.)
NOTES TO STATUTORY-BASIS FINANCIAL STATEMENTS – (CONTINUED)
8. Reinsurance - (continued)
The Company entered into a Stop Loss Reinsurance Agreement with MRBL, effective April 1, 2017, simultaneous with entering into a coinsurance with partial funds withheld agreement with MMRC, as described below.
The table and commentary below consist of the impact of the reinsurance agreements with an affiliate, MRL:
| Years ended December 31, | ||||||||||||
| 2018 | 2017 | 2016 | ||||||||||
|
|
|
|||||||||||
| (in millions) | ||||||||||||
| Premiums ceded |
$ | (133 | ) | $ | (255 | ) | $ | (298 | ) | |||
| Benefits ceded |
(595 | ) | (545 | ) | (468 | ) | ||||||
| Other reinsurance receivable |
- | - | 5 | |||||||||
| Other amounts payable on reinsurance |
7 | 7 | - | |||||||||
| Funds withheld from unauthorized reinsurers |
329 | 66 | - | |||||||||
| Treaty settlement received (paid)* |
(30 | ) | (28 | ) | (74 | ) | ||||||
| * | Treaty settlement consisted primarily of ceded investment income, ceded benefit payments and ceded statutory reserves. |
The Company entered into a coinsurance/modified coinsurance agreement with an affiliate, MRL, to reinsure 90% of all risks not already reinsured to third parties on various universal life contracts effective December 15, 2000. Subsequent amendments added further UL and some term contracts. The Company amended the agreement during 2014 to simplify treaty administration and to modify the structure of the treaty to a modified coinsurance FWH structure.
The table and commentary below consist of the impact of the reinsurance agreement with an affiliate, JHLH:
| Years ended December 31, | ||||||||||||
| 2018 | 2017 | 2016 | ||||||||||
|
|
|
|||||||||||
| (in millions) | ||||||||||||
| Premiums ceded |
$ | (28 | ) | $ | (27 | ) | $ | (28 | ) | |||
| Premiums assumed |
- | - | 241 | |||||||||
| Benefits ceded |
(22 | ) | (19 | ) | (10 | ) | ||||||
| Benefits assumed |
19 | 22 | 8 | |||||||||
| Other reinsurance receivable |
- | - | 1 | |||||||||
| Other amounts payable on reinsurance |
5 | 7 | - | |||||||||
| Funds withheld from authorized reinsurers |
- | - | 3 | |||||||||
| Treaty settlement received (paid)* |
(23 | ) | (28 | ) | 7 | |||||||
* Treaty settlement consisted primarily of ceded investment income, ceded benefit payments and ceded statutory reserves.
On December 31, 2016, the Company entered into a coinsurance agreement with an affiliate, JHLH, to reinsure 100% of a block of single premium universal life policies. The transaction included the transfer from JHLH of $282 million of invested assets and $241 million in net policy liabilities. The transaction resulted in a pre-tax gain and ceding commission received of $36 million and an increase in surplus of $52 million, net of tax.
F-53
Table of Contents
JOHN HANCOCK LIFE INSURANCE COMPANY (U.S.A.)
NOTES TO STATUTORY-BASIS FINANCIAL STATEMENTS – (CONTINUED)
8. Reinsurance - (continued)
The table and commentary below consist of the impact of the reinsurance agreement with an affiliate, MMRC:
| Year ended December 31, | ||||||||
| 2018 | 2017 | |||||||
|
|
|
|||||||
| (in millions) | ||||||||
| Premiums ceded |
$ | (135) | $ | (373) | ||||
| Premiums assumed |
- | - | ||||||
| Benefits ceded |
(17) | (14) | ||||||
| Benefits assumed |
- | - | ||||||
| Other reinsurance receivable |
- | - | ||||||
| Other amounts payable on reinsurance |
22 | 18 | ||||||
| Funds withheld from authorized reinsurers |
102 | 50 | ||||||
| Treaty settlement received (paid)* |
(68 | ) | (55 | ) | ||||
| * | Treaty settlement consisted primarily of ceded investment income, ceded benefit payments and ceded statutory reserves. |
Effective April 1, 2017, the Company entered into a coinsurance with partial FWH agreement with an affiliate, MMRC, to reinsure 100% of the Company’s in-force single-life term life insurance policies and related riders, for certain policy years. The transaction included the transfer to MMRC of $284 million in net policy liabilities. Also, the Company recognized $33 million of FWH liabilities. The transactions resulted in a pre-tax gain of $251 million, including a ceding commission received of $252 million, and an increase in surplus of $163 million, net of tax, which was deferred and will be amortized over a period of approximately 15 years. Subsequent amendment added additional term contracts.
The reinsurance agreement with MMRC was entered into to address the surplus strain caused by the excess of XXX NAIC reserves over the VM-20 reserve levels. This transaction was within the scope of Actuarial Guideline 48, the NAIC Term Life and Universal Life with Secondary Guarantees (XXX/AXXX) Credit for Reinsurance Model Regulation (“AG 48”). In accordance with the terms of AG 48, the obligations of MMRC under the reinsurance agreement are supported by a FWH account and a credit-linked note. The FWH account is funded with assets meeting the definition of “Primary Security” under AG 48 and in an amount equal to or in excess of the VM-20 reserve. The credit-linked note is in the amount of the excess of the statutory reserves over the then current “Required Level of Primary Security”.
The Company did not commute any material ceded reinsurance in 2018.
F-54
Table of Contents
JOHN HANCOCK LIFE INSURANCE COMPANY (U.S.A.)
NOTES TO STATUTORY-BASIS FINANCIAL STATEMENTS – (CONTINUED)
9. Federal Income Taxes
The components of the net deferred tax asset/(liability) are as follows:
| December 31, 2018 | ||||||||||||
| (1) Ordinary |
(2) Capital |
(3) (Col 1 + 2) Total |
||||||||||
|
|
|
|||||||||||
| (in millions) | ||||||||||||
| (a) Gross deferred tax assets |
$ | 1,674 | $ | 67 | $ | 1,741 | ||||||
| (b) Statutory valuation allowance adjustments |
121 | - | 121 | |||||||||
|
|
|
|||||||||||
| (c) Adjusted gross deferred tax assets (a - b) |
1,553 | 67 | 1,620 | |||||||||
| (d) Deferred tax assets nonadmitted |
- | - | - | |||||||||
|
|
|
|||||||||||
| (e) Subtotal net admitted deferred tax asset (c - d) |
1,553 | 67 | 1,620 | |||||||||
| (f) Deferred tax liabilities |
1,628 | 69 | 1,697 | |||||||||
|
|
|
|||||||||||
| (g) Net admitted deferred tax asset / (net deferred tax liability) (e - f) |
$ | (75 | ) | $ | (2 | ) | $ | (77 | ) | |||
|
|
|
|||||||||||
| December 31, 2017 | ||||||||||||
| (4) Ordinary |
(5) Capital |
(6) (Col 4 + 5) Total |
||||||||||
|
|
|
|||||||||||
| (in millions) | ||||||||||||
| (a) Gross deferred tax assets |
$ | 2,432 | $ | 63 | $ | 2,495 | ||||||
| (b) Statutory valuation allowance adjustments |
121 | - | 121 | |||||||||
|
|
|
|||||||||||
| (c) Adjusted gross deferred tax assets (a - b) |
2,311 | 63 | 2,374 | |||||||||
| (d) Deferred tax assets nonadmitted |
- | - | - | |||||||||
|
|
|
|||||||||||
| (e) Subtotal net admitted deferred tax asset (c - d) |
2,311 | 63 | 2,374 | |||||||||
| (f) Deferred tax liabilities |
2,289 | 72 | 2,361 | |||||||||
|
|
|
|||||||||||
| (g) Net admitted deferred tax asset / (net deferred tax liability) (e - f) |
$ | 22 | $ | (9 | ) | $ | 13 | |||||
|
|
|
|||||||||||
| Change | ||||||||||||
| (7) (Col 1 - 4) Ordinary |
(8) (Col 2 - 5) Capital |
(9) (Col 7 + 8) Total |
||||||||||
|
|
|
|||||||||||
| (in millions) | ||||||||||||
| (a) Gross deferred tax assets |
$ | (758 | ) | $ | 4 | $ | (754 | ) | ||||
| (b) Statutory valuation allowance adjustments |
- | - | - | |||||||||
|
|
|
|||||||||||
| (c) Adjusted gross deferred tax assets (a - b) |
(758 | ) | 4 | (754 | ) | |||||||
| (d) Deferred tax assets nonadmitted |
- | - | - | |||||||||
|
|
|
|||||||||||
| (e) Subtotal net admitted deferred tax asset (c - d) |
(758 | ) | 4 | (754 | ) | |||||||
| (f) Deferred tax liabilities |
(661 | ) | (3 | ) | (664 | ) | ||||||
|
|
|
|||||||||||
| (g) Net admitted deferred tax asset / (net deferred tax liability) (e - f) |
$ | (97 | ) | $ | 7 | $ | (90 | ) | ||||
|
|
|
|||||||||||
The Company has recorded a valuation allowance against specific general business tax credit carryforwards of $121 million for the year ended December 31, 2018. These tax credits were generated by the legacy JHFC group and are subject to the separate return limitation rules. These credits will not expire until 2027, however due to restrictions on the utilization, management believes that it is more likely than not that the Company will not realize the benefit. In assessing the need for a valuation allowance, management considered the future reversal of taxable temporary differences, future taxable income exclusive of reversing temporary differences, taxable income in the carry back period, as well as tax planning strategies. Tax
F-55
Table of Contents
JOHN HANCOCK LIFE INSURANCE COMPANY (U.S.A.)
NOTES TO STATUTORY-BASIS FINANCIAL STATEMENTS – (CONTINUED)
9. Federal Income Taxes - (continued)
planning strategies were considered to the extent they were both prudent and feasible and if implemented, would result in the realization of deferred tax assets.
The amount of adjusted gross deferred tax assets admitted under each component and the resulting increase in deferred tax assets by character are as follows:
| December 31, 2018 | ||||||||||||
| (1) Ordinary |
(2) Capital |
(3) (Col 1 + 2) Total |
||||||||||
|
|
|
|||||||||||
| (in millions) | ||||||||||||
| 2. Admission calculation components SSAP No. 101 |
||||||||||||
| (a) Federal income taxes paid in prior years recoverable through loss carrybacks. |
$ | - | $ | 65 | $ | 65 | ||||||
| (b) Adjusted gross deferred tax assets expected to be realized (excluding the amount of deferred tax assets from 2(a) above) after application of the threshold limitation. (The lesser of 2(b)1 and 2(b)2 below) |
649 | - | 649 | |||||||||
| 1. Adjusted gross deferred tax assets expected to be realized following the Balance Sheet date. |
649 | - | 649 | |||||||||
| 2. Adjusted gross deferred tax assets allowed per limitation threshold. |
1,328 | - | 1,328 | |||||||||
| (c) Adjusted gross deferred tax assets (excluding the amount of deferred tax assets from 2(a) and 2(b) above) offset by gross deferred tax liabilities. |
904 | 2 | 906 | |||||||||
|
|
|
|||||||||||
| (d) Deferred tax assets admitted as the result of application of SSAP No. 101. Total (2(a) + 2(b) + 2(c)) |
$ | 1,553 | $ | 67 | $ | 1,620 | ||||||
|
|
|
|||||||||||
F-56
Table of Contents
JOHN HANCOCK LIFE INSURANCE COMPANY (U.S.A.)
NOTES TO STATUTORY-BASIS FINANCIAL STATEMENTS – (CONTINUED)
9. Federal Income Taxes - (continued)
| December 31, 2017 | ||||||||||||
| (4) Ordinary |
(5) Capital |
(6) (Col 4 + 5) Total |
||||||||||
|
|
|
|||||||||||
| (in millions) | ||||||||||||
| 2. Admission calculation components SSAP No. 101 |
||||||||||||
| (a) Federal income taxes paid in prior years recoverable through loss carrybacks. |
$ | - | $ | 53 | $ | 53 | ||||||
| (b) Adjusted gross deferred tax assets expected to be realized (excluding the amount of deferred tax assets from 2(a) above) after application of the threshold limitation. (The lesser of 2(b)1 and 2(b)2 below) |
742 | - | 742 | |||||||||
| 1. Adjusted gross deferred tax assets expected to be realized following the Balance Sheet date. |
742 | - | 742 | |||||||||
| 2. Adjusted gross deferred tax assets allowed per limitation threshold. |
1,212 | - | 1,212 | |||||||||
| (c) Adjusted gross deferred tax assets (excluding the amount of deferred tax assets from 2(a) and 2(b) above) offset by gross deferred tax liabilities. |
1,569 | 10 | 1,579 | |||||||||
|
|
|
|||||||||||
| (d) Deferred tax assets admitted as the result of application of SSAP No. 101. Total (2(a) + 2(b) + 2(c)) |
$ | 2,311 | $ | 63 | $ | 2,374 | ||||||
|
|
|
|||||||||||
| Change | ||||||||||||
| (7) (Col 1 - 4) Ordinary |
(8) (Col 2 - 5) Capital |
(9) (Col 7 + 8) Total |
||||||||||
|
|
|
|||||||||||
| (in millions) | ||||||||||||
| 2. Admission calculation components SSAP No. 101 |
||||||||||||
| (a) Federal income taxes paid in prior years recoverable through loss carrybacks. |
$ | - | $ | 12 | $ | 12 | ||||||
| (b) Adjusted gross deferred tax assets expected to be realized (excluding the amount of deferred tax assets from 2(a) above) after application of the threshold limitation. (The lesser of 2(b)1 and 2(b)2 below) |
(93 | ) | - | (93 | ) | |||||||
| 1. Adjusted gross deferred tax assets expected to be realized following the Balance Sheet date. |
(93 | ) | - | (93 | ) | |||||||
| 2. Adjusted gross deferred tax assets allowed per limitation threshold. |
116 | - | 116 | |||||||||
| (c) Adjusted gross deferred tax assets (excluding the amount of deferred tax assets from 2(a) and 2(b) above) offset by gross deferred tax liabilities. |
(665 | ) | (8 | ) | (673 | ) | ||||||
|
|
|
|||||||||||
| (d) Deferred tax assets admitted as the result of application of SSAP No. 101. Total (2(a) + 2(b) + 2(c)) |
$ | (758) | $ | 4 | $ | (754) | ||||||
|
|
|
|||||||||||
F-57
Table of Contents
JOHN HANCOCK LIFE INSURANCE COMPANY (U.S.A.)
NOTES TO STATUTORY-BASIS FINANCIAL STATEMENTS – (CONTINUED)
9. Federal Income Taxes - (continued)
| 2018 | 2017 | |||||||
|
|
|
|||||||
| (in millions) | ||||||||
| (a) Ratio percentage used to determine recovery period and threshold limitation amount |
800 | % | 849 | % | ||||
| (b) Amount of adjusted capital and surplus used to determine recovery period and threshold limitation in 2(b)2 above |
$ | 8,854 | $ | 8,082 | ||||
Impact of tax planning strategies is as follows:
| December 31, 2018 | ||||||||
| (1) Ordinary |
(2) Capital |
|||||||
|
|
|
|||||||
| (in millions) | ||||||||
| (a) Determination of Adjusted Gross Deferred Tax Assets and Net Admitted Deferred Tax Assets by tax character as a percentage. |
||||||||
| 1. Adjusted Gross DTAs Amount From Note 9A1(c) |
$ | 1,553 | $ | 67 | ||||
| 2. Percentage of Adjusted Gross DTAs By Tax Character Attributable To The Impact of Tax Planning Strategies |
0 | % | 0 | % | ||||
| 3. Net Admitted Adjusted Gross DTAs Amount from Note 9A1(e) |
$ | 1,553 | $ | 67 | ||||
| 4. Percentage of Net Admitted Adjusted Gross DTAs by Tax Character Attributable To The Impact of Tax Planning Strategies |
0 | % | 0 | % | ||||
| December 31, 2017 | ||||||||
| (3) Ordinary |
(4) Capital |
|||||||
|
|
|
|||||||
| (in millions) | ||||||||
| (a) Determination of Adjusted Gross Deferred Tax Assets and Net Admitted Deferred Tax Assets by tax character as a percentage. |
||||||||
| 1. Adjusted Gross DTAs Amount From Note 9A1(c) |
$ | 2,311 | $ | 63 | ||||
| 2. Percentage of Adjusted Gross DTAs By Tax Character Attributable To The Impact of Tax Planning Strategies |
0 | % | 0 | % | ||||
| 3. Net Admitted Adjusted Gross DTAs Amount from Note 9A1(e) |
$ | 2,311 | $ | 63 | ||||
| 4. Percentage of Net Admitted Adjusted Gross DTAs by Tax Character Attributable To The Impact of Tax Planning Strategies |
0 | % | 0 | % | ||||
F-58
Table of Contents
JOHN HANCOCK LIFE INSURANCE COMPANY (U.S.A.)
NOTES TO STATUTORY-BASIS FINANCIAL STATEMENTS – (CONTINUED)
9. Federal Income Taxes - (continued)
| Change | ||||||||
| (5) (Col 1 - 3) Ordinary |
(6) (Col 2 - 4) Capital |
|||||||
|
|
|
|||||||
| (in millions) | ||||||||
| (a) Determination of Adjusted Gross Deferred Tax Assets and Net Admitted Deferred Tax Assets by tax character as a percentage. |
||||||||
| 1. Adjusted Gross DTAs Amount From Note 9A1(c) |
$ | (758 | ) | $ | 4 | |||
| 2. Percentage of Adjusted Gross DTAs By Tax Character Attributable To The Impact of Tax Planning Strategies |
0 | % | 0 | % | ||||
| 3. Net Admitted Adjusted Gross DTAs Amount from Note 9A1(e) |
$ | (758 | ) | $ | 4 | |||
| 4. Percentage of Net Admitted Adjusted Gross DTAs by Tax Character Attributable To The Impact of Tax Planning Strategies |
0 | % | 0 | % | ||||
The Company’s tax planning strategies do not include the use of reinsurance.
There are no unrecognized deferred tax liabilities for amounts described in ASC 740-10-25-3.
Current income taxes incurred consist of the following major components:
| Years Ended December 31, | ||||||||||||
| (1) 2018 |
(2) 2017 |
(3) (Col 1 - 2) Change |
||||||||||
|
|
|
|||||||||||
| (in millions) | ||||||||||||
| 1. Current income tax |
||||||||||||
| (a) Federal |
$ | (725 | ) | $ | 446 | $ | (1,171 | ) | ||||
| (b) Foreign |
- | - | - | |||||||||
|
|
|
|||||||||||
| (c) Subtotal |
(725 | ) | 446 | (1,171 | ) | |||||||
| (d) Federal income tax on net capital gains |
396 | 243 | 153 | |||||||||
| (e) Utilization of capital loss carryforwards |
- | - | - | |||||||||
| (f) Other |
- | - | - | |||||||||
|
|
|
|||||||||||
| (g) Federal and foreign income taxes incurred |
$ | (329 | ) | $ | 689 | $ | (1,018 | ) | ||||
|
|
|
|||||||||||
F-59
Table of Contents
JOHN HANCOCK LIFE INSURANCE COMPANY (U.S.A.)
NOTES TO STATUTORY-BASIS FINANCIAL STATEMENTS – (CONTINUED)
9. Federal Income Taxes - (continued)
The tax effects of temporary differences that give rise to significant portions of the deferred tax assets and liabilities are as follows:
| December 31, | ||||||||||||
| (1) 2018 |
(2) 2017 |
(3) (Col 1 - 2) Change |
||||||||||
|
|
|
|||||||||||
| (in millions) | ||||||||||||
| 2. Deferred tax assets: |
||||||||||||
| (a) Ordinary: |
||||||||||||
| (1) Discounting of unpaid losses |
$ | - | $ | - | $ | - | ||||||
| (2) Unearned premium reserve |
- | - | - | |||||||||
| (3) Policyholder reserves |
654 | 1,489 | (835 | ) | ||||||||
| (4) Investments |
72 | 88 | (16 | ) | ||||||||
| (5) Deferred acquisition costs |
412 | 357 | 55 | |||||||||
| (6) Policyholder dividends accrual |
53 | 49 | 4 | |||||||||
| (7) Fixed assets |
- | - | - | |||||||||
| (8) Compensation and benefits accrual |
34 | 28 | 6 | |||||||||
| (9) Pension accrual |
17 | 16 | 1 | |||||||||
| (10) Receivables - nonadmitted |
54 | 48 | 6 | |||||||||
| (11) Net operating loss carryforward |
35 | - | 35 | |||||||||
| (12) Tax credit carry-forward |
333 | 329 | 4 | |||||||||
| (13) Other (including items <5% of total ordinary tax assets) |
10 | 28 | (18 | ) | ||||||||
|
|
|
|||||||||||
| (99) Subtotal |
$ | 1,674 | $ | 2,432 | $ | (758 | ) | |||||
| (b) Statutory valuation allowance adjustment |
121 | 121 | - | |||||||||
| (c) Nonadmitted |
- | - | - | |||||||||
|
|
|
|||||||||||
| (d) Admitted ordinary deferred tax assets (2(a)(99) - 2(b) - 2(c)) |
$ | 1,553 | $ | 2,311 | $ | (758 | ) | |||||
| (e) Capital: |
||||||||||||
| (1) Investments |
$ | 67 | $ | 63 | $ | 4 | ||||||
| (2) Net capital loss carryforward |
- | - | - | |||||||||
| (3) Real estate |
- | - | - | |||||||||
| (4) Other (including items <5% of total capital tax assets) |
- | - | - | |||||||||
|
|
|
|||||||||||
| (99) Subtotal |
$ | 67 | $ | 63 | $ | 4 | ||||||
| (f) Statutory valuation allowance adjustment |
- | - | - | |||||||||
| (g) Nonadmitted |
- | - | - | |||||||||
|
|
|
|||||||||||
| (h) Admitted capital deferred tax assets (2(e)(99) - 2(f) - 2(g)) |
$ | 67 | $ | 63 | $ | 4 | ||||||
| (i) Admitted deferred tax assets (2(d)+2(h)) |
$ | 1,620 | $ | 2,374 | $ | (754 | ) | |||||
F-60
Table of Contents
JOHN HANCOCK LIFE INSURANCE COMPANY (U.S.A.)
NOTES TO STATUTORY-BASIS FINANCIAL STATEMENTS – (CONTINUED)
9. Federal Income Taxes - (continued)
| 3. Deferred tax liabilities: |
||||||||||||
| (a) Ordinary: |
||||||||||||
| (1) Investments |
$ | 1,150 | $ | 1,178 | $ | (28 | ) | |||||
| (2) Fixed assets |
18 | 18 | - | |||||||||
| (3) Deferred and uncollected premium |
9 | 9 | - | |||||||||
| (4) Policyholder reserves |
324 | 934 | (610 | ) | ||||||||
| (5) Other (including items <5% of total ordinary tax liabilities) |
127 | 150 | (23 | ) | ||||||||
|
|
|
|||||||||||
| (99) Subtotal |
$ | 1,628 | $ | 2,289 | $ | (661 | ) | |||||
| (b) Capital: |
||||||||||||
| (1) Investments |
$ | 69 | $ | 72 | $ | (3 | ) | |||||
| (2) Real estate |
- | - | - | |||||||||
| (3) Other (including items <5% of total capital tax liabilities) |
- | - | - | |||||||||
|
|
|
|||||||||||
| (99) Subtotal |
$ | 69 | $ | 72 | $ | (3 | ) | |||||
|
|
|
|||||||||||
| (c) Deferred tax liabilities (3(a)(99) + 3(b)(99)) |
$ | 1,697 | $ | 2,361 | $ | (664 | ) | |||||
|
|
|
|||||||||||
| 4. Net deferred tax assets/liabilities (2(i) - 3(c)) |
$ | (77 | ) | $ | 13 | $ | (90 | ) | ||||
|
|
|
|||||||||||
The change in net deferred income taxes is comprised of the following:
| December 31, | ||||||||||||
| 2018 | 2017 | Change | ||||||||||
|
|
|
|||||||||||
| (in millions) | ||||||||||||
| Total deferred tax assets |
$ | 1,620 | $ | 2,374 | $ | (754 | ) | |||||
| Total deferred tax liabilities |
1,697 | 2,361 | (664 | ) | ||||||||
|
|
|
|||||||||||
| Net deferred tax assets (liabilities) |
$ | (77 | ) | $ | 13 | $ | (90 | ) | ||||
|
|
|
|||||||||||
| Tax effect of unrealized gains and losses |
137 | |||||||||||
| Tax effect of unrealized foreign exchange gains (losses) |
5 | |||||||||||
| Other |
(215 | ) | ||||||||||
|
|
|
|||||||||||
| Change in net deferred income taxes |
$ | (17 | ) | |||||||||
|
|
|
|||||||||||
F-61
Table of Contents
JOHN HANCOCK LIFE INSURANCE COMPANY (U.S.A.)
NOTES TO STATUTORY-BASIS FINANCIAL STATEMENTS – (CONTINUED)
9. Federal Income Taxes - (continued)
The provision for federal and foreign income taxes incurred is different from that which would be obtained by applying the statutory federal income tax rate of 21% for 2018 and 35% for 2017 and 2016 to income before income tax (including realized capital gains). The significant items causing this difference are as follows:
| Years Ended December 31, | ||||||||||||
| 2018 | 2017 | 2016 | ||||||||||
|
|
|
|||||||||||
| (in millions) | ||||||||||||
| Ordinary provisions computed at statutory rate |
$ | (7 | ) | $ | 962 | $ | 294 | |||||
| Net realized capital gains (losses) before IMR at statutory rate |
153 | 253 | (173 | ) | ||||||||
| Change in nonadmitted assets |
- | - | - | |||||||||
| Reinsurance |
77 | 22 | (47 | ) | ||||||||
| Valuation allowance |
- | - | 71 | |||||||||
| Tax-exempt income |
1 | (22 | ) | (16 | ) | |||||||
| Nondeductible expenses |
2 | 1 | (1 | ) | ||||||||
| Foreign tax expense gross up |
5 | 8 | 8 | |||||||||
| Amortization of IMR |
(138 | ) | (68 | ) | (78 | ) | ||||||
| Tax recorded in surplus |
14 | 68 | (4 | ) | ||||||||
| Dividend received deduction |
(159 | ) | (184 | ) | (183 | ) | ||||||
| Investment in subsidiaries |
(18 | ) | (25 | ) | (25 | ) | ||||||
| Prior year adjustment |
(69 | ) | (151 | ) | (54 | ) | ||||||
| Tax credits |
(23 | ) | (24 | ) | (26 | ) | ||||||
| Change in tax reserve |
33 | 4 | (200 | ) | ||||||||
| Pension |
- | - | - | |||||||||
| Tax rate change |
(185 | ) | 570 | - | ||||||||
| Other |
2 | 1 | (1 | ) | ||||||||
|
|
|
|||||||||||
| Total |
$ | (312 | ) | $ | 1,415 | $ | (435 | ) | ||||
|
|
|
|||||||||||
| Federal and foreign income taxes incurred |
$ | (725 | ) | $ | 446 | $ | (121 | ) | ||||
| Capital gains tax |
396 | 243 | 496 | |||||||||
| Change in net deferred income taxes |
17 | 726 | (810 | ) | ||||||||
|
|
|
|||||||||||
| Total statutory income tax expense (benefit) |
$ | (312 | ) | $ | 1,415 | $ | (435 | ) | ||||
|
|
|
|||||||||||
F-62
Table of Contents
JOHN HANCOCK LIFE INSURANCE COMPANY (U.S.A.)
NOTES TO STATUTORY-BASIS FINANCIAL STATEMENTS – (CONTINUED)
9. Federal Income Taxes - (continued)
As of December 31, 2018, the Company had the following carry forwards:
| Origination Year |
Expiration Year |
Amount | ||||||||||
|
|
|
|||||||||||
| (in millions) | ||||||||||||
| Affordable housing tax credits |
2001 | 2021 | $ | 1 | ||||||||
| 2002 | 2022 | 1 | ||||||||||
| 2003 | 2023 | 1 | ||||||||||
| 2004 | 2024 | 1 | ||||||||||
| 2005 | 2025 | 1 | ||||||||||
| 2006 | 2026 | 2 | ||||||||||
| 2007 | 2027 | 23 | ||||||||||
| 2008 | 2028 | 57 | ||||||||||
| 2009 | 2029 | 54 | ||||||||||
| 2010 | 2030 | 47 | ||||||||||
| 2011 | 2031 | 41 | ||||||||||
| 2012 | 2032 | 32 | ||||||||||
| 2013 | 2033 | 21 | ||||||||||
| 2014 | 2034 | 12 | ||||||||||
| 2015 | 2035 | 5 | ||||||||||
| 2016 | 2036 | 3 | ||||||||||
| 2017 | 2037 | 1 | ||||||||||
| 2018 | 2038 | - | ||||||||||
|
|
|
|||||||||||
| $ | 303 | |||||||||||
|
|
|
|||||||||||
| Net Operating Losses |
2008 | 2023 | $ | - | ||||||||
| 2009 | 2024 | - | ||||||||||
| 2010 | 2025 | - | ||||||||||
| 2013 | 2028 | - | ||||||||||
| 2014 | 2029 | - | ||||||||||
| 2018 | 35 | |||||||||||
|
|
|
|||||||||||
| $ | 35 | |||||||||||
|
|
|
|||||||||||
| Foreign Tax Credits |
2006 | 2016 | $ | - | ||||||||
| 2007 | 2017 | - | ||||||||||
| 2008 | 2018 | - | ||||||||||
| 2009 | 2019 | - | ||||||||||
| 2010 | 2020 | - | ||||||||||
| 2011 | 2021 | - | ||||||||||
| 2012 | 2022 | - | ||||||||||
| 2013 | 2023 | - | ||||||||||
| 2014 | 2024 | - | ||||||||||
| 2015 | 2025 | - | ||||||||||
| 2016 | 2026 | - | ||||||||||
| 2017 | 2027 | - | ||||||||||
| 2018 | 2028 | 23 | ||||||||||
|
|
|
|||||||||||
| $ | 23 | |||||||||||
|
|
|
|||||||||||
F-63
Table of Contents
JOHN HANCOCK LIFE INSURANCE COMPANY (U.S.A.)
NOTES TO STATUTORY-BASIS FINANCIAL STATEMENTS – (CONTINUED)
9. Federal Income Taxes - (continued)
| Origination Year |
Expiration Year |
Amount | ||||||||||
|
|
|
|||||||||||
| (in millions) | ||||||||||||
| Other credits |
2000 | 2020 | $ | - | ||||||||
| 2001 | 2021 | - | ||||||||||
| 2002 | 2022 | - | ||||||||||
| 2003 | 2023 | - | ||||||||||
| 2004 | 2024 | - | ||||||||||
| 2005 | 2025 | - | ||||||||||
| 2006 | 2026 | - | ||||||||||
| 2007 | 2027 | - | ||||||||||
| 2008 | 2028 | - | ||||||||||
| 2009 | 2029 | - | ||||||||||
| 2010 | 2030 | - | ||||||||||
| 2011 | 2031 | - | ||||||||||
| 2012 | 2032 | - | ||||||||||
| 2013 | 2033 | 2 | ||||||||||
| 2014 | 2034 | 2 | ||||||||||
| 2015 | 2035 | 3 | ||||||||||
| 2016 | 2036 | - | ||||||||||
|
|
|
|||||||||||
| $ | 7 | |||||||||||
|
|
|
|||||||||||
With the enactment of the Tax Cuts and Jobs Act on December 22, 2017, the net operating loss carryback provision was repealed effective January 1, 2018. The federal income taxes incurred on capital gains available for recoupment in the event of future net capital losses were $0 million, $323 million and $0 million for the years 2018, 2017 and 2016 respectively.
The Company has no deposits under Section 6603 of the Internal Revenue Code.
The Company is included in the consolidated federal income tax return of JHFC with the following entities:
| Essex Corporation | John Hancock Insurance Agency Inc. | |
| Farmland Management Services, Inc. | John Hancock Leasing Corp. | |
| Guide Financial, Inc. | John Hancock Life Insurance Company of New York | |
| Hancock Farmland Services, Inc. | John Hancock Life & Health Insurance Company | |
| Hancock Forest Management Inc. | John Hancock Natural Resource Corp. | |
| Hancock Natural Resource Group Inc. | John Hancock Realty Advisors Inc. | |
| JH 575 Rengstorff LLC | John Hancock Realty Mgt. Inc. | |
| JH Hostetler LLC | John Hancock Signature Services Inc. | |
| JH Kearny Mesa 5 LLC | Manulife Holding (USA) LLC | |
| JH Kearny Mesa 7 LLC | Manulife (Michigan) Reassurance Company | |
| JH Kearny Mesa 9 LLC | Manulife Reinsurance (Bermuda) Limited | |
| JH Networking Insurance Agency Inc. | Manulife Reinsurance Limited | |
| JH Ott LLC | Manulife Service Corporation | |
| JH Tulare 8 LLC | MCC Asset Management Inc. | |
| JHFS One Corp. | PT Timber Inc. | |
| John Hancock Assignment Company | Signator Insurance Agency Inc. | |
| John Hancock Financial Corporation | Signator Investors Inc. | |
| John Hancock Financial Network Inc. | The Manufacturers Investment Corporation |
In accordance with the income tax sharing agreements in effect for the applicable tax years, the Company’s income tax expense (benefit) is computed as if the Company filed separate federal income tax returns with tax benefits provided for operating losses and tax credits when utilized by the consolidated group. Intercompany settlements of income taxes are made through an increase or reduction to amounts due to or from affiliates. Such settlements occur on a periodic basis in accordance with the tax sharing agreements.
F-64
Table of Contents
JOHN HANCOCK LIFE INSURANCE COMPANY (U.S.A.)
NOTES TO STATUTORY-BASIS FINANCIAL STATEMENTS – (CONTINUED)
9. Federal Income Taxes - (continued)
Taxes receivable from (payable to) affiliates are ($47) million and ($156) million at December 31, 2018 and 2017, respectively, and are included in other assets or current federal income taxes payable on the Balance Sheets.
The Company files income tax returns in the U.S. federal jurisdiction and various state and local jurisdictions. The Company is under continuous examination by the Internal Revenue Service (“IRS”). Effective for 2010, the Company’s common parent, JHFC, merged into Manulife Holdings (Delaware) LLC (“MHDLLC”) resulting in a new combined group. With respect to the legacy MHDLLC consolidated return group, the IRS audit for tax years through 2009 have been closed. With respect to the legacy JHFC group, the IRS has completed its examinations of tax years 1997 through 2009. On March 30, 2016, the Company and the IRS finalized an agreement for tax years 2002-2009. The agreement applies the U.S. Tax Court’s opinion on the Company’s tax treatment of certain leveraged lease investments pertaining to tax years 1997-2001. There was no material impact to the Company’s financial position or results of operations as a result of the agreement.
In August 2017, the Company received and signed an IRS Revenue Agent Report for tax years 2010-2013. Tax years 2014 and forward are open under the statute of limitations.
A reconciliation of the beginning and ending amount of unrecognized tax benefits is as follows:
| 2018 | 2017 | |||||||
|
|
|
|||||||
| (in millions) | ||||||||
| Balance at beginning of year |
$ | 60 | $ | 37 | ||||
| Additions based on tax positions related to the current year |
2 | 14 | ||||||
| Payments |
- | - | ||||||
| Additions for tax positions of prior years |
48 | 22 | ||||||
| Reductions for tax positions of prior years |
(2 | ) | (13 | ) | ||||
|
|
|
|||||||
| Balance at end of year |
$ | 108 | $ | 60 | ||||
|
|
|
|||||||
Included in the balances as of December 31, 2018 and 2017, are $108 million and $75 million, respectively, of unrecognized benefits that, if recognized, would affect the Company’s effective tax rate. Included in the balances as of December 31, 2018 and 2017, are ($1) million and ($16) million of tax positions for which the ultimate deductibility is highly certain but for which there is uncertainty about the timing of such deductibility.
The Company’s liability for unrecognized tax benefits is not expected to materially change in the next twelve months.
The Company recognizes interest accrued related to unrecognized tax benefits and penalties in income tax expense in the Statements of Operations. The Company recognized approximately ($3) million, ($10) million, and ($177) million of interest expense / (benefit) for the years ended December 31, 2018, 2017 and 2016, respectively. The Company had approximately $6 million and $6 million accrued for interest as of December 31, 2018 and 2017, respectively. The Company did not recognize any material penalties for the years ended December 31, 2018, 2017 and 2016.
The Company reported a Repatriation Transition Tax liability in the amount of $1 million for 2017. This amount was fully remitted to the IRS with the filing of the 2017 federal income tax return.
As of December 31, 2017, the Company reported an Alternative Minimum Tax (AMT) Credit carryforward of $485 million, all of which was recorded as a current tax recoverable. The Company expects to recover $243 million of this balance with the filing of its 2018 tax return, while the remaining $242 million is expected to be recovered in 2019 through 2021.
With the enactment of the Tax Cuts and Jobs Act (the “Act”) on December 22, 2017, the Company applied existing guidance to the best available information in the recording of its tax provisions reflected in the 2017 financial statements. In 2018, the Company completed its analysis on the income tax effects of the Act and adjusted its provisional amounts accordingly. The Company updated policy level tax reserves and reflected impacts of $108 million in its temporary differences for Actuarial Liabilities in both deferred tax assets and deferred tax liabilities. The transitional deferred tax liability is being amortized into taxable income over 8 years, in the amount of $13 million per year. In addition, with the completion of the 2017 tax return,
F-65
Table of Contents
JOHN HANCOCK LIFE INSURANCE COMPANY (U.S.A.)
NOTES TO STATUTORY-BASIS FINANCIAL STATEMENTS – (CONTINUED)
9. Federal Income Taxes - (continued)
the Company recorded all provision to return adjustments of which ($185) million impacted the effective tax rate related to the revaluation of deferred tax assets and liabilities from 35% to 21%.
10. Capital and Surplus
There are no restrictions placed on the Company’s unassigned surplus other than restrictions on dividend payments described below.
Under Michigan State insurance laws, no insurer may pay any shareholder dividends from any source other than statutory earned surplus without the prior approval of the Director. Dividends to the shareholder that may be paid without prior approval of the Director are limited by the laws of the State of Michigan. Such dividends are permissible if, together with other dividends or distributions made within the preceding 12 months, they do not exceed the greater of 10% of the JHUSA surplus as of December 31 of the preceding year, or the net gain from operations excluding realized capital gains and (losses) for the 12 month period ending December 31 of the immediately preceding year. For the years ended December 31, 2018, 2017 and 2016, the Company paid ordinary dividends of $600 million, $807 million and $0 million and extraordinary dividends of $0 million, $93 million, and $0 million to its parent company MIC, respectively.
Life/health insurance companies are subject to certain Risk-Based Capital (“RBC”) requirements as specified by the NAIC. Under those requirements, the amount of capital and surplus maintained by a life/health insurance company is to be determined based on the various risk factors related to it. As of December 31, 2018 and 2017, based on calculations pursuant to those requirements, the Company’s total adjusted capital exceeds the company action level RBC.
The Company has surplus notes described below in the amount of $585 million outstanding as of December 31, 2018. During 2016, $405 million was repaid. The issuance of the surplus notes was approved by the insurance regulators with the following repayment conditions and restrictions: payment of principal and accrued interest otherwise required or permissible cannot be made unless approved by the Board of Directors, approved in writing by the Director, and the Company has sufficient earned surplus or such other funds as may be approved by the Director available for such payment.
Surplus notes in the amount of $450 million were issued on February 25, 1994, for cash pursuant to Rule 144A under the Securities Act of 1933. 100% of the issued and outstanding surplus notes are represented by a global note registered in the name of a nominee of the Depository Trust Company. The interest rate is fixed at 7.375%, and interest is payable semi-annually. The notes mature on February 15, 2024. Interest expense was $33 million for years ended December 31, 2018, 2017 and 2016. Total interest paid through December 31, 2018 was $813 million.
Pursuant to two subordinated surplus notes dated September 30, 2008, the Company borrowed the respective amount of $295 million and $110 million from an affiliate, John Hancock Insurance Agency, Inc. (“JHIA”). The interest rate is fixed at 7% per annum and is payable semi-annually. The surplus notes which were to have matured on March 31, 2033 were repaid on November 1, 2016. For the year ended December 31, 2016, the combined interest expense on the notes was $31 million.
Pursuant to an amended and restated subordinated surplus note dated September 30, 2008, the Company borrowed $136 million from JHFC. Interest is calculated and reset quarterly at a fluctuating rate equal to 3-month LIBOR plus 125 basis points and is payable semi-annually. The note which was to have matured on December 15, 2016 was extended to December 14, 2021. Interest expense was $5 million, $3 million, and $3 million for the years ended December 31, 2018, 2017 and 2016, respectively. Total interest paid through December 31, 2018 was $24 million.
Under Michigan State liquidation statutes, the claims of the Depository Trust Company and JHFC (“the surplus noteholders”) come before those of the Company’s shareholders. There is no preferential treatment in claims between the surplus noteholders.
F-66
Table of Contents
JOHN HANCOCK LIFE INSURANCE COMPANY (U.S.A.)
NOTES TO STATUTORY-BASIS FINANCIAL STATEMENTS – (CONTINUED)
11. Related Party Transactions
Service Agreements
The Company has formal service agreements with MFC and MLI, which can be terminated by either party upon two months’ notice. Under the various agreements, the Company will pay a fee for services received under the agreement which includes legal, actuarial, investment, data processing, accounting, and certain other administrative services. Management fees relating to the agreement were $296 million, $347 million, and $329 million, respectively, for the years ended December 31, 2018, 2017 and 2016.
The Company has Administrative Service Agreements with its subsidiaries and affiliates whereby the Company will be reimbursed for operating expenses incurred by the Company. Services provided under the agreement include legal, personnel, marketing, investment accounting, and certain other administrative services and are billed based on intercompany cost allocations or total average daily net assets. The amounts earned under the agreements were $748 million, $767 million, and $811 million for the years ended December 31, 2018, 2017 and 2016, respectively.
Management believes the allocation methods used are reasonable and appropriate in the circumstances; however, the Company’s Balance Sheets and Statements of Operations may not necessarily be indicative of the financial condition that would have existed if the Company operated as an unaffiliated entity.
Other
During 2018, 2017 and 2016, respectively, the Company received dividends of $28 million, $31 million, and $34 million from John Hancock Investment Management Services LLC, $83 million, $72 million, and $71 million from JHD, $100 million, $0 million, and $0 million from JHNY, $0 million, $0 million, and $0 million from JHLH, $404 million, $231 million, and $214 million from John Hancock Subsidiaries, LLC (“JHS LLC”), and $0 million, $0 million, and $19 million from John Hancock Partnership Holdings I & II, $1 million, $10 million, and $0 million from CLA CRE Opportunity Fund I LP and $27 million, $0 million and $0 million from CIP / MCRT Longview Meadows LLC (“Concord Mews”). These dividends are included in the Company’s net investment income.
During 2018 and 2017, the Company made a capital contribution of $0 million and $0 million to JHS LLC.
The Company did not make a capital contribution to its wholly-owned subsidiary, MMRC in 2018. During 2017, the Company made a capital contribution of $40 million to MMRC, in exchange for one hundred and one shares of the common stock of MMRC.
During 2018 and 2017, the Company received a return of capital of $80 million and $0 million from its 91% ownership of Concord Mews.
The Company did not own any shares of the stock of its parent, MIC, or its ultimate parent, MFC at December 31, 2018 and 2017, respectively.
The Company did not recognize any impairment write-down for its investment in subsidiaries, controlled or affiliated companies for the years ended December 31, 2018, 2017 and 2016, respectively.
The Company is the owner and beneficiary of corporate owned life insurance (“COLI”) policies issued by JHLH. The asset balances equal to the cash surrender value of the internal COLI policies was $572 million and $558 million at December 31, 2018 and 2017, respectively.
The Company operates a liquidity pool in which affiliates can invest excess cash. Terms of operation and participation in the liquidity pool are set out in the Second Restated and Amended Liquidity Pool and Loan Facility Agreement effective January 1, 2010. The maximum aggregate amounts that JHUSA can accept into the Liquidity Pool are $5 billion in U.S. dollar deposits and $200 million in Canadian dollar deposits. Under the terms of the agreement, certain participants may receive advances from the Liquidity Pool up to certain predetermined limits. By acting as the banker the Company can earn a spread over the amount it pays its affiliates and this aggregation and resulting economies of scale allows the affiliates to improve the investment return on their excess cash. Interest payable on U.S. dollar funds will be reset daily to the one-month U.S. Dollar
F-67
Table of Contents
JOHN HANCOCK LIFE INSURANCE COMPANY (U.S.A.)
NOTES TO STATUTORY-BASIS FINANCIAL STATEMENTS – (CONTINUED)
11. Related Party Transactions - (continued)
London Inter-Bank Bid Rate (“LIBID”) and interest payable on Canadian dollar funds is based off the one-month Canadian Dollar Offering Rate (“CDOR”) plus a spread.
The following table details the affiliates and their participation in the Company’s Liquidity Pool:
| December 31, | ||||||||
| 2018 | 2017 | |||||||
|
|
|
|||||||
| (In millions) | ||||||||
| The Manufacturers Investment Corporation |
$ | 66 | $ | 134 | ||||
| John Hancock Financial Corporation |
113 | 114 | ||||||
| Manulife Reinsurance Limited |
17 | 56 | ||||||
| Manulife Reinsurance (Bermuda) Ltd. |
141 | 111 | ||||||
| Manulife (Michigan) Reassurance Company |
6 | 4 | ||||||
| John Hancock Life & Health Insurance Company |
159 | 180 | ||||||
| John Hancock Reassurance Company, Ltd. |
91 | 179 | ||||||
| John Hancock Life Insurance Company New York |
293 | 170 | ||||||
| John Hancock Investment Management Services LLC |
25 | 23 | ||||||
| John Hancock Subsidiaries LLC |
24 | 31 | ||||||
| John Hancock Insurance Agency, Inc. |
5 | 5 | ||||||
| Essex Corporation |
1 | - | ||||||
| JH Signature Services Inc. |
9 | 8 | ||||||
| JH Partnership Holdings I, II LP |
- | 7 | ||||||
| John Hancock Realty Advisors |
6 | 2 | ||||||
| JH Advisors LLC |
47 | 66 | ||||||
| Manulife Asset Management (US) LLC |
35 | 76 | ||||||
| Hancock Capital Investment Management LLC |
15 | 11 | ||||||
| John Hancock RPS, LLC |
41 | 31 | ||||||
| The Berkeley Financial Group, LLC |
2 | 2 | ||||||
| Manulife Holdings (USA), LLC |
- | - | ||||||
| Signator Insurance Agency, Inc. |
11 | 11 | ||||||
| JH Networking Insurance Agency, Inc. |
4 | 5 | ||||||
| John Hancock Administrative Services LLC |
- | - | ||||||
| John Hancock Financial Network, Inc. |
45 | 1 | ||||||
| Hancock Natural Resource Group, Inc. |
68 | 30 | ||||||
| Hancock Forest Management, Inc. |
5 | 5 | ||||||
| John Hancock Personal Financial Services, LLC |
1 | 2 | ||||||
| John Hancock Funding Company LLC |
(9 | ) | - | |||||
|
|
|
|||||||
| Total |
$ | 1,221 | $ | 1,264 | ||||
|
|
|
|||||||
Effective March 31, 1996, MLI provides a claims paying guarantee to certain U.S. policyholders. The claims guarantee agreement was terminated effective August 13, 2008, but still remains in effect with respect to policies issued by the Company prior to that date.
MFC fully and unconditionally guarantees payments from the guarantee periods of the accumulation phase for certain of the Company’s market value adjusted annuity contracts.
MFC fully and unconditionally guarantees JHLICO’s SignatureNotes. In December 2009, the entity that formerly issued these notes, JHLICO, ceased to exist and its property and obligations became the property and obligations of the Company.
MFC’s guarantees of the market value adjusted deferred annuity contracts and SignatureNotes are unsecured obligations of MFC and are subordinated in right of payment to the prior payment in full of all other obligations of MFC, except for other
F-68
Table of Contents
JOHN HANCOCK LIFE INSURANCE COMPANY (U.S.A.)
NOTES TO STATUTORY-BASIS FINANCIAL STATEMENTS – (CONTINUED)
11. Related Party Transactions - (continued)
guarantees or obligations of MFC, which by their terms are designated as ranking equally in right of payment with or subordinate to MFC’s guarantees of the market value adjusted deferred annuity contracts and SignatureNotes.
The Company also enters into debt and reinsurance transactions with its affiliates. Refer to the debt and reinsurance notes for further details.
12. Commitments, Guarantees, Contingencies, and Legal Proceedings
Commitments: The Company has extended commitments to purchase long-term bonds of $723 million, purchase other invested assets of $2,118 million, purchase real estate of $87 million, and issue agricultural and commercial mortgages of $152 million at December 31, 2018. If funded, loans related to real estate mortgages would be fully collateralized by related properties. Approximately 42% of these commitments expire in 2019.
There were no leasing arrangements that the Company entered into as lessee which could have a material financial effect.
During 2001, the Company entered into an office ground lease agreement, which expires on September 20, 2096. In conjunction with the September 25, 2018 sale of the home office property, the total lease commitment for future years related to the office ground lease was reduced by $343 million. During 2012, the Company entered into a parking lease agreement, which expires on December 31, 2050. The terms of the lease agreements provide for adjustments in future periods. The future minimum lease payments, by year and in the aggregate, under these leases and other non-cancelable operating leases along with the associated sub-lease income are as follows:
| Non-cancelable Operating Leases |
||||
| (in millions) | ||||
| 2019 |
$ | 9 | ||
| 2020 |
8 | |||
| 2021 |
5 | |||
| 2022 |
3 | |||
| 2023 |
3 | |||
| Thereafter |
16 | |||
|
|
|
|||
| Total |
$ | 44 | ||
|
|
|
|||
The Company does not have any sublease income related to its office space.
The Company’s investment in leveraged leases relates to equipment used primarily in the transportation industries; however, this type of leasing transaction is not a significant part of the Company’s business activities in terms of revenue, net income, or assets.
As of December 31, 2018, the Company recorded a restructuring charge of approximately $56 million, net of tax, primarily related to a voluntary early retirement program as well as costs to optimize our real estate footprint in the United States.
Guarantees: In the course of business, the Company enters into guarantees which vary in nature and purpose and which are accounted for and disclosed under statutory accounting principles.
The Company has issued guarantee agreements pursuant to which the Company guarantees the obligations of JHNY and JHLH under the OTC International Swaps and Derivatives Association, Inc. (“ISDA”) cleared and exchange-traded derivative agreements and transactions entered into by JHNY and JHLH with external counterparties. The ISDA guarantees are subject to an overall limit of $1 billion of Potential Future Exposure, using a three-week and 95% confidence parameters, in calculating the counterparty risk exposure.
The Company is party to a financial support agreement with JHLH pursuant to which it has agreed to maintain JHLH’s capital level such that its risk-based capital ratio shall be at or above 225% of the company action level annually. In addition,
F-69
Table of Contents
JOHN HANCOCK LIFE INSURANCE COMPANY (U.S.A.)
NOTES TO STATUTORY-BASIS FINANCIAL STATEMENTS – (CONTINUED)
12. Commitments, Guarantees, Contingencies, and Legal Proceedings - (continued)
under the terms of the financial support agreement, the Company undertakes to provide sufficient liquidity to enable JHLH to make timely payment of its contractual obligations.
Contingencies: The Company is an investor in a number of leasing transactions. On August 5, 2013, the U.S. Tax Court issued an opinion effectively ruling in the government’s favor in the litigation between John Hancock and the IRS involving the tax treatment of John Hancock’s investment in certain leveraged leases. On March 30, 2016, the Company and the IRS finalized an agreement determining the impact of the decision on tax years subsequent to the years that were decided by the Court. There was no material impact to the Company’s financial position or results of operations as a result of the agreement.
The Company acts as an intermediary/broker in OTC derivative instruments. In these cases, the Company enters into derivative transactions on behalf of affiliated companies and then enters into offsetting derivative transactions with the affiliate. In the event of default of either party, the Company is still obligated to fulfill its obligations with the other party.
The Company is subject to insurance guaranty fund laws in the states in which it does business. Pursuant to these laws, insurance companies are assessed, and required to make periodic payments, to be used to pay benefits to policyholders and claimants of insolvent or rehabilitated insurance companies. Many states allow these assessments to be credited against future premium taxes. The Company believes such assessments in excess of amounts accrued will not materially affect its financial position.
Legal Proceedings: The Company is regularly involved in litigation, both as a defendant and as a plaintiff. The litigation naming the Company as a defendant ordinarily involves its activities as a provider of insurance protection and wealth management products, an employer, and a taxpayer. In addition, the Michigan Department of Insurance and Financial Services, the Michigan Attorney General, the SEC, the Financial Regulatory Authority, and other government and regulatory bodies regularly make inquiries and, from time to time, require the production of information or conduct examinations concerning the Company’s compliance with, among other things, insurance laws, securities laws, and laws governing the activities of broker-dealers. An estimation of the range of potential outcomes in any given matter is often unavailable until such matters have developed and sufficient information emerges to support an assessment of the range of possible loss, such as quantification of a damage demand from plaintiffs, discovery from other parties and investigation of factual allegations, rulings by the court on motions or appeals, analysis by experts, and the progress of settlement negotiations. On a quarterly and annual basis, the Company reviews relevant information with respect to litigation contingencies and updates its accruals and estimates of reasonably possible losses or ranges of loss based on such reviews.
A class action against the Company is pending in the U.S. District Court for the Southern District of New York (the “Southern District of NY”) in which claims are made that the Company breached, and continues to breach, the contractual terms of certain universal life policies issued between approximately 1990 and 2006 by including impermissible charges in its cost of insurance (“COI”) calculations and certain other rider charges. The Company believes that its COI calculations have been, and continue to be, in accordance with the terms of the policies. In May 2018, the parties agreed to the financial terms of a settlement in the amount of $91 million. On November 1, 2018, the court granted preliminary approval of the $91 million settlement for Besen and scheduled a fairness hearing for February 19, 2019. Distribution of notice of the settlement to the class commenced on December 26, 2018. A similar class action based on the same policy language in dispute in the case pending in New York had been pending in California. The parties have settled all claims alleged in the California action. On May 8, 2018, the court granted final approval of the settlement, and the settlement amount of $60 million has been paid.
In June 2018, a class action was initiated against the Company in the Southern District of NY on behalf of owners of performance universal life policies issued between 2003 and 2009 whose policies are subject to a COI increase announced in 2018. In October 2018, an almost identical class action was initiated against the Company in the Southern District of New York. It was filed as a related case as the one filed in June and has been assigned to the same judge. Discovery has commenced in these cases and will continue through 2019. It is too early to assess the range of potential outcomes for these two related lawsuits.
F-70
Table of Contents
JOHN HANCOCK LIFE INSURANCE COMPANY (U.S.A.)
NOTES TO STATUTORY-BASIS FINANCIAL STATEMENTS – (CONTINUED)
13. Annuity Actuarial Reserves
The Company’s annuity actuarial reserves and deposit fund liabilities and related separate account liabilities that are subject to discretionary withdrawal (with adjustment), subject to discretionary withdrawal (without adjustment), and not subject to discretionary withdrawal provisions are summarized as follows:
| December 31, 2018 | ||||||||||||||||||||
| General Account |
Separate Account with Guarantees |
Separate Account Nonguaranteed |
Total | Percent of Total |
||||||||||||||||
|
|
|
|||||||||||||||||||
| (in millions) | ||||||||||||||||||||
| Subject to discretionary withdrawal: |
||||||||||||||||||||
| With fair value adjustment |
$ | 522 | $ | 337 | $ | 1,385 | $ | 2,244 | 2 | % | ||||||||||
| At book value less current surrender charge of 5% or more |
2 | - | - | 2 | 0 | % | ||||||||||||||
| At fair value |
- | - | 109,160 | 109,160 | 83 | % | ||||||||||||||
|
|
|
|||||||||||||||||||
| Total with adjustment or at fair value |
524 | 337 | 110,545 | 111,406 | 85 | % | ||||||||||||||
| At book value without adjustment (minimal or no charge or adjustment) |
4,937 | - | - | 4,937 | 4 | % | ||||||||||||||
| Not subject to discretionary withdrawal |
14,577 | 207 | 147 | 14,931 | 11 | % | ||||||||||||||
|
|
|
|||||||||||||||||||
| Total (gross) |
20,038 | 544 | 110,692 | 131,274 | 100 | % | ||||||||||||||
|
|
|
|||||||||||||||||||
| Reinsurance ceded |
10,830 | - | - | 10,830 | ||||||||||||||||
|
|
|
|||||||||||||||||||
| Total (net) |
$ | 9,208 | $ | 544 | $ | 110,692 | $ | 120,444 | ||||||||||||
|
|
|
|||||||||||||||||||
| December 31, 2017 | ||||||||||||||||||||
| General Account |
Separate Account with Guarantees |
Separate Account Nonguaranteed |
Total | Percent of Total |
||||||||||||||||
|
|
|
|||||||||||||||||||
| (in millions) | ||||||||||||||||||||
| Subject to discretionary withdrawal: |
||||||||||||||||||||
| With fair value adjustment |
$ | 448 | $ | 400 | $ | 1,720 | $ | 2,568 | 2 | % | ||||||||||
| At book value less current surrender charge of 5% or more |
2 | - | - | 2 | 0 | % | ||||||||||||||
| At fair value |
- | - | 124,432 | 124,432 | 84 | % | ||||||||||||||
|
|
|
|||||||||||||||||||
| Total with adjustment or at fair value |
450 | 400 | 126,152 | 127,002 | 86 | % | ||||||||||||||
| At book value without adjustment (minimal or no charge or adjustment) |
5,412 | - | - | 5,412 | 4 | % | ||||||||||||||
| Not subject to discretionary withdrawal |
14,987 | 227 | 171 | 15,385 | 10 | % | ||||||||||||||
|
|
|
|||||||||||||||||||
| Total (gross) |
20,849 | 627 | 126,323 | 147,799 | 100 | % | ||||||||||||||
|
|
|
|||||||||||||||||||
| Reinsurance ceded |
4,526 | - | - | 4,526 | ||||||||||||||||
|
|
|
|||||||||||||||||||
| Total (net) |
$ | 16,323 | $ | 627 | $ | 126,323 | $ | 143,273 | ||||||||||||
|
|
|
|||||||||||||||||||
F-71
Table of Contents
JOHN HANCOCK LIFE INSURANCE COMPANY (U.S.A.)
NOTES TO STATUTORY-BASIS FINANCIAL STATEMENTS – (CONTINUED)
14. Separate Accounts
Separate accounts held by the Company include individual and group variable annuity and variable life products that offer guaranteed and non-guaranteed returns. The net investment experience of the separate account is credited directly to the policyholder and can be positive or negative.
For guarantees of amounts in the event of death, the net amount at risk is defined as the excess of the initial sum insured over the current sum insured for fixed premium variable life insurance contracts, and, for other variable life insurance contracts, is equal to the sum insured when the account value is zero and the policy is still in force.
The deposits related to variable annuities generally provide a GMDB. For annuity products, this can take the form of either (a) return of no less than total deposits made to the contract less any partial withdrawals; (b) total deposits made to the contract less any partial withdrawals plus a minimum return; (c) the highest contract value on a specified anniversary date minus any withdrawals following the contract anniversary; or (d) a combination benefit of (b) and (c) above. The assets and liabilities of these accounts are carried at fair value. The GMDB reserve is held in the Company’s general account policy reserves.
The Company sold contracts with GMIB riders from 1998 to 2004. The GMIB rider provides a guaranteed lifetime annuity which may be elected by the contract holder after a stipulated waiting period (7 to 15 years), and which may be larger than what the contract account balance could purchase at then-current annuity purchase rates.
The Company sold contracts with a GMWB rider and has since offered multiple variations of this optional benefit. The GMWB rider provides contract holders a guaranteed annual withdrawal amount over a specified time period or in some cases for as long as they live. In general, guaranteed annual withdrawal amounts are based on deposits and may be reduced if withdrawals exceed allowed amounts. Guaranteed amounts may also be increased as a result of “step-up” provisions which increase the benefit base to higher account values at specified intervals. Guaranteed amounts may also be increased if withdrawals are deferred over a specified period. In addition, certain versions of the GMWB rider extend lifetime guarantees to spouses.
Reinsurance has been utilized to mitigate risk related to some of the GMDB and GMIB riders.
For GMDB, the net amount at risk is defined as the current guaranteed minimum death benefit in excess of the current account balance. For GMIB, the net amount at risk is defined as the excess of the current annuitization income base over the current account value. For GMWB, the net amount at risk is defined as the current guaranteed withdrawal amount minus the current account value. For all the guarantees, the net amount at risk is floored at zero at the single contract level.
The deposits related to the variable life insurance contracts are invested in separate accounts and the Company guarantees a specified death benefit if certain specified premiums are paid by the policyholder, regardless of separate account performance.
The assets legally insulated from the general account are attributed to the following products/transactions:
| Product/Transaction | Separate Account Legally Insulated Assets |
Separate Account Not Legally |
||||||||||||||
|
|
|
|||||||||||||||
| December 31, | ||||||||||||||||
| 2018 | 2017 | 2018 | 2017 | |||||||||||||
|
|
|
|||||||||||||||
| (in millions) | ||||||||||||||||
| Group Annuity Contracts (401K) |
$ | 78,443 | $ | 87,377 | $ | - | $ | - | ||||||||
| Variable and Fixed Annuities |
29,250 | 35,552 | 21 | 23 | ||||||||||||
| Life Insurance |
12,771 | 14,081 | - | - | ||||||||||||
| Fixed Products - Institutional and stable value fund |
1,743 | 2,140 | - | - | ||||||||||||
| Fixed Products - Retail |
26 | 26 | 351 | 413 | ||||||||||||
| Investments - Funds |
1,526 | 1,555 | - | - | ||||||||||||
|
|
|
|||||||||||||||
| Total |
$ | 123,759 | $ | 140,731 | $ | 372 | $ | 436 | ||||||||
|
|
|
|||||||||||||||
F-72
Table of Contents
JOHN HANCOCK LIFE INSURANCE COMPANY (U.S.A.)
NOTES TO STATUTORY-BASIS FINANCIAL STATEMENTS – (CONTINUED)
14. Separate Accounts - (continued)
To compensate the general account for the risk taken, the separate account paid risk charges and amounts toward separate account guarantees as follows:
| Risk Charges Paid to General Account |
Amounts toward Separate Account Guarantees |
|||||||
|
|
|
|||||||
| (in millions) | ||||||||
| 2018 |
$ | 210 | $ | 54 | ||||
| 2017 |
$ | 220 | $ | 62 | ||||
| 2016 |
$ | 231 | $ | 89 | ||||
| 2015 |
$ | 241 | $ | 59 | ||||
| 2014 |
$ | 252 | $ | 74 | ||||
The Company had the following variable annuities with guaranteed benefits:
| December 31, | ||||||||
| 2018 | 2017 | |||||||
|
|
|
|||||||
| (in millions, except for ages) | ||||||||
| Account value |
$ | 29,577 | $ | 36,044 | ||||
| Amount of reserve held |
1,230 | 821 | ||||||
| Net amount at risk - gross |
7,778 | 4,817 | ||||||
| Weighted average attained age |
69 | 69 | ||||||
The following assumptions and methodology were used to determine the amounts above at December 31, 2018 and 2017:
| • | Actuarial Guideline 43 (“AG 43”) is used in both years to determine the aggregate reserve for products falling under the scope. Assumptions used in the standard scenario are prescribed by the guideline. Assumptions used in the stochastic scenarios are detailed below. |
| • | The stochastically generated projection scenarios have met the scenario calibration criteria prescribed in AG 43. |
| • | In 2018 and 2017, annuity mortality is based on the Ruark Variable Annuity Table, which is based on an industry study of variable annuity deaths. The table is further adjusted by factors varied by rider types (living benefit/GMDB only) and qualified and non-qualified business. |
| • | In 2018 and 2017, annuity base lapse rates vary by product, policy year, and rider type, where the lapse rates range from 0.5% to 40% for GMDB, GMIB and GMWB. In 2018 the base lapse rates also varied by utilizer status. These rates are dynamically reduced for guarantees that are in-the-money. Beginning in 2012, rates are also dynamically increased for GMWBs that are out-of-the-money. |
| • | For variable annuities, the swap curve at December 31 is used for discounting in both years. |
| • | For variable annuities, mean return, volatility and correlation assumptions are determined by indices, which have met the calibration criteria prescribed in AG 43. |
Account balances of variable contracts with guarantees were invested in various separate accounts with the following characteristics:
F-73
Table of Contents
JOHN HANCOCK LIFE INSURANCE COMPANY (U.S.A.)
NOTES TO STATUTORY-BASIS FINANCIAL STATEMENTS – (CONTINUED)
14. Separate Accounts - (continued)
| December 31, | ||||||||
| 2018 | 2017 | |||||||
|
|
|
|||||||
| (in millions) | ||||||||
| Type of Fund |
||||||||
| Equity |
$ | 24,071 | $ | 28,880 | ||||
| Balanced |
8,365 | 10,009 | ||||||
| Bonds |
5,615 | 6,381 | ||||||
| Money Market |
517 | 519 | ||||||
|
|
|
|||||||
| Total |
$ | 38,568 | $ | 45,789 | ||||
|
|
|
|||||||
Information regarding the separate accounts of the Company is as follows:
| December 31, | ||||||||||||||||||||||||
| 2018 | 2017 | |||||||||||||||||||||||
|
|
|
|||||||||||||||||||||||
| Nonindexed Guarantee Less than or Equal to 4% |
Nonguaranteed Separate Account |
Total | Nonindexed Guarantee Less than or Equal to 4% |
Nonguaranteed Separate Account |
Total | |||||||||||||||||||
|
|
|
|||||||||||||||||||||||
| (in millions) | ||||||||||||||||||||||||
| Premiums, deposits and other considerations |
$ | - | $ | 14,007 | $ | 14,007 | $ | - | $ | 14,395 | $ | 14,395 | ||||||||||||
|
|
|
|||||||||||||||||||||||
| Reserves for accounts with assets at: |
||||||||||||||||||||||||
| Fair value |
544 | 123,076 | 123,620 | 627 | 139,896 | 140,523 | ||||||||||||||||||
| Amortized cost |
- | - | - | - | - | - | ||||||||||||||||||
|
|
|
|||||||||||||||||||||||
| Total |
$ | 544 | $ | 123,076 | $ | 123,620 | $ | 627 | $ | 139,896 | $ | 140,523 | ||||||||||||
|
|
|
|||||||||||||||||||||||
F-74
Table of Contents
JOHN HANCOCK LIFE INSURANCE COMPANY (U.S.A.)
NOTES TO STATUTORY-BASIS FINANCIAL STATEMENTS – (CONTINUED)
14. Separate Accounts - (continued)
| December 31, | ||||||||||||||||||||||||
| 2018 | 2017 | |||||||||||||||||||||||
|
|
|
|||||||||||||||||||||||
| Nonindexed Guarantee Less than or Equal to 4% |
Nonguaranteed Separate Account |
Total | Nonindexed Guarantee Less than or Equal to 4% |
Nonguaranteed Separate Account |
Total | |||||||||||||||||||
|
|
|
|||||||||||||||||||||||
| (in millions) | ||||||||||||||||||||||||
| Reserves for separate accounts by withdrawal characteristics: |
||||||||||||||||||||||||
| Subject to discretionary withdrawal: |
||||||||||||||||||||||||
| With fair value adjustment |
$ | 337 | $ | 1,385 | $ | 1,722 | $ | 400 | $ | 1,720 | $ | 2,120 | ||||||||||||
| At book value without fair value adjustments and with current surrender charge of 5% or more |
- | 1,329 | 1,329 | - | 1,494 | 1,494 | ||||||||||||||||||
| At fair value |
- | 118,543 | 118,543 | - | 134,740 | 134,740 | ||||||||||||||||||
| At book value without fair value adjustments and with current surrender charge of less than 5% |
- | 1,671 | 1,671 | - | 1,771 | 1,771 | ||||||||||||||||||
|
|
|
|||||||||||||||||||||||
| Subtotal |
337 | 122,928 | 123,265 | 400 | 139,725 | 140,125 | ||||||||||||||||||
| Not subject to discretionary withdrawal |
207 | 148 | 355 | 227 | 171 | 398 | ||||||||||||||||||
|
|
|
|||||||||||||||||||||||
| Total |
$ | 544 | $ | 123,076 | $ | 123,620 | $ | 627 | $ | 139,896 | $ | 140,523 | ||||||||||||
|
|
|
|||||||||||||||||||||||
Amounts transferred to and from separate accounts are as follows:
| December 31, | ||||||||||||
| 2018 | 2017 | 2016 | ||||||||||
|
|
|
|||||||||||
| (in millions) | ||||||||||||
| Transfers to separate accounts |
$ | 15,071 | $ | 17,679 | $ | 17,163 | ||||||
| Transfers from separate accounts |
22,687 | 26,385 | 22,744 | |||||||||
|
|
|
|||||||||||
| Net transfers to (from) separate accounts |
$ | (7,616 | ) | $ | (8,706 | ) | $ | (5,581 | ) | |||
|
|
|
|||||||||||
F-75
Table of Contents
JOHN HANCOCK LIFE INSURANCE COMPANY (U.S.A.)
NOTES TO STATUTORY-BASIS FINANCIAL STATEMENTS – (CONTINUED)
15. Employee Benefit Plans
Retirement Plans: The Company participates in the John Hancock Pension Plan, a qualified defined benefit plan that covers substantially all of its employees. The Company also participates in the John Hancock Non-Qualified Pension Plan, a nonqualified defined benefit plan for employees whose qualified cash balance benefit is restricted by the Internal Revenue Code. Both plans are sponsored by MIC. The non-qualified defined benefit plan was frozen except for grandfathered participants as of January 1, 2008, and the benefits accrued under this plan continue to be subject to the plan’s provisions.
The Company is jointly and severally liable for the funding requirements of the plans and will recognize its allocation, from MIC, of the required contributions to the plans as pension expense in its Statements of Operations. The allocation is derived by utilizing participant data, provided by the plan actuary, to calculate payments into the trust for the qualified plan and payments to participants for the non-qualified plan. The expense for these plans was $26 million, $34 million, and $30 million in 2018, 2017 and 2016, respectively.
The Company participates in the John Hancock Supplemental Retirement Plan, a non-qualified defined contribution plan maintained by MFC, which was established as of January 1, 2008 with participant directed investment options. The expense for this plan was not material for the years ended 2018, 2017 and 2016, respectively. The prior non-qualified defined contribution plan was frozen except for grandfathered participants as of January 1, 2008, and the benefits accrued under the prior plan continue to be subject to the prior plan provisions.
The Company also maintains a separate rabbi trust for the purpose of holding assets to be used to satisfy its obligations with respect to certain other non-qualified retirement plans of $308 million and $328 million at December 31, 2018 and 2017, respectively. In the event of insolvency of the Company, the rabbi trust assets can be used to satisfy claims of general creditors.
During the year, the Company implemented its North American voluntary early retirement program. The program will result in the voluntary separation of 229 employees in the U.S. by the end of 2019. A curtailment loss of $7 million resulting from the program was recorded by MIC in earnings during the 4th quarter of 2018. This loss represents the change in net defined benefit and retiree welfare liabilities due to employees separating sooner and with different post-retirement benefits than had previously been assumed. The Company will recognize its allocation of the curtailment loss in earnings as payments to participants are made.
401 (k) Plans: The Company participates in qualified defined contribution plans for its employees who meet certain eligibility requirements. These plans include the Investment-Incentive Plan for John Hancock Employees and the John Hancock Savings and Investment Plan. Both plans are sponsored by JHUSA. Expense is primarily comprised of the amounts the Company contributes to the plans, which fully matches eligible participants’ basic pre-tax or Roth contributions, subject to a 4% per participant maximum. The expense for the defined contribution plans was not material for the years ended 2018, 2017 and 2016, respectively.
Deferred Compensation Plan: The Company maintains the Deferred Compensation Plan for Certain Employees of John Hancock, and the Deferred Compensation Plan of the John Hancock Financial Network, both of which are deferred compensation plans sponsored by MFC. These plans are for a select group of management or highly compensated employees and certain qualified agents. The plans are fully funded and accounts are maintained by a third-party administrator. Under these plans, participants have the flexibility and opportunity to invest their plan balances in mutual funds. The liability for these plans at December 31, 2018 and 2017 was $108 million and $112 million, respectively.
Prior to January 1, 2006, the Company offered the Legacy Deferred Compensation Plan for Certain Employees of John Hancock Life Insurance Company (USA), the legacy plan, which is closed to new participation and is unfunded. These are notional accounts and all liabilities have remained with the Company and are paid out of general account assets when a distribution is taken. The liability for this plan was not material as of December 31, 2018 and 2017 respectively.
Postretirement Benefit Plan: The Company participates in the John Hancock Employee Welfare Plan which is sponsored by MIC. Consistent with the pension plan, the Company is jointly and severally liable for the funding requirements of the plan and will recognize its allocation, from MIC, of the benefits earned by plan participants as postretirement benefits expense in its Statements of Operations. The allocation is derived by utilizing participant data, provided by the plan actuary, to calculate the benefits earned; i.e., service cost, relating to participants employed by the Company. In addition, any difference between
F-76
Table of Contents
JOHN HANCOCK LIFE INSURANCE COMPANY (U.S.A.)
NOTES TO STATUTORY-BASIS FINANCIAL STATEMENTS – (CONTINUED)
15. Employee Benefit Plans - (continued)
actual cash paid for benefits to plan participants and benefits earned is recorded directly to unassigned surplus. The expense
and charge to surplus for the John Hancock Employee Welfare Plan were not material for the years ended 2018, 2017 and 2016, respectively.
16. Lines of Credit, Consumer Notes and Affiliated Debt
Lines of Credit: At December 31, 2018, JHUSA and MIC share in a committed line of credit established by MFC totaling $1 billion, which was extended to 2023. MFC will commit, when requested, to loan funds at prevailing interest rates as determined in accordance with the line of credit agreement. Under the terms of the agreement, the Company is required to maintain a certain minimum level of net worth and comply with certain other covenants, as long as any amount is owed to the lender under the agreement. At December 31, 2018, the Company had no outstanding borrowings under the agreement.
The Company had a committed line of credit agreement established by MLI totaling $1 billion. MLI committed, when requested, to loan funds at prevailing interest rates as determined in accordance with the line of credit agreement. Under the terms of the agreement, the Company is required to maintain a certain minimum level of net worth and comply with certain other covenants as long as any amount is owed to the lender under the agreement. The committed line of credit expired on March 18, 2018.
At December 31, 2018, the Company, MFC, and other MFC subsidiaries had a committed line of credit through a group of banks totaling $500 million pursuant to a multi-year facility, which will expire in 2021. The banks will commit, when requested, to loan funds at prevailing interest rates as determined in accordance with the line of credit agreement. Under the terms of the agreement, MFC is required to maintain a certain minimum level of net worth, and MFC and the Company are required to comply with certain other covenants, which were met at December 31, 2018. At December 31, 2018, MFC and its subsidiaries, including the Company, had no outstanding borrowings under the agreement.
At December 31, 2018, the Company had a line of credit agreement established with JHS LLC totaling up to $120 million, which will expire February 15, 2022. Under the agreement, the Company may loan funds, when requested, at prevailing interest rates as determined in accordance with the line of credit agreement. At December 31, 2018, the Company had $115 million outstanding borrowings under the agreement with a fair value of $115 million. This loan replaced a senior note receivable for $30 million issued by JHS LLC during 2016, and additional advances of $25 million on February 15, 2017 and $60 million on May 21, 2018. Interest on the loan is calculated at a fluctuating rate equal to the 360 day-year for the actual number of days elapsed and is payable annually. The combined interest income on the loans was $3 million and $1 million for the year ended December 31, 2018 and 2017.
Effective April 17, 2018, the Company entered into a committed line of credit agreement with John Hancock Funding Company LLC, (“JHFLLC”), a wholly-owned subsidiary of JHS LLC, totaling up to $400 million which will expire April 27, 2023. Under the agreement, the Company may loan funds, when requested, at prevailing interest rates as determined in accordance with the line of credit agreement. Interest on the loan is calculated at a fluctuating rate equal to the 360 day-year for the actual number of days elapsed and is payable quarterly. At December 31, 2018, the Company had no outstanding borrowings under the agreement.
Consumer Notes: The Company issued consumer notes through its SignatureNotes Program. SignatureNotes may be redeemed upon the death of the holder, subject to an annual overall program redemption limitation of 1% of the aggregate securities outstanding, or $1 million, or an individual redemption limitation of $200,000 of aggregate principal. SignatureNotes have a variety of issue dates, maturities, interest rates and call provisions. The notes payable balance as of December 31, 2018 and 2017 was $154 million and $197 million, respectively. Interest ranging from 4.9% to 6.0%. The notes are due in varying amounts to 2032.
Aggregate maturities of consumer notes are as follows: 2019-$16 million; 2020-$0 million; 2021-$0 million; 2022-$13 million; 2023-$33 million; and thereafter $92 million.
Interest expense on consumer notes, included in benefits to policyholders, was $10 million, $11 million, and $12 million in 2018, 2017 and 2016, respectively. Interest paid amounted to $8 million, $11 million, and $11 million in 2018, 2017 and 2016, respectively.
F-77
Table of Contents
JOHN HANCOCK LIFE INSURANCE COMPANY (U.S.A.)
NOTES TO STATUTORY-BASIS FINANCIAL STATEMENTS – (CONTINUED)
16. Lines of Credit, Consumer Notes and Affiliated Debt - (continued)
Affiliated Debt: Pursuant to a demand note receivable dated September 30, 2008, the Company had $295 million outstanding with MIC. The note, which was to have matured on March 31, 2013, was extended to March 31, 2018. This note was reported
as a nonadmitted asset at December 31, 2016 since the counterparty is the parent entity of the Company; however, this note continued to accrue interest throughout the duration of the contract as per the terms of the note. Prior to March 31, 2013, the interest rate was calculated at a fluctuating rate equal to 3-month LIBOR plus 83 basis points per annum. Following the extension, the interest rate was calculated at a fluctuating rate equal to 3-month LIBOR plus 180 basis points per annum. Interest income was $0 million, $7 million, and $7 million for the years ended December 31, 2018, 2017 and 2016, respectively. The demand note receivable was fully repaid on September 30, 2017.
Pursuant to a promissory note dated June 28, 2012, the Company borrowed $153 million from Manulife Finance Switzerland AG (“MFSA”). Interest on the loan was calculated at a fluctuating rate equal to 3-month LIBOR plus 90 basis points per annum and was payable quarterly. In addition, the Company renewed two previously outstanding promissory notes to MFSA with an outstanding balance of $7 million and combined these notes with the new note issued on June 28, 2012, thus bringing the total principal balance due to $160 million. On June 3, 2015, the maturity date was extended for a period of one year to June 28, 2016. Following the extension, the interest rate was amended and was calculated at a fluctuating rate equal to 3-month LIBOR plus 88 basis points per annum and was payable quarterly effective from June 28, 2015. On May 31, 2016, the maturity date was extended for a period of one year to June 28, 2017. Following the extension, the interest rate was amended and was calculated at a fluctuating rate equal to 3-month LIBOR plus 88 basis points per annum and was payable quarterly effective from June 28, 2016. On May 22, 2017, the maturity date was extended for a period of one year to June 28, 2018. Following the extension, the interest rate was amended and was calculated at a fluctuating rate equal to 3-month LIBOR plus 88 basis points per annum and was payable quarterly effective from June 28, 2017. Interest expense was $0 million, $3 million, and $3 million for the years ended December 31, 2018, 2017 and 2016, respectively. The promissory note was fully repaid as of December 31, 2017.
Pursuant to a senior note receivable dated December 9, 2014, the Company had $40 million outstanding with JHS LLC as of December 31, 2016. During 2017, JHS LLC repaid $15 million of the outstanding loan bringing the outstanding principal balance to $25 million with a fair value of $25 million as of December 31, 2017. During 2018, JHS LLC repaid $15 million of the outstanding loan bringing the outstanding principal balance to $10 million with a fair value of $10 million as of December 31, 2018. The note matures on December 9, 2019. Interest on the loan is calculated at a fluctuating rate equal to the 3-month LIBOR rate plus 180 basis points per annum and is payable quarterly. Interest income was $1 million, $1 million, and $1 million for the years ended December 31, 2018, 2017 and 2016, respectively.
FHLB (Federal Home Loan Bank) Agreements: The Company is a member of the Federal Home Loan Bank of Indianapolis (FHLBI). The Company uses advances from the FHLBI as a part of its liquidity management program, and any funds obtained for this purpose would be accounted for as borrowed money.
F-78
Table of Contents
JOHN HANCOCK LIFE INSURANCE COMPANY (U.S.A.)
NOTES TO STATUTORY-BASIS FINANCIAL STATEMENTS – (CONTINUED)
16. Lines of Credit, Consumer Notes and Affiliated Debt - (continued)
The following table indicates the aggregate amount of the FHLBI capital stock held related to the agreement:
| December 31, 2018 | ||||||||||||
| (1) (Col 2 +3) Total |
(2) General |
(3) Separate |
||||||||||
|
|
|
|||||||||||
| (in millions) | ||||||||||||
| (a) Membership stock - Class A |
$ | - | $ | - | $ | - | ||||||
| (b) Membership stock - Class B |
19 | 19 | - | |||||||||
| (c) Activity stock |
- | - | - | |||||||||
| (d) Excess stock |
- | - | - | |||||||||
| (e) Aggregate total |
$ | 19 | $ | 19 | $ | - | ||||||
| (f) Actual or estimated borrowing capacity as determined by the insurer |
$ | 430 | ||||||||||
| December 31, 2017 | ||||||||||||
| (1) (Col 2 +3) Total |
(2) General |
(3) Separate |
||||||||||
|
|
|
|||||||||||
| (in millions) | ||||||||||||
| (a) Membership stock - Class A |
$ | - | $ | - | $ | - | ||||||
| (b) Membership stock - Class B |
19 | 19 | - | |||||||||
| (c) Activity stock |
- | - | - | |||||||||
| (d) Excess stock |
- | - | - | |||||||||
| (e) Aggregate total |
$ | 19 | $ | 19 | $ | - | ||||||
| (f) Actual or estimated borrowing capacity as determined by the insurer |
$ | 421 | ||||||||||
FHLBI membership stock of $0 million and $0 million was classified as not eligible for redemption for the years ended December 31, 2018 and 2017, respectively.
The following table indicates the collateral pledged to the FHLBI at the end of the year:
| December 31, 2018 | ||||||||||||
| Fair Value | Carrying Value |
Aggregate Total Borrowing |
||||||||||
|
|
|
|||||||||||
| (in millions) | ||||||||||||
| (a) General account |
$ | - | $ | - | $ | - | ||||||
| (b) Separate account |
- | - | - | |||||||||
|
|
|
|||||||||||
| (c) Total collateral pledged |
$ | - | $ | - | $ | - | ||||||
|
|
|
|||||||||||
| December 31, 2017 | ||||||||||||
| Fair Value | Carrying Value |
Aggregate Total Borrowing |
||||||||||
|
|
|
|||||||||||
| (in millions) | ||||||||||||
| (a) General account |
$ | - | $ | - | $ | - | ||||||
| (b) Separate account |
- | - | - | |||||||||
|
|
|
|||||||||||
| (c) Total collateral pledged |
$ | - | $ | - | $ | - | ||||||
|
|
|
|||||||||||
The following table indicates the maximum collateral pledged to the FHLBI during the year:
F-79
Table of Contents
JOHN HANCOCK LIFE INSURANCE COMPANY (U.S.A.)
NOTES TO STATUTORY-BASIS FINANCIAL STATEMENTS – (CONTINUED)
16. Lines of Credit, Consumer Notes and Affiliated Debt - (continued)
| December 31, 2018 | ||||||||||||
| Fair Value | Carrying Value |
Amount Borrowed at Time of Maximum Collateral |
||||||||||
|
|
|
|||||||||||
| (in millions) | ||||||||||||
| (a) General account |
$ | - | $ | - | $ | - | ||||||
| (b) Separate account |
- | - | - | |||||||||
|
|
|
|||||||||||
| (c) Total maximum collateral pledged |
$ | - | $ | - | $ | - | ||||||
|
|
|
|||||||||||
| December 31, 2017 | ||||||||||||
| Fair Value | Carrying Value |
Amount Collateral |
||||||||||
|
|
|
|||||||||||
| (in millions) | ||||||||||||
| (a) General account |
$ | 803 | $ | 755 | $ | 400 | ||||||
| (b) Separate account |
- | - | - | |||||||||
|
|
|
|||||||||||
| (c) Total maximum collateral pledged |
$ | 803 | $ | 755 | $ | 400 | ||||||
|
|
|
|||||||||||
The following table represents the aggregate amount of borrowing from FHLBI:
| December 31, 2018 | ||||||||||||||||
| (1) (Col 2 +3) Total |
(2) General |
(3) Separate |
(4) Funding |
|||||||||||||
|
|
|
|||||||||||||||
| (in millions) | ||||||||||||||||
| (a) Debt |
$ | - | $ | - | $ | - | $ | - | ||||||||
| (b) Funding agreements |
- | - | - | - | ||||||||||||
| (c) Other |
- | - | - | - | ||||||||||||
| (d) Aggregate total |
$ | - | $ | - | $ | - | $ | - | ||||||||
| December 31, 2017 | ||||||||||||||||
| (1) (Col 2 +3) Total |
(2) General |
(3) Separate |
(4) Funding |
|||||||||||||
|
|
|
|||||||||||||||
| (in millions) | ||||||||||||||||
| (a) Debt |
$ | - | $ | - | $ | - | $ | - | ||||||||
| (b) Funding agreements |
- | - | - | - | ||||||||||||
| (c) Other |
- | - | - | - | ||||||||||||
| (d) Aggregate total |
$ | - | $ | - | $ | - | $ | - | ||||||||
The maximum amount of aggregate borrowings from FHLBI during 2018 was $0 million. The Company is not subject to any prepayment obligations under current borrowing agreements.
17. Closed Block
The Company operates a closed block for the benefit of certain classes of individual or joint traditional participating whole life insurance policies. The JHUSA closed block was established upon the demutualization of MLI for those designated participating policies that were in-force on September 23, 1999.
F-80
Table of Contents
JOHN HANCOCK LIFE INSURANCE COMPANY (U.S.A.)
NOTES TO STATUTORY-BASIS FINANCIAL STATEMENTS – (CONTINUED)
17. Closed Block - (continued)
Assets were allocated to the closed block in an amount that, together with anticipated revenues from policies included in the closed block, was reasonably expected to be sufficient to support such business, including provision for payment of benefits, direct asset acquisition and disposition costs, taxes, and for continuation of dividend scales, assuming experience underlying such dividend scales continues.
Assets allocated to the closed block inure solely to the benefit of policyholders included in the closed block and will not revert to the benefit of the shareholders of the Company. In addition, if the assets allocated to the closed block and the revenues from the closed block business prove to be insufficient to pay the benefits guaranteed in the closed block, the Company will be required to make payments from its general funds in an amount equal to the shortfall.
If, over time, the aggregate performance of the assets and policies of a closed block is better than was assumed in funding that closed block, dividends to policyholders for that closed block will be increased. If, over time, the aggregate performance of the assets and policies of a closed block is less favorable than was assumed in funding that closed block, dividends to policyholders for that closed block will be reduced.
No reallocation, transfer, borrowing, or lending of assets can be made between the closed block and other portions of the Company’s general account, any of its separate accounts, or any affiliate of the Company without prior notification to or approval of the Insurance Department.
The excess of the closed block liabilities over the closed block assets represents the expected future post-tax contribution from the closed block which may be recognized in income over the period the policies and contracts in the closed block remain in force.
The following table sets forth certain summarized financial information relating to the JHUSA closed block.
| JHUSA | ||||||||
| 2018 | 2017 | |||||||
|
|
|
|||||||
| (in millions) | ||||||||
| Assets: |
||||||||
| Bonds |
$ | 2,222 | $ | 2,744 | ||||
| Stocks: |
||||||||
| Preferred stocks |
- | - | ||||||
| Common stocks |
- | - | ||||||
| Mortgage loans on real estate |
327 | 247 | ||||||
| Real estate |
661 | 704 | ||||||
| Cash, cash equivalents and short-term investments |
332 | 4 | ||||||
| Policy loans |
1,734 | 1,694 | ||||||
| Other invested assets |
407 | 248 | ||||||
|
|
|
|||||||
| Total cash and invested assets |
5,683 | 5,641 | ||||||
| Investment income due and accrued |
110 | 102 | ||||||
| Premiums due |
4 | 5 | ||||||
| Net deferred tax asset |
32 | 73 | ||||||
| Other closed block assets |
372 | 46 | ||||||
|
|
|
|||||||
| Total closed block assets |
$ | 6,201 | $ | 5,867 | ||||
|
|
|
|||||||
| Obligations: |
||||||||
| Policy reserves |
5,407 | 5,515 | ||||||
| Policyholders’ and beneficiaries’ funds |
58 | 60 | ||||||
| Dividends payable to policyholders |
304 | 322 | ||||||
| Policy benefits in process of payment |
61 | 71 | ||||||
| Other policy obligations |
6 | 1 | ||||||
| Other closed block obligations |
663 | 500 | ||||||
|
|
|
|||||||
| Total closed block obligations |
$ | 6,499 | $ | 6,469 | ||||
|
|
|
|||||||
F-81
Table of Contents
JOHN HANCOCK LIFE INSURANCE COMPANY (U.S.A.)
NOTES TO STATUTORY-BASIS FINANCIAL STATEMENTS – (CONTINUED)
18. Subsequent Events
The Company evaluated the recognition and disclosure of subsequent events for its December 31, 2018 financial statements through April 3, 2019, the date the financial statements were issued.
The Company has a number of reinsurance agreements with Scottish Re (U.S.), Inc. (“SRUS”). On March 6, 2019, SRUS was declared impaired and placed into rehabilitation by the Delaware Chancery Court with the anticipation that a Plan of Rehabilitation that addresses and removes the causes of SRUS’s impairment be submitted to the Receiver and the Court for approval. In the event a Plan of Rehabilitation is not submitted and approved, the rehabilitation proceedings could convert into liquidation proceedings. As of December 31, 2018, the Company recorded a reserve credit and a reinsurance receivable of approximately $209 million and $33 million, respectively, related to the various agreements with SRUS.
F-82
Table of Contents
AUDITED FINANCIAL STATEMENTS
John Hancock Life Insurance Company (U.S.A.) Separate Account N
December 31, 2018
Table of Contents
John Hancock Life Insurance Company (U.S.A.) Separate Account N
Audited Financial Statements
December 31, 2018
Contents
| 3 | ||||
| 6 | ||||
| Statements of Operations and Changes in Contract Owners’ Equity |
22 | |||
| 54 |
Table of Contents
REPORT OF INDEPENDENT REGISTERED PUBLIC ACCOUNTING FIRM
To the Board of Directors of John Hancock Life Insurance Company (U.S.A.) and Contract Owners of
John Hancock Life Insurance Company (U.S.A.) Separate Account N
Opinion on the Financial Statements
We have audited the accompanying statements of assets and liabilities of each of the subaccounts listed in the Appendix that comprise John Hancock Life Insurance Company (U.S.A.) Separate Account N (the “Separate Account”), as of December 31, 2018, and the related statements of operations and changes in contract owners’ equity for the two years then ended, and the related notes (collectively referred to as the “financial statements”). In our opinion, the financial statements present fairly, in all material respects, the financial position of each subaccount as of December 31, 2018 and the results of its operations and changes in contract owners’ equity for the two years then ended, in conformity with U.S. generally accepted accounting principles.
Basis for Opinion
These financial statements are the responsibility of the Separate Account’s management. Our responsibility is to express an opinion on each of the subaccounts’ financial statements based on our audits. We are a public accounting firm registered with the Public Company Accounting Oversight Board (United States) (“PCAOB”) and are required to be independent with respect to the Separate Account in accordance with the U.S. federal securities laws and the applicable rules and regulations of the Securities and Exchange Commission and the PCAOB.
We conducted our audits in accordance with the standards of the PCAOB. Those standards require that we plan and perform the audits to obtain reasonable assurance about whether the financial statements are free of material misstatement, whether due to error or fraud. Our audits included performing procedures to assess the risks of material misstatement of the financial statements, whether due to error or fraud, and performing procedures that respond to those risks. Such procedures included examining, on a test basis, evidence regarding the amounts and disclosures in the financial statements. Our procedures included confirmation of securities owned as of December 31, 2018, by correspondence with the fund companies, or their transfer agents, as applicable. Our audits also included evaluating the accounting principles used and significant estimates made by management, as well as evaluating the overall presentation of the financial statements. We believe that our audits provide a reasonable basis for our opinion.

We have served as the auditor of the Separate Account since 1987.
Boston, Massachusetts
April 3, 2019
3
Table of Contents
Appendix
Subaccounts comprising John Hancock Life
Insurance Company (U.S.A.) Separate Account N
|
500 Index Fund Series NAV |
M Large Cap Growth | |
| Active Bond Trust Series I |
||
| Active Bond Trust Series NAV |
Managed Volatility Aggressive Portfolio Series I | |
| American Asset Allocation Trust Series I |
Managed Volatility Aggressive Portfolio Series NAV | |
| American Global Growth Trust Series I |
Managed Volatility Balanced Portfolio Series I | |
| American Growth Trust Series I |
Managed Volatility Balanced Portfolio Series NAV | |
| American Growth-Income Trust Series I |
Managed Volatility Conservative Portfolio Series I | |
| American International Trust Series I |
Managed Volatility Conservative Portfolio Series NAV | |
| Blue Chip Growth Trust Series I |
Managed Volatility Growth Portfolio Series I | |
| Blue Chip Growth Trust Series NAV |
Managed Volatility Growth Portfolio Series NAV | |
| Capital Appreciation Trust Series I |
Managed Volatility Moderate Portfolio Series I | |
| Capital Appreciation Trust Series NAV |
Managed Volatility Moderate Portfolio Series NAV | |
| Capital Appreciation Value Trust Series I |
Mid Cap Index Trust Series I | |
| Capital Appreciation Value Trust Series NAV |
Mid Cap Index Trust Series NAV | |
| Core Bond Trust Series I |
Mid Cap Stock Trust Series I | |
| Core Bond Trust Series NAV |
Mid Cap Stock Trust Series NAV | |
| Emerging Markets Value Trust Series I |
Mid Value Trust Series I | |
| Emerging Markets Value Trust Series NAV |
Mid Value Trust Series NAV | |
| Equity Income Trust Series I |
Money Market Trust Series I | |
| Equity Income Trust Series NAV |
Money-Market Trust Series NAV | |
| Financial Industries Trust Series I |
PIMCO All Asset | |
| Financial Industries Trust Series NAV |
Real Estate Securities Trust Series I | |
| Fundamental All Cap Core Trust Series I |
Real Estate Securities Trust Series NAV | |
| Fundamental All Cap Core Trust Series NAV |
Science & Technology Trust Series I | |
| Fundamental Large Cap Value Trust Series I |
Science & Technology Trust Series NAV | |
| Fundamental Large Cap Value Trust Series NAV |
Select Bond Trust Series I | |
| Global Bond Trust Series I |
Select Bond Trust Series NAV | |
| Global Bond Trust Series NAV |
Short Term Government Income Trust Series I | |
| Global Trust Series I |
Short Term Government Income Trust Series NAV | |
| Global Trust Series NAV |
Small Cap Index Trust Series I | |
| Health Sciences Trust Series I |
Small Cap Index Trust Series NAV | |
| Health Sciences Trust Series NAV |
Small Cap Opportunities Trust Series I | |
| High Yield Trust Series I |
Small Cap Opportunities Trust Series NAV | |
| High Yield Trust Series NAV |
Small Cap Stock Trust Series I | |
| International Equity Index Series I |
Small Cap Stock Trust Series NAV | |
| International Equity Index Series NAV |
Small Cap Value Trust Series I | |
| International Growth Stock Trust Series I |
Small Cap Value Trust Series NAV | |
| International Growth Stock Trust Series NAV |
Small Company Value Trust Series I | |
| International Small Company Trust Series I |
Small Company Value Trust Series NAV | |
| International Small Company Trust Series NAV
|
Strategic Income Opportunities Trust Series I
|
4
Table of Contents
Subaccounts comprising John Hancock Life
Insurance Company (U.S.A.) Separate Account N
|
International Value Trust Series I |
Strategic Income Opportunities Trust Series NAV | |
| International Value Trust Series NAV |
Total Bond Market Series Trust NAV | |
| Investment Quality Bond Trust Series I |
Total Stock Market Index Trust Series I | |
| Investment Quality Bond Trust Series NAV |
Total Stock Market Index Trust Series NAV | |
| Lifestyle Balanced Portfolio Series NAV |
Ultra Short Term Bond Trust Series I | |
| Lifestyle Growth Portfolio Series I |
Ultra Short Term Bond Trust Series NAV | |
| Lifestyle Growth Portfolio Series NAV |
Utilities Trust Series I | |
| M Capital Appreciation
|
Utilities Trust Series NAV
|
5
Table of Contents
JOHN HANCOCK LIFE INSURANCE COMPANY (U.S.A.) SEPARATE ACCOUNT N
STATEMENTS OF ASSETS AND LIABILITIES
December 31, 2018
| 500 Index Fund Series NAV |
Active Bond Trust Series I |
Active Bond Trust Series NAV |
American Asset Allocation Trust Series I |
American Global Growth Trust Series I |
American Growth Trust Series I |
|||||||||||||||||||
| Total Assets |
||||||||||||||||||||||||
| Investments at fair value |
$ | 77,745,432 | $ | 675,151 | $ | 1,356,670 | $ | 10,660,598 | $ | 727,984 | $ | 12,294,236 | ||||||||||||
|
|
|
|
|
|
|
|
|
|
|
|
|
|||||||||||||
| Units outstanding |
1,733,291 | 30,449 | 17,492 | 604,317 | 39,140 | 380,816 | ||||||||||||||||||
| Unit value |
$ | 44.85 | $ | 22.17 | $ | 77.56 | $ | 17.64 | $ | 18.60 | $ | 32.28 | ||||||||||||
| Shares |
2,608,907 | 73,306 | 147,144 | 900,388 | 53,215 | 742,854 | ||||||||||||||||||
| Cost |
$ | 73,009,276 | $ | 710,765 | $ | 1,411,055 | $ | 11,718,233 | $ | 851,324 | $ | 14,509,362 | ||||||||||||
See accompanying notes.
6
Table of Contents
JOHN HANCOCK LIFE INSURANCE COMPANY (U.S.A.) SEPARATE ACCOUNT N
STATEMENTS OF ASSETS AND LIABILITIES
December 31, 2018
| American Growth-Income Trust Series I |
American International Trust Series I |
Blue Chip Growth Trust Series I |
Blue Chip Growth Trust Series NAV |
Capital Appreciation Trust Series I |
Capital Appreciation Trust Series NAV |
|||||||||||||||||||
| Total Assets |
||||||||||||||||||||||||
| Investments at fair value |
$ | 9,361,341 | $ | 6,117,851 | $ | 9,433,755 | $ | 60,593,751 | $ | 7,388,114 | $ | 2,100,347 | ||||||||||||
|
|
|
|
|
|
|
|
|
|
|
|
|
|||||||||||||
| Units outstanding |
279,840 | 268,373 | 137,342 | 317,840 | 213,043 | 57,726 | ||||||||||||||||||
| Unit value |
$ | 33.45 | $ | 22.80 | $ | 68.69 | $ | 190.64 | $ | 34.68 | $ | 36.38 | ||||||||||||
| Shares |
622,844 | 346,228 | 304,708 | 1,956,531 | 611,093 | 173,439 | ||||||||||||||||||
| Cost |
$ | 10,478,342 | $ | 7,057,468 | $ | 9,575,792 | $ | 71,156,648 | $ | 8,380,168 | $ | 2,298,585 | ||||||||||||
See accompanying notes.
7
Table of Contents
JOHN HANCOCK LIFE INSURANCE COMPANY (U.S.A.) SEPARATE ACCOUNT N
STATEMENTS OF ASSETS AND LIABILITIES
December 31, 2018
| Capital Appreciation Value Trust Series I |
Capital Appreciation Value Trust Series NAV |
Core Bond Trust Series I |
Core Bond Trust Series NAV |
Emerging Markets Value Trust Series I |
Emerging Markets Value Trust Series NAV |
|||||||||||||||||||
| Total Assets |
||||||||||||||||||||||||
| Investments at fair value |
$ | 1,051,215 | $ | 2,416,048 | $ | 7,854,654 | $ | 27,181,865 | $ | 1,904,461 | $ | 3,758,913 | ||||||||||||
|
|
|
|
|
|
|
|
|
|
|
|
|
|||||||||||||
| Units outstanding |
47,729 | 104,608 | 382,086 | 1,575,653 | 126,708 | 302,479 | ||||||||||||||||||
| Unit value |
$ | 22.02 | $ | 23.10 | $ | 20.56 | $ | 17.25 | $ | 15.03 | $ | 12.43 | ||||||||||||
| Shares |
96,265 | 221,859 | 619,452 | 2,153,872 | 213,266 | 421,403 | ||||||||||||||||||
| Cost |
$ | 1,142,022 | $ | 2,590,758 | $ | 8,156,537 | $ | 28,375,006 | $ | 2,190,380 | $ | 4,079,110 | ||||||||||||
See accompanying notes.
8
Table of Contents
JOHN HANCOCK LIFE INSURANCE COMPANY (U.S.A.) SEPARATE ACCOUNT N
STATEMENTS OF ASSETS AND LIABILITIES
December 31, 2018
| Equity Income Trust Series I |
Equity Income Trust Series NAV |
Financial Industries Trust Series I |
Financial Industries Trust Series NAV |
Fundamental All Cap Core Trust Series I |
Fundamental All Cap Core Trust Series NAV |
|||||||||||||||||||
| Total Assets |
||||||||||||||||||||||||
| Investments at fair value |
$ | 6,780,184 | $ | 38,345,877 | $ | 611,881 | $ | 346,689 | $ | 192,735 | $ | 2,369,825 | ||||||||||||
|
|
|
|
|
|
|
|
|
|
|
|
|
|||||||||||||
| Units outstanding |
141,225 | 714,628 | 24,878 | 10,602 | 4,466 | 87,406 | ||||||||||||||||||
| Unit value |
$ | 48.01 | $ | 53.66 | $ | 24.60 | $ | 32.70 | $ | 43.16 | $ | 27.11 | ||||||||||||
| Shares |
496,717 | 2,823,702 | 51,419 | 29,183 | 9,813 | 120,052 | ||||||||||||||||||
| Cost |
$ | 8,354,628 | $ | 48,210,461 | $ | 715,885 | $ | 406,086 | $ | 225,965 | $ | 2,751,675 | ||||||||||||
See accompanying notes.
9
Table of Contents
JOHN HANCOCK LIFE INSURANCE COMPANY (U.S.A.) SEPARATE ACCOUNT N
STATEMENTS OF ASSETS AND LIABILITIES
December 31, 2018
| Fundamental Large Cap Value Trust Series I |
Fundamental Large Cap Value Trust Series NAV |
Global Bond Trust Series I |
Global Bond Trust Series NAV |
Global Trust Series I |
Global Trust Series NAV |
|||||||||||||||||||
| Total Assets |
||||||||||||||||||||||||
| Investments at fair value |
$ | 2,841,607 | $ | 6,469,451 | $ | 1,065,007 | $ | 9,226,750 | $ | 1,514,984 | $ | 2,357,563 | ||||||||||||
|
|
|
|
|
|
|
|
|
|
|
|
|
|||||||||||||
| Units outstanding |
100,819 | 304,694 | 36,145 | 281,707 | 52,210 | 130,924 | ||||||||||||||||||
| Unit value |
$ | 28.19 | $ | 21.23 | $ | 29.46 | $ | 32.75 | $ | 29.02 | $ | 18.01 | ||||||||||||
| Shares |
162,285 | 369,472 | 86,305 | 750,142 | 82,471 | 128,478 | ||||||||||||||||||
| Cost |
$ | 2,871,981 | $ | 6,644,464 | $ | 1,082,386 | $ | 9,506,139 | $ | 1,709,159 | $ | 2,539,265 | ||||||||||||
See accompanying notes.
10
Table of Contents
JOHN HANCOCK LIFE INSURANCE COMPANY (U.S.A.) SEPARATE ACCOUNT N
STATEMENTS OF ASSETS AND LIABILITIES
December 31, 2018
| Health Sciences Trust Series I |
Health Sciences Trust Series NAV |
High Yield Trust Series I |
High Yield Trust Series NAV |
International Equity Index Series I |
International Equity Index Series NAV |
|||||||||||||||||||
| Total Assets |
||||||||||||||||||||||||
| Investments at fair value |
$ | 5,103,601 | $ | 5,691,173 | $ | 2,522,828 | $ | 2,011,077 | $ | 7,382,903 | $ | 15,197,146 | ||||||||||||
|
|
|
|
|
|
|
|
|
|
|
|
|
|||||||||||||
| Units outstanding |
61,069 | 81,539 | 78,312 | 85,515 | 607,637 | 310,723 | ||||||||||||||||||
| Unit value |
$ | 83.57 | $ | 69.80 | $ | 32.22 | $ | 23.52 | $ | 12.15 | $ | 48.91 | ||||||||||||
| Shares |
223,157 | 244,992 | 520,171 | 421,609 | 478,167 | 984,909 | ||||||||||||||||||
| Cost |
$ | 6,110,940 | $ | 6,222,623 | $ | 2,788,558 | $ | 2,138,007 | $ | 7,476,177 | $ | 16,360,793 | ||||||||||||
See accompanying notes.
11
Table of Contents
JOHN HANCOCK LIFE INSURANCE COMPANY (U.S.A.) SEPARATE ACCOUNT N
STATEMENTS OF ASSETS AND LIABILITIES
December 31, 2018
| International Growth Stock Trust Series I |
International Growth Stock Trust Series NAV |
International Small Company Trust Series I |
International Small Company Trust Series NAV |
International Value Trust Series I |
International Value Trust Series NAV |
|||||||||||||||||||
| Total Assets |
||||||||||||||||||||||||
| Investments at fair value |
$ | 918,798 | $ | 9,222,960 | $ | 435,351 | $ | 1,216,040 | $ | 4,299,242 | $ | 5,191,538 | ||||||||||||
|
|
|
|
|
|
|
|
|
|
|
|
|
|||||||||||||
| Units outstanding |
74,542 | 736,222 | 28,135 | 73,902 | 187,925 | 325,673 | ||||||||||||||||||
| Unit value |
$ | 12.33 | $ | 12.53 | $ | 15.47 | $ | 16.45 | $ | 22.88 | $ | 15.94 | ||||||||||||
| Shares |
60,727 | 609,581 | 34,689 | 96,818 | 363,112 | 441,833 | ||||||||||||||||||
| Cost |
$ | 1,016,337 | $ | 10,554,041 | $ | 484,545 | $ | 1,338,155 | $ | 4,590,952 | $ | 5,577,263 | ||||||||||||
See accompanying notes.
12
Table of Contents
JOHN HANCOCK LIFE INSURANCE COMPANY (U.S.A.) SEPARATE ACCOUNT N
STATEMENTS OF ASSETS AND LIABILITIES
December 31, 2018
| Investment Quality Bond Trust Series I |
Investment Quality Bond Trust Series NAV |
Lifestyle Balanced Portfolio Series NAV |
Lifestyle Growth Portfolio Series I |
Lifestyle Growth Portfolio Series NAV |
M Capital Appreciation |
|||||||||||||||||||
| Total Assets |
||||||||||||||||||||||||
| Investments at fair value |
$ | 4,278,827 | $ | 727,413 | $ | 6,777 | $ | 107,518 | $ | 2,501,052 | $ | 266,230 | ||||||||||||
|
|
|
|
|
|
|
|
|
|
|
|
|
|||||||||||||
| Units outstanding |
129,783 | 42,284 | 554 | 9,806 | 197,788 | 2,708 | ||||||||||||||||||
| Unit value |
$ | 32.97 | $ | 17.20 | $ | 12.23 | $ | 10.96 | $ | 12.65 | $ | 98.31 | ||||||||||||
| Shares |
400,640 | 68,302 | 493 | 7,235 | 168,421 | 12,594 | ||||||||||||||||||
| Cost |
$ | 4,541,427 | $ | 755,867 | $ | 7,186 | $ | 117,663 | $ | 2,736,347 | $ | 365,139 | ||||||||||||
See accompanying notes.
13
Table of Contents
JOHN HANCOCK LIFE INSURANCE COMPANY (U.S.A.) SEPARATE ACCOUNT N
STATEMENTS OF ASSETS AND LIABILITIES
December 31, 2018
| M Large Cap Growth |
Managed Volatility Aggressive Portfolio Series I |
Managed Volatility Aggressive Portfolio Series NAV |
Managed Volatility Balanced Portfolio Series I |
Managed Volatility Balanced Portfolio Series NAV |
Managed Volatility Conservative Portfolio Series I |
|||||||||||||||||||
| Total Assets |
||||||||||||||||||||||||
| Investments at fair value |
$ | 9 | $ | 1,163,145 | $ | 4,346,674 | $ | 3,320,519 | $ | 15,599,695 | $ | 1,248,540 | ||||||||||||
|
|
|
|
|
|
|
|
|
|
|
|
|
|||||||||||||
| Units outstanding |
— | 39,564 | 215,205 | 97,349 | 796,399 | 37,037 | ||||||||||||||||||
| Unit value |
$ | 0.00 | $ | 29.40 | $ | 20.20 | $ | 34.11 | $ | 19.59 | $ | 33.71 | ||||||||||||
| Shares |
— | 116,664 | 435,539 | 295,683 | 1,385,408 | 117,676 | ||||||||||||||||||
| Cost |
$ | 11 | $ | 1,203,392 | $ | 4,610,627 | $ | 3,727,143 | $ | 18,005,868 | $ | 1,337,078 | ||||||||||||
See accompanying notes.
14
Table of Contents
JOHN HANCOCK LIFE INSURANCE COMPANY (U.S.A.) SEPARATE ACCOUNT N
STATEMENTS OF ASSETS AND LIABILITIES
December 31, 2018
| Managed Volatility Conservative Portfolio Series NAV |
Managed Volatility Growth Portfolio Series I |
Managed Volatility Growth Portfolio Series NAV |
Managed Volatility Moderate Portfolio Series I |
Managed Volatility Moderate Portfolio Series NAV |
Mid Cap Index Trust Series I |
|||||||||||||||||||
| Total Assets |
||||||||||||||||||||||||
| Investments at fair value |
$ | 5,693,587 | $ | 2,776,648 | $ | 20,003,515 | $ | 2,090,781 | $ | 6,363,505 | $ | 7,927,350 | ||||||||||||
|
|
|
|
|
|
|
|
|
|
|
|
|
|||||||||||||
| Units outstanding |
314,017 | 85,836 | 1,014,085 | 58,445 | 327,981 | 171,433 | ||||||||||||||||||
| Unit value |
$ | 18.13 | $ | 32.35 | $ | 19.73 | $ | 35.77 | $ | 19.40 | $ | 46.24 | ||||||||||||
| Shares |
535,615 | 227,594 | 1,638,290 | 192,877 | 586,498 | 420,996 | ||||||||||||||||||
| Cost |
$ | 6,111,498 | $ | 3,082,809 | $ | 22,634,627 | $ | 2,363,256 | $ | 7,345,107 | $ | 9,079,230 | ||||||||||||
See accompanying notes.
15
Table of Contents
JOHN HANCOCK LIFE INSURANCE COMPANY (U.S.A.) SEPARATE ACCOUNT N
STATEMENTS OF ASSETS AND LIABILITIES
December 31, 2018
| Mid Cap Index Trust Series NAV |
Mid Cap Stock Trust Series I |
Mid Cap Stock Trust Series NAV |
Mid Value Trust Series I |
Mid Value Trust Series NAV |
Money Market Trust Series I |
|||||||||||||||||||
| Total Assets |
||||||||||||||||||||||||
| Investments at fair value |
$ | 12,527,176 | $ | 3,611,075 | $ | 6,197,924 | $ | 2,991,029 | $ | 8,720,369 | $ | 18,871,731 | ||||||||||||
|
|
|
|
|
|
|
|
|
|
|
|
|
|||||||||||||
| Units outstanding |
377,811 | 87,718 | 64,035 | 99,663 | 183,104 | 904,658 | ||||||||||||||||||
| Unit value |
$ | 33.16 | $ | 41.17 | $ | 96.79 | $ | 30.01 | $ | 47.63 | $ | 20.86 | ||||||||||||
| Shares |
665,631 | 228,694 | 387,370 | 315,842 | 925,729 | 18,871,731 | ||||||||||||||||||
| Cost |
$ | 14,416,373 | $ | 3,569,593 | $ | 7,046,831 | $ | 3,577,473 | $ | 10,416,227 | $ | 18,871,731 | ||||||||||||
See accompanying notes.
16
Table of Contents
JOHN HANCOCK LIFE INSURANCE COMPANY (U.S.A.) SEPARATE ACCOUNT N
STATEMENTS OF ASSETS AND LIABILITIES
December 31, 2018
| Money-Market Trust Series NAV |
PIMCO All Asset | Real Estate Securities Trust Series I |
Real Estate Securities Trust Series NAV |
Science & Technology Trust Series I |
Science & Technology Trust Series NAV |
|||||||||||||||||||
| Total Assets |
||||||||||||||||||||||||
| Investments at fair value |
$ | 64,149,392 | $ | 4,941,941 | $ | 7,802,619 | $ | 11,529,146 | $ | 7,891,672 | $ | 7,253,706 | ||||||||||||
|
|
|
|
|
|
|
|
|
|
|
|
|
|||||||||||||
| Units outstanding |
6,269,924 | 266,790 | 44,393 | 73,556 | 160,836 | 166,136 | ||||||||||||||||||
| Unit value |
$ | 10.23 | $ | 18.52 | $ | 175.76 | $ | 156.74 | $ | 49.07 | $ | 43.66 | ||||||||||||
| Shares |
64,149,392 | 488,334 | 416,807 | 619,513 | 305,879 | 277,920 | ||||||||||||||||||
| Cost |
$ | 64,149,392 | $ | 5,162,143 | $ | 5,667,123 | $ | 11,760,630 | $ | 7,668,410 | $ | 8,658,903 | ||||||||||||
See accompanying notes.
17
Table of Contents
JOHN HANCOCK LIFE INSURANCE COMPANY (U.S.A.) SEPARATE ACCOUNT N
STATEMENTS OF ASSETS AND LIABILITIES
December 31, 2018
| Select Bond Trust Series I (a) |
Select Bond Trust Series NAV (b) |
Short Term Government Income Trust Series I |
Short Term Government Income Trust Series NAV |
Small Cap Index Trust Series I |
Small Cap Index Trust Series NAV |
|||||||||||||||||||
| Total Assets |
||||||||||||||||||||||||
| Investments at fair value |
$ | 6,213,553 | $ | 1,187,865 | $ | 1,589,481 | $ | 5,322,712 | $ | 5,473,398 | $ | 8,878,011 | ||||||||||||
|
|
|
|
|
|
|
|
|
|
|
|
|
|||||||||||||
| Units outstanding |
537,193 | 99,532 | 152,384 | 485,904 | 155,055 | 291,837 | ||||||||||||||||||
| Unit value |
$ | 11.57 | $ | 11.93 | $ | 10.43 | $ | 10.95 | $ | 35.30 | $ | 30.42 | ||||||||||||
| Shares |
478,334 | 91,515 | 133,907 | 448,417 | 409,685 | 663,529 | ||||||||||||||||||
| Cost |
$ | 6,534,996 | $ | 1,230,862 | $ | 1,641,147 | $ | 5,375,254 | $ | 6,080,231 | $ | 10,693,521 | ||||||||||||
| (a) | Renamed on April 30, 2018. Previously known as Bond Trust Series I. |
| (b) | Renamed on April 30, 2018. Previously known as Bond Trust Series NAV. |
See accompanying notes.
18
Table of Contents
JOHN HANCOCK LIFE INSURANCE COMPANY (U.S.A.) SEPARATE ACCOUNT N
STATEMENTS OF ASSETS AND LIABILITIES
December 31, 2018
| Small Cap Opportunities Trust Series I |
Small Cap Opportunities Trust Series NAV |
Small Cap Stock Trust Series I (c) |
Small Cap Stock Trust Series NAV (d) |
Small Cap Value Trust Series I |
Small Cap Value Trust Series NAV |
|||||||||||||||||||
| Total Assets |
||||||||||||||||||||||||
| Investments at fair value |
$ | 11,455,762 | $ | 330,876 | $ | 1,176,018 | $ | 1,742,293 | $ | 635,814 | $ | 6,365,599 | ||||||||||||
|
|
|
|
|
|
|
|
|
|
|
|
|
|||||||||||||
| Units outstanding |
294,387 | 15,670 | 40,024 | 47,456 | 24,550 | 83,621 | ||||||||||||||||||
| Unit value |
$ | 38.91 | $ | 21.12 | $ | 29.38 | $ | 36.71 | $ | 25.90 | $ | 76.12 | ||||||||||||
| Shares |
512,104 | 14,884 | 129,517 | 189,586 | 40,757 | 409,627 | ||||||||||||||||||
| Cost |
$ | 15,056,119 | $ | 437,812 | $ | 1,233,001 | $ | 1,918,418 | $ | 837,326 | $ | 8,055,820 | ||||||||||||
| (c) | Renamed on April 30, 2018. Previously known as Small Cap Growth Trust Series I. |
| (d) | Renamed on April 30, 2018. Previously known as Small Cap Growth Trust Series NAV. |
See accompanying notes.
19
Table of Contents
JOHN HANCOCK LIFE INSURANCE COMPANY (U.S.A.) SEPARATE ACCOUNT N
STATEMENTS OF ASSETS AND LIABILITIES
December 31, 2018
| Small Company Value Trust Series I |
Small Company Value Trust Series NAV |
Strategic Income Opportunities Trust Series I |
Strategic Income Opportunities Trust Series NAV |
Total Bond Market Series Trust NAV |
Total Stock Market Index Trust Series I |
|||||||||||||||||||
| Total Assets |
||||||||||||||||||||||||
| Investments at fair value |
$ | 2,145,775 | $ | 1,061,586 | $ | 2,315,714 | $ | 4,978,390 | $ | 19,993,099 | $ | 6,265,365 | ||||||||||||
|
|
|
|
|
|
|
|
|
|
|
|
|
|||||||||||||
| Units outstanding |
55,895 | 38,304 | 87,920 | 243,138 | 798,955 | 219,468 | ||||||||||||||||||
| Unit value |
$ | 38.39 | $ | 27.71 | $ | 26.34 | $ | 20.48 | $ | 25.02 | $ | 28.55 | ||||||||||||
| Shares |
129,108 | 64,067 | 184,814 | 398,590 | 2,038,033 | 309,860 | ||||||||||||||||||
| Cost |
$ | 2,610,263 | $ | 1,310,849 | $ | 2,499,260 | $ | 5,364,988 | $ | 20,222,896 | $ | 6,008,566 | ||||||||||||
See accompanying notes.
20
Table of Contents
JOHN HANCOCK LIFE INSURANCE COMPANY (U.S.A.) SEPARATE ACCOUNT N
STATEMENTS OF ASSETS AND LIABILITIES
December 31, 2018
| Total Stock Market Index Trust Series NAV |
Ultra Short Term Bond Trust Series I |
Ultra Short Term Bond Trust Series NAV |
Utilities Trust Series I |
Utilities Trust Series NAV |
||||||||||||||||
| Total Assets |
||||||||||||||||||||
| Investments at fair value |
$ | 5,908,847 | $ | 2,708 | $ | 697,628 | $ | 894,138 | $ | 1,920,736 | ||||||||||
|
|
|
|
|
|
|
|
|
|
|
|||||||||||
| Units outstanding |
58,253 | 274 | 67,356 | 23,514 | 58,414 | |||||||||||||||
| Unit value |
$ | 101.43 | $ | 9.88 | $ | 10.36 | $ | 38.03 | $ | 32.88 | ||||||||||
| Shares |
292,372 | 238 | 61,303 | 64,887 | 139,588 | |||||||||||||||
| Cost |
$ | 6,550,065 | $ | 2,832 | $ | 707,743 | $ | 886,032 | $ | 1,913,635 | ||||||||||
See accompanying notes.
21
Table of Contents
JOHN HANCOCK LIFE INSURANCE COMPANY (U.S.A.) SEPARATE ACCOUNT N
STATEMENTS OF OPERATIONS AND CHANGES IN CONTRACT OWNERS’ EQUITY
For the years ended December 31,
| 500 Index Fund Series NAV | Active Bond Trust Series I | Active Bond Trust Series NAV | ||||||||||||||||||||||
| 2018 | 2017 | 2018 | 2017 | 2018 | 2017 | |||||||||||||||||||
| Income: |
||||||||||||||||||||||||
| Dividend distributions received |
$ | 1,257,614 | $ | 1,504,042 | $ | 22,112 | $ | 26,383 | $ | 42,287 | $ | 35,330 | ||||||||||||
| Expenses: |
||||||||||||||||||||||||
| Mortality and expense risk and administrative charges |
(127,970 | ) | (119,621 | ) | (3,508 | ) | (3,543 | ) | — | — | ||||||||||||||
|
|
|
|
|
|
|
|
|
|
|
|
|
|||||||||||||
| Net investment income (loss) |
1,129,644 | 1,384,421 | 18,604 | 22,840 | 42,287 | 35,330 | ||||||||||||||||||
|
|
|
|
|
|
|
|
|
|
|
|
|
|||||||||||||
| Realized gains (losses) on investments: |
||||||||||||||||||||||||
| Capital gain distributions received |
1,442,034 | 1,079,249 | (6 | ) | (6 | ) | — | — | ||||||||||||||||
| Net realized gain (loss) |
4,460,630 | 4,520,161 | (8,772 | ) | (7,299 | ) | (6,454 | ) | (1,318 | ) | ||||||||||||||
|
|
|
|
|
|
|
|
|
|
|
|
|
|||||||||||||
| Realized gains (losses) |
5,902,664 | 5,599,410 | (8,778 | ) | (7,305 | ) | (6,454 | ) | (1,318 | ) | ||||||||||||||
|
|
|
|
|
|
|
|
|
|
|
|
|
|||||||||||||
| Unrealized appreciation (depreciation) during the period |
(10,980,471 | ) | 9,900,241 | (18,932 | ) | 8,771 | (38,009 | ) | 4,599 | |||||||||||||||
|
|
|
|
|
|
|
|
|
|
|
|
|
|||||||||||||
| Net increase (decrease) in net assets from operations |
(3,948,163 | ) | 16,884,072 | (9,106 | ) | 24,306 | (2,176 | ) | 38,611 | |||||||||||||||
|
|
|
|
|
|
|
|
|
|
|
|
|
|||||||||||||
| Changes from principal transactions: |
||||||||||||||||||||||||
| Purchase payments |
1,810,886 | 1,609,611 | 101,081 | 93,630 | 199,687 | 118,331 | ||||||||||||||||||
| Transfers between sub-accounts and the company |
(1,731,271 | ) | (5,437,492 | ) | 205 | 229,777 | 117,468 | 427,109 | ||||||||||||||||
| Transfers on general account policy loans |
(13,995 | ) | (54,678 | ) | (2,002 | ) | (204 | ) | — | — | ||||||||||||||
| Withdrawals |
(5,879,141 | ) | (4,482,699 | ) | 92 | (63 | ) | (122 | ) | (15,439 | ) | |||||||||||||
| Annual contract fee |
(1,893,246 | ) | (1,918,288 | ) | (178,586 | ) | (170,361 | ) | (26,107 | ) | (18,597 | ) | ||||||||||||
|
|
|
|
|
|
|
|
|
|
|
|
|
|||||||||||||
| Net increase (decrease) in net assets from principal transactions |
(7,706,767 | ) | (10,283,546 | ) | (79,210 | ) | 152,779 | 290,926 | 511,404 | |||||||||||||||
|
|
|
|
|
|
|
|
|
|
|
|
|
|||||||||||||
| Total increase (decrease) in net assets |
(11,654,930 | ) | 6,600,526 | (88,316 | ) | 177,085 | 288,750 | 550,015 | ||||||||||||||||
| Net assets at beginning of period |
89,400,362 | 82,799,836 | 763,467 | 586,382 | 1,067,920 | 517,905 | ||||||||||||||||||
|
|
|
|
|
|
|
|
|
|
|
|
|
|||||||||||||
| Net assets at end of period |
$ | 77,745,432 | $ | 89,400,362 | $ | 675,151 | $ | 763,467 | $ | 1,356,670 | $ | 1,067,920 | ||||||||||||
|
|
|
|
|
|
|
|
|
|
|
|
|
|||||||||||||
| 2018 | 2017 | 2018 | 2017 | 2018 | 2017 | |||||||||||||||||||
| Units, beginning of period |
1,887,547 | 2,089,276 | 34,088 | 27,608 | 13,693 | 6,966 | ||||||||||||||||||
| Units issued |
239,716 | 332,880 | 5,513 | 15,040 | 4,970 | 7,276 | ||||||||||||||||||
| Units redeemed |
(393,972 | ) | (534,609 | ) | (9,152 | ) | (8,560 | ) | (1,171 | ) | (549 | ) | ||||||||||||
|
|
|
|
|
|
|
|
|
|
|
|
|
|||||||||||||
| Units, end of period |
1,733,291 | 1,887,547 | 30,449 | 34,088 | 17,492 | 13,693 | ||||||||||||||||||
|
|
|
|
|
|
|
|
|
|
|
|
|
|||||||||||||
See accompanying notes.
22
Table of Contents
JOHN HANCOCK LIFE INSURANCE COMPANY (U.S.A.) SEPARATE ACCOUNT N
STATEMENTS OF OPERATIONS AND CHANGES IN CONTRACT OWNERS’ EQUITY
For the years ended December 31,
| American Asset Allocation Trust Series I |
American Global Growth Trust Series I |
American Growth Trust Series I |
||||||||||||||||||||||
| 2018 | 2017 | 2018 | 2017 | 2018 | 2017 | |||||||||||||||||||
| Income: |
||||||||||||||||||||||||
| Dividend distributions received |
$ | 188,246 | $ | 136,200 | $ | 5,776 | $ | 1,529 | $ | 53,735 | $ | 54,866 | ||||||||||||
| Expenses: |
||||||||||||||||||||||||
| Mortality and expense risk and administrative charges |
(49,555 | ) | (49,378 | ) | (158 | ) | (345 | ) | (10,729 | ) | (10,047 | ) | ||||||||||||
|
|
|
|
|
|
|
|
|
|
|
|
|
|||||||||||||
| Net investment income (loss) |
138,691 | 86,822 | 5,618 | 1,184 | 43,006 | 44,819 | ||||||||||||||||||
|
|
|
|
|
|
|
|
|
|
|
|
|
|||||||||||||
| Realized gains (losses) on investments: |
||||||||||||||||||||||||
| Capital gain distributions received |
1,302,055 | 723,443 | 53,488 | 52,097 | 2,949,997 | 2,179,527 | ||||||||||||||||||
| Net realized gain (loss) |
311,642 | 396,443 | (1,749 | ) | (39,068 | ) | (557,508 | ) | (291,425 | ) | ||||||||||||||
|
|
|
|
|
|
|
|
|
|
|
|
|
|||||||||||||
| Realized gains (losses) |
1,613,697 | 1,119,886 | 51,739 | 13,029 | 2,392,489 | 1,888,102 | ||||||||||||||||||
|
|
|
|
|
|
|
|
|
|
|
|
|
|||||||||||||
| Unrealized appreciation (depreciation) during the period |
(2,350,943 | ) | 306,957 | (150,596 | ) | 87,540 | (2,515,436 | ) | 1,671,259 | |||||||||||||||
|
|
|
|
|
|
|
|
|
|
|
|
|
|||||||||||||
| Net increase (decrease) in net assets from operations |
(598,555 | ) | 1,513,665 | (93,239 | ) | 101,753 | (79,941 | ) | 3,604,180 | |||||||||||||||
|
|
|
|
|
|
|
|
|
|
|
|
|
|||||||||||||
| Changes from principal transactions: |
||||||||||||||||||||||||
| Purchase payments |
898,117 | 794,148 | 124,713 | 89,535 | 417,574 | 410,408 | ||||||||||||||||||
| Transfers between sub-accounts and the company |
(76,167 | ) | 2,219,563 | 208,301 | 446 | (2,797,204 | ) | 209,428 | ||||||||||||||||
| Transfers on general account policy loans |
24,151 | 3,604 | (3,342 | ) | 1,911 | (10,876 | ) | 68,951 | ||||||||||||||||
| Withdrawals |
(395,614 | ) | (898,011 | ) | (127,938 | ) | 31,984 | (180,872 | ) | (2,697,910 | ) | |||||||||||||
| Annual contract fee |
(919,617 | ) | (909,668 | ) | (40,242 | ) | (35,094 | ) | (311,638 | ) | (297,884 | ) | ||||||||||||
|
|
|
|
|
|
|
|
|
|
|
|
|
|||||||||||||
| Net increase (decrease) in net assets from principal transactions |
(469,130 | ) | 1,209,636 | 161,492 | 88,782 | (2,883,016 | ) | (2,307,007 | ) | |||||||||||||||
|
|
|
|
|
|
|
|
|
|
|
|
|
|||||||||||||
| Total increase (decrease) in net assets |
(1,067,685 | ) | 2,723,301 | 68,253 | 190,535 | (2,962,957 | ) | 1,297,173 | ||||||||||||||||
| Net assets at beginning of period |
11,728,283 | 9,004,982 | 659,731 | 469,196 | 15,257,193 | 13,960,020 | ||||||||||||||||||
|
|
|
|
|
|
|
|
|
|
|
|
|
|||||||||||||
| Net assets at end of period |
$ | 10,660,598 | $ | 11,728,283 | $ | 727,984 | $ | 659,731 | $ | 12,294,236 | $ | 15,257,193 | ||||||||||||
|
|
|
|
|
|
|
|
|
|
|
|
|
|||||||||||||
| 2018 | 2017 | 2018 | 2017 | 2018 | 2017 | |||||||||||||||||||
| Units, beginning of period |
630,470 | 563,452 | 32,161 | 30,020 | 471,529 | 536,522 | ||||||||||||||||||
| Units issued |
58,586 | 171,860 | 30,441 | 346,601 | 108,325 | 315,568 | ||||||||||||||||||
| Units redeemed |
(84,739 | ) | (104,842 | ) | (23,462 | ) | (344,460 | ) | (199,038 | ) | (380,561 | ) | ||||||||||||
|
|
|
|
|
|
|
|
|
|
|
|
|
|||||||||||||
| Units, end of period |
604,317 | 630,470 | 39,140 | 32,161 | 380,816 | 471,529 | ||||||||||||||||||
|
|
|
|
|
|
|
|
|
|
|
|
|
|||||||||||||
See accompanying notes.
23
Table of Contents
JOHN HANCOCK LIFE INSURANCE COMPANY (U.S.A.) SEPARATE ACCOUNT N
STATEMENTS OF OPERATIONS AND CHANGES IN CONTRACT OWNERS’ EQUITY
For the years ended December 31,
| American Growth-Income Trust Series I |
American International Trust Series I |
Blue Chip Growth Trust Series I |
||||||||||||||||||||||
| 2018 | 2017 | 2018 | 2017 | 2018 | 2017 | |||||||||||||||||||
| Income: |
||||||||||||||||||||||||
| Dividend distributions received |
$ | 146,244 | $ | 135,241 | $ | 190,885 | $ | 66,736 | $ | 2,476 | $ | 6,372 | ||||||||||||
| Expenses: |
||||||||||||||||||||||||
| Mortality and expense risk and administrative charges |
(47,747 | ) | (45,722 | ) | (8,185 | ) | (8,552 | ) | (41,522 | ) | (35,454 | ) | ||||||||||||
|
|
|
|
|
|
|
|
|
|
|
|
|
|||||||||||||
| Net investment income (loss) |
98,497 | 89,519 | 182,700 | 58,184 | (39,046 | ) | (29,082 | ) | ||||||||||||||||
|
|
|
|
|
|
|
|
|
|
|
|
|
|||||||||||||
| Realized gains (losses) on investments: |
||||||||||||||||||||||||
| Capital gain distributions received |
1,643,194 | 2,077,455 | 303,689 | 802,984 | 1,403,338 | 592,409 | ||||||||||||||||||
| Net realized gain (loss) |
(311,123 | ) | 133,740 | 111,742 | 1,735,045 | 146,976 | (34,611 | ) | ||||||||||||||||
|
|
|
|
|
|
|
|
|
|
|
|
|
|||||||||||||
| Realized gains (losses) |
1,332,071 | 2,211,195 | 415,431 | 2,538,029 | 1,550,314 | 557,798 | ||||||||||||||||||
|
|
|
|
|
|
|
|
|
|
|
|
|
|||||||||||||
| Unrealized appreciation (depreciation) during the period |
(1,512,963 | ) | 230,086 | (1,646,879 | ) | 1,070,601 | (1,353,727 | ) | 2,077,243 | |||||||||||||||
|
|
|
|
|
|
|
|
|
|
|
|
|
|||||||||||||
| Net increase (decrease) in net assets from operations |
(82,395 | ) | 2,530,800 | (1,048,748 | ) | 3,666,814 | 157,541 | 2,605,959 | ||||||||||||||||
|
|
|
|
|
|
|
|
|
|
|
|
|
|||||||||||||
| Changes from principal transactions: |
||||||||||||||||||||||||
| Purchase payments |
487,510 | 675,290 | 453,016 | 360,610 | 80,416 | 87,239 | ||||||||||||||||||
| Transfers between sub-accounts and the company |
(3,256,940 | ) | (638,306 | ) | (897,655 | ) | (8,371,616 | ) | 188,688 | 145,267 | ||||||||||||||
| Transfers on general account policy loans |
33,240 | (12,552 | ) | (10,468 | ) | 45,275 | (8,078 | ) | 29,191 | |||||||||||||||
| Withdrawals |
(553,503 | ) | (1,892,325 | ) | (94,553 | ) | (2,353,956 | ) | (136,515 | ) | (668,263 | ) | ||||||||||||
| Annual contract fee |
(667,982 | ) | (676,587 | ) | (271,829 | ) | (296,989 | ) | (412,151 | ) | (359,870 | ) | ||||||||||||
|
|
|
|
|
|
|
|
|
|
|
|
|
|||||||||||||
| Net increase (decrease) in net assets from principal transactions |
(3,957,675 | ) | (2,544,480 | ) | (821,489 | ) | (10,616,676 | ) | (287,640 | ) | (766,436 | ) | ||||||||||||
|
|
|
|
|
|
|
|
|
|
|
|
|
|||||||||||||
| Total increase (decrease) in net assets |
(4,040,070 | ) | (13,680 | ) | (1,870,237 | ) | (6,949,862 | ) | (130,099 | ) | 1,839,523 | |||||||||||||
| Net assets at beginning of period |
13,401,411 | 13,415,091 | 7,988,088 | 14,937,950 | 9,563,854 | 7,724,331 | ||||||||||||||||||
|
|
|
|
|
|
|
|
|
|
|
|
|
|||||||||||||
| Net assets at end of period |
$ | 9,361,341 | $ | 13,401,411 | $ | 6,117,851 | $ | 7,988,088 | $ | 9,433,755 | $ | 9,563,854 | ||||||||||||
|
|
|
|
|
|
|
|
|
|
|
|
|
|||||||||||||
| 2018 | 2017 | 2018 | 2017 | 2018 | 2017 | |||||||||||||||||||
| Units, beginning of period |
414,194 | 486,038 | 306,451 | 776,080 | 141,623 | 153,004 | ||||||||||||||||||
| Units issued |
53,746 | 28,459 | 86,790 | 212,017 | 11,398 | 20,795 | ||||||||||||||||||
| Units redeemed |
(188,100 | ) | (100,303 | ) | (124,868 | ) | (681,646 | ) | (15,679 | ) | (32,176 | ) | ||||||||||||
|
|
|
|
|
|
|
|
|
|
|
|
|
|||||||||||||
| Units, end of period |
279,840 | 414,194 | 268,373 | 306,451 | 137,342 | 141,623 | ||||||||||||||||||
|
|
|
|
|
|
|
|
|
|
|
|
|
|||||||||||||
See accompanying notes.
24
Table of Contents
JOHN HANCOCK LIFE INSURANCE COMPANY (U.S.A.) SEPARATE ACCOUNT N
STATEMENTS OF OPERATIONS AND CHANGES IN CONTRACT OWNERS’ EQUITY
For the years ended December 31,
| Blue Chip Growth Trust Series NAV |
Capital Appreciation Trust Series I |
Capital Appreciation Trust Series NAV |
||||||||||||||||||||||
| 2018 | 2017 | 2018 | 2017 | 2018 | 2017 | |||||||||||||||||||
| Income: |
||||||||||||||||||||||||
| Dividend distributions received |
$ | 24,374 | $ | 68,648 | $ | 22,419 | $ | 4,790 | $ | 8,083 | $ | 1,994 | ||||||||||||
| Expenses: |
||||||||||||||||||||||||
| Mortality and expense risk and administrative charges |
— | — | (31,960 | ) | (28,668 | ) | — | — | ||||||||||||||||
|
|
|
|
|
|
|
|
|
|
|
|
|
|||||||||||||
| Net investment income (loss) |
24,374 | 68,648 | (9,541 | ) | (23,878 | ) | 8,083 | 1,994 | ||||||||||||||||
|
|
|
|
|
|
|
|
|
|
|
|
|
|||||||||||||
| Realized gains (losses) on investments: |
||||||||||||||||||||||||
| Capital gain distributions received |
5,689,902 | 4,065,571 | 1,452,085 | 636,200 | 363,654 | 159,436 | ||||||||||||||||||
| Net realized gain (loss) |
13,989,750 | 729,906 | 110,835 | (163,701 | ) | (20,410 | ) | (81,609 | ) | |||||||||||||||
|
|
|
|
|
|
|
|
|
|
|
|
|
|||||||||||||
| Realized gains (losses) |
19,679,652 | 4,795,477 | 1,562,920 | 472,499 | 343,244 | 77,827 | ||||||||||||||||||
|
|
|
|
|
|
|
|
|
|
|
|
|
|||||||||||||
| Unrealized appreciation (depreciation) during the period |
(17,284,882 | ) | 13,836,624 | (1,531,168 | ) | 1,892,510 | (368,302 | ) | 502,366 | |||||||||||||||
|
|
|
|
|
|
|
|
|
|
|
|
|
|||||||||||||
| Net increase (decrease) in net assets from operations |
2,419,144 | 18,700,749 | 22,211 | 2,341,131 | (16,975 | ) | 582,187 | |||||||||||||||||
|
|
|
|
|
|
|
|
|
|
|
|
|
|||||||||||||
| Changes from principal transactions: |
||||||||||||||||||||||||
| Purchase payments |
421,609 | 307,176 | 35,767 | 29,192 | 74,286 | 88,456 | ||||||||||||||||||
| Transfers between sub-accounts and the company |
(6,194,749 | ) | (3,808,107 | ) | (674,999 | ) | (325,652 | ) | 237,452 | (292,295 | ) | |||||||||||||
| Transfers on general account policy loans |
41,229 | (3,790 | ) | 471 | (79 | ) | 14,566 | 9,800 | ||||||||||||||||
| Withdrawals |
(3,767,725 | ) | (267,352 | ) | (355,948 | ) | (359,353 | ) | (98,358 | ) | (48,791 | ) | ||||||||||||
| Annual contract fee |
(654,942 | ) | (631,923 | ) | (205,620 | ) | (177,415 | ) | (56,159 | ) | (60,340 | ) | ||||||||||||
|
|
|
|
|
|
|
|
|
|
|
|
|
|||||||||||||
| Net increase (decrease) in net assets from principal transactions |
(10,154,578 | ) | (4,403,996 | ) | (1,200,329 | ) | (833,307 | ) | 171,787 | (303,170 | ) | |||||||||||||
|
|
|
|
|
|
|
|
|
|
|
|
|
|||||||||||||
| Total increase (decrease) in net assets |
(7,735,434 | ) | 14,296,753 | (1,178,118 | ) | 1,507,824 | 154,812 | 279,017 | ||||||||||||||||
| Net assets at beginning of period |
68,329,185 | 54,032,432 | 8,566,232 | 7,058,408 | 1,945,535 | 1,666,518 | ||||||||||||||||||
|
|
|
|
|
|
|
|
|
|
|
|
|
|||||||||||||
| Net assets at end of period |
$ | 60,593,751 | $ | 68,329,185 | $ | 7,388,114 | $ | 8,566,232 | $ | 2,100,347 | $ | 1,945,535 | ||||||||||||
|
|
|
|
|
|
|
|
|
|
|
|
|
|||||||||||||
| 2018 | 2017 | 2018 | 2017 | 2018 | 2017 | |||||||||||||||||||
| Units, beginning of period |
365,708 | 394,278 | 244,298 | 274,009 | 53,085 | 62,077 | ||||||||||||||||||
| Units issued |
279,107 | 43,478 | 17,985 | 16,716 | 13,588 | 7,453 | ||||||||||||||||||
| Units redeemed |
(326,975 | ) | (72,048 | ) | (49,240 | ) | (46,427 | ) | (8,947 | ) | (16,445 | ) | ||||||||||||
|
|
|
|
|
|
|
|
|
|
|
|
|
|||||||||||||
| Units, end of period |
317,840 | 365,708 | 213,043 | 244,298 | 57,726 | 53,085 | ||||||||||||||||||
|
|
|
|
|
|
|
|
|
|
|
|
|
|||||||||||||
See accompanying notes.
25
Table of Contents
JOHN HANCOCK LIFE INSURANCE COMPANY (U.S.A.) SEPARATE ACCOUNT N
STATEMENTS OF OPERATIONS AND CHANGES IN CONTRACT OWNERS’ EQUITY
For the years ended December 31,
| Capital Appreciation Value Trust Series I |
Capital Appreciation Value Trust Series NAV |
Core Bond Trust Series I | ||||||||||||||||||||||
| 2018 | 2017 | 2018 | 2017 | 2018 | 2017 | |||||||||||||||||||
| Income: |
||||||||||||||||||||||||
| Dividend distributions received |
$ | 23,665 | $ | 15,560 | $ | 55,296 | $ | 33,825 | $ | 187,242 | $ | 163,357 | ||||||||||||
| Expenses: |
||||||||||||||||||||||||
| Mortality and expense risk and administrative charges |
(4,581 | ) | (3,325 | ) | — | — | (23,039 | ) | (25,856 | ) | ||||||||||||||
|
|
|
|
|
|
|
|
|
|
|
|
|
|||||||||||||
| Net investment income (loss) |
19,084 | 12,235 | 55,296 | 33,825 | 164,203 | 137,501 | ||||||||||||||||||
|
|
|
|
|
|
|
|
|
|
|
|
|
|||||||||||||
| Realized gains (losses) on investments: |
||||||||||||||||||||||||
| Capital gain distributions received |
84,697 | 46,325 | 183,241 | 106,942 | — | 99,340 | ||||||||||||||||||
| Net realized gain (loss) |
(215 | ) | (4,227 | ) | (14,722 | ) | (9,591 | ) | (81,431 | ) | (15,944 | ) | ||||||||||||
|
|
|
|
|
|
|
|
|
|
|
|
|
|||||||||||||
| Realized gains (losses) |
84,482 | 42,098 | 168,519 | 97,351 | (81,431 | ) | 83,396 | |||||||||||||||||
|
|
|
|
|
|
|
|
|
|
|
|
|
|||||||||||||
| Unrealized appreciation (depreciation) during the period |
(98,954 | ) | 50,615 | (214,230 | ) | 174,137 | (140,387 | ) | 34,200 | |||||||||||||||
|
|
|
|
|
|
|
|
|
|
|
|
|
|||||||||||||
| Net increase (decrease) in net assets from operations |
4,612 | 104,948 | 9,585 | 305,313 | (57,615 | ) | 255,097 | |||||||||||||||||
|
|
|
|
|
|
|
|
|
|
|
|
|
|||||||||||||
| Changes from principal transactions: |
||||||||||||||||||||||||
| Purchase payments |
2,204 | 2,466 | 50,604 | 26,665 | 109,837 | 107,359 | ||||||||||||||||||
| Transfers between sub-accounts and the company |
(86,097 | ) | 740,892 | 58,429 | 295,836 | 648,071 | (695,830 | ) | ||||||||||||||||
| Transfers on general account policy loans |
— | 15,718 | (241 | ) | (669 | ) | 501 | 3,289 | ||||||||||||||||
| Withdrawals |
(1 | ) | (19,585 | ) | 1,128 | (118,855 | ) | (232,627 | ) | (1,497,371 | ) | |||||||||||||
| Annual contract fee |
(23,430 | ) | (20,111 | ) | (59,731 | ) | (52,096 | ) | (259,198 | ) | (270,430 | ) | ||||||||||||
|
|
|
|
|
|
|
|
|
|
|
|
|
|||||||||||||
| Net increase (decrease) in net assets from principal transactions |
(107,324 | ) | 719,380 | 50,189 | 150,881 | 266,584 | (2,352,983 | ) | ||||||||||||||||
|
|
|
|
|
|
|
|
|
|
|
|
|
|||||||||||||
| Total increase (decrease) in net assets |
(102,712 | ) | 824,328 | 59,774 | 456,194 | 208,969 | (2,097,886 | ) | ||||||||||||||||
| Net assets at beginning of period |
1,153,927 | 329,599 | 2,356,274 | 1,900,080 | 7,645,685 | 9,743,571 | ||||||||||||||||||
|
|
|
|
|
|
|
|
|
|
|
|
|
|||||||||||||
| Net assets at end of period |
$ | 1,051,215 | $ | 1,153,927 | $ | 2,416,048 | $ | 2,356,274 | $ | 7,854,654 | $ | 7,645,685 | ||||||||||||
|
|
|
|
|
|
|
|
|
|
|
|
|
|||||||||||||
| 2018 | 2017 | 2018 | 2017 | 2018 | 2017 | |||||||||||||||||||
| Units, beginning of period |
52,325 | 17,505 | 102,475 | 95,143 | 368,867 | 484,218 | ||||||||||||||||||
| Units issued |
281 | 38,058 | 22,395 | 16,685 | 173,587 | 26,911 | ||||||||||||||||||
| Units redeemed |
(4,877 | ) | (3,238 | ) | (20,262 | ) | (9,353 | ) | (160,368 | ) | (142,262 | ) | ||||||||||||
|
|
|
|
|
|
|
|
|
|
|
|
|
|||||||||||||
| Units, end of period |
47,729 | 52,325 | 104,608 | 102,475 | 382,086 | 368,867 | ||||||||||||||||||
|
|
|
|
|
|
|
|
|
|
|
|
|
|||||||||||||
See accompanying notes.
26
Table of Contents
JOHN HANCOCK LIFE INSURANCE COMPANY (U.S.A.) SEPARATE ACCOUNT N
STATEMENTS OF OPERATIONS AND CHANGES IN CONTRACT OWNERS’ EQUITY
For the years ended December 31,
| Core Bond Trust Series NAV | Emerging Markets Value Trust Series I |
Emerging Markets Value Trust Series NAV |
||||||||||||||||||||||
| 2018 | 2017 | 2018 | 2017 | 2018 | 2017 | |||||||||||||||||||
| Income: |
||||||||||||||||||||||||
| Dividend distributions received |
$ | 662,462 | $ | 557,434 | $ | 54,149 | $ | 18,197 | $ | 107,004 | $ | 52,002 | ||||||||||||
| Expenses: |
||||||||||||||||||||||||
| Mortality and expense risk and administrative charges |
— | — | (4,670 | ) | (1,226 | ) | — | — | ||||||||||||||||
|
|
|
|
|
|
|
|
|
|
|
|
|
|||||||||||||
| Net investment income (loss) |
662,462 | 557,434 | 49,479 | 16,971 | 107,004 | 52,002 | ||||||||||||||||||
|
|
|
|
|
|
|
|
|
|
|
|
|
|||||||||||||
| Realized gains (losses) on investments: |
||||||||||||||||||||||||
| Capital gain distributions received |
— | 323,348 | — | — | — | — | ||||||||||||||||||
| Net realized gain (loss) |
(219,939 | ) | (28,076 | ) | 12,513 | 73 | 41,776 | 3,585 | ||||||||||||||||
|
|
|
|
|
|
|
|
|
|
|
|
|
|||||||||||||
| Realized gains (losses) |
(219,939 | ) | 295,272 | 12,513 | 73 | 41,776 | 3,585 | |||||||||||||||||
|
|
|
|
|
|
|
|
|
|
|
|
|
|||||||||||||
| Unrealized appreciation (depreciation) during the period |
(544,158 | ) | (40,622 | ) | (351,219 | ) | 78,657 | (702,742 | ) | 504,490 | ||||||||||||||
|
|
|
|
|
|
|
|
|
|
|
|
|
|||||||||||||
| Net increase (decrease) in net assets from operations |
(101,635 | ) | 812,084 | (289,227 | ) | 95,701 | (553,962 | ) | 560,077 | |||||||||||||||
|
|
|
|
|
|
|
|
|
|
|
|
|
|||||||||||||
| Changes from principal transactions: |
||||||||||||||||||||||||
| Purchase payments |
225,676 | 317,465 | 3,087 | 1,984 | 306,582 | 223,186 | ||||||||||||||||||
| Transfers between sub-accounts and the company |
2,577,079 | 3,980,400 | 230,385 | 1,823,261 | 387,733 | 2,070,330 | ||||||||||||||||||
| Transfers on general account policy loans |
(16,857 | ) | (1,448 | ) | — | — | 1,517 | 3,911 | ||||||||||||||||
| Withdrawals |
(855,940 | ) | (358,148 | ) | (13,039 | ) | — | (336,280 | ) | (45,579 | ) | |||||||||||||
| Annual contract fee |
(319,012 | ) | (365,043 | ) | (13,749 | ) | (6,088 | ) | (132,992 | ) | (93,967 | ) | ||||||||||||
|
|
|
|
|
|
|
|
|
|
|
|
|
|||||||||||||
| Net increase (decrease) in net assets from principal transactions |
1,610,946 | 3,573,226 | 206,684 | 1,819,157 | 226,560 | 2,157,881 | ||||||||||||||||||
|
|
|
|
|
|
|
|
|
|
|
|
|
|||||||||||||
| Total increase (decrease) in net assets |
1,509,311 | 4,385,310 | (82,543 | ) | 1,914,858 | (327,402 | ) | 2,717,958 | ||||||||||||||||
| Net assets at beginning of period |
25,672,554 | 21,287,244 | 1,987,004 | 72,146 | 4,086,315 | 1,368,357 | ||||||||||||||||||
|
|
|
|
|
|
|
|
|
|
|
|
|
|||||||||||||
| Net assets at end of period |
$ | 27,181,865 | $ | 25,672,554 | $ | 1,904,461 | $ | 1,987,004 | $ | 3,758,913 | $ | 4,086,315 | ||||||||||||
|
|
|
|
|
|
|
|
|
|
|
|
|
|||||||||||||
| 2018 | 2017 | 2018 | 2017 | 2018 | 2017 | |||||||||||||||||||
| Units, beginning of period |
1,480,100 | 1,269,890 | 114,038 | 5,694 | 284,502 | 126,400 | ||||||||||||||||||
| Units issued |
348,993 | 344,222 | 21,803 | 108,708 | 85,938 | 319,459 | ||||||||||||||||||
| Units redeemed |
(253,440 | ) | (134,012 | ) | (9,133 | ) | (364 | ) | (67,961 | ) | (161,357 | ) | ||||||||||||
|
|
|
|
|
|
|
|
|
|
|
|
|
|||||||||||||
| Units, end of period |
1,575,653 | 1,480,100 | 126,708 | 114,038 | 302,479 | 284,502 | ||||||||||||||||||
|
|
|
|
|
|
|
|
|
|
|
|
|
|||||||||||||
See accompanying notes.
27
Table of Contents
JOHN HANCOCK LIFE INSURANCE COMPANY (U.S.A.) SEPARATE ACCOUNT N
STATEMENTS OF OPERATIONS AND CHANGES IN CONTRACT OWNERS’ EQUITY
For the years ended December 31,
| Equity Income Trust Series I | Equity Income Trust Series NAV | Financial Industries Trust Series I |
||||||||||||||||||||||
| 2018 | 2017 | 2018 | 2017 | 2018 | 2017 | |||||||||||||||||||
| Income: |
||||||||||||||||||||||||
| Dividend distributions received |
$ | 144,313 | $ | 184,168 | $ | 962,526 | $ | 1,035,076 | $ | 9,452 | $ | 9,337 | ||||||||||||
| Expenses: |
||||||||||||||||||||||||
| Mortality and expense risk and administrative charges |
(31,639 | ) | (33,914 | ) | — | — | (4,334 | ) | (4,970 | ) | ||||||||||||||
|
|
|
|
|
|
|
|
|
|
|
|
|
|||||||||||||
| Net investment income (loss) |
112,674 | 150,254 | 962,526 | 1,035,076 | 5,118 | 4,367 | ||||||||||||||||||
|
|
|
|
|
|
|
|
|
|
|
|
|
|||||||||||||
| Realized gains (losses) on investments: |
||||||||||||||||||||||||
| Capital gain distributions received |
947,828 | 603,704 | 8,282,738 | 3,350,547 | 51,305 | 4 | ||||||||||||||||||
| Net realized gain (loss) |
(123,318 | ) | (125,791 | ) | (3,339,608 | ) | (1,200,133 | ) | 20,197 | 89,620 | ||||||||||||||
|
|
|
|
|
|
|
|
|
|
|
|
|
|||||||||||||
| Realized gains (losses) |
824,510 | 477,913 | 4,943,130 | 2,150,414 | 71,502 | 89,624 | ||||||||||||||||||
|
|
|
|
|
|
|
|
|
|
|
|
|
|||||||||||||
| Unrealized appreciation (depreciation) during the period |
(1,679,641 | ) | 601,378 | (10,464,058 | ) | 3,263,383 | (184,387 | ) | 23,485 | |||||||||||||||
|
|
|
|
|
|
|
|
|
|
|
|
|
|||||||||||||
| Net increase (decrease) in net assets from operations |
(742,457 | ) | 1,229,545 | (4,558,402 | ) | 6,448,873 | (107,767 | ) | 117,476 | |||||||||||||||
|
|
|
|
|
|
|
|
|
|
|
|
|
|||||||||||||
| Changes from principal transactions: |
||||||||||||||||||||||||
| Purchase payments |
181,050 | 161,881 | 157,686 | 196,030 | 32,046 | 24,779 | ||||||||||||||||||
| Transfers between sub-accounts and the company |
(340,303 | ) | (543,783 | ) | (814,685 | ) | 5,627,512 | (28,728 | ) | (43,329 | ) | |||||||||||||
| Transfers on general account policy loans |
409 | (1,863 | ) | (11,701 | ) | 54,183 | (87 | ) | 153 | |||||||||||||||
| Withdrawals |
(416,540 | ) | (454,414 | ) | (2,512,901 | ) | (2,622,568 | ) | (21,766 | ) | (87,011 | ) | ||||||||||||
| Annual contract fee |
(534,411 | ) | (521,645 | ) | (446,876 | ) | (399,988 | ) | (82,496 | ) | (79,442 | ) | ||||||||||||
|
|
|
|
|
|
|
|
|
|
|
|
|
|||||||||||||
| Net increase (decrease) in net assets from principal transactions |
(1,109,795 | ) | (1,359,824 | ) | (3,628,477 | ) | 2,855,169 | (101,031 | ) | (184,850 | ) | |||||||||||||
|
|
|
|
|
|
|
|
|
|
|
|
|
|||||||||||||
| Total increase (decrease) in net assets |
(1,852,252 | ) | (130,279 | ) | (8,186,879 | ) | 9,304,042 | (208,798 | ) | (67,374 | ) | |||||||||||||
| Net assets at beginning of period |
8,632,436 | 8,762,715 | 46,532,756 | 37,228,714 | 820,679 | 888,053 | ||||||||||||||||||
|
|
|
|
|
|
|
|
|
|
|
|
|
|||||||||||||
| Net assets at end of period |
$ | 6,780,184 | $ | 8,632,436 | $ | 38,345,877 | $ | 46,532,756 | $ | 611,881 | $ | 820,679 | ||||||||||||
|
|
|
|
|
|
|
|
|
|
|
|
|
|||||||||||||
| 2018 | 2017 | 2018 | 2017 | 2018 | 2017 | |||||||||||||||||||
| Units, beginning of period |
161,955 | 190,429 | 784,687 | 729,979 | 28,443 | 35,247 | ||||||||||||||||||
| Units issued |
12,957 | 9,954 | 928,785 | 174,692 | 3,850 | 18,241 | ||||||||||||||||||
| Units redeemed |
(33,687 | ) | (38,428 | ) | (998,844 | ) | (119,984 | ) | (7,415 | ) | (25,045 | ) | ||||||||||||
|
|
|
|
|
|
|
|
|
|
|
|
|
|||||||||||||
| Units, end of period |
141,225 | 161,955 | 714,628 | 784,687 | 24,878 | 28,443 | ||||||||||||||||||
|
|
|
|
|
|
|
|
|
|
|
|
|
|||||||||||||
See accompanying notes.
28
Table of Contents
JOHN HANCOCK LIFE INSURANCE COMPANY (U.S.A.) SEPARATE ACCOUNT N
STATEMENTS OF OPERATIONS AND CHANGES IN CONTRACT OWNERS’ EQUITY
For the years ended December 31,
| Financial Industries Trust Series NAV |
Fundamental All Cap Core Trust Series I |
Fundamental All Cap Core Trust Series NAV |
||||||||||||||||||||||
| 2018 | 2017 | 2018 | 2017 | 2018 | 2017 | |||||||||||||||||||
| Income: |
||||||||||||||||||||||||
| Dividend distributions received |
$ | 4,681 | $ | 4,442 | $ | 997 | $ | 2,817 | $ | 13,785 | $ | 19,487 | ||||||||||||
| Expenses: |
||||||||||||||||||||||||
| Mortality and expense risk and administrative charges |
— | — | (979 | ) | (1,354 | ) | — | — | ||||||||||||||||
|
|
|
|
|
|
|
|
|
|
|
|
|
|||||||||||||
| Net investment income (loss) |
4,681 | 4,442 | 18 | 1,463 | 13,785 | 19,487 | ||||||||||||||||||
|
|
|
|
|
|
|
|
|
|
|
|
|
|||||||||||||
| Realized gains (losses) on investments: |
||||||||||||||||||||||||
| Capital gain distributions received |
25,235 | — | 30,869 | 8,945 | 367,987 | 58,404 | ||||||||||||||||||
| Net realized gain (loss) |
55,712 | 5,685 | 42,238 | 18,020 | 62,267 | 53,591 | ||||||||||||||||||
|
|
|
|
|
|
|
|
|
|
|
|
|
|||||||||||||
| Realized gains (losses) |
80,947 | 5,685 | 73,107 | 26,965 | 430,254 | 111,995 | ||||||||||||||||||
|
|
|
|
|
|
|
|
|
|
|
|
|
|||||||||||||
| Unrealized appreciation (depreciation) during the period |
(142,420 | ) | 38,987 | (94,565 | ) | 61,046 | (816,816 | ) | 385,370 | |||||||||||||||
|
|
|
|
|
|
|
|
|
|
|
|
|
|||||||||||||
| Net increase (decrease) in net assets from operations |
(56,792 | ) | 49,114 | (21,440 | ) | 89,474 | (372,777 | ) | 516,852 | |||||||||||||||
|
|
|
|
|
|
|
|
|
|
|
|
|
|||||||||||||
| Changes from principal transactions: |
||||||||||||||||||||||||
| Purchase payments |
38,128 | 47,809 | 1,429 | 516 | 198,993 | 219,454 | ||||||||||||||||||
| Transfers between sub-accounts and the company |
52,392 | 6,459 | (154,604 | ) | 67,957 | (17,171 | ) | 678,855 | ||||||||||||||||
| Transfers on general account policy loans |
(341 | ) | (229 | ) | — | — | (29 | ) | (27 | ) | ||||||||||||||
| Withdrawals |
(50,484 | ) | (8,002 | ) | (39,348 | ) | (53,827 | ) | (138,421 | ) | (48,425 | ) | ||||||||||||
| Annual contract fee |
(15,696 | ) | (15,653 | ) | (11,708 | ) | (13,141 | ) | (61,372 | ) | (51,984 | ) | ||||||||||||
|
|
|
|
|
|
|
|
|
|
|
|
|
|||||||||||||
| Net increase (decrease) in net assets from principal transactions |
23,999 | 30,384 | (204,231 | ) | 1,505 | (18,000 | ) | 797,873 | ||||||||||||||||
|
|
|
|
|
|
|
|
|
|
|
|
|
|||||||||||||
| Total increase (decrease) in net assets |
(32,793 | ) | 79,498 | (225,671 | ) | 90,979 | (390,777 | ) | 1,314,725 | |||||||||||||||
| Net assets at beginning of period |
379,482 | 299,984 | 418,406 | 327,427 | 2,760,602 | 1,445,877 | ||||||||||||||||||
|
|
|
|
|
|
|
|
|
|
|
|
|
|||||||||||||
| Net assets at end of period |
$ | 346,689 | $ | 379,482 | $ | 192,735 | $ | 418,406 | $ | 2,369,825 | $ | 2,760,602 | ||||||||||||
|
|
|
|
|
|
|
|
|
|
|
|
|
|||||||||||||
| 2018 | 2017 | 2018 | 2017 | 2018 | 2017 | |||||||||||||||||||
| Units, beginning of period |
9,936 | 9,055 | 8,401 | 8,365 | 88,415 | 59,166 | ||||||||||||||||||
| Units issued |
7,617 | 1,694 | 673 | 2,471 | 10,344 | 35,551 | ||||||||||||||||||
| Units redeemed |
(6,951 | ) | (813 | ) | (4,608 | ) | (2,435 | ) | (11,353 | ) | (6,302 | ) | ||||||||||||
|
|
|
|
|
|
|
|
|
|
|
|
|
|||||||||||||
| Units, end of period |
10,602 | 9,936 | 4,466 | 8,401 | 87,406 | 88,415 | ||||||||||||||||||
|
|
|
|
|
|
|
|
|
|
|
|
|
|||||||||||||
See accompanying notes.
29
Table of Contents
JOHN HANCOCK LIFE INSURANCE COMPANY (U.S.A.) SEPARATE ACCOUNT N
STATEMENTS OF OPERATIONS AND CHANGES IN CONTRACT OWNERS’ EQUITY
For the years ended December 31,
| Fundamental Large Cap Value Trust Series I |
Fundamental Large Cap Value Trust Series NAV |
Global Bond Trust Series I | ||||||||||||||||||||||
| 2018 | 2017 | 2018 | 2017 | 2018 | 2017 | |||||||||||||||||||
| Income: |
||||||||||||||||||||||||
| Dividend distributions received |
$ | 37,940 | $ | 58,352 | $ | 92,563 | $ | 124,902 | $ | 27,477 | $ | 23,748 | ||||||||||||
| Expenses: |
||||||||||||||||||||||||
| Mortality and expense risk and administrative charges |
(15,329 | ) | (17,032 | ) | — | — | (4,074 | ) | (4,131 | ) | ||||||||||||||
|
|
|
|
|
|
|
|
|
|
|
|
|
|||||||||||||
| Net investment income (loss) |
22,611 | 41,320 | 92,563 | 124,902 | 23,403 | 19,617 | ||||||||||||||||||
|
|
|
|
|
|
|
|
|
|
|
|
|
|||||||||||||
| Realized gains (losses) on investments: |
||||||||||||||||||||||||
| Capital gain distributions received |
— | (1 | ) | — | — | — | (1 | ) | ||||||||||||||||
| Net realized gain (loss) |
70,228 | 259,766 | 194,681 | 73,115 | 2,049 | 10,284 | ||||||||||||||||||
|
|
|
|
|
|
|
|
|
|
|
|
|
|||||||||||||
| Realized gains (losses) |
70,228 | 259,765 | 194,681 | 73,115 | 2,049 | 10,283 | ||||||||||||||||||
|
|
|
|
|
|
|
|
|
|
|
|
|
|||||||||||||
| Unrealized appreciation (depreciation) during the period |
(693,285 | ) | 298,161 | (1,641,467 | ) | 982,327 | (48,665 | ) | 50,214 | |||||||||||||||
|
|
|
|
|
|
|
|
|
|
|
|
|
|||||||||||||
| Net increase (decrease) in net assets from operations |
(600,446 | ) | 599,246 | (1,354,223 | ) | 1,180,344 | (23,213 | ) | 80,114 | |||||||||||||||
|
|
|
|
|
|
|
|
|
|
|
|
|
|||||||||||||
| Changes from principal transactions: |
||||||||||||||||||||||||
| Purchase payments |
133,798 | 139,573 | 483,055 | 328,332 | 37,315 | 38,367 | ||||||||||||||||||
| Transfers between sub-accounts and the company |
(103,876 | ) | (871,268 | ) | (387,142 | ) | (56,359 | ) | 98,011 | 70,021 | ||||||||||||||
| Transfers on general account policy loans |
(6,861 | ) | 15,545 | (16,794 | ) | (5,645 | ) | 106 | 103 | |||||||||||||||
| Withdrawals |
(10,703 | ) | (605,147 | ) | (322,263 | ) | (60,122 | ) | (1,549 | ) | (126,846 | ) | ||||||||||||
| Annual contract fee |
(269,422 | ) | (277,075 | ) | (118,308 | ) | (112,708 | ) | (61,107 | ) | (61,353 | ) | ||||||||||||
|
|
|
|
|
|
|
|
|
|
|
|
|
|||||||||||||
| Net increase (decrease) in net assets from principal transactions |
(257,064 | ) | (1,598,372 | ) | (361,452 | ) | 93,498 | 72,776 | (79,708 | ) | ||||||||||||||
|
|
|
|
|
|
|
|
|
|
|
|
|
|||||||||||||
| Total increase (decrease) in net assets |
(857,510 | ) | (999,126 | ) | (1,715,675 | ) | 1,273,842 | 49,563 | 406 | |||||||||||||||
| Net assets at beginning of period |
3,699,117 | 4,698,243 | 8,185,126 | 6,911,284 | 1,015,444 | 1,015,038 | ||||||||||||||||||
|
|
|
|
|
|
|
|
|
|
|
|
|
|||||||||||||
| Net assets at end of period |
$ | 2,841,607 | $ | 3,699,117 | $ | 6,469,451 | $ | 8,185,126 | $ | 1,065,007 | $ | 1,015,444 | ||||||||||||
|
|
|
|
|
|
|
|
|
|
|
|
|
|||||||||||||
| 2018 | 2017 | 2018 | 2017 | 2018 | 2017 | |||||||||||||||||||
| Units, beginning of period |
108,435 | 159,972 | 319,859 | 317,450 | 33,610 | 36,364 | ||||||||||||||||||
| Units issued |
3,449 | 4,891 | 47,269 | 36,767 | 5,603 | 8,239 | ||||||||||||||||||
| Units redeemed |
(11,065 | ) | (56,428 | ) | (62,434 | ) | (34,358 | ) | (3,068 | ) | (10,993 | ) | ||||||||||||
|
|
|
|
|
|
|
|
|
|
|
|
|
|||||||||||||
| Units, end of period |
100,819 | 108,435 | 304,694 | 319,859 | 36,145 | 33,610 | ||||||||||||||||||
|
|
|
|
|
|
|
|
|
|
|
|
|
|||||||||||||
See accompanying notes.
30
Table of Contents
JOHN HANCOCK LIFE INSURANCE COMPANY (U.S.A.) SEPARATE ACCOUNT N
STATEMENTS OF OPERATIONS AND CHANGES IN CONTRACT OWNERS’ EQUITY
For the years ended December 31,
| Global Bond Trust Series NAV | Global Trust Series I | Global Trust Series NAV | ||||||||||||||||||||||
| 2018 | 2017 | 2018 | 2017 | 2018 | 2017 | |||||||||||||||||||
| Income: |
||||||||||||||||||||||||
| Dividend distributions received |
$ | 252,484 | $ | 169,097 | $ | 33,171 | $ | 43,961 | $ | 51,008 | $ | 47,285 | ||||||||||||
| Expenses: |
||||||||||||||||||||||||
| Mortality and expense risk and administrative charges |
— | — | (11,159 | ) | (11,436 | ) | — | — | ||||||||||||||||
|
|
|
|
|
|
|
|
|
|
|
|
|
|||||||||||||
| Net investment income (loss) |
252,484 | 169,097 | 22,012 | 32,525 | 51,008 | 47,285 | ||||||||||||||||||
|
|
|
|
|
|
|
|
|
|
|
|
|
|||||||||||||
| Realized gains (losses) on investments: |
||||||||||||||||||||||||
| Capital gain distributions received |
1 | — | (2 | ) | (2 | ) | — | — | ||||||||||||||||
| Net realized gain (loss) |
97,878 | 2,677 | 157,186 | 36,001 | 20,640 | 6,699 | ||||||||||||||||||
|
|
|
|
|
|
|
|
|
|
|
|
|
|||||||||||||
| Realized gains (losses) |
97,879 | 2,677 | 157,184 | 35,999 | 20,640 | 6,699 | ||||||||||||||||||
|
|
|
|
|
|
|
|
|
|
|
|
|
|||||||||||||
| Unrealized appreciation (depreciation) during the period |
(512,279 | ) | 377,179 | (454,152 | ) | 304,347 | (474,634 | ) | 346,361 | |||||||||||||||
|
|
|
|
|
|
|
|
|
|
|
|
|
|||||||||||||
| Net increase (decrease) in net assets from operations |
(161,916 | ) | 548,953 | (274,956 | ) | 372,871 | (402,986 | ) | 400,345 | |||||||||||||||
|
|
|
|
|
|
|
|
|
|
|
|
|
|||||||||||||
| Changes from principal transactions: |
||||||||||||||||||||||||
| Purchase payments |
219,683 | 207,979 | 29,903 | 31,766 | 66,173 | 113,847 | ||||||||||||||||||
| Transfers between sub-accounts and the company |
635,848 | 2,270,923 | (446,216 | ) | 357,981 | 223,170 | 162,209 | |||||||||||||||||
| Transfers on general account policy loans |
1,753 | 6,906 | (281 | ) | 80 | (8,238 | ) | 4,201 | ||||||||||||||||
| Withdrawals |
(378,354 | ) | (415,736 | ) | (277,693 | ) | (200,073 | ) | (25,103 | ) | (62,880 | ) | ||||||||||||
| Annual contract fee |
(133,361 | ) | (121,402 | ) | (124,022 | ) | (112,533 | ) | (74,198 | ) | (71,396 | ) | ||||||||||||
|
|
|
|
|
|
|
|
|
|
|
|
|
|||||||||||||
| Net increase (decrease) in net assets from principal transactions |
345,569 | 1,948,670 | (818,309 | ) | 77,221 | 181,804 | 145,981 | |||||||||||||||||
|
|
|
|
|
|
|
|
|
|
|
|
|
|||||||||||||
| Total increase (decrease) in net assets |
183,653 | 2,497,623 | (1,093,265 | ) | 450,092 | (221,182 | ) | 546,326 | ||||||||||||||||
| Net assets at beginning of period |
9,043,097 | 6,545,474 | 2,608,249 | 2,158,157 | 2,578,745 | 2,032,419 | ||||||||||||||||||
|
|
|
|
|
|
|
|
|
|
|
|
|
|||||||||||||
| Net assets at end of period |
$ | 9,226,750 | $ | 9,043,097 | $ | 1,514,984 | $ | 2,608,249 | $ | 2,357,563 | $ | 2,578,745 | ||||||||||||
|
|
|
|
|
|
|
|
|
|
|
|
|
|||||||||||||
| 2018 | 2017 | 2018 | 2017 | 2018 | 2017 | |||||||||||||||||||
| Units, beginning of period |
271,299 | 213,478 | 76,411 | 74,558 | 122,558 | 114,849 | ||||||||||||||||||
| Units issued |
98,472 | 125,091 | 14,540 | 24,188 | 25,542 | 15,706 | ||||||||||||||||||
| Units redeemed |
(88,064 | ) | (67,270 | ) | (38,741 | ) | (22,335 | ) | (17,176 | ) | (7,997 | ) | ||||||||||||
|
|
|
|
|
|
|
|
|
|
|
|
|
|||||||||||||
| Units, end of period |
281,707 | 271,299 | 52,210 | 76,411 | 130,924 | 122,558 | ||||||||||||||||||
|
|
|
|
|
|
|
|
|
|
|
|
|
|||||||||||||
See accompanying notes.
31
Table of Contents
JOHN HANCOCK LIFE INSURANCE COMPANY (U.S.A.) SEPARATE ACCOUNT N
STATEMENTS OF OPERATIONS AND CHANGES IN CONTRACT OWNERS’ EQUITY
For the years ended December 31,
| Health Sciences Trust Series I | Health Sciences Trust Series NAV | High Yield Trust Series I | ||||||||||||||||||||||
| 2018 | 2017 | 2018 | 2017 | 2018 | 2017 | |||||||||||||||||||
| Income: |
||||||||||||||||||||||||
| Dividend distributions received |
$ | — | $ | — | $ | — | $ | — | $ | 160,142 | $ | 194,606 | ||||||||||||
| Expenses: |
||||||||||||||||||||||||
| Mortality and expense risk and administrative charges |
(20,230 | ) | (18,194 | ) | — | — | (11,169 | ) | (13,851 | ) | ||||||||||||||
|
|
|
|
|
|
|
|
|
|
|
|
|
|||||||||||||
| Net investment income (loss) |
(20,230 | ) | (18,194 | ) | — | — | 148,973 | 180,755 | ||||||||||||||||
|
|
|
|
|
|
|
|
|
|
|
|
|
|||||||||||||
| Realized gains (losses) on investments: |
||||||||||||||||||||||||
| Capital gain distributions received |
533,541 | 497,113 | 591,825 | 616,620 | — | (2 | ) | |||||||||||||||||
| Net realized gain (loss) |
(53,581 | ) | (135,232 | ) | (90,186 | ) | (831,773 | ) | (59,946 | ) | (60,400 | ) | ||||||||||||
|
|
|
|
|
|
|
|
|
|
|
|
|
|||||||||||||
| Realized gains (losses) |
479,960 | 361,881 | 501,639 | (215,153 | ) | (59,946 | ) | (60,402 | ) | |||||||||||||||
|
|
|
|
|
|
|
|
|
|
|
|
|
|||||||||||||
| Unrealized appreciation (depreciation) during the period |
(446,221 | ) | 792,136 | (379,070 | ) | 1,613,338 | (176,232 | ) | 113,293 | |||||||||||||||
|
|
|
|
|
|
|
|
|
|
|
|
|
|||||||||||||
| Net increase (decrease) in net assets from operations |
13,509 | 1,135,823 | 122,569 | 1,398,185 | (87,205 | ) | 233,646 | |||||||||||||||||
|
|
|
|
|
|
|
|
|
|
|
|
|
|||||||||||||
| Changes from principal transactions: |
||||||||||||||||||||||||
| Purchase payments |
17,509 | 13,095 | 176,473 | 248,594 | 72,504 | 66,385 | ||||||||||||||||||
| Transfers between sub-accounts and the company |
42,987 | 59,348 | (616,006 | ) | 98,237 | (103,350 | ) | 178,560 | ||||||||||||||||
| Transfers on general account policy loans |
(241 | ) | 80 | 27,641 | 4,250 | 3 | 31 | |||||||||||||||||
| Withdrawals |
(15,796 | ) | (321,211 | ) | (446,325 | ) | (80,814 | ) | (136,872 | ) | (851,708 | ) | ||||||||||||
| Annual contract fee |
(112,479 | ) | (103,668 | ) | (128,553 | ) | (164,360 | ) | (201,189 | ) | (209,412 | ) | ||||||||||||
|
|
|
|
|
|
|
|
|
|
|
|
|
|||||||||||||
| Net increase (decrease) in net assets from principal transactions |
(68,020 | ) | (352,356 | ) | (986,770 | ) | 105,907 | (368,904 | ) | (816,144 | ) | |||||||||||||
|
|
|
|
|
|
|
|
|
|
|
|
|
|||||||||||||
| Total increase (decrease) in net assets |
(54,511 | ) | 783,467 | (864,201 | ) | 1,504,092 | (456,109 | ) | (582,498 | ) | ||||||||||||||
| Net assets at beginning of period |
5,158,112 | 4,374,645 | 6,555,374 | 5,051,282 | 2,978,937 | 3,561,435 | ||||||||||||||||||
|
|
|
|
|
|
|
|
|
|
|
|
|
|||||||||||||
| Net assets at end of period |
$ | 5,103,601 | $ | 5,158,112 | $ | 5,691,173 | $ | 6,555,374 | $ | 2,522,828 | $ | 2,978,937 | ||||||||||||
|
|
|
|
|
|
|
|
|
|
|
|
|
|||||||||||||
| 2018 | 2017 | 2018 | 2017 | 2018 | 2017 | |||||||||||||||||||
| Units, beginning of period |
61,871 | 66,543 | 94,638 | 93,056 | 89,337 | 113,511 | ||||||||||||||||||
| Units issued |
4,186 | 6,994 | 14,517 | 60,143 | 8,423 | 35,818 | ||||||||||||||||||
| Units redeemed |
(4,988 | ) | (11,666 | ) | (27,616 | ) | (58,561 | ) | (19,448 | ) | (59,992 | ) | ||||||||||||
|
|
|
|
|
|
|
|
|
|
|
|
|
|||||||||||||
| Units, end of period |
61,069 | 61,871 | 81,539 | 94,638 | 78,312 | 89,337 | ||||||||||||||||||
|
|
|
|
|
|
|
|
|
|
|
|
|
|||||||||||||
See accompanying notes.
32
Table of Contents
JOHN HANCOCK LIFE INSURANCE COMPANY (U.S.A.) SEPARATE ACCOUNT N
STATEMENTS OF OPERATIONS AND CHANGES IN CONTRACT OWNERS’ EQUITY
For the years ended December 31,
| High Yield Trust Series NAV | International Equity Index Series I | International Equity Index Series NAV | ||||||||||||||||||||||
| 2018 | 2017 | 2018 | 2017 | 2018 | 2017 | |||||||||||||||||||
| Income: |
||||||||||||||||||||||||
| Dividend distributions received |
$ | 122,664 | $ | 112,212 | $ | 193,600 | $ | 183,067 | $ | 420,032 | $ | 340,345 | ||||||||||||
| Expenses: |
||||||||||||||||||||||||
| Mortality and expense risk and administrative charges |
— | — | (33,719 | ) | (29,289 | ) | — | — | ||||||||||||||||
|
|
|
|
|
|
|
|
|
|
|
|
|
|||||||||||||
| Net investment income (loss) |
122,664 | 112,212 | 159,881 | 153,778 | 420,032 | 340,345 | ||||||||||||||||||
|
|
|
|
|
|
|
|
|
|
|
|
|
|||||||||||||
| Realized gains (losses) on investments: |
||||||||||||||||||||||||
| Capital gain distributions received |
— | — | 2,917 | 2 | 5,983 | — | ||||||||||||||||||
| Net realized gain (loss) |
(15,419 | ) | (18,799 | ) | 93,174 | 42,586 | 388,008 | 22,511 | ||||||||||||||||
|
|
|
|
|
|
|
|
|
|
|
|
|
|||||||||||||
| Realized gains (losses) |
(15,419 | ) | (18,799 | ) | 96,091 | 42,588 | 393,991 | 22,511 | ||||||||||||||||
|
|
|
|
|
|
|
|
|
|
|
|
|
|||||||||||||
| Unrealized appreciation (depreciation) during the period |
(176,418 | ) | 97,293 | (1,505,370 | ) | 1,467,937 | (3,354,573 | ) | 3,013,784 | |||||||||||||||
|
|
|
|
|
|
|
|
|
|
|
|
|
|||||||||||||
| Net increase (decrease) in net assets from operations |
(69,173 | ) | 190,706 | (1,249,398 | ) | 1,664,303 | (2,540,550 | ) | 3,376,640 | |||||||||||||||
|
|
|
|
|
|
|
|
|
|
|
|
|
|||||||||||||
| Changes from principal transactions: |
||||||||||||||||||||||||
| Purchase payments |
71,581 | 116,875 | 41,020 | 43,086 | 310,188 | 256,958 | ||||||||||||||||||
| Transfers between sub-accounts and the company |
440,232 | (1,030,285 | ) | (479,977 | ) | 2,194,518 | 532,226 | 2,816,641 | ||||||||||||||||
| Transfers on general account policy loans |
(1,866 | ) | 2,342 | 1,756 | 1,538 | (632 | ) | 5,488 | ||||||||||||||||
| Withdrawals |
(33,768 | ) | (434,663 | ) | (1,706 | ) | (83,144 | ) | (137,301 | ) | (77,135 | ) | ||||||||||||
| Annual contract fee |
(18,091 | ) | (24,765 | ) | (170,064 | ) | (148,515 | ) | (289,758 | ) | (300,680 | ) | ||||||||||||
|
|
|
|
|
|
|
|
|
|
|
|
|
|||||||||||||
| Net increase (decrease) in net assets from principal transactions |
458,088 | (1,370,496 | ) | (608,971 | ) | 2,007,483 | 414,723 | 2,701,272 | ||||||||||||||||
|
|
|
|
|
|
|
|
|
|
|
|
|
|||||||||||||
| Total increase (decrease) in net assets |
388,915 | (1,179,790 | ) | (1,858,369 | ) | 3,671,786 | (2,125,827 | ) | 6,077,912 | |||||||||||||||
| Net assets at beginning of period |
1,622,162 | 2,801,952 | 9,241,272 | 5,569,486 | 17,322,973 | 11,245,061 | ||||||||||||||||||
|
|
|
|
|
|
|
|
|
|
|
|
|
|||||||||||||
| Net assets at end of period |
$ | 2,011,077 | $ | 1,622,162 | $ | 7,382,903 | $ | 9,241,272 | $ | 15,197,146 | $ | 17,322,973 | ||||||||||||
|
|
|
|
|
|
|
|
|
|
|
|
|
|||||||||||||
| 2018 | 2017 | 2018 | 2017 | 2018 | 2017 | |||||||||||||||||||
| Units, beginning of period |
66,895 | 124,161 | 650,594 | 497,581 | 304,244 | 251,701 | ||||||||||||||||||
| Units issued |
26,575 | 42,537 | 52,072 | 191,142 | 119,106 | 100,108 | ||||||||||||||||||
| Units redeemed |
(7,955 | ) | (99,803 | ) | (95,029 | ) | (38,129 | ) | (112,627 | ) | (47,565 | ) | ||||||||||||
|
|
|
|
|
|
|
|
|
|
|
|
|
|||||||||||||
| Units, end of period |
85,515 | 66,895 | 607,637 | 650,594 | 310,723 | 304,244 | ||||||||||||||||||
|
|
|
|
|
|
|
|
|
|
|
|
|
|||||||||||||
See accompanying notes.
33
Table of Contents
JOHN HANCOCK LIFE INSURANCE COMPANY (U.S.A.) SEPARATE ACCOUNT N
STATEMENTS OF OPERATIONS AND CHANGES IN CONTRACT OWNERS’ EQUITY
For the years ended December 31,
| International Growth Stock Trust Series I |
International Growth Stock Trust Series NAV |
International Small Company Trust Series I |
||||||||||||||||||||||
| 2018 | 2017 | 2018 | 2017 | 2018 | 2017 | |||||||||||||||||||
| Income: |
||||||||||||||||||||||||
| Dividend distributions received |
$ | 16,696 | $ | 39,666 | $ | 181,015 | $ | 146,915 | $ | 10,737 | $ | 7,998 | ||||||||||||
| Expenses: |
||||||||||||||||||||||||
| Mortality and expense risk and administrative charges |
(5,684 | ) | (6,961 | ) | — | — | (4,449 | ) | (3,411 | ) | ||||||||||||||
|
|
|
|
|
|
|
|
|
|
|
|
|
|||||||||||||
| Net investment income (loss) |
11,012 | 32,705 | 181,015 | 146,915 | 6,288 | 4,587 | ||||||||||||||||||
|
|
|
|
|
|
|
|
|
|
|
|
|
|||||||||||||
| Realized gains (losses) on investments: |
||||||||||||||||||||||||
| Capital gain distributions received |
30,078 | — | 315,344 | — | 1 | — | ||||||||||||||||||
| Net realized gain (loss) |
127,657 | 4,369 | 185,195 | 134,969 | 41,681 | 15,196 | ||||||||||||||||||
|
|
|
|
|
|
|
|
|
|
|
|
|
|||||||||||||
| Realized gains (losses) |
157,735 | 4,369 | 500,539 | 134,969 | 41,682 | 15,196 | ||||||||||||||||||
|
|
|
|
|
|
|
|
|
|
|
|
|
|||||||||||||
| Unrealized appreciation (depreciation) during the period |
(412,093 | ) | 405,643 | (2,343,376 | ) | 1,563,629 | (180,823 | ) | 121,736 | |||||||||||||||
|
|
|
|
|
|
|
|
|
|
|
|
|
|||||||||||||
| Net increase (decrease) in net assets from operations |
(243,346 | ) | 442,717 | (1,661,822 | ) | 1,845,513 | (132,853 | ) | 141,519 | |||||||||||||||
|
|
|
|
|
|
|
|
|
|
|
|
|
|||||||||||||
| Changes from principal transactions: |
||||||||||||||||||||||||
| Purchase payments |
676 | 6,696 | 123,116 | 77,706 | 11,170 | 12,991 | ||||||||||||||||||
| Transfers between sub-accounts and the company |
(1,848,559 | ) | 1,122,150 | 4,815 | 2,160,156 | (253,023 | ) | 302,044 | ||||||||||||||||
| Transfers on general account policy loans |
— | — | 2,749 | (736 | ) | 288 | (427 | ) | ||||||||||||||||
| Withdrawals |
9,482 | (35 | ) | (123,465 | ) | (1,921,538 | ) | (5,407 | ) | (69,935 | ) | |||||||||||||
| Annual contract fee |
(20,060 | ) | (35,614 | ) | (94,186 | ) | (81,653 | ) | (38,469 | ) | (29,255 | ) | ||||||||||||
|
|
|
|
|
|
|
|
|
|
|
|
|
|||||||||||||
| Net increase (decrease) in net assets from principal transactions |
(1,858,461 | ) | 1,093,197 | (86,971 | ) | 233,935 | (285,441 | ) | 215,418 | |||||||||||||||
|
|
|
|
|
|
|
|
|
|
|
|
|
|||||||||||||
| Total increase (decrease) in net assets |
(2,101,807 | ) | 1,535,914 | (1,748,793 | ) | 2,079,448 | (418,294 | ) | 356,937 | |||||||||||||||
| Net assets at beginning of period |
3,020,605 | 1,484,691 | 10,971,753 | 8,892,305 | 853,645 | 496,708 | ||||||||||||||||||
|
|
|
|
|
|
|
|
|
|
|
|
|
|||||||||||||
| Net assets at end of period |
$ | 918,798 | $ | 3,020,605 | $ | 9,222,960 | $ | 10,971,753 | $ | 435,351 | $ | 853,645 | ||||||||||||
|
|
|
|
|
|
|
|
|
|
|
|
|
|||||||||||||
| 2018 | 2017 | 2018 | 2017 | 2018 | 2017 | |||||||||||||||||||
| Units, beginning of period |
209,929 | 125,595 | 749,454 | 740,462 | 43,760 | 32,688 | ||||||||||||||||||
| Units issued |
6,272 | 89,473 | 213,208 | 359,656 | 6,805 | 18,340 | ||||||||||||||||||
| Units redeemed |
(141,659 | ) | (5,139 | ) | (226,440 | ) | (350,664 | ) | (22,430 | ) | (7,268 | ) | ||||||||||||
|
|
|
|
|
|
|
|
|
|
|
|
|
|||||||||||||
| Units, end of period |
74,542 | 209,929 | 736,222 | 749,454 | 28,135 | 43,760 | ||||||||||||||||||
|
|
|
|
|
|
|
|
|
|
|
|
|
|||||||||||||
See accompanying notes.
34
Table of Contents
JOHN HANCOCK LIFE INSURANCE COMPANY (U.S.A.) SEPARATE ACCOUNT N
STATEMENTS OF OPERATIONS AND CHANGES IN CONTRACT OWNERS’ EQUITY
For the years ended December 31,
| International Small Company Trust Series NAV |
International Value Trust Series I |
International Value Trust Series NAV |
||||||||||||||||||||||
| 2018 | 2017 | 2018 | 2017 | 2018 | 2017 | |||||||||||||||||||
| Income: |
||||||||||||||||||||||||
| Dividend distributions received |
$ | 17,379 | $ | 21,854 | $ | 123,411 | $ | 109,973 | $ | 166,058 | $ | 130,309 | ||||||||||||
| Expenses: |
||||||||||||||||||||||||
| Mortality and expense risk and administrative charges |
— | — | (19,456 | ) | (21,944 | ) | — | — | ||||||||||||||||
|
|
|
|
|
|
|
|
|
|
|
|
|
|||||||||||||
| Net investment income (loss) |
17,379 | 21,854 | 103,955 | 88,029 | 166,058 | 130,309 | ||||||||||||||||||
|
|
|
|
|
|
|
|
|
|
|
|
|
|||||||||||||
| Realized gains (losses) on investments: |
||||||||||||||||||||||||
| Capital gain distributions received |
— | — | — | 2 | — | — | ||||||||||||||||||
| Net realized gain (loss) |
133,615 | 41,739 | 155,697 | 35,992 | (101,142 | ) | (39,421 | ) | ||||||||||||||||
|
|
|
|
|
|
|
|
|
|
|
|
|
|||||||||||||
| Realized gains (losses) |
133,615 | 41,739 | 155,697 | 35,994 | (101,142 | ) | (39,421 | ) | ||||||||||||||||
|
|
|
|
|
|
|
|
|
|
|
|
|
|||||||||||||
| Unrealized appreciation (depreciation) during the period |
(440,086 | ) | 258,155 | (1,083,965 | ) | 790,685 | (1,086,477 | ) | 912,121 | |||||||||||||||
|
|
|
|
|
|
|
|
|
|
|
|
|
|||||||||||||
| Net increase (decrease) in net assets from operations |
(289,092 | ) | 321,748 | (824,313 | ) | 914,708 | (1,021,561 | ) | 1,003,009 | |||||||||||||||
|
|
|
|
|
|
|
|
|
|
|
|
|
|||||||||||||
| Changes from principal transactions: |
||||||||||||||||||||||||
| Purchase payments |
69,387 | 24,089 | 88,188 | 100,353 | 107,554 | 74,881 | ||||||||||||||||||
| Transfers between sub-accounts and the company |
177,708 | 477,222 | (739,304 | ) | 92,280 | (401,543 | ) | 875,007 | ||||||||||||||||
| Transfers on general account policy loans |
1,243 | 1,196 | (4,904 | ) | (519 | ) | (1,870 | ) | 7,947 | |||||||||||||||
| Withdrawals |
(326,879 | ) | (16,384 | ) | (214,020 | ) | (317,263 | ) | (603,352 | ) | (144,166 | ) | ||||||||||||
| Annual contract fee |
(63,901 | ) | (63,933 | ) | (228,448 | ) | (232,723 | ) | (102,271 | ) | (119,676 | ) | ||||||||||||
|
|
|
|
|
|
|
|
|
|
|
|
|
|||||||||||||
| Net increase (decrease) in net assets from principal transactions |
(142,442 | ) | 422,190 | (1,098,488 | ) | (357,872 | ) | (1,001,482 | ) | 693,993 | ||||||||||||||
|
|
|
|
|
|
|
|
|
|
|
|
|
|||||||||||||
| Total increase (decrease) in net assets |
(431,534 | ) | 743,938 | (1,922,801 | ) | 556,836 | (2,023,043 | ) | 1,697,002 | |||||||||||||||
| Net assets at beginning of period |
1,647,574 | 903,636 | 6,222,043 | 5,665,207 | 7,214,581 | 5,517,579 | ||||||||||||||||||
|
|
|
|
|
|
|
|
|
|
|
|
|
|||||||||||||
| Net assets at end of period |
$ | 1,216,040 | $ | 1,647,574 | $ | 4,299,242 | $ | 6,222,043 | $ | 5,191,538 | $ | 7,214,581 | ||||||||||||
|
|
|
|
|
|
|
|
|
|
|
|
|
|||||||||||||
| 2018 | 2017 | 2018 | 2017 | 2018 | 2017 | |||||||||||||||||||
| Units, beginning of period |
80,027 | 56,882 | 230,516 | 245,286 | 384,866 | 345,121 | ||||||||||||||||||
| Units issued |
23,272 | 30,385 | 18,439 | 25,472 | 51,527 | 100,486 | ||||||||||||||||||
| Units redeemed |
(29,397 | ) | (7,240 | ) | (61,030 | ) | (40,242 | ) | (110,720 | ) | (60,741 | ) | ||||||||||||
|
|
|
|
|
|
|
|
|
|
|
|
|
|||||||||||||
| Units, end of period |
73,902 | 80,027 | 187,925 | 230,516 | 325,673 | 384,866 | ||||||||||||||||||
|
|
|
|
|
|
|
|
|
|
|
|
|
|||||||||||||
See accompanying notes.
35
Table of Contents
JOHN HANCOCK LIFE INSURANCE COMPANY (U.S.A.) SEPARATE ACCOUNT N
STATEMENTS OF OPERATIONS AND CHANGES IN CONTRACT OWNERS’ EQUITY
For the years ended December 31,
| Investment Quality Bond Trust Series I |
Investment Quality Bond Trust Series NAV |
Lifestyle Balanced Portfolio Series NAV |
||||||||||||||||||||||
| 2018 | 2017 | 2018 | 2017 | 2018 (g) | 2017 | |||||||||||||||||||
| Income: |
||||||||||||||||||||||||
| Dividend distributions received |
$ | 117,420 | $ | 120,623 | $ | 26,802 | $ | 20,927 | $ | 171 | $ | — | ||||||||||||
| Expenses: |
||||||||||||||||||||||||
| Mortality and expense risk and administrative charges |
(18,353 | ) | (20,485 | ) | — | — | — | — | ||||||||||||||||
|
|
|
|
|
|
|
|
|
|
|
|
|
|||||||||||||
| Net investment income (loss) |
99,067 | 100,138 | 26,802 | 20,927 | 171 | — | ||||||||||||||||||
|
|
|
|
|
|
|
|
|
|
|
|
|
|||||||||||||
| Realized gains (losses) on investments: |
||||||||||||||||||||||||
| Capital gain distributions received |
29,804 | 19,592 | 6,535 | 3,162 | — | — | ||||||||||||||||||
| Net realized gain (loss) |
(36,084 | ) | 5,001 | (21,555 | ) | (7,822 | ) | (241 | ) | — | ||||||||||||||
|
|
|
|
|
|
|
|
|
|
|
|
|
|||||||||||||
| Realized gains (losses) |
(6,280 | ) | 24,593 | (15,020 | ) | (4,660 | ) | (241 | ) | — | ||||||||||||||
|
|
|
|
|
|
|
|
|
|
|
|
|
|||||||||||||
| Unrealized appreciation (depreciation) during the period |
(151,490 | ) | 62,276 | (18,536 | ) | 18,164 | (410 | ) | — | |||||||||||||||
|
|
|
|
|
|
|
|
|
|
|
|
|
|||||||||||||
| Net increase (decrease) in net assets from operations |
(58,703 | ) | 187,007 | (6,754 | ) | 34,431 | (480 | ) | — | |||||||||||||||
|
|
|
|
|
|
|
|
|
|
|
|
|
|||||||||||||
| Changes from principal transactions: |
||||||||||||||||||||||||
| Purchase payments |
73,061 | 73,820 | 65,847 | 128,849 | 313 | — | ||||||||||||||||||
| Transfers between sub-accounts and the company |
473,549 | 64,484 | 109,825 | 40,336 | 6,979 | — | ||||||||||||||||||
| Transfers on general account policy loans |
20,990 | (22,463 | ) | (607 | ) | 7,342 | — | — | ||||||||||||||||
| Withdrawals |
(652,129 | ) | (163,235 | ) | (240,592 | ) | (94,337 | ) | 19 | — | ||||||||||||||
| Annual contract fee |
(185,869 | ) | (197,853 | ) | (22,751 | ) | (23,004 | ) | (54 | ) | — | |||||||||||||
|
|
|
|
|
|
|
|
|
|
|
|
|
|||||||||||||
| Net increase (decrease) in net assets from principal transactions |
(270,398 | ) | (245,247 | ) | (88,278 | ) | 59,186 | 7,257 | — | |||||||||||||||
|
|
|
|
|
|
|
|
|
|
|
|
|
|||||||||||||
| Total increase (decrease) in net assets |
(329,101 | ) | (58,240 | ) | (95,032 | ) | 93,617 | 6,777 | — | |||||||||||||||
| Net assets at beginning of period |
4,607,928 | 4,666,168 | 822,445 | 728,828 | — | — | ||||||||||||||||||
|
|
|
|
|
|
|
|
|
|
|
|
|
|||||||||||||
| Net assets at end of period |
$ | 4,278,827 | $ | 4,607,928 | $ | 727,413 | $ | 822,445 | $ | 6,777 | $ | — | ||||||||||||
|
|
|
|
|
|
|
|
|
|
|
|
|
|||||||||||||
| 2018 | 2017 | 2018 | 2017 | 2018 | 2017 | |||||||||||||||||||
| Units, beginning of period |
138,776 | 146,714 | 47,484 | 44,046 | — | — | ||||||||||||||||||
| Units issued |
16,176 | 19,501 | 15,762 | 13,288 | 1,089 | — | ||||||||||||||||||
| Units redeemed |
(25,169 | ) | (27,439 | ) | (20,962 | ) | (9,850 | ) | (535 | ) | — | |||||||||||||
|
|
|
|
|
|
|
|
|
|
|
|
|
|||||||||||||
| Units, end of period |
129,783 | 138,776 | 42,284 | 47,484 | 554 | — | ||||||||||||||||||
|
|
|
|
|
|
|
|
|
|
|
|
|
|||||||||||||
| (g) | Sub-account available in prior year but no activity. |
See accompanying notes.
36
Table of Contents
JOHN HANCOCK LIFE INSURANCE COMPANY (U.S.A.) SEPARATE ACCOUNT N
STATEMENTS OF OPERATIONS AND CHANGES IN CONTRACT OWNERS’ EQUITY
For the years ended December 31,
| Lifestyle Growth Portfolio Series I |
Lifestyle Growth Portfolio Series NAV |
M Capital Appreciation | ||||||||||||||||||||||
| 2018 | 2017 | 2018 | 2017 | 2018 | 2017 | |||||||||||||||||||
| Income: |
||||||||||||||||||||||||
| Dividend distributions received |
$ | 2,514 | $ | 5,838 | $ | 59,800 | $ | 49,052 | $ | 942 | $ | — | ||||||||||||
| Expenses: |
||||||||||||||||||||||||
| Mortality and expense risk and administrative charges |
(1,138 | ) | (1,273 | ) | — | — | — | — | ||||||||||||||||
|
|
|
|
|
|
|
|
|
|
|
|
|
|||||||||||||
| Net investment income (loss) |
1,376 | 4,565 | 59,800 | 49,052 | 942 | — | ||||||||||||||||||
|
|
|
|
|
|
|
|
|
|
|
|
|
|||||||||||||
| Realized gains (losses) on investments: |
||||||||||||||||||||||||
| Capital gain distributions received |
1,421 | 2,001 | 33,706 | 1,723 | 58,479 | 31,100 | ||||||||||||||||||
| Net realized gain (loss) |
14,520 | 2,051 | 10,422 | 1,935 | 111 | 45,003 | ||||||||||||||||||
|
|
|
|
|
|
|
|
|
|
|
|
|
|||||||||||||
| Realized gains (losses) |
15,941 | 4,052 | 44,128 | 3,658 | 58,590 | 76,103 | ||||||||||||||||||
|
|
|
|
|
|
|
|
|
|
|
|
|
|||||||||||||
| Unrealized appreciation (depreciation) during the period |
(26,278 | ) | 16,121 | (267,661 | ) | 32,362 | (104,586 | ) | (25,888 | ) | ||||||||||||||
|
|
|
|
|
|
|
|
|
|
|
|
|
|||||||||||||
| Net increase (decrease) in net assets from operations |
(8,961 | ) | 24,738 | (163,733 | ) | 85,072 | (45,054 | ) | 50,215 | |||||||||||||||
|
|
|
|
|
|
|
|
|
|
|
|
|
|||||||||||||
| Changes from principal transactions: |
||||||||||||||||||||||||
| Purchase payments |
2,371 | 4,754 | 96,164 | 29,223 | — | — | ||||||||||||||||||
| Transfers between sub-accounts and the company |
(208,194 | ) | 310,431 | 2,001 | 2,430,539 | 25,000 | (287,004 | ) | ||||||||||||||||
| Transfers on general account policy loans |
— | — | (277 | ) | 83 | — | — | |||||||||||||||||
| Withdrawals |
— | (19,130 | ) | (14,580 | ) | (16 | ) | (1 | ) | 9,872 | ||||||||||||||
| Annual contract fee |
(1,557 | ) | (6,302 | ) | (71,231 | ) | (20,437 | ) | (7,551 | ) | (8,406 | ) | ||||||||||||
|
|
|
|
|
|
|
|
|
|
|
|
|
|||||||||||||
| Net increase (decrease) in net assets from principal transactions |
(207,380 | ) | 289,753 | 12,077 | 2,439,392 | 17,448 | (285,538 | ) | ||||||||||||||||
|
|
|
|
|
|
|
|
|
|
|
|
|
|||||||||||||
| Total increase (decrease) in net assets |
(216,341 | ) | 314,491 | (151,656 | ) | 2,524,464 | (27,606 | ) | (235,323 | ) | ||||||||||||||
| Net assets at beginning of period |
323,859 | 9,368 | 2,652,708 | 128,244 | 293,836 | 529,159 | ||||||||||||||||||
|
|
|
|
|
|
|
|
|
|
|
|
|
|||||||||||||
| Net assets at end of period |
$ | 107,518 | $ | 323,859 | $ | 2,501,052 | $ | 2,652,708 | $ | 266,230 | $ | 293,836 | ||||||||||||
|
|
|
|
|
|
|
|
|
|
|
|
|
|||||||||||||
| 2018 | 2017 | 2018 | 2017 | 2018 | 2017 | |||||||||||||||||||
| Units, beginning of period |
27,555 | 920 | 197,048 | 11,069 | 2,566 | 5,500 | ||||||||||||||||||
| Units issued |
207 | 28,832 | 23,613 | 188,696 | 208 | 4,102 | ||||||||||||||||||
| Units redeemed |
(17,956 | ) | (2,197 | ) | (22,873 | ) | (2,717 | ) | (66 | ) | (7,036 | ) | ||||||||||||
|
|
|
|
|
|
|
|
|
|
|
|
|
|||||||||||||
| Units, end of period |
9,806 | 27,555 | 197,788 | 197,048 | 2,708 | 2,566 | ||||||||||||||||||
|
|
|
|
|
|
|
|
|
|
|
|
|
|||||||||||||
See accompanying notes.
37
Table of Contents
JOHN HANCOCK LIFE INSURANCE COMPANY (U.S.A.) SEPARATE ACCOUNT N
STATEMENTS OF OPERATIONS AND CHANGES IN CONTRACT OWNERS’ EQUITY
For the years ended December 31,
| M Large Cap Growth |
Managed Volatility Aggressive Portfolio Series I |
Managed Volatility Aggressive Portfolio Series NAV |
||||||||||||||||||||||
| 2018 | 2017 | 2018 | 2017 | 2018 | 2017 | |||||||||||||||||||
| Income: |
||||||||||||||||||||||||
| Dividend distributions received |
$ | — | $ | — | $ | 26,441 | $ | 19,637 | $ | 101,204 | $ | 76,933 | ||||||||||||
| Expenses: |
||||||||||||||||||||||||
| Mortality and expense risk and administrative charges |
— | — | (6,931 | ) | (6,480 | ) | — | — | ||||||||||||||||
|
|
|
|
|
|
|
|
|
|
|
|
|
|||||||||||||
| Net investment income (loss) |
— | — | 19,510 | 13,157 | 101,204 | 76,933 | ||||||||||||||||||
|
|
|
|
|
|
|
|
|
|
|
|
|
|||||||||||||
| Realized gains (losses) on investments: |
||||||||||||||||||||||||
| Capital gain distributions received |
1 | — | 80,633 | — | 298,764 | — | ||||||||||||||||||
| Net realized gain (loss) |
— | — | 25,904 | 2,408 | 104,902 | 36,706 | ||||||||||||||||||
|
|
|
|
|
|
|
|
|
|
|
|
|
|||||||||||||
| Realized gains (losses) |
1 | — | 106,537 | 2,408 | 403,666 | 36,706 | ||||||||||||||||||
|
|
|
|
|
|
|
|
|
|
|
|
|
|||||||||||||
| Unrealized appreciation (depreciation) during the period |
(2 | ) | 2 | (240,634 | ) | 211,474 | (868,406 | ) | 816,070 | |||||||||||||||
|
|
|
|
|
|
|
|
|
|
|
|
|
|||||||||||||
| Net increase (decrease) in net assets from operations |
(1 | ) | 2 | (114,587 | ) | 227,039 | (363,536 | ) | 929,709 | |||||||||||||||
|
|
|
|
|
|
|
|
|
|
|
|
|
|||||||||||||
| Changes from principal transactions: |
||||||||||||||||||||||||
| Purchase payments |
— | — | 27,832 | 21,229 | 671,593 | 470,320 | ||||||||||||||||||
| Transfers between sub-accounts and the company |
— | — | 134,541 | (20,445 | ) | (29,858 | ) | (553,045 | ) | |||||||||||||||
| Transfers on general account policy loans |
— | — | — | — | (135,273 | ) | (212,945 | ) | ||||||||||||||||
| Withdrawals |
— | — | (34,027 | ) | (36,702 | ) | (138,475 | ) | (603,414 | ) | ||||||||||||||
| Annual contract fee |
— | — | (50,766 | ) | (46,472 | ) | (233,971 | ) | (220,573 | ) | ||||||||||||||
|
|
|
|
|
|
|
|
|
|
|
|
|
|||||||||||||
| Net increase (decrease) in net assets from principal transactions |
— | — | 77,580 | (82,390 | ) | 134,016 | (1,119,657 | ) | ||||||||||||||||
|
|
|
|
|
|
|
|
|
|
|
|
|
|||||||||||||
| Total increase (decrease) in net assets |
(1 | ) | 2 | (37,007 | ) | 144,649 | (229,520 | ) | (189,948 | ) | ||||||||||||||
| Net assets at beginning of period |
10 | 8 | 1,200,152 | 1,055,503 | 4,576,194 | 4,766,142 | ||||||||||||||||||
|
|
|
|
|
|
|
|
|
|
|
|
|
|||||||||||||
| Net assets at end of period |
$ | 9 | $ | 10 | $ | 1,163,145 | $ | 1,200,152 | $ | 4,346,674 | $ | 4,576,194 | ||||||||||||
|
|
|
|
|
|
|
|
|
|
|
|
|
|||||||||||||
| 2018 | 2017 | 2018 | 2017 | 2018 | 2017 | |||||||||||||||||||
| Units, beginning of period |
— | — | 37,230 | 39,879 | 207,715 | 265,838 | ||||||||||||||||||
| Units issued |
— | — | 6,676 | 5,720 | 60,707 | 51,569 | ||||||||||||||||||
| Units redeemed |
— | — | (4,342 | ) | (8,369 | ) | (53,217 | ) | (109,692 | ) | ||||||||||||||
|
|
|
|
|
|
|
|
|
|
|
|
|
|||||||||||||
| Units, end of period |
— | — | 39,564 | 37,230 | 215,205 | 207,715 | ||||||||||||||||||
|
|
|
|
|
|
|
|
|
|
|
|
|
|||||||||||||
See accompanying notes.
38
Table of Contents
JOHN HANCOCK LIFE INSURANCE COMPANY (U.S.A.) SEPARATE ACCOUNT N
STATEMENTS OF OPERATIONS AND CHANGES IN CONTRACT OWNERS’ EQUITY
For the years ended December 31,
| Managed Volatility Balanced Portfolio Series I |
Managed Volatility Balanced Portfolio Series NAV |
Managed Volatility Conservative Portfolio Series I |
||||||||||||||||||||||
| 2018 | 2017 | 2018 | 2017 | 2018 | 2017 | |||||||||||||||||||
| Income: |
||||||||||||||||||||||||
| Dividend distributions received |
$ | 82,453 | $ | 84,015 | $ | 395,193 | $ | 359,757 | $ | 33,816 | $ | 36,401 | ||||||||||||
| Expenses: |
||||||||||||||||||||||||
| Mortality and expense risk and administrative charges |
(20,416 | ) | (22,736 | ) | — | — | (6,637 | ) | (7,285 | ) | ||||||||||||||
|
|
|
|
|
|
|
|
|
|
|
|
|
|||||||||||||
| Net investment income (loss) |
62,037 | 61,279 | 395,193 | 359,757 | 27,179 | 29,116 | ||||||||||||||||||
|
|
|
|
|
|
|
|
|
|
|
|
|
|||||||||||||
| Realized gains (losses) on investments: |
||||||||||||||||||||||||
| Capital gain distributions received |
243,860 | 151,730 | 1,112,505 | 593,766 | 37,899 | 25,802 | ||||||||||||||||||
| Net realized gain (loss) |
12,863 | (61,329 | ) | (202,149 | ) | (223,488 | ) | (21,419 | ) | (44,640 | ) | |||||||||||||
|
|
|
|
|
|
|
|
|
|
|
|
|
|||||||||||||
| Realized gains (losses) |
256,723 | 90,401 | 910,356 | 370,278 | 16,480 | (18,838 | ) | |||||||||||||||||
|
|
|
|
|
|
|
|
|
|
|
|
|
|||||||||||||
| Unrealized appreciation (depreciation) during the period |
(509,701 | ) | 377,708 | (2,107,502 | ) | 1,472,439 | (77,305 | ) | 96,519 | |||||||||||||||
|
|
|
|
|
|
|
|
|
|
|
|
|
|||||||||||||
| Net increase (decrease) in net assets from operations |
(190,941 | ) | 529,388 | (801,953 | ) | 2,202,474 | (33,646 | ) | 106,797 | |||||||||||||||
|
|
|
|
|
|
|
|
|
|
|
|
|
|||||||||||||
| Changes from principal transactions: |
||||||||||||||||||||||||
| Purchase payments |
63,440 | 119,614 | 1,090,742 | 769,080 | 9,801 | 10,528 | ||||||||||||||||||
| Transfers between sub-accounts and the company |
(2,723 | ) | (372,089 | ) | (136,849 | ) | (1,814,601 | ) | (106,351 | ) | (363,897 | ) | ||||||||||||
| Transfers on general account policy loans |
(2,584 | ) | (10,307 | ) | (12,185 | ) | (46,770 | ) | (213 | ) | (197 | ) | ||||||||||||
| Withdrawals |
(127,199 | ) | (221,112 | ) | (564,548 | ) | (1,086,037 | ) | (21,390 | ) | (49,198 | ) | ||||||||||||
| Annual contract fee |
(360,354 | ) | (349,523 | ) | (521,280 | ) | (604,002 | ) | (63,631 | ) | (69,214 | ) | ||||||||||||
|
|
|
|
|
|
|
|
|
|
|
|
|
|||||||||||||
| Net increase (decrease) in net assets from principal transactions |
(429,420 | ) | (833,417 | ) | (144,120 | ) | (2,782,330 | ) | (181,784 | ) | (471,978 | ) | ||||||||||||
|
|
|
|
|
|
|
|
|
|
|
|
|
|||||||||||||
| Total increase (decrease) in net assets |
(620,361 | ) | (304,029 | ) | (946,073 | ) | (579,856 | ) | (215,430 | ) | (365,181 | ) | ||||||||||||
| Net assets at beginning of period |
3,940,880 | 4,244,909 | 16,545,768 | 17,125,624 | 1,463,970 | 1,829,151 | ||||||||||||||||||
|
|
|
|
|
|
|
|
|
|
|
|
|
|||||||||||||
| Net assets at end of period |
$ | 3,320,519 | $ | 3,940,880 | $ | 15,599,695 | $ | 16,545,768 | $ | 1,248,540 | $ | 1,463,970 | ||||||||||||
|
|
|
|
|
|
|
|
|
|
|
|
|
|||||||||||||
| 2018 | 2017 | 2018 | 2017 | 2018 | 2017 | |||||||||||||||||||
| Units, beginning of period |
108,896 | 132,703 | 803,982 | 949,957 | 41,931 | 55,799 | ||||||||||||||||||
| Units issued |
7,854 | 11,837 | 87,715 | 59,991 | 13,469 | 7,549 | ||||||||||||||||||
| Units redeemed |
(19,401 | ) | (35,644 | ) | (95,298 | ) | (205,966 | ) | (18,363 | ) | (21,417 | ) | ||||||||||||
|
|
|
|
|
|
|
|
|
|
|
|
|
|||||||||||||
| Units, end of period |
97,349 | 108,896 | 796,399 | 803,982 | 37,037 | 41,931 | ||||||||||||||||||
|
|
|
|
|
|
|
|
|
|
|
|
|
|||||||||||||
See accompanying notes.
39
Table of Contents
JOHN HANCOCK LIFE INSURANCE COMPANY (U.S.A.) SEPARATE ACCOUNT N
STATEMENTS OF OPERATIONS AND CHANGES IN CONTRACT OWNERS’ EQUITY
For the years ended December 31,
| Managed Volatility Conservative Portfolio Series NAV |
Managed Volatility Growth Portfolio Series I |
Managed Volatility Growth Portfolio Series NAV |
||||||||||||||||||||||
| 2018 | 2017 | 2018 | 2017 | 2018 | 2017 | |||||||||||||||||||
| Income: |
||||||||||||||||||||||||
| Dividend distributions received |
$ | 156,822 | $ | 121,318 | $ | 65,239 | $ | 60,104 | $ | 481,026 | $ | 455,615 | ||||||||||||
| Expenses: |
||||||||||||||||||||||||
| Mortality and expense risk and administrative charges |
— | — | (15,966 | ) | (16,554 | ) | — | — | ||||||||||||||||
|
|
|
|
|
|
|
|
|
|
|
|
|
|||||||||||||
| Net investment income (loss) |
156,822 | 121,318 | 49,273 | 43,550 | 481,026 | 455,615 | ||||||||||||||||||
|
|
|
|
|
|
|
|
|
|
|
|
|
|||||||||||||
| Realized gains (losses) on investments: |
||||||||||||||||||||||||
| Capital gain distributions received |
152,040 | 82,018 | 267,791 | 118,236 | 1,752,244 | 893,206 | ||||||||||||||||||
| Net realized gain (loss) |
218 | (174,721 | ) | 34,329 | 64,520 | (52,718 | ) | 433,810 | ||||||||||||||||
|
|
|
|
|
|
|
|
|
|
|
|
|
|||||||||||||
| Realized gains (losses) |
152,258 | (92,703 | ) | 302,120 | 182,756 | 1,699,526 | 1,327,016 | |||||||||||||||||
|
|
|
|
|
|
|
|
|
|
|
|
|
|||||||||||||
| Unrealized appreciation (depreciation) during the period |
(436,446 | ) | 350,382 | (562,102 | ) | 291,743 | (3,508,943 | ) | 2,373,560 | |||||||||||||||
|
|
|
|
|
|
|
|
|
|
|
|
|
|||||||||||||
| Net increase (decrease) in net assets from operations |
(127,366 | ) | 378,997 | (210,709 | ) | 518,049 | (1,328,391 | ) | 4,156,191 | |||||||||||||||
|
|
|
|
|
|
|
|
|
|
|
|
|
|||||||||||||
| Changes from principal transactions: |
||||||||||||||||||||||||
| Purchase payments |
1,662,672 | 1,111,725 | 97,500 | 84,831 | 1,792,598 | 1,940,969 | ||||||||||||||||||
| Transfers between sub-accounts and the company |
(273,668 | ) | (1,012,830 | ) | 73,283 | 3,039 | (2,584,187 | ) | (1,992,114 | ) | ||||||||||||||
| Transfers on general account policy loans |
(75,432 | ) | (21,645 | ) | 64,542 | (35,498 | ) | (33,085 | ) | (268,816 | ) | |||||||||||||
| Withdrawals |
(37,825 | ) | (272,400 | ) | (177,530 | ) | (152,335 | ) | (572,670 | ) | (4,189,421 | ) | ||||||||||||
| Annual contract fee |
(254,845 | ) | (222,390 | ) | (227,423 | ) | (220,250 | ) | (658,898 | ) | (757,754 | ) | ||||||||||||
|
|
|
|
|
|
|
|
|
|
|
|
|
|||||||||||||
| Net increase (decrease) in net assets from principal transactions |
1,020,902 | (417,540 | ) | (169,628 | ) | (320,213 | ) | (2,056,242 | ) | (5,267,136 | ) | |||||||||||||
|
|
|
|
|
|
|
|
|
|
|
|
|
|||||||||||||
| Total increase (decrease) in net assets |
893,536 | (38,543 | ) | (380,337 | ) | 197,836 | (3,384,633 | ) | (1,110,945 | ) | ||||||||||||||
| Net assets at beginning of period |
4,800,051 | 4,838,594 | 3,156,985 | 2,959,149 | 23,388,148 | 24,499,093 | ||||||||||||||||||
|
|
|
|
|
|
|
|
|
|
|
|
|
|||||||||||||
| Net assets at end of period |
$ | 5,693,587 | $ | 4,800,051 | $ | 2,776,648 | $ | 3,156,985 | $ | 20,003,515 | $ | 23,388,148 | ||||||||||||
|
|
|
|
|
|
|
|
|
|
|
|
|
|||||||||||||
| 2018 | 2017 | 2018 | 2017 | 2018 | 2017 | |||||||||||||||||||
| Units, beginning of period |
258,867 | 281,681 | 90,667 | 100,401 | 1,107,957 | 1,377,723 | ||||||||||||||||||
| Units issued |
108,392 | 104,343 | 11,544 | 13,266 | 147,391 | 113,865 | ||||||||||||||||||
| Units redeemed |
(53,242 | ) | (127,157 | ) | (16,375 | ) | (23,000 | ) | (241,263 | ) | (383,631 | ) | ||||||||||||
|
|
|
|
|
|
|
|
|
|
|
|
|
|||||||||||||
| Units, end of period |
314,017 | 258,867 | 85,836 | 90,667 | 1,014,085 | 1,107,957 | ||||||||||||||||||
|
|
|
|
|
|
|
|
|
|
|
|
|
|||||||||||||
See accompanying notes.
40
Table of Contents
JOHN HANCOCK LIFE INSURANCE COMPANY (U.S.A.) SEPARATE ACCOUNT N
STATEMENTS OF OPERATIONS AND CHANGES IN CONTRACT OWNERS’ EQUITY
For the years ended December 31,
| Managed Volatility Moderate Portfolio Series I |
Managed Volatility Moderate Portfolio Series NAV |
Mid Cap Index Trust Series I |
||||||||||||||||||||||
| 2018 | 2017 | 2018 | 2017 | 2018 | 2017 | |||||||||||||||||||
| Income: |
||||||||||||||||||||||||
| Dividend distributions received |
$ | 54,267 | $ | 46,251 | $ | 168,519 | $ | 160,093 | $ | 103,728 | $ | 39,990 | ||||||||||||
| Expenses: |
||||||||||||||||||||||||
| Mortality and expense risk and administrative charges |
(10,122 | ) | (9,281 | ) | — | — | (43,475 | ) | (32,279 | ) | ||||||||||||||
|
|
|
|
|
|
|
|
|
|
|
|
|
|||||||||||||
| Net investment income (loss) |
44,145 | 36,970 | 168,519 | 160,093 | 60,253 | 7,711 | ||||||||||||||||||
|
|
|
|
|
|
|
|
|
|
|
|
|
|||||||||||||
| Realized gains (losses) on investments: |
||||||||||||||||||||||||
| Capital gain distributions received |
140,588 | 61,552 | 426,274 | 215,870 | 636,030 | 442,191 | ||||||||||||||||||
| Net realized gain (loss) |
(57,250 | ) | (43,723 | ) | (128,511 | ) | (177,785 | ) | 78,006 | 18,029 | ||||||||||||||
|
|
|
|
|
|
|
|
|
|
|
|
|
|||||||||||||
| Realized gains (losses) |
83,338 | 17,829 | 297,763 | 38,085 | 714,036 | 460,220 | ||||||||||||||||||
|
|
|
|
|
|
|
|
|
|
|
|
|
|||||||||||||
| Unrealized appreciation (depreciation) during the period |
(234,321 | ) | 147,960 | (731,145 | ) | 786,747 | (1,826,520 | ) | 642,486 | |||||||||||||||
|
|
|
|
|
|
|
|
|
|
|
|
|
|||||||||||||
| Net increase (decrease) in net assets from operations |
(106,838 | ) | 202,759 | (264,863 | ) | 984,925 | (1,052,231 | ) | 1,110,417 | |||||||||||||||
|
|
|
|
|
|
|
|
|
|
|
|
|
|||||||||||||
| Changes from principal transactions: |
||||||||||||||||||||||||
| Purchase payments |
56,680 | 47,048 | 259,395 | 336,733 | 192,913 | 110,993 | ||||||||||||||||||
| Transfers between sub-accounts and the company |
297,900 | 203,308 | 58,437 | (3,487,568 | ) | (346,567 | ) | 1,830,494 | ||||||||||||||||
| Transfers on general account policy loans |
(7,893 | ) | (289 | ) | (16,583 | ) | 768 | 196 | 13 | |||||||||||||||
| Withdrawals |
(33,933 | ) | (87,475 | ) | (472,492 | ) | (321,830 | ) | (134,775 | ) | (144,406 | ) | ||||||||||||
| Annual contract fee |
(162,557 | ) | (143,045 | ) | (149,806 | ) | (187,768 | ) | (497,142 | ) | (217,632 | ) | ||||||||||||
|
|
|
|
|
|
|
|
|
|
|
|
|
|||||||||||||
| Net increase (decrease) in net assets from principal transactions |
150,197 | 19,547 | (321,049 | ) | (3,659,665 | ) | (785,375 | ) | 1,579,462 | |||||||||||||||
|
|
|
|
|
|
|
|
|
|
|
|
|
|||||||||||||
| Total increase (decrease) in net assets |
43,359 | 222,306 | (585,912 | ) | (2,674,740 | ) | (1,837,606 | ) | 2,689,879 | |||||||||||||||
| Net assets at beginning of period |
2,047,422 | 1,825,116 | 6,949,417 | 9,624,157 | 9,764,956 | 7,075,077 | ||||||||||||||||||
|
|
|
|
|
|
|
|
|
|
|
|
|
|||||||||||||
| Net assets at end of period |
$ | 2,090,781 | $ | 2,047,422 | $ | 6,363,505 | $ | 6,949,417 | $ | 7,927,350 | $ | 9,764,956 | ||||||||||||
|
|
|
|
|
|
|
|
|
|
|
|
|
|||||||||||||
| 2018 | 2017 | 2018 | 2017 | 2018 | 2017 | |||||||||||||||||||
| Units, beginning of period |
54,906 | 54,394 | 344,088 | 533,840 | 186,083 | 154,279 | ||||||||||||||||||
| Units issued |
14,935 | 11,382 | 27,193 | 18,704 | 8,917 | 49,248 | ||||||||||||||||||
| Units redeemed |
(11,396 | ) | (10,870 | ) | (43,300 | ) | (208,456 | ) | (23,567 | ) | (17,444 | ) | ||||||||||||
|
|
|
|
|
|
|
|
|
|
|
|
|
|||||||||||||
| Units, end of period |
58,445 | 54,906 | 327,981 | 344,088 | 171,433 | 186,083 | ||||||||||||||||||
|
|
|
|
|
|
|
|
|
|
|
|
|
|||||||||||||
See accompanying notes.
41
Table of Contents
JOHN HANCOCK LIFE INSURANCE COMPANY (U.S.A.) SEPARATE ACCOUNT N
STATEMENTS OF OPERATIONS AND CHANGES IN CONTRACT OWNERS’ EQUITY
For the years ended December 31,
| Mid Cap Index Trust Series NAV |
Mid Cap Stock Trust Series I |
Mid Cap Stock Trust Series NAV |
||||||||||||||||||||||
| 2018 | 2017 | 2018 | 2017 | 2018 | 2017 | |||||||||||||||||||
| Income: |
||||||||||||||||||||||||
| Dividend distributions received |
$ | 173,869 | $ | 75,941 | $ | — | $ | — | $ | — | $ | — | ||||||||||||
| Expenses: |
||||||||||||||||||||||||
| Mortality and expense risk and administrative charges |
— | — | (14,196 | ) | (12,555 | ) | — | — | ||||||||||||||||
|
|
|
|
|
|
|
|
|
|
|
|
|
|||||||||||||
| Net investment income (loss) |
173,869 | 75,941 | (14,196 | ) | (12,555 | ) | — | — | ||||||||||||||||
|
|
|
|
|
|
|
|
|
|
|
|
|
|||||||||||||
| Realized gains (losses) on investments: |
||||||||||||||||||||||||
| Capital gain distributions received |
1,006,849 | 801,568 | 424,105 | 68,969 | 838,342 | 116,269 | ||||||||||||||||||
| Net realized gain (loss) |
(97,501 | ) | 405,409 | 116,246 | (2,669 | ) | 368,115 | 393,367 | ||||||||||||||||
|
|
|
|
|
|
|
|
|
|
|
|
|
|||||||||||||
| Realized gains (losses) |
909,348 | 1,206,977 | 540,351 | 66,300 | 1,206,457 | 509,636 | ||||||||||||||||||
|
|
|
|
|
|
|
|
|
|
|
|
|
|||||||||||||
| Unrealized appreciation (depreciation) during the period |
(2,774,097 | ) | 658,498 | (592,112 | ) | 840,403 | (1,310,574 | ) | 958,926 | |||||||||||||||
|
|
|
|
|
|
|
|
|
|
|
|
|
|||||||||||||
| Net increase (decrease) in net assets from operations |
(1,690,880 | ) | 1,941,416 | (65,957 | ) | 894,148 | (104,117 | ) | 1,468,562 | |||||||||||||||
|
|
|
|
|
|
|
|
|
|
|
|
|
|||||||||||||
| Changes from principal transactions: |
||||||||||||||||||||||||
| Purchase payments |
369,613 | 331,750 | 29,554 | 29,286 | 244,676 | 196,406 | ||||||||||||||||||
| Transfers between sub-accounts and the company |
(352,128 | ) | 2,937,674 | 152,462 | (424,258 | ) | 239,893 | (799,711 | ) | |||||||||||||||
| Transfers on general account policy loans |
(29,945 | ) | (13,461 | ) | (221 | ) | 249 | (6,071 | ) | 8,358 | ||||||||||||||
| Withdrawals |
(650,625 | ) | (445,433 | ) | (63,306 | ) | (171,622 | ) | (107,873 | ) | (712,125 | ) | ||||||||||||
| Annual contract fee |
(335,895 | ) | (350,967 | ) | (103,805 | ) | (90,775 | ) | (124,111 | ) | (97,924 | ) | ||||||||||||
|
|
|
|
|
|
|
|
|
|
|
|
|
|||||||||||||
| Net increase (decrease) in net assets from principal transactions |
(998,980 | ) | 2,459,563 | 14,684 | (657,120 | ) | 246,514 | (1,404,996 | ) | |||||||||||||||
|
|
|
|
|
|
|
|
|
|
|
|
|
|||||||||||||
| Total increase (decrease) in net assets |
(2,689,860 | ) | 4,400,979 | (51,273 | ) | 237,028 | 142,397 | 63,566 | ||||||||||||||||
| Net assets at beginning of period |
15,217,036 | 10,816,057 | 3,662,348 | 3,425,320 | 6,055,527 | 5,991,961 | ||||||||||||||||||
|
|
|
|
|
|
|
|
|
|
|
|
|
|||||||||||||
| Net assets at end of period |
$ | 12,527,176 | $ | 15,217,036 | $ | 3,611,075 | $ | 3,662,348 | $ | 6,197,924 | $ | 6,055,527 | ||||||||||||
|
|
|
|
|
|
|
|
|
|
|
|
|
|||||||||||||
| 2018 | 2017 | 2018 | 2017 | 2018 | 2017 | |||||||||||||||||||
| Units, beginning of period |
406,367 | 334,660 | 87,269 | 104,260 | 61,598 | 78,421 | ||||||||||||||||||
| Units issued |
67,805 | 209,051 | 9,172 | 7,475 | 35,582 | 70,307 | ||||||||||||||||||
| Units redeemed |
(96,361 | ) | (137,344 | ) | (8,723 | ) | (24,466 | ) | (33,145 | ) | (87,130 | ) | ||||||||||||
|
|
|
|
|
|
|
|
|
|
|
|
|
|||||||||||||
| Units, end of period |
377,811 | 406,367 | 87,718 | 87,269 | 64,035 | 61,598 | ||||||||||||||||||
|
|
|
|
|
|
|
|
|
|
|
|
|
|||||||||||||
See accompanying notes.
42
Table of Contents
JOHN HANCOCK LIFE INSURANCE COMPANY (U.S.A.) SEPARATE ACCOUNT N
STATEMENTS OF OPERATIONS AND CHANGES IN CONTRACT OWNERS’ EQUITY
For the years ended December 31,
| Mid Value Trust Series I | Mid Value Trust Series NAV | Money Market Trust Series I | ||||||||||||||||||||||
| 2018 | 2017 | 2018 | 2017 | 2018 | 2017 | |||||||||||||||||||
| Income: |
||||||||||||||||||||||||
| Dividend distributions received |
$ | 27,112 | $ | 34,091 | $ | 88,263 | $ | 115,103 | $ | 309,941 | $ | 120,166 | ||||||||||||
| Expenses: |
||||||||||||||||||||||||
| Mortality and expense risk and administrative charges |
(10,835 | ) | (11,972 | ) | — | — | (82,511 | ) | (87,154 | ) | ||||||||||||||
|
|
|
|
|
|
|
|
|
|
|
|
|
|||||||||||||
| Net investment income (loss) |
16,277 | 22,119 | 88,263 | 115,103 | 227,430 | 33,012 | ||||||||||||||||||
|
|
|
|
|
|
|
|
|
|
|
|
|
|||||||||||||
| Realized gains (losses) on investments: |
||||||||||||||||||||||||
| Capital gain distributions received |
275,600 | 321,029 | 837,177 | 1,053,741 | (2 | ) | 218 | |||||||||||||||||
| Net realized gain (loss) |
21,515 | (172,388 | ) | (134,535 | ) | (922,102 | ) | — | — | |||||||||||||||
|
|
|
|
|
|
|
|
|
|
|
|
|
|||||||||||||
| Realized gains (losses) |
297,115 | 148,641 | 702,642 | 131,639 | (2 | ) | 218 | |||||||||||||||||
|
|
|
|
|
|
|
|
|
|
|
|
|
|||||||||||||
| Unrealized appreciation (depreciation) during the period |
(683,656 | ) | 231,068 | (1,887,045 | ) | 983,867 | — | 1 | ||||||||||||||||
|
|
|
|
|
|
|
|
|
|
|
|
|
|||||||||||||
| Net increase (decrease) in net assets from operations |
(370,264 | ) | 401,828 | (1,096,140 | ) | 1,230,609 | 227,428 | 33,231 | ||||||||||||||||
|
|
|
|
|
|
|
|
|
|
|
|
|
|||||||||||||
| Changes from principal transactions: |
||||||||||||||||||||||||
| Purchase payments |
12,601 | 10,887 | 167,975 | 189,498 | 159,332 | 155,229 | ||||||||||||||||||
| Transfers between sub-accounts and the company |
104,211 | (742,686 | ) | (885,287 | ) | (67,165 | ) | 1,863,022 | 1,522,747 | |||||||||||||||
| Transfers on general account policy loans |
(7,270 | ) | 63 | (1,704 | ) | 6,547 | 219,680 | 3,073 | ||||||||||||||||
| Withdrawals |
(233,700 | ) | (822,650 | ) | (552,600 | ) | (1,053,737 | ) | (1,984,261 | ) | (9,047,955 | ) | ||||||||||||
| Annual contract fee |
(101,670 | ) | (102,752 | ) | (134,346 | ) | (148,786 | ) | (821,780 | ) | (874,354 | ) | ||||||||||||
|
|
|
|
|
|
|
|
|
|
|
|
|
|||||||||||||
| Net increase (decrease) in net assets from principal transactions |
(225,828 | ) | (1,657,138 | ) | (1,405,962 | ) | (1,073,643 | ) | (564,007 | ) | (8,241,260 | ) | ||||||||||||
|
|
|
|
|
|
|
|
|
|
|
|
|
|||||||||||||
| Total increase (decrease) in net assets |
(596,092 | ) | (1,255,310 | ) | (2,502,102 | ) | 156,966 | (336,579 | ) | (8,208,029 | ) | |||||||||||||
| Net assets at beginning of period |
3,587,121 | 4,842,431 | 11,222,471 | 11,065,505 | 19,208,310 | 27,416,339 | ||||||||||||||||||
|
|
|
|
|
|
|
|
|
|
|
|
|
|||||||||||||
| Net assets at end of period |
$ | 2,991,029 | $ | 3,587,121 | $ | 8,720,369 | $ | 11,222,471 | $ | 18,871,731 | $ | 19,208,310 | ||||||||||||
|
|
|
|
|
|
|
|
|
|
|
|
|
|||||||||||||
| 2018 | 2017 | 2018 | 2017 | 2018 | 2017 | |||||||||||||||||||
| Units, beginning of period |
106,318 | 159,334 | 210,469 | 231,302 | 930,799 | 1,316,851 | ||||||||||||||||||
| Units issued |
10,592 | 9,806 | 31,658 | 66,040 | 585,774 | 373,918 | ||||||||||||||||||
| Units redeemed |
(17,247 | ) | (62,822 | ) | (59,023 | ) | (86,873 | ) | (611,915 | ) | (759,970 | ) | ||||||||||||
|
|
|
|
|
|
|
|
|
|
|
|
|
|||||||||||||
| Units, end of period |
99,663 | 106,318 | 183,104 | 210,469 | 904,658 | 930,799 | ||||||||||||||||||
|
|
|
|
|
|
|
|
|
|
|
|
|
|||||||||||||
See accompanying notes.
43
Table of Contents
JOHN HANCOCK LIFE INSURANCE COMPANY (U.S.A.) SEPARATE ACCOUNT N
STATEMENTS OF OPERATIONS AND CHANGES IN CONTRACT OWNERS’ EQUITY
For the years ended December 31,
| Money-Market Trust Series NAV |
PIMCO All Asset | Real Estate Securities Trust Series I |
||||||||||||||||||||||
| 2018 | 2017 | 2018 | 2017 | 2018 | 2017 | |||||||||||||||||||
| Income: |
||||||||||||||||||||||||
| Dividend distributions received |
$ | 810,631 | $ | 243,058 | $ | 141,819 | $ | 180,156 | $ | 138,701 | $ | 45,421 | ||||||||||||
| Expenses: |
||||||||||||||||||||||||
| Mortality and expense risk and administrative charges |
— | — | (6,561 | ) | (4,318 | ) | (46,970 | ) | (51,203 | ) | ||||||||||||||
|
|
|
|
|
|
|
|
|
|
|
|
|
|||||||||||||
| Net investment income (loss) |
810,631 | 243,058 | 135,258 | 175,838 | 91,731 | (5,782 | ) | |||||||||||||||||
|
|
|
|
|
|
|
|
|
|
|
|
|
|||||||||||||
| Realized gains (losses) on investments: |
||||||||||||||||||||||||
| Capital gain distributions received |
(1 | ) | 295 | — | — | 1 | 1 | |||||||||||||||||
| Net realized gain (loss) |
— | — | (35,841 | ) | (21,424 | ) | 329,979 | 458,033 | ||||||||||||||||
|
|
|
|
|
|
|
|
|
|
|
|
|
|||||||||||||
| Realized gains (losses) |
(1 | ) | 295 | (35,841 | ) | (21,424 | ) | 329,980 | 458,034 | |||||||||||||||
|
|
|
|
|
|
|
|
|
|
|
|
|
|||||||||||||
| Unrealized appreciation (depreciation) during the period |
— | — | (377,403 | ) | 339,568 | (750,638 | ) | 45,877 | ||||||||||||||||
|
|
|
|
|
|
|
|
|
|
|
|
|
|||||||||||||
| Net increase (decrease) in net assets from operations |
810,630 | 243,353 | (277,986 | ) | 493,982 | (328,927 | ) | 498,129 | ||||||||||||||||
|
|
|
|
|
|
|
|
|
|
|
|
|
|||||||||||||
| Changes from principal transactions: |
||||||||||||||||||||||||
| Purchase payments |
4,686,280 | 6,074,083 | 124,150 | 149,864 | 119,085 | 143,778 | ||||||||||||||||||
| Transfers between sub-accounts and the company |
9,294,173 | 15,888,771 | 743,415 | 678,667 | 164,727 | (941,221 | ) | |||||||||||||||||
| Transfers on general account policy loans |
6,548 | (108,055 | ) | (40 | ) | (43 | ) | (15,786 | ) | 14,363 | ||||||||||||||
| Withdrawals |
(2,695,360 | ) | (4,218,543 | ) | (41,100 | ) | (305,595 | ) | (443,784 | ) | (615,916 | ) | ||||||||||||
| Annual contract fee |
(1,134,332 | ) | (1,015,843 | ) | (152,494 | ) | (138,531 | ) | (362,313 | ) | (400,818 | ) | ||||||||||||
|
|
|
|
|
|
|
|
|
|
|
|
|
|||||||||||||
| Net increase (decrease) in net assets from principal transactions |
10,157,309 | 16,620,413 | 673,931 | 384,362 | (538,071 | ) | (1,799,814 | ) | ||||||||||||||||
|
|
|
|
|
|
|
|
|
|
|
|
|
|||||||||||||
| Total increase (decrease) in net assets |
10,967,939 | 16,863,766 | 395,945 | 878,344 | (866,998 | ) | (1,301,685 | ) | ||||||||||||||||
| Net assets at beginning of period |
53,181,453 | 36,317,687 | 4,545,996 | 3,667,652 | 8,669,617 | 9,971,302 | ||||||||||||||||||
|
|
|
|
|
|
|
|
|
|
|
|
|
|||||||||||||
| Net assets at end of period |
$ | 64,149,392 | $ | 53,181,453 | $ | 4,941,941 | $ | 4,545,996 | $ | 7,802,619 | $ | 8,669,617 | ||||||||||||
|
|
|
|
|
|
|
|
|
|
|
|
|
|||||||||||||
| 2018 | 2017 | 2018 | 2017 | 2018 | 2017 | |||||||||||||||||||
| Units, beginning of period |
5,280,323 | 3,628,112 | 235,317 | 215,036 | 47,363 | 57,395 | ||||||||||||||||||
| Units issued |
4,944,326 | 6,177,745 | 67,094 | 57,183 | 3,074 | 773 | ||||||||||||||||||
| Units redeemed |
(3,954,725 | ) | (4,525,534 | ) | (35,621 | ) | (36,902 | ) | (6,044 | ) | (10,805 | ) | ||||||||||||
|
|
|
|
|
|
|
|
|
|
|
|
|
|||||||||||||
| Units, end of period |
6,269,924 | 5,280,323 | 266,790 | 235,317 | 44,393 | 47,363 | ||||||||||||||||||
|
|
|
|
|
|
|
|
|
|
|
|
|
|||||||||||||
See accompanying notes.
44
Table of Contents
JOHN HANCOCK LIFE INSURANCE COMPANY (U.S.A.) SEPARATE ACCOUNT N
STATEMENTS OF OPERATIONS AND CHANGES IN CONTRACT OWNERS’ EQUITY
For the years ended December 31,
| Real Estate Securities Trust Series NAV |
Science & Technology Trust Series I |
Science & Technology Trust Series NAV |
||||||||||||||||||||||
| 2018 | 2017 | 2018 | 2017 | 2018 | 2017 | |||||||||||||||||||
| Income: |
||||||||||||||||||||||||
| Dividend distributions received |
$ | 202,332 | $ | 79,163 | $ | — | $ | 4,029 | $ | — | $ | 4,395 | ||||||||||||
| Expenses: |
||||||||||||||||||||||||
| Mortality and expense risk and administrative charges |
— | — | (34,184 | ) | (31,614 | ) | — | — | ||||||||||||||||
|
|
|
|
|
|
|
|
|
|
|
|
|
|||||||||||||
| Net investment income (loss) |
202,332 | 79,163 | (34,184 | ) | (27,585 | ) | — | 4,395 | ||||||||||||||||
|
|
|
|
|
|
|
|
|
|
|
|
|
|||||||||||||
| Realized gains (losses) on investments: |
||||||||||||||||||||||||
| Capital gain distributions received |
— | — | 1,273,882 | 430,935 | 1,110,658 | 278,799 | ||||||||||||||||||
| Net realized gain (loss) |
477,547 | 761,238 | 447,346 | 184,346 | 366,610 | 636,610 | ||||||||||||||||||
|
|
|
|
|
|
|
|
|
|
|
|
|
|||||||||||||
| Realized gains (losses) |
477,547 | 761,238 | 1,721,228 | 615,281 | 1,477,268 | 915,409 | ||||||||||||||||||
|
|
|
|
|
|
|
|
|
|
|
|
|
|||||||||||||
| Unrealized appreciation (depreciation) during the period |
(1,137,176 | ) | (96,267 | ) | (1,679,630 | ) | 2,289,543 | (1,749,546 | ) | 596,538 | ||||||||||||||
|
|
|
|
|
|
|
|
|
|
|
|
|
|||||||||||||
| Net increase (decrease) in net assets from operations |
(457,297 | ) | 744,134 | 7,414 | 2,877,239 | (272,278 | ) | 1,516,342 | ||||||||||||||||
|
|
|
|
|
|
|
|
|
|
|
|
|
|||||||||||||
| Changes from principal transactions: |
||||||||||||||||||||||||
| Purchase payments |
311,476 | 390,328 | 66,565 | 55,700 | 218,349 | 239,955 | ||||||||||||||||||
| Transfers between sub-accounts and the company |
(1,419,759 | ) | (127,354 | ) | (162,950 | ) | (1,313,079 | ) | 2,269,470 | 723,003 | ||||||||||||||
| Transfers on general account policy loans |
(9,553 | ) | 7,615 | (1,091 | ) | 2,050 | (1,458 | ) | 245 | |||||||||||||||
| Withdrawals |
(405,968 | ) | (493,434 | ) | (384,912 | ) | (650,687 | ) | (469,031 | ) | (129,876 | ) | ||||||||||||
| Annual contract fee |
(181,329 | ) | (200,042 | ) | (295,533 | ) | (256,903 | ) | (196,153 | ) | (140,426 | ) | ||||||||||||
|
|
|
|
|
|
|
|
|
|
|
|
|
|||||||||||||
| Net increase (decrease) in net assets from principal transactions |
(1,705,133 | ) | (422,887 | ) | (777,921 | ) | (2,162,919 | ) | 1,821,177 | 692,901 | ||||||||||||||
|
|
|
|
|
|
|
|
|
|
|
|
|
|||||||||||||
| Total increase (decrease) in net assets |
(2,162,430 | ) | 321,247 | (770,507 | ) | 714,320 | 1,548,899 | 2,209,243 | ||||||||||||||||
| Net assets at beginning of period |
13,691,576 | 13,370,329 | 8,662,179 | 7,947,859 | 5,704,807 | 3,495,564 | ||||||||||||||||||
|
|
|
|
|
|
|
|
|
|
|
|
|
|||||||||||||
| Net assets at end of period |
$ | 11,529,146 | $ | 13,691,576 | $ | 7,891,672 | $ | 8,662,179 | $ | 7,253,706 | $ | 5,704,807 | ||||||||||||
|
|
|
|
|
|
|
|
|
|
|
|
|
|||||||||||||
| 2018 | 2017 | 2018 | 2017 | 2018 | 2017 | |||||||||||||||||||
| Units, beginning of period |
84,360 | 87,538 | 176,794 | 225,197 | 129,919 | 112,415 | ||||||||||||||||||
| Units issued |
21,338 | 32,511 | 15,261 | 19,880 | 92,463 | 137,973 | ||||||||||||||||||
| Units redeemed |
(32,142 | ) | (35,689 | ) | (31,219 | ) | (68,283 | ) | (56,246 | ) | (120,469 | ) | ||||||||||||
|
|
|
|
|
|
|
|
|
|
|
|
|
|||||||||||||
| Units, end of period |
73,556 | 84,360 | 160,836 | 176,794 | 166,136 | 129,919 | ||||||||||||||||||
|
|
|
|
|
|
|
|
|
|
|
|
|
|||||||||||||
See accompanying notes.
45
Table of Contents
JOHN HANCOCK LIFE INSURANCE COMPANY (U.S.A.) SEPARATE ACCOUNT N
STATEMENTS OF OPERATIONS AND CHANGES IN CONTRACT OWNERS’ EQUITY
For the years ended December 31,
| Select Bond Trust Series I | Select Bond Trust Series NAV | Short Term Government Income Trust Series I |
||||||||||||||||||||||
| 2018 (a) | 2017 | 2018 (b) | 2017 | 2018 | 2017 | |||||||||||||||||||
| Income: |
||||||||||||||||||||||||
| Dividend distributions received |
$ | 173,071 | $ | 178,782 | $ | 36,563 | $ | 46,906 | $ | 30,495 | $ | 19,180 | ||||||||||||
| Expenses: |
||||||||||||||||||||||||
| Mortality and expense risk and administrative charges |
(25,047 | ) | (26,481 | ) | — | — | (7,279 | ) | (7,141 | ) | ||||||||||||||
|
|
|
|
|
|
|
|
|
|
|
|
|
|||||||||||||
| Net investment income (loss) |
148,024 | 152,301 | 36,563 | 46,906 | 23,216 | 12,039 | ||||||||||||||||||
|
|
|
|
|
|
|
|
|
|
|
|
|
|||||||||||||
| Realized gains (losses) on investments: |
||||||||||||||||||||||||
| Capital gain distributions received |
1 | — | — | — | — | — | ||||||||||||||||||
| Net realized gain (loss) |
(43,393 | ) | (25,659 | ) | (48,294 | ) | (231,488 | ) | (14,871 | ) | (5,024 | ) | ||||||||||||
|
|
|
|
|
|
|
|
|
|
|
|
|
|||||||||||||
| Realized gains (losses) |
(43,392 | ) | (25,659 | ) | (48,294 | ) | (231,488 | ) | (14,871 | ) | (5,024 | ) | ||||||||||||
|
|
|
|
|
|
|
|
|
|
|
|
|
|||||||||||||
| Unrealized appreciation (depreciation) during the period |
(163,984 | ) | 87,731 | (3,507 | ) | 267,171 | (2,742 | ) | (6,086 | ) | ||||||||||||||
|
|
|
|
|
|
|
|
|
|
|
|
|
|||||||||||||
| Net increase (decrease) in net assets from operations |
(59,352 | ) | 214,373 | (15,238 | ) | 82,589 | 5,603 | 929 | ||||||||||||||||
|
|
|
|
|
|
|
|
|
|
|
|
|
|||||||||||||
| Changes from principal transactions: |
||||||||||||||||||||||||
| Purchase payments |
17,520 | 18,537 | 101,926 | 198,751 | 19,019 | 21,059 | ||||||||||||||||||
| Transfers between sub-accounts and the company |
(231,872 | ) | (265,123 | ) | (500,480 | ) | (6,092,942 | ) | 246,501 | 72,040 | ||||||||||||||
| Transfers on general account policy loans |
(23 | ) | (22 | ) | 4,805 | 7,186 | (80 | ) | 163 | |||||||||||||||
| Withdrawals |
(34,326 | ) | (346,355 | ) | (18,758 | ) | (109,748 | ) | (51,046 | ) | (475 | ) | ||||||||||||
| Annual contract fee |
(131,881 | ) | (148,311 | ) | (66,040 | ) | (81,160 | ) | (81,841 | ) | (78,268 | ) | ||||||||||||
|
|
|
|
|
|
|
|
|
|
|
|
|
|||||||||||||
| Net increase (decrease) in net assets from principal transactions |
(380,582 | ) | (741,274 | ) | (478,547 | ) | (6,077,913 | ) | 132,553 | 14,519 | ||||||||||||||
|
|
|
|
|
|
|
|
|
|
|
|
|
|||||||||||||
| Total increase (decrease) in net assets |
(439,934 | ) | (526,901 | ) | (493,785 | ) | (5,995,324 | ) | 138,156 | 15,448 | ||||||||||||||
| Net assets at beginning of period |
6,653,487 | 7,180,388 | 1,681,650 | 7,676,974 | 1,451,325 | 1,435,877 | ||||||||||||||||||
|
|
|
|
|
|
|
|
|
|
|
|
|
|||||||||||||
| Net assets at end of period |
$ | 6,213,553 | $ | 6,653,487 | $ | 1,187,865 | $ | 1,681,650 | $ | 1,589,481 | $ | 1,451,325 | ||||||||||||
|
|
|
|
|
|
|
|
|
|
|
|
|
|||||||||||||
| 2018 | 2017 | 2018 | 2017 | 2018 | 2017 | |||||||||||||||||||
| Units, beginning of period |
570,745 | 636,003 | 140,363 | 664,134 | 139,708 | 138,264 | ||||||||||||||||||
| Units issued |
47,545 | 47,516 | 27,620 | 18,764 | 35,795 | 15,046 | ||||||||||||||||||
| Units redeemed |
(81,097 | ) | (112,774 | ) | (68,451 | ) | (542,535 | ) | (23,119 | ) | (13,602 | ) | ||||||||||||
|
|
|
|
|
|
|
|
|
|
|
|
|
|||||||||||||
| Units, end of period |
537,193 | 570,745 | 99,532 | 140,363 | 152,384 | 139,708 | ||||||||||||||||||
|
|
|
|
|
|
|
|
|
|
|
|
|
|||||||||||||
| (a) | Renamed on April 30, 2018. Previously known as Bond Trust Series I. |
| (b) | Renamed on April 30, 2018. Previously known as Bond Trust Series NAV. |
See accompanying notes.
46
Table of Contents
JOHN HANCOCK LIFE INSURANCE COMPANY (U.S.A.) SEPARATE ACCOUNT N
STATEMENTS OF OPERATIONS AND CHANGES IN CONTRACT OWNERS’ EQUITY
For the years ended December 31,
| Short Term Government Income Trust Series NAV |
Small Cap Index Trust Series I |
Small Cap Index Trust Series NAV |
||||||||||||||||||||||
| 2018 | 2017 | 2018 | 2017 | 2018 | 2017 | |||||||||||||||||||
| Income: |
||||||||||||||||||||||||
| Dividend distributions received |
$ | 114,686 | $ | 29,960 | $ | 60,811 | $ | 26,087 | $ | 111,046 | $ | 33,897 | ||||||||||||
| Expenses: |
||||||||||||||||||||||||
| Mortality and expense risk and administrative charges |
— | — | (25,027 | ) | (23,028 | ) | — | — | ||||||||||||||||
|
|
|
|
|
|
|
|
|
|
|
|
|
|||||||||||||
| Net investment income (loss) |
114,686 | 29,960 | 35,784 | 3,059 | 111,046 | 33,897 | ||||||||||||||||||
|
|
|
|
|
|
|
|
|
|
|
|
|
|||||||||||||
| Realized gains (losses) on investments: |
||||||||||||||||||||||||
| Capital gain distributions received |
— | — | 378,619 | 237,959 | 659,260 | 270,895 | ||||||||||||||||||
| Net realized gain (loss) |
(42,645 | ) | (23,736 | ) | 23,472 | 19,130 | (114,755 | ) | 211,488 | |||||||||||||||
|
|
|
|
|
|
|
|
|
|
|
|
|
|||||||||||||
| Realized gains (losses) |
(42,645 | ) | (23,736 | ) | 402,091 | 257,089 | 544,505 | 482,383 | ||||||||||||||||
|
|
|
|
|
|
|
|
|
|
|
|
|
|||||||||||||
| Unrealized appreciation (depreciation) during the period |
(5,310 | ) | 5,427 | (1,168,595 | ) | 524,113 | (2,307,636 | ) | 379,532 | |||||||||||||||
|
|
|
|
|
|
|
|
|
|
|
|
|
|||||||||||||
| Net increase (decrease) in net assets from operations |
66,731 | 11,651 | (730,720 | ) | 784,261 | (1,652,085 | ) | 895,812 | ||||||||||||||||
|
|
|
|
|
|
|
|
|
|
|
|
|
|||||||||||||
| Changes from principal transactions: |
||||||||||||||||||||||||
| Purchase payments |
39,495 | 22,130 | 24,494 | 24,331 | 176,340 | 162,394 | ||||||||||||||||||
| Transfers between sub-accounts and the company |
3,927,798 | 71,738 | 88,187 | (434,650 | ) | 4,543,854 | 138,193 | |||||||||||||||||
| Transfers on general account policy loans |
1,836 | 2,332 | 110 | 350 | (9,286 | ) | (13,591 | ) | ||||||||||||||||
| Withdrawals |
(806,914 | ) | (1,020 | ) | 1,889 | (5,775 | ) | (813,316 | ) | (87,818 | ) | |||||||||||||
| Annual contract fee |
(39,572 | ) | (30,981 | ) | (97,156 | ) | (92,258 | ) | (180,857 | ) | (188,096 | ) | ||||||||||||
|
|
|
|
|
|
|
|
|
|
|
|
|
|||||||||||||
| Net increase (decrease) in net assets from principal transactions |
3,122,643 | 64,199 | 17,524 | (508,002 | ) | 3,716,735 | 11,082 | |||||||||||||||||
|
|
|
|
|
|
|
|
|
|
|
|
|
|||||||||||||
| Total increase (decrease) in net assets |
3,189,374 | 75,850 | (713,196 | ) | 276,259 | 2,064,650 | 906,894 | |||||||||||||||||
| Net assets at beginning of period |
2,133,338 | 2,057,488 | 6,186,594 | 5,910,335 | 6,813,361 | 5,906,467 | ||||||||||||||||||
|
|
|
|
|
|
|
|
|
|
|
|
|
|||||||||||||
| Net assets at end of period |
$ | 5,322,712 | $ | 2,133,338 | $ | 5,473,398 | $ | 6,186,594 | $ | 8,878,011 | $ | 6,813,361 | ||||||||||||
|
|
|
|
|
|
|
|
|
|
|
|
|
|||||||||||||
| 2018 | 2017 | 2018 | 2017 | 2018 | 2017 | |||||||||||||||||||
| Units, beginning of period |
196,487 | 190,676 | 154,601 | 168,328 | 198,652 | 197,055 | ||||||||||||||||||
| Units issued |
406,070 | 120,962 | 14,562 | 9,200 | 188,172 | 118,344 | ||||||||||||||||||
| Units redeemed |
(116,653 | ) | (115,151 | ) | (14,108 | ) | (22,927 | ) | (94,987 | ) | (116,747 | ) | ||||||||||||
|
|
|
|
|
|
|
|
|
|
|
|
|
|||||||||||||
| Units, end of period |
485,904 | 196,487 | 155,055 | 154,601 | 291,837 | 198,652 | ||||||||||||||||||
|
|
|
|
|
|
|
|
|
|
|
|
|
|||||||||||||
See accompanying notes.
47
Table of Contents
JOHN HANCOCK LIFE INSURANCE COMPANY (U.S.A.) SEPARATE ACCOUNT N
STATEMENTS OF OPERATIONS AND CHANGES IN CONTRACT OWNERS’ EQUITY
For the years ended December 31,
| Small Cap Opportunities Trust Series I |
Small Cap Opportunities Trust Series NAV |
Small Cap Stock Trust Series I |
||||||||||||||||||||||
| 2018 | 2017 | 2018 | 2017 | 2018 (c) | 2017 | |||||||||||||||||||
| Income: |
||||||||||||||||||||||||
| Dividend distributions received |
$ | 58,896 | $ | 58,421 | $ | 1,888 | $ | 1,512 | $ | — | $ | — | ||||||||||||
| Expenses: |
||||||||||||||||||||||||
| Mortality and expense risk and administrative charges |
(86,108 | ) | (85,892 | ) | — | — | (7,317 | ) | (7,171 | ) | ||||||||||||||
|
|
|
|
|
|
|
|
|
|
|
|
|
|||||||||||||
| Net investment income (loss) |
(27,212 | ) | (27,471 | ) | 1,888 | 1,512 | (7,317 | ) | (7,171 | ) | ||||||||||||||
|
|
|
|
|
|
|
|
|
|
|
|
|
|||||||||||||
| Realized gains (losses) on investments: |
||||||||||||||||||||||||
| Capital gain distributions received |
2,783,208 | 912,342 | 80,203 | 21,320 | 91,715 | — | ||||||||||||||||||
| Net realized gain (loss) |
30,713 | 82,697 | (13,226 | ) | 4,658 | 41,757 | (137,101 | ) | ||||||||||||||||
|
|
|
|
|
|
|
|
|
|
|
|
|
|||||||||||||
| Realized gains (losses) |
2,813,921 | 995,039 | 66,977 | 25,978 | 133,472 | (137,101 | ) | |||||||||||||||||
|
|
|
|
|
|
|
|
|
|
|
|
|
|||||||||||||
| Unrealized appreciation (depreciation) during the period |
(4,681,250 | ) | 453,868 | (126,218 | ) | 13,475 | (210,621 | ) | 472,028 | |||||||||||||||
|
|
|
|
|
|
|
|
|
|
|
|
|
|||||||||||||
| Net increase (decrease) in net assets from operations |
(1,894,541 | ) | 1,421,436 | (57,353 | ) | 40,965 | (84,466 | ) | 327,756 | |||||||||||||||
|
|
|
|
|
|
|
|
|
|
|
|
|
|||||||||||||
| Changes from principal transactions: |
||||||||||||||||||||||||
| Purchase payments |
360,987 | 389,940 | 35,173 | 39,999 | 5,910 | 3,544 | ||||||||||||||||||
| Transfers between sub-accounts and the company |
(133,096 | ) | (139,559 | ) | 44,814 | (127,897 | ) | 29,138 | (346,240 | ) | ||||||||||||||
| Transfers on general account policy loans |
4,806 | (5,261 | ) | (933 | ) | (33 | ) | (8 | ) | 143 | ||||||||||||||
| Withdrawals |
(738,692 | ) | (910,803 | ) | (14,100 | ) | (3,888 | ) | (81,038 | ) | (95,619 | ) | ||||||||||||
| Annual contract fee |
(859,067 | ) | (858,897 | ) | (15,523 | ) | (19,091 | ) | (65,960 | ) | (61,607 | ) | ||||||||||||
|
|
|
|
|
|
|
|
|
|
|
|
|
|||||||||||||
| Net increase (decrease) in net assets from principal transactions |
(1,365,062 | ) | (1,524,580 | ) | 49,431 | (110,910 | ) | (111,958 | ) | (499,779 | ) | |||||||||||||
|
|
|
|
|
|
|
|
|
|
|
|
|
|||||||||||||
| Total increase (decrease) in net assets |
(3,259,603 | ) | (103,144 | ) | (7,922 | ) | (69,945 | ) | (196,424 | ) | (172,023 | ) | ||||||||||||
| Net assets at beginning of period |
14,715,365 | 14,818,509 | 338,798 | 408,743 | 1,372,442 | 1,544,465 | ||||||||||||||||||
|
|
|
|
|
|
|
|
|
|
|
|
|
|||||||||||||
| Net assets at end of period |
$ | 11,455,762 | $ | 14,715,365 | $ | 330,876 | $ | 338,798 | $ | 1,176,018 | $ | 1,372,442 | ||||||||||||
|
|
|
|
|
|
|
|
|
|
|
|
|
|||||||||||||
| 2018 | 2017 | 2018 | 2017 | 2018 | 2017 | |||||||||||||||||||
| Units, beginning of period |
323,762 | 359,768 | 13,830 | 18,551 | 44,078 | 62,515 | ||||||||||||||||||
| Units issued |
5,738 | 9,347 | 6,211 | 8,159 | 9,675 | 8,141 | ||||||||||||||||||
| Units redeemed |
(35,113 | ) | (45,353 | ) | (4,371 | ) | (12,880 | ) | (13,729 | ) | (26,578 | ) | ||||||||||||
|
|
|
|
|
|
|
|
|
|
|
|
|
|||||||||||||
| Units, end of period |
294,387 | 323,762 | 15,670 | 13,830 | 40,024 | 44,078 | ||||||||||||||||||
|
|
|
|
|
|
|
|
|
|
|
|
|
|||||||||||||
| (c) | Renamed on April 30, 2018. Previously known as Small Cap Growth Trust Series I. |
See accompanying notes.
48
Table of Contents
JOHN HANCOCK LIFE INSURANCE COMPANY (U.S.A.) SEPARATE ACCOUNT N
STATEMENTS OF OPERATIONS AND CHANGES IN CONTRACT OWNERS’ EQUITY
For the years ended December 31,
| Small Cap Stock Trust Series NAV |
Small Cap Value Trust Series I |
Small Cap Value Trust Series NAV |
||||||||||||||||||||||
| 2018 (d) | 2017 | 2018 | 2017 | 2018 | 2017 | |||||||||||||||||||
| Income: |
||||||||||||||||||||||||
| Dividend distributions received |
$ | — | $ | — | $ | 5,305 | $ | 7,780 | $ | 57,650 | $ | 85,252 | ||||||||||||
| Expenses: |
||||||||||||||||||||||||
| Mortality and expense risk and administrative charges |
— | — | (3,413 | ) | (4,096 | ) | — | — | ||||||||||||||||
|
|
|
|
|
|
|
|
|
|
|
|
|
|||||||||||||
| Net investment income (loss) |
— | — | 1,892 | 3,684 | 57,650 | 85,252 | ||||||||||||||||||
|
|
|
|
|
|
|
|
|
|
|
|
|
|||||||||||||
| Realized gains (losses) on investments: |
||||||||||||||||||||||||
| Capital gain distributions received |
96,902 | — | 96,359 | 67,862 | 948,496 | 674,417 | ||||||||||||||||||
| Net realized gain (loss) |
1,464,455 | (724,743 | ) | (21,861 | ) | (32,746 | ) | (428,381 | ) | (98,500 | ) | |||||||||||||
|
|
|
|
|
|
|
|
|
|
|
|
|
|||||||||||||
| Realized gains (losses) |
1,561,357 | (724,743 | ) | 74,498 | 35,116 | 520,115 | 575,917 | |||||||||||||||||
|
|
|
|
|
|
|
|
|
|
|
|
|
|||||||||||||
| Unrealized appreciation (depreciation) during the period |
(1,047,288 | ) | 2,135,455 | (170,927 | ) | (16,383 | ) | (1,541,331 | ) | (393,966 | ) | |||||||||||||
|
|
|
|
|
|
|
|
|
|
|
|
|
|||||||||||||
| Net increase (decrease) in net assets from operations |
514,069 | 1,410,712 | (94,537 | ) | 22,417 | (963,566 | ) | 267,203 | ||||||||||||||||
|
|
|
|
|
|
|
|
|
|
|
|
|
|||||||||||||
| Changes from principal transactions: |
||||||||||||||||||||||||
| Purchase payments |
145,571 | 138,317 | 1,646 | 2,473 | 239,103 | 275,270 | ||||||||||||||||||
| Transfers between sub-accounts and the company |
(3,618,949 | ) | (3,673,471 | ) | (31,997 | ) | (257,214 | ) | (1,064,374 | ) | (138,533 | ) | ||||||||||||
| Transfers on general account policy loans |
(7,099 | ) | 11,886 | — | — | (12,716 | ) | 989 | ||||||||||||||||
| Withdrawals |
(439,681 | ) | (386,909 | ) | (20,950 | ) | (15,645 | ) | (53,354 | ) | (945,151 | ) | ||||||||||||
| Annual contract fee |
(95,288 | ) | (106,789 | ) | (26,794 | ) | (33,220 | ) | (135,517 | ) | (153,420 | ) | ||||||||||||
|
|
|
|
|
|
|
|
|
|
|
|
|
|||||||||||||
| Net increase (decrease) in net assets from principal transactions |
(4,015,446 | ) | (4,016,966 | ) | (78,095 | ) | (303,606 | ) | (1,026,858 | ) | (960,845 | ) | ||||||||||||
|
|
|
|
|
|
|
|
|
|
|
|
|
|||||||||||||
| Total increase (decrease) in net assets |
(3,501,377 | ) | (2,606,254 | ) | (172,632 | ) | (281,189 | ) | (1,990,424 | ) | (693,642 | ) | ||||||||||||
| Net assets at beginning of period |
5,243,670 | 7,849,924 | 808,446 | 1,089,635 | 8,356,023 | 9,049,665 | ||||||||||||||||||
|
|
|
|
|
|
|
|
|
|
|
|
|
|||||||||||||
| Net assets at end of period |
$ | 1,742,293 | $ | 5,243,670 | $ | 635,814 | $ | 808,446 | $ | 6,365,599 | $ | 8,356,023 | ||||||||||||
|
|
|
|
|
|
|
|
|
|
|
|
|
|||||||||||||
| 2018 | 2017 | 2018 | 2017 | 2018 | 2017 | |||||||||||||||||||
| Units, beginning of period |
135,350 | 256,722 | 27,201 | 37,965 | 96,106 | 108,027 | ||||||||||||||||||
| Units issued |
55,334 | 98,309 | 2,321 | 11,762 | 20,089 | 58,984 | ||||||||||||||||||
| Units redeemed |
(143,228 | ) | (219,681 | ) | (4,972 | ) | (22,526 | ) | (32,574 | ) | (70,905 | ) | ||||||||||||
|
|
|
|
|
|
|
|
|
|
|
|
|
|||||||||||||
| Units, end of period |
47,456 | 135,350 | 24,550 | 27,201 | 83,621 | 96,106 | ||||||||||||||||||
|
|
|
|
|
|
|
|
|
|
|
|
|
|||||||||||||
| (d) | Renamed on April 30, 2018. Previously known as Small Cap Growth Trust Series NAV. |
See accompanying notes.
49
Table of Contents
JOHN HANCOCK LIFE INSURANCE COMPANY (U.S.A.) SEPARATE ACCOUNT N
STATEMENTS OF OPERATIONS AND CHANGES IN CONTRACT OWNERS’ EQUITY
For the years ended December 31,
| Small Company Value Trust Series I |
Small Company Value Trust Series NAV |
Strategic Income Opportunities Trust Series I |
||||||||||||||||||||||
| 2018 | 2017 | 2018 | 2017 | 2018 | 2017 | |||||||||||||||||||
| Income: |
||||||||||||||||||||||||
| Dividend distributions received |
$ | 9,363 | $ | 6,007 | $ | 5,345 | $ | 2,420 | $ | 91,874 | $ | 80,272 | ||||||||||||
| Expenses: |
||||||||||||||||||||||||
| Mortality and expense risk and administrative charges |
(8,582 | ) | (8,866 | ) | — | — | (7,883 | ) | (9,121 | ) | ||||||||||||||
|
|
|
|
|
|
|
|
|
|
|
|
|
|||||||||||||
| Net investment income (loss) |
781 | (2,859 | ) | 5,345 | 2,420 | 83,991 | 71,151 | |||||||||||||||||
|
|
|
|
|
|
|
|
|
|
|
|
|
|||||||||||||
| Realized gains (losses) on investments: |
||||||||||||||||||||||||
| Capital gain distributions received |
220,761 | 366,011 | 111,085 | 143,025 | — | — | ||||||||||||||||||
| Net realized gain (loss) |
22,979 | 2,504 | (49,687 | ) | 11,504 | (2,199 | ) | 11,070 | ||||||||||||||||
|
|
|
|
|
|
|
|
|
|
|
|
|
|||||||||||||
| Realized gains (losses) |
243,740 | 368,515 | 61,398 | 154,529 | (2,199 | ) | 11,070 | |||||||||||||||||
|
|
|
|
|
|
|
|
|
|
|
|
|
|||||||||||||
| Unrealized appreciation (depreciation) during the period |
(572,889 | ) | (92,179 | ) | (228,849 | ) | (39,798 | ) | (217,160 | ) | 55,887 | |||||||||||||
|
|
|
|
|
|
|
|
|
|
|
|
|
|||||||||||||
| Net increase (decrease) in net assets from operations |
(328,368 | ) | 273,477 | (162,106 | ) | 117,151 | (135,368 | ) | 138,108 | |||||||||||||||
|
|
|
|
|
|
|
|
|
|
|
|
|
|||||||||||||
| Changes from principal transactions: |
||||||||||||||||||||||||
| Purchase payments |
24,115 | 11,634 | 55,321 | 49,190 | 28,388 | 29,264 | ||||||||||||||||||
| Transfers between sub-accounts and the company |
(77,189 | ) | (119,118 | ) | 180,761 | 353,852 | 69,090 | (164,203 | ) | |||||||||||||||
| Transfers on general account policy loans |
(3,946 | ) | (622 | ) | (9,971 | ) | (475 | ) | 6 | 40 | ||||||||||||||
| Withdrawals |
(118,028 | ) | (821,087 | ) | (100,925 | ) | (8,354 | ) | (117,893 | ) | (174,804 | ) | ||||||||||||
| Annual contract fee |
(90,031 | ) | (72,461 | ) | (30,094 | ) | (30,453 | ) | (89,543 | ) | (100,969 | ) | ||||||||||||
|
|
|
|
|
|
|
|
|
|
|
|
|
|||||||||||||
| Net increase (decrease) in net assets from principal transactions |
(265,079 | ) | (1,001,654 | ) | 95,092 | 363,760 | (109,952 | ) | (410,672 | ) | ||||||||||||||
|
|
|
|
|
|
|
|
|
|
|
|
|
|||||||||||||
| Total increase (decrease) in net assets |
(593,447 | ) | (728,177 | ) | (67,014 | ) | 480,911 | (245,320 | ) | (272,564 | ) | |||||||||||||
| Net assets at beginning of period |
2,739,222 | 3,467,399 | 1,128,600 | 647,689 | 2,561,034 | 2,833,598 | ||||||||||||||||||
|
|
|
|
|
|
|
|
|
|
|
|
|
|||||||||||||
| Net assets at end of period |
$ | 2,145,775 | $ | 2,739,222 | $ | 1,061,586 | $ | 1,128,600 | $ | 2,315,714 | $ | 2,561,034 | ||||||||||||
|
|
|
|
|
|
|
|
|
|
|
|
|
|||||||||||||
| 2018 | 2017 | 2018 | 2017 | 2018 | 2017 | |||||||||||||||||||
| Units, beginning of period |
61,798 | 86,670 | 35,455 | 22,703 | 92,337 | 107,747 | ||||||||||||||||||
| Units issued |
7,416 | 2,521 | 13,254 | 30,153 | 18,400 | 9,813 | ||||||||||||||||||
| Units redeemed |
(13,319 | ) | (27,393 | ) | (10,405 | ) | (17,401 | ) | (22,817 | ) | (25,223 | ) | ||||||||||||
|
|
|
|
|
|
|
|
|
|
|
|
|
|||||||||||||
| Units, end of period |
55,895 | 61,798 | 38,304 | 35,455 | 87,920 | 92,337 | ||||||||||||||||||
|
|
|
|
|
|
|
|
|
|
|
|
|
|||||||||||||
See accompanying notes.
50
Table of Contents
JOHN HANCOCK LIFE INSURANCE COMPANY (U.S.A.) SEPARATE ACCOUNT N
STATEMENTS OF OPERATIONS AND CHANGES IN CONTRACT OWNERS’ EQUITY
For the years ended December 31,
| Strategic Income Opportunities Trust Series NAV |
Total Bond Market Series Trust NAV |
Total Stock Market Index Trust Series I |
||||||||||||||||||||||
| 2018 | 2017 | 2018 | 2017 | 2018 | 2017 | |||||||||||||||||||
| Income: |
||||||||||||||||||||||||
| Dividend distributions received |
$ | 203,671 | $ | 155,343 | $ | 624,416 | $ | 723,630 | $ | 84,592 | $ | 124,746 | ||||||||||||
| Expenses: |
||||||||||||||||||||||||
| Mortality and expense risk and administrative charges |
— | — | — | — | (24,709 | ) | (27,188 | ) | ||||||||||||||||
|
|
|
|
|
|
|
|
|
|
|
|
|
|||||||||||||
| Net investment income (loss) |
203,671 | 155,343 | 624,416 | 723,630 | 59,883 | 97,558 | ||||||||||||||||||
|
|
|
|
|
|
|
|
|
|
|
|
|
|||||||||||||
| Realized gains (losses) on investments: |
||||||||||||||||||||||||
| Capital gain distributions received |
— | — | — | — | 245,343 | 189,840 | ||||||||||||||||||
| Net realized gain (loss) |
(10,539 | ) | 15,852 | (879,545 | ) | (425,824 | ) | 503,370 | 581,916 | |||||||||||||||
|
|
|
|
|
|
|
|
|
|
|
|
|
|||||||||||||
| Realized gains (losses) |
(10,539 | ) | 15,852 | (879,545 | ) | (425,824 | ) | 748,713 | 771,756 | |||||||||||||||
|
|
|
|
|
|
|
|
|
|
|
|
|
|||||||||||||
| Unrealized appreciation (depreciation) during the period |
(461,874 | ) | 76,202 | 197,635 | 599,713 | (1,108,702 | ) | 694,016 | ||||||||||||||||
|
|
|
|
|
|
|
|
|
|
|
|
|
|||||||||||||
| Net increase (decrease) in net assets from operations |
(268,742 | ) | 247,397 | (57,494 | ) | 897,519 | (300,106 | ) | 1,563,330 | |||||||||||||||
|
|
|
|
|
|
|
|
|
|
|
|
|
|||||||||||||
| Changes from principal transactions: |
||||||||||||||||||||||||
| Purchase payments |
283,182 | 324,297 | 127,360 | 604,808 | 24,217 | 18,041 | ||||||||||||||||||
| Transfers between sub-accounts and the company |
193,350 | 810,266 | (1,696,312 | ) | (2,721,137 | ) | (1,376,449 | ) | (584,967 | ) | ||||||||||||||
| Transfers on general account policy loans |
(1,728 | ) | (780 | ) | 7,044 | 10,468 | 4,751 | 717 | ||||||||||||||||
| Withdrawals |
(96,812 | ) | (53,178 | ) | (1,224,876 | ) | (3,199,216 | ) | (1,429 | ) | (11,737 | ) | ||||||||||||
| Annual contract fee |
(119,096 | ) | (111,475 | ) | (308,984 | ) | (400,979 | ) | (111,355 | ) | (112,781 | ) | ||||||||||||
|
|
|
|
|
|
|
|
|
|
|
|
|
|||||||||||||
| Net increase (decrease) in net assets from principal transactions |
258,896 | 969,130 | (3,095,768 | ) | (5,706,056 | ) | (1,460,265 | ) | (690,727 | ) | ||||||||||||||
|
|
|
|
|
|
|
|
|
|
|
|
|
|||||||||||||
| Total increase (decrease) in net assets |
(9,846 | ) | 1,216,527 | (3,153,262 | ) | (4,808,537 | ) | (1,760,371 | ) | 872,603 | ||||||||||||||
| Net assets at beginning of period |
4,988,236 | 3,771,709 | 23,146,361 | 27,954,898 | 8,025,736 | 7,153,133 | ||||||||||||||||||
|
|
|
|
|
|
|
|
|
|
|
|
|
|||||||||||||
| Net assets at end of period |
$ | 4,978,390 | $ | 4,988,236 | $ | 19,993,099 | $ | 23,146,361 | $ | 6,265,365 | $ | 8,025,736 | ||||||||||||
|
|
|
|
|
|
|
|
|
|
|
|
|
|||||||||||||
| 2018 | 2017 | 2018 | 2017 | 2018 | 2017 | |||||||||||||||||||
| Units, beginning of period |
231,440 | 184,903 | 922,711 | 1,151,623 | 263,987 | 282,138 | ||||||||||||||||||
| Units issued |
45,709 | 101,450 | 869,854 | 1,336,838 | 14,484 | 73,390 | ||||||||||||||||||
| Units redeemed |
(34,011 | ) | (54,913 | ) | (993,610 | ) | (1,565,750 | ) | (59,003 | ) | (91,541 | ) | ||||||||||||
|
|
|
|
|
|
|
|
|
|
|
|
|
|||||||||||||
| Units, end of period |
243,138 | 231,440 | 798,955 | 922,711 | 219,468 | 263,987 | ||||||||||||||||||
|
|
|
|
|
|
|
|
|
|
|
|
|
|||||||||||||
See accompanying notes.
51
Table of Contents
JOHN HANCOCK LIFE INSURANCE COMPANY (U.S.A.) SEPARATE ACCOUNT N
STATEMENTS OF OPERATIONS AND CHANGES IN CONTRACT OWNERS’ EQUITY
For the years ended December 31,
| Total Stock Market Index Trust Series NAV |
Ultra Short Term Bond Trust Series I |
Ultra Short Term Bond Trust Series NAV |
||||||||||||||||||||||
| 2018 | 2017 | 2018 | 2017 | 2018 | 2017 | |||||||||||||||||||
| Income: |
||||||||||||||||||||||||
| Dividend distributions received |
$ | 79,888 | $ | 74,353 | $ | 48 | $ | 52 | $ | 12,184 | $ | 9,773 | ||||||||||||
| Expenses: |
||||||||||||||||||||||||
| Mortality and expense risk and administrative charges |
— | — | (18 | ) | (38 | ) | — | — | ||||||||||||||||
|
|
|
|
|
|
|
|
|
|
|
|
|
|||||||||||||
| Net investment income (loss) |
79,888 | 74,353 | 30 | 14 | 12,184 | 9,773 | ||||||||||||||||||
|
|
|
|
|
|
|
|
|
|
|
|
|
|||||||||||||
| Realized gains (losses) on investments: |
||||||||||||||||||||||||
| Capital gain distributions received |
208,050 | 108,943 | — | — | — | — | ||||||||||||||||||
| Net realized gain (loss) |
452,975 | 468,594 | (24 | ) | (199 | ) | (5,129 | ) | (1,230 | ) | ||||||||||||||
|
|
|
|
|
|
|
|
|
|
|
|
|
|||||||||||||
| Realized gains (losses) |
661,025 | 577,537 | (24 | ) | (199 | ) | (5,129 | ) | (1,230 | ) | ||||||||||||||
|
|
|
|
|
|
|
|
|
|
|
|
|
|||||||||||||
| Unrealized appreciation (depreciation) during the period |
(1,044,932 | ) | 166,788 | 15 | 191 | 3,177 | (4,486 | ) | ||||||||||||||||
|
|
|
|
|
|
|
|
|
|
|
|
|
|||||||||||||
| Net increase (decrease) in net assets from operations |
(304,019 | ) | 818,678 | 21 | 6 | 10,232 | 4,057 | |||||||||||||||||
|
|
|
|
|
|
|
|
|
|
|
|
|
|||||||||||||
| Changes from principal transactions: |
||||||||||||||||||||||||
| Purchase payments |
550,782 | 315,491 | — | 57 | 3,012 | 2,726 | ||||||||||||||||||
| Transfers between sub-accounts and the company |
(24,669 | ) | 2,393,867 | — | — | 119,348 | 83,698 | |||||||||||||||||
| Transfers on general account policy loans |
(297 | ) | — | — | — | 863 | (893 | ) | ||||||||||||||||
| Withdrawals |
(47,412 | ) | (74,018 | ) | — | (4,876 | ) | 38 | (108,192 | ) | ||||||||||||||
| Annual contract fee |
(126,298 | ) | (98,002 | ) | (479 | ) | (543 | ) | (25,719 | ) | (26,945 | ) | ||||||||||||
|
|
|
|
|
|
|
|
|
|
|
|
|
|||||||||||||
| Net increase (decrease) in net assets from principal transactions |
352,106 | 2,537,338 | (479 | ) | (5,362 | ) | 97,542 | (49,606 | ) | |||||||||||||||
|
|
|
|
|
|
|
|
|
|
|
|
|
|||||||||||||
| Total increase (decrease) in net assets |
48,087 | 3,356,016 | (458 | ) | (5,356 | ) | 107,774 | (45,549 | ) | |||||||||||||||
| Net assets at beginning of period |
5,860,760 | 2,504,744 | 3,166 | 8,522 | 589,854 | 635,403 | ||||||||||||||||||
|
|
|
|
|
|
|
|
|
|
|
|
|
|||||||||||||
| Net assets at end of period |
$ | 5,908,847 | $ | 5,860,760 | $ | 2,708 | $ | 3,166 | $ | 697,628 | $ | 589,854 | ||||||||||||
|
|
|
|
|
|
|
|
|
|
|
|
|
|||||||||||||
| 2018 | 2017 | 2018 | 2017 | 2018 | 2017 | |||||||||||||||||||
| Units, beginning of period |
54,510 | 28,108 | 324 | 877 | 57,823 | 62,672 | ||||||||||||||||||
| Units issued |
157,939 | 256,085 | — | 4 | 32,193 | 10,345 | ||||||||||||||||||
| Units redeemed |
(154,196 | ) | (229,683 | ) | (50 | ) | (557 | ) | (22,660 | ) | (15,194 | ) | ||||||||||||
|
|
|
|
|
|
|
|
|
|
|
|
|
|||||||||||||
| Units, end of period |
58,253 | 54,510 | 274 | 324 | 67,356 | 57,823 | ||||||||||||||||||
|
|
|
|
|
|
|
|
|
|
|
|
|
|||||||||||||
See accompanying notes.
52
Table of Contents
JOHN HANCOCK LIFE INSURANCE COMPANY (U.S.A.) SEPARATE ACCOUNT N
STATEMENTS OF OPERATIONS AND CHANGES IN CONTRACT OWNERS’ EQUITY
For the years ended December 31,
| Utilities Trust Series I | Utilities Trust Series NAV | |||||||||||||||
| 2018 | 2017 | 2018 | 2017 | |||||||||||||
| Income: |
||||||||||||||||
| Dividend distributions received |
$ | 29,842 | $ | 26,231 | $ | 67,506 | $ | 50,898 | ||||||||
| Expenses: |
||||||||||||||||
| Mortality and expense risk and administrative charges |
(4,185 | ) | (4,957 | ) | — | — | ||||||||||
|
|
|
|
|
|
|
|
|
|||||||||
| Net investment income (loss) |
25,657 | 21,274 | 67,506 | 50,898 | ||||||||||||
|
|
|
|
|
|
|
|
|
|||||||||
| Realized gains (losses) on investments: |
||||||||||||||||
| Capital gain distributions received |
— | — | (1 | ) | 4 | |||||||||||
| Net realized gain (loss) |
4,972 | (10,384 | ) | (53,170 | ) | (11,666 | ) | |||||||||
|
|
|
|
|
|
|
|
|
|||||||||
| Realized gains (losses) |
4,972 | (10,384 | ) | (53,171 | ) | (11,662 | ) | |||||||||
|
|
|
|
|
|
|
|
|
|||||||||
| Unrealized appreciation (depreciation) during the period |
(26,322 | ) | 136,243 | 4,138 | 221,144 | |||||||||||
|
|
|
|
|
|
|
|
|
|||||||||
| Net increase (decrease) in net assets from operations |
4,307 | 147,133 | 18,473 | 260,380 | ||||||||||||
|
|
|
|
|
|
|
|
|
|||||||||
| Changes from principal transactions: |
||||||||||||||||
| Purchase payments |
4,556 | 5,291 | 87,347 | 162,451 | ||||||||||||
| Transfers between sub-accounts and the company |
(122,673 | ) | (23,438 | ) | (100,454 | ) | 35,400 | |||||||||
| Transfers on general account policy loans |
— | — | (75,990 | ) | (5,367 | ) | ||||||||||
| Withdrawals |
(2,374 | ) | (166,476 | ) | (56,245 | ) | (28,459 | ) | ||||||||
| Annual contract fee |
(31,644 | ) | (37,854 | ) | (43,184 | ) | (46,162 | ) | ||||||||
|
|
|
|
|
|
|
|
|
|||||||||
| Net increase (decrease) in net assets from principal transactions |
(152,135 | ) | (222,477 | ) | (188,526 | ) | 117,863 | |||||||||
|
|
|
|
|
|
|
|
|
|||||||||
| Total increase (decrease) in net assets |
(147,828 | ) | (75,344 | ) | (170,053 | ) | 378,243 | |||||||||
| Net assets at beginning of period |
1,041,966 | 1,117,310 | 2,090,789 | 1,712,546 | ||||||||||||
|
|
|
|
|
|
|
|
|
|||||||||
| Net assets at end of period |
$ | 894,138 | $ | 1,041,966 | $ | 1,920,736 | $ | 2,090,789 | ||||||||
|
|
|
|
|
|
|
|
|
|||||||||
| 2018 | 2017 | 2018 | 2017 | |||||||||||||
| Units, beginning of period |
27,607 | 33,660 | 64,181 | 60,361 | ||||||||||||
| Units issued |
2,069 | 5,155 | 8,978 | 8,038 | ||||||||||||
| Units redeemed |
(6,162 | ) | (11,208 | ) | (14,745 | ) | (4,218 | ) | ||||||||
|
|
|
|
|
|
|
|
|
|||||||||
| Units, end of period |
23,514 | 27,607 | 58,414 | 64,181 | ||||||||||||
|
|
|
|
|
|
|
|
|
|||||||||
See accompanying notes.
53
Table of Contents
JOHN HANCOCK LIFE INSURANCE COMPANY (U.S.A.) SEPARATE ACCOUNT N
December 31, 2018
| 1. | Organization |
John Hancock Life Insurance Company (U.S.A.) Separate Account N (the “Account”) is a separate account established by John Hancock Life Insurance Company (U.S.A.) (the “Company”). The Account operates as a Unit Investment Trust under the Investment Company Act of 1940, as amended (the “Act”) and is an investment company and accordingly follows the investment company accounting and reporting guidance of the Financial Accounting Standards Board (“FASB”) Accounting Standards Codification (“ASC”) Topic 946 Financial Services – Investment Companies. The Account consists of 92 active sub-accounts which are exclusively invested in a corresponding portfolio of the John Hancock Variable Insurance Trust (the “Trust”), and 3 active sub-accounts that are invested in portfolios of other Non-affiliated Trusts (the “Non-affiliated Trusts”). The Trust and Non-affiliated Trusts are registered under the Act as an open-ended management investment company, commonly known as a mutual fund, which does not transact with the general public. The Account is a funding vehicle for the allocation of net premiums under single premium variable life and variable universal life insurance contracts (the “Contracts”) issued by the Company.
The Company is a stock life insurance company organized originally under the laws of the State of Maine in 1955 and later in 1992, the Company changed its state of domicile to the State of Michigan. The Company is an indirect, wholly owned subsidiary of Manulife Financial Corporation (“MFC”), a Canadian based publicly traded life insurance company. MFC and its subsidiaries are known collectively as Manulife Financial.
The Company is required to maintain assets in the Account with a total fair value of at least equal to the reserves and other liabilities relating to the variable benefits under all Contracts participating in the Account. These assets may not be charged with liabilities which arise from any other business the Company conducts. However, all obligations under the Contracts are general corporate obligations of the Company.
In addition to the Account, certain contract owners may also allocate funds to the fixed account, which is part of the Company’s general account. Because of exemptive and exclusionary provisions, interests in the fixed account have not been registered under the Securities Act of 1933, and the Company’s general account has not been registered as an investment company under the Investment Company Act of 1940. Net interfund transfers include transfers between separate and general accounts.
Each sub-account holds shares of a particular series (“Portfolio”) of a registered investment company. Sub-accounts that invest in Portfolios of the Trust may offer 2 classes of units to fund Contracts issued by the Company. These classes, Series I and Series NAV, represent an interest in the same Trust Portfolio, but in different classes of that Portfolio. Series I and Series NAV shares of the Trust Portfolio differ in the level of 12b-1 fees and other expenses assessed against the Portfolio’s assets.
As a result of a portfolio change, the following sub-accounts of the Account were renamed as follows:
| Previous Name |
New Name |
Effective | ||
| Bond Trust Series I |
Select Bond Trust Series I |
04/30/2018 | ||
| Bond Trust Series NAV |
Select Bond Trust Series NAV |
04/30/2018 | ||
| Small Cap Growth Trust Series I |
Small Cap Stock Trust Series I |
04/30/2018 | ||
| Small Cap Growth Trust Series NAV |
Small Cap Stock Trust Series NAV |
04/30/2018 |
Funds transferred in 2018 are as follows:
| Transferred from |
Transferred to |
Effective | ||
| Alpha Opportunities Trust Series I |
Mid Cap Stock Trust Series I |
04/27/2018 | ||
| Alpha Opportunities Trust Series NAV |
Mid Cap Stock Trust Series NAV |
04/27/2018 |
54
Table of Contents
JOHN HANCOCK LIFE INSURANCE COMPANY (U.S.A.) SEPARATE ACCOUNT N
NOTES TO FINANCIAL STATEMENTS — (CONTINUED)
December 31, 2018
| 2. | Significant Accounting Policies |
Estimates
The preparation of financial statements in conformity with U.S. generally accepted accounting principles requires management to make estimates and assumptions that affect the amounts reported in the financial statements and accompanying notes. Actual results could differ from reported results using those estimates.
Valuation of Investments
Investments made in the Portfolios of the Trust, and of the Non-affiliated Trusts, are valued at fair value based on the reported net asset values of such Portfolios. Investment transactions are recorded on the trade date. Income from dividends, and gains from realized gain distributions are recorded on the ex-dividend date. Realized gains and losses on the sales of investments are computed on a first-in, first-out basis.
Amounts Receivable/Payable
Receivables/Payables from/to Portfolios/the Company are due to unsettled contract transactions (net of asset-based charges) and/or subsequent/preceding purchases/sales of the respective Portfolios’ shares. The amounts are due from/to either the respective Portfolio and/or the Company for the benefit of contract owners. There are no unsettled policy transactions at December 31, 2018.
55
Table of Contents
JOHN HANCOCK LIFE INSURANCE COMPANY (U.S.A.) SEPARATE ACCOUNT N
NOTES TO FINANCIAL STATEMENTS — (CONTINUED)
December 31, 2018
| 3. | Federal Income Taxes |
The Account does not file separate tax returns. The taxable income of the Account is consolidated with that of the Company within the consolidated federal tax return. Any tax contingencies arising from the taxable income generated by the Account is the responsibility of the Company and the Company holds any and all tax contingencies on its financial statements. The Company’s consolidated federal tax return for the years 2014 and 2015 are currently under examination by the Internal Revenue Service. The years from 2015 are also open for examination by the internal revenue service. The Account is not a party to the consolidated tax sharing agreement thus no amount of income taxes or tax contingencies are passed through to the Account. The legal form of the Account is not taxable in any state or foreign jurisdictions.
The income taxes topic of the FASB ASC establishes a minimum threshold for financial statement recognition of the benefit of positions taken, or expected to be taken, in filing tax returns (including whether the Account is taxable in certain jurisdictions). The topic requires the evaluation of tax positions taken or expected to be taken in the course of preparing the Company’s tax returns to determine whether tax positions are “more-likely-than-not” of being sustained by the applicable tax authority. Tax positions deemed to meet the more-likely-than-not threshold would be recorded as tax expense or benefit.
The Account complies with the provisions of FASB ASC Topic 740, Income Taxes. As of December 31, 2018, the Account did not have a liability for any uncertain tax positions. The Account recognizes interest and penalties, if any, related to tax liabilities as income tax expense in the Statements of Operations and Changes in Contract Owners’ Equity.
| 4. | Transactions with Affiliates |
The Company has an administrative services agreement with Manulife Financial, whereby Manulife Financial or its designee, with the consent of the Company, performs certain services on behalf of the Company necessary for the operation of the Account. John Hancock Investment Management Services, LLC (“JHIMS”), a Delaware limited liability company controlled by MFC, serves as investment adviser for the Trust.
John Hancock Distributors, LLC, a registered broker-dealer and wholly owned subsidiary of JHUSA, acts as the principle underwriter of the Contracts pursuant to a distribution agreement with the Company. Contracts are sold by registered representatives of either John Hancock Distributors, LLC or other broker-dealers having distribution agreements with John Hancock Distributors, LLC.
Certain officers of the Account are officers and directors of JHUSA or the Trust.
Contract charges, as described in Note 9, are paid to the Company.
56
Table of Contents
JOHN HANCOCK LIFE INSURANCE COMPANY (U.S.A.) SEPARATE ACCOUNT N
NOTES TO FINANCIAL STATEMENTS — (CONTINUED)
December 31, 2018
| 5. | Fair Value Measurements |
ASC 820 “Fair Value Measurements and Disclosures” provides a single definition of fair value for accounting purposes, establishes a consistent framework for measuring fair value, and expands disclosure requirements about fair value measurements. ASC 820 defines fair value as the value that would be received to sell an asset or paid to transfer a liability in an orderly transaction between market participants at the measurement date; that is, an exit value. An exit value is not a forced liquidation or distressed sale.
Following ASC 820 guidance, the Account has categorized its fair value measurements according to a three-level hierarchy. The hierarchy prioritizes the inputs used by the Account’s valuation techniques. A level is assigned to each fair value measurement based on the lowest level input significant to the fair value measurement in its entirety. The three levels of the fair value hierarchy are defined as follows:
| • | Level 1 – Fair value measurements that reflect unadjusted, quoted prices in active markets for identical assets and liabilities that the Account has the ability to access at the measurement date. |
| • | Level 2 – Fair value measurements using inputs other than quoted prices included within Level 1 that are observable, either directly or indirectly. |
| • | Level 3 – Fair value measurements using significant non market observable inputs. |
All of the Account’s sub-accounts’ investments in a Portfolio of the Trust were valued at the reported net asset value of the Portfolio and categorized as Level 1 as of December 31, 2018. The following table presents the Account’s assets that are measured at fair value on a recurring basis by fair value hierarchy level under ASC 820, as of December 31, 2018:
| Level 1 | Level 2 | Level 3 | Total | |||||||||||||
| Mutual Funds |
||||||||||||||||
| Affiliated |
$ | 700,194,349 | — | — | 700,194,349 | |||||||||||
| NonAffiliated |
$ | 5,208,180 | — | — | 5,208,180 | |||||||||||
|
|
|
|
|
|
|
|
|
|||||||||
| Total |
$ | 705,402,529 | — | — | 705,402,529 | |||||||||||
|
|
|
|
|
|
|
|
|
|||||||||
Assets owned by the Account are primarily open-ended mutual fund investments issued by the Trust. These are classified within Level 1, as fair values of the underlying funds are based upon reported net asset values (“NAV”), which represent the values at which each sub-account can redeem its investments.
Changes in valuation techniques may result in transfer in or out of an assigned level within the disclosure hierarchy. Transfers between investment levels may occur as the availability of a price source or data used in an investment’s valuation changes. Transfers between investment levels are recognized at the beginning of the reporting period. There have been no transfers between any level of fair value measurements during the period ended December 31, 2018.
57
Table of Contents
JOHN HANCOCK LIFE INSURANCE COMPANY (U.S.A.) SEPARATE ACCOUNT N
NOTES TO FINANCIAL STATEMENTS — (CONTINUED)
December 31, 2018
| 6. | Purchases and Sales of Investments |
The cost of purchases including reinvestment of dividend distributions and proceeds from the sales of investments in the Portfolios of the Trust and Non-affiliated Trusts during 2018 were as follows:
| Purchases | Sales | |||||||
| Sub-Account |
||||||||
| 500 Index Fund Series NAV |
$ | 15,262,111 | $ | 20,397,200 | ||||
| Active Bond Trust Series I |
143,503 | 204,116 | ||||||
| Active Bond Trust Series NAV |
423,414 | 90,201 | ||||||
| Alpha Opportunities Trust Series I (a) |
4,783 | 43,615 | ||||||
| Alpha Opportunities Trust Series NAV (b) |
84,116 | 657,538 | ||||||
| American Asset Allocation Trust Series I |
2,607,797 | 1,636,182 | ||||||
| American Global Growth Trust Series I |
697,201 | 476,601 | ||||||
| American Growth Trust Series I |
6,676,436 | 6,566,449 | ||||||
| American Growth-Income Trust Series I |
3,825,842 | 6,041,828 | ||||||
| American International Trust Series I |
3,040,849 | 3,375,948 | ||||||
| Blue Chip Growth Trust Series I |
2,264,967 | 1,188,315 | ||||||
| Blue Chip Growth Trust Series NAV |
65,156,371 | 69,596,673 | ||||||
| Capital Appreciation Trust Series I |
2,176,875 | 1,934,661 | ||||||
| Capital Appreciation Trust Series NAV |
902,291 | 358,768 | ||||||
| Capital Appreciation Value Trust Series I |
114,472 | 118,015 | ||||||
| Capital Appreciation Value Trust Series NAV |
768,695 | 479,967 | ||||||
| Core Bond Trust Series I |
3,693,916 | 3,263,129 | ||||||
| Core Bond Trust Series NAV |
6,577,515 | 4,304,106 | ||||||
| Emerging Markets Value Trust Series I |
426,897 | 170,734 | ||||||
| Emerging Markets Value Trust Series NAV |
1,250,637 | 917,072 | ||||||
| Equity Income Trust Series I |
1,785,750 | 1,835,043 | ||||||
| Equity Income Trust Series NAV |
65,384,140 | 59,767,354 | ||||||
| Financial Industries Trust Series I |
175,398 | 220,005 | ||||||
| Financial Industries Trust Series NAV |
318,099 | 264,183 | ||||||
| Fundamental All Cap Core Trust Series I |
66,053 | 239,397 | ||||||
| Fundamental All Cap Core Trust Series NAV |
709,710 | 345,935 | ||||||
| Fundamental Large Cap Value Trust Series I |
150,449 | 384,902 | ||||||
| Fundamental Large Cap Value Trust Series NAV |
1,256,388 | 1,525,277 | ||||||
| Global Bond Trust Series I |
189,896 | 93,718 | ||||||
| Global Bond Trust Series NAV |
3,519,406 | 2,921,350 | ||||||
| Global Trust Series I |
520,384 | 1,316,683 | ||||||
| Global Trust Series NAV |
584,248 | 351,436 | ||||||
| Health Sciences Trust Series I |
908,095 | 462,805 | ||||||
| Health Sciences Trust Series NAV |
1,671,699 | 2,066,644 | ||||||
| High Yield Trust Series I |
437,631 | 657,561 | ||||||
| High Yield Trust Series NAV |
774,494 | 193,742 | ||||||
| International Equity Index Series I |
902,752 | 1,348,924 | ||||||
| International Equity Index Series NAV |
6,883,988 | 6,043,250 | ||||||
| International Growth Stock Trust Series I |
134,145 | 1,951,516 | ||||||
| International Growth Stock Trust Series NAV |
3,504,879 | 3,095,490 | ||||||
| International Small Company Trust Series I |
142,285 | 421,437 | ||||||
| International Small Company Trust Series NAV |
460,347 | 585,409 | ||||||
| International Value Trust Series I |
617,615 | 1,612,150 | ||||||
| International Value Trust Series NAV |
1,099,203 | 1,934,628 | ||||||
| Investment Quality Bond Trust Series I |
691,630 | 833,157 | ||||||
| Investment Quality Bond Trust Series NAV |
301,204 | 356,146 | ||||||
| Lifestyle Balanced Portfolio Series NAV |
14,192 | 6,765 | ||||||
| Lifestyle Growth Portfolio Series I |
6,300 | 210,882 | ||||||
| Lifestyle Growth Portfolio Series NAV |
410,848 | 305,265 | ||||||
58
Table of Contents
JOHN HANCOCK LIFE INSURANCE COMPANY (U.S.A.) SEPARATE ACCOUNT N
NOTES TO FINANCIAL STATEMENTS — (CONTINUED)
December 31, 2018
| 6. | Purchases and Sales of Investments — (continued): |
| Purchases | Sales | |||||||
| Sub-Account |
||||||||
| M Capital Appreciation |
$ | 84,420 | $ | 7,552 | ||||
| M Large Cap Growth |
1 | 0 | ||||||
| Managed Volatility Aggressive Portfolio Series I |
327,929 | 150,206 | ||||||
| Managed Volatility Aggressive Portfolio Series NAV |
1,714,734 | 1,180,751 | ||||||
| Managed Volatility Balanced Portfolio Series I |
607,963 | 731,486 | ||||||
| Managed Volatility Balanced Portfolio Series NAV |
3,324,935 | 1,961,356 | ||||||
| Managed Volatility Conservative Portfolio Series I |
525,981 | 642,685 | ||||||
| Managed Volatility Conservative Portfolio Series NAV |
2,311,448 | 981,684 | ||||||
| Managed Volatility Growth Portfolio Series I |
740,445 | 593,010 | ||||||
| Managed Volatility Growth Portfolio Series NAV |
5,340,767 | 5,163,740 | ||||||
| Managed Volatility Moderate Portfolio Series I |
762,033 | 427,102 | ||||||
| Managed Volatility Moderate Portfolio Series NAV |
1,141,509 | 867,764 | ||||||
| Mid Cap Index Trust Series I |
1,211,118 | 1,300,210 | ||||||
| Mid Cap Index Trust Series NAV |
3,735,658 | 3,553,921 | ||||||
| Mid Cap Stock Trust Series I |
837,373 | 412,779 | ||||||
| Mid Cap Stock Trust Series NAV |
4,642,311 | 3,557,456 | ||||||
| Mid Value Trust Series I |
665,024 | 598,975 | ||||||
| Mid Value Trust Series NAV |
2,616,416 | 3,096,938 | ||||||
| Money Market Trust Series I |
12,606,798 | 12,943,377 | ||||||
| Money-Market Trust Series NAV |
51,019,221 | 40,051,282 | ||||||
| PIMCO All Asset |
1,480,137 | 670,949 | ||||||
| Real Estate Securities Trust Series I |
661,296 | 1,107,635 | ||||||
| Real Estate Securities Trust Series NAV |
3,580,287 | 5,083,091 | ||||||
| Science & Technology Trust Series I |
2,120,550 | 1,658,774 | ||||||
| Science & Technology Trust Series NAV |
5,623,069 | 2,691,232 | ||||||
| Select Bond Trust Series I |
718,744 | 951,302 | ||||||
| Select Bond Trust Series NAV |
362,001 | 803,986 | ||||||
| Short Term Government Income Trust Series I |
399,961 | 244,192 | ||||||
| Short Term Government Income Trust Series NAV |
4,507,467 | 1,270,137 | ||||||
| Small Cap Index Trust Series I |
1,043,853 | 611,929 | ||||||
| Small Cap Index Trust Series NAV |
7,707,152 | 3,220,110 | ||||||
| Small Cap Opportunities Trust Series I |
3,101,851 | 1,710,915 | ||||||
| Small Cap Opportunities Trust Series NAV |
236,760 | 105,238 | ||||||
| Small Cap Stock Trust Series I |
430,109 | 457,668 | ||||||
| Small Cap Stock Trust Series NAV |
2,322,875 | 6,241,417 | ||||||
| Small Cap Value Trust Series I |
169,859 | 149,703 | ||||||
| Small Cap Value Trust Series NAV |
2,744,156 | 2,764,869 | ||||||
| Small Company Value Trust Series I |
563,785 | 607,322 | ||||||
| Small Company Value Trust Series NAV |
538,832 | 327,311 | ||||||
| Strategic Income Opportunities Trust Series I |
598,354 | 624,317 | ||||||
| Strategic Income Opportunities Trust Series NAV |
1,176,196 | 713,628 | ||||||
| Total Bond Market Series Trust NAV |
22,011,385 | 24,482,737 | ||||||
| Total Stock Market Index Trust Series I |
769,061 | 1,924,098 | ||||||
| Total Stock Market Index Trust Series NAV |
17,545,629 | 16,905,585 | ||||||
| Ultra Short Term Bond Trust Series I |
48 | 497 | ||||||
| Ultra Short Term Bond Trust Series NAV |
341,807 | 232,082 | ||||||
| Utilities Trust Series I |
109,633 | 236,110 | ||||||
| Utilities Trust Series NAV |
366,545 | 487,565 | ||||||
59
Table of Contents
JOHN HANCOCK LIFE INSURANCE COMPANY (U.S.A.) SEPARATE ACCOUNT N
NOTES TO FINANCIAL STATEMENTS — (CONTINUED)
December 31, 2018
| 6. | Purchases and Sales of Investments — (continued): |
| (a) | Terminated as an investment option and funds transferred to Mid Cap Stock Trust Series I on April 27, 2018. The information above represents operations and change in owner’s contract holder equities from beginning of the year through termination date. |
| (b) | Terminated as an investment option and funds transferred to Mid Cap Stock Trust Series NAV on April 27, 2018. The information above represents operations and change in owner’s contract holder equities from beginning of the year through termination date. |
60
Table of Contents
JOHN HANCOCK LIFE INSURANCE COMPANY (U.S.A.) SEPARATE ACCOUNT N
NOTES TO FINANCIAL STATEMENTS — (CONTINUED)
December 31, 2018
| 7. | Unit Values |
A summary of unit values and units outstanding for variable life contracts and the expense and income ratios, excluding expenses of the underlying Portfolios, were as follows:
| At December 31, | For the years and periods ended December 31, | ||||||||||||||||||||||||||||||||||
| Sub-account |
Year | Units (000s) |
Unit Fair Value Highest to Lowest (a) |
Assets (000s) |
Expense Ratio Highest to Lowest (b) |
Investment Income Ratio (c) |
Total Return Highest to Lowest (d) | ||||||||||||||||||||||||||||
| 500 Index Fund Series NAV (*) |
2018 | 1,733 | $ | 55.90 to $ 31.75 | $ | 77,745 | 0.70% to 0.00 | % | 1.37 | % | -4.64% to -5.32 | % | |||||||||||||||||||||||
| 2017 | 1,888 | 58.62 to 33.53 | 89,400 | 0.70 to 0.00 | 1.69 | 21.54 to 20.70 | |||||||||||||||||||||||||||||
| 2016 | 2,089 | 48.23 to 27.78 | 82,800 | 0.70 to 0.00 | 1.84 | 11.64 to 10.86 | |||||||||||||||||||||||||||||
| 2015 | 1,981 | 43.20 to 25.06 | 71,734 | 0.70 to 0.00 | 1.79 | 1.15 to 0.44 | |||||||||||||||||||||||||||||
| 2014 | 1,978 | 26.70 to 24.48 | 70,166 | 0.90 to 0.00 | 1.74 | 13.43 to 12.41 | |||||||||||||||||||||||||||||
| Active Bond Trust Series I (*) |
2018 | 30 | 23.10 to 21.73 | 675 | 0.65 to 0.20 | 3.13 | -0.80 to -1.25 | ||||||||||||||||||||||||||||
| 2017 | 34 | 23.29 to 22.00 | 763 | 0.65 to 0.20 | 4.13 | 4.63 to 4.16 | |||||||||||||||||||||||||||||
| 2016 | 28 | 22.26 to 21.12 | 586 | 0.65 to 0.20 | 3.60 | 4.14 to 3.66 | |||||||||||||||||||||||||||||
| 2015 | 30 | 21.37 to 20.38 | 623 | 0.65 to 0.20 | 4.95 | -0.03 to -0.49 | |||||||||||||||||||||||||||||
| 2014 | 32 | 21.80 to 19.99 | 652 | 0.90 to 0.00 | 3.76 | 6.82 to 5.85 | |||||||||||||||||||||||||||||
| Active Bond Trust Series NAV (*) |
2018 | 17 | 77.56 to 77.56 | 1,357 | 0.00 to 0.00 | 3.48 | -0.55 to -0.55 | ||||||||||||||||||||||||||||
| 2017 | 14 | 77.99 to 77.99 | 1,068 | 0.00 to 0.00 | 4.02 | 4.89 to 4.89 | |||||||||||||||||||||||||||||
| 2016 | 7 | 74.36 to 74.36 | 518 | 0.00 to 0.00 | 4.10 | 4.50 to 4.50 | |||||||||||||||||||||||||||||
| 2015 | 5 | 71.15 to 71.15 | 340 | 0.00 to 0.00 | 5.26 | 0.12 to 0.12 | |||||||||||||||||||||||||||||
| 2014 | 4 | 71.07 to 71.07 | 258 | 0.00 to 0.00 | 4.64 | 6.97 to 6.97 | |||||||||||||||||||||||||||||
| American Asset Allocation Trust Series I (*) |
2018 | 604 | 18.46 to 17.12 | 10,661 | 0.70 to 0.00 | 1.64 | -4.91 to -5.57 | ||||||||||||||||||||||||||||
| 2017 | 630 | 19.41 to 18.13 | 11,728 | 0.70 to 0.00 | 1.26 | 15.79 to 14.99 | |||||||||||||||||||||||||||||
| 2016 | 563 | 16.76 to 15.77 | 9,005 | 0.70 to 0.00 | 1.27 | 8.99 to 8.23 | |||||||||||||||||||||||||||||
| 2015 | 598 | 15.38 to 14.57 | 8,795 | 0.70 to 0.00 | 2.04 | 1.06 to 0.35 | |||||||||||||||||||||||||||||
| 2014 | 638 | 15.22 to 14.33 | 9,330 | 0.90 to 0.00 | 1.40 | 5.05 to 4.10 | |||||||||||||||||||||||||||||
| American Global Growth Trust Series I (*) |
2018 | 39 | 18.63 to 17.67 | 728 | 0.65 to 0.00 | 0.68 | -9.37 to -9.96 | ||||||||||||||||||||||||||||
| 2017 | 32 | 20.55 to 19.62 | 660 | 0.65 to 0.00 | 0.24 | 30.92 to 30.06 | |||||||||||||||||||||||||||||
| 2016 | 30 | 15.70 to 15.09 | 469 | 0.65 to 0.00 | 1.02 | 0.29 to -0.36 | |||||||||||||||||||||||||||||
| 2015 | 27 | 15.66 to 15.14 | 427 | 0.65 to 0.00 | 1.58 | 6.64 to 5.94 | |||||||||||||||||||||||||||||
| 2014 | 20 | 14.68 to 14.14 | 294 | 0.90 to 0.00 | 1.03 | 1.97 to 1.05 | |||||||||||||||||||||||||||||
| American Growth Trust Series I (*) |
2018 | 381 | 42.51 to 31.23 | 12,294 | 0.65 to 0.00 | 0.33 | -0.66 to -1.30 | ||||||||||||||||||||||||||||
| 2017 | 472 | 43.07 to 31.43 | 15,257 | 0.65 to 0.00 | 0.38 | 27.86 to 27.04 | |||||||||||||||||||||||||||||
| 2016 | 537 | 33.90 to 24.58 | 13,960 | 0.65 to 0.00 | 0.41 | 9.08 to 8.37 | |||||||||||||||||||||||||||||
| 2015 | 488 | 31.29 to 22.54 | 11,721 | 0.65 to 0.00 | 0.23 | 6.44 to 5.75 | |||||||||||||||||||||||||||||
| 2014 | 606 | 28.74 to 21.17 | 13,915 | 0.90 to 0.00 | 0.83 | 8.13 to 7.17 | |||||||||||||||||||||||||||||
| American Growth-Income Trust Series I (*) |
2018 | 280 | 35.87 to 26.78 | 9,361 | 0.70 to 0.00 | 1.10 | -2.18 to -2.87 | ||||||||||||||||||||||||||||
| 2017 | 414 | 36.92 to 27.38 | 13,401 | 0.70 to 0.00 | 1.06 | 22.03 to 21.18 | |||||||||||||||||||||||||||||
| 2016 | 486 | 30.47 to 22.44 | 13,415 | 0.70 to 0.00 | 1.72 | 11.10 to 10.33 | |||||||||||||||||||||||||||||
| 2015 | 469 | 27.62 to 20.19 | 11,818 | 0.70 to 0.00 | 1.32 | 1.11 to 0.41 | |||||||||||||||||||||||||||||
| 2014 | 502 | 26.88 to 19.97 | 12,621 | 0.90 to 0.00 | 0.93 | 10.25 to 9.27 | |||||||||||||||||||||||||||||
| American International Trust Series I (*) |
2018 | 268 | 32.54 to 20.44 | 6,118 | 0.65 to 0.00 | 2.46 | -13.46 to -14.02 | ||||||||||||||||||||||||||||
| 2017 | 306 | 37.84 to 23.62 | 7,988 | 0.65 to 0.00 | 0.53 | 31.65 to 30.80 | |||||||||||||||||||||||||||||
| 2016 | 776 | 28.93 to 17.94 | 14,938 | 0.65 to 0.00 | 0.97 | 3.12 to 2.45 | |||||||||||||||||||||||||||||
| 2015 | 849 | 28.24 to 17.40 | 15,951 | 0.65 to 0.00 | 1.13 | -4.82 to -5.44 | |||||||||||||||||||||||||||||
| 2014 | 886 | 29.02 to 18.28 | 17,920 | 0.90 to 0.00 | 1.07 | -3.05 to -3.92 | |||||||||||||||||||||||||||||
| Blue Chip Growth Trust Series I (*) |
2018 | 137 | 73.44 to 67.11 | 9,434 | 0.70 to 0.20 | 0.02 | 1.77 to 1.26 | ||||||||||||||||||||||||||||
| 2017 | 142 | 72.16 to 66.28 | 9,564 | 0.70 to 0.20 | 0.07 | 36.01 to 35.33 | |||||||||||||||||||||||||||||
| 2016 | 153 | 53.06 to 48.98 | 7,724 | 0.70 to 0.20 | 0.01 | 0.61 to 0.11 | |||||||||||||||||||||||||||||
| 2015 | 174 | 52.74 to 48.92 | 8,641 | 0.70 to 0.20 | 0.00 | 10.84 to 10.29 | |||||||||||||||||||||||||||||
| 2014 | 154 | 48.93 to 43.14 | 6,900 | 0.90 to 0.00 | 0.00 | 9.07 to 8.09 | |||||||||||||||||||||||||||||
| Blue Chip Growth Trust Series NAV (*) |
2018 | 318 | 190.64 to 190.64 | 60,594 | 0.00 to 0.00 | 0.04 | 2.03 to 2.03 | ||||||||||||||||||||||||||||
| 2017 | 366 | 186.84 to 186.84 | 68,329 | 0.00 to 0.00 | 0.11 | 36.34 to 36.34 | |||||||||||||||||||||||||||||
| 2016 | 394 | 137.04 to 137.04 | 54,032 | 0.00 to 0.00 | 0.06 | 0.85 to 0.85 | |||||||||||||||||||||||||||||
| 2015 | 345 | 135.88 to 135.88 | 46,931 | 0.00 to 0.00 | 0.00 | 11.13 to 11.13 | |||||||||||||||||||||||||||||
| 2014 | 310 | 122.28 to 122.28 | 37,958 | 0.00 to 0.00 | 0.00 | 9.11 to 9.11 | |||||||||||||||||||||||||||||
| Capital Appreciation Trust Series I (*) |
2018 | 213 | 35.70 to 32.69 | 7,388 | 0.70 to 0.20 | 0.26 | -1.00 to -1.50 | ||||||||||||||||||||||||||||
| 2017 | 244 | 36.06 to 33.18 | 8,566 | 0.70 to 0.20 | 0.06 | 36.26 to 35.58 | |||||||||||||||||||||||||||||
| 2016 | 274 | 26.47 to 24.48 | 7,058 | 0.70 to 0.20 | 0.00 | -1.27 to -1.77 | |||||||||||||||||||||||||||||
| 2015 | 327 | 26.81 to 24.92 | 8,542 | 0.70 to 0.20 | 0.00 | 11.23 to 10.68 | |||||||||||||||||||||||||||||
| 2014 | 332 | 24.78 to 21.90 | 7,804 | 0.90 to 0.00 | 0.05 | 9.65 to 8.67 | |||||||||||||||||||||||||||||
| Capital Appreciation Trust Series NAV (*) |
2018 | 58 | 36.38 to 36.38 | 2,100 | 0.00 to 0.00 | 0.38 | -0.72 to -0.72 | ||||||||||||||||||||||||||||
| 2017 | 53 | 36.64 to 36.64 | 1,946 | 0.00 to 0.00 | 0.11 | 36.51 to 36.51 | |||||||||||||||||||||||||||||
| 2016 | 62 | 26.84 to 26.84 | 1,667 | 0.00 to 0.00 | 0.01 | -1.00 to -1.00 | |||||||||||||||||||||||||||||
| 2015 | 65 | 27.11 to 27.11 | 1,756 | 0.00 to 0.00 | 0.03 | 11.47 to 11.47 | |||||||||||||||||||||||||||||
| 2014 | 54 | 24.32 to 24.32 | 1,316 | 0.00 to 0.00 | 0.09 | 9.68 to 9.68 | |||||||||||||||||||||||||||||
| Capital Appreciation Value Trust Series I (*) |
2018 | 48 | 22.52 to 21.47 | 1,051 | 0.65 to 0.20 | 2.08 | 0.19 to -0.26 | ||||||||||||||||||||||||||||
| 2017 | 52 | 22.48 to 21.52 | 1,154 | 0.65 to 0.20 | 1.85 | 14.91 to 14.40 | |||||||||||||||||||||||||||||
| 2016 | 18 | 19.31 to 18.81 | 330 | 0.65 to 0.35 | 1.32 | 7.74 to 7.42 | |||||||||||||||||||||||||||||
| 2015 | 18 | 17.92 to 17.52 | 321 | 0.65 to 0.35 | 0.39 | 4.92 to 4.60 | |||||||||||||||||||||||||||||
| 2014 | 180 | 17.48 to 16.46 | 3,068 | 0.90 to 0.00 | 1.95 | 12.22 to 11.22 | |||||||||||||||||||||||||||||
61
Table of Contents
JOHN HANCOCK LIFE INSURANCE COMPANY (U.S.A.) SEPARATE ACCOUNT N
NOTES TO FINANCIAL STATEMENTS — (CONTINUED)
December 31, 2018
| 7. | Unit Values — (continued): |
| At December 31, | For the years and periods ended December 31, | ||||||||||||||||||||||||||||||||||
| Sub-account |
Year | Units (000s) |
Unit Fair Value Highest to Lowest (a) |
Assets (000s) |
Expense Ratio Highest to Lowest (b) |
Investment Income Ratio (c) |
Total Return Highest to Lowest (d) | ||||||||||||||||||||||||||||
| Capital Appreciation Value Trust Series NAV (*) |
2018 | 105 | $ | 23.09 to $ 23.09 | $ | 2,416 | 0.00% to 0.00 | % | 2.24 | % | 0.45% to 0.45 | % | |||||||||||||||||||||||
| 2017 | 102 | 22.99 to 22.99 | 2,356 | 0.00 to 0.00 | 1.53 | 15.13 to 15.13 | |||||||||||||||||||||||||||||
| 2016 | 95 | 19.97 to 19.97 | 1,900 | 0.00 to 0.00 | 2.04 | 8.19 to 8.19 | |||||||||||||||||||||||||||||
| 2015 | 14 | 18.46 to 18.46 | 263 | 0.00 to 0.00 | 1.40 | 5.27 to 5.27 | |||||||||||||||||||||||||||||
| 2014 | 10 | 17.54 to 17.54 | 170 | 0.00 to 0.00 | 1.68 | 12.38 to 12.38 | |||||||||||||||||||||||||||||
| Core Bond Trust Series I (*) |
2018 | 382 | 20.87 to 19.63 | 7,855 | 0.65 to 0.20 | 2.54 | -0.79 to -1.23 | ||||||||||||||||||||||||||||
| 2017 | 369 | 21.03 to 19.88 | 7,646 | 0.65 to 0.20 | 2.00 | 3.20 to 2.73 | |||||||||||||||||||||||||||||
| 2016 | 484 | 20.38 to 19.35 | 9,744 | 0.65 to 0.20 | 1.95 | 2.54 to 2.08 | |||||||||||||||||||||||||||||
| 2015 | 557 | 19.87 to 18.96 | 10,922 | 0.65 to 0.20 | 2.59 | 0.12 to -0.33 | |||||||||||||||||||||||||||||
| 2014 | 1 | 20.25 to 18.56 | 14 | 0.90 to 0.00 | 2.89 | 5.93 to 4.98 | |||||||||||||||||||||||||||||
| Core Bond Trust Series NAV (*) |
2018 | 1,576 | 17.25 to 17.25 | 27,182 | 0.00 to 0.00 | 2.68 | -0.54 to -0.54 | ||||||||||||||||||||||||||||
| 2017 | 1,480 | 17.35 to 17.35 | 25,673 | 0.00 to 0.00 | 2.30 | 3.47 to 3.47 | |||||||||||||||||||||||||||||
| 2016 | 1,270 | 16.76 to 16.76 | 21,287 | 0.00 to 0.00 | 2.15 | 2.73 to 2.73 | |||||||||||||||||||||||||||||
| 2015 | 1,411 | 16.32 to 16.32 | 23,019 | 0.00 to 0.00 | 2.19 | 0.36 to 0.36 | |||||||||||||||||||||||||||||
| 2014 | 63 | 16.26 to 16.26 | 1,029 | 0.00 to 0.00 | 3.47 | 6.01 to 6.01 | |||||||||||||||||||||||||||||
| Emerging Markets Value Trust Series I (*) |
2018 | 127 | 15.09 to 14.31 | 1,904 | 0.65 to 0.20 | 2.71 | -13.77 to -14.16 | ||||||||||||||||||||||||||||
| 2017 | 114 | 17.50 to 16.68 | 1,987 | 0.65 to 0.20 | 4.52 | 32.44 to 31.84 | |||||||||||||||||||||||||||||
| 2016 | 6 | 13.02 to 12.65 | 72 | 0.65 to 0.35 | 2.13 | 17.60 to 17.24 | |||||||||||||||||||||||||||||
| 2015 | 6 | 11.07 to 10.79 | 68 | 0.65 to 0.35 | 1.99 | -19.36 to -19.60 | |||||||||||||||||||||||||||||
| 2014 | 13 | 14.10 to 13.16 | 174 | 0.90 to 0.00 | 0.96 | -5.50 to -6.35 | |||||||||||||||||||||||||||||
| Emerging Markets Value Trust Series NAV (*) |
2018 | 302 | 12.43 to 12.43 | 3,759 | 0.00 to 0.00 | 2.72 | -13.48 to -13.48 | ||||||||||||||||||||||||||||
| 2017 | 285 | 14.36 to 14.36 | 4,086 | 0.00 to 0.00 | 2.38 | 32.67 to 32.67 | |||||||||||||||||||||||||||||
| 2016 | 126 | 10.83 to 10.83 | 1,368 | 0.00 to 0.00 | 2.42 | 18.09 to 18.09 | |||||||||||||||||||||||||||||
| 2015 | 91 | 9.17 to 9.17 | 833 | 0.00 to 0.00 | 2.21 | -19.05 to -19.05 | |||||||||||||||||||||||||||||
| 2014 | 94 | 11.32 to 11.32 | 1,069 | 0.00 to 0.00 | 1.65 | -5.37 to -5.37 | |||||||||||||||||||||||||||||
| Equity Income Trust Series I (*) |
2018 | 141 | 50.10 to 45.79 | 6,780 | 0.70 to 0.20 | 1.85 | -9.76 to -10.21 | ||||||||||||||||||||||||||||
| 2017 | 162 | 55.52 to 51.00 | 8,632 | 0.70 to 0.20 | 2.21 | 16.06 to 15.48 | |||||||||||||||||||||||||||||
| 2016 | 190 | 47.84 to 44.16 | 8,763 | 0.70 to 0.20 | 2.14 | 18.88 to 18.29 | |||||||||||||||||||||||||||||
| 2015 | 240 | 40.24 to 37.33 | 9,307 | 0.70 to 0.20 | 1.68 | -6.93 to -7.40 | |||||||||||||||||||||||||||||
| 2014 | 330 | 44.46 to 39.20 | 13,816 | 0.90 to 0.00 | 1.98 | 7.47 to 6.51 | |||||||||||||||||||||||||||||
| Equity Income Trust Series NAV (*) |
2018 | 715 | 53.66 to 53.66 | 38,346 | 0.00 to 0.00 | 2.00 | -9.52 to -9.52 | ||||||||||||||||||||||||||||
| 2017 | 785 | 59.30 to 59.30 | 46,533 | 0.00 to 0.00 | 2.47 | 16.28 to 16.28 | |||||||||||||||||||||||||||||
| 2016 | 730 | 51.00 to 51.00 | 37,229 | 0.00 to 0.00 | 2.26 | 19.18 to 19.18 | |||||||||||||||||||||||||||||
| 2015 | 824 | 42.79 to 42.79 | 35,253 | 0.00 to 0.00 | 1.98 | -6.66 to -6.66 | |||||||||||||||||||||||||||||
| 2014 | 908 | 45.85 to 45.85 | 41,633 | 0.00 to 0.00 | 2.00 | 7.55 to 7.55 | |||||||||||||||||||||||||||||
| Financial Industries Trust Series I (*) |
2018 | 25 | 26.14 to 24.15 | 612 | 0.65 to 0.20 | 1.20 | -14.66 to -15.05 | ||||||||||||||||||||||||||||
| 2017 | 28 | 30.63 to 28.43 | 821 | 0.65 to 0.20 | 1.03 | 15.05 to 14.54 | |||||||||||||||||||||||||||||
| 2016 | 35 | 26.63 to 24.82 | 888 | 0.65 to 0.20 | 1.31 | 19.13 to 18.60 | |||||||||||||||||||||||||||||
| 2015 | 32 | 22.35 to 20.93 | 682 | 0.65 to 0.20 | 0.60 | -2.84 to -3.27 | |||||||||||||||||||||||||||||
| 2014 | 66 | 23.65 to 20.91 | 1,468 | 0.90 to 0.00 | 0.85 | 8.65 to 7.67 | |||||||||||||||||||||||||||||
| Financial Industries Trust Series NAV (*) |
2018 | 11 | 32.70 to 32.70 | 347 | 0.00 to 0.00 | 1.16 | -14.38 to -14.38 | ||||||||||||||||||||||||||||
| 2017 | 10 | 38.19 to 38.19 | 379 | 0.00 to 0.00 | 1.32 | 15.29 to 15.29 | |||||||||||||||||||||||||||||
| 2016 | 9 | 33.13 to 33.13 | 300 | 0.00 to 0.00 | 1.30 | 19.47 to 19.47 | |||||||||||||||||||||||||||||
| 2015 | 14 | 27.73 to 27.73 | 379 | 0.00 to 0.00 | 1.02 | -2.58 to -2.58 | |||||||||||||||||||||||||||||
| 2014 | 15 | 28.46 to 28.46 | 421 | 0.00 to 0.00 | 0.68 | 8.64 to 8.64 | |||||||||||||||||||||||||||||
| Fundamental All Cap Core Trust Series I (*) |
2018 | 4 | 44.17 to 41.16 | 193 | 0.65 to 0.20 | 0.36 | -13.33 to -13.73 | ||||||||||||||||||||||||||||
| 2017 | 8 | 50.96 to 47.71 | 418 | 0.65 to 0.20 | 0.74 | 27.44 to 26.87 | |||||||||||||||||||||||||||||
| 2016 | 8 | 39.99 to 37.61 | 327 | 0.65 to 0.20 | 0.52 | 8.12 to 7.64 | |||||||||||||||||||||||||||||
| 2015 | 12 | 36.99 to 34.94 | 438 | 0.65 to 0.20 | 0.00 | 3.81 to 3.34 | |||||||||||||||||||||||||||||
| 2014 | 9 | 36.47 to 32.84 | 306 | 0.90 to 0.00 | 0.38 | 9.75 to 8.76 | |||||||||||||||||||||||||||||
| Fundamental All Cap Core Trust Series NAV (*) |
2018 | 87 | 27.11 to 27.11 | 2,370 | 0.00 to 0.00 | 0.48 | -13.16 to -13.16 | ||||||||||||||||||||||||||||
| 2017 | 88 | 31.22 to 31.22 | 2,761 | 0.00 to 0.00 | 0.92 | 27.77 to 27.77 | |||||||||||||||||||||||||||||
| 2016 | 59 | 24.44 to 24.44 | 1,446 | 0.00 to 0.00 | 0.70 | 8.40 to 8.40 | |||||||||||||||||||||||||||||
| 2015 | 58 | 22.55 to 22.55 | 1,309 | 0.00 to 0.00 | 0.00 | 4.09 to 4.09 | |||||||||||||||||||||||||||||
| 2014 | 47 | 21.66 to 21.66 | 1,009 | 0.00 to 0.00 | 0.48 | 9.81 to 9.81 | |||||||||||||||||||||||||||||
| Fundamental Large Cap Value Trust Series I (*) |
2018 | 101 | 29.23 to 27.17 | 2,842 | 0.70 to 0.20 | 1.11 | -17.20 to -17.61 | ||||||||||||||||||||||||||||
| 2017 | 108 | 35.30 to 32.98 | 3,699 | 0.70 to 0.20 | 1.51 | 17.20 to 16.62 | |||||||||||||||||||||||||||||
| 2016 | 160 | 30.12 to 28.28 | 4,698 | 0.70 to 0.20 | 2.16 | 9.95 to 9.41 | |||||||||||||||||||||||||||||
| 2015 | 217 | 27.40 to 25.85 | 5,781 | 0.70 to 0.20 | 0.97 | -1.31 to -1.80 | |||||||||||||||||||||||||||||
| 2014 | 270 | 28.36 to 25.76 | 7,281 | 0.90 to 0.00 | 1.21 | 10.61 to 9.62 | |||||||||||||||||||||||||||||
| Fundamental Large Cap Value Trust Series NAV (*) |
2018 | 305 | 21.23 to 21.23 | 6,469 | 0.00 to 0.00 | 1.18 | -17.03 to -17.03 | ||||||||||||||||||||||||||||
| 2017 | 320 | 25.59 to 25.59 | 8,185 | 0.00 to 0.00 | 1.72 | 17.54 to 17.54 | |||||||||||||||||||||||||||||
| 2016 | 317 | 21.77 to 21.77 | 6,911 | 0.00 to 0.00 | 2.58 | 10.21 to 10.21 | |||||||||||||||||||||||||||||
| 2015 | 191 | 19.75 to 19.75 | 3,773 | 0.00 to 0.00 | 1.03 | -1.06 to -1.06 | |||||||||||||||||||||||||||||
| 2014 | 168 | 19.96 to 19.96 | 3,363 | 0.00 to 0.00 | 0.84 | 10.66 to 10.66 | |||||||||||||||||||||||||||||
62
Table of Contents
JOHN HANCOCK LIFE INSURANCE COMPANY (U.S.A.) SEPARATE ACCOUNT N
NOTES TO FINANCIAL STATEMENTS — (CONTINUED)
December 31, 2018
| 7. | Unit Values — (continued): |
| At December 31, | For the years and periods ended December 31, | ||||||||||||||||||||||||||||||||||
| Sub-account |
Year | Units (000s) |
Unit Fair Value Highest to Lowest (a) |
Assets (000s) |
Expense Ratio Highest to Lowest (b) |
Investment Income Ratio (c) |
Total Return Highest to Lowest (d) | ||||||||||||||||||||||||||||
| Global Bond Trust Series I (*) |
2018 | 36 | $ | 30.67 to $ 28.04 | $ | 1,065 | 0.70% to 0.20 | % | 2.71 | % | -2.10% to -2.58 | % | |||||||||||||||||||||||
| 2017 | 34 | 31.33 to 28.78 | 1,015 | 0.70 to 0.20 | 2.36 | 8.54 to 8.00 | |||||||||||||||||||||||||||||
| 2016 | 36 | 28.86 to 26.65 | 1,015 | 0.70 to 0.20 | 0.00 | 2.85 to 2.33 | |||||||||||||||||||||||||||||
| 2015 | 41 | 28.07 to 26.04 | 1,123 | 0.70 to 0.20 | 1.76 | -3.70 to -4.17 | |||||||||||||||||||||||||||||
| 2014 | 89 | 29.98 to 26.43 | 2,487 | 0.90 to 0.00 | 0.93 | 2.28 to 1.36 | |||||||||||||||||||||||||||||
| Global Bond Trust Series NAV (*) |
2018 | 282 | 32.75 to 32.75 | 9,227 | 0.00 to 0.00 | 2.70 | -1.74 to -1.74 | ||||||||||||||||||||||||||||
| 2017 | 271 | 33.33 to 33.33 | 9,043 | 0.00 to 0.00 | 2.29 | 8.71 to 8.71 | |||||||||||||||||||||||||||||
| 2016 | 213 | 30.66 to 30.66 | 6,545 | 0.00 to 0.00 | 0.00 | 3.15 to 3.15 | |||||||||||||||||||||||||||||
| 2015 | 201 | 29.73 to 29.73 | 5,977 | 0.00 to 0.00 | 2.49 | -3.51 to -3.51 | |||||||||||||||||||||||||||||
| 2014 | 225 | 30.81 to 30.81 | 6,936 | 0.00 to 0.00 | 1.08 | 2.42 to 2.42 | |||||||||||||||||||||||||||||
| Global Trust Series I (*) |
2018 | 52 | 31.30 to 28.60 | 1,515 | 0.70 to 0.20 | 1.53 | -14.67 to -15.09 | ||||||||||||||||||||||||||||
| 2017 | 76 | 36.67 to 33.68 | 2,608 | 0.70 to 0.20 | 1.97 | 18.64 to 18.05 | |||||||||||||||||||||||||||||
| 2016 | 75 | 30.91 to 28.53 | 2,158 | 0.70 to 0.20 | 4.37 | 9.25 to 8.70 | |||||||||||||||||||||||||||||
| 2015 | 83 | 28.30 to 26.25 | 2,224 | 0.70 to 0.20 | 1.81 | -6.61 to -7.08 | |||||||||||||||||||||||||||||
| 2014 | 113 | 31.16 to 27.47 | 3,234 | 0.90 to 0.00 | 3.40 | -2.60 to -3.47 | |||||||||||||||||||||||||||||
| Global Trust Series NAV (*) |
2018 | 131 | 18.01 to 18.01 | 2,358 | 0.00 to 0.00 | 1.91 | -14.42 to -14.42 | ||||||||||||||||||||||||||||
| 2017 | 123 | 21.04 to 21.04 | 2,579 | 0.00 to 0.00 | 2.00 | 18.90 to 18.90 | |||||||||||||||||||||||||||||
| 2016 | 115 | 17.70 to 17.70 | 2,032 | 0.00 to 0.00 | 4.62 | 9.46 to 9.46 | |||||||||||||||||||||||||||||
| 2015 | 123 | 16.17 to 16.17 | 1,989 | 0.00 to 0.00 | 1.96 | -6.33 to -6.33 | |||||||||||||||||||||||||||||
| 2014 | 128 | 17.26 to 17.26 | 2,209 | 0.00 to 0.00 | 4.54 | -2.51 to -2.51 | |||||||||||||||||||||||||||||
| Health Sciences Trust Series I (*) |
2018 | 61 | 86.24 to 79.65 | 5,104 | 0.65 to 0.20 | 0.00 | 0.48 to 0.03 | ||||||||||||||||||||||||||||
| 2017 | 62 | 85.82 to 79.62 | 5,158 | 0.65 to 0.20 | 0.00 | 27.25 to 26.68 | |||||||||||||||||||||||||||||
| 2016 | 67 | 67.44 to 62.85 | 4,375 | 0.65 to 0.20 | 0.06 | -10.75 to -11.15 | |||||||||||||||||||||||||||||
| 2015 | 110 | 75.57 to 70.74 | 8,069 | 0.65 to 0.20 | 0.00 | 12.47 to 11.97 | |||||||||||||||||||||||||||||
| 2014 | 100 | 69.05 to 61.05 | 6,505 | 0.90 to 0.00 | 0.00 | 31.83 to 30.65 | |||||||||||||||||||||||||||||
| Health Sciences Trust Series NAV (*) |
2018 | 82 | 69.79 to 69.79 | 5,691 | 0.00 to 0.00 | 0.00 | 0.76 to 0.76 | ||||||||||||||||||||||||||||
| 2017 | 95 | 69.27 to 69.27 | 6,555 | 0.00 to 0.00 | 0.00 | 27.61 to 27.61 | |||||||||||||||||||||||||||||
| 2016 | 93 | 54.28 to 54.28 | 5,051 | 0.00 to 0.00 | 0.11 | -10.54 to -10.54 | |||||||||||||||||||||||||||||
| 2015 | 81 | 60.67 to 60.67 | 4,921 | 0.00 to 0.00 | 0.00 | 12.76 to 12.76 | |||||||||||||||||||||||||||||
| 2014 | 83 | 53.81 to 53.81 | 4,454 | 0.00 to 0.00 | 0.00 | 31.85 to 31.85 | |||||||||||||||||||||||||||||
| High Yield Trust Series I (*) |
2018 | 78 | 33.50 to 30.63 | 2,523 | 0.70 to 0.20 | 5.76 | -3.21 to -3.69 | ||||||||||||||||||||||||||||
| 2017 | 89 | 34.61 to 31.81 | 2,979 | 0.70 to 0.20 | 5.79 | 7.28 to 6.75 | |||||||||||||||||||||||||||||
| 2016 | 114 | 32.27 to 29.80 | 3,561 | 0.70 to 0.20 | 7.03 | 16.03 to 15.45 | |||||||||||||||||||||||||||||
| 2015 | 102 | 27.81 to 25.81 | 2,758 | 0.70 to 0.20 | 7.30 | -8.51 to -8.96 | |||||||||||||||||||||||||||||
| 2014 | 134 | 31.25 to 27.57 | 3,941 | 0.90 to 0.00 | 6.42 | 0.12 to -0.78 | |||||||||||||||||||||||||||||
| High Yield Trust Series NAV (*) |
2018 | 86 | 23.52 to 23.52 | 2,011 | 0.00 to 0.00 | 6.89 | -3.02 to -3.02 | ||||||||||||||||||||||||||||
| 2017 | 67 | 24.25 to 24.25 | 1,622 | 0.00 to 0.00 | 4.30 | 7.46 to 7.46 | |||||||||||||||||||||||||||||
| 2016 | 124 | 22.57 to 22.57 | 2,802 | 0.00 to 0.00 | 6.85 | 16.56 to 16.56 | |||||||||||||||||||||||||||||
| 2015 | 117 | 19.36 to 19.36 | 2,264 | 0.00 to 0.00 | 6.07 | -8.38 to -8.38 | |||||||||||||||||||||||||||||
| 2014 | 185 | 21.14 to 21.14 | 3,920 | 0.00 to 0.00 | 7.74 | 0.00 to 0.00 | |||||||||||||||||||||||||||||
| International Equity Index Series I (*) |
2018 | 608 | 12.30 to 11.96 | 7,383 | 0.65 to 0.20 | 2.26 | -14.27 to -14.66 | ||||||||||||||||||||||||||||
| 2017 | 651 | 14.34 to 14.02 | 9,241 | 0.65 to 0.20 | 2.46 | 27.05 to 26.49 | |||||||||||||||||||||||||||||
| 2016 | 498 | 11.29 to 11.08 | 5,569 | 0.65 to 0.20 | 2.47 | 4.24 to 3.77 | |||||||||||||||||||||||||||||
| 2015 | 420 | 10.83 to 10.68 | 4,525 | 0.65 to 0.20 | 2.54 | -6.11 to -6.53 | |||||||||||||||||||||||||||||
| 2014 | 382 | 11.58 to 11.36 | 4,392 | 0.90 to 0.00 | 3.21 | -4.61 to -5.47 | |||||||||||||||||||||||||||||
| International Equity Index Series NAV (*) |
2018 | 311 | 48.91 to 48.91 | 15,197 | 0.00 to 0.00 | 2.43 | -14.10 to -14.10 | ||||||||||||||||||||||||||||
| 2017 | 304 | 56.94 to 56.94 | 17,323 | 0.00 to 0.00 | 2.37 | 27.45 to 27.45 | |||||||||||||||||||||||||||||
| 2016 | 252 | 44.68 to 44.68 | 11,245 | 0.00 to 0.00 | 2.78 | 4.43 to 4.43 | |||||||||||||||||||||||||||||
| 2015 | 276 | 42.78 to 42.78 | 11,819 | 0.00 to 0.00 | 2.45 | -5.80 to -5.80 | |||||||||||||||||||||||||||||
| 2014 | 274 | 45.42 to 45.42 | 12,445 | 0.00 to 0.00 | 3.02 | -4.57 to -4.57 | |||||||||||||||||||||||||||||
| International Growth Stock Trust Series I (*) |
2018 | 75 | 12.34 to 12.00 | 919 | 0.65 to 0.20 | 0.78 | -14.60 to -14.98 | ||||||||||||||||||||||||||||
| 2017 | 210 | 14.45 to 14.12 | 3,021 | 0.65 to 0.20 | 1.61 | 21.61 to 21.07 | |||||||||||||||||||||||||||||
| 2016 | 126 | 11.88 to 11.66 | 1,485 | 0.65 to 0.20 | 1.81 | -1.51 to -1.95 | |||||||||||||||||||||||||||||
| 2015 | 131 | 12.06 to 11.89 | 1,579 | 0.65 to 0.20 | 3.18 | -2.46 to -2.90 | |||||||||||||||||||||||||||||
| 2014 | 32 | 12.42 to 12.18 | 390 | 0.90 to 0.00 | 2.16 | 0.20 to -0.70 | |||||||||||||||||||||||||||||
| International Growth Stock Trust Series NAV (*) |
2018 | 736 | 12.53 to 12.53 | 9,223 | 0.00 to 0.00 | 1.64 | -14.43 to -14.43 | ||||||||||||||||||||||||||||
| 2017 | 749 | 14.64 to 14.64 | 10,972 | 0.00 to 0.00 | 1.51 | 21.90 to 21.90 | |||||||||||||||||||||||||||||
| 2016 | 740 | 12.01 to 12.01 | 8,892 | 0.00 to 0.00 | 1.73 | -1.19 to -1.19 | |||||||||||||||||||||||||||||
| 2015 | 696 | 12.16 to 12.16 | 8,457 | 0.00 to 0.00 | 1.83 | -2.23 to -2.23 | |||||||||||||||||||||||||||||
| 2014 | 664 | 12.43 to 12.43 | 8,259 | 0.00 to 0.00 | 1.93 | 0.19 to 0.19 | |||||||||||||||||||||||||||||
| International Small Company Trust Series I (*) |
2018 | 28 | 16.08 to 15.37 | 435 | 0.70 to 0.20 | 1.47 | -20.26 to -20.66 | ||||||||||||||||||||||||||||
| 2017 | 44 | 20.16 to 19.37 | 854 | 0.70 to 0.20 | 1.44 | 29.20 to 28.56 | |||||||||||||||||||||||||||||
| 2016 | 33 | 15.61 to 15.06 | 497 | 0.70 to 0.20 | 1.86 | 4.69 to 4.17 | |||||||||||||||||||||||||||||
| 2015 | 40 | 14.91 to 14.46 | 587 | 0.70 to 0.20 | 1.51 | 6.32 to 5.80 | |||||||||||||||||||||||||||||
| 2014 | 70 | 14.17 to 13.53 | 964 | 0.90 to 0.00 | 1.38 | -6.89 to -7.73 | |||||||||||||||||||||||||||||
63
Table of Contents
JOHN HANCOCK LIFE INSURANCE COMPANY (U.S.A.) SEPARATE ACCOUNT N
NOTES TO FINANCIAL STATEMENTS — (CONTINUED)
December 31, 2018
| 7. | Unit Values — (continued): |
| At December 31, | For the years and periods ended December 31, | ||||||||||||||||||||||||||||||||||
| Sub-account |
Year | Units (000s) |
Unit Fair Value Highest to Lowest (a) |
Assets (000s) |
Expense Ratio Highest to Lowest (b) |
Investment Income Ratio (c) |
Total Return Highest to Lowest (d) | ||||||||||||||||||||||||||||
| International Small Company Trust Series NAV (*) |
2018 | 74 | $ | 16.45 to $16.45 | $ | 1,216 | 0.00% to 0.00 | % | 1.17 | % | -20.07% to -20.07 | % | |||||||||||||||||||||||
| 2017 | 80 | 20.59 to 20.59 | 1,648 | 0.00 to 0.00 | 1.69 | 29.59 to 29.59 | |||||||||||||||||||||||||||||
| 2016 | 57 | 15.89 to 15.89 | 904 | 0.00 to 0.00 | 1.97 | 4.95 to 4.95 | |||||||||||||||||||||||||||||
| 2015 | 66 | 15.14 to 15.14 | 1,004 | 0.00 to 0.00 | 1.77 | 6.68 to 6.68 | |||||||||||||||||||||||||||||
| 2014 | 78 | 14.19 to 14.19 | 1,103 | 0.00 to 0.00 | 1.44 | -6.85 to -6.85 | |||||||||||||||||||||||||||||
| International Value Trust Series I (*) |
2018 | 188 | 23.54 to 21.51 | 4,299 | 0.70 to 0.20 | 2.28 | -15.20 to -15.63 | ||||||||||||||||||||||||||||
| 2017 | 231 | 27.75 to 25.49 | 6,222 | 0.70 to 0.20 | 1.84 | 16.91 to 16.32 | |||||||||||||||||||||||||||||
| 2016 | 245 | 23.74 to 21.91 | 5,665 | 0.70 to 0.20 | 2.83 | 12.02 to 11.46 | |||||||||||||||||||||||||||||
| 2015 | 174 | 21.19 to 19.66 | 3,623 | 0.70 to 0.20 | 1.92 | -7.99 to -8.45 | |||||||||||||||||||||||||||||
| 2014 | 159 | 23.69 to 20.88 | 3,565 | 0.90 to 0.00 | 2.80 | -12.51 to -13.29 | |||||||||||||||||||||||||||||
| International Value Trust Series NAV (*) |
2018 | 326 | 15.94 to 15.94 | 5,192 | 0.00 to 0.00 | 2.53 | -14.96 to -14.96 | ||||||||||||||||||||||||||||
| 2017 | 385 | 18.75 to 18.75 | 7,215 | 0.00 to 0.00 | 2.01 | 17.25 to 17.25 | |||||||||||||||||||||||||||||
| 2016 | 345 | 15.99 to 15.99 | 5,518 | 0.00 to 0.00 | 2.38 | 12.20 to 12.20 | |||||||||||||||||||||||||||||
| 2015 | 288 | 14.25 to 14.25 | 4,105 | 0.00 to 0.00 | 1.96 | -7.72 to -7.72 | |||||||||||||||||||||||||||||
| 2014 | 297 | 15.44 to 15.44 | 4,589 | 0.00 to 0.00 | 2.99 | -12.47 to -12.47 | |||||||||||||||||||||||||||||
| Investment Quality Bond Trust Series I (*) |
2018 | 130 | 34.22 to 31.28 | 4,279 | 0.70 to 0.20 | 2.68 | -1.02 to -1.51 | ||||||||||||||||||||||||||||
| 2017 | 139 | 34.57 to 31.76 | 4,608 | 0.70 to 0.20 | 2.62 | 4.39 to 3.88 | |||||||||||||||||||||||||||||
| 2016 | 147 | 33.12 to 30.57 | 4,666 | 0.70 to 0.20 | 2.20 | 4.09 to 3.56 | |||||||||||||||||||||||||||||
| 2015 | 156 | 31.82 to 29.52 | 4,775 | 0.70 to 0.20 | 1.85 | -1.02 to -1.51 | |||||||||||||||||||||||||||||
| 2014 | 169 | 33.07 to 29.15 | 5,210 | 0.90 to 0.00 | 3.35 | 5.48 to 4.53 | |||||||||||||||||||||||||||||
| Investment Quality Bond Trust Series NAV (*) |
2018 | 42 | 17.20 to 17.20 | 727 | 0.00 to 0.00 | 3.02 | -0.67 to -0.67 | ||||||||||||||||||||||||||||
| 2017 | 47 | 17.32 to 17.32 | 822 | 0.00 to 0.00 | 2.73 | 4.67 to 4.67 | |||||||||||||||||||||||||||||
| 2016 | 44 | 16.55 to 16.55 | 729 | 0.00 to 0.00 | 2.42 | 4.26 to 4.26 | |||||||||||||||||||||||||||||
| 2015 | 44 | 15.87 to 15.87 | 691 | 0.00 to 0.00 | 1.94 | -0.68 to -0.68 | |||||||||||||||||||||||||||||
| 2014 | 44 | 15.98 to 15.98 | 697 | 0.00 to 0.00 | 3.30 | 5.54 to 5.54 | |||||||||||||||||||||||||||||
| Lifestyle Balanced Portfolio Series NAV (*) |
2018 | (i) | 1 | 12.24 to 12.24 | 7 | 0.00 to 0.00 | 10.50 | -3.29 to -3.29 | |||||||||||||||||||||||||||
| Lifestyle Growth Portfolio Series I (*) |
2018 | 10 | 10.96 to 10.96 | 108 | 0.65 to 0.65 | 1.45 | -6.73 to -6.73 | ||||||||||||||||||||||||||||
| 2017 | 28 | 11.75 to 11.75 | 324 | 0.65 to 0.65 | 2.93 | 15.37 to 15.37 | |||||||||||||||||||||||||||||
| 2016 | 1 | 10.19 to 10.19 | 9 | 0.65 to 0.65 | 9.65 | 1.87 to 1.87 | |||||||||||||||||||||||||||||
| Lifestyle Growth Portfolio Series NAV (*) |
2018 | 198 | 12.64 to 12.64 | 2,501 | 0.00 to 0.00 | 2.22 | -6.07 to -6.07 | ||||||||||||||||||||||||||||
| 2017 | 197 | 13.46 to 13.46 | 2,653 | 0.00 to 0.00 | 8.30 | 16.20 to 16.20 | |||||||||||||||||||||||||||||
| 2016 | 11 | 11.59 to 11.59 | 128 | 0.00 to 0.00 | 10.08 | 1.99 to 1.99 | |||||||||||||||||||||||||||||
| M Capital Appreciation |
2018 | 3 | 98.31 to 98.31 | 266 | 0.00 to 0.00 | 0.30 | -14.15 to -14.15 | ||||||||||||||||||||||||||||
| 2017 | 3 | 114.51 to 114.51 | 294 | 0.00 to 0.00 | 0.00 | 19.02 to 19.02 | |||||||||||||||||||||||||||||
| 2016 | 6 | 96.21 to 96.21 | 529 | 0.00 to 0.00 | 0.00 | 21.06 to 21.06 | |||||||||||||||||||||||||||||
| 2015 | 4 | 79.47 to 79.47 | 329 | 0.00 to 0.00 | 0.00 | -6.58 to -6.58 | |||||||||||||||||||||||||||||
| 2014 | 3 | 85.07 to 85.07 | 285 | 0.00 to 0.00 | 0.00 | 12.42 to 12.42 | |||||||||||||||||||||||||||||
| Managed Volatility Aggressive Portfolio Series I (*) |
2018 | 40 | 31.66 to 29.20 | 1,163 | 0.65 to 0.20 | 2.16 | -8.65 to -9.06 | ||||||||||||||||||||||||||||
| 2017 | 37 | 34.65 to 32.11 | 1,200 | 0.65 to 0.20 | 1.71 | 22.57 to 22.03 | |||||||||||||||||||||||||||||
| 2016 | 40 | 28.27 to 26.31 | 1,056 | 0.65 to 0.20 | 1.55 | 1.75 to 1.29 | |||||||||||||||||||||||||||||
| 2015 | 40 | 27.78 to 25.98 | 1,050 | 0.65 to 0.20 | 1.41 | -6.04 to -6.46 | |||||||||||||||||||||||||||||
| 2014 | 66 | 30.41 to 26.82 | 1,847 | 0.90 to 0.00 | 1.98 | 1.40 to 0.49 | |||||||||||||||||||||||||||||
| Managed Volatility Aggressive Portfolio Series NAV (*) |
2018 | 215 | 20.19 to 20.19 | 4,347 | 0.00 to 0.00 | 2.20 | -8.32 to -8.32 | ||||||||||||||||||||||||||||
| 2017 | 208 | 22.03 to 22.03 | 4,576 | 0.00 to 0.00 | 1.73 | 22.88 to 22.88 | |||||||||||||||||||||||||||||
| 2016 | 266 | 17.93 to 17.93 | 4,766 | 0.00 to 0.00 | 1.35 | 1.89 to 1.89 | |||||||||||||||||||||||||||||
| 2015 | 366 | 17.59 to 17.59 | 6,434 | 0.00 to 0.00 | 2.05 | -5.79 to -5.79 | |||||||||||||||||||||||||||||
| 2014 | 384 | 18.67 to 18.67 | 7,176 | 0.00 to 0.00 | 3.07 | 1.54 to 1.54 | |||||||||||||||||||||||||||||
| Managed Volatility Balanced Portfolio Series I (*) |
2018 | 97 | 37.02 to 34.14 | 3,321 | 0.65 to 0.20 | 2.24 | -5.08 to -5.51 | ||||||||||||||||||||||||||||
| 2017 | 109 | 39.00 to 36.13 | 3,941 | 0.65 to 0.20 | 2.02 | 13.90 to 13.40 | |||||||||||||||||||||||||||||
| 2016 | 133 | 34.24 to 31.86 | 4,245 | 0.65 to 0.20 | 1.95 | 4.58 to 4.11 | |||||||||||||||||||||||||||||
| 2015 | 147 | 32.74 to 30.60 | 4,491 | 0.65 to 0.20 | 2.84 | -2.45 to -2.88 | |||||||||||||||||||||||||||||
| 2014 | 142 | 34.52 to 30.43 | 4,473 | 0.90 to 0.00 | 1.67 | 4.29 to 3.35 | |||||||||||||||||||||||||||||
| Managed Volatility Balanced Portfolio Series NAV (*) |
2018 | 796 | 19.58 to 19.58 | 15,600 | 0.00 to 0.00 | 2.37 | -4.82 to -4.82 | ||||||||||||||||||||||||||||
| 2017 | 804 | 20.58 to 20.58 | 16,546 | 0.00 to 0.00 | 2.18 | 14.15 to 14.15 | |||||||||||||||||||||||||||||
| 2016 | 950 | 18.02 to 18.02 | 17,126 | 0.00 to 0.00 | 2.23 | 4.91 to 4.91 | |||||||||||||||||||||||||||||
| 2015 | 880 | 17.18 to 17.18 | 15,117 | 0.00 to 0.00 | 2.49 | -2.20 to -2.20 | |||||||||||||||||||||||||||||
| 2014 | 942 | 17.57 to 17.57 | 16,551 | 0.00 to 0.00 | 2.70 | 4.25 to 4.25 | |||||||||||||||||||||||||||||
| Managed Volatility Conservative Portfolio Series I (*) |
2018 | 37 | 36.45 to 33.61 | 1,249 | 0.65 to 0.20 | 2.50 | -2.37 to -2.82 | ||||||||||||||||||||||||||||
| 2017 | 42 | 37.34 to 34.59 | 1,464 | 0.65 to 0.20 | 2.40 | 7.60 to 7.12 | |||||||||||||||||||||||||||||
| 2016 | 56 | 34.70 to 32.29 | 1,829 | 0.65 to 0.20 | 2.39 | 4.37 to 3.91 | |||||||||||||||||||||||||||||
| 2015 | 58 | 33.25 to 31.08 | 1,842 | 0.65 to 0.20 | 2.54 | -0.15 to -0.61 | |||||||||||||||||||||||||||||
| 2014 | 72 | 34.24 to 30.19 | 2,267 | 0.90 to 0.00 | 1.72 | 5.02 to 4.08 | |||||||||||||||||||||||||||||
| Managed Volatility Conservative Portfolio Series NAV (*) |
2018 | 314 | 18.13 to 18.13 | 5,694 | 0.00 to 0.00 | 2.96 | -2.21 to -2.21 | ||||||||||||||||||||||||||||
| 2017 | 259 | 18.54 to 18.54 | 4,800 | 0.00 to 0.00 | 2.51 | 7.94 to 7.94 | |||||||||||||||||||||||||||||
64
Table of Contents
JOHN HANCOCK LIFE INSURANCE COMPANY (U.S.A.) SEPARATE ACCOUNT N
NOTES TO FINANCIAL STATEMENTS — (CONTINUED)
December 31, 2018
| 7. | Unit Values — (continued): |
| At December 31, | For the years and periods ended December 31, | ||||||||||||||||||||||||||||||||||
| Sub-account |
Year | Units (000s) |
Unit Fair Value Highest to Lowest (a) |
Assets (000s) |
Expense Ratio Highest to Lowest (b) |
Investment Income Ratio (c) |
Total Return Highest to Lowest (d) | ||||||||||||||||||||||||||||
| Managed Volatility Conservative Portfolio Series NAV (*) |
2016 | 282 | $ | 17.17 to $17.17 | $ | 4,839 | 0.00% to 0.00 | % | 2.57 | % | 4.53% to 4.53 | % | |||||||||||||||||||||||
| 2015 | 277 | 16.43 to 16.43 | 4,546 | 0.00 to 0.00 | 2.71 | 0.18 to 0.18 | |||||||||||||||||||||||||||||
| 2014 | 338 | 16.40 to 16.40 | 5,549 | 0.00 to 0.00 | 2.76 | 4.98 to 4.98 | |||||||||||||||||||||||||||||
| Managed Volatility Growth Portfolio Series I (*) |
2018 | 86 | 34.61 to 31.91 | 2,777 | 0.65 to 0.20 | 2.09 | -6.73 to -7.15 | ||||||||||||||||||||||||||||
| 2017 | 91 | 37.11 to 34.37 | 3,157 | 0.65 to 0.20 | 1.91 | 18.35 to 17.82 | |||||||||||||||||||||||||||||
| 2016 | 100 | 31.36 to 29.17 | 2,959 | 0.65 to 0.20 | 1.61 | 3.12 to 2.67 | |||||||||||||||||||||||||||||
| 2015 | 127 | 30.41 to 28.41 | 3,612 | 0.65 to 0.20 | 2.66 | -4.72 to -5.15 | |||||||||||||||||||||||||||||
| 2014 | 110 | 32.82 to 28.93 | 3,336 | 0.90 to 0.00 | 1.94 | 2.16 to 1.25 | |||||||||||||||||||||||||||||
| Managed Volatility Growth Portfolio Series NAV (*) |
2018 | 1,014 | 19.72 to 19.72 | 20,004 | 0.00 to 0.00 | 2.13 | -6.56 to -6.56 | ||||||||||||||||||||||||||||
| 2017 | 1,108 | 21.11 to 21.11 | 23,388 | 0.00 to 0.00 | 1.88 | 18.71 to 18.71 | |||||||||||||||||||||||||||||
| 2016 | 1,378 | 17.78 to 17.78 | 24,499 | 0.00 to 0.00 | 1.95 | 3.38 to 3.38 | |||||||||||||||||||||||||||||
| 2015 | 1,440 | 17.20 to 17.20 | 24,773 | 0.00 to 0.00 | 2.29 | -4.55 to -4.55 | |||||||||||||||||||||||||||||
| 2014 | 1,382 | 18.02 to 18.02 | 24,906 | 0.00 to 0.00 | 2.72 | 2.28 to 2.28 | |||||||||||||||||||||||||||||
| Managed Volatility Moderate Portfolio Series I (*) |
2018 | 58 | 37.90 to 34.95 | 2,091 | 0.65 to 0.20 | 2.57 | -4.18 to -4.61 | ||||||||||||||||||||||||||||
| 2017 | 55 | 39.56 to 36.64 | 2,047 | 0.65 to 0.20 | 2.43 | 11.66 to 11.16 | |||||||||||||||||||||||||||||
| 2016 | 54 | 35.43 to 32.96 | 1,825 | 0.65 to 0.20 | 2.25 | 5.08 to 4.61 | |||||||||||||||||||||||||||||
| 2015 | 57 | 33.71 to 31.51 | 1,808 | 0.65 to 0.20 | 2.58 | -1.11 to -1.56 | |||||||||||||||||||||||||||||
| 2014 | 58 | 35.06 to 30.90 | 1,869 | 0.90 to 0.00 | 2.75 | 4.94 to 4.00 | |||||||||||||||||||||||||||||
| Managed Volatility Moderate Portfolio Series NAV (*) |
2018 | 328 | 19.40 to 19.40 | 6,364 | 0.00 to 0.00 | 2.42 | -3.93 to -3.93 | ||||||||||||||||||||||||||||
| 2017 | 344 | 20.19 to 20.19 | 6,949 | 0.00 to 0.00 | 1.92 | 12.02 to 12.02 | |||||||||||||||||||||||||||||
| 2016 | 534 | 18.03 to 18.03 | 9,624 | 0.00 to 0.00 | 2.22 | 5.25 to 5.25 | |||||||||||||||||||||||||||||
| 2015 | 528 | 17.13 to 17.13 | 9,046 | 0.00 to 0.00 | 2.49 | -0.86 to -0.86 | |||||||||||||||||||||||||||||
| 2014 | 580 | 17.27 to 17.27 | 10,015 | 0.00 to 0.00 | 2.97 | 4.99 to 4.99 | |||||||||||||||||||||||||||||
| Mid Cap Index Trust Series I (*) |
2018 | 171 | 48.50 to 44.31 | 7,927 | 0.70 to 0.20 | 1.11 | -11.63 to -12.08 | ||||||||||||||||||||||||||||
| 2017 | 186 | 54.88 to 50.40 | 9,765 | 0.70 to 0.20 | 0.53 | 15.58 to 15.00 | |||||||||||||||||||||||||||||
| 2016 | 154 | 47.49 to 43.83 | 7,075 | 0.70 to 0.20 | 1.18 | 19.87 to 19.28 | |||||||||||||||||||||||||||||
| 2015 | 165 | 39.61 to 36.74 | 6,321 | 0.70 to 0.20 | 1.13 | -2.79 to -3.27 | |||||||||||||||||||||||||||||
| 2014 | 145 | 41.90 to 36.95 | 5,654 | 0.90 to 0.00 | 0.98 | 9.34 to 8.36 | |||||||||||||||||||||||||||||
| Mid Cap Index Trust Series NAV (*) |
2018 | 378 | 33.16 to 33.16 | 12,527 | 0.00 to 0.00 | 1.16 | -11.45 to -11.45 | ||||||||||||||||||||||||||||
| 2017 | 406 | 37.45 to 37.45 | 15,217 | 0.00 to 0.00 | 0.58 | 15.86 to 15.86 | |||||||||||||||||||||||||||||
| 2016 | 335 | 32.32 to 32.32 | 10,816 | 0.00 to 0.00 | 0.87 | 20.17 to 20.17 | |||||||||||||||||||||||||||||
| 2015 | 861 | 26.89 to 26.89 | 23,160 | 0.00 to 0.00 | 1.35 | -2.54 to -2.54 | |||||||||||||||||||||||||||||
| 2014 | 346 | 27.60 to 27.60 | 9,542 | 0.00 to 0.00 | 1.01 | 9.40 to 9.40 | |||||||||||||||||||||||||||||
| Mid Cap Stock Trust Series I (*) |
2018 | 88 | 42.37 to 38.72 | 3,611 | 0.70 to 0.20 | 0.00 | -1.76 to -2.25 | ||||||||||||||||||||||||||||
| 2017 | 87 | 43.13 to 39.61 | 3,662 | 0.70 to 0.20 | 0.00 | 28.29 to 27.65 | |||||||||||||||||||||||||||||
| 2016 | 104 | 33.62 to 31.03 | 3,425 | 0.70 to 0.20 | 0.00 | 0.39 to -0.11 | |||||||||||||||||||||||||||||
| 2015 | 107 | 33.49 to 31.06 | 3,500 | 0.70 to 0.20 | 0.00 | 2.79 to 2.28 | |||||||||||||||||||||||||||||
| 2014 | 100 | 33.50 to 29.53 | 3,179 | 0.90 to 0.00 | 0.10 | 8.02 to 7.05 | |||||||||||||||||||||||||||||
| Mid Cap Stock Trust Series NAV (*) |
2018 | 64 | 96.79 to 96.79 | 6,198 | 0.00 to 0.00 | 0.00 | -1.54 to -1.54 | ||||||||||||||||||||||||||||
| 2017 | 62 | 98.30 to 98.30 | 6,056 | 0.00 to 0.00 | 0.00 | 28.66 to 28.66 | |||||||||||||||||||||||||||||
| 2016 | 78 | 76.41 to 76.41 | 5,992 | 0.00 to 0.00 | 0.00 | 0.58 to 0.58 | |||||||||||||||||||||||||||||
| 2015 | 85 | 75.96 to 75.96 | 6,484 | 0.00 to 0.00 | 0.00 | 3.04 to 3.04 | |||||||||||||||||||||||||||||
| 2014 | 91 | 73.72 to 73.72 | 6,701 | 0.00 to 0.00 | 0.20 | 8.11 to 8.11 | |||||||||||||||||||||||||||||
| Mid Value Trust Series I (*) |
2018 | 100 | 30.32 to 29.03 | 2,991 | 0.65 to 0.20 | 0.78 | -11.02 to -11.42 | ||||||||||||||||||||||||||||
| 2017 | 106 | 34.08 to 32.78 | 3,587 | 0.65 to 0.20 | 0.90 | 11.21 to 10.71 | |||||||||||||||||||||||||||||
| 2016 | 159 | 30.64 to 29.60 | 4,842 | 0.65 to 0.20 | 1.17 | 23.77 to 23.22 | |||||||||||||||||||||||||||||
| 2015 | 162 | 24.76 to 24.03 | 3,980 | 0.65 to 0.20 | 0.96 | -3.62 to -4.06 | |||||||||||||||||||||||||||||
| 2014 | 229 | 25.98 to 24.69 | 5,817 | 0.90 to 0.00 | 0.74 | 10.60 to 9.62 | |||||||||||||||||||||||||||||
| Mid Value Trust Series NAV (*) |
2018 | 183 | 47.62 to 47.62 | 8,720 | 0.00 to 0.00 | 0.83 | -10.68 to -10.68 | ||||||||||||||||||||||||||||
| 2017 | 210 | 53.32 to 53.32 | 11,222 | 0.00 to 0.00 | 0.99 | 11.46 to 11.46 | |||||||||||||||||||||||||||||
| 2016 | 231 | 47.84 to 47.84 | 11,066 | 0.00 to 0.00 | 1.24 | 24.09 to 24.09 | |||||||||||||||||||||||||||||
| 2015 | 217 | 38.55 to 38.55 | 8,364 | 0.00 to 0.00 | 0.78 | -3.41 to -3.41 | |||||||||||||||||||||||||||||
| 2014 | 511 | 39.91 to 39.91 | 20,406 | 0.00 to 0.00 | 0.99 | 10.70 to 10.70 | |||||||||||||||||||||||||||||
| Money Market Trust Series I (*) |
2018 | 905 | 21.98 to 20.07 | 18,872 | 0.70 to 0.20 | 1.52 | 1.34 to 0.83 | ||||||||||||||||||||||||||||
| 2017 | 931 | 21.69 to 19.91 | 19,208 | 0.70 to 0.20 | 0.57 | 0.38 to -0.11 | |||||||||||||||||||||||||||||
| 2016 | 1,317 | 21.60 to 19.93 | 27,416 | 0.70 to 0.20 | 0.07 | -0.15 to -0.62 | |||||||||||||||||||||||||||||
| 2015 | 1,286 | 21.64 to 20.05 | 26,532 | 0.70 to 0.20 | 0.00 | -0.19 to -0.72 | |||||||||||||||||||||||||||||
| 2014 | 1,221 | 22.29 to 19.65 | 25,348 | 0.90 to 0.00 | 0.00 | 0.00 to -0.92 | |||||||||||||||||||||||||||||
| Money-Market Trust Series NAV (*) |
2018 | 6,270 | 10.23 to 10.23 | 64,149 | 0.00 to 0.00 | 1.58 | 1.60 to 1.60 | ||||||||||||||||||||||||||||
| 2017 | 5,280 | 10.07 to 10.07 | 53,181 | 0.00 to 0.00 | 0.63 | 0.61 to 0.61 | |||||||||||||||||||||||||||||
| 2016 | 3,628 | 10.00 to 10.00 | 36,318 | 0.00 to 0.00 | 0.16 | 0.05 to 0.05 | |||||||||||||||||||||||||||||
| PIMCO All Asset |
2018 | 267 | 22.17 to 17.29 | 4,942 | 0.65 to 0.00 | 2.97 | -5.59 to -6.21 | ||||||||||||||||||||||||||||
| 2017 | 235 | 23.64 to 18.31 | 4,546 | 0.65 to 0.00 | 4.49 | 13.19 to 12.46 | |||||||||||||||||||||||||||||
| 2016 | 215 | 21.02 to 16.18 | 3,668 | 0.65 to 0.00 | 2.36 | 12.59 to 11.85 | |||||||||||||||||||||||||||||
| 2015 | 208 | 18.79 to 14.37 | 3,158 | 0.65 to 0.00 | 2.98 | -9.31 to -9.90 | |||||||||||||||||||||||||||||
65
Table of Contents
JOHN HANCOCK LIFE INSURANCE COMPANY (U.S.A.) SEPARATE ACCOUNT N
NOTES TO FINANCIAL STATEMENTS — (CONTINUED)
December 31, 2018
| 7. | Unit Values — (continued): |
| At December 31, | For the years and periods ended December 31, | ||||||||||||||||||||||||||||||||||
| Sub-account |
Year | Units (000s) |
Unit Fair Value Highest to Lowest (a) |
Assets (000s) |
Expense Ratio Highest to Lowest (b) |
Investment Income Ratio (c) |
Total Return Highest to Lowest (d) | ||||||||||||||||||||||||||||
| PIMCO All Asset |
2014 | 223 | $ | 20.32 to $ 15.84 | $ | 3,705 | 0.90% to 0.00 | % | 5.08 | % | 0.23% to -0.66 | % | |||||||||||||||||||||||
| Real Estate Securities Trust Series I (*) |
2018 | 44 | 188.45 to 172.22 | 7,803 | 0.70 to 0.20 | 1.68 | -3.66 to -4.14 | ||||||||||||||||||||||||||||
| 2017 | 47 | 195.60 to 179.66 | 8,670 | 0.70 to 0.20 | 0.50 | 6.02 to 5.50 | |||||||||||||||||||||||||||||
| 2016 | 57 | 184.49 to 170.30 | 9,971 | 0.70 to 0.20 | 3.37 | 6.71 to 6.17 | |||||||||||||||||||||||||||||
| 2015 | 64 | 172.90 to 160.39 | 10,349 | 0.70 to 0.20 | 1.83 | 2.47 to 1.96 | |||||||||||||||||||||||||||||
| 2014 | 74 | 173.52 to 152.98 | 11,707 | 0.90 to 0.00 | 1.68 | 31.73 to 30.55 | |||||||||||||||||||||||||||||
| Real Estate Securities Trust Series NAV (*) |
2018 | 74 | 156.74 to 156.74 | 11,529 | 0.00 to 0.00 | 1.70 | -3.43 to -3.43 | ||||||||||||||||||||||||||||
| 2017 | 84 | 162.30 to 162.30 | 13,692 | 0.00 to 0.00 | 0.63 | 6.26 to 6.26 | |||||||||||||||||||||||||||||
| 2016 | 88 | 152.74 to 152.74 | 13,370 | 0.00 to 0.00 | 3.58 | 6.96 to 6.96 | |||||||||||||||||||||||||||||
| 2015 | 89 | 142.80 to 142.80 | 12,731 | 0.00 to 0.00 | 1.90 | 2.80 to 2.80 | |||||||||||||||||||||||||||||
| 2014 | 99 | 138.91 to 138.91 | 13,743 | 0.00 to 0.00 | 1.75 | 31.75 to 31.75 | |||||||||||||||||||||||||||||
| Science & Technology Trust Series I (*) |
2018 | 161 | 51.77 to 47.31 | 7,892 | 0.70 to 0.20 | 0.00 | -0.81 to -1.31 | ||||||||||||||||||||||||||||
| 2017 | 177 | 52.19 to 47.93 | 8,662 | 0.70 to 0.20 | 0.05 | 40.85 to 40.15 | |||||||||||||||||||||||||||||
| 2016 | 225 | 37.05 to 34.20 | 7,948 | 0.70 to 0.20 | 0.00 | 8.17 to 7.63 | |||||||||||||||||||||||||||||
| 2015 | 271 | 34.25 to 31.78 | 8,846 | 0.70 to 0.20 | 0.00 | 6.47 to 5.94 | |||||||||||||||||||||||||||||
| 2014 | 274 | 33.10 to 29.18 | 8,265 | 0.90 to 0.00 | 0.00 | 12.90 to 11.88 | |||||||||||||||||||||||||||||
| Science & Technology Trust Series NAV (*) |
2018 | 166 | 43.66 to 43.66 | 7,254 | 0.00 to 0.00 | 0.00 | -0.57 to -0.57 | ||||||||||||||||||||||||||||
| 2017 | 130 | 43.91 to 43.91 | 5,705 | 0.00 to 0.00 | 0.10 | 41.21 to 41.21 | |||||||||||||||||||||||||||||
| 2016 | 112 | 31.10 to 31.10 | 3,496 | 0.00 to 0.00 | 0.00 | 8.41 to 8.41 | |||||||||||||||||||||||||||||
| 2015 | 82 | 28.68 to 28.68 | 2,339 | 0.00 to 0.00 | 0.00 | 6.78 to 6.78 | |||||||||||||||||||||||||||||
| 2014 | 84 | 26.86 to 26.86 | 2,268 | 0.00 to 0.00 | 0.00 | 12.95 to 12.95 | |||||||||||||||||||||||||||||
| Select Bond Trust Series I (*) |
2018 | (e) | 537 | 11.71 to 11.35 | 6,214 | 0.65 to 0.20 | 2.72 | -0.64 to -1.08 | |||||||||||||||||||||||||||
| 2017 | 571 | 11.79 to 11.47 | 6,653 | 0.65 to 0.20 | 2.69 | 3.45 to 2.99 | |||||||||||||||||||||||||||||
| 2016 | 636 | 11.39 to 11.14 | 7,180 | 0.65 to 0.20 | 3.14 | 2.85 to 2.39 | |||||||||||||||||||||||||||||
| 2015 | 528 | 11.08 to 10.88 | 5,810 | 0.65 to 0.20 | 3.49 | 0.01 to -0.41 | |||||||||||||||||||||||||||||
| 2014 | 69 | 11.16 to 10.84 | 764 | 0.90 to 0.00 | 3.08 | 5.53 to 4.57 | |||||||||||||||||||||||||||||
| Select Bond Trust Series NAV (*) |
2018 | (f) | 100 | 11.94 to 11.94 | 1,188 | 0.00 to 0.00 | 2.32 | -0.38 to -0.38 | |||||||||||||||||||||||||||
| 2017 | 140 | 11.98 to 11.98 | 1,682 | 0.00 to 0.00 | 1.98 | 3.65 to 3.65 | |||||||||||||||||||||||||||||
| 2016 | 664 | 11.56 to 11.56 | 7,677 | 0.00 to 0.00 | 4.98 | 3.19 to 3.19 | |||||||||||||||||||||||||||||
| 2015 | 62 | 11.20 to 11.20 | 699 | 0.00 to 0.00 | 3.02 | 0.30 to 0.30 | |||||||||||||||||||||||||||||
| 2014 | 59 | 11.17 to 11.17 | 661 | 0.00 to 0.00 | 2.64 | 5.59 to 5.59 | |||||||||||||||||||||||||||||
| Short Term Government Income Trust Series I (*) |
2018 | 152 | 10.69 to 10.26 | 1,589 | 0.70 to 0.20 | 2.09 | 0.60 to 0.12 | ||||||||||||||||||||||||||||
| 2017 | 140 | 10.63 to 10.25 | 1,451 | 0.70 to 0.20 | 1.38 | 0.35 to -0.13 | |||||||||||||||||||||||||||||
| 2016 | 138 | 10.59 to 10.26 | 1,436 | 0.70 to 0.20 | 1.80 | 0.33 to -0.13 | |||||||||||||||||||||||||||||
| 2015 | 151 | 10.55 to 10.27 | 1,562 | 0.70 to 0.20 | 1.66 | 0.41 to -0.06 | |||||||||||||||||||||||||||||
| 2014 | 163 | 10.62 to 10.17 | 1,684 | 0.90 to 0.00 | 2.62 | 1.15 to 0.19 | |||||||||||||||||||||||||||||
| Short Term Government Income Trust Series |
2018 | 486 | 10.95 to 10.95 | 5,323 | 0.00 to 0.00 | 3.55 | 0.89 to 0.89 | ||||||||||||||||||||||||||||
| 2017 | 196 | 10.86 to 10.86 | 2,133 | 0.00 to 0.00 | 1.52 | 0.62 to 0.62 | |||||||||||||||||||||||||||||
| 2016 | 191 | 10.79 to 10.79 | 2,057 | 0.00 to 0.00 | 1.75 | 0.63 to 0.63 | |||||||||||||||||||||||||||||
| 2015 | 132 | 10.72 to 10.72 | 1,410 | 0.00 to 0.00 | 2.13 | 0.69 to 0.69 | |||||||||||||||||||||||||||||
| 2014 | 134 | 10.65 to 10.65 | 1,430 | 0.00 to 0.00 | 2.08 | 1.19 to 1.19 | |||||||||||||||||||||||||||||
| Small Cap Index Trust Series I (*) |
2018 | 155 | 36.54 to 33.39 | 5,473 | 0.70 to 0.20 | 0.95 | -11.60 to -12.05 | ||||||||||||||||||||||||||||
| 2017 | 155 | 41.34 to 37.96 | 6,187 | 0.70 to 0.20 | 0.44 | 14.16 to 13.59 | |||||||||||||||||||||||||||||
| 2016 | 168 | 36.21 to 33.42 | 5,910 | 0.70 to 0.20 | 1.13 | 20.73 to 20.13 | |||||||||||||||||||||||||||||
| 2015 | 200 | 29.99 to 27.82 | 5,827 | 0.70 to 0.20 | 1.06 | -4.77 to -5.24 | |||||||||||||||||||||||||||||
| 2014 | 186 | 32.38 to 28.55 | 5,649 | 0.90 to 0.00 | 0.95 | 4.59 to 3.65 | |||||||||||||||||||||||||||||
| Small Cap Index Trust Series NAV (*) |
2018 | 292 | 30.42 to 30.42 | 8,878 | 0.00 to 0.00 | 1.22 | -11.31 to -11.31 | ||||||||||||||||||||||||||||
| 2017 | 199 | 34.30 to 34.30 | 6,813 | 0.00 to 0.00 | 0.52 | 14.43 to 14.43 | |||||||||||||||||||||||||||||
| 2016 | 197 | 29.98 to 29.98 | 5,906 | 0.00 to 0.00 | 1.17 | 21.02 to 21.02 | |||||||||||||||||||||||||||||
| 2015 | 217 | 24.77 to 24.77 | 5,375 | 0.00 to 0.00 | 1.09 | -4.59 to -4.59 | |||||||||||||||||||||||||||||
| 2014 | 230 | 25.96 to 25.96 | 5,962 | 0.00 to 0.00 | 0.93 | 4.71 to 4.71 | |||||||||||||||||||||||||||||
| Small Cap Opportunities Trust Series I (*) |
2018 | 294 | 41.46 to 38.34 | 11,456 | 0.70 to 0.20 | 0.42 | -14.02 to -14.45 | ||||||||||||||||||||||||||||
| 2017 | 324 | 48.22 to 44.81 | 14,715 | 0.70 to 0.20 | 0.41 | 10.85 to 10.30 | |||||||||||||||||||||||||||||
| 2016 | 360 | 43.50 to 40.62 | 14,819 | 0.70 to 0.20 | 0.47 | 19.23 to 18.63 | |||||||||||||||||||||||||||||
| 2015 | 394 | 36.49 to 34.24 | 13,649 | 0.70 to 0.20 | 0.07 | -5.35 to -5.83 | |||||||||||||||||||||||||||||
| 2014 | 430 | 39.46 to 35.53 | 15,811 | 0.90 to 0.00 | 0.05 | 2.39 to 1.47 | |||||||||||||||||||||||||||||
| Small Cap Opportunities Trust Series NAV (*) |
2018 | 16 | 21.11 to 21.11 | 331 | 0.00 to 0.00 | 0.50 | -13.81 to -13.81 | ||||||||||||||||||||||||||||
| 2017 | 14 | 24.50 to 24.50 | 339 | 0.00 to 0.00 | 0.39 | 11.18 to 11.18 | |||||||||||||||||||||||||||||
| 2016 | 19 | 22.03 to 22.03 | 409 | 0.00 to 0.00 | 0.54 | 19.51 to 19.51 | |||||||||||||||||||||||||||||
| 2015 | 16 | 18.44 to 18.44 | 286 | 0.00 to 0.00 | 0.14 | -5.12 to -5.12 | |||||||||||||||||||||||||||||
| 2014 | 17 | 19.43 to 19.43 | 321 | 0.00 to 0.00 | 0.08 | 2.42 to 2.42 | |||||||||||||||||||||||||||||
| Small Cap Stock Trust Series I (*) |
2018 | (g) | 40 | 30.27 to 28.93 | 1,176 | 0.65 to 0.20 | 0.00 | -5.38 to -5.81 | |||||||||||||||||||||||||||
| 2017 | 44 | 32.00 to 30.71 | 1,372 | 0.65 to 0.20 | 0.00 | 26.21 to 25.65 | |||||||||||||||||||||||||||||
| 2016 | 63 | 25.35 to 24.44 | 1,544 | 0.65 to 0.20 | 0.00 | 2.09 to 1.63 | |||||||||||||||||||||||||||||
| 2015 | 46 | 24.83 to 24.05 | 1,118 | 0.65 to 0.20 | 0.00 | -9.03 to -9.44 | |||||||||||||||||||||||||||||
66
Table of Contents
JOHN HANCOCK LIFE INSURANCE COMPANY (U.S.A.) SEPARATE ACCOUNT N
NOTES TO FINANCIAL STATEMENTS — (CONTINUED)
December 31, 2018
| 7. | Unit Values — (continued): |
| At December 31, | For the years and periods ended December 31, | ||||||||||||||||||||||||||||||||||
| Sub-account |
Year | Units (000s) |
Unit Fair Value Highest to Lowest (a) |
Assets (000s) |
Expense Ratio Highest to Lowest (b) |
Investment Income Ratio (c) |
Total Return Highest to Lowest (d) | ||||||||||||||||||||||||||||
| Small Cap Stock Trust Series I (*) |
2014 | 41 | $ | 27.64 to $ 26.15 | $ | 1,100 | 0.90% to 0.00 | % | 0.00 | 7.57% to 6.61 | % | ||||||||||||||||||||||||
| Small Cap Stock Trust Series NAV (*) |
2018 | (h) | 47 | 36.72 to 36.72 | 1,742 | 0.00 to 0.00 | 0.00 | -5.22 to -5.22 | |||||||||||||||||||||||||||
| 2017 | 135 | 38.74 to 38.74 | 5,244 | 0.00 to 0.00 | 0.00 | 26.70 to 26.70 | |||||||||||||||||||||||||||||
| 2016 | 257 | 30.58 to 30.58 | 7,850 | 0.00 to 0.00 | 0.00 | 2.27 to 2.27 | |||||||||||||||||||||||||||||
| 2015 | 274 | 29.90 to 29.90 | 8,184 | 0.00 to 0.00 | 0.00 | -8.78 to -8.78 | |||||||||||||||||||||||||||||
| 2014 | 293 | 32.78 to 32.78 | 9,611 | 0.00 to 0.00 | 0.00 | 7.60 to 7.60 | |||||||||||||||||||||||||||||
| Small Cap Value Trust Series I (*) |
2018 | 25 | 26.68 to 25.37 | 636 | 0.65 to 0.20 | 0.68 | -12.67 to -13.07 | ||||||||||||||||||||||||||||
| 2017 | 27 | 30.55 to 29.18 | 808 | 0.65 to 0.20 | 0.86 | 3.52 to 3.06 | |||||||||||||||||||||||||||||
| 2016 | 38 | 29.51 to 28.32 | 1,090 | 0.65 to 0.20 | 0.74 | 22.43 to 21.88 | |||||||||||||||||||||||||||||
| 2015 | 34 | 24.11 to 23.24 | 790 | 0.65 to 0.20 | 0.38 | -1.56 to -2.00 | |||||||||||||||||||||||||||||
| 2014 | 37 | 24.84 to 23.29 | 888 | 0.90 to 0.00 | 0.57 | 7.18 to 6.22 | |||||||||||||||||||||||||||||
| Small Cap Value Trust Series NAV (*) |
2018 | 84 | 76.12 to 76.12 | 6,366 | 0.00 to 0.00 | 0.72 | -12.45 to -12.45 | ||||||||||||||||||||||||||||
| 2017 | 96 | 86.94 to 86.94 | 8,356 | 0.00 to 0.00 | 0.94 | 3.79 to 3.79 | |||||||||||||||||||||||||||||
| 2016 | 108 | 83.77 to 83.77 | 9,050 | 0.00 to 0.00 | 0.76 | 22.68 to 22.68 | |||||||||||||||||||||||||||||
| 2015 | 115 | 68.28 to 68.28 | 7,882 | 0.00 to 0.00 | 0.50 | -1.31 to -1.31 | |||||||||||||||||||||||||||||
| 2014 | 128 | 69.19 to 69.19 | 8,868 | 0.00 to 0.00 | 0.63 | 7.25 to 7.25 | |||||||||||||||||||||||||||||
| Small Company Value Trust Series I (*) |
2018 | 56 | 39.40 to 36.00 | 2,146 | 0.70 to 0.20 | 0.37 | -13.12 to -13.55 | ||||||||||||||||||||||||||||
| 2017 | 62 | 45.35 to 41.65 | 2,739 | 0.70 to 0.20 | 0.22 | 11.27 to 10.72 | |||||||||||||||||||||||||||||
| 2016 | 87 | 40.75 to 37.62 | 3,467 | 0.70 to 0.20 | 0.77 | 32.05 to 31.39 | |||||||||||||||||||||||||||||
| 2015 | 101 | 30.86 to 28.63 | 3,053 | 0.70 to 0.20 | 1.09 | -5.79 to -6.26 | |||||||||||||||||||||||||||||
| 2014 | 167 | 33.69 to 29.70 | 5,332 | 0.90 to 0.00 | 0.03 | 0.11 to -0.79 | |||||||||||||||||||||||||||||
| Small Company Value Trust Series NAV (*) |
2018 | 38 | 27.71 to 27.71 | 1,062 | 0.00 to 0.00 | 0.43 | -12.93 to -12.93 | ||||||||||||||||||||||||||||
| 2017 | 35 | 31.83 to 31.83 | 1,129 | 0.00 to 0.00 | 0.24 | 11.58 to 11.58 | |||||||||||||||||||||||||||||
| 2016 | 23 | 28.53 to 28.53 | 648 | 0.00 to 0.00 | 0.90 | 32.33 to 32.33 | |||||||||||||||||||||||||||||
| 2015 | 21 | 21.56 to 21.56 | 454 | 0.00 to 0.00 | 0.75 | -5.51 to -5.51 | |||||||||||||||||||||||||||||
| 2014 | 61 | 22.81 to 22.81 | 1,392 | 0.00 to 0.00 | 0.06 | 0.14 to 0.14 | |||||||||||||||||||||||||||||
| Strategic Income Opportunities Trust Series I (*) |
2018 | 88 | 26.77 to 25.05 | 2,316 | 0.65 to 0.20 | 3.68 | -5.23 to -5.66 | ||||||||||||||||||||||||||||
| 2017 | 92 | 28.25 to 26.55 | 2,561 | 0.65 to 0.20 | 3.00 | 5.38 to 4.90 | |||||||||||||||||||||||||||||
| 2016 | 108 | 26.80 to 25.31 | 2,834 | 0.65 to 0.20 | 2.56 | 4.92 to 4.45 | |||||||||||||||||||||||||||||
| 2015 | 105 | 25.55 to 24.23 | 2,624 | 0.65 to 0.20 | 2.91 | 1.02 to 0.56 | |||||||||||||||||||||||||||||
| 2014 | 75 | 25.83 to 23.47 | 1,846 | 0.90 to 0.00 | 4.00 | 5.06 to 4.12 | |||||||||||||||||||||||||||||
| Strategic Income Opportunities Trust Series NAV (*) |
2018 | 243 | 20.48 to 20.48 | 4,978 | 0.00 to 0.00 | 3.90 | -5.00 to -5.00 | ||||||||||||||||||||||||||||
| 2017 | 231 | 21.56 to 21.56 | 4,988 | 0.00 to 0.00 | 3.38 | 5.66 to 5.66 | |||||||||||||||||||||||||||||
| 2016 | 185 | 20.40 to 20.40 | 3,772 | 0.00 to 0.00 | 2.55 | 5.19 to 5.19 | |||||||||||||||||||||||||||||
| 2015 | 179 | 19.39 to 19.39 | 3,462 | 0.00 to 0.00 | 2.41 | 1.27 to 1.27 | |||||||||||||||||||||||||||||
| 2014 | 200 | 19.15 to 19.15 | 3,828 | 0.00 to 0.00 | 4.09 | 5.13 to 5.13 | |||||||||||||||||||||||||||||
| Total Bond Market Series Trust NAV (*) |
2018 | 799 | 25.02 to 25.02 | 19,993 | 0.00 to 0.00 | 2.75 | -0.24 to -0.24 | ||||||||||||||||||||||||||||
| 2017 | 923 | 25.08 to 25.08 | 23,146 | 0.00 to 0.00 | 2.73 | 3.34 to 3.34 | |||||||||||||||||||||||||||||
| 2016 | 1,152 | 24.27 to 24.27 | 27,955 | 0.00 to 0.00 | 3.32 | 2.45 to 2.45 | |||||||||||||||||||||||||||||
| 2015 | 687 | 23.69 to 23.69 | 16,288 | 0.00 to 0.00 | 2.85 | 0.30 to 0.30 | |||||||||||||||||||||||||||||
| 2014 | 693 | 23.62 to 23.62 | 16,376 | 0.00 to 0.00 | 3.54 | 6.06 to 6.06 | |||||||||||||||||||||||||||||
| Total Stock Market Index Trust Series I (*) |
2018 | 219 | 29.21 to 26.69 | 6,265 | 0.70 to 0.20 | 1.11 | -5.89 to -6.36 | ||||||||||||||||||||||||||||
| 2017 | 264 | 31.03 to 28.50 | 8,026 | 0.70 to 0.20 | 1.47 | 20.35 to 19.75 | |||||||||||||||||||||||||||||
| 2016 | 282 | 25.79 to 23.80 | 7,153 | 0.70 to 0.20 | 1.42 | 12.16 to 11.60 | |||||||||||||||||||||||||||||
| 2015 | 274 | 22.99 to 21.33 | 6,177 | 0.70 to 0.20 | 1.75 | -0.83 to -1.33 | |||||||||||||||||||||||||||||
| 2014 | 134 | 23.84 to 21.02 | 2,980 | 0.90 to 0.00 | 1.35 | 11.48 to 10.46 | |||||||||||||||||||||||||||||
| Total Stock Market Index Trust Series NAV (*) |
2018 | 58 | 101.44 to 101.44 | 5,909 | 0.00 to 0.00 | 1.23 | -5.66 to -5.66 | ||||||||||||||||||||||||||||
| 2017 | 55 | 107.52 to 107.52 | 5,861 | 0.00 to 0.00 | 1.62 | 20.65 to 20.65 | |||||||||||||||||||||||||||||
| 2016 | 28 | 89.11 to 89.11 | 2,505 | 0.00 to 0.00 | 1.60 | 12.38 to 12.38 | |||||||||||||||||||||||||||||
| 2015 | 22 | 79.30 to 79.30 | 1,706 | 0.00 to 0.00 | 1.43 | -0.53 to -0.53 | |||||||||||||||||||||||||||||
| 2014 | 19 | 79.72 to 79.72 | 1,553 | 0.00 to 0.00 | 1.30 | 11.46 to 11.46 | |||||||||||||||||||||||||||||
| Ultra Short Term Bond Trust Series I (*) |
2018 | 0 | 9.95 to 9.75 | 3 | 0.65 to 0.45 | 1.64 | 0.97 to 0.70 | ||||||||||||||||||||||||||||
| 2017 | 0 | 9.86 to 9.68 | 3 | 0.65 to 0.45 | 0.90 | 0.23 to -0.04 | |||||||||||||||||||||||||||||
| 2016 | 1 | 9.84 to 9.68 | 9 | 0.65 to 0.45 | 1.53 | 0.10 to -0.17 | |||||||||||||||||||||||||||||
| 2015 | 1 | 9.83 to 9.70 | 9 | 0.65 to 0.45 | 1.31 | -0.47 to -0.71 | |||||||||||||||||||||||||||||
| 2014 | 1 | 10.05 to 9.72 | 9 | 0.90 to 0.00 | 1.61 | -0.02 to -0.84 | |||||||||||||||||||||||||||||
| Ultra Short Term Bond Trust Series NAV (*) |
2018 | 67 | 10.36 to 10.36 | 698 | 0.00 to 0.00 | 1.81 | 1.53 to 1.53 | ||||||||||||||||||||||||||||
| 2017 | 58 | 10.20 to 10.20 | 590 | 0.00 to 0.00 | 1.55 | 0.62 to 0.62 | |||||||||||||||||||||||||||||
| 2016 | 63 | 10.14 to 10.14 | 635 | 0.00 to 0.00 | 1.36 | 0.67 to 0.67 | |||||||||||||||||||||||||||||
| 2015 | 124 | 10.07 to 10.07 | 1,252 | 0.00 to 0.00 | 2.02 | 0.01 to 0.01 | |||||||||||||||||||||||||||||
| 2014 | 73 | 10.07 to 10.07 | 736 | 0.00 to 0.00 | 3.39 | 0.03 to 0.03 | |||||||||||||||||||||||||||||
| Utilities Trust Series I (*) |
2018 | 24 | 39.58 to 36.54 | 894 | 0.65 to 0.20 | 3.06 | 0.68 to 0.23 | ||||||||||||||||||||||||||||
| 2017 | 28 | 39.31 to 36.46 | 1,042 | 0.65 to 0.20 | 2.38 | 14.52 to 14.00 | |||||||||||||||||||||||||||||
| 2016 | 34 | 34.33 to 31.98 | 1,117 | 0.65 to 0.20 | 4.59 | 11.13 to 10.63 | |||||||||||||||||||||||||||||
| 2015 | 40 | 30.89 to 28.91 | 1,200 | 0.65 to 0.20 | 2.74 | -14.93 to -15.31 | |||||||||||||||||||||||||||||
67
Table of Contents
JOHN HANCOCK LIFE INSURANCE COMPANY (U.S.A.) SEPARATE ACCOUNT N
NOTES TO FINANCIAL STATEMENTS — (CONTINUED)
December 31, 2018
| 7. | Unit Values — (continued): |
| At December 31, | For the years and periods ended December 31, | ||||||||||||||||||||||||||||||||||
| Sub-account |
Year | Units (000s) |
Unit Fair Value Highest to Lowest (a) |
Assets (000s) |
Expense Ratio Highest to Lowest (b) |
Investment Income Ratio (c) |
Total Return Highest to Lowest (d) | ||||||||||||||||||||||||||||
| Utilities Trust Series I (*) |
2014 | 64 | $ | 37.33 to $ 33.00 | $ | 2,201 | 0.90% to 0.00 | % | 3.07 | % | 12.59% to 11.58 | % | |||||||||||||||||||||||
| Utilities Trust Series NAV (*) |
2018 | 58 | 32.88 to 32.88 | 1,921 | 0.00 to 0.00 | 3.36 | 0.93 to 0.93 | ||||||||||||||||||||||||||||
| 2017 | 64 | 32.57 to 32.57 | 2,091 | 0.00 to 0.00 | 2.56 | 14.82 to 14.82 | |||||||||||||||||||||||||||||
| 2016 | 60 | 28.37 to 28.37 | 1,713 | 0.00 to 0.00 | 4.56 | 11.43 to 11.43 | |||||||||||||||||||||||||||||
| 2015 | 61 | 25.46 to 25.46 | 1,544 | 0.00 to 0.00 | 3.30 | -14.79 to -14.79 | |||||||||||||||||||||||||||||
| 2014 | 150 | 29.88 to 29.88 | 4,484 | 0.00 to 0.00 | 3.46 | 12.72 to 12.72 | |||||||||||||||||||||||||||||
68
Table of Contents
JOHN HANCOCK LIFE INSURANCE COMPANY (U.S.A.) SEPARATE ACCOUNT N
NOTES TO FINANCIAL STATEMENTS — (CONTINUED)
December 31, 2018
| 7. | Unit Values — (continued): |
| (*) | Sub-account that invests in affiliated Trust. |
| (a) | As the unit fair value is presented as a range of minimum to maximum values, based on the product grouping representing the minimum and maximum expense ratio amounts, some individual contract unit values are not within the ranges presented. |
| (b) | These ratios represent the annualized contract expenses of the separate account, consisting primarily of the items known as “Revenue from underlying fund (12b-1, STA, Other)” and “Revenue from Sub-account” (formerly referred to as the administrative maintenance charges and sales and service fees (AMC and SSF)). The ratios include only those expenses that result in a direct reduction to unit values. Charges made directly to unitholder accounts through the redemption of units and expenses of the underlying fund are excluded. |
| (c) | These ratios represent the distributions from net investment income received by the sub-account from the underlying Portfolio, net of management fees assessed by the portfolio manager, divided by the average net assets. These ratios exclude those expenses, such as mortality and expense charges, that are assessed against policyholder accounts either through the reductions in the unit values or the redemptions of units. The recognition of investment income by the sub-account is affected by the timing of the declaration of dividends by the underlying Portfolio in which the sub-accounts invest. |
| (d) | These ratios, represent the total return for the periods indicated, including changes in the value of the underlying Portfolio, and expenses assessed through the reduction of unit values. These ratios do not include any expenses assessed through the redemption of units. Investment options indicated in footnote 1 with a date notation, if any, denote the effective date of that investment option in the variable account. The total return is calculated for the period indicated or from the effective date through the end of the reporting period. For closed sub-accounts, the total return is calculated from the beginning of the reporting period to the date the sub-account closed. As the total return is presented as a range of minimum to maximum values, based on the product grouping representing the minimum and maximum expense ratio amounts, some individual contract total returns are not within the ranges presented. |
| (e) | Renamed on April 30, 2018. Previously known as Bond Trust Series I. |
| (f) | Renamed on April 30, 2018. Previously known as Bond Trust Series NAV. |
| (g) | Renamed on April 30, 2018. Previously known as Small Cap Growth Trust Series I. |
| (h) | Renamed on April 30, 2018. Previously known as Small Cap Growth Trust Series NAV. |
| (i) | Sub-account available in prior year but no activity. |
69
Table of Contents
JOHN HANCOCK LIFE INSURANCE COMPANY (U.S.A.) SEPARATE ACCOUNT N
NOTES TO FINANCIAL STATEMENTS — (CONTINUED)
December 31, 2018
| 8. | Diversification Requirements |
The Internal Revenue Service has issued regulations under Section 817(h) of the Internal Revenue Code (“the Code”). Under the provisions of Section 817(h) of the Code, a Contract will not be treated as a variable life contract for federal tax purposes for any period for which the investments of the Account on which the contract is based are not adequately diversified. The Code provides that the “adequately diversified” requirement may be met if the underlying investments satisfy either a statutory safe harbor test or diversification requirement set forth in regulations issued by the Secretary of the Treasury. The Company believes that the Account satisfies the current requirements of the regulations, and the Account will continue to meet such requirements.
| 9. | Contract Charges |
The Company deducts certain charges from gross premiums before placing the remaining net premiums in the sub-account. In the event of a surrender by the contract holder, surrender charges may be levied by the Company against the contract value at the time of termination to cover sales and administrative expenses associated with underwriting and issuing the Contract. Additionally, each month a deduction consisting of an administrative charge, a charge for cost of insurance, and charges for supplementary benefits is deducted from the contract value. Contract charges are paid through the redemption of sub-accounts and are reflected as terminations.
The Company deducts from the assets of the Account a daily charge equivalent to annual rates between 0.00% and 0.70% of the average net value of the Account’s assets for the assumption of mortality and expense risks.
70
Table of Contents
OTHER INFORMATION
(8) Reinsurance Agreement between John Hancock Life Insurance Company (U.S.A.) and Generali USA Life Reassurance Company of America, incorporated by reference to post-effective amendment number 5, file number 333-179570, filed with the Commission on December 6, 2013.
(9) Reinsurance Agreement between John Hancock Life Insurance Company (U.S.A.) and RGA Reinsurance Company, incorporated by reference to post-effective amendment number 5, file number 333-179570, filed with the Commission on December 6, 2013.
| Name and Principal Business Address | Position with Depositor | |
|
Marianne Harrison 200 Berkeley Street Boston, MA
02116 |
Chair, President & Chief Executive Officer | |
|
Paul M. Connolly 75 Indian Spring Road Milton, MA
02186 |
Director | |
|
James D. Gallagher 200 Berkeley Street Boston, MA
02116 |
Director, Executive Vice President | |
|
Rex Schlaybaugh, Jr. 400 Renaissance Center Detroit, MI
48243 |
Director | |
|
Brooks Tingle 200 Berkeley Street Boston, MA
02116 |
Director, Senior Vice President | |
|
John G. Vrysen 200 Berkeley Street Boston, MA
02116 |
Director |
| Name and Principal Business Address | Position with Depositor | |
|
Linda A. Davis Watters 200 Berkeley Street Boston, MA
02116 |
Director, Vice President | |
|
Henry H. Wong 200 Berkeley Street Boston, MA
02116 |
Director | |
| Executive
Vice Presidents |
||
|
Andrew G.
Arnott* |
||
|
Christopher Paul
Conkey** |
||
|
Gregory
Framke* |
||
|
Gretchen
Garrigues* |
||
|
Scott S.
Hartz** |
Chief Investment Officer – U.S. Investments | |
|
Naveed
Irshad** |
Head of Legacy Business | |
|
Halina K. von dem
Hagen*** |
Treasurer | |
| Senior
Vice Presidents |
||
|
Emanuel
Alves* |
General Counsel | |
|
John C.S.
Anderson** |
||
|
Michael
Biagiotti* |
||
|
Kevin J.
Cloherty** |
||
|
Steven F.
Dorval* |
||
|
Barbara
Goose* |
Chief Marketing Officer | |
|
Linda
Levyne* |
||
|
Patrick
McGuinness* |
||
|
William
McPadden** |
||
|
Joelle
Metzman** |
||
|
Patrick M.
Murphy* |
||
|
Lee Ann
Murray** |
||
|
Sebastian
Pariath* |
Head of Operations and Chief Information Officer | |
|
Alan R.
Seghezzi** |
||
|
Martin
Sheerin* |
Chief Financial Officer | |
|
Curt
Smith* |
||
|
Anthony
Teta* |
||
|
Leo
Zerilli** |
||
| Vice
Presidents |
||
|
Lynda
Abend* |
||
|
John
Addeo** |
||
|
Abigail M.
Armstrong** |
||
|
Kevin
Askew** |
||
|
Dwayne
Bertrand** |
||
|
Zahir
Bhanji*** |
CFO JH Insurance | |
|
Stephen J.
Blewitt** |
||
|
Alan M.
Block** |
||
|
John
Bourgault** |
Senior Counsel | |
|
Paul
Boyne** |
||
|
Ian B.
Brodie** |
||
|
Ted
Bruntrager* |
Chief Risk Officer | |
|
Grant
Buchanan*** |
||
|
Daniel C.
Budde** |
||
|
Robert
Burrow** |
||
|
Jennifer Toone
Campanella** |
||
|
Thomas
Carlisle** |
||
|
Rick A.
Carlson* |
||
|
Patricia Rosch
Carrington** |
||
|
Todd J.
Cassler* |
||
|
Ken K.
Cha* |
||
|
Brian
Collins* |
| Name and Principal Business Address | Position with Depositor | |
|
Marcelle
Dahar* |
||
|
Kenneth
D’Amato* |
||
|
John J.
Danello** |
||
|
Andreas
Deutschmann* |
||
|
Robert
Donahue* |
||
|
Jeffrey
Duckworth* |
||
|
Carolyn
Flanagan** |
||
|
Lauren Marx
Fleming** |
||
|
Philip J.
Fontana** |
||
|
Carl O.
Fowler** |
||
|
Ryan
Fox* |
||
|
Scott
Francolini* |
||
|
Paul
Gallagher** |
||
|
Thomas C.
Goggins** |
||
|
Susan
Ghalili* |
||
|
Geoff
Gittins**** |
||
|
Jeffrey N.
Given** |
||
|
Howard C.
Greene** |
||
|
Christopher
Griswold* |
||
|
Richard
Harris*** |
Appointed Actuary | |
|
Ellie
Harrison* |
US Human Resources | |
|
John
Hatch* |
||
|
Michael
Hession* |
||
|
Kevin
Hill* |
||
|
James C.
Hoodlet* |
||
|
Steven
Hutcheon** |
||
|
Daniel S. Janis
III** |
||
|
Mitchell
Karman** |
CCO & Counsel | |
|
Recep C.
Kendircioglu** |
||
|
Neal P.
Kerins* |
||
|
Frank
Knox** |
CCO – Retail Funds/Separate Accounts | |
|
Hung
Ko*** |
Treasury | |
|
Diane R.
Landers** |
||
|
Scott
Lively** |
||
|
Jeffrey H.
Long** |
||
|
Jennifer
Lundmark* |
||
|
Patrick
MacDonnell** |
||
|
Nathaniel I.
Margolis** |
Chief Counsel | |
|
Christopher
Maryanopolis* |
||
|
Robert
Maulden** |
||
|
John B.
Maynard** |
||
|
Karen
McCafferty** |
||
|
Scott A.
McFetridge** |
||
|
Jonathan
McGee** |
||
|
Ann
McNally* |
||
|
Michael
McNamara* |
||
|
Steven E.
Medina** |
||
|
Maureen
Milet** |
CCO – Investments | |
|
Scott
Morin* |
||
|
Camille
Mucci** |
||
|
Jeffrey H.
Nataupsky** |
||
|
Scott
Navin** |
||
|
Sinead
O’Connor* |
||
|
Jacques
Ouimet* |
||
|
Jeffrey
Packard** |
||
|
Gary M.
Pelletier** |
||
|
David
Pemstein** |
| Name and Principal Business Address | Position with Depositor | |
|
Charlie
Philbrook* |
||
|
David
Plumb* |
||
|
Tracey
Polsgrove* |
||
|
Rahim
Rajpur* |
||
|
Jill
Rebman*** |
||
|
Charles A.
Rizzo** |
||
|
Robert William
Rizzo* |
||
|
Susan
Roberts* |
||
|
Keri
Rogers** |
||
|
Ian
Roke** |
||
|
Josephine M.
Rollka* |
||
|
Ken
Ross* |
||
|
Ronald J.
Rovner* |
||
|
Devon
Russell* |
||
|
Lisa Anne
Ryan* |
||
|
Thomas
Samoluk** |
||
|
Emory W.
Sanders* |
||
|
Jeffrey R.
Santerre** |
||
|
Martin C.
Schafer* |
||
|
Christopher L.
Sechler** |
||
|
Thomas
Shea** |
||
|
Gordon
Shone** |
||
|
Susan
Simi** |
||
|
Darren
Smith** |
||
|
Rob
Stanley* |
||
|
Paddy
Subbaraman** |
||
|
Wilfred
Talbot* |
||
|
Gary
Tankersley* |
||
|
Nathan
Thooft** |
||
|
Tony
Todisco* |
||
|
Brian E.
Torrisi** |
||
|
Len van
Greuning* |
||
|
Simonetta
Vendittelli* |
Controller | |
|
Peter de
Vries* |
||
|
Lisa Ann
Welch** |
||
|
Adam
Wise** |
||
|
R. Blake
Witherington** |
||
|
Sameh
Youssef* |
||
|
Ross
Zilber* |
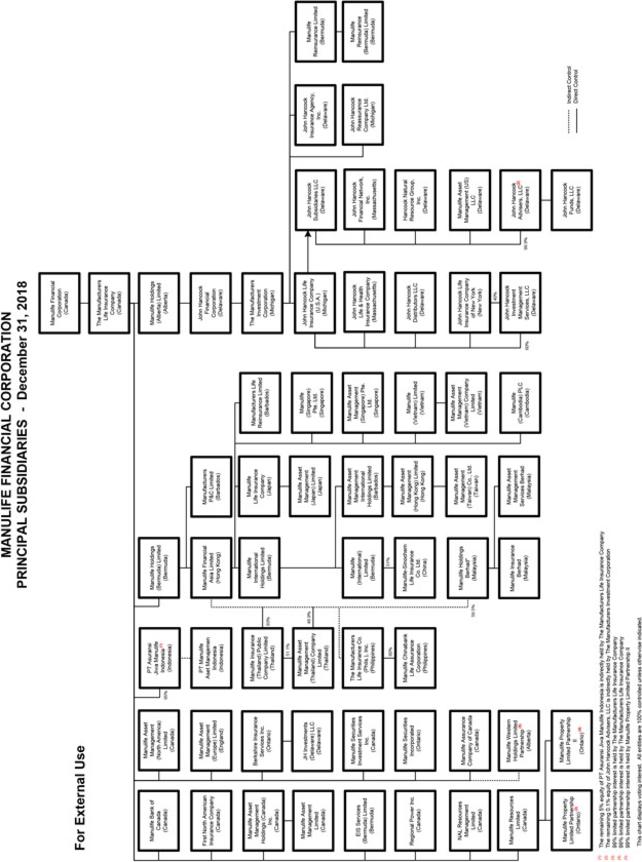
| Name of Investment Company | Capacity in Which Acting | |
|
John Hancock Variable Life Account
S |
Principal Underwriter | |
|
John Hancock Variable Life Account
U |
Principal Underwriter | |
|
John Hancock Variable Life Account
V |
Principal Underwriter | |
|
John Hancock Variable Life Account
UV |
Principal Underwriter | |
|
John Hancock Life Insurance Company (U.S.A.) Separate Account
R |
Principal Underwriter | |
|
John Hancock Life Insurance Company (U.S.A.) Separate Account
T |
Principal Underwriter | |
|
John Hancock Life Insurance Company (U.S.A.) Separate Account
W |
Principal Underwriter | |
|
John Hancock Life Insurance Company (U.S.A.) Separate Account
X |
Principal Underwriter | |
|
John Hancock Life Insurance Company (U.S.A.) Separate Account
Q |
Principal Underwriter | |
|
John Hancock Life Insurance Company (U.S.A.) Separate Account
A |
Principal Underwriter | |
|
John Hancock Life Insurance Company (U.S.A.) Separate Account
N |
Principal Underwriter | |
|
John Hancock Life Insurance Company (U.S.A.) Separate Account
H |
Principal Underwriter | |
|
John Hancock Life Insurance Company (U.S.A.) Separate Account
I |
Principal Underwriter | |
|
John Hancock Life Insurance Company (U.S.A.) Separate Account
J |
Principal Underwriter | |
|
John Hancock Life Insurance Company (U.S.A.) Separate Account
K |
Principal Underwriter | |
|
John Hancock Life Insurance Company (U.S.A.) Separate Account
L |
Principal Underwriter | |
|
John Hancock Life Insurance Company (U.S.A.) Separate Account
M |
Principal Underwriter | |
|
John Hancock Life Insurance Company of New York Separate Account
B |
Principal Underwriter | |
|
John Hancock Life Insurance Company of New York Separate Account
A |
Principal Underwriter |
| Name | Title | |
|
James C.
Hoodlet* |
Director | |
|
Gary
Tankersley* |
Director, President and Chief Executive Officer | |
|
Alan
Seghezzi** |
Director | |
|
Martin
Sheerin* |
Director | |
|
Christopher
Walker*** |
Director, Vice President, Investments | |
|
Tracy
Lannigan** |
Secretary | |
|
Brian
Collins** |
Vice President, US Taxation | |
|
Jeffrey H.
Long** |
Chief Financial Officer and Financial Operations Principal |
| (1) | (2) | (3) | (4) | (5) | ||||
| Name
of Principal Underwriter |
Net
Underwriting Discounts and Commissions |
Compensation
on Events Occasioning the Deduction of a Deferred Sales Load |
Brokerage
Commissions |
Other
Compensation | ||||
| John Hancock Distributors LLC | $0 | $0 | $0 | $0 |
| Signatures | Title |
| /s/
Simonetta Vendittelli Simonetta Vendittelli |
Vice President and Controller |
| /s/
Martin Sheerin Martin Sheerin |
Senior Vice President and Chief Financial Officer |
| *
Marianne Harrison |
Chair, President and Chief Executive Officer |
| *
Paul M. Connolly |
Director |
| *
James D. Gallagher |
Director |
| *
Rex Schlaybaugh, Jr. |
Director |
| *
Brooks Tingle |
Director |
| *
John G. Vrysen |
Director |
| *
Linda A. Davis Watters |
Director |
|
Henry H. Wong |
Director |
| /s/James
C. Hoodlet James C. Hoodlet |
Table of Contents
| Total Annual Portfolio Operating Expenses | Minimum | Maximum |
| Range of expenses, including management fees, distribution and/or service (12b-1) fees, and other expenses1 | 0.42% | 1.87% |
| Total Annual Portfolio Operating Expenses | Minimum | Maximum |
| Range of expenses, including management fees, distribution and/or service (12b-1) fees, and other expenses | 0.47% | 1.87% |
| Portfolio | Subadviser | Investment Objective |
| 500 Index | John Hancock Asset Management, a division of Manulife Asset Management (North America) Limited | To approximate the aggregate total return of a broad-based U.S. domestic equity market index. |
| Active Bond | John Hancock Asset Management, a division of Manulife Asset Management (US) LLC | To seek to provide income and capital appreciation. |
| American Asset Allocation | Capital Research and Management Company (Adviser to the American Funds Insurance Series) | To seek to provide high total return (including income and capital gains) consistent with preservation of capital over the long-term. |
| American Global Growth | Capital Research and Management Company (Adviser to the American Funds Insurance Series) | To seek to provide long-term growth of capital. |
| American Growth | Capital Research and Management Company (Adviser to the American Funds Insurance Series) | To seek to provide growth of capital. |
| American Growth–Income | Capital Research and Management Company (Adviser to the American Funds Insurance Series) | To seek to provide growth of capital and income. |
| American International | Capital Research and Management Company (Adviser to the American Funds Insurance Series) | To seek to provide long-term growth of capital. |
| Blue Chip Growth | T. Rowe Price Associates, Inc. | To seek to provide long-term growth of capital. Current income is a secondary objective. |
| Capital Appreciation | Jennison Associates LLC | To seek to provide long-term growth of capital. |
| Capital Appreciation Value | T. Rowe Price Associates, Inc. | To seek to provide long-term capital appreciation. |
| Core Bond | Wells Capital Management, Incorporated | To seek to provide total return consisting of income and capital appreciation. |
| Emerging Markets Value | Dimensional Fund Advisors LP | To seek to provide long-term capital appreciation. |
| Portfolio | Subadviser | Investment Objective |
| Equity Income | T. Rowe Price Associates, Inc. | To seek to provide substantial dividend income and also long-term growth of capital. |
| Financial Industries | John Hancock Asset Management, a division of Manulife Asset Management (US) LLC | To seek to provide growth of capital. |
| Fundamental All Cap Core | John Hancock Asset Management, a division of Manulife Asset Management (US) LLC | To seek to provide long-term growth of capital. |
| Fundamental Large Cap Value | John Hancock Asset Management, a division of Manulife Asset Management (US) LLC | To seek to provide long-term capital appreciation. |
| Global | Templeton Global Advisors Limited | To seek to provide long-term capital appreciation. |
| Global Bond | Pacific Investment Management Company LLC | To seek to provide maximum total return, consistent with preservation of capital and prudent investment management. |
| Health Sciences | T. Rowe Price Associates, Inc. | To seek to provide long-term capital appreciation. |
| High Yield | Western Asset Management Company | To seek to provide an above-average total return over a market cycle of 3 to 5 years, consistent with reasonable risk. |
| International Equity Index | SSgA Funds Management, Inc. | To seek to track the performance of a broad-based equity index of foreign companies primarily in developed countries and, to a lesser extent, in emerging markets. |
| International Growth Stock | Invesco Advisers, Inc. | To seek to provide long-term growth of capital. |
| International Small Company | Dimensional Fund Advisors LP | To seek to provide long-term capital appreciation. |
| International Value | Templeton Investment Counsel, LLC | To seek to provide long-term growth of capital. |
| Investment Quality Bond | Wellington Management Company, LLP | To seek to provide a high level of current income consistent with the maintenance of principal and liquidity. |
| Lifestyle Aggressive | John Hancock Asset Management, a division of Manulife Asset Management (US) LLC; and John Hancock Asset Management, a division of Manulife Asset Management (North America) Limited | To seek long-term growth of capital. |
| Lifestyle Balanced | John Hancock Asset Management, a division of Manulife Asset Management (US) LLC; and John Hancock Asset Management, a division of Manulife Asset Management (North America) Limited | To seek to provide a high level of current income and growth of capital, with a greater emphasis on growth of capital. |
| Lifestyle Conservative | John Hancock Asset Management, a division of Manulife Asset Management (US) LLC; and John Hancock Asset Management, a division of Manulife Asset Management (North America) Limited | To seek to provide a high level of current income with some consideration given to growth of capital. |
| Lifestyle Growth | John Hancock Asset Management, a division of Manulife Asset Management (US) LLC; and John Hancock Asset Management, a division of Manulife Asset Management (North America) Limited | To seek to provide long-term growth of capital. Current income is also a consideration. |
| Portfolio | Subadviser | Investment Objective |
| Lifestyle Moderate | John Hancock Asset Management, a division of Manulife Asset Management (US) LLC; and John Hancock Asset Management, a division of Manulife Asset Management (North America) Limited | To seek to provide a balance between a high level of current income and growth of capital, with a greater emphasis on income. |
| Managed Volatility Aggressive | John Hancock Asset Management, a division of Manulife Asset Management (US) LLC; and John Hancock Asset Management, a division of Manulife Asset Management (North America) Limited | To seek to provide long-term growth of capital while seeking to both manage the volatility of return and limit the magnitude of portfolio losses. |
| Managed Volatility Balanced | John Hancock Asset Management, a division of Manulife Asset Management (US) LLC; and John Hancock Asset Management, a division of Manulife Asset Management (North America) Limited | To seek to provide growth of capital and current income while seeking to both manage the volatility of return and limit the magnitude of portfolio losses. |
| Managed Volatility Conservative | John Hancock Asset Management, a division of Manulife Asset Management (US) LLC; and John Hancock Asset Management, a division of Manulife Asset Management (North America) Limited | To seek to provide current income and growth of capital while seeking to both manage the volatility of return and limit the magnitude of portfolio losses. |
| Managed Volatility Growth | John Hancock Asset Management, a division of Manulife Asset Management (US) LLC; and John Hancock Asset Management, a division of Manulife Asset Management (North America) Limited | To seek to provide long-term growth of capital while seeking to both manage the volatility of return and limit the magnitude of portfolio losses. |
| Managed Volatility Moderate | John Hancock Asset Management, a division of Manulife Asset Management (US) LLC; and John Hancock Asset Management, a division of Manulife Asset Management (North America) Limited | To seek to provide current income and growth of capital while seeking to both manage the volatility of return and limit the magnitude of portfolio losses. |
| Mid Cap Index | John Hancock Asset Management, a division of Manulife Asset Management (North America) Limited | To seek to approximate the aggregate total return of a medium-capitalization U.S. domestic equity market index. |
| Mid Cap Stock | Wellington Management Company, LLP | To seek to provide long-term growth of capital. |
| Mid Value | T. Rowe Price Associates, Inc. | To seek to provide long-term capital appreciation. |
| Money Market | John Hancock Asset Management, a division of Manulife Asset Management (US) LLC | To seek to obtain maximum current income consistent with preservation of principal and liquidity. Certain market conditions may cause the return of the portfolio to become low or possibly negative. |
| PIMCO VIT All Asset (a series of PIMCO Variable Insurance Trust) (only Class M is available) | Pacific Investment Management Company LLC | To seek to provide maximum real return, consistent with preservation of real capital and prudent investment management. |
| Real Estate Securities | Deutsche Investment Management Americas Inc. | To seek to provide a combination of long-term capital appreciation and current income. |
| Science & Technology | T. Rowe Price Associates, Inc.; and Allianz Global Investors U.S. LLC | To seek to provide long-term growth of capital. Current income is incidental to the portfolio’s objective. |
| Portfolio | Subadviser | Investment Objective |
| Select Bond | John Hancock Asset Management, a division of Manulife Asset Management (US) LLC | To seek to provide income and capital appreciation. |
| Short Term Government Income | John Hancock Asset Management, a division of Manulife Asset Management (US) LLC | To seek to provide a high level of current income consistent with preservation of capital. Maintaining a stable share price is a secondary goal. |
| Small Cap Index | John Hancock Asset Management, a division of Manulife Asset Management (North America) Limited | To seek to approximate the aggregate total return of a small-capitalization U.S. domestic equity market index. |
| Small Cap Opportunities | Dimensional Fund Advisors LP; and GW&K Investment Management, LLC | To seek to provide long-term capital appreciation. |
| Small Cap Stock | Wellington Management Company, LLP | To seek to provide long-term capital appreciation. |
| Small Cap Value | Wellington Management Company, LLP | To seek to provide long-term capital appreciation. |
| Small Company Value | T. Rowe Price Associates, Inc. | To seek to provide long-term growth of capital. |
| Strategic Income Opportunities | John Hancock Asset Management, a division of Manulife Asset Management (US) LLC | To seek to provide a high level of current income. |
| Total Bond Market | John Hancock Asset Management, a division of Manulife Asset Management (US) LLC | To seek to track the performance of the Bloomberg Barclays U.S. Aggregate Bond Index.* |
| Total Stock Market Index | John Hancock Asset Management, a division of Manulife Asset Management (North America) Limited | To seek to approximate the aggregate total return of a broad U.S. domestic equity market index. |
| Ultra Short Term Bond | John Hancock Asset Management, a division of Manulife Asset Management (US) LLC | To seek to provide a high level of current income consistent with the maintenance of liquidity and the preservation of capital. |
| Utilities | Massachusetts Financial Services Company | To seek to provide capital growth and current income (income above that available from the portfolio invested entirely in equity securities). |
| M Capital Appreciation (a series of M Fund, Inc.) | Frontier Capital Management Company, LLC | To seek to provide maximum capital appreciation. |
| M International Equity (a series of M Fund, Inc.) | Northern Cross, LLC | To seek to provide long-term capital appreciation. |
| M Large Cap Growth (a series of M Fund, Inc.) | DSM Capital Partners LLC | To seek to provide long-term capital appreciation. |
| M Large Cap Value (a series of M Fund, Inc.) | AJO, LP | To seek to provide long-term capital appreciation. |
| • | First, all withdrawals from such a policy are treated as ordinary income subject to tax up to the amount equal to the excess (if any) of the policy value immediately before the withdrawal over the investment in the policy at such time. If you own any other modified endowment contracts issued to you in the same calendar year by the same insurance company or its affiliates, their values will be combined with the value of the policy from which you take the withdrawal for purposes of determining how much of the withdrawal is taxable as ordinary income. |
| • | Second, loans taken from or secured by such a policy and assignments or pledges of any part of its value are treated as partial withdrawals from the policy and taxed accordingly. Past-due loan interest that is added to the loan amount is treated as an additional loan. |
| • | Third, a 10% additional penalty tax is imposed on the portion of any distribution (including distributions on surrender) from, or loan taken from or secured by, such a policy that is included in income except where the distribution or loan: |
| • | is made on or after the date on which the policy owner attains age 59½; |
| • | is attributable to the policy owner becoming disabled; or |
| • | is part of a series of substantially equal periodic payments for the life (or life expectancy) of the policy owner or the joint lives (or joint life expectancies) of the policy owner and the policy owner’s beneficiary. |
Table of Contents
TO
M International Equity
M Large Cap Growth
M Large Cap Value