Table of Contents
As filed with the U.S. Securities and Exchange Commission on April 23, 2013Registration No. 333-100567
U.S. SECURITIES AND EXCHANGE COMMISSION
Washington, D.C. 20549
FORM N-6
SEC File No 811-5130
REGISTRATION STATEMENT UNDER THE SECURITIES ACT OF 1933
POST EFFECTIVE AMENDMENT NO. 13 [X]
REGISTRATION STATEMENT UNDER THE INVESTMENT COMPANY ACT OF 1940
AMENDMENT NO. 21 [X]
John Hancock Life Insurance Company (U.S.A.) Separate Account N
(Exact Name of Registrant)
John Hancock Life Insurance Company (U.S.A.)
(Name of Depositor)
197 Clarendon Street
Boston, MA 02116
(Complete address of depositor’s principal executive offices)
Depositor’s Telephone Number: 617-572-6000
JAMES C. HOODLET
John
Hancock Life Insurance Company (U.S.A.)
U.S. INSURANCE LAW
JOHN HANCOCK PLACE
BOSTON, MA 02117
(Name and complete address of agent for service)
It is proposed that this filing will become effective (check appropriate box)
[ ] immediately upon filing pursuant to paragraph (b) of
Rule 485
[X ] on April 29, 2013 pursuant to paragraph (b) of Rule 485
[ ] 60 days after filing pursuant to paragraph (a) (1) of Rule 485
[ ] on (date) pursuant to paragraph (a) (1) of Rule 485
If appropriate check the following box
[ ] this post-effective amendment designates a new effective date for a previously filed amendment
Pursuant to the provisions of Rule 24f-2, Registrant has registered an indefinite amount of the securities under the Securities Act of 1933.
Table of Contents
Prospectus dated April 29, 2013
for interests in
John Hancock Life Insurance Company (U.S.A.) Separate Account N
Interests are made available under
CORPORATE VUL
JOHN HANCOCK LIFE INSURANCE COMPANY (U.S.A.)
(“John Hancock USA”)
| 500 Index B Active Bond All Cap Core All Cap Value Alpha Opportunities American Asset Allocation American Global Growth American Growth American Growth-Income American International American New World Blue Chip Growth Bond Capital Appreciation Capital Appreciation Value Core Allocation Plus Core Bond Core Strategy Disciplined Diversification Emerging Markets Value Equity-Income Financial Services Franklin Templeton Founding Allocation |
Fundamental All Cap Core Fundamental Holdings Fundamental Large Cap Value Fundamental Value Global Global Bond Global Diversification Health Sciences High Yield International Core International Equity Index B International Growth Stock International Opportunities International Small Company International Value Investment Quality Bond Lifestyle Aggressive Lifestyle Balanced Lifestyle Conservative Lifestyle Growth Lifestyle Moderate Mid Cap Index |
Mid Cap Stock Mid Value Money Market Natural Resources PIMCO VIT All Asset Real Estate Securities Real Return Bond Science & Technology Short Term Government Income Small Cap Growth Small Cap Index Small Cap Opportunities Small Cap Value Small Company Value Smaller Company Growth Strategic Income Opportunities Total Return Total Stock Market Index Ultra Short Term Bond U.S. Equity Utilities Value |
* * * * * * * * * * * *
Please note that the Securities and Exchange Commission (“SEC”) has not approved or disapproved these securities, or determined if this prospectus is truthful or complete. Any representation to the contrary is a criminal offense.
CVUL03 4/2013
This prospectus does not constitute an offering in any jurisdiction in which such offering may not lawfully be made. No person is authorized to make any representations in connection with this offering other than those contained in this prospectus, the portfolios prospectuses, or the corresponding Statements of Additional Information.
The purpose of this variable life insurance policy is to provide insurance protection for the beneficiary named therein. No claim is made that this variable life insurance policy is in any way similar or comparable to a systematic investment plan of a mutual fund.
Examine this prospectus carefully. The Policy Summary will briefly describe the policy. More detailed information will be found further in the prospectus. You should rely on the information contained in this prospectus, the portfolio prospectuses, and the corresponding Statements of Additional Information, which contains the audited financial statements for John Hancock NY and Separate Account B. The portfolio prospectuses describe the investment objectives, policies and restrictions of, and the risks relating to, investment in the investment options. In the case of any of the portfolios that are operated as “feeder funds,” the prospectus for the corresponding “master fund” is also provided. We have not authorized anyone to provide you with information that is different from the information contained in the aforementioned documents.
Some of the benefits of purchasing the policy are described below. Death Benefit Protection. This prospectus describes a flexible premium variable life insurance policy, which provides for a death benefit payable to the beneficiary of the policy upon the death of the insured. Variable life insurance is a flexible tool for financial and investment planning for persons needing death benefit protection. You should consider other forms of investments if death benefit protection is not one of your financial planning objectives, as there are additional costs and expenses in providing the insurance.
Access To Your Policy Values. Variable life insurance offers access to Policy Value. You may borrow against your policy, or surrender all, or a portion of your policy through a partial withdrawal. There are limitations on partial withdrawals. See “Policy Surrender and Partial Withdrawals” for further information.
Tax Deferred Accumulation. Variable life insurance has several tax advantages under current tax laws. For example, Policy Value accumulates on a tax-deferred basis and a transfer of values from one sub-account to another within the policy generates no taxable gain or loss. Any investment income and realized capital gains within a sub-account or interest from the Fixed Account are automatically reinvested without current income taxation to the policy owner.
Investment Options. In addition to the Fixed Account, the policy provides for access to a number of variable investment options, which permit you to reallocate your Policy Value to meet your changing personal objectives, goals, and investment conditions. Information regarding each investment option may be found in the portfolio prospectuses.
Flexibility. The policy is a flexible premium variable life insurance policy in which varying premium payments are permitted. You may select death benefit options and an additional policy rider. You may increase or decrease the amount of death benefit. You are able to select, monitor, and change investment choices within your policy.
Some of the risks of purchasing the policy are described below.
Fluctuating Investment Performance. Policy Value invested in a sub-account is not guaranteed and will increase and decrease according to investment performance. You assume the investment risk of Policy Value allocated to the sub-accounts. A comprehensive discussion of each sub-account’s objective and risk is found in the portfolio prospectuses. You should review these prospectuses carefully before allocating Policy Value to any sub-accounts.
Unsuitable for Short-Term Investment. The Policy is intended for long-term financial planning, and is unsuitable for short-term goals. Your policy is not designed to serve as a vehicle for frequent trading.
Policy Lapse. Sufficient premiums must be paid to keep a policy in force. There is a risk of lapse if the Policy Value is too low in relation to the insurance amount, if investment results are less favorable than anticipated or if extensive policy loans are taken. A policy lapse could have adverse tax consequences since the amount received (including any loans) less the
investment in the policy may be treated as ordinary income subject to tax. Since withdrawals reduce your Policy Value, withdrawals increase the risk of lapse.Decreasing Death Benefit. Any outstanding policy loans and any amount that you have surrendered or withdrawn will reduce your policy’s death benefit.
Adverse Consequences of Early Surrender. There are surrender charges assessed if you surrender your policy in the first 10 years from the purchase of the policy or the effective date of a Face Amount increase. Depending on the amount of premium paid and the Policy Value at the time of surrender, there may be little or no Net Cash Surrender Value paid to you when the policy is surrendered. In addition, there are adverse consequences associated with partial withdrawals including potential policy lapse and adverse tax consequences. There may also be adverse consequences associated with full surrender of the policy.
Adverse Tax Consequences. You should always consult a tax adviser about the application of federal and state tax law to your individual situation. The federal income tax treatment of life insurance is complex and current tax treatment of life insurance may change.
The following tables describe the fees and expenses that you will pay when buying, owning, and surrendering the policy. Except where necessary to show a rate greater than zero, all rates shown in the tables have been rounded to two decimal places as required by the prospectus disclosure rules. Consequently, the actual rates charged may be slightly higher or lower than those shown. The first table describes the fees and expenses that you will pay at the time that you buy the policy, surrender the policy, or transfer cash value between investment options.
| Transaction Fees | ||
| Charge | When Charge is Deducted | Amount Deducted |
| Maximum Premium Load ChargeImposed on Premium (Load) | Upon receipt of premium | 2% of each premium paid |
| Maximum Sales Load Charge Imposed on Premium1 | Upon receipt of premium | 8% (Coverage Year 1)2 |
| Maximum Surrender Charge (Load)1 | Upon termination or reduction of anyCoverage Amount that is subject to a surrender charge including surrender of the policy for its Net Cash Surrender Value, partial withdrawal in excess of the Free Withdrawal Amount, decrease in the Face Amount, or policy lapse. | 5% (Coverage Year 1)3 |
| Transfer Fees | Upon transfer | $25 (only applies to transfers in excess of 12 in a Policy Year) |
| Dollar Cost Averaging | Upon transfer | Guaranteed $5.00 |
| Current $0.00 | ||
| Asset Allocation Rebalancer | Upon transfer | Guaranteed $15.00 |
| Current $5.00 | ||
1 A policy is subject to either a Sales Charge or a Surrender Charge but not both. The policy indicates which charge is applicable.
2 The Sales Load Charge declines in subsequent Coverage Years as noted below:
| Coverage Year |
Percentage |
| 1 | 8.00% |
| 2 | 6.00% |
| 3 | 3.00% |
| 4 | 2.00% |
| 5 | 1.00% |
| 6+ | 0.00% |
3 The Surrender Charge declines in subsequent Policy Years as noted below:
| Coverage Year |
Percentage |
| 1 | 5.00% |
| 2 | 4.00% |
| 3 | 3.00% |
| 4 | 2.50% |
| 5 | 2.00% |
| 6 | 1.50% |
| 7 | 1.00% |
| 8 | 1.00% |
| 9 | 0.50% |
| 10+ | 0.00% |
The surrender charge are a percentage of the sum of all premium payments attributed to a Coverage Amount in the first five Coverage Years.
The next table describes the fees and expenses that you will pay periodically during the time that you own the policy, not including fees and expenses of the portfolios, the underlying variable investment options for your policy.
| Charges Other Than Those of the Portfolios | |||
| Charge | When Charge isDeducted | Amount Deducted | |
| Cost of Insurance1 | Monthly | Minimum and Maximum Charge | The possible range of the cost of insurance is from $0.00 to $83.33 per month per $1,000 of the net amount at risk. |
| Charge for a Representative policy owner (a 45 year old non-smoking male) (rating classification is for short form underwriting) | Policy Subject to Sales Charge: The Cost of Insurance rate is $0.16 per month per $1,000 of the net amount at risk. | ||
| Policy Subject to Surrender Charge: The Cost of Insurance rate is $0.35 per month per $1,000 of the net amount at risk. | |||
| Cost of Insurance - Optional FTIO Rider (Flexible Term Insurance Option)1 | Monthly | Minimum and Maximum Charges | The possible range of the cost of insurance is from $0.00 to $83.33 per month per $1,000 of the net amount at risk |
| Charge for a Representative policy owner (a 45 year old non-smoking male) rating classification is for short form underwriting) | The Cost of Insurance rate is $0.10 per month per $1,000 of the net amount at risk | ||
| Mortality and Expense Risk Fees | Monthly | 0.04% (0.50% annually)2 | |
| Administration Fees | Monthly | $12 per Policy Month | |
| Loan Interest Rate (Net) | Annually | 0.75%3 | |
1 The cost of insurance varies based on individual characteristics and the charges shown in the table may not be representative of the charge a particular policy owner will pay. A policy owner may obtain additional information regarding cost of insurance charge by contacting the Company. The election (or failure to elect) the optional FTIO rider will impact the total cost of insurance charges.
2 Currently the Company is charging the following rates:
| Policy Year | Annual Rate |
| 1-10 | 0.50% |
| 11+ | 0.20% |
3 The Loan Interest Rate (Net) is equal to the rate of interest charged on the policy loan less the interest credited to the Loan Account. Currently this rate is 0.75% for Policy Years 1-10 and 0.25% for Policy Years 11 and higher. The maximum loan rate is 4%.
The next table describes the minimum and maximum portfolio level fees and expenses charged by any of the portfolios underlying a variable investment option offered through this prospectus, expressed as a percentage of average net assets (rounded to two decimal places). These expenses are deducted from portfolio assets.
| Total Annual Portfolio Operating Expenses | Minimum | Maximum |
| Range of expenses, including management fees, distribution and/or service (12b-1) fees, and other expenses | 0.54% | 1.63% |
1 Certain of the portfolios’ advisers or subadvisers have contractually agreed to reimburse or waive certain portfolio level expenses. The minimum and maximum expenses shown do not reflect these contractual expense reimbursements or waivers. If such reimbursements or waivers were reflected, the minimum and maximum expenses would be 0.30% and 1.54%, respectively.
Table of Investment Options and Investment Subadvisers
When you select a Separate Account investment option, we invest your money in shares of a corresponding portfolio of the John Hancock Variable Insurance Trust (the “Trust” or “JHVIT”) (or the PIMCO Variable Insurance Trust (the “PIMCO Trust”) with respect to the PIMCO VIT All Asset portfolio) and hold the shares in a subaccount of the Separate Account. Fees and expenses of the portfolios are not fixed or specified under the terms of the policies and may vary from year to year. These fees and expenses differ for each portfolio and reduce the investment return of each portfolio. Therefore, they also indirectly reduce the return you will earn on any Separate Account investment options you select. For more information, please refer to the prospectus for the underlying portfolios.
The JHVIT and the PIMCO Trust are so-called “series” type mutual funds and each is registered under the Investment Company Act of 1940 (“1940 Act”) as an open-end management investment company. John Hancock Investment Management Services, LLC (“JHIMS”) provides investment advisory services to the Trust and receives investment management fees for doing so. JHIMS pays a portion of its investment management fees to other firms that manage the Trust’s portfolios. We are affiliated with JHIMS and may indirectly benefit from any investment management fees JHIMS retains. The PIMCO VIT All Asset portfolio of the PIMCO Trust receives investment advisory services from Pacific Investment Management Company LLC (“PIMCO”) and pays investment management fees to PIMCO.
Each of the American Asset Allocation, American Global Growth, American Growth, American Growth-Income, American International, American New World, Fundamental Holdings and Global Diversification portfolios invests in Series 1 shares of the corresponding investment portfolio of the Trust. The American Asset Allocation, American Global Growth, American Growth, American Growth-Income, American International, and American New World portfolios operate as “feeder funds,” which means that the portfolios do not buy investment securities directly. Instead, they invest in a “master fund” which in turn purchases investment securities. Each of the American feeder fund portfolios has the same investment objective and limitations as its master fund. The prospectus for the American Fund master fund is included with the prospectuses for the underlying funds. We pay American Funds Distributors, Inc., the principal underwriter for the American Funds Insurance Series, a percentage of some or all of the amounts allocated to the “American” portfolios of the Trust for the marketing support services it provides.
The portfolios pay us or certain of our affiliates compensation for some of the distribution, administrative, shareholder support, marketing and other services we or our affiliates provide to the portfolios. The amount of this compensation is based on a percentage of the assets of the portfolios attributable to the variable insurance products that we and our affiliates issue. These percentages may differ from portfolio to portfolio and among classes of shares within a portfolio. In some cases, the compensation is derived from the Rule 12b-1 fees that are deducted from a portfolio’s assets for the services we or our affiliates provide to that portfolio. These compensation payments do not, however, result in any charge to you in addition to what is shown in the Fee Tables.
The following table provides a general description of the portfolios that underlie the variable investment options we make available under the policy. You bear the investment risk of any portfolio you choose as an investment option for your policy. You can find a full description of each portfolio, including the investment objectives, policies, restrictions, and risks, in the prospectus for that portfolio. You should read the portfolio’s prospectus carefully before investing in the corresponding variable investment option.
The investment options in the Separate Account are not publicly traded mutual funds. The investment options are only available to you as investment options in the policies, or in some cases through other variable annuity contracts or variable life insurance policies issued by us or by other life insurance companies. In some cases, the investment options also may be available through participation in certain qualified pension or retirement plans. The portfolios’ investment advisers and managers (i.e. subadvisers) may manage publicly traded mutual funds with similar names and investment objectives. However, the portfolios are not directly related to any publicly traded mutual fund. You should not compare the performance of any investment option described in this prospectus with the performance of a publicly traded mutual fund. The performance of any publicly traded mutual fund could differ substantially from that of any of the investment options of our Separate Account.
The portfolios available under the policies are as described in the following table:
| Portfolio | Portfolio Manager | Investment Objective |
| 500 Index B | John Hancock Asset Management, a division of Manulife Asset Management (North America) Limited | To seek to approximate the aggregate total return of a broad-based U.S. domestic equity market index. Under normal market conditions, the portfolio seeks to approximate the aggregate total return of a broad-based U.S. domestic equity market index. |
| Active Bond | Declaration Management & Research LLC; and John Hancock Asset Management, a division of Manulife Asset Management (US) LLC | To seek income and capital appreciation. Under normal market conditions, the portfolio invests at least 80% of its net assets (plus any borrowings for investment purposes) in a diversified mix of debt securities and instruments. The portfolio seeks to invest its assets in debt securities and instruments with an average duration of between 4 to 6 years; however, there is no limit on the portfolio’s average maturity. |
| All Cap Core | QS Investors, LLC | To seek long-term growth of capital. Under normal market conditions, the portfolio invests in common stocks and other equity securities within all asset classes (small, medium and large-capitalization) of those included in the Russell 3000 Index.* |
| All Cap Value | Lord, Abbett & Co. LLC | To seek capital appreciation. Under normal market conditions, the portfolio primarily purchases equity securities of U.S. and multinational companies in all capitalization ranges that the subadviser believes are undervalued. |
| Alpha Opportunities | Wellington Management Company, LLP | To seek long-term total return. The portfolio employs a “multiple sleeve structure,” which means the portfolio has several components that are managed separately in different styles. The portfolio seeks to obtain its objective by combining these different component styles in a single portfolio. |
| American Asset Allocation | Capital Research and Management Company (Adviser to the American Funds Insurance Series) | To seek to provide high total return (including income and capital gains) consistent with preservation of capital over the long-term. The portfolio invests all of its assets in Class 1 shares of its master fund, the Asset Allocation Fund, a series of the American Funds Insurance Series. The master fund invests in a diversified portfolio of common stocks and other equity securities, bonds and other intermediate and long-term debt securities, and money market instruments. |
| American Global Growth | Capital Research and Management Company (Adviser to the American Funds Insurance Series) | To seek to provide long-term growth of capital. The portfolio invests all of its assets in Class 1 shares of its master fund, the Global Growth Fund, a series of the American Funds Insurance Series. The master fund invests primarily in common stocks of companies located around the world that the adviser believes have potential for growth. |
| American Growth | Capital Research and Management Company (Adviser to the American Funds Insurance Series) | To seek to provide growth of capital. The portfolio invests all of its assets in Class 1 shares of its master fund, the Growth Fund, a series of the American Funds Insurance Series. The master fund invests primarily in common stocks and seeks to invest in companies that appear to offer superior opportunities for growth of capital. The master fund may also invest a portion of its assets in common stocks and other securities of issuers domiciled outside the U.S. |
| American Growth–Income | Capital Research and Management Company (Adviser to the American Funds Insurance Series) | To seek to provide growth of capital and income. The portfolio invests all of its assets in Class 1 shares of its master fund, the Growth-Income Fund, a series of the American Funds Insurance Series. The master fund invests primarily in common stocks or other securities that the master fund’s adviser believes demonstrate the potential for appreciation and/or dividends. Although the master fund focuses on investments in medium-to large-capitalization companies, the master fund’s investments are not limited to a particular capitalization size. |
| American International | Capital Research and Management Company (Adviser to the American Funds Insurance Series) | To seek to provide long-term growth of capital. The portfolio invests all of its assets in Class 1 shares of its master fund, the International Fund, a series of the American Funds Insurance Series. The master fund invests primarily in common stocks of companies domiciled outside the U.S., including companies domiciled in developing countries, that the adviser believes have the potential for growth. Although the master fund focuses on investments in medium-to large-capitalization companies, the master fund’s investments are not limited to a particular capitalization size. |
| Portfolio | Portfolio Manager | Investment Objective |
| American New World | Capital Research and Management Company (Adviser to the American Funds Insurance Series) | To seek long-term capital appreciation. The portfolio invests all of its assets in Class 1 shares of its master fund, the New World Fund, a series of the American Funds Insurance Series. The master fund invests primarily in stocks of companies with significant exposure to countries with developing economies and/or markets that the adviser believes have potential of providing capital appreciation. The master fund may also invest in companies without regard to market capitalization, including companies with small market capitalizations. |
| Blue Chip Growth | T. Rowe Price Associates, Inc. | To seek to provide long-term growth of capital. Current income is a secondary objective. Under normal market conditions, the portfolio invests at least 80% of its net assets (plus any borrowings for investment purposes) in the common stocks of large- and medium-sized blue chip growth companies. |
| Bond | John Hancock Asset Management, a division of Manulife Asset Management (US) LLC | To seek to provide income and capital appreciation. Under normal market conditions, the portfolio invests at least 80% of its net assets (plus any borrowings for investment purposes) in a diversified mix of debt securities and instruments. |
| Capital Appreciation | Jennison Associates LLC | To seek long-term growth of capital. Under normal market conditions, the portfolio invests at least 65% of its total assets in equity and equity-related securities of companies that, at the time of investment, that exceed $1 billion in market capitalization and that the subadviser believes have above-average growth prospects. These companies are generally medium- to large-capitalization companies. |
| Capital Appreciation Value | T. Rowe Price Associates, Inc. | To seek long-term capital appreciation. Under normal market conditions, the portfolio invests primarily in common stocks of established U.S. companies that have above-average potential for capital growth. Common stocks typically constitute at least 50% of the portfolio’s total assets. The remaining assets are generally invested in other securities, including convertible securities, corporate and government debt, bank loans (which represent an interest in amounts owed by a borrower to a syndicate of lenders), foreign securities, futures and options. The portfolio may invest up to 20% of its total assets in foreign securities. |
| Core Allocation Plus | Wellington Management Company, LLP | To seek total return, consisting of long-term capital appreciation and current income. Under normal market conditions, the portfolio invests in equity and fixed-income securities of issuers located within and outside the U.S. The portfolio will allocate its assets between fixed-income securities, which may include investment-grade and below investment-grade debt securities with maturities that range from short to longer term, and equity securities based upon the subadviser’s targeted asset mix, which may change over time. Under normal market conditions, the targeted asset mix may range between 75%-50% equity instruments and 50%-25% fixed-income instruments and will generally reflect the subadviser’s long-term, strategic asset allocation analysis. |
| Core Bond | Wells Capital Management, Incorporated | To seek total return consisting of income and capital appreciation. Under normal market conditions, the portfolio invests at least 80% of its net assets (plus any borrowings for investment purposes) in a broad range of investment-grade debt securities, including U.S. Government obligations, corporate bonds, mortgage-backed and other asset-backed securities and money market instruments. |
| Core Strategy | John Hancock Asset Management, a division of Manulife Asset Management (US) LLC; and John Hancock Asset Management, a division of Manulife Asset Management (North America) Limited |
To seek long-term growth of capital. Current income is also a consideration. Under normal market conditions, the portfolio invests in other portfolios of JHVIT and other investment companies (including exchange traded funds) as well as other types of investments. The portfolio invests approximately 70% of its total assets in equity securities and underlying funds that invest primarily in equity securities, and approximately 30% of its total assets in fixed-income securities and underlying funds that invest primarily in fixed-income securities. |
| Disciplined Diversification | Dimensional Fund Advisors LP | To seek total return consisting of capital appreciation and current income. Under normal market conditions, the portfolio invests primarily in equity
securities and fixed-income securities of domestic and international issuers, including equities of issuers in emerging markets, in accordance with the following range of allocations: Target Allocation Range of Allocation Equity Securities: 70% 65% – 75% Fixed-Income Securities: 30% 25% – 35% |
| Portfolio | Portfolio Manager | Investment Objective |
| Emerging Markets Value | Dimensional Fund Advisors LP | To seek long-term capital appreciation. Under normal market conditions, the portfolio invests at least 80% of its net assets (plus any borrowings for investment purposes) in companies associated with emerging markets designated from time to time by the subadviser. |
| Equity-Income | T. Rowe Price Associates, Inc. | To seek to provide substantial dividend income and also long-term growth of capital. Under normal market conditions, the portfolio invests at least 80% of its net assets (plus any borrowings for investment purposes) in equity securities, with at least 65% in common stocks of well-established companies paying above-average dividends. |
| Financial Services | Davis Selected Advisers, L.P. | To seek growth of capital. Under normal market conditions, the portfolio invests at least 80% of its net assets (plus any borrowings for investment purposes) in companies that, at the time of investment, are principally engaged in financial services, and the portfolio invests primarily in common stocks of financial services companies. |
| Franklin Templeton Founding Allocation | John Hancock Asset Management, a division of Manulife Asset Management (US) LLC | To seek long-term growth of capital. The portfolio invests in other funds and in other investment companies, as well as other types of investments. The portfolio currently invests primarily in three underlying funds: Global Fund, Income Fund and Mutual Shares Fund. |
| Fundamental All Cap Core | John Hancock Asset Management, a division of Manulife Asset Management (US) LLC | To seek long-term growth of capital. Under normal market conditions, the portfolio invests at least 80% of its net assets (plus any borrowings for investment purposes) in equity securities. Market capitalizations of these companies will span the capitalization spectrum. Equity securities include common, convertible, and preferred securities and their equivalents. |
| Fundamental Holdings | John Hancock Asset Management, a division of Manulife Asset Management (US) LLC; and John Hancock Asset Management, a division of Manulife Asset Management (North America) Limited |
To seek long-term growth of capital. The portfolio invests in other funds and other investment companies as well as other types of investments. Underlying funds may include other JHVIT funds and funds of the American Funds Insurance Series. However, the portfolio is authorized to invest without limitation in other underlying funds and in other types of investments. |
| Fundamental Large Cap Value | John Hancock Asset Management, a division of Manulife Asset Management (US) LLC | To seek long-term capital appreciation. Under normal market conditions, the portfolio invests at least 80% of its net assets in equity securities of large-capitalization companies. The portfolio considers large-capitalization companies to be those that at the time of purchase have a market capitalization equal to or greater than that of the top 80% of the companies that comprise the Russell 1000 Index.* |
| Fundamental Value | Davis Selected Advisers, L.P. | To seek growth of capital. Under normal market conditions, the portfolio invests primarily in common stocks of U.S. companies with market capitalizations of at least $10 billion. The portfolio may also invest in companies with smaller capitalizations. |
| Global | Templeton Global Advisors Limited | To seek long-term capital appreciation. Under normal market conditions, the portfolio invests primarily in the equity securities of companies located throughout the world, including emerging markets. |
| Global Bond | Pacific Investment Management Company LLC | To seek maximum total return, consistent with preservation of capital and prudent investment management. Under normal market conditions, the portfolio invests at least 80% of its net assets (plus any borrowings for investment purposes) in fixed-income instruments that are economically tied to at least three countries (one of which may be the U.S.), which may be represented by futures contracts (including related options) with respect to such securities, and options on such securities. These fixed-income instruments may be denominated in foreign currencies or in U.S. dollars, which may be represented by forwards or derivatives, such as options, futures contracts, or swap agreements. |
| Global Diversification | John Hancock Asset Management, a division of Manulife Asset Management (US) LLC; and John Hancock Asset Management, a division of Manulife Asset Management (North America) Limited |
To seek long-term growth of capital. The portfolio invests in other funds and other investment companies as well as other types of investments. Underlying funds may include other JHVIT funds and funds of American Fund Insurance Series. The portfolio is authorized to invest without limitation in other underlying funds. Under normal market conditions, the portfolio intends to invest a portion of its assets in funds that invest primarily in foreign securities or in foreign securities directly. |
| Portfolio | Portfolio Manager | Investment Objective |
| Health Sciences | T. Rowe Price Associates, Inc. | To seek long-term capital appreciation. Under normal market conditions, the portfolio invests at least 80% of its net assets (plus any borrowings for investment purposes) in common stocks of companies engaged, at the time of investment, in the research, development, production, or distribution of products or services related to health care, medicine, or the life sciences. While the portfolio may invest in companies of any size, the majority of its assets are expected to be invested in large and medium-capitalization companies. |
| High Yield | Western Asset Management Company | To seek to realize an above-average total return over a market cycle of three to five years, consistent with reasonable risk. Under normal market
conditions, the portfolio invests at least 80% of its net assets (plus any borrowings for investment purposes) at the time of investment in high yield securities. The portfolio’s investments may include corporate bonds, preferred stocks, U.S.
Government and foreign securities, mortgage-backed securities, loan assignments or participations and convertible securities that have the following ratings (or, if unrated, are considered by the subadviser to be of equivalent quality): Rating Agency Moody’s: Ba through C S&P’s: BB through D |
| International Core | Grantham, Mayo, Van Otterloo & Co. LLC | To seek high total return. Under normal market conditions, the portfolio invests at least 80% of its total assets in equity investments. The portfolio typically invests in equity investments in companies from developed markets outside the U.S. |
| International Equity Index B | SSgA Funds Management, Inc. | To seek to track the performance of a broad-based equity index of foreign companies primarily in developed countries and, to a lesser extent, in emerging markets. Under normal market conditions, the portfolio invests at least 80% of its assets in securities listed in the Morgan Stanley Capital International All Country World Excluding U.S. Index* or American Depositary Receipts or Global Depositary Receipts representing such securities. |
| International Growth Stock | Invesco Advisers, Inc. | To seek to achieve long-term growth of capital. The portfolio invests primarily in a diversified portfolio of international securities whose issuers are considered by the portfolio’s subadviser to have potential for earnings or revenue growth. Under normal market conditions, the portfolio invests at least 80% of its net assets (plus any borrowings for investment purposes) in stocks of any market capitalization. |
| International Small Company | Dimensional Fund Advisors LP | To seek long-term capital appreciation. Under normal market conditions, the portfolio invests at least 80% of its net assets (plus any borrowings for investment purposes) in securities of small capitalization companies in the particular markets in which the portfolio invests. The portfolio primarily invests in a broad and diverse group of equity securities of non-U.S. small companies of developed markets, but may also hold equity securities of companies located in emerging markets. |
| International Value | Templeton Investment Counsel, LLC | To seek long-term growth of capital. Under normal market conditions, the portfolio invests primarily in equity securities of companies located outside the U.S., including in emerging markets. |
| Investment Quality Bond | Wellington Management Company, LLP | To seek to provide a high level of current income consistent with the maintenance of principal and liquidity. Under normal market conditions, the portfolio invests at least 80% of its net assets (plus any borrowings for investment purposes) in bonds rated investment-grade at the time of investment. The portfolio will tend to focus on corporate bonds and U.S. Government bonds with intermediate to longer-term maturities. |
| Lifestyle Aggressive | John Hancock Asset Management, a division of Manulife Asset Management (US) LLC; and John Hancock Asset Management, a division of Manulife Asset Management (North America) Limited |
To seek long-term growth of capital. Current income is not a consideration. The portfolio normally invests approximately 100% of its assets in underlying funds that invest primarily in equity securities. |
| Portfolio | Portfolio Manager | Investment Objective |
| Lifestyle Balanced | John Hancock Asset Management, a division of Manulife Asset Management (US) LLC; and John Hancock Asset Management, a division of Manulife Asset Management (North America) Limited |
To seek a balance between a high level of current income and growth of capital, with a greater emphasis on growth of capital. The portfolio normally invests approximately 50% of its assets in underlying funds that invest primarily in equity securities and approximately 50% of its assets in underlying funds that invest primarily in fixed-income securities. |
| Lifestyle Conservative | John Hancock Asset Management, a division of Manulife Asset Management (US) LLC; and John Hancock Asset Management, a division of Manulife Asset Management (North America) Limited |
To seek a high level of current income with some consideration given to growth of capital. The portfolio normally invests approximately 80% of its assets in underlying funds that invest primarily in fixed-income securities and approximately 20% in underlying funds that invest primarily in equity securities. |
| Lifestyle Growth | John Hancock Asset Management, a division of Manulife Asset Management (US) LLC; and John Hancock Asset Management, a division of Manulife Asset Management (North America) Limited |
To seek long-term growth of capital. Current income is also a consideration. The portfolio normally invests approximately 70% of its assets in underlying funds that invest primarily in equity securities and approximately 30% of its assets in underlying funds that invest primarily in fixed-income securities. |
| Lifestyle Moderate | John Hancock Asset Management, a division of Manulife Asset Management (US) LLC; and John Hancock Asset Management, a division of Manulife Asset Management (North America) Limited |
To seek a balance between a high level of current income and growth of capital, with a greater emphasis on income. The portfolio normally invests approximately 60% of its assets in underlying funds that invest primarily in fixed-income securities and approximately 40% in underlying funds that invest primarily in equity securities. |
| Mid Cap Index | John Hancock Asset Management, a division of Manulife Asset Management (North America) Limited | To seek to approximate the aggregate total return of a medium-capitalization U.S. domestic equity market index. Under normal market conditions, the portfolio invests at least 80% of its net assets (plus any borrowings for investment purposes) at the time of investment in (a) the common stocks that are included in the S&P MidCap 400 Index* and (b) securities (which may or may not be included in the S&P MidCap 400 Index) that the subadviser believes as a group will behave in a manner similar to the index. |
| Mid Cap Stock | Wellington Management Company, LLP | To seek long-term growth of capital. Under normal market conditions, the portfolio invests at least 80% of its net assets (plus any borrowings for investment purposes) in equity securities of medium-sized companies with significant capital appreciation potential. For the portfolio, “medium-sized companies” are those with market capitalizations within the collective market capitalization range of companies represented in either the Russell Midcap Index* or the S&P MidCap 400 Index.* |
| Mid Value | T. Rowe Price Associates, Inc. | To seek long-term capital appreciation. Under normal market conditions, the portfolio invests at least 80% of its net assets in companies with market capitalizations that are within the Russell Midcap Value Index.* The portfolio invests in a diversified mix of common stocks of mid-size U.S. companies that are believed to be undervalued by various measures and offer good prospects for capital appreciation. |
| Money Market |
John Hancock Asset Management, a division of Manulife Asset Management (North America) Limited | To seek to obtain maximum current income consistent with preservation of principal and liquidity. Under normal market conditions, the portfolio invests in high quality, U.S. dollar-denominated money market instruments. Certain market conditions may cause the return of the portfolio to become low or possibly negative. |
| Natural Resources | RS Investment Management Co. LLC; andWellington Management Company, LLP | To seek long-term total return. Under normal market conditions, the portfolio invests at least 80% of its net assets (plus any borrowings for investment purposes) in equity and equity-related securities of natural resource-related companies worldwide, including emerging markets. Natural resource-related companies include companies that own or develop energy, metals, forest products and other natural resources, or supply goods and services to such companies. |
| PIMCO VIT All Asset (a series of PIMCO Variable Insurance Trust) (only Class M is available) | Pacific Investment Management Company LLC | To seek maximum real return consistent with preservation of real capital and prudent investment management. The portfolio is a fund of funds and normally invests substantially all of its assets in Institutional Class shares or, as applicable, Class M shares of underlying PIMCO funds. |
| Portfolio | Portfolio Manager | Investment Objective |
| Real Estate Securities | Deutsche Investment Management Americas Inc. | To seek to achieve a combination of long-term capital appreciation and current income. Under normal market conditions, the portfolio invests at least 80% of its net assets (plus any borrowings for investment purposes) in equity securities of real estate investment trusts and real estate companies. Equity securities include common stock, preferred stock and securities convertible into common stock. |
| Real Return Bond | Pacific Investment Management Company LLC | To seek maximum real return, consistent with preservation of real capital and prudent investment management. Under normal market conditions, the portfolio invests at least 80% of its net assets (plus any borrowings for investment purposes) in inflation-indexed bonds of varying maturities issued by the U.S. and non-U.S. Governments, their agencies or instrumentalities and corporations, which may be represented by forwards or derivatives such as options, futures contracts, or swap agreements. |
| Science & Technology | Alliance Global Investors U.S. LLC; and T. Rowe Price Associates, Inc. | To seek long-term growth of capital. Current income is incidental to the portfolio’s objective. Under normal market conditions, the portfolio invests at least 80% of its net assets (plus any borrowings for investment purposes) in the common stocks of companies expected to benefit from the development, advancement, and/or use of science and technology. For purposes of satisfying this requirement, common stock may include equity-linked notes and derivatives relating to common stocks, such as options on equity-linked notes. |
| Short Term Government Income | John Hancock Asset Management, a division of Manulife Asset Management (US) LLC | To seek a high level of current income consistent with preservation of capital. Maintaining a stable share price is a secondary goal. Under normal market conditions, the portfolio invests at least 80% of its net assets in obligations issued or guaranteed by the U.S. Government and its agencies, authorities or instrumentalities. Under normal circumstances, the portfolio’s effective duration is no more than 3 years. |
| Small Cap Growth | Wellington Management Company, LLP | To seek long-term capital appreciation. Under normal market conditions, the portfolio invests at least 80% of its net assets (plus any borrowings for investment purposes) in small-capitalization companies. For the purposes of the portfolio, “small-capitalization companies” are those with market capitalizations, at the time of investment, not exceeding the maximum market capitalization of any company represented in either the Russell 2000 Index* or the S&P SmallCap 600 Index.* |
| Small Cap Index | John Hancock Asset Management, a division of Manulife Asset Management (North America) Limited | To seek to approximate the aggregate total return of a small-capitalization U.S. domestic equity market index. Under normal market conditions, the portfolio invests at least 80% of its net assets (plus any borrowings for investment purposes) at the time of investment in (a) the common stocks that are included in the Russell 2000 Index* and (b) securities (which may or may not be included in the Russell 2000 Index) that the subadviser believes as a group will behave in a manner similar to the index. |
| Small Cap Opportunities | Dimensional Fund Advisors LP; and Invesco Advisers, Inc. | To seek long-term capital appreciation. Under normal market conditions, Invesco Advisers, Inc. invests at least 80% of its subadvised net assets (plus any borrowings for investment purposes) in equity securities, including convertible securities, of small-capitalization companies. Dimensional Fund Advisors LP generally invests its subadvised net assets in a broad and diverse group of common stocks of small and medium-capitalization companies traded on a U.S. national securities exchange or on the over-the-counter market that Dimensional Fund Advisors LP determines to be value stocks at the time of purchase. |
| Small Cap Value | Wellington Management Company, LLP | To seek long-term capital appreciation. Under normal market conditions, the portfolio invests at least 80% of its net assets (plus any borrowings for investment purposes) in small-capitalization companies that are believed to be undervalued by various measures and offer good prospects for capital appreciation. For the purposes of the portfolio, “small-capitalization companies” are those with market capitalizations, at the time of investment, not exceeding the maximum market capitalization of any company represented in either the Russell 2000 Index* or the S&P SmallCap 600 Index.* |
| Portfolio | Portfolio Manager | Investment Objective |
| Small Company Value | T. Rowe Price Associates, Inc. | To seek long-term growth of capital. Under normal market conditions, the portfolio invests at least 80% of its net assets (plus any borrowings for investment purposes) in companies with market capitalizations, at the time of investment, that do not exceed the maximum market capitalization of any security in the Russell 2000 Index.* The portfolio invests in small companies whose common stocks are believed to be undervalued. |
| Smaller Company Growth | Frontier Capital Management Company, LLC; Perimeter Capital Management; and John Hancock Asset Management, a division of Manulife Asset Management (North America) Limited |
To seek long-term capital appreciation. Under normal market conditions, the portfolio invests at least 80% of its assets in small-capitalization equity securities. |
| Strategic Income Opportunities | John Hancock Asset Management, a division of Manulife Asset Management (US) LLC | To seek a high level of current income. Under normal market conditions, the portfolio invests primarily in the following types of securities: non-U.S. government and corporate debt securities from developed and emerging markets, U.S. Government and agency securities, and high-yield bonds. The portfolio may also invest in preferred stock and other types of debt securities. |
| Total Return | Pacific Investment Management Company LLC | To seek to maximum total return, consistent with preservation of capital and prudent investment management. Under normal market conditions, the portfolio invests at least 65% of its net assets in a diversified portfolio of fixed-income instruments of varying maturities, which may be represented by forwards or derivatives, such as options, futures contracts, or swap agreements. |
| Total Stock Market Index | John Hancock Asset Management, a division of Manulife Asset Management (North America) Limited | To seek to approximate the aggregate total return of a broad U.S. domestic equity market index. Under normal market conditions, the portfolio invests at least 80% of its net assets (plus any borrowings for investment purposes) at the time of investment in (a) the common stocks that are included in the Wilshire 5000 Total Market Index* and (b) securities (which may or may not be included in the Wilshire 5000 Total Market Index) that the subadviser believes as a group will behave in a manner similar to the index. |
| Ultra Short Term Bond | John Hancock Asset Management, a division of Manulife Asset Management (US) LLC | To seek a high level of current income consistent with the maintenance of liquidity and the preservation of capital. Under normal market conditions, the portfolio invests at least 80% of its net assets in a diversified portfolio of domestic, investment-grade, debt securities. Debt securities may be issued by governments, companies or special purpose entities and may include notes, discount notes, bonds, debentures, commercial paper, repurchase agreements, mortgage-backed and other asset-backed securities and assignments, participations and other interests in bank loans. The portfolio may also invest in cash and cash equivalents. |
| U.S. Equity | Grantham, Mayo, Van Otterloo & Co. LLC | To seek long-term capital appreciation. Under normal market conditions, the portfolio invests at least 80% of its net assets (plus any borrowings for investment purposes) in equity securities. To achieve the objective, the portfolio will be invested in equity investments that the subadviser believes will provide higher returns than the Russell 3000 Index.* |
| Utilities | Massachusetts Financial Services Company | To seek capital growth and current income (income above that available from the portfolio invested entirely in equity securities). Under normal market conditions, the portfolio invests at least 80% of its net assets (plus any borrowing for investment purposes) in securities of companies in the utilities industry. The subadviser considers a company to be in the utilities industry if, at the time of investment, the subadviser determines that a substantial portion (i.e., at least 50%) of the company’s assets or revenues are derived from one or more utilities. |
| Value | Invesco Advisers, Inc. | To seek to realize an above-average total return over a market cycle of 3 to 5 years, consistent with reasonable risk. Under normal market conditions, the portfolio invests in equity securities of companies with capitalizations, at the time of investment, similar to the market capitalization of companies in the Russell Midcap Value Index.* |
*Wilshire 5000 Total Market Index® is a trademark of Wilshire Associates. MSCI All Country World Excluding U.S. Index is a trademark of Morgan Stanley & Co. Incorporated. Russell 1000,® Russell 2000,® Russell 3000,® Russell Midcap,® and Russell Midcap Value® are
trademarks of Frank Russell Company. S&P MidCap 400,® and S&P SmallCap 600® are trademarks of The McGraw-Hill Companies, Inc. None of the portfolios are sponsored, endorsed, managed, advised, sold or promoted by any of these companies, and none of these companies make any representation regarding the advisability of investing in the portfolios.The indices referred to in the portfolio objectives track companies having the approximate market capitalization, as of February 28, 2013 (except as otherwise indicated), set out below:
MSCI All Country World Ex US Index — $676 million to $215.6 billion
Russell
1000 Index — minimum of $315 million
Russell 2000 Index — less than $1 million to $6.1 billion
Russell 3000 Index — less than $1 million to $414.5 billion
Russell
Midcap Index — $315 million to $42 billion
Russell Midcap Value Index — $315 million to $42 billion
S&P MidCap 400 Index — $322 million to $16.2 billion
S&P SmallCap 600 Index — $4 billion
Wilshire 5000 Total Market Index — less than $1 million to $415.2 billion
**The U.S. Aggregate Bond Index is a broad-based benchmark that measures the investment grade, U.S. dollar-enominated, fixed-rate taxable bond market, including Treasuries, government-related and corporate securities, MBS (agency fixed-rate and hybrid ARM pass throughs), ABS, and CMBS.
The policy is a flexible premium variable universal life insurance policy. This summary provides a general description of the important features of the policy. It is not comprehensive and is qualified in its entirety by the more detailed information contained in this prospectus. Unless otherwise stated or implied by the context, the discussions in this prospectus assume that the policy has not gone into default, there is no outstanding Policy Debt and the death benefit is not determined by the Minimum Death Benefit percentage. The policy’s provisions may vary in some states. The terms of the policy and any endorsements or riders will supersede the disclosure in this prospectus.
The policy provides a death benefit in the event of the death of the Life Insured while the policy is in force. The basic death benefit amount is the Face Amount, which is provided for the lifetime of the Life Insured with no maturity or expiration date. There may be other amounts added to the death benefit as described below.
Flexible Term Insurance Option. You may add a flexible term insurance option rider (the “FTIO Rider”) to the policy to provide additional term life insurance coverage on the Life Insured. Cost of insurance rates are less than or equal to those of the policy and no Sales Loads or surrender charge will apply. However, unlike the Face Amount of the policy, the FTIO Rider will terminate at the Life Insured’s Attained Age 100. The FTIO Rider also offers the flexibility to schedule varying death benefit amounts on future dates (the “Scheduled Death Benefits”).
Death Benefit Options. There are two death benefit Options. Option 1 provides a death benefit equal to the Face Amount of the policy and the Scheduled Death Benefits of the FTIO Rider or, if greater, the Minimum Death Benefit. Option 2 provides a death benefit equal to the Face Amount and the Scheduled Death Benefits, plus the Policy Value or, if greater, the Minimum Death Benefit. You may change the death benefit Option and increase or decrease the Face Amount and Scheduled Death Benefits.
Age 100 Advantage. If the Life Insured is alive on the Policy Anniversary when the Life Insured reaches Attained Age 100, the policy will continue in force subject to the following unless the policy owner chooses to surrender the policy for its Net Cash Surrender Value:
- the policy will be continued until the earlier of the death of the Life Insured or the date the policy owner surrenders the policy;
- no additional premium payments will be accepted although loan repayments will be accepted;
- no additional charges or deductions (described under “Charges and Deductions”) will be assessed;
- interest on any Policy Debt will continue to accrue;
- the policy owner may continue to transfer portions of the Policy Value among the Investment Accounts and the Fixed Accounts as described in this prospectus.
Premium payments may be made at any time prior to Attained Age 100 and in any amount, subject to certain limitations (see “Premium Payments—Premium Limitations”). Net Premiums will be allocated to one or more of the Fixed Account and the sub-accounts of the Separate Account. You may change allocations and make transfers among the accounts subject to limitations described below.
The Policy Value is the accumulation of premiums paid, less charges and deductions we take for expenses and cost of insurance, plus or minus the investment returns of the accounts to which the Policy Value has been allocated. You may obtain a portion of the Policy Value by taking a policy loan or a partial withdrawal or by full surrender of the policy.
You may borrow against the Net Cash Surrender Value of the policy. Loan interest will accrue daily and be payable in arrears on each Policy Anniversary. The Policy Debt will be deducted from amounts payable at the Life Insured’s death or upon surrender.
Surrender and Partial Withdrawals
You may make a partial withdrawal of Policy Value. It may result in a decrease in the Face Amount and Scheduled Death Benefits and assessment of a portion of the surrender charge. You may surrender the policy for its Net Cash Surrender Value at any time.
A policy will lapse and terminate without value when the Net Cash Surrender Value is insufficient to pay the next monthly deduction and a grace period of 61 days expires without an adequate premium payment from you. You may reinstate a lapsed policy within five years following lapse if the policy was not surrendered for its Net Cash Surrender Value. Evidence of insurability is required, along with a premium payment described under “Reinstatement.”
The policy differs in two important ways from a conventional life insurance policy. First, failure to make planned premium payments will not itself cause the policy to lapse. Second, the policy can lapse even if planned premiums have been paid.
We assess charges and deductions in connection with the policy, in the form of monthly deductions for the cost of insurance and administrative expenses, charges assessed daily against amounts in the Investment Accounts and loads deducted from premiums paid.
For more information, please refer to the prospectus for the underlying portfolio.
Sales Load or Surrender Charge. You may choose Coverage Amounts with one of two alternative charge structures representing different ways to cover a portion of our marketing and distribution costs. Generally, policy benefits will be approximately equal in present value under either alternative. However, there is no guarantee each alternative will perform the same in all circumstances. Therefore, you should obtain individualized illustrations for both charge structures.
Sales Load coverage features a load deducted immediately from premiums paid and no surrender charge. Surrender Charge coverage features no added sales load with surrender charges assessed upon early surrender, lapse, partial withdrawal or coverage decrease. Current cost of insurance charges in early years are higher for Surrender Charge coverage.
Reduction in Charges and Enhancement of Surrender Values. The policy is designed for employers and other sponsoring organizations that may purchases multiple policies as a Case. The size or nature of the Case may result in
expected savings of sales, underwriting, administrative or other costs. If so, we may offer reductions of policy charges and enhancements of surrender value. We may change the nature and amount of reductions and enhancements available from time to time. They will be determined in a way that is not unfairly discriminatory to policyholders.Investment Options and Investment Subadvisers
You may allocate Net Premiums to the Fixed Account or to one or more of the sub-accounts of the Separate Account. Each of the sub-accounts invests in the shares of one of the portfolios described in the Table of Investment Options and Investment Subadvisers.
The portfolios also employ subadvisers. The Table of Investment Options and Investment Subadvisers shows the subadvisers that provide investment subadvisory services to the indicated portfolios.
Allocating Net Premiums only to one or a small number of the investment options (other than the Lifestyle Trusts) should not be considered a balanced investment strategy. In particular, allocating Net Premiums to a small number of investment options that concentrate their investments in a particular business or market sector will increase the risk that the value of your policy will be more volatile since these investment options may react similarly to business or market specific events. Examples of business or market sectors where this risk historically has been and may continue to be particularly high include: (a) technology related businesses, including internet related businesses, (b) small cap securities and © foreign securities. The Company does not provide advice regarding appropriate investment allocations. Please discuss this matter with your financial adviser.
Description of John Hancock (USA)
We are a stock life insurance company incorporated in Maine on August 20, 1955 by a special act of the Maine legislature and redomesticated under the laws of Michigan. We are a licensed life insurance company in the District of Columbia and all states of the United States except New York. Our ultimate parent is Manulife Financial Corporation (“MFC”), a publicly traded company based in Toronto, Canada. MFC is the holding company of John Hancock USA and its subsidiaries. However, neither John Hancock USA nor any of its affiliated companies guarantees the investment performance of the Separate Account.
We are ranked and rated by independent financial rating services, which may include Moody’s, Standard & Poor’s, Fitch and A.M. Best. The purpose of these ratings is to reflect the financial strength or claims-paying ability of the company, but they do not specifically relate to its products, the performance (return) of these products, the value of any investment in these products upon withdrawal or to individual securities held in any portfolio. These ratings do not apply to the safety and performance of the Separate Account.
Description of Separate Account N
The investment accounts shown on page 1 are in fact subaccounts of the John Hancock Life Insurance Company (U.S.A.) Separate Account N, a separate account operated by us under Michigan law. The Separate Account meets the definition of “separate account” under the Federal securities laws and is registered as a unit investment trust under the 1940 Act. Such registration does not involve supervision by the SEC of the management of the Separate Account or of us.
The Separate Account’s assets are our property. Each policy provides that amounts we hold in the Separate Account pursuant to the policies cannot be reached by any other persons who may have claims against us and can’t be used to pay any indebtedness of John Hancock USA other than those arising out of policies that use the Separate Account. Income, gains and losses credited to, or charged against, the Separate Account reflect the Separate Account’s own investment experience and not the investment experience of John Hancock USA’s other assets. John Hancock USA is obligated to pay all amounts promised to policy owners under the policies.
New subaccounts may be added and made available to policy owners from time to time. Existing subaccounts may be modified or deleted at any time.
The policy is designed to provide employers or other organizations with life insurance coverage on employees or other individuals in whose lives they have an insurable interest. The policy may be owned by an individual or a corporation, trust, association, or similar entity. The policy may be used for such purposes as funding non-qualified executive deferred compensation or salary continuation liabilities or death benefit liabilities of executive retirement plans, or as a source for funding cash flow obligations under such plans.
To purchase a policy, an applicant must submit a completed application. A policy will not be issued until the underwriting process is completed to our satisfaction and we approve issuance of the policy.
Policies may be issued on a basis that does not distinguish between the Life Insured’s sex and/or smoking status, with prior approval from us. A policy will only be issued on the lives of insureds from Issue Ages 20 through 80. Each policy has a Policy Date, an Effective Date and an Issue Date. The Policy Date is the date from which the first monthly deductions are calculated and from which Policy Years, Policy Months and Policy Anniversaries are measured. The Policy Date is also the effective date of the initial Coverage Amount. The Policy Date is the same date as the Effective Date unless the policy is backdated (see “Backdating a Policy”). The Effective Date is the date we become obligated under the policy and when the first monthly deductions are taken. It is the later of the date we approve issuance of the policy and the date we receive at least the Minimum Initial Premium. The Issue Date is the date from which the Suicide and Incontestability provisions of the policy are measured.
If we approve issuance of a policy before we receive the Minimum Initial Premium then the Effective Date will be later than the Issue Date. The Minimum Initial Premium must be received by us within 60 days after the Issue Date and the Life Insured must be in good health on the Effective Date. If the Minimum Initial Premium is not paid or if the application is rejected, the policy will be canceled and any premiums paid will be returned to the applicant.
Net Premiums received prior to the Effective Date will be credited with interest at the rate of return earned on amounts allocated to the Money Market portfolio. On the Effective Date, Net Premiums received plus any interest credited will be allocated to Investment Accounts and the Fixed Account according to your instructions, unless first allocated to the Money Market Trust for the duration of the right to examine period (see “Right to Examine the Policy”).
Minimum Face Amount and Scheduled Death Benefit. The minimum Face Amount is $50,000 unless the FTIO Rider is added to the policy. With an FTIO Rider, the minimum Face Amount is $25,000 and the minimum Scheduled Death Benefit is $50,000 at all times.
Backdating a Policy. You may request that we backdate the policy by assigning a Policy Date earlier than the date the application is signed. We will not backdate the policy to a date earlier than that allowed by state law, which is generally three months to one year prior to the date of application for the policy. Monthly deductions will be made for the period the Policy Date is backdated.
Temporary insurance coverage may be provided under the terms of a Temporary Insurance Agreement, subject to our underwriting practices. Generally, temporary life insurance may not exceed $1,000,000 and may not be in effect for more than 90 days. It is issued on a conditional receipt basis, which means that benefits would only be paid if the Life Insured met our usual and customary underwriting standards for the coverage applied for.
The policies are offered on three underwriting classes that require different types and amounts of information from the applicant and prospective Life Insured. Current cost of insurance charges in early Policy Years will vary by the type of underwriting and charges will generally be lower where underwriting information is more extensive. Under any of the underwriting bases, the acceptance of an application is subject to our underwriting rules and we may request additional information or reject an application for any reason.
Short Form Underwriting. The proposed Life Insured must answer qualifying questions in the application but is not required to provide detailed medical history, submit records or undergo examinations or tests unless requested to do so by us. Availability of Short Form underwriting depends on characteristics of the Case, such as the number of lives to be insured, the amounts of insurance and other factors, and it is generally available only up to Issue Age 65.
Simplified Underwriting. The proposed Life Insured must satisfactorily answer certain health questions in the application and may be required to submit existing medical records, but requirements to undergo examinations and tests are minimized. Availability of Simplified underwriting and the nature of the requirements will depend on characteristics of the Case and the proposed lives to be insured.
Regular (Medical) Underwriting. Where Short Form or Simplified underwriting is unavailable we require satisfactory evidence of insurability under our regular underwriting guidelines for individual applicants. This may include medical exams and other information. A proposed Life Insured who fails to qualify for a standard risk classification may be eligible to be insured with an additional substandard rating.
A policy may be returned for a refund within 10 days after you receive it. Some states provide a longer period of time for this right, which will be stated in the policy if applicable. The policy can be mailed or delivered to the John Hancock USA agent who sold it or to the Service Office. Immediately upon such delivery or mailing, the policy shall be deemed void from the beginning. Within seven days after receipt of the returned policy at the Service Office we will refund an amount equal to the value of amounts in the Investment Accounts and the Fixed Account on the date we receive the returned policy, plus all charges deducted prior to that date, not including fees and expenses of the portfolios, minus any partial withdrawals and policy loans.
Some state laws require the refund of premiums paid without adjustment for investment gains and losses of the Separate Account. In these states, all Net Premiums will be allocated to the Money Market Trust during the right to examine period and the refund amount will be equal to all premiums received less any partial withdrawals and policy loans.
If you request a Face Amount increase that results in new surrender charge or sales loads, you will have the same rights described above to cancel the increase. If canceled, the premiums paid during this right to examine period will be refunded, and the Policy Value and surrender charge or sales loads will be recalculated to be as they would have been had the premiums not been paid.
We reserve the right to delay the refund of any premium paid by check until the check has cleared.
(Applicable to Residents of California Only)
Residents in California age 60 and greater may return the policy for a refund at any time within 30 days after receiving it. The policy can be mailed or delivered to the Company’s agent who sold it or to the Service Office. If you cancel the policy during this 30 day period and your premiums were allocated to a Fixed Account or the Money-Market investment option, we will refund you the amount of all premiums paid. If your premiums were allocated to one or more of the Investment Accounts (other than the Money Market portfolio), we will refund you the value of amounts in the Investment Accounts and the Fixed Account on the date we receive the returned policy plus all charges deducted prior to that date, not including fees and expenses of the portfolios; minus any partial withdrawals and policy loans.
Your premiums will be placed in either (a) the Fixed Account, (b) the Money Market investment option or © in one or more of the Investment Accounts, based upon your instructions. If no instructions are given, your premiums will be placed in the Money Market investment option.
A policy must satisfy either of two tests to qualify as a life insurance contract as defined in Section 7702 of the Internal Revenue Code of 1986, as amended (the “Code”). At the time of application, you must choose either the Cash Value Accumulation Test (“CVA Test”) or the Guideline Premium Test (“GP Test”) and the test cannot be changed once the policy is issued.
Cash Value Accumulation Test. The CVA Test requires the death benefit at any time to be at least a certain ratio of the Policy Value, based on prescribed calculations. The Minimum Death Benefit provision described below will ensure that the CVA Test is met. There is no restriction on the amount of premiums you may pay, but we will require you to provide
satisfactory evidence of insurability before we accept an amount of premium that would increase the death benefit by more than the increase in Policy Value.Guideline Premium Test. The GP Test limits the amount of premiums you may pay into the policy, given its death benefit, based on prescribed calculations. In addition, the GP Test requires the death benefit at any time to be at least a prescribed ratio of the Policy Value. These prescribed multiples are generally lower than those calculated under the CVA Test. The Minimum Death Benefit provision described below will ensure that this second requirement is met.
Changes to the policy or FTIO Rider, such as changes in Face Amount, Scheduled Death Benefit, death benefit Option or partial withdrawals, may affect the premium limits under the GP Test. Some changes will reduce future premium limits and may cause premiums already paid to exceed the new limits and force you to make a partial withdrawal.
If the policy is in force at the time of the Life Insured’s death we will pay an insurance benefit to the beneficiary. The policy may remain in force for the Life Insured’s entire lifetime and there is no specified maturity or expiration date.
Insurance benefits are only payable when we receive due proof of death at the Service Office, in the form of either a certified copy of the death certificate, a certified copy of a decree of a court of competent jurisdiction as to the finding of death or other proof satisfactory to us.
The amount of the insurance benefit payable will be the death benefit on the date of death, as described below, less any Policy Debt and outstanding monthly deductions on the date of death. The insurance benefit will be paid in one lump sum unless another form of settlement is agreed to by the beneficiary and us. If the insurance benefit is paid in one sum, we will pay interest from the date of death to the date of payment. If the Life Insured should die after our receipt of a request for surrender, no insurance benefit will be payable, and we will pay only the Net Cash Surrender Value.
Minimum Death Benefit. Both the CVA Test and the GP Test require the death benefit to be at least a prescribed ratio of the Policy Value at all times. The Policy’s Minimum Death Benefit ensures that these requirements are met by providing that the death benefit shall be at least equal to the Policy Value multiplied by the applicable Minimum Death Benefit Percentage for the Attained Age of the Life Insured. Tables of Minimum Death Benefit Percentages appear below.
Table of Minimum Death Benefit Percentages.
| Age | GP Test Percent |
Male | CVA Test Female |
Unisex |
| 20 | 250% | 653% | 779% | 67.4% |
| 21 | 250% | 634% | 754% | 654% |
| 22 | 250% | 615% | 730% | 635% |
| 23 | 250% | 597% | 706% | 616% |
| 24 | 250% | 580% | 684% | 598% |
| 25 | 250% | 562% | 662% | 579% |
| 26 | 250% | 545% | 640% | 561% |
| 27 | 250% | 528% | 619% | 544% |
| 28 | 250% | 511% | 599% | 526% |
| 29 | 250% | 494% | 580% | 509% |
| 30 | 250% | 479% | 561% | 493% |
| 31 | 250% | 463% | 542% | 477% |
| 32 | 250% | 448% | 525% | 461% |
| 33 | 250% | 433% | 507% | 446% |
| 34 | 250% | 419% | 491% | 432% |
| 35 | 250% | 406% | 475% | 418% |
| 36 | 250% | 392% | 459% | 404% |
| 37 | 250% | 380% | 444% | 391% |
| 38 | 250% | 367% | 430% | 378% |
| 39 | 250% | 356% | 416% | 366% |
| 40 | 250% | 344% | 403% | 355% |
| 41 | 243% | 333% | 390% | 343% |
| 42 | 236% | 323% | 378% | 333% |
| 43 | 229% | 313% | 366% | 322% |
| 44 | 222% | 303% | 355% | 312% |
| 45 | 215% | 294% | 344% | 303% |
| 46 | 209% | 285% | 333% | 294% |
| 47 | 203% | 277% | 323% | 285% |
| 48 | 197% | 268% | 313% | 276% |
| 49 | 191% | 260% | 304% | 268% |
| 50 | 185% | 253% | 295% | 260% |
| 51 | 178% | 245% | 286% | 253% |
| 52 | 171% | 238% | 278% | 245% |
| 53 | 164% | 232% | 270% | 238% |
| 54 | 157% | 225% | 262% | 232% |
| 55 | 150% | 219% | 254% | 225% |
| 56 | 146% | 213% | 247% | 219% |
| 57 | 142% | 207% | 240% | 213% |
| 58 | 138% | 202% | 233% | 208% |
| 59 | 134% | 197% | 227% | 202% |
| 100% |
| Age | GP Test Percent |
Male | CVA Test Female |
Unisex |
| 60 | 130% | 192% | 221% | 197% |
| 61 | 128% | 187% | 214% | 192% |
| 62 | 126% | 182% | 208% | 187% |
| 63 | 124% | 178% | 203% | 183% |
| 64 | 122% | 174% | 197% | 178% |
| 65 | 120% | 170% | 192% | 174% |
| 66 | 119% | 166% | 187% | 170% |
| 67 | 118% | 162% | 182% | 166% |
| 68 | 117% | 159% | 177% | 162% |
| 69 | 116% | 155% | 173% | 159% |
| 70 | 115% | 152% | 169% | 156% |
| 71 | 113% | 149% | 164% | 152% |
| 72 | 111% | 146% | 160% | 149% |
| 73 | 109% | 144% | 156% | 146% |
| 74 | 107% | 141% | 153% | 144% |
| 75 | 105% | 139% | 149% | 141% |
| 76 | 105% | 136% | 146% | 139% |
| 77 | 105% | 134% | 143% | 136% |
| 78 | 105% | 132% | 140% | 134% |
| 79 | 105% | 130% | 138% | 132% |
| 80 | 105% | 129% | 135% | 130% |
| 81 | 105% | 127% | 133% | 128% |
| 82 | 105% | 125% | 130% | 127% |
| 83 | 105% | 124% | 128% | 125% |
| 84 | 105% | 122% | 126% | 123% |
| 85 | 105% | 121% | 124% | 122% |
| 86 | 105% | 120% | 123% | 121% |
| 87 | 105% | 119% | 121% | 119% |
| 88 | 105% | 118% | 119% | 118% |
| 89 | 105% | 116% | 118% | 117% |
| 90 | 105% | 116% | 117% | 116% |
| 91 | 104% | 115% | 115% | 115% |
| 92 | 103% | 114% | 114% | 114% |
| 93 | 102% | 112% | 113% | 113% |
| 94 | 101% | 111% | 112% | 111% |
| 95 | 100% | 110% | 110% | 110% |
| 96 | 100% | 109% | 109% | 109% |
| 97 | 100% | 107% | 107% | 107% |
| 98 | 100% | 106% | 106% | 106% |
| 99 | 100% | 105% | 105% | 105% |
| 100+ | 100% | 100% | 100% | 100% |
Flexible Term Insurance Option Rider
You may add the FTIO Rider to the policy to provide additional death benefit coverage on the Life Insured. The FTIO Rider provides flexible term life insurance to Attained Age 100 with cost of insurance charges less than or equal to those of the policy. The Rider will terminate at the earlier of Attained Age 100, the date the policy lapses or is surrendered, and your request to cancel the FTIO Rider.
You may schedule the death benefit amounts that will apply at specified times (the “Scheduled Death Benefits”). Scheduled Death Benefits may be constant or varying from time to time. The Death Benefit Schedule will be shown in the policy.
The Term Insurance Benefit of the FTIO Rider is equal to (a) minus (b) but not less than zero where:
(a) the Scheduled Death Benefit for the Policy Month, and
(b) the Face Amount of the policy or, if greater, the policy’s Minimum Death Benefit
Even if the Term Insurance Benefit may be zero in a Policy Month, the Rider will not terminate.
Example. A policy is purchased for an executive as part of an employee benefit plan. The death benefit provided by the policy is to be equal to the executive’s salary of $100,000 increasing at 5% per year through age 64. Assuming the executive is currently 55, the policy will be issued with a death benefit Schedule as follows:
| Policy Year | Scheduled Death Benefit |
| 1 | 100,000 |
| 2 | 105,000 |
| 3 | 110,250 |
| 4 | 115,763 |
| 5 | 121,551 |
| 6 | 127,628 |
| 7 | 134,010 |
| 8 | 140,710 |
| 9 | 147,746 |
| 10+ | 155,133 |
The FTIO Rider amount will change each year as necessary to provide the benefits shown in the schedule, as follows:
| Policy Year | Total Death Benefit |
Face Amount |
Flexible Term Insurance Amount |
| 1 | 100,000 | 100000 | 0 |
| 2 | 105,000 | 100000 | 5,000 |
| 3 | 110,250 | 100000 | 10,250 |
| 4 | 115,763 | 100000 | 15,763 |
| 5 | 121,551 | 100000 | 21,551 |
| 6 | 127,628 | 100000 | 27,628 |
| 7 | 134,010 | 100000 | 34,010 |
| 8 | 140,710 | 100000 | 40,710 |
| 9 | 147,746 | 100000 | 47,746 |
| 10 | 155,133 | 100000 | 55,133 |
You may choose either of two death benefit Options:
Death Benefit Option 1. The death benefit on any date is the Face Amount of the policy or, if greater, the Minimum Death Benefit, plus the Term Insurance Benefit of the FTIO Rider.
Death Benefit Option 2. The death benefit on any date is the Face Amount plus the Policy Value or, if greater, the Minimum Death Benefit, plus the Term Insurance Benefit of the FTIO Rider.
Changing the Death Benefit Option
You may change the death benefit Option at any time. The change will take effect at the beginning of the next Policy Month that is at least 30 days after your written request is received at the Service Office. We reserve the right to limit changes that could cause the policy to fail to qualify as life insurance for tax purposes.
A change in the death benefit Option will result in a change in the Face Amount and Scheduled Death Benefits to avoid any change in the amount of death benefit, as follows:
- Change from Option 1 to Option 2. The new Face Amount will be the Face Amount prior to the change less the Policy Value on the date of the change.
- The Scheduled Death benefit amounts for dates on or after the date of the change will be the amounts scheduled prior to the change less the Policy Value on the date of the change.
- Coverage Amounts will be reduced or eliminated in the order that they are listed in the policy until the total decrease in Coverage Amounts equals the decrease in Face Amount.
- surrender charge will not be assessed for reductions that are solely due to a change in the death benefit Option.
Example. A policy is issued with a Face amount of $100,000, death benefit Option 1, and the following schedule:
| Policy Year | Scheduled Death Benefit |
| 1 | 100,000 |
| 2 | 125,000 |
| 3 | 150,000 |
| 4 | 175,000 |
| 5+ | 200,000 |
The death benefit Option is changed to Option 2 at the beginning of Policy Year 3. If the Policy Value at the time of the change is $10,000, then the Face Amount after the change will be $90,000 (the Face Amount prior to the change less the Policy Value) and the Death Benefit Schedule after the change will become:
| Policy Year | Scheduled Death Benefit |
| 3 | 140,000 |
| 4 | 165,000 |
| 5+ | 190,000 |
Change from Option 2 to Option 1. The new Face Amount will be the Face Amount prior to the change plus the Policy Value on the date of the change (but the new Face Amount will be no greater than the Scheduled Death Benefit on the date of the change.)
The resulting Face Amount increase will be added to the first Coverage Amount listed in the policy.
The Annual Premium Target for this Coverage Amount will not be increased and new surrender charge or Sales Loads will not apply, however, for an increase solely due to a change in the death benefit Option.
Example. A policy is issued with a Face amount of $100,000, death benefit Option 2, and the following schedule:
| Policy Year | Scheduled Death Benefit |
| 1 | 100,000 |
| 2 | 125,000 |
| 3 | 150,000 |
| 4 | 175,000 |
| 5+ | 200,000 |
The death benefit Option is changed to Option 1 at the beginning of Policy Year 3. If the Policy Value at the time of the change is $10,000, then the Face Amount after the change will be $110,000 (the Face Amount prior to the change plus the Policy Value), and the Death Benefit Schedule after the change will become:
| Policy Year | Scheduled Death Benefit |
| 3 | 160,000 |
| 4 | 185,000 |
| 5+ | 210,000 |
Changing the Face Amount and Scheduled Death Benefits
- At any time, you may request an increase or decrease to the Face Amount or any Scheduled Death Benefits effective on or after the date of change. We reserve the right to limit changes that could cause the policy to fail to qualify as life insurance for tax purposes.
- Increases in Face Amount and Scheduled Death Benefits. Increases in Face Amount and Scheduled Death Benefits are subject to the following conditions:
- Increases in Face Amount and Scheduled Death Benefits will require satisfactory evidence of the Life Insured’s insurability.
- Increases will take effect at the beginning of the next Policy Month after we approve the request.
- We may refuse a requested increase that would not meet our requirements for new policy issues at the time due to the Life Insured’s Attained Age or other factors.
- If the Face Amount is increased (other than as required by a death benefit Option change) then all Scheduled Death Benefits effective on or after the date of the change will be increased by the amount of the Face Amount increase.
New Surrender Charges or Sales Loads for a Face Amount Increase. Coverage Amounts equal to the amount of the increase will be added to the policy as follows:
- First, Coverage Amounts that were reduced or eliminated by a prior Face Amount decrease will be restored.
- Second, if needed, a new Coverage Amount will be added to the policy with an Annual Premium Target and new surrender charge or Sales Loads. Any new Coverage Amount will be based on the Life Insured’s Attained Age and other relevant factors on the effective date of the increase.
Premiums paid on or after the increase may be attributed to the new Coverage Amount and result in surrender charge or Sales Loads (see “Charges and Deductions — Attribution of Premiums”).
Decreases in Face Amount and Scheduled Death Benefits. Decreases in Face Amount and Scheduled Death Benefits are subject to the following conditions:
- Decreases in Face Amount and Scheduled Death Benefits will take effect at the beginning of the next policy Month which is at least 30 days after your written request is received at the Service Office.
- If the Face Amount is decreased then all Scheduled Death Benefits effective on or after the date of the change will be decreased by the same amount.
- If at any time the Scheduled Death Benefit decreases to less than the Face Amount, the Face Amount will be decreased to be equal to the Scheduled Death Benefit at that time.
- Coverage Amounts equal to the amount of the Face Amount decrease will be reduced or eliminated in the reverse order that they are listed in the policy. surrender charge may be assessed (see “Charges and Deductions — Sales Load or Surrender Charge”).
Decreases in Face Amount under Death Benefit Option 1 due to a Partial Withdrawal. If death benefit Option 1 is in effect when a partial withdrawal is made, the Face Amount will be decreased by an amount equal to (a) minus (b) but not less than zero, where:
| (a) | is the partial withdrawal amount plus any applicable Surrender Charge and |
| (b) | is the excess, if any, of the policy’s Minimum Death Benefit over its Face Amount, immediately prior to the partial withdrawal. |
Decreases in Face Amount under death benefit Option 1 due to a Partial Withdrawal are subject to the following conditions:
- Coverage Amounts equal to the amount of the Face Amount decrease will be reduced or eliminated in the reverse order that they are listed in the policy.
- All Scheduled Death Benefits effective on or after the date of the partial withdrawal will be decreased by the amount of the Face Amount decrease, unless you request otherwise and we approve.
- A Face Amount decrease due to a partial withdrawal will not incur any Surrender Charge in addition to that applicable to the partial withdrawal (see “Charges and Deductions — Sales Load or Surrender Charge”).
Example for Face Increases and Decreases. A policy is issued with a Face Amount of $100,000, death benefit Option 1, and a Death Benefit Schedule as follows:
| Policy Year |
Scheduled Death Benefit |
| 1 | 100,000 |
| 2 | 125,000 |
| 3 | 150,000 |
| 4 | 175,000 |
| 5+ | 200,000 |
Assume the following policy activity:
| Activity | Effect on Policy | Change in Benefit Schedule |
| In Policy Year 2, the Face Amount is reduced to $80,000. | The initial Coverage amount is reduced to $80,000. | Policy Year |
Scheduled Death Benefit |
| 2 | 105,000 |
| 3 | 130,000 |
| 4 | 155,000 |
| 5+ | 180,000 |
| In Policy Year 3, the Face Amount is increased to $120,000 | The initial Coverage Amount (which earlier was reduced to $80,000) is restored to its original level of $100,000. A new Coverage Amount for $20,000 is added to the policy. This new coverage amount will have its own Annual Premium Target, and if applicable, its own Sales Load or surrender charge. A portion of the future premiums paid will be attributed to this Coverage Amount to determine the amount of the Sales Load or Surrender Charge. | Policy Year |
Scheduled Death Benefit |
| 3 | 170,000 |
| 4 | 195,000 |
| 5+ | 220,000 |
| In Policy Year 4, a Partial Withdrawal of $30,000 is made. | The Face Amount is reduced to $90,000. The most recent Coverage Amount of $20,000 is reduced to $0, and the initial Coverage Amount is reduced to $90,000. | Policy Year |
Scheduled Death Benefit |
| 4 | 165,000 |
| 5 | 190,000 |
Factors that Affect the Death Benefit. In the case of death benefit Option 2 where the death benefit is the Face Amount plus the Policy Value, changes in the Policy Value will affect the amount of death benefit. Factors that affect the Policy Value are the investment performance of the variable investment options chosen and the charges deducted. For a discussion of how these factors affect Policy Value see the “Risks/Benefits Summary.” These factors do not affect the Face Amount of the policy. Therefore, the amount of death benefit under Option 1 will not be less than the Face Amount as long as the policy does not lapse.
No premiums will be accepted prior to receipt of a completed application by us. All premiums received prior to the Effective Date of the policy will be held in the general account and credited with interest from the date of receipt at the rate of return earned on amounts allocated to the Money Market Trust.
On the Effective Date, the Net Premiums paid plus interest credited will be allocated among the Investment Accounts or the Fixed Account in accordance with your instructions, unless first allocated to the Money Market Trust for the duration of the right to examine period (see “Right to Examine the Policy”).
After the payment of the initial premium, premiums may be paid at any time during the lifetime of the Life Insured prior to Attained Age 100 and in any amount subject to the premium limitations described below. A policy will be issued with a planned premium, which is based on the amount of premium you wish to pay. We will send you notices of your planned premium at the payment interval you select. However, you are under no obligation to make the planned premium payment.
Payment of premiums will not guarantee that the policy will stay in force and failure to pay premiums will not necessarily cause the policy to lapse. The policy will remain in force so long as the Net Cash Surrender Value is sufficient to cover policy charges.
If the policy is issued under the GP Test, the total of all premiums paid may not exceed the then-current maximum premium limitations established by federal income tax law for the policy to qualify as life insurance. The GP Test premium limits are stated in the policy. If a premium is received which would result in total premiums exceeding the applicable GP Test limit, we will only accept that portion of the premium that will not exceed the limit. Any premium in excess of that amount will be returned.
If the policy is issued under the CVA Test, there is no restriction on the amount of premiums that may be paid into a policy, but you must provide satisfactory evidence of insurability before we accept any premium that would increase the death benefit by an amount greater than the increase in Policy Value.
You may allocate premiums to the Fixed Account and Investment Accounts. Allocations may be made as percentages that are between zero and 100% that sum to exactly 100%. Alternatively, you may allocate a premium in dollar amounts that sum to exactly the Net Premium amount. You may change premium allocations at any time and the change will take effect on the date a request for change satisfactory to us is received at the Service Office.
We will deduct a Premium Load as a percentage of each premium payment that is guaranteed never to exceed 2.0%. Currently, we waive this load in Policy Years 11 and later and charge 0%.
The charge is intended to cover a portion of the aggregate amount of various taxes and fees we pay to federal, state and local governments. It is not based on the actual premium tax rate of your state of residence or any other specific tax.
Sales Load or Surrender Charge
Each Coverage Amount listed in the policy is designated as having either a Sales Load or Surrender Charge. One or the other of these charges will apply to a Coverage Amount, but not both. This designation cannot be changed after a Coverage Amount is effective and, currently, the same alternative must apply to all Coverage Amounts.
Generally, policy benefits will be approximately equal in present value under either alternative. However, there is no guarantee each alternative will perform the same in all circumstances. Therefore, you should obtain individualized illustrations for both charge structures. Current cost of insurance rates in early Policy Years will be higher for the Surrender Charge alternative.
The Sales Load or Surrender Charge is intended to cover a portion of our costs of marketing and distributing the policies.
Attribution of Premiums. An Annual Premium Target is associated with each Coverage Amount. Annual Premium Targets are based on the Coverage Amount and the Life Insured’s Attained Age, sex and smoking status on the effective date of the Coverage Amount. The Annual Premium Targets are listed with the Coverage Amounts in the policy.
Premium payments will be attributed to Coverage Amounts that have been in effect for less than 5 years. Attribution will begin with the first applicable Coverage Amount that is listed in the policy. The sum of all premium amounts attributed to a Coverage Amount in a Coverage Year is limited to the Annual Premium Target shown in the policy. Premium amounts that exceed the Annual Premium Target will be attributed to the next listed Coverage Amount, up to its own Annual Premium Target. Attribution will continue in this manner until either the entire premium is attributed to Coverage Amounts or the Annual Premium Target is exceeded for all applicable Coverage Amounts.
Sales Load. We deduct a Sales Load from all premium amounts attributed to a Coverage Amount designated as having a Sales Load. The Sales Load is a percentage of premiums guaranteed never to exceed the percentages below.
Currently we are charging these percentages.
| Coverage Year | Percentage | Coverage Year | Percentage |
| 1 | 8% | 4 | 2% |
| 2 | 6% | 5 | 1% |
| 3 | 3% | 6+ | 0% |
Surrender Charge. We will deduct a Surrender Charge from the Net Policy Value upon elimination or reduction of a Coverage Amount designated as having a Surrender Charge during the first 9 Coverage Years. Coverage Amounts may be eliminated or reduced and a Surrender Charge assessed due to:
- surrender of the policy for its Net Cash Surrender Value,
- a partial withdrawal which exceeds the Free Partial Withdrawal Amount,
- a Face Amount decrease that is not solely due to a death benefit Option change, or
- lapse of the policy.
The Surrender Charge for an applicable Coverage Amount is a percentage of the sum of all premiums attributed to it since its effective date. Surrender Charge percentages are guaranteed never to exceed those below. Currently, we are charging these percentages:
| Coverage Year | Percentage | Coverage Year | Percentage |
| 1 | 5.0% | 6 | 1.5% |
| 2 | 4.0% | 7 | 1.0% |
| 3 | 3.0% | 8 | 1.0% |
| 4 | 2.5% | 9 | 0.5% |
| 5 | 2.0% | 10+ | 0.0% |
Although the Surrender Charge percentages remain level or decrease as the Coverage Year increases, the total dollar amount of surrender charge may increase, as the total premium paid increases. Premiums paid in any Coverage Year in excess of the Annual Premium Target and premiums paid after the fifth Coverage Year may not add to the Surrender Charge, so the timing of premium payments may affect the amount of the Surrender Charge.
Depending upon circumstances such as premiums paid and performance of the underlying investment options, there may be a Policy Value but no Cash Surrender Value available due to the existence of the Surrender Charge.
Unless otherwise allowed by us and specified by you, surrender charge will be allocated among the Investment Accounts and the Fixed Account in the same proportion as the Policy Value in each Account bears to the Net Policy Value.
Surrender Charges on a Partial Withdrawal. We will assess a portion of the Surrender Charge if you take a partial withdrawal that exceeds the Free Withdrawal Amount. The Free Withdrawal Amount is 10% of the Net Cash Surrender Value at the time of the withdrawal less the amount of any partial withdrawals already taken in the same Policy Year.
The portion of the policy’s total Surrender Charge that will be assessed is the ratio of (a) to (b), where (a) is the amount being withdrawn in excess of the Free Withdrawal Amount and (b) is the Net Cash Surrender Value immediately prior to the withdrawal. The remaining surrender charge for all Coverage Amounts will be reduced in the same proportion that the Surrender Charge assessed bears to the policy’s total Surrender Charge immediately prior to the partial withdrawal.
Surrender Charges on a Face Amount Decrease. We will assess a portion of the Surrender Charge upon a Face Amount decrease that is not required due to a death benefit Option change or partial withdrawal. For each Coverage Amount that is reduced or eliminated as a result of the decrease, we will assess a portion of any applicable Surrender Charge. The
proportion of the Surrender Charge that is assessed will be the ratio of amount by which the Coverage Amount is reduced to the Coverage Amount prior to reduction. The remaining surrender charge for affected Coverage Amounts will be reduced by the same ratio.On the Policy Date and at the beginning of each Policy Month prior to Attained Age 100, a deduction is due from the Net Policy Value to cover certain charges described below. Monthly deductions due prior to the policy’s Effective Date will be taken on the Effective Date. Unless otherwise allowed by us and specified by you, the monthly deduction will be allocated among the Investment Accounts and the Fixed Account in the same proportion as the Policy Value in each of the Investment Accounts and the Fixed Account bears to the Net Policy Value.
Administration Charge. Currently we deduct a charge of $12 per Policy Month, which is guaranteed never to be exceeded. This charge is intended to cover certain administrative expenses associated with the policy, including maintaining policy records, collecting premiums and processing death claims, surrender and withdrawal requests and various changes permitted under a policy.
Cost of Insurance Charge. A monthly charge for the cost of insurance is paid to the Company and is determined by multiplying a cost of insurance rate by the net amount at risk at the beginning of each Policy Month.
Death Benefit Option 1. The net amount at risk is equal to the greater of zero, or (a) minus (b), where
(a) is the applicable death benefit amount on the first day of the Policy Month, divided by 1.0024663; and
(b) is the Policy Value attributed to that death benefit amount on the first day of the Policy Month.
Death Benefit Option 2. The net amount at risk is equal to the Face Amount of insurance.
Cost of insurance rates and net amounts at risk are determined separately for each Coverage Amount and for the excess of the death benefit over the Face Amount (the Face Amount is the sum of the Coverage Amounts).
Attribution of Policy Value to Net Amounts at Risk. To determine the net amounts at risk, the Policy Value will be attributed to Coverage Amounts in the order listed in the policy. The amount of Policy Value attributed to a Coverage Amount will be limited to the amount that results in zero net amount at risk, and any excess Policy Value will then be attributed to the next listed Coverage Amount. Attribution will continue in this manner until either the entire Policy Value is attributed or the end of the list of Coverage Amounts is reached. Any remaining Policy Value will then be attributed to the excess of the death benefit over the Face Amount.
Current Cost of Insurance Rates. Cost of insurance rates are determined separately for each Coverage Amount and the excess of the death benefit over the Face Amount. There are different current cost of insurance rate bases for:
- Coverage Amounts having Sales Loads,
- Coverage Amounts having surrender charge, and
- The excess of the death benefit over the Face Amount, including any Term Insurance Benefit under the FTIO Rider.
The cost of insurance rate in a specific Policy Month for an applicable death benefit amount will depend on:
- the cost of insurance rate basis for the applicable death benefit amount,
- the Life Insured’s Attained Age, sex (unless unisex rates are required by law) and smoking status on the effective date of the applicable death benefit amount,
- the underwriting class of the applicable death benefit amount,
- the Coverage Year, or Policy Year for the excess of the death benefit over the Face Amount,
- any extra charges for substandard ratings, as stated in the policy.
Since the net amount at risk for death benefit Option 1 is based on a formula that includes as factors the Policy Value, the net amount at risk is affected by the investment performance of the underlying investment options chosen, payment of premiums and charges assessed.
Cost of insurance rates will generally increase with the Life Insured’s age and the Coverage Year.
Cost of insurance rates reflect our expectation as to future mortality experience. They are also intended to cover our general costs of providing the policy, to the extent that these costs are not covered by other charges. Current cost of insurance rates may be changed by us on a basis that does not unfairly discriminate within the class of lives insured.
Guaranteed Maximum Cost of Insurance Rates. In no event will the cost of insurance rates we charge exceed the guaranteed maximum rates set forth in the policy, except to the extent that an extra charge is imposed for a substandard rating. The guaranteed rates are the based on 1980 Commissioners Standard Ordinary Sex Distinct (unless unisex rates are required by law) ANB Aggregate Ultimate Mortality Tables. Current cost of insurance rates may be less than the guaranteed rates.
Asset Based Risk Charge Deducted from Investment Accounts
We assess a daily charge against amounts in the Investment Accounts. This charge is intended to compensate us for insurance risks we assume under the policy, such as benefit payments and expenses that are higher than we expected. We will realize a gain from this charge to the extent it is not needed to provide benefits and pay expenses under the policy.
The charge is a percentage of amounts in the Investment Accounts, which will reduce Unit Values of the sub-accounts. The charge is guaranteed never to exceed an annual rate of 0.50%. Currently, we charge the following rates:
| PolicyYear | Annual Rate |
| 1-10 | 0.50% |
| 11+ | 0.25% |
Reduction in Charges and Enhanced Surrender Values
The policy is designed for employers and other sponsoring organizations that may purchase multiple policies as a Case. The size or nature of the Case may result in expected savings of sales, underwriting, administrative or other costs. If so, we expect to offer reductions of policy charges and enhancements of surrender value. Eligibility for reductions and enhancements and the amounts available will be determined by a number of factors, including the number of lives to be insured, the total premiums expected to be paid, total assets under management for the policy owner, the nature of the relationship among the lives insured, the purpose for which the policies are being purchased, expected persistency of the individual policies, and any other circumstances which we believe to be relevant to the expected reduction of our expenses. Some of reductions and enhancements may be guaranteed and others may be subject to restrictions or to withdrawal or modification, on a uniform case basis. We may change the nature and amount of reductions and enhancements available from time to time. Reductions and enhancements will be determined in a way that is not unfairly discriminatory to policy owners.
Currently, we make no specific charge for any federal, state, or local taxes that we incur that may be attributable to such Account or to the policy. We reserve the right in the future to make a charge for any such tax or other economic burden resulting from the application of tax laws that we determines to be attributable to the Separate Account or to the policy.
Determination of the Policy Value
A policy has a Policy Value, a portion of which is available to you by making a policy loan or partial withdrawal, or upon surrender of the policy. The Policy Value may also affect the amount of the death benefit. The Policy Value at any time is equal to the sum of the values in the Investment Accounts, the Fixed Account, and the Loan Account.
The Policy Value is affected by the investment performance of the Investment Account chosen and the rate of interest credited if amounts are allocated to the Fixed Account. The Policy Value is also affected by the charges deducted. For a discussion of how these factors affect Policy Value see the “Risks/Benefits Summary.”
Investment Accounts. An Investment Account is established under each policy for each sub-account of the Separate Account to which Net Premiums or transfer amounts have been allocated. Each Investment Account under a policy measures the interest of the policy in the corresponding sub-account. The value of the Investment Account established for a particular sub-account is equal to the number of units of that sub-account credited to the policy times the value of such units.
Fixed Account. Amounts in the Fixed Account do not vary with the investment performance of any sub-account. Instead, these amounts are credited with interest at a rate determined by John Hancock USA. See “The General Account — Fixed Account”.
Loan Account. Amounts borrowed from the policy are transferred to the Loan Account. Amounts in the Loan Account do not vary with the investment performance of any sub-account. Instead, these amounts are credited with interest at a rate determined by John Hancock USA that is lower than the loan interest rate charged on Policy Debt. See “Policy Loans — Loan Account”.
Crediting and Canceling Units. Units of a particular sub-account are credited to a policy when Net Premiums are allocated to that sub-account or amounts are transferred to that sub-account. Units of a sub-account are cancelled whenever amounts are deducted, transferred or withdrawn from the sub-account. The number of units credited or cancelled for a specific transaction is based on the dollar amount of the transaction divided by the value of the unit on the Business Day on which the transaction occurs. The number of units credited with respect to a premium payment will be based on the applicable unit values for the Business Day on which the premium is received at the Service Office, except for any premiums received before the Effective Date. For premiums received before the Effective Date, the values will be determined on the Effective Date.
Units are valued at the end of each Business Day. When an order involving the crediting or canceling of units is received after the end of a Business Day, or on a day that is not a Business Day, the order will be processed on the basis of unit values determined on the next Business Day. Similarly, any determination of Policy Value, Investment Account value or death benefit to be made on a day that is not a Business Day will be made on the next Business Day.
Unit Values. For each Business Day the unit value for a sub-account is determined by multiplying the unit value for the immediately preceding Business Day by the net investment factor for that sub-account on such subsequent Business Day.
The net investment factor for a sub-account on any Business Day is equal to (a) divided by (b) minus (c), where:
| (a) | is the net asset value of the underlying portfolio shares held by that sub-account as of the end of such Business Day before any policy transactions are made on that day; |
| (b) | is the net asset value of the underlying portfolio shares held by that sub-account as of the end of the immediately preceding Business Day after all policy transactions were made for that day; and |
| (c) | is a charge not exceeding the daily mortality and expense risk charge shown in the “Charges and Deductions — Asset Based Risk Charge Deducted from Investment Accounts” section. |
The value of a unit may increase, decrease, or remain the same, depending on the investment performance of a sub-account from one Business Day to the next.
Market timing and disruptive trading risks
The policy is not designed for professional market timers or highly active traders, including persons or entities that engage in programmed, large or frequent transfers among the investment accounts or between the investment accounts and any available fixed account. The policy is also not designed to accommodate trading that results in transfers that are large in relation to the total assets of the underlying portfolio.
Variable investment options in variable life insurance products can be a prime target for abusive transfer activity because these products value their investment options on a daily basis and allow transfers among investment options without immediate tax consequences. As a result, some investors may seek to frequently transfer into and out of variable investment options or to make large transfers in reaction to market news or to exploit a perceived pricing inefficiency. Whatever the reason, long-term investors in a variable investment option can be harmed by large or frequent transfer activity. For example, such activity may expose the investment account’s underlying portfolio to increased portfolio transaction costs and/or disrupt the portfolio manager‘s ability to effectively manage the portfolio’s investments in accordance with the portfolio’s investment objectives and policies. This could include causing the portfolio to maintain higher levels of cash than would otherwise be the
case, or liquidating investments prematurely. Accordingly, frequent or large transfers may result in dilution with respect to interests held for long-term investment and adversely affect policy owners, beneficiaries and the underlying portfolios.To discourage market timing and disruptive trading activity, we impose restrictions on transfers and reserve the right to change, suspend or terminate telephone and facsimile transaction privileges. In addition, we reserve the right to take other actions at any time to restrict trading, including, but not limited to: (i) restricting the number of transfers made during a defined period, (ii) restricting the dollar amount of transfers, (iii) restricting transfers into and out of certain investment options, (iv) restricting the method used to submit transfers, and (v) deferring a transfer at any time we are unable to purchase or redeem shares of the underlying portfolio.
We may also impose additional administrative conditions upon, or prohibit a transfer request made by a third party giving instructions on behalf of multiple policies, whether owned by the same owner or different owners. If you engage a third party for asset allocation services, then you may be subject to these transfer restrictions because of the actions of that party in providing those services. We will notify the third party you have engaged if we exercise this right.
While we seek to identify and prevent disruptive trading activity, it may not always be possible to do so. Therefore, no assurance can be given that the restrictions we impose will be successful in preventing all disruptive trading and avoiding harm to long-term investors.
Our current practice is to restrict transfers into or out of variable investment options to two per calendar month (except with respect to those policies described in the following paragraph). In applying this restriction any transfer request involving the transfer of account value into or out of multiple variable investment options will still count as only one request. No more than one transfer request may be made on any day. You may, however, transfer to the Money Market portfolio even if the two transfer per month limit has been reached, but only if 100% of the Policy Value in all variable investment options is transferred to the Money Market portfolio. If such a transfer to the Money Market investment portfolio is made, then, for the 30 calendar day period after such transfer, no transfers from the Money Market portfolio to any other variable investment options or to the Fixed Account may be made. If a policy offers a dollar cost averaging or automatic asset allocation rebalancing program, any transfers pursuant to such program are not considered transfers subject to these restrictions on frequent trading. The restrictions described in this paragraph will be applied uniformly to all policy owners subject to the restrictions.
Policies may be purchased by a corporation or other entity as a means to informally finance the liabilities created by an employee benefit plan, and to this end the entity may aggregately manage the policies purchased to match its liabilities under the plan. Policies sold under these circumstances are subject to special transfer restrictions. In lieu of the two transfers per month restriction, we will allow the policy owner under these circumstances to rebalance the investment options in its policies within the following limits: (i) during the 10 calendar day period after any account values are transferred from one portfolio into a second portfolio, the values can only be transferred out of the second investment option if they are transferred into the Money Market portfolio; and (ii) any account values that would otherwise not be transferable by application of the 10 day limit described above and that are transferred into the Money Market portfolio may not be transferred out of the Money Market portfolio into any other investment options (variable or fixed) for 30 calendar days. The restrictions described in this paragraph will be applied uniformly to all policy owners subject to the restrictions.
Subject to our approval, we may offer policies purchased by a corporation or other entity that has purchased policies to match its liabilities under an employee benefit plan, as described above, the ability to electronically rebalance the investment options in its policies. Under these circumstances, in lieu of imposing any specific limit upon the number or timing of transfers, we will monitor aggregate trades among the sub-accounts for frequency, pattern and size for potentially harmful investment practices. If we detect trading activity that we believe may be harmful to the overall operation of any investment account or underlying portfolio, we may impose conditions on policies employing electronic rebalancing to submit trades, including setting limits upon the number and timing of transfers, and revoking privileges to make trades by any means other than written communication submitted via U.S. mail. The restrictions described in these paragraphs will be applied uniformly to all policy owners subject to the restrictions.
We reserve the right to modify or terminate the transfer privilege at any time in accordance with applicable law. Transfer privileges are also subject to any restrictions that may be imposed by the portfolios. In addition, we reserve the right to defer the transfer privilege at any time that we are unable to purchase or redeem shares of a portfolio.
Rule 22c-2 under the 1940 Act requires us to provide tax identification numbers and other policy owner transaction information to John Hancock Trust or to other investment companies in which the Separate Account invests, at their request. An investment company will use this information to identify any pattern or frequency of investment account transfers that
may violate their frequent trading policy. An investment company may require us to impose trading restrictions in addition to those described above if violations of their frequent trading policy are discovered.Transfers Involving Fixed Account.
While the policy is in force, you may transfer the Policy Value from any of the Investment Accounts to the Fixed Account without incurring transfer charges:
- within eighteen months after the Issue Date; or
- within 60 days of the effective date of a material change in the investment objectives of any of the sub-accounts; or
- within 60 days of the date of notification of such change, whichever is later.
Such transfers will not count against the twelve transfers that may be made free of charge in any Policy Year.
The maximum amount that you may transfer from the Fixed Account in any one Policy Year is the greater of $2,000, 15% of the Fixed Account value at the previous Policy Anniversary, or the amount transferred out of the Fixed Account during the previous policy year. Any transfer which involves a transfer out of the Fixed Account may not involve a transfer to the Investment Account for the Money Market portfolio.
Telephone Transfers. Transfer requests must be in writing in a form satisfactory to us, or by telephone if a currently valid telephone transfer authorization form is on file. Although failure to follow reasonable procedures may result in our being liable for any losses resulting from unauthorized or fraudulent telephone transfers, we will not be liable for following instructions communicated by telephone that we reasonably believe to be genuine. We will employ reasonable procedures to confirm that instructions communicated by telephone are genuine. Such procedures shall consist of confirming that a valid telephone authorization form is on file, tape recording of all telephone transactions and providing written confirmation thereof.
At any time while the policy is in force, you may borrow against the Policy Value. The policy is the only security for the loan. policy loans may have tax consequences. See “Tax Treatment of Policy Benefits — Policy Loan Interest.”
A policy loan will affect future Policy Values, since the portion of the Policy Value in the Loan Account will receive the loan interest credited rate rather than varying with the performance of the underlying portfolios or increasing at the Fixed Account interest credited rate. A policy loan may cause a policy to be more susceptible to lapse since it reduces the Net Cash Surrender Value from which monthly deductions are taken. A policy loan causes the amount payable upon death of the Life Insured to be reduced by the amount of outstanding Policy Debt.
Maximum Loan. The amount of any loan cannot exceed the amount that would cause the Policy Debt to equal the Policy’s Cash Surrender Value less the monthly deductions due from the date of the loan to the next Policy Anniversary.
Interest Charged on Policy Loans
Interest on the Policy Debt will accrue daily and be payable annually on the Policy Anniversary. The rate of interest charged will be an effective annual rate of 4%.
When a loan is made, an amount equal to the loan will be deducted from the Investment Accounts or the Fixed Account and transferred to the Loan Account. You may designate how this amount is allocated among the Accounts. If you give no instructions, the amount transferred will be allocated among the Investment Accounts and the Fixed Account in the same proportion as the Policy Value in each Investment Account and the Fixed Account bears to the Net Policy Value. A transfer from an Investment Account will result in the cancellation of units of the underlying sub-account equal in value to the amount transferred from the Investment Account. However, since the Loan Account is part of the Policy Value, transfers made in connection with a loan will not change the Policy Value.
Interest Credited to the Loan Account. Policy Value in the Loan Account will earn interest at an effective annual rate guaranteed to be at least 3.25%. We may declare a current interest rate that is greater than this, subject to change at any time.
The excess of the loan interest charged rate (4%) over the loan interest credited rates will result in a net charge against the Policy Value with respect to any Policy Debt.Currently we credit loan interest rates which vary by Policy Year as follows:
| Policy Years |
Current Loan Interest Credited Rates |
Excess of Loan Interest Charged Rate |
| 1-10 | 3.25% | 0.75% |
| 11+ | 3.75% | 0.25% |
Loan Account Adjustments. On the first day of each Policy Month the difference between the Loan Account and the Policy Debt is transferred to the Loan Account from the Investment Accounts or the Fixed Account. The amount transferred will be allocated to the Investment Accounts and the Fixed Account in the same proportion as the Policy Value in each Investment Account or the Fixed Account bears to the Net Policy Value.
Loan Repayments. Policy Debt may be repaid, in whole or in part, at any time prior to the death of the Life Insured while the policy is in force. A loan repayment amount will be credited to the Loan Account and transferred to the Fixed Account or the Investment Accounts in the same proportion as the Policy Value in each Account bears to the Net Policy Value.
Amounts paid to us not specifically designated in writing as loan repayments will be treated as premiums.
POLICY SURRENDER AND PARTIAL WITHDRAWALS
A policy may be surrendered for its Net Cash Surrender Value at any time while the Life Insured is living. The Net Cash Surrender Value is equal to the Policy Value less any surrender charge, monthly deductions due and Policy Debt. The Net Cash Surrender Value will be determined at the end of the Business Day on which we receive the policy and a written request for surrender at the Service Office. When a policy is surrendered, the insurance coverage and all other benefits under the policy will terminate.
You may make a partial withdrawal of the Net Cash Surrender Value at any time. You may designate how the withdrawal amount is allocated among the Investment Account and the Fixed Account. If you give no instructions, the withdrawal amount will be allocated among the Accounts in the same proportion as the Policy Value in each Account bears to the Net Policy Value.
Surrender Charges may be assessed on a Partial Withdrawal. See “Charges and Deductions — Surrender Charges.” The death benefit may be reduced as a result of a Partial Withdrawal. See “Death Benefits — Decreases in Face Amount under death benefit Option 1 due to a Partial Withdrawal”.
A policy will go into default at the beginning of a Policy Month if the Net Cash Surrender Value would go below zero after deducting the monthly deduction then due. A lapse could have adverse tax consequences as described under “Tax Considerations — Tax Treatment of Policy Benefits — Surrender or Lapse.” We will notify you of the default and will allow you a 61-day grace period in which to make a premium payment sufficient to bring the policy out of default. The required payment will be equal to the amount necessary to bring the Net Cash Surrender Value to zero, if it was less than zero on the date of default, plus the monthly deductions due at the date of default and payable at the beginning of each of the two Policy Months thereafter, plus any applicable premium load charge. If the required payment is not received by the end of the grace period, the policy will terminate with no value.
Death During Grace Period. If the Life Insured should die during the grace period, the Policy Value used in the calculation of the death benefit will be the Policy Value on the date of default and the insurance benefit will be reduced by any outstanding monthly deductions due at the time of death.
You may reinstate a policy that has terminated after going into default at any time within the five-year period following the date of termination subject to the following conditions:
- The policy must not have been surrendered for its Net Cash Surrender Value;
- Evidence of the Life Insured’s insurability satisfactory to us must be provided; and
- A premium equal to the payment required during the grace period following default to keep the policy in force is paid.
The general account of John Hancock USA consists of all assets owned by us other than those in the Separate Account and other Separate Accounts of the Company. Subject to applicable law, we have sole discretion over investment of the assets of the general account.
By virtue of exclusionary provisions, interests in the general account of John Hancock USA have not been registered under the Securities Act of 1933 and the general account has not been registered as an investment company under the Investment Company Act of 1940. Accordingly, neither the general account nor any interests therein are subject to the provisions of these acts, and as a result the staff of the SEC has not reviewed the disclosures in this prospectus relating to the general account. Disclosures regarding the general account may, however, be subject to certain generally applicable provisions of the federal securities laws relating to the accuracy and completeness of statements made in a prospectus.
You may allocate Net Premiums to the Fixed Account or transfer all or a portion of the Policy Value to the Fixed Account from the Investment Accounts. John Hancock USA will hold the reserves required for any portion of the policy Value allocated to the Fixed Account in our general account. Transfers from the Fixed Account to the Investment Accounts are subject to restrictions.
Policy Value in the Fixed Account. The Policy Value in the Fixed Account is equal to:
- the portion of the Net Premiums allocated to it; plus
- any amounts transferred to it; plus
- interest credited to it; less
- any charges deducted from it; less
- any partial withdrawals from it; less
- any amounts transferred from it.
Interest on the Fixed Account. An allocation of Policy Value to the Fixed Account does not entitle you to share in the investment experience of the general account. Instead, we guarantee that the Policy Value in the Fixed Account will accrue interest daily at an effective annual rate of at least 3%, without regard to the actual investment experience of the general account. We may declare a current interest rate in excess of the guaranteed rate, subject to change at any time.
OTHER PROVISIONS OF THE POLICY
Unless otherwise restricted by a separate agreement, you may:
- Vary the premiums paid under the policy.
- Change the death benefit Option.
- Change the premium allocation for future premiums.
- Transfer amounts between sub-accounts.
- Take loans and/or partial withdrawals.
- Surrender the contract.
- Transfer ownership to a new owner.
- Name a contingent owner that will automatically become owner if you die before the Life Insured.
- Change or revoke a contingent owner.
- Change or revoke a beneficiary.
Assignment of Rights. We will not be bound by an assignment until we receive a copy of the assignment at the Service Office. We assume no responsibility for the validity or effects of any assignment.
You may appoint one or more beneficiaries of the policy by naming them in the application. Beneficiaries may be appointed in three classes — primary, secondary, and final. Beneficiaries may also be revocable or irrevocable. Unless an irrevocable designation has been elected, you may change the beneficiary during the Life Insured’s lifetime by giving written notice in a form satisfactory to us. If the Life Insured dies and there is no surviving beneficiary, you, or your estate if you are the Life Insured, will be the beneficiary. If a beneficiary dies before the seventh day after the death of the Life Insured, we will pay the insurance benefit as if the beneficiary had died before the Life Insured.
We will not contest the validity of a policy after it has been in force during the Life Insured’s lifetime for two years from the Issue Date stated in the policy, nor will we contest the validity of an increase in Face Amount after it has been in force during the Life Insured’s lifetime for two years. If a policy has been reinstated, we can contest any misrepresentation of a fact material to the reinstatement for a period of two years after the reinstatement date.
If the Life Insured’s stated age or sex or both in the policy are incorrect, we will change the Face Amount so that the death benefit will be that which the most recent monthly charge for the cost of insurance would have purchased for the correct age and sex.
If the Life Insured, whether sane or insane, dies by suicide within two years from the Issue Date stated in the policy (or within the maximum period permitted by the state in which the policy was delivered, if less than two years), we will pay only the premiums paid less any partial withdrawals and any Policy Debt. If the Life Insured should die by suicide within two years after a Face Amount increase, the death benefit for the increase will be limited to the monthly deductions for the increase. At our discretion, this provision may be waived.
Subject to certain requirements, one or more supplementary benefits may be added to a policy, including the FTIO Rider (see “Death Benefits — Flexible term Insurance Option Rider”) and, in the case of a policy owned by a corporation or other similar entity, a benefit permitting a change in the Life Insured (a taxable event). More detailed information concerning these supplementary benefits may be obtained from us. There is no cost for any supplementary benefit currently offered by us, with the exception of FTIO Rider (see “Charges and Deductions — Monthly Deductions”).
This description of Federal income tax consequences is only a brief summary and is neither exhaustive nor authoritative. It was written to support the promotion of our products. It does not constitute legal or tax advice, and it is not intended to be used and cannot be used to avoid any penalties that may be imposed on you. Tax consequences will vary based on your own particular circumstances, and for further information you should consult a qualified tax adviser. Federal, state and local tax laws, regulations and interpretations can change from time to time. As a result, the tax consequences to you and the beneficiary may be altered, in some cases retroactively. The policy may be used in various arrangements, including non-qualified deferred compensation or salary continuation plans, split dollar insurance plans, executive bonus plans, retiree
medical benefit plans and others. The tax consequences of such plans may vary depending on the particular facts and circumstances of each individual arrangement. Therefore, if the value of using the policy in any such arrangement depends in part on the tax consequences, a qualified tax adviser should be consulted for advice.We are taxed as a life insurance company. Under current tax law rules, we include the investment income (exclusive of capital gains) of the Separate Account in our taxable income and take deductions for investment income credited to our policy holder reserves. We are also required to capitalize and amortize certain costs instead of deducting those costs when they are incurred. We do not currently charge the Separate Account for any resulting income tax costs, other than a charge we may impose against the Separate Account to compensate us for the cost of a delay in the deductibility of deferred acquisition costs (the “DAC tax” adjustment) pursuant to section 848 of the Internal Revenue Code. We also claim certain tax credits or deductions relating to foreign taxes paid and dividends received by the series funds. These benefits can be material. We do not pass these benefits through to the Separate Account, principally because: (i) the deductions and credits are allowed to us and not the policy owners under applicable tax law; and (ii) the deductions and credits do not represent investment return on the Separate Account assets that is passed through to policy owners.
The policies permit us to deduct a charge for any taxes we incur that are attributable to the operation or existence of the policies or the Separate Account. Currently, we do not anticipate making any specific charge for such taxes other than any DAC tax charge and premium taxes where applicable. If the level of the current taxes increases, however, or is expected to increase in the future, we reserve the right to make a charge in the future.
Death benefit proceeds and other policy distributions
Generally, death benefits paid under policies such as yours are not subject to income tax unless policy ownership has been transferred in exchange for payment. Earnings on your policy value are ordinarily not subject to income tax as long as we don’t pay them out to you. If we do pay out any amount of your policy value upon surrender or partial withdrawal, all or part of that distribution would generally be treated as a return of the premiums you’ve paid and not subjected to income tax. However certain distributions associated with a reduction in death benefit or other policy benefits within the first fifteen years after issuance of the policy are ordinarily taxable in whole or in part. Amounts you borrow are generally not taxable to you.
However, some of the tax rules change if your policy becomes a modified endowment contract. This can happen if you’ve paid premiums in excess of limits prescribed by the tax laws. Additional taxes and penalties may be payable for policy distributions of any kind, including loans. (See “7-pay premium limit and modified endowment contract status” below.)
We expect the policy to receive the same Federal income and estate tax treatment as fixed benefit life insurance policies. Section 7702 of the Internal Revenue Code defines a life insurance contract for Federal tax purposes. For a policy to be treated as a life insurance contract, it must satisfy either the cash value accumulation test or the guideline premium test. These tests limit the amount of premium that you may pay into the policy. We will monitor compliance with these standards. If we determine that a policy does not satisfy section 7702, we may take whatever steps are appropriate and reasonable to bring it into compliance with section 7702.
If the policy complies with section 7702, the death benefit proceeds under the policy ordinarily should be excludable from the beneficiary’s gross income under section 101 of the Internal Revenue Code. (As noted above, a transfer of the policy for valuable consideration may limit the exclusion of death benefits from the beneficiary’s income.)
Increases in policy value as a result of interest or investment experience will not be subject to Federal income tax unless and until values are received through actual or deemed distributions. In general, unless the policy is a modified endowment contract, the owner will be taxed only on the amount of distributions that exceed the premiums paid under the policy. An exception to this general rule occurs in the case of a decrease in the policy’s death benefit or any other change that reduces benefits under the policy in the first fifteen years after the policy is issued and that results in a cash distribution to the policy owner. Changes that reduce benefits include partial withdrawals, death benefit option changes, and distributions required to keep the policy in compliance with section 7702. For purposes of this rule any distribution within the two years immediately before a reduction in benefits will also be treated as if it were a result of the reduction. A cash distribution that reduces policy benefits will be taxed in whole or in part (to the extent of any gain in the policy) under rules prescribed in section 7702. The taxable amount is subject to limits prescribed in section 7702(f)(7). Any taxable distribution will be ordinary income to the owner (rather than capital gain).
Distributions for tax purposes include amounts received upon surrender or partial withdrawals. You may also be deemed to have received a distribution for tax purposes if you assign all or part of your policy rights or change your policy’s ownership.
It is possible that, despite our monitoring, a policy might fail to qualify as a life insurance contract under section 7702 of the Internal Revenue Code. This could happen, for example, if we inadvertently failed to return to you any premium payments that were in excess of permitted amounts, or if any of the funds failed to meet certain investment diversification or other requirements of the Internal Revenue Code. If this were to occur, you would be subject to income tax on the income credited to the policy from the date of issue to the date of the disqualification and for subsequent periods.
Tax consequences of ownership or receipt of policy proceeds under Federal, state and local estate, inheritance, gift and other tax laws will depend on the circumstances of each owner or beneficiary. If the person insured by the policy is also its owner, either directly or indirectly through an entity such as a revocable trust, the death benefit will be includible in his or her estate for purposes of the Federal estate tax. If the owner is not the person insured, the value of the policy will be includible in the owner’s estate upon his or her death. Even if ownership has been transferred, the death proceeds or the policy value may be includible in the former owner’s estate if the transfer occurred less than three years before the former owner’s death or if the former owner retained certain kinds of control over the policy. You should consult your tax adviser regarding these possible tax consequences.
Because there may be unfavorable tax consequences (including recognition of taxable income and the loss of income tax-free treatment for any death benefit payable to the beneficiary), you should consult a qualified tax adviser prior to changing the policy’s ownership or making any assignment of ownership interests.
We expect that, except as noted below (see “7-pay premium limit and modified endowment contract status”), loans received under the policy will be treated as indebtedness of an owner and that no part of any loan will constitute income to the owner. However, if the policy terminates for any reason other than the payment of the death benefit, the amount of any outstanding loan that was not previously considered income will be treated as if it had been distributed to the owner upon such termination. This could result in a considerable tax bill. Under certain circumstances involving large amounts of outstanding loans, you might find yourself having to choose between high premiums required to keep your policy from lapsing and a significant tax burden if you allow the lapse to occur.
Diversification rules and ownership of the Separate Account
Your policy will not qualify for the tax benefits of a life insurance contract unless the Separate Account follows certain rules requiring diversification of investments underlying the policy. In addition, the rules require that the policy owner not have “investor control” over the underlying assets.
In certain circumstances, the owner of a variable life insurance policy may be considered the owner, for Federal income tax purposes, of the assets of the Separate Account used to support the policy. In those circumstances, income and gains from the Separate Account assets would be includible in the policy owner’s gross income. The Internal Revenue Service (“IRS”) has stated in published rulings that a variable policy owner will be considered the owner of Separate Account assets if the policy owner possesses incidents of ownership in those assets, such as the ability to exercise investment control over the assets. A Treasury Decision issued in 1986 stated that guidance would be issued in the form of regulations or rulings on the “extent to which Policyholders may direct their investments to particular sub-accounts of a Separate Account without being treated as owners of the underlying assets.” As of the date of this prospectus, no comprehensive guidance on this point has been issued. In Rev. Rul. 2003-91, however, the IRS ruled that a contract holder would not be treated as the owner of assets underlying a variable life insurance or annuity contract despite the owner’s ability to allocate funds among as many as twenty subaccounts.
The ownership rights under your policy are similar to, but different in certain respects from, those described in IRS rulings in which it was determined that policyholders were not owners of Separate Account assets. Since you have greater flexibility in allocating premiums and policy values than was the case in those rulings, it is possible that you would be treated as the owner of your policy’s proportionate share of the assets of the Separate Account.
We do not know what future Treasury Department regulations or other guidance may require. We cannot guarantee that the funds will be able to operate as currently described in the series funds’ prospectuses, or that a series fund will not have to change any fund’s investment objectives or policies. We have reserved the right to modify your policy if we believe doing so
will prevent you from being considered the owner of your policy’s proportionate share of the assets of the Separate Account, but we are under no obligation to do so.7-pay premium limit and modified endowment contract status
At the time of policy issuance, we will determine whether the Planned Premium schedule will exceed the 7-pay limit discussed below. If so, our standard procedures prohibit issuance of the policy unless you sign a form acknowledging that fact.
The 7-pay limit at any time during the first seven contract years is the total of net level premiums that would have been payable at or before that time under a comparable fixed policy that would be fully “paid-up” after the payment of seven equal annual premiums. “Paid-up” means that no further premiums would be required to continue the coverage in force until maturity, based on certain prescribed assumptions. If the total premiums paid at any time during the first seven policy years exceed the 7-pay limit, the policy will be treated as a modified endowment contract, which can have adverse tax consequences.
Policies classified as modified endowment contracts are subject to the following tax rules:
- First, all withdrawals from such a policy are treated as ordinary income subject to tax up to the amount equal to the excess (if any) of the policy value immediately before the withdrawal over the investment in the policy at such time. If you own any other modified endowment contracts issued to you in the same calendar year by the same insurance company or its affiliates, their values will be combined with the value of the policy from which you take the withdrawal for purposes of determining how much of the withdrawal is taxable as ordinary income.
- Second, loans taken from or secured by such a policy and assignments or pledges of any part of its value are treated as partial withdrawals from the policy and taxed accordingly. Past-due loan interest that is added to the loan amount is treated as an additional loan.
- Third, a 10% additional penalty tax is imposed on the portion of any distribution (including distributions on surrender) from, or loan taken from or secured by, such a policy that is included in income except where the distribution or loan:
- is made on or after the date on which the policy owner attains age 59½;
- is attributable to the policy owner becoming disabled; or
- is part of a series of substantially equal periodic payments for the life (or life expectancy) of the policy owner or the joint lives (or joint life expectancies) of the policy owner and the policy owner’s beneficiary.
These exceptions to the 10% additional tax do not apply in situations where the policy is not owned by an individual.
Furthermore, any time there is a “material change” in a policy, the policy will begin a new 7-pay testing period as if it were a newly-issued policy. The material change rules for determining whether a policy is a modified endowment contract are complex. In general, however, the determination of whether a policy will be a modified endowment contract after a material change depends upon the relationship among the death benefit of the policy at the time of such change, the policy value at the time of the change, and the additional premiums paid into the policy during the seven years starting with the date on which the material change occurs.
Moreover, under a policy insuring a single life, if there is a reduction in benefits (such as a reduction in the death benefit or the reduction or cancellation of certain rider benefits) during a 7-pay testing period, the 7-pay limit will generally be recalculated based on the reduced benefits and the policy will be re-tested, from the beginning of the 7-pay testing period using the lower limit. If the premiums paid to date at any point during the 7-pay testing period are greater than the recalculated 7-pay limit, the policy will become a modified endowment contract. If your policy is a survivorship policy, a reduction in benefits under the policy at any time will require re-testing. For such a policy the 7-pay limit will generally be recalculated based on the reduced benefits and the policy will be re-tested, using the lower limit, from the date it was issued.
If your policy is issued as a result of an exchange subject to section 1035 of the Internal Revenue Code, it may be considered to be a modified endowment contract if the death benefit under the new policy is smaller than the death benefit under the exchanged policy, or if you reduce coverage in your new policy after it is issued. Therefore, if you desire to reduce the face amount as part of a 1035 exchange, a qualified tax adviser should be consulted for advice. A new policy issued in exchange for a modified endowment contract will also be a modified endowment contract regardless of any change in the death benefit.
All modified endowment contracts issued by the same insurer (or its affiliates) to the same owner during any calendar year generally are required to be treated as one contract for the purpose of applying the rules on taxation of withdrawals from modified endowment contracts. You should consult your tax adviser if you have questions regarding the possible impact of the 7-pay limit on your policy.
Corporate and H.R. 10 retirement plans
The policy may be acquired in connection with the funding of retirement plans satisfying the qualification requirements of section 401 of the Internal Revenue Code. If so, the Internal Revenue Code provisions relating to such plans and life insurance benefits thereunder should be carefully scrutinized. We are not responsible for compliance with the terms of any such plan or with the requirements of applicable provisions of the Internal Revenue Code.
To the extent that policy distributions to you are taxable, they are generally subject to withholding for your Federal income tax liability. However if you reside in the United States, you can generally choose not to have tax withheld from distributions.
Life insurance purchases by residents of Puerto Rico
In Rev. Rul. 2004-75, 2004-31 I.R.B. 109, the Internal Revenue Service ruled that income received by residents of Puerto Rico under a life insurance policy issued by a United States company is U.S.-source income that is subject to United States Federal income tax.
Life insurance purchases by non-resident aliens
If you are not a U.S. citizen or resident, you will generally be subject to U.S. Federal withholding tax on taxable distributions from life insurance policies at a 30% rate, unless a lower treaty rate applies. In addition, you may be subject to state and/or municipal taxes and taxes imposed by your country of citizenship or residence. You should consult with a qualified tax adviser before purchasing a policy.
As long as the policy is in force, we will ordinarily pay any policy loans, surrenders, partial withdrawals or insurance benefit within seven days after receipt at the Service Office of all the documents required for such a payment. We will ordinarily pay any death benefit, withdrawal, surrender value or loan within 7 days after we receive the last required form or request (and, with respect to the death benefit, any other documentation that may be required). If we don’t have information about the desired manner of payment within 7 days after the date we receive documentation of the insured person’s death, we will pay the proceeds as a single sum.
We may delay the payment of any policy loans, surrenders, partial withdrawals, or insurance benefit that depends on Fixed Account values for up to six months or in the case of any Investment Account for any period during which (i) the New York Stock Exchange is closed for trading (except for normal weekend and holiday closings), (ii) trading on the New York Stock Exchange is restricted (iii) an emergency exists, as determined by the SEC, as a result of which disposal of securities held in the Separate Account is not reasonably practicable or it is not reasonably practicable to determine the value of the Separate Account’s net assets or (iv) the SEC, by order, so permits for the protection of security holders; provided that applicable rules and regulations of the SEC shall govern as to whether the conditions described in (ii) and (iii) exist.
Within 30 days after each Policy Anniversary, we will send you a statement showing, among other things:
- the amount of death benefit;
- the Policy Value and its allocation among the Investment Accounts, the Fixed Account and the Loan Account;
- the value of the units in each Investment Account to which the Policy Value is allocated;
- the Policy Debt and any loan interest charged since the last report;
- the premiums paid and other policy transactions made during the period since the last report; and
- any other information required by law.
You will also be sent an annual and a semi-annual report for the portfolios, which will include a list of the securities, held in each portfolio as required by the 1940 Act.
John Hancock Distributors LLC (“JH Distributors”), a Delaware limited liability company affiliated with us, is the principal distributor and underwriter of the securities offered through this prospectus and of other annuity and life insurance products we and our affiliates offer. JH Distributors also acts as the principal underwriter of the Trust, whose securities are used to fund certain investment accounts under the policies and under other annuity and life insurance products we offer.
JH Distributors’ principal address is 601 Congress Street, Boston, MA 02210 and it also maintains offices with us at 197 Clarendon Street, Boston, Massachusetts 02116. JH Distributors is a broker-dealer registered under the Securities Exchange Act of 1934 (the “1934 Act”) and a member of the Financial Industry Regulatory Authority (“FINRA”).
We offer the policies for sale through individuals who are licensed as insurance agents and who are registered representatives of broker-dealers that have entered into selling agreements with JH Distributors. Our affiliate, Signator Investors, Inc., is one such broker-dealer. In addition, we, either directly or through JH Distributors, have entered into agreements with other financial intermediaries that provide marketing, sales support and certain administrative services to help promote the policies (“financial intermediaries”). In a limited number of cases, we have entered into loans, leases or other financial agreements with these broker-dealers or financial intermediaries or their affiliates.
The broker-dealers and other financial intermediaries that distribute or support the marketing of our policies may be compensated by means of various compensation and revenue sharing arrangements. A general description of these arrangements is set out below under “Standard compensation” and “Additional compensation and revenue sharing.” These arrangements may differ between firms, and not all broker-dealers or financial intermediaries will receive the same compensation and revenue sharing benefits for distributing our policies. Also, a broker-dealer may receive more or less compensation or other benefits for the promotion and sale of our policy than it would expect to receive from another issuer.
Under their own arrangements, broker-dealers determine how much of any amounts received from us is to be paid to their registered representatives. Our affiliated broker-dealer, Signator Investors, Inc., may pay its registered representatives additional compensation and benefits, such as bonus payments, expense payments, health and retirement benefits or the waiver of overhead costs or expenses in connection with the sale of the policies that they would not receive in connection with the sale of policies issued by unaffiliated companies.
Policy owners do not pay any compensation or revenue sharing benefits directly. These payments are made from JH Distributors’ and our own revenues, profits or retained earnings, which may be derived from a number of sources, such as fees received from an underlying fund’s distribution plan (“12b-1 fees”), the fees and charges imposed under the policy and other sources.
You should contact your registered representative for more information on compensation arrangements in connection with your purchase of a policy. We provide additional information on special compensation or reimbursement arrangements involving broker-dealers and other financial intermediaries in the Statement of Additional Information, which is available upon request.
Standard compensation. JH Distributors pays compensation to broker-dealers for the promotion and sale of the policies, and for providing ongoing service in relation to policies that have already been purchased. We may also pay a limited number of broker-dealers commissions or overrides to “wholesale” the policies; that is, to provide marketing support and training services to the broker-dealer firms that do the actual selling.
The compensation JH Distributors pays to broker-dealers may vary depending on the selling agreement. The compensation paid is not expected to exceed 15% of the target premium paid in the first policy year, 9.0% of the target premium in years 2-5, and 2.5% of the target premium paid in years 6 and after. Compensation on any premium paid in excess of target premium in any year will not exceed 2.5%. This compensation schedule is exclusive of additional
compensation and revenue sharing and inclusive of overrides and expense allowances paid to broker-dealers for sale of the policies (not including riders).Additional compensation and revenue sharing. To the extent permitted by SEC and FINRA rules and other applicable laws and regulations, we may enter into special compensation or reimbursement arrangements (“revenue sharing”), either directly or through JH Distributors, with selected broker-dealers and other financial intermediaries. In consideration of these arrangements, a firm may feature our policy in its sales system, give us preferential access to sales staff, or allow JH Distributors or its affiliates to participate in conferences, seminars or other programs attended by the firm’s sales force. We hope to benefit from these revenue sharing and other arrangements through increased sales of our policies.
Selling broker-dealers and other financial intermediaries may receive, directly or indirectly, additional payments in the form of cash, other compensation or reimbursement. These additional compensation or reimbursement arrangements may include, for example, payments in connection with the firm’s “due diligence” examination of the policies, payments for providing conferences or seminars, sales or training programs for invited registered representatives and other employees, payment for travel expenses, including lodging, incurred by registered representatives and other employees for such seminars or training programs, seminars for the public or client seminars, advertising and sales campaigns regarding the policies, payments to assist a firm in connection with its systems, operations and marketing expenses and/or other events or activities sponsored by the firms. We may contribute to, as well as sponsor, various educational programs, sales promotions, and/or other contests in which participating firms and their sales persons may receive gifts and prizes such as merchandise, cash or other rewards as may be permitted under FINRA rules and other applicable laws and regulations.
Responsibilities of John Hancock USA
John Hancock USA entered into an agreement with JH Distributors pursuant to which John Hancock USA, on behalf of JH Distributors will pay the sales commissions in respect of the policies and certain other policies issued by John Hancock USA, prepare and maintain all books and records required to be prepared and maintained by JH Distributors with respect to the policies and such other policies, and send all confirmations required to be sent by JH Distributors with respect to the policies and such other policies. JH Distributors will promptly reimburse John Hancock USA for all sales commissions paid by John Hancock USA and will pay John Hancock USA for its other services under the agreement in such amounts and at such times as agreed to by the parties.
Finally, John Hancock USA may, from time to time in its sole discretion, enter into one or more reinsurance agreements with other life insurance companies under which policies issued by it may be reinsured, such that its total amount at risk under a policy would be limited for the life of the insured.
As stated previously, all of the assets held in each sub-account of the Separate Account will be invested in shares of a particular portfolio. John Hancock USA is the legal owner of those shares and as such has the right to vote upon certain matters that are required by the 1940 Act to be approved or ratified by the shareholders of a mutual fund and to vote upon any other matters that may be voted upon at a shareholders’ meeting. However, John Hancock USA will vote shares held in the sub-accounts in accordance with instructions received from policyholders having an interest in such sub-accounts. Shares held in each sub-account for which no timely instructions from policyholders are received, including shares not attributable to the policies, will be voted by John Hancock USA in the same proportion as those shares in that sub-account for which instructions are received. Should the applicable federal securities laws or regulations change so as to permit John Hancock USA to vote shares held in the Separate Account in its own right, it may elect to do so.
The number of shares in each sub-account for which instructions may be given by a policyholder is determined by dividing the portion of the Policy Value derived from participation in that sub-account, if any, by the value of one share of the corresponding portfolio. The number will be determined as of a date chosen by John Hancock USA, but not more than 90 days before the shareholders’ meeting. Fractional votes are counted. Voting instructions will be solicited in writing at least 14 days prior to the meeting.
John Hancock USA may, if required by state officials, disregard voting instructions if such instructions would require shares to be voted so as to cause a change in the sub-classification or investment policies of one or more of the portfolios, or to approve or disapprove an investment management contract. In addition, we may disregard voting instructions that would require changes in the investment policies or investment adviser, provided that we reasonably disapprove such changes in
accordance with applicable federal regulations. If John Hancock USA does disregard voting instructions, it will advise policyholders of that action and its reasons for such action in the next communication to policyholders.Substitution of Portfolio Shares
It is possible that in the judgment of the Company, one or more of the portfolios may become unsuitable for investment by the Separate Account because of a change in investment policy or a change in the applicable laws or regulations, because the shares are no longer available for investment, or for some other reason. In that event, John Hancock USA may seek to substitute the shares of another portfolio or of an entirely different mutual fund. Before this can be done, the approval of the SEC and one or more state insurance departments may be required.
John Hancock USA also reserves the right (i) to combine other Separate Accounts with the Separate Account, (ii) to create new Separate Accounts, (iii) to establish additional sub-accounts within the Separate Account to invest in additional portfolios of the Trust or another management investment company, (iv) to eliminate existing sub-accounts and to stop accepting new allocations and transfers into the corresponding portfolio, (v) to combine sub-accounts or to transfer assets in one sub-account to another sub-account or (vi) to transfer assets from the Separate Account to another Separate Account and from another Separate Account to the Separate Account. We also reserve the right to operate the Separate Account as a management investment company or other form permitted by law, and to de-register the Separate Account under the 1940 Act. Any such change would be made only if permissible under applicable federal and state law.
Our Service Office is responsible for performing all administrative functions, such as decreases, increases, surrender and partial withdrawals, and fund transfers although certain of these functions may be delegated to a third party administrator.
All records and accounts relating to the Separate Account and the portfolios will be maintained by us. All financial transactions will be handled by us. All reports required to be made and information required to be given will be provided the Company or by McCamish Systems on behalf of us.
John Hancock USA is subject to the regulation and supervision by the Michigan Department of Insurance, which periodically examines its financial condition and operations. It is also subject to the insurance laws and regulations of all jurisdictions in which it is authorized to do business. The policies have been filed with insurance officials in each jurisdiction where they are sold.
John Hancock USA is required to submit annual statements of its operations, including financial statements, to the insurance departments of the various jurisdictions in which it does business for the purposes of determining solvency and compliance with local insurance laws and regulations.
Financial statements reference
The financial statements of John Hancock USA and the Separate Account can be found in the Statement of Additional Information. The financial statements of John Hancock USA should be distinguished from the financial statements of the Separate Account and should be considered only as bearing upon the ability of John Hancock USA to meet its obligations under the policies. Our general account is comprised of securities and other investments, the value of which may decline during periods of adverse market conditions.
Registration statement filed with the SEC
This prospectus omits certain information contained in the Registration Statement which has been filed with the SEC. More details may be obtained from the SEC upon payment of the prescribed fee.
Independent registered public accounting firm
The consolidated financial statements of John Hancock Life Insurance Company (U.S.A.) at December 31, 2012 and 2011, and for each of the three years in the period ended December 31, 2012, and the financial statements of John Hancock
Life Insurance Company (U.S.A.) Separate Account N at December 31, 2012, and for each of the two years in the period ended December 31, 2012, appearing in the Statement of Additional Information of the Registration Statement have been audited by Ernst &Young LLP, independent registered public accounting firm, as set forth in their reports thereon appearing elsewhere herein, and are included in reliance upon such reports given on the authority of such firm as experts in accounting and auditing.Annual Premium Target: is an amount set forth in the policy that limits the amount of premium attributable to a Coverage Amount in Surrender Charge or Sales Load calculations.
Attained Age: is the Issue Age of the Life Insured plus the number of completed Policy Years.
Business Day: is any day that the New York Stock Exchange is open for business. A Business Day ends at the close of regularly scheduled trading of the New York Stock Exchange (currently 4:00 p.m. Eastern Time) on that day.
Case: is a group of Policies insuring individual lives with common employment or other relationship, independent of the Policies.
Cash Surrender Value: is the Policy Value less the Surrender Charge and any outstanding monthly deductions due.
Coverage Amount: is an amount of insurance coverage under the policy with a distinct effective date. The Face Amount of the policy at any time is the sum of the Coverage Amounts in effect.
Coverage Year: is a one-year period beginning on a Coverage Amount‘s effective date and on each anniversary of this date. For Coverage Amounts in effect on the policy’s Effective Date, the Coverage Year is the same as the Policy Year.
Fixed Account: is the part of the Policy Value that reflects the value you have in our general account.
Investment Account: is the part of the Policy Value that reflects the value you have in one of the sub-accounts of the Separate Account.
Issue Age: is the Life Insured’s age on the birthday closest to the Policy Date.
Loan Account: is the part of the Policy Value that reflects policy loans and interest credited to the Policy Value in connection with such loans.
Minimum Initial Premium: is the sum of the monthly deductions due for the first 3 Policy Months plus the Premium Charges deductible from this amount.
Net Cash Surrender Value: is the Cash Surrender Value less the Policy Debt. Net Policy Value: is the Policy Value less the value in the Loan Account. Net Premium: is the premium paid less the Premium Load and Sales Load.
Policy Date, Policy Anniversary, Policy Month and Policy Year: Policy Date is the date from which the first monthly deductions are calculated and from which Policy Years, Policy Months, and Policy Anniversaries are measured.
Policy Debt: on any date is the aggregate amount of policy loans, including borrowed and accrued interest, less any loan repayments.
Policy Value: is the sum of the values in the Loan Account, the Fixed Account, and the Investment Accounts.
Service Office: is PO Box 192, Boston, MA 02117 or such other address as we specify to you by written notice.
In addition to this prospectus, John Hancock USA has filed with the SEC a Statement of Additional Information (the “SAI”) which contains additional information about John Hancock USA and the Separate Account, including information on our history, services provided to the Separate Account, legal and regulatory matters and the audited financial statements for John Hancock USA and the Separate Account. The SAI and personalized illustrations of death benefits, policy values and surrender values are available, without charge, upon request. You may obtain the personalized illustrations from your John Hancock USA representative. The SAI may be obtained by contacting the John Hancock USA Service Office. You should also contact the John Hancock USA Service Office to request any other information about your policy or to make any inquiries about its operation.
| JOHN HANCOCK USA SERVICE OFFICE | |
| Principal Office & Express Delivery | Mail Delivery |
| Specialty Products & Distribution 197 Clarendon Street, C-6-10 Boston, MA 02116-5010 |
1 John Hancock Way, Suite 1350 Boston, MA 02217-1099 |
| Phone: | Fax: |
| 1-800-521-1234 | 1-617-572-1571 |
Information about the Separate Account (including the SAI) can be reviewed and copied at the SEC’s Public Reference Branch, 100 F Street, NE, Room 1580, Washington, DC, 20549. Information
on the operation of the Public Reference Room may be obtained by calling the SEC at 202-551-5850. Reports and other information about the Account are available on the SEC’s Internet website at http://www.sec.gov. Copies of
such information may be obtained, upon payment of a duplicating fee, by writing the Public Reference Section of the SEC at 100 F Street, NE, Washington, DC 20549-0102.
1940 Act File No. 811-5130 — 1933 Act File No.
333-100567
Table of Contents
| Statement of Additional Information for interests in John Hancock Life Insurance Company (U.S.A.) Separate Account N JOHN
HANCOCK LIFE INSURANCE COMPANY (U.S.A.) This is a Statement of Additional Information (“SAI”). It is not the prospectus. The prospectus, dated the same date as this SAI, may be obtained from a John Hancock USA representative or by contacting the John Hancock USA Service Office by mail or telephone at the address or telephone number listed on the back page of the prospectus. | |
| Contents of this SAI | Page No. |
| Description of the Depositor |
2 |
| Description of the Registrant |
2 |
| Services |
2 |
| Independent registered public accounting firm |
2 |
| Legal and Regulatory Matters |
2 |
| Principal Underwriter/Distributor |
2 |
| Additional Information About Charges |
3 |
| Reduction in Charges |
4 |
| Financial Statements of Registrant and Depositor |
F-1 |
Under the Federal securities laws, the entity responsible for organization of the registered separate account underlying the variable life insurance policy is known as the “Depositor.” John Hancock USA (“Depositor”) is a stock life insurance company organized under the laws of Maine on August 20, 1955 by a special act of the Maine legislature and redomesticated under the laws of Michigan. The Depositor is a licensed life insurance company in the District of Columbia and all states of the United States except New York. Until 2004, the Depositor was known as The Manufacturers Life Insurance Company (U.S.A.).
The Depositor’s ultimate parent is Manulife Financial Corporation (“MFC”), a publicly traded company based in Toronto, Canada. MFC is the holding company of The Manufacturers Life Insurance Company and its subsidiaries, collectively known as Manulife Financial.
Under the Federal securities laws, the registered separate account underlying the variable life insurance policy is known as the “Registrant.” John Hancock Life Insurance Company (U.S.A.) Separate Account N (the “Registrant” or “Separate Account”), is a separate account established by the Depositor under Michigan law. The variable investment options shown on page 1 of the prospectus are subaccounts of the Separate Account. The Separate Account meets the definition of “separate account” under the Federal securities laws and is registered as a unit investment trust under the Investment Company Act of 1940 (“1940 Act”). Such registration does not involve supervision by the Securities and Exchange Commission (“SEC”) of the management of the Separate Account or of the Depositor.
New subaccounts may be added and made available to policy owners from time to time. Existing subaccounts may be modified or deleted at any time.
Administration of policies issued by the Depositor and of registered separate accounts organized by the Depositor may be provided by other affiliates. Neither the Depositor nor the separate accounts are assessed any charges for such services.
Custodianship and depository services for the Registrant are provided by State Street Investment Services (“State Street”). State Street’s address is 2 Avenue De Lafayette, LCC5N, Boston, Massachusetts, 02111.
Independent registered public accounting firm
The consolidated financial statements of John Hancock Life Insurance Company (U.S.A.) at December 31, 2012 and 2011, and for each of the three years in the period ended December 31, 2012, and the financial statements of John Hancock Life Insurance Company (U.S.A.) Separate Account N at December 31, 2012, and for each of the two years in the period ended December 31, 2012, appearing in the Statement of Additional Information of the Registration Statement have been audited by Ernst &Young LLP, independent registered public accounting firm, as set forth in their reports thereon appearing elsewhere herein, and are included in reliance upon such reports given on the authority of such firm as experts in accounting and auditing.
There are no legal proceedings to which the Depositor, the Separate Account or the principal underwriter is a party or to which the assets of the Separate Account are subject that are likely to have a material adverse effect on the Separate Account or the ability of the principal underwriter to perform its contract with the Separate Account or of the Depositor to meet its obligations under the policies.
Principal Underwriter/Distributor
John Hancock Distributors LLC (“JH Distributors”), a Delaware limited liability company affiliated with the Depositor, is the principal distributor and underwriter of the securities offered through the prospectus. JH Distributors acts as the principal distributor of a number of other life insurance and annuity products we and our affiliates offer or maintain. JH
Distributors also acts as the principal underwriter of John Hancock Variable Insurance Trust (the “Trust”), whose securities are used to fund certain variable investment options under the policies and under other life insurance and annuity products we offer or maintain.JH Distributors’ principal address is 601 Congress Street, Boston, MA 02210, and it also maintains offices with us at 197 Clarendon Street, Boston, MA 02116. JH Distributors is a broker-dealer registered under the Securities Act of 1934 (the “1934 Act”) and is a member of the Financial Industry Regulatory Authority (“FINRA”).
We offer the policies for sale through individuals who are licensed as insurance agents and who are registered representatives of broker-dealers that have entered into selling agreements with JH Distributors. Our affiliate Signator Investors, Inc. is one such broker-dealer.
The aggregate dollar amount of underwriting commissions paid to JH Distributors by the Depositor and its affiliates in connection with the sale of variable life products in 2012, 2011, and 2010 was $156,801,522, $158,741,294 and $145,301,936, respectively. JH Distributors did not retain any of these amounts during such periods.
The registered representative through whom your policy is sold will be compensated pursuant to the registered representative’s own arrangement with his or her broker-dealer. Compensation to broker-dealers for the promotion and sale of the policies is not paid directly by policy owners but will be recouped through the fees and charges imposed under the policy.
Additional compensation and revenue sharing arrangements may be offered to certain broker-dealer firms and other financial intermediaries. The terms of such arrangements may differ among firms we select based on various factors. In general, the arrangements involve three types of payments or any combination thereof:
- Fixed dollar payments: The amount of these payments varies widely. JH Distributors may, for example, make one or more payments in connection with a firm’s conferences, seminars or training programs, seminars for the public, advertising and sales campaigns regarding the policies, to assist a firm in connection with its systems, operations and marketing expenses, or for other activities of a selling firm or wholesaler. JH Distributors may make these payments upon the initiation of a relationship with a firm, and at any time thereafter.
- Payments based upon sales: These payments are based upon a percentage of the total amount of money received, or anticipated to be received, for sales through a firm of some or all of the insurance products that we and/or our affiliates offer. JH Distributors makes these payments on a periodic basis.
- Payments based upon “assets under management”: These payments are based upon a percentage of the policy value of some or all of our (and/or our affiliates’) insurance products that were sold through the firm. JH Distributors makes these payments on a periodic basis.
Our affiliated broker-dealer, Signator Investors, Inc., may pay its respective registered representatives additional cash incentives, such as bonus payments, expense payments, health and retirement benefits or the waiver of overhead costs or expenses in connection with the sale of the policies that they would not receive in connection with the sale of policies issued by unaffiliated companies.
Additional Information About Charges
A policy will not be issued until the underwriting process has been completed to our satisfaction. The underwriting process generally includes the obtaining of information concerning your age, medical history, occupation and other personal information. This information is then used to determine the cost of insurance charge.
The policy is available for purchase by corporations and other groups or sponsoring organizations. Group or sponsored arrangements may include reduction or elimination of withdrawal charges and deductions for employees, officers, directors, agents and immediate family members of the foregoing. We reserve the right to reduce any of the policy’s charges on certain cases where it is expected that the amount or nature of such cases will result in savings of sales, underwriting, administrative, commissions or other costs. Eligibility for these reductions and the amount of reductions will be determined by a number of factors, including the number of lives to be insured, the total premiums expected to be paid, total assets under management for the policyowner, the nature of the relationship among the insured individuals, the purpose for which the policies are being purchased, expected persistency of the individual policies, and any other circumstances which we believe to be relevant to the expected reduction of its expenses. Some of these reductions may be guaranteed and others may be subject to withdrawal or modifications, on a uniform case basis. Reductions in charges will not be unfairly discriminatory to any policyowners. We may modify from time to time, on a uniform basis, both the amounts of reductions and the criteria for qualification.
| 333-100567 |
| 333-126668 |
| 333-152409 |
Table of Contents
AUDITED CONSOLIDATED FINANCIAL STATEMENTS
John Hancock Life Insurance Company (U.S.A.)
For the Years Ended December 31, 2012, 2011, and 2010
Table of Contents
JOHN HANCOCK LIFE INSURANCE COMPANY (U.S.A.)
INDEX TO AUDITED CONSOLIDATED FINANCIAL STATEMENTS
| F-1 | ||||
| Audited Consolidated Financial Statements |
||||
| Consolidated Balance Sheets- |
F-2 | |||
| Consolidated Statements of Operations- |
F-4 | |||
| Consolidated Statements of Comprehensive Income (Loss)- |
F-5 | |||
| Consolidated Statements of Changes in Shareholder’s Equity- |
F-6 | |||
| Consolidated Statements of Cash Flows- |
F-8 | |||
| F-10 | ||||
Table of Contents
Report of Independent Registered Public Accounting Firm
The Board of Directors
John Hancock Life Insurance Company (U.S.A.)
We have audited the accompanying consolidated balance sheets of John Hancock Life Insurance Company (U.S.A.) (the Company) as of December 31, 2012 and 2011, and the related consolidated statements of operations, comprehensive income (loss), changes in shareholder’s equity, and cash flows for each of the three years in the period ended December 31, 2012. These financial statements are the responsibility of the Company’s management. Our responsibility is to express an opinion on these financial statements based on our audits.
We conducted our audits in accordance with the standards of the Public Company Accounting Oversight Board (United States). Those standards require that we plan and perform the audit to obtain reasonable assurance about whether the financial statements are free of material misstatement. We were not engaged to perform an audit of the Company’s internal control over financial reporting. Our audits included consideration of internal control over financial reporting as a basis for designing audit procedures that are appropriate in the circumstances, but not for the purpose of expressing an opinion on the effectiveness of the Company’s internal control over financial reporting. Accordingly, we express no such opinion. An audit also includes examining, on a test basis, evidence supporting the amounts and disclosures in the financial statements, assessing the accounting principles used and significant estimates made by management, and evaluating the overall financial statement presentation. We believe that our audits provide a reasonable basis for our opinion.
In our opinion, the financial statements referred to above present fairly, in all material respects, the consolidated financial position of the Company at December 31, 2012 and 2011, and the consolidated results of its operations and its cash flows for each of the three years in the period ended December 31, 2012, in conformity with U.S. generally accepted accounting principles.
As discussed in Note 1 to the consolidated financial statements, in 2012 the Company changed its method of accounting for costs relating to the acquisition of insurance contracts; in 2011 the Company changed its method of accounting for separate account assets; and in 2010 the Company changed its method of accounting and reporting for variable interest entities.
/s/ Ernst & Young LLP
Boston, Massachusetts
March 27, 2013
F-1
Table of Contents
JOHN HANCOCK LIFE INSURANCE COMPANY (U.S.A.)
| December 31, | ||||||||
| 2012 | 2011 | |||||||
|
|
|
|||||||
| (in millions) | ||||||||
| Assets |
||||||||
| Investments |
||||||||
| Fixed maturities: |
||||||||
| Available-for-sale—at fair value |
$ | 64,996 | $ | 69,225 | ||||
| Held-for-trading—at fair value |
1,441 | 1,477 | ||||||
| Equity securities: |
||||||||
| Available-for-sale—at fair value |
386 | 439 | ||||||
| Held-for-trading—at fair value |
130 | 97 | ||||||
| Mortgage loans on real estate |
13,192 | 13,974 | ||||||
| Investment real estate, agriculture, and timber |
5,316 | 4,304 | ||||||
| Policy loans |
5,264 | 5,220 | ||||||
| Short-term investments |
2,166 | 1,618 | ||||||
| Other invested assets |
4,887 | 4,501 | ||||||
|
|
|
|
|
|||||
| Total Investments |
97,778 | 100,855 | ||||||
| Cash and cash equivalents (includes variable interest entity assets of $8 and $18 at December 31, 2012 and 2011, respectively) |
3,511 | 3,296 | ||||||
| Accrued investment income (includes variable interest entity assets of $1 and $3 at December 31, 2012 and 2011, respectively) |
1,039 | 1,065 | ||||||
| Goodwill |
953 | 953 | ||||||
| Value of business acquired |
1,196 | 1,321 | ||||||
| Deferred policy acquisition costs and deferred sales inducements |
5,913 | 6,298 | ||||||
| Amounts due from and held for affiliates |
3,805 | 3,808 | ||||||
| Intangible assets |
1,250 | 1,270 | ||||||
| Reinsurance recoverable |
12,812 | 11,263 | ||||||
| Derivative assets |
11,853 | 11,953 | ||||||
| Current income tax receivable |
135 | 20 | ||||||
| Amounts on deposit with reinsurers |
6,763 | - | ||||||
| Other assets |
2,740 | 2,444 | ||||||
| Separate account assets |
140,626 | 129,326 | ||||||
|
|
|
|
|
|||||
| Total Assets |
$ | 290,374 | $ | 273,872 | ||||
|
|
|
|
|
|||||
The accompanying notes are an integral part of these consolidated financial statements.
F-2
Table of Contents
JOHN HANCOCK LIFE INSURANCE COMPANY (U.S.A.)
CONSOLIDATED BALANCE SHEETS – (CONTINUED)
| December 31, | ||||||||
| 2012 | 2011 | |||||||
|
|
|
|||||||
| (in millions) | ||||||||
| Liabilities and Shareholder’s Equity |
||||||||
| Liabilities |
||||||||
| Future policy benefits |
$ | 92,264 | $ | 88,989 | ||||
| Policyholders’ funds |
6,788 | 7,162 | ||||||
| Unearned revenue |
1,466 | 1,966 | ||||||
| Unpaid claims and claim expense reserves |
1,269 | 1,445 | ||||||
| Policyholder dividends payable |
497 | 558 | ||||||
| Amounts due to affiliates |
2,490 | 2,556 | ||||||
| Short-term debt |
14 | 11 | ||||||
| Long-term debt (includes variable interest entity liabilities of $47 and $139 at December 31, 2012 and 2011, respectively) |
520 | 627 | ||||||
| Consumer notes |
716 | 819 | ||||||
| Deferred income tax liability |
4,218 | 3,922 | ||||||
| Coinsurance funds withheld |
6,275 | 5,452 | ||||||
| Payables for collateral on derivatives |
2,126 | 1,446 | ||||||
| Derivative liabilities (includes variable interest entity liabilities of $0 and $4 at December 31, 2012 and 2011, respectively) |
8,439 | 7,813 | ||||||
| Other liabilities (includes variable interest entity liabilities of $3 and $4 at December 31, 2012 and 2011, respectively) |
4,006 | 4,163 | ||||||
| Separate account liabilities |
140,626 | 129,326 | ||||||
|
|
|
|
|
|||||
| Total Liabilities |
271,714 | 256,255 | ||||||
| Commitments, Guarantees, Contingencies, and Legal Proceedings |
||||||||
| Shareholder’s Equity |
||||||||
| Preferred stock ($1.00 par value; 50,000,000 shares authorized; 100,000 shares issued and outstanding at December 31, 2012 and 2011) |
- | - | ||||||
| Common stock ($1.00 par value; 50,000,000 shares authorized; 4,728,939 shares issued and outstanding at December 31, 2012 and 2011) |
5 | 5 | ||||||
| Additional paid-in capital |
12,790 | 12,789 | ||||||
| Retained earnings |
247 | 406 | ||||||
| Accumulated other comprehensive income |
5,405 | 4,158 | ||||||
|
|
|
|
|
|||||
| Total Company Shareholder’s Equity |
18,447 | 17,358 | ||||||
| Noncontrolling interests |
213 | 259 | ||||||
|
|
|
|
|
|||||
| Total Shareholder’s Equity |
18,660 | 17,617 | ||||||
|
|
|
|
|
|||||
| Total Liabilities and Shareholder’s Equity |
$ | 290,374 | $ | 273,872 | ||||
|
|
|
|
|
|||||
The accompanying notes are an integral part of these consolidated financial statements.
F-3
Table of Contents
JOHN HANCOCK LIFE INSURANCE COMPANY (U.S.A.)
CONSOLIDATED STATEMENTS OF OPERATIONS
| Years ended December 31, | ||||||||||||
| 2012 | 2011 | 2010 | ||||||||||
|
|
|
|||||||||||
| (in millions) | ||||||||||||
| Revenues |
||||||||||||
| Premiums |
$ | 2,799 | $ | 2,996 | $ | 3,632 | ||||||
| Fee income |
4,724 | 5,717 | 3,771 | |||||||||
| Net investment income |
4,559 | 4,989 | 4,496 | |||||||||
| Net realized investment and other gains (losses): |
||||||||||||
| Total other-than-temporary impairment losses |
(125 | ) | (93 | ) | (176 | ) | ||||||
| Portion of loss recognized in other comprehensive income |
26 | 21 | 57 | |||||||||
|
|
|
|
|
|
|
|||||||
| Net impairment losses recognized in earnings |
(99 | ) | (72 | ) | (119 | ) | ||||||
| Other net realized investment and other gains (losses) |
(2,069 | ) | 3,207 | 201 | ||||||||
|
|
|
|
|
|
|
|||||||
| Total net realized investment and other gains (losses) |
(2,168 | ) | 3,135 | 82 | ||||||||
| Other revenue |
143 | 124 | 200 | |||||||||
|
|
|
|
|
|
|
|||||||
| Total revenues |
10,057 | 16,961 | 12,181 | |||||||||
| Benefits and expenses |
||||||||||||
| Benefits to policyholders |
6,401 | 7,639 | 6,611 | |||||||||
| Policyholder dividends |
663 | 811 | 846 | |||||||||
| Amortization of deferred policy acquisition costs, deferred sales inducements, and value of business acquired |
1,385 | 2,841 | 682 | |||||||||
| Goodwill impairment |
- | 500 | 1,600 | |||||||||
| Other operating costs and expenses |
2,374 | 6,313 | 3,230 | |||||||||
|
|
|
|
|
|
|
|||||||
| Total benefits and expenses |
10,823 | 18,104 | 12,969 | |||||||||
|
|
|
|
|
|
|
|||||||
| Income (loss) before income taxes |
(766 | ) | (1,143 | ) | (788 | ) | ||||||
| Income tax expense (benefit) |
(633 | ) | (332 | ) | 176 | |||||||
|
|
|
|
|
|
|
|||||||
| Net income (loss) |
(133 | ) | (811 | ) | (964 | ) | ||||||
| Less: net income (loss) attributable to noncontrolling interests |
26 | 44 | 36 | |||||||||
|
|
|
|
|
|
|
|||||||
| Net income (loss) attributable to the Company |
$ | (159 | ) | $ | (855 | ) | $ | (1,000 | ) | |||
|
|
|
|
|
|
|
|||||||
The accompanying notes are an integral part of these consolidated financial statements.
F-4
Table of Contents
JOHN HANCOCK LIFE INSURANCE COMPANY (U.S.A.)
CONSOLIDATED STATEMENTS OF COMPREHENSIVE INCOME (LOSS)
| Years ended December 31, | ||||||||||||
| 2012 | 2011 | 2010 | ||||||||||
|
|
|
|||||||||||
| (in millions) | ||||||||||||
| Net income (loss) |
$ | (133 | ) | $ | (811 | ) | $ | (964 | ) | |||
|
|
|
|||||||||||
| Other comprehensive income (loss), net of tax |
||||||||||||
| Change in unrealized investment gains (losses): |
||||||||||||
| Unrealized investment gains (losses) arising during the period |
1,544 | 1,937 | 1,291 | |||||||||
| Reclassification adjustment for (gains) losses realized in net income |
(686 | ) | (692 | ) | (510 | ) | ||||||
| Change in foreign currency translation adjustment |
(50 | ) | 13 | (53 | ) | |||||||
| Change in pension and postretirement benefits: |
||||||||||||
| Prior service cost |
- | - | (2 | ) | ||||||||
| Net actuarial loss |
- | - | 9 | |||||||||
| Change in net unrealized gain on split-dollar life insurance benefit |
- | - | 2 | |||||||||
| Change in unrealized gains (losses) on derivative instruments designated as cash flow hedges: |
||||||||||||
| Unrealized gains (losses) on the effective portion of the change in fair value of cash flow hedges |
648 | 1,777 | (37 | ) | ||||||||
| Reclassification of net cash flow hedge (gains) losses to net income |
(209 | ) | (59 | ) | (129 | ) | ||||||
| Transfer of certain pension and postretirement benefit plans to Parent |
- | - | 473 | |||||||||
|
|
|
|||||||||||
| Total other comprehensive income (loss), net of tax |
1,247 | 2,976 | 1,044 | |||||||||
|
|
|
|||||||||||
| Total comprehensive income (loss) |
$ | 1,114 | $ | 2,165 | $ | 80 | ||||||
|
|
|
|||||||||||
| Income taxes included in other comprehensive income (loss) |
||||||||||||
| Change in unrealized investment gains (losses): |
||||||||||||
| Income tax expense (benefit) from unrealized investment gains arising during the period |
831 | 1,044 | 696 | |||||||||
| Income tax (expense) benefit related to reclassification adjustment for gains realized in net income (loss) |
(369 | ) | (373 | ) | (275 | ) | ||||||
| Change in pension and postretirement benefits: |
||||||||||||
| Income tax expense (benefit) related to change in prior service cost |
- | - | (1 | ) | ||||||||
| Income tax expense (benefit) from change in net actuarial loss |
- | - | 5 | |||||||||
| Change in income tax expense (benefit) from change in net unrealized gain on split-dollar life insurance benefit |
- | - | 1 | |||||||||
| Change in unrealized gains (losses) on derivative instruments designated as cash flow hedges: |
||||||||||||
| Income tax expense (benefit) from unrealized gains on the effective portion of the change in fair value cash flow hedges |
349 | 957 | (20 | ) | ||||||||
| Income tax (expense) benefit related to reclassification of net cash flow hedge gains to net income (loss) |
(113 | ) | (32 | ) | (69 | ) | ||||||
| Income tax expense (benefit) related to transfer of certain pension and postretirement benefit plans to Parent |
- | - | 255 | |||||||||
|
|
|
|||||||||||
| Total income tax expense (benefit) in other comprehensive income (loss) |
$ | 698 | $ | 1,596 | $ | 592 | ||||||
|
|
|
|||||||||||
The accompanying notes are an integral part of these consolidated financial statements.
F-5
Table of Contents
JOHN HANCOCK LIFE INSURANCE COMPANY (U.S.A.)
CONSOLIDATED STATEMENTS OF CHANGES IN SHAREHOLDER’S EQUITY
| Capital Stock |
Additional Paid-in Capital |
Retained Earnings |
Accumulated Other Comprehensive Income (Loss) |
Total Shareholder’s Equity attributable to the Company |
Non-controlling Interests |
Total Shareholders’s Equity |
Outstanding Shares |
|||||||||||||||||||||||||
|
|
|
|||||||||||||||||||||||||||||||
| (in millions, except for shares outstanding) | (in thousands) | |||||||||||||||||||||||||||||||
| Balance at January 1, 2010 (as previously reported) |
$ | 5 | $ | 12,427 | $ | 2,822 | $ | 129 | $ | 15,383 | $ | 193 | $ | 15,576 | 4,829 | |||||||||||||||||
| Cumulative effect of change in accounting principle, net of tax (Note 1) |
- | - | (595 | ) | 9 | (586 | ) | - | (586 | ) | ||||||||||||||||||||||
|
|
|
|||||||||||||||||||||||||||||||
| Balance at January 1, 2010 (as currently reported) |
$ | 5 | $ | 12,427 | $ | 2,227 | $ | 138 | $ | 14,797 | $ | 193 | $ | 14,990 | 4,829 | |||||||||||||||||
| Net income (loss) |
- | - | (1,000 | ) | - | (1,000 | ) | 36 | (964 | ) | ||||||||||||||||||||||
| Other comprehensive income (loss), net of tax |
- | - | - | 571 | 571 | - | 571 | |||||||||||||||||||||||||
| Adoption of ASC 810, consolidation of variable interest entities |
- | - | (2 | ) | - | (2 | ) | 45 | 43 | |||||||||||||||||||||||
| Share-based payments |
- | 12 | - | - | 12 | - | 12 | |||||||||||||||||||||||||
| Contributions from noncontrolling interests |
- | - | - | - | - | 23 | 23 | |||||||||||||||||||||||||
| Distributions to non-controlling interests |
- | - | - | - | - | (52 | ) | (52 | ) | |||||||||||||||||||||||
| Transfer of certain pension and postretirement benefit plans to Parent |
- | (13 | ) | - | 473 | 460 | - | 460 | ||||||||||||||||||||||||
| Capital contribution from Parent |
- | 350 | - | - | 350 | - | 350 | |||||||||||||||||||||||||
|
|
|
|||||||||||||||||||||||||||||||
| Balance at December 31, 2010 |
$ | 5 | $ | 12,776 | $ | 1,225 | $ | 1,182 | $ | 15,188 | $ | 245 | $ | 15,433 | 4,829 | |||||||||||||||||
|
|
|
|||||||||||||||||||||||||||||||
The accompanying notes are an integral part of these consolidated financial statements.
F-6
Table of Contents
JOHN HANCOCK LIFE INSURANCE COMPANY (U.S.A.)
CONSOLIDATED STATEMENTS OF CHANGES IN SHAREHOLDER’S EQUITY – (CONTINUED)
| Capital Stock |
Additional Paid-in Capital |
Retained Earnings |
Accumulated Other Comprehensive Income (Loss) |
Total Shareholder’s Equity attributable to the Company |
Non-controlling Interests |
Total Shareholders’s Equity |
Outstanding Shares |
|||||||||||||||||||||||||
|
|
|
|||||||||||||||||||||||||||||||
| (in millions, except for shares outstanding) | (in thousands) | |||||||||||||||||||||||||||||||
| Balance at January 1, 2011 |
$ | 5 | $ | 12,776 | $ | 1,225 | $ | 1,182 | $ | 15,188 | $ | 245 | $ | 15,433 | 4,829 | |||||||||||||||||
| Cumulative effect of change in accounting principle, net of tax (Note 1) |
- | - | 36 | - | 36 | - | 36 | |||||||||||||||||||||||||
|
|
|
|||||||||||||||||||||||||||||||
| Balance at January 1, 2011 |
$ | 5 | $ | 12,776 | $ | 1,261 | $ | 1,182 | $ | 15,224 | $ | 245 | $ | 15,469 | 4,829 | |||||||||||||||||
| Net income (loss) |
- | - | (855 | ) | - | (855 | ) | 44 | (811 | ) | ||||||||||||||||||||||
| Other comprehensive income (loss), net of tax |
- | - | - | 2,976 | 2,976 | - | 2,976 | |||||||||||||||||||||||||
| Share-based payments |
- | 13 | - | - | 13 | - | 13 | |||||||||||||||||||||||||
| Contributions from noncontrolling interests |
- | - | - | - | - | 64 | 64 | |||||||||||||||||||||||||
| Distributions to non-controlling interests |
- | - | - | - | - | (94 | ) | (94 | ) | |||||||||||||||||||||||
|
|
|
|||||||||||||||||||||||||||||||
| Balance at December 31, 2011 |
$ | 5 | $ | 12,789 | $ | 406 | $ | 4,158 | $ | 17,358 | $ | 259 | $ | 17,617 | 4,829 | |||||||||||||||||
|
|
|
|||||||||||||||||||||||||||||||
| Net income (loss) |
- | - | (159 | ) | - | (159 | ) | 26 | (133 | ) | ||||||||||||||||||||||
| Other comprehensive income (loss), net of tax |
- | - | - | 1,247 | 1,247 | - | 1,247 | |||||||||||||||||||||||||
| Share-based payments |
- | 3 | - | - | 3 | - | 3 | |||||||||||||||||||||||||
| Acquisition of noncontrolling interests |
- | (2 | ) | - | - | (2 | ) | - | (2 | ) | ||||||||||||||||||||||
| Contributions from noncontrolling interests |
- | - | - | - | - | 42 | 42 | |||||||||||||||||||||||||
| Distributions to non-controlling interests |
- | - | - | - | - | (114 | ) | (114 | ) | |||||||||||||||||||||||
|
|
|
|||||||||||||||||||||||||||||||
| Balance at December 31, 2012 |
$ | 5 | $ | 12,790 | $ | 247 | $ | 5,405 | $ | 18,447 | $ | 213 | $ | 18,660 | 4,829 | |||||||||||||||||
|
|
|
|||||||||||||||||||||||||||||||
The accompanying notes are an integral part of these consolidated financial statements.
F-7
Table of Contents
JOHN HANCOCK LIFE INSURANCE COMPANY (U.S.A.)
CONSOLIDATED STATEMENTS OF CASH FLOWS
| Years ended December 31, | ||||||||||||
| 2012 | 2011 | 2010 | ||||||||||
|
|
|
|||||||||||
| (in millions) | ||||||||||||
| Cash flows from operating activities: |
||||||||||||
| Net income (loss) |
$ | (133 | ) | $ | (811 | ) | $ | (964 | ) | |||
| Adjustments to reconcile net income (loss) to net cash provided by (used in) operating activities: |
||||||||||||
| Amortization of premiums and accretion of discounts associated with investments, net |
(5 | ) | 27 | 174 | ||||||||
| Net realized investments and other (gains) losses |
2,168 | (3,135 | ) | (82 | ) | |||||||
| Change in expected internal rate of return on leveraged leases |
247 | - | 118 | |||||||||
| Amortization of deferred policy acquisition costs, deferred sales inducements, and value of business acquired |
1,385 | 2,841 | 682 | |||||||||
| Capitalization of deferred policy acquisition costs and deferred sales inducements |
(719 | ) | (766 | ) | (1,039 | ) | ||||||
| Goodwill impairment |
- | 500 | 1,600 | |||||||||
| Depreciation and amortization |
152 | 140 | 132 | |||||||||
| Net cash flows from trading securities |
73 | 234 | 143 | |||||||||
| (Increase) decrease in accrued investment income |
27 | (91 | ) | (77 | ) | |||||||
| (Increase) decrease in other assets and other liabilities, net |
(752 | ) | 521 | 151 | ||||||||
| Increase (decrease) in policyholder liabilities and accruals, net |
(1,279 | ) | 3,980 | 1,305 | ||||||||
| Interest credited to policyholder liabilities |
1,180 | 1,156 | 1,148 | |||||||||
| Increase (decrease) in deferred income taxes |
(378 | ) | (100 | ) | 401 | |||||||
|
|
|
|||||||||||
| Net cash provided by (used in) operating activities |
1,966 | 4,496 | 3,692 | |||||||||
| Cash flows from investing activities: |
||||||||||||
| Sales of: |
||||||||||||
| Fixed maturities |
21,625 | 27,779 | 20,277 | |||||||||
| Equity securities |
264 | 233 | 1,153 | |||||||||
| Mortgage loans on real estate |
1,347 | 1,367 | 961 | |||||||||
| Investment real estate, agriculture, and timber |
42 | 43 | 22 | |||||||||
| Other invested assets |
527 | 122 | 377 | |||||||||
| Maturities, prepayments, and scheduled redemptions of: |
||||||||||||
| Fixed maturities |
1,369 | 2,316 | 1,834 | |||||||||
| Mortgage loans on real estate |
338 | 367 | 383 | |||||||||
| Other invested assets |
238 | 267 | 233 | |||||||||
| Purchases of: |
||||||||||||
| Fixed maturities |
(22,647 | ) | (31,201 | ) | (27,115 | ) | ||||||
| Equity securities |
(193 | ) | (185 | ) | (1,118 | ) | ||||||
| Investment real estate, agriculture, and timber |
(1,134 | ) | (814 | ) | (602 | ) | ||||||
| Other invested assets |
(1,082 | ) | (943 | ) | (1,031 | ) | ||||||
| Mortgage loans on real estate issued |
(1,821 | ) | (2,443 | ) | (2,117 | ) | ||||||
| Net (purchases) redemptions of short-term investments |
(548 | ) | (147 | ) | 2,501 | |||||||
| Other, net |
(27 | ) | 111 | 15 | ||||||||
|
|
|
|||||||||||
| Net cash provided by (used in) investing activities |
(1,702 | ) | (3,128 | ) | (4,227 | ) | ||||||
The accompanying notes are an integral part of these consolidated financial statements.
F-8
Table of Contents
JOHN HANCOCK LIFE INSURANCE COMPANY (U.S.A.)
CONSOLIDATED STATEMENTS OF CASH FLOWS – (CONTINUED)
| Years ended December 31, | ||||||||||||
| 2012 | 2011 | 2010 | ||||||||||
|
|
|
|||||||||||
| (in millions) | ||||||||||||
| Cash flows from financing activities: |
||||||||||||
| Capital contribution from Parent |
- | - | 350 | |||||||||
| Increase (decrease) in amounts due to affiliates |
(37 | ) | 63 | (1,254 | ) | |||||||
| Universal life and investment-type contract deposits |
3,090 | 3,573 | 4,015 | |||||||||
| Universal life and investment-type contract maturities and withdrawals |
(3,083 | ) | (4,168 | ) | (4,269 | ) | ||||||
| Net transfers from (to) separate accounts related to universal life and investment-type contracts |
512 | 156 | 7 | |||||||||
| Excess tax benefits related to share-based payments |
- | - | 5 | |||||||||
| Repayments of consumer notes, net |
(103 | ) | (147 | ) | (239 | ) | ||||||
| Issuance of short-term debt |
2 | 6 | 2 | |||||||||
| Repayments of short-term debt |
- | (2 | ) | (1 | ) | |||||||
| Issuance of long-term debt |
1 | 1 | 2 | |||||||||
| Repayments of long-term debt |
(106 | ) | (213 | ) | (101 | ) | ||||||
| Contributions from noncontrolling interests |
42 | 64 | 23 | |||||||||
| Distributions to noncontrolling interests |
(114 | ) | (94 | ) | (52 | ) | ||||||
| Unearned revenue on financial reinsurance |
(254 | ) | (82 | ) | (112 | ) | ||||||
| Net reinsurance recoverable |
1 | (1 | ) | (23 | ) | |||||||
|
|
|
|||||||||||
| Net cash provided by (used in) financing activities |
(49 | ) | (844 | ) | (1,647 | ) | ||||||
|
|
|
|||||||||||
| Net increase (decrease) in cash and cash equivalents |
215 | 524 | (2,182 | ) | ||||||||
| Adoption of ASC 810, consolidation of variable interest entities |
- | - | 39 | |||||||||
| Cash and cash equivalents at beginning of year |
3,296 | 2,772 | 4,915 | |||||||||
|
|
|
|||||||||||
| Cash and cash equivalents at end of year |
$ | 3,511 | $ | 3,296 | $ | 2,772 | ||||||
|
|
|
|||||||||||
| Non-cash financing activities during the year: |
||||||||||||
| Transfer of assets for fixed deferred annuity reinsurance transactions |
$ | (6,768 | ) | $ | - | $ | - | |||||
| Transfer of certain pension and postretirement benefit plans to Parent |
- | |
- |
|
(13 | ) | ||||||
The accompanying notes are an integral part of these consolidated financial statements.
F-9
Table of Contents
JOHN HANCOCK LIFE INSURANCE COMPANY (U.S.A.)
NOTES TO CONSOLIDATED FINANCIAL STATEMENTS
Note 1 — Summary of Significant Accounting Policies
Business. John Hancock Life Insurance Company (U.S.A.) (“JHUSA”) is a wholly-owned subsidiary of The Manufacturers Investment Corporation (“MIC”). MIC is a wholly-owned subsidiary of John Hancock Financial Corporation (“JHFC”), which is an indirect, wholly-owned subsidiary of The Manufacturers Life Insurance Company (“MLI”). MLI, in turn, is a wholly-owned subsidiary of Manulife Financial Corporation (“MFC”), a Canadian-based, publicly traded financial services holding company.
JHUSA and its subsidiaries (“the Company”) provide a wide range of insurance and investment products to both individual and institutional customers located primarily in the United States. These products, including individual life insurance, individual and group long-term care insurance, and mutual funds, are sold through an extensive network of agents, securities dealers, and other financial institutions. The Company also offers investment management services to the Company’s separate account, mutual fund, and institutional customers. The Company suspended sales of all its individual and group fixed and variable annuities. The Company is licensed to sell insurance in 50 states of the United States.
The Company manages individual and group fixed and variable annuity, and individual life insurance contracts (collectively, the contracts) for both individual and institutional customers. Amounts invested in the fixed portion of the contracts are allocated to the general account of the Company. Amounts invested in the variable portion of the contracts are allocated to the separate accounts of the Company. Each of these separate accounts invests in shares of one of the various portfolios of the John Hancock Variable Insurance Trust (“JHVIT”), a no-load, open-end investment management company organized as a Massachusetts business trust, or in open-end investment management companies offered and managed by unaffiliated third parties.
Basis of Presentation. These financial statements have been prepared in conformity with U.S. generally accepted accounting principles (“U.S. GAAP”), which require management to make estimates and assumptions that affect the amounts reported in the consolidated financial statements and accompanying notes. Actual results could differ from these estimates.
The accompanying consolidated financial statements include the accounts of the Company, including its majority-owned and controlled subsidiaries and variable interest entities (“VIEs”) in which the Company is the primary beneficiary or has control over the VIE. Partnerships, joint venture interests, and other equity investments in which the Company does not have a controlling financial interest, but has significant influence, are recorded using the equity method of accounting and are included in other invested assets. All significant intercompany transactions and balances have been eliminated. For further discussion regarding VIEs, see the Relationships with Variable Interest Entities Note.
Reclassifications. Certain prior year amounts have been reclassified to conform to the current year presentation. The Company’s accounting policy is to present all ceded net investment income and realized gains (losses) associated with affiliated reinsurance contracts as part of other operating costs and expenses. To be consistent for all affiliated reinsurance contracts, the Company reclassified $1,788 million and ($196) million from net realized investment and other gains (losses) to other operating costs and expenses for the years ended December 31, 2011 and 2010, respectively. There was no impact to net income for this change in presentation.
Investments. The Company determines the classification of its financial assets at initial recognition. Fixed maturity and equity securities are recognized initially at fair value plus, in the case of investments not held for trading, directly attributable transaction costs. The Company classifies its fixed maturity and equity securities, other than leveraged leases, as either available-for-sale or held-for-trading and records these securities at fair value. Unrealized investment gains and losses related to available-for-sale securities are reflected in shareholder’s equity, net of policyholder related amounts and deferred income taxes. Unrealized investment gains and losses related to held-for-trading securities are reflected in net realized investment and other gains (losses).
Interest income on fixed maturity securities is generally recognized on the accrual basis. The amortized cost of fixed maturity securities is adjusted for other-than-temporary impairments, amortization of premiums, and accretion of discounts to maturity. Amortization of premiums and accretion of discounts is on an effective yield basis and is included in net investment income. The Company recognizes an impairment loss only when management does not expect to recover the amortized cost of the fixed maturity security.
The Company classifies its leveraged leases as fixed maturity securities and calculates their carrying value by accruing income at their expected internal rate of return.
F-10
Table of Contents
JOHN HANCOCK LIFE INSURANCE COMPANY (U.S.A.)
NOTES TO CONSOLIDATED FINANCIAL STATEMENTS – (CONTINUED)
Note 1 — Summary of Significant Accounting Policies - (continued)
For mortgage-backed securities, the Company recognizes income using a constant effective yield based on anticipated prepayments and the estimated economic life of the securities. When actual prepayments differ significantly from anticipated prepayments, the effective yield is recalculated to reflect actual payments to date plus anticipated future payments, and any resulting adjustment is included in net investment income.
Equity securities primarily include common stock. Dividends are recorded as income on the ex-dividend date. The Company recognizes an impairment loss only when management does not expect to recover the cost of the equity security. In determining whether an equity security is impaired, the Company considers its intent and ability to hold a particular equity security for a period of time sufficient to allow for the recovery of its value. Equity securities that do not have readily determinable fair values are included in other invested assets.
Mortgage loans on real estate are carried at unpaid principal balances and are adjusted for amortization of premiums or accretion of discounts, less an allowance for probable losses. Premiums or discounts are amortized over the life of the mortgage loan contract in a manner that results in a constant effective yield. Interest income and amortization amounts and other costs that are recognized as an adjustment of yield are included as components of net investment income. When contractual payments of mortgage investments are more than 90 days in arrears or when loans are considered impaired, interest is no longer accrued. Mortgage loans on real estate are evaluated periodically as part of the Company’s loan review procedures and are considered impaired when it is probable that the Company will be unable to collect all amounts of principal and interest due according to the contractual terms of the mortgage loan agreement. The valuation allowance established as a result of impairment is based on the present value of the expected future cash flows, discounted at the loan’s original effective interest rate, or is based on the collateral value of the loan if the loan is collateral dependent. The Company estimates this level to be adequate to absorb estimated probable credit losses that exist at the balance sheet date. Any change to the valuation allowance for mortgage loans on real estate is reported as a component of net realized investment and other gains (losses). Interest received on impaired mortgage loans on real estate is applied to reduce the outstanding investment balance. Interest received on other mortgage loans that are on non-accrual status is recorded as interest income on a cash basis. If foreclosure becomes probable, the measurement method used is based on the collateral’s fair value. Foreclosed real estate is recorded at the collateral’s fair value at the date of foreclosure, which establishes a new cost basis.
Investment real estate, agriculture, and timber, which the Company has the intent to hold for the production of income, is carried at depreciated cost, using the straight-line method of depreciation, less adjustments for impairments in value. In those cases where it is determined that the carrying amount of investment real estate, agriculture, and timber is not recoverable, an impairment loss is recognized based on the difference between the depreciated cost and fair value of the asset. The Company reports impairment losses as part of net realized investment and other gains (losses).
Policy loans are carried at unpaid principal balances.
Short-term investments, which include investments with remaining maturities of one year or less, but greater than three months, at the time of purchase, are reported at fair value.
Net realized investment and other gains (losses), other than those related to separate accounts for which the Company does not bear the investment risk, are determined on a specific identification method and are reported net of amounts credited to participating contract holder accounts.
Derivative Financial Instruments. The Company uses derivative financial instruments (“derivatives”) to manage exposures to foreign currency, interest rate, credit, and other market risks arising from on-balance sheet financial instruments, certain insurance contract liabilities, and selected anticipated transactions. Derivatives are recorded at fair value. Derivatives with unrealized gains are reported as derivative assets and derivatives with unrealized losses are reported as derivative liabilities. Derivatives embedded in other instruments (“host instruments”), such as investment securities, reinsurance contracts, and certain benefit guarantees, are separately recorded as derivatives when their economic characteristics and risks are not closely related to those of the host instrument, the terms of the embedded derivative are the same as those of a stand-alone derivative, and the host instrument is not held-for-trading or carried at fair value.
A determination is made for each relationship as to whether hedge accounting can be applied. Where hedge accounting is not applied, changes in fair value of derivatives are recorded in net realized investment and other gains (losses).
Where the Company has elected to use hedge accounting, a hedge relationship is designated and documented at inception. Hedge effectiveness is evaluated at inception and throughout the term of the hedge, and hedge accounting is only applied
F-11
Table of Contents
JOHN HANCOCK LIFE INSURANCE COMPANY (U.S.A.)
NOTES TO CONSOLIDATED FINANCIAL STATEMENTS – (CONTINUED)
Note 1 — Summary of Significant Accounting Policies - (continued)
when the Company expects that each hedging instrument will be highly effective in achieving offsetting changes in fair value or changes in cash flows attributable to the risk being hedged. Hedge effectiveness is assessed quarterly using a variety of consistently applied techniques, including regression analysis and cumulative dollar offset. When it is determined that the hedging relationship is no longer effective or the hedged item has been sold or terminated, the Company discontinues hedge accounting prospectively. In such cases, if the derivative hedging instruments are not sold or terminated, any subsequent changes in fair value of the derivative are recognized in net realized investment and other gains (losses).
For derivatives that are designated as hedging instruments, changes in fair value are recognized according to the nature of the risks being hedged, as discussed below.
Fair Value Hedges. In a fair value hedging relationship, changes in the fair value of the hedging derivatives are recorded in net realized investment and other gains (losses), along with changes in fair value attributable to the hedged risk. The carrying value of the hedged item is adjusted for changes in fair value attributable to the hedged risk. To the extent the changes in the fair value of derivatives do not offset the changes in the fair value of the hedged item attributable to the hedged risk in net realized investment and other gains (losses), any ineffectiveness will remain in net realized investment and other gains (losses). When hedge accounting is discontinued, the carrying value of the hedged item is no longer adjusted and the cumulative fair value adjustments are amortized to net investment income over the remaining term of the hedged item unless the hedged item is sold, at which time the balance is recognized immediately in net investment income.
Cash Flow Hedges. In a cash flow hedge relationship, the effective portion of the changes in the fair value of the hedging instrument is recorded in accumulated other comprehensive income (AOCI), while the ineffective portion is recognized in net realized investment and other gains (losses). Unrealized gains and losses recorded in AOCI are recognized in income during the same periods as the variability in the cash flows hedged or the hedged forecasted transactions are recognized.
Unrealized gains and losses on cash flow hedges recorded in AOCI are reclassified immediately to income when the hedged item is sold or the forecasted transaction is no longer expected to occur. When a hedge is discontinued, but the hedged forecasted transaction remains highly probable to occur, the amounts in AOCI are reclassified to net realized investment and other gains (losses) in the periods during which variability in the cash flows hedged or the hedged forecasted transaction is recognized in income.
Cash and Cash Equivalents. Cash and cash equivalents include cash and all highly liquid debt investments with a remaining maturity of three months or less when purchased.
Goodwill, Value of Business Acquired, and Other Intangible Assets. Goodwill represents primarily the excess of the cost over the fair value of identifiable net assets acquired by MFC, on April 28, 2004 (the “acquisition date”). The allocation of purchase consideration resulted in the recognition of goodwill, value of business acquired (“VOBA”), and other intangible assets as of the acquisition date.
VOBA is the present value of estimated future profits of insurance policies in-force related to businesses acquired by MFC. The Company amortizes VOBA using the same methodology and assumptions used to amortize deferred policy acquisition costs (“DAC”) and tests for recoverability at least annually.
Other intangible assets include brand name, investment management contracts (fair value of the investment management relationships between the Company and the mutual funds managed by the Company), distribution networks, and other investment management contracts (institutional investment management contracts managed by the Company’s investment management subsidiaries) recognized at the acquisition date. Brand name and investment management contracts are not subject to amortization. Distribution networks and other investment management contracts are amortized over their respective estimated lives in other operating costs and expenses.
The Company tests goodwill and intangible assets not subject to amortization for impairment at least annually, or more frequently if circumstances indicate impairment may have occurred. Amortizing intangible assets are reviewed for impairment only upon the occurrence of certain triggering events. An impairment is recorded whenever goodwill or an intangible asset’s fair value is deemed to be less than its carrying value. For discussions regarding goodwill impairments recorded during the years ended December 31, 2012, 2011, and 2010, see the Goodwill, Value of Business Acquired, and Other Intangible Assets Note.
F-12
Table of Contents
JOHN HANCOCK LIFE INSURANCE COMPANY (U.S.A.)
NOTES TO CONSOLIDATED FINANCIAL STATEMENTS – (CONTINUED)
Note 1 — Summary of Significant Accounting Policies - (continued)
Deferred Policy Acquisition Costs, Deferred Sales Inducements, and Unearned Revenue. DAC are costs that are directly related to the successful acquisition or renewal of insurance contracts. Such costs include: (1) incremental direct costs of contract acquisition, such as commissions; (2) the portion of an employee’s total compensation and benefits directly related to underwriting, policy issuance and processing, medical inspection, and contract selling of new and renewal insurance contracts with respect to actual policies acquired or renewed; (3) other costs directly related to acquisition or renewal activities that would not have been incurred had a policy not been acquired or renewed; and (4) in limited circumstances, the costs of direct response advertising whose primary purpose is to elicit sales to customers who could be shown to have responded specifically to the advertising and that results in contract acquisition. All other acquisition-related costs, including those related to general advertising and solicitation, market research, agent training, product development, unsuccessful sales and underwriting efforts, as well as all indirect costs, are expensed as incurred. Similarly, any amounts assessed as initiation fees or front-end loads are recorded as unearned revenue. The Company tests the recoverability of DAC at least annually.
DAC related to participating traditional life insurance is amortized over the life of the policies at a constant rate based on the present value of the estimated gross margin amounts expected to be realized over the lives of the policies. Estimated gross margin amounts include anticipated premiums and investment results less claims and administrative expenses, changes in the net level premium reserve, and expected annual policyholder dividends. For annuity, universal life insurance, and investment-type products, DAC and unearned revenue are amortized generally in proportion to the change in present value of expected gross profits arising principally from surrender charges, investment results, including realized investment and other gains (losses), and mortality and expense margins. DAC amortization includes retrospective adjustments when estimates are revised. For annuity, universal life insurance, and investment-type products, the DAC asset is adjusted for the impact of unrealized gains (losses) on investments as if these gains (losses) had been realized, with corresponding credits or charges included in AOCI.
DAC and unearned revenue related to non-participating traditional life insurance and DAC related to long-term care insurance are amortized over the premium-paying period of the related policies using assumptions consistent with those used in computing policy benefit reserves.
The Company offers sales inducements, including enhanced crediting rates or bonus payments, to contract holders on certain of its individual and group annuity products. The Company defers sales inducements (“DSI”) and amortizes them over the life of the underlying contracts using the same methodology and assumptions used to amortize DAC.
Reinsurance. Assets and liabilities related to reinsurance ceded contracts are reported on a gross basis. The accompanying Consolidated Statements of Operations reflect premiums, benefits, and settlement expenses net of reinsurance ceded. Reinsurance premiums, commissions, expense reimbursements, benefits, and reserves related to reinsured business are accounted for on a basis consistent with those used in accounting for the original policies issued and the terms of the reinsurance contracts.
The Company utilizes reinsurance agreements to provide for greater diversification of business, allowing management to control exposure to potential losses arising from large risks, and provide additional capacity for growth. Reinsurance ceded contracts do not relieve the Company from its obligations to policyholders. The Company remains liable to its contract holders to the extent that counterparties to reinsurance ceded contracts do not meet their contractual obligations. Failure of the reinsurers to honor their obligations could result in losses to the Company; consequently, estimates are established for amounts deemed or estimated to be uncollectible. To minimize its exposure to significant losses from reinsurance insolvencies, the Company evaluates the financial condition of its reinsurers and monitors concentration of credit risk arising from similar characteristics among the reinsurers.
When a reinsurance agreement does not subject the reinsurer to the reasonable possibility of significant loss, the Company accounts for the agreement as financial reinsurance and uses deposit-type accounting treatment with only the reinsurance risk fee being reported in other operating costs and expenses.
Separate Account Assets and Liabilities. Separate account assets and liabilities reported on the Company’s Consolidated Balance Sheets represent funds that are administered and invested by the Company to meet specific investment objectives of contract holders. Net investment income and net realized investment and other gains (losses) generally accrue directly to such contract holders who bear the investment risk, subject, in some cases, to principal guarantees and minimum guaranteed rates of income. The assets of each separate account are legally segregated and are not subject to claims that arise out of any other business of the Company. Separate account assets are reported at fair value, and separate account liabilities are set equal to
F-13
Table of Contents
JOHN HANCOCK LIFE INSURANCE COMPANY (U.S.A.)
NOTES TO CONSOLIDATED FINANCIAL STATEMENTS – (CONTINUED)
Note 1 — Summary of Significant Accounting Policies - (continued)
the fair value of the separate account assets. Deposits, surrenders, net investment income, net realized investment and other gains (losses), and the related liability changes of separate accounts are offset within the same line item in the Consolidated Statements of Operations. Fees charged to contract holders, principally mortality, policy administration, investment management, and surrender charges, are included in the revenues of the Company. For the years ended December 31, 2012, 2011, and 2010 there were no gains or losses on transfers of assets from the general account to the separate account.
Future Policy Benefits and Policyholders’ Funds. Future policy benefits for participating traditional life insurance policies are based on the net level premium method. The net level premium reserve is calculated using the guaranteed mortality and dividend fund interest rates. The liability for annual dividends represents the accrual of annual dividends earned. Settlement dividends are accrued in proportion to gross margins over the life of the policies. Participating business represented 33% and 34% of the Company’s traditional life net insurance in-force at December 31, 2012 and 2011, respectively, and 78%, 76%, and 77% of the Company’s traditional life net insurance premiums for the years ended December 31, 2012, 2011, and 2010, respectively.
Benefit liabilities for annuities during the accumulation period are equal to accumulated contract holders’ fund balances and after annuitization are equal to the present value of expected future payments.
Future policy benefits for long-term care insurance policies are based on the net level premium method. Assumptions established at policy issue as to mortality, morbidity, persistency, and interest and expenses, which include a margin for adverse deviation, are based on estimates developed by management.
For non-participating traditional life insurance policies, future policy benefits are estimated using a net level premium method based upon actuarial assumptions as to mortality, persistency, interest, and expenses established at the policy issue or acquisition date. Assumptions established at policy issue as to mortality and persistency are based on the Company’s experience, which, together with interest and expense assumptions, include a margin for adverse deviation.
Policyholders’ funds are generally equal to the total of the policyholder account values before surrender charges, additional reserves established to adjust for lower market interest rates as of the acquisition date, and additional reserves established on certain guarantees offered in certain investment-type products. Policyholder account values include deposits plus credited interest or change in investment value less expense and mortality fees, as applicable, and withdrawals. Policy benefits are charged to expense and include benefit claims incurred in the period in excess of related policy account balances and interest credited to policyholders’ account balances.
Components of policyholders’ funds were as follows:
| December 31, | ||||||||
| 2012 | 2011 | |||||||
|
|
|
|||||||
| (in millions) | ||||||||
| Participating pension contracts |
$ | 1,613 | $ | 1,771 | ||||
| Funding agreements |
384 | 434 | ||||||
| Guaranteed investments contracts |
81 | 143 | ||||||
|
|
|
|||||||
| Total liabilities for investment-type products |
2,078 | 2,348 | ||||||
| Individual and group annuities |
1,923 | 2,216 | ||||||
| Certain traditional life policies, life insurance retained asset accounts and other |
2,787 | 2,598 | ||||||
|
|
|
|||||||
| Total policyholders’ funds |
$ | 6,788 | $ | 7,162 | ||||
|
|
|
|||||||
Funding agreements are purchased from the Company by special purpose entities (“SPEs”), which in turn issue medium-term notes to global investors that are non-recourse to the Company. The SPEs are not consolidated in the Company’s consolidated financial statements.
Liabilities for unpaid claims and claim expense reserves include estimates of payments to be made on reported individual and group life, long-term care, and group accident and health insurance claims and estimates of incurred but not reported claims based on historical claims development patterns.
F-14
Table of Contents
JOHN HANCOCK LIFE INSURANCE COMPANY (U.S.A.)
NOTES TO CONSOLIDATED FINANCIAL STATEMENTS – (CONTINUED)
Note 1 — Summary of Significant Accounting Policies - (continued)
Estimates of future policy benefit reserves, claim reserves, and expenses are reviewed on a regular basis and adjusted as necessary. Any changes in estimates are reflected in current earnings.
Policyholder Dividends. Policyholder dividends for the closed blocks are approved annually by JHUSA’s Board of Directors. The aggregate amount of policyholder dividends is calculated based upon actual interest, mortality, morbidity, persistency, and expense experience for the year as appropriate, as well as management’s judgment as to the proper level of statutory surplus to be retained by JHUSA. For policies included in the JHUSA closed block, expense experience is included in determining policyholder dividends. Expense experience is not included for policies included in the John Hancock Life Insurance Company (“JHLICO”) closed block. JHLICO was a predecessor company that was merged into JHUSA on December 31, 2009. For additional information on the closed blocks, see the Closed Blocks Note.
Revenue Recognition. Premiums from participating and non-participating traditional life insurance, annuity policies with life contingencies, and reinsurance contracts are recognized as revenue when due. When premiums are due over a significantly shorter period than the period over which benefits are provided, any excess profit is deferred and recognized into income in a constant relationship to insurance in-force or, for annuities, the amount of expected future benefit payments.
Premiums from long-term care insurance contracts are recognized as income when due.
Deposits related to universal life and investment-type products are credited to policyholders’ account balances. Revenues from these contracts, as well as annuity contracts, consist of amounts assessed against policyholders’ account balances for mortality, policy administration, and surrender charges and are recorded in fee income in the period in which the services are provided.
Fee income also includes advisory fees, broker-dealer commissions and fees, and administration service fees. Such fees and commissions are recognized in the period in which the services are performed. Commissions related to security transactions and related expenses are recognized as income on the trade date. Contingent deferred selling charge commissions are recognized as income when received. Selling commissions paid to the selling broker-dealer for sales of mutual funds that do not have a front-end sales charge are deferred and amortized on a straight-line basis over periods ranging from one to six years. This is the approximate period of time expected to be benefited and during which fees earned pursuant to Rule 12b-1 distribution plans are received from the funds and contingent deferred sales charges are received from shareholders of the funds.
Income Taxes. The provision for federal income taxes includes amounts currently payable or recoverable and deferred income taxes, computed under the liability method, resulting from temporary differences between the tax and financial statement bases of assets and liabilities. A valuation allowance is established for deferred tax assets when it is more likely than not that an amount will not be realized. Foreign subsidiaries and U.S. subsidiaries operating outside of the United States are taxed under applicable foreign statutory rates. In accordance with the income tax sharing agreements in effect for the applicable tax years, the income tax expense (benefit) is computed as if each entity filed separate federal income tax returns with tax benefits provided for operating losses and tax credits when utilized for the consolidation group. Intercompany settlements of income taxes are made through an increase or reduction to amounts due to or from affiliates. Such settlements occur on a periodic basis in accordance with the tax sharing agreements.
Foreign Currency. Assets and liabilities of foreign operations are translated into U.S. dollars using current exchange rates as of the balance sheet date. Revenues and expenses are translated using the average exchange rates during the year. The resulting net translation adjustments for each year are included in AOCI. Gains or losses on foreign currency transactions are reflected in earnings.
Adoption of Recent Accounting Pronouncements
New accounting standards that do not have a material impact to the Company’s primary financial statements or notes thereto are not included below.
F-15
Table of Contents
JOHN HANCOCK LIFE INSURANCE COMPANY (U.S.A.)
NOTES TO CONSOLIDATED FINANCIAL STATEMENTS – (CONTINUED)
Note 1 — Summary of Significant Accounting Policies - (continued)
Consolidated Financial Statements
Effective January 1, 2010, the Company adopted ASU No. 2009-17, “Consolidation – Improvements to Financial Reporting by Enterprises Involved with Variable Interest Entities,” (“ASU 2009-17”) which amends ASC Topic 810, “Consolidation” (“ASC 810”).
The amendments revise the accounting principles for assessing consolidation of a VIE and include the following features:
| • | A new concept of control — now defined as an entity’s ability to make decisions that are most economically significant to the VIE coupled with economic exposure to the VIE’s variability. This definition replaces the previous concept of “exposure to the majority of the VIE’s variability” in determining when to consolidate another entity. |
| • | New guidance for determining which party, among parties with shared decision making powers over a VIE, makes the most significant decisions for the VIE. |
| • | A bright line test for removal rights over an entity’s decision maker by its equity owners, whereby removal rights are disregarded as an element of control unless they can be exercised successfully by a single party. |
| • | Expanded guidance on whether fees charged to a VIE by its decision maker are variable interests, leading to consolidation by the decision maker. |
| • | Removal of the previous scope exception for qualifying special purpose entities. |
ASC 810 retains a scope exception for consolidation by investment companies of their investments.
The Company also adopted ASU No. 2010-10, “Consolidation — Amendments for Certain Investment Funds,” (“ASU 2010-10”) which amends ASC 810. This guidance was effective January 1, 2010 and deferred application of the amendments described above to certain entities that apply specialized accounting guidance for investment companies.
Adoption of these amendments resulted in consolidation of certain collateralized debt obligations sponsored by the Company. The impact on the Company’s Consolidated Statements of Changes in Shareholder’s Equity at January 1, 2010 was an increase in noncontrolling interests of $45 million, and a decrease in retained earnings of $2 million, net of tax.
In April 2010, the FASB issued ASU No. 2010-15, “How Investments Held through Separate Accounts Affect an Insurer’s Consolidation Analysis of Those Investments,” (“ASU 2010-15”) which amends ASC 944, “Financial Services-Insurance” (“ASC 944”). Under ASU No. 2010-15, an insurance entity should not consider the interests held through separate accounts for the benefit of policyholders in the insurer’s evaluation of its economics in a VIE, unless the separate account contract holder is a related party. This guidance is to be applied retrospectively to all prior periods upon the date of adoption. ASU No. 2010-15 was effective for the Company on January 1, 2011. Adoption of this guidance resulted in deconsolidation of $983 million of separate account assets, offset by deconsolidation of $983 million of separate account liabilities.
Fair Value Measurements
In May 2011, the FASB issued ASU No. 2011-04, “Amendments to Achieve Common Fair Value Measurement and Disclosure Requirements in U.S. GAAP and IFRS” (“ASU 2011-04”) which amends ASC Topic 820, “Fair Value Measurements”. The key changes in measurement principles include limiting the concepts of highest and best use and valuation premise to nonfinancial assets, providing a framework for considering whether a premium or discount can be applied in a fair value measurement, and aligning the fair value measurement of instruments classified within an entity’s shareholders’ equity with the guidance for liabilities. Disclosures will be required for all transfers between Levels 1 and 2 within the valuation hierarchy, the use of a nonfinancial asset measured at fair value if its use differs from its highest and best use, the level in the valuation hierarchy of assets and liabilities not recorded at fair value but for which fair value is required to be disclosed, and for Level 3 measurements, quantitative information about unobservable inputs used, a description of the valuation processes used, and qualitative discussion about the sensitivity of the measurements. The Company adopted the revised accounting standard effective January 1, 2012 via prospective adoption, as required. The expanded disclosures required by this guidance are included in the Fair Value Measurements Note. The adoption of ASU 2011-04 did not impact the Company’s financial position or results of operations.
F-16
Table of Contents
JOHN HANCOCK LIFE INSURANCE COMPANY (U.S.A.)
NOTES TO CONSOLIDATED FINANCIAL STATEMENTS – (CONTINUED)
Note 1 — Summary of Significant Accounting Policies - (continued)
Comprehensive Income
In June 2011, the FASB issued ASU No. 2011-05, “Presentation of Comprehensive Income” (“ASU 2011-05”), and in December 2011 issued ASU No. 2011-12, “Deferral of the Effective Date for Amendments to the Presentation of Reclassification of Items Out of Accumulated Other Comprehensive Income in Accounting Standards Update No. 2011-05” (“ASU 2011-12”) both of which amend ASC Topic 220, “Comprehensive Income”. These standards require entities to present items of net income and other comprehensive income either in a single continuous statement, or in separate, but consecutive statements of net income and other comprehensive income. The new requirements did not change which components of comprehensive income are recognized in net income or other comprehensive income, or when an item of other comprehensive income must be reclassified to net income. These standards became effective retrospectively beginning January 1, 2012. The Company opted to present the statements of net income and other comprehensive income in separate, but consecutive statements. The adoptions of ASU 2011-05 and ASU 2011-12 did not impact the Company’s financial position or results of operations.
Goodwill Impairment Testing
In September 2011, the FASB issued ASU No. 2011-08, “Testing for Goodwill Impairment” (“ASU 2011-08”) which amends ASC Topic 350, “Intangibles-Goodwill and Other” (“ASC 350”). ASU 2011-08 is intended to simplify how a company tests goodwill for impairment by giving companies the option to perform a qualitative assessment before calculating the fair value of the reporting unit. Under the guidance in ASU 2011-08, if this option is selected, a company is not required to calculate the fair value of a reporting unit unless the entity determines that it is more likely than not that its fair value is less than its carrying amount. The provisions of ASU 2011-08 became effective for the 2012 goodwill impairment testing. The adoption of ASU 2011-08 did not impact the Company’s financial position or results of operations.
Multiemployer Pension Plans
In September 2011, the FASB issued ASU No. 2011-09, “Disclosures about an Employer’s Participation in a Multiemployer Plan” (“ASU 2011-09”) which amends ASC Subtopic 715-80, “Compensation-Retirement Benefits-Multiemployer Plans.” For a subsidiary participating in the pension plan of its parent, the revised standard requires the disclosure of the name of the plan in which the subsidiary participates and the amount of contributions it made. This guidance became effective as of December 15, 2011 and has been applied retrospectively. The adoption of ASU 2011-09 did not impact the Company’s financial position or results of operations.
Deferred Policy Acquisition Costs and Deferred Sales Inducements
Effective January 1, 2012, the Company adopted ASU No. 2010-26, “Accounting for Costs Associated with Acquiring or Renewing Insurance Contracts” (“ASU 2010-26”) which amends ASC 944. ASU 2010-26 modifies the definition of the types of costs incurred by insurance entities that can be capitalized in the acquisition of new and renewal contracts. This guidance has been applied retrospectively, as permitted by the standard. As a result of this accounting change, shareholder’s equity, as of January 1, 2010, decreased by $586 million, after tax, from $15,576 million, as previously reported, to $14,990 million due to a reduction of the Company’s DAC and DSI asset balance related to certain costs that did not meet the provisions of the standard.
Other Invested Assets
The Company has an investment in a power fund which is recorded using the equity method of accounting and the balance is recorded in other invested assets. Prior to 2012, the portfolio investments held by the power fund were recorded at cost. As reported to the Company in 2012, the investee met the requirements of an investment company under ASC Topic 946, “Financial Services — Investment Companies” and recognized the portfolio investments at fair value. This change by the investee was accounted for as a change in accounting principle effective January 1, 2011. Consistent with the investee’s approach, the Company has also treated this as a change in accounting principle applied retrospectively. This change resulted in an increase to retained earnings of $36 million, net of tax of $19 million, and other invested assets of $55 million as of January 1, 2011.
F-17
Table of Contents
JOHN HANCOCK LIFE INSURANCE COMPANY (U.S.A.)
NOTES TO CONSOLIDATED FINANCIAL STATEMENTS – (CONTINUED)
Note 1 — Summary of Significant Accounting Policies - (continued)
The following tables present the effects of retrospective adjustments and reclassifications to the Company’s previously reported Consolidated Balance Sheet, Consolidated Statements of Operations and Consolidated Statements of Cash Flows related to the adoption of ASU 2010-26 for DAC and DSI, the change in accounting for its other invested assets, and for the presentation reclassification:
| December 31, 2011 | ||||||||||||||||||||
| As Previously Reported |
DAC and DSI Change in Accounting Principle (1) |
Other Accounting Principle (2) |
Presentation Reclassification (3) |
As Reported |
||||||||||||||||
|
|
|
|||||||||||||||||||
| (in millions) | ||||||||||||||||||||
| Assets |
||||||||||||||||||||
| Other invested assets |
$ | 4,446 | $ | - | $ | 55 | $ | - | $ | 4,501 | ||||||||||
| Deferred policy acquisition costs and deferred sales inducements |
7,186 | (888 | ) | - | - | 6,298 | ||||||||||||||
| Liabilities |
||||||||||||||||||||
| Future policy benefits |
88,879 | 2 | - | 108 | 88,989 | |||||||||||||||
| Deferred income tax liability |
4,214 | (311 | ) | 19 | - | 3,922 | ||||||||||||||
| Other liabilities |
4,271 | - | - | (108 | ) | 4,163 | ||||||||||||||
| Shareholder’s Equity |
||||||||||||||||||||
| Retained earnings |
1,005 | (635 | ) | 36 | - | 406 | ||||||||||||||
| Accumulated other comprehensive income |
4,102 | 56 | - | - | 4,158 | |||||||||||||||
| Total shareholder’s equity |
18,160 | (579 | ) | 36 | - | 17,617 | ||||||||||||||
F-18
Table of Contents
JOHN HANCOCK LIFE INSURANCE COMPANY (U.S.A.)
NOTES TO CONSOLIDATED FINANCIAL STATEMENTS – (CONTINUED)
Note 1 — Summary of Significant Accounting Policies - (continued)
| Year ended December 31, 2011 | ||||||||||||||||||||
| As Previously Reported |
DAC and Accounting |
Other Invested Assets Change in Accounting |
Presentation Reclassification (3) |
As Reported |
||||||||||||||||
|
|
|
|||||||||||||||||||
| (in millions) | ||||||||||||||||||||
| Revenues |
||||||||||||||||||||
| Fee income |
$ | 5,718 | $ | (1 | ) | $ | - | $ | - | $ | 5,717 | |||||||||
| Net realized investment and other gains (losses) |
1,347 | - | - | 1,788 | 3,135 | |||||||||||||||
| Other Revenue |
121 | - | - | 3 | 124 | |||||||||||||||
| Benefits and Expenses |
||||||||||||||||||||
| Benefits to policyholders |
7,638 | 1 | - | - | 7,639 | |||||||||||||||
| Amortization of deferred policy acquisition costs, deferred sales inducements, and value of business acquired |
3,076 | (235 | ) | - | 2,841 | |||||||||||||||
| Other operating costs and expenses |
4,362 | 160 | - | 1,791 | 6,313 | |||||||||||||||
| Income (loss) before income taxes |
(1,216 | ) | 73 | - | - | (1,143 | ) | |||||||||||||
| Income tax expense (benefit) |
(358 | ) | 26 | - | - | (332 | ) | |||||||||||||
| Net income (loss) |
(858 | ) | 47 | - | - | (811 | ) | |||||||||||||
| Net income (loss) attributable to the Company |
(902 | ) | 47 | - | - | (855 | ) | |||||||||||||
| Year ended December 31, 2010 | ||||||||||||||||||||
| As Previously Reported |
DAC and DSI Change in Accounting Principle (1) |
Other Invested Assets Change in Accounting Principle (2) |
Presentation Reclassification (3) |
As Reported |
||||||||||||||||
|
|
|
|||||||||||||||||||
| (in millions) | ||||||||||||||||||||
| Revenues |
||||||||||||||||||||
| Fee income |
$ | 3,773 | $ | (2 | ) | $ | - | $ | - | $ | 3,771 | |||||||||
| Net realized investment and other gains (losses) |
278 | - | - | (196 | ) | 82 | ||||||||||||||
| Benefits and Expenses |
||||||||||||||||||||
| Amortization of deferred policy acquisition costs, deferred sales inducements, and value of business acquired |
752 | (70 | ) | - | - | 682 | ||||||||||||||
| Other operating costs and expenses |
3,225 | 201 | - | (196 | ) | 3,230 | ||||||||||||||
| Income (loss) before income taxes |
(655 | ) | (133 | ) | - | - | (788 | ) | ||||||||||||
| Income tax expense (benefit) |
222 | (46 | ) | - | - | 176 | ||||||||||||||
| Net income (loss) |
(877 | ) | (87 | ) | - | - | (964 | ) | ||||||||||||
| Net income (loss) attributable to the Company |
(913 | ) | (87 | ) | - | - | (1,000 | ) | ||||||||||||
F-19
Table of Contents
JOHN HANCOCK LIFE INSURANCE COMPANY (U.S.A.)
NOTES TO CONSOLIDATED FINANCIAL STATEMENTS – (CONTINUED)
Note 1 — Summary of Significant Accounting Policies - (continued)
| Year ended December 31, 2011 | ||||||||||||||||||||
| As Previously Reported |
DAC and DSI Change in Accounting Principle (1) |
Other Invested Assets Change in Accounting Principle (2) |
Presentation Reclassification (3) |
As Reported |
||||||||||||||||
|
|
|
|||||||||||||||||||
| (in millions) | ||||||||||||||||||||
| Cash flows from operating activities |
||||||||||||||||||||
| Net income (loss) |
$ | (858 | ) | $ | 47 | $ | - | $ | - | $ | (811 | ) | ||||||||
| Adjustments to reconcile net income (loss) to net cash provided by operating activities: |
||||||||||||||||||||
| Net realized investment and other gains (losses) |
(1,347 | ) | - | - | (1,788 | ) | (3,135 | ) | ||||||||||||
| Amortization of deferred policy acquisition costs, deferred sales inducements, and value of business acquired |
3,076 | (235 | ) | - | - | 2,841 | ||||||||||||||
| Capitalization of deferred policy acquisition costs and deferred sales inducements |
(926 | ) | 160 | - | - | (766 | ) | |||||||||||||
| Increase (decrease) in other assets and other liabilities, net |
(1,269 | ) | 2 | - | 1,788 | 521 | ||||||||||||||
| Increase (decrease) in deferred income taxes |
(126 | ) | 26 | - | - | (100 | ) | |||||||||||||
F-20
Table of Contents
JOHN HANCOCK LIFE INSURANCE COMPANY (U.S.A.)
NOTES TO CONSOLIDATED FINANCIAL STATEMENTS – (CONTINUED)
Note 1 — Summary of Significant Accounting Policies - (continued)
| Year ended December 31, 2010 | ||||||||||||||||||||
| As Previously Reported |
DAC and Change in Principle (1) |
Other Invested Assets Change in Accounting Principle (2) |
Presentation Reclassification (3) |
As Reported |
||||||||||||||||
|
|
|
|||||||||||||||||||
| (in millions) | ||||||||||||||||||||
| Cash flows from operating activities |
||||||||||||||||||||
| Net income (loss) |
$ | (877 | ) | $ | (87 | ) | $ | - | $ | - | $ | (964 | ) | |||||||
| Adjustments to reconcile net income (loss) to net cash provided by operating activities: |
||||||||||||||||||||
| Net realized investment and other gains (losses) |
(278 | ) | - | - | 196 | (82 | ) | |||||||||||||
| Change in expected internal rate of return on leveraged leases |
- | - | - | 118 | 118 | |||||||||||||||
| Amortization of deferred policy acquisition costs, deferred sales inducements, and value of business acquired |
752 | (70 | ) | - | - | 682 | ||||||||||||||
| Capitalization of deferred policy acquisition costs and deferred sales inducements |
(1,240 | ) | 201 | - | - | (1,039 | ) | |||||||||||||
| Increase (decrease) in other assets and other liabilities, net |
345 | 2 | - | (196 | ) | 151 | ||||||||||||||
| Increase (decrease) in deferred income taxes |
447 | (46 | ) | - | - | 401 | ||||||||||||||
| Cash flows from investing activities |
||||||||||||||||||||
| Other, net |
133 | - | - | (118 | ) | 15 | ||||||||||||||
| (1) | See discussion included in the Significant Accounting Policies Note – Adoption of Recent Accounting Pronouncements – Deferred Policy Acquisition Costs and Deferred Sales Inducements for further information on this change to the Company’s previously reported results. |
| (2) | See discussion included in the Significant Accounting Policies Note – Adoption of Recent Accounting Pronouncements – Other Invested Assets for further information on this change to the Company’s previously reported results. |
| (3) | See discussion included in the Significant Accounting Policies Note – Reclassifications for further information on this change to the Company’s previously reported results. |
Future Adoption of Recent Accounting Pronouncements
Offsetting Assets and Liabilities
In December 2011, the FASB released ASU No. 2011-11, “Disclosures about Offsetting Assets and Liabilities” (“ASU 2011-11”) which amends ASC Topic 210, “Balance Sheet”. ASU 2011-11 requires companies to provide new disclosures about offsetting and related arrangements for financial instruments and derivatives. The provisions of ASU 2011-11 are effective for annual reporting periods beginning on or after January 1, 2013, and are required to be applied retrospectively. When adopted, ASU 2011-11 is not expected to materially impact the Company’s financial position or results of operations.
F-21
Table of Contents
JOHN HANCOCK LIFE INSURANCE COMPANY (U.S.A.)
NOTES TO CONSOLIDATED FINANCIAL STATEMENTS – (CONTINUED)
Note 1 — Summary of Significant Accounting Policies - (continued)
Indefinite-Lived Intangible Asset Impairment Testing
In July 2012, the FASB issued ASU No. 2012-02, “Testing Indefinite-Lived Intangible Assets for Impairment” (“ASU 2012-02”) which amends ASC 350. ASU 2012-02 is intended to simplify how a company tests indefinite-lived intangible assets for impairment by giving companies the option to perform a qualitative assessment before calculating the fair value of the indefinite-lived intangible asset. Under the guidance in ASU 2012-02, if this option is selected, a company is not required to calculate the fair value of an indefinite-lived intangible asset unless the entity determines that it is more likely than not that its fair value is less than its carrying amount. The provisions of ASU 2012-02 are effective for annual and interim impairment tests performed for fiscal years beginning after September 15, 2012. Upon adoption, ASU 2012-02 is not expected to materially impact the Company’s financial position or results of operations.
Note 2 — Investments
Fixed Maturities and Equity Securities
The Company’s investments in available-for-sale fixed maturity and equity securities are summarized below:
| December 31, 2012 | ||||||||||||||||||||
| Amortized Cost |
Gross Unrealized Gains |
Gross Unrealized Losses |
Fair Value |
Other-Than- Impairments in AOCI |
||||||||||||||||
|
|
|
|||||||||||||||||||
| (in millions) | ||||||||||||||||||||
| Fixed maturities and equity securities: |
||||||||||||||||||||
| Corporate debt securities |
$ | 36,804 | $ | 5,160 | $ | (271 | ) | $ | 41,693 | $ | (38 | ) | ||||||||
| Commercial mortgage-backed securities |
1,427 | 48 | (81 | ) | 1,394 | (17 | ) | |||||||||||||
| Residential mortgage-backed securities |
301 | 1 | (60 | ) | 242 | (20 | ) | |||||||||||||
| Collateralized debt obligations |
152 | - | (46 | ) | 106 | (33 | ) | |||||||||||||
| Other asset-backed securities |
794 | 102 | (2 | ) | 894 | (1 | ) | |||||||||||||
| U.S. Treasury securities and obligations of U.S. government corporations and agencies |
11,165 | 1,009 | (79 | ) | 12,095 | - | ||||||||||||||
| Obligations of states and political subdivisions |
4,482 | 913 | (1 | ) | 5,394 | - | ||||||||||||||
| Debt securities issued by foreign governments |
1,230 | 243 | (6 | ) | 1,467 | - | ||||||||||||||
|
|
|
|||||||||||||||||||
| Fixed maturities |
56,355 | 7,476 | (546 | ) | 63,285 | (109 | ) | |||||||||||||
| Other fixed maturities (1) |
1,711 | - | - | 1,711 | - | |||||||||||||||
|
|
|
|||||||||||||||||||
| Total fixed maturities available-for-sale |
58,066 | 7,476 | (546 | ) | 64,996 | (109 | ) | |||||||||||||
| Equity securities available-for-sale |
294 | 97 | (5 | ) | 386 | - | ||||||||||||||
|
|
|
|||||||||||||||||||
| Total fixed maturities and equity securities available-for-sale |
$ | 58,360 | $ | 7,573 | $ | (551 | ) | $ | 65,382 | $ | (109 | ) | ||||||||
|
|
|
|||||||||||||||||||
F-22
Table of Contents
JOHN HANCOCK LIFE INSURANCE COMPANY (U.S.A.)
NOTES TO CONSOLIDATED FINANCIAL STATEMENTS – (CONTINUED)
Note 2 — Investments - (continued)
| December 31, 2011 | ||||||||||||||||||||
| Amortized Cost |
Gross Unrealized Gains |
Gross Unrealized Losses |
Fair Value | Other-Than- Temporary Impairments in AOCI |
||||||||||||||||
|
|
|
|||||||||||||||||||
| (in millions) | ||||||||||||||||||||
| Fixed maturities and equity securities: |
||||||||||||||||||||
| Corporate debt securities |
$ | 39,646 | $ | 4,258 | $ | (573 | ) | $ | 43,331 | $ | (50 | ) | ||||||||
| Commercial mortgage-backed securities |
3,163 | 101 | (132 | ) | 3,132 | (11 | ) | |||||||||||||
| Residential mortgage-backed securities |
577 | 1 | (208 | ) | 370 | (32 | ) | |||||||||||||
| Collateralized debt obligations |
217 | - | (86 | ) | 131 | (32 | ) | |||||||||||||
| Other asset-backed securities |
1,013 | 89 | (9 | ) | 1,093 | (2 | ) | |||||||||||||
| U.S. Treasury securities and obligations of |
11,573 | 1,250 | - | 12,823 | - | |||||||||||||||
| Obligations of states and political subdivisions |
4,323 | 642 | (1 | ) | 4,964 | - | ||||||||||||||
| Debt securities issued by foreign governments |
1,178 | 250 | (6 | ) | 1,422 | - | ||||||||||||||
|
|
|
|||||||||||||||||||
| Fixed maturities |
61,690 | 6,591 | (1,015 | ) | 67,266 | (127 | ) | |||||||||||||
| Other fixed maturities (1) |
1,959 | - | - | 1,959 | - | |||||||||||||||
|
|
|
|||||||||||||||||||
| Total fixed maturities available-for-sale |
63,649 | 6,591 | (1,015 | ) | 69,225 | (127 | ) | |||||||||||||
| Equity securities available-for-sale |
358 | 91 | (10 | ) | 439 | - | ||||||||||||||
|
|
|
|||||||||||||||||||
| Total fixed maturities and equity securities available-for-sale |
$ | 64,007 | $ | 6,682 | $ | (1,025 | ) | $ | 69,664 | $ | (127 | ) | ||||||||
|
|
|
|||||||||||||||||||
| (1) | The Company classifies its leveraged leases as fixed maturities and calculates their carrying value by accruing income at their expected internal rate of return. |
The amortized cost and fair value of available-for-sale fixed maturities at December 31, 2012, by contractual maturity, are shown below:
| Amortized Cost | Fair Value | |||||||
|
|
|
|||||||
| (in millions) | ||||||||
| Fixed maturities: |
||||||||
| Due in one year or less |
$ | 1,742 | $ | 1,782 | ||||
| Due after one year through five years |
7,325 | 7,863 | ||||||
| Due after five years through ten years |
8,622 | 9,530 | ||||||
| Due after ten years |
35,992 | 41,474 | ||||||
|
|
|
|||||||
| 53,681 | 60,649 | |||||||
| Asset-backed and mortgage-backed securities |
2,674 | 2,636 | ||||||
|
|
|
|||||||
| Total |
$ | 56,355 | $ | 63,285 | ||||
|
|
|
|||||||
Expected maturities may differ from contractual maturities because eligible borrowers may exercise their right to call or prepay obligations with or without call or prepayment penalties. Asset-backed and mortgage-backed securities are shown separately in the table above, as they are not due at a single maturity date.
F-23
Table of Contents
JOHN HANCOCK LIFE INSURANCE COMPANY (U.S.A.)
NOTES TO CONSOLIDATED FINANCIAL STATEMENTS – (CONTINUED)
Note 2 — Investments - (continued)
Fixed Maturities and Equity Securities Impairment Review
The Company has a process in place to identify securities that could potentially have an impairment that is other-than-temporary. This process involves monitoring market events that could impact issuers’ credit ratings, business climate, management changes, litigation and government actions, and other similar factors. This process also involves monitoring late payments, downgrades by rating agencies, key financial ratios, financial statements, revenue forecasts, and cash flow projections as indicators of credit issues.
At the end of each quarter, the MFC Loan Review Committee reviews all fixed maturity securities where there is evidence of impairment or a significant unrealized loss at the balance sheet date. Generally, securities with market value less than 60 percent of amortized cost for six months or more indicate an impairment is present. Accordingly, securities in this category are normally deemed impaired unless there is clear evidence they should not be impaired. The analysis focuses on each company’s or project’s ability to service its debts in a timely fashion and the length of time the security has been trading below amortized cost. The results of this analysis are reviewed by the Credit Committee at MFC. This committee includes MFC’s Chief Financial Officer, Chief Investment Officer, Chief Risk Officer, Chief Credit Officer, and other senior management. This quarterly process includes a fresh assessment of the credit quality of each investment in the entire fixed maturity security portfolio.
The Company considers relevant facts and circumstances in evaluating whether the impairment of a fixed maturity security is other-than-temporary. Relevant facts and circumstances considered include (1) the length of time the fair value has been below cost; (2) the financial position of the issuer, including the current and future impact of any specific events; and (3) the Company’s ability and intent to hold the fixed maturity security to maturity or until it recovers in value. If the Company intends to sell, or if it is more likely than not that it will be required to sell an impaired fixed maturity security prior to recovery of its cost basis, the security is considered other-than-temporarily impaired, and the Company records a charge to earnings for the full amount of impairment (the difference between the current carrying amount and fair value of the security). For fixed maturity securities in an unrealized loss position where the Company does not intend to sell or is not more likely than not to be required to sell, the Company determines its ability to recover the amortized cost of the security by comparing the net present value of the projected future cash flows to the amortized cost of the security. If the net present value of the cash flow is less than the security’s amortized cost, then the difference is recorded as a credit loss. The difference between the estimates of the credit loss and the overall unrealized loss on the security is the non-credit-related component. The credit loss portion is charged to net realized investment and other gains (losses) on the Consolidated Statements of Operations, while the non-credit loss is charged to AOCI on the Consolidated Balance Sheets.
The net present value used to determine the credit loss is calculated by discounting the Company’s best estimate of projected future cash flows at the effective interest rate implicit in the fixed maturity security prior to impairment. The Company may use the estimated fair value of collateral as a proxy for the net present value if it believes that the security is dependent on the liquidation of collateral for recovery of its investment. The projection of future cash flows is subject to the same analysis the Company applies to its overall impairment evaluation process, as noted above, which incorporates security specific information such as late payments, downgrades by rating agencies, key financial ratios, investee financial statements, and fundamentals of the industry and geographic area in which the issuer operates, as well as overall macroeconomic conditions.
The projections are estimated using assumptions regarding probability of default and estimates regarding timing and amount of recoveries associated with a default. For mortgage-backed and asset-backed securities, cash flow estimates, including prepayment assumptions, are based on data from third-party data sources or internal estimates and are driven by assumptions regarding the underlying collateral, including default rates, recoveries, and changes in value.
Similarly, management evaluates all facts and circumstances and exercises professional judgment in determining whether an other-than-temporary impairment of equity securities exists. The MFC Credit Committee reviews and approves the proposed impairments based on an analysis of the evidence, including the current market price, the length of time the security has been in an unrealized loss position, forecasted EPS, consensus price targets, projected P/E ratios, overall financial health of each issuer, liquidity or solvency issues, announced changes in ownership structure, changes to issuer debt ratings, changes to dividend payments, changes in products, markets or competition, and other industry specific or macro economic factors.
There are a number of significant risks and uncertainties inherent in the process of monitoring impairments and determining if impairment is other-than-temporary. These risks and uncertainties include (1) the risk that the Company’s assessment of an issuer’s ability to meet all of its contractual obligations will change based on changes in the credit characteristics of that issuer; (2) the risk that the economic outlook will be worse than expected or have more of an impact on the issuer than anticipated; (3) the risk that fraudulent information could be provided to the Company’s investment professionals who determine the fair value estimates and other-than-temporary impairments; and (4) the risk that new information obtained by
F-24
Table of Contents
JOHN HANCOCK LIFE INSURANCE COMPANY (U.S.A.)
NOTES TO CONSOLIDATED FINANCIAL STATEMENTS – (CONTINUED)
Note 2 — Investments - (continued)
the Company or changes in other facts and circumstances lead it to change its intent to hold the security to maturity or until it recovers in value. Any of these situations could result in a charge to earnings in a future period.
The cost amounts for both fixed maturity securities and equity securities are net of other-than-temporary impairment charges.
The following table rolls forward the amount of credit losses recognized in earnings on available-for-sale fixed maturity securities for which a portion of the other-than-temporary impairment was also recognized in AOCI:
Credit losses on available-for-sale fixed maturities:
| December 31, | ||||||||||||
| 2012 | 2011 | 2010 | ||||||||||
|
|
|
|||||||||||
| (in millions) | ||||||||||||
| Balance, beginning of year |
$ | 380 | $ | 399 | $ | 361 | ||||||
| Additions: |
||||||||||||
| Credit losses for which an other-than-temporary impairment was not previously recognized |
75 | 38 | 93 | |||||||||
| Credit losses for which an other-than-temporary impairment was previously recognized |
12 | 13 | 10 | |||||||||
| Deletions: |
||||||||||||
| Amounts related to sold, matured, or paid down available-for-sale fixed maturities |
(96 | ) | (70 | ) | (65) | |||||||
|
|
|
|||||||||||
| Balance, end of year |
$ | 371 | $ | 380 | $ | 399 | ||||||
|
|
|
|||||||||||
F-25
Table of Contents
JOHN HANCOCK LIFE INSURANCE COMPANY (U.S.A.)
NOTES TO CONSOLIDATED FINANCIAL STATEMENTS – (CONTINUED)
Note 2 — Investments - (continued)
The following table shows the carrying value and gross unrealized losses aggregated by investment category and length of time that individual available-for-sale fixed maturity and equity securities have been in a continuous unrealized loss position:
Unrealized Losses on Available-For-Sale Fixed Maturity and Equity Securities — By Investment Age
| December 31, 2012 | ||||||||||||||||||||||||
| Less than 12 months | 12 months or more | Total | ||||||||||||||||||||||
| Carrying Value |
Unrealized Losses |
Carrying Value |
Unrealized Losses |
Carrying Value |
Unrealized Losses |
|||||||||||||||||||
| (in millions) | ||||||||||||||||||||||||
| Corporate debt securities |
$ | 2,008 | $ | (85 | ) | $ | 1,404 | $ | (186 | ) | $ | 3,412 | $ | (271 | ) | |||||||||
| Commercial mortgage-backed securities |
129 | (1 | ) | 223 | (80 | ) | 352 | (81 | ) | |||||||||||||||
| Residential mortgage-backed securities |
1 | - | 214 | (60 | ) | 215 | (60 | ) | ||||||||||||||||
| Collateralized debt obligations |
- | - | 99 | (46 | ) | 99 | (46 | ) | ||||||||||||||||
| Other asset-backed securities |
5 | - | 30 | (2 | ) | 35 | (2 | ) | ||||||||||||||||
| US Treasury securities and obligations of US government corps and agencies |
3,847 | (79 | ) | - | - | 3,847 | (79 | ) | ||||||||||||||||
| Obligations of states and political subdivisions |
116 | (1 | ) | - | - | 116 | (1 | ) | ||||||||||||||||
| Debt securities issued by foreign governments |
7 | - | 86 | (6 | ) | 93 | (6 | ) | ||||||||||||||||
| Total fixed maturities available-for-sale |
6,113 | (166 | ) | 2,056 | (380 | ) | 8,169 | (546 | ) | |||||||||||||||
| Equity securities available-for-sale |
14 | (3 | ) | 4 | (2 | ) | 18 | (5 | ) | |||||||||||||||
| Total |
$ | 6,127 | $ | (169 | ) | $ | 2,060 | $ | (382 | ) | $ | 8,187 | $ | (551 | ) | |||||||||
F-26
Table of Contents
JOHN HANCOCK LIFE INSURANCE COMPANY (U.S.A.)
NOTES TO CONSOLIDATED FINANCIAL STATEMENTS – (CONTINUED)
Note 2 — Investments - (continued)
| December 31, 2011 | ||||||||||||||||||||||||
| Less than 12 months | 12 months or more | Total | ||||||||||||||||||||||
| Carrying Value |
Unrealized Losses |
Carrying Value |
Unrealized Losses |
Carrying Value |
Unrealized Losses |
|||||||||||||||||||
| (in millions) | ||||||||||||||||||||||||
| Corporate debt securities |
$ | 2,854 | $ | (106 | ) | $ | 2,911 | $ | (467 | ) | $ | 5,765 | $ | (573 | ) | |||||||||
| Commercial mortgage-backed securities |
359 | (8 | ) | 327 | (124 | ) | 686 | (132 | ) | |||||||||||||||
| Residential mortgage-backed securities |
30 | (2 | ) | 320 | (206 | ) | 350 | (208 | ) | |||||||||||||||
| Collateralized debt obligations |
5 | (1 | ) | 123 | (85 | ) | 128 | (86 | ) | |||||||||||||||
| Other asset-backed securities |
74 | (3 | ) | 80 | (6 | ) | 154 | (9 | ) | |||||||||||||||
| US Treasury securities and obligations of US government corps and agencies |
- | - | - | - | - | - | ||||||||||||||||||
| Obligations of states and political subdivisions |
- | - | 93 | (1 | ) | 93 | (1 | ) | ||||||||||||||||
| Debt securities issued by foreign governments |
- | - | 104 | (6 | ) | 104 | (6 | ) | ||||||||||||||||
| Total fixed maturities available-for-sale |
3,322 | (120 | ) | 3,958 | (895 | ) | 7,280 | (1,015 | ) | |||||||||||||||
| Equity securities available-for-sale |
37 | (9 | ) | 12 | (1 | ) | 49 | (10 | ) | |||||||||||||||
| Total |
$ | 3,359 | $ | (129 | ) | $ | 3,970 | $ | (896 | ) | $ | 7,329 | $ | (1,025 | ) | |||||||||
Unrealized losses can be created by rising interest rates or by rising credit concerns and hence widening credit spreads. Credit concerns are apt to play a larger role in the unrealized loss on below investment grade securities. Unrealized losses on investment grade securities principally relate to changes in interest rates or changes in credit spreads since the securities were acquired. Credit rating agencies’ statistics indicate that investment grade securities have been found to be less likely to develop credit concerns. The gross unrealized loss on below investment grade available-for-sale fixed maturity securities decreased to $280 million at December 31, 2012 from $619 million at December 31, 2011.
At December 31, 2012 and 2011, there were 624 and 919 available-for-sale fixed maturity securities with an aggregate gross unrealized loss of $546 million and $1,015 million, respectively, of which the single largest unrealized loss was $33 million and $31 million, respectively. The Company anticipates that these fixed maturity securities will perform in accordance with their contractual terms and currently has the ability and intent to hold these securities until they recover or mature.
At December 31, 2012 and 2011, there were 75 and 125 equity securities with an aggregate gross unrealized loss of $5 million and $10 million, respectively, of which the single largest unrealized loss was $2 million and $2 million, respectively. The Company anticipates that these equity securities will recover in value in the near term.
Available-for-sale securities with amortized cost of $336 million were non-income producing for the year ended December 31, 2012. Non-income producing assets represent investments that have not produced income for the 12 months preceding December 31, 2012.
Securities Lending
The Company participated in a securities lending program for the purpose of enhancing income on securities held. There were no securities on loan and no collateral held as of December 31, 2012 and 2011. The Company maintains collateral at a level of at least 102% of the loaned securities’ market value and monitors the market value of the loaned securities on a daily basis.
F-27
Table of Contents
JOHN HANCOCK LIFE INSURANCE COMPANY (U.S.A.)
NOTES TO CONSOLIDATED FINANCIAL STATEMENTS – (CONTINUED)
Note 2 — Investments - (continued)
Assets on Deposit and Pledged as Collateral
The Company maintains assets which are pledged as collateral in connection with various agreements and transactions. Additionally, the Company holds assets on deposit with government authorities as required by state law. The following table summarizes the fair value of the pledged or deposited assets:
| December 31, | ||||||||
| 2012 | 2011 | |||||||
|
|
|
|||||||
| (in millions) | ||||||||
| Bonds pledged in support of over-the-counter derivative instruments |
$ | 114 | $ | 134 | ||||
| Bonds pledged in support of exchange-traded futures |
552 | 800 | ||||||
| Bonds on deposit with government authorities |
36 | 36 | ||||||
| Mortgage loans pledged in support of real estate |
52 | 52 | ||||||
|
|
|
|
|
|||||
| Total assets pledged as collateral and on deposit |
$ | 754 | $ | 1,022 | ||||
|
|
|
|
|
|||||
Mortgage Loans on Real Estate
At December 31, 2012 and 2011, the mortgage portfolio was diversified by specific collateral property type and geographic region as displayed below:
December 31, 2012:
| Collateral Property Type |
Carrying Amount |
Geographic Concentration |
Carrying Amount |
|||||||
|
|
|
|||||||||
| (in millions) | (in millions) | |||||||||
| Apartments |
$ | 2,162 | East North Central | $ | 1,477 | |||||
| Industrial |
1,380 | East South Central | 166 | |||||||
| Office buildings |
3,711 | Middle Atlantic | 2,258 | |||||||
| Retail |
3,613 | Mountain | 719 | |||||||
| Mixed use |
6 | New England | 939 | |||||||
| Agricultural |
507 | Pacific | 3,589 | |||||||
| Agribusiness |
853 | South Atlantic | 2,782 | |||||||
| Other |
1,004 | West North Central | 482 | |||||||
| West South Central | 649 | |||||||||
| Canada / Other | 175 | |||||||||
| Provision for losses |
(44 | ) | Provision for losses | (44 | ) | |||||
|
|
|
|
|
|||||||
| Total |
$ | 13,192 | Total | $ | 13,192 | |||||
|
|
|
|
|
|||||||
F-28
Table of Contents
JOHN HANCOCK LIFE INSURANCE COMPANY (U.S.A.)
NOTES TO CONSOLIDATED FINANCIAL STATEMENTS – (CONTINUED)
Note 2 — Investments - (continued)
December 31, 2011:
| Collateral Property Type |
Carrying Amount |
Geographic Concentration |
Carrying Amount |
|||||||
|
|
|
|||||||||
| (in millions) | (in millions) | |||||||||
| Apartments |
$ | 2,017 | East North Central | $ | 1,511 | |||||
| Industrial |
1,743 | East South Central | 219 | |||||||
| Office buildings |
4,029 | Middle Atlantic | 2,288 | |||||||
| Retail |
3,579 | Mountain | 888 | |||||||
| Mixed use |
183 | New England | 1,017 | |||||||
| Agricultural |
622 | Pacific | 3,665 | |||||||
| Agribusiness |
930 | South Atlantic | 2,904 | |||||||
| Other |
916 | West North Central | 568 | |||||||
| West South Central | 771 | |||||||||
| Canada / Other | 188 | |||||||||
| Provision for losses |
(45 | ) | Provision for losses | (45 | ) | |||||
|
|
|
|
|
|||||||
| Total |
$ | 13,974 | Total | $ | 13,974 | |||||
|
|
|
|
|
|||||||
At the end of each quarter, the MFC Loan Review Committee reviews all mortgage loans rated BB or lower, as determined by review of the underlying collateral, and decides whether an allowance for credit loss is needed. The Company considers collateral value, the borrower’s ability to pay, normal historical credit loss levels, and future expectations in evaluating whether an allowance for credit losses is required for impaired loans.
Changes in the allowance for probable losses on mortgage loans on real estate are summarized below:
| Balance at Beginning of Period |
Additions | Recoveries | Charge-offs and Disposals |
Balance at End of Period |
||||||||||||||||
|
|
|
|||||||||||||||||||
| (in millions) | ||||||||||||||||||||
| Year ended December 31, 2012 |
$ | 45 | $ | 24 | $ | (1 | ) | $ | (24 | ) | $ | 44 | ||||||||
| Year ended December 31, 2011 |
34 | 38 | (1 | ) | (26 | ) | 45 | |||||||||||||
| Year ended December 31, 2010 |
42 | 38 | (5 | ) | (41 | ) | 34 | |||||||||||||
A mortgage loan charge-off is recorded when the impaired loan is disposed or when an impaired loan is determined to be a full loss with no possibility of recovery. Charge-offs are deducted from the allowance for probable losses.
Mortgage loans with a carrying value of $75 million were non-income producing for the year ended December 31, 2012. Mortgage loans with a carrying value of $75 million were on nonaccrual status at December 31, 2012. At December 31, 2012, mortgage loans with a carrying value of $15 million were delinquent by less than 90 days and $22 million were delinquent by 90 days or more.
F-29
Table of Contents
JOHN HANCOCK LIFE INSURANCE COMPANY (U.S.A.)
NOTES TO CONSOLIDATED FINANCIAL STATEMENTS – (CONTINUED)
Note 2 — Investments - (continued)
The Company provides for credit risk on mortgage loans by establishing allowances against the carrying value of the impaired loans. The total recorded investment in mortgage loans that is considered to be impaired along with the related allowance for credit losses was as follows:
| December 31, | ||||||||
| 2012 | 2011 | |||||||
|
|
|
|||||||
| (in millions) | ||||||||
| Impaired mortgage loans on real estate with provision for losses |
$ | 119 | $ | 131 | ||||
| Allowance for credit losses |
(44 | ) | (45 | ) | ||||
|
|
|
|
|
|||||
| Net impaired mortgage loans on real estate |
$ | 75 | $ | 86 | ||||
|
|
|
|
|
|||||
The average recorded investment in impaired loans and the interest income recognized on impaired loans were as follows:
| December 31, | ||||||||||||
| 2012 | 2011 | 2010 | ||||||||||
|
|
|
|||||||||||
| (in millions) | ||||||||||||
| Average recorded investment in impaired loans |
$ | 105 | $ | 109 | $ | 130 | ||||||
| Interest income recognized on impaired loans |
- | - | - | |||||||||
For mortgage loans, the Company evaluates credit quality through regular monitoring of credit related exposures, considering both qualitative and quantitative factors in assigning an internal risk rating (IRR). These ratings are updated at least annually.
The carrying value of mortgage loans by IRR was as follows:
| December 31, | ||||||||
| 2012 | 2011 | |||||||
|
|
|
|||||||
| (in millions) | ||||||||
| AAA |
$ | 319 | $ | 154 | ||||
| AA |
1,460 | 1,310 | ||||||
| A |
2,928 | 2,749 | ||||||
| BBB |
7,648 | 8,811 | ||||||
| BB |
529 | 577 | ||||||
| B and lower and unrated |
308 | 373 | ||||||
|
|
|
|
|
|||||
| Total |
$ | 13,192 | $ | 13,974 | ||||
|
|
|
|
|
|||||
Investment Real Estate, Agriculture, and Timber
Investment real estate, agriculture, and timber of $136 million was non-income producing for the year ended December 31, 2012. Depreciation expense on investment real estate, agriculture, and timber was $84 million, $69 million, and $63 million in 2012, 2011, and 2010, respectively. Accumulated depreciation was $602 million and $514 million at December 31, 2012 and 2011, respectively.
F-30
Table of Contents
JOHN HANCOCK LIFE INSURANCE COMPANY (U.S.A.)
NOTES TO CONSOLIDATED FINANCIAL STATEMENTS – (CONTINUED)
Note 2 — Investments - (continued)
Other Invested Assets
Other invested assets primarily consist of unconsolidated joint ventures, partnerships, and limited liability corporations, which are accounted for using the equity method of accounting. The carrying value of equity method investments totaled $4,458 million and $3,951 million at December 31, 2012 and 2011, respectively. Net investment income on investments accounted for under the equity method totaled $218 million, $222 million, and $197 million in 2012, 2011, and 2010, respectively. Total combined assets of such investments were $62,974 million and $55,010 million (consisting primarily of investments) and total combined liabilities were $14,830 million and $16,466 million (including $9,698 million and $10,547 million of debt) at December 31, 2012 and 2011, respectively. Total combined revenues and expenses of these investments in 2012 were $8,639 million and $4,696 million, respectively, resulting in $3,943 million of total combined income (loss) from operations. Total combined revenues and expenses of these investments in 2011 were $8,516 million and $4,750 million, respectively, resulting in $3,766 million of total combined income (loss) from operations. Total combined revenues and expenses of these investments in 2010 were $5,772 million and $4,884 million, respectively, resulting in $888 million of total combined income (loss) from operations. Depending on the timing of receipt of the audited financial statements of these other invested assets, the above investee level financial data may be up to one year in arrears.
Net Investment Income and Net Realized Investment and Other Gains (Losses)
The following information summarizes the components of net investment income and net realized investment and other gains (losses):
| December 31, | ||||||||||||
| 2012 | 2011 | 2010 | ||||||||||
|
|
|
|||||||||||
| (in millions) | ||||||||||||
| Net investment income |
||||||||||||
| Fixed maturities |
$ | 2,943 | $ | 3,425 | $ | 3,199 | ||||||
| Equity securities |
7 | 9 | 10 | |||||||||
| Mortgage loans on real estate |
771 | 798 | 766 | |||||||||
| Investment real estate, agriculture, and timber |
216 | 205 | 171 | |||||||||
| Policy loans |
300 | 305 | 326 | |||||||||
| Short-term investments |
8 | 9 | 12 | |||||||||
| Derivatives |
405 | 196 | 12 | |||||||||
| Equity method investments and other |
182 | 303 | 269 | |||||||||
|
|
|
|||||||||||
| Gross investment income |
4,832 | 5,250 | 4,765 | |||||||||
| Less investment expenses |
(273 | ) | (261 | ) | (269 | ) | ||||||
|
|
|
|||||||||||
| Net investment income |
$ | 4,559 | $ | 4,989 | $ | 4,496 | ||||||
|
|
|
|||||||||||
| December 31, | ||||||||||||
|
|
|
|||||||||||
| 2012 | 2011 | 2010 | ||||||||||
|
|
|
|||||||||||
| (in millions) | ||||||||||||
| Net realized investment and other gains (losses) |
||||||||||||
| Fixed maturities |
$ | 1,025 | $ | 1,131 | $ | 726 | ||||||
| Equity securities |
40 | (11 | ) | 29 | ||||||||
| Mortgage loans on real estate |
58 | (82 | ) | (62 | ) | |||||||
| Derivatives |
(3,441 | ) | 2,137 | (558 | ) | |||||||
| Other invested assets |
189 | 62 | 30 | |||||||||
| Amounts credited to participating contract holders |
(39 | ) | (102 | ) | (83 | ) | ||||||
|
|
|
|
|
|
|
|||||||
| Net realized investment and other gains (losses) |
$ | (2,168 | ) | $ | 3,135 | $ | 82 | |||||
|
|
|
|
|
|
|
|||||||
F-31
Table of Contents
JOHN HANCOCK LIFE INSURANCE COMPANY (U.S.A.)
NOTES TO CONSOLIDATED FINANCIAL STATEMENTS – (CONTINUED)
Note 2 — Investments - (continued)
The change in net unrealized gains (losses) on fixed maturities classified as held-for-trading of $33 million, $46 million, and $34 million is included in net realized investment and other gains (losses) for the years ended December 31, 2012, 2011, and 2010, respectively.
The change in net unrealized gains (losses) on held-for-trading equities, included in net realized investment and other gains (losses) was $7 million, $(10) million, and $10 million for the years ended December 31, 2012, 2011, and 2010, respectively.
The change in net unrealized gains (losses) on derivatives of $(1,941) million, $2,687 million, and $(229) million is included in net realized investment and other gains (losses) for the years ended December 31, 2012, 2011, and 2010, respectively.
For the years ended December 31, 2012, 2011, and 2010, net investment income passed through to participating contract holders as interest credited to policyholders’ account balances amounted to $91 million, $100 million, and $106 million, respectively.
Gross gains were realized on the sale of available-for-sale securities of $1,284 million, $1,619 million, and $774 million for the years ended December 31, 2012, 2011, and 2010, respectively, and gross losses were realized on the sale of available-for-sale securities of $199 million, $291 million, and $194 million for the years ended December 31, 2012, 2011, and 2010, respectively. In addition, other-than-temporary impairments on available-for-sale securities of $95 million, $70 million, and $115 million for the years ended December 31, 2012, 2011, and 2010, respectively, were recognized in the Consolidated Statements of Operations.
Note 3 — Relationships with Variable Interest Entities
In its capacities as an investor and as an investment manager, the Company has relationships with various types of entities, some of which are considered variable interest entities (“VIEs”).
The Company consolidates a VIE when it is determined that it is the primary beneficiary of the VIE, or controls the VIE. The Company’s analysis to determine whether it must consolidate the VIE includes review of the Company’s contractual rights and responsibilities, fees received, and interests held. For the purpose of disclosing consolidated variable interest entities, the Company aggregates similar entities.
If it is not considered to be the primary beneficiary of the VIE, nor does it have control over the VIE, the Company assesses the materiality of its relationship with the VIE to determine if it holds a significant variable interest, which requires disclosure. This assessment considers the materiality of the VIE relationship to the Company as, among other factors, a percentage of total investments, percentage of total net investment income, and percentage of total funds under management. For purposes of assessing materiality and disclosing significant variable interests, the Company aggregates similar entities.
Consolidated Variable Interest Entities
The following table presents the total assets and total liabilities relating to VIEs for which the Company has concluded that it is the primary beneficiary or in control and which are consolidated in the Company’s financial statements. The liabilities recognized as a result of consolidating the VIEs do not represent claims against the general assets of the Company. Conversely, the assets recognized as a result of consolidating the VIEs can only be used to settle the liabilities recognized as a result of consolidating the VIEs.
| December 31, | ||||||||||||||||
| 2012 | 2011 | |||||||||||||||
|
|
|
|||||||||||||||
| Total Assets | Total Liabilities | Total Assets | Total Liabilities | |||||||||||||
| (in millions) | ||||||||||||||||
| Collateralized debt obligations |
||||||||||||||||
| (“CDOs”) |
$ | 71 | $ | 50 | $ | 198 | $ | 147 | ||||||||
F-32
Table of Contents
JOHN HANCOCK LIFE INSURANCE COMPANY (U.S.A.)
NOTES TO CONSOLIDATED FINANCIAL STATEMENTS – (CONTINUED)
Note 3 — Relationships with Variable Interest Entities - (continued)
Significant Variable Interests in Unconsolidated Variable Interest Entities
The following table presents the total assets of, investment in, and maximum exposure to loss relating to VIEs for which the Company has concluded that it holds significant variable interests, but it is not the primary beneficiary, nor does it have control over the VIE, and which have not been consolidated. The Company does not record any liabilities related to these unconsolidated VIEs.
| 2012 | 2011 | |||||||||||||||||||||||
| Total Assets | Investment (1) | Maximum Exposure to Loss (2) |
Total Assets | Investment (1) | Maximum Exposure to Loss (2) |
|||||||||||||||||||
| (in millions) | ||||||||||||||||||||||||
| Collateralized debt obligations (3) |
$ | 341 | $ | - | $ | - | $ | 448 | $ | - | $ | - | ||||||||||||
| Real estate limited partnerships (4) |
1,158 | 314 | 323 | 1,289 | 378 | 392 | ||||||||||||||||||
| Timber funds (5) |
3,601 | 478 | 496 | 2,058 | 109 | 136 | ||||||||||||||||||
|
|
|
|
|
|
|
|
|
|
|
|
|
|||||||||||||
| Total |
$ | 5,100 | $ | 792 | $ | 819 | $ | 3,795 | $ | 487 | $ | 528 | ||||||||||||
|
|
|
|
|
|
|
|
|
|
|
|
|
|||||||||||||
| (1) | The Company’s investments in unconsolidated VIEs are included in available-for-sale fixed maturity securities and other invested assets on the Consolidated Balance Sheets. |
| (2) | The maximum exposure to loss related to CDOs is limited to the investment reported on the Company’s Consolidated Balance Sheets. The maximum exposure to loss related to real estate limited partnerships and timber funds is limited to the Company’s investment plus unfunded capital commitments. The maximum loss is expected to occur only upon bankruptcy of the issuer or investee or as a result of a natural disaster in the case of the timber funds. |
| (3) | The Company acts as an investment manager to certain CDOs for which it collects a management fee. In addition, the Company may invest in debt or equity securities issued by these CDOs or by CDOs managed by others. CDOs raise capital by issuing debt and equity securities and use the proceeds to purchase investments. |
| (4) | Real estate limited partnerships include partnerships established for the purpose of investing in real estate that qualifies for low income housing and/or historic tax credits. Limited partnerships are owned by a general partner, who manages the business, and by limited partners, who invest capital, but have limited liability and are not involved in the partnerships’ management. The Company is typically the sole limited partner or investor member of each and is not the general partner or managing member. |
| (5) | The Company acts as investment manager for the VIEs owning the timberland properties (the “timber funds”), in which the general account and institutional separate accounts invests. Timber funds are investment vehicles used primarily by large institutional investors, such as public and corporate pension plans, whose primary source of return is derived from the growth and harvest of timber and long-term appreciation of the property. The primary risks related to timberland investments include market value uncertainty (due to fluctuations in market prices for timberland outputs), liquidity risk (as compared to stocks and other financial instruments), and environmental risk (natural hazards or legislation related to threatened or endangered species). These risks are mitigated through effective investment management and geographic diversification of timberland investments and sound environmental risk governance practices. The Company collects an advisory fee from each timber fund and is also eligible for performance and forestry management fees. |
F-33
Table of Contents
JOHN HANCOCK LIFE INSURANCE COMPANY (U.S.A.)
NOTES TO CONSOLIDATED FINANCIAL STATEMENTS – (CONTINUED)
Note 4 — Goodwill, Value of Business Acquired, and Other Intangible Assets
The changes in the carrying value of goodwill by segment were as follows:
| Insurance | Wealth Management |
Corporate and Other |
Total | |||||||||||||
|
|
|
|||||||||||||||
| (in millions) | ||||||||||||||||
| Balance at January 1, 2012 |
$ | - | $ | 807 | $ | 146 | $ | 953 | ||||||||
| Impairment |
- | - | - | - | ||||||||||||
|
|
|
|||||||||||||||
| Balance at December 31, 2012 |
$ | - | $ | 807 | $ | 146 | $ | 953 | ||||||||
|
|
|
|||||||||||||||
| Insurance | Wealth Management |
Corporate and Other |
Total | |||||||||||||
|
|
|
|||||||||||||||
| (in millions) | ||||||||||||||||
| Balance at January 1, 2011 |
$ | - | $ | 1,307 | $ | 146 | $ | 1,453 | ||||||||
| Impairment |
- | (500 | ) | - | (500 | ) | ||||||||||
|
|
|
|||||||||||||||
| Balance at December 31, 2011 |
$ | - | $ | 807 | $ | 146 | $ | 953 | ||||||||
|
|
|
|||||||||||||||
The Company tests goodwill for impairment annually and more frequently if an event occurs or circumstances change that would more likely than not reduce the fair value of a reporting unit below its carrying amount. A reporting unit is defined as an operating segment or one level below an operating segment. In 2012, the Company had no goodwill impairment. In 2011, the Company impaired $500 million of goodwill associated with the Wealth Management segment. In 2010, the Company impaired the entire $1,600 million of goodwill associated with the Insurance segment. The impairments were reflective of the decrease in the expected future earnings for these businesses. The fair values were determined primarily using an earnings-based approach, which incorporated the segments’ in-force and new business embedded value using internal forecasts of revenue and expense.
Value of Business Acquired
The balance of and changes in VOBA were as follows:
| December 31, | ||||||||
| 2012 | 2011 | |||||||
|
|
|
|||||||
| (in millions) | ||||||||
| Balance, beginning of year |
$ | 1,321 | $ | 1,959 | ||||
| Amortization |
(224 | ) | (389 | ) | ||||
| Change due to unrealized investment gains (losses) |
136 | (249 | ) | |||||
| Reinsurance recapture (1) |
(37 | ) | - | |||||
|
|
|
|||||||
| Balance, end of year |
$ | 1,196 | $ | 1,321 | ||||
|
|
|
|||||||
| (1) | The amount relates to a universal life block of business that was recaptured by a third party resulting in the write off of the associated value of business acquired. The net impact of this recapture transaction was an $8 million gain and was recorded in fee income in the Consolidated Statement of Operations. |
F-34
Table of Contents
JOHN HANCOCK LIFE INSURANCE COMPANY (U.S.A.)
NOTES TO CONSOLIDATED FINANCIAL STATEMENTS – (CONTINUED)
Note 4 — Goodwill, Value of Business Acquired, and Other Intangible Assets - (continued)
The following table provides estimated future amortization for the periods indicated:
| VOBA Amortization |
||||
| (in millions) | ||||
| 2013 |
$ | 116 | ||
| 2014 |
96 | |||
| 2015 |
92 | |||
| 2016 |
85 | |||
| 2017 |
81 | |||
F-35
Table of Contents
JOHN HANCOCK LIFE INSURANCE COMPANY (U.S.A.)
NOTES TO CONSOLIDATED FINANCIAL STATEMENTS – (CONTINUED)
Note 4 — Goodwill, Value of Business Acquired, and Other Intangible Assets - (continued)
Other Intangible Assets
Other intangible assets were as follows:
| Gross Carrying Amount |
Accumulated Net Amortization |
Net Carrying Amount |
||||||||||
|
|
|
|||||||||||
| (in millions) | ||||||||||||
| December 31, 2012 |
||||||||||||
| Not subject to amortization: |
||||||||||||
| Brand name |
$ | 600 | $ | - | $ | 600 | ||||||
| Investment management contracts |
295 | - | 295 | |||||||||
| Other |
5 | - | 5 | |||||||||
| Subject to amortization: |
||||||||||||
| Distribution networks |
397 | (73 | ) | 324 | ||||||||
| Other investment management contracts |
56 | (30 | ) | 26 | ||||||||
|
|
|
|||||||||||
| Total |
$ | 1,353 | $ | (103 | ) | $ | 1,250 | |||||
|
|
|
|||||||||||
| December 31, 2011 |
||||||||||||
| Not subject to amortization: |
||||||||||||
| Brand name |
$ | 600 | $ | - | $ | 600 | ||||||
| Investment management contracts |
295 | - | 295 | |||||||||
| Other |
5 | - | 5 | |||||||||
| Subject to amortization: |
||||||||||||
| Distribution networks |
397 | (60 | ) | 337 | ||||||||
| Other investment management contracts |
64 | (31 | ) | 33 | ||||||||
|
|
|
|||||||||||
| Total |
$ | 1,361 | $ | (91 | ) | $ | 1,270 | |||||
|
|
|
|||||||||||
Amortization expense for other intangible assets was $16 million, $15 million, and $14 million for the years ended December 31, 2012, 2011, and 2010, respectively. Amortization expense for other intangible assets is expected to be approximately $17 million in 2013, $18 million in 2014, $17 million in 2015, $16 million in 2016, and $16 million in 2017.
During 2012, the Company impaired $4 million of other investment management contracts subject to amortization associated with the Corporate and Other segment. The impairment was recorded in other operating costs and expenses in the Consolidated Statement of Operations. The gross carrying value of the impaired other investment management contracts was $8 million and the associated accumulated amortization was $4 million. The impairments were reflective of a decrease in expected future earnings. The fair values were determined primarily using an earnings based approach using internal forecasts of revenue and expense.
F-36
Table of Contents
JOHN HANCOCK LIFE INSURANCE COMPANY (U.S.A.)
NOTES TO CONSOLIDATED FINANCIAL STATEMENTS – (CONTINUED)
Note 5 — Deferred Policy Acquisition Costs and Deferred Sales Inducements
The balance of and changes in deferred policy acquisition costs were as follows:
| December 31, | ||||||||
| 2012 | 2011 | |||||||
|
|
|
|||||||
| (in millions) | ||||||||
| Balance, beginning of year |
$ | 6,111 | $ | 8,657 | ||||
| Capitalization |
715 | 755 | ||||||
| Amortization |
(1,084 | ) | (2,330 | ) | ||||
| Change due to unrealized investment gains |
25 | (971 | ) | |||||
|
|
|
|||||||
| Balance, end of year |
$ | 5,767 | $ | 6,111 | ||||
|
|
|
|||||||
The balance of and changes in deferred sales inducements were as follows:
| December 31, | ||||||||
| 2012 | 2011 | |||||||
|
|
|
|||||||
| (in millions) | ||||||||
| Balance, beginning of year |
$ | 187 | $ | 321 | ||||
| Capitalization |
4 | 11 | ||||||
| Amortization |
(77 | ) | (122 | ) | ||||
| Change due to unrealized investment gains |
32 | (23 | ) | |||||
|
|
|
|||||||
| Balance, end of year |
$ | 146 | $ | 187 | ||||
|
|
|
|||||||
See the Summary of Significant Accounting Policies Note for information on the retrospective application of the adoption of new accounting guidance related to DAC and DSI.
Note 6 — Related Party Transactions
Reinsurance Transactions
Effective December 31, 2008, the Company entered into an amended and restated reinsurance agreement with an affiliate, John Hancock Reassurance Company Limited (“JHRECO”), to reinsure 20% of the risk related to payout annuity policies issued January 1, 2008 through September 30, 2008 and 65% of the risk related to payout annuity policies issued prior to January 1, 2008. The reinsurance agreement is written on a modified coinsurance basis where the assets supporting the reinsured policies remain invested with the Company. The Company reported a reinsurance recoverable from JHRECO for ceded reserves and cost of reinsurance of ($180) million and ($161) million at December 31, 2012 and 2011, respectively, on the Company’s Consolidated Balance Sheets. As of December 31, 2012 and 2011, respectively, the Company reported a reinsurance payable to JHRECO of $29 million and $32 million, which was included with amounts due from and held for affiliates on the Company’s Consolidated Balance Sheets. Premiums ceded to JHRECO were $1 million, $93 million, and $1 million during the years ended December 31, 2012, 2011, and 2010 , respectively. Claims incurred ceded to JHRECO were $438 million, $520 million, and $465 million during the years ended December 31, 2012, 2011, and 2010, respectively.
The Company reinsured certain portions of its long-term care insurance and group annuity contracts with JHRECO. The Company entered into these reinsurance contracts in order to facilitate its capital management process. These reinsurance contracts are written both on a funds withheld basis and a modified coinsurance basis. As of July 1, 2010, amendments were made to the contracts to update the calculation of investment income and the expense allowance to reflect current experience. The Company recorded a liability for coinsurance funds withheld from JHRECO of $5,995 million and $5,439 million at December 31, 2012 and 2011, respectively, and recorded reinsurance recoverable from JHRECO of $6,232 million and $5,981 million at December 31, 2012 and 2011, respectively, on the Company’s Consolidated Balance Sheets. Premiums ceded to JHRECO were $613 million, $609 million, and $625 million during the years ended December 31, 2012, 2011, and 2010, respectively. Claims
F-37
Table of Contents
JOHN HANCOCK LIFE INSURANCE COMPANY (U.S.A.)
NOTES TO CONSOLIDATED FINANCIAL STATEMENTS – (CONTINUED)
Note 6 — Related Party Transactions - (continued)
incurred ceded to JHRECO were $313 million, $271 million, and $245 million during the years ended December 31, 2012, 2011, and 2010, respectively.
Effective October 1, 2008, the Company entered into a reinsurance agreement with an affiliate, Manulife Reinsurance (Bermuda) Limited (“MRBL”), to reinsure 75% of certain group annuity contracts in-force. The reinsurance agreement covers all contracts, excluding the guaranteed benefit rider, issued and in-force as of September 30, 2008. As the underlying contracts being reinsured are considered investment contracts, the agreement does not meet the criteria for reinsurance accounting and was classified as a financial instrument. Effective October 1, 2009, the original agreement was amended to increase the quota share percentage from 75% to 87%. Under the terms of the amended agreement, additional consideration of $250 million was paid by MRBL and is being amortized into income through other operating costs and expenses on a basis consistent with the manner in which the deferred policy acquisition costs on the underlying reinsured contracts are recognized. The balance of the unearned revenue liability was $1,072 million and $1,308 million as of December 31, 2012 and 2011, respectively.
Effective October 1, 2008, the Company entered into an amended and restated reinsurance agreement with MRBL to reinsure 90% of a significant block of variable annuity contracts in-force. All substantial risks, including all guaranteed benefits, related to certain specified policies not already reinsured to third parties, are reinsured under the agreement. The base contracts are reinsured on a modified coinsurance basis, while the guaranteed benefit reinsurance coverage is apportioned in accordance with the reinsurance agreement provisions between modified coinsurance and coinsurance funds withheld. The assets supporting the reinsured policies remain invested with the Company. Since the inception of the treaty in 2008, several amendments have been enacted to refine certain aspects of the treaty. As of December 31, 2012 and 2011, respectively, the Company reported a reinsurance recoverable (payable) for ceded reserves and cost of reinsurance of $1,083 million and ($205) million. As of December 31, 2012 and 2011, respectively, the Company reported a coinsurance funds withheld liability of $267 million and $0 million on the Consolidated Balance Sheets. As of December 31, 2012 and 2011, respectively, the Company reported a reinsurance receivable from MRBL of $(35) million and $47 million, which was included with amounts due from and held for affiliates. The net MRBL reinsurance recoverable includes the impact of ongoing reinsurance cash flows and is accounted for over the life of the underlying reinsured policies using assumptions consistent with those used to account for the underlying policies with changes to ceded reserves and cost of reinsurance recognized as a component of benefits to policyholders on the Consolidated Statements of Operations.
Effective December 31, 2004, the Company entered into a reinsurance agreement with MRBL to reinsure 75% of the non-reinsured risk of the JHLICO closed block. The Company amended this treaty during 2008 to increase the portion of non-reinsured risk reinsured under this treaty to 90% and amended it during 2009 to provide additional surplus relief. The reinsurance agreement is written on a modified coinsurance basis where the related financial assets remain invested with the Company. As the reinsurance agreement does not subject the reinsurer to the reasonable possibility of significant loss, it was classified as financial reinsurance and given deposit-type accounting treatment with only the reinsurance risk fee being reported in other operating costs and expenses in the Consolidated Statements of Operations.
Effective December 31, 2003, the Company entered into a reinsurance agreement with MRBL to reinsure 90% of the non-reinsured risk of the JHUSA closed block. As approximately 90% of the mortality risk is covered under previously existing contracts with third-party reinsurers and the resulting limited mortality risk is inherent in the new contract with MRBL, it was classified as financial reinsurance and given deposit-type accounting treatment. The Company retained title to the invested assets supporting this block of business. These invested assets are held in trust on behalf of MRBL and are included in amounts due from and held for affiliates on the Consolidated Balance Sheets. The amounts held at December 31, 2012 and 2011 were $2,487 million and $2,463 million, respectively, and are accounted for on a basis consistent with the methodologies described in the Significant Accounting Policy Note for similar financial instruments.
Service Agreements
The Company has formal service agreements with MFC and MLI, which can be terminated by either party upon two months’ notice. Under the various agreements, the Company will pay operating expenses incurred by MFC and MLI on behalf of the Company. Services provided under the agreements include legal, actuarial, investment, data processing, accounting, and certain other administrative services. Costs incurred under the agreements were $482 million, $457 million, and $412 million for the years ended December 31, 2012, 2011, and 2010, respectively. As of December 31, 2012 and 2011, the Company had amounts payable to MFC and MLI of $17 million and $11 million, respectively.
F-38
Table of Contents
JOHN HANCOCK LIFE INSURANCE COMPANY (U.S.A.)
NOTES TO CONSOLIDATED FINANCIAL STATEMENTS – (CONTINUED)
Note 6 — Related Party Transactions - (continued)
Management believes the allocation methods used are reasonable and appropriate in the circumstances; however, the Company’s Consolidated Balance Sheets and Consolidated Statements of Operations may not necessarily be indicative of the financial condition that would have existed if the Company operated as an unaffiliated entity.
Debt Transactions
Pursuant to subordinated surplus notes dated September 30, 2008, the Company borrowed $405 million from an affiliate, John Hancock Insurance Agency, Inc. (“JHIA”). The interest rate is fixed at 7%, and interest is payable semi-annually. The notes mature on March 31, 2033. Interest expense was $29 million, $29 million, and $29 million for the years ended December 31, 2012, 2011, and 2010, respectively.
On December 22, 2006, the Company issued a subordinated note that was converted on September 30, 2008 to a subordinated surplus note. The outstanding amount to JHFC of $136 million is due December 15, 2016. Interest on the subordinated surplus note from October 1, 2008 until December 15, 2011 accrued at a variable rate equal to LIBOR plus 0.3% per annum calculated and reset quarterly on March 31, June 30, September 30, and December 31 and payable semi-annually on March 31 and September 30 of each year. Thereafter, interest accrues at a variable rate equal to LIBOR plus 1.3% per annum reset quarterly as aforementioned and payable semi-annually on June 15 and December 15 of each year until payment in full. Interest expense was $2 million, $0 million, and $1 million for the years ended December 31, 2012, 2011, and 2010, respectively.
The issuance of the above surplus notes by the Company was approved by the Michigan Commissioner of Financial and Insurance Regulation (the “Commissioner”), and any payments of interest or principal on the surplus notes require the prior approval of the Commissioner. The surplus notes are included with amounts due to affiliates on the Consolidated Balance Sheets.
Pursuant to a demand note receivable dated September 30, 2008, the Company has $295 million outstanding with MIC. The interest rate is calculated at a fluctuating rate equal to 3-month LIBOR plus 0.83% per annum. Interest income was $4 million, $3 million, and $3 million for the years ended December 31, 2012, 2011, and 2010, respectively.
On December 28, 2011, the Company issued a promissory note to Manulife Management Services Limited (“MMSL”) in the amount of $200 million. During 2012, this balance was repaid in full. Interest on the loan was calculated at a fluctuating rate equal to LIBOR plus 0.1% per annum calculated and reset monthly and payable at maturity. Interest expense was $1 million and $0 million for the years ended December 31, 2012 and 2011, respectively.
On June 28, 2012, the Company issued a promissory note to Manulife Finance Switzerland AG (“MFSA”) in the amount of $153 million. Interest on the loan is calculated at a fluctuating rate equal to 3-month LIBOR plus 0.9% per annum payable quarterly with a maturity date of June 28, 2013. In addition, the Company renewed two previously outstanding promissory notes to MFSA with an outstanding balance of $7 million and combined these notes with the new note issued on June 12, 2012, thus bringing the total principal balance due to $160 million, with the terms noted above. Interest expense was $1 million and $0 million for the years ended December 31, 2012 and 2011, respectively.
On December 20, 2012, MIC issued a demand note to the Company in the amount of $130 million. Interest on the loan is calculated at a fluctuating rate equal to the LIBOR rate and is payable monthly. Interest expense was $0 million for the year ended December 31, 2012.
The fair value of the Company’s related party notes payable and note receivable totaled $831 million and $295 million, respectively, at December 31, 2012, and $748 million and $295 million, respectively at December 31, 2011.
Capital Stock Transactions
On December 16, 2010, the Company issued one share of common stock to MIC for $350 million in cash.
Other
On December 31, 2010, the Company issued a noncash dividend of $13 million to MIC as part of the transfer of certain pension and postretirement benefit plans.
F-39
Table of Contents
JOHN HANCOCK LIFE INSURANCE COMPANY (U.S.A.)
NOTES TO CONSOLIDATED FINANCIAL STATEMENTS – (CONTINUED)
Note 6 — Related Party Transactions - (continued)
The Company, in the ordinary course of business invests funds deposited by customers and manages the resulting invested assets for growth and income for customers. From time to time, successful investment strategies of the Company may attract deposits from affiliates of the Company. At December 31, 2012 and 2011, the Company managed approximately $8,947 million and $5,040 million of affiliate assets under management, respectively.
The Company has entered into two currency swap agreements with JHFC which are recorded at fair value. JHFC utilizes the currency swaps to hedge currency exposure on foreign currency financial instruments. The Company has also entered into two currency agreements with external counterparties which offset the currency swap agreements with JHFC. As of December 31, 2012 and 2011, the currency swap agreements with JHFC and the external counterparties had offsetting fair values of $84 million and $124 million, respectively.
JHUSA operates a liquidity pool in which affiliates can invest excess cash. Terms of operation and participation in the liquidity pool are set out in the Second Restated and Amended Liquidity Pool and Loan Facility Agreement effective January 1, 2010. The maximum aggregate amounts that JHUSA can accept into the Liquidity Pool are $5,000 million in U.S. dollar deposits and $200 million in Canadian dollar deposits. Under the terms of the agreement, certain participants may receive advances from the Liquidity Pool up to certain predetermined limits. Interest payable on the funds will be reset daily to the one-month London Interbank Bid Rate.
The following table details the affiliates and their participation in JHUSA’s Liquidity Pool:
| December 31, | ||||||||
| 2012 | 2011 | |||||||
|
|
|
|||||||
| (in millions) | ||||||||
| The Manufacturers Investment Corporation |
$ | 100 | $ | 202 | ||||
| John Hancock Financial Corporation |
89 | 40 | ||||||
| Manulife Reinsurance Limited |
35 | 121 | ||||||
| Manulife Reinsurance (Bermuda) Limited |
89 | 81 | ||||||
| Manulife Hungary Holdings KFT |
5 | 5 | ||||||
| John Hancock Insurance Company of Vermont |
18 | 16 | ||||||
| John Hancock Reassurance Company Limited |
15 | 10 | ||||||
| John Hancock Insurance Agency, Inc. |
10 | 6 | ||||||
|
|
|
|||||||
| Total |
$ | 361 | $ | 481 | ||||
|
|
|
|||||||
The balances above are reported on the Consolidated Balance Sheets as amounts due to affiliates.
On July 15, 2009, MFC fully and unconditionally guaranteed payments from the guarantee periods of the accumulation phase of the Company’s new market value adjusted deferred annuity contracts.
On July 8, 2005, MFC fully and unconditionally guaranteed JHLICO’s SignatureNotes, both those outstanding at that time and those to be issued subsequently. On December 9, 2009, MFC issued a guarantee of any new SignatureNotes to be issued by the Company.
MFC’s guarantees of the market value adjusted deferred annuity contracts and SignatureNotes are unsecured obligations of MFC and are subordinated in right of payment to the prior payment in full of all other obligations of MFC, except for other guarantees or obligations of MFC, which by their terms are designated as ranking equally in right of payment with or subordinate to MFC’s guarantees of the market value adjusted deferred annuity contracts and SignatureNotes. As a result of the guarantees by MFC, the Company is exempt from filing quarterly and annual reports with the U.S. Securities and Exchange Commission (“SEC”) pursuant to SEC Rule 12h-5, and in lieu thereof, MFC reports condensed consolidating financial information regarding the Company in its quarterly and annual reports.
F-40
Table of Contents
JOHN HANCOCK LIFE INSURANCE COMPANY (U.S.A.)
NOTES TO CONSOLIDATED FINANCIAL STATEMENTS – (CONTINUED)
Note 6 — Related Party Transactions - (continued)
Effective March 31, 1996, MLI provides a claims paying guarantee to certain U.S. policyholders. The claims guarantee agreement was revoked effective August 13, 2008, but still remains in effect with respect to policies issued by the Company prior to that date.
Note 7 — Reinsurance
The effect of reinsurance on life, health, and annuity premiums earned was as follows:
| Years ended December 31, | ||||||||||||
| 2012 | 2011 | 2010 | ||||||||||
|
|
|
|||||||||||
| (in millions) | ||||||||||||
| Direct |
$ | 3,591 | $ | 3,782 | $ | 4,192 | ||||||
| Assumed |
1,127 | 1,188 | 1,091 | |||||||||
| Ceded |
(1,919 | ) | (1,974 | ) | (1,651 | ) | ||||||
|
|
|
|||||||||||
| Net |
$ | 2,799 | $ | 2,996 | $ | 3,632 | ||||||
|
|
|
|||||||||||
For the years ended December 31, 2012, 2011, and 2010, benefits to policyholders under life, health, and annuity ceded reinsurance contracts were $3,101 million, $2,770 million, and $2,597 million, respectively.
The Company entered into a coinsurance agreement with Reinsurance Group of America (“RGA”) to reinsure 90% of its JHUSA fixed deferred annuity business effective April 1, 2012. The transaction was structured such that the Company transferred the actuarial liabilities and related invested assets which included $387 million in cash and approximately $4,916 million in fixed maturities and mortgage loans. The Company incurred a pre-tax loss of $56 million in connection with the transaction. Under the terms of the agreement, the Company will maintain responsibility for servicing of the policies and managing some of the assets. In addition, the agreement does not meet the criteria for reinsurance accounting and was given deposit-type accounting treatment that resulted in the recognition of an asset for amounts on deposit with reinsurers of $5,062 million on the Consolidated Balance Sheets.
The Company also entered into a coinsurance agreement with Commonwealth Annuity to reinsure 90% of its JHNY fixed deferred annuity business effective July 1, 2012. The transaction was structured such that the Company transferred the actuarial liabilities and related invested assets which included $231 million in cash and $1,481 million in fixed maturities. The Company incurred a pre-tax gain of $46 million in connection with the transaction. Under the terms of the agreement, the Company will maintain responsibility for servicing of the policies. In addition, the agreement does not meet the criteria for reinsurance accounting and was given deposit-type accounting treatment that resulted in the recognition of an asset for amounts on deposit with reinsurers of $1,701 million on the Consolidated Balance Sheets.
On July 1, 2011, the Company paid $159 million in fees to affiliates related to the recapture of Life Retrocession business reserves and net liabilities of $103 million from Manulife Reinsurance Limited and Manufacturers Life Insurance Company (Barbados Branch) resulting in a decrease to net income of $170 million, net of tax. Subsequent to the recapture transactions, the Company entered into a 100% coinsurance treaty with Pacific Life Insurance Company effective July 1, 2011. This treaty facilitated the transfer of Life Retrocession business reserves and net liabilities of $655 million, cash of $199 million and miscellaneous assets of $30 million resulting in a pre-tax gain of $426 million, which was deferred and included in reinsurance recoverable on the Consolidated Balance Sheets. This gain is amortized on a straight line basis over 10 years. Gain amortization for the years ended December 31, 2012 and 2011 were $43 million and $21 million, respectively.
Note 8 — Derivatives and Hedging Instruments
Derivatives are financial contracts, the value of which is derived from underlying interest rates, foreign exchange rates, other financial instruments, commodity prices or indices. The Company uses derivatives including swaps, forward and futures agreements, caps and floors, and options to manage current and anticipated exposures to changes in interest rates, foreign exchange rates, commodity prices and equity market prices, and to replicate permissible investments.
F-41
Table of Contents
JOHN HANCOCK LIFE INSURANCE COMPANY (U.S.A.)
NOTES TO CONSOLIDATED FINANCIAL STATEMENTS – (CONTINUED)
Note 8 — Derivatives and Hedging Instruments - (continued)
Swaps are over-the-counter (“OTC”) contractual agreements between the Company and a third party to exchange a series of cash flows based upon rates applied to a notional amount. For interest rate swaps, counterparties generally exchange fixed or floating interest rate payments based on a notional value in a single currency. Cross currency swaps involve the exchange of principal amounts between parties as well as the exchange of interest payments in one currency for the receipt of interest payments in another currency. Total return swaps are contracts that involve the exchange of payments based on changes in the values of a reference asset, including any returns such as interest earned on these assets, in return for amounts based on reference rates specified in the contract.
Forward and futures agreements are contractual obligations to buy or sell a financial instrument, foreign currency or other underlying commodity on a predetermined future date at a specified price. Forward contracts are OTC contracts negotiated between counterparties, whereas futures agreements are contracts with standard amounts and settlement dates that are traded on regulated exchanges.
Interest rate cap agreements are contracts with counterparties which require the payment of a premium for the right to receive payments for the difference between the cap interest rate and a market interest rate on specified future dates based on an underlying principal balance (notional principal). Similarly, interest rate floors are contracts with counterparties which require payment of a premium for the right to receive payments when the market interest rate on specified future dates falls below the agreed upon strike price.
Options are contractual agreements whereby the holder has the right, but not the obligation, to buy (call option) or sell (put option) a security, exchange rate, interest rate, or other financial instrument at a predetermined price/rate within a specified time.
Types of Derivatives and Derivative Strategies
Interest Rate Contracts. The Company uses interest rate futures contracts, interest rate swap agreements, and pre-payable interest rate swap agreements as part of its overall strategies of managing the duration of assets and liabilities or the average life of certain asset portfolios to specified targets. Interest rate swap agreements are contracts with counterparties to exchange interest rate payments of a differing character (i.e., fixed-rate payments exchanged for variable-rate payments) based on an underlying principal balance (notional principal). The net differential to be paid or received on interest rate swap agreements is accrued and recognized as a component of net investment income.
The Company uses interest rate swap agreements to hedge the variable cash flows associated with future fixed income asset acquisitions, which will support the Company’s long-term care and life insurance businesses. These agreements will reduce the impact of future interest rate changes on the cost of acquiring adequate assets to support the investment income assumptions used in pricing these products. During future periods when the acquired assets are held by the Company, the accumulated gain or loss will be amortized into investment income as a yield adjustment on the assets.
The Company also uses interest rate swap agreements to hedge the variable cash flows associated with payments that it will receive on certain floating rate fixed income securities. The accumulated gain or loss will be amortized into investment income as a yield adjustment when the payments are made.
The Company also enters into basis swaps to better match the cash flows from assets and related liabilities. Basis swaps are included in interest rate swaps for disclosure purposes. The Company utilizes basis swaps in non-qualifying hedging relationships.
Inflation swaps are used to reduce inflation risk generated from inflation-indexed liabilities. Inflation swaps are classified within interest rate swaps for disclosure purposes. The Company utilizes inflation swaps in qualifying and non-qualifying hedging relationships.
The Company uses exchange-traded interest rate futures primarily to hedge mismatches between the duration of assets in a portfolio and the duration of liabilities supported by those assets, to hedge against changes in value of securities the Company owns or anticipates acquiring, and to hedge against changes in interest rates on anticipated liability issuances by replicating U.S. Treasury or swap curve performance. The Company utilizes exchange-traded interest rate futures in non-qualifying hedging relationships.
F-42
Table of Contents
JOHN HANCOCK LIFE INSURANCE COMPANY (U.S.A.)
NOTES TO CONSOLIDATED FINANCIAL STATEMENTS – (CONTINUED)
Note 8 — Derivatives and Hedging Instruments - (continued)
The Company also purchases interest rate caps and floors primarily to protect against interest rate exposure arising from mismatches between assets and liabilities (duration mismatches). The Company utilizes interest rate caps and floors in non-qualifying hedging relationships.
Foreign Currency Contracts. Foreign currency derivatives, including foreign currency swaps and foreign currency forwards, are used by the Company to reduce the risk from fluctuations in foreign currency exchange rates associated with its assets and liabilities denominated in foreign currencies.
Cross currency rate swap agreements are used to manage the Company’s exposure to foreign exchange rate fluctuations, interest rate fluctuations, or both, on foreign currency financial instruments. Cross currency rate swap agreements are contracts to exchange the currencies of two different countries at the same rate of exchange at specified future dates. The net differential to be paid or received on cross currency rate swap agreements is accrued and recognized as a component of net investment income.
Under foreign currency forwards, the Company agrees with other parties to deliver a specified amount of an identified currency at a specified future date. Typically, the price is agreed upon at the time of the contract and payment for such a contract is made at the specified future date. The maturities of these forwards correspond with the future periods in which the foreign currency transactions are expected to occur. The Company utilizes currency forwards in qualifying and non-qualifying hedging relationships.
Credit Default Swaps. The Company manages credit risk through the issuance of credit default swaps (“CDS”). A CDS is a derivative instrument representing an agreement between two parties to exchange the credit risk of a single specified entity or an index based on the credit risk of a group of entities (all commonly referred to as the “reference entity” or a portfolio of “reference entities”), in return for a periodic premium. CDS contracts typically have a five-year term.
Equity Market Contracts. Total return swaps are contracts that involve the exchange of payments based on changes in the value of a reference asset, including any returns such as interest earned on these assets, in exchange for amounts based on reference rates specified in the contract. The Company utilizes total return swaps in qualifying and non-qualifying hedging relationships.
Equity index futures contracts are contractual obligations to buy or sell a specified amount of an underlying equity index at an agreed contract price on a specified date. Equity index futures are contracts with standard amounts and settlement dates that are traded on regulated exchanges. The Company utilizes equity index futures in non-qualifying hedging relationships.
F-43
Table of Contents
JOHN HANCOCK LIFE INSURANCE COMPANY (U.S.A.)
NOTES TO CONSOLIDATED FINANCIAL STATEMENTS – (CONTINUED)
Note 8 — Derivatives and Hedging Instruments - (continued)
The table below provides a summary of the gross notional amount and fair value of derivatives contracts for all derivatives in hedging and non-hedging relationships:
| December 31, 2012 | December 31, 2011 | |||||||||||||||||||||||||
| Notional Amount |
Fair Value Assets |
Fair Value Liabilities |
Notional Amount |
Fair Value Assets |
Fair Value Liabilities |
|||||||||||||||||||||
|
|
|
|
|
|||||||||||||||||||||||
| (in millions) | ||||||||||||||||||||||||||
| Qualifying Hedging Relationships |
||||||||||||||||||||||||||
| Fair value hedges |
Interest rate swaps |
$ | 9,336 | $ | 739 | $ | 1,048 | $ | 9,353 | $ | 734 | $ | 1,140 | |||||||||||||
| Foreign currency swaps |
232 | - | 157 | 246 | - | 171 | ||||||||||||||||||||
| Cash flow hedges |
Interest rate swaps |
13,232 | 2,669 | 73 | 15,472 | 3,627 | 192 | |||||||||||||||||||
| Foreign currency swaps |
1,763 | 147 | 255 | 1,833 | 183 | 325 | ||||||||||||||||||||
| Foreign currency forwards |
182 | 9 | - | 201 | 4 | - | ||||||||||||||||||||
| Equity market contracts |
29 | 3 | 2 | 25 | - | 10 | ||||||||||||||||||||
|
|
|
|
|
|||||||||||||||||||||||
| Total Derivatives in Hedging Relationships |
$ | 24,774 | $ | 3,567 | $ | 1,535 | $ | 27,130 | $ | 4,548 | $ | 1,838 | ||||||||||||||
|
|
|
|
|
|||||||||||||||||||||||
| Non-Hedging Relationships |
||||||||||||||||||||||||||
| Interest rate swaps |
$ | 94,343 | $ | 8,094 | $ | 3,378 | $ | 71,640 | $ | 7,219 | $ | 3,122 | ||||||||||||||
| Interest rate futures |
3,987 | - | - | 6,009 | - | - | ||||||||||||||||||||
| Foreign currency swaps |
1,463 | 121 | 150 | 1,561 | 163 | 154 | ||||||||||||||||||||
| Foreign currency forwards |
40 | 1 | - | 33 | - | 2 | ||||||||||||||||||||
| Foreign currency futures |
1,860 | - | - | 2,072 | - | - | ||||||||||||||||||||
| Equity market contracts |
108 | 7 | 5 | 24 | - | 10 | ||||||||||||||||||||
| Equity index futures |
9,107 | - | - | 9,063 | - | - | ||||||||||||||||||||
| Interest rate options |
1,323 | 43 | - | 336 | 9 | - | ||||||||||||||||||||
| Credit default swaps |
265 | 6 | - | 246 | 4 | 1 | ||||||||||||||||||||
| Embedded derivatives – fixed maturities |
- | - | - | - | - | - | ||||||||||||||||||||
| Embedded derivatives – reinsurance contracts |
- | 14 | 3,371 | - | 10 | 2,686 | ||||||||||||||||||||
| Embedded derivatives – participating pension contracts (1) |
- | - | 129 | - | - | 106 | ||||||||||||||||||||
| Embedded derivatives – benefit guarantees (1) |
- | 2,701 | 1,217 | - | 2,914 | 1,169 | ||||||||||||||||||||
|
|
|
|
|
|||||||||||||||||||||||
| Total Derivatives in Non-Hedging Relationships |
112,496 | 10,987 | 8,250 | 90,984 | 10,319 | 7,250 | ||||||||||||||||||||
|
|
|
|
|
|||||||||||||||||||||||
| Total Derivatives (2) |
$ | 137,270 | $ | 14,554 | $ | 9,785 | $ | 118,114 | $ | 14,867 | $ | 9,088 | ||||||||||||||
|
|
|
|
|
|||||||||||||||||||||||
| (1) | Embedded derivatives related to participating pension contracts are reported as part of future policy benefits and embedded derivatives related to benefit guarantees are reported as part of reinsurance recoverable or future policy benefits on the Consolidated Balance Sheets. |
| (2) | The fair values of all derivatives in an asset position are reported within derivative assets on the Consolidated Balance Sheets, and derivatives in a liability position are reported within derivative liabilities on the Consolidated Balance Sheets, excluding embedded derivatives related to participating pension contracts and benefit guarantees. |
F-44
Table of Contents
JOHN HANCOCK LIFE INSURANCE COMPANY (U.S.A.)
NOTES TO CONSOLIDATED FINANCIAL STATEMENTS – (CONTINUED)
Note 8 — Derivatives and Hedging Instruments - (continued)
The following table provides a summary of the derivative assets and liabilities including embedded derivatives as of December 31, 31, 2012 and 2011, respectively.
| December 31, 2012 | December 31, 2011 | |||||||||||||||
| Fair Value Assets |
Fair Value Liabilities |
Fair Value Assets |
Fair Value Liabilities |
|||||||||||||
|
|
|
|
|
|||||||||||||
| (in millions) | ||||||||||||||||
| Derivatives on balance sheets |
$ | 11,853 | $ | 8,439 | $ | 11,953 | $ | 7,813 | ||||||||
| Non-reinsurance embedded derivatives |
2,701 | 1,346 | 2,914 | 1,275 | ||||||||||||
|
|
|
|
|
|||||||||||||
| Total derivatives |
14,554 | 9,785 | 14,867 | 9,088 | ||||||||||||
| Netting adjustments (a) |
(1,701 | ) | (3,367 | ) | (550 | ) | (4,572 | ) | ||||||||
| Assets and cash collateral used to offset asset/liabilities |
(8,288 | ) | (1,408 | ) | (10,156 | ) | (342 | ) | ||||||||
| Affiliate reinsurance related to embedded derivatives (b) |
(1,317 | ) | (3,223 | ) | (1,342 | ) | (2,572 | ) | ||||||||
|
|
|
|
|
|||||||||||||
| Total derivatives after netting adjustments, collateral and net of reinsurance related embedded derivatives |
$ | 3,248 | $ | 1,787 | $ | 2,819 | $ | 1,602 | ||||||||
|
|
|
|
|
|||||||||||||
| (a) | Represents the netting of derivative exposures covered by a master netting agreement. For these purposes, a master netting agreement is an arrangement between the Company and a counterparty where more than one derivative contract exists between the two entities. |
| (b) | Represents activity related to reinsurance contracts between the Company and affiliated reinsurers. These entities are under common control with the Company by the Company’s ultimate parent, MFC, and they do not create an inter-connection to any third party financial institution unaffiliated with the Company. |
Hedging Relationships
The Company uses derivatives for economic hedging purposes only. In certain circumstances, these hedges also meet the requirements for hedge accounting. Hedging relationships eligible for hedge accounting are designated as either fair value hedges or cash flow hedges, as described below.
Fair Value Hedges. The Company uses interest rate swaps to manage its exposure to changes in fair value of fixed-rate financial instruments caused by changes in interest rates. The Company also uses cross currency swaps and currency forwards to manage its exposure to foreign exchange rate fluctuations and interest rate fluctuations.
For the years ended December 31, 2012, 2011, and 2010, the Company did not recognize any gains or losses related to the portion of the hedging instruments that were excluded from the assessment of hedge effectiveness. At December 31, 2012, the Company had no hedges of firm commitments.
F-45
Table of Contents
JOHN HANCOCK LIFE INSURANCE COMPANY (U.S.A.)
NOTES TO CONSOLIDATED FINANCIAL STATEMENTS – (CONTINUED)
Note 8 — Derivatives and Hedging Instruments - (continued)
The following tables show the investment gains (losses) recognized:
| Year ended December 31, 2012
|
||||||||||||||
| Derivatives in Fair Value Hedging Relationships |
Hedged Items in Fair Value Hedging Relationships |
Gains (Losses) Recognized on Derivatives |
Gains (Losses) Recognized for Hedged Items |
Ineffectiveness Recognized |
||||||||||
| (in millions) | ||||||||||||||
| Interest rate swaps |
Fixed-rate assets |
$ | 118 | $ | (93 | ) | $ | 25 | ||||||
| Fixed-rate liabilities |
(4 | ) | 1 | (3 | ) | |||||||||
| Foreign Currency Swaps |
Fixed-rate assets |
(1 | ) | (22 | ) | (23 | ) | |||||||
| Fixed-rate liabilities |
- | - | - | |||||||||||
|
|
||||||||||||||
| Total |
$ | 113 | $ | (114 | ) | $ | (1 | ) | ||||||
|
|
||||||||||||||
| Year ended December 31, 2011
|
||||||||||||||
| Derivatives in Fair Value Hedging Relationships |
Hedged Items in Fair Value Hedging Relationships |
Gains (Losses) Recognized on Derivatives |
Gains (Losses) Recognized for Hedged Items |
Ineffectiveness Recognized |
||||||||||
| (in millions) | ||||||||||||||
| Interest rate swaps |
Fixed-rate assets |
$ | (546 | ) | $ | 679 | $ | 133 | ||||||
| Fixed-rate liabilities |
339 | (370 | ) | (31 | ) | |||||||||
| Foreign Currency Swaps |
Fixed-rate assets |
(21 | ) | 10 | (11 | ) | ||||||||
| Fixed-rate liabilities |
- | - | - | |||||||||||
|
|
||||||||||||||
| Total |
$ | (228 | ) | $ | 319 | $ | 91 | |||||||
|
|
||||||||||||||
| Year ended December 31, 2010
|
||||||||||||||
| Derivatives in Fair Value Hedging Relationships |
Hedged Items in Fair Value Hedging Relationships |
Gains (Losses) Recognized on Derivatives |
Gains (Losses) Recognized for Hedged Items |
Ineffectiveness Recognized |
||||||||||
| (in millions) | ||||||||||||||
| Interest rate swaps |
Fixed-rate assets |
$ | (70 | ) | $ | 157 | $ | 87 | ||||||
| Fixed-rate liabilities |
62 | (64 | ) | (2 | ) | |||||||||
| Foreign Currency Swaps |
Fixed-rate assets |
(73 | ) | 111 | 38 | |||||||||
| Fixed-rate liabilities |
- | - | - | |||||||||||
|
|
||||||||||||||
| Total |
$ | (81 | ) | $ | 204 | $ | 123 | |||||||
|
|
||||||||||||||
Cash Flow Hedges. The Company uses interest rate swaps to hedge the variability in cash flows from variable rate financial instruments and forecasted transactions. The Company also uses cross currency swaps and forward agreements to hedge
F-46
Table of Contents
JOHN HANCOCK LIFE INSURANCE COMPANY (U.S.A.)
NOTES TO CONSOLIDATED FINANCIAL STATEMENTS – (CONTINUED)
Note 8 — Derivatives and Hedging Instruments - (continued)
currency exposure on foreign currency financial instruments and foreign currency denominated expenses, respectively. Total return swaps are used to hedge the variability in cash flows associated with certain stock-based compensation awards. Inflation swaps are used to reduce inflation risk generated from inflation-indexed liabilities.
For the year ended December 31, 2010, all of the Company’s hedged forecast transactions qualified as cash flow hedges. For the year ended December 31, 2011 certain cash flow hedges were discontinued because it was no longer probable that the original forecasted transaction would occur by the end of the originally specified time period documented at inception of the hedging relationship. In 2012 and 2011, the Company completed a comprehensive review of its projections of future cash flows related to hedging activity for its life insurance business and its long-term care business, respectively. As a result of the continued volatility in interest rates and current trends within the long-term care and life insurance businesses, the Company de-designated $1.6 billion (notional principal) of forward-starting interest rate swaps for the life insurance business in 2012, and $3.9 billion (notional principal) of forward-starting interest rate swaps for the long-term care business in 2011.
The accumulated other comprehensive income related to de-designated swaps continues to be deferred because the forecasted transactions are still possible of occurring. During 2012 and 2011, the deferred OCI related to the de-designated swaps amounted to $312 million, net of tax and $432 million, net of tax, respectively. If the forecasted transactions do occur, these amounts will be reclassified to earnings in the periods during which variability in the cash flows hedged or the hedged forecasted transactions are recognized in earnings. If the forecasted transactions become unlikely, the amounts will be reclassified to earnings in that period.
In addition, during 2012 the Company completed a review of the investment strategy for the JHNY universal life (“UL”) business. As part of this review, it was determined that it was appropriate for the UL business to begin investing in non-fixed income assets. Under the revised investment strategy, UL cash flows will be invested in a combination of fixed income and non-fixed income assets, potentially resulting in lower cash flows available for reinvestments in fixed income assets than originally anticipated for the UL cash flow hedging program. The Company voluntarily de-designated $150 million (notional principal) of forward-starting interest rate swaps in 2012, however believes that the originally forecasted fixed income asset purchases are still probable of occurring as forecasted. Accordingly, the accumulated other comprehensive income related to these de-designated swaps continues to be deferred. During 2012, the deferred OCI related to the de-designated swaps amounted to $30 million, net of tax. If the forecasted transactions do occur as expected, these amounts will be allocated to the acquired fixed income assets in the periods during which the hedged forecasted transactions occur and amortized to earnings over the life of the underlying fixed income assets acquired. If the forecasted transactions are no longer possible of occurring, the amounts will be reclassified to earnings in that period.
F-47
Table of Contents
JOHN HANCOCK LIFE INSURANCE COMPANY (U.S.A.)
NOTES TO CONSOLIDATED FINANCIAL STATEMENTS – (CONTINUED)
Note 8 — Derivatives and Hedging Instruments - (continued)
The following tables present the effects of derivatives in cash flow hedging relationships on the Consolidated Statements of Operations, the Consolidated Statements of Comprehensive Income (Loss) and the Consolidated Statements of Changes in Shareholder’s Equity.
| Year ended December 31, 2012
|
| |||||||||||||
| Derivatives in Cash Flow Hedging Relationships |
Hedged Items in Cash Flow Hedging Relationships |
Gains (Losses) Deferred in AOCI on Derivatives (Net of Tax) |
Gains Reclassified from (Net of Tax) |
Ineffectiveness and Other Gains (Losses) |
||||||||||
| (in millions) | ||||||||||||||
| Interest rate swaps |
Forecasted fixed-rate assets |
$ | 526 | $ | 212 | $ | 9 | |||||||
| Floating rate assets |
(5 | ) | - | - | ||||||||||
| Inflation indexed liabilities |
134 | - | - | |||||||||||
| Forecasted fixed-rate liabilities |
- | - | - | |||||||||||
| Foreign currency swaps |
Fixed-rate assets |
(16 | ) | (4 | ) | - | ||||||||
| Floating rate assets |
(1 | ) | - | - | ||||||||||
| Floating rate liabilities |
- | - | - | |||||||||||
| Foreign currency forwards |
Forecasted expenses |
3 | 1 | - | ||||||||||
| Foreign currency assets |
- | - | - | |||||||||||
| Equity market contracts |
Share-based payments |
7 | - | - | ||||||||||
|
|
||||||||||||||
| Total |
$ | 648 | $ | 209 | $ | 9 | ||||||||
|
|
||||||||||||||
| Year ended December 31, 2011
|
| |||||||||||||
| Derivatives in Cash Flow Hedging Relationships |
Hedged Items in Cash Flow Hedging Relationships |
Gains (Losses) Deferred in AOCI on Derivatives (Net of Tax) |
Gains Reclassified from (Net of Tax) |
Ineffectiveness Gains (Losses) |
||||||||||
| (in millions) | ||||||||||||||
| Interest rate swaps |
Forecasted fixed-rate assets |
$ | 1,916 | $ | 59 | $ | 14 | |||||||
| Floating rate assets |
5 | - | - | |||||||||||
| Inflation indexed liabilities |
(136 | ) | - | - | ||||||||||
| Forecasted fixed-rate liabilities |
- | - | - | |||||||||||
| Foreign currency swaps |
Fixed-rate assets |
16 | - | - | ||||||||||
| Floating rate assets |
(1 | ) | - | - | ||||||||||
| Floating rate liabilities |
- | - | - | |||||||||||
| Foreign currency forwards |
Forecasted expenses |
(16 | ) | - | - | |||||||||
| Foreign currency assets |
- | - | - | |||||||||||
| Equity market contracts |
Share-based payments |
(7 | ) | - | - | |||||||||
|
|
||||||||||||||
| Total |
$ | 1,777 | $ | 59 | $ | 14 | ||||||||
|
|
||||||||||||||
F-48
Table of Contents
JOHN HANCOCK LIFE INSURANCE COMPANY (U.S.A.)
NOTES TO CONSOLIDATED FINANCIAL STATEMENTS – (CONTINUED)
Note 8 — Derivatives and Hedging Instruments - (continued)
Year ended December 31, 2010
| Derivatives in Cash Flow Hedging Relationships |
Hedged Items in Cash Flow Hedging Relationships |
Gains
(Losses) Derivatives (Net of Tax) |
Gains Reclassified from (Net of Tax) |
Ineffectiveness and Other Gains (Losses) |
||||||||||
| (in millions) | ||||||||||||||
| Interest rate swaps |
Forecasted fixed-rate assets |
$ | 48 | $ | (129 | ) | $ | 3 | ||||||
| Floating rate assets |
- | - | - | |||||||||||
| Inflation indexed liabilities |
(43 | ) | - | - | ||||||||||
| Forecasted fixed-rate liabilities |
- | - | - | |||||||||||
| Foreign currency swaps |
Fixed-rate assets |
(25 | ) | - | - | |||||||||
| Floating rate assets |
(4 | ) | - | - | ||||||||||
| Floating rate liabilities |
- | - | - | |||||||||||
| Foreign currency forwards |
Forecasted expenses |
(9 | ) | - | - | |||||||||
| Foreign currency assets |
(1 | ) | - | - | ||||||||||
| Equity market contracts |
Share-based payments |
(3 | ) | - | - | |||||||||
|
|
||||||||||||||
| Total |
$ | (37 | ) | $ | (129 | ) | $ | 3 | ||||||
|
|
||||||||||||||
The Company anticipates that pre-tax net gains of approximately $70 million will be reclassified from AOCI to earnings within the next 12 months. The maximum time frame for which variable cash flows are hedged is 34 years.
For a rollforward of the net accumulated gains (losses) on cash flow hedges see the Shareholder’s Equity Note.
Derivatives Not Designated as Hedging Instruments. The Company enters into interest rate swap agreements, cancelable interest rate swap agreements, total return swap agreements, interest rate futures contracts and CDS to manage credit risk, and interest rate cap and floor agreements to manage exposure to interest rates without designating the derivatives as hedging instruments. Interest rate floor agreements hedge the interest rate risk associated with minimum interest rate guarantees in certain life insurance and annuity businesses.
The Company offers certain variable annuity products with a guaranteed minimum withdrawal benefit (“GMWB”) and guaranteed minimum death benefit (“GMDB”). These guarantees are effectively an embedded option on the basket of mutual funds offered to contract holders. Beginning in November 2007, for certain contracts, the Company implemented a hedging program to reduce its exposure to the GMWB and GMDB guarantees. This dynamic hedging program uses interest rate swap agreements, equity index futures (including but not limited to the Dow Jones Industrial, Standard & Poor’s 500, Russell 2000, and Dow Jones Euro Stoxx 50 indices), and U.S. Treasury futures to match the sensitivities of the GMWB and GMDB liabilities to the market risk factors.
The Company also has a macro equity risk hedging program using equity and currency futures. This program is designed to reduce the Company’s overall exposure to public equity markets arising from several sources including, but not limited to, variable annuity guarantees not dynamically hedged, separate account fees not associated with guarantees, and Company equity holdings.
F-49
Table of Contents
JOHN HANCOCK LIFE INSURANCE COMPANY (U.S.A.)
NOTES TO CONSOLIDATED FINANCIAL STATEMENTS – (CONTINUED)
Note 8 — Derivatives and Hedging Instruments - (continued)
For the years ended December 31, 2012, 2011, and 2010, net losses and net gains related to derivatives in a non-hedging relationship were recognized by the Company and the components were recorded in net realized investment and other gains (losses) as follows:
| Years ended December 31, | 2012 | 2011 | 2010 | |||||||||
| (in millions) | ||||||||||||
| Non-Hedging Relationships |
||||||||||||
| Interest rate swaps |
$ | (336 | ) | $ | 3,230 | $ | 145 | |||||
| Interest rate futures |
(53 | ) | (237 | ) | (56 | ) | ||||||
| Interest rate options |
(8 | ) | 1 | (1 | ) | |||||||
| Credit defaults swaps |
1 | - | - | |||||||||
| Foreign currency swaps |
(32 | ) | 17 | (68 | ) | |||||||
| Foreign currency forwards |
(5 | ) | (10 | ) | 22 | |||||||
| Foreign currency futures |
- | 16 | (18 | ) | ||||||||
| Embedded derivatives |
(1,730 | ) | 153 | (93 | ) | |||||||
| Equity market contracts |
7 | (1 | ) | 12 | ||||||||
| Equity index futures |
(1,555 | ) | (318 | ) | (652 | ) | ||||||
|
|
|
|||||||||||
| Total Investment Gains (Losses) from Derivatives in Non-Hedging Relationships |
$ | (3,711 | ) | $ | 2,851 | $ | (709 | ) | ||||
|
|
|
|||||||||||
Credit Default Swaps. The Company replicates exposure to specific issuers by selling credit protection via CDS in order to complement its cash bond investing. The Company does not employ leverage in its CDS program and therefore, does not write CDS protection in excess of its government bond holdings.
The following table provides details of the CDS protection sold by type of contract and external agency rating for the underlying reference security, as of December 31, 2012 and 2011, respectively.
| December 31, 2012 | December 31, 2011 | |||||||||||||||||||||||
| Notional amount2 |
Fair Value |
Weighted average maturity (in years)3 |
Notional amount2 |
Fair Value |
Weighted average maturity (in years)3 |
|||||||||||||||||||
| (in millions) | ||||||||||||||||||||||||
| Single name CDS1 |
||||||||||||||||||||||||
| Corporate Debt |
||||||||||||||||||||||||
| AAA |
$ | 25 | $ | 1 | 4 | $ | 25 | $ | 1 | 5 | ||||||||||||||
| AA |
85 | 2 | 4 | 85 | 2 | 5 | ||||||||||||||||||
| A |
145 | 3 | 4 | 105 | 1 | 5 | ||||||||||||||||||
| BBB |
10 | - | 5 | - | - | |||||||||||||||||||
|
|
|
|
|
|||||||||||||||||||||
| Total CDS protection sold | $ | 265 | $ | 6 | $ | 215 | $ | 4 | ||||||||||||||||
|
|
|
|
|
|||||||||||||||||||||
| 1 | The rating agency designations are based on S&P where available followed by Moody’s, Dominion Bond Rating Services (DBRS), and Fitch. If no rating is available from a rating agency, then an internally developed rating is used. |
| 2 | Notional amount represents the maximum future payments the Company would have to pay its counterparties assuming a default of the underlying credit and zero recovery on the underlying issuer obligation. |
| 3 | The weighted average maturity of the CDS is weighted based on notional amounts. |
F-50
Table of Contents
JOHN HANCOCK LIFE INSURANCE COMPANY (U.S.A.)
NOTES TO CONSOLIDATED FINANCIAL STATEMENTS – (CONTINUED)
Note 8 — Derivatives and Hedging Instruments - (continued)
The Company holds no purchased credit protection at December 31, 2012. At December 31, 2011 the Company held purchased credit protection with a total notional amount of $31 million and a fair value of $1 million. The average credit rating of the counterparties guaranteeing the underlying credit is A+ and the weighted average maturity is 5.5 years.
Embedded Derivatives. The Company has certain embedded derivatives that are required to be separated from their host contracts and accounted for as derivatives. These host contracts include fixed maturities, reinsurance contracts, participating pension contracts, and certain benefit guarantees.
For more details on the Company’s embedded derivatives, see the Fair Value Measurements Note.
Credit Risk. The Company’s exposure to loss on derivatives is limited to the amount of any net gains that may have accrued with a particular counterparty. Gross derivative counterparty exposure is measured as the total fair value (including accrued interest) of all outstanding contracts in a gain position excluding any offsetting contracts in negative positions and the impact of collateral on hand. The Company may be exposed to credit-related losses in the event of nonperformance by counterparties to the derivative financial instruments. The current credit exposure of the Company’s derivative contracts is limited to the fair value in excess of the collateral held at the reporting date.
The Company manages its credit risk by entering into transactions with creditworthy counterparties, obtaining collateral where appropriate, and entering into master netting agreements that provide for a netting of payments and receipts with a single counterparty. The Company enters into credit support annexes with its over-the-counter derivative dealers in order to manage its credit exposure to those counterparties. As part of the terms and conditions of those agreements, the pledging and accepting of collateral in connection with the Company’s derivative usage is required. As of December 31, 2012 and 2011, the Company accepted collateral consisting of cash of $2,142 million and $1,446 million and various securities with a fair value of $5,430 million and $5,591 million, respectively, which is held in separate custodial accounts. In addition, the Company has pledged collateral to support both the over-the-counter derivative instruments and exchange traded futures. For further details regarding pledged collateral see the Investments Note.
Note 9 — Certain Separate Accounts
The Company issues variable annuity and variable life contracts through its separate accounts for which investment income and investment gains and losses accrue to, and investment risk is borne by, the contract holder. Most contracts contain certain guarantees, which are discussed more fully below.
The deposits related to the variable life insurance contracts are invested in separate accounts, and the Company guarantees a specified death benefit on certain policies if specified premiums on these policies are paid by the policyholder, regardless of separate account performance.
The following table reflects variable life insurance contracts with guarantees held by the Company:
| December 31, | ||||||||
| 2012 | 2011 | |||||||
|
|
|
|||||||
| (in millions, except for age) | ||||||||
| Life insurance contracts with guaranteed benefits |
||||||||
| In the event of death |
||||||||
| Account value |
$ | 8,346 | $ | 7,586 | ||||
| Net amount at risk related to deposits |
182 | 174 | ||||||
| Average attained age of contract holders |
52 | 52 | ||||||
Many of the variable annuity contracts issued by the Company offer various guaranteed minimum death, income, and/or withdrawal benefits. GMDB features guarantee the contract holder either (a) a return of no less than total deposits made to the contract less any partial withdrawals; (b) total deposits made to the contract less any partial withdrawals plus a minimum return; (c) the highest contract value on a specified anniversary date minus any withdrawals following the contract anniversary, or (d) a combination of (b) and (c) above.
F-51
Table of Contents
JOHN HANCOCK LIFE INSURANCE COMPANY (U.S.A.)
NOTES TO CONSOLIDATED FINANCIAL STATEMENTS – (CONTINUED)
Note 9 — Certain Separate Accounts - (continued)
Contracts with Guaranteed Minimum Income Benefit (“GMIB”) riders provide a guaranteed lifetime annuity, which may be elected by the contract holder after a stipulated waiting period (7 to 15 years), and which may be larger than what the contract account balance would purchase at then-current annuity purchase rates.
Multiple variations of an optional GMWB rider have also been offered by the Company. The GMWB rider provides contract holders a guaranteed annual withdrawal amount over a specified time period or in some cases for as long as they live. In general, guaranteed annual withdrawal amounts are based on deposits and may be reduced if withdrawals exceed allowed amounts. Guaranteed amounts may also be increased as a result of “step-up” provisions, which increase the benefit base to higher account values at specified intervals. Guaranteed amounts may also be increased if withdrawals are deferred over a specified period. In addition, certain versions of the GMWB rider extend lifetime guarantees to spouses.
Unaffiliated and affiliated reinsurance has been utilized to mitigate risk related to some of the guarantee benefit riders. Hedging has also been utilized to mitigate risk related to some of the GMWB riders.
For GMDB, the net amount at risk is defined as the current guaranteed minimum death benefit in excess of the current account balance. For GMIB, the net amount at risk is defined as the excess of the current annuitization income base over the current account value. For GMWB, the net amount at risk is defined as the current guaranteed withdrawal amount minus the current account value. For all the guarantees, the net amount at risk is floored at zero at the single contract level.
F-52
Table of Contents
JOHN HANCOCK LIFE INSURANCE COMPANY (U.S.A.)
NOTES TO CONSOLIDATED FINANCIAL STATEMENTS – (CONTINUED)
Note 9 — Certain Separate Accounts - (continued)
The Company had the following variable annuity contracts with guarantees. Amounts at risk are shown net of reinsurance. Note that the Company’s variable annuity contracts with guarantees may offer more than one type of guarantee in each contract; therefore, the amounts listed are not mutually exclusive.
| December 31, | ||||||||
| 2012 | 2011 | |||||||
|
|
|
|||||||
| (in millions, except for ages and percentages) | ||||||||
| Guaranteed Minimum Death Benefit |
||||||||
| Return of net deposits |
||||||||
| In the event of death |
||||||||
| Account value |
$ | 24,553 | $ | 23,864 | ||||
| Net amount at risk — net of reinsurance |
64 | 174 | ||||||
| Average attained age of contract holders |
66 | 65 | ||||||
| Return of net deposits plus a minimum return |
||||||||
| In the event of death |
||||||||
| Account value |
$ | 542 | $ | 562 | ||||
| Net amount at risk — net of reinsurance |
305 | 332 | ||||||
| Average attained age of contract holders |
70 | 70 | ||||||
| Guaranteed minimum return rate |
5 | % | 5 | % | ||||
| Highest specified anniversary account value minus withdrawals post anniversary |
||||||||
| In the event of death |
||||||||
| Account value |
$ | 25,350 | $ | 25,558 | ||||
| Net amount at risk — net of reinsurance |
265 | 559 | ||||||
| Average attained age of contract holders |
66 | 65 | ||||||
| Guaranteed Minimum Income Benefit |
||||||||
| Account value |
$ | 4,816 | $ | 5,102 | ||||
| Net amount at risk — net of reinsurance |
40 | 50 | ||||||
| Average attained age of contract holders |
65 | 64 | ||||||
| Guaranteed Minimum Withdrawal Benefit |
||||||||
| Account value |
$ | 38,613 | $ | 36,581 | ||||
| Net amount at risk |
774 | 1,116 | ||||||
| Average attained age of contract holders |
63 | 65 | ||||||
F-53
Table of Contents
JOHN HANCOCK LIFE INSURANCE COMPANY (U.S.A.)
NOTES TO CONSOLIDATED FINANCIAL STATEMENTS – (CONTINUED)
Note 9 — Certain Separate Accounts - (continued)
Account balances of variable contracts with guarantees were invested in various separate accounts with the following characteristics:
| December 31, | ||||||||
| 2012 | 2011 | |||||||
|
|
|
|||||||
| (in millions) | ||||||||
| Type of Fund |
||||||||
| Equity |
$ | 28,537 | $ | 27,351 | ||||
| Balanced |
21,539 | 20,850 | ||||||
| Bond |
7,557 | 7,321 | ||||||
| Money Market |
1,407 | 1,667 | ||||||
|
|
|
|||||||
| Total |
$ | 59,040 | $ | 57,189 | ||||
|
|
|
|||||||
The following table summarizes the liabilities for guarantees on variable annuity contracts reflected in future policy benefits in the general account:
| Guaranteed Minimum Death Benefit (GMDB) |
Guaranteed Minimum Income Benefit (GMIB) |
Guaranteed Minimum Withdrawal Benefit (GMWB) |
Total | |||||||||||||
|
|
|
|||||||||||||||
| (in millions) | ||||||||||||||||
| Balance at January 1, 2012 |
$ | 247 | $ | 211 | $ | 1,165 | $ | 1,623 | ||||||||
| Incurred guarantee benefits |
(51 | ) | (91 | ) | - | (142 | ) | |||||||||
| Other reserve changes |
33 | 59 | 145 | 237 | ||||||||||||
|
|
|
|||||||||||||||
| Balance at December 31, 2012 |
229 | 179 | 1,310 | 1,718 | ||||||||||||
| Reinsurance recoverable |
(68 | ) | (1,801 | ) | (1,071 | ) | (2,940 | ) | ||||||||
|
|
|
|||||||||||||||
| Net balance at December 31, 2012 |
$ | 161 | $ | (1,622 | ) | $ | 239 | $ | (1,222 | ) | ||||||
|
|
|
|||||||||||||||
| Balance at January 1, 2011 |
$ | 225 | $ | 177 | $ | 507 | $ | 909 | ||||||||
| Incurred guarantee benefits |
(66 | ) | (75 | ) | - | (141 | ) | |||||||||
| Other reserve changes |
88 | 109 | 658 | 855 | ||||||||||||
|
|
|
|||||||||||||||
| Balance at December 31, 2011 |
247 | 211 | 1,165 | 1,623 | ||||||||||||
| Reinsurance recoverable |
(82 | ) | (2,046 | ) | (953 | ) | (3,081 | ) | ||||||||
|
|
|
|||||||||||||||
| Net balance at December 31, 2011 |
$ | 165 | $ | (1,835 | ) | $ | 212 | $ | (1,458 | ) | ||||||
|
|
|
|||||||||||||||
The GMDB gross and ceded reserves, the GMIB gross reserves, and the life contingent portion of the GMWB reserves were determined in accordance with ASC 944, and the GMIB reinsurance recoverable and non-life contingent GMWB gross reserves were determined in accordance with ASC 815 “Derivatives and Hedging”.
The Company regularly evaluates estimates used and adjusts the additional liability balance, with a related charge or credit to benefits to policyholders, if actual experience or other evidence suggests that earlier assumptions should be revised.
The following assumptions and methodology were used to determine the amounts above at December 31, 2012 and 2011:
| • | Data used included 1,000 stochastically generated investment performance scenarios. For the GMIB reinsurance recoverable and non-life contingent GMWB gross reserve calculations, risk neutral scenarios were used. |
F-54
Table of Contents
JOHN HANCOCK LIFE INSURANCE COMPANY (U.S.A.)
NOTES TO CONSOLIDATED FINANCIAL STATEMENTS – (CONTINUED)
Note 9 — Certain Separate Accounts - (continued)
| • | For life products, reserves were established using stochastic modeling of future separate account returns and best estimate mortality, lapse, and premium persistency assumptions, which vary by product. |
| • | Mean return and volatility assumptions were determined by asset class. Market consistent observed volatilities were used where available for ASC 815 calculations. |
| • | Annuity mortality was based on the Ruark table multiplied by factors varied by rider types (living benefit/GMDB only) and qualified and non-qualified business. |
| • | Annuity base lapse rates vary by contract type, duration, type of living benefit or death benefit rider, and whether guaranteed withdrawals are being taken. The lapse rates range from 0.5% to 40%. |
| • | The discount rates used in the GMDB gross and ceded reserves, the GMIB gross reserves, and the life contingent portion of the GMWB reserve calculations range from 6.4% to 7%. The discount rates used in the GMIB reinsurance recoverable and non-life contingent GMWB gross reserve calculations were based on the term structure of swap curves with a credit spread based on the credit standing of MFC (for GMWB) and the reinsurers (for GMIB). |
Note 10 — Closed Blocks
The Company operates two separate closed blocks for the benefit of certain classes of individual or joint traditional participating whole life insurance policies. The JHUSA closed block was established upon the demutualization of MLI for those designated participating policies that were in-force on September 23, 1999. The JHLICO closed block was established upon the demutualization of JHLICO for those designated participating policies that were in-force on February 1, 2000.
Assets were allocated to the closed blocks in an amount that, together with anticipated revenues from policies included in the closed blocks, was reasonably expected to be sufficient to support such business, including provision for payment of benefits, direct asset acquisition and disposition costs, taxes, and for continuation of dividend scales, assuming experience underlying such dividend scales continues. Assets allocated to the closed blocks inure solely to the benefit of the holders of the policies included in the closed blocks and will not revert to the benefit of the shareholder of the Company. No reallocation, transfer, borrowing, or lending of assets can be made between the closed blocks and other portions of the Company’s general account, any of its separate accounts, or any affiliate of the Company without prior approval from the State of Michigan Office of Financial and Insurance Regulation.
If, over time, the aggregate performance of the assets and policies of a closed block is better than was assumed in funding that closed block, dividends to policyholders for that closed block will be increased. If, over time, the aggregate performance of the assets and policies of a closed block is less favorable than was assumed in funding that closed block, dividends to policyholders for that closed block will be reduced.
The assets and liabilities allocated to the closed blocks are recorded in the Company’s Consolidated Balance Sheets and Consolidated Statements of Operations on the same basis as other similar assets and liabilities. The carrying amount of the closed blocks’ liabilities in excess of the carrying amount of the closed blocks’ assets at the date the closed blocks were established (adjusted to eliminate the impact of related amounts in accumulated other comprehensive income) represents the maximum future earnings from the assets and liabilities designated to the closed blocks that can be recognized in income over the period the policies in the closed blocks remain in force. The Company has developed an actuarial calculation of the timing of such maximum future shareholder earnings, and this is the basis of the policyholder dividend obligation.
If actual cumulative earnings of a closed block are greater than expected cumulative earnings of that block, only expected earnings will be recognized in that closed block’s income. Actual cumulative earnings in excess of expected cumulative earnings of a closed block represent undistributed accumulated earnings attributable to policyholders, which are recorded as a policyholder dividend obligation because the excess will be paid to the policyholders of that closed block as an additional policyholder dividend unless otherwise offset by future closed block performance that is less favorable than originally expected. If actual cumulative performance of a closed block is less favorable than expected, expected earnings for that closed block will be recognized in net income, unless the policyholder dividend obligation has been reduced to zero, in which case actual earnings will be recognized in income. The policyholder dividend obligation for the JHLICO and JHUSA closed blocks was zero at December 31, 2012 and 2011.
F-55
Table of Contents
JOHN HANCOCK LIFE INSURANCE COMPANY (U.S.A.)
NOTES TO CONSOLIDATED FINANCIAL STATEMENTS – (CONTINUED)
Note 10 — Closed Blocks - (continued)
For all closed block policies, the principal cash flow items that affect the amount of closed block assets and liabilities are premiums, net investment income, purchases and sales of investments, policyholders’ benefits, policyholder dividends, premium taxes, guaranty fund assessments, and income taxes. For the JHLICO closed block policies, the principal income and expense items excluded from the closed block are management and maintenance expenses, commissions, and net investment income and realized investment gains and losses of investment assets outside the closed block that support the closed block business, all of which enter into the determination of total gross margins of closed block policies for the purpose of the amortization of deferred policy acquisition costs. There are no exclusions applicable to the JHUSA closed block. The amounts shown in the following tables for assets, liabilities, revenues, and expenses of the closed blocks are those that enter into the determination of amounts that are to be paid to policyholders.
The following tables set forth certain summarized financial information relating to the closed blocks as of the dates indicated:
JHUSA Closed Block
| December 31, | ||||||||
| 2012 | 2011 | |||||||
|
|
|
|||||||
| (in millions) | ||||||||
| Liabilities |
||||||||
| Future policy benefits |
$ | 8,258 | $ | 8,349 | ||||
| Policyholders’ funds |
74 | 76 | ||||||
| Policyholder dividends payable |
162 | 180 | ||||||
| Other closed block liabilities |
659 | 636 | ||||||
|
|
|
|||||||
| Total closed block liabilities |
9,153 | 9,241 | ||||||
|
|
|
|||||||
| Assets |
||||||||
| Investments |
||||||||
| Fixed maturities: |
||||||||
| Available-for-sale—at fair value (amortized cost: 2012—$2,733; 2011—$2,918) |
3,163 | 3,250 | ||||||
| Mortgage loans on real estate |
519 | 579 | ||||||
| Investment real estate |
710 | 692 | ||||||
| Policy loans |
1,589 | 1,586 | ||||||
| Other invested assets |
5 | 4 | ||||||
|
|
|
|||||||
| Total investments |
5,986 | 6,111 | ||||||
| Cash borrowings, cash, and cash equivalents |
(513 | ) | (339 | ) | ||||
| Accrued investment income |
101 | 102 | ||||||
| Amount due from and held for affiliates |
2,047 | 1,885 | ||||||
| Other closed block assets |
588 | 574 | ||||||
|
|
|
|||||||
| Total assets designated to the closed block |
8,209 | 8,333 | ||||||
|
|
|
|||||||
| Excess of closed block liabilities over assets designated to the closed block |
944 | 908 | ||||||
| Portion of above representing accumulated other comprehensive income: |
||||||||
| Unrealized appreciation, net of deferred income tax expense of $322 and $265, respectively |
597 | 492 | ||||||
| Adjustment for deferred policy acquisition costs, net deferred income tax benefit of $111 and $82, respectively |
(206 | ) | (153 | ) | ||||
| Foreign currency translation adjustment |
(79 | ) | (70 | ) | ||||
|
|
|
|||||||
| Total amounts included in accumulated other comprehensive income |
312 | 269 | ||||||
|
|
|
|||||||
| Maximum future earnings to be recognized from closed block assets and liabilities |
$ | 1,256 | $ | 1,177 | ||||
|
|
|
|||||||
F-56
Table of Contents
JOHN HANCOCK LIFE INSURANCE COMPANY (U.S.A.)
NOTES TO CONSOLIDATED FINANCIAL STATEMENTS – (CONTINUED)
Note 10 — Closed Blocks - (continued)
JHUSA Closed Block
| Years ended December 31, | ||||||||||||
| 2012 | 2011 | 2010 | ||||||||||
|
|
|
|||||||||||
| (in millions) | ||||||||||||
| Revenues |
||||||||||||
| Premiums |
$ | 538 | $ | 558 | $ | 597 | ||||||
| Net investment income |
339 | 331 | 351 | |||||||||
| Net realized investment income and other gains (losses) |
111 | 67 | 161 | |||||||||
|
|
|
|||||||||||
| Total revenues |
988 | 956 | 1,109 | |||||||||
| Benefits and Expenses |
||||||||||||
| Benefits to policyholders |
656 | 668 | 713 | |||||||||
| Policyholder dividends |
331 | 354 | 367 | |||||||||
| Amortization of deferred policy acquisition costs |
94 | 14 | (28 | ) | ||||||||
| Other closed block operating costs and expenses |
29 | 29 | 28 | |||||||||
|
|
|
|||||||||||
| Total benefits and expenses |
1,110 | 1,065 | 1,080 | |||||||||
| Revenues, net of benefits and expenses |
(122 | ) | (109 | ) | 29 | |||||||
| Income tax expense (benefit) |
(43 | ) | (41 | ) | 11 | |||||||
|
|
|
|||||||||||
| Revenues, net of benefits and expenses and income taxes |
$ | (79 | ) | $ | (68 | ) | $ | 18 | ||||
|
|
|
|||||||||||
Maximum future earnings from closed block assets and liabilities:
| December 31, | ||||||||
| 2012 | 2011 | |||||||
|
|
|
|||||||
| (in millions) | ||||||||
| Beginning of period |
$ | 1,177 | $ | 1,109 | ||||
| Revenues, net of benefits and expenses and income taxes |
79 | 68 | ||||||
|
|
|
|||||||
| End of period |
$ | 1,256 | $ | 1,177 | ||||
|
|
|
|||||||
F-57
Table of Contents
JOHN HANCOCK LIFE INSURANCE COMPANY (U.S.A.)
NOTES TO CONSOLIDATED FINANCIAL STATEMENTS – (CONTINUED)
Note 10 — Closed Blocks - (continued)
JHLICO Closed Block
| December 31, | ||||||||
| 2012 | 2011 | |||||||
|
|
|
|||||||
| (in millions) | ||||||||
| Liabilities |
||||||||
| Future policy benefits |
$ | 10,488 | $ | 10,654 | ||||
| Policyholders’ funds |
1,446 | 1,506 | ||||||
| Policyholder dividends payable |
324 | 367 | ||||||
| Other closed block liabilities |
418 | 409 | ||||||
|
|
|
|||||||
| Total closed block liabilities |
12,676 | 12,936 | ||||||
|
|
|
|||||||
| Assets |
||||||||
| Investments |
||||||||
| Fixed maturities: |
||||||||
| Available-for-sale—at fair value |
6,839 | 6,939 | ||||||
| Equity securities: |
||||||||
| Available-for-sale—at fair value |
9 | 12 | ||||||
| Mortgage loans on real estate |
2,176 | 2,284 | ||||||
| Policy loans |
1,449 | 1,491 | ||||||
| Other invested assets |
88 | 104 | ||||||
|
|
|
|||||||
| Total investments |
10,561 | 10,830 | ||||||
| Cash borrowings, cash, and cash equivalents |
154 | (36 | ) | |||||
| Accrued investment income |
128 | 133 | ||||||
| Other closed block assets |
88 | 88 | ||||||
|
|
|
|||||||
| Total assets designated to the closed block |
10,931 | 11,015 | ||||||
|
|
|
|||||||
| Excess of closed block liabilities over assets designated to the closed block |
1,745 | 1,921 | ||||||
| Portion of above representing accumulated other comprehensive income: |
||||||||
| Unrealized appreciation, net of deferred income tax expense of $229 and $194, respectively |
425 | 358 | ||||||
|
|
|
|||||||
| Maximum future earnings to be recognized from closed block assets and liabilities |
$ | 2,170 | $ | 2,279 | ||||
|
|
|
|||||||
F-58
Table of Contents
JOHN HANCOCK LIFE INSURANCE COMPANY (U.S.A.)
NOTES TO CONSOLIDATED FINANCIAL STATEMENTS – (CONTINUED)
Note 10 — Closed Blocks - (continued)
JHLICO Closed Block
| Years ended December 31, | ||||||||||||
| 2012 | 2011 | 2010 | ||||||||||
|
|
|
|||||||||||
| (in millions) | ||||||||||||
| Revenues |
||||||||||||
| Premiums |
$ | 514 | $ | 577 | $ | 621 | ||||||
| Net investment income |
555 | 576 | 585 | |||||||||
| Net realized investment income and other gains (losses) |
65 | 73 | 18 | |||||||||
|
|
|
|||||||||||
| Total revenues |
1,134 | 1,226 | 1,224 | |||||||||
| Benefits and Expenses |
||||||||||||
| Benefits to policyholders |
665 | 729 | 733 | |||||||||
| Policyholder dividends |
289 | 412 | 439 | |||||||||
| Other closed block operating costs and expenses |
12 | 52 | 11 | |||||||||
|
|
|
|||||||||||
| Total benefits and expenses |
966 | 1,193 | 1,183 | |||||||||
| Revenues, net of benefits and expenses |
168 | 33 | 41 | |||||||||
| Income tax expense (benefit) |
59 | 12 | 12 | |||||||||
|
|
|
|||||||||||
| Revenues, net of benefits and expenses and income taxes |
$ | 109 | $ | 21 | $ | 29 | ||||||
|
|
|
|||||||||||
Maximum future earnings from closed block assets and liabilities:
| December 31, | ||||||||
| 2012 | 2011 | |||||||
|
|
|
|||||||
| (in millions) | ||||||||
| Beginning of period |
$ | 2,279 | $ | 2,300 | ||||
| Revenues, net of benefits and expenses and income taxes |
(109 | ) | (21 | ) | ||||
|
|
|
|||||||
| End of period |
$ | 2,170 | $ | 2,279 | ||||
|
|
|
|||||||
F-59
Table of Contents
JOHN HANCOCK LIFE INSURANCE COMPANY (U.S.A.)
NOTES TO CONSOLIDATED FINANCIAL STATEMENTS – (CONTINUED)
Note 11 — Debt and Line of Credit
External short-term and long-term debt consisted of the following:
| December 31, | ||||||||
| 2012 | 2011 | |||||||
|
|
|
|||||||
| (in millions) | ||||||||
| Short-term debt: |
||||||||
| Current maturities of long-term debt |
$ | 14 | $ | 11 | ||||
| Long-term debt: |
||||||||
| Surplus notes, 7.38% maturing in 2024 |
472 | 473 | ||||||
| Fixed rate notes payable, interest ranging from 5.4% to 13.84% due in varying amounts to 2016 |
62 | 106 | ||||||
| Variable rate notes payable, interest ranging from LIBOR plus 0.45% to LIBOR plus 3.15% |
- | 59 | ||||||
|
|
|
|||||||
| 534 | 638 | |||||||
| Less current maturities of long-term debt |
(14 | ) | (11 | ) | ||||
|
|
|
|||||||
| Total long-term debt |
$ | 520 | $ | 627 | ||||
|
|
|
|||||||
| Consumer notes: |
||||||||
| Notes payable, interest ranging from 0.80% to 6.00% due in varying amounts to 2032 |
$ | 716 | $ | 819 | ||||
|
|
|
|||||||
Long-Term Debt
Aggregate maturities of long-term debt are as follows: 2013—$14 million; 2014—$32 million; 2015—$0 million ; 2016—$16 million; 2017—$0 million; and thereafter—$472 million.
Interest expense on debt, included in other operating costs and expenses, was $41 million, $46 million and $47 million in 2012, 2011, and 2010, respectively. Interest paid on debt was $38 million, $43 million, and $47 million in 2012, 2011, and 2010, respectively.
The fixed rate notes payable includes $47 million of collateralized debt and therefore ranks highest in priority. The remaining fixed rate notes payable are unsecured. Any payment of interest or principal on the surplus notes requires the prior approval of the Commissioner.
Consumer Notes
The Company issued consumer notes through its SignatureNotes program. The SignatureNotes investment product was sold through a broker-dealer network to retail customers in the form of publicly traded fixed and/or floating rate securities. SignatureNotes have a variety of maturities, interest rates, and call provisions.
Aggregate maturities of consumer notes, net of unamortized dealer fees, are as follows: 2013—$56 million; 2014—$237 million; 2015—$148 million; 2016—$67 million; 2017—$8 million; and thereafter—$204 million.
Interest expense on consumer notes, included in other operating costs and expenses, was $34 million, $42 million, and $48 million in 2012, 2011, and 2010, respectively. Interest paid amounted to $36 million, $42 million, and $48 million in 2012, 2011, and 2010, respectively.
F-60
Table of Contents
JOHN HANCOCK LIFE INSURANCE COMPANY (U.S.A.)
NOTES TO CONSOLIDATED FINANCIAL STATEMENTS – (CONTINUED)
Note 11 — Debt and Line of Credit - (continued)
Line of Credit
At December 31, 2012, the Company had a committed line of credit established by MFC totaling $1 billion pursuant to a 364-day revolving credit facility. MFC will commit, when requested, to loan funds at prevailing interest rates as determined in accordance with the line of credit agreement. Under the terms of the agreement, the Company is required to maintain a certain minimum level of net worth and comply with certain other covenants, which were met at December 31, 2012. At December 31, 2012, the Company had no outstanding borrowings under the agreement.
At December 31, 2012, the Company, MFC, and other MFC subsidiaries had a committed line of credit through a group of banks totaling $500 million pursuant to a multi-year facility, which will expire in 2015. The banks will commit, when requested, to loan funds at prevailing interest rates as determined in accordance with the line of credit agreement. Under the terms of the agreement, MFC is required to maintain a certain minimum level of net worth, and MFC and the Company are required to comply with certain other covenants, which were met at December 31, 2012. At December 31, 2012, MFC and its subsidiaries, including the Company, had no outstanding borrowings under the agreement.
Note 12 — Income Taxes
The Company is included in the consolidated federal income tax return of JHFC. In 2010, the Company’s common parent, Manulife Holdings Delaware LLC (“MHDLLC”) merged with JHFC resulting in a new combined group. John Hancock Life and Health Insurance Company (“JHLH”), an affiliate, files a separate federal income tax return for a five-year period that began in 2010.
Income (loss) before income taxes includes the following:
| Years ended December 31, | ||||||||||||
| 2012 | 2011 | 2010 | ||||||||||
|
|
|
|||||||||||
| (in millions) | ||||||||||||
| Domestic |
$ | (766 | ) | $ | (1,143 | ) | $ | (788 | ) | |||
|
|
|
|||||||||||
| Income (loss) before income taxes |
$ | (766 | ) | $ | (1,143 | ) | $ | (788 | ) | |||
|
|
|
|||||||||||
The components of income taxes were as follows:
| Years ended December 31, | ||||||||||||
| 2012 | 2011 | 2010 | ||||||||||
|
|
|
|||||||||||
| (in millions) | ||||||||||||
| Current taxes: |
||||||||||||
| Federal |
$ | (255 | ) | $ | (233 | ) | $ | (224 | ) | |||
| State |
- | 1 | - | |||||||||
|
|
|
|||||||||||
| Total |
(255 | ) | (232 | ) | (224 | ) | ||||||
|
|
|
|||||||||||
| Deferred taxes: |
||||||||||||
| Federal |
(378 | ) | (100 | ) | 403 | |||||||
| State |
- | - | (3 | ) | ||||||||
|
|
|
|||||||||||
| Total |
(378 | ) | (100 | ) | 400 | |||||||
|
|
|
|||||||||||
| Total income tax expense (benefit) |
$ | (633 | ) | $ | (332 | ) | $ | 176 | ||||
|
|
|
|||||||||||
F-61
Table of Contents
JOHN HANCOCK LIFE INSURANCE COMPANY (U.S.A.)
NOTES TO CONSOLIDATED FINANCIAL STATEMENTS – (CONTINUED)
Note 12 — Income Taxes - (continued)
A reconciliation of income taxes at the federal income tax rate to income tax expense (benefit) charged to operations follows:
| Years ended December 31, | ||||||||||||
| 2012 | 2011 | 2010 | ||||||||||
|
|
|
|||||||||||
| (in millions) | ||||||||||||
| Tax at 35% |
$ | (268 | ) | $ | (400 | ) | $ | (276 | ) | |||
| Add (deduct): |
||||||||||||
| Prior year taxes |
(61 | ) | 27 | 47 | ||||||||
| Tax credits |
(76 | ) | (74 | ) | (65 | ) | ||||||
| Tax-exempt investment income |
(29 | ) | (31 | ) | (34 | ) | ||||||
| Lease income |
27 | 1 | (5 | ) | ||||||||
| Dividend received deduction |
(113 | ) | (102 | ) | (88 | ) | ||||||
| Change in tax reserves |
(128 | ) | 67 | 34 | ||||||||
| Goodwill impairment |
- | 175 | 560 | |||||||||
| Foreign tax expense gross-up |
10 | 3 | 3 | |||||||||
| Other |
5 | 2 | - | |||||||||
|
|
|
|||||||||||
| Total income tax expense (benefit) |
$ | (633 | ) | $ | (332 | ) | $ | 176 | ||||
|
|
|
|||||||||||
F-62
Table of Contents
JOHN HANCOCK LIFE INSURANCE COMPANY (U.S.A.)
NOTES TO CONSOLIDATED FINANCIAL STATEMENTS – (CONTINUED)
Note 12 — Income Taxes - (continued)
Deferred income tax assets and liabilities result from tax affecting the differences between the financial statement values and income tax values of assets and liabilities at each Consolidated Balance Sheet date. Deferred tax assets and liabilities consisted of the following:
| December 31, | ||||||||
| 2012 | 2011 | |||||||
|
|
|
|||||||
| (in millions) | ||||||||
| Deferred tax assets: |
||||||||
| Policy reserves |
$ | 2,401 | $ | 2,752 | ||||
| Net operating loss carryforwards |
661 | 666 | ||||||
| Net capital loss carryforwards |
- | - | ||||||
| Tax credits |
831 | 698 | ||||||
| Unearned revenue |
523 | 702 | ||||||
| Deferred compensation |
53 | 61 | ||||||
| Accrued interest |
414 | 437 | ||||||
| Policyholder dividends payable |
91 | 156 | ||||||
| Other |
91 | 147 | ||||||
|
|
|
|||||||
| Total deferred tax assets |
5,065 | 5,619 | ||||||
|
|
|
|||||||
| Deferred tax liabilities |
||||||||
| Unrealized investment gains on securities |
2,954 | 2,225 | ||||||
| Deferred policy acquisition costs |
1,606 | 1,751 | ||||||
| Intangible assets |
946 | 1,042 | ||||||
| Premiums receivable |
36 | 37 | ||||||
| Deferred sales inducements |
57 | 89 | ||||||
| Deferred gains |
527 | 577 | ||||||
| Securities and other investments |
2,969 | 3,690 | ||||||
| Other |
188 | 130 | ||||||
|
|
|
|||||||
| Total deferred tax liabilities |
9,283 | 9,541 | ||||||
|
|
|
|||||||
| Net deferred tax liabilities |
$ | 4,218 | $ | 3,922 | ||||
|
|
|
|||||||
At December 31, 2012, the Company had $1,889 million of net operating loss carryforwards which will expire between 2023 and 2030. At December 31, 2012, the Company had $831 million of tax credits, which consist of $633 million of general business credits, $172 million of foreign tax credits, and $26 million of alternative minimum tax credits. The general business credits begin to expire in tax year 2021 through tax year 2032. The foreign tax credits begin to expire in tax year 2013 through tax year 2022. The alternative minimum tax credits do not have an expiration date.
The Company has not recorded a valuation allowance with respect to the realizability of its deferred tax assets. In assessing the need for a valuation allowance, management considered the future reversal of taxable temporary differences, future taxable income exclusive of reversing temporary differences, taxable income in the carry back period, as well as tax planning strategies. Tax planning strategies were considered to the extent they were both prudent and feasible and if implemented, would result in the realization of deferred tax assets. Based on management’s assessment of all available information, management believes that it is more likely than not the Company will realize the full benefit of its deferred tax assets.
In 2012, the Company received income tax refunds of $190 million from subsidiaries under the terms of its inter-company tax-sharing agreement and made income tax payments of $43 million to the Internal Revenue Service (“IRS”). In 2011, the Company received income tax refunds of $181 million from subsidiaries under the terms of its inter-company tax-sharing agreement and received income tax refunds of $20 million from the IRS. In 2010, the Company received income tax refunds of $60 million from subsidiaries under the inter-company tax sharing agreement and made income tax payments of $29 million to the IRS.
F-63
Table of Contents
JOHN HANCOCK LIFE INSURANCE COMPANY (U.S.A.)
NOTES TO CONSOLIDATED FINANCIAL STATEMENTS – (CONTINUED)
Note 12 — Income Taxes - (continued)
The Company files income tax returns in the U.S. federal jurisdiction and various state and local jurisdictions. The Company is under continuous examination by the IRS. Effective for 2010, the Company’s common parent JHFC merged into MHDLLC resulting in a new combined group. The returns for the new combined group have not yet been examined by the IRS. With respect to the legacy MHDLLC consolidated return group, the IRS audits for tax years prior to 2006 have been closed. Tax years 2006 and 2007 for MHDLLC are in IRS appeals and tax years 2008 and 2009 are currently under examination. With respect to the legacy JHFC group, the IRS has completed its examinations of tax years 1997 through 2006. The IRS has issued statutory notices of deficiency relating to issues in years 1997 through 2001. The Company resolved all issues with the IRS except leveraged leases, for which the Company is waiting on a decision from the U.S. Tax Court. For tax years 2002 through 2004, all issues have been resolved except those pertaining to the Tax Court case. For tax years 2005 and 2006, the legacy JHFC group is currently in appeals. Tax years 2007 through 2009 are currently under examination by the IRS. Tax years 1997 through 2004 remain open until the Tax Court case is resolved. Management believes that adequate provision has been made in the financial statements for potential assessments relating to all open tax years.
A reconciliation of the beginning and ending amount of unrecognized tax benefits is as follows:
| December 31, | ||||||||
| 2012 | 2011 | |||||||
|
|
|
|||||||
| (in millions) | ||||||||
| Balance, beginning of year |
$ | 2,477 | $ | 2,261 | ||||
| Additions based on tax positions related to the current year |
350 | 212 | ||||||
| Additions for tax positions of prior years |
616 | 10 | ||||||
| Reductions for tax positions of prior years |
(217 | ) | (6 | ) | ||||
|
|
|
|||||||
| Balance, end of year |
$ | 3,226 | $ | 2,477 | ||||
|
|
|
|||||||
Included in the balances as of December 31, 2012 and 2011, respectively, are $237 million and $387 million of unrecognized benefits that, if recognized, would affect the Company’s effective tax rate. Included in the balances as of December 31, 2012 and 2011, respectively, are $2,989 million and $2,090 million of tax positions for which the ultimate deductibility is highly certain but for which there is uncertainty about the timing of such deductibility. Excluding the effect of interest and penalties, this has no impact on the annual effective rate, but would accelerate the payment of taxes to an earlier period.
The Company’s liability for unrecognized tax benefits may decrease in the next twelve months pending the outcome of remaining issues associated with the 1997 through 2009 IRS audit. A reasonable estimate of the decrease cannot be determined at this time; however, the Company believes that the ultimate resolution will not result in a material change to its consolidated financial statements.
The Company recognizes interest accrued related to unrecognized tax benefits in interest expense (part of other operating costs and expenses) and penalties in income tax expense. The Company recognized approximately $34 million of interest benefit for the year ended December 31, 2012, $161 million and $166 million of interest expense for the years ended December 31, 2011 and 2010, respectively. The Company had approximately $1,157 million and $1,191 million accrued for interest as of December 31, 2012 and 2011, respectively. The Company did not recognize material penalties for the years ended December 31, 2012, 2011, and 2010.
Note 13 — Commitments, Guarantees, Contingencies, and Legal Proceedings
Commitments. The Company has extended commitments to purchase U.S. private debt and to issue mortgage loans on real estate totaling $1,957 million and $124 million, respectively, at December 31, 2012. If funded, loans related to real estate mortgages would be fully collateralized by the mortgaged properties. The Company monitors the creditworthiness of borrowers under long-term bond commitments and requires collateral as deemed necessary. Approximately 40% of these commitments expire in 2013 and the remainder expire by 2017.
The Company leases office space under non-cancelable operating lease agreements with various expiration dates. Rental expenses, net of sub-lease income, were $18 million, $20 million and $24 million for the years ended December 31, 2012, 2011, and 2010, respectively.
F-64
Table of Contents
JOHN HANCOCK LIFE INSURANCE COMPANY (U.S.A.)
NOTES TO CONSOLIDATED FINANCIAL STATEMENTS – (CONTINUED)
Note 13 — Commitments, Guarantees, Contingencies, and Legal Proceedings - (continued)
During 2001, the Company entered into an office ground lease agreement, which expires on September 20, 2096. During 2012, the Company entered into a parking lease agreement, which expires on December 31, 2050. The terms of the lease agreements provide for adjustments in future periods. The future minimum lease payments, by year and in the aggregate, under these leases and other non-cancelable operating leases along with the associated sub-lease income are as follows:
| Non-cancelable Operating Leases |
Sub-lease Income |
|||||||
| (in millions) | ||||||||
| 2013 |
$ | 43 | $ | 17 | ||||
| 2014 |
33 | 14 | ||||||
| 2015 |
18 | 3 | ||||||
| 2016 |
10 | - | ||||||
| 2017 |
7 | - | ||||||
| Thereafter |
365 | - | ||||||
|
|
|
|||||||
| Total |
$ | 476 | $ | 34 | ||||
|
|
|
|||||||
Other than the Company’s investment in real estate, the Company does not have any material sub-lease income related to its office space. Leasing of investment real estate is not a significant part of the Company’s business activities in terms of revenue, net income, or assets.
The Company’s investment in leveraged leases relates to equipment used primarily in the transportation industries; however, this type of leasing transaction is not a significant part of the Company’s business activities in terms of revenue, net income, or assets.
Guarantees. In the course of business, the Company enters into guarantees which vary in nature and purpose and which are accounted for and disclosed under U.S. GAAP specific to the insurance industry. The Company had no guarantees outstanding outside the scope of insurance accounting at December 31, 2012.
Contingencies. The Company is an investor in leveraged leases and has established provisions for possible disallowance of the tax treatment and for interest on past due taxes. The Company continues to believe that deductions originally claimed in relation to these arrangements are appropriate. Although not expected to occur, should the tax attributes of the leveraged leases be fully denied, no material impact to the Company’s results are expected.
The Company acts as an intermediary/broker in over-the-counter derivative instruments. In these cases, the Company enters into derivative transactions on behalf of affiliated companies and then enters into offsetting derivative transactions with the affiliate. In the event of default of either party, the Company is still obligated to fulfill its obligations with the other party.
Legal Proceedings. The Company is regularly involved in litigation, both as a defendant and as a plaintiff. The litigation naming the Company as a defendant ordinarily involves its activities as a provider of insurance protection and wealth management products, an employer, and a taxpayer. In addition, the Michigan Office of Financial and Insurance Regulation, state attorneys general, the SEC, the Financial Regulatory Authority, and other government and regulatory bodies regularly make inquiries and, from time to time, require the production of information or conduct examinations concerning the Company’s compliance with, among other things, insurance laws, securities laws, and laws governing the activities of broker-dealers. An estimation of the range of potential outcomes in any given matter is often unavailable until developments in such matters have provided sufficient information to support an assessment of the range of possible loss, such as quantification of a damage demand from plaintiffs, discovery from other parties and investigation of factual allegations, rulings by the court on motions or appeals, analysis by experts, and the progress of settlement negotiations. On a regular quarterly and annual basis, we review relevant information with respect to litigation contingencies and update our accruals and estimates of reasonably possible losses or ranges of loss based on such reviews.
F-65
Table of Contents
JOHN HANCOCK LIFE INSURANCE COMPANY (U.S.A.)
NOTES TO CONSOLIDATED FINANCIAL STATEMENTS – (CONTINUED)
Note 14 — Shareholder’s Equity
Capital Stock
The Company has two classes of capital stock, preferred stock and common stock. All of the outstanding preferred and common stock of the Company is owned by MIC, its parent.
F-66
Table of Contents
JOHN HANCOCK LIFE INSURANCE COMPANY (U.S.A.)
NOTES TO CONSOLIDATED FINANCIAL STATEMENTS – (CONTINUED)
Note 14 — Shareholder’s Equity - (continued)
Accumulated Other Comprehensive Income (Loss)
The components of accumulated other comprehensive income (loss) were as follows:
| Net Unrealized Investment Gains (Losses) |
Net Accumulated Gain (loss) on Cash Flow Hedges |
Foreign Currency Translation Adjustment |
Additional Pension and Postretirement Unrecognized Net Periodic Benefit Cost |
Accumulated Other Comprehensive Income (Loss) |
||||||||||||||||
|
|
|
|||||||||||||||||||
| (in millions) | ||||||||||||||||||||
| Balance at January 1, 2010 |
$ | 207 | $ | 400 | $ | 9 | $ | (478 | ) | $ | 138 | |||||||||
| Gross unrealized investment gains (net of deferred income tax expense of $770) |
1,429 | 1,429 | ||||||||||||||||||
| Reclassification adjustment for gains realized in net income (net of deferred income tax expense of $275) |
(510 | ) | (510 | ) | ||||||||||||||||
| Adjustment for policyholder liabilities (net of deferred income tax expense of $23) |
42 | 42 | ||||||||||||||||||
| Adjustment for deferred policy acquisition costs, deferred sales inducements, value of business acquired, and unearned revenue liability (net of deferred income tax benefit of $97) |
(180 | ) | (180 | ) | ||||||||||||||||
|
|
|
|||||||||||||||||||
| Net unrealized investment gains |
781 | 781 | ||||||||||||||||||
| Foreign currency translation adjustment |
(53 | ) | (53 | ) | ||||||||||||||||
| Pension and postretirement benefits: |
||||||||||||||||||||
| Change in prior service cost (net of deferred income tax benefit of $1) |
(2 | ) | (2 | ) | ||||||||||||||||
| Change in net actuarial loss (net of deferred income tax expense of $5) |
9 | 9 | ||||||||||||||||||
| Net unrealized gain on split-dollar life insurance benefit (net of deferred income tax expense of $1) |
2 | 2 | ||||||||||||||||||
| Net losses on the effective portion of the change in fair value of cash flow hedges (net of deferred income tax benefit of $20) |
(37 | ) | (37 | ) | ||||||||||||||||
| Reclassification of net cash flow hedge gains to net income (net of deferred income tax expense of $69) |
(129 | ) | (129 | ) | ||||||||||||||||
| Transfer of certain pension and postretirement benefit plans to Parent (net of deferred income tax expense of $255) |
473 | 473 | ||||||||||||||||||
|
|
|
|||||||||||||||||||
| Balance at December 31, 2010 |
$ | 988 | $ | 234 | $ | (44 | ) | $ | 4 | $ | 1,182 | |||||||||
|
|
|
|||||||||||||||||||
F-67
Table of Contents
JOHN HANCOCK LIFE INSURANCE COMPANY (U.S.A.)
NOTES TO CONSOLIDATED FINANCIAL STATEMENTS – (CONTINUED)
Note 14 — Shareholder’s Equity - (continued)
| Net Unrealized Investment Gains (Losses) |
Net Accumulated Gain (loss) on Cash Flow Hedges |
Foreign Currency Translation Adjustment |
Additional Pension and Postretirement Unrecognized Net Periodic Benefit Cost |
Accumulated Other Comprehensive Income (Loss) |
||||||||||||||||
|
|
|
|||||||||||||||||||
| (in millions) | ||||||||||||||||||||
| Balance at January 1, 2011 |
$ | 988 | $ | 234 | $ | (44 | ) | $ | 4 | $ | 1,182 | |||||||||
| Gross unrealized investment gains (net of deferred income tax expense of $1,817) |
3,371 | 3,371 | ||||||||||||||||||
| Reclassification adjustment for gains realized in net income (net of deferred income tax expense of $373) |
(692 | ) | (692 | ) | ||||||||||||||||
| Adjustment for policyholder liabilities (net of deferred income tax benefit of $355) |
(659 | ) | (659 | ) | ||||||||||||||||
| Adjustment for deferred policy acquisition costs, deferred sales inducements, value of business acquired, and unearned revenue liability (net of deferred income tax benefit of $418) |
(775 | ) | (775 | ) | ||||||||||||||||
|
|
|
|||||||||||||||||||
| Net unrealized investment gains |
1,245 | 1,245 | ||||||||||||||||||
| Foreign currency translation adjustment |
13 | 13 | ||||||||||||||||||
| Net losses on the effective portion of the change in fair value of cash flow hedges (net of deferred income tax expense of $957) |
1,777 | 1,777 | ||||||||||||||||||
| Reclassification of net cash flow hedge gains to net income (net of deferred income tax expense of $32) |
(59 | ) | (59 | ) | ||||||||||||||||
|
|
|
|||||||||||||||||||
| Balance at December 31, 2011 |
$ | 2,233 | $ | 1,952 | $ | (31 | ) | $ | 4 | $ | 4,158 | |||||||||
|
|
|
|||||||||||||||||||
F-68
Table of Contents
JOHN HANCOCK LIFE INSURANCE COMPANY (U.S.A.)
NOTES TO CONSOLIDATED FINANCIAL STATEMENTS – (CONTINUED)
Note 14 — Shareholder’s Equity - (continued)
| Net Unrealized Investment Gains (Losses) |
Net Accumulated Gain (loss) on Cash Flow Hedges |
Foreign Currency Translation Adjustment |
Additional Pension and Postretirement Unrecognized Net Periodic Benefit Cost |
Accumulated Other Comprehensive Income (Loss) |
||||||||||||||||
|
|
|
|||||||||||||||||||
| (in millions) | ||||||||||||||||||||
| Balance at January 1, 2012 |
$ | 2,233 | $ | 1,952 | $ | (31 | ) | $ | 4 | $ | 4,158 | |||||||||
| Gross unrealized investment gains (net of deferred income tax expense of $902) |
1,677 | 1,677 | ||||||||||||||||||
| Reclassification adjustment for gains realized in net income (net of deferred income tax expense of $369) |
(686 | ) | (686 | ) | ||||||||||||||||
| Adjustment for policyholder liabilities (net of deferred income tax benefit of $135) |
(251 | ) | (251 | ) | ||||||||||||||||
| Adjustment for deferred policy acquisition costs, deferred sales inducements, value of business acquired, and unearned revenue liability (net of deferred income tax expense of $64) |
118 | 118 | ||||||||||||||||||
|
|
|
|||||||||||||||||||
| Net unrealized investment gains |
858 | 858 | ||||||||||||||||||
| Foreign currency translation adjustment |
(50 | ) | (50 | ) | ||||||||||||||||
| Pension and postretirement benefits: |
||||||||||||||||||||
| Net unrealized gain on split-dollar life insurance benefit (net of deferred income tax expense of $-) |
- | - | ||||||||||||||||||
| Net losses on the effective portion of the change in fair value of cash flow hedges (net of deferred income tax expense of $349) |
648 | 648 | ||||||||||||||||||
| Reclassification of net cash flow hedge gains to net income (net of deferred income tax expense of $113) |
(209 | ) | (209 | ) | ||||||||||||||||
|
|
|
|||||||||||||||||||
| Balance at December 31, 2012 |
$ | 3,091 | $ | 2,391 | $ | (81 | ) | $ | 4 | $ | 5,405 | |||||||||
|
|
|
|||||||||||||||||||
F-69
Table of Contents
JOHN HANCOCK LIFE INSURANCE COMPANY (U.S.A.)
NOTES TO CONSOLIDATED FINANCIAL STATEMENTS – (CONTINUED)
Note 14 — Shareholder’s Equity - (continued)
Net unrealized investment gains (losses) included on the Company’s Consolidated Balance Sheets as a component of shareholder’s equity are summarized below:
| Years ended December 31, | ||||||||||||
| 2012 | 2011 | 2010 | ||||||||||
|
|
|
|||||||||||
| (in millions) | ||||||||||||
| Balance, end of year comprises: |
||||||||||||
| Unrealized investment gains (losses) on: |
||||||||||||
| Fixed maturities |
$ | 7,378 | $ | 5,932 | $ | 1,861 | ||||||
| Equity securities |
471 | 365 | 360 | |||||||||
| Other investments |
5 | 33 | (14 | ) | ||||||||
|
|
|
|||||||||||
| Total (1) |
7,854 | 6,330 | 2,207 | |||||||||
| Amounts of unrealized investment gains (losses) attributable to: |
||||||||||||
| Deferred policy acquisition costs, deferred sales inducements, value of business acquired, and unearned revenue liability |
(1,642 | ) | (1,824 | ) | (631 | ) | ||||||
| Policyholder liabilities |
(1,456 | ) | (1,070 | ) | (56 | ) | ||||||
| Deferred income taxes |
(1,665 | ) | (1,203 | ) | (532 | ) | ||||||
|
|
|
|||||||||||
| Total |
(4,763 | ) | (4,097 | ) | (1,219 | ) | ||||||
|
|
|
|||||||||||
| Net unrealized investment gains (losses) |
$ | 3,091 | $ | 2,233 | $ | 988 | ||||||
|
|
|
|||||||||||
| (1) | Includes unrealized investment gains (losses) on invested assets held in trust on behalf of MRBL, which are included in amounts due from and held for affiliates on the Consolidated Balance Sheets. See Related Party Transactions Note, for information on the associated MRBL reinsurance agreement. |
Statutory Results
The Company and its wholly-owned subsidiaries, JHNY and JHLH, are required to prepare statutory financial statements in accordance with statutory accounting practices prescribed or permitted by the insurance departments of their states of domicile, which are Michigan, New York, and Massachusetts, respectively.
The Company’s statutory net (loss) income for the years ended December 31, 2012, 2011, and 2010 was $221 million, $(2,888) million, and $40 million, respectively. The Company’s statutory capital and surplus as of December 31, 2012 and 2011 was $5,794 million and $4,971 million, respectively.
Under Michigan State insurance laws, no insurer may pay any shareholder dividends from any source other than statutory earned surplus without the prior approval of the Insurance Commissioner. Dividends to the shareholder that may be paid without prior approval of the Commissioner are limited by the laws of the State of Michigan. Such dividends are permissible if, together with other dividends or distributions made within the preceding 12 months, they do not exceed the greater of 10% of the JHUSA surplus as of December 31 of the preceding year, or the net gain from operations for the 12 month period ending December 31 of the immediately preceding year. JHUSA paid no shareholder dividends to MIC for the years ended December 31, 2012 and 2011.
F-70
Table of Contents
JOHN HANCOCK LIFE INSURANCE COMPANY (U.S.A.)
NOTES TO CONSOLIDATED FINANCIAL STATEMENTS – (CONTINUED)
Note 15 — Pension and Other Postretirement Benefit Plans
Prior to December 31, 2010, the Company accounted for its share of the John Hancock Pension Plan, a qualified defined benefit plan, and the John Hancock Non-Qualified Pension Plan, a non-qualified defined benefit plan (collectively, “the Plans”), and the John Hancock Employee Welfare Plan (the “Welfare Plan”) as direct legal obligations of the Company and accounted for the corresponding plan obligations on its Consolidated Balance Sheets and Consolidated Statements of Operations. Effective December 31, 2010, the Company transferred the sponsorship of these plans to MIC along with the associated net liabilities. The impact of the transfer on the Company’s December 31, 2010 Consolidated Statements of Changes in Shareholder’s Equity was a decrease in additional paid-in capital of $13 million and an increase in accumulated other comprehensive income of $473 million, net of tax.
Prior to December 31, 2010, the Company sponsored the John Hancock Pension Plan that covers substantially all of its employees. Historically, pension benefits were calculated utilizing a traditional formula. Under the traditional formula, benefits were provided based upon length of service and final average compensation. As of January 1, 2002, all defined benefit pension plans were amended to a cash balance basis. Under the cash balance formula, participants are credited with benefits equal to a percentage of eligible pay, as well as interest. Certain grandfathered employees are eligible to receive benefits based upon the greater of the traditional formula or cash balance formula. In addition, early retirement benefits are subsidized for certain grandfathered employees.
Prior to December 31, 2010, the Company’s funding policy for its qualified defined benefit plan was to contribute annually an amount at least equal to the minimum annual contribution required under the Employee Retirement Income Security Act of 1974, as amended (“ERISA”), and other applicable laws and generally not greater than the maximum amount that can be deducted for federal income tax purposes. In 2010, no contributions were made to the qualified plan.
Prior to December 31, 2010, the Company also sponsored the John Hancock Non-Qualified Pension Plan. an unfunded non-qualified defined benefit plan. This plan provides supplemental benefits in excess of the compensation limit outlined in the Internal Revenue Code for certain employees.
Prior to December 31, 2010, the Company’s funding policy for the John Hancock Non-Qualified Pension Plan was to contribute an amount equal to the plan’s benefit payments made during the year. The contribution to the non-qualified plan was $31 million in 2010.
As of the transfer date, the assets and liabilities of the Plans became direct obligations of MIC, while JHUSA became a participating employer in the plans transferred. Prospectively, the Company will remain jointly and severally liable for the funding requirements of the Plans and will recognize its allocation from MIC of the required contributions to the plans as pension expense in its Consolidated Statements of Operations. The allocation is derived by utilizing participant data, provided by the plan actuary, to calculate payments into the trust for the qualified plan and payments to participants for the non-qualified plan. Prior to 2011, pension expense was the net periodic benefit cost incurred for these plans as determined by the plan actuary and consistent with actuarial practice for a plan sponsor. The expense for the Plans was $59 million, $41 million and $7 million in 2012, 2011, and 2010, respectively. The components of the $7 million in 2010 consisted of $32 million service cost, $124 million interest cost, ($161) million expected return on plan assets, ($3) million amortization of prior service cost and $15 million recognized actuarial loss. In 2010, benefits paid related to the qualified defined benefit plan and the non-qualified plan were $175 million.
The Company participates in the John Hancock Supplemental Retirement Plan, a non-qualified defined contribution plan maintained by MFC, which was established as of January 1, 2008 with participant directed investment options. The expense for the plan was $ 7 million, $6 million, and $8 million in 2012, 2011, and 2010, respectively. The prior non-qualified defined contribution plan was frozen except for grandfathered participants as of January 1, 2008, and the benefits accrued under the prior plan continue to be subject to the prior plan provisions.
Prior to December 31, 2010, the Company provided postretirement medical and life insurance benefits for its retired employees and their spouses through its sponsorship of the John Hancock Financial Services, Inc. Employee Welfare Plan. Effective January 1, 2010, the plan was renamed the John Hancock Employee Welfare Plan and plan sponsorship was transferred from MIC to the Company. Certain employees hired prior to January 1, 2005 who meet age and service criteria may be eligible for these postretirement benefits in accordance with the plan’s provisions. The majority of retirees contribute a portion of the total cost of postretirement medical benefits. Life insurance benefits are based on final compensation subject to the plan maximum.
F-71
Table of Contents
JOHN HANCOCK LIFE INSURANCE COMPANY (U.S.A.)
NOTES TO CONSOLIDATED FINANCIAL STATEMENTS – (CONTINUED)
Note 15 — Pension and Other Postretirement Benefit Plans - (continued)
The Welfare Plan was amended effective January 1, 2007 whereby participants who had not reached a certain age and years of service with the Company were no longer eligible for such Company contributory benefits. Also, the number of years of service required to be eligible for the benefit was increased to 15 years for all participants. The future retiree life insurance coverage amount was frozen as of December 31, 2006.
Prior to December 31, 2010, the Company’s policy was to fund the Welfare Plan in amounts at or below the annual tax qualified limits. The contribution to the Welfare Plan was $48 million in 2010.
As of the transfer date, the liabilities of the Welfare Plan became direct obligations of MIC, while JHUSA became a participating employer in the plan. Prospectively, the Company will remain jointly and severally liable for the funding requirements of the Welfare Plan and will recognize its allocation from MIC of the benefits paid on behalf of plan participants as postretirement benefits expense in its Consolidated Statements of Operations. The allocation is derived by utilizing participant data to calculate claim payments relating to participants in these plans. Prior to 2011, the Welfare Plan expense was the net periodic benefit cost incurred for these plans as determined by the plan actuary and consistent with actuarial practice for a plan sponsor. The expense for this plan was $30 million, $46 million, and $3 million in 2012, 2011, and 2010, respectively. The components of the $3 million in 2010 consisted of $1 million service cost, $28 million interest cost and ($26) million expected return on plan assets.
The Company participates in qualified defined contribution plans for its employees who meet certain eligibility requirements. Sponsorship of these plans transferred from MIC to the Company effective January 1, 2010. These plans include the Investment-Incentive Plan for John Hancock Employees and the John Hancock Savings and Investment Plan. Expense for these plans is primarily comprised of the amounts the Company contributes to the plans, which fully matches eligible participants’ basic pre-tax or Roth contributions, subject to a 4% per participant maximum. The expense for these defined contribution plans was $19 million, $19 million, and $18 million in 2012, 2011, and 2010, respectively.
Assumptions
Weighted-average assumptions used to determine the Company’s net periodic benefit cost for the year ended December 31, 2010, when the Company was the sponsor, are as follows:
| Pension Benefits | Other Postretirement Benefits |
|||||||
|
|
|
|||||||
| Discount rate |
5.50 | % | 5.50 | % | ||||
| Expected long-term return on plan assets |
7.75 | % | 7.75 | % | ||||
| Rate of compensation increase |
4.35 | % | N/A | |||||
| Health care cost trend rate for the following year |
8.50 | % | ||||||
| Ultimate trend rate |
5.00 | % | ||||||
| Year ultimate rate reached |
2028 | |||||||
The overall expected long-term rate of return on plan assets assumption reflects the Company’s best estimate. The general approach used to develop the assumption takes into consideration the allocation of assets held on the measurement date, plus the target allocation of expected contributions to the plan for the upcoming fiscal year, net of investment expenses. The rate is calculated using historical weighted-average real returns for each significant class of plan assets including the effects of continuous reinvestment of earnings. In addition, the calculation includes a long-term expectation of general inflation. Current market conditions and published commentary are also considered when assessing the reasonableness of the overall expected long-term rate of return on plan assets assumption.
F-72
Table of Contents
JOHN HANCOCK LIFE INSURANCE COMPANY (U.S.A.)
NOTES TO CONSOLIDATED FINANCIAL STATEMENTS – (CONTINUED)
Note 16 — Fair Value Measurements
The following table presents the carrying amounts and fair values of the items measured or disclosed at fair value by the Company. Fair values have been determined by using available market information and the valuation methodologies described below.
| December 31, | ||||||||||||||||
| 2012 | 2011 | |||||||||||||||
| Carrying Value |
Fair Value |
Carrying Value |
Fair Value |
|||||||||||||
|
|
|
|||||||||||||||
| (in millions) | ||||||||||||||||
| Assets: |
||||||||||||||||
| Fixed maturities: |
||||||||||||||||
| Available-for-sale (1) |
$ | 63,285 | $ | 63,285 | $ | 67,266 | $ | 67,266 | ||||||||
| Held-for-trading |
1,441 | 1,441 | 1,477 | 1,477 | ||||||||||||
| Equity securities: |
||||||||||||||||
| Available-for-sale |
386 | 386 | 439 | 439 | ||||||||||||
| Held-for-trading |
130 | 130 | 97 | 97 | ||||||||||||
| Mortgage loans on real estate |
13,192 | 15,065 | 13,974 | 15,335 | ||||||||||||
| Policy loans |
5,264 | 5,264 | 5,220 | 5,220 | ||||||||||||
| Short-term investments |
2,166 | 2,166 | 1,618 | 1,618 | ||||||||||||
| Cash and cash equivalents |
3,511 | 3,511 | 3,296 | 3,296 | ||||||||||||
| Other invested assets (2) |
367 | 367 | 425 | 425 | ||||||||||||
| Derivatives: |
||||||||||||||||
| Interest rate swaps |
11,502 | 11,502 | 11,580 | 11,580 | ||||||||||||
| Foreign currency swaps |
268 | 268 | 346 | 346 | ||||||||||||
| Foreign currency forwards |
10 | 10 | 4 | 4 | ||||||||||||
| Interest rate options |
43 | 43 | 9 | 9 | ||||||||||||
| Equity market contracts |
10 | 10 | - | - | ||||||||||||
| Credit default swaps |
6 | 6 | 4 | 4 | ||||||||||||
| Embedded derivatives |
2,715 | 2,715 | 2,924 | 2,924 | ||||||||||||
| Assets held in trust |
2,487 | 2,487 | 2,463 | 2,463 | ||||||||||||
| Separate account assets |
140,626 | 140,626 | 129,326 | 129,326 | ||||||||||||
|
|
|
|||||||||||||||
| Total assets |
$ | 247,409 | $ | 249,282 | $ | 240,468 | $ | 241,829 | ||||||||
|
|
|
|||||||||||||||
| Liabilities: |
||||||||||||||||
| Consumer notes |
$ | 716 | $ | 757 | $ | 819 | $ | 837 | ||||||||
| Debt |
534 | 593 | 638 | 677 | ||||||||||||
| Guaranteed investment contracts and funding agreements |
465 | 471 | 577 | 577 | ||||||||||||
| Fixed-rate deferred and immediate annuities |
8,903 | 9,219 | 9,415 | 9,307 | ||||||||||||
| Supplementary contracts without life contingencies |
67 | 72 | 48 | 48 | ||||||||||||
| Derivatives: |
||||||||||||||||
| Interest rate swaps |
4,499 | 4,499 | 4,454 | 4,454 | ||||||||||||
| Foreign currency swaps |
562 | 562 | 650 | 650 | ||||||||||||
| Foreign currency forwards |
- | - | 2 | 2 | ||||||||||||
| Equity market contracts |
7 | 7 | 20 | 20 | ||||||||||||
| Credit default swaps |
- | - | 1 | 1 | ||||||||||||
| Embedded derivatives |
4,717 | 4,717 | 3,961 | 3,961 | ||||||||||||
|
|
|
|||||||||||||||
| Total liabilities |
$ | 20,470 | $ | 20,897 | $ | 20,585 | $ | 20,534 | ||||||||
|
|
|
|||||||||||||||
F-73
Table of Contents
JOHN HANCOCK LIFE INSURANCE COMPANY (U.S.A.)
NOTES TO CONSOLIDATED FINANCIAL STATEMENTS – (CONTINUED)
Note 16 — Fair Value Measurements - (continued)
| 1) | Fixed maturities available-for-sale exclude leveraged leases of $1,711 million and $1,959 million at December 31, 2012 and 2011, respectively. The Company calculates the carrying value of its leveraged leases by accruing income at its expected internal rate of return. |
| 2) | Other invested assets exclude equity method and cost-accounted investments of $4,520 million and $4,076 million at December 31, 2012 and 2011, respectively. |
ASC 820 defines fair value, establishes a framework for measuring fair value, and expands disclosures about fair value measurements. This guidance defines fair value as the price that would be received to sell an asset or paid to transfer a liability in an orderly transaction between market participants at the measurement date; that is, an exit value. The exit value assumes the asset or liability is exchanged in an orderly transaction; it is not a forced liquidation or distressed sale.
Following ASC 820 guidance, the Company categorizes its fair value measurements according to a three-level hierarchy. The hierarchy prioritizes the inputs used by the Company’s valuation techniques. A level is assigned to each fair value measurement based on the lowest level input significant to the fair value measurement in its entirety. The three levels of the fair value hierarchy are defined as follows:
| • | Level 1 – Fair value measurements that reflect unadjusted, quoted prices in active markets for identical assets and liabilities that the Company has the ability to access at the measurement date. Active markets are defined as having the following characteristics for the measured asset/liability; (i) many transactions, (ii) current prices, (iii) price quotes not varying substantially among market makers, (iv) narrow bid/ask spreads, and (v) most information publicly available. Valuations are based on quoted prices reflecting market transactions involving assets or liabilities identical to those being measured. Level 1 assets primarily include exchange traded equity securities and certain separate account assets. |
| • | Level 2 – Fair value measurements using inputs other than quoted prices included within Level 1 that are observable for the asset or liability, either directly or indirectly. These include quoted prices for similar assets and liabilities in active markets, quoted prices for identical or similar assets and liabilities in inactive markets, inputs that are observable that are not prices (such as interest rates, credit risks, etc.), and inputs that are derived from or corroborated by observable market data. |
Most debt securities are classified within Level 2. Also included in the Level 2 category are financial instruments that are priced using models with observable market inputs, including most derivative financial instruments and certain separate account assets.
| • | Level 3 – Fair value measurements using significant nonmarket observable inputs. These include valuations for assets and liabilities that are derived using data, some or all of which is not market observable data, including assumptions about risk. |
Level 3 securities include less liquid securities, such as structured asset-backed securities, commercial mortgage-backed securities, and other securities that have little or no price transparency. Embedded and complex derivative financial instruments and separate account investments in timber and agriculture are also included in Level 3.
Determination of Fair Value
The valuation methodologies used to determine the fair values of assets and liabilities under ASC 820 reflect market participant assumptions and are based on the application of the fair value hierarchy that prioritizes observable market inputs over unobservable inputs. When available, the Company uses quoted market prices to determine fair value and classifies such items within Level 1. If quoted market prices are not available, fair value is based upon valuation techniques, which discount expected cash flows utilizing independent market observable interest rates based on the credit quality and duration of the instrument. Items valued using models are classified according to the lowest level input that is significant to the valuation. Thus, an item may be classified in Level 3 even though significant market observable inputs are used.
The Company utilizes a Valuation Quality Assurance (“VQA”) team of security analysts. The MFC Chief Investment Officer has ultimate responsibility over the VQA team. The team ensures quality and completeness of all daily and monthly prices. Prices are received from external pricing vendors and brokers and put through a quality assurance process which includes review of price movements relative to the market, comparison of prices between vendors, and internal matrix
F-74
Table of Contents
JOHN HANCOCK LIFE INSURANCE COMPANY (U.S.A.)
NOTES TO CONSOLIDATED FINANCIAL STATEMENTS – (CONTINUED)
Note 16 — Fair Value Measurements - (continued)
pricing. All inputs to our pricing matrix are external observable inputs extracted and entered by the VQA team. Broker quotes are used only when no external public vendor prices are available.
The following is a description of the valuation techniques used to measure fair value and the general classification of these instruments pursuant to the fair value hierarchy.
In general, ASC 820 created the following two primary categories for the purpose of fair value disclosure:
| • | Assets and Liabilities Measured and Disclosed at Fair Value on a Recurring Basis and Reported in the Consolidated Balance Sheets-This category includes assets and liabilities measured at fair value on a recurring and nonrecurring basis. Financial instruments measured on a recurring basis include fixed maturities, equity securities, short-term investments, derivatives, and separate account assets. Assets measured at fair value on a nonrecurring basis include limited partnership interests, and goodwill, which are reported at fair value only in the period in which an impairment is recognized. |
| • | Assets and Liabilities Disclosed at Fair Value on a Recurring Basis – This category includes mortgage loans on real estate, policy loans, cash and cash equivalents, consumer notes, guaranteed investment contracts, funding agreements and fixed-rate deferred and immediate annuities. |
Assets and Liabilities Measured and Disclosed at Fair Value on a Recurring Basis
Fixed Maturities
For fixed maturities, including corporate debt, U.S. Treasury, commercial and residential mortgage-backed securities, asset-backed securities, collateralized debt obligations, issuances by foreign governments, and obligations of state and political subdivisions, fair values are based on quoted market prices when available. When market prices are not available, fair value is generally estimated using discounted cash flow analyses, incorporating current market inputs for similar financial instruments with comparable terms and credit quality (matrix pricing). The significant inputs into these models include, but are not limited to, yield curves, credit risks and spreads, measures of volatility, and prepayment speeds. These fixed maturities are classified within Level 2. Fixed maturities with significant pricing inputs which are unobservable are classified within Level 3.
Equity Securities
Equity securities are comprised of common stock and are classified within Level 1, as fair values are based on quoted market prices in active markets.
Short-term Investments
Short-term investments are comprised of securities due to mature within one year of the date of purchase. Those that are traded in active markets are classified within Level 1, as fair values are based on quoted market prices. Securities such as commercial paper and discount notes are classified within Level 2 because these securities are typically not actively traded due to their short maturities and, as such, their cost generally approximates fair value.
Derivatives
The fair value of derivatives is determined through the use of quoted market prices for exchange-traded derivatives or through the use of pricing models for over-the-counter (“OTC”) derivatives. The pricing models used are based on market standard valuation methodologies, and the inputs to these models are consistent with what a market participant would use when pricing the instruments. Derivative valuations can be affected by changes in interest rates, currency exchange rates, financial indices, credit spreads, default risk (including the counterparties to the contract), and volatility. The Company’s derivatives are generally classified within Level 2 given the significant inputs to the pricing models for most OTC derivatives are observable or can be corroborated by observable market data. Inputs that are observable generally include interest rates, foreign currency exchange rates, and interest rate curves; however, certain OTC derivatives may rely on inputs that are significant to the fair value, but are unobservable in the market or cannot be derived principally from or corroborated by observable market data and would be classified within Level 3. Inputs that are unobservable generally include broker quotes, volatilities, and inputs that are outside of the observable portion of the interest rate curve or other relevant market measures. These unobservable inputs may involve significant management judgment or estimation.
F-75
Table of Contents
JOHN HANCOCK LIFE INSURANCE COMPANY (U.S.A.)
NOTES TO CONSOLIDATED FINANCIAL STATEMENTS – (CONTINUED)
Note 16 — Fair Value Measurements - (continued)
Even though unobservable, these inputs are based on assumptions deemed appropriate given the circumstances and consistent with what market participants would use when pricing such instruments. The credit risk of both the counterparty and the Company are considered in determining the fair value for all OTC derivatives after taking into account the effects of netting agreements and collateral arrangements.
Embedded Derivatives
As defined in ASC 815, the Company holds assets and liabilities classified as embedded derivatives on the Consolidated Balance Sheets. These assets include guaranteed minimum income benefits that are ceded under modified coinsurance reinsurance arrangements (“Reinsurance GMIB Assets”). Liabilities include policyholder benefits offered under variable annuity contracts such as GMWB with a term certain and embedded reinsurance derivatives.
Embedded derivatives are recorded on the Consolidated Balance Sheets at fair value, separately from their host contract, and the change in their fair value is reflected in net income. Many observable factors including, but not limited to, market conditions, credit ratings, and risk margins related to non-capital market inputs may result in significant fluctuations in the fair value of embedded derivatives that could materially affect net income. Embedded derivatives which are valued using observable market inputs are classified within Level 2 of the fair value hierarchy. Some embedded derivatives, mainly benefit guarantees for variable annuity products, utilize significant pricing inputs which are unobservable. These unobservable inputs are received from third party valuation experts and include equity volatility, mortality rates, lapse rates and utilization rates. Embedded derivatives with significant unobservable inputs are classified within Level 3.
The fair value of embedded derivatives related to GMIB and GMWB is estimated as the present value of future benefits less the present value of future fees. The fair value calculation includes assumptions for risk margins including nonperformance risk.
Risk margins are established to capture the risks of the instrument which represent the additional compensation a market participant would require to assume the risks related to the uncertainties of such actuarial assumptions as annuitization, persistency, partial withdrawal, and surrenders. The establishment of these actuarial assumptions, risk margins, nonperformance risk, and other inputs requires the use of significant judgment.
Nonperformance risk refers to the risk that the obligation will not be fulfilled and affects the value of the liability. The fair value measurement assumes that the nonperformance risk is the same before and after the transfer; therefore, fair value reflects the reporting entity’s own credit risk.
Nonperformance risk for liabilities held by the Company is based on MFC’s own credit risk, which is determined by taking into consideration publicly available information relating to MFC’s debt, as well as its claims paying ability. Nonperformance risk is also reflected in the reinsurance GMIB assets held by the Company. The credit risk of the reinsurance companies is most representative of the nonperformance risk for the reinsurance GMIB assets and is derived from publicly available information relating to the reinsurance companies’ publicly issued debt. As such, the reinsurance contract embedded derivatives are classified within Level 2.
The fair value of embedded derivatives related to reinsurance agreements is determined based on a total return swap methodology. These total return swaps are reflected as assets or liabilities on the Consolidated Balance Sheets representing the difference between the adjusted statutory book value and fair value of the related modified coinsurance assets with ongoing changes in fair value recorded in net realized investment and other gains (losses). The fair value of the underlying assets is based on the valuation approach for similar assets described herein.
Separate Account Assets
Separate account assets are carried at fair value and reported as a summarized total on the Consolidated Balance Sheets. Assets owned by the Company’s separate accounts primarily include investments in funds, fixed maturity securities, equity securities, real estate, short-term investments, and cash and cash equivalents. For separate accounts structured as a non-unitized fund, the fair value of the separate account assets is based on the fair value of the underlying assets owned by the separate account. For separate accounts structured as a unitized fund, the fair value of the separate account assets is based on the fair value of the underlying funds owned by the separate account.
The fair value of fund investments is based upon quoted market prices or reported net asset values. Fund investments that are traded in an active market and have a net asset value that the Company can access at the measurement date are classified within Level 1. The fair values of fixed maturity securities, equity securities, short-term investments, and cash equivalents held by separate accounts are determined on a basis consistent with the methodologies described herein for similar financial instruments held within the Company’s general account and may be classified within Level 1, 2, or 3 accordingly.
F-76
Table of Contents
JOHN HANCOCK LIFE INSURANCE COMPANY (U.S.A.)
NOTES TO CONSOLIDATED FINANCIAL STATEMENTS – (CONTINUED)
Note 16 — Fair Value Measurements - (continued)
Separate account assets classified as Level 3 consist primarily of debt and equity investments in private companies, which own timber and agriculture and carry it at fair value. The values of the timber and agriculture investments are estimated using generally accepted valuation techniques. A comprehensive appraisal is performed shortly after initial purchase and at two or three-year intervals thereafter. Appraisal updates are conducted according to client contracts, generally at one-year or six-month intervals. In the quarters in which an investment is not independently appraised or its valuation updated, the market value is reviewed by management. The valuation of an investment is adjusted only if there has been a significant change in economic circumstances related to the investment since acquisition or the most recent independent valuation and upon the independent appraiser’s review and concurrence with management. Further, these valuations are prepared giving consideration to the income, cost, and sales comparison approaches of estimating asset value. These investments are classified as Level 3 by the companies owning them, and therefore the equity investments in these companies are considered to be Level 3 by the Company.
Assets and Liabilities Disclosed at Fair Value on a Recurring Basis
Mortgage loans on real estate
The fair value of unimpaired mortgage loans is estimated using discounted cash flows and takes into account the contractual maturities and discount rates, which were based on current market rates for similar maturity ranges and adjusted for risk due to the property type.
Policy loans
These loans are carried at unpaid principal balances, which approximate their fair values.
Cash and cash equivalents
The carrying values for cash and cash equivalents approximate fair value due to the short-term maturities of these instruments.
Consumer notes, guaranteed investment contracts, and funding agreements
The fair values associated with these financial instruments are determined by projecting cash flows and discounting at current corporate rates, defined as U.S. Treasury rates plus MFC’s corporate spread. The fair value attributable to credit risk represents the present value of the spread.
Debt
The fair value of the Company’s long-term debt is estimated using discounted cash flows based on the Company’s incremental borrowing rates for similar type of borrowing arrangements. Long-term debt includes variable and fixed rate notes related to consolidated variable interest entities.
Fixed-rate deferred and immediate annuities
The fair value of fixed-rate deferred annuities is estimated by projecting multiple stochastically generated interest rate scenarios under a risk neutral environment reflecting inputs (interest rates, volatility, etc.) observable at the valuation date. The fair value of fixed immediate annuities is determined by projecting cash flows and discounting at current corporate rates, defined as U.S. Treasury rates plus MFC’s corporate spread. The fair value attributable to credit risk represents the present value of the spread.
F-77
Table of Contents
JOHN HANCOCK LIFE INSURANCE COMPANY (U.S.A.)
NOTES TO CONSOLIDATED FINANCIAL STATEMENTS – (CONTINUED)
Note 16 — Fair Value Measurements - (continued)
The table below presents the fair value by fair value hierarchy level for assets and liabilities that are reported at fair value in the Consolidated Balance Sheet:
| December 31, 2012 | ||||||||||||||||
| Total Fair Value |
Level 1 | Level 2 | Level 3 | |||||||||||||
|
|
|
|||||||||||||||
| (in millions) | ||||||||||||||||
| Assets: |
||||||||||||||||
| Fixed maturities available-for-sale (1): |
||||||||||||||||
| Corporate debt securities |
$ | 41,693 | $ | - | $ | 38,004 | $ | 3,689 | ||||||||
| Commercial mortgage-backed securities |
1,394 | - | 1,166 | 228 | ||||||||||||
| Residential mortgage-backed securities |
242 | - | 4 | 238 | ||||||||||||
| Collateralized debt obligations |
106 | - | 6 | 100 | ||||||||||||
| Other asset-backed securities |
894 | - | 847 | 47 | ||||||||||||
| U.S. Treasury and agency securities |
12,095 | - | 12,095 | - | ||||||||||||
| Obligations of states and political subdivisions |
5,394 | - | 4,831 | 563 | ||||||||||||
| Debt securities issued by foreign governments |
1,467 | - | 1,467 | - | ||||||||||||
|
|
|
|||||||||||||||
| Total fixed maturities available-for-sale |
63,285 | - | 58,420 | 4,865 | ||||||||||||
| Fixed maturities held-for-trading: |
||||||||||||||||
| Corporate debt securities |
997 | - | 955 | 42 | ||||||||||||
| Commercial mortgage-backed securities |
145 | - | 134 | 11 | ||||||||||||
| Residential mortgage-backed securities |
1 | - | - | 1 | ||||||||||||
| Collateralized debt obligations |
2 | - | 1 | 1 | ||||||||||||
| Other asset-backed securities |
24 | - | 23 | 1 | ||||||||||||
| U.S. Treasury and agency securities |
190 | - | 190 | - | ||||||||||||
| Obligations of states and political subdivisions |
81 | - | 70 | 11 | ||||||||||||
| Debt securities issued by foreign governments |
1 | - | 1 | - | ||||||||||||
|
|
|
|||||||||||||||
| Total fixed maturities held-for-trading |
1,441 | - | 1,374 | 67 | ||||||||||||
| Equity securities available-for-sale |
386 | 386 | - | - | ||||||||||||
| Equity securities held-for-trading |
130 | 130 | - | - | ||||||||||||
| Short-term investments |
2,166 | - | 2,166 | - | ||||||||||||
| Other invested assets (2) |
367 | - | - | 367 | ||||||||||||
| Derivative assets (3): |
||||||||||||||||
| Interest rate swaps |
11,502 | - | 11,484 | 18 | ||||||||||||
| Foreign currency swaps |
268 | - | 268 | - | ||||||||||||
| Foreign currency forwards |
10 | - | 10 | - | ||||||||||||
| Interest rate options |
43 | - | - | 43 | ||||||||||||
| Credit default swaps |
6 | - | 6 | - | ||||||||||||
| Equity market contracts |
10 | - | 5 | 5 | ||||||||||||
| Embedded derivatives (4): |
||||||||||||||||
| Reinsurance contracts |
14 | - | 14 | - | ||||||||||||
| Benefit guarantees |
2,701 | - | - | 2,701 | ||||||||||||
| Assets held in trust (6) |
2,487 | 886 | 1,546 | 55 | ||||||||||||
| Separate account assets (5) |
140,626 | 130,912 | 7,491 | 2,223 | ||||||||||||
|
|
|
|||||||||||||||
| Total assets at fair value |
$ | 225,442 | $ | 132,314 | $ | 82,784 | $ | 10,344 | ||||||||
|
|
|
|||||||||||||||
| Liabilities: |
||||||||||||||||
| Derivatives liabilities (3): |
||||||||||||||||
| Interest rate swaps |
$ | 4,499 | $ | - | $ | 4,498 | $ | 1 | ||||||||
| Foreign currency swaps |
562 | - | 517 | 45 | ||||||||||||
| Foreign currency forwards |
- | - | - | - | ||||||||||||
| Equity market contracts |
7 | - | 1 | 6 | ||||||||||||
| Credit default swaps |
- | - | - | - | ||||||||||||
| Embedded derivatives (4): |
||||||||||||||||
| Reinsurance contracts |
3,371 | - | 3,371 | - | ||||||||||||
| Participating pension contracts |
129 | - | 129 | - | ||||||||||||
| Benefit guarantees |
1,217 | - | - | 1,217 | ||||||||||||
|
|
|
|||||||||||||||
| Total liabilities at fair value |
$ | 9,785 | $ | - | $ | 8,516 | $ | 1,269 | ||||||||
|
|
|
|||||||||||||||
F-78
Table of Contents
JOHN HANCOCK LIFE INSURANCE COMPANY (U.S.A.)
NOTES TO CONSOLIDATED FINANCIAL STATEMENTS – (CONTINUED)
Note 16 — Fair Value Measurements - (continued)
| December 31, 2011 | ||||||||||||||||
| Total Fair Value |
Level 1 | Level 2 | Level 3 | |||||||||||||
|
|
|
|||||||||||||||
| (in millions) | ||||||||||||||||
| Assets: |
||||||||||||||||
| Fixed maturities available-for-sale (1): |
||||||||||||||||
| Corporate debt securities |
$ | 43,331 | $ | - | $ | 39,183 | $ | 4,148 | ||||||||
| Commercial mortgage-backed securities |
3,132 | - | 2,834 | 298 | ||||||||||||
| Residential mortgage-backed securities |
370 | - | 9 | 361 | ||||||||||||
| Collateralized debt obligations |
131 | - | 17 | 114 | ||||||||||||
| Other asset-backed securities |
1,093 | - | 1,049 | 44 | ||||||||||||
| U.S. Treasury and agency securities |
12,823 | - | 12,823 | - | ||||||||||||
| Obligations of states and political subdivisions |
4,964 | - | 4,428 | 536 | ||||||||||||
| Debt securities issued by foreign governments |
1,422 | - | 1,422 | - | ||||||||||||
|
|
|
|||||||||||||||
| Total fixed maturities available-for-sale |
67,266 | - | 61,765 | 5,501 | ||||||||||||
| Fixed maturities held-for-trading: |
||||||||||||||||
| Corporate debt securities |
1,037 | - | 985 | 52 | ||||||||||||
| Commercial mortgage-backed securities |
183 | - | 172 | 11 | ||||||||||||
| Residential mortgage-backed securities |
2 | - | - | 2 | ||||||||||||
| Collateralized debt obligations |
4 | - | 1 | 3 | ||||||||||||
| Other asset-backed securities |
31 | - | 31 | - | ||||||||||||
| U.S. Treasury and agency securities |
144 | - | 144 | - | ||||||||||||
| Obligations of states and political subdivisions |
75 | - | 65 | 10 | ||||||||||||
| Debt securities issued by foreign governments |
1 | - | 1 | - | ||||||||||||
|
|
|
|||||||||||||||
| Total fixed maturities held-for-trading |
1,477 | - | 1,399 | 78 | ||||||||||||
| Equity securities available-for-sale |
439 | 439 | - | - | ||||||||||||
| Equity securities held-for-trading |
97 | 97 | - | - | ||||||||||||
| Short-term investments |
1,618 | - | 1,618 | - | ||||||||||||
| Other invested assets (2) |
425 | - | - | 425 | ||||||||||||
| Derivative assets (3): |
||||||||||||||||
| Interest rate swaps |
11,580 | - | 11,518 | 62 | ||||||||||||
| Foreign currency swaps |
346 | - | 346 | - | ||||||||||||
| Foreign currency forwards |
4 | - | 4 | - | ||||||||||||
| Interest rate options |
9 | - | - | 9 | ||||||||||||
| Credit default swaps |
4 | - | - | 4 | ||||||||||||
| Equity market contracts |
- | - | - | - | ||||||||||||
| Embedded derivatives (4): |
||||||||||||||||
| Reinsurance contracts |
10 | - | 10 | - | ||||||||||||
| Benefit guarantees |
2,914 | - | - | 2,914 | ||||||||||||
| Assets held in trust (6) |
2,463 | 786 | 1,605 | 72 | ||||||||||||
| Separate account assets (5) |
129,326 | 120,310 | 6,864 | 2,152 | ||||||||||||
|
|
|
|||||||||||||||
| Total assets at fair value |
$ | 217,978 | $ | 121,632 | $ | 85,129 | $ | 11,217 | ||||||||
|
|
|
|||||||||||||||
| Liabilities: |
||||||||||||||||
| Derivatives liabilities (3): |
||||||||||||||||
| Interest rate swaps |
$ | 4,454 | $ | - | $ | 4,446 | $ | 8 | ||||||||
| Foreign currency swaps |
650 | - | 612 | 38 | ||||||||||||
| Foreign currency forwards |
2 | - | 2 | - | ||||||||||||
| Equity market contracts |
20 | - | - | 20 | ||||||||||||
| Credit default swaps |
1 | - | - | 1 | ||||||||||||
| Embedded derivatives (4): |
||||||||||||||||
| Reinsurance contracts |
2,686 | - | 2,686 | - | ||||||||||||
| Participating pension contracts |
106 | - | 106 | - | ||||||||||||
| Benefit guarantees |
1,169 | - | - | 1,169 | ||||||||||||
|
|
|
|||||||||||||||
| Total liabilities at fair value |
$ | 9,088 | $ | - | $ | 7,852 | $ | 1,236 | ||||||||
|
|
|
|||||||||||||||
F-79
Table of Contents
JOHN HANCOCK LIFE INSURANCE COMPANY (U.S.A.)
NOTES TO CONSOLIDATED FINANCIAL STATEMENTS – (CONTINUED)
Note 16 — Fair Value Measurements - (continued)
| (1) | Fixed maturities available-for-sale exclude leveraged leases of $1,711 million and $1,959 million at December 31, 2012 and 2011, respectively. The Company calculates the carrying value of its leveraged leases by accruing income at its expected internal rate of return. |
| (2) | Other invested assets exclude equity method and cost-accounted investments of $4,520 million and $4,076 million at December 31, 2012 and 2011, respectively. |
| (3) | Derivative assets and liabilities are presented gross to reflect the presentation in the Consolidated Balance Sheets, but are presented net for purposes of the Level 3 rollforward. |
| (4) | Embedded derivatives related to fixed maturities and reinsurance contracts are reported as part of the derivative asset or liability on the Consolidated Balance Sheets. Embedded derivatives related to benefit guarantees are reported as part of the reinsurance recoverable or future policy benefits on the Consolidated Balance Sheets. Embedded derivatives related to participating pension contracts are reported as part of future policy benefits on the Consolidated Balance Sheets. |
| (5) | Separate account assets are recorded at fair value. Investment performance related to separate account assets is fully offset by corresponding amounts credited to contract holders whose interest in the separate account assets is recorded by the Company as separate account liabilities. Separate account liabilities are set equal to the fair value of separate account assets. |
| (6) | Represents the fair value of assets held in trust on behalf of MRBL, which are included in amounts due from and held for affiliates on the Consolidated Balance Sheets. See the Related Party Transactions Note for information on the associated MRBL reinsurance agreement. The fair value of the trust assets is determined on a basis consistent with the methodologies described herein for similar financial instruments. |
The table below presents the fair value by fair value hierarchy level for certain assets and liabilities that are not reported at fair value in the Consolidated Balance Sheet, but are disclosed at fair value.
F-80
Table of Contents
JOHN HANCOCK LIFE INSURANCE COMPANY (U.S.A.)
NOTES TO CONSOLIDATED FINANCIAL STATEMENTS – (CONTINUED)
Note 16 — Fair Value Measurements - (continued)
| December 31, 2012 | ||||||||||||||||
| Total Fair Value |
Level 1 | Level 2 | Level 3 | |||||||||||||
|
|
|
|||||||||||||||
| (in millions) | ||||||||||||||||
| Assets |
||||||||||||||||
| Mortgage loans on real estate |
$ | 15,065 | $ | - | $ | 15,065 | $ | - | ||||||||
| Policy loans |
5,264 | - | 5,264 | - | ||||||||||||
| Cash and cash equivalents |
3,511 | 3,511 | - | - | ||||||||||||
|
|
|
|||||||||||||||
| Total assets at fair value |
$ | 23,840 | $ | 3,511 | $ | 20,329 | $ | - | ||||||||
|
|
|
|||||||||||||||
| Liabilities |
||||||||||||||||
| Consumer notes |
$ | 757 | $ | - | $ | - | $ | 757 | ||||||||
| Debt |
593 | - | 593 | - | ||||||||||||
| Guaranteed investment contracts and funding agreements |
471 | - | - | 471 | ||||||||||||
| Fixed rate deferred and immediate annuities |
9,219 | - | 1,253 | 7,966 | ||||||||||||
| Supplementary contracts without life contingencies |
72 | - | 72 | - | ||||||||||||
|
|
|
|||||||||||||||
| Total liabilities at fair value |
$ | 11,112 | $ | - | $ | 1,918 | $ | 9,194 | ||||||||
|
|
|
|||||||||||||||
Transfers of Level 1 and Level 2 Assets and Liabilities
The Company’s policy is to record transfers of assets and liabilities between Level 1 and Level 2 at their fair values as of the end of each reporting period, consistent with the date of the determination of fair value. Assets are transferred out of Level 1 when they are no longer transacted with sufficient frequency and volume in an active market. During the year ended December 31, 2012, the Company did not have any transfers from Level 1 to Level 2. Conversely, assets are transferred from Level 2 to Level 1 when transaction volume and frequency are indicative of an active market. The Company did not transfer assets from Level 2 to Level 1 during the year ended December 31, 2012.
F-81
Table of Contents
JOHN HANCOCK LIFE INSURANCE COMPANY (U.S.A.)
NOTES TO CONSOLIDATED FINANCIAL STATEMENTS – (CONTINUED)
Note 16 — Fair Value Measurements - (continued)
Level 3 Financial Instruments
The changes in Level 3 financial instruments measured at fair value on a recurring basis for the years ended December 31, 2012 and 2011 are summarized as follows:
| Balance at |
Net realized/unrealized gains (losses) included in: |
Purchases |
Issuances |
Sales |
Settlements |
Transfers | Balance at |
Change in unrealized gains in earnings on still held |
||||||||||||||||||||||||||||||||||||
| Earnings (1) | AOCI (2) | Into Level 3 (3) |
Out of Level 3 (3) |
|||||||||||||||||||||||||||||||||||||||||
|
|
|
|||||||||||||||||||||||||||||||||||||||||||
| (in millions) | ||||||||||||||||||||||||||||||||||||||||||||
| Fixed maturities available-for-sale: |
||||||||||||||||||||||||||||||||||||||||||||
| Corporate debt securities |
$ | 4,148 | $ | 78 | $ | 127 | $ | 1,759 | $ | - | $ | (1,478 | ) | $ | (217 | ) | $ | 50 | $ | (778 | ) | $ | 3,689 | $ | - | |||||||||||||||||||
| Commercial mortgage-backed securities |
298 | (21 | ) | 48 | 41 | - | (23 | ) | (109 | ) | 1 | (7 | ) | 228 | - | |||||||||||||||||||||||||||||
| Residential mortgage-backed securities |
361 | (47 | ) | 132 | 85 | - | (206 | ) | (87 | ) | - | - | 238 | - | ||||||||||||||||||||||||||||||
| Collateralized debt obligations |
114 | (29 | ) | 36 | 8 | - | (13 | ) | (16 | ) | - | - | 100 | - | ||||||||||||||||||||||||||||||
| Other asset-backed securities |
44 | 5 | 8 | 8 | - | (7 | ) | (11 | ) | - | - | 47 | - | |||||||||||||||||||||||||||||||
| Obligations of states and political subdivisions |
536 | 12 | 3 | 106 | - | (74 | ) | - | 20 | (40 | ) | 563 | - | |||||||||||||||||||||||||||||||
|
|
|
|||||||||||||||||||||||||||||||||||||||||||
| Total fixed maturities available-for-sale |
5,501 | (2 | ) | 354 | 2,007 | - | (1,801 | ) | (440 | ) | 71 | (825 | ) | 4,865 | - | |||||||||||||||||||||||||||||
| Fixed maturities held-for-trading: |
||||||||||||||||||||||||||||||||||||||||||||
| Corporate debt securities |
52 | 5 | - | 9 | - | (3 | ) | (1 | ) | 2 | (22 | ) | 42 | 5 | ||||||||||||||||||||||||||||||
| Commercial mortgage-backed securities |
11 | 1 | - | - | - | - | - | - | (1 | ) | 11 | 3 | ||||||||||||||||||||||||||||||||
| Residential mortgage-backed securities |
2 | - | - | - | - | - | (1 | ) | - | - | 1 | - | ||||||||||||||||||||||||||||||||
| Collateralized debt obligations |
3 | - | - | - | - | - | (2 | ) | - | - | 1 | - | ||||||||||||||||||||||||||||||||
| Other asset-backed securities |
- | 1 | - | - | - | - | - | - | - | 1 | - | |||||||||||||||||||||||||||||||||
| Obligations of states and political subdivisions |
10 | 1 | - | - | - | - | - | - | - | 11 | 1 | |||||||||||||||||||||||||||||||||
|
|
|
|||||||||||||||||||||||||||||||||||||||||||
| Total fixed maturities held-for-trading |
78 | 8 | - | 9 | - | (3 | ) | (4 | ) | 2 | (23 | ) | 67 | 9 | ||||||||||||||||||||||||||||||
| Other invested assets |
425 | 54 | (31 | ) | 111 | (16 | ) | (176 | ) | - | - | - | 367 | 6 | ||||||||||||||||||||||||||||||
| Net derivatives |
8 | (13 | ) | 5 | 45 | - | 7 | - | - | (38 | ) | 14 | 34 | |||||||||||||||||||||||||||||||
| Net embedded derivatives (4) |
1,745 | (256 | ) | - | - | - | - | - | - | (5 | ) | 1,484 | (256 | ) | ||||||||||||||||||||||||||||||
| Assets held in trust |
72 | - | - | - | - | - | (2 | ) | - | (15 | ) | 55 | - | |||||||||||||||||||||||||||||||
| Separate account assets (5) |
2,152 | 101 | - | 111 | - | (141 | ) | - | - | - | 2,223 | - | ||||||||||||||||||||||||||||||||
|
|
|
|||||||||||||||||||||||||||||||||||||||||||
| Total |
$ | 9,981 | $ | (108 | ) | $ | 328 | $ | 2,283 | $ | (16 | ) | $ | (2,114 | ) | $ | (446 | ) | $ | 73 | $ | (906 | ) | $ | 9,075 | $ | (207 | ) | ||||||||||||||||
|
|
|
|||||||||||||||||||||||||||||||||||||||||||
F-82
Table of Contents
JOHN HANCOCK LIFE INSURANCE COMPANY (U.S.A.)
NOTES TO CONSOLIDATED FINANCIAL STATEMENTS – (CONTINUED)
Note 16 — Fair Value Measurements - (continued)
| Balance at |
Net realized/unrealized gains (losses) included in: |
Purchases |
Issuances |
Sales |
Settlements |
Transfers | Balance at |
Change in unrealized gains (losses) included in earnings on instruments still held |
||||||||||||||||||||||||||||||||||||
| Earnings (1) | AOCI (2) | Into Level 3 (3) |
Out of Level 3 (3) |
|||||||||||||||||||||||||||||||||||||||||
|
|
|
|||||||||||||||||||||||||||||||||||||||||||
| (in millions) | ||||||||||||||||||||||||||||||||||||||||||||
| Fixed maturities available-for-sale: |
||||||||||||||||||||||||||||||||||||||||||||
| Corporate debt securities |
$ | 3,301 | $ | 13 | $ | 200 | $ | 872 | $ | - | $ | - | $ | (424 | ) | $ | 336 | $ | (150 | ) | $ | 4,148 | $ | - | ||||||||||||||||||||
| Commercial mortgage-backed securities |
485 | (17 | ) | (11 | ) | - | - | - | (159 | ) | - | - | 298 | - | ||||||||||||||||||||||||||||||
| Residential mortgage-backed securities |
450 | 1 | 17 | - | - | - | (107 | ) | - | - | 361 | - | ||||||||||||||||||||||||||||||||
| Collateralized debt obligations |
103 | (6 | ) | 29 | - | - | - | (12 | ) | - | - | 114 | - | |||||||||||||||||||||||||||||||
| Other asset-backed securities |
79 | (7 | ) | 1 | - | - | - | (25 | ) | 16 | (20 | ) | 44 | - | ||||||||||||||||||||||||||||||
| Obligations of states and political subdivisions |
408 | - | 55 | 87 | - | - | - | - | (14 | ) | 536 | - | ||||||||||||||||||||||||||||||||
|
|
|
|||||||||||||||||||||||||||||||||||||||||||
| Total fixed maturities available-for-sale |
4,826 | (16 | ) | 291 | 959 | - | - | (727 | ) | 352 | (184 | ) | 5,501 | - | ||||||||||||||||||||||||||||||
| Fixed maturities held-for-trading: |
||||||||||||||||||||||||||||||||||||||||||||
| Corporate debt securities |
36 | 14 | - | 23 | - | - | (3 | ) | - | (18 | ) | 52 | 14 | |||||||||||||||||||||||||||||||
| Commercial mortgage-backed securities |
15 | (1 | ) | - | - | - | - | (3 | ) | - | - | 11 | (1 | ) | ||||||||||||||||||||||||||||||
| Residential mortgage-backed securities |
3 | - | - | - | - | - | (1 | ) | - | - | 2 | - | ||||||||||||||||||||||||||||||||
| Collateralized debt obligations |
3 | - | - | - | - | - | - | - | - | 3 | - | |||||||||||||||||||||||||||||||||
| Other asset-backed securities |
1 | - | - | - | - | - | - | - | (1 | ) | - | - | ||||||||||||||||||||||||||||||||
| Obligations of states and political subdivisions |
- | 1 | - | 9 | - | - | - | - | - | 10 | 1 | |||||||||||||||||||||||||||||||||
|
|
|
|||||||||||||||||||||||||||||||||||||||||||
| Total fixed maturities held-for-trading |
58 | 14 | - | 32 | - | - | (7 | ) | - | (19 | ) | 78 | 14 | |||||||||||||||||||||||||||||||
| Other invested assets |
230 | 20 | (3 | ) | 75 | - | (6 | ) | (50 | ) | 159 | - | 425 | 22 | ||||||||||||||||||||||||||||||
| Net derivatives |
19 | 1 | 19 | 13 | - | - | - | - | (44 | ) | 8 | 2 | ||||||||||||||||||||||||||||||||
| Net embedded derivatives (4) |
967 | 778 | - | - | - | - | - | - | - | 1,745 | 778 | |||||||||||||||||||||||||||||||||
| Assets held in trust |
61 | - | 12 | - | - | - | (1 | ) | - | - | 72 | 12 | ||||||||||||||||||||||||||||||||
| Separate account assets (5) |
2,075 | (14 | ) | 53 | 67 | - | - | (29 | ) | - | - | 2,152 | 60 | |||||||||||||||||||||||||||||||
|
|
|
|||||||||||||||||||||||||||||||||||||||||||
| Total |
$ | 8,236 | $ | 783 | $ | 372 | $ | 1,146 | $ | - | $ | (6 | ) | $ | (814 | ) | $ | 511 | $ | (247 | ) | $ | 9,981 | $ | 888 | |||||||||||||||||||
|
|
|
|||||||||||||||||||||||||||||||||||||||||||
F-83
Table of Contents
JOHN HANCOCK LIFE INSURANCE COMPANY (U.S.A.)
NOTES TO CONSOLIDATED FINANCIAL STATEMENTS – (CONTINUED)
Note 16 — Fair Value Measurements - (continued)
| 1) | This amount is included in net realized investment and other gains (losses) on the Consolidated Statements of Operations. |
| 2) | This amount is included in net unrealized investment gains (losses) within AOCI on the Consolidated Balance Sheets. |
| 3) | For financial assets that are transferred into and/or out of Level 3, the Company uses the fair value of the assets at the beginning of the reporting period. |
| 4) | The earnings amount is included in benefits to policyholders on the Consolidated Statements of Operations. |
| 5) | Investment performance related to separate account assets is fully offset by corresponding amounts credited to contract holders whose liability is reflected within separate account liabilities. |
The Company may hedge positions with offsetting positions that are classified in a different level. For example, the gains and losses for assets and liabilities in the Level 3 category presented in the tables above may not reflect the effect of offsetting gains and losses on hedging instruments that have been classified by the Company in the Level 1 and Level 2 categories.
The transfers into Level 3 primarily result from securities that were impaired during the year or securities where a lack of observable market data (versus the previous year) resulted in reclassifying assets into Level 3. The transfers out of Level 3 primarily result from observable market data becoming available for that asset, thus eliminating the need to extrapolate market data beyond observable points.
Information about Sensitivity to Changes in Significant Unobservable Inputs (Level 3)
The Company determines the estimated fair value of its Level 3 investments using primarily the market approach and the income approach. Matrix pricing or other similar techniques are examples of market approaches, while the use of discounted cash flow methodologies is an example of the income approach. The Company attempts to maximize the use of observable inputs and minimize the use of unobservable inputs in selecting whether the market or income approach is used.
Corporate Debt Securities and Obligations of States and Political Subdivisions
Corporate debt securities and obligations of states and political subdivisions included in Level 3 are primarily private placement issuances that are not traded in active markets or that are subject to transfer restrictions. Fair value measurements consider illiquidity and non-transferability. When quoted prices are not available, fair value is determined based on discounted cash flow models using discount rates based on credit spreads, yields or price levels of publicly-traded debt of the issuer or other comparable securities, considering illiquidity and structure. The significant unobservable input used in the fair value measurement of corporate debt is the yield, only if the yield is carried forward at the 30 year point. The yield is affected by the market movements in credit spreads and state and political subdivision yields. In addition, the migration in credit quality of a given security generally has a corresponding effect on the fair value measurement of the securities. For example, a downward migration of credit quality would increase spreads. Holding state and political subdivision yields constant, an increase in corporate credit spreads would decrease the fair value of corporate debt.
Benefit Guarantees
The significant unobservable inputs used for embedded derivatives in policyholder contract deposits measured at fair value, benefit guarantees for variable annuity products, are equity implied volatility, mortality rates, lapse rates and utilization rates. In general, increases in volatilities and utilization rates will increase the fair value, while increases in lapse rates and mortality rates will decrease the fair value of the liability associated with the guarantee.
Separate Account Assets
The Company’s Level 3 separate account assets are predominantly invested in timberland properties valued by third-party valuation service providers. The significant unobservable inputs used in the fair value measurement of the Company’s timberland investments are harvest volumes, timber prices, operating costs and discount rates. Significant changes to any one of these inputs in isolation could result in a significant change to fair value measurement. Holding other factors constant, an increase to either harvest volumes or timber prices would tend to increase the fair value of a timberland investment, while an increase in operating costs or discount rate would have the opposite effect.
F-84
Table of Contents
JOHN HANCOCK LIFE INSURANCE COMPANY (U.S.A.)
NOTES TO CONSOLIDATED FINANCIAL STATEMENTS – (CONTINUED)
Note 16 — Fair Value Measurements - (continued)
Quantitative Information About Level 3 Fair Value Measurements
The table below presents information about the significant unobservable inputs used for recurring fair value measurements for certain Level 3 instruments, and includes only those instruments for which information about the inputs is reasonably available, such as data from pricing vendors and from internal valuation models. Because not all Level 3 instruments have input information reasonably available, balances shown below may not equal total amounts reported for such Level 3 assets and liabilities:
| Fair Value at December 31, 2012 (in millions) |
Predominant |
Unobservable Input |
Range (1) | |||||||||||||||||
| Corporate debt securities |
$ | 3,731 | Discounted cash flow |
Yield if greater than 30 years | 0 | to | 61 | |||||||||||||
| Delta spread adjustment | 0 | to | 1919 | |||||||||||||||||
| Obligation of states and political subdivisions |
$ | 574 | Discounted cash flow |
Yield if greater than 30 years | 97 | to | 364 | |||||||||||||
| Benefit guarantees |
$ | 1,484 | Discounted cash flow |
Equity implied volatility | 0 | % | to | 35 | % | |||||||||||
| Base lapse rates | 1 | % | to | 35 | % | |||||||||||||||
| Dynamic lapse rates | 0 | % | to | 70 | % | |||||||||||||||
| Mortality rates | 0 | % | to | 38 | % | |||||||||||||||
| Utilization rates | 80 | % | to | 100 | % | |||||||||||||||
| (1) | For the unobservable inputs, the range is presented in basis points unless otherwise specified. |
Assets Measured at Fair Value on a Nonrecurring Basis
Certain assets are reported at fair value on a nonrecurring basis, including investments such as, limited partnership interests and goodwill, which are reported at fair value only in the period in which an impairment is recognized. The fair value is calculated using models that are widely accepted in the financial services industry. For the year ended December 31, 2012, the Company did not record a goodwill impairment. During the year ended December 31, 2011, the Company recorded a goodwill impairment of $500 million and the fair value measurement was classified as Level 3. For additional information regarding the impairments, see the Goodwill, Value of Business Acquired, and Other Intangible Assets Note.
Note 17 — Segment Information
The Company operates in the following three business segments: (1) Insurance and (2) Wealth Management, which primarily serve retail and institutional customers and (3) Corporate and Other, which includes the institutional advisory business, the reinsurance operations, and the corporate account.
The Company’s reportable segments are strategic business units offering different products and services. The reportable segments are managed separately, as they focus on different products, markets, and distribution channels.
Insurance Segment. Offers a variety of individual life insurance products and individual and group long-term care insurance. Products are distributed through multiple distribution channels, including insurance agents, brokers, banks, financial planners, and direct marketing. In 2012, the Company’s remaining international insurance operations were transferred to the Corporate and Other Segment.
Wealth Management Segment. Offers annuities and mutual fund products and services. These businesses also offer a variety of retirement products to group benefit plans. Annuity contracts provide non-guaranteed, partially guaranteed, and fully guaranteed investment options through general and separate account products. These businesses distribute products through multiple distribution channels, including insurance agents and brokers affiliated with the Company, securities brokerage firms, financial planners, pension plan sponsors, pension plan consultants, and banks. As discussed in the Significant Accounting Policies Note, the Company suspended sales of all its individual and group fixed and variable annuities.
Corporate and Other Segment. Primarily consists of certain corporate operations, the institutional advisory business, reinsurance operations, and businesses that are either disposed or in run-off. Corporate operations primarily include certain
F-85
Table of Contents
JOHN HANCOCK LIFE INSURANCE COMPANY (U.S.A.)
NOTES TO CONSOLIDATED FINANCIAL STATEMENTS – (CONTINUED)
Note 17 — Segment Information - (continued)
financing activities, income on capital not specifically allocated to the operating segments, and certain non-recurring expenses not allocated to the segments. The income statement impact of goodwill impairment charges are reported in this segment. In 2012, the Company’s remaining international insurance operations were transferred from the Insurance Segment.
The accounting policies of the segments are the same as those described in the Summary of Significant Accounting Policies Note. Allocations of net investment income are based on the amount of assets allocated to each segment. Other costs and operating expenses are allocated to each segment based on a review of the nature of such costs, cost allocations utilizing time studies, and other relevant allocation methodologies.
The following tables summarize selected financial information by segment for the periods indicated. Included in the Insurance Segment for all periods presented are the assets, liabilities, revenues, and expenses of the closed blocks. For additional information on the closed blocks, see the Closed Blocks Note.
| Insurance | Wealth Management |
Corporate and Other |
Total | |||||||||||||
|
|
|
|||||||||||||||
| (in millions) | ||||||||||||||||
| 2012 |
||||||||||||||||
| Revenues from external customers |
$ | 5,118 | $ | 2,253 | $ | 295 | $ | 7,666 | ||||||||
| Net investment income |
2,956 | 1,641 | (38 | ) | 4,559 | |||||||||||
| Net realized investment and other gains (losses) |
(269 | ) | (1,606 | ) | (293 | ) | (2,168 | ) | ||||||||
| Inter-segment revenues |
- | - | - | - | ||||||||||||
|
|
|
|||||||||||||||
| Revenues |
$ | 7,805 | $ | 2,288 | $ | (36 | ) | $ | 10,057 | |||||||
|
|
|
|||||||||||||||
| Net income (loss) |
$ | (220 | ) | $ | 94 | $ | (7 | ) | $ | (133 | ) | |||||
|
|
|
|||||||||||||||
| Supplemental Information: |
||||||||||||||||
| Equity in net income (loss) of investees accounted for under the equity method |
$ | 208 | $ | 28 | $ | (18 | ) | $ | 218 | |||||||
| Carrying value of investments under the equity method |
3,259 | 912 | 287 | 4,458 | ||||||||||||
| Amortization of deferred policy acquisition costs, deferred sales inducements, and value of business acquired |
1,001 | 384 | - | 1,385 | ||||||||||||
| Goodwill impairment |
- | - | - | - | ||||||||||||
| Interest expense |
- | - | 41 | 41 | ||||||||||||
| Income tax expense (benefit) |
(174 | ) | (381 | ) | (78 | ) | (633 | ) | ||||||||
| Segment assets |
$ | 101,334 | $ | 163,135 | $ | 25,905 | $ | 290,374 | ||||||||
F-86
Table of Contents
JOHN HANCOCK LIFE INSURANCE COMPANY (U.S.A.)
NOTES TO CONSOLIDATED FINANCIAL STATEMENTS – (CONTINUED)
Note 17 — Segment Information - (continued)
| Insurance | Wealth Management |
Corporate and Other |
Total | |||||||||||||
|
|
|
|||||||||||||||
| (in millions) | ||||||||||||||||
| 2011 |
||||||||||||||||
| Revenues from external customers |
$ | 6,288 | $ | 2,166 | $ | 383 | $ | 8,837 | ||||||||
| Net investment income |
2,831 | 1,824 | 334 | 4,989 | ||||||||||||
| Net realized investment and other gains (losses) |
1,108 | 2,004 | 23 | 3,135 | ||||||||||||
| Inter-segment revenues |
- | - | - | - | ||||||||||||
|
|
|
|||||||||||||||
| Revenues |
$ | 10,227 | $ | 5,994 | $ | 740 | $ | 16,961 | ||||||||
|
|
|
|||||||||||||||
| Net income (loss) |
$ | 30 | $ | (200 | ) | $ | (641 | ) | $ | (811 | ) | |||||
|
|
|
|||||||||||||||
| Supplemental Information: |
||||||||||||||||
| Equity in net income (loss) of investees accounted for under the equity method |
$ | 178 | $ | 46 | $ | (2 | ) | $ | 222 | |||||||
| Carrying value of investments under the equity method |
2,582 | 1,056 | 313 | 3,951 | ||||||||||||
| Amortization of deferred policy acquisition costs, deferred sales inducements, and value of business acquired |
1,673 | 1,167 | 1 | 2,841 | ||||||||||||
| Goodwill impairment |
- | - | 500 | 500 | ||||||||||||
| Interest expense |
- | - | 47 | 47 | ||||||||||||
| Income tax expense (benefit) |
(19 | ) | (246 | ) | (67 | ) | (332 | ) | ||||||||
| Segment assets |
$ | 94,267 | $ | 153,822 | $ | 25,783 | $ | 273,872 | ||||||||
| Insurance | Wealth Management |
Corporate and Other |
Total | |||||||||||||
|
|
|
|||||||||||||||
| (in millions) | ||||||||||||||||
| 2010 |
||||||||||||||||
| Revenues from external customers |
$ | 4,589 | $ | 2,487 | $ | 527 | $ | 7,603 | ||||||||
| Net investment income |
2,553 | 1,710 | 233 | 4,496 | ||||||||||||
| Net realized investment and other gains (losses) |
321 | (398 | ) | 159 | 82 | |||||||||||
| Inter-segment revenues |
- | - | - | - | ||||||||||||
|
|
|
|||||||||||||||
| Revenues |
$ | 7,463 | $ | 3,799 | $ | 919 | $ | 12,181 | ||||||||
|
|
|
|||||||||||||||
| Net income (loss) |
$ | 67 | $ | 466 | $ | (1,497 | ) | $ | (964 | ) | ||||||
|
|
|
|||||||||||||||
| Supplemental Information: |
||||||||||||||||
| Equity in net income (loss) of investees accounted for under the equity method |
$ | 156 | $ | 61 | $ | (20 | ) | $ | 197 | |||||||
| Amortization of deferred policy acquisition costs, deferred sales inducements, and value of business acquired |
478 | 203 | 1 | 682 | ||||||||||||
| Goodwill impairment |
- | - | 1,600 | 1,600 | ||||||||||||
| Interest expense |
- | - | 47 | 47 | ||||||||||||
| Income tax expense (benefit) |
23 | 114 | 39 | 176 | ||||||||||||
The Company operates primarily in the United States and has no reportable major customers.
F-87
Table of Contents
JOHN HANCOCK LIFE INSURANCE COMPANY (U.S.A.)
NOTES TO CONSOLIDATED FINANCIAL STATEMENTS – (CONTINUED)
Note 18 — Subsequent Events
The Company evaluated the recognition and disclosure of subsequent events for its December 31, 2012 consolidated financial statements through the date on which the consolidated financial statements were issued.
On March 18, 2013, the Company entered into a committed line of credit agreement established by MLI totaling $1 billion which will expire in 2018. MLI will commit, when requested, to loan funds at prevailing interest rates as determined in accordance with the line of credit agreement. Under the terms of the agreement, the Company is required to maintain a certain minimum level of net worth and comply with certain other covenants.
F-88
Table of Contents
John Hancock Life Insurance Company (U.S.A.) Separate Account N
Audited Financial Statements
Year ended December 31, 2012 with Report of Independent Registered Public Accounting Firm
Table of Contents
Table of Contents
John Hancock Life Insurance Company (U.S.A.) Separate Account N
Audited Financial Statements
Year ended December 31, 2012
Contents
| 5 | ||||
| 8 | ||||
| Statements of Operations and Changes in Contract Owners’ Equity |
12 | |||
| 70 | ||||
| 70 | ||||
| 71 | ||||
| 72 | ||||
| 72 | ||||
| 72 | ||||
| 73 | ||||
| 76 | ||||
| 76 | ||||
| 76 | ||||
| 77 |
Table of Contents
Table of Contents
Report of Independent Registered Public Accounting Firm
Board of Directors of the John Hancock Life Insurance Company (U.S.A.) and Contract Owners of John Hancock Life Insurance Company (U.S.A.) Separate Account N
| “Active” sub-accounts |
||
| 500 Index Trust B Series 0 | Financial Services Trust Series 0 | |
| Active Bond Trust Series 0 | Financial Services Trust Series 1 | |
| Active Bond Trust Series 1 | Franklin Templeton Founding Allocation Trust Series 0 | |
| All Cap Core Trust Series 0 | Franklin Templeton Founding Allocation Trust Series 1 | |
| All Cap Core Trust Series 1 | Fundamental All Cap Core Trust Series 0 | |
| All Cap Value Trust Series 0 | Fundamental All Cap Core Trust Series 1 | |
| All Cap Value Trust Series 1 | Fundamental Holdings Trust Series 1 | |
| Alpha Opportunities Trust Series 0 | Fundamental Large Cap Value Trust Series 0 | |
| Alpha Opportunities Trust Series 1 | Fundamental Large Cap Value Trust Series 1 | |
| American Asset Allocation Trust Series 1 | Fundamental Value Trust Series 0 | |
| American Global Growth Trust Series 1 | Fundamental Value Trust Series 1 | |
| American Global Small Capitalization Trust Series 1 | Global Bond Trust Series 0 | |
| American Growth Trust Series 1 | Global Bond Trust Series 1 | |
| American Growth-Income Trust Series 1 | Global Diversification Trust Series 1 | |
| American High-Income Bond Trust Series 1 | Global Trust Series 0 | |
| American International Trust Series 1 | Global Trust Series 1 | |
| American New World Trust Series 1 | Health Sciences Trust Series 0 | |
| Blue Chip Growth Trust Series 0 | Health Sciences Trust Series 1 | |
| Blue Chip Growth Trust Series 1 | High Yield Trust Series 0 | |
| Bond Trust Series 0 | High Yield Trust Series 1 | |
| Bond Trust Series 1 | International Core Trust Series 0 | |
| Capital Appreciation Trust Series 0 | International Core Trust Series 1 | |
| Capital Appreciation Trust Series 1 | International Equity Index Trust B Series 0 | |
| Capital Appreciation Value Trust Series 0 | International Equity Index Trust B Series 1 | |
| Capital Appreciation Value Trust Series 1 | International Growth Stock Trust Series 0 | |
| Core Allocation Plus Trust Series 0 | International Growth Stock Trust Series 1 | |
| Core Allocation Plus Trust Series 1 | International Small Company Trust Series 0 | |
| Core Bond Trust Series 0 | International Small Company Trust Series 1 | |
| Core Bond Trust Series 1 | International Value Trust Series 0 | |
| Core Strategy Trust Series 0 | International Value Trust Series 1 | |
| Core Strategy Trust Series 1 | Investment Quality Bond Trust Series 0 | |
| Disciplined Diversification Trust Series 0 | Investment Quality Bond Trust Series 1 | |
| Disciplined Diversification Trust Series 1 | Lifestyle Aggressive Trust Series 0 | |
| Emerging Markets Value Trust Series 0 | Lifestyle Aggressive Trust Series 1 | |
| Emerging Markets Value Trust Series 1 | Lifestyle Balanced Trust Series 0 | |
| Equity-Income Trust Series 0 | Lifestyle Balanced Trust Series 1 | |
| Equity-Income Trust Series 1 | Lifestyle Conservative Trust Series 0 | |
5
Table of Contents
Report of Independent Registered Public Accounting Firm
| Lifestyle Conservative Trust Series 1 | Small Cap Opportunities Trust Series 1 | |
| Lifestyle Growth Trust Series 0 | Small Cap Value Trust Series 0 | |
| Lifestyle Growth Trust Series 1 | Small Cap Value Trust Series 1 | |
| Lifestyle Moderate Trust Series 0 | Small Company Value Trust Series 0 | |
| Lifestyle Moderate Trust Series 1 | Small Company Value Trust Series 1 | |
| Mid Cap Index Trust Series 0 | Smaller Company Growth Trust Series 0 | |
| Mid Cap Index Trust Series 1 | Smaller Company Growth Trust Series 1 | |
| Mid Cap Stock Trust Series 0 | Strategic Income Opportunities Trust Series 0 | |
| Mid Cap Stock Trust Series 1 | Strategic Income Opportunities Trust Series 1 | |
| Mid Value Trust Series 0 | Total Bond Market Trust B Series 0 | |
| Mid Value Trust Series 1 | Total Return Trust Series 0 | |
| Money Market Trust B Series 0 | Total Return Trust Series 1 | |
| Money Market Trust Series 1 | Total Stock Market Index Trust Series 0 | |
| Natural Resources Trust Series 0 | Total Stock Market Index Trust Series 1 | |
| Natural Resources Trust Series 1 | Ultra Short Term Bond Trust Series 0 | |
| Real Estate Securities Trust Series 0 | Ultra Short Term Bond Trust Series 1 | |
| Real Estate Securities Trust Series 1 | U.S. Equity Trust Series 0 | |
| Real Return Bond Trust Series 0 | U.S. Equity Trust Series 1 | |
| Real Return Bond Trust Series 1 | Utilities Trust Series 0 | |
| Science & Technology Trust Series 0 | Utilities Trust Series 1 | |
| Science & Technology Trust Series 1 | Value Trust Series 0 | |
| Short Term Government Income Trust Series 0 | Value Trust Series 1 | |
| Short Term Government Income Trust Series 1 | All Asset Portfolio | |
| Small Cap Growth Trust Series 0 | Brandes International Equity Trust | |
| Small Cap Growth Trust Series 1 | Frontier Capital Appreciation Trust | |
| Small Cap Index Trust Series 0 | Large Cap Growth Trust | |
| Small Cap Index Trust Series 1 | ||
| Small Cap Opportunities Trust Series 0 | ||
| “Closed” sub-accounts |
||
| 500 Index Trust Series 1 | International Equity Index Trust A Series 1 | |
| American Blue Chip Income and Growth Trust Series 1 | International Opportunities Trust Series 0 | |
| Balanced Trust Series 0 | International Opportunities Trust Series 1 | |
| Balanced Trust Series 1 | Large Cap Trust Series 0 | |
| International Equity Index Trust A Series 0 | Large Cap Trust Series 1 | |
6
Table of Contents
Report of Independent Registered Public Accounting Firm
We have audited the accompanying statements of assets and contract owners’ equity of John Hancock Life Insurance Company (U.S.A.) Separate Account N (the “Account”), comprised of the active sub-accounts as of December 31, 2012, and the related statements of operations and changes in contract owners’ equity of the active and closed sub-accounts for each of the two years in the period then ended (or years since inception), and the financial highlights for each of the five years in the period then ended (or years since inception). These financial statements and financial highlights are the responsibility of the Account’s management. Our responsibility is to express an opinion on these financial statements and financial highlights based on our audits.
We conducted our audits in accordance with the standards of the Public Company Accounting Oversight Board (United States). Those standards require that we plan and perform the audit to obtain reasonable assurance about whether the financial statements and financial highlights are free of material misstatement. We were not engaged to perform an audit of the Account’s internal control over financial reporting. Our audits included consideration of internal control over financial reporting as a basis for designing audit procedures that are appropriate in the circumstances, but not for the purpose of expressing an opinion on the effectiveness of the Account’s internal control over financial reporting. Accordingly, we express no such opinion. An audit also includes examining, on a test basis, evidence supporting the amounts and disclosures in the financial statements and financial highlights, assessing the accounting principles used and significant estimates made by management, and evaluating the overall financial statement presentation. Our procedures included confirmation of securities owned as of December 31, 2012, by correspondence with the custodian or fund manager of the underlying portfolios. We believe that our audits provide a reasonable basis for our opinion.
In our opinion, the financial statements and financial highlights referred to above present fairly, in all material respects, the financial position of each of the active sub-accounts constituting John Hancock Life Insurance Company (U.S.A.) Separate Account N at December 31, 2012, and the results of its operations and changes in contract owners’ equity of the active and closed sub-accounts for each of the two years in the period then ended (or years since inception), and the financial highlights for each of the five years in the period then ended (or years since inception), in conformity with U.S. generally accepted accounting principles.
/s/ ERNST & YOUNG LLP
Chartered Accountants
Licensed Public Accountants
Toronto, Canada
March 28, 2013
7
Table of Contents
John Hancock Life Insurance Company (U.S.A.) Separate Account N
Statements of Assets and Contract Owners’ Equity
December 31, 2012
| Assets |
||||
| Investments at fair value: |
||||
| Sub-accounts invested in John Hancock Variable Insurance Trust portfolios: |
||||
| 500 Index Trust B Series 0 - 2,165,429 shares (cost $35,183,965) |
$ | 38,999,373 | ||
| 500 Index Trust Series 1 |
— | |||
| Active Bond Trust Series 0 - 23,547 shares (cost $243,447) |
239,468 | |||
| Active Bond Trust Series 1 - 53,527 shares (cost $533,332) |
543,833 | |||
| All Cap Core Trust Series 0 - 42,925 shares (cost $701,978) |
813,432 | |||
| All Cap Core Trust Series 1 - 21,534 shares (cost $362,890) |
408,071 | |||
| All Cap Value Trust Series 0 - 132,696 shares (cost $1,108,993) |
1,111,990 | |||
| All Cap Value Trust Series 1 - 298,211 shares (cost $2,434,705) |
2,510,933 | |||
| Alpha Opportunities Trust Series 0 - 1,440 shares (cost $18,786) |
19,259 | |||
| Alpha Opportunities Trust Series 1 - 2,989 shares (cost $39,008) |
39,931 | |||
| American Asset Allocation Trust Series 1 - 692,130 shares (cost $6,352,223) |
8,630,865 | |||
| American Blue Chip Income and Growth Trust Series 1 |
— | |||
| American Global Growth Trust Series 1 - 30,927 shares (cost $344,076) |
380,096 | |||
| American Global Small Capitalization Trust Series 1 - 4,893 shares (cost $44,639) |
46,142 | |||
| American Growth Trust Series 1 - 747,151 shares (cost $11,907,718) |
13,000,429 | |||
| American Growth-Income Trust Series 1 - 574,319 shares (cost $7,793,227) |
9,568,162 | |||
| American High-Income Bond Trust Series 1 - 3,105 shares (cost $34,403) |
33,846 | |||
| American International Trust Series 1 - 1,008,464 shares (cost $15,445,543) |
16,145,508 | |||
| American New World Trust Series 1 - 52,760 shares (cost $688,847) |
714,892 | |||
| Balanced Trust Series 0 |
— | |||
| Balanced Trust Series 1 |
— | |||
| Blue Chip Growth Trust Series 0 - 682,901 shares (cost $14,588,774) |
16,560,343 | |||
| Blue Chip Growth Trust Series 1 - 227,149 shares (cost $4,463,187) |
5,515,169 | |||
| Bond Trust Series 0 - 64,127 shares (cost $898,652) |
896,492 | |||
| Bond Trust Series 1 - 31,006 shares (cost $430,164) |
433,780 | |||
| Capital Appreciation Trust Series 0 - 75,815 shares (cost $777,329) |
872,628 | |||
| Capital Appreciation Trust Series 1 - 225,760 shares (cost $2,221,513) |
2,598,498 | |||
| Capital Appreciation Value Trust Series 0 - 3,800 shares (cost $46,028) |
44,611 | |||
| Capital Appreciation Value Trust Series 1 - 28,876 shares (cost $350,782) |
339,289 | |||
| Core Allocation Plus Trust Series 0 - 4,224 shares (cost $43,320) |
44,019 | |||
| Core Allocation Plus Trust Series 1 - 126,976 shares (cost $1,326,088) |
1,324,363 | |||
| Core Bond Trust Series 0 - 56,885 shares (cost $810,384) |
791,272 | |||
| Core Bond Trust Series 1 - 1,887 shares (cost $26,563) |
26,337 | |||
| Core Strategy Trust Series 0 - 2,238 shares (cost $28,926) |
30,393 | |||
| Core Strategy Trust Series 1 - 86 shares (cost $1,083) |
1,173 | |||
| Disciplined Diversification Trust Series 0 - 1,445 shares (cost $17,852) |
18,421 | |||
| Disciplined Diversification Trust Series 1 - 52 shares (cost $665) |
665 | |||
| Emerging Markets Value Trust Series 0 - 109,498 shares (cost $1,209,069) |
1,173,816 | |||
| Emerging Markets Value Trust Series 1 - 125,223 shares (cost $1,434,437) |
1,344,896 | |||
| Equity-Income Trust Series 0 - 1,577,629 shares (cost $22,004,982) |
24,421,690 |
8
Table of Contents
John Hancock Life Insurance Company (U.S.A.) Separate Account N
Statements of Assets and Contract Owners’ Equity
December 31, 2012
| Assets (continued) |
||||
| Investments at fair value: |
||||
| Sub-accounts invested in John Hancock Variable Insurance Trust portfolios: |
||||
| Equity-Income Trust Series 1 - 709,922 shares (cost $9,662,024) |
$ | 11,017,989 | ||
| Financial Services Trust Series 0 - 26,169 shares (cost $303,446) |
321,878 | |||
| Financial Services Trust Series 1 - 47,994 shares (cost $535,243) |
591,284 | |||
| Franklin Templeton Founding Allocation Trust Series 0 - 12,811 shares (cost $132,278) |
137,330 | |||
| Franklin Templeton Founding Allocation Trust Series 1 - 976 shares (cost $9,896) |
10,473 | |||
| Fundamental All Cap Core Trust Series 0 - 35,488 shares (cost $502,769) |
545,096 | |||
| Fundamental All Cap Core Trust Series 1 - 20,417 shares (cost $255,285) |
312,388 | |||
| Fundamental Holdings Trust Series 1 - 1,600 shares (cost $15,649) |
17,835 | |||
| Fundamental Large Cap Value Trust Series 0 - 25,169 shares (cost $300,299) |
306,562 | |||
| Fundamental Large Cap Value Trust Series 1 - 242 shares (cost $2,856) |
2,945 | |||
| Fundamental Value Trust Series 0 - 258,376 shares (cost $3,834,737) |
3,947,978 | |||
| Fundamental Value Trust Series 1 - 372,408 shares (cost $4,802,366) |
5,709,007 | |||
| Global Bond Trust Series 0 - 1,006,671 shares (cost $13,641,207) |
13,207,522 | |||
| Global Bond Trust Series 1 - 230,474 shares (cost $3,045,085) |
3,033,036 | |||
| Global Diversification Trust Series 1 - 13,964 shares (cost $143,078) |
152,071 | |||
| Global Trust Series 0 - 25,976 shares (cost $389,526) |
411,720 | |||
| Global Trust Series 1 - 99,056 shares (cost $1,421,406) |
1,571,023 | |||
| Health Sciences Trust Series 0 - 92,375 shares (cost $1,741,153) |
1,947,265 | |||
| Health Sciences Trust Series 1 - 162,451 shares (cost $2,880,307) |
3,409,850 | |||
| High Yield Trust Series 0 - 398,251 shares (cost $2,383,787) |
2,369,595 | |||
| High Yield Trust Series 1 - 665,904 shares (cost $4,047,220) |
4,002,086 | |||
| International Core Trust Series 0 - 22,459 shares (cost $208,226) |
215,155 | |||
| International Core Trust Series 1 - 247,551 shares (cost $2,332,698) |
2,378,965 | |||
| International Equity Index Trust A Series 0 |
— | |||
| International Equity Index Trust A Series 1 |
— | |||
| International Equity Index Trust B Series 0 - 946,607 shares (cost $13,342,042) |
14,502,017 | |||
| International Equity Index Trust B Series 1 - 225,845 shares (cost $3,299,746) |
3,459,938 | |||
| International Growth Stock Trust Series 0 - 366,514 shares (cost $5,061,596) |
5,244,815 | |||
| International Growth Stock Trust Series 1 - 31,072 shares (cost $427,158) |
444,636 | |||
| International Opportunities Trust Series 0 |
— | |||
| International Opportunities Trust Series 1 |
— | |||
| International Small Company Trust Series 0 - 82,507 shares (cost $791,417) |
837,448 | |||
| International Small Company Trust Series 1 - 100,976 shares (cost $939,082) |
1,024,902 | |||
| International Value Trust Series 0 - 390,275 shares (cost $4,307,126) |
4,616,954 | |||
| International Value Trust Series 1 - 396,804 shares (cost $4,472,046) |
4,725,939 | |||
| Investment Quality Bond Trust Series 0 - 52,326 shares (cost $620,054) |
643,610 | |||
| Investment Quality Bond Trust Series 1 - 343,289 shares (cost $3,903,576) |
4,236,189 | |||
| Large Cap Trust Series 0 |
— | |||
| Large Cap Trust Series 1 |
— | |||
| Lifestyle Aggressive Trust Series 0 - 657,956 shares (cost $5,324,212) |
5,796,593 | |||
| Lifestyle Aggressive Trust Series 1 - 247,353 shares (cost $2,168,222) |
2,179,183 | |||
| Lifestyle Balanced Trust Series 0 - 1,368,135 shares (cost $16,503,270) |
17,101,682 |
9
Table of Contents
John Hancock Life Insurance Company (U.S.A.) Separate Account N
Statements of Assets and Contract Owners’ Equity
December 31, 2012
| Assets (continued) |
||||
| Investments at fair value: |
||||
| Sub-accounts invested in John Hancock Variable Insurance Trust portfolios: |
||||
| Lifestyle Balanced Trust Series 1 - 695,227 shares (cost $8,386,712) |
$ | 8,676,435 | ||
| Lifestyle Conservative Trust Series 0 - 601,521 shares (cost $7,799,558) |
7,807,743 | |||
| Lifestyle Conservative Trust Series 1 - 498,880 shares (cost $6,511,170) |
6,465,480 | |||
| Lifestyle Growth Trust Series 0 - 1,687,212 shares (cost $19,266,995) |
20,617,727 | |||
| Lifestyle Growth Trust Series 1 - 399,985 shares (cost $4,414,214) |
4,883,819 | |||
| Lifestyle Moderate Trust Series 0 - 682,452 shares (cost $8,574,264) |
8,728,555 | |||
| Lifestyle Moderate Trust Series 1 - 178,277 shares (cost $2,200,841) |
2,278,379 | |||
| Mid Cap Index Trust Series 0 - 391,059 shares (cost $6,820,251) |
6,823,978 | |||
| Mid Cap Index Trust Series 1 - 304,965 shares (cost $5,190,197) |
5,321,646 | |||
| Mid Cap Stock Trust Series 0 - 382,174 shares (cost $5,726,886) |
6,026,881 | |||
| Mid Cap Stock Trust Series 1 - 160,378 shares (cost $2,087,535) |
2,514,726 | |||
| Mid Value Trust Series 0 - 645,492 shares (cost $7,285,032) |
7,390,879 | |||
| Mid Value Trust Series 1 - 336,590 shares (cost $3,632,589) |
3,867,416 | |||
| Money Market Trust B Series 0 - 59,153,840 shares (cost $59,153,840) |
59,153,840 | |||
| Money Market Trust Series 1 - 82,144,640 shares (cost $82,144,640) |
82,144,640 | |||
| Natural Resources Trust Series 0 - 256,639 shares (cost $2,823,409) |
2,545,863 | |||
| Natural Resources Trust Series 1 - 317,590 shares (cost $3,565,056) |
3,204,486 | |||
| Real Estate Securities Trust Series 0 - 696,351 shares (cost $8,454,051) |
9,783,730 | |||
| Real Estate Securities Trust Series 1 - 799,540 shares (cost $9,870,594) |
11,297,501 | |||
| Real Return Bond Trust Series 0 - 866,093 shares (cost $11,323,828) |
11,415,103 | |||
| Real Return Bond Trust Series 1 - 381,082 shares (cost $4,793,860) |
5,091,250 | |||
| Science & Technology Trust Series 0 - 75,231 shares (cost $1,206,661) |
1,302,245 | |||
| Science & Technology Trust Series 1 - 313,827 shares (cost $5,297,026) |
5,407,245 | |||
| Short Term Government Income Trust Series 0 - 187,307 shares (cost $2,437,171) |
2,408,770 | |||
| Short Term Government Income Trust Series 1 - 166,694 shares (cost $2,172,811) |
2,145,355 | |||
| Small Cap Growth Trust Series 0 - 553,132 shares (cost $5,526,837) |
5,160,719 | |||
| Small Cap Growth Trust Series 1 - 120,630 shares (cost $1,220,797) |
1,120,649 | |||
| Small Cap Index Trust Series 0 - 408,083 shares (cost $5,454,681) |
5,056,149 | |||
| Small Cap Index Trust Series 1 - 449,727 shares (cost $5,747,357) |
5,572,123 | |||
| Small Cap Opportunities Trust Series 0 - 5,935 shares (cost $114,838) |
130,698 | |||
| Small Cap Opportunities Trust Series 1 - 19,728 shares (cost $411,645) |
436,591 | |||
| Small Cap Value Trust Series 0 - 378,081 shares (cost $7,140,728) |
7,814,941 | |||
| Small Cap Value Trust Series 1 - 43,031 shares (cost $825,811) |
890,741 | |||
| Small Company Value Trust Series 0 - 66,943 shares (cost $1,156,008) |
1,302,715 | |||
| Small Company Value Trust Series 1 - 239,022 shares (cost $3,854,056) |
4,660,932 | |||
| Smaller Company Growth Trust Series 0 - 9,497 shares (cost $165,396) |
165,343 | |||
| Smaller Company Growth Trust Series 1 - 754,783 shares (cost $10,780,730) |
13,118,124 | |||
| Strategic Income Opportunities Trust Series 0 - 238,220 shares (cost $3,271,823) |
3,194,530 | |||
| Strategic Income Opportunities Trust Series 1 - 101,709 shares (cost $1,399,388) |
1,366,967 | |||
| Total Bond Market Trust B Series 0 - 1,209,603 shares (cost $12,939,584) |
12,954,850 | |||
| Total Return Trust Series 0 - 2,143,979 shares (cost $30,582,756) |
31,387,850 |
10
Table of Contents
John Hancock Life Insurance Company (U.S.A.) Separate Account N
Statements of Assets and Contract Owners’ Equity
December 31, 2012
| Assets (continued) |
||||
| Investments at fair value: |
||||
| Sub-accounts invested in John Hancock Variable Insurance Trust portfolios: |
||||
| Total Return Trust Series 1 - 1,812,790 shares (cost $25,578,521) |
$ | 26,629,883 | ||
| Total Stock Market Index Trust Series 0 - 34,862 shares (cost $432,007) |
458,437 | |||
| Total Stock Market Index Trust Series 1 - 150,730 shares (cost $1,825,918) |
1,982,096 | |||
| Ultra Short Term Bond Trust Series 0 - 28,061 shares (cost $342,285) |
340,380 | |||
| Ultra Short Term Bond Trust Series 1 - 2,706 shares (cost $33,435) |
32,819 | |||
| U.S. Equity Trust Series 0 - 38,377 shares (cost $532,132) |
538,430 | |||
| U.S. Equity Trust Series 1 - 76,419 shares (cost $1,059,097) |
1,072,153 | |||
| Utilities Trust Series 0 - 90,023 shares (cost $1,085,893) |
1,173,906 | |||
| Utilities Trust Series 1 - 125,852 shares (cost $1,535,675) |
1,643,623 | |||
| Value Trust Series 0 - 39,085 shares (cost $621,324) |
753,948 | |||
| Value Trust Series 1 - 141,653 shares (cost $2,427,638) |
2,735,313 | |||
| Sub-accounts invested in Outside Trust portfolios: |
||||
| All Asset Portfolio - 228,918 shares (cost $2,540,023) |
$ | 2,641,719 | ||
| Brandes International Equity Trust |
— | |||
| Frontier Capital Appreciation Trust - 5,021 shares (cost $119,889) |
117,400 | |||
| Large Cap Growth Trust - 16,116 shares (cost $305,519) |
309,425 | |||
|
|
|
|||
| Total assets |
$ | 692,144,190 | ||
|
|
|
|||
| Contract Owners’ Equity |
||||
| Variable universal life insurance contracts |
$ | 692,144,190 | ||
|
|
|
|||
See accompanying notes.
11
Table of Contents
John Hancock Life Insurance Company (U.S.A.) Separate Account N
Statements of Operations and Changes in Contract Owners’ Equity
| Sub-Account | ||||||||||||||||
| 500 Index Trust B Series 0 | 500 Index Trust Series 1 | |||||||||||||||
| Year Ended Dec. 31/12 |
Year Ended Dec. 31/11 |
Year Ended Dec. 31/12 (t) |
Year Ended Dec. 31/11 |
|||||||||||||
| Income: |
||||||||||||||||
| Dividend income distribution |
$ | 453,120 | $ | 547,053 | $ | 57,066 | $ | 32,414 | ||||||||
|
|
|
|
|
|
|
|
|
|||||||||
| Total Investment Income |
453,120 | 547,053 | 57,066 | 32,414 | ||||||||||||
| Expenses: |
||||||||||||||||
| Mortality and expense risk |
68,403 | 30,729 | 5,359 | 10,277 | ||||||||||||
|
|
|
|
|
|
|
|
|
|||||||||
| Net investment income (loss) |
384,717 | 516,324 | 51,707 | 22,137 | ||||||||||||
|
|
|
|
|
|
|
|
|
|||||||||
| Realized gains (losses) on investments: |
||||||||||||||||
| Capital gain distributions |
— | — | 122,095 | 13,721 | ||||||||||||
| Net realized gains (losses) |
4,185,504 | 1,670,226 | 275,215 | 447,788 | ||||||||||||
|
|
|
|
|
|
|
|
|
|||||||||
| Realized gains (losses) |
4,185,504 | 1,670,226 | 397,310 | 461,509 | ||||||||||||
| Unrealized appreciation (depreciation) during the period |
971,282 | (1,797,811 | ) | (121,493 | ) | (581,370 | ) | |||||||||
|
|
|
|
|
|
|
|
|
|||||||||
| Net increase (decrease) in assets from operations |
5,541,503 | 388,739 | 327,524 | (97,724 | ) | |||||||||||
|
|
|
|
|
|
|
|
|
|||||||||
| Changes from principal transactions: |
||||||||||||||||
| Transfer of net premiums |
2,444,029 | 2,126,794 | 74,704 | 101,731 | ||||||||||||
| Transfer on terminations |
(3,442,935 | ) | (2,404,957 | ) | (142,055 | ) | (258,577 | ) | ||||||||
| Transfer on policy loans |
(776,460 | ) | 131,210 | 14 | (196 | ) | ||||||||||
| Net interfund transfers |
5,509,355 | 3,047,845 | (1,481,949 | ) | (4,336,370 | ) | ||||||||||
|
|
|
|
|
|
|
|
|
|||||||||
| Net increase (decrease) in assets from principal transactions |
3,733,989 | 2,900,892 | (1,549,286 | ) | (4,493,412 | ) | ||||||||||
|
|
|
|
|
|
|
|
|
|||||||||
| Total increase (decrease) in assets |
9,275,492 | 3,289,631 | (1,221,762 | ) | (4,591,136 | ) | ||||||||||
| Assets, beginning of period |
29,723,881 | 26,434,250 | 1,221,762 | 5,812,898 | ||||||||||||
|
|
|
|
|
|
|
|
|
|||||||||
| Assets, end of period |
$ | 38,999,373 | $ | 29,723,881 | — | $ | 1,221,762 | |||||||||
|
|
|
|
|
|
|
|
|
|||||||||
| (t) | Terminated as an investment option and funds transferred to 500 Index Trust B Series 0 on November 5, 2012. |
| (bf) | Fund has no Series. Previously presented as Series 0 and Series 1. |
See accompanying notes.
12
Table of Contents
| Sub-Account | ||||||||||||||||||||||
| Active Bond Trust Series 0 | Active Bond Trust Series 1 | All Asset Portfolio | ||||||||||||||||||||
| Year Ended Dec. 31/12 |
Year Ended Dec. 31/11 |
Year Ended Dec. 31/12 |
Year Ended Dec. 31/11 |
Year Ended Dec. 31/12 (bf) |
Year Ended Dec. 31/11 (bf) |
|||||||||||||||||
| $ | 8,814 | $ | 14,436 | $ | 33,051 | $ | 49,974 | $ | 102,568 | $ | 124,244 | |||||||||||
|
|
|
|
|
|
|
|
|
|
|
|
|
|||||||||||
| 8,814 | 14,436 | 33,051 | 49,974 | 102,568 | 124,244 | |||||||||||||||||
| — | — | 4,198 | 6,639 | 3,416 | 3,471 | |||||||||||||||||
|
|
|
|
|
|
|
|
|
|
|
|
|
|||||||||||
| 8,814 | 14,436 | 28,853 | 43,335 | 99,152 | 120,773 | |||||||||||||||||
|
|
|
|
|
|
|
|
|
|
|
|
|
|||||||||||
| 703 | — | 5,559 | — | — | — | |||||||||||||||||
| 5,061 | 17,558 | 26,162 | 70,563 | (247 | ) | 12,068 | ||||||||||||||||
|
|
|
|
|
|
|
|
|
|
|
|
|
|||||||||||
| 5,764 | 17,558 | 31,721 | 70,563 | (247 | ) | 12,068 | ||||||||||||||||
| 3,054 | (11,628 | ) | 9,556 | (51,960 | ) | 173,487 | (96,101 | ) | ||||||||||||||
|
|
|
|
|
|
|
|
|
|
|
|
|
|||||||||||
| 17,632 | 20,366 | 70,130 | 61,938 | 272,392 | 36,740 | |||||||||||||||||
|
|
|
|
|
|
|
|
|
|
|
|
|
|||||||||||
| 22,431 | 39,151 | 4,903 | 38,752 | 258,677 | 386,600 | |||||||||||||||||
| (123,479 | ) | (192,867 | ) | (363,693 | ) | (175,989 | ) | (469,991 | ) | (274,021 | ) | |||||||||||
| — | (1,882 | ) | (360 | ) | 1,925 | (15,146 | ) | (671 | ) | |||||||||||||
| 89,078 | (20,934 | ) | (94,132 | ) | (419,373 | ) | 820,234 | (360,264 | ) | |||||||||||||
|
|
|
|
|
|
|
|
|
|
|
|
|
|||||||||||
| (11,970 | ) | (176,532 | ) | (453,282 | ) | (554,685 | ) | 593,774 | (248,356 | ) | ||||||||||||
|
|
|
|
|
|
|
|
|
|
|
|
|
|||||||||||
| 5,662 | (156,166 | ) | (383,152 | ) | (492,747 | ) | 866,166 | (211,616 | ) | |||||||||||||
| 233,806 | 389,972 | 926,985 | 1,419,732 | 1,775,553 | 1,987,169 | |||||||||||||||||
|
|
|
|
|
|
|
|
|
|
|
|
|
|||||||||||
| $ | 239,468 | $ | 233,806 | $ | 543,833 | $ | 926,985 | $ | 2,641,719 | $ | 1,775,553 | |||||||||||
|
|
|
|
|
|
|
|
|
|
|
|
|
|||||||||||
13
Table of Contents
John Hancock Life Insurance Company (U.S.A.) Separate Account N
Statements of Operations and Changes in Contract Owners’ Equity
(continued)
| Sub-Account | ||||||||||||||||
| All Cap Core Trust Series 0 | All Cap Core Trust Series 1 | |||||||||||||||
| Year Ended Dec. 31/12 |
Year Ended Dec. 31/11 |
Year Ended Dec. 31/12 |
Year Ended Dec. 31/11 |
|||||||||||||
| Income: |
||||||||||||||||
| Dividend income distribution |
$ | 7,656 | $ | 2,698 | $ | 4,448 | $ | 4,371 | ||||||||
|
|
|
|
|
|
|
|
|
|||||||||
| Total Investment Income |
7,656 | 2,698 | 4,448 | 4,371 | ||||||||||||
| Expenses: |
||||||||||||||||
| Mortality and expense risk |
— | — | 2,819 | 2,933 | ||||||||||||
|
|
|
|
|
|
|
|
|
|||||||||
| Net investment income (loss) |
7,656 | 2,698 | 1,629 | 1,438 | ||||||||||||
|
|
|
|
|
|
|
|
|
|||||||||
| Realized gains (losses) on investments: |
||||||||||||||||
| Capital gain distributions |
— | — | — | — | ||||||||||||
| Net realized gains (losses) |
12,042 | 10,342 | 11,086 | 19,267 | ||||||||||||
|
|
|
|
|
|
|
|
|
|||||||||
| Realized gains (losses) |
12,042 | 10,342 | 11,086 | 19,267 | ||||||||||||
| Unrealized appreciation (depreciation) during the period |
65,066 | (12,217 | ) | 52,669 | (15,344 | ) | ||||||||||
|
|
|
|
|
|
|
|
|
|||||||||
| Net increase (decrease) in assets from operations |
84,764 | 823 | 65,384 | 5,361 | ||||||||||||
|
|
|
|
|
|
|
|
|
|||||||||
| Changes from principal transactions: |
||||||||||||||||
| Transfer of net premiums |
376,843 | 18,455 | 16,485 | 16,838 | ||||||||||||
| Transfer on terminations |
(18,907 | ) | (22,906 | ) | (70,488 | ) | (135,681 | ) | ||||||||
| Transfer on policy loans |
— | — | (165 | ) | 10,362 | |||||||||||
| Net interfund transfers |
126,287 | 6,936 | (16,956 | ) | 12,187 | |||||||||||
|
|
|
|
|
|
|
|
|
|||||||||
| Net increase (decrease) in assets from principal transactions |
484,223 | 2,485 | (71,124 | ) | (96,294 | ) | ||||||||||
|
|
|
|
|
|
|
|
|
|||||||||
| Total increase (decrease) in assets |
568,987 | 3,308 | (5,740 | ) | (90,933 | ) | ||||||||||
| Assets, beginning of period |
244,445 | 241,137 | 413,811 | 504,744 | ||||||||||||
|
|
|
|
|
|
|
|
|
|||||||||
| Assets, end of period |
$ | 813,432 | $ | 244,445 | $ | 408,071 | $ | 413,811 | ||||||||
|
|
|
|
|
|
|
|
|
|||||||||
See accompanying notes.
14
Table of Contents
| Sub-Account | ||||||||||||||||||||||
| All Cap Value Trust Series 0 | All Cap Value Trust Series 1 | Alpha Opportunities Trust Series 0 | ||||||||||||||||||||
| Year Ended Dec. 31/12 |
Year Ended Dec. 31/11 |
Year Ended Dec. 31/12 |
Year Ended Dec. 31/11 |
Year Ended Dec. 31/12 |
Year Ended Dec. 31/11 |
|||||||||||||||||
| $ | 7,693 | $ | 2,132 | $ | 22,652 | $ | 13,525 | $ | 106 | $ | 25 | |||||||||||
|
|
|
|
|
|
|
|
|
|
|
|
|
|||||||||||
| 7,693 | 2,132 | 22,652 | 13,525 | 106 | 25 | |||||||||||||||||
| — | — | 11,353 | 16,283 | — | — | |||||||||||||||||
|
|
|
|
|
|
|
|
|
|
|
|
|
|||||||||||
| 7,693 | 2,132 | 11,299 | (2,758 | ) | 106 | 25 | ||||||||||||||||
|
|
|
|
|
|
|
|
|
|
|
|
|
|||||||||||
| 31,341 | — | 106,191 | — | 1,007 | 1,181 | |||||||||||||||||
| 11,765 | 15,056 | 296,919 | 184,246 | 5 | 12 | |||||||||||||||||
|
|
|
|
|
|
|
|
|
|
|
|
|
|||||||||||
| 43,106 | 15,056 | 403,110 | 184,246 | 1,012 | 1,193 | |||||||||||||||||
| 25,702 | (50,012 | ) | (62,256 | ) | (409,427 | ) | 1,549 | (1,743 | ) | |||||||||||||
|
|
|
|
|
|
|
|
|
|
|
|
|
|||||||||||
| 76,501 | (32,824 | ) | 352,153 | (227,939 | ) | 2,667 | (525 | ) | ||||||||||||||
|
|
|
|
|
|
|
|
|
|
|
|
|
|||||||||||
| 453,302 | 59,640 | 51,056 | 66,812 | 4,203 | 1,500 | |||||||||||||||||
| (82,903 | ) | (13,298 | ) | (334,789 | ) | (120,314 | ) | (611 | ) | (294 | ) | |||||||||||
| (1,310 | ) | (1,507 | ) | — | — | — | — | |||||||||||||||
| 147,730 | 285,990 | (1,271,284 | ) | 502,839 | 1,797 | 5,705 | ||||||||||||||||
|
|
|
|
|
|
|
|
|
|
|
|
|
|||||||||||
| 516,819 | 330,825 | (1,555,017 | ) | 449,337 | 5,389 | 6,911 | ||||||||||||||||
|
|
|
|
|
|
|
|
|
|
|
|
|
|||||||||||
| 593,320 | 298,001 | (1,202,864 | ) | 221,398 | 8,056 | 6,386 | ||||||||||||||||
| 518,670 | 220,669 | 3,713,797 | 3,492,399 | 11,203 | 4,817 | |||||||||||||||||
|
|
|
|
|
|
|
|
|
|
|
|
|
|||||||||||
| $ | 1,111,990 | $ | 518,670 | $ | 2,510,933 | $ | 3,713,797 | $ | 19,259 | $ | 11,203 | |||||||||||
|
|
|
|
|
|
|
|
|
|
|
|
|
|||||||||||
15
Table of Contents
John Hancock Life Insurance Company (U.S.A.) Separate Account N
Statements of Operations and Changes in Contract Owners’ Equity
(continued)
| Sub-Account | ||||||||||||||||
| Alpha Opportunities Trust Series 1 | American Asset Allocation Trust Series 1 | |||||||||||||||
| Year Ended Dec. 31/12 |
Year Ended Dec. 31/11 |
Year Ended Dec. 31/12 |
Year Ended Dec. 31/11 |
|||||||||||||
| Income: |
||||||||||||||||
| Dividend income distribution |
$ | 207 | $ | 15 | $ | 131,905 | $ | 149,725 | ||||||||
|
|
|
|
|
|
|
|
|
|||||||||
| Total Investment Income |
207 | 15 | 131,905 | 149,725 | ||||||||||||
| Expenses: |
||||||||||||||||
| Mortality and expense risk |
199 | 15 | 56,047 | 63,304 | ||||||||||||
|
|
|
|
|
|
|
|
|
|||||||||
| Net investment income (loss) |
8 | — | 75,858 | 86,421 | ||||||||||||
|
|
|
|
|
|
|
|
|
|||||||||
| Realized gains (losses) on investments: |
||||||||||||||||
| Capital gain distributions |
2,691 | 106 | — | — | ||||||||||||
| Net realized gains (losses) |
12 | 15 | 654,043 | 523,900 | ||||||||||||
|
|
|
|
|
|
|
|
|
|||||||||
| Realized gains (losses) |
2,703 | 121 | 654,043 | 523,900 | ||||||||||||
| Unrealized appreciation (depreciation) during the period |
1,245 | (410 | ) | 601,283 | (576,072 | ) | ||||||||||
|
|
|
|
|
|
|
|
|
|||||||||
| Net increase (decrease) in assets from operations |
3,956 | (289 | ) | 1,331,184 | 34,249 | |||||||||||
|
|
|
|
|
|
|
|
|
|||||||||
| Changes from principal transactions: |
||||||||||||||||
| Transfer of net premiums |
— | — | 613,846 | 638,061 | ||||||||||||
| Transfer on terminations |
(508 | ) | (166 | ) | (2,459,154 | ) | (2,164,756 | ) | ||||||||
| Transfer on policy loans |
— | — | 71,682 | 113,580 | ||||||||||||
| Net interfund transfers |
23,621 | 12,368 | (635,649 | ) | (220,756 | ) | ||||||||||
|
|
|
|
|
|
|
|
|
|||||||||
| Net increase (decrease) in assets from principal transactions |
23,113 | 12,202 | (2,409,275 | ) | (1,633,871 | ) | ||||||||||
|
|
|
|
|
|
|
|
|
|||||||||
| Total increase (decrease) in assets |
27,069 | 11,913 | (1,078,091 | ) | (1,599,622 | ) | ||||||||||
| Assets, beginning of period |
12,862 | 949 | 9,708,956 | 11,308,578 | ||||||||||||
|
|
|
|
|
|
|
|
|
|||||||||
| Assets, end of period |
$ | 39,931 | $ | 12,862 | $ | 8,630,865 | $ | 9,708,956 | ||||||||
|
|
|
|
|
|
|
|
|
|||||||||
| (v) | Terminated as an investment option and funds transferred to American Growth-Income Trust Series 1 on November 5, 2012. |
| (a) | Terminated as an investment option and funds transferred to Bond Trust Series 1 on October 31, 2011. |
See accompanying notes.
16
Table of Contents
| Sub-Account | ||||||||||||||||||||
| American Blue Chip Income and Growth Trust Series 1 | American Bond Trust Series 1 | American Global Growth
Trust Series 1 |
||||||||||||||||||
| Year Ended Dec. 31/12 (v) |
Year Ended Dec. 31/11 |
Year Ended Dec. 31/11 (a) |
Year Ended Dec. 31/12 |
Year Ended Dec. 31/11 |
||||||||||||||||
| — | $ | 29,555 | — | $ | 1,742 | $ | 3,389 | |||||||||||||
|
|
|
|
|
|
|
|
|
|
|
|||||||||||
| — | 29,555 | — | 1,742 | 3,389 | ||||||||||||||||
| 5,848 | 8,026 | 3,956 | 1,559 | 1,409 | ||||||||||||||||
|
|
|
|
|
|
|
|
|
|
|
|||||||||||
| (5,848 | ) | 21,529 | (3,956 | ) | 183 | 1,980 | ||||||||||||||
|
|
|
|
|
|
|
|
|
|
|
|||||||||||
| 290,365 | — | — | — | — | ||||||||||||||||
| 76,298 | 106,646 | 82,092 | (4,775 | ) | (108 | ) | ||||||||||||||
|
|
|
|
|
|
|
|
|
|
|
|||||||||||
| 366,663 | 106,646 | 82,092 | (4,775 | ) | (108 | ) | ||||||||||||||
| (123,201 | ) | (149,439 | ) | (18,453 | ) | 71,381 | (34,012 | ) | ||||||||||||
|
|
|
|
|
|
|
|
|
|
|
|||||||||||
| 237,614 | (21,264 | ) | 59,683 | 66,789 | (32,140 | ) | ||||||||||||||
|
|
|
|
|
|
|
|
|
|
|
|||||||||||
| 99,860 | 151,026 | 89,726 | 1,279 | 153 | ||||||||||||||||
| (101,419 | ) | (144,260 | ) | (360,144 | ) | (1,802 | ) | (1,110 | ) | |||||||||||
| (13,842 | ) | (2,237 | ) | (10,568 | ) | 3,096 | 1,150 | |||||||||||||
| (2,370,556 | ) | (97,481 | ) | (1,688,893 | ) | (33,094 | ) | 68,124 | ||||||||||||
|
|
|
|
|
|
|
|
|
|
|
|||||||||||
| (2,385,957 | ) | (92,952 | ) | (1,969,879 | ) | (30,521 | ) | 68,317 | ||||||||||||
|
|
|
|
|
|
|
|
|
|
|
|||||||||||
| (2,148,343 | ) | (114,216 | ) | (1,910,196 | ) | 36,268 | 36,177 | |||||||||||||
| 2,148,343 | 2,262,559 | 1,910,196 | 343,828 | 307,651 | ||||||||||||||||
|
|
|
|
|
|
|
|
|
|
|
|||||||||||
| — | $ | 2,148,343 | — | $ | 380,096 | $ | 343,828 | |||||||||||||
|
|
|
|
|
|
|
|
|
|
|
|||||||||||
17
Table of Contents
John Hancock Life Insurance Company (U.S.A.) Separate Account N
Statements of Operations and Changes in Contract Owners’ Equity
(continued)
| Sub-Account | ||||||||||||||||
| American Global
Small Capitalization Trust Series 1 |
American Growth Trust Series 1 | |||||||||||||||
| Year Ended Dec. 31/12 |
Year Ended Dec. 31/11 (g) |
Year Ended Dec. 31/12 |
Year Ended Dec. 31/11 |
|||||||||||||
| Income: |
||||||||||||||||
| Dividend income distribution |
$ | 379 | $ | 253 | $ | 52,888 | $ | 37,279 | ||||||||
|
|
|
|
|
|
|
|
|
|||||||||
| Total Investment Income |
379 | 253 | 52,888 | 37,279 | ||||||||||||
| Expenses: |
||||||||||||||||
| Mortality and expense risk |
48 | 25 | 31,039 | 45,460 | ||||||||||||
|
|
|
|
|
|
|
|
|
|||||||||
| Net investment income (loss) |
331 | 228 | 21,849 | (8,181 | ) | |||||||||||
|
|
|
|
|
|
|
|
|
|||||||||
| Realized gains (losses) on investments: |
||||||||||||||||
| Capital gain distributions |
— | — | — | — | ||||||||||||
| Net realized gains (losses) |
(3,736 | ) | (2,023 | ) | 1,964,408 | 1,684,771 | ||||||||||
|
|
|
|
|
|
|
|
|
|||||||||
| Realized gains (losses) |
(3,736 | ) | (2,023 | ) | 1,964,408 | 1,684,771 | ||||||||||
| Unrealized appreciation (depreciation) during the period |
8,443 | (6,940 | ) | 393,295 | (2,492,583 | ) | ||||||||||
|
|
|
|
|
|
|
|
|
|||||||||
| Net increase (decrease) in assets from operations |
5,038 | (8,735 | ) | 2,379,552 | (815,993 | ) | ||||||||||
|
|
|
|
|
|
|
|
|
|||||||||
| Changes from principal transactions: |
||||||||||||||||
| Transfer of net premiums |
5,626 | 409 | 673,885 | 1,097,186 | ||||||||||||
| Transfer on terminations |
(6,252 | ) | (355 | ) | (1,039,921 | ) | (757,856 | ) | ||||||||
| Transfer on policy loans |
— | — | (25,753 | ) | (51,415 | ) | ||||||||||
| Net interfund transfers |
16,457 | 33,954 | (4,079,079 | ) | (3,673,789 | ) | ||||||||||
|
|
|
|
|
|
|
|
|
|||||||||
| Net increase (decrease) in assets from principal transactions |
15,831 | 34,008 | (4,470,868 | ) | (3,385,874 | ) | ||||||||||
|
|
|
|
|
|
|
|
|
|||||||||
| Total increase (decrease) in assets |
20,869 | 25,273 | (2,091,316 | ) | (4,201,867 | ) | ||||||||||
| Assets, beginning of period |
25,273 | — | 15,091,745 | 19,293,612 | ||||||||||||
|
|
|
|
|
|
|
|
|
|||||||||
| Assets, end of period |
$ | 46,142 | $ | 25,273 | $ | 13,000,429 | $ | 15,091,745 | ||||||||
|
|
|
|
|
|
|
|
|
|||||||||
| (g) | Fund available in prior year but no activity. |
See accompanying notes.
18
Table of Contents
| Sub-Account | ||||||||||||||||||||||
| American Growth-Income Trust Series 1 | American High-Income Bond Trust Series 1 | American International Trust Series 1 | ||||||||||||||||||||
| Year Ended Dec. 31/12 |
Year Ended Dec. 31/11 |
Year Ended Dec. 31/12 |
Year Ended Dec. 31/11 (g) |
Year Ended Dec. 31/12 |
Year Ended Dec. 31/11 |
|||||||||||||||||
| $ | 118,699 | $ | 123,717 | $ | 2,151 | $ | 1,292 | $ | 178,380 | $ | 365,846 | |||||||||||
|
|
|
|
|
|
|
|
|
|
|
|
|
|||||||||||
| 118,699 | 123,717 | 2,151 | 1,292 | 178,380 | 365,846 | |||||||||||||||||
| 48,131 | 55,953 | 136 | 39 | 30,171 | 63,785 | |||||||||||||||||
|
|
|
|
|
|
|
|
|
|
|
|
|
|||||||||||
| 70,568 | 67,764 | 2,015 | 1,253 | 148,209 | 302,061 | |||||||||||||||||
|
|
|
|
|
|
|
|
|
|
|
|
|
|||||||||||
| — | — | — | — | — | — | |||||||||||||||||
| 1,335,885 | 533,576 | (59 | ) | 90 | 332,147 | 325,910 | ||||||||||||||||
|
|
|
|
|
|
|
|
|
|
|
|
|
|||||||||||
| 1,335,885 | 533,576 | (59 | ) | 90 | 332,147 | 325,910 | ||||||||||||||||
| 137,449 | (935,989 | ) | 1,179 | (1,736 | ) | 2,896,233 | (5,060,782 | ) | ||||||||||||||
|
|
|
|
|
|
|
|
|
|
|
|
|
|||||||||||
| 1,543,902 | (334,649 | ) | 3,135 | (393 | ) | 3,376,589 | (4,432,811 | ) | ||||||||||||||
|
|
|
|
|
|
|
|
|
|
|
|
|
|||||||||||
| 466,364 | 671,125 | 6,691 | 473 | 1,069,780 | 714,952 | |||||||||||||||||
| (3,647,502 | ) | (1,981,772 | ) | (1,238 | ) | (376 | ) | (1,646,821 | ) | (1,004,770 | ) | |||||||||||
| 31,856 | 120,167 | — | — | (33,133 | ) | (63,250 | ) | |||||||||||||||
| 1,092,856 | 464,002 | 7,776 | 17,778 | (9,080,951 | ) | (3,354,412 | ) | |||||||||||||||
|
|
|
|
|
|
|
|
|
|
|
|
|
|||||||||||
| (2,056,426 | ) | (726,478 | ) | 13,229 | 17,875 | (9,691,125 | ) | (3,707,480 | ) | |||||||||||||
|
|
|
|
|
|
|
|
|
|
|
|
|
|||||||||||
| (512,524 | ) | (1,061,127 | ) | 16,364 | 17,482 | (6,314,536 | ) | (8,140,291 | ) | |||||||||||||
| 10,080,686 | 11,141,813 | 17,482 | — | 22,460,044 | 30,600,335 | |||||||||||||||||
|
|
|
|
|
|
|
|
|
|
|
|
|
|||||||||||
| $ | 9,568,162 | $ | 10,080,686 | $ | 33,846 | $ | 17,482 | $ | 16,145,508 | $ | 22,460,044 | |||||||||||
|
|
|
|
|
|
|
|
|
|
|
|
|
|||||||||||
19
Table of Contents
John Hancock Life Insurance Company (U.S.A.) Separate Account N
Statements of Operations and Changes in Contract Owners’ Equity
(continued)
| Sub-Account | ||||||||||||||||
| American New World Trust Series 1 | Balanced Trust Series 0 | |||||||||||||||
| Year Ended Dec. 31/12 |
Year Ended Dec. 31/11 |
Year Ended Dec. 31/12 (j) |
Year Ended Dec. 31/11 |
|||||||||||||
| Income: |
||||||||||||||||
| Dividend income distribution |
$ | 3,983 | $ | 7,116 | $ | 934 | $ | 833 | ||||||||
|
|
|
|
|
|
|
|
|
|||||||||
| Total Investment Income |
3,983 | 7,116 | 934 | 833 | ||||||||||||
| Expenses: |
||||||||||||||||
| Mortality and expense risk |
2,049 | 2,129 | — | — | ||||||||||||
|
|
|
|
|
|
|
|
|
|||||||||
| Net investment income (loss) |
1,934 | 4,987 | 934 | 833 | ||||||||||||
|
|
|
|
|
|
|
|
|
|||||||||
| Realized gains (losses) on investments: |
||||||||||||||||
| Capital gain distributions |
— | — | 21,326 | 289 | ||||||||||||
| Net realized gains (losses) |
10,059 | 1,447 | (15,673 | ) | 781 | |||||||||||
|
|
|
|
|
|
|
|
|
|||||||||
| Realized gains (losses) |
10,059 | 1,447 | 5,653 | 1,070 | ||||||||||||
| Unrealized appreciation (depreciation) during the period |
65,858 | (83,713 | ) | (1,502 | ) | (1,409 | ) | |||||||||
|
|
|
|
|
|
|
|
|
|||||||||
| Net increase (decrease) in assets from operations |
77,851 | (77,279 | ) | 5,085 | 494 | |||||||||||
|
|
|
|
|
|
|
|
|
|||||||||
| Changes from principal transactions: |
||||||||||||||||
| Transfer of net premiums |
21,741 | 7,387 | 2,171 | 17,874 | ||||||||||||
| Transfer on terminations |
(18,910 | ) | (5,360 | ) | (1,067 | ) | (9,095 | ) | ||||||||
| Transfer on policy loans |
2,879 | 1,349 | (54 | ) | (31 | ) | ||||||||||
| Net interfund transfers |
137,994 | 11,097 | (65,353 | ) | 7,722 | |||||||||||
|
|
|
|
|
|
|
|
|
|||||||||
| Net increase (decrease) in assets from principal transactions |
143,704 | 14,473 | (64,303 | ) | 16,470 | |||||||||||
|
|
|
|
|
|
|
|
|
|||||||||
| Total increase (decrease) in assets |
221,555 | (62,806 | ) | (59,218 | ) | 16,964 | ||||||||||
| Assets, beginning of period |
493,337 | 556,143 | 59,218 | 42,254 | ||||||||||||
|
|
|
|
|
|
|
|
|
|||||||||
| Assets, end of period |
$ | 714,892 | $ | 493,337 | — | $ | 59,218 | |||||||||
|
|
|
|
|
|
|
|
|
|||||||||
| (j) | Terminated as an investment option and funds transferred to Lifestyle Growth Trust on April 30, 2012. |
See accompanying notes.
20
Table of Contents
| Sub-Account | ||||||||||||||||||||||
| Balanced Trust Series 1 | Blue Chip Growth Trust Series 0 | Blue Chip Growth Trust Series 1 | ||||||||||||||||||||
| Year Ended Dec. 31/12 (j) |
Year Ended Dec. 31/11 |
Year Ended Dec. 31/12 |
Year Ended Dec. 31/11 |
Year Ended Dec. 31/12 |
Year Ended Dec. 31/11 |
|||||||||||||||||
| $ | 379 | $ | 352 | $ | 24,466 | $ | 2,210 | $ | 7,481 | $ | 822 | |||||||||||
|
|
|
|
|
|
|
|
|
|
|
|
|
|||||||||||
| 379 | 352 | 24,466 | 2,210 | 7,481 | 822 | |||||||||||||||||
| 54 | 130 | — | — | 37,473 | 46,959 | |||||||||||||||||
|
|
|
|
|
|
|
|
|
|
|
|
|
|||||||||||
| 325 | 222 | 24,466 | 2,210 | (29,992 | ) | (46,137 | ) | |||||||||||||||
|
|
|
|
|
|
|
|
|
|
|
|
|
|||||||||||
| 8,809 | 137 | — | — | — | — | |||||||||||||||||
| (7,402 | ) | 2,920 | 1,555,536 | 2,503,866 | 1,722,728 | 1,012,458 | ||||||||||||||||
|
|
|
|
|
|
|
|
|
|
|
|
|
|||||||||||
| 1,407 | 3,057 | 1,555,536 | 2,503,866 | 1,722,728 | 1,012,458 | |||||||||||||||||
| 423 | (2,838 | ) | 1,219,581 | (2,326,458 | ) | (14,785 | ) | (801,220 | ) | |||||||||||||
|
|
|
|
|
|
|
|
|
|
|
|
|
|||||||||||
| 2,155 | 441 | 2,799,583 | 179,618 | 1,677,951 | 165,101 | |||||||||||||||||
|
|
|
|
|
|
|
|
|
|
|
|
|
|||||||||||
| 790 | 1,603 | 1,322,190 | 1,972,317 | 86,038 | 256,725 | |||||||||||||||||
| (788 | ) | (1,543 | ) | (423,640 | ) | (430,901 | ) | (3,748,657 | ) | (2,787,621 | ) | |||||||||||
| — | — | (48,459 | ) | (74,305 | ) | (352,284 | ) | 11,192 | ||||||||||||||
| (27,794 | ) | (10,131 | ) | (1,482,944 | ) | (357,637 | ) | (2,602,155 | ) | 203,393 | ||||||||||||
|
|
|
|
|
|
|
|
|
|
|
|
|
|||||||||||
| (27,792 | ) | (10,071 | ) | (632,853 | ) | 1,109,474 | (6,617,058 | ) | (2,316,311 | ) | ||||||||||||
|
|
|
|
|
|
|
|
|
|
|
|
|
|||||||||||
| (25,637 | ) | (9,630 | ) | 2,166,730 | 1,289,092 | (4,939,107 | ) | (2,151,210 | ) | |||||||||||||
| 25,637 | 35,267 | 14,393,613 | 13,104,521 | 10,454,276 | 12,605,486 | |||||||||||||||||
|
|
|
|
|
|
|
|
|
|
|
|
|
|||||||||||
| — | $ | 25,637 | $ | 16,560,343 | $ | 14,393,613 | $ | 5,515,169 | $ | 10,454,276 | ||||||||||||
|
|
|
|
|
|
|
|
|
|
|
|
|
|||||||||||
21
Table of Contents
John Hancock Life Insurance Company (U.S.A.) Separate Account N
Statements of Operations and Changes in Contract Owners’ Equity
(continued)
| Sub-Account | ||||||||||||||||
| Bond Trust Series 0 | Bond Trust Series 1 | |||||||||||||||
| Year Ended Dec. 31/12 |
Year Ended Dec. 31/11 (c) |
Year Ended Dec. 31/12 |
Year
Ended Dec. 31/11 (c) |
|||||||||||||
| Income: |
||||||||||||||||
| Dividend income distribution |
$ | 22,221 | $ | 11,636 | $ | 25,491 | $ | 31,078 | ||||||||
|
|
|
|
|
|
|
|
|
|||||||||
| Total Investment Income |
22,221 | 11,636 | 25,491 | 31,078 | ||||||||||||
| Expenses: |
||||||||||||||||
| Mortality and expense risk |
— | — | 3,023 | 840 | ||||||||||||
|
|
|
|
|
|
|
|
|
|||||||||
| Net investment income (loss) |
22,221 | 11,636 | 22,468 | 30,238 | ||||||||||||
|
|
|
|
|
|
|
|
|
|||||||||
| Realized gains (losses) on investments: |
||||||||||||||||
| Capital gain distributions |
3,587 | — | 6,162 | — | ||||||||||||
| Net realized gains (losses) |
(1,264 | ) | 15 | 4,280 | 137 | |||||||||||
|
|
|
|
|
|
|
|
|
|||||||||
| Realized gains (losses) |
2,323 | 15 | 10,442 | 137 | ||||||||||||
| Unrealized appreciation (depreciation) during the period |
5,807 | (7,967 | ) | 25,324 | (21,708 | ) | ||||||||||
|
|
|
|
|
|
|
|
|
|||||||||
| Net increase (decrease) in assets from operations |
30,351 | 3,684 | 58,234 | 8,667 | ||||||||||||
|
|
|
|
|
|
|
|
|
|||||||||
| Changes from principal transactions: |
||||||||||||||||
| Transfer of net premiums |
85,720 | 5,036 | 1,163 | 5,362 | ||||||||||||
| Transfer on terminations |
(35,963 | ) | (5,099 | ) | (580,100 | ) | (10,117 | ) | ||||||||
| Transfer on policy loans |
(16,647 | ) | — | — | — | |||||||||||
| Net interfund transfers |
378,891 | 450,519 | (277,198 | ) | 1,227,769 | |||||||||||
|
|
|
|
|
|
|
|
|
|||||||||
| Net increase (decrease) in assets from principal transactions |
412,001 | 450,456 | (856,135 | ) | 1,223,014 | |||||||||||
|
|
|
|
|
|
|
|
|
|||||||||
| Total increase (decrease) in assets |
442,352 | 454,140 | (797,901 | ) | 1,231,681 | |||||||||||
| Assets, beginning of period |
454,140 | — | 1,231,681 | — | ||||||||||||
|
|
|
|
|
|
|
|
|
|||||||||
| Assets, end of period |
$ | 896,492 | $ | 454,140 | $ | 433,780 | $ | 1,231,681 | ||||||||
|
|
|
|
|
|
|
|
|
|||||||||
| (c) | Reflects the period from commencement of operations on October 31, 2011 through December 31, 2011. |
| (g) | Fund available in prior year but no activity. |
See accompanying notes.
22
Table of Contents
| Sub-Account | ||||||||||||||||||||
| Brandes International Equity Trust | Capital Appreciation Trust Series 0 | Capital Appreciation Trust Series 1 | ||||||||||||||||||
| Year Ended Dec. 31/12 (g) |
Year Ended Dec. 31/12 |
Year Ended Dec. 31/11 |
Year Ended Dec. 31/12 |
Year Ended Dec. 31/11 |
||||||||||||||||
| — | $ | 1,603 | $ | 632 | $ | 5,513 | $ | 2,916 | ||||||||||||
|
|
|
|
|
|
|
|
|
|
|
|||||||||||
| — | 1,603 | 632 | 5,513 | 2,916 | ||||||||||||||||
| — | — | — | 15,798 | 18,894 | ||||||||||||||||
|
|
|
|
|
|
|
|
|
|
|
|||||||||||
| — | 1,603 | 632 | (10,285 | ) | (15,978 | ) | ||||||||||||||
|
|
|
|
|
|
|
|
|
|
|
|||||||||||
| — | — | — | — | — | ||||||||||||||||
| 233 | 22,729 | 27,213 | 565,540 | 260,608 | ||||||||||||||||
|
|
|
|
|
|
|
|
|
|
|
|||||||||||
| 233 | 22,729 | 27,213 | 565,540 | 260,608 | ||||||||||||||||
| — | 69,344 | (34,928 | ) | 365 | (246,072 | ) | ||||||||||||||
|
|
|
|
|
|
|
|
|
|
|
|||||||||||
| 233 | 93,676 | (7,083 | ) | 555,620 | (1,442 | ) | ||||||||||||||
|
|
|
|
|
|
|
|
|
|
|
|||||||||||
| — | 154,626 | 104,256 | 37,732 | 68,332 | ||||||||||||||||
| (234 | ) | (34,297 | ) | (32,207 | ) | (1,087,402 | ) | (864,764 | ) | |||||||||||
| — | (17,357 | ) | (1,001 | ) | 16,562 | (4,433 | ) | |||||||||||||
| 1 | 105,322 | 71,198 | (1,115,456 | ) | 712,194 | |||||||||||||||
|
|
|
|
|
|
|
|
|
|
|
|||||||||||
| (233 | ) | 208,294 | 142,246 | (2,148,564 | ) | (88,671 | ) | |||||||||||||
|
|
|
|
|
|
|
|
|
|
|
|||||||||||
| — | 301,970 | 135,163 | (1,592,944 | ) | (90,113 | ) | ||||||||||||||
| — | 570,658 | 435,495 | 4,191,442 | 4,281,555 | ||||||||||||||||
|
|
|
|
|
|
|
|
|
|
|
|||||||||||
| — | $ | 872,628 | $ | 570,658 | $ | 2,598,498 | $ | 4,191,442 | ||||||||||||
|
|
|
|
|
|
|
|
|
|
|
|||||||||||
23
Table of Contents
John Hancock Life Insurance Company (U.S.A.) Separate Account N
Statements of Operations and Changes in Contract Owners’ Equity
(continued)
| Sub-Account | ||||||||||||||||
| Capital Appreciation Value Trust Series 0 |
Capital Appreciation Value Trust Series 1 |
|||||||||||||||
| Year Ended Dec. 31/12 |
Year Ended Dec. 31/11 |
Year Ended Dec. 31/12 |
Year Ended Dec. 31/11 |
|||||||||||||
| Income: |
||||||||||||||||
| Dividend income distribution |
$ | 357 | $ | 47 | $ | 4,843 | $ | 5,938 | ||||||||
|
|
|
|
|
|
|
|
|
|||||||||
| Total Investment Income |
357 | 47 | 4,843 | 5,938 | ||||||||||||
| Expenses: |
||||||||||||||||
| Mortality and expense risk |
— | — | 1,428 | 2,186 | ||||||||||||
|
|
|
|
|
|
|
|
|
|||||||||
| Net investment income (loss) |
357 | 47 | 3,415 | 3,752 | ||||||||||||
|
|
|
|
|
|
|
|
|
|||||||||
| Realized gains (losses) on investments: |
||||||||||||||||
| Capital gain distributions |
2,099 | 40 | 32,688 | 6,066 | ||||||||||||
| Net realized gains (losses) |
2,101 | 6,905 | 19,573 | 8,010 | ||||||||||||
|
|
|
|
|
|
|
|
|
|||||||||
| Realized gains (losses) |
4,200 | 6,945 | 52,261 | 14,076 | ||||||||||||
| Unrealized appreciation (depreciation) during the period |
(1,361 | ) | 3,953 | (5,626 | ) | 757 | ||||||||||
|
|
|
|
|
|
|
|
|
|||||||||
| Net increase (decrease) in assets from operations |
3,196 | 10,945 | 50,050 | 18,585 | ||||||||||||
|
|
|
|
|
|
|
|
|
|||||||||
| Changes from principal transactions: |
||||||||||||||||
| Transfer of net premiums |
3,947 | 1,679 | 1,247 | 1,134 | ||||||||||||
| Transfer on terminations |
(2,407 | ) | (1,169 | ) | (39,705 | ) | (27,992 | ) | ||||||||
| Transfer on policy loans |
— | — | (58 | ) | (99 | ) | ||||||||||
| Net interfund transfers |
36,621 | (266,302 | ) | (102,341 | ) | (115,449 | ) | |||||||||
|
|
|
|
|
|
|
|
|
|||||||||
| Net increase (decrease) in assets from principal transactions |
38,161 | (265,792 | ) | (140,857 | ) | (142,406 | ) | |||||||||
|
|
|
|
|
|
|
|
|
|||||||||
| Total increase (decrease) in assets |
41,357 | (254,847 | ) | (90,807 | ) | (123,821 | ) | |||||||||
| Assets, beginning of period |
3,254 | 258,101 | 430,096 | 553,917 | ||||||||||||
|
|
|
|
|
|
|
|
|
|||||||||
| Assets, end of period |
$ | 44,611 | $ | 3,254 | $ | 339,289 | $ | 430,096 | ||||||||
|
|
|
|
|
|
|
|
|
|||||||||
See accompanying notes.
24
Table of Contents
| Sub-Account | ||||||||||||||||||||||
| Core Allocation Plus Trust Series 0 | Core Allocation Plus Trust Series 1 | Core Bond Trust Series 0 | ||||||||||||||||||||
| Year Ended Dec. 31/12 |
Year Ended Dec. 31/11 |
Year Ended Dec. 31/12 |
Year Ended Dec. 31/11 |
Year Ended Dec. 31/12 |
Year Ended Dec. 31/11 |
|||||||||||||||||
| $ | 503 | $ | 284 | $ | 19,157 | $ | 62,171 | $ | 19,173 | $ | 18,619 | |||||||||||
|
|
|
|
|
|
|
|
|
|
|
|
|
|||||||||||
| 503 | 284 | 19,157 | 62,171 | 19,173 | 18,619 | |||||||||||||||||
| — | — | 7,277 | 17,168 | — | — | |||||||||||||||||
|
|
|
|
|
|
|
|
|
|
|
|
|
|||||||||||
| 503 | 284 | 11,880 | 45,003 | 19,173 | 18,619 | |||||||||||||||||
|
|
|
|
|
|
|
|
|
|
|
|
|
|||||||||||
| 1,917 | 771 | 90,530 | 276,408 | 18,009 | 20,906 | |||||||||||||||||
| (973 | ) | 36 | 122,232 | 86,552 | 11,828 | (370 | ) | |||||||||||||||
|
|
|
|
|
|
|
|
|
|
|
|
|
|||||||||||
| 944 | 807 | 212,762 | 362,960 | 29,837 | 20,536 | |||||||||||||||||
| 1,863 | (1,510 | ) | 172,650 | (544,182 | ) | (9,218 | ) | 3,180 | ||||||||||||||
|
|
|
|
|
|
|
|
|
|
|
|
|
|||||||||||
| 3,310 | (419 | ) | 397,292 | (136,219 | ) | 39,792 | 42,335 | |||||||||||||||
|
|
|
|
|
|
|
|
|
|
|
|
|
|||||||||||
| 18,262 | 16,262 | 187 | 345 | 99,528 | 146,809 | |||||||||||||||||
| (1,114 | ) | (494 | ) | (62,306 | ) | (134,578 | ) | (40,619 | ) | (19,125 | ) | |||||||||||
| — | — | — | — | (2,603 | ) | (165 | ) | |||||||||||||||
| 2,260 | 1 | (3,226,650 | ) | (837,399 | ) | 96,510 | (255,406 | ) | ||||||||||||||
|
|
|
|
|
|
|
|
|
|
|
|
|
|||||||||||
| 19,408 | 15,769 | (3,288,769 | ) | (971,632 | ) | 152,816 | (127,887 | ) | ||||||||||||||
|
|
|
|
|
|
|
|
|
|
|
|
|
|||||||||||
| 22,718 | 15,350 | (2,891,477 | ) | (1,107,851 | ) | 192,608 | (85,552 | ) | ||||||||||||||
| 21,301 | 5,951 | 4,215,840 | 5,323,691 | 598,664 | 684,216 | |||||||||||||||||
|
|
|
|
|
|
|
|
|
|
|
|
|
|||||||||||
| $ | 44,019 | $ | 21,301 | $ | 1,324,363 | $ | 4,215,840 | $ | 791,272 | $ | 598,664 | |||||||||||
|
|
|
|
|
|
|
|
|
|
|
|
|
|||||||||||
25
Table of Contents
John Hancock Life Insurance Company (U.S.A.) Separate Account N
Statements of Operations and Changes in Contract Owners’ Equity
(continued)
| Sub-Account | ||||||||||||||
| Core Bond Trust Series 1 |
Core Diversified Growth & Income Trust Series 1 |
|||||||||||||
| Year Ended Dec. 31/12 |
Year Ended Dec. 31/11 |
Year Ended Dec. 31/11 (d) |
||||||||||||
| Income: |
||||||||||||||
| Dividend income distribution |
$ | 714 | $ | 11,217 | $ | 218 | ||||||||
|
|
|
|
|
|
|
|||||||||
| Total Investment Income |
714 | 11,217 | 218 | |||||||||||
| Expenses: |
||||||||||||||
| Mortality and expense risk |
538 | 684 | — | |||||||||||
|
|
|
|
|
|
|
|||||||||
| Net investment income (loss) |
176 | 10,533 | 218 | |||||||||||
|
|
|
|
|
|
|
|||||||||
| Realized gains (losses) on investments: |
||||||||||||||
| Capital gain distributions |
698 | 1,017 | 110 | |||||||||||
| Net realized gains (losses) |
(2,119 | ) | 22,963 | 738 | ||||||||||
|
|
|
|
|
|
|
|||||||||
| Realized gains (losses) |
(1,421 | ) | 23,980 | 848 | ||||||||||
| Unrealized appreciation (depreciation) during the period |
8,162 | (26,373 | ) | (777 | ) | |||||||||
|
|
|
|
|
|
|
|||||||||
| Net increase (decrease) in assets from operations |
6,917 | 8,140 | 289 | |||||||||||
|
|
|
|
|
|
|
|||||||||
| Changes from principal transactions: |
||||||||||||||
| Transfer of net premiums |
2,133 | 10,969 | 4,362 | |||||||||||
| Transfer on terminations |
(8,519 | ) | (8,501 | ) | (555 | ) | ||||||||
| Transfer on policy loans |
— | — | — | |||||||||||
| Net interfund transfers |
(421,466 | ) | (48,610 | ) | (14,242 | ) | ||||||||
|
|
|
|
|
|
|
|||||||||
| Net increase (decrease) in assets from principal transactions |
(427,852 | ) | (46,142 | ) | (10,435 | ) | ||||||||
|
|
|
|
|
|
|
|||||||||
| Total increase (decrease) in assets |
(420,935 | ) | (38,002 | ) | (10,146 | ) | ||||||||
| Assets, beginning of period |
447,272 | 485,274 | 10,146 | |||||||||||
|
|
|
|
|
|
|
|||||||||
| Assets, end of period |
$ | 26,337 | $ | 447,272 | — | |||||||||
|
|
|
|
|
|
|
|||||||||
| (d) | Terminated as an investment option and funds transferred to Lifestyle Growth Trust on October 31, 2011. |
See accompanying notes.
26
Table of Contents
| Sub-Account | ||||||||||||||||||||||
| Core Strategy Trust Series 0 | Core Strategy Trust Series 1 | Disciplined Diversification Trust Series 0 | ||||||||||||||||||||
| Year Ended Dec. 31/12 |
Year Ended Dec. 31/11 |
Year Ended Dec. 31/12 |
Year Ended Dec. 31/11 |
Year Ended Dec. 31/12 |
Year Ended Dec. 31/11 |
|||||||||||||||||
| $ | 825 | $ | 413 | $ | 31 | $ | 14 | $ | 377 | $ | 506 | |||||||||||
|
|
|
|
|
|
|
|
|
|
|
|
|
|||||||||||
| 825 | 413 | 31 | 14 | 377 | 506 | |||||||||||||||||
| — | — | 5 | 4 | — | — | |||||||||||||||||
|
|
|
|
|
|
|
|
|
|
|
|
|
|||||||||||
| 825 | 413 | 26 | 10 | 377 | 506 | |||||||||||||||||
|
|
|
|
|
|
|
|
|
|
|
|
|
|||||||||||
| — | — | — | — | 177 | 88 | |||||||||||||||||
| 106 | 2,337 | 21 | 9 | 138 | 9,003 | |||||||||||||||||
|
|
|
|
|
|
|
|
|
|
|
|
|
|||||||||||
| 106 | 2,337 | 21 | 9 | 315 | 9,091 | |||||||||||||||||
| 1,896 | (407 | ) | 40 | (25 | ) | 1,411 | (8,209 | ) | ||||||||||||||
|
|
|
|
|
|
|
|
|
|
|
|
|
|||||||||||
| 2,827 | 2,343 | 87 | (6 | ) | 2,103 | 1,388 | ||||||||||||||||
|
|
|
|
|
|
|
|
|
|
|
|
|
|||||||||||
| 6,030 | 8,001 | 372 | 111 | 11,274 | 13,646 | |||||||||||||||||
| (996 | ) | (863 | ) | (217 | ) | (91 | ) | (1,134 | ) | (1,110 | ) | |||||||||||
| — | — | — | — | (17,356 | ) | (168 | ) | |||||||||||||||
| 4,641 | (80,464 | ) | 307 | 23 | 756 | (82,745 | ) | |||||||||||||||
|
|
|
|
|
|
|
|
|
|
|
|
|
|||||||||||
| 9,675 | (73,326 | ) | 462 | 43 | (6,460 | ) | (70,377 | ) | ||||||||||||||
|
|
|
|
|
|
|
|
|
|
|
|
|
|||||||||||
| 12,502 | (70,983 | ) | 549 | 37 | (4,357 | ) | (68,989 | ) | ||||||||||||||
| 17,891 | 88,874 | 624 | 587 | 22,778 | 91,767 | |||||||||||||||||
|
|
|
|
|
|
|
|
|
|
|
|
|
|||||||||||
| $ | 30,393 | $ | 17,891 | $ | 1,173 | $ | 624 | $ | 18,421 | $ | 22,778 | |||||||||||
|
|
|
|
|
|
|
|
|
|
|
|
|
|||||||||||
27
Table of Contents
John Hancock Life Insurance Company (U.S.A.) Separate Account N
Statements of Operations and Changes in Contract Owners’ Equity
(continued)
| Sub-Account | ||||||||||||||||
| Disciplined Diversification Trust Series 1 | Emerging Markets Value Trust Series 0 | |||||||||||||||
| Year Ended Dec. 31/12 |
Year Ended Dec. 31/11 |
Year Ended Dec. 31/12 |
Year Ended Dec. 31/11 |
|||||||||||||
| Income: |
||||||||||||||||
| Dividend income distribution |
$ | 16 | $ | 13 | $ | 11,235 | $ | 19,042 | ||||||||
|
|
|
|
|
|
|
|
|
|||||||||
| Total Investment Income |
16 | 13 | 11,235 | 19,042 | ||||||||||||
| Expenses: |
||||||||||||||||
| Mortality and expense risk |
4 | 122 | — | — | ||||||||||||
|
|
|
|
|
|
|
|
|
|||||||||
| Net investment income (loss) |
12 | (109 | ) | 11,235 | 19,042 | |||||||||||
|
|
|
|
|
|
|
|
|
|||||||||
| Realized gains (losses) on investments: |
||||||||||||||||
| Capital gain distributions |
8 | 3 | 81,899 | 135,249 | ||||||||||||
| Net realized gains (losses) |
(1 | ) | 1,363 | (260,785 | ) | (44,875 | ) | |||||||||
|
|
|
|
|
|
|
|
|
|||||||||
| Realized gains (losses) |
7 | 1,366 | (178,886 | ) | 90,374 | |||||||||||
| Unrealized appreciation (depreciation) during the period |
51 | (580 | ) | 344,347 | (405,993 | ) | ||||||||||
|
|
|
|
|
|
|
|
|
|||||||||
| Net increase (decrease) in assets from operations |
70 | 677 | 176,696 | (296,577 | ) | |||||||||||
|
|
|
|
|
|
|
|
|
|||||||||
| Changes from principal transactions: |
||||||||||||||||
| Transfer of net premiums |
34 | 34 | 268,147 | 390,307 | ||||||||||||
| Transfer on terminations |
(27 | ) | (134 | ) | (137,209 | ) | (29,409 | ) | ||||||||
| Transfer on policy loans |
— | — | (3,974 | ) | (357 | ) | ||||||||||
| Net interfund transfers |
16 | (44,621 | ) | (146,249 | ) | 131,313 | ||||||||||
|
|
|
|
|
|
|
|
|
|||||||||
| Net increase (decrease) in assets from principal transactions |
23 | (44,721 | ) | (19,285 | ) | 491,854 | ||||||||||
|
|
|
|
|
|
|
|
|
|||||||||
| Total increase (decrease) in assets |
93 | (44,044 | ) | 157,411 | 195,277 | |||||||||||
| Assets, beginning of period |
572 | 44,616 | 1,016,405 | 821,128 | ||||||||||||
|
|
|
|
|
|
|
|
|
|||||||||
| Assets, end of period |
$ | 665 | $ | 572 | $ | 1,173,816 | $ | 1,016,405 | ||||||||
|
|
|
|
|
|
|
|
|
|||||||||
See accompanying notes.
28
Table of Contents
| Sub-Account | ||||||||||||||||||||||
| Emerging Markets Value Trust Series 1 | Equity-Income Trust Series 0 | Equity-Income Trust Series 1 | ||||||||||||||||||||
| Year Ended Dec. 31/12 |
Year Ended Dec. 31/11 |
Year Ended Dec. 31/12 |
Year Ended Dec. 31/11 |
Year Ended Dec. 31/12 |
Year Ended Dec. 31/11 |
|||||||||||||||||
| $ | 12,551 | $ | 13,729 | $ | 493,953 | $ | 410,313 | $ | 244,107 | $ | 227,887 | |||||||||||
|
|
|
|
|
|
|
|
|
|
|
|
|
|||||||||||
| 12,551 | 13,729 | 493,953 | 410,313 | 244,107 | 227,887 | |||||||||||||||||
| 5,383 | 4,731 | — | — | 51,965 | 56,603 | |||||||||||||||||
|
|
|
|
|
|
|
|
|
|
|
|
|
|||||||||||
| 7,168 | 8,998 | 493,953 | 410,313 | 192,142 | 171,284 | |||||||||||||||||
|
|
|
|
|
|
|
|
|
|
|
|
|
|||||||||||
| 83,576 | 107,485 | — | — | — | — | |||||||||||||||||
| (148,381 | ) | 116,959 | 3,491,381 | 694,221 | 1,209,221 | 675,335 | ||||||||||||||||
|
|
|
|
|
|
|
|
|
|
|
|
|
|||||||||||
| (64,805 | ) | 224,444 | 3,491,381 | 694,221 | 1,209,221 | 675,335 | ||||||||||||||||
| 200,294 | (511,432 | ) | (144,486 | ) | (1,437,414 | ) | 480,490 | (1,024,678 | ) | |||||||||||||
|
|
|
|
|
|
|
|
|
|
|
|
|
|||||||||||
| 142,657 | (277,990 | ) | 3,840,848 | (332,880 | ) | 1,881,853 | (178,059 | ) | ||||||||||||||
|
|
|
|
|
|
|
|
|
|
|
|
|
|||||||||||
| 21,603 | 22,168 | 1,775,236 | 2,012,226 | 96,740 | 217,632 | |||||||||||||||||
| (26,717 | ) | (34,499 | ) | (815,502 | ) | (681,386 | ) | (2,806,269 | ) | (2,329,226 | ) | |||||||||||
| — | — | (38,338 | ) | (26,575 | ) | 2,963 | 12,582 | |||||||||||||||
| 465,494 | (249,123 | ) | (1,233,496 | ) | (265,390 | ) | (343,854 | ) | (513,627 | ) | ||||||||||||
|
|
|
|
|
|
|
|
|
|
|
|
|
|||||||||||
| 460,380 | (261,454 | ) | (312,100 | ) | 1,038,875 | (3,050,420 | ) | (2,612,639 | ) | |||||||||||||
|
|
|
|
|
|
|
|
|
|
|
|
|
|||||||||||
| 603,037 | (539,444 | ) | 3,528,748 | 705,995 | (1,168,567 | ) | (2,790,698 | ) | ||||||||||||||
| 741,859 | 1,281,303 | 20,892,942 | 20,186,947 | 12,186,556 | 14,977,254 | |||||||||||||||||
|
|
|
|
|
|
|
|
|
|
|
|
|
|||||||||||
| $ | 1,344,896 | $ | 741,859 | $ | 24,421,690 | $ | 20,892,942 | $ | 11,017,989 | $ | 12,186,556 | |||||||||||
|
|
|
|
|
|
|
|
|
|
|
|
|
|||||||||||
29
Table of Contents
John Hancock Life Insurance Company (U.S.A.) Separate Account N
Statements of Operations and Changes in Contract Owners’ Equity
(continued)
| Sub-Account | ||||||||||||||||
| Financial Services Trust Series 0 | Financial Services Trust Series 1 | |||||||||||||||
| Year Ended Dec. 31/12 |
Year Ended Dec. 31/11 |
Year Ended Dec. 31/12 |
Year Ended Dec. 31/11 |
|||||||||||||
| Income: |
||||||||||||||||
| Dividend income distribution |
$ | 2,519 | $ | 6,603 | $ | 3,250 | $ | 7,139 | ||||||||
|
|
|
|
|
|
|
|
|
|||||||||
| Total Investment Income |
2,519 | 6,603 | 3,250 | 7,139 | ||||||||||||
| Expenses: |
||||||||||||||||
| Mortality and expense risk |
— | — | 2,014 | 3,693 | ||||||||||||
|
|
|
|
|
|
|
|
|
|||||||||
| Net investment income (loss) |
2,519 | 6,603 | 1,236 | 3,446 | ||||||||||||
|
|
|
|
|
|
|
|
|
|||||||||
| Realized gains (losses) on investments: |
||||||||||||||||
| Capital gain distributions |
— | — | — | — | ||||||||||||
| Net realized gains (losses) |
27,469 | 4,156 | 3,396 | 86,415 | ||||||||||||
|
|
|
|
|
|
|
|
|
|||||||||
| Realized gains (losses) |
27,469 | 4,156 | 3,396 | 86,415 | ||||||||||||
| Unrealized appreciation (depreciation) during the period |
32,410 | (44,079 | ) | 55,952 | (155,388 | ) | ||||||||||
|
|
|
|
|
|
|
|
|
|||||||||
| Net increase (decrease) in assets from operations |
62,398 | (33,320 | ) | 60,584 | (65,527 | ) | ||||||||||
|
|
|
|
|
|
|
|
|
|||||||||
| Changes from principal transactions: |
||||||||||||||||
| Transfer of net premiums |
33,483 | 43,927 | 11,574 | 38,062 | ||||||||||||
| Transfer on terminations |
(21,596 | ) | (9,149 | ) | (25,790 | ) | (31,650 | ) | ||||||||
| Transfer on policy loans |
(13,996 | ) | — | (20 | ) | (25 | ) | |||||||||
| Net interfund transfers |
(108,588 | ) | 87,516 | 240,441 | (541,748 | ) | ||||||||||
|
|
|
|
|
|
|
|
|
|||||||||
| Net increase (decrease) in assets from principal transactions |
(110,697 | ) | 122,294 | 226,205 | (535,361 | ) | ||||||||||
|
|
|
|
|
|
|
|
|
|||||||||
| Total increase (decrease) in assets |
(48,299 | ) | 88,974 | 286,789 | (600,888 | ) | ||||||||||
| Assets, beginning of period |
370,177 | 281,203 | 304,495 | 905,383 | ||||||||||||
|
|
|
|
|
|
|
|
|
|||||||||
| Assets, end of period |
$ | 321,878 | $ | 370,177 | $ | 591,284 | $ | 304,495 | ||||||||
|
|
|
|
|
|
|
|
|
|||||||||
| (g) | Fund available in prior year but no activity. |
See accompanying notes.
30
Table of Contents
| Sub-Account | ||||||||||||||||||||
| Franklin Templeton Founding Allocation Trust Series 0 |
Franklin Templeton Founding Allocation Trust Series 1 |
Frontier Capital Appreciation Trust | ||||||||||||||||||
| Year Ended Dec. 31/12 |
Year Ended Dec. 31/11 |
Year Ended Dec. 31/12 |
Year Ended Dec. 31/11 (g) |
Year Ended Dec. 31/12 (g) |
||||||||||||||||
| $ | 4,086 | $ | 8,880 | $ | 309 | $ | 217 | $ | 365 | |||||||||||
|
|
|
|
|
|
|
|
|
|
|
|||||||||||
| 4,086 | 8,880 | 309 | 217 | 365 | ||||||||||||||||
| — | — | 56 | 6 | — | ||||||||||||||||
|
|
|
|
|
|
|
|
|
|
|
|||||||||||
| 4,086 | 8,880 | 253 | 211 | 365 | ||||||||||||||||
|
|
|
|
|
|
|
|
|
|
|
|||||||||||
| — | — | — | — | 7,047 | ||||||||||||||||
| 23,823 | 18,168 | 161 | (2 | ) | 17,258 | |||||||||||||||
|
|
|
|
|
|
|
|
|
|
|
|||||||||||
| 23,823 | 18,168 | 161 | (2 | ) | 24,305 | |||||||||||||||
| 6,717 | (34,751 | ) | 809 | (232 | ) | (2,489 | ) | |||||||||||||
|
|
|
|
|
|
|
|
|
|
|
|||||||||||
| 34,626 | (7,703 | ) | 1,223 | (23 | ) | 22,181 | ||||||||||||||
|
|
|
|
|
|
|
|
|
|
|
|||||||||||
| 20,251 | 87,811 | 5,016 | 418 | — | ||||||||||||||||
| (205,295 | ) | (29,982 | ) | (4,453 | ) | (348 | ) | (21,876 | ) | |||||||||||
| (31 | ) | (29 | ) | — | — | — | ||||||||||||||
| 2,721 | (404,985 | ) | 1,617 | 7,023 | 117,095 | |||||||||||||||
|
|
|
|
|
|
|
|
|
|
|
|||||||||||
| (182,354 | ) | (347,185 | ) | 2,180 | 7,093 | 95,219 | ||||||||||||||
|
|
|
|
|
|
|
|
|
|
|
|||||||||||
| (147,728 | ) | (354,888 | ) | 3,403 | 7,070 | 117,400 | ||||||||||||||
| 285,058 | 639,946 | 7,070 | — | — | ||||||||||||||||
|
|
|
|
|
|
|
|
|
|
|
|||||||||||
| $ | 137,330 | $ | 285,058 | $ | 10,473 | $ | 7,070 | $ | 117,400 | |||||||||||
|
|
|
|
|
|
|
|
|
|
|
|||||||||||
31
Table of Contents
John Hancock Life Insurance Company (U.S.A.) Separate Account N
Statements of Operations and Changes in Contract Owners’ Equity
(continued)
| Sub-Account | ||||||||||||||||
| Fundamental All Cap Core Trust Series 0 | Fundamental All Cap Core Trust Series 1 | |||||||||||||||
| Year Ended Dec. 31/12 |
Year Ended Dec. 31/11 (m) |
Year Ended Dec. 31/12 |
Year Ended Dec. 31/11 (m) |
|||||||||||||
| Income: |
||||||||||||||||
| Dividend income distribution |
$ | 3,927 | $ | 3,925 | $ | 4,156 | $ | 3,176 | ||||||||
|
|
|
|
|
|
|
|
|
|||||||||
| Total Investment Income |
3,927 | 3,925 | 4,156 | 3,176 | ||||||||||||
| Expenses: |
||||||||||||||||
| Mortality and expense risk |
— | — | 2,019 | 1,625 | ||||||||||||
|
|
|
|
|
|
|
|
|
|||||||||
| Net investment income (loss) |
3,927 | 3,925 | 2,137 | 1,551 | ||||||||||||
|
|
|
|
|
|
|
|
|
|||||||||
| Realized gains (losses) on investments: |
||||||||||||||||
| Capital gain distributions |
— | — | — | — | ||||||||||||
| Net realized gains (losses) |
98,271 | 6,227 | 44,506 | 47,132 | ||||||||||||
|
|
|
|
|
|
|
|
|
|||||||||
| Realized gains (losses) |
98,271 | 6,227 | 44,506 | 47,132 | ||||||||||||
| Unrealized appreciation (depreciation) during the period |
(709 | ) | (17,452 | ) | 53,853 | (23,866 | ) | |||||||||
|
|
|
|
|
|
|
|
|
|||||||||
| Net increase (decrease) in assets from operations |
101,489 | (7,300 | ) | 100,496 | 24,817 | |||||||||||
|
|
|
|
|
|
|
|
|
|||||||||
| Changes from principal transactions: |
||||||||||||||||
| Transfer of net premiums |
87,649 | 82,233 | 1,133 | 32,424 | ||||||||||||
| Transfer on terminations |
(21,649 | ) | (10,863 | ) | (279,116 | ) | (35,342 | ) | ||||||||
| Transfer on policy loans |
(5,629 | ) | — | — | — | |||||||||||
| Net interfund transfers |
36,329 | (7,563 | ) | 207,893 | (46,145 | ) | ||||||||||
|
|
|
|
|
|
|
|
|
|||||||||
| Net increase (decrease) in assets from principal transactions |
96,700 | 63,807 | (70,090 | ) | (49,063 | ) | ||||||||||
|
|
|
|
|
|
|
|
|
|||||||||
| Total increase (decrease) in assets |
198,189 | 56,507 | 30,406 | (24,246 | ) | |||||||||||
| Assets, beginning of period |
346,907 | 290,400 | 281,982 | 306,228 | ||||||||||||
|
|
|
|
|
|
|
|
|
|||||||||
| Assets, end of period |
$ | 545,096 | $ | 346,907 | $ | 312,388 | $ | 281,982 | ||||||||
|
|
|
|
|
|
|
|
|
|||||||||
| (m) | Renamed on June 27, 2011. Previously known as Optimized All Cap Trust. |
| (l) | Renamed on October 31, 2011. Previously known as American Fundamental Holdings Trust Series 1. |
| (o) | Renamed on June 27, 2011. Previously known as Optimized Value Trust. |
See accompanying notes.
32
Table of Contents
| Sub-Account | ||||||||||||||||||||||
| Fundamental Holdings Trust Series 1 | Fundamental Large Cap Value Trust Series 0 | Fundamental Large Cap Value Trust Series 1 | ||||||||||||||||||||
| Year Ended Dec. 31/12 |
Year Ended Dec. 31/11 (l) |
Year Ended Dec. 31/12 |
Year Ended Dec. 31/11 (o) |
Year Ended Dec. 31/12 |
Year Ended Dec. 31/11 (o) |
|||||||||||||||||
| $ | 296 | $ | 246 | $ | 16,849 | $ | 2,054 | $ | 28 | — | ||||||||||||
|
|
|
|
|
|
|
|
|
|
|
|
|
|||||||||||
| 296 | 246 | 16,849 | 2,054 | 28 | — | |||||||||||||||||
| 106 | 103 | — | — | 3 | — | |||||||||||||||||
|
|
|
|
|
|
|
|
|
|
|
|
|
|||||||||||
| 190 | 143 | 16,849 | 2,054 | 25 | — | |||||||||||||||||
|
|
|
|
|
|
|
|
|
|
|
|
|
|||||||||||
| — | — | — | — | — | — | |||||||||||||||||
| 109 | 102 | 63,906 | 2,001 | 1 | — | |||||||||||||||||
|
|
|
|
|
|
|
|
|
|
|
|
|
|||||||||||
| 109 | 102 | 63,906 | 2,001 | 1 | — | |||||||||||||||||
| 1,549 | (511 | ) | (23,716 | ) | (431 | ) | 87 | — | ||||||||||||||
|
|
|
|
|
|
|
|
|
|
|
|
|
|||||||||||
| 1,848 | (266 | ) | 57,039 | 3,624 | 113 | — | ||||||||||||||||
|
|
|
|
|
|
|
|
|
|
|
|
|
|||||||||||
| 1,463 | 401 | 49,325 | 46,609 | — | — | |||||||||||||||||
| (661 | ) | (596 | ) | (15,163 | ) | (4,339 | ) | (56 | ) | — | ||||||||||||
| — | — | — | — | — | — | |||||||||||||||||
| (439 | ) | 42 | 16,958 | (5,168 | ) | 2,874 | — | |||||||||||||||
|
|
|
|
|
|
|
|
|
|
|
|
|
|||||||||||
| 363 | (153 | ) | 51,120 | 37,102 | 2,818 | — | ||||||||||||||||
|
|
|
|
|
|
|
|
|
|
|
|
|
|||||||||||
| 2,211 | (419 | ) | 108,159 | 40,726 | 2,931 | — | ||||||||||||||||
| 15,624 | 16,043 | 198,403 | 157,677 | 14 | 14 | |||||||||||||||||
|
|
|
|
|
|
|
|
|
|
|
|
|
|||||||||||
| $ | 17,835 | $ | 15,624 | $ | 306,562 | $ | 198,403 | $ | 2,945 | $ | 14 | |||||||||||
|
|
|
|
|
|
|
|
|
|
|
|
|
|||||||||||
33
Table of Contents
John Hancock Life Insurance Company (U.S.A.) Separate Account N
Statements of Operations and Changes in Contract Owners’ Equity
(continued)
| Sub-Account | ||||||||||||||||
| Fundamental Value Trust Series 0 | Fundamental Value Trust Series 1 | |||||||||||||||
| Year Ended Dec. 31/12 |
Year Ended Dec. 31/11 |
Year Ended Dec. 31/12 |
Year Ended Dec. 31/11 |
|||||||||||||
| Income: |
||||||||||||||||
| Dividend income distribution |
$ | 25,376 | $ | 27,094 | $ | 56,138 | $ | 74,320 | ||||||||
|
|
|
|
|
|
|
|
|
|||||||||
| Total Investment Income |
25,376 | 27,094 | 56,138 | 74,320 | ||||||||||||
| Expenses: |
||||||||||||||||
| Mortality and expense risk |
— | — | 29,032 | 43,184 | ||||||||||||
|
|
|
|
|
|
|
|
|
|||||||||
| Net investment income (loss) |
25,376 | 27,094 | 27,106 | 31,136 | ||||||||||||
|
|
|
|
|
|
|
|
|
|||||||||
| Realized gains (losses) on investments: |
||||||||||||||||
| Capital gain distributions |
— | — | — | — | ||||||||||||
| Net realized gains (losses) |
495,449 | 186,927 | 769,874 | 595,858 | ||||||||||||
|
|
|
|
|
|
|
|
|
|||||||||
| Realized gains (losses) |
495,449 | 186,927 | 769,874 | 595,858 | ||||||||||||
| Unrealized appreciation (depreciation) during the period |
(73,353 | ) | (362,551 | ) | 128,058 | (1,117,792 | ) | |||||||||
|
|
|
|
|
|
|
|
|
|||||||||
| Net increase (decrease) in assets from operations |
447,472 | (148,530 | ) | 925,038 | (490,798 | ) | ||||||||||
|
|
|
|
|
|
|
|
|
|||||||||
| Changes from principal transactions: |
||||||||||||||||
| Transfer of net premiums |
78,507 | 398,987 | 205,264 | 290,355 | ||||||||||||
| Transfer on terminations |
(82,575 | ) | (143,150 | ) | (748,850 | ) | (1,207,054 | ) | ||||||||
| Transfer on policy loans |
— | — | 1,323 | (4,405 | ) | |||||||||||
| Net interfund transfers |
554,215 | 953 | (3,033,606 | ) | (1,346,949 | ) | ||||||||||
|
|
|
|
|
|
|
|
|
|||||||||
| Net increase (decrease) in assets from principal transactions |
550,147 | 256,790 | (3,575,869 | ) | (2,268,053 | ) | ||||||||||
|
|
|
|
|
|
|
|
|
|||||||||
| Total increase (decrease) in assets |
997,619 | 108,260 | (2,650,831 | ) | (2,758,851 | ) | ||||||||||
| Assets, beginning of period |
2,950,359 | 2,842,099 | 8,359,838 | 11,118,689 | ||||||||||||
|
|
|
|
|
|
|
|
|
|||||||||
| Assets, end of period |
$ | 3,947,978 | $ | 2,950,359 | $ | 5,709,007 | $ | 8,359,838 | ||||||||
|
|
|
|
|
|
|
|
|
|||||||||
| (i) | Renamed on October 31, 2011. Previously known as American Global Diversification Trust Series 1. |
See accompanying notes.
34
Table of Contents
| Sub-Account | ||||||||||||||||||||||
| Global Bond Trust Series 0 | Global Bond Trust Series 1 | Global Diversification Trust Series 1 | ||||||||||||||||||||
| Year Ended Dec. 31/12 |
Year Ended Dec. 31/11 |
Year Ended Dec. 31/12 |
Year Ended Dec. 31/11 |
Year Ended Dec. 31/12 |
Year Ended Dec. 31/11 (i) |
|||||||||||||||||
| $ | 960,253 | $ | 771,516 | $ | 263,143 | $ | 234,079 | $ | 2,514 | $ | 1,706 | |||||||||||
|
|
|
|
|
|
|
|
|
|
|
|
|
|||||||||||
| 960,253 | 771,516 | 263,143 | 234,079 | 2,514 | 1,706 | |||||||||||||||||
| — | — | 16,792 | 17,105 | 679 | 395 | |||||||||||||||||
|
|
|
|
|
|
|
|
|
|
|
|
|
|||||||||||
| 960,253 | 771,516 | 246,351 | 216,974 | 1,835 | 1,311 | |||||||||||||||||
|
|
|
|
|
|
|
|
|
|
|
|
|
|||||||||||
| — | — | — | — | — | — | |||||||||||||||||
| 553,092 | 631,123 | 27,695 | 212,330 | 62 | 710 | |||||||||||||||||
|
|
|
|
|
|
|
|
|
|
|
|
|
|||||||||||
| 553,092 | 631,123 | 27,695 | 212,330 | 62 | 710 | |||||||||||||||||
| (600,066 | ) | (440,994 | ) | (30,459 | ) | (125,961 | ) | 15,704 | (7,477 | ) | ||||||||||||
|
|
|
|
|
|
|
|
|
|
|
|
|
|||||||||||
| 913,279 | 961,645 | 243,587 | 303,343 | 17,601 | (5,456 | ) | ||||||||||||||||
|
|
|
|
|
|
|
|
|
|
|
|
|
|||||||||||
| 283,632 | 496,917 | 201,518 | 246,704 | 14,742 | 10,048 | |||||||||||||||||
| (406,236 | ) | (377,040 | ) | (1,324,176 | ) | (358,194 | ) | (3,742 | ) | (1,794 | ) | |||||||||||
| 1,703 | 61 | 1,193 | 590 | (791 | ) | — | ||||||||||||||||
| (1,334,245 | ) | 864,191 | 217,124 | (571,487 | ) | 38,060 | (62,231 | ) | ||||||||||||||
|
|
|
|
|
|
|
|
|
|
|
|
|
|||||||||||
| (1,455,146 | ) | 984,129 | (904,341 | ) | (682,387 | ) | 48,269 | (53,977 | ) | |||||||||||||
|
|
|
|
|
|
|
|
|
|
|
|
|
|||||||||||
| (541,867 | ) | 1,945,774 | (660,754 | ) | (379,044 | ) | 65,870 | (59,433 | ) | |||||||||||||
| 13,749,389 | 11,803,615 | 3,693,790 | 4,072,834 | 86,201 | 145,634 | |||||||||||||||||
|
|
|
|
|
|
|
|
|
|
|
|
|
|||||||||||
| $ | 13,207,522 | $ | 13,749,389 | $ | 3,033,036 | $ | 3,693,790 | $ | 152,071 | $ | 86,201 | |||||||||||
|
|
|
|
|
|
|
|
|
|
|
|
|
|||||||||||
35
Table of Contents
John Hancock Life Insurance Company (U.S.A.) Separate Account N
Statements of Operations and Changes in Contract Owners’ Equity
(continued)
| Sub-Account | ||||||||||||||||
| Global Trust Series 0 | Global Trust Series 1 | |||||||||||||||
| Year Ended Dec. 31/12 |
Year Ended Dec. 31/11 |
Year Ended Dec. 31/12 |
Year Ended Dec. 31/11 |
|||||||||||||
| Income: |
||||||||||||||||
| Dividend income distribution |
$ | 6,464 | $ | 4,055 | $ | 43,116 | $ | 23,686 | ||||||||
|
|
|
|
|
|
|
|
|
|||||||||
| Total Investment Income |
6,464 | 4,055 | 43,116 | 23,686 | ||||||||||||
| Expenses: |
||||||||||||||||
| Mortality and expense risk |
— | — | 9,989 | 9,320 | ||||||||||||
|
|
|
|
|
|
|
|
|
|||||||||
| Net investment income (loss) |
6,464 | 4,055 | 33,127 | 14,366 | ||||||||||||
|
|
|
|
|
|
|
|
|
|||||||||
| Realized gains (losses) on investments: |
||||||||||||||||
| Capital gain distributions |
— | — | — | — | ||||||||||||
| Net realized gains (losses) |
2,121 | 13,110 | 14,608 | 138,193 | ||||||||||||
|
|
|
|
|
|
|
|
|
|||||||||
| Realized gains (losses) |
2,121 | 13,110 | 14,608 | 138,193 | ||||||||||||
| Unrealized appreciation (depreciation) during the period |
33,743 | (25,934 | ) | 249,294 | (255,915 | ) | ||||||||||
|
|
|
|
|
|
|
|
|
|||||||||
| Net increase (decrease) in assets from operations |
42,328 | (8,769 | ) | 297,029 | (103,356 | ) | ||||||||||
|
|
|
|
|
|
|
|
|
|||||||||
| Changes from principal transactions: |
||||||||||||||||
| Transfer of net premiums |
33,698 | 34,580 | 37,406 | 117,271 | ||||||||||||
| Transfer on terminations |
(7,877 | ) | (7,062 | ) | (931,363 | ) | (200,356 | ) | ||||||||
| Transfer on policy loans |
(2,925 | ) | (511 | ) | 4,906 | 476 | ||||||||||
| Net interfund transfers |
167,584 | (76,477 | ) | 1,127,465 | (719,650 | ) | ||||||||||
|
|
|
|
|
|
|
|
|
|||||||||
| Net increase (decrease) in assets from principal transactions |
190,480 | (49,470 | ) | 238,414 | (802,259 | ) | ||||||||||
|
|
|
|
|
|
|
|
|
|||||||||
| Total increase (decrease) in assets |
232,808 | (58,239 | ) | 535,443 | (905,615 | ) | ||||||||||
| Assets, beginning of period |
178,912 | 237,151 | 1,035,580 | 1,941,195 | ||||||||||||
|
|
|
|
|
|
|
|
|
|||||||||
| Assets, end of period |
$ | 411,720 | $ | 178,912 | $ | 1,571,023 | $ | 1,035,580 | ||||||||
|
|
|
|
|
|
|
|
|
|||||||||
See accompanying notes.
36
Table of Contents
| Sub-Account | ||||||||||||||||||||||
| Health Sciences Trust Series 0 | Health Sciences Trust Series 1 | High Yield Trust Series 0 | ||||||||||||||||||||
| Year Ended Dec. 31/12 |
Year Ended Dec. 31/11 |
Year Ended Dec. 31/12 |
Year Ended Dec. 31/11 |
Year Ended Dec. 31/12 |
Year Ended Dec. 31/11 |
|||||||||||||||||
| — | — | — | — | $ | 172,095 | $ | 148,552 | |||||||||||||||
|
|
|
|
|
|
|
|
|
|
|
|
|
|||||||||||
| — | — | — | — | 172,095 | 148,552 | |||||||||||||||||
| — | — | 16,733 | 14,178 | — | — | |||||||||||||||||
|
|
|
|
|
|
|
|
|
|
|
|
|
|||||||||||
| — | — | (16,733 | ) | (14,178 | ) | 172,095 | 148,552 | |||||||||||||||
|
|
|
|
|
|
|
|
|
|
|
|
|
|||||||||||
| 107,714 | 11,216 | 198,483 | 33,170 | — | — | |||||||||||||||||
| 224,502 | 72,946 | 293,644 | 401,777 | (43,312 | ) | (578,809 | ) | |||||||||||||||
|
|
|
|
|
|
|
|
|
|
|
|
|
|||||||||||
| 332,216 | 84,162 | 492,127 | 434,947 | (43,312 | ) | (578,809 | ) | |||||||||||||||
| 53,675 | 8,089 | 344,099 | (174,221 | ) | 224,961 | 450,697 | ||||||||||||||||
|
|
|
|
|
|
|
|
|
|
|
|
|
|||||||||||
| 385,891 | 92,251 | 819,493 | 246,548 | 353,744 | 20,440 | |||||||||||||||||
|
|
|
|
|
|
|
|
|
|
|
|
|
|||||||||||
| 150,963 | 58,185 | 70,517 | 129,665 | 81,158 | 95,548 | |||||||||||||||||
| (74,936 | ) | (51,873 | ) | (510,472 | ) | (217,708 | ) | (59,864 | ) | (163,021 | ) | |||||||||||
| (9,732 | ) | (4,512 | ) | (317 | ) | (55 | ) | (13,414 | ) | (40,835 | ) | |||||||||||
| 360,503 | 222,563 | 272,997 | 629,317 | 457,969 | (918,583 | ) | ||||||||||||||||
|
|
|
|
|
|
|
|
|
|
|
|
|
|||||||||||
| 426,798 | 224,363 | (167,275 | ) | 541,219 | 465,849 | (1,026,891 | ) | |||||||||||||||
|
|
|
|
|
|
|
|
|
|
|
|
|
|||||||||||
| 812,689 | 316,614 | 652,218 | 787,767 | 819,593 | (1,006,451 | ) | ||||||||||||||||
| 1,134,576 | 817,962 | 2,757,632 | 1,969,865 | 1,550,002 | 2,556,453 | |||||||||||||||||
|
|
|
|
|
|
|
|
|
|
|
|
|
|||||||||||
| $ | 1,947,265 | $ | 1,134,576 | $ | 3,409,850 | $ | 2,757,632 | $ | 2,369,595 | $ | 1,550,002 | |||||||||||
|
|
|
|
|
|
|
|
|
|
|
|
|
|||||||||||
37
Table of Contents
John Hancock Life Insurance Company (U.S.A.) Separate Account N
Statements of Operations and Changes in Contract Owners’ Equity
(continued)
| Sub-Account | ||||||||||||||||
| High Yield Trust Series 1 | International Core Trust Series 0 | |||||||||||||||
| Year Ended Dec. 31/12 |
Year Ended Dec. 31/11 |
Year Ended Dec. 31/12 |
Year Ended Dec. 31/11 |
|||||||||||||
| Income: |
||||||||||||||||
| Dividend income distribution |
$ | 348,632 | $ | 427,477 | $ | 5,898 | $ | 4,650 | ||||||||
|
|
|
|
|
|
|
|
|
|||||||||
| Total Investment Income |
348,632 | 427,477 | 5,898 | 4,650 | ||||||||||||
| Expenses: |
||||||||||||||||
| Mortality and expense risk |
21,354 | 24,960 | — | — | ||||||||||||
|
|
|
|
|
|
|
|
|
|||||||||
| Net investment income (loss) |
327,278 | 402,517 | 5,898 | 4,650 | ||||||||||||
|
|
|
|
|
|
|
|
|
|||||||||
| Realized gains (losses) on investments: |
||||||||||||||||
| Capital gain distributions |
— | — | — | — | ||||||||||||
| Net realized gains (losses) |
(325,842 | ) | (1,230,402 | ) | (3,550 | ) | (3,571 | ) | ||||||||
|
|
|
|
|
|
|
|
|
|||||||||
| Realized gains (losses) |
(325,842 | ) | (1,230,402 | ) | (3,550 | ) | (3,571 | ) | ||||||||
| Unrealized appreciation (depreciation) during the period |
804,694 | 849,354 | 24,364 | (32,448 | ) | |||||||||||
|
|
|
|
|
|
|
|
|
|||||||||
| Net increase (decrease) in assets from operations |
806,130 | 21,469 | 26,712 | (31,369 | ) | |||||||||||
|
|
|
|
|
|
|
|
|
|||||||||
| Changes from principal transactions: |
||||||||||||||||
| Transfer of net premiums |
66,583 | 93,243 | 50,003 | 70,296 | ||||||||||||
| Transfer on terminations |
(1,230,130 | ) | (1,087,936 | ) | (23,452 | ) | (102,206 | ) | ||||||||
| Transfer on policy loans |
49 | 66 | (6,000 | ) | (122 | ) | ||||||||||
| Net interfund transfers |
(341,580 | ) | (229,894 | ) | 1,245 | 6,599 | ||||||||||
|
|
|
|
|
|
|
|
|
|||||||||
| Net increase (decrease) in assets from principal transactions |
(1,505,078 | ) | (1,224,521 | ) | 21,796 | (25,433 | ) | |||||||||
|
|
|
|
|
|
|
|
|
|||||||||
| Total increase (decrease) in assets |
(698,948 | ) | (1,203,052 | ) | 48,508 | (56,802 | ) | |||||||||
| Assets, beginning of period |
4,701,034 | 5,904,086 | 166,647 | 223,449 | ||||||||||||
|
|
|
|
|
|
|
|
|
|||||||||
| Assets, end of period |
$ | 4,002,086 | $ | 4,701,034 | $ | 215,155 | $ | 166,647 | ||||||||
|
|
|
|
|
|
|
|
|
|||||||||
| (u) | Terminated as an investment option and funds transferred to International Equity Index Trust B on November 5, 2012. |
See accompanying notes.
38
Table of Contents
| Sub-Account | ||||||||||||||||||||||
| International Core Trust Series 1 | International Equity Index Trust A Series 0 | International Equity Index Trust A Series 1 | ||||||||||||||||||||
| Year Ended Dec. 31/12 |
Year Ended Dec. 31/11 |
Year Ended Dec. 31/12 (u) |
Year Ended Dec. 31/11 |
Year Ended Dec. 31/12 (u) |
Year Ended Dec. 31/11 |
|||||||||||||||||
| $ | 64,795 | $ | 77,106 | $ | 7,750 | $ | 9,814 | $ | 107,104 | $ | 145,536 | |||||||||||
|
|
|
|
|
|
|
|
|
|
|
|
|
|||||||||||
| 64,795 | 77,106 | 7,750 | 9,814 | 107,104 | 145,536 | |||||||||||||||||
| 12,946 | 17,497 | — | — | 13,494 | 19,883 | |||||||||||||||||
|
|
|
|
|
|
|
|
|
|
|
|
|
|||||||||||
| 51,849 | 59,609 | 7,750 | 9,814 | 93,610 | 125,653 | |||||||||||||||||
|
|
|
|
|
|
|
|
|
|
|
|
|
|||||||||||
| — | — | 13,490 | 6,652 | 192,157 | 107,074 | |||||||||||||||||
| (82,782 | ) | (1,889 | ) | (41,377 | ) | (24,338 | ) | (790,361 | ) | (361,246 | ) | |||||||||||
|
|
|
|
|
|
|
|
|
|
|
|
|
|||||||||||
| (82,782 | ) | (1,889 | ) | (27,887 | ) | (17,686 | ) | (598,204 | ) | (254,172 | ) | |||||||||||
| 376,035 | (367,945 | ) | 50,482 | (31,845 | ) | 899,946 | (550,110 | ) | ||||||||||||||
|
|
|
|
|
|
|
|
|
|
|
|
|
|||||||||||
| 345,102 | (310,225 | ) | 30,345 | (39,717 | ) | 395,352 | (678,629 | ) | ||||||||||||||
|
|
|
|
|
|
|
|
|
|
|
|
|
|||||||||||
| 56,516 | 75,436 | 37,317 | 92,785 | 140,790 | 214,394 | |||||||||||||||||
| (330,936 | ) | (773,532 | ) | (10,993 | ) | (15,055 | ) | (213,579 | ) | (528,569 | ) | |||||||||||
| 7,313 | 11,297 | (10,237 | ) | (1,587 | ) | 163 | 9,256 | |||||||||||||||
| (619,124 | ) | 463,834 | (314,349 | ) | 3,326 | (4,318,079 | ) | (569,119 | ) | |||||||||||||
|
|
|
|
|
|
|
|
|
|
|
|
|
|||||||||||
| (886,231 | ) | (222,965 | ) | (298,262 | ) | 79,469 | (4,390,705 | ) | (874,038 | ) | ||||||||||||
|
|
|
|
|
|
|
|
|
|
|
|
|
|||||||||||
| (541,129 | ) | (533,190 | ) | (267,917 | ) | 39,752 | (3,995,353 | ) | (1,552,667 | ) | ||||||||||||
| 2,920,094 | 3,453,284 | 267,917 | 228,165 | 3,995,353 | 5,548,020 | |||||||||||||||||
|
|
|
|
|
|
|
|
|
|
|
|
|
|||||||||||
| $ | 2,378,965 | $ | 2,920,094 | — | $ | 267,917 | — | $ | 3,995,353 | |||||||||||||
|
|
|
|
|
|
|
|
|
|
|
|
|
|||||||||||
39
Table of Contents
John Hancock Life Insurance Company (U.S.A.) Separate Account N
Statements of Operations and Changes in Contract Owners’ Equity
(continued)
| Sub-Account | ||||||||||||||
| International Equity Index Trust B Series 0 | International Equity Index Trust B Series 1 | |||||||||||||
| Year Ended Dec. 31/12 |
Year Ended Dec. 31/11 |
Year Ended Dec. 31/12 (s) |
||||||||||||
| Income: |
||||||||||||||
| Dividend income distribution |
$ | 168,098 | $ | 338,591 | $ | 39,586 | ||||||||
|
|
|
|
|
|
|
|||||||||
| Total Investment Income |
168,098 | 338,591 | 39,586 | |||||||||||
| Expenses: |
||||||||||||||
| Mortality and expense risk |
— | — | 2,263 | |||||||||||
|
|
|
|
|
|
|
|||||||||
| Net investment income (loss) |
168,098 | 338,591 | 37,323 | |||||||||||
|
|
|
|
|
|
|
|||||||||
| Realized gains (losses) on investments: |
||||||||||||||
| Capital gain distributions |
— | — | — | |||||||||||
| Net realized gains (losses) |
(155,634 | ) | 843,361 | 9,739 | ||||||||||
|
|
|
|
|
|
|
|||||||||
| Realized gains (losses) |
(155,634 | ) | 843,361 | 9,739 | ||||||||||
| Unrealized appreciation (depreciation) during the period |
2,085,229 | (2,569,655 | ) | 160,192 | ||||||||||
|
|
|
|
|
|
|
|||||||||
| Net increase (decrease) in assets from operations |
2,097,693 | (1,387,703 | ) | 207,254 | ||||||||||
|
|
|
|
|
|
|
|||||||||
| Changes from principal transactions: |
||||||||||||||
| Transfer of net premiums |
1,032,428 | 1,868,155 | 3,758 | |||||||||||
| Transfer on terminations |
(462,095 | ) | (958,494 | ) | (21,807 | ) | ||||||||
| Transfer on policy loans |
(405,563 | ) | 72,749 | 187 | ||||||||||
| Net interfund transfers |
3,481,584 | (383,619 | ) | 3,270,546 | ||||||||||
|
|
|
|
|
|
|
|||||||||
| Net increase (decrease) in assets from principal transactions |
3,646,354 | 598,791 | 3,252,684 | |||||||||||
|
|
|
|
|
|
|
|||||||||
| Total increase (decrease) in assets |
5,744,047 | (788,912 | ) | 3,459,938 | ||||||||||
| Assets, beginning of period |
8,757,970 | 9,546,882 | — | |||||||||||
|
|
|
|
|
|
|
|||||||||
| Assets, end of period |
$ | 14,502,017 | $ | 8,757,970 | $ | 3,459,938 | ||||||||
|
|
|
|
|
|
|
|||||||||
| (s) | Reflects the period from commencement of operations on November 5, 2012 through December 31, 2012. |
| (r) | Reflects the period from commencement of operations on November 5, 2012 through December 31, 2012. |
| (w) | Terminated as an investment option and funds transferred to International Growth Stock Trust on November 5, 2012. |
See accompanying notes.
40
Table of Contents
| Sub-Account | ||||||||||||||||||
| International Growth Stock Trust Series 0 | International Growth Stock Trust Series 1 | International Opportunities Trust Series 0 | ||||||||||||||||
| Year Ended Dec. 31/12 (r) |
Year Ended Dec. 31/12 (r) |
Year Ended Dec. 31/12 (w) |
Year Ended Dec. 31/11 |
|||||||||||||||
| $ | 36,502 | $ | 2,795 | $ | 92,220 | $ | 36,348 | |||||||||||
|
|
|
|
|
|
|
|
|
|||||||||||
| 36,502 | 2,795 | 92,220 | 36,348 | |||||||||||||||
| — | 268 | — | — | |||||||||||||||
|
|
|
|
|
|
|
|
|
|||||||||||
| 36,502 | 2,527 | 92,220 | 36,348 | |||||||||||||||
|
|
|
|
|
|
|
|
|
|||||||||||
| — | — | — | — | |||||||||||||||
| 14,855 | 237 | (669,559 | ) | 1,048,506 | ||||||||||||||
|
|
|
|
|
|
|
|
|
|||||||||||
| 14,855 | 237 | (669,559 | ) | 1,048,506 | ||||||||||||||
| 183,219 | 17,478 | 893,118 | (1,826,852 | ) | ||||||||||||||
|
|
|
|
|
|
|
|
|
|||||||||||
| 234,576 | 20,242 | 315,779 | (741,998 | ) | ||||||||||||||
|
|
|
|
|
|
|
|
|
|||||||||||
| 488,562 | 97 | 70,762 | 68,373 | |||||||||||||||
| (6,464 | ) | (2,906 | ) | (62,376 | ) | (173,675 | ) | |||||||||||
| — | — | (10,044 | ) | (1,138 | ) | |||||||||||||
| 4,528,141 | 427,203 | (4,282,547 | ) | (123,003 | ) | |||||||||||||
|
|
|
|
|
|
|
|
|
|||||||||||
| 5,010,239 | 424,394 | (4,284,205 | ) | (229,443 | ) | |||||||||||||
|
|
|
|
|
|
|
|
|
|||||||||||
| 5,244,815 | 444,636 | (3,968,426 | ) | (971,441 | ) | |||||||||||||
| — | — | 3,968,426 | 4,939,867 | |||||||||||||||
|
|
|
|
|
|
|
|
|
|||||||||||
| $ | 5,244,815 | $ | 444,636 | — | $ | 3,968,426 | ||||||||||||
|
|
|
|
|
|
|
|
|
|||||||||||
41
Table of Contents
John Hancock Life Insurance Company (U.S.A.) Separate Account N
Statements of Operations and Changes in Contract Owners’ Equity
(continued)
| Sub-Account | ||||||||||||||||
| International Opportunities Trust Series 1 | International Small Company Trust Series 0 | |||||||||||||||
| Year Ended Dec. 31/12 (w) |
Year Ended Dec. 31/11 |
Year Ended Dec. 31/12 |
Year Ended Dec. 31/11 |
|||||||||||||
| Income: |
||||||||||||||||
| Dividend income distribution |
$ | 6,453 | $ | 3,133 | $ | 9,256 | $ | 11,768 | ||||||||
|
|
|
|
|
|
|
|
|
|||||||||
| Total Investment Income |
6,453 | 3,133 | 9,256 | 11,768 | ||||||||||||
| Expenses: |
||||||||||||||||
| Mortality and expense risk |
1,492 | 3,268 | — | — | ||||||||||||
|
|
|
|
|
|
|
|
|
|||||||||
| Net investment income (loss) |
4,961 | (135 | ) | 9,256 | 11,768 | |||||||||||
|
|
|
|
|
|
|
|
|
|||||||||
| Realized gains (losses) on investments: |
||||||||||||||||
| Capital gain distributions |
— | — | — | — | ||||||||||||
| Net realized gains (losses) |
(38,732 | ) | 49,574 | 18,111 | 14,997 | |||||||||||
|
|
|
|
|
|
|
|
|
|||||||||
| Realized gains (losses) |
(38,732 | ) | 49,574 | 18,111 | 14,997 | |||||||||||
| Unrealized appreciation (depreciation) during the period |
89,481 | (204,757 | ) | 91,820 | (130,278 | ) | ||||||||||
|
|
|
|
|
|
|
|
|
|||||||||
| Net increase (decrease) in assets from operations |
55,710 | (155,318 | ) | 119,187 | (103,513 | ) | ||||||||||
|
|
|
|
|
|
|
|
|
|||||||||
| Changes from principal transactions: |
||||||||||||||||
| Transfer of net premiums |
2,334 | 34,518 | 78,369 | 114,981 | ||||||||||||
| Transfer on terminations |
(20,913 | ) | (27,989 | ) | (41,242 | ) | (42,499 | ) | ||||||||
| Transfer on policy loans |
— | — | 4,821 | 1,135 | ||||||||||||
| Net interfund transfers |
(715,627 | ) | 307,561 | 62,129 | 29,676 | |||||||||||
|
|
|
|
|
|
|
|
|
|||||||||
| Net increase (decrease) in assets from principal transactions |
(734,206 | ) | 314,090 | 104,077 | 103,293 | |||||||||||
|
|
|
|
|
|
|
|
|
|||||||||
| Total increase (decrease) in assets |
(678,496 | ) | 158,772 | 223,264 | (220 | ) | ||||||||||
| Assets, beginning of period |
678,496 | 519,724 | 614,184 | 614,404 | ||||||||||||
|
|
|
|
|
|
|
|
|
|||||||||
| Assets, end of period |
— | $ | 678,496 | $ | 837,448 | $ | 614,184 | |||||||||
|
|
|
|
|
|
|
|
|
|||||||||
| (w) | Terminated as an investment option and funds transferred to International Growth Stock Trust on November 5, 2012. |
See accompanying notes.
42
Table of Contents
| Sub-Account | ||||||||||||||||||||||
| International Small Company Trust Series 1 | International Value Trust Series 0 | International Value Trust Series 1 | ||||||||||||||||||||
| Year Ended Dec. 31/12 |
Year Ended Dec. 31/11 |
Year Ended Dec. 31/12 |
Year Ended Dec. 31/11 |
Year Ended Dec. 31/12 |
Year Ended Dec. 31/11 |
|||||||||||||||||
| $ | 16,551 | $ | 37,107 | $ | 117,318 | $ | 109,877 | $ | 135,246 | $ | 163,419 | |||||||||||
|
|
|
|
|
|
|
|
|
|
|
|
|
|||||||||||
| 16,551 | 37,107 | 117,318 | 109,877 | 135,246 | 163,419 | |||||||||||||||||
| 7,156 | 10,503 | — | — | 20,056 | 28,780 | |||||||||||||||||
|
|
|
|
|
|
|
|
|
|
|
|
|
|||||||||||
| 9,395 | 26,604 | 117,318 | 109,877 | 115,190 | 134,639 | |||||||||||||||||
|
|
|
|
|
|
|
|
|
|
|
|
|
|||||||||||
| — | — | — | — | — | — | |||||||||||||||||
| 18,003 | 260,979 | (633,920 | ) | 442,550 | (50,375 | ) | 498,524 | |||||||||||||||
|
|
|
|
|
|
|
|
|
|
|
|
|
|||||||||||
| 18,003 | 260,979 | (633,920 | ) | 442,550 | (50,375 | ) | 498,524 | |||||||||||||||
| 242,164 | (603,039 | ) | 1,255,781 | (1,235,805 | ) | 879,202 | (1,421,892 | ) | ||||||||||||||
|
|
|
|
|
|
|
|
|
|
|
|
|
|||||||||||
| 269,562 | (315,456 | ) | 739,179 | (683,378 | ) | 944,017 | (788,729 | ) | ||||||||||||||
|
|
|
|
|
|
|
|
|
|
|
|
|
|||||||||||
| 70,172 | 124,154 | 186,486 | 489,362 | 108,542 | 132,035 | |||||||||||||||||
| (452,158 | ) | (216,481 | ) | (148,664 | ) | (129,815 | ) | (1,030,428 | ) | (2,593,005 | ) | |||||||||||
| 1,557 | 978 | (1,192 | ) | (1,791 | ) | 2,938 | (1,006 | ) | ||||||||||||||
| (895,042 | ) | (372,681 | ) | 90,814 | (60,866 | ) | (1,098,783 | ) | (255,918 | ) | ||||||||||||
|
|
|
|
|
|
|
|
|
|
|
|
|
|||||||||||
| (1,275,471 | ) | (464,030 | ) | 127,444 | 296,890 | (2,017,731 | ) | (2,717,894 | ) | |||||||||||||
|
|
|
|
|
|
|
|
|
|
|
|
|
|||||||||||
| (1,005,909 | ) | (779,486 | ) | 866,623 | (386,488 | ) | (1,073,714 | ) | (3,506,623 | ) | ||||||||||||
| 2,030,811 | 2,810,297 | 3,750,331 | 4,136,819 | 5,799,653 | 9,306,276 | |||||||||||||||||
|
|
|
|
|
|
|
|
|
|
|
|
|
|||||||||||
| $ | 1,024,902 | $ | 2,030,811 | $ | 4,616,954 | $ | 3,750,331 | $ | 4,725,939 | $ | 5,799,653 | |||||||||||
|
|
|
|
|
|
|
|
|
|
|
|
|
|||||||||||
43
Table of Contents
John Hancock Life Insurance Company (U.S.A.) Separate Account N
Statements of Operations and Changes in Contract Owners’ Equity
(continued)
| Sub-Account | ||||||||||||||||
| Investment Quality Bond Trust Series 0 | Investment Quality Bond Trust Series 1 | |||||||||||||||
| Year Ended Dec. 31/12 |
Year Ended Dec. 31/11 |
Year Ended Dec. 31/12 |
Year Ended Dec. 31/11 |
|||||||||||||
| Income: |
||||||||||||||||
| Dividend income distribution |
$ | 13,466 | $ | 21,248 | $ | 104,616 | $ | 256,333 | ||||||||
|
|
|
|
|
|
|
|
|
|||||||||
| Total Investment Income |
13,466 | 21,248 | 104,616 | 256,333 | ||||||||||||
| Expenses: |
||||||||||||||||
| Mortality and expense risk |
— | — | 28,447 | 32,372 | ||||||||||||
|
|
|
|
|
|
|
|
|
|||||||||
| Net investment income (loss) |
13,466 | 21,248 | 76,169 | 223,961 | ||||||||||||
|
|
|
|
|
|
|
|
|
|||||||||
| Realized gains (losses) on investments: |
||||||||||||||||
| Capital gain distributions |
— | — | — | — | ||||||||||||
| Net realized gains (losses) |
2,872 | 13,981 | 104,815 | 25,305 | ||||||||||||
|
|
|
|
|
|
|
|
|
|||||||||
| Realized gains (losses) |
2,872 | 13,981 | 104,815 | 25,305 | ||||||||||||
| Unrealized appreciation (depreciation) during the period |
25,790 | 9,968 | 192,060 | 182,248 | ||||||||||||
|
|
|
|
|
|
|
|
|
|||||||||
| Net increase (decrease) in assets from operations |
42,128 | 45,197 | 373,044 | 431,514 | ||||||||||||
|
|
|
|
|
|
|
|
|
|||||||||
| Changes from principal transactions: |
||||||||||||||||
| Transfer of net premiums |
38,611 | 42,427 | 155,720 | 249,548 | ||||||||||||
| Transfer on terminations |
(21,582 | ) | (220,501 | ) | (1,435,724 | ) | (729,366 | ) | ||||||||
| Transfer on policy loans |
(818 | ) | (5,717 | ) | 11,170 | 57,681 | ||||||||||
| Net interfund transfers |
78,015 | 4,259 | (1,109,654 | ) | 1,061,506 | |||||||||||
|
|
|
|
|
|
|
|
|
|||||||||
| Net increase (decrease) in assets from principal transactions |
94,226 | (179,532 | ) | (2,378,488 | ) | 639,369 | ||||||||||
|
|
|
|
|
|
|
|
|
|||||||||
| Total increase (decrease) in assets |
136,354 | (134,335 | ) | (2,005,444 | ) | 1,070,883 | ||||||||||
| Assets, beginning of period |
507,256 | 641,591 | 6,241,633 | 5,170,750 | ||||||||||||
|
|
|
|
|
|
|
|
|
|||||||||
| Assets, end of period |
$ | 643,610 | $ | 507,256 | $ | 4,236,189 | $ | 6,241,633 | ||||||||
|
|
|
|
|
|
|
|
|
|||||||||
| (g) | Fund available in prior year but no activity. |
| (p) | Terminated as an investment option and funds transferred to U.S. Equity Trust on April 30, 2012. |
See accompanying notes.
44
Table of Contents
| Sub-Account | ||||||||||||||||||||
| Large Cap Growth Trust | Large Cap Trust Series 0 | Large Cap Trust Series 1 | ||||||||||||||||||
| Year Ended Dec. 31/12 (g) |
Year Ended Dec. 31/12 (p) |
Year Ended Dec. 31/11 |
Year Ended Dec. 31/12 (p) |
Year Ended Dec. 31/11 |
||||||||||||||||
| $ | 68 | $ | 2,830 | $ | 6,609 | $ | 7,319 | $ | 27,114 | |||||||||||
|
|
|
|
|
|
|
|
|
|
|
|||||||||||
| 68 | 2,830 | 6,609 | 7,319 | 27,114 | ||||||||||||||||
| — | — | — | 2,580 | 9,866 | ||||||||||||||||
|
|
|
|
|
|
|
|
|
|
|
|||||||||||
| 68 | 2,830 | 6,609 | 4,739 | 17,248 | ||||||||||||||||
|
|
|
|
|
|
|
|
|
|
|
|||||||||||
| — | — | — | — | — | ||||||||||||||||
| (17 | ) | 81,845 | (353,610 | ) | 217,776 | (55,309 | ) | |||||||||||||
|
|
|
|
|
|
|
|
|
|
|
|||||||||||
| (17 | ) | 81,845 | (353,610 | ) | 217,776 | (55,309 | ) | |||||||||||||
| 3,907 | (19,598 | ) | (21,230 | ) | 11,164 | 11,216 | ||||||||||||||
|
|
|
|
|
|
|
|
|
|
|
|||||||||||
| 3,958 | 65,077 | (368,231 | ) | 233,679 | (26,845 | ) | ||||||||||||||
|
|
|
|
|
|
|
|
|
|
|
|||||||||||
| — | 4,346 | 412,227 | 10,627 | 82,738 | ||||||||||||||||
| (4,075 | ) | (5,532 | ) | (29,476 | ) | (47,342 | ) | (567,772 | ) | |||||||||||
| — | (324 | ) | (338 | ) | (158,280 | ) | 30,480 | |||||||||||||
| 309,542 | (513,708 | ) | 12,055 | (1,990,606 | ) | 297,434 | ||||||||||||||
|
|
|
|
|
|
|
|
|
|
|
|||||||||||
| 305,467 | (515,218 | ) | 394,468 | (2,185,601 | ) | (157,120 | ) | |||||||||||||
|
|
|
|
|
|
|
|
|
|
|
|||||||||||
| 309,425 | (450,141 | ) | 26,237 | (1,951,922 | ) | (183,965 | ) | |||||||||||||
| — | 450,141 | 423,904 | 1,951,922 | 2,135,887 | ||||||||||||||||
|
|
|
|
|
|
|
|
|
|
|
|||||||||||
| $ | 309,425 | — | $ | 450,141 | — | $ | 1,951,922 | |||||||||||||
|
|
|
|
|
|
|
|
|
|
|
|||||||||||
45
Table of Contents
John Hancock Life Insurance Company (U.S.A.) Separate Account N
Statements of Operations and Changes in Contract Owners’ Equity
(continued)
| Sub-Account | ||||||||||||
| Large Cap Value Trust Series 0 | Large Cap Value Trust Series 1 | |||||||||||
| Year Ended Dec. 31/11 (h) |
Year Ended Dec. 31/11 (h) |
|||||||||||
| Income: |
||||||||||||
| Dividend income distribution |
$ | 4,623 | $ | 5,769 | ||||||||
|
|
|
|
|
|||||||||
| Total Investment Income |
4,623 | 5,769 | ||||||||||
| Expenses: |
||||||||||||
| Mortality and expense risk |
— | 1,945 | ||||||||||
|
|
|
|
|
|||||||||
| Net investment income (loss) |
4,623 | 3,824 | ||||||||||
|
|
|
|
|
|||||||||
| Realized gains (losses) on investments: |
||||||||||||
| Capital gain distributions |
— | — | ||||||||||
| Net realized gains (losses) |
107,242 | 292,554 | ||||||||||
|
|
|
|
|
|||||||||
| Realized gains (losses) |
107,242 | 292,554 | ||||||||||
| Unrealized appreciation (depreciation) during the period |
(42,934 | ) | (214,956 | ) | ||||||||
|
|
|
|
|
|||||||||
| Net increase (decrease) in assets from operations |
68,931 | 81,422 | ||||||||||
| Changes from principal transactions: |
||||||||||||
|
|
|
|
|
|||||||||
| Transfer of net premiums |
47,024 | 15,331 | ||||||||||
| Transfer on terminations |
(16,801 | ) | (51,308 | ) | ||||||||
| Transfer on policy loans |
(337 | ) | 934 | |||||||||
| Net interfund transfers |
(965,009 | ) | (1,151,218 | ) | ||||||||
|
|
|
|
|
|||||||||
| Net increase (decrease) in assets from principal transactions |
(935,123 | ) | (1,186,261 | ) | ||||||||
|
|
|
|
|
|||||||||
| Total increase (decrease) in assets |
(866,192 | ) | (1,104,839 | ) | ||||||||
| Assets, beginning of period |
866,192 | 1,104,839 | ||||||||||
|
|
|
|
|
|||||||||
| Assets, end of period |
— | — | ||||||||||
|
|
|
|
|
|||||||||
| (h) | Terminated as an investment option and funds transferred to Equity-Income Trust on May 2, 2011. |
See accompanying notes.
46
Table of Contents
| Sub-Account | ||||||||||||||||||||||
| Lifestyle Aggressive Trust Series 0 | Lifestyle Aggressive Trust Series 1 | Lifestyle Balanced Trust Series 0 | ||||||||||||||||||||
| Year Ended Dec. 31/12 |
Year Ended Dec. 31/11 |
Year Ended Dec. 31/12 |
Year Ended Dec. 31/11 |
Year Ended Dec. 31/12 |
Year Ended Dec. 31/11 |
|||||||||||||||||
| $ | 81,493 | $ | 142,100 | $ | 29,646 | $ | 81,896 | $ | 385,384 | $ | 618,841 | |||||||||||
|
|
|
|
|
|
|
|
|
|
|
|
|
|||||||||||
| 81,493 | 142,100 | 29,646 | 81,896 | 385,384 | 618,841 | |||||||||||||||||
| — | — | 10,122 | 28,224 | — | — | |||||||||||||||||
|
|
|
|
|
|
|
|
|
|
|
|
|
|||||||||||
| 81,493 | 142,100 | 19,524 | 53,672 | 385,384 | 618,841 | |||||||||||||||||
|
|
|
|
|
|
|
|
|
|
|
|
|
|||||||||||
| — | — | — | — | — | — | |||||||||||||||||
| 485,194 | 425,844 | 123,547 | 557,640 | 547,421 | 482,358 | |||||||||||||||||
|
|
|
|
|
|
|
|
|
|
|
|
|
|||||||||||
| 485,194 | 425,844 | 123,547 | 557,640 | 547,421 | 482,358 | |||||||||||||||||
| 335,175 | (1,084,072 | ) | 169,130 | (958,076 | ) | 841,932 | (1,059,344 | ) | ||||||||||||||
|
|
|
|
|
|
|
|
|
|
|
|
|
|||||||||||
| 901,862 | (516,128 | ) | 312,201 | (346,764 | ) | 1,774,737 | 41,855 | |||||||||||||||
|
|
|
|
|
|
|
|
|
|
|
|
|
|||||||||||
| 1,153,332 | 1,076,748 | 75,957 | 362,816 | 3,119,273 | 4,718,186 | |||||||||||||||||
| (334,924 | ) | (464,998 | ) | (102,510 | ) | (164,707 | ) | (1,290,743 | ) | (901,158 | ) | |||||||||||
| (661,359 | ) | 110,675 | (33,133 | ) | — | (1,668,554 | ) | 23,609 | ||||||||||||||
| (2,639,915 | ) | 285,717 | (2,418,117 | ) | (103,314 | ) | (2,797,778 | ) | 2,691,918 | |||||||||||||
|
|
|
|
|
|
|
|
|
|
|
|
|
|||||||||||
| (2,482,866 | ) | 1,008,142 | (2,477,803 | ) | 94,795 | (2,637,802 | ) | 6,532,555 | ||||||||||||||
|
|
|
|
|
|
|
|
|
|
|
|
|
|||||||||||
| (1,581,004 | ) | 492,014 | (2,165,602 | ) | (251,969 | ) | (863,065 | ) | 6,574,410 | |||||||||||||
| 7,377,597 | 6,885,583 | 4,344,785 | 4,596,754 | 17,964,747 | 11,390,337 | |||||||||||||||||
|
|
|
|
|
|
|
|
|
|
|
|
|
|||||||||||
| $ | 5,796,593 | $ | 7,377,597 | $ | 2,179,183 | $ | 4,344,785 | $ | 17,101,682 | $ | 17,964,747 | |||||||||||
|
|
|
|
|
|
|
|
|
|
|
|
|
|||||||||||
47
Table of Contents
John Hancock Life Insurance Company (U.S.A.) Separate Account N
Statements of Operations and Changes in Contract Owners’ Equity
(continued)
| Sub-Account | ||||||||||||||||
| Lifestyle Balanced Trust Series 1 | Lifestyle Conservative Trust Series 0 | |||||||||||||||
| Year Ended Dec. 31/12 |
Year Ended Dec. 31/11 |
Year Ended Dec. 31/12 |
Year Ended Dec. 31/11 |
|||||||||||||
| Income: |
||||||||||||||||
| Dividend income distribution |
$ | 192,503 | $ | 440,155 | $ | 223,297 | $ | 206,775 | ||||||||
|
|
|
|
|
|
|
|
|
|||||||||
| Total Investment Income |
192,503 | 440,155 | 223,297 | 206,775 | ||||||||||||
| Expenses: |
||||||||||||||||
| Mortality and expense risk |
46,330 | 70,825 | — | — | ||||||||||||
|
|
|
|
|
|
|
|
|
|||||||||
| Net investment income (loss) |
146,173 | 369,330 | 223,297 | 206,775 | ||||||||||||
|
|
|
|
|
|
|
|
|
|||||||||
| Realized gains (losses) on investments: |
||||||||||||||||
| Capital gain distributions |
— | — | 144,250 | — | ||||||||||||
| Net realized gains (losses) |
388,837 | 566,173 | 71,780 | 75,131 | ||||||||||||
|
|
|
|
|
|
|
|
|
|||||||||
| Realized gains (losses) |
388,837 | 566,173 | 216,030 | 75,131 | ||||||||||||
| Unrealized appreciation (depreciation) during the period |
462,475 | (960,209 | ) | 57,431 | (121,182 | ) | ||||||||||
|
|
|
|
|
|
|
|
|
|||||||||
| Net increase (decrease) in assets from operations |
997,485 | (24,706 | ) | 496,758 | 160,724 | |||||||||||
|
|
|
|
|
|
|
|
|
|||||||||
| Changes from principal transactions: |
||||||||||||||||
| Transfer of net premiums |
293,280 | 1,657,591 | 1,220,876 | 1,195,149 | ||||||||||||
| Transfer on terminations |
(1,504,614 | ) | (748,736 | ) | (324,620 | ) | (261,178 | ) | ||||||||
| Transfer on policy loans |
(20,752 | ) | (12,598 | ) | (185,513 | ) | 38,914 | |||||||||
| Net interfund transfers |
(3,997,297 | ) | 334,995 | 1,606,196 | 592,287 | |||||||||||
|
|
|
|
|
|
|
|
|
|||||||||
| Net increase (decrease) in assets from principal transactions |
(5,229,383 | ) | 1,231,252 | 2,316,939 | 1,565,172 | |||||||||||
|
|
|
|
|
|
|
|
|
|||||||||
| Total increase (decrease) in assets |
(4,231,898 | ) | 1,206,546 | 2,813,697 | 1,725,896 | |||||||||||
| Assets, beginning of period |
12,908,333 | 11,701,787 | 4,994,046 | 3,268,150 | ||||||||||||
|
|
|
|
|
|
|
|
|
|||||||||
| Assets, end of period |
$ | 8,676,435 | $ | 12,908,333 | $ | 7,807,743 | $ | 4,994,046 | ||||||||
|
|
|
|
|
|
|
|
|
|||||||||
See accompanying notes.
48
Table of Contents
| Sub-Account | ||||||||||||||||||||||
| Lifestyle Conservative Trust Series 1 | Lifestyle Growth Trust Series 0 | Lifestyle Growth Trust Series 1 | ||||||||||||||||||||
| Year Ended Dec. 31/12 |
Year Ended Dec. 31/11 |
Year Ended Dec. 31/12 |
Year Ended Dec. 31/11 |
Year Ended Dec. 31/12 |
Year Ended Dec. 31/11 |
|||||||||||||||||
| $ | 182,230 | $ | 131,641 | $ | 379,723 | $ | 549,279 | $ | 87,821 | $ | 248,018 | |||||||||||
|
|
|
|
|
|
|
|
|
|
|
|
|
|||||||||||
| 182,230 | 131,641 | 379,723 | 549,279 | 87,821 | 248,018 | |||||||||||||||||
| 23,264 | 13,820 | — | — | 26,673 | 46,623 | |||||||||||||||||
|
|
|
|
|
|
|
|
|
|
|
|
|
|||||||||||
| 158,966 | 117,821 | 379,723 | 549,279 | 61,148 | 201,395 | |||||||||||||||||
|
|
|
|
|
|
|
|
|
|
|
|
|
|||||||||||
| 149,630 | — | — | — | — | — | |||||||||||||||||
| 13,793 | 187,704 | 954,641 | 477,219 | 554,579 | 403,541 | |||||||||||||||||
|
|
|
|
|
|
|
|
|
|
|
|
|
|||||||||||
| 163,423 | 187,704 | 954,641 | 477,219 | 554,579 | 403,541 | |||||||||||||||||
| 33,773 | (209,508 | ) | 1,102,143 | (1,458,157 | ) | 120,557 | (752,758 | ) | ||||||||||||||
|
|
|
|
|
|
|
|
|
|
|
|
|
|||||||||||
| 356,162 | 96,017 | 2,436,507 | (431,659 | ) | 736,284 | (147,822 | ) | |||||||||||||||
|
|
|
|
|
|
|
|
|
|
|
|
|
|||||||||||
| 225,792 | 220,262 | 3,845,491 | 3,737,859 | 185,448 | 368,334 | |||||||||||||||||
| (317,582 | ) | (269,431 | ) | (1,342,031 | ) | (1,209,132 | ) | (610,878 | ) | (629,181 | ) | |||||||||||
| 474 | 554 | (1,021,067 | ) | 129,991 | (60,104 | ) | (26,766 | ) | ||||||||||||||
| 3,009,259 | 793,679 | (2,499,198 | ) | 2,510,778 | (4,141,005 | ) | 798,112 | |||||||||||||||
|
|
|
|
|
|
|
|
|
|
|
|
|
|||||||||||
| 2,917,943 | 745,064 | (1,016,805 | ) | 5,169,496 | (4,626,539 | ) | 510,499 | |||||||||||||||
|
|
|
|
|
|
|
|
|
|
|
|
|
|||||||||||
| 3,274,105 | 841,081 | 1,419,702 | 4,737,837 | (3,890,255 | ) | 362,677 | ||||||||||||||||
| 3,191,375 | 2,350,294 | 19,198,025 | 14,460,188 | 8,774,074 | 8,411,397 | |||||||||||||||||
|
|
|
|
|
|
|
|
|
|
|
|
|
|||||||||||
| $ | 6,465,480 | $ | 3,191,375 | $ | 20,617,727 | $ | 19,198,025 | $ | 4,883,819 | $ | 8,774,074 | |||||||||||
|
|
|
|
|
|
|
|
|
|
|
|
|
|||||||||||
49
Table of Contents
John Hancock Life Insurance Company (U.S.A.) Separate Account N
Statements of Operations and Changes in Contract Owners’ Equity
(continued)
| Sub-Account | ||||||||||||||||
| Lifestyle Moderate Trust Series 0 | Lifestyle Moderate Trust Series 1 | |||||||||||||||
| Year Ended Dec. 31/12 |
Year Ended Dec. 31/11 |
Year Ended Dec. 31/12 |
Year Ended Dec. 31/11 |
|||||||||||||
| Income: |
||||||||||||||||
| Dividend income distribution |
$ | 218,659 | $ | 246,494 | $ | 56,039 | $ | 95,647 | ||||||||
|
|
|
|
|
|
|
|
|
|||||||||
| Total Investment Income |
218,659 | 246,494 | 56,039 | 95,647 | ||||||||||||
| Expenses: |
||||||||||||||||
| Mortality and expense risk |
— | — | 11,833 | 16,953 | ||||||||||||
|
|
|
|
|
|
|
|
|
|||||||||
| Net investment income (loss) |
218,659 | 246,494 | 44,206 | 78,694 | ||||||||||||
|
|
|
|
|
|
|
|
|
|||||||||
| Realized gains (losses) on investments: |
||||||||||||||||
| Capital gain distributions |
— | — | — | — | ||||||||||||
| Net realized gains (losses) |
289,447 | 133,053 | 6,932 | 184,058 | ||||||||||||
|
|
|
|
|
|
|
|
|
|||||||||
| Realized gains (losses) |
289,447 | 133,053 | 6,932 | 184,058 | ||||||||||||
| Unrealized appreciation (depreciation) during the period |
231,427 | (258,512 | ) | 167,084 | (217,280 | ) | ||||||||||
|
|
|
|
|
|
|
|
|
|||||||||
| Net increase (decrease) in assets from operations |
739,533 | 121,035 | 218,222 | 45,472 | ||||||||||||
|
|
|
|
|
|
|
|
|
|||||||||
| Changes from principal transactions: |
||||||||||||||||
| Transfer of net premiums |
1,662,291 | 2,039,285 | 52,162 | 536,431 | ||||||||||||
| Transfer on terminations |
(344,817 | ) | (391,709 | ) | (315,856 | ) | (1,306,985 | ) | ||||||||
| Transfer on policy loans |
(4,220 | ) | 17,636 | 709 | (2,565 | ) | ||||||||||
| Net interfund transfers |
(4,288 | ) | 274,027 | (293,207 | ) | 376,261 | ||||||||||
|
|
|
|
|
|
|
|
|
|||||||||
| Net increase (decrease) in assets from principal transactions |
1,308,966 | 1,939,239 | (556,192 | ) | (396,858 | ) | ||||||||||
|
|
|
|
|
|
|
|
|
|||||||||
| Total increase (decrease) in assets |
2,048,499 | 2,060,274 | (337,970 | ) | (351,386 | ) | ||||||||||
| Assets, beginning of period |
6,680,056 | 4,619,782 | 2,616,349 | 2,967,735 | ||||||||||||
|
|
|
|
|
|
|
|
|
|||||||||
| Assets, end of period |
$ | 8,728,555 | $ | 6,680,056 | $ | 2,278,379 | $ | 2,616,349 | ||||||||
|
|
|
|
|
|
|
|
|
|||||||||
See accompanying notes.
50
Table of Contents
| Sub-Account | ||||||||||||||||||||||
| Mid Cap Index Trust Series 0 | Mid Cap Index Trust Series 1 | Mid Cap Stock Trust Series 0 | ||||||||||||||||||||
| Year Ended Dec. 31/12 |
Year Ended Dec. 31/11 |
Year Ended Dec. 31/12 |
Year Ended Dec. 31/11 |
Year Ended Dec. 31/12 |
Year Ended Dec. 31/11 |
|||||||||||||||||
| $ | 97,462 | $ | 38,121 | $ | 80,941 | $ | 66,886 | — | — | |||||||||||||
|
|
|
|
|
|
|
|
|
|
|
|
|
|||||||||||
| 97,462 | 38,121 | 80,941 | 66,886 | — | — | |||||||||||||||||
| — | — | 28,173 | 44,755 | — | — | |||||||||||||||||
|
|
|
|
|
|
|
|
|
|
|
|
|
|||||||||||
| 97,462 | 38,121 | 52,768 | 22,131 | — | — | |||||||||||||||||
|
|
|
|
|
|
|
|
|
|
|
|
|
|||||||||||
| 616,979 | 128,464 | 552,441 | 316,342 | — | — | |||||||||||||||||
| 188,894 | 558,949 | 1,086,871 | 696,448 | 841,475 | 475,526 | |||||||||||||||||
|
|
|
|
|
|
|
|
|
|
|
|
|
|||||||||||
| 805,873 | 687,413 | 1,639,312 | 1,012,790 | 841,475 | 475,526 | |||||||||||||||||
| 69,046 | (831,773 | ) | (316,692 | ) | (1,471,784 | ) | 257,748 | (1,029,297 | ) | |||||||||||||
|
|
|
|
|
|
|
|
|
|
|
|
|
|||||||||||
| 972,381 | (106,239 | ) | 1,375,388 | (436,863 | ) | 1,099,223 | (553,771 | ) | ||||||||||||||
|
|
|
|
|
|
|
|
|
|
|
|
|
|||||||||||
| 1,124,175 | 1,282,852 | 121,055 | 157,780 | 529,734 | 161,448 | |||||||||||||||||
| (410,281 | ) | (322,340 | ) | (739,450 | ) | (473,974 | ) | (186,857 | ) | (224,629 | ) | |||||||||||
| (404,107 | ) | 66,969 | 13 | (290 | ) | (16,217 | ) | (50,072 | ) | |||||||||||||
| 491,053 | 357,149 | (4,425,568 | ) | (2,458,703 | ) | (307,057 | ) | 1,132,169 | ||||||||||||||
|
|
|
|
|
|
|
|
|
|
|
|
|
|||||||||||
| 800,840 | 1,384,630 | (5,043,950 | ) | (2,775,187 | ) | 19,603 | 1,018,916 | |||||||||||||||
|
|
|
|
|
|
|
|
|
|
|
|
|
|||||||||||
| 1,773,221 | 1,278,391 | (3,668,562 | ) | (3,212,050 | ) | 1,118,826 | 465,145 | |||||||||||||||
| 5,050,757 | 3,772,366 | 8,990,208 | 12,202,258 | 4,908,055 | 4,442,910 | |||||||||||||||||
|
|
|
|
|
|
|
|
|
|
|
|
|
|||||||||||
| $ | 6,823,978 | $ | 5,050,757 | $ | 5,321,646 | $ | 8,990,208 | $ | 6,026,881 | $ | 4,908,055 | |||||||||||
|
|
|
|
|
|
|
|
|
|
|
|
|
|||||||||||
51
Table of Contents
John Hancock Life Insurance Company (U.S.A.) Separate Account N
Statements of Operations and Changes in Contract Owners’ Equity
(continued)
| Sub-Account | ||||||||||||||||
| Mid Cap Stock Trust Series 1 | Mid Value Trust Series 0 | |||||||||||||||
| Year Ended Dec. 31/12 |
Year Ended Dec. 31/11 |
Year Ended Dec. 31/12 |
Year Ended Dec. 31/11 |
|||||||||||||
| Income: |
||||||||||||||||
| Dividend income distribution |
— | — | $ | 67,209 | $ | 53,288 | ||||||||||
|
|
|
|
|
|
|
|
|
|||||||||
| Total Investment Income |
— | — | 67,209 | 53,288 | ||||||||||||
| Expenses: |
||||||||||||||||
| Mortality and expense risk |
14,703 | 22,276 | — | — | ||||||||||||
|
|
|
|
|
|
|
|
|
|||||||||
| Net investment income (loss) |
(14,703 | ) | (22,276 | ) | 67,209 | 53,288 | ||||||||||
|
|
|
|
|
|
|
|
|
|||||||||
| Realized gains (losses) on investments: |
||||||||||||||||
| Capital gain distributions |
— | — | 569,783 | — | ||||||||||||
| Net realized gains (losses) |
532,777 | 762,390 | 626,692 | 643,404 | ||||||||||||
|
|
|
|
|
|
|
|
|
|||||||||
| Realized gains (losses) |
532,777 | 762,390 | 1,196,475 | 643,404 | ||||||||||||
| Unrealized appreciation (depreciation) during the period |
296,451 | (1,133,978 | ) | (8,322 | ) | (1,107,644 | ) | |||||||||
|
|
|
|
|
|
|
|
|
|||||||||
| Net increase (decrease) in assets from operations |
814,525 | (393,864 | ) | 1,255,362 | (410,952 | ) | ||||||||||
|
|
|
|
|
|
|
|
|
|||||||||
| Changes from principal transactions: |
||||||||||||||||
| Transfer of net premiums |
27,359 | 107,199 | 116,440 | 501,312 | ||||||||||||
| Transfer on terminations |
(1,414,981 | ) | (1,378,649 | ) | (154,300 | ) | (199,360 | ) | ||||||||
| Transfer on policy loans |
(81 | ) | (393 | ) | (7,723 | ) | (1,847 | ) | ||||||||
| Net interfund transfers |
(1,363,601 | ) | (131,291 | ) | 106,704 | (87,112 | ) | |||||||||
|
|
|
|
|
|
|
|
|
|||||||||
| Net increase (decrease) in assets from principal transactions |
(2,751,304 | ) | (1,403,134 | ) | 61,121 | 212,993 | ||||||||||
|
|
|
|
|
|
|
|
|
|||||||||
| Total increase (decrease) in assets |
(1,936,779 | ) | (1,796,998 | ) | 1,316,483 | (197,959 | ) | |||||||||
| Assets, beginning of period |
4,451,505 | 6,248,503 | 6,074,396 | 6,272,355 | ||||||||||||
|
|
|
|
|
|
|
|
|
|||||||||
| Assets, end of period |
$ | 2,514,726 | $ | 4,451,505 | $ | 7,390,879 | $ | 6,074,396 | ||||||||
|
|
|
|
|
|
|
|
|
|||||||||
See accompanying notes.
52
Table of Contents
| Sub-Account | ||||||||||||||||||||||
| Mid Value Trust Series 1 | Money Market Trust B Series 0 | Money Market Trust Series 1 | ||||||||||||||||||||
| Year Ended Dec. 31/12 |
Year Ended Dec. 31/11 |
Year Ended Dec. 31/12 |
Year Ended Dec. 31/11 |
Year Ended Dec. 31/12 |
Year Ended Dec. 31/11 |
|||||||||||||||||
| $ | 31,335 | $ | 30,591 | $ | 20,248 | — | — | — | ||||||||||||||
|
|
|
|
|
|
|
|
|
|
|
|
|
|||||||||||
| 31,335 | 30,591 | 20,248 | — | — | — | |||||||||||||||||
| 15,123 | 17,860 | — | — | 277,716 | 105,261 | |||||||||||||||||
|
|
|
|
|
|
|
|
|
|
|
|
|
|||||||||||
| 16,212 | 12,731 | 20,248 | — | (277,716 | ) | (105,261 | ) | |||||||||||||||
|
|
|
|
|
|
|
|
|
|
|
|
|
|||||||||||
| 286,004 | — | 3,511 | 34,393 | 6,492 | 18,732 | |||||||||||||||||
| 284,642 | 587,344 | — | — | — | — | |||||||||||||||||
|
|
|
|
|
|
|
|
|
|
|
|
|
|||||||||||
| 570,646 | 587,344 | 3,511 | 34,393 | 6,492 | 18,732 | |||||||||||||||||
| 95,952 | (788,213 | ) | — | — | — | — | ||||||||||||||||
|
|
|
|
|
|
|
|
|
|
|
|
|
|||||||||||
| 682,810 | (188,138 | ) | 23,759 | 34,393 | (271,224 | ) | (86,529 | ) | ||||||||||||||
|
|
|
|
|
|
|
|
|
|
|
|
|
|||||||||||
| 97,448 | 154,595 | 37,335,546 | 28,096,396 | 2,571,938 | 1,872,597 | |||||||||||||||||
| (387,826 | ) | (1,233,562 | ) | (13,682,629 | ) | (4,094,644 | ) | (7,462,416 | ) | (2,612,820 | ) | |||||||||||
| 4,086 | 3,151 | (1,858,913 | ) | (37,229 | ) | 14,326 | (10,740 | ) | ||||||||||||||
| (466,445 | ) | 35,312 | (13,019,020 | ) | (11,173,707 | ) | 59,917,269 | 6,930,639 | ||||||||||||||
|
|
|
|
|
|
|
|
|
|
|
|
|
|||||||||||
| (752,737 | ) | (1,040,504 | ) | 8,774,984 | 12,790,816 | 55,041,117 | 6,179,676 | |||||||||||||||
|
|
|
|
|
|
|
|
|
|
|
|
|
|||||||||||
| (69,927 | ) | (1,228,642 | ) | 8,798,743 | 12,825,209 | 54,769,893 | 6,093,147 | |||||||||||||||
| 3,937,343 | 5,165,985 | 50,355,097 | 37,529,888 | 27,374,747 | 21,281,600 | |||||||||||||||||
|
|
|
|
|
|
|
|
|
|
|
|
|
|||||||||||
| $ | 3,867,416 | $ | 3,937,343 | $ | 59,153,840 | $ | 50,355,097 | $ | 82,144,640 | $ | 27,374,747 | |||||||||||
|
|
|
|
|
|
|
|
|
|
|
|
|
|||||||||||
53
Table of Contents
John Hancock Life Insurance Company (U.S.A.) Separate Account N
Statements of Operations and Changes in Contract Owners’ Equity
(continued)
| Sub-Account | ||||||||||||||||
| Natural Resources Trust Series 0 | Natural Resources Trust Series 1 | |||||||||||||||
| Year Ended Dec. 31/12 |
Year Ended Dec. 31/11 |
Year Ended Dec. 31/12 |
Year Ended Dec. 31/11 |
|||||||||||||
| Income: |
||||||||||||||||
| Dividend income distribution |
$ | 20,130 | $ | 14,088 | $ | 31,690 | $ | 27,842 | ||||||||
|
|
|
|
|
|
|
|
|
|||||||||
| Total Investment Income |
20,130 | 14,088 | 31,690 | 27,842 | ||||||||||||
| Expenses: |
||||||||||||||||
| Mortality and expense risk |
— | — | 20,624 | 30,373 | ||||||||||||
|
|
|
|
|
|
|
|
|
|||||||||
| Net investment income (loss) |
20,130 | 14,088 | 11,066 | (2,531 | ) | |||||||||||
|
|
|
|
|
|
|
|
|
|||||||||
| Realized gains (losses) on investments: |
||||||||||||||||
| Capital gain distributions |
— | — | — | — | ||||||||||||
| Net realized gains (losses) |
(71,051 | ) | 40,534 | (418,842 | ) | 727,379 | ||||||||||
|
|
|
|
|
|
|
|
|
|||||||||
| Realized gains (losses) |
(71,051 | ) | 40,534 | (418,842 | ) | 727,379 | ||||||||||
| Unrealized appreciation (depreciation) during the period |
70,977 | (627,816 | ) | 409,621 | (2,054,299 | ) | ||||||||||
|
|
|
|
|
|
|
|
|
|||||||||
| Net increase (decrease) in assets from operations |
20,056 | (573,194 | ) | 1,845 | (1,329,451 | ) | ||||||||||
|
|
|
|
|
|
|
|
|
|||||||||
| Changes from principal transactions: |
||||||||||||||||
| Transfer of net premiums |
241,279 | 170,618 | 111,810 | 346,607 | ||||||||||||
| Transfer on terminations |
(223,332 | ) | (119,606 | ) | (1,103,571 | ) | (389,007 | ) | ||||||||
| Transfer on policy loans |
(32,638 | ) | (27,288 | ) | 7,743 | 14 | ||||||||||
| Net interfund transfers |
346,474 | 951,981 | (607,734 | ) | (13,276 | ) | ||||||||||
|
|
|
|
|
|
|
|
|
|||||||||
| Net increase (decrease) in assets from principal transactions |
331,783 | 975,705 | (1,591,752 | ) | (55,662 | ) | ||||||||||
|
|
|
|
|
|
|
|
|
|||||||||
| Total increase (decrease) in assets |
351,839 | 402,511 | (1,589,907 | ) | (1,385,113 | ) | ||||||||||
| Assets, beginning of period |
2,194,024 | 1,791,513 | 4,794,393 | 6,179,506 | ||||||||||||
|
|
|
|
|
|
|
|
|
|||||||||
| Assets, end of period |
$ | 2,545,863 | $ | 2,194,024 | $ | 3,204,486 | $ | 4,794,393 | ||||||||
|
|
|
|
|
|
|
|
|
|||||||||
See accompanying notes.
54
Table of Contents
| Sub-Account | ||||||||||||||||||||||
| Real Estate Securities Trust Series 0 | Real Estate Securities Trust Series 1 | Real Return Bond Trust Series 0 | ||||||||||||||||||||
| Year Ended Dec. 31/12 |
Year Ended Dec. 31/11 |
Year Ended Dec. 31/12 |
Year Ended Dec. 31/11 |
Year Ended Dec. 31/12 |
Year Ended Dec. 31/11 |
|||||||||||||||||
| $ | 170,323 | $ | 123,217 | $ | 198,592 | $ | 185,922 | $ | 182,576 | $ | 333,880 | |||||||||||
|
|
|
|
|
|
|
|
|
|
|
|
|
|||||||||||
| 170,323 | 123,217 | 198,592 | 185,922 | 182,576 | 333,880 | |||||||||||||||||
| — | — | 69,450 | 77,462 | — | — | |||||||||||||||||
|
|
|
|
|
|
|
|
|
|
|
|
|
|||||||||||
| 170,323 | 123,217 | 129,142 | 108,460 | 182,576 | 333,880 | |||||||||||||||||
|
|
|
|
|
|
|
|
|
|
|
|
|
|||||||||||
| — | — | — | — | — | — | |||||||||||||||||
| 1,765,820 | 1,218,060 | (36,855 | ) | (581,355 | ) | 613,975 | 148,213 | |||||||||||||||
|
|
|
|
|
|
|
|
|
|
|
|
|
|||||||||||
| 1,765,820 | 1,218,060 | (36,855 | ) | (581,355 | ) | 613,975 | 148,213 | |||||||||||||||
| (531,311 | ) | (641,294 | ) | 1,760,908 | 1,651,615 | (1,251 | ) | 402,264 | ||||||||||||||
|
|
|
|
|
|
|
|
|
|
|
|
|
|||||||||||
| 1,404,832 | 699,983 | 1,853,195 | 1,178,720 | 795,300 | 884,357 | |||||||||||||||||
|
|
|
|
|
|
|
|
|
|
|
|
|
|||||||||||
| 328,829 | 608,545 | 315,144 | 426,410 | 1,233,306 | 1,163,340 | |||||||||||||||||
| (255,792 | ) | (246,463 | ) | (2,597,112 | ) | (2,329,533 | ) | (193,308 | ) | (428,981 | ) | |||||||||||
| (21,039 | ) | 942 | 14,186 | 240,978 | 33,062 | 5,830 | ||||||||||||||||
| 561,937 | (826,882 | ) | (678,835 | ) | (1,083,193 | ) | 600,477 | 310,745 | ||||||||||||||
|
|
|
|
|
|
|
|
|
|
|
|
|
|||||||||||
| 613,935 | (463,858 | ) | (2,946,617 | ) | (2,745,338 | ) | 1,673,537 | 1,050,934 | ||||||||||||||
|
|
|
|
|
|
|
|
|
|
|
|
|
|||||||||||
| 2,018,767 | 236,125 | (1,093,422 | ) | (1,566,618 | ) | 2,468,837 | 1,935,291 | |||||||||||||||
| 7,764,963 | 7,528,838 | 12,390,923 | 13,957,541 | 8,946,266 | 7,010,975 | |||||||||||||||||
|
|
|
|
|
|
|
|
|
|
|
|
|
|||||||||||
| $ | 9,783,730 | $ | 7,764,963 | $ | 11,297,501 | $ | 12,390,923 | $ | 11,415,103 | $ | 8,946,266 | |||||||||||
|
|
|
|
|
|
|
|
|
|
|
|
|
|||||||||||
55
Table of Contents
John Hancock Life Insurance Company (U.S.A.) Separate Account N
Statements of Operations and Changes in Contract Owners’ Equity
(continued)
| Sub-Account | ||||||||||||||||
| Real Return Bond Trust Series 1 | Science & Technology Trust Series 0 | |||||||||||||||
| Year Ended Dec. 31/12 |
Year Ended Dec. 31/11 |
Year Ended Dec. 31/12 |
Year Ended Dec. 31/11 |
|||||||||||||
| Income: |
||||||||||||||||
| Dividend income distribution |
$ | 85,952 | $ | 194,602 | — | — | ||||||||||
|
|
|
|
|
|
|
|
|
|||||||||
| Total Investment Income |
85,952 | 194,602 | — | — | ||||||||||||
| Expenses: |
||||||||||||||||
| Mortality and expense risk |
23,900 | 20,664 | — | — | ||||||||||||
|
|
|
|
|
|
|
|
|
|||||||||
| Net investment income (loss) |
62,052 | 173,938 | — | — | ||||||||||||
|
|
|
|
|
|
|
|
|
|||||||||
| Realized gains (losses) on investments: |
||||||||||||||||
| Capital gain distributions |
— | — | — | — | ||||||||||||
| Net realized gains (losses) |
93,150 | (55,102 | ) | 54,682 | 68,481 | |||||||||||
|
|
|
|
|
|
|
|
|
|||||||||
| Realized gains (losses) |
93,150 | (55,102 | ) | 54,682 | 68,481 | |||||||||||
| Unrealized appreciation (depreciation) during the period |
236,531 | 324,423 | 56,674 | (144,368 | ) | |||||||||||
|
|
|
|
|
|
|
|
|
|||||||||
| Net increase (decrease) in assets from operations |
391,733 | 443,259 | 111,356 | (75,887 | ) | |||||||||||
|
|
|
|
|
|
|
|
|
|||||||||
| Changes from principal transactions: |
||||||||||||||||
| Transfer of net premiums |
56,462 | 69,243 | 201,855 | 254,638 | ||||||||||||
| Transfer on terminations |
(559,225 | ) | (252,820 | ) | (58,790 | ) | (55,357 | ) | ||||||||
| Transfer on policy loans |
1,270 | 417 | (8,966 | ) | (39,989 | ) | ||||||||||
| Net interfund transfers |
(168,182 | ) | 218,812 | (31,965 | ) | 54,555 | ||||||||||
|
|
|
|
|
|
|
|
|
|||||||||
| Net increase (decrease) in assets from principal transactions |
(669,675 | ) | 35,652 | 102,134 | 213,847 | |||||||||||
|
|
|
|
|
|
|
|
|
|||||||||
| Total increase (decrease) in assets |
(277,942 | ) | 478,911 | 213,490 | 137,960 | |||||||||||
| Assets, beginning of period |
5,369,192 | 4,890,281 | 1,088,755 | 950,795 | ||||||||||||
|
|
|
|
|
|
|
|
|
|||||||||
| Assets, end of period |
$ | 5,091,250 | $ | 5,369,192 | $ | 1,302,245 | $ | 1,088,755 | ||||||||
|
|
|
|
|
|
|
|
|
|||||||||
See accompanying notes.
56
Table of Contents
| Sub-Account | ||||||||||||||||||||||
| Science & Technology Trust Series 1 | Short Term Government Income Trust Series 0 | Short Term Government Income Trust Series 1 | ||||||||||||||||||||
| Year Ended Dec. 31/12 |
Year Ended Dec. 31/11 |
Year Ended Dec. 31/12 |
Year Ended Dec. 31/11 |
Year Ended Dec. 31/12 |
Year Ended Dec. 31/11 |
|||||||||||||||||
| — | — | $ | 37,207 | $ | 22,261 | $ | 35,143 | $ | 61,097 | |||||||||||||
|
|
|
|
|
|
|
|
|
|
|
|
|
|||||||||||
| — | — | 37,207 | 22,261 | 35,143 | 61,097 | |||||||||||||||||
| 28,246 | 33,898 | — | — | 11,868 | 12,812 | |||||||||||||||||
|
|
|
|
|
|
|
|
|
|
|
|
|
|||||||||||
| (28,246 | ) | (33,898 | ) | 37,207 | 22,261 | 23,275 | 48,285 | |||||||||||||||
|
|
|
|
|
|
|
|
|
|
|
|
|
|||||||||||
| — | — | — | 4,474 | — | 6,830 | |||||||||||||||||
| 448,187 | 1,298,477 | 12,295 | (11,473 | ) | (14,978 | ) | 11,428 | |||||||||||||||
|
|
|
|
|
|
|
|
|
|
|
|
|
|||||||||||
| 448,187 | 1,298,477 | 12,295 | (6,999 | ) | (14,978 | ) | 18,258 | |||||||||||||||
| 195,111 | (1,894,038 | ) | (27,054 | ) | 36,046 | 6,972 | (8,921 | ) | ||||||||||||||
|
|
|
|
|
|
|
|
|
|
|
|
|
|||||||||||
| 615,052 | (629,459 | ) | 22,448 | 51,308 | 15,269 | 57,622 | ||||||||||||||||
|
|
|
|
|
|
|
|
|
|
|
|
|
|||||||||||
| 143,835 | 293,967 | 24,966 | 181,292 | 35,280 | 87,435 | |||||||||||||||||
| (1,181,546 | ) | (994,761 | ) | (80,333 | ) | (202,982 | ) | (866,244 | ) | (750,313 | ) | |||||||||||
| (207,984 | ) | 4,417 | (7,506 | ) | (2,380 | ) | 294 | 746 | ||||||||||||||
| (265,332 | ) | 814,076 | 1,701,578 | (1,642,434 | ) | 457,872 | (845,472 | ) | ||||||||||||||
|
|
|
|
|
|
|
|
|
|
|
|
|
|||||||||||
| (1,511,027 | ) | 117,699 | 1,638,705 | (1,666,504 | ) | (372,798 | ) | (1,507,604 | ) | |||||||||||||
|
|
|
|
|
|
|
|
|
|
|
|
|
|||||||||||
| (895,975 | ) | (511,760 | ) | 1,661,153 | (1,615,196 | ) | (357,529 | ) | (1,449,982 | ) | ||||||||||||
| 6,303,220 | 6,814,980 | 747,617 | 2,362,813 | 2,502,884 | 3,952,866 | |||||||||||||||||
|
|
|
|
|
|
|
|
|
|
|
|
|
|||||||||||
| $ | 5,407,245 | $ | 6,303,220 | $ | 2,408,770 | $ | 747,617 | $ | 2,145,355 | $ | 2,502,884 | |||||||||||
|
|
|
|
|
|
|
|
|
|
|
|
|
|||||||||||
57
Table of Contents
John Hancock Life Insurance Company (U.S.A.) Separate Account N
Statements of Operations and Changes in Contract Owners’ Equity
(continued)
| Sub-Account | ||||||||||||||||
| Small Cap Growth Trust Series 0 | Small Cap Growth Trust Series 1 | |||||||||||||||
| Year Ended Dec. 31/12 |
Year Ended Dec. 31/11 |
Year Ended Dec. 31/12 |
Year Ended Dec. 31/11 |
|||||||||||||
| Income: |
||||||||||||||||
| Dividend income distribution |
— | — | — | — | ||||||||||||
|
|
|
|
|
|
|
|
|
|||||||||
| Total Investment Income |
— | — | — | — | ||||||||||||
| Expenses: |
||||||||||||||||
| Mortality and expense risk |
— | — | 6,463 | 5,479 | ||||||||||||
|
|
|
|
|
|
|
|
|
|||||||||
| Net investment income (loss) |
— | — | (6,463 | ) | (5,479 | ) | ||||||||||
|
|
|
|
|
|
|
|
|
|||||||||
| Realized gains (losses) on investments: |
||||||||||||||||
| Capital gain distributions |
675,695 | 120,421 | 158,734 | 18,651 | ||||||||||||
| Net realized gains (losses) |
446,111 | 435,632 | 86,053 | 138,218 | ||||||||||||
|
|
|
|
|
|
|
|
|
|||||||||
| Realized gains (losses) |
1,121,806 | 556,053 | 244,787 | 156,869 | ||||||||||||
| Unrealized appreciation (depreciation) during the period |
(438,127 | ) | (917,348 | ) | (73,691 | ) | (232,179 | ) | ||||||||
|
|
|
|
|
|
|
|
|
|||||||||
| Net increase (decrease) in assets from operations |
683,679 | (361,295 | ) | 164,633 | (80,789 | ) | ||||||||||
|
|
|
|
|
|
|
|
|
|||||||||
| Changes from principal transactions: |
||||||||||||||||
| Transfer of net premiums |
201,039 | 104,100 | 20,478 | 39,714 | ||||||||||||
| Transfer on terminations |
(103,539 | ) | (136,283 | ) | (231,561 | ) | (47,327 | ) | ||||||||
| Transfer on policy loans |
(4,907 | ) | (6,302 | ) | — | — | ||||||||||
| Net interfund transfers |
59,272 | 381,241 | 109,956 | 151,645 | ||||||||||||
|
|
|
|
|
|
|
|
|
|||||||||
| Net increase (decrease) in assets from principal transactions |
151,865 | 342,756 | (101,127 | ) | 144,032 | |||||||||||
|
|
|
|
|
|
|
|
|
|||||||||
| Total increase (decrease) in assets |
835,544 | (18,539 | ) | 63,506 | 63,243 | |||||||||||
| Assets, beginning of period |
4,325,175 | 4,343,714 | 1,057,143 | 993,900 | ||||||||||||
|
|
|
|
|
|
|
|
|
|||||||||
| Assets, end of period |
$ | 5,160,719 | $ | 4,325,175 | $ | 1,120,649 | $ | 1,057,143 | ||||||||
|
|
|
|
|
|
|
|
|
|||||||||
See accompanying notes.
58
Table of Contents
| Sub-Account | ||||||||||||||||||||||
| Small Cap Index Trust Series 0 | Small Cap Index Trust Series 1 | Small Cap Opportunities Trust Series 0 | ||||||||||||||||||||
| Year Ended Dec. 31/12 |
Year Ended Dec. 31/11 |
Year Ended Dec. 31/12 |
Year Ended Dec. 31/11 |
Year Ended Dec. 31/12 |
Year Ended Dec. 31/11 |
|||||||||||||||||
| $ | 97,113 | $ | 38,025 | $ | 71,355 | $ | 29,761 | — | $ | 145 | ||||||||||||
|
|
|
|
|
|
|
|
|
|
|
|
|
|||||||||||
| 97,113 | 38,025 | 71,355 | 29,761 | — | 145 | |||||||||||||||||
| — | — | 17,341 | 12,094 | — | — | |||||||||||||||||
|
|
|
|
|
|
|
|
|
|
|
|
|
|||||||||||
| 97,113 | 38,025 | 54,014 | 17,667 | — | 145 | |||||||||||||||||
|
|
|
|
|
|
|
|
|
|
|
|
|
|||||||||||
| 760,305 | 13,335 | 586,834 | 11,925 | — | — | |||||||||||||||||
| 101,537 | 338,196 | 99,406 | 265,071 | 14,468 | 23,181 | |||||||||||||||||
|
|
|
|
|
|
|
|
|
|
|
|
|
|||||||||||
| 861,842 | 351,531 | 686,240 | 276,996 | 14,468 | 23,181 | |||||||||||||||||
| (351,730 | ) | (544,417 | ) | (234,508 | ) | (483,223 | ) | 5,856 | (19,985 | ) | ||||||||||||
|
|
|
|
|
|
|
|
|
|
|
|
|
|||||||||||
| 607,225 | (154,861 | ) | 505,746 | (188,560 | ) | 20,324 | 3,341 | |||||||||||||||
|
|
|
|
|
|
|
|
|
|
|
|
|
|||||||||||
| 682,422 | 1,005,926 | 93,874 | 138,883 | 17,997 | 12,393 | |||||||||||||||||
| (242,983 | ) | (222,313 | ) | (522,150 | ) | (224,852 | ) | (26,073 | ) | (38,310 | ) | |||||||||||
| (152,873 | ) | 32,228 | — | — | (9,174 | ) | (1,938 | ) | ||||||||||||||
| 1,065,810 | 201,337 | 3,259,343 | (84,746 | ) | (2,233 | ) | 13,614 | |||||||||||||||
|
|
|
|
|
|
|
|
|
|
|
|
|
|||||||||||
| 1,352,376 | 1,017,178 | 2,831,067 | (170,715 | ) | (19,483 | ) | (14,241 | ) | ||||||||||||||
|
|
|
|
|
|
|
|
|
|
|
|
|
|||||||||||
| 1,959,601 | 862,317 | 3,336,813 | (359,275 | ) | 841 | (10,900 | ) | |||||||||||||||
| 3,096,548 | 2,234,231 | 2,235,310 | 2,594,585 | 129,857 | 140,757 | |||||||||||||||||
|
|
|
|
|
|
|
|
|
|
|
|
|
|||||||||||
| $ | 5,056,149 | $ | 3,096,548 | $ | 5,572,123 | $ | 2,235,310 | $ | 130,698 | $ | 129,857 | |||||||||||
|
|
|
|
|
|
|
|
|
|
|
|
|
|||||||||||
59
Table of Contents
John Hancock Life Insurance Company (U.S.A.) Separate Account N
Statements of Operations and Changes in Contract Owners’ Equity
(continued)
| Sub-Account | ||||||||||||||||
| Small Cap Opportunities Trust Series 1 | Small Cap Value Trust Series 0 | |||||||||||||||
| Year Ended Dec. 31/12 |
Year Ended Dec. 31/11 |
Year Ended Dec. 31/12 |
Year Ended Dec. 31/11 |
|||||||||||||
| Income: |
||||||||||||||||
| Dividend income distribution |
— | $ | 828 | $ | 71,381 | $ | 61,587 | |||||||||
|
|
|
|
|
|
|
|
|
|||||||||
| Total Investment Income |
— | 828 | 71,381 | 61,587 | ||||||||||||
| Expenses: |
||||||||||||||||
| Mortality and expense risk |
2,371 | 5,067 | — | — | ||||||||||||
|
|
|
|
|
|
|
|
|
|||||||||
| Net investment income (loss) |
(2,371 | ) | (4,239 | ) | 71,381 | 61,587 | ||||||||||
|
|
|
|
|
|
|
|
|
|||||||||
| Realized gains (losses) on investments: |
||||||||||||||||
| Capital gain distributions |
— | — | 370,084 | — | ||||||||||||
| Net realized gains (losses) |
28,461 | 105,850 | 1,072,732 | 633,587 | ||||||||||||
|
|
|
|
|
|
|
|
|
|||||||||
| Realized gains (losses) |
28,461 | 105,850 | 1,442,816 | 633,587 | ||||||||||||
| Unrealized appreciation (depreciation) during the period |
65,090 | (165,454 | ) | (390,175 | ) | (618,941 | ) | |||||||||
|
|
|
|
|
|
|
|
|
|||||||||
| Net increase (decrease) in assets from operations |
91,180 | (63,843 | ) | 1,124,022 | 76,233 | |||||||||||
|
|
|
|
|
|
|
|
|
|||||||||
| Changes from principal transactions: |
||||||||||||||||
| Transfer of net premiums |
16,606 | 11,846 | 275,858 | 612,306 | ||||||||||||
| Transfer on terminations |
(35,026 | ) | (124,270 | ) | (312,822 | ) | (172,678 | ) | ||||||||
| Transfer on policy loans |
101 | (1,888 | ) | (17,073 | ) | (1,594 | ) | |||||||||
| Net interfund transfers |
(371,726 | ) | (447,834 | ) | (218,231 | ) | 39,121 | |||||||||
|
|
|
|
|
|
|
|
|
|||||||||
| Net increase (decrease) in assets from principal transactions |
(390,045 | ) | (562,146 | ) | (272,268 | ) | 477,155 | |||||||||
|
|
|
|
|
|
|
|
|
|||||||||
| Total increase (decrease) in assets |
(298,865 | ) | (625,989 | ) | 851,754 | 553,388 | ||||||||||
| Assets, beginning of period |
735,456 | 1,361,445 | 6,963,187 | 6,409,799 | ||||||||||||
|
|
|
|
|
|
|
|
|
|||||||||
| Assets, end of period |
$ | 436,591 | $ | 735,456 | $ | 7,814,941 | $ | 6,963,187 | ||||||||
|
|
|
|
|
|
|
|
|
|||||||||
See accompanying notes.
60
Table of Contents
| Sub-Account | ||||||||||||||||||||||
| Small Cap Value Trust Series 1 | Small Company Value Trust Series 0 | Small Company Value Trust Series 1 | ||||||||||||||||||||
| Year Ended Dec. 31/12 |
Year Ended Dec. 31/11 |
Year Ended Dec. 31/12 |
Year Ended Dec. 31/11 |
Year Ended Dec. 31/12 |
Year Ended Dec. 31/11 |
|||||||||||||||||
| $ | 9,620 | $ | 3,867 | $ | 2,631 | $ | 6,684 | $ | 12,565 | $ | 35,353 | |||||||||||
|
|
|
|
|
|
|
|
|
|
|
|
|
|||||||||||
| 9,620 | 3,867 | 2,631 | 6,684 | 12,565 | 35,353 | |||||||||||||||||
| 6,115 | 2,530 | — | — | 20,162 | 26,243 | |||||||||||||||||
|
|
|
|
|
|
|
|
|
|
|
|
|
|||||||||||
| 3,505 | 1,337 | 2,631 | 6,684 | (7,597 | ) | 9,110 | ||||||||||||||||
|
|
|
|
|
|
|
|
|
|
|
|
|
|||||||||||
| 51,849 | — | — | — | — | — | |||||||||||||||||
| 73,773 | 48,047 | 86,076 | 83,701 | 606,448 | 841,618 | |||||||||||||||||
|
|
|
|
|
|
|
|
|
|
|
|
|
|||||||||||
| 125,622 | 48,047 | 86,076 | 83,701 | 606,448 | 841,618 | |||||||||||||||||
| (21,545 | ) | (40,234 | ) | 74,974 | (114,200 | ) | 212,641 | (893,080 | ) | |||||||||||||
|
|
|
|
|
|
|
|
|
|
|
|
|
|||||||||||
| 107,582 | 9,150 | 163,681 | (23,815 | ) | 811,492 | (42,352 | ) | |||||||||||||||
|
|
|
|
|
|
|
|
|
|
|
|
|
|||||||||||
| 17,703 | 8,524 | 127,644 | 135,986 | 84,585 | 182,943 | |||||||||||||||||
| (312,091 | ) | (30,914 | ) | (46,055 | ) | (51,600 | ) | (1,199,834 | ) | (1,135,136 | ) | |||||||||||
| — | — | 6,560 | (3,619 | ) | 25,135 | 2,218 | ||||||||||||||||
| 615,087 | 24,555 | 21,754 | 50,717 | (1,216,493 | ) | (347,315 | ) | |||||||||||||||
|
|
|
|
|
|
|
|
|
|
|
|
|
|||||||||||
| 320,699 | 2,165 | 109,903 | 131,484 | (2,306,607 | ) | (1,297,290 | ) | |||||||||||||||
|
|
|
|
|
|
|
|
|
|
|
|
|
|||||||||||
| 428,281 | 11,315 | 273,584 | 107,669 | (1,495,115 | ) | (1,339,642 | ) | |||||||||||||||
| 462,460 | 451,145 | 1,029,131 | 921,462 | 6,156,047 | 7,495,689 | |||||||||||||||||
|
|
|
|
|
|
|
|
|
|
|
|
|
|||||||||||
| $ | 890,741 | $ | 462,460 | $ | 1,302,715 | $ | 1,029,131 | $ | 4,660,932 | $ | 6,156,047 | |||||||||||
|
|
|
|
|
|
|
|
|
|
|
|
|
|||||||||||
61
Table of Contents
John Hancock Life Insurance Company (U.S.A.) Separate Account N
Statements of Operations and Changes in Contract Owners’ Equity
(continued)
| Sub-Account | ||||||||||||||||
| Smaller Company Growth Trust Series 0 | Smaller Company Growth Trust Series 1 | |||||||||||||||
| Year Ended Dec. 31/12 |
Year Ended Dec. 31/11 |
Year Ended Dec. 31/12 |
Year Ended Dec. 31/11 |
|||||||||||||
| Income: |
||||||||||||||||
| Dividend income distribution |
— | — | — | — | ||||||||||||
|
|
|
|
|
|
|
|
|
|||||||||
| Total Investment Income |
— | — | — | — | ||||||||||||
| Expenses: |
||||||||||||||||
| Mortality and expense risk |
— | — | 90,857 | 106,431 | ||||||||||||
|
|
|
|
|
|
|
|
|
|||||||||
| Net investment income (loss) |
— | — | (90,857 | ) | (106,431 | ) | ||||||||||
|
|
|
|
|
|
|
|
|
|||||||||
| Realized gains (losses) on investments: |
||||||||||||||||
| Capital gain distributions |
12,685 | — | 1,238,295 | — | ||||||||||||
| Net realized gains (losses) |
2,568 | 11,014 | 895,692 | 787,681 | ||||||||||||
|
|
|
|
|
|
|
|
|
|||||||||
| Realized gains (losses) |
15,253 | 11,014 | 2,133,987 | 787,681 | ||||||||||||
| Unrealized appreciation (depreciation) during the period |
11,766 | (47,527 | ) | 162,929 | (1,933,951 | ) | ||||||||||
|
|
|
|
|
|
|
|
|
|||||||||
| Net increase (decrease) in assets from operations |
27,019 | (36,513 | ) | 2,206,059 | (1,252,701 | ) | ||||||||||
|
|
|
|
|
|
|
|
|
|||||||||
| Changes from principal transactions: |
||||||||||||||||
| Transfer of net premiums |
43,211 | 80,711 | 555,524 | 737,886 | ||||||||||||
| Transfer on terminations |
(14,616 | ) | (23,589 | ) | (4,185,161 | ) | (3,574,520 | ) | ||||||||
| Transfer on policy loans |
(24,069 | ) | (348 | ) | 171,708 | 320,634 | ||||||||||
| Net interfund transfers |
(74,300 | ) | (3,714 | ) | (1,016,794 | ) | (74,821 | ) | ||||||||
|
|
|
|
|
|
|
|
|
|||||||||
| Net increase (decrease) in assets from principal transactions |
(69,774 | ) | 53,060 | (4,474,723 | ) | (2,590,821 | ) | |||||||||
|
|
|
|
|
|
|
|
|
|||||||||
| Total increase (decrease) in assets |
(42,755 | ) | 16,547 | (2,268,664 | ) | (3,843,522 | ) | |||||||||
| Assets, beginning of period |
208,098 | 191,551 | 15,386,788 | 19,230,310 | ||||||||||||
|
|
|
|
|
|
|
|
|
|||||||||
| Assets, end of period |
$ | 165,343 | $ | 208,098 | $ | 13,118,124 | $ | 15,386,788 | ||||||||
|
|
|
|
|
|
|
|
|
|||||||||
See accompanying notes.
62
Table of Contents
| Sub-Account | ||||||||||||||||||||||
| Strategic Income Opportunities Trust Series 0 | Strategic Income Opportunities Trust Series 1 | Total Bond Market Trust B Series 0 | ||||||||||||||||||||
| Year Ended Dec. 31/12 |
Year Ended Dec. 31/11 |
Year Ended Dec. 31/12 |
Year Ended Dec. 31/11 |
Year Ended Dec. 31/12 |
Year Ended Dec. 31/11 |
|||||||||||||||||
| $ | 193,473 | $ | 230,954 | $ | 125,334 | $ | 241,041 | $ | 209,800 | $ | 387,636 | |||||||||||
|
|
|
|
|
|
|
|
|
|
|
|
|
|||||||||||
| 193,473 | 230,954 | 125,334 | 241,041 | 209,800 | 387,636 | |||||||||||||||||
| — | — | 9,162 | 13,133 | — | — | |||||||||||||||||
|
|
|
|
|
|
|
|
|
|
|
|
|
|||||||||||
| 193,473 | 230,954 | 116,172 | 227,908 | 209,800 | 387,636 | |||||||||||||||||
|
|
|
|
|
|
|
|
|
|
|
|
|
|||||||||||
| — | — | — | — | — | — | |||||||||||||||||
| (42,254 | ) | (16,331 | ) | (131,905 | ) | (6,984 | ) | 222,631 | 179,355 | |||||||||||||
|
|
|
|
|
|
|
|
|
|
|
|
|
|||||||||||
| (42,254 | ) | (16,331 | ) | (131,905 | ) | (6,984 | ) | 222,631 | 179,355 | |||||||||||||
| 162,474 | (189,905 | ) | 243,295 | (166,122 | ) | (17,998 | ) | 98,941 | ||||||||||||||
|
|
|
|
|
|
|
|
|
|
|
|
|
|||||||||||
| 313,693 | 24,718 | 227,562 | 54,802 | 414,433 | 665,932 | |||||||||||||||||
|
|
|
|
|
|
|
|
|
|
|
|
|
|||||||||||
| 283,080 | 511,030 | 72,048 | 164,049 | 1,311,175 | 456,217 | |||||||||||||||||
| (158,433 | ) | (232,441 | ) | (603,888 | ) | (213,040 | ) | (396,895 | ) | (504,423 | ) | |||||||||||
| (8,779 | ) | (4,607 | ) | (437 | ) | (356 | ) | 30,864 | 2,192 | |||||||||||||
| 659,353 | 257,390 | (496,267 | ) | (467,874 | ) | 3,845,152 | (1,739,725 | ) | ||||||||||||||
|
|
|
|
|
|
|
|
|
|
|
|
|
|||||||||||
| 775,221 | 531,372 | (1,028,544 | ) | (517,221 | ) | 4,790,296 | (1,785,739 | ) | ||||||||||||||
|
|
|
|
|
|
|
|
|
|
|
|
|
|||||||||||
| 1,088,914 | 556,090 | (800,982 | ) | (462,419 | ) | 5,204,729 | (1,119,807 | ) | ||||||||||||||
| 2,105,616 | 1,549,526 | 2,167,949 | 2,630,368 | 7,750,121 | 8,869,928 | |||||||||||||||||
|
|
|
|
|
|
|
|
|
|
|
|
|
|||||||||||
| $ | 3,194,530 | $ | 2,105,616 | $ | 1,366,967 | $ | 2,167,949 | $ | 12,954,850 | $ | 7,750,121 | |||||||||||
|
|
|
|
|
|
|
|
|
|
|
|
|
|||||||||||
63
Table of Contents
John Hancock Life Insurance Company (U.S.A.) Separate Account N
Statements of Operations and Changes in Contract Owners’ Equity
(continued)
| Sub-Account | ||||||||||||||||
| Total Return Trust Series 0 | Total Return Trust Series 1 | |||||||||||||||
| Year Ended Dec. 31/12 |
Year Ended Dec. 31/11 |
Year Ended Dec. 31/12 |
Year Ended Dec. 31/11 |
|||||||||||||
| Income: |
||||||||||||||||
| Dividend income distribution |
$ | 596,165 | $ | 1,161,847 | $ | 540,465 | $ | 1,892,623 | ||||||||
|
|
|
|
|
|
|
|
|
|||||||||
| Total Investment Income |
596,165 | 1,161,847 | 540,465 | 1,892,623 | ||||||||||||
| Expenses: |
||||||||||||||||
| Mortality and expense risk |
— | — | 116,360 | 149,437 | ||||||||||||
|
|
|
|
|
|
|
|
|
|||||||||
| Net investment income (loss) |
596,165 | 1,161,847 | 424,105 | 1,743,186 | ||||||||||||
|
|
|
|
|
|
|
|
|
|||||||||
| Realized gains (losses) on investments: |
||||||||||||||||
| Capital gain distributions |
— | 954,479 | — | 1,545,407 | ||||||||||||
| Net realized gains (losses) |
21,365 | 265,931 | (262,321 | ) | 359,709 | |||||||||||
|
|
|
|
|
|
|
|
|
|||||||||
| Realized gains (losses) |
21,365 | 1,220,410 | (262,321 | ) | 1,905,116 | |||||||||||
| Unrealized appreciation (depreciation) during the period |
1,796,755 | (1,440,344 | ) | 2,492,566 | (2,034,093 | ) | ||||||||||
|
|
|
|
|
|
|
|
|
|||||||||
| Net increase (decrease) in assets from operations |
2,414,285 | 941,913 | 2,654,350 | 1,614,209 | ||||||||||||
|
|
|
|
|
|
|
|
|
|||||||||
| Changes from principal transactions: |
||||||||||||||||
| Transfer of net premiums |
4,900,233 | 3,774,677 | 238,258 | 329,869 | ||||||||||||
| Transfer on terminations |
(1,134,035 | ) | (1,553,640 | ) | (4,431,468 | ) | (3,915,591 | ) | ||||||||
| Transfer on policy loans |
(445,988 | ) | (96,401 | ) | (124,743 | ) | 513 | |||||||||
| Net interfund transfers |
(2,898,015 | ) | 3,884,912 | (19,580,804 | ) | 4,105,029 | ||||||||||
|
|
|
|
|
|
|
|
|
|||||||||
| Net increase (decrease) in assets from principal transactions |
422,195 | 6,009,548 | (23,898,757 | ) | 519,820 | |||||||||||
|
|
|
|
|
|
|
|
|
|||||||||
| Total increase (decrease) in assets |
2,836,480 | 6,951,461 | (21,244,407 | ) | 2,134,029 | |||||||||||
| Assets, beginning of period |
28,551,370 | 21,599,909 | 47,874,290 | 45,740,261 | ||||||||||||
|
|
|
|
|
|
|
|
|
|||||||||
| Assets, end of period |
$ | 31,387,850 | $ | 28,551,370 | $ | 26,629,883 | $ | 47,874,290 | ||||||||
|
|
|
|
|
|
|
|
|
|||||||||
| (g) | Fund available in prior year but no activity. |
See accompanying notes.
64
Table of Contents
| Sub-Account | ||||||||||||||||||||||
| Total Stock Market Index Trust Series 0 | Total Stock Market Index Trust Series 1 | Ultra Short Term Bond Trust Series 0 | ||||||||||||||||||||
| Year Ended Dec. 31/12 |
Year Ended Dec. 31/11 |
Year Ended Dec. 31/12 |
Year Ended Dec. 31/11 |
Year Ended Dec. 31/12 |
Year Ended Dec. 31/11 (g) |
|||||||||||||||||
| $ | 6,835 | $ | 8,082 | $ | 30,946 | $ | 24,074 | $ | 2,550 | $ | 1,693 | |||||||||||
|
|
|
|
|
|
|
|
|
|
|
|
|
|||||||||||
| 6,835 | 8,082 | 30,946 | 24,074 | 2,550 | 1,693 | |||||||||||||||||
| — | — | 9,074 | 10,010 | — | — | |||||||||||||||||
|
|
|
|
|
|
|
|
|
|
|
|
|
|||||||||||
| 6,835 | 8,082 | 21,872 | 14,064 | 2,550 | 1,693 | |||||||||||||||||
|
|
|
|
|
|
|
|
|
|
|
|
|
|||||||||||
| 1,063 | — | 5,213 | — | — | — | |||||||||||||||||
| 19,687 | 479,641 | 233,290 | 54,973 | (1,524 | ) | (239 | ) | |||||||||||||||
|
|
|
|
|
|
|
|
|
|
|
|
|
|||||||||||
| 20,750 | 479,641 | 238,503 | 54,973 | (1,524 | ) | (239 | ) | |||||||||||||||
| 51,315 | (391,665 | ) | 22,731 | (73,821 | ) | (89 | ) | (1,816 | ) | |||||||||||||
|
|
|
|
|
|
|
|
|
|
|
|
|
|||||||||||
| 78,900 | 96,058 | 283,106 | (4,784 | ) | 937 | (362 | ) | |||||||||||||||
|
|
|
|
|
|
|
|
|
|
|
|
|
|||||||||||
| 90,869 | 457,546 | 133,763 | 151,861 | 114,035 | — | |||||||||||||||||
| (280,634 | ) | (38,999 | ) | (52,363 | ) | (194,401 | ) | (94,329 | ) | (4,008 | ) | |||||||||||
| (10,737 | ) | (169 | ) | — | — | — | — | |||||||||||||||
| (40,856 | ) | (1,603,094 | ) | (293,249 | ) | 58,600 | 204,035 | 120,072 | ||||||||||||||
|
|
|
|
|
|
|
|
|
|
|
|
|
|||||||||||
| (241,358 | ) | (1,184,716 | ) | (211,849 | ) | 16,060 | 223,741 | 116,064 | ||||||||||||||
|
|
|
|
|
|
|
|
|
|
|
|
|
|||||||||||
| (162,458 | ) | (1,088,658 | ) | 71,257 | 11,276 | 224,678 | 115,702 | |||||||||||||||
| 620,895 | 1,709,553 | 1,910,839 | 1,899,563 | 115,702 | — | |||||||||||||||||
|
|
|
|
|
|
|
|
|
|
|
|
|
|||||||||||
| $ | 458,437 | $ | 620,895 | $ | 1,982,096 | $ | 1,910,839 | $ | 340,380 | $ | 115,702 | |||||||||||
|
|
|
|
|
|
|
|
|
|
|
|
|
|||||||||||
65
Table of Contents
John Hancock Life Insurance Company (U.S.A.) Separate Account N
Statements of Operations and Changes in Contract Owners’ Equity
(continued)
| Sub-Account | ||||||||||||||
| Ultra Short Term Bond Trust Series 1 | U.S. Equity Trust Series 0 | |||||||||||||
| Year Ended Dec. 31/12 |
Year Ended Dec. 31/11 (g) |
Year Ended Dec. 31/12 (q) |
| |||||||||||
| Income: |
||||||||||||||
| Dividend income distribution |
$ | 364 | $ | 379 | $ | 7,889 | ||||||||
|
|
|
|
|
|
|
|||||||||
| Total Investment Income |
364 | 379 | 7,889 | |||||||||||
| Expenses: |
||||||||||||||
| Mortality and expense risk |
203 | 118 | — | |||||||||||
|
|
|
|
|
|
|
|||||||||
| Net investment income (loss) |
161 | 261 | 7,889 | |||||||||||
|
|
|
|
|
|
|
|||||||||
| Realized gains (losses) on investments: |
||||||||||||||
| Capital gain distributions |
— | — | — | |||||||||||
| Net realized gains (losses) |
(26 | ) | (3 | ) | 669 | |||||||||
|
|
|
|
|
|
|
|||||||||
| Realized gains (losses) |
(26 | ) | (3 | ) | 669 | |||||||||
| Unrealized appreciation (depreciation) during the period |
(182 | ) | (433 | ) | 6,298 | |||||||||
|
|
|
|
|
|
|
|||||||||
| Net increase (decrease) in assets from operations |
(47 | ) | (175 | ) | 14,856 | |||||||||
|
|
|
|
|
|
|
|||||||||
| Changes from principal transactions: |
||||||||||||||
| Transfer of net premiums |
— | — | 12,789 | |||||||||||
| Transfer on terminations |
(1,767 | ) | (1,000 | ) | (13,230 | ) | ||||||||
| Transfer on policy loans |
— | — | (10,696 | ) | ||||||||||
| Net interfund transfers |
7,808 | 28,000 | 534,711 | |||||||||||
|
|
|
|
|
|
|
|||||||||
| Net increase (decrease) in assets from principal transactions |
6,041 | 27,000 | 523,574 | |||||||||||
|
|
|
|
|
|
|
|||||||||
| Total increase (decrease) in assets |
5,994 | 26,825 | 538,430 | |||||||||||
| Assets, beginning of period |
26,825 | — | — | |||||||||||
|
|
|
|
|
|
|
|||||||||
| Assets, end of period |
$ | 32,819 | $ | 26,825 | $ | 538,430 | ||||||||
|
|
|
|
|
|
|
|||||||||
| (g) | Fund available in prior year but no activity. |
| (q) | Reflects the period from commencement of operations on April 30, 2012 through December 31, 2012. |
See accompanying notes.
66
Table of Contents
| Sub-Account | ||||||||||||||||||||
| U.S. Equity Trust Series 1 | Utilities Trust Series 0 | Utilities Trust Series 1 | ||||||||||||||||||
| Year Ended Dec. 31/12 (q) |
Year Ended Dec. 31/12 |
Year Ended Dec. 31/11 |
Year Ended Dec. 31/12 |
Year Ended Dec. 31/11 |
||||||||||||||||
| $ | 15,550 | $ | 41,518 | $ | 37,227 | $ | 69,574 | $ | 71,733 | |||||||||||
|
|
|
|
|
|
|
|
|
|
|
|||||||||||
| 15,550 | 41,518 | 37,227 | 69,574 | 71,733 | ||||||||||||||||
| 3,657 | — | — | 10,138 | 10,776 | ||||||||||||||||
|
|
|
|
|
|
|
|
|
|
|
|||||||||||
| 11,893 | 41,518 | 37,227 | 59,436 | 60,957 | ||||||||||||||||
|
|
|
|
|
|
|
|
|
|
|
|||||||||||
| — | — | — | — | — | ||||||||||||||||
| (7,373 | ) | 43,373 | 72,261 | 136,298 | 254,033 | |||||||||||||||
|
|
|
|
|
|
|
|
|
|
|
|||||||||||
| (7,373 | ) | 43,373 | 72,261 | 136,298 | 254,033 | |||||||||||||||
| 13,057 | 56,347 | (39,015 | ) | 32,088 | (222,387 | ) | ||||||||||||||
|
|
|
|
|
|
|
|
|
|
|
|||||||||||
| 17,577 | 141,238 | 70,473 | 227,822 | 92,603 | ||||||||||||||||
|
|
|
|
|
|
|
|
|
|
|
|||||||||||
| 18,131 | 131,614 | 237,024 | 61,444 | 116,067 | ||||||||||||||||
| (163,284 | ) | (121,634 | ) | (82,194 | ) | (669,845 | ) | (195,757 | ) | |||||||||||
| (5,806 | ) | (2,783 | ) | (26,800 | ) | (59 | ) | (94 | ) | |||||||||||
| 1,205,535 | 32,542 | (218,775 | ) | 194,406 | 148,282 | |||||||||||||||
|
|
|
|
|
|
|
|
|
|
|
|||||||||||
| 1,054,576 | 39,739 | (90,745 | ) | (414,054 | ) | 68,498 | ||||||||||||||
|
|
|
|
|
|
|
|
|
|
|
|||||||||||
| 1,072,153 | 180,977 | (20,272 | ) | (186,232 | ) | 161,101 | ||||||||||||||
| — | 992,929 | 1,013,201 | 1,829,855 | 1,668,754 | ||||||||||||||||
|
|
|
|
|
|
|
|
|
|
|
|||||||||||
| $ | 1,072,153 | $ | 1,173,906 | $ | 992,929 | $ | 1,643,623 | $ | 1,829,855 | |||||||||||
|
|
|
|
|
|
|
|
|
|
|
|||||||||||
67
Table of Contents
John Hancock Life Insurance Company (U.S.A.) Separate Account N
Statements of Operations and Changes in Contract Owners’ Equity
(continued)
| Sub-Account | ||||||||||||||||
| Value Trust Series 0 | Value Trust Series 1 | |||||||||||||||
| Year Ended Dec. 31/12 |
Year Ended Dec. 31/11 |
Year Ended Dec. 31/12 |
Year Ended Dec. 31/11 |
|||||||||||||
| Income: |
||||||||||||||||
| Dividend income distribution |
$ | 6,144 | $ | 6,286 | $ | 30,495 | $ | 40,992 | ||||||||
|
|
|
|
|
|
|
|
|
|||||||||
| Total Investment Income |
6,144 | 6,286 | 30,495 | 40,992 | ||||||||||||
| Expenses: |
||||||||||||||||
| Mortality and expense risk |
— | — | 17,275 | 18,599 | ||||||||||||
|
|
|
|
|
|
|
|
|
|||||||||
| Net investment income (loss) |
6,144 | 6,286 | 13,220 | 22,393 | ||||||||||||
|
|
|
|
|
|
|
|
|
|||||||||
| Realized gains (losses) on investments: |
||||||||||||||||
| Capital gain distributions |
— | — | — | — | ||||||||||||
| Net realized gains (losses) |
12,483 | 27,446 | 554,076 | 220,059 | ||||||||||||
|
|
|
|
|
|
|
|
|
|||||||||
| Realized gains (losses) |
12,483 | 27,446 | 554,076 | 220,059 | ||||||||||||
| Unrealized appreciation (depreciation) during the period |
80,571 | (31,498 | ) | (6,977 | ) | (253,027 | ) | |||||||||
|
|
|
|
|
|
|
|
|
|||||||||
| Net increase (decrease) in assets from operations |
99,198 | 2,234 | 560,319 | (10,575 | ) | |||||||||||
|
|
|
|
|
|
|
|
|
|||||||||
| Changes from principal transactions: |
||||||||||||||||
| Transfer of net premiums |
101,749 | 68,051 | 29,773 | 49,629 | ||||||||||||
| Transfer on terminations |
(31,935 | ) | (32,088 | ) | (1,201,422 | ) | (384,002 | ) | ||||||||
| Transfer on policy loans |
(2,011 | ) | (78,905 | ) | 474 | 292 | ||||||||||
| Net interfund transfers |
63,487 | (20,857 | ) | (153,270 | ) | 325,866 | ||||||||||
|
|
|
|
|
|
|
|
|
|||||||||
| Net increase (decrease) in assets from principal transactions |
131,290 | (63,799 | ) | (1,324,445 | ) | (8,215 | ) | |||||||||
|
|
|
|
|
|
|
|
|
|||||||||
| Total increase (decrease) in assets |
230,488 | (61,565 | ) | (764,126 | ) | (18,790 | ) | |||||||||
| Assets, beginning of period |
523,460 | 585,025 | 3,499,439 | 3,518,229 | ||||||||||||
|
|
|
|
|
|
|
|
|
|||||||||
| Assets, end of period |
$ | 753,948 | $ | 523,460 | $ | 2,735,313 | $ | 3,499,439 | ||||||||
|
|
|
|
|
|
|
|
|
|||||||||
See accompanying notes.
68
Table of Contents
| Total | ||||||||||||||
| Year
Ended Dec. 31/12 |
Year
Ended Dec. 31/11 |
|||||||||||||
| $ | 9,972,195 | $ | 13,527,177 | |||||||||||
|
|
|
|
|
|||||||||||
| 9,972,195 | 13,527,177 | |||||||||||||
| 1,498,405 | 1,603,160 | |||||||||||||
|
|
|
|
|
|||||||||||
| 8,473,790 | 11,924,017 | |||||||||||||
|
|
|
|
|
|||||||||||
| 7,620,175 | 3,895,142 | |||||||||||||
| 31,527,281 | 30,179,269 | |||||||||||||
|
|
|
|
|
|||||||||||
| 39,147,456 | 34,074,411 | |||||||||||||
| 26,311,717 | (57,467,660 | ) | ||||||||||||
|
|
|
|
|
|||||||||||
| 73,932,963 | (11,469,232 | ) | ||||||||||||
|
|
|
|
|
|||||||||||
| 80,716,462 | 79,177,306 | |||||||||||||
| (88,780,052 | ) | (64,334,701 | ) | |||||||||||
| (8,565,243 | ) | 855,694 | ||||||||||||
| (11,459,227 | ) | (8,975,465 | ) | |||||||||||
|
|
|
|
|
|||||||||||
| (28,088,060 | ) | 6,722,834 | ||||||||||||
|
|
|
|
|
|||||||||||
| 45,844,903 | (4,746,398 | ) | ||||||||||||
| 646,299,287 | 651,045,685 | |||||||||||||
|
|
|
|
|
|||||||||||
| $ | 692,144,190 | $ | 646,299,287 | |||||||||||
|
|
|
|
|
|||||||||||
69
Table of Contents
John Hancock Life Insurance Company (U.S.A.) Separate Account N
December 31, 2012
| 1. | Organization |
John Hancock Life Insurance Company (U.S.A.) Separate Account N (the “Account”) is a separate account administered and sponsored by John Hancock Life Insurance Company (U.S.A.) (“JHUSA” or the “Company”). The Account operates as a Unit Investment Trust registered under the Investment Company Act of 1940, as amended (the “Act”) and has 124 active investment sub-accounts that invest in shares of a particular John Hancock Variable Insurance Trust (the “Trust”), which was formerly known as the John Hancock Trust, portfolio and 4 sub-accounts that invests in shares of other outside investment trusts as of December 31, 2012. The Trust is registered under the Act as an open-end management investment company, commonly known as a mutual fund, which does not transact with the general public. Instead, the Trust deals primarily with insurance companies by providing the investment medium for variable contracts. The Account is a funding vehicle for the allocation of net premiums under variable universal life insurance contracts (the “Contracts”) issued by the Company.
The Company is a stock life insurance company incorporated under the laws of Michigan in 1979. The Company is an indirect wholly owned subsidiary of Manulife Financial Corporation (“MFC”), a Canadian based publicly traded life insurance company.
The Company is required to maintain assets in the Account with a total fair value at least equal to the reserves and other liabilities relating to the variable benefits under all Contracts participating in the Account. These assets may not be charged with liabilities which arise from any other business the Company conducts. However, all obligations under the Contracts are general corporate obligations of the Company.
Additional assets are held in the Company’s general account to cover the contingency that the guaranteed minimum death benefit might exceed the death benefit which would have been payable in the absence of such guarantee.
Each sub-account that invests in portfolios of the Trust may offer two classes of units to fund the Contracts issued by the Company. These classes, Series 1 and Series 0 represent an interest in the same Trust portfolio but in different share classes of that portfolio. Series 1 represents interests in Series 1 shares of the Trust’s portfolio and Series 0 represents interests in Series NAV shares of the Trust’s portfolio. Series 1 and Series NAV shares differ in the level of 12b-1 fees and other expenses assessed against the portfolio’s assets.
The following sub-accounts of the Account were commenced as investment options:
| New Sub-Accounts |
Effective Date | |
| International Equity Index Trust B Series 1 | November 5, 2012 | |
| International Growth Stock Trust | November 5, 2012 | |
| U.S. Equity Trust | April 30, 2012 |
70
Table of Contents
John Hancock Life Insurance Company (U.S.A.) Separate Account N
Notes to Financial Statements (continued)
The following sub-accounts of the Account were terminated as investment options and the funds were transferred to existing sub-account funds as follows:
| Terminated |
Transferred To |
Effective Date | ||
| 500 Index Trust Series 1 | 500 Index Trust B Series 0 | November 5, 2012 | ||
| American Blue Chip Income and Growth Trust Series 1 | American Growth-Income Trust Series 1 | November 5, 2012 | ||
| Balanced Trust | Lifestyle Growth Trust | April 30, 2012 | ||
| International Equity Index Trust A | International Equity Index Trust B | November 5, 2012 | ||
| International Opportunities Trust | International Growth Stock Trust | November 5, 2012 | ||
| Large Cap Trust | U.S. Equity Trust | April 30, 2012 |
Where a sub-account has two series, the changes noted above apply to both Series 0 and Series 1.
| 2. | Significant Accounting Policies |
Investments of each sub-account consist of shares in the respective portfolios of the Trust. These shares are carried at fair value which is calculated using the fair value of the investment securities underlying each Trust portfolio. Transactions are recorded on the trade date. Income from dividends is recorded on the ex-dividend date. Realized gains and losses on the sale of investments are computed on the basis of the specifically identified cost of the investment sold.
In addition to the Account, a contract holder may also allocate funds to the fixed account contained within the Company’s general account. Because of exemptive and exclusionary provisions, interests in the fixed account have not been registered under the Securities Act of 1933 and the Company’s general account has not been registered as an investment company under the Act. Net interfund transfers include interfund transfers between separate and general accounts.
FASB ASC Topic 820 - Fair Value Measurement and Disclosure (“ASC 820”) provides a single definition of fair value for accounting purposes, establishes a consistent framework for measuring fair value and expands disclosure requirements about fair value measurements. ASC 820 defines fair value as the price that would be received to sell an asset or paid to transfer a liability in an orderly transaction between market participants at the measurement date; that is, an exit value. An exit value is not a forced liquidation or distressed sale. Assets not measured at fair value are excluded from ASC 820 note disclosure, including Policy Loans which are held to maturity and accounted for at cost.
Following ASC 820 guidance, the Account has categorized its fair value measurements according to a three-level hierarchy. The hierarchy prioritizes the inputs used by the Account’s valuation techniques. A level is assigned to each fair value measurement based on the lowest level input significant to the fair value measurement in its entirety. The three levels of the fair value hierarchy are defined as follows:
| • | Level 1 – Fair value measurements that reflect unadjusted, quoted prices in active markets for identical assets and liabilities that the Account has the ability to access at the measurement date. |
| • | Level 2 – Fair value measurements using inputs other than quoted prices included within Level 1 that are observable, either directly or indirectly. |
| • | Level 3 – Fair value measurements using significant non-market observable inputs. |
71
Table of Contents
John Hancock Life Insurance Company (U.S.A.) Separate Account N
Notes to Financial Statements (continued)
Assets owned by the Account are primarily open-ended mutual fund investments issued by the Trust. These are classified within Level 1, as fair values of the underlying funds are based upon reported net asset values (“NAV”), which represent the values at which each sub-account can redeem its investments.
The following table presents the Account’s assets that are measured at fair value on a recurring basis by fair value hierarchy level under ASC 820, as of December 31, 2012.
| Mutual Funds | ||||
| Level 1 |
$ | 692,144,190 | ||
| Level 2 |
— | |||
| Level 3 |
— | |||
|
|
|
|||
| $ | 692,144,190 | |||
|
|
|
|||
The preparation of financial statements in conformity with accounting principles generally accepted in the United States requires management to make estimates and assumptions that affect the amounts reported herein. Actual results could differ from those estimates.
| 3. | Mortality and Expense Risks Charges |
The Company deducts from the assets of the Account a daily charge equivalent to annual rates between 0% and 0.70% of the average net value of the Account’s assets for the assumption of mortality and expense risks.
| 4. | Contract Charges |
The Company deducts certain charges from gross premiums before placing the remaining net premiums in the sub-account. In the event of a surrender by the contract holder, surrender charges may be levied by the Company against the contract value at the time of termination to cover sales and administrative expenses associated with underwriting and issuing the Contract. Additionally, each month a deduction consisting of an administration charge, a charge for cost of insurance and charges for supplementary benefits is deducted from the contract value. Contract charges are paid through the redemption of sub-account units and are reflected as terminations.
| 5. | Federal Income Taxes |
The Account does not file separate tax returns. The taxable income of the Account is consolidated with that of the Company within the consolidated federal tax return. Any tax contingencies arising from the taxable income generated by the Account are the responsibility of the Company and the Company holds any and all tax contingencies on its financial statements. The Account is not a party to the consolidated tax sharing agreement thus no amount of income taxes or tax contingencies are passed through to the Account. The legal form of the Account is not taxable in any state or foreign jurisdictions.
72
Table of Contents
John Hancock Life Insurance Company (U.S.A.) Separate Account N
Notes to Financial Statements (continued)
The Income Taxes topic of the FASB Accounting Standard Codification establishes a minimum threshold for financial statement recognition of the benefit of positions taken, or expected to be taken, in filing tax returns (including whether the Account is taxable in certain jurisdictions). The topic requires the evaluation of tax positions taken or expected to be taken in the course of preparing the Company’s tax returns to determine whether tax positions are “more-likely-than not” of being sustained by the applicable tax authority. Tax positions deemed to meet the more-likely-than-not threshold would be recorded as tax expense or benefit.
The Account complies with the provisions of FASB ASC Topic 740, Income Taxes. As of December 31, 2012, the Account did not have a liability for any uncertain tax positions. The Account recognizes interest and penalties, if any, related to tax liabilities as income tax expense in the Statements of Operations.
| 6. | Purchases and Sales of Investments |
The cost of purchases and proceeds from sales of investments for the year ended December 31, 2012 were as follows:
| Purchases | Sales | |||||||
| Sub-accounts: |
||||||||
| 500 Index Trust B Series 0 |
$ | 24,666,132 | $ | 20,547,426 | ||||
| 500 Index Trust Series 1 |
5,035,388 | 6,410,872 | ||||||
| Active Bond Trust Series 0 |
3,991,956 | 3,994,410 | ||||||
| Active Bond Trust Series 1 |
579,706 | 998,576 | ||||||
| All Cap Core Trust Series 0 |
555,971 | 64,091 | ||||||
| All Cap Core Trust Series 1 |
572,049 | 641,544 | ||||||
| All Cap Value Trust Series 0 |
689,235 | 133,382 | ||||||
| All Cap Value Trust Series 1 |
2,119,036 | 3,556,564 | ||||||
| Alpha Opportunities Trust Series 0 |
7,124 | 621 | ||||||
| Alpha Opportunities Trust Series 1 |
27,229 | 1,417 | ||||||
| American Asset Allocation Trust Series 1 |
753,182 | 3,086,600 | ||||||
| American Blue Chip Income and Growth Trust Series 1 |
599,474 | 2,700,913 | ||||||
| American Global Growth Trust Series 1 |
95,922 | 126,259 | ||||||
| American Global Small Capitalization Trust Series 1 |
64,451 | 48,289 | ||||||
| American Growth Trust Series 1 |
5,969,001 | 10,418,020 | ||||||
| American Growth-Income Trust Series 1 |
6,567,531 | 8,553,389 | ||||||
| American High-Income Bond Trust Series 1 |
25,902 | 10,657 | ||||||
| American International Trust Series 1 |
5,733,423 | 15,276,339 | ||||||
| American New World Trust Series 1 |
324,082 | 178,445 | ||||||
| Balanced Trust Series 0 |
28,339 | 70,381 | ||||||
| Balanced Trust Series 1 |
9,906 | 28,563 | ||||||
| Blue Chip Growth Trust Series 0 |
5,614,710 | 6,223,098 | ||||||
| Blue Chip Growth Trust Series 1 |
1,603,274 | 8,250,324 | ||||||
| Bond Trust Series 0 |
822,173 | 384,363 | ||||||
| Bond Trust Series 1 |
125,139 | 952,644 | ||||||
| Capital Appreciation Trust Series 0 |
322,216 | 112,318 | ||||||
| Capital Appreciation Trust Series 1 |
580,124 | 2,738,973 | ||||||
| Capital Appreciation Value Trust Series 0 |
2,367,717 | 2,327,100 | ||||||
| Capital Appreciation Value Trust Series 1 |
325,492 | 430,247 | ||||||
| Core Allocation Plus Trust Series 0 |
33,403 | 11,575 | ||||||
| Core Allocation Plus Trust Series 1 |
122,916 | 3,309,275 | ||||||
| Core Bond Trust Series 0 |
811,839 | 621,841 | ||||||
| Core Bond Trust Series 1 |
11,011 | 437,989 | ||||||
| Core Strategy Trust Series 0 |
11,562 | 1,062 | ||||||
| Core Strategy Trust Series 1 |
589 | 100 | ||||||
73
Table of Contents
John Hancock Life Insurance Company (U.S.A.) Separate Account N
Notes to Financial Statements (continued)
| Purchases | Sales | |||||||
| Sub-accounts: |
||||||||
| Disciplined Diversification Trust Series 0 |
$ | 15,308 | $ | 21,214 | ||||
| Disciplined Diversification Trust Series 1 |
69 | 27 | ||||||
| Emerging Markets Value Trust Series 0 |
610,379 | 536,531 | ||||||
| Emerging Markets Value Trust Series 1 |
1,085,156 | 534,031 | ||||||
| Equity-Income Trust Series 0 |
11,010,303 | 10,828,450 | ||||||
| Equity-Income Trust Series 1 |
3,180,536 | 6,038,814 | ||||||
| Financial Services Trust Series 0 |
144,477 | 252,655 | ||||||
| Financial Services Trust Series 1 |
321,829 | 94,388 | ||||||
| Franklin Templeton Founding Allocation Trust Series 0 |
302,255 | 480,524 | ||||||
| Franklin Templeton Founding Allocation Trust Series 1 |
6,188 | 3,755 | ||||||
| Fundamental All Cap Core Trust Series 0 |
2,201,259 | 2,100,631 | ||||||
| Fundamental All Cap Core Trust Series 1 |
913,029 | 980,983 | ||||||
| Fundamental Holdings Trust Series 1 |
2,008 | 1,455 | ||||||
| Fundamental Large Cap Value Trust Series 0 |
1,401,972 | 1,334,003 | ||||||
| Fundamental Large Cap Value Trust Series 1 |
2,902 | 59 | ||||||
| Fundamental Value Trust Series 0 |
3,650,458 | 3,074,934 | ||||||
| Fundamental Value Trust Series 1 |
688,720 | 4,237,483 | ||||||
| Global Bond Trust Series 0 |
15,066,994 | 15,561,885 | ||||||
| Global Bond Trust Series 1 |
1,209,627 | 1,867,617 | ||||||
| Global Diversification Trust Series 1 |
95,396 | 45,293 | ||||||
| Global Trust Series 0 |
258,322 | 61,378 | ||||||
| Global Trust Series 1 |
1,570,474 | 1,298,933 | ||||||
| Health Sciences Trust Series 0 |
1,372,320 | 837,808 | ||||||
| Health Sciences Trust Series 1 |
1,413,444 | 1,398,970 | ||||||
| High Yield Trust Series 0 |
6,063,363 | 5,425,419 | ||||||
| High Yield Trust Series 1 |
2,240,058 | 3,417,858 | ||||||
| International Core Trust Series 0 |
123,900 | 96,205 | ||||||
| International Core Trust Series 1 |
217,933 | 1,052,316 | ||||||
| International Equity Index Trust A Series 0 |
86,031 | 363,051 | ||||||
| International Equity Index Trust A Series 1 |
1,564,437 | 5,669,375 | ||||||
| International Equity Index Trust B Series 0 |
10,044,236 | 6,229,782 | ||||||
| International Equity Index Trust B Series 1 |
4,081,044 | 791,037 | ||||||
| International Growth Stock Trust Series 0 |
6,123,548 | 1,076,807 | ||||||
| International Growth Stock Trust Series 1 |
436,017 | 9,095 | ||||||
| International Opportunities Trust Series 0 |
2,133,889 | 6,325,874 | ||||||
| International Opportunities Trust Series 1 |
40,394 | 769,639 | ||||||
| International Small Company Trust Series 0 |
342,835 | 229,502 | ||||||
| International Small Company Trust Series 1 |
143,589 | 1,409,665 | ||||||
| International Value Trust Series 0 |
3,232,579 | 2,987,816 | ||||||
| International Value Trust Series 1 |
1,494,921 | 3,397,461 | ||||||
| Investment Quality Bond Trust Series 0 |
175,054 | 67,362 | ||||||
| Investment Quality Bond Trust Series 1 |
525,993 | 2,828,312 | ||||||
| Large Cap Trust Series 0 |
97,963 | 610,351 | ||||||
| Large Cap Trust Series 1 |
261,711 | 2,442,573 | ||||||
| Lifestyle Aggressive Trust Series 0 |
3,868,536 | 6,269,909 | ||||||
| Lifestyle Aggressive Trust Series 1 |
794,766 | 3,253,046 | ||||||
| Lifestyle Balanced Trust Series 0 |
7,827,160 | 10,079,577 | ||||||
| Lifestyle Balanced Trust Series 1 |
5,504,568 | 10,587,778 | ||||||
| Lifestyle Conservative Trust Series 0 |
3,814,541 | 1,130,056 | ||||||
| Lifestyle Conservative Trust Series 1 |
5,870,962 | 2,644,423 | ||||||
| Lifestyle Growth Trust Series 0 |
5,120,271 | 5,757,353 | ||||||
74
Table of Contents
John Hancock Life Insurance Company (U.S.A.) Separate Account N
Notes to Financial Statements (continued)
| Purchases | Sales | |||||||
| Sub-accounts: |
||||||||
| Lifestyle Growth Trust Series 1 |
$ | 1,972,454 | $ | 6,537,846 | ||||
| Lifestyle Moderate Trust Series 0 |
5,215,326 | 3,687,702 | ||||||
| Lifestyle Moderate Trust Series 1 |
875,901 | 1,387,888 | ||||||
| Mid Cap Index Trust Series 0 |
4,584,210 | 3,068,929 | ||||||
| Mid Cap Index Trust Series 1 |
2,468,472 | 6,907,214 | ||||||
| Mid Cap Stock Trust Series 0 |
7,453,930 | 7,434,327 | ||||||
| Mid Cap Stock Trust Series 1 |
317,313 | 3,083,320 | ||||||
| Mid Value Trust Series 0 |
4,300,613 | 3,602,501 | ||||||
| Mid Value Trust Series 1 |
1,334,051 | 1,784,572 | ||||||
| Money Market Trust B Series 0 |
87,922,275 | 79,123,533 | ||||||
| Money Market Trust Series 1 |
71,633,519 | 16,863,627 | ||||||
| Natural Resources Trust Series 0 |
863,791 | 511,878 | ||||||
| Natural Resources Trust Series 1 |
1,696,758 | 3,277,444 | ||||||
| Real Estate Securities Trust Series 0 |
4,796,250 | 4,011,992 | ||||||
| Real Estate Securities Trust Series 1 |
2,115,280 | 4,932,755 | ||||||
| Real Return Bond Trust Series 0 |
12,394,802 | 10,538,688 | ||||||
| Real Return Bond Trust Series 1 |
1,589,401 | 2,197,023 | ||||||
| Science & Technology Trust Series 0 |
372,185 | 270,051 | ||||||
| Science & Technology Trust Series 1 |
1,997,148 | 3,536,422 | ||||||
| Short Term Government Income Trust Series 0 |
7,094,056 | 5,418,144 | ||||||
| Short Term Government Income Trust Series 1 |
1,570,593 | 1,920,117 | ||||||
| Small Cap Growth Trust Series 0 |
4,855,214 | 4,027,654 | ||||||
| Small Cap Growth Trust Series 1 |
876,511 | 825,367 | ||||||
| Small Cap Index Trust Series 0 |
4,696,928 | 2,487,134 | ||||||
| Small Cap Index Trust Series 1 |
5,663,448 | 2,191,533 | ||||||
| Small Cap Opportunities Trust Series 0 |
52,177 | 71,661 | ||||||
| Small Cap Opportunities Trust Series 1 |
51,435 | 443,852 | ||||||
| Small Cap Value Trust Series 0 |
3,655,770 | 3,486,573 | ||||||
| Small Cap Value Trust Series 1 |
1,155,870 | 779,817 | ||||||
| Small Company Value Trust Series 0 |
542,898 | 430,363 | ||||||
| Small Company Value Trust Series 1 |
916,097 | 3,230,300 | ||||||
| Smaller Company Growth Trust Series 0 |
60,866 | 117,955 | ||||||
| Smaller Company Growth Trust Series 1 |
1,721,660 | 5,048,945 | ||||||
| Strategic Income Opportunities Trust Series 0 |
1,386,462 | 417,768 | ||||||
| Strategic Income Opportunities Trust Series 1 |
539,023 | 1,451,397 | ||||||
| Total Bond Market Trust B Series 0 |
13,360,956 | 8,360,860 | ||||||
| Total Return Trust Series 0 |
18,031,749 | 17,013,391 | ||||||
| Total Return Trust Series 1 |
8,576,287 | 32,050,941 | ||||||
| Total Stock Market Index Trust Series 0 |
226,764 | 460,225 | ||||||
| Total Stock Market Index Trust Series 1 |
1,101,821 | 1,286,585 | ||||||
| Ultra Short Term Bond Trust Series 0 |
450,039 | 223,748 | ||||||
| Ultra Short Term Bond Trust Series 1 |
8,172 | 1,970 | ||||||
| U.S. Equity Trust Series 0 |
574,855 | 43,392 | ||||||
| U.S. Equity Trust Series 1 |
1,525,946 | 459,476 | ||||||
| Utilities Trust Series 0 |
358,569 | 277,312 | ||||||
| Utilities Trust Series 1 |
675,989 | 1,030,608 | ||||||
| Value Trust Series 0 |
188,900 | 51,466 | ||||||
| Value Trust Series 1 |
1,600,437 | 2,911,662 | ||||||
| All Asset Portfolio |
1,352,555 | 659,629 | ||||||
| Brandes International Equity Trust |
62,689 | 62,923 | ||||||
| Frontier Capital Appreciation Trust |
3,731,024 | 3,628,393 | ||||||
| Large Cap Growth Trust |
308,158 | 2,622 | ||||||
|
|
|
|
|
|||||
| $ | 490,798,525 | $ | 502,792,625 | |||||
|
|
|
|
|
|||||
75
Table of Contents
John Hancock Life Insurance Company (U.S.A.) Separate Account N
Notes to Financial Statements (continued)
| 7. | Transaction with Affiliates |
John Hancock Distributors LLC, a registered broker-dealer and wholly owned subsidiary of JHUSA, acts as the principal underwriter of the Contracts pursuant to a distribution agreement with the Company. Contracts are sold by registered representatives of either John Hancock Distributors LLC or other broker-dealers having distribution agreements with John Hancock Distributors LLC who are also authorized as variable life insurance agents under applicable state insurance laws. Registered representatives are compensated on a commission basis.
JHUSA has a formal service agreement with its ultimate parent company, MFC, which can be terminated by either party upon two months’ notice. Under this agreement, JHUSA pays for legal, actuarial, investment and certain other administrative services.
The majority of the investments held by the Account are invested in the Trust (Note 1).
Mortality and expense risks charges, as described in Note 3, are paid to JHUSA.
| 8. | Diversification Requirements |
The Internal Revenue Service has issued regulations under Section 817(h) of the Internal Revenue Code (the “Code”). Under the provisions of Section 817(h) of the Code, a variable life contract will not be treated as a life contract for federal tax purposes for any period for which the investments of the Account on which the contract is based are not adequately diversified. The Code provides that the “adequately diversified” requirement may be met if the underlying investments satisfy either a statutory safe harbour test or diversification requirements set forth in regulations issued by the Secretary of Treasury. JHUSA believes that the Account satisfies the current requirements of the regulations, and the Account will continue to meet such requirements.
| 9. | Subsequent Events |
In accordance with the provision set forth in FASB ASC Topic 855 - Subsequent Events (“ASC 855”), management has evaluated the possibility of subsequent events existing in the Account’s financial statements through March 28, 2013 and has determined that no events have occurred that require additional disclosure.
76
Table of Contents
John Hancock Life Insurance Company (U.S.A.) Separate Account N
Notes to Financial Statements (continued)
| 10. | Financial Highlights |
| Sub-Account | ||||||||||||||||||||
| 500 Index Trust B Series 0 | ||||||||||||||||||||
| Year Ended Dec. 31/12 |
Year Ended Dec. 31/11 |
Year Ended Dec. 31/10 |
Year Ended Dec. 31/09 |
Year Ended Dec. 31/08 |
||||||||||||||||
| Units, beginning of period |
1,390,856 | 1,290,604 | 1,301,021 | 1,219,448 | 1,025,869 | |||||||||||||||
| Units issued |
1,230,219 | 619,564 | 517,339 | 698,381 | 805,900 | |||||||||||||||
| Units redeemed |
(1,022,518 | ) | (519,312 | ) | (527,756 | ) | (616,808 | ) | (612,321 | ) | ||||||||||
|
|
|
|
|
|
|
|
|
|
|
|||||||||||
| Units, end of period |
1,598,557 | 1,390,856 | 1,290,604 | 1,301,021 | 1,219,448 | |||||||||||||||
|
|
|
|
|
|
|
|
|
|
|
|||||||||||
| Unit value, end of period $ |
16.90 to 28.52 | 14.50 to 24.63 | 14.53 to 24.18 | 12.77 to 21.05 | 10.17 to 16.66 | |||||||||||||||
| Assets, end of period $ |
38,999,373 | 29,723,881 | 26,434,250 | 22,312,778 | 16,165,681 | |||||||||||||||
| Investment income ratio* |
1.07 | % | 1.93 | % | 1.84 | % | 2.30 | % | 2.35 | % | ||||||||||
| Expense ratio, lowest to highest** |
0.00% to 0.70 | % | 0.00% to 0.70 | % | 0.00% to 0.70 | % | 0.00% to 0.65 | % | 0.00% to 0.65 | % | ||||||||||
| Total return, lowest to highest*** |
14.99% to 15.80 | % | 0.95% to 1.87 | % | 14.06% to 14.85 | % | 25.53% to 26.36 | % | (37.60%) to (37.19 | %) | ||||||||||
| Sub-Account | ||||||||||||||||||||
| 500 Index Trust Series 1 | ||||||||||||||||||||
| Year Ended Dec. 31/12 (t) |
Year Ended Dec. 31/11 |
Year Ended Dec. 31/10 |
Year Ended Dec. 31/09 |
Year Ended Dec. 31/08 |
||||||||||||||||
| Units, beginning of period |
101,308 | 481,864 | 622,022 | 1,495,132 | 1,964,200 | |||||||||||||||
| Units issued |
385,798 | 69,345 | 257,975 | 1,120,394 | 694,681 | |||||||||||||||
| Units redeemed |
(487,106 | ) | (449,901 | ) | (398,133 | ) | (1,993,504 | ) | (1,163,749 | ) | ||||||||||
|
|
|
|
|
|
|
|
|
|
|
|||||||||||
| Units, end of period |
— | 101,308 | 481,864 | 622,022 | 1,495,132 | |||||||||||||||
|
|
|
|
|
|
|
|
|
|
|
|||||||||||
| Unit value, end of period $ |
13.46 to 14.12 | 11.54 to 12.73 | 11.73 to 12.21 | 10.29 to 10.67 | 8.22 to 8.49 | |||||||||||||||
| Assets, end of period $ |
— | 1,221,762 | 5,812,898 | 6,527,296 | 12,533,893 | |||||||||||||||
| Investment income ratio* |
3.97 | % | 0.67 | % | 1.35 | % | 1.52 | % | 0.68 | % | ||||||||||
| Expense ratio, lowest to highest** |
0.25% to 0.65 | % | 0.00% to 0.65 | % | 0.25% to 0.65 | % | 0.25% to 0.65 | % | 0.25% to 0.65 | % | ||||||||||
| Total return, lowest to highest*** |
13.51% to 13.90 | % | 0.83% to 1.75 | % | 14.03% to 14.48 | % | 25.13% to 25.64 | % | (37.51%) to (37.26 | %) | ||||||||||
| (t) | Terminated as an investment option and funds transferred to 500 Index Trust B Series 0 on November 5, 2012. |
77
Table of Contents
John Hancock Life Insurance Company (U.S.A.) Separate Account N
Notes to Financial Statements (continued)
| 10. | Financial Highlights |
| Sub-Account | ||||||||||||||||||||
| Active Bond Trust Series 0 | ||||||||||||||||||||
| Year Ended Dec. 31/12 |
Year Ended Dec. 31/11 |
Year Ended Dec. 31/10 |
Year Ended Dec. 31/09 |
Year Ended Dec. 31/08 |
||||||||||||||||
| Units, beginning of period |
3,871 | 6,841 | 4,896 | 10,376 | 10,394 | |||||||||||||||
| Units issued |
61,998 | 2,108 | 4,921 | 3,279 | 13,837 | |||||||||||||||
| Units redeemed |
(62,256 | ) | (5,078 | ) | (2,976 | ) | (8,759 | ) | (13,855 | ) | ||||||||||
|
|
|
|
|
|
|
|
|
|
|
|||||||||||
| Units, end of period |
3,613 | 3,871 | 6,841 | 4,896 | 10,376 | |||||||||||||||
|
|
|
|
|
|
|
|
|
|
|
|||||||||||
| Unit value, end of period $ |
66.31 | 60.42 | 57.02 | 50.05 | 40.09 | |||||||||||||||
| Assets, end of period $ |
239,468 | 233,806 | 389,972 | 245,021 | 415,916 | |||||||||||||||
| Investment income ratio* |
4.25 | % | 4.23 | % | 10.01 | % | 4.48 | % | 5.06 | % | ||||||||||
| Expense ratio, lowest to highest** |
0.00 | % | 0.00 | % | 0.00 | % | 0.00 | % | 0.00 | % | ||||||||||
| Total return, lowest to highest*** |
9.76 | % | 5.97 | % | 13.91 | % | 24.86 | % | (10.48%) to (7.37 | %) | ||||||||||
| Sub-Account | ||||||||||||||||||||
| Active Bond Trust Series 1 | ||||||||||||||||||||
| Year Ended Dec. 31/12 |
Year Ended Dec. 31/11 |
Year Ended Dec. 31/10 |
Year Ended Dec. 31/09 |
Year Ended Dec. 31/08 |
||||||||||||||||
| Units, beginning of period |
52,039 | 83,593 | 86,344 | 67,710 | 141,516 | |||||||||||||||
| Units issued |
29,071 | 25,119 | 36,499 | 108,085 | 174,296 | |||||||||||||||
| Units redeemed |
(53,108 | ) | (56,673 | ) | (39,250 | ) | (89,451 | ) | (248,102 | ) | ||||||||||
|
|
|
|
|
|
|
|
|
|
|
|||||||||||
| Units, end of period |
28,002 | 52,039 | 83,593 | 86,344 | 67,710 | |||||||||||||||
|
|
|
|
|
|
|
|
|
|
|
|||||||||||
| Unit value, end of period $ |
19.38 to 20.05 | 17.48 to 18.56 | 16.91 to 17.34 | 14.95 to 15.19 | 12.06 to 12.21 | |||||||||||||||
| Assets, end of period $ |
543,833 | 926,985 | 1,419,732 | 1,297,722 | 820,988 | |||||||||||||||
| Investment income ratio* |
4.45 | % | 4.54 | % | 7.99 | % | 9.00 | % | 4.00 | % | ||||||||||
| Expense ratio, lowest to highest** |
0.20% to 0.65 | % | 0.00% to 0.65 | % | 0.20% to 0.65 | % | 0.30% to 0.65 | % | 0.30% to 0.65 | % | ||||||||||
| Total return, lowest to highest*** |
8.99% to 9.49 | % | 4.87% to 5.81 | % | 13.11% to 13.62 | % | 24.00% to 24.44 | % | (11.11%) to (10.80 | %) | ||||||||||
78
Table of Contents
John Hancock Life Insurance Company (U.S.A.) Separate Account N
Notes to Financial Statements (continued)
| 10. | Financial Highlights |
| Sub-Account | ||||||||||||||||||||
| All Asset Portfolio | ||||||||||||||||||||
| Year Ended Dec. 31/12 (bf) |
Year Ended Dec. 31/11 (bf) |
Year Ended Dec. 31/10 (bf) |
Year Ended Dec. 31/09 |
Year Ended Dec. 31/08 |
||||||||||||||||
| Units, beginning of period |
120,106 | 131,872 | 116,482 | 50,680 | 52,918 | |||||||||||||||
| Units issued |
74,562 | 43,749 | 69,869 | 97,260 | 51,452 | |||||||||||||||
| Units redeemed |
(37,842 | ) | (55,515 | ) | (54,479 | ) | (31,458 | ) | (53,690 | ) | ||||||||||
|
|
|
|
|
|
|
|
|
|
|
|||||||||||
| Units, end of period |
156,826 | 120,106 | 131,872 | 116,482 | 50,680 | |||||||||||||||
|
|
|
|
|
|
|
|
|
|
|
|||||||||||
| Unit value, end of period $ |
15.82 to 21.11 | 18.18 to 19.48 | 13.58 to 18.35 | 12.05 to 16.67 | 9.93 to 13.72 | |||||||||||||||
| Assets, end of period $ |
2,641,719 | 1,775,553 | 1,987,169 | 1,563,518 | 671,955 | |||||||||||||||
| Investment income ratio* |
4.87 | % | 6.34 | % | 6.94 | % | 9.51 | % | 5.40 | % | ||||||||||
| Expense ratio, lowest to highest** |
0.00% to 0.65 | % | 0.00% to 0.65 | % | 0.00% to 0.65 | % | 0.35% to 0.65 | % | 0.00% to 0.65 | % | ||||||||||
| Total return, lowest to highest*** |
13.90% to 14.65 | % | 0.75% to 1.66 | % | 11.98% to 12.71 | % | 20.52% to 20.89 | % | (16.71%) to (12.60 | %) | ||||||||||
| (bf) Fund has no Series. Previously presented as Series 0 and Series 1. |
| |||||||||||||||||||
| Sub-Account | ||||||||||||||||||||
| All Cap Core Trust Series 0 | ||||||||||||||||||||
| Year Ended Dec. 31/12 |
Year Ended Dec. 31/11 |
Year Ended Dec. 31/10 |
Year Ended Dec. 31/09 |
Year Ended Dec. 31/08 |
||||||||||||||||
| Units, beginning of period |
20,786 | 20,587 | 14,832 | 1,899 | 2,196 | |||||||||||||||
| Units issued |
43,314 | 5,406 | 7,798 | 15,567 | 207,065 | |||||||||||||||
| Units redeemed |
(4,795 | ) | (5,207 | ) | (2,043 | ) | (2,634 | ) | (207,362 | ) | ||||||||||
|
|
|
|
|
|
|
|
|
|
|
|||||||||||
| Units, end of period |
59,305 | 20,786 | 20,587 | 14,832 | 1,899 | |||||||||||||||
|
|
|
|
|
|
|
|
|
|
|
|||||||||||
| Unit value, end of period $ |
13.72 | 11.76 | 11.71 | 10.36 | 8.05 | |||||||||||||||
| Assets, end of period $ |
813,432 | 244,445 | 241,137 | 153,621 | 15,283 | |||||||||||||||
| Investment income ratio* |
1.24 | % | 1.09 | % | 1.26 | % | 2.08 | % | 1.09 | % | ||||||||||
| Expense ratio, lowest to highest** |
0.00 | % | 0.00 | % | 0.00 | % | 0.00 | % | 0.00 | % | ||||||||||
| Total return, lowest to highest*** |
16.62 | % | 0.40 | % | 13.09 | % | 28.61 | % | (39.60%) to (26.69 | %) | ||||||||||
79
Table of Contents
John Hancock Life Insurance Company (U.S.A.) Separate Account N
Notes to Financial Statements (continued)
| 10. | Financial Highlights |
| Sub-Account | ||||||||||||||||||||
| All Cap Core Trust Series 1 | ||||||||||||||||||||
| Year Ended Dec. 31/12 |
Year Ended Dec. 31/11 |
Year Ended Dec. 31/10 |
Year Ended Dec. 31/09 |
Year Ended Dec. 31/08 |
||||||||||||||||
| Units, beginning of period |
24,152 | 29,325 | 68,668 | 411,878 | 556,146 | |||||||||||||||
| Units issued |
28,690 | 14,019 | 4,369 | 79,155 | 155,444 | |||||||||||||||
| Units redeemed |
(32,269 | ) | (19,192 | ) | (43,712 | ) | (422,365 | ) | (299,712 | ) | ||||||||||
|
|
|
|
|
|
|
|
|
|
|
|||||||||||
| Units, end of period |
20,573 | 24,152 | 29,325 | 68,668 | 411,878 | |||||||||||||||
|
|
|
|
|
|
|
|
|
|
|
|||||||||||
| Unit value, end of |
19.72 to 20.68 | 9.50 to 18.40 | 17.08 to 17.78 | 15.29 to 15.77 | 11.98 to 12.31 | |||||||||||||||
| Assets, end of period $ |
408,071 | 413,811 | 504,744 | 1,059,003 | 5,019,487 | |||||||||||||||
| Investment income ratio* |
0.97 | % | 0.94 | % | 0.76 | % | 1.25 | % | 1.55 | % | ||||||||||
| Expense ratio, lowest to highest** |
0.30% to 0.70 | % | 0.00% to 0.65 | % | 0.30% to 0.70 | % | 0.30% to 0.65 | % | 0.30% to 0.65 | % | ||||||||||
| Total return, lowest to highest*** |
15.75% to 16.21 | % | (0.49%) to 0.41 | % | 12.25% to 12.70 | % | 27.62% to 28.08 | % | (40.02%) to (39.81 | %) | ||||||||||
| Sub-Account | ||||||||||||||||||||
| All Cap Value Trust Series 0 | ||||||||||||||||||||
| Year Ended Dec. 31/12 |
Year Ended Dec. 31/11 |
Year Ended Dec. 31/10 |
Year Ended Dec. 31/09 |
Year Ended Dec. 31/08 |
||||||||||||||||
| Units, beginning of period |
36,891 | 15,042 | 42,141 | 21,831 | 3,203 | |||||||||||||||
| Units issued |
43,228 | 33,908 | 24,757 | 44,155 | 22,505 | |||||||||||||||
| Units redeemed |
(8,817 | ) | (12,059 | ) | (51,856 | ) | (23,845 | ) | (3,877 | ) | ||||||||||
|
|
|
|
|
|
|
|
|
|
|
|||||||||||
| Units, end of period |
71,302 | 36,891 | 15,042 | 42,141 | 21,831 | |||||||||||||||
|
|
|
|
|
|
|
|
|
|
|
|||||||||||
| Unit value, end of |
15.60 | 14.06 | 14.67 | 12.38 | 9.78 | |||||||||||||||
| Assets, end of period $ |
1,111,990 | 518,670 | 220,669 | 521,779 | 213,526 | |||||||||||||||
| Investment income ratio* |
0.93 | % | 0.48 | % | 0.20 | % | 0.74 | % | 2.30 | % | ||||||||||
| Expense ratio, lowest to highest** |
0.00 | % | 0.00 | % | 0.00 | % | 0.00 | % | 0.00 | % | ||||||||||
| Total return, lowest to highest*** |
10.92 | % | (4.17 | %) | 18.50 | % | 26.59 | % | (28.80%) to (19.83 | %) | ||||||||||
80
Table of Contents
John Hancock Life Insurance Company (U.S.A.) Separate Account N
Notes to Financial Statements (continued)
| 10. | Financial Highlights |
| Sub-Account | ||||||||||||||||||||
| All Cap Value Trust Series 1 | ||||||||||||||||||||
| Year Ended Dec. 31/12 |
Year Ended Dec. 31/11 |
Year Ended Dec. 31/10 |
Year Ended Dec. 31/09 |
Year Ended Dec. 31/08 |
||||||||||||||||
| Units, beginning of period |
200,208 | 179,275 | 115,523 | 363,932 | 462,488 | |||||||||||||||
| Units issued |
100,075 | 70,122 | 129,563 | 33,538 | 67,408 | |||||||||||||||
| Units redeemed |
(178,261 | ) | (49,189 | ) | (65,811 | ) | (281,947 | ) | (165,964 | ) | ||||||||||
|
|
|
|
|
|
|
|
|
|
|
|||||||||||
| Units, end of period |
122,022 | 200,208 | 179,275 | 115,523 | 363,932 | |||||||||||||||
|
|
|
|
|
|
|
|
|
|
|
|||||||||||
| Unit value, end of |
19.99 to 21.07 | 17.66 to 19.44 | 19.05 to 19.90 | 16.21 to 16.71 | 12.88 to 13.23 | |||||||||||||||
| Assets, end of period $ |
2,510,933 | 3,713,797 | 3,492,399 | 1,904,662 | 4,771,874 | |||||||||||||||
| Investment income ratio* |
0.84 | % | 0.36 | % | 0.46 | % | 0.47 | % | 0.80 | % | ||||||||||
| Expense ratio, lowest to highest** |
0.20% to 0.65 | % | 0.00% to 0.65 | % | 0.20% to 0.65 | % | 0.30% to 0.65 | % | 0.30% to 0.65 | % | ||||||||||
| Total return, lowest to highest*** |
10.23% to 10.73 | % | (5.06%) to (4.21 | %) | 17.59% to 18.12 | % | 25.79% to 26.23 | % | (29.25%) to (28.99 | %) | ||||||||||
| Sub-Account | ||||||||||||||||
| Alpha Opportunities Trust Series 0 | ||||||||||||||||
| Year Ended Dec. 31/12 |
Year Ended Dec. 31/11 |
Year Ended Dec. 31/10 |
Year Ended Dec. 31/09 (ak) |
|||||||||||||
| Units, beginning of period |
818 | 324 | 15,886 | — | ||||||||||||
| Units issued |
380 | 513 | 379 | 15,886 | ||||||||||||
| Units redeemed |
(40 | ) | (19 | ) | (15,941 | ) | — | |||||||||
|
|
|
|
|
|
|
|
|
|||||||||
| Units, end of period |
1,158 | 818 | 324 | 15,886 | ||||||||||||
|
|
|
|
|
|
|
|
|
|||||||||
| Unit value, end of period $ |
16.63 | 13.70 | 14.89 | 12.73 | ||||||||||||
| Assets, end of period $ |
19,259 | 11,203 | 4,817 | 202,244 | ||||||||||||
| Investment income ratio* |
0.76 | % | 0.35 | % | 0.35 | % | 0.00 | % | ||||||||
| Expense ratio, lowest to highest** |
0.00 | % | 0.00 | % | 0.00 | % | 0.00 | % | ||||||||
| Total return, lowest to highest*** |
21.38 | % | (8.02 | %) | 16.98 | % | 27.31 | % | ||||||||
| (ak) | Reflects the period from commencement of operations on May 4, 2009 through December 31, 2009. |
81
Table of Contents
John Hancock Life Insurance Company (U.S.A.) Separate Account N
Notes to Financial Statements (continued)
| 10. | Financial Highlights |
| Sub-Account | ||||||||||||
| Alpha Opportunities Trust Series 1 | ||||||||||||
| Year Ended Dec. 31/12 |
Year Ended Dec. 31/11 |
Year Ended Dec. 31/10 (g) |
||||||||||
| Units, beginning of period |
1,009 | 68 | — | |||||||||
| Units issued |
1,675 | 958 | 70 | |||||||||
| Units redeemed |
(85 | ) | (17 | ) | (2 | ) | ||||||
|
|
|
|
|
|
|
|||||||
| Units, end of period |
2,599 | 1,009 | 68 | |||||||||
|
|
|
|
|
|
|
|||||||
| Unit value, end of period $ |
15.36 | 12.66 to 12.96 | 13.97 | |||||||||
| Assets, end of period $ |
39,931 | 12,862 | 949 | |||||||||
| Investment income ratio* |
0.67 | % | 0.62 | % | 0.70 | % | ||||||
| Expense ratio, lowest to highest** |
0.65 | % | 0.00% to 0.65 | % | 0.65 | % | ||||||
| Total return, lowest to highest*** |
20.55 | % | (8.96%) to (8.14 | %) | 16.17 | % | ||||||
| (g) Fund available in prior year but no activity. |
| |||||||||||
| Sub-Account | ||||||||||||||||||||
| American Asset Allocation Trust Series 1 | ||||||||||||||||||||
| Year Ended Dec. 31/12 |
Year Ended Dec. 31/11 |
Year Ended Dec. 31/10 |
Year Ended Dec. 31/09 |
Year Ended Dec. 31/08 (f) |
||||||||||||||||
| Units, beginning of period |
977,731 | 1,142,310 | 1,347,946 | 29,748 | — | |||||||||||||||
| Units issued |
58,651 | 119,383 | 228,225 | 1,527,333 | 30,140 | |||||||||||||||
| Units redeemed |
(280,284 | ) | (283,962 | ) | (433,861 | ) | (209,135 | ) | (392 | ) | ||||||||||
|
|
|
|
|
|
|
|
|
|
|
|||||||||||
| Units, end of period |
756,098 | 977,731 | 1,142,310 | 1,347,946 | 29,748 | |||||||||||||||
|
|
|
|
|
|
|
|
|
|
|
|||||||||||
| Unit value, end of period $ |
11.37 to 11.75 | 9.82 to 10.15 | 9.87 to 10.06 | 8.87 to 8.98 | 7.23 to 7.26 | |||||||||||||||
| Assets, end of period $ |
8,630,865 | 9,708,956 | 11,308,578 | 11,976,200 | 215,822 | |||||||||||||||
| Investment income ratio* |
1.43 | % | 1.40 | % | 1.53 | % | 2.77 | % | 8.19 | % | ||||||||||
| Expense ratio, lowest to highest** |
0.00% to 0.70 | % | 0.00% to 0.65 | % | 0.00% to 0.70 | % | 0.00% to 0.70 | % | 0.00% to 0.65 | % | ||||||||||
| Total return, lowest to highest*** |
14.95% to 15.77 | % | 0.01% to 0.91 | % | 11.27% to 12.07 | % | 22.75% to 23.61 | % | (27.71%) to (27.39 | %) | ||||||||||
| (f) | Reflects the period from commencement of operations on April 28, 2008 through December 31, 2008. |
82
Table of Contents
John Hancock Life Insurance Company (U.S.A.) Separate Account N
Notes to Financial Statements (continued)
| 10. | Financial Highlights |
| Sub-Account | ||||||||||||||||||||
| American Blue Chip Income and Growth Trust Series 1 | ||||||||||||||||||||
| Year Ended Dec. 31/12 (v) |
Year Ended Dec. 31/11 |
Year Ended Dec. 31/10 |
Year Ended Dec. 31/09 |
Year Ended Dec. 31/08 |
||||||||||||||||
| Units, beginning of period |
143,035 | 148,499 | 112,395 | 235,456 | 198,959 | |||||||||||||||
| Units issued |
21,887 | 51,321 | 69,650 | 114,968 | 219,437 | |||||||||||||||
| Units redeemed |
(164,922 | ) | (56,785 | ) | (33,546 | ) | (238,029 | ) | (182,940 | ) | ||||||||||
|
|
|
|
|
|
|
|
|
|
|
|||||||||||
| Units, end of period |
— | 143,035 | 148,499 | 112,395 | 235,456 | |||||||||||||||
|
|
|
|
|
|
|
|
|
|
|
|||||||||||
| Unit value, end of period $ |
13.19 to 18.54 | 16.28 to 17.57 | 11.92 to 16.95 | 10.64 to 15.23 | 8.36 to 12.04 | |||||||||||||||
| Assets, end of |
— | 2,148,343 | 2,262,559 | 1,502,607 | 2,652,929 | |||||||||||||||
| Investment income ratio* |
0.00 | % | 1.36 | % | 1.60 | % | 1.30 | % | 4.38 | % | ||||||||||
| Expense ratio, lowest to highest** |
0.00% to 0.65 | % | 0.00% to 0.65 | % | 0.00% to 0.65 | % | 0.00% to 0.65 | % | 0.00% to 0.65 | % | ||||||||||
| Total return, lowest to highest*** |
11.54% to 12.15 | % | (2.18%) to (1.29 | %) | 11.29% to 12.02 | % | 26.52% to 27.32 | % | (37.14%) to (36.72 | %) | ||||||||||
| (v) | Terminated as an investment option and funds transferred to American Growth-Income Trust Series 1 on November 5, 2012. |
| Sub-Account | ||||||||||||
| American Global Growth Trust Series 1 | ||||||||||||
| Year Ended Dec. 31/12 |
Year Ended Dec. 31/11 |
Year Ended Dec. 31/10 (bd) |
||||||||||
| Units, beginning of period |
37,700 | 30,482 | — | |||||||||
| Units issued |
9,306 | 7,284 | 30,482 | |||||||||
| Units redeemed |
(12,718 | ) | (66 | ) | — | |||||||
|
|
|
|
|
|
|
|||||||
| Units, end of period |
34,288 | 37,700 | 30,482 | |||||||||
|
|
|
|
|
|
|
|||||||
| Unit value, end of period $ |
11.04 to 11.19 | 9.07 to 9.17 | 10.09 to 10.10 | |||||||||
| Assets, end of period $ |
380,096 | 343,828 | 307,651 | |||||||||
| Investment income ratio* |
0.50 | % | 1.06 | % | 6.23 | % | ||||||
| Expense ratio, lowest to highest** |
0.00% to 0.65 | % | 0.00% to 0.65 | % | 0.00% to 0.65 | % | ||||||
| Total return, lowest to highest*** |
21.33% to 22.12 | % | (10.05%) to (9.24 | %) | 0.90% to 0.99 | % | ||||||
| (bd) | Reflects the period from commencement of operations on November 8, 2010 through December 31, 2010. |
83
Table of Contents
John Hancock Life Insurance Company (U.S.A.) Separate Account N
Notes to Financial Statements (continued)
| 10. | Financial Highlights |
| Sub-Account | ||||||||
| American Global Small Capitalization Trust Series 1 |
||||||||
| Year Ended Dec. 31/12 |
Year Ended Dec. 31/11 (g) |
|||||||
| Units, beginning of period |
3,085 | — | ||||||
| Units issued |
6,926 | 7,101 | ||||||
| Units redeemed |
(5,214 | ) | (4,016 | ) | ||||
|
|
|
|
|
|||||
| Units, end of period |
4,797 | 3,085 | ||||||
|
|
|
|
|
|||||
| Unit value, end of period $ |
9.51 to 9.64 | 8.10 to 8.19 | ||||||
| Assets, end of period $ |
46,142 | 25,273 | ||||||
| Investment income ratio* |
1.13 | % | 1.64 | % | ||||
| Expense ratio, lowest to highest** |
0.00% to 0.65 | % | 0.00% to 0.65 | % | ||||
| Total return, lowest to highest*** |
16.95% to 17.71 | % | (20.15%) to (19.43 | %) | ||||
| (g) | Fund available in prior year but no activity. |
| Sub-Account | ||||||||||||||||||||
| American Growth Trust Series 1 | ||||||||||||||||||||
| Year Ended Dec. 31/12 |
Year Ended Dec. 31/11 |
Year Ended Dec. 31/10 |
Year Ended Dec. 31/09 |
Year Ended Dec. 31/08 |
||||||||||||||||
| Units, beginning of period |
942,082 | 1,150,584 | 1,055,312 | 1,656,204 | 1,130,158 | |||||||||||||||
| Units issued |
364,673 | 220,746 | 602,474 | 1,119,034 | 1,206,254 | |||||||||||||||
| Units redeemed |
(574,961 | ) | (429,248 | ) | (507,202 | ) | (1,719,926 | ) | (680,208 | ) | ||||||||||
|
|
|
|
|
|
|
|
|
|
|
|||||||||||
| Units, end of period |
731,794 | 942,082 | 1,150,584 | 1,055,312 | 1,656,204 | |||||||||||||||
|
|
|
|
|
|
|
|
|
|
|
|||||||||||
| Unit value, end of period $ |
15.11 to 21.39 | 17.93 to 19.36 | 13.48 to 19.34 | 11.40 to 16.46 | 8.21 to 11.93 | |||||||||||||||
| Assets, end of |
13,000,429 | 15,091,745 | 19,293,612 | 15,119,166 | 18,483,137 | |||||||||||||||
| Investment income ratio* |
0.38 | % | 0.21 | % | 0.36 | % | 0.25 | % | 2.08 | % | ||||||||||
| Expense ratio, lowest to highest** |
0.00% to 0.65 | % | 0.00% to 0.65 | % | 0.00% to 0.65 | % | 0.00% to 0.65 | % | 0.00% to 0.65 | % | ||||||||||
| Total return, lowest to highest*** |
16.73% to 17.49 | % | (5.48%) to (4.63 | %) | 17.47% to 18.24 | % | 37.98% to 38.87 | % | (44.56%) to (44.20 | %) | ||||||||||
84
Table of Contents
John Hancock Life Insurance Company (U.S.A.) Separate Account N
Notes to Financial Statements (continued)
| 10. | Financial Highlights |
| Sub-Account | ||||||||||||||||||||
| American Growth-Income Trust Series 1 | ||||||||||||||||||||
| Year Ended Dec. 31/12 |
Year Ended Dec. 31/11 |
Year Ended Dec. 31/10 |
Year Ended Dec. 31/09 |
Year Ended Dec. 31/08 |
||||||||||||||||
| Units, beginning of period |
647,424 | 687,527 | 839,780 | 158,070 | 246,940 | |||||||||||||||
| Units issued |
462,947 | 275,600 | 90,377 | 957,864 | 282,920 | |||||||||||||||
| Units redeemed |
(565,675 | ) | (315,703 | ) | (242,630 | ) | (276,154 | ) | (371,790 | ) | ||||||||||
|
|
|
|
|
|
|
|
|
|
|
|||||||||||
| Units, end of period |
544,696 | 647,424 | 687,527 | 839,780 | 158,070 | |||||||||||||||
|
|
|
|
|
|
|
|
|
|
|
|||||||||||
| Unit value, end of period $ |
13.62 to 19.02 | 16.08 to 17.35 | 11.87 to 16.82 | 10.69 to 15.25 | 8.17 to 11.77 | |||||||||||||||
| Assets, end of |
9,568,162 | 10,080,686 | 11,141,813 | 12,417,690 | 1,533,150 | |||||||||||||||
| Investment income ratio* |
1.22 | % | 1.15 | % | 1.03 | % | 1.61 | % | 1.08 | % | ||||||||||
| Expense ratio, lowest to highest** |
0.00% to 0.70 | % | 0.00% to 0.65 | % | 0.00% to 0.70 | % | 0.00% to 0.70 | % | 0.00% to 0.65 | % | ||||||||||
| Total return, lowest to highest*** |
16.33% to 17.16 | % | (2.97%) to (2.09 | %) | 10.28% to 11.06 | % | 29.88% to 30.79 | % | (38.48%) to (38.08 | %) | ||||||||||
| Sub-Account | ||||||||
| American High-Income Bond Trust Series 1 |
||||||||
| Year Ended Dec. 31/12 |
Year Ended Dec. 31/11 (g) |
|||||||
| Units, beginning of period |
1,731 | — | ||||||
| Units issued |
2,182 | 4,254 | ||||||
| Units redeemed |
(945 | ) | (2,523 | ) | ||||
|
|
|
|
|
|||||
| Units, end of period |
2,968 | 1,731 | ||||||
|
|
|
|
|
|||||
| Unit value, end of period $ |
11.34 to 11.49 | 10.06 to 10.16 | ||||||
| Assets, end of period $ |
33,846 | 17,482 | ||||||
| Investment income ratio* |
7.33 | % | 14.92 | % | ||||
| Expense ratio, lowest to highest** |
0.00% to 0.65 | % | 0.00% to 0.65 | % | ||||
| Total return, lowest to highest*** |
12.38% to 13.11 | % | 0.55% to 1.46 | % | ||||
| (g) | Fund available in prior year but no activity. |
85
Table of Contents
John Hancock Life Insurance Company (U.S.A.) Separate Account N
Notes to Financial Statements (continued)
| 10. | Financial Highlights |
| Sub-Account | ||||||||||||||||||||
| American International Trust Series 1 | ||||||||||||||||||||
| Year Ended Dec. 31/12 |
Year Ended Dec. 31/11 |
Year Ended Dec. 31/10 |
Year Ended Dec. 31/09 |
Year Ended Dec. 31/08 |
||||||||||||||||
| Units, beginning of period |
1,290,175 | 1,471,085 | 1,474,064 | 1,592,548 | 1,766,825 | |||||||||||||||
| Units issued |
341,326 | 267,335 | 680,229 | 761,348 | 777,351 | |||||||||||||||
| Units redeemed |
(744,971 | ) | (448,245 | ) | (683,208 | ) | (879,832 | ) | (951,628 | ) | ||||||||||
|
|
|
|
|
|
|
|
|
|
|
|||||||||||
| Units, end of period |
886,530 | 1,290,175 | 1,471,085 | 1,474,064 | 1,592,548 | |||||||||||||||
|
|
|
|
|
|
|
|
|
|
|
|||||||||||
| Unit value, end of |
15.55 to 25.75 | 21.60 to 23.31 | 15.45 to 25.92 | 14.46 to 24.41 | 10.14 to 17.23 | |||||||||||||||
| Assets, end of |
16,145,508 | 22,460,044 | 30,600,335 | 28,772,677 | 22,506,461 | |||||||||||||||
| Investment income ratio* |
0.99 | % | 1.28 | % | 1.68 | % | 1.14 | % | 3.64 | % | ||||||||||
| Expense ratio, lowest to highest** |
0.00% to 0.65 | % | 0.00% to 0.65 | % | 0.00% to 0.65 | % | 0.00% to 0.65 | % | 0.00% to 0.65 | % | ||||||||||
| Total return, lowest to highest*** |
16.73% to 17.50 | % | (15.11%) to (14.34 | %) | 6.19% to 6.88 | % | 41.67% to 42.58 | % | (42.74%) to (42.37 | %) | ||||||||||
| Sub-Account | ||||||||||||||||
| American New World Trust Series 1 | ||||||||||||||||
| Year Ended Dec. 31/12 |
Year Ended Dec. 31/11 |
Year Ended Dec. 31/10 |
Year Ended Dec. 31/09 (ak) |
|||||||||||||
| Units, beginning of period |
37,149 | 35,679 | 1,441 | — | ||||||||||||
| Units issued |
21,231 | 8,115 | 49,000 | 1,900 | ||||||||||||
| Units redeemed |
(12,557 | ) | (6,645 | ) | (14,762 | ) | (459 | ) | ||||||||
|
|
|
|
|
|
|
|
|
|||||||||
| Units, end of period |
45,823 | 37,149 | 35,679 | 1,441 | ||||||||||||
|
|
|
|
|
|
|
|
|
|||||||||
| Unit value, end of period $ |
15.40 to 15.77 | 13.12 to 13.44 | 15.52 to 15.69 | 13.30 to 13.36 | ||||||||||||
| Assets, end of period $ |
714,892 | 493,337 | 556,143 | 19,195 | ||||||||||||
| Investment income ratio* |
0.72 | % | 1.48 | % | 3.05 | % | 4.29 | % | ||||||||
| Expense ratio, lowest to highest** |
0.00% to 0.65 | % | 0.00% to 0.65 | % | 0.00% to 0.65 | % | 0.00% to 0.65 | % | ||||||||
| Total return, lowest to highest*** |
16.60% to 17.37 | % | (15.10%) to (14.33 | %) | 16.67% to 17.43 | % | 33.01% to 33.58 | % | ||||||||
| (ak) | Reflects the period from commencement of operations on May 4, 2009 through December 31, 2009. |
86
Table of Contents
John Hancock Life Insurance Company (U.S.A.) Separate Account N
Notes to Financial Statements (continued)
| 10. | Financial Highlights |
| Sub-Account | ||||||||||||||||
| Balanced Trust Series 0 | ||||||||||||||||
| Year Ended Dec. 31/12 (j) |
Year Ended Dec. 31/11 |
Year Ended Dec. 31/10 |
Year Ended Dec. 31/09 (ak) |
|||||||||||||
| Units, beginning of period |
4,365 | 3,150 | 1,515 | — | ||||||||||||
| Units issued |
426 | 1,930 | 2,068 | 1,520 | ||||||||||||
| Units redeemed |
(4,791 | ) | (715 | ) | (433 | ) | (5 | ) | ||||||||
|
|
|
|
|
|
|
|
|
|||||||||
| Units, end of period |
— | 4,365 | 3,150 | 1,515 | ||||||||||||
|
|
|
|
|
|
|
|
|
|||||||||
| Unit value, end of period $ |
14.73 | 13.57 | 13.41 | 11.91 | ||||||||||||
| Assets, end of period $ |
— | 59,218 | 42,254 | 18,049 | ||||||||||||
| Investment income ratio* |
4.49 | % | 1.70 | % | 1.18 | % | 4.81 | % | ||||||||
| Expense ratio, lowest to highest** |
0.00 | % | 0.00 | % | 0.00 | % | 0.00 | % | ||||||||
| Total return, lowest to highest*** |
8.57 | % | 1.13 | % | 12.63 | % | 19.11 | % | ||||||||
| (j) Terminated as an investment option and funds transferred to Lifestyle Growth Trust on April 30, 2012. |
| |||||||||||||||
| (ak) Reflects the period from commencement of operations on May 4, 2009 through December 31, 2009. |
| |||||||||||||||
| Sub-Account | ||||||||||||
| Balanced Trust Series 1 | ||||||||||||
| Year Ended Dec. 31/12 (j) |
Year Ended Dec. 31/11 |
Year Ended Dec. 31/10 (g) |
||||||||||
| Units, beginning of period |
1,927 | 2,660 | — | |||||||||
| Units issued |
52 | 1,419 | 2,668 | |||||||||
| Units redeemed |
(1,979 | ) | (2,152 | ) | (8 | ) | ||||||
|
|
|
|
|
|
|
|||||||
| Units, end of period |
— | 1,927 | 2,660 | |||||||||
|
|
|
|
|
|
|
|||||||
| Unit value, end of period $ |
14.42 | 13.22 to 13.54 | 13.26 | |||||||||
| Assets, end of period $ |
— | 25,637 | 35,267 | |||||||||
| Investment income ratio* |
4.33 | % | 1.76 | % | 2.12 | % | ||||||
| Expense ratio, lowest to highest** |
0.65 | % | 0.00% to 0.65 | % | 0.65 | % | ||||||
| Total return, lowest to highest*** |
8.38 | % | 0.11% to 1.01 | % | 11.86 | % | ||||||
| (j) | Terminated as an investment option and funds transferred to Lifestyle Growth Trust on April 30, 2012. |
| (g) | Fund available in prior year but no activity. |
87
Table of Contents
John Hancock Life Insurance Company (U.S.A.) Separate Account N
Notes to Financial Statements (continued)
| 10. | Financial Highlights |
| Sub-Account | ||||||||||||||||||||
| Blue Chip Growth Trust Series 0 | ||||||||||||||||||||
| Year Ended Dec. 31/12 |
Year Ended Dec. 31/11 |
Year Ended Dec. 31/10 |
Year Ended Dec. 31/09 |
Year Ended Dec. 31/08 |
||||||||||||||||
| Units, beginning of period |
215,060 | 198,638 | 151,164 | 51,156 | 31,993 | |||||||||||||||
| Units issued |
75,023 | 128,002 | 83,088 | 127,285 | 35,457 | |||||||||||||||
| Units redeemed |
(81,087 | ) | (111,580 | ) | (35,614 | ) | (27,277 | ) | (16,294 | ) | ||||||||||
|
|
|
|
|
|
|
|
|
|
|
|||||||||||
| Units, end of period |
208,996 | 215,060 | 198,638 | 151,164 | 51,156 | |||||||||||||||
|
|
|
|
|
|
|
|
|
|
|
|||||||||||
| Unit value, end of period $ |
79.24 | 66.93 | 65.97 | 56.75 | 39.69 | |||||||||||||||
| Assets, end of period $ |
16,560,343 | 14,393,613 | 13,104,521 | 8,578,346 | 2,030,472 | |||||||||||||||
| Investment income ratio* |
0.14 | % | 0.01 | % | 0.09 | % | 0.19 | % | 0.47 | % | ||||||||||
| Expense ratio, lowest to highest** |
0.00 | % | 0.00 | % | 0.00 | % | 0.00 | % | 0.00 | % | ||||||||||
| Total return, lowest to highest*** |
18.39 | % | 1.45 | % | 16.25 | % | 42.97 | % | (42.52%) to (28.71 | %) | ||||||||||
| Sub-Account | ||||||||||||||||||||
| Blue Chip Growth Trust Series 1 | ||||||||||||||||||||
| Year Ended Dec. 31/12 |
Year Ended Dec. 31/11 |
Year Ended Dec. 31/10 |
Year Ended Dec. 31/09 |
Year Ended Dec. 31/08 |
||||||||||||||||
| Units, beginning of period |
415,800 | 503,904 | 691,737 | 759,580 | 996,389 | |||||||||||||||
| Units issued |
59,930 | 150,811 | 306,704 | 334,151 | 442,153 | |||||||||||||||
| Units redeemed |
(286,879 | ) | (238,915 | ) | (494,537 | ) | (401,994 | ) | (678,962 | ) | ||||||||||
|
|
|
|
|
|
|
|
|
|
|
|||||||||||
| Units, end of period |
188,851 | 415,800 | 503,904 | 691,737 | 759,580 | |||||||||||||||
|
|
|
|
|
|
|
|
|
|
|
|||||||||||
| Unit value, end of period $ |
29.18 to 30.99 | 13.51 to 26.83 | 24.66 to 25.92 | 21.48 to 22.26 | 15.13 to 15.62 | |||||||||||||||
| Assets, end of period $ |
5,515,169 | 10,454,276 | 12,605,486 | 13,629,384 | 10,660,570 | |||||||||||||||
| Investment income ratio* |
0.09 | % | 0.01 | % | 0.08 | % | 0.13 | % | 0.30 | % | ||||||||||
| Expense ratio, lowest to highest** |
0.20% to 0.70 | % | 0.00% to 0.65 | % | 0.20% to 0.70 | % | 0.25% to 0.65 | % | 0.25% to 0.65 | % | ||||||||||
| Total return, lowest to highest*** |
17.49% to 18.08 | % | 0.53% to 1.44 | % | 15.34% to 15.92 | % | 41.96% to 42.54 | % | (42.91%) to (42.68 | %) | ||||||||||
88
Table of Contents
John Hancock Life Insurance Company (U.S.A.) Separate Account N
Notes to Financial Statements (continued)
| 10. | Financial Highlights |
| Sub-Account | ||||||||
| Bond Trust Series 0 | ||||||||
| Year Ended Dec. 31/12 |
Year Ended Dec. 31/11 (c) |
|||||||
| Units, beginning of period |
45,046 | — | ||||||
| Units issued |
76,163 | 45,553 | ||||||
| Units redeemed |
(37,566 | ) | (507 | ) | ||||
|
|
|
|
|
|||||
| Units, end of period |
83,643 | 45,046 | ||||||
|
|
|
|
|
|||||
| Unit value, end of period $ |
10.72 | 10.08 | ||||||
| Assets, end of period $ |
896,492 | 454,140 | ||||||
| Investment income ratio* |
3.96 | % | 14.78 | % | ||||
| Expense ratio, lowest to highest** |
0.00 | % | 0.00 | % | ||||
| Total return, lowest to highest*** |
6.31 | % | 0.82 | % | ||||
| (c) Reflects the period from commencement of operations on October 31, 2011 through December 31, 2011. |
| |||||||
| Sub-Account | ||||||||
| Bond Trust Series 1 | ||||||||
| Year Ended Dec. 31/12 |
Year Ended Dec. 31/11 (c) |
|||||||
| Units, beginning of period |
122,304 | — | ||||||
| Units issued |
9,043 | 126,358 | ||||||
| Units redeemed |
(90,715 | ) | (4,054 | ) | ||||
|
|
|
|
|
|||||
| Units, end of period |
40,632 | 122,304 | ||||||
|
|
|
|
|
|||||
| Unit value, end of period $ |
10.63 to 10.69 | 10.06 to 10.08 | ||||||
| Assets, end of period $ |
433,780 | 1,231,681 | ||||||
| Investment income ratio* |
2.83 | % | 14.34 | % | ||||
| Expense ratio, lowest to highest** |
0.20% to 0.65 | % | 0.00% to 0.65 | % | ||||
| Total return, lowest to highest*** |
5.64% to 6.10 | % | 0.62% to 0.78 | % | ||||
| (c) | Reflects the period from commencement of operations on October 31, 2011 through December 31, 2011. |
89
Table of Contents
John Hancock Life Insurance Company (U.S.A.) Separate Account N
Notes to Financial Statements (continued)
| 10. | Financial Highlights |
| Sub-Account | ||||
| Brandes International Equity Trust | ||||
| Year Ended Dec. 31/12 (g) |
||||
| Units, beginning of period |
— | |||
| Units issued |
2,250 | |||
| Units redeemed |
(2,250 | ) | ||
|
|
|
|||
| Units, end of period |
— | |||
|
|
|
|||
| Unit value, end of period $ |
30.57 | |||
| Assets, end of period $ |
— | |||
| Investment income ratio* |
0.00 | % | ||
| Expense ratio, lowest to highest** |
0.00 | % | ||
| Total return, lowest to highest*** |
20.68 | % | ||
| (g) Fund available in prior year but no activity. |
| |||||||||||||||||||
| Sub-Account | ||||||||||||||||||||
| Capital Appreciation Trust Series 0 | ||||||||||||||||||||
| Year Ended Dec. 31/12 |
Year Ended Dec. 31/11 |
Year Ended Dec. 31/10 |
Year Ended Dec. 31/09 |
Year Ended Dec. 31/08 |
||||||||||||||||
| Units, beginning of period |
41,055 | 31,367 | 22,064 | 13,784 | 15,717 | |||||||||||||||
| Units issued |
20,234 | 19,021 | 17,891 | 23,788 | 80,292 | |||||||||||||||
| Units redeemed |
(7,182 | ) | (9,333 | ) | (8,588 | ) | (15,508 | ) | (82,225 | ) | ||||||||||
|
|
|
|
|
|
|
|
|
|
|
|||||||||||
| Units, end of period |
54,107 | 41,055 | 31,367 | 22,064 | 13,784 | |||||||||||||||
|
|
|
|
|
|
|
|
|
|
|
|||||||||||
| Unit value, end of period $ |
16.13 | 13.90 | 13.88 | 12.41 | 8.72 | |||||||||||||||
| Assets, end of period $ |
872,628 | 570,658 | 435,495 | 273,810 | 120,161 | |||||||||||||||
| Investment income ratio* |
0.22 | % | 0.12 | % | 0.22 | % | 0.31 | % | 0.21 | % | ||||||||||
| Expense ratio, lowest to highest** |
0.00 | % | 0.00 | % | 0.00 | % | 0.00 | % | 0.00 | % | ||||||||||
| Total return, lowest to highest*** |
16.03 | % | 0.11 | % | 11.88 | % | 42.35 | % | (37.24%) to (23.78 | %) | ||||||||||
90
Table of Contents
John Hancock Life Insurance Company (U.S.A.) Separate Account N
Notes to Financial Statements (continued)
| 10. | Financial Highlights |
| Sub-Account | ||||||||||||||||||||
| Capital Appreciation Trust Series 1 | ||||||||||||||||||||
| Year Ended | Year Ended | Year Ended | Year Ended | Year Ended | ||||||||||||||||
| Dec. 31/12 | Dec. 31/11 | Dec. 31/10 | Dec. 31/09 | Dec. 31/08 | ||||||||||||||||
| Units, beginning of period |
310,510 | 315,408 | 321,766 | 533,714 | 579,428 | |||||||||||||||
| Units issued |
37,277 | 94,547 | 259,764 | 300,813 | 275,841 | |||||||||||||||
| Units redeemed |
(180,959 | ) | (99,445 | ) | (266,122 | ) | (512,761 | ) | (321,555 | ) | ||||||||||
|
|
|
|
|
|
|
|
|
|
|
|||||||||||
| Units, end of period |
166,828 | 310,510 | 315,408 | 321,766 | 533,714 | |||||||||||||||
|
|
|
|
|
|
|
|
|
|
|
|||||||||||
| Unit value, end of period $ |
15.15 to 16.06 | 12.88 to 14.18 | 13.24 to 13.89 | 11.97 to 12.34 | 8.47 to 8.70 | |||||||||||||||
| Assets, end of period $ |
2,598,498 | 4,191,442 | 4,281,555 | 3,898,184 | 4,582,828 | |||||||||||||||
| Investment income ratio* |
0.15 | % | 0.07 | % | 0.13 | % | 0.24 | % | 0.45 | % | ||||||||||
| Expense ratio, lowest to highest** |
0.20% to 0.70 | % | 0.00% to 0.65 | % | 0.20% to 0.70 | % | 0.30% to 0.65 | % | 0.30% to 0.65 | % | ||||||||||
| Total return, lowest to highest*** |
15.16% to 15.75 | % | (0.82%) to 0.07 | % | 11.05% to 11.61 | % | 41.37% to 41.87 | % | (37.63%) to (37.42 | %) | ||||||||||
| Sub-Account | ||||||||||||||||
| Capital Appreciation Value Trust Series 0 | ||||||||||||||||
| Year Ended Dec. 31/12 |
Year Ended Dec. 31/11 |
Year Ended Dec. 31/10 |
Year Ended Dec. 31/09 (g) |
|||||||||||||
| Units, beginning of period |
292 | 23,931 | 15,751 | — | ||||||||||||
| Units issued |
193,310 | 161 | 9,722 | 16,050 | ||||||||||||
| Units redeemed |
(190,106 | ) | (23,800 | ) | (1,542 | ) | (299 | ) | ||||||||
|
|
|
|
|
|
|
|
|
|||||||||
| Units, end of period |
3,496 | 292 | 23,931 | 15,751 | ||||||||||||
|
|
|
|
|
|
|
|
|
|||||||||
| Unit value, end of period $ |
12.76 | 11.12 | 10.79 | 9.47 | ||||||||||||
| Assets, end of period $ |
44,611 | 3,254 | 258,101 | 149,143 | ||||||||||||
| Investment income ratio* |
1.63 | % | 0.12 | % | 2.04 | % | 17.30 | % | ||||||||
| Expense ratio, lowest to highest** |
0.00 | % | 0.00 | % | 0.00 | % | 0.00 | % | ||||||||
| Total return, lowest to highest*** |
14.77 | % | 3.09 | % | 13.91 | % | 30.26 | % | ||||||||
| (g) | Fund available in prior year but no activity. |
91
Table of Contents
John Hancock Life Insurance Company (U.S.A.) Separate Account N
Notes to Financial Statements (continued)
| 10. | Financial Highlights |
| Sub-Account | ||||||||||||||||||||
| Capital Appreciation Value Trust Series 1 | ||||||||||||||||||||
| Year Ended Dec. 31/12 |
Year Ended Dec. 31/11 |
Year Ended Dec. 31/10 |
Year Ended Dec. 31/09 |
Year Ended Dec. 31/08 (f) |
||||||||||||||||
| Units, beginning of period |
39,327 | 52,030 | 2,458 | 407 | — | |||||||||||||||
| Units issued |
24,283 | 7,209 | 61,199 | 2,153 | 422 | |||||||||||||||
| Units redeemed |
(36,508 | ) | (19,912 | ) | (11,627 | ) | (102 | ) | (15 | ) | ||||||||||
|
|
|
|
|
|
|
|
|
|
|
|||||||||||
| Units, end of period |
27,102 | 39,327 | 52,030 | 2,458 | 407 | |||||||||||||||
|
|
|
|
|
|
|
|
|
|
|
|||||||||||
| Unit value, end of period $ |
12.36 to 12.53 | 10.75 to 11.12 | 10.59 to 10.67 | 9.36 | 7.23 | |||||||||||||||
| Assets, end of period $ |
339,289 | 430,096 | 553,917 | 23,009 | 2,947 | |||||||||||||||
| Investment income ratio* |
1.41 | % | 1.25 | % | 2.45 | % | 7.80 | % | 3.95 | % | ||||||||||
| Expense ratio, lowest to highest** |
0.35% to 0.65 | % | 0.00% to 0.65 | % | 0.40% to 0.65 | % | 0.65 | % | 0.65 | % | ||||||||||
| Total return, lowest to highest*** |
13.86% to 14.19 | % | 2.21% to 3.13 | % | 13.21% to 13.49 | % | 29.36 | % | (27.66 | %) | ||||||||||
| (f) | Reflects the period from commencement of operations on April 28, 2008 through December 31, 2008. |
| Sub-Account | ||||||||||||
| Core Allocation Plus Trust Series 0 | ||||||||||||
| Year Ended Dec. 31/12 |
Year Ended Dec. 31/11 |
Year Ended Dec. 31/10 (g) |
||||||||||
| Units, beginning of period |
2,275 | 621 | — | |||||||||
| Units issued |
3,081 | 1,705 | 634 | |||||||||
| Units redeemed |
(1,215 | ) | (51 | ) | (13 | ) | ||||||
|
|
|
|
|
|
|
|||||||
| Units, end of period |
4,141 | 2,275 | 621 | |||||||||
|
|
|
|
|
|
|
|||||||
| Unit value, end of period $ |
10.63 | 9.36 | 9.58 | |||||||||
| Assets, end of period $ |
44,019 | 21,301 | 5,951 | |||||||||
| Investment income ratio* |
1.79 | % | 2.24 | % | 2.36 | % | ||||||
| Expense ratio, lowest to highest** |
0.00 | % | 0.00 | % | 0.00 | % | ||||||
| Total return, lowest to highest*** |
13.53 | % | (2.26 | %) | 10.57 | % | ||||||
| (g) Fund available in prior year but no activity. |
||||||||||||
92
Table of Contents
John Hancock Life Insurance Company (U.S.A.) Separate Account N
Notes to Financial Statements (continued)
| 10. | Financial Highlights |
| Sub-Account | ||||||||||||||||
| Core Allocation Plus Trust Series 1 | ||||||||||||||||
| Year Ended Dec. 31/12 |
Year Ended Dec. 31/11 |
Year Ended Dec. 31/10 |
Year
Ended Dec. 31/09 (g) |
|||||||||||||
| Units, beginning of period |
457,013 | 561,892 | 581,747 | — | ||||||||||||
| Units issued |
1,322 | — | 310,318 | 609,771 | ||||||||||||
| Units redeemed |
(331,586 | ) | (104,879 | ) | (330,173 | ) | (28,024 | ) | ||||||||
|
|
|
|
|
|
|
|
|
|||||||||
| Units, end of period |
126,749 | 457,013 | 561,892 | 581,747 | ||||||||||||
|
|
|
|
|
|
|
|
|
|||||||||
| Unit value, end of period $ |
10.36 to 10.46 | 9.04 to 9.34 | 9.43 to 9.48 | 8.58 to 8.61 | ||||||||||||
| Assets, end of period $ |
1,324,363 | 4,215,840 | 5,323,691 | 4,999,225 | ||||||||||||
| Investment income ratio* |
0.90 | % | 1.22 | % | 1.14 | % | 3.03 | % | ||||||||
| Expense ratio, lowest to highest** |
0.30% to 0.50 | % | 0.00% to 0.65 | % | 0.30% to 0.50 | % | 0.30% to 0.50 | % | ||||||||
| Total return, lowest to highest*** |
13.01% to 13.25 | % | (3.19%) to (2.32 | %) | 9.95% to 10.17 | % | 24.57% to 24.81 | % | ||||||||
| (g) | Fund available in prior year but no activity. |
| Sub-Account | ||||||||||||||||||||
| Core Bond Trust Series 0 | ||||||||||||||||||||
| Year Ended Dec. 31/12 |
Year Ended Dec. 31/11 |
Year Ended Dec. 31/10 |
Year Ended Dec. 31/09 |
Year Ended Dec. 31/08 (g) |
||||||||||||||||
| Units, beginning of period |
40,704 | 50,392 | 8,529 | 265 | — | |||||||||||||||
| Units issued |
50,447 | 10,634 | 43,634 | 9,696 | 523 | |||||||||||||||
| Units redeemed |
(40,655 | ) | (20,322 | ) | (1,771 | ) | (1,432 | ) | (258 | ) | ||||||||||
|
|
|
|
|
|
|
|
|
|
|
|||||||||||
| Units, end of period |
50,496 | 40,704 | 50,392 | 8,529 | 265 | |||||||||||||||
|
|
|
|
|
|
|
|
|
|
|
|||||||||||
| Unit value, end of period $ |
15.67 | 14.71 | 13.58 | 12.67 | 11.53 | |||||||||||||||
| Assets, end of period $ |
791,272 | 598,664 | 684,216 | 108,070 | 3,058 | |||||||||||||||
| Investment income ratio* |
2.84 | % | 3.28 | % | 6.30 | % | 3.96 | % | 10.44 | % | ||||||||||
| Expense ratio, lowest to highest** |
0.00 | % | 0.00 | % | 0.00 | % | 0.00 | % | 0.00 | % | ||||||||||
| Total return, lowest to highest*** |
6.54 | % | 8.32 | % | 7.17 | % | 9.93 | % | 1.41% to 3.36 | % | ||||||||||
| (g) | Fund available in prior year but no activity. |
93
Table of Contents
John Hancock Life Insurance Company (U.S.A.) Separate Account N
Notes to Financial Statements (continued)
| 10. | Financial Highlights |
| Sub-Account | ||||||||||||||||||||
| Core Bond Trust Series 1 | ||||||||||||||||||||
| Year Ended Dec. 31/12 |
Year Ended Dec. 31/11 |
Year Ended Dec. 31/10 |
Year Ended Dec. 31/09 |
Year Ended Dec. 31/08 |
||||||||||||||||
| Units, beginning of period |
25,354 | 29,647 | 28,219 | 1,599 | 87 | |||||||||||||||
| Units issued |
541 | 43,772 | 10,682 | 86,727 | 1,518 | |||||||||||||||
| Units redeemed |
(24,479 | ) | (48,065 | ) | (9,254 | ) | (60,107 | ) | (6 | ) | ||||||||||
|
|
|
|
|
|
|
|
|
|
|
|||||||||||
| Units, end of period |
1,416 | 25,354 | 29,647 | 28,219 | 1,599 | |||||||||||||||
|
|
|
|
|
|
|
|
|
|
|
|||||||||||
| Unit value, end of period $ |
18.59 to 19.23 | 17.28 to 18.35 | 16.33 to 16.74 | 15.35 to 15.56 | 14.05 to 14.15 | |||||||||||||||
| Assets, end of period $ |
26,337 | 447,272 | 485,274 | 433,606 | 22,482 | |||||||||||||||
| Investment income ratio* |
0.87 | % | 10.22 | % | 2.70 | % | 2.61 | % | 15.48 | % | ||||||||||
| Expense ratio, lowest to highest** |
0.20% to 0.65 | % | 0.00% to 0.65 | % | 0.20% to 0.65 | % | 0.35% to 0.65 | % | 0.45% to 0.65 | % | ||||||||||
| Total return, lowest to highest*** |
5.78% to 6.25 | % | 7.35% to 8.32 | % | 6.39% to 6.87 | % | 9.22% to 9.55 | % | 2.63% to 2.82 | % | ||||||||||
| Sub-Account | ||||||||||||||||
| Core Strategy Trust Series 0 | ||||||||||||||||
| Year Ended Dec. 31/12 |
Year Ended Dec. 31/11 |
Year Ended Dec. 31/10 |
Year Ended Dec. 31/09 (ay) |
|||||||||||||
| Units, beginning of period |
1,731 | 8,614 | 185 | — | ||||||||||||
| Units issued |
977 | 1,136 | 8,646 | 189 | ||||||||||||
| Units redeemed |
(96 | ) | (8,019 | ) | (217 | ) | (4 | ) | ||||||||
|
|
|
|
|
|
|
|
|
|||||||||
| Units, end of period |
2,612 | 1,731 | 8,614 | 185 | ||||||||||||
|
|
|
|
|
|
|
|
|
|||||||||
| Unit value, end of period $ |
11.64 | 10.34 | 10.32 | 9.17 | ||||||||||||
| Assets, end of period $ |
30,393 | 17,891 | 88,874 | 1,693 | ||||||||||||
| Investment income ratio* |
3.18 | % | 1.65 | % | 20.72 | % | 2.88 | % | ||||||||
| Expense ratio, lowest to highest** |
0.00 | % | 0.00 | % | 0.00 | % | 0.00 | % | ||||||||
| Total return, lowest to highest*** |
12.58 | % | 0.19 | % | 12.57 | % | 21.93 | % | ||||||||
| (ay) | Fund available in prior year but no activity. Renamed on May 4, 2009. Previously known as Index Allocation Trust. |
94
Table of Contents
John Hancock Life Insurance Company (U.S.A.) Separate Account N
Notes to Financial Statements (continued)
| 10. | Financial Highlights |
| Sub-Account | ||||||||||||||||
| Core Strategy Trust Series 1 | ||||||||||||||||
| Year Ended Dec. 31/12 |
Year Ended Dec. 31/11 |
Year Ended Dec. 31/10 |
Year Ended Dec. 31/09 (ay) |
|||||||||||||
| Units, beginning of period |
62 | 58 | 111 | — | ||||||||||||
| Units issued |
51 | 10 | 6 | 113 | ||||||||||||
| Units redeemed |
(9 | ) | (6 | ) | (59 | ) | (2 | ) | ||||||||
|
|
|
|
|
|
|
|
|
|||||||||
| Units, end of period |
104 | 62 | 58 | 111 | ||||||||||||
|
|
|
|
|
|
|
|
|
|||||||||
| Unit value, end of period $ |
11.26 | 9.98 to 10.32 | 10.12 | 9.06 | ||||||||||||
| Assets, end of period $ |
1,173 | 624 | 587 | 1,011 | ||||||||||||
| Investment income ratio* |
3.89 | % | 2.25 | % | 1.51 | % | 4.35 | % | ||||||||
| Expense ratio, lowest to highest** |
0.65 | % | 0.00% to 0.65 | % | 0.65 | % | 0.65 | % | ||||||||
| Total return, lowest to highest*** |
11.79 | % | (0.69%) to 0.20 | % | 11.70 | % | 21.09 | % | ||||||||
| (ay) | Fund available in prior year but no activity. Renamed on May 4, 2009. Previously known as Index Allocation Trust. |
| Sub-Account | ||||||||||||||||
| Disciplined Diversification Trust Series 0 | ||||||||||||||||
| Year Ended Dec. 31/12 |
Year Ended Dec. 31/11 |
Year Ended Dec. 31/10 |
Year Ended Dec. 31/09 (g) |
|||||||||||||
| Units, beginning of period |
2,230 | 8,805 | 16,326 | — | ||||||||||||
| Units issued |
1,352 | 1,564 | 9,331 | 16,641 | ||||||||||||
| Units redeemed |
(1,983 | ) | (8,139 | ) | (16,852 | ) | (315 | ) | ||||||||
|
|
|
|
|
|
|
|
|
|||||||||
| Units, end of period |
1,599 | 2,230 | 8,805 | 16,326 | ||||||||||||
|
|
|
|
|
|
|
|
|
|||||||||
| Unit value, end of period $ |
11.51 | 10.21 | 10.42 | 9.19 | ||||||||||||
| Assets, end of period $ |
18,421 | 22,778 | 91,767 | 149,965 | ||||||||||||
| Investment income ratio* |
1.85 | % | 1.70 | % | 0.82 | % | 15.46 | % | ||||||||
| Expense ratio, lowest to highest** |
0.00 | % | 0.00 | % | 0.00 | % | 0.00 | % | ||||||||
| Total return, lowest to highest*** |
12.79 | % | (2.04 | %) | 13.45 | % | 27.27 | % | ||||||||
| (g) | Fund available in prior year but no activity. |
95
Table of Contents
John Hancock Life Insurance Company (U.S.A.) Separate Account N
Notes to Financial Statements (continued)
| 10. | Financial Highlights |
| Sub-Account | ||||||||||||||||||||
| Disciplined Diversification Trust Series 1 | ||||||||||||||||||||
| Year Ended Dec. 31/12 |
Year Ended Dec. 31/11 |
Year Ended Dec. 31/10 |
Year Ended Dec. 31/09 |
Year Ended Dec. 31/08 (f) |
||||||||||||||||
| Units, beginning of period |
57 | 4,363 | 111 | — | — | |||||||||||||||
| Units issued |
4 | 881 | 4,316 | 113 | 5,952 | |||||||||||||||
| Units redeemed |
(2 | ) | (5,187 | ) | (64 | ) | (2 | ) | (5,952 | ) | ||||||||||
|
|
|
|
|
|
|
|
|
|
|
|||||||||||
| Units, end of period |
59 | 57 | 4,363 | 111 | — | |||||||||||||||
|
|
|
|
|
|
|
|
|
|
|
|||||||||||
| Unit value, end of period $ |
11.14 | 9.86 to 10.19 | 10.23 | 9.08 | 7.18 | |||||||||||||||
| Assets, end of period $ |
665 | 572 | 44,616 | 1,009 | — | |||||||||||||||
| Investment income ratio* |
2.44 | % | 0.07 | % | 8.29 | % | 4.72 | % | 0.00 | % | ||||||||||
| Expense ratio, lowest to highest** |
0.65 | % | 0.00% to 0.65 | % | 0.65 | % | 0.65 | % | 0.65 | % | ||||||||||
| Total return, lowest to highest*** |
12.00 | % | (2.96%) to (2.09 | %) | 12.66 | % | 26.40 | % | (28.19 | %) | ||||||||||
| (f) Reflects the period from commencement of operations on April 28, 2008 through December 31, 2008. |
| |||||||||||||||||||
| Sub-Account | ||||||||||||||||||||
| Emerging Markets Value Trust Series 0 | ||||||||||||||||||||
| Year Ended Dec. 31/12 |
Year Ended Dec. 31/11 |
Year Ended Dec. 31/10 |
Year Ended Dec. 31/09 |
Year Ended Dec. 31/08 (g) |
||||||||||||||||
| Units, beginning of period |
97,441 | 57,448 | 48,314 | 17,645 | — | |||||||||||||||
| Units issued |
44,804 | 54,626 | 60,080 | 52,715 | 17,760 | |||||||||||||||
| Units redeemed |
(47,277 | ) | (14,633 | ) | (50,946 | ) | (22,046 | ) | (115 | ) | ||||||||||
|
|
|
|
|
|
|
|
|
|
|
|||||||||||
| Units, end of period |
94,968 | 97,441 | 57,448 | 48,314 | 17,645 | |||||||||||||||
|
|
|
|
|
|
|
|
|
|
|
|||||||||||
| Unit value, end of period $ |
12.36 | 10.43 | 14.29 | 11.61 | 5.77 | |||||||||||||||
| Assets, end of period $ |
1,173,816 | 1,016,405 | 821,128 | 560,976 | 101,749 | |||||||||||||||
| Investment income ratio* |
0.97 | % | 2.03 | % | 1.95 | % | 0.13 | % | 18.41 | % | ||||||||||
| Expense ratio, lowest to highest** |
0.00 | % | 0.00 | % | 0.00 | % | 0.00 | % | 0.00 | % | ||||||||||
| Total return, lowest to highest*** |
18.49 | % | (27.02 | %) | 23.11 | % | 1.56% to 101.36 | % | (51.92 | %) | ||||||||||
| (g) | Fund available in prior year but no activity. |
96
Table of Contents
John Hancock Life Insurance Company (U.S.A.) Separate Account N
Notes to Financial Statements (continued)
| 10. | Financial Highlights |
| Sub-Account | ||||||||||||||||||||
| Emerging Markets Value Trust Series 1 | ||||||||||||||||||||
| Year Ended Dec. 31/12 |
Year Ended Dec. 31/11 |
Year Ended Dec. 31/10 |
Year Ended Dec. 31/09 |
Year Ended Dec. 31/08 |
||||||||||||||||
| Units, beginning of period |
58,303 | 73,173 | 53,349 | 38,735 | 6,228 | |||||||||||||||
| Units issued |
71,067 | 23,815 | 49,763 | 39,554 | 35,677 | |||||||||||||||
| Units redeemed |
(39,845 | ) | (38,685 | ) | (29,939 | ) | (24,940 | ) | (3,170 | ) | ||||||||||
|
|
|
|
|
|
|
|
|
|
|
|||||||||||
| Units, end of period |
89,525 | 58,303 | 73,173 | 53,349 | 38,735 | |||||||||||||||
|
|
|
|
|
|
|
|
|
|
|
|||||||||||
| Unit value, end of period $ |
14.86 to 15.12 | 12.47 to 13.01 | 17.42 to 17.58 | 14.25 to 14.35 | 7.13 to 7.16 | |||||||||||||||
| Assets, end of period $ |
1,344,896 | 741,859 | 1,281,303 | 763,018 | 277,069 | |||||||||||||||
| Investment income ratio* |
1.11 | % | 1.41 | % | 1.58 | % | 0.08 | % | 4.00 | % | ||||||||||
| Expense ratio, lowest to highest** |
0.35% to 0.65 | % | 0.00% to 0.65 | % | 0.40% to 0.65 | % | 0.40% to 0.65 | % | 0.40% to 0.65 | % | ||||||||||
| Total return, lowest to highest*** |
17.76% to 18.12 | % | (27.71%) to (27.06 | %) | 22.23% to 22.53 | % | 99.84% to 100.34 | % | (52.25%) to (52.13 | %) | ||||||||||
| Sub-Account | ||||||||||||||||||||
| Equity-Income Trust Series 0 | ||||||||||||||||||||
| Year Ended Dec. 31/12 |
Year Ended Dec. 31/11 |
Year Ended Dec. 31/10 |
Year Ended Dec. 31/09 |
Year Ended Dec. 31/08 |
||||||||||||||||
| Units, beginning of period |
748,752 | 717,950 | 608,455 | 422,688 | 354,274 | |||||||||||||||
| Units issued |
345,589 | 223,078 | 214,121 | 379,345 | 269,861 | |||||||||||||||
| Units redeemed |
(349,288 | ) | (192,276 | ) | (104,626 | ) | (193,578 | ) | (201,447 | ) | ||||||||||
|
|
|
|
|
|
|
|
|
|
|
|||||||||||
| Units, end of period |
745,053 | 748,752 | 717,950 | 608,455 | 422,688 | |||||||||||||||
|
|
|
|
|
|
|
|
|
|
|
|||||||||||
| Unit value, end of period $ |
32.78 | 27.90 | 28.12 | 24.40 | 19.40 | |||||||||||||||
| Assets, end of period $ |
24,421,690 | 20,892,942 | 20,186,947 | 14,847,359 | 8,202,004 | |||||||||||||||
| Investment income ratio* |
2.06 | % | 1.90 | % | 2.09 | % | 2.41 | % | 2.71 | % | ||||||||||
| Expense ratio, lowest to highest** |
0.00 | % | 0.00 | % | 0.00 | % | 0.00 | % | 0.00 | % | ||||||||||
| Total return, lowest to highest*** |
17.47 | % | (0.76 | %) | 15.23 | % | 25.76 | % | (35.94%) to (24.93 | %) | ||||||||||
97
Table of Contents
John Hancock Life Insurance Company (U.S.A.) Separate Account N
Notes to Financial Statements (continued)
| 10. | Financial Highlights |
| Sub-Account | ||||||||||||||||||||
| Equity-Income Trust Series 1 | ||||||||||||||||||||
| Year Ended Dec. 31/12 |
Year Ended Dec. 31/11 |
Year Ended Dec. 31/10 |
Year Ended Dec. 31/09 |
Year Ended Dec. 31/08 |
||||||||||||||||
| Units, beginning of period |
474,127 | 573,745 | 616,496 | 944,208 | 1,209,463 | |||||||||||||||
| Units issued |
103,932 | 161,901 | 274,455 | 610,045 | 365,614 | |||||||||||||||
| Units redeemed |
(211,052 | ) | (261,519 | ) | (317,206 | ) | (937,757 | ) | (630,869 | ) | ||||||||||
|
|
|
|
|
|
|
|
|
|
|
|||||||||||
| Units, end of period |
367,007 | 474,127 | 573,745 | 616,496 | 944,208 | |||||||||||||||
|
|
|
|
|
|
|
|
|
|
|
|||||||||||
| Unit value, end of period $ |
29.25 to 31.06 | 18.77 to 27.11 | 25.48 to 26.79 | 22.39 to 23.21 | 17.93 to 18.51 | |||||||||||||||
| Assets, end of period $ |
11,017,989 | 12,186,556 | 14,977,254 | 13,270,305 | 16,578,137 | |||||||||||||||
| Investment income ratio* |
2.05 | % | 1.73 | % | 1.97 | % | 2.19 | % | 2.35 | % | ||||||||||
| Expense ratio, lowest to highest** |
0.20% to 0.70 | % | 0.00% to 0.70 | % | 0.20% to 0.70 | % | 0.25% to 0.65 | % | 0.25% to 0.65 | % | ||||||||||
| Total return, lowest to highest*** |
16.54% to 17.13 | % | (1.70%) to (0.81 | %) | 14.31% to 14.89 | % | 24.91% to 25.41 | % | (36.38%) to (36.12 | %) | ||||||||||
| Sub-Account | ||||||||||||||||||||
| Financial Services Trust Series 0 | ||||||||||||||||||||
| Year Ended Dec. 31/12 |
Year Ended Dec. 31/11 |
Year Ended Dec. 31/10 |
Year Ended Dec. 31/09 |
Year Ended Dec. 31/08 |
||||||||||||||||
| Units, beginning of period |
21,823 | 15,021 | 11,361 | 11,844 | 2,300 | |||||||||||||||
| Units issued |
7,409 | 8,182 | 9,351 | 12,978 | 14,881 | |||||||||||||||
| Units redeemed |
(13,155 | ) | (1,380 | ) | (5,691 | ) | (13,461 | ) | (5,337 | ) | ||||||||||
|
|
|
|
|
|
|
|
|
|
|
|||||||||||
| Units, end of period |
16,077 | 21,823 | 15,021 | 11,361 | 11,844 | |||||||||||||||
|
|
|
|
|
|
|
|
|
|
|
|||||||||||
| Unit value, end of period $ |
20.02 | 16.96 | 18.72 | 16.68 | 11.79 | |||||||||||||||
| Assets, end of period $ |
321,878 | 370,177 | 281,203 | 189,531 | 139,607 | |||||||||||||||
| Investment income ratio* |
0.64 | % | 2.01 | % | 0.48 | % | 0.77 | % | 1.34 | % | ||||||||||
| Expense ratio, lowest to highest** |
0.00 | % | 0.00 | % | 0.00 | % | 0.00 | % | 0.00 | % | ||||||||||
| Total return, lowest to highest*** |
18.03 | % | (9.39 | %) | 12.22 | % | 41.53 | % | (44.63%) to (29.96 | %) | ||||||||||
98
Table of Contents
John Hancock Life Insurance Company (U.S.A.) Separate Account N
Notes to Financial Statements (continued)
| 10. | Financial Highlights |
| Sub-Account | ||||||||||||||||||||
| Financial Services Trust Series 1 | ||||||||||||||||||||
| Year Ended Dec. 31/12 |
Year Ended Dec. 31/11 |
Year Ended Dec. 31/10 |
Year Ended Dec. 31/09 |
Year Ended Dec. 31/08 |
||||||||||||||||
| Units, beginning of period |
22,770 | 61,154 | 40,884 | 158,003 | 37,610 | |||||||||||||||
| Units issued |
21,267 | 16,544 | 91,248 | 53,886 | 251,270 | |||||||||||||||
| Units redeemed |
(6,201 | ) | (54,928 | ) | (70,978 | ) | (171,005 | ) | (130,877 | ) | ||||||||||
|
|
|
|
|
|
|
|
|
|
|
|||||||||||
| Units, end of period |
37,836 | 22,770 | 61,154 | 40,884 | 158,003 | |||||||||||||||
|
|
|
|
|
|
|
|
|
|
|
|||||||||||
| Unit value, end of period $ |
15.43 to 16.26 | 12.81 to 14.10 | 14.63 to 15.28 | 13.12 to 13.47 | 9.34 to 9.56 | |||||||||||||||
| Assets, end of period $ |
591,284 | 304,495 | 905,383 | 544,204 | 1,505,269 | |||||||||||||||
| Investment income ratio* |
0.81 | % | 1.01 | % | 0.31 | % | 0.63 | % | 1.65 | % | ||||||||||
| Expense ratio, lowest to highest** |
0.20% to 0.65 | % | 0.00% to 0.65 | % | 0.20% to 0.65 | % | 0.35% to 0.65 | % | 0.35% to 0.65 | % | ||||||||||
| Total return, lowest to highest*** |
17.28% to 17.80 | % | (10.32%) to (9.51 | %) | 11.53% to 12.03 | % | 40.49% to 40.91 | % | (45.01%) to (44.85 | %) | ||||||||||
| Sub-Account | ||||||||||||||||||||
| Franklin Templeton Founding Allocation Trust Series 0 | ||||||||||||||||||||
| Year Ended Dec. 31/12 |
Year Ended Dec. 31/11 |
Year Ended Dec. 31/10 |
Year Ended Dec. 31/09 |
Year Ended Dec. 31/08 (f) |
||||||||||||||||
| Units, beginning of period |
29,247 | 64,706 | 38,206 | 23,066 | — | |||||||||||||||
| Units issued |
27,966 | 9,528 | 42,673 | 39,529 | 23,225 | |||||||||||||||
| Units redeemed |
(45,103 | ) | (44,987 | ) | (16,173 | ) | (24,389 | ) | (159 | ) | ||||||||||
|
|
|
|
|
|
|
|
|
|
|
|||||||||||
| Units, end of period |
12,110 | 29,247 | 64,706 | 38,206 | 23,066 | |||||||||||||||
|
|
|
|
|
|
|
|
|
|
|
|||||||||||
| Unit value, end of period $ |
11.34 | 9.75 | 9.89 | 8.93 | 6.79 | |||||||||||||||
| Assets, end of period $ |
137,330 | 285,058 | 639,946 | 341,295 | 156,653 | |||||||||||||||
| Investment income ratio* |
2.48 | % | 1.72 | % | 5.10 | % | 6.82 | % | 20.48 | % | ||||||||||
| Expense ratio, lowest to highest** |
0.00 | % | 0.00 | % | 0.00 | % | 0.00 | % | 0.00 | % | ||||||||||
| Total return, lowest to highest*** |
16.33 | % | (1.45 | %) | 10.71 | % | 31.52 | % | (32.08%) to (21.32 | %) | ||||||||||
| (f) | Reflects the period from commencement of operations on April 28, 2008 through December 31, 2008. |
99
Table of Contents
John Hancock Life Insurance Company (U.S.A.) Separate Account N
Notes to Financial Statements (continued)
| 10. | Financial Highlights |
| Sub-Account | ||||||||
| Franklin Templeton Founding Allocation Trust Series 1 | ||||||||
| Year Ended Dec. 31/12 |
Year Ended Dec. 31/11 (g) |
|||||||
| Units, beginning of period |
743 | — | ||||||
| Units issued |
571 | 780 | ||||||
| Units redeemed |
(361 | ) | (37 | ) | ||||
|
|
|
|
|
|||||
| Units, end of period |
953 | 743 | ||||||
|
|
|
|
|
|||||
| Unit value, end of period $ |
10.98 | 9.42 to 9.74 | ||||||
| Assets, end of period $ |
10,473 | 7,070 | ||||||
| Investment income ratio* |
3.60 | % | 20.73 | % | ||||
| Expense ratio, lowest to highest** |
0.65 | % | 0.00% to 0.65 | % | ||||
| Total return, lowest to highest*** |
15.51 | % | (2.28%) to (1.41 | %) | ||||
| (g) Fund available in prior year but no activity. |
| |||||||
| Sub-Account | ||||
| Frontier Capital Appreciation Trust | ||||
| Year Ended Dec. 31/12 (g) |
||||
| Units, beginning of period |
— | |||
| Units issued |
74,148 | |||
| Units redeemed |
(71,989 | ) | ||
|
|
|
|||
| Units, end of period |
2,159 | |||
|
|
|
|||
| Unit value, end of period $ |
54.36 | |||
| Assets, end of period $ |
117,400 | |||
| Investment income ratio* |
0.61 | % | ||
| Expense ratio, lowest to highest** |
0.00 | % | ||
| Total return, lowest to highest*** |
17.43 | % | ||
| (g) | Fund available in prior year but no activity. |
100
Table of Contents
John Hancock Life Insurance Company (U.S.A.) Separate Account N
Notes to Financial Statements (continued)
| 10. | Financial Highlights |
| Sub-Account | ||||||||||||||||||||
| Fundamental All Cap Core Trust Series 0 | ||||||||||||||||||||
| Year Ended Dec. 31/12 |
Year Ended Dec. 31/11 (m) |
Year Ended Dec. 31/10 |
Year Ended Dec. 31/09 |
Year Ended Dec. 31/08 (ae) |
||||||||||||||||
| Units, beginning of period |
29,551 | 24,237 | 18,535 | 90,036 | 2,943 | |||||||||||||||
| Units issued |
166,368 | 6,839 | 9,686 | 18,980 | 142,562 | |||||||||||||||
| Units redeemed |
(158,371 | ) | (1,525 | ) | (3,984 | ) | (90,481 | ) | (55,469 | ) | ||||||||||
|
|
|
|
|
|
|
|
|
|
|
|||||||||||
| Units, end of period |
37,548 | 29,551 | 24,237 | 18,535 | 90,036 | |||||||||||||||
|
|
|
|
|
|
|
|
|
|
|
|||||||||||
| Unit value, end of period $ |
14.52 | 11.74 | 11.98 | 10.02 | 7.81 | |||||||||||||||
| Assets, end of period $ |
545,096 | 346,907 | 290,400 | 185,772 | 703,064 | |||||||||||||||
| Investment income ratio* |
0.90 | % | 1.22 | % | 1.37 | % | 1.12 | % | 1.17 | % | ||||||||||
| Expense ratio, lowest to highest** |
0.00 | % | 0.00 | % | 0.00 | % | 0.00 | % | 0.00 | % | ||||||||||
| Total return, lowest to highest*** |
23.67 | % | (2.02 | %) | 19.55 | % | 28.35 | % | (43.12%) to (28.05 | %) | ||||||||||
| (m) Renamed on June 27, 2011. Previously known as Optimized All Cap Trust. |
| |||||||||||||||||||
| (ae) Renamed on April 28, 2008. Previously known as Quantitative All Cap Trust. |
| |||||||||||||||||||
| Sub-Account | ||||||||||||||||||||
| Fundamental All Cap Core Trust Series 1 | ||||||||||||||||||||
| Year Ended Dec. 31/12 |
Year Ended Dec. 31/11 (m) |
Year Ended Dec. 31/10 |
Year Ended Dec. 31/09 |
Year Ended Dec. 31/08 (ae) |
||||||||||||||||
| Units, beginning of period |
14,807 | 15,676 | 5,876 | 4,357 | 53 | |||||||||||||||
| Units issued |
44,158 | 103,499 | 68,404 | 10,781 | 10,535 | |||||||||||||||
| Units redeemed |
(45,619 | ) | (104,368 | ) | (58,604 | ) | (9,262 | ) | (6,231 | ) | ||||||||||
|
|
|
|
|
|
|
|
|
|
|
|||||||||||
| Units, end of period |
13,346 | 14,807 | 15,676 | 5,876 | 4,357 | |||||||||||||||
|
|
|
|
|
|
|
|
|
|
|
|||||||||||
| Unit value, end of period $ |
22.97 to 23.99 | 18.32 to 19.80 | 19.24 to 19.91 | 16.20 to 16.52 | 12.71 to 12.85 | |||||||||||||||
| Assets, end of period $ |
312,388 | 281,982 | 306,228 | 96,452 | 56,007 | |||||||||||||||
| Investment income ratio* |
0.80 | % | 0.86 | % | 1.64 | % | 1.50 | % | 0.96 | % | ||||||||||
| Expense ratio, lowest to highest** |
0.20% to 0.65 | % | 0.00% to 0.65 | % | 0.20% to 0.65 | % | 0.35% to 0.65 | % | 0.45% to 0.65 | % | ||||||||||
| Total return, lowest to highest*** |
22.72% to 23.27 | % | (2.95%) to (2.08 | %) | 18.78% to 19.31 | % | 27.44% to 27.82 | % | (43.55%) to (43.43 | %) | ||||||||||
| (m) | Renamed on June 27, 2011. Previously known as Optimized All Cap Trust. |
| (ae) | Renamed on April 28, 2008. Previously known as Quantitative All Cap Trust. |
101
Table of Contents
John Hancock Life Insurance Company (U.S.A.) Separate Account N
Notes to Financial Statements (continued)
| 10. | Financial Highlights |
| Sub-Account | ||||||||||||||||
| Fundamental Holdings Trust Series 1 | ||||||||||||||||
| Year Ended Dec. 31/12 |
Year Ended Dec. 31/11 (l) |
Year Ended Dec. 31/10 |
Year Ended Dec. 31/09 (ak) |
|||||||||||||
| Units, beginning of period |
1,221 | 1,232 | 75 | — | ||||||||||||
| Units issued |
121 | 30 | 1,187 | 149 | ||||||||||||
| Units redeemed |
(98 | ) | (41 | ) | (30 | ) | (74 | ) | ||||||||
|
|
|
|
|
|
|
|
|
|||||||||
| Units, end of period |
1,244 | 1,221 | 1,232 | 75 | ||||||||||||
|
|
|
|
|
|
|
|
|
|||||||||
| Unit value, end of period $ |
14.32 to 14.66 | 12.71 to 13.02 | 13.01 to 13.15 | 11.87 to 11.92 | ||||||||||||
| Assets, end of period $ |
17,835 | 15,624 | 16,043 | 897 | ||||||||||||
| Investment income ratio* |
1.79 | % | 1.53 | % | 3.18 | % | 2.19 | % | ||||||||
| Expense ratio, lowest to highest** |
0.00% to 0.65 | % | 0.00% to 0.65 | % | 0.00% to 0.65 | % | 0.00% to 0.65 | % | ||||||||
| Total return, lowest to highest*** |
11.92% to 12.65 | % | (1.94%) to (1.05 | %) | 9.64% to 10.36 | % | 18.70% to 19.20 | % | ||||||||
| (l) | Renamed on October 31, 2011. Previously known as American Fundamental Holdings Trust Series 1. |
| (ak) | Reflects the period from commencement of operations on May 4, 2009 through December 31, 2009. |
| Sub-Account | ||||||||||||||||||||
| Fundamental Large Cap Value Trust Series 0 | ||||||||||||||||||||
| Year Ended Dec. 31/12 |
Year Ended Dec. 31/11 (o) |
Year Ended Dec. 31/10 |
Year Ended Dec. 31/09 |
Year Ended Dec. 31/08 (af) |
||||||||||||||||
| Units, beginning of period |
18,135 | 14,686 | 10,692 | 3,363 | 3,611 | |||||||||||||||
| Units issued |
104,968 | 4,306 | 4,788 | 9,599 | 2,253 | |||||||||||||||
| Units redeemed |
(100,593 | ) | (857 | ) | (794 | ) | (2,270 | ) | (2,501 | ) | ||||||||||
|
|
|
|
|
|
|
|
|
|
|
|||||||||||
| Units, end of period |
22,510 | 18,135 | 14,686 | 10,692 | 3,363 | |||||||||||||||
|
|
|
|
|
|
|
|
|
|
|
|||||||||||
| Unit value, end of period $ |
13.62 | 10.94 | 10.74 | 9.46 | 7.60 | |||||||||||||||
| Assets, end of period $ |
306,562 | 198,403 | 157,677 | 101,134 | 25,545 | |||||||||||||||
| Investment income ratio* |
4.85 | % | 1.15 | % | 2.37 | % | 2.64 | % | 2.76 | % | ||||||||||
| Expense ratio, lowest to highest** |
0.00 | % | 0.00 | % | 0.00 | % | 0.00 | % | 0.00 | % | ||||||||||
| Total return, lowest to highest*** |
24.48 | % | 1.90 | % | 13.51 | % | 24.53 | % | (41.15%) to (27.37 | %) | ||||||||||
| (o) | Renamed on June 27, 2011. Previously known as Optimized Value Trust. |
(af) Renamed on April 28, 2008. Previously known as Quantitative Value Trust.
102
Table of Contents
John Hancock Life Insurance Company (U.S.A.) Separate Account N
Notes to Financial Statements (continued)
| 10. | Financial Highlights |
| Sub-Account | ||||||||||||||||||||
| Fundamental Large Cap Value Trust Series 1 | ||||||||||||||||||||
| Year Ended Dec. 31/12 |
Year Ended Dec. 31/11 (o) |
Year Ended Dec. 31/10 |
Year Ended Dec. 31/09 |
Year Ended Dec. 31/08 (af) |
||||||||||||||||
| Units, beginning of period |
— | — | — | 50 | 29,814 | |||||||||||||||
| Units issued |
163 | — | 1,285 | 2,897 | 8,708 | |||||||||||||||
| Units redeemed |
(3 | ) | — | (1,285 | ) | (2,947 | ) | (38,472 | ) | |||||||||||
|
|
|
|
|
|
|
|
|
|
|
|||||||||||
| Units, end of period |
160 | — | — | — | 50 | |||||||||||||||
|
|
|
|
|
|
|
|
|
|
|
|||||||||||
| Unit value, end of |
18.30 to 19.03 | |
14.52 to 15.56 |
|
14.65 to 15.09 | 13.13 to 13.20 | 10.50 to 10.65 | |||||||||||||
| Assets, end of period $ |
2,945 | 14 | 14 | 12 | 538 | |||||||||||||||
| Investment income ratio* |
5.59 | % | 1.01 | % | 0.04 | % | 0.07 | % | 0.05 | % | ||||||||||
| Expense ratio, lowest to highest** |
0.20% to 0.65 | % | 0.00% to 0.65 | % | 0.20% to 0.65 | % | 0.35% to 0.45 | % | 0.35% to 0.65 | % | ||||||||||
| Total return, lowest to highest*** |
23.61% to 24.17 | % | 0.83% to 1.75 | % | 12.83% to 13.34 | % | 23.92% to 24.02 | % | (41.58%) to (41.40 | %) | ||||||||||
| (o) Renamed on June 27, 2011. Previously known as Optimized Value Trust. |
| |||||||||||||||||||
| (af) Renamed on April 28, 2008. Previously known as Quantitative Value Trust. |
| |||||||||||||||||||
| Sub-Account | ||||||||||||||||||||
| Fundamental Value Trust Series 0 | ||||||||||||||||||||
| Year Ended Dec. 31/12 |
Year Ended Dec. 31/11 |
Year Ended Dec. 31/10 |
Year Ended Dec. 31/09 |
Year Ended Dec. 31/08 |
||||||||||||||||
| Units, beginning of period |
256,193 | 237,558 | 215,913 | 83,985 | 8,642 | |||||||||||||||
| Units issued |
287,534 | 71,293 | 135,430 | 253,970 | 84,974 | |||||||||||||||
| Units redeemed |
(241,420 | ) | (52,658 | ) | (113,785 | ) | (122,042 | ) | (9,631 | ) | ||||||||||
|
|
|
|
|
|
|
|
|
|
|
|||||||||||
| Units, end of period |
302,307 | 256,193 | 237,558 | 215,913 | 83,985 | |||||||||||||||
|
|
|
|
|
|
|
|
|
|
|
|||||||||||
| Unit value, end of period $ |
13.06 | 11.52 | 11.96 | 10.57 | 8.02 | |||||||||||||||
| Assets, end of period $ |
3,947,978 | 2,950,359 | 2,842,099 | 2,281,949 | 673,278 | |||||||||||||||
| Investment income ratio* |
0.73 | % | 0.88 | % | 1.23 | % | 1.00 | % | 3.24 | % | ||||||||||
| Expense ratio, lowest to highest** |
0.00 | % | 0.00 | % | 0.00 | % | 0.00 | % | 0.00 | % | ||||||||||
| Total return, lowest to highest*** |
13.40 | % | (3.74 | %) | 13.20 | % | 31.83 | % | (39.27%) to (27.52 | %) | ||||||||||
103
Table of Contents
John Hancock Life Insurance Company (U.S.A.) Separate Account N
Notes to Financial Statements (continued)
| 10. | Financial Highlights |
| Sub-Account | ||||||||||||||||||||
| Fundamental Value Trust Series 1 | ||||||||||||||||||||
| Year Ended Dec. 31/12 |
Year Ended Dec. 31/11 |
Year Ended Dec. 31/10 |
Year Ended Dec. 31/09 |
Year Ended Dec. 31/08 |
||||||||||||||||
| Units, beginning of period |
544,450 | 692,765 | 702,850 | 591,549 | 235,968 | |||||||||||||||
| Units issued |
37,577 | 60,908 | 358,046 | 468,005 | 477,588 | |||||||||||||||
| Units redeemed |
(252,275 | ) | (209,223 | ) | (368,131 | ) | (356,704 | ) | (122,007 | ) | ||||||||||
|
|
|
|
|
|
|
|
|
|
|
|||||||||||
| Units, end of period |
329,752 | 544,450 | 692,765 | 702,850 | 591,549 | |||||||||||||||
|
|
|
|
|
|
|
|
|
|
|
|||||||||||
| Unit value, end of period $ |
16.82 to 17.83 | 14.62 to 16.10 | 15.64 to 16.41 | 13.98 to 14.42 | 10.68 to 10.97 | |||||||||||||||
| Assets, end of |
5,709,007 | 8,359,838 | 11,118,689 | 9,947,392 | 6,384,680 | |||||||||||||||
| Investment income ratio* |
0.88 | % | 0.75 | % | 1.15 | % | 1.08 | % | 1.75 | % | ||||||||||
| Expense ratio, lowest to highest** |
0.20% to 0.70 | % | 0.00% to 0.70 | % | 0.20% to 0.70 | % | 0.30% to 0.65 | % | 0.30% to 0.65 | % | ||||||||||
| Total return, lowest to highest*** |
12.59% to 13.15 | % | (4.64%) to (3.78 | %) | 12.32% to 12.87 | % | 30.92% to 31.39 | % | (39.71%) to (39.50 | %) | ||||||||||
| Sub-Account | ||||||||||||||||||||
| Global Bond Trust Series 0 | ||||||||||||||||||||
| Year Ended Dec. 31/12 |
Year Ended Dec. 31/11 |
Year Ended Dec. 31/10 |
Year Ended Dec. 31/09 |
Year Ended Dec. 31/08 |
||||||||||||||||
| Units, beginning of period |
462,668 | 433,270 | 312,324 | 280,537 | 232,906 | |||||||||||||||
| Units issued |
458,209 | 209,504 | 219,286 | 147,097 | 192,157 | |||||||||||||||
| Units redeemed |
(506,083 | ) | (180,106 | ) | (98,340 | ) | (115,310 | ) | (144,526 | ) | ||||||||||
|
|
|
|
|
|
|
|
|
|
|
|||||||||||
| Units, end of period |
414,794 | 462,668 | 433,270 | 312,324 | 280,537 | |||||||||||||||
|
|
|
|
|
|
|
|
|
|
|
|||||||||||
| Unit value, end of period $ |
31.84 | 29.72 | 27.24 | 24.68 | 21.38 | |||||||||||||||
| Assets, end of period $ |
13,207,522 | 13,749,389 | 11,803,615 | 7,706,881 | 5,998,144 | |||||||||||||||
| Investment income ratio* |
7.03 | % | 6.84 | % | 4.19 | % | 12.29 | % | 0.56 | % | ||||||||||
| Expense ratio, lowest to highest** |
0.00 | % | 0.00 | % | 0.00 | % | 0.00 | % | 0.00 | % | ||||||||||
| Total return, lowest to highest*** |
7.15 | % | 9.08 | % | 10.40 | % | 15.41 | % | (4.42%) to (1.77 | %) | ||||||||||
104
Table of Contents
John Hancock Life Insurance Company (U.S.A.) Separate Account N
Notes to Financial Statements (continued)
| 10. | Financial Highlights |
| Sub-Account | ||||||||||||||||||||
| Global Bond Trust Series 1 | ||||||||||||||||||||
| Year Ended Dec. 31/12 |
Year Ended Dec. 31/11 |
Year Ended Dec. 31/10 |
Year Ended Dec. 31/09 |
Year Ended Dec. 31/08 |
||||||||||||||||
| Units, beginning of period |
134,298 | 160,641 | 142,403 | 216,580 | 252,132 | |||||||||||||||
| Units issued |
33,052 | 65,777 | 107,848 | 174,925 | 279,869 | |||||||||||||||
| Units redeemed |
(63,582 | ) | (92,120 | ) | (89,610 | ) | (249,102 | ) | (315,421 | ) | ||||||||||
|
|
|
|
|
|
|
|
|
|
|
|||||||||||
| Units, end of period |
103,768 | 134,298 | 160,641 | 142,403 | 216,580 | |||||||||||||||
|
|
|
|
|
|
|
|
|
|
|
|||||||||||
| Unit value, end of period $ |
28.49 to 30.25 | 25.75 to 28.95 | 24.75 to 26.01 | 22.70 to 23.42 | 19.80 to 20.36 | |||||||||||||||
| Assets, end of period $ |
3,033,036 | 3,693,790 | 4,072,834 | 3,275,176 | 4,354,555 | |||||||||||||||
| Investment income ratio* |
7.12 | % | 6.14 | % | 3.88 | % | 14.45 | % | 0.57 | % | ||||||||||
| Expense ratio, lowest to highest** |
0.20% to 0.70 | % | 0.00% to 0.70 | % | 0.20% to 0.70 | % | 0.30% to 0.65 | % | 0.30% to 0.65 | % | ||||||||||
| Total return, lowest to highest*** |
6.28% to 6.81 | % | 8.11% to 9.08 | % | 9.54% to 10.09 | % | 14.65% to 15.05 | % | (5.10%) to (4.78 | %) | ||||||||||
| Sub-Account | ||||||||||||||||
| Global Diversification Trust Series 1 | ||||||||||||||||
| Year Ended Dec. 31/12 |
Year Ended Dec. 31/11 (i) |
Year Ended Dec. 31/10 |
Year Ended Dec. 31/09 (ak) |
|||||||||||||
| Units, beginning of period |
6,584 | 10,310 | 6,219 | — | ||||||||||||
| Units issued |
6,662 | 3,053 | 10,108 | 8,119 | ||||||||||||
| Units redeemed |
(3,162 | ) | (6,779 | ) | (6,017 | ) | (1,900 | ) | ||||||||
|
|
|
|
|
|
|
|
|
|||||||||
| Units, end of period |
10,084 | 6,584 | 10,310 | 6,219 | ||||||||||||
|
|
|
|
|
|
|
|
|
|||||||||
| Unit value, end of period $ |
15.00 to 15.36 | 12.94 to 13.26 | 14.03 to 14.18 | 12.54 to 12.59 | ||||||||||||
| Assets, end of period $ |
152,071 | 86,201 | 145,634 | 78,010 | ||||||||||||
| Investment income ratio* |
1.86 | % | 1.87 | % | 6.90 | % | 1.89 | % | ||||||||
| Expense ratio, lowest to highest** |
0.00% to 0.65 | % | 0.00% to 0.65 | % | 0.00% to 0.65 | % | 0.00% to 0.65 | % | ||||||||
| Total return, lowest to highest*** |
15.09% to 15.84 | % | (7.32%) to (6.49 | %) | 11.85% to 12.57 | % | 25.40% to 25.94 | % | ||||||||
| (i) | Renamed on October 31, 2011. Previously known as American Global Diversification Trust Series 1. |
| (ak) | Reflects the period from commencement of operations on May 4, 2009 through December 31, 2009. |
105
Table of Contents
John Hancock Life Insurance Company (U.S.A.) Separate Account N
Notes to Financial Statements (continued)
| 10. | Financial Highlights |
| Sub-Account | ||||||||||||||||||||
| Global Trust Series 0 | ||||||||||||||||||||
| Year Ended Dec. 31/12 |
Year Ended Dec. 31/11 |
Year Ended Dec. 31/10 |
Year Ended Dec. 31/09 |
Year Ended Dec. 31/08 |
||||||||||||||||
| Units, beginning of period |
16,131 | 20,110 | 21,685 | 32,930 | 40,340 | |||||||||||||||
| Units issued |
19,600 | 4,516 | 14,679 | 24,262 | 24,420 | |||||||||||||||
| Units redeemed |
(5,257 | ) | (8,495 | ) | (16,254 | ) | (35,507 | ) | (31,830 | ) | ||||||||||
|
|
|
|
|
|
|
|
|
|
|
|||||||||||
| Units, end of period |
30,474 | 16,131 | 20,110 | 21,685 | 32,930 | |||||||||||||||
|
|
|
|
|
|
|
|
|
|
|
|||||||||||
| Unit value, end of |
13.51 | 11.09 | 11.79 | 10.94 | 8.32 | |||||||||||||||
| Assets, end of period $ |
411,720 | 178,912 | 237,151 | 237,159 | 273,952 | |||||||||||||||
| Investment income ratio* |
2.63 | % | 2.15 | % | 2.10 | % | 1.16 | % | 2.41 | % | ||||||||||
| Expense ratio, lowest to highest** |
0.00 | % | 0.00 | % | 0.00 | % | 0.00 | % | 0.00 | % | ||||||||||
| Total return, lowest to highest*** |
21.82 | % | (5.96 | %) | 7.82 | % | 31.47 | % | (39.49%) to (23.39 | %) | ||||||||||
| Sub-Account | ||||||||||||||||||||
| Global Trust Series 1 | ||||||||||||||||||||
| Year Ended Dec. 31/12 |
Year Ended Dec. 31/11 |
Year Ended Dec. 31/10 |
Year Ended Dec. 31/09 |
Year Ended Dec. 31/08 |
||||||||||||||||
| Units, beginning of period |
55,386 | 97,222 | 96,641 | 145,276 | 261,353 | |||||||||||||||
| Units issued |
76,790 | 15,746 | 45,219 | 62,853 | 68,244 | |||||||||||||||
| Units redeemed |
(61,726 | ) | (57,582 | ) | (44,638 | ) | (111,488 | ) | (184,321 | ) | ||||||||||
|
|
|
|
|
|
|
|
|
|
|
|||||||||||
| Units, end of period |
70,450 | 55,386 | 97,222 | 96,641 | 145,276 | |||||||||||||||
|
|
|
|
|
|
|
|
|
|
|
|||||||||||
| Unit value, end of period $ |
22.44 to 23.83 | 14.34 to 20.05 | 19.88 to 20.90 | 18.66 to 19.26 | 14.30 to 14.71 | |||||||||||||||
| Assets, end of period $ |
1,571,023 | 1,035,580 | 1,941,195 | 1,785,233 | 2,096,612 | |||||||||||||||
| Investment income ratio* |
2.25 | % | 1.36 | % | 1.57 | % | 1.83 | % | 1.77 | % | ||||||||||
| Expense ratio, lowest to highest** |
0.20% to 0.70 | % | 0.00% to 0.65 | % | 0.20% to 0.70 | % | 0.30% to 0.65 | % | 0.30% to 0.65 | % | ||||||||||
| Total return, lowest to highest*** |
20.89% to 21.50 | % | (6.84%) to (6.00 | %) | 7.01% to 7.54 | % | 30.52% to 30.97 | % | (39.94%) to (39.73 | %) | ||||||||||
106
Table of Contents
John Hancock Life Insurance Company (U.S.A.) Separate Account N
Notes to Financial Statements (continued)
| 10. | Financial Highlights |
| Sub-Account | ||||||||||||||||||||
| Health Sciences Trust Series 0 | ||||||||||||||||||||
| Year Ended Dec. 31/12 |
Year Ended Dec. 31/11 |
Year Ended Dec. 31/10 |
Year Ended Dec. 31/09 |
Year Ended Dec. 31/08 |
||||||||||||||||
| Units, beginning of period |
55,470 | 44,254 | 43,037 | 40,949 | 11,504 | |||||||||||||||
| Units issued |
53,368 | 21,681 | 24,062 | 32,120 | 73,492 | |||||||||||||||
| Units redeemed |
(36,678 | ) | (10,465 | ) | (22,845 | ) | (30,032 | ) | (44,047 | ) | ||||||||||
|
|
|
|
|
|
|
|
|
|
|
|||||||||||
| Units, end of period |
72,160 | 55,470 | 44,254 | 43,037 | 40,949 | |||||||||||||||
|
|
|
|
|
|
|
|
|
|
|
|||||||||||
| Unit value, end of period $ |
26.99 | 20.45 | 18.48 | 15.96 | 12.11 | |||||||||||||||
| Assets, end of period $ |
1,947,265 | 1,134,576 | 817,962 | 686,852 | 495,670 | |||||||||||||||
| Investment income ratio* |
0.00 | % | 0.00 | % | 0.00 | % | 0.00 | % | 0.00 | % | ||||||||||
| Expense ratio, lowest to highest** |
0.00 | % | 0.00 | % | 0.00 | % | 0.00 | % | 0.00 | % | ||||||||||
| Total return, lowest to highest*** |
31.93 | % | 10.66 | % | 15.81 | % | 31.84 | % | (29.86%) to (21.80 | %) | ||||||||||
| Sub-Account | ||||||||||||||||||||
| Health Sciences Trust Series 1 | ||||||||||||||||||||
| Year Ended Dec. 31/12 |
Year Ended Dec. 31/11 |
Year Ended Dec. 31/10 |
Year Ended Dec. 31/09 |
Year Ended Dec. 31/08 |
||||||||||||||||
| Units, beginning of period |
111,013 | 87,399 | 100,165 | 260,191 | 235,072 | |||||||||||||||
| Units issued |
41,452 | 104,522 | 51,255 | 114,028 | 280,570 | |||||||||||||||
| Units redeemed |
(47,965 | ) | (80,908 | ) | (64,021 | ) | (274,054 | ) | (255,451 | ) | ||||||||||
|
|
|
|
|
|
|
|
|
|
|
|||||||||||
| Units, end of period |
104,500 | 111,013 | 87,399 | 100,165 | 260,191 | |||||||||||||||
|
|
|
|
|
|
|
|
|
|
|
|||||||||||
| Unit value, end of period $ |
32.14 to 33.87 | 23.87 to 26.28 | 22.32 to 23.31 | 19.41 to 20.01 | 14.82 to 15.23 | |||||||||||||||
| Assets, end of period $ |
3,409,850 | 2,757,632 | 1,969,865 | 1,957,724 | 3,897,285 | |||||||||||||||
| Investment income ratio* |
0.00 | % | 0.00 | % | 0.00 | % | 0.00 | % | 0.00 | % | ||||||||||
| Expense ratio, lowest to highest** |
0.20% to 0.65 | % | 0.00% to 0.65 | % | 0.20% to 0.65 | % | 0.30% to 0.65 | % | 0.30% to 0.65 | % | ||||||||||
| Total return, lowest to highest*** |
31.09% to 31.69 | % | 9.58% to 10.57 | % | 14.95% to 15.47 | % | 30.95% to 31.41 | % | (30.36%) to (30.11 | %) | ||||||||||
107
Table of Contents
John Hancock Life Insurance Company (U.S.A.) Separate Account N
Notes to Financial Statements (continued)
| 10. | Financial Highlights |
| Sub-Account | ||||||||||||||||||||
| High Yield Trust Series 0 | ||||||||||||||||||||
| Year Ended Dec. 31/12 |
Year Ended Dec. 31/11 |
Year Ended Dec. 31/10 |
Year Ended Dec. 31/09 |
Year Ended Dec. 31/08 |
||||||||||||||||
| Units, beginning of period |
94,907 | 158,303 | 131,736 | 77,172 | 58,466 | |||||||||||||||
| Units issued |
327,606 | 27,554 | 103,145 | 142,835 | 64,061 | |||||||||||||||
| Units redeemed |
(300,650 | ) | (90,950 | ) | (76,578 | ) | (88,271 | ) | (45,355 | ) | ||||||||||
|
|
|
|
|
|
|
|
|
|
|
|||||||||||
| Units, end of period |
121,863 | 94,907 | 158,303 | 131,736 | 77,172 | |||||||||||||||
|
|
|
|
|
|
|
|
|
|
|
|||||||||||
| Unit value, end of period $ |
19.45 | 16.33 | 16.15 | 14.20 | 9.19 | |||||||||||||||
| Assets, end of period $ |
2,369,595 | 1,550,002 | 2,556,453 | 1,870,386 | 709,188 | |||||||||||||||
| Investment income ratio* |
8.40 | % | 8.02 | % | 42.98 | % | 13.46 | % | 9.25 | % | ||||||||||
| Expense ratio, lowest to highest** |
0.00 | % | 0.00 | % | 0.00 | % | 0.00 | % | 0.00 | % | ||||||||||
| Total return, lowest to highest*** |
19.07 | % | 1.14 | % | 13.75 | % | 54.51 | % | (29.48%) to (24.36 | %) | ||||||||||
| Sub-Account | ||||||||||||||||||||
| High Yield Trust Series 1 | ||||||||||||||||||||
| Year Ended Dec. 31/12 |
Year Ended Dec. 31/11 |
Year Ended Dec. 31/10 |
Year Ended Dec. 31/09 |
Year Ended Dec. 31/08 |
||||||||||||||||
| Units, beginning of period |
205,205 | 259,083 | 224,470 | 294,419 | 456,353 | |||||||||||||||
| Units issued |
77,305 | 81,326 | 262,764 | 170,151 | 139,507 | |||||||||||||||
| Units redeemed |
(134,746 | ) | (135,204 | ) | (228,151 | ) | (240,100 | ) | (301,441 | ) | ||||||||||
|
|
|
|
|
|
|
|
|
|
|
|||||||||||
| Units, end of period |
147,764 | 205,205 | 259,083 | 224,470 | 294,419 | |||||||||||||||
|
|
|
|
|
|
|
|
|
|
|
|||||||||||
| Unit value, end of period $ |
26.46 to 28.09 | 19.17 to 24.17 | 22.35 to 23.49 | 19.87 to 20.50 | 12.94 to 13.31 | |||||||||||||||
| Assets, end of period $ |
4,002,086 | 4,701,034 | 5,904,086 | 4,385,652 | 3,740,054 | |||||||||||||||
| Investment income ratio* |
7.52 | % | 7.86 | % | 45.08 | % | 11.42 | % | 7.50 | % | ||||||||||
| Expense ratio, lowest to highest** |
0.20% to 0.70 | % | 0.00% to 0.65 | % | 0.20% to 0.70 | % | 0.30% to 0.65 | % | 0.30% to 0.65 | % | ||||||||||
| Total return, lowest to highest*** |
18.15% to 18.77 | % | (0.01%) to 0.90 | % | 12.99% to 13.56 | % | 53.51% to 54.05 | % | (29.98%) to (29.73 | %) | ||||||||||
108
Table of Contents
John Hancock Life Insurance Company (U.S.A.) Separate Account N
Notes to Financial Statements (continued)
| 10. | Financial Highlights |
| Sub-Account | ||||||||||||||||||||
| International Core Trust Series 0 | ||||||||||||||||||||
| Year Ended Dec. 31/12 |
Year Ended Dec. 31/11 |
Year Ended Dec. 31/10 |
Year Ended Dec. 31/09 |
Year Ended Dec. 31/08 |
||||||||||||||||
| Units, beginning of period |
13,939 | 16,904 | 35,484 | 20,154 | 13,585 | |||||||||||||||
| Units issued |
9,283 | 7,375 | 8,201 | 30,718 | 20,613 | |||||||||||||||
| Units redeemed |
(7,594 | ) | (10,340 | ) | (26,781 | ) | (15,388 | ) | (14,044 | ) | ||||||||||
|
|
|
|
|
|
|
|
|
|
|
|||||||||||
| Units, end of period |
15,628 | 13,939 | 16,904 | 35,484 | 20,154 | |||||||||||||||
|
|
|
|
|
|
|
|
|
|
|
|||||||||||
| Unit value, end of period $ |
13.77 | 11.96 | 13.22 | 12.05 | 10.16 | |||||||||||||||
| Assets, end of period $ |
215,155 | 166,647 | 223,449 | 427,723 | 204,797 | |||||||||||||||
| Investment income ratio* |
3.23 | % | 2.07 | % | 1.74 | % | 3.08 | % | 6.12 | % | ||||||||||
| Expense ratio, lowest to highest** |
0.00 | % | 0.00 | % | 0.00 | % | 0.00 | % | 0.00 | % | ||||||||||
| Total return, lowest to highest*** |
15.16 | % | (9.55 | %) | 9.67 | % | 18.62 | % | (38.58%) to (22.22 | %) | ||||||||||
| Sub-Account | ||||||||||||||||||||
| International Core Trust Series 1 | ||||||||||||||||||||
| Year Ended Dec. 31/12 |
Year Ended Dec. 31/11 |
Year Ended Dec. 31/10 |
Year Ended Dec. 31/09 |
Year Ended Dec. 31/08 |
||||||||||||||||
| Units, beginning of period |
198,568 | 211,061 | 305,807 | 391,213 | 504,258 | |||||||||||||||
| Units issued |
10,259 | 86,394 | 106,060 | 127,741 | 137,701 | |||||||||||||||
| Units redeemed |
(67,093 | ) | (98,887 | ) | (200,806 | ) | (213,147 | ) | (250,746 | ) | ||||||||||
|
|
|
|
|
|
|
|
|
|
|
|||||||||||
| Units, end of period |
141,734 | 198,568 | 211,061 | 305,807 | 391,213 | |||||||||||||||
|
|
|
|
|
|
|
|
|
|
|
|||||||||||
| Unit value, end of period $ |
16.51 to 17.53 | 11.97 to 15.61 | 16.10 to 16.92 | 14.85 to 15.33 | 12.60 to 12.96 | |||||||||||||||
| Assets, end of period $ |
2,378,965 | 2,920,094 | 3,453,284 | 4,569,358 | 4,958,400 | |||||||||||||||
| Investment income ratio* |
2.68 | % | 2.37 | % | 1.67 | % | 2.35 | % | 4.50 | % | ||||||||||
| Expense ratio, lowest to highest** |
0.20% to 0.70 | % | 0.00% to 0.65 | % | 0.20% to 0.70 | % | 0.30% to 0.65 | % | 0.30% to 0.65 | % | ||||||||||
| Total return, lowest to highest*** |
14.24% to 14.82 | % | (10.38%) to (9.57 | %) | 8.82% to 9.36 | % | 17.87% to 18.28 | % | (39.02%) to (38.80 | %) | ||||||||||
109
Table of Contents
John Hancock Life Insurance Company (U.S.A.) Separate Account N
Notes to Financial Statements (continued)
| 10. | Financial Highlights |
| Sub-Account | ||||||||||||
| International Equity Index Trust A Series 0 | ||||||||||||
| Year Ended Dec. 31/12 (u) |
Year Ended Dec. 31/11 |
Year Ended Dec. 31/10 (be) |
||||||||||
| Units, beginning of period |
28,195 | 20,599 | — | |||||||||
| Units issued |
6,402 | 13,518 | 23,934 | |||||||||
| Units redeemed |
(34,597 | ) | (5,922 | ) | (3,335 | ) | ||||||
|
|
|
|
|
|
|
|||||||
| Units, end of period |
— | 28,195 | 20,599 | |||||||||
|
|
|
|
|
|
|
|||||||
| Unit value, end of period $ |
10.54 | 9.50 | 11.08 | |||||||||
| Assets, end of period $ |
— | 267,917 | 228,165 | |||||||||
| Investment income ratio* |
3.42 | % | 3.77 | % | 2.63 | % | ||||||
| Expense ratio, lowest to highest** |
0.00 | % | 0.00 | % | 0.00 | % | ||||||
| Total return, lowest to highest*** |
10.94 | % | (14.21 | %) | 10.76 | % | ||||||
| (u) | Terminated as an investment option and funds transferred to International Equity Index Trust B on November 5, 2012. |
| (be) | Reflects the period from commencement of operations on May 3, 2010 through December 31, 2010. |
| Sub-Account | ||||||||||||||||||||
| International Equity Index Trust A Series 1 | ||||||||||||||||||||
| Year Ended Dec. 31/12 (u) |
Year Ended Dec. 31/11 |
Year Ended Dec. 31/10 |
Year Ended Dec. 31/09 |
Year Ended Dec. 31/08 |
||||||||||||||||
| Units, beginning of period |
226,937 | 269,360 | 174,689 | 263,204 | 164,962 | |||||||||||||||
| Units issued |
66,726 | 119,457 | 233,168 | 61,341 | 231,501 | |||||||||||||||
| Units redeemed |
(293,663 | ) | (161,880 | ) | (138,497 | ) | (149,856 | ) | (133,259 | ) | ||||||||||
|
|
|
|
|
|
|
|
|
|
|
|||||||||||
| Units, end of period |
— | 226,937 | 269,360 | 174,689 | 263,204 | |||||||||||||||
|
|
|
|
|
|
|
|
|
|
|
|||||||||||
| Unit value, end of |
18.99 to 19.81 | 16.96 to 18.18 | 20.23 to 20.91 | 18.43 to 18.79 | 13.45 to 13.67 | |||||||||||||||
| Assets, end of period $ |
— | 3,995,353 | 5,548,020 | 3,266,527 | 3,585,626 | |||||||||||||||
| Investment income ratio* |
3.18 | % | 3.06 | % | 2.33 | % | 12.43 | % | 2.45 | % | ||||||||||
| Expense ratio, lowest to highest** |
0.20% to 0.70 | % | 0.00% to 0.65 | % | 0.20% to 0.70 | % | 0.30% to 0.65 | % | 0.30% to 0.65 | % | ||||||||||
| Total return, lowest to highest*** |
10.23% to 10.70 | % | (15.01%) to (14.24 | %) | 10.09% to 10.64 | % | 36.96% to 37.44 | % | (44.90%) to (44.71 | %) | ||||||||||
| (u) | Terminated as an investment option and funds transferred to International Equity Index Trust B on November 5, 2012. |
110
Table of Contents
John Hancock Life Insurance Company (U.S.A.) Separate Account N
Notes to Financial Statements (continued)
| 10. | Financial Highlights |
| Sub-Account | ||||||||||||||||||||
| International Equity Index Trust B Series 0 | ||||||||||||||||||||
| Year Ended Dec. 31/12 |
Year Ended Dec. 31/11 |
Year Ended Dec. 31/10 |
Year Ended Dec. 31/09 |
Year Ended Dec. 31/08 |
||||||||||||||||
| Units, beginning of period |
248,211 | 232,718 | 191,837 | 117,054 | 34,648 | |||||||||||||||
| Units issued |
267,310 | 114,913 | 110,334 | 139,800 | 146,008 | |||||||||||||||
| Units redeemed |
(166,506 | ) | (99,420 | ) | (69,453 | ) | (65,017 | ) | (63,602 | ) | ||||||||||
|
|
|
|
|
|
|
|
|
|
|
|||||||||||
| Units, end of period |
349,015 | 248,211 | 232,718 | 191,837 | 117,054 | |||||||||||||||
|
|
|
|
|
|
|
|
|
|
|
|||||||||||
| Unit value, end of period $ |
41.55 | 35.28 | 41.02 | 36.81 | 26.52 | |||||||||||||||
| Assets, end of period $ |
14,502,017 | 8,757,970 | 9,546,882 | 7,062,159 | 3,104,506 | |||||||||||||||
| Investment income ratio* |
1.26 | % | 3.62 | % | 2.79 | % | 4.04 | % | 3.69 | % | ||||||||||
| Expense ratio, lowest to highest** |
0.00 | % | 0.00 | % | 0.00 | % | 0.00 | % | 0.00 | % | ||||||||||
| Total return, lowest to highest*** |
17.76 | % | (13.99 | %) | 11.43 | % | 38.80 | % | (44.38%) to (27.72 | %) | ||||||||||
| Sub-Account | ||||
| International Equity Index Trust B Series 1 | ||||
| Year Ended | ||||
| Dec. 31/12 (s) | ||||
| Units, beginning of period |
— | |||
| Units issued |
404,251 | |||
| Units redeemed |
(77,689 | ) | ||
|
|
|
|||
| Units, end of period |
326,562 | |||
|
|
|
|||
| Unit value, end of period $ |
10.59 to 10.60 | |||
| Assets, end of period $ |
3,459,938 | |||
| Investment income ratio* |
6.74 | % | ||
| Expense ratio, lowest to highest** |
0.20% to 0.65 | % | ||
| Total return, lowest to highest*** |
5.91% to 5.98 | % | ||
| (s) | Reflects the period from commencement of operations on November 5, 2012 through December 31, 2012. |
111
Table of Contents
John Hancock Life Insurance Company (U.S.A.) Separate Account N
Notes to Financial Statements (continued)
| 10. | Financial Highlights |
| Sub-Account | ||||
| International Growth Stock Trust Series 0 | ||||
| Year Ended Dec. 31/12 (r) |
||||
| Units, beginning of period |
— | |||
| Units issued |
609,250 | |||
| Units redeemed |
(105,503 | ) | ||
|
|
|
|||
| Units, end of period |
503,747 | |||
|
|
|
|||
| Unit value, end of period $ |
10.41 | |||
| Assets, end of period $ |
5,244,815 | |||
| Investment income ratio* |
4.39 | % | ||
| Expense ratio, lowest to highest** |
0.00 | % | ||
| Total return, lowest to highest*** |
4.12 | % | ||
| (r) | Reflects the period from commencement of operations on November 5, 2012 through December 31, 2012. |
| Sub-Account | ||||
| International Growth Stock Trust Series 1 | ||||
| Year Ended Dec. 31/12 (r) |
||||
| Units, beginning of period |
— | |||
| Units issued |
43,605 | |||
| Units redeemed |
(855 | ) | ||
|
|
|
|||
| Units, end of period |
42,750 | |||
|
|
|
|||
| Unit value, end of period $ |
10.40 to 10.40 | |||
| Assets, end of period $ |
444,636 | |||
| Investment income ratio* |
4.22 | % | ||
| Expense ratio, lowest to highest** |
0.20% to 0.65 | % | ||
| Total return, lowest to highest*** |
3.96% to 4.04 | % | ||
| (r) | Reflects the period from commencement of operations on November 5, 2012 through December 31, 2012. |
112
Table of Contents
John Hancock Life Insurance Company (U.S.A.) Separate Account N
Notes to Financial Statements (continued)
| 10. | Financial Highlights |
| Sub-Account | ||||||||||||||||||||
| International Opportunities Trust Series 0 | ||||||||||||||||||||
| Year Ended Dec. 31/12 (w) |
Year Ended Dec. 31/11 |
Year Ended Dec. 31/10 |
Year Ended Dec. 31/09 |
Year Ended Dec. 31/08 |
||||||||||||||||
| Units, beginning of period |
329,437 | 344,833 | 295,908 | 228,989 | 110,205 | |||||||||||||||
| Units issued |
155,092 | 363,383 | 153,539 | 181,534 | 202,989 | |||||||||||||||
| Units redeemed |
(484,529 | ) | (378,779 | ) | (104,614 | ) | (114,615 | ) | (84,205 | ) | ||||||||||
|
|
|
|
|
|
|
|
|
|
|
|||||||||||
| Units, end of period |
— | 329,437 | 344,833 | 295,908 | 228,989 | |||||||||||||||
|
|
|
|
|
|
|
|
|
|
|
|||||||||||
| Unit value, end of period $ |
13.05 | 12.05 | 14.33 | 12.59 | 9.16 | |||||||||||||||
| Assets, end of period $ |
— | 3,968,426 | 4,939,867 | 3,726,727 | 2,097,481 | |||||||||||||||
| Investment income ratio* |
2.34 | % | 0.77 | % | 1.58 | % | 1.29 | % | 1.55 | % | ||||||||||
| Expense ratio, lowest to highest** |
0.00 | % | 0.00 | % | 0.00 | % | 0.00 | % | 0.00 | % | ||||||||||
| Total return, lowest to highest*** |
8.32 | % | (15.91 | %) | 13.75 | % | 37.49 | % | (50.51%) to (34.21 | %) | ||||||||||
| (w) Terminated as an investment option and funds transferred to International Growth Stock Trust on November 5, 2012. |
| |||||||||||||||||||
| Sub-Account | ||||||||||||||||||||
| International Opportunities Trust Series 1 | ||||||||||||||||||||
| Year Ended Dec. 31/12 (w) |
Year Ended Dec. 31/11 |
Year Ended Dec. 31/10 |
Year Ended Dec. 31/09 |
Year Ended Dec. 31/08 |
||||||||||||||||
| Units, beginning of period |
46,784 | 29,874 | 51,258 | 159,575 | 144,407 | |||||||||||||||
| Units issued |
2,213 | 69,517 | 35,228 | 49,349 | 175,070 | |||||||||||||||
| Units redeemed |
(48,997 | ) | (52,607 | ) | (56,612 | ) | (157,666 | ) | (159,902 | ) | ||||||||||
|
|
|
|
|
|
|
|
|
|
|
|||||||||||
| Units, end of period |
— | 46,784 | 29,874 | 51,258 | 159,575 | |||||||||||||||
|
|
|
|
|
|
|
|
|
|
|
|||||||||||
| Unit value, end of period $ |
15.47 to 16.00 | 14.13 to 15.00 | 17.20 to 17.64 | 15.24 to 15.45 | 11.15 to 11.27 | |||||||||||||||
| Assets, end of period $ |
— | 678,496 | 519,724 | 787,343 | 1,795,448 | |||||||||||||||
| Investment income ratio* |
2.03 | % | 0.46 | % | 1.02 | % | 0.75 | % | 1.25 | % | ||||||||||
| Expense ratio, lowest to highest** |
0.20% to 0.65 | % | 0.00% to 0.65 | % | 0.20% to 0.65 | % | 0.35% to 0.65 | % | 0.35% to 0.65 | % | ||||||||||
| Total return, lowest to highest*** |
7.69% to 8.09 | % | (16.68%) to (15.92 | %) | 12.85% to 13.36 | % | 36.67% to 37.08 | % | (50.88%) to (50.73 | %) | ||||||||||
| (w) | Terminated as an investment option and funds transferred to International Growth Stock Trust on November 5, 2012. |
113
Table of Contents
John Hancock Life Insurance Company (U.S.A.) Separate Account N
Notes to Financial Statements (continued)
| 10. | Financial Highlights |
| Sub-Account | ||||||||||||||||
| International Small Company Trust Series 0 | ||||||||||||||||
| Year Ended Dec. 31/12 |
Year Ended Dec. 31/11 |
Year Ended Dec. 31/10 |
Year Ended Dec. 31/09 (al) |
|||||||||||||
| Units, beginning of period |
60,716 | 50,913 | 37,839 | — | ||||||||||||
| Units issued |
28,924 | 21,938 | 26,186 | 64,995 | ||||||||||||
| Units redeemed |
(20,209 | ) | (12,135 | ) | (13,112 | ) | (27,156 | ) | ||||||||
|
|
|
|
|
|
|
|
|
|||||||||
| Units, end of period |
69,431 | 60,716 | 50,913 | 37,839 | ||||||||||||
|
|
|
|
|
|
|
|
|
|||||||||
| Unit value, end of period $ |
12.06 | 10.12 | 12.07 | 9.84 | ||||||||||||
| Assets, end of period $ |
837,448 | 614,184 | 614,404 | 372,374 | ||||||||||||
| Investment income ratio* |
1.27 | % | 1.93 | % | 3.20 | % | 0.59 | % | ||||||||
| Expense ratio, lowest to highest** |
0.00 | % | 0.00 | % | 0.00 | % | 0.00 | % | ||||||||
| Total return, lowest to highest*** |
19.23 | % | (16.18 | %) | 22.62 | % | (1.59 | %) | ||||||||
| (al) | Reflects the period from commencement of operations on November 16, 2009 through December 31, 2009. |
| Sub-Account | ||||||||||||||||
| International Small Company Trust Series 1 | ||||||||||||||||
| Year Ended Dec. 31/12 |
Year Ended Dec. 31/11 |
Year Ended Dec. 31/10 |
Year Ended Dec. 31/09 (al) |
|||||||||||||
| Units, beginning of period |
203,153 | 234,275 | 255,220 | — | ||||||||||||
| Units issued |
11,791 | 85,662 | 164,375 | 265,040 | ||||||||||||
| Units redeemed |
(128,331 | ) | (116,784 | ) | (185,320 | ) | (9,820 | ) | ||||||||
| Units, end of period |
86,613 | 203,153 | 234,275 | 255,220 | ||||||||||||
|
|
|
|
|
|
|
|
|
|||||||||
| Unit value, end of period $ |
11.78 to 11.97 | 9.91 to 10.10 | 11.97 to 12.03 | 9.82 to 9.83 | ||||||||||||
|
|
|
|
|
|
|
|
|
|||||||||
| Assets, end of period $ |
1,024,902 | 2,030,811 | 2,810,297 | 2,507,098 | ||||||||||||
| Investment income ratio* |
1.18 | % | 1.69 | % | 2.63 | % | 0.82 | % | ||||||||
| Expense ratio, lowest to highest** |
0.20% to 0.70 | % | 0.00% to 0.65 | % | 0.20% to 0.70 | % | 0.30% to 0.65 | % | ||||||||
| Total return, lowest to highest*** |
18.36% to 18.95 | % | (16.97%) to (16.23 | %) | 21.85% to 22.46 | % | (1.79%) to (1.74 | %) | ||||||||
| (al) | Reflects the period from commencement of operations on November 16, 2009 through December 31, 2009. |
114
Table of Contents
John Hancock Life Insurance Company (U.S.A.) Separate Account N
Notes to Financial Statements (continued)
| 10. | Financial Highlights |
| Sub-Account | ||||||||||||||||||||
| International Value Trust Series 0 | ||||||||||||||||||||
| Year Ended Dec. 31/12 |
Year Ended Dec. 31/11 |
Year Ended Dec. 31/10 |
Year Ended Dec. 31/09 |
Year Ended Dec. 31/08 |
||||||||||||||||
| Units, beginning of period |
320,232 | 308,050 | 110,091 | 67,718 | 8,699 | |||||||||||||||
| Units issued |
250,848 | 392,599 | 303,935 | 114,220 | 89,308 | |||||||||||||||
| Units redeemed |
(240,779 | ) | (380,417 | ) | (105,976 | ) | (71,847 | ) | (30,289 | ) | ||||||||||
|
|
|
|
|
|
|
|
|
|
|
|||||||||||
| Units, end of period |
330,301 | 320,232 | 308,050 | 110,091 | 67,718 | |||||||||||||||
|
|
|
|
|
|
|
|
|
|
|
|||||||||||
| Unit value, end of period $ |
13.98 | 11.71 | 13.43 | 12.43 | 9.15 | |||||||||||||||
| Assets, end of period $ |
4,616,954 | 3,750,331 | 4,136,819 | 1,368,878 | 619,413 | |||||||||||||||
| Investment income ratio* |
2.78 | % | 2.37 | % | 2.47 | % | 2.33 | % | 4.68 | % | ||||||||||
| Expense ratio, lowest to highest** |
0.00 | % | 0.00 | % | 0.00 | % | 0.00 | % | 0.00 | % | ||||||||||
| Total return, lowest to highest*** |
19.36 | % | (12.80 | %) | 8.00 | % | 35.94 | % | (42.64%) to (26.82 | %) | ||||||||||
| Sub-Account | ||||||||||||||||||||
| International Value Trust Series 1 | ||||||||||||||||||||
| Year Ended Dec. 31/12 |
Year Ended Dec. 31/11 |
Year Ended Dec. 31/10 |
Year Ended Dec. 31/09 |
Year Ended Dec. 31/08 |
||||||||||||||||
| Units, beginning of period |
335,983 | 467,868 | 554,278 | 833,727 | 1,343,264 | |||||||||||||||
| Units issued |
76,527 | 104,672 | 291,724 | 342,720 | 462,638 | |||||||||||||||
| Units redeemed |
(181,427 | ) | (236,557 | ) | (378,134 | ) | (622,169 | ) | (972,175 | ) | ||||||||||
|
|
|
|
|
|
|
|
|
|
|
|||||||||||
| Units, end of period |
231,083 | 335,983 | 467,868 | 554,278 | 833,727 | |||||||||||||||
|
|
|
|
|
|
|
|
|
|
|
|||||||||||
| Unit value, end of period $ |
19.73 to 20.95 | 16.28 to 17.98 | 19.23 to 20.22 | 18.02 to 18.68 | 13.35 to 13.79 | |||||||||||||||
| Assets, end of period $ |
4,725,939 | 5,799,653 | 9,306,276 | 10,226,216 | 11,386,567 | |||||||||||||||
| Investment income ratio* |
2.67 | % | 2.18 | % | 1.85 | % | 2.20 | % | 3.01 | % | ||||||||||
| Expense ratio, lowest to highest** |
0.20% to 0.70 | % | 0.00% to 0.65 | % | 0.20% to 0.70 | % | 0.25% to 0.65 | % | 0.25% to 0.65 | % | ||||||||||
| Total return, lowest to highest*** |
18.54% to 19.14 | % | (13.63%) to (12.85 | %) | 7.23% to 7.77 | % | 34.90% to 35.44 | % | (43.04%) to (42.81 | %) | ||||||||||
115
Table of Contents
John Hancock Life Insurance Company (U.S.A.) Separate Account N
Notes to Financial Statements (continued)
| 10. | Financial Highlights |
| Sub-Account | ||||||||||||||||||||
| Investment Quality Bond Trust Series 0 | ||||||||||||||||||||
| Year Ended Dec. 31/12 |
Year Ended Dec. 31/11 |
Year Ended Dec. 31/10 |
Year Ended Dec. 31/09 |
Year Ended Dec. 31/08 |
||||||||||||||||
| Units, beginning of period |
35,394 | 48,371 | 21,951 | 23,104 | 21,474 | |||||||||||||||
| Units issued |
10,727 | 6,480 | 41,545 | 16,454 | 22,172 | |||||||||||||||
| Units redeemed |
(4,411 | ) | (19,457 | ) | (15,125 | ) | (17,607 | ) | (20,542 | ) | ||||||||||
|
|
|
|
|
|
|
|
|
|
|
|||||||||||
| Units, end of period |
41,710 | 35,394 | 48,371 | 21,951 | 23,104 | |||||||||||||||
|
|
|
|
|
|
|
|
|
|
|
|||||||||||
| Unit value, end of period $ |
15.43 | 14.33 | 13.26 | 12.33 | 10.97 | |||||||||||||||
| Assets, end of period $ |
643,610 | 507,256 | 641,591 | 270,739 | 253,456 | |||||||||||||||
| Investment income ratio* |
2.33 | % | 3.65 | % | 7.27 | % | 3.98 | % | 6.27 | % | ||||||||||
| Expense ratio, lowest to highest** |
0.00 | % | 0.00 | % | 0.00 | % | 0.00 | % | 0.00 | % | ||||||||||
| Total return, lowest to highest*** |
7.66 | % | 8.06 | % | 7.54 | % | 12.43 | % | (1.61%) to 0.35 | % | ||||||||||
| Sub-Account | ||||||||||||||||||||
| Investment Quality Bond Trust Series 1 | ||||||||||||||||||||
| Year Ended Dec. 31/12 |
Year Ended Dec. 31/11 |
Year Ended Dec. 31/10 |
Year Ended Dec. 31/09 |
Year Ended Dec. 31/08 |
||||||||||||||||
| Units, beginning of period |
223,350 | 199,835 | 224,572 | 288,229 | 364,134 | |||||||||||||||
| Units issued |
14,451 | 81,166 | 48,281 | 94,522 | 58,613 | |||||||||||||||
| Units redeemed |
(95,874 | ) | (57,651 | ) | (73,018 | ) | (158,179 | ) | (134,518 | ) | ||||||||||
|
|
|
|
|
|
|
|
|
|
|
|||||||||||
| Units, end of period |
141,927 | 223,350 | 199,835 | 224,572 | 288,229 | |||||||||||||||
|
|
|
|
|
|
|
|
|
|
|
|||||||||||
| Unit value, end of period $ |
29.38 to 31.20 | 24.31 to 29.71 | 25.63 to 26.95 | 24.12 to 24.90 | 21.59 to 22.21 | |||||||||||||||
| Assets, end of period $ |
4,236,189 | 6,241,633 | 5,170,750 | 5,426,904 | 6,251,474 | |||||||||||||||
| Investment income ratio* |
1.98 | % | 4.35 | % | 5.22 | % | 4.75 | % | 6.28 | % | ||||||||||
| Expense ratio, lowest to highest** |
0.20% to 0.70 | % | 0.00% to 0.70 | % | 0.20% to 0.70 | % | 0.30% to 0.65 | % | 0.30% to 0.65 | % | ||||||||||
| Total return, lowest to highest*** |
6.83% to 7.36 | % | 7.10% to 8.07 | % | 6.71% to 7.24 | % | 11.72% to 12.11 | % | (2.31%) to (1.97 | %) | ||||||||||
116
Table of Contents
John Hancock Life Insurance Company (U.S.A.) Separate Account N
Notes to Financial Statements (continued)
| 10. | Financial Highlights |
| Sub-Account | ||||
| Large Cap Growth Trust | ||||
| Year Ended Dec. 31/12 (g) |
||||
| Units, beginning of period |
— | |||
| Units issued |
9,328 | |||
| Units redeemed |
(80 | ) | ||
|
|
|
|||
| Units, end of period |
9,248 | |||
|
|
|
|||
| Unit value, end of period $ |
33.46 | |||
| Assets, end of period $ |
309,425 | |||
| Investment income ratio* |
0.06 | % | ||
| Expense ratio, lowest to highest** |
0.00 | % | ||
| Total return, lowest to highest*** |
19.31 | % | ||
| (g) | Fund available in prior year but no activity. |
| Sub-Account | ||||||||||||||||||||
| Large Cap Trust Series 0 | ||||||||||||||||||||
| Year Ended Dec. 31/12 (p) |
Year Ended Dec. 31/11 |
Year Ended Dec. 31/10 |
Year Ended Dec. 31/09 |
Year Ended Dec. 31/08 |
||||||||||||||||
| Units, beginning of period |
39,305 | 36,268 | 26,559 | 8,969 | 3,559 | |||||||||||||||
| Units issued |
7,952 | 1,304,514 | 41,910 | 30,965 | 7,799 | |||||||||||||||
| Units redeemed |
(47,257 | ) | (1,301,477 | ) | (32,201 | ) | (13,375 | ) | (2,389 | ) | ||||||||||
|
|
|
|
|
|
|
|
|
|
|
|||||||||||
| Units, end of period |
— | 39,305 | 36,268 | 26,559 | 8,969 | |||||||||||||||
|
|
|
|
|
|
|
|
|
|
|
|||||||||||
| Unit value, end of period $ |
13.04 | 11.45 | 11.69 | 10.27 | 7.84 | |||||||||||||||
| Assets, end of period $ |
— | 450,141 | 423,904 | 272,677 | 70,272 | |||||||||||||||
| Investment income ratio* |
1.68 | % | 1.20 | % | 1.46 | % | 2.72 | % | 2.41 | % | ||||||||||
| Expense ratio, lowest to highest** |
0.00 | % | 0.00 | % | 0.00 | % | 0.00 | % | 0.00 | % | ||||||||||
| Total return, lowest to highest*** |
13.84 | % | (2.02 | %) | 13.84 | % | 31.02 | % | (39.55%) to (28.84 | %) | ||||||||||
| (p) | Terminated as an investment option and funds transferred to U.S. Equity Trust on April 30, 2012. |
117
Table of Contents
John Hancock Life Insurance Company (U.S.A.) Separate Account N
Notes to Financial Statements (continued)
| 10. | Financial Highlights |
| Sub-Account | ||||||||||||||||||||
| Large Cap Trust Series 1 | ||||||||||||||||||||
| Year Ended Dec. 31/12 (p) |
Year Ended Dec. 31/11 |
Year Ended Dec. 31/10 |
Year Ended Dec. 31/09 |
Year Ended Dec. 31/08 |
||||||||||||||||
| Units, beginning of period |
141,291 | 150,723 | 181,411 | 314,175 | 303,754 | |||||||||||||||
| Units issued |
16,786 | 79,192 | 61,049 | 73,118 | 102,040 | |||||||||||||||
| Units redeemed |
(158,077 | ) | (88,624 | ) | (91,737 | ) | (205,882 | ) | (91,619 | ) | ||||||||||
|
|
|
|
|
|
|
|
|
|
|
|||||||||||
| Units, end of period |
— | 141,291 | 150,723 | 181,411 | 314,175 | |||||||||||||||
|
|
|
|
|
|
|
|
|
|
|
|||||||||||
| Unit value, end of period $ |
15.47 to 16.02 | 13.44 to 14.27 | 14.01 to 14.41 | 12.43 to 12.64 | 9.54 to 9.69 | |||||||||||||||
| Assets, end of period $ |
— | 1,951,922 | 2,135,887 | 2,261,005 | 3,019,835 | |||||||||||||||
| Investment income ratio* |
1.39 | % | 1.35 | % | 1.07 | % | 1.86 | % | 1.55 | % | ||||||||||
| Expense ratio, lowest to highest** |
0.20% to 0.70 | % | 0.00% to 0.70 | % | 0.20% to 0.70 | % | 0.30% to 0.65 | % | 0.30% to 0.70 | % | ||||||||||
| Total return, lowest to highest*** |
13.57% to 13.75 | % | (2.94%) to (2.06 | %) | 12.95% to 13.51 | % | 29.99% to 30.46 | % | (39.94%) to (39.70 | %) | ||||||||||
| (p) Terminated as an investment option and funds transferred to U.S. Equity Trust on April 30, 2012. |
| |||||||||||||||||||
| Sub-Account | ||||||||||||||||||||
| Lifestyle Aggressive Trust Series 0 | ||||||||||||||||||||
| Year Ended Dec. 31/12 |
Year Ended Dec. 31/11 |
Year Ended Dec. 31/10 |
Year Ended Dec. 31/09 |
Year Ended Dec. 31/08 |
||||||||||||||||
| Units, beginning of period |
593,290 | 517,979 | 281,048 | 208,575 | 49,164 | |||||||||||||||
| Units issued |
288,158 | 215,514 | 395,592 | 204,213 | 193,153 | |||||||||||||||
| Units redeemed |
(481,896 | ) | (140,203 | ) | (158,661 | ) | (131,740 | ) | (33,742 | ) | ||||||||||
|
|
|
|
|
|
|
|
|
|
|
|||||||||||
| Units, end of period |
399,552 | 593,290 | 517,979 | 281,048 | 208,575 | |||||||||||||||
|
|
|
|
|
|
|
|
|
|
|
|||||||||||
| Unit value, end of period $ |
14.51 | 12.43 | 13.29 | 11.41 | 8.41 | |||||||||||||||
| Assets, end of period $ |
5,796,593 | 7,377,597 | 6,885,583 | 3,206,926 | 1,753,973 | |||||||||||||||
| Investment income ratio* |
1.53 | % | 1.94 | % | 2.58 | % | 1.13 | % | 2.74 | % | ||||||||||
| Expense ratio, lowest to highest** |
0.00 | % | 0.00 | % | 0.00 | % | 0.00 | % | 0.00 | % | ||||||||||
| Total return, lowest to highest*** |
16.67 | % | (6.46 | %) | 16.50 | % | 35.70 | % | (42.00%) to (28.35 | %) | ||||||||||
118
Table of Contents
John Hancock Life Insurance Company (U.S.A.) Separate Account N
Notes to Financial Statements (continued)
| 10. | Financial Highlights |
| Sub-Account | ||||||||||||||||||||
| Lifestyle Aggressive Trust Series 1 | ||||||||||||||||||||
| Year Ended Dec. 31/12 |
Year Ended Dec. 31/11 |
Year Ended Dec. 31/10 |
Year Ended Dec. 31/09 |
Year Ended Dec. 31/08 |
||||||||||||||||
| Units, beginning of period |
228,294 | 224,221 | 382,180 | 378,274 | 462,444 | |||||||||||||||
| Units issued |
36,665 | 73,036 | 70,885 | 369,002 | 178,424 | |||||||||||||||
| Units redeemed |
(166,151 | ) | (68,963 | ) | (228,844 | ) | (365,096 | ) | (262,594 | ) | ||||||||||
|
|
|
|
|
|
|
|
|
|
|
|||||||||||
| Units, end of period |
98,808 | 228,294 | 224,221 | 382,180 | 378,274 | |||||||||||||||
|
|
|
|
|
|
|
|
|
|
|
|||||||||||
| Unit value, end of period $ |
21.90 to 23.11 | 15.21 to 20.30 | 20.35 to 21.28 | 17.59 to 18.15 | 13.05 to 13.42 | |||||||||||||||
| Assets, end of period $ |
2,179,183 | 4,344,785 | 4,596,754 | 6,742,728 | 4,954,739 | |||||||||||||||
| Investment income ratio* |
1.68 | % | 1.70 | % | 1.47 | % | 1.09 | % | 1.90 | % | ||||||||||
| Expense ratio, lowest to highest** |
0.20% to 0.65 | % | 0.00% to 0.65 | % | 0.20% to 0.65 | % | 0.30% to 0.65 | % | 0.30% to 0.65 | % | ||||||||||
| Total return, lowest to highest*** |
15.85% to 16.38 | % | (7.34%) to (6.50 | %) | 15.69% to 16.22 | % | 34.75% to 35.22 | % | (42.37%) to (42.16 | %) | ||||||||||
| Sub-Account | ||||||||||||||||||||
| Lifestyle Balanced Trust Series 0 | ||||||||||||||||||||
| Year Ended Dec. 31/12 |
Year Ended Dec. 31/11 |
Year Ended Dec. 31/10 |
Year Ended Dec. 31/09 |
Year Ended Dec. 31/08 |
||||||||||||||||
| Units, beginning of period |
1,346,741 | 859,624 | 372,821 | 345,505 | 218,765 | |||||||||||||||
| Units issued |
520,597 | 689,190 | 682,181 | 542,287 | 252,640 | |||||||||||||||
| Units redeemed |
(721,634 | ) | (202,073 | ) | (195,378 | ) | (514,971 | ) | (125,900 | ) | ||||||||||
|
|
|
|
|
|
|
|
|
|
|
|||||||||||
| Units, end of period |
1,145,704 | 1,346,741 | 859,624 | 372,821 | 345,505 | |||||||||||||||
|
|
|
|
|
|
|
|
|
|
|
|||||||||||
| Unit value, end of period $ |
14.93 | 13.34 | 13.25 | 11.85 | 9.06 | |||||||||||||||
| Assets, end of period $ |
17,101,682 | 17,964,747 | 11,390,337 | 4,419,554 | 3,128,937 | |||||||||||||||
| Investment income ratio* |
2.41 | % | 3.98 | % | 4.09 | % | 4.92 | % | 4.16 | % | ||||||||||
| Expense ratio, lowest to highest** |
0.00 | % | 0.00 | % | 0.00 | % | 0.00 | % | 0.00 | % | ||||||||||
| Total return, lowest to highest*** |
11.90% | 0.67% | 11.78% | 30.89% | (31.33%) to (21.25 | %) | ||||||||||||||
119
Table of Contents
John Hancock Life Insurance Company (U.S.A.) Separate Account N
Notes to Financial Statements (continued)
| 10. | Financial Highlights |
| Sub-Account | ||||||||||||||||||||
| Lifestyle Balanced Trust Series 1 | ||||||||||||||||||||
| Year Ended Dec. 31/12 |
Year Ended Dec. 31/11 |
Year Ended Dec. 31/10 |
Year Ended Dec. 31/09 |
Year Ended Dec. 31/08 |
||||||||||||||||
| Units, beginning of period |
524,150 | 475,830 | 409,137 | 512,877 | 525,031 | |||||||||||||||
| Units issued |
199,283 | 253,651 | 320,506 | 313,368 | 216,482 | |||||||||||||||
| Units redeemed |
(407,620 | ) | (205,331 | ) | (253,813 | ) | (417,108 | ) | (228,636 | ) | ||||||||||
|
|
|
|
|
|
|
|
|
|
|
|||||||||||
| Units, end of period |
315,813 | 524,150 | 475,830 | 409,137 | 512,877 | |||||||||||||||
|
|
|
|
|
|
|
|
|
|
|
|||||||||||
| Unit value, end of period $ |
27.14 to 28.64 | 19.47 to 26.23 | 24.43 to 25.55 | 22.00 to 22.71 | 16.94 to 17.42 | |||||||||||||||
| Assets, end of period $ |
8,676,435 | 12,908,333 | 11,701,787 | 9,013,279 | 8,730,517 | |||||||||||||||
| Investment income ratio* |
2.13 | % | 3.34 | % | 3.02 | % | 4.47 | % | 3.23 | % | ||||||||||
| Expense ratio, lowest to highest** |
0.20% to 0.65 | % | 0.00% to 0.65 | % | 0.20% to 0.65 | % | 0.30% to 0.65 | % | 0.30% to 0.65 | % | ||||||||||
| Total return, lowest to highest*** |
11.14% to 11.64 | % | (0.28%) to 0.62 | % | 11.02% to 11.53 | % | 29.90% to 30.35 | % | (31.74%) to (31.50 | %) | ||||||||||
| Sub-Account | ||||||||||||||||||||
| Lifestyle Conservative Trust Series 0 | ||||||||||||||||||||
| Year Ended Dec. 31/12 |
Year Ended Dec. 31/11 |
Year Ended Dec. 31/10 |
Year Ended Dec. 31/09 |
Year Ended Dec. 31/08 |
||||||||||||||||
| Units, beginning of period |
360,851 | 246,229 | 100,145 | 34,442 | 2,736 | |||||||||||||||
| Units issued |
237,145 | 162,562 | 177,951 | 102,908 | 34,420 | |||||||||||||||
| Units redeemed |
(78,294 | ) | (47,940 | ) | (31,867 | ) | (37,205 | ) | (2,714 | ) | ||||||||||
|
|
|
|
|
|
|
|
|
|
|
|||||||||||
| Units, end of period |
519,702 | 360,851 | 246,229 | 100,145 | 34,442 | |||||||||||||||
|
|
|
|
|
|
|
|
|
|
|
|||||||||||
| Unit value, end of period $ |
15.02 | 13.84 | 13.27 | 12.15 | 9.99 | |||||||||||||||
| Assets, end of period $ |
7,807,743 | 4,994,046 | 3,268,150 | 1,216,629 | 344,025 | |||||||||||||||
| Investment income ratio* |
3.53 | % | 5.32 | % | 4.36 | % | 8.43 | % | 25.38 | % | ||||||||||
| Expense ratio, lowest to highest** |
0.00 | % | 0.00 | % | 0.00 | % | 0.00 | % | 0.00 | % | ||||||||||
| Total return, lowest to highest*** |
8.55 | % | 4.27 | % | 9.25 | % | 21.63 | % | (15.43%) to (10.74 | %) | ||||||||||
120
Table of Contents
John Hancock Life Insurance Company (U.S.A.) Separate Account N
Notes to Financial Statements (continued)
| 10. | Financial Highlights |
| Sub-Account | ||||||||||||||||||||
| Lifestyle Conservative Trust Series 1 | ||||||||||||||||||||
| Year Ended Dec. 31/12 |
Year Ended Dec. 31/11 |
Year Ended Dec. 31/10 |
Year Ended Dec. 31/09 |
Year Ended Dec. 31/08 |
||||||||||||||||
| Units, beginning of period |
116,560 | 89,871 | 75,416 | 178,286 | 289,337 | |||||||||||||||
| Units issued |
194,759 | 103,124 | 65,315 | 22,075 | 153,526 | |||||||||||||||
| Units redeemed |
(90,902 | ) | (76,435 | ) | (50,860 | ) | (124,945 | ) | (264,577 | ) | ||||||||||
|
|
|
|
|
|
|
|
|
|
|
|||||||||||
| Units, end of period |
220,417 | 116,560 | 89,871 | 75,416 | 178,286 | |||||||||||||||
|
|
|
|
|
|
|
|
|
|
|
|||||||||||
| Unit value, end of period $ |
29.03 to 30.65 | 22.14 to 28.92 | 26.01 to 27.21 | 23.99 to 24.76 | 19.84 to 20.40 | |||||||||||||||
| Assets, end of period $ |
6,465,480 | 3,191,375 | 2,350,294 | 1,800,796 | 3,567,617 | |||||||||||||||
| Investment income ratio* |
3.82 | % | 4.60 | % | 3.07 | % | 4.29 | % | 3.34 | % | ||||||||||
| Expense ratio, lowest to highest** |
0.20% to 0.65 | % | 0.00% to 0.65 | % | 0.20% to 0.65 | % | 0.30% to 0.65 | % | 0.30% to 0.65 | % | ||||||||||
| Total return, lowest to highest*** |
7.81% to 8.29 | % | 3.30% to 4.23 | % | 8.42% to 8.92 | % | 20.92% to 21.35 | % | (16.12%) to (15.82 | %) | ||||||||||
| Sub-Account | ||||||||||||||||||||
| Lifestyle Growth Trust Series 0 | ||||||||||||||||||||
| Year Ended Dec. 31/12 |
Year Ended Dec. 31/11 |
Year Ended Dec. 31/10 |
Year Ended Dec. 31/09 |
Year Ended Dec. 31/08 |
||||||||||||||||
| Units, beginning of period |
1,481,824 | 1,098,800 | 723,983 | 492,467 | 279,917 | |||||||||||||||
| Units issued |
335,541 | 567,853 | 752,935 | 372,790 | 324,378 | |||||||||||||||
| Units redeemed |
(420,296 | ) | (184,829 | ) | (378,118 | ) | (141,274 | ) | (111,828 | ) | ||||||||||
|
|
|
|
|
|
|
|
|
|
|
|||||||||||
| Units, end of period |
1,397,069 | 1,481,824 | 1,098,800 | 723,983 | 492,467 | |||||||||||||||
|
|
|
|
|
|
|
|
|
|
|
|||||||||||
| Unit value, end of period $ |
14.76 | 12.96 | 13.16 | 11.64 | 8.73 | |||||||||||||||
| Assets, end of period $ |
20,617,727 | 19,198,025 | 14,460,188 | 8,427,534 | 4,299,878 | |||||||||||||||
| Investment income ratio* |
2.02 | % | 3.15 | % | 2.91 | % | 4.17 | % | 3.60 | % | ||||||||||
| Expense ratio, lowest to highest** |
0.00 | % | 0.00 | % | 0.00 | % | 0.00 | % | 0.00 | % | ||||||||||
| Total return, lowest to highest*** |
13.91 | % | (1.55 | %) | 13.04 | % | 33.33 | % | (36.54%) to (24.41 | %) | ||||||||||
121
Table of Contents
John Hancock Life Insurance Company (U.S.A.) Separate Account N
Notes to Financial Statements (continued)
| 10. | Financial Highlights |
| Sub-Account | ||||||||||||||||||||
| Lifestyle Growth Trust Series 1 | ||||||||||||||||||||
| Year Ended Dec. 31/12 |
Year Ended Dec. 31/11 |
Year Ended Dec. 31/10 |
Year Ended Dec. 31/09 |
Year Ended Dec. 31/08 |
||||||||||||||||
| Units, beginning of period |
393,934 | 370,626 | 567,681 | 616,972 | 589,218 | |||||||||||||||
| Units issued |
77,368 | 121,643 | 129,098 | 342,277 | 167,165 | |||||||||||||||
| Units redeemed |
(277,455 | ) | (98,335 | ) | (326,153 | ) | (391,568 | ) | (139,411 | ) | ||||||||||
|
|
|
|
|
|
|
|
|
|
|
|||||||||||
| Units, end of period |
193,847 | 393,934 | 370,626 | 567,681 | 616,972 | |||||||||||||||
|
|
|
|
|
|
|
|
|
|
|
|||||||||||
| Unit value, end of period $ |
24.89 to 26.28 | 17.13 to 23.64 | 22.51 to 23.55 | 20.04 to 20.69 | 15.14 to 15.57 | |||||||||||||||
| Assets, end of period $ |
4,883,819 | 8,774,074 | 8,411,397 | 11,437,781 | 9,400,374 | |||||||||||||||
| Investment income ratio* |
1.75 | % | 2.88 | % | 1.95 | % | 3.52 | % | 2.71 | % | ||||||||||
| Expense ratio, lowest to highest** |
0.20% to 0.65 | % | 0.00% to 0.65 | % | 0.20% to 0.65 | % | 0.30% to 0.65 | % | 0.30% to 0.65 | % | ||||||||||
| Total return, lowest to highest*** |
13.13% to 13.64 | % | (2.48%) to (1.60 | %) | 12.29% to 12.79 | % | 32.43% to 32.90 | % | (37.01%) to (36.79 | %) | ||||||||||
| Sub-Account | ||||||||||||||||||||
| Lifestyle Moderate Trust Series 0 | ||||||||||||||||||||
| Year Ended Dec. 31/12 |
Year Ended Dec. 31/11 |
Year Ended Dec. 31/10 |
Year Ended Dec. 31/09 |
Year Ended Dec. 31/08 |
||||||||||||||||
| Units, beginning of period |
495,546 | 350,849 | 275,555 | 128,902 | 36,346 | |||||||||||||||
| Units issued |
343,424 | 248,355 | 272,501 | 290,244 | 185,989 | |||||||||||||||
| Units redeemed |
(254,106 | ) | (103,658 | ) | (197,207 | ) | (143,591 | ) | (93,433 | ) | ||||||||||
|
|
|
|
|
|
|
|
|
|
|
|||||||||||
| Units, end of period |
584,864 | 495,546 | 350,849 | 275,555 | 128,902 | |||||||||||||||
|
|
|
|
|
|
|
|
|
|
|
|||||||||||
| Unit value, end of period $ |
14.92 | 13.48 | 13.17 | 11.90 | 9.35 | |||||||||||||||
| Assets, end of period $ |
8,728,555 | 6,680,056 | 4,619,782 | 3,277,916 | 1,205,627 | |||||||||||||||
| Investment income ratio* |
2.90 | % | 4.71 | % | 3.46 | % | 9.25 | % | 7.22 | % | ||||||||||
| Expense ratio, lowest to highest** |
0.00 | % | 0.00 | % | 0.00 | % | 0.00 | % | 0.00 | % | ||||||||||
| Total return, lowest to highest*** |
10.70 | % | 2.38 | % | 10.69 | % | 27.18 | % | (24.16%) to (16.44 | %) | ||||||||||
122
Table of Contents
John Hancock Life Insurance Company (U.S.A.) Separate Account N
Notes to Financial Statements (continued)
| 10. | Financial Highlights |
| Sub-Account | ||||||||||||||||||||
| Lifestyle Moderate Trust Series 1 | ||||||||||||||||||||
| Year Ended Dec. 31/12 |
Year Ended Dec. 31/11 |
Year Ended Dec. 31/10 |
Year Ended Dec. 31/09 |
Year Ended Dec. 31/08 |
||||||||||||||||
| Units, beginning of period |
101,893 | 116,532 | 97,341 | 93,927 | 103,478 | |||||||||||||||
| Units issued |
30,821 | 106,507 | 98,781 | 84,461 | 61,722 | |||||||||||||||
| Units redeemed |
(51,678 | ) | (121,146 | ) | (79,590 | ) | (81,047 | ) | (71,273 | ) | ||||||||||
|
|
|
|
|
|
|
|
|
|
|
|||||||||||
| Units, end of period |
81,036 | 101,893 | 116,532 | 97,341 | 93,927 | |||||||||||||||
|
|
|
|
|
|
|
|
|
|
|
|||||||||||
| Unit value, end of period $ |
28.04 to 29.59 | 20.37 to 27.39 | 25.08 to 26.24 | 22.84 to 23.57 | 18.06 to 18.57 | |||||||||||||||
| Assets, end of period $ |
2,278,379 | 2,616,349 | 2,967,735 | 2,238,073 | 1,708,801 | |||||||||||||||
| Investment income ratio* |
2.68 | % | 2.88 | % | 3.17 | % | 4.98 | % | 3.94 | % | ||||||||||
| Expense ratio, lowest to highest** |
0.20% to 0.65 | % | 0.00% to 0.65 | % | 0.20% to 0.65 | % | 0.30% to 0.65 | % | 0.30% to 0.65 | % | ||||||||||
| Total return, lowest to highest*** |
9.94% to 10.44 | % | 1.42% to 2.33 | % | 9.84% to 10.34 | % | 26.44% to 26.88 | % | (24.72%) to (24.46 | %) | ||||||||||
| Sub-Account | ||||||||||||||||||||
| Mid Cap Index Trust Series 0 | ||||||||||||||||||||
| Year Ended Dec. 31/12 |
Year Ended Dec. 31/11 |
Year Ended Dec. 31/10 |
Year Ended Dec. 31/09 |
Year Ended Dec. 31/08 |
||||||||||||||||
| Units, beginning of period |
313,220 | 228,927 | 136,807 | 105,314 | 71,068 | |||||||||||||||
| Units issued |
222,036 | 187,723 | 137,152 | 101,997 | 65,541 | |||||||||||||||
| Units redeemed |
(175,231 | ) | (103,430 | ) | (45,032 | ) | (70,504 | ) | (31,295 | ) | ||||||||||
|
|
|
|
|
|
|
|
|
|
|
|||||||||||
| Units, end of period |
360,025 | 313,220 | 228,927 | 136,807 | 105,314 | |||||||||||||||
|
|
|
|
|
|
|
|
|
|
|
|||||||||||
| Unit value, end of period $ |
18.95 | 16.13 | 16.48 | 13.07 | 9.56 | |||||||||||||||
| Assets, end of period $ |
6,823,978 | 5,050,757 | 3,772,366 | 1,788,270 | 1,006,767 | |||||||||||||||
| Investment income ratio* |
1.54 | % | 0.81 | % | 1.44 | % | 1.18 | % | 1.14 | % | ||||||||||
| Expense ratio, lowest to highest** |
0.00 | % | 0.00 | % | 0.00 | % | 0.00 | % | 0.00 | % | ||||||||||
| Total return, lowest to highest*** |
17.54 | % | (2.14 | %) | 26.06 | % | 36.74 | % | (36.36%) to (29.45 | %) | ||||||||||
123
Table of Contents
John Hancock Life Insurance Company (U.S.A.) Separate Account N
Notes to Financial Statements (continued)
| 10. | Financial Highlights |
| Sub-Account | ||||||||||||||||||||
| Mid Cap Index Trust Series 1 | ||||||||||||||||||||
| Year Ended Dec. 31/12 |
Year Ended Dec. 31/11 |
Year Ended Dec. 31/10 |
Year Ended Dec. 31/09 |
Year Ended Dec. 31/08 |
||||||||||||||||
| Units, beginning of period |
382,033 | 504,659 | 544,192 | 855,105 | 1,227,846 | |||||||||||||||
| Units issued |
74,985 | 78,808 | 261,685 | 136,277 | 151,549 | |||||||||||||||
| Units redeemed |
(261,820 | ) | (201,434 | ) | (301,218 | ) | (447,190 | ) | (524,290 | ) | ||||||||||
|
|
|
|
|
|
|
|
|
|
|
|||||||||||
| Units, end of period |
195,198 | 382,033 | 504,659 | 544,192 | 855,105 | |||||||||||||||
|
|
|
|
|
|
|
|
|
|
|
|||||||||||
| Unit value, end of period $ |
26.48 to 28.13 | 22.21 to 24.52 | 23.39 to 24.59 | 18.78 to 19.38 | 13.82 to 14.22 | |||||||||||||||
| Assets, end of period $ |
5,321,646 | 8,990,208 | 12,202,258 | 10,434,709 | 12,037,182 | |||||||||||||||
| Investment income ratio* |
1.25 | % | 0.56 | % | 1.06 | % | 0.95 | % | 0.91 | % | ||||||||||
| Expense ratio, lowest to highest** |
0.20% to 0.70 | % | 0.00% to 0.65 | % | 0.20% to 0.70 | % | 0.30% to 0.65 | % | 0.30% to 0.65 | % | ||||||||||
| Total return, lowest to highest*** |
16.66% to 17.25 | % | (3.13%) to (2.25 | %) | 25.11% to 25.73 | % | 35.88% to 36.36 | % | (36.82%) to (36.61 | %) | ||||||||||
| Sub-Account | ||||||||||||||||||||
| Mid Cap Stock Trust Series 0 | ||||||||||||||||||||
| Year Ended Dec. 31/12 |
Year Ended Dec. 31/11 |
Year Ended Dec. 31/10 |
Year Ended Dec. 31/09 |
Year Ended Dec. 31/08 |
||||||||||||||||
| Units, beginning of period |
120,496 | 99,083 | 101,106 | 60,664 | 29,434 | |||||||||||||||
| Units issued |
158,543 | 51,889 | 36,064 | 82,168 | 61,193 | |||||||||||||||
| Units redeemed |
(158,097 | ) | (30,476 | ) | (38,087 | ) | (41,726 | ) | (29,963 | ) | ||||||||||
|
|
|
|
|
|
|
|
|
|
|
|||||||||||
| Units, end of period |
120,942 | 120,496 | 99,083 | 101,106 | 60,664 | |||||||||||||||
|
|
|
|
|
|
|
|
|
|
|
|||||||||||
| Unit value, end of period $ |
49.83 | 40.73 | 44.84 | 36.43 | 27.71 | |||||||||||||||
| Assets, end of period $ |
6,026,881 | 4,908,055 | 4,442,910 | 3,683,767 | 1,681,202 | |||||||||||||||
| Investment income ratio* |
0.00 | % | 0.00 | % | 0.00 | % | 0.00 | % | 0.00 | % | ||||||||||
| Expense ratio, lowest to highest** |
0.00 | % | 0.00 | % | 0.00 | % | 0.00 | % | 0.00 | % | ||||||||||
| Total return, lowest to highest*** |
22.34 | % | (9.16 | %) | 23.07 | % | 31.47 | % | (43.75%) to (29.90 | %) | ||||||||||
124
Table of Contents
John Hancock Life Insurance Company (U.S.A.) Separate Account N
Notes to Financial Statements (continued)
| 10. | Financial Highlights |
| Sub-Account | ||||||||||||||||||||
| Mid Cap Stock Trust Series 1 | ||||||||||||||||||||
| Year Ended Dec. 31/12 |
Year Ended Dec. 31/11 |
Year Ended Dec. 31/10 |
Year Ended Dec. 31/09 |
Year Ended Dec. 31/08 |
||||||||||||||||
| Units, beginning of period |
250,553 | 318,928 | 395,538 | 736,367 | 690,454 | |||||||||||||||
| Units issued |
15,981 | 112,149 | 221,170 | 362,044 | 379,942 | |||||||||||||||
| Units redeemed |
(150,036 | ) | (180,524 | ) | (297,780 | ) | (702,873 | ) | (334,029 | ) | ||||||||||
|
|
|
|
|
|
|
|
|
|
|
|||||||||||
| Units, end of period |
116,498 | 250,553 | 318,928 | 395,538 | 736,367 | |||||||||||||||
|
|
|
|
|
|
|
|
|
|
|
|||||||||||
| Unit value, end of period $ |
20.84 to 22.13 | 16.80 to 18.55 | 19.05 to 20.03 | 15.65 to 16.23 | 12.00 to 12.39 | |||||||||||||||
| Assets, end of period $ |
2,514,726 | 4,451,505 | 6,248,503 | 6,306,437 | 9,024,765 | |||||||||||||||
| Investment income ratio* |
0.00 | % | 0.00 | % | 0.00 | % | 0.00 | % | 0.00 | % | ||||||||||
| Expense ratio, lowest to highest** |
0.20% to 0.70 | % | 0.00% to 0.70 | % | 0.20% to 0.70 | % | 0.25% to 0.65 | % | 0.25% to 0.65 | % | ||||||||||
| Total return, lowest to highest*** |
21.35% to 21.97 | % | (10.01%) to (9.20 | %) | 22.23% to 22.84 | % | 30.50% to 31.03 | % | (44.13%) to (43.90 | %) | ||||||||||
| Sub-Account | ||||||||||||||||||||
| Mid Value Trust Series 0 | ||||||||||||||||||||
| Year Ended Dec. 31/12 |
Year Ended Dec. 31/11 |
Year Ended Dec. 31/10 |
Year Ended Dec. 31/09 |
Year Ended Dec. 31/08 |
||||||||||||||||
| Units, beginning of period |
264,797 | 260,297 | 254,696 | 84,702 | 110,206 | |||||||||||||||
| Units issued |
143,831 | 93,169 | 120,791 | 251,826 | 161,497 | |||||||||||||||
| Units redeemed |
(139,118 | ) | (88,669 | ) | (115,190 | ) | (81,832 | ) | (187,001 | ) | ||||||||||
|
|
|
|
|
|
|
|
|
|
|
|||||||||||
| Units, end of period |
269,510 | 264,797 | 260,297 | 254,696 | 84,702 | |||||||||||||||
|
|
|
|
|
|
|
|
|
|
|
|||||||||||
| Unit value, end of period $ |
27.42 | 22.94 | 24.10 | 20.74 | 14.18 | |||||||||||||||
| Assets, end of period $ |
7,390,879 | 6,074,396 | 6,272,355 | 5,283,386 | 1,201,290 | |||||||||||||||
| Investment income ratio* |
0.92 | % | 0.75 | % | 2.12 | % | 0.78 | % | 1.31 | % | ||||||||||
| Expense ratio, lowest to highest** |
0.00 | % | 0.00 | % | 0.00 | % | 0.00 | % | 0.00 | % | ||||||||||
| Total return, lowest to highest*** |
19.54 | % | (4.80 | %) | 16.16 | % | 46.27 | % | (34.67%) to (27.51 | %) | ||||||||||
125
Table of Contents
John Hancock Life Insurance Company (U.S.A.) Separate Account N
Notes to Financial Statements (continued)
| 10. | Financial Highlights |
| Sub-Account | ||||||||||||||||||||
| Mid Value Trust Series 1 | ||||||||||||||||||||
| Year Ended Dec. 31/12 |
Year Ended Dec. 31/11 |
Year Ended Dec. 31/10 |
Year Ended Dec. 31/09 (g) |
|||||||||||||||||
| Units, beginning of period |
266,100 | 330,552 | 363,628 | — | ||||||||||||||||
| Units issued |
63,640 | 117,985 | 149,464 | 473,014 | ||||||||||||||||
| Units redeemed |
(110,133 | ) | (182,437 | ) | (182,540 | ) | (109,386 | ) | ||||||||||||
|
|
|
|
|
|
|
|
|
|||||||||||||
| Units, end of period |
219,607 | 266,100 | 330,552 | 363,628 | ||||||||||||||||
|
|
|
|
|
|
|
|
|
|||||||||||||
| Unit value, end of period $ |
17.46 to 17.75 | 14.60 to 14.96 | 15.56 to 15.68 | 13.49 to 13.52 | ||||||||||||||||
| Assets, end of period $ |
3,867,416 | 3,937,343 | 5,165,985 | 4,909,319 | ||||||||||||||||
| Investment income ratio* |
0.85 | % | 0.69 | % | 2.07 | % | 0.51 | % | ||||||||||||
| Expense ratio, lowest to highest** |
0.20% to 0.65 | % | 0.00% to 0.65 | % | 0.20% to 0.65 | % | 0.25% to 0.65 | % | ||||||||||||
| Total return, lowest to highest*** |
18.75% to 19.29 | % | (5.77%) to (4.93 | %) | 15.41% to 15.93 | % | 34.85% to 35.21 | % | ||||||||||||
| (g) Fund available in prior year but no activity. |
| |||||||||||||||||||
| Sub-Account | ||||||||||||||||||||
| Money Market Trust B Series 0 | ||||||||||||||||||||
| Year Ended Dec. 31/12 |
Year Ended Dec. 31/11 |
Year Ended Dec. 31/10 |
Year Ended Dec. 31/09 |
Year Ended Dec. 31/08 |
||||||||||||||||
| Units, beginning of period |
2,900,049 | 2,163,145 | 2,590,839 | 4,093,720 | 1,343,526 | |||||||||||||||
| Units issued |
5,062,208 | 3,604,563 | 2,354,422 | 2,868,379 | 4,806,729 | |||||||||||||||
| Units redeemed |
(4,556,953 | ) | (2,867,659 | ) | (2,782,116 | ) | (4,371,260 | ) | (2,056,535 | ) | ||||||||||
|
|
|
|
|
|
|
|
|
|
|
|||||||||||
| Units, end of period |
3,405,304 | 2,900,049 | 2,163,145 | 2,590,839 | 4,093,720 | |||||||||||||||
|
|
|
|
|
|
|
|
|
|
|
|||||||||||
| Unit value, end of period $ |
17.37 | 17.36 | 17.35 | 17.34 | 17.26 | |||||||||||||||
| Assets, end of period $ |
59,153,840 | 50,355,097 | 37,529,888 | 44,928,442 | 70,653,639 | |||||||||||||||
| Investment income ratio* |
0.04 | % | 0.00 | % | 0.05 | % | 0.51 | % | 2.02 | % | ||||||||||
| Expense ratio, lowest to highest** |
0.00 | % | 0.00 | % | 0.00 | % | 0.00 | % | 0.00 | % | ||||||||||
| Total return, lowest to highest*** |
0.03 | % | 0.08 | % | 0.03 | % | 0.47 | % | 0.40% to 2.12 | % | ||||||||||
126
Table of Contents
John Hancock Life Insurance Company (U.S.A.) Separate Account N
Notes to Financial Statements (continued)
| 10. | Financial Highlights |
| Sub-Account | ||||||||||||||||||||
| Money Market Trust Series 1 | ||||||||||||||||||||
| Year Ended Dec. 31/12 |
Year Ended Dec. 31/11 |
Year Ended Dec. 31/10 |
Year Ended Dec. 31/09 |
Year Ended Dec. 31/08 |
||||||||||||||||
| Units, beginning of period |
1,293,433 | 1,006,382 | 1,733,854 | 4,818,232 | 4,025,524 | |||||||||||||||
| Units issued |
3,354,748 | 1,069,517 | 2,512,559 | 2,542,228 | 2,612,046 | |||||||||||||||
| Units redeemed |
(782,862 | ) | (782,466 | ) | (3,240,031 | ) | (5,626,606 | ) | (1,819,338 | ) | ||||||||||
|
|
|
|
|
|
|
|
|
|
|
|||||||||||
| Units, end of period |
3,865,319 | 1,293,433 | 1,006,382 | 1,733,854 | 4,818,232 | |||||||||||||||
|
|
|
|
|
|
|
|
|
|
|
|||||||||||
| Unit value, end of period $ |
20.49 to 21.76 | 15.15 to 22.28 | 20.77 to 21.83 | 21.00 to 21.78 | 21.09 to 21.78 | |||||||||||||||
| Assets, end of period $ |
82,144,640 | 27,374,747 | 21,281,600 | 35,883,153 | 101,314,436 | |||||||||||||||
| Investment income ratio* |
0.00 | % | 0.00 | % | 0.00 | % | 0.24 | % | 1.73 | % | ||||||||||
| Expense ratio, lowest to highest** |
0.20% to 0.70 | % | 0.00% to 0.70 | % | 0.20% to 0.70 | % | 0.25% to 0.65 | % | 0.25% to 0.65 | % | ||||||||||
| Total return, lowest to highest*** |
(0.70%) to (0.18 | %) | (0.82%) to 0.07 | % | (0.70%) to (0.19 | %) | (0.46%) to (0.04 | %) | 1.09% to 1.52 | % | ||||||||||
| Sub-Account | ||||||||||||||||||||
| Natural Resources Trust Series 0 | ||||||||||||||||||||
| Year Ended Dec. 31/12 |
Year Ended Dec. 31/11 |
Year Ended Dec. 31/10 |
Year Ended Dec. 31/09 |
Year Ended Dec. 31/08 |
||||||||||||||||
| Units, beginning of period |
130,067 | 84,677 | 113,681 | 59,882 | 34,188 | |||||||||||||||
| Units issued |
50,479 | 67,067 | 48,901 | 136,941 | 80,652 | |||||||||||||||
| Units redeemed |
(30,493 | ) | (21,677 | ) | (77,905 | ) | (83,142 | ) | (54,958 | ) | ||||||||||
|
|
|
|
|
|
|
|
|
|
|
|||||||||||
| Units, end of period |
150,053 | 130,067 | 84,677 | 113,681 | 59,882 | |||||||||||||||
|
|
|
|
|
|
|
|
|
|
|
|||||||||||
| Unit value, end of period $ |
16.97 | 16.87 | 21.16 | 18.36 | 11.53 | |||||||||||||||
| Assets, end of period $ |
2,545,863 | 2,194,024 | 1,791,513 | 2,086,992 | 690,422 | |||||||||||||||
| Investment income ratio* |
0.89 | % | 0.61 | % | 0.62 | % | 1.11 | % | 0.74 | % | ||||||||||
| Expense ratio, lowest to highest** |
0.00 | % | 0.00 | % | 0.00 | % | 0.00 | % | 0.00 | % | ||||||||||
| Total return, lowest to highest*** |
0.58 | % | (20.27 | %) | 15.25 | % | 59.23 | % | (51.60%) to (41.22 | %) | ||||||||||
127
Table of Contents
John Hancock Life Insurance Company (U.S.A.) Separate Account N
Notes to Financial Statements (continued)
| 10. | Financial Highlights |
| Sub-Account | ||||||||||||||||||||
| Natural Resources Trust Series 1 | ||||||||||||||||||||
| Year Ended Dec. 31/12 |
Year Ended Dec. 31/11 |
Year Ended Dec. 31/10 |
Year Ended Dec. 31/09 |
Year Ended Dec. 31/08 |
||||||||||||||||
| Units, beginning of period |
125,092 | 128,093 | 124,917 | 241,760 | 254,942 | |||||||||||||||
| Units issued |
41,306 | 72,195 | 78,918 | 121,039 | 266,782 | |||||||||||||||
| Units redeemed |
(82,804 | ) | (75,196 | ) | (75,742 | ) | (237,882 | ) | (279,964 | ) | ||||||||||
|
|
|
|
|
|
|
|
|
|
|
|||||||||||
| Units, end of period |
83,594 | 125,092 | 128,093 | 124,917 | 241,760 | |||||||||||||||
|
|
|
|
|
|
|
|
|
|
|
|||||||||||
| Unit value, end of period $ |
37.73 to 39.41 | 36.98 to 39.97 | 47.71 to 49.38 | 41.68 to 42.66 | 26.35 to 26.88 | |||||||||||||||
| Assets, end of period $ |
3,204,486 | 4,794,393 | 6,179,506 | 5,252,760 | 6,450,461 | |||||||||||||||
| Investment income ratio* |
0.73 | % | 0.45 | % | 0.64 | % | 1.02 | % | 0.59 | % | ||||||||||
| Expense ratio, lowest to highest** |
0.20% to 0.65 | % | 0.00% to 0.65 | % | 0.20% to 0.65 | % | 0.30% to 0.65 | % | 0.30% to 0.65 | % | ||||||||||
| Total return, lowest to highest*** |
(0.13%) to 0.32 | % | (21.00%) to (20.29 | %) | 14.47% to 14.99 | % | 58.16% to 58.71 | % | (51.93%) to (51.76 | %) | ||||||||||
| Sub-Account | ||||||||||||||||||||
| Real Estate Securities Trust Series 0 | ||||||||||||||||||||
| Year Ended Dec. 31/12 |
Year Ended Dec. 31/11 |
Year Ended Dec. 31/10 |
Year Ended Dec. 31/09 |
Year Ended Dec. 31/08 |
||||||||||||||||
| Units, beginning of period |
86,372 | 91,765 | 87,356 | 71,624 | 61,644 | |||||||||||||||
| Units issued |
46,227 | 22,574 | 34,131 | 76,003 | 95,202 | |||||||||||||||
| Units redeemed |
(39,848 | ) | (27,967 | ) | (29,722 | ) | (60,271 | ) | (85,222 | ) | ||||||||||
|
|
|
|
|
|
|
|
|
|
|
|||||||||||
| Units, end of period |
92,751 | 86,372 | 91,765 | 87,356 | 71,624 | |||||||||||||||
|
|
|
|
|
|
|
|
|
|
|
|||||||||||
| Unit value, end of period $ |
105.48 | 89.90 | 82.05 | 63.50 | 48.75 | |||||||||||||||
| Assets, end of period $ |
9,783,730 | 7,764,963 | 7,528,838 | 5,547,371 | 3,491,635 | |||||||||||||||
| Investment income ratio* |
1.82 | % | 1.53 | % | 2.02 | % | 3.49 | % | 3.49 | % | ||||||||||
| Expense ratio, lowest to highest** |
0.00 | % | 0.00 | % | 0.00 | % | 0.00 | % | 0.00 | % | ||||||||||
| Total return, lowest to highest*** |
17.33 | % | 9.58 | % | 29.20 | % | 30.26 | % | (39.39%) to (38.33 | %) | ||||||||||
128
Table of Contents
John Hancock Life Insurance Company (U.S.A.) Separate Account N
Notes to Financial Statements (continued)
| 10. | Financial Highlights |
| Sub-Account | ||||||||||||||||||||
| Real Estate Securities Trust Series 1 | ||||||||||||||||||||
| Year Ended Dec. 31/12 |
Year Ended Dec. 31/11 |
Year Ended Dec. 31/10 |
Year Ended Dec. 31/09 |
Year Ended Dec. 31/08 |
||||||||||||||||
| Units, beginning of period |
120,266 | 146,488 | 165,443 | 221,440 | 283,937 | |||||||||||||||
| Units issued |
16,196 | 26,656 | 34,463 | 58,954 | 73,525 | |||||||||||||||
| Units redeemed |
(43,030 | ) | (52,878 | ) | (53,418 | ) | (114,951 | ) | (136,022 | ) | ||||||||||
|
|
|
|
|
|
|
|
|
|
|
|||||||||||
| Units, end of period |
93,432 | 120,266 | 146,488 | 165,443 | 221,440 | |||||||||||||||
|
|
|
|
|
|
|
|
|
|
|
|||||||||||
| Unit value, end of period $ |
121.22 to 128.73 | 41.48 to 112.45 | 95.78 to 100.69 | 74.65 to 77.39 | 57.75 to 59.63 | |||||||||||||||
| Assets, end of period $ |
11,297,501 | 12,390,923 | 13,957,541 | 12,238,675 | 12,770,010 | |||||||||||||||
| Investment income ratio* |
1.66 | % | 1.38 | % | 1.82 | % | 3.52 | % | 3.23 | % | ||||||||||
| Expense ratio, lowest to highest** |
0.20% to 0.70 | % | 0.00% to 0.65 | % | 0.20% to 0.70 | % | 0.30% to 0.70 | % | 0.30% to 0.70 | % | ||||||||||
| Total return, lowest to highest*** |
16.44% to 17.02 | % | 8.49% to 9.46 | % | 28.30% to 28.94 | % | 29.27% to 29.78 | % | (39.85%) to (39.60 | %) | ||||||||||
| Sub-Account | ||||||||||||||||||||
| Real Return Bond Trust Series 0 | ||||||||||||||||||||
| Year Ended Dec. 31/12 |
Year Ended Dec. 31/11 |
Year Ended Dec. 31/10 |
Year Ended Dec. 31/09 |
Year Ended Dec. 31/08 |
||||||||||||||||
| Units, beginning of period |
620,592 | 545,434 | 318,234 | 91,101 | 14,342 | |||||||||||||||
| Units issued |
798,056 | 565,865 | 337,653 | 300,552 | 115,493 | |||||||||||||||
| Units redeemed |
(691,232 | ) | (490,707 | ) | (110,453 | ) | (73,419 | ) | (38,734 | ) | ||||||||||
|
|
|
|
|
|
|
|
|
|
|
|||||||||||
| Units, end of period |
727,416 | 620,592 | 545,434 | 318,234 | 91,101 | |||||||||||||||
|
|
|
|
|
|
|
|
|
|
|
|||||||||||
| Unit value, end of period $ |
15.69 | 14.41 | 12.85 | 11.81 | 9.88 | |||||||||||||||
| Assets, end of period $ |
11,415,103 | 8,946,266 | 7,010,975 | 3,759,357 | 900,310 | |||||||||||||||
| Investment income ratio* |
1.83 | % | 4.19 | % | 13.22 | % | 10.16 | % | 0.58 | % | ||||||||||
| Expense ratio, lowest to highest** |
0.00 | % | 0.00 | % | 0.00 | % | 0.00 | % | 0.00 | % | ||||||||||
| Total return, lowest to highest*** |
8.86 | % | 12.14 | % | 8.82 | % | 19.54 | % | (11.50%) to (11.30 | %) | ||||||||||
129
Table of Contents
John Hancock Life Insurance Company (U.S.A.) Separate Account N
Notes to Financial Statements (continued)
| 10. | Financial Highlights |
| Sub-Account | ||||||||||||||||||||
| Real Return Bond Trust Series 1 | ||||||||||||||||||||
| Year Ended Dec. 31/12 |
Year Ended Dec. 31/11 |
Year Ended Dec. 31/10 |
Year Ended Dec. 31/09 |
Year Ended Dec. 31/08 |
||||||||||||||||
| Units, beginning of period |
267,266 | 271,156 | 242,646 | 373,272 | 350,490 | |||||||||||||||
| Units issued |
71,604 | 197,462 | 152,618 | 207,023 | 476,953 | |||||||||||||||
| Units redeemed |
(105,047 | ) | (201,352 | ) | (124,108 | ) | (337,649 | ) | (454,171 | ) | ||||||||||
|
|
|
|
|
|
|
|
|
|
|
|||||||||||
| Units, end of period |
233,823 | 267,266 | 271,156 | 242,646 | 373,272 | |||||||||||||||
|
|
|
|
|
|
|
|
|
|
|
|||||||||||
| Unit value, end of period $ |
21.41 to 22.36 | 19.38 to 20.95 | 17.78 to 18.41 | 16.45 to 16.79 | 13.86 to 14.10 | |||||||||||||||
| Assets, end of period $ |
5,091,250 | 5,369,192 | 4,890,281 | 4,034,568 | 5,236,778 | |||||||||||||||
| Investment income ratio* |
1.74 | % | 4.40 | % | 12.15 | % | 9.48 | % | 0.55 | % | ||||||||||
| Expense ratio, lowest to highest** |
0.20% to 0.65 | % | 0.00% to 0.65 | % | 0.20% to 0.65 | % | 0.35% to 0.65 | % | 0.35% to 0.65 | % | ||||||||||
| Total return, lowest to highest*** |
8.15% to 8.64 | % | 11.03% to 12.02 | % | 8.12% to 8.61 | % | 18.70% to 19.06 | % | (11.86%) to (11.59 | %) | ||||||||||
| Sub-Account | ||||||||||||||||||||
| Science & Technology Trust Series 0 | ||||||||||||||||||||
| Year Ended Dec. 31/12 |
Year Ended Dec. 31/11 |
Year Ended Dec. 31/10 |
Year Ended Dec. 31/09 |
Year Ended Dec. 31/08 |
||||||||||||||||
| Units, beginning of period |
72,649 | 58,546 | 60,306 | 61,404 | 31,366 | |||||||||||||||
| Units issued |
22,590 | 28,318 | 36,563 | 67,062 | 105,213 | |||||||||||||||
| Units redeemed |
(16,628 | ) | (14,215 | ) | (38,323 | ) | (68,160 | ) | (75,175 | ) | ||||||||||
|
|
|
|
|
|
|
|
|
|
|
|||||||||||
| Units, end of period |
78,611 | 72,649 | 58,546 | 60,306 | 61,404 | |||||||||||||||
|
|
|
|
|
|
|
|
|
|
|
|||||||||||
| Unit value, end of period $ |
16.57 | 14.99 | 16.24 | 13.02 | 7.91 | |||||||||||||||
| Assets, end of period $ |
1,302,245 | 1,088,755 | 950,795 | 785,456 | 485,962 | |||||||||||||||
| Investment income ratio* |
0.00 | % | 0.00 | % | 0.00 | % | 0.00 | % | 0.00 | % | ||||||||||
| Expense ratio, lowest to highest** |
0.00 | % | 0.00 | % | 0.00 | % | 0.00 | % | 0.00 | % | ||||||||||
| Total return, lowest to highest*** |
10.54 | % | (7.72 | %) | 24.69 | % | 64.57 | % | (44.42%) to (29.01 | %) | ||||||||||
130
Table of Contents
John Hancock Life Insurance Company (U.S.A.) Separate Account N
Notes to Financial Statements (continued)
| 10. | Financial Highlights |
| Sub-Account | ||||||||||||||||||||
| Science & Technology Trust Series 1 | ||||||||||||||||||||
| Year Ended Dec. 31/12 |
Year Ended Dec. 31/11 |
Year Ended Dec. 31/10 |
Year Ended Dec. 31/09 |
Year Ended Dec. 31/08 |
||||||||||||||||
| Units, beginning of period |
373,442 | 366,903 | 448,641 | 635,775 | 857,168 | |||||||||||||||
| Units issued |
105,181 | 212,571 | 207,018 | 186,685 | 370,686 | |||||||||||||||
| Units redeemed |
(187,010 | ) | (206,032 | ) | (288,756 | ) | (373,819 | ) | (592,079 | ) | ||||||||||
|
|
|
|
|
|
|
|
|
|
|
|||||||||||
| Units, end of period |
291,613 | 373,442 | 366,903 | 448,641 | 635,775 | |||||||||||||||
|
|
|
|
|
|
|
|
|
|
|
|||||||||||
| Unit value, end of period $ |
18.77 to 19.94 | 6.61 to 18.49 | 18.68 to 19.64 | 15.17 to 15.66 | 9.28 to 9.55 | |||||||||||||||
| Assets, end of period $ |
5,407,245 | 6,303,220 | 6,814,980 | 5,600,349 | 5,102,005 | |||||||||||||||
| Investment income ratio* |
0.00 | % | 0.00 | % | 0.00 | % | 0.00 | % | 0.00 | % | ||||||||||
| Expense ratio, lowest to highest** |
0.20% to 0.70 | % | 0.00% to 0.70 | % | 0.20% to 0.70 | % | 0.30% to 0.65 | % | 0.30% to 0.65 | % | ||||||||||
| Total return, lowest to highest*** |
9.67% to 10.23 | % | (8.57%) to (7.75 | %) | 23.74% to 24.36 | % | 63.41% to 64.00 | % | (44.81%) to (44.61 | %) | ||||||||||
| Sub-Account | ||||||||||||
| Short Term Government Income Trust Series 0 | ||||||||||||
| Year Ended Dec. 31/12 |
Year Ended Dec. 31/11 |
Year Ended Dec. 31/10 (be) |
||||||||||
| Units, beginning of period |
71,361 | 231,857 | — | |||||||||
| Units issued |
668,684 | 109,848 | 520,659 | |||||||||
| Units redeemed |
(512,849 | ) | (270,344 | ) | (288,802 | ) | ||||||
|
|
|
|
|
|
|
|||||||
| Units, end of period |
227,196 | 71,361 | 231,857 | |||||||||
|
|
|
|
|
|
|
|||||||
| Unit value, end of period $ |
10.60 | 10.48 | 10.19 | |||||||||
| Assets, end of period $ |
2,408,770 | 747,617 | 2,362,813 | |||||||||
| Investment income ratio* |
1.96 | % | 1.39 | % | 1.20 | % | ||||||
| Expense ratio, lowest to highest** |
0.00 | % | 0.00 | % | 0.00 | % | ||||||
| Total return, lowest to highest*** |
1.18 | % | 2.83 | % | 1.91 | % | ||||||
| (be) | Reflects the period from commencement of operations on May 3, 2010 through December 31, 2010. |
131
Table of Contents
John Hancock Life Insurance Company (U.S.A.) Separate Account N
Notes to Financial Statements (continued)
| 10. | Financial Highlights |
| Sub-Account | ||||||||||||
| Short Term Government Income Trust Series 1 | ||||||||||||
| Year Ended Dec. 31/12 |
Year Ended Dec. 31/11 |
Year Ended Dec. 31/10 (be) |
||||||||||
| Units, beginning of period |
241,317 | 389,362 | — | |||||||||
| Units issued |
147,124 | 314,099 | 635,549 | |||||||||
| Units redeemed |
(182,985 | ) | (462,144 | ) | (246,187 | ) | ||||||
|
|
|
|
|
|
|
|||||||
| Units, end of period |
205,456 | 241,317 | 389,362 | |||||||||
|
|
|
|
|
|
|
|||||||
| Unit value, end of period $ |
10.40 to 10.53 | 10.31 to 10.47 | 10.14 to 10.17 | |||||||||
| Assets, end of period $ |
2,145,355 | 2,502,884 | 3,952,866 | |||||||||
| Investment income ratio* |
1.61 | % | 2.31 | % | 1.58 | % | ||||||
| Expense ratio, lowest to highest** |
0.20% to 0.70 | % | 0.00% to 0.65 | % | 0.20% to 0.70 | % | ||||||
| Total return, lowest to highest*** |
0.50% to 0.96 | % | 1.83% to 2.77 | % | 1.39% to 1.71 | % | ||||||
| (be) Reflects the period from commencement of operations on May 3, 2010 through December 31, 2010. |
| |||||||||||
| Sub-Account | ||||||||||||||||||||
| Small Cap Growth Trust Series 0 | ||||||||||||||||||||
| Year Ended Dec. 31/12 |
Year Ended Dec. 31/11 |
Year Ended Dec. 31/10 |
Year Ended Dec. 31/09 |
Year Ended Dec. 31/08 |
||||||||||||||||
| Units, beginning of period |
238,585 | 223,327 | 225,128 | 193,656 | 174,922 | |||||||||||||||
| Units issued |
203,288 | 76,959 | 130,664 | 155,489 | 162,394 | |||||||||||||||
| Units redeemed |
(197,559 | ) | (61,701 | ) | (132,465 | ) | (124,017 | ) | (143,660 | ) | ||||||||||
|
|
|
|
|
|
|
|
|
|
|
|||||||||||
| Units, end of period |
244,314 | 238,585 | 223,327 | 225,128 | 193,656 | |||||||||||||||
|
|
|
|
|
|
|
|
|
|
|
|||||||||||
| Unit value, end of period $ |
21.12 | 18.13 | 19.45 | 15.92 | 11.84 | |||||||||||||||
| Assets, end of period $ |
5,160,719 | 4,325,175 | 4,343,714 | 3,584,964 | 2,293,376 | |||||||||||||||
| Investment income ratio* |
0.00 | % | 0.00 | % | 0.00 | % | 0.00 | % | 0.00 | % | ||||||||||
| Expense ratio, lowest to highest** |
0.00 | % | 0.00 | % | 0.00 | % | 0.00 | % | 0.00 | % | ||||||||||
| Total return, lowest to highest*** |
16.53 | % | (6.80 | %) | 22.14 | % | 34.46 | % | (39.54%) to (28.06 | %) | ||||||||||
132
Table of Contents
John Hancock Life Insurance Company (U.S.A.) Separate Account N
Notes to Financial Statements (continued)
| 10. | Financial Highlights |
| Sub-Account | ||||||||||||||||||||
| Small Cap Growth Trust Series 1 | ||||||||||||||||||||
| Year Ended Dec. 31/12 |
Year Ended Dec. 31/11 |
Year Ended Dec. 31/10 |
Year Ended Dec. 31/09 |
Year Ended Dec. 31/08 (ai) |
||||||||||||||||
| Units, beginning of period |
70,153 | 61,158 | 26,160 | 6,857 | — | |||||||||||||||
| Units issued |
41,908 | 47,538 | 71,307 | 114,312 | 46,848 | |||||||||||||||
| Units redeemed |
(47,928 | ) | (38,543 | ) | (36,309 | ) | (95,009 | ) | (39,991 | ) | ||||||||||
|
|
|
|
|
|
|
|
|
|
|
|||||||||||
| Units, end of period |
64,133 | 70,153 | 61,158 | 26,160 | 6,857 | |||||||||||||||
|
|
|
|
|
|
|
|
|
|
|
|||||||||||
| Unit value, end of |
17.36 to 17.68 | 14.88 to 15.31 | 16.20 to 16.36 | 13.36 to 13.41 | 9.99 to 10.00 | |||||||||||||||
| Assets, end of |
1,120,649 | 1,057,143 | 993,900 | 350,191 | 68,532 | |||||||||||||||
| Investment income ratio* |
0.00 | % | 0.00 | % | 0.00 | % | 0.00 | % | 0.00 | % | ||||||||||
| Expense ratio, lowest to highest** |
0.20% to 0.65 | % | 0.00% to 0.65 | % | 0.20% to 0.65 | % | 0.35% to 0.65 | % | 0.35% to 0.65 | % | ||||||||||
| Total return, lowest to highest*** |
15.71% to 16.24 | % | (7.65%) to (6.81 | %) | 21.29% to 21.83 | % | 33.71% to 34.12 | % | (0.08%) to (0.04 | %) | ||||||||||
| (ai) Reflects the period from commencement of operations on November 10, 2008 through December 31, 2008. |
| |||||||||||||||||||
| Sub-Account | ||||||||||||||||||||
| Small Cap Index Trust Series 0 | ||||||||||||||||||||
| Year Ended Dec. 31/12 |
Year Ended Dec. 31/11 |
Year Ended Dec. 31/10 |
Year Ended Dec. 31/09 |
Year Ended Dec. 31/08 |
||||||||||||||||
| Units, beginning of period |
201,116 | 138,757 | 101,272 | 42,355 | 25,817 | |||||||||||||||
| Units issued |
232,792 | 162,436 | 85,957 | 86,168 | 53,939 | |||||||||||||||
| Units redeemed |
(150,957 | ) | (100,077 | ) | (48,472 | ) | (27,251 | ) | (37,401 | ) | ||||||||||
|
|
|
|
|
|
|
|
|
|
|
|||||||||||
| Units, end of period |
282,951 | 201,116 | 138,757 | 101,272 | 42,355 | |||||||||||||||
|
|
|
|
|
|
|
|
|
|
|
|||||||||||
| Unit value, end of period $ |
17.87 | 15.40 | 16.10 | 12.74 | 10.05 | |||||||||||||||
| Assets, end of |
5,056,149 | 3,096,548 | 2,234,231 | 1,289,837 | 425,740 | |||||||||||||||
| Investment income ratio* |
2.17 | % | 1.32 | % | 0.63 | % | 1.12 | % | 1.47 | % | ||||||||||
| Expense ratio, lowest to highest** |
0.00 | % | 0.00 | % | 0.00 | % | 0.00 | % | 0.00 | % | ||||||||||
| Total return, lowest to highest*** |
16.06 | % | (4.37 | %) | 26.43 | % | 26.70 | % | (33.70%) to (30.20 | %) | ||||||||||
133
Table of Contents
John Hancock Life Insurance Company (U.S.A.) Separate Account N
Notes to Financial Statements (continued)
| 10. | Financial Highlights |
| Sub-Account | ||||||||||||||||||||
| Small Cap Index Trust Series 1 | ||||||||||||||||||||
| Year Ended Dec. 31/12 |
Year Ended Dec. 31/11 |
Year Ended Dec. 31/10 |
Year Ended Dec. 31/09 |
Year Ended Dec. 31/08 |
||||||||||||||||
| Units, beginning of period |
121,883 | 134,920 | 134,379 | 245,098 | 339,311 | |||||||||||||||
| Units issued |
253,618 | 110,385 | 96,468 | 349,934 | 89,307 | |||||||||||||||
| Units redeemed |
(110,076 | ) | (123,422 | ) | (95,927 | ) | (460,653 | ) | (183,520 | ) | ||||||||||
|
|
|
|
|
|
|
|
|
|
|
|||||||||||
| Units, end of period |
265,425 | 121,883 | 134,920 | 134,379 | 245,098 | |||||||||||||||
|
|
|
|
|
|
|
|
|
|
|
|||||||||||
| Unit value, end of period $ |
20.53 to 21.81 | 17.43 to 19.23 | 18.78 to 19.75 | 15.04 to 15.52 | 11.95 to 12.29 | |||||||||||||||
| Assets, end of period $ |
5,572,123 | 2,235,310 | 2,594,585 | 2,052,561 | 2,975,902 | |||||||||||||||
| Investment income ratio* |
1.96 | % | 1.13 | % | 0.51 | % | 0.68 | % | 1.23 | % | ||||||||||
| Expense ratio, lowest to highest** |
0.20% to 0.70 | % | 0.00% to 0.70 | % | 0.20% to 0.70 | % | 0.30% to 0.65 | % | 0.30% to 0.65 | % | ||||||||||
| Total return, lowest to highest*** |
15.29% to 15.87 | % | (5.36%) to (4.50 | %) | 25.48% to 26.11 | % | 25.82% to 26.27 | % | (34.14%) to (33.91 | %) | ||||||||||
| Sub-Account | ||||||||||||||||||||
| Small Cap Opportunities Trust Series 0 | ||||||||||||||||||||
| Year Ended Dec. 31/12 |
Year Ended Dec. 31/11 |
Year Ended Dec. 31/10 |
Year Ended Dec. 31/09 |
Year Ended Dec. 31/08 |
||||||||||||||||
| Units, beginning of period |
11,222 | 11,785 | 6,758 | 3,802 | 3,554 | |||||||||||||||
| Units issued |
4,187 | 8,312 | 7,481 | 9,497 | 4,502 | |||||||||||||||
| Units redeemed |
(5,746 | ) | (8,875 | ) | (2,454 | ) | (6,541 | ) | (4,254 | ) | ||||||||||
|
|
|
|
|
|
|
|
|
|
|
|||||||||||
| Units, end of period |
9,663 | 11,222 | 11,785 | 6,758 | 3,802 | |||||||||||||||
|
|
|
|
|
|
|
|
|
|
|
|||||||||||
| Unit value, end of period $ |
13.52 | 11.57 | 11.94 | 9.21 | 6.87 | |||||||||||||||
| Assets, end of period $ |
130,698 | 129,857 | 140,757 | 62,221 | 26,117 | |||||||||||||||
| Investment income ratio* |
0.00 | % | 0.12 | % | 0.00 | % | 0.00 | % | 2.38 | % | ||||||||||
| Expense ratio, lowest to highest** |
0.00 | % | 0.00 | % | 0.00 | % | 0.00 | % | 0.00 | % | ||||||||||
| Total return, lowest to highest*** |
16.88 | % | (3.13 | %) | 29.71 | % | 34.03 | % | (42.13%) to (30.69 | %) | ||||||||||
134
Table of Contents
John Hancock Life Insurance Company (U.S.A.) Separate Account N
Notes to Financial Statements (continued)
| 10. | Financial Highlights |
| Sub-Account | ||||||||||||||||||||
| Small Cap Opportunities Trust Series 1 | ||||||||||||||||||||
| Year Ended Dec. 31/12 |
Year Ended Dec. 31/11 |
Year Ended Dec. 31/10 |
Year Ended Dec. 31/09 |
Year Ended Dec. 31/08 |
||||||||||||||||
| Units, beginning of period |
32,741 | 58,239 | 51,003 | 57,063 | 137,943 | |||||||||||||||
| Units issued |
2,181 | 18,268 | 72,168 | 55,858 | 31,333 | |||||||||||||||
| Units redeemed |
(18,245 | ) | (43,766 | ) | (64,932 | ) | (61,918 | ) | (112,213 | ) | ||||||||||
|
|
|
|
|
|
|
|
|
|
|
|||||||||||
| Units, end of period |
16,677 | 32,741 | 58,239 | 51,003 | 57,063 | |||||||||||||||
|
|
|
|
|
|
|
|
|
|
|
|||||||||||
| Unit value, end of period $ |
25.70 to 26.97 | 21.77 to 23.54 | 23.03 to 23.93 | 17.95 to 18.37 | 13.50 to 13.77 | |||||||||||||||
| Assets, end of period $ |
436,591 | 735,456 | 1,361,445 | 923,018 | 775,813 | |||||||||||||||
| Investment income ratio* |
0.00 | % | 0.09 | % | 0.00 | % | 0.00 | % | 2.16 | % | ||||||||||
| Expense ratio, lowest to highest** |
0.20% to 0.70 | % | 0.00% to 0.70 | % | 0.20% to 0.70 | % | 0.30% to 0.65 | % | 0.30% to 0.65 | % | ||||||||||
| Total return, lowest to highest*** |
16.02% to 16.61 | % | (4.03%) to (3.16 | %) | 28.76% to 29.41 | % | 33.00% to 33.46 | % | (42.51%) to (42.30 | %) | ||||||||||
| Sub-Account | ||||||||||||||||||||
| Small Cap Value Trust Series 0 | ||||||||||||||||||||
| Year Ended Dec. 31/12 |
Year Ended Dec. 31/11 |
Year Ended Dec. 31/10 |
Year Ended Dec. 31/09 |
Year Ended Dec. 31/08 |
||||||||||||||||
| Units, beginning of period |
166,604 | 155,124 | 138,090 | 104,513 | 102,009 | |||||||||||||||
| Units issued |
71,472 | 51,785 | 70,716 | 101,116 | 94,913 | |||||||||||||||
| Units redeemed |
(76,573 | ) | (40,305 | ) | (53,682 | ) | (67,539 | ) | (92,409 | ) | ||||||||||
|
|
|
|
|
|
|
|
|
|
|
|||||||||||
| Units, end of period |
161,503 | 166,604 | 155,124 | 138,090 | 104,513 | |||||||||||||||
|
|
|
|
|
|
|
|
|
|
|
|||||||||||
| Unit value, end of period $ |
48.39 | 41.79 | 41.32 | 32.75 | 25.43 | |||||||||||||||
| Assets, end of period $ |
7,814,941 | 6,963,187 | 6,409,799 | 4,523,174 | 2,658,179 | |||||||||||||||
| Investment income ratio* |
0.91 | % | 0.90 | % | 0.44 | % | 0.74 | % | 1.36 | % | ||||||||||
| Expense ratio, lowest to highest** |
0.00 | % | 0.00 | % | 0.00 | % | 0.00 | % | 0.00 | % | ||||||||||
| Total return, lowest to highest*** |
15.78 | % | 1.15 | % | 26.15 | % | 28.79 | % | (27.51%) to (26.07 | %) | ||||||||||
135
Table of Contents
John Hancock Life Insurance Company (U.S.A.) Separate Account N
Notes to Financial Statements (continued)
| 10. | Financial Highlights |
| Sub-Account | ||||||||||||||||||||
| Small Cap Value Trust Series 1 | ||||||||||||||||||||
| Year Ended Dec. 31/12 |
Year Ended Dec. 31/11 |
Year Ended Dec. 31/10 |
Year Ended Dec. 31/09 |
Year Ended Dec. 31/08 |
||||||||||||||||
| Units, beginning of period |
31,562 | 30,923 | 26,455 | 64,320 | 747 | |||||||||||||||
| Units issued |
69,766 | 31,165 | 16,761 | 34,363 | 127,542 | |||||||||||||||
| Units redeemed |
(48,562 | ) | (30,526 | ) | (12,293 | ) | (72,228 | ) | (63,969 | ) | ||||||||||
|
|
|
|
|
|
|
|
|
|
|
|||||||||||
| Units, end of period |
52,766 | 31,562 | 30,923 | 26,455 | 64,320 | |||||||||||||||
|
|
|
|
|
|
|
|
|
|
|
|||||||||||
| Unit value, end of period $ |
16.81 to 17.21 | 14.47 to 15.03 | 14.57 to 14.78 | 11.51 to 11.68 | 9.10 to 9.12 | |||||||||||||||
| Assets, end of period $ |
890,741 | 462,460 | 451,145 | 308,717 | 582,478 | |||||||||||||||
| Investment income ratio* |
0.87 | % | 0.80 | % | 0.36 | % | 0.52 | % | 2.10 | % | ||||||||||
| Expense ratio, lowest to highest** |
0.20% to 0.65 | % | 0.00% to 0.65 | % | 0.20% to 0.65 | % | 0.45% to 0.65 | % | 0.45% to 0.65 | % | ||||||||||
| Total return, lowest to highest*** |
14.94% to 15.47 | % | 0.14% to 1.04 | % | 25.28% to 25.85 | % | 27.80% to 28.07 | % | (26.56%) to (26.41 | %) | ||||||||||
| Sub-Account | ||||||||||||||||||||
| Small Company Value Trust Series 0 | ||||||||||||||||||||
| Year Ended Dec. 31/12 |
Year Ended Dec. 31/11 |
Year Ended Dec. 31/10 |
Year Ended Dec. 31/09 |
Year Ended Dec. 31/08 |
||||||||||||||||
| Units, beginning of period |
69,238 | 61,411 | 64,463 | 92,095 | 50,455 | |||||||||||||||
| Units issued |
33,203 | 26,511 | 29,669 | 53,623 | 80,014 | |||||||||||||||
| Units redeemed |
(27,150 | ) | (18,684 | ) | (32,721 | ) | (81,255 | ) | (38,374 | ) | ||||||||||
|
|
|
|
|
|
|
|
|
|
|
|||||||||||
| Units, end of period |
75,291 | 69,238 | 61,411 | 64,463 | 92,095 | |||||||||||||||
|
|
|
|
|
|
|
|
|
|
|
|||||||||||
| Unit value, end of |
17.30 | 14.86 | 15.00 | 12.36 | 9.67 | |||||||||||||||
| Assets, end of period $ |
1,302,715 | 1,029,131 | 921,462 | 796,777 | 890,555 | |||||||||||||||
| Investment income ratio* |
0.25 | % | 0.64 | % | 1.53 | % | 0.40 | % | 0.86 | % | ||||||||||
| Expense ratio, lowest to highest** |
0.00 | % | 0.00 | % | 0.00 | % | 0.00 | % | 0.00 | % | ||||||||||
| Total return, lowest to highest*** |
16.41 | % | (0.94 | %) | 21.39 | % | 27.82 | % | (29.59%) to (27.05 | %) | ||||||||||
136
Table of Contents
John Hancock Life Insurance Company (U.S.A.) Separate Account N
Notes to Financial Statements (continued)
| 10. | Financial Highlights |
| Sub-Account | ||||||||||||||||||||
| Small Company Value Trust Series 1 | ||||||||||||||||||||
| Year Ended Dec. 31/12 |
Year Ended Dec. 31/11 |
Year Ended Dec. 31/10 |
Year Ended Dec. 31/09 |
Year Ended Dec. 31/08 |
||||||||||||||||
| Units, beginning of period |
291,566 | 350,159 | 409,071 | 659,315 | 896,860 | |||||||||||||||
| Units issued |
40,056 | 112,759 | 188,953 | 232,804 | 326,502 | |||||||||||||||
| Units redeemed |
(140,128 | ) | (171,352 | ) | (247,865 | ) | (483,048 | ) | (564,047 | ) | ||||||||||
|
|
|
|
|
|
|
|
|
|
|
|||||||||||
| Units, end of period |
191,494 | 291,566 | 350,159 | 409,071 | 659,315 | |||||||||||||||
|
|
|
|
|
|
|
|
|
|
|
|||||||||||
| Unit value, end of period $ |
23.51 to 24.96 | 19.92 to 30.62 | 20.69 to 21.75 | 17.25 to 17.88 | 13.60 to 14.04 | |||||||||||||||
| Assets, end of period $ |
4,660,932 | 6,156,047 | 7,495,689 | 7,560,437 | 9,496,541 | |||||||||||||||
| Investment income ratio* |
0.25 | % | 0.54 | % | 1.34 | % | 0.39 | % | 0.66 | % | ||||||||||
| Expense ratio, lowest to highest** |
0.20% to 0.70 | % | 0.00% to 0.65 | % | 0.20% to 0.70 | % | 0.25% to 0.65 | % | 0.25% to 0.65 | % | ||||||||||
| Total return, lowest to highest*** |
15.48% to 16.06 | % | (1.82%) to (0.93 | %) | 20.51% to 21.11 | % | 26.86% to 27.37 | % | (27.52%) to (27.24 | %) | ||||||||||
| Sub-Account | ||||||||||||||||
| Smaller Company Growth Trust Series 0 | ||||||||||||||||
| Year Ended Dec. 31/12 |
Year Ended Dec. 31/11 |
Year Ended Dec. 31/10 |
Year Ended Dec. 31/09 (al) |
|||||||||||||
| Units, beginning of period |
17,007 | 14,551 | 18,939 | — | ||||||||||||
| Units issued |
3,522 | 16,404 | 7,783 | 22,836 | ||||||||||||
| Units redeemed |
(8,906 | ) | (13,948 | ) | (12,171 | ) | (3,897 | ) | ||||||||
|
|
|
|
|
|
|
|
|
|||||||||
| Units, end of period |
11,623 | 17,007 | 14,551 | 18,939 | ||||||||||||
|
|
|
|
|
|
|
|
|
|||||||||
| Unit value, end of period $ |
14.23 | 12.24 | 13.16 | 10.52 | ||||||||||||
| Assets, end of period $ |
165,343 | 208,098 | 191,551 | 199,275 | ||||||||||||
| Investment income ratio* |
0.00 | % | 0.00 | % | 0.00 | % | 0.00 | % | ||||||||
| Expense ratio, lowest to highest** |
0.00 | % | 0.00 | % | 0.00 | % | 0.00 | % | ||||||||
| Total return, lowest to highest*** |
16.27 | % | (7.04 | %) | 25.12 | % | 5.22 | % | ||||||||
| (al) | Reflects the period from commencement of operations on November 16, 2009 through December 31, 2009. |
137
Table of Contents
John Hancock Life Insurance Company (U.S.A.) Separate Account N
Notes to Financial Statements (continued)
| 10. | Financial Highlights |
| Sub-Account | ||||||||||||||||
| Smaller Company Growth Trust Series 1 | ||||||||||||||||
| Year Ended Dec. 31/12 |
Year Ended Dec. 31/11 |
Year Ended Dec. 31/10 |
Year Ended Dec. 31/09 (al) |
|||||||||||||
| Units, beginning of period |
1,275,254 | 1,471,612 | 1,713,753 | — | ||||||||||||
| Units issued |
39,157 | 90,738 | 256,311 | 1,751,431 | ||||||||||||
| Units redeemed |
(372,975 | ) | (287,096 | ) | (498,452 | ) | (37,678 | ) | ||||||||
|
|
|
|
|
|
|
|
|
|||||||||
| Units, end of period |
941,436 | 1,275,254 | 1,471,612 | 1,713,753 | ||||||||||||
|
|
|
|
|
|
|
|
|
|||||||||
| Unit value, end of period $ |
13.90 to 14.12 | 11.99 to 12.22 | 13.05 to 13.13 | 10.51 to 10.52 | ||||||||||||
| Assets, end of period $ |
13,118,124 | 15,386,788 | 19,230,310 | 18,017,839 | ||||||||||||
| Investment income ratio* |
0.00 | % | 0.00 | % | 0.00 | % | 0.00 | % | ||||||||
| Expense ratio, lowest to highest** |
0.20% to 0.70 | % | 0.00% to 0.65 | % | 0.20% to 0.70 | % | 0.25% to 0.70 | % | ||||||||
| Total return, lowest to highest*** |
15.41% to 15.99 | % | (7.94%) to (7.10 | %) | 24.17% to 24.79 | % | 5.12% to 5.19 | % | ||||||||
| (al) | Reflects the period from commencement of operations on November 16, 2009 through December 31, 2009. |
| Sub-Account | ||||||||||||||||||||
| Strategic Income Opportunities Trust Series 0 | ||||||||||||||||||||
| Year Ended Dec. 31/12 |
Year Ended Dec. 31/11 |
Year Ended Dec. 31/10 (bc) |
Year Ended Dec. 31/09 |
Year Ended Dec. 31/08 |
||||||||||||||||
| Units, beginning of period |
135,531 | 101,816 | 30,334 | 1,515 | 1,248 | |||||||||||||||
| Units issued |
71,787 | 75,477 | 83,957 | 35,273 | 766 | |||||||||||||||
| Units redeemed |
(25,268 | ) | (41,762 | ) | (12,475 | ) | (6,454 | ) | (499 | ) | ||||||||||
|
|
|
|
|
|
|
|
|
|
|
|||||||||||
| Units, end of period |
182,050 | 135,531 | 101,816 | 30,334 | 1,515 | |||||||||||||||
|
|
|
|
|
|
|
|
|
|
|
|||||||||||
| Unit value, end of period $ |
17.55 | 15.54 | 15.22 | 13.13 | 10.36 | |||||||||||||||
| Assets, end of period $ |
3,194,530 | 2,105,616 | 1,549,526 | 398,301 | 15,689 | |||||||||||||||
| Investment income ratio* |
7.25 | % | 12.08 | % | 19.58 | % | 11.32 | % | 11.82 | % | ||||||||||
| Expense ratio, lowest to highest** |
0.00 | % | 0.00 | % | 0.00 | % | 0.00 | % | 0.00 | % | ||||||||||
| Total return, lowest to highest*** |
12.94 | % | 2.08 | % | 15.91 | % | 26.78 | % | (8.57%) to (8.05 | %) | ||||||||||
| (bc) | Renamed on May 3, 2010. Previously known as Strategic Income Trust. |
138
Table of Contents
John Hancock Life Insurance Company (U.S.A.) Separate Account N
Notes to Financial Statements (continued)
| 10. | Financial Highlights |
| Sub-Account | ||||||||||||||||||||
| Strategic Income Opportunities Trust Series 1 | ||||||||||||||||||||
| Year Ended Dec. 31/12 |
Year Ended Dec. 31/11 |
Year Ended Dec. 31/10 (bc) |
Year Ended Dec. 31/09 |
Year Ended Dec. 31/08 |
||||||||||||||||
| Units, beginning of period |
107,503 | 132,773 | 39,687 | 83,658 | 16,393 | |||||||||||||||
| Units issued |
19,715 | 37,047 | 127,475 | 44,874 | 185,983 | |||||||||||||||
| Units redeemed |
(66,696 | ) | (62,317 | ) | (34,389 | ) | (88,845 | ) | (118,718 | ) | ||||||||||
|
|
|
|
|
|
|
|
|
|
|
|||||||||||
| Units, end of period |
60,522 | 107,503 | 132,773 | 39,687 | 83,658 | |||||||||||||||
|
|
|
|
|
|
|
|
|
|
|
|||||||||||
| Unit value, end of period $ |
22.38 to 23.27 | 19.59 to 20.98 | 19.69 to 20.29 | 17.10 to 17.40 | 13.59 to 13.79 | |||||||||||||||
| Assets, end of period $ |
1,366,967 | 2,167,949 | 2,630,368 | 679,706 | 1,151,717 | |||||||||||||||
| Investment income ratio* |
6.72 | % | 9.78 | % | 23.98 | % | 10.03 | % | 12.21 | % | ||||||||||
| Expense ratio, lowest to highest** |
0.20% to 0.65 | % | 0.00% to 0.65 | % | 0.20% to 0.65 | % | 0.35% to 0.65 | % | 0.35% to 0.65 | % | ||||||||||
| Total return, lowest to highest*** |
12.12% to 12.64 | % | 1.11% to 2.03 | % | 15.13% to 15.66 | % | 25.84% to 26.23 | % | (9.22%) to (8.93 | %) | ||||||||||
| (bc) Renamed on May 3, 2010. Previously known as Strategic Income Trust. |
| |||||||||||||||||||
| Sub-Account | ||||||||||||||||||||
| Total Bond Market Trust B Series 0 | ||||||||||||||||||||
| Year Ended Dec. 31/12 |
Year Ended Dec. 31/11 |
Year Ended Dec. 31/10 |
Year Ended Dec. 31/09 |
Year Ended Dec. 31/08 |
||||||||||||||||
| Units, beginning of period |
353,317 | 435,088 | 372,059 | 279,913 | 156,154 | |||||||||||||||
| Units issued |
585,480 | 200,377 | 286,144 | 294,840 | 259,709 | |||||||||||||||
| Units redeemed |
(371,374 | ) | (282,148 | ) | (223,115 | ) | (202,694 | ) | (135,950 | ) | ||||||||||
|
|
|
|
|
|
|
|
|
|
|
|||||||||||
| Units, end of period |
567,423 | 353,317 | 435,088 | 372,059 | 279,913 | |||||||||||||||
|
|
|
|
|
|
|
|
|
|
|
|||||||||||
| Unit value, end of period $ |
22.83 | 21.94 | 20.39 | 19.14 | 18.01 | |||||||||||||||
| Assets, end of period $ |
12,954,850 | 7,750,121 | 8,869,928 | 7,122,388 | 5,041,514 | |||||||||||||||
| Investment income ratio* |
1.88 | % | 4.38 | % | 4.49 | % | 5.55 | % | 6.26 | % | ||||||||||
| Expense ratio, lowest to highest** |
0.00 | % | 0.00 | % | 0.00 | % | 0.00 | % | 0.00 | % | ||||||||||
| Total return, lowest to highest*** |
4.08 | % | 7.60 | % | 6.49 | % | 6.29 | % | 3.52% to 5.79 | % | ||||||||||
139
Table of Contents
John Hancock Life Insurance Company (U.S.A.) Separate Account N
Notes to Financial Statements (continued)
| 10. | Financial Highlights |
| Sub-Account | ||||||||||||||||||||
| Total Return Trust Series 0 | ||||||||||||||||||||
| Year Ended Dec. 31/12 |
Year Ended Dec. 31/11 |
Year Ended Dec. 31/10 |
Year Ended Dec. 31/09 |
Year Ended Dec. 31/08 |
||||||||||||||||
| Units, beginning of period |
1,764,258 | 1,387,764 | 870,388 | 224,706 | 72,293 | |||||||||||||||
| Units issued |
1,027,665 | 771,951 | 680,834 | 744,455 | 237,637 | |||||||||||||||
| Units redeemed |
(1,005,499 | ) | (395,457 | ) | (163,458 | ) | (98,773 | ) | (85,224 | ) | ||||||||||
|
|
|
|
|
|
|
|
|
|
|
|||||||||||
| Units, end of period |
1,786,424 | 1,764,258 | 1,387,764 | 870,388 | 224,706 | |||||||||||||||
|
|
|
|
|
|
|
|
|
|
|
|||||||||||
| Unit value, end of period $ |
17.57 | 16.18 | 15.57 | 14.46 | 12.71 | |||||||||||||||
| Assets, end of period $ |
31,387,850 | 28,551,370 | 21,599,909 | 12,583,045 | 2,857,007 | |||||||||||||||
| Investment income ratio* |
2.00 | % | 4.80 | % | 2.58 | % | 5.68 | % | 5.58 | % | ||||||||||
| Expense ratio, lowest to highest** |
0.00 | % | 0.00 | % | 0.00 | % | 0.00 | % | 0.00 | % | ||||||||||
| Total return, lowest to highest*** |
8.57 | % | 3.97 | % | 7.66 | % | 13.71 | % | 2.76 | % | ||||||||||
| Sub-Account | ||||||||||||||||||||
| Total Return Trust Series 1 | ||||||||||||||||||||
| Year Ended Dec. 31/12 |
Year Ended Dec. 31/11 |
Year Ended Dec. 31/10 |
Year Ended Dec. 31/09 |
Year Ended Dec. 31/08 |
||||||||||||||||
| Units, beginning of period |
1,864,813 | 1,847,382 | 1,965,055 | 2,143,657 | 1,745,005 | |||||||||||||||
| Units issued |
301,982 | 640,355 | 1,318,461 | 1,140,824 | 1,884,675 | |||||||||||||||
| Units redeemed |
(1,204,584 | ) | (622,924 | ) | (1,436,134 | ) | (1,319,426 | ) | (1,486,023 | ) | ||||||||||
|
|
|
|
|
|
|
|
|
|
|
|||||||||||
| Units, end of period |
962,211 | 1,864,813 | 1,847,382 | 1,965,055 | 2,143,657 | |||||||||||||||
|
|
|
|
|
|
|
|
|
|
|
|||||||||||
| Unit value, end of period $ |
26.77 to 28.26 | 24.17 to 26.68 | 24.06 to 25.16 | 22.49 to 23.33 | 19.93 to 20.59 | |||||||||||||||
| Assets, end of period $ |
26,629,883 | 47,874,290 | 45,740,261 | 45,086,578 | 43,539,894 | |||||||||||||||
| Investment income ratio* |
1.72 | % | 4.47 | % | 2.32 | % | 4.05 | % | 4.60 | % | ||||||||||
| Expense ratio, lowest to highest** |
0.20% to 0.65 | % | 0.00% to 0.65 | % | 0.20% to 0.65 | % | 0.25% to 0.65 | % | 0.25% to 0.65 | % | ||||||||||
| Total return, lowest to highest*** |
7.78% to 8.27 | % | 2.98% to 3.91 | % | 6.95% to 7.43 | % | 12.86% to 13.31 | % | 2.10% to 2.52 | % | ||||||||||
140
Table of Contents
John Hancock Life Insurance Company (U.S.A.) Separate Account N
Notes to Financial Statements (continued)
| 10. | Financial Highlights |
| Sub-Account | ||||||||||||||||||||
| Total Stock Market Index Trust Series 0 | ||||||||||||||||||||
| Year Ended Dec. 31/12 |
Year Ended Dec. 31/11 |
Year Ended Dec. 31/10 |
Year Ended Dec. 31/09 |
Year Ended Dec. 31/08 |
||||||||||||||||
| Units, beginning of period |
13,388 | 36,982 | 26,528 | 6,539 | 6,922 | |||||||||||||||
| Units issued |
4,258 | 16,284 | 20,727 | 44,607 | 23,133 | |||||||||||||||
| Units redeemed |
(9,091 | ) | (39,878 | ) | (10,273 | ) | (24,618 | ) | (23,516 | ) | ||||||||||
|
|
|
|
|
|
|
|
|
|
|
|||||||||||
| Units, end of period |
8,555 | 13,388 | 36,982 | 26,528 | 6,539 | |||||||||||||||
|
|
|
|
|
|
|
|
|
|
|
|||||||||||
| Unit value, end of period $ |
53.59 | 46.38 | 46.23 | 39.42 | 30.58 | |||||||||||||||
| Assets, end of |
458,437 | 620,895 | 1,709,553 | 1,045,820 | 199,933 | |||||||||||||||
| Investment income ratio* |
1.34 | % | 0.59 | % | 1.54 | % | 1.76 | % | 0.93 | % | ||||||||||
| Expense ratio, lowest to highest** |
0.00 | % | 0.00 | % | 0.00 | % | 0.00 | % | 0.00 | % | ||||||||||
| Total return, lowest to highest*** |
15.56 | % | 0.33 | % | 17.26 | % | 28.93 | % | (37.15%) to (25.73 | %) | ||||||||||
| Sub-Account | ||||||||||||||||||||
| Total Stock Market Index Trust Series 1 | ||||||||||||||||||||
| Year Ended Dec. 31/12 |
Year Ended Dec. 31/11 |
Year Ended Dec. 31/10 |
Year Ended Dec. 31/09 |
Year Ended Dec. 31/08 |
||||||||||||||||
| Units, beginning of period |
144,884 | 144,037 | 65,078 | 186,446 | 260,998 | |||||||||||||||
| Units issued |
72,972 | 63,665 | 104,838 | 125,758 | 90,395 | |||||||||||||||
| Units redeemed |
(87,665 | ) | (62,818 | ) | (25,879 | ) | (247,126 | ) | (164,947 | ) | ||||||||||
|
|
|
|
|
|
|
|
|
|
|
|||||||||||
| Units, end of period |
130,191 | 144,884 | 144,037 | 65,078 | 186,446 | |||||||||||||||
|
|
|
|
|
|
|
|
|
|
|
|||||||||||
| Unit value, end of period $ |
14.74 to 15.65 | 12.57 to 13.88 | 12.91 to 13.43 | 11.14 to 11.45 | 8.70 to 8.91 | |||||||||||||||
| Assets, end of period $ |
1,982,096 | 1,910,839 | 1,899,563 | 729,447 | 1,649,478 | |||||||||||||||
| Investment income ratio* |
1.54 | % | 1.16 | % | 1.73 | % | 1.04 | % | 1.61 | % | ||||||||||
| Expense ratio, lowest to highest** |
0.20% to 0.70 | % | 0.00% to 0.65 | % | 0.30% to 0.70 | % | 0.35% to 0.65 | % | 0.35% to 0.65 | % | ||||||||||
| Total return, lowest to highest*** |
14.69% to 15.26 | % | (0.62%) to 0.28 | % | 16.37% to 16.84 | % | 28.03% to 28.42 | % | (37.61%) to (37.42 | %) | ||||||||||
141
Table of Contents
John Hancock Life Insurance Company (U.S.A.) Separate Account N
Notes to Financial Statements (continued)
| 10. | Financial Highlights |
| Sub-Account | ||||||||
| Ultra Short Term Bond Trust Series 0 | ||||||||
| Year Ended Dec. 31/12 |
Year Ended Dec. 31/11 (g) |
|||||||
| Units, beginning of period |
11,566 | — | ||||||
| Units issued |
44,490 | 26,551 | ||||||
| Units redeemed |
(22,252 | ) | (14,985 | ) | ||||
|
|
|
|
|
|||||
| Units, end of period |
33,804 | 11,566 | ||||||
|
|
|
|
|
|||||
| Unit value, end of period $ |
10.07 | 10.00 | ||||||
| Assets, end of period $ |
340,380 | 115,702 | ||||||
| Investment income ratio* |
1.10 | % | 1.32 | % | ||||
| Expense ratio, lowest to highest** |
0.00 | % | 0.00 | % | ||||
| Total return, lowest to highest*** |
0.66 | % | 0.09 | % | ||||
| (g) Fund available in prior year but no activity. |
||||||||
| Sub-Account | ||||||||
| Ultra Short Term Bond Trust Series 1 | ||||||||
| Year Ended Dec. 31/12 |
Year Ended Dec. 31/11 (g) |
|||||||
| Units, beginning of period |
2,701 | — | ||||||
| Units issued |
785 | 2,802 | ||||||
| Units redeemed |
(178 | ) | (101 | ) | ||||
|
|
|
|
|
|||||
| Units, end of period |
3,308 | 2,701 | ||||||
|
|
|
|
|
|||||
| Unit value, end of period $ |
9.91 | 9.91 | ||||||
| Assets, end of period $ |
32,819 | 26,825 | ||||||
| Investment income ratio* |
1.16 | % | 2.05 | % | ||||
| Expense ratio, lowest to highest** |
0.65 | % | 0.00% to 0.65 | % | ||||
| Total return, lowest to highest*** |
(0.15 | %) | (0.69%) to 0.12 | % | ||||
| (g) | Fund available in prior year but no activity. |
142
Table of Contents
John Hancock Life Insurance Company (U.S.A.) Separate Account N
Notes to Financial Statements (continued)
| 10. | Financial Highlights |
| Sub-Account | ||||
| U.S. Equity Trust Series 0 | ||||
| Year Ended Dec. 31/12 (q) |
||||
| Units, beginning of period |
— | |||
| Units issued |
56,636 | |||
| Units redeemed |
(4,265 | ) | ||
|
|
|
|||
| Units, end of period |
52,371 | |||
|
|
|
|||
| Unit value, end of period $ |
10.28 | |||
| Assets, end of period $ |
538,430 | |||
| Investment income ratio* |
2.14 | % | ||
| Expense ratio, lowest to highest** |
0.00 | % | ||
| Total return, lowest to highest*** |
2.81 | % | ||
| (q) Reflects the period from commencement of operations on April 30, 2012 through December 31, 2012. |
| |||
| Sub-Account | ||||
| U.S. Equity Trust Series 1 | ||||
| Year Ended Dec. 31/12 (q) |
||||
| Units, beginning of period |
— | |||
| Units issued |
151,071 | |||
| Units redeemed |
(46,422 | ) | ||
|
|
|
|||
| Units, end of period |
104,649 | |||
|
|
|
|||
| Unit value, end of period $ |
10.23 to 10.26 | |||
| Assets, end of period $ |
1,072,153 | |||
| Investment income ratio* |
1.97 | % | ||
| Expense ratio, lowest to highest** |
0.20% to 0.70 | % | ||
| Total return, lowest to highest*** |
2.28% to 2.63 | % | ||
| (q) | Reflects the period from commencement of operations on April 30, 2012 through December 31, 2012. |
143
Table of Contents
John Hancock Life Insurance Company (U.S.A.) Separate Account N
Notes to Financial Statements (continued)
| 10. | Financial Highlights |
| Sub-Account | ||||||||||||||||||||
| Utilities Trust Series 0 | ||||||||||||||||||||
| Year Ended Dec. 31/12 |
Year Ended Dec. 31/11 |
Year Ended Dec. 31/10 |
Year Ended Dec. 31/09 |
Year Ended Dec. 31/08 |
||||||||||||||||
| Units, beginning of period |
51,356 | 55,968 | 32,844 | 55,369 | 17,927 | |||||||||||||||
| Units issued |
15,272 | 21,449 | 34,059 | 56,984 | 78,710 | |||||||||||||||
| Units redeemed |
(13,197 | ) | (26,061 | ) | (10,935 | ) | (79,509 | ) | (41,268 | ) | ||||||||||
|
|
|
|
|
|
|
|
|
|
|
|||||||||||
| Units, end of period |
53,431 | 51,356 | 55,968 | 32,844 | 55,369 | |||||||||||||||
|
|
|
|
|
|
|
|
|
|
|
|||||||||||
| Unit value, end of period $ |
21.97 | 19.33 | 18.10 | 15.88 | 11.89 | |||||||||||||||
| Assets, end of period $ |
1,173,906 | 992,929 | 1,013,201 | 521,594 | 658,222 | |||||||||||||||
| Investment income ratio* |
3.78 | % | 3.82 | % | 3.58 | % | 4.85 | % | 2.83 | % | ||||||||||
| Expense ratio, lowest to highest** |
0.00 | % | 0.00 | % | 0.00 | % | 0.00 | % | 0.00 | % | ||||||||||
| Total return, lowest to highest*** |
13.63 | % | 6.80 | % | 14.00 | % | 33.58 | % | (38.50%) to (21.20 | %) | ||||||||||
| Sub-Account | ||||||||||||||||||||
| Utilities Trust Series 1 | ||||||||||||||||||||
| Year Ended Dec. 31/12 |
Year Ended Dec. 31/11 |
Year Ended Dec. 31/10 |
Year Ended Dec. 31/09 |
Year Ended Dec. 31/08 |
||||||||||||||||
| Units, beginning of period |
80,036 | 77,427 | 79,013 | 249,807 | 225,244 | |||||||||||||||
| Units issued |
25,922 | 46,158 | 31,683 | 75,136 | 156,245 | |||||||||||||||
| Units redeemed |
(42,167 | ) | (43,549 | ) | (33,269 | ) | (245,930 | ) | (131,682 | ) | ||||||||||
|
|
|
|
|
|
|
|
|
|
|
|||||||||||
| Units, end of period |
63,791 | 80,036 | 77,427 | 79,013 | 249,807 | |||||||||||||||
|
|
|
|
|
|
|
|
|
|
|
|||||||||||
| Unit value, end of period $ |
25.48 to 26.86 | 21.98 to 24.19 | 21.29 to 22.25 | 18.81 to 19.40 | 14.16 to 14.55 | |||||||||||||||
| Assets, end of period $ |
1,643,623 | 1,829,855 | 1,668,754 | 1,494,713 | 3,594,971 | |||||||||||||||
| Investment income ratio* |
3.65 | % | 3.56 | % | 2.52 | % | 3.61 | % | 3.24 | % | ||||||||||
| Expense ratio, lowest to highest** |
0.20% to 0.65 | % | 0.00% to 0.65 | % | 0.20% to 0.65 | % | 0.30% to 0.65 | % | 0.30% to 0.65 | % | ||||||||||
| Total return, lowest to highest*** |
12.92% to 13.43 | % | 5.70% to 6.65 | % | 13.18% to 13.69 | % | 32.91% to 33.37 | % | (39.04%) to (38.83 | %) | ||||||||||
144
Table of Contents
John Hancock Life Insurance Company (U.S.A.) Separate Account N
Notes to Financial Statements (continued)
| 10. | Financial Highlights |
| Sub-Account | ||||||||||||||||||||
| Value Trust Series 0 | ||||||||||||||||||||
| Year Ended Dec. 31/12 |
Year Ended Dec. 31/11 |
Year Ended Dec. 31/10 |
Year Ended Dec. 31/09 |
Year Ended Dec. 31/08 |
||||||||||||||||
| Units, beginning of period |
33,704 | 38,056 | 52,511 | 35,076 | 34,210 | |||||||||||||||
| Units issued |
10,626 | 5,484 | 30,722 | 69,744 | 64,360 | |||||||||||||||
| Units redeemed |
(3,015 | ) | (9,836 | ) | (45,177 | ) | (52,309 | ) | (63,494 | ) | ||||||||||
|
|
|
|
|
|
|
|
|
|
|
|||||||||||
| Units, end of period |
41,315 | 33,704 | 38,056 | 52,511 | 35,076 | |||||||||||||||
|
|
|
|
|
|
|
|
|
|
|
|||||||||||
| Unit value, end of |
18.25 | 15.53 | 15.37 | 12.57 | 8.90 | |||||||||||||||
| Assets, end of period $ |
753,948 | 523,460 | 585,025 | 659,988 | 312,241 | |||||||||||||||
| Investment income ratio* |
0.95 | % | 1.10 | % | 1.12 | % | 1.09 | % | 0.84 | % | ||||||||||
| Expense ratio, lowest to highest** |
0.00 | % | 0.00 | % | 0.00 | % | 0.00 | % | 0.00 | % | ||||||||||
| Total return, lowest to highest*** |
17.50 | % | 1.03 | % | 22.30 | % | 41.19 | % | (40.84%) to (31.48 | %) | ||||||||||
| Sub-Account | ||||||||||||||||||||
| Value Trust Series 1 | ||||||||||||||||||||
| Year Ended Dec. 31/12 |
Year Ended Dec. 31/11 |
Year Ended Dec. 31/10 |
Year Ended Dec. 31/09 |
Year Ended Dec. 31/08 |
||||||||||||||||
| Units, beginning of period |
113,325 | 114,791 | 142,586 | 310,735 | 395,785 | |||||||||||||||
| Units issued |
46,637 | 38,553 | 64,708 | 287,392 | 134,441 | |||||||||||||||
| Units redeemed |
(83,592 | ) | (40,019 | ) | (92,503 | ) | (455,541 | ) | (219,491 | ) | ||||||||||
|
|
|
|
|
|
|
|
|
|
|
|||||||||||
| Units, end of period |
76,370 | 113,325 | 114,791 | 142,586 | 310,735 | |||||||||||||||
|
|
|
|
|
|
|
|
|
|
|
|||||||||||
| Unit value, end of |
35.15 to 37.32 | 27.35 to 32.56 | 30.06 to 31.60 | 24.88 to 25.68 | 17.74 to 18.24 | |||||||||||||||
| Assets, end of period $ |
2,735,313 | 3,499,439 | 3,518,229 | 3,571,204 | 5,587,755 | |||||||||||||||
| Investment income ratio* |
0.84 | % | 1.04 | % | 0.96 | % | 1.29 | % | 1.10 | % | ||||||||||
| Expense ratio, lowest to highest** |
0.20% to 0.70 | % | 0.00% to 0.70 | % | 0.20% to 0.70 | % | 0.30% to 0.65 | % | 0.30% to 0.65 | % | ||||||||||
| Total return, lowest to highest*** |
16.60% to 17.19 | % | 0.07% to 0.98 | % | 21.36% to 21.97 | % | 40.27% to 40.75 | % | (41.25%) to (41.05 | %) | ||||||||||
145
Table of Contents
John Hancock Life Insurance Company (U.S.A.) Separate Account N
Notes to Financial Statements (continued)
The Account is a funding vehicle for a number of variable universal life insurance products which have unique combinations of features and fees that are charged against the contract owners’ account balances. Differences in the fee structures result in a variety of unit values, expense ratios and total returns.
The preceding table was developed by determining which products offered by the Company have the lowest and highest total return. Only product designs within each sub-account that had units outstanding during the period were considered when determining the lowest and highest total return. The summary may not reflect the minimum and maximum mortality and expense risks charges offered by the Company as contract owners may not have selected all available and applicable contract options as discussed in Notes 3 and 4.
| (*) | These ratios, which are not annualized, represent the dividends, excluding distributions of capital gains, received by the sub-account from the underlying Trust portfolio, net of management fees assessed by the Trust portfolio adviser, divided by the average net assets of the sub-account. These ratios exclude those expenses, such as mortality and expense risks charges, that result in direct reductions in unit values. The recognition of investment income by the sub-account is affected by the timing of the declarations of dividends by the underlying Trust portfolio in which the sub-accounts invest. It is the practice of the Trust, for income tax reasons, to declare dividends in April for investment income received in the previous calendar year for all sub-accounts of the Trust except for the Money Market Trust which declares and reinvests dividends on a daily basis. Any dividend distribution received from a sub-account of the Trust is reinvested immediately, at the net asset value, in shares of that sub-account and retained as assets of the corresponding sub-account so that the unit value of the sub-account is not affected by the declaration and reinvestment of dividends. |
| (**) | These ratios represent the annualized contract expenses of the separate account, consisting primarily of mortality and expense risks charges, for the period indicated. The ratios include only those expenses that result in a direct reduction in unit values. Charges made directly to contract owner accounts through the redemption of units and expenses of the underlying Trust portfolio are excluded. When no range is given, the lowest and highest values are the same. |
| (***) | These ratios, which are not annualized, represent the total return for the period indicated, including changes in the value of the underlying Trust portfolio, and reflect deductions for all items included in the expense ratio. The total return does not include any expenses assessed through the redemption of units; inclusion of these expenses in the calculation would result in a reduction in the total return presented. When no range is given, the lowest and highest values are the same. |
146
Table of Contents
Prospectus dated April 29, 2013
for interests in
John Hancock Life Insurance Company (U.S.A.) Separate Account N
Interests are made available under
CORPORATE VUL
JOHN HANCOCK LIFE INSURANCE COMPANY (U.S.A.)
(“John Hancock USA”)
| 500 Index B Active Bond All Cap Core All Cap Value Alpha Opportunities American Asset Allocation American Global Growth American Growth American Growth-Income American International American New World Blue Chip Growth Bond Capital Appreciation Capital Appreciation Value Core Allocation Plus Core Bond Core Strategy Disciplined Diversification Emerging Markets Value Equity-Income Financial Services Franklin Templeton Founding Allocation |
Fundamental All Cap Core Fundamental Holdings Fundamental Large Cap Value Fundamental Value Global Global Bond Global Diversification Health Sciences High Yield International Core International Equity Index B International Growth Stock International Opportunities International Small Company International Value Investment Quality Bond Lifestyle Aggressive Lifestyle Balanced Lifestyle Conservative Lifestyle Growth Lifestyle Moderate Mid Cap Index |
Mid Cap Stock Mid Value Money Market Natural Resources PIMCO VIT All Asset Real Estate Securities Real Return Bond Science & Technology Short Term Government Income Small Cap Growth Small Cap Index Small Cap Opportunities Small Cap Value Small Company Value Smaller Company Growth Strategic Income Opportunities Total Return Total Stock Market Index Ultra Short Term Bond U.S. Equity Utilities Value |
* * * * * * * * * * * *
Please note that the Securities and Exchange Commission (“SEC”) has not approved or disapproved these securities, or determined if this prospectus is truthful or complete. Any representation to the contrary is a criminal offense.
CVUL04 4/2013
The purpose of this variable life insurance policy is to provide insurance protection for the beneficiary named therein. No claim is made that this variable life insurance policy is in any way similar or comparable to a systematic investment plan of a mutual fund.
Examine this prospectus carefully. The Policy Summary will briefly describe the policy. More detailed information will be found further in the prospectus. You should rely on the information contained in this prospectus, the portfolio prospectuses, and the corresponding Statements of Additional Information, which contains the audited financial statements for JHUSA and Separate Account N. The portfolio prospectuses describe the investment objectives, policies and restrictions of, and the risks relating to, investment in the investment options. In the case of any of the portfolios that are operated as “feeder funds,” the prospectus for the corresponding “master fund” is also provided. We have not authorized anyone to provide you with information that is different from the information contained in the aforementioned documents.
Some of the benefits of purchasing the policy are described below.
Death Benefit Protection: This prospectus describes a flexible premium variable life insurance policy, which provides for a death benefit payable to the beneficiary of the policy upon the death of the insured person. Variable life insurance is a flexible tool for financial and investment planning for persons needing death benefit protection. You should consider other forms of investments if death benefit protection is not one of your financial planning objectives, as there are additional costs and expenses in providing the insurance.
Access to Your Policy Values: Your variable life insurance policy offers access to your Policy Value through policy loans, policy surrender and partial withdrawal. There are limitations on partial withdrawals. See “Policy Surrender and Partial Withdrawals” for further information. Policy loans permanently affect the Policy Value, and may also result in adverse tax consequences.
Tax Deferred Accumulation: Variable life insurance has several tax advantages under current tax laws. For example, Policy Value accumulates on a tax-deferred basis and a transfer of values from one sub-account to another within the policy does not generate a taxable gain or loss. Any investment income and realized capital gains within a sub-account or interest from the Fixed Account are automatically reinvested without current income taxation to the policy owner.
Investment Options: In addition to the Fixed Account, the policy provides for access to a number of variable investment options, which permit you to reallocate your Policy Value to meet your changing personal objectives, goals, and investment conditions. Information regarding each investment option may be found in the portfolio prospectuses.
Flexibility: The policy is a flexible premium variable life insurance policy in which varying premium payments are permitted. You may select death benefit options and policy riders. You may increase or decrease the amount of death benefit. You are able to select, monitor, and change investment choices within your policy.
Some of the risks of purchasing the policy are described below.
Fluctuating Investment Performance: Policy Values invested in a sub-account are not guaranteed. Policy Values will increase and decrease according to investment performance. You assume the investment risk of Policy Value allocated to the sub-accounts. A comprehensive discussion of each sub-account’s objective and risk is found in the portfolio prospectuses. You should review the prospectuses carefully before allocating Policy Values to any sub-accounts.
Unsuitable for Short-Term Investment: The policy is intended for long-term financial planning, and is unsuitable for short-term goals. The policy is not designed to serve as a vehicle for frequent trading.
Policy Lapse: Sufficient premiums must be paid to keep the policy in force. There is a risk of lapse if the Policy Value is too low in relation to the insurance amount, if investment results are less favorable than anticipated or if extensive policy loans are taken. A policy lapse could have adverse tax consequences since the amount received (including any loans) less the investment in the policy may be treated as ordinary income subject to tax. Withdrawals reduce your Policy Value and increase the risk of lapse.
Decreasing Death Benefit: Any outstanding policy loans and any amount that you have surrendered or withdrawn will reduce your policy’s death benefit.
Adverse Consequences of Early Surrender: Depending on the Policy Value at the time of surrender, there may be little or no Net Cash Surrender Value paid to you when the policy is surrendered. In addition, there are adverse consequences associated with partial withdrawals including potential policy lapse and adverse tax consequences. There may also be adverse consequences associated with full surrender of the policy.
Adverse Tax Consequences: You should always consult a tax adviser about the application of federal and state tax law to your individual situation. The federal income tax treatment of life insurance is complex and current tax treatment of life insurance may change.
The following tables describe the fees and expenses (on a guaranteed basis) that you will pay when buying, owning, and surrendering the policy. Except where necessary to show a rate greater than zero, all rates shown in the tables have been rounded to two decimal places as required by the prospectus disclosure rules. Consequently, the actual rates charged may be slightly higher or lower than those shown. The first table describes the fees and expenses that you will pay at the time that you buy the policy, surrender the policy, or transfer cash value between investment options.
| Transaction Fees | ||
| Charge | When Charge is Deducted | Amount Deducted |
| Premium Charge | Upon receipt of premium | 2.5% of each premium paid |
| Sales Charge | Upon receipt of premium | 13% (Coverage Year 1)1 |
| Transfer Fees | Upon transfer | $25 (only applies to transfers in excess of 12 in a Policy Year) |
| Dollar Cost Averaging | Upon transfer | Guaranteed $ 5.00 |
| Current $ 0.00 | ||
| Asset Allocation Balancer | Upon transfer | Guaranteed $ 15.00 |
| Current $ 0.00 | ||
1 The sales charge declines in subsequent Coverage Years as noted below:
| Coverage Year | Percentage |
| 1 | 13.00% |
| 2 | 6.25% |
| 3 | 3.50% |
| 4 | 2.50% |
| 5 | 0.50% |
| 6 | 0.50% |
| 7+ | 0.00% |
The next table describes the fees and expenses (on a guaranteed basis) that you will pay periodically during the time that you own the policy. These fees and expenses do not include fees and expenses of the portfolios, which are the underlying variable investment options for your policy.
| Charges Other Than Those of the Portfolios | |||
| Charge | When Charge is Deducted |
Amount Deducted | |
| Cost of Insurance1 | Monthly | Minimum and Maximum Charge | The possible range of the cost of insurance is from $0.00 to $83.33 per month per $1,000 of the net amount at risk. |
| Charge for a Representative Policy Owner (a 45 year old non-smoking male) (rating classification is for short form underwriting) | The cost of insurance rate is $0.08 per month per $1,000 of the net amount at risk. | ||
| Cost of Insurance – Optional FTIO Rider (Flexible Term Insurance Option)1 | Monthly | Minimum and Maximum Charges | The possible range of the cost of insurance is from $0.00 to $83.33 per month per $1,000 of the net amount at risk. |
| Charge for a Representative Policy Owner (a 45 year old non-smoking male) rating classification is for short form underwriting) | The cost of insurance rate is $0.38 per month per $1,000 of the net amount at risk. | ||
| Mortality and Expense Risk Charge | Monthly | 0.50% annually2 | |
| Administration Charge | Monthly | $12 per Policy Month | |
| Loan Interest Rate (Net) | Annually | 0.75%3 | |
1 The cost of insurance varies based on individual characteristics and the charges shown in the table may not be representative of the charge a particular policy owner will pay. A policy owner may obtain additional information regarding cost of insurance charge by contacting the Company. The election (or failure to elect) the optional FTIO rider will impact the total cost of insurance charges.
2 Currently the Company is charging the following rates:
| Policy Years | Annual Rate |
| 1-10 | 0.45% |
| 11+ | 0.25% |
3 The Loan Interest Rate (Net) is equal to the rate of interest charged on the policy loan less the interest credited to the Loan Account. Currently this rate is 0.75% for Policy Years 1-10 and 0.25% for Policy Years 11 and higher. The maximum loan rate is 4%.
The next table describes the minimum and maximum portfolio level fees and expenses charged by any of the portfolios underlying a variable investment option offered through this prospectus, expressed as a percentage of average net assets (rounded to two decimal places). These expenses are deducted from portfolio assets.
| Total Annual Portfolio Operating Expenses | Minimum | Maximum |
| Range of expenses, including management fees, distribution and/or service (12b-1) fees, and other expenses | 0.54% | 1.63% |
1 Certain of the portfolios’ advisers or subadvisers have contractually agreed to reimburse or waive certain portfolio level expenses. The minimum and maximum expenses shown do not reflect these contractual expense reimbursements or waivers. If such reimbursements or waivers were reflected, the minimum and maximum expenses would be 0.30% and 1.54%, respectively.
Table of Investment Options and Investment Subadvisers
When you select a Separate Account investment option, we invest your money in shares of a corresponding portfolio of the John Hancock Variable Insurance Trust (the “Trust” or “JHVIT”) (or the PIMCO Variable Insurance Trust (the “PIMCO Trust”) with respect to the PIMCO VIT All Asset portfolio) and hold the shares in a subaccount of the Separate Account. Fees and expenses of the portfolios are not fixed or specified under the terms of the policies and may vary from year to year. These fees and expenses differ for each portfolio and reduce the investment return of each portfolio. Therefore, they also indirectly reduce the return you will earn on any Separate Account investment options you select. For more information, please refer to the prospectus for the underlying portfolios.
The JHVIT and the PIMCO Trust are so-called “series” type mutual funds and each is registered under the Investment Company Act of 1940 (“1940 Act”) as an open-end management investment company. John Hancock Investment Management Services, LLC (“JHIMS”) provides investment advisory services to the Trust and receives investment management fees for doing so. JHIMS pays a portion of its investment management fees to other firms that manage the Trust’s portfolios. We are affiliated with JHIMS and may indirectly benefit from any investment management fees JHIMS retains. The PIMCO VIT All Asset portfolio of the PIMCO Trust receives investment advisory services from Pacific Investment Management Company LLC (“PIMCO”) and pays investment management fees to PIMCO.
Each of the American Asset Allocation, American Global Growth, American Growth, American Growth-Income, American International, American New World, Fundamental Holdings and Global Diversification portfolios invests in Series 1 shares of the corresponding investment portfolio of the Trust. The American Asset Allocation, American Global Growth, American Growth, American Growth-Income, American International, and American New World portfolios operate as “feeder funds,” which means that the portfolios do not buy investment securities directly. Instead, they invest in a “master fund” which in turn purchases investment securities. Each of the American feeder fund portfolios has the same investment objective and limitations as its master fund. The prospectus for the American Fund master fund is included with the prospectuses for the underlying funds. We pay American Funds Distributors, Inc., the principal underwriter for the American Funds Insurance Series, a percentage of some or all of the amounts allocated to the “American” portfolios of the Trust for the marketing support services it provides.
The portfolios pay us or certain of our affiliates compensation for some of the distribution, administrative, shareholder support, marketing and other services we or our affiliates provide to the portfolios. The amount of this compensation is based on a percentage of the assets of the portfolios attributable to the variable insurance products that we and our affiliates issue. These percentages may differ from portfolio to portfolio and among classes of shares within a portfolio. In some cases, the compensation is derived from the Rule 12b-1 fees that are deducted from a portfolio’s assets for the services we or our affiliates provide to that portfolio. These compensation payments do not, however, result in any charge to you in addition to what is shown in the Fee Tables.
The following table provides a general description of the portfolios that underlie the variable investment options we make available under the policy. You bear the investment risk of any portfolio you choose as an investment option for your policy. You can find a full description of each portfolio, including the investment objectives, policies, restrictions, and risks, in the prospectus for that portfolio. You should read the portfolio’s prospectus carefully before investing in the corresponding variable investment option.
The investment options in the Separate Account are not publicly traded mutual funds. The investment options are only available to you as investment options in the policies, or in some cases through other variable annuity contracts or variable life insurance policies issued by us or by other life insurance companies. In some cases, the investment options also may be available through participation in certain qualified pension or retirement plans. The portfolios’ investment advisers and managers (i.e. subadvisers) may manage publicly traded mutual funds with similar names and investment objectives. However, the portfolios are not directly related to any publicly traded mutual fund. You should not compare the performance of any investment option described in this prospectus with the performance of a publicly traded mutual fund. The performance of any publicly traded mutual fund could differ substantially from that of any of the investment options of our Separate Account.
The portfolios available under the policies are as described in the following table:
| Portfolio | Portfolio Manager | Investment Objective |
| 500 Index B | John Hancock Asset Management, a division of Manulife Asset Management (North America) Limited | To seek to approximate the aggregate total return of a broad-based U.S. domestic equity market index. Under normal market conditions, the portfolio seeks to approximate the aggregate total return of a broad-based U.S. domestic equity market index. |
| Active Bond | Declaration Management & Research LLC; and John Hancock Asset Management, a division of Manulife Asset Management (US) LLC | To seek income and capital appreciation. Under normal market conditions, the portfolio invests at least 80% of its net assets (plus any borrowings for investment purposes) in a diversified mix of debt securities and instruments. The portfolio seeks to invest its assets in debt securities and instruments with an average duration of between 4 to 6 years; however, there is no limit on the portfolio’s average maturity. |
| All Cap Core | QS Investors, LLC | To seek long-term growth of capital. Under normal market conditions, the portfolio invests in common stocks and other equity securities within all asset classes (small, medium and large-capitalization) of those included in the Russell 3000 Index.* |
| All Cap Value | Lord, Abbett & Co. LLC | To seek capital appreciation. Under normal market conditions, the portfolio primarily purchases equity securities of U.S. and multinational companies in all capitalization ranges that the subadviser believes are undervalued. |
| Alpha Opportunities | Wellington Management Company, LLP | To seek long-term total return. The portfolio employs a “multiple sleeve structure,” which means the portfolio has several components that are managed separately in different styles. The portfolio seeks to obtain its objective by combining these different component styles in a single portfolio. |
| American Asset Allocation | Capital Research and Management Company (Adviser to the American Funds Insurance Series) | To seek to provide high total return (including income and capital gains) consistent with preservation of capital over the long-term. The portfolio invests all of its assets in Class 1 shares of its master fund, the Asset Allocation Fund, a series of the American Funds Insurance Series. The master fund invests in a diversified portfolio of common stocks and other equity securities, bonds and other intermediate and long-term debt securities, and money market instruments. |
| American Global Growth | Capital Research and Management Company (Adviser to the American Funds Insurance Series) | To seek to provide long-term growth of capital. The portfolio invests all of its assets in Class 1 shares of its master fund, the Global Growth Fund, a series of the American Funds Insurance Series. The master fund invests primarily in common stocks of companies located around the world that the adviser believes have potential for growth. |
| American Growth | Capital Research and Management Company (Adviser to the American Funds Insurance Series) | To seek to provide growth of capital. The portfolio invests all of its assets in Class 1 shares of its master fund, the Growth Fund, a series of the American Funds Insurance Series. The master fund invests primarily in common stocks and seeks to invest in companies that appear to offer superior opportunities for growth of capital. The master fund may also invest a portion of its assets in common stocks and other securities of issuers domiciled outside the U.S. |
| American Growth–Income | Capital Research and Management Company (Adviser to the American Funds Insurance Series) | To seek to provide growth of capital and income. The portfolio invests all of its assets in Class 1 shares of its master fund, the Growth-Income Fund, a series of the American Funds Insurance Series. The master fund invests primarily in common stocks or other securities that the master fund’s adviser believes demonstrate the potential for appreciation and/or dividends. Although the master fund focuses on investments in medium-to large-capitalization companies, the master fund’s investments are not limited to a particular capitalization size. |
| American International | Capital Research and Management Company (Adviser to the American Funds Insurance Series) | To seek to provide long-term growth of capital. The portfolio invests all of its assets in Class 1 shares of its master fund, the International Fund, a series of the American Funds Insurance Series. The master fund invests primarily in common stocks of companies domiciled outside the U.S., including companies domiciled in developing countries, that the adviser believes have the potential for growth. Although the master fund focuses on investments in medium-to large-capitalization companies, the master fund’s investments are not limited to a particular capitalization size. |
| Portfolio | Portfolio Manager | Investment Objective |
| American New World | Capital Research and Management Company (Adviser to the American Funds Insurance Series) | To seek long-term capital appreciation. The portfolio invests all of its assets in Class 1 shares of its master fund, the New World Fund, a series of the American Funds Insurance Series. The master fund invests primarily in stocks of companies with significant exposure to countries with developing economies and/or markets that the adviser believes have potential of providing capital appreciation. The master fund may also invest in companies without regard to market capitalization, including companies with small market capitalizations. |
| Blue Chip Growth | T. Rowe Price Associates, Inc. | To seek to provide long-term growth of capital. Current income is a secondary objective. Under normal market conditions, the portfolio invests at least 80% of its net assets (plus any borrowings for investment purposes) in the common stocks of large- and medium-sized blue chip growth companies. |
| Bond | John Hancock Asset Management, a division of Manulife Asset Management (US) LLC | To seek to provide income and capital appreciation. Under normal market conditions, the portfolio invests at least 80% of its net assets (plus any borrowings for investment purposes) in a diversified mix of debt securities and instruments. |
| Capital Appreciation | Jennison Associates LLC | To seek long-term growth of capital. Under normal market conditions, the portfolio invests at least 65% of its total assets in equity and equity-related securities of companies that, at the time of investment, that exceed $1 billion in market capitalization and that the subadviser believes have above-average growth prospects. These companies are generally medium- to large-capitalization companies. |
| Capital Appreciation Value | T. Rowe Price Associates, Inc. | To seek long-term capital appreciation. Under normal market conditions, the portfolio invests primarily in common stocks of established U.S. companies that have above-average potential for capital growth. Common stocks typically constitute at least 50% of the portfolio’s total assets. The remaining assets are generally invested in other securities, including convertible securities, corporate and government debt, bank loans (which represent an interest in amounts owed by a borrower to a syndicate of lenders), foreign securities, futures and options. The portfolio may invest up to 20% of its total assets in foreign securities. |
| Core Allocation Plus | Wellington Management Company, LLP | To seek total return, consisting of long-term capital appreciation and current income. Under normal market conditions, the portfolio invests in equity and fixed-income securities of issuers located within and outside the U.S. The portfolio will allocate its assets between fixed-income securities, which may include investment-grade and below investment-grade debt securities with maturities that range from short to longer term, and equity securities based upon the subadviser’s targeted asset mix, which may change over time. Under normal market conditions, the targeted asset mix may range between 75%-50% equity instruments and 50%-25% fixed-income instruments and will generally reflect the subadviser’s long-term, strategic asset allocation analysis. |
| Core Bond | Wells Capital Management, Incorporated | To seek total return consisting of income and capital appreciation. Under normal market conditions, the portfolio invests at least 80% of its net assets (plus any borrowings for investment purposes) in a broad range of investment-grade debt securities, including U.S. Government obligations, corporate bonds, mortgage-backed and other asset-backed securities and money market instruments. |
| Core Strategy | John Hancock Asset Management, a division of Manulife Asset Management (US) LLC; and John Hancock Asset Management, a division of Manulife Asset Management (North America) Limited |
To seek long-term growth of capital. Current income is also a consideration. Under normal market conditions, the portfolio invests in other portfolios of JHVIT and other investment companies (including exchange traded funds) as well as other types of investments. The portfolio invests approximately 70% of its total assets in equity securities and underlying funds that invest primarily in equity securities, and approximately 30% of its total assets in fixed-income securities and underlying funds that invest primarily in fixed-income securities. |
| Disciplined Diversification | Dimensional Fund Advisors LP | To seek total return consisting of capital appreciation and current income. Under normal market conditions, the portfolio invests primarily in equity
securities and fixed-income securities of domestic and international issuers, including equities of issuers in emerging markets, in accordance with the following range of allocations: Target Allocation Range of Allocation Equity Securities: 70% 65% – 75% Fixed-Income Securities: 30% 25% – 35% |
| Portfolio | Portfolio Manager | Investment Objective |
| Emerging Markets Value | Dimensional Fund Advisors LP | To seek long-term capital appreciation. Under normal market conditions, the portfolio invests at least 80% of its net assets (plus any borrowings for investment purposes) in companies associated with emerging markets designated from time to time by the subadviser. |
| Equity-Income | T. Rowe Price Associates, Inc. | To seek to provide substantial dividend income and also long-term growth of capital. Under normal market conditions, the portfolio invests at least 80% of its net assets (plus any borrowings for investment purposes) in equity securities, with at least 65% in common stocks of well-established companies paying above-average dividends. |
| Financial Services | Davis Selected Advisers, L.P. | To seek growth of capital. Under normal market conditions, the portfolio invests at least 80% of its net assets (plus any borrowings for investment purposes) in companies that, at the time of investment, are principally engaged in financial services, and the portfolio invests primarily in common stocks of financial services companies. |
| Franklin Templeton Founding Allocation | John Hancock Asset Management, a division of Manulife Asset Management (US) LLC | To seek long-term growth of capital. The portfolio invests in other funds and in other investment companies, as well as other types of investments. The portfolio currently invests primarily in three underlying funds: Global Fund, Income Fund and Mutual Shares Fund. |
| Fundamental All Cap Core | John Hancock Asset Management, a division of Manulife Asset Management (US) LLC | To seek long-term growth of capital. Under normal market conditions, the portfolio invests at least 80% of its net assets (plus any borrowings for investment purposes) in equity securities. Market capitalizations of these companies will span the capitalization spectrum. Equity securities include common, convertible, and preferred securities and their equivalents. |
| Fundamental Holdings | John Hancock Asset Management, a division of Manulife Asset Management (US) LLC; and John Hancock Asset Management, a division of Manulife Asset Management (North America) Limited |
To seek long-term growth of capital. The portfolio invests in other funds and other investment companies as well as other types of investments. Underlying funds may include other JHVIT funds and funds of the American Funds Insurance Series. However, the portfolio is authorized to invest without limitation in other underlying funds and in other types of investments. |
| Fundamental Large Cap Value | John Hancock Asset Management, a division of Manulife Asset Management (US) LLC | To seek long-term capital appreciation. Under normal market conditions, the portfolio invests at least 80% of its net assets in equity securities of large-capitalization companies. The portfolio considers large-capitalization companies to be those that at the time of purchase have a market capitalization equal to or greater than that of the top 80% of the companies that comprise the Russell 1000 Index.* |
| Fundamental Value | Davis Selected Advisers, L.P. | To seek growth of capital. Under normal market conditions, the portfolio invests primarily in common stocks of U.S. companies with market capitalizations of at least $10 billion. The portfolio may also invest in companies with smaller capitalizations. |
| Global | Templeton Global Advisors Limited | To seek long-term capital appreciation. Under normal market conditions, the portfolio invests primarily in the equity securities of companies located throughout the world, including emerging markets. |
| Global Bond | Pacific Investment Management Company LLC | To seek maximum total return, consistent with preservation of capital and prudent investment management. Under normal market conditions, the portfolio invests at least 80% of its net assets (plus any borrowings for investment purposes) in fixed-income instruments that are economically tied to at least three countries (one of which may be the U.S.), which may be represented by futures contracts (including related options) with respect to such securities, and options on such securities. These fixed-income instruments may be denominated in foreign currencies or in U.S. dollars, which may be represented by forwards or derivatives, such as options, futures contracts, or swap agreements. |
| Global Diversification | John Hancock Asset Management, a division of Manulife Asset Management (US) LLC; and John Hancock Asset Management, a division of Manulife Asset Management (North America) Limited |
To seek long-term growth of capital. The portfolio invests in other funds and other investment companies as well as other types of investments. Underlying funds may include other JHVIT funds and funds of American Fund Insurance Series. The portfolio is authorized to invest without limitation in other underlying funds. Under normal market conditions, the portfolio intends to invest a portion of its assets in funds that invest primarily in foreign securities or in foreign securities directly. |
| Portfolio | Portfolio Manager | Investment Objective |
| Health Sciences | T. Rowe Price Associates, Inc. | To seek long-term capital appreciation. Under normal market conditions, the portfolio invests at least 80% of its net assets (plus any borrowings for investment purposes) in common stocks of companies engaged, at the time of investment, in the research, development, production, or distribution of products or services related to health care, medicine, or the life sciences. While the portfolio may invest in companies of any size, the majority of its assets are expected to be invested in large and medium-capitalization companies. |
| High Yield | Western Asset Management Company | To seek to realize an above-average total return over a market cycle of three to five years, consistent with reasonable risk. Under normal market
conditions, the portfolio invests at least 80% of its net assets (plus any borrowings for investment purposes) at the time of investment in high yield securities. The portfolio’s investments may include corporate bonds, preferred stocks, U.S.
Government and foreign securities, mortgage-backed securities, loan assignments or participations and convertible securities that have the following ratings (or, if unrated, are considered by the subadviser to be of equivalent quality): Rating Agency Moody’s: Ba through C S&P’s: BB through D |
| International Core | Grantham, Mayo, Van Otterloo & Co. LLC | To seek high total return. Under normal market conditions, the portfolio invests at least 80% of its total assets in equity investments. The portfolio typically invests in equity investments in companies from developed markets outside the U.S. |
| International Equity Index B | SSgA Funds Management, Inc. | To seek to track the performance of a broad-based equity index of foreign companies primarily in developed countries and, to a lesser extent, in emerging markets. Under normal market conditions, the portfolio invests at least 80% of its assets in securities listed in the Morgan Stanley Capital International All Country World Excluding U.S. Index* or American Depositary Receipts or Global Depositary Receipts representing such securities. |
| International Growth Stock | Invesco Advisers, Inc. | To seek to achieve long-term growth of capital. The portfolio invests primarily in a diversified portfolio of international securities whose issuers are considered by the portfolio’s subadviser to have potential for earnings or revenue growth. Under normal market conditions, the portfolio invests at least 80% of its net assets (plus any borrowings for investment purposes) in stocks of any market capitalization. |
| International Small Company | Dimensional Fund Advisors LP | To seek long-term capital appreciation. Under normal market conditions, the portfolio invests at least 80% of its net assets (plus any borrowings for investment purposes) in securities of small capitalization companies in the particular markets in which the portfolio invests. The portfolio primarily invests in a broad and diverse group of equity securities of non-U.S. small companies of developed markets, but may also hold equity securities of companies located in emerging markets. |
| International Value | Templeton Investment Counsel, LLC | To seek long-term growth of capital. Under normal market conditions, the portfolio invests primarily in equity securities of companies located outside the U.S., including in emerging markets. |
| Investment Quality Bond | Wellington Management Company, LLP | To seek to provide a high level of current income consistent with the maintenance of principal and liquidity. Under normal market conditions, the portfolio invests at least 80% of its net assets (plus any borrowings for investment purposes) in bonds rated investment-grade at the time of investment. The portfolio will tend to focus on corporate bonds and U.S. Government bonds with intermediate to longer-term maturities. |
| Lifestyle Aggressive | John Hancock Asset Management, a division of Manulife Asset Management (US) LLC; and John Hancock Asset Management, a division of Manulife Asset Management (North America) Limited |
To seek long-term growth of capital. Current income is not a consideration. The portfolio normally invests approximately 100% of its assets in underlying funds that invest primarily in equity securities. |
| Portfolio | Portfolio Manager | Investment Objective |
| Lifestyle Balanced | John Hancock Asset Management, a division of Manulife Asset Management (US) LLC; and John Hancock Asset Management, a division of Manulife Asset Management (North America) Limited |
To seek a balance between a high level of current income and growth of capital, with a greater emphasis on growth of capital. The portfolio normally invests approximately 50% of its assets in underlying funds that invest primarily in equity securities and approximately 50% of its assets in underlying funds that invest primarily in fixed-income securities. |
| Lifestyle Conservative | John Hancock Asset Management, a division of Manulife Asset Management (US) LLC; and John Hancock Asset Management, a division of Manulife Asset Management (North America) Limited |
To seek a high level of current income with some consideration given to growth of capital. The portfolio normally invests approximately 80% of its assets in underlying funds that invest primarily in fixed-income securities and approximately 20% in underlying funds that invest primarily in equity securities. |
| Lifestyle Growth | John Hancock Asset Management, a division of Manulife Asset Management (US) LLC; and John Hancock Asset Management, a division of Manulife Asset Management (North America) Limited |
To seek long-term growth of capital. Current income is also a consideration. The portfolio normally invests approximately 70% of its assets in underlying funds that invest primarily in equity securities and approximately 30% of its assets in underlying funds that invest primarily in fixed-income securities. |
| Lifestyle Moderate | John Hancock Asset Management, a division of Manulife Asset Management (US) LLC; and John Hancock Asset Management, a division of Manulife Asset Management (North America) Limited |
To seek a balance between a high level of current income and growth of capital, with a greater emphasis on income. The portfolio normally invests approximately 60% of its assets in underlying funds that invest primarily in fixed-income securities and approximately 40% in underlying funds that invest primarily in equity securities. |
| Mid Cap Index | John Hancock Asset Management, a division of Manulife Asset Management (North America) Limited | To seek to approximate the aggregate total return of a medium-capitalization U.S. domestic equity market index. Under normal market conditions, the portfolio invests at least 80% of its net assets (plus any borrowings for investment purposes) at the time of investment in (a) the common stocks that are included in the S&P MidCap 400 Index* and (b) securities (which may or may not be included in the S&P MidCap 400 Index) that the subadviser believes as a group will behave in a manner similar to the index. |
| Mid Cap Stock | Wellington Management Company, LLP | To seek long-term growth of capital. Under normal market conditions, the portfolio invests at least 80% of its net assets (plus any borrowings for investment purposes) in equity securities of medium-sized companies with significant capital appreciation potential. For the portfolio, “medium-sized companies” are those with market capitalizations within the collective market capitalization range of companies represented in either the Russell Midcap Index* or the S&P MidCap 400 Index.* |
| Mid Value | T. Rowe Price Associates, Inc. | To seek long-term capital appreciation. Under normal market conditions, the portfolio invests at least 80% of its net assets in companies with market capitalizations that are within the Russell Midcap Value Index.* The portfolio invests in a diversified mix of common stocks of mid-size U.S. companies that are believed to be undervalued by various measures and offer good prospects for capital appreciation. |
| Money Market |
John Hancock Asset Management, a division of Manulife Asset Management (North America) Limited | To seek to obtain maximum current income consistent with preservation of principal and liquidity. Under normal market conditions, the portfolio invests in high quality, U.S. dollar-denominated money market instruments. Certain market conditions may cause the return of the portfolio to become low or possibly negative. |
| Natural Resources | RS Investment Management Co. LLC; andWellington Management Company, LLP | To seek long-term total return. Under normal market conditions, the portfolio invests at least 80% of its net assets (plus any borrowings for investment purposes) in equity and equity-related securities of natural resource-related companies worldwide, including emerging markets. Natural resource-related companies include companies that own or develop energy, metals, forest products and other natural resources, or supply goods and services to such companies. |
| PIMCO VIT All Asset (a series of PIMCO Variable Insurance Trust) (only Class M is available) | Pacific Investment Management Company LLC | To seek maximum real return consistent with preservation of real capital and prudent investment management. The portfolio is a fund of funds and normally invests substantially all of its assets in Institutional Class shares or, as applicable, Class M shares of underlying PIMCO funds. |
| Portfolio | Portfolio Manager | Investment Objective |
| Real Estate Securities | Deutsche Investment Management Americas Inc. | To seek to achieve a combination of long-term capital appreciation and current income. Under normal market conditions, the portfolio invests at least 80% of its net assets (plus any borrowings for investment purposes) in equity securities of real estate investment trusts and real estate companies. Equity securities include common stock, preferred stock and securities convertible into common stock. |
| Real Return Bond | Pacific Investment Management Company LLC | To seek maximum real return, consistent with preservation of real capital and prudent investment management. Under normal market conditions, the portfolio invests at least 80% of its net assets (plus any borrowings for investment purposes) in inflation-indexed bonds of varying maturities issued by the U.S. and non-U.S. Governments, their agencies or instrumentalities and corporations, which may be represented by forwards or derivatives such as options, futures contracts, or swap agreements. |
| Science & Technology | Alliance Global Investors U.S. LLC; and T. Rowe Price Associates, Inc. | To seek long-term growth of capital. Current income is incidental to the portfolio’s objective. Under normal market conditions, the portfolio invests at least 80% of its net assets (plus any borrowings for investment purposes) in the common stocks of companies expected to benefit from the development, advancement, and/or use of science and technology. For purposes of satisfying this requirement, common stock may include equity-linked notes and derivatives relating to common stocks, such as options on equity-linked notes. |
| Short Term Government Income | John Hancock Asset Management, a division of Manulife Asset Management (US) LLC | To seek a high level of current income consistent with preservation of capital. Maintaining a stable share price is a secondary goal. Under normal market conditions, the portfolio invests at least 80% of its net assets in obligations issued or guaranteed by the U.S. Government and its agencies, authorities or instrumentalities. Under normal circumstances, the portfolio’s effective duration is no more than 3 years. |
| Small Cap Growth | Wellington Management Company, LLP | To seek long-term capital appreciation. Under normal market conditions, the portfolio invests at least 80% of its net assets (plus any borrowings for investment purposes) in small-capitalization companies. For the purposes of the portfolio, “small-capitalization companies” are those with market capitalizations, at the time of investment, not exceeding the maximum market capitalization of any company represented in either the Russell 2000 Index* or the S&P SmallCap 600 Index.* |
| Small Cap Index | John Hancock Asset Management, a division of Manulife Asset Management (North America) Limited | To seek to approximate the aggregate total return of a small-capitalization U.S. domestic equity market index. Under normal market conditions, the portfolio invests at least 80% of its net assets (plus any borrowings for investment purposes) at the time of investment in (a) the common stocks that are included in the Russell 2000 Index* and (b) securities (which may or may not be included in the Russell 2000 Index) that the subadviser believes as a group will behave in a manner similar to the index. |
| Small Cap Opportunities | Dimensional Fund Advisors LP; and Invesco Advisers, Inc. | To seek long-term capital appreciation. Under normal market conditions, Invesco Advisers, Inc. invests at least 80% of its subadvised net assets (plus any borrowings for investment purposes) in equity securities, including convertible securities, of small-capitalization companies. Dimensional Fund Advisors LP generally invests its subadvised net assets in a broad and diverse group of common stocks of small and medium-capitalization companies traded on a U.S. national securities exchange or on the over-the-counter market that Dimensional Fund Advisors LP determines to be value stocks at the time of purchase. |
| Small Cap Value | Wellington Management Company, LLP | To seek long-term capital appreciation. Under normal market conditions, the portfolio invests at least 80% of its net assets (plus any borrowings for investment purposes) in small-capitalization companies that are believed to be undervalued by various measures and offer good prospects for capital appreciation. For the purposes of the portfolio, “small-capitalization companies” are those with market capitalizations, at the time of investment, not exceeding the maximum market capitalization of any company represented in either the Russell 2000 Index* or the S&P SmallCap 600 Index.* |
| Portfolio | Portfolio Manager | Investment Objective |
| Small Company Value | T. Rowe Price Associates, Inc. | To seek long-term growth of capital. Under normal market conditions, the portfolio invests at least 80% of its net assets (plus any borrowings for investment purposes) in companies with market capitalizations, at the time of investment, that do not exceed the maximum market capitalization of any security in the Russell 2000 Index.* The portfolio invests in small companies whose common stocks are believed to be undervalued. |
| Smaller Company Growth | Frontier Capital Management Company, LLC; Perimeter Capital Management; and John Hancock Asset Management, a division of Manulife Asset Management (North America) Limited |
To seek long-term capital appreciation. Under normal market conditions, the portfolio invests at least 80% of its assets in small-capitalization equity securities. |
| Strategic Income Opportunities | John Hancock Asset Management, a division of Manulife Asset Management (US) LLC | To seek a high level of current income. Under normal market conditions, the portfolio invests primarily in the following types of securities: non-U.S. government and corporate debt securities from developed and emerging markets, U.S. Government and agency securities, and high-yield bonds. The portfolio may also invest in preferred stock and other types of debt securities. |
| Total Return | Pacific Investment Management Company LLC | To seek to maximum total return, consistent with preservation of capital and prudent investment management. Under normal market conditions, the portfolio invests at least 65% of its net assets in a diversified portfolio of fixed-income instruments of varying maturities, which may be represented by forwards or derivatives, such as options, futures contracts, or swap agreements. |
| Total Stock Market Index | John Hancock Asset Management, a division of Manulife Asset Management (North America) Limited | To seek to approximate the aggregate total return of a broad U.S. domestic equity market index. Under normal market conditions, the portfolio invests at least 80% of its net assets (plus any borrowings for investment purposes) at the time of investment in (a) the common stocks that are included in the Wilshire 5000 Total Market Index* and (b) securities (which may or may not be included in the Wilshire 5000 Total Market Index) that the subadviser believes as a group will behave in a manner similar to the index. |
| Ultra Short Term Bond | John Hancock Asset Management, a division of Manulife Asset Management (US) LLC | To seek a high level of current income consistent with the maintenance of liquidity and the preservation of capital. Under normal market conditions, the portfolio invests at least 80% of its net assets in a diversified portfolio of domestic, investment-grade, debt securities. Debt securities may be issued by governments, companies or special purpose entities and may include notes, discount notes, bonds, debentures, commercial paper, repurchase agreements, mortgage-backed and other asset-backed securities and assignments, participations and other interests in bank loans. The portfolio may also invest in cash and cash equivalents. |
| U.S. Equity | Grantham, Mayo, Van Otterloo & Co. LLC | To seek long-term capital appreciation. Under normal market conditions, the portfolio invests at least 80% of its net assets (plus any borrowings for investment purposes) in equity securities. To achieve the objective, the portfolio will be invested in equity investments that the subadviser believes will provide higher returns than the Russell 3000 Index.* |
| Utilities | Massachusetts Financial Services Company | To seek capital growth and current income (income above that available from the portfolio invested entirely in equity securities). Under normal market conditions, the portfolio invests at least 80% of its net assets (plus any borrowing for investment purposes) in securities of companies in the utilities industry. The subadviser considers a company to be in the utilities industry if, at the time of investment, the subadviser determines that a substantial portion (i.e., at least 50%) of the company’s assets or revenues are derived from one or more utilities. |
| Value | Invesco Advisers, Inc. | To seek to realize an above-average total return over a market cycle of 3 to 5 years, consistent with reasonable risk. Under normal market conditions, the portfolio invests in equity securities of companies with capitalizations, at the time of investment, similar to the market capitalization of companies in the Russell Midcap Value Index.* |
*Wilshire 5000 Total Market Index® is a trademark of Wilshire Associates. MSCI All Country World Excluding U.S. Index is a trademark of Morgan Stanley & Co. Incorporated. Russell 1000,® Russell 2000,® Russell 3000,® Russell Midcap,® and Russell Midcap Value® are
trademarks of Frank Russell Company. S&P MidCap 400,® and S&P SmallCap 600® are trademarks of The McGraw-Hill Companies, Inc. None of the portfolios are sponsored, endorsed, managed, advised, sold or promoted by any of these companies, and none of these companies make any representation regarding the advisability of investing in the portfolios.The indices referred to in the portfolio objectives track companies having the approximate market capitalization, as of February 28, 2013 (except as otherwise indicated), set out below:
MSCI All Country World Ex US Index — $676 million to $215.6 billion
Russell
1000 Index — minimum of $315 million
Russell 2000 Index — less than $1 million to $6.1 billion
Russell 3000 Index — less than $1 million to $414.5 billion
Russell
Midcap Index — $315 million to $42 billion
Russell Midcap Value Index — $315 million to $42 billion
S&P MidCap 400 Index — $322 million to $16.2 billion
S&P SmallCap 600 Index — $4 billion
Wilshire 5000 Total Market Index — less than $1 million to $415.2 billion
**The U.S. Aggregate Bond Index is a broad-based benchmark that measures the investment grade, U.S. dollar-enominated, fixed-rate taxable bond market, including Treasuries, government-related and corporate securities, MBS (agency fixed-rate and hybrid ARM pass throughs), ABS, and CMBS.
The policy is a flexible premium variable universal life insurance policy. This summary provides a general description of the important features of the policy. It is not comprehensive and is qualified in its entirety by the more detailed information contained in this prospectus. Unless otherwise stated or implied by the context, the discussions in this prospectus assume that the policy is not in default, that there is no outstanding Policy Debt and the death benefit is not determined by the Minimum Death Benefit Percentage. Your policy’s provisions may vary in some states and the terms of the policy, and any endorsements or riders, supersede the disclosure in this prospectus.
The policy provides a death benefit in the event of the death of the Life Insured while the policy is in force. The basic death benefit amount is the Face Amount, which is provided for the lifetime of the Life Insured with no maturity or expiration date. There may be other amounts added to the death benefit as described below.
Flexible Term Insurance Option. You may add a Flexible Term Insurance Option rider (the “FTIO Rider”) to the policy to provide additional term life insurance coverage on the Life Insured. Cost of insurance rates are less than or equal to those of the policy and no sales charge will apply. However, unlike the Face Amount of the policy, the FTIO Rider will terminate at the Life Insured’s Attained Age 100. The FTIO Rider also offers the flexibility to schedule varying death benefit amounts on future dates (the “Scheduled Death Benefits”).
Death Benefit Options. There are two death benefit options. Option 1 provides a death benefit equal to the Face Amount of the policy or, if greater, the Minimum Death Benefit, plus the term insurance benefit of the FTIO option. Option 2 provides a death benefit equal to the Face Amount plus the Policy Value or, if greater, the Minimum Death Benefit, plus the term insurance benefit of the FTIO option. You may change the death benefit option and increase or decrease the Face Amount and Scheduled Death Benefits.
Age 100 Advantage. If the Life Insured is alive on the Policy Anniversary when the Life Insured reaches Attained Age 100, the policy will continue in force subject to the following unless the policy owner chooses to surrender the policy for its Net Cash Surrender Value:
- the policy will be continued until the earlier of the death of the Life Insured or the date the policy owner surrenders the policy;
- no additional premium payments will be accepted although loan repayments will be accepted;
- no additional charges or deductions (described under “Charges and Deductions”) will be assessed;
- interest on any Policy Debt will continue to accrue;
- the policy owner may continue to transfer portions of the Policy Value among the Investment Accounts and the Fixed Accounts as described in this prospectus.
Premium payments may be made at any time prior to Attained Age 100 and in any amount, subject to certain limitations (see “Premium Payments — Premium Limitations”). Net Premiums will be allocated to one or more of the Fixed Account and the sub-accounts of the Separate Account. You may change allocations and make transfers among the accounts subject to limitations described below.
The Policy Value is the accumulation of premiums paid, less charges and deductions we take for expenses and cost of insurance, plus or minus the investment returns of the accounts to which the Policy Value has been allocated. You may obtain a portion of the Policy Value by taking a policy loan or a partial withdrawal or by full surrender of the policy.
You may borrow against the Net Cash Surrender Value of the policy. Loan interest will accrue daily and be payable in arrears on each Policy Anniversary. The Policy Debt will be deducted from amounts payable at the Life Insured’s death or upon surrender of the policy.
Surrender and Partial Withdrawals
You may make a partial withdrawal of the Policy Value. It may result in a decrease in the Face Amount and Scheduled Death Benefits. You may surrender the policy for its Net Cash Surrender Value at any time.
Your policy will lapse and terminate without value when the Net Cash Surrender Value is insufficient to pay the next monthly deduction and a grace period of 61 days expires without an adequate premium payment from you. You may reinstate a lapsed policy within five years following lapse if the policy was not surrendered for its Net Cash Surrender Value. Evidence of insurability is required, along with a premium payment described under “Lapse and Reinstatement — Reinstatement.”
The policy differs in two important ways from conventional life insurance policies. First, failure to make planned premium payments will not in itself cause the policy to lapse. Second, a policy can lapse even if planned premiums have been paid.
We assess certain charges and deductions in connection with the policy. These include: (i) charges in the form of monthly deductions for the cost of insurance and administrative expenses, (ii) charges assessed daily against amounts in the Investment Account and (iii) charges deducted from premiums paid. These charges are summarized in the Fee Tables.
In addition, there are charges deducted from each portfolio. For more information, please refer to the prospectus for the underlying portfolio.
Reduction in Charges and Enhancement of Surrender Values: The policy is designed for employers and other sponsoring organizations that may purchase multiple policies as a case. The size or nature of the case may result in expected savings of sales, underwriting, administrative or other costs. If so, we expect to offer reductions of policy charges and enhancements of surrender value. We may change the nature and amount of reductions and enhancements available from time to time. They will be determined in a way that is not unfairly discriminatory to policy owners.
Investment Options and Investment Subadvisers
You may allocate Net Premiums to the Fixed Account or to one or more of the sub-accounts of the Separate Account. Each of the sub-accounts invests in the shares of one of the portfolios described in the Table of Investment Options and Investment Subadvisers.
The Table of Investment Options and Investment Subadvisers describes the portfolios and shows the subadvisers that provide investment subadvisory services.
Allocating Net Premiums only to one or a small number of the investment options (other than the Lifestyle Trusts) should not be considered a balanced investment strategy. In particular, allocating Net Premiums to a small number of investment options that concentrate their investments in a particular business or market sector will increase the risk that the value of your policy will be more volatile since these investment options may react similarly to business or market specific events. Examples of business or market sectors where this risk historically has been and may continue to be particularly high include: (a) technology related businesses, including internet related businesses, (b) small cap securities, and (c) foreign securities. The Company does not provide advice regarding appropriate investment allocations. Please discuss this matter with your financial adviser.
Description of John Hancock (USA)
We are a stock life insurance company incorporated in Maine on August 20, 1955 by a special act of the Maine legislature and redomesticated under the laws of Michigan. We are a licensed life insurance company in the District of Columbia and all states of the United States except New York. Our ultimate parent is Manulife Financial Corporation (“MFC”), a publicly traded company based in Toronto, Canada. MFC is the holding company of John Hancock USA and its subsidiaries. However, neither John Hancock USA nor any of its affiliated companies guarantees the investment performance of the Separate Account.
We are ranked and rated by independent financial rating services, which may include Moody’s, Standard & Poor’s, Fitch and A.M. Best. The purpose of these ratings is to reflect the financial strength or claims-paying ability of the company, but they do not specifically relate to its products, the performance (return) of these products, the value of any investment in these products upon withdrawal or to individual securities held in any portfolio. These ratings do not apply to the safety and performance of the Separate Account.
Description of Separate Account N
The investment accounts shown on page 1 are in fact subaccounts of the John Hancock Life Insurance Company (U.S.A.) Separate Account N, a separate account operated by us under Michigan law. The Separate Account meets the definition of “separate account” under the Federal securities laws and is registered as a unit investment trust under the 1940 Act. Such registration does not involve supervision by the SEC of the management of the Separate Account or of us.
The Separate Account’s assets are our property. Each policy provides that amounts we hold in the Separate Account pursuant to the policies cannot be reached by any other persons who may have claims against us and can’t be used to pay any indebtedness of John Hancock USA other than those arising out of policies that use the Separate Account. Income, gains and losses credited to, or charged against, the Separate Account reflect the Separate Account’s own investment experience and not the investment experience of John Hancock USA’s other assets. John Hancock USA is obligated to pay all amounts promised to policy owners under the policies.
New subaccounts may be added and made available to policy owners from time to time. Existing subaccounts may be modified or deleted at any time.
The policy is designed to provide employers or other organizations with life insurance coverage on employees or other individuals in whose lives they have an insurable interest. The policy may be owned by an individual or a corporation, trust, association, or similar entity. The policy may be used for such purposes as funding non-qualified executive deferred
compensation or salary continuation liabilities or death benefit liabilities of executive retirement plans, or as a source for funding cash flow obligations under such plans.To purchase a policy, you must submit a completed application. Your policy will not be issued until the underwriting process is completed to our satisfaction.
With our prior approval, the policy may be issued on a basis that does not distinguish between the Life Insured’s sex and/or smoking status. A policy will only be issued on the lives of insureds from Issue Ages 20 through 80.
Each policy has a Policy Date, an Effective Date and an Issue Date (see “Definitions” in Appendix A). The Policy Date is the date from which the first monthly deductions are calculated and from which Policy Years, Policy Months and Policy Anniversaries are determined. The Policy Date is also the effective date of the initial Coverage Amount. The Policy Date is the same date as the Effective Date unless the policy is backdated (see “Backdating a Policy”). The Effective Date is the date we become obligated under the policy and when the first monthly deductions are taken. It is the later of the date we approve issuance of the policy and the date we receive at least the Minimum Initial Premium. The Issue Date is the date from which the Suicide and Incontestability provisions of the policy are determined.
If we approve issuance of a policy before we receive the Minimum Initial Premium then the Effective Date will be later than the Issue Date. The Minimum Initial Premium must be received by us within 60 days after the Issue Date and the Life Insured must be in good health on the Effective Date. If the Minimum Initial Premium is not paid or if the application is rejected, the policy will be canceled and any premiums paid will be returned to the applicant.
Net Premiums received prior to the Effective Date will be credited with interest at the rate of return earned on amounts allocated to the Money Market portfolio. On the Effective Date, Net Premiums received plus any interest credited will be allocated to Investment Accounts and the Fixed Account according to your instructions, unless first allocated to the Money Market portfolio for the duration of the right to examine period (see “Right to Examine the Policy”).
Minimum Face Amount and Scheduled Death Benefit. The minimum Face Amount is $50,000 unless the FTIO Rider is added to the policy. With an FTIO Rider, the minimum Face Amount is $25,000 and the minimum Scheduled Death Benefit is $50,000.
Backdating a Policy. You may request that we backdate the policy by assigning a Policy Date earlier than the date the application is signed. We will not backdate the policy to a date earlier than that allowed by state law, which is generally three months to one year prior to the date of application for the policy. Monthly deductions will be made for the period the Policy Date is backdated.
Temporary insurance coverage may be provided under the terms of a Temporary Insurance Agreement, subject to our underwriting practices. Generally, temporary life insurance may not exceed $1,000,000 and may not be in effect for more than 90 days. It is issued on a conditional receipt basis, which means that benefits would only be paid if the Life Insured met our usual and customary underwriting standards for the coverage applied for.
The policies are offered on three underwriting classes that require different types and amounts of information from the applicant and prospective Life Insured. Current cost of insurance charges in early Policy Years will vary by the type of underwriting, and charges will generally be lower where underwriting information is more extensive. Under any of the underwriting bases, the acceptance of an application is subject to our underwriting rules and we may request additional information or reject an application for any reason.
Short Form Underwriting. The proposed Life Insured must answer qualifying questions in the application but is not required to provide detailed medical history, submit records or undergo examinations or tests unless requested to do so by us. Availability of short form underwriting depends on characteristics of the case, such as the number of lives to be insured, the amounts of insurance and other factors, and it is generally available only up to Issue Age 65.
Simplified Underwriting. The proposed Life Insured must satisfactorily answer certain health questions in the application and may be required to submit existing medical records, but requirements to undergo examinations and tests are minimized. Availability of simplified underwriting and the nature of the requirements will depend on characteristics of the case and the proposed lives to be insured.
Regular (Medical) Underwriting. Where short form or simplified underwriting is unavailable we require satisfactory evidence of insurability under our regular underwriting guidelines for individual applicants. This may include medical exams and other information. A proposed Life Insured who fails to qualify for a standard risk classification may be eligible to be insured with an additional substandard rating.
You may return your policy for a refund within 10 days after you receive it. Some states provide a longer period of time for this right, which will be stated in the policy if applicable. The policy can be mailed or delivered to the Company agent who sold it to you or to our Service Office. Immediately upon such delivery or mailing, the policy shall be deemed void from the beginning. Within seven days after receipt of the returned policy at our Service Office we will refund an amount equal to the value of amounts in the Investment Accounts and the Fixed Account on the date we receive the returned policy, plus all charges deducted prior to that date, not including the fees and expenses of the portfolios, minus any partial withdrawals and policy loans.
Some state laws require the refund of premiums paid without adjustment for investment gains and losses of the Separate Account. In these states, all Net Premiums will be allocated to the Money Market portfolio during the Right to Examine period and the refund amount will be equal to all premiums received less any partial withdrawals and policy loans.
If you request a Face Amount increase that results in new sales charge, you will have the same rights described above to cancel the increase. If canceled the Policy Value and sales charge will be recalculated to be as they would have been had the premiums not been paid.
We reserve the right to delay the refund of any premium paid by check until the check has cleared.
(Applicable to Residents of California Only)
Residents of California, age 60 and greater, may return the policy for a refund at any time within 30 days after receiving it. The policy can be mailed or delivered to the Company’s agent who sold it, or to our Service Office. If you cancel the policy during this 30 day period and your premiums were allocated to a Fixed Account or the Money Market portfolio, we will refund you the amount of all premiums paid. If your premiums were allocated to one or more of the Investment Accounts (other than the Money Market portfolio), we will refund you the value of amounts in the Investment Accounts and the Fixed Account on the date we receive the returned policy plus all charges deducted prior to that date, not including the fees and expenses of the portfolios, minus any partial withdrawals and policy loans. Your premiums will be placed in either (a) the Fixed Account, (b) the Money Market portfolio or (c) in one or more of the Investment Accounts, based upon your instructions. If no instructions are given, your premiums will be placed in the Money Market portfolio.
A policy must satisfy either of two tests to qualify as a life insurance contract as defined in Section 7702 of the Internal Revenue Code of 1986, as amended (the “Code”). At the time of application, you must choose either the Cash Value Accumulation Test (“CVA Test”) or the Guideline Premium Test (“GP Test”) and the test cannot be changed once the policy is issued.
Cash Value Accumulation Test. The CVA Test requires the death benefit at any time to be at least a certain ratio of the Policy Value, based on prescribed calculations. The Minimum Death Benefit provision described below will ensure that the CVA Test is met. There is no restriction on the amount of premiums you may pay, but we will require you to provide satisfactory evidence of insurability before we accept an amount of premium that would increase the death benefit by more than the increase in Policy Value.
Guideline Premium Test. The GP Test limits the amount of premiums you may pay into the policy, given its death benefit, based on prescribed calculations. In addition, the GP Test requires the death benefit at any time to be at least a prescribed ratio of the Policy Value. These prescribed multiples are generally lower than those calculated under the CVA Test. The Minimum Death Benefit provision described below will ensure that this second requirement is met.
Changes to the policy or FTIO Rider, such as changes in Face Amount, Scheduled Death Benefit, death benefit option or partial withdrawals, may affect the premium limits under the GP Test. Some changes will reduce future premium limits and may cause premiums already paid to exceed the new limits and force you to make a partial withdrawal.
If the policy is in force at the time of the Life Insured’s death we will pay an insurance benefit to the beneficiary. The policy may remain in force for the Life Insured’s entire lifetime and there is no specified maturity or expiration date.
Insurance benefits are only payable when we receive due proof of death at our Service Office, in the form of either a certified copy of the death certificate, a certified copy of a decree of a court of competent jurisdiction as to the finding of death or other proof satisfactory to us.
The amount of the insurance benefit payable will be the death benefit on the date of death, as described below, less any Policy Debt, accrued interest, and outstanding monthly deductions on the date of death. The insurance benefit will be paid in one lump sum unless another form of settlement is agreed to by the beneficiary and us. If the insurance benefit is paid in one sum, we will pay interest from the date of death to the date of payment. If the Life Insured should die after our receipt of a request for surrender, no insurance benefit will be payable, and we will pay only the Net Cash Surrender Value.
Minimum Death Benefit. Both the CVA Test and the GP Test require the death benefit to be at least a prescribed ratio of the Policy Value at all times. The policy’s Minimum Death Benefit ensures that these requirements are met by providing that the death benefit shall be at least equal to the Policy Value multiplied by the applicable Minimum Death Benefit Percentage for the Attained Age of the Life Insured. Tables of Minimum Death Benefit Percentages appear below.
| Table of Minimum Death Benefit Percentages. | |||||||||
| GP Test | CVA Test | GP Test | CVA Test | ||||||
| Age | Percent | Male | Female | Unisex | Age | Percent | Male | Female | Unisex |
| 20 | 250% | 644% | 768% | 665% | 42 | 236% | 319% | 372% | 328% |
| 21 | 250% | 625% | 743% | 645% | 43 | 229% | 309% | 361% | 318% |
| 22 | 250% | 607% | 720% | 626% | 44 | 222% | 299% | 350% | 308% |
| 23 | 250% | 589% | 697% | 608% | 45 | 215% | 290% | 339% | 299% |
| 24 | 250% | 572% | 674% | 589% | 46 | 209% | 281% | 329% | 290% |
| 25 | 250% | 554% | 652% | 571% | 47 | 203% | 273% | 319% | 281% |
| 26 | 250% | 537% | 631% | 554% | 48 | 197% | 265% | 309% | 272% |
| 27 | 250% | 520% | 611% | 536% | 49 | 191% | 257% | 300% | 264% |
| 28 | 250% | 504% | 591% | 519% | 50 | 185% | 249% | 291% | 257% |
| 29 | 250% | 488% | 572% | 502% | 51 | 178% | 242% | 282% | 249% |
| 30 | 250% | 472% | 553% | 486% | 52 | 171% | 235% | 274% | 242% |
| 31 | 250% | 457% | 535% | 470% | 53 | 164% | 228% | 266% | 235% |
| 32 | 250% | 442% | 517% | 455% | 54 | 157% | 222% | 258% | 229% |
| 33 | 250% | 428% | 500% | 440% | 55 | 150% | 216% | 251% | 222% |
| 34 | 250% | 414% | 484% | 426% | 56 | 146% | 210% | 244% | 216% |
| 35 | 250% | 400% | 468% | 412% | 57 | 142% | 205% | 237% | 210% |
| 36 | 250% | 387% | 453% | 399% | 58 | 138% | 199% | 230% | 205% |
| 37 | 250% | 375% | 438% | 386% | 59 | 134% | 194% | 224% | 199% |
| 38 | 250% | 362% | 424% | 373% | 60 | 130% | 189% | 218% | 194% |
| 39 | 250% | 351% | 410% | 361% | 61 | 128% | 184% | 211% | 189% |
| 40 | 250% | 340% | 397% | 350% | 62 | 126% | 180% | 206% | 185% |
| 41 | 243% | 329% | 384% | 339% | 63 | 124% | 175% | 200% | 180% |
| 64 | 122% | 171% | 194% | 176% | 83 | 105% | 122% | 127% | 124% |
| 65 | 120% | 167% | 189% | 172% | 84 | 105% | 121% | 125% | 122% |
| 66 | 119% | 164% | 184% | 168% | 85 | 105% | 120% | 123% | 121% |
| 67 | 118% | 160% | 180% | 164% | 86 | 105% | 118% | 121% | 119% |
| 68 | 117% | 157% | 175% | 160% | 87 | 105% | 117% | 120% | 118% |
| 69 | 116% | 153% | 171% | 157% | 88 | 105% | 116% | 118% | 117% |
| 70 | 115% | 150% | 166% | 154% | 89 | 105% | 115% | 117% | 116% |
| Table of Minimum Death Benefit Percentages. | |||||||||
| GP Test | CVA Test | GP Test | CVA Test | ||||||
| Age | Percent | Male | Female | Unisex | Age | Percent | Male | Female | Unisex |
| 71 | 113% | 147% | 162% | 151% | 90 | 105% | 114% | 115% | 115% |
| 72 | 111% | 145% | 158% | 147% | 91 | 104% | 113% | 114% | 114% |
| 73 | 109% | 142% | 154% | 145% | 92 | 103% | 112% | 113% | 112% |
| 74 | 107% | 139% | 151% | 142% | 93 | 102% | 111% | 112% | 111% |
| 75 | 105% | 137% | 147% | 139% | 94 | 101% | 110% | 110% | 110% |
| 76 | 105% | 135% | 144% | 137% | 95 | 100% | 109% | 109% | 109% |
| 77 | 105% | 133% | 141% | 135% | 96 | 100% | 107% | 107% | 107% |
| 78 | 105% | 131% | 139% | 133% | 97 | 100% | 106% | 106% | 106% |
| 79 | 105% | 129% | 136% | 131% | 98 | 100% | 104% | 104% | 104% |
| 80 | 105% | 127% | 133% | 129% | 99 | 100% | 103% | 103% | 103% |
| 81 | 105% | 125% | 131% | 127% | 100+ | 100% | 100% | 100% | 100% |
| 82 | 105% | 124% | 129% | 125% | |||||
Flexible Term Insurance Option Rider
You may add an FTIO Rider to the policy to provide additional death benefit coverage on the Life Insured. The FTIO Rider provides flexible term life insurance to Attained Age 100 with cost of insurance charges less than or equal to those of the policy. The election of (or failure to elect) the FTIO Rider will impact the total cost of insurance charges. The FTIO Rider will terminate at the earlier of Attained Age 100, the date the policy lapses or is surrendered, and your request to cancel the FTIO Rider.
You may schedule the death benefit amounts that will apply at specified times (the “Scheduled Death Benefits”). Scheduled Death Benefits may be constant or varying from time to time. The Scheduled Death Benefits will be shown in the policy .
The term insurance benefit of the FTIO Rider is equal to (a) minus (b) but not less than zero where:
(a) is the Scheduled Death Benefit for the Policy Month, and
(b) is the Face Amount of the policy or, if greater, the policy’s Minimum Death Benefit.
Even if the term insurance benefit may be zero in a Policy Month, the FTIO Rider will not terminate.
Example. A policy is purchased for an executive as part of an employee benefit plan. The death benefit provided by the policy is to be equal to the executive’s salary of $100,000 increasing at 5% per year through age 64. Assuming the executive is currently 55, the policy will be issued with a Scheduled Death Benefit as follows:
| Policy Year | Scheduled Death Benefit |
| 1 | 100,000 |
| 2 | 105,000 |
| 3 | 110,250 |
| 4 | 115,763 |
| 5 | 121,551 |
| 6 | 127,628 |
| 7 | 134,010 |
| 8 | 140,710 |
| 9 | 147,746 |
| 10+ | 155,133 |
The FTIO Rider amount will change each year as necessary to provide the benefits shown in the schedule, as follows:
| Policy Year |
Total Death Benefit |
Face Amount |
Flexible Term Insurance Amount |
| 1 | 100,000 | 100,000 | 0 |
| 2 | 105,000 | 100,000 | 5,000 |
| 3 | 110,250 | 100,000 | 10,250 |
| 4 | 115,763 | 100,000 | 15,763 |
| 5 | 121,551 | 100,000 | 21,551 |
| 6 | 127,628 | 100,000 | 27,628 |
| 7 | 134,010 | 100,000 | 34,010 |
| 8 | 140,710 | 100,000 | 40,710 |
| 9 | 147,746 | 100,000 | 47,746 |
| 10 | 155,133 | 100,000 | 55,133 |
You may choose either of two death benefit options:
Death Benefit Option 1. The death benefit on any date is the Face Amount of the policy or, if greater, the Minimum Death Benefit, plus the term insurance benefit of the FTIO Rider.
Death Benefit Option 2. The death benefit on any date is the Face Amount plus the Policy Value or, if greater, the Minimum Death Benefit, plus the term insurance benefit of the FTIO Rider.
Changing the Death Benefit Option
You may change the death benefit option at any time. The change will take effect at the beginning of the next Policy Month at least 30 days after your written request is received at our Service Office. We reserve the right to limit changes that could cause the policy to fail to qualify as life insurance for tax purposes.
A change in the death benefit option will result in a change in the Face Amount and Scheduled Death Benefits to avoid any change in the amount of death benefit, as follows:
Change from Option 1 to Option 2. The new Face Amount will be equal to the Face Amount prior to the change less the Policy Value on the date of the change.
The Scheduled Death Benefit amounts for dates on or after the date of the change will be the amounts scheduled prior to the change less the Policy Value on the date of the change.
Coverage Amounts will be reduced or eliminated in the order that they are listed in the policy until the total decrease in coverage amounts equals the decrease in Face Amount.
Example. A policy is issued with a Face Amount of $100,000, death benefit Option 1, and the following schedule:
| Policy Year | Scheduled Death Benefit |
| 1 | 100,000 |
| 2 | 125,000 |
| 3 | 150,000 |
| 4 | 175,000 |
| 5+ | 200,000 |
The death benefit option is changed to Option 2 at the beginning of Policy Year 3. If the Policy Value at the time of the change is $10,000, then the Face Amount after the change will be $90,000 (the Face Amount prior to the change less the Policy Value), and the Scheduled Death Benefit after the change will become:
| Policy Year | Scheduled Death Benefit |
| 3 | 140,000 |
| 4 | 165,000 |
| 5+ | 190,000 |
Change from Option 2 to Option 1. The new Face Amount will be the Face Amount prior to the change plus the Policy Value on the date of the change (but the new Face Amount will be no greater than the Scheduled Death Benefit on the date of the change).
The resulting Face Amount increase amount will be added to the first Coverage Amount listed in the policy.
The Annual Premium Target for this Coverage Amount will not be increased and new sales charges will not apply, however, for an increase solely due to a change in the death benefit option.
Example. A policy is issued with a Face amount of $100,000, death benefit Option 2, and the following schedule:
| Policy Year | Scheduled Death Benefit |
| 1 | 100,000 |
| 2 | 125,000 |
| 3 | 150,000 |
| 4 | 175,000 |
| 5+ | 200,000 |
The death benefit option is changed to Option 1 at the beginning of Policy Year 3. If the Policy Value at the time of the change is $10,000, then the Face Amount after the change will be $110,000 (the Face Amount prior to the change plus the Policy Value), and the Scheduled Death Benefit after the change will become:
| Policy Year | Scheduled Death Benefit |
| 3 | 160,000 |
| 4 | 185,000 |
| 5+ | 210,000 |
Changing the Face Amount and Scheduled Death Benefits
At any time, you may request an increase or decrease to the Face Amount or any Scheduled Death Benefits effective on or after the date of change. We reserve the right to limit changes that could cause the policy to fail to qualify as life insurance for tax purposes.
Increases in Face Amount and Scheduled Death Benefits. Increases in Face Amount and Scheduled Death Benefits are subject to the following conditions:
- Increases in Face Amount and Scheduled Death Benefits will require satisfactory evidence of the Life Insured’s insurability.
- Increases will take effect at the beginning of the next Policy Month after we approve the request.
- We may refuse a requested increase that would not meet our requirements for new policy issues at the time due to the Life Insured’s Attained Age or other factors.
- If the Face Amount is increased (other than as required by a death benefit option change) then all Scheduled Death Benefits effective on or after the date of the change will be increased by the amount of the Face Amount increase.
New Sales Loads for a Face Amount Increase. Coverage Amounts equal to the amount of the increase will be added to the policy as follows:
- First, Coverage Amounts that were reduced or eliminated by a prior Face Amount decrease will be restored.
- Second, if needed, a new Coverage Amount will be added to the policy with an Annual Premium Target and new sales charges. Any new Coverage Amount will be based on the Life Insured’s Attained Age and other relevant factors on the effective date of the increase.
Premiums paid on or after the increase may be attributed to the new Coverage Amount and result in sales charges (see “Charges and Deductions — Attribution of Premiums”).
Decreases in Face Amount and Scheduled Death Benefits. Decreases in Face Amount and Scheduled Death Benefits are subject to the following conditions:
- Decreases in Face Amount and Scheduled Death Benefits will take effect at the beginning of the next Policy Month which is 30 days after your written request is received at our Service Office.
- If the Face Amount is decreased then all Scheduled Death Benefits effective on or after the date of the change will be decreased by the same amount.
- If at any time the Scheduled Death Benefit decreases to less than the Face Amount, the Face Amount will be decreased to be equal to the Scheduled Death Benefit at that time.
- Coverage Amounts equal to the amount of the Face Amount decrease will be reduced or eliminated in the reverse order that they are listed in the policy.
Decreases in Face Amount Under Death Benefit Option 1 Due to a Partial Withdrawal. If death benefit Option 1 is in effect when a partial withdrawal is made, the Face Amount will be decreased by an amount equal to (a) minus (b) but not less than zero, where:
(a) is the partial withdrawal amount and
(b) is the excess, if any, of the policy’s Minimum Death Benefit over its Face Amount, immediately prior to the partial withdrawal.
Decreases in Face Amount under death benefit Option 1 due to a partial withdrawal are subject to the following conditions:
- Coverage Amounts equal to the amount of the Face Amount decrease will be reduced or eliminated in the reverse order that they are listed in the policy.
- All Scheduled Death Benefits effective on or after the date of the partial withdrawal will be decreased by the amount of the Face Amount decrease, unless you request otherwise and we approve.
Example for Face Increases and Decreases. A policy is issued with a Face Amount of $100,000, death benefit Option 1, and a Scheduled Death Benefit as follows:
| Policy Year | Scheduled Death Benefit |
| 1 | 100,000 |
| 2 | 125,000 |
| 3 | 150,000 |
| 4 | 175,000 |
| 5+ | 200,000 |
Assume the following policy activity:
| Activity | Effect on Policy | Change in Benefit Schedule |
| In Policy Year 2, the Face Amount is reduced to $80,000. | The initial Coverage Amount is reduced to $80,000. | Policy Year | Scheduled Death Benefit |
| 2 | 105,000 |
| 3 | 130,000 |
| 4 | 155,000 |
| 5+ | 180,000 |
| In Policy Year 3, the Face Amount is increased to $120,000 | The initial Coverage Amount (which earlier was reduced to $80,000) is restored to its original level of $100,000. A new Coverage Amount for $20,000 is added to the policy. This new Coverage Amount will have its own Annual Premium Target, and its own sales charges. A portion of the future premiums paid will be attributed to this Coverage Amount to determine the amount of the sales charges. | Policy Year | Scheduled Death Benefit |
| 3 | 170,000 |
| 4 | 195,000 |
| 5+ | 220,000 |
| In Policy Year 4, a partial withdrawal of $30,000 is made. | The Face Amount is reduced to $90,000. The most recent Coverage Amount of $20,000 is reduced to $0, and the initial Coverage Amount is reduced to $90,000. | Policy Year | Scheduled Death Benefit |
| 4 | 165,000 |
| 5 | 190,000 |
Factors that Affect the Death Benefit. In the case of death benefit Option 2 where the death benefit is the Face Amount plus the Policy Value, changes in the Policy Value will affect the amount of death benefit. Factors that affect the Policy Value are the investment performance of the variable investment options chosen and the charges deducted. For a discussion of how these factors affect Policy Value see the “Summary of Benefits and Risks”. These factors do not affect the Face Amount of the policy. Therefore, the amount of death benefit under Option 1 will not be less than the Face Amount as long as the policy does not lapse.
No premiums will be accepted prior to receipt of a completed application by us. All premiums received prior to the Effective Date of the policy will be held in our general account and credited with interest from the date of receipt at the rate of return earned on amounts allocated to the Money Market portfolio.
On the Effective Date, the Net Premiums paid plus interest credited will be allocated among the Investment Accounts or the Fixed Account in accordance with your instructions, unless first allocated to the Money Market portfolio for the duration of the Right to Examine period (see “Right to Examine the Policy”).
After the payment of the initial premium, premiums may be paid at any time during the lifetime of the Life Insured prior to Attained Age 100 and in any amount subject to the premium limitations described below.
A policy will be issued with a planned premium, which is based on the amount of premium you wish to pay. We will send you notices of your planned premium at the payment interval you select. However, you are under no obligation to make the planned premium payment.
Payment of premiums will not guarantee that the policy will stay in force and failure to pay premiums will not necessarily cause the policy to lapse. The policy will remain in force so long as the Net Cash Surrender Value is sufficient to cover policy charges.
If the policy is issued under the GP Test, the total of all premiums paid may not exceed the then-current maximum premium limitations established by federal income tax law for the policy to qualify as life insurance. The GP Test premium limits are stated in the policy. If a premium is received which would result in total premiums exceeding the applicable GP Test limit, we will only accept that portion of the premium that will not exceed the limit. Any premium in excess of that amount will be returned to you.
If the policy is issued under the CVA Test, there is no restriction on the amount of premiums that may be paid into a policy, but you must provide satisfactory evidence of insurability before we accept any premium that would increase the death benefit by an amount greater than the increase in Policy Value.
You may allocate premiums to the Fixed Account and Investment Accounts. Allocations may be made as percentages that are between zero and 100% that sum to exactly 100%. Alternatively, you may allocate a premium in dollar amounts that sum to exactly the Net Premium amount. You may change premium allocations at any time and the change will take effect on the date a request for change satisfactory to us is received at our Service Office.
We will deduct a premium charge as a percentage of each premium payment that is guaranteed never to exceed 2.5%. Currently, we waive this charge in Policy Years 4 and later and charge 0%.
The charge is intended to cover a portion of the aggregate amount of various taxes and fees we pay to federal, state and local governments. It is not based on the actual premium tax rate of your state of residence or any other specific tax.
The sales charge is intended to cover a portion of our costs of marketing and distributing the policies.
Attribution of Premiums. An Annual Premium Target is associated with each Coverage Amount. Annual Premium Targets are based on the Coverage Amount and the Life Insured’s Attained Age, sex and smoking status on the effective date of the Coverage Amount. The Annual Premium Targets are listed with the Coverage Amounts in the policy.
Premium payments will be attributed to Coverage Amounts that have been in effect for less than 5 years. Attribution will begin with the first applicable Coverage Amount that is listed in the policy. The sum of all premium amounts attributed to a Coverage Amount in a Coverage Year is limited to the Annual Premium Target shown in the policy. Premium amounts that exceed the Annual Premium Target will be attributed to the next listed Coverage Amount, up to its own Annual Premium Target. Attribution will continue in this manner until either the entire premium is attributed to Coverage Amounts or the Annual Premium Target is exceeded for all applicable Coverage Amounts.
Sales Charge. We deduct a sales charge from all premium amounts attributed to a Coverage Amount designated as having a sales charge. The sales charge is a percentage of premiums guaranteed never to exceed the percentages below. Currently we are charging these percentages.
| Coverage Year | Percentage |
| 1 | 13.00% |
| Coverage Year | Percentage |
| 2 | 6.25% |
| 3 | 3.50% |
| 4 | 2.50% |
| 5 | 0.50% |
| 6 | 0.50% |
| 7+ | 0.00% |
On the Policy Date and at the beginning of each Policy Month prior to Attained Age 100, a deduction is due from the Net Policy Value to cover certain charges described below. Monthly deductions due prior to the policy’s Effective Date will be taken on the Effective Date. Unless otherwise allowed by us and specified by you, the monthly deduction will be allocated among the Investment Accounts and the Fixed Account in the same proportion as the Policy Value in each of the Investment Accounts and the Fixed Account bears to the Net Policy Value.
Administration Charge. Currently we deduct a charge of $12 per Policy Month, which is guaranteed never to be exceeded. This charge is intended to cover certain administrative expenses associated with the policy, including maintaining policy records, collecting premiums and processing death claims, surrender and withdrawal requests and various changes permitted under a policy.
Cost of Insurance Charge. A monthly charge for the cost of insurance is paid to us and is determined by multiplying a cost of insurance rate by the net amount at risk at the beginning of each Policy Month.
Death Benefit Option 1. The net amount at risk is equal to the greater of zero, or (a) minus (b), where
(a) is the applicable death benefit amount on the first day of the month, divided by 1.0024663; and
(b) is the Policy Value attributed to that death benefit amount on the first day of the month.
Death Benefit Option 2. The net amount at risk is equal to the Face Amount of insurance.
Cost of insurance rates and net amounts at risk are determined separately for each Coverage Amount and for the excess of the death benefit over the Face Amount (the Face Amount is the sum of the Coverage Amounts).
Attribution of Policy Value for Net Amounts at Risk. To determine the net amounts at risk, the Policy Value will be attributed to Coverage Amounts in the order listed in the policy. The amount of Policy Value attributed to a Coverage Amount will be limited to the amount that results in zero net amount at risk, and any excess Policy Value will then be attributed to the next listed Coverage Amount. Attribution will continue in this manner until either the entire Policy Value is attributed or the end of the list of Coverage Amounts is reached. Any remaining Policy Value will then be attributed to the excess of the death benefit over the Face Amount.
Current Cost of Insurance Rates. Cost of insurance rates are determined separately for each Coverage Amount and the excess of the death benefit over the Face Amount. There are different current cost of insurance rate bases for:
- Coverage Amounts having sales charges, and
- The excess of the death benefit over the Face Amount, including any term insurance benefit under the FTIO Rider.
The cost of insurance rate in a specific Policy Month for an applicable death benefit amount will depend on:
- the cost of insurance rate basis for the applicable death benefit amount,
- the Life Insured’s Attained Age, sex (unless unisex rates are required by law) and smoking status on the effective date of the applicable death benefit amount,
- the underwriting class of the applicable death benefit amount,
- the Coverage Year, or Policy Year for the excess of the death benefit over the Face Amount,
- any extra charges for substandard ratings, as stated in the policy.
Since the net amount of risk for death benefit Option 1 is based on a formula that includes as factors the Policy Value, the net amount at risk is affected by the investment performance of the underlying investment options chosen, payment of premiums and charges assessed.
Cost of insurance rates will generally increase with the Life Insured’s age and the Coverage Year.
Cost of insurance rates reflect our expectation as to future mortality experience. They are also intended to cover our general costs of providing the policy, to the extent that these costs are not covered by other charges. Current cost of insurance rates may be changed by us on a basis that does not unfairly discriminate within the class of lives insured.
Guaranteed Maximum Cost of Insurance Rates. In no event will the cost of insurance rates we charge exceed the guaranteed maximum rates set forth in the policy, except to the extent that an extra charge is imposed for a substandard rating. The guaranteed rates are based on the 1980 Commissioners Standard Ordinary Sex Distinct (unless unisex rates are required by law) ANB Aggregate Ultimate Mortality Tables. Current cost of insurance rates may be less than the guaranteed rates.
Asset Based Risk Charge Deducted from Investment Accounts
We assess a daily charge against amounts in the Investment Accounts. This charge is intended to compensate us for insurance risks we assume under the policy, such as benefit payments and expenses that are higher than we expected. We will realize a gain from this charge to the extent it is not needed to provide benefits and pay expenses under the policy. The charge is a percentage of amounts in the Investment Accounts, which will reduce unit values of the sub-accounts. The charge is guaranteed never to exceed an annual rate of 0.50%. Currently, we charge the following rates:
| Policy Year | Annual Rate |
| 1-10 | 0.45% |
| 11+ | 0.25% |
Reduction in Charges and Enhanced Surrender Values
The policy is designed for employers and other sponsoring organizations that may purchase multiple policies as a case. The size or nature of the case may result in expected savings of sales, underwriting, administrative or other costs. If so, we expect to offer reductions of policy charges and enhancements of surrender value. Eligibility for reductions and enhancements and the amounts available will be determined by a number of factors, including the number of lives to be insured, the total premiums expected to be paid, total assets under management for the policy owner, the nature of the relationship among the lives insured, the purpose for which the policies are being purchased, expected persistency of the individual policies, and any other circumstances which we believe to be relevant to the expected reduction of our expenses. Some of reductions and enhancements may be guaranteed and others may be subject to restrictions or to withdrawal or modification, on a uniform case basis. We may change the nature and amount of reductions and enhancements available from time to time. Reductions and enhancements will be determined in a way that is not unfairly discriminatory to policy owners.
Currently, we make no specific charge for any federal, state, or local taxes that we incur that may be attributable to the Separate Account or to the policy. We reserve the right in the future, however, to make a charge for any such tax or other economic burden resulting from the application of tax laws that we determine to be properly attributable to the Separate Account or to the policy.
Determination of the Policy Value
A policy has a Policy Value, a portion of which is available to you by making a policy loan or partial withdrawal, or upon surrender of the policy. The Policy Value may also affect the amount of the death benefit. The Policy Value at any time is equal to the sum of the values in the Investment Accounts, the Fixed Account, and the Loan Account.
The Policy Value is affected by the investment performance of the Investment Account chosen and the rate of interest credited if amounts are allocated to the Fixed Account. The Policy Value is also affected by the charges deducted. For a discussion of how these factors affect Policy Value see the “Summary of Benefits and Risks”.
Investment Accounts. An Investment Account is established under each policy for each sub-account of the Separate Account to which Net Premiums or transfer amounts have been allocated. Each Investment Account under a policy measures
the interest of the policy in the corresponding sub-account. The value of the Investment Account established for a particular sub-account is equal to the number of units of that sub-account credited to the policy multiplied by the value of such units.Fixed Account. Amounts in the Fixed Account do not vary with the investment performance of any sub-account. Instead, these amounts are credited with interest at a rate determined by us. See “The General Account — Fixed Account”.
Loan Account. Amounts borrowed from the policy are transferred to the Loan Account. Amounts in the Loan Account do not vary with the investment performance of any sub-account. Instead, these amounts are credited with interest at a rate determined by us that is lower than the loan interest rate charged on Policy Debt. See “Policy Loans — Loan Account”.
Crediting and Canceling Units. Units of a particular sub-account are credited to a policy when Net Premiums are allocated to that sub-account or amounts are transferred to that sub-account. Units of a sub-account are cancelled whenever amounts are deducted, transferred or withdrawn from the sub-account. The number of units credited or cancelled for a specific transaction is based on the dollar amount of the transaction divided by the value of the unit on the Business Day on which the transaction occurs. The number of units credited with respect to a premium payment will be based on the applicable unit values for the Business Day on which the premium is received at our Service Office, except for any premiums received before the Effective Date. For premiums received before the Effective Date, the values will be determined on the Effective Date.
Units are valued at the end of each Business Day. When an order involving the crediting or canceling of units is received after the end of a Business Day, or on a day that is not a Business Day, the order will be processed on the basis of unit values determined on the next Business Day. Similarly, any determination of Policy Value, Investment Account value or death benefit to be made on a day that is not a Business Day will be made on the next Business Day.
Unit Values. For each Business Day the unit value for each sub-account is determined by multiplying the net investment factor for the that sub-account by the unit value for the immediately preceding Business Day.
The net investment factor for a sub-account on any Business Day is equal to (a) divided by (b) minus (c), where:
| (a) | is the net asset value of the underlying portfolio shares held by that sub-account as of the end of such Business Day before any policy transactions are made on that day; |
| (b) | is the net asset value of the underlying portfolio shares held by that sub-account as of the end of the immediately preceding Business Day after all policy transactions were made for that day; and |
| (c) | is a charge not exceeding the daily mortality and expense risk charge shown in the “Charges and Deductions — Asset Based Risk Charge Deducted from Investment Accounts” section. |
The value of a unit may increase, decrease, or remain the same, depending on the investment performance of a sub-account from one Business Day to the next.
Market timing and disruptive trading risks
The policy is not designed for professional market timers or highly active traders, including persons or entities that engage in programmed, large or frequent transfers among the investment accounts or between the investment accounts and any available fixed account. The policy is also not designed to accommodate trading that results in transfers that are large in relation to the total assets of the underlying portfolio.
Variable investment options in variable life insurance products can be a prime target for abusive transfer activity because these products value their investment options on a daily basis and allow transfers among investment options without immediate tax consequences. As a result, some investors may seek to frequently transfer into and out of variable investment options or to make large transfers in reaction to market news or to exploit a perceived pricing inefficiency. Whatever the reason, long-term investors in a variable investment option can be harmed by large or frequent transfer activity. For example, such activity may expose the investment account’s underlying portfolio to increased portfolio transaction costs and/or disrupt the portfolio manager‘s ability to effectively manage the portfolio’s investments in accordance with the portfolio’s investment objectives and policies. This could include causing the portfolio to maintain higher levels of cash than would otherwise be the
case, or liquidating investments prematurely. Accordingly, frequent or large transfers may result in dilution with respect to interests held for long-term investment and adversely affect policy owners, beneficiaries and the underlying portfolios.To discourage market timing and disruptive trading activity, we impose restrictions on transfers and reserve the right to change, suspend or terminate telephone and facsimile transaction privileges. In addition, we reserve the right to take other actions at any time to restrict trading, including, but not limited to: (i) restricting the number of transfers made during a defined period, (ii) restricting the dollar amount of transfers, (iii) restricting transfers into and out of certain investment options, (iv) restricting the method used to submit transfers, and (v) deferring a transfer at any time we are unable to purchase or redeem shares of the underlying portfolio.
We may also impose additional administrative conditions upon, or prohibit a transfer request made by a third party giving instructions on behalf of multiple policies, whether owned by the same owner or different owners. If you engage a third party for asset allocation services, then you may be subject to these transfer restrictions because of the actions of that party in providing those services. We will notify the third party you have engaged if we exercise this right.
While we seek to identify and prevent disruptive trading activity, it may not always be possible to do so. Therefore, no assurance can be given that the restrictions we impose will be successful in preventing all disruptive trading and avoiding harm to long-term investors.
Our current practice is to restrict transfers into or out of variable investment options to two per calendar month (except with respect to those policies described in the following paragraph). In applying this restriction any transfer request involving the transfer of account value into or out of multiple variable investment options will still count as only one request. No more than one transfer request may be made on any day. You may, however, transfer to the Money Market portfolio even if the two transfer per month limit has been reached, but only if 100% of the Policy Value in all variable investment options is transferred to the Money Market portfolio. If such a transfer to the Money Market investment portfolio is made, then, for the 30 calendar day period after such transfer, no transfers from the Money Market portfolio to any other variable investment options or to the Fixed Account may be made. If a policy offers a dollar cost averaging or automatic asset allocation rebalancing program, any transfers pursuant to such program are not considered transfers subject to these restrictions on frequent trading. The restrictions described in this paragraph will be applied uniformly to all policy owners subject to the restrictions.
Policies may be purchased by a corporation or other entity as a means to informally finance the liabilities created by an employee benefit plan, and to this end the entity may aggregately manage the policies purchased to match its liabilities under the plan. Policies sold under these circumstances are subject to special transfer restrictions. In lieu of the two transfers per month restriction, we will allow the policy owner under these circumstances to rebalance the investment options in its policies within the following limits: (i) during the 10 calendar day period after any account values are transferred from one portfolio into a second portfolio, the values can only be transferred out of the second investment option if they are transferred into the Money Market portfolio; and (ii) any account values that would otherwise not be transferable by application of the 10 day limit described above and that are transferred into the Money Market portfolio may not be transferred out of the Money Market portfolio into any other investment options (variable or fixed) for 30 calendar days. The restrictions described in this paragraph will be applied uniformly to all policy owners subject to the restrictions.
Subject to our approval, we may offer policies purchased by a corporation or other entity that has purchased policies to match its liabilities under an employee benefit plan, as described above, the ability to electronically rebalance the investment options in its policies. Under these circumstances, in lieu of imposing any specific limit upon the number or timing of transfers, we will monitor aggregate trades among the sub-accounts for frequency, pattern and size for potentially harmful investment practices. If we detect trading activity that we believe may be harmful to the overall operation of any investment account or underlying portfolio, we may impose conditions on policies employing electronic rebalancing to submit trades, including setting limits upon the number and timing of transfers, and revoking privileges to make trades by any means other than written communication submitted via U.S. mail. The restrictions described in these paragraphs will be applied uniformly to all policy owners subject to the restrictions.
We reserve the right to modify or terminate the transfer privilege at any time in accordance with applicable law. Transfer privileges are also subject to any restrictions that may be imposed by the portfolios. In addition, we reserve the right to defer the transfer privilege at any time that we are unable to purchase or redeem shares of a portfolio.
Rule 22c-2 under the 1940 Act requires us to provide tax identification numbers and other policy owner transaction information to John Hancock Trust or to other investment companies in which the Separate Account invests, at their request. An investment company will use this information to identify any pattern or frequency of investment account transfers that
may violate their frequent trading policy. An investment company may require us to impose trading restrictions in addition to those described above if violations of their frequent trading policy are discovered.Transfers Involving Fixed Account.
While the policy is in force, you may transfer the Policy Value from any of the Investment Accounts to the Fixed Account without incurring transfer charges:
- within eighteen months after the Issue Date; or
- within 60 days of the effective date of a material change in the investment objectives of any of the sub-accounts; or
- within 60 days of the date of notification of such change, whichever is later.
Such transfers will not count against the twelve transfers that may be made free of charge in any Policy Year.
The maximum amount that you may transfer from the Fixed Account in any one Policy Year is the greater of $2,000, 15% of the Fixed Account value at the previous Policy Anniversary, or the amount transferred out of the Fixed Account during the previous policy year. Any transfer which involves a transfer out of the Fixed Account may not involve a transfer to the Investment Account for the Money Market portfolio.
Telephone Transfers. Transfer requests must be in writing in a form satisfactory to us, or by telephone if a currently valid telephone transfer authorization form is on file. Although failure to follow reasonable procedures may result in our being liable for any losses resulting from unauthorized or fraudulent telephone transfers, we will not be liable for following instructions communicated by telephone that we reasonably believe to be genuine. We will employ reasonable procedures to confirm that instructions communicated by telephone are genuine. Such procedures shall consist of confirming that a valid telephone authorization form is on file, tape recording of all telephone transactions and providing written confirmation thereof.
At any time while this policy is in force, you may borrow against the Policy Value. This policy is the only security for the loan. Policy loans may have tax consequences, see “Tax Treatment of Policy Benefits — Policy Loans”.
A policy loan will affect future Policy Values, since the portion of the Policy Value in the Loan Account will receive the loan interest credited rate rather than varying with the performance of the underlying portfolios or increasing at the Fixed Account interest credited rate. A policy loan may cause a policy to be more susceptible to lapse since it reduces the Net Cash Surrender Value from which monthly deductions are taken. A policy loan causes the amount payable upon death of the Life Insured to be reduced by the amount of outstanding Policy Debt.
Maximum Loan. The amount of any loan cannot exceed the amount that would cause the Policy Debt to equal the policy’s Cash Surrender Value less the monthly deductions due from the date of the loan to the next Policy Anniversary.
Interest Charged on Policy Loans
Interest on the Policy Debt will accrue daily and be payable annually on the Policy Anniversary. The rate of interest charged will be an effective annual rate of 4%.
When a loan is made, an amount equal to the loan will be deducted from the Investment Accounts or the Fixed Account and transferred to the Loan Account. You may designate how this amount is allocated among the accounts. If you give no instructions, the amount transferred will be allocated among the Investment Accounts and the Fixed Account in the same proportion as the Policy Value in each Investment Account and the Fixed Account bears to the Net Policy Value. A transfer from an Investment Account will result in the cancellation of units of the underlying sub-account equal in value to the amount transferred from the Investment Account. However, since the Loan Account is part of the Policy Value, transfers made in connection with a loan will not change the Policy Value.
Interest Credited to the Loan Account. Policy Value in the Loan Account will earn interest at an effective annual rate guaranteed to be at least 3.25%. We may declare a current interest rate that is greater than this, subject to change at any time.
The excess of the loan interest charged rate (4%) over the loan interest credited rates will result in a net charge against the Policy Value with respect to any Policy Debt.Currently we credit loan interest rates which vary by Policy Year as follows:
| Policy Years | Current Loan Interest Credited Rates |
Excess Loan Interest Charged Rate |
| 1-10 | 3.25% | 0.75% |
| 11+ | 3.75% | 0.25% |
Loan Account Adjustments. On the first day of each Policy Month the difference between the Loan Account and the Policy Debt is transferred to the Loan Account from the Investment Accounts or the Fixed Account. The amount transferred will be allocated to the Investment Accounts and the Fixed Account in the same proportion as the Policy Value in each Investment Account or the Fixed Account bears to the Net Policy Value.
Loan Repayments. Policy Debt may be repaid, in whole or in part, at any time prior to the death of the Life Insured while the policy is in force. A loan repayment amount will be credited to the Loan Account and transferred to the Fixed Account or the Investment Accounts in the same proportion as the Policy Value in each account bears to the Net Policy Value.
Amounts paid to us not specifically designated in writing as loan repayments will be treated as premiums.
POLICY SURRENDER AND PARTIAL WITHDRAWALS
A policy may be surrendered for its Net Cash Surrender Value at any time while the Life Insured is living. The Net Cash Surrender Value is equal to the Policy Value less any outstanding monthly deductions due minus the Policy Debt. The Net Cash Surrender Value will be determined at the end of the Business Day on which we receive the policy and a written request for surrender at our our Service Office. After a policy is surrendered, the insurance coverage and all other benefits under the policy will terminate.
You may make a partial withdrawal of the Net Cash Surrender Value at any time. You may designate how the withdrawal amount is allocated among the Investment Account and the Fixed Account. If you give no instructions, the withdrawal amount will be allocated among the accounts in the same proportion as the Policy Value in each account bears to the Net Policy Value.
The death benefit may be reduced as a result of a Partial Withdrawal. (See “Death Benefits — Decreases in Face Amount under Death Benefit Option 1 due to a Partial Withdrawal”).
A policy will go into default at the beginning of a Policy Month if the Net Cash Surrender Value would be zero and below after deducting the monthly deduction then due. A lapse could have adverse tax consequences as described under “Tax Considerations — Other Policy Distributions”. We will notify you of the default and will allow you a 61 day grace period in which you may make a premium payment sufficient to bring the policy out of default. The required payment will be equal to the amount necessary to bring the Net Cash Surrender Value to zero, if it was less than zero on the date of default, plus the monthly deductions due at the date of default and payable at the beginning of each of the two Policy Months thereafter, plus any applicable premium charge. If the required payment is not received by the end of the grace period, the policy will terminate with no value.
Death During Grace Period. If the Life Insured should die during the grace period, the Policy Value used in the calculation of the death benefit will be the Policy Value on the date of default and the insurance benefit will be reduced by any outstanding monthly deductions due at the time of death.
You may reinstate a policy that has terminated after going into default at any time within the five-year period following the date of termination subject to the following conditions:
- The policy must not have been surrendered for its Net Cash Surrender Value;
- Evidence of the Life Insured’s insurability satisfactory to us must be provided; and
- A premium equal to the payment required during the grace period following default to keep the policy in force is paid.
Generally, the suicide exclusion and incontestability provision will apply from the effective date of the reinstatement. Your policy will indicate if this is not the case.
The general account of John Hancock USA consists of all assets owned by us other than those in Separate Account N and other separate accounts of the Company. Subject to applicable law, we have sole discretion over investment of the assets of the general account.
By virtue of exclusionary provisions, interests in the general account of John Hancock USA have not been registered under the Securities Act of 1933 (“1933 Act”) and the general account has not been registered as an investment company under the 1940 Act. Accordingly, neither the general account nor any interests therein are subject to the provisions of these acts, and as a result the staff of the SEC has not reviewed the disclosures in this prospectus relating to the general account. Disclosures regarding the general account may, however, be subject to certain generally applicable provisions of the federal securities laws relating to the accuracy and completeness of statements made in a prospectus.
You may elect to allocate Net Premiums to the Fixed Account or transfer all or a portion of the Policy Value to the Fixed Account from the Investment Accounts. We will hold the reserves required for any portion of the Policy Value allocated to the Fixed Account in our general account. Transfers from the Fixed Account to the Investment Accounts are subject to restrictions.
Policy Value in the Fixed Account. The Policy Value in the Fixed Account is equal to:
- the portion of the Net Premiums allocated to it; plus
- any amounts transferred to it; plus
- interest credited to it; less
- any charges deducted from it; less
- any partial withdrawals from it; less
- any amounts transferred from it.
Interest on the Fixed Account. An allocation of Policy Value to the Fixed Account does not entitle you to share in the investment experience of the general account. Instead, we guarantee that the Policy Value in the Fixed Account will accrue interest daily at an effective annual rate of at least 3%, without regard to the actual investment experience of the general account. We may declare a current interest rate in excess of the guaranteed rate, subject to change at any time.
OTHER PROVISIONS OF THE POLICY
Who owns the policy? That’s up to the person who applies for the policy. The owner of the policy is the person who can exercise most of the rights under the policy, such as the right to choose the accounts in which to invest or the right to surrender the policy. In many cases, the person buying the policy is also the person who will be the owner. However, the application for a policy can name another person or entity (such as a trust) as owner. Whenever we‘ve used the term “you” in this prospectus, we’ve assumed that the reader is the person who has whatever right or privilege is being discussed. There may be tax consequences if the owner and the insured person are different, so you should discuss this issue with your tax adviser.
While the insured person is alive, you will have a number of options under the policy. Here are some major ones:
- Determine when and how much you invest in the various accounts
- Borrow or withdraw amounts you have in the accounts
- Change the beneficiary who will receive the death benefit
- Change the amount of insurance
- Turn in (i.e., “surrender”) the policy for the full amount of its Net Cash surrender value
- Choose the form in which we will pay out the death benefit or other proceeds
It is possible to name so-called “joint owners” of the policy. If more than one person owns a policy, all owners must join in most requests to exercise rights under the policy.
Unless otherwise restricted by a separate agreement, you may:
- Vary the premiums paid under the policy.
- Change the death benefit option.
- Change the premium allocation for future premiums.
- Take loans and/or partial withdrawals.
- Surrender the policy.
- Transfer ownership to a new owner.
- Name a contingent owner that will automatically become owner if you die before the Life Insured.
- Change or revoke a contingent owner.
- Change or revoke a beneficiary.
Assignment of Rights. We will not be bound by an assignment until we receive a copy of the assignment at our Service Office. We assume no responsibility for the validity or effects of any assignment.
You may appoint one or more beneficiaries of the policy by naming them in the application. Beneficiaries may be appointed in three classes — primary, secondary, and final. Beneficiaries may also be revocable or irrevocable. Unless an irrevocable designation has been elected, you may change the beneficiary during the Life Insured’s lifetime by giving written notice in a form satisfactory to us. If the Life Insured dies and there is no surviving beneficiary, you, or your estate if you are the Life Insured, will be the beneficiary. If a beneficiary dies before the seventh day after the death of the Life Insured, we will pay the insurance benefit as if the beneficiary had died before the Life Insured.
We will not contest the validity of a policy after it has been in force during the Life Insured’s lifetime for two years from the Issue Date stated in the policy, nor will we contest the validity of an increase in Face Amount after it has been in force during the Life Insured’s lifetime for two years. If a policy has been reinstated, we can contest any misrepresentation of a fact material to the reinstatement for a period of two years after the reinstatement date.
If the Life Insured’s stated age or sex or both in the policy are incorrect, we will change the Face Amount so that the death benefit will be that which the most recent monthly charge for the cost of insurance would have purchased for the correct age and sex.
If the Life Insured, whether sane or insane, dies by suicide within two years from the Issue Date stated in the policy (or within the maximum period permitted by the state in which the policy was delivered, if less than two years), we will pay only the premiums paid less any partial withdrawals and any Policy Debt. If the Life Insured should die by suicide within two years after a Face Amount increase, the death benefit for the increase will be limited to the monthly deductions for the increase. At our discretion, this provision may be waived; for example, with policies purchased in conjunction with certain existing benefit plans.
Subject to certain requirements, one or more supplementary benefits may be added to a policy, including the FTIO Rider (see “Death Benefits — Flexible Term Insurance Option Rider”) and, in the case of a policy owned by a corporation or other similar entity, a benefit permitting a change in the Life Insured (a taxable event). More detailed information concerning this supplementary benefit may be obtained from us. There is no cost for any supplementary benefit currently offered by us, with the exception of the FTIO Rider (see “Charges and Deductions — Monthly Deductions”).
This description of Federal income tax consequences is only a brief summary and is neither exhaustive nor authoritative. It was written to support the promotion of our products. It does not constitute legal or tax advice, and it is not intended to be used and cannot be used to avoid any penalties that may be imposed on you. Tax consequences will vary based on your own particular circumstances, and for further information you should consult a qualified tax adviser. Federal, state and local tax laws, regulations and interpretations can change from time to time. As a result, the tax consequences to you and the beneficiary may be altered, in some cases retroactively. The policy may be used in various arrangements, including non-qualified deferred compensation or salary continuation plans, split dollar insurance plans, executive bonus plans, retiree medical benefit plans and others. The tax consequences of such plans may vary depending on the particular facts and circumstances of each individual arrangement. Therefore, if the value of using the policy in any such arrangement depends in part on the tax consequences, a qualified tax adviser should be consulted for advice.
We are taxed as a life insurance company. Under current tax law rules, we include the investment income (exclusive of capital gains) of the Separate Account in our taxable income and take deductions for investment income credited to our policy holder reserves. We are also required to capitalize and amortize certain costs instead of deducting those costs when they are incurred. We do not currently charge the Separate Account for any resulting income tax costs, other than a charge we may impose against the Separate Account to compensate us for the cost of a delay in the deductibility of deferred acquisition costs (the “DAC tax” adjustment) pursuant to section 848 of the Internal Revenue Code. We also claim certain tax credits or deductions relating to foreign taxes paid and dividends received by the series funds. These benefits can be material. We do not pass these benefits through to the Separate Account, principally because: (i) the deductions and credits are allowed to us and not the policy owners under applicable tax law; and (ii) the deductions and credits do not represent investment return on the Separate Account assets that is passed through to policy owners.
The policies permit us to deduct a charge for any taxes we incur that are attributable to the operation or existence of the policies or the Separate Account. Currently, we do not anticipate making any specific charge for such taxes other than any DAC tax charge and premium taxes where applicable. If the level of the current taxes increases, however, or is expected to increase in the future, we reserve the right to make a charge in the future.
Death benefit proceeds and other policy distributions
Generally, death benefits paid under policies such as yours are not subject to income tax unless policy ownership has been transferred in exchange for payment. Earnings on your policy value are ordinarily not subject to income tax as long as we don’t pay them out to you. If we do pay out any amount of your policy value upon surrender or partial withdrawal, all or part of that distribution would generally be treated as a return of the premiums you’ve paid and not subjected to income tax. However certain distributions associated with a reduction in death benefit or other policy benefits within the first fifteen years after issuance of the policy are ordinarily taxable in whole or in part. Amounts you borrow are generally not taxable to you.
However, some of the tax rules change if your policy becomes a modified endowment contract. This can happen if you’ve paid premiums in excess of limits prescribed by the tax laws. Additional taxes and penalties may be payable for policy distributions of any kind, including loans. (See “7-pay premium limit and modified endowment contract status” below.)
We expect the policy to receive the same Federal income and estate tax treatment as fixed benefit life insurance policies. Section 7702 of the Internal Revenue Code defines a life insurance contract for Federal tax purposes. For a policy to be treated as a life insurance contract, it must satisfy either the cash value accumulation test or the guideline premium test. These tests limit the amount of premium that you may pay into the policy. We will monitor compliance with these standards. If we determine that a policy does not satisfy section 7702, we may take whatever steps are appropriate and reasonable to bring it into compliance with section 7702.
If the policy complies with section 7702, the death benefit proceeds under the policy ordinarily should be excludable from the beneficiary’s gross income under section 101 of the Internal Revenue Code. (As noted above, a transfer of the policy for valuable consideration may limit the exclusion of death benefits from the beneficiary’s income.)
Increases in policy value as a result of interest or investment experience will not be subject to Federal income tax unless and until values are received through actual or deemed distributions. In general, unless the policy is a modified endowment contract, the owner will be taxed only on the amount of distributions that exceed the premiums paid under the policy. An exception to this general rule occurs in the case of a decrease in the policy’s death benefit or any other change that reduces benefits under the policy in the first fifteen years after the policy is issued and that results in a cash distribution to the policy owner. Changes that reduce benefits include partial withdrawals, death benefit option changes, and distributions required to keep the policy in compliance with section 7702. For purposes of this rule any distribution within the two years immediately before a reduction in benefits will also be treated as if it were a result of the reduction. A cash distribution that reduces policy benefits will be taxed in whole or in part (to the extent of any gain in the policy) under rules prescribed in section 7702. The taxable amount is subject to limits prescribed in section 7702(f)(7). Any taxable distribution will be ordinary income to the owner (rather than capital gain).
Distributions for tax purposes include amounts received upon surrender or partial withdrawals. You may also be deemed to have received a distribution for tax purposes if you assign all or part of your policy rights or change your policy’s ownership.
It is possible that, despite our monitoring, a policy might fail to qualify as a life insurance contract under section 7702 of the Internal Revenue Code. This could happen, for example, if we inadvertently failed to return to you any premium payments that were in excess of permitted amounts, or if any of the funds failed to meet certain investment diversification or other requirements of the Internal Revenue Code. If this were to occur, you would be subject to income tax on the income credited to the policy from the date of issue to the date of the disqualification and for subsequent periods.
Tax consequences of ownership or receipt of policy proceeds under Federal, state and local estate, inheritance, gift and other tax laws will depend on the circumstances of each owner or beneficiary. If the person insured by the policy is also its owner, either directly or indirectly through an entity such as a revocable trust, the death benefit will be includible in his or her estate for purposes of the Federal estate tax. If the owner is not the person insured, the value of the policy will be includible in the owner’s estate upon his or her death. Even if ownership has been transferred, the death proceeds or the policy value may be includible in the former owner’s estate if the transfer occurred less than three years before the former owner’s death or if the former owner retained certain kinds of control over the policy. You should consult your tax adviser regarding these possible tax consequences.
Because there may be unfavorable tax consequences (including recognition of taxable income and the loss of income tax-free treatment for any death benefit payable to the beneficiary), you should consult a qualified tax adviser prior to changing the policy’s ownership or making any assignment of ownership interests.
We expect that, except as noted below (see “7-pay premium limit and modified endowment contract status”), loans received under the policy will be treated as indebtedness of an owner and that no part of any loan will constitute income to the owner. However, if the policy terminates for any reason other than the payment of the death benefit, the amount of any outstanding loan that was not previously considered income will be treated as if it had been distributed to the owner upon such termination. This could result in a considerable tax bill. Under certain circumstances involving large amounts of outstanding loans, you might find yourself having to choose between high premiums required to keep your policy from lapsing and a significant tax burden if you allow the lapse to occur.
Diversification rules and ownership of the Separate Account
Your policy will not qualify for the tax benefits of a life insurance contract unless the Separate Account follows certain rules requiring diversification of investments underlying the policy. In addition, the rules require that the policy owner not have “investor control” over the underlying assets.
In certain circumstances, the owner of a variable life insurance policy may be considered the owner, for Federal income tax purposes, of the assets of the Separate Account used to support the policy. In those circumstances, income and gains from the Separate Account assets would be includible in the policy owner’s gross income. The Internal Revenue Service (“IRS”) has stated in published rulings that a variable policy owner will be considered the owner of Separate Account assets if the policy owner possesses incidents of ownership in those assets, such as the ability to exercise investment control over the assets. A Treasury Decision issued in 1986 stated that guidance would be issued in the form of regulations or rulings on the “extent to which Policyholders may direct their investments to particular sub-accounts of a Separate Account without being treated as owners of the underlying assets.” As of the date of this prospectus, no comprehensive guidance on this point has been issued. In Rev. Rul. 2003-91, however, the IRS ruled that a contract holder would not be treated as the owner of assets underlying a variable life insurance or annuity contract despite the owner’s ability to allocate funds among as many as twenty subaccounts.
The ownership rights under your policy are similar to, but different in certain respects from, those described in IRS rulings in which it was determined that policyholders were not owners of Separate Account assets. Since you have greater flexibility in allocating premiums and policy values than was the case in those rulings, it is possible that you would be treated as the owner of your policy’s proportionate share of the assets of the Separate Account.
We do not know what future Treasury Department regulations or other guidance may require. We cannot guarantee that the funds will be able to operate as currently described in the series funds’ prospectuses, or that a series fund will not have to change any fund’s investment objectives or policies. We have reserved the right to modify your policy if we believe doing so will prevent you from being considered the owner of your policy’s proportionate share of the assets of the Separate Account, but we are under no obligation to do so.
7-pay premium limit and modified endowment contract status
At the time of policy issuance, we will determine whether the Planned Premium schedule will exceed the 7-pay limit discussed below. If so, our standard procedures prohibit issuance of the policy unless you sign a form acknowledging that fact.
The 7-pay limit at any time during the first seven contract years is the total of net level premiums that would have been payable at or before that time under a comparable fixed policy that would be fully “paid-up” after the payment of seven equal annual premiums. “Paid-up” means that no further premiums would be required to continue the coverage in force until maturity, based on certain prescribed assumptions. If the total premiums paid at any time during the first seven policy years exceed the 7-pay limit, the policy will be treated as a modified endowment contract, which can have adverse tax consequences.
Policies classified as modified endowment contracts are subject to the following tax rules:
- First, all withdrawals from such a policy are treated as ordinary income subject to tax up to the amount equal to the excess (if any) of the policy value immediately before the withdrawal over the investment in the policy at such time. If you own any other modified endowment contracts issued to you in the same calendar year by the same insurance company or its affiliates, their values will be combined with the value of the policy from which you take the withdrawal for purposes of determining how much of the withdrawal is taxable as ordinary income.
- Second, loans taken from or secured by such a policy and assignments or pledges of any part of its value are treated as partial withdrawals from the policy and taxed accordingly. Past-due loan interest that is added to the loan amount is treated as an additional loan.
- Third, a 10% additional penalty tax is imposed on the portion of any distribution (including distributions on surrender) from, or loan taken from or secured by, such a policy that is included in income except where the distribution or loan:
- is made on or after the date on which the policy owner attains age 59½;
- is attributable to the policy owner becoming disabled; or
- is part of a series of substantially equal periodic payments for the life (or life expectancy) of the policy owner or the joint lives (or joint life expectancies) of the policy owner and the policy owner’s beneficiary.
These exceptions to the 10% additional tax do not apply in situations where the policy is not owned by an individual.
Furthermore, any time there is a “material change” in a policy, the policy will begin a new 7-pay testing period as if it were a newly-issued policy. The material change rules for determining whether a policy is a modified endowment contract are complex. In general, however, the determination of whether a policy will be a modified endowment contract after a material change depends upon the relationship among the death benefit of the policy at the time of such change, the policy value at the time of the change, and the additional premiums paid into the policy during the seven years starting with the date on which the material change occurs.
Moreover, under a policy insuring a single life, if there is a reduction in benefits (such as a reduction in the death benefit or the reduction or cancellation of certain rider benefits) during a 7-pay testing period, the 7-pay limit will generally be recalculated based on the reduced benefits and the policy will be re-tested, from the beginning of the 7-pay testing period using the lower limit. If the premiums paid to date at any point during the 7-pay testing period are greater than the recalculated 7-pay limit, the policy will become a modified endowment contract. If your policy is a survivorship policy, a reduction in benefits under the policy at any time will require re-testing. For such a policy the 7-pay limit will generally be recalculated based on the reduced benefits and the policy will be re-tested, using the lower limit, from the date it was issued.
If your policy is issued as a result of an exchange subject to section 1035 of the Internal Revenue Code, it may be considered to be a modified endowment contract if the death benefit under the new policy is smaller than the death benefit under the exchanged policy, or if you reduce coverage in your new policy after it is issued. Therefore, if you desire to reduce the face amount as part of a 1035 exchange, a qualified tax adviser should be consulted for advice. A new policy issued in exchange for a modified endowment contract will also be a modified endowment contract regardless of any change in the death benefit.
All modified endowment contracts issued by the same insurer (or its affiliates) to the same owner during any calendar year generally are required to be treated as one contract for the purpose of applying the rules on taxation of withdrawals from modified endowment contracts. You should consult your tax adviser if you have questions regarding the possible impact of the 7-pay limit on your policy.
Corporate and H.R. 10 retirement plans
The policy may be acquired in connection with the funding of retirement plans satisfying the qualification requirements of section 401 of the Internal Revenue Code. If so, the Internal Revenue Code provisions relating to such plans and life insurance benefits thereunder should be carefully scrutinized. We are not responsible for compliance with the terms of any such plan or with the requirements of applicable provisions of the Internal Revenue Code.
To the extent that policy distributions to you are taxable, they are generally subject to withholding for your Federal income tax liability. However if you reside in the United States, you can generally choose not to have tax withheld from distributions.
Life insurance purchases by residents of Puerto Rico
In Rev. Rul. 2004-75, 2004-31 I.R.B. 109, the Internal Revenue Service ruled that income received by residents of Puerto Rico under a life insurance policy issued by a United States company is U.S.-source income that is subject to United States Federal income tax.
Life insurance purchases by non-resident aliens
If you are not a U.S. citizen or resident, you will generally be subject to U.S. Federal withholding tax on taxable distributions from life insurance policies at a 30% rate, unless a lower treaty rate applies. In addition, you may be subject to state and/or municipal taxes and taxes imposed by your country of citizenship or residence. You should consult with a qualified tax adviser before purchasing a policy.
As long as the policy is in force, we will ordinarily pay any policy loans, surrenders, partial withdrawals or insurance benefit within seven days after receipt at our Service Office of all the documents required for such a payment. We will ordinarily pay any death benefit, withdrawal, surrender value or loan within 7 days after we receive the last required form or request (and, with respect to the death benefit, any other documentation that may be required). If we don’t have information about the desired manner of payment within 7 days after the date we receive documentation of the insured person’s death, we will pay the proceeds as a single sum.
We will ordinarily pay any death benefit, withdrawal, surrender value or loan within 7 days after we receive the last required form or request (and, with respect to the death benefit, any other documentation that may be required). If we don’t have information about the desired manner of payment within 7 days after the date we receive documentation of the insured person’s death, we will pay the proceeds as a single sum. We may delay the payment of any policy loans, surrenders, partial withdrawals, or insurance benefit that depends on Fixed Account values for up to six months or in the case of any Investment Account for any period during which:
| (i) | the New York Stock Exchange is closed for trading (except for normal weekend and holiday closings), |
| (ii) | trading on the New York Stock Exchange is restricted |
| (iii) | an emergency exists, as determined by the SEC, as a result of which disposal of securities held in the Separate Account is not reasonably practicable or it is not reasonably practicable to determine the value of the Separate Account’s net assets or |
| (iv) | the SEC, by order, so permits for the protection of security holders; provided that applicable rules and regulations of the SEC shall govern as to whether the conditions described in (ii) and (iii) exist. |
Within 30 days after each Policy Anniversary, we will send you a statement showing, among other things:
- the amount of death benefit;
- the Policy Value and its allocation among the Investment Accounts, the Fixed Account and the Loan Account;
- the value of the units in each Investment Account to which the Policy Value is allocated;
- the Policy Debt and any loan interest charged since the last report;
- the premiums paid and other policy transactions made during the period since the last report; and
- any other information required by law.
You will also be sent an annual and a semi-annual report for each portfolio, which will include a list of the securities, held in each portfolio as required by the 1940 Act.
John Hancock Distributors LLC (“JH Distributors”), a Delaware limited liability company affiliated with us, is the principal distributor and underwriter of the securities offered through this prospectus and of other annuity and life insurance products we and our affiliates offer. JH Distributors also acts as the principal underwriter of the Trust, whose securities are used to fund certain investment accounts under the policies and under other annuity and life insurance products we offer.
JH Distributors’ principal address is 601 Congress Street, Boston, MA 02210 and it also maintains offices with us at 197 Clarendon Street, Boston, Massachusetts 02116. JH Distributors is a broker-dealer registered under the Securities Exchange Act of 1934 (the “1934 Act”) and a member of the Financial Industry Regulatory Authority (“FINRA”).
We offer the policies for sale through individuals who are licensed as insurance agents and who are registered representatives of broker-dealers that have entered into selling agreements with JH Distributors. Our affiliate, Signator Investors, Inc., is one such broker-dealer. In addition, we, either directly or through JH Distributors, have entered into agreements with other financial intermediaries that provide marketing, sales support and certain administrative services to
help promote the policies (“financial intermediaries”). In a limited number of cases, we have entered into loans, leases or other financial agreements with these broker-dealers or financial intermediaries or their affiliates.The broker-dealers and other financial intermediaries that distribute or support the marketing of our policies may be compensated by means of various compensation and revenue sharing arrangements. A general description of these arrangements is set out below under “Standard compensation” and “Additional compensation and revenue sharing.” These arrangements may differ between firms, and not all broker-dealers or financial intermediaries will receive the same compensation and revenue sharing benefits for distributing our policies. Also, a broker-dealer may receive more or less compensation or other benefits for the promotion and sale of our policy than it would expect to receive from another issuer.
Under their own arrangements, broker-dealers determine how much of any amounts received from us is to be paid to their registered representatives. Our affiliated broker-dealer, Signator Investors, Inc., may pay its registered representatives additional compensation and benefits, such as bonus payments, expense payments, health and retirement benefits or the waiver of overhead costs or expenses in connection with the sale of the policies that they would not receive in connection with the sale of policies issued by unaffiliated companies.
Policy owners do not pay any compensation or revenue sharing benefits directly. These payments are made from JH Distributors’ and our own revenues, profits or retained earnings, which may be derived from a number of sources, such as fees received from an underlying fund’s distribution plan (“12b-1 fees”), the fees and charges imposed under the policy and other sources.
You should contact your registered representative for more information on compensation arrangements in connection with your purchase of a policy. We provide additional information on special compensation or reimbursement arrangements involving broker-dealers and other financial intermediaries in the Statement of Additional Information, which is available upon request.
Standard compensation. JH Distributors pays compensation to broker-dealers for the promotion and sale of the policies, and for providing ongoing service in relation to policies that have already been purchased. We may also pay a limited number of broker-dealers commissions or overrides to “wholesale” the policies; that is, to provide marketing support and training services to the broker-dealer firms that do the actual selling.
The compensation JH Distributors pays to broker-dealers may vary depending on the selling agreement. The compensation paid is not expected to exceed 30% of the target premium paid in policy year 1, 5% of target premium paid in years 2-5, and 2.5% of the target premium paid in years 6 and after. Compensation on any premium paid in excess of target premium in any year will not exceed 2.5%. Broker-dealers may also receive a service fee of up to $100 per policy per year, and an asset trail of up to .10%. This compensation schedule is exclusive of additional compensation and revenue sharing and inclusive of overrides and expense allowances paid to broker-dealers for sale of the policies (not including riders).
Additional compensation and revenue sharing. To the extent permitted by SEC and FINRA rules and other applicable laws and regulations, we may enter into special compensation or reimbursement arrangements (“revenue sharing”), either directly or through JH Distributors, with selected broker-dealers and other financial intermediaries. In consideration of these arrangements, a firm may feature our policy in its sales system, give us preferential access to sales staff, or allow JH Distributors or its affiliates to participate in conferences, seminars or other programs attended by the firm’s sales force. We hope to benefit from these revenue sharing and other arrangements through increased sales of our policies.
Selling broker-dealers and other financial intermediaries may receive, directly or indirectly, additional payments in the form of cash, other compensation or reimbursement. These additional compensation or reimbursement arrangements may include, for example, payments in connection with the firm’s “due diligence” examination of the policies, payments for providing conferences or seminars, sales or training programs for invited registered representatives and other employees, payment for travel expenses, including lodging, incurred by registered representatives and other employees for such seminars or training programs, seminars for the public or client seminars, advertising and sales campaigns regarding the policies, payments to assist a firm in connection with its systems, operations and marketing expenses and/or other events or activities sponsored by the firms. We may contribute to, as well as sponsor, various educational programs, sales promotions, and/or other contests in which participating firms and their sales persons may receive gifts and prizes such as merchandise, cash or other rewards as may be permitted under FINRA rules and other applicable laws and regulations.
Responsibilities of John Hancock USA
John Hancock USA entered into an agreement with JH Distributors pursuant to which John Hancock USA, on behalf of JH Distributors will pay the sales commissions in respect of the policies and certain other policies issued by John Hancock USA, prepare and maintain all books and records required to be prepared and maintained by JH Distributors with respect to the policies and such other policies, and send all confirmations required to be sent by JH Distributors with respect to the policies and such other policies. JH Distributors will promptly reimburse John Hancock USA for all sales commissions paid by John Hancock USA and will pay John Hancock USA for its other services under the agreement in such amounts and at such times as agreed to by the parties.
Finally, John Hancock USA may, from time to time in its sole discretion, enter into one or more reinsurance agreements with other life insurance companies under which policies issued by it may be reinsured, such that its total amount at risk under a policy would be limited for the life of the insured.
As stated previously, all of the assets held in each sub-account of the Separate Account will be invested in shares of a particular portfolio. John Hancock USA is the legal owner of those shares and as such has the right to vote upon certain matters that are required by the 1940 Act to be approved or ratified by the shareholders of a mutual fund and to vote upon any other matters that may be voted upon at a shareholders’ meeting. However, John Hancock USA will vote shares held in the sub-accounts in accordance with instructions received from policyholders having an interest in such sub-accounts. Shares held in each sub-account for which no timely instructions from policyholders are received, including shares not attributable to the policies, will be voted by John Hancock USA in the same proportion as those shares in that sub-account for which instructions are received. Should the applicable federal securities laws or regulations change so as to permit John Hancock USA to vote shares held in the Separate Account in its own right, it may elect to do so.
The number of shares in each sub-account for which instructions may be given by a policyholder is determined by dividing the portion of the Policy Value derived from participation in that sub-account, if any, by the value of one share of the corresponding portfolio. The number will be determined as of a date chosen by John Hancock USA, but not more than 90 days before the shareholders’ meeting. Fractional votes are counted. Voting instructions will be solicited in writing at least 14 days prior to the meeting.
John Hancock USA may, if required by state officials, disregard voting instructions if such instructions would require shares to be voted so as to cause a change in the sub-classification or investment policies of one or more of the portfolios, or to approve or disapprove an investment management contract. In addition, we may disregard voting instructions that would require changes in the investment policies or investment adviser, provided that we reasonably disapprove such changes in accordance with applicable federal regulations. If John Hancock USA does disregard voting instructions, it will advise policyholders of that action and its reasons for such action in the next communication to policyholders.
Substitution of Portfolio Shares
It is possible that in the judgment of the Company, one or more of the portfolios may become unsuitable for investment by the Separate Account because of a change in investment policy or a change in the applicable laws or regulations, because the shares are no longer available for investment, or for some other reason. In that event, John Hancock USA may seek to substitute the shares of another portfolio or of an entirely different mutual fund. Before this can be done, the approval of the SEC and one or more state insurance departments may be required.
John Hancock USA also reserves the right (i) to combine other Separate Accounts with the Separate Account, (ii) to create new Separate Accounts, (iii) to establish additional sub-accounts within the Separate Account to invest in additional portfolios of the Trust or another management investment company, (iv) to eliminate existing sub-accounts and to stop accepting new allocations and transfers into the corresponding portfolio, (v) to combine sub-accounts or to transfer assets in one sub-account to another sub-account or (vi) to transfer assets from the Separate Account to another Separate Account and from another Separate Account to the Separate Account. We also reserve the right to operate the Separate Account as a management investment company or other form permitted by law, and to de-register the Separate Account under the 1940 Act. Any such change would be made only if permissible under applicable federal and state law.
Our Service Office is responsible for performing all administrative functions, such as decreases, increases, surrender and partial withdrawals, and fund transfers although certain of these functions may be delegated to a third party administrator.
All records and accounts relating to the Separate Account and the portfolios will be maintained by us. All financial transactions will be handled by us. All reports required to be made and information required to be given will be provided the Company or by McCamish Systems on behalf of us.
John Hancock USA is subject to the regulation and supervision by the Michigan Department of Insurance, which periodically examines its financial condition and operations. It is also subject to the insurance laws and regulations of all jurisdictions in which it is authorized to do business. The policies have been filed with insurance officials in each jurisdiction where they are sold.
John Hancock USA is required to submit annual statements of its operations, including financial statements, to the insurance departments of the various jurisdictions in which it does business for the purposes of determining solvency and compliance with local insurance laws and regulations.
Financial statements reference
The financial statements of John Hancock USA and the Separate Account can be found in the Statement of Additional Information. The financial statements of John Hancock USA should be distinguished from the financial statements of the Separate Account and should be considered only as bearing upon the ability of John Hancock USA to meet its obligations under the policies. Our general account is comprised of securities and other investments, the value of which may decline during periods of adverse market conditions.
Registration statement filed with the SEC
This prospectus omits certain information contained in the Registration Statement which has been filed with the SEC. More details may be obtained from the SEC upon payment of the prescribed fee.
Independent registered public accounting firm
The consolidated financial statements of John Hancock Life Insurance Company (U.S.A.) at December 31, 2012 and 2011, and for each of the three years in the period ended December 31, 2012, and the financial statements of John Hancock Life Insurance Company (U.S.A.) Separate Account N at December 31, 2012, and for each of the two years in the period ended December 31, 2012, appearing in the Statement of Additional Information of the Registration Statement have been audited by Ernst &Young LLP, independent registered public accounting firm, as set forth in their reports thereon appearing elsewhere herein, and are included in reliance upon such reports given on the authority of such firm as experts in accounting and auditing.
Annual Premium Target: is an amount set forth in the policy that limits the amount of premium attributable to a Coverage Amount in Sales Load calculations.
Attained Age: is the Issue Age of the Life Insured plus the number of completed Policy Years.
Business Day: is any day that the New York Stock Exchange is open for business. A Business Day ends at the close of regularly scheduled trading of the New York Stock Exchange (currently 4:00 p.m. Eastern Time) on that day.
Case: is a group of policies insuring individual lives with common employment or other relationship, independent of the policies.
Cash Surrender Value: is the Policy Value less any outstanding monthly deductions due.
Coverage Amount: is an amount of insurance coverage under the policy with a distinct effective date. The Face Amount of the policy at any time is the sum of the Coverage Amounts in effect.
Coverage Year: is a one-year period beginning on a Coverage Amount‘s effective date and on each anniversary of this date. For Coverage Amounts in effect on the policy’s Effective Date, the Coverage Year is the same as the Policy Year.
Fixed Account: is the part of the Policy Value that reflects the value you have in our general account.
Investment Account: is the part of the Policy Value that reflects the value you have in one of the sub-accounts of the Separate Account.
Issue Age: is the Life Insured’s age on the birthday closest to the Policy Date.
Loan Account: is the part of the Policy Value that reflects policy loans and interest credited to the Policy Value in connection with such loans.
Minimum Initial Premium: is the sum of the monthly deductions due for the first 3 Policy Months plus the Premium Charges deductible from this amount.
Net Cash Surrender Value: is the Cash Surrender Value less the Policy Debt.
Net Policy Value: is the Policy Value less the value in the Loan Account.
Net Premium: is the premium paid less the Premium Load and Sales Load.
Policy Date, Policy Anniversary, Policy Month and Policy Year: Policy Date is the date from which the first monthly deductions are calculated and from which Policy Years, Policy Months, and Policy Anniversaries are measured.
Policy Debt: on any date is the aggregate amount of policy loans, including borrowed and accrued interest, less any loan repayments.
Policy Value: is the sum of the values in the Loan Account, the Fixed Account, and the Investment Accounts.
Service Office: is PO Box 192, Boston, MA 02117-0192, or such other address as we specify to you by written notice.
In addition to this prospectus, John Hancock USA has filed with the SEC a Statement of Additional Information (the “SAI”) which contains additional information about John Hancock USA and the Separate Account, including information on our history, services provided to the Separate Account, legal and regulatory matters and the audited financial statements for John Hancock USA and the Separate Account. The SAI and personalized illustrations of death benefits, policy values and surrender values are available, without charge, upon request. You may obtain the personalized illustrations from your John Hancock USA representative. The SAI may be obtained by contacting the John Hancock USA Service Office. You should also contact the John Hancock USA Service Office to request any other information about your policy or to make any inquiries about its operation.
| JOHN HANCOCK USA SERVICE OFFICE | |
| Principal Office & Express Delivery | Mail Delivery |
| Specialty Products & Distribution 197 Clarendon Street, C-6-10 Boston, MA 02116-5010 |
1 John Hancock Way, Suite 1350 Boston, MA 02217-1099 |
| Phone: | Fax: |
| 1-800-521-1234 | 1-617-572-1571 |
Information about the Separate Account (including the SAI) can be reviewed and copied at the SEC’s Public Reference Branch, 100 F Street, NE, Room 1580, Washington, DC, 20549. Information
on the operation of the Public Reference Room may be obtained by calling the SEC at 202-551-5850. Reports and other information about the Account are available on the SEC’s Internet website at http://www.sec.gov. Copies of
such information may be obtained, upon payment of a duplicating fee, by writing the Public Reference Section of the SEC at 100 F Street, NE, Washington, DC 20549-0102.
1940 Act File No. 811-5130 — 1933 Act File No.
333-100567
Table of Contents
| Statement of Additional Information for interests in John Hancock Life Insurance Company (U.S.A.) Separate Account N JOHN
HANCOCK LIFE INSURANCE COMPANY (U.S.A.) This is a Statement of Additional Information (“SAI”). It is not the prospectus. The prospectus, dated the same date as this SAI, may be obtained from a John Hancock USA representative or by contacting the John Hancock USA Service Office by mail or telephone at the address or telephone number listed on the back page of the prospectus. | |
| Contents of this SAI | Page No. |
| Description of the Depositor |
2 |
| Description of the Registrant |
2 |
| Services |
2 |
| Independent registered public accounting firm |
2 |
| Legal and Regulatory Matters |
2 |
| Principal Underwriter/Distributor |
2 |
| Additional Information About Charges |
3 |
| Reduction in Charges |
4 |
| Financial Statements of Registrant and Depositor |
F-1 |
Under the Federal securities laws, the entity responsible for organization of the registered separate account underlying the variable life insurance policy is known as the “Depositor.” John Hancock USA (“Depositor”) is a stock life insurance company organized under the laws of Maine on August 20, 1955 by a special act of the Maine legislature and redomesticated under the laws of Michigan. The Depositor is a licensed life insurance company in the District of Columbia and all states of the United States except New York. Until 2004, the Depositor was known as The Manufacturers Life Insurance Company (U.S.A.).
The Depositor’s ultimate parent is Manulife Financial Corporation (“MFC”), a publicly traded company based in Toronto, Canada. MFC is the holding company of The Manufacturers Life Insurance Company and its subsidiaries, collectively known as Manulife Financial.
Under the Federal securities laws, the registered separate account underlying the variable life insurance policy is known as the “Registrant.” John Hancock Life Insurance Company (U.S.A.) Separate Account N (the “Registrant” or “Separate Account”), is a separate account established by the Depositor under Michigan law. The variable investment options shown on page 1 of the prospectus are subaccounts of the Separate Account. The Separate Account meets the definition of “separate account” under the Federal securities laws and is registered as a unit investment trust under the Investment Company Act of 1940 (“1940 Act”). Such registration does not involve supervision by the Securities and Exchange Commission (“SEC”) of the management of the Separate Account or of the Depositor.
New subaccounts may be added and made available to policy owners from time to time. Existing subaccounts may be modified or deleted at any time.
Administration of policies issued by the Depositor and of registered separate accounts organized by the Depositor may be provided by other affiliates. Neither the Depositor nor the separate accounts are assessed any charges for such services.
Custodianship and depository services for the Registrant are provided by State Street Investment Services (“State Street”). State Street’s address is 2 Avenue De Lafayette, LCC5N, Boston, Massachusetts, 02111.
Independent registered public accounting firm
The consolidated financial statements of John Hancock Life Insurance Company (U.S.A.) at December 31, 2012 and 2011, and for each of the three years in the period ended December 31, 2012, and the financial statements of John Hancock Life Insurance Company (U.S.A.) Separate Account N at December 31, 2012, and for each of the two years in the period ended December 31, 2012, appearing in the Statement of Additional Information of the Registration Statement have been audited by Ernst &Young LLP, independent registered public accounting firm, as set forth in their reports thereon appearing elsewhere herein, and are included in reliance upon such reports given on the authority of such firm as experts in accounting and auditing.
There are no legal proceedings to which the Depositor, the Separate Account or the principal underwriter is a party or to which the assets of the Separate Account are subject that are likely to have a material adverse effect on the Separate Account or the ability of the principal underwriter to perform its contract with the Separate Account or of the Depositor to meet its obligations under the policies.
Principal Underwriter/Distributor
John Hancock Distributors LLC (“JH Distributors”), a Delaware limited liability company affiliated with the Depositor, is the principal distributor and underwriter of the securities offered through the prospectus. JH Distributors acts as the principal distributor of a number of other life insurance and annuity products we and our affiliates offer or maintain. JH
Distributors also acts as the principal underwriter of John Hancock Variable Insurance Trust (the “Trust”), whose securities are used to fund certain variable investment options under the policies and under other life insurance and annuity products we offer or maintain.JH Distributors’ principal address is 601 Congress Street, Boston, MA 02210, and it also maintains offices with us at 197 Clarendon Street, Boston, MA 02116. JH Distributors is a broker-dealer registered under the Securities Act of 1934 (the “1934 Act”) and is a member of the Financial Industry Regulatory Authority (“FINRA”).
We offer the policies for sale through individuals who are licensed as insurance agents and who are registered representatives of broker-dealers that have entered into selling agreements with JH Distributors. Our affiliate Signator Investors, Inc. is one such broker-dealer.
The aggregate dollar amount of underwriting commissions paid to JH Distributors by the Depositor and its affiliates in connection with the sale of variable life products in 2012, 2011, and 2010 was $156,801,522, $158,741,294 and $145,301,936, respectively. JH Distributors did not retain any of these amounts during such periods.
The registered representative through whom your policy is sold will be compensated pursuant to the registered representative’s own arrangement with his or her broker-dealer. Compensation to broker-dealers for the promotion and sale of the policies is not paid directly by policy owners but will be recouped through the fees and charges imposed under the policy.
Additional compensation and revenue sharing arrangements may be offered to certain broker-dealer firms and other financial intermediaries. The terms of such arrangements may differ among firms we select based on various factors. In general, the arrangements involve three types of payments or any combination thereof:
- Fixed dollar payments: The amount of these payments varies widely. JH Distributors may, for example, make one or more payments in connection with a firm’s conferences, seminars or training programs, seminars for the public, advertising and sales campaigns regarding the policies, to assist a firm in connection with its systems, operations and marketing expenses, or for other activities of a selling firm or wholesaler. JH Distributors may make these payments upon the initiation of a relationship with a firm, and at any time thereafter.
- Payments based upon sales: These payments are based upon a percentage of the total amount of money received, or anticipated to be received, for sales through a firm of some or all of the insurance products that we and/or our affiliates offer. JH Distributors makes these payments on a periodic basis.
- Payments based upon “assets under management”: These payments are based upon a percentage of the policy value of some or all of our (and/or our affiliates’) insurance products that were sold through the firm. JH Distributors makes these payments on a periodic basis.
Our affiliated broker-dealer, Signator Investors, Inc., may pay its respective registered representatives additional cash incentives, such as bonus payments, expense payments, health and retirement benefits or the waiver of overhead costs or expenses in connection with the sale of the policies that they would not receive in connection with the sale of policies issued by unaffiliated companies.
Additional Information About Charges
A policy will not be issued until the underwriting process has been completed to our satisfaction. The underwriting process generally includes the obtaining of information concerning your age, medical history, occupation and other personal information. This information is then used to determine the cost of insurance charge.
The policy is available for purchase by corporations and other groups or sponsoring organizations. Group or sponsored arrangements may include reduction or elimination of withdrawal charges and deductions for employees, officers, directors, agents and immediate family members of the foregoing. We reserve the right to reduce any of the policy’s charges on certain cases where it is expected that the amount or nature of such cases will result in savings of sales, underwriting, administrative, commissions or other costs. Eligibility for these reductions and the amount of reductions will be determined by a number of factors, including the number of lives to be insured, the total premiums expected to be paid, total assets under management for the policyowner, the nature of the relationship among the insured individuals, the purpose for which the policies are being purchased, expected persistency of the individual policies, and any other circumstances which we believe to be relevant to the expected reduction of its expenses. Some of these reductions may be guaranteed and others may be subject to withdrawal or modifications, on a uniform case basis. Reductions in charges will not be unfairly discriminatory to any policyowners. We may modify from time to time, on a uniform basis, both the amounts of reductions and the criteria for qualification.
| 333-100567 |
| 333-126668 |
| 333-152409 |
Table of Contents
AUDITED CONSOLIDATED FINANCIAL STATEMENTS
John Hancock Life Insurance Company (U.S.A.)
For the Years Ended December 31, 2012, 2011, and 2010
Table of Contents
JOHN HANCOCK LIFE INSURANCE COMPANY (U.S.A.)
INDEX TO AUDITED CONSOLIDATED FINANCIAL STATEMENTS
| F-1 | ||||
| Audited Consolidated Financial Statements |
||||
| Consolidated Balance Sheets- |
F-2 | |||
| Consolidated Statements of Operations- |
F-4 | |||
| Consolidated Statements of Comprehensive Income (Loss)- |
F-5 | |||
| Consolidated Statements of Changes in Shareholder’s Equity- |
F-6 | |||
| Consolidated Statements of Cash Flows- |
F-8 | |||
| F-10 | ||||
Table of Contents
Report of Independent Registered Public Accounting Firm
The Board of Directors
John Hancock Life Insurance Company (U.S.A.)
We have audited the accompanying consolidated balance sheets of John Hancock Life Insurance Company (U.S.A.) (the Company) as of December 31, 2012 and 2011, and the related consolidated statements of operations, comprehensive income (loss), changes in shareholder’s equity, and cash flows for each of the three years in the period ended December 31, 2012. These financial statements are the responsibility of the Company’s management. Our responsibility is to express an opinion on these financial statements based on our audits.
We conducted our audits in accordance with the standards of the Public Company Accounting Oversight Board (United States). Those standards require that we plan and perform the audit to obtain reasonable assurance about whether the financial statements are free of material misstatement. We were not engaged to perform an audit of the Company’s internal control over financial reporting. Our audits included consideration of internal control over financial reporting as a basis for designing audit procedures that are appropriate in the circumstances, but not for the purpose of expressing an opinion on the effectiveness of the Company’s internal control over financial reporting. Accordingly, we express no such opinion. An audit also includes examining, on a test basis, evidence supporting the amounts and disclosures in the financial statements, assessing the accounting principles used and significant estimates made by management, and evaluating the overall financial statement presentation. We believe that our audits provide a reasonable basis for our opinion.
In our opinion, the financial statements referred to above present fairly, in all material respects, the consolidated financial position of the Company at December 31, 2012 and 2011, and the consolidated results of its operations and its cash flows for each of the three years in the period ended December 31, 2012, in conformity with U.S. generally accepted accounting principles.
As discussed in Note 1 to the consolidated financial statements, in 2012 the Company changed its method of accounting for costs relating to the acquisition of insurance contracts; in 2011 the Company changed its method of accounting for separate account assets; and in 2010 the Company changed its method of accounting and reporting for variable interest entities.
/s/ Ernst & Young LLP
Boston, Massachusetts
March 27, 2013
F-1
Table of Contents
JOHN HANCOCK LIFE INSURANCE COMPANY (U.S.A.)
| December 31, | ||||||||
| 2012 | 2011 | |||||||
|
|
|
|||||||
| (in millions) | ||||||||
| Assets |
||||||||
| Investments |
||||||||
| Fixed maturities: |
||||||||
| Available-for-sale—at fair value |
$ | 64,996 | $ | 69,225 | ||||
| Held-for-trading—at fair value |
1,441 | 1,477 | ||||||
| Equity securities: |
||||||||
| Available-for-sale—at fair value |
386 | 439 | ||||||
| Held-for-trading—at fair value |
130 | 97 | ||||||
| Mortgage loans on real estate |
13,192 | 13,974 | ||||||
| Investment real estate, agriculture, and timber |
5,316 | 4,304 | ||||||
| Policy loans |
5,264 | 5,220 | ||||||
| Short-term investments |
2,166 | 1,618 | ||||||
| Other invested assets |
4,887 | 4,501 | ||||||
|
|
|
|
|
|||||
| Total Investments |
97,778 | 100,855 | ||||||
| Cash and cash equivalents (includes variable interest entity assets of $8 and $18 at December 31, 2012 and 2011, respectively) |
3,511 | 3,296 | ||||||
| Accrued investment income (includes variable interest entity assets of $1 and $3 at December 31, 2012 and 2011, respectively) |
1,039 | 1,065 | ||||||
| Goodwill |
953 | 953 | ||||||
| Value of business acquired |
1,196 | 1,321 | ||||||
| Deferred policy acquisition costs and deferred sales inducements |
5,913 | 6,298 | ||||||
| Amounts due from and held for affiliates |
3,805 | 3,808 | ||||||
| Intangible assets |
1,250 | 1,270 | ||||||
| Reinsurance recoverable |
12,812 | 11,263 | ||||||
| Derivative assets |
11,853 | 11,953 | ||||||
| Current income tax receivable |
135 | 20 | ||||||
| Amounts on deposit with reinsurers |
6,763 | - | ||||||
| Other assets |
2,740 | 2,444 | ||||||
| Separate account assets |
140,626 | 129,326 | ||||||
|
|
|
|
|
|||||
| Total Assets |
$ | 290,374 | $ | 273,872 | ||||
|
|
|
|
|
|||||
The accompanying notes are an integral part of these consolidated financial statements.
F-2
Table of Contents
JOHN HANCOCK LIFE INSURANCE COMPANY (U.S.A.)
CONSOLIDATED BALANCE SHEETS – (CONTINUED)
| December 31, | ||||||||
| 2012 | 2011 | |||||||
|
|
|
|||||||
| (in millions) | ||||||||
| Liabilities and Shareholder’s Equity |
||||||||
| Liabilities |
||||||||
| Future policy benefits |
$ | 92,264 | $ | 88,989 | ||||
| Policyholders’ funds |
6,788 | 7,162 | ||||||
| Unearned revenue |
1,466 | 1,966 | ||||||
| Unpaid claims and claim expense reserves |
1,269 | 1,445 | ||||||
| Policyholder dividends payable |
497 | 558 | ||||||
| Amounts due to affiliates |
2,490 | 2,556 | ||||||
| Short-term debt |
14 | 11 | ||||||
| Long-term debt (includes variable interest entity liabilities of $47 and $139 at December 31, 2012 and 2011, respectively) |
520 | 627 | ||||||
| Consumer notes |
716 | 819 | ||||||
| Deferred income tax liability |
4,218 | 3,922 | ||||||
| Coinsurance funds withheld |
6,275 | 5,452 | ||||||
| Payables for collateral on derivatives |
2,126 | 1,446 | ||||||
| Derivative liabilities (includes variable interest entity liabilities of $0 and $4 at December 31, 2012 and 2011, respectively) |
8,439 | 7,813 | ||||||
| Other liabilities (includes variable interest entity liabilities of $3 and $4 at December 31, 2012 and 2011, respectively) |
4,006 | 4,163 | ||||||
| Separate account liabilities |
140,626 | 129,326 | ||||||
|
|
|
|
|
|||||
| Total Liabilities |
271,714 | 256,255 | ||||||
| Commitments, Guarantees, Contingencies, and Legal Proceedings |
||||||||
| Shareholder’s Equity |
||||||||
| Preferred stock ($1.00 par value; 50,000,000 shares authorized; 100,000 shares issued and outstanding at December 31, 2012 and 2011) |
- | - | ||||||
| Common stock ($1.00 par value; 50,000,000 shares authorized; 4,728,939 shares issued and outstanding at December 31, 2012 and 2011) |
5 | 5 | ||||||
| Additional paid-in capital |
12,790 | 12,789 | ||||||
| Retained earnings |
247 | 406 | ||||||
| Accumulated other comprehensive income |
5,405 | 4,158 | ||||||
|
|
|
|
|
|||||
| Total Company Shareholder’s Equity |
18,447 | 17,358 | ||||||
| Noncontrolling interests |
213 | 259 | ||||||
|
|
|
|
|
|||||
| Total Shareholder’s Equity |
18,660 | 17,617 | ||||||
|
|
|
|
|
|||||
| Total Liabilities and Shareholder’s Equity |
$ | 290,374 | $ | 273,872 | ||||
|
|
|
|
|
|||||
The accompanying notes are an integral part of these consolidated financial statements.
F-3
Table of Contents
JOHN HANCOCK LIFE INSURANCE COMPANY (U.S.A.)
CONSOLIDATED STATEMENTS OF OPERATIONS
| Years ended December 31, | ||||||||||||
| 2012 | 2011 | 2010 | ||||||||||
|
|
|
|||||||||||
| (in millions) | ||||||||||||
| Revenues |
||||||||||||
| Premiums |
$ | 2,799 | $ | 2,996 | $ | 3,632 | ||||||
| Fee income |
4,724 | 5,717 | 3,771 | |||||||||
| Net investment income |
4,559 | 4,989 | 4,496 | |||||||||
| Net realized investment and other gains (losses): |
||||||||||||
| Total other-than-temporary impairment losses |
(125 | ) | (93 | ) | (176 | ) | ||||||
| Portion of loss recognized in other comprehensive income |
26 | 21 | 57 | |||||||||
|
|
|
|
|
|
|
|||||||
| Net impairment losses recognized in earnings |
(99 | ) | (72 | ) | (119 | ) | ||||||
| Other net realized investment and other gains (losses) |
(2,069 | ) | 3,207 | 201 | ||||||||
|
|
|
|
|
|
|
|||||||
| Total net realized investment and other gains (losses) |
(2,168 | ) | 3,135 | 82 | ||||||||
| Other revenue |
143 | 124 | 200 | |||||||||
|
|
|
|
|
|
|
|||||||
| Total revenues |
10,057 | 16,961 | 12,181 | |||||||||
| Benefits and expenses |
||||||||||||
| Benefits to policyholders |
6,401 | 7,639 | 6,611 | |||||||||
| Policyholder dividends |
663 | 811 | 846 | |||||||||
| Amortization of deferred policy acquisition costs, deferred sales inducements, and value of business acquired |
1,385 | 2,841 | 682 | |||||||||
| Goodwill impairment |
- | 500 | 1,600 | |||||||||
| Other operating costs and expenses |
2,374 | 6,313 | 3,230 | |||||||||
|
|
|
|
|
|
|
|||||||
| Total benefits and expenses |
10,823 | 18,104 | 12,969 | |||||||||
|
|
|
|
|
|
|
|||||||
| Income (loss) before income taxes |
(766 | ) | (1,143 | ) | (788 | ) | ||||||
| Income tax expense (benefit) |
(633 | ) | (332 | ) | 176 | |||||||
|
|
|
|
|
|
|
|||||||
| Net income (loss) |
(133 | ) | (811 | ) | (964 | ) | ||||||
| Less: net income (loss) attributable to noncontrolling interests |
26 | 44 | 36 | |||||||||
|
|
|
|
|
|
|
|||||||
| Net income (loss) attributable to the Company |
$ | (159 | ) | $ | (855 | ) | $ | (1,000 | ) | |||
|
|
|
|
|
|
|
|||||||
The accompanying notes are an integral part of these consolidated financial statements.
F-4
Table of Contents
JOHN HANCOCK LIFE INSURANCE COMPANY (U.S.A.)
CONSOLIDATED STATEMENTS OF COMPREHENSIVE INCOME (LOSS)
| Years ended December 31, | ||||||||||||
| 2012 | 2011 | 2010 | ||||||||||
|
|
|
|||||||||||
| (in millions) | ||||||||||||
| Net income (loss) |
$ | (133 | ) | $ | (811 | ) | $ | (964 | ) | |||
|
|
|
|||||||||||
| Other comprehensive income (loss), net of tax |
||||||||||||
| Change in unrealized investment gains (losses): |
||||||||||||
| Unrealized investment gains (losses) arising during the period |
1,544 | 1,937 | 1,291 | |||||||||
| Reclassification adjustment for (gains) losses realized in net income |
(686 | ) | (692 | ) | (510 | ) | ||||||
| Change in foreign currency translation adjustment |
(50 | ) | 13 | (53 | ) | |||||||
| Change in pension and postretirement benefits: |
||||||||||||
| Prior service cost |
- | - | (2 | ) | ||||||||
| Net actuarial loss |
- | - | 9 | |||||||||
| Change in net unrealized gain on split-dollar life insurance benefit |
- | - | 2 | |||||||||
| Change in unrealized gains (losses) on derivative instruments designated as cash flow hedges: |
||||||||||||
| Unrealized gains (losses) on the effective portion of the change in fair value of cash flow hedges |
648 | 1,777 | (37 | ) | ||||||||
| Reclassification of net cash flow hedge (gains) losses to net income |
(209 | ) | (59 | ) | (129 | ) | ||||||
| Transfer of certain pension and postretirement benefit plans to Parent |
- | - | 473 | |||||||||
|
|
|
|||||||||||
| Total other comprehensive income (loss), net of tax |
1,247 | 2,976 | 1,044 | |||||||||
|
|
|
|||||||||||
| Total comprehensive income (loss) |
$ | 1,114 | $ | 2,165 | $ | 80 | ||||||
|
|
|
|||||||||||
| Income taxes included in other comprehensive income (loss) |
||||||||||||
| Change in unrealized investment gains (losses): |
||||||||||||
| Income tax expense (benefit) from unrealized investment gains arising during the period |
831 | 1,044 | 696 | |||||||||
| Income tax (expense) benefit related to reclassification adjustment for gains realized in net income (loss) |
(369 | ) | (373 | ) | (275 | ) | ||||||
| Change in pension and postretirement benefits: |
||||||||||||
| Income tax expense (benefit) related to change in prior service cost |
- | - | (1 | ) | ||||||||
| Income tax expense (benefit) from change in net actuarial loss |
- | - | 5 | |||||||||
| Change in income tax expense (benefit) from change in net unrealized gain on split-dollar life insurance benefit |
- | - | 1 | |||||||||
| Change in unrealized gains (losses) on derivative instruments designated as cash flow hedges: |
||||||||||||
| Income tax expense (benefit) from unrealized gains on the effective portion of the change in fair value cash flow hedges |
349 | 957 | (20 | ) | ||||||||
| Income tax (expense) benefit related to reclassification of net cash flow hedge gains to net income (loss) |
(113 | ) | (32 | ) | (69 | ) | ||||||
| Income tax expense (benefit) related to transfer of certain pension and postretirement benefit plans to Parent |
- | - | 255 | |||||||||
|
|
|
|||||||||||
| Total income tax expense (benefit) in other comprehensive income (loss) |
$ | 698 | $ | 1,596 | $ | 592 | ||||||
|
|
|
|||||||||||
The accompanying notes are an integral part of these consolidated financial statements.
F-5
Table of Contents
JOHN HANCOCK LIFE INSURANCE COMPANY (U.S.A.)
CONSOLIDATED STATEMENTS OF CHANGES IN SHAREHOLDER’S EQUITY
| Capital Stock |
Additional Paid-in Capital |
Retained Earnings |
Accumulated Other Comprehensive Income (Loss) |
Total Shareholder’s Equity attributable to the Company |
Non-controlling Interests |
Total Shareholders’s Equity |
Outstanding Shares |
|||||||||||||||||||||||||
|
|
|
|||||||||||||||||||||||||||||||
| (in millions, except for shares outstanding) | (in thousands) | |||||||||||||||||||||||||||||||
| Balance at January 1, 2010 (as previously reported) |
$ | 5 | $ | 12,427 | $ | 2,822 | $ | 129 | $ | 15,383 | $ | 193 | $ | 15,576 | 4,829 | |||||||||||||||||
| Cumulative effect of change in accounting principle, net of tax (Note 1) |
- | - | (595 | ) | 9 | (586 | ) | - | (586 | ) | ||||||||||||||||||||||
|
|
|
|||||||||||||||||||||||||||||||
| Balance at January 1, 2010 (as currently reported) |
$ | 5 | $ | 12,427 | $ | 2,227 | $ | 138 | $ | 14,797 | $ | 193 | $ | 14,990 | 4,829 | |||||||||||||||||
| Net income (loss) |
- | - | (1,000 | ) | - | (1,000 | ) | 36 | (964 | ) | ||||||||||||||||||||||
| Other comprehensive income (loss), net of tax |
- | - | - | 571 | 571 | - | 571 | |||||||||||||||||||||||||
| Adoption of ASC 810, consolidation of variable interest entities |
- | - | (2 | ) | - | (2 | ) | 45 | 43 | |||||||||||||||||||||||
| Share-based payments |
- | 12 | - | - | 12 | - | 12 | |||||||||||||||||||||||||
| Contributions from noncontrolling interests |
- | - | - | - | - | 23 | 23 | |||||||||||||||||||||||||
| Distributions to non-controlling interests |
- | - | - | - | - | (52 | ) | (52 | ) | |||||||||||||||||||||||
| Transfer of certain pension and postretirement benefit plans to Parent |
- | (13 | ) | - | 473 | 460 | - | 460 | ||||||||||||||||||||||||
| Capital contribution from Parent |
- | 350 | - | - | 350 | - | 350 | |||||||||||||||||||||||||
|
|
|
|||||||||||||||||||||||||||||||
| Balance at December 31, 2010 |
$ | 5 | $ | 12,776 | $ | 1,225 | $ | 1,182 | $ | 15,188 | $ | 245 | $ | 15,433 | 4,829 | |||||||||||||||||
|
|
|
|||||||||||||||||||||||||||||||
The accompanying notes are an integral part of these consolidated financial statements.
F-6
Table of Contents
JOHN HANCOCK LIFE INSURANCE COMPANY (U.S.A.)
CONSOLIDATED STATEMENTS OF CHANGES IN SHAREHOLDER’S EQUITY – (CONTINUED)
| Capital Stock |
Additional Paid-in Capital |
Retained Earnings |
Accumulated Other Comprehensive Income (Loss) |
Total Shareholder’s Equity attributable to the Company |
Non-controlling Interests |
Total Shareholders’s Equity |
Outstanding Shares |
|||||||||||||||||||||||||
|
|
|
|||||||||||||||||||||||||||||||
| (in millions, except for shares outstanding) | (in thousands) | |||||||||||||||||||||||||||||||
| Balance at January 1, 2011 |
$ | 5 | $ | 12,776 | $ | 1,225 | $ | 1,182 | $ | 15,188 | $ | 245 | $ | 15,433 | 4,829 | |||||||||||||||||
| Cumulative effect of change in accounting principle, net of tax (Note 1) |
- | - | 36 | - | 36 | - | 36 | |||||||||||||||||||||||||
|
|
|
|||||||||||||||||||||||||||||||
| Balance at January 1, 2011 |
$ | 5 | $ | 12,776 | $ | 1,261 | $ | 1,182 | $ | 15,224 | $ | 245 | $ | 15,469 | 4,829 | |||||||||||||||||
| Net income (loss) |
- | - | (855 | ) | - | (855 | ) | 44 | (811 | ) | ||||||||||||||||||||||
| Other comprehensive income (loss), net of tax |
- | - | - | 2,976 | 2,976 | - | 2,976 | |||||||||||||||||||||||||
| Share-based payments |
- | 13 | - | - | 13 | - | 13 | |||||||||||||||||||||||||
| Contributions from noncontrolling interests |
- | - | - | - | - | 64 | 64 | |||||||||||||||||||||||||
| Distributions to non-controlling interests |
- | - | - | - | - | (94 | ) | (94 | ) | |||||||||||||||||||||||
|
|
|
|||||||||||||||||||||||||||||||
| Balance at December 31, 2011 |
$ | 5 | $ | 12,789 | $ | 406 | $ | 4,158 | $ | 17,358 | $ | 259 | $ | 17,617 | 4,829 | |||||||||||||||||
|
|
|
|||||||||||||||||||||||||||||||
| Net income (loss) |
- | - | (159 | ) | - | (159 | ) | 26 | (133 | ) | ||||||||||||||||||||||
| Other comprehensive income (loss), net of tax |
- | - | - | 1,247 | 1,247 | - | 1,247 | |||||||||||||||||||||||||
| Share-based payments |
- | 3 | - | - | 3 | - | 3 | |||||||||||||||||||||||||
| Acquisition of noncontrolling interests |
- | (2 | ) | - | - | (2 | ) | - | (2 | ) | ||||||||||||||||||||||
| Contributions from noncontrolling interests |
- | - | - | - | - | 42 | 42 | |||||||||||||||||||||||||
| Distributions to non-controlling interests |
- | - | - | - | - | (114 | ) | (114 | ) | |||||||||||||||||||||||
|
|
|
|||||||||||||||||||||||||||||||
| Balance at December 31, 2012 |
$ | 5 | $ | 12,790 | $ | 247 | $ | 5,405 | $ | 18,447 | $ | 213 | $ | 18,660 | 4,829 | |||||||||||||||||
|
|
|
|||||||||||||||||||||||||||||||
The accompanying notes are an integral part of these consolidated financial statements.
F-7
Table of Contents
JOHN HANCOCK LIFE INSURANCE COMPANY (U.S.A.)
CONSOLIDATED STATEMENTS OF CASH FLOWS
| Years ended December 31, | ||||||||||||
| 2012 | 2011 | 2010 | ||||||||||
|
|
|
|||||||||||
| (in millions) | ||||||||||||
| Cash flows from operating activities: |
||||||||||||
| Net income (loss) |
$ | (133 | ) | $ | (811 | ) | $ | (964 | ) | |||
| Adjustments to reconcile net income (loss) to net cash provided by (used in) operating activities: |
||||||||||||
| Amortization of premiums and accretion of discounts associated with investments, net |
(5 | ) | 27 | 174 | ||||||||
| Net realized investments and other (gains) losses |
2,168 | (3,135 | ) | (82 | ) | |||||||
| Change in expected internal rate of return on leveraged leases |
247 | - | 118 | |||||||||
| Amortization of deferred policy acquisition costs, deferred sales inducements, and value of business acquired |
1,385 | 2,841 | 682 | |||||||||
| Capitalization of deferred policy acquisition costs and deferred sales inducements |
(719 | ) | (766 | ) | (1,039 | ) | ||||||
| Goodwill impairment |
- | 500 | 1,600 | |||||||||
| Depreciation and amortization |
152 | 140 | 132 | |||||||||
| Net cash flows from trading securities |
73 | 234 | 143 | |||||||||
| (Increase) decrease in accrued investment income |
27 | (91 | ) | (77 | ) | |||||||
| (Increase) decrease in other assets and other liabilities, net |
(752 | ) | 521 | 151 | ||||||||
| Increase (decrease) in policyholder liabilities and accruals, net |
(1,279 | ) | 3,980 | 1,305 | ||||||||
| Interest credited to policyholder liabilities |
1,180 | 1,156 | 1,148 | |||||||||
| Increase (decrease) in deferred income taxes |
(378 | ) | (100 | ) | 401 | |||||||
|
|
|
|||||||||||
| Net cash provided by (used in) operating activities |
1,966 | 4,496 | 3,692 | |||||||||
| Cash flows from investing activities: |
||||||||||||
| Sales of: |
||||||||||||
| Fixed maturities |
21,625 | 27,779 | 20,277 | |||||||||
| Equity securities |
264 | 233 | 1,153 | |||||||||
| Mortgage loans on real estate |
1,347 | 1,367 | 961 | |||||||||
| Investment real estate, agriculture, and timber |
42 | 43 | 22 | |||||||||
| Other invested assets |
527 | 122 | 377 | |||||||||
| Maturities, prepayments, and scheduled redemptions of: |
||||||||||||
| Fixed maturities |
1,369 | 2,316 | 1,834 | |||||||||
| Mortgage loans on real estate |
338 | 367 | 383 | |||||||||
| Other invested assets |
238 | 267 | 233 | |||||||||
| Purchases of: |
||||||||||||
| Fixed maturities |
(22,647 | ) | (31,201 | ) | (27,115 | ) | ||||||
| Equity securities |
(193 | ) | (185 | ) | (1,118 | ) | ||||||
| Investment real estate, agriculture, and timber |
(1,134 | ) | (814 | ) | (602 | ) | ||||||
| Other invested assets |
(1,082 | ) | (943 | ) | (1,031 | ) | ||||||
| Mortgage loans on real estate issued |
(1,821 | ) | (2,443 | ) | (2,117 | ) | ||||||
| Net (purchases) redemptions of short-term investments |
(548 | ) | (147 | ) | 2,501 | |||||||
| Other, net |
(27 | ) | 111 | 15 | ||||||||
|
|
|
|||||||||||
| Net cash provided by (used in) investing activities |
(1,702 | ) | (3,128 | ) | (4,227 | ) | ||||||
The accompanying notes are an integral part of these consolidated financial statements.
F-8
Table of Contents
JOHN HANCOCK LIFE INSURANCE COMPANY (U.S.A.)
CONSOLIDATED STATEMENTS OF CASH FLOWS – (CONTINUED)
| Years ended December 31, | ||||||||||||
| 2012 | 2011 | 2010 | ||||||||||
|
|
|
|||||||||||
| (in millions) | ||||||||||||
| Cash flows from financing activities: |
||||||||||||
| Capital contribution from Parent |
- | - | 350 | |||||||||
| Increase (decrease) in amounts due to affiliates |
(37 | ) | 63 | (1,254 | ) | |||||||
| Universal life and investment-type contract deposits |
3,090 | 3,573 | 4,015 | |||||||||
| Universal life and investment-type contract maturities and withdrawals |
(3,083 | ) | (4,168 | ) | (4,269 | ) | ||||||
| Net transfers from (to) separate accounts related to universal life and investment-type contracts |
512 | 156 | 7 | |||||||||
| Excess tax benefits related to share-based payments |
- | - | 5 | |||||||||
| Repayments of consumer notes, net |
(103 | ) | (147 | ) | (239 | ) | ||||||
| Issuance of short-term debt |
2 | 6 | 2 | |||||||||
| Repayments of short-term debt |
- | (2 | ) | (1 | ) | |||||||
| Issuance of long-term debt |
1 | 1 | 2 | |||||||||
| Repayments of long-term debt |
(106 | ) | (213 | ) | (101 | ) | ||||||
| Contributions from noncontrolling interests |
42 | 64 | 23 | |||||||||
| Distributions to noncontrolling interests |
(114 | ) | (94 | ) | (52 | ) | ||||||
| Unearned revenue on financial reinsurance |
(254 | ) | (82 | ) | (112 | ) | ||||||
| Net reinsurance recoverable |
1 | (1 | ) | (23 | ) | |||||||
|
|
|
|||||||||||
| Net cash provided by (used in) financing activities |
(49 | ) | (844 | ) | (1,647 | ) | ||||||
|
|
|
|||||||||||
| Net increase (decrease) in cash and cash equivalents |
215 | 524 | (2,182 | ) | ||||||||
| Adoption of ASC 810, consolidation of variable interest entities |
- | - | 39 | |||||||||
| Cash and cash equivalents at beginning of year |
3,296 | 2,772 | 4,915 | |||||||||
|
|
|
|||||||||||
| Cash and cash equivalents at end of year |
$ | 3,511 | $ | 3,296 | $ | 2,772 | ||||||
|
|
|
|||||||||||
| Non-cash financing activities during the year: |
||||||||||||
| Transfer of assets for fixed deferred annuity reinsurance transactions |
$ | (6,768 | ) | $ | - | $ | - | |||||
| Transfer of certain pension and postretirement benefit plans to Parent |
- | |
- |
|
(13 | ) | ||||||
The accompanying notes are an integral part of these consolidated financial statements.
F-9
Table of Contents
JOHN HANCOCK LIFE INSURANCE COMPANY (U.S.A.)
NOTES TO CONSOLIDATED FINANCIAL STATEMENTS
Note 1 — Summary of Significant Accounting Policies
Business. John Hancock Life Insurance Company (U.S.A.) (“JHUSA”) is a wholly-owned subsidiary of The Manufacturers Investment Corporation (“MIC”). MIC is a wholly-owned subsidiary of John Hancock Financial Corporation (“JHFC”), which is an indirect, wholly-owned subsidiary of The Manufacturers Life Insurance Company (“MLI”). MLI, in turn, is a wholly-owned subsidiary of Manulife Financial Corporation (“MFC”), a Canadian-based, publicly traded financial services holding company.
JHUSA and its subsidiaries (“the Company”) provide a wide range of insurance and investment products to both individual and institutional customers located primarily in the United States. These products, including individual life insurance, individual and group long-term care insurance, and mutual funds, are sold through an extensive network of agents, securities dealers, and other financial institutions. The Company also offers investment management services to the Company’s separate account, mutual fund, and institutional customers. The Company suspended sales of all its individual and group fixed and variable annuities. The Company is licensed to sell insurance in 50 states of the United States.
The Company manages individual and group fixed and variable annuity, and individual life insurance contracts (collectively, the contracts) for both individual and institutional customers. Amounts invested in the fixed portion of the contracts are allocated to the general account of the Company. Amounts invested in the variable portion of the contracts are allocated to the separate accounts of the Company. Each of these separate accounts invests in shares of one of the various portfolios of the John Hancock Variable Insurance Trust (“JHVIT”), a no-load, open-end investment management company organized as a Massachusetts business trust, or in open-end investment management companies offered and managed by unaffiliated third parties.
Basis of Presentation. These financial statements have been prepared in conformity with U.S. generally accepted accounting principles (“U.S. GAAP”), which require management to make estimates and assumptions that affect the amounts reported in the consolidated financial statements and accompanying notes. Actual results could differ from these estimates.
The accompanying consolidated financial statements include the accounts of the Company, including its majority-owned and controlled subsidiaries and variable interest entities (“VIEs”) in which the Company is the primary beneficiary or has control over the VIE. Partnerships, joint venture interests, and other equity investments in which the Company does not have a controlling financial interest, but has significant influence, are recorded using the equity method of accounting and are included in other invested assets. All significant intercompany transactions and balances have been eliminated. For further discussion regarding VIEs, see the Relationships with Variable Interest Entities Note.
Reclassifications. Certain prior year amounts have been reclassified to conform to the current year presentation. The Company’s accounting policy is to present all ceded net investment income and realized gains (losses) associated with affiliated reinsurance contracts as part of other operating costs and expenses. To be consistent for all affiliated reinsurance contracts, the Company reclassified $1,788 million and ($196) million from net realized investment and other gains (losses) to other operating costs and expenses for the years ended December 31, 2011 and 2010, respectively. There was no impact to net income for this change in presentation.
Investments. The Company determines the classification of its financial assets at initial recognition. Fixed maturity and equity securities are recognized initially at fair value plus, in the case of investments not held for trading, directly attributable transaction costs. The Company classifies its fixed maturity and equity securities, other than leveraged leases, as either available-for-sale or held-for-trading and records these securities at fair value. Unrealized investment gains and losses related to available-for-sale securities are reflected in shareholder’s equity, net of policyholder related amounts and deferred income taxes. Unrealized investment gains and losses related to held-for-trading securities are reflected in net realized investment and other gains (losses).
Interest income on fixed maturity securities is generally recognized on the accrual basis. The amortized cost of fixed maturity securities is adjusted for other-than-temporary impairments, amortization of premiums, and accretion of discounts to maturity. Amortization of premiums and accretion of discounts is on an effective yield basis and is included in net investment income. The Company recognizes an impairment loss only when management does not expect to recover the amortized cost of the fixed maturity security.
The Company classifies its leveraged leases as fixed maturity securities and calculates their carrying value by accruing income at their expected internal rate of return.
F-10
Table of Contents
JOHN HANCOCK LIFE INSURANCE COMPANY (U.S.A.)
NOTES TO CONSOLIDATED FINANCIAL STATEMENTS – (CONTINUED)
Note 1 — Summary of Significant Accounting Policies - (continued)
For mortgage-backed securities, the Company recognizes income using a constant effective yield based on anticipated prepayments and the estimated economic life of the securities. When actual prepayments differ significantly from anticipated prepayments, the effective yield is recalculated to reflect actual payments to date plus anticipated future payments, and any resulting adjustment is included in net investment income.
Equity securities primarily include common stock. Dividends are recorded as income on the ex-dividend date. The Company recognizes an impairment loss only when management does not expect to recover the cost of the equity security. In determining whether an equity security is impaired, the Company considers its intent and ability to hold a particular equity security for a period of time sufficient to allow for the recovery of its value. Equity securities that do not have readily determinable fair values are included in other invested assets.
Mortgage loans on real estate are carried at unpaid principal balances and are adjusted for amortization of premiums or accretion of discounts, less an allowance for probable losses. Premiums or discounts are amortized over the life of the mortgage loan contract in a manner that results in a constant effective yield. Interest income and amortization amounts and other costs that are recognized as an adjustment of yield are included as components of net investment income. When contractual payments of mortgage investments are more than 90 days in arrears or when loans are considered impaired, interest is no longer accrued. Mortgage loans on real estate are evaluated periodically as part of the Company’s loan review procedures and are considered impaired when it is probable that the Company will be unable to collect all amounts of principal and interest due according to the contractual terms of the mortgage loan agreement. The valuation allowance established as a result of impairment is based on the present value of the expected future cash flows, discounted at the loan’s original effective interest rate, or is based on the collateral value of the loan if the loan is collateral dependent. The Company estimates this level to be adequate to absorb estimated probable credit losses that exist at the balance sheet date. Any change to the valuation allowance for mortgage loans on real estate is reported as a component of net realized investment and other gains (losses). Interest received on impaired mortgage loans on real estate is applied to reduce the outstanding investment balance. Interest received on other mortgage loans that are on non-accrual status is recorded as interest income on a cash basis. If foreclosure becomes probable, the measurement method used is based on the collateral’s fair value. Foreclosed real estate is recorded at the collateral’s fair value at the date of foreclosure, which establishes a new cost basis.
Investment real estate, agriculture, and timber, which the Company has the intent to hold for the production of income, is carried at depreciated cost, using the straight-line method of depreciation, less adjustments for impairments in value. In those cases where it is determined that the carrying amount of investment real estate, agriculture, and timber is not recoverable, an impairment loss is recognized based on the difference between the depreciated cost and fair value of the asset. The Company reports impairment losses as part of net realized investment and other gains (losses).
Policy loans are carried at unpaid principal balances.
Short-term investments, which include investments with remaining maturities of one year or less, but greater than three months, at the time of purchase, are reported at fair value.
Net realized investment and other gains (losses), other than those related to separate accounts for which the Company does not bear the investment risk, are determined on a specific identification method and are reported net of amounts credited to participating contract holder accounts.
Derivative Financial Instruments. The Company uses derivative financial instruments (“derivatives”) to manage exposures to foreign currency, interest rate, credit, and other market risks arising from on-balance sheet financial instruments, certain insurance contract liabilities, and selected anticipated transactions. Derivatives are recorded at fair value. Derivatives with unrealized gains are reported as derivative assets and derivatives with unrealized losses are reported as derivative liabilities. Derivatives embedded in other instruments (“host instruments”), such as investment securities, reinsurance contracts, and certain benefit guarantees, are separately recorded as derivatives when their economic characteristics and risks are not closely related to those of the host instrument, the terms of the embedded derivative are the same as those of a stand-alone derivative, and the host instrument is not held-for-trading or carried at fair value.
A determination is made for each relationship as to whether hedge accounting can be applied. Where hedge accounting is not applied, changes in fair value of derivatives are recorded in net realized investment and other gains (losses).
Where the Company has elected to use hedge accounting, a hedge relationship is designated and documented at inception. Hedge effectiveness is evaluated at inception and throughout the term of the hedge, and hedge accounting is only applied
F-11
Table of Contents
JOHN HANCOCK LIFE INSURANCE COMPANY (U.S.A.)
NOTES TO CONSOLIDATED FINANCIAL STATEMENTS – (CONTINUED)
Note 1 — Summary of Significant Accounting Policies - (continued)
when the Company expects that each hedging instrument will be highly effective in achieving offsetting changes in fair value or changes in cash flows attributable to the risk being hedged. Hedge effectiveness is assessed quarterly using a variety of consistently applied techniques, including regression analysis and cumulative dollar offset. When it is determined that the hedging relationship is no longer effective or the hedged item has been sold or terminated, the Company discontinues hedge accounting prospectively. In such cases, if the derivative hedging instruments are not sold or terminated, any subsequent changes in fair value of the derivative are recognized in net realized investment and other gains (losses).
For derivatives that are designated as hedging instruments, changes in fair value are recognized according to the nature of the risks being hedged, as discussed below.
Fair Value Hedges. In a fair value hedging relationship, changes in the fair value of the hedging derivatives are recorded in net realized investment and other gains (losses), along with changes in fair value attributable to the hedged risk. The carrying value of the hedged item is adjusted for changes in fair value attributable to the hedged risk. To the extent the changes in the fair value of derivatives do not offset the changes in the fair value of the hedged item attributable to the hedged risk in net realized investment and other gains (losses), any ineffectiveness will remain in net realized investment and other gains (losses). When hedge accounting is discontinued, the carrying value of the hedged item is no longer adjusted and the cumulative fair value adjustments are amortized to net investment income over the remaining term of the hedged item unless the hedged item is sold, at which time the balance is recognized immediately in net investment income.
Cash Flow Hedges. In a cash flow hedge relationship, the effective portion of the changes in the fair value of the hedging instrument is recorded in accumulated other comprehensive income (AOCI), while the ineffective portion is recognized in net realized investment and other gains (losses). Unrealized gains and losses recorded in AOCI are recognized in income during the same periods as the variability in the cash flows hedged or the hedged forecasted transactions are recognized.
Unrealized gains and losses on cash flow hedges recorded in AOCI are reclassified immediately to income when the hedged item is sold or the forecasted transaction is no longer expected to occur. When a hedge is discontinued, but the hedged forecasted transaction remains highly probable to occur, the amounts in AOCI are reclassified to net realized investment and other gains (losses) in the periods during which variability in the cash flows hedged or the hedged forecasted transaction is recognized in income.
Cash and Cash Equivalents. Cash and cash equivalents include cash and all highly liquid debt investments with a remaining maturity of three months or less when purchased.
Goodwill, Value of Business Acquired, and Other Intangible Assets. Goodwill represents primarily the excess of the cost over the fair value of identifiable net assets acquired by MFC, on April 28, 2004 (the “acquisition date”). The allocation of purchase consideration resulted in the recognition of goodwill, value of business acquired (“VOBA”), and other intangible assets as of the acquisition date.
VOBA is the present value of estimated future profits of insurance policies in-force related to businesses acquired by MFC. The Company amortizes VOBA using the same methodology and assumptions used to amortize deferred policy acquisition costs (“DAC”) and tests for recoverability at least annually.
Other intangible assets include brand name, investment management contracts (fair value of the investment management relationships between the Company and the mutual funds managed by the Company), distribution networks, and other investment management contracts (institutional investment management contracts managed by the Company’s investment management subsidiaries) recognized at the acquisition date. Brand name and investment management contracts are not subject to amortization. Distribution networks and other investment management contracts are amortized over their respective estimated lives in other operating costs and expenses.
The Company tests goodwill and intangible assets not subject to amortization for impairment at least annually, or more frequently if circumstances indicate impairment may have occurred. Amortizing intangible assets are reviewed for impairment only upon the occurrence of certain triggering events. An impairment is recorded whenever goodwill or an intangible asset’s fair value is deemed to be less than its carrying value. For discussions regarding goodwill impairments recorded during the years ended December 31, 2012, 2011, and 2010, see the Goodwill, Value of Business Acquired, and Other Intangible Assets Note.
F-12
Table of Contents
JOHN HANCOCK LIFE INSURANCE COMPANY (U.S.A.)
NOTES TO CONSOLIDATED FINANCIAL STATEMENTS – (CONTINUED)
Note 1 — Summary of Significant Accounting Policies - (continued)
Deferred Policy Acquisition Costs, Deferred Sales Inducements, and Unearned Revenue. DAC are costs that are directly related to the successful acquisition or renewal of insurance contracts. Such costs include: (1) incremental direct costs of contract acquisition, such as commissions; (2) the portion of an employee’s total compensation and benefits directly related to underwriting, policy issuance and processing, medical inspection, and contract selling of new and renewal insurance contracts with respect to actual policies acquired or renewed; (3) other costs directly related to acquisition or renewal activities that would not have been incurred had a policy not been acquired or renewed; and (4) in limited circumstances, the costs of direct response advertising whose primary purpose is to elicit sales to customers who could be shown to have responded specifically to the advertising and that results in contract acquisition. All other acquisition-related costs, including those related to general advertising and solicitation, market research, agent training, product development, unsuccessful sales and underwriting efforts, as well as all indirect costs, are expensed as incurred. Similarly, any amounts assessed as initiation fees or front-end loads are recorded as unearned revenue. The Company tests the recoverability of DAC at least annually.
DAC related to participating traditional life insurance is amortized over the life of the policies at a constant rate based on the present value of the estimated gross margin amounts expected to be realized over the lives of the policies. Estimated gross margin amounts include anticipated premiums and investment results less claims and administrative expenses, changes in the net level premium reserve, and expected annual policyholder dividends. For annuity, universal life insurance, and investment-type products, DAC and unearned revenue are amortized generally in proportion to the change in present value of expected gross profits arising principally from surrender charges, investment results, including realized investment and other gains (losses), and mortality and expense margins. DAC amortization includes retrospective adjustments when estimates are revised. For annuity, universal life insurance, and investment-type products, the DAC asset is adjusted for the impact of unrealized gains (losses) on investments as if these gains (losses) had been realized, with corresponding credits or charges included in AOCI.
DAC and unearned revenue related to non-participating traditional life insurance and DAC related to long-term care insurance are amortized over the premium-paying period of the related policies using assumptions consistent with those used in computing policy benefit reserves.
The Company offers sales inducements, including enhanced crediting rates or bonus payments, to contract holders on certain of its individual and group annuity products. The Company defers sales inducements (“DSI”) and amortizes them over the life of the underlying contracts using the same methodology and assumptions used to amortize DAC.
Reinsurance. Assets and liabilities related to reinsurance ceded contracts are reported on a gross basis. The accompanying Consolidated Statements of Operations reflect premiums, benefits, and settlement expenses net of reinsurance ceded. Reinsurance premiums, commissions, expense reimbursements, benefits, and reserves related to reinsured business are accounted for on a basis consistent with those used in accounting for the original policies issued and the terms of the reinsurance contracts.
The Company utilizes reinsurance agreements to provide for greater diversification of business, allowing management to control exposure to potential losses arising from large risks, and provide additional capacity for growth. Reinsurance ceded contracts do not relieve the Company from its obligations to policyholders. The Company remains liable to its contract holders to the extent that counterparties to reinsurance ceded contracts do not meet their contractual obligations. Failure of the reinsurers to honor their obligations could result in losses to the Company; consequently, estimates are established for amounts deemed or estimated to be uncollectible. To minimize its exposure to significant losses from reinsurance insolvencies, the Company evaluates the financial condition of its reinsurers and monitors concentration of credit risk arising from similar characteristics among the reinsurers.
When a reinsurance agreement does not subject the reinsurer to the reasonable possibility of significant loss, the Company accounts for the agreement as financial reinsurance and uses deposit-type accounting treatment with only the reinsurance risk fee being reported in other operating costs and expenses.
Separate Account Assets and Liabilities. Separate account assets and liabilities reported on the Company’s Consolidated Balance Sheets represent funds that are administered and invested by the Company to meet specific investment objectives of contract holders. Net investment income and net realized investment and other gains (losses) generally accrue directly to such contract holders who bear the investment risk, subject, in some cases, to principal guarantees and minimum guaranteed rates of income. The assets of each separate account are legally segregated and are not subject to claims that arise out of any other business of the Company. Separate account assets are reported at fair value, and separate account liabilities are set equal to
F-13
Table of Contents
JOHN HANCOCK LIFE INSURANCE COMPANY (U.S.A.)
NOTES TO CONSOLIDATED FINANCIAL STATEMENTS – (CONTINUED)
Note 1 — Summary of Significant Accounting Policies - (continued)
the fair value of the separate account assets. Deposits, surrenders, net investment income, net realized investment and other gains (losses), and the related liability changes of separate accounts are offset within the same line item in the Consolidated Statements of Operations. Fees charged to contract holders, principally mortality, policy administration, investment management, and surrender charges, are included in the revenues of the Company. For the years ended December 31, 2012, 2011, and 2010 there were no gains or losses on transfers of assets from the general account to the separate account.
Future Policy Benefits and Policyholders’ Funds. Future policy benefits for participating traditional life insurance policies are based on the net level premium method. The net level premium reserve is calculated using the guaranteed mortality and dividend fund interest rates. The liability for annual dividends represents the accrual of annual dividends earned. Settlement dividends are accrued in proportion to gross margins over the life of the policies. Participating business represented 33% and 34% of the Company’s traditional life net insurance in-force at December 31, 2012 and 2011, respectively, and 78%, 76%, and 77% of the Company’s traditional life net insurance premiums for the years ended December 31, 2012, 2011, and 2010, respectively.
Benefit liabilities for annuities during the accumulation period are equal to accumulated contract holders’ fund balances and after annuitization are equal to the present value of expected future payments.
Future policy benefits for long-term care insurance policies are based on the net level premium method. Assumptions established at policy issue as to mortality, morbidity, persistency, and interest and expenses, which include a margin for adverse deviation, are based on estimates developed by management.
For non-participating traditional life insurance policies, future policy benefits are estimated using a net level premium method based upon actuarial assumptions as to mortality, persistency, interest, and expenses established at the policy issue or acquisition date. Assumptions established at policy issue as to mortality and persistency are based on the Company’s experience, which, together with interest and expense assumptions, include a margin for adverse deviation.
Policyholders’ funds are generally equal to the total of the policyholder account values before surrender charges, additional reserves established to adjust for lower market interest rates as of the acquisition date, and additional reserves established on certain guarantees offered in certain investment-type products. Policyholder account values include deposits plus credited interest or change in investment value less expense and mortality fees, as applicable, and withdrawals. Policy benefits are charged to expense and include benefit claims incurred in the period in excess of related policy account balances and interest credited to policyholders’ account balances.
Components of policyholders’ funds were as follows:
| December 31, | ||||||||
| 2012 | 2011 | |||||||
|
|
|
|||||||
| (in millions) | ||||||||
| Participating pension contracts |
$ | 1,613 | $ | 1,771 | ||||
| Funding agreements |
384 | 434 | ||||||
| Guaranteed investments contracts |
81 | 143 | ||||||
|
|
|
|||||||
| Total liabilities for investment-type products |
2,078 | 2,348 | ||||||
| Individual and group annuities |
1,923 | 2,216 | ||||||
| Certain traditional life policies, life insurance retained asset accounts and other |
2,787 | 2,598 | ||||||
|
|
|
|||||||
| Total policyholders’ funds |
$ | 6,788 | $ | 7,162 | ||||
|
|
|
|||||||
Funding agreements are purchased from the Company by special purpose entities (“SPEs”), which in turn issue medium-term notes to global investors that are non-recourse to the Company. The SPEs are not consolidated in the Company’s consolidated financial statements.
Liabilities for unpaid claims and claim expense reserves include estimates of payments to be made on reported individual and group life, long-term care, and group accident and health insurance claims and estimates of incurred but not reported claims based on historical claims development patterns.
F-14
Table of Contents
JOHN HANCOCK LIFE INSURANCE COMPANY (U.S.A.)
NOTES TO CONSOLIDATED FINANCIAL STATEMENTS – (CONTINUED)
Note 1 — Summary of Significant Accounting Policies - (continued)
Estimates of future policy benefit reserves, claim reserves, and expenses are reviewed on a regular basis and adjusted as necessary. Any changes in estimates are reflected in current earnings.
Policyholder Dividends. Policyholder dividends for the closed blocks are approved annually by JHUSA’s Board of Directors. The aggregate amount of policyholder dividends is calculated based upon actual interest, mortality, morbidity, persistency, and expense experience for the year as appropriate, as well as management’s judgment as to the proper level of statutory surplus to be retained by JHUSA. For policies included in the JHUSA closed block, expense experience is included in determining policyholder dividends. Expense experience is not included for policies included in the John Hancock Life Insurance Company (“JHLICO”) closed block. JHLICO was a predecessor company that was merged into JHUSA on December 31, 2009. For additional information on the closed blocks, see the Closed Blocks Note.
Revenue Recognition. Premiums from participating and non-participating traditional life insurance, annuity policies with life contingencies, and reinsurance contracts are recognized as revenue when due. When premiums are due over a significantly shorter period than the period over which benefits are provided, any excess profit is deferred and recognized into income in a constant relationship to insurance in-force or, for annuities, the amount of expected future benefit payments.
Premiums from long-term care insurance contracts are recognized as income when due.
Deposits related to universal life and investment-type products are credited to policyholders’ account balances. Revenues from these contracts, as well as annuity contracts, consist of amounts assessed against policyholders’ account balances for mortality, policy administration, and surrender charges and are recorded in fee income in the period in which the services are provided.
Fee income also includes advisory fees, broker-dealer commissions and fees, and administration service fees. Such fees and commissions are recognized in the period in which the services are performed. Commissions related to security transactions and related expenses are recognized as income on the trade date. Contingent deferred selling charge commissions are recognized as income when received. Selling commissions paid to the selling broker-dealer for sales of mutual funds that do not have a front-end sales charge are deferred and amortized on a straight-line basis over periods ranging from one to six years. This is the approximate period of time expected to be benefited and during which fees earned pursuant to Rule 12b-1 distribution plans are received from the funds and contingent deferred sales charges are received from shareholders of the funds.
Income Taxes. The provision for federal income taxes includes amounts currently payable or recoverable and deferred income taxes, computed under the liability method, resulting from temporary differences between the tax and financial statement bases of assets and liabilities. A valuation allowance is established for deferred tax assets when it is more likely than not that an amount will not be realized. Foreign subsidiaries and U.S. subsidiaries operating outside of the United States are taxed under applicable foreign statutory rates. In accordance with the income tax sharing agreements in effect for the applicable tax years, the income tax expense (benefit) is computed as if each entity filed separate federal income tax returns with tax benefits provided for operating losses and tax credits when utilized for the consolidation group. Intercompany settlements of income taxes are made through an increase or reduction to amounts due to or from affiliates. Such settlements occur on a periodic basis in accordance with the tax sharing agreements.
Foreign Currency. Assets and liabilities of foreign operations are translated into U.S. dollars using current exchange rates as of the balance sheet date. Revenues and expenses are translated using the average exchange rates during the year. The resulting net translation adjustments for each year are included in AOCI. Gains or losses on foreign currency transactions are reflected in earnings.
Adoption of Recent Accounting Pronouncements
New accounting standards that do not have a material impact to the Company’s primary financial statements or notes thereto are not included below.
F-15
Table of Contents
JOHN HANCOCK LIFE INSURANCE COMPANY (U.S.A.)
NOTES TO CONSOLIDATED FINANCIAL STATEMENTS – (CONTINUED)
Note 1 — Summary of Significant Accounting Policies - (continued)
Consolidated Financial Statements
Effective January 1, 2010, the Company adopted ASU No. 2009-17, “Consolidation – Improvements to Financial Reporting by Enterprises Involved with Variable Interest Entities,” (“ASU 2009-17”) which amends ASC Topic 810, “Consolidation” (“ASC 810”).
The amendments revise the accounting principles for assessing consolidation of a VIE and include the following features:
| • | A new concept of control — now defined as an entity’s ability to make decisions that are most economically significant to the VIE coupled with economic exposure to the VIE’s variability. This definition replaces the previous concept of “exposure to the majority of the VIE’s variability” in determining when to consolidate another entity. |
| • | New guidance for determining which party, among parties with shared decision making powers over a VIE, makes the most significant decisions for the VIE. |
| • | A bright line test for removal rights over an entity’s decision maker by its equity owners, whereby removal rights are disregarded as an element of control unless they can be exercised successfully by a single party. |
| • | Expanded guidance on whether fees charged to a VIE by its decision maker are variable interests, leading to consolidation by the decision maker. |
| • | Removal of the previous scope exception for qualifying special purpose entities. |
ASC 810 retains a scope exception for consolidation by investment companies of their investments.
The Company also adopted ASU No. 2010-10, “Consolidation — Amendments for Certain Investment Funds,” (“ASU 2010-10”) which amends ASC 810. This guidance was effective January 1, 2010 and deferred application of the amendments described above to certain entities that apply specialized accounting guidance for investment companies.
Adoption of these amendments resulted in consolidation of certain collateralized debt obligations sponsored by the Company. The impact on the Company’s Consolidated Statements of Changes in Shareholder’s Equity at January 1, 2010 was an increase in noncontrolling interests of $45 million, and a decrease in retained earnings of $2 million, net of tax.
In April 2010, the FASB issued ASU No. 2010-15, “How Investments Held through Separate Accounts Affect an Insurer’s Consolidation Analysis of Those Investments,” (“ASU 2010-15”) which amends ASC 944, “Financial Services-Insurance” (“ASC 944”). Under ASU No. 2010-15, an insurance entity should not consider the interests held through separate accounts for the benefit of policyholders in the insurer’s evaluation of its economics in a VIE, unless the separate account contract holder is a related party. This guidance is to be applied retrospectively to all prior periods upon the date of adoption. ASU No. 2010-15 was effective for the Company on January 1, 2011. Adoption of this guidance resulted in deconsolidation of $983 million of separate account assets, offset by deconsolidation of $983 million of separate account liabilities.
Fair Value Measurements
In May 2011, the FASB issued ASU No. 2011-04, “Amendments to Achieve Common Fair Value Measurement and Disclosure Requirements in U.S. GAAP and IFRS” (“ASU 2011-04”) which amends ASC Topic 820, “Fair Value Measurements”. The key changes in measurement principles include limiting the concepts of highest and best use and valuation premise to nonfinancial assets, providing a framework for considering whether a premium or discount can be applied in a fair value measurement, and aligning the fair value measurement of instruments classified within an entity’s shareholders’ equity with the guidance for liabilities. Disclosures will be required for all transfers between Levels 1 and 2 within the valuation hierarchy, the use of a nonfinancial asset measured at fair value if its use differs from its highest and best use, the level in the valuation hierarchy of assets and liabilities not recorded at fair value but for which fair value is required to be disclosed, and for Level 3 measurements, quantitative information about unobservable inputs used, a description of the valuation processes used, and qualitative discussion about the sensitivity of the measurements. The Company adopted the revised accounting standard effective January 1, 2012 via prospective adoption, as required. The expanded disclosures required by this guidance are included in the Fair Value Measurements Note. The adoption of ASU 2011-04 did not impact the Company’s financial position or results of operations.
F-16
Table of Contents
JOHN HANCOCK LIFE INSURANCE COMPANY (U.S.A.)
NOTES TO CONSOLIDATED FINANCIAL STATEMENTS – (CONTINUED)
Note 1 — Summary of Significant Accounting Policies - (continued)
Comprehensive Income
In June 2011, the FASB issued ASU No. 2011-05, “Presentation of Comprehensive Income” (“ASU 2011-05”), and in December 2011 issued ASU No. 2011-12, “Deferral of the Effective Date for Amendments to the Presentation of Reclassification of Items Out of Accumulated Other Comprehensive Income in Accounting Standards Update No. 2011-05” (“ASU 2011-12”) both of which amend ASC Topic 220, “Comprehensive Income”. These standards require entities to present items of net income and other comprehensive income either in a single continuous statement, or in separate, but consecutive statements of net income and other comprehensive income. The new requirements did not change which components of comprehensive income are recognized in net income or other comprehensive income, or when an item of other comprehensive income must be reclassified to net income. These standards became effective retrospectively beginning January 1, 2012. The Company opted to present the statements of net income and other comprehensive income in separate, but consecutive statements. The adoptions of ASU 2011-05 and ASU 2011-12 did not impact the Company’s financial position or results of operations.
Goodwill Impairment Testing
In September 2011, the FASB issued ASU No. 2011-08, “Testing for Goodwill Impairment” (“ASU 2011-08”) which amends ASC Topic 350, “Intangibles-Goodwill and Other” (“ASC 350”). ASU 2011-08 is intended to simplify how a company tests goodwill for impairment by giving companies the option to perform a qualitative assessment before calculating the fair value of the reporting unit. Under the guidance in ASU 2011-08, if this option is selected, a company is not required to calculate the fair value of a reporting unit unless the entity determines that it is more likely than not that its fair value is less than its carrying amount. The provisions of ASU 2011-08 became effective for the 2012 goodwill impairment testing. The adoption of ASU 2011-08 did not impact the Company’s financial position or results of operations.
Multiemployer Pension Plans
In September 2011, the FASB issued ASU No. 2011-09, “Disclosures about an Employer’s Participation in a Multiemployer Plan” (“ASU 2011-09”) which amends ASC Subtopic 715-80, “Compensation-Retirement Benefits-Multiemployer Plans.” For a subsidiary participating in the pension plan of its parent, the revised standard requires the disclosure of the name of the plan in which the subsidiary participates and the amount of contributions it made. This guidance became effective as of December 15, 2011 and has been applied retrospectively. The adoption of ASU 2011-09 did not impact the Company’s financial position or results of operations.
Deferred Policy Acquisition Costs and Deferred Sales Inducements
Effective January 1, 2012, the Company adopted ASU No. 2010-26, “Accounting for Costs Associated with Acquiring or Renewing Insurance Contracts” (“ASU 2010-26”) which amends ASC 944. ASU 2010-26 modifies the definition of the types of costs incurred by insurance entities that can be capitalized in the acquisition of new and renewal contracts. This guidance has been applied retrospectively, as permitted by the standard. As a result of this accounting change, shareholder’s equity, as of January 1, 2010, decreased by $586 million, after tax, from $15,576 million, as previously reported, to $14,990 million due to a reduction of the Company’s DAC and DSI asset balance related to certain costs that did not meet the provisions of the standard.
Other Invested Assets
The Company has an investment in a power fund which is recorded using the equity method of accounting and the balance is recorded in other invested assets. Prior to 2012, the portfolio investments held by the power fund were recorded at cost. As reported to the Company in 2012, the investee met the requirements of an investment company under ASC Topic 946, “Financial Services — Investment Companies” and recognized the portfolio investments at fair value. This change by the investee was accounted for as a change in accounting principle effective January 1, 2011. Consistent with the investee’s approach, the Company has also treated this as a change in accounting principle applied retrospectively. This change resulted in an increase to retained earnings of $36 million, net of tax of $19 million, and other invested assets of $55 million as of January 1, 2011.
F-17
Table of Contents
JOHN HANCOCK LIFE INSURANCE COMPANY (U.S.A.)
NOTES TO CONSOLIDATED FINANCIAL STATEMENTS – (CONTINUED)
Note 1 — Summary of Significant Accounting Policies - (continued)
The following tables present the effects of retrospective adjustments and reclassifications to the Company’s previously reported Consolidated Balance Sheet, Consolidated Statements of Operations and Consolidated Statements of Cash Flows related to the adoption of ASU 2010-26 for DAC and DSI, the change in accounting for its other invested assets, and for the presentation reclassification:
| December 31, 2011 | ||||||||||||||||||||
| As Previously Reported |
DAC and DSI Change in Accounting Principle (1) |
Other Accounting Principle (2) |
Presentation Reclassification (3) |
As Reported |
||||||||||||||||
|
|
|
|||||||||||||||||||
| (in millions) | ||||||||||||||||||||
| Assets |
||||||||||||||||||||
| Other invested assets |
$ | 4,446 | $ | - | $ | 55 | $ | - | $ | 4,501 | ||||||||||
| Deferred policy acquisition costs and deferred sales inducements |
7,186 | (888 | ) | - | - | 6,298 | ||||||||||||||
| Liabilities |
||||||||||||||||||||
| Future policy benefits |
88,879 | 2 | - | 108 | 88,989 | |||||||||||||||
| Deferred income tax liability |
4,214 | (311 | ) | 19 | - | 3,922 | ||||||||||||||
| Other liabilities |
4,271 | - | - | (108 | ) | 4,163 | ||||||||||||||
| Shareholder’s Equity |
||||||||||||||||||||
| Retained earnings |
1,005 | (635 | ) | 36 | - | 406 | ||||||||||||||
| Accumulated other comprehensive income |
4,102 | 56 | - | - | 4,158 | |||||||||||||||
| Total shareholder’s equity |
18,160 | (579 | ) | 36 | - | 17,617 | ||||||||||||||
F-18
Table of Contents
JOHN HANCOCK LIFE INSURANCE COMPANY (U.S.A.)
NOTES TO CONSOLIDATED FINANCIAL STATEMENTS – (CONTINUED)
Note 1 — Summary of Significant Accounting Policies - (continued)
| Year ended December 31, 2011 | ||||||||||||||||||||
| As Previously Reported |
DAC and Accounting |
Other Invested Assets Change in Accounting |
Presentation Reclassification (3) |
As Reported |
||||||||||||||||
|
|
|
|||||||||||||||||||
| (in millions) | ||||||||||||||||||||
| Revenues |
||||||||||||||||||||
| Fee income |
$ | 5,718 | $ | (1 | ) | $ | - | $ | - | $ | 5,717 | |||||||||
| Net realized investment and other gains (losses) |
1,347 | - | - | 1,788 | 3,135 | |||||||||||||||
| Other Revenue |
121 | - | - | 3 | 124 | |||||||||||||||
| Benefits and Expenses |
||||||||||||||||||||
| Benefits to policyholders |
7,638 | 1 | - | - | 7,639 | |||||||||||||||
| Amortization of deferred policy acquisition costs, deferred sales inducements, and value of business acquired |
3,076 | (235 | ) | - | 2,841 | |||||||||||||||
| Other operating costs and expenses |
4,362 | 160 | - | 1,791 | 6,313 | |||||||||||||||
| Income (loss) before income taxes |
(1,216 | ) | 73 | - | - | (1,143 | ) | |||||||||||||
| Income tax expense (benefit) |
(358 | ) | 26 | - | - | (332 | ) | |||||||||||||
| Net income (loss) |
(858 | ) | 47 | - | - | (811 | ) | |||||||||||||
| Net income (loss) attributable to the Company |
(902 | ) | 47 | - | - | (855 | ) | |||||||||||||
| Year ended December 31, 2010 | ||||||||||||||||||||
| As Previously Reported |
DAC and DSI Change in Accounting Principle (1) |
Other Invested Assets Change in Accounting Principle (2) |
Presentation Reclassification (3) |
As Reported |
||||||||||||||||
|
|
|
|||||||||||||||||||
| (in millions) | ||||||||||||||||||||
| Revenues |
||||||||||||||||||||
| Fee income |
$ | 3,773 | $ | (2 | ) | $ | - | $ | - | $ | 3,771 | |||||||||
| Net realized investment and other gains (losses) |
278 | - | - | (196 | ) | 82 | ||||||||||||||
| Benefits and Expenses |
||||||||||||||||||||
| Amortization of deferred policy acquisition costs, deferred sales inducements, and value of business acquired |
752 | (70 | ) | - | - | 682 | ||||||||||||||
| Other operating costs and expenses |
3,225 | 201 | - | (196 | ) | 3,230 | ||||||||||||||
| Income (loss) before income taxes |
(655 | ) | (133 | ) | - | - | (788 | ) | ||||||||||||
| Income tax expense (benefit) |
222 | (46 | ) | - | - | 176 | ||||||||||||||
| Net income (loss) |
(877 | ) | (87 | ) | - | - | (964 | ) | ||||||||||||
| Net income (loss) attributable to the Company |
(913 | ) | (87 | ) | - | - | (1,000 | ) | ||||||||||||
F-19
Table of Contents
JOHN HANCOCK LIFE INSURANCE COMPANY (U.S.A.)
NOTES TO CONSOLIDATED FINANCIAL STATEMENTS – (CONTINUED)
Note 1 — Summary of Significant Accounting Policies - (continued)
| Year ended December 31, 2011 | ||||||||||||||||||||
| As Previously Reported |
DAC and DSI Change in Accounting Principle (1) |
Other Invested Assets Change in Accounting Principle (2) |
Presentation Reclassification (3) |
As Reported |
||||||||||||||||
|
|
|
|||||||||||||||||||
| (in millions) | ||||||||||||||||||||
| Cash flows from operating activities |
||||||||||||||||||||
| Net income (loss) |
$ | (858 | ) | $ | 47 | $ | - | $ | - | $ | (811 | ) | ||||||||
| Adjustments to reconcile net income (loss) to net cash provided by operating activities: |
||||||||||||||||||||
| Net realized investment and other gains (losses) |
(1,347 | ) | - | - | (1,788 | ) | (3,135 | ) | ||||||||||||
| Amortization of deferred policy acquisition costs, deferred sales inducements, and value of business acquired |
3,076 | (235 | ) | - | - | 2,841 | ||||||||||||||
| Capitalization of deferred policy acquisition costs and deferred sales inducements |
(926 | ) | 160 | - | - | (766 | ) | |||||||||||||
| Increase (decrease) in other assets and other liabilities, net |
(1,269 | ) | 2 | - | 1,788 | 521 | ||||||||||||||
| Increase (decrease) in deferred income taxes |
(126 | ) | 26 | - | - | (100 | ) | |||||||||||||
F-20
Table of Contents
JOHN HANCOCK LIFE INSURANCE COMPANY (U.S.A.)
NOTES TO CONSOLIDATED FINANCIAL STATEMENTS – (CONTINUED)
Note 1 — Summary of Significant Accounting Policies - (continued)
| Year ended December 31, 2010 | ||||||||||||||||||||
| As Previously Reported |
DAC and Change in Principle (1) |
Other Invested Assets Change in Accounting Principle (2) |
Presentation Reclassification (3) |
As Reported |
||||||||||||||||
|
|
|
|||||||||||||||||||
| (in millions) | ||||||||||||||||||||
| Cash flows from operating activities |
||||||||||||||||||||
| Net income (loss) |
$ | (877 | ) | $ | (87 | ) | $ | - | $ | - | $ | (964 | ) | |||||||
| Adjustments to reconcile net income (loss) to net cash provided by operating activities: |
||||||||||||||||||||
| Net realized investment and other gains (losses) |
(278 | ) | - | - | 196 | (82 | ) | |||||||||||||
| Change in expected internal rate of return on leveraged leases |
- | - | - | 118 | 118 | |||||||||||||||
| Amortization of deferred policy acquisition costs, deferred sales inducements, and value of business acquired |
752 | (70 | ) | - | - | 682 | ||||||||||||||
| Capitalization of deferred policy acquisition costs and deferred sales inducements |
(1,240 | ) | 201 | - | - | (1,039 | ) | |||||||||||||
| Increase (decrease) in other assets and other liabilities, net |
345 | 2 | - | (196 | ) | 151 | ||||||||||||||
| Increase (decrease) in deferred income taxes |
447 | (46 | ) | - | - | 401 | ||||||||||||||
| Cash flows from investing activities |
||||||||||||||||||||
| Other, net |
133 | - | - | (118 | ) | 15 | ||||||||||||||
| (1) | See discussion included in the Significant Accounting Policies Note – Adoption of Recent Accounting Pronouncements – Deferred Policy Acquisition Costs and Deferred Sales Inducements for further information on this change to the Company’s previously reported results. |
| (2) | See discussion included in the Significant Accounting Policies Note – Adoption of Recent Accounting Pronouncements – Other Invested Assets for further information on this change to the Company’s previously reported results. |
| (3) | See discussion included in the Significant Accounting Policies Note – Reclassifications for further information on this change to the Company’s previously reported results. |
Future Adoption of Recent Accounting Pronouncements
Offsetting Assets and Liabilities
In December 2011, the FASB released ASU No. 2011-11, “Disclosures about Offsetting Assets and Liabilities” (“ASU 2011-11”) which amends ASC Topic 210, “Balance Sheet”. ASU 2011-11 requires companies to provide new disclosures about offsetting and related arrangements for financial instruments and derivatives. The provisions of ASU 2011-11 are effective for annual reporting periods beginning on or after January 1, 2013, and are required to be applied retrospectively. When adopted, ASU 2011-11 is not expected to materially impact the Company’s financial position or results of operations.
F-21
Table of Contents
JOHN HANCOCK LIFE INSURANCE COMPANY (U.S.A.)
NOTES TO CONSOLIDATED FINANCIAL STATEMENTS – (CONTINUED)
Note 1 — Summary of Significant Accounting Policies - (continued)
Indefinite-Lived Intangible Asset Impairment Testing
In July 2012, the FASB issued ASU No. 2012-02, “Testing Indefinite-Lived Intangible Assets for Impairment” (“ASU 2012-02”) which amends ASC 350. ASU 2012-02 is intended to simplify how a company tests indefinite-lived intangible assets for impairment by giving companies the option to perform a qualitative assessment before calculating the fair value of the indefinite-lived intangible asset. Under the guidance in ASU 2012-02, if this option is selected, a company is not required to calculate the fair value of an indefinite-lived intangible asset unless the entity determines that it is more likely than not that its fair value is less than its carrying amount. The provisions of ASU 2012-02 are effective for annual and interim impairment tests performed for fiscal years beginning after September 15, 2012. Upon adoption, ASU 2012-02 is not expected to materially impact the Company’s financial position or results of operations.
Note 2 — Investments
Fixed Maturities and Equity Securities
The Company’s investments in available-for-sale fixed maturity and equity securities are summarized below:
| December 31, 2012 | ||||||||||||||||||||
| Amortized Cost |
Gross Unrealized Gains |
Gross Unrealized Losses |
Fair Value |
Other-Than- Impairments in AOCI |
||||||||||||||||
|
|
|
|||||||||||||||||||
| (in millions) | ||||||||||||||||||||
| Fixed maturities and equity securities: |
||||||||||||||||||||
| Corporate debt securities |
$ | 36,804 | $ | 5,160 | $ | (271 | ) | $ | 41,693 | $ | (38 | ) | ||||||||
| Commercial mortgage-backed securities |
1,427 | 48 | (81 | ) | 1,394 | (17 | ) | |||||||||||||
| Residential mortgage-backed securities |
301 | 1 | (60 | ) | 242 | (20 | ) | |||||||||||||
| Collateralized debt obligations |
152 | - | (46 | ) | 106 | (33 | ) | |||||||||||||
| Other asset-backed securities |
794 | 102 | (2 | ) | 894 | (1 | ) | |||||||||||||
| U.S. Treasury securities and obligations of U.S. government corporations and agencies |
11,165 | 1,009 | (79 | ) | 12,095 | - | ||||||||||||||
| Obligations of states and political subdivisions |
4,482 | 913 | (1 | ) | 5,394 | - | ||||||||||||||
| Debt securities issued by foreign governments |
1,230 | 243 | (6 | ) | 1,467 | - | ||||||||||||||
|
|
|
|||||||||||||||||||
| Fixed maturities |
56,355 | 7,476 | (546 | ) | 63,285 | (109 | ) | |||||||||||||
| Other fixed maturities (1) |
1,711 | - | - | 1,711 | - | |||||||||||||||
|
|
|
|||||||||||||||||||
| Total fixed maturities available-for-sale |
58,066 | 7,476 | (546 | ) | 64,996 | (109 | ) | |||||||||||||
| Equity securities available-for-sale |
294 | 97 | (5 | ) | 386 | - | ||||||||||||||
|
|
|
|||||||||||||||||||
| Total fixed maturities and equity securities available-for-sale |
$ | 58,360 | $ | 7,573 | $ | (551 | ) | $ | 65,382 | $ | (109 | ) | ||||||||
|
|
|
|||||||||||||||||||
F-22
Table of Contents
JOHN HANCOCK LIFE INSURANCE COMPANY (U.S.A.)
NOTES TO CONSOLIDATED FINANCIAL STATEMENTS – (CONTINUED)
Note 2 — Investments - (continued)
| December 31, 2011 | ||||||||||||||||||||
| Amortized Cost |
Gross Unrealized Gains |
Gross Unrealized Losses |
Fair Value | Other-Than- Temporary Impairments in AOCI |
||||||||||||||||
|
|
|
|||||||||||||||||||
| (in millions) | ||||||||||||||||||||
| Fixed maturities and equity securities: |
||||||||||||||||||||
| Corporate debt securities |
$ | 39,646 | $ | 4,258 | $ | (573 | ) | $ | 43,331 | $ | (50 | ) | ||||||||
| Commercial mortgage-backed securities |
3,163 | 101 | (132 | ) | 3,132 | (11 | ) | |||||||||||||
| Residential mortgage-backed securities |
577 | 1 | (208 | ) | 370 | (32 | ) | |||||||||||||
| Collateralized debt obligations |
217 | - | (86 | ) | 131 | (32 | ) | |||||||||||||
| Other asset-backed securities |
1,013 | 89 | (9 | ) | 1,093 | (2 | ) | |||||||||||||
| U.S. Treasury securities and obligations of |
11,573 | 1,250 | - | 12,823 | - | |||||||||||||||
| Obligations of states and political subdivisions |
4,323 | 642 | (1 | ) | 4,964 | - | ||||||||||||||
| Debt securities issued by foreign governments |
1,178 | 250 | (6 | ) | 1,422 | - | ||||||||||||||
|
|
|
|||||||||||||||||||
| Fixed maturities |
61,690 | 6,591 | (1,015 | ) | 67,266 | (127 | ) | |||||||||||||
| Other fixed maturities (1) |
1,959 | - | - | 1,959 | - | |||||||||||||||
|
|
|
|||||||||||||||||||
| Total fixed maturities available-for-sale |
63,649 | 6,591 | (1,015 | ) | 69,225 | (127 | ) | |||||||||||||
| Equity securities available-for-sale |
358 | 91 | (10 | ) | 439 | - | ||||||||||||||
|
|
|
|||||||||||||||||||
| Total fixed maturities and equity securities available-for-sale |
$ | 64,007 | $ | 6,682 | $ | (1,025 | ) | $ | 69,664 | $ | (127 | ) | ||||||||
|
|
|
|||||||||||||||||||
| (1) | The Company classifies its leveraged leases as fixed maturities and calculates their carrying value by accruing income at their expected internal rate of return. |
The amortized cost and fair value of available-for-sale fixed maturities at December 31, 2012, by contractual maturity, are shown below:
| Amortized Cost | Fair Value | |||||||
|
|
|
|||||||
| (in millions) | ||||||||
| Fixed maturities: |
||||||||
| Due in one year or less |
$ | 1,742 | $ | 1,782 | ||||
| Due after one year through five years |
7,325 | 7,863 | ||||||
| Due after five years through ten years |
8,622 | 9,530 | ||||||
| Due after ten years |
35,992 | 41,474 | ||||||
|
|
|
|||||||
| 53,681 | 60,649 | |||||||
| Asset-backed and mortgage-backed securities |
2,674 | 2,636 | ||||||
|
|
|
|||||||
| Total |
$ | 56,355 | $ | 63,285 | ||||
|
|
|
|||||||
Expected maturities may differ from contractual maturities because eligible borrowers may exercise their right to call or prepay obligations with or without call or prepayment penalties. Asset-backed and mortgage-backed securities are shown separately in the table above, as they are not due at a single maturity date.
F-23
Table of Contents
JOHN HANCOCK LIFE INSURANCE COMPANY (U.S.A.)
NOTES TO CONSOLIDATED FINANCIAL STATEMENTS – (CONTINUED)
Note 2 — Investments - (continued)
Fixed Maturities and Equity Securities Impairment Review
The Company has a process in place to identify securities that could potentially have an impairment that is other-than-temporary. This process involves monitoring market events that could impact issuers’ credit ratings, business climate, management changes, litigation and government actions, and other similar factors. This process also involves monitoring late payments, downgrades by rating agencies, key financial ratios, financial statements, revenue forecasts, and cash flow projections as indicators of credit issues.
At the end of each quarter, the MFC Loan Review Committee reviews all fixed maturity securities where there is evidence of impairment or a significant unrealized loss at the balance sheet date. Generally, securities with market value less than 60 percent of amortized cost for six months or more indicate an impairment is present. Accordingly, securities in this category are normally deemed impaired unless there is clear evidence they should not be impaired. The analysis focuses on each company’s or project’s ability to service its debts in a timely fashion and the length of time the security has been trading below amortized cost. The results of this analysis are reviewed by the Credit Committee at MFC. This committee includes MFC’s Chief Financial Officer, Chief Investment Officer, Chief Risk Officer, Chief Credit Officer, and other senior management. This quarterly process includes a fresh assessment of the credit quality of each investment in the entire fixed maturity security portfolio.
The Company considers relevant facts and circumstances in evaluating whether the impairment of a fixed maturity security is other-than-temporary. Relevant facts and circumstances considered include (1) the length of time the fair value has been below cost; (2) the financial position of the issuer, including the current and future impact of any specific events; and (3) the Company’s ability and intent to hold the fixed maturity security to maturity or until it recovers in value. If the Company intends to sell, or if it is more likely than not that it will be required to sell an impaired fixed maturity security prior to recovery of its cost basis, the security is considered other-than-temporarily impaired, and the Company records a charge to earnings for the full amount of impairment (the difference between the current carrying amount and fair value of the security). For fixed maturity securities in an unrealized loss position where the Company does not intend to sell or is not more likely than not to be required to sell, the Company determines its ability to recover the amortized cost of the security by comparing the net present value of the projected future cash flows to the amortized cost of the security. If the net present value of the cash flow is less than the security’s amortized cost, then the difference is recorded as a credit loss. The difference between the estimates of the credit loss and the overall unrealized loss on the security is the non-credit-related component. The credit loss portion is charged to net realized investment and other gains (losses) on the Consolidated Statements of Operations, while the non-credit loss is charged to AOCI on the Consolidated Balance Sheets.
The net present value used to determine the credit loss is calculated by discounting the Company’s best estimate of projected future cash flows at the effective interest rate implicit in the fixed maturity security prior to impairment. The Company may use the estimated fair value of collateral as a proxy for the net present value if it believes that the security is dependent on the liquidation of collateral for recovery of its investment. The projection of future cash flows is subject to the same analysis the Company applies to its overall impairment evaluation process, as noted above, which incorporates security specific information such as late payments, downgrades by rating agencies, key financial ratios, investee financial statements, and fundamentals of the industry and geographic area in which the issuer operates, as well as overall macroeconomic conditions.
The projections are estimated using assumptions regarding probability of default and estimates regarding timing and amount of recoveries associated with a default. For mortgage-backed and asset-backed securities, cash flow estimates, including prepayment assumptions, are based on data from third-party data sources or internal estimates and are driven by assumptions regarding the underlying collateral, including default rates, recoveries, and changes in value.
Similarly, management evaluates all facts and circumstances and exercises professional judgment in determining whether an other-than-temporary impairment of equity securities exists. The MFC Credit Committee reviews and approves the proposed impairments based on an analysis of the evidence, including the current market price, the length of time the security has been in an unrealized loss position, forecasted EPS, consensus price targets, projected P/E ratios, overall financial health of each issuer, liquidity or solvency issues, announced changes in ownership structure, changes to issuer debt ratings, changes to dividend payments, changes in products, markets or competition, and other industry specific or macro economic factors.
There are a number of significant risks and uncertainties inherent in the process of monitoring impairments and determining if impairment is other-than-temporary. These risks and uncertainties include (1) the risk that the Company’s assessment of an issuer’s ability to meet all of its contractual obligations will change based on changes in the credit characteristics of that issuer; (2) the risk that the economic outlook will be worse than expected or have more of an impact on the issuer than anticipated; (3) the risk that fraudulent information could be provided to the Company’s investment professionals who determine the fair value estimates and other-than-temporary impairments; and (4) the risk that new information obtained by
F-24
Table of Contents
JOHN HANCOCK LIFE INSURANCE COMPANY (U.S.A.)
NOTES TO CONSOLIDATED FINANCIAL STATEMENTS – (CONTINUED)
Note 2 — Investments - (continued)
the Company or changes in other facts and circumstances lead it to change its intent to hold the security to maturity or until it recovers in value. Any of these situations could result in a charge to earnings in a future period.
The cost amounts for both fixed maturity securities and equity securities are net of other-than-temporary impairment charges.
The following table rolls forward the amount of credit losses recognized in earnings on available-for-sale fixed maturity securities for which a portion of the other-than-temporary impairment was also recognized in AOCI:
Credit losses on available-for-sale fixed maturities:
| December 31, | ||||||||||||
| 2012 | 2011 | 2010 | ||||||||||
|
|
|
|||||||||||
| (in millions) | ||||||||||||
| Balance, beginning of year |
$ | 380 | $ | 399 | $ | 361 | ||||||
| Additions: |
||||||||||||
| Credit losses for which an other-than-temporary impairment was not previously recognized |
75 | 38 | 93 | |||||||||
| Credit losses for which an other-than-temporary impairment was previously recognized |
12 | 13 | 10 | |||||||||
| Deletions: |
||||||||||||
| Amounts related to sold, matured, or paid down available-for-sale fixed maturities |
(96 | ) | (70 | ) | (65) | |||||||
|
|
|
|||||||||||
| Balance, end of year |
$ | 371 | $ | 380 | $ | 399 | ||||||
|
|
|
|||||||||||
F-25
Table of Contents
JOHN HANCOCK LIFE INSURANCE COMPANY (U.S.A.)
NOTES TO CONSOLIDATED FINANCIAL STATEMENTS – (CONTINUED)
Note 2 — Investments - (continued)
The following table shows the carrying value and gross unrealized losses aggregated by investment category and length of time that individual available-for-sale fixed maturity and equity securities have been in a continuous unrealized loss position:
Unrealized Losses on Available-For-Sale Fixed Maturity and Equity Securities — By Investment Age
| December 31, 2012 | ||||||||||||||||||||||||
| Less than 12 months | 12 months or more | Total | ||||||||||||||||||||||
| Carrying Value |
Unrealized Losses |
Carrying Value |
Unrealized Losses |
Carrying Value |
Unrealized Losses |
|||||||||||||||||||
| (in millions) | ||||||||||||||||||||||||
| Corporate debt securities |
$ | 2,008 | $ | (85 | ) | $ | 1,404 | $ | (186 | ) | $ | 3,412 | $ | (271 | ) | |||||||||
| Commercial mortgage-backed securities |
129 | (1 | ) | 223 | (80 | ) | 352 | (81 | ) | |||||||||||||||
| Residential mortgage-backed securities |
1 | - | 214 | (60 | ) | 215 | (60 | ) | ||||||||||||||||
| Collateralized debt obligations |
- | - | 99 | (46 | ) | 99 | (46 | ) | ||||||||||||||||
| Other asset-backed securities |
5 | - | 30 | (2 | ) | 35 | (2 | ) | ||||||||||||||||
| US Treasury securities and obligations of US government corps and agencies |
3,847 | (79 | ) | - | - | 3,847 | (79 | ) | ||||||||||||||||
| Obligations of states and political subdivisions |
116 | (1 | ) | - | - | 116 | (1 | ) | ||||||||||||||||
| Debt securities issued by foreign governments |
7 | - | 86 | (6 | ) | 93 | (6 | ) | ||||||||||||||||
| Total fixed maturities available-for-sale |
6,113 | (166 | ) | 2,056 | (380 | ) | 8,169 | (546 | ) | |||||||||||||||
| Equity securities available-for-sale |
14 | (3 | ) | 4 | (2 | ) | 18 | (5 | ) | |||||||||||||||
| Total |
$ | 6,127 | $ | (169 | ) | $ | 2,060 | $ | (382 | ) | $ | 8,187 | $ | (551 | ) | |||||||||
F-26
Table of Contents
JOHN HANCOCK LIFE INSURANCE COMPANY (U.S.A.)
NOTES TO CONSOLIDATED FINANCIAL STATEMENTS – (CONTINUED)
Note 2 — Investments - (continued)
| December 31, 2011 | ||||||||||||||||||||||||
| Less than 12 months | 12 months or more | Total | ||||||||||||||||||||||
| Carrying Value |
Unrealized Losses |
Carrying Value |
Unrealized Losses |
Carrying Value |
Unrealized Losses |
|||||||||||||||||||
| (in millions) | ||||||||||||||||||||||||
| Corporate debt securities |
$ | 2,854 | $ | (106 | ) | $ | 2,911 | $ | (467 | ) | $ | 5,765 | $ | (573 | ) | |||||||||
| Commercial mortgage-backed securities |
359 | (8 | ) | 327 | (124 | ) | 686 | (132 | ) | |||||||||||||||
| Residential mortgage-backed securities |
30 | (2 | ) | 320 | (206 | ) | 350 | (208 | ) | |||||||||||||||
| Collateralized debt obligations |
5 | (1 | ) | 123 | (85 | ) | 128 | (86 | ) | |||||||||||||||
| Other asset-backed securities |
74 | (3 | ) | 80 | (6 | ) | 154 | (9 | ) | |||||||||||||||
| US Treasury securities and obligations of US government corps and agencies |
- | - | - | - | - | - | ||||||||||||||||||
| Obligations of states and political subdivisions |
- | - | 93 | (1 | ) | 93 | (1 | ) | ||||||||||||||||
| Debt securities issued by foreign governments |
- | - | 104 | (6 | ) | 104 | (6 | ) | ||||||||||||||||
| Total fixed maturities available-for-sale |
3,322 | (120 | ) | 3,958 | (895 | ) | 7,280 | (1,015 | ) | |||||||||||||||
| Equity securities available-for-sale |
37 | (9 | ) | 12 | (1 | ) | 49 | (10 | ) | |||||||||||||||
| Total |
$ | 3,359 | $ | (129 | ) | $ | 3,970 | $ | (896 | ) | $ | 7,329 | $ | (1,025 | ) | |||||||||
Unrealized losses can be created by rising interest rates or by rising credit concerns and hence widening credit spreads. Credit concerns are apt to play a larger role in the unrealized loss on below investment grade securities. Unrealized losses on investment grade securities principally relate to changes in interest rates or changes in credit spreads since the securities were acquired. Credit rating agencies’ statistics indicate that investment grade securities have been found to be less likely to develop credit concerns. The gross unrealized loss on below investment grade available-for-sale fixed maturity securities decreased to $280 million at December 31, 2012 from $619 million at December 31, 2011.
At December 31, 2012 and 2011, there were 624 and 919 available-for-sale fixed maturity securities with an aggregate gross unrealized loss of $546 million and $1,015 million, respectively, of which the single largest unrealized loss was $33 million and $31 million, respectively. The Company anticipates that these fixed maturity securities will perform in accordance with their contractual terms and currently has the ability and intent to hold these securities until they recover or mature.
At December 31, 2012 and 2011, there were 75 and 125 equity securities with an aggregate gross unrealized loss of $5 million and $10 million, respectively, of which the single largest unrealized loss was $2 million and $2 million, respectively. The Company anticipates that these equity securities will recover in value in the near term.
Available-for-sale securities with amortized cost of $336 million were non-income producing for the year ended December 31, 2012. Non-income producing assets represent investments that have not produced income for the 12 months preceding December 31, 2012.
Securities Lending
The Company participated in a securities lending program for the purpose of enhancing income on securities held. There were no securities on loan and no collateral held as of December 31, 2012 and 2011. The Company maintains collateral at a level of at least 102% of the loaned securities’ market value and monitors the market value of the loaned securities on a daily basis.
F-27
Table of Contents
JOHN HANCOCK LIFE INSURANCE COMPANY (U.S.A.)
NOTES TO CONSOLIDATED FINANCIAL STATEMENTS – (CONTINUED)
Note 2 — Investments - (continued)
Assets on Deposit and Pledged as Collateral
The Company maintains assets which are pledged as collateral in connection with various agreements and transactions. Additionally, the Company holds assets on deposit with government authorities as required by state law. The following table summarizes the fair value of the pledged or deposited assets:
| December 31, | ||||||||
| 2012 | 2011 | |||||||
|
|
|
|||||||
| (in millions) | ||||||||
| Bonds pledged in support of over-the-counter derivative instruments |
$ | 114 | $ | 134 | ||||
| Bonds pledged in support of exchange-traded futures |
552 | 800 | ||||||
| Bonds on deposit with government authorities |
36 | 36 | ||||||
| Mortgage loans pledged in support of real estate |
52 | 52 | ||||||
|
|
|
|
|
|||||
| Total assets pledged as collateral and on deposit |
$ | 754 | $ | 1,022 | ||||
|
|
|
|
|
|||||
Mortgage Loans on Real Estate
At December 31, 2012 and 2011, the mortgage portfolio was diversified by specific collateral property type and geographic region as displayed below:
December 31, 2012:
| Collateral Property Type |
Carrying Amount |
Geographic Concentration |
Carrying Amount |
|||||||
|
|
|
|||||||||
| (in millions) | (in millions) | |||||||||
| Apartments |
$ | 2,162 | East North Central | $ | 1,477 | |||||
| Industrial |
1,380 | East South Central | 166 | |||||||
| Office buildings |
3,711 | Middle Atlantic | 2,258 | |||||||
| Retail |
3,613 | Mountain | 719 | |||||||
| Mixed use |
6 | New England | 939 | |||||||
| Agricultural |
507 | Pacific | 3,589 | |||||||
| Agribusiness |
853 | South Atlantic | 2,782 | |||||||
| Other |
1,004 | West North Central | 482 | |||||||
| West South Central | 649 | |||||||||
| Canada / Other | 175 | |||||||||
| Provision for losses |
(44 | ) | Provision for losses | (44 | ) | |||||
|
|
|
|
|
|||||||
| Total |
$ | 13,192 | Total | $ | 13,192 | |||||
|
|
|
|
|
|||||||
F-28
Table of Contents
JOHN HANCOCK LIFE INSURANCE COMPANY (U.S.A.)
NOTES TO CONSOLIDATED FINANCIAL STATEMENTS – (CONTINUED)
Note 2 — Investments - (continued)
December 31, 2011:
| Collateral Property Type |
Carrying Amount |
Geographic Concentration |
Carrying Amount |
|||||||
|
|
|
|||||||||
| (in millions) | (in millions) | |||||||||
| Apartments |
$ | 2,017 | East North Central | $ | 1,511 | |||||
| Industrial |
1,743 | East South Central | 219 | |||||||
| Office buildings |
4,029 | Middle Atlantic | 2,288 | |||||||
| Retail |
3,579 | Mountain | 888 | |||||||
| Mixed use |
183 | New England | 1,017 | |||||||
| Agricultural |
622 | Pacific | 3,665 | |||||||
| Agribusiness |
930 | South Atlantic | 2,904 | |||||||
| Other |
916 | West North Central | 568 | |||||||
| West South Central | 771 | |||||||||
| Canada / Other | 188 | |||||||||
| Provision for losses |
(45 | ) | Provision for losses | (45 | ) | |||||
|
|
|
|
|
|||||||
| Total |
$ | 13,974 | Total | $ | 13,974 | |||||
|
|
|
|
|
|||||||
At the end of each quarter, the MFC Loan Review Committee reviews all mortgage loans rated BB or lower, as determined by review of the underlying collateral, and decides whether an allowance for credit loss is needed. The Company considers collateral value, the borrower’s ability to pay, normal historical credit loss levels, and future expectations in evaluating whether an allowance for credit losses is required for impaired loans.
Changes in the allowance for probable losses on mortgage loans on real estate are summarized below:
| Balance at Beginning of Period |
Additions | Recoveries | Charge-offs and Disposals |
Balance at End of Period |
||||||||||||||||
|
|
|
|||||||||||||||||||
| (in millions) | ||||||||||||||||||||
| Year ended December 31, 2012 |
$ | 45 | $ | 24 | $ | (1 | ) | $ | (24 | ) | $ | 44 | ||||||||
| Year ended December 31, 2011 |
34 | 38 | (1 | ) | (26 | ) | 45 | |||||||||||||
| Year ended December 31, 2010 |
42 | 38 | (5 | ) | (41 | ) | 34 | |||||||||||||
A mortgage loan charge-off is recorded when the impaired loan is disposed or when an impaired loan is determined to be a full loss with no possibility of recovery. Charge-offs are deducted from the allowance for probable losses.
Mortgage loans with a carrying value of $75 million were non-income producing for the year ended December 31, 2012. Mortgage loans with a carrying value of $75 million were on nonaccrual status at December 31, 2012. At December 31, 2012, mortgage loans with a carrying value of $15 million were delinquent by less than 90 days and $22 million were delinquent by 90 days or more.
F-29
Table of Contents
JOHN HANCOCK LIFE INSURANCE COMPANY (U.S.A.)
NOTES TO CONSOLIDATED FINANCIAL STATEMENTS – (CONTINUED)
Note 2 — Investments - (continued)
The Company provides for credit risk on mortgage loans by establishing allowances against the carrying value of the impaired loans. The total recorded investment in mortgage loans that is considered to be impaired along with the related allowance for credit losses was as follows:
| December 31, | ||||||||
| 2012 | 2011 | |||||||
|
|
|
|||||||
| (in millions) | ||||||||
| Impaired mortgage loans on real estate with provision for losses |
$ | 119 | $ | 131 | ||||
| Allowance for credit losses |
(44 | ) | (45 | ) | ||||
|
|
|
|
|
|||||
| Net impaired mortgage loans on real estate |
$ | 75 | $ | 86 | ||||
|
|
|
|
|
|||||
The average recorded investment in impaired loans and the interest income recognized on impaired loans were as follows:
| December 31, | ||||||||||||
| 2012 | 2011 | 2010 | ||||||||||
|
|
|
|||||||||||
| (in millions) | ||||||||||||
| Average recorded investment in impaired loans |
$ | 105 | $ | 109 | $ | 130 | ||||||
| Interest income recognized on impaired loans |
- | - | - | |||||||||
For mortgage loans, the Company evaluates credit quality through regular monitoring of credit related exposures, considering both qualitative and quantitative factors in assigning an internal risk rating (IRR). These ratings are updated at least annually.
The carrying value of mortgage loans by IRR was as follows:
| December 31, | ||||||||
| 2012 | 2011 | |||||||
|
|
|
|||||||
| (in millions) | ||||||||
| AAA |
$ | 319 | $ | 154 | ||||
| AA |
1,460 | 1,310 | ||||||
| A |
2,928 | 2,749 | ||||||
| BBB |
7,648 | 8,811 | ||||||
| BB |
529 | 577 | ||||||
| B and lower and unrated |
308 | 373 | ||||||
|
|
|
|
|
|||||
| Total |
$ | 13,192 | $ | 13,974 | ||||
|
|
|
|
|
|||||
Investment Real Estate, Agriculture, and Timber
Investment real estate, agriculture, and timber of $136 million was non-income producing for the year ended December 31, 2012. Depreciation expense on investment real estate, agriculture, and timber was $84 million, $69 million, and $63 million in 2012, 2011, and 2010, respectively. Accumulated depreciation was $602 million and $514 million at December 31, 2012 and 2011, respectively.
F-30
Table of Contents
JOHN HANCOCK LIFE INSURANCE COMPANY (U.S.A.)
NOTES TO CONSOLIDATED FINANCIAL STATEMENTS – (CONTINUED)
Note 2 — Investments - (continued)
Other Invested Assets
Other invested assets primarily consist of unconsolidated joint ventures, partnerships, and limited liability corporations, which are accounted for using the equity method of accounting. The carrying value of equity method investments totaled $4,458 million and $3,951 million at December 31, 2012 and 2011, respectively. Net investment income on investments accounted for under the equity method totaled $218 million, $222 million, and $197 million in 2012, 2011, and 2010, respectively. Total combined assets of such investments were $62,974 million and $55,010 million (consisting primarily of investments) and total combined liabilities were $14,830 million and $16,466 million (including $9,698 million and $10,547 million of debt) at December 31, 2012 and 2011, respectively. Total combined revenues and expenses of these investments in 2012 were $8,639 million and $4,696 million, respectively, resulting in $3,943 million of total combined income (loss) from operations. Total combined revenues and expenses of these investments in 2011 were $8,516 million and $4,750 million, respectively, resulting in $3,766 million of total combined income (loss) from operations. Total combined revenues and expenses of these investments in 2010 were $5,772 million and $4,884 million, respectively, resulting in $888 million of total combined income (loss) from operations. Depending on the timing of receipt of the audited financial statements of these other invested assets, the above investee level financial data may be up to one year in arrears.
Net Investment Income and Net Realized Investment and Other Gains (Losses)
The following information summarizes the components of net investment income and net realized investment and other gains (losses):
| December 31, | ||||||||||||
| 2012 | 2011 | 2010 | ||||||||||
|
|
|
|||||||||||
| (in millions) | ||||||||||||
| Net investment income |
||||||||||||
| Fixed maturities |
$ | 2,943 | $ | 3,425 | $ | 3,199 | ||||||
| Equity securities |
7 | 9 | 10 | |||||||||
| Mortgage loans on real estate |
771 | 798 | 766 | |||||||||
| Investment real estate, agriculture, and timber |
216 | 205 | 171 | |||||||||
| Policy loans |
300 | 305 | 326 | |||||||||
| Short-term investments |
8 | 9 | 12 | |||||||||
| Derivatives |
405 | 196 | 12 | |||||||||
| Equity method investments and other |
182 | 303 | 269 | |||||||||
|
|
|
|||||||||||
| Gross investment income |
4,832 | 5,250 | 4,765 | |||||||||
| Less investment expenses |
(273 | ) | (261 | ) | (269 | ) | ||||||
|
|
|
|||||||||||
| Net investment income |
$ | 4,559 | $ | 4,989 | $ | 4,496 | ||||||
|
|
|
|||||||||||
| December 31, | ||||||||||||
|
|
|
|||||||||||
| 2012 | 2011 | 2010 | ||||||||||
|
|
|
|||||||||||
| (in millions) | ||||||||||||
| Net realized investment and other gains (losses) |
||||||||||||
| Fixed maturities |
$ | 1,025 | $ | 1,131 | $ | 726 | ||||||
| Equity securities |
40 | (11 | ) | 29 | ||||||||
| Mortgage loans on real estate |
58 | (82 | ) | (62 | ) | |||||||
| Derivatives |
(3,441 | ) | 2,137 | (558 | ) | |||||||
| Other invested assets |
189 | 62 | 30 | |||||||||
| Amounts credited to participating contract holders |
(39 | ) | (102 | ) | (83 | ) | ||||||
|
|
|
|
|
|
|
|||||||
| Net realized investment and other gains (losses) |
$ | (2,168 | ) | $ | 3,135 | $ | 82 | |||||
|
|
|
|
|
|
|
|||||||
F-31
Table of Contents
JOHN HANCOCK LIFE INSURANCE COMPANY (U.S.A.)
NOTES TO CONSOLIDATED FINANCIAL STATEMENTS – (CONTINUED)
Note 2 — Investments - (continued)
The change in net unrealized gains (losses) on fixed maturities classified as held-for-trading of $33 million, $46 million, and $34 million is included in net realized investment and other gains (losses) for the years ended December 31, 2012, 2011, and 2010, respectively.
The change in net unrealized gains (losses) on held-for-trading equities, included in net realized investment and other gains (losses) was $7 million, $(10) million, and $10 million for the years ended December 31, 2012, 2011, and 2010, respectively.
The change in net unrealized gains (losses) on derivatives of $(1,941) million, $2,687 million, and $(229) million is included in net realized investment and other gains (losses) for the years ended December 31, 2012, 2011, and 2010, respectively.
For the years ended December 31, 2012, 2011, and 2010, net investment income passed through to participating contract holders as interest credited to policyholders’ account balances amounted to $91 million, $100 million, and $106 million, respectively.
Gross gains were realized on the sale of available-for-sale securities of $1,284 million, $1,619 million, and $774 million for the years ended December 31, 2012, 2011, and 2010, respectively, and gross losses were realized on the sale of available-for-sale securities of $199 million, $291 million, and $194 million for the years ended December 31, 2012, 2011, and 2010, respectively. In addition, other-than-temporary impairments on available-for-sale securities of $95 million, $70 million, and $115 million for the years ended December 31, 2012, 2011, and 2010, respectively, were recognized in the Consolidated Statements of Operations.
Note 3 — Relationships with Variable Interest Entities
In its capacities as an investor and as an investment manager, the Company has relationships with various types of entities, some of which are considered variable interest entities (“VIEs”).
The Company consolidates a VIE when it is determined that it is the primary beneficiary of the VIE, or controls the VIE. The Company’s analysis to determine whether it must consolidate the VIE includes review of the Company’s contractual rights and responsibilities, fees received, and interests held. For the purpose of disclosing consolidated variable interest entities, the Company aggregates similar entities.
If it is not considered to be the primary beneficiary of the VIE, nor does it have control over the VIE, the Company assesses the materiality of its relationship with the VIE to determine if it holds a significant variable interest, which requires disclosure. This assessment considers the materiality of the VIE relationship to the Company as, among other factors, a percentage of total investments, percentage of total net investment income, and percentage of total funds under management. For purposes of assessing materiality and disclosing significant variable interests, the Company aggregates similar entities.
Consolidated Variable Interest Entities
The following table presents the total assets and total liabilities relating to VIEs for which the Company has concluded that it is the primary beneficiary or in control and which are consolidated in the Company’s financial statements. The liabilities recognized as a result of consolidating the VIEs do not represent claims against the general assets of the Company. Conversely, the assets recognized as a result of consolidating the VIEs can only be used to settle the liabilities recognized as a result of consolidating the VIEs.
| December 31, | ||||||||||||||||
| 2012 | 2011 | |||||||||||||||
|
|
|
|||||||||||||||
| Total Assets | Total Liabilities | Total Assets | Total Liabilities | |||||||||||||
| (in millions) | ||||||||||||||||
| Collateralized debt obligations |
||||||||||||||||
| (“CDOs”) |
$ | 71 | $ | 50 | $ | 198 | $ | 147 | ||||||||
F-32
Table of Contents
JOHN HANCOCK LIFE INSURANCE COMPANY (U.S.A.)
NOTES TO CONSOLIDATED FINANCIAL STATEMENTS – (CONTINUED)
Note 3 — Relationships with Variable Interest Entities - (continued)
Significant Variable Interests in Unconsolidated Variable Interest Entities
The following table presents the total assets of, investment in, and maximum exposure to loss relating to VIEs for which the Company has concluded that it holds significant variable interests, but it is not the primary beneficiary, nor does it have control over the VIE, and which have not been consolidated. The Company does not record any liabilities related to these unconsolidated VIEs.
| 2012 | 2011 | |||||||||||||||||||||||
| Total Assets | Investment (1) | Maximum Exposure to Loss (2) |
Total Assets | Investment (1) | Maximum Exposure to Loss (2) |
|||||||||||||||||||
| (in millions) | ||||||||||||||||||||||||
| Collateralized debt obligations (3) |
$ | 341 | $ | - | $ | - | $ | 448 | $ | - | $ | - | ||||||||||||
| Real estate limited partnerships (4) |
1,158 | 314 | 323 | 1,289 | 378 | 392 | ||||||||||||||||||
| Timber funds (5) |
3,601 | 478 | 496 | 2,058 | 109 | 136 | ||||||||||||||||||
|
|
|
|
|
|
|
|
|
|
|
|
|
|||||||||||||
| Total |
$ | 5,100 | $ | 792 | $ | 819 | $ | 3,795 | $ | 487 | $ | 528 | ||||||||||||
|
|
|
|
|
|
|
|
|
|
|
|
|
|||||||||||||
| (1) | The Company’s investments in unconsolidated VIEs are included in available-for-sale fixed maturity securities and other invested assets on the Consolidated Balance Sheets. |
| (2) | The maximum exposure to loss related to CDOs is limited to the investment reported on the Company’s Consolidated Balance Sheets. The maximum exposure to loss related to real estate limited partnerships and timber funds is limited to the Company’s investment plus unfunded capital commitments. The maximum loss is expected to occur only upon bankruptcy of the issuer or investee or as a result of a natural disaster in the case of the timber funds. |
| (3) | The Company acts as an investment manager to certain CDOs for which it collects a management fee. In addition, the Company may invest in debt or equity securities issued by these CDOs or by CDOs managed by others. CDOs raise capital by issuing debt and equity securities and use the proceeds to purchase investments. |
| (4) | Real estate limited partnerships include partnerships established for the purpose of investing in real estate that qualifies for low income housing and/or historic tax credits. Limited partnerships are owned by a general partner, who manages the business, and by limited partners, who invest capital, but have limited liability and are not involved in the partnerships’ management. The Company is typically the sole limited partner or investor member of each and is not the general partner or managing member. |
| (5) | The Company acts as investment manager for the VIEs owning the timberland properties (the “timber funds”), in which the general account and institutional separate accounts invests. Timber funds are investment vehicles used primarily by large institutional investors, such as public and corporate pension plans, whose primary source of return is derived from the growth and harvest of timber and long-term appreciation of the property. The primary risks related to timberland investments include market value uncertainty (due to fluctuations in market prices for timberland outputs), liquidity risk (as compared to stocks and other financial instruments), and environmental risk (natural hazards or legislation related to threatened or endangered species). These risks are mitigated through effective investment management and geographic diversification of timberland investments and sound environmental risk governance practices. The Company collects an advisory fee from each timber fund and is also eligible for performance and forestry management fees. |
F-33
Table of Contents
JOHN HANCOCK LIFE INSURANCE COMPANY (U.S.A.)
NOTES TO CONSOLIDATED FINANCIAL STATEMENTS – (CONTINUED)
Note 4 — Goodwill, Value of Business Acquired, and Other Intangible Assets
The changes in the carrying value of goodwill by segment were as follows:
| Insurance | Wealth Management |
Corporate and Other |
Total | |||||||||||||
|
|
|
|||||||||||||||
| (in millions) | ||||||||||||||||
| Balance at January 1, 2012 |
$ | - | $ | 807 | $ | 146 | $ | 953 | ||||||||
| Impairment |
- | - | - | - | ||||||||||||
|
|
|
|||||||||||||||
| Balance at December 31, 2012 |
$ | - | $ | 807 | $ | 146 | $ | 953 | ||||||||
|
|
|
|||||||||||||||
| Insurance | Wealth Management |
Corporate and Other |
Total | |||||||||||||
|
|
|
|||||||||||||||
| (in millions) | ||||||||||||||||
| Balance at January 1, 2011 |
$ | - | $ | 1,307 | $ | 146 | $ | 1,453 | ||||||||
| Impairment |
- | (500 | ) | - | (500 | ) | ||||||||||
|
|
|
|||||||||||||||
| Balance at December 31, 2011 |
$ | - | $ | 807 | $ | 146 | $ | 953 | ||||||||
|
|
|
|||||||||||||||
The Company tests goodwill for impairment annually and more frequently if an event occurs or circumstances change that would more likely than not reduce the fair value of a reporting unit below its carrying amount. A reporting unit is defined as an operating segment or one level below an operating segment. In 2012, the Company had no goodwill impairment. In 2011, the Company impaired $500 million of goodwill associated with the Wealth Management segment. In 2010, the Company impaired the entire $1,600 million of goodwill associated with the Insurance segment. The impairments were reflective of the decrease in the expected future earnings for these businesses. The fair values were determined primarily using an earnings-based approach, which incorporated the segments’ in-force and new business embedded value using internal forecasts of revenue and expense.
Value of Business Acquired
The balance of and changes in VOBA were as follows:
| December 31, | ||||||||
| 2012 | 2011 | |||||||
|
|
|
|||||||
| (in millions) | ||||||||
| Balance, beginning of year |
$ | 1,321 | $ | 1,959 | ||||
| Amortization |
(224 | ) | (389 | ) | ||||
| Change due to unrealized investment gains (losses) |
136 | (249 | ) | |||||
| Reinsurance recapture (1) |
(37 | ) | - | |||||
|
|
|
|||||||
| Balance, end of year |
$ | 1,196 | $ | 1,321 | ||||
|
|
|
|||||||
| (1) | The amount relates to a universal life block of business that was recaptured by a third party resulting in the write off of the associated value of business acquired. The net impact of this recapture transaction was an $8 million gain and was recorded in fee income in the Consolidated Statement of Operations. |
F-34
Table of Contents
JOHN HANCOCK LIFE INSURANCE COMPANY (U.S.A.)
NOTES TO CONSOLIDATED FINANCIAL STATEMENTS – (CONTINUED)
Note 4 — Goodwill, Value of Business Acquired, and Other Intangible Assets - (continued)
The following table provides estimated future amortization for the periods indicated:
| VOBA Amortization |
||||
| (in millions) | ||||
| 2013 |
$ | 116 | ||
| 2014 |
96 | |||
| 2015 |
92 | |||
| 2016 |
85 | |||
| 2017 |
81 | |||
F-35
Table of Contents
JOHN HANCOCK LIFE INSURANCE COMPANY (U.S.A.)
NOTES TO CONSOLIDATED FINANCIAL STATEMENTS – (CONTINUED)
Note 4 — Goodwill, Value of Business Acquired, and Other Intangible Assets - (continued)
Other Intangible Assets
Other intangible assets were as follows:
| Gross Carrying Amount |
Accumulated Net Amortization |
Net Carrying Amount |
||||||||||
|
|
|
|||||||||||
| (in millions) | ||||||||||||
| December 31, 2012 |
||||||||||||
| Not subject to amortization: |
||||||||||||
| Brand name |
$ | 600 | $ | - | $ | 600 | ||||||
| Investment management contracts |
295 | - | 295 | |||||||||
| Other |
5 | - | 5 | |||||||||
| Subject to amortization: |
||||||||||||
| Distribution networks |
397 | (73 | ) | 324 | ||||||||
| Other investment management contracts |
56 | (30 | ) | 26 | ||||||||
|
|
|
|||||||||||
| Total |
$ | 1,353 | $ | (103 | ) | $ | 1,250 | |||||
|
|
|
|||||||||||
| December 31, 2011 |
||||||||||||
| Not subject to amortization: |
||||||||||||
| Brand name |
$ | 600 | $ | - | $ | 600 | ||||||
| Investment management contracts |
295 | - | 295 | |||||||||
| Other |
5 | - | 5 | |||||||||
| Subject to amortization: |
||||||||||||
| Distribution networks |
397 | (60 | ) | 337 | ||||||||
| Other investment management contracts |
64 | (31 | ) | 33 | ||||||||
|
|
|
|||||||||||
| Total |
$ | 1,361 | $ | (91 | ) | $ | 1,270 | |||||
|
|
|
|||||||||||
Amortization expense for other intangible assets was $16 million, $15 million, and $14 million for the years ended December 31, 2012, 2011, and 2010, respectively. Amortization expense for other intangible assets is expected to be approximately $17 million in 2013, $18 million in 2014, $17 million in 2015, $16 million in 2016, and $16 million in 2017.
During 2012, the Company impaired $4 million of other investment management contracts subject to amortization associated with the Corporate and Other segment. The impairment was recorded in other operating costs and expenses in the Consolidated Statement of Operations. The gross carrying value of the impaired other investment management contracts was $8 million and the associated accumulated amortization was $4 million. The impairments were reflective of a decrease in expected future earnings. The fair values were determined primarily using an earnings based approach using internal forecasts of revenue and expense.
F-36
Table of Contents
JOHN HANCOCK LIFE INSURANCE COMPANY (U.S.A.)
NOTES TO CONSOLIDATED FINANCIAL STATEMENTS – (CONTINUED)
Note 5 — Deferred Policy Acquisition Costs and Deferred Sales Inducements
The balance of and changes in deferred policy acquisition costs were as follows:
| December 31, | ||||||||
| 2012 | 2011 | |||||||
|
|
|
|||||||
| (in millions) | ||||||||
| Balance, beginning of year |
$ | 6,111 | $ | 8,657 | ||||
| Capitalization |
715 | 755 | ||||||
| Amortization |
(1,084 | ) | (2,330 | ) | ||||
| Change due to unrealized investment gains |
25 | (971 | ) | |||||
|
|
|
|||||||
| Balance, end of year |
$ | 5,767 | $ | 6,111 | ||||
|
|
|
|||||||
The balance of and changes in deferred sales inducements were as follows:
| December 31, | ||||||||
| 2012 | 2011 | |||||||
|
|
|
|||||||
| (in millions) | ||||||||
| Balance, beginning of year |
$ | 187 | $ | 321 | ||||
| Capitalization |
4 | 11 | ||||||
| Amortization |
(77 | ) | (122 | ) | ||||
| Change due to unrealized investment gains |
32 | (23 | ) | |||||
|
|
|
|||||||
| Balance, end of year |
$ | 146 | $ | 187 | ||||
|
|
|
|||||||
See the Summary of Significant Accounting Policies Note for information on the retrospective application of the adoption of new accounting guidance related to DAC and DSI.
Note 6 — Related Party Transactions
Reinsurance Transactions
Effective December 31, 2008, the Company entered into an amended and restated reinsurance agreement with an affiliate, John Hancock Reassurance Company Limited (“JHRECO”), to reinsure 20% of the risk related to payout annuity policies issued January 1, 2008 through September 30, 2008 and 65% of the risk related to payout annuity policies issued prior to January 1, 2008. The reinsurance agreement is written on a modified coinsurance basis where the assets supporting the reinsured policies remain invested with the Company. The Company reported a reinsurance recoverable from JHRECO for ceded reserves and cost of reinsurance of ($180) million and ($161) million at December 31, 2012 and 2011, respectively, on the Company’s Consolidated Balance Sheets. As of December 31, 2012 and 2011, respectively, the Company reported a reinsurance payable to JHRECO of $29 million and $32 million, which was included with amounts due from and held for affiliates on the Company’s Consolidated Balance Sheets. Premiums ceded to JHRECO were $1 million, $93 million, and $1 million during the years ended December 31, 2012, 2011, and 2010 , respectively. Claims incurred ceded to JHRECO were $438 million, $520 million, and $465 million during the years ended December 31, 2012, 2011, and 2010, respectively.
The Company reinsured certain portions of its long-term care insurance and group annuity contracts with JHRECO. The Company entered into these reinsurance contracts in order to facilitate its capital management process. These reinsurance contracts are written both on a funds withheld basis and a modified coinsurance basis. As of July 1, 2010, amendments were made to the contracts to update the calculation of investment income and the expense allowance to reflect current experience. The Company recorded a liability for coinsurance funds withheld from JHRECO of $5,995 million and $5,439 million at December 31, 2012 and 2011, respectively, and recorded reinsurance recoverable from JHRECO of $6,232 million and $5,981 million at December 31, 2012 and 2011, respectively, on the Company’s Consolidated Balance Sheets. Premiums ceded to JHRECO were $613 million, $609 million, and $625 million during the years ended December 31, 2012, 2011, and 2010, respectively. Claims
F-37
Table of Contents
JOHN HANCOCK LIFE INSURANCE COMPANY (U.S.A.)
NOTES TO CONSOLIDATED FINANCIAL STATEMENTS – (CONTINUED)
Note 6 — Related Party Transactions - (continued)
incurred ceded to JHRECO were $313 million, $271 million, and $245 million during the years ended December 31, 2012, 2011, and 2010, respectively.
Effective October 1, 2008, the Company entered into a reinsurance agreement with an affiliate, Manulife Reinsurance (Bermuda) Limited (“MRBL”), to reinsure 75% of certain group annuity contracts in-force. The reinsurance agreement covers all contracts, excluding the guaranteed benefit rider, issued and in-force as of September 30, 2008. As the underlying contracts being reinsured are considered investment contracts, the agreement does not meet the criteria for reinsurance accounting and was classified as a financial instrument. Effective October 1, 2009, the original agreement was amended to increase the quota share percentage from 75% to 87%. Under the terms of the amended agreement, additional consideration of $250 million was paid by MRBL and is being amortized into income through other operating costs and expenses on a basis consistent with the manner in which the deferred policy acquisition costs on the underlying reinsured contracts are recognized. The balance of the unearned revenue liability was $1,072 million and $1,308 million as of December 31, 2012 and 2011, respectively.
Effective October 1, 2008, the Company entered into an amended and restated reinsurance agreement with MRBL to reinsure 90% of a significant block of variable annuity contracts in-force. All substantial risks, including all guaranteed benefits, related to certain specified policies not already reinsured to third parties, are reinsured under the agreement. The base contracts are reinsured on a modified coinsurance basis, while the guaranteed benefit reinsurance coverage is apportioned in accordance with the reinsurance agreement provisions between modified coinsurance and coinsurance funds withheld. The assets supporting the reinsured policies remain invested with the Company. Since the inception of the treaty in 2008, several amendments have been enacted to refine certain aspects of the treaty. As of December 31, 2012 and 2011, respectively, the Company reported a reinsurance recoverable (payable) for ceded reserves and cost of reinsurance of $1,083 million and ($205) million. As of December 31, 2012 and 2011, respectively, the Company reported a coinsurance funds withheld liability of $267 million and $0 million on the Consolidated Balance Sheets. As of December 31, 2012 and 2011, respectively, the Company reported a reinsurance receivable from MRBL of $(35) million and $47 million, which was included with amounts due from and held for affiliates. The net MRBL reinsurance recoverable includes the impact of ongoing reinsurance cash flows and is accounted for over the life of the underlying reinsured policies using assumptions consistent with those used to account for the underlying policies with changes to ceded reserves and cost of reinsurance recognized as a component of benefits to policyholders on the Consolidated Statements of Operations.
Effective December 31, 2004, the Company entered into a reinsurance agreement with MRBL to reinsure 75% of the non-reinsured risk of the JHLICO closed block. The Company amended this treaty during 2008 to increase the portion of non-reinsured risk reinsured under this treaty to 90% and amended it during 2009 to provide additional surplus relief. The reinsurance agreement is written on a modified coinsurance basis where the related financial assets remain invested with the Company. As the reinsurance agreement does not subject the reinsurer to the reasonable possibility of significant loss, it was classified as financial reinsurance and given deposit-type accounting treatment with only the reinsurance risk fee being reported in other operating costs and expenses in the Consolidated Statements of Operations.
Effective December 31, 2003, the Company entered into a reinsurance agreement with MRBL to reinsure 90% of the non-reinsured risk of the JHUSA closed block. As approximately 90% of the mortality risk is covered under previously existing contracts with third-party reinsurers and the resulting limited mortality risk is inherent in the new contract with MRBL, it was classified as financial reinsurance and given deposit-type accounting treatment. The Company retained title to the invested assets supporting this block of business. These invested assets are held in trust on behalf of MRBL and are included in amounts due from and held for affiliates on the Consolidated Balance Sheets. The amounts held at December 31, 2012 and 2011 were $2,487 million and $2,463 million, respectively, and are accounted for on a basis consistent with the methodologies described in the Significant Accounting Policy Note for similar financial instruments.
Service Agreements
The Company has formal service agreements with MFC and MLI, which can be terminated by either party upon two months’ notice. Under the various agreements, the Company will pay operating expenses incurred by MFC and MLI on behalf of the Company. Services provided under the agreements include legal, actuarial, investment, data processing, accounting, and certain other administrative services. Costs incurred under the agreements were $482 million, $457 million, and $412 million for the years ended December 31, 2012, 2011, and 2010, respectively. As of December 31, 2012 and 2011, the Company had amounts payable to MFC and MLI of $17 million and $11 million, respectively.
F-38
Table of Contents
JOHN HANCOCK LIFE INSURANCE COMPANY (U.S.A.)
NOTES TO CONSOLIDATED FINANCIAL STATEMENTS – (CONTINUED)
Note 6 — Related Party Transactions - (continued)
Management believes the allocation methods used are reasonable and appropriate in the circumstances; however, the Company’s Consolidated Balance Sheets and Consolidated Statements of Operations may not necessarily be indicative of the financial condition that would have existed if the Company operated as an unaffiliated entity.
Debt Transactions
Pursuant to subordinated surplus notes dated September 30, 2008, the Company borrowed $405 million from an affiliate, John Hancock Insurance Agency, Inc. (“JHIA”). The interest rate is fixed at 7%, and interest is payable semi-annually. The notes mature on March 31, 2033. Interest expense was $29 million, $29 million, and $29 million for the years ended December 31, 2012, 2011, and 2010, respectively.
On December 22, 2006, the Company issued a subordinated note that was converted on September 30, 2008 to a subordinated surplus note. The outstanding amount to JHFC of $136 million is due December 15, 2016. Interest on the subordinated surplus note from October 1, 2008 until December 15, 2011 accrued at a variable rate equal to LIBOR plus 0.3% per annum calculated and reset quarterly on March 31, June 30, September 30, and December 31 and payable semi-annually on March 31 and September 30 of each year. Thereafter, interest accrues at a variable rate equal to LIBOR plus 1.3% per annum reset quarterly as aforementioned and payable semi-annually on June 15 and December 15 of each year until payment in full. Interest expense was $2 million, $0 million, and $1 million for the years ended December 31, 2012, 2011, and 2010, respectively.
The issuance of the above surplus notes by the Company was approved by the Michigan Commissioner of Financial and Insurance Regulation (the “Commissioner”), and any payments of interest or principal on the surplus notes require the prior approval of the Commissioner. The surplus notes are included with amounts due to affiliates on the Consolidated Balance Sheets.
Pursuant to a demand note receivable dated September 30, 2008, the Company has $295 million outstanding with MIC. The interest rate is calculated at a fluctuating rate equal to 3-month LIBOR plus 0.83% per annum. Interest income was $4 million, $3 million, and $3 million for the years ended December 31, 2012, 2011, and 2010, respectively.
On December 28, 2011, the Company issued a promissory note to Manulife Management Services Limited (“MMSL”) in the amount of $200 million. During 2012, this balance was repaid in full. Interest on the loan was calculated at a fluctuating rate equal to LIBOR plus 0.1% per annum calculated and reset monthly and payable at maturity. Interest expense was $1 million and $0 million for the years ended December 31, 2012 and 2011, respectively.
On June 28, 2012, the Company issued a promissory note to Manulife Finance Switzerland AG (“MFSA”) in the amount of $153 million. Interest on the loan is calculated at a fluctuating rate equal to 3-month LIBOR plus 0.9% per annum payable quarterly with a maturity date of June 28, 2013. In addition, the Company renewed two previously outstanding promissory notes to MFSA with an outstanding balance of $7 million and combined these notes with the new note issued on June 12, 2012, thus bringing the total principal balance due to $160 million, with the terms noted above. Interest expense was $1 million and $0 million for the years ended December 31, 2012 and 2011, respectively.
On December 20, 2012, MIC issued a demand note to the Company in the amount of $130 million. Interest on the loan is calculated at a fluctuating rate equal to the LIBOR rate and is payable monthly. Interest expense was $0 million for the year ended December 31, 2012.
The fair value of the Company’s related party notes payable and note receivable totaled $831 million and $295 million, respectively, at December 31, 2012, and $748 million and $295 million, respectively at December 31, 2011.
Capital Stock Transactions
On December 16, 2010, the Company issued one share of common stock to MIC for $350 million in cash.
Other
On December 31, 2010, the Company issued a noncash dividend of $13 million to MIC as part of the transfer of certain pension and postretirement benefit plans.
F-39
Table of Contents
JOHN HANCOCK LIFE INSURANCE COMPANY (U.S.A.)
NOTES TO CONSOLIDATED FINANCIAL STATEMENTS – (CONTINUED)
Note 6 — Related Party Transactions - (continued)
The Company, in the ordinary course of business invests funds deposited by customers and manages the resulting invested assets for growth and income for customers. From time to time, successful investment strategies of the Company may attract deposits from affiliates of the Company. At December 31, 2012 and 2011, the Company managed approximately $8,947 million and $5,040 million of affiliate assets under management, respectively.
The Company has entered into two currency swap agreements with JHFC which are recorded at fair value. JHFC utilizes the currency swaps to hedge currency exposure on foreign currency financial instruments. The Company has also entered into two currency agreements with external counterparties which offset the currency swap agreements with JHFC. As of December 31, 2012 and 2011, the currency swap agreements with JHFC and the external counterparties had offsetting fair values of $84 million and $124 million, respectively.
JHUSA operates a liquidity pool in which affiliates can invest excess cash. Terms of operation and participation in the liquidity pool are set out in the Second Restated and Amended Liquidity Pool and Loan Facility Agreement effective January 1, 2010. The maximum aggregate amounts that JHUSA can accept into the Liquidity Pool are $5,000 million in U.S. dollar deposits and $200 million in Canadian dollar deposits. Under the terms of the agreement, certain participants may receive advances from the Liquidity Pool up to certain predetermined limits. Interest payable on the funds will be reset daily to the one-month London Interbank Bid Rate.
The following table details the affiliates and their participation in JHUSA’s Liquidity Pool:
| December 31, | ||||||||
| 2012 | 2011 | |||||||
|
|
|
|||||||
| (in millions) | ||||||||
| The Manufacturers Investment Corporation |
$ | 100 | $ | 202 | ||||
| John Hancock Financial Corporation |
89 | 40 | ||||||
| Manulife Reinsurance Limited |
35 | 121 | ||||||
| Manulife Reinsurance (Bermuda) Limited |
89 | 81 | ||||||
| Manulife Hungary Holdings KFT |
5 | 5 | ||||||
| John Hancock Insurance Company of Vermont |
18 | 16 | ||||||
| John Hancock Reassurance Company Limited |
15 | 10 | ||||||
| John Hancock Insurance Agency, Inc. |
10 | 6 | ||||||
|
|
|
|||||||
| Total |
$ | 361 | $ | 481 | ||||
|
|
|
|||||||
The balances above are reported on the Consolidated Balance Sheets as amounts due to affiliates.
On July 15, 2009, MFC fully and unconditionally guaranteed payments from the guarantee periods of the accumulation phase of the Company’s new market value adjusted deferred annuity contracts.
On July 8, 2005, MFC fully and unconditionally guaranteed JHLICO’s SignatureNotes, both those outstanding at that time and those to be issued subsequently. On December 9, 2009, MFC issued a guarantee of any new SignatureNotes to be issued by the Company.
MFC’s guarantees of the market value adjusted deferred annuity contracts and SignatureNotes are unsecured obligations of MFC and are subordinated in right of payment to the prior payment in full of all other obligations of MFC, except for other guarantees or obligations of MFC, which by their terms are designated as ranking equally in right of payment with or subordinate to MFC’s guarantees of the market value adjusted deferred annuity contracts and SignatureNotes. As a result of the guarantees by MFC, the Company is exempt from filing quarterly and annual reports with the U.S. Securities and Exchange Commission (“SEC”) pursuant to SEC Rule 12h-5, and in lieu thereof, MFC reports condensed consolidating financial information regarding the Company in its quarterly and annual reports.
F-40
Table of Contents
JOHN HANCOCK LIFE INSURANCE COMPANY (U.S.A.)
NOTES TO CONSOLIDATED FINANCIAL STATEMENTS – (CONTINUED)
Note 6 — Related Party Transactions - (continued)
Effective March 31, 1996, MLI provides a claims paying guarantee to certain U.S. policyholders. The claims guarantee agreement was revoked effective August 13, 2008, but still remains in effect with respect to policies issued by the Company prior to that date.
Note 7 — Reinsurance
The effect of reinsurance on life, health, and annuity premiums earned was as follows:
| Years ended December 31, | ||||||||||||
| 2012 | 2011 | 2010 | ||||||||||
|
|
|
|||||||||||
| (in millions) | ||||||||||||
| Direct |
$ | 3,591 | $ | 3,782 | $ | 4,192 | ||||||
| Assumed |
1,127 | 1,188 | 1,091 | |||||||||
| Ceded |
(1,919 | ) | (1,974 | ) | (1,651 | ) | ||||||
|
|
|
|||||||||||
| Net |
$ | 2,799 | $ | 2,996 | $ | 3,632 | ||||||
|
|
|
|||||||||||
For the years ended December 31, 2012, 2011, and 2010, benefits to policyholders under life, health, and annuity ceded reinsurance contracts were $3,101 million, $2,770 million, and $2,597 million, respectively.
The Company entered into a coinsurance agreement with Reinsurance Group of America (“RGA”) to reinsure 90% of its JHUSA fixed deferred annuity business effective April 1, 2012. The transaction was structured such that the Company transferred the actuarial liabilities and related invested assets which included $387 million in cash and approximately $4,916 million in fixed maturities and mortgage loans. The Company incurred a pre-tax loss of $56 million in connection with the transaction. Under the terms of the agreement, the Company will maintain responsibility for servicing of the policies and managing some of the assets. In addition, the agreement does not meet the criteria for reinsurance accounting and was given deposit-type accounting treatment that resulted in the recognition of an asset for amounts on deposit with reinsurers of $5,062 million on the Consolidated Balance Sheets.
The Company also entered into a coinsurance agreement with Commonwealth Annuity to reinsure 90% of its JHNY fixed deferred annuity business effective July 1, 2012. The transaction was structured such that the Company transferred the actuarial liabilities and related invested assets which included $231 million in cash and $1,481 million in fixed maturities. The Company incurred a pre-tax gain of $46 million in connection with the transaction. Under the terms of the agreement, the Company will maintain responsibility for servicing of the policies. In addition, the agreement does not meet the criteria for reinsurance accounting and was given deposit-type accounting treatment that resulted in the recognition of an asset for amounts on deposit with reinsurers of $1,701 million on the Consolidated Balance Sheets.
On July 1, 2011, the Company paid $159 million in fees to affiliates related to the recapture of Life Retrocession business reserves and net liabilities of $103 million from Manulife Reinsurance Limited and Manufacturers Life Insurance Company (Barbados Branch) resulting in a decrease to net income of $170 million, net of tax. Subsequent to the recapture transactions, the Company entered into a 100% coinsurance treaty with Pacific Life Insurance Company effective July 1, 2011. This treaty facilitated the transfer of Life Retrocession business reserves and net liabilities of $655 million, cash of $199 million and miscellaneous assets of $30 million resulting in a pre-tax gain of $426 million, which was deferred and included in reinsurance recoverable on the Consolidated Balance Sheets. This gain is amortized on a straight line basis over 10 years. Gain amortization for the years ended December 31, 2012 and 2011 were $43 million and $21 million, respectively.
Note 8 — Derivatives and Hedging Instruments
Derivatives are financial contracts, the value of which is derived from underlying interest rates, foreign exchange rates, other financial instruments, commodity prices or indices. The Company uses derivatives including swaps, forward and futures agreements, caps and floors, and options to manage current and anticipated exposures to changes in interest rates, foreign exchange rates, commodity prices and equity market prices, and to replicate permissible investments.
F-41
Table of Contents
JOHN HANCOCK LIFE INSURANCE COMPANY (U.S.A.)
NOTES TO CONSOLIDATED FINANCIAL STATEMENTS – (CONTINUED)
Note 8 — Derivatives and Hedging Instruments - (continued)
Swaps are over-the-counter (“OTC”) contractual agreements between the Company and a third party to exchange a series of cash flows based upon rates applied to a notional amount. For interest rate swaps, counterparties generally exchange fixed or floating interest rate payments based on a notional value in a single currency. Cross currency swaps involve the exchange of principal amounts between parties as well as the exchange of interest payments in one currency for the receipt of interest payments in another currency. Total return swaps are contracts that involve the exchange of payments based on changes in the values of a reference asset, including any returns such as interest earned on these assets, in return for amounts based on reference rates specified in the contract.
Forward and futures agreements are contractual obligations to buy or sell a financial instrument, foreign currency or other underlying commodity on a predetermined future date at a specified price. Forward contracts are OTC contracts negotiated between counterparties, whereas futures agreements are contracts with standard amounts and settlement dates that are traded on regulated exchanges.
Interest rate cap agreements are contracts with counterparties which require the payment of a premium for the right to receive payments for the difference between the cap interest rate and a market interest rate on specified future dates based on an underlying principal balance (notional principal). Similarly, interest rate floors are contracts with counterparties which require payment of a premium for the right to receive payments when the market interest rate on specified future dates falls below the agreed upon strike price.
Options are contractual agreements whereby the holder has the right, but not the obligation, to buy (call option) or sell (put option) a security, exchange rate, interest rate, or other financial instrument at a predetermined price/rate within a specified time.
Types of Derivatives and Derivative Strategies
Interest Rate Contracts. The Company uses interest rate futures contracts, interest rate swap agreements, and pre-payable interest rate swap agreements as part of its overall strategies of managing the duration of assets and liabilities or the average life of certain asset portfolios to specified targets. Interest rate swap agreements are contracts with counterparties to exchange interest rate payments of a differing character (i.e., fixed-rate payments exchanged for variable-rate payments) based on an underlying principal balance (notional principal). The net differential to be paid or received on interest rate swap agreements is accrued and recognized as a component of net investment income.
The Company uses interest rate swap agreements to hedge the variable cash flows associated with future fixed income asset acquisitions, which will support the Company’s long-term care and life insurance businesses. These agreements will reduce the impact of future interest rate changes on the cost of acquiring adequate assets to support the investment income assumptions used in pricing these products. During future periods when the acquired assets are held by the Company, the accumulated gain or loss will be amortized into investment income as a yield adjustment on the assets.
The Company also uses interest rate swap agreements to hedge the variable cash flows associated with payments that it will receive on certain floating rate fixed income securities. The accumulated gain or loss will be amortized into investment income as a yield adjustment when the payments are made.
The Company also enters into basis swaps to better match the cash flows from assets and related liabilities. Basis swaps are included in interest rate swaps for disclosure purposes. The Company utilizes basis swaps in non-qualifying hedging relationships.
Inflation swaps are used to reduce inflation risk generated from inflation-indexed liabilities. Inflation swaps are classified within interest rate swaps for disclosure purposes. The Company utilizes inflation swaps in qualifying and non-qualifying hedging relationships.
The Company uses exchange-traded interest rate futures primarily to hedge mismatches between the duration of assets in a portfolio and the duration of liabilities supported by those assets, to hedge against changes in value of securities the Company owns or anticipates acquiring, and to hedge against changes in interest rates on anticipated liability issuances by replicating U.S. Treasury or swap curve performance. The Company utilizes exchange-traded interest rate futures in non-qualifying hedging relationships.
F-42
Table of Contents
JOHN HANCOCK LIFE INSURANCE COMPANY (U.S.A.)
NOTES TO CONSOLIDATED FINANCIAL STATEMENTS – (CONTINUED)
Note 8 — Derivatives and Hedging Instruments - (continued)
The Company also purchases interest rate caps and floors primarily to protect against interest rate exposure arising from mismatches between assets and liabilities (duration mismatches). The Company utilizes interest rate caps and floors in non-qualifying hedging relationships.
Foreign Currency Contracts. Foreign currency derivatives, including foreign currency swaps and foreign currency forwards, are used by the Company to reduce the risk from fluctuations in foreign currency exchange rates associated with its assets and liabilities denominated in foreign currencies.
Cross currency rate swap agreements are used to manage the Company’s exposure to foreign exchange rate fluctuations, interest rate fluctuations, or both, on foreign currency financial instruments. Cross currency rate swap agreements are contracts to exchange the currencies of two different countries at the same rate of exchange at specified future dates. The net differential to be paid or received on cross currency rate swap agreements is accrued and recognized as a component of net investment income.
Under foreign currency forwards, the Company agrees with other parties to deliver a specified amount of an identified currency at a specified future date. Typically, the price is agreed upon at the time of the contract and payment for such a contract is made at the specified future date. The maturities of these forwards correspond with the future periods in which the foreign currency transactions are expected to occur. The Company utilizes currency forwards in qualifying and non-qualifying hedging relationships.
Credit Default Swaps. The Company manages credit risk through the issuance of credit default swaps (“CDS”). A CDS is a derivative instrument representing an agreement between two parties to exchange the credit risk of a single specified entity or an index based on the credit risk of a group of entities (all commonly referred to as the “reference entity” or a portfolio of “reference entities”), in return for a periodic premium. CDS contracts typically have a five-year term.
Equity Market Contracts. Total return swaps are contracts that involve the exchange of payments based on changes in the value of a reference asset, including any returns such as interest earned on these assets, in exchange for amounts based on reference rates specified in the contract. The Company utilizes total return swaps in qualifying and non-qualifying hedging relationships.
Equity index futures contracts are contractual obligations to buy or sell a specified amount of an underlying equity index at an agreed contract price on a specified date. Equity index futures are contracts with standard amounts and settlement dates that are traded on regulated exchanges. The Company utilizes equity index futures in non-qualifying hedging relationships.
F-43
Table of Contents
JOHN HANCOCK LIFE INSURANCE COMPANY (U.S.A.)
NOTES TO CONSOLIDATED FINANCIAL STATEMENTS – (CONTINUED)
Note 8 — Derivatives and Hedging Instruments - (continued)
The table below provides a summary of the gross notional amount and fair value of derivatives contracts for all derivatives in hedging and non-hedging relationships:
| December 31, 2012 | December 31, 2011 | |||||||||||||||||||||||||
| Notional Amount |
Fair Value Assets |
Fair Value Liabilities |
Notional Amount |
Fair Value Assets |
Fair Value Liabilities |
|||||||||||||||||||||
|
|
|
|
|
|||||||||||||||||||||||
| (in millions) | ||||||||||||||||||||||||||
| Qualifying Hedging Relationships |
||||||||||||||||||||||||||
| Fair value hedges |
Interest rate swaps |
$ | 9,336 | $ | 739 | $ | 1,048 | $ | 9,353 | $ | 734 | $ | 1,140 | |||||||||||||
| Foreign currency swaps |
232 | - | 157 | 246 | - | 171 | ||||||||||||||||||||
| Cash flow hedges |
Interest rate swaps |
13,232 | 2,669 | 73 | 15,472 | 3,627 | 192 | |||||||||||||||||||
| Foreign currency swaps |
1,763 | 147 | 255 | 1,833 | 183 | 325 | ||||||||||||||||||||
| Foreign currency forwards |
182 | 9 | - | 201 | 4 | - | ||||||||||||||||||||
| Equity market contracts |
29 | 3 | 2 | 25 | - | 10 | ||||||||||||||||||||
|
|
|
|
|
|||||||||||||||||||||||
| Total Derivatives in Hedging Relationships |
$ | 24,774 | $ | 3,567 | $ | 1,535 | $ | 27,130 | $ | 4,548 | $ | 1,838 | ||||||||||||||
|
|
|
|
|
|||||||||||||||||||||||
| Non-Hedging Relationships |
||||||||||||||||||||||||||
| Interest rate swaps |
$ | 94,343 | $ | 8,094 | $ | 3,378 | $ | 71,640 | $ | 7,219 | $ | 3,122 | ||||||||||||||
| Interest rate futures |
3,987 | - | - | 6,009 | - | - | ||||||||||||||||||||
| Foreign currency swaps |
1,463 | 121 | 150 | 1,561 | 163 | 154 | ||||||||||||||||||||
| Foreign currency forwards |
40 | 1 | - | 33 | - | 2 | ||||||||||||||||||||
| Foreign currency futures |
1,860 | - | - | 2,072 | - | - | ||||||||||||||||||||
| Equity market contracts |
108 | 7 | 5 | 24 | - | 10 | ||||||||||||||||||||
| Equity index futures |
9,107 | - | - | 9,063 | - | - | ||||||||||||||||||||
| Interest rate options |
1,323 | 43 | - | 336 | 9 | - | ||||||||||||||||||||
| Credit default swaps |
265 | 6 | - | 246 | 4 | 1 | ||||||||||||||||||||
| Embedded derivatives – fixed maturities |
- | - | - | - | - | - | ||||||||||||||||||||
| Embedded derivatives – reinsurance contracts |
- | 14 | 3,371 | - | 10 | 2,686 | ||||||||||||||||||||
| Embedded derivatives – participating pension contracts (1) |
- | - | 129 | - | - | 106 | ||||||||||||||||||||
| Embedded derivatives – benefit guarantees (1) |
- | 2,701 | 1,217 | - | 2,914 | 1,169 | ||||||||||||||||||||
|
|
|
|
|
|||||||||||||||||||||||
| Total Derivatives in Non-Hedging Relationships |
112,496 | 10,987 | 8,250 | 90,984 | 10,319 | 7,250 | ||||||||||||||||||||
|
|
|
|
|
|||||||||||||||||||||||
| Total Derivatives (2) |
$ | 137,270 | $ | 14,554 | $ | 9,785 | $ | 118,114 | $ | 14,867 | $ | 9,088 | ||||||||||||||
|
|
|
|
|
|||||||||||||||||||||||
| (1) | Embedded derivatives related to participating pension contracts are reported as part of future policy benefits and embedded derivatives related to benefit guarantees are reported as part of reinsurance recoverable or future policy benefits on the Consolidated Balance Sheets. |
| (2) | The fair values of all derivatives in an asset position are reported within derivative assets on the Consolidated Balance Sheets, and derivatives in a liability position are reported within derivative liabilities on the Consolidated Balance Sheets, excluding embedded derivatives related to participating pension contracts and benefit guarantees. |
F-44
Table of Contents
JOHN HANCOCK LIFE INSURANCE COMPANY (U.S.A.)
NOTES TO CONSOLIDATED FINANCIAL STATEMENTS – (CONTINUED)
Note 8 — Derivatives and Hedging Instruments - (continued)
The following table provides a summary of the derivative assets and liabilities including embedded derivatives as of December 31, 31, 2012 and 2011, respectively.
| December 31, 2012 | December 31, 2011 | |||||||||||||||
| Fair Value Assets |
Fair Value Liabilities |
Fair Value Assets |
Fair Value Liabilities |
|||||||||||||
|
|
|
|
|
|||||||||||||
| (in millions) | ||||||||||||||||
| Derivatives on balance sheets |
$ | 11,853 | $ | 8,439 | $ | 11,953 | $ | 7,813 | ||||||||
| Non-reinsurance embedded derivatives |
2,701 | 1,346 | 2,914 | 1,275 | ||||||||||||
|
|
|
|
|
|||||||||||||
| Total derivatives |
14,554 | 9,785 | 14,867 | 9,088 | ||||||||||||
| Netting adjustments (a) |
(1,701 | ) | (3,367 | ) | (550 | ) | (4,572 | ) | ||||||||
| Assets and cash collateral used to offset asset/liabilities |
(8,288 | ) | (1,408 | ) | (10,156 | ) | (342 | ) | ||||||||
| Affiliate reinsurance related to embedded derivatives (b) |
(1,317 | ) | (3,223 | ) | (1,342 | ) | (2,572 | ) | ||||||||
|
|
|
|
|
|||||||||||||
| Total derivatives after netting adjustments, collateral and net of reinsurance related embedded derivatives |
$ | 3,248 | $ | 1,787 | $ | 2,819 | $ | 1,602 | ||||||||
|
|
|
|
|
|||||||||||||
| (a) | Represents the netting of derivative exposures covered by a master netting agreement. For these purposes, a master netting agreement is an arrangement between the Company and a counterparty where more than one derivative contract exists between the two entities. |
| (b) | Represents activity related to reinsurance contracts between the Company and affiliated reinsurers. These entities are under common control with the Company by the Company’s ultimate parent, MFC, and they do not create an inter-connection to any third party financial institution unaffiliated with the Company. |
Hedging Relationships
The Company uses derivatives for economic hedging purposes only. In certain circumstances, these hedges also meet the requirements for hedge accounting. Hedging relationships eligible for hedge accounting are designated as either fair value hedges or cash flow hedges, as described below.
Fair Value Hedges. The Company uses interest rate swaps to manage its exposure to changes in fair value of fixed-rate financial instruments caused by changes in interest rates. The Company also uses cross currency swaps and currency forwards to manage its exposure to foreign exchange rate fluctuations and interest rate fluctuations.
For the years ended December 31, 2012, 2011, and 2010, the Company did not recognize any gains or losses related to the portion of the hedging instruments that were excluded from the assessment of hedge effectiveness. At December 31, 2012, the Company had no hedges of firm commitments.
F-45
Table of Contents
JOHN HANCOCK LIFE INSURANCE COMPANY (U.S.A.)
NOTES TO CONSOLIDATED FINANCIAL STATEMENTS – (CONTINUED)
Note 8 — Derivatives and Hedging Instruments - (continued)
The following tables show the investment gains (losses) recognized:
| Year ended December 31, 2012
|
||||||||||||||
| Derivatives in Fair Value Hedging Relationships |
Hedged Items in Fair Value Hedging Relationships |
Gains (Losses) Recognized on Derivatives |
Gains (Losses) Recognized for Hedged Items |
Ineffectiveness Recognized |
||||||||||
| (in millions) | ||||||||||||||
| Interest rate swaps |
Fixed-rate assets |
$ | 118 | $ | (93 | ) | $ | 25 | ||||||
| Fixed-rate liabilities |
(4 | ) | 1 | (3 | ) | |||||||||
| Foreign Currency Swaps |
Fixed-rate assets |
(1 | ) | (22 | ) | (23 | ) | |||||||
| Fixed-rate liabilities |
- | - | - | |||||||||||
|
|
||||||||||||||
| Total |
$ | 113 | $ | (114 | ) | $ | (1 | ) | ||||||
|
|
||||||||||||||
| Year ended December 31, 2011
|
||||||||||||||
| Derivatives in Fair Value Hedging Relationships |
Hedged Items in Fair Value Hedging Relationships |
Gains (Losses) Recognized on Derivatives |
Gains (Losses) Recognized for Hedged Items |
Ineffectiveness Recognized |
||||||||||
| (in millions) | ||||||||||||||
| Interest rate swaps |
Fixed-rate assets |
$ | (546 | ) | $ | 679 | $ | 133 | ||||||
| Fixed-rate liabilities |
339 | (370 | ) | (31 | ) | |||||||||
| Foreign Currency Swaps |
Fixed-rate assets |
(21 | ) | 10 | (11 | ) | ||||||||
| Fixed-rate liabilities |
- | - | - | |||||||||||
|
|
||||||||||||||
| Total |
$ | (228 | ) | $ | 319 | $ | 91 | |||||||
|
|
||||||||||||||
| Year ended December 31, 2010
|
||||||||||||||
| Derivatives in Fair Value Hedging Relationships |
Hedged Items in Fair Value Hedging Relationships |
Gains (Losses) Recognized on Derivatives |
Gains (Losses) Recognized for Hedged Items |
Ineffectiveness Recognized |
||||||||||
| (in millions) | ||||||||||||||
| Interest rate swaps |
Fixed-rate assets |
$ | (70 | ) | $ | 157 | $ | 87 | ||||||
| Fixed-rate liabilities |
62 | (64 | ) | (2 | ) | |||||||||
| Foreign Currency Swaps |
Fixed-rate assets |
(73 | ) | 111 | 38 | |||||||||
| Fixed-rate liabilities |
- | - | - | |||||||||||
|
|
||||||||||||||
| Total |
$ | (81 | ) | $ | 204 | $ | 123 | |||||||
|
|
||||||||||||||
Cash Flow Hedges. The Company uses interest rate swaps to hedge the variability in cash flows from variable rate financial instruments and forecasted transactions. The Company also uses cross currency swaps and forward agreements to hedge
F-46
Table of Contents
JOHN HANCOCK LIFE INSURANCE COMPANY (U.S.A.)
NOTES TO CONSOLIDATED FINANCIAL STATEMENTS – (CONTINUED)
Note 8 — Derivatives and Hedging Instruments - (continued)
currency exposure on foreign currency financial instruments and foreign currency denominated expenses, respectively. Total return swaps are used to hedge the variability in cash flows associated with certain stock-based compensation awards. Inflation swaps are used to reduce inflation risk generated from inflation-indexed liabilities.
For the year ended December 31, 2010, all of the Company’s hedged forecast transactions qualified as cash flow hedges. For the year ended December 31, 2011 certain cash flow hedges were discontinued because it was no longer probable that the original forecasted transaction would occur by the end of the originally specified time period documented at inception of the hedging relationship. In 2012 and 2011, the Company completed a comprehensive review of its projections of future cash flows related to hedging activity for its life insurance business and its long-term care business, respectively. As a result of the continued volatility in interest rates and current trends within the long-term care and life insurance businesses, the Company de-designated $1.6 billion (notional principal) of forward-starting interest rate swaps for the life insurance business in 2012, and $3.9 billion (notional principal) of forward-starting interest rate swaps for the long-term care business in 2011.
The accumulated other comprehensive income related to de-designated swaps continues to be deferred because the forecasted transactions are still possible of occurring. During 2012 and 2011, the deferred OCI related to the de-designated swaps amounted to $312 million, net of tax and $432 million, net of tax, respectively. If the forecasted transactions do occur, these amounts will be reclassified to earnings in the periods during which variability in the cash flows hedged or the hedged forecasted transactions are recognized in earnings. If the forecasted transactions become unlikely, the amounts will be reclassified to earnings in that period.
In addition, during 2012 the Company completed a review of the investment strategy for the JHNY universal life (“UL”) business. As part of this review, it was determined that it was appropriate for the UL business to begin investing in non-fixed income assets. Under the revised investment strategy, UL cash flows will be invested in a combination of fixed income and non-fixed income assets, potentially resulting in lower cash flows available for reinvestments in fixed income assets than originally anticipated for the UL cash flow hedging program. The Company voluntarily de-designated $150 million (notional principal) of forward-starting interest rate swaps in 2012, however believes that the originally forecasted fixed income asset purchases are still probable of occurring as forecasted. Accordingly, the accumulated other comprehensive income related to these de-designated swaps continues to be deferred. During 2012, the deferred OCI related to the de-designated swaps amounted to $30 million, net of tax. If the forecasted transactions do occur as expected, these amounts will be allocated to the acquired fixed income assets in the periods during which the hedged forecasted transactions occur and amortized to earnings over the life of the underlying fixed income assets acquired. If the forecasted transactions are no longer possible of occurring, the amounts will be reclassified to earnings in that period.
F-47
Table of Contents
JOHN HANCOCK LIFE INSURANCE COMPANY (U.S.A.)
NOTES TO CONSOLIDATED FINANCIAL STATEMENTS – (CONTINUED)
Note 8 — Derivatives and Hedging Instruments - (continued)
The following tables present the effects of derivatives in cash flow hedging relationships on the Consolidated Statements of Operations, the Consolidated Statements of Comprehensive Income (Loss) and the Consolidated Statements of Changes in Shareholder’s Equity.
| Year ended December 31, 2012
|
| |||||||||||||
| Derivatives in Cash Flow Hedging Relationships |
Hedged Items in Cash Flow Hedging Relationships |
Gains (Losses) Deferred in AOCI on Derivatives (Net of Tax) |
Gains Reclassified from (Net of Tax) |
Ineffectiveness and Other Gains (Losses) |
||||||||||
| (in millions) | ||||||||||||||
| Interest rate swaps |
Forecasted fixed-rate assets |
$ | 526 | $ | 212 | $ | 9 | |||||||
| Floating rate assets |
(5 | ) | - | - | ||||||||||
| Inflation indexed liabilities |
134 | - | - | |||||||||||
| Forecasted fixed-rate liabilities |
- | - | - | |||||||||||
| Foreign currency swaps |
Fixed-rate assets |
(16 | ) | (4 | ) | - | ||||||||
| Floating rate assets |
(1 | ) | - | - | ||||||||||
| Floating rate liabilities |
- | - | - | |||||||||||
| Foreign currency forwards |
Forecasted expenses |
3 | 1 | - | ||||||||||
| Foreign currency assets |
- | - | - | |||||||||||
| Equity market contracts |
Share-based payments |
7 | - | - | ||||||||||
|
|
||||||||||||||
| Total |
$ | 648 | $ | 209 | $ | 9 | ||||||||
|
|
||||||||||||||
| Year ended December 31, 2011
|
| |||||||||||||
| Derivatives in Cash Flow Hedging Relationships |
Hedged Items in Cash Flow Hedging Relationships |
Gains (Losses) Deferred in AOCI on Derivatives (Net of Tax) |
Gains Reclassified from (Net of Tax) |
Ineffectiveness Gains (Losses) |
||||||||||
| (in millions) | ||||||||||||||
| Interest rate swaps |
Forecasted fixed-rate assets |
$ | 1,916 | $ | 59 | $ | 14 | |||||||
| Floating rate assets |
5 | - | - | |||||||||||
| Inflation indexed liabilities |
(136 | ) | - | - | ||||||||||
| Forecasted fixed-rate liabilities |
- | - | - | |||||||||||
| Foreign currency swaps |
Fixed-rate assets |
16 | - | - | ||||||||||
| Floating rate assets |
(1 | ) | - | - | ||||||||||
| Floating rate liabilities |
- | - | - | |||||||||||
| Foreign currency forwards |
Forecasted expenses |
(16 | ) | - | - | |||||||||
| Foreign currency assets |
- | - | - | |||||||||||
| Equity market contracts |
Share-based payments |
(7 | ) | - | - | |||||||||
|
|
||||||||||||||
| Total |
$ | 1,777 | $ | 59 | $ | 14 | ||||||||
|
|
||||||||||||||
F-48
Table of Contents
JOHN HANCOCK LIFE INSURANCE COMPANY (U.S.A.)
NOTES TO CONSOLIDATED FINANCIAL STATEMENTS – (CONTINUED)
Note 8 — Derivatives and Hedging Instruments - (continued)
Year ended December 31, 2010
| Derivatives in Cash Flow Hedging Relationships |
Hedged Items in Cash Flow Hedging Relationships |
Gains
(Losses) Derivatives (Net of Tax) |
Gains Reclassified from (Net of Tax) |
Ineffectiveness and Other Gains (Losses) |
||||||||||
| (in millions) | ||||||||||||||
| Interest rate swaps |
Forecasted fixed-rate assets |
$ | 48 | $ | (129 | ) | $ | 3 | ||||||
| Floating rate assets |
- | - | - | |||||||||||
| Inflation indexed liabilities |
(43 | ) | - | - | ||||||||||
| Forecasted fixed-rate liabilities |
- | - | - | |||||||||||
| Foreign currency swaps |
Fixed-rate assets |
(25 | ) | - | - | |||||||||
| Floating rate assets |
(4 | ) | - | - | ||||||||||
| Floating rate liabilities |
- | - | - | |||||||||||
| Foreign currency forwards |
Forecasted expenses |
(9 | ) | - | - | |||||||||
| Foreign currency assets |
(1 | ) | - | - | ||||||||||
| Equity market contracts |
Share-based payments |
(3 | ) | - | - | |||||||||
|
|
||||||||||||||
| Total |
$ | (37 | ) | $ | (129 | ) | $ | 3 | ||||||
|
|
||||||||||||||
The Company anticipates that pre-tax net gains of approximately $70 million will be reclassified from AOCI to earnings within the next 12 months. The maximum time frame for which variable cash flows are hedged is 34 years.
For a rollforward of the net accumulated gains (losses) on cash flow hedges see the Shareholder’s Equity Note.
Derivatives Not Designated as Hedging Instruments. The Company enters into interest rate swap agreements, cancelable interest rate swap agreements, total return swap agreements, interest rate futures contracts and CDS to manage credit risk, and interest rate cap and floor agreements to manage exposure to interest rates without designating the derivatives as hedging instruments. Interest rate floor agreements hedge the interest rate risk associated with minimum interest rate guarantees in certain life insurance and annuity businesses.
The Company offers certain variable annuity products with a guaranteed minimum withdrawal benefit (“GMWB”) and guaranteed minimum death benefit (“GMDB”). These guarantees are effectively an embedded option on the basket of mutual funds offered to contract holders. Beginning in November 2007, for certain contracts, the Company implemented a hedging program to reduce its exposure to the GMWB and GMDB guarantees. This dynamic hedging program uses interest rate swap agreements, equity index futures (including but not limited to the Dow Jones Industrial, Standard & Poor’s 500, Russell 2000, and Dow Jones Euro Stoxx 50 indices), and U.S. Treasury futures to match the sensitivities of the GMWB and GMDB liabilities to the market risk factors.
The Company also has a macro equity risk hedging program using equity and currency futures. This program is designed to reduce the Company’s overall exposure to public equity markets arising from several sources including, but not limited to, variable annuity guarantees not dynamically hedged, separate account fees not associated with guarantees, and Company equity holdings.
F-49
Table of Contents
JOHN HANCOCK LIFE INSURANCE COMPANY (U.S.A.)
NOTES TO CONSOLIDATED FINANCIAL STATEMENTS – (CONTINUED)
Note 8 — Derivatives and Hedging Instruments - (continued)
For the years ended December 31, 2012, 2011, and 2010, net losses and net gains related to derivatives in a non-hedging relationship were recognized by the Company and the components were recorded in net realized investment and other gains (losses) as follows:
| Years ended December 31, | 2012 | 2011 | 2010 | |||||||||
| (in millions) | ||||||||||||
| Non-Hedging Relationships |
||||||||||||
| Interest rate swaps |
$ | (336 | ) | $ | 3,230 | $ | 145 | |||||
| Interest rate futures |
(53 | ) | (237 | ) | (56 | ) | ||||||
| Interest rate options |
(8 | ) | 1 | (1 | ) | |||||||
| Credit defaults swaps |
1 | - | - | |||||||||
| Foreign currency swaps |
(32 | ) | 17 | (68 | ) | |||||||
| Foreign currency forwards |
(5 | ) | (10 | ) | 22 | |||||||
| Foreign currency futures |
- | 16 | (18 | ) | ||||||||
| Embedded derivatives |
(1,730 | ) | 153 | (93 | ) | |||||||
| Equity market contracts |
7 | (1 | ) | 12 | ||||||||
| Equity index futures |
(1,555 | ) | (318 | ) | (652 | ) | ||||||
|
|
|
|||||||||||
| Total Investment Gains (Losses) from Derivatives in Non-Hedging Relationships |
$ | (3,711 | ) | $ | 2,851 | $ | (709 | ) | ||||
|
|
|
|||||||||||
Credit Default Swaps. The Company replicates exposure to specific issuers by selling credit protection via CDS in order to complement its cash bond investing. The Company does not employ leverage in its CDS program and therefore, does not write CDS protection in excess of its government bond holdings.
The following table provides details of the CDS protection sold by type of contract and external agency rating for the underlying reference security, as of December 31, 2012 and 2011, respectively.
| December 31, 2012 | December 31, 2011 | |||||||||||||||||||||||
| Notional amount2 |
Fair Value |
Weighted average maturity (in years)3 |
Notional amount2 |
Fair Value |
Weighted average maturity (in years)3 |
|||||||||||||||||||
| (in millions) | ||||||||||||||||||||||||
| Single name CDS1 |
||||||||||||||||||||||||
| Corporate Debt |
||||||||||||||||||||||||
| AAA |
$ | 25 | $ | 1 | 4 | $ | 25 | $ | 1 | 5 | ||||||||||||||
| AA |
85 | 2 | 4 | 85 | 2 | 5 | ||||||||||||||||||
| A |
145 | 3 | 4 | 105 | 1 | 5 | ||||||||||||||||||
| BBB |
10 | - | 5 | - | - | |||||||||||||||||||
|
|
|
|
|
|||||||||||||||||||||
| Total CDS protection sold | $ | 265 | $ | 6 | $ | 215 | $ | 4 | ||||||||||||||||
|
|
|
|
|
|||||||||||||||||||||
| 1 | The rating agency designations are based on S&P where available followed by Moody’s, Dominion Bond Rating Services (DBRS), and Fitch. If no rating is available from a rating agency, then an internally developed rating is used. |
| 2 | Notional amount represents the maximum future payments the Company would have to pay its counterparties assuming a default of the underlying credit and zero recovery on the underlying issuer obligation. |
| 3 | The weighted average maturity of the CDS is weighted based on notional amounts. |
F-50
Table of Contents
JOHN HANCOCK LIFE INSURANCE COMPANY (U.S.A.)
NOTES TO CONSOLIDATED FINANCIAL STATEMENTS – (CONTINUED)
Note 8 — Derivatives and Hedging Instruments - (continued)
The Company holds no purchased credit protection at December 31, 2012. At December 31, 2011 the Company held purchased credit protection with a total notional amount of $31 million and a fair value of $1 million. The average credit rating of the counterparties guaranteeing the underlying credit is A+ and the weighted average maturity is 5.5 years.
Embedded Derivatives. The Company has certain embedded derivatives that are required to be separated from their host contracts and accounted for as derivatives. These host contracts include fixed maturities, reinsurance contracts, participating pension contracts, and certain benefit guarantees.
For more details on the Company’s embedded derivatives, see the Fair Value Measurements Note.
Credit Risk. The Company’s exposure to loss on derivatives is limited to the amount of any net gains that may have accrued with a particular counterparty. Gross derivative counterparty exposure is measured as the total fair value (including accrued interest) of all outstanding contracts in a gain position excluding any offsetting contracts in negative positions and the impact of collateral on hand. The Company may be exposed to credit-related losses in the event of nonperformance by counterparties to the derivative financial instruments. The current credit exposure of the Company’s derivative contracts is limited to the fair value in excess of the collateral held at the reporting date.
The Company manages its credit risk by entering into transactions with creditworthy counterparties, obtaining collateral where appropriate, and entering into master netting agreements that provide for a netting of payments and receipts with a single counterparty. The Company enters into credit support annexes with its over-the-counter derivative dealers in order to manage its credit exposure to those counterparties. As part of the terms and conditions of those agreements, the pledging and accepting of collateral in connection with the Company’s derivative usage is required. As of December 31, 2012 and 2011, the Company accepted collateral consisting of cash of $2,142 million and $1,446 million and various securities with a fair value of $5,430 million and $5,591 million, respectively, which is held in separate custodial accounts. In addition, the Company has pledged collateral to support both the over-the-counter derivative instruments and exchange traded futures. For further details regarding pledged collateral see the Investments Note.
Note 9 — Certain Separate Accounts
The Company issues variable annuity and variable life contracts through its separate accounts for which investment income and investment gains and losses accrue to, and investment risk is borne by, the contract holder. Most contracts contain certain guarantees, which are discussed more fully below.
The deposits related to the variable life insurance contracts are invested in separate accounts, and the Company guarantees a specified death benefit on certain policies if specified premiums on these policies are paid by the policyholder, regardless of separate account performance.
The following table reflects variable life insurance contracts with guarantees held by the Company:
| December 31, | ||||||||
| 2012 | 2011 | |||||||
|
|
|
|||||||
| (in millions, except for age) | ||||||||
| Life insurance contracts with guaranteed benefits |
||||||||
| In the event of death |
||||||||
| Account value |
$ | 8,346 | $ | 7,586 | ||||
| Net amount at risk related to deposits |
182 | 174 | ||||||
| Average attained age of contract holders |
52 | 52 | ||||||
Many of the variable annuity contracts issued by the Company offer various guaranteed minimum death, income, and/or withdrawal benefits. GMDB features guarantee the contract holder either (a) a return of no less than total deposits made to the contract less any partial withdrawals; (b) total deposits made to the contract less any partial withdrawals plus a minimum return; (c) the highest contract value on a specified anniversary date minus any withdrawals following the contract anniversary, or (d) a combination of (b) and (c) above.
F-51
Table of Contents
JOHN HANCOCK LIFE INSURANCE COMPANY (U.S.A.)
NOTES TO CONSOLIDATED FINANCIAL STATEMENTS – (CONTINUED)
Note 9 — Certain Separate Accounts - (continued)
Contracts with Guaranteed Minimum Income Benefit (“GMIB”) riders provide a guaranteed lifetime annuity, which may be elected by the contract holder after a stipulated waiting period (7 to 15 years), and which may be larger than what the contract account balance would purchase at then-current annuity purchase rates.
Multiple variations of an optional GMWB rider have also been offered by the Company. The GMWB rider provides contract holders a guaranteed annual withdrawal amount over a specified time period or in some cases for as long as they live. In general, guaranteed annual withdrawal amounts are based on deposits and may be reduced if withdrawals exceed allowed amounts. Guaranteed amounts may also be increased as a result of “step-up” provisions, which increase the benefit base to higher account values at specified intervals. Guaranteed amounts may also be increased if withdrawals are deferred over a specified period. In addition, certain versions of the GMWB rider extend lifetime guarantees to spouses.
Unaffiliated and affiliated reinsurance has been utilized to mitigate risk related to some of the guarantee benefit riders. Hedging has also been utilized to mitigate risk related to some of the GMWB riders.
For GMDB, the net amount at risk is defined as the current guaranteed minimum death benefit in excess of the current account balance. For GMIB, the net amount at risk is defined as the excess of the current annuitization income base over the current account value. For GMWB, the net amount at risk is defined as the current guaranteed withdrawal amount minus the current account value. For all the guarantees, the net amount at risk is floored at zero at the single contract level.
F-52
Table of Contents
JOHN HANCOCK LIFE INSURANCE COMPANY (U.S.A.)
NOTES TO CONSOLIDATED FINANCIAL STATEMENTS – (CONTINUED)
Note 9 — Certain Separate Accounts - (continued)
The Company had the following variable annuity contracts with guarantees. Amounts at risk are shown net of reinsurance. Note that the Company’s variable annuity contracts with guarantees may offer more than one type of guarantee in each contract; therefore, the amounts listed are not mutually exclusive.
| December 31, | ||||||||
| 2012 | 2011 | |||||||
|
|
|
|||||||
| (in millions, except for ages and percentages) | ||||||||
| Guaranteed Minimum Death Benefit |
||||||||
| Return of net deposits |
||||||||
| In the event of death |
||||||||
| Account value |
$ | 24,553 | $ | 23,864 | ||||
| Net amount at risk — net of reinsurance |
64 | 174 | ||||||
| Average attained age of contract holders |
66 | 65 | ||||||
| Return of net deposits plus a minimum return |
||||||||
| In the event of death |
||||||||
| Account value |
$ | 542 | $ | 562 | ||||
| Net amount at risk — net of reinsurance |
305 | 332 | ||||||
| Average attained age of contract holders |
70 | 70 | ||||||
| Guaranteed minimum return rate |
5 | % | 5 | % | ||||
| Highest specified anniversary account value minus withdrawals post anniversary |
||||||||
| In the event of death |
||||||||
| Account value |
$ | 25,350 | $ | 25,558 | ||||
| Net amount at risk — net of reinsurance |
265 | 559 | ||||||
| Average attained age of contract holders |
66 | 65 | ||||||
| Guaranteed Minimum Income Benefit |
||||||||
| Account value |
$ | 4,816 | $ | 5,102 | ||||
| Net amount at risk — net of reinsurance |
40 | 50 | ||||||
| Average attained age of contract holders |
65 | 64 | ||||||
| Guaranteed Minimum Withdrawal Benefit |
||||||||
| Account value |
$ | 38,613 | $ | 36,581 | ||||
| Net amount at risk |
774 | 1,116 | ||||||
| Average attained age of contract holders |
63 | 65 | ||||||
F-53
Table of Contents
JOHN HANCOCK LIFE INSURANCE COMPANY (U.S.A.)
NOTES TO CONSOLIDATED FINANCIAL STATEMENTS – (CONTINUED)
Note 9 — Certain Separate Accounts - (continued)
Account balances of variable contracts with guarantees were invested in various separate accounts with the following characteristics:
| December 31, | ||||||||
| 2012 | 2011 | |||||||
|
|
|
|||||||
| (in millions) | ||||||||
| Type of Fund |
||||||||
| Equity |
$ | 28,537 | $ | 27,351 | ||||
| Balanced |
21,539 | 20,850 | ||||||
| Bond |
7,557 | 7,321 | ||||||
| Money Market |
1,407 | 1,667 | ||||||
|
|
|
|||||||
| Total |
$ | 59,040 | $ | 57,189 | ||||
|
|
|
|||||||
The following table summarizes the liabilities for guarantees on variable annuity contracts reflected in future policy benefits in the general account:
| Guaranteed Minimum Death Benefit (GMDB) |
Guaranteed Minimum Income Benefit (GMIB) |
Guaranteed Minimum Withdrawal Benefit (GMWB) |
Total | |||||||||||||
|
|
|
|||||||||||||||
| (in millions) | ||||||||||||||||
| Balance at January 1, 2012 |
$ | 247 | $ | 211 | $ | 1,165 | $ | 1,623 | ||||||||
| Incurred guarantee benefits |
(51 | ) | (91 | ) | - | (142 | ) | |||||||||
| Other reserve changes |
33 | 59 | 145 | 237 | ||||||||||||
|
|
|
|||||||||||||||
| Balance at December 31, 2012 |
229 | 179 | 1,310 | 1,718 | ||||||||||||
| Reinsurance recoverable |
(68 | ) | (1,801 | ) | (1,071 | ) | (2,940 | ) | ||||||||
|
|
|
|||||||||||||||
| Net balance at December 31, 2012 |
$ | 161 | $ | (1,622 | ) | $ | 239 | $ | (1,222 | ) | ||||||
|
|
|
|||||||||||||||
| Balance at January 1, 2011 |
$ | 225 | $ | 177 | $ | 507 | $ | 909 | ||||||||
| Incurred guarantee benefits |
(66 | ) | (75 | ) | - | (141 | ) | |||||||||
| Other reserve changes |
88 | 109 | 658 | 855 | ||||||||||||
|
|
|
|||||||||||||||
| Balance at December 31, 2011 |
247 | 211 | 1,165 | 1,623 | ||||||||||||
| Reinsurance recoverable |
(82 | ) | (2,046 | ) | (953 | ) | (3,081 | ) | ||||||||
|
|
|
|||||||||||||||
| Net balance at December 31, 2011 |
$ | 165 | $ | (1,835 | ) | $ | 212 | $ | (1,458 | ) | ||||||
|
|
|
|||||||||||||||
The GMDB gross and ceded reserves, the GMIB gross reserves, and the life contingent portion of the GMWB reserves were determined in accordance with ASC 944, and the GMIB reinsurance recoverable and non-life contingent GMWB gross reserves were determined in accordance with ASC 815 “Derivatives and Hedging”.
The Company regularly evaluates estimates used and adjusts the additional liability balance, with a related charge or credit to benefits to policyholders, if actual experience or other evidence suggests that earlier assumptions should be revised.
The following assumptions and methodology were used to determine the amounts above at December 31, 2012 and 2011:
| • | Data used included 1,000 stochastically generated investment performance scenarios. For the GMIB reinsurance recoverable and non-life contingent GMWB gross reserve calculations, risk neutral scenarios were used. |
F-54
Table of Contents
JOHN HANCOCK LIFE INSURANCE COMPANY (U.S.A.)
NOTES TO CONSOLIDATED FINANCIAL STATEMENTS – (CONTINUED)
Note 9 — Certain Separate Accounts - (continued)
| • | For life products, reserves were established using stochastic modeling of future separate account returns and best estimate mortality, lapse, and premium persistency assumptions, which vary by product. |
| • | Mean return and volatility assumptions were determined by asset class. Market consistent observed volatilities were used where available for ASC 815 calculations. |
| • | Annuity mortality was based on the Ruark table multiplied by factors varied by rider types (living benefit/GMDB only) and qualified and non-qualified business. |
| • | Annuity base lapse rates vary by contract type, duration, type of living benefit or death benefit rider, and whether guaranteed withdrawals are being taken. The lapse rates range from 0.5% to 40%. |
| • | The discount rates used in the GMDB gross and ceded reserves, the GMIB gross reserves, and the life contingent portion of the GMWB reserve calculations range from 6.4% to 7%. The discount rates used in the GMIB reinsurance recoverable and non-life contingent GMWB gross reserve calculations were based on the term structure of swap curves with a credit spread based on the credit standing of MFC (for GMWB) and the reinsurers (for GMIB). |
Note 10 — Closed Blocks
The Company operates two separate closed blocks for the benefit of certain classes of individual or joint traditional participating whole life insurance policies. The JHUSA closed block was established upon the demutualization of MLI for those designated participating policies that were in-force on September 23, 1999. The JHLICO closed block was established upon the demutualization of JHLICO for those designated participating policies that were in-force on February 1, 2000.
Assets were allocated to the closed blocks in an amount that, together with anticipated revenues from policies included in the closed blocks, was reasonably expected to be sufficient to support such business, including provision for payment of benefits, direct asset acquisition and disposition costs, taxes, and for continuation of dividend scales, assuming experience underlying such dividend scales continues. Assets allocated to the closed blocks inure solely to the benefit of the holders of the policies included in the closed blocks and will not revert to the benefit of the shareholder of the Company. No reallocation, transfer, borrowing, or lending of assets can be made between the closed blocks and other portions of the Company’s general account, any of its separate accounts, or any affiliate of the Company without prior approval from the State of Michigan Office of Financial and Insurance Regulation.
If, over time, the aggregate performance of the assets and policies of a closed block is better than was assumed in funding that closed block, dividends to policyholders for that closed block will be increased. If, over time, the aggregate performance of the assets and policies of a closed block is less favorable than was assumed in funding that closed block, dividends to policyholders for that closed block will be reduced.
The assets and liabilities allocated to the closed blocks are recorded in the Company’s Consolidated Balance Sheets and Consolidated Statements of Operations on the same basis as other similar assets and liabilities. The carrying amount of the closed blocks’ liabilities in excess of the carrying amount of the closed blocks’ assets at the date the closed blocks were established (adjusted to eliminate the impact of related amounts in accumulated other comprehensive income) represents the maximum future earnings from the assets and liabilities designated to the closed blocks that can be recognized in income over the period the policies in the closed blocks remain in force. The Company has developed an actuarial calculation of the timing of such maximum future shareholder earnings, and this is the basis of the policyholder dividend obligation.
If actual cumulative earnings of a closed block are greater than expected cumulative earnings of that block, only expected earnings will be recognized in that closed block’s income. Actual cumulative earnings in excess of expected cumulative earnings of a closed block represent undistributed accumulated earnings attributable to policyholders, which are recorded as a policyholder dividend obligation because the excess will be paid to the policyholders of that closed block as an additional policyholder dividend unless otherwise offset by future closed block performance that is less favorable than originally expected. If actual cumulative performance of a closed block is less favorable than expected, expected earnings for that closed block will be recognized in net income, unless the policyholder dividend obligation has been reduced to zero, in which case actual earnings will be recognized in income. The policyholder dividend obligation for the JHLICO and JHUSA closed blocks was zero at December 31, 2012 and 2011.
F-55
Table of Contents
JOHN HANCOCK LIFE INSURANCE COMPANY (U.S.A.)
NOTES TO CONSOLIDATED FINANCIAL STATEMENTS – (CONTINUED)
Note 10 — Closed Blocks - (continued)
For all closed block policies, the principal cash flow items that affect the amount of closed block assets and liabilities are premiums, net investment income, purchases and sales of investments, policyholders’ benefits, policyholder dividends, premium taxes, guaranty fund assessments, and income taxes. For the JHLICO closed block policies, the principal income and expense items excluded from the closed block are management and maintenance expenses, commissions, and net investment income and realized investment gains and losses of investment assets outside the closed block that support the closed block business, all of which enter into the determination of total gross margins of closed block policies for the purpose of the amortization of deferred policy acquisition costs. There are no exclusions applicable to the JHUSA closed block. The amounts shown in the following tables for assets, liabilities, revenues, and expenses of the closed blocks are those that enter into the determination of amounts that are to be paid to policyholders.
The following tables set forth certain summarized financial information relating to the closed blocks as of the dates indicated:
JHUSA Closed Block
| December 31, | ||||||||
| 2012 | 2011 | |||||||
|
|
|
|||||||
| (in millions) | ||||||||
| Liabilities |
||||||||
| Future policy benefits |
$ | 8,258 | $ | 8,349 | ||||
| Policyholders’ funds |
74 | 76 | ||||||
| Policyholder dividends payable |
162 | 180 | ||||||
| Other closed block liabilities |
659 | 636 | ||||||
|
|
|
|||||||
| Total closed block liabilities |
9,153 | 9,241 | ||||||
|
|
|
|||||||
| Assets |
||||||||
| Investments |
||||||||
| Fixed maturities: |
||||||||
| Available-for-sale—at fair value (amortized cost: 2012—$2,733; 2011—$2,918) |
3,163 | 3,250 | ||||||
| Mortgage loans on real estate |
519 | 579 | ||||||
| Investment real estate |
710 | 692 | ||||||
| Policy loans |
1,589 | 1,586 | ||||||
| Other invested assets |
5 | 4 | ||||||
|
|
|
|||||||
| Total investments |
5,986 | 6,111 | ||||||
| Cash borrowings, cash, and cash equivalents |
(513 | ) | (339 | ) | ||||
| Accrued investment income |
101 | 102 | ||||||
| Amount due from and held for affiliates |
2,047 | 1,885 | ||||||
| Other closed block assets |
588 | 574 | ||||||
|
|
|
|||||||
| Total assets designated to the closed block |
8,209 | 8,333 | ||||||
|
|
|
|||||||
| Excess of closed block liabilities over assets designated to the closed block |
944 | 908 | ||||||
| Portion of above representing accumulated other comprehensive income: |
||||||||
| Unrealized appreciation, net of deferred income tax expense of $322 and $265, respectively |
597 | 492 | ||||||
| Adjustment for deferred policy acquisition costs, net deferred income tax benefit of $111 and $82, respectively |
(206 | ) | (153 | ) | ||||
| Foreign currency translation adjustment |
(79 | ) | (70 | ) | ||||
|
|
|
|||||||
| Total amounts included in accumulated other comprehensive income |
312 | 269 | ||||||
|
|
|
|||||||
| Maximum future earnings to be recognized from closed block assets and liabilities |
$ | 1,256 | $ | 1,177 | ||||
|
|
|
|||||||
F-56
Table of Contents
JOHN HANCOCK LIFE INSURANCE COMPANY (U.S.A.)
NOTES TO CONSOLIDATED FINANCIAL STATEMENTS – (CONTINUED)
Note 10 — Closed Blocks - (continued)
JHUSA Closed Block
| Years ended December 31, | ||||||||||||
| 2012 | 2011 | 2010 | ||||||||||
|
|
|
|||||||||||
| (in millions) | ||||||||||||
| Revenues |
||||||||||||
| Premiums |
$ | 538 | $ | 558 | $ | 597 | ||||||
| Net investment income |
339 | 331 | 351 | |||||||||
| Net realized investment income and other gains (losses) |
111 | 67 | 161 | |||||||||
|
|
|
|||||||||||
| Total revenues |
988 | 956 | 1,109 | |||||||||
| Benefits and Expenses |
||||||||||||
| Benefits to policyholders |
656 | 668 | 713 | |||||||||
| Policyholder dividends |
331 | 354 | 367 | |||||||||
| Amortization of deferred policy acquisition costs |
94 | 14 | (28 | ) | ||||||||
| Other closed block operating costs and expenses |
29 | 29 | 28 | |||||||||
|
|
|
|||||||||||
| Total benefits and expenses |
1,110 | 1,065 | 1,080 | |||||||||
| Revenues, net of benefits and expenses |
(122 | ) | (109 | ) | 29 | |||||||
| Income tax expense (benefit) |
(43 | ) | (41 | ) | 11 | |||||||
|
|
|
|||||||||||
| Revenues, net of benefits and expenses and income taxes |
$ | (79 | ) | $ | (68 | ) | $ | 18 | ||||
|
|
|
|||||||||||
Maximum future earnings from closed block assets and liabilities:
| December 31, | ||||||||
| 2012 | 2011 | |||||||
|
|
|
|||||||
| (in millions) | ||||||||
| Beginning of period |
$ | 1,177 | $ | 1,109 | ||||
| Revenues, net of benefits and expenses and income taxes |
79 | 68 | ||||||
|
|
|
|||||||
| End of period |
$ | 1,256 | $ | 1,177 | ||||
|
|
|
|||||||
F-57
Table of Contents
JOHN HANCOCK LIFE INSURANCE COMPANY (U.S.A.)
NOTES TO CONSOLIDATED FINANCIAL STATEMENTS – (CONTINUED)
Note 10 — Closed Blocks - (continued)
JHLICO Closed Block
| December 31, | ||||||||
| 2012 | 2011 | |||||||
|
|
|
|||||||
| (in millions) | ||||||||
| Liabilities |
||||||||
| Future policy benefits |
$ | 10,488 | $ | 10,654 | ||||
| Policyholders’ funds |
1,446 | 1,506 | ||||||
| Policyholder dividends payable |
324 | 367 | ||||||
| Other closed block liabilities |
418 | 409 | ||||||
|
|
|
|||||||
| Total closed block liabilities |
12,676 | 12,936 | ||||||
|
|
|
|||||||
| Assets |
||||||||
| Investments |
||||||||
| Fixed maturities: |
||||||||
| Available-for-sale—at fair value |
6,839 | 6,939 | ||||||
| Equity securities: |
||||||||
| Available-for-sale—at fair value |
9 | 12 | ||||||
| Mortgage loans on real estate |
2,176 | 2,284 | ||||||
| Policy loans |
1,449 | 1,491 | ||||||
| Other invested assets |
88 | 104 | ||||||
|
|
|
|||||||
| Total investments |
10,561 | 10,830 | ||||||
| Cash borrowings, cash, and cash equivalents |
154 | (36 | ) | |||||
| Accrued investment income |
128 | 133 | ||||||
| Other closed block assets |
88 | 88 | ||||||
|
|
|
|||||||
| Total assets designated to the closed block |
10,931 | 11,015 | ||||||
|
|
|
|||||||
| Excess of closed block liabilities over assets designated to the closed block |
1,745 | 1,921 | ||||||
| Portion of above representing accumulated other comprehensive income: |
||||||||
| Unrealized appreciation, net of deferred income tax expense of $229 and $194, respectively |
425 | 358 | ||||||
|
|
|
|||||||
| Maximum future earnings to be recognized from closed block assets and liabilities |
$ | 2,170 | $ | 2,279 | ||||
|
|
|
|||||||
F-58
Table of Contents
JOHN HANCOCK LIFE INSURANCE COMPANY (U.S.A.)
NOTES TO CONSOLIDATED FINANCIAL STATEMENTS – (CONTINUED)
Note 10 — Closed Blocks - (continued)
JHLICO Closed Block
| Years ended December 31, | ||||||||||||
| 2012 | 2011 | 2010 | ||||||||||
|
|
|
|||||||||||
| (in millions) | ||||||||||||
| Revenues |
||||||||||||
| Premiums |
$ | 514 | $ | 577 | $ | 621 | ||||||
| Net investment income |
555 | 576 | 585 | |||||||||
| Net realized investment income and other gains (losses) |
65 | 73 | 18 | |||||||||
|
|
|
|||||||||||
| Total revenues |
1,134 | 1,226 | 1,224 | |||||||||
| Benefits and Expenses |
||||||||||||
| Benefits to policyholders |
665 | 729 | 733 | |||||||||
| Policyholder dividends |
289 | 412 | 439 | |||||||||
| Other closed block operating costs and expenses |
12 | 52 | 11 | |||||||||
|
|
|
|||||||||||
| Total benefits and expenses |
966 | 1,193 | 1,183 | |||||||||
| Revenues, net of benefits and expenses |
168 | 33 | 41 | |||||||||
| Income tax expense (benefit) |
59 | 12 | 12 | |||||||||
|
|
|
|||||||||||
| Revenues, net of benefits and expenses and income taxes |
$ | 109 | $ | 21 | $ | 29 | ||||||
|
|
|
|||||||||||
Maximum future earnings from closed block assets and liabilities:
| December 31, | ||||||||
| 2012 | 2011 | |||||||
|
|
|
|||||||
| (in millions) | ||||||||
| Beginning of period |
$ | 2,279 | $ | 2,300 | ||||
| Revenues, net of benefits and expenses and income taxes |
(109 | ) | (21 | ) | ||||
|
|
|
|||||||
| End of period |
$ | 2,170 | $ | 2,279 | ||||
|
|
|
|||||||
F-59
Table of Contents
JOHN HANCOCK LIFE INSURANCE COMPANY (U.S.A.)
NOTES TO CONSOLIDATED FINANCIAL STATEMENTS – (CONTINUED)
Note 11 — Debt and Line of Credit
External short-term and long-term debt consisted of the following:
| December 31, | ||||||||
| 2012 | 2011 | |||||||
|
|
|
|||||||
| (in millions) | ||||||||
| Short-term debt: |
||||||||
| Current maturities of long-term debt |
$ | 14 | $ | 11 | ||||
| Long-term debt: |
||||||||
| Surplus notes, 7.38% maturing in 2024 |
472 | 473 | ||||||
| Fixed rate notes payable, interest ranging from 5.4% to 13.84% due in varying amounts to 2016 |
62 | 106 | ||||||
| Variable rate notes payable, interest ranging from LIBOR plus 0.45% to LIBOR plus 3.15% |
- | 59 | ||||||
|
|
|
|||||||
| 534 | 638 | |||||||
| Less current maturities of long-term debt |
(14 | ) | (11 | ) | ||||
|
|
|
|||||||
| Total long-term debt |
$ | 520 | $ | 627 | ||||
|
|
|
|||||||
| Consumer notes: |
||||||||
| Notes payable, interest ranging from 0.80% to 6.00% due in varying amounts to 2032 |
$ | 716 | $ | 819 | ||||
|
|
|
|||||||
Long-Term Debt
Aggregate maturities of long-term debt are as follows: 2013—$14 million; 2014—$32 million; 2015—$0 million ; 2016—$16 million; 2017—$0 million; and thereafter—$472 million.
Interest expense on debt, included in other operating costs and expenses, was $41 million, $46 million and $47 million in 2012, 2011, and 2010, respectively. Interest paid on debt was $38 million, $43 million, and $47 million in 2012, 2011, and 2010, respectively.
The fixed rate notes payable includes $47 million of collateralized debt and therefore ranks highest in priority. The remaining fixed rate notes payable are unsecured. Any payment of interest or principal on the surplus notes requires the prior approval of the Commissioner.
Consumer Notes
The Company issued consumer notes through its SignatureNotes program. The SignatureNotes investment product was sold through a broker-dealer network to retail customers in the form of publicly traded fixed and/or floating rate securities. SignatureNotes have a variety of maturities, interest rates, and call provisions.
Aggregate maturities of consumer notes, net of unamortized dealer fees, are as follows: 2013—$56 million; 2014—$237 million; 2015—$148 million; 2016—$67 million; 2017—$8 million; and thereafter—$204 million.
Interest expense on consumer notes, included in other operating costs and expenses, was $34 million, $42 million, and $48 million in 2012, 2011, and 2010, respectively. Interest paid amounted to $36 million, $42 million, and $48 million in 2012, 2011, and 2010, respectively.
F-60
Table of Contents
JOHN HANCOCK LIFE INSURANCE COMPANY (U.S.A.)
NOTES TO CONSOLIDATED FINANCIAL STATEMENTS – (CONTINUED)
Note 11 — Debt and Line of Credit - (continued)
Line of Credit
At December 31, 2012, the Company had a committed line of credit established by MFC totaling $1 billion pursuant to a 364-day revolving credit facility. MFC will commit, when requested, to loan funds at prevailing interest rates as determined in accordance with the line of credit agreement. Under the terms of the agreement, the Company is required to maintain a certain minimum level of net worth and comply with certain other covenants, which were met at December 31, 2012. At December 31, 2012, the Company had no outstanding borrowings under the agreement.
At December 31, 2012, the Company, MFC, and other MFC subsidiaries had a committed line of credit through a group of banks totaling $500 million pursuant to a multi-year facility, which will expire in 2015. The banks will commit, when requested, to loan funds at prevailing interest rates as determined in accordance with the line of credit agreement. Under the terms of the agreement, MFC is required to maintain a certain minimum level of net worth, and MFC and the Company are required to comply with certain other covenants, which were met at December 31, 2012. At December 31, 2012, MFC and its subsidiaries, including the Company, had no outstanding borrowings under the agreement.
Note 12 — Income Taxes
The Company is included in the consolidated federal income tax return of JHFC. In 2010, the Company’s common parent, Manulife Holdings Delaware LLC (“MHDLLC”) merged with JHFC resulting in a new combined group. John Hancock Life and Health Insurance Company (“JHLH”), an affiliate, files a separate federal income tax return for a five-year period that began in 2010.
Income (loss) before income taxes includes the following:
| Years ended December 31, | ||||||||||||
| 2012 | 2011 | 2010 | ||||||||||
|
|
|
|||||||||||
| (in millions) | ||||||||||||
| Domestic |
$ | (766 | ) | $ | (1,143 | ) | $ | (788 | ) | |||
|
|
|
|||||||||||
| Income (loss) before income taxes |
$ | (766 | ) | $ | (1,143 | ) | $ | (788 | ) | |||
|
|
|
|||||||||||
The components of income taxes were as follows:
| Years ended December 31, | ||||||||||||
| 2012 | 2011 | 2010 | ||||||||||
|
|
|
|||||||||||
| (in millions) | ||||||||||||
| Current taxes: |
||||||||||||
| Federal |
$ | (255 | ) | $ | (233 | ) | $ | (224 | ) | |||
| State |
- | 1 | - | |||||||||
|
|
|
|||||||||||
| Total |
(255 | ) | (232 | ) | (224 | ) | ||||||
|
|
|
|||||||||||
| Deferred taxes: |
||||||||||||
| Federal |
(378 | ) | (100 | ) | 403 | |||||||
| State |
- | - | (3 | ) | ||||||||
|
|
|
|||||||||||
| Total |
(378 | ) | (100 | ) | 400 | |||||||
|
|
|
|||||||||||
| Total income tax expense (benefit) |
$ | (633 | ) | $ | (332 | ) | $ | 176 | ||||
|
|
|
|||||||||||
F-61
Table of Contents
JOHN HANCOCK LIFE INSURANCE COMPANY (U.S.A.)
NOTES TO CONSOLIDATED FINANCIAL STATEMENTS – (CONTINUED)
Note 12 — Income Taxes - (continued)
A reconciliation of income taxes at the federal income tax rate to income tax expense (benefit) charged to operations follows:
| Years ended December 31, | ||||||||||||
| 2012 | 2011 | 2010 | ||||||||||
|
|
|
|||||||||||
| (in millions) | ||||||||||||
| Tax at 35% |
$ | (268 | ) | $ | (400 | ) | $ | (276 | ) | |||
| Add (deduct): |
||||||||||||
| Prior year taxes |
(61 | ) | 27 | 47 | ||||||||
| Tax credits |
(76 | ) | (74 | ) | (65 | ) | ||||||
| Tax-exempt investment income |
(29 | ) | (31 | ) | (34 | ) | ||||||
| Lease income |
27 | 1 | (5 | ) | ||||||||
| Dividend received deduction |
(113 | ) | (102 | ) | (88 | ) | ||||||
| Change in tax reserves |
(128 | ) | 67 | 34 | ||||||||
| Goodwill impairment |
- | 175 | 560 | |||||||||
| Foreign tax expense gross-up |
10 | 3 | 3 | |||||||||
| Other |
5 | 2 | - | |||||||||
|
|
|
|||||||||||
| Total income tax expense (benefit) |
$ | (633 | ) | $ | (332 | ) | $ | 176 | ||||
|
|
|
|||||||||||
F-62
Table of Contents
JOHN HANCOCK LIFE INSURANCE COMPANY (U.S.A.)
NOTES TO CONSOLIDATED FINANCIAL STATEMENTS – (CONTINUED)
Note 12 — Income Taxes - (continued)
Deferred income tax assets and liabilities result from tax affecting the differences between the financial statement values and income tax values of assets and liabilities at each Consolidated Balance Sheet date. Deferred tax assets and liabilities consisted of the following:
| December 31, | ||||||||
| 2012 | 2011 | |||||||
|
|
|
|||||||
| (in millions) | ||||||||
| Deferred tax assets: |
||||||||
| Policy reserves |
$ | 2,401 | $ | 2,752 | ||||
| Net operating loss carryforwards |
661 | 666 | ||||||
| Net capital loss carryforwards |
- | - | ||||||
| Tax credits |
831 | 698 | ||||||
| Unearned revenue |
523 | 702 | ||||||
| Deferred compensation |
53 | 61 | ||||||
| Accrued interest |
414 | 437 | ||||||
| Policyholder dividends payable |
91 | 156 | ||||||
| Other |
91 | 147 | ||||||
|
|
|
|||||||
| Total deferred tax assets |
5,065 | 5,619 | ||||||
|
|
|
|||||||
| Deferred tax liabilities |
||||||||
| Unrealized investment gains on securities |
2,954 | 2,225 | ||||||
| Deferred policy acquisition costs |
1,606 | 1,751 | ||||||
| Intangible assets |
946 | 1,042 | ||||||
| Premiums receivable |
36 | 37 | ||||||
| Deferred sales inducements |
57 | 89 | ||||||
| Deferred gains |
527 | 577 | ||||||
| Securities and other investments |
2,969 | 3,690 | ||||||
| Other |
188 | 130 | ||||||
|
|
|
|||||||
| Total deferred tax liabilities |
9,283 | 9,541 | ||||||
|
|
|
|||||||
| Net deferred tax liabilities |
$ | 4,218 | $ | 3,922 | ||||
|
|
|
|||||||
At December 31, 2012, the Company had $1,889 million of net operating loss carryforwards which will expire between 2023 and 2030. At December 31, 2012, the Company had $831 million of tax credits, which consist of $633 million of general business credits, $172 million of foreign tax credits, and $26 million of alternative minimum tax credits. The general business credits begin to expire in tax year 2021 through tax year 2032. The foreign tax credits begin to expire in tax year 2013 through tax year 2022. The alternative minimum tax credits do not have an expiration date.
The Company has not recorded a valuation allowance with respect to the realizability of its deferred tax assets. In assessing the need for a valuation allowance, management considered the future reversal of taxable temporary differences, future taxable income exclusive of reversing temporary differences, taxable income in the carry back period, as well as tax planning strategies. Tax planning strategies were considered to the extent they were both prudent and feasible and if implemented, would result in the realization of deferred tax assets. Based on management’s assessment of all available information, management believes that it is more likely than not the Company will realize the full benefit of its deferred tax assets.
In 2012, the Company received income tax refunds of $190 million from subsidiaries under the terms of its inter-company tax-sharing agreement and made income tax payments of $43 million to the Internal Revenue Service (“IRS”). In 2011, the Company received income tax refunds of $181 million from subsidiaries under the terms of its inter-company tax-sharing agreement and received income tax refunds of $20 million from the IRS. In 2010, the Company received income tax refunds of $60 million from subsidiaries under the inter-company tax sharing agreement and made income tax payments of $29 million to the IRS.
F-63
Table of Contents
JOHN HANCOCK LIFE INSURANCE COMPANY (U.S.A.)
NOTES TO CONSOLIDATED FINANCIAL STATEMENTS – (CONTINUED)
Note 12 — Income Taxes - (continued)
The Company files income tax returns in the U.S. federal jurisdiction and various state and local jurisdictions. The Company is under continuous examination by the IRS. Effective for 2010, the Company’s common parent JHFC merged into MHDLLC resulting in a new combined group. The returns for the new combined group have not yet been examined by the IRS. With respect to the legacy MHDLLC consolidated return group, the IRS audits for tax years prior to 2006 have been closed. Tax years 2006 and 2007 for MHDLLC are in IRS appeals and tax years 2008 and 2009 are currently under examination. With respect to the legacy JHFC group, the IRS has completed its examinations of tax years 1997 through 2006. The IRS has issued statutory notices of deficiency relating to issues in years 1997 through 2001. The Company resolved all issues with the IRS except leveraged leases, for which the Company is waiting on a decision from the U.S. Tax Court. For tax years 2002 through 2004, all issues have been resolved except those pertaining to the Tax Court case. For tax years 2005 and 2006, the legacy JHFC group is currently in appeals. Tax years 2007 through 2009 are currently under examination by the IRS. Tax years 1997 through 2004 remain open until the Tax Court case is resolved. Management believes that adequate provision has been made in the financial statements for potential assessments relating to all open tax years.
A reconciliation of the beginning and ending amount of unrecognized tax benefits is as follows:
| December 31, | ||||||||
| 2012 | 2011 | |||||||
|
|
|
|||||||
| (in millions) | ||||||||
| Balance, beginning of year |
$ | 2,477 | $ | 2,261 | ||||
| Additions based on tax positions related to the current year |
350 | 212 | ||||||
| Additions for tax positions of prior years |
616 | 10 | ||||||
| Reductions for tax positions of prior years |
(217 | ) | (6 | ) | ||||
|
|
|
|||||||
| Balance, end of year |
$ | 3,226 | $ | 2,477 | ||||
|
|
|
|||||||
Included in the balances as of December 31, 2012 and 2011, respectively, are $237 million and $387 million of unrecognized benefits that, if recognized, would affect the Company’s effective tax rate. Included in the balances as of December 31, 2012 and 2011, respectively, are $2,989 million and $2,090 million of tax positions for which the ultimate deductibility is highly certain but for which there is uncertainty about the timing of such deductibility. Excluding the effect of interest and penalties, this has no impact on the annual effective rate, but would accelerate the payment of taxes to an earlier period.
The Company’s liability for unrecognized tax benefits may decrease in the next twelve months pending the outcome of remaining issues associated with the 1997 through 2009 IRS audit. A reasonable estimate of the decrease cannot be determined at this time; however, the Company believes that the ultimate resolution will not result in a material change to its consolidated financial statements.
The Company recognizes interest accrued related to unrecognized tax benefits in interest expense (part of other operating costs and expenses) and penalties in income tax expense. The Company recognized approximately $34 million of interest benefit for the year ended December 31, 2012, $161 million and $166 million of interest expense for the years ended December 31, 2011 and 2010, respectively. The Company had approximately $1,157 million and $1,191 million accrued for interest as of December 31, 2012 and 2011, respectively. The Company did not recognize material penalties for the years ended December 31, 2012, 2011, and 2010.
Note 13 — Commitments, Guarantees, Contingencies, and Legal Proceedings
Commitments. The Company has extended commitments to purchase U.S. private debt and to issue mortgage loans on real estate totaling $1,957 million and $124 million, respectively, at December 31, 2012. If funded, loans related to real estate mortgages would be fully collateralized by the mortgaged properties. The Company monitors the creditworthiness of borrowers under long-term bond commitments and requires collateral as deemed necessary. Approximately 40% of these commitments expire in 2013 and the remainder expire by 2017.
The Company leases office space under non-cancelable operating lease agreements with various expiration dates. Rental expenses, net of sub-lease income, were $18 million, $20 million and $24 million for the years ended December 31, 2012, 2011, and 2010, respectively.
F-64
Table of Contents
JOHN HANCOCK LIFE INSURANCE COMPANY (U.S.A.)
NOTES TO CONSOLIDATED FINANCIAL STATEMENTS – (CONTINUED)
Note 13 — Commitments, Guarantees, Contingencies, and Legal Proceedings - (continued)
During 2001, the Company entered into an office ground lease agreement, which expires on September 20, 2096. During 2012, the Company entered into a parking lease agreement, which expires on December 31, 2050. The terms of the lease agreements provide for adjustments in future periods. The future minimum lease payments, by year and in the aggregate, under these leases and other non-cancelable operating leases along with the associated sub-lease income are as follows:
| Non-cancelable Operating Leases |
Sub-lease Income |
|||||||
| (in millions) | ||||||||
| 2013 |
$ | 43 | $ | 17 | ||||
| 2014 |
33 | 14 | ||||||
| 2015 |
18 | 3 | ||||||
| 2016 |
10 | - | ||||||
| 2017 |
7 | - | ||||||
| Thereafter |
365 | - | ||||||
|
|
|
|||||||
| Total |
$ | 476 | $ | 34 | ||||
|
|
|
|||||||
Other than the Company’s investment in real estate, the Company does not have any material sub-lease income related to its office space. Leasing of investment real estate is not a significant part of the Company’s business activities in terms of revenue, net income, or assets.
The Company’s investment in leveraged leases relates to equipment used primarily in the transportation industries; however, this type of leasing transaction is not a significant part of the Company’s business activities in terms of revenue, net income, or assets.
Guarantees. In the course of business, the Company enters into guarantees which vary in nature and purpose and which are accounted for and disclosed under U.S. GAAP specific to the insurance industry. The Company had no guarantees outstanding outside the scope of insurance accounting at December 31, 2012.
Contingencies. The Company is an investor in leveraged leases and has established provisions for possible disallowance of the tax treatment and for interest on past due taxes. The Company continues to believe that deductions originally claimed in relation to these arrangements are appropriate. Although not expected to occur, should the tax attributes of the leveraged leases be fully denied, no material impact to the Company’s results are expected.
The Company acts as an intermediary/broker in over-the-counter derivative instruments. In these cases, the Company enters into derivative transactions on behalf of affiliated companies and then enters into offsetting derivative transactions with the affiliate. In the event of default of either party, the Company is still obligated to fulfill its obligations with the other party.
Legal Proceedings. The Company is regularly involved in litigation, both as a defendant and as a plaintiff. The litigation naming the Company as a defendant ordinarily involves its activities as a provider of insurance protection and wealth management products, an employer, and a taxpayer. In addition, the Michigan Office of Financial and Insurance Regulation, state attorneys general, the SEC, the Financial Regulatory Authority, and other government and regulatory bodies regularly make inquiries and, from time to time, require the production of information or conduct examinations concerning the Company’s compliance with, among other things, insurance laws, securities laws, and laws governing the activities of broker-dealers. An estimation of the range of potential outcomes in any given matter is often unavailable until developments in such matters have provided sufficient information to support an assessment of the range of possible loss, such as quantification of a damage demand from plaintiffs, discovery from other parties and investigation of factual allegations, rulings by the court on motions or appeals, analysis by experts, and the progress of settlement negotiations. On a regular quarterly and annual basis, we review relevant information with respect to litigation contingencies and update our accruals and estimates of reasonably possible losses or ranges of loss based on such reviews.
F-65
Table of Contents
JOHN HANCOCK LIFE INSURANCE COMPANY (U.S.A.)
NOTES TO CONSOLIDATED FINANCIAL STATEMENTS – (CONTINUED)
Note 14 — Shareholder’s Equity
Capital Stock
The Company has two classes of capital stock, preferred stock and common stock. All of the outstanding preferred and common stock of the Company is owned by MIC, its parent.
F-66
Table of Contents
JOHN HANCOCK LIFE INSURANCE COMPANY (U.S.A.)
NOTES TO CONSOLIDATED FINANCIAL STATEMENTS – (CONTINUED)
Note 14 — Shareholder’s Equity - (continued)
Accumulated Other Comprehensive Income (Loss)
The components of accumulated other comprehensive income (loss) were as follows:
| Net Unrealized Investment Gains (Losses) |
Net Accumulated Gain (loss) on Cash Flow Hedges |
Foreign Currency Translation Adjustment |
Additional Pension and Postretirement Unrecognized Net Periodic Benefit Cost |
Accumulated Other Comprehensive Income (Loss) |
||||||||||||||||
|
|
|
|||||||||||||||||||
| (in millions) | ||||||||||||||||||||
| Balance at January 1, 2010 |
$ | 207 | $ | 400 | $ | 9 | $ | (478 | ) | $ | 138 | |||||||||
| Gross unrealized investment gains (net of deferred income tax expense of $770) |
1,429 | 1,429 | ||||||||||||||||||
| Reclassification adjustment for gains realized in net income (net of deferred income tax expense of $275) |
(510 | ) | (510 | ) | ||||||||||||||||
| Adjustment for policyholder liabilities (net of deferred income tax expense of $23) |
42 | 42 | ||||||||||||||||||
| Adjustment for deferred policy acquisition costs, deferred sales inducements, value of business acquired, and unearned revenue liability (net of deferred income tax benefit of $97) |
(180 | ) | (180 | ) | ||||||||||||||||
|
|
|
|||||||||||||||||||
| Net unrealized investment gains |
781 | 781 | ||||||||||||||||||
| Foreign currency translation adjustment |
(53 | ) | (53 | ) | ||||||||||||||||
| Pension and postretirement benefits: |
||||||||||||||||||||
| Change in prior service cost (net of deferred income tax benefit of $1) |
(2 | ) | (2 | ) | ||||||||||||||||
| Change in net actuarial loss (net of deferred income tax expense of $5) |
9 | 9 | ||||||||||||||||||
| Net unrealized gain on split-dollar life insurance benefit (net of deferred income tax expense of $1) |
2 | 2 | ||||||||||||||||||
| Net losses on the effective portion of the change in fair value of cash flow hedges (net of deferred income tax benefit of $20) |
(37 | ) | (37 | ) | ||||||||||||||||
| Reclassification of net cash flow hedge gains to net income (net of deferred income tax expense of $69) |
(129 | ) | (129 | ) | ||||||||||||||||
| Transfer of certain pension and postretirement benefit plans to Parent (net of deferred income tax expense of $255) |
473 | 473 | ||||||||||||||||||
|
|
|
|||||||||||||||||||
| Balance at December 31, 2010 |
$ | 988 | $ | 234 | $ | (44 | ) | $ | 4 | $ | 1,182 | |||||||||
|
|
|
|||||||||||||||||||
F-67
Table of Contents
JOHN HANCOCK LIFE INSURANCE COMPANY (U.S.A.)
NOTES TO CONSOLIDATED FINANCIAL STATEMENTS – (CONTINUED)
Note 14 — Shareholder’s Equity - (continued)
| Net Unrealized Investment Gains (Losses) |
Net Accumulated Gain (loss) on Cash Flow Hedges |
Foreign Currency Translation Adjustment |
Additional Pension and Postretirement Unrecognized Net Periodic Benefit Cost |
Accumulated Other Comprehensive Income (Loss) |
||||||||||||||||
|
|
|
|||||||||||||||||||
| (in millions) | ||||||||||||||||||||
| Balance at January 1, 2011 |
$ | 988 | $ | 234 | $ | (44 | ) | $ | 4 | $ | 1,182 | |||||||||
| Gross unrealized investment gains (net of deferred income tax expense of $1,817) |
3,371 | 3,371 | ||||||||||||||||||
| Reclassification adjustment for gains realized in net income (net of deferred income tax expense of $373) |
(692 | ) | (692 | ) | ||||||||||||||||
| Adjustment for policyholder liabilities (net of deferred income tax benefit of $355) |
(659 | ) | (659 | ) | ||||||||||||||||
| Adjustment for deferred policy acquisition costs, deferred sales inducements, value of business acquired, and unearned revenue liability (net of deferred income tax benefit of $418) |
(775 | ) | (775 | ) | ||||||||||||||||
|
|
|
|||||||||||||||||||
| Net unrealized investment gains |
1,245 | 1,245 | ||||||||||||||||||
| Foreign currency translation adjustment |
13 | 13 | ||||||||||||||||||
| Net losses on the effective portion of the change in fair value of cash flow hedges (net of deferred income tax expense of $957) |
1,777 | 1,777 | ||||||||||||||||||
| Reclassification of net cash flow hedge gains to net income (net of deferred income tax expense of $32) |
(59 | ) | (59 | ) | ||||||||||||||||
|
|
|
|||||||||||||||||||
| Balance at December 31, 2011 |
$ | 2,233 | $ | 1,952 | $ | (31 | ) | $ | 4 | $ | 4,158 | |||||||||
|
|
|
|||||||||||||||||||
F-68
Table of Contents
JOHN HANCOCK LIFE INSURANCE COMPANY (U.S.A.)
NOTES TO CONSOLIDATED FINANCIAL STATEMENTS – (CONTINUED)
Note 14 — Shareholder’s Equity - (continued)
| Net Unrealized Investment Gains (Losses) |
Net Accumulated Gain (loss) on Cash Flow Hedges |
Foreign Currency Translation Adjustment |
Additional Pension and Postretirement Unrecognized Net Periodic Benefit Cost |
Accumulated Other Comprehensive Income (Loss) |
||||||||||||||||
|
|
|
|||||||||||||||||||
| (in millions) | ||||||||||||||||||||
| Balance at January 1, 2012 |
$ | 2,233 | $ | 1,952 | $ | (31 | ) | $ | 4 | $ | 4,158 | |||||||||
| Gross unrealized investment gains (net of deferred income tax expense of $902) |
1,677 | 1,677 | ||||||||||||||||||
| Reclassification adjustment for gains realized in net income (net of deferred income tax expense of $369) |
(686 | ) | (686 | ) | ||||||||||||||||
| Adjustment for policyholder liabilities (net of deferred income tax benefit of $135) |
(251 | ) | (251 | ) | ||||||||||||||||
| Adjustment for deferred policy acquisition costs, deferred sales inducements, value of business acquired, and unearned revenue liability (net of deferred income tax expense of $64) |
118 | 118 | ||||||||||||||||||
|
|
|
|||||||||||||||||||
| Net unrealized investment gains |
858 | 858 | ||||||||||||||||||
| Foreign currency translation adjustment |
(50 | ) | (50 | ) | ||||||||||||||||
| Pension and postretirement benefits: |
||||||||||||||||||||
| Net unrealized gain on split-dollar life insurance benefit (net of deferred income tax expense of $-) |
- | - | ||||||||||||||||||
| Net losses on the effective portion of the change in fair value of cash flow hedges (net of deferred income tax expense of $349) |
648 | 648 | ||||||||||||||||||
| Reclassification of net cash flow hedge gains to net income (net of deferred income tax expense of $113) |
(209 | ) | (209 | ) | ||||||||||||||||
|
|
|
|||||||||||||||||||
| Balance at December 31, 2012 |
$ | 3,091 | $ | 2,391 | $ | (81 | ) | $ | 4 | $ | 5,405 | |||||||||
|
|
|
|||||||||||||||||||
F-69
Table of Contents
JOHN HANCOCK LIFE INSURANCE COMPANY (U.S.A.)
NOTES TO CONSOLIDATED FINANCIAL STATEMENTS – (CONTINUED)
Note 14 — Shareholder’s Equity - (continued)
Net unrealized investment gains (losses) included on the Company’s Consolidated Balance Sheets as a component of shareholder’s equity are summarized below:
| Years ended December 31, | ||||||||||||
| 2012 | 2011 | 2010 | ||||||||||
|
|
|
|||||||||||
| (in millions) | ||||||||||||
| Balance, end of year comprises: |
||||||||||||
| Unrealized investment gains (losses) on: |
||||||||||||
| Fixed maturities |
$ | 7,378 | $ | 5,932 | $ | 1,861 | ||||||
| Equity securities |
471 | 365 | 360 | |||||||||
| Other investments |
5 | 33 | (14 | ) | ||||||||
|
|
|
|||||||||||
| Total (1) |
7,854 | 6,330 | 2,207 | |||||||||
| Amounts of unrealized investment gains (losses) attributable to: |
||||||||||||
| Deferred policy acquisition costs, deferred sales inducements, value of business acquired, and unearned revenue liability |
(1,642 | ) | (1,824 | ) | (631 | ) | ||||||
| Policyholder liabilities |
(1,456 | ) | (1,070 | ) | (56 | ) | ||||||
| Deferred income taxes |
(1,665 | ) | (1,203 | ) | (532 | ) | ||||||
|
|
|
|||||||||||
| Total |
(4,763 | ) | (4,097 | ) | (1,219 | ) | ||||||
|
|
|
|||||||||||
| Net unrealized investment gains (losses) |
$ | 3,091 | $ | 2,233 | $ | 988 | ||||||
|
|
|
|||||||||||
| (1) | Includes unrealized investment gains (losses) on invested assets held in trust on behalf of MRBL, which are included in amounts due from and held for affiliates on the Consolidated Balance Sheets. See Related Party Transactions Note, for information on the associated MRBL reinsurance agreement. |
Statutory Results
The Company and its wholly-owned subsidiaries, JHNY and JHLH, are required to prepare statutory financial statements in accordance with statutory accounting practices prescribed or permitted by the insurance departments of their states of domicile, which are Michigan, New York, and Massachusetts, respectively.
The Company’s statutory net (loss) income for the years ended December 31, 2012, 2011, and 2010 was $221 million, $(2,888) million, and $40 million, respectively. The Company’s statutory capital and surplus as of December 31, 2012 and 2011 was $5,794 million and $4,971 million, respectively.
Under Michigan State insurance laws, no insurer may pay any shareholder dividends from any source other than statutory earned surplus without the prior approval of the Insurance Commissioner. Dividends to the shareholder that may be paid without prior approval of the Commissioner are limited by the laws of the State of Michigan. Such dividends are permissible if, together with other dividends or distributions made within the preceding 12 months, they do not exceed the greater of 10% of the JHUSA surplus as of December 31 of the preceding year, or the net gain from operations for the 12 month period ending December 31 of the immediately preceding year. JHUSA paid no shareholder dividends to MIC for the years ended December 31, 2012 and 2011.
F-70
Table of Contents
JOHN HANCOCK LIFE INSURANCE COMPANY (U.S.A.)
NOTES TO CONSOLIDATED FINANCIAL STATEMENTS – (CONTINUED)
Note 15 — Pension and Other Postretirement Benefit Plans
Prior to December 31, 2010, the Company accounted for its share of the John Hancock Pension Plan, a qualified defined benefit plan, and the John Hancock Non-Qualified Pension Plan, a non-qualified defined benefit plan (collectively, “the Plans”), and the John Hancock Employee Welfare Plan (the “Welfare Plan”) as direct legal obligations of the Company and accounted for the corresponding plan obligations on its Consolidated Balance Sheets and Consolidated Statements of Operations. Effective December 31, 2010, the Company transferred the sponsorship of these plans to MIC along with the associated net liabilities. The impact of the transfer on the Company’s December 31, 2010 Consolidated Statements of Changes in Shareholder’s Equity was a decrease in additional paid-in capital of $13 million and an increase in accumulated other comprehensive income of $473 million, net of tax.
Prior to December 31, 2010, the Company sponsored the John Hancock Pension Plan that covers substantially all of its employees. Historically, pension benefits were calculated utilizing a traditional formula. Under the traditional formula, benefits were provided based upon length of service and final average compensation. As of January 1, 2002, all defined benefit pension plans were amended to a cash balance basis. Under the cash balance formula, participants are credited with benefits equal to a percentage of eligible pay, as well as interest. Certain grandfathered employees are eligible to receive benefits based upon the greater of the traditional formula or cash balance formula. In addition, early retirement benefits are subsidized for certain grandfathered employees.
Prior to December 31, 2010, the Company’s funding policy for its qualified defined benefit plan was to contribute annually an amount at least equal to the minimum annual contribution required under the Employee Retirement Income Security Act of 1974, as amended (“ERISA”), and other applicable laws and generally not greater than the maximum amount that can be deducted for federal income tax purposes. In 2010, no contributions were made to the qualified plan.
Prior to December 31, 2010, the Company also sponsored the John Hancock Non-Qualified Pension Plan. an unfunded non-qualified defined benefit plan. This plan provides supplemental benefits in excess of the compensation limit outlined in the Internal Revenue Code for certain employees.
Prior to December 31, 2010, the Company’s funding policy for the John Hancock Non-Qualified Pension Plan was to contribute an amount equal to the plan’s benefit payments made during the year. The contribution to the non-qualified plan was $31 million in 2010.
As of the transfer date, the assets and liabilities of the Plans became direct obligations of MIC, while JHUSA became a participating employer in the plans transferred. Prospectively, the Company will remain jointly and severally liable for the funding requirements of the Plans and will recognize its allocation from MIC of the required contributions to the plans as pension expense in its Consolidated Statements of Operations. The allocation is derived by utilizing participant data, provided by the plan actuary, to calculate payments into the trust for the qualified plan and payments to participants for the non-qualified plan. Prior to 2011, pension expense was the net periodic benefit cost incurred for these plans as determined by the plan actuary and consistent with actuarial practice for a plan sponsor. The expense for the Plans was $59 million, $41 million and $7 million in 2012, 2011, and 2010, respectively. The components of the $7 million in 2010 consisted of $32 million service cost, $124 million interest cost, ($161) million expected return on plan assets, ($3) million amortization of prior service cost and $15 million recognized actuarial loss. In 2010, benefits paid related to the qualified defined benefit plan and the non-qualified plan were $175 million.
The Company participates in the John Hancock Supplemental Retirement Plan, a non-qualified defined contribution plan maintained by MFC, which was established as of January 1, 2008 with participant directed investment options. The expense for the plan was $ 7 million, $6 million, and $8 million in 2012, 2011, and 2010, respectively. The prior non-qualified defined contribution plan was frozen except for grandfathered participants as of January 1, 2008, and the benefits accrued under the prior plan continue to be subject to the prior plan provisions.
Prior to December 31, 2010, the Company provided postretirement medical and life insurance benefits for its retired employees and their spouses through its sponsorship of the John Hancock Financial Services, Inc. Employee Welfare Plan. Effective January 1, 2010, the plan was renamed the John Hancock Employee Welfare Plan and plan sponsorship was transferred from MIC to the Company. Certain employees hired prior to January 1, 2005 who meet age and service criteria may be eligible for these postretirement benefits in accordance with the plan’s provisions. The majority of retirees contribute a portion of the total cost of postretirement medical benefits. Life insurance benefits are based on final compensation subject to the plan maximum.
F-71
Table of Contents
JOHN HANCOCK LIFE INSURANCE COMPANY (U.S.A.)
NOTES TO CONSOLIDATED FINANCIAL STATEMENTS – (CONTINUED)
Note 15 — Pension and Other Postretirement Benefit Plans - (continued)
The Welfare Plan was amended effective January 1, 2007 whereby participants who had not reached a certain age and years of service with the Company were no longer eligible for such Company contributory benefits. Also, the number of years of service required to be eligible for the benefit was increased to 15 years for all participants. The future retiree life insurance coverage amount was frozen as of December 31, 2006.
Prior to December 31, 2010, the Company’s policy was to fund the Welfare Plan in amounts at or below the annual tax qualified limits. The contribution to the Welfare Plan was $48 million in 2010.
As of the transfer date, the liabilities of the Welfare Plan became direct obligations of MIC, while JHUSA became a participating employer in the plan. Prospectively, the Company will remain jointly and severally liable for the funding requirements of the Welfare Plan and will recognize its allocation from MIC of the benefits paid on behalf of plan participants as postretirement benefits expense in its Consolidated Statements of Operations. The allocation is derived by utilizing participant data to calculate claim payments relating to participants in these plans. Prior to 2011, the Welfare Plan expense was the net periodic benefit cost incurred for these plans as determined by the plan actuary and consistent with actuarial practice for a plan sponsor. The expense for this plan was $30 million, $46 million, and $3 million in 2012, 2011, and 2010, respectively. The components of the $3 million in 2010 consisted of $1 million service cost, $28 million interest cost and ($26) million expected return on plan assets.
The Company participates in qualified defined contribution plans for its employees who meet certain eligibility requirements. Sponsorship of these plans transferred from MIC to the Company effective January 1, 2010. These plans include the Investment-Incentive Plan for John Hancock Employees and the John Hancock Savings and Investment Plan. Expense for these plans is primarily comprised of the amounts the Company contributes to the plans, which fully matches eligible participants’ basic pre-tax or Roth contributions, subject to a 4% per participant maximum. The expense for these defined contribution plans was $19 million, $19 million, and $18 million in 2012, 2011, and 2010, respectively.
Assumptions
Weighted-average assumptions used to determine the Company’s net periodic benefit cost for the year ended December 31, 2010, when the Company was the sponsor, are as follows:
| Pension Benefits | Other Postretirement Benefits |
|||||||
|
|
|
|||||||
| Discount rate |
5.50 | % | 5.50 | % | ||||
| Expected long-term return on plan assets |
7.75 | % | 7.75 | % | ||||
| Rate of compensation increase |
4.35 | % | N/A | |||||
| Health care cost trend rate for the following year |
8.50 | % | ||||||
| Ultimate trend rate |
5.00 | % | ||||||
| Year ultimate rate reached |
2028 | |||||||
The overall expected long-term rate of return on plan assets assumption reflects the Company’s best estimate. The general approach used to develop the assumption takes into consideration the allocation of assets held on the measurement date, plus the target allocation of expected contributions to the plan for the upcoming fiscal year, net of investment expenses. The rate is calculated using historical weighted-average real returns for each significant class of plan assets including the effects of continuous reinvestment of earnings. In addition, the calculation includes a long-term expectation of general inflation. Current market conditions and published commentary are also considered when assessing the reasonableness of the overall expected long-term rate of return on plan assets assumption.
F-72
Table of Contents
JOHN HANCOCK LIFE INSURANCE COMPANY (U.S.A.)
NOTES TO CONSOLIDATED FINANCIAL STATEMENTS – (CONTINUED)
Note 16 — Fair Value Measurements
The following table presents the carrying amounts and fair values of the items measured or disclosed at fair value by the Company. Fair values have been determined by using available market information and the valuation methodologies described below.
| December 31, | ||||||||||||||||
| 2012 | 2011 | |||||||||||||||
| Carrying Value |
Fair Value |
Carrying Value |
Fair Value |
|||||||||||||
|
|
|
|||||||||||||||
| (in millions) | ||||||||||||||||
| Assets: |
||||||||||||||||
| Fixed maturities: |
||||||||||||||||
| Available-for-sale (1) |
$ | 63,285 | $ | 63,285 | $ | 67,266 | $ | 67,266 | ||||||||
| Held-for-trading |
1,441 | 1,441 | 1,477 | 1,477 | ||||||||||||
| Equity securities: |
||||||||||||||||
| Available-for-sale |
386 | 386 | 439 | 439 | ||||||||||||
| Held-for-trading |
130 | 130 | 97 | 97 | ||||||||||||
| Mortgage loans on real estate |
13,192 | 15,065 | 13,974 | 15,335 | ||||||||||||
| Policy loans |
5,264 | 5,264 | 5,220 | 5,220 | ||||||||||||
| Short-term investments |
2,166 | 2,166 | 1,618 | 1,618 | ||||||||||||
| Cash and cash equivalents |
3,511 | 3,511 | 3,296 | 3,296 | ||||||||||||
| Other invested assets (2) |
367 | 367 | 425 | 425 | ||||||||||||
| Derivatives: |
||||||||||||||||
| Interest rate swaps |
11,502 | 11,502 | 11,580 | 11,580 | ||||||||||||
| Foreign currency swaps |
268 | 268 | 346 | 346 | ||||||||||||
| Foreign currency forwards |
10 | 10 | 4 | 4 | ||||||||||||
| Interest rate options |
43 | 43 | 9 | 9 | ||||||||||||
| Equity market contracts |
10 | 10 | - | - | ||||||||||||
| Credit default swaps |
6 | 6 | 4 | 4 | ||||||||||||
| Embedded derivatives |
2,715 | 2,715 | 2,924 | 2,924 | ||||||||||||
| Assets held in trust |
2,487 | 2,487 | 2,463 | 2,463 | ||||||||||||
| Separate account assets |
140,626 | 140,626 | 129,326 | 129,326 | ||||||||||||
|
|
|
|||||||||||||||
| Total assets |
$ | 247,409 | $ | 249,282 | $ | 240,468 | $ | 241,829 | ||||||||
|
|
|
|||||||||||||||
| Liabilities: |
||||||||||||||||
| Consumer notes |
$ | 716 | $ | 757 | $ | 819 | $ | 837 | ||||||||
| Debt |
534 | 593 | 638 | 677 | ||||||||||||
| Guaranteed investment contracts and funding agreements |
465 | 471 | 577 | 577 | ||||||||||||
| Fixed-rate deferred and immediate annuities |
8,903 | 9,219 | 9,415 | 9,307 | ||||||||||||
| Supplementary contracts without life contingencies |
67 | 72 | 48 | 48 | ||||||||||||
| Derivatives: |
||||||||||||||||
| Interest rate swaps |
4,499 | 4,499 | 4,454 | 4,454 | ||||||||||||
| Foreign currency swaps |
562 | 562 | 650 | 650 | ||||||||||||
| Foreign currency forwards |
- | - | 2 | 2 | ||||||||||||
| Equity market contracts |
7 | 7 | 20 | 20 | ||||||||||||
| Credit default swaps |
- | - | 1 | 1 | ||||||||||||
| Embedded derivatives |
4,717 | 4,717 | 3,961 | 3,961 | ||||||||||||
|
|
|
|||||||||||||||
| Total liabilities |
$ | 20,470 | $ | 20,897 | $ | 20,585 | $ | 20,534 | ||||||||
|
|
|
|||||||||||||||
F-73
Table of Contents
JOHN HANCOCK LIFE INSURANCE COMPANY (U.S.A.)
NOTES TO CONSOLIDATED FINANCIAL STATEMENTS – (CONTINUED)
Note 16 — Fair Value Measurements - (continued)
| 1) | Fixed maturities available-for-sale exclude leveraged leases of $1,711 million and $1,959 million at December 31, 2012 and 2011, respectively. The Company calculates the carrying value of its leveraged leases by accruing income at its expected internal rate of return. |
| 2) | Other invested assets exclude equity method and cost-accounted investments of $4,520 million and $4,076 million at December 31, 2012 and 2011, respectively. |
ASC 820 defines fair value, establishes a framework for measuring fair value, and expands disclosures about fair value measurements. This guidance defines fair value as the price that would be received to sell an asset or paid to transfer a liability in an orderly transaction between market participants at the measurement date; that is, an exit value. The exit value assumes the asset or liability is exchanged in an orderly transaction; it is not a forced liquidation or distressed sale.
Following ASC 820 guidance, the Company categorizes its fair value measurements according to a three-level hierarchy. The hierarchy prioritizes the inputs used by the Company’s valuation techniques. A level is assigned to each fair value measurement based on the lowest level input significant to the fair value measurement in its entirety. The three levels of the fair value hierarchy are defined as follows:
| • | Level 1 – Fair value measurements that reflect unadjusted, quoted prices in active markets for identical assets and liabilities that the Company has the ability to access at the measurement date. Active markets are defined as having the following characteristics for the measured asset/liability; (i) many transactions, (ii) current prices, (iii) price quotes not varying substantially among market makers, (iv) narrow bid/ask spreads, and (v) most information publicly available. Valuations are based on quoted prices reflecting market transactions involving assets or liabilities identical to those being measured. Level 1 assets primarily include exchange traded equity securities and certain separate account assets. |
| • | Level 2 – Fair value measurements using inputs other than quoted prices included within Level 1 that are observable for the asset or liability, either directly or indirectly. These include quoted prices for similar assets and liabilities in active markets, quoted prices for identical or similar assets and liabilities in inactive markets, inputs that are observable that are not prices (such as interest rates, credit risks, etc.), and inputs that are derived from or corroborated by observable market data. |
Most debt securities are classified within Level 2. Also included in the Level 2 category are financial instruments that are priced using models with observable market inputs, including most derivative financial instruments and certain separate account assets.
| • | Level 3 – Fair value measurements using significant nonmarket observable inputs. These include valuations for assets and liabilities that are derived using data, some or all of which is not market observable data, including assumptions about risk. |
Level 3 securities include less liquid securities, such as structured asset-backed securities, commercial mortgage-backed securities, and other securities that have little or no price transparency. Embedded and complex derivative financial instruments and separate account investments in timber and agriculture are also included in Level 3.
Determination of Fair Value
The valuation methodologies used to determine the fair values of assets and liabilities under ASC 820 reflect market participant assumptions and are based on the application of the fair value hierarchy that prioritizes observable market inputs over unobservable inputs. When available, the Company uses quoted market prices to determine fair value and classifies such items within Level 1. If quoted market prices are not available, fair value is based upon valuation techniques, which discount expected cash flows utilizing independent market observable interest rates based on the credit quality and duration of the instrument. Items valued using models are classified according to the lowest level input that is significant to the valuation. Thus, an item may be classified in Level 3 even though significant market observable inputs are used.
The Company utilizes a Valuation Quality Assurance (“VQA”) team of security analysts. The MFC Chief Investment Officer has ultimate responsibility over the VQA team. The team ensures quality and completeness of all daily and monthly prices. Prices are received from external pricing vendors and brokers and put through a quality assurance process which includes review of price movements relative to the market, comparison of prices between vendors, and internal matrix
F-74
Table of Contents
JOHN HANCOCK LIFE INSURANCE COMPANY (U.S.A.)
NOTES TO CONSOLIDATED FINANCIAL STATEMENTS – (CONTINUED)
Note 16 — Fair Value Measurements - (continued)
pricing. All inputs to our pricing matrix are external observable inputs extracted and entered by the VQA team. Broker quotes are used only when no external public vendor prices are available.
The following is a description of the valuation techniques used to measure fair value and the general classification of these instruments pursuant to the fair value hierarchy.
In general, ASC 820 created the following two primary categories for the purpose of fair value disclosure:
| • | Assets and Liabilities Measured and Disclosed at Fair Value on a Recurring Basis and Reported in the Consolidated Balance Sheets-This category includes assets and liabilities measured at fair value on a recurring and nonrecurring basis. Financial instruments measured on a recurring basis include fixed maturities, equity securities, short-term investments, derivatives, and separate account assets. Assets measured at fair value on a nonrecurring basis include limited partnership interests, and goodwill, which are reported at fair value only in the period in which an impairment is recognized. |
| • | Assets and Liabilities Disclosed at Fair Value on a Recurring Basis – This category includes mortgage loans on real estate, policy loans, cash and cash equivalents, consumer notes, guaranteed investment contracts, funding agreements and fixed-rate deferred and immediate annuities. |
Assets and Liabilities Measured and Disclosed at Fair Value on a Recurring Basis
Fixed Maturities
For fixed maturities, including corporate debt, U.S. Treasury, commercial and residential mortgage-backed securities, asset-backed securities, collateralized debt obligations, issuances by foreign governments, and obligations of state and political subdivisions, fair values are based on quoted market prices when available. When market prices are not available, fair value is generally estimated using discounted cash flow analyses, incorporating current market inputs for similar financial instruments with comparable terms and credit quality (matrix pricing). The significant inputs into these models include, but are not limited to, yield curves, credit risks and spreads, measures of volatility, and prepayment speeds. These fixed maturities are classified within Level 2. Fixed maturities with significant pricing inputs which are unobservable are classified within Level 3.
Equity Securities
Equity securities are comprised of common stock and are classified within Level 1, as fair values are based on quoted market prices in active markets.
Short-term Investments
Short-term investments are comprised of securities due to mature within one year of the date of purchase. Those that are traded in active markets are classified within Level 1, as fair values are based on quoted market prices. Securities such as commercial paper and discount notes are classified within Level 2 because these securities are typically not actively traded due to their short maturities and, as such, their cost generally approximates fair value.
Derivatives
The fair value of derivatives is determined through the use of quoted market prices for exchange-traded derivatives or through the use of pricing models for over-the-counter (“OTC”) derivatives. The pricing models used are based on market standard valuation methodologies, and the inputs to these models are consistent with what a market participant would use when pricing the instruments. Derivative valuations can be affected by changes in interest rates, currency exchange rates, financial indices, credit spreads, default risk (including the counterparties to the contract), and volatility. The Company’s derivatives are generally classified within Level 2 given the significant inputs to the pricing models for most OTC derivatives are observable or can be corroborated by observable market data. Inputs that are observable generally include interest rates, foreign currency exchange rates, and interest rate curves; however, certain OTC derivatives may rely on inputs that are significant to the fair value, but are unobservable in the market or cannot be derived principally from or corroborated by observable market data and would be classified within Level 3. Inputs that are unobservable generally include broker quotes, volatilities, and inputs that are outside of the observable portion of the interest rate curve or other relevant market measures. These unobservable inputs may involve significant management judgment or estimation.
F-75
Table of Contents
JOHN HANCOCK LIFE INSURANCE COMPANY (U.S.A.)
NOTES TO CONSOLIDATED FINANCIAL STATEMENTS – (CONTINUED)
Note 16 — Fair Value Measurements - (continued)
Even though unobservable, these inputs are based on assumptions deemed appropriate given the circumstances and consistent with what market participants would use when pricing such instruments. The credit risk of both the counterparty and the Company are considered in determining the fair value for all OTC derivatives after taking into account the effects of netting agreements and collateral arrangements.
Embedded Derivatives
As defined in ASC 815, the Company holds assets and liabilities classified as embedded derivatives on the Consolidated Balance Sheets. These assets include guaranteed minimum income benefits that are ceded under modified coinsurance reinsurance arrangements (“Reinsurance GMIB Assets”). Liabilities include policyholder benefits offered under variable annuity contracts such as GMWB with a term certain and embedded reinsurance derivatives.
Embedded derivatives are recorded on the Consolidated Balance Sheets at fair value, separately from their host contract, and the change in their fair value is reflected in net income. Many observable factors including, but not limited to, market conditions, credit ratings, and risk margins related to non-capital market inputs may result in significant fluctuations in the fair value of embedded derivatives that could materially affect net income. Embedded derivatives which are valued using observable market inputs are classified within Level 2 of the fair value hierarchy. Some embedded derivatives, mainly benefit guarantees for variable annuity products, utilize significant pricing inputs which are unobservable. These unobservable inputs are received from third party valuation experts and include equity volatility, mortality rates, lapse rates and utilization rates. Embedded derivatives with significant unobservable inputs are classified within Level 3.
The fair value of embedded derivatives related to GMIB and GMWB is estimated as the present value of future benefits less the present value of future fees. The fair value calculation includes assumptions for risk margins including nonperformance risk.
Risk margins are established to capture the risks of the instrument which represent the additional compensation a market participant would require to assume the risks related to the uncertainties of such actuarial assumptions as annuitization, persistency, partial withdrawal, and surrenders. The establishment of these actuarial assumptions, risk margins, nonperformance risk, and other inputs requires the use of significant judgment.
Nonperformance risk refers to the risk that the obligation will not be fulfilled and affects the value of the liability. The fair value measurement assumes that the nonperformance risk is the same before and after the transfer; therefore, fair value reflects the reporting entity’s own credit risk.
Nonperformance risk for liabilities held by the Company is based on MFC’s own credit risk, which is determined by taking into consideration publicly available information relating to MFC’s debt, as well as its claims paying ability. Nonperformance risk is also reflected in the reinsurance GMIB assets held by the Company. The credit risk of the reinsurance companies is most representative of the nonperformance risk for the reinsurance GMIB assets and is derived from publicly available information relating to the reinsurance companies’ publicly issued debt. As such, the reinsurance contract embedded derivatives are classified within Level 2.
The fair value of embedded derivatives related to reinsurance agreements is determined based on a total return swap methodology. These total return swaps are reflected as assets or liabilities on the Consolidated Balance Sheets representing the difference between the adjusted statutory book value and fair value of the related modified coinsurance assets with ongoing changes in fair value recorded in net realized investment and other gains (losses). The fair value of the underlying assets is based on the valuation approach for similar assets described herein.
Separate Account Assets
Separate account assets are carried at fair value and reported as a summarized total on the Consolidated Balance Sheets. Assets owned by the Company’s separate accounts primarily include investments in funds, fixed maturity securities, equity securities, real estate, short-term investments, and cash and cash equivalents. For separate accounts structured as a non-unitized fund, the fair value of the separate account assets is based on the fair value of the underlying assets owned by the separate account. For separate accounts structured as a unitized fund, the fair value of the separate account assets is based on the fair value of the underlying funds owned by the separate account.
The fair value of fund investments is based upon quoted market prices or reported net asset values. Fund investments that are traded in an active market and have a net asset value that the Company can access at the measurement date are classified within Level 1. The fair values of fixed maturity securities, equity securities, short-term investments, and cash equivalents held by separate accounts are determined on a basis consistent with the methodologies described herein for similar financial instruments held within the Company’s general account and may be classified within Level 1, 2, or 3 accordingly.
F-76
Table of Contents
JOHN HANCOCK LIFE INSURANCE COMPANY (U.S.A.)
NOTES TO CONSOLIDATED FINANCIAL STATEMENTS – (CONTINUED)
Note 16 — Fair Value Measurements - (continued)
Separate account assets classified as Level 3 consist primarily of debt and equity investments in private companies, which own timber and agriculture and carry it at fair value. The values of the timber and agriculture investments are estimated using generally accepted valuation techniques. A comprehensive appraisal is performed shortly after initial purchase and at two or three-year intervals thereafter. Appraisal updates are conducted according to client contracts, generally at one-year or six-month intervals. In the quarters in which an investment is not independently appraised or its valuation updated, the market value is reviewed by management. The valuation of an investment is adjusted only if there has been a significant change in economic circumstances related to the investment since acquisition or the most recent independent valuation and upon the independent appraiser’s review and concurrence with management. Further, these valuations are prepared giving consideration to the income, cost, and sales comparison approaches of estimating asset value. These investments are classified as Level 3 by the companies owning them, and therefore the equity investments in these companies are considered to be Level 3 by the Company.
Assets and Liabilities Disclosed at Fair Value on a Recurring Basis
Mortgage loans on real estate
The fair value of unimpaired mortgage loans is estimated using discounted cash flows and takes into account the contractual maturities and discount rates, which were based on current market rates for similar maturity ranges and adjusted for risk due to the property type.
Policy loans
These loans are carried at unpaid principal balances, which approximate their fair values.
Cash and cash equivalents
The carrying values for cash and cash equivalents approximate fair value due to the short-term maturities of these instruments.
Consumer notes, guaranteed investment contracts, and funding agreements
The fair values associated with these financial instruments are determined by projecting cash flows and discounting at current corporate rates, defined as U.S. Treasury rates plus MFC’s corporate spread. The fair value attributable to credit risk represents the present value of the spread.
Debt
The fair value of the Company’s long-term debt is estimated using discounted cash flows based on the Company’s incremental borrowing rates for similar type of borrowing arrangements. Long-term debt includes variable and fixed rate notes related to consolidated variable interest entities.
Fixed-rate deferred and immediate annuities
The fair value of fixed-rate deferred annuities is estimated by projecting multiple stochastically generated interest rate scenarios under a risk neutral environment reflecting inputs (interest rates, volatility, etc.) observable at the valuation date. The fair value of fixed immediate annuities is determined by projecting cash flows and discounting at current corporate rates, defined as U.S. Treasury rates plus MFC’s corporate spread. The fair value attributable to credit risk represents the present value of the spread.
F-77
Table of Contents
JOHN HANCOCK LIFE INSURANCE COMPANY (U.S.A.)
NOTES TO CONSOLIDATED FINANCIAL STATEMENTS – (CONTINUED)
Note 16 — Fair Value Measurements - (continued)
The table below presents the fair value by fair value hierarchy level for assets and liabilities that are reported at fair value in the Consolidated Balance Sheet:
| December 31, 2012 | ||||||||||||||||
| Total Fair Value |
Level 1 | Level 2 | Level 3 | |||||||||||||
|
|
|
|||||||||||||||
| (in millions) | ||||||||||||||||
| Assets: |
||||||||||||||||
| Fixed maturities available-for-sale (1): |
||||||||||||||||
| Corporate debt securities |
$ | 41,693 | $ | - | $ | 38,004 | $ | 3,689 | ||||||||
| Commercial mortgage-backed securities |
1,394 | - | 1,166 | 228 | ||||||||||||
| Residential mortgage-backed securities |
242 | - | 4 | 238 | ||||||||||||
| Collateralized debt obligations |
106 | - | 6 | 100 | ||||||||||||
| Other asset-backed securities |
894 | - | 847 | 47 | ||||||||||||
| U.S. Treasury and agency securities |
12,095 | - | 12,095 | - | ||||||||||||
| Obligations of states and political subdivisions |
5,394 | - | 4,831 | 563 | ||||||||||||
| Debt securities issued by foreign governments |
1,467 | - | 1,467 | - | ||||||||||||
|
|
|
|||||||||||||||
| Total fixed maturities available-for-sale |
63,285 | - | 58,420 | 4,865 | ||||||||||||
| Fixed maturities held-for-trading: |
||||||||||||||||
| Corporate debt securities |
997 | - | 955 | 42 | ||||||||||||
| Commercial mortgage-backed securities |
145 | - | 134 | 11 | ||||||||||||
| Residential mortgage-backed securities |
1 | - | - | 1 | ||||||||||||
| Collateralized debt obligations |
2 | - | 1 | 1 | ||||||||||||
| Other asset-backed securities |
24 | - | 23 | 1 | ||||||||||||
| U.S. Treasury and agency securities |
190 | - | 190 | - | ||||||||||||
| Obligations of states and political subdivisions |
81 | - | 70 | 11 | ||||||||||||
| Debt securities issued by foreign governments |
1 | - | 1 | - | ||||||||||||
|
|
|
|||||||||||||||
| Total fixed maturities held-for-trading |
1,441 | - | 1,374 | 67 | ||||||||||||
| Equity securities available-for-sale |
386 | 386 | - | - | ||||||||||||
| Equity securities held-for-trading |
130 | 130 | - | - | ||||||||||||
| Short-term investments |
2,166 | - | 2,166 | - | ||||||||||||
| Other invested assets (2) |
367 | - | - | 367 | ||||||||||||
| Derivative assets (3): |
||||||||||||||||
| Interest rate swaps |
11,502 | - | 11,484 | 18 | ||||||||||||
| Foreign currency swaps |
268 | - | 268 | - | ||||||||||||
| Foreign currency forwards |
10 | - | 10 | - | ||||||||||||
| Interest rate options |
43 | - | - | 43 | ||||||||||||
| Credit default swaps |
6 | - | 6 | - | ||||||||||||
| Equity market contracts |
10 | - | 5 | 5 | ||||||||||||
| Embedded derivatives (4): |
||||||||||||||||
| Reinsurance contracts |
14 | - | 14 | - | ||||||||||||
| Benefit guarantees |
2,701 | - | - | 2,701 | ||||||||||||
| Assets held in trust (6) |
2,487 | 886 | 1,546 | 55 | ||||||||||||
| Separate account assets (5) |
140,626 | 130,912 | 7,491 | 2,223 | ||||||||||||
|
|
|
|||||||||||||||
| Total assets at fair value |
$ | 225,442 | $ | 132,314 | $ | 82,784 | $ | 10,344 | ||||||||
|
|
|
|||||||||||||||
| Liabilities: |
||||||||||||||||
| Derivatives liabilities (3): |
||||||||||||||||
| Interest rate swaps |
$ | 4,499 | $ | - | $ | 4,498 | $ | 1 | ||||||||
| Foreign currency swaps |
562 | - | 517 | 45 | ||||||||||||
| Foreign currency forwards |
- | - | - | - | ||||||||||||
| Equity market contracts |
7 | - | 1 | 6 | ||||||||||||
| Credit default swaps |
- | - | - | - | ||||||||||||
| Embedded derivatives (4): |
||||||||||||||||
| Reinsurance contracts |
3,371 | - | 3,371 | - | ||||||||||||
| Participating pension contracts |
129 | - | 129 | - | ||||||||||||
| Benefit guarantees |
1,217 | - | - | 1,217 | ||||||||||||
|
|
|
|||||||||||||||
| Total liabilities at fair value |
$ | 9,785 | $ | - | $ | 8,516 | $ | 1,269 | ||||||||
|
|
|
|||||||||||||||
F-78
Table of Contents
JOHN HANCOCK LIFE INSURANCE COMPANY (U.S.A.)
NOTES TO CONSOLIDATED FINANCIAL STATEMENTS – (CONTINUED)
Note 16 — Fair Value Measurements - (continued)
| December 31, 2011 | ||||||||||||||||
| Total Fair Value |
Level 1 | Level 2 | Level 3 | |||||||||||||
|
|
|
|||||||||||||||
| (in millions) | ||||||||||||||||
| Assets: |
||||||||||||||||
| Fixed maturities available-for-sale (1): |
||||||||||||||||
| Corporate debt securities |
$ | 43,331 | $ | - | $ | 39,183 | $ | 4,148 | ||||||||
| Commercial mortgage-backed securities |
3,132 | - | 2,834 | 298 | ||||||||||||
| Residential mortgage-backed securities |
370 | - | 9 | 361 | ||||||||||||
| Collateralized debt obligations |
131 | - | 17 | 114 | ||||||||||||
| Other asset-backed securities |
1,093 | - | 1,049 | 44 | ||||||||||||
| U.S. Treasury and agency securities |
12,823 | - | 12,823 | - | ||||||||||||
| Obligations of states and political subdivisions |
4,964 | - | 4,428 | 536 | ||||||||||||
| Debt securities issued by foreign governments |
1,422 | - | 1,422 | - | ||||||||||||
|
|
|
|||||||||||||||
| Total fixed maturities available-for-sale |
67,266 | - | 61,765 | 5,501 | ||||||||||||
| Fixed maturities held-for-trading: |
||||||||||||||||
| Corporate debt securities |
1,037 | - | 985 | 52 | ||||||||||||
| Commercial mortgage-backed securities |
183 | - | 172 | 11 | ||||||||||||
| Residential mortgage-backed securities |
2 | - | - | 2 | ||||||||||||
| Collateralized debt obligations |
4 | - | 1 | 3 | ||||||||||||
| Other asset-backed securities |
31 | - | 31 | - | ||||||||||||
| U.S. Treasury and agency securities |
144 | - | 144 | - | ||||||||||||
| Obligations of states and political subdivisions |
75 | - | 65 | 10 | ||||||||||||
| Debt securities issued by foreign governments |
1 | - | 1 | - | ||||||||||||
|
|
|
|||||||||||||||
| Total fixed maturities held-for-trading |
1,477 | - | 1,399 | 78 | ||||||||||||
| Equity securities available-for-sale |
439 | 439 | - | - | ||||||||||||
| Equity securities held-for-trading |
97 | 97 | - | - | ||||||||||||
| Short-term investments |
1,618 | - | 1,618 | - | ||||||||||||
| Other invested assets (2) |
425 | - | - | 425 | ||||||||||||
| Derivative assets (3): |
||||||||||||||||
| Interest rate swaps |
11,580 | - | 11,518 | 62 | ||||||||||||
| Foreign currency swaps |
346 | - | 346 | - | ||||||||||||
| Foreign currency forwards |
4 | - | 4 | - | ||||||||||||
| Interest rate options |
9 | - | - | 9 | ||||||||||||
| Credit default swaps |
4 | - | - | 4 | ||||||||||||
| Equity market contracts |
- | - | - | - | ||||||||||||
| Embedded derivatives (4): |
||||||||||||||||
| Reinsurance contracts |
10 | - | 10 | - | ||||||||||||
| Benefit guarantees |
2,914 | - | - | 2,914 | ||||||||||||
| Assets held in trust (6) |
2,463 | 786 | 1,605 | 72 | ||||||||||||
| Separate account assets (5) |
129,326 | 120,310 | 6,864 | 2,152 | ||||||||||||
|
|
|
|||||||||||||||
| Total assets at fair value |
$ | 217,978 | $ | 121,632 | $ | 85,129 | $ | 11,217 | ||||||||
|
|
|
|||||||||||||||
| Liabilities: |
||||||||||||||||
| Derivatives liabilities (3): |
||||||||||||||||
| Interest rate swaps |
$ | 4,454 | $ | - | $ | 4,446 | $ | 8 | ||||||||
| Foreign currency swaps |
650 | - | 612 | 38 | ||||||||||||
| Foreign currency forwards |
2 | - | 2 | - | ||||||||||||
| Equity market contracts |
20 | - | - | 20 | ||||||||||||
| Credit default swaps |
1 | - | - | 1 | ||||||||||||
| Embedded derivatives (4): |
||||||||||||||||
| Reinsurance contracts |
2,686 | - | 2,686 | - | ||||||||||||
| Participating pension contracts |
106 | - | 106 | - | ||||||||||||
| Benefit guarantees |
1,169 | - | - | 1,169 | ||||||||||||
|
|
|
|||||||||||||||
| Total liabilities at fair value |
$ | 9,088 | $ | - | $ | 7,852 | $ | 1,236 | ||||||||
|
|
|
|||||||||||||||
F-79
Table of Contents
JOHN HANCOCK LIFE INSURANCE COMPANY (U.S.A.)
NOTES TO CONSOLIDATED FINANCIAL STATEMENTS – (CONTINUED)
Note 16 — Fair Value Measurements - (continued)
| (1) | Fixed maturities available-for-sale exclude leveraged leases of $1,711 million and $1,959 million at December 31, 2012 and 2011, respectively. The Company calculates the carrying value of its leveraged leases by accruing income at its expected internal rate of return. |
| (2) | Other invested assets exclude equity method and cost-accounted investments of $4,520 million and $4,076 million at December 31, 2012 and 2011, respectively. |
| (3) | Derivative assets and liabilities are presented gross to reflect the presentation in the Consolidated Balance Sheets, but are presented net for purposes of the Level 3 rollforward. |
| (4) | Embedded derivatives related to fixed maturities and reinsurance contracts are reported as part of the derivative asset or liability on the Consolidated Balance Sheets. Embedded derivatives related to benefit guarantees are reported as part of the reinsurance recoverable or future policy benefits on the Consolidated Balance Sheets. Embedded derivatives related to participating pension contracts are reported as part of future policy benefits on the Consolidated Balance Sheets. |
| (5) | Separate account assets are recorded at fair value. Investment performance related to separate account assets is fully offset by corresponding amounts credited to contract holders whose interest in the separate account assets is recorded by the Company as separate account liabilities. Separate account liabilities are set equal to the fair value of separate account assets. |
| (6) | Represents the fair value of assets held in trust on behalf of MRBL, which are included in amounts due from and held for affiliates on the Consolidated Balance Sheets. See the Related Party Transactions Note for information on the associated MRBL reinsurance agreement. The fair value of the trust assets is determined on a basis consistent with the methodologies described herein for similar financial instruments. |
The table below presents the fair value by fair value hierarchy level for certain assets and liabilities that are not reported at fair value in the Consolidated Balance Sheet, but are disclosed at fair value.
F-80
Table of Contents
JOHN HANCOCK LIFE INSURANCE COMPANY (U.S.A.)
NOTES TO CONSOLIDATED FINANCIAL STATEMENTS – (CONTINUED)
Note 16 — Fair Value Measurements - (continued)
| December 31, 2012 | ||||||||||||||||
| Total Fair Value |
Level 1 | Level 2 | Level 3 | |||||||||||||
|
|
|
|||||||||||||||
| (in millions) | ||||||||||||||||
| Assets |
||||||||||||||||
| Mortgage loans on real estate |
$ | 15,065 | $ | - | $ | 15,065 | $ | - | ||||||||
| Policy loans |
5,264 | - | 5,264 | - | ||||||||||||
| Cash and cash equivalents |
3,511 | 3,511 | - | - | ||||||||||||
|
|
|
|||||||||||||||
| Total assets at fair value |
$ | 23,840 | $ | 3,511 | $ | 20,329 | $ | - | ||||||||
|
|
|
|||||||||||||||
| Liabilities |
||||||||||||||||
| Consumer notes |
$ | 757 | $ | - | $ | - | $ | 757 | ||||||||
| Debt |
593 | - | 593 | - | ||||||||||||
| Guaranteed investment contracts and funding agreements |
471 | - | - | 471 | ||||||||||||
| Fixed rate deferred and immediate annuities |
9,219 | - | 1,253 | 7,966 | ||||||||||||
| Supplementary contracts without life contingencies |
72 | - | 72 | - | ||||||||||||
|
|
|
|||||||||||||||
| Total liabilities at fair value |
$ | 11,112 | $ | - | $ | 1,918 | $ | 9,194 | ||||||||
|
|
|
|||||||||||||||
Transfers of Level 1 and Level 2 Assets and Liabilities
The Company’s policy is to record transfers of assets and liabilities between Level 1 and Level 2 at their fair values as of the end of each reporting period, consistent with the date of the determination of fair value. Assets are transferred out of Level 1 when they are no longer transacted with sufficient frequency and volume in an active market. During the year ended December 31, 2012, the Company did not have any transfers from Level 1 to Level 2. Conversely, assets are transferred from Level 2 to Level 1 when transaction volume and frequency are indicative of an active market. The Company did not transfer assets from Level 2 to Level 1 during the year ended December 31, 2012.
F-81
Table of Contents
JOHN HANCOCK LIFE INSURANCE COMPANY (U.S.A.)
NOTES TO CONSOLIDATED FINANCIAL STATEMENTS – (CONTINUED)
Note 16 — Fair Value Measurements - (continued)
Level 3 Financial Instruments
The changes in Level 3 financial instruments measured at fair value on a recurring basis for the years ended December 31, 2012 and 2011 are summarized as follows:
| Balance at |
Net realized/unrealized gains (losses) included in: |
Purchases |
Issuances |
Sales |
Settlements |
Transfers | Balance at |
Change in unrealized gains in earnings on still held |
||||||||||||||||||||||||||||||||||||
| Earnings (1) | AOCI (2) | Into Level 3 (3) |
Out of Level 3 (3) |
|||||||||||||||||||||||||||||||||||||||||
|
|
|
|||||||||||||||||||||||||||||||||||||||||||
| (in millions) | ||||||||||||||||||||||||||||||||||||||||||||
| Fixed maturities available-for-sale: |
||||||||||||||||||||||||||||||||||||||||||||
| Corporate debt securities |
$ | 4,148 | $ | 78 | $ | 127 | $ | 1,759 | $ | - | $ | (1,478 | ) | $ | (217 | ) | $ | 50 | $ | (778 | ) | $ | 3,689 | $ | - | |||||||||||||||||||
| Commercial mortgage-backed securities |
298 | (21 | ) | 48 | 41 | - | (23 | ) | (109 | ) | 1 | (7 | ) | 228 | - | |||||||||||||||||||||||||||||
| Residential mortgage-backed securities |
361 | (47 | ) | 132 | 85 | - | (206 | ) | (87 | ) | - | - | 238 | - | ||||||||||||||||||||||||||||||
| Collateralized debt obligations |
114 | (29 | ) | 36 | 8 | - | (13 | ) | (16 | ) | - | - | 100 | - | ||||||||||||||||||||||||||||||
| Other asset-backed securities |
44 | 5 | 8 | 8 | - | (7 | ) | (11 | ) | - | - | 47 | - | |||||||||||||||||||||||||||||||
| Obligations of states and political subdivisions |
536 | 12 | 3 | 106 | - | (74 | ) | - | 20 | (40 | ) | 563 | - | |||||||||||||||||||||||||||||||
|
|
|
|||||||||||||||||||||||||||||||||||||||||||
| Total fixed maturities available-for-sale |
5,501 | (2 | ) | 354 | 2,007 | - | (1,801 | ) | (440 | ) | 71 | (825 | ) | 4,865 | - | |||||||||||||||||||||||||||||
| Fixed maturities held-for-trading: |
||||||||||||||||||||||||||||||||||||||||||||
| Corporate debt securities |
52 | 5 | - | 9 | - | (3 | ) | (1 | ) | 2 | (22 | ) | 42 | 5 | ||||||||||||||||||||||||||||||
| Commercial mortgage-backed securities |
11 | 1 | - | - | - | - | - | - | (1 | ) | 11 | 3 | ||||||||||||||||||||||||||||||||
| Residential mortgage-backed securities |
2 | - | - | - | - | - | (1 | ) | - | - | 1 | - | ||||||||||||||||||||||||||||||||
| Collateralized debt obligations |
3 | - | - | - | - | - | (2 | ) | - | - | 1 | - | ||||||||||||||||||||||||||||||||
| Other asset-backed securities |
- | 1 | - | - | - | - | - | - | - | 1 | - | |||||||||||||||||||||||||||||||||
| Obligations of states and political subdivisions |
10 | 1 | - | - | - | - | - | - | - | 11 | 1 | |||||||||||||||||||||||||||||||||
|
|
|
|||||||||||||||||||||||||||||||||||||||||||
| Total fixed maturities held-for-trading |
78 | 8 | - | 9 | - | (3 | ) | (4 | ) | 2 | (23 | ) | 67 | 9 | ||||||||||||||||||||||||||||||
| Other invested assets |
425 | 54 | (31 | ) | 111 | (16 | ) | (176 | ) | - | - | - | 367 | 6 | ||||||||||||||||||||||||||||||
| Net derivatives |
8 | (13 | ) | 5 | 45 | - | 7 | - | - | (38 | ) | 14 | 34 | |||||||||||||||||||||||||||||||
| Net embedded derivatives (4) |
1,745 | (256 | ) | - | - | - | - | - | - | (5 | ) | 1,484 | (256 | ) | ||||||||||||||||||||||||||||||
| Assets held in trust |
72 | - | - | - | - | - | (2 | ) | - | (15 | ) | 55 | - | |||||||||||||||||||||||||||||||
| Separate account assets (5) |
2,152 | 101 | - | 111 | - | (141 | ) | - | - | - | 2,223 | - | ||||||||||||||||||||||||||||||||
|
|
|
|||||||||||||||||||||||||||||||||||||||||||
| Total |
$ | 9,981 | $ | (108 | ) | $ | 328 | $ | 2,283 | $ | (16 | ) | $ | (2,114 | ) | $ | (446 | ) | $ | 73 | $ | (906 | ) | $ | 9,075 | $ | (207 | ) | ||||||||||||||||
|
|
|
|||||||||||||||||||||||||||||||||||||||||||
F-82
Table of Contents
JOHN HANCOCK LIFE INSURANCE COMPANY (U.S.A.)
NOTES TO CONSOLIDATED FINANCIAL STATEMENTS – (CONTINUED)
Note 16 — Fair Value Measurements - (continued)
| Balance at |
Net realized/unrealized gains (losses) included in: |
Purchases |
Issuances |
Sales |
Settlements |
Transfers | Balance at |
Change in unrealized gains (losses) included in earnings on instruments still held |
||||||||||||||||||||||||||||||||||||
| Earnings (1) | AOCI (2) | Into Level 3 (3) |
Out of Level 3 (3) |
|||||||||||||||||||||||||||||||||||||||||
|
|
|
|||||||||||||||||||||||||||||||||||||||||||
| (in millions) | ||||||||||||||||||||||||||||||||||||||||||||
| Fixed maturities available-for-sale: |
||||||||||||||||||||||||||||||||||||||||||||
| Corporate debt securities |
$ | 3,301 | $ | 13 | $ | 200 | $ | 872 | $ | - | $ | - | $ | (424 | ) | $ | 336 | $ | (150 | ) | $ | 4,148 | $ | - | ||||||||||||||||||||
| Commercial mortgage-backed securities |
485 | (17 | ) | (11 | ) | - | - | - | (159 | ) | - | - | 298 | - | ||||||||||||||||||||||||||||||
| Residential mortgage-backed securities |
450 | 1 | 17 | - | - | - | (107 | ) | - | - | 361 | - | ||||||||||||||||||||||||||||||||
| Collateralized debt obligations |
103 | (6 | ) | 29 | - | - | - | (12 | ) | - | - | 114 | - | |||||||||||||||||||||||||||||||
| Other asset-backed securities |
79 | (7 | ) | 1 | - | - | - | (25 | ) | 16 | (20 | ) | 44 | - | ||||||||||||||||||||||||||||||
| Obligations of states and political subdivisions |
408 | - | 55 | 87 | - | - | - | - | (14 | ) | 536 | - | ||||||||||||||||||||||||||||||||
|
|
|
|||||||||||||||||||||||||||||||||||||||||||
| Total fixed maturities available-for-sale |
4,826 | (16 | ) | 291 | 959 | - | - | (727 | ) | 352 | (184 | ) | 5,501 | - | ||||||||||||||||||||||||||||||
| Fixed maturities held-for-trading: |
||||||||||||||||||||||||||||||||||||||||||||
| Corporate debt securities |
36 | 14 | - | 23 | - | - | (3 | ) | - | (18 | ) | 52 | 14 | |||||||||||||||||||||||||||||||
| Commercial mortgage-backed securities |
15 | (1 | ) | - | - | - | - | (3 | ) | - | - | 11 | (1 | ) | ||||||||||||||||||||||||||||||
| Residential mortgage-backed securities |
3 | - | - | - | - | - | (1 | ) | - | - | 2 | - | ||||||||||||||||||||||||||||||||
| Collateralized debt obligations |
3 | - | - | - | - | - | - | - | - | 3 | - | |||||||||||||||||||||||||||||||||
| Other asset-backed securities |
1 | - | - | - | - | - | - | - | (1 | ) | - | - | ||||||||||||||||||||||||||||||||
| Obligations of states and political subdivisions |
- | 1 | - | 9 | - | - | - | - | - | 10 | 1 | |||||||||||||||||||||||||||||||||
|
|
|
|||||||||||||||||||||||||||||||||||||||||||
| Total fixed maturities held-for-trading |
58 | 14 | - | 32 | - | - | (7 | ) | - | (19 | ) | 78 | 14 | |||||||||||||||||||||||||||||||
| Other invested assets |
230 | 20 | (3 | ) | 75 | - | (6 | ) | (50 | ) | 159 | - | 425 | 22 | ||||||||||||||||||||||||||||||
| Net derivatives |
19 | 1 | 19 | 13 | - | - | - | - | (44 | ) | 8 | 2 | ||||||||||||||||||||||||||||||||
| Net embedded derivatives (4) |
967 | 778 | - | - | - | - | - | - | - | 1,745 | 778 | |||||||||||||||||||||||||||||||||
| Assets held in trust |
61 | - | 12 | - | - | - | (1 | ) | - | - | 72 | 12 | ||||||||||||||||||||||||||||||||
| Separate account assets (5) |
2,075 | (14 | ) | 53 | 67 | - | - | (29 | ) | - | - | 2,152 | 60 | |||||||||||||||||||||||||||||||
|
|
|
|||||||||||||||||||||||||||||||||||||||||||
| Total |
$ | 8,236 | $ | 783 | $ | 372 | $ | 1,146 | $ | - | $ | (6 | ) | $ | (814 | ) | $ | 511 | $ | (247 | ) | $ | 9,981 | $ | 888 | |||||||||||||||||||
|
|
|
|||||||||||||||||||||||||||||||||||||||||||
F-83
Table of Contents
JOHN HANCOCK LIFE INSURANCE COMPANY (U.S.A.)
NOTES TO CONSOLIDATED FINANCIAL STATEMENTS – (CONTINUED)
Note 16 — Fair Value Measurements - (continued)
| 1) | This amount is included in net realized investment and other gains (losses) on the Consolidated Statements of Operations. |
| 2) | This amount is included in net unrealized investment gains (losses) within AOCI on the Consolidated Balance Sheets. |
| 3) | For financial assets that are transferred into and/or out of Level 3, the Company uses the fair value of the assets at the beginning of the reporting period. |
| 4) | The earnings amount is included in benefits to policyholders on the Consolidated Statements of Operations. |
| 5) | Investment performance related to separate account assets is fully offset by corresponding amounts credited to contract holders whose liability is reflected within separate account liabilities. |
The Company may hedge positions with offsetting positions that are classified in a different level. For example, the gains and losses for assets and liabilities in the Level 3 category presented in the tables above may not reflect the effect of offsetting gains and losses on hedging instruments that have been classified by the Company in the Level 1 and Level 2 categories.
The transfers into Level 3 primarily result from securities that were impaired during the year or securities where a lack of observable market data (versus the previous year) resulted in reclassifying assets into Level 3. The transfers out of Level 3 primarily result from observable market data becoming available for that asset, thus eliminating the need to extrapolate market data beyond observable points.
Information about Sensitivity to Changes in Significant Unobservable Inputs (Level 3)
The Company determines the estimated fair value of its Level 3 investments using primarily the market approach and the income approach. Matrix pricing or other similar techniques are examples of market approaches, while the use of discounted cash flow methodologies is an example of the income approach. The Company attempts to maximize the use of observable inputs and minimize the use of unobservable inputs in selecting whether the market or income approach is used.
Corporate Debt Securities and Obligations of States and Political Subdivisions
Corporate debt securities and obligations of states and political subdivisions included in Level 3 are primarily private placement issuances that are not traded in active markets or that are subject to transfer restrictions. Fair value measurements consider illiquidity and non-transferability. When quoted prices are not available, fair value is determined based on discounted cash flow models using discount rates based on credit spreads, yields or price levels of publicly-traded debt of the issuer or other comparable securities, considering illiquidity and structure. The significant unobservable input used in the fair value measurement of corporate debt is the yield, only if the yield is carried forward at the 30 year point. The yield is affected by the market movements in credit spreads and state and political subdivision yields. In addition, the migration in credit quality of a given security generally has a corresponding effect on the fair value measurement of the securities. For example, a downward migration of credit quality would increase spreads. Holding state and political subdivision yields constant, an increase in corporate credit spreads would decrease the fair value of corporate debt.
Benefit Guarantees
The significant unobservable inputs used for embedded derivatives in policyholder contract deposits measured at fair value, benefit guarantees for variable annuity products, are equity implied volatility, mortality rates, lapse rates and utilization rates. In general, increases in volatilities and utilization rates will increase the fair value, while increases in lapse rates and mortality rates will decrease the fair value of the liability associated with the guarantee.
Separate Account Assets
The Company’s Level 3 separate account assets are predominantly invested in timberland properties valued by third-party valuation service providers. The significant unobservable inputs used in the fair value measurement of the Company’s timberland investments are harvest volumes, timber prices, operating costs and discount rates. Significant changes to any one of these inputs in isolation could result in a significant change to fair value measurement. Holding other factors constant, an increase to either harvest volumes or timber prices would tend to increase the fair value of a timberland investment, while an increase in operating costs or discount rate would have the opposite effect.
F-84
Table of Contents
JOHN HANCOCK LIFE INSURANCE COMPANY (U.S.A.)
NOTES TO CONSOLIDATED FINANCIAL STATEMENTS – (CONTINUED)
Note 16 — Fair Value Measurements - (continued)
Quantitative Information About Level 3 Fair Value Measurements
The table below presents information about the significant unobservable inputs used for recurring fair value measurements for certain Level 3 instruments, and includes only those instruments for which information about the inputs is reasonably available, such as data from pricing vendors and from internal valuation models. Because not all Level 3 instruments have input information reasonably available, balances shown below may not equal total amounts reported for such Level 3 assets and liabilities:
| Fair Value at December 31, 2012 (in millions) |
Predominant |
Unobservable Input |
Range (1) | |||||||||||||||||
| Corporate debt securities |
$ | 3,731 | Discounted cash flow |
Yield if greater than 30 years | 0 | to | 61 | |||||||||||||
| Delta spread adjustment | 0 | to | 1919 | |||||||||||||||||
| Obligation of states and political subdivisions |
$ | 574 | Discounted cash flow |
Yield if greater than 30 years | 97 | to | 364 | |||||||||||||
| Benefit guarantees |
$ | 1,484 | Discounted cash flow |
Equity implied volatility | 0 | % | to | 35 | % | |||||||||||
| Base lapse rates | 1 | % | to | 35 | % | |||||||||||||||
| Dynamic lapse rates | 0 | % | to | 70 | % | |||||||||||||||
| Mortality rates | 0 | % | to | 38 | % | |||||||||||||||
| Utilization rates | 80 | % | to | 100 | % | |||||||||||||||
| (1) | For the unobservable inputs, the range is presented in basis points unless otherwise specified. |
Assets Measured at Fair Value on a Nonrecurring Basis
Certain assets are reported at fair value on a nonrecurring basis, including investments such as, limited partnership interests and goodwill, which are reported at fair value only in the period in which an impairment is recognized. The fair value is calculated using models that are widely accepted in the financial services industry. For the year ended December 31, 2012, the Company did not record a goodwill impairment. During the year ended December 31, 2011, the Company recorded a goodwill impairment of $500 million and the fair value measurement was classified as Level 3. For additional information regarding the impairments, see the Goodwill, Value of Business Acquired, and Other Intangible Assets Note.
Note 17 — Segment Information
The Company operates in the following three business segments: (1) Insurance and (2) Wealth Management, which primarily serve retail and institutional customers and (3) Corporate and Other, which includes the institutional advisory business, the reinsurance operations, and the corporate account.
The Company’s reportable segments are strategic business units offering different products and services. The reportable segments are managed separately, as they focus on different products, markets, and distribution channels.
Insurance Segment. Offers a variety of individual life insurance products and individual and group long-term care insurance. Products are distributed through multiple distribution channels, including insurance agents, brokers, banks, financial planners, and direct marketing. In 2012, the Company’s remaining international insurance operations were transferred to the Corporate and Other Segment.
Wealth Management Segment. Offers annuities and mutual fund products and services. These businesses also offer a variety of retirement products to group benefit plans. Annuity contracts provide non-guaranteed, partially guaranteed, and fully guaranteed investment options through general and separate account products. These businesses distribute products through multiple distribution channels, including insurance agents and brokers affiliated with the Company, securities brokerage firms, financial planners, pension plan sponsors, pension plan consultants, and banks. As discussed in the Significant Accounting Policies Note, the Company suspended sales of all its individual and group fixed and variable annuities.
Corporate and Other Segment. Primarily consists of certain corporate operations, the institutional advisory business, reinsurance operations, and businesses that are either disposed or in run-off. Corporate operations primarily include certain
F-85
Table of Contents
JOHN HANCOCK LIFE INSURANCE COMPANY (U.S.A.)
NOTES TO CONSOLIDATED FINANCIAL STATEMENTS – (CONTINUED)
Note 17 — Segment Information - (continued)
financing activities, income on capital not specifically allocated to the operating segments, and certain non-recurring expenses not allocated to the segments. The income statement impact of goodwill impairment charges are reported in this segment. In 2012, the Company’s remaining international insurance operations were transferred from the Insurance Segment.
The accounting policies of the segments are the same as those described in the Summary of Significant Accounting Policies Note. Allocations of net investment income are based on the amount of assets allocated to each segment. Other costs and operating expenses are allocated to each segment based on a review of the nature of such costs, cost allocations utilizing time studies, and other relevant allocation methodologies.
The following tables summarize selected financial information by segment for the periods indicated. Included in the Insurance Segment for all periods presented are the assets, liabilities, revenues, and expenses of the closed blocks. For additional information on the closed blocks, see the Closed Blocks Note.
| Insurance | Wealth Management |
Corporate and Other |
Total | |||||||||||||
|
|
|
|||||||||||||||
| (in millions) | ||||||||||||||||
| 2012 |
||||||||||||||||
| Revenues from external customers |
$ | 5,118 | $ | 2,253 | $ | 295 | $ | 7,666 | ||||||||
| Net investment income |
2,956 | 1,641 | (38 | ) | 4,559 | |||||||||||
| Net realized investment and other gains (losses) |
(269 | ) | (1,606 | ) | (293 | ) | (2,168 | ) | ||||||||
| Inter-segment revenues |
- | - | - | - | ||||||||||||
|
|
|
|||||||||||||||
| Revenues |
$ | 7,805 | $ | 2,288 | $ | (36 | ) | $ | 10,057 | |||||||
|
|
|
|||||||||||||||
| Net income (loss) |
$ | (220 | ) | $ | 94 | $ | (7 | ) | $ | (133 | ) | |||||
|
|
|
|||||||||||||||
| Supplemental Information: |
||||||||||||||||
| Equity in net income (loss) of investees accounted for under the equity method |
$ | 208 | $ | 28 | $ | (18 | ) | $ | 218 | |||||||
| Carrying value of investments under the equity method |
3,259 | 912 | 287 | 4,458 | ||||||||||||
| Amortization of deferred policy acquisition costs, deferred sales inducements, and value of business acquired |
1,001 | 384 | - | 1,385 | ||||||||||||
| Goodwill impairment |
- | - | - | - | ||||||||||||
| Interest expense |
- | - | 41 | 41 | ||||||||||||
| Income tax expense (benefit) |
(174 | ) | (381 | ) | (78 | ) | (633 | ) | ||||||||
| Segment assets |
$ | 101,334 | $ | 163,135 | $ | 25,905 | $ | 290,374 | ||||||||
F-86
Table of Contents
JOHN HANCOCK LIFE INSURANCE COMPANY (U.S.A.)
NOTES TO CONSOLIDATED FINANCIAL STATEMENTS – (CONTINUED)
Note 17 — Segment Information - (continued)
| Insurance | Wealth Management |
Corporate and Other |
Total | |||||||||||||
|
|
|
|||||||||||||||
| (in millions) | ||||||||||||||||
| 2011 |
||||||||||||||||
| Revenues from external customers |
$ | 6,288 | $ | 2,166 | $ | 383 | $ | 8,837 | ||||||||
| Net investment income |
2,831 | 1,824 | 334 | 4,989 | ||||||||||||
| Net realized investment and other gains (losses) |
1,108 | 2,004 | 23 | 3,135 | ||||||||||||
| Inter-segment revenues |
- | - | - | - | ||||||||||||
|
|
|
|||||||||||||||
| Revenues |
$ | 10,227 | $ | 5,994 | $ | 740 | $ | 16,961 | ||||||||
|
|
|
|||||||||||||||
| Net income (loss) |
$ | 30 | $ | (200 | ) | $ | (641 | ) | $ | (811 | ) | |||||
|
|
|
|||||||||||||||
| Supplemental Information: |
||||||||||||||||
| Equity in net income (loss) of investees accounted for under the equity method |
$ | 178 | $ | 46 | $ | (2 | ) | $ | 222 | |||||||
| Carrying value of investments under the equity method |
2,582 | 1,056 | 313 | 3,951 | ||||||||||||
| Amortization of deferred policy acquisition costs, deferred sales inducements, and value of business acquired |
1,673 | 1,167 | 1 | 2,841 | ||||||||||||
| Goodwill impairment |
- | - | 500 | 500 | ||||||||||||
| Interest expense |
- | - | 47 | 47 | ||||||||||||
| Income tax expense (benefit) |
(19 | ) | (246 | ) | (67 | ) | (332 | ) | ||||||||
| Segment assets |
$ | 94,267 | $ | 153,822 | $ | 25,783 | $ | 273,872 | ||||||||
| Insurance | Wealth Management |
Corporate and Other |
Total | |||||||||||||
|
|
|
|||||||||||||||
| (in millions) | ||||||||||||||||
| 2010 |
||||||||||||||||
| Revenues from external customers |
$ | 4,589 | $ | 2,487 | $ | 527 | $ | 7,603 | ||||||||
| Net investment income |
2,553 | 1,710 | 233 | 4,496 | ||||||||||||
| Net realized investment and other gains (losses) |
321 | (398 | ) | 159 | 82 | |||||||||||
| Inter-segment revenues |
- | - | - | - | ||||||||||||
|
|
|
|||||||||||||||
| Revenues |
$ | 7,463 | $ | 3,799 | $ | 919 | $ | 12,181 | ||||||||
|
|
|
|||||||||||||||
| Net income (loss) |
$ | 67 | $ | 466 | $ | (1,497 | ) | $ | (964 | ) | ||||||
|
|
|
|||||||||||||||
| Supplemental Information: |
||||||||||||||||
| Equity in net income (loss) of investees accounted for under the equity method |
$ | 156 | $ | 61 | $ | (20 | ) | $ | 197 | |||||||
| Amortization of deferred policy acquisition costs, deferred sales inducements, and value of business acquired |
478 | 203 | 1 | 682 | ||||||||||||
| Goodwill impairment |
- | - | 1,600 | 1,600 | ||||||||||||
| Interest expense |
- | - | 47 | 47 | ||||||||||||
| Income tax expense (benefit) |
23 | 114 | 39 | 176 | ||||||||||||
The Company operates primarily in the United States and has no reportable major customers.
F-87
Table of Contents
JOHN HANCOCK LIFE INSURANCE COMPANY (U.S.A.)
NOTES TO CONSOLIDATED FINANCIAL STATEMENTS – (CONTINUED)
Note 18 — Subsequent Events
The Company evaluated the recognition and disclosure of subsequent events for its December 31, 2012 consolidated financial statements through the date on which the consolidated financial statements were issued.
On March 18, 2013, the Company entered into a committed line of credit agreement established by MLI totaling $1 billion which will expire in 2018. MLI will commit, when requested, to loan funds at prevailing interest rates as determined in accordance with the line of credit agreement. Under the terms of the agreement, the Company is required to maintain a certain minimum level of net worth and comply with certain other covenants.
F-88
Table of Contents
John Hancock Life Insurance Company (U.S.A.) Separate Account N
Audited Financial Statements
Year ended December 31, 2012 with Report of Independent Registered Public Accounting Firm
Table of Contents
Table of Contents
John Hancock Life Insurance Company (U.S.A.) Separate Account N
Audited Financial Statements
Year ended December 31, 2012
Contents
| 5 | ||||
| 8 | ||||
| Statements of Operations and Changes in Contract Owners’ Equity |
12 | |||
| 70 | ||||
| 70 | ||||
| 71 | ||||
| 72 | ||||
| 72 | ||||
| 72 | ||||
| 73 | ||||
| 76 | ||||
| 76 | ||||
| 76 | ||||
| 77 |
Table of Contents
Table of Contents
Report of Independent Registered Public Accounting Firm
Board of Directors of the John Hancock Life Insurance Company (U.S.A.) and Contract Owners of John Hancock Life Insurance Company (U.S.A.) Separate Account N
| “Active” sub-accounts |
||
| 500 Index Trust B Series 0 | Financial Services Trust Series 0 | |
| Active Bond Trust Series 0 | Financial Services Trust Series 1 | |
| Active Bond Trust Series 1 | Franklin Templeton Founding Allocation Trust Series 0 | |
| All Cap Core Trust Series 0 | Franklin Templeton Founding Allocation Trust Series 1 | |
| All Cap Core Trust Series 1 | Fundamental All Cap Core Trust Series 0 | |
| All Cap Value Trust Series 0 | Fundamental All Cap Core Trust Series 1 | |
| All Cap Value Trust Series 1 | Fundamental Holdings Trust Series 1 | |
| Alpha Opportunities Trust Series 0 | Fundamental Large Cap Value Trust Series 0 | |
| Alpha Opportunities Trust Series 1 | Fundamental Large Cap Value Trust Series 1 | |
| American Asset Allocation Trust Series 1 | Fundamental Value Trust Series 0 | |
| American Global Growth Trust Series 1 | Fundamental Value Trust Series 1 | |
| American Global Small Capitalization Trust Series 1 | Global Bond Trust Series 0 | |
| American Growth Trust Series 1 | Global Bond Trust Series 1 | |
| American Growth-Income Trust Series 1 | Global Diversification Trust Series 1 | |
| American High-Income Bond Trust Series 1 | Global Trust Series 0 | |
| American International Trust Series 1 | Global Trust Series 1 | |
| American New World Trust Series 1 | Health Sciences Trust Series 0 | |
| Blue Chip Growth Trust Series 0 | Health Sciences Trust Series 1 | |
| Blue Chip Growth Trust Series 1 | High Yield Trust Series 0 | |
| Bond Trust Series 0 | High Yield Trust Series 1 | |
| Bond Trust Series 1 | International Core Trust Series 0 | |
| Capital Appreciation Trust Series 0 | International Core Trust Series 1 | |
| Capital Appreciation Trust Series 1 | International Equity Index Trust B Series 0 | |
| Capital Appreciation Value Trust Series 0 | International Equity Index Trust B Series 1 | |
| Capital Appreciation Value Trust Series 1 | International Growth Stock Trust Series 0 | |
| Core Allocation Plus Trust Series 0 | International Growth Stock Trust Series 1 | |
| Core Allocation Plus Trust Series 1 | International Small Company Trust Series 0 | |
| Core Bond Trust Series 0 | International Small Company Trust Series 1 | |
| Core Bond Trust Series 1 | International Value Trust Series 0 | |
| Core Strategy Trust Series 0 | International Value Trust Series 1 | |
| Core Strategy Trust Series 1 | Investment Quality Bond Trust Series 0 | |
| Disciplined Diversification Trust Series 0 | Investment Quality Bond Trust Series 1 | |
| Disciplined Diversification Trust Series 1 | Lifestyle Aggressive Trust Series 0 | |
| Emerging Markets Value Trust Series 0 | Lifestyle Aggressive Trust Series 1 | |
| Emerging Markets Value Trust Series 1 | Lifestyle Balanced Trust Series 0 | |
| Equity-Income Trust Series 0 | Lifestyle Balanced Trust Series 1 | |
| Equity-Income Trust Series 1 | Lifestyle Conservative Trust Series 0 | |
5
Table of Contents
Report of Independent Registered Public Accounting Firm
| Lifestyle Conservative Trust Series 1 | Small Cap Opportunities Trust Series 1 | |
| Lifestyle Growth Trust Series 0 | Small Cap Value Trust Series 0 | |
| Lifestyle Growth Trust Series 1 | Small Cap Value Trust Series 1 | |
| Lifestyle Moderate Trust Series 0 | Small Company Value Trust Series 0 | |
| Lifestyle Moderate Trust Series 1 | Small Company Value Trust Series 1 | |
| Mid Cap Index Trust Series 0 | Smaller Company Growth Trust Series 0 | |
| Mid Cap Index Trust Series 1 | Smaller Company Growth Trust Series 1 | |
| Mid Cap Stock Trust Series 0 | Strategic Income Opportunities Trust Series 0 | |
| Mid Cap Stock Trust Series 1 | Strategic Income Opportunities Trust Series 1 | |
| Mid Value Trust Series 0 | Total Bond Market Trust B Series 0 | |
| Mid Value Trust Series 1 | Total Return Trust Series 0 | |
| Money Market Trust B Series 0 | Total Return Trust Series 1 | |
| Money Market Trust Series 1 | Total Stock Market Index Trust Series 0 | |
| Natural Resources Trust Series 0 | Total Stock Market Index Trust Series 1 | |
| Natural Resources Trust Series 1 | Ultra Short Term Bond Trust Series 0 | |
| Real Estate Securities Trust Series 0 | Ultra Short Term Bond Trust Series 1 | |
| Real Estate Securities Trust Series 1 | U.S. Equity Trust Series 0 | |
| Real Return Bond Trust Series 0 | U.S. Equity Trust Series 1 | |
| Real Return Bond Trust Series 1 | Utilities Trust Series 0 | |
| Science & Technology Trust Series 0 | Utilities Trust Series 1 | |
| Science & Technology Trust Series 1 | Value Trust Series 0 | |
| Short Term Government Income Trust Series 0 | Value Trust Series 1 | |
| Short Term Government Income Trust Series 1 | All Asset Portfolio | |
| Small Cap Growth Trust Series 0 | Brandes International Equity Trust | |
| Small Cap Growth Trust Series 1 | Frontier Capital Appreciation Trust | |
| Small Cap Index Trust Series 0 | Large Cap Growth Trust | |
| Small Cap Index Trust Series 1 | ||
| Small Cap Opportunities Trust Series 0 | ||
| “Closed” sub-accounts |
||
| 500 Index Trust Series 1 | International Equity Index Trust A Series 1 | |
| American Blue Chip Income and Growth Trust Series 1 | International Opportunities Trust Series 0 | |
| Balanced Trust Series 0 | International Opportunities Trust Series 1 | |
| Balanced Trust Series 1 | Large Cap Trust Series 0 | |
| International Equity Index Trust A Series 0 | Large Cap Trust Series 1 | |
6
Table of Contents
Report of Independent Registered Public Accounting Firm
We have audited the accompanying statements of assets and contract owners’ equity of John Hancock Life Insurance Company (U.S.A.) Separate Account N (the “Account”), comprised of the active sub-accounts as of December 31, 2012, and the related statements of operations and changes in contract owners’ equity of the active and closed sub-accounts for each of the two years in the period then ended (or years since inception), and the financial highlights for each of the five years in the period then ended (or years since inception). These financial statements and financial highlights are the responsibility of the Account’s management. Our responsibility is to express an opinion on these financial statements and financial highlights based on our audits.
We conducted our audits in accordance with the standards of the Public Company Accounting Oversight Board (United States). Those standards require that we plan and perform the audit to obtain reasonable assurance about whether the financial statements and financial highlights are free of material misstatement. We were not engaged to perform an audit of the Account’s internal control over financial reporting. Our audits included consideration of internal control over financial reporting as a basis for designing audit procedures that are appropriate in the circumstances, but not for the purpose of expressing an opinion on the effectiveness of the Account’s internal control over financial reporting. Accordingly, we express no such opinion. An audit also includes examining, on a test basis, evidence supporting the amounts and disclosures in the financial statements and financial highlights, assessing the accounting principles used and significant estimates made by management, and evaluating the overall financial statement presentation. Our procedures included confirmation of securities owned as of December 31, 2012, by correspondence with the custodian or fund manager of the underlying portfolios. We believe that our audits provide a reasonable basis for our opinion.
In our opinion, the financial statements and financial highlights referred to above present fairly, in all material respects, the financial position of each of the active sub-accounts constituting John Hancock Life Insurance Company (U.S.A.) Separate Account N at December 31, 2012, and the results of its operations and changes in contract owners’ equity of the active and closed sub-accounts for each of the two years in the period then ended (or years since inception), and the financial highlights for each of the five years in the period then ended (or years since inception), in conformity with U.S. generally accepted accounting principles.
/s/ ERNST & YOUNG LLP
Chartered Accountants
Licensed Public Accountants
Toronto, Canada
March 28, 2013
7
Table of Contents
John Hancock Life Insurance Company (U.S.A.) Separate Account N
Statements of Assets and Contract Owners’ Equity
December 31, 2012
| Assets |
||||
| Investments at fair value: |
||||
| Sub-accounts invested in John Hancock Variable Insurance Trust portfolios: |
||||
| 500 Index Trust B Series 0 - 2,165,429 shares (cost $35,183,965) |
$ | 38,999,373 | ||
| 500 Index Trust Series 1 |
— | |||
| Active Bond Trust Series 0 - 23,547 shares (cost $243,447) |
239,468 | |||
| Active Bond Trust Series 1 - 53,527 shares (cost $533,332) |
543,833 | |||
| All Cap Core Trust Series 0 - 42,925 shares (cost $701,978) |
813,432 | |||
| All Cap Core Trust Series 1 - 21,534 shares (cost $362,890) |
408,071 | |||
| All Cap Value Trust Series 0 - 132,696 shares (cost $1,108,993) |
1,111,990 | |||
| All Cap Value Trust Series 1 - 298,211 shares (cost $2,434,705) |
2,510,933 | |||
| Alpha Opportunities Trust Series 0 - 1,440 shares (cost $18,786) |
19,259 | |||
| Alpha Opportunities Trust Series 1 - 2,989 shares (cost $39,008) |
39,931 | |||
| American Asset Allocation Trust Series 1 - 692,130 shares (cost $6,352,223) |
8,630,865 | |||
| American Blue Chip Income and Growth Trust Series 1 |
— | |||
| American Global Growth Trust Series 1 - 30,927 shares (cost $344,076) |
380,096 | |||
| American Global Small Capitalization Trust Series 1 - 4,893 shares (cost $44,639) |
46,142 | |||
| American Growth Trust Series 1 - 747,151 shares (cost $11,907,718) |
13,000,429 | |||
| American Growth-Income Trust Series 1 - 574,319 shares (cost $7,793,227) |
9,568,162 | |||
| American High-Income Bond Trust Series 1 - 3,105 shares (cost $34,403) |
33,846 | |||
| American International Trust Series 1 - 1,008,464 shares (cost $15,445,543) |
16,145,508 | |||
| American New World Trust Series 1 - 52,760 shares (cost $688,847) |
714,892 | |||
| Balanced Trust Series 0 |
— | |||
| Balanced Trust Series 1 |
— | |||
| Blue Chip Growth Trust Series 0 - 682,901 shares (cost $14,588,774) |
16,560,343 | |||
| Blue Chip Growth Trust Series 1 - 227,149 shares (cost $4,463,187) |
5,515,169 | |||
| Bond Trust Series 0 - 64,127 shares (cost $898,652) |
896,492 | |||
| Bond Trust Series 1 - 31,006 shares (cost $430,164) |
433,780 | |||
| Capital Appreciation Trust Series 0 - 75,815 shares (cost $777,329) |
872,628 | |||
| Capital Appreciation Trust Series 1 - 225,760 shares (cost $2,221,513) |
2,598,498 | |||
| Capital Appreciation Value Trust Series 0 - 3,800 shares (cost $46,028) |
44,611 | |||
| Capital Appreciation Value Trust Series 1 - 28,876 shares (cost $350,782) |
339,289 | |||
| Core Allocation Plus Trust Series 0 - 4,224 shares (cost $43,320) |
44,019 | |||
| Core Allocation Plus Trust Series 1 - 126,976 shares (cost $1,326,088) |
1,324,363 | |||
| Core Bond Trust Series 0 - 56,885 shares (cost $810,384) |
791,272 | |||
| Core Bond Trust Series 1 - 1,887 shares (cost $26,563) |
26,337 | |||
| Core Strategy Trust Series 0 - 2,238 shares (cost $28,926) |
30,393 | |||
| Core Strategy Trust Series 1 - 86 shares (cost $1,083) |
1,173 | |||
| Disciplined Diversification Trust Series 0 - 1,445 shares (cost $17,852) |
18,421 | |||
| Disciplined Diversification Trust Series 1 - 52 shares (cost $665) |
665 | |||
| Emerging Markets Value Trust Series 0 - 109,498 shares (cost $1,209,069) |
1,173,816 | |||
| Emerging Markets Value Trust Series 1 - 125,223 shares (cost $1,434,437) |
1,344,896 | |||
| Equity-Income Trust Series 0 - 1,577,629 shares (cost $22,004,982) |
24,421,690 |
8
Table of Contents
John Hancock Life Insurance Company (U.S.A.) Separate Account N
Statements of Assets and Contract Owners’ Equity
December 31, 2012
| Assets (continued) |
||||
| Investments at fair value: |
||||
| Sub-accounts invested in John Hancock Variable Insurance Trust portfolios: |
||||
| Equity-Income Trust Series 1 - 709,922 shares (cost $9,662,024) |
$ | 11,017,989 | ||
| Financial Services Trust Series 0 - 26,169 shares (cost $303,446) |
321,878 | |||
| Financial Services Trust Series 1 - 47,994 shares (cost $535,243) |
591,284 | |||
| Franklin Templeton Founding Allocation Trust Series 0 - 12,811 shares (cost $132,278) |
137,330 | |||
| Franklin Templeton Founding Allocation Trust Series 1 - 976 shares (cost $9,896) |
10,473 | |||
| Fundamental All Cap Core Trust Series 0 - 35,488 shares (cost $502,769) |
545,096 | |||
| Fundamental All Cap Core Trust Series 1 - 20,417 shares (cost $255,285) |
312,388 | |||
| Fundamental Holdings Trust Series 1 - 1,600 shares (cost $15,649) |
17,835 | |||
| Fundamental Large Cap Value Trust Series 0 - 25,169 shares (cost $300,299) |
306,562 | |||
| Fundamental Large Cap Value Trust Series 1 - 242 shares (cost $2,856) |
2,945 | |||
| Fundamental Value Trust Series 0 - 258,376 shares (cost $3,834,737) |
3,947,978 | |||
| Fundamental Value Trust Series 1 - 372,408 shares (cost $4,802,366) |
5,709,007 | |||
| Global Bond Trust Series 0 - 1,006,671 shares (cost $13,641,207) |
13,207,522 | |||
| Global Bond Trust Series 1 - 230,474 shares (cost $3,045,085) |
3,033,036 | |||
| Global Diversification Trust Series 1 - 13,964 shares (cost $143,078) |
152,071 | |||
| Global Trust Series 0 - 25,976 shares (cost $389,526) |
411,720 | |||
| Global Trust Series 1 - 99,056 shares (cost $1,421,406) |
1,571,023 | |||
| Health Sciences Trust Series 0 - 92,375 shares (cost $1,741,153) |
1,947,265 | |||
| Health Sciences Trust Series 1 - 162,451 shares (cost $2,880,307) |
3,409,850 | |||
| High Yield Trust Series 0 - 398,251 shares (cost $2,383,787) |
2,369,595 | |||
| High Yield Trust Series 1 - 665,904 shares (cost $4,047,220) |
4,002,086 | |||
| International Core Trust Series 0 - 22,459 shares (cost $208,226) |
215,155 | |||
| International Core Trust Series 1 - 247,551 shares (cost $2,332,698) |
2,378,965 | |||
| International Equity Index Trust A Series 0 |
— | |||
| International Equity Index Trust A Series 1 |
— | |||
| International Equity Index Trust B Series 0 - 946,607 shares (cost $13,342,042) |
14,502,017 | |||
| International Equity Index Trust B Series 1 - 225,845 shares (cost $3,299,746) |
3,459,938 | |||
| International Growth Stock Trust Series 0 - 366,514 shares (cost $5,061,596) |
5,244,815 | |||
| International Growth Stock Trust Series 1 - 31,072 shares (cost $427,158) |
444,636 | |||
| International Opportunities Trust Series 0 |
— | |||
| International Opportunities Trust Series 1 |
— | |||
| International Small Company Trust Series 0 - 82,507 shares (cost $791,417) |
837,448 | |||
| International Small Company Trust Series 1 - 100,976 shares (cost $939,082) |
1,024,902 | |||
| International Value Trust Series 0 - 390,275 shares (cost $4,307,126) |
4,616,954 | |||
| International Value Trust Series 1 - 396,804 shares (cost $4,472,046) |
4,725,939 | |||
| Investment Quality Bond Trust Series 0 - 52,326 shares (cost $620,054) |
643,610 | |||
| Investment Quality Bond Trust Series 1 - 343,289 shares (cost $3,903,576) |
4,236,189 | |||
| Large Cap Trust Series 0 |
— | |||
| Large Cap Trust Series 1 |
— | |||
| Lifestyle Aggressive Trust Series 0 - 657,956 shares (cost $5,324,212) |
5,796,593 | |||
| Lifestyle Aggressive Trust Series 1 - 247,353 shares (cost $2,168,222) |
2,179,183 | |||
| Lifestyle Balanced Trust Series 0 - 1,368,135 shares (cost $16,503,270) |
17,101,682 |
9
Table of Contents
John Hancock Life Insurance Company (U.S.A.) Separate Account N
Statements of Assets and Contract Owners’ Equity
December 31, 2012
| Assets (continued) |
||||
| Investments at fair value: |
||||
| Sub-accounts invested in John Hancock Variable Insurance Trust portfolios: |
||||
| Lifestyle Balanced Trust Series 1 - 695,227 shares (cost $8,386,712) |
$ | 8,676,435 | ||
| Lifestyle Conservative Trust Series 0 - 601,521 shares (cost $7,799,558) |
7,807,743 | |||
| Lifestyle Conservative Trust Series 1 - 498,880 shares (cost $6,511,170) |
6,465,480 | |||
| Lifestyle Growth Trust Series 0 - 1,687,212 shares (cost $19,266,995) |
20,617,727 | |||
| Lifestyle Growth Trust Series 1 - 399,985 shares (cost $4,414,214) |
4,883,819 | |||
| Lifestyle Moderate Trust Series 0 - 682,452 shares (cost $8,574,264) |
8,728,555 | |||
| Lifestyle Moderate Trust Series 1 - 178,277 shares (cost $2,200,841) |
2,278,379 | |||
| Mid Cap Index Trust Series 0 - 391,059 shares (cost $6,820,251) |
6,823,978 | |||
| Mid Cap Index Trust Series 1 - 304,965 shares (cost $5,190,197) |
5,321,646 | |||
| Mid Cap Stock Trust Series 0 - 382,174 shares (cost $5,726,886) |
6,026,881 | |||
| Mid Cap Stock Trust Series 1 - 160,378 shares (cost $2,087,535) |
2,514,726 | |||
| Mid Value Trust Series 0 - 645,492 shares (cost $7,285,032) |
7,390,879 | |||
| Mid Value Trust Series 1 - 336,590 shares (cost $3,632,589) |
3,867,416 | |||
| Money Market Trust B Series 0 - 59,153,840 shares (cost $59,153,840) |
59,153,840 | |||
| Money Market Trust Series 1 - 82,144,640 shares (cost $82,144,640) |
82,144,640 | |||
| Natural Resources Trust Series 0 - 256,639 shares (cost $2,823,409) |
2,545,863 | |||
| Natural Resources Trust Series 1 - 317,590 shares (cost $3,565,056) |
3,204,486 | |||
| Real Estate Securities Trust Series 0 - 696,351 shares (cost $8,454,051) |
9,783,730 | |||
| Real Estate Securities Trust Series 1 - 799,540 shares (cost $9,870,594) |
11,297,501 | |||
| Real Return Bond Trust Series 0 - 866,093 shares (cost $11,323,828) |
11,415,103 | |||
| Real Return Bond Trust Series 1 - 381,082 shares (cost $4,793,860) |
5,091,250 | |||
| Science & Technology Trust Series 0 - 75,231 shares (cost $1,206,661) |
1,302,245 | |||
| Science & Technology Trust Series 1 - 313,827 shares (cost $5,297,026) |
5,407,245 | |||
| Short Term Government Income Trust Series 0 - 187,307 shares (cost $2,437,171) |
2,408,770 | |||
| Short Term Government Income Trust Series 1 - 166,694 shares (cost $2,172,811) |
2,145,355 | |||
| Small Cap Growth Trust Series 0 - 553,132 shares (cost $5,526,837) |
5,160,719 | |||
| Small Cap Growth Trust Series 1 - 120,630 shares (cost $1,220,797) |
1,120,649 | |||
| Small Cap Index Trust Series 0 - 408,083 shares (cost $5,454,681) |
5,056,149 | |||
| Small Cap Index Trust Series 1 - 449,727 shares (cost $5,747,357) |
5,572,123 | |||
| Small Cap Opportunities Trust Series 0 - 5,935 shares (cost $114,838) |
130,698 | |||
| Small Cap Opportunities Trust Series 1 - 19,728 shares (cost $411,645) |
436,591 | |||
| Small Cap Value Trust Series 0 - 378,081 shares (cost $7,140,728) |
7,814,941 | |||
| Small Cap Value Trust Series 1 - 43,031 shares (cost $825,811) |
890,741 | |||
| Small Company Value Trust Series 0 - 66,943 shares (cost $1,156,008) |
1,302,715 | |||
| Small Company Value Trust Series 1 - 239,022 shares (cost $3,854,056) |
4,660,932 | |||
| Smaller Company Growth Trust Series 0 - 9,497 shares (cost $165,396) |
165,343 | |||
| Smaller Company Growth Trust Series 1 - 754,783 shares (cost $10,780,730) |
13,118,124 | |||
| Strategic Income Opportunities Trust Series 0 - 238,220 shares (cost $3,271,823) |
3,194,530 | |||
| Strategic Income Opportunities Trust Series 1 - 101,709 shares (cost $1,399,388) |
1,366,967 | |||
| Total Bond Market Trust B Series 0 - 1,209,603 shares (cost $12,939,584) |
12,954,850 | |||
| Total Return Trust Series 0 - 2,143,979 shares (cost $30,582,756) |
31,387,850 |
10
Table of Contents
John Hancock Life Insurance Company (U.S.A.) Separate Account N
Statements of Assets and Contract Owners’ Equity
December 31, 2012
| Assets (continued) |
||||
| Investments at fair value: |
||||
| Sub-accounts invested in John Hancock Variable Insurance Trust portfolios: |
||||
| Total Return Trust Series 1 - 1,812,790 shares (cost $25,578,521) |
$ | 26,629,883 | ||
| Total Stock Market Index Trust Series 0 - 34,862 shares (cost $432,007) |
458,437 | |||
| Total Stock Market Index Trust Series 1 - 150,730 shares (cost $1,825,918) |
1,982,096 | |||
| Ultra Short Term Bond Trust Series 0 - 28,061 shares (cost $342,285) |
340,380 | |||
| Ultra Short Term Bond Trust Series 1 - 2,706 shares (cost $33,435) |
32,819 | |||
| U.S. Equity Trust Series 0 - 38,377 shares (cost $532,132) |
538,430 | |||
| U.S. Equity Trust Series 1 - 76,419 shares (cost $1,059,097) |
1,072,153 | |||
| Utilities Trust Series 0 - 90,023 shares (cost $1,085,893) |
1,173,906 | |||
| Utilities Trust Series 1 - 125,852 shares (cost $1,535,675) |
1,643,623 | |||
| Value Trust Series 0 - 39,085 shares (cost $621,324) |
753,948 | |||
| Value Trust Series 1 - 141,653 shares (cost $2,427,638) |
2,735,313 | |||
| Sub-accounts invested in Outside Trust portfolios: |
||||
| All Asset Portfolio - 228,918 shares (cost $2,540,023) |
$ | 2,641,719 | ||
| Brandes International Equity Trust |
— | |||
| Frontier Capital Appreciation Trust - 5,021 shares (cost $119,889) |
117,400 | |||
| Large Cap Growth Trust - 16,116 shares (cost $305,519) |
309,425 | |||
|
|
|
|||
| Total assets |
$ | 692,144,190 | ||
|
|
|
|||
| Contract Owners’ Equity |
||||
| Variable universal life insurance contracts |
$ | 692,144,190 | ||
|
|
|
|||
See accompanying notes.
11
Table of Contents
John Hancock Life Insurance Company (U.S.A.) Separate Account N
Statements of Operations and Changes in Contract Owners’ Equity
| Sub-Account | ||||||||||||||||
| 500 Index Trust B Series 0 | 500 Index Trust Series 1 | |||||||||||||||
| Year Ended Dec. 31/12 |
Year Ended Dec. 31/11 |
Year Ended Dec. 31/12 (t) |
Year Ended Dec. 31/11 |
|||||||||||||
| Income: |
||||||||||||||||
| Dividend income distribution |
$ | 453,120 | $ | 547,053 | $ | 57,066 | $ | 32,414 | ||||||||
|
|
|
|
|
|
|
|
|
|||||||||
| Total Investment Income |
453,120 | 547,053 | 57,066 | 32,414 | ||||||||||||
| Expenses: |
||||||||||||||||
| Mortality and expense risk |
68,403 | 30,729 | 5,359 | 10,277 | ||||||||||||
|
|
|
|
|
|
|
|
|
|||||||||
| Net investment income (loss) |
384,717 | 516,324 | 51,707 | 22,137 | ||||||||||||
|
|
|
|
|
|
|
|
|
|||||||||
| Realized gains (losses) on investments: |
||||||||||||||||
| Capital gain distributions |
— | — | 122,095 | 13,721 | ||||||||||||
| Net realized gains (losses) |
4,185,504 | 1,670,226 | 275,215 | 447,788 | ||||||||||||
|
|
|
|
|
|
|
|
|
|||||||||
| Realized gains (losses) |
4,185,504 | 1,670,226 | 397,310 | 461,509 | ||||||||||||
| Unrealized appreciation (depreciation) during the period |
971,282 | (1,797,811 | ) | (121,493 | ) | (581,370 | ) | |||||||||
|
|
|
|
|
|
|
|
|
|||||||||
| Net increase (decrease) in assets from operations |
5,541,503 | 388,739 | 327,524 | (97,724 | ) | |||||||||||
|
|
|
|
|
|
|
|
|
|||||||||
| Changes from principal transactions: |
||||||||||||||||
| Transfer of net premiums |
2,444,029 | 2,126,794 | 74,704 | 101,731 | ||||||||||||
| Transfer on terminations |
(3,442,935 | ) | (2,404,957 | ) | (142,055 | ) | (258,577 | ) | ||||||||
| Transfer on policy loans |
(776,460 | ) | 131,210 | 14 | (196 | ) | ||||||||||
| Net interfund transfers |
5,509,355 | 3,047,845 | (1,481,949 | ) | (4,336,370 | ) | ||||||||||
|
|
|
|
|
|
|
|
|
|||||||||
| Net increase (decrease) in assets from principal transactions |
3,733,989 | 2,900,892 | (1,549,286 | ) | (4,493,412 | ) | ||||||||||
|
|
|
|
|
|
|
|
|
|||||||||
| Total increase (decrease) in assets |
9,275,492 | 3,289,631 | (1,221,762 | ) | (4,591,136 | ) | ||||||||||
| Assets, beginning of period |
29,723,881 | 26,434,250 | 1,221,762 | 5,812,898 | ||||||||||||
|
|
|
|
|
|
|
|
|
|||||||||
| Assets, end of period |
$ | 38,999,373 | $ | 29,723,881 | — | $ | 1,221,762 | |||||||||
|
|
|
|
|
|
|
|
|
|||||||||
| (t) | Terminated as an investment option and funds transferred to 500 Index Trust B Series 0 on November 5, 2012. |
| (bf) | Fund has no Series. Previously presented as Series 0 and Series 1. |
See accompanying notes.
12
Table of Contents
| Sub-Account | ||||||||||||||||||||||
| Active Bond Trust Series 0 | Active Bond Trust Series 1 | All Asset Portfolio | ||||||||||||||||||||
| Year Ended Dec. 31/12 |
Year Ended Dec. 31/11 |
Year Ended Dec. 31/12 |
Year Ended Dec. 31/11 |
Year Ended Dec. 31/12 (bf) |
Year Ended Dec. 31/11 (bf) |
|||||||||||||||||
| $ | 8,814 | $ | 14,436 | $ | 33,051 | $ | 49,974 | $ | 102,568 | $ | 124,244 | |||||||||||
|
|
|
|
|
|
|
|
|
|
|
|
|
|||||||||||
| 8,814 | 14,436 | 33,051 | 49,974 | 102,568 | 124,244 | |||||||||||||||||
| — | — | 4,198 | 6,639 | 3,416 | 3,471 | |||||||||||||||||
|
|
|
|
|
|
|
|
|
|
|
|
|
|||||||||||
| 8,814 | 14,436 | 28,853 | 43,335 | 99,152 | 120,773 | |||||||||||||||||
|
|
|
|
|
|
|
|
|
|
|
|
|
|||||||||||
| 703 | — | 5,559 | — | — | — | |||||||||||||||||
| 5,061 | 17,558 | 26,162 | 70,563 | (247 | ) | 12,068 | ||||||||||||||||
|
|
|
|
|
|
|
|
|
|
|
|
|
|||||||||||
| 5,764 | 17,558 | 31,721 | 70,563 | (247 | ) | 12,068 | ||||||||||||||||
| 3,054 | (11,628 | ) | 9,556 | (51,960 | ) | 173,487 | (96,101 | ) | ||||||||||||||
|
|
|
|
|
|
|
|
|
|
|
|
|
|||||||||||
| 17,632 | 20,366 | 70,130 | 61,938 | 272,392 | 36,740 | |||||||||||||||||
|
|
|
|
|
|
|
|
|
|
|
|
|
|||||||||||
| 22,431 | 39,151 | 4,903 | 38,752 | 258,677 | 386,600 | |||||||||||||||||
| (123,479 | ) | (192,867 | ) | (363,693 | ) | (175,989 | ) | (469,991 | ) | (274,021 | ) | |||||||||||
| — | (1,882 | ) | (360 | ) | 1,925 | (15,146 | ) | (671 | ) | |||||||||||||
| 89,078 | (20,934 | ) | (94,132 | ) | (419,373 | ) | 820,234 | (360,264 | ) | |||||||||||||
|
|
|
|
|
|
|
|
|
|
|
|
|
|||||||||||
| (11,970 | ) | (176,532 | ) | (453,282 | ) | (554,685 | ) | 593,774 | (248,356 | ) | ||||||||||||
|
|
|
|
|
|
|
|
|
|
|
|
|
|||||||||||
| 5,662 | (156,166 | ) | (383,152 | ) | (492,747 | ) | 866,166 | (211,616 | ) | |||||||||||||
| 233,806 | 389,972 | 926,985 | 1,419,732 | 1,775,553 | 1,987,169 | |||||||||||||||||
|
|
|
|
|
|
|
|
|
|
|
|
|
|||||||||||
| $ | 239,468 | $ | 233,806 | $ | 543,833 | $ | 926,985 | $ | 2,641,719 | $ | 1,775,553 | |||||||||||
|
|
|
|
|
|
|
|
|
|
|
|
|
|||||||||||
13
Table of Contents
John Hancock Life Insurance Company (U.S.A.) Separate Account N
Statements of Operations and Changes in Contract Owners’ Equity
(continued)
| Sub-Account | ||||||||||||||||
| All Cap Core Trust Series 0 | All Cap Core Trust Series 1 | |||||||||||||||
| Year Ended Dec. 31/12 |
Year Ended Dec. 31/11 |
Year Ended Dec. 31/12 |
Year Ended Dec. 31/11 |
|||||||||||||
| Income: |
||||||||||||||||
| Dividend income distribution |
$ | 7,656 | $ | 2,698 | $ | 4,448 | $ | 4,371 | ||||||||
|
|
|
|
|
|
|
|
|
|||||||||
| Total Investment Income |
7,656 | 2,698 | 4,448 | 4,371 | ||||||||||||
| Expenses: |
||||||||||||||||
| Mortality and expense risk |
— | — | 2,819 | 2,933 | ||||||||||||
|
|
|
|
|
|
|
|
|
|||||||||
| Net investment income (loss) |
7,656 | 2,698 | 1,629 | 1,438 | ||||||||||||
|
|
|
|
|
|
|
|
|
|||||||||
| Realized gains (losses) on investments: |
||||||||||||||||
| Capital gain distributions |
— | — | — | — | ||||||||||||
| Net realized gains (losses) |
12,042 | 10,342 | 11,086 | 19,267 | ||||||||||||
|
|
|
|
|
|
|
|
|
|||||||||
| Realized gains (losses) |
12,042 | 10,342 | 11,086 | 19,267 | ||||||||||||
| Unrealized appreciation (depreciation) during the period |
65,066 | (12,217 | ) | 52,669 | (15,344 | ) | ||||||||||
|
|
|
|
|
|
|
|
|
|||||||||
| Net increase (decrease) in assets from operations |
84,764 | 823 | 65,384 | 5,361 | ||||||||||||
|
|
|
|
|
|
|
|
|
|||||||||
| Changes from principal transactions: |
||||||||||||||||
| Transfer of net premiums |
376,843 | 18,455 | 16,485 | 16,838 | ||||||||||||
| Transfer on terminations |
(18,907 | ) | (22,906 | ) | (70,488 | ) | (135,681 | ) | ||||||||
| Transfer on policy loans |
— | — | (165 | ) | 10,362 | |||||||||||
| Net interfund transfers |
126,287 | 6,936 | (16,956 | ) | 12,187 | |||||||||||
|
|
|
|
|
|
|
|
|
|||||||||
| Net increase (decrease) in assets from principal transactions |
484,223 | 2,485 | (71,124 | ) | (96,294 | ) | ||||||||||
|
|
|
|
|
|
|
|
|
|||||||||
| Total increase (decrease) in assets |
568,987 | 3,308 | (5,740 | ) | (90,933 | ) | ||||||||||
| Assets, beginning of period |
244,445 | 241,137 | 413,811 | 504,744 | ||||||||||||
|
|
|
|
|
|
|
|
|
|||||||||
| Assets, end of period |
$ | 813,432 | $ | 244,445 | $ | 408,071 | $ | 413,811 | ||||||||
|
|
|
|
|
|
|
|
|
|||||||||
See accompanying notes.
14
Table of Contents
| Sub-Account | ||||||||||||||||||||||
| All Cap Value Trust Series 0 | All Cap Value Trust Series 1 | Alpha Opportunities Trust Series 0 | ||||||||||||||||||||
| Year Ended Dec. 31/12 |
Year Ended Dec. 31/11 |
Year Ended Dec. 31/12 |
Year Ended Dec. 31/11 |
Year Ended Dec. 31/12 |
Year Ended Dec. 31/11 |
|||||||||||||||||
| $ | 7,693 | $ | 2,132 | $ | 22,652 | $ | 13,525 | $ | 106 | $ | 25 | |||||||||||
|
|
|
|
|
|
|
|
|
|
|
|
|
|||||||||||
| 7,693 | 2,132 | 22,652 | 13,525 | 106 | 25 | |||||||||||||||||
| — | — | 11,353 | 16,283 | — | — | |||||||||||||||||
|
|
|
|
|
|
|
|
|
|
|
|
|
|||||||||||
| 7,693 | 2,132 | 11,299 | (2,758 | ) | 106 | 25 | ||||||||||||||||
|
|
|
|
|
|
|
|
|
|
|
|
|
|||||||||||
| 31,341 | — | 106,191 | — | 1,007 | 1,181 | |||||||||||||||||
| 11,765 | 15,056 | 296,919 | 184,246 | 5 | 12 | |||||||||||||||||
|
|
|
|
|
|
|
|
|
|
|
|
|
|||||||||||
| 43,106 | 15,056 | 403,110 | 184,246 | 1,012 | 1,193 | |||||||||||||||||
| 25,702 | (50,012 | ) | (62,256 | ) | (409,427 | ) | 1,549 | (1,743 | ) | |||||||||||||
|
|
|
|
|
|
|
|
|
|
|
|
|
|||||||||||
| 76,501 | (32,824 | ) | 352,153 | (227,939 | ) | 2,667 | (525 | ) | ||||||||||||||
|
|
|
|
|
|
|
|
|
|
|
|
|
|||||||||||
| 453,302 | 59,640 | 51,056 | 66,812 | 4,203 | 1,500 | |||||||||||||||||
| (82,903 | ) | (13,298 | ) | (334,789 | ) | (120,314 | ) | (611 | ) | (294 | ) | |||||||||||
| (1,310 | ) | (1,507 | ) | — | — | — | — | |||||||||||||||
| 147,730 | 285,990 | (1,271,284 | ) | 502,839 | 1,797 | 5,705 | ||||||||||||||||
|
|
|
|
|
|
|
|
|
|
|
|
|
|||||||||||
| 516,819 | 330,825 | (1,555,017 | ) | 449,337 | 5,389 | 6,911 | ||||||||||||||||
|
|
|
|
|
|
|
|
|
|
|
|
|
|||||||||||
| 593,320 | 298,001 | (1,202,864 | ) | 221,398 | 8,056 | 6,386 | ||||||||||||||||
| 518,670 | 220,669 | 3,713,797 | 3,492,399 | 11,203 | 4,817 | |||||||||||||||||
|
|
|
|
|
|
|
|
|
|
|
|
|
|||||||||||
| $ | 1,111,990 | $ | 518,670 | $ | 2,510,933 | $ | 3,713,797 | $ | 19,259 | $ | 11,203 | |||||||||||
|
|
|
|
|
|
|
|
|
|
|
|
|
|||||||||||
15
Table of Contents
John Hancock Life Insurance Company (U.S.A.) Separate Account N
Statements of Operations and Changes in Contract Owners’ Equity
(continued)
| Sub-Account | ||||||||||||||||
| Alpha Opportunities Trust Series 1 | American Asset Allocation Trust Series 1 | |||||||||||||||
| Year Ended Dec. 31/12 |
Year Ended Dec. 31/11 |
Year Ended Dec. 31/12 |
Year Ended Dec. 31/11 |
|||||||||||||
| Income: |
||||||||||||||||
| Dividend income distribution |
$ | 207 | $ | 15 | $ | 131,905 | $ | 149,725 | ||||||||
|
|
|
|
|
|
|
|
|
|||||||||
| Total Investment Income |
207 | 15 | 131,905 | 149,725 | ||||||||||||
| Expenses: |
||||||||||||||||
| Mortality and expense risk |
199 | 15 | 56,047 | 63,304 | ||||||||||||
|
|
|
|
|
|
|
|
|
|||||||||
| Net investment income (loss) |
8 | — | 75,858 | 86,421 | ||||||||||||
|
|
|
|
|
|
|
|
|
|||||||||
| Realized gains (losses) on investments: |
||||||||||||||||
| Capital gain distributions |
2,691 | 106 | — | — | ||||||||||||
| Net realized gains (losses) |
12 | 15 | 654,043 | 523,900 | ||||||||||||
|
|
|
|
|
|
|
|
|
|||||||||
| Realized gains (losses) |
2,703 | 121 | 654,043 | 523,900 | ||||||||||||
| Unrealized appreciation (depreciation) during the period |
1,245 | (410 | ) | 601,283 | (576,072 | ) | ||||||||||
|
|
|
|
|
|
|
|
|
|||||||||
| Net increase (decrease) in assets from operations |
3,956 | (289 | ) | 1,331,184 | 34,249 | |||||||||||
|
|
|
|
|
|
|
|
|
|||||||||
| Changes from principal transactions: |
||||||||||||||||
| Transfer of net premiums |
— | — | 613,846 | 638,061 | ||||||||||||
| Transfer on terminations |
(508 | ) | (166 | ) | (2,459,154 | ) | (2,164,756 | ) | ||||||||
| Transfer on policy loans |
— | — | 71,682 | 113,580 | ||||||||||||
| Net interfund transfers |
23,621 | 12,368 | (635,649 | ) | (220,756 | ) | ||||||||||
|
|
|
|
|
|
|
|
|
|||||||||
| Net increase (decrease) in assets from principal transactions |
23,113 | 12,202 | (2,409,275 | ) | (1,633,871 | ) | ||||||||||
|
|
|
|
|
|
|
|
|
|||||||||
| Total increase (decrease) in assets |
27,069 | 11,913 | (1,078,091 | ) | (1,599,622 | ) | ||||||||||
| Assets, beginning of period |
12,862 | 949 | 9,708,956 | 11,308,578 | ||||||||||||
|
|
|
|
|
|
|
|
|
|||||||||
| Assets, end of period |
$ | 39,931 | $ | 12,862 | $ | 8,630,865 | $ | 9,708,956 | ||||||||
|
|
|
|
|
|
|
|
|
|||||||||
| (v) | Terminated as an investment option and funds transferred to American Growth-Income Trust Series 1 on November 5, 2012. |
| (a) | Terminated as an investment option and funds transferred to Bond Trust Series 1 on October 31, 2011. |
See accompanying notes.
16
Table of Contents
| Sub-Account | ||||||||||||||||||||
| American Blue Chip Income and Growth Trust Series 1 | American Bond Trust Series 1 | American Global Growth
Trust Series 1 |
||||||||||||||||||
| Year Ended Dec. 31/12 (v) |
Year Ended Dec. 31/11 |
Year Ended Dec. 31/11 (a) |
Year Ended Dec. 31/12 |
Year Ended Dec. 31/11 |
||||||||||||||||
| — | $ | 29,555 | — | $ | 1,742 | $ | 3,389 | |||||||||||||
|
|
|
|
|
|
|
|
|
|
|
|||||||||||
| — | 29,555 | — | 1,742 | 3,389 | ||||||||||||||||
| 5,848 | 8,026 | 3,956 | 1,559 | 1,409 | ||||||||||||||||
|
|
|
|
|
|
|
|
|
|
|
|||||||||||
| (5,848 | ) | 21,529 | (3,956 | ) | 183 | 1,980 | ||||||||||||||
|
|
|
|
|
|
|
|
|
|
|
|||||||||||
| 290,365 | — | — | — | — | ||||||||||||||||
| 76,298 | 106,646 | 82,092 | (4,775 | ) | (108 | ) | ||||||||||||||
|
|
|
|
|
|
|
|
|
|
|
|||||||||||
| 366,663 | 106,646 | 82,092 | (4,775 | ) | (108 | ) | ||||||||||||||
| (123,201 | ) | (149,439 | ) | (18,453 | ) | 71,381 | (34,012 | ) | ||||||||||||
|
|
|
|
|
|
|
|
|
|
|
|||||||||||
| 237,614 | (21,264 | ) | 59,683 | 66,789 | (32,140 | ) | ||||||||||||||
|
|
|
|
|
|
|
|
|
|
|
|||||||||||
| 99,860 | 151,026 | 89,726 | 1,279 | 153 | ||||||||||||||||
| (101,419 | ) | (144,260 | ) | (360,144 | ) | (1,802 | ) | (1,110 | ) | |||||||||||
| (13,842 | ) | (2,237 | ) | (10,568 | ) | 3,096 | 1,150 | |||||||||||||
| (2,370,556 | ) | (97,481 | ) | (1,688,893 | ) | (33,094 | ) | 68,124 | ||||||||||||
|
|
|
|
|
|
|
|
|
|
|
|||||||||||
| (2,385,957 | ) | (92,952 | ) | (1,969,879 | ) | (30,521 | ) | 68,317 | ||||||||||||
|
|
|
|
|
|
|
|
|
|
|
|||||||||||
| (2,148,343 | ) | (114,216 | ) | (1,910,196 | ) | 36,268 | 36,177 | |||||||||||||
| 2,148,343 | 2,262,559 | 1,910,196 | 343,828 | 307,651 | ||||||||||||||||
|
|
|
|
|
|
|
|
|
|
|
|||||||||||
| — | $ | 2,148,343 | — | $ | 380,096 | $ | 343,828 | |||||||||||||
|
|
|
|
|
|
|
|
|
|
|
|||||||||||
17
Table of Contents
John Hancock Life Insurance Company (U.S.A.) Separate Account N
Statements of Operations and Changes in Contract Owners’ Equity
(continued)
| Sub-Account | ||||||||||||||||
| American Global
Small Capitalization Trust Series 1 |
American Growth Trust Series 1 | |||||||||||||||
| Year Ended Dec. 31/12 |
Year Ended Dec. 31/11 (g) |
Year Ended Dec. 31/12 |
Year Ended Dec. 31/11 |
|||||||||||||
| Income: |
||||||||||||||||
| Dividend income distribution |
$ | 379 | $ | 253 | $ | 52,888 | $ | 37,279 | ||||||||
|
|
|
|
|
|
|
|
|
|||||||||
| Total Investment Income |
379 | 253 | 52,888 | 37,279 | ||||||||||||
| Expenses: |
||||||||||||||||
| Mortality and expense risk |
48 | 25 | 31,039 | 45,460 | ||||||||||||
|
|
|
|
|
|
|
|
|
|||||||||
| Net investment income (loss) |
331 | 228 | 21,849 | (8,181 | ) | |||||||||||
|
|
|
|
|
|
|
|
|
|||||||||
| Realized gains (losses) on investments: |
||||||||||||||||
| Capital gain distributions |
— | — | — | — | ||||||||||||
| Net realized gains (losses) |
(3,736 | ) | (2,023 | ) | 1,964,408 | 1,684,771 | ||||||||||
|
|
|
|
|
|
|
|
|
|||||||||
| Realized gains (losses) |
(3,736 | ) | (2,023 | ) | 1,964,408 | 1,684,771 | ||||||||||
| Unrealized appreciation (depreciation) during the period |
8,443 | (6,940 | ) | 393,295 | (2,492,583 | ) | ||||||||||
|
|
|
|
|
|
|
|
|
|||||||||
| Net increase (decrease) in assets from operations |
5,038 | (8,735 | ) | 2,379,552 | (815,993 | ) | ||||||||||
|
|
|
|
|
|
|
|
|
|||||||||
| Changes from principal transactions: |
||||||||||||||||
| Transfer of net premiums |
5,626 | 409 | 673,885 | 1,097,186 | ||||||||||||
| Transfer on terminations |
(6,252 | ) | (355 | ) | (1,039,921 | ) | (757,856 | ) | ||||||||
| Transfer on policy loans |
— | — | (25,753 | ) | (51,415 | ) | ||||||||||
| Net interfund transfers |
16,457 | 33,954 | (4,079,079 | ) | (3,673,789 | ) | ||||||||||
|
|
|
|
|
|
|
|
|
|||||||||
| Net increase (decrease) in assets from principal transactions |
15,831 | 34,008 | (4,470,868 | ) | (3,385,874 | ) | ||||||||||
|
|
|
|
|
|
|
|
|
|||||||||
| Total increase (decrease) in assets |
20,869 | 25,273 | (2,091,316 | ) | (4,201,867 | ) | ||||||||||
| Assets, beginning of period |
25,273 | — | 15,091,745 | 19,293,612 | ||||||||||||
|
|
|
|
|
|
|
|
|
|||||||||
| Assets, end of period |
$ | 46,142 | $ | 25,273 | $ | 13,000,429 | $ | 15,091,745 | ||||||||
|
|
|
|
|
|
|
|
|
|||||||||
| (g) | Fund available in prior year but no activity. |
See accompanying notes.
18
Table of Contents
| Sub-Account | ||||||||||||||||||||||
| American Growth-Income Trust Series 1 | American High-Income Bond Trust Series 1 | American International Trust Series 1 | ||||||||||||||||||||
| Year Ended Dec. 31/12 |
Year Ended Dec. 31/11 |
Year Ended Dec. 31/12 |
Year Ended Dec. 31/11 (g) |
Year Ended Dec. 31/12 |
Year Ended Dec. 31/11 |
|||||||||||||||||
| $ | 118,699 | $ | 123,717 | $ | 2,151 | $ | 1,292 | $ | 178,380 | $ | 365,846 | |||||||||||
|
|
|
|
|
|
|
|
|
|
|
|
|
|||||||||||
| 118,699 | 123,717 | 2,151 | 1,292 | 178,380 | 365,846 | |||||||||||||||||
| 48,131 | 55,953 | 136 | 39 | 30,171 | 63,785 | |||||||||||||||||
|
|
|
|
|
|
|
|
|
|
|
|
|
|||||||||||
| 70,568 | 67,764 | 2,015 | 1,253 | 148,209 | 302,061 | |||||||||||||||||
|
|
|
|
|
|
|
|
|
|
|
|
|
|||||||||||
| — | — | — | — | — | — | |||||||||||||||||
| 1,335,885 | 533,576 | (59 | ) | 90 | 332,147 | 325,910 | ||||||||||||||||
|
|
|
|
|
|
|
|
|
|
|
|
|
|||||||||||
| 1,335,885 | 533,576 | (59 | ) | 90 | 332,147 | 325,910 | ||||||||||||||||
| 137,449 | (935,989 | ) | 1,179 | (1,736 | ) | 2,896,233 | (5,060,782 | ) | ||||||||||||||
|
|
|
|
|
|
|
|
|
|
|
|
|
|||||||||||
| 1,543,902 | (334,649 | ) | 3,135 | (393 | ) | 3,376,589 | (4,432,811 | ) | ||||||||||||||
|
|
|
|
|
|
|
|
|
|
|
|
|
|||||||||||
| 466,364 | 671,125 | 6,691 | 473 | 1,069,780 | 714,952 | |||||||||||||||||
| (3,647,502 | ) | (1,981,772 | ) | (1,238 | ) | (376 | ) | (1,646,821 | ) | (1,004,770 | ) | |||||||||||
| 31,856 | 120,167 | — | — | (33,133 | ) | (63,250 | ) | |||||||||||||||
| 1,092,856 | 464,002 | 7,776 | 17,778 | (9,080,951 | ) | (3,354,412 | ) | |||||||||||||||
|
|
|
|
|
|
|
|
|
|
|
|
|
|||||||||||
| (2,056,426 | ) | (726,478 | ) | 13,229 | 17,875 | (9,691,125 | ) | (3,707,480 | ) | |||||||||||||
|
|
|
|
|
|
|
|
|
|
|
|
|
|||||||||||
| (512,524 | ) | (1,061,127 | ) | 16,364 | 17,482 | (6,314,536 | ) | (8,140,291 | ) | |||||||||||||
| 10,080,686 | 11,141,813 | 17,482 | — | 22,460,044 | 30,600,335 | |||||||||||||||||
|
|
|
|
|
|
|
|
|
|
|
|
|
|||||||||||
| $ | 9,568,162 | $ | 10,080,686 | $ | 33,846 | $ | 17,482 | $ | 16,145,508 | $ | 22,460,044 | |||||||||||
|
|
|
|
|
|
|
|
|
|
|
|
|
|||||||||||
19
Table of Contents
John Hancock Life Insurance Company (U.S.A.) Separate Account N
Statements of Operations and Changes in Contract Owners’ Equity
(continued)
| Sub-Account | ||||||||||||||||
| American New World Trust Series 1 | Balanced Trust Series 0 | |||||||||||||||
| Year Ended Dec. 31/12 |
Year Ended Dec. 31/11 |
Year Ended Dec. 31/12 (j) |
Year Ended Dec. 31/11 |
|||||||||||||
| Income: |
||||||||||||||||
| Dividend income distribution |
$ | 3,983 | $ | 7,116 | $ | 934 | $ | 833 | ||||||||
|
|
|
|
|
|
|
|
|
|||||||||
| Total Investment Income |
3,983 | 7,116 | 934 | 833 | ||||||||||||
| Expenses: |
||||||||||||||||
| Mortality and expense risk |
2,049 | 2,129 | — | — | ||||||||||||
|
|
|
|
|
|
|
|
|
|||||||||
| Net investment income (loss) |
1,934 | 4,987 | 934 | 833 | ||||||||||||
|
|
|
|
|
|
|
|
|
|||||||||
| Realized gains (losses) on investments: |
||||||||||||||||
| Capital gain distributions |
— | — | 21,326 | 289 | ||||||||||||
| Net realized gains (losses) |
10,059 | 1,447 | (15,673 | ) | 781 | |||||||||||
|
|
|
|
|
|
|
|
|
|||||||||
| Realized gains (losses) |
10,059 | 1,447 | 5,653 | 1,070 | ||||||||||||
| Unrealized appreciation (depreciation) during the period |
65,858 | (83,713 | ) | (1,502 | ) | (1,409 | ) | |||||||||
|
|
|
|
|
|
|
|
|
|||||||||
| Net increase (decrease) in assets from operations |
77,851 | (77,279 | ) | 5,085 | 494 | |||||||||||
|
|
|
|
|
|
|
|
|
|||||||||
| Changes from principal transactions: |
||||||||||||||||
| Transfer of net premiums |
21,741 | 7,387 | 2,171 | 17,874 | ||||||||||||
| Transfer on terminations |
(18,910 | ) | (5,360 | ) | (1,067 | ) | (9,095 | ) | ||||||||
| Transfer on policy loans |
2,879 | 1,349 | (54 | ) | (31 | ) | ||||||||||
| Net interfund transfers |
137,994 | 11,097 | (65,353 | ) | 7,722 | |||||||||||
|
|
|
|
|
|
|
|
|
|||||||||
| Net increase (decrease) in assets from principal transactions |
143,704 | 14,473 | (64,303 | ) | 16,470 | |||||||||||
|
|
|
|
|
|
|
|
|
|||||||||
| Total increase (decrease) in assets |
221,555 | (62,806 | ) | (59,218 | ) | 16,964 | ||||||||||
| Assets, beginning of period |
493,337 | 556,143 | 59,218 | 42,254 | ||||||||||||
|
|
|
|
|
|
|
|
|
|||||||||
| Assets, end of period |
$ | 714,892 | $ | 493,337 | — | $ | 59,218 | |||||||||
|
|
|
|
|
|
|
|
|
|||||||||
| (j) | Terminated as an investment option and funds transferred to Lifestyle Growth Trust on April 30, 2012. |
See accompanying notes.
20
Table of Contents
| Sub-Account | ||||||||||||||||||||||
| Balanced Trust Series 1 | Blue Chip Growth Trust Series 0 | Blue Chip Growth Trust Series 1 | ||||||||||||||||||||
| Year Ended Dec. 31/12 (j) |
Year Ended Dec. 31/11 |
Year Ended Dec. 31/12 |
Year Ended Dec. 31/11 |
Year Ended Dec. 31/12 |
Year Ended Dec. 31/11 |
|||||||||||||||||
| $ | 379 | $ | 352 | $ | 24,466 | $ | 2,210 | $ | 7,481 | $ | 822 | |||||||||||
|
|
|
|
|
|
|
|
|
|
|
|
|
|||||||||||
| 379 | 352 | 24,466 | 2,210 | 7,481 | 822 | |||||||||||||||||
| 54 | 130 | — | — | 37,473 | 46,959 | |||||||||||||||||
|
|
|
|
|
|
|
|
|
|
|
|
|
|||||||||||
| 325 | 222 | 24,466 | 2,210 | (29,992 | ) | (46,137 | ) | |||||||||||||||
|
|
|
|
|
|
|
|
|
|
|
|
|
|||||||||||
| 8,809 | 137 | — | — | — | — | |||||||||||||||||
| (7,402 | ) | 2,920 | 1,555,536 | 2,503,866 | 1,722,728 | 1,012,458 | ||||||||||||||||
|
|
|
|
|
|
|
|
|
|
|
|
|
|||||||||||
| 1,407 | 3,057 | 1,555,536 | 2,503,866 | 1,722,728 | 1,012,458 | |||||||||||||||||
| 423 | (2,838 | ) | 1,219,581 | (2,326,458 | ) | (14,785 | ) | (801,220 | ) | |||||||||||||
|
|
|
|
|
|
|
|
|
|
|
|
|
|||||||||||
| 2,155 | 441 | 2,799,583 | 179,618 | 1,677,951 | 165,101 | |||||||||||||||||
|
|
|
|
|
|
|
|
|
|
|
|
|
|||||||||||
| 790 | 1,603 | 1,322,190 | 1,972,317 | 86,038 | 256,725 | |||||||||||||||||
| (788 | ) | (1,543 | ) | (423,640 | ) | (430,901 | ) | (3,748,657 | ) | (2,787,621 | ) | |||||||||||
| — | — | (48,459 | ) | (74,305 | ) | (352,284 | ) | 11,192 | ||||||||||||||
| (27,794 | ) | (10,131 | ) | (1,482,944 | ) | (357,637 | ) | (2,602,155 | ) | 203,393 | ||||||||||||
|
|
|
|
|
|
|
|
|
|
|
|
|
|||||||||||
| (27,792 | ) | (10,071 | ) | (632,853 | ) | 1,109,474 | (6,617,058 | ) | (2,316,311 | ) | ||||||||||||
|
|
|
|
|
|
|
|
|
|
|
|
|
|||||||||||
| (25,637 | ) | (9,630 | ) | 2,166,730 | 1,289,092 | (4,939,107 | ) | (2,151,210 | ) | |||||||||||||
| 25,637 | 35,267 | 14,393,613 | 13,104,521 | 10,454,276 | 12,605,486 | |||||||||||||||||
|
|
|
|
|
|
|
|
|
|
|
|
|
|||||||||||
| — | $ | 25,637 | $ | 16,560,343 | $ | 14,393,613 | $ | 5,515,169 | $ | 10,454,276 | ||||||||||||
|
|
|
|
|
|
|
|
|
|
|
|
|
|||||||||||
21
Table of Contents
John Hancock Life Insurance Company (U.S.A.) Separate Account N
Statements of Operations and Changes in Contract Owners’ Equity
(continued)
| Sub-Account | ||||||||||||||||
| Bond Trust Series 0 | Bond Trust Series 1 | |||||||||||||||
| Year Ended Dec. 31/12 |
Year Ended Dec. 31/11 (c) |
Year Ended Dec. 31/12 |
Year
Ended Dec. 31/11 (c) |
|||||||||||||
| Income: |
||||||||||||||||
| Dividend income distribution |
$ | 22,221 | $ | 11,636 | $ | 25,491 | $ | 31,078 | ||||||||
|
|
|
|
|
|
|
|
|
|||||||||
| Total Investment Income |
22,221 | 11,636 | 25,491 | 31,078 | ||||||||||||
| Expenses: |
||||||||||||||||
| Mortality and expense risk |
— | — | 3,023 | 840 | ||||||||||||
|
|
|
|
|
|
|
|
|
|||||||||
| Net investment income (loss) |
22,221 | 11,636 | 22,468 | 30,238 | ||||||||||||
|
|
|
|
|
|
|
|
|
|||||||||
| Realized gains (losses) on investments: |
||||||||||||||||
| Capital gain distributions |
3,587 | — | 6,162 | — | ||||||||||||
| Net realized gains (losses) |
(1,264 | ) | 15 | 4,280 | 137 | |||||||||||
|
|
|
|
|
|
|
|
|
|||||||||
| Realized gains (losses) |
2,323 | 15 | 10,442 | 137 | ||||||||||||
| Unrealized appreciation (depreciation) during the period |
5,807 | (7,967 | ) | 25,324 | (21,708 | ) | ||||||||||
|
|
|
|
|
|
|
|
|
|||||||||
| Net increase (decrease) in assets from operations |
30,351 | 3,684 | 58,234 | 8,667 | ||||||||||||
|
|
|
|
|
|
|
|
|
|||||||||
| Changes from principal transactions: |
||||||||||||||||
| Transfer of net premiums |
85,720 | 5,036 | 1,163 | 5,362 | ||||||||||||
| Transfer on terminations |
(35,963 | ) | (5,099 | ) | (580,100 | ) | (10,117 | ) | ||||||||
| Transfer on policy loans |
(16,647 | ) | — | — | — | |||||||||||
| Net interfund transfers |
378,891 | 450,519 | (277,198 | ) | 1,227,769 | |||||||||||
|
|
|
|
|
|
|
|
|
|||||||||
| Net increase (decrease) in assets from principal transactions |
412,001 | 450,456 | (856,135 | ) | 1,223,014 | |||||||||||
|
|
|
|
|
|
|
|
|
|||||||||
| Total increase (decrease) in assets |
442,352 | 454,140 | (797,901 | ) | 1,231,681 | |||||||||||
| Assets, beginning of period |
454,140 | — | 1,231,681 | — | ||||||||||||
|
|
|
|
|
|
|
|
|
|||||||||
| Assets, end of period |
$ | 896,492 | $ | 454,140 | $ | 433,780 | $ | 1,231,681 | ||||||||
|
|
|
|
|
|
|
|
|
|||||||||
| (c) | Reflects the period from commencement of operations on October 31, 2011 through December 31, 2011. |
| (g) | Fund available in prior year but no activity. |
See accompanying notes.
22
Table of Contents
| Sub-Account | ||||||||||||||||||||
| Brandes International Equity Trust | Capital Appreciation Trust Series 0 | Capital Appreciation Trust Series 1 | ||||||||||||||||||
| Year Ended Dec. 31/12 (g) |
Year Ended Dec. 31/12 |
Year Ended Dec. 31/11 |
Year Ended Dec. 31/12 |
Year Ended Dec. 31/11 |
||||||||||||||||
| — | $ | 1,603 | $ | 632 | $ | 5,513 | $ | 2,916 | ||||||||||||
|
|
|
|
|
|
|
|
|
|
|
|||||||||||
| — | 1,603 | 632 | 5,513 | 2,916 | ||||||||||||||||
| — | — | — | 15,798 | 18,894 | ||||||||||||||||
|
|
|
|
|
|
|
|
|
|
|
|||||||||||
| — | 1,603 | 632 | (10,285 | ) | (15,978 | ) | ||||||||||||||
|
|
|
|
|
|
|
|
|
|
|
|||||||||||
| — | — | — | — | — | ||||||||||||||||
| 233 | 22,729 | 27,213 | 565,540 | 260,608 | ||||||||||||||||
|
|
|
|
|
|
|
|
|
|
|
|||||||||||
| 233 | 22,729 | 27,213 | 565,540 | 260,608 | ||||||||||||||||
| — | 69,344 | (34,928 | ) | 365 | (246,072 | ) | ||||||||||||||
|
|
|
|
|
|
|
|
|
|
|
|||||||||||
| 233 | 93,676 | (7,083 | ) | 555,620 | (1,442 | ) | ||||||||||||||
|
|
|
|
|
|
|
|
|
|
|
|||||||||||
| — | 154,626 | 104,256 | 37,732 | 68,332 | ||||||||||||||||
| (234 | ) | (34,297 | ) | (32,207 | ) | (1,087,402 | ) | (864,764 | ) | |||||||||||
| — | (17,357 | ) | (1,001 | ) | 16,562 | (4,433 | ) | |||||||||||||
| 1 | 105,322 | 71,198 | (1,115,456 | ) | 712,194 | |||||||||||||||
|
|
|
|
|
|
|
|
|
|
|
|||||||||||
| (233 | ) | 208,294 | 142,246 | (2,148,564 | ) | (88,671 | ) | |||||||||||||
|
|
|
|
|
|
|
|
|
|
|
|||||||||||
| — | 301,970 | 135,163 | (1,592,944 | ) | (90,113 | ) | ||||||||||||||
| — | 570,658 | 435,495 | 4,191,442 | 4,281,555 | ||||||||||||||||
|
|
|
|
|
|
|
|
|
|
|
|||||||||||
| — | $ | 872,628 | $ | 570,658 | $ | 2,598,498 | $ | 4,191,442 | ||||||||||||
|
|
|
|
|
|
|
|
|
|
|
|||||||||||
23
Table of Contents
John Hancock Life Insurance Company (U.S.A.) Separate Account N
Statements of Operations and Changes in Contract Owners’ Equity
(continued)
| Sub-Account | ||||||||||||||||
| Capital Appreciation Value Trust Series 0 |
Capital Appreciation Value Trust Series 1 |
|||||||||||||||
| Year Ended Dec. 31/12 |
Year Ended Dec. 31/11 |
Year Ended Dec. 31/12 |
Year Ended Dec. 31/11 |
|||||||||||||
| Income: |
||||||||||||||||
| Dividend income distribution |
$ | 357 | $ | 47 | $ | 4,843 | $ | 5,938 | ||||||||
|
|
|
|
|
|
|
|
|
|||||||||
| Total Investment Income |
357 | 47 | 4,843 | 5,938 | ||||||||||||
| Expenses: |
||||||||||||||||
| Mortality and expense risk |
— | — | 1,428 | 2,186 | ||||||||||||
|
|
|
|
|
|
|
|
|
|||||||||
| Net investment income (loss) |
357 | 47 | 3,415 | 3,752 | ||||||||||||
|
|
|
|
|
|
|
|
|
|||||||||
| Realized gains (losses) on investments: |
||||||||||||||||
| Capital gain distributions |
2,099 | 40 | 32,688 | 6,066 | ||||||||||||
| Net realized gains (losses) |
2,101 | 6,905 | 19,573 | 8,010 | ||||||||||||
|
|
|
|
|
|
|
|
|
|||||||||
| Realized gains (losses) |
4,200 | 6,945 | 52,261 | 14,076 | ||||||||||||
| Unrealized appreciation (depreciation) during the period |
(1,361 | ) | 3,953 | (5,626 | ) | 757 | ||||||||||
|
|
|
|
|
|
|
|
|
|||||||||
| Net increase (decrease) in assets from operations |
3,196 | 10,945 | 50,050 | 18,585 | ||||||||||||
|
|
|
|
|
|
|
|
|
|||||||||
| Changes from principal transactions: |
||||||||||||||||
| Transfer of net premiums |
3,947 | 1,679 | 1,247 | 1,134 | ||||||||||||
| Transfer on terminations |
(2,407 | ) | (1,169 | ) | (39,705 | ) | (27,992 | ) | ||||||||
| Transfer on policy loans |
— | — | (58 | ) | (99 | ) | ||||||||||
| Net interfund transfers |
36,621 | (266,302 | ) | (102,341 | ) | (115,449 | ) | |||||||||
|
|
|
|
|
|
|
|
|
|||||||||
| Net increase (decrease) in assets from principal transactions |
38,161 | (265,792 | ) | (140,857 | ) | (142,406 | ) | |||||||||
|
|
|
|
|
|
|
|
|
|||||||||
| Total increase (decrease) in assets |
41,357 | (254,847 | ) | (90,807 | ) | (123,821 | ) | |||||||||
| Assets, beginning of period |
3,254 | 258,101 | 430,096 | 553,917 | ||||||||||||
|
|
|
|
|
|
|
|
|
|||||||||
| Assets, end of period |
$ | 44,611 | $ | 3,254 | $ | 339,289 | $ | 430,096 | ||||||||
|
|
|
|
|
|
|
|
|
|||||||||
See accompanying notes.
24
Table of Contents
| Sub-Account | ||||||||||||||||||||||
| Core Allocation Plus Trust Series 0 | Core Allocation Plus Trust Series 1 | Core Bond Trust Series 0 | ||||||||||||||||||||
| Year Ended Dec. 31/12 |
Year Ended Dec. 31/11 |
Year Ended Dec. 31/12 |
Year Ended Dec. 31/11 |
Year Ended Dec. 31/12 |
Year Ended Dec. 31/11 |
|||||||||||||||||
| $ | 503 | $ | 284 | $ | 19,157 | $ | 62,171 | $ | 19,173 | $ | 18,619 | |||||||||||
|
|
|
|
|
|
|
|
|
|
|
|
|
|||||||||||
| 503 | 284 | 19,157 | 62,171 | 19,173 | 18,619 | |||||||||||||||||
| — | — | 7,277 | 17,168 | — | — | |||||||||||||||||
|
|
|
|
|
|
|
|
|
|
|
|
|
|||||||||||
| 503 | 284 | 11,880 | 45,003 | 19,173 | 18,619 | |||||||||||||||||
|
|
|
|
|
|
|
|
|
|
|
|
|
|||||||||||
| 1,917 | 771 | 90,530 | 276,408 | 18,009 | 20,906 | |||||||||||||||||
| (973 | ) | 36 | 122,232 | 86,552 | 11,828 | (370 | ) | |||||||||||||||
|
|
|
|
|
|
|
|
|
|
|
|
|
|||||||||||
| 944 | 807 | 212,762 | 362,960 | 29,837 | 20,536 | |||||||||||||||||
| 1,863 | (1,510 | ) | 172,650 | (544,182 | ) | (9,218 | ) | 3,180 | ||||||||||||||
|
|
|
|
|
|
|
|
|
|
|
|
|
|||||||||||
| 3,310 | (419 | ) | 397,292 | (136,219 | ) | 39,792 | 42,335 | |||||||||||||||
|
|
|
|
|
|
|
|
|
|
|
|
|
|||||||||||
| 18,262 | 16,262 | 187 | 345 | 99,528 | 146,809 | |||||||||||||||||
| (1,114 | ) | (494 | ) | (62,306 | ) | (134,578 | ) | (40,619 | ) | (19,125 | ) | |||||||||||
| — | — | — | — | (2,603 | ) | (165 | ) | |||||||||||||||
| 2,260 | 1 | (3,226,650 | ) | (837,399 | ) | 96,510 | (255,406 | ) | ||||||||||||||
|
|
|
|
|
|
|
|
|
|
|
|
|
|||||||||||
| 19,408 | 15,769 | (3,288,769 | ) | (971,632 | ) | 152,816 | (127,887 | ) | ||||||||||||||
|
|
|
|
|
|
|
|
|
|
|
|
|
|||||||||||
| 22,718 | 15,350 | (2,891,477 | ) | (1,107,851 | ) | 192,608 | (85,552 | ) | ||||||||||||||
| 21,301 | 5,951 | 4,215,840 | 5,323,691 | 598,664 | 684,216 | |||||||||||||||||
|
|
|
|
|
|
|
|
|
|
|
|
|
|||||||||||
| $ | 44,019 | $ | 21,301 | $ | 1,324,363 | $ | 4,215,840 | $ | 791,272 | $ | 598,664 | |||||||||||
|
|
|
|
|
|
|
|
|
|
|
|
|
|||||||||||
25
Table of Contents
John Hancock Life Insurance Company (U.S.A.) Separate Account N
Statements of Operations and Changes in Contract Owners’ Equity
(continued)
| Sub-Account | ||||||||||||||
| Core Bond Trust Series 1 |
Core Diversified Growth & Income Trust Series 1 |
|||||||||||||
| Year Ended Dec. 31/12 |
Year Ended Dec. 31/11 |
Year Ended Dec. 31/11 (d) |
||||||||||||
| Income: |
||||||||||||||
| Dividend income distribution |
$ | 714 | $ | 11,217 | $ | 218 | ||||||||
|
|
|
|
|
|
|
|||||||||
| Total Investment Income |
714 | 11,217 | 218 | |||||||||||
| Expenses: |
||||||||||||||
| Mortality and expense risk |
538 | 684 | — | |||||||||||
|
|
|
|
|
|
|
|||||||||
| Net investment income (loss) |
176 | 10,533 | 218 | |||||||||||
|
|
|
|
|
|
|
|||||||||
| Realized gains (losses) on investments: |
||||||||||||||
| Capital gain distributions |
698 | 1,017 | 110 | |||||||||||
| Net realized gains (losses) |
(2,119 | ) | 22,963 | 738 | ||||||||||
|
|
|
|
|
|
|
|||||||||
| Realized gains (losses) |
(1,421 | ) | 23,980 | 848 | ||||||||||
| Unrealized appreciation (depreciation) during the period |
8,162 | (26,373 | ) | (777 | ) | |||||||||
|
|
|
|
|
|
|
|||||||||
| Net increase (decrease) in assets from operations |
6,917 | 8,140 | 289 | |||||||||||
|
|
|
|
|
|
|
|||||||||
| Changes from principal transactions: |
||||||||||||||
| Transfer of net premiums |
2,133 | 10,969 | 4,362 | |||||||||||
| Transfer on terminations |
(8,519 | ) | (8,501 | ) | (555 | ) | ||||||||
| Transfer on policy loans |
— | — | — | |||||||||||
| Net interfund transfers |
(421,466 | ) | (48,610 | ) | (14,242 | ) | ||||||||
|
|
|
|
|
|
|
|||||||||
| Net increase (decrease) in assets from principal transactions |
(427,852 | ) | (46,142 | ) | (10,435 | ) | ||||||||
|
|
|
|
|
|
|
|||||||||
| Total increase (decrease) in assets |
(420,935 | ) | (38,002 | ) | (10,146 | ) | ||||||||
| Assets, beginning of period |
447,272 | 485,274 | 10,146 | |||||||||||
|
|
|
|
|
|
|
|||||||||
| Assets, end of period |
$ | 26,337 | $ | 447,272 | — | |||||||||
|
|
|
|
|
|
|
|||||||||
| (d) | Terminated as an investment option and funds transferred to Lifestyle Growth Trust on October 31, 2011. |
See accompanying notes.
26
Table of Contents
| Sub-Account | ||||||||||||||||||||||
| Core Strategy Trust Series 0 | Core Strategy Trust Series 1 | Disciplined Diversification Trust Series 0 | ||||||||||||||||||||
| Year Ended Dec. 31/12 |
Year Ended Dec. 31/11 |
Year Ended Dec. 31/12 |
Year Ended Dec. 31/11 |
Year Ended Dec. 31/12 |
Year Ended Dec. 31/11 |
|||||||||||||||||
| $ | 825 | $ | 413 | $ | 31 | $ | 14 | $ | 377 | $ | 506 | |||||||||||
|
|
|
|
|
|
|
|
|
|
|
|
|
|||||||||||
| 825 | 413 | 31 | 14 | 377 | 506 | |||||||||||||||||
| — | — | 5 | 4 | — | — | |||||||||||||||||
|
|
|
|
|
|
|
|
|
|
|
|
|
|||||||||||
| 825 | 413 | 26 | 10 | 377 | 506 | |||||||||||||||||
|
|
|
|
|
|
|
|
|
|
|
|
|
|||||||||||
| — | — | — | — | 177 | 88 | |||||||||||||||||
| 106 | 2,337 | 21 | 9 | 138 | 9,003 | |||||||||||||||||
|
|
|
|
|
|
|
|
|
|
|
|
|
|||||||||||
| 106 | 2,337 | 21 | 9 | 315 | 9,091 | |||||||||||||||||
| 1,896 | (407 | ) | 40 | (25 | ) | 1,411 | (8,209 | ) | ||||||||||||||
|
|
|
|
|
|
|
|
|
|
|
|
|
|||||||||||
| 2,827 | 2,343 | 87 | (6 | ) | 2,103 | 1,388 | ||||||||||||||||
|
|
|
|
|
|
|
|
|
|
|
|
|
|||||||||||
| 6,030 | 8,001 | 372 | 111 | 11,274 | 13,646 | |||||||||||||||||
| (996 | ) | (863 | ) | (217 | ) | (91 | ) | (1,134 | ) | (1,110 | ) | |||||||||||
| — | — | — | — | (17,356 | ) | (168 | ) | |||||||||||||||
| 4,641 | (80,464 | ) | 307 | 23 | 756 | (82,745 | ) | |||||||||||||||
|
|
|
|
|
|
|
|
|
|
|
|
|
|||||||||||
| 9,675 | (73,326 | ) | 462 | 43 | (6,460 | ) | (70,377 | ) | ||||||||||||||
|
|
|
|
|
|
|
|
|
|
|
|
|
|||||||||||
| 12,502 | (70,983 | ) | 549 | 37 | (4,357 | ) | (68,989 | ) | ||||||||||||||
| 17,891 | 88,874 | 624 | 587 | 22,778 | 91,767 | |||||||||||||||||
|
|
|
|
|
|
|
|
|
|
|
|
|
|||||||||||
| $ | 30,393 | $ | 17,891 | $ | 1,173 | $ | 624 | $ | 18,421 | $ | 22,778 | |||||||||||
|
|
|
|
|
|
|
|
|
|
|
|
|
|||||||||||
27
Table of Contents
John Hancock Life Insurance Company (U.S.A.) Separate Account N
Statements of Operations and Changes in Contract Owners’ Equity
(continued)
| Sub-Account | ||||||||||||||||
| Disciplined Diversification Trust Series 1 | Emerging Markets Value Trust Series 0 | |||||||||||||||
| Year Ended Dec. 31/12 |
Year Ended Dec. 31/11 |
Year Ended Dec. 31/12 |
Year Ended Dec. 31/11 |
|||||||||||||
| Income: |
||||||||||||||||
| Dividend income distribution |
$ | 16 | $ | 13 | $ | 11,235 | $ | 19,042 | ||||||||
|
|
|
|
|
|
|
|
|
|||||||||
| Total Investment Income |
16 | 13 | 11,235 | 19,042 | ||||||||||||
| Expenses: |
||||||||||||||||
| Mortality and expense risk |
4 | 122 | — | — | ||||||||||||
|
|
|
|
|
|
|
|
|
|||||||||
| Net investment income (loss) |
12 | (109 | ) | 11,235 | 19,042 | |||||||||||
|
|
|
|
|
|
|
|
|
|||||||||
| Realized gains (losses) on investments: |
||||||||||||||||
| Capital gain distributions |
8 | 3 | 81,899 | 135,249 | ||||||||||||
| Net realized gains (losses) |
(1 | ) | 1,363 | (260,785 | ) | (44,875 | ) | |||||||||
|
|
|
|
|
|
|
|
|
|||||||||
| Realized gains (losses) |
7 | 1,366 | (178,886 | ) | 90,374 | |||||||||||
| Unrealized appreciation (depreciation) during the period |
51 | (580 | ) | 344,347 | (405,993 | ) | ||||||||||
|
|
|
|
|
|
|
|
|
|||||||||
| Net increase (decrease) in assets from operations |
70 | 677 | 176,696 | (296,577 | ) | |||||||||||
|
|
|
|
|
|
|
|
|
|||||||||
| Changes from principal transactions: |
||||||||||||||||
| Transfer of net premiums |
34 | 34 | 268,147 | 390,307 | ||||||||||||
| Transfer on terminations |
(27 | ) | (134 | ) | (137,209 | ) | (29,409 | ) | ||||||||
| Transfer on policy loans |
— | — | (3,974 | ) | (357 | ) | ||||||||||
| Net interfund transfers |
16 | (44,621 | ) | (146,249 | ) | 131,313 | ||||||||||
|
|
|
|
|
|
|
|
|
|||||||||
| Net increase (decrease) in assets from principal transactions |
23 | (44,721 | ) | (19,285 | ) | 491,854 | ||||||||||
|
|
|
|
|
|
|
|
|
|||||||||
| Total increase (decrease) in assets |
93 | (44,044 | ) | 157,411 | 195,277 | |||||||||||
| Assets, beginning of period |
572 | 44,616 | 1,016,405 | 821,128 | ||||||||||||
|
|
|
|
|
|
|
|
|
|||||||||
| Assets, end of period |
$ | 665 | $ | 572 | $ | 1,173,816 | $ | 1,016,405 | ||||||||
|
|
|
|
|
|
|
|
|
|||||||||
See accompanying notes.
28
Table of Contents
| Sub-Account | ||||||||||||||||||||||
| Emerging Markets Value Trust Series 1 | Equity-Income Trust Series 0 | Equity-Income Trust Series 1 | ||||||||||||||||||||
| Year Ended Dec. 31/12 |
Year Ended Dec. 31/11 |
Year Ended Dec. 31/12 |
Year Ended Dec. 31/11 |
Year Ended Dec. 31/12 |
Year Ended Dec. 31/11 |
|||||||||||||||||
| $ | 12,551 | $ | 13,729 | $ | 493,953 | $ | 410,313 | $ | 244,107 | $ | 227,887 | |||||||||||
|
|
|
|
|
|
|
|
|
|
|
|
|
|||||||||||
| 12,551 | 13,729 | 493,953 | 410,313 | 244,107 | 227,887 | |||||||||||||||||
| 5,383 | 4,731 | — | — | 51,965 | 56,603 | |||||||||||||||||
|
|
|
|
|
|
|
|
|
|
|
|
|
|||||||||||
| 7,168 | 8,998 | 493,953 | 410,313 | 192,142 | 171,284 | |||||||||||||||||
|
|
|
|
|
|
|
|
|
|
|
|
|
|||||||||||
| 83,576 | 107,485 | — | — | — | — | |||||||||||||||||
| (148,381 | ) | 116,959 | 3,491,381 | 694,221 | 1,209,221 | 675,335 | ||||||||||||||||
|
|
|
|
|
|
|
|
|
|
|
|
|
|||||||||||
| (64,805 | ) | 224,444 | 3,491,381 | 694,221 | 1,209,221 | 675,335 | ||||||||||||||||
| 200,294 | (511,432 | ) | (144,486 | ) | (1,437,414 | ) | 480,490 | (1,024,678 | ) | |||||||||||||
|
|
|
|
|
|
|
|
|
|
|
|
|
|||||||||||
| 142,657 | (277,990 | ) | 3,840,848 | (332,880 | ) | 1,881,853 | (178,059 | ) | ||||||||||||||
|
|
|
|
|
|
|
|
|
|
|
|
|
|||||||||||
| 21,603 | 22,168 | 1,775,236 | 2,012,226 | 96,740 | 217,632 | |||||||||||||||||
| (26,717 | ) | (34,499 | ) | (815,502 | ) | (681,386 | ) | (2,806,269 | ) | (2,329,226 | ) | |||||||||||
| — | — | (38,338 | ) | (26,575 | ) | 2,963 | 12,582 | |||||||||||||||
| 465,494 | (249,123 | ) | (1,233,496 | ) | (265,390 | ) | (343,854 | ) | (513,627 | ) | ||||||||||||
|
|
|
|
|
|
|
|
|
|
|
|
|
|||||||||||
| 460,380 | (261,454 | ) | (312,100 | ) | 1,038,875 | (3,050,420 | ) | (2,612,639 | ) | |||||||||||||
|
|
|
|
|
|
|
|
|
|
|
|
|
|||||||||||
| 603,037 | (539,444 | ) | 3,528,748 | 705,995 | (1,168,567 | ) | (2,790,698 | ) | ||||||||||||||
| 741,859 | 1,281,303 | 20,892,942 | 20,186,947 | 12,186,556 | 14,977,254 | |||||||||||||||||
|
|
|
|
|
|
|
|
|
|
|
|
|
|||||||||||
| $ | 1,344,896 | $ | 741,859 | $ | 24,421,690 | $ | 20,892,942 | $ | 11,017,989 | $ | 12,186,556 | |||||||||||
|
|
|
|
|
|
|
|
|
|
|
|
|
|||||||||||
29
Table of Contents
John Hancock Life Insurance Company (U.S.A.) Separate Account N
Statements of Operations and Changes in Contract Owners’ Equity
(continued)
| Sub-Account | ||||||||||||||||
| Financial Services Trust Series 0 | Financial Services Trust Series 1 | |||||||||||||||
| Year Ended Dec. 31/12 |
Year Ended Dec. 31/11 |
Year Ended Dec. 31/12 |
Year Ended Dec. 31/11 |
|||||||||||||
| Income: |
||||||||||||||||
| Dividend income distribution |
$ | 2,519 | $ | 6,603 | $ | 3,250 | $ | 7,139 | ||||||||
|
|
|
|
|
|
|
|
|
|||||||||
| Total Investment Income |
2,519 | 6,603 | 3,250 | 7,139 | ||||||||||||
| Expenses: |
||||||||||||||||
| Mortality and expense risk |
— | — | 2,014 | 3,693 | ||||||||||||
|
|
|
|
|
|
|
|
|
|||||||||
| Net investment income (loss) |
2,519 | 6,603 | 1,236 | 3,446 | ||||||||||||
|
|
|
|
|
|
|
|
|
|||||||||
| Realized gains (losses) on investments: |
||||||||||||||||
| Capital gain distributions |
— | — | — | — | ||||||||||||
| Net realized gains (losses) |
27,469 | 4,156 | 3,396 | 86,415 | ||||||||||||
|
|
|
|
|
|
|
|
|
|||||||||
| Realized gains (losses) |
27,469 | 4,156 | 3,396 | 86,415 | ||||||||||||
| Unrealized appreciation (depreciation) during the period |
32,410 | (44,079 | ) | 55,952 | (155,388 | ) | ||||||||||
|
|
|
|
|
|
|
|
|
|||||||||
| Net increase (decrease) in assets from operations |
62,398 | (33,320 | ) | 60,584 | (65,527 | ) | ||||||||||
|
|
|
|
|
|
|
|
|
|||||||||
| Changes from principal transactions: |
||||||||||||||||
| Transfer of net premiums |
33,483 | 43,927 | 11,574 | 38,062 | ||||||||||||
| Transfer on terminations |
(21,596 | ) | (9,149 | ) | (25,790 | ) | (31,650 | ) | ||||||||
| Transfer on policy loans |
(13,996 | ) | — | (20 | ) | (25 | ) | |||||||||
| Net interfund transfers |
(108,588 | ) | 87,516 | 240,441 | (541,748 | ) | ||||||||||
|
|
|
|
|
|
|
|
|
|||||||||
| Net increase (decrease) in assets from principal transactions |
(110,697 | ) | 122,294 | 226,205 | (535,361 | ) | ||||||||||
|
|
|
|
|
|
|
|
|
|||||||||
| Total increase (decrease) in assets |
(48,299 | ) | 88,974 | 286,789 | (600,888 | ) | ||||||||||
| Assets, beginning of period |
370,177 | 281,203 | 304,495 | 905,383 | ||||||||||||
|
|
|
|
|
|
|
|
|
|||||||||
| Assets, end of period |
$ | 321,878 | $ | 370,177 | $ | 591,284 | $ | 304,495 | ||||||||
|
|
|
|
|
|
|
|
|
|||||||||
| (g) | Fund available in prior year but no activity. |
See accompanying notes.
30
Table of Contents
| Sub-Account | ||||||||||||||||||||
| Franklin Templeton Founding Allocation Trust Series 0 |
Franklin Templeton Founding Allocation Trust Series 1 |
Frontier Capital Appreciation Trust | ||||||||||||||||||
| Year Ended Dec. 31/12 |
Year Ended Dec. 31/11 |
Year Ended Dec. 31/12 |
Year Ended Dec. 31/11 (g) |
Year Ended Dec. 31/12 (g) |
||||||||||||||||
| $ | 4,086 | $ | 8,880 | $ | 309 | $ | 217 | $ | 365 | |||||||||||
|
|
|
|
|
|
|
|
|
|
|
|||||||||||
| 4,086 | 8,880 | 309 | 217 | 365 | ||||||||||||||||
| — | — | 56 | 6 | — | ||||||||||||||||
|
|
|
|
|
|
|
|
|
|
|
|||||||||||
| 4,086 | 8,880 | 253 | 211 | 365 | ||||||||||||||||
|
|
|
|
|
|
|
|
|
|
|
|||||||||||
| — | — | — | — | 7,047 | ||||||||||||||||
| 23,823 | 18,168 | 161 | (2 | ) | 17,258 | |||||||||||||||
|
|
|
|
|
|
|
|
|
|
|
|||||||||||
| 23,823 | 18,168 | 161 | (2 | ) | 24,305 | |||||||||||||||
| 6,717 | (34,751 | ) | 809 | (232 | ) | (2,489 | ) | |||||||||||||
|
|
|
|
|
|
|
|
|
|
|
|||||||||||
| 34,626 | (7,703 | ) | 1,223 | (23 | ) | 22,181 | ||||||||||||||
|
|
|
|
|
|
|
|
|
|
|
|||||||||||
| 20,251 | 87,811 | 5,016 | 418 | — | ||||||||||||||||
| (205,295 | ) | (29,982 | ) | (4,453 | ) | (348 | ) | (21,876 | ) | |||||||||||
| (31 | ) | (29 | ) | — | — | — | ||||||||||||||
| 2,721 | (404,985 | ) | 1,617 | 7,023 | 117,095 | |||||||||||||||
|
|
|
|
|
|
|
|
|
|
|
|||||||||||
| (182,354 | ) | (347,185 | ) | 2,180 | 7,093 | 95,219 | ||||||||||||||
|
|
|
|
|
|
|
|
|
|
|
|||||||||||
| (147,728 | ) | (354,888 | ) | 3,403 | 7,070 | 117,400 | ||||||||||||||
| 285,058 | 639,946 | 7,070 | — | — | ||||||||||||||||
|
|
|
|
|
|
|
|
|
|
|
|||||||||||
| $ | 137,330 | $ | 285,058 | $ | 10,473 | $ | 7,070 | $ | 117,400 | |||||||||||
|
|
|
|
|
|
|
|
|
|
|
|||||||||||
31
Table of Contents
John Hancock Life Insurance Company (U.S.A.) Separate Account N
Statements of Operations and Changes in Contract Owners’ Equity
(continued)
| Sub-Account | ||||||||||||||||
| Fundamental All Cap Core Trust Series 0 | Fundamental All Cap Core Trust Series 1 | |||||||||||||||
| Year Ended Dec. 31/12 |
Year Ended Dec. 31/11 (m) |
Year Ended Dec. 31/12 |
Year Ended Dec. 31/11 (m) |
|||||||||||||
| Income: |
||||||||||||||||
| Dividend income distribution |
$ | 3,927 | $ | 3,925 | $ | 4,156 | $ | 3,176 | ||||||||
|
|
|
|
|
|
|
|
|
|||||||||
| Total Investment Income |
3,927 | 3,925 | 4,156 | 3,176 | ||||||||||||
| Expenses: |
||||||||||||||||
| Mortality and expense risk |
— | — | 2,019 | 1,625 | ||||||||||||
|
|
|
|
|
|
|
|
|
|||||||||
| Net investment income (loss) |
3,927 | 3,925 | 2,137 | 1,551 | ||||||||||||
|
|
|
|
|
|
|
|
|
|||||||||
| Realized gains (losses) on investments: |
||||||||||||||||
| Capital gain distributions |
— | — | — | — | ||||||||||||
| Net realized gains (losses) |
98,271 | 6,227 | 44,506 | 47,132 | ||||||||||||
|
|
|
|
|
|
|
|
|
|||||||||
| Realized gains (losses) |
98,271 | 6,227 | 44,506 | 47,132 | ||||||||||||
| Unrealized appreciation (depreciation) during the period |
(709 | ) | (17,452 | ) | 53,853 | (23,866 | ) | |||||||||
|
|
|
|
|
|
|
|
|
|||||||||
| Net increase (decrease) in assets from operations |
101,489 | (7,300 | ) | 100,496 | 24,817 | |||||||||||
|
|
|
|
|
|
|
|
|
|||||||||
| Changes from principal transactions: |
||||||||||||||||
| Transfer of net premiums |
87,649 | 82,233 | 1,133 | 32,424 | ||||||||||||
| Transfer on terminations |
(21,649 | ) | (10,863 | ) | (279,116 | ) | (35,342 | ) | ||||||||
| Transfer on policy loans |
(5,629 | ) | — | — | — | |||||||||||
| Net interfund transfers |
36,329 | (7,563 | ) | 207,893 | (46,145 | ) | ||||||||||
|
|
|
|
|
|
|
|
|
|||||||||
| Net increase (decrease) in assets from principal transactions |
96,700 | 63,807 | (70,090 | ) | (49,063 | ) | ||||||||||
|
|
|
|
|
|
|
|
|
|||||||||
| Total increase (decrease) in assets |
198,189 | 56,507 | 30,406 | (24,246 | ) | |||||||||||
| Assets, beginning of period |
346,907 | 290,400 | 281,982 | 306,228 | ||||||||||||
|
|
|
|
|
|
|
|
|
|||||||||
| Assets, end of period |
$ | 545,096 | $ | 346,907 | $ | 312,388 | $ | 281,982 | ||||||||
|
|
|
|
|
|
|
|
|
|||||||||
| (m) | Renamed on June 27, 2011. Previously known as Optimized All Cap Trust. |
| (l) | Renamed on October 31, 2011. Previously known as American Fundamental Holdings Trust Series 1. |
| (o) | Renamed on June 27, 2011. Previously known as Optimized Value Trust. |
See accompanying notes.
32
Table of Contents
| Sub-Account | ||||||||||||||||||||||
| Fundamental Holdings Trust Series 1 | Fundamental Large Cap Value Trust Series 0 | Fundamental Large Cap Value Trust Series 1 | ||||||||||||||||||||
| Year Ended Dec. 31/12 |
Year Ended Dec. 31/11 (l) |
Year Ended Dec. 31/12 |
Year Ended Dec. 31/11 (o) |
Year Ended Dec. 31/12 |
Year Ended Dec. 31/11 (o) |
|||||||||||||||||
| $ | 296 | $ | 246 | $ | 16,849 | $ | 2,054 | $ | 28 | — | ||||||||||||
|
|
|
|
|
|
|
|
|
|
|
|
|
|||||||||||
| 296 | 246 | 16,849 | 2,054 | 28 | — | |||||||||||||||||
| 106 | 103 | — | — | 3 | — | |||||||||||||||||
|
|
|
|
|
|
|
|
|
|
|
|
|
|||||||||||
| 190 | 143 | 16,849 | 2,054 | 25 | — | |||||||||||||||||
|
|
|
|
|
|
|
|
|
|
|
|
|
|||||||||||
| — | — | — | — | — | — | |||||||||||||||||
| 109 | 102 | 63,906 | 2,001 | 1 | — | |||||||||||||||||
|
|
|
|
|
|
|
|
|
|
|
|
|
|||||||||||
| 109 | 102 | 63,906 | 2,001 | 1 | — | |||||||||||||||||
| 1,549 | (511 | ) | (23,716 | ) | (431 | ) | 87 | — | ||||||||||||||
|
|
|
|
|
|
|
|
|
|
|
|
|
|||||||||||
| 1,848 | (266 | ) | 57,039 | 3,624 | 113 | — | ||||||||||||||||
|
|
|
|
|
|
|
|
|
|
|
|
|
|||||||||||
| 1,463 | 401 | 49,325 | 46,609 | — | — | |||||||||||||||||
| (661 | ) | (596 | ) | (15,163 | ) | (4,339 | ) | (56 | ) | — | ||||||||||||
| — | — | — | — | — | — | |||||||||||||||||
| (439 | ) | 42 | 16,958 | (5,168 | ) | 2,874 | — | |||||||||||||||
|
|
|
|
|
|
|
|
|
|
|
|
|
|||||||||||
| 363 | (153 | ) | 51,120 | 37,102 | 2,818 | — | ||||||||||||||||
|
|
|
|
|
|
|
|
|
|
|
|
|
|||||||||||
| 2,211 | (419 | ) | 108,159 | 40,726 | 2,931 | — | ||||||||||||||||
| 15,624 | 16,043 | 198,403 | 157,677 | 14 | 14 | |||||||||||||||||
|
|
|
|
|
|
|
|
|
|
|
|
|
|||||||||||
| $ | 17,835 | $ | 15,624 | $ | 306,562 | $ | 198,403 | $ | 2,945 | $ | 14 | |||||||||||
|
|
|
|
|
|
|
|
|
|
|
|
|
|||||||||||
33
Table of Contents
John Hancock Life Insurance Company (U.S.A.) Separate Account N
Statements of Operations and Changes in Contract Owners’ Equity
(continued)
| Sub-Account | ||||||||||||||||
| Fundamental Value Trust Series 0 | Fundamental Value Trust Series 1 | |||||||||||||||
| Year Ended Dec. 31/12 |
Year Ended Dec. 31/11 |
Year Ended Dec. 31/12 |
Year Ended Dec. 31/11 |
|||||||||||||
| Income: |
||||||||||||||||
| Dividend income distribution |
$ | 25,376 | $ | 27,094 | $ | 56,138 | $ | 74,320 | ||||||||
|
|
|
|
|
|
|
|
|
|||||||||
| Total Investment Income |
25,376 | 27,094 | 56,138 | 74,320 | ||||||||||||
| Expenses: |
||||||||||||||||
| Mortality and expense risk |
— | — | 29,032 | 43,184 | ||||||||||||
|
|
|
|
|
|
|
|
|
|||||||||
| Net investment income (loss) |
25,376 | 27,094 | 27,106 | 31,136 | ||||||||||||
|
|
|
|
|
|
|
|
|
|||||||||
| Realized gains (losses) on investments: |
||||||||||||||||
| Capital gain distributions |
— | — | — | — | ||||||||||||
| Net realized gains (losses) |
495,449 | 186,927 | 769,874 | 595,858 | ||||||||||||
|
|
|
|
|
|
|
|
|
|||||||||
| Realized gains (losses) |
495,449 | 186,927 | 769,874 | 595,858 | ||||||||||||
| Unrealized appreciation (depreciation) during the period |
(73,353 | ) | (362,551 | ) | 128,058 | (1,117,792 | ) | |||||||||
|
|
|
|
|
|
|
|
|
|||||||||
| Net increase (decrease) in assets from operations |
447,472 | (148,530 | ) | 925,038 | (490,798 | ) | ||||||||||
|
|
|
|
|
|
|
|
|
|||||||||
| Changes from principal transactions: |
||||||||||||||||
| Transfer of net premiums |
78,507 | 398,987 | 205,264 | 290,355 | ||||||||||||
| Transfer on terminations |
(82,575 | ) | (143,150 | ) | (748,850 | ) | (1,207,054 | ) | ||||||||
| Transfer on policy loans |
— | — | 1,323 | (4,405 | ) | |||||||||||
| Net interfund transfers |
554,215 | 953 | (3,033,606 | ) | (1,346,949 | ) | ||||||||||
|
|
|
|
|
|
|
|
|
|||||||||
| Net increase (decrease) in assets from principal transactions |
550,147 | 256,790 | (3,575,869 | ) | (2,268,053 | ) | ||||||||||
|
|
|
|
|
|
|
|
|
|||||||||
| Total increase (decrease) in assets |
997,619 | 108,260 | (2,650,831 | ) | (2,758,851 | ) | ||||||||||
| Assets, beginning of period |
2,950,359 | 2,842,099 | 8,359,838 | 11,118,689 | ||||||||||||
|
|
|
|
|
|
|
|
|
|||||||||
| Assets, end of period |
$ | 3,947,978 | $ | 2,950,359 | $ | 5,709,007 | $ | 8,359,838 | ||||||||
|
|
|
|
|
|
|
|
|
|||||||||
| (i) | Renamed on October 31, 2011. Previously known as American Global Diversification Trust Series 1. |
See accompanying notes.
34
Table of Contents
| Sub-Account | ||||||||||||||||||||||
| Global Bond Trust Series 0 | Global Bond Trust Series 1 | Global Diversification Trust Series 1 | ||||||||||||||||||||
| Year Ended Dec. 31/12 |
Year Ended Dec. 31/11 |
Year Ended Dec. 31/12 |
Year Ended Dec. 31/11 |
Year Ended Dec. 31/12 |
Year Ended Dec. 31/11 (i) |
|||||||||||||||||
| $ | 960,253 | $ | 771,516 | $ | 263,143 | $ | 234,079 | $ | 2,514 | $ | 1,706 | |||||||||||
|
|
|
|
|
|
|
|
|
|
|
|
|
|||||||||||
| 960,253 | 771,516 | 263,143 | 234,079 | 2,514 | 1,706 | |||||||||||||||||
| — | — | 16,792 | 17,105 | 679 | 395 | |||||||||||||||||
|
|
|
|
|
|
|
|
|
|
|
|
|
|||||||||||
| 960,253 | 771,516 | 246,351 | 216,974 | 1,835 | 1,311 | |||||||||||||||||
|
|
|
|
|
|
|
|
|
|
|
|
|
|||||||||||
| — | — | — | — | — | — | |||||||||||||||||
| 553,092 | 631,123 | 27,695 | 212,330 | 62 | 710 | |||||||||||||||||
|
|
|
|
|
|
|
|
|
|
|
|
|
|||||||||||
| 553,092 | 631,123 | 27,695 | 212,330 | 62 | 710 | |||||||||||||||||
| (600,066 | ) | (440,994 | ) | (30,459 | ) | (125,961 | ) | 15,704 | (7,477 | ) | ||||||||||||
|
|
|
|
|
|
|
|
|
|
|
|
|
|||||||||||
| 913,279 | 961,645 | 243,587 | 303,343 | 17,601 | (5,456 | ) | ||||||||||||||||
|
|
|
|
|
|
|
|
|
|
|
|
|
|||||||||||
| 283,632 | 496,917 | 201,518 | 246,704 | 14,742 | 10,048 | |||||||||||||||||
| (406,236 | ) | (377,040 | ) | (1,324,176 | ) | (358,194 | ) | (3,742 | ) | (1,794 | ) | |||||||||||
| 1,703 | 61 | 1,193 | 590 | (791 | ) | — | ||||||||||||||||
| (1,334,245 | ) | 864,191 | 217,124 | (571,487 | ) | 38,060 | (62,231 | ) | ||||||||||||||
|
|
|
|
|
|
|
|
|
|
|
|
|
|||||||||||
| (1,455,146 | ) | 984,129 | (904,341 | ) | (682,387 | ) | 48,269 | (53,977 | ) | |||||||||||||
|
|
|
|
|
|
|
|
|
|
|
|
|
|||||||||||
| (541,867 | ) | 1,945,774 | (660,754 | ) | (379,044 | ) | 65,870 | (59,433 | ) | |||||||||||||
| 13,749,389 | 11,803,615 | 3,693,790 | 4,072,834 | 86,201 | 145,634 | |||||||||||||||||
|
|
|
|
|
|
|
|
|
|
|
|
|
|||||||||||
| $ | 13,207,522 | $ | 13,749,389 | $ | 3,033,036 | $ | 3,693,790 | $ | 152,071 | $ | 86,201 | |||||||||||
|
|
|
|
|
|
|
|
|
|
|
|
|
|||||||||||
35
Table of Contents
John Hancock Life Insurance Company (U.S.A.) Separate Account N
Statements of Operations and Changes in Contract Owners’ Equity
(continued)
| Sub-Account | ||||||||||||||||
| Global Trust Series 0 | Global Trust Series 1 | |||||||||||||||
| Year Ended Dec. 31/12 |
Year Ended Dec. 31/11 |
Year Ended Dec. 31/12 |
Year Ended Dec. 31/11 |
|||||||||||||
| Income: |
||||||||||||||||
| Dividend income distribution |
$ | 6,464 | $ | 4,055 | $ | 43,116 | $ | 23,686 | ||||||||
|
|
|
|
|
|
|
|
|
|||||||||
| Total Investment Income |
6,464 | 4,055 | 43,116 | 23,686 | ||||||||||||
| Expenses: |
||||||||||||||||
| Mortality and expense risk |
— | — | 9,989 | 9,320 | ||||||||||||
|
|
|
|
|
|
|
|
|
|||||||||
| Net investment income (loss) |
6,464 | 4,055 | 33,127 | 14,366 | ||||||||||||
|
|
|
|
|
|
|
|
|
|||||||||
| Realized gains (losses) on investments: |
||||||||||||||||
| Capital gain distributions |
— | — | — | — | ||||||||||||
| Net realized gains (losses) |
2,121 | 13,110 | 14,608 | 138,193 | ||||||||||||
|
|
|
|
|
|
|
|
|
|||||||||
| Realized gains (losses) |
2,121 | 13,110 | 14,608 | 138,193 | ||||||||||||
| Unrealized appreciation (depreciation) during the period |
33,743 | (25,934 | ) | 249,294 | (255,915 | ) | ||||||||||
|
|
|
|
|
|
|
|
|
|||||||||
| Net increase (decrease) in assets from operations |
42,328 | (8,769 | ) | 297,029 | (103,356 | ) | ||||||||||
|
|
|
|
|
|
|
|
|
|||||||||
| Changes from principal transactions: |
||||||||||||||||
| Transfer of net premiums |
33,698 | 34,580 | 37,406 | 117,271 | ||||||||||||
| Transfer on terminations |
(7,877 | ) | (7,062 | ) | (931,363 | ) | (200,356 | ) | ||||||||
| Transfer on policy loans |
(2,925 | ) | (511 | ) | 4,906 | 476 | ||||||||||
| Net interfund transfers |
167,584 | (76,477 | ) | 1,127,465 | (719,650 | ) | ||||||||||
|
|
|
|
|
|
|
|
|
|||||||||
| Net increase (decrease) in assets from principal transactions |
190,480 | (49,470 | ) | 238,414 | (802,259 | ) | ||||||||||
|
|
|
|
|
|
|
|
|
|||||||||
| Total increase (decrease) in assets |
232,808 | (58,239 | ) | 535,443 | (905,615 | ) | ||||||||||
| Assets, beginning of period |
178,912 | 237,151 | 1,035,580 | 1,941,195 | ||||||||||||
|
|
|
|
|
|
|
|
|
|||||||||
| Assets, end of period |
$ | 411,720 | $ | 178,912 | $ | 1,571,023 | $ | 1,035,580 | ||||||||
|
|
|
|
|
|
|
|
|
|||||||||
See accompanying notes.
36
Table of Contents
| Sub-Account | ||||||||||||||||||||||
| Health Sciences Trust Series 0 | Health Sciences Trust Series 1 | High Yield Trust Series 0 | ||||||||||||||||||||
| Year Ended Dec. 31/12 |
Year Ended Dec. 31/11 |
Year Ended Dec. 31/12 |
Year Ended Dec. 31/11 |
Year Ended Dec. 31/12 |
Year Ended Dec. 31/11 |
|||||||||||||||||
| — | — | — | — | $ | 172,095 | $ | 148,552 | |||||||||||||||
|
|
|
|
|
|
|
|
|
|
|
|
|
|||||||||||
| — | — | — | — | 172,095 | 148,552 | |||||||||||||||||
| — | — | 16,733 | 14,178 | — | — | |||||||||||||||||
|
|
|
|
|
|
|
|
|
|
|
|
|
|||||||||||
| — | — | (16,733 | ) | (14,178 | ) | 172,095 | 148,552 | |||||||||||||||
|
|
|
|
|
|
|
|
|
|
|
|
|
|||||||||||
| 107,714 | 11,216 | 198,483 | 33,170 | — | — | |||||||||||||||||
| 224,502 | 72,946 | 293,644 | 401,777 | (43,312 | ) | (578,809 | ) | |||||||||||||||
|
|
|
|
|
|
|
|
|
|
|
|
|
|||||||||||
| 332,216 | 84,162 | 492,127 | 434,947 | (43,312 | ) | (578,809 | ) | |||||||||||||||
| 53,675 | 8,089 | 344,099 | (174,221 | ) | 224,961 | 450,697 | ||||||||||||||||
|
|
|
|
|
|
|
|
|
|
|
|
|
|||||||||||
| 385,891 | 92,251 | 819,493 | 246,548 | 353,744 | 20,440 | |||||||||||||||||
|
|
|
|
|
|
|
|
|
|
|
|
|
|||||||||||
| 150,963 | 58,185 | 70,517 | 129,665 | 81,158 | 95,548 | |||||||||||||||||
| (74,936 | ) | (51,873 | ) | (510,472 | ) | (217,708 | ) | (59,864 | ) | (163,021 | ) | |||||||||||
| (9,732 | ) | (4,512 | ) | (317 | ) | (55 | ) | (13,414 | ) | (40,835 | ) | |||||||||||
| 360,503 | 222,563 | 272,997 | 629,317 | 457,969 | (918,583 | ) | ||||||||||||||||
|
|
|
|
|
|
|
|
|
|
|
|
|
|||||||||||
| 426,798 | 224,363 | (167,275 | ) | 541,219 | 465,849 | (1,026,891 | ) | |||||||||||||||
|
|
|
|
|
|
|
|
|
|
|
|
|
|||||||||||
| 812,689 | 316,614 | 652,218 | 787,767 | 819,593 | (1,006,451 | ) | ||||||||||||||||
| 1,134,576 | 817,962 | 2,757,632 | 1,969,865 | 1,550,002 | 2,556,453 | |||||||||||||||||
|
|
|
|
|
|
|
|
|
|
|
|
|
|||||||||||
| $ | 1,947,265 | $ | 1,134,576 | $ | 3,409,850 | $ | 2,757,632 | $ | 2,369,595 | $ | 1,550,002 | |||||||||||
|
|
|
|
|
|
|
|
|
|
|
|
|
|||||||||||
37
Table of Contents
John Hancock Life Insurance Company (U.S.A.) Separate Account N
Statements of Operations and Changes in Contract Owners’ Equity
(continued)
| Sub-Account | ||||||||||||||||
| High Yield Trust Series 1 | International Core Trust Series 0 | |||||||||||||||
| Year Ended Dec. 31/12 |
Year Ended Dec. 31/11 |
Year Ended Dec. 31/12 |
Year Ended Dec. 31/11 |
|||||||||||||
| Income: |
||||||||||||||||
| Dividend income distribution |
$ | 348,632 | $ | 427,477 | $ | 5,898 | $ | 4,650 | ||||||||
|
|
|
|
|
|
|
|
|
|||||||||
| Total Investment Income |
348,632 | 427,477 | 5,898 | 4,650 | ||||||||||||
| Expenses: |
||||||||||||||||
| Mortality and expense risk |
21,354 | 24,960 | — | — | ||||||||||||
|
|
|
|
|
|
|
|
|
|||||||||
| Net investment income (loss) |
327,278 | 402,517 | 5,898 | 4,650 | ||||||||||||
|
|
|
|
|
|
|
|
|
|||||||||
| Realized gains (losses) on investments: |
||||||||||||||||
| Capital gain distributions |
— | — | — | — | ||||||||||||
| Net realized gains (losses) |
(325,842 | ) | (1,230,402 | ) | (3,550 | ) | (3,571 | ) | ||||||||
|
|
|
|
|
|
|
|
|
|||||||||
| Realized gains (losses) |
(325,842 | ) | (1,230,402 | ) | (3,550 | ) | (3,571 | ) | ||||||||
| Unrealized appreciation (depreciation) during the period |
804,694 | 849,354 | 24,364 | (32,448 | ) | |||||||||||
|
|
|
|
|
|
|
|
|
|||||||||
| Net increase (decrease) in assets from operations |
806,130 | 21,469 | 26,712 | (31,369 | ) | |||||||||||
|
|
|
|
|
|
|
|
|
|||||||||
| Changes from principal transactions: |
||||||||||||||||
| Transfer of net premiums |
66,583 | 93,243 | 50,003 | 70,296 | ||||||||||||
| Transfer on terminations |
(1,230,130 | ) | (1,087,936 | ) | (23,452 | ) | (102,206 | ) | ||||||||
| Transfer on policy loans |
49 | 66 | (6,000 | ) | (122 | ) | ||||||||||
| Net interfund transfers |
(341,580 | ) | (229,894 | ) | 1,245 | 6,599 | ||||||||||
|
|
|
|
|
|
|
|
|
|||||||||
| Net increase (decrease) in assets from principal transactions |
(1,505,078 | ) | (1,224,521 | ) | 21,796 | (25,433 | ) | |||||||||
|
|
|
|
|
|
|
|
|
|||||||||
| Total increase (decrease) in assets |
(698,948 | ) | (1,203,052 | ) | 48,508 | (56,802 | ) | |||||||||
| Assets, beginning of period |
4,701,034 | 5,904,086 | 166,647 | 223,449 | ||||||||||||
|
|
|
|
|
|
|
|
|
|||||||||
| Assets, end of period |
$ | 4,002,086 | $ | 4,701,034 | $ | 215,155 | $ | 166,647 | ||||||||
|
|
|
|
|
|
|
|
|
|||||||||
| (u) | Terminated as an investment option and funds transferred to International Equity Index Trust B on November 5, 2012. |
See accompanying notes.
38
Table of Contents
| Sub-Account | ||||||||||||||||||||||
| International Core Trust Series 1 | International Equity Index Trust A Series 0 | International Equity Index Trust A Series 1 | ||||||||||||||||||||
| Year Ended Dec. 31/12 |
Year Ended Dec. 31/11 |
Year Ended Dec. 31/12 (u) |
Year Ended Dec. 31/11 |
Year Ended Dec. 31/12 (u) |
Year Ended Dec. 31/11 |
|||||||||||||||||
| $ | 64,795 | $ | 77,106 | $ | 7,750 | $ | 9,814 | $ | 107,104 | $ | 145,536 | |||||||||||
|
|
|
|
|
|
|
|
|
|
|
|
|
|||||||||||
| 64,795 | 77,106 | 7,750 | 9,814 | 107,104 | 145,536 | |||||||||||||||||
| 12,946 | 17,497 | — | — | 13,494 | 19,883 | |||||||||||||||||
|
|
|
|
|
|
|
|
|
|
|
|
|
|||||||||||
| 51,849 | 59,609 | 7,750 | 9,814 | 93,610 | 125,653 | |||||||||||||||||
|
|
|
|
|
|
|
|
|
|
|
|
|
|||||||||||
| — | — | 13,490 | 6,652 | 192,157 | 107,074 | |||||||||||||||||
| (82,782 | ) | (1,889 | ) | (41,377 | ) | (24,338 | ) | (790,361 | ) | (361,246 | ) | |||||||||||
|
|
|
|
|
|
|
|
|
|
|
|
|
|||||||||||
| (82,782 | ) | (1,889 | ) | (27,887 | ) | (17,686 | ) | (598,204 | ) | (254,172 | ) | |||||||||||
| 376,035 | (367,945 | ) | 50,482 | (31,845 | ) | 899,946 | (550,110 | ) | ||||||||||||||
|
|
|
|
|
|
|
|
|
|
|
|
|
|||||||||||
| 345,102 | (310,225 | ) | 30,345 | (39,717 | ) | 395,352 | (678,629 | ) | ||||||||||||||
|
|
|
|
|
|
|
|
|
|
|
|
|
|||||||||||
| 56,516 | 75,436 | 37,317 | 92,785 | 140,790 | 214,394 | |||||||||||||||||
| (330,936 | ) | (773,532 | ) | (10,993 | ) | (15,055 | ) | (213,579 | ) | (528,569 | ) | |||||||||||
| 7,313 | 11,297 | (10,237 | ) | (1,587 | ) | 163 | 9,256 | |||||||||||||||
| (619,124 | ) | 463,834 | (314,349 | ) | 3,326 | (4,318,079 | ) | (569,119 | ) | |||||||||||||
|
|
|
|
|
|
|
|
|
|
|
|
|
|||||||||||
| (886,231 | ) | (222,965 | ) | (298,262 | ) | 79,469 | (4,390,705 | ) | (874,038 | ) | ||||||||||||
|
|
|
|
|
|
|
|
|
|
|
|
|
|||||||||||
| (541,129 | ) | (533,190 | ) | (267,917 | ) | 39,752 | (3,995,353 | ) | (1,552,667 | ) | ||||||||||||
| 2,920,094 | 3,453,284 | 267,917 | 228,165 | 3,995,353 | 5,548,020 | |||||||||||||||||
|
|
|
|
|
|
|
|
|
|
|
|
|
|||||||||||
| $ | 2,378,965 | $ | 2,920,094 | — | $ | 267,917 | — | $ | 3,995,353 | |||||||||||||
|
|
|
|
|
|
|
|
|
|
|
|
|
|||||||||||
39
Table of Contents
John Hancock Life Insurance Company (U.S.A.) Separate Account N
Statements of Operations and Changes in Contract Owners’ Equity
(continued)
| Sub-Account | ||||||||||||||
| International Equity Index Trust B Series 0 | International Equity Index Trust B Series 1 | |||||||||||||
| Year Ended Dec. 31/12 |
Year Ended Dec. 31/11 |
Year Ended Dec. 31/12 (s) |
||||||||||||
| Income: |
||||||||||||||
| Dividend income distribution |
$ | 168,098 | $ | 338,591 | $ | 39,586 | ||||||||
|
|
|
|
|
|
|
|||||||||
| Total Investment Income |
168,098 | 338,591 | 39,586 | |||||||||||
| Expenses: |
||||||||||||||
| Mortality and expense risk |
— | — | 2,263 | |||||||||||
|
|
|
|
|
|
|
|||||||||
| Net investment income (loss) |
168,098 | 338,591 | 37,323 | |||||||||||
|
|
|
|
|
|
|
|||||||||
| Realized gains (losses) on investments: |
||||||||||||||
| Capital gain distributions |
— | — | — | |||||||||||
| Net realized gains (losses) |
(155,634 | ) | 843,361 | 9,739 | ||||||||||
|
|
|
|
|
|
|
|||||||||
| Realized gains (losses) |
(155,634 | ) | 843,361 | 9,739 | ||||||||||
| Unrealized appreciation (depreciation) during the period |
2,085,229 | (2,569,655 | ) | 160,192 | ||||||||||
|
|
|
|
|
|
|
|||||||||
| Net increase (decrease) in assets from operations |
2,097,693 | (1,387,703 | ) | 207,254 | ||||||||||
|
|
|
|
|
|
|
|||||||||
| Changes from principal transactions: |
||||||||||||||
| Transfer of net premiums |
1,032,428 | 1,868,155 | 3,758 | |||||||||||
| Transfer on terminations |
(462,095 | ) | (958,494 | ) | (21,807 | ) | ||||||||
| Transfer on policy loans |
(405,563 | ) | 72,749 | 187 | ||||||||||
| Net interfund transfers |
3,481,584 | (383,619 | ) | 3,270,546 | ||||||||||
|
|
|
|
|
|
|
|||||||||
| Net increase (decrease) in assets from principal transactions |
3,646,354 | 598,791 | 3,252,684 | |||||||||||
|
|
|
|
|
|
|
|||||||||
| Total increase (decrease) in assets |
5,744,047 | (788,912 | ) | 3,459,938 | ||||||||||
| Assets, beginning of period |
8,757,970 | 9,546,882 | — | |||||||||||
|
|
|
|
|
|
|
|||||||||
| Assets, end of period |
$ | 14,502,017 | $ | 8,757,970 | $ | 3,459,938 | ||||||||
|
|
|
|
|
|
|
|||||||||
| (s) | Reflects the period from commencement of operations on November 5, 2012 through December 31, 2012. |
| (r) | Reflects the period from commencement of operations on November 5, 2012 through December 31, 2012. |
| (w) | Terminated as an investment option and funds transferred to International Growth Stock Trust on November 5, 2012. |
See accompanying notes.
40
Table of Contents
| Sub-Account | ||||||||||||||||||
| International Growth Stock Trust Series 0 | International Growth Stock Trust Series 1 | International Opportunities Trust Series 0 | ||||||||||||||||
| Year Ended Dec. 31/12 (r) |
Year Ended Dec. 31/12 (r) |
Year Ended Dec. 31/12 (w) |
Year Ended Dec. 31/11 |
|||||||||||||||
| $ | 36,502 | $ | 2,795 | $ | 92,220 | $ | 36,348 | |||||||||||
|
|
|
|
|
|
|
|
|
|||||||||||
| 36,502 | 2,795 | 92,220 | 36,348 | |||||||||||||||
| — | 268 | — | — | |||||||||||||||
|
|
|
|
|
|
|
|
|
|||||||||||
| 36,502 | 2,527 | 92,220 | 36,348 | |||||||||||||||
|
|
|
|
|
|
|
|
|
|||||||||||
| — | — | — | — | |||||||||||||||
| 14,855 | 237 | (669,559 | ) | 1,048,506 | ||||||||||||||
|
|
|
|
|
|
|
|
|
|||||||||||
| 14,855 | 237 | (669,559 | ) | 1,048,506 | ||||||||||||||
| 183,219 | 17,478 | 893,118 | (1,826,852 | ) | ||||||||||||||
|
|
|
|
|
|
|
|
|
|||||||||||
| 234,576 | 20,242 | 315,779 | (741,998 | ) | ||||||||||||||
|
|
|
|
|
|
|
|
|
|||||||||||
| 488,562 | 97 | 70,762 | 68,373 | |||||||||||||||
| (6,464 | ) | (2,906 | ) | (62,376 | ) | (173,675 | ) | |||||||||||
| — | — | (10,044 | ) | (1,138 | ) | |||||||||||||
| 4,528,141 | 427,203 | (4,282,547 | ) | (123,003 | ) | |||||||||||||
|
|
|
|
|
|
|
|
|
|||||||||||
| 5,010,239 | 424,394 | (4,284,205 | ) | (229,443 | ) | |||||||||||||
|
|
|
|
|
|
|
|
|
|||||||||||
| 5,244,815 | 444,636 | (3,968,426 | ) | (971,441 | ) | |||||||||||||
| — | — | 3,968,426 | 4,939,867 | |||||||||||||||
|
|
|
|
|
|
|
|
|
|||||||||||
| $ | 5,244,815 | $ | 444,636 | — | $ | 3,968,426 | ||||||||||||
|
|
|
|
|
|
|
|
|
|||||||||||
41
Table of Contents
John Hancock Life Insurance Company (U.S.A.) Separate Account N
Statements of Operations and Changes in Contract Owners’ Equity
(continued)
| Sub-Account | ||||||||||||||||
| International Opportunities Trust Series 1 | International Small Company Trust Series 0 | |||||||||||||||
| Year Ended Dec. 31/12 (w) |
Year Ended Dec. 31/11 |
Year Ended Dec. 31/12 |
Year Ended Dec. 31/11 |
|||||||||||||
| Income: |
||||||||||||||||
| Dividend income distribution |
$ | 6,453 | $ | 3,133 | $ | 9,256 | $ | 11,768 | ||||||||
|
|
|
|
|
|
|
|
|
|||||||||
| Total Investment Income |
6,453 | 3,133 | 9,256 | 11,768 | ||||||||||||
| Expenses: |
||||||||||||||||
| Mortality and expense risk |
1,492 | 3,268 | — | — | ||||||||||||
|
|
|
|
|
|
|
|
|
|||||||||
| Net investment income (loss) |
4,961 | (135 | ) | 9,256 | 11,768 | |||||||||||
|
|
|
|
|
|
|
|
|
|||||||||
| Realized gains (losses) on investments: |
||||||||||||||||
| Capital gain distributions |
— | — | — | — | ||||||||||||
| Net realized gains (losses) |
(38,732 | ) | 49,574 | 18,111 | 14,997 | |||||||||||
|
|
|
|
|
|
|
|
|
|||||||||
| Realized gains (losses) |
(38,732 | ) | 49,574 | 18,111 | 14,997 | |||||||||||
| Unrealized appreciation (depreciation) during the period |
89,481 | (204,757 | ) | 91,820 | (130,278 | ) | ||||||||||
|
|
|
|
|
|
|
|
|
|||||||||
| Net increase (decrease) in assets from operations |
55,710 | (155,318 | ) | 119,187 | (103,513 | ) | ||||||||||
|
|
|
|
|
|
|
|
|
|||||||||
| Changes from principal transactions: |
||||||||||||||||
| Transfer of net premiums |
2,334 | 34,518 | 78,369 | 114,981 | ||||||||||||
| Transfer on terminations |
(20,913 | ) | (27,989 | ) | (41,242 | ) | (42,499 | ) | ||||||||
| Transfer on policy loans |
— | — | 4,821 | 1,135 | ||||||||||||
| Net interfund transfers |
(715,627 | ) | 307,561 | 62,129 | 29,676 | |||||||||||
|
|
|
|
|
|
|
|
|
|||||||||
| Net increase (decrease) in assets from principal transactions |
(734,206 | ) | 314,090 | 104,077 | 103,293 | |||||||||||
|
|
|
|
|
|
|
|
|
|||||||||
| Total increase (decrease) in assets |
(678,496 | ) | 158,772 | 223,264 | (220 | ) | ||||||||||
| Assets, beginning of period |
678,496 | 519,724 | 614,184 | 614,404 | ||||||||||||
|
|
|
|
|
|
|
|
|
|||||||||
| Assets, end of period |
— | $ | 678,496 | $ | 837,448 | $ | 614,184 | |||||||||
|
|
|
|
|
|
|
|
|
|||||||||
| (w) | Terminated as an investment option and funds transferred to International Growth Stock Trust on November 5, 2012. |
See accompanying notes.
42
Table of Contents
| Sub-Account | ||||||||||||||||||||||
| International Small Company Trust Series 1 | International Value Trust Series 0 | International Value Trust Series 1 | ||||||||||||||||||||
| Year Ended Dec. 31/12 |
Year Ended Dec. 31/11 |
Year Ended Dec. 31/12 |
Year Ended Dec. 31/11 |
Year Ended Dec. 31/12 |
Year Ended Dec. 31/11 |
|||||||||||||||||
| $ | 16,551 | $ | 37,107 | $ | 117,318 | $ | 109,877 | $ | 135,246 | $ | 163,419 | |||||||||||
|
|
|
|
|
|
|
|
|
|
|
|
|
|||||||||||
| 16,551 | 37,107 | 117,318 | 109,877 | 135,246 | 163,419 | |||||||||||||||||
| 7,156 | 10,503 | — | — | 20,056 | 28,780 | |||||||||||||||||
|
|
|
|
|
|
|
|
|
|
|
|
|
|||||||||||
| 9,395 | 26,604 | 117,318 | 109,877 | 115,190 | 134,639 | |||||||||||||||||
|
|
|
|
|
|
|
|
|
|
|
|
|
|||||||||||
| — | — | — | — | — | — | |||||||||||||||||
| 18,003 | 260,979 | (633,920 | ) | 442,550 | (50,375 | ) | 498,524 | |||||||||||||||
|
|
|
|
|
|
|
|
|
|
|
|
|
|||||||||||
| 18,003 | 260,979 | (633,920 | ) | 442,550 | (50,375 | ) | 498,524 | |||||||||||||||
| 242,164 | (603,039 | ) | 1,255,781 | (1,235,805 | ) | 879,202 | (1,421,892 | ) | ||||||||||||||
|
|
|
|
|
|
|
|
|
|
|
|
|
|||||||||||
| 269,562 | (315,456 | ) | 739,179 | (683,378 | ) | 944,017 | (788,729 | ) | ||||||||||||||
|
|
|
|
|
|
|
|
|
|
|
|
|
|||||||||||
| 70,172 | 124,154 | 186,486 | 489,362 | 108,542 | 132,035 | |||||||||||||||||
| (452,158 | ) | (216,481 | ) | (148,664 | ) | (129,815 | ) | (1,030,428 | ) | (2,593,005 | ) | |||||||||||
| 1,557 | 978 | (1,192 | ) | (1,791 | ) | 2,938 | (1,006 | ) | ||||||||||||||
| (895,042 | ) | (372,681 | ) | 90,814 | (60,866 | ) | (1,098,783 | ) | (255,918 | ) | ||||||||||||
|
|
|
|
|
|
|
|
|
|
|
|
|
|||||||||||
| (1,275,471 | ) | (464,030 | ) | 127,444 | 296,890 | (2,017,731 | ) | (2,717,894 | ) | |||||||||||||
|
|
|
|
|
|
|
|
|
|
|
|
|
|||||||||||
| (1,005,909 | ) | (779,486 | ) | 866,623 | (386,488 | ) | (1,073,714 | ) | (3,506,623 | ) | ||||||||||||
| 2,030,811 | 2,810,297 | 3,750,331 | 4,136,819 | 5,799,653 | 9,306,276 | |||||||||||||||||
|
|
|
|
|
|
|
|
|
|
|
|
|
|||||||||||
| $ | 1,024,902 | $ | 2,030,811 | $ | 4,616,954 | $ | 3,750,331 | $ | 4,725,939 | $ | 5,799,653 | |||||||||||
|
|
|
|
|
|
|
|
|
|
|
|
|
|||||||||||
43
Table of Contents
John Hancock Life Insurance Company (U.S.A.) Separate Account N
Statements of Operations and Changes in Contract Owners’ Equity
(continued)
| Sub-Account | ||||||||||||||||
| Investment Quality Bond Trust Series 0 | Investment Quality Bond Trust Series 1 | |||||||||||||||
| Year Ended Dec. 31/12 |
Year Ended Dec. 31/11 |
Year Ended Dec. 31/12 |
Year Ended Dec. 31/11 |
|||||||||||||
| Income: |
||||||||||||||||
| Dividend income distribution |
$ | 13,466 | $ | 21,248 | $ | 104,616 | $ | 256,333 | ||||||||
|
|
|
|
|
|
|
|
|
|||||||||
| Total Investment Income |
13,466 | 21,248 | 104,616 | 256,333 | ||||||||||||
| Expenses: |
||||||||||||||||
| Mortality and expense risk |
— | — | 28,447 | 32,372 | ||||||||||||
|
|
|
|
|
|
|
|
|
|||||||||
| Net investment income (loss) |
13,466 | 21,248 | 76,169 | 223,961 | ||||||||||||
|
|
|
|
|
|
|
|
|
|||||||||
| Realized gains (losses) on investments: |
||||||||||||||||
| Capital gain distributions |
— | — | — | — | ||||||||||||
| Net realized gains (losses) |
2,872 | 13,981 | 104,815 | 25,305 | ||||||||||||
|
|
|
|
|
|
|
|
|
|||||||||
| Realized gains (losses) |
2,872 | 13,981 | 104,815 | 25,305 | ||||||||||||
| Unrealized appreciation (depreciation) during the period |
25,790 | 9,968 | 192,060 | 182,248 | ||||||||||||
|
|
|
|
|
|
|
|
|
|||||||||
| Net increase (decrease) in assets from operations |
42,128 | 45,197 | 373,044 | 431,514 | ||||||||||||
|
|
|
|
|
|
|
|
|
|||||||||
| Changes from principal transactions: |
||||||||||||||||
| Transfer of net premiums |
38,611 | 42,427 | 155,720 | 249,548 | ||||||||||||
| Transfer on terminations |
(21,582 | ) | (220,501 | ) | (1,435,724 | ) | (729,366 | ) | ||||||||
| Transfer on policy loans |
(818 | ) | (5,717 | ) | 11,170 | 57,681 | ||||||||||
| Net interfund transfers |
78,015 | 4,259 | (1,109,654 | ) | 1,061,506 | |||||||||||
|
|
|
|
|
|
|
|
|
|||||||||
| Net increase (decrease) in assets from principal transactions |
94,226 | (179,532 | ) | (2,378,488 | ) | 639,369 | ||||||||||
|
|
|
|
|
|
|
|
|
|||||||||
| Total increase (decrease) in assets |
136,354 | (134,335 | ) | (2,005,444 | ) | 1,070,883 | ||||||||||
| Assets, beginning of period |
507,256 | 641,591 | 6,241,633 | 5,170,750 | ||||||||||||
|
|
|
|
|
|
|
|
|
|||||||||
| Assets, end of period |
$ | 643,610 | $ | 507,256 | $ | 4,236,189 | $ | 6,241,633 | ||||||||
|
|
|
|
|
|
|
|
|
|||||||||
| (g) | Fund available in prior year but no activity. |
| (p) | Terminated as an investment option and funds transferred to U.S. Equity Trust on April 30, 2012. |
See accompanying notes.
44
Table of Contents
| Sub-Account | ||||||||||||||||||||
| Large Cap Growth Trust | Large Cap Trust Series 0 | Large Cap Trust Series 1 | ||||||||||||||||||
| Year Ended Dec. 31/12 (g) |
Year Ended Dec. 31/12 (p) |
Year Ended Dec. 31/11 |
Year Ended Dec. 31/12 (p) |
Year Ended Dec. 31/11 |
||||||||||||||||
| $ | 68 | $ | 2,830 | $ | 6,609 | $ | 7,319 | $ | 27,114 | |||||||||||
|
|
|
|
|
|
|
|
|
|
|
|||||||||||
| 68 | 2,830 | 6,609 | 7,319 | 27,114 | ||||||||||||||||
| — | — | — | 2,580 | 9,866 | ||||||||||||||||
|
|
|
|
|
|
|
|
|
|
|
|||||||||||
| 68 | 2,830 | 6,609 | 4,739 | 17,248 | ||||||||||||||||
|
|
|
|
|
|
|
|
|
|
|
|||||||||||
| — | — | — | — | — | ||||||||||||||||
| (17 | ) | 81,845 | (353,610 | ) | 217,776 | (55,309 | ) | |||||||||||||
|
|
|
|
|
|
|
|
|
|
|
|||||||||||
| (17 | ) | 81,845 | (353,610 | ) | 217,776 | (55,309 | ) | |||||||||||||
| 3,907 | (19,598 | ) | (21,230 | ) | 11,164 | 11,216 | ||||||||||||||
|
|
|
|
|
|
|
|
|
|
|
|||||||||||
| 3,958 | 65,077 | (368,231 | ) | 233,679 | (26,845 | ) | ||||||||||||||
|
|
|
|
|
|
|
|
|
|
|
|||||||||||
| — | 4,346 | 412,227 | 10,627 | 82,738 | ||||||||||||||||
| (4,075 | ) | (5,532 | ) | (29,476 | ) | (47,342 | ) | (567,772 | ) | |||||||||||
| — | (324 | ) | (338 | ) | (158,280 | ) | 30,480 | |||||||||||||
| 309,542 | (513,708 | ) | 12,055 | (1,990,606 | ) | 297,434 | ||||||||||||||
|
|
|
|
|
|
|
|
|
|
|
|||||||||||
| 305,467 | (515,218 | ) | 394,468 | (2,185,601 | ) | (157,120 | ) | |||||||||||||
|
|
|
|
|
|
|
|
|
|
|
|||||||||||
| 309,425 | (450,141 | ) | 26,237 | (1,951,922 | ) | (183,965 | ) | |||||||||||||
| — | 450,141 | 423,904 | 1,951,922 | 2,135,887 | ||||||||||||||||
|
|
|
|
|
|
|
|
|
|
|
|||||||||||
| $ | 309,425 | — | $ | 450,141 | — | $ | 1,951,922 | |||||||||||||
|
|
|
|
|
|
|
|
|
|
|
|||||||||||
45
Table of Contents
John Hancock Life Insurance Company (U.S.A.) Separate Account N
Statements of Operations and Changes in Contract Owners’ Equity
(continued)
| Sub-Account | ||||||||||||
| Large Cap Value Trust Series 0 | Large Cap Value Trust Series 1 | |||||||||||
| Year Ended Dec. 31/11 (h) |
Year Ended Dec. 31/11 (h) |
|||||||||||
| Income: |
||||||||||||
| Dividend income distribution |
$ | 4,623 | $ | 5,769 | ||||||||
|
|
|
|
|
|||||||||
| Total Investment Income |
4,623 | 5,769 | ||||||||||
| Expenses: |
||||||||||||
| Mortality and expense risk |
— | 1,945 | ||||||||||
|
|
|
|
|
|||||||||
| Net investment income (loss) |
4,623 | 3,824 | ||||||||||
|
|
|
|
|
|||||||||
| Realized gains (losses) on investments: |
||||||||||||
| Capital gain distributions |
— | — | ||||||||||
| Net realized gains (losses) |
107,242 | 292,554 | ||||||||||
|
|
|
|
|
|||||||||
| Realized gains (losses) |
107,242 | 292,554 | ||||||||||
| Unrealized appreciation (depreciation) during the period |
(42,934 | ) | (214,956 | ) | ||||||||
|
|
|
|
|
|||||||||
| Net increase (decrease) in assets from operations |
68,931 | 81,422 | ||||||||||
| Changes from principal transactions: |
||||||||||||
|
|
|
|
|
|||||||||
| Transfer of net premiums |
47,024 | 15,331 | ||||||||||
| Transfer on terminations |
(16,801 | ) | (51,308 | ) | ||||||||
| Transfer on policy loans |
(337 | ) | 934 | |||||||||
| Net interfund transfers |
(965,009 | ) | (1,151,218 | ) | ||||||||
|
|
|
|
|
|||||||||
| Net increase (decrease) in assets from principal transactions |
(935,123 | ) | (1,186,261 | ) | ||||||||
|
|
|
|
|
|||||||||
| Total increase (decrease) in assets |
(866,192 | ) | (1,104,839 | ) | ||||||||
| Assets, beginning of period |
866,192 | 1,104,839 | ||||||||||
|
|
|
|
|
|||||||||
| Assets, end of period |
— | — | ||||||||||
|
|
|
|
|
|||||||||
| (h) | Terminated as an investment option and funds transferred to Equity-Income Trust on May 2, 2011. |
See accompanying notes.
46
Table of Contents
| Sub-Account | ||||||||||||||||||||||
| Lifestyle Aggressive Trust Series 0 | Lifestyle Aggressive Trust Series 1 | Lifestyle Balanced Trust Series 0 | ||||||||||||||||||||
| Year Ended Dec. 31/12 |
Year Ended Dec. 31/11 |
Year Ended Dec. 31/12 |
Year Ended Dec. 31/11 |
Year Ended Dec. 31/12 |
Year Ended Dec. 31/11 |
|||||||||||||||||
| $ | 81,493 | $ | 142,100 | $ | 29,646 | $ | 81,896 | $ | 385,384 | $ | 618,841 | |||||||||||
|
|
|
|
|
|
|
|
|
|
|
|
|
|||||||||||
| 81,493 | 142,100 | 29,646 | 81,896 | 385,384 | 618,841 | |||||||||||||||||
| — | — | 10,122 | 28,224 | — | — | |||||||||||||||||
|
|
|
|
|
|
|
|
|
|
|
|
|
|||||||||||
| 81,493 | 142,100 | 19,524 | 53,672 | 385,384 | 618,841 | |||||||||||||||||
|
|
|
|
|
|
|
|
|
|
|
|
|
|||||||||||
| — | — | — | — | — | — | |||||||||||||||||
| 485,194 | 425,844 | 123,547 | 557,640 | 547,421 | 482,358 | |||||||||||||||||
|
|
|
|
|
|
|
|
|
|
|
|
|
|||||||||||
| 485,194 | 425,844 | 123,547 | 557,640 | 547,421 | 482,358 | |||||||||||||||||
| 335,175 | (1,084,072 | ) | 169,130 | (958,076 | ) | 841,932 | (1,059,344 | ) | ||||||||||||||
|
|
|
|
|
|
|
|
|
|
|
|
|
|||||||||||
| 901,862 | (516,128 | ) | 312,201 | (346,764 | ) | 1,774,737 | 41,855 | |||||||||||||||
|
|
|
|
|
|
|
|
|
|
|
|
|
|||||||||||
| 1,153,332 | 1,076,748 | 75,957 | 362,816 | 3,119,273 | 4,718,186 | |||||||||||||||||
| (334,924 | ) | (464,998 | ) | (102,510 | ) | (164,707 | ) | (1,290,743 | ) | (901,158 | ) | |||||||||||
| (661,359 | ) | 110,675 | (33,133 | ) | — | (1,668,554 | ) | 23,609 | ||||||||||||||
| (2,639,915 | ) | 285,717 | (2,418,117 | ) | (103,314 | ) | (2,797,778 | ) | 2,691,918 | |||||||||||||
|
|
|
|
|
|
|
|
|
|
|
|
|
|||||||||||
| (2,482,866 | ) | 1,008,142 | (2,477,803 | ) | 94,795 | (2,637,802 | ) | 6,532,555 | ||||||||||||||
|
|
|
|
|
|
|
|
|
|
|
|
|
|||||||||||
| (1,581,004 | ) | 492,014 | (2,165,602 | ) | (251,969 | ) | (863,065 | ) | 6,574,410 | |||||||||||||
| 7,377,597 | 6,885,583 | 4,344,785 | 4,596,754 | 17,964,747 | 11,390,337 | |||||||||||||||||
|
|
|
|
|
|
|
|
|
|
|
|
|
|||||||||||
| $ | 5,796,593 | $ | 7,377,597 | $ | 2,179,183 | $ | 4,344,785 | $ | 17,101,682 | $ | 17,964,747 | |||||||||||
|
|
|
|
|
|
|
|
|
|
|
|
|
|||||||||||
47
Table of Contents
John Hancock Life Insurance Company (U.S.A.) Separate Account N
Statements of Operations and Changes in Contract Owners’ Equity
(continued)
| Sub-Account | ||||||||||||||||
| Lifestyle Balanced Trust Series 1 | Lifestyle Conservative Trust Series 0 | |||||||||||||||
| Year Ended Dec. 31/12 |
Year Ended Dec. 31/11 |
Year Ended Dec. 31/12 |
Year Ended Dec. 31/11 |
|||||||||||||
| Income: |
||||||||||||||||
| Dividend income distribution |
$ | 192,503 | $ | 440,155 | $ | 223,297 | $ | 206,775 | ||||||||
|
|
|
|
|
|
|
|
|
|||||||||
| Total Investment Income |
192,503 | 440,155 | 223,297 | 206,775 | ||||||||||||
| Expenses: |
||||||||||||||||
| Mortality and expense risk |
46,330 | 70,825 | — | — | ||||||||||||
|
|
|
|
|
|
|
|
|
|||||||||
| Net investment income (loss) |
146,173 | 369,330 | 223,297 | 206,775 | ||||||||||||
|
|
|
|
|
|
|
|
|
|||||||||
| Realized gains (losses) on investments: |
||||||||||||||||
| Capital gain distributions |
— | — | 144,250 | — | ||||||||||||
| Net realized gains (losses) |
388,837 | 566,173 | 71,780 | 75,131 | ||||||||||||
|
|
|
|
|
|
|
|
|
|||||||||
| Realized gains (losses) |
388,837 | 566,173 | 216,030 | 75,131 | ||||||||||||
| Unrealized appreciation (depreciation) during the period |
462,475 | (960,209 | ) | 57,431 | (121,182 | ) | ||||||||||
|
|
|
|
|
|
|
|
|
|||||||||
| Net increase (decrease) in assets from operations |
997,485 | (24,706 | ) | 496,758 | 160,724 | |||||||||||
|
|
|
|
|
|
|
|
|
|||||||||
| Changes from principal transactions: |
||||||||||||||||
| Transfer of net premiums |
293,280 | 1,657,591 | 1,220,876 | 1,195,149 | ||||||||||||
| Transfer on terminations |
(1,504,614 | ) | (748,736 | ) | (324,620 | ) | (261,178 | ) | ||||||||
| Transfer on policy loans |
(20,752 | ) | (12,598 | ) | (185,513 | ) | 38,914 | |||||||||
| Net interfund transfers |
(3,997,297 | ) | 334,995 | 1,606,196 | 592,287 | |||||||||||
|
|
|
|
|
|
|
|
|
|||||||||
| Net increase (decrease) in assets from principal transactions |
(5,229,383 | ) | 1,231,252 | 2,316,939 | 1,565,172 | |||||||||||
|
|
|
|
|
|
|
|
|
|||||||||
| Total increase (decrease) in assets |
(4,231,898 | ) | 1,206,546 | 2,813,697 | 1,725,896 | |||||||||||
| Assets, beginning of period |
12,908,333 | 11,701,787 | 4,994,046 | 3,268,150 | ||||||||||||
|
|
|
|
|
|
|
|
|
|||||||||
| Assets, end of period |
$ | 8,676,435 | $ | 12,908,333 | $ | 7,807,743 | $ | 4,994,046 | ||||||||
|
|
|
|
|
|
|
|
|
|||||||||
See accompanying notes.
48
Table of Contents
| Sub-Account | ||||||||||||||||||||||
| Lifestyle Conservative Trust Series 1 | Lifestyle Growth Trust Series 0 | Lifestyle Growth Trust Series 1 | ||||||||||||||||||||
| Year Ended Dec. 31/12 |
Year Ended Dec. 31/11 |
Year Ended Dec. 31/12 |
Year Ended Dec. 31/11 |
Year Ended Dec. 31/12 |
Year Ended Dec. 31/11 |
|||||||||||||||||
| $ | 182,230 | $ | 131,641 | $ | 379,723 | $ | 549,279 | $ | 87,821 | $ | 248,018 | |||||||||||
|
|
|
|
|
|
|
|
|
|
|
|
|
|||||||||||
| 182,230 | 131,641 | 379,723 | 549,279 | 87,821 | 248,018 | |||||||||||||||||
| 23,264 | 13,820 | — | — | 26,673 | 46,623 | |||||||||||||||||
|
|
|
|
|
|
|
|
|
|
|
|
|
|||||||||||
| 158,966 | 117,821 | 379,723 | 549,279 | 61,148 | 201,395 | |||||||||||||||||
|
|
|
|
|
|
|
|
|
|
|
|
|
|||||||||||
| 149,630 | — | — | — | — | — | |||||||||||||||||
| 13,793 | 187,704 | 954,641 | 477,219 | 554,579 | 403,541 | |||||||||||||||||
|
|
|
|
|
|
|
|
|
|
|
|
|
|||||||||||
| 163,423 | 187,704 | 954,641 | 477,219 | 554,579 | 403,541 | |||||||||||||||||
| 33,773 | (209,508 | ) | 1,102,143 | (1,458,157 | ) | 120,557 | (752,758 | ) | ||||||||||||||
|
|
|
|
|
|
|
|
|
|
|
|
|
|||||||||||
| 356,162 | 96,017 | 2,436,507 | (431,659 | ) | 736,284 | (147,822 | ) | |||||||||||||||
|
|
|
|
|
|
|
|
|
|
|
|
|
|||||||||||
| 225,792 | 220,262 | 3,845,491 | 3,737,859 | 185,448 | 368,334 | |||||||||||||||||
| (317,582 | ) | (269,431 | ) | (1,342,031 | ) | (1,209,132 | ) | (610,878 | ) | (629,181 | ) | |||||||||||
| 474 | 554 | (1,021,067 | ) | 129,991 | (60,104 | ) | (26,766 | ) | ||||||||||||||
| 3,009,259 | 793,679 | (2,499,198 | ) | 2,510,778 | (4,141,005 | ) | 798,112 | |||||||||||||||
|
|
|
|
|
|
|
|
|
|
|
|
|
|||||||||||
| 2,917,943 | 745,064 | (1,016,805 | ) | 5,169,496 | (4,626,539 | ) | 510,499 | |||||||||||||||
|
|
|
|
|
|
|
|
|
|
|
|
|
|||||||||||
| 3,274,105 | 841,081 | 1,419,702 | 4,737,837 | (3,890,255 | ) | 362,677 | ||||||||||||||||
| 3,191,375 | 2,350,294 | 19,198,025 | 14,460,188 | 8,774,074 | 8,411,397 | |||||||||||||||||
|
|
|
|
|
|
|
|
|
|
|
|
|
|||||||||||
| $ | 6,465,480 | $ | 3,191,375 | $ | 20,617,727 | $ | 19,198,025 | $ | 4,883,819 | $ | 8,774,074 | |||||||||||
|
|
|
|
|
|
|
|
|
|
|
|
|
|||||||||||
49
Table of Contents
John Hancock Life Insurance Company (U.S.A.) Separate Account N
Statements of Operations and Changes in Contract Owners’ Equity
(continued)
| Sub-Account | ||||||||||||||||
| Lifestyle Moderate Trust Series 0 | Lifestyle Moderate Trust Series 1 | |||||||||||||||
| Year Ended Dec. 31/12 |
Year Ended Dec. 31/11 |
Year Ended Dec. 31/12 |
Year Ended Dec. 31/11 |
|||||||||||||
| Income: |
||||||||||||||||
| Dividend income distribution |
$ | 218,659 | $ | 246,494 | $ | 56,039 | $ | 95,647 | ||||||||
|
|
|
|
|
|
|
|
|
|||||||||
| Total Investment Income |
218,659 | 246,494 | 56,039 | 95,647 | ||||||||||||
| Expenses: |
||||||||||||||||
| Mortality and expense risk |
— | — | 11,833 | 16,953 | ||||||||||||
|
|
|
|
|
|
|
|
|
|||||||||
| Net investment income (loss) |
218,659 | 246,494 | 44,206 | 78,694 | ||||||||||||
|
|
|
|
|
|
|
|
|
|||||||||
| Realized gains (losses) on investments: |
||||||||||||||||
| Capital gain distributions |
— | — | — | — | ||||||||||||
| Net realized gains (losses) |
289,447 | 133,053 | 6,932 | 184,058 | ||||||||||||
|
|
|
|
|
|
|
|
|
|||||||||
| Realized gains (losses) |
289,447 | 133,053 | 6,932 | 184,058 | ||||||||||||
| Unrealized appreciation (depreciation) during the period |
231,427 | (258,512 | ) | 167,084 | (217,280 | ) | ||||||||||
|
|
|
|
|
|
|
|
|
|||||||||
| Net increase (decrease) in assets from operations |
739,533 | 121,035 | 218,222 | 45,472 | ||||||||||||
|
|
|
|
|
|
|
|
|
|||||||||
| Changes from principal transactions: |
||||||||||||||||
| Transfer of net premiums |
1,662,291 | 2,039,285 | 52,162 | 536,431 | ||||||||||||
| Transfer on terminations |
(344,817 | ) | (391,709 | ) | (315,856 | ) | (1,306,985 | ) | ||||||||
| Transfer on policy loans |
(4,220 | ) | 17,636 | 709 | (2,565 | ) | ||||||||||
| Net interfund transfers |
(4,288 | ) | 274,027 | (293,207 | ) | 376,261 | ||||||||||
|
|
|
|
|
|
|
|
|
|||||||||
| Net increase (decrease) in assets from principal transactions |
1,308,966 | 1,939,239 | (556,192 | ) | (396,858 | ) | ||||||||||
|
|
|
|
|
|
|
|
|
|||||||||
| Total increase (decrease) in assets |
2,048,499 | 2,060,274 | (337,970 | ) | (351,386 | ) | ||||||||||
| Assets, beginning of period |
6,680,056 | 4,619,782 | 2,616,349 | 2,967,735 | ||||||||||||
|
|
|
|
|
|
|
|
|
|||||||||
| Assets, end of period |
$ | 8,728,555 | $ | 6,680,056 | $ | 2,278,379 | $ | 2,616,349 | ||||||||
|
|
|
|
|
|
|
|
|
|||||||||
See accompanying notes.
50
Table of Contents
| Sub-Account | ||||||||||||||||||||||
| Mid Cap Index Trust Series 0 | Mid Cap Index Trust Series 1 | Mid Cap Stock Trust Series 0 | ||||||||||||||||||||
| Year Ended Dec. 31/12 |
Year Ended Dec. 31/11 |
Year Ended Dec. 31/12 |
Year Ended Dec. 31/11 |
Year Ended Dec. 31/12 |
Year Ended Dec. 31/11 |
|||||||||||||||||
| $ | 97,462 | $ | 38,121 | $ | 80,941 | $ | 66,886 | — | — | |||||||||||||
|
|
|
|
|
|
|
|
|
|
|
|
|
|||||||||||
| 97,462 | 38,121 | 80,941 | 66,886 | — | — | |||||||||||||||||
| — | — | 28,173 | 44,755 | — | — | |||||||||||||||||
|
|
|
|
|
|
|
|
|
|
|
|
|
|||||||||||
| 97,462 | 38,121 | 52,768 | 22,131 | — | — | |||||||||||||||||
|
|
|
|
|
|
|
|
|
|
|
|
|
|||||||||||
| 616,979 | 128,464 | 552,441 | 316,342 | — | — | |||||||||||||||||
| 188,894 | 558,949 | 1,086,871 | 696,448 | 841,475 | 475,526 | |||||||||||||||||
|
|
|
|
|
|
|
|
|
|
|
|
|
|||||||||||
| 805,873 | 687,413 | 1,639,312 | 1,012,790 | 841,475 | 475,526 | |||||||||||||||||
| 69,046 | (831,773 | ) | (316,692 | ) | (1,471,784 | ) | 257,748 | (1,029,297 | ) | |||||||||||||
|
|
|
|
|
|
|
|
|
|
|
|
|
|||||||||||
| 972,381 | (106,239 | ) | 1,375,388 | (436,863 | ) | 1,099,223 | (553,771 | ) | ||||||||||||||
|
|
|
|
|
|
|
|
|
|
|
|
|
|||||||||||
| 1,124,175 | 1,282,852 | 121,055 | 157,780 | 529,734 | 161,448 | |||||||||||||||||
| (410,281 | ) | (322,340 | ) | (739,450 | ) | (473,974 | ) | (186,857 | ) | (224,629 | ) | |||||||||||
| (404,107 | ) | 66,969 | 13 | (290 | ) | (16,217 | ) | (50,072 | ) | |||||||||||||
| 491,053 | 357,149 | (4,425,568 | ) | (2,458,703 | ) | (307,057 | ) | 1,132,169 | ||||||||||||||
|
|
|
|
|
|
|
|
|
|
|
|
|
|||||||||||
| 800,840 | 1,384,630 | (5,043,950 | ) | (2,775,187 | ) | 19,603 | 1,018,916 | |||||||||||||||
|
|
|
|
|
|
|
|
|
|
|
|
|
|||||||||||
| 1,773,221 | 1,278,391 | (3,668,562 | ) | (3,212,050 | ) | 1,118,826 | 465,145 | |||||||||||||||
| 5,050,757 | 3,772,366 | 8,990,208 | 12,202,258 | 4,908,055 | 4,442,910 | |||||||||||||||||
|
|
|
|
|
|
|
|
|
|
|
|
|
|||||||||||
| $ | 6,823,978 | $ | 5,050,757 | $ | 5,321,646 | $ | 8,990,208 | $ | 6,026,881 | $ | 4,908,055 | |||||||||||
|
|
|
|
|
|
|
|
|
|
|
|
|
|||||||||||
51
Table of Contents
John Hancock Life Insurance Company (U.S.A.) Separate Account N
Statements of Operations and Changes in Contract Owners’ Equity
(continued)
| Sub-Account | ||||||||||||||||
| Mid Cap Stock Trust Series 1 | Mid Value Trust Series 0 | |||||||||||||||
| Year Ended Dec. 31/12 |
Year Ended Dec. 31/11 |
Year Ended Dec. 31/12 |
Year Ended Dec. 31/11 |
|||||||||||||
| Income: |
||||||||||||||||
| Dividend income distribution |
— | — | $ | 67,209 | $ | 53,288 | ||||||||||
|
|
|
|
|
|
|
|
|
|||||||||
| Total Investment Income |
— | — | 67,209 | 53,288 | ||||||||||||
| Expenses: |
||||||||||||||||
| Mortality and expense risk |
14,703 | 22,276 | — | — | ||||||||||||
|
|
|
|
|
|
|
|
|
|||||||||
| Net investment income (loss) |
(14,703 | ) | (22,276 | ) | 67,209 | 53,288 | ||||||||||
|
|
|
|
|
|
|
|
|
|||||||||
| Realized gains (losses) on investments: |
||||||||||||||||
| Capital gain distributions |
— | — | 569,783 | — | ||||||||||||
| Net realized gains (losses) |
532,777 | 762,390 | 626,692 | 643,404 | ||||||||||||
|
|
|
|
|
|
|
|
|
|||||||||
| Realized gains (losses) |
532,777 | 762,390 | 1,196,475 | 643,404 | ||||||||||||
| Unrealized appreciation (depreciation) during the period |
296,451 | (1,133,978 | ) | (8,322 | ) | (1,107,644 | ) | |||||||||
|
|
|
|
|
|
|
|
|
|||||||||
| Net increase (decrease) in assets from operations |
814,525 | (393,864 | ) | 1,255,362 | (410,952 | ) | ||||||||||
|
|
|
|
|
|
|
|
|
|||||||||
| Changes from principal transactions: |
||||||||||||||||
| Transfer of net premiums |
27,359 | 107,199 | 116,440 | 501,312 | ||||||||||||
| Transfer on terminations |
(1,414,981 | ) | (1,378,649 | ) | (154,300 | ) | (199,360 | ) | ||||||||
| Transfer on policy loans |
(81 | ) | (393 | ) | (7,723 | ) | (1,847 | ) | ||||||||
| Net interfund transfers |
(1,363,601 | ) | (131,291 | ) | 106,704 | (87,112 | ) | |||||||||
|
|
|
|
|
|
|
|
|
|||||||||
| Net increase (decrease) in assets from principal transactions |
(2,751,304 | ) | (1,403,134 | ) | 61,121 | 212,993 | ||||||||||
|
|
|
|
|
|
|
|
|
|||||||||
| Total increase (decrease) in assets |
(1,936,779 | ) | (1,796,998 | ) | 1,316,483 | (197,959 | ) | |||||||||
| Assets, beginning of period |
4,451,505 | 6,248,503 | 6,074,396 | 6,272,355 | ||||||||||||
|
|
|
|
|
|
|
|
|
|||||||||
| Assets, end of period |
$ | 2,514,726 | $ | 4,451,505 | $ | 7,390,879 | $ | 6,074,396 | ||||||||
|
|
|
|
|
|
|
|
|
|||||||||
See accompanying notes.
52
Table of Contents
| Sub-Account | ||||||||||||||||||||||
| Mid Value Trust Series 1 | Money Market Trust B Series 0 | Money Market Trust Series 1 | ||||||||||||||||||||
| Year Ended Dec. 31/12 |
Year Ended Dec. 31/11 |
Year Ended Dec. 31/12 |
Year Ended Dec. 31/11 |
Year Ended Dec. 31/12 |
Year Ended Dec. 31/11 |
|||||||||||||||||
| $ | 31,335 | $ | 30,591 | $ | 20,248 | — | — | — | ||||||||||||||
|
|
|
|
|
|
|
|
|
|
|
|
|
|||||||||||
| 31,335 | 30,591 | 20,248 | — | — | — | |||||||||||||||||
| 15,123 | 17,860 | — | — | 277,716 | 105,261 | |||||||||||||||||
|
|
|
|
|
|
|
|
|
|
|
|
|
|||||||||||
| 16,212 | 12,731 | 20,248 | — | (277,716 | ) | (105,261 | ) | |||||||||||||||
|
|
|
|
|
|
|
|
|
|
|
|
|
|||||||||||
| 286,004 | — | 3,511 | 34,393 | 6,492 | 18,732 | |||||||||||||||||
| 284,642 | 587,344 | — | — | — | — | |||||||||||||||||
|
|
|
|
|
|
|
|
|
|
|
|
|
|||||||||||
| 570,646 | 587,344 | 3,511 | 34,393 | 6,492 | 18,732 | |||||||||||||||||
| 95,952 | (788,213 | ) | — | — | — | — | ||||||||||||||||
|
|
|
|
|
|
|
|
|
|
|
|
|
|||||||||||
| 682,810 | (188,138 | ) | 23,759 | 34,393 | (271,224 | ) | (86,529 | ) | ||||||||||||||
|
|
|
|
|
|
|
|
|
|
|
|
|
|||||||||||
| 97,448 | 154,595 | 37,335,546 | 28,096,396 | 2,571,938 | 1,872,597 | |||||||||||||||||
| (387,826 | ) | (1,233,562 | ) | (13,682,629 | ) | (4,094,644 | ) | (7,462,416 | ) | (2,612,820 | ) | |||||||||||
| 4,086 | 3,151 | (1,858,913 | ) | (37,229 | ) | 14,326 | (10,740 | ) | ||||||||||||||
| (466,445 | ) | 35,312 | (13,019,020 | ) | (11,173,707 | ) | 59,917,269 | 6,930,639 | ||||||||||||||
|
|
|
|
|
|
|
|
|
|
|
|
|
|||||||||||
| (752,737 | ) | (1,040,504 | ) | 8,774,984 | 12,790,816 | 55,041,117 | 6,179,676 | |||||||||||||||
|
|
|
|
|
|
|
|
|
|
|
|
|
|||||||||||
| (69,927 | ) | (1,228,642 | ) | 8,798,743 | 12,825,209 | 54,769,893 | 6,093,147 | |||||||||||||||
| 3,937,343 | 5,165,985 | 50,355,097 | 37,529,888 | 27,374,747 | 21,281,600 | |||||||||||||||||
|
|
|
|
|
|
|
|
|
|
|
|
|
|||||||||||
| $ | 3,867,416 | $ | 3,937,343 | $ | 59,153,840 | $ | 50,355,097 | $ | 82,144,640 | $ | 27,374,747 | |||||||||||
|
|
|
|
|
|
|
|
|
|
|
|
|
|||||||||||
53
Table of Contents
John Hancock Life Insurance Company (U.S.A.) Separate Account N
Statements of Operations and Changes in Contract Owners’ Equity
(continued)
| Sub-Account | ||||||||||||||||
| Natural Resources Trust Series 0 | Natural Resources Trust Series 1 | |||||||||||||||
| Year Ended Dec. 31/12 |
Year Ended Dec. 31/11 |
Year Ended Dec. 31/12 |
Year Ended Dec. 31/11 |
|||||||||||||
| Income: |
||||||||||||||||
| Dividend income distribution |
$ | 20,130 | $ | 14,088 | $ | 31,690 | $ | 27,842 | ||||||||
|
|
|
|
|
|
|
|
|
|||||||||
| Total Investment Income |
20,130 | 14,088 | 31,690 | 27,842 | ||||||||||||
| Expenses: |
||||||||||||||||
| Mortality and expense risk |
— | — | 20,624 | 30,373 | ||||||||||||
|
|
|
|
|
|
|
|
|
|||||||||
| Net investment income (loss) |
20,130 | 14,088 | 11,066 | (2,531 | ) | |||||||||||
|
|
|
|
|
|
|
|
|
|||||||||
| Realized gains (losses) on investments: |
||||||||||||||||
| Capital gain distributions |
— | — | — | — | ||||||||||||
| Net realized gains (losses) |
(71,051 | ) | 40,534 | (418,842 | ) | 727,379 | ||||||||||
|
|
|
|
|
|
|
|
|
|||||||||
| Realized gains (losses) |
(71,051 | ) | 40,534 | (418,842 | ) | 727,379 | ||||||||||
| Unrealized appreciation (depreciation) during the period |
70,977 | (627,816 | ) | 409,621 | (2,054,299 | ) | ||||||||||
|
|
|
|
|
|
|
|
|
|||||||||
| Net increase (decrease) in assets from operations |
20,056 | (573,194 | ) | 1,845 | (1,329,451 | ) | ||||||||||
|
|
|
|
|
|
|
|
|
|||||||||
| Changes from principal transactions: |
||||||||||||||||
| Transfer of net premiums |
241,279 | 170,618 | 111,810 | 346,607 | ||||||||||||
| Transfer on terminations |
(223,332 | ) | (119,606 | ) | (1,103,571 | ) | (389,007 | ) | ||||||||
| Transfer on policy loans |
(32,638 | ) | (27,288 | ) | 7,743 | 14 | ||||||||||
| Net interfund transfers |
346,474 | 951,981 | (607,734 | ) | (13,276 | ) | ||||||||||
|
|
|
|
|
|
|
|
|
|||||||||
| Net increase (decrease) in assets from principal transactions |
331,783 | 975,705 | (1,591,752 | ) | (55,662 | ) | ||||||||||
|
|
|
|
|
|
|
|
|
|||||||||
| Total increase (decrease) in assets |
351,839 | 402,511 | (1,589,907 | ) | (1,385,113 | ) | ||||||||||
| Assets, beginning of period |
2,194,024 | 1,791,513 | 4,794,393 | 6,179,506 | ||||||||||||
|
|
|
|
|
|
|
|
|
|||||||||
| Assets, end of period |
$ | 2,545,863 | $ | 2,194,024 | $ | 3,204,486 | $ | 4,794,393 | ||||||||
|
|
|
|
|
|
|
|
|
|||||||||
See accompanying notes.
54
Table of Contents
| Sub-Account | ||||||||||||||||||||||
| Real Estate Securities Trust Series 0 | Real Estate Securities Trust Series 1 | Real Return Bond Trust Series 0 | ||||||||||||||||||||
| Year Ended Dec. 31/12 |
Year Ended Dec. 31/11 |
Year Ended Dec. 31/12 |
Year Ended Dec. 31/11 |
Year Ended Dec. 31/12 |
Year Ended Dec. 31/11 |
|||||||||||||||||
| $ | 170,323 | $ | 123,217 | $ | 198,592 | $ | 185,922 | $ | 182,576 | $ | 333,880 | |||||||||||
|
|
|
|
|
|
|
|
|
|
|
|
|
|||||||||||
| 170,323 | 123,217 | 198,592 | 185,922 | 182,576 | 333,880 | |||||||||||||||||
| — | — | 69,450 | 77,462 | — | — | |||||||||||||||||
|
|
|
|
|
|
|
|
|
|
|
|
|
|||||||||||
| 170,323 | 123,217 | 129,142 | 108,460 | 182,576 | 333,880 | |||||||||||||||||
|
|
|
|
|
|
|
|
|
|
|
|
|
|||||||||||
| — | — | — | — | — | — | |||||||||||||||||
| 1,765,820 | 1,218,060 | (36,855 | ) | (581,355 | ) | 613,975 | 148,213 | |||||||||||||||
|
|
|
|
|
|
|
|
|
|
|
|
|
|||||||||||
| 1,765,820 | 1,218,060 | (36,855 | ) | (581,355 | ) | 613,975 | 148,213 | |||||||||||||||
| (531,311 | ) | (641,294 | ) | 1,760,908 | 1,651,615 | (1,251 | ) | 402,264 | ||||||||||||||
|
|
|
|
|
|
|
|
|
|
|
|
|
|||||||||||
| 1,404,832 | 699,983 | 1,853,195 | 1,178,720 | 795,300 | 884,357 | |||||||||||||||||
|
|
|
|
|
|
|
|
|
|
|
|
|
|||||||||||
| 328,829 | 608,545 | 315,144 | 426,410 | 1,233,306 | 1,163,340 | |||||||||||||||||
| (255,792 | ) | (246,463 | ) | (2,597,112 | ) | (2,329,533 | ) | (193,308 | ) | (428,981 | ) | |||||||||||
| (21,039 | ) | 942 | 14,186 | 240,978 | 33,062 | 5,830 | ||||||||||||||||
| 561,937 | (826,882 | ) | (678,835 | ) | (1,083,193 | ) | 600,477 | 310,745 | ||||||||||||||
|
|
|
|
|
|
|
|
|
|
|
|
|
|||||||||||
| 613,935 | (463,858 | ) | (2,946,617 | ) | (2,745,338 | ) | 1,673,537 | 1,050,934 | ||||||||||||||
|
|
|
|
|
|
|
|
|
|
|
|
|
|||||||||||
| 2,018,767 | 236,125 | (1,093,422 | ) | (1,566,618 | ) | 2,468,837 | 1,935,291 | |||||||||||||||
| 7,764,963 | 7,528,838 | 12,390,923 | 13,957,541 | 8,946,266 | 7,010,975 | |||||||||||||||||
|
|
|
|
|
|
|
|
|
|
|
|
|
|||||||||||
| $ | 9,783,730 | $ | 7,764,963 | $ | 11,297,501 | $ | 12,390,923 | $ | 11,415,103 | $ | 8,946,266 | |||||||||||
|
|
|
|
|
|
|
|
|
|
|
|
|
|||||||||||
55
Table of Contents
John Hancock Life Insurance Company (U.S.A.) Separate Account N
Statements of Operations and Changes in Contract Owners’ Equity
(continued)
| Sub-Account | ||||||||||||||||
| Real Return Bond Trust Series 1 | Science & Technology Trust Series 0 | |||||||||||||||
| Year Ended Dec. 31/12 |
Year Ended Dec. 31/11 |
Year Ended Dec. 31/12 |
Year Ended Dec. 31/11 |
|||||||||||||
| Income: |
||||||||||||||||
| Dividend income distribution |
$ | 85,952 | $ | 194,602 | — | — | ||||||||||
|
|
|
|
|
|
|
|
|
|||||||||
| Total Investment Income |
85,952 | 194,602 | — | — | ||||||||||||
| Expenses: |
||||||||||||||||
| Mortality and expense risk |
23,900 | 20,664 | — | — | ||||||||||||
|
|
|
|
|
|
|
|
|
|||||||||
| Net investment income (loss) |
62,052 | 173,938 | — | — | ||||||||||||
|
|
|
|
|
|
|
|
|
|||||||||
| Realized gains (losses) on investments: |
||||||||||||||||
| Capital gain distributions |
— | — | — | — | ||||||||||||
| Net realized gains (losses) |
93,150 | (55,102 | ) | 54,682 | 68,481 | |||||||||||
|
|
|
|
|
|
|
|
|
|||||||||
| Realized gains (losses) |
93,150 | (55,102 | ) | 54,682 | 68,481 | |||||||||||
| Unrealized appreciation (depreciation) during the period |
236,531 | 324,423 | 56,674 | (144,368 | ) | |||||||||||
|
|
|
|
|
|
|
|
|
|||||||||
| Net increase (decrease) in assets from operations |
391,733 | 443,259 | 111,356 | (75,887 | ) | |||||||||||
|
|
|
|
|
|
|
|
|
|||||||||
| Changes from principal transactions: |
||||||||||||||||
| Transfer of net premiums |
56,462 | 69,243 | 201,855 | 254,638 | ||||||||||||
| Transfer on terminations |
(559,225 | ) | (252,820 | ) | (58,790 | ) | (55,357 | ) | ||||||||
| Transfer on policy loans |
1,270 | 417 | (8,966 | ) | (39,989 | ) | ||||||||||
| Net interfund transfers |
(168,182 | ) | 218,812 | (31,965 | ) | 54,555 | ||||||||||
|
|
|
|
|
|
|
|
|
|||||||||
| Net increase (decrease) in assets from principal transactions |
(669,675 | ) | 35,652 | 102,134 | 213,847 | |||||||||||
|
|
|
|
|
|
|
|
|
|||||||||
| Total increase (decrease) in assets |
(277,942 | ) | 478,911 | 213,490 | 137,960 | |||||||||||
| Assets, beginning of period |
5,369,192 | 4,890,281 | 1,088,755 | 950,795 | ||||||||||||
|
|
|
|
|
|
|
|
|
|||||||||
| Assets, end of period |
$ | 5,091,250 | $ | 5,369,192 | $ | 1,302,245 | $ | 1,088,755 | ||||||||
|
|
|
|
|
|
|
|
|
|||||||||
See accompanying notes.
56
Table of Contents
| Sub-Account | ||||||||||||||||||||||
| Science & Technology Trust Series 1 | Short Term Government Income Trust Series 0 | Short Term Government Income Trust Series 1 | ||||||||||||||||||||
| Year Ended Dec. 31/12 |
Year Ended Dec. 31/11 |
Year Ended Dec. 31/12 |
Year Ended Dec. 31/11 |
Year Ended Dec. 31/12 |
Year Ended Dec. 31/11 |
|||||||||||||||||
| — | — | $ | 37,207 | $ | 22,261 | $ | 35,143 | $ | 61,097 | |||||||||||||
|
|
|
|
|
|
|
|
|
|
|
|
|
|||||||||||
| — | — | 37,207 | 22,261 | 35,143 | 61,097 | |||||||||||||||||
| 28,246 | 33,898 | — | — | 11,868 | 12,812 | |||||||||||||||||
|
|
|
|
|
|
|
|
|
|
|
|
|
|||||||||||
| (28,246 | ) | (33,898 | ) | 37,207 | 22,261 | 23,275 | 48,285 | |||||||||||||||
|
|
|
|
|
|
|
|
|
|
|
|
|
|||||||||||
| — | — | — | 4,474 | — | 6,830 | |||||||||||||||||
| 448,187 | 1,298,477 | 12,295 | (11,473 | ) | (14,978 | ) | 11,428 | |||||||||||||||
|
|
|
|
|
|
|
|
|
|
|
|
|
|||||||||||
| 448,187 | 1,298,477 | 12,295 | (6,999 | ) | (14,978 | ) | 18,258 | |||||||||||||||
| 195,111 | (1,894,038 | ) | (27,054 | ) | 36,046 | 6,972 | (8,921 | ) | ||||||||||||||
|
|
|
|
|
|
|
|
|
|
|
|
|
|||||||||||
| 615,052 | (629,459 | ) | 22,448 | 51,308 | 15,269 | 57,622 | ||||||||||||||||
|
|
|
|
|
|
|
|
|
|
|
|
|
|||||||||||
| 143,835 | 293,967 | 24,966 | 181,292 | 35,280 | 87,435 | |||||||||||||||||
| (1,181,546 | ) | (994,761 | ) | (80,333 | ) | (202,982 | ) | (866,244 | ) | (750,313 | ) | |||||||||||
| (207,984 | ) | 4,417 | (7,506 | ) | (2,380 | ) | 294 | 746 | ||||||||||||||
| (265,332 | ) | 814,076 | 1,701,578 | (1,642,434 | ) | 457,872 | (845,472 | ) | ||||||||||||||
|
|
|
|
|
|
|
|
|
|
|
|
|
|||||||||||
| (1,511,027 | ) | 117,699 | 1,638,705 | (1,666,504 | ) | (372,798 | ) | (1,507,604 | ) | |||||||||||||
|
|
|
|
|
|
|
|
|
|
|
|
|
|||||||||||
| (895,975 | ) | (511,760 | ) | 1,661,153 | (1,615,196 | ) | (357,529 | ) | (1,449,982 | ) | ||||||||||||
| 6,303,220 | 6,814,980 | 747,617 | 2,362,813 | 2,502,884 | 3,952,866 | |||||||||||||||||
|
|
|
|
|
|
|
|
|
|
|
|
|
|||||||||||
| $ | 5,407,245 | $ | 6,303,220 | $ | 2,408,770 | $ | 747,617 | $ | 2,145,355 | $ | 2,502,884 | |||||||||||
|
|
|
|
|
|
|
|
|
|
|
|
|
|||||||||||
57
Table of Contents
John Hancock Life Insurance Company (U.S.A.) Separate Account N
Statements of Operations and Changes in Contract Owners’ Equity
(continued)
| Sub-Account | ||||||||||||||||
| Small Cap Growth Trust Series 0 | Small Cap Growth Trust Series 1 | |||||||||||||||
| Year Ended Dec. 31/12 |
Year Ended Dec. 31/11 |
Year Ended Dec. 31/12 |
Year Ended Dec. 31/11 |
|||||||||||||
| Income: |
||||||||||||||||
| Dividend income distribution |
— | — | — | — | ||||||||||||
|
|
|
|
|
|
|
|
|
|||||||||
| Total Investment Income |
— | — | — | — | ||||||||||||
| Expenses: |
||||||||||||||||
| Mortality and expense risk |
— | — | 6,463 | 5,479 | ||||||||||||
|
|
|
|
|
|
|
|
|
|||||||||
| Net investment income (loss) |
— | — | (6,463 | ) | (5,479 | ) | ||||||||||
|
|
|
|
|
|
|
|
|
|||||||||
| Realized gains (losses) on investments: |
||||||||||||||||
| Capital gain distributions |
675,695 | 120,421 | 158,734 | 18,651 | ||||||||||||
| Net realized gains (losses) |
446,111 | 435,632 | 86,053 | 138,218 | ||||||||||||
|
|
|
|
|
|
|
|
|
|||||||||
| Realized gains (losses) |
1,121,806 | 556,053 | 244,787 | 156,869 | ||||||||||||
| Unrealized appreciation (depreciation) during the period |
(438,127 | ) | (917,348 | ) | (73,691 | ) | (232,179 | ) | ||||||||
|
|
|
|
|
|
|
|
|
|||||||||
| Net increase (decrease) in assets from operations |
683,679 | (361,295 | ) | 164,633 | (80,789 | ) | ||||||||||
|
|
|
|
|
|
|
|
|
|||||||||
| Changes from principal transactions: |
||||||||||||||||
| Transfer of net premiums |
201,039 | 104,100 | 20,478 | 39,714 | ||||||||||||
| Transfer on terminations |
(103,539 | ) | (136,283 | ) | (231,561 | ) | (47,327 | ) | ||||||||
| Transfer on policy loans |
(4,907 | ) | (6,302 | ) | — | — | ||||||||||
| Net interfund transfers |
59,272 | 381,241 | 109,956 | 151,645 | ||||||||||||
|
|
|
|
|
|
|
|
|
|||||||||
| Net increase (decrease) in assets from principal transactions |
151,865 | 342,756 | (101,127 | ) | 144,032 | |||||||||||
|
|
|
|
|
|
|
|
|
|||||||||
| Total increase (decrease) in assets |
835,544 | (18,539 | ) | 63,506 | 63,243 | |||||||||||
| Assets, beginning of period |
4,325,175 | 4,343,714 | 1,057,143 | 993,900 | ||||||||||||
|
|
|
|
|
|
|
|
|
|||||||||
| Assets, end of period |
$ | 5,160,719 | $ | 4,325,175 | $ | 1,120,649 | $ | 1,057,143 | ||||||||
|
|
|
|
|
|
|
|
|
|||||||||
See accompanying notes.
58
Table of Contents
| Sub-Account | ||||||||||||||||||||||
| Small Cap Index Trust Series 0 | Small Cap Index Trust Series 1 | Small Cap Opportunities Trust Series 0 | ||||||||||||||||||||
| Year Ended Dec. 31/12 |
Year Ended Dec. 31/11 |
Year Ended Dec. 31/12 |
Year Ended Dec. 31/11 |
Year Ended Dec. 31/12 |
Year Ended Dec. 31/11 |
|||||||||||||||||
| $ | 97,113 | $ | 38,025 | $ | 71,355 | $ | 29,761 | — | $ | 145 | ||||||||||||
|
|
|
|
|
|
|
|
|
|
|
|
|
|||||||||||
| 97,113 | 38,025 | 71,355 | 29,761 | — | 145 | |||||||||||||||||
| — | — | 17,341 | 12,094 | — | — | |||||||||||||||||
|
|
|
|
|
|
|
|
|
|
|
|
|
|||||||||||
| 97,113 | 38,025 | 54,014 | 17,667 | — | 145 | |||||||||||||||||
|
|
|
|
|
|
|
|
|
|
|
|
|
|||||||||||
| 760,305 | 13,335 | 586,834 | 11,925 | — | — | |||||||||||||||||
| 101,537 | 338,196 | 99,406 | 265,071 | 14,468 | 23,181 | |||||||||||||||||
|
|
|
|
|
|
|
|
|
|
|
|
|
|||||||||||
| 861,842 | 351,531 | 686,240 | 276,996 | 14,468 | 23,181 | |||||||||||||||||
| (351,730 | ) | (544,417 | ) | (234,508 | ) | (483,223 | ) | 5,856 | (19,985 | ) | ||||||||||||
|
|
|
|
|
|
|
|
|
|
|
|
|
|||||||||||
| 607,225 | (154,861 | ) | 505,746 | (188,560 | ) | 20,324 | 3,341 | |||||||||||||||
|
|
|
|
|
|
|
|
|
|
|
|
|
|||||||||||
| 682,422 | 1,005,926 | 93,874 | 138,883 | 17,997 | 12,393 | |||||||||||||||||
| (242,983 | ) | (222,313 | ) | (522,150 | ) | (224,852 | ) | (26,073 | ) | (38,310 | ) | |||||||||||
| (152,873 | ) | 32,228 | — | — | (9,174 | ) | (1,938 | ) | ||||||||||||||
| 1,065,810 | 201,337 | 3,259,343 | (84,746 | ) | (2,233 | ) | 13,614 | |||||||||||||||
|
|
|
|
|
|
|
|
|
|
|
|
|
|||||||||||
| 1,352,376 | 1,017,178 | 2,831,067 | (170,715 | ) | (19,483 | ) | (14,241 | ) | ||||||||||||||
|
|
|
|
|
|
|
|
|
|
|
|
|
|||||||||||
| 1,959,601 | 862,317 | 3,336,813 | (359,275 | ) | 841 | (10,900 | ) | |||||||||||||||
| 3,096,548 | 2,234,231 | 2,235,310 | 2,594,585 | 129,857 | 140,757 | |||||||||||||||||
|
|
|
|
|
|
|
|
|
|
|
|
|
|||||||||||
| $ | 5,056,149 | $ | 3,096,548 | $ | 5,572,123 | $ | 2,235,310 | $ | 130,698 | $ | 129,857 | |||||||||||
|
|
|
|
|
|
|
|
|
|
|
|
|
|||||||||||
59
Table of Contents
John Hancock Life Insurance Company (U.S.A.) Separate Account N
Statements of Operations and Changes in Contract Owners’ Equity
(continued)
| Sub-Account | ||||||||||||||||
| Small Cap Opportunities Trust Series 1 | Small Cap Value Trust Series 0 | |||||||||||||||
| Year Ended Dec. 31/12 |
Year Ended Dec. 31/11 |
Year Ended Dec. 31/12 |
Year Ended Dec. 31/11 |
|||||||||||||
| Income: |
||||||||||||||||
| Dividend income distribution |
— | $ | 828 | $ | 71,381 | $ | 61,587 | |||||||||
|
|
|
|
|
|
|
|
|
|||||||||
| Total Investment Income |
— | 828 | 71,381 | 61,587 | ||||||||||||
| Expenses: |
||||||||||||||||
| Mortality and expense risk |
2,371 | 5,067 | — | — | ||||||||||||
|
|
|
|
|
|
|
|
|
|||||||||
| Net investment income (loss) |
(2,371 | ) | (4,239 | ) | 71,381 | 61,587 | ||||||||||
|
|
|
|
|
|
|
|
|
|||||||||
| Realized gains (losses) on investments: |
||||||||||||||||
| Capital gain distributions |
— | — | 370,084 | — | ||||||||||||
| Net realized gains (losses) |
28,461 | 105,850 | 1,072,732 | 633,587 | ||||||||||||
|
|
|
|
|
|
|
|
|
|||||||||
| Realized gains (losses) |
28,461 | 105,850 | 1,442,816 | 633,587 | ||||||||||||
| Unrealized appreciation (depreciation) during the period |
65,090 | (165,454 | ) | (390,175 | ) | (618,941 | ) | |||||||||
|
|
|
|
|
|
|
|
|
|||||||||
| Net increase (decrease) in assets from operations |
91,180 | (63,843 | ) | 1,124,022 | 76,233 | |||||||||||
|
|
|
|
|
|
|
|
|
|||||||||
| Changes from principal transactions: |
||||||||||||||||
| Transfer of net premiums |
16,606 | 11,846 | 275,858 | 612,306 | ||||||||||||
| Transfer on terminations |
(35,026 | ) | (124,270 | ) | (312,822 | ) | (172,678 | ) | ||||||||
| Transfer on policy loans |
101 | (1,888 | ) | (17,073 | ) | (1,594 | ) | |||||||||
| Net interfund transfers |
(371,726 | ) | (447,834 | ) | (218,231 | ) | 39,121 | |||||||||
|
|
|
|
|
|
|
|
|
|||||||||
| Net increase (decrease) in assets from principal transactions |
(390,045 | ) | (562,146 | ) | (272,268 | ) | 477,155 | |||||||||
|
|
|
|
|
|
|
|
|
|||||||||
| Total increase (decrease) in assets |
(298,865 | ) | (625,989 | ) | 851,754 | 553,388 | ||||||||||
| Assets, beginning of period |
735,456 | 1,361,445 | 6,963,187 | 6,409,799 | ||||||||||||
|
|
|
|
|
|
|
|
|
|||||||||
| Assets, end of period |
$ | 436,591 | $ | 735,456 | $ | 7,814,941 | $ | 6,963,187 | ||||||||
|
|
|
|
|
|
|
|
|
|||||||||
See accompanying notes.
60
Table of Contents
| Sub-Account | ||||||||||||||||||||||
| Small Cap Value Trust Series 1 | Small Company Value Trust Series 0 | Small Company Value Trust Series 1 | ||||||||||||||||||||
| Year Ended Dec. 31/12 |
Year Ended Dec. 31/11 |
Year Ended Dec. 31/12 |
Year Ended Dec. 31/11 |
Year Ended Dec. 31/12 |
Year Ended Dec. 31/11 |
|||||||||||||||||
| $ | 9,620 | $ | 3,867 | $ | 2,631 | $ | 6,684 | $ | 12,565 | $ | 35,353 | |||||||||||
|
|
|
|
|
|
|
|
|
|
|
|
|
|||||||||||
| 9,620 | 3,867 | 2,631 | 6,684 | 12,565 | 35,353 | |||||||||||||||||
| 6,115 | 2,530 | — | — | 20,162 | 26,243 | |||||||||||||||||
|
|
|
|
|
|
|
|
|
|
|
|
|
|||||||||||
| 3,505 | 1,337 | 2,631 | 6,684 | (7,597 | ) | 9,110 | ||||||||||||||||
|
|
|
|
|
|
|
|
|
|
|
|
|
|||||||||||
| 51,849 | — | — | — | — | — | |||||||||||||||||
| 73,773 | 48,047 | 86,076 | 83,701 | 606,448 | 841,618 | |||||||||||||||||
|
|
|
|
|
|
|
|
|
|
|
|
|
|||||||||||
| 125,622 | 48,047 | 86,076 | 83,701 | 606,448 | 841,618 | |||||||||||||||||
| (21,545 | ) | (40,234 | ) | 74,974 | (114,200 | ) | 212,641 | (893,080 | ) | |||||||||||||
|
|
|
|
|
|
|
|
|
|
|
|
|
|||||||||||
| 107,582 | 9,150 | 163,681 | (23,815 | ) | 811,492 | (42,352 | ) | |||||||||||||||
|
|
|
|
|
|
|
|
|
|
|
|
|
|||||||||||
| 17,703 | 8,524 | 127,644 | 135,986 | 84,585 | 182,943 | |||||||||||||||||
| (312,091 | ) | (30,914 | ) | (46,055 | ) | (51,600 | ) | (1,199,834 | ) | (1,135,136 | ) | |||||||||||
| — | — | 6,560 | (3,619 | ) | 25,135 | 2,218 | ||||||||||||||||
| 615,087 | 24,555 | 21,754 | 50,717 | (1,216,493 | ) | (347,315 | ) | |||||||||||||||
|
|
|
|
|
|
|
|
|
|
|
|
|
|||||||||||
| 320,699 | 2,165 | 109,903 | 131,484 | (2,306,607 | ) | (1,297,290 | ) | |||||||||||||||
|
|
|
|
|
|
|
|
|
|
|
|
|
|||||||||||
| 428,281 | 11,315 | 273,584 | 107,669 | (1,495,115 | ) | (1,339,642 | ) | |||||||||||||||
| 462,460 | 451,145 | 1,029,131 | 921,462 | 6,156,047 | 7,495,689 | |||||||||||||||||
|
|
|
|
|
|
|
|
|
|
|
|
|
|||||||||||
| $ | 890,741 | $ | 462,460 | $ | 1,302,715 | $ | 1,029,131 | $ | 4,660,932 | $ | 6,156,047 | |||||||||||
|
|
|
|
|
|
|
|
|
|
|
|
|
|||||||||||
61
Table of Contents
John Hancock Life Insurance Company (U.S.A.) Separate Account N
Statements of Operations and Changes in Contract Owners’ Equity
(continued)
| Sub-Account | ||||||||||||||||
| Smaller Company Growth Trust Series 0 | Smaller Company Growth Trust Series 1 | |||||||||||||||
| Year Ended Dec. 31/12 |
Year Ended Dec. 31/11 |
Year Ended Dec. 31/12 |
Year Ended Dec. 31/11 |
|||||||||||||
| Income: |
||||||||||||||||
| Dividend income distribution |
— | — | — | — | ||||||||||||
|
|
|
|
|
|
|
|
|
|||||||||
| Total Investment Income |
— | — | — | — | ||||||||||||
| Expenses: |
||||||||||||||||
| Mortality and expense risk |
— | — | 90,857 | 106,431 | ||||||||||||
|
|
|
|
|
|
|
|
|
|||||||||
| Net investment income (loss) |
— | — | (90,857 | ) | (106,431 | ) | ||||||||||
|
|
|
|
|
|
|
|
|
|||||||||
| Realized gains (losses) on investments: |
||||||||||||||||
| Capital gain distributions |
12,685 | — | 1,238,295 | — | ||||||||||||
| Net realized gains (losses) |
2,568 | 11,014 | 895,692 | 787,681 | ||||||||||||
|
|
|
|
|
|
|
|
|
|||||||||
| Realized gains (losses) |
15,253 | 11,014 | 2,133,987 | 787,681 | ||||||||||||
| Unrealized appreciation (depreciation) during the period |
11,766 | (47,527 | ) | 162,929 | (1,933,951 | ) | ||||||||||
|
|
|
|
|
|
|
|
|
|||||||||
| Net increase (decrease) in assets from operations |
27,019 | (36,513 | ) | 2,206,059 | (1,252,701 | ) | ||||||||||
|
|
|
|
|
|
|
|
|
|||||||||
| Changes from principal transactions: |
||||||||||||||||
| Transfer of net premiums |
43,211 | 80,711 | 555,524 | 737,886 | ||||||||||||
| Transfer on terminations |
(14,616 | ) | (23,589 | ) | (4,185,161 | ) | (3,574,520 | ) | ||||||||
| Transfer on policy loans |
(24,069 | ) | (348 | ) | 171,708 | 320,634 | ||||||||||
| Net interfund transfers |
(74,300 | ) | (3,714 | ) | (1,016,794 | ) | (74,821 | ) | ||||||||
|
|
|
|
|
|
|
|
|
|||||||||
| Net increase (decrease) in assets from principal transactions |
(69,774 | ) | 53,060 | (4,474,723 | ) | (2,590,821 | ) | |||||||||
|
|
|
|
|
|
|
|
|
|||||||||
| Total increase (decrease) in assets |
(42,755 | ) | 16,547 | (2,268,664 | ) | (3,843,522 | ) | |||||||||
| Assets, beginning of period |
208,098 | 191,551 | 15,386,788 | 19,230,310 | ||||||||||||
|
|
|
|
|
|
|
|
|
|||||||||
| Assets, end of period |
$ | 165,343 | $ | 208,098 | $ | 13,118,124 | $ | 15,386,788 | ||||||||
|
|
|
|
|
|
|
|
|
|||||||||
See accompanying notes.
62
Table of Contents
| Sub-Account | ||||||||||||||||||||||
| Strategic Income Opportunities Trust Series 0 | Strategic Income Opportunities Trust Series 1 | Total Bond Market Trust B Series 0 | ||||||||||||||||||||
| Year Ended Dec. 31/12 |
Year Ended Dec. 31/11 |
Year Ended Dec. 31/12 |
Year Ended Dec. 31/11 |
Year Ended Dec. 31/12 |
Year Ended Dec. 31/11 |
|||||||||||||||||
| $ | 193,473 | $ | 230,954 | $ | 125,334 | $ | 241,041 | $ | 209,800 | $ | 387,636 | |||||||||||
|
|
|
|
|
|
|
|
|
|
|
|
|
|||||||||||
| 193,473 | 230,954 | 125,334 | 241,041 | 209,800 | 387,636 | |||||||||||||||||
| — | — | 9,162 | 13,133 | — | — | |||||||||||||||||
|
|
|
|
|
|
|
|
|
|
|
|
|
|||||||||||
| 193,473 | 230,954 | 116,172 | 227,908 | 209,800 | 387,636 | |||||||||||||||||
|
|
|
|
|
|
|
|
|
|
|
|
|
|||||||||||
| — | — | — | — | — | — | |||||||||||||||||
| (42,254 | ) | (16,331 | ) | (131,905 | ) | (6,984 | ) | 222,631 | 179,355 | |||||||||||||
|
|
|
|
|
|
|
|
|
|
|
|
|
|||||||||||
| (42,254 | ) | (16,331 | ) | (131,905 | ) | (6,984 | ) | 222,631 | 179,355 | |||||||||||||
| 162,474 | (189,905 | ) | 243,295 | (166,122 | ) | (17,998 | ) | 98,941 | ||||||||||||||
|
|
|
|
|
|
|
|
|
|
|
|
|
|||||||||||
| 313,693 | 24,718 | 227,562 | 54,802 | 414,433 | 665,932 | |||||||||||||||||
|
|
|
|
|
|
|
|
|
|
|
|
|
|||||||||||
| 283,080 | 511,030 | 72,048 | 164,049 | 1,311,175 | 456,217 | |||||||||||||||||
| (158,433 | ) | (232,441 | ) | (603,888 | ) | (213,040 | ) | (396,895 | ) | (504,423 | ) | |||||||||||
| (8,779 | ) | (4,607 | ) | (437 | ) | (356 | ) | 30,864 | 2,192 | |||||||||||||
| 659,353 | 257,390 | (496,267 | ) | (467,874 | ) | 3,845,152 | (1,739,725 | ) | ||||||||||||||
|
|
|
|
|
|
|
|
|
|
|
|
|
|||||||||||
| 775,221 | 531,372 | (1,028,544 | ) | (517,221 | ) | 4,790,296 | (1,785,739 | ) | ||||||||||||||
|
|
|
|
|
|
|
|
|
|
|
|
|
|||||||||||
| 1,088,914 | 556,090 | (800,982 | ) | (462,419 | ) | 5,204,729 | (1,119,807 | ) | ||||||||||||||
| 2,105,616 | 1,549,526 | 2,167,949 | 2,630,368 | 7,750,121 | 8,869,928 | |||||||||||||||||
|
|
|
|
|
|
|
|
|
|
|
|
|
|||||||||||
| $ | 3,194,530 | $ | 2,105,616 | $ | 1,366,967 | $ | 2,167,949 | $ | 12,954,850 | $ | 7,750,121 | |||||||||||
|
|
|
|
|
|
|
|
|
|
|
|
|
|||||||||||
63
Table of Contents
John Hancock Life Insurance Company (U.S.A.) Separate Account N
Statements of Operations and Changes in Contract Owners’ Equity
(continued)
| Sub-Account | ||||||||||||||||
| Total Return Trust Series 0 | Total Return Trust Series 1 | |||||||||||||||
| Year Ended Dec. 31/12 |
Year Ended Dec. 31/11 |
Year Ended Dec. 31/12 |
Year Ended Dec. 31/11 |
|||||||||||||
| Income: |
||||||||||||||||
| Dividend income distribution |
$ | 596,165 | $ | 1,161,847 | $ | 540,465 | $ | 1,892,623 | ||||||||
|
|
|
|
|
|
|
|
|
|||||||||
| Total Investment Income |
596,165 | 1,161,847 | 540,465 | 1,892,623 | ||||||||||||
| Expenses: |
||||||||||||||||
| Mortality and expense risk |
— | — | 116,360 | 149,437 | ||||||||||||
|
|
|
|
|
|
|
|
|
|||||||||
| Net investment income (loss) |
596,165 | 1,161,847 | 424,105 | 1,743,186 | ||||||||||||
|
|
|
|
|
|
|
|
|
|||||||||
| Realized gains (losses) on investments: |
||||||||||||||||
| Capital gain distributions |
— | 954,479 | — | 1,545,407 | ||||||||||||
| Net realized gains (losses) |
21,365 | 265,931 | (262,321 | ) | 359,709 | |||||||||||
|
|
|
|
|
|
|
|
|
|||||||||
| Realized gains (losses) |
21,365 | 1,220,410 | (262,321 | ) | 1,905,116 | |||||||||||
| Unrealized appreciation (depreciation) during the period |
1,796,755 | (1,440,344 | ) | 2,492,566 | (2,034,093 | ) | ||||||||||
|
|
|
|
|
|
|
|
|
|||||||||
| Net increase (decrease) in assets from operations |
2,414,285 | 941,913 | 2,654,350 | 1,614,209 | ||||||||||||
|
|
|
|
|
|
|
|
|
|||||||||
| Changes from principal transactions: |
||||||||||||||||
| Transfer of net premiums |
4,900,233 | 3,774,677 | 238,258 | 329,869 | ||||||||||||
| Transfer on terminations |
(1,134,035 | ) | (1,553,640 | ) | (4,431,468 | ) | (3,915,591 | ) | ||||||||
| Transfer on policy loans |
(445,988 | ) | (96,401 | ) | (124,743 | ) | 513 | |||||||||
| Net interfund transfers |
(2,898,015 | ) | 3,884,912 | (19,580,804 | ) | 4,105,029 | ||||||||||
|
|
|
|
|
|
|
|
|
|||||||||
| Net increase (decrease) in assets from principal transactions |
422,195 | 6,009,548 | (23,898,757 | ) | 519,820 | |||||||||||
|
|
|
|
|
|
|
|
|
|||||||||
| Total increase (decrease) in assets |
2,836,480 | 6,951,461 | (21,244,407 | ) | 2,134,029 | |||||||||||
| Assets, beginning of period |
28,551,370 | 21,599,909 | 47,874,290 | 45,740,261 | ||||||||||||
|
|
|
|
|
|
|
|
|
|||||||||
| Assets, end of period |
$ | 31,387,850 | $ | 28,551,370 | $ | 26,629,883 | $ | 47,874,290 | ||||||||
|
|
|
|
|
|
|
|
|
|||||||||
| (g) | Fund available in prior year but no activity. |
See accompanying notes.
64
Table of Contents
| Sub-Account | ||||||||||||||||||||||
| Total Stock Market Index Trust Series 0 | Total Stock Market Index Trust Series 1 | Ultra Short Term Bond Trust Series 0 | ||||||||||||||||||||
| Year Ended Dec. 31/12 |
Year Ended Dec. 31/11 |
Year Ended Dec. 31/12 |
Year Ended Dec. 31/11 |
Year Ended Dec. 31/12 |
Year Ended Dec. 31/11 (g) |
|||||||||||||||||
| $ | 6,835 | $ | 8,082 | $ | 30,946 | $ | 24,074 | $ | 2,550 | $ | 1,693 | |||||||||||
|
|
|
|
|
|
|
|
|
|
|
|
|
|||||||||||
| 6,835 | 8,082 | 30,946 | 24,074 | 2,550 | 1,693 | |||||||||||||||||
| — | — | 9,074 | 10,010 | — | — | |||||||||||||||||
|
|
|
|
|
|
|
|
|
|
|
|
|
|||||||||||
| 6,835 | 8,082 | 21,872 | 14,064 | 2,550 | 1,693 | |||||||||||||||||
|
|
|
|
|
|
|
|
|
|
|
|
|
|||||||||||
| 1,063 | — | 5,213 | — | — | — | |||||||||||||||||
| 19,687 | 479,641 | 233,290 | 54,973 | (1,524 | ) | (239 | ) | |||||||||||||||
|
|
|
|
|
|
|
|
|
|
|
|
|
|||||||||||
| 20,750 | 479,641 | 238,503 | 54,973 | (1,524 | ) | (239 | ) | |||||||||||||||
| 51,315 | (391,665 | ) | 22,731 | (73,821 | ) | (89 | ) | (1,816 | ) | |||||||||||||
|
|
|
|
|
|
|
|
|
|
|
|
|
|||||||||||
| 78,900 | 96,058 | 283,106 | (4,784 | ) | 937 | (362 | ) | |||||||||||||||
|
|
|
|
|
|
|
|
|
|
|
|
|
|||||||||||
| 90,869 | 457,546 | 133,763 | 151,861 | 114,035 | — | |||||||||||||||||
| (280,634 | ) | (38,999 | ) | (52,363 | ) | (194,401 | ) | (94,329 | ) | (4,008 | ) | |||||||||||
| (10,737 | ) | (169 | ) | — | — | — | — | |||||||||||||||
| (40,856 | ) | (1,603,094 | ) | (293,249 | ) | 58,600 | 204,035 | 120,072 | ||||||||||||||
|
|
|
|
|
|
|
|
|
|
|
|
|
|||||||||||
| (241,358 | ) | (1,184,716 | ) | (211,849 | ) | 16,060 | 223,741 | 116,064 | ||||||||||||||
|
|
|
|
|
|
|
|
|
|
|
|
|
|||||||||||
| (162,458 | ) | (1,088,658 | ) | 71,257 | 11,276 | 224,678 | 115,702 | |||||||||||||||
| 620,895 | 1,709,553 | 1,910,839 | 1,899,563 | 115,702 | — | |||||||||||||||||
|
|
|
|
|
|
|
|
|
|
|
|
|
|||||||||||
| $ | 458,437 | $ | 620,895 | $ | 1,982,096 | $ | 1,910,839 | $ | 340,380 | $ | 115,702 | |||||||||||
|
|
|
|
|
|
|
|
|
|
|
|
|
|||||||||||
65
Table of Contents
John Hancock Life Insurance Company (U.S.A.) Separate Account N
Statements of Operations and Changes in Contract Owners’ Equity
(continued)
| Sub-Account | ||||||||||||||
| Ultra Short Term Bond Trust Series 1 | U.S. Equity Trust Series 0 | |||||||||||||
| Year Ended Dec. 31/12 |
Year Ended Dec. 31/11 (g) |
Year Ended Dec. 31/12 (q) |
| |||||||||||
| Income: |
||||||||||||||
| Dividend income distribution |
$ | 364 | $ | 379 | $ | 7,889 | ||||||||
|
|
|
|
|
|
|
|||||||||
| Total Investment Income |
364 | 379 | 7,889 | |||||||||||
| Expenses: |
||||||||||||||
| Mortality and expense risk |
203 | 118 | — | |||||||||||
|
|
|
|
|
|
|
|||||||||
| Net investment income (loss) |
161 | 261 | 7,889 | |||||||||||
|
|
|
|
|
|
|
|||||||||
| Realized gains (losses) on investments: |
||||||||||||||
| Capital gain distributions |
— | — | — | |||||||||||
| Net realized gains (losses) |
(26 | ) | (3 | ) | 669 | |||||||||
|
|
|
|
|
|
|
|||||||||
| Realized gains (losses) |
(26 | ) | (3 | ) | 669 | |||||||||
| Unrealized appreciation (depreciation) during the period |
(182 | ) | (433 | ) | 6,298 | |||||||||
|
|
|
|
|
|
|
|||||||||
| Net increase (decrease) in assets from operations |
(47 | ) | (175 | ) | 14,856 | |||||||||
|
|
|
|
|
|
|
|||||||||
| Changes from principal transactions: |
||||||||||||||
| Transfer of net premiums |
— | — | 12,789 | |||||||||||
| Transfer on terminations |
(1,767 | ) | (1,000 | ) | (13,230 | ) | ||||||||
| Transfer on policy loans |
— | — | (10,696 | ) | ||||||||||
| Net interfund transfers |
7,808 | 28,000 | 534,711 | |||||||||||
|
|
|
|
|
|
|
|||||||||
| Net increase (decrease) in assets from principal transactions |
6,041 | 27,000 | 523,574 | |||||||||||
|
|
|
|
|
|
|
|||||||||
| Total increase (decrease) in assets |
5,994 | 26,825 | 538,430 | |||||||||||
| Assets, beginning of period |
26,825 | — | — | |||||||||||
|
|
|
|
|
|
|
|||||||||
| Assets, end of period |
$ | 32,819 | $ | 26,825 | $ | 538,430 | ||||||||
|
|
|
|
|
|
|
|||||||||
| (g) | Fund available in prior year but no activity. |
| (q) | Reflects the period from commencement of operations on April 30, 2012 through December 31, 2012. |
See accompanying notes.
66
Table of Contents
| Sub-Account | ||||||||||||||||||||
| U.S. Equity Trust Series 1 | Utilities Trust Series 0 | Utilities Trust Series 1 | ||||||||||||||||||
| Year Ended Dec. 31/12 (q) |
Year Ended Dec. 31/12 |
Year Ended Dec. 31/11 |
Year Ended Dec. 31/12 |
Year Ended Dec. 31/11 |
||||||||||||||||
| $ | 15,550 | $ | 41,518 | $ | 37,227 | $ | 69,574 | $ | 71,733 | |||||||||||
|
|
|
|
|
|
|
|
|
|
|
|||||||||||
| 15,550 | 41,518 | 37,227 | 69,574 | 71,733 | ||||||||||||||||
| 3,657 | — | — | 10,138 | 10,776 | ||||||||||||||||
|
|
|
|
|
|
|
|
|
|
|
|||||||||||
| 11,893 | 41,518 | 37,227 | 59,436 | 60,957 | ||||||||||||||||
|
|
|
|
|
|
|
|
|
|
|
|||||||||||
| — | — | — | — | — | ||||||||||||||||
| (7,373 | ) | 43,373 | 72,261 | 136,298 | 254,033 | |||||||||||||||
|
|
|
|
|
|
|
|
|
|
|
|||||||||||
| (7,373 | ) | 43,373 | 72,261 | 136,298 | 254,033 | |||||||||||||||
| 13,057 | 56,347 | (39,015 | ) | 32,088 | (222,387 | ) | ||||||||||||||
|
|
|
|
|
|
|
|
|
|
|
|||||||||||
| 17,577 | 141,238 | 70,473 | 227,822 | 92,603 | ||||||||||||||||
|
|
|
|
|
|
|
|
|
|
|
|||||||||||
| 18,131 | 131,614 | 237,024 | 61,444 | 116,067 | ||||||||||||||||
| (163,284 | ) | (121,634 | ) | (82,194 | ) | (669,845 | ) | (195,757 | ) | |||||||||||
| (5,806 | ) | (2,783 | ) | (26,800 | ) | (59 | ) | (94 | ) | |||||||||||
| 1,205,535 | 32,542 | (218,775 | ) | 194,406 | 148,282 | |||||||||||||||
|
|
|
|
|
|
|
|
|
|
|
|||||||||||
| 1,054,576 | 39,739 | (90,745 | ) | (414,054 | ) | 68,498 | ||||||||||||||
|
|
|
|
|
|
|
|
|
|
|
|||||||||||
| 1,072,153 | 180,977 | (20,272 | ) | (186,232 | ) | 161,101 | ||||||||||||||
| — | 992,929 | 1,013,201 | 1,829,855 | 1,668,754 | ||||||||||||||||
|
|
|
|
|
|
|
|
|
|
|
|||||||||||
| $ | 1,072,153 | $ | 1,173,906 | $ | 992,929 | $ | 1,643,623 | $ | 1,829,855 | |||||||||||
|
|
|
|
|
|
|
|
|
|
|
|||||||||||
67
Table of Contents
John Hancock Life Insurance Company (U.S.A.) Separate Account N
Statements of Operations and Changes in Contract Owners’ Equity
(continued)
| Sub-Account | ||||||||||||||||
| Value Trust Series 0 | Value Trust Series 1 | |||||||||||||||
| Year Ended Dec. 31/12 |
Year Ended Dec. 31/11 |
Year Ended Dec. 31/12 |
Year Ended Dec. 31/11 |
|||||||||||||
| Income: |
||||||||||||||||
| Dividend income distribution |
$ | 6,144 | $ | 6,286 | $ | 30,495 | $ | 40,992 | ||||||||
|
|
|
|
|
|
|
|
|
|||||||||
| Total Investment Income |
6,144 | 6,286 | 30,495 | 40,992 | ||||||||||||
| Expenses: |
||||||||||||||||
| Mortality and expense risk |
— | — | 17,275 | 18,599 | ||||||||||||
|
|
|
|
|
|
|
|
|
|||||||||
| Net investment income (loss) |
6,144 | 6,286 | 13,220 | 22,393 | ||||||||||||
|
|
|
|
|
|
|
|
|
|||||||||
| Realized gains (losses) on investments: |
||||||||||||||||
| Capital gain distributions |
— | — | — | — | ||||||||||||
| Net realized gains (losses) |
12,483 | 27,446 | 554,076 | 220,059 | ||||||||||||
|
|
|
|
|
|
|
|
|
|||||||||
| Realized gains (losses) |
12,483 | 27,446 | 554,076 | 220,059 | ||||||||||||
| Unrealized appreciation (depreciation) during the period |
80,571 | (31,498 | ) | (6,977 | ) | (253,027 | ) | |||||||||
|
|
|
|
|
|
|
|
|
|||||||||
| Net increase (decrease) in assets from operations |
99,198 | 2,234 | 560,319 | (10,575 | ) | |||||||||||
|
|
|
|
|
|
|
|
|
|||||||||
| Changes from principal transactions: |
||||||||||||||||
| Transfer of net premiums |
101,749 | 68,051 | 29,773 | 49,629 | ||||||||||||
| Transfer on terminations |
(31,935 | ) | (32,088 | ) | (1,201,422 | ) | (384,002 | ) | ||||||||
| Transfer on policy loans |
(2,011 | ) | (78,905 | ) | 474 | 292 | ||||||||||
| Net interfund transfers |
63,487 | (20,857 | ) | (153,270 | ) | 325,866 | ||||||||||
|
|
|
|
|
|
|
|
|
|||||||||
| Net increase (decrease) in assets from principal transactions |
131,290 | (63,799 | ) | (1,324,445 | ) | (8,215 | ) | |||||||||
|
|
|
|
|
|
|
|
|
|||||||||
| Total increase (decrease) in assets |
230,488 | (61,565 | ) | (764,126 | ) | (18,790 | ) | |||||||||
| Assets, beginning of period |
523,460 | 585,025 | 3,499,439 | 3,518,229 | ||||||||||||
|
|
|
|
|
|
|
|
|
|||||||||
| Assets, end of period |
$ | 753,948 | $ | 523,460 | $ | 2,735,313 | $ | 3,499,439 | ||||||||
|
|
|
|
|
|
|
|
|
|||||||||
See accompanying notes.
68
Table of Contents
| Total | ||||||||||||||
| Year
Ended Dec. 31/12 |
Year
Ended Dec. 31/11 |
|||||||||||||
| $ | 9,972,195 | $ | 13,527,177 | |||||||||||
|
|
|
|
|
|||||||||||
| 9,972,195 | 13,527,177 | |||||||||||||
| 1,498,405 | 1,603,160 | |||||||||||||
|
|
|
|
|
|||||||||||
| 8,473,790 | 11,924,017 | |||||||||||||
|
|
|
|
|
|||||||||||
| 7,620,175 | 3,895,142 | |||||||||||||
| 31,527,281 | 30,179,269 | |||||||||||||
|
|
|
|
|
|||||||||||
| 39,147,456 | 34,074,411 | |||||||||||||
| 26,311,717 | (57,467,660 | ) | ||||||||||||
|
|
|
|
|
|||||||||||
| 73,932,963 | (11,469,232 | ) | ||||||||||||
|
|
|
|
|
|||||||||||
| 80,716,462 | 79,177,306 | |||||||||||||
| (88,780,052 | ) | (64,334,701 | ) | |||||||||||
| (8,565,243 | ) | 855,694 | ||||||||||||
| (11,459,227 | ) | (8,975,465 | ) | |||||||||||
|
|
|
|
|
|||||||||||
| (28,088,060 | ) | 6,722,834 | ||||||||||||
|
|
|
|
|
|||||||||||
| 45,844,903 | (4,746,398 | ) | ||||||||||||
| 646,299,287 | 651,045,685 | |||||||||||||
|
|
|
|
|
|||||||||||
| $ | 692,144,190 | $ | 646,299,287 | |||||||||||
|
|
|
|
|
|||||||||||
69
Table of Contents
John Hancock Life Insurance Company (U.S.A.) Separate Account N
December 31, 2012
| 1. | Organization |
John Hancock Life Insurance Company (U.S.A.) Separate Account N (the “Account”) is a separate account administered and sponsored by John Hancock Life Insurance Company (U.S.A.) (“JHUSA” or the “Company”). The Account operates as a Unit Investment Trust registered under the Investment Company Act of 1940, as amended (the “Act”) and has 124 active investment sub-accounts that invest in shares of a particular John Hancock Variable Insurance Trust (the “Trust”), which was formerly known as the John Hancock Trust, portfolio and 4 sub-accounts that invests in shares of other outside investment trusts as of December 31, 2012. The Trust is registered under the Act as an open-end management investment company, commonly known as a mutual fund, which does not transact with the general public. Instead, the Trust deals primarily with insurance companies by providing the investment medium for variable contracts. The Account is a funding vehicle for the allocation of net premiums under variable universal life insurance contracts (the “Contracts”) issued by the Company.
The Company is a stock life insurance company incorporated under the laws of Michigan in 1979. The Company is an indirect wholly owned subsidiary of Manulife Financial Corporation (“MFC”), a Canadian based publicly traded life insurance company.
The Company is required to maintain assets in the Account with a total fair value at least equal to the reserves and other liabilities relating to the variable benefits under all Contracts participating in the Account. These assets may not be charged with liabilities which arise from any other business the Company conducts. However, all obligations under the Contracts are general corporate obligations of the Company.
Additional assets are held in the Company’s general account to cover the contingency that the guaranteed minimum death benefit might exceed the death benefit which would have been payable in the absence of such guarantee.
Each sub-account that invests in portfolios of the Trust may offer two classes of units to fund the Contracts issued by the Company. These classes, Series 1 and Series 0 represent an interest in the same Trust portfolio but in different share classes of that portfolio. Series 1 represents interests in Series 1 shares of the Trust’s portfolio and Series 0 represents interests in Series NAV shares of the Trust’s portfolio. Series 1 and Series NAV shares differ in the level of 12b-1 fees and other expenses assessed against the portfolio’s assets.
The following sub-accounts of the Account were commenced as investment options:
| New Sub-Accounts |
Effective Date | |
| International Equity Index Trust B Series 1 | November 5, 2012 | |
| International Growth Stock Trust | November 5, 2012 | |
| U.S. Equity Trust | April 30, 2012 |
70
Table of Contents
John Hancock Life Insurance Company (U.S.A.) Separate Account N
Notes to Financial Statements (continued)
The following sub-accounts of the Account were terminated as investment options and the funds were transferred to existing sub-account funds as follows:
| Terminated |
Transferred To |
Effective Date | ||
| 500 Index Trust Series 1 | 500 Index Trust B Series 0 | November 5, 2012 | ||
| American Blue Chip Income and Growth Trust Series 1 | American Growth-Income Trust Series 1 | November 5, 2012 | ||
| Balanced Trust | Lifestyle Growth Trust | April 30, 2012 | ||
| International Equity Index Trust A | International Equity Index Trust B | November 5, 2012 | ||
| International Opportunities Trust | International Growth Stock Trust | November 5, 2012 | ||
| Large Cap Trust | U.S. Equity Trust | April 30, 2012 |
Where a sub-account has two series, the changes noted above apply to both Series 0 and Series 1.
| 2. | Significant Accounting Policies |
Investments of each sub-account consist of shares in the respective portfolios of the Trust. These shares are carried at fair value which is calculated using the fair value of the investment securities underlying each Trust portfolio. Transactions are recorded on the trade date. Income from dividends is recorded on the ex-dividend date. Realized gains and losses on the sale of investments are computed on the basis of the specifically identified cost of the investment sold.
In addition to the Account, a contract holder may also allocate funds to the fixed account contained within the Company’s general account. Because of exemptive and exclusionary provisions, interests in the fixed account have not been registered under the Securities Act of 1933 and the Company’s general account has not been registered as an investment company under the Act. Net interfund transfers include interfund transfers between separate and general accounts.
FASB ASC Topic 820 - Fair Value Measurement and Disclosure (“ASC 820”) provides a single definition of fair value for accounting purposes, establishes a consistent framework for measuring fair value and expands disclosure requirements about fair value measurements. ASC 820 defines fair value as the price that would be received to sell an asset or paid to transfer a liability in an orderly transaction between market participants at the measurement date; that is, an exit value. An exit value is not a forced liquidation or distressed sale. Assets not measured at fair value are excluded from ASC 820 note disclosure, including Policy Loans which are held to maturity and accounted for at cost.
Following ASC 820 guidance, the Account has categorized its fair value measurements according to a three-level hierarchy. The hierarchy prioritizes the inputs used by the Account’s valuation techniques. A level is assigned to each fair value measurement based on the lowest level input significant to the fair value measurement in its entirety. The three levels of the fair value hierarchy are defined as follows:
| • | Level 1 – Fair value measurements that reflect unadjusted, quoted prices in active markets for identical assets and liabilities that the Account has the ability to access at the measurement date. |
| • | Level 2 – Fair value measurements using inputs other than quoted prices included within Level 1 that are observable, either directly or indirectly. |
| • | Level 3 – Fair value measurements using significant non-market observable inputs. |
71
Table of Contents
John Hancock Life Insurance Company (U.S.A.) Separate Account N
Notes to Financial Statements (continued)
Assets owned by the Account are primarily open-ended mutual fund investments issued by the Trust. These are classified within Level 1, as fair values of the underlying funds are based upon reported net asset values (“NAV”), which represent the values at which each sub-account can redeem its investments.
The following table presents the Account’s assets that are measured at fair value on a recurring basis by fair value hierarchy level under ASC 820, as of December 31, 2012.
| Mutual Funds | ||||
| Level 1 |
$ | 692,144,190 | ||
| Level 2 |
— | |||
| Level 3 |
— | |||
|
|
|
|||
| $ | 692,144,190 | |||
|
|
|
|||
The preparation of financial statements in conformity with accounting principles generally accepted in the United States requires management to make estimates and assumptions that affect the amounts reported herein. Actual results could differ from those estimates.
| 3. | Mortality and Expense Risks Charges |
The Company deducts from the assets of the Account a daily charge equivalent to annual rates between 0% and 0.70% of the average net value of the Account’s assets for the assumption of mortality and expense risks.
| 4. | Contract Charges |
The Company deducts certain charges from gross premiums before placing the remaining net premiums in the sub-account. In the event of a surrender by the contract holder, surrender charges may be levied by the Company against the contract value at the time of termination to cover sales and administrative expenses associated with underwriting and issuing the Contract. Additionally, each month a deduction consisting of an administration charge, a charge for cost of insurance and charges for supplementary benefits is deducted from the contract value. Contract charges are paid through the redemption of sub-account units and are reflected as terminations.
| 5. | Federal Income Taxes |
The Account does not file separate tax returns. The taxable income of the Account is consolidated with that of the Company within the consolidated federal tax return. Any tax contingencies arising from the taxable income generated by the Account are the responsibility of the Company and the Company holds any and all tax contingencies on its financial statements. The Account is not a party to the consolidated tax sharing agreement thus no amount of income taxes or tax contingencies are passed through to the Account. The legal form of the Account is not taxable in any state or foreign jurisdictions.
72
Table of Contents
John Hancock Life Insurance Company (U.S.A.) Separate Account N
Notes to Financial Statements (continued)
The Income Taxes topic of the FASB Accounting Standard Codification establishes a minimum threshold for financial statement recognition of the benefit of positions taken, or expected to be taken, in filing tax returns (including whether the Account is taxable in certain jurisdictions). The topic requires the evaluation of tax positions taken or expected to be taken in the course of preparing the Company’s tax returns to determine whether tax positions are “more-likely-than not” of being sustained by the applicable tax authority. Tax positions deemed to meet the more-likely-than-not threshold would be recorded as tax expense or benefit.
The Account complies with the provisions of FASB ASC Topic 740, Income Taxes. As of December 31, 2012, the Account did not have a liability for any uncertain tax positions. The Account recognizes interest and penalties, if any, related to tax liabilities as income tax expense in the Statements of Operations.
| 6. | Purchases and Sales of Investments |
The cost of purchases and proceeds from sales of investments for the year ended December 31, 2012 were as follows:
| Purchases | Sales | |||||||
| Sub-accounts: |
||||||||
| 500 Index Trust B Series 0 |
$ | 24,666,132 | $ | 20,547,426 | ||||
| 500 Index Trust Series 1 |
5,035,388 | 6,410,872 | ||||||
| Active Bond Trust Series 0 |
3,991,956 | 3,994,410 | ||||||
| Active Bond Trust Series 1 |
579,706 | 998,576 | ||||||
| All Cap Core Trust Series 0 |
555,971 | 64,091 | ||||||
| All Cap Core Trust Series 1 |
572,049 | 641,544 | ||||||
| All Cap Value Trust Series 0 |
689,235 | 133,382 | ||||||
| All Cap Value Trust Series 1 |
2,119,036 | 3,556,564 | ||||||
| Alpha Opportunities Trust Series 0 |
7,124 | 621 | ||||||
| Alpha Opportunities Trust Series 1 |
27,229 | 1,417 | ||||||
| American Asset Allocation Trust Series 1 |
753,182 | 3,086,600 | ||||||
| American Blue Chip Income and Growth Trust Series 1 |
599,474 | 2,700,913 | ||||||
| American Global Growth Trust Series 1 |
95,922 | 126,259 | ||||||
| American Global Small Capitalization Trust Series 1 |
64,451 | 48,289 | ||||||
| American Growth Trust Series 1 |
5,969,001 | 10,418,020 | ||||||
| American Growth-Income Trust Series 1 |
6,567,531 | 8,553,389 | ||||||
| American High-Income Bond Trust Series 1 |
25,902 | 10,657 | ||||||
| American International Trust Series 1 |
5,733,423 | 15,276,339 | ||||||
| American New World Trust Series 1 |
324,082 | 178,445 | ||||||
| Balanced Trust Series 0 |
28,339 | 70,381 | ||||||
| Balanced Trust Series 1 |
9,906 | 28,563 | ||||||
| Blue Chip Growth Trust Series 0 |
5,614,710 | 6,223,098 | ||||||
| Blue Chip Growth Trust Series 1 |
1,603,274 | 8,250,324 | ||||||
| Bond Trust Series 0 |
822,173 | 384,363 | ||||||
| Bond Trust Series 1 |
125,139 | 952,644 | ||||||
| Capital Appreciation Trust Series 0 |
322,216 | 112,318 | ||||||
| Capital Appreciation Trust Series 1 |
580,124 | 2,738,973 | ||||||
| Capital Appreciation Value Trust Series 0 |
2,367,717 | 2,327,100 | ||||||
| Capital Appreciation Value Trust Series 1 |
325,492 | 430,247 | ||||||
| Core Allocation Plus Trust Series 0 |
33,403 | 11,575 | ||||||
| Core Allocation Plus Trust Series 1 |
122,916 | 3,309,275 | ||||||
| Core Bond Trust Series 0 |
811,839 | 621,841 | ||||||
| Core Bond Trust Series 1 |
11,011 | 437,989 | ||||||
| Core Strategy Trust Series 0 |
11,562 | 1,062 | ||||||
| Core Strategy Trust Series 1 |
589 | 100 | ||||||
73
Table of Contents
John Hancock Life Insurance Company (U.S.A.) Separate Account N
Notes to Financial Statements (continued)
| Purchases | Sales | |||||||
| Sub-accounts: |
||||||||
| Disciplined Diversification Trust Series 0 |
$ | 15,308 | $ | 21,214 | ||||
| Disciplined Diversification Trust Series 1 |
69 | 27 | ||||||
| Emerging Markets Value Trust Series 0 |
610,379 | 536,531 | ||||||
| Emerging Markets Value Trust Series 1 |
1,085,156 | 534,031 | ||||||
| Equity-Income Trust Series 0 |
11,010,303 | 10,828,450 | ||||||
| Equity-Income Trust Series 1 |
3,180,536 | 6,038,814 | ||||||
| Financial Services Trust Series 0 |
144,477 | 252,655 | ||||||
| Financial Services Trust Series 1 |
321,829 | 94,388 | ||||||
| Franklin Templeton Founding Allocation Trust Series 0 |
302,255 | 480,524 | ||||||
| Franklin Templeton Founding Allocation Trust Series 1 |
6,188 | 3,755 | ||||||
| Fundamental All Cap Core Trust Series 0 |
2,201,259 | 2,100,631 | ||||||
| Fundamental All Cap Core Trust Series 1 |
913,029 | 980,983 | ||||||
| Fundamental Holdings Trust Series 1 |
2,008 | 1,455 | ||||||
| Fundamental Large Cap Value Trust Series 0 |
1,401,972 | 1,334,003 | ||||||
| Fundamental Large Cap Value Trust Series 1 |
2,902 | 59 | ||||||
| Fundamental Value Trust Series 0 |
3,650,458 | 3,074,934 | ||||||
| Fundamental Value Trust Series 1 |
688,720 | 4,237,483 | ||||||
| Global Bond Trust Series 0 |
15,066,994 | 15,561,885 | ||||||
| Global Bond Trust Series 1 |
1,209,627 | 1,867,617 | ||||||
| Global Diversification Trust Series 1 |
95,396 | 45,293 | ||||||
| Global Trust Series 0 |
258,322 | 61,378 | ||||||
| Global Trust Series 1 |
1,570,474 | 1,298,933 | ||||||
| Health Sciences Trust Series 0 |
1,372,320 | 837,808 | ||||||
| Health Sciences Trust Series 1 |
1,413,444 | 1,398,970 | ||||||
| High Yield Trust Series 0 |
6,063,363 | 5,425,419 | ||||||
| High Yield Trust Series 1 |
2,240,058 | 3,417,858 | ||||||
| International Core Trust Series 0 |
123,900 | 96,205 | ||||||
| International Core Trust Series 1 |
217,933 | 1,052,316 | ||||||
| International Equity Index Trust A Series 0 |
86,031 | 363,051 | ||||||
| International Equity Index Trust A Series 1 |
1,564,437 | 5,669,375 | ||||||
| International Equity Index Trust B Series 0 |
10,044,236 | 6,229,782 | ||||||
| International Equity Index Trust B Series 1 |
4,081,044 | 791,037 | ||||||
| International Growth Stock Trust Series 0 |
6,123,548 | 1,076,807 | ||||||
| International Growth Stock Trust Series 1 |
436,017 | 9,095 | ||||||
| International Opportunities Trust Series 0 |
2,133,889 | 6,325,874 | ||||||
| International Opportunities Trust Series 1 |
40,394 | 769,639 | ||||||
| International Small Company Trust Series 0 |
342,835 | 229,502 | ||||||
| International Small Company Trust Series 1 |
143,589 | 1,409,665 | ||||||
| International Value Trust Series 0 |
3,232,579 | 2,987,816 | ||||||
| International Value Trust Series 1 |
1,494,921 | 3,397,461 | ||||||
| Investment Quality Bond Trust Series 0 |
175,054 | 67,362 | ||||||
| Investment Quality Bond Trust Series 1 |
525,993 | 2,828,312 | ||||||
| Large Cap Trust Series 0 |
97,963 | 610,351 | ||||||
| Large Cap Trust Series 1 |
261,711 | 2,442,573 | ||||||
| Lifestyle Aggressive Trust Series 0 |
3,868,536 | 6,269,909 | ||||||
| Lifestyle Aggressive Trust Series 1 |
794,766 | 3,253,046 | ||||||
| Lifestyle Balanced Trust Series 0 |
7,827,160 | 10,079,577 | ||||||
| Lifestyle Balanced Trust Series 1 |
5,504,568 | 10,587,778 | ||||||
| Lifestyle Conservative Trust Series 0 |
3,814,541 | 1,130,056 | ||||||
| Lifestyle Conservative Trust Series 1 |
5,870,962 | 2,644,423 | ||||||
| Lifestyle Growth Trust Series 0 |
5,120,271 | 5,757,353 | ||||||
74
Table of Contents
John Hancock Life Insurance Company (U.S.A.) Separate Account N
Notes to Financial Statements (continued)
| Purchases | Sales | |||||||
| Sub-accounts: |
||||||||
| Lifestyle Growth Trust Series 1 |
$ | 1,972,454 | $ | 6,537,846 | ||||
| Lifestyle Moderate Trust Series 0 |
5,215,326 | 3,687,702 | ||||||
| Lifestyle Moderate Trust Series 1 |
875,901 | 1,387,888 | ||||||
| Mid Cap Index Trust Series 0 |
4,584,210 | 3,068,929 | ||||||
| Mid Cap Index Trust Series 1 |
2,468,472 | 6,907,214 | ||||||
| Mid Cap Stock Trust Series 0 |
7,453,930 | 7,434,327 | ||||||
| Mid Cap Stock Trust Series 1 |
317,313 | 3,083,320 | ||||||
| Mid Value Trust Series 0 |
4,300,613 | 3,602,501 | ||||||
| Mid Value Trust Series 1 |
1,334,051 | 1,784,572 | ||||||
| Money Market Trust B Series 0 |
87,922,275 | 79,123,533 | ||||||
| Money Market Trust Series 1 |
71,633,519 | 16,863,627 | ||||||
| Natural Resources Trust Series 0 |
863,791 | 511,878 | ||||||
| Natural Resources Trust Series 1 |
1,696,758 | 3,277,444 | ||||||
| Real Estate Securities Trust Series 0 |
4,796,250 | 4,011,992 | ||||||
| Real Estate Securities Trust Series 1 |
2,115,280 | 4,932,755 | ||||||
| Real Return Bond Trust Series 0 |
12,394,802 | 10,538,688 | ||||||
| Real Return Bond Trust Series 1 |
1,589,401 | 2,197,023 | ||||||
| Science & Technology Trust Series 0 |
372,185 | 270,051 | ||||||
| Science & Technology Trust Series 1 |
1,997,148 | 3,536,422 | ||||||
| Short Term Government Income Trust Series 0 |
7,094,056 | 5,418,144 | ||||||
| Short Term Government Income Trust Series 1 |
1,570,593 | 1,920,117 | ||||||
| Small Cap Growth Trust Series 0 |
4,855,214 | 4,027,654 | ||||||
| Small Cap Growth Trust Series 1 |
876,511 | 825,367 | ||||||
| Small Cap Index Trust Series 0 |
4,696,928 | 2,487,134 | ||||||
| Small Cap Index Trust Series 1 |
5,663,448 | 2,191,533 | ||||||
| Small Cap Opportunities Trust Series 0 |
52,177 | 71,661 | ||||||
| Small Cap Opportunities Trust Series 1 |
51,435 | 443,852 | ||||||
| Small Cap Value Trust Series 0 |
3,655,770 | 3,486,573 | ||||||
| Small Cap Value Trust Series 1 |
1,155,870 | 779,817 | ||||||
| Small Company Value Trust Series 0 |
542,898 | 430,363 | ||||||
| Small Company Value Trust Series 1 |
916,097 | 3,230,300 | ||||||
| Smaller Company Growth Trust Series 0 |
60,866 | 117,955 | ||||||
| Smaller Company Growth Trust Series 1 |
1,721,660 | 5,048,945 | ||||||
| Strategic Income Opportunities Trust Series 0 |
1,386,462 | 417,768 | ||||||
| Strategic Income Opportunities Trust Series 1 |
539,023 | 1,451,397 | ||||||
| Total Bond Market Trust B Series 0 |
13,360,956 | 8,360,860 | ||||||
| Total Return Trust Series 0 |
18,031,749 | 17,013,391 | ||||||
| Total Return Trust Series 1 |
8,576,287 | 32,050,941 | ||||||
| Total Stock Market Index Trust Series 0 |
226,764 | 460,225 | ||||||
| Total Stock Market Index Trust Series 1 |
1,101,821 | 1,286,585 | ||||||
| Ultra Short Term Bond Trust Series 0 |
450,039 | 223,748 | ||||||
| Ultra Short Term Bond Trust Series 1 |
8,172 | 1,970 | ||||||
| U.S. Equity Trust Series 0 |
574,855 | 43,392 | ||||||
| U.S. Equity Trust Series 1 |
1,525,946 | 459,476 | ||||||
| Utilities Trust Series 0 |
358,569 | 277,312 | ||||||
| Utilities Trust Series 1 |
675,989 | 1,030,608 | ||||||
| Value Trust Series 0 |
188,900 | 51,466 | ||||||
| Value Trust Series 1 |
1,600,437 | 2,911,662 | ||||||
| All Asset Portfolio |
1,352,555 | 659,629 | ||||||
| Brandes International Equity Trust |
62,689 | 62,923 | ||||||
| Frontier Capital Appreciation Trust |
3,731,024 | 3,628,393 | ||||||
| Large Cap Growth Trust |
308,158 | 2,622 | ||||||
|
|
|
|
|
|||||
| $ | 490,798,525 | $ | 502,792,625 | |||||
|
|
|
|
|
|||||
75
Table of Contents
John Hancock Life Insurance Company (U.S.A.) Separate Account N
Notes to Financial Statements (continued)
| 7. | Transaction with Affiliates |
John Hancock Distributors LLC, a registered broker-dealer and wholly owned subsidiary of JHUSA, acts as the principal underwriter of the Contracts pursuant to a distribution agreement with the Company. Contracts are sold by registered representatives of either John Hancock Distributors LLC or other broker-dealers having distribution agreements with John Hancock Distributors LLC who are also authorized as variable life insurance agents under applicable state insurance laws. Registered representatives are compensated on a commission basis.
JHUSA has a formal service agreement with its ultimate parent company, MFC, which can be terminated by either party upon two months’ notice. Under this agreement, JHUSA pays for legal, actuarial, investment and certain other administrative services.
The majority of the investments held by the Account are invested in the Trust (Note 1).
Mortality and expense risks charges, as described in Note 3, are paid to JHUSA.
| 8. | Diversification Requirements |
The Internal Revenue Service has issued regulations under Section 817(h) of the Internal Revenue Code (the “Code”). Under the provisions of Section 817(h) of the Code, a variable life contract will not be treated as a life contract for federal tax purposes for any period for which the investments of the Account on which the contract is based are not adequately diversified. The Code provides that the “adequately diversified” requirement may be met if the underlying investments satisfy either a statutory safe harbour test or diversification requirements set forth in regulations issued by the Secretary of Treasury. JHUSA believes that the Account satisfies the current requirements of the regulations, and the Account will continue to meet such requirements.
| 9. | Subsequent Events |
In accordance with the provision set forth in FASB ASC Topic 855 - Subsequent Events (“ASC 855”), management has evaluated the possibility of subsequent events existing in the Account’s financial statements through March 28, 2013 and has determined that no events have occurred that require additional disclosure.
76
Table of Contents
John Hancock Life Insurance Company (U.S.A.) Separate Account N
Notes to Financial Statements (continued)
| 10. | Financial Highlights |
| Sub-Account | ||||||||||||||||||||
| 500 Index Trust B Series 0 | ||||||||||||||||||||
| Year Ended Dec. 31/12 |
Year Ended Dec. 31/11 |
Year Ended Dec. 31/10 |
Year Ended Dec. 31/09 |
Year Ended Dec. 31/08 |
||||||||||||||||
| Units, beginning of period |
1,390,856 | 1,290,604 | 1,301,021 | 1,219,448 | 1,025,869 | |||||||||||||||
| Units issued |
1,230,219 | 619,564 | 517,339 | 698,381 | 805,900 | |||||||||||||||
| Units redeemed |
(1,022,518 | ) | (519,312 | ) | (527,756 | ) | (616,808 | ) | (612,321 | ) | ||||||||||
|
|
|
|
|
|
|
|
|
|
|
|||||||||||
| Units, end of period |
1,598,557 | 1,390,856 | 1,290,604 | 1,301,021 | 1,219,448 | |||||||||||||||
|
|
|
|
|
|
|
|
|
|
|
|||||||||||
| Unit value, end of period $ |
16.90 to 28.52 | 14.50 to 24.63 | 14.53 to 24.18 | 12.77 to 21.05 | 10.17 to 16.66 | |||||||||||||||
| Assets, end of period $ |
38,999,373 | 29,723,881 | 26,434,250 | 22,312,778 | 16,165,681 | |||||||||||||||
| Investment income ratio* |
1.07 | % | 1.93 | % | 1.84 | % | 2.30 | % | 2.35 | % | ||||||||||
| Expense ratio, lowest to highest** |
0.00% to 0.70 | % | 0.00% to 0.70 | % | 0.00% to 0.70 | % | 0.00% to 0.65 | % | 0.00% to 0.65 | % | ||||||||||
| Total return, lowest to highest*** |
14.99% to 15.80 | % | 0.95% to 1.87 | % | 14.06% to 14.85 | % | 25.53% to 26.36 | % | (37.60%) to (37.19 | %) | ||||||||||
| Sub-Account | ||||||||||||||||||||
| 500 Index Trust Series 1 | ||||||||||||||||||||
| Year Ended Dec. 31/12 (t) |
Year Ended Dec. 31/11 |
Year Ended Dec. 31/10 |
Year Ended Dec. 31/09 |
Year Ended Dec. 31/08 |
||||||||||||||||
| Units, beginning of period |
101,308 | 481,864 | 622,022 | 1,495,132 | 1,964,200 | |||||||||||||||
| Units issued |
385,798 | 69,345 | 257,975 | 1,120,394 | 694,681 | |||||||||||||||
| Units redeemed |
(487,106 | ) | (449,901 | ) | (398,133 | ) | (1,993,504 | ) | (1,163,749 | ) | ||||||||||
|
|
|
|
|
|
|
|
|
|
|
|||||||||||
| Units, end of period |
— | 101,308 | 481,864 | 622,022 | 1,495,132 | |||||||||||||||
|
|
|
|
|
|
|
|
|
|
|
|||||||||||
| Unit value, end of period $ |
13.46 to 14.12 | 11.54 to 12.73 | 11.73 to 12.21 | 10.29 to 10.67 | 8.22 to 8.49 | |||||||||||||||
| Assets, end of period $ |
— | 1,221,762 | 5,812,898 | 6,527,296 | 12,533,893 | |||||||||||||||
| Investment income ratio* |
3.97 | % | 0.67 | % | 1.35 | % | 1.52 | % | 0.68 | % | ||||||||||
| Expense ratio, lowest to highest** |
0.25% to 0.65 | % | 0.00% to 0.65 | % | 0.25% to 0.65 | % | 0.25% to 0.65 | % | 0.25% to 0.65 | % | ||||||||||
| Total return, lowest to highest*** |
13.51% to 13.90 | % | 0.83% to 1.75 | % | 14.03% to 14.48 | % | 25.13% to 25.64 | % | (37.51%) to (37.26 | %) | ||||||||||
| (t) | Terminated as an investment option and funds transferred to 500 Index Trust B Series 0 on November 5, 2012. |
77
Table of Contents
John Hancock Life Insurance Company (U.S.A.) Separate Account N
Notes to Financial Statements (continued)
| 10. | Financial Highlights |
| Sub-Account | ||||||||||||||||||||
| Active Bond Trust Series 0 | ||||||||||||||||||||
| Year Ended Dec. 31/12 |
Year Ended Dec. 31/11 |
Year Ended Dec. 31/10 |
Year Ended Dec. 31/09 |
Year Ended Dec. 31/08 |
||||||||||||||||
| Units, beginning of period |
3,871 | 6,841 | 4,896 | 10,376 | 10,394 | |||||||||||||||
| Units issued |
61,998 | 2,108 | 4,921 | 3,279 | 13,837 | |||||||||||||||
| Units redeemed |
(62,256 | ) | (5,078 | ) | (2,976 | ) | (8,759 | ) | (13,855 | ) | ||||||||||
|
|
|
|
|
|
|
|
|
|
|
|||||||||||
| Units, end of period |
3,613 | 3,871 | 6,841 | 4,896 | 10,376 | |||||||||||||||
|
|
|
|
|
|
|
|
|
|
|
|||||||||||
| Unit value, end of period $ |
66.31 | 60.42 | 57.02 | 50.05 | 40.09 | |||||||||||||||
| Assets, end of period $ |
239,468 | 233,806 | 389,972 | 245,021 | 415,916 | |||||||||||||||
| Investment income ratio* |
4.25 | % | 4.23 | % | 10.01 | % | 4.48 | % | 5.06 | % | ||||||||||
| Expense ratio, lowest to highest** |
0.00 | % | 0.00 | % | 0.00 | % | 0.00 | % | 0.00 | % | ||||||||||
| Total return, lowest to highest*** |
9.76 | % | 5.97 | % | 13.91 | % | 24.86 | % | (10.48%) to (7.37 | %) | ||||||||||
| Sub-Account | ||||||||||||||||||||
| Active Bond Trust Series 1 | ||||||||||||||||||||
| Year Ended Dec. 31/12 |
Year Ended Dec. 31/11 |
Year Ended Dec. 31/10 |
Year Ended Dec. 31/09 |
Year Ended Dec. 31/08 |
||||||||||||||||
| Units, beginning of period |
52,039 | 83,593 | 86,344 | 67,710 | 141,516 | |||||||||||||||
| Units issued |
29,071 | 25,119 | 36,499 | 108,085 | 174,296 | |||||||||||||||
| Units redeemed |
(53,108 | ) | (56,673 | ) | (39,250 | ) | (89,451 | ) | (248,102 | ) | ||||||||||
|
|
|
|
|
|
|
|
|
|
|
|||||||||||
| Units, end of period |
28,002 | 52,039 | 83,593 | 86,344 | 67,710 | |||||||||||||||
|
|
|
|
|
|
|
|
|
|
|
|||||||||||
| Unit value, end of period $ |
19.38 to 20.05 | 17.48 to 18.56 | 16.91 to 17.34 | 14.95 to 15.19 | 12.06 to 12.21 | |||||||||||||||
| Assets, end of period $ |
543,833 | 926,985 | 1,419,732 | 1,297,722 | 820,988 | |||||||||||||||
| Investment income ratio* |
4.45 | % | 4.54 | % | 7.99 | % | 9.00 | % | 4.00 | % | ||||||||||
| Expense ratio, lowest to highest** |
0.20% to 0.65 | % | 0.00% to 0.65 | % | 0.20% to 0.65 | % | 0.30% to 0.65 | % | 0.30% to 0.65 | % | ||||||||||
| Total return, lowest to highest*** |
8.99% to 9.49 | % | 4.87% to 5.81 | % | 13.11% to 13.62 | % | 24.00% to 24.44 | % | (11.11%) to (10.80 | %) | ||||||||||
78
Table of Contents
John Hancock Life Insurance Company (U.S.A.) Separate Account N
Notes to Financial Statements (continued)
| 10. | Financial Highlights |
| Sub-Account | ||||||||||||||||||||
| All Asset Portfolio | ||||||||||||||||||||
| Year Ended Dec. 31/12 (bf) |
Year Ended Dec. 31/11 (bf) |
Year Ended Dec. 31/10 (bf) |
Year Ended Dec. 31/09 |
Year Ended Dec. 31/08 |
||||||||||||||||
| Units, beginning of period |
120,106 | 131,872 | 116,482 | 50,680 | 52,918 | |||||||||||||||
| Units issued |
74,562 | 43,749 | 69,869 | 97,260 | 51,452 | |||||||||||||||
| Units redeemed |
(37,842 | ) | (55,515 | ) | (54,479 | ) | (31,458 | ) | (53,690 | ) | ||||||||||
|
|
|
|
|
|
|
|
|
|
|
|||||||||||
| Units, end of period |
156,826 | 120,106 | 131,872 | 116,482 | 50,680 | |||||||||||||||
|
|
|
|
|
|
|
|
|
|
|
|||||||||||
| Unit value, end of period $ |
15.82 to 21.11 | 18.18 to 19.48 | 13.58 to 18.35 | 12.05 to 16.67 | 9.93 to 13.72 | |||||||||||||||
| Assets, end of period $ |
2,641,719 | 1,775,553 | 1,987,169 | 1,563,518 | 671,955 | |||||||||||||||
| Investment income ratio* |
4.87 | % | 6.34 | % | 6.94 | % | 9.51 | % | 5.40 | % | ||||||||||
| Expense ratio, lowest to highest** |
0.00% to 0.65 | % | 0.00% to 0.65 | % | 0.00% to 0.65 | % | 0.35% to 0.65 | % | 0.00% to 0.65 | % | ||||||||||
| Total return, lowest to highest*** |
13.90% to 14.65 | % | 0.75% to 1.66 | % | 11.98% to 12.71 | % | 20.52% to 20.89 | % | (16.71%) to (12.60 | %) | ||||||||||
| (bf) Fund has no Series. Previously presented as Series 0 and Series 1. |
| |||||||||||||||||||
| Sub-Account | ||||||||||||||||||||
| All Cap Core Trust Series 0 | ||||||||||||||||||||
| Year Ended Dec. 31/12 |
Year Ended Dec. 31/11 |
Year Ended Dec. 31/10 |
Year Ended Dec. 31/09 |
Year Ended Dec. 31/08 |
||||||||||||||||
| Units, beginning of period |
20,786 | 20,587 | 14,832 | 1,899 | 2,196 | |||||||||||||||
| Units issued |
43,314 | 5,406 | 7,798 | 15,567 | 207,065 | |||||||||||||||
| Units redeemed |
(4,795 | ) | (5,207 | ) | (2,043 | ) | (2,634 | ) | (207,362 | ) | ||||||||||
|
|
|
|
|
|
|
|
|
|
|
|||||||||||
| Units, end of period |
59,305 | 20,786 | 20,587 | 14,832 | 1,899 | |||||||||||||||
|
|
|
|
|
|
|
|
|
|
|
|||||||||||
| Unit value, end of period $ |
13.72 | 11.76 | 11.71 | 10.36 | 8.05 | |||||||||||||||
| Assets, end of period $ |
813,432 | 244,445 | 241,137 | 153,621 | 15,283 | |||||||||||||||
| Investment income ratio* |
1.24 | % | 1.09 | % | 1.26 | % | 2.08 | % | 1.09 | % | ||||||||||
| Expense ratio, lowest to highest** |
0.00 | % | 0.00 | % | 0.00 | % | 0.00 | % | 0.00 | % | ||||||||||
| Total return, lowest to highest*** |
16.62 | % | 0.40 | % | 13.09 | % | 28.61 | % | (39.60%) to (26.69 | %) | ||||||||||
79
Table of Contents
John Hancock Life Insurance Company (U.S.A.) Separate Account N
Notes to Financial Statements (continued)
| 10. | Financial Highlights |
| Sub-Account | ||||||||||||||||||||
| All Cap Core Trust Series 1 | ||||||||||||||||||||
| Year Ended Dec. 31/12 |
Year Ended Dec. 31/11 |
Year Ended Dec. 31/10 |
Year Ended Dec. 31/09 |
Year Ended Dec. 31/08 |
||||||||||||||||
| Units, beginning of period |
24,152 | 29,325 | 68,668 | 411,878 | 556,146 | |||||||||||||||
| Units issued |
28,690 | 14,019 | 4,369 | 79,155 | 155,444 | |||||||||||||||
| Units redeemed |
(32,269 | ) | (19,192 | ) | (43,712 | ) | (422,365 | ) | (299,712 | ) | ||||||||||
|
|
|
|
|
|
|
|
|
|
|
|||||||||||
| Units, end of period |
20,573 | 24,152 | 29,325 | 68,668 | 411,878 | |||||||||||||||
|
|
|
|
|
|
|
|
|
|
|
|||||||||||
| Unit value, end of |
19.72 to 20.68 | 9.50 to 18.40 | 17.08 to 17.78 | 15.29 to 15.77 | 11.98 to 12.31 | |||||||||||||||
| Assets, end of period $ |
408,071 | 413,811 | 504,744 | 1,059,003 | 5,019,487 | |||||||||||||||
| Investment income ratio* |
0.97 | % | 0.94 | % | 0.76 | % | 1.25 | % | 1.55 | % | ||||||||||
| Expense ratio, lowest to highest** |
0.30% to 0.70 | % | 0.00% to 0.65 | % | 0.30% to 0.70 | % | 0.30% to 0.65 | % | 0.30% to 0.65 | % | ||||||||||
| Total return, lowest to highest*** |
15.75% to 16.21 | % | (0.49%) to 0.41 | % | 12.25% to 12.70 | % | 27.62% to 28.08 | % | (40.02%) to (39.81 | %) | ||||||||||
| Sub-Account | ||||||||||||||||||||
| All Cap Value Trust Series 0 | ||||||||||||||||||||
| Year Ended Dec. 31/12 |
Year Ended Dec. 31/11 |
Year Ended Dec. 31/10 |
Year Ended Dec. 31/09 |
Year Ended Dec. 31/08 |
||||||||||||||||
| Units, beginning of period |
36,891 | 15,042 | 42,141 | 21,831 | 3,203 | |||||||||||||||
| Units issued |
43,228 | 33,908 | 24,757 | 44,155 | 22,505 | |||||||||||||||
| Units redeemed |
(8,817 | ) | (12,059 | ) | (51,856 | ) | (23,845 | ) | (3,877 | ) | ||||||||||
|
|
|
|
|
|
|
|
|
|
|
|||||||||||
| Units, end of period |
71,302 | 36,891 | 15,042 | 42,141 | 21,831 | |||||||||||||||
|
|
|
|
|
|
|
|
|
|
|
|||||||||||
| Unit value, end of |
15.60 | 14.06 | 14.67 | 12.38 | 9.78 | |||||||||||||||
| Assets, end of period $ |
1,111,990 | 518,670 | 220,669 | 521,779 | 213,526 | |||||||||||||||
| Investment income ratio* |
0.93 | % | 0.48 | % | 0.20 | % | 0.74 | % | 2.30 | % | ||||||||||
| Expense ratio, lowest to highest** |
0.00 | % | 0.00 | % | 0.00 | % | 0.00 | % | 0.00 | % | ||||||||||
| Total return, lowest to highest*** |
10.92 | % | (4.17 | %) | 18.50 | % | 26.59 | % | (28.80%) to (19.83 | %) | ||||||||||
80
Table of Contents
John Hancock Life Insurance Company (U.S.A.) Separate Account N
Notes to Financial Statements (continued)
| 10. | Financial Highlights |
| Sub-Account | ||||||||||||||||||||
| All Cap Value Trust Series 1 | ||||||||||||||||||||
| Year Ended Dec. 31/12 |
Year Ended Dec. 31/11 |
Year Ended Dec. 31/10 |
Year Ended Dec. 31/09 |
Year Ended Dec. 31/08 |
||||||||||||||||
| Units, beginning of period |
200,208 | 179,275 | 115,523 | 363,932 | 462,488 | |||||||||||||||
| Units issued |
100,075 | 70,122 | 129,563 | 33,538 | 67,408 | |||||||||||||||
| Units redeemed |
(178,261 | ) | (49,189 | ) | (65,811 | ) | (281,947 | ) | (165,964 | ) | ||||||||||
|
|
|
|
|
|
|
|
|
|
|
|||||||||||
| Units, end of period |
122,022 | 200,208 | 179,275 | 115,523 | 363,932 | |||||||||||||||
|
|
|
|
|
|
|
|
|
|
|
|||||||||||
| Unit value, end of |
19.99 to 21.07 | 17.66 to 19.44 | 19.05 to 19.90 | 16.21 to 16.71 | 12.88 to 13.23 | |||||||||||||||
| Assets, end of period $ |
2,510,933 | 3,713,797 | 3,492,399 | 1,904,662 | 4,771,874 | |||||||||||||||
| Investment income ratio* |
0.84 | % | 0.36 | % | 0.46 | % | 0.47 | % | 0.80 | % | ||||||||||
| Expense ratio, lowest to highest** |
0.20% to 0.65 | % | 0.00% to 0.65 | % | 0.20% to 0.65 | % | 0.30% to 0.65 | % | 0.30% to 0.65 | % | ||||||||||
| Total return, lowest to highest*** |
10.23% to 10.73 | % | (5.06%) to (4.21 | %) | 17.59% to 18.12 | % | 25.79% to 26.23 | % | (29.25%) to (28.99 | %) | ||||||||||
| Sub-Account | ||||||||||||||||
| Alpha Opportunities Trust Series 0 | ||||||||||||||||
| Year Ended Dec. 31/12 |
Year Ended Dec. 31/11 |
Year Ended Dec. 31/10 |
Year Ended Dec. 31/09 (ak) |
|||||||||||||
| Units, beginning of period |
818 | 324 | 15,886 | — | ||||||||||||
| Units issued |
380 | 513 | 379 | 15,886 | ||||||||||||
| Units redeemed |
(40 | ) | (19 | ) | (15,941 | ) | — | |||||||||
|
|
|
|
|
|
|
|
|
|||||||||
| Units, end of period |
1,158 | 818 | 324 | 15,886 | ||||||||||||
|
|
|
|
|
|
|
|
|
|||||||||
| Unit value, end of period $ |
16.63 | 13.70 | 14.89 | 12.73 | ||||||||||||
| Assets, end of period $ |
19,259 | 11,203 | 4,817 | 202,244 | ||||||||||||
| Investment income ratio* |
0.76 | % | 0.35 | % | 0.35 | % | 0.00 | % | ||||||||
| Expense ratio, lowest to highest** |
0.00 | % | 0.00 | % | 0.00 | % | 0.00 | % | ||||||||
| Total return, lowest to highest*** |
21.38 | % | (8.02 | %) | 16.98 | % | 27.31 | % | ||||||||
| (ak) | Reflects the period from commencement of operations on May 4, 2009 through December 31, 2009. |
81
Table of Contents
John Hancock Life Insurance Company (U.S.A.) Separate Account N
Notes to Financial Statements (continued)
| 10. | Financial Highlights |
| Sub-Account | ||||||||||||
| Alpha Opportunities Trust Series 1 | ||||||||||||
| Year Ended Dec. 31/12 |
Year Ended Dec. 31/11 |
Year Ended Dec. 31/10 (g) |
||||||||||
| Units, beginning of period |
1,009 | 68 | — | |||||||||
| Units issued |
1,675 | 958 | 70 | |||||||||
| Units redeemed |
(85 | ) | (17 | ) | (2 | ) | ||||||
|
|
|
|
|
|
|
|||||||
| Units, end of period |
2,599 | 1,009 | 68 | |||||||||
|
|
|
|
|
|
|
|||||||
| Unit value, end of period $ |
15.36 | 12.66 to 12.96 | 13.97 | |||||||||
| Assets, end of period $ |
39,931 | 12,862 | 949 | |||||||||
| Investment income ratio* |
0.67 | % | 0.62 | % | 0.70 | % | ||||||
| Expense ratio, lowest to highest** |
0.65 | % | 0.00% to 0.65 | % | 0.65 | % | ||||||
| Total return, lowest to highest*** |
20.55 | % | (8.96%) to (8.14 | %) | 16.17 | % | ||||||
| (g) Fund available in prior year but no activity. |
| |||||||||||
| Sub-Account | ||||||||||||||||||||
| American Asset Allocation Trust Series 1 | ||||||||||||||||||||
| Year Ended Dec. 31/12 |
Year Ended Dec. 31/11 |
Year Ended Dec. 31/10 |
Year Ended Dec. 31/09 |
Year Ended Dec. 31/08 (f) |
||||||||||||||||
| Units, beginning of period |
977,731 | 1,142,310 | 1,347,946 | 29,748 | — | |||||||||||||||
| Units issued |
58,651 | 119,383 | 228,225 | 1,527,333 | 30,140 | |||||||||||||||
| Units redeemed |
(280,284 | ) | (283,962 | ) | (433,861 | ) | (209,135 | ) | (392 | ) | ||||||||||
|
|
|
|
|
|
|
|
|
|
|
|||||||||||
| Units, end of period |
756,098 | 977,731 | 1,142,310 | 1,347,946 | 29,748 | |||||||||||||||
|
|
|
|
|
|
|
|
|
|
|
|||||||||||
| Unit value, end of period $ |
11.37 to 11.75 | 9.82 to 10.15 | 9.87 to 10.06 | 8.87 to 8.98 | 7.23 to 7.26 | |||||||||||||||
| Assets, end of period $ |
8,630,865 | 9,708,956 | 11,308,578 | 11,976,200 | 215,822 | |||||||||||||||
| Investment income ratio* |
1.43 | % | 1.40 | % | 1.53 | % | 2.77 | % | 8.19 | % | ||||||||||
| Expense ratio, lowest to highest** |
0.00% to 0.70 | % | 0.00% to 0.65 | % | 0.00% to 0.70 | % | 0.00% to 0.70 | % | 0.00% to 0.65 | % | ||||||||||
| Total return, lowest to highest*** |
14.95% to 15.77 | % | 0.01% to 0.91 | % | 11.27% to 12.07 | % | 22.75% to 23.61 | % | (27.71%) to (27.39 | %) | ||||||||||
| (f) | Reflects the period from commencement of operations on April 28, 2008 through December 31, 2008. |
82
Table of Contents
John Hancock Life Insurance Company (U.S.A.) Separate Account N
Notes to Financial Statements (continued)
| 10. | Financial Highlights |
| Sub-Account | ||||||||||||||||||||
| American Blue Chip Income and Growth Trust Series 1 | ||||||||||||||||||||
| Year Ended Dec. 31/12 (v) |
Year Ended Dec. 31/11 |
Year Ended Dec. 31/10 |
Year Ended Dec. 31/09 |
Year Ended Dec. 31/08 |
||||||||||||||||
| Units, beginning of period |
143,035 | 148,499 | 112,395 | 235,456 | 198,959 | |||||||||||||||
| Units issued |
21,887 | 51,321 | 69,650 | 114,968 | 219,437 | |||||||||||||||
| Units redeemed |
(164,922 | ) | (56,785 | ) | (33,546 | ) | (238,029 | ) | (182,940 | ) | ||||||||||
|
|
|
|
|
|
|
|
|
|
|
|||||||||||
| Units, end of period |
— | 143,035 | 148,499 | 112,395 | 235,456 | |||||||||||||||
|
|
|
|
|
|
|
|
|
|
|
|||||||||||
| Unit value, end of period $ |
13.19 to 18.54 | 16.28 to 17.57 | 11.92 to 16.95 | 10.64 to 15.23 | 8.36 to 12.04 | |||||||||||||||
| Assets, end of |
— | 2,148,343 | 2,262,559 | 1,502,607 | 2,652,929 | |||||||||||||||
| Investment income ratio* |
0.00 | % | 1.36 | % | 1.60 | % | 1.30 | % | 4.38 | % | ||||||||||
| Expense ratio, lowest to highest** |
0.00% to 0.65 | % | 0.00% to 0.65 | % | 0.00% to 0.65 | % | 0.00% to 0.65 | % | 0.00% to 0.65 | % | ||||||||||
| Total return, lowest to highest*** |
11.54% to 12.15 | % | (2.18%) to (1.29 | %) | 11.29% to 12.02 | % | 26.52% to 27.32 | % | (37.14%) to (36.72 | %) | ||||||||||
| (v) | Terminated as an investment option and funds transferred to American Growth-Income Trust Series 1 on November 5, 2012. |
| Sub-Account | ||||||||||||
| American Global Growth Trust Series 1 | ||||||||||||
| Year Ended Dec. 31/12 |
Year Ended Dec. 31/11 |
Year Ended Dec. 31/10 (bd) |
||||||||||
| Units, beginning of period |
37,700 | 30,482 | — | |||||||||
| Units issued |
9,306 | 7,284 | 30,482 | |||||||||
| Units redeemed |
(12,718 | ) | (66 | ) | — | |||||||
|
|
|
|
|
|
|
|||||||
| Units, end of period |
34,288 | 37,700 | 30,482 | |||||||||
|
|
|
|
|
|
|
|||||||
| Unit value, end of period $ |
11.04 to 11.19 | 9.07 to 9.17 | 10.09 to 10.10 | |||||||||
| Assets, end of period $ |
380,096 | 343,828 | 307,651 | |||||||||
| Investment income ratio* |
0.50 | % | 1.06 | % | 6.23 | % | ||||||
| Expense ratio, lowest to highest** |
0.00% to 0.65 | % | 0.00% to 0.65 | % | 0.00% to 0.65 | % | ||||||
| Total return, lowest to highest*** |
21.33% to 22.12 | % | (10.05%) to (9.24 | %) | 0.90% to 0.99 | % | ||||||
| (bd) | Reflects the period from commencement of operations on November 8, 2010 through December 31, 2010. |
83
Table of Contents
John Hancock Life Insurance Company (U.S.A.) Separate Account N
Notes to Financial Statements (continued)
| 10. | Financial Highlights |
| Sub-Account | ||||||||
| American Global Small Capitalization Trust Series 1 |
||||||||
| Year Ended Dec. 31/12 |
Year Ended Dec. 31/11 (g) |
|||||||
| Units, beginning of period |
3,085 | — | ||||||
| Units issued |
6,926 | 7,101 | ||||||
| Units redeemed |
(5,214 | ) | (4,016 | ) | ||||
|
|
|
|
|
|||||
| Units, end of period |
4,797 | 3,085 | ||||||
|
|
|
|
|
|||||
| Unit value, end of period $ |
9.51 to 9.64 | 8.10 to 8.19 | ||||||
| Assets, end of period $ |
46,142 | 25,273 | ||||||
| Investment income ratio* |
1.13 | % | 1.64 | % | ||||
| Expense ratio, lowest to highest** |
0.00% to 0.65 | % | 0.00% to 0.65 | % | ||||
| Total return, lowest to highest*** |
16.95% to 17.71 | % | (20.15%) to (19.43 | %) | ||||
| (g) | Fund available in prior year but no activity. |
| Sub-Account | ||||||||||||||||||||
| American Growth Trust Series 1 | ||||||||||||||||||||
| Year Ended Dec. 31/12 |
Year Ended Dec. 31/11 |
Year Ended Dec. 31/10 |
Year Ended Dec. 31/09 |
Year Ended Dec. 31/08 |
||||||||||||||||
| Units, beginning of period |
942,082 | 1,150,584 | 1,055,312 | 1,656,204 | 1,130,158 | |||||||||||||||
| Units issued |
364,673 | 220,746 | 602,474 | 1,119,034 | 1,206,254 | |||||||||||||||
| Units redeemed |
(574,961 | ) | (429,248 | ) | (507,202 | ) | (1,719,926 | ) | (680,208 | ) | ||||||||||
|
|
|
|
|
|
|
|
|
|
|
|||||||||||
| Units, end of period |
731,794 | 942,082 | 1,150,584 | 1,055,312 | 1,656,204 | |||||||||||||||
|
|
|
|
|
|
|
|
|
|
|
|||||||||||
| Unit value, end of period $ |
15.11 to 21.39 | 17.93 to 19.36 | 13.48 to 19.34 | 11.40 to 16.46 | 8.21 to 11.93 | |||||||||||||||
| Assets, end of |
13,000,429 | 15,091,745 | 19,293,612 | 15,119,166 | 18,483,137 | |||||||||||||||
| Investment income ratio* |
0.38 | % | 0.21 | % | 0.36 | % | 0.25 | % | 2.08 | % | ||||||||||
| Expense ratio, lowest to highest** |
0.00% to 0.65 | % | 0.00% to 0.65 | % | 0.00% to 0.65 | % | 0.00% to 0.65 | % | 0.00% to 0.65 | % | ||||||||||
| Total return, lowest to highest*** |
16.73% to 17.49 | % | (5.48%) to (4.63 | %) | 17.47% to 18.24 | % | 37.98% to 38.87 | % | (44.56%) to (44.20 | %) | ||||||||||
84
Table of Contents
John Hancock Life Insurance Company (U.S.A.) Separate Account N
Notes to Financial Statements (continued)
| 10. | Financial Highlights |
| Sub-Account | ||||||||||||||||||||
| American Growth-Income Trust Series 1 | ||||||||||||||||||||
| Year Ended Dec. 31/12 |
Year Ended Dec. 31/11 |
Year Ended Dec. 31/10 |
Year Ended Dec. 31/09 |
Year Ended Dec. 31/08 |
||||||||||||||||
| Units, beginning of period |
647,424 | 687,527 | 839,780 | 158,070 | 246,940 | |||||||||||||||
| Units issued |
462,947 | 275,600 | 90,377 | 957,864 | 282,920 | |||||||||||||||
| Units redeemed |
(565,675 | ) | (315,703 | ) | (242,630 | ) | (276,154 | ) | (371,790 | ) | ||||||||||
|
|
|
|
|
|
|
|
|
|
|
|||||||||||
| Units, end of period |
544,696 | 647,424 | 687,527 | 839,780 | 158,070 | |||||||||||||||
|
|
|
|
|
|
|
|
|
|
|
|||||||||||
| Unit value, end of period $ |
13.62 to 19.02 | 16.08 to 17.35 | 11.87 to 16.82 | 10.69 to 15.25 | 8.17 to 11.77 | |||||||||||||||
| Assets, end of |
9,568,162 | 10,080,686 | 11,141,813 | 12,417,690 | 1,533,150 | |||||||||||||||
| Investment income ratio* |
1.22 | % | 1.15 | % | 1.03 | % | 1.61 | % | 1.08 | % | ||||||||||
| Expense ratio, lowest to highest** |
0.00% to 0.70 | % | 0.00% to 0.65 | % | 0.00% to 0.70 | % | 0.00% to 0.70 | % | 0.00% to 0.65 | % | ||||||||||
| Total return, lowest to highest*** |
16.33% to 17.16 | % | (2.97%) to (2.09 | %) | 10.28% to 11.06 | % | 29.88% to 30.79 | % | (38.48%) to (38.08 | %) | ||||||||||
| Sub-Account | ||||||||
| American High-Income Bond Trust Series 1 |
||||||||
| Year Ended Dec. 31/12 |
Year Ended Dec. 31/11 (g) |
|||||||
| Units, beginning of period |
1,731 | — | ||||||
| Units issued |
2,182 | 4,254 | ||||||
| Units redeemed |
(945 | ) | (2,523 | ) | ||||
|
|
|
|
|
|||||
| Units, end of period |
2,968 | 1,731 | ||||||
|
|
|
|
|
|||||
| Unit value, end of period $ |
11.34 to 11.49 | 10.06 to 10.16 | ||||||
| Assets, end of period $ |
33,846 | 17,482 | ||||||
| Investment income ratio* |
7.33 | % | 14.92 | % | ||||
| Expense ratio, lowest to highest** |
0.00% to 0.65 | % | 0.00% to 0.65 | % | ||||
| Total return, lowest to highest*** |
12.38% to 13.11 | % | 0.55% to 1.46 | % | ||||
| (g) | Fund available in prior year but no activity. |
85
Table of Contents
John Hancock Life Insurance Company (U.S.A.) Separate Account N
Notes to Financial Statements (continued)
| 10. | Financial Highlights |
| Sub-Account | ||||||||||||||||||||
| American International Trust Series 1 | ||||||||||||||||||||
| Year Ended Dec. 31/12 |
Year Ended Dec. 31/11 |
Year Ended Dec. 31/10 |
Year Ended Dec. 31/09 |
Year Ended Dec. 31/08 |
||||||||||||||||
| Units, beginning of period |
1,290,175 | 1,471,085 | 1,474,064 | 1,592,548 | 1,766,825 | |||||||||||||||
| Units issued |
341,326 | 267,335 | 680,229 | 761,348 | 777,351 | |||||||||||||||
| Units redeemed |
(744,971 | ) | (448,245 | ) | (683,208 | ) | (879,832 | ) | (951,628 | ) | ||||||||||
|
|
|
|
|
|
|
|
|
|
|
|||||||||||
| Units, end of period |
886,530 | 1,290,175 | 1,471,085 | 1,474,064 | 1,592,548 | |||||||||||||||
|
|
|
|
|
|
|
|
|
|
|
|||||||||||
| Unit value, end of |
15.55 to 25.75 | 21.60 to 23.31 | 15.45 to 25.92 | 14.46 to 24.41 | 10.14 to 17.23 | |||||||||||||||
| Assets, end of |
16,145,508 | 22,460,044 | 30,600,335 | 28,772,677 | 22,506,461 | |||||||||||||||
| Investment income ratio* |
0.99 | % | 1.28 | % | 1.68 | % | 1.14 | % | 3.64 | % | ||||||||||
| Expense ratio, lowest to highest** |
0.00% to 0.65 | % | 0.00% to 0.65 | % | 0.00% to 0.65 | % | 0.00% to 0.65 | % | 0.00% to 0.65 | % | ||||||||||
| Total return, lowest to highest*** |
16.73% to 17.50 | % | (15.11%) to (14.34 | %) | 6.19% to 6.88 | % | 41.67% to 42.58 | % | (42.74%) to (42.37 | %) | ||||||||||
| Sub-Account | ||||||||||||||||
| American New World Trust Series 1 | ||||||||||||||||
| Year Ended Dec. 31/12 |
Year Ended Dec. 31/11 |
Year Ended Dec. 31/10 |
Year Ended Dec. 31/09 (ak) |
|||||||||||||
| Units, beginning of period |
37,149 | 35,679 | 1,441 | — | ||||||||||||
| Units issued |
21,231 | 8,115 | 49,000 | 1,900 | ||||||||||||
| Units redeemed |
(12,557 | ) | (6,645 | ) | (14,762 | ) | (459 | ) | ||||||||
|
|
|
|
|
|
|
|
|
|||||||||
| Units, end of period |
45,823 | 37,149 | 35,679 | 1,441 | ||||||||||||
|
|
|
|
|
|
|
|
|
|||||||||
| Unit value, end of period $ |
15.40 to 15.77 | 13.12 to 13.44 | 15.52 to 15.69 | 13.30 to 13.36 | ||||||||||||
| Assets, end of period $ |
714,892 | 493,337 | 556,143 | 19,195 | ||||||||||||
| Investment income ratio* |
0.72 | % | 1.48 | % | 3.05 | % | 4.29 | % | ||||||||
| Expense ratio, lowest to highest** |
0.00% to 0.65 | % | 0.00% to 0.65 | % | 0.00% to 0.65 | % | 0.00% to 0.65 | % | ||||||||
| Total return, lowest to highest*** |
16.60% to 17.37 | % | (15.10%) to (14.33 | %) | 16.67% to 17.43 | % | 33.01% to 33.58 | % | ||||||||
| (ak) | Reflects the period from commencement of operations on May 4, 2009 through December 31, 2009. |
86
Table of Contents
John Hancock Life Insurance Company (U.S.A.) Separate Account N
Notes to Financial Statements (continued)
| 10. | Financial Highlights |
| Sub-Account | ||||||||||||||||
| Balanced Trust Series 0 | ||||||||||||||||
| Year Ended Dec. 31/12 (j) |
Year Ended Dec. 31/11 |
Year Ended Dec. 31/10 |
Year Ended Dec. 31/09 (ak) |
|||||||||||||
| Units, beginning of period |
4,365 | 3,150 | 1,515 | — | ||||||||||||
| Units issued |
426 | 1,930 | 2,068 | 1,520 | ||||||||||||
| Units redeemed |
(4,791 | ) | (715 | ) | (433 | ) | (5 | ) | ||||||||
|
|
|
|
|
|
|
|
|
|||||||||
| Units, end of period |
— | 4,365 | 3,150 | 1,515 | ||||||||||||
|
|
|
|
|
|
|
|
|
|||||||||
| Unit value, end of period $ |
14.73 | 13.57 | 13.41 | 11.91 | ||||||||||||
| Assets, end of period $ |
— | 59,218 | 42,254 | 18,049 | ||||||||||||
| Investment income ratio* |
4.49 | % | 1.70 | % | 1.18 | % | 4.81 | % | ||||||||
| Expense ratio, lowest to highest** |
0.00 | % | 0.00 | % | 0.00 | % | 0.00 | % | ||||||||
| Total return, lowest to highest*** |
8.57 | % | 1.13 | % | 12.63 | % | 19.11 | % | ||||||||
| (j) Terminated as an investment option and funds transferred to Lifestyle Growth Trust on April 30, 2012. |
| |||||||||||||||
| (ak) Reflects the period from commencement of operations on May 4, 2009 through December 31, 2009. |
| |||||||||||||||
| Sub-Account | ||||||||||||
| Balanced Trust Series 1 | ||||||||||||
| Year Ended Dec. 31/12 (j) |
Year Ended Dec. 31/11 |
Year Ended Dec. 31/10 (g) |
||||||||||
| Units, beginning of period |
1,927 | 2,660 | — | |||||||||
| Units issued |
52 | 1,419 | 2,668 | |||||||||
| Units redeemed |
(1,979 | ) | (2,152 | ) | (8 | ) | ||||||
|
|
|
|
|
|
|
|||||||
| Units, end of period |
— | 1,927 | 2,660 | |||||||||
|
|
|
|
|
|
|
|||||||
| Unit value, end of period $ |
14.42 | 13.22 to 13.54 | 13.26 | |||||||||
| Assets, end of period $ |
— | 25,637 | 35,267 | |||||||||
| Investment income ratio* |
4.33 | % | 1.76 | % | 2.12 | % | ||||||
| Expense ratio, lowest to highest** |
0.65 | % | 0.00% to 0.65 | % | 0.65 | % | ||||||
| Total return, lowest to highest*** |
8.38 | % | 0.11% to 1.01 | % | 11.86 | % | ||||||
| (j) | Terminated as an investment option and funds transferred to Lifestyle Growth Trust on April 30, 2012. |
| (g) | Fund available in prior year but no activity. |
87
Table of Contents
John Hancock Life Insurance Company (U.S.A.) Separate Account N
Notes to Financial Statements (continued)
| 10. | Financial Highlights |
| Sub-Account | ||||||||||||||||||||
| Blue Chip Growth Trust Series 0 | ||||||||||||||||||||
| Year Ended Dec. 31/12 |
Year Ended Dec. 31/11 |
Year Ended Dec. 31/10 |
Year Ended Dec. 31/09 |
Year Ended Dec. 31/08 |
||||||||||||||||
| Units, beginning of period |
215,060 | 198,638 | 151,164 | 51,156 | 31,993 | |||||||||||||||
| Units issued |
75,023 | 128,002 | 83,088 | 127,285 | 35,457 | |||||||||||||||
| Units redeemed |
(81,087 | ) | (111,580 | ) | (35,614 | ) | (27,277 | ) | (16,294 | ) | ||||||||||
|
|
|
|
|
|
|
|
|
|
|
|||||||||||
| Units, end of period |
208,996 | 215,060 | 198,638 | 151,164 | 51,156 | |||||||||||||||
|
|
|
|
|
|
|
|
|
|
|
|||||||||||
| Unit value, end of period $ |
79.24 | 66.93 | 65.97 | 56.75 | 39.69 | |||||||||||||||
| Assets, end of period $ |
16,560,343 | 14,393,613 | 13,104,521 | 8,578,346 | 2,030,472 | |||||||||||||||
| Investment income ratio* |
0.14 | % | 0.01 | % | 0.09 | % | 0.19 | % | 0.47 | % | ||||||||||
| Expense ratio, lowest to highest** |
0.00 | % | 0.00 | % | 0.00 | % | 0.00 | % | 0.00 | % | ||||||||||
| Total return, lowest to highest*** |
18.39 | % | 1.45 | % | 16.25 | % | 42.97 | % | (42.52%) to (28.71 | %) | ||||||||||
| Sub-Account | ||||||||||||||||||||
| Blue Chip Growth Trust Series 1 | ||||||||||||||||||||
| Year Ended Dec. 31/12 |
Year Ended Dec. 31/11 |
Year Ended Dec. 31/10 |
Year Ended Dec. 31/09 |
Year Ended Dec. 31/08 |
||||||||||||||||
| Units, beginning of period |
415,800 | 503,904 | 691,737 | 759,580 | 996,389 | |||||||||||||||
| Units issued |
59,930 | 150,811 | 306,704 | 334,151 | 442,153 | |||||||||||||||
| Units redeemed |
(286,879 | ) | (238,915 | ) | (494,537 | ) | (401,994 | ) | (678,962 | ) | ||||||||||
|
|
|
|
|
|
|
|
|
|
|
|||||||||||
| Units, end of period |
188,851 | 415,800 | 503,904 | 691,737 | 759,580 | |||||||||||||||
|
|
|
|
|
|
|
|
|
|
|
|||||||||||
| Unit value, end of period $ |
29.18 to 30.99 | 13.51 to 26.83 | 24.66 to 25.92 | 21.48 to 22.26 | 15.13 to 15.62 | |||||||||||||||
| Assets, end of period $ |
5,515,169 | 10,454,276 | 12,605,486 | 13,629,384 | 10,660,570 | |||||||||||||||
| Investment income ratio* |
0.09 | % | 0.01 | % | 0.08 | % | 0.13 | % | 0.30 | % | ||||||||||
| Expense ratio, lowest to highest** |
0.20% to 0.70 | % | 0.00% to 0.65 | % | 0.20% to 0.70 | % | 0.25% to 0.65 | % | 0.25% to 0.65 | % | ||||||||||
| Total return, lowest to highest*** |
17.49% to 18.08 | % | 0.53% to 1.44 | % | 15.34% to 15.92 | % | 41.96% to 42.54 | % | (42.91%) to (42.68 | %) | ||||||||||
88
Table of Contents
John Hancock Life Insurance Company (U.S.A.) Separate Account N
Notes to Financial Statements (continued)
| 10. | Financial Highlights |
| Sub-Account | ||||||||
| Bond Trust Series 0 | ||||||||
| Year Ended Dec. 31/12 |
Year Ended Dec. 31/11 (c) |
|||||||
| Units, beginning of period |
45,046 | — | ||||||
| Units issued |
76,163 | 45,553 | ||||||
| Units redeemed |
(37,566 | ) | (507 | ) | ||||
|
|
|
|
|
|||||
| Units, end of period |
83,643 | 45,046 | ||||||
|
|
|
|
|
|||||
| Unit value, end of period $ |
10.72 | 10.08 | ||||||
| Assets, end of period $ |
896,492 | 454,140 | ||||||
| Investment income ratio* |
3.96 | % | 14.78 | % | ||||
| Expense ratio, lowest to highest** |
0.00 | % | 0.00 | % | ||||
| Total return, lowest to highest*** |
6.31 | % | 0.82 | % | ||||
| (c) Reflects the period from commencement of operations on October 31, 2011 through December 31, 2011. |
| |||||||
| Sub-Account | ||||||||
| Bond Trust Series 1 | ||||||||
| Year Ended Dec. 31/12 |
Year Ended Dec. 31/11 (c) |
|||||||
| Units, beginning of period |
122,304 | — | ||||||
| Units issued |
9,043 | 126,358 | ||||||
| Units redeemed |
(90,715 | ) | (4,054 | ) | ||||
|
|
|
|
|
|||||
| Units, end of period |
40,632 | 122,304 | ||||||
|
|
|
|
|
|||||
| Unit value, end of period $ |
10.63 to 10.69 | 10.06 to 10.08 | ||||||
| Assets, end of period $ |
433,780 | 1,231,681 | ||||||
| Investment income ratio* |
2.83 | % | 14.34 | % | ||||
| Expense ratio, lowest to highest** |
0.20% to 0.65 | % | 0.00% to 0.65 | % | ||||
| Total return, lowest to highest*** |
5.64% to 6.10 | % | 0.62% to 0.78 | % | ||||
| (c) | Reflects the period from commencement of operations on October 31, 2011 through December 31, 2011. |
89
Table of Contents
John Hancock Life Insurance Company (U.S.A.) Separate Account N
Notes to Financial Statements (continued)
| 10. | Financial Highlights |
| Sub-Account | ||||
| Brandes International Equity Trust | ||||
| Year Ended Dec. 31/12 (g) |
||||
| Units, beginning of period |
— | |||
| Units issued |
2,250 | |||
| Units redeemed |
(2,250 | ) | ||
|
|
|
|||
| Units, end of period |
— | |||
|
|
|
|||
| Unit value, end of period $ |
30.57 | |||
| Assets, end of period $ |
— | |||
| Investment income ratio* |
0.00 | % | ||
| Expense ratio, lowest to highest** |
0.00 | % | ||
| Total return, lowest to highest*** |
20.68 | % | ||
| (g) Fund available in prior year but no activity. |
| |||||||||||||||||||
| Sub-Account | ||||||||||||||||||||
| Capital Appreciation Trust Series 0 | ||||||||||||||||||||
| Year Ended Dec. 31/12 |
Year Ended Dec. 31/11 |
Year Ended Dec. 31/10 |
Year Ended Dec. 31/09 |
Year Ended Dec. 31/08 |
||||||||||||||||
| Units, beginning of period |
41,055 | 31,367 | 22,064 | 13,784 | 15,717 | |||||||||||||||
| Units issued |
20,234 | 19,021 | 17,891 | 23,788 | 80,292 | |||||||||||||||
| Units redeemed |
(7,182 | ) | (9,333 | ) | (8,588 | ) | (15,508 | ) | (82,225 | ) | ||||||||||
|
|
|
|
|
|
|
|
|
|
|
|||||||||||
| Units, end of period |
54,107 | 41,055 | 31,367 | 22,064 | 13,784 | |||||||||||||||
|
|
|
|
|
|
|
|
|
|
|
|||||||||||
| Unit value, end of period $ |
16.13 | 13.90 | 13.88 | 12.41 | 8.72 | |||||||||||||||
| Assets, end of period $ |
872,628 | 570,658 | 435,495 | 273,810 | 120,161 | |||||||||||||||
| Investment income ratio* |
0.22 | % | 0.12 | % | 0.22 | % | 0.31 | % | 0.21 | % | ||||||||||
| Expense ratio, lowest to highest** |
0.00 | % | 0.00 | % | 0.00 | % | 0.00 | % | 0.00 | % | ||||||||||
| Total return, lowest to highest*** |
16.03 | % | 0.11 | % | 11.88 | % | 42.35 | % | (37.24%) to (23.78 | %) | ||||||||||
90
Table of Contents
John Hancock Life Insurance Company (U.S.A.) Separate Account N
Notes to Financial Statements (continued)
| 10. | Financial Highlights |
| Sub-Account | ||||||||||||||||||||
| Capital Appreciation Trust Series 1 | ||||||||||||||||||||
| Year Ended | Year Ended | Year Ended | Year Ended | Year Ended | ||||||||||||||||
| Dec. 31/12 | Dec. 31/11 | Dec. 31/10 | Dec. 31/09 | Dec. 31/08 | ||||||||||||||||
| Units, beginning of period |
310,510 | 315,408 | 321,766 | 533,714 | 579,428 | |||||||||||||||
| Units issued |
37,277 | 94,547 | 259,764 | 300,813 | 275,841 | |||||||||||||||
| Units redeemed |
(180,959 | ) | (99,445 | ) | (266,122 | ) | (512,761 | ) | (321,555 | ) | ||||||||||
|
|
|
|
|
|
|
|
|
|
|
|||||||||||
| Units, end of period |
166,828 | 310,510 | 315,408 | 321,766 | 533,714 | |||||||||||||||
|
|
|
|
|
|
|
|
|
|
|
|||||||||||
| Unit value, end of period $ |
15.15 to 16.06 | 12.88 to 14.18 | 13.24 to 13.89 | 11.97 to 12.34 | 8.47 to 8.70 | |||||||||||||||
| Assets, end of period $ |
2,598,498 | 4,191,442 | 4,281,555 | 3,898,184 | 4,582,828 | |||||||||||||||
| Investment income ratio* |
0.15 | % | 0.07 | % | 0.13 | % | 0.24 | % | 0.45 | % | ||||||||||
| Expense ratio, lowest to highest** |
0.20% to 0.70 | % | 0.00% to 0.65 | % | 0.20% to 0.70 | % | 0.30% to 0.65 | % | 0.30% to 0.65 | % | ||||||||||
| Total return, lowest to highest*** |
15.16% to 15.75 | % | (0.82%) to 0.07 | % | 11.05% to 11.61 | % | 41.37% to 41.87 | % | (37.63%) to (37.42 | %) | ||||||||||
| Sub-Account | ||||||||||||||||
| Capital Appreciation Value Trust Series 0 | ||||||||||||||||
| Year Ended Dec. 31/12 |
Year Ended Dec. 31/11 |
Year Ended Dec. 31/10 |
Year Ended Dec. 31/09 (g) |
|||||||||||||
| Units, beginning of period |
292 | 23,931 | 15,751 | — | ||||||||||||
| Units issued |
193,310 | 161 | 9,722 | 16,050 | ||||||||||||
| Units redeemed |
(190,106 | ) | (23,800 | ) | (1,542 | ) | (299 | ) | ||||||||
|
|
|
|
|
|
|
|
|
|||||||||
| Units, end of period |
3,496 | 292 | 23,931 | 15,751 | ||||||||||||
|
|
|
|
|
|
|
|
|
|||||||||
| Unit value, end of period $ |
12.76 | 11.12 | 10.79 | 9.47 | ||||||||||||
| Assets, end of period $ |
44,611 | 3,254 | 258,101 | 149,143 | ||||||||||||
| Investment income ratio* |
1.63 | % | 0.12 | % | 2.04 | % | 17.30 | % | ||||||||
| Expense ratio, lowest to highest** |
0.00 | % | 0.00 | % | 0.00 | % | 0.00 | % | ||||||||
| Total return, lowest to highest*** |
14.77 | % | 3.09 | % | 13.91 | % | 30.26 | % | ||||||||
| (g) | Fund available in prior year but no activity. |
91
Table of Contents
John Hancock Life Insurance Company (U.S.A.) Separate Account N
Notes to Financial Statements (continued)
| 10. | Financial Highlights |
| Sub-Account | ||||||||||||||||||||
| Capital Appreciation Value Trust Series 1 | ||||||||||||||||||||
| Year Ended Dec. 31/12 |
Year Ended Dec. 31/11 |
Year Ended Dec. 31/10 |
Year Ended Dec. 31/09 |
Year Ended Dec. 31/08 (f) |
||||||||||||||||
| Units, beginning of period |
39,327 | 52,030 | 2,458 | 407 | — | |||||||||||||||
| Units issued |
24,283 | 7,209 | 61,199 | 2,153 | 422 | |||||||||||||||
| Units redeemed |
(36,508 | ) | (19,912 | ) | (11,627 | ) | (102 | ) | (15 | ) | ||||||||||
|
|
|
|
|
|
|
|
|
|
|
|||||||||||
| Units, end of period |
27,102 | 39,327 | 52,030 | 2,458 | 407 | |||||||||||||||
|
|
|
|
|
|
|
|
|
|
|
|||||||||||
| Unit value, end of period $ |
12.36 to 12.53 | 10.75 to 11.12 | 10.59 to 10.67 | 9.36 | 7.23 | |||||||||||||||
| Assets, end of period $ |
339,289 | 430,096 | 553,917 | 23,009 | 2,947 | |||||||||||||||
| Investment income ratio* |
1.41 | % | 1.25 | % | 2.45 | % | 7.80 | % | 3.95 | % | ||||||||||
| Expense ratio, lowest to highest** |
0.35% to 0.65 | % | 0.00% to 0.65 | % | 0.40% to 0.65 | % | 0.65 | % | 0.65 | % | ||||||||||
| Total return, lowest to highest*** |
13.86% to 14.19 | % | 2.21% to 3.13 | % | 13.21% to 13.49 | % | 29.36 | % | (27.66 | %) | ||||||||||
| (f) | Reflects the period from commencement of operations on April 28, 2008 through December 31, 2008. |
| Sub-Account | ||||||||||||
| Core Allocation Plus Trust Series 0 | ||||||||||||
| Year Ended Dec. 31/12 |
Year Ended Dec. 31/11 |
Year Ended Dec. 31/10 (g) |
||||||||||
| Units, beginning of period |
2,275 | 621 | — | |||||||||
| Units issued |
3,081 | 1,705 | 634 | |||||||||
| Units redeemed |
(1,215 | ) | (51 | ) | (13 | ) | ||||||
|
|
|
|
|
|
|
|||||||
| Units, end of period |
4,141 | 2,275 | 621 | |||||||||
|
|
|
|
|
|
|
|||||||
| Unit value, end of period $ |
10.63 | 9.36 | 9.58 | |||||||||
| Assets, end of period $ |
44,019 | 21,301 | 5,951 | |||||||||
| Investment income ratio* |
1.79 | % | 2.24 | % | 2.36 | % | ||||||
| Expense ratio, lowest to highest** |
0.00 | % | 0.00 | % | 0.00 | % | ||||||
| Total return, lowest to highest*** |
13.53 | % | (2.26 | %) | 10.57 | % | ||||||
| (g) Fund available in prior year but no activity. |
||||||||||||
92
Table of Contents
John Hancock Life Insurance Company (U.S.A.) Separate Account N
Notes to Financial Statements (continued)
| 10. | Financial Highlights |
| Sub-Account | ||||||||||||||||
| Core Allocation Plus Trust Series 1 | ||||||||||||||||
| Year Ended Dec. 31/12 |
Year Ended Dec. 31/11 |
Year Ended Dec. 31/10 |
Year
Ended Dec. 31/09 (g) |
|||||||||||||
| Units, beginning of period |
457,013 | 561,892 | 581,747 | — | ||||||||||||
| Units issued |
1,322 | — | 310,318 | 609,771 | ||||||||||||
| Units redeemed |
(331,586 | ) | (104,879 | ) | (330,173 | ) | (28,024 | ) | ||||||||
|
|
|
|
|
|
|
|
|
|||||||||
| Units, end of period |
126,749 | 457,013 | 561,892 | 581,747 | ||||||||||||
|
|
|
|
|
|
|
|
|
|||||||||
| Unit value, end of period $ |
10.36 to 10.46 | 9.04 to 9.34 | 9.43 to 9.48 | 8.58 to 8.61 | ||||||||||||
| Assets, end of period $ |
1,324,363 | 4,215,840 | 5,323,691 | 4,999,225 | ||||||||||||
| Investment income ratio* |
0.90 | % | 1.22 | % | 1.14 | % | 3.03 | % | ||||||||
| Expense ratio, lowest to highest** |
0.30% to 0.50 | % | 0.00% to 0.65 | % | 0.30% to 0.50 | % | 0.30% to 0.50 | % | ||||||||
| Total return, lowest to highest*** |
13.01% to 13.25 | % | (3.19%) to (2.32 | %) | 9.95% to 10.17 | % | 24.57% to 24.81 | % | ||||||||
| (g) | Fund available in prior year but no activity. |
| Sub-Account | ||||||||||||||||||||
| Core Bond Trust Series 0 | ||||||||||||||||||||
| Year Ended Dec. 31/12 |
Year Ended Dec. 31/11 |
Year Ended Dec. 31/10 |
Year Ended Dec. 31/09 |
Year Ended Dec. 31/08 (g) |
||||||||||||||||
| Units, beginning of period |
40,704 | 50,392 | 8,529 | 265 | — | |||||||||||||||
| Units issued |
50,447 | 10,634 | 43,634 | 9,696 | 523 | |||||||||||||||
| Units redeemed |
(40,655 | ) | (20,322 | ) | (1,771 | ) | (1,432 | ) | (258 | ) | ||||||||||
|
|
|
|
|
|
|
|
|
|
|
|||||||||||
| Units, end of period |
50,496 | 40,704 | 50,392 | 8,529 | 265 | |||||||||||||||
|
|
|
|
|
|
|
|
|
|
|
|||||||||||
| Unit value, end of period $ |
15.67 | 14.71 | 13.58 | 12.67 | 11.53 | |||||||||||||||
| Assets, end of period $ |
791,272 | 598,664 | 684,216 | 108,070 | 3,058 | |||||||||||||||
| Investment income ratio* |
2.84 | % | 3.28 | % | 6.30 | % | 3.96 | % | 10.44 | % | ||||||||||
| Expense ratio, lowest to highest** |
0.00 | % | 0.00 | % | 0.00 | % | 0.00 | % | 0.00 | % | ||||||||||
| Total return, lowest to highest*** |
6.54 | % | 8.32 | % | 7.17 | % | 9.93 | % | 1.41% to 3.36 | % | ||||||||||
| (g) | Fund available in prior year but no activity. |
93
Table of Contents
John Hancock Life Insurance Company (U.S.A.) Separate Account N
Notes to Financial Statements (continued)
| 10. | Financial Highlights |
| Sub-Account | ||||||||||||||||||||
| Core Bond Trust Series 1 | ||||||||||||||||||||
| Year Ended Dec. 31/12 |
Year Ended Dec. 31/11 |
Year Ended Dec. 31/10 |
Year Ended Dec. 31/09 |
Year Ended Dec. 31/08 |
||||||||||||||||
| Units, beginning of period |
25,354 | 29,647 | 28,219 | 1,599 | 87 | |||||||||||||||
| Units issued |
541 | 43,772 | 10,682 | 86,727 | 1,518 | |||||||||||||||
| Units redeemed |
(24,479 | ) | (48,065 | ) | (9,254 | ) | (60,107 | ) | (6 | ) | ||||||||||
|
|
|
|
|
|
|
|
|
|
|
|||||||||||
| Units, end of period |
1,416 | 25,354 | 29,647 | 28,219 | 1,599 | |||||||||||||||
|
|
|
|
|
|
|
|
|
|
|
|||||||||||
| Unit value, end of period $ |
18.59 to 19.23 | 17.28 to 18.35 | 16.33 to 16.74 | 15.35 to 15.56 | 14.05 to 14.15 | |||||||||||||||
| Assets, end of period $ |
26,337 | 447,272 | 485,274 | 433,606 | 22,482 | |||||||||||||||
| Investment income ratio* |
0.87 | % | 10.22 | % | 2.70 | % | 2.61 | % | 15.48 | % | ||||||||||
| Expense ratio, lowest to highest** |
0.20% to 0.65 | % | 0.00% to 0.65 | % | 0.20% to 0.65 | % | 0.35% to 0.65 | % | 0.45% to 0.65 | % | ||||||||||
| Total return, lowest to highest*** |
5.78% to 6.25 | % | 7.35% to 8.32 | % | 6.39% to 6.87 | % | 9.22% to 9.55 | % | 2.63% to 2.82 | % | ||||||||||
| Sub-Account | ||||||||||||||||
| Core Strategy Trust Series 0 | ||||||||||||||||
| Year Ended Dec. 31/12 |
Year Ended Dec. 31/11 |
Year Ended Dec. 31/10 |
Year Ended Dec. 31/09 (ay) |
|||||||||||||
| Units, beginning of period |
1,731 | 8,614 | 185 | — | ||||||||||||
| Units issued |
977 | 1,136 | 8,646 | 189 | ||||||||||||
| Units redeemed |
(96 | ) | (8,019 | ) | (217 | ) | (4 | ) | ||||||||
|
|
|
|
|
|
|
|
|
|||||||||
| Units, end of period |
2,612 | 1,731 | 8,614 | 185 | ||||||||||||
|
|
|
|
|
|
|
|
|
|||||||||
| Unit value, end of period $ |
11.64 | 10.34 | 10.32 | 9.17 | ||||||||||||
| Assets, end of period $ |
30,393 | 17,891 | 88,874 | 1,693 | ||||||||||||
| Investment income ratio* |
3.18 | % | 1.65 | % | 20.72 | % | 2.88 | % | ||||||||
| Expense ratio, lowest to highest** |
0.00 | % | 0.00 | % | 0.00 | % | 0.00 | % | ||||||||
| Total return, lowest to highest*** |
12.58 | % | 0.19 | % | 12.57 | % | 21.93 | % | ||||||||
| (ay) | Fund available in prior year but no activity. Renamed on May 4, 2009. Previously known as Index Allocation Trust. |
94
Table of Contents
John Hancock Life Insurance Company (U.S.A.) Separate Account N
Notes to Financial Statements (continued)
| 10. | Financial Highlights |
| Sub-Account | ||||||||||||||||
| Core Strategy Trust Series 1 | ||||||||||||||||
| Year Ended Dec. 31/12 |
Year Ended Dec. 31/11 |
Year Ended Dec. 31/10 |
Year Ended Dec. 31/09 (ay) |
|||||||||||||
| Units, beginning of period |
62 | 58 | 111 | — | ||||||||||||
| Units issued |
51 | 10 | 6 | 113 | ||||||||||||
| Units redeemed |
(9 | ) | (6 | ) | (59 | ) | (2 | ) | ||||||||
|
|
|
|
|
|
|
|
|
|||||||||
| Units, end of period |
104 | 62 | 58 | 111 | ||||||||||||
|
|
|
|
|
|
|
|
|
|||||||||
| Unit value, end of period $ |
11.26 | 9.98 to 10.32 | 10.12 | 9.06 | ||||||||||||
| Assets, end of period $ |
1,173 | 624 | 587 | 1,011 | ||||||||||||
| Investment income ratio* |
3.89 | % | 2.25 | % | 1.51 | % | 4.35 | % | ||||||||
| Expense ratio, lowest to highest** |
0.65 | % | 0.00% to 0.65 | % | 0.65 | % | 0.65 | % | ||||||||
| Total return, lowest to highest*** |
11.79 | % | (0.69%) to 0.20 | % | 11.70 | % | 21.09 | % | ||||||||
| (ay) | Fund available in prior year but no activity. Renamed on May 4, 2009. Previously known as Index Allocation Trust. |
| Sub-Account | ||||||||||||||||
| Disciplined Diversification Trust Series 0 | ||||||||||||||||
| Year Ended Dec. 31/12 |
Year Ended Dec. 31/11 |
Year Ended Dec. 31/10 |
Year Ended Dec. 31/09 (g) |
|||||||||||||
| Units, beginning of period |
2,230 | 8,805 | 16,326 | — | ||||||||||||
| Units issued |
1,352 | 1,564 | 9,331 | 16,641 | ||||||||||||
| Units redeemed |
(1,983 | ) | (8,139 | ) | (16,852 | ) | (315 | ) | ||||||||
|
|
|
|
|
|
|
|
|
|||||||||
| Units, end of period |
1,599 | 2,230 | 8,805 | 16,326 | ||||||||||||
|
|
|
|
|
|
|
|
|
|||||||||
| Unit value, end of period $ |
11.51 | 10.21 | 10.42 | 9.19 | ||||||||||||
| Assets, end of period $ |
18,421 | 22,778 | 91,767 | 149,965 | ||||||||||||
| Investment income ratio* |
1.85 | % | 1.70 | % | 0.82 | % | 15.46 | % | ||||||||
| Expense ratio, lowest to highest** |
0.00 | % | 0.00 | % | 0.00 | % | 0.00 | % | ||||||||
| Total return, lowest to highest*** |
12.79 | % | (2.04 | %) | 13.45 | % | 27.27 | % | ||||||||
| (g) | Fund available in prior year but no activity. |
95
Table of Contents
John Hancock Life Insurance Company (U.S.A.) Separate Account N
Notes to Financial Statements (continued)
| 10. | Financial Highlights |
| Sub-Account | ||||||||||||||||||||
| Disciplined Diversification Trust Series 1 | ||||||||||||||||||||
| Year Ended Dec. 31/12 |
Year Ended Dec. 31/11 |
Year Ended Dec. 31/10 |
Year Ended Dec. 31/09 |
Year Ended Dec. 31/08 (f) |
||||||||||||||||
| Units, beginning of period |
57 | 4,363 | 111 | — | — | |||||||||||||||
| Units issued |
4 | 881 | 4,316 | 113 | 5,952 | |||||||||||||||
| Units redeemed |
(2 | ) | (5,187 | ) | (64 | ) | (2 | ) | (5,952 | ) | ||||||||||
|
|
|
|
|
|
|
|
|
|
|
|||||||||||
| Units, end of period |
59 | 57 | 4,363 | 111 | — | |||||||||||||||
|
|
|
|
|
|
|
|
|
|
|
|||||||||||
| Unit value, end of period $ |
11.14 | 9.86 to 10.19 | 10.23 | 9.08 | 7.18 | |||||||||||||||
| Assets, end of period $ |
665 | 572 | 44,616 | 1,009 | — | |||||||||||||||
| Investment income ratio* |
2.44 | % | 0.07 | % | 8.29 | % | 4.72 | % | 0.00 | % | ||||||||||
| Expense ratio, lowest to highest** |
0.65 | % | 0.00% to 0.65 | % | 0.65 | % | 0.65 | % | 0.65 | % | ||||||||||
| Total return, lowest to highest*** |
12.00 | % | (2.96%) to (2.09 | %) | 12.66 | % | 26.40 | % | (28.19 | %) | ||||||||||
| (f) Reflects the period from commencement of operations on April 28, 2008 through December 31, 2008. |
| |||||||||||||||||||
| Sub-Account | ||||||||||||||||||||
| Emerging Markets Value Trust Series 0 | ||||||||||||||||||||
| Year Ended Dec. 31/12 |
Year Ended Dec. 31/11 |
Year Ended Dec. 31/10 |
Year Ended Dec. 31/09 |
Year Ended Dec. 31/08 (g) |
||||||||||||||||
| Units, beginning of period |
97,441 | 57,448 | 48,314 | 17,645 | — | |||||||||||||||
| Units issued |
44,804 | 54,626 | 60,080 | 52,715 | 17,760 | |||||||||||||||
| Units redeemed |
(47,277 | ) | (14,633 | ) | (50,946 | ) | (22,046 | ) | (115 | ) | ||||||||||
|
|
|
|
|
|
|
|
|
|
|
|||||||||||
| Units, end of period |
94,968 | 97,441 | 57,448 | 48,314 | 17,645 | |||||||||||||||
|
|
|
|
|
|
|
|
|
|
|
|||||||||||
| Unit value, end of period $ |
12.36 | 10.43 | 14.29 | 11.61 | 5.77 | |||||||||||||||
| Assets, end of period $ |
1,173,816 | 1,016,405 | 821,128 | 560,976 | 101,749 | |||||||||||||||
| Investment income ratio* |
0.97 | % | 2.03 | % | 1.95 | % | 0.13 | % | 18.41 | % | ||||||||||
| Expense ratio, lowest to highest** |
0.00 | % | 0.00 | % | 0.00 | % | 0.00 | % | 0.00 | % | ||||||||||
| Total return, lowest to highest*** |
18.49 | % | (27.02 | %) | 23.11 | % | 1.56% to 101.36 | % | (51.92 | %) | ||||||||||
| (g) | Fund available in prior year but no activity. |
96
Table of Contents
John Hancock Life Insurance Company (U.S.A.) Separate Account N
Notes to Financial Statements (continued)
| 10. | Financial Highlights |
| Sub-Account | ||||||||||||||||||||
| Emerging Markets Value Trust Series 1 | ||||||||||||||||||||
| Year Ended Dec. 31/12 |
Year Ended Dec. 31/11 |
Year Ended Dec. 31/10 |
Year Ended Dec. 31/09 |
Year Ended Dec. 31/08 |
||||||||||||||||
| Units, beginning of period |
58,303 | 73,173 | 53,349 | 38,735 | 6,228 | |||||||||||||||
| Units issued |
71,067 | 23,815 | 49,763 | 39,554 | 35,677 | |||||||||||||||
| Units redeemed |
(39,845 | ) | (38,685 | ) | (29,939 | ) | (24,940 | ) | (3,170 | ) | ||||||||||
|
|
|
|
|
|
|
|
|
|
|
|||||||||||
| Units, end of period |
89,525 | 58,303 | 73,173 | 53,349 | 38,735 | |||||||||||||||
|
|
|
|
|
|
|
|
|
|
|
|||||||||||
| Unit value, end of period $ |
14.86 to 15.12 | 12.47 to 13.01 | 17.42 to 17.58 | 14.25 to 14.35 | 7.13 to 7.16 | |||||||||||||||
| Assets, end of period $ |
1,344,896 | 741,859 | 1,281,303 | 763,018 | 277,069 | |||||||||||||||
| Investment income ratio* |
1.11 | % | 1.41 | % | 1.58 | % | 0.08 | % | 4.00 | % | ||||||||||
| Expense ratio, lowest to highest** |
0.35% to 0.65 | % | 0.00% to 0.65 | % | 0.40% to 0.65 | % | 0.40% to 0.65 | % | 0.40% to 0.65 | % | ||||||||||
| Total return, lowest to highest*** |
17.76% to 18.12 | % | (27.71%) to (27.06 | %) | 22.23% to 22.53 | % | 99.84% to 100.34 | % | (52.25%) to (52.13 | %) | ||||||||||
| Sub-Account | ||||||||||||||||||||
| Equity-Income Trust Series 0 | ||||||||||||||||||||
| Year Ended Dec. 31/12 |
Year Ended Dec. 31/11 |
Year Ended Dec. 31/10 |
Year Ended Dec. 31/09 |
Year Ended Dec. 31/08 |
||||||||||||||||
| Units, beginning of period |
748,752 | 717,950 | 608,455 | 422,688 | 354,274 | |||||||||||||||
| Units issued |
345,589 | 223,078 | 214,121 | 379,345 | 269,861 | |||||||||||||||
| Units redeemed |
(349,288 | ) | (192,276 | ) | (104,626 | ) | (193,578 | ) | (201,447 | ) | ||||||||||
|
|
|
|
|
|
|
|
|
|
|
|||||||||||
| Units, end of period |
745,053 | 748,752 | 717,950 | 608,455 | 422,688 | |||||||||||||||
|
|
|
|
|
|
|
|
|
|
|
|||||||||||
| Unit value, end of period $ |
32.78 | 27.90 | 28.12 | 24.40 | 19.40 | |||||||||||||||
| Assets, end of period $ |
24,421,690 | 20,892,942 | 20,186,947 | 14,847,359 | 8,202,004 | |||||||||||||||
| Investment income ratio* |
2.06 | % | 1.90 | % | 2.09 | % | 2.41 | % | 2.71 | % | ||||||||||
| Expense ratio, lowest to highest** |
0.00 | % | 0.00 | % | 0.00 | % | 0.00 | % | 0.00 | % | ||||||||||
| Total return, lowest to highest*** |
17.47 | % | (0.76 | %) | 15.23 | % | 25.76 | % | (35.94%) to (24.93 | %) | ||||||||||
97
Table of Contents
John Hancock Life Insurance Company (U.S.A.) Separate Account N
Notes to Financial Statements (continued)
| 10. | Financial Highlights |
| Sub-Account | ||||||||||||||||||||
| Equity-Income Trust Series 1 | ||||||||||||||||||||
| Year Ended Dec. 31/12 |
Year Ended Dec. 31/11 |
Year Ended Dec. 31/10 |
Year Ended Dec. 31/09 |
Year Ended Dec. 31/08 |
||||||||||||||||
| Units, beginning of period |
474,127 | 573,745 | 616,496 | 944,208 | 1,209,463 | |||||||||||||||
| Units issued |
103,932 | 161,901 | 274,455 | 610,045 | 365,614 | |||||||||||||||
| Units redeemed |
(211,052 | ) | (261,519 | ) | (317,206 | ) | (937,757 | ) | (630,869 | ) | ||||||||||
|
|
|
|
|
|
|
|
|
|
|
|||||||||||
| Units, end of period |
367,007 | 474,127 | 573,745 | 616,496 | 944,208 | |||||||||||||||
|
|
|
|
|
|
|
|
|
|
|
|||||||||||
| Unit value, end of period $ |
29.25 to 31.06 | 18.77 to 27.11 | 25.48 to 26.79 | 22.39 to 23.21 | 17.93 to 18.51 | |||||||||||||||
| Assets, end of period $ |
11,017,989 | 12,186,556 | 14,977,254 | 13,270,305 | 16,578,137 | |||||||||||||||
| Investment income ratio* |
2.05 | % | 1.73 | % | 1.97 | % | 2.19 | % | 2.35 | % | ||||||||||
| Expense ratio, lowest to highest** |
0.20% to 0.70 | % | 0.00% to 0.70 | % | 0.20% to 0.70 | % | 0.25% to 0.65 | % | 0.25% to 0.65 | % | ||||||||||
| Total return, lowest to highest*** |
16.54% to 17.13 | % | (1.70%) to (0.81 | %) | 14.31% to 14.89 | % | 24.91% to 25.41 | % | (36.38%) to (36.12 | %) | ||||||||||
| Sub-Account | ||||||||||||||||||||
| Financial Services Trust Series 0 | ||||||||||||||||||||
| Year Ended Dec. 31/12 |
Year Ended Dec. 31/11 |
Year Ended Dec. 31/10 |
Year Ended Dec. 31/09 |
Year Ended Dec. 31/08 |
||||||||||||||||
| Units, beginning of period |
21,823 | 15,021 | 11,361 | 11,844 | 2,300 | |||||||||||||||
| Units issued |
7,409 | 8,182 | 9,351 | 12,978 | 14,881 | |||||||||||||||
| Units redeemed |
(13,155 | ) | (1,380 | ) | (5,691 | ) | (13,461 | ) | (5,337 | ) | ||||||||||
|
|
|
|
|
|
|
|
|
|
|
|||||||||||
| Units, end of period |
16,077 | 21,823 | 15,021 | 11,361 | 11,844 | |||||||||||||||
|
|
|
|
|
|
|
|
|
|
|
|||||||||||
| Unit value, end of period $ |
20.02 | 16.96 | 18.72 | 16.68 | 11.79 | |||||||||||||||
| Assets, end of period $ |
321,878 | 370,177 | 281,203 | 189,531 | 139,607 | |||||||||||||||
| Investment income ratio* |
0.64 | % | 2.01 | % | 0.48 | % | 0.77 | % | 1.34 | % | ||||||||||
| Expense ratio, lowest to highest** |
0.00 | % | 0.00 | % | 0.00 | % | 0.00 | % | 0.00 | % | ||||||||||
| Total return, lowest to highest*** |
18.03 | % | (9.39 | %) | 12.22 | % | 41.53 | % | (44.63%) to (29.96 | %) | ||||||||||
98
Table of Contents
John Hancock Life Insurance Company (U.S.A.) Separate Account N
Notes to Financial Statements (continued)
| 10. | Financial Highlights |
| Sub-Account | ||||||||||||||||||||
| Financial Services Trust Series 1 | ||||||||||||||||||||
| Year Ended Dec. 31/12 |
Year Ended Dec. 31/11 |
Year Ended Dec. 31/10 |
Year Ended Dec. 31/09 |
Year Ended Dec. 31/08 |
||||||||||||||||
| Units, beginning of period |
22,770 | 61,154 | 40,884 | 158,003 | 37,610 | |||||||||||||||
| Units issued |
21,267 | 16,544 | 91,248 | 53,886 | 251,270 | |||||||||||||||
| Units redeemed |
(6,201 | ) | (54,928 | ) | (70,978 | ) | (171,005 | ) | (130,877 | ) | ||||||||||
|
|
|
|
|
|
|
|
|
|
|
|||||||||||
| Units, end of period |
37,836 | 22,770 | 61,154 | 40,884 | 158,003 | |||||||||||||||
|
|
|
|
|
|
|
|
|
|
|
|||||||||||
| Unit value, end of period $ |
15.43 to 16.26 | 12.81 to 14.10 | 14.63 to 15.28 | 13.12 to 13.47 | 9.34 to 9.56 | |||||||||||||||
| Assets, end of period $ |
591,284 | 304,495 | 905,383 | 544,204 | 1,505,269 | |||||||||||||||
| Investment income ratio* |
0.81 | % | 1.01 | % | 0.31 | % | 0.63 | % | 1.65 | % | ||||||||||
| Expense ratio, lowest to highest** |
0.20% to 0.65 | % | 0.00% to 0.65 | % | 0.20% to 0.65 | % | 0.35% to 0.65 | % | 0.35% to 0.65 | % | ||||||||||
| Total return, lowest to highest*** |
17.28% to 17.80 | % | (10.32%) to (9.51 | %) | 11.53% to 12.03 | % | 40.49% to 40.91 | % | (45.01%) to (44.85 | %) | ||||||||||
| Sub-Account | ||||||||||||||||||||
| Franklin Templeton Founding Allocation Trust Series 0 | ||||||||||||||||||||
| Year Ended Dec. 31/12 |
Year Ended Dec. 31/11 |
Year Ended Dec. 31/10 |
Year Ended Dec. 31/09 |
Year Ended Dec. 31/08 (f) |
||||||||||||||||
| Units, beginning of period |
29,247 | 64,706 | 38,206 | 23,066 | — | |||||||||||||||
| Units issued |
27,966 | 9,528 | 42,673 | 39,529 | 23,225 | |||||||||||||||
| Units redeemed |
(45,103 | ) | (44,987 | ) | (16,173 | ) | (24,389 | ) | (159 | ) | ||||||||||
|
|
|
|
|
|
|
|
|
|
|
|||||||||||
| Units, end of period |
12,110 | 29,247 | 64,706 | 38,206 | 23,066 | |||||||||||||||
|
|
|
|
|
|
|
|
|
|
|
|||||||||||
| Unit value, end of period $ |
11.34 | 9.75 | 9.89 | 8.93 | 6.79 | |||||||||||||||
| Assets, end of period $ |
137,330 | 285,058 | 639,946 | 341,295 | 156,653 | |||||||||||||||
| Investment income ratio* |
2.48 | % | 1.72 | % | 5.10 | % | 6.82 | % | 20.48 | % | ||||||||||
| Expense ratio, lowest to highest** |
0.00 | % | 0.00 | % | 0.00 | % | 0.00 | % | 0.00 | % | ||||||||||
| Total return, lowest to highest*** |
16.33 | % | (1.45 | %) | 10.71 | % | 31.52 | % | (32.08%) to (21.32 | %) | ||||||||||
| (f) | Reflects the period from commencement of operations on April 28, 2008 through December 31, 2008. |
99
Table of Contents
John Hancock Life Insurance Company (U.S.A.) Separate Account N
Notes to Financial Statements (continued)
| 10. | Financial Highlights |
| Sub-Account | ||||||||
| Franklin Templeton Founding Allocation Trust Series 1 | ||||||||
| Year Ended Dec. 31/12 |
Year Ended Dec. 31/11 (g) |
|||||||
| Units, beginning of period |
743 | — | ||||||
| Units issued |
571 | 780 | ||||||
| Units redeemed |
(361 | ) | (37 | ) | ||||
|
|
|
|
|
|||||
| Units, end of period |
953 | 743 | ||||||
|
|
|
|
|
|||||
| Unit value, end of period $ |
10.98 | 9.42 to 9.74 | ||||||
| Assets, end of period $ |
10,473 | 7,070 | ||||||
| Investment income ratio* |
3.60 | % | 20.73 | % | ||||
| Expense ratio, lowest to highest** |
0.65 | % | 0.00% to 0.65 | % | ||||
| Total return, lowest to highest*** |
15.51 | % | (2.28%) to (1.41 | %) | ||||
| (g) Fund available in prior year but no activity. |
| |||||||
| Sub-Account | ||||
| Frontier Capital Appreciation Trust | ||||
| Year Ended Dec. 31/12 (g) |
||||
| Units, beginning of period |
— | |||
| Units issued |
74,148 | |||
| Units redeemed |
(71,989 | ) | ||
|
|
|
|||
| Units, end of period |
2,159 | |||
|
|
|
|||
| Unit value, end of period $ |
54.36 | |||
| Assets, end of period $ |
117,400 | |||
| Investment income ratio* |
0.61 | % | ||
| Expense ratio, lowest to highest** |
0.00 | % | ||
| Total return, lowest to highest*** |
17.43 | % | ||
| (g) | Fund available in prior year but no activity. |
100
Table of Contents
John Hancock Life Insurance Company (U.S.A.) Separate Account N
Notes to Financial Statements (continued)
| 10. | Financial Highlights |
| Sub-Account | ||||||||||||||||||||
| Fundamental All Cap Core Trust Series 0 | ||||||||||||||||||||
| Year Ended Dec. 31/12 |
Year Ended Dec. 31/11 (m) |
Year Ended Dec. 31/10 |
Year Ended Dec. 31/09 |
Year Ended Dec. 31/08 (ae) |
||||||||||||||||
| Units, beginning of period |
29,551 | 24,237 | 18,535 | 90,036 | 2,943 | |||||||||||||||
| Units issued |
166,368 | 6,839 | 9,686 | 18,980 | 142,562 | |||||||||||||||
| Units redeemed |
(158,371 | ) | (1,525 | ) | (3,984 | ) | (90,481 | ) | (55,469 | ) | ||||||||||
|
|
|
|
|
|
|
|
|
|
|
|||||||||||
| Units, end of period |
37,548 | 29,551 | 24,237 | 18,535 | 90,036 | |||||||||||||||
|
|
|
|
|
|
|
|
|
|
|
|||||||||||
| Unit value, end of period $ |
14.52 | 11.74 | 11.98 | 10.02 | 7.81 | |||||||||||||||
| Assets, end of period $ |
545,096 | 346,907 | 290,400 | 185,772 | 703,064 | |||||||||||||||
| Investment income ratio* |
0.90 | % | 1.22 | % | 1.37 | % | 1.12 | % | 1.17 | % | ||||||||||
| Expense ratio, lowest to highest** |
0.00 | % | 0.00 | % | 0.00 | % | 0.00 | % | 0.00 | % | ||||||||||
| Total return, lowest to highest*** |
23.67 | % | (2.02 | %) | 19.55 | % | 28.35 | % | (43.12%) to (28.05 | %) | ||||||||||
| (m) Renamed on June 27, 2011. Previously known as Optimized All Cap Trust. |
| |||||||||||||||||||
| (ae) Renamed on April 28, 2008. Previously known as Quantitative All Cap Trust. |
| |||||||||||||||||||
| Sub-Account | ||||||||||||||||||||
| Fundamental All Cap Core Trust Series 1 | ||||||||||||||||||||
| Year Ended Dec. 31/12 |
Year Ended Dec. 31/11 (m) |
Year Ended Dec. 31/10 |
Year Ended Dec. 31/09 |
Year Ended Dec. 31/08 (ae) |
||||||||||||||||
| Units, beginning of period |
14,807 | 15,676 | 5,876 | 4,357 | 53 | |||||||||||||||
| Units issued |
44,158 | 103,499 | 68,404 | 10,781 | 10,535 | |||||||||||||||
| Units redeemed |
(45,619 | ) | (104,368 | ) | (58,604 | ) | (9,262 | ) | (6,231 | ) | ||||||||||
|
|
|
|
|
|
|
|
|
|
|
|||||||||||
| Units, end of period |
13,346 | 14,807 | 15,676 | 5,876 | 4,357 | |||||||||||||||
|
|
|
|
|
|
|
|
|
|
|
|||||||||||
| Unit value, end of period $ |
22.97 to 23.99 | 18.32 to 19.80 | 19.24 to 19.91 | 16.20 to 16.52 | 12.71 to 12.85 | |||||||||||||||
| Assets, end of period $ |
312,388 | 281,982 | 306,228 | 96,452 | 56,007 | |||||||||||||||
| Investment income ratio* |
0.80 | % | 0.86 | % | 1.64 | % | 1.50 | % | 0.96 | % | ||||||||||
| Expense ratio, lowest to highest** |
0.20% to 0.65 | % | 0.00% to 0.65 | % | 0.20% to 0.65 | % | 0.35% to 0.65 | % | 0.45% to 0.65 | % | ||||||||||
| Total return, lowest to highest*** |
22.72% to 23.27 | % | (2.95%) to (2.08 | %) | 18.78% to 19.31 | % | 27.44% to 27.82 | % | (43.55%) to (43.43 | %) | ||||||||||
| (m) | Renamed on June 27, 2011. Previously known as Optimized All Cap Trust. |
| (ae) | Renamed on April 28, 2008. Previously known as Quantitative All Cap Trust. |
101
Table of Contents
John Hancock Life Insurance Company (U.S.A.) Separate Account N
Notes to Financial Statements (continued)
| 10. | Financial Highlights |
| Sub-Account | ||||||||||||||||
| Fundamental Holdings Trust Series 1 | ||||||||||||||||
| Year Ended Dec. 31/12 |
Year Ended Dec. 31/11 (l) |
Year Ended Dec. 31/10 |
Year Ended Dec. 31/09 (ak) |
|||||||||||||
| Units, beginning of period |
1,221 | 1,232 | 75 | — | ||||||||||||
| Units issued |
121 | 30 | 1,187 | 149 | ||||||||||||
| Units redeemed |
(98 | ) | (41 | ) | (30 | ) | (74 | ) | ||||||||
|
|
|
|
|
|
|
|
|
|||||||||
| Units, end of period |
1,244 | 1,221 | 1,232 | 75 | ||||||||||||
|
|
|
|
|
|
|
|
|
|||||||||
| Unit value, end of period $ |
14.32 to 14.66 | 12.71 to 13.02 | 13.01 to 13.15 | 11.87 to 11.92 | ||||||||||||
| Assets, end of period $ |
17,835 | 15,624 | 16,043 | 897 | ||||||||||||
| Investment income ratio* |
1.79 | % | 1.53 | % | 3.18 | % | 2.19 | % | ||||||||
| Expense ratio, lowest to highest** |
0.00% to 0.65 | % | 0.00% to 0.65 | % | 0.00% to 0.65 | % | 0.00% to 0.65 | % | ||||||||
| Total return, lowest to highest*** |
11.92% to 12.65 | % | (1.94%) to (1.05 | %) | 9.64% to 10.36 | % | 18.70% to 19.20 | % | ||||||||
| (l) | Renamed on October 31, 2011. Previously known as American Fundamental Holdings Trust Series 1. |
| (ak) | Reflects the period from commencement of operations on May 4, 2009 through December 31, 2009. |
| Sub-Account | ||||||||||||||||||||
| Fundamental Large Cap Value Trust Series 0 | ||||||||||||||||||||
| Year Ended Dec. 31/12 |
Year Ended Dec. 31/11 (o) |
Year Ended Dec. 31/10 |
Year Ended Dec. 31/09 |
Year Ended Dec. 31/08 (af) |
||||||||||||||||
| Units, beginning of period |
18,135 | 14,686 | 10,692 | 3,363 | 3,611 | |||||||||||||||
| Units issued |
104,968 | 4,306 | 4,788 | 9,599 | 2,253 | |||||||||||||||
| Units redeemed |
(100,593 | ) | (857 | ) | (794 | ) | (2,270 | ) | (2,501 | ) | ||||||||||
|
|
|
|
|
|
|
|
|
|
|
|||||||||||
| Units, end of period |
22,510 | 18,135 | 14,686 | 10,692 | 3,363 | |||||||||||||||
|
|
|
|
|
|
|
|
|
|
|
|||||||||||
| Unit value, end of period $ |
13.62 | 10.94 | 10.74 | 9.46 | 7.60 | |||||||||||||||
| Assets, end of period $ |
306,562 | 198,403 | 157,677 | 101,134 | 25,545 | |||||||||||||||
| Investment income ratio* |
4.85 | % | 1.15 | % | 2.37 | % | 2.64 | % | 2.76 | % | ||||||||||
| Expense ratio, lowest to highest** |
0.00 | % | 0.00 | % | 0.00 | % | 0.00 | % | 0.00 | % | ||||||||||
| Total return, lowest to highest*** |
24.48 | % | 1.90 | % | 13.51 | % | 24.53 | % | (41.15%) to (27.37 | %) | ||||||||||
| (o) | Renamed on June 27, 2011. Previously known as Optimized Value Trust. |
(af) Renamed on April 28, 2008. Previously known as Quantitative Value Trust.
102
Table of Contents
John Hancock Life Insurance Company (U.S.A.) Separate Account N
Notes to Financial Statements (continued)
| 10. | Financial Highlights |
| Sub-Account | ||||||||||||||||||||
| Fundamental Large Cap Value Trust Series 1 | ||||||||||||||||||||
| Year Ended Dec. 31/12 |
Year Ended Dec. 31/11 (o) |
Year Ended Dec. 31/10 |
Year Ended Dec. 31/09 |
Year Ended Dec. 31/08 (af) |
||||||||||||||||
| Units, beginning of period |
— | — | — | 50 | 29,814 | |||||||||||||||
| Units issued |
163 | — | 1,285 | 2,897 | 8,708 | |||||||||||||||
| Units redeemed |
(3 | ) | — | (1,285 | ) | (2,947 | ) | (38,472 | ) | |||||||||||
|
|
|
|
|
|
|
|
|
|
|
|||||||||||
| Units, end of period |
160 | — | — | — | 50 | |||||||||||||||
|
|
|
|
|
|
|
|
|
|
|
|||||||||||
| Unit value, end of |
18.30 to 19.03 | |
14.52 to 15.56 |
|
14.65 to 15.09 | 13.13 to 13.20 | 10.50 to 10.65 | |||||||||||||
| Assets, end of period $ |
2,945 | 14 | 14 | 12 | 538 | |||||||||||||||
| Investment income ratio* |
5.59 | % | 1.01 | % | 0.04 | % | 0.07 | % | 0.05 | % | ||||||||||
| Expense ratio, lowest to highest** |
0.20% to 0.65 | % | 0.00% to 0.65 | % | 0.20% to 0.65 | % | 0.35% to 0.45 | % | 0.35% to 0.65 | % | ||||||||||
| Total return, lowest to highest*** |
23.61% to 24.17 | % | 0.83% to 1.75 | % | 12.83% to 13.34 | % | 23.92% to 24.02 | % | (41.58%) to (41.40 | %) | ||||||||||
| (o) Renamed on June 27, 2011. Previously known as Optimized Value Trust. |
| |||||||||||||||||||
| (af) Renamed on April 28, 2008. Previously known as Quantitative Value Trust. |
| |||||||||||||||||||
| Sub-Account | ||||||||||||||||||||
| Fundamental Value Trust Series 0 | ||||||||||||||||||||
| Year Ended Dec. 31/12 |
Year Ended Dec. 31/11 |
Year Ended Dec. 31/10 |
Year Ended Dec. 31/09 |
Year Ended Dec. 31/08 |
||||||||||||||||
| Units, beginning of period |
256,193 | 237,558 | 215,913 | 83,985 | 8,642 | |||||||||||||||
| Units issued |
287,534 | 71,293 | 135,430 | 253,970 | 84,974 | |||||||||||||||
| Units redeemed |
(241,420 | ) | (52,658 | ) | (113,785 | ) | (122,042 | ) | (9,631 | ) | ||||||||||
|
|
|
|
|
|
|
|
|
|
|
|||||||||||
| Units, end of period |
302,307 | 256,193 | 237,558 | 215,913 | 83,985 | |||||||||||||||
|
|
|
|
|
|
|
|
|
|
|
|||||||||||
| Unit value, end of period $ |
13.06 | 11.52 | 11.96 | 10.57 | 8.02 | |||||||||||||||
| Assets, end of period $ |
3,947,978 | 2,950,359 | 2,842,099 | 2,281,949 | 673,278 | |||||||||||||||
| Investment income ratio* |
0.73 | % | 0.88 | % | 1.23 | % | 1.00 | % | 3.24 | % | ||||||||||
| Expense ratio, lowest to highest** |
0.00 | % | 0.00 | % | 0.00 | % | 0.00 | % | 0.00 | % | ||||||||||
| Total return, lowest to highest*** |
13.40 | % | (3.74 | %) | 13.20 | % | 31.83 | % | (39.27%) to (27.52 | %) | ||||||||||
103
Table of Contents
John Hancock Life Insurance Company (U.S.A.) Separate Account N
Notes to Financial Statements (continued)
| 10. | Financial Highlights |
| Sub-Account | ||||||||||||||||||||
| Fundamental Value Trust Series 1 | ||||||||||||||||||||
| Year Ended Dec. 31/12 |
Year Ended Dec. 31/11 |
Year Ended Dec. 31/10 |
Year Ended Dec. 31/09 |
Year Ended Dec. 31/08 |
||||||||||||||||
| Units, beginning of period |
544,450 | 692,765 | 702,850 | 591,549 | 235,968 | |||||||||||||||
| Units issued |
37,577 | 60,908 | 358,046 | 468,005 | 477,588 | |||||||||||||||
| Units redeemed |
(252,275 | ) | (209,223 | ) | (368,131 | ) | (356,704 | ) | (122,007 | ) | ||||||||||
|
|
|
|
|
|
|
|
|
|
|
|||||||||||
| Units, end of period |
329,752 | 544,450 | 692,765 | 702,850 | 591,549 | |||||||||||||||
|
|
|
|
|
|
|
|
|
|
|
|||||||||||
| Unit value, end of period $ |
16.82 to 17.83 | 14.62 to 16.10 | 15.64 to 16.41 | 13.98 to 14.42 | 10.68 to 10.97 | |||||||||||||||
| Assets, end of |
5,709,007 | 8,359,838 | 11,118,689 | 9,947,392 | 6,384,680 | |||||||||||||||
| Investment income ratio* |
0.88 | % | 0.75 | % | 1.15 | % | 1.08 | % | 1.75 | % | ||||||||||
| Expense ratio, lowest to highest** |
0.20% to 0.70 | % | 0.00% to 0.70 | % | 0.20% to 0.70 | % | 0.30% to 0.65 | % | 0.30% to 0.65 | % | ||||||||||
| Total return, lowest to highest*** |
12.59% to 13.15 | % | (4.64%) to (3.78 | %) | 12.32% to 12.87 | % | 30.92% to 31.39 | % | (39.71%) to (39.50 | %) | ||||||||||
| Sub-Account | ||||||||||||||||||||
| Global Bond Trust Series 0 | ||||||||||||||||||||
| Year Ended Dec. 31/12 |
Year Ended Dec. 31/11 |
Year Ended Dec. 31/10 |
Year Ended Dec. 31/09 |
Year Ended Dec. 31/08 |
||||||||||||||||
| Units, beginning of period |
462,668 | 433,270 | 312,324 | 280,537 | 232,906 | |||||||||||||||
| Units issued |
458,209 | 209,504 | 219,286 | 147,097 | 192,157 | |||||||||||||||
| Units redeemed |
(506,083 | ) | (180,106 | ) | (98,340 | ) | (115,310 | ) | (144,526 | ) | ||||||||||
|
|
|
|
|
|
|
|
|
|
|
|||||||||||
| Units, end of period |
414,794 | 462,668 | 433,270 | 312,324 | 280,537 | |||||||||||||||
|
|
|
|
|
|
|
|
|
|
|
|||||||||||
| Unit value, end of period $ |
31.84 | 29.72 | 27.24 | 24.68 | 21.38 | |||||||||||||||
| Assets, end of period $ |
13,207,522 | 13,749,389 | 11,803,615 | 7,706,881 | 5,998,144 | |||||||||||||||
| Investment income ratio* |
7.03 | % | 6.84 | % | 4.19 | % | 12.29 | % | 0.56 | % | ||||||||||
| Expense ratio, lowest to highest** |
0.00 | % | 0.00 | % | 0.00 | % | 0.00 | % | 0.00 | % | ||||||||||
| Total return, lowest to highest*** |
7.15 | % | 9.08 | % | 10.40 | % | 15.41 | % | (4.42%) to (1.77 | %) | ||||||||||
104
Table of Contents
John Hancock Life Insurance Company (U.S.A.) Separate Account N
Notes to Financial Statements (continued)
| 10. | Financial Highlights |
| Sub-Account | ||||||||||||||||||||
| Global Bond Trust Series 1 | ||||||||||||||||||||
| Year Ended Dec. 31/12 |
Year Ended Dec. 31/11 |
Year Ended Dec. 31/10 |
Year Ended Dec. 31/09 |
Year Ended Dec. 31/08 |
||||||||||||||||
| Units, beginning of period |
134,298 | 160,641 | 142,403 | 216,580 | 252,132 | |||||||||||||||
| Units issued |
33,052 | 65,777 | 107,848 | 174,925 | 279,869 | |||||||||||||||
| Units redeemed |
(63,582 | ) | (92,120 | ) | (89,610 | ) | (249,102 | ) | (315,421 | ) | ||||||||||
|
|
|
|
|
|
|
|
|
|
|
|||||||||||
| Units, end of period |
103,768 | 134,298 | 160,641 | 142,403 | 216,580 | |||||||||||||||
|
|
|
|
|
|
|
|
|
|
|
|||||||||||
| Unit value, end of period $ |
28.49 to 30.25 | 25.75 to 28.95 | 24.75 to 26.01 | 22.70 to 23.42 | 19.80 to 20.36 | |||||||||||||||
| Assets, end of period $ |
3,033,036 | 3,693,790 | 4,072,834 | 3,275,176 | 4,354,555 | |||||||||||||||
| Investment income ratio* |
7.12 | % | 6.14 | % | 3.88 | % | 14.45 | % | 0.57 | % | ||||||||||
| Expense ratio, lowest to highest** |
0.20% to 0.70 | % | 0.00% to 0.70 | % | 0.20% to 0.70 | % | 0.30% to 0.65 | % | 0.30% to 0.65 | % | ||||||||||
| Total return, lowest to highest*** |
6.28% to 6.81 | % | 8.11% to 9.08 | % | 9.54% to 10.09 | % | 14.65% to 15.05 | % | (5.10%) to (4.78 | %) | ||||||||||
| Sub-Account | ||||||||||||||||
| Global Diversification Trust Series 1 | ||||||||||||||||
| Year Ended Dec. 31/12 |
Year Ended Dec. 31/11 (i) |
Year Ended Dec. 31/10 |
Year Ended Dec. 31/09 (ak) |
|||||||||||||
| Units, beginning of period |
6,584 | 10,310 | 6,219 | — | ||||||||||||
| Units issued |
6,662 | 3,053 | 10,108 | 8,119 | ||||||||||||
| Units redeemed |
(3,162 | ) | (6,779 | ) | (6,017 | ) | (1,900 | ) | ||||||||
|
|
|
|
|
|
|
|
|
|||||||||
| Units, end of period |
10,084 | 6,584 | 10,310 | 6,219 | ||||||||||||
|
|
|
|
|
|
|
|
|
|||||||||
| Unit value, end of period $ |
15.00 to 15.36 | 12.94 to 13.26 | 14.03 to 14.18 | 12.54 to 12.59 | ||||||||||||
| Assets, end of period $ |
152,071 | 86,201 | 145,634 | 78,010 | ||||||||||||
| Investment income ratio* |
1.86 | % | 1.87 | % | 6.90 | % | 1.89 | % | ||||||||
| Expense ratio, lowest to highest** |
0.00% to 0.65 | % | 0.00% to 0.65 | % | 0.00% to 0.65 | % | 0.00% to 0.65 | % | ||||||||
| Total return, lowest to highest*** |
15.09% to 15.84 | % | (7.32%) to (6.49 | %) | 11.85% to 12.57 | % | 25.40% to 25.94 | % | ||||||||
| (i) | Renamed on October 31, 2011. Previously known as American Global Diversification Trust Series 1. |
| (ak) | Reflects the period from commencement of operations on May 4, 2009 through December 31, 2009. |
105
Table of Contents
John Hancock Life Insurance Company (U.S.A.) Separate Account N
Notes to Financial Statements (continued)
| 10. | Financial Highlights |
| Sub-Account | ||||||||||||||||||||
| Global Trust Series 0 | ||||||||||||||||||||
| Year Ended Dec. 31/12 |
Year Ended Dec. 31/11 |
Year Ended Dec. 31/10 |
Year Ended Dec. 31/09 |
Year Ended Dec. 31/08 |
||||||||||||||||
| Units, beginning of period |
16,131 | 20,110 | 21,685 | 32,930 | 40,340 | |||||||||||||||
| Units issued |
19,600 | 4,516 | 14,679 | 24,262 | 24,420 | |||||||||||||||
| Units redeemed |
(5,257 | ) | (8,495 | ) | (16,254 | ) | (35,507 | ) | (31,830 | ) | ||||||||||
|
|
|
|
|
|
|
|
|
|
|
|||||||||||
| Units, end of period |
30,474 | 16,131 | 20,110 | 21,685 | 32,930 | |||||||||||||||
|
|
|
|
|
|
|
|
|
|
|
|||||||||||
| Unit value, end of |
13.51 | 11.09 | 11.79 | 10.94 | 8.32 | |||||||||||||||
| Assets, end of period $ |
411,720 | 178,912 | 237,151 | 237,159 | 273,952 | |||||||||||||||
| Investment income ratio* |
2.63 | % | 2.15 | % | 2.10 | % | 1.16 | % | 2.41 | % | ||||||||||
| Expense ratio, lowest to highest** |
0.00 | % | 0.00 | % | 0.00 | % | 0.00 | % | 0.00 | % | ||||||||||
| Total return, lowest to highest*** |
21.82 | % | (5.96 | %) | 7.82 | % | 31.47 | % | (39.49%) to (23.39 | %) | ||||||||||
| Sub-Account | ||||||||||||||||||||
| Global Trust Series 1 | ||||||||||||||||||||
| Year Ended Dec. 31/12 |
Year Ended Dec. 31/11 |
Year Ended Dec. 31/10 |
Year Ended Dec. 31/09 |
Year Ended Dec. 31/08 |
||||||||||||||||
| Units, beginning of period |
55,386 | 97,222 | 96,641 | 145,276 | 261,353 | |||||||||||||||
| Units issued |
76,790 | 15,746 | 45,219 | 62,853 | 68,244 | |||||||||||||||
| Units redeemed |
(61,726 | ) | (57,582 | ) | (44,638 | ) | (111,488 | ) | (184,321 | ) | ||||||||||
|
|
|
|
|
|
|
|
|
|
|
|||||||||||
| Units, end of period |
70,450 | 55,386 | 97,222 | 96,641 | 145,276 | |||||||||||||||
|
|
|
|
|
|
|
|
|
|
|
|||||||||||
| Unit value, end of period $ |
22.44 to 23.83 | 14.34 to 20.05 | 19.88 to 20.90 | 18.66 to 19.26 | 14.30 to 14.71 | |||||||||||||||
| Assets, end of period $ |
1,571,023 | 1,035,580 | 1,941,195 | 1,785,233 | 2,096,612 | |||||||||||||||
| Investment income ratio* |
2.25 | % | 1.36 | % | 1.57 | % | 1.83 | % | 1.77 | % | ||||||||||
| Expense ratio, lowest to highest** |
0.20% to 0.70 | % | 0.00% to 0.65 | % | 0.20% to 0.70 | % | 0.30% to 0.65 | % | 0.30% to 0.65 | % | ||||||||||
| Total return, lowest to highest*** |
20.89% to 21.50 | % | (6.84%) to (6.00 | %) | 7.01% to 7.54 | % | 30.52% to 30.97 | % | (39.94%) to (39.73 | %) | ||||||||||
106
Table of Contents
John Hancock Life Insurance Company (U.S.A.) Separate Account N
Notes to Financial Statements (continued)
| 10. | Financial Highlights |
| Sub-Account | ||||||||||||||||||||
| Health Sciences Trust Series 0 | ||||||||||||||||||||
| Year Ended Dec. 31/12 |
Year Ended Dec. 31/11 |
Year Ended Dec. 31/10 |
Year Ended Dec. 31/09 |
Year Ended Dec. 31/08 |
||||||||||||||||
| Units, beginning of period |
55,470 | 44,254 | 43,037 | 40,949 | 11,504 | |||||||||||||||
| Units issued |
53,368 | 21,681 | 24,062 | 32,120 | 73,492 | |||||||||||||||
| Units redeemed |
(36,678 | ) | (10,465 | ) | (22,845 | ) | (30,032 | ) | (44,047 | ) | ||||||||||
|
|
|
|
|
|
|
|
|
|
|
|||||||||||
| Units, end of period |
72,160 | 55,470 | 44,254 | 43,037 | 40,949 | |||||||||||||||
|
|
|
|
|
|
|
|
|
|
|
|||||||||||
| Unit value, end of period $ |
26.99 | 20.45 | 18.48 | 15.96 | 12.11 | |||||||||||||||
| Assets, end of period $ |
1,947,265 | 1,134,576 | 817,962 | 686,852 | 495,670 | |||||||||||||||
| Investment income ratio* |
0.00 | % | 0.00 | % | 0.00 | % | 0.00 | % | 0.00 | % | ||||||||||
| Expense ratio, lowest to highest** |
0.00 | % | 0.00 | % | 0.00 | % | 0.00 | % | 0.00 | % | ||||||||||
| Total return, lowest to highest*** |
31.93 | % | 10.66 | % | 15.81 | % | 31.84 | % | (29.86%) to (21.80 | %) | ||||||||||
| Sub-Account | ||||||||||||||||||||
| Health Sciences Trust Series 1 | ||||||||||||||||||||
| Year Ended Dec. 31/12 |
Year Ended Dec. 31/11 |
Year Ended Dec. 31/10 |
Year Ended Dec. 31/09 |
Year Ended Dec. 31/08 |
||||||||||||||||
| Units, beginning of period |
111,013 | 87,399 | 100,165 | 260,191 | 235,072 | |||||||||||||||
| Units issued |
41,452 | 104,522 | 51,255 | 114,028 | 280,570 | |||||||||||||||
| Units redeemed |
(47,965 | ) | (80,908 | ) | (64,021 | ) | (274,054 | ) | (255,451 | ) | ||||||||||
|
|
|
|
|
|
|
|
|
|
|
|||||||||||
| Units, end of period |
104,500 | 111,013 | 87,399 | 100,165 | 260,191 | |||||||||||||||
|
|
|
|
|
|
|
|
|
|
|
|||||||||||
| Unit value, end of period $ |
32.14 to 33.87 | 23.87 to 26.28 | 22.32 to 23.31 | 19.41 to 20.01 | 14.82 to 15.23 | |||||||||||||||
| Assets, end of period $ |
3,409,850 | 2,757,632 | 1,969,865 | 1,957,724 | 3,897,285 | |||||||||||||||
| Investment income ratio* |
0.00 | % | 0.00 | % | 0.00 | % | 0.00 | % | 0.00 | % | ||||||||||
| Expense ratio, lowest to highest** |
0.20% to 0.65 | % | 0.00% to 0.65 | % | 0.20% to 0.65 | % | 0.30% to 0.65 | % | 0.30% to 0.65 | % | ||||||||||
| Total return, lowest to highest*** |
31.09% to 31.69 | % | 9.58% to 10.57 | % | 14.95% to 15.47 | % | 30.95% to 31.41 | % | (30.36%) to (30.11 | %) | ||||||||||
107
Table of Contents
John Hancock Life Insurance Company (U.S.A.) Separate Account N
Notes to Financial Statements (continued)
| 10. | Financial Highlights |
| Sub-Account | ||||||||||||||||||||
| High Yield Trust Series 0 | ||||||||||||||||||||
| Year Ended Dec. 31/12 |
Year Ended Dec. 31/11 |
Year Ended Dec. 31/10 |
Year Ended Dec. 31/09 |
Year Ended Dec. 31/08 |
||||||||||||||||
| Units, beginning of period |
94,907 | 158,303 | 131,736 | 77,172 | 58,466 | |||||||||||||||
| Units issued |
327,606 | 27,554 | 103,145 | 142,835 | 64,061 | |||||||||||||||
| Units redeemed |
(300,650 | ) | (90,950 | ) | (76,578 | ) | (88,271 | ) | (45,355 | ) | ||||||||||
|
|
|
|
|
|
|
|
|
|
|
|||||||||||
| Units, end of period |
121,863 | 94,907 | 158,303 | 131,736 | 77,172 | |||||||||||||||
|
|
|
|
|
|
|
|
|
|
|
|||||||||||
| Unit value, end of period $ |
19.45 | 16.33 | 16.15 | 14.20 | 9.19 | |||||||||||||||
| Assets, end of period $ |
2,369,595 | 1,550,002 | 2,556,453 | 1,870,386 | 709,188 | |||||||||||||||
| Investment income ratio* |
8.40 | % | 8.02 | % | 42.98 | % | 13.46 | % | 9.25 | % | ||||||||||
| Expense ratio, lowest to highest** |
0.00 | % | 0.00 | % | 0.00 | % | 0.00 | % | 0.00 | % | ||||||||||
| Total return, lowest to highest*** |
19.07 | % | 1.14 | % | 13.75 | % | 54.51 | % | (29.48%) to (24.36 | %) | ||||||||||
| Sub-Account | ||||||||||||||||||||
| High Yield Trust Series 1 | ||||||||||||||||||||
| Year Ended Dec. 31/12 |
Year Ended Dec. 31/11 |
Year Ended Dec. 31/10 |
Year Ended Dec. 31/09 |
Year Ended Dec. 31/08 |
||||||||||||||||
| Units, beginning of period |
205,205 | 259,083 | 224,470 | 294,419 | 456,353 | |||||||||||||||
| Units issued |
77,305 | 81,326 | 262,764 | 170,151 | 139,507 | |||||||||||||||
| Units redeemed |
(134,746 | ) | (135,204 | ) | (228,151 | ) | (240,100 | ) | (301,441 | ) | ||||||||||
|
|
|
|
|
|
|
|
|
|
|
|||||||||||
| Units, end of period |
147,764 | 205,205 | 259,083 | 224,470 | 294,419 | |||||||||||||||
|
|
|
|
|
|
|
|
|
|
|
|||||||||||
| Unit value, end of period $ |
26.46 to 28.09 | 19.17 to 24.17 | 22.35 to 23.49 | 19.87 to 20.50 | 12.94 to 13.31 | |||||||||||||||
| Assets, end of period $ |
4,002,086 | 4,701,034 | 5,904,086 | 4,385,652 | 3,740,054 | |||||||||||||||
| Investment income ratio* |
7.52 | % | 7.86 | % | 45.08 | % | 11.42 | % | 7.50 | % | ||||||||||
| Expense ratio, lowest to highest** |
0.20% to 0.70 | % | 0.00% to 0.65 | % | 0.20% to 0.70 | % | 0.30% to 0.65 | % | 0.30% to 0.65 | % | ||||||||||
| Total return, lowest to highest*** |
18.15% to 18.77 | % | (0.01%) to 0.90 | % | 12.99% to 13.56 | % | 53.51% to 54.05 | % | (29.98%) to (29.73 | %) | ||||||||||
108
Table of Contents
John Hancock Life Insurance Company (U.S.A.) Separate Account N
Notes to Financial Statements (continued)
| 10. | Financial Highlights |
| Sub-Account | ||||||||||||||||||||
| International Core Trust Series 0 | ||||||||||||||||||||
| Year Ended Dec. 31/12 |
Year Ended Dec. 31/11 |
Year Ended Dec. 31/10 |
Year Ended Dec. 31/09 |
Year Ended Dec. 31/08 |
||||||||||||||||
| Units, beginning of period |
13,939 | 16,904 | 35,484 | 20,154 | 13,585 | |||||||||||||||
| Units issued |
9,283 | 7,375 | 8,201 | 30,718 | 20,613 | |||||||||||||||
| Units redeemed |
(7,594 | ) | (10,340 | ) | (26,781 | ) | (15,388 | ) | (14,044 | ) | ||||||||||
|
|
|
|
|
|
|
|
|
|
|
|||||||||||
| Units, end of period |
15,628 | 13,939 | 16,904 | 35,484 | 20,154 | |||||||||||||||
|
|
|
|
|
|
|
|
|
|
|
|||||||||||
| Unit value, end of period $ |
13.77 | 11.96 | 13.22 | 12.05 | 10.16 | |||||||||||||||
| Assets, end of period $ |
215,155 | 166,647 | 223,449 | 427,723 | 204,797 | |||||||||||||||
| Investment income ratio* |
3.23 | % | 2.07 | % | 1.74 | % | 3.08 | % | 6.12 | % | ||||||||||
| Expense ratio, lowest to highest** |
0.00 | % | 0.00 | % | 0.00 | % | 0.00 | % | 0.00 | % | ||||||||||
| Total return, lowest to highest*** |
15.16 | % | (9.55 | %) | 9.67 | % | 18.62 | % | (38.58%) to (22.22 | %) | ||||||||||
| Sub-Account | ||||||||||||||||||||
| International Core Trust Series 1 | ||||||||||||||||||||
| Year Ended Dec. 31/12 |
Year Ended Dec. 31/11 |
Year Ended Dec. 31/10 |
Year Ended Dec. 31/09 |
Year Ended Dec. 31/08 |
||||||||||||||||
| Units, beginning of period |
198,568 | 211,061 | 305,807 | 391,213 | 504,258 | |||||||||||||||
| Units issued |
10,259 | 86,394 | 106,060 | 127,741 | 137,701 | |||||||||||||||
| Units redeemed |
(67,093 | ) | (98,887 | ) | (200,806 | ) | (213,147 | ) | (250,746 | ) | ||||||||||
|
|
|
|
|
|
|
|
|
|
|
|||||||||||
| Units, end of period |
141,734 | 198,568 | 211,061 | 305,807 | 391,213 | |||||||||||||||
|
|
|
|
|
|
|
|
|
|
|
|||||||||||
| Unit value, end of period $ |
16.51 to 17.53 | 11.97 to 15.61 | 16.10 to 16.92 | 14.85 to 15.33 | 12.60 to 12.96 | |||||||||||||||
| Assets, end of period $ |
2,378,965 | 2,920,094 | 3,453,284 | 4,569,358 | 4,958,400 | |||||||||||||||
| Investment income ratio* |
2.68 | % | 2.37 | % | 1.67 | % | 2.35 | % | 4.50 | % | ||||||||||
| Expense ratio, lowest to highest** |
0.20% to 0.70 | % | 0.00% to 0.65 | % | 0.20% to 0.70 | % | 0.30% to 0.65 | % | 0.30% to 0.65 | % | ||||||||||
| Total return, lowest to highest*** |
14.24% to 14.82 | % | (10.38%) to (9.57 | %) | 8.82% to 9.36 | % | 17.87% to 18.28 | % | (39.02%) to (38.80 | %) | ||||||||||
109
Table of Contents
John Hancock Life Insurance Company (U.S.A.) Separate Account N
Notes to Financial Statements (continued)
| 10. | Financial Highlights |
| Sub-Account | ||||||||||||
| International Equity Index Trust A Series 0 | ||||||||||||
| Year Ended Dec. 31/12 (u) |
Year Ended Dec. 31/11 |
Year Ended Dec. 31/10 (be) |
||||||||||
| Units, beginning of period |
28,195 | 20,599 | — | |||||||||
| Units issued |
6,402 | 13,518 | 23,934 | |||||||||
| Units redeemed |
(34,597 | ) | (5,922 | ) | (3,335 | ) | ||||||
|
|
|
|
|
|
|
|||||||
| Units, end of period |
— | 28,195 | 20,599 | |||||||||
|
|
|
|
|
|
|
|||||||
| Unit value, end of period $ |
10.54 | 9.50 | 11.08 | |||||||||
| Assets, end of period $ |
— | 267,917 | 228,165 | |||||||||
| Investment income ratio* |
3.42 | % | 3.77 | % | 2.63 | % | ||||||
| Expense ratio, lowest to highest** |
0.00 | % | 0.00 | % | 0.00 | % | ||||||
| Total return, lowest to highest*** |
10.94 | % | (14.21 | %) | 10.76 | % | ||||||
| (u) | Terminated as an investment option and funds transferred to International Equity Index Trust B on November 5, 2012. |
| (be) | Reflects the period from commencement of operations on May 3, 2010 through December 31, 2010. |
| Sub-Account | ||||||||||||||||||||
| International Equity Index Trust A Series 1 | ||||||||||||||||||||
| Year Ended Dec. 31/12 (u) |
Year Ended Dec. 31/11 |
Year Ended Dec. 31/10 |
Year Ended Dec. 31/09 |
Year Ended Dec. 31/08 |
||||||||||||||||
| Units, beginning of period |
226,937 | 269,360 | 174,689 | 263,204 | 164,962 | |||||||||||||||
| Units issued |
66,726 | 119,457 | 233,168 | 61,341 | 231,501 | |||||||||||||||
| Units redeemed |
(293,663 | ) | (161,880 | ) | (138,497 | ) | (149,856 | ) | (133,259 | ) | ||||||||||
|
|
|
|
|
|
|
|
|
|
|
|||||||||||
| Units, end of period |
— | 226,937 | 269,360 | 174,689 | 263,204 | |||||||||||||||
|
|
|
|
|
|
|
|
|
|
|
|||||||||||
| Unit value, end of |
18.99 to 19.81 | 16.96 to 18.18 | 20.23 to 20.91 | 18.43 to 18.79 | 13.45 to 13.67 | |||||||||||||||
| Assets, end of period $ |
— | 3,995,353 | 5,548,020 | 3,266,527 | 3,585,626 | |||||||||||||||
| Investment income ratio* |
3.18 | % | 3.06 | % | 2.33 | % | 12.43 | % | 2.45 | % | ||||||||||
| Expense ratio, lowest to highest** |
0.20% to 0.70 | % | 0.00% to 0.65 | % | 0.20% to 0.70 | % | 0.30% to 0.65 | % | 0.30% to 0.65 | % | ||||||||||
| Total return, lowest to highest*** |
10.23% to 10.70 | % | (15.01%) to (14.24 | %) | 10.09% to 10.64 | % | 36.96% to 37.44 | % | (44.90%) to (44.71 | %) | ||||||||||
| (u) | Terminated as an investment option and funds transferred to International Equity Index Trust B on November 5, 2012. |
110
Table of Contents
John Hancock Life Insurance Company (U.S.A.) Separate Account N
Notes to Financial Statements (continued)
| 10. | Financial Highlights |
| Sub-Account | ||||||||||||||||||||
| International Equity Index Trust B Series 0 | ||||||||||||||||||||
| Year Ended Dec. 31/12 |
Year Ended Dec. 31/11 |
Year Ended Dec. 31/10 |
Year Ended Dec. 31/09 |
Year Ended Dec. 31/08 |
||||||||||||||||
| Units, beginning of period |
248,211 | 232,718 | 191,837 | 117,054 | 34,648 | |||||||||||||||
| Units issued |
267,310 | 114,913 | 110,334 | 139,800 | 146,008 | |||||||||||||||
| Units redeemed |
(166,506 | ) | (99,420 | ) | (69,453 | ) | (65,017 | ) | (63,602 | ) | ||||||||||
|
|
|
|
|
|
|
|
|
|
|
|||||||||||
| Units, end of period |
349,015 | 248,211 | 232,718 | 191,837 | 117,054 | |||||||||||||||
|
|
|
|
|
|
|
|
|
|
|
|||||||||||
| Unit value, end of period $ |
41.55 | 35.28 | 41.02 | 36.81 | 26.52 | |||||||||||||||
| Assets, end of period $ |
14,502,017 | 8,757,970 | 9,546,882 | 7,062,159 | 3,104,506 | |||||||||||||||
| Investment income ratio* |
1.26 | % | 3.62 | % | 2.79 | % | 4.04 | % | 3.69 | % | ||||||||||
| Expense ratio, lowest to highest** |
0.00 | % | 0.00 | % | 0.00 | % | 0.00 | % | 0.00 | % | ||||||||||
| Total return, lowest to highest*** |
17.76 | % | (13.99 | %) | 11.43 | % | 38.80 | % | (44.38%) to (27.72 | %) | ||||||||||
| Sub-Account | ||||
| International Equity Index Trust B Series 1 | ||||
| Year Ended | ||||
| Dec. 31/12 (s) | ||||
| Units, beginning of period |
— | |||
| Units issued |
404,251 | |||
| Units redeemed |
(77,689 | ) | ||
|
|
|
|||
| Units, end of period |
326,562 | |||
|
|
|
|||
| Unit value, end of period $ |
10.59 to 10.60 | |||
| Assets, end of period $ |
3,459,938 | |||
| Investment income ratio* |
6.74 | % | ||
| Expense ratio, lowest to highest** |
0.20% to 0.65 | % | ||
| Total return, lowest to highest*** |
5.91% to 5.98 | % | ||
| (s) | Reflects the period from commencement of operations on November 5, 2012 through December 31, 2012. |
111
Table of Contents
John Hancock Life Insurance Company (U.S.A.) Separate Account N
Notes to Financial Statements (continued)
| 10. | Financial Highlights |
| Sub-Account | ||||
| International Growth Stock Trust Series 0 | ||||
| Year Ended Dec. 31/12 (r) |
||||
| Units, beginning of period |
— | |||
| Units issued |
609,250 | |||
| Units redeemed |
(105,503 | ) | ||
|
|
|
|||
| Units, end of period |
503,747 | |||
|
|
|
|||
| Unit value, end of period $ |
10.41 | |||
| Assets, end of period $ |
5,244,815 | |||
| Investment income ratio* |
4.39 | % | ||
| Expense ratio, lowest to highest** |
0.00 | % | ||
| Total return, lowest to highest*** |
4.12 | % | ||
| (r) | Reflects the period from commencement of operations on November 5, 2012 through December 31, 2012. |
| Sub-Account | ||||
| International Growth Stock Trust Series 1 | ||||
| Year Ended Dec. 31/12 (r) |
||||
| Units, beginning of period |
— | |||
| Units issued |
43,605 | |||
| Units redeemed |
(855 | ) | ||
|
|
|
|||
| Units, end of period |
42,750 | |||
|
|
|
|||
| Unit value, end of period $ |
10.40 to 10.40 | |||
| Assets, end of period $ |
444,636 | |||
| Investment income ratio* |
4.22 | % | ||
| Expense ratio, lowest to highest** |
0.20% to 0.65 | % | ||
| Total return, lowest to highest*** |
3.96% to 4.04 | % | ||
| (r) | Reflects the period from commencement of operations on November 5, 2012 through December 31, 2012. |
112
Table of Contents
John Hancock Life Insurance Company (U.S.A.) Separate Account N
Notes to Financial Statements (continued)
| 10. | Financial Highlights |
| Sub-Account | ||||||||||||||||||||
| International Opportunities Trust Series 0 | ||||||||||||||||||||
| Year Ended Dec. 31/12 (w) |
Year Ended Dec. 31/11 |
Year Ended Dec. 31/10 |
Year Ended Dec. 31/09 |
Year Ended Dec. 31/08 |
||||||||||||||||
| Units, beginning of period |
329,437 | 344,833 | 295,908 | 228,989 | 110,205 | |||||||||||||||
| Units issued |
155,092 | 363,383 | 153,539 | 181,534 | 202,989 | |||||||||||||||
| Units redeemed |
(484,529 | ) | (378,779 | ) | (104,614 | ) | (114,615 | ) | (84,205 | ) | ||||||||||
|
|
|
|
|
|
|
|
|
|
|
|||||||||||
| Units, end of period |
— | 329,437 | 344,833 | 295,908 | 228,989 | |||||||||||||||
|
|
|
|
|
|
|
|
|
|
|
|||||||||||
| Unit value, end of period $ |
13.05 | 12.05 | 14.33 | 12.59 | 9.16 | |||||||||||||||
| Assets, end of period $ |
— | 3,968,426 | 4,939,867 | 3,726,727 | 2,097,481 | |||||||||||||||
| Investment income ratio* |
2.34 | % | 0.77 | % | 1.58 | % | 1.29 | % | 1.55 | % | ||||||||||
| Expense ratio, lowest to highest** |
0.00 | % | 0.00 | % | 0.00 | % | 0.00 | % | 0.00 | % | ||||||||||
| Total return, lowest to highest*** |
8.32 | % | (15.91 | %) | 13.75 | % | 37.49 | % | (50.51%) to (34.21 | %) | ||||||||||
| (w) Terminated as an investment option and funds transferred to International Growth Stock Trust on November 5, 2012. |
| |||||||||||||||||||
| Sub-Account | ||||||||||||||||||||
| International Opportunities Trust Series 1 | ||||||||||||||||||||
| Year Ended Dec. 31/12 (w) |
Year Ended Dec. 31/11 |
Year Ended Dec. 31/10 |
Year Ended Dec. 31/09 |
Year Ended Dec. 31/08 |
||||||||||||||||
| Units, beginning of period |
46,784 | 29,874 | 51,258 | 159,575 | 144,407 | |||||||||||||||
| Units issued |
2,213 | 69,517 | 35,228 | 49,349 | 175,070 | |||||||||||||||
| Units redeemed |
(48,997 | ) | (52,607 | ) | (56,612 | ) | (157,666 | ) | (159,902 | ) | ||||||||||
|
|
|
|
|
|
|
|
|
|
|
|||||||||||
| Units, end of period |
— | 46,784 | 29,874 | 51,258 | 159,575 | |||||||||||||||
|
|
|
|
|
|
|
|
|
|
|
|||||||||||
| Unit value, end of period $ |
15.47 to 16.00 | 14.13 to 15.00 | 17.20 to 17.64 | 15.24 to 15.45 | 11.15 to 11.27 | |||||||||||||||
| Assets, end of period $ |
— | 678,496 | 519,724 | 787,343 | 1,795,448 | |||||||||||||||
| Investment income ratio* |
2.03 | % | 0.46 | % | 1.02 | % | 0.75 | % | 1.25 | % | ||||||||||
| Expense ratio, lowest to highest** |
0.20% to 0.65 | % | 0.00% to 0.65 | % | 0.20% to 0.65 | % | 0.35% to 0.65 | % | 0.35% to 0.65 | % | ||||||||||
| Total return, lowest to highest*** |
7.69% to 8.09 | % | (16.68%) to (15.92 | %) | 12.85% to 13.36 | % | 36.67% to 37.08 | % | (50.88%) to (50.73 | %) | ||||||||||
| (w) | Terminated as an investment option and funds transferred to International Growth Stock Trust on November 5, 2012. |
113
Table of Contents
John Hancock Life Insurance Company (U.S.A.) Separate Account N
Notes to Financial Statements (continued)
| 10. | Financial Highlights |
| Sub-Account | ||||||||||||||||
| International Small Company Trust Series 0 | ||||||||||||||||
| Year Ended Dec. 31/12 |
Year Ended Dec. 31/11 |
Year Ended Dec. 31/10 |
Year Ended Dec. 31/09 (al) |
|||||||||||||
| Units, beginning of period |
60,716 | 50,913 | 37,839 | — | ||||||||||||
| Units issued |
28,924 | 21,938 | 26,186 | 64,995 | ||||||||||||
| Units redeemed |
(20,209 | ) | (12,135 | ) | (13,112 | ) | (27,156 | ) | ||||||||
|
|
|
|
|
|
|
|
|
|||||||||
| Units, end of period |
69,431 | 60,716 | 50,913 | 37,839 | ||||||||||||
|
|
|
|
|
|
|
|
|
|||||||||
| Unit value, end of period $ |
12.06 | 10.12 | 12.07 | 9.84 | ||||||||||||
| Assets, end of period $ |
837,448 | 614,184 | 614,404 | 372,374 | ||||||||||||
| Investment income ratio* |
1.27 | % | 1.93 | % | 3.20 | % | 0.59 | % | ||||||||
| Expense ratio, lowest to highest** |
0.00 | % | 0.00 | % | 0.00 | % | 0.00 | % | ||||||||
| Total return, lowest to highest*** |
19.23 | % | (16.18 | %) | 22.62 | % | (1.59 | %) | ||||||||
| (al) | Reflects the period from commencement of operations on November 16, 2009 through December 31, 2009. |
| Sub-Account | ||||||||||||||||
| International Small Company Trust Series 1 | ||||||||||||||||
| Year Ended Dec. 31/12 |
Year Ended Dec. 31/11 |
Year Ended Dec. 31/10 |
Year Ended Dec. 31/09 (al) |
|||||||||||||
| Units, beginning of period |
203,153 | 234,275 | 255,220 | — | ||||||||||||
| Units issued |
11,791 | 85,662 | 164,375 | 265,040 | ||||||||||||
| Units redeemed |
(128,331 | ) | (116,784 | ) | (185,320 | ) | (9,820 | ) | ||||||||
| Units, end of period |
86,613 | 203,153 | 234,275 | 255,220 | ||||||||||||
|
|
|
|
|
|
|
|
|
|||||||||
| Unit value, end of period $ |
11.78 to 11.97 | 9.91 to 10.10 | 11.97 to 12.03 | 9.82 to 9.83 | ||||||||||||
|
|
|
|
|
|
|
|
|
|||||||||
| Assets, end of period $ |
1,024,902 | 2,030,811 | 2,810,297 | 2,507,098 | ||||||||||||
| Investment income ratio* |
1.18 | % | 1.69 | % | 2.63 | % | 0.82 | % | ||||||||
| Expense ratio, lowest to highest** |
0.20% to 0.70 | % | 0.00% to 0.65 | % | 0.20% to 0.70 | % | 0.30% to 0.65 | % | ||||||||
| Total return, lowest to highest*** |
18.36% to 18.95 | % | (16.97%) to (16.23 | %) | 21.85% to 22.46 | % | (1.79%) to (1.74 | %) | ||||||||
| (al) | Reflects the period from commencement of operations on November 16, 2009 through December 31, 2009. |
114
Table of Contents
John Hancock Life Insurance Company (U.S.A.) Separate Account N
Notes to Financial Statements (continued)
| 10. | Financial Highlights |
| Sub-Account | ||||||||||||||||||||
| International Value Trust Series 0 | ||||||||||||||||||||
| Year Ended Dec. 31/12 |
Year Ended Dec. 31/11 |
Year Ended Dec. 31/10 |
Year Ended Dec. 31/09 |
Year Ended Dec. 31/08 |
||||||||||||||||
| Units, beginning of period |
320,232 | 308,050 | 110,091 | 67,718 | 8,699 | |||||||||||||||
| Units issued |
250,848 | 392,599 | 303,935 | 114,220 | 89,308 | |||||||||||||||
| Units redeemed |
(240,779 | ) | (380,417 | ) | (105,976 | ) | (71,847 | ) | (30,289 | ) | ||||||||||
|
|
|
|
|
|
|
|
|
|
|
|||||||||||
| Units, end of period |
330,301 | 320,232 | 308,050 | 110,091 | 67,718 | |||||||||||||||
|
|
|
|
|
|
|
|
|
|
|
|||||||||||
| Unit value, end of period $ |
13.98 | 11.71 | 13.43 | 12.43 | 9.15 | |||||||||||||||
| Assets, end of period $ |
4,616,954 | 3,750,331 | 4,136,819 | 1,368,878 | 619,413 | |||||||||||||||
| Investment income ratio* |
2.78 | % | 2.37 | % | 2.47 | % | 2.33 | % | 4.68 | % | ||||||||||
| Expense ratio, lowest to highest** |
0.00 | % | 0.00 | % | 0.00 | % | 0.00 | % | 0.00 | % | ||||||||||
| Total return, lowest to highest*** |
19.36 | % | (12.80 | %) | 8.00 | % | 35.94 | % | (42.64%) to (26.82 | %) | ||||||||||
| Sub-Account | ||||||||||||||||||||
| International Value Trust Series 1 | ||||||||||||||||||||
| Year Ended Dec. 31/12 |
Year Ended Dec. 31/11 |
Year Ended Dec. 31/10 |
Year Ended Dec. 31/09 |
Year Ended Dec. 31/08 |
||||||||||||||||
| Units, beginning of period |
335,983 | 467,868 | 554,278 | 833,727 | 1,343,264 | |||||||||||||||
| Units issued |
76,527 | 104,672 | 291,724 | 342,720 | 462,638 | |||||||||||||||
| Units redeemed |
(181,427 | ) | (236,557 | ) | (378,134 | ) | (622,169 | ) | (972,175 | ) | ||||||||||
|
|
|
|
|
|
|
|
|
|
|
|||||||||||
| Units, end of period |
231,083 | 335,983 | 467,868 | 554,278 | 833,727 | |||||||||||||||
|
|
|
|
|
|
|
|
|
|
|
|||||||||||
| Unit value, end of period $ |
19.73 to 20.95 | 16.28 to 17.98 | 19.23 to 20.22 | 18.02 to 18.68 | 13.35 to 13.79 | |||||||||||||||
| Assets, end of period $ |
4,725,939 | 5,799,653 | 9,306,276 | 10,226,216 | 11,386,567 | |||||||||||||||
| Investment income ratio* |
2.67 | % | 2.18 | % | 1.85 | % | 2.20 | % | 3.01 | % | ||||||||||
| Expense ratio, lowest to highest** |
0.20% to 0.70 | % | 0.00% to 0.65 | % | 0.20% to 0.70 | % | 0.25% to 0.65 | % | 0.25% to 0.65 | % | ||||||||||
| Total return, lowest to highest*** |
18.54% to 19.14 | % | (13.63%) to (12.85 | %) | 7.23% to 7.77 | % | 34.90% to 35.44 | % | (43.04%) to (42.81 | %) | ||||||||||
115
Table of Contents
John Hancock Life Insurance Company (U.S.A.) Separate Account N
Notes to Financial Statements (continued)
| 10. | Financial Highlights |
| Sub-Account | ||||||||||||||||||||
| Investment Quality Bond Trust Series 0 | ||||||||||||||||||||
| Year Ended Dec. 31/12 |
Year Ended Dec. 31/11 |
Year Ended Dec. 31/10 |
Year Ended Dec. 31/09 |
Year Ended Dec. 31/08 |
||||||||||||||||
| Units, beginning of period |
35,394 | 48,371 | 21,951 | 23,104 | 21,474 | |||||||||||||||
| Units issued |
10,727 | 6,480 | 41,545 | 16,454 | 22,172 | |||||||||||||||
| Units redeemed |
(4,411 | ) | (19,457 | ) | (15,125 | ) | (17,607 | ) | (20,542 | ) | ||||||||||
|
|
|
|
|
|
|
|
|
|
|
|||||||||||
| Units, end of period |
41,710 | 35,394 | 48,371 | 21,951 | 23,104 | |||||||||||||||
|
|
|
|
|
|
|
|
|
|
|
|||||||||||
| Unit value, end of period $ |
15.43 | 14.33 | 13.26 | 12.33 | 10.97 | |||||||||||||||
| Assets, end of period $ |
643,610 | 507,256 | 641,591 | 270,739 | 253,456 | |||||||||||||||
| Investment income ratio* |
2.33 | % | 3.65 | % | 7.27 | % | 3.98 | % | 6.27 | % | ||||||||||
| Expense ratio, lowest to highest** |
0.00 | % | 0.00 | % | 0.00 | % | 0.00 | % | 0.00 | % | ||||||||||
| Total return, lowest to highest*** |
7.66 | % | 8.06 | % | 7.54 | % | 12.43 | % | (1.61%) to 0.35 | % | ||||||||||
| Sub-Account | ||||||||||||||||||||
| Investment Quality Bond Trust Series 1 | ||||||||||||||||||||
| Year Ended Dec. 31/12 |
Year Ended Dec. 31/11 |
Year Ended Dec. 31/10 |
Year Ended Dec. 31/09 |
Year Ended Dec. 31/08 |
||||||||||||||||
| Units, beginning of period |
223,350 | 199,835 | 224,572 | 288,229 | 364,134 | |||||||||||||||
| Units issued |
14,451 | 81,166 | 48,281 | 94,522 | 58,613 | |||||||||||||||
| Units redeemed |
(95,874 | ) | (57,651 | ) | (73,018 | ) | (158,179 | ) | (134,518 | ) | ||||||||||
|
|
|
|
|
|
|
|
|
|
|
|||||||||||
| Units, end of period |
141,927 | 223,350 | 199,835 | 224,572 | 288,229 | |||||||||||||||
|
|
|
|
|
|
|
|
|
|
|
|||||||||||
| Unit value, end of period $ |
29.38 to 31.20 | 24.31 to 29.71 | 25.63 to 26.95 | 24.12 to 24.90 | 21.59 to 22.21 | |||||||||||||||
| Assets, end of period $ |
4,236,189 | 6,241,633 | 5,170,750 | 5,426,904 | 6,251,474 | |||||||||||||||
| Investment income ratio* |
1.98 | % | 4.35 | % | 5.22 | % | 4.75 | % | 6.28 | % | ||||||||||
| Expense ratio, lowest to highest** |
0.20% to 0.70 | % | 0.00% to 0.70 | % | 0.20% to 0.70 | % | 0.30% to 0.65 | % | 0.30% to 0.65 | % | ||||||||||
| Total return, lowest to highest*** |
6.83% to 7.36 | % | 7.10% to 8.07 | % | 6.71% to 7.24 | % | 11.72% to 12.11 | % | (2.31%) to (1.97 | %) | ||||||||||
116
Table of Contents
John Hancock Life Insurance Company (U.S.A.) Separate Account N
Notes to Financial Statements (continued)
| 10. | Financial Highlights |
| Sub-Account | ||||
| Large Cap Growth Trust | ||||
| Year Ended Dec. 31/12 (g) |
||||
| Units, beginning of period |
— | |||
| Units issued |
9,328 | |||
| Units redeemed |
(80 | ) | ||
|
|
|
|||
| Units, end of period |
9,248 | |||
|
|
|
|||
| Unit value, end of period $ |
33.46 | |||
| Assets, end of period $ |
309,425 | |||
| Investment income ratio* |
0.06 | % | ||
| Expense ratio, lowest to highest** |
0.00 | % | ||
| Total return, lowest to highest*** |
19.31 | % | ||
| (g) | Fund available in prior year but no activity. |
| Sub-Account | ||||||||||||||||||||
| Large Cap Trust Series 0 | ||||||||||||||||||||
| Year Ended Dec. 31/12 (p) |
Year Ended Dec. 31/11 |
Year Ended Dec. 31/10 |
Year Ended Dec. 31/09 |
Year Ended Dec. 31/08 |
||||||||||||||||
| Units, beginning of period |
39,305 | 36,268 | 26,559 | 8,969 | 3,559 | |||||||||||||||
| Units issued |
7,952 | 1,304,514 | 41,910 | 30,965 | 7,799 | |||||||||||||||
| Units redeemed |
(47,257 | ) | (1,301,477 | ) | (32,201 | ) | (13,375 | ) | (2,389 | ) | ||||||||||
|
|
|
|
|
|
|
|
|
|
|
|||||||||||
| Units, end of period |
— | 39,305 | 36,268 | 26,559 | 8,969 | |||||||||||||||
|
|
|
|
|
|
|
|
|
|
|
|||||||||||
| Unit value, end of period $ |
13.04 | 11.45 | 11.69 | 10.27 | 7.84 | |||||||||||||||
| Assets, end of period $ |
— | 450,141 | 423,904 | 272,677 | 70,272 | |||||||||||||||
| Investment income ratio* |
1.68 | % | 1.20 | % | 1.46 | % | 2.72 | % | 2.41 | % | ||||||||||
| Expense ratio, lowest to highest** |
0.00 | % | 0.00 | % | 0.00 | % | 0.00 | % | 0.00 | % | ||||||||||
| Total return, lowest to highest*** |
13.84 | % | (2.02 | %) | 13.84 | % | 31.02 | % | (39.55%) to (28.84 | %) | ||||||||||
| (p) | Terminated as an investment option and funds transferred to U.S. Equity Trust on April 30, 2012. |
117
Table of Contents
John Hancock Life Insurance Company (U.S.A.) Separate Account N
Notes to Financial Statements (continued)
| 10. | Financial Highlights |
| Sub-Account | ||||||||||||||||||||
| Large Cap Trust Series 1 | ||||||||||||||||||||
| Year Ended Dec. 31/12 (p) |
Year Ended Dec. 31/11 |
Year Ended Dec. 31/10 |
Year Ended Dec. 31/09 |
Year Ended Dec. 31/08 |
||||||||||||||||
| Units, beginning of period |
141,291 | 150,723 | 181,411 | 314,175 | 303,754 | |||||||||||||||
| Units issued |
16,786 | 79,192 | 61,049 | 73,118 | 102,040 | |||||||||||||||
| Units redeemed |
(158,077 | ) | (88,624 | ) | (91,737 | ) | (205,882 | ) | (91,619 | ) | ||||||||||
|
|
|
|
|
|
|
|
|
|
|
|||||||||||
| Units, end of period |
— | 141,291 | 150,723 | 181,411 | 314,175 | |||||||||||||||
|
|
|
|
|
|
|
|
|
|
|
|||||||||||
| Unit value, end of period $ |
15.47 to 16.02 | 13.44 to 14.27 | 14.01 to 14.41 | 12.43 to 12.64 | 9.54 to 9.69 | |||||||||||||||
| Assets, end of period $ |
— | 1,951,922 | 2,135,887 | 2,261,005 | 3,019,835 | |||||||||||||||
| Investment income ratio* |
1.39 | % | 1.35 | % | 1.07 | % | 1.86 | % | 1.55 | % | ||||||||||
| Expense ratio, lowest to highest** |
0.20% to 0.70 | % | 0.00% to 0.70 | % | 0.20% to 0.70 | % | 0.30% to 0.65 | % | 0.30% to 0.70 | % | ||||||||||
| Total return, lowest to highest*** |
13.57% to 13.75 | % | (2.94%) to (2.06 | %) | 12.95% to 13.51 | % | 29.99% to 30.46 | % | (39.94%) to (39.70 | %) | ||||||||||
| (p) Terminated as an investment option and funds transferred to U.S. Equity Trust on April 30, 2012. |
| |||||||||||||||||||
| Sub-Account | ||||||||||||||||||||
| Lifestyle Aggressive Trust Series 0 | ||||||||||||||||||||
| Year Ended Dec. 31/12 |
Year Ended Dec. 31/11 |
Year Ended Dec. 31/10 |
Year Ended Dec. 31/09 |
Year Ended Dec. 31/08 |
||||||||||||||||
| Units, beginning of period |
593,290 | 517,979 | 281,048 | 208,575 | 49,164 | |||||||||||||||
| Units issued |
288,158 | 215,514 | 395,592 | 204,213 | 193,153 | |||||||||||||||
| Units redeemed |
(481,896 | ) | (140,203 | ) | (158,661 | ) | (131,740 | ) | (33,742 | ) | ||||||||||
|
|
|
|
|
|
|
|
|
|
|
|||||||||||
| Units, end of period |
399,552 | 593,290 | 517,979 | 281,048 | 208,575 | |||||||||||||||
|
|
|
|
|
|
|
|
|
|
|
|||||||||||
| Unit value, end of period $ |
14.51 | 12.43 | 13.29 | 11.41 | 8.41 | |||||||||||||||
| Assets, end of period $ |
5,796,593 | 7,377,597 | 6,885,583 | 3,206,926 | 1,753,973 | |||||||||||||||
| Investment income ratio* |
1.53 | % | 1.94 | % | 2.58 | % | 1.13 | % | 2.74 | % | ||||||||||
| Expense ratio, lowest to highest** |
0.00 | % | 0.00 | % | 0.00 | % | 0.00 | % | 0.00 | % | ||||||||||
| Total return, lowest to highest*** |
16.67 | % | (6.46 | %) | 16.50 | % | 35.70 | % | (42.00%) to (28.35 | %) | ||||||||||
118
Table of Contents
John Hancock Life Insurance Company (U.S.A.) Separate Account N
Notes to Financial Statements (continued)
| 10. | Financial Highlights |
| Sub-Account | ||||||||||||||||||||
| Lifestyle Aggressive Trust Series 1 | ||||||||||||||||||||
| Year Ended Dec. 31/12 |
Year Ended Dec. 31/11 |
Year Ended Dec. 31/10 |
Year Ended Dec. 31/09 |
Year Ended Dec. 31/08 |
||||||||||||||||
| Units, beginning of period |
228,294 | 224,221 | 382,180 | 378,274 | 462,444 | |||||||||||||||
| Units issued |
36,665 | 73,036 | 70,885 | 369,002 | 178,424 | |||||||||||||||
| Units redeemed |
(166,151 | ) | (68,963 | ) | (228,844 | ) | (365,096 | ) | (262,594 | ) | ||||||||||
|
|
|
|
|
|
|
|
|
|
|
|||||||||||
| Units, end of period |
98,808 | 228,294 | 224,221 | 382,180 | 378,274 | |||||||||||||||
|
|
|
|
|
|
|
|
|
|
|
|||||||||||
| Unit value, end of period $ |
21.90 to 23.11 | 15.21 to 20.30 | 20.35 to 21.28 | 17.59 to 18.15 | 13.05 to 13.42 | |||||||||||||||
| Assets, end of period $ |
2,179,183 | 4,344,785 | 4,596,754 | 6,742,728 | 4,954,739 | |||||||||||||||
| Investment income ratio* |
1.68 | % | 1.70 | % | 1.47 | % | 1.09 | % | 1.90 | % | ||||||||||
| Expense ratio, lowest to highest** |
0.20% to 0.65 | % | 0.00% to 0.65 | % | 0.20% to 0.65 | % | 0.30% to 0.65 | % | 0.30% to 0.65 | % | ||||||||||
| Total return, lowest to highest*** |
15.85% to 16.38 | % | (7.34%) to (6.50 | %) | 15.69% to 16.22 | % | 34.75% to 35.22 | % | (42.37%) to (42.16 | %) | ||||||||||
| Sub-Account | ||||||||||||||||||||
| Lifestyle Balanced Trust Series 0 | ||||||||||||||||||||
| Year Ended Dec. 31/12 |
Year Ended Dec. 31/11 |
Year Ended Dec. 31/10 |
Year Ended Dec. 31/09 |
Year Ended Dec. 31/08 |
||||||||||||||||
| Units, beginning of period |
1,346,741 | 859,624 | 372,821 | 345,505 | 218,765 | |||||||||||||||
| Units issued |
520,597 | 689,190 | 682,181 | 542,287 | 252,640 | |||||||||||||||
| Units redeemed |
(721,634 | ) | (202,073 | ) | (195,378 | ) | (514,971 | ) | (125,900 | ) | ||||||||||
|
|
|
|
|
|
|
|
|
|
|
|||||||||||
| Units, end of period |
1,145,704 | 1,346,741 | 859,624 | 372,821 | 345,505 | |||||||||||||||
|
|
|
|
|
|
|
|
|
|
|
|||||||||||
| Unit value, end of period $ |
14.93 | 13.34 | 13.25 | 11.85 | 9.06 | |||||||||||||||
| Assets, end of period $ |
17,101,682 | 17,964,747 | 11,390,337 | 4,419,554 | 3,128,937 | |||||||||||||||
| Investment income ratio* |
2.41 | % | 3.98 | % | 4.09 | % | 4.92 | % | 4.16 | % | ||||||||||
| Expense ratio, lowest to highest** |
0.00 | % | 0.00 | % | 0.00 | % | 0.00 | % | 0.00 | % | ||||||||||
| Total return, lowest to highest*** |
11.90% | 0.67% | 11.78% | 30.89% | (31.33%) to (21.25 | %) | ||||||||||||||
119
Table of Contents
John Hancock Life Insurance Company (U.S.A.) Separate Account N
Notes to Financial Statements (continued)
| 10. | Financial Highlights |
| Sub-Account | ||||||||||||||||||||
| Lifestyle Balanced Trust Series 1 | ||||||||||||||||||||
| Year Ended Dec. 31/12 |
Year Ended Dec. 31/11 |
Year Ended Dec. 31/10 |
Year Ended Dec. 31/09 |
Year Ended Dec. 31/08 |
||||||||||||||||
| Units, beginning of period |
524,150 | 475,830 | 409,137 | 512,877 | 525,031 | |||||||||||||||
| Units issued |
199,283 | 253,651 | 320,506 | 313,368 | 216,482 | |||||||||||||||
| Units redeemed |
(407,620 | ) | (205,331 | ) | (253,813 | ) | (417,108 | ) | (228,636 | ) | ||||||||||
|
|
|
|
|
|
|
|
|
|
|
|||||||||||
| Units, end of period |
315,813 | 524,150 | 475,830 | 409,137 | 512,877 | |||||||||||||||
|
|
|
|
|
|
|
|
|
|
|
|||||||||||
| Unit value, end of period $ |
27.14 to 28.64 | 19.47 to 26.23 | 24.43 to 25.55 | 22.00 to 22.71 | 16.94 to 17.42 | |||||||||||||||
| Assets, end of period $ |
8,676,435 | 12,908,333 | 11,701,787 | 9,013,279 | 8,730,517 | |||||||||||||||
| Investment income ratio* |
2.13 | % | 3.34 | % | 3.02 | % | 4.47 | % | 3.23 | % | ||||||||||
| Expense ratio, lowest to highest** |
0.20% to 0.65 | % | 0.00% to 0.65 | % | 0.20% to 0.65 | % | 0.30% to 0.65 | % | 0.30% to 0.65 | % | ||||||||||
| Total return, lowest to highest*** |
11.14% to 11.64 | % | (0.28%) to 0.62 | % | 11.02% to 11.53 | % | 29.90% to 30.35 | % | (31.74%) to (31.50 | %) | ||||||||||
| Sub-Account | ||||||||||||||||||||
| Lifestyle Conservative Trust Series 0 | ||||||||||||||||||||
| Year Ended Dec. 31/12 |
Year Ended Dec. 31/11 |
Year Ended Dec. 31/10 |
Year Ended Dec. 31/09 |
Year Ended Dec. 31/08 |
||||||||||||||||
| Units, beginning of period |
360,851 | 246,229 | 100,145 | 34,442 | 2,736 | |||||||||||||||
| Units issued |
237,145 | 162,562 | 177,951 | 102,908 | 34,420 | |||||||||||||||
| Units redeemed |
(78,294 | ) | (47,940 | ) | (31,867 | ) | (37,205 | ) | (2,714 | ) | ||||||||||
|
|
|
|
|
|
|
|
|
|
|
|||||||||||
| Units, end of period |
519,702 | 360,851 | 246,229 | 100,145 | 34,442 | |||||||||||||||
|
|
|
|
|
|
|
|
|
|
|
|||||||||||
| Unit value, end of period $ |
15.02 | 13.84 | 13.27 | 12.15 | 9.99 | |||||||||||||||
| Assets, end of period $ |
7,807,743 | 4,994,046 | 3,268,150 | 1,216,629 | 344,025 | |||||||||||||||
| Investment income ratio* |
3.53 | % | 5.32 | % | 4.36 | % | 8.43 | % | 25.38 | % | ||||||||||
| Expense ratio, lowest to highest** |
0.00 | % | 0.00 | % | 0.00 | % | 0.00 | % | 0.00 | % | ||||||||||
| Total return, lowest to highest*** |
8.55 | % | 4.27 | % | 9.25 | % | 21.63 | % | (15.43%) to (10.74 | %) | ||||||||||
120
Table of Contents
John Hancock Life Insurance Company (U.S.A.) Separate Account N
Notes to Financial Statements (continued)
| 10. | Financial Highlights |
| Sub-Account | ||||||||||||||||||||
| Lifestyle Conservative Trust Series 1 | ||||||||||||||||||||
| Year Ended Dec. 31/12 |
Year Ended Dec. 31/11 |
Year Ended Dec. 31/10 |
Year Ended Dec. 31/09 |
Year Ended Dec. 31/08 |
||||||||||||||||
| Units, beginning of period |
116,560 | 89,871 | 75,416 | 178,286 | 289,337 | |||||||||||||||
| Units issued |
194,759 | 103,124 | 65,315 | 22,075 | 153,526 | |||||||||||||||
| Units redeemed |
(90,902 | ) | (76,435 | ) | (50,860 | ) | (124,945 | ) | (264,577 | ) | ||||||||||
|
|
|
|
|
|
|
|
|
|
|
|||||||||||
| Units, end of period |
220,417 | 116,560 | 89,871 | 75,416 | 178,286 | |||||||||||||||
|
|
|
|
|
|
|
|
|
|
|
|||||||||||
| Unit value, end of period $ |
29.03 to 30.65 | 22.14 to 28.92 | 26.01 to 27.21 | 23.99 to 24.76 | 19.84 to 20.40 | |||||||||||||||
| Assets, end of period $ |
6,465,480 | 3,191,375 | 2,350,294 | 1,800,796 | 3,567,617 | |||||||||||||||
| Investment income ratio* |
3.82 | % | 4.60 | % | 3.07 | % | 4.29 | % | 3.34 | % | ||||||||||
| Expense ratio, lowest to highest** |
0.20% to 0.65 | % | 0.00% to 0.65 | % | 0.20% to 0.65 | % | 0.30% to 0.65 | % | 0.30% to 0.65 | % | ||||||||||
| Total return, lowest to highest*** |
7.81% to 8.29 | % | 3.30% to 4.23 | % | 8.42% to 8.92 | % | 20.92% to 21.35 | % | (16.12%) to (15.82 | %) | ||||||||||
| Sub-Account | ||||||||||||||||||||
| Lifestyle Growth Trust Series 0 | ||||||||||||||||||||
| Year Ended Dec. 31/12 |
Year Ended Dec. 31/11 |
Year Ended Dec. 31/10 |
Year Ended Dec. 31/09 |
Year Ended Dec. 31/08 |
||||||||||||||||
| Units, beginning of period |
1,481,824 | 1,098,800 | 723,983 | 492,467 | 279,917 | |||||||||||||||
| Units issued |
335,541 | 567,853 | 752,935 | 372,790 | 324,378 | |||||||||||||||
| Units redeemed |
(420,296 | ) | (184,829 | ) | (378,118 | ) | (141,274 | ) | (111,828 | ) | ||||||||||
|
|
|
|
|
|
|
|
|
|
|
|||||||||||
| Units, end of period |
1,397,069 | 1,481,824 | 1,098,800 | 723,983 | 492,467 | |||||||||||||||
|
|
|
|
|
|
|
|
|
|
|
|||||||||||
| Unit value, end of period $ |
14.76 | 12.96 | 13.16 | 11.64 | 8.73 | |||||||||||||||
| Assets, end of period $ |
20,617,727 | 19,198,025 | 14,460,188 | 8,427,534 | 4,299,878 | |||||||||||||||
| Investment income ratio* |
2.02 | % | 3.15 | % | 2.91 | % | 4.17 | % | 3.60 | % | ||||||||||
| Expense ratio, lowest to highest** |
0.00 | % | 0.00 | % | 0.00 | % | 0.00 | % | 0.00 | % | ||||||||||
| Total return, lowest to highest*** |
13.91 | % | (1.55 | %) | 13.04 | % | 33.33 | % | (36.54%) to (24.41 | %) | ||||||||||
121
Table of Contents
John Hancock Life Insurance Company (U.S.A.) Separate Account N
Notes to Financial Statements (continued)
| 10. | Financial Highlights |
| Sub-Account | ||||||||||||||||||||
| Lifestyle Growth Trust Series 1 | ||||||||||||||||||||
| Year Ended Dec. 31/12 |
Year Ended Dec. 31/11 |
Year Ended Dec. 31/10 |
Year Ended Dec. 31/09 |
Year Ended Dec. 31/08 |
||||||||||||||||
| Units, beginning of period |
393,934 | 370,626 | 567,681 | 616,972 | 589,218 | |||||||||||||||
| Units issued |
77,368 | 121,643 | 129,098 | 342,277 | 167,165 | |||||||||||||||
| Units redeemed |
(277,455 | ) | (98,335 | ) | (326,153 | ) | (391,568 | ) | (139,411 | ) | ||||||||||
|
|
|
|
|
|
|
|
|
|
|
|||||||||||
| Units, end of period |
193,847 | 393,934 | 370,626 | 567,681 | 616,972 | |||||||||||||||
|
|
|
|
|
|
|
|
|
|
|
|||||||||||
| Unit value, end of period $ |
24.89 to 26.28 | 17.13 to 23.64 | 22.51 to 23.55 | 20.04 to 20.69 | 15.14 to 15.57 | |||||||||||||||
| Assets, end of period $ |
4,883,819 | 8,774,074 | 8,411,397 | 11,437,781 | 9,400,374 | |||||||||||||||
| Investment income ratio* |
1.75 | % | 2.88 | % | 1.95 | % | 3.52 | % | 2.71 | % | ||||||||||
| Expense ratio, lowest to highest** |
0.20% to 0.65 | % | 0.00% to 0.65 | % | 0.20% to 0.65 | % | 0.30% to 0.65 | % | 0.30% to 0.65 | % | ||||||||||
| Total return, lowest to highest*** |
13.13% to 13.64 | % | (2.48%) to (1.60 | %) | 12.29% to 12.79 | % | 32.43% to 32.90 | % | (37.01%) to (36.79 | %) | ||||||||||
| Sub-Account | ||||||||||||||||||||
| Lifestyle Moderate Trust Series 0 | ||||||||||||||||||||
| Year Ended Dec. 31/12 |
Year Ended Dec. 31/11 |
Year Ended Dec. 31/10 |
Year Ended Dec. 31/09 |
Year Ended Dec. 31/08 |
||||||||||||||||
| Units, beginning of period |
495,546 | 350,849 | 275,555 | 128,902 | 36,346 | |||||||||||||||
| Units issued |
343,424 | 248,355 | 272,501 | 290,244 | 185,989 | |||||||||||||||
| Units redeemed |
(254,106 | ) | (103,658 | ) | (197,207 | ) | (143,591 | ) | (93,433 | ) | ||||||||||
|
|
|
|
|
|
|
|
|
|
|
|||||||||||
| Units, end of period |
584,864 | 495,546 | 350,849 | 275,555 | 128,902 | |||||||||||||||
|
|
|
|
|
|
|
|
|
|
|
|||||||||||
| Unit value, end of period $ |
14.92 | 13.48 | 13.17 | 11.90 | 9.35 | |||||||||||||||
| Assets, end of period $ |
8,728,555 | 6,680,056 | 4,619,782 | 3,277,916 | 1,205,627 | |||||||||||||||
| Investment income ratio* |
2.90 | % | 4.71 | % | 3.46 | % | 9.25 | % | 7.22 | % | ||||||||||
| Expense ratio, lowest to highest** |
0.00 | % | 0.00 | % | 0.00 | % | 0.00 | % | 0.00 | % | ||||||||||
| Total return, lowest to highest*** |
10.70 | % | 2.38 | % | 10.69 | % | 27.18 | % | (24.16%) to (16.44 | %) | ||||||||||
122
Table of Contents
John Hancock Life Insurance Company (U.S.A.) Separate Account N
Notes to Financial Statements (continued)
| 10. | Financial Highlights |
| Sub-Account | ||||||||||||||||||||
| Lifestyle Moderate Trust Series 1 | ||||||||||||||||||||
| Year Ended Dec. 31/12 |
Year Ended Dec. 31/11 |
Year Ended Dec. 31/10 |
Year Ended Dec. 31/09 |
Year Ended Dec. 31/08 |
||||||||||||||||
| Units, beginning of period |
101,893 | 116,532 | 97,341 | 93,927 | 103,478 | |||||||||||||||
| Units issued |
30,821 | 106,507 | 98,781 | 84,461 | 61,722 | |||||||||||||||
| Units redeemed |
(51,678 | ) | (121,146 | ) | (79,590 | ) | (81,047 | ) | (71,273 | ) | ||||||||||
|
|
|
|
|
|
|
|
|
|
|
|||||||||||
| Units, end of period |
81,036 | 101,893 | 116,532 | 97,341 | 93,927 | |||||||||||||||
|
|
|
|
|
|
|
|
|
|
|
|||||||||||
| Unit value, end of period $ |
28.04 to 29.59 | 20.37 to 27.39 | 25.08 to 26.24 | 22.84 to 23.57 | 18.06 to 18.57 | |||||||||||||||
| Assets, end of period $ |
2,278,379 | 2,616,349 | 2,967,735 | 2,238,073 | 1,708,801 | |||||||||||||||
| Investment income ratio* |
2.68 | % | 2.88 | % | 3.17 | % | 4.98 | % | 3.94 | % | ||||||||||
| Expense ratio, lowest to highest** |
0.20% to 0.65 | % | 0.00% to 0.65 | % | 0.20% to 0.65 | % | 0.30% to 0.65 | % | 0.30% to 0.65 | % | ||||||||||
| Total return, lowest to highest*** |
9.94% to 10.44 | % | 1.42% to 2.33 | % | 9.84% to 10.34 | % | 26.44% to 26.88 | % | (24.72%) to (24.46 | %) | ||||||||||
| Sub-Account | ||||||||||||||||||||
| Mid Cap Index Trust Series 0 | ||||||||||||||||||||
| Year Ended Dec. 31/12 |
Year Ended Dec. 31/11 |
Year Ended Dec. 31/10 |
Year Ended Dec. 31/09 |
Year Ended Dec. 31/08 |
||||||||||||||||
| Units, beginning of period |
313,220 | 228,927 | 136,807 | 105,314 | 71,068 | |||||||||||||||
| Units issued |
222,036 | 187,723 | 137,152 | 101,997 | 65,541 | |||||||||||||||
| Units redeemed |
(175,231 | ) | (103,430 | ) | (45,032 | ) | (70,504 | ) | (31,295 | ) | ||||||||||
|
|
|
|
|
|
|
|
|
|
|
|||||||||||
| Units, end of period |
360,025 | 313,220 | 228,927 | 136,807 | 105,314 | |||||||||||||||
|
|
|
|
|
|
|
|
|
|
|
|||||||||||
| Unit value, end of period $ |
18.95 | 16.13 | 16.48 | 13.07 | 9.56 | |||||||||||||||
| Assets, end of period $ |
6,823,978 | 5,050,757 | 3,772,366 | 1,788,270 | 1,006,767 | |||||||||||||||
| Investment income ratio* |
1.54 | % | 0.81 | % | 1.44 | % | 1.18 | % | 1.14 | % | ||||||||||
| Expense ratio, lowest to highest** |
0.00 | % | 0.00 | % | 0.00 | % | 0.00 | % | 0.00 | % | ||||||||||
| Total return, lowest to highest*** |
17.54 | % | (2.14 | %) | 26.06 | % | 36.74 | % | (36.36%) to (29.45 | %) | ||||||||||
123
Table of Contents
John Hancock Life Insurance Company (U.S.A.) Separate Account N
Notes to Financial Statements (continued)
| 10. | Financial Highlights |
| Sub-Account | ||||||||||||||||||||
| Mid Cap Index Trust Series 1 | ||||||||||||||||||||
| Year Ended Dec. 31/12 |
Year Ended Dec. 31/11 |
Year Ended Dec. 31/10 |
Year Ended Dec. 31/09 |
Year Ended Dec. 31/08 |
||||||||||||||||
| Units, beginning of period |
382,033 | 504,659 | 544,192 | 855,105 | 1,227,846 | |||||||||||||||
| Units issued |
74,985 | 78,808 | 261,685 | 136,277 | 151,549 | |||||||||||||||
| Units redeemed |
(261,820 | ) | (201,434 | ) | (301,218 | ) | (447,190 | ) | (524,290 | ) | ||||||||||
|
|
|
|
|
|
|
|
|
|
|
|||||||||||
| Units, end of period |
195,198 | 382,033 | 504,659 | 544,192 | 855,105 | |||||||||||||||
|
|
|
|
|
|
|
|
|
|
|
|||||||||||
| Unit value, end of period $ |
26.48 to 28.13 | 22.21 to 24.52 | 23.39 to 24.59 | 18.78 to 19.38 | 13.82 to 14.22 | |||||||||||||||
| Assets, end of period $ |
5,321,646 | 8,990,208 | 12,202,258 | 10,434,709 | 12,037,182 | |||||||||||||||
| Investment income ratio* |
1.25 | % | 0.56 | % | 1.06 | % | 0.95 | % | 0.91 | % | ||||||||||
| Expense ratio, lowest to highest** |
0.20% to 0.70 | % | 0.00% to 0.65 | % | 0.20% to 0.70 | % | 0.30% to 0.65 | % | 0.30% to 0.65 | % | ||||||||||
| Total return, lowest to highest*** |
16.66% to 17.25 | % | (3.13%) to (2.25 | %) | 25.11% to 25.73 | % | 35.88% to 36.36 | % | (36.82%) to (36.61 | %) | ||||||||||
| Sub-Account | ||||||||||||||||||||
| Mid Cap Stock Trust Series 0 | ||||||||||||||||||||
| Year Ended Dec. 31/12 |
Year Ended Dec. 31/11 |
Year Ended Dec. 31/10 |
Year Ended Dec. 31/09 |
Year Ended Dec. 31/08 |
||||||||||||||||
| Units, beginning of period |
120,496 | 99,083 | 101,106 | 60,664 | 29,434 | |||||||||||||||
| Units issued |
158,543 | 51,889 | 36,064 | 82,168 | 61,193 | |||||||||||||||
| Units redeemed |
(158,097 | ) | (30,476 | ) | (38,087 | ) | (41,726 | ) | (29,963 | ) | ||||||||||
|
|
|
|
|
|
|
|
|
|
|
|||||||||||
| Units, end of period |
120,942 | 120,496 | 99,083 | 101,106 | 60,664 | |||||||||||||||
|
|
|
|
|
|
|
|
|
|
|
|||||||||||
| Unit value, end of period $ |
49.83 | 40.73 | 44.84 | 36.43 | 27.71 | |||||||||||||||
| Assets, end of period $ |
6,026,881 | 4,908,055 | 4,442,910 | 3,683,767 | 1,681,202 | |||||||||||||||
| Investment income ratio* |
0.00 | % | 0.00 | % | 0.00 | % | 0.00 | % | 0.00 | % | ||||||||||
| Expense ratio, lowest to highest** |
0.00 | % | 0.00 | % | 0.00 | % | 0.00 | % | 0.00 | % | ||||||||||
| Total return, lowest to highest*** |
22.34 | % | (9.16 | %) | 23.07 | % | 31.47 | % | (43.75%) to (29.90 | %) | ||||||||||
124
Table of Contents
John Hancock Life Insurance Company (U.S.A.) Separate Account N
Notes to Financial Statements (continued)
| 10. | Financial Highlights |
| Sub-Account | ||||||||||||||||||||
| Mid Cap Stock Trust Series 1 | ||||||||||||||||||||
| Year Ended Dec. 31/12 |
Year Ended Dec. 31/11 |
Year Ended Dec. 31/10 |
Year Ended Dec. 31/09 |
Year Ended Dec. 31/08 |
||||||||||||||||
| Units, beginning of period |
250,553 | 318,928 | 395,538 | 736,367 | 690,454 | |||||||||||||||
| Units issued |
15,981 | 112,149 | 221,170 | 362,044 | 379,942 | |||||||||||||||
| Units redeemed |
(150,036 | ) | (180,524 | ) | (297,780 | ) | (702,873 | ) | (334,029 | ) | ||||||||||
|
|
|
|
|
|
|
|
|
|
|
|||||||||||
| Units, end of period |
116,498 | 250,553 | 318,928 | 395,538 | 736,367 | |||||||||||||||
|
|
|
|
|
|
|
|
|
|
|
|||||||||||
| Unit value, end of period $ |
20.84 to 22.13 | 16.80 to 18.55 | 19.05 to 20.03 | 15.65 to 16.23 | 12.00 to 12.39 | |||||||||||||||
| Assets, end of period $ |
2,514,726 | 4,451,505 | 6,248,503 | 6,306,437 | 9,024,765 | |||||||||||||||
| Investment income ratio* |
0.00 | % | 0.00 | % | 0.00 | % | 0.00 | % | 0.00 | % | ||||||||||
| Expense ratio, lowest to highest** |
0.20% to 0.70 | % | 0.00% to 0.70 | % | 0.20% to 0.70 | % | 0.25% to 0.65 | % | 0.25% to 0.65 | % | ||||||||||
| Total return, lowest to highest*** |
21.35% to 21.97 | % | (10.01%) to (9.20 | %) | 22.23% to 22.84 | % | 30.50% to 31.03 | % | (44.13%) to (43.90 | %) | ||||||||||
| Sub-Account | ||||||||||||||||||||
| Mid Value Trust Series 0 | ||||||||||||||||||||
| Year Ended Dec. 31/12 |
Year Ended Dec. 31/11 |
Year Ended Dec. 31/10 |
Year Ended Dec. 31/09 |
Year Ended Dec. 31/08 |
||||||||||||||||
| Units, beginning of period |
264,797 | 260,297 | 254,696 | 84,702 | 110,206 | |||||||||||||||
| Units issued |
143,831 | 93,169 | 120,791 | 251,826 | 161,497 | |||||||||||||||
| Units redeemed |
(139,118 | ) | (88,669 | ) | (115,190 | ) | (81,832 | ) | (187,001 | ) | ||||||||||
|
|
|
|
|
|
|
|
|
|
|
|||||||||||
| Units, end of period |
269,510 | 264,797 | 260,297 | 254,696 | 84,702 | |||||||||||||||
|
|
|
|
|
|
|
|
|
|
|
|||||||||||
| Unit value, end of period $ |
27.42 | 22.94 | 24.10 | 20.74 | 14.18 | |||||||||||||||
| Assets, end of period $ |
7,390,879 | 6,074,396 | 6,272,355 | 5,283,386 | 1,201,290 | |||||||||||||||
| Investment income ratio* |
0.92 | % | 0.75 | % | 2.12 | % | 0.78 | % | 1.31 | % | ||||||||||
| Expense ratio, lowest to highest** |
0.00 | % | 0.00 | % | 0.00 | % | 0.00 | % | 0.00 | % | ||||||||||
| Total return, lowest to highest*** |
19.54 | % | (4.80 | %) | 16.16 | % | 46.27 | % | (34.67%) to (27.51 | %) | ||||||||||
125
Table of Contents
John Hancock Life Insurance Company (U.S.A.) Separate Account N
Notes to Financial Statements (continued)
| 10. | Financial Highlights |
| Sub-Account | ||||||||||||||||||||
| Mid Value Trust Series 1 | ||||||||||||||||||||
| Year Ended Dec. 31/12 |
Year Ended Dec. 31/11 |
Year Ended Dec. 31/10 |
Year Ended Dec. 31/09 (g) |
|||||||||||||||||
| Units, beginning of period |
266,100 | 330,552 | 363,628 | — | ||||||||||||||||
| Units issued |
63,640 | 117,985 | 149,464 | 473,014 | ||||||||||||||||
| Units redeemed |
(110,133 | ) | (182,437 | ) | (182,540 | ) | (109,386 | ) | ||||||||||||
|
|
|
|
|
|
|
|
|
|||||||||||||
| Units, end of period |
219,607 | 266,100 | 330,552 | 363,628 | ||||||||||||||||
|
|
|
|
|
|
|
|
|
|||||||||||||
| Unit value, end of period $ |
17.46 to 17.75 | 14.60 to 14.96 | 15.56 to 15.68 | 13.49 to 13.52 | ||||||||||||||||
| Assets, end of period $ |
3,867,416 | 3,937,343 | 5,165,985 | 4,909,319 | ||||||||||||||||
| Investment income ratio* |
0.85 | % | 0.69 | % | 2.07 | % | 0.51 | % | ||||||||||||
| Expense ratio, lowest to highest** |
0.20% to 0.65 | % | 0.00% to 0.65 | % | 0.20% to 0.65 | % | 0.25% to 0.65 | % | ||||||||||||
| Total return, lowest to highest*** |
18.75% to 19.29 | % | (5.77%) to (4.93 | %) | 15.41% to 15.93 | % | 34.85% to 35.21 | % | ||||||||||||
| (g) Fund available in prior year but no activity. |
| |||||||||||||||||||
| Sub-Account | ||||||||||||||||||||
| Money Market Trust B Series 0 | ||||||||||||||||||||
| Year Ended Dec. 31/12 |
Year Ended Dec. 31/11 |
Year Ended Dec. 31/10 |
Year Ended Dec. 31/09 |
Year Ended Dec. 31/08 |
||||||||||||||||
| Units, beginning of period |
2,900,049 | 2,163,145 | 2,590,839 | 4,093,720 | 1,343,526 | |||||||||||||||
| Units issued |
5,062,208 | 3,604,563 | 2,354,422 | 2,868,379 | 4,806,729 | |||||||||||||||
| Units redeemed |
(4,556,953 | ) | (2,867,659 | ) | (2,782,116 | ) | (4,371,260 | ) | (2,056,535 | ) | ||||||||||
|
|
|
|
|
|
|
|
|
|
|
|||||||||||
| Units, end of period |
3,405,304 | 2,900,049 | 2,163,145 | 2,590,839 | 4,093,720 | |||||||||||||||
|
|
|
|
|
|
|
|
|
|
|
|||||||||||
| Unit value, end of period $ |
17.37 | 17.36 | 17.35 | 17.34 | 17.26 | |||||||||||||||
| Assets, end of period $ |
59,153,840 | 50,355,097 | 37,529,888 | 44,928,442 | 70,653,639 | |||||||||||||||
| Investment income ratio* |
0.04 | % | 0.00 | % | 0.05 | % | 0.51 | % | 2.02 | % | ||||||||||
| Expense ratio, lowest to highest** |
0.00 | % | 0.00 | % | 0.00 | % | 0.00 | % | 0.00 | % | ||||||||||
| Total return, lowest to highest*** |
0.03 | % | 0.08 | % | 0.03 | % | 0.47 | % | 0.40% to 2.12 | % | ||||||||||
126
Table of Contents
John Hancock Life Insurance Company (U.S.A.) Separate Account N
Notes to Financial Statements (continued)
| 10. | Financial Highlights |
| Sub-Account | ||||||||||||||||||||
| Money Market Trust Series 1 | ||||||||||||||||||||
| Year Ended Dec. 31/12 |
Year Ended Dec. 31/11 |
Year Ended Dec. 31/10 |
Year Ended Dec. 31/09 |
Year Ended Dec. 31/08 |
||||||||||||||||
| Units, beginning of period |
1,293,433 | 1,006,382 | 1,733,854 | 4,818,232 | 4,025,524 | |||||||||||||||
| Units issued |
3,354,748 | 1,069,517 | 2,512,559 | 2,542,228 | 2,612,046 | |||||||||||||||
| Units redeemed |
(782,862 | ) | (782,466 | ) | (3,240,031 | ) | (5,626,606 | ) | (1,819,338 | ) | ||||||||||
|
|
|
|
|
|
|
|
|
|
|
|||||||||||
| Units, end of period |
3,865,319 | 1,293,433 | 1,006,382 | 1,733,854 | 4,818,232 | |||||||||||||||
|
|
|
|
|
|
|
|
|
|
|
|||||||||||
| Unit value, end of period $ |
20.49 to 21.76 | 15.15 to 22.28 | 20.77 to 21.83 | 21.00 to 21.78 | 21.09 to 21.78 | |||||||||||||||
| Assets, end of period $ |
82,144,640 | 27,374,747 | 21,281,600 | 35,883,153 | 101,314,436 | |||||||||||||||
| Investment income ratio* |
0.00 | % | 0.00 | % | 0.00 | % | 0.24 | % | 1.73 | % | ||||||||||
| Expense ratio, lowest to highest** |
0.20% to 0.70 | % | 0.00% to 0.70 | % | 0.20% to 0.70 | % | 0.25% to 0.65 | % | 0.25% to 0.65 | % | ||||||||||
| Total return, lowest to highest*** |
(0.70%) to (0.18 | %) | (0.82%) to 0.07 | % | (0.70%) to (0.19 | %) | (0.46%) to (0.04 | %) | 1.09% to 1.52 | % | ||||||||||
| Sub-Account | ||||||||||||||||||||
| Natural Resources Trust Series 0 | ||||||||||||||||||||
| Year Ended Dec. 31/12 |
Year Ended Dec. 31/11 |
Year Ended Dec. 31/10 |
Year Ended Dec. 31/09 |
Year Ended Dec. 31/08 |
||||||||||||||||
| Units, beginning of period |
130,067 | 84,677 | 113,681 | 59,882 | 34,188 | |||||||||||||||
| Units issued |
50,479 | 67,067 | 48,901 | 136,941 | 80,652 | |||||||||||||||
| Units redeemed |
(30,493 | ) | (21,677 | ) | (77,905 | ) | (83,142 | ) | (54,958 | ) | ||||||||||
|
|
|
|
|
|
|
|
|
|
|
|||||||||||
| Units, end of period |
150,053 | 130,067 | 84,677 | 113,681 | 59,882 | |||||||||||||||
|
|
|
|
|
|
|
|
|
|
|
|||||||||||
| Unit value, end of period $ |
16.97 | 16.87 | 21.16 | 18.36 | 11.53 | |||||||||||||||
| Assets, end of period $ |
2,545,863 | 2,194,024 | 1,791,513 | 2,086,992 | 690,422 | |||||||||||||||
| Investment income ratio* |
0.89 | % | 0.61 | % | 0.62 | % | 1.11 | % | 0.74 | % | ||||||||||
| Expense ratio, lowest to highest** |
0.00 | % | 0.00 | % | 0.00 | % | 0.00 | % | 0.00 | % | ||||||||||
| Total return, lowest to highest*** |
0.58 | % | (20.27 | %) | 15.25 | % | 59.23 | % | (51.60%) to (41.22 | %) | ||||||||||
127
Table of Contents
John Hancock Life Insurance Company (U.S.A.) Separate Account N
Notes to Financial Statements (continued)
| 10. | Financial Highlights |
| Sub-Account | ||||||||||||||||||||
| Natural Resources Trust Series 1 | ||||||||||||||||||||
| Year Ended Dec. 31/12 |
Year Ended Dec. 31/11 |
Year Ended Dec. 31/10 |
Year Ended Dec. 31/09 |
Year Ended Dec. 31/08 |
||||||||||||||||
| Units, beginning of period |
125,092 | 128,093 | 124,917 | 241,760 | 254,942 | |||||||||||||||
| Units issued |
41,306 | 72,195 | 78,918 | 121,039 | 266,782 | |||||||||||||||
| Units redeemed |
(82,804 | ) | (75,196 | ) | (75,742 | ) | (237,882 | ) | (279,964 | ) | ||||||||||
|
|
|
|
|
|
|
|
|
|
|
|||||||||||
| Units, end of period |
83,594 | 125,092 | 128,093 | 124,917 | 241,760 | |||||||||||||||
|
|
|
|
|
|
|
|
|
|
|
|||||||||||
| Unit value, end of period $ |
37.73 to 39.41 | 36.98 to 39.97 | 47.71 to 49.38 | 41.68 to 42.66 | 26.35 to 26.88 | |||||||||||||||
| Assets, end of period $ |
3,204,486 | 4,794,393 | 6,179,506 | 5,252,760 | 6,450,461 | |||||||||||||||
| Investment income ratio* |
0.73 | % | 0.45 | % | 0.64 | % | 1.02 | % | 0.59 | % | ||||||||||
| Expense ratio, lowest to highest** |
0.20% to 0.65 | % | 0.00% to 0.65 | % | 0.20% to 0.65 | % | 0.30% to 0.65 | % | 0.30% to 0.65 | % | ||||||||||
| Total return, lowest to highest*** |
(0.13%) to 0.32 | % | (21.00%) to (20.29 | %) | 14.47% to 14.99 | % | 58.16% to 58.71 | % | (51.93%) to (51.76 | %) | ||||||||||
| Sub-Account | ||||||||||||||||||||
| Real Estate Securities Trust Series 0 | ||||||||||||||||||||
| Year Ended Dec. 31/12 |
Year Ended Dec. 31/11 |
Year Ended Dec. 31/10 |
Year Ended Dec. 31/09 |
Year Ended Dec. 31/08 |
||||||||||||||||
| Units, beginning of period |
86,372 | 91,765 | 87,356 | 71,624 | 61,644 | |||||||||||||||
| Units issued |
46,227 | 22,574 | 34,131 | 76,003 | 95,202 | |||||||||||||||
| Units redeemed |
(39,848 | ) | (27,967 | ) | (29,722 | ) | (60,271 | ) | (85,222 | ) | ||||||||||
|
|
|
|
|
|
|
|
|
|
|
|||||||||||
| Units, end of period |
92,751 | 86,372 | 91,765 | 87,356 | 71,624 | |||||||||||||||
|
|
|
|
|
|
|
|
|
|
|
|||||||||||
| Unit value, end of period $ |
105.48 | 89.90 | 82.05 | 63.50 | 48.75 | |||||||||||||||
| Assets, end of period $ |
9,783,730 | 7,764,963 | 7,528,838 | 5,547,371 | 3,491,635 | |||||||||||||||
| Investment income ratio* |
1.82 | % | 1.53 | % | 2.02 | % | 3.49 | % | 3.49 | % | ||||||||||
| Expense ratio, lowest to highest** |
0.00 | % | 0.00 | % | 0.00 | % | 0.00 | % | 0.00 | % | ||||||||||
| Total return, lowest to highest*** |
17.33 | % | 9.58 | % | 29.20 | % | 30.26 | % | (39.39%) to (38.33 | %) | ||||||||||
128
Table of Contents
John Hancock Life Insurance Company (U.S.A.) Separate Account N
Notes to Financial Statements (continued)
| 10. | Financial Highlights |
| Sub-Account | ||||||||||||||||||||
| Real Estate Securities Trust Series 1 | ||||||||||||||||||||
| Year Ended Dec. 31/12 |
Year Ended Dec. 31/11 |
Year Ended Dec. 31/10 |
Year Ended Dec. 31/09 |
Year Ended Dec. 31/08 |
||||||||||||||||
| Units, beginning of period |
120,266 | 146,488 | 165,443 | 221,440 | 283,937 | |||||||||||||||
| Units issued |
16,196 | 26,656 | 34,463 | 58,954 | 73,525 | |||||||||||||||
| Units redeemed |
(43,030 | ) | (52,878 | ) | (53,418 | ) | (114,951 | ) | (136,022 | ) | ||||||||||
|
|
|
|
|
|
|
|
|
|
|
|||||||||||
| Units, end of period |
93,432 | 120,266 | 146,488 | 165,443 | 221,440 | |||||||||||||||
|
|
|
|
|
|
|
|
|
|
|
|||||||||||
| Unit value, end of period $ |
121.22 to 128.73 | 41.48 to 112.45 | 95.78 to 100.69 | 74.65 to 77.39 | 57.75 to 59.63 | |||||||||||||||
| Assets, end of period $ |
11,297,501 | 12,390,923 | 13,957,541 | 12,238,675 | 12,770,010 | |||||||||||||||
| Investment income ratio* |
1.66 | % | 1.38 | % | 1.82 | % | 3.52 | % | 3.23 | % | ||||||||||
| Expense ratio, lowest to highest** |
0.20% to 0.70 | % | 0.00% to 0.65 | % | 0.20% to 0.70 | % | 0.30% to 0.70 | % | 0.30% to 0.70 | % | ||||||||||
| Total return, lowest to highest*** |
16.44% to 17.02 | % | 8.49% to 9.46 | % | 28.30% to 28.94 | % | 29.27% to 29.78 | % | (39.85%) to (39.60 | %) | ||||||||||
| Sub-Account | ||||||||||||||||||||
| Real Return Bond Trust Series 0 | ||||||||||||||||||||
| Year Ended Dec. 31/12 |
Year Ended Dec. 31/11 |
Year Ended Dec. 31/10 |
Year Ended Dec. 31/09 |
Year Ended Dec. 31/08 |
||||||||||||||||
| Units, beginning of period |
620,592 | 545,434 | 318,234 | 91,101 | 14,342 | |||||||||||||||
| Units issued |
798,056 | 565,865 | 337,653 | 300,552 | 115,493 | |||||||||||||||
| Units redeemed |
(691,232 | ) | (490,707 | ) | (110,453 | ) | (73,419 | ) | (38,734 | ) | ||||||||||
|
|
|
|
|
|
|
|
|
|
|
|||||||||||
| Units, end of period |
727,416 | 620,592 | 545,434 | 318,234 | 91,101 | |||||||||||||||
|
|
|
|
|
|
|
|
|
|
|
|||||||||||
| Unit value, end of period $ |
15.69 | 14.41 | 12.85 | 11.81 | 9.88 | |||||||||||||||
| Assets, end of period $ |
11,415,103 | 8,946,266 | 7,010,975 | 3,759,357 | 900,310 | |||||||||||||||
| Investment income ratio* |
1.83 | % | 4.19 | % | 13.22 | % | 10.16 | % | 0.58 | % | ||||||||||
| Expense ratio, lowest to highest** |
0.00 | % | 0.00 | % | 0.00 | % | 0.00 | % | 0.00 | % | ||||||||||
| Total return, lowest to highest*** |
8.86 | % | 12.14 | % | 8.82 | % | 19.54 | % | (11.50%) to (11.30 | %) | ||||||||||
129
Table of Contents
John Hancock Life Insurance Company (U.S.A.) Separate Account N
Notes to Financial Statements (continued)
| 10. | Financial Highlights |
| Sub-Account | ||||||||||||||||||||
| Real Return Bond Trust Series 1 | ||||||||||||||||||||
| Year Ended Dec. 31/12 |
Year Ended Dec. 31/11 |
Year Ended Dec. 31/10 |
Year Ended Dec. 31/09 |
Year Ended Dec. 31/08 |
||||||||||||||||
| Units, beginning of period |
267,266 | 271,156 | 242,646 | 373,272 | 350,490 | |||||||||||||||
| Units issued |
71,604 | 197,462 | 152,618 | 207,023 | 476,953 | |||||||||||||||
| Units redeemed |
(105,047 | ) | (201,352 | ) | (124,108 | ) | (337,649 | ) | (454,171 | ) | ||||||||||
|
|
|
|
|
|
|
|
|
|
|
|||||||||||
| Units, end of period |
233,823 | 267,266 | 271,156 | 242,646 | 373,272 | |||||||||||||||
|
|
|
|
|
|
|
|
|
|
|
|||||||||||
| Unit value, end of period $ |
21.41 to 22.36 | 19.38 to 20.95 | 17.78 to 18.41 | 16.45 to 16.79 | 13.86 to 14.10 | |||||||||||||||
| Assets, end of period $ |
5,091,250 | 5,369,192 | 4,890,281 | 4,034,568 | 5,236,778 | |||||||||||||||
| Investment income ratio* |
1.74 | % | 4.40 | % | 12.15 | % | 9.48 | % | 0.55 | % | ||||||||||
| Expense ratio, lowest to highest** |
0.20% to 0.65 | % | 0.00% to 0.65 | % | 0.20% to 0.65 | % | 0.35% to 0.65 | % | 0.35% to 0.65 | % | ||||||||||
| Total return, lowest to highest*** |
8.15% to 8.64 | % | 11.03% to 12.02 | % | 8.12% to 8.61 | % | 18.70% to 19.06 | % | (11.86%) to (11.59 | %) | ||||||||||
| Sub-Account | ||||||||||||||||||||
| Science & Technology Trust Series 0 | ||||||||||||||||||||
| Year Ended Dec. 31/12 |
Year Ended Dec. 31/11 |
Year Ended Dec. 31/10 |
Year Ended Dec. 31/09 |
Year Ended Dec. 31/08 |
||||||||||||||||
| Units, beginning of period |
72,649 | 58,546 | 60,306 | 61,404 | 31,366 | |||||||||||||||
| Units issued |
22,590 | 28,318 | 36,563 | 67,062 | 105,213 | |||||||||||||||
| Units redeemed |
(16,628 | ) | (14,215 | ) | (38,323 | ) | (68,160 | ) | (75,175 | ) | ||||||||||
|
|
|
|
|
|
|
|
|
|
|
|||||||||||
| Units, end of period |
78,611 | 72,649 | 58,546 | 60,306 | 61,404 | |||||||||||||||
|
|
|
|
|
|
|
|
|
|
|
|||||||||||
| Unit value, end of period $ |
16.57 | 14.99 | 16.24 | 13.02 | 7.91 | |||||||||||||||
| Assets, end of period $ |
1,302,245 | 1,088,755 | 950,795 | 785,456 | 485,962 | |||||||||||||||
| Investment income ratio* |
0.00 | % | 0.00 | % | 0.00 | % | 0.00 | % | 0.00 | % | ||||||||||
| Expense ratio, lowest to highest** |
0.00 | % | 0.00 | % | 0.00 | % | 0.00 | % | 0.00 | % | ||||||||||
| Total return, lowest to highest*** |
10.54 | % | (7.72 | %) | 24.69 | % | 64.57 | % | (44.42%) to (29.01 | %) | ||||||||||
130
Table of Contents
John Hancock Life Insurance Company (U.S.A.) Separate Account N
Notes to Financial Statements (continued)
| 10. | Financial Highlights |
| Sub-Account | ||||||||||||||||||||
| Science & Technology Trust Series 1 | ||||||||||||||||||||
| Year Ended Dec. 31/12 |
Year Ended Dec. 31/11 |
Year Ended Dec. 31/10 |
Year Ended Dec. 31/09 |
Year Ended Dec. 31/08 |
||||||||||||||||
| Units, beginning of period |
373,442 | 366,903 | 448,641 | 635,775 | 857,168 | |||||||||||||||
| Units issued |
105,181 | 212,571 | 207,018 | 186,685 | 370,686 | |||||||||||||||
| Units redeemed |
(187,010 | ) | (206,032 | ) | (288,756 | ) | (373,819 | ) | (592,079 | ) | ||||||||||
|
|
|
|
|
|
|
|
|
|
|
|||||||||||
| Units, end of period |
291,613 | 373,442 | 366,903 | 448,641 | 635,775 | |||||||||||||||
|
|
|
|
|
|
|
|
|
|
|
|||||||||||
| Unit value, end of period $ |
18.77 to 19.94 | 6.61 to 18.49 | 18.68 to 19.64 | 15.17 to 15.66 | 9.28 to 9.55 | |||||||||||||||
| Assets, end of period $ |
5,407,245 | 6,303,220 | 6,814,980 | 5,600,349 | 5,102,005 | |||||||||||||||
| Investment income ratio* |
0.00 | % | 0.00 | % | 0.00 | % | 0.00 | % | 0.00 | % | ||||||||||
| Expense ratio, lowest to highest** |
0.20% to 0.70 | % | 0.00% to 0.70 | % | 0.20% to 0.70 | % | 0.30% to 0.65 | % | 0.30% to 0.65 | % | ||||||||||
| Total return, lowest to highest*** |
9.67% to 10.23 | % | (8.57%) to (7.75 | %) | 23.74% to 24.36 | % | 63.41% to 64.00 | % | (44.81%) to (44.61 | %) | ||||||||||
| Sub-Account | ||||||||||||
| Short Term Government Income Trust Series 0 | ||||||||||||
| Year Ended Dec. 31/12 |
Year Ended Dec. 31/11 |
Year Ended Dec. 31/10 (be) |
||||||||||
| Units, beginning of period |
71,361 | 231,857 | — | |||||||||
| Units issued |
668,684 | 109,848 | 520,659 | |||||||||
| Units redeemed |
(512,849 | ) | (270,344 | ) | (288,802 | ) | ||||||
|
|
|
|
|
|
|
|||||||
| Units, end of period |
227,196 | 71,361 | 231,857 | |||||||||
|
|
|
|
|
|
|
|||||||
| Unit value, end of period $ |
10.60 | 10.48 | 10.19 | |||||||||
| Assets, end of period $ |
2,408,770 | 747,617 | 2,362,813 | |||||||||
| Investment income ratio* |
1.96 | % | 1.39 | % | 1.20 | % | ||||||
| Expense ratio, lowest to highest** |
0.00 | % | 0.00 | % | 0.00 | % | ||||||
| Total return, lowest to highest*** |
1.18 | % | 2.83 | % | 1.91 | % | ||||||
| (be) | Reflects the period from commencement of operations on May 3, 2010 through December 31, 2010. |
131
Table of Contents
John Hancock Life Insurance Company (U.S.A.) Separate Account N
Notes to Financial Statements (continued)
| 10. | Financial Highlights |
| Sub-Account | ||||||||||||
| Short Term Government Income Trust Series 1 | ||||||||||||
| Year Ended Dec. 31/12 |
Year Ended Dec. 31/11 |
Year Ended Dec. 31/10 (be) |
||||||||||
| Units, beginning of period |
241,317 | 389,362 | — | |||||||||
| Units issued |
147,124 | 314,099 | 635,549 | |||||||||
| Units redeemed |
(182,985 | ) | (462,144 | ) | (246,187 | ) | ||||||
|
|
|
|
|
|
|
|||||||
| Units, end of period |
205,456 | 241,317 | 389,362 | |||||||||
|
|
|
|
|
|
|
|||||||
| Unit value, end of period $ |
10.40 to 10.53 | 10.31 to 10.47 | 10.14 to 10.17 | |||||||||
| Assets, end of period $ |
2,145,355 | 2,502,884 | 3,952,866 | |||||||||
| Investment income ratio* |
1.61 | % | 2.31 | % | 1.58 | % | ||||||
| Expense ratio, lowest to highest** |
0.20% to 0.70 | % | 0.00% to 0.65 | % | 0.20% to 0.70 | % | ||||||
| Total return, lowest to highest*** |
0.50% to 0.96 | % | 1.83% to 2.77 | % | 1.39% to 1.71 | % | ||||||
| (be) Reflects the period from commencement of operations on May 3, 2010 through December 31, 2010. |
| |||||||||||
| Sub-Account | ||||||||||||||||||||
| Small Cap Growth Trust Series 0 | ||||||||||||||||||||
| Year Ended Dec. 31/12 |
Year Ended Dec. 31/11 |
Year Ended Dec. 31/10 |
Year Ended Dec. 31/09 |
Year Ended Dec. 31/08 |
||||||||||||||||
| Units, beginning of period |
238,585 | 223,327 | 225,128 | 193,656 | 174,922 | |||||||||||||||
| Units issued |
203,288 | 76,959 | 130,664 | 155,489 | 162,394 | |||||||||||||||
| Units redeemed |
(197,559 | ) | (61,701 | ) | (132,465 | ) | (124,017 | ) | (143,660 | ) | ||||||||||
|
|
|
|
|
|
|
|
|
|
|
|||||||||||
| Units, end of period |
244,314 | 238,585 | 223,327 | 225,128 | 193,656 | |||||||||||||||
|
|
|
|
|
|
|
|
|
|
|
|||||||||||
| Unit value, end of period $ |
21.12 | 18.13 | 19.45 | 15.92 | 11.84 | |||||||||||||||
| Assets, end of period $ |
5,160,719 | 4,325,175 | 4,343,714 | 3,584,964 | 2,293,376 | |||||||||||||||
| Investment income ratio* |
0.00 | % | 0.00 | % | 0.00 | % | 0.00 | % | 0.00 | % | ||||||||||
| Expense ratio, lowest to highest** |
0.00 | % | 0.00 | % | 0.00 | % | 0.00 | % | 0.00 | % | ||||||||||
| Total return, lowest to highest*** |
16.53 | % | (6.80 | %) | 22.14 | % | 34.46 | % | (39.54%) to (28.06 | %) | ||||||||||
132
Table of Contents
John Hancock Life Insurance Company (U.S.A.) Separate Account N
Notes to Financial Statements (continued)
| 10. | Financial Highlights |
| Sub-Account | ||||||||||||||||||||
| Small Cap Growth Trust Series 1 | ||||||||||||||||||||
| Year Ended Dec. 31/12 |
Year Ended Dec. 31/11 |
Year Ended Dec. 31/10 |
Year Ended Dec. 31/09 |
Year Ended Dec. 31/08 (ai) |
||||||||||||||||
| Units, beginning of period |
70,153 | 61,158 | 26,160 | 6,857 | — | |||||||||||||||
| Units issued |
41,908 | 47,538 | 71,307 | 114,312 | 46,848 | |||||||||||||||
| Units redeemed |
(47,928 | ) | (38,543 | ) | (36,309 | ) | (95,009 | ) | (39,991 | ) | ||||||||||
|
|
|
|
|
|
|
|
|
|
|
|||||||||||
| Units, end of period |
64,133 | 70,153 | 61,158 | 26,160 | 6,857 | |||||||||||||||
|
|
|
|
|
|
|
|
|
|
|
|||||||||||
| Unit value, end of |
17.36 to 17.68 | 14.88 to 15.31 | 16.20 to 16.36 | 13.36 to 13.41 | 9.99 to 10.00 | |||||||||||||||
| Assets, end of |
1,120,649 | 1,057,143 | 993,900 | 350,191 | 68,532 | |||||||||||||||
| Investment income ratio* |
0.00 | % | 0.00 | % | 0.00 | % | 0.00 | % | 0.00 | % | ||||||||||
| Expense ratio, lowest to highest** |
0.20% to 0.65 | % | 0.00% to 0.65 | % | 0.20% to 0.65 | % | 0.35% to 0.65 | % | 0.35% to 0.65 | % | ||||||||||
| Total return, lowest to highest*** |
15.71% to 16.24 | % | (7.65%) to (6.81 | %) | 21.29% to 21.83 | % | 33.71% to 34.12 | % | (0.08%) to (0.04 | %) | ||||||||||
| (ai) Reflects the period from commencement of operations on November 10, 2008 through December 31, 2008. |
| |||||||||||||||||||
| Sub-Account | ||||||||||||||||||||
| Small Cap Index Trust Series 0 | ||||||||||||||||||||
| Year Ended Dec. 31/12 |
Year Ended Dec. 31/11 |
Year Ended Dec. 31/10 |
Year Ended Dec. 31/09 |
Year Ended Dec. 31/08 |
||||||||||||||||
| Units, beginning of period |
201,116 | 138,757 | 101,272 | 42,355 | 25,817 | |||||||||||||||
| Units issued |
232,792 | 162,436 | 85,957 | 86,168 | 53,939 | |||||||||||||||
| Units redeemed |
(150,957 | ) | (100,077 | ) | (48,472 | ) | (27,251 | ) | (37,401 | ) | ||||||||||
|
|
|
|
|
|
|
|
|
|
|
|||||||||||
| Units, end of period |
282,951 | 201,116 | 138,757 | 101,272 | 42,355 | |||||||||||||||
|
|
|
|
|
|
|
|
|
|
|
|||||||||||
| Unit value, end of period $ |
17.87 | 15.40 | 16.10 | 12.74 | 10.05 | |||||||||||||||
| Assets, end of |
5,056,149 | 3,096,548 | 2,234,231 | 1,289,837 | 425,740 | |||||||||||||||
| Investment income ratio* |
2.17 | % | 1.32 | % | 0.63 | % | 1.12 | % | 1.47 | % | ||||||||||
| Expense ratio, lowest to highest** |
0.00 | % | 0.00 | % | 0.00 | % | 0.00 | % | 0.00 | % | ||||||||||
| Total return, lowest to highest*** |
16.06 | % | (4.37 | %) | 26.43 | % | 26.70 | % | (33.70%) to (30.20 | %) | ||||||||||
133
Table of Contents
John Hancock Life Insurance Company (U.S.A.) Separate Account N
Notes to Financial Statements (continued)
| 10. | Financial Highlights |
| Sub-Account | ||||||||||||||||||||
| Small Cap Index Trust Series 1 | ||||||||||||||||||||
| Year Ended Dec. 31/12 |
Year Ended Dec. 31/11 |
Year Ended Dec. 31/10 |
Year Ended Dec. 31/09 |
Year Ended Dec. 31/08 |
||||||||||||||||
| Units, beginning of period |
121,883 | 134,920 | 134,379 | 245,098 | 339,311 | |||||||||||||||
| Units issued |
253,618 | 110,385 | 96,468 | 349,934 | 89,307 | |||||||||||||||
| Units redeemed |
(110,076 | ) | (123,422 | ) | (95,927 | ) | (460,653 | ) | (183,520 | ) | ||||||||||
|
|
|
|
|
|
|
|
|
|
|
|||||||||||
| Units, end of period |
265,425 | 121,883 | 134,920 | 134,379 | 245,098 | |||||||||||||||
|
|
|
|
|
|
|
|
|
|
|
|||||||||||
| Unit value, end of period $ |
20.53 to 21.81 | 17.43 to 19.23 | 18.78 to 19.75 | 15.04 to 15.52 | 11.95 to 12.29 | |||||||||||||||
| Assets, end of period $ |
5,572,123 | 2,235,310 | 2,594,585 | 2,052,561 | 2,975,902 | |||||||||||||||
| Investment income ratio* |
1.96 | % | 1.13 | % | 0.51 | % | 0.68 | % | 1.23 | % | ||||||||||
| Expense ratio, lowest to highest** |
0.20% to 0.70 | % | 0.00% to 0.70 | % | 0.20% to 0.70 | % | 0.30% to 0.65 | % | 0.30% to 0.65 | % | ||||||||||
| Total return, lowest to highest*** |
15.29% to 15.87 | % | (5.36%) to (4.50 | %) | 25.48% to 26.11 | % | 25.82% to 26.27 | % | (34.14%) to (33.91 | %) | ||||||||||
| Sub-Account | ||||||||||||||||||||
| Small Cap Opportunities Trust Series 0 | ||||||||||||||||||||
| Year Ended Dec. 31/12 |
Year Ended Dec. 31/11 |
Year Ended Dec. 31/10 |
Year Ended Dec. 31/09 |
Year Ended Dec. 31/08 |
||||||||||||||||
| Units, beginning of period |
11,222 | 11,785 | 6,758 | 3,802 | 3,554 | |||||||||||||||
| Units issued |
4,187 | 8,312 | 7,481 | 9,497 | 4,502 | |||||||||||||||
| Units redeemed |
(5,746 | ) | (8,875 | ) | (2,454 | ) | (6,541 | ) | (4,254 | ) | ||||||||||
|
|
|
|
|
|
|
|
|
|
|
|||||||||||
| Units, end of period |
9,663 | 11,222 | 11,785 | 6,758 | 3,802 | |||||||||||||||
|
|
|
|
|
|
|
|
|
|
|
|||||||||||
| Unit value, end of period $ |
13.52 | 11.57 | 11.94 | 9.21 | 6.87 | |||||||||||||||
| Assets, end of period $ |
130,698 | 129,857 | 140,757 | 62,221 | 26,117 | |||||||||||||||
| Investment income ratio* |
0.00 | % | 0.12 | % | 0.00 | % | 0.00 | % | 2.38 | % | ||||||||||
| Expense ratio, lowest to highest** |
0.00 | % | 0.00 | % | 0.00 | % | 0.00 | % | 0.00 | % | ||||||||||
| Total return, lowest to highest*** |
16.88 | % | (3.13 | %) | 29.71 | % | 34.03 | % | (42.13%) to (30.69 | %) | ||||||||||
134
Table of Contents
John Hancock Life Insurance Company (U.S.A.) Separate Account N
Notes to Financial Statements (continued)
| 10. | Financial Highlights |
| Sub-Account | ||||||||||||||||||||
| Small Cap Opportunities Trust Series 1 | ||||||||||||||||||||
| Year Ended Dec. 31/12 |
Year Ended Dec. 31/11 |
Year Ended Dec. 31/10 |
Year Ended Dec. 31/09 |
Year Ended Dec. 31/08 |
||||||||||||||||
| Units, beginning of period |
32,741 | 58,239 | 51,003 | 57,063 | 137,943 | |||||||||||||||
| Units issued |
2,181 | 18,268 | 72,168 | 55,858 | 31,333 | |||||||||||||||
| Units redeemed |
(18,245 | ) | (43,766 | ) | (64,932 | ) | (61,918 | ) | (112,213 | ) | ||||||||||
|
|
|
|
|
|
|
|
|
|
|
|||||||||||
| Units, end of period |
16,677 | 32,741 | 58,239 | 51,003 | 57,063 | |||||||||||||||
|
|
|
|
|
|
|
|
|
|
|
|||||||||||
| Unit value, end of period $ |
25.70 to 26.97 | 21.77 to 23.54 | 23.03 to 23.93 | 17.95 to 18.37 | 13.50 to 13.77 | |||||||||||||||
| Assets, end of period $ |
436,591 | 735,456 | 1,361,445 | 923,018 | 775,813 | |||||||||||||||
| Investment income ratio* |
0.00 | % | 0.09 | % | 0.00 | % | 0.00 | % | 2.16 | % | ||||||||||
| Expense ratio, lowest to highest** |
0.20% to 0.70 | % | 0.00% to 0.70 | % | 0.20% to 0.70 | % | 0.30% to 0.65 | % | 0.30% to 0.65 | % | ||||||||||
| Total return, lowest to highest*** |
16.02% to 16.61 | % | (4.03%) to (3.16 | %) | 28.76% to 29.41 | % | 33.00% to 33.46 | % | (42.51%) to (42.30 | %) | ||||||||||
| Sub-Account | ||||||||||||||||||||
| Small Cap Value Trust Series 0 | ||||||||||||||||||||
| Year Ended Dec. 31/12 |
Year Ended Dec. 31/11 |
Year Ended Dec. 31/10 |
Year Ended Dec. 31/09 |
Year Ended Dec. 31/08 |
||||||||||||||||
| Units, beginning of period |
166,604 | 155,124 | 138,090 | 104,513 | 102,009 | |||||||||||||||
| Units issued |
71,472 | 51,785 | 70,716 | 101,116 | 94,913 | |||||||||||||||
| Units redeemed |
(76,573 | ) | (40,305 | ) | (53,682 | ) | (67,539 | ) | (92,409 | ) | ||||||||||
|
|
|
|
|
|
|
|
|
|
|
|||||||||||
| Units, end of period |
161,503 | 166,604 | 155,124 | 138,090 | 104,513 | |||||||||||||||
|
|
|
|
|
|
|
|
|
|
|
|||||||||||
| Unit value, end of period $ |
48.39 | 41.79 | 41.32 | 32.75 | 25.43 | |||||||||||||||
| Assets, end of period $ |
7,814,941 | 6,963,187 | 6,409,799 | 4,523,174 | 2,658,179 | |||||||||||||||
| Investment income ratio* |
0.91 | % | 0.90 | % | 0.44 | % | 0.74 | % | 1.36 | % | ||||||||||
| Expense ratio, lowest to highest** |
0.00 | % | 0.00 | % | 0.00 | % | 0.00 | % | 0.00 | % | ||||||||||
| Total return, lowest to highest*** |
15.78 | % | 1.15 | % | 26.15 | % | 28.79 | % | (27.51%) to (26.07 | %) | ||||||||||
135
Table of Contents
John Hancock Life Insurance Company (U.S.A.) Separate Account N
Notes to Financial Statements (continued)
| 10. | Financial Highlights |
| Sub-Account | ||||||||||||||||||||
| Small Cap Value Trust Series 1 | ||||||||||||||||||||
| Year Ended Dec. 31/12 |
Year Ended Dec. 31/11 |
Year Ended Dec. 31/10 |
Year Ended Dec. 31/09 |
Year Ended Dec. 31/08 |
||||||||||||||||
| Units, beginning of period |
31,562 | 30,923 | 26,455 | 64,320 | 747 | |||||||||||||||
| Units issued |
69,766 | 31,165 | 16,761 | 34,363 | 127,542 | |||||||||||||||
| Units redeemed |
(48,562 | ) | (30,526 | ) | (12,293 | ) | (72,228 | ) | (63,969 | ) | ||||||||||
|
|
|
|
|
|
|
|
|
|
|
|||||||||||
| Units, end of period |
52,766 | 31,562 | 30,923 | 26,455 | 64,320 | |||||||||||||||
|
|
|
|
|
|
|
|
|
|
|
|||||||||||
| Unit value, end of period $ |
16.81 to 17.21 | 14.47 to 15.03 | 14.57 to 14.78 | 11.51 to 11.68 | 9.10 to 9.12 | |||||||||||||||
| Assets, end of period $ |
890,741 | 462,460 | 451,145 | 308,717 | 582,478 | |||||||||||||||
| Investment income ratio* |
0.87 | % | 0.80 | % | 0.36 | % | 0.52 | % | 2.10 | % | ||||||||||
| Expense ratio, lowest to highest** |
0.20% to 0.65 | % | 0.00% to 0.65 | % | 0.20% to 0.65 | % | 0.45% to 0.65 | % | 0.45% to 0.65 | % | ||||||||||
| Total return, lowest to highest*** |
14.94% to 15.47 | % | 0.14% to 1.04 | % | 25.28% to 25.85 | % | 27.80% to 28.07 | % | (26.56%) to (26.41 | %) | ||||||||||
| Sub-Account | ||||||||||||||||||||
| Small Company Value Trust Series 0 | ||||||||||||||||||||
| Year Ended Dec. 31/12 |
Year Ended Dec. 31/11 |
Year Ended Dec. 31/10 |
Year Ended Dec. 31/09 |
Year Ended Dec. 31/08 |
||||||||||||||||
| Units, beginning of period |
69,238 | 61,411 | 64,463 | 92,095 | 50,455 | |||||||||||||||
| Units issued |
33,203 | 26,511 | 29,669 | 53,623 | 80,014 | |||||||||||||||
| Units redeemed |
(27,150 | ) | (18,684 | ) | (32,721 | ) | (81,255 | ) | (38,374 | ) | ||||||||||
|
|
|
|
|
|
|
|
|
|
|
|||||||||||
| Units, end of period |
75,291 | 69,238 | 61,411 | 64,463 | 92,095 | |||||||||||||||
|
|
|
|
|
|
|
|
|
|
|
|||||||||||
| Unit value, end of |
17.30 | 14.86 | 15.00 | 12.36 | 9.67 | |||||||||||||||
| Assets, end of period $ |
1,302,715 | 1,029,131 | 921,462 | 796,777 | 890,555 | |||||||||||||||
| Investment income ratio* |
0.25 | % | 0.64 | % | 1.53 | % | 0.40 | % | 0.86 | % | ||||||||||
| Expense ratio, lowest to highest** |
0.00 | % | 0.00 | % | 0.00 | % | 0.00 | % | 0.00 | % | ||||||||||
| Total return, lowest to highest*** |
16.41 | % | (0.94 | %) | 21.39 | % | 27.82 | % | (29.59%) to (27.05 | %) | ||||||||||
136
Table of Contents
John Hancock Life Insurance Company (U.S.A.) Separate Account N
Notes to Financial Statements (continued)
| 10. | Financial Highlights |
| Sub-Account | ||||||||||||||||||||
| Small Company Value Trust Series 1 | ||||||||||||||||||||
| Year Ended Dec. 31/12 |
Year Ended Dec. 31/11 |
Year Ended Dec. 31/10 |
Year Ended Dec. 31/09 |
Year Ended Dec. 31/08 |
||||||||||||||||
| Units, beginning of period |
291,566 | 350,159 | 409,071 | 659,315 | 896,860 | |||||||||||||||
| Units issued |
40,056 | 112,759 | 188,953 | 232,804 | 326,502 | |||||||||||||||
| Units redeemed |
(140,128 | ) | (171,352 | ) | (247,865 | ) | (483,048 | ) | (564,047 | ) | ||||||||||
|
|
|
|
|
|
|
|
|
|
|
|||||||||||
| Units, end of period |
191,494 | 291,566 | 350,159 | 409,071 | 659,315 | |||||||||||||||
|
|
|
|
|
|
|
|
|
|
|
|||||||||||
| Unit value, end of period $ |
23.51 to 24.96 | 19.92 to 30.62 | 20.69 to 21.75 | 17.25 to 17.88 | 13.60 to 14.04 | |||||||||||||||
| Assets, end of period $ |
4,660,932 | 6,156,047 | 7,495,689 | 7,560,437 | 9,496,541 | |||||||||||||||
| Investment income ratio* |
0.25 | % | 0.54 | % | 1.34 | % | 0.39 | % | 0.66 | % | ||||||||||
| Expense ratio, lowest to highest** |
0.20% to 0.70 | % | 0.00% to 0.65 | % | 0.20% to 0.70 | % | 0.25% to 0.65 | % | 0.25% to 0.65 | % | ||||||||||
| Total return, lowest to highest*** |
15.48% to 16.06 | % | (1.82%) to (0.93 | %) | 20.51% to 21.11 | % | 26.86% to 27.37 | % | (27.52%) to (27.24 | %) | ||||||||||
| Sub-Account | ||||||||||||||||
| Smaller Company Growth Trust Series 0 | ||||||||||||||||
| Year Ended Dec. 31/12 |
Year Ended Dec. 31/11 |
Year Ended Dec. 31/10 |
Year Ended Dec. 31/09 (al) |
|||||||||||||
| Units, beginning of period |
17,007 | 14,551 | 18,939 | — | ||||||||||||
| Units issued |
3,522 | 16,404 | 7,783 | 22,836 | ||||||||||||
| Units redeemed |
(8,906 | ) | (13,948 | ) | (12,171 | ) | (3,897 | ) | ||||||||
|
|
|
|
|
|
|
|
|
|||||||||
| Units, end of period |
11,623 | 17,007 | 14,551 | 18,939 | ||||||||||||
|
|
|
|
|
|
|
|
|
|||||||||
| Unit value, end of period $ |
14.23 | 12.24 | 13.16 | 10.52 | ||||||||||||
| Assets, end of period $ |
165,343 | 208,098 | 191,551 | 199,275 | ||||||||||||
| Investment income ratio* |
0.00 | % | 0.00 | % | 0.00 | % | 0.00 | % | ||||||||
| Expense ratio, lowest to highest** |
0.00 | % | 0.00 | % | 0.00 | % | 0.00 | % | ||||||||
| Total return, lowest to highest*** |
16.27 | % | (7.04 | %) | 25.12 | % | 5.22 | % | ||||||||
| (al) | Reflects the period from commencement of operations on November 16, 2009 through December 31, 2009. |
137
Table of Contents
John Hancock Life Insurance Company (U.S.A.) Separate Account N
Notes to Financial Statements (continued)
| 10. | Financial Highlights |
| Sub-Account | ||||||||||||||||
| Smaller Company Growth Trust Series 1 | ||||||||||||||||
| Year Ended Dec. 31/12 |
Year Ended Dec. 31/11 |
Year Ended Dec. 31/10 |
Year Ended Dec. 31/09 (al) |
|||||||||||||
| Units, beginning of period |
1,275,254 | 1,471,612 | 1,713,753 | — | ||||||||||||
| Units issued |
39,157 | 90,738 | 256,311 | 1,751,431 | ||||||||||||
| Units redeemed |
(372,975 | ) | (287,096 | ) | (498,452 | ) | (37,678 | ) | ||||||||
|
|
|
|
|
|
|
|
|
|||||||||
| Units, end of period |
941,436 | 1,275,254 | 1,471,612 | 1,713,753 | ||||||||||||
|
|
|
|
|
|
|
|
|
|||||||||
| Unit value, end of period $ |
13.90 to 14.12 | 11.99 to 12.22 | 13.05 to 13.13 | 10.51 to 10.52 | ||||||||||||
| Assets, end of period $ |
13,118,124 | 15,386,788 | 19,230,310 | 18,017,839 | ||||||||||||
| Investment income ratio* |
0.00 | % | 0.00 | % | 0.00 | % | 0.00 | % | ||||||||
| Expense ratio, lowest to highest** |
0.20% to 0.70 | % | 0.00% to 0.65 | % | 0.20% to 0.70 | % | 0.25% to 0.70 | % | ||||||||
| Total return, lowest to highest*** |
15.41% to 15.99 | % | (7.94%) to (7.10 | %) | 24.17% to 24.79 | % | 5.12% to 5.19 | % | ||||||||
| (al) | Reflects the period from commencement of operations on November 16, 2009 through December 31, 2009. |
| Sub-Account | ||||||||||||||||||||
| Strategic Income Opportunities Trust Series 0 | ||||||||||||||||||||
| Year Ended Dec. 31/12 |
Year Ended Dec. 31/11 |
Year Ended Dec. 31/10 (bc) |
Year Ended Dec. 31/09 |
Year Ended Dec. 31/08 |
||||||||||||||||
| Units, beginning of period |
135,531 | 101,816 | 30,334 | 1,515 | 1,248 | |||||||||||||||
| Units issued |
71,787 | 75,477 | 83,957 | 35,273 | 766 | |||||||||||||||
| Units redeemed |
(25,268 | ) | (41,762 | ) | (12,475 | ) | (6,454 | ) | (499 | ) | ||||||||||
|
|
|
|
|
|
|
|
|
|
|
|||||||||||
| Units, end of period |
182,050 | 135,531 | 101,816 | 30,334 | 1,515 | |||||||||||||||
|
|
|
|
|
|
|
|
|
|
|
|||||||||||
| Unit value, end of period $ |
17.55 | 15.54 | 15.22 | 13.13 | 10.36 | |||||||||||||||
| Assets, end of period $ |
3,194,530 | 2,105,616 | 1,549,526 | 398,301 | 15,689 | |||||||||||||||
| Investment income ratio* |
7.25 | % | 12.08 | % | 19.58 | % | 11.32 | % | 11.82 | % | ||||||||||
| Expense ratio, lowest to highest** |
0.00 | % | 0.00 | % | 0.00 | % | 0.00 | % | 0.00 | % | ||||||||||
| Total return, lowest to highest*** |
12.94 | % | 2.08 | % | 15.91 | % | 26.78 | % | (8.57%) to (8.05 | %) | ||||||||||
| (bc) | Renamed on May 3, 2010. Previously known as Strategic Income Trust. |
138
Table of Contents
John Hancock Life Insurance Company (U.S.A.) Separate Account N
Notes to Financial Statements (continued)
| 10. | Financial Highlights |
| Sub-Account | ||||||||||||||||||||
| Strategic Income Opportunities Trust Series 1 | ||||||||||||||||||||
| Year Ended Dec. 31/12 |
Year Ended Dec. 31/11 |
Year Ended Dec. 31/10 (bc) |
Year Ended Dec. 31/09 |
Year Ended Dec. 31/08 |
||||||||||||||||
| Units, beginning of period |
107,503 | 132,773 | 39,687 | 83,658 | 16,393 | |||||||||||||||
| Units issued |
19,715 | 37,047 | 127,475 | 44,874 | 185,983 | |||||||||||||||
| Units redeemed |
(66,696 | ) | (62,317 | ) | (34,389 | ) | (88,845 | ) | (118,718 | ) | ||||||||||
|
|
|
|
|
|
|
|
|
|
|
|||||||||||
| Units, end of period |
60,522 | 107,503 | 132,773 | 39,687 | 83,658 | |||||||||||||||
|
|
|
|
|
|
|
|
|
|
|
|||||||||||
| Unit value, end of period $ |
22.38 to 23.27 | 19.59 to 20.98 | 19.69 to 20.29 | 17.10 to 17.40 | 13.59 to 13.79 | |||||||||||||||
| Assets, end of period $ |
1,366,967 | 2,167,949 | 2,630,368 | 679,706 | 1,151,717 | |||||||||||||||
| Investment income ratio* |
6.72 | % | 9.78 | % | 23.98 | % | 10.03 | % | 12.21 | % | ||||||||||
| Expense ratio, lowest to highest** |
0.20% to 0.65 | % | 0.00% to 0.65 | % | 0.20% to 0.65 | % | 0.35% to 0.65 | % | 0.35% to 0.65 | % | ||||||||||
| Total return, lowest to highest*** |
12.12% to 12.64 | % | 1.11% to 2.03 | % | 15.13% to 15.66 | % | 25.84% to 26.23 | % | (9.22%) to (8.93 | %) | ||||||||||
| (bc) Renamed on May 3, 2010. Previously known as Strategic Income Trust. |
| |||||||||||||||||||
| Sub-Account | ||||||||||||||||||||
| Total Bond Market Trust B Series 0 | ||||||||||||||||||||
| Year Ended Dec. 31/12 |
Year Ended Dec. 31/11 |
Year Ended Dec. 31/10 |
Year Ended Dec. 31/09 |
Year Ended Dec. 31/08 |
||||||||||||||||
| Units, beginning of period |
353,317 | 435,088 | 372,059 | 279,913 | 156,154 | |||||||||||||||
| Units issued |
585,480 | 200,377 | 286,144 | 294,840 | 259,709 | |||||||||||||||
| Units redeemed |
(371,374 | ) | (282,148 | ) | (223,115 | ) | (202,694 | ) | (135,950 | ) | ||||||||||
|
|
|
|
|
|
|
|
|
|
|
|||||||||||
| Units, end of period |
567,423 | 353,317 | 435,088 | 372,059 | 279,913 | |||||||||||||||
|
|
|
|
|
|
|
|
|
|
|
|||||||||||
| Unit value, end of period $ |
22.83 | 21.94 | 20.39 | 19.14 | 18.01 | |||||||||||||||
| Assets, end of period $ |
12,954,850 | 7,750,121 | 8,869,928 | 7,122,388 | 5,041,514 | |||||||||||||||
| Investment income ratio* |
1.88 | % | 4.38 | % | 4.49 | % | 5.55 | % | 6.26 | % | ||||||||||
| Expense ratio, lowest to highest** |
0.00 | % | 0.00 | % | 0.00 | % | 0.00 | % | 0.00 | % | ||||||||||
| Total return, lowest to highest*** |
4.08 | % | 7.60 | % | 6.49 | % | 6.29 | % | 3.52% to 5.79 | % | ||||||||||
139
Table of Contents
John Hancock Life Insurance Company (U.S.A.) Separate Account N
Notes to Financial Statements (continued)
| 10. | Financial Highlights |
| Sub-Account | ||||||||||||||||||||
| Total Return Trust Series 0 | ||||||||||||||||||||
| Year Ended Dec. 31/12 |
Year Ended Dec. 31/11 |
Year Ended Dec. 31/10 |
Year Ended Dec. 31/09 |
Year Ended Dec. 31/08 |
||||||||||||||||
| Units, beginning of period |
1,764,258 | 1,387,764 | 870,388 | 224,706 | 72,293 | |||||||||||||||
| Units issued |
1,027,665 | 771,951 | 680,834 | 744,455 | 237,637 | |||||||||||||||
| Units redeemed |
(1,005,499 | ) | (395,457 | ) | (163,458 | ) | (98,773 | ) | (85,224 | ) | ||||||||||
|
|
|
|
|
|
|
|
|
|
|
|||||||||||
| Units, end of period |
1,786,424 | 1,764,258 | 1,387,764 | 870,388 | 224,706 | |||||||||||||||
|
|
|
|
|
|
|
|
|
|
|
|||||||||||
| Unit value, end of period $ |
17.57 | 16.18 | 15.57 | 14.46 | 12.71 | |||||||||||||||
| Assets, end of period $ |
31,387,850 | 28,551,370 | 21,599,909 | 12,583,045 | 2,857,007 | |||||||||||||||
| Investment income ratio* |
2.00 | % | 4.80 | % | 2.58 | % | 5.68 | % | 5.58 | % | ||||||||||
| Expense ratio, lowest to highest** |
0.00 | % | 0.00 | % | 0.00 | % | 0.00 | % | 0.00 | % | ||||||||||
| Total return, lowest to highest*** |
8.57 | % | 3.97 | % | 7.66 | % | 13.71 | % | 2.76 | % | ||||||||||
| Sub-Account | ||||||||||||||||||||
| Total Return Trust Series 1 | ||||||||||||||||||||
| Year Ended Dec. 31/12 |
Year Ended Dec. 31/11 |
Year Ended Dec. 31/10 |
Year Ended Dec. 31/09 |
Year Ended Dec. 31/08 |
||||||||||||||||
| Units, beginning of period |
1,864,813 | 1,847,382 | 1,965,055 | 2,143,657 | 1,745,005 | |||||||||||||||
| Units issued |
301,982 | 640,355 | 1,318,461 | 1,140,824 | 1,884,675 | |||||||||||||||
| Units redeemed |
(1,204,584 | ) | (622,924 | ) | (1,436,134 | ) | (1,319,426 | ) | (1,486,023 | ) | ||||||||||
|
|
|
|
|
|
|
|
|
|
|
|||||||||||
| Units, end of period |
962,211 | 1,864,813 | 1,847,382 | 1,965,055 | 2,143,657 | |||||||||||||||
|
|
|
|
|
|
|
|
|
|
|
|||||||||||
| Unit value, end of period $ |
26.77 to 28.26 | 24.17 to 26.68 | 24.06 to 25.16 | 22.49 to 23.33 | 19.93 to 20.59 | |||||||||||||||
| Assets, end of period $ |
26,629,883 | 47,874,290 | 45,740,261 | 45,086,578 | 43,539,894 | |||||||||||||||
| Investment income ratio* |
1.72 | % | 4.47 | % | 2.32 | % | 4.05 | % | 4.60 | % | ||||||||||
| Expense ratio, lowest to highest** |
0.20% to 0.65 | % | 0.00% to 0.65 | % | 0.20% to 0.65 | % | 0.25% to 0.65 | % | 0.25% to 0.65 | % | ||||||||||
| Total return, lowest to highest*** |
7.78% to 8.27 | % | 2.98% to 3.91 | % | 6.95% to 7.43 | % | 12.86% to 13.31 | % | 2.10% to 2.52 | % | ||||||||||
140
Table of Contents
John Hancock Life Insurance Company (U.S.A.) Separate Account N
Notes to Financial Statements (continued)
| 10. | Financial Highlights |
| Sub-Account | ||||||||||||||||||||
| Total Stock Market Index Trust Series 0 | ||||||||||||||||||||
| Year Ended Dec. 31/12 |
Year Ended Dec. 31/11 |
Year Ended Dec. 31/10 |
Year Ended Dec. 31/09 |
Year Ended Dec. 31/08 |
||||||||||||||||
| Units, beginning of period |
13,388 | 36,982 | 26,528 | 6,539 | 6,922 | |||||||||||||||
| Units issued |
4,258 | 16,284 | 20,727 | 44,607 | 23,133 | |||||||||||||||
| Units redeemed |
(9,091 | ) | (39,878 | ) | (10,273 | ) | (24,618 | ) | (23,516 | ) | ||||||||||
|
|
|
|
|
|
|
|
|
|
|
|||||||||||
| Units, end of period |
8,555 | 13,388 | 36,982 | 26,528 | 6,539 | |||||||||||||||
|
|
|
|
|
|
|
|
|
|
|
|||||||||||
| Unit value, end of period $ |
53.59 | 46.38 | 46.23 | 39.42 | 30.58 | |||||||||||||||
| Assets, end of |
458,437 | 620,895 | 1,709,553 | 1,045,820 | 199,933 | |||||||||||||||
| Investment income ratio* |
1.34 | % | 0.59 | % | 1.54 | % | 1.76 | % | 0.93 | % | ||||||||||
| Expense ratio, lowest to highest** |
0.00 | % | 0.00 | % | 0.00 | % | 0.00 | % | 0.00 | % | ||||||||||
| Total return, lowest to highest*** |
15.56 | % | 0.33 | % | 17.26 | % | 28.93 | % | (37.15%) to (25.73 | %) | ||||||||||
| Sub-Account | ||||||||||||||||||||
| Total Stock Market Index Trust Series 1 | ||||||||||||||||||||
| Year Ended Dec. 31/12 |
Year Ended Dec. 31/11 |
Year Ended Dec. 31/10 |
Year Ended Dec. 31/09 |
Year Ended Dec. 31/08 |
||||||||||||||||
| Units, beginning of period |
144,884 | 144,037 | 65,078 | 186,446 | 260,998 | |||||||||||||||
| Units issued |
72,972 | 63,665 | 104,838 | 125,758 | 90,395 | |||||||||||||||
| Units redeemed |
(87,665 | ) | (62,818 | ) | (25,879 | ) | (247,126 | ) | (164,947 | ) | ||||||||||
|
|
|
|
|
|
|
|
|
|
|
|||||||||||
| Units, end of period |
130,191 | 144,884 | 144,037 | 65,078 | 186,446 | |||||||||||||||
|
|
|
|
|
|
|
|
|
|
|
|||||||||||
| Unit value, end of period $ |
14.74 to 15.65 | 12.57 to 13.88 | 12.91 to 13.43 | 11.14 to 11.45 | 8.70 to 8.91 | |||||||||||||||
| Assets, end of period $ |
1,982,096 | 1,910,839 | 1,899,563 | 729,447 | 1,649,478 | |||||||||||||||
| Investment income ratio* |
1.54 | % | 1.16 | % | 1.73 | % | 1.04 | % | 1.61 | % | ||||||||||
| Expense ratio, lowest to highest** |
0.20% to 0.70 | % | 0.00% to 0.65 | % | 0.30% to 0.70 | % | 0.35% to 0.65 | % | 0.35% to 0.65 | % | ||||||||||
| Total return, lowest to highest*** |
14.69% to 15.26 | % | (0.62%) to 0.28 | % | 16.37% to 16.84 | % | 28.03% to 28.42 | % | (37.61%) to (37.42 | %) | ||||||||||
141
Table of Contents
John Hancock Life Insurance Company (U.S.A.) Separate Account N
Notes to Financial Statements (continued)
| 10. | Financial Highlights |
| Sub-Account | ||||||||
| Ultra Short Term Bond Trust Series 0 | ||||||||
| Year Ended Dec. 31/12 |
Year Ended Dec. 31/11 (g) |
|||||||
| Units, beginning of period |
11,566 | — | ||||||
| Units issued |
44,490 | 26,551 | ||||||
| Units redeemed |
(22,252 | ) | (14,985 | ) | ||||
|
|
|
|
|
|||||
| Units, end of period |
33,804 | 11,566 | ||||||
|
|
|
|
|
|||||
| Unit value, end of period $ |
10.07 | 10.00 | ||||||
| Assets, end of period $ |
340,380 | 115,702 | ||||||
| Investment income ratio* |
1.10 | % | 1.32 | % | ||||
| Expense ratio, lowest to highest** |
0.00 | % | 0.00 | % | ||||
| Total return, lowest to highest*** |
0.66 | % | 0.09 | % | ||||
| (g) Fund available in prior year but no activity. |
||||||||
| Sub-Account | ||||||||
| Ultra Short Term Bond Trust Series 1 | ||||||||
| Year Ended Dec. 31/12 |
Year Ended Dec. 31/11 (g) |
|||||||
| Units, beginning of period |
2,701 | — | ||||||
| Units issued |
785 | 2,802 | ||||||
| Units redeemed |
(178 | ) | (101 | ) | ||||
|
|
|
|
|
|||||
| Units, end of period |
3,308 | 2,701 | ||||||
|
|
|
|
|
|||||
| Unit value, end of period $ |
9.91 | 9.91 | ||||||
| Assets, end of period $ |
32,819 | 26,825 | ||||||
| Investment income ratio* |
1.16 | % | 2.05 | % | ||||
| Expense ratio, lowest to highest** |
0.65 | % | 0.00% to 0.65 | % | ||||
| Total return, lowest to highest*** |
(0.15 | %) | (0.69%) to 0.12 | % | ||||
| (g) | Fund available in prior year but no activity. |
142
Table of Contents
John Hancock Life Insurance Company (U.S.A.) Separate Account N
Notes to Financial Statements (continued)
| 10. | Financial Highlights |
| Sub-Account | ||||
| U.S. Equity Trust Series 0 | ||||
| Year Ended Dec. 31/12 (q) |
||||
| Units, beginning of period |
— | |||
| Units issued |
56,636 | |||
| Units redeemed |
(4,265 | ) | ||
|
|
|
|||
| Units, end of period |
52,371 | |||
|
|
|
|||
| Unit value, end of period $ |
10.28 | |||
| Assets, end of period $ |
538,430 | |||
| Investment income ratio* |
2.14 | % | ||
| Expense ratio, lowest to highest** |
0.00 | % | ||
| Total return, lowest to highest*** |
2.81 | % | ||
| (q) Reflects the period from commencement of operations on April 30, 2012 through December 31, 2012. |
| |||
| Sub-Account | ||||
| U.S. Equity Trust Series 1 | ||||
| Year Ended Dec. 31/12 (q) |
||||
| Units, beginning of period |
— | |||
| Units issued |
151,071 | |||
| Units redeemed |
(46,422 | ) | ||
|
|
|
|||
| Units, end of period |
104,649 | |||
|
|
|
|||
| Unit value, end of period $ |
10.23 to 10.26 | |||
| Assets, end of period $ |
1,072,153 | |||
| Investment income ratio* |
1.97 | % | ||
| Expense ratio, lowest to highest** |
0.20% to 0.70 | % | ||
| Total return, lowest to highest*** |
2.28% to 2.63 | % | ||
| (q) | Reflects the period from commencement of operations on April 30, 2012 through December 31, 2012. |
143
Table of Contents
John Hancock Life Insurance Company (U.S.A.) Separate Account N
Notes to Financial Statements (continued)
| 10. | Financial Highlights |
| Sub-Account | ||||||||||||||||||||
| Utilities Trust Series 0 | ||||||||||||||||||||
| Year Ended Dec. 31/12 |
Year Ended Dec. 31/11 |
Year Ended Dec. 31/10 |
Year Ended Dec. 31/09 |
Year Ended Dec. 31/08 |
||||||||||||||||
| Units, beginning of period |
51,356 | 55,968 | 32,844 | 55,369 | 17,927 | |||||||||||||||
| Units issued |
15,272 | 21,449 | 34,059 | 56,984 | 78,710 | |||||||||||||||
| Units redeemed |
(13,197 | ) | (26,061 | ) | (10,935 | ) | (79,509 | ) | (41,268 | ) | ||||||||||
|
|
|
|
|
|
|
|
|
|
|
|||||||||||
| Units, end of period |
53,431 | 51,356 | 55,968 | 32,844 | 55,369 | |||||||||||||||
|
|
|
|
|
|
|
|
|
|
|
|||||||||||
| Unit value, end of period $ |
21.97 | 19.33 | 18.10 | 15.88 | 11.89 | |||||||||||||||
| Assets, end of period $ |
1,173,906 | 992,929 | 1,013,201 | 521,594 | 658,222 | |||||||||||||||
| Investment income ratio* |
3.78 | % | 3.82 | % | 3.58 | % | 4.85 | % | 2.83 | % | ||||||||||
| Expense ratio, lowest to highest** |
0.00 | % | 0.00 | % | 0.00 | % | 0.00 | % | 0.00 | % | ||||||||||
| Total return, lowest to highest*** |
13.63 | % | 6.80 | % | 14.00 | % | 33.58 | % | (38.50%) to (21.20 | %) | ||||||||||
| Sub-Account | ||||||||||||||||||||
| Utilities Trust Series 1 | ||||||||||||||||||||
| Year Ended Dec. 31/12 |
Year Ended Dec. 31/11 |
Year Ended Dec. 31/10 |
Year Ended Dec. 31/09 |
Year Ended Dec. 31/08 |
||||||||||||||||
| Units, beginning of period |
80,036 | 77,427 | 79,013 | 249,807 | 225,244 | |||||||||||||||
| Units issued |
25,922 | 46,158 | 31,683 | 75,136 | 156,245 | |||||||||||||||
| Units redeemed |
(42,167 | ) | (43,549 | ) | (33,269 | ) | (245,930 | ) | (131,682 | ) | ||||||||||
|
|
|
|
|
|
|
|
|
|
|
|||||||||||
| Units, end of period |
63,791 | 80,036 | 77,427 | 79,013 | 249,807 | |||||||||||||||
|
|
|
|
|
|
|
|
|
|
|
|||||||||||
| Unit value, end of period $ |
25.48 to 26.86 | 21.98 to 24.19 | 21.29 to 22.25 | 18.81 to 19.40 | 14.16 to 14.55 | |||||||||||||||
| Assets, end of period $ |
1,643,623 | 1,829,855 | 1,668,754 | 1,494,713 | 3,594,971 | |||||||||||||||
| Investment income ratio* |
3.65 | % | 3.56 | % | 2.52 | % | 3.61 | % | 3.24 | % | ||||||||||
| Expense ratio, lowest to highest** |
0.20% to 0.65 | % | 0.00% to 0.65 | % | 0.20% to 0.65 | % | 0.30% to 0.65 | % | 0.30% to 0.65 | % | ||||||||||
| Total return, lowest to highest*** |
12.92% to 13.43 | % | 5.70% to 6.65 | % | 13.18% to 13.69 | % | 32.91% to 33.37 | % | (39.04%) to (38.83 | %) | ||||||||||
144
Table of Contents
John Hancock Life Insurance Company (U.S.A.) Separate Account N
Notes to Financial Statements (continued)
| 10. | Financial Highlights |
| Sub-Account | ||||||||||||||||||||
| Value Trust Series 0 | ||||||||||||||||||||
| Year Ended Dec. 31/12 |
Year Ended Dec. 31/11 |
Year Ended Dec. 31/10 |
Year Ended Dec. 31/09 |
Year Ended Dec. 31/08 |
||||||||||||||||
| Units, beginning of period |
33,704 | 38,056 | 52,511 | 35,076 | 34,210 | |||||||||||||||
| Units issued |
10,626 | 5,484 | 30,722 | 69,744 | 64,360 | |||||||||||||||
| Units redeemed |
(3,015 | ) | (9,836 | ) | (45,177 | ) | (52,309 | ) | (63,494 | ) | ||||||||||
|
|
|
|
|
|
|
|
|
|
|
|||||||||||
| Units, end of period |
41,315 | 33,704 | 38,056 | 52,511 | 35,076 | |||||||||||||||
|
|
|
|
|
|
|
|
|
|
|
|||||||||||
| Unit value, end of |
18.25 | 15.53 | 15.37 | 12.57 | 8.90 | |||||||||||||||
| Assets, end of period $ |
753,948 | 523,460 | 585,025 | 659,988 | 312,241 | |||||||||||||||
| Investment income ratio* |
0.95 | % | 1.10 | % | 1.12 | % | 1.09 | % | 0.84 | % | ||||||||||
| Expense ratio, lowest to highest** |
0.00 | % | 0.00 | % | 0.00 | % | 0.00 | % | 0.00 | % | ||||||||||
| Total return, lowest to highest*** |
17.50 | % | 1.03 | % | 22.30 | % | 41.19 | % | (40.84%) to (31.48 | %) | ||||||||||
| Sub-Account | ||||||||||||||||||||
| Value Trust Series 1 | ||||||||||||||||||||
| Year Ended Dec. 31/12 |
Year Ended Dec. 31/11 |
Year Ended Dec. 31/10 |
Year Ended Dec. 31/09 |
Year Ended Dec. 31/08 |
||||||||||||||||
| Units, beginning of period |
113,325 | 114,791 | 142,586 | 310,735 | 395,785 | |||||||||||||||
| Units issued |
46,637 | 38,553 | 64,708 | 287,392 | 134,441 | |||||||||||||||
| Units redeemed |
(83,592 | ) | (40,019 | ) | (92,503 | ) | (455,541 | ) | (219,491 | ) | ||||||||||
|
|
|
|
|
|
|
|
|
|
|
|||||||||||
| Units, end of period |
76,370 | 113,325 | 114,791 | 142,586 | 310,735 | |||||||||||||||
|
|
|
|
|
|
|
|
|
|
|
|||||||||||
| Unit value, end of |
35.15 to 37.32 | 27.35 to 32.56 | 30.06 to 31.60 | 24.88 to 25.68 | 17.74 to 18.24 | |||||||||||||||
| Assets, end of period $ |
2,735,313 | 3,499,439 | 3,518,229 | 3,571,204 | 5,587,755 | |||||||||||||||
| Investment income ratio* |
0.84 | % | 1.04 | % | 0.96 | % | 1.29 | % | 1.10 | % | ||||||||||
| Expense ratio, lowest to highest** |
0.20% to 0.70 | % | 0.00% to 0.70 | % | 0.20% to 0.70 | % | 0.30% to 0.65 | % | 0.30% to 0.65 | % | ||||||||||
| Total return, lowest to highest*** |
16.60% to 17.19 | % | 0.07% to 0.98 | % | 21.36% to 21.97 | % | 40.27% to 40.75 | % | (41.25%) to (41.05 | %) | ||||||||||
145
Table of Contents
John Hancock Life Insurance Company (U.S.A.) Separate Account N
Notes to Financial Statements (continued)
The Account is a funding vehicle for a number of variable universal life insurance products which have unique combinations of features and fees that are charged against the contract owners’ account balances. Differences in the fee structures result in a variety of unit values, expense ratios and total returns.
The preceding table was developed by determining which products offered by the Company have the lowest and highest total return. Only product designs within each sub-account that had units outstanding during the period were considered when determining the lowest and highest total return. The summary may not reflect the minimum and maximum mortality and expense risks charges offered by the Company as contract owners may not have selected all available and applicable contract options as discussed in Notes 3 and 4.
| (*) | These ratios, which are not annualized, represent the dividends, excluding distributions of capital gains, received by the sub-account from the underlying Trust portfolio, net of management fees assessed by the Trust portfolio adviser, divided by the average net assets of the sub-account. These ratios exclude those expenses, such as mortality and expense risks charges, that result in direct reductions in unit values. The recognition of investment income by the sub-account is affected by the timing of the declarations of dividends by the underlying Trust portfolio in which the sub-accounts invest. It is the practice of the Trust, for income tax reasons, to declare dividends in April for investment income received in the previous calendar year for all sub-accounts of the Trust except for the Money Market Trust which declares and reinvests dividends on a daily basis. Any dividend distribution received from a sub-account of the Trust is reinvested immediately, at the net asset value, in shares of that sub-account and retained as assets of the corresponding sub-account so that the unit value of the sub-account is not affected by the declaration and reinvestment of dividends. |
| (**) | These ratios represent the annualized contract expenses of the separate account, consisting primarily of mortality and expense risks charges, for the period indicated. The ratios include only those expenses that result in a direct reduction in unit values. Charges made directly to contract owner accounts through the redemption of units and expenses of the underlying Trust portfolio are excluded. When no range is given, the lowest and highest values are the same. |
| (***) | These ratios, which are not annualized, represent the total return for the period indicated, including changes in the value of the underlying Trust portfolio, and reflect deductions for all items included in the expense ratio. The total return does not include any expenses assessed through the redemption of units; inclusion of these expenses in the calculation would result in a reduction in the total return presented. When no range is given, the lowest and highest values are the same. |
146
Table of Contents
PART COTHER INFORMATION
Item 26. Exhibits
The following exhibits are filed as part of this Registration Statement:
(a) Resolution of Board of Directors establishing Separate Account N is incorporated by reference to post-effective amendment number 1, file number 333-152409, filed with the Commission in April 2010.
(b) Not applicable.
(c) (1) Distribution Agreement and Servicing Agreement between John Hancock Distributors and John Hancock Life Insurance Company (U.S.A.) dated February 17, 2009, incorporated by reference to pre-effective amendment number 1, file number 333-157212, filed with the Commission on April 7, 2009.
(2)(a) Specimen General Agent and Broker-Dealer Selling Agreement by and among John Hancock Life Insurance Company
(U.S.A.) and John Hancock Distributors LLC effective August 2009, incorporated by reference to pre-effective amendment number 2, file number 333-157212, filed with the Commission in April 2011.
(b) List
of third party broker-dealer firms included as Attachment A, incorporated by reference to pre-effective amendment number 3, file number 333-157212, filed with the Commission in April 2012.
(d) Form of Specimen Flexible Premium Variable Life Insurance Policy, incorporated by reference to post-effective amendment number 6, file number 333-100567 filed with the Commission on April 30, 2007.
(2) Form of Specimen Flexible Term Insurance Option Term Life Rider, incorporated by reference to post-effective amendment number 6, file number 333-100567, filed with the Commission on April 30, 2007.
(e)(1) Specimen Application for Flexible Premium Variable Life Insurance Policy, incorporated by reference to
post-effective amendment number 7, file number 33-52310, filed with the Commission on April 26, 1996.
(2) Specimen Application Supplement for Flexible Premium Variable Life Insurance Policy, incorporated by reference to post-effective amendment
number 9, file number 33-52310, filed with the Commission on April 26, 1996.
(f) (1) Restated Articles of Redomestication of the John Hancock Life Insurance Company (U.S.A.) (formerly, The Manufacturers Life Insurance Company (U.S.A.)) dated December 30, 1992, incorporated by reference to post-effective amendment number 9, file number 333-85284, filed with the Commission in April, 2007.
(a) Amendment to the Articles of Redomestication of John Hancock Life Insurance Company (U.S.A.) (formerly, The Manufacturers Life Insurance Company (U.S.A.)) dated July 16, 2004, incorporated by reference to pre-effective amendment number 1, file number 333-126668, filed with the Commission on October 12, 2005.
(b) Amendment to the Articles of Redomestication effective January 1, 2005, incorporated by reference to post-effective amendment number 9, file number 333-85284, filed with the Commission in April, 2007.
(c) Amended and Restated Articles of Redomestication and Articles of Incorporation of John Hancock Life Insurnace Company (U.S.A.) dated July 26, 2010, and further amended as of November 20, 2012, incorporated by reference to post-effective amendment number 1, file number 333-179570, filed with the Commission in April 2013.
(2) By-laws of John Hancock Life Insurance Company (U.S.A.) (formerly, The Manufacturers Life Insurance Company (U.S.A.)) dated December 2, 1992, incorporated by reference to pre-effective amendment number 1, file number 333-126668, filed with the Commission on October 12, 2005.
(a) Amendment to the By-laws of John Hancock Life Insurance Company (U.S.A.) (formerly, The Manufacturers Life Insurance Company (U.S.A.)) dated June 7, 2000, incorporated by reference to pre-effective amendment number 1, file number 333-126668, filed with the Commission on October 12, 2005.
(b) Amendment to the By-laws of John Hancock Life Insurance Company (U.S.A.) (formerly, The Manufacturers Life Insurance Company (U.S.A.)) dated March 12, 1999, incorporated by reference to pre-effective amendment number 1, file number 333-126668, filed with the Commission on October 12, 2005.
(c) Amendment to the By-laws of John Hancock Life Insurance Company (U.S.A.) (formerly, The Manufacturers Life Insurance Company (U.S.A.)) dated July 16, 2004, incorporated by reference to post-effective amendment number 9, file number 333-85284, filed with the Commission in April, 2007.
(d) Amended and Restated By-laws of John Hancock Life Insurance Company (U.S.A.) dated June 15, 2010, incorporated by reference to post-effective amendment number 1, file number 333-179570, filed with the Commission in April 2013.
(g) The Depositor maintains reinsurance arrangements in the normal course of business, none of which are material.
(h)(1) Participation Agreement among the Manufacturers Insurance Company (U.S.A.), the Manufacturers Insurance Company of New York, PIMCO Variable Insurance Trust and PIMCO Advisors Distributors LLC dated April 30, 2004, incorporated by reference to pre-effective amendment number 1, file number 333-126668, filed with the Commission on October 12, 2005.
(2) Participation Agreement among John Hancock Life Insurance Company (U.S.A.), John Hancock Life Insurance Company of New York, and John Hancock Trust dated April 20, 2005, incorporated by reference to pre-effective amendment number 1, file number 333-126668, filed with the Commission on October 12, 2005.
(3) Participation Agreement among John Hancock Life Insurance Company (U.S.A.), John Hancock Life Insurance Company of New York, and M Financial Investment Advisers, Inc. dated November 13, 2009, incorporated by reference to file number 333-164150, filed with the Commission on January 4, 2010.
4) Shareholder Information Agreement between John Hancock Life Insurance Company (U.S.A.), John Hancock Life Insurance Company of New York, John Hancock Life Insurance Company, John Hancock Variable Life Insurance, and John Hancock Trust portfolios (except American Funds Insurance Series) dated April 16, 2007, incorporated by reference to post-effective amendment number 9, file number 333-85284, filed with the Commission in April, 2007.
(5) Shareholder Information Agreement between John Hancock Life Insurance Company (U.S.A.), John Hancock Life Insurance Company of New York, John Hancock Life Insurance Company, John Hancock Variable Life Insurance, and John Hancock Trust on behalf of series of the Trust that are feeder funds of the American Funds Insurance Series dated April 16, 2007, incorporated by reference to post-effective amendment number 9, file number 333-85284, filed with the Commission in April, 2007.
(i) (1) Service Agreement between John Hancock Life Insurance Company (U.S.A.) and John Hancock Life Insurance Company dated April 28, 2004, incorporated by reference to post-effective amendment number 9, file number 333-85284, filed with the Commission in April, 2007.
(j) Not applicable.
(k) Opinion and consent of counsel for John Hancock Life Insurance Company (U.S.A.), incorporated by reference to pre-effective amendment number 1, file number 333-100597, filed with the Commission on December 16, 2002.
(l) Not Applicable.
(m) Not Applicable.
(n) Consents of Independent Registered Public Accounting Firm are filed herewith.
(n)(1) Opinion of Counsel as to the eligibility of this post-effective amendment to be filed pursuant to Rule 485(b), filed herewith.
(o) Not Applicable.
(p) Not Applicable.
(q) Memorandum Regarding Issuance, Face Amount Increase, Redemption and Transfer Procedures for the policies, incorporated by reference to pre-effective amendment number 1, file number 333-100597, filed with the Commission on December 16, 2002.
Powers of Attorney
(i) Powers of Attorney for Craig Bromley, Thomas Borshoff, Paul M. Connolly, Michael Doughty, Ruth Ann Fleming, James D. Gallagher, Scott S. Hartz, Rex Schlaybaugh, Jr., and John Vrysen, incorporated by reference to post effective amendment number 1, file number 333-179570, filed with the Commission in April, 2013.
Item 27. Directors and Officers of the Depositor
OFFICERS AND DIRECTORS OF JOHN HANCOCK LIFE INSURANCE COMPANY (U.S.A.)
| Name and Principal Business Address | Position with Depositor |
| Directors |
| Craig Bromley 601 Congress Street Boston, MA 02210 |
Director, Chairman and President |
| Thomas Borshoff 536 Stone Road Pittsford, NY 14534 |
Director |
| Name and Principal Business Address | Position with Depositor |
| Paul M. Connolly 75 Indian Spring Road Milton, MA 02186 |
Director |
| Michael Doughty 197 Clarendon Street Boston, MA 02116 |
Director |
| Ruth Ann Fleming 205 Highland Avenue Short Hills, NJ 07078 |
Director |
| James D. Gallagher 601 Congress Street Boston, MA 02210 |
Director, Executive Vice President, General Counsel and Chief Administrative Officer |
| Scott S. Hartz 197 Clarendon Street Boston, MA 02116 |
Director, Executive Vice President and Chief Investment Officer |
| Rex Schlaybaugh, Jr. 400 Renaissance Center Detroit, MI 48243 |
Director |
| John G. Vrysen 601 Congress Street Boston, MA 02210 |
Director and Senior Vice President |
| Executive Vice Presidents |
| Marc Costantini* |
| Michael Doughty** |
| Steven Finch** | and Chief Financial Officer |
| James D. Gallagher* | and General Counsel & Chief Administrative Officer |
| Scott S. Hartz** | and Chief Investment Officer – US Investments |
| Hugh McHaffie* |
| Senior Vice Presidents |
| Kevin J. Cloherty* |
| Peter Gordon** |
| Allan Hackney* | and Chief Information Officer |
| Gregory Mack† |
| Steven Moore | and Treasurer |
| Sebastian Pariath | and Head of Operations |
| Diana L. Scott** |
| Alan R. Seghezzi** |
| Anthony Teta** |
| Brooks Tingle** |
| John G. Vrysen** |
| Vice Presidents |
| Emanuel Alves* | Counsel and Corporate Secretary |
| John C.S. Anderson** |
| Roy V. Anderson* |
| Abigail M. Armstrong |
| Kevin Askew |
| James Bacharach |
| Arnold Bergman* |
| Ann Birle |
| Stephen J. Blewitt** |
| Alan Block |
| Robert Boyda* |
| Grant Buchanan |
| David Campbell |
| Bob Carroll** |
| Joseph Catalano* |
| Name and Principal Business Address | Position with Depositor |
| Brian Collins* |
| Art Creel* |
| John J. Danello* |
| Anthony J. Della Piana** |
| Brent Dennis** |
| Robert Donahue***** |
| Edward Eng**** |
| Paul Gallagher** |
| Ann Gencarella** |
| Richard Harris*** | and Appointed Actuary |
| John Hatch* |
| Kevin Hill** |
| Eugene Xavier Hodge, Jr.** |
| James C. Hoodlet** |
| Roy Kapoor**** |
| Mitchell Karman** | and Chief Compliance Officer & Counsel |
| Frank Knox* | and Chief Compliance Officer – Retail Funds/Separate |
| Accounts** |
| Hung Ko | Vice President, Treasury |
| David Kroach*** |
| Cynthia Lacasse** |
| Denise Lang*** |
| Robert Leach* |
| Scott Lively* |
| Cheryl Mallett**** |
| Nathaniel I. Margolis** |
| John Maynard* |
| Janis K. McDonough** |
| Scott A. McFetridge** |
| William McPadden** |
| Maureen Milet** | and Chief Compliance Officer – Investments |
| Peter J. Mongeau** |
| Scott Morin* |
| Tom Mullen* |
| Scott Navin** |
| Betty Ng*** |
| Nina Nicolosi* |
| James O’Brien |
| Frank O’Neill* |
| Daragh O’Sullivan |
| Jacques Ouimet** |
| Gary M. Pelletier** |
| David Plumb* |
| Tracey Polsgrove |
| Krishna Ramdial**** | Vice President, Treasury |
| S. Mark Ray** |
| Jill Rebman*** |
| George Revoir* |
| Mark Rizza* |
| Andrew Ross**** |
| Lisa Anne Ryan |
| Thomas Samoluk* |
| Martin Sheerin* |
| Gordon Shone* |
| Rob Stanley* |
| Yiji S. Starr* |
| Christopher Sutherland |
| Tony Todisco***** |
| Simonetta Vendittelli***** | and Controller |
| Name and Principal Business Address | Position with Depositor |
| Peter de Vries††† |
| Linda A. Watters* |
| Joseph P. Welch** |
| Jeffery Whitehead* |
| Brent Wilkinson |
| Henry Wong** |
| Assistant Vice Presidents |
| Joanne Adkins |
| Stacey Agretelis |
| Patricia L. Allison |
| Eynshteyn Averbukh |
| William Ball |
| Michael Barnes |
| Jack Barry |
| Naomi S. Bazak |
| P.J. Beltramini |
| William D. Bertrand |
| Jon Bourgault |
| Daniel C. Budde |
| Jennifer Toone Campanella |
| Suzanne Cartledge |
| Tabitha Chinniah |
| Sean Cochrane |
| Catherine Collins |
| Thomas Corrigan |
| Thomas D. Crohan |
| Diane Cronin |
| Paul M. Crowley |
| Jaime Hertel Dasque |
| Lorn C. Davis |
| Todd D. Emmel |
| Allan M. Fen |
| Paul A. Fishbin |
| Michael A. Foreman |
| Arthur Francis |
| Donna Frankel |
| Philip W. Freiberger |
| Scott B. Garfield |
| John M. Garrison |
| Keith Gendron |
| William A. Gottlieb |
| Gerald C. Hanrahan, Jr. |
| Teresa S. Hayes |
| Charles Whitney Hill |
| Tina Joseph |
| Recep C. Kendircioglu |
| Robert J. Keough |
| Bruce Kinna |
| Patty Kisielis |
| Sally Kwan |
| Brigitte Labreche |
| Mei-Ling Lee |
| Thomas Loftus |
| Jennifer Lynn |
| Timothy J. Malik |
| Robert Maulden |
| Kathleen E. McDonough |
| Reid W. McLay |
| Name and Principal Business Address | Position with Depositor |
| Pamela Memishian |
| John P. Monahan |
| Jeffrey H. Nataupsky |
| Geoffrey Norris |
| John O’Connor |
| Jeffrey Packard |
| E. David Pemsteim |
| Charlie Philbrook | and Chief Risk Officer |
| David Pickett |
| Michael A. Pirrello |
| Malcolm Pittman |
| Sonya Prear |
| David P. Previte |
| Peta-Gaye Prinn |
| Malcolm Quinn |
| Hilary Quosai |
| John Retsos |
| Kathryn Riley |
| Josephine M. Rollka |
| Timothy A. Roseen |
| Louise Santosuosso |
| Eileen Schindler | and Chief Accountant |
| Michael L. Short |
| Susan Simi |
| Debbie Stickland |
| Maura Swan |
| Joan Marie Uzdavinis |
| Hang T. Vu |
| John Wallace |
| Sean A. Williams |
| Sameh Youssef |
| Paolo Zadra |
*Principal Business Office is 601 Congress Street, Boston, MA 02210
**Principal Business Office is 197 Clarendon Street, Boston, MA 02116
***Principal Business Office is 200 Bloor Street, Toronto, Canada M4W1E5
****Principal Business Office is 250 Bloor Street, Toronto, Canada M4W1E5
*****Principal Business Office is 380 Stuart Street, Boston, MA 02116
†Principal Business is 6400 Sheridan Drive, Williamsville, NY 14221
††Principal Business is 2001 Butterfield Road, Downers Grove, Illinois 60515
†††Principal Business is 200 Berkeley Street, Boston, MA 02116
Item 28. Persons Controlled by or Under Common Control with the Depositor or the Registrant
The Registrant is a separate account of the Depositor operating as a unit investment trust. The Registrant supports benefits payable under the Depositor’s variable life insurance policies by investing assets allocated to various investment options in shares of John Hancock Variable Insurance Trust (formerly, John Hancock Trust) and other mutual funds registered under the Investment Company Act of 1940 as open-end management investment companies of the “series” type.
As of the effective date of the registration statement, the Company and its affiliates are controlled by Manulife Financial Corporation.
Table of Contents
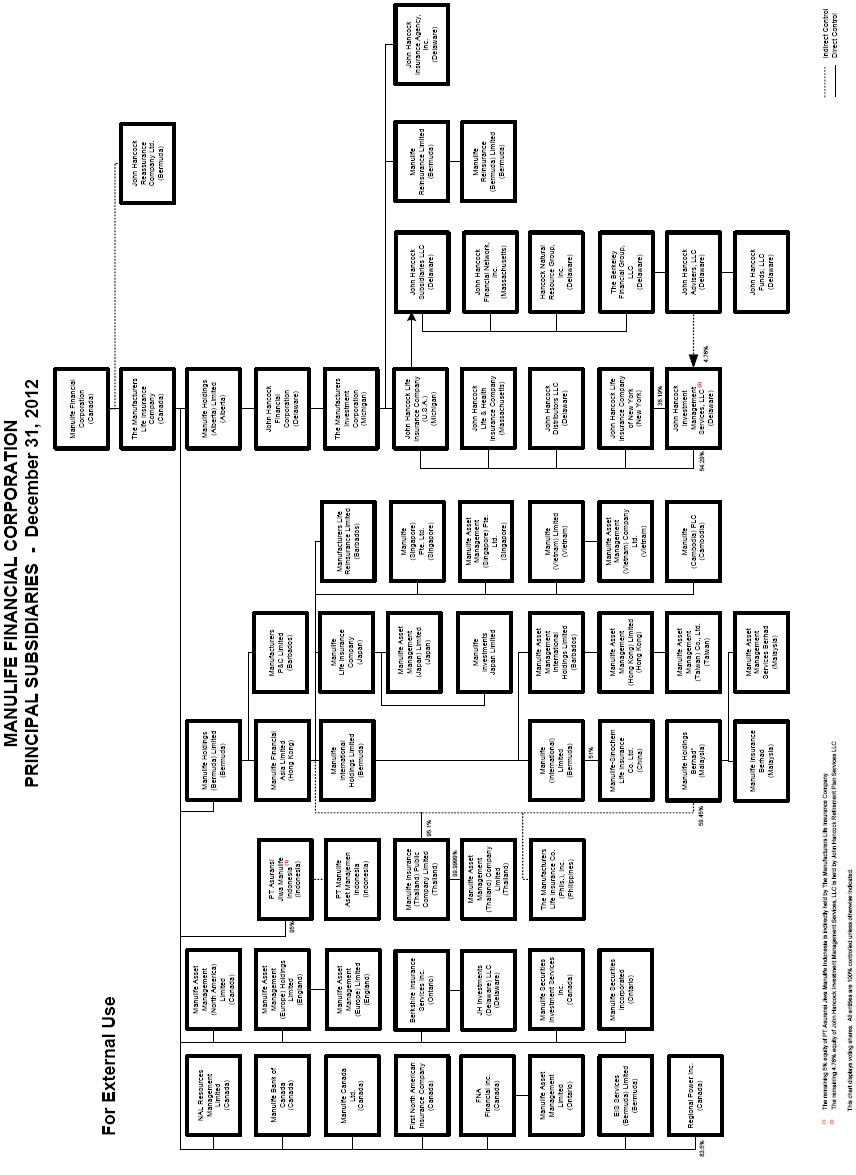
Table of Contents
Item 29. Indemnification
The Form of Selling Agreement or Service Agreement between John Hancock Distributors LLC (“JH Distributors”) and various broker-dealers may provide that the selling broker-dealer indemnify and hold harmless JH Distributors and the Company, including their affiliates, officers, directors, employees and agents against losses, claims, liabilities or expenses
Insofar as indemnification for liability arising under the Securities Act of 1933 may be permitted to directors, officers and controlling persons of the registrant pursuant to the foregoing provisions, or otherwise, the registrant has been advised that in the opinion of the Securities and Exchange Commission such indemnification is against public policy as expressed in the Act and is, therefore, unenforceable. In the event that a claim for indemnification against such liabilities (other than the payment by the registrant of expenses incurred or paid by a director, officer or controlling person of the registrant in the successful defense of any action, suit or proceeding) is asserted by such director, officer or controlling person in connection with the securities being registered, the registrant will, unless in the opinion of its counsel the matter has been settled by controlling precedent, submit to a court of appropriate jurisdiction the question whether such indemnification by it is against public policy as expressed in the Act and will be governed by the final adjudication of such issue.
Item 30. Principal Underwriter
(a) Set forth below is information concerning other investment companies for which JH Distributors, the principal underwriter of the contracts, acts as investment adviser or principal underwriter.
| Name of Investment Company | Capacity in Which Acting |
| John Hancock Variable Life Account S | Principal Underwriter |
| John Hancock Variable Life Account U | Principal Underwriter |
| John Hancock Variable Life Account V | Principal Underwriter |
| John Hancock Variable Life Account UV | Principal Underwriter |
| John Hancock Life Insurance Company (U.S.A.) Separate Account R |
Principal Underwriter |
| John Hancock Life Insurance Company (U.S.A.) Separate Account T |
Principal Underwriter |
| John Hancock Life Insurance Company (U.S.A.) Separate Account W |
Principal Underwriter |
| John Hancock Life Insurance Company (U.S.A.) Separate Account X |
Principal Underwriter |
| John Hancock Life Insurance Company (U.S.A.) Separate Account Q |
Principal Underwriter |
| John Hancock Life Insurance Company (U.S.A.) Separate Account A |
Principal Underwriter |
| John Hancock Life Insurance Company (U.S.A.) Separate Account N |
Principal Underwriter |
| John Hancock Life Insurance Company (U.S.A.) Separate Account H |
Principal Underwriter |
| John Hancock Life Insurance Company (U.S.A.) Separate Account I |
Principal Underwriter |
| John Hancock Life Insurance Company (U.S.A.) Separate Account J |
Principal Underwriter |
| John Hancock Life Insurance Company (U.S.A.) Separate Account K |
Principal Underwriter |
| John Hancock Life Insurance Company (U.S.A.) Separate Account M |
Principal Underwriter |
| John Hancock Life Insurance Company of New York Separate Account B |
Principal Underwriter |
| John Hancock Life Insurance Company of New York Separate Account A |
Principal Underwriter |
(b) John Hancock Life Insurance Company (U.S.A.) is the sole member of JH Distributors and the following comprise the Board of Managers and Officers of JH Distributors.
| Name | Title |
| Michael Doughty** | Chairman, Director |
| Edward Eng*** | Director, Vice President, Product Development Retirement Plan Services |
| Steven Finch* | Director |
| Al Seghezzi** | Director |
| Christopher Walker*** | Director, Vice President, Investments |
| Karen Walsh* | Director |
| Emanuel Alves* | Secretary |
| Steven Moore**** | Senior Vice President, Treasurer |
| Brian Collins* | Vice President, US Taxation |
| Kris Ramdial**** | Vice President, Treasury |
| Jeffrey H. Long* | Chief Financial Officer and Financial Operations Principal |
| Kathleen Petit** | Chief Compliance Officer |
*Principal Business Office is 601 Congress Street, Boston, MA 02210
**Principal Business Office is 197 Clarendon Street, Boston, MA 02116
***Principal Business Office is 200 Bloor Street, Toronto, Canada M4W1E5
****Principal Business Office is 250 Bloor Street, Toronto, Canada M4W1E5
(c) John Hancock Distributors LLC
The information contained in the section titled “Principal Underwriter and Distributor” in the Statement of Additional Information, contained in this Registration Statement, is hereby incorporated by reference in response to Item 31.(c)(2-5).
Item 31. Location of Accounts and Records
The following entities prepare, maintain, and preserve the records required by Section 31(a) of the Act for the Registrant through written agreements between the parties to the effect that such services will be provided to the Registrant for such periods prescribed by the Rules and Regulations of the Commission under the Act and such records will be surrendered promptly on request: John Hancock Distributors LLC, John Hancock Place, Boston, Massachusetts 02117, serves as Registrant’s distributor and principal underwriter, and, in such capacities, keeps records regarding shareholders account records, cancelled stock certificates. John Hancock Life Insurance Company (U.S.A.) (at the same address), in its capacity as Registrant’s depositor keeps all other records required by Section 31 (a) of the Act.
Item 32. Management Services
All management services contracts are discussed in Part A or Part B.
Item 33. Fee Representation
Representation of Insurer Pursuant to Section 26 of the Investment Company Act of 1940
John Hancock Life Insurance Company (U.S.A.) hereby represents that the fees and charges deducted under the contracts issued pursuant to this registration statement, in the aggregate, are reasonable in relation to the services rendered, the expenses expected to be incurred, and the risks assumed by the Company.
Table of Contents
Signatures
Pursuant to the requirements of the Securities Act of 1933 and the Investment Company Act of 1940, the Registrant has caused this amendment to the Registration Statement to be signed on its behalf in the City of Boston, Commonwealth of Massachusetts, as of the 23rd day of April, 2013.
John Hancock Life Insurance Company (U.S.A.) Separate Account N
(Registrant)
JOHN HANCOCK LIFE INSURANCE COMPANY (U.S.A.)
By: /s/ Craig Bromley
Criag Bromley
Principal Executive Officer
JOHN HANCOCK LIFE INSURANCE COMPANY (U.S.A.)
(Depositor)
By: /s/ Craig Bromley
Craig Bromley
Principal Executive Officer
Signatures
Pursuant to the requirements of the Securities Act of 1933, this post-effective amendment to the Registration Statement has been signed by the following persons in the capacities indicated as of the 23rd day of April, 2013.
| Signatures | Title |
| /s/ Simonetta Vendittelli Simonetta Vendittelli |
Vice President and Controller |
| /s/ Steven Finch Steven Finch |
Executive Vice President and Chief Financial Officer |
| * Craig Bromley |
Director |
| * Thomas Borshoff |
Director |
| * Paul M. Connolly |
Director |
| * Ruth Ann Fleming |
Director |
| * Michael Doughty |
Director |
| * James D. Gallagher |
Director |
| * Scott S. Hartz |
Director |
| * Rex E. Schlaybaugh, Jr. |
Director |
| * John G. Vrysen |
Director |
| /s/James C. Hoodlet James C. Hoodlet |
Table of Contents
April, 2013
This disclosure is distributed to policy owners of variable life insurance policies issued by John Hancock Life Insurance Company (U.S.A.) (“John Hancock USA”) and offering interests in John Hancock Life Insurance Company (U.S.A.) Separate Account N (the “Account” or “Separate Account”). Certain of the investment options described in this disclosure may not be available to you under your policy. You may contact the John Hancock USA Service Office for more information at 1-800-521-1234 or write to us at 197 Clarendon Street, Boston, MA 02117.
Certain of the investment options listed below are offered under variable life insurance policies bearing the title Corporate VUL.
| 500 Index B Active Bond All Cap Core All Cap Value Alpha Opportunities American Asset Allocation American Global Growth American Growth American Growth-Income American International American New World Blue Chip Growth Bond Capital Appreciation Capital Appreciation Value Core Allocation Plus Core Bond Core Strategy Disciplined Diversification Emerging Markets Value Equity-Income Financial Services Franklin Templeton Founding Allocation Fundamental All Cap Core |
Fundamental Holdings Fundamental Large Cap Value Fundamental Value Global Global Bond Global Diversification Health Sciences High Yield International Core International Equity Index B International Growth Stock International Small Company International Value Investment Quality Bond Lifestyle Aggressive Lifestyle Balanced Lifestyle Conservative Lifestyle Growth Lifestyle Moderate Mid Cap Index Mid Cap Stock Mid Value Money Market Money Market B |
Natural Resources PIMCO VIT All Asset Real Estate Securities Real Return Bond Science & Technology Short Term Government Income Small Cap Growth Small Cap Index Small Cap Opportunities Small Cap Value Small Company Value Smaller Company Growth Strategic Income Opportunities Total Bond Market B Total Return Total Stock Market Index Ultra Short Term Bond U.S. Equity Utilities Value M Capital Appreciation M International Equity M Large Cap Growth M Large Cap Value |
Market timing and disruptive trading risks
The policy is not designed for professional market timers or highly active traders, including persons or entities that engage in programmed, large or frequent transfers among the investment accounts or between the investment accounts and any available fixed account. The policy is also not designed to accommodate trading that results in transfers that are large in relation to the total assets of the underlying portfolio.
Variable investment accounts in variable life insurance products can be a prime target for abusive transfer activity because these products value their investment accounts on a daily basis and allow transfers among investment accounts without immediate tax consequences. As a result, some investors may seek to frequently transfer into and out of investment accounts or to make large transfers in reaction to market news or to exploit a perceived pricing inefficiency. Whatever the reason, long-term investors in an investment account can be harmed by large or frequent transfer activity. For example, such activity may expose the investment account’s underlying portfolio to increased portfolio transaction costs and/or disrupt the portfolio manager’s ability to effectively manage the portfolio’s investments in accordance with the portfolio’s investment objectives and policies. This could include causing the portfolio to maintain higher levels of cash than would otherwise be the case, or liquidating investments prematurely. Accordingly, frequent or large transfers may result in dilution with respect to interests held for long-term investment and adversely affect policy owners, beneficiaries and the underlying portfolios.
To discourage market timing and disruptive trading activity, we impose restrictions on transfers and reserve the right to change, suspend or terminate telephone, facsimile and internet transaction privileges. In addition, we reserve the right to take other actions at any time to restrict trading, including, but not limited to:
(i) restricting the number of transfers made during a defined period,
(ii) restricting the dollar amount of transfers,
(iii) restricting transfers into and out of certain investment accounts,
(iv) restricting the method used to submit transfers, and
(v) deferring a transfer at any time we are unable to purchase or redeem shares of the underlying portfolio.
We may also impose additional administrative conditions upon, or prohibit a transfer request made by a third party giving instructions on behalf of multiple policies, whether owned by the same owner or different owners. If you engage a third party for asset allocation services, then you may be subject to these transfer restrictions because of the actions of that party in providing those services. We will notify the third party you have engaged if we exercise this right.
While we seek to identify and prevent disruptive trading activity, it may not always be possible to do so. Therefore, no assurance can be given that the restrictions we impose will be successful in preventing all disruptive trading and avoiding harm to long-term investors.
Total annual portfolio operating expenses
The following table describes the minimum and maximum portfolio level fees and expenses charged by any of the portfolios underlying a variable investment option offered through CVUL policies purchased on or after October 12, 2005, expressed as a percentage of average net assets (rounded to two decimal places). These expenses are deducted from portfolio assets. For more information, please refer to the prospectus for the underlying portfolio.
| Total Annual Portfolio Operating Expenses | Minimum | Maximum |
| Range of expenses, including management fees, distribution and/or service (12b-1) fees, and other expenses1 | 0.49% | 1.63% |
1 Certain of the portfolios’ advisers or subadvisers have contractually agreed to reimburse or waive certain portfolio level expenses. The minimum and maximum expenses shown do not reflect these contractual expense reimbursements or waivers. If such reimbursements or waivers were reflected, the minimum and maximum expenses would be 0.25% and 1.54%, respectively.
The next table describes the minimum and maximum portfolio level fees and expenses charged by any of the portfolios underlying a variable investment option offered through a Corporate VUL policy purchased prior to October 12, 2005, expressed as a percentage of average net assets (rounded to two decimal places). These expenses are deducted from portfolio assets.
| Total Annual Portfolio Operating Expenses | Minimum | Maximum |
| Range of expenses, including management fees, distribution and/or service (12b-1) fees, and other expenses | 0.54% | 1.63% |
1 Certain of the portfolios’ advisers or subadvisers have contractually agreed to reimburse or waive certain portfolio level expenses. The minimum and maximum expenses shown do not reflect these contractual expense reimbursements or waivers. If such reimbursements or waivers were reflected, the minimum and maximum expenses would be 0.30% and 1.54%, respectively.
Table of Investment Options and Investment Subadvisers
Please note that certain of the investment options described in this table may not be available to you under your policy.
When you select a Separate Account investment option, we invest your money in shares of a corresponding portfolio of the John Hancock Variable Insurance Trust (the “Trust” or “JHVIT”) (or the PIMCO Variable Insurance Trust (the “PIMCO Trust”) or M Fund, Inc. (the “M Fund”)), and hold the shares in a subaccount of the Separate Account. Fees and expenses of the portfolios are not fixed or specified under the terms of the policies and may vary from year to year. These fees and expenses differ for each portfolio and reduce the investment return of each portfolio. Therefore, they also indirectly reduce the return you will earn on any Separate Account investment options you select. For more information, please refer to the prospectus for the underlying portfolio.
The JHVIT, the PIMCO Trust, and the M Fund are so-called “series” type mutual funds and each is registered under the Investment Company Act of 1940 (“1940 Act”) as an open-end management investment company. John Hancock Investment Management Services, LLC (“JHIMS”) provides investment advisory services to the Trust and receives investment management fees for doing so. JHIMS pays a portion of its investment management fees to other firms that manage the Trust’s portfolios. We are affiliated with JHIMS and may indirectly benefit from any investment management fees JHIMS retains. The PIMCO VIT All Asset portfolio of the PIMCO Trust receives investment advisory services from Pacific Investment Management Company LLC (“PIMCO”) and pays investment management fees to PIMCO.
Each of the American Asset Allocation, American Global Growth, American Growth, American Growth-Income, American International, American New World, Fundamental Holdings and Global Diversification portfolios invests in shares of the corresponding investment portfolio of the Trust. The American Asset Allocation, American Global Growth, American Growth, American Growth-Income, American International and American New World portfolios (“American Portfolios”) operate as “feeder funds,” which means that the portfolios do not buy investment securities directly. Instead, they invest in a “master fund” which in turn purchases investment securities. Each of the American feeder fund portfolios has the same investment objective and limitations as its master fund. The prospectus for the American Fund master fund is included with the prospectuses for the underlying funds. We pay American Funds Distributors, Inc., the principal underwriter for the American Funds Insurance Series, a percentage of some or all of the amounts allocated to the American Portfolios of the Trust for the marketing support services it provides.
The M Capital Appreciation, M International Equity, M Large Cap Growth and M Large Cap Value portfolios are series of the M Fund, an open-end management investment company registered under the 1940 Act. The assets of these subaccounts are invested in the corresponding portfolios of the M Fund. M Financial Investment Advisers, Inc. (“M Financial”) is the investment adviser for all portfolios of the M Fund. The entities shown in the table below as “Portfolio Managers” of the M Fund portfolios are sub-investment advisers selected by M Financial and are the entities that manage the portfolio’s assets.
The portfolios pay us or certain of our affiliates compensation for some of the distribution, administrative, shareholder support, marketing and other services we or our affiliates provide to the portfolios. The amount of this compensation is based on a percentage of the assets of the portfolios attributable to the variable insurance products that we and our affiliates issue. These percentages may differ from portfolio to portfolio and among classes of shares within a portfolio. In some cases, the compensation is derived from the Rule 12b-1 fees that are deducted from a portfolio’s assets for the services we or our
The following table provides a general description of the portfolios that underlie the variable investment options we make available under the policy. You bear the investment risk of any portfolio you choose as an investment option for your policy. You can find a full description of each portfolio, including the investment objectives, policies, restrictions, and risks, in the prospectus for that portfolio. You should read the portfolio’s prospectus carefully before investing in the corresponding variable investment option.
The investment options in the Separate Account are not publicly traded mutual funds. The investment options are only available to you as investment options in the policies, or in some cases through other variable annuity contracts or variable life insurance policies issued by us or by other life insurance companies. In some cases, the investment options also may be available through participation in certain qualified pension or retirement plans. The portfolios’ investment advisers and managers (i.e. subadvisers) may manage publicly traded mutual funds with similar names and investment objectives. However, the portfolios are not directly related to any publicly traded mutual fund. You should not compare the performance of any investment option described in this prospectus with the performance of a publicly traded mutual fund. The performance of any publicly traded mutual fund could differ substantially from that of any of the investment options of our Separate Account.
The portfolios available under the policies, the portfolio managers (engaged by JHIMS, M Financial or PIMCO) and the investment objective for the portfolio are as described in the following table:
Portfolio
Portfolio Manager
Investment Objective
500 Index B
John Hancock Asset Management, a division of Manulife Asset Management (North America) Limited
To seek to approximate the aggregate total return of a broad-based U.S. domestic equity market index. Under normal market conditions, the portfolio
seeks to approximate the aggregate total return of a broad-based U.S. domestic equity market index.
Active Bond
Declaration Management & Research LLC; and John Hancock Asset Management, a division of Manulife Asset Management (US) LLC
To seek income and capital appreciation. Under normal market conditions, the portfolio invests at least 80% of its net assets (plus any borrowings for
investment purposes) in a diversified mix of debt securities and instruments. The portfolio seeks to invest its assets in debt securities and instruments with an average duration of between 4 to 6 years; however, there is no limit on the
portfolio’s average maturity.
All Cap Core
QS Investors, LLC
To seek long-term growth of capital. Under normal market conditions, the portfolio invests in common stocks and other equity securities within all
asset classes (small, medium and large-capitalization) of those included in the Russell 3000 Index.*
All Cap Value
Lord, Abbett & Co. LLC
To seek capital appreciation. Under normal market conditions, the portfolio primarily purchases equity securities of U.S. and multinational companies
in all capitalization ranges that the subadviser believes are undervalued.
Alpha Opportunities
Wellington Management Company, LLP
To seek long-term total return. The portfolio employs a “multiple sleeve structure,” which means the portfolio has several components that
are managed separately in different styles. The portfolio seeks to obtain its objective by combining these different component styles in a single portfolio.
American Asset Allocation
Capital Research and Management Company (Adviser to the American Funds Insurance Series)
To seek to provide high total return (including income and capital gains) consistent with preservation of capital over the long-term. The portfolio
invests all of its assets in Class 1 shares of its master fund, the Asset Allocation Fund, a series of the American Funds Insurance Series. The master fund invests in a diversified portfolio of common stocks and other equity securities, bonds and
other intermediate and long-term debt securities, and money market instruments.
American Blue Chip Income and Growth
Capital Research and Management Company (Adviser to the American Funds Insurance Series)
To seek to produce income exceeding the average yield on U.S. stocks generally and to provide an opportunity for growth of principal consistent with
sound common stock investing. The portfolio invests all of its assets in Class 1 shares of its master fund, the Blue Chip Income and Growth Fund, a series of the American Funds Insurance Series. The master fund invests primarily in dividend-paying
common stocks of larger, more established companies domiciled in the U.S. with market capitalizations of $4 billion and above.
| Portfolio | Portfolio Manager | Investment Objective |
| American Global Growth | Capital Research and Management Company (Adviser to the American Funds Insurance Series) | To seek to provide long-term growth of capital. The portfolio invests all of its assets in Class 1 shares of its master fund, the Global Growth Fund, a series of the American Funds Insurance Series. The master fund invests primarily in common stocks of companies located around the world that the adviser believes have potential for growth. |
| American Global Small Capitalization | Capital Research and Management Company (Adviser to the American Funds Insurance Series) | To seek to provide long-term growth of capital. The portfolio invests all of its assets in Class 1 shares of its master fund, the Global Small Capitalization Fund, a series of the American Funds Insurance Series. Under normal market conditions, the master fund invests primarily in stocks of smaller companies located around the world. |
| American Growth | Capital Research and Management Company (Adviser to the American Funds Insurance Series) | To seek to provide growth of capital. The portfolio invests all of its assets in Class 1 shares of its master fund, the Growth Fund, a series of the American Funds Insurance Series. The master fund invests primarily in common stocks and seeks to invest in companies that appear to offer superior opportunities for growth of capital. The master fund may also invest a portion of its assets in common stocks and other securities of issuers domiciled outside the U.S. |
| American Growth–Income | Capital Research and Management Company (Adviser to the American Funds Insurance Series) | To seek to provide growth of capital and income. The portfolio invests all of its assets in Class 1 shares of its master fund, the Growth-Income Fund, a series of the American Funds Insurance Series. The master fund invests primarily in common stocks or other securities which demonstrate the potential for appreciation and/or dividends. Although the master fund focuses on investments in medium to large-capitalization companies, the master fund’s investments are not limited to a particular capitalization size. |
| American High-Income Bond | Capital Research and Management Company (Adviser to the American Funds Insurance Series) | To seek to provide a high level of current income and, secondarily, capital appreciation. The portfolio invests all of its assets in Class 1 shares of its master fund, the High-Income Bond Fund, a series of the American Funds Insurance Series. The master fund invests primarily in higher yielding and generally lower quality debt securities rated Ba1 or below or BB+ or below by NRSROs or unrated but determined to be of equivalent quality, including corporate loan obligations. Such securities are sometimes referred to as “junk bonds.” The portfolio may also invest a portion of its assets in securities of issuers domiciled outside the U.S. |
| American International | Capital Research and Management Company (Adviser to the American Funds Insurance Series) | To seek to provide long-term growth of capital. The portfolio invests all of its assets in Class 1 shares of its master fund, the International Fund, a series of the American Funds Insurance Series. The master fund invests primarily in common stocks of companies located outside the U.S. that the adviser believes have the potential for growth. The master fund may invest a portion of its assets in common stocks and other securities of companies in emerging market countries. |
| American New World | Capital Research and Management Company (Adviser to the American Funds Insurance Series) | To seek long-term capital appreciation. The portfolio invests all of its assets in Class 1 shares of its master fund, the New World Fund, a series of the American Funds Insurance Series. The master fund invests primarily in stocks of companies with significant exposure to countries with developing economies and/or markets that the adviser believes have potential of providing capital appreciation. The master fund may also invest in debt securities of issuers, including issuers of lower rated bonds, with exposure to these countries. |
| Blue Chip Growth | T. Rowe Price Associates, Inc. | To seek to provide long-term growth of capital. Current income is a secondary objective. Under normal market conditions, the portfolio invests at least 80% of its net assets (plus any borrowings for investment purposes) in the common stocks of large and medium-sized blue chip growth companies. |
| Bond | John Hancock Asset Management, a division of Manulife Asset Management (US) LLC | To seek a high level of current income consistent with prudent investment risk. Under normal market conditions, the portfolio invests at least 80% of its net assets (plus any borrowings for investment purposes) in a diversified portfolio of bonds. These may include, but are not limited to, corporate bonds and debentures, as well as U.S. government and agency securities. |
| Capital Appreciation | Jennison Associates LLC | To seek long-term growth of capital. Under normal market conditions, the portfolio invests at least 65% of its total assets in equity and equity-related securities of companies that, at the time of investment, exceed $1 billion in market capitalization and that the subadviser believes have above-average growth prospects. These companies are generally medium to large-capitalization companies. |
| Portfolio | Portfolio Manager | Investment Objective |
| Capital Appreciation Value | T. Rowe Price Associates, Inc. | To seek long-term capital appreciation. Under normal market conditions, the portfolio invests primarily in common stocks of established U.S. companies that have above-average potential for capital growth. Common stocks typically constitute at least 50% of the portfolio’s total assets. The remaining assets are generally invested in other securities, including convertible securities, corporate and government debt, bank loans (which represent an interest in amounts owed by a borrower to a syndicate of lenders), foreign securities, futures and options. The portfolio may invest up to 20% of its total assets in foreign securities. |
| Core Allocation Plus | Wellington Management Company, LLP | To seek total return, consisting of long-term capital appreciation and current income. Under normal market conditions, the portfolio invests in equity and fixed-income securities of issuers located within and outside the U.S. The portfolio allocates its assets between fixed-income securities, which may include investment-grade and below investment-grade debt securities with maturities that range from short to longer term, and equity securities based upon the subadviser’s targeted asset mix, which may change over time. Under normal market conditions, the targeted asset mix may range between 75%-50% equity instruments and 50%-25% fixed-income instruments and will generally reflect the subadviser’s long-term, strategic asset allocation analysis. |
| Core Bond | Wells Capital Management, Incorporated | To seek total return consisting of income and capital appreciation. Under normal market conditions, the portfolio invests at least 80% of its net assets (plus any borrowings for investment purposes) in a broad range of investment-grade debt securities, including U.S. Government obligations, corporate bonds, mortgage-backed and other asset-backed securities and money market instruments. |
| Core Strategy | John Hancock Asset Management, a division of Manulife Asset Management (US) LLC; and John Hancock Asset Management, a division of Manulife Asset Management (North America) Limited |
To seek long-term growth of capital. Current income is also a consideration. Under normal market conditions, the portfolio invests in other portfolios of JHVIT and other investment companies (including exchange traded funds) as well as other types of investments. The portfolio invests approximately 70% of its total assets in equity securities and underlying funds that invest primarily in equity securities, and approximately 30% of its total assets in fixed-income securities and underlying funds that invest primarily in fixed-income securities. |
| Disciplined Diversification | Dimensional Fund Advisors LP | To seek total return consisting of capital appreciation and current income. Under normal market conditions, the portfolio invests primarily in equity
securities and fixed-income securities of domestic and international issuers, including equities of issuers in emerging markets, in accordance with the following range of allocations: Target Allocation Range of Allocation Equity Securities: 70% 65% – 75% Fixed-Income Securities: 30% 25% – 35% |
| Emerging Markets Value | Dimensional Fund Advisors LP | To seek long-term capital appreciation. Under normal market conditions, the portfolio invests at least 80% of its net assets (plus any borrowings for investment purposes) in companies associated with emerging markets designated from time to time by the subadviser. |
| Equity-Income | T. Rowe Price Associates, Inc. | To seek to provide substantial dividend income and also long-term growth of capital. Under normal market conditions, the portfolio invests at least 80% of its net assets (plus any borrowings for investment purposes) in equity securities, with at least 65% in common stocks of well-established companies paying above-average dividends. |
| Financial Services | Davis Selected Advisers, L.P. | To seek growth of capital. Under normal market conditions, the portfolio invests at least 80% of its net assets (plus any borrowings for investment purposes) in companies that, at the time of investment, are principally engaged in financial services, and the portfolio invests primarily in common stocks of financial services companies. |
| Franklin Templeton Founding Allocation | John Hancock Asset Management, a division of Manulife Asset Management (US) LLC | To seek long-term growth of capital. The portfolio invests in other funds and in other investment companies, as well as other types of investments. The portfolio currently invests primarily in three underlying funds: Global Fund, Income Fund and Mutual Shares Fund. |
| Fundamental All Cap Core | John Hancock Asset Management, a division of Manulife Asset Management (US) LLC | To seek long-term growth of capital. Under normal market conditions, the portfolio invests at least 80% of its net assets (plus any borrowings for investment purposes) in equity securities. Market capitalizations of these companies will span the capitalization spectrum. Equity securities include common, convertible, and preferred securities and their equivalents. |
| Portfolio | Portfolio Manager | Investment Objective |
| Fundamental Holdings | John Hancock Asset Management, a division of Manulife Asset Management (US) LLC; and John Hancock Asset Management, a division of Manulife Asset Management (North America) Limited |
To seek long-term growth of capital. The portfolio invests in other funds and other investment companies as well as other types of investments. Underlying funds may include other JHVIT funds and funds of the American Funds Insurance Series. However, the portfolio is authorized to invest without limitation in other underlying funds and in other types of investments. |
| Fundamental Large Cap Value | John Hancock Asset Management, a division of Manulife Asset Management (US) LLC | To seek long-term capital appreciation. Under normal market conditions, the portfolio invests at least 80% of its net assets in equity securities of large-capitalization companies. The portfolio considers large-capitalization companies to be those that at the time of purchase have a market capitalization equal to or greater than that of the top 80% of the companies that comprise the Russell 1000 Index.* |
| Fundamental Value | Davis Selected Advisers, L.P. | To seek growth of capital. Under normal market conditions, the portfolio invests primarily in common stocks of U.S. companies with market capitalizations of at least $10 billion. The portfolio may also invest in companies with smaller capitalizations. |
| Global | Templeton Global Advisors Limited | To seek long-term capital appreciation. Under normal market conditions, the portfolio invests primarily in the equity securities of companies located throughout the world, including emerging markets. |
| Global Bond | Pacific Investment Management Company LLC | To seek maximum total return, consistent with preservation of capital and prudent investment management. Under normal market conditions, the portfolio invests at least 80% of its net assets (plus any borrowings for investment purposes) in fixed-income instruments that are economically tied to at least three countries (one of which may be the U.S.), which may be represented by futures contracts (including related options) with respect to such securities, and options on such securities. These fixed-income instruments may be denominated in foreign currencies or in U.S. dollars, which may be represented by forwards or derivatives, such as options, futures contracts, or swap agreements. |
| Global Diversification | John Hancock Asset Management, a division of Manulife Asset Management (US) LLC; and John Hancock Asset Management, a division of Manulife Asset Management (North America) Limited |
To seek long-term growth of capital. The portfolio invests in other funds and other investment companies as well as other types of investments. Underlying funds may include other JHVIT funds and funds of American Fund Insurance Series. The portfolio is authorized to invest without limitation in other underlying funds. Under normal market conditions, the portfolio intends to invest a portion of its assets in funds that invest primarily in foreign securities or in foreign securities directly. |
| Health Sciences | T. Rowe Price Associates, Inc. | To seek long-term capital appreciation. Under normal market conditions, the portfolio invests at least 80% of its net assets (plus any borrowings for investment purposes) in common stocks of companies engaged, at the time of investment, in the research, development, production, or distribution of products or services related to health care, medicine, or the life sciences. While the portfolio may invest in companies of any size, the majority of its assets are expected to be invested in large and medium-capitalization companies. |
| High Yield | Western Asset Management Company | To seek to realize an above-average total return over a market cycle of three to five years, consistent with reasonable risk. Under normal market
conditions, the portfolio invests at least 80% of its net assets (plus any borrowings for investment purposes) at the time of investment in high yield securities. The portfolio’s investments may include corporate bonds, preferred stocks, U.S.
Government and foreign securities, mortgage-backed securities, loan assignments or participations and convertible securities that have the following ratings (or, if unrated, are considered by the subadviser to be of equivalent quality): Rating Agency Moody’s: Ba through C S&P’s: BB through D |
| International Core | Grantham, Mayo, Van Otterloo & Co. LLC | To seek high total return. Under normal market conditions, the portfolio invests at least 80% of its total assets in equity investments. The portfolio typically invests in equity investments in companies from developed markets outside the U.S. |
| Portfolio | Portfolio Manager | Investment Objective |
| International Equity Index A | SSgA Funds Management, Inc. | To seek to track the performance of a broad-based equity index of foreign companies primarily in developed countries and, to a lesser extent, in emerging markets. Under normal market conditions, the portfolio invests at least 80% of its assets in securities listed in the Morgan Stanley Capital International All Country World Excluding U.S. Index* or American Depositary Receipts or Global Depositary Receipts representing such securities. |
| International Equity Index B | SSgA Funds Management, Inc. | To seek to track the performance of a broad-based equity index of foreign companies primarily in developed countries and, to a lesser extent, in emerging markets. Under normal market conditions, the portfolio invests at least 80% of its assets in securities listed in the Morgan Stanley Capital International All Country World Excluding U.S. Index* or American Depositary Receipts or Global Depositary Receipts representing such securities. |
| International Opportunities | Marsico Capital Management, LLC | To seek long-term growth of capital. Under normal market conditions, the portfolio invests at least 65% of its total assets in common stocks of foreign companies that are selected for their long-term growth potential. The portfolio may invest in an unlimited number of companies of any size throughout the world. The portfolio invests in issuers from at least three different countries not including the U.S. The portfolio may invest in common stocks of companies economically tied to emerging markets. Some issuers of securities in the portfolio may be based in or economically tied to the U.S. |
| International Small Company | Dimensional Fund Advisors LP | To seek long-term capital appreciation. Under normal market conditions, the portfolio invests at least 80% of its net assets (plus any borrowings for investment purposes) in securities of small capitalization companies in the particular markets in which the portfolio invests. The portfolio primarily invests in a broad and diverse group of equity securities of non-U.S. small companies of developed markets, but may also hold equity securities of companies located in emerging markets. |
| International Value | Templeton Investment Counsel, LLC | To seek long-term growth of capital. Under normal market conditions, the portfolio invests primarily in equity securities of companies located outside the U.S., including in emerging markets. |
| Investment Quality Bond | Wellington Management Company, LLP | To seek to provide a high level of current income consistent with the maintenance of principal and liquidity. Under normal market conditions, the portfolio invests at least 80% of its net assets (plus any borrowings for investment purposes) in bonds rated investment-grade at the time of investment. The portfolio will tend to focus on corporate bonds and U.S. Government bonds with intermediate to longer-term maturities. |
| Lifestyle Aggressive | John Hancock Asset Management, a division of Manulife Asset Management (US) LLC; and John Hancock Asset Management, a division of Manulife Asset Management (North America) Limited |
To seek long-term growth of capital. Current income is not a consideration. The portfolio normally invests approximately 100% of its assets in underlying funds that invest primarily in equity securities. |
| Lifestyle Balanced | John Hancock Asset Management, a division of Manulife Asset Management (US) LLC; and John Hancock Asset Management, a division of Manulife Asset Management (North America) Limited |
To seek a balance between a high level of current income and growth of capital, with a greater emphasis on growth of capital. The portfolio normally invests approximately 50% of its assets in underlying funds that invest primarily in equity securities and approximately 50% of its assets in underlying funds that invest primarily in fixed-income securities. |
| Lifestyle Conservative | John Hancock Asset Management, a division of Manulife Asset Management (US) LLC; and John Hancock Asset Management, a division of Manulife Asset Management (North America) Limited |
To seek a high level of current income with some consideration given to growth of capital. The portfolio normally invests approximately 80% of its assets in underlying funds that invest primarily in fixed-income securities and approximately 20% in underlying funds that invest primarily in equity securities. |
| Portfolio | Portfolio Manager | Investment Objective |
| Lifestyle Growth | John Hancock Asset Management, a division of Manulife Asset Management (US) LLC; and John Hancock Asset Management, a division of Manulife Asset Management (North America) Limited |
To seek long-term growth of capital. Current income is also a consideration. The portfolio normally invests approximately 70% of its assets in underlying funds that invest primarily in equity securities and approximately 30% of its assets in underlying funds that invest primarily in fixed-income securities. |
| Lifestyle Moderate | John Hancock Asset Management, a division of Manulife Asset Management (US) LLC; and John Hancock Asset Management, a division of Manulife Asset Management (North America) Limited |
To seek a balance between a high level of current income and growth of capital, with a greater emphasis on income. The portfolio normally invests approximately 60% of its assets in underlying funds that invest primarily in fixed-income securities and approximately 40% in underlying funds that invest primarily in equity securities. |
| Mid Cap Index | John Hancock Asset Management, a division of Manulife Asset Management (North America) Limited | To seek to approximate the aggregate total return of a medium-capitalization U.S. domestic equity market index. Under normal market conditions, the portfolio invests at least 80% of its net assets (plus any borrowings for investment purposes) at the time of investment in (a) the common stocks that are included in the S&P MidCap 400 Index* and (b) securities (which may or may not be included in the S&P MidCap 400 Index) that the subadviser believes as a group will behave in a manner similar to the index. |
| Mid Cap Stock | Wellington Management Company, LLP | To seek long-term growth of capital. Under normal market conditions, the portfolio invests at least 80% of its net assets (plus any borrowings for investment purposes) in equity securities of medium-sized companies with significant capital appreciation potential. For the portfolio, “medium-sized companies” are those with market capitalizations within the collective market capitalization range of companies represented in either the Russell Midcap Index* or the S&P MidCap 400 Index.* |
| Mid Value | T. Rowe Price Associates, Inc. | To seek long-term capital appreciation. Under normal market conditions, the portfolio invests at least 80% of its net assets in companies with market capitalizations that are within the Russell Midcap Value Index.* The portfolio invests in a diversified mix of common stocks of mid-size U.S. companies that are believed to be undervalued by various measures and offer good prospects for capital appreciation. |
| Money Market | John Hancock Asset Management, a division of Manulife Asset Management (North America) Limited | To seek to obtain maximum current income consistent with preservation of principal and liquidity. Under normal market conditions, the portfolio invests in high quality, U.S. dollar-denominated money market instruments. Certain market conditions may cause the return of the portfolio to become low or possibly negative. |
| Money Market B | John Hancock Asset Management, a division of Manulife Asset Management (North America) Limited | To seek to obtain maximum current income consistent with preservation of principal and liquidity. Under normal market conditions, the portfolio invests in high quality, U.S. dollar-denominated money market instruments. Certain market conditions may cause the return of the portfolio to become low or possibly negative. |
| Natural Resources | Wellington Management Company, LLP | To seek long-term total return. Under normal market conditions, the portfolio invests at least 80% of its net assets (plus any borrowings for investment purposes) in equity and equity-related securities of natural resource-related companies worldwide, including emerging markets. Natural resource-related companies include companies that own or develop energy, metals, forest products and other natural resources, or supply goods and services to such companies. |
| PIMCO VIT All Asset (a series of PIMCO Variable Insurance Trust) (only Class M is available) | Pacific Investment Management Company LLC | To seek maximum real return consistent with preservation of real capital and prudent investment management. The portfolio is a fund of funds and normally invests substantially all of its assets in Institutional Class shares of underlying PIMCO funds. |
| Real Estate Securities | Deutsche Investment Management Americas Inc. | To seek to achieve a combination of long-term capital appreciation and current income. Under normal market conditions, the portfolio invests at least 80% of its net assets (plus any borrowings for investment purposes) in equity securities of real estate investment trusts and real estate companies. Equity securities include common stock, preferred stock and securities convertible into common stock. |
| Portfolio | Portfolio Manager | Investment Objective |
| Real Return Bond | Pacific Investment Management Company LLC | To seek maximum real return, consistent with preservation of real capital and prudent investment management. Under normal market conditions, the portfolio invests at least 80% of its net assets (plus any borrowings for investment purposes) in inflation-indexed bonds of varying maturities issued by the U.S. and non-U.S. Governments, their agencies or instrumentalities and corporations, which may be represented by forwards or derivatives such as options, futures contracts, or swap agreements. |
| Science & Technology | RCM Capital Management LLC; and T. Rowe Price Associates, Inc. |
To seek long-term growth of capital. Current income is incidental to the portfolio’s objective. Under normal market conditions, the portfolio invests at least 80% of its net assets (plus any borrowings for investment purposes) in the common stocks of companies expected to benefit from the development, advancement, and/or use of science and technology. For purposes of satisfying this requirement, common stock may include equity-linked notes and derivatives relating to common stocks, such as options on equity-linked notes. |
| Short Term Government Income | John Hancock Asset Management, a division of Manulife Asset Management (US) LLC | To seek a high level of current income consistent with preservation of capital. Maintaining a stable share price is a secondary goal. Under normal market conditions, the portfolio invests at least 80% of its net assets in obligations issued or guaranteed by the U.S. Government and its agencies, authorities or instrumentalities. Under normal circumstances, the portfolio’s effective duration is no more than 3 years. |
| Small Cap Growth | Wellington Management Company, LLP | To seek long-term capital appreciation. Under normal market conditions, the portfolio invests at least 80% of its net assets (plus any borrowings for investment purposes) in small-capitalization companies. For the purposes of the portfolio, “small-capitalization companies” are those with market capitalizations, at the time of investment, not exceeding the maximum market capitalization of any company represented in either the Russell 2000 Index* or the S&P SmallCap 600 Index.* |
| Small Cap Index | John Hancock Asset Management, a division of Manulife Asset Management (North America) Limited | To seek to approximate the aggregate total return of a small-capitalization U.S. domestic equity market index. Under normal market conditions, the portfolio invests at least 80% of its net assets (plus any borrowings for investment purposes) at the time of investment in (a) the common stocks that are included in the Russell 2000 Index* and (b) securities (which may or may not be included in the Russell 2000 Index) that the subadviser believes as a group will behave in a manner similar to the index. |
| Small Cap Opportunities | Dimensional Fund Advisors LP; and Invesco Advisers, Inc. | To seek long-term capital appreciation. Under normal market conditions, Invesco Advisers, Inc. invests at least 80% of its subadvised net assets (plus any borrowings for investment purposes) in equity securities of small-capitalization companies. Dimensional Fund Advisors LP generally invests its subadvised net assets in a broad and diverse group of common stocks of small and medium-capitalization companies traded on a U.S. national securities exchange or on the over-the-counter market that Dimensional Fund Advisors LP determines to be value stocks at the time of purchase. |
| Small Cap Value | Wellington Management Company, LLP | To seek long-term capital appreciation. Under normal market conditions, the portfolio invests at least 80% of its net assets (plus any borrowings for investment purposes) in small-capitalization companies that are believed to be undervalued by various measures and offer good prospects for capital appreciation. For the purposes of the portfolio, “small-capitalization companies” are those with market capitalizations, at the time of investment, not exceeding the maximum market capitalization of any company represented in either the Russell 2000 Index* or the S&P SmallCap 600 Index.* |
| Small Company Value | T. Rowe Price Associates, Inc. | To seek long-term growth of capital. Under normal market conditions, the portfolio invests at least 80% of its net assets (plus any borrowings for investment purposes) in companies with market capitalizations, at the time of investment, that do not exceed the maximum market capitalization of any security in the Russell 2000 Index.* The portfolio invests in small companies whose common stocks are believed to be undervalued. |
| Portfolio | Portfolio Manager | Investment Objective |
| Smaller Company Growth | Frontier Capital Management Company, LLC; Perimeter Capital Management; and John Hancock Asset Management, a division of Manulife Asset Management (North America) Limited |
To seek long-term capital appreciation. Under normal market conditions, the portfolio invests at least 80% of its assets in small-capitalization equity securities. |
| Strategic Income Opportunities | John Hancock Asset Management, a division of Manulife Asset Management (US) LLC | To seek a high level of current income. Under normal market conditions, the portfolio invests primarily in the following types of securities: non-U.S. government and corporate debt securities from developed and emerging markets, U.S. Government and agency securities, and domestic high-yield bonds. The portfolio may also invest in preferred stock and other types of debt securities. |
| Total Bond Market B | Declaration Management & Research LLC | To seek to track the performance of the Barclays Capital U.S. Aggregate Bond Index** (which represents the U.S. investment-grade bond market). Under normal market conditions, the portfolio invests at least 80% of its net assets (plus any borrowing for investment purposes) in securities listed in the Barclays Capital U.S. Aggregate Bond Index. |
| Total Return | Pacific Investment Management Company LLC | To seek maximum total return, consistent with preservation of capital and prudent investment management. Under normal market conditions, the portfolio invests at least 65% of its net assets in a diversified portfolio of fixed-income instruments of varying maturities, which may be represented by forwards or derivatives, such as options, futures contracts, or swap agreements. |
| Total Stock Market Index | John Hancock Asset Management, a division of Manulife Asset Management (North America) Limited | To seek to approximate the aggregate total return of a broad U.S. domestic equity market index. Under normal market conditions, the portfolio invests at least 80% of its net assets (plus any borrowings for investment purposes) at the time of investment in (a) the common stocks that are included in the Wilshire 5000 Total Market Index* and (b) securities (which may or may not be included in the Wilshire 5000 Total Market Index) that the subadviser believes as a group will behave in a manner similar to the index. |
| Ultra Short Term Bond | John Hancock Asset Management, a division of Manulife Asset Management (US) LLC | To seek a high level of current income consistent with the maintenance of liquidity and the preservation of capital. Under normal market conditions, the portfolio invests at least 80% of its net assets in a diversified portfolio of domestic, investment-grade, debt securities. Debt securities may be issued by governments, companies or special purpose entities and may include notes, discount notes, bonds, debentures, commercial paper, repurchase agreements, mortgage-backed and other asset-backed securities and assignments, participations and other interests in bank loans. The portfolio may also invest in cash and cash equivalents. |
| U.S. Equity | Grantham, Mayo, Van Otterloo & Co. LLC | To seek long-term capital appreciation. Under normal market conditions, the portfolio invests at least 80% of its net assets (plus any borrowings for investment purposes) in equity securities. To achieve the objective, the portfolio will be invested in equity investments that the subadviser believes will provide higher returns than the Russell 3000 Index.* |
| Utilities | Massachusetts Financial Services Company | To seek capital growth and current income (income above that available from the portfolio invested entirely in equity securities). Under normal market conditions, the portfolio invests at least 80% of its net assets (plus any borrowing for investment purposes) in securities of companies in the utilities industry. The subadviser considers a company to be in the utilities industry if, at the time of investment, the subadviser determines that a substantial portion (i.e., at least 50%) of the company’s assets or revenues are derived from one or more utilities. |
| Value | Invesco Advisers, Inc. | To seek to realize an above-average total return over a market cycle of 3 to 5 years, consistent with reasonable risk. Under normal market conditions, the portfolio invests in equity securities of companies with capitalizations, at the time of investment, similar to the market capitalization of companies in the Russell Midcap Value Index.* |
| M Business Opportunity Value (a series of M Fund, Inc.) | Iridian Asset Management LLC | To seek long-term capital appreciation through investment primarily in equity securities of U.S. issuers in the large-capitalization segment of the U.S. stock market. |
| Portfolio | Portfolio Manager | Investment Objective |
| M Capital Appreciation (a series of M Fund, Inc.) | Frontier Capital Management Company, LLC | To seek maximum capital appreciation through investment in common stocks of U.S. companies of all sizes, with emphasis on stocks of companies with capitalizations consistent with the capitalizations of those companies found in the Russell 2500 Index.* |
| M International Equity (a series of M Fund, Inc.) | Northern Cross, LLC | To seek long-term capital appreciation through investment in equity securities of foreign issuers, including common stocks, and securities that are convertible into common stocks. |
| M Large Cap Growth (a series of M Fund, Inc.) | DSM Capital Partners LLC | To seek long-term capital appreciation through investment mainly in common stocks of U.S. companies that the portfolio manager believes have strong earnings-growth potential. |
*Wilshire 5000 Total Market Index® is a trademark of Wilshire Associates. MSCI All Country World Excluding U.S. Index is a trademark of Morgan Stanley & Co. Incorporated. Russell 1000,® Russell 2000,® Russell 2500,® Russell 3000,® Russell Midcap,® and Russell Midcap Value® are trademarks of Frank Russell Company. S&P MidCap 400,® and S&P SmallCap 600® are trademarks of The McGraw-Hill Companies, Inc. None of the portfolios are sponsored, endorsed, managed, advised, sold or promoted by any of these companies, and none of these companies make any representation regarding the advisability of investing in the portfolios.
The indices referred to in the portfolio objectives track companies having the approximate market capitalization, as of February 28, 2013 (except as otherwise indicated), set out below:
MSCI All Country World Ex US
Index — $676 million to $215.6 billion
Russell 1000 Index — minimum of $315 million
Russell 2000 Index — less than $1 million to $6.1 billion
Russell 2500 Index (as
of March 31, 2013) — $11 billion
Russell 3000 Index — less than $1 million to $414.5 billion
Russell Midcap Index — $315 million to $42 billion
Russell Midcap Value
Index — $315 million to $42 billion
S&P MidCap 400 Index — $322 million to $16.2 billion
S&P SmallCap 600 Index — $4 billion
Wilshire 5000 Total Market
Index — less than $1 million to $415.2 billion
**The U.S. Aggregate Bond Index is a broad-based benchmark that measures the investment grade, U.S. dollar-enominated, fixed-rate taxable bond market, including Treasuries, government-related and corporate securities, MBS (agency fixed-rate and hybrid ARM pass throughs), ABS, and CMBS.
This description of Federal income tax consequences is only a brief summary and is neither exhaustive nor authoritative. It was written to support the promotion of our products. It does not constitute legal or tax advice, and it is not intended to be used and cannot be used to avoid any penalties that may be imposed on you. Tax consequences will vary based on your own particular circumstances, and for further information you should consult a qualified tax adviser. Federal, state and local tax laws, regulations and interpretations can change from time to time. As a result, the tax consequences to you and the beneficiary may be altered, in some cases retroactively. The policy may be used in various arrangements, including non-qualified deferred compensation or salary continuation plans, split dollar insurance plans, executive bonus plans, retiree medical benefit plans and others. The tax consequences of such plans may vary depending on the particular facts and circumstances of each individual arrangement. Therefore, if the value of using the policy in any such arrangement depends in part on the tax consequences, a qualified tax adviser should be consulted for advice.
We are taxed as a life insurance company. Under current tax law rules, we include the investment income (exclusive of capital gains) of the Separate Account in our taxable income and take deductions for investment income credited to our policy holder reserves. We are also required to capitalize and amortize certain costs instead of deducting those costs when they are incurred. We do not currently charge the Separate Account for any resulting income tax costs, other than a charge we may impose against the Separate Account to compensate us for the cost of a delay in the deductibility of deferred acquisition costs (the “DAC tax” adjustment) pursuant to section 848 of the Internal Revenue Code. We also claim certain tax credits or deductions relating to foreign taxes paid and dividends received by the series funds. These benefits can be material. We do not pass these benefits through to the Separate Account, principally because: (i) the deductions and credits are allowed to us and not the policy owners under applicable tax law; and (ii) the deductions and credits do not represent investment return on the Separate Account assets that is passed through to policy owners.
The policies permit us to deduct a charge for any taxes we incur that are attributable to the operation or existence of the policies or the Separate Account. Currently, we do not anticipate making any specific charge for such taxes other than any DAC tax charge and premium taxes where applicable. If the level of the current taxes increases, however, or is expected to increase in the future, we reserve the right to make a charge in the future.
Death benefit proceeds and other policy distributions
Generally, death benefits paid under policies such as yours are not subject to income tax unless policy ownership has been transferred in exchange for payment. Earnings on your policy value are ordinarily not subject to income tax as long as we don’t pay them out to you. If we do pay out any amount of your policy value upon surrender or partial withdrawal, all or part of that distribution would generally be treated as a return of the premiums you’ve paid and not subjected to income tax. However certain distributions associated with a reduction in death benefit or other policy benefits within the first fifteen years after issuance of the policy are ordinarily taxable in whole or in part. Amounts you borrow are generally not taxable to you.
However, some of the tax rules change if your policy becomes a modified endowment contract. This can happen if you’ve paid premiums in excess of limits prescribed by the tax laws. Additional taxes and penalties may be payable for policy distributions of any kind, including loans. (See “7-pay premium limit and modified endowment contract status” below.)
We expect the policy to receive the same Federal income and estate tax treatment as fixed benefit life insurance policies. Section 7702 of the Internal Revenue Code defines a life insurance contract for Federal tax purposes. For a policy to be treated as a life insurance contract, it must satisfy either the cash value accumulation test or the guideline premium test. These tests limit the amount of premium that you may pay into the policy. We will monitor compliance with these standards. If we determine that a policy does not satisfy section 7702, we may take whatever steps are appropriate and reasonable to bring it into compliance with section 7702.
If
the policy complies with section 7702, the death benefit proceeds under the policy ordinarily should be excludable from the beneficiary’s gross income under section 101 of the Internal Revenue Code. (As noted above, a transfer of the policy
for valuable consideration may limit the exclusion of death benefits from the beneficiary’s income.) In addition, if your policy offers a Long-Term Care Rider, and you have elected it, the rider’s benefits generally will be excludable
from gross income under the Internal Revenue Code. The tax-free nature of these accelerated benefits is contingent on the rider meeting specific requirements under section 101 and/or section 7702B of the Internal Revenue Code. The riders are
intended to meet these standards. If you have elected a Long-Term Care Rider, we caution you that there is a significant risk that ownership by anyone other than the person insured by the policy will cause adverse tax consequences. If the owner
of the policy is not the insured person, benefit payments may be included in the owner’s income, and the death benefit may be part of the insured person’s estate for purposes of the Federal estate tax. A policy with a Long-Term Care
Rider should not be purchased by or transferred to a person other than the insured person unless you have carefully reviewed the tax implications with your tax adviser.
Increases in policy value as a result of interest or investment experience will not be subject to Federal income tax unless and until values are received through actual or deemed distributions. In general, unless the policy is a modified endowment contract, the owner will be taxed only on the amount of distributions that exceed the premiums paid under the policy. An exception to this general rule occurs in the case of a decrease in the policy’s death benefit or any other change that reduces benefits under the policy in the first fifteen years after the policy is issued and that results in a cash distribution to the policy owner. Changes that reduce benefits include partial withdrawals, death benefit option changes, and distributions required to keep the policy in compliance with section 7702. For purposes of this rule any distribution within the two years immediately before a reduction in benefits will also be treated as if it were a result of the reduction. A cash distribution that reduces policy benefits will be taxed in whole or in part (to the extent of any gain in the policy) under rules prescribed in section 7702. The taxable amount is subject to limits prescribed in section 7702(f)(7). Any taxable distribution will be ordinary income to the owner (rather than capital gain).
Distributions for tax purposes include amounts received upon surrender or partial withdrawals. You may also be deemed to have received a distribution for tax purposes if you assign all or part of your policy rights or change your policy’s ownership. If your policy offers a Long-Term Care Rider, and if you have elected it, deductions from policy value to pay the rider charges will reduce your investment in the contract, but will not be included in income even if you have recovered all of your investment in the contract.
It is possible that, despite our monitoring, a policy might fail to qualify as a life insurance contract under section 7702 of the Internal Revenue Code. This could happen, for example, if we inadvertently failed to return to you any premium payments that were in excess of permitted amounts, or if any of the funds failed to meet certain investment diversification or other requirements of the Internal Revenue Code. If this were to occur, you would be subject to income tax on the income credited to the policy from the date of issue to the date of the disqualification and for subsequent periods.
Tax consequences of ownership or receipt of policy proceeds under Federal, state and local estate, inheritance, gift and other tax laws will depend on the circumstances of each owner or beneficiary. If the person insured by the policy is also its owner, either directly or indirectly through an entity such as a revocable trust, the death benefit will be includible in his or her estate for purposes of the Federal estate tax. If the owner is not the person insured, the value of the policy will be includible in the owner’s estate upon his or her death. Even if ownership has been transferred, the death proceeds or the policy value may be includible in the former owner’s estate if the transfer occurred less than three years before the former owner’s death or if the former owner retained certain kinds of control over the policy. You should consult your tax adviser regarding these possible tax consequences.
Because there may be unfavorable tax consequences (including recognition of taxable income and the loss of income tax-free treatment for any death benefit payable to the beneficiary), you should consult a qualified tax adviser prior to changing the policy’s ownership or making any assignment of ownership interests.
We expect that, except as noted below (see “7-pay premium limit and modified endowment contract status”), loans received under the policy will be treated as indebtedness of an owner and that no part of any loan will constitute income to the owner. However, if the policy terminates for any reason other than the payment of the death benefit, the amount of any outstanding loan that was not previously considered income will be treated as if it had been distributed to the owner upon such termination. This could result in a considerable tax bill. Under certain circumstances involving large amounts of outstanding loans, you might find yourself having to choose between high premiums required to keep your policy from lapsing and a significant tax burden if you allow the lapse to occur.
Diversification rules and ownership of the Separate Account
Your policy will not qualify for the tax benefits of a life insurance contract unless the Separate Account follows certain rules requiring diversification of investments underlying the policy. In addition, the rules require that the policy owner not have “investor control” over the underlying assets.
In certain circumstances, the owner of a variable life insurance policy may be considered the owner, for Federal income tax purposes, of the assets of the Separate Account used to support the policy. In those circumstances, income and gains from the Separate Account assets would be includible in the policy owner’s gross income. The Internal Revenue Service (“IRS”) has stated in published rulings that a variable policy owner will be considered the owner of Separate Account assets if the policy owner possesses incidents of ownership in those assets, such as the ability to exercise investment control over the assets. A Treasury Decision issued in 1986 stated that guidance would be issued in the form of regulations or rulings on the “extent to which Policyholders may direct their investments to particular sub-accounts of a Separate Account without being treated as owners of the underlying assets.” As of the date of this prospectus, no comprehensive guidance on this point has been issued. In Rev. Rul. 2003-91, however, the IRS ruled that a contract holder would not be treated as the owner of assets underlying a variable life insurance or annuity contract despite the owner’s ability to allocate funds among as many as twenty subaccounts.
The ownership rights under your policy are similar to, but different in certain respects from, those described in IRS rulings in which it was determined that policyholders were not owners of Separate Account assets. Since you have greater flexibility in allocating premiums and policy values than was the case in those rulings, it is possible that you would be treated as the owner of your policy’s proportionate share of the assets of the Separate Account.
We do not know what future Treasury Department regulations or other guidance may require. We cannot guarantee that the funds will be able to operate as currently described in the series funds’ prospectuses, or that a series fund will not have to change any fund’s investment objectives or policies. We have reserved the right to modify your policy if we believe doing so will prevent you from being considered the owner of your policy’s proportionate share of the assets of the Separate Account, but we are under no obligation to do so.
7-pay premium limit and modified endowment contract status
At the time of policy issuance, we will determine whether the Planned Premium schedule will exceed the 7-pay limit discussed below. If so, our standard procedures prohibit issuance of the policy unless you sign a form acknowledging that fact.
The 7-pay limit at any time during the first seven contract years is the total of net level premiums that would have been payable at or before that time under a comparable fixed policy that would be fully “paid-up” after the payment of seven equal annual premiums. “Paid-up” means that no further premiums would be required to continue the coverage in force until maturity, based on certain prescribed assumptions. If the total premiums paid at any time during the first seven policy years exceed the 7-pay limit, the policy will be treated as a modified endowment contract, which can have adverse tax consequences.
Policies classified as modified endowment contracts are subject to the following tax rules:
- First, all withdrawals from such a policy are treated as ordinary income subject to tax up to the amount equal to the excess (if any) of the policy value immediately before the withdrawal over the investment in the policy at such time. If you own any other modified endowment contracts issued to you in the same calendar year by the same insurance company or its affiliates, their values will be combined with the value of the policy from which you take the withdrawal for purposes of determining how much of the withdrawal is taxable as ordinary income.
- Second, loans taken from or secured by such a policy and assignments or pledges of any part of its value are treated as partial withdrawals from the policy and taxed accordingly. Past-due loan interest that is added to the loan amount is treated as an additional loan.
- Third, a 10% additional penalty tax is imposed on the portion of any distribution (including distributions on surrender) from, or loan taken from or secured by, such a policy that is included in income except where the distribution or loan:
- is made on or after the date on which the policy owner attains age 59½;
- is attributable to the policy owner becoming disabled; or
- is part of a series of substantially equal periodic payments for the life (or life expectancy) of the policy owner or the joint lives (or joint life expectancies) of the policy owner and the policy owner’s beneficiary.
These exceptions to the 10% additional tax do not apply in situations where the policy is not owned by an individual.
Furthermore, any time there is a “material change” in a policy, the policy will begin a new 7-pay testing period as if it were a newly-issued policy. The material change rules for determining whether a policy is a modified endowment contract are complex. In general, however, the determination of whether a policy will be a modified endowment contract after a material change depends upon the relationship among the death benefit of the policy at the time of such change, the policy value at the time of the change, and the additional premiums paid into the policy during the seven years starting with the date on which the material change occurs.
Moreover, under a policy insuring a single life, if there is a reduction in benefits (such as a reduction in the death benefit or the reduction or cancellation of certain rider benefits) during a 7-pay testing period, the 7-pay limit will generally be recalculated based on the reduced benefits and the policy will be re-tested, from the beginning of the 7-pay testing period using the lower limit. If the premiums paid to date at any point during the 7-pay testing period are greater than the recalculated 7-pay limit, the policy will become a modified endowment contract. If your policy is a survivorship policy, a reduction in benefits under the policy at any time will require re-testing. For such a policy the 7-pay limit will generally be recalculated based on the reduced benefits and the policy will be re-tested, using the lower limit, from the date it was issued.
If your policy is issued as a result of an exchange subject to section 1035 of the Internal Revenue Code, it may be considered to be a modified endowment contract if the death benefit under the new policy is smaller than the death benefit under the exchanged policy, or if you reduce coverage in your new policy after it is issued. Therefore, if you desire to reduce the face amount as part of a 1035 exchange, a qualified tax adviser should be consulted for advice. A new policy issued in exchange for a modified endowment contract will also be a modified endowment contract regardless of any change in the death benefit.
All modified endowment contracts issued by the same insurer (or its affiliates) to the same owner during any calendar year generally are required to be treated as one contract for the purpose of applying the rules on taxation of withdrawals from modified endowment contracts. You should consult your tax adviser if you have questions regarding the possible impact of the 7-pay limit on your policy.
Corporate and H.R. 10 retirement plans
The policy may be acquired in connection with the funding of retirement plans satisfying the qualification requirements of section 401 of the Internal Revenue Code. If so, the Internal Revenue Code provisions relating to such plans and life insurance benefits thereunder should be carefully scrutinized. We are not responsible for compliance with the terms of any such plan or with the requirements of applicable provisions of the Internal Revenue Code.
To the extent that policy distributions to you are taxable, they are generally subject to withholding for your Federal income tax liability. However if you reside in the United States, you can generally choose not to have tax withheld from distributions.
Life insurance purchases by residents of Puerto Rico
In Rev. Rul. 2004-75, 2004-31 I.R.B. 109, the Internal Revenue Service ruled that income received by residents of Puerto Rico under a life insurance policy issued by a United States company is U.S.-source income that is subject to United States Federal income tax.
Life insurance purchases by non-resident aliens
If you are not a U.S. citizen or resident, you will generally be subject to U.S. Federal withholding tax on taxable distributions from life insurance policies at a 30% rate, unless a lower treaty rate applies. In addition, you may be subject to state and/or municipal taxes and taxes imposed by your country of citizenship or residence. You should consult with a qualified tax adviser before purchasing a policy.
In addition to the disclosure contained herein, John Hancock USA has filed with the SEC a prospectus and a Statement of Additional Information (the “SAI”) which contains additional information about John Hancock USA and the Separate Account, including information on our history, services provided to the Separate Account, legal and regulatory matters and the audited financial statements of John Hancock USA and the Separate Account. The SAI and personalized illustrations of death benefits, account values and surrender values are available, without charge, upon request. You may obtain the personalized illustrations from your John Hancock USA representative. The SAI may be obtained by contacting the John Hancock USA Servicing Office. You should also contact the John Hancock USA Servicing Office to request any other information about your policy or to make any inquiries about its operation.
Information about the Separate Account (including the SAI) can be reviewed and copied at the SEC’s Public Reference Branch, 100 F Street, NE, Room 1580, Washington, DC, 20549. Information on the operation of the Public Reference Room may be obtained by calling the SEC at 202-551-5850. Reports and other information about the Account are available on the SEC’s Internet website at http://www.sec.gov. Copies of such information may be obtained, upon payment of a duplicating fee, by writing the Public Reference Section of the SEC at 100 F Street, NE, Washington, DC 20549-0102.