| UNITED STATES SECURITIES AND EXCHANGE COMMISSION | ||
| Washington, D.C. 20549 | ||
FORM N-CSR | ||
| CERTIFIED SHAREHOLDER REPORT OF REGISTERED MANAGEMENT INVESTMENT COMPANIES | ||
| Investment Company Act file number: | (811-01403) |
| Exact name of registrant as specified in charter: | Putnam Focused International Equity Fund |
| Address of principal executive offices: | 100 Federal Street, Boston, Massachusetts 02110 |
| Name and address of agent for service: | Robert T. Burns, Vice President 100 Federal Street Boston, Massachusetts 02110 |
| Copy to: | Bryan Chegwidden, Esq. Ropes & Gray LLP 1211 Avenue of the Americas New York, New York 10036 |
| Registrant's telephone number, including area code: | (617) 292-1000 |
| Date of fiscal year end: | October 31, 2021 |
| Date of reporting period: | November 1, 2020 — April 30, 2021 |
Item 1. Report to Stockholders: |
| The following is a copy of the report transmitted to stockholders pursuant to Rule 30e-1 under the Investment Company Act of 1940: | |||
Putnam Focused
International Equity
Fund
Semiannual report
4 | 30 | 21
Message from the Trustees
June 9, 2021
Dear Fellow Shareholder:
With summer at hand, it’s worth asking whether the economy has returned to normal. More than half of the 50 states have lifted pandemic-related restrictions. First-quarter growth in U.S. gross domestic product was 6%, reflecting a return nearly to pre-pandemic levels of economic output. The global economy is a different story. Beyond our shores, many nations lag the United States in vaccination rates and business activity.
While there are reasons to feel some relief, it’s important to recognize what may be a new normal. The pandemic is not in the past, and many of the changes precipitated by it could last. During this time, dynamic, well-managed companies have adapted to seize new, more sustainable growth opportunities.
Putnam’s active philosophy is well suited to this time. Putnam’s investment teams are analyzing companies, industries, consumers, and even governments. They try to understand the fundamentals of what has stayed the same and what has changed to uncover valuable investment insights or potential risks.
Thank you for investing with Putnam.

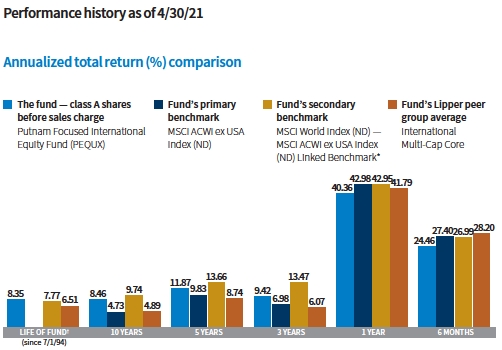
As of April 1, 2021, the MSCI ACWI ex USA Index (ND) replaced the MSCI World Index (ND) as the primary benchmark for this fund. In Putnam Investment Management, LLC’s opinion, the securities tracked by the MSCI ACWI ex USA Index (ND) more accurately reflect the types of securities that generally will be held by the fund.
Current performance may be lower or higher than the quoted past performance, which cannot guarantee future results. Share price, principal value, and return will fluctuate, and you may have a gain or a loss when you sell your shares. Performance of class A shares assumes reinvestment of distributions and does not account for taxes. Fund returns in the bar chart do not reflect a sales charge of 5.75%; had they, returns would have been lower. See page 3 and pages 8–10 for additional performance information. For a portion of the periods, the fund had expense limitations, without which returns would have been lower. To obtain the most recent month-end performance, visit putnam.com.
Before April 1, 2021, the fund was managed with a materially different investment strategy and may have achieved materially different performance results under its current investment strategy from that shown for periods before this date.
Returns for periods less than one year are cumulative.
Lipper peer group average provided by Lipper, a Refinitiv company.
* The MSCI World Index (ND) — MSCI ACWI ex USA Index (ND) Linked Benchmark represents performance of the MSCI World Index (ND) from the inception date of the fund, July 1, 1994, through March 31, 2021, and performance of the MSCI ACWI ex USA Index (ND) from April 1, 2021 and thereafter.
† The fund’s primary benchmark, the MSCI ACWI ex USA Index (ND), was introduced on 12/31/00, which post-dates the inception of the fund’s class A shares.
| 2 Focused International Equity Fund |

This comparison shows your fund’s performance in the context of broad market indexes for the six months ended 4/30/21. See page 2 and pages 8–10 for additional fund performance information. Index descriptions can be found on pages 13–14.
All Bloomberg Barclays indices provided by Bloomberg Index Services Limited.
| Focused International Equity Fund 3 |

Spencer, can you describe the investing environment for the reporting period?
A number of factors drove positive performance for stocks during the period. Record fiscal and monetary stimulus, distribution of the world’s first Covid-19 vaccines, and signs of global economic recovery boosted investors’ appetite for stocks. As countries eased restrictions, investors shifted their preference toward value-centric, cyclical stocks, which outperformed growth-oriented stocks during the period.
For the six-month reporting period, international stocks in developed markets, as measured by the MSCI EAFE Index [ND], posted a return of 28.84%. U.S. stocks mirrored this strength, with the S&P 500 Index returning 28.85% for the period. Emerging-market stocks also performed well, posting a return of 22.95% as measured by the MSCI Emerging Markets Index [ND].
| 4 Focused International Equity Fund |
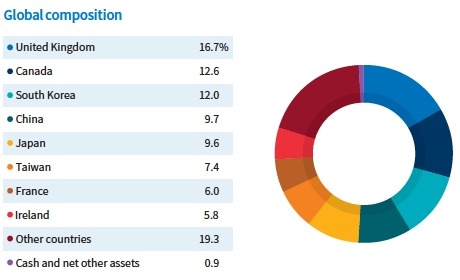
Allocations are shown as a percentage of the fund’s net assets as of 4/30/21. Cash and net other assets, if any, represent the market value weights of cash, derivatives, short-term securities, and other unclassified assets in the portfolio. Summary information may differ from the information in the portfolio schedule notes included in the financial statements due to the inclusion of derivative securities, any interest accruals, the exclusion of as-of trades, if any, and rounding. Holdings and allocations may vary over time.

This table shows the fund’s top 10 holdings by percentage of the fund’s net assets as of 4/30/21. Short-term investments and derivatives, if any, are excluded. Holdings may vary over time.
| Focused International Equity Fund 5 |
As of April 1, 2021, you and Karan Sodhi, CFA, were appointed portfolio managers of the fund. Can you describe other material changes to the fund’s investment process and strategy?
Putnam Focused International Equity Fund, formerly known as Putnam Global Equity Fund, has shifted its focus to investments outside the United States. The fund invests in developing and emerging markets, seeking high-quality companies that we believe are trading at deep discounts relative to their intrinsic value. We have the flexibility to invest across sectors and investment styles. While our stock universe is broad, the fund’s portfolio is expected to invest in about 25 to 35 holdings, representing our best stock picks.
Through intensive fundamental research, Karan and I look for companies with wide moats, high and sustainable returns on capital, low debt, and strong management teams. Our goal is to invest in these companies when their market prices reflect steep discounts to our estimates of intrinsic value.
How did Putnam Focused International Equity Fund perform for the period?
The fund’s class A shares reported a return of 24.46%, underperforming the fund’s primary benchmark, the MSCI ACWI ex USA Index [ND], which returned 27.40% for the period.
What were some of the fund’s top detractors from performance during the period?
Our investment in e-commerce giant Amazon.com Inc. was a top detractor to results. U.S.-based Amazon was one of the early beneficiaries of the pandemic. In early 2020, demand for the company’s online deliveries, digital-based entertainment, and web-based computing services skyrocketed under quarantines. When economies began to reopen in mid-2020, some of Amazon’s e-commerce business slowed. Concerns that the stock had become overvalued also contributed to investor sell-offs during the period. We exited our position in the stock before period-end.

Alibaba, China’s leading e-commerce and cloud-service provider, also detracted from results during the period. In late 2020, the Chinese government terminated a highly anticipated initial public offering of Alibaba’s financial arm, Ant Group. Alibaba underwent an anti-trust investigation and incurred a $2.8 billion fine, which cut into the company’s profits in the first quarter of calendar 2021. We believe Alibaba remains deeply discounted relative to its intrinsic value, and we continue to own the stock.
ServiceNow, a U.S.-based workflow services provider serving global enterprises, also detracted from results. Investor interest dampened when management lowered its sales outlook for the full-year 2021. In order to focus on more attractive non-U.S. opportunities, we sold our position in the stock during the period.
What were some top contributors to performance during the period?
Our investment in Bermuda-based Assured Guaranty, which is not held in the primary benchmark, was the fund’s top performer. Assured Guaranty provides credit enhancement products to the U.S. and international public finance, infrastructure, and structured finance markets. As interest rates moved to historic lows and credit markets strengthened, major construction and infrastructure projects resumed. This helped boost demand for Assured Guaranty’s financial services. We benefited from the stock’s rise before selling our position.
Cenovus Energy, an oil sands operator in Calgary, Alberta, also performed well for the fund. With Cenovus’ acquisition of Husky Energy in January 2021, the company established itself as Canada’s third-largest crude oil and natural gas producer. Management remained upbeat that the combined
| 6 Focused International Equity Fund |
companies would bring $1.2 billion in cost and capital synergy savings to make the acquisition immediately accretive to shareholder value. We captured gains from the stock and then exited our position before period-end.
Alphabet Inc., owner of the search engine Google and other high-tech subsidiaries, was another highlight for the period. The company reported impressive financial results, with earnings per share increasing over 165% year over year in the first quarter of calendar 2021. In addition to its rapidly growing core business, which comprises nine products with over one billion users, Alphabet has made considerable investments in disruptive technologies. These include Waymo self-driving vehicles and quantum computing. While these so-called “moonshots” tend to depress near-term profitability, we believe that they will add significant long-term value, and we continue to own Alphabet.
What is your outlook for the economy and the fund?
With the distribution of vaccines underway, the world is moving closer to a return to normalcy. Gross domestic product [GDP] growth has surged throughout many parts of the world as economies recover from the Covid-19 pandemic. However, we believe much of this optimism is already reflected in current stock prices, and the market’s price-to-earnings ratio is expensive relative to history. Unprecedented monetary and fiscal stimulus could eventually lead to higher inflation, which could create headwinds for stock markets, in our view.
We do not factor macroeconomic forecasts into our investment decisions and instead focus all our efforts on finding quality companies at bargain prices. We seek companies with high returns on capital, a low price-to-intrinsic value, and minimal debt, which we believe will deliver better returns and reduced risk for the portfolio over the long term.
Thank you, Spencer, for your time and insights today.
The views expressed in this report are exclusively those of Putnam Management and are subject to change. They are not meant as investment advice.
Please note that the holdings discussed in this report may not have been held by the fund for the entire period. Portfolio composition is subject to review in accordance with the fund’s investment strategy and may vary in the future. Current and future portfolio holdings are subject to risk.
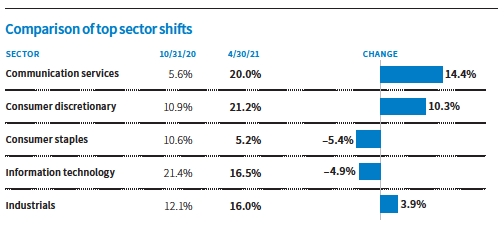
This chart shows the fund’s largest allocation shifts, by percentage, over the past six months. Allocations are shown as a percentage of the fund’s net assets. Current period summary information may differ from the portfolio schedule included in the financial statements due to the inclusion of derivative securities, any interest accruals, the exclusion of as-of trades, if any, the use of different classifications of securities for presentation purposes, and rounding. Holdings and allocations may vary over time.
| Focused International Equity Fund 7 |
Your fund’s performance
This section shows your fund’s performance, price, and distribution information for periods ended April 30, 2021, the end of the first half of its current fiscal year. In accordance with regulatory requirements for mutual funds, we also include performance information as of the most recent calendar quarter-end and expense information taken from the fund’s current prospectus. Performance should always be considered in light of a fund’s investment strategy. Before April 1, 2021, the fund was managed with a materially different investment strategy and may have achieved materially different performance results under its current investment strategy from that shown for periods before this date. Data represent past performance. Past performance does not guarantee future results. More recent returns may be less or more than those shown. Investment return and principal value will fluctuate, and you may have a gain or a loss when you sell your shares. Performance information does not reflect any deduction for taxes a shareholder may owe on fund distributions or on the redemption of fund shares. For the most recent month-end performance, please visit the Individual Investors section at putnam.com or call Putnam at 1-800-225-1581. Class R, R6, and Y shares are not available to all investors. See the Terms and definitions section in this report for definitions of the share classes offered by your fund.
Fund performance Total return for periods ended 4/30/21
| Annual | |||||||||
| average | Annual | Annual | Annual | ||||||
| (life of fund) | 10 years | average | 5 years | average | 3 years | average | 1 year | 6 months | |
| Class A (7/1/94) | |||||||||
| Before sales charge | 8.35% | 125.33% | 8.46% | 75.20% | 11.87% | 31.00% | 9.42% | 40.36% | 24.46% |
| After sales charge | 8.11 | 112.37 | 7.82 | 65.12 | 10.55 | 23.46 | 7.28 | 32.29 | 17.30 |
| Class B (7/1/94) | |||||||||
| Before CDSC | 8.15 | 112.14 | 7.81 | 68.85 | 11.04 | 28.08 | 8.60 | 39.25 | 23.98 |
| After CDSC | 8.15 | 112.14 | 7.81 | 66.85 | 10.78 | 25.08 | 7.74 | 34.25 | 18.98 |
| Class C (2/1/99) | |||||||||
| Before CDSC | 8.15 | 112.20 | 7.81 | 68.77 | 11.03 | 28.09 | 8.60 | 39.27 | 23.95 |
| After CDSC | 8.15 | 112.20 | 7.81 | 68.77 | 11.03 | 28.09 | 8.60 | 38.27 | 22.95 |
| Class R (1/21/03) | |||||||||
| Net asset value | 8.08 | 119.53 | 8.18 | 73.01 | 11.59 | 30.03 | 9.15 | 39.93 | 24.29 |
| Class R6 (7/2/12) | |||||||||
| Net asset value | 8.59 | 134.13 | 8.88 | 78.72 | 12.31 | 32.54 | 9.85 | 40.86 | 24.67 |
| Class Y (9/23/02) | |||||||||
| Net asset value | 8.53 | 130.98 | 8.73 | 77.43 | 12.15 | 31.96 | 9.69 | 40.69 | 24.60 |
Current performance may be lower or higher than the quoted past performance, which cannot guarantee future results. After-sales-charge returns for class A shares reflect the deduction of the maximum 5.75% sales charge levied at the time of purchase. Class B share returns after contingent deferred sales charge (CDSC) reflect the applicable CDSC, which is 5% in the first year, declining over time to 1% in the sixth year, and is eliminated thereafter. Class C share returns after CDSC reflect a 1% CDSC for the first year that is eliminated thereafter. Class R, R6, and Y shares have no initial sales charge or CDSC. Performance for class C, R, and Y shares before their inception is derived from the historical performance of class A shares, adjusted for the applicable sales charge (or CDSC) and the higher operating expenses for such shares, except for class Y shares, for which 12b-1 fees are not applicable. Performance for class R6 shares prior to their inception is derived from the historical performance of class Y shares and has not been adjusted for the lower investor servicing fees applicable to class R6 shares; had it, returns would have been higher.
For a portion of the periods, the fund had expense limitations, without which returns would have been lower.
The fund has had performance fee adjustments that may have had a positive or negative impact on returns.
Class B and C share performance reflects conversion to class A shares after eight years.
| 8 Focused International Equity Fund |
Comparative index returns For periods ended 4/30/21
| Annual | |||||||||
| average | Annual | Annual | Annual | ||||||
| (life of fund) | 10 years | average | 5 years | average | 3 years | average | 1 year | 6 months | |
| MSCI ACWI ex USA | |||||||||
| Index (ND) | —* | 58.77% | 4.73% | 59.78% | 9.83% | 22.43% | 6.98% | 42.98% | 27.40% |
| MSCI World (ND) — | |||||||||
| MSCI ACWI ex USA (ND) | 7.77% | 153.37 | 9.74 | 89.67 | 13.66 | 46.12 | 13.47 | 42.95 | 26.99 |
| Linked Benchmark† | |||||||||
| Lipper International | |||||||||
| Multi-Cap Core | 6.51 | 62.40 | 4.89 | 52.35 | 8.74 | 19.48 | 6.07 | 41.79 | 28.20 |
| category average‡ |
Index and Lipper results should be compared with fund performance before sales charge, before CDSC, or at net asset value.
As of April 1, 2021, the MSCI ACWI ex USA Index (ND) replaced the MSCI World Index (ND) as the primary benchmark for this fund. In Putnam Investment Management, LLC’s opinion, the securities tracked by the MSCI ACWI ex USA Index (ND) more accurately reflect the types of securities that generally will be held by the fund.
* The fund’s primary benchmark, the MSCI ACWI ex USA Index (ND), was introduced on 12/31/00, which post-dates the inception of the fund’s class A shares.
† The MSCI World Index (ND) — MSCI ACWI ex USA Index (ND) Linked Benchmark represents performance of the MSCI World Index (ND) from the inception date of the fund, July 1, 1994, through March 31, 2021, and performance of the MSCI ACWI ex USA Index (ND) from April 1, 2021 and thereafter.
‡ Over the 6-month, 1-year, 3-year, 5-year, 10-year, and life-of-fund periods ended 4/30/21, there were 360, 352, 319, 270, 174, and 17 funds, respectively, in this Lipper category.
Fund price and distribution information For the six-month period ended 4/30/21
| Distributions | Class A | Class B | Class C | Class R | Class R6 | Class Y | |
| Number | 1 | — | — | — | 1 | 1 | |
| Income | $0.101 | — | — | — | $0.168 | $0.145 | |
| Capital gains | — | — | — | — | — | — | |
| Total | $0.101 | — | — | — | $0.168 | $0.145 | |
| Before | After | Net | Net | Net | Net | Net | |
| sales | sales | asset | asset | asset | asset | asset | |
| Share value | charge | charge | value | value | value | value | value |
| 10/31/20 | $16.77 | $17.79 | $14.68 | $15.45 | $16.55 | $17.49 | $17.40 |
| 4/30/21 | 20.76 | 22.03 | 18.20 | 19.15 | 20.57 | 21.62 | 21.52 |
The classification of distributions, if any, is an estimate. Before-sales-charge share value and current dividend rate for class A shares, if applicable, do not take into account any sales charge levied at the time of purchase. After-sales-charge share value, current dividend rate, and current 30-day SEC yield, if applicable, are calculated assuming that the maximum sales charge (5.75% for class A shares) was levied at the time of purchase. Final distribution information will appear on your year-end tax forms.
| Focused International Equity Fund 9 |
Fund performance as of most recent calendar quarter Total return for periods ended 3/31/21
| Annual | |||||||||
| average | Annual | Annual | Annual | ||||||
| (life of fund) | 10 years | average | 5 years | average | 3 years | average | 1 year | 6 months | |
| Class A (7/1/94) | |||||||||
| Before sales charge | 8.24% | 126.26% | 8.51% | 72.81% | 11.56% | 28.38% | 8.68% | 53.83% | 16.41% |
| After sales charge | 8.00 | 113.25 | 7.87 | 62.88 | 10.25 | 21.00 | 6.56 | 44.98 | 9.72 |
| Class B (7/1/94) | |||||||||
| Before CDSC | 8.04 | 113.17 | 7.86 | 66.37 | 10.72 | 25.50 | 7.86 | 52.55 | 15.92 |
| After CDSC | 8.04 | 113.17 | 7.86 | 64.37 | 10.45 | 22.50 | 7.00 | 47.55 | 10.92 |
| Class C (2/1/99) | |||||||||
| Before CDSC | 8.04 | 112.98 | 7.85 | 66.39 | 10.72 | 25.51 | 7.87 | 52.67 | 16.01 |
| After CDSC | 8.04 | 112.98 | 7.85 | 66.39 | 10.72 | 25.51 | 7.87 | 51.67 | 15.01 |
| Class R (1/21/03) | |||||||||
| Net asset value | 7.98 | 120.56 | 8.23 | 70.57 | 11.27 | 27.38 | 8.40 | 53.39 | 16.30 |
| Class R6 (7/2/12) | |||||||||
| Net asset value | 8.48 | 135.04 | 8.92 | 76.16 | 11.99 | 29.82 | 9.09 | 54.35 | 16.64 |
| Class Y (9/23/02) | |||||||||
| Net asset value | 8.43 | 131.95 | 8.78 | 74.95 | 11.84 | 29.38 | 8.97 | 54.19 | 16.58 |
See the discussion following the fund performance table on page 8 for information about the calculation of fund performance.
As a mutual fund investor, you pay ongoing expenses, such as management fees, distribution fees (12b-1 fees), and other expenses. Using the following information, you can estimate how these expenses affect your investment and compare them with the expenses of other funds. You may also pay one-time transaction expenses, including sales charges (loads) and redemption fees, which are not shown in this section and would have resulted in higher total expenses. For more information, see your fund’s prospectus or talk to your financial representative.
Expense ratios
| Class A | Class B | Class C | Class R | Class R6 | Class Y | |
| Total annual operating expenses for the | ||||||
| fiscal year ended 10/31/20 | 1.13% | 1.88% | 1.88% | 1.38% | 0.74% | 0.88% |
| Annualized expense ratio for the | ||||||
| six-month period ended 4/30/21* | 1.12% | 1.87% | 1.87% | 1.37% | 0.75% | 0.87% |
Fiscal year expense information in this table is taken from the most recent prospectus, is subject to change, and may differ from that shown for the annualized expense ratio and in the financial highlights of this report.
Expenses are shown as a percentage of average net assets.
* Includes a decrease of 0.11% from annualizing the performance fee adjustment for the six months ended 4/30/21.
| 10 Focused International Equity Fund |
Expenses per $1,000
The following table shows the expenses you would have paid on a $1,000 investment in each class of the fund from 11/1/20 to 4/30/21. It also shows how much a $1,000 investment would be worth at the close of the period, assuming actual returns and expenses.
| Class A | Class B | Class C | Class R | Class R6 | Class Y | |
| Expenses paid per $1,000*† | $6.23 | $10.39 | $10.38 | $7.62 | $4.18 | $4.84 |
| Ending value (after expenses) | $1,244.60 | $1,239.80 | $1,239.50 | $1,242.90 | $1,246.70 | $1,246.00 |
* Expenses for each share class are calculated using the fund’s annualized expense ratio for each class, which represents the ongoing expenses as a percentage of average net assets for the six months ended 4/30/21. The expense ratio may differ for each share class.
† Expenses are calculated by multiplying the expense ratio by the average account value for the period; then multiplying the result by the number of days in the period; and then dividing that result by the number of days in the year.
Estimate the expenses you paid
To estimate the ongoing expenses you paid for the six months ended 4/30/21, use the following calculation method. To find the value of your investment on 11/1/20, call Putnam at 1-800-225-1581.

Compare expenses using the SEC’s method
The Securities and Exchange Commission (SEC) has established guidelines to help investors assess fund expenses. Per these guidelines, the following table shows your fund’s expenses based on a $1,000 investment, assuming a hypothetical 5% annualized return. You can use this information to compare the ongoing expenses (but not transaction expenses or total costs) of investing in the fund with those of other funds. All mutual fund shareholder reports will provide this information to help you make this comparison. Please note that you cannot use this information to estimate your actual ending account balance and expenses paid during the period.
| Class A | Class B | Class C | Class R | Class R6 | Class Y | |
| Expenses paid per $1,000*† | $5.61 | $9.35 | $9.35 | $6.85 | $3.76 | $4.36 |
| Ending value (after expenses) | $1,019.24 | $1,015.52 | $1,015.52 | $1,018.00 | $1,021.08 | $1,020.48 |
* Expenses for each share class are calculated using the fund’s annualized expense ratio for each class, which represents the ongoing expenses as a percentage of average net assets for the six months ended 4/30/21. The expense ratio may differ for each share class.
† Expenses are calculated by multiplying the expense ratio by the average account value for the six-month period; then multiplying the result by the number of days in the six-month period; and then dividing that result by the number of days in the year.
| Focused International Equity Fund 11 |
Consider these risks before investing
International investing involves currency, economic, and political risks. Emerging-market securities carry illiquidity and volatility risks. Investments in small and/or midsize companies increase the risk of greater price fluctuations. Growth stocks may be more susceptible to earnings disappointments, and value stocks may fail to rebound. As a non-diversified fund, the fund invests in fewer issuers and is more vulnerable than a more broadly diversified fund to fluctuations in the values of the securities it holds. If the fund invests a substantial percentage of its assets in issuers located in a single country, a small number of countries, or a particular geographic region, the fund’s performance will likely be closely tied to the conditions in such countries or region. Risks associated with derivatives include increased investment exposure (which may be considered leverage) and, in the case of over-the-counter instruments, the potential inability to terminate or sell derivatives positions and the potential failure of the other party to the instrument to meet its obligations. The value of investments in the fund’s portfolio may fall or fail to rise over extended periods of time for a variety of reasons, including general economic, political or financial market conditions, investor sentiment and market perceptions, government actions, geopolitical events or changes, and factors related to a specific issuer, geography, industry or sector. These and other factors may lead to increased volatility and reduced liquidity in the fund’s portfolio holdings. The fund will be more susceptible to these risks than other funds because it invests in a limited number of issuers or sectors, and the fund may perform poorly as a result of adverse developments affecting those issuers or sectors. Our investment techniques, analyses, and judgments may not produce the outcome we intend. The investments we select for the fund may not perform as well as other securities that we do not select for the fund. We, or the fund’s other service providers, may experience disruptions or operating errors that could have a negative effect on the fund. You can lose money by investing in the fund.
| 12 Focused International Equity Fund |
Terms and definitions
Important terms
Total return shows how the value of the fund’s shares changed over time, assuming you held the shares through the entire period and reinvested all distributions in the fund.
Before sales charge, or net asset value, is the price, or value, of one share of a mutual fund, without a sales charge. Before-sales-charge figures fluctuate with market conditions, and are calculated by dividing the net assets of each class of shares by the number of outstanding shares in the class.
After sales charge is the price of a mutual fund share plus the maximum sales charge levied at the time of purchase. After-sales-charge performance figures shown here assume the 5.75% maximum sales charge for class A shares.
Contingent deferred sales charge (CDSC) is generally a charge applied at the time of the redemption of class B or C shares and assumes redemption at the end of the period. Your fund’s class B CDSC declines over time from a 5% maximum during the first year to 1% during the sixth year. After the sixth year, the CDSC no longer applies. The CDSC for class C shares is 1% for one year after purchase.
Share classes
Class A shares are generally subject to an initial sales charge and no CDSC (except on certain redemptions of shares bought without an initial sales charge).
Class B shares are closed to new investments and are only available by exchange from another Putnam fund or through dividend and/or capital gains reinvestment. They are not subject to an initial sales charge and may be subject to a CDSC.
Class C shares are not subject to an initial sales charge and are subject to a CDSC only if the shares are redeemed during the first year.
Class R shares are not subject to an initial sales charge or CDSC and are only available to employer-sponsored retirement plans.
Class R6 shares are not subject to an initial sales charge or CDSC and carry no 12b-1 fee. They are generally only available to employer-sponsored retirement plans, corporate and institutional clients, and clients in other approved programs.
Class Y shares are not subject to an initial sales charge or CDSC and carry no 12b-1 fee. They are generally only available to corporate and institutional clients and clients in other approved programs.
Comparative indexes
Bloomberg Barclays U.S. Aggregate Bond Index is an unmanaged index of U.S. investment-grade fixed-income securities.
ICE BofA (Intercontinental Exchange Bank of America) U.S. 3-Month Treasury Bill Index is an unmanaged index that seeks to measure the performance of U.S. Treasury bills available in the marketplace.
MSCI ACWI ex USA Index (ND) is a free float-adjusted market capitalization index that is designed to measure non-U.S.-developed and emerging-markets equity market performance. Calculated with net dividends (ND), this total return index reflects the reinvestment of dividends after the deduction of withholding taxes, using a tax rate applicable to non-resident institutional investors who do not benefit from double taxation treaties.
MSCI EAFE Index (ND) is an unmanaged index of equity securities from developed countries in Western Europe, the Far East, and Australasia. Calculated with net dividends (ND), this total return index reflects the reinvestment of dividends after the deduction of withholding taxes, using a tax rate applicable to
| Focused International Equity Fund 13 |
non-resident institutional investors who do not benefit from double taxation treaties.
MSCI Emerging Markets Index (ND) is a free float-adjusted market capitalization index that is designed to measure equity market performance in the global emerging markets. Calculated with net dividends (ND), this total return index reflects the reinvestment of dividends after the deduction of withholding taxes, using a tax rate applicable to non-resident institutional investors who do not benefit from double taxation treaties.
MSCI World Index (ND) is an unmanaged index of equity securities from developed countries. Calculated with net dividends (ND), this total return index reflects the reinvestment of dividends after the deduction of withholding taxes, using a tax rate applicable to non-resident institutional investors who do not benefit from double taxation treaties.
MSCI World Index (ND) — MSCI ACWI ex USA Index (ND) Linked Benchmark represents performance of the MSCI World Index (ND) from the inception date of the fund, July 1, 1994, through March 31, 2021, and performance of the MSCI ACWI ex USA Index (ND) since April 1, 2021. Calculated with net dividends (ND), this total return index reflects the reinvestment of dividends after the deduction of withholding taxes, using a tax rate applicable to non-resident institutional investors who do not benefit from double taxation treaties.
S&P 500 Index is an unmanaged index of common stock performance.
Indexes assume reinvestment of all distributions and do not account for fees. Securities and performance of a fund and an index will differ. You cannot invest directly in an index.
BLOOMBERG® is a trademark and service mark of Bloomberg Finance L.P. and its affiliates (collectively “Bloomberg”). BARCLAYS® is a trademark and service mark of Barclays Bank Plc (collectively with its affiliates, “Barclays”), used under license. Bloomberg or Bloomberg’s licensors, including Barclays, own all proprietary rights in the Bloomberg Barclays Indices. Neither Bloomberg nor Barclays approves or endorses this material, or guarantees the accuracy or completeness of any information herein, or makes any warranty, express or limited, as to the results to be obtained therefrom, and to the maximum extent allowed by law, neither shall have any liability or responsibility for injury or damages arising in connection therewith.
ICE Data Indices, LLC (“ICE BofA”), used with permission. ICE BofA permits use of the ICE BofA indices and related data on an “as is” basis; makes no warranties regarding same; does not guarantee the suitability, quality, accuracy, timeliness, and/or completeness of the ICE BofA indices or any data included in, related to, or derived therefrom; assumes no liability in connection with the use of the foregoing; and does not sponsor, endorse, or recommend Putnam Investments, or any of its products or services.
Lipper, a Refinitiv company, is a third-party industry-ranking entity that ranks mutual funds. Its rankings do not reflect sales charges. Lipper rankings are based on total return at net asset value relative to other funds that have similar current investment styles or objectives as determined by Lipper. Lipper may change a fund’s category assignment at its discretion. Lipper category averages reflect performance trends for funds within a category.
| 14 Focused International Equity Fund |
Other information for shareholders
Important notice regarding delivery of shareholder documents
In accordance with Securities and Exchange Commission (SEC) regulations, Putnam sends a single notice of internet availability, or a single printed copy, of annual and semiannual shareholder reports, prospectuses, and proxy statements to Putnam shareholders who share the same address, unless a shareholder requests otherwise. If you prefer to receive your own copy of these documents, please call Putnam at 1-800-225-1581, and Putnam will begin sending individual copies within 30 days.
Proxy voting
Putnam is committed to managing our mutual funds in the best interests of our shareholders. The Putnam funds’ proxy voting guidelines and procedures, as well as information regarding how your fund voted proxies relating to portfolio securities during the 12-month period ended June 30, 2020, are available in the Individual Investors section of putnam.com and on the SEC’s website, www.sec.gov. If you have questions about finding forms on the SEC’s website, you may call the SEC at 1-800-SEC-0330. You may also obtain the Putnam funds’ proxy voting guidelines and procedures at no charge by calling Putnam’s Shareholder Services at 1-800-225-1581.
Fund portfolio holdings
The fund will file a complete schedule of its portfolio holdings with the SEC for the first and third quarters of each fiscal year on Form N-PORT within 60 days of the end of such fiscal quarter. Shareholders may obtain the fund’s Form N-PORT on the SEC’s website at www.sec.gov.
Prior to its use of Form N-PORT, the fund filed its complete schedule of its portfolio holdings with the SEC on Form N-Q, which is available online at www.sec.gov.
Trustee and employee fund ownership
Putnam employees and members of the Board of Trustees place their faith, confidence, and, most importantly, investment dollars in Putnam mutual funds. As of April 30, 2021, Putnam employees had approximately $580,000,000 and the Trustees had approximately $81,000,000 invested in Putnam mutual funds. These amounts include investments by the Trustees’ and employees’ immediate family members as well as investments through retirement and deferred compensation plans.
Liquidity risk management program
Putnam, as the administrator of the fund’s liquidity risk management program (appointed by the Board of Trustees), presented the most recent annual report on the program to the Trustees in April 2021. The report covered the structure of the program, including the program documents and related policies and procedures adopted to comply with Rule 22e-4 under the Investment Company Act of 1940, and reviewed the operation of the program from January 2020 through December 2020. The report included a description of the annual liquidity assessment of the fund that Putnam performed in November 2020. The report noted that there were no material compliance exceptions identified under Rule 22e-4 during the period. The report included a review of the governance of the program and the methodology for classification of the fund’s investments. The report also included a discussion of liquidity monitoring during the period, including during the market liquidity challenges caused by the Covid-19 pandemic, and the impact those challenges had on the liquidity of the fund’s investments. Putnam concluded that the program has been operating effectively and adequately to ensure compliance with Rule 22e-4.
| Focused International Equity Fund 15 |
Trustee approval of management contract
Consideration of a new management contract
At their meeting on November 20, 2020, the Trustees of the fund, including all of the Trustees who are not “interested persons” (as this term is defined in the Investment Company Act of 1940, as amended) of The Putnam Funds (the “Independent Trustees”) approved a new management contract with Putnam Investment Management (“Putnam Management”), effective April 1, 2021. In substance, the new management contract differed from the existing management contract only in that it provided for a new performance index for use, prospectively, in calculating performance adjustments to the fund’s base management fee.
In considering whether to approve the new management contract, the Trustees took into account that they had most recently approved the annual continuation of the existing management contract in June 2020. Because, other than differences in performance index, the effective date of the contract, and the initial term of the contract, the new management contract was identical to the existing management contract, the Trustees relied to a considerable extent on their previous approval of the continuance of the existing management contract. The Trustees also noted that they would be considering the annual continuation of the existing management contract (or the proposed new management contract, if it became effective) in June 2021.
In approving the change in performance index for the fund, the Trustees considered information provided by Putnam Management, including, among other things, comparative data regarding the proposed characteristics (e.g., capitalization, risk characteristics, and country and region weightings) of the fund’s portfolio following the repositioning of the fund as Putnam Focused International Equity Fund (the “Repositioning”), the current performance index, MSCI World Index (ND), and the proposed performance index, MSCI ACWI ex USA Index (ND).
The Trustees considered Putnam Management’s view that the MSCI ACWI ex USA Index (ND), as a broad-based securities index representative of the non-U.S. equity markets, would be an appropriate index for the fund following the Repositioning, when the fund would be expected to invest mainly in developed markets and emerging markets but to have little or no exposure to the United States. The Trustees also observed Putnam Management’s view that the Repositioning would allow it to more effectively manage the fund in the best interests of the fund’s shareholders and may enhance the fund’s long-term return potential if international and emerging market equities outperform U.S. equities.
The Trustees also considered that, under the plan of performance fee calculation transition, the fund’s performance history against the current performance index would appropriately remain a factor in the calculation of performance adjustments to the fund’s base management fees for a significant period of time.
After considering the factors described above relating to the proposed performance index under the proposed new management contract, and taking into account all of the factors considered as part of the approval of the continuance of the existing management contract in June 2020, the Trustees, including the Independent Trustees, concluded that the proposed new management contract was in the best interests of the fund and its shareholders and approved the proposed new management contract.
General conclusions in connection with the Trustees’ June 2020 approvals
The Board of Trustees of The Putnam Funds oversees the management of each fund and, as required by law, determines annually whether to approve the continuance of your fund’s management contract with Putnam Management, the sub-management contract with respect to your fund between Putnam Management and its affiliate, Putnam Investments Limited (“PIL”), and the sub-advisory contract among Putnam Management, PIL, and another affiliate, The Putnam Advisory Company (“PAC”). The Board, with the assistance of its Contract Committee, requests and evaluates all information it deems reasonably necessary under the circumstances in connection with its annual contract review. The Contract Committee consists solely of Independent Trustees.
At the outset of the review process, members of the Board’s independent staff and independent legal counsel considered any possible changes to the annual contract review materials furnished to the Contract Committee during the course of the previous year’s review and, as applicable, identified those changes to Putnam Management.
| 16 Focused International Equity Fund |
Following these discussions and in consultation with the Contract Committee, the Independent Trustees’ independent legal counsel requested that Putnam Management and its affiliates furnish specified information, together with any additional information that Putnam Management considered relevant, to the Contract Committee. Over the course of several months ending in June 2020, the Contract Committee met on a number of occasions with representatives of Putnam Management, and separately in executive session, to consider the information that Putnam Management provided. Throughout this process, the Contract Committee was assisted by the members of the Board’s independent staff and by independent legal counsel for The Putnam Funds and the Independent Trustees.
In May 2020, the Contract Committee met in executive session to discuss and consider its recommendations with respect to the continuance of the contracts. At the Trustees’ June 2020 meeting, the Contract Committee met in executive session with the other Independent Trustees to review a summary of the key financial, performance and other data that the Contract Committee considered in the course of its review. The Contract Committee then presented its written report, which summarized the key factors that the Committee had considered and set forth its recommendations. The Contract Committee recommended, and the Independent Trustees approved, the continuance of your fund’s management, sub-management and sub-advisory contracts, effective July 1, 2020. (Because PIL and PAC are affiliates of Putnam Management and Putnam Management remains fully responsible for all services provided by PIL and PAC, the Trustees have not attempted to evaluate PIL or PAC as separate entities, and all subsequent references to Putnam Management below should be deemed to include reference to PIL and PAC as necessary or appropriate in the context.)
The Independent Trustees’ approval was based on the following conclusions:
• That the fee schedule in effect for your fund represented reasonable compensation in light of the nature and quality of the services being provided to the fund, the fees paid by competitive funds, the costs incurred by Putnam Management in providing services to the fund, and the application of certain reductions and waivers noted below; and
• That the fee schedule in effect for your fund represented an appropriate sharing between fund shareholders and Putnam Management of such economies of scale as may exist in the management of the fund at current asset levels.
These conclusions were based on a comprehensive consideration of all information provided to the Trustees and were not the result of any single factor. Some of the factors that figured particularly in the Trustees’ deliberations and how the Trustees considered these factors are described below, although individual Trustees may have evaluated the information presented differently, giving different weights to various factors. It is also important to recognize that the management arrangements for your fund and the other Putnam funds are the result of many years of review and discussion between the Independent Trustees and Putnam Management, that some aspects of the arrangements may receive greater scrutiny in some years than others, and that the Trustees’ conclusions may be based, in part, on their consideration of fee arrangements in previous years. For example, with certain exceptions primarily involving newly launched or repositioned funds, the current fee arrangements under the vast majority of the funds’ management contracts were first implemented at the beginning of 2010 following extensive review by the Contract Committee and discussions with representatives of Putnam Management, as well as approval by shareholders.
Management fee schedules and total expenses
The Trustees reviewed the management fee schedules in effect for all Putnam funds, including fee levels and breakpoints. The Trustees also reviewed the total expenses of each Putnam fund, recognizing that in most cases management fees represented the major, but not the sole, determinant of total costs to fund shareholders. (Two funds have implemented so-called “all-in” management fees covering substantially all routine fund operating costs.) In reviewing fees and expenses, the Trustees generally focus their attention on material changes in circumstances — for example, changes in assets under management, changes in a fund’s investment strategy, changes in Putnam Management’s operating costs or profitability, or changes in competitive practices in the mutual fund industry — that suggest that consideration of fee changes might be warranted. The Trustees concluded that the circumstances did not indicate that changes to the management fee schedule for your fund would be appropriate at this time.
| Focused International Equity Fund 17 |
Under its management contract, your fund has the benefit of breakpoints in its management fee schedule that provide shareholders with economies of scale in the form of reduced fee levels as assets under management in the Putnam family of funds increase. The Trustees concluded that the fee schedule in effect for your fund represented an appropriate sharing of economies of scale between fund shareholders and Putnam Management.
Your fund’s management contract provides that its management fees will be adjusted up or down depending upon whether your fund’s performance is better or worse than the performance of an appropriate index of securities prices specified in the management contract. In the course of reviewing investment performance, the Trustees examined the operation of your fund’s performance fees and concluded that these fees were operating effectively to align further Putnam Management’s economic interests with those of the fund’s shareholders. In addition, the Trustees previously approved, at their meeting on January 25, 2019, an amended and restated management contract in connection with the proposed mergers (which subsequently closed on June 17, 2019) of Putnam Global Utilities Fund, Putnam Global Consumer Fund, Putnam Global Financials Fund, and Putnam Global Sector Fund, other mutual funds managed by Putnam Management, with and into your fund. The amended and restated management contract provided that, effective upon the closing of the mergers, the performance adjustment calculation for your fund would take into account the net assets of the acquired funds in the proposed mergers for periods before the consummation of the mergers, except that if the use of combined assets would result in a higher management fee, only the assets of your fund would be used.
As in the past, the Trustees also focused on the competitiveness of each fund’s total expense ratio. In order to support the effort to have fund expenses meet competitive standards, the Trustees and Putnam Management and the funds’ investor servicing agent, Putnam Investor Services, Inc. (“PSERV”), have implemented expense limitations that were in effect during your fund’s fiscal year ending in 2019. These expense limitations were: (i) a contractual expense limitation applicable to specified open-end funds, including your fund, of 25 basis points on investor servicing fees and expenses and (ii) a contractual expense limitation applicable to specified open-end funds, including your fund, of 20 basis points on so-called “other expenses” (i.e., all expenses exclusive of management fees, distribution fees, investor servicing fees, investment-related expenses, interest, taxes, brokerage commissions, acquired fund fees and expenses and extraordinary expenses). These expense limitations attempt to maintain competitive expense levels for the funds. Most funds, including your fund, had sufficiently low expenses that these expense limitations were not operative during their fiscal years ending in 2019. Putnam Management and PSERV have agreed to maintain these expense limitations until at least February 28, 2022. The support of Putnam Management and PSERV for these expense limitation arrangements was an important factor in the Trustees’ decision to approve the continuance of your fund’s management, sub-management and sub-advisory contracts.
The Trustees reviewed comparative fee and expense information for a custom group of competitive funds selected by Broadridge Financial Solutions, Inc. (“Broadridge”). This comparative information included your fund’s percentile ranking for effective management fees and total expenses (excluding any applicable 12b-1 fees), which provides a general indication of your fund’s relative standing. In the custom peer group, your fund ranked in the second quintile in effective management fees (determined for your fund and the other funds in the custom peer group based on fund asset size and the applicable contractual management fee schedule) and in the first quintile in total expenses (excluding any applicable 12b-1 fees) as of December 31, 2019. The first quintile represents the least expensive funds and the fifth quintile the most expensive funds. The fee and expense data reported by Broadridge as of December 31, 2019 reflected the most recent fiscal year-end data available in Broadridge’s database at that time.
In connection with their review of fund management fees and total expenses, the Trustees also reviewed the costs of the services provided and the profits realized by Putnam Management and its affiliates from their contractual relationships with the funds. This information included trends in revenues, expenses and profitability of Putnam Management and its affiliates relating to the investment management, investor servicing and distribution services provided to the funds. In this regard, the Trustees also reviewed an analysis of the revenues, expenses and profitability of
| 18 Focused International Equity Fund |
Putnam Management and its affiliates, allocated on a fund-by-fund basis, with respect to the funds’ management, distribution, and investor servicing contracts. For each fund, the analysis presented information about revenues, expenses and profitability for each of the agreements separately and for the agreements taken together on a combined basis. The Trustees concluded that, at current asset levels, the fee schedules in place represented reasonable compensation for the services being provided and represented an appropriate sharing between fund shareholders and Putnam Management of such economies of scale as may exist in the management of the Putnam funds at that time.
The information examined by the Trustees in connection with their annual contract review for the Putnam funds included information regarding services provided and fees charged by Putnam Management and its affiliates to other clients, including defined benefit pension and profit-sharing plans, sub-advised mutual funds, private funds sponsored by affiliates of Putnam Management, and model-only separately managed accounts. This information included, in cases where a product’s investment strategy corresponds with a fund’s strategy, comparisons of those fees with fees charged to the Putnam funds, as well as an assessment of the differences in the services provided to these clients as compared to the services provided to the Putnam funds. The Trustees observed that the differences in fee rates between these clients and the Putnam funds are by no means uniform when examined by individual asset sectors, suggesting that differences in the pricing of investment management services to these types of clients may reflect, among other things, historical competitive forces operating in separate marketplaces. The Trustees considered the fact that in many cases fee rates across different asset classes are higher on average for mutual funds than for other clients, and the Trustees also considered the differences between the services that Putnam Management provides to the Putnam funds and those that it provides to its other clients. The Trustees did not rely on these comparisons to any significant extent in concluding that the management fees paid by your fund are reasonable.
Investment performance
The quality of the investment process provided by Putnam Management represented a major factor in the Trustees’ evaluation of the quality of services provided by Putnam Management under your fund’s management contract. The Trustees were assisted in their review of Putnam Management’s investment process and performance by the work of the investment oversight committees of the Trustees and the full Board of Trustees, which meet on a regular basis with individual portfolio managers and with senior management of Putnam Management’s Investment Division throughout the year. The Trustees concluded that Putnam Management generally provides a high-quality investment process — based on the experience and skills of the individuals assigned to the management of fund portfolios, the resources made available to them, and in general Putnam Management’s ability to attract and retain high-quality personnel — but also recognized that this does not guarantee favorable investment results for every fund in every time period.
The Trustees considered that, in the aggregate, 2019 was a strong year of performance for The Putnam Funds, with the Putnam funds, on an asset-weighted basis, ranking in the top quartile of their Lipper Inc. (“Lipper”) peers for the year ended December 31, 2019. For those funds that are evaluated based on their total returns versus selected investment benchmarks, the Trustees observed that the funds, on an asset-weighted-basis, delivered a gross return that was 2.3% ahead of their benchmarks in 2019. In addition to the performance of the individual Putnam funds, the Trustees considered, as they had in prior years, the performance of The Putnam Fund complex versus competitor fund complexes.
In this regard, the Trustees observed that The Putnam Funds’ relative performance, as reported in the Barron’s/Lipper Fund Families survey, was exceptionally strong over both the short and long term, with The Putnam Funds ranking as the 8th best performing mutual fund complex out of 55 complexes for the one-year period ended December 31, 2019 and the 8th best performing mutual fund complex out of 45 complexes for the ten-year period, with 2019 marking the third consecutive year that The Putnam Funds have ranked in the top ten fund complexes for the ten-year period. The Trustees also noted that The Putnam Funds ranked 26th out of 52 complexes for the five-year period ended December 31, 2019. In addition to the Barron’s/Lipper Fund Families Survey, the Trustees also considered the funds’ ratings assigned by Morningstar Inc., noting that 22 of the funds were four- or five-star rated at the end of 2019 and that this included five funds
| Focused International Equity Fund 19 |
that had achieved a five-star rating. They also noted, however, the disappointing investment performance of some funds for periods ended December 31, 2019 and considered information provided by Putnam Management regarding the factors contributing to the underperformance and actions being taken to improve the performance of these particular funds. The Trustees indicated their intention to continue to monitor closely the performance of those funds, including the effectiveness of any efforts Putnam Management has undertaken to address underperformance and whether additional actions to address areas of underperformance are warranted.
For purposes of the Trustees’ evaluation of the Putnam funds’ investment performance, the Trustees generally focus on a competitive industry ranking of each fund’s total net return over a one-year, three-year and five-year period. For a number of Putnam funds with relatively unique investment mandates for which Putnam Management informed the Trustees that meaningful competitive performance rankings are not considered to be available, the Trustees evaluated performance based on their total gross and net returns and comparisons of those returns with the returns of selected investment benchmarks. In the case of your fund, the Trustees considered that its class A share cumulative total return performance at net asset value was in the following quartiles of its Lipper peer group (Lipper Global Multi-Cap Growth Funds) for the one-year, three-year and five-year periods ended December 31, 2019 (the first quartile representing the best-performing funds and the fourth quartile the worst-performing funds):
| One-year period | 4th |
| Three-year period | 3rd |
| Five-year period | 4th |
Over the one-year, three-year and five-year periods ended December 31, 2019, there were 202, 157 and 132 funds, respectively, in your fund’s Lipper peer group. (When considering performance information, shareholders should be mindful that past performance is not a guarantee of future results.) The Trustees expressed concern about your fund’s fourth quartile performance over the one-year and five-year periods ended December 31, 2019. The Trustees considered Putnam Management’s continued efforts to support fund performance through changes in the portfolio management team in 2019 and through initiatives including structuring compensation for portfolio managers and research analysts to enhance accountability for fund performance, emphasizing accountability in the portfolio management process, and affirming its commitment to a fundamental-driven approach to investing. The Trustees noted further that Putnam Management had made selective hires and internal promotions in 2019 to strengthen its investment team.
As a general matter, the Trustees believe that cooperative efforts between the Trustees and Putnam Management represent the most effective way to address investment performance concerns that may arise from time to time. The Trustees noted that investors in the Putnam funds have, in effect, placed their trust in the Putnam organization, under the oversight of the funds’ Trustees, to make appropriate decisions regarding the management of the funds. Based on Putnam Management’s willingness to take appropriate measures to address fund performance issues and Putnam Management’s responsiveness to Trustee concerns about investment performance, the Trustees concluded that it continued to be advisable to seek change within Putnam Management to address performance shortcomings. In the Trustees’ view, the alternative of engaging a new investment adviser for an underperforming fund, with all the attendant risks and disruptions, would not likely provide any greater assurance of improved investment performance.
Brokerage and soft-dollar allocations; investor servicing
The Trustees considered various potential benefits that Putnam Management may receive in connection with the services it provides under the management contract with your fund. These include benefits related to brokerage allocation and the use of soft dollars, whereby a portion of the commissions paid by a fund for brokerage may be used to acquire research services that are expected to be useful to Putnam Management in managing the assets of the fund and of other clients. Subject to policies established by the Trustees, soft dollars generated by these means are used predominantly to acquire brokerage and research services (including third-party research and market data) that enhance Putnam Management’s investment capabilities and supplement Putnam Management’s internal research efforts. The Trustees noted that, in 2019, they had approved the elimination of a fund expense recapture program, whereby a portion
| 20 Focused International Equity Fund |
of available soft dollars were used to pay fund expenses, and that the amount of commissions allocated to that program were instead used to increase, by a corresponding amount, the budget allocated for execution services. The Trustees indicated their continued intent to monitor regulatory and industry developments in this area with the assistance of their Brokerage Committee. In addition, with the assistance of their Brokerage Committee, the Trustees indicated their continued intent to monitor the allocation of the Putnam funds’ brokerage in order to ensure that the principle of seeking best price and execution remains paramount in the portfolio trading process.
Putnam Management may also receive benefits from payments that the funds make to Putnam Management’s affiliates for investor or distribution services. In conjunction with the annual review of your fund’s management, sub-management and sub-advisory contracts, the Trustees reviewed your fund’s investor servicing agreement with PSERV and its distributor’s contracts and distribution plans with Putnam Retail Management Limited Partnership (“PRM”), both of which are affiliates of Putnam Management. The Trustees concluded that the fees payable by the funds to PSERV and PRM, as applicable, for such services are fair and reasonable in relation to the nature and quality of such services, the fees paid by competitive funds, and the costs incurred by PSERV and PRM, as applicable, in providing such services. Furthermore, the Trustees were of the view that the services provided were required for the operation of the funds, and that they were of a quality at least equal to those provided by other providers.
| Focused International Equity Fund 21 |
Financial statements
These sections of the report, as well as the accompanying Notes, constitute the fund’s financial statements.
The fund’s portfolio lists all the fund’s investments and their values as of the last day of the reporting period. Holdings are organized by asset type and industry sector, country, or state to show areas of concentration and diversification.
Statement of assets and liabilities shows how the fund’s net assets and share price are determined. All investment and non-investment assets are added together. Any unpaid expenses and other liabilities are subtracted from this total. The result is divided by the number of shares to determine the net asset value per share, which is calculated separately for each class of shares. (For funds with preferred shares, the amount subtracted from total assets includes the liquidation preference of preferred shares.)
Statement of operations shows the fund’s net investment gain or loss. This is done by first adding up all the fund’s earnings — from dividends and interest income — and subtracting its operating expenses to determine net investment income (or loss). Then, any net gain or loss the fund realized on the sales of its holdings — as well as any unrealized gains or losses over the period — is added to or subtracted from the net investment result to determine the fund’s net gain or loss for the fiscal period.
Statement of changes in net assets shows how the fund’s net assets were affected by the fund’s net investment gain or loss, by distributions to shareholders, and by changes in the number of the fund’s shares. It lists distributions and their sources (net investment income or realized capital gains) over the current reporting period and the most recent fiscal year-end. The distributions listed here may not match the sources listed in the Statement of operations because the distributions are determined on a tax basis and may be paid in a different period from the one in which they were earned. Dividend sources are estimated at the time of declaration. Actual results may vary. Any non-taxable return of capital cannot be determined until final tax calculations are completed after the end of the fund’s fiscal year.
Financial highlights provide an overview of the fund’s investment results, per-share distributions, expense ratios, net investment income ratios, and portfolio turnover in one summary table, reflecting the five most recent reporting periods. In a semiannual report, the highlights table also includes the current reporting period.
| 22 Focused International Equity Fund |
The fund’s portfolio 4/30/21 (Unaudited)
| COMMON STOCKS (99.2%)* | Shares | Value |
| Aerospace and defense (3.0%) | ||
| Thales SA (France) | 305,193 | $31,107,323 |
| 31,107,323 | ||
| Airlines (3.0%) | ||
| Ryanair Holdings PLC ADR (Ireland) † | 273,126 | 31,914,773 |
| 31,914,773 | ||
| Automobiles (1.9%) | ||
| Bayerische Motoren Werke (BMW) AG (Germany) | 204,137 | 20,468,331 |
| 20,468,331 | ||
| Banks (5.3%) | ||
| Hana Financial Group, Inc. (South Korea) | 678,959 | 27,863,962 |
| HDFC Bank, Ltd. (India) † | 1,495,027 | 28,504,865 |
| 56,368,827 | ||
| Capital markets (5.6%) | ||
| BGP Holdings PLC (Malta) | 82,319 | — |
| CI Financial Corp. (Canada) | 2,042,208 | 32,830,843 |
| London Stock Exchange Group PLC (United Kingdom) | 257,287 | 26,294,130 |
| 59,124,973 | ||
| Construction and engineering (1.4%) | ||
| Kyudenko Corp. (Japan) | 410,500 | 14,273,035 |
| 14,273,035 | ||
| Diversified telecommunication services (4.0%) | ||
| Liberty Global PLC Class C (United Kingdom) † | 1,572,210 | 42,544,003 |
| 42,544,003 | ||
| Entertainment (2.6%) | ||
| CTS Eventim AG & Co. KGaA (Germany) † | 398,195 | 27,517,389 |
| 27,517,389 | ||
| Food and staples retail (1.7%) | ||
| Jeronimo Martins SGPS SA (Portugal) | 966,884 | 17,657,402 |
| 17,657,402 | ||
| Health-care equipment and supplies (2.9%) | ||
| Koninklijke Philips NV (Netherlands) | 541,364 | 30,512,067 |
| 30,512,067 | ||
| Household durables (5.7%) | ||
| Berkeley Group Holdings PLC (The) (United Kingdom) | 501,182 | 32,026,112 |
| HC Brillant Services GmbH (acquired 8/2/13, cost $17) (Private) | ||
| (Germany) † ∆∆ F | 26 | 23 |
| Sony Group Corp. (Japan) | 281,500 | 28,075,304 |
| 60,101,439 | ||
| Interactive media and services (7.1%) | ||
| Alphabet, Inc. Class C † | 15,865 | 38,236,554 |
| Kakao Corp. (South Korea) | 354,297 | 36,151,130 |
| 74,387,684 | ||
| Internet and direct marketing retail (13.5%) | ||
| Alibaba Group Holding, Ltd. (China) † | 2,031,600 | 58,847,157 |
| JD.com, Inc. Class A (China) † | 612,950 | 23,578,187 |
| Naspers, Ltd. Class N (South Africa) | 175,760 | 40,119,818 |
| Prosus NV (China) | 184,820 | 20,049,086 |
| 142,594,248 |
| Focused International Equity Fund 23 |
| COMMON STOCKS (99.2%)* cont. | Shares | Value |
| IT Services (3.0%) | ||
| Capgemini SE (France) | 173,801 | $31,844,314 |
| 31,844,314 | ||
| Life sciences tools and services (2.8%) | ||
| ICON PLC (Ireland) † S | 137,009 | 29,724,103 |
| 29,724,103 | ||
| Machinery (2.8%) | ||
| MinebeaMitsumi, Inc. (Japan) | 1,179,500 | 29,581,933 |
| 29,581,933 | ||
| Media (3.4%) | ||
| Cogeco Communications, Inc. (Canada) | 374,312 | 35,553,778 |
| 35,553,778 | ||
| Personal products (3.5%) | ||
| Unilever PLC (United Kingdom) | 635,733 | 37,151,671 |
| 37,151,671 | ||
| Pharmaceuticals (3.6%) | ||
| AstraZeneca PLC (United Kingdom) | 354,293 | 37,749,200 |
| 37,749,200 | ||
| Professional services (3.0%) | ||
| Thomson Reuters Corp. (Canada) | 341,151 | 31,637,963 |
| 31,637,963 | ||
| Semiconductors and semiconductor equipment (7.4%) | ||
| Sino-American Silicon Products, Inc. (Taiwan) | 3,523,000 | 24,657,090 |
| Taiwan Semiconductor Manufacturing Co., Ltd. (Taiwan) | 2,474,000 | 53,141,446 |
| 77,798,536 | ||
| Software (3.2%) | ||
| Constellation Software, Inc. (Canada) | 22,643 | 33,231,410 |
| 33,231,410 | ||
| Technology hardware, storage, and peripherals (3.0%) | ||
| Samsung Electronics Co., Ltd. (South Korea) | 426,361 | 31,238,748 |
| 31,238,748 | ||
| Trading companies and distributors (2.8%) | ||
| ITOCHU Corp. (Japan) | 954,400 | 29,761,142 |
| 29,761,142 | ||
| Wireless telecommunication services (3.0%) | ||
| SK Telecom Co., Ltd. (South Korea) | 114,364 | 31,203,734 |
| 31,203,734 | ||
| Total common stocks (cost $991,999,228) | $1,045,048,026 | |
| Principal | ||
| U.S. TREASURY OBLIGATIONS (—%)* | amount | Value |
| U.S. Treasury Notes | ||
| 2.00%, 2/15/25 i | $154,000 | $163,035 |
| 2.00%, 4/30/24 i | 145,000 | 152,173 |
| Total U.S. treasury obligations (cost $315,208) | $315,208 | |
| 24 Focused International Equity Fund |
| Principal amount/ | |||
| SHORT-TERM INVESTMENTS (1.1%)* | shares | Value | |
| Putnam Cash Collateral Pool, LLC 0.10% d | Shares | 617,400 | $617,400 |
| Putnam Short Term Investment Fund Class P 0.10% L | Shares | 6,780,044 | 6,780,044 |
| State Street Institutional U.S. Government Money Market Fund, | |||
| Premier Class 0.03% P | Shares | 800,000 | 800,000 |
| U.S. Treasury Bills 0.347%, 5/25/21 ∆ | $97,000 | 97,000 | |
| U.S. Treasury Bills 0.084%, 5/6/21 ∆ | 509,000 | 509,000 | |
| U.S. Treasury Bills 0.077%, 5/13/21 ∆ | 300,000 | 300,000 | |
| U.S. Treasury Bills 0.054%, 6/3/21 ∆ | 517,000 | 516,998 | |
| U.S. Treasury Bills 0.046%, 6/10/21 # ∆ | 700,000 | 699,992 | |
| U.S. Treasury Bills 0.037%, 6/29/21 ∆ | 400,000 | 399,991 | |
| U.S. Treasury Bills 0.037%, 6/1/21 ∆ | 600,000 | 599,995 | |
| U.S. Treasury Cash Management Bills 0.011%, 7/6/21 ∆ | 600,000 | 599,991 | |
| Total short-term investments (cost $11,920,313) | $11,920,411 | ||
| TOTAL INVESTMENTS | |||
| Total investments (cost $1,004,234,749) | $1,057,283,645 | ||
Key to holding’s abbreviations
| ADR | American Depository Receipts: represents ownership of foreign securities on deposit with a custodian bank |
Notes to the fund’s portfolio
Unless noted otherwise, the notes to the fund’s portfolio are for the close of the fund’s reporting period, which ran from November 1, 2020 through April 30, 2021 (the reporting period). Within the following notes to the portfolio, references to “Putnam Management” represent Putnam Investment Management, LLC, the fund’s manager, an indirect wholly-owned subsidiary of Putnam Investments, LLC and references to “ASC 820” represent Accounting Standards Codification 820 Fair Value Measurements and Disclosures.
* Percentages indicated are based on net assets of $1,053,840,298.
† This security is non-income-producing.
∆∆ This security is restricted with regard to public resale. The total fair value of this security and any other restricted securities (excluding 144A securities), if any, held at the close of the reporting period was $23, or less than 0.1% of net assets.
# This security, in part or in entirety, was pledged and segregated with the broker to cover margin requirements for futures contracts at the close of the reporting period. Collateral at period end totaled $355,000 and is included in Investments in securities on the Statement of assets and liabilities (Notes 1 and 8).
∆ This security, in part or in entirety, was pledged and segregated with the custodian for collateral on certain derivative contracts at the close of the reporting period. Collateral at period end totaled $1,998,000 and is included in Investments in securities on the Statement of assets and liabilities (Notes 1 and 8).
d Affiliated company. See Notes 1 and 5 to the financial statements regarding securities lending. The rate quoted in the security description is the annualized 7-day yield of the fund at the close of the reporting period.
F This security is valued by Putnam Management at fair value following procedures approved by the Trustees. Securities are classified as Level 3 for ASC 820 based on the securities’ valuation inputs (Note 1).
i This security was pledged, or purchased with cash that was pledged, to the fund for collateral on certain derivative contracts (Note 1).
L Affiliated company (Note 5). The rate quoted in the security description is the annualized 7-day yield of the fund at the close of the reporting period.
P This security was pledged, or purchased with cash that was pledged, to the fund for collateral on certain derivative contracts. The rate quoted in the security description is the annualized 7-day yield of the fund at the close of the reporting period.
| Focused International Equity Fund 25 |
S Security on loan, in part or in entirety, at the close of the reporting period (Note 1).
At the close of the reporting period, the fund maintained liquid assets totaling $2,104,017 to cover certain derivative contracts.
Unless otherwise noted, the rates quoted in Short-term investments security descriptions represent the weighted average yield to maturity.
The dates shown on debt obligations are the original maturity dates.
| DIVERSIFICATION BY COUNTRY ⌂ |
Distribution of investments by country of risk at the close of the reporting period, excluding collateral received, if any (as a percentage of Portfolio Value):
| United Kingdom | 16.7% | United States | 4.6% | |
| Canada | 12.6 | Germany | 4.5 | |
| South Korea | 12.0 | South Africa | 3.8 | |
| China | 9.7 | Netherlands | 2.9 | |
| Japan | 9.6 | India | 2.7 | |
| Taiwan | 7.4 | Portugal | 1.7 | |
| France | 6.0 | Other | <0.1 | |
| Ireland | 5.8 | Total | 100.0% |
⌂Methodology differs from that used for purposes of complying with the fund’s policy regarding investments in securities of foreign issuers, as discussed further in the fund’s prospectus.
| FORWARD CURRENCY CONTRACTS at 4/30/21 (aggregate face value $621,525,514) (Unaudited) | ||||||
| Unrealized | ||||||
| Contract | Delivery | Aggregate | appreciation/ | |||
| Counterparty | Currency | type* | date | Value | face value | (depreciation) |
| Bank of America N.A. | ||||||
| British Pound | Buy | 6/16/21 | $15,565,173 | $15,523,122 | $42,051 | |
| British Pound | Sell | 6/16/21 | 15,565,173 | 15,758,679 | 193,506 | |
| Euro | Buy | 6/16/21 | 3,139,988 | 3,097,595 | 42,393 | |
| Euro | Sell | 6/16/21 | 3,139,988 | 3,082,655 | (57,333) | |
| Japanese Yen | Buy | 5/19/21 | 2,428,430 | 2,510,843 | (82,413) | |
| Japanese Yen | Sell | 5/19/21 | 2,428,430 | 2,438,085 | 9,655 | |
| Barclays Bank PLC | ||||||
| British Pound | Buy | 6/16/21 | 3,339,301 | 3,328,982 | 10,319 | |
| British Pound | Sell | 6/16/21 | 3,339,301 | 3,330,101 | (9,200) | |
| Euro | Buy | 6/16/21 | 7,923,188 | 7,762,173 | 161,015 | |
| Euro | Sell | 6/16/21 | 7,923,188 | 7,834,543 | (88,645) | |
| Hong Kong Dollar | Buy | 5/20/21 | 8,110,843 | 8,128,827 | (17,984) | |
| Hong Kong Dollar | Sell | 5/20/21 | 8,110,843 | 8,105,886 | (4,957) | |
| Japanese Yen | Buy | 5/19/21 | 613,560 | 611,146 | 2,414 | |
| Japanese Yen | Sell | 5/19/21 | 613,560 | 634,544 | 20,984 | |
| Swedish Krona | Buy | 6/16/21 | 2,271,741 | 2,258,406 | 13,335 | |
| Swedish Krona | Sell | 6/16/21 | 2,271,741 | 2,209,497 | (62,244) | |
| Citibank, N.A. | ||||||
| British Pound | Buy | 6/16/21 | 3,484,187 | 3,515,707 | (31,520) | |
| British Pound | Sell | 6/16/21 | 3,484,187 | 3,528,962 | 44,775 | |
| Chinese Yuan (Offshore) | Buy | 5/20/21 | 48,960 | 48,747 | 213 | |
| Chinese Yuan (Offshore) | Sell | 5/20/21 | 48,960 | 48,028 | (932) | |
| Danish Krone | Buy | 6/16/21 | 16,262,954 | 15,922,249 | 340,705 | |
| 26 Focused International Equity Fund |
| FORWARD CURRENCY CONTRACTS at 4/30/21 (aggregate face value $621,525,514) (Unaudited) cont. | ||||||
| Unrealized | ||||||
| Contract | Delivery | Aggregate | appreciation/ | |||
| Counterparty | Currency | type* | date | Value | face value | (depreciation) |
| Citibank, N.A. cont. | ||||||
| Danish Krone | Sell | 6/16/21 | $16,262,954 | $16,264,803 | $1,849 | |
| Euro | Buy | 6/16/21 | 2,553,864 | 2,502,890 | 50,974 | |
| Euro | Sell | 6/16/21 | 2,553,864 | 2,525,054 | (28,810) | |
| Japanese Yen | Buy | 5/19/21 | 4,094,075 | 4,078,039 | 16,036 | |
| Japanese Yen | Sell | 5/19/21 | 4,094,075 | 4,266,465 | 172,390 | |
| Goldman Sachs International | ||||||
| British Pound | Buy | 6/16/21 | 13,590,073 | 13,553,203 | 36,870 | |
| British Pound | Sell | 6/16/21 | 13,590,073 | 13,754,704 | 164,631 | |
| Euro | Buy | 6/16/21 | 263,521 | 260,673 | 2,848 | |
| Euro | Sell | 6/16/21 | 263,521 | 258,045 | (5,476) | |
| Japanese Yen | Buy | 5/19/21 | 151,815 | 158,183 | (6,368) | |
| Japanese Yen | Sell | 5/19/21 | 151,815 | 151,216 | (599) | |
| HSBC Bank USA, National Association | ||||||
| British Pound | Buy | 6/16/21 | 10,945,924 | 10,916,196 | 29,728 | |
| British Pound | Sell | 6/16/21 | 10,945,924 | 11,077,914 | 131,990 | |
| Chinese Yuan (Offshore) | Buy | 5/20/21 | 13,469,994 | 13,214,603 | 255,391 | |
| Chinese Yuan (Offshore) | Sell | 5/20/21 | 13,469,994 | 13,412,295 | (57,699) | |
| Euro | Buy | 6/16/21 | 21,711,456 | 21,478,322 | 233,134 | |
| Euro | Sell | 6/16/21 | 21,711,456 | 21,260,213 | (451,243) | |
| Hong Kong Dollar | Buy | 5/20/21 | 6,160,517 | 6,157,333 | 3,184 | |
| Hong Kong Dollar | Sell | 5/20/21 | 6,160,517 | 6,172,541 | 12,024 | |
| Japanese Yen | Buy | 5/19/21 | 4,450,820 | 4,498,486 | (47,666) | |
| Japanese Yen | Sell | 5/19/21 | 4,450,820 | 4,440,230 | (10,590) | |
| JPMorgan Chase Bank N.A. | ||||||
| Euro | Buy | 6/16/21 | 10,219,548 | 10,007,463 | 212,085 | |
| Euro | Sell | 6/16/21 | 10,219,548 | 10,109,175 | (110,373) | |
| Japanese Yen | Buy | 5/19/21 | 11,744,892 | 12,237,115 | (492,223) | |
| Japanese Yen | Sell | 5/19/21 | 11,744,892 | 11,698,388 | (46,504) | |
| Norwegian Krone | Buy | 6/16/21 | 1,946,575 | 1,902,108 | 44,467 | |
| Norwegian Krone | Sell | 6/16/21 | 1,946,575 | 1,892,685 | (53,890) | |
| Singapore Dollar | Buy | 5/19/21 | 3,945,152 | 3,937,926 | 7,226 | |
| Singapore Dollar | Sell | 5/19/21 | 3,945,152 | 3,890,659 | (54,493) | |
| Swedish Krona | Buy | 6/16/21 | 7,050,257 | 7,008,981 | 41,276 | |
| Swedish Krona | Sell | 6/16/21 | 7,050,257 | 6,857,311 | (192,946) | |
| Swiss Franc | Buy | 6/16/21 | 5,496,372 | 5,363,756 | 132,616 | |
| Swiss Franc | Sell | 6/16/21 | 5,496,372 | 5,466,377 | (29,995) | |
| Morgan Stanley & Co. International PLC | ||||||
| British Pound | Buy | 6/16/21 | 3,533,220 | 3,523,614 | 9,606 | |
| British Pound | Sell | 6/16/21 | 3,533,220 | 3,575,505 | 42,285 | |
| Euro | Buy | 6/16/21 | 6,192,375 | 6,066,476 | 125,899 | |
| Euro | Sell | 6/16/21 | 6,192,375 | 6,125,586 | (66,789) | |
| Japanese Yen | Buy | 5/19/21 | 4,916,122 | 5,111,118 | (194,996) | |
| Japanese Yen | Sell | 5/19/21 | 4,916,122 | 4,903,711 | (12,411) | |
| Focused International Equity Fund 27 |
| FORWARD CURRENCY CONTRACTS at 4/30/21 (aggregate face value $621,525,514) (Unaudited) cont. | ||||||
| Unrealized | ||||||
| Contract | Delivery | Aggregate | appreciation/ | |||
| Counterparty | Currency | type* | date | Value | face value | (depreciation) |
| NatWest Markets PLC | ||||||
| British Pound | Buy | 6/16/21 | $5,149,764 | $5,135,677 | $14,087 | |
| British Pound | Sell | 6/16/21 | 5,149,764 | 5,217,435 | 67,671 | |
| Euro | Buy | 6/16/21 | 11,005,057 | 10,884,325 | 120,732 | |
| Euro | Sell | 6/16/21 | 11,005,057 | 10,776,222 | (228,835) | |
| Hong Kong Dollar | Buy | 5/20/21 | 42,305 | 42,398 | (93) | |
| Hong Kong Dollar | Sell | 5/20/21 | 42,305 | 42,281 | (24) | |
| Japanese Yen | Buy | 5/19/21 | 840,180 | 836,864 | 3,316 | |
| Japanese Yen | Sell | 5/19/21 | 840,180 | 875,421 | 35,241 | |
| State Street Bank and Trust Co. | ||||||
| British Pound | Buy | 6/16/21 | 18,648,954 | 18,663,692 | (14,738) | |
| British Pound | Sell | 6/16/21 | 18,648,954 | 18,533,760 | (115,194) | |
| Chinese Yuan (Offshore) | Buy | 5/20/21 | 7,719,787 | 7,685,851 | 33,936 | |
| Chinese Yuan (Offshore) | Sell | 5/20/21 | 7,719,787 | 7,572,876 | (146,911) | |
| Euro | Buy | 6/16/21 | 2,755,897 | 2,714,428 | 41,469 | |
| Euro | Sell | 6/16/21 | 2,755,897 | 2,710,441 | (45,456) | |
| Japanese Yen | Buy | 5/19/21 | 12,564,833 | 13,091,518 | (526,685) | |
| Japanese Yen | Sell | 5/19/21 | 12,564,833 | 12,682,260 | 117,427 | |
| Swedish Krona | Buy | 6/16/21 | 126,976 | 126,231 | 745 | |
| Swedish Krona | Sell | 6/16/21 | 126,976 | 123,498 | (3,478) | |
| Toronto-Dominion Bank | ||||||
| Chinese Yuan (Offshore) | Buy | 5/20/21 | 3,062,905 | 3,005,099 | 57,806 | |
| Chinese Yuan (Offshore) | Sell | 5/20/21 | 3,062,905 | 3,049,676 | (13,229) | |
| UBS AG | ||||||
| British Pound | Buy | 6/16/21 | 1,290,859 | 1,302,881 | (12,022) | |
| British Pound | Sell | 6/16/21 | 1,290,859 | 1,290,975 | 116 | |
| Euro | Buy | 6/16/21 | 21,525,789 | 21,286,598 | 239,191 | |
| Euro | Sell | 6/16/21 | 21,525,789 | 21,078,244 | (447,545) | |
| Japanese Yen | Buy | 5/19/21 | 11,911,528 | 12,277,241 | (365,713) | |
| Japanese Yen | Sell | 5/19/21 | 11,911,528 | 11,864,255 | (47,273) | |
| Swiss Franc | Buy | 6/16/21 | 81,888 | 81,609 | 279 | |
| Swiss Franc | Sell | 6/16/21 | 81,888 | 79,736 | (2,152) | |
| WestPac Banking Corp. | ||||||
| British Pound | Buy | 6/16/21 | 7,215,885 | 7,196,386 | 19,499 | |
| British Pound | Sell | 6/16/21 | 7,215,885 | 7,311,307 | 95,422 | |
| Euro | Buy | 6/16/21 | 7,036,604 | 7,038,328 | (1,724) | |
| Euro | Sell | 6/16/21 | 7,036,604 | 6,890,293 | (146,311) | |
| Japanese Yen | Buy | 5/19/21 | 5,054,025 | 5,265,711 | (211,686) | |
| Japanese Yen | Sell | 5/19/21 | 5,054,025 | 5,033,858 | (20,167) | |
| Unrealized appreciation | 3,454,811 | |||||
| Unrealized (depreciation) | (4,567,535) | |||||
| Total | $(1,112,724) | |||||
* The exchange currency for all contracts listed is the United States Dollar.
| 28 Focused International Equity Fund |
| FUTURES CONTRACTS OUTSTANDING at 4/30/21 (Unaudited) | |||||
| Unrealized | |||||
| Number of | Notional | Expiration | appreciation/ | ||
| contracts | amount | Value | date | (depreciation) | |
| MSCI EAFE Index (Long) | 35 | $3,969,896 | $3,950,275 | Jun-21 | $(29,206) |
| Unrealized appreciation | — | ||||
| Unrealized (depreciation) | (29,206) | ||||
| Total | $(29,206) | ||||
ASC 820 establishes a three-level hierarchy for disclosure of fair value measurements. The valuation hierarchy is based upon the transparency of inputs to the valuation of the fund’s investments. The three levels are defined as follows:
Level 1: Valuations based on quoted prices for identical securities in active markets.
Level 2: Valuations based on quoted prices in markets that are not active or for which all significant inputs are observable, either directly or indirectly.
Level 3: Valuations based on inputs that are unobservable and significant to the fair value measurement.
The following is a summary of the inputs used to value the fund’s net assets as of the close of the reporting period:
| Valuation inputs | |||||
| Investments in securities: | Level 1 | Level 2 | Level 3 | ||
| Common stocks*: | |||||
| Communication services | $211,206,588 | $— | $— | ||
| Consumer discretionary | 223,163,995 | — | 23 | ||
| Consumer staples | 54,809,073 | — | — | ||
| Financials | 115,493,800 | — | — | ||
| Health care | 97,985,370 | — | — | ||
| Industrials | 168,276,169 | — | — | ||
| Information technology | 174,113,008 | — | — | ||
| Total common stocks | 1,045,048,003 | — | 23 | ||
| U.S. treasury obligations | — | 315,208 | — | ||
| Short-term investments | 800,000 | 11,120,411 | — | ||
| Totals by level | $1,045,848,003 | $11,435,619 | $23 | ||
| Valuation inputs | |||||
| Other financial instruments: | Level 1 | Level 2 | Level 3 | ||
| Forward currency contracts | $— | $(1,112,724) | $— | ||
| Futures contracts | (29,206) | — | — | ||
| Totals by level | $(29,206) | $(1,112,724) | $— | ||
* Common stock classifications are presented at the sector level, which may differ from the fund’s portfolio presentation.
At the start and close of the reporting period, Level 3 investments in securities represented less than 1% of the fund’s net assets and were not considered a significant portion of the fund’s portfolio.
The accompanying notes are an integral part of these financial statements.
| Focused International Equity Fund 29 |
Statement of assets and liabilities 4/30/21 (Unaudited)
| ASSETS | |
| Investment in securities, at value, including $607,460 of securities on loan (Notes 1 and 8): | |
| Unaffiliated issuers (identified cost $996,837,305) | $1,049,886,201 |
| Affiliated issuers (identified cost $7,397,444) (Notes 1 and 5) | 7,397,444 |
| Foreign currency (cost $5,425) (Note 1) | 5,435 |
| Dividends, interest and other receivables | 1,103,180 |
| Foreign tax reclaim | 435,187 |
| Receivable for shares of the fund sold | 211,894 |
| Unrealized appreciation on forward currency contracts (Note 1) | 3,454,811 |
| Prepaid assets | 56,787 |
| Total assets | 1,062,550,939 |
| LIABILITIES | |
| Payable to custodian | 90 |
| Payable for shares of the fund repurchased | 573,329 |
| Payable for compensation of Manager (Note 2) | 443,560 |
| Payable for custodian fees (Note 2) | 24,048 |
| Payable for investor servicing fees (Note 2) | 281,954 |
| Payable for Trustee compensation and expenses (Note 2) | 634,728 |
| Payable for administrative services (Note 2) | 2,924 |
| Payable for distribution fees (Note 2) | 218,028 |
| Payable for variation margin on futures contracts (Note 1) | 52,639 |
| Unrealized depreciation on forward currency contracts (Note 1) | 4,567,535 |
| Collateral on securities loaned, at value (Note 1) | 617,400 |
| Collateral on certain derivative contracts, at value (Notes 1 and 8) | 1,115,208 |
| Other accrued expenses | 179,198 |
| Total liabilities | 8,710,641 |
| Net assets | $1,053,840,298 |
| REPRESENTED BY | |
| Paid-in capital (Unlimited shares authorized) (Notes 1 and 4) | $757,630,753 |
| Total distributable earnings (Note 1) | 296,209,545 |
| Total — Representing net assets applicable to capital shares outstanding | $1,053,840,298 |
(Continued on next page)
| 30 Focused International Equity Fund |
Statement of assets and liabilities cont.
| COMPUTATION OF NET ASSET VALUE AND OFFERING PRICE | |
| Net asset value and redemption price per class A share | |
| ($952,872,306 divided by 45,907,041 shares) | $20.76 |
| Offering price per class A share (100/94.25 of $20.76)* | $22.03 |
| Net asset value and offering price per class B share ($8,585,817 divided by 471,749 shares)** | $18.20 |
| Net asset value and offering price per class C share ($18,558,648 divided by 968,952 shares)** | $19.15 |
| Net asset value, offering price and redemption price per class R share | |
| ($708,461 divided by 34,438 shares) | $20.57 |
| Net asset value, offering price and redemption price per class R6 share | |
| ($19,394,475 divided by 896,991 shares) | $21.62 |
| Net asset value, offering price and redemption price per class Y share | |
| ($53,720,591 divided by 2,495,828 shares) | $21.52 |
*On single retail sales of less than $50,000. On sales of $50,000 or more the offering price is reduced.
**Redemption price per share is equal to net asset value less any applicable contingent deferred sales charge.
The accompanying notes are an integral part of these financial statements.
| Focused International Equity Fund 31 |
Statement of operations Six months ended 4/30/21 (Unaudited)
| INVESTMENT INCOME | |
| Dividends (net of foreign tax of $222,439) | $5,464,965 |
| Interest (including interest income of $8,550 from investments in affiliated issuers) (Note 5) | 8,550 |
| Securities lending (net of expenses) (Notes 1 and 5) | 1,549 |
| Total investment income | 5,475,064 |
| EXPENSES | |
| Compensation of Manager (Note 2) | 2,872,738 |
| Investor servicing fees (Note 2) | 837,399 |
| Custodian fees (Note 2) | 15,998 |
| Trustee compensation and expenses (Note 2) | 23,375 |
| Distribution fees (Note 2) | 1,271,067 |
| Administrative services (Note 2) | 16,869 |
| Other | 565,416 |
| Total expenses | 5,602,862 |
| Expense reduction (Note 2) | (410) |
| Net expenses | 5,602,452 |
| Net investment loss | (127,388) |
| REALIZED AND UNREALIZED GAIN (LOSS) | |
| Net realized gain (loss) on: | |
| Securities from unaffiliated issuers (Notes 1 and 3) | 283,940,777 |
| Foreign currency transactions (Note 1) | (612,307) |
| Forward currency contracts (Note 1) | (3,794,788) |
| Futures contracts (Note 1) | (1,994,878) |
| Total net realized gain | 277,538,804 |
| Change in net unrealized appreciation (depreciation) on: | |
| Securities from unaffiliated issuers | (63,113,615) |
| Assets and liabilities in foreign currencies | 3,155 |
| Forward currency contracts | (224,873) |
| Futures contracts | (29,206) |
| Total change in net unrealized depreciation | (63,364,539) |
| Net gain on investments | 214,174,265 |
| Net increase in net assets resulting from operations | $214,046,877 |
The accompanying notes are an integral part of these financial statements.
| 32 Focused International Equity Fund |
Statement of changes in net assets
| INCREASE (DECREASE) IN NET ASSETS | Six months ended 4/30/21* | Year ended 10/31/20 |
| Operations | ||
| Net investment income (loss) | $(127,388) | $3,514,461 |
| Net realized gain on investments | ||
| and foreign currency transactions | 277,538,804 | 2,841,301 |
| Change in net unrealized appreciation (depreciation) | ||
| of investments and assets and liabilities | ||
| in foreign currencies | (63,364,539) | 4,213,613 |
| Net increase in net assets resulting from operations | 214,046,877 | 10,569,375 |
| Distributions to shareholders (Note 1): | ||
| From ordinary income | ||
| Net investment income | ||
| Class A | (4,752,593) | (420,954) |
| Class R6 | (186,849) | (80,244) |
| Class Y | (354,792) | (123,109) |
| Decrease from capital share transactions (Note 4) | (44,310,920) | (108,156,694) |
| Total increase (decrease) in net assets | 164,441,723 | (98,211,626) |
| NET ASSETS | ||
| Beginning of period | 889,398,575 | 987,610,201 |
| End of period | $1,053,840,298 | $889,398,575 |
*Unaudited.
The accompanying notes are an integral part of these financial statements.
| Focused International Equity Fund 33 |
Financial highlights (For a common share outstanding throughout the period)
| INVESTMENT OPERATIONS | LESS DISTRIBUTIONS | RATIOS AND SUPPLEMENTAL DATA | ||||||||||||
| Ratio of | Ratio of net | |||||||||||||
| Net asset | Net realized | expenses | investment | |||||||||||
| value, | and unrealized | Total from | From | From | Non-recurring | Net asset | Total return | Net assets, | to average | income (loss) | Portfolio | |||
| beginning | Net investment | gain (loss) on | investment | net investment | return of | Total | reimburse- | value, end | at net asset | end of period | net assets | to average | turnover | |
| Period ended | of period | income (loss)a | investments | operations | income | capital | distributions | ments | of period | value (%)b | (in thousands) | (%)c | net assets (%) | (%) |
| Class A | ||||||||||||||
| April 30, 2021** | $16.77 | —d | 4.09 | 4.09 | (.10) | — | (.10) | — | $20.76 | 24.46* | $952,872 | .55* | (.01)* | 118* |
| October 31, 2020 | 16.51 | .06 | .21 | .27 | (.01) | — | (.01) | — | 16.77 | 1.62 | 799,870 | 1.13 | .39 | 62 |
| October 31, 2019 | 14.72 | .05 | 1.74 | 1.79 | — | — | — | —d,e | 16.51 | 12.16 | 871,070 | 1.15 | .34 | 35 |
| October 31, 2018 | 15.29 | .03 | (.54) | (.51) | (.05) | (.01) | (.06) | — | 14.72 | (3.39) | 685,082 | 1.15 | .19 | 60 |
| October 31, 2017 | 12.34 | .06 | 3.09 | 3.15 | (.20) | — | (.20) | —d,f | 15.29 | 25.87 | 744,923 | 1.12 | .48 | 220 |
| October 31, 2016 | 12.72 | .10 | (.41) | (.31) | (.07) | — | (.07) | — | 12.34 | (2.45) | 665,085 | 1.16h | .79h | 48 |
| Class B | ||||||||||||||
| April 30, 2021** | $14.68 | (.07) | 3.59 | 3.52 | — | — | — | — | $18.20 | 23.98* | $8,586 | .93* | (.38)* | 118* |
| October 31, 2020 | 14.56 | (.05) | .17 | .12 | — | — | — | — | 14.68 | .82 | 8,168 | 1.88 | (.36) | 62 |
| October 31, 2019 | 13.07 | (.06) | 1.55 | 1.49 | — | — | — | —d,e | 14.56 | 11.40 | 12,250 | 1.90 | (.44) | 35 |
| October 31, 2018 | 13.63 | (.08) | (.48) | (.56) | — | — | — | — | 13.07 | (4.11) | 7,103 | 1.90 | (.55) | 60 |
| October 31, 2017 | 11.02 | (.03) | 2.74 | 2.71 | (.10) | — | (.10) | —d,f | 13.63 | 24.84 | 9,541 | 1.87 | (.26) | 220 |
| October 31, 2016 | 11.38 | .01 | (.37) | (.36) | — | — | — | — | 11.02 | (3.16) | 10,467 | 1.91h | .05h | 48 |
| Class C | ||||||||||||||
| April 30, 2021** | $15.45 | (.07) | 3.77 | 3.70 | — | — | — | — | $19.15 | 23.95* | $18,559 | .93* | (.38)* | 118* |
| October 31, 2020 | 15.32 | (.05) | .18 | .13 | — | — | — | — | 15.45 | .85 | 18,122 | 1.88 | (.36) | 62 |
| October 31, 2019 | 13.76 | (.06) | 1.62 | 1.56 | — | — | — | —d,e | 15.32 | 11.34 | 22,912 | 1.90 | (.45) | 35 |
| October 31, 2018 | 14.35 | (.08) | (.51) | (.59) | — | — | — | — | 13.76 | (4.11) | 10,942 | 1.90 | (.54) | 60 |
| October 31, 2017 | 11.59 | (.03) | 2.90 | 2.87 | (.11) | — | (.11) | —d,f | 14.35 | 24.94 | 19,322 | 1.87 | (.27) | 220 |
| October 31, 2016 | 11.98 | —d | (.38) | (.38) | (.01) | — | (.01) | — | 11.59 | (3.20) | 18,589 | 1.91h | .04h | 48 |
| Class R | ||||||||||||||
| April 30, 2021** | $16.55 | (.03) | 4.05 | 4.02 | — | — | — | — | $20.57 | 24.29* | $708 | .68* | (.14)* | 118* |
| October 31, 2020 | 16.33 | .03 | .19 | .22 | — | — | — | — | 16.55 | 1.35 | 752 | 1.38 | .18 | 62 |
| October 31, 2019 | 14.59 | .01 | 1.73 | 1.74 | — | — | — | —d,e | 16.33 | 11.93 | 1,304 | 1.40 | —g | 35 |
| October 31, 2018 | 15.16 | (.01) | (.54) | (.55) | (.02) | —d | (.02) | — | 14.59 | (3.62) | 282 | 1.40 | (.08) | 60 |
| October 31, 2017 | 12.22 | .03 | 3.06 | 3.09 | (.15) | — | (.15) | —d,f | 15.16 | 25.55 | 571 | 1.37 | .22 | 220 |
| October 31, 2016 | 12.57 | .07 | (.42) | (.35) | — | — | — | — | 12.22 | (2.78) | 498 | 1.41h | .56h | 48 |
| Class R6 | ||||||||||||||
| April 30, 2021** | $17.49 | .03 | 4.27 | 4.30 | (.17) | — | (.17) | — | $21.62 | 24.67* | $19,394 | .37* | .17* | 118* |
| October 31, 2020 | 17.21 | .13 | .21 | .34 | (.06) | — | (.06) | — | 17.49 | 1.99 | 19,620 | .74 | .78 | 62 |
| October 31, 2019 | 15.28 | .12 | 1.81 | 1.93 | — | — | — | —d,e | 17.21 | 12.63 | 21,642 | .77 | .73 | 35 |
| October 31, 2018 | 15.87 | .09 | (.57) | (.48) | (.10) | (.01) | (.11) | — | 15.28 | (3.04) | 17,636 | .76 | .57 | 60 |
| October 31, 2017 | 12.80 | .12 | 3.20 | 3.32 | (.25) | — | (.25) | —d,f | 15.87 | 26.40 | 16,773 | .72 | .88 | 220 |
| October 31, 2016 | 13.20 | .15 | (.43) | (.28) | (.12) | — | (.12) | — | 12.80 | (2.11) | 11,433 | .75h | 1.19h | 48 |
See notes to financial highlights at the end of this section.
The accompanying notes are an integral part of these financial statements.
| 34 Focused International Equity Fund | Focused International Equity Fund 35 |
Financial highlights cont.
| INVESTMENT OPERATIONS | LESS DISTRIBUTIONS | RATIOS AND SUPPLEMENTAL DATA | ||||||||||||
| Ratio of | Ratio of net | |||||||||||||
| Net asset | Net realized | expenses | investment | |||||||||||
| value, | and unrealized | Total from | From | From | Non-recurring | Net asset | Total return | Net assets, | to average | income (loss) | Portfolio | |||
| beginning | Net investment | gain (loss) on | investment | net investment | return of | Total | reimburse- | value, end | at net asset | end of period | net assets | to average | turnover | |
| Period ended | of period | income (loss)a | investments | operations | income | capital | distributions | ments | of period | value (%)b | (in thousands) | (%)c | net assets (%) | (%) |
| Class Y | ||||||||||||||
| April 30, 2021** | $17.40 | .02 | 4.25 | 4.27 | (.15) | — | (.15) | — | $21.52 | 24.60* | $53,721 | .43* | .11* | 118* |
| October 31, 2020 | 17.13 | .11 | .21 | .32 | (.05) | — | (.05) | — | 17.40 | 1.83 | 42,867 | .88 | .64 | 62 |
| October 31, 2019 | 15.23 | .09 | 1.81 | 1.90 | — | — | — | —d,e | 17.13 | 12.48 | 47,215 | .90 | .58 | 35 |
| October 31, 2018 | 15.81 | .07 | (.56) | (.49) | (.08) | (.01) | (.09) | — | 15.23 | (3.12) | 33,325 | .90 | .44 | 60 |
| October 31, 2017 | 12.76 | .10 | 3.18 | 3.28 | (.23) | — | (.23) | —d,f | 15.81 | 26.13 | 34,179 | .87 | .72 | 220 |
| October 31, 2016 | 13.15 | .13 | (.42) | (.29) | (.10) | — | (.10) | — | 12.76 | (2.20) | 28,487 | .91h | 1.03h | 48 |
Before April 1, 2021, the fund was managed with a materially different investment strategy and may have achieved materially different performance results under its current investment strategy from that shown for periods before this date.
* Not annualized.
** Unaudited.
a Per share net investment income (loss) has been determined on the basis of the weighted average number of shares outstanding during the period.
b Total return assumes dividend reinvestment and does not reflect the effect of sales charges.
c Includes amounts paid through expense offset and brokerage/service arrangements, if any (Note 2). Also excludes acquired fund fees, if any.
d Amount represents less than $0.01 per share.
e Reflects a non-recurring reimbursement pursuant to a settlement between the Securities and Exchange Commission (the SEC) and Canadian Imperial Holdings, Inc. and CIBC World Markets Corp., which amounted to less than $0.01 per share outstanding on March 6, 2019.
f Reflects a non-recurring reimbursement pursuant to a settlement between the SEC and Haidar Capital Management/Haidar Capital Advisors, which amounted to less than $0.01 per share outstanding on February 15, 2017.
g Amount represents less than 0.01%.
h Reflects a voluntary waiver of certain fund expenses in effect during the period. As a result of such waivers, the expenses of each class reflects a reduction of less than 0.01% as a percentage of average net assets (Note 2).
The accompanying notes are an integral part of these financial statements.
| 36 Focused International Equity Fund | Focused International Equity Fund 37 |
Notes to financial statements 4/30/21 (Unaudited)
Within the following Notes to financial statements, references to “State Street” represent State Street Bank and Trust Company, references to “the SEC” represent the Securities and Exchange Commission, references to “Putnam Management” represent Putnam Investment Management, LLC, the fund’s manager, an indirect wholly-owned subsidiary of Putnam Investments, LLC and references to “OTC”, if any, represent over-the-counter. Unless otherwise noted, the “reporting period” represents the period from November 1, 2020 through April 30, 2021.
Putnam Focused International Equity Fund (the fund) is a Massachusetts business trust, which is registered under the Investment Company Act of 1940, as amended, as a non-diversified open-end management investment company. Prior to April 1, 2021, the name of the fund was Putnam Global Equity Fund. The goal of the fund is to seek capital appreciation. The fund invests mainly in common stocks (growth or value stocks or both) of companies of any size outside the United States that Putnam Management believes have favorable investment potential. Under normal circumstances, Putnam Management invests at least 80% of the fund’s net assets in equity investments. This policy may be changed only after 60 days’ notice to shareholders. The fund’s equity investments may include common stocks, preferred stocks, convertible securities, warrants, American Depositary Receipts (ADRs) and Global Depositary Receipts (GDRs). The fund invests in both developed countries and in emerging markets. Putnam Management may consider, among other factors, a company’s valuation, financial strength, growth potential, competitive position in its industry, projected future earnings, cash flows and dividends when deciding whether to buy or sell investments. Putnam Management may also consider other factors that it believes will cause the stock price to rise. The fund may also use derivatives, such as futures, options, certain foreign currency transactions, warrants and swap contracts, for both hedging and non-hedging purposes. The fund is “non-diversified,” which means it may invest a greater percentage of its assets in fewer issuers than a “diversified” fund. The fund expects to invest in a limited number of issuers.
The fund offers class A, class B, class C, class R, class R6 and class Y shares. Purchases of class B shares are closed to new and existing investors except by exchange from class B shares of another Putnam fund or through dividend and/or capital gains reinvestment. Class A shares are sold with a maximum front-end sales charge of 5.75%. Class A shares generally are not subject to a contingent deferred sales charge, and class R, class R6 and class Y shares are not subject to a contingent deferred sales charge. Class B shares, which convert to class A shares after approximately eight years, are not subject to a front-end sales charge and are subject to a contingent deferred sales charge if those shares are redeemed within six years of purchase. Class C shares are subject to a one-year 1.00% contingent deferred sales charge and generally convert to class A shares after approximately eight years. Prior to March 1, 2021, class C shares generally converted to class A shares after approximately ten years. Class R shares, which are not available to all investors, are sold at net asset value. The expenses for class A, class B, class C and class R shares may differ based on the distribution fee of each class, which is identified in Note 2. Class R6 and class Y shares, which are sold at net asset value, are generally subject to the same expenses as class A, class B, class C and class R shares, but do not bear a distribution fee, and in the case of class R6 shares, bear a lower investor servicing fee, which is identified in Note 2. Class R6 and class Y shares are not available to all investors.
In the normal course of business, the fund enters into contracts that may include agreements to indemnify another party under given circumstances. The fund’s maximum exposure under these arrangements is unknown as this would involve future claims that may be, but have not yet been, made against the fund. However, the fund’s management team expects the risk of material loss to be remote.
The fund has entered into contractual arrangements with an investment adviser, administrator, distributor, shareholder servicing agent and custodian, who each provide services to the fund. Unless expressly stated otherwise, shareholders are not parties to, or intended beneficiaries of these contractual arrangements, and these contractual arrangements are not intended to create any shareholder right to enforce them against the service providers or to seek any remedy under them against the service providers, either directly or on behalf of the fund.
Under the fund’s Amended and Restated Agreement and Declaration of Trust, any claims asserted against or on behalf of the Putnam Funds, including claims against Trustees and Officers, must be brought in state and federal courts located within the Commonwealth of Massachusetts.
Note 1: Significant accounting policies
The following is a summary of significant accounting policies consistently followed by the fund in the preparation of its financial statements. The preparation of financial statements is in conformity with accounting principles generally accepted in the United States of America and requires management to make estimates and assumptions that affect the reported amounts of assets and liabilities in the financial statements and the reported amounts of increases and decreases in net assets from operations. Actual results could differ from those
| 38 Focused International Equity Fund |
estimates. Subsequent events after the Statement of assets and liabilities date through the date that the financial statements were issued have been evaluated in the preparation of the financial statements.
Investment income, realized and unrealized gains and losses and expenses of the fund are borne pro-rata based on the relative net assets of each class to the total net assets of the fund, except that each class bears expenses unique to that class (including the distribution fees applicable to such classes). Each class votes as a class only with respect to its own distribution plan or other matters on which a class vote is required by law or determined by the Trustees. If the fund were liquidated, shares of each class would receive their pro-rata share of the net assets of the fund. In addition, the Trustees declare separate dividends on each class of shares.
Security valuation Portfolio securities and other investments are valued using policies and procedures adopted by the Board of Trustees. The Trustees have formed a Pricing Committee to oversee the implementation of these procedures and have delegated responsibility for valuing the fund’s assets in accordance with these procedures to Putnam Management. Putnam Management has established an internal Valuation Committee that is responsible for making fair value determinations, evaluating the effectiveness of the pricing policies of the fund and reporting to the Pricing Committee.
Investments for which market quotations are readily available are valued at the last reported sales price on their principal exchange, or official closing price for certain markets, and are classified as Level 1 securities under Accounting Standards Codification 820 Fair Value Measurements and Disclosures (ASC 820). If no sales are reported, as in the case of some securities that are traded OTC, a security is valued at its last reported bid price and is generally categorized as a Level 2 security.
Investments in open-end investment companies (excluding exchange-traded funds), if any, which can be classified as Level 1 or Level 2 securities, are valued based on their net asset value. The net asset value of such investment companies equals the total value of their assets less their liabilities and divided by the number of their outstanding shares.
Market quotations are not considered to be readily available for certain debt obligations (including short-term investments with remaining maturities of 60 days or less) and other investments; such investments are valued on the basis of valuations furnished by an independent pricing service approved by the Trustees or dealers selected by Putnam Management. Such services or dealers determine valuations for normal institutional-size trading units of such securities using methods based on market transactions for comparable securities and various relationships, generally recognized by institutional traders, between securities (which consider such factors as security prices, yields, maturities and ratings). These securities will generally be categorized as Level 2.
Many securities markets and exchanges outside the U.S. close prior to the scheduled close of the New York Stock Exchange and therefore the closing prices for securities in such markets or on such exchanges may not fully reflect events that occur after such close but before the scheduled close of the New York Stock Exchange. Accordingly, on certain days, the fund will fair value certain foreign equity securities taking into account multiple factors including movements in the U.S. securities markets, currency valuations and comparisons to the valuation of American Depository Receipts, exchange-traded funds and futures contracts. The foreign equity securities, which would generally be classified as Level 1 securities, will be transferred to Level 2 of the fair value hierarchy when they are valued at fair value. The number of days on which fair value prices will be used will depend on market activity and it is possible that fair value prices will be used by the fund to a significant extent. Securities quoted in foreign currencies, if any, are translated into U.S. dollars at the current exchange rate.
To the extent a pricing service or dealer is unable to value a security or provides a valuation that Putnam Management does not believe accurately reflects the security’s fair value, the security will be valued at fair value by Putnam Management in accordance with policies and procedures approved by the Trustees. Certain investments, including certain restricted and illiquid securities and derivatives, are also valued at fair value following procedures approved by the Trustees. These valuations consider such factors as significant market or specific security events such as interest rate or credit quality changes, various relationships with other securities, discount rates, U.S. Treasury, U.S. swap and credit yields, index levels, convexity exposures, recovery rates, sales and other multiples and resale restrictions. These securities are classified as Level 2 or as Level 3 depending on the priority of the significant inputs.
To assess the continuing appropriateness of fair valuations, the Valuation Committee reviews and affirms the reasonableness of such valuations on a regular basis after considering all relevant information that is reasonably available. Such valuations and procedures are reviewed periodically by the Trustees. The fair value of securities is generally determined as the amount that the fund could reasonably expect to realize from an orderly disposition of such securities over a reasonable period of time. By its nature, a fair value price is a good faith estimate of
| Focused International Equity Fund 39 |
the value of a security in a current sale and does not reflect an actual market price, which may be different by a material amount.
Security transactions and related investment income Security transactions are recorded on the trade date (the date the order to buy or sell is executed). Gains or losses on securities sold are determined on the identified cost basis.
Interest income, net of any applicable withholding taxes, if any, and including amortization and accretion of premiums and discounts on debt securities, is recorded on the accrual basis. Dividend income, net of any applicable withholding taxes, is recognized on the ex-dividend date except that certain dividends from foreign securities, if any, are recognized as soon as the fund is informed of the ex-dividend date. Non-cash dividends, if any, are recorded at the fair value of the securities received. Dividends representing a return of capital or capital gains, if any, are reflected as a reduction of cost and/or as a realized gain.
Foreign currency translation The accounting records of the fund are maintained in U.S. dollars. The fair value of foreign securities, currency holdings, and other assets and liabilities is recorded in the books and records of the fund after translation to U.S. dollars based on the exchange rates on that day. The cost of each security is determined using historical exchange rates. Income and withholding taxes are translated at prevailing exchange rates when earned or incurred. The fund does not isolate that portion of realized or unrealized gains or losses resulting from changes in the foreign exchange rate on investments from fluctuations arising from changes in the market prices of the securities. Such gains and losses are included with the net realized and unrealized gain or loss on investments. Net realized gains and losses on foreign currency transactions represent net realized exchange gains or losses on disposition of foreign currencies, currency gains and losses realized between the trade and settlement dates on securities transactions and the difference between the amount of investment income and foreign withholding taxes recorded on the fund’s books and the U.S. dollar equivalent amounts actually received or paid. Net unrealized appreciation and depreciation of assets and liabilities in foreign currencies arise from changes in the value of assets and liabilities other than investments at the period end, resulting from changes in the exchange rate.
Futures contracts The fund uses futures contracts to equitize cash.
The potential risk to the fund is that the change in value of futures contracts may not correspond to the change in value of the hedged instruments. In addition, losses may arise from changes in the value of the underlying instruments, if there is an illiquid secondary market for the contracts, if interest or exchange rates move unexpectedly or if the counterparty to the contract is unable to perform. With futures, there is minimal counterparty credit risk to the fund since futures are exchange traded and the exchange’s clearinghouse, as counterparty to all exchange traded futures, guarantees the futures against default. Risks may exceed amounts recognized on the Statement of assets and liabilities. When the contract is closed, the fund records a realized gain or loss equal to the difference between the value of the contract at the time it was opened and the value at the time it was closed.
Futures contracts are valued at the quoted daily settlement prices established by the exchange on which they trade. The fund and the broker agree to exchange an amount of cash equal to the daily fluctuation in the value of the futures contract. Such receipts or payments are known as “variation margin.”
Futures contracts outstanding at period end, if any, are listed after the fund’s portfolio.
Forward currency contracts The fund buys and sells forward currency contracts, which are agreements between two parties to buy and sell currencies at a set price on a future date. These contracts are used to hedge foreign exchange risk.
The U.S. dollar value of forward currency contracts is determined using current forward currency exchange rates supplied by a quotation service. The fair value of the contract will fluctuate with changes in currency exchange rates. The contract is marked to market daily and the change in fair value is recorded as an unrealized gain or loss. The fund records a realized gain or loss equal to the difference between the value of the contract at the time it was opened and the value at the time it was closed when the contract matures or by delivery of the currency. The fund could be exposed to risk if the value of the currency changes unfavorably, if the counterparties to the contracts are unable to meet the terms of their contracts or if the fund is unable to enter into a closing position. Risks may exceed amounts recognized on the Statement of assets and liabilities.
Forward currency contracts outstanding at period end, if any, are listed after the fund’s portfolio.
Master agreements The fund is a party to ISDA (International Swaps and Derivatives Association, Inc.) Master Agreements (Master Agreements) with certain counterparties that govern OTC derivative and foreign exchange contracts entered into from time to time. The Master Agreements may contain provisions regarding, among other
| 40 Focused International Equity Fund |
things, the parties’ general obligations, representations, agreements, collateral requirements, events of default and early termination. With respect to certain counterparties, in accordance with the terms of the Master Agreements, collateral pledged to the fund is held in a segregated account by the fund’s custodian and, with respect to those amounts which can be sold or repledged, is presented in the fund’s portfolio.
Collateral pledged by the fund is segregated by the fund’s custodian and identified in the fund’s portfolio. Collateral can be in the form of cash or debt securities issued by the U.S. Government or related agencies or other securities as agreed to by the fund and the applicable counterparty. Collateral requirements are determined based on the fund’s net position with each counterparty.
Termination events applicable to the fund may occur upon a decline in the fund’s net assets below a specified threshold over a certain period of time. Termination events applicable to counterparties may occur upon a decline in the counterparty’s long-term and short-term credit ratings below a specified level. In each case, upon occurrence, the other party may elect to terminate early and cause settlement of all derivative and foreign exchange contracts outstanding, including the payment of any losses and costs resulting from such early termination, as reasonably determined by the terminating party. Any decision by one or more of the fund’s counterparties to elect early termination could impact the fund’s future derivative activity.
At the close of the reporting period, the fund had a net liability position of $2,198,131 on open derivative contracts subject to the Master Agreements. Collateral pledged by the fund at period end for these agreements totaled $1,998,000 and may include amounts related to unsettled agreements.
Securities lending The fund may lend securities, through its agent, to qualified borrowers in order to earn additional income. The loans are collateralized by cash in an amount at least equal to the fair value of the securities loaned. The fair value of securities loaned is determined daily and any additional required collateral is allocated to the fund on the next business day. The remaining maturities of the securities lending transactions are considered overnight and continuous. The risk of borrower default will be borne by the fund’s agent; the fund will bear the risk of loss with respect to the investment of the cash collateral. Income from securities lending, net of expenses, is included in investment income on the Statement of operations. Cash collateral is invested in Putnam Cash Collateral Pool, LLC, a limited liability company managed by an affiliate of Putnam Management. Investments in Putnam Cash Collateral Pool, LLC are valued at its closing net asset value each business day. There are no management fees charged to Putnam Cash Collateral Pool, LLC. At the close of the reporting period, the fund received cash collateral of $617,400 and the value of securities loaned amounted to $607,460.
Interfund lending The fund, along with other Putnam funds, may participate in an interfund lending program pursuant to an exemptive order issued by the SEC. This program allows the fund to borrow from or lend to other Putnam funds that permit such transactions. Interfund lending transactions are subject to each fund’s investment policies and borrowing and lending limits. Interest earned or paid on the interfund lending transaction will be based on the average of certain current market rates. During the reporting period, the fund did not utilize the program.
Lines of credit The fund participates, along with other Putnam funds, in a $317.5 million unsecured committed line of credit and a $235.5 million unsecured uncommitted line of credit, both provided by State Street. Borrowings may be made for temporary or emergency purposes, including the funding of shareholder redemption requests and trade settlements. Interest is charged to the fund based on the fund’s borrowing at a rate equal to 1.25% plus the higher of (1) the Federal Funds rate and (2) the Overnight Bank Funding Rate for the committed line of credit and 1.30% plus the higher of (1) the Federal Funds rate and (2) the Overnight Bank Funding Rate for the uncommitted line of credit. A closing fee equal to 0.04% of the committed line of credit and 0.04% of the uncommitted line of credit has been paid by the participating funds. In addition, a commitment fee of 0.21% per annum on any unutilized portion of the committed line of credit is allocated to the participating funds based on their relative net assets and paid quarterly. During the reporting period, the fund had no borrowings against these arrangements.
Federal taxes It is the policy of the fund to distribute all of its taxable income within the prescribed time period and otherwise comply with the provisions of the Internal Revenue Code of 1986, as amended (the Code), applicable to regulated investment companies. It is also the intention of the fund to distribute an amount sufficient to avoid imposition of any excise tax under Section 4982 of the Code.
The fund is subject to the provisions of Accounting Standards Codification 740 Income Taxes (ASC 740). ASC 740 sets forth a minimum threshold for financial statement recognition of the benefit of a tax position taken or expected to be taken in a tax return. The fund did not have a liability to record for any unrecognized tax benefits in the accompanying financial statements. No provision has been made for federal taxes on income, capital gains
| Focused International Equity Fund 41 |
or unrealized appreciation on securities held nor for excise tax on income and capital gains. Each of the fund’s federal tax returns for the prior three fiscal years remains subject to examination by the Internal Revenue Service.
The fund may also be subject to taxes imposed by governments of countries in which it invests. Such taxes are generally based on either income or gains earned or repatriated. The fund accrues and applies such taxes to net investment income, net realized gains and net unrealized gains as income and/or capital gains are earned. In some cases, the fund may be entitled to reclaim all or a portion of such taxes, and such reclaim amounts, if any, are reflected as an asset on the fund’s books. In many cases, however, the fund may not receive such amounts for an extended period of time, depending on the country of investment.
Under the Regulated Investment Company Modernization Act of 2010, the fund will be permitted to carry forward capital losses incurred for an unlimited period and the carry forwards will retain their character as either short-term or long-term capital losses. At October 31, 2020, the fund had the following capital loss carryovers available, to the extent allowed by the Code, to offset future net capital gain, if any:
| Loss carryover | ||
| Short-term | Long-term | Total |
| $16,868,484 | $15,653,049 | $32,521,533 |
Tax cost of investments includes adjustments to net unrealized appreciation (depreciation) which may not necessarily be final tax cost basis adjustments, but closely approximate the tax basis unrealized gains and losses that may be realized and distributed to shareholders. The aggregate identified cost on a tax basis is $1,004,652,551, resulting in gross unrealized appreciation and depreciation of $70,883,699 and $19,394,535, respectively, or net unrealized appreciation of $51,489,164.
Distributions to shareholders Distributions to shareholders from net investment income are recorded by the fund on the ex-dividend date. Distributions from capital gains, if any, are recorded on the ex-dividend date and paid at least annually. The amount and character of income and gains to be distributed are determined in accordance with income tax regulations, which may differ from generally accepted accounting principles. Dividend sources are estimated at the time of declaration. Actual results may vary. Any non-taxable return of capital cannot be determined until final tax calculations are completed after the end of the fund’s fiscal year. Reclassifications are made to the fund’s capital accounts to reflect income and gains available for distribution (or available capital loss carryovers) under income tax regulations.
Note 2: Management fee, administrative services and other transactions
The fund pays Putnam Management a management fee (base fee) (based on the fund’s average net assets and computed and paid monthly) at annual rates that may vary based on the average of the aggregate net assets of all open-end mutual funds sponsored by Putnam Management (excluding net assets of funds that are invested in, or that are invested in by, other Putnam funds to the extent necessary to avoid “double counting” of those assets). Such annual rates may vary as follows:
| 0.850% | of the first $5 billion, | 0.650% | of the next $50 billion, | |
| 0.800% | of the next $5 billion, | 0.630% | of the next $50 billion, | |
| 0.750% | of the next $10 billion, | 0.620% | of the next $100 billion and | |
| 0.700% | of the next $10 billion, | 0.615% | of any excess thereafter. |
In addition, the monthly management fee consists of the monthly base fee plus or minus a performance adjustment for the month. The performance adjustment is determined based on performance over the thirty-six month period then ended. Each month, the performance adjustment is calculated by multiplying the performance adjustment rate and the fund’s average net assets over the performance period and dividing the result by twelve. The resulting dollar amount is added to, or subtracted from the base fee for that month. The performance adjustment rate is equal to 0.03 multiplied by the difference between the fund’s annualized performance (measured by the fund’s class A shares) and the annualized performance of the MSCI ACWI ex USA Index (Net Dividends) (MSCI World Index (Net Dividends) prior to April 1, 2021) measured over the performance period. Because the performance adjustment is based on a rolling thirty-six-month performance period, there will be a transition period during which the fund’s performance will be compared to a composite index that reflects the performance of the MSCI World Index (Net Dividends) for the portion of the performance period before April 1, 2021, and the performance of the MSCI ACWI ex USA Index (Net Dividends) for the remainder of the period. The maximum
| 42 Focused International Equity Fund |
annualized performance adjustment rate is +/- 0.15%. The monthly base fee is determined based on the fund’s average net assets for the month, while the performance adjustment is determined based on the fund’s average net assets over the thirty-six month performance period. This means it is possible that, if the fund underperforms significantly over the performance period, and the fund’s assets have declined significantly over that period, the negative performance adjustment may exceed the base fee. In this event, Putnam Management would make a payment to the fund.
In connection with the mergers of Putnam Global Consumer Fund, Putnam Global Financials Fund, Putnam Global Utilities Fund and Putnam Global Sector Fund (“acquired funds”) into the fund on June 17, 2019, the management contract was amended such that, after completion of the mergers, the combined fund’s performance adjustment will be calculated based on the combined assets of the fund and all acquired funds for any portion of a performance period that is prior to the mergers, unless the use of the combined assets results in a fee payable by the fund under the amended management contract that is higher than the management fee that would have been paid under the fund’s current management contract. Under those circumstances, Putnam Management has agreed to reduce its management fee to reflect the lower amount that would have been payable under the fund’s current fee schedule, which would only take into account the assets of the fund for the period prior to the closing of the mergers. As a result of these management contract changes, the fund’s shareholders may pay a lower management fee, but would never pay a higher management fee, under the amended management contract than they would have paid under the fund’s current management contract.
Because the performance adjustment is based on the fund’s performance relative to its applicable benchmark index, and not its absolute performance, the performance adjustment could increase Putnam Management’s fee even if the fund’s shares lose value during the performance period provided that the fund outperformed its benchmark index, and could decrease Putnam Management’s fee even if the fund’s shares increase in value during the performance period provided that the fund underperformed its benchmark index.
For the reporting period, the management fee represented an effective rate (excluding the impact of any expense waiver in effect) of 0.284% of the fund’s average net assets, which included an effective base fee of 0.338% and a decrease of 0.054% ($554,226) based on performance.
Putnam Management has contractually agreed, through February 28, 2022, to waive fees and/or reimburse the fund’s expenses to the extent necessary to limit the cumulative expenses of the fund, exclusive of brokerage, interest, taxes, investment-related expenses, extraordinary expenses, acquired fund fees and expenses and payments under the fund’s investor servicing contract, investment management contract and distribution plans, on a fiscal year-to-date basis to an annual rate of 0.20% of the fund’s average net assets over such fiscal year-to-date period. During the reporting period, the fund’s expenses were not reduced as a result of this limit.
Putnam Investments Limited (PIL), an affiliate of Putnam Management, is authorized by the Trustees to manage a separate portion of the assets of the fund as determined by Putnam Management from time to time. PIL did not manage any portion of the assets of the fund during the reporting period. If Putnam Management were to engage the services of PIL, Putnam Management would pay a quarterly sub-management fee to PIL for its services at an annual rate of 0.35% of the average net assets of the portion of the fund managed by PIL.
The Putnam Advisory Company, LLC (PAC), an affiliate of Putnam Management, is authorized by the Trustees to manage a separate portion of the assets of the fund, as designated from time to time by Putnam Management or PIL. PAC did not manage any portion of the assets of the fund during the reporting period. If Putnam Management or PIL were to engage the services of PAC, Putnam Management or PIL, as applicable, would pay a quarterly sub-advisory fee to PAC for its services at the annual rate of 0.35% of the average net assets of the portion of the fund’s assets for which PAC is engaged as sub-adviser.
The fund reimburses Putnam Management an allocated amount for the compensation and related expenses of certain officers of the fund and their staff who provide administrative services to the fund. The aggregate amount of all such reimbursements is determined annually by the Trustees.
Custodial functions for the fund’s assets are provided by State Street. Custody fees are based on the fund’s asset level, the number of its security holdings and transaction volumes.
Putnam Investor Services, Inc., an affiliate of Putnam Management, provides investor servicing agent functions to the fund. Putnam Investor Services, Inc. received fees for investor servicing for class A, class B, class C, class R and class Y shares that included (1) a per account fee for each direct and underlying non-defined contribution account (retail account) of the fund; (2) a specified rate of the fund’s assets attributable to defined contribution plan accounts; and (3) a specified rate based on the average net assets in retail accounts. Putnam Investor Services, Inc. has agreed that the aggregate investor servicing fees for each fund’s retail and defined contribution
| Focused International Equity Fund 43 |
accounts for these share classes will not exceed an annual rate of 0.25% of the fund’s average assets attributable to such accounts.
Class R6 shares paid a monthly fee based on the average net assets of class R6 shares at an annual rate of 0.05%.
During the reporting period, the expenses for each class of shares related to investor servicing fees were as follows:
| Class A | $765,592 | Class R6 | 5,546 | |
| Class B | 7,367 | Class Y | 41,854 | |
| Class C | 16,459 | Total | $837,399 | |
| Class R | 581 |
The fund has entered into expense offset arrangements with Putnam Investor Services, Inc. and State Street whereby Putnam Investor Services, Inc.’s and State Street’s fees are reduced by credits allowed on cash balances. For the reporting period, the fund’s expenses were reduced by $410 under the expense offset arrangements.
Each Independent Trustee of the fund receives an annual Trustee fee, of which $691, as a quarterly retainer, has been allocated to the fund, and an additional fee for each Trustees meeting attended. Trustees also are reimbursed for expenses they incur relating to their services as Trustees.
The fund has adopted a Trustee Fee Deferral Plan (the Deferral Plan) which allows the Trustees to defer the receipt of all or a portion of Trustees fees payable on or after July 1, 1995. The deferred fees remain invested in certain Putnam funds until distribution in accordance with the Deferral Plan.
The fund has adopted an unfunded noncontributory defined benefit pension plan (the Pension Plan) covering all Trustees of the fund who have served as a Trustee for at least five years and were first elected prior to 2004. Benefits under the Pension Plan are equal to 50% of the Trustee’s average annual attendance and retainer fees for the three years ended December 31, 2005. The retirement benefit is payable during a Trustee’s lifetime, beginning the year following retirement, for the number of years of service through December 31, 2006. Pension expense for the fund is included in Trustee compensation and expenses in the Statement of operations. Accrued pension liability is included in Payable for Trustee compensation and expenses in the Statement of assets and liabilities. The Trustees have terminated the Pension Plan with respect to any Trustee first elected after 2003.
The fund has adopted distribution plans (the Plans) with respect to the following share classes pursuant to Rule 12b–1 under the Investment Company Act of 1940. The purpose of the Plans is to compensate Putnam Retail Management Limited Partnership, an indirect wholly-owned subsidiary of Putnam Investments, LLC, for services provided and expenses incurred in distributing shares of the fund. The Plans provide payments by the fund to Putnam Retail Management Limited Partnership at an annual rate of up to the following amounts (Maximum %) of the average net assets attributable to each class. The Trustees have approved payment by the fund at the following annual rate (Approved %) of the average net assets attributable to each class. During the reporting period, the class-specific expenses related to distribution fees were as follows:
| Maximum % | Approved % | Amount | |
| Class A | 0.35% | 0.25% | $1,129,004 |
| Class B | 1.00% | 1.00% | 43,411 |
| Class C | 1.00% | 1.00% | 96,941 |
| Class R | 1.00% | 0.50% | 1,711 |
| Total | $1,271,067 |
For the reporting period, Putnam Retail Management Limited Partnership, acting as underwriter, received net commissions of $23,769 from the sale of class A shares and received $353 and $105 in contingent deferred sales charges from redemptions of class B and class C shares, respectively.
| 44 Focused International Equity Fund |
A deferred sales charge of up to 1.00% is assessed on certain redemptions of class A shares. For the reporting period, Putnam Retail Management Limited Partnership, acting as underwriter, received $106 on class A redemptions.
Note 3: Purchases and sales of securities
During the reporting period, the cost of purchases and the proceeds from sales, excluding short-term investments, were as follows:
| Cost of purchases | Proceeds from sales | |
| Investments in securities (Long-term) | $1,065,087,964 | $1,117,160,857 |
| U.S. government securities (Long-term) | — | — |
| Total | $1,065,087,964 | $1,117,160,857 |
The fund may purchase or sell investments from or to other Putnam funds in the ordinary course of business, which can reduce the fund’s transaction costs, at prices determined in accordance with SEC requirements and policies approved by the Trustees. During the reporting period, purchases or sales of long-term securities from or to other Putnam funds, if any, did not represent more than 5% of the fund’s total cost of purchases and/or total proceeds from sales.
Note 4: Capital shares
At the close of the reporting period, there were an unlimited number of shares of beneficial interest authorized. Transactions, including, if applicable, direct exchanges pursuant to share conversions, in capital shares were as follows:
| SIX MONTHS ENDED 4/30/21 | YEAR ENDED 10/31/20 | |||
| Class A | Shares | Amount | Shares | Amount |
| Shares sold | 581,182 | $11,363,844 | 1,507,619 | $25,035,956 |
| Shares issued in connection with | ||||
| reinvestment of distributions | 236,676 | 4,456,615 | 22,761 | 395,354 |
| 817,858 | 15,820,459 | 1,530,380 | 25,431,310 | |
| Shares repurchased | (2,606,412) | (50,659,234) | (6,584,403) | (106,270,256) |
| Net decrease | (1,788,554) | $(34,838,775) | (5,054,023) | $(80,838,946) |
| SIX MONTHS ENDED 4/30/21 | YEAR ENDED 10/31/20 | |||
| Class B | Shares | Amount | Shares | Amount |
| Shares sold | 6,176 | $102,692 | 7,058 | $104,655 |
| Shares issued in connection with | ||||
| reinvestment of distributions | — | — | — | — |
| 6,176 | 102,692 | 7,058 | 104,655 | |
| Shares repurchased | (90,749) | (1,548,731) | (292,139) | (4,168,346) |
| Net decrease | (84,573) | $(1,446,039) | (285,081) | $(4,063,691) |
| SIX MONTHS ENDED 4/30/21 | YEAR ENDED 10/31/20 | |||
| Class C | Shares | Amount | Shares | Amount |
| Shares sold | 51,083 | $915,240 | 67,571 | $1,005,877 |
| Shares issued in connection with | ||||
| reinvestment of distributions | — | — | — | — |
| 51,083 | 915,240 | 67,571 | 1,005,877 | |
| Shares repurchased | (254,997) | (4,608,046) | (390,165) | (5,800,155) |
| Net decrease | (203,914) | $(3,692,806) | (322,594) | $(4,794,278) |
| Focused International Equity Fund 45 |
| YEAR ENDED 10/31/20* | ||||
| Class M | Shares | Amount | ||
| Shares sold | 394 | $6,248 | ||
| Shares issued in connection with reinvestment of distributions | — | — | ||
| 394 | 6,248 | |||
| Shares repurchased | (716,677) | (11,529,746) | ||
| Net decrease | (716,283) | $(11,523,498) | ||
| SIX MONTHS ENDED 4/30/21 | YEAR ENDED 10/31/20 | |||
| Class R | Shares | Amount | Shares | Amount |
| Shares sold | 2,080 | $40,373 | 11,393 | $183,185 |
| Shares issued in connection with | ||||
| reinvestment of distributions | — | — | — | — |
| 2,080 | 40,373 | 11,393 | 183,185 | |
| Shares repurchased | (13,063) | (237,867) | (45,778) | (721,095) |
| Net decrease | (10,983) | $(197,494) | (34,385) | $(537,910) |
| SIX MONTHS ENDED 4/30/21 | YEAR ENDED 10/31/20 | |||
| Class R6 | Shares | Amount | Shares | Amount |
| Shares sold | 74,442 | $1,498,853 | 152,480 | $2,532,390 |
| Shares issued in connection with | ||||
| reinvestment of distributions | 9,538 | 186,840 | 4,443 | 80,243 |
| 83,980 | 1,685,693 | 156,923 | 2,612,633 | |
| Shares repurchased | (308,552) | (6,532,935) | (292,705) | (4,767,896) |
| Net decrease | (224,572) | $(4,847,242) | (135,782) | $(2,155,263) |
| SIX MONTHS ENDED 4/30/21 | YEAR ENDED 10/31/20 | |||
| Class Y | Shares | Amount | Shares | Amount |
| Shares sold | 208,909 | $4,261,137 | 596,746 | $10,434,866 |
| Shares issued in connection with | ||||
| reinvestment of distributions | 17,658 | 344,517 | 6,665 | 119,911 |
| 226,567 | 4,605,654 | 603,411 | 10,554,777 | |
| Shares repurchased | (193,666) | (3,894,218) | (896,716) | (14,797,885) |
| Net increase (decrease) | 32,901 | $711,436 | (293,305) | $(4,243,108) |
* Effective November 25, 2019, the fund converted all of its class M shares to class A shares and class M shares were no longer able to be purchased.
| 46 Focused International Equity Fund |
Note 5: Affiliated transactions
Transactions during the reporting period with any company which is under common ownership or control were as follows:
| Shares | |||||
| outstanding | |||||
| and fair | |||||
| Fair value as | Purchase | Sale | Investment | value as | |
| Name of affiliate | of 10/31/20 | cost | proceeds | income | of 4/30/21 |
| Short-term investments | |||||
| Putnam Cash Collateral | |||||
| Pool, LLC* | $5,643,375 | $67,961,565 | $72,987,540 | $3,014 | $617,400 |
| Putnam Short Term | |||||
| Investment Fund** | 12,776,828 | 320,751,332 | 326,748,116 | 8,550 | 6,780,044 |
| Total Short-term | |||||
| investments | $18,420,203 | $388,712,897 | $399,735,656 | $11,564 | $7,397,444 |
* No management fees are charged to Putnam Cash Collateral Pool, LLC (Note 1). Investment income shown is included in securities lending income on the Statement of operations. There were no realized or unrealized gains or losses during the period.
** Management fees charged to Putnam Short Term Investment Fund have been waived by Putnam Management. There were no realized or unrealized gains or losses during the period.
Note 6: Market, credit and other risks
In the normal course of business, the fund trades financial instruments and enters into financial transactions where risk of potential loss exists due to changes in the market (market risk) or failure of the contracting party to the transaction to perform (credit risk). The fund may be exposed to additional credit risk that an institution or other entity with which the fund has unsettled or open transactions will default. Investments in foreign securities involve certain risks, including those related to economic instability, unfavorable political developments, and currency fluctuations.
Beginning in January 2020, global financial markets have experienced, and may continue to experience, significant volatility resulting from the spread of a virus known as Covid–19. The outbreak of Covid–19 has resulted in travel and border restrictions, quarantines, supply chain disruptions, lower consumer demand, and general market uncertainty. The effects of Covid–19 have adversely affected, and may continue to adversely affect, the global economy, the economies of certain nations, and individual issuers, all of which may negatively impact the fund’s performance.
Note 7: Summary of derivative activity
The volume of activity for the reporting period for any derivative type that was held during the period is listed below and was based on an average of the holdings at the end of each fiscal quarter:
| Futures contracts (number of contracts) | 20 |
| Forward currency contracts (contract amount) | $492,100,000 |
| Focused International Equity Fund 47 |
The following is a summary of the fair value of derivative instruments as of the close of the reporting period:
| Fair value of derivative instruments as of the close of the reporting period | ||||
| ASSET DERIVATIVES | LIABILITY DERIVATIVES | |||
| Derivatives not | ||||
| accounted for as | Statement of | Statement of | ||
| hedging instruments | assets and | assets and | ||
| under ASC 815 | liabilities location | Fair value | liabilities location | Fair value |
| Foreign exchange | ||||
| contracts | Receivables | $3,454,811 | Payables | $4,567,535 |
| Receivables, Net | ||||
| assets — Unrealized | Payables, Net assets — | |||
| Equity contracts | appreciation | — | Unrealized depreciation | 29,206* |
| Total | $3,454,811 | $4,596,741 | ||
* Includes cumulative appreciation/depreciation of futures contracts as reported in the fund’s portfolio. Only current day’s variation margin is reported within the Statement of assets and liabilities.
The following is a summary of realized and change in unrealized gains or losses of derivative instruments in the Statement of operations for the reporting period (Note 1):
| Amount of realized gain or (loss) on derivatives recognized in net gain or (loss) on investments | |||
| Derivatives not accounted for as hedging | Forward currency | ||
| instruments under ASC 815 | Futures | contracts | Total |
| Foreign exchange contracts | $— | $(3,794,788) | $(3,794,788) |
| Equity contracts | (1,994,878) | — | $(1,994,878) |
| Total | $(1,994,878) | $(3,794,788) | $(5,789,666) |
| Change in unrealized appreciation or (depreciation) on derivatives recognized in net gain or (loss) | |||
| on investments | |||
| Derivatives not accounted for as hedging | Forward currency | ||
| instruments under ASC 815 | Futures | contracts | Total |
| Foreign exchange contracts | $— | $(224,873) | $(224,873) |
| Equity contracts | (29,206) | — | $(29,206) |
| Total | $(29,206) | $(224,873) | $(254,079) |
| 48 Focused International Equity Fund |
| This page left blank intentionally. |
| Focused International Equity Fund 49 |
Note 8: Offsetting of financial and derivative assets and liabilities
The following table summarizes any derivatives, repurchase agreements and reverse repurchase agreements, at the end of the reporting period, that are subject to an enforceable master netting agreement or similar agreement. For securities lending transactions or borrowing transactions associated with securities sold short, if any, see Note 1. For financial reporting purposes, the fund does not offset financial assets and financial liabilities that are subject to the master netting agreements in the Statement of assets and liabilities.
| Bank of America N.A. |
Barclays Bank PLC |
BofA Securities, Inc. |
Citibank, N.A. | Goldman Sachs International |
HSBC Bank USA, National Association |
JPMorgan Chase Bank N.A. |
Morgan Stanley & Co. International PLC |
NatWest Markets PLC |
State Street Bank and Trust Co. |
Toronto- Dominion Bank |
UBS AG | WestPac Banking Corp. |
Total | |
| Assets: | ||||||||||||||
| Futures contracts§ | $— | $— | $— | $— | $— | $— | $— | $— | $— | $— | $— | $— | $— | $— |
| Forward currency contracts# | 287,605 | 208,067 | — | 626,942 | 204,349 | 665,451 | 437,670 | 177,790 | 241,047 | 193,577 | 57,806 | 239,586 | 114,921 | 3,454,811 |
| Total Assets | $287,605 | $208,067 | $— | $626,942 | $204,349 | $665,451 | $437,670 | $177,790 | $241,047 | $193,577 | $57,806 | $239,586 | $114,921 | $3,454,811 |
| Liabilities: | ||||||||||||||
| Futures contracts§ | — | — | 52,639 | — | — | — | — | — | — | — | — | — | — | 52,639 |
| Forward currency contracts# | 139,746 | 183,030 | — | 61,262 | 12,443 | 567,198 | 980,424 | 274,196 | 228,952 | 852,462 | 13,229 | 874,705 | 379,888 | 4,567,535 |
| Total Liabilities | $139,746 | $183,030 | $52,639 | $61,262 | $12,443 | $567,198 | $980,424 | $274,196 | $228,952 | $852,462 | $13,229 | $874,705 | $379,888 | $4,620,174 |
| Total Financial and | ||||||||||||||
| Derivative Net Assets | $147,859 | $25,037 | $(52,639) | $565,680 | $191,906 | $98,253 | $(542,754) | $(96,406) | $12,095 | $(658,885) | $44,577 | $(635,119) | $(264,967) | $(1,165,363) |
| Total collateral received | ||||||||||||||
| (pledged)†## | $147,859 | $— | $— | $565,680 | $191,906 | $98,253 | $(503,000) | $(96,406) | $— | $(658,885) | $— | $(635,119) | $— | |
| Net amount | $— | $25,037 | $(52,639) | $— | $— | $— | $(39,754) | $— | $12,095 | $— | $44,577 | $— | $(264,967) | |
| Controlled collateral | ||||||||||||||
| received (including TBA | ||||||||||||||
| commitments)** | $152,173 | $— | $— | $570,000 | $230,000 | $163,035 | $— | $— | $— | $— | $— | $— | $— | $1,115,208 |
| Uncontrolled collateral | ||||||||||||||
| received | $— | $— | $— | $— | $— | $— | $— | $— | $— | $— | $— | $— | $— | $— |
| Collateral (pledged) (including | ||||||||||||||
| TBA commitments)** | $— | $— | $— | $— | $— | $— | $(503,000) | $(191,000) | $— | $(666,000) | $— | $(638,000) | $— | $(1,998,000) |
**Included with Investments in securities on the Statement of assets and liabilities.
† Additional collateral may be required from certain brokers based on individual agreements.
# Covered by master netting agreement (Note 1).
##Any over-collateralization of total financial and derivative net assets is not shown. Collateral may include amounts related to unsettled agreements.
§ Includes current day’s variation margin only as reported on the Statement of assets and liabilities, which is not collateralized. Cumulative appreciation/(depreciation) for futures contracts is represented in the tables listed after the fund’s portfolio. Collateral pledged for initial margin on futures contracts, which is not included in the table above, amounted to $355,000.
| 50 Focused International Equity Fund | Focused International Equity Fund 51 |
Shareholder meeting results (Unaudited)
March 18, 2021 meeting
A proposal to approve a change to your fund’s sub classification under the Investment Company Act of 1940 from “diversified” to “non-diversified” was approved as follows:
| Votes for | Votes against | Abstentions non-votes |
| 21,646,950 | 3,553,717 | 2,660,907 |
A proposal to approve a new management contract that will change your fund’s performance index was approved as follows:
| Votes for | Votes against | Abstentions non-votes |
| 21,717,187 | 3,398,002 | 2,746,385 |
All tabulations are rounded to the nearest whole number.
| 52 Focused International Equity Fund |
Fund information
Founded over 80 years ago, Putnam Investments was built around the concept that a balance between risk and reward is the hallmark of a well-rounded financial program. We manage funds across income, value, blend, growth, sustainable, asset allocation, absolute return, and global sector categories.
| Investment Manager | Trustees | Michael J. Higgins |
| Putnam Investment | Kenneth R. Leibler, Chair | Vice President, Treasurer, |
| Management, LLC | Liaquat Ahamed | and Clerk |
| 100 Federal Street | Ravi Akhoury | |
| Boston, MA 02110 | Barbara M. Baumann | Jonathan S. Horwitz |
| Katinka Domotorffy | Executive Vice President, | |
| Investment Sub-Advisors | Catharine Bond Hill | Principal Executive Officer, |
| Putnam Investments Limited | Paul L. Joskow | and Compliance Liaison |
| 16 St James’s Street | George Putnam, III | |
| London, England SW1A 1ER | Robert L. Reynolds | Richard T. Kircher |
| Manoj P. Singh | Vice President and BSA | |
| The Putnam Advisory Company, LLC | Mona K. Sutphen | Compliance Officer |
| 100 Federal Street | ||
| Boston, MA 02110 | Officers | Susan G. Malloy |
| Robert L. Reynolds | Vice President and | |
| Marketing Services | President | Assistant Treasurer |
| Putnam Retail Management | ||
| 100 Federal Street | Robert T. Burns | Denere P. Poulack |
| Boston, MA 02110 | Vice President and | Assistant Vice President, Assistant |
| Chief Legal Officer | Clerk, and Assistant Treasurer | |
| Custodian | ||
| State Street Bank | James F. Clark | Janet C. Smith |
| and Trust Company | Vice President, Chief Compliance | Vice President, |
| Officer, and Chief Risk Officer | Principal Financial Officer, | |
| Legal Counsel | Principal Accounting Officer, | |
| Ropes & Gray LLP | Nancy E. Florek | and Assistant Treasurer |
| Vice President, Director of | ||
| Proxy Voting and Corporate | Mark C. Trenchard | |
| Governance, Assistant Clerk, | Vice President | |
| and Assistant Treasurer |
This report is for the information of shareholders of Putnam Focused International Equity Fund. It may also be used as sales literature when preceded or accompanied by the current prospectus, the most recent copy of Putnam’s Quarterly Performance Summary, and Putnam’s Quarterly Ranking Summary. For more recent performance, please visit putnam.com. Investors should carefully consider the investment objectives, risks, charges, and expenses of a fund, which are described in its prospectus. For this and other information or to request a prospectus or summary prospectus, call 1-800-225-1581 toll free. Please read the prospectus carefully before investing. The fund’s Statement of Additional Information contains additional information about the fund’s Trustees and is available without charge upon request by calling 1-800-225-1581.

| Item 2. Code of Ethics: |
| Not applicable |
| Item 3. Audit Committee Financial Expert: |
| Not applicable |
| Item 4. Principal Accountant Fees and Services: |
| Not applicable |
| Item 5. Audit Committee of Listed Registrants |
| Not applicable |
| Item 6. Schedule of Investments: |
| The registrant's schedule of investments in unaffiliated issuers is included in the report to shareholders in Item 1 above. |
| Item 7. Disclosure of Proxy Voting Policies and Procedures For Closed-End Management Investment Companies: |
| Not applicable |
| Item 8. Portfolio Managers of Closed-End Investment Companies |
| Not Applicable |
| Item 9. Purchases of Equity Securities by Closed-End Management Investment Companies and Affiliated Purchasers: |
| Not applicable |
| Item 10. Submission of Matters to a Vote of Security Holders: |
| Not applicable |
| Item 11. Controls and Procedures: |
| (a) The registrant's principal executive officer and principal financial officer have concluded, based on their evaluation of the effectiveness of the design and operation of the registrant's disclosure controls and procedures as of a date within 180 days of the filing date of this report, that the design and operation of such procedures are generally effective to provide reasonable assurance that information required to be disclosed by the registrant in this report is recorded, processed, summarized and reported within the time periods specified in the Commission's rules and forms. |
| (b) Changes in internal control over financial reporting: Not applicable |
| Item 12. Disclosures of Securities Lending Activities for Closed-End Investment Companies: |
| Not Applicable |
| Item 13. Exhibits: |
| (a)(1) Not applicable |
| (b) The certifications required by Rule 30a-2(b) under the Investment Company Act of 1940, as amended, are filed herewith. |
| SIGNATURES |
| Pursuant to the requirements of the Securities Exchange Act of 1934 and the Investment Company Act of 1940, the registrant has duly caused this report to be signed on its behalf by the undersigned, thereunto duly authorized. |
| Putnam Focused International Equity Fund |
| By (Signature and Title): |
| /s/ Janet C. Smith Janet C. Smith Principal Accounting Officer |
| Date: June 28, 2021 |
| Pursuant to the requirements of the Securities Exchange Act of 1934 and the Investment Company Act of 1940, this report has been signed below by the following persons on behalf of the registrant and in the capacities and on the dates indicated. |
| By (Signature and Title): |
| /s/ Jonathan S. Horwitz Jonathan S. Horwitz Principal Executive Officer |
| Date: June 28, 2021 |
| By (Signature and Title): |
| /s/ Janet C. Smith Janet C. Smith Principal Financial Officer |
| Date: June 28, 2021 |