| UNITED STATES SECURITIES AND EXCHANGE COMMISSION | ||
| Washington, D.C. 20549 | ||
FORM N-CSR | ||
| CERTIFIED SHAREHOLDER REPORT OF REGISTERED MANAGEMENT INVESTMENT COMPANIES | ||
| Investment Company Act file number: | (811-01403) |
| Exact name of registrant as specified in charter: | Putnam Global Equity Fund |
| Address of principal executive offices: | One Post Office Square, Boston, Massachusetts 02109 |
| Name and address of agent for service: | Robert T. Burns, Vice President One Post Office Square Boston, Massachusetts 02109 |
| Copy to: | John W. Gerstmayr, Esq. Ropes & Gray LLP 800 Boylston Street Boston, Massachusetts 02199-3600 |
| Registrant’s telephone number, including area code: | (617) 292-1000 |
| Date of fiscal year end: | October 31, 2014 |
| Date of reporting period: | November 1, 2013 — April 30, 2014 |
Item 1. Report to Stockholders: |
| The following is a copy of the report transmitted to stockholders pursuant to Rule 30e-1 under the Investment Company Act of 1940: | |||
Putnam
Global Equity
Fund
Semiannual report
4 | 30 | 14
| Message from the Trustees | 1 | ||
|
|
|||
| About the fund | 2 | ||
|
|
|||
| Performance snapshot | 4 | ||
|
|
|||
| Interview with your fund’s portfolio manager | 5 | ||
|
|
|||
| Your fund’s performance | 11 | ||
|
|
|||
| Your fund’s expenses | 13 | ||
|
|
|||
| Terms and definitions | 15 | ||
|
|
|||
| Other information for shareholders | 16 | ||
|
|
|||
| Financial statements | 17 | ||
|
|
|||
| Shareholder meeting results | 44 | ||
|
|
|||
Consider these risks before investing: International investing involves currency, economic, and political risks. Emerging-market securities carry illiquidity and volatility risks. Investments in small and/or midsize companies increase the risk of greater price fluctuations. Growth stocks may be more susceptible to earnings disappointments, and value stocks may fail to rebound. Risks associated with derivatives include increased investment exposure (which may be considered leverage) and, in the case of over-the-counter instruments, the potential inability to terminate or sell derivatives positions and the potential failure of the other party to the instrument to meet its obligations. Stock prices may fall or fail to rise over time for several reasons, including general financial market conditions and factors related to a specific issuer or industry. You can lose money by investing in the fund.
Message from the Trustees
Dear Fellow Shareholder:
Global stock markets continue to advance, albeit at a slower pace than in 2013, as the recovery in economies around the world progresses.
In the United States, recent improvements in the vital areas of employment, manufacturing, and consumer sales appear to have returned the economy to its upward trajectory. Likewise, capital spending by businesses — a key variable needed to support continued economic expansion — has risen. This strength, along with the leadership transition at the Federal Reserve, has fueled debate about future monetary policy.
In this environment, we believe Putnam’s commitment to active fundamental research and new ways of thinking can serve the best interests of investors. We are pleased to report that this commitment has played a positive role in investment performance. Barron’s has ranked Putnam second among 55 fund families based on total return across asset classes for the five years ending in December 2013.
We also believe that it is worthwhile to meet with your financial advisor periodically to discuss the range of strategies that Putnam offers. Your advisor can help you assess your individual needs, time horizon, and risk tolerance — crucial considerations as you work toward your investment goals.


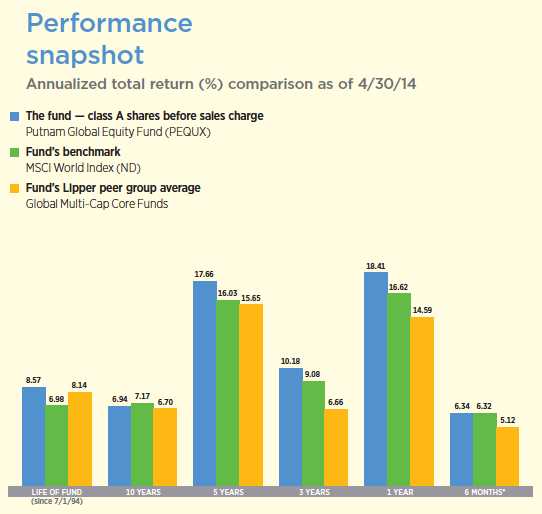
Current performance may be lower or higher than the quoted past performance, which cannot guarantee future results. Share price, principal value, and return will fluctuate, and you may have a gain or a loss when you sell your shares. Performance of class A shares assumes reinvestment of distributions and does not account for taxes. Fund returns in the bar chart do not reflect a sales charge of 5.75%; had they, returns would have been lower. See pages 5 and 11–13 for additional performance information. For a portion of the periods, the fund had expense limitations, without which returns would have been lower. To obtain the most recent month-end performance, visit putnam.com.
* Returns for the six-month period are not annualized, but cumulative.
| 4 | Global Equity Fund |
Interview with your fund’s portfolio manager

How would you describe the global investment environment over the past six months?
Leading up to the start of the period, developed market economies performed very well. However, uncertainties crept back into the market at the turn of the year, which caused a number of markets to pull back. In the United States, for example, economic strength was somewhat masked by harsh winter weather, while a number of uncertainties in Federal Reserve policy were introduced under the new Fed Chair, Janet Yellen.
In Europe, similar questions about the central bank’s course of action clouded the markets somewhat, even as deflation and anemic economic growth posed an increasingly real risk to the eurozone’s sluggish recovery. Having said that, government bond yields dropped sharply in a number of peripheral European economies, which may be supportive of equity markets going forward.
In Japan, while the economy had been improved over a low base for more than a year, a recent consumption tax rate hike may potentially lead to some fallout in terms of scaled-back demand. At this point, the worst fears about a drop in consumption aren’t materializing.
On top of this, the increased geopolitical tensions between Russia and the West over Russia’s actions in Ukraine have intensified some of the uncertainties plaguing the

This comparison shows your fund’s performance in the context of broad market indexes for the six months ended 4/30/14. See pages 4 and 11–13 for additional fund performance information. Index descriptions can be found on page 15.
| Global Equity Fund | 5 |
markets. And yet, despite all of these downward pressures in the first few months of 2014, global markets have largely been flat to somewhat positive, which I believe is a testimony to the markets’ growing resilience — including the fund’s holdings, which helped the fund keep pace with the benchmark.
What helped the markets stay above water?
I think the continued low-interest-rate environment is the biggest factor. In addition, we saw better growth in developed markets than we saw over the past three to four years. The growth may not have been as dramatic as some observers were hoping, but it’s still better than we have seen for some time.
In light of better growth, as well as cheaper capital in some areas of Europe, companies are becoming more confident and eager to grow in scale. This has led to a substantial pickup in M&A [merger-and-acquisition] activity, which tends to be supportive of equity prices.
How have low interest rates — which in some markets have been low for some time — prompted the rise in M&A activity?
There is a growing concern that if interest rates are at historic lows today, they will have to rise in the future — potentially the near future. This means that CEOs and corporate boardrooms are realizing that the most attractive deal-financing windows are open now, but maybe they won’t be open or as attractive for long. In addition, companies are finding it quite tempting to see that in many large deals today, both the target company’s stock price and the acquiring company’s stock price tend to rise, where typically the target company is the only near-term stock-price beneficiary.
In typical M&A activity, moreover, we tend to see larger companies buying smaller

Allocations are shown as a percentage of the fund’s net assets as of 4/30/14. Short-term investments and net other assets, if any, represent the market value weights of cash, derivatives, short-term securities, and other unclassified assets in the portfolio. Summary information may differ from the information in the portfolio schedule notes included in the financial statements due to the inclusion of derivative securities, any interest accruals, and the exclusion of as-of trades, if any. Holdings and allocations may vary over time.
| 6 | Global Equity Fund |
companies. But today, we’re seeing big companies buying or attempting to buy other big companies, sometimes with significant tax advantages sweetening the deal. A few of the notable recent M&A proposals and rumored announcements include names like Pfizer and AstraZeneca; AT&T and DirecTV; Comcast and Time Warner; and Sprint and T-Mobile.

Some of these deals may not happen — and a common defense of an unwilling target is to go out and buy another company itself, activity that boosts the overall level of M&A. With respect to the recent large deals, a number of them appear to run upward of $50 billion. All of these developments are helping large-cap stocks in general, propelling them to outperform smaller and more growth-oriented stocks.
Which stocks or strategies were the primary contributors to performance?
U.S.-based Micron Technology, one of the fund’s top 10 holdings, was the top contributor to results. This semiconductor manufacturer benefited from healthy DRAM [dynamic random access memory] prices. Overall, the company is using this pricing strength to reduce debt on its balance sheet and improve its profit margins. As there has been some consolidation in this industry, we believe Micron has potentially accessed a new level of sustainably higher profitability.
Another top 10 holding, the U.K. pharmaceutical company, AstraZeneca, benefited from an attempt by Pfizer, another global
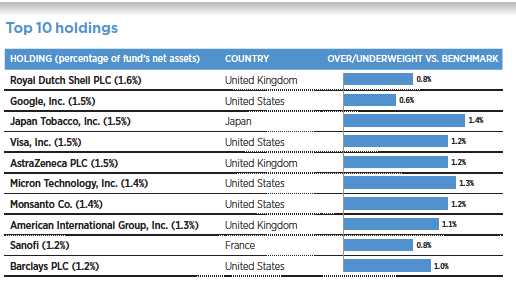
This table shows the fund’s top 10 holdings by percentage of the fund’s net assets as of 4/30/14. Short-term holdings and derivatives, if any, are excluded. Holdings may vary over time.
| Global Equity Fund | 7 |
pharmaceutical company, to buy it out. At the moment, AstaZeneca’s stock price has retreated somewhat after its management team rebuffed Pfizer’s offer, but the chance of an eventual buyout remains reasonable, in our view. In general, we believe this highlights the value in AstraZeneca’s existing business as well as its pipeline of cancer drugs.
Exposures to European financials helped early in the period, but tended to decline in value as the period wore on. Unipol, an Italian financial company, is one such example of a contributor that lost some of its momentum. Others include the Portugal-based Banco Espirito Santo, and two Italian banks, Unione Di Banche Italiane and Unicredit. These companies benefited from a number of factors, including the decline of sovereign bond spreads, the stabilization of their respective economies, and the passage of the European financial industry through the worst part of the cycle related to Europe’s sovereign debt crisis.
Which stocks or strategies detracted from returns?
The largest detractor from returns was the stock of Catamaran, a provider of pharmacy benefit management services and health-care information technology solutions. During the period, Catamaran’s management decided to invest more in improving its information technology infrastructure and customer service, which took a toll on the company’s earnings. We trimmed the fund’s exposure to the company.
Samsung, the South Korean technology company and direct competitor — and chip supplier — to Apple, lost ground in the face of the market’s anticipation of Apple’s 2014 product launches. Curiously, Samsung and Toshiba, another chip maker that is also a holding and a detractor during the period,
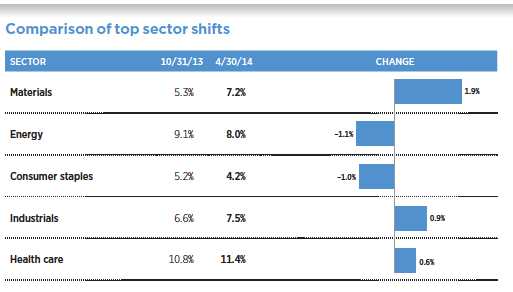
This chart shows the fund’s largest allocation shifts, by percentage, over the past six months. Allocations are shown as a percentage of the fund’s net assets. Current period summary information may differ from the portfolio schedule included in the financial statements due to the inclusion of derivative securities, any interest accruals, the exclusion of as-of trades, if any, and the use of different classifications of securities for presentation purposes. Holdings and allocations may vary over time.
| 8 | Global Equity Fund |
both benefited — much like Micron — from improving pricing in DRAM during the period, though not enough to stop their stock prices from sliding. We added to our position in Toshiba and maintain a somewhat smaller position in Samsung.
Groupon, a discount e-commerce company, also detracted from the fund’s returns. We believe this company is in turnaround mode. It continues to grow its revenues and has a business model that we consider promising for the way it capitalizes on two types of customers: the vendors whose products and services it advertises as well as the end customer who can benefit from Groupon’s discounting features. We added to this position as the stock price pulled back.
What is your outlook for global equity markets?
In general, we have sought to take advantage of cases where we see indiscriminate selling, adding to existing positions that we think are fundamentally strong. We would not be surprised to see a return to equilibrium between growth stocks and more value-oriented names in the coming quarters. Some stocks have fallen by 20 to 30 percent in just a few months, and this decline does not appear to be caused by a fundamental change in corporate outlooks. In some cases, valuations of these lagging performers were stretched, but that was not particularly the case for the fund’s holdings.
For global markets, softer economic data from China pose an important risk, as do various political transitions in emerging-market countries such as India, Indonesia, and Brazil. Political regime change is rarely a seamless process, so there is room for economic and market disappointments. In addition, a number of emerging-market countries, including India, Indonesia, Brazil, Russia, and Turkey, have had to raise interest rates to stem capital outflows from their countries. Ultimately, this can have a negative impact on growth, so we remain watchful with respect to these risks and continue to be on the lookout for opportunities.
Thank you, Shep, for this update on the fund.
The views expressed in this report are exclusively those of Putnam Management and are subject to change. They are not meant as investment advice.
Please note that the holdings discussed in this report may not have been held by the fund for the entire period. Portfolio composition is subject to review in accordance with the fund’s investment strategy and may vary in the future. Current and future portfolio holdings are subject to risk.
Portfolio Manager Shep Perkins is Co-Head of International Equities at Putnam. He has a B.A. from Amherst College. He joined Putnam in 2011 and has been in the investment industry since 1993.
| Global Equity Fund | 9 |
IN THE NEWS
An anticipated boom in capital spending by U.S. businesses may provide the nation’s economy with a much-needed boost in 2014. Capital expenditures this year are expected to increase by 10.3% among manufacturing companies and 10.8% among non-manufacturers, according to a recent forecast by the Business Survey Committee of the Institute for Supply Management (ISM). A rise in business investment — upgrading factories and industrial buildings, as well as buying new equipment and machinery — could provide a major catalyst to economic and corporate earnings growth. Since the 2008 financial crisis, most companies with extra cash have deployed it to repair balance sheets or have returned it to shareholders through stock buybacks or higher dividends. Today, some investors would rather see companies devote that capital to expand their operations.
| 10 | Global Equity Fund |
Your fund’s performance
This section shows your fund’s performance, price, and distribution information for periods ended April 30, 2014, the end of the first half of its current fiscal year. In accordance with regulatory requirements for mutual funds, we also include performance information as of the most recent calendar quarter-end and expense information taken from the fund’s current prospectus. Performance should always be considered in light of a fund’s investment strategy. Data represent past performance. Past performance does not guarantee future results. More recent returns may be less or more than those shown. Investment return and principal value will fluctuate, and you may have a gain or a loss when you sell your shares. Performance information does not reflect any deduction for taxes a shareholder may owe on fund distributions or on the redemption of fund shares. For the most recent month-end performance, please visit the Individual Investors section at putnam.com or call Putnam at 1-800-225-1581. Class R, class R5, class R6, and class Y shares are not available to all investors. See the Terms and Definitions section in this report for definitions of the share classes offered by your fund.
Fund performance Total return for periods ended 4/30/14
| Class A | Class B | Class C | Class M | Class R | Class R5 | Class R6 | Class Y | |||||
| (inception dates) | (7/1/94) | (7/1/94) | (2/1/99) | (7/3/95) | (1/21/03) | (7/2/12) | (7/2/12) | (9/23/02) | ||||
|
| ||||||||||||
| Before | After | Before | After | Net | Net | Net | Net | |||||
| sales | sales | Before | After | Before | After | sales | sales | asset | asset | asset | asset | |
| charge | charge | CDSC | CDSC | CDSC | CDSC | charge | charge | value | value | value | value | |
|
| ||||||||||||
| Annual average | ||||||||||||
| (life of fund) | 8.57% | 8.24% | 8.29% | 8.29% | 7.80% | 7.80% | 8.08% | 7.88% | 8.31% | 8.73% | 8.74% | 8.73% |
|
| ||||||||||||
| 10 years | 95.54 | 84.29 | 84.16 | 84.16 | 81.39 | 81.39 | 86.02 | 79.51 | 90.81 | 101.00 | 101.29 | 100.66 |
| Annual average | 6.94 | 6.30 | 6.30 | 6.30 | 6.14 | 6.14 | 6.40 | 6.03 | 6.67 | 7.23 | 7.25 | 7.21 |
|
| ||||||||||||
| 5 years | 125.47 | 112.51 | 117.25 | 115.25 | 116.95 | 116.95 | 119.81 | 112.12 | 122.77 | 128.87 | 129.19 | 128.49 |
| Annual average | 17.66 | 16.27 | 16.79 | 16.57 | 16.75 | 16.75 | 17.06 | 16.23 | 17.37 | 18.01 | 18.04 | 17.97 |
|
| ||||||||||||
| 3 years | 33.76 | 26.07 | 30.81 | 27.81 | 30.77 | 30.77 | 31.79 | 27.17 | 32.71 | 35.08 | 35.27 | 34.85 |
| Annual average | 10.18 | 8.03 | 9.36 | 8.52 | 9.35 | 9.35 | 9.64 | 8.34 | 9.89 | 10.54 | 10.59 | 10.48 |
|
| ||||||||||||
| 1 year | 18.41 | 11.60 | 17.59 | 12.59 | 17.48 | 16.48 | 17.90 | 13.78 | 18.17 | 18.78 | 18.90 | 18.73 |
|
| ||||||||||||
| 6 months | 6.34 | 0.23 | 5.99 | 0.99 | 5.86 | 4.86 | 6.06 | 2.35 | 6.20 | 6.45 | 6.56 | 6.55 |
|
| ||||||||||||
Current performance may be lower or higher than the quoted past performance, which cannot guarantee future results. After-sales-charge returns for class A and M shares reflect the deduction of the maximum 5.75% and 3.50% sales charge, respectively, levied at the time of purchase. Class B share returns after contingent deferred sales charge (CDSC) reflect the applicable CDSC, which is 5% in the first year, declining over time to 1% in the sixth year, and is eliminated thereafter. Class C share returns after CDSC reflect a 1% CDSC for the first year that is eliminated thereafter. Class R, R5, R6, and Y shares have no initial sales charge or CDSC. Performance for class C, M, R, and Y shares before their inception is derived from the historical performance of class A shares, adjusted for the applicable sales charge (or CDSC) and the higher operating expenses for such shares, except for class Y shares, for which 12b-1 fees are not applicable. Performance for class R5 and R6 shares prior to their inception is derived from the historical performance of class Y shares and has not been adjusted for the lower investor servicing fees applicable to class R5 and R6 shares; had it, returns would have been higher.
Recent performance may have benefited from one or more legal settlements.
For a portion of the periods, the fund had expense limitations, without which returns would have been lower.
Class B share performance reflects conversion to class A shares after eight years.
| Global Equity Fund | 11 |
Comparative index returns For periods ended 4/30/14
| Lipper Global Multi-Cap Core Funds | ||
| MSCI World Index (ND) | category average* | |
|
| ||
| Annual average (life of fund) | 6.98% | 8.14% |
|
| ||
| 10 years | 99.77 | 92.09 |
| Annual average | 7.17 | 6.70 |
|
| ||
| 5 years | 110.28 | 107.81 |
| Annual average | 16.03 | 15.65 |
|
| ||
| 3 years | 29.78 | 21.83 |
| Annual average | 9.08 | 6.66 |
|
| ||
| 1 year | 16.62 | 14.59 |
|
| ||
| 6 months | 6.32 | 5.12 |
|
| ||
Index and Lipper results should be compared with fund performance before sales charge, before CDSC, or at net asset value.
* Over the 6-month, 1-year, 3-year, 5-year, 10-year, and life-of-fund periods ended 4/30/14, there were 180, 171, 128, 104, 49, and 6 funds, respectively, in this Lipper category.
Fund price and distribution information For the six-month period ended 4/30/14
| Distributions | Class A | Class B | Class C | Class M | Class R | Class R5 | Class R6 | Class Y | ||
|
| ||||||||||
| Number | 1 | — | — | — | 1 | 1 | 1 | 1 | ||
|
| ||||||||||
| Income | $0.054 | — | — | — | $0.029 | $0.095 | $0.108 | $0.084 | ||
|
| ||||||||||
| Capital gains | — | — | — | — | — | — | — | — | ||
|
| ||||||||||
| Total | $0.054 | — | — | — | $0.029 | $0.095 | $0.108 | $0.084 | ||
|
| ||||||||||
| Before | After | Net | Net | Before | After | Net | Net | Net | Net | |
| sales | sales | asset | asset | sales | sales | asset | asset | asset | asset | |
| Share value | charge | charge | value | value | charge | charge | value | value | value | value |
|
| ||||||||||
| 10/31/13 | $12.07 | $12.81 | $10.85 | $11.43 | $11.55 | $11.97 | $11.94 | $12.52 | $12.52 | $12.47 |
|
| ||||||||||
| 4/30/14 | 12.78 | 13.56 | 11.50 | 12.10 | 12.25 | 12.69 | 12.65 | 13.23 | 13.23 | 13.20 |
|
| ||||||||||
The classification of distributions, if any, is an estimate. Before-sales-charge share value and current dividend rate for class A and M shares, if applicable, do not take into account any sales charge levied at the time of purchase. After-sales-charge share value, current dividend rate, and current 30-day SEC yield, if applicable, are calculated assuming that the maximum sales charge (5.75% for class A shares and 3.50% for class M shares) was levied at the time of purchase. Final distribution information will appear on your year-end tax forms.
| 12 | Global Equity Fund |
Fund performance as of most recent calendar quarter
Total return for periods ended 3/31/14
| Class A | Class B | Class C | Class M | Class R | Class R5 | Class R6 | Class Y | |||||
| (inception dates) | (7/1/94) | (7/1/94) | (2/1/99) | (7/3/95) | (1/21/03) | (7/2/12) | (7/2/12) | (9/23/02) | ||||
|
| ||||||||||||
| Before | After | Before | After | Net | Net | Net | Net | |||||
| sales | sales | Before | After | Before | After | sales | sales | asset | asset | asset | asset | |
| charge | charge | CDSC | CDSC | CDSC | CDSC | charge | charge | value | value | value | value | |
|
| ||||||||||||
| Annual average | ||||||||||||
| (life of fund) | 8.63% | 8.30% | 8.35% | 8.35% | 7.86% | 7.86% | 8.13% | 7.94% | 8.36% | 8.79% | 8.80% | 8.78% |
|
| ||||||||||||
| 10 years | 90.08 | 79.15 | 79.02 | 79.02 | 76.41 | 76.41 | 80.78 | 74.46 | 85.35 | 95.40 | 95.68 | 95.07 |
| Annual average | 6.63 | 6.00 | 6.00 | 6.00 | 5.84 | 5.84 | 6.10 | 5.72 | 6.37 | 6.93 | 6.94 | 6.91 |
|
| ||||||||||||
| 5 years | 146.69 | 132.50 | 137.48 | 135.48 | 137.55 | 137.55 | 140.29 | 131.88 | 143.33 | 149.97 | 150.32 | 149.55 |
| Annual average | 19.79 | 18.38 | 18.88 | 18.68 | 18.89 | 18.89 | 19.16 | 18.32 | 19.46 | 20.11 | 20.14 | 20.07 |
|
| ||||||||||||
| 3 years | 39.44 | 31.42 | 36.24 | 33.24 | 36.18 | 36.18 | 37.22 | 32.42 | 38.30 | 40.67 | 40.87 | 40.43 |
| Annual average | 11.72 | 9.54 | 10.86 | 10.04 | 10.84 | 10.84 | 11.12 | 9.81 | 11.41 | 12.05 | 12.10 | 11.98 |
|
| ||||||||||||
| 1 year | 21.54 | 14.55 | 20.56 | 15.56 | 20.52 | 19.52 | 20.83 | 16.60 | 21.12 | 21.84 | 21.96 | 21.80 |
|
| ||||||||||||
| 6 months | 10.41 | 4.06 | 9.90 | 4.90 | 9.95 | 8.95 | 10.12 | 6.26 | 10.22 | 10.47 | 10.58 | 10.49 |
|
| ||||||||||||
See the discussion following the Fund performance table on page 11 for information about the calculation of fund performance.
Your fund’s expenses
As a mutual fund investor, you pay ongoing expenses, such as management fees, distribution fees (12b-1 fees), and other expenses. Using the following information, you can estimate how these expenses affect your investment and compare them with the expenses of other funds. You may also pay one-time transaction expenses, including sales charges (loads) and redemption fees, which are not shown in this section and would have resulted in higher total expenses. For more information, see your fund’s prospectus or talk to your financial representative.
Expense ratios
| Class A | Class B | Class C | Class M | Class R | Class R5 | Class R6 | Class Y | |
|
| ||||||||
| Total annual operating expenses for | ||||||||
| the fiscal year ended 10/31/13 | 1.33% | 2.08% | 2.08% | 1.83% | 1.58% | 0.97% | 0.87% | 1.08% |
|
| ||||||||
| Annualized expense ratio for the | ||||||||
| six-month period ended 4/30/14* | 1.31% | 2.06% | 2.06% | 1.81% | 1.56% | 0.99% | 0.89% | 1.06% |
|
| ||||||||
Fiscal-year expense information in this table is taken from the most recent prospectus, is subject to change, and may differ from that shown for the annualized expense ratio and in the financial highlights of this report.
Expenses are shown as a percentage of average net assets.
* Includes an increase of 0.06% from annualizing the performance fee adjustment for the six months ended 4/30/14.
| Global Equity Fund | 13 |
Expenses per $1,000
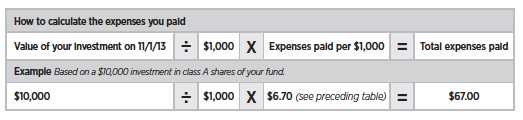
The following table shows the expenses you would have paid on a $1,000 investment in the fund from November 1, 2013, to April 30, 2014. It also shows how much a $1,000 investment would be worth at the close of the period, assuming actual returns and expenses.
| Class A | Class B | Class C | Class M | Class R | Class R5 | Class R6 | Class Y | |
|
| ||||||||
| Expenses paid per $1,000*† | $6.70 | $10.52 | $10.51 | $9.25 | $7.98 | $5.07 | $4.56 | $5.43 |
|
| ||||||||
| Ending value (after expenses) | $1,063.40 | $1,059.90 | $1,058.60 | $1,060.60 | $1,062.00 | $1,064.50 | $1,065.60 | $1,065.50 |
|
| ||||||||
* Expenses for each share class are calculated using the fund’s annualized expense ratio for each class, which represents the ongoing expenses as a percentage of average net assets for the six months ended 4/30/14. The expense ratio may differ for each share class.
† Expenses are calculated by multiplying the expense ratio by the average account value for the period; then multiplying the result by the number of days in the period; and then dividing that result by the number of days in the year.
Estimate the expenses you paid
To estimate the ongoing expenses you paid for the six months ended April 30, 2014, use the following calculation method. To find the value of your investment on November 1, 2013, call Putnam at 1-800-225-1581.
Compare expenses using the SEC’s method
The Securities and Exchange Commission (SEC) has established guidelines to help investors assess fund expenses. Per these guidelines, the following table shows your fund’s expenses based on a $1,000 investment, assuming a hypothetical 5% annualized return. You can use this information to compare the ongoing expenses (but not transaction expenses or total costs) of investing in the fund with those of other funds. All mutual fund shareholder reports will provide this information to help you make this comparison. Please note that you cannot use this information to estimate your actual ending account balance and expenses paid during the period.
| Class A | Class B | Class C | Class M | Class R | Class R5 | Class R6 | Class Y | |
|
| ||||||||
| Expenses paid per $1,000*† | $6.56 | $10.29 | $10.29 | $9.05 | $7.80 | $4.96 | $4.46 | $5.31 |
|
| ||||||||
| Ending value (after expenses) | $1,018.30 | $1,014.58 | $1,014.58 | $1,015.82 | $1,017.06 | $1,019.89 | $1,020.38 | $1,019.54 |
|
| ||||||||
* Expenses for each share class are calculated using the fund’s annualized expense ratio for each class, which represents the ongoing expenses as a percentage of average net assets for the six months ended 4/30/14. The expense ratio may differ for each share class.
† Expenses are calculated by multiplying the expense ratio by the average account value for the six-month period; then multiplying the result by the number of days in the six-month period; and then dividing that result by the number of days in the year.
| 14 | Global Equity Fund |
Terms and definitions
Important terms
Total return shows how the value of the fund’s shares changed over time, assuming you held the shares through the entire period and reinvested all distributions in the fund.
Before sales charge, or net asset value, is the price, or value, of one share of a mutual fund, without a sales charge. Before-sales-charge figures fluctuate with market conditions, and are calculated by dividing the net assets of each class of shares by the number of outstanding shares in the class.
After sales charge is the price of a mutual fund share plus the maximum sales charge levied at the time of purchase. After-sales-charge performance figures shown here assume the 5.75% maximum sales charge for class A shares and 3.50% for class M shares.
Contingent deferred sales charge (CDSC) is generally a charge applied at the time of the redemption of class B or C shares and assumes redemption at the end of the period. Your fund’s class B CDSC declines over time from a 5% maximum during the first year to 1% during the sixth year. After the sixth year, the CDSC no longer applies. The CDSC for class C shares is 1% for one year after purchase.
Share classes
Class A shares are generally subject to an initial sales charge and no CDSC (except on certain redemptions of shares bought without an initial sales charge).
Class B shares are not subject to an initial sales charge. They may be subject to a CDSC.
Class C shares are not subject to an initial sales charge and are subject to a CDSC only if the shares are redeemed during the first year.
Class M shares have a lower initial sales charge and a higher 12b-1 fee than class A shares and no CDSC (except on certain redemptions of shares bought without an initial sales charge).
Class R shares are not subject to an initial sales charge or CDSC and are available only to certain employer-sponsored retirement plans.
Class R5 shares and class R6 shares are not subject to an initial sales charge or CDSC, and carry no 12b-1 fee. They are only available to certain employer-sponsored retirement plans.
Class Y shares are not subject to an initial sales charge or CDSC, and carry no 12b-1 fee. They are generally only available to corporate and institutional clients and clients in other approved programs.
Comparative indexes
Barclays U.S. Aggregate Bond Index is an unmanaged index of U.S. investment-grade fixed-income securities.
BofA Merrill Lynch U.S. 3-Month Treasury Bill Index is an unmanaged index that seeks to measure the performance of U.S. Treasury bills available in the marketplace.
MSCI World Index (ND) is an unmanaged index of equity securities from developed countries.
S&P 500 Index is an unmanaged index of common stock performance.
Indexes assume reinvestment of all distributions and do not account for fees. Securities and performance of a fund and an index will differ. You cannot invest directly in an index.
Lipper is a third-party industry-ranking entity that ranks mutual funds. Its rankings do not reflect sales charges. Lipper rankings are based on total return at net asset value relative to other funds that have similar current investment styles or objectives as determined by Lipper. Lipper may change a fund’s category assignment at its discretion. Lipper category averages reflect performance trends for funds within a category.
| Global Equity Fund | 15 |
Other information for shareholders
Important notice regarding delivery of shareholder documents
In accordance with Securities and Exchange Commission (SEC) regulations, Putnam sends a single copy of annual and semiannual shareholder reports, prospectuses, and proxy statements to Putnam shareholders who share the same address, unless a shareholder requests otherwise. If you prefer to receive your own copy of these documents, please call Putnam at 1-800-225-1581, and Putnam will begin sending individual copies within 30 days.
Proxy voting
Putnam is committed to managing our mutual funds in the best interests of our shareholders. The Putnam funds’ proxy voting guidelines and procedures, as well as information regarding how your fund voted proxies relating to portfolio securities during the 12-month period ended June 30, 2013, are available in the Individual Investors section of putnam.com, and on the SEC’s website, www.sec.gov. If you have questions about finding forms on the SEC’s website, you may call the SEC at 1-800-SEC-0330. You may also obtain the Putnam funds’ proxy voting guidelines and procedures at no charge by calling Putnam’s Shareholder Services at 1-800-225-1581.
Fund portfolio holdings
The fund will file a complete schedule of its portfolio holdings with the SEC for the first and third quarters of each fiscal year on Form N-Q. Shareholders may obtain the fund’s Forms N-Q on the SEC’s website at www.sec.gov. In addition, the fund’s Forms N-Q may be reviewed and copied at the SEC’s Public Reference Room in Washington, D.C. You may call the SEC at 1-800-SEC-0330 for information about the SEC’s website or the operation of the Public Reference Room.
Trustee and employee fund ownership
Putnam employees and members of the Board of Trustees place their faith, confidence, and, most importantly, investment dollars in Putnam mutual funds. As of April 30, 2014, Putnam employees had approximately $458,000,000 and the Trustees had approximately $110,000,000 invested in Putnam mutual funds. These amounts include investments by the Trustees’ and employees’ immediate family members as well as investments through retirement and deferred compensation plans.
| 16 | Global Equity Fund |
Financial statements
A guide to financial statements
These sections of the report, as well as the accompanying Notes, constitute the fund’s financial statements.
The fund’s portfolio lists all the fund’s investments and their values as of the last day of the reporting period. Holdings are organized by asset type and industry sector, country, or state to show areas of concentration and diversification.
Statement of assets and liabilities shows how the fund’s net assets and share price are determined. All investment and non-investment assets are added together. Any unpaid expenses and other liabilities are subtracted from this total. The result is divided by the number of shares to determine the net asset value per share, which is calculated separately for each class of shares. (For funds with preferred shares, the amount subtracted from total assets includes the liquidation preference of preferred shares.)
Statement of operations shows the fund’s net investment gain or loss. This is done by first adding up all the fund’s earnings — from dividends and interest income — and subtracting its operating expenses to determine net investment income (or loss). Then, any net gain or loss the fund realized on the sales of its holdings — as well as any unrealized gains or losses over the period — is added to or subtracted from the net investment result to determine the fund’s net gain or loss for the fiscal period.
Statement of changes in net assets shows how the fund’s net assets were affected by the fund’s net investment gain or loss, by distributions to shareholders, and by changes in the number of the fund’s shares. It lists distributions and their sources (net investment income or realized capital gains) over the current reporting period and the most recent fiscal year-end. The distributions listed here may not match the sources listed in the Statement of operations because the distributions are determined on a tax basis and may be paid in a different period from the one in which they were earned. Dividend sources are estimated at the time of declaration. Actual results may vary. Any non-taxable return of capital cannot be determined until final tax calculations are completed after the end of the fund’s fiscal year.
Financial highlights provide an overview of the fund’s investment results, per-share distributions, expense ratios, net investment income ratios, and portfolio turnover in one summary table, reflecting the five most recent reporting periods. In a semiannual report, the highlights table also includes the current reporting period.
| Global Equity Fund | 17 |
The fund’s portfolio 4/30/14 (Unaudited)
| COMMON STOCKS (99.2%)* | Shares | Value |
|
| ||
| Aerospace and defense (1.1%) | ||
| General Dynamics Corp. | 44,100 | $4,826,745 |
|
| ||
| Northrop Grumman Corp. | 46,200 | 5,613,762 |
|
| ||
| 10,440,507 | ||
| Airlines (0.9%) | ||
| American Airlines Group, Inc. † | 112,500 | 3,945,375 |
|
| ||
| Spirit Airlines, Inc. † | 83,100 | 4,723,404 |
|
| ||
| 8,668,779 | ||
| Auto components (0.6%) | ||
| Faurecia (France) † | 129,525 | 5,829,305 |
|
| ||
| 5,829,305 | ||
| Automobiles (2.1%) | ||
| Mazda Motor Corp. (Japan) † | 878,000 | 3,924,024 |
|
| ||
| Nissan Motor Co., Ltd. (Japan) | 532,300 | 4,566,093 |
|
| ||
| Toyota Motor Corp. (Japan) | 100,000 | 5,403,678 |
|
| ||
| Yamaha Motor Co., Ltd. (Japan) | 390,700 | 6,026,408 |
|
| ||
| 19,920,203 | ||
| Banks (8.4%) | ||
| Banco Espirito Santo SA (Portugal) † S | 5,094,785 | 9,083,269 |
|
| ||
| Bank of America Corp. | 399,600 | 6,049,944 |
|
| ||
| Barclays PLC (United Kingdom) | 2,752,508 | 11,735,936 |
|
| ||
| Credicorp, Ltd. (Peru) S | 36,800 | 5,492,400 |
|
| ||
| Erste Group Bank AG (Czech Republic) | 192,648 | 6,490,109 |
|
| ||
| Grupo Financiero Banorte SAB de CV (Mexico) | 782,300 | 5,195,700 |
|
| ||
| Metro Bank PLC (acquired 1/15/14, cost $2,776,744) (Private) | ||
| (United Kingdom) † ∆∆ F | 130,448 | 2,788,068 |
|
| ||
| Natixis (France) | 1,110,047 | 7,891,384 |
|
| ||
| Societe Generale SA (France) | 63,301 | 3,941,712 |
|
| ||
| UniCredit SpA (Italy) | 1,201,313 | 10,773,598 |
|
| ||
| Unione di Banche Italiane ScpA (Italy) | 552,073 | 5,272,141 |
|
| ||
| Zions Bancorp. | 172,300 | 4,982,916 |
|
| ||
| 79,697,177 | ||
| Beverages (1.2%) | ||
| Britvic PLC (United Kingdom) | 534,146 | 6,547,290 |
|
| ||
| Remy Cointreau SA (France) S | 49,418 | 4,348,545 |
|
| ||
| 10,895,835 | ||
| Biotechnology (1.7%) | ||
| Celgene Corp. † | 57,800 | 8,497,178 |
|
| ||
| Gilead Sciences, Inc. † | 91,500 | 7,181,835 |
|
| ||
| 15,679,013 | ||
| Building products (1.0%) | ||
| Fortune Brands Home & Security, Inc. | 124,571 | 4,964,154 |
|
| ||
| Masco Corp. | 235,300 | 4,727,177 |
|
| ||
| 9,691,331 | ||
| Capital markets (3.2%) | ||
| Blackstone Group LP (The) | 171,491 | 5,064,129 |
|
| ||
| Charles Schwab Corp. (The) | 260,100 | 6,905,655 |
|
| ||
| Morgan Stanley | 358,100 | 11,076,033 |
|
| ||
| Carlyle Group LP (The) | 228,300 | 7,323,864 |
|
| ||
| 30,369,681 | ||
| Chemicals (4.4%) | ||
| Airgas, Inc. | 34,400 | 3,655,344 |
|
| ||
| Axiall Corp. | 170,529 | 7,946,651 |
|
| ||
| 18 | Global Equity Fund |
| COMMON STOCKS (99.2%)* cont. | Shares | Value |
|
| ||
| Chemicals cont. | ||
| Monsanto Co. | 118,500 | $13,117,950 |
|
| ||
| Solvay SA (Belgium) S | 35,975 | 5,838,364 |
|
| ||
| Tronox, Ltd. Class A | 196,481 | 4,813,785 |
|
| ||
| Wacker Chemie AG (Germany) | 48,506 | 5,696,598 |
|
| ||
| 41,068,692 | ||
| Commercial services and supplies (0.4%) | ||
| Regus PLC (United Kingdom) | 1,073,287 | 3,798,583 |
|
| ||
| 3,798,583 | ||
| Communications equipment (0.7%) | ||
| Alcatel-Lucent ADR (France) † | 1,703,500 | 6,643,650 |
|
| ||
| 6,643,650 | ||
| Construction and engineering (0.6%) | ||
| Mota-Engil SGPS SA (Portugal) | 776,127 | 5,943,363 |
|
| ||
| 5,943,363 | ||
| Construction materials (1.3%) | ||
| Cemex SAB de CV ADR (Mexico) S | 394,368 | 4,984,812 |
|
| ||
| HeidelbergCement AG (Germany) | 78,899 | 6,840,403 |
|
| ||
| 11,825,215 | ||
| Consumer finance (1.3%) | ||
| Ally Financial, Inc. † F | 188,170 | 4,544,306 |
|
| ||
| Credit Saison Co., Ltd. (Japan) | 358,700 | 7,682,724 |
|
| ||
| 12,227,030 | ||
| Containers and packaging (1.3%) | ||
| MeadWestvaco Corp. | 141,600 | 5,532,312 |
|
| ||
| Sealed Air Corp. | 182,600 | 6,265,006 |
|
| ||
| 11,797,318 | ||
| Diversified financial services (3.2%) | ||
| Challenger, Ltd. (Australia) | 969,560 | 6,380,382 |
|
| ||
| CME Group, Inc. | 149,900 | 10,551,461 |
|
| ||
| Eurazeo SA (France) | 50,514 | 4,260,917 |
|
| ||
| ING Groep NV GDR (Netherlands) † | 627,446 | 8,963,156 |
|
| ||
| 30,155,916 | ||
| Diversified telecommunication services (0.4%) | ||
| Koninklijke (Royal) KPN NV (Netherlands) † | 1,050,811 | 3,738,733 |
|
| ||
| 3,738,733 | ||
| Electronic equipment, instruments, and components (0.6%) | ||
| Hitachi, Ltd. (Japan) | 830,000 | 5,901,218 |
|
| ||
| 5,901,218 | ||
| Energy equipment and services (2.3%) | ||
| Ezion Holdings, Ltd. (Singapore) | 5,693,200 | 10,337,561 |
|
| ||
| Halliburton Co. | 104,400 | 6,584,508 |
|
| ||
| Petrofac, Ltd. (United Kingdom) | 190,789 | 4,696,260 |
|
| ||
| 21,618,329 | ||
| Health-care equipment and supplies (0.5%) | ||
| St. Jude Medical, Inc. | 74,000 | 4,696,780 |
|
| ||
| 4,696,780 | ||
| Health-care providers and services (1.7%) | ||
| Capital Senior Living Corp. † | 215,853 | 5,338,045 |
|
| ||
| Catamaran Corp. † | 168,200 | 6,349,550 |
|
| ||
| LifePoint Hospitals, Inc. † | 80,600 | 4,507,152 |
|
| ||
| 16,194,747 | ||
| Hotels, restaurants, and leisure (2.7%) | ||
| Dalata Hotel Group, Ltd. (Ireland) † | 442,999 | 1,788,470 |
|
| ||
| Grand Korea Leisure Co., Ltd. (South Korea) | 103,120 | 4,309,161 |
|
| ||
| Global Equity Fund | 19 |
| COMMON STOCKS (99.2%)* cont. | Shares | Value |
|
| ||
| Hotels, restaurants, and leisure cont. | ||
| NH Hoteles SA (Spain) † | 577,838 | $3,701,143 |
|
| ||
| Thomas Cook Group PLC (United Kingdom) † | 3,190,987 | 9,437,860 |
|
| ||
| TUI Travel PLC (United Kingdom) | 855,870 | 6,193,880 |
|
| ||
| 25,430,514 | ||
| Household durables (5.4%) | ||
| Coway Co., Ltd. (South Korea) | 73,255 | 5,775,614 |
|
| ||
| Haier Electronics Group Co., Ltd. (China) | 1,417,000 | 3,480,599 |
|
| ||
| Hovnanian Enterprises, Inc. Class A † S | 868,200 | 3,872,172 |
|
| ||
| Panasonic Corp. (Japan) | 593,000 | 6,490,274 |
|
| ||
| Persimmon PLC (United Kingdom) | 174,745 | 3,888,648 |
|
| ||
| PulteGroup, Inc. | 237,100 | 4,360,269 |
|
| ||
| Sekisui House, Ltd. (Japan) | 408,300 | 4,899,790 |
|
| ||
| Standard Pacific Corp. † | 470,135 | 3,756,379 |
|
| ||
| Taylor Morrison Home Corp. Class A † | 204,973 | 4,347,477 |
|
| ||
| Techtronic Industries Co. (Hong Kong) | 1,579,500 | 5,032,929 |
|
| ||
| Whirlpool Corp. | 35,200 | 5,398,976 |
|
| ||
| 51,303,127 | ||
| Independent power and renewable electricity producers (0.5%) | ||
| NRG Energy, Inc. | 145,000 | 4,744,400 |
|
| ||
| 4,744,400 | ||
| Industrial conglomerates (1.6%) | ||
| Siemens AG (Germany) | 35,959 | 4,740,625 |
|
| ||
| Toshiba Corp. (Japan) | 2,761,000 | 10,802,206 |
|
| ||
| 15,542,831 | ||
| Insurance (4.8%) | ||
| American International Group, Inc. | 237,823 | 12,635,536 |
|
| ||
| Assured Guaranty, Ltd. | 170,200 | 4,069,482 |
|
| ||
| Genworth Financial, Inc. Class A † | 430,500 | 7,684,425 |
|
| ||
| Hartford Financial Services Group, Inc. (The) | 232,400 | 8,336,188 |
|
| ||
| Prudential PLC (United Kingdom) | 342,591 | 7,880,112 |
|
| ||
| Unipol Gruppo Finanziario SpA (Preference) (Italy) | 683,678 | 4,518,373 |
|
| ||
| 45,124,116 | ||
| Internet and catalog retail (0.6%) | ||
| Bigfoot GmbH (acquired 8/2/13, cost $857,248) (Private) | ||
| (Brazil) † ∆∆ F | 39 | 582,175 |
|
| ||
| Groupon, Inc. † S | 467,500 | 3,267,825 |
|
| ||
| Zalando AG (acquired 9/30/13, cost $1,479,680) (Private) | ||
| (Germany) † ∆∆ F | 66 | 1,494,924 |
|
| ||
| 5,344,924 | ||
| Internet software and services (4.1%) | ||
| Facebook, Inc. Class A † | 195,500 | 11,686,990 |
|
| ||
| Google, Inc. Class C † | 27,502 | 14,484,203 |
|
| ||
| Telecity Group PLC (United Kingdom) | 438,073 | 5,312,875 |
|
| ||
| Yahoo!, Inc. † | 210,400 | 7,563,880 |
|
| ||
| 39,047,948 | ||
| IT Services (2.0%) | ||
| Computer Sciences Corp. | 76,400 | 4,521,352 |
|
| ||
| Visa, Inc. Class A | 69,900 | 14,162,439 |
|
| ||
| 18,683,791 | ||
| Leisure products (0.8%) | ||
| Brunswick Corp. | 108,500 | 4,360,615 |
|
| ||
| Sega Sammy Holdings, Inc. (Japan) | 173,600 | 3,491,045 |
|
| ||
| 7,851,660 | ||
| 20 | Global Equity Fund |
| COMMON STOCKS (99.2%)* cont. | Shares | Value |
|
| ||
| Machinery (0.7%) | ||
| Mota-Engil Africa (Rights) (Portugal) † F | 687,645 | $357,751 |
|
| ||
| Volvo AB Class B (Sweden) | 408,203 | 6,451,426 |
|
| ||
| 6,809,177 | ||
| Media (4.6%) | ||
| Atresmedia Corporacion de Medios de Comunicacion SA (Spain) † | 449,899 | 6,462,217 |
|
| ||
| Comcast Corp. Class A | 140,000 | 7,246,400 |
|
| ||
| DISH Network Corp. Class A † | 147,300 | 8,375,478 |
|
| ||
| Global Mediacom Tbk PT (Indonesia) | 24,840,500 | 4,707,816 |
|
| ||
| Liberty Global PLC Class A (United Kingdom) † S | 111,500 | 4,439,930 |
|
| ||
| Mediaset SpA (Italy) † | 1,085,000 | 6,003,204 |
|
| ||
| Numericable Group SA (France) † S | 131,072 | 6,251,415 |
|
| ||
| 43,486,460 | ||
| Multi-utilities (0.6%) | ||
| Veolia Environnement SA (France) S | 301,207 | 5,622,206 |
|
| ||
| 5,622,206 | ||
| Multiline retail (0.4%) | ||
| Mitra Adiperkasa Tbk PT (Indonesia) | 6,510,800 | 3,587,022 |
|
| ||
| 3,587,022 | ||
| Oil, gas, and consumable fuels (5.7%) | ||
| BG Group PLC (United Kingdom) | 444,518 | 9,008,520 |
|
| ||
| Cabot Oil & Gas Corp. | 109,400 | 4,297,232 |
|
| ||
| Gaztransport Et Technigaz SA (France) † | 61,170 | 4,238,116 |
|
| ||
| Genel Energy PLC (United Kingdom) † | 360,050 | 5,898,900 |
|
| ||
| Kodiak Oil & Gas Corp. † | 523,400 | 6,652,414 |
|
| ||
| Marathon Oil Corp. | 129,500 | 4,681,425 |
|
| ||
| Origin Energy, Ltd. (Australia) | 281,302 | 3,903,110 |
|
| ||
| Royal Dutch Shell PLC Class A (United Kingdom) | 378,141 | 14,936,027 |
|
| ||
| 53,615,744 | ||
| Paper and forest products (0.4%) | ||
| Norbord, Inc. (Canada) | 145,495 | 3,564,199 |
|
| ||
| 3,564,199 | ||
| Personal products (0.4%) | ||
| Coty, Inc. Class A | 253,100 | 4,062,255 |
|
| ||
| 4,062,255 | ||
| Pharmaceuticals (7.3%) | ||
| Allergan, Inc. | 28,100 | 4,660,104 |
|
| ||
| Astellas Pharma, Inc. (Japan) | 897,500 | 9,980,511 |
|
| ||
| AstraZeneca PLC (United Kingdom) | 176,628 | 13,951,906 |
|
| ||
| Bristol-Myers Squibb Co. | 172,500 | 8,640,525 |
|
| ||
| Impax Laboratories, Inc. † | 169,500 | 4,432,425 |
|
| ||
| Jazz Pharmaceuticals PLC † | 34,000 | 4,586,600 |
|
| ||
| Novartis AG (Switzerland) | 58,547 | 5,088,043 |
|
| ||
| Sanofi (France) | 108,964 | 11,749,128 |
|
| ||
| Valeant Pharmaceuticals International, Inc. † | 42,700 | 5,709,417 |
|
| ||
| 68,798,659 | ||
| Professional services (0.5%) | ||
| Experian PLC (United Kingdom) | 231,778 | 4,454,456 |
|
| ||
| 4,454,456 | ||
| Real estate investment trusts (REITs) (1.8%) | ||
| Altisource Residential Corp. (Virgin Islands) | 142,647 | 4,011,234 |
|
| ||
| Gaming and Leisure Properties, Inc. | 143,144 | 5,260,542 |
|
| ||
| Hibernia REIT PLC (Ireland) † | 5,788,046 | 8,032,138 |
|
| ||
| 17,303,914 | ||
| Global Equity Fund | 21 |
| COMMON STOCKS (99.2%)* cont. | Shares | Value |
|
| ||
| Real estate management and development (2.0%) | ||
| Forestar Group, Inc. † | 226,018 | $3,853,607 |
|
| ||
| Howard Hughes Corp. (The) † | 39,700 | 5,667,572 |
|
| ||
| Iguatemi Empresa de Shopping Centers SA (Brazil) | 404,541 | 4,022,278 |
|
| ||
| RE/MAX Holdings, Inc. Class A | 201,057 | 5,673,829 |
|
| ||
| 19,217,286 | ||
| Semiconductors and semiconductor equipment (4.5%) | ||
| Applied Materials, Inc. | 323,200 | 6,160,192 |
|
| ||
| Inotera Memories, Inc. (Taiwan) † | 5,439,000 | 5,590,510 |
|
| ||
| Lam Research Corp. † | 104,600 | 6,026,006 |
|
| ||
| Micron Technology, Inc. † | 521,300 | 13,616,356 |
|
| ||
| Samsung Electronics Co., Ltd. (South Korea) | 8,827 | 11,504,826 |
|
| ||
| 42,897,890 | ||
| Software (1.0%) | ||
| Electronic Arts, Inc. † | 199,900 | 5,657,170 |
|
| ||
| Fidessa Group PLC (United Kingdom) | 108,002 | 4,089,246 |
|
| ||
| 9,746,416 | ||
| Specialty retail (2.7%) | ||
| Home Depot, Inc. (The) | 73,600 | 5,851,936 |
|
| ||
| Industria de Diseno Textil (Inditex) SA (Spain) | 56,250 | 8,460,522 |
|
| ||
| Lowe’s Cos., Inc. | 131,100 | 6,018,801 |
|
| ||
| Sears Hometown and Outlet Stores, Inc. † | 98,500 | 2,325,585 |
|
| ||
| Tile Shop Holdings, Inc. † S | 209,582 | 2,954,058 |
|
| ||
| 25,610,902 | ||
| Thrifts and mortgage finance (0.7%) | ||
| Radian Group, Inc. | 492,700 | 6,887,946 |
|
| ||
| 6,887,946 | ||
| Tobacco (2.6%) | ||
| Japan Tobacco, Inc. (Japan) | 439,900 | 14,438,758 |
|
| ||
| Philip Morris International, Inc. | 122,200 | 10,439,546 |
|
| ||
| 24,878,304 | ||
| Trading companies and distributors (0.5%) | ||
| Mitsubishi Corp. (Japan) | 281,600 | 5,034,645 |
|
| ||
| 5,034,645 | ||
| Wireless telecommunication services (1.4%) | ||
| SoftBank Corp. (Japan) | 123,000 | 9,129,883 |
|
| ||
| Vodafone Group PLC ADR (United Kingdom) | 116,981 | 4,440,602 |
|
| ||
| 13,570,485 | ||
| Total common stocks (cost $820,962,788) | $939,022,682 | |
| SHORT-TERM INVESTMENTS (3.9%)* | Principal amount/shares | Value |
|
| ||
| Putnam Cash Collateral Pool, LLC 0.18% d | 35,149,839 | $35,149,839 |
|
| ||
| Putnam Short Term Investment Fund 0.06% L | 1,732,102 | 1,732,102 |
|
| ||
| U.S. Treasury Bills with an effective yield of 0.13%, | ||
| December 11, 2014 ∆ | $170,000 | 169,945 |
|
| ||
| U.S. Treasury Bills with an effective yield of 0.11%, | ||
| October 16, 2014 | 100,000 | 99,980 |
|
| ||
| U.S. Treasury Bills with an effective yield of 0.10%, May 29, 2014 | 150,000 | 149,988 |
|
| ||
| Total short-term investments (cost $37,301,741) | $37,301,854 | |
| TOTAL INVESTMENTS | ||
|
| ||
| Total investments (cost $858,264,529) | $976,324,536 | |
| 22 | Global Equity Fund |
Key to holding’s abbreviations
| ADR | American Depository Receipts: represents ownership of foreign securities on deposit with a |
| custodian bank | |
| GDR | Global Depository Receipts: represents ownership of foreign securities on deposit with a custodian bank |
Notes to the fund’s portfolio
Unless noted otherwise, the notes to the fund’s portfolio are for the close of the fund’s reporting period, which ran from November 1, 2013 through April 30, 2014 (the reporting period). Within the following notes to the portfolio, references to “ASC 820” represent Accounting Standards Codification 820 Fair Value Measurements and Disclosures and references to “OTC”, if any, represent over-the-counter.
* Percentages indicated are based on net assets of $946,222,697.
† Non-income-producing security.
∆∆ Security is restricted with regard to public resale. The total fair value of this security and any other restricted securities (excluding 144A securities), if any, held at the close of the reporting period was $4,865,167 or 0.5% of net assets.
∆ This security, in part or in entirety, was pledged and segregated with the custodian for collateral on certain derivative contracts at the close of the reporting period.
d Affiliated company. See Note 1 to the financial statements regarding securities lending. The rate quoted in the security description is the annualized 7-day yield of the fund at the close of the reporting period.
F Security is valued at fair value following procedures approved by the Trustees. Securities may be classified as Level 2 or Level 3 for ASC 820 based on the securities’ valuation inputs. At the close of the reporting period, fair value pricing was also used for certain foreign securities in the portfolio (Note 1).
L Affiliated company (Note 5). The rate quoted in the security description is the annualized 7-day yield of the fund at the close of the reporting period.
S Security on loan, in part or in entirety, at the close of the reporting period (Note 1).
At the close of the reporting period, the fund maintained liquid assets totaling $342,714 to cover certain derivatives contracts.
| DIVERSIFICATION BY COUNTRY ⌂ |
|
|
Distribution of investments by country of risk at the close of the reporting period, excluding collateral received, if any (as a percentage of Portfolio Value):
| United States | 46.8% | Ireland | 1.0% | |
|
|
| |||
| United Kingdom | 13.1 | Indonesia | 0.9 | |
|
|
| |||
| Japan | 10.4 | Czech Republic | 0.7 | |
|
|
| |||
| France | 6.5 | Sweden | 0.7 | |
|
|
| |||
| Italy | 2.8 | Belgium | 0.6 | |
|
|
| |||
| South Korea | 2.3 | Taiwan | 0.6 | |
|
|
| |||
| Germany | 2.0 | Peru | 0.6 | |
|
|
| |||
| Spain | 2.0 | Switzerland | 0.5 | |
|
|
| |||
| Portugal | 1.6 | Hong Kong | 0.5 | |
|
|
| |||
| Netherlands | 1.3 | Brazil | 0.5 | |
|
|
| |||
| Singapore | 1.1 | Other | 1.3 | |
|
|
| |||
| Australia | 1.1 | Total | 100.0% | |
|
|
||||
| Mexico | 1.1 | |||
|
|
||||
⌂ Methodology differs from that used for purposes of complying with the fund’s policy regarding investments in securities of foreign issuers, as discussed further in the fund’s prospectus.
| Global Equity Fund | 23 |
FORWARD CURRENCY CONTRACTS at 4/30/14 (aggregate face value $212,753,764) (Unaudited)
| Unrealized | ||||||
| Contract | Delivery | Aggregate | appreciation/ | |||
| Counterparty | Currency | type | date | Value | face value | (depreciation) |
|
| ||||||
| Barclays Bank PLC | ||||||
| British Pound | Sell | 6/18/14 | $6,826,568 | $6,749,229 | $(77,339) | |
|
| ||||||
| Hong Kong Dollar | Buy | 5/21/14 | 7,242,483 | 7,232,440 | 10,043 | |
|
| ||||||
| Japanese Yen | Sell | 5/21/14 | 6,675,843 | 6,725,047 | 49,204 | |
|
| ||||||
| Singapore Dollar | Sell | 5/21/14 | 2,670,165 | 2,625,177 | (44,988) | |
|
| ||||||
| Swedish Krona | Buy | 6/18/14 | 1,955,434 | 1,972,525 | (17,091) | |
|
| ||||||
| Swiss Franc | Buy | 6/18/14 | 10,933,738 | 10,841,204 | 92,534 | |
|
| ||||||
| Citibank, N.A. | ||||||
| Australian Dollar | Buy | 7/17/14 | 4,637,678 | 4,602,292 | 35,386 | |
|
| ||||||
| Canadian Dollar | Buy | 7/17/14 | 844,683 | 837,342 | 7,341 | |
|
| ||||||
| Danish Krone | Buy | 6/18/14 | 5,263,465 | 5,207,958 | 55,507 | |
|
| ||||||
| Euro | Sell | 6/18/14 | 19,576,036 | 19,470,918 | (105,118) | |
|
| ||||||
| Japanese Yen | Sell | 5/21/14 | 5,660,958 | 5,640,310 | (20,648) | |
|
| ||||||
| Credit Suisse International | ||||||
| Australian Dollar | Buy | 7/17/14 | 1,559,539 | 1,485,282 | 74,257 | |
|
| ||||||
| Canadian Dollar | Buy | 7/17/14 | 3,533,280 | 3,501,522 | 31,758 | |
|
| ||||||
| Swiss Franc | Buy | 6/18/14 | 12,546,849 | 12,439,261 | 107,588 | |
|
| ||||||
| Deutsche Bank AG | ||||||
| British Pound | Sell | 6/18/14 | 8,094,261 | 7,962,367 | (131,894) | |
|
| ||||||
| Canadian Dollar | Buy | 7/17/14 | 1,961,122 | 1,943,642 | 17,480 | |
|
| ||||||
| Euro | Sell | 6/18/14 | 16,034,651 | 15,906,802 | (127,849) | |
|
| ||||||
| Goldman Sachs International | ||||||
| Australian Dollar | Buy | 7/17/14 | 902,638 | 895,624 | 7,014 | |
|
| ||||||
| HSBC Bank USA, National Association | ||||||
| British Pound | Sell | 6/18/14 | 5,097,437 | 5,037,090 | (60,347) | |
|
| ||||||
| JPMorgan Chase Bank N.A. | ||||||
| Canadian Dollar | Buy | 7/17/14 | 1,551,758 | 1,538,212 | 13,546 | |
|
| ||||||
| Euro | Buy | 6/18/14 | 8,398,112 | 8,360,689 | 37,423 | |
|
| ||||||
| Norwegian Krone | Buy | 6/18/14 | 3,285,828 | 3,249,045 | 36,783 | |
|
| ||||||
| Singapore Dollar | Sell | 5/21/14 | 2,834,000 | 2,813,192 | (20,808) | |
|
| ||||||
| Swedish Krona | Buy | 6/18/14 | 4,533,112 | 4,515,619 | 17,493 | |
|
| ||||||
| State Street Bank and Trust Co. | ||||||
| Canadian Dollar | Buy | 7/17/14 | 2,629,674 | 2,605,694 | 23,980 | |
|
| ||||||
| Euro | Sell | 6/18/14 | 22,394,689 | 22,225,554 | (169,135) | |
|
| ||||||
| Israeli Shekel | Buy | 7/17/14 | 2,376,598 | 2,366,860 | 9,738 | |
|
| ||||||
| Japanese Yen | Sell | 5/21/14 | 11,088,705 | 11,133,053 | 44,348 | |
|
| ||||||
| UBS AG | ||||||
| British Pound | Sell | 6/18/14 | 6,274,664 | 6,201,094 | (73,570) | |
|
| ||||||
| Canadian Dollar | Buy | 7/17/14 | 731,118 | 725,750 | 5,368 | |
|
| ||||||
| Swiss Franc | Buy | 6/18/14 | 8,448,487 | 8,373,797 | 74,690 | |
|
| ||||||
| 24 | Global Equity Fund |
FORWARD CURRENCY CONTRACTS at 4/30/14 (aggregate face value $212,753,764) (Unaudited) cont.
| Unrealized | ||||||
| Contract | Delivery | Aggregate | appreciation/ | |||
| Counterparty | Currency | type | date | Value | face value | (depreciation) |
|
| ||||||
| WestPac Banking Corp. | ||||||
| British Pound | Sell | 6/18/14 | $6,936,949 | $6,854,537 | $(82,412) | |
|
| ||||||
| Canadian Dollar | Buy | 7/17/14 | 2,069,587 | 2,051,456 | 18,131 | |
|
| ||||||
| Euro | Sell | 6/18/14 | 8,742,693 | 8,663,180 | (79,513) | |
|
| ||||||
| Total | $(241,100) | |||||
ASC 820 establishes a three-level hierarchy for disclosure of fair value measurements. The valuation hierarchy is based upon the transparency of inputs to the valuation of the fund’s investments. The three levels are defined as follows:
Level 1: Valuations based on quoted prices for identical securities in active markets.
Level 2: Valuations based on quoted prices in markets that are not active or for which all significant inputs are observable, either directly or indirectly.
Level 3: Valuations based on inputs that are unobservable and significant to the fair value measurement.
The following is a summary of the inputs used to value the fund’s net assets as of the close of the reporting period:
| Valuation inputs | ||||
|
| ||||
| Investments in securities: | Level 1 | Level 2 | Level 3 | |
|
| ||||
| Common stocks*: | ||||
|
| ||||
| Consumer discretionary | $68,364,371 | $117,922,647 | $2,077,099 | |
|
| ||||
| Consumer staples | 14,501,801 | 25,334,593 | — | |
|
| ||||
| Energy | 26,453,695 | 48,780,378 | — | |
|
| ||||
| Financials | 130,744,741 | 107,450,257 | 2,788,068 | |
|
| ||||
| Health care | 64,599,611 | 40,769,588 | — | |
|
| ||||
| Industrials | 28,800,617 | 41,225,304 | 357,751 | |
|
| ||||
| Information technology | 90,522,238 | 32,398,675 | — | |
|
| ||||
| Materials | 49,880,059 | 18,375,365 | — | |
|
| ||||
| Telecommunication services | 4,440,602 | 12,868,616 | — | |
|
| ||||
| Utilities | 4,744,400 | 5,622,206 | — | |
|
| ||||
| Total common stocks | 483,052,135 | 450,747,629 | 5,222,918 | |
| Short-term investments | 1,732,102 | 35,569,752 | — | |
|
| ||||
| Totals by level | $484,784,237 | $486,317,381 | $5,222,918 | |
| Valuation inputs | ||||
|
| ||||
| Other financial instruments: | Level 1 | Level 2 | Level 3 | |
|
| ||||
| Forward currency contracts | $— | $(241,100) | $— | |
|
| ||||
| Totals by level | $— | $(241,100) | $— | |
* Common stock classifications are presented at the sector level, which may differ from the fund’s portfolio presentation.
At the start and close of the reporting period, Level 3 investments in securities were not considered a significant portion of the fund’s portfolio.
The accompanying notes are an integral part of these financial statements.
| Global Equity Fund | 25 |
Statement of assets and liabilities 4/30/14 (Unaudited)
| ASSETS | |
|
| |
| Investment in securities, at value, including $33,904,829 of securities on loan (Note 1): | |
| Unaffiliated issuers (identified cost $821,382,588) | $939,442,595 |
| Affiliated issuers (identified cost $36,881,941) (Notes 1 and 5) | 36,881,941 |
|
| |
| Dividends, interest and other receivables | 2,089,296 |
|
| |
| Foreign currency (cost $1,815) (Note 1) | 2,055 |
|
| |
| Receivable for shares of the fund sold | 1,871,383 |
|
| |
| Receivable for investments sold | 9,068,985 |
|
| |
| Unrealized appreciation on forward currency contracts (Note 1) | 769,612 |
|
| |
| Prepaid assets | 59,860 |
|
| |
| Foreign tax reclaim | 162,525 |
|
| |
| Total assets | 990,348,252 |
| LIABILITIES | |
|
| |
| Payable for investments purchased | 5,920,661 |
|
| |
| Payable for shares of the fund repurchased | 356,626 |
|
| |
| Payable for compensation of Manager (Note 2) | 557,743 |
|
| |
| Payable for custodian fees (Note 2) | 28,124 |
|
| |
| Payable for investor servicing fees (Note 2) | 120,024 |
|
| |
| Payable for Trustee compensation and expenses (Note 2) | 537,557 |
|
| |
| Payable for administrative services (Note 2) | 3,068 |
|
| |
| Payable for distribution fees (Note 2) | 211,809 |
|
| |
| Unrealized depreciation on forward currency contracts (Note 1) | 1,010,712 |
|
| |
| Collateral on securities loaned, at value (Note 1) | 35,149,839 |
|
| |
| Other accrued expenses | 229,392 |
|
| |
| Total liabilities | 44,125,555 |
| Net assets | $946,222,697 |
|
| |
| REPRESENTED BY | |
|
| |
| Paid-in capital (Unlimited shares authorized) (Notes 1 and 4) | $1,091,018,399 |
|
| |
| Undistributed net investment income (Note 1) | 4,568,216 |
|
| |
| Accumulated net realized loss on investments and foreign currency transactions (Note 1) | (267,190,271) |
|
| |
| Net unrealized appreciation of investments and assets and liabilities in foreign currencies | 117,826,353 |
|
| |
| Total — Representing net assets applicable to capital shares outstanding | $946,222,697 |
(Continued on next page)
| 26 | Global Equity Fund |
Statement of assets and liabilities (Continued)
| COMPUTATION OF NET ASSET VALUE AND OFFERING PRICE | |
|
| |
| Net asset value and redemption price per class A share | |
| ($852,341,107 divided by 66,671,061 shares) | $12.78 |
|
| |
| Offering price per class A share (100/94.25 of $12.78)* | $13.56 |
|
| |
| Net asset value and offering price per class B share ($18,954,298 divided by 1,648,353 shares)** | $11.50 |
|
| |
| Net asset value and offering price per class C share ($17,136,654 divided by 1,415,687 shares)** | $12.10 |
|
| |
| Net asset value and redemption price per class M share ($12,381,876 divided by 1,011,097 shares) | $12.25 |
|
| |
| Offering price per class M share (100/96.50 of $12.25)* | $12.69 |
|
| |
| Net asset value, offering price and redemption price per class R share | |
| ($1,307,835 divided by 103,397 shares) | $12.65 |
|
| |
| Net asset value, offering price and redemption price per class R5 share | |
| ($15,066 divided by 1,139 shares) | $13.23 |
|
| |
| Net asset value, offering price and redemption price per class R6 share | |
| ($10,426,347 divided by 787,889 shares) | $13.23 |
|
| |
| Net asset value, offering price and redemption price per class Y share | |
| ($33,659,514 divided by 2,550,846 shares) | $13.20 |
|
| |
* On single retail sales of less than $50,000. On sales of $50,000 or more the offering price is reduced.
** Redemption price per share is equal to net asset value less any applicable contingent deferred sales charge.
The accompanying notes are an integral part of these financial statements.
| Global Equity Fund | 27 |
Statement of operations Six months ended 4/30/14 (Unaudited)
| INVESTMENT INCOME | |
|
| |
| Dividends (net of foreign tax of $326,304) | $10,770,531 |
|
| |
| Interest (including interest income of $3,448 from investments in affiliated issuers) (Note 5) | 3,860 |
|
| |
| Securities lending (Note 1) | 74,297 |
|
| |
| Total investment income | 10,848,688 |
| EXPENSES | |
|
| |
| Compensation of Manager (Note 2) | 3,495,958 |
|
| |
| Investor servicing fees (Note 2) | 1,006,576 |
|
| |
| Custodian fees (Note 2) | 44,871 |
|
| |
| Trustee compensation and expenses (Note 2) | 33,654 |
|
| |
| Distribution fees (Note 2) | 1,269,710 |
|
| |
| Administrative services (Note 2) | 14,321 |
|
| |
| Other | 292,346 |
|
| |
| Total expenses | 6,157,436 |
| Expense reduction (Note 2) | (84,897) |
|
| |
| Net expenses | 6,072,539 |
| Net investment income | 4,776,149 |
|
| |
| Net realized gain on investments (Notes 1 and 3) | 74,016,326 |
|
| |
| Net realized loss on foreign currency transactions (Note 1) | (1,846,967) |
|
| |
| Net unrealized depreciation of assets and liabilities in foreign currencies during the period | (441,903) |
|
| |
| Net unrealized depreciation of investments during the period | (19,759,890) |
|
| |
| Net gain on investments | 51,967,566 |
| Net increase in net assets resulting from operations | $56,743,715 |
|
| |
The accompanying notes are an integral part of these financial statements.
| 28 | Global Equity Fund |
Statement of changes in net assets
| INCREASE IN NET ASSETS | Six months ended 4/30/14* | Year ended 10/31/13 |
|
| ||
| Operations: | ||
| Net investment income | $4,776,149 | $2,476,580 |
|
| ||
| Net realized gain on investments | ||
| and foreign currency transactions | 72,169,359 | 132,337,920 |
|
| ||
| Net unrealized appreciation (depreciation) of investments | ||
| and assets and liabilities in foreign currencies | (20,201,793) | 91,870,414 |
|
| ||
| Net increase in net assets resulting from operations | 56,743,715 | 226,684,914 |
|
| ||
| Distributions to shareholders (Note 1): | ||
| From ordinary income | ||
| Net investment income | ||
|
| ||
| Class A | (3,649,488) | (5,498,576) |
|
| ||
| Class B | — | (16,055) |
|
| ||
| Class C | — | (8,885) |
|
| ||
| Class M | — | (34,288) |
|
| ||
| Class R | (2,827) | (4,573) |
|
| ||
| Class R5 | (107) | (96) |
|
| ||
| Class R6 | (81,621) | (101) |
|
| ||
| Class Y | (198,620) | (271,513) |
|
| ||
| Increase in capital from settlement payments | 196,875 | — |
|
| ||
| Decrease from capital share transactions (Note 4) | (14,633,954) | (74,327,524) |
|
| ||
| Total increase in net assets | 38,373,973 | 146,523,303 |
| NET ASSETS | ||
|
| ||
| Beginning of period | 907,848,724 | 761,325,421 |
|
| ||
| End of period (including undistributed net investment | ||
| income of $4,568,216 and $3,724,730, respectively) | $946,222,697 | $907,848,724 |
|
| ||
* Unaudited.
The accompanying notes are an integral part of these financial statements.
| Global Equity Fund | 29 |
Financial highlights (For a common share outstanding throughout the period)
| INVESTMENT OPERATIONS: | LESS DISTRIBUTIONS: | RATIOS AND SUPPLEMENTAL DATA: | ||||||||||||
|
| ||||||||||||||
| Ratio | Ratio of | |||||||||||||
| Net realized | of expenses | net investment | ||||||||||||
| Net asset value, | and unrealized | Total from | From | Total return | Net assets, | to average | income (loss) | Portfolio | ||||||
| beginning | Net investment | gain (loss) | investment | net investment | Total | Redemption | Non-recurring | Net asset value, | at net asset | end of period | net assets | to average | turnover | |
| Period ended | of period | income (loss) a | on investments | operations | income | distributions | fees | reimbursements | end of period | value (%) b | (in thousands) | (%) c | net assets (%) | (%) |
|
| ||||||||||||||
| Class A | ||||||||||||||
| April 30, 2014** | $12.07 | .07 | .69 | .76 | (.05) | (.05) | — | — d,e | $12.78 | 6.34 * | $852,341 | .65 * | .52 * | 39 * |
| October 31, 2013 | 9.26 | .03 | 2.86 | 2.89 | (.08) | (.08) | — | — | 12.07 | 31.37 | 823,261 | 1.33 | .32 | 113 |
| October 31, 2012 | 8.55 | .05 | .87 | .92 | (.21) | (.21) | — | — e,f | 9.26 | 11.20 | 691,972 | 1.35 | .55 | 117 |
| October 31, 2011 | 8.41 | .09 | .13 | .22 | (.10) | (.10) | — e | .02 g,h | 8.55 | 2.85 | 721,575 | 1.38 | 1.02 | 87 |
| October 31, 2010 | 7.79 | .10 | .74 | .84 | (.22) | (.22) | — e | — e,i | 8.41 | 10.87 | 796,770 | 1.42 | 1.29 | 125 |
| October 31, 2009 | 6.55 | .15 | 1.10 j | 1.25 | (.01) | (.01) | — e | — e,k,l | 7.79 | 19.13 j | 821,586 | 1.42 m | 2.22 m | 105 |
|
| ||||||||||||||
| Class B | ||||||||||||||
| April 30, 2014** | $10.85 | .02 | .63 | .65 | — | — | — | — d,e | $11.50 | 5.99 * | $18,954 | 1.02 * | .15 * | 39 * |
| October 31, 2013 | 8.33 | (.04) | 2.57 | 2.53 | (.01) | (.01) | — | — | 10.85 | 30.36 | 20,407 | 2.08 | (.42) | 113 |
| October 31, 2012 | 7.69 | (.02) | .80 | .78 | (.14) | (.14) | — | — e,f | 8.33 | 10.43 | 19,831 | 2.10 | (.21) | 117 |
| October 31, 2011 | 7.57 | .02 | .11 | .13 | (.03) | (.03) | — e | .02 g,h | 7.69 | 2.01 | 24,597 | 2.13 | .25 | 87 |
| October 31, 2010 | 7.02 | .04 | .67 | .71 | (.16) | (.16) | — e | — e,i | 7.57 | 10.15 | 34,938 | 2.17 | .55 | 125 |
| October 31, 2009 | 5.94 | .09 | .99 j | 1.08 | — | — | — e | — e,k,l | 7.02 | 18.18 j | 48,621 | 2.17 m | 1.52 m | 105 |
|
| ||||||||||||||
| Class C | ||||||||||||||
| April 30, 2014** | $11.43 | .02 | .65 | .67 | — | — | — | — d,e | $12.10 | 5.86 * | $17,137 | 1.02 * | .17 * | 39 * |
| October 31, 2013 | 8.77 | (.04) | 2.71 | 2.67 | (.01) | (.01) | — | — | 11.43 | 30.43 | 13,638 | 2.08 | (.43) | 113 |
| October 31, 2012 | 8.10 | (.02) | .84 | .82 | (.15) | (.15) | — | — e,f | 8.77 | 10.38 | 11,460 | 2.10 | (.20) | 117 |
| October 31, 2011 | 7.97 | .02 | .13 | .15 | (.04) | (.04) | — e | .02 g,h | 8.10 | 2.14 | 11,987 | 2.13 | .27 | 87 |
| October 31, 2010 | 7.40 | .04 | .69 | .73 | (.16) | (.16) | — e | — e,i | 7.97 | 10.00 | 13,543 | 2.17 | .54 | 125 |
| October 31, 2009 | 6.26 | .09 | 1.05 j | 1.14 | — | — | — e | — e,k,l | 7.40 | 18.21 j | 14,315 | 2.17 m | 1.48 m | 105 |
|
| ||||||||||||||
| Class M | ||||||||||||||
| April 30, 2014** | $11.55 | .03 | .67 | .70 | — | — | — | — d,e | $12.25 | 6.06 * | $12,382 | .90 * | .27 * | 39 * |
| October 31, 2013 | 8.85 | (.02) | 2.75 | 2.73 | (.03) | (.03) | — | — | 11.55 | 30.91 | 12,378 | 1.83 | (.18) | 113 |
| October 31, 2012 | 8.18 | — e | .84 | .84 | (.17) | (.17) | — | — e,f | 8.85 | 10.59 | 11,050 | 1.85 | .05 | 117 |
| October 31, 2011 | 8.05 | .05 | .12 | .17 | (.06) | (.06) | — e | .02 g,h | 8.18 | 2.35 | 12,173 | 1.88 | .52 | 87 |
| October 31, 2010 | 7.47 | .06 | .70 | .76 | (.18) | (.18) | — e | — e,i | 8.05 | 10.29 | 13,348 | 1.92 | .79 | 125 |
| October 31, 2009 | 6.30 | .11 | 1.06 j | 1.17 | — | — | — e | — e,k,l | 7.47 | 18.57 j | 14,007 | 1.92 m | 1.72 m | 105 |
|
| ||||||||||||||
| Class R | ||||||||||||||
| April 30, 2014** | $11.94 | .05 | .69 | .74 | (.03) | (.03) | — | — d,e | $12.65 | 6.20 * | $1,308 | .77 * | .42 * | 39 * |
| October 31, 2013 | 9.15 | .01 | 2.83 | 2.84 | (.05) | (.05) | — | — | 11.94 | 31.14 | 1,194 | 1.58 | .07 | 113 |
| October 31, 2012 | 8.45 | .02 | .87 | .89 | (.19) | (.19) | — | — e,f | 9.15 | 10.85 | 884 | 1.60 | .28 | 117 |
| October 31, 2011 | 8.31 | .07 | .13 | .20 | (.08) | (.08) | — e | .02 g,h | 8.45 | 2.65 | 1,180 | 1.63 | .79 | 87 |
| October 31, 2010 | 7.70 | .08 | .73 | .81 | (.20) | (.20) | — e | — e,i | 8.31 | 10.64 | 1,246 | 1.67 | 1.03 | 125 |
| October 31, 2009 | 6.48 | .13 | 1.09 j | 1.22 | — | — | — e | — e,k,l | 7.70 | 18.83 j | 1,484 | 1.67 m | 1.94 m | 105 |
|
| ||||||||||||||
| Class R5 | ||||||||||||||
| April 30, 2014** | $12.52 | .09 | .72 | .81 | (.10) | (.10) | — | — d,e | $13.23 | 6.45 * | $15 | .49 * | .68 * | 39 * |
| October 31, 2013 | 9.56 | .08 | 2.97 | 3.05 | (.09) | (.09) | — | — | 12.52 | 32.10 | 14 | .97 | .69 | 113 |
| October 31, 2012† | 8.92 | .03 | .61 | .64 | — | — | — | — | 9.56 | 7.18 * | 11 | .31 * | .31 * | 117 |
|
| ||||||||||||||
| Class R6 | ||||||||||||||
| April 30, 2014** | $12.52 | .10 | .72 | .82 | (.11) | (.11) | — | — d,e | $13.23 | 6.56 * | $10,426 | .44 * | .74 * | 39* |
| October 31, 2013 | 9.56 | .09 | 2.96 | 3.05 | (.09) | (.09) | — | — | 12.52 | 32.16 | 9,404 | .87 | .76 | 113 |
| October 31, 2012† | 8.92 | .03 | .61 | .64 | — | — | — | — | 9.56 | 7.18 * | 11 | .28 * | .34 * | 117 |
|
| ||||||||||||||
See notes to financial highlights at the end of this section.
The accompanying notes are an integral part of these financial statements.
| 30 | Global Equity Fund | Global Equity Fund | 31 |
Financial highlights (Continued)
| INVESTMENT OPERATIONS: | LESS DISTRIBUTIONS: | RATIOS AND SUPPLEMENTAL DATA: | ||||||||||||
|
| ||||||||||||||
| Ratio | Ratio of | |||||||||||||
| Net realized | of expenses | net investment | ||||||||||||
| Net asset value, | and unrealized | Total from | From | Total return | Net assets, | to average | income (loss) | Portfolio | ||||||
| beginning | Net investment | gain (loss) | investment | net investment | Total | Redemption | Non-recurring | Net asset value, | at net asset | end of period | net assets | to average | turnover | |
| Period ended | of period | income (loss) a | on investments | operations | income | distributions | fees | reimbursements | end of period | value (%) b | (in thousands) | (%) c | net assets (%) | (%) |
|
| ||||||||||||||
| Class Y | ||||||||||||||
| April 30, 2014** | $12.47 | .09 | .72 | .81 | (.08) | (.08) | — | — d,e | $13.20 | 6.55 * | $33,660 | .52 * | .67 * | 39 * |
| October 31, 2013 | 9.56 | .06 | 2.95 | 3.01 | (.10) | (.10) | — | — | 12.47 | 31.76 | 27,553 | 1.08 | .56 | 113 |
| October 31, 2012 | 8.83 | .07 | .90 | .97 | (.24) | (.24) | — | — e,f | 9.56 | 11.39 | 26,107 | 1.10 | .78 | 117 |
| October 31, 2011 | 8.68 | .12 | .13 | .25 | (.12) | (.12) | — e | .02 g,h | 8.83 | 3.12 | 21,462 | 1.13 | 1.27 | 87 |
| October 31, 2010 | 8.02 | .13 | .76 | .89 | (.23) | (.23) | — e | — e,i | 8.68 | 11.30 | 20,286 | 1.17 | 1.54 | 125 |
| October 31, 2009 | 6.76 | .17 | 1.13 j | 1.30 | (.04) | (.04) | — e | — e,k,l | 8.02 | 19.34 j | 21,769 | 1.16 m | 2.51 m | 105 |
|
| ||||||||||||||
* Not annualized.
** Unaudited.
† For the period July 3, 2012 (commencement of operations) to October 31, 2012.
a Per share net investment income (loss) has been determined on the basis of the weighted average number of shares outstanding during the period.
b Total return assumes dividend reinvestment and does not reflect the effect of sales charges.
c Includes amounts paid through expense offset and brokerage/service arrangements (Note 2). Also excludes acquired fund fees, if any.
d Reflects a non-recurring reimbursement pursuant to a settlement between the Securities and Exchange Commission (the SEC) and Morgan Stanley and Co. which amounted to less than $0.01 per share outstanding on November 27, 2013.
e Amount represents less than $0.01 per share.
f Reflects a non-recurring reimbursement pursuant to a settlement between the SEC and Canadian Imperial Holdings, Inc. and CIBC World Markets Corp. which amounted to less than $0.01 per share outstanding on November 29, 2011.
g Reflects a non-recurring reimbursement related to restitution amounts in connection with a distribution plan approved by the SEC which amounted to $0.02 per share outstanding on July 21, 2011. Also reflects a non-recurring reimbursement related to short-term trading related lawsuits, which amounted to less than $0.01 per share outstanding on May 11, 2011.
h Reflects a non-recurring reimbursement pursuant to a settlement between the SEC and Zurich Capital Markets, Inc. which amounted to less than $0.01 per share outstanding on December 21, 2010.
i Reflects a non-recurring reimbursement pursuant to a settlement between the SEC and Prudential Securities, Inc. which amounted to less than $0.01 per share outstanding on March 30, 2010.
j Reflects a non-recurring litigation payment received by the fund from Tyco International, Ltd. which amounted to $0.06 per class share outstanding on March 13, 2009.
This payment resulted in an increase to total returns of 0.92% for the year ended October 31, 2009.
k Reflects a non-recurring reimbursement pursuant to a settlement between the SEC and Bear, Stearns & Co., Inc. and Bear, Stearns Securities Corp. which amounted to less than $0.01 per share outstanding on May 21, 2009.
l Reflects a non-recurring reimbursement pursuant to a settlement between the SEC and Millennium Partners, L.P., Millennium Management, L.L.C. and Millennium International Management, L.L.C. which amounted to less than $0.01 per share outstanding on June 23, 2009.
m Reflects an involuntary contractual expense limitation in effect during the period. As a result of such limitation, the expenses of each class reflect a reduction of 0.12% of average net assets as of October 31, 2009.
| The accompanying notes are an integral part of these financial statements. | The accompanying notes are an integral part of these financial statements. |
| 32 | Global Equity Fund | Global Equity Fund | 33 |
Notes to financial statements 4/30/14 (Unaudited)
Within the following Notes to financial statements, references to “State Street” represent State Street Bank and Trust Company, references to “the SEC” represent the Securities and Exchange Commission, references to “Putnam Management” represent Putnam Investment Management, LLC, the fund’s manager, an indirect wholly-owned subsidiary of Putnam Investments, LLC and references to “OTC”, if any, represent over-the-counter. Unless otherwise noted, the “reporting period” represents the period from November 1, 2013 through April 30, 2014.
Putnam Global Equity Fund (the fund) is a Massachusetts business trust, which is registered under the Investment Company Act of 1940, as amended, as a diversified open-end management investment company. The investment objective of the fund is to seek capital appreciation by investing mainly in common stocks (growth or value stocks or both) of large and midsize companies worldwide that Putnam Management believes have favorable investment potential. For example, we may purchase stocks of companies with stock prices that reflect a value lower than that which we place on the company. We may also consider other factors that we believe will cause the price to rise. The fund invests mainly in developed countries, but may invest in emerging markets. Putnam Management may consider, among other factors, a company’s valuation, financial strength, growth potential, competitive position in its industry, projected future earnings, cash flows and dividends when deciding whether to buy or sell investments.
The fund offers class A, class B, class C, class M, class R, class R5, class R6 and class Y shares. Class A and class M shares are sold with a maximum front-end sales charge of 5.75% and 3.50%, respectively, and generally do not pay a contingent deferred sales charge. Class B shares, which convert to class A shares after approximately eight years, do not pay a front-end sales charge and are subject to a contingent deferred sales charge if those shares are redeemed within six years of purchase. Class C shares have a one-year 1.00% contingent deferred sales charge and do not convert to class A shares. Class R shares, which are not available to all investors, are sold at net asset value. The expenses for class A, class B, class C, class M and class R shares may differ based on the distribution fee of each class, which is identified in Note 2. Class R5, class R6 and class Y shares, which are sold at net asset value, are generally subject to the same expenses as class A, class B, class C, class M and class R shares, but do not bear a distribution fee and in the case of class R5 and class R6 shares, bear a lower investor servicing fee, which is identified in Note 2. Class R5, class R6 and class Y shares are not available to all investors.
In the normal course of business, the fund enters into contracts that may include agreements to indemnify another party under given circumstances. The fund’s maximum exposure under these arrangements is unknown as this would involve future claims that may be, but have not yet been, made against the fund. However, the fund’s management team expects the risk of material loss to be remote.
Note 1: Significant accounting policies
The following is a summary of significant accounting policies consistently followed by the fund in the preparation of its financial statements. The preparation of financial statements is in conformity with accounting principles generally accepted in the United States of America and requires management to make estimates and assumptions that affect the reported amounts of assets and liabilities in the financial statements and the reported amounts of increases and decreases in net assets from operations. Actual results could differ from those estimates. Subsequent events after the Statement of assets and liabilities date through the date that the financial statements were issued have been evaluated in the preparation of the financial statements.
Investment income, realized and unrealized gains and losses and expenses of the fund are borne pro-rata based on the relative net assets of each class to the total net assets of the fund, except that each class bears expenses unique to that class (including the distribution fees applicable to such classes). Each class votes as a class only with respect to its own distribution plan or other matters on which a class vote is required by law or determined by the Trustees. If the fund were liquidated, shares of each class would receive their pro-rata share of the net assets of the fund. In addition, the Trustees declare separate dividends on each class of shares.
Security valuation Investments for which market quotations are readily available are valued at the last reported sales price on their principal exchange, or official closing price for certain markets, and are classified as Level 1 securities under Accounting Standards Codification 820 Fair Value Measurements and Disclosures (ASC 820). If no sales are reported, as in the case of some securities that are traded OTC, a security is valued at its last reported bid price and is generally categorized as a Level 2 security.
Investments in open-end investment companies (excluding exchange traded funds), if any, which can be classified as Level 1 or Level 2 securities, are valued based on their net asset value. The net asset value of such
| 34 | Global Equity Fund |
investment companies equals the total value of their assets less their liabilities and divided by the number of their outstanding shares.
Many securities markets and exchanges outside the U.S. close prior to the close of the New York Stock Exchange and therefore the closing prices for securities in such markets or on such exchanges may not fully reflect events that occur after such close but before the close of the New York Stock Exchange. Accordingly, on certain days, the fund will fair value foreign equity securities taking into account multiple factors including movements in the U.S. securities markets, currency valuations and comparisons to the valuation of American Depository Receipts, exchange-traded funds and futures contracts. These securities, which would generally be classified as Level 1 securities, will be transferred to Level 2 of the fair value hierarchy when they are valued at fair value. The number of days on which fair value prices will be used will depend on market activity and it is possible that fair value prices will be used by the fund to a significant extent. At the close of the reporting period, fair value pricing was used for certain foreign securities in the portfolio. Securities quoted in foreign currencies, if any, are translated into U.S. dollars at the current exchange rate. Short-term securities with remaining maturities of 60 days or less may be valued at amortized cost, which approximates fair value and are classified as Level 2 securities.
To the extent a pricing service or dealer is unable to value a security or provides a valuation that Putnam Management does not believe accurately reflects the security’s fair value, the security will be valued at fair value by Putnam Management in accordance with policies and procedures approved by the Trustees. Certain investments, including certain restricted and illiquid securities and derivatives, are also valued at fair value following procedures approved by the Trustees. These valuations consider such factors as significant market or specific security events such as interest rate or credit quality changes, various relationships with other securities, discount rates, U.S. Treasury, U.S. swap and credit yields, index levels, convexity exposures and recovery rates. These securities are classified as Level 2 or as Level 3 depending on the priority of the significant inputs.
Such valuations and procedures are reviewed periodically by the Trustees. The fair value of securities is generally determined as the amount that the fund could reasonably expect to realize from an orderly disposition of such securities over a reasonable period of time. By its nature, a fair value price is a good faith estimate of the value of a security in a current sale and does not reflect an actual market price, which may be different by a material amount.
Security transactions and related investment income Security transactions are recorded on the trade date (the date the order to buy or sell is executed). Gains or losses on securities sold are determined on the identified cost basis.
Interest income, net of any applicable withholding taxes, is recorded on the accrual basis. Dividend income, net of any applicable withholding taxes, is recognized on the ex-dividend date except that certain dividends from foreign securities, if any, are recognized as soon as the fund is informed of the ex-dividend date. Non-cash dividends, if any, are recorded at the fair value of the securities received. Dividends representing a return of capital or capital gains, if any, are reflected as a reduction of cost and/or as a realized gain.
All premiums/discounts are amortized/accreted on a yield-to-maturity basis.
Foreign currency translation The accounting records of the fund are maintained in U.S. dollars. The fair value of foreign securities, currency holdings, and other assets and liabilities is recorded in the books and records of the fund after translation to U.S. dollars based on the exchange rates on that day. The cost of each security is determined using historical exchange rates. Income and withholding taxes are translated at prevailing exchange rates when earned or incurred. The fund does not isolate that portion of realized or unrealized gains or losses resulting from changes in the foreign exchange rate on investments from fluctuations arising from changes in the market prices of the securities. Such gains and losses are included with the net realized and unrealized gain or loss on investments. Net realized gains and losses on foreign currency transactions represent net realized exchange gains or losses on closed forward currency contracts, disposition of foreign currencies, currency gains and losses realized between the trade and settlement dates on securities transactions and the difference between the amount of investment income and foreign withholding taxes recorded on the fund’s books and the U.S. dollar equivalent amounts actually received or paid. Net unrealized appreciation and depreciation of assets and liabilities in foreign currencies arise from changes in the value of open forward currency contracts and assets and liabilities other than investments at the period end, resulting from changes in the exchange rate.
Forward currency contracts The fund buys and sells forward currency contracts, which are agreements between two parties to buy and sell currencies at a set price on a future date. These contracts are used to hedge foreign exchange risk and to gain exposure on currency.
The U.S. dollar value of forward currency contracts is determined using current forward currency exchange rates supplied by a quotation service. The fair value of the contract will fluctuate with changes in currency exchange
| Global Equity Fund | 35 |
rates. The contract is marked to market daily and the change in fair value is recorded as an unrealized gain or loss. The fund records a realized gain or loss equal to the difference between the value of the contract at the time it was opened and the value at the time it was closed when the contract matures or by delivery of the currency. The fund could be exposed to risk if the value of the currency changes unfavorably, if the counterparties to the contracts are unable to meet the terms of their contracts or if the fund is unable to enter into a closing position. Risks may exceed amounts recognized on the Statement of assets and liabilities.
Forward currency contracts outstanding at period end, if any, are listed after the fund’s portfolio.
Master agreements The fund is a party to ISDA (International Swaps and Derivatives Association, Inc.) Master Agreements (Master Agreements) with certain counterparties that govern OTC derivative and foreign exchange contracts entered into from time to time. The Master Agreements may contain provisions regarding, among other things, the parties’ general obligations, representations, agreements, collateral requirements, events of default and early termination. With respect to certain counterparties, in accordance with the terms of the Master Agreements, collateral posted to the fund is held in a segregated account by the fund’s custodian and with respect to those amounts which can be sold or repledged, are presented in the fund’s portfolio. Collateral posted to the fund which cannot be sold or repledged totaled $193,909 at the close of the reporting period.
Collateral pledged by the fund is segregated by the fund’s custodian and identified in the fund’s portfolio. Collateral can be in the form of cash or debt securities issued by the U.S. Government or related agencies or other securities as agreed to by the fund and the applicable counterparty. Collateral requirements are determined based on the fund’s net position with each counterparty.
Termination events applicable to the fund may occur upon a decline in the fund’s net assets below a specified threshold over a certain period of time. Termination events applicable to counterparties may occur upon a decline in the counterparty’s long-term and short-term credit ratings below a specified level. In each case, upon occurrence, the other party may elect to terminate early and cause settlement of all derivative and foreign exchange contracts outstanding, including the payment of any losses and costs resulting from such early termination, as reasonably determined by the terminating party. Any decision by one or more of the fund’s counterparties to elect early termination could impact the fund’s future derivative activity.
At the close of the reporting period, the fund had a net liability position of $565,005 on open derivative contracts subject to the Master Agreements. Collateral posted by the fund at period end for these agreements totaled $139,944 and may include amounts related to unsettled agreements.
Securities lending The fund may lend securities, through its agent, to qualified borrowers in order to earn additional income. The loans are collateralized by cash in an amount at least equal to the fair value of the securities loaned. The fair value of securities loaned is determined daily and any additional required collateral is allocated to the fund on the next business day. The risk of borrower default will be borne by the fund’s agent; the fund will bear the risk of loss with respect to the investment of the cash collateral. Income from securities lending is included in investment income on the Statement of operations. Cash collateral is invested in Putnam Cash Collateral Pool, LLC, a limited liability company managed by an affiliate of Putnam Management. Investments in Putnam Cash Collateral Pool, LLC are valued at its closing net asset value each business day. There are no management fees charged to Putnam Cash Collateral Pool, LLC. At the close of the reporting period, the fund received cash collateral of $35,149,839 and the value of securities loaned amounted to $33,904,829.
Interfund lending The fund, along with other Putnam funds, may participate in an interfund lending program pursuant to an exemptive order issued by the SEC. This program allows the fund to borrow from or lend to other Putnam funds that permit such transactions. Interfund lending transactions are subject to each fund’s investment policies and borrowing and lending limits. Interest earned or paid on the interfund lending transaction will be based on the average of certain current market rates. During the reporting period, the fund did not utilize the program.
Line of credit The fund participates, along with other Putnam funds, in a $315 million unsecured committed line of credit and a $185 million unsecured uncommitted line of credit, both provided by State Street. Borrowings may be made for temporary or emergency purposes, including the funding of shareholder redemption requests and trade settlements. Interest is charged to the fund based on the fund’s borrowing at a rate equal to the Federal Funds rate plus 1.25% for the committed line of credit and the Federal Funds rate plus 1.30% for the uncommitted line of credit. A closing fee equal to 0.02% of the committed line of credit and $50,000 for the uncommitted line of credit has been paid by the participating funds. In addition, a commitment fee of 0.11% per annum on any unutilized portion of the committed line of credit is allocated to the participating funds based on their relative net assets and paid quarterly. During the reporting period, the fund had no borrowings against these arrangements.
| 36 | Global Equity Fund |
Federal taxes It is the policy of the fund to distribute all of its taxable income within the prescribed time period and otherwise comply with the provisions of the Internal Revenue Code of 1986, as amended (the Code), applicable to regulated investment companies. It is also the intention of the fund to distribute an amount sufficient to avoid imposition of any excise tax under Section 4982 of the Code.
The fund is subject to the provisions of Accounting Standards Codification 740 Income Taxes (ASC 740). ASC 740 sets forth a minimum threshold for financial statement recognition of the benefit of a tax position taken or expected to be taken in a tax return. The fund did not have a liability to record for any unrecognized tax benefits in the accompanying financial statements. No provision has been made for federal taxes on income, capital gains or unrealized appreciation on securities held nor for excise tax on income and capital gains. Each of the fund’s federal tax returns for the prior three fiscal years remains subject to examination by the Internal Revenue Service.
The fund may also be subject to taxes imposed by governments of countries in which it invests. Such taxes are generally based on either income or gains earned or repatriated. The fund accrues and applies such taxes to net investment income, net realized gains and net unrealized gains as income and/or capital gains are earned. In some cases, the fund may be entitled to reclaim all or a portion of such taxes, and such reclaim amounts, if any, are reflected as an asset on the fund’s books. In many cases, however, the fund may not receive such amounts for an extended period of time, depending on the country of investment.
At October 31, 2013, the fund had a capital loss carryover of $338,455,539 available to the extent allowed by the Code to offset future net capital gain, if any. The amounts of the carryovers and the expiration dates are:
| Loss carryover | |||
|
| |||
| Short-term | Long-term | Total | Expiration |
|
| |||
| $52,503,868 | N/A | $52,503,868 | October 31, 2016 |
|
| |||
| 285,951,671 | N/A | 285,951,671 | October 31, 2017 |
|
| |||
Under the Regulated Investment Company Modernization Act of 2010, the fund will be permitted to carry forward capital losses incurred in taxable years beginning after December 22, 2010 for an unlimited period. However, any losses incurred will be required to be utilized prior to the losses incurred in pre-enactment tax years. As a result of this ordering rule, pre-enactment capital loss carryforwards may be more likely to expire unused. Additionally, post-enactment capital losses that are carried forward will retain their character as either short-term or long-term capital losses rather than being considered all short-term as under previous law.
The aggregate identified cost on a tax basis is $859,168,617, resulting in gross unrealized appreciation and depreciation of $149,310,623 and $32,154,704, respectively, or net unrealized appreciation of $117,155,919.
Distributions to shareholders Distributions to shareholders from net investment income are recorded by the fund on the ex-dividend date. Distributions from capital gains, if any, are recorded on the ex-dividend date and paid at least annually. The amount and character of income and gains to be distributed are determined in accordance with income tax regulations, which may differ from generally accepted accounting principles. Dividend sources are estimated at the time of declaration. Actual results may vary. Any non-taxable return of capital cannot be determined until final tax calculations are completed after the end of the fund’s fiscal year. Reclassifications are made to the fund’s capital accounts to reflect income and gains available for distribution (or available capital loss carryovers) under income tax regulations.
Note 2: Management fee, administrative services and other transactions
The fund pays Putnam Management a management fee (base fee) (based on the fund’s average net assets and computed and paid monthly) at annual rates that may vary based on the average of the aggregate net assets of most open-end funds, as defined in the fund’s management contract, sponsored by Putnam Management. Such annual rates may vary as follows:
| 0.850% | of the first $5 billion, | 0.650% | of the next $50 billion, | |
|
|
| |||
| 0.800% | of the next $5 billion, | 0.630% | of the next $50 billion, | |
|
|
| |||
| 0.750% | of the next $10 billion, | 0.620% | of the next $100 billion and | |
|
|
| |||
| 0.700% | of the next $10 billion, | 0.615% | of any excess thereafter. | |
|
|
| |||
| Global Equity Fund | 37 |
The fund’s shareholders approved the fund’s current management contract with Putnam Management effective February 27, 2014. Shareholders were asked to approve the fund’s management contract following the death on October 8, 2013 of The Honourable Paul G. Desmarais, who had controlled directly and indirectly a majority of the voting shares of Power Corporation of Canada, the ultimate parent company of Putnam Management. The substantive terms of the management contract, including terms relating to fees, are identical to the terms of the fund’s previous management contract and reflect the rates provided in the table above.
In addition, beginning with January 2011, the monthly management fee consists of the monthly base fee plus or minus a performance adjustment for the month. The performance adjustment is determined based on performance over the thirty-six month period then ended. Each month, the performance adjustment is calculated by multiplying the performance adjustment rate and the fund’s average net assets over the performance period and the result is divided by twelve. The resulting dollar amount is added to, or subtracted from the base fee for that month. The performance adjustment rate is equal to 0.03 multiplied by the difference between the fund’s annualized performance (measured by the fund’s class A shares) and the annualized performance of the MSCI World Index (Net Dividends), each measured over the performance period. The maximum annualized performance adjustment rates are +/– 0.15%. The monthly base fee is determined based on the fund’s average net assets for the month, while the performance adjustment is determined based on the fund’s average net assets over the performance period of up to thirty-six months. This means it is possible that, if the fund underperforms significantly over the performance period, and the fund’s assets have declined significantly over that period, the negative performance adjustment may exceed the base fee. In this event, Putnam Management would make a payment to the fund.
Because the performance adjustment is based on the fund’s performance relative to its applicable benchmark index, and not its absolute performance, the performance adjustment could increase Putnam Management’s fee even if the fund’s shares lose value during the performance period provided that the fund outperformed its benchmark index, and could decrease Putnam Management’s fee even if the fund’s shares increase in value during the performance period provided that the fund underperformed its benchmark index.
For the reporting period, the base fee represented an effective rate (excluding the impact from any expense waivers in effect) of 0.344% of the fund’s average net assets before an increase of $287,388 (0.031% of the fund’s average net assets) based on performance.
Putnam Management has contractually agreed, through June 30, 2014, to waive fees or reimburse the fund’s expenses to the extent necessary to limit the cumulative expenses of the fund, exclusive of brokerage, interest, taxes, investment-related expenses, extraordinary expenses, acquired fund fees and expenses and payments under the fund’s investor servicing contract, investment management contract and distribution plans, on a fiscal year-to-date basis to an annual rate of 0.20% of the fund’s average net assets over such fiscal year-to-date period. During the reporting period, the fund’s expenses were not reduced as a result of this limit.
Putnam Investments Limited (PIL), an affiliate of Putnam Management, is authorized by the Trustees to manage a separate portion of the assets of the fund as determined by Putnam Management from time to time. Putnam Management pays a quarterly sub-management fee to PIL for its services at an annual rate of 0.35% of the average net assets of the portion of the fund managed by PIL.
The Putnam Advisory Company, LLC (PAC), an affiliate of Putnam Management, is authorized by the Trustees to manage a separate portion of the assets of the fund, as designated from time to time by Putnam Management or PIL. Putnam Management or PIL, as applicable, pays a quarterly sub-advisory fee to PAC for its services at the annual rate of 0.35% of the average net assets of the portion of the fund’s assets for which PAC is engaged as sub-adviser.
The fund reimburses Putnam Management an allocated amount for the compensation and related expenses of certain officers of the fund and their staff who provide administrative services to the fund. The aggregate amount of all such reimbursements is determined annually by the Trustees.
Custodial functions for the fund’s assets are provided by State Street. Custody fees are based on the fund’s asset level, the number of its security holdings and transaction volumes.
Putnam Investor Services, Inc., an affiliate of Putnam Management, provides investor servicing agent functions to the fund. Putnam Investor Services, Inc. received fees for investor servicing (except for Class R5 and R6 shares) based on the fund’s retail asset level, the number of shareholder accounts in the fund and the level of defined contribution plan assets in the fund. Class R5 shares pay a monthly fee based on the average net assets of class R5 shares at an annual rate of 0.15%. Class R6 shares pay a monthly fee based on the average net assets of class R6 shares at an annual rate of 0.05%. Investor servicing fees will not exceed an annual rate of 0.32% of the fund’s
| 38 | Global Equity Fund |
average net assets. During the reporting period, the expenses for each class of shares related to investor servicing fees were as follows:
| Class A | $916,021 | Class R5 | 11 | |
|
|
| |||
| Class B | 21,703 | Class R6 | 2,500 | |
|
|
| |||
| Class C | 16,930 | Class Y | 34,438 | |
|
|
| |||
| Class M | 13,550 | Total | $1,006,576 | |
|
|
| |||
| Class R | 1,423 | |||
|
|
||||
The fund has entered into expense offset arrangements with Putnam Investor Services, Inc. and State Street whereby Putnam Investor Services, Inc.’s and State Street’s fees are reduced by credits allowed on cash balances. The fund also reduced expenses through brokerage/service arrangements. For the reporting period, the fund’s expenses were reduced by $938 under the expense offset arrangements and by $83,959 under the brokerage/service arrangements.
Each independent Trustee of the fund receives an annual Trustee fee, of which $578, as a quarterly retainer, has been allocated to the fund, and an additional fee for each Trustees meeting attended. Trustees also are reimbursed for expenses they incur relating to their services as Trustees.
The fund has adopted a Trustee Fee Deferral Plan (the Deferral Plan) which allows the Trustees to defer the receipt of all or a portion of Trustees fees payable on or after July 1, 1995. The deferred fees remain invested in certain Putnam funds until distribution in accordance with the Deferral Plan.
The fund has adopted an unfunded noncontributory defined benefit pension plan (the Pension Plan) covering all Trustees of the fund who have served as a Trustee for at least five years and were first elected prior to 2004. Benefits under the Pension Plan are equal to 50% of the Trustee’s average annual attendance and retainer fees for the three years ended December 31, 2005. The retirement benefit is payable during a Trustee’s lifetime, beginning the year following retirement, for the number of years of service through December 31, 2006. Pension expense for the fund is included in Trustee compensation and expenses in the Statement of operations. Accrued pension liability is included in Payable for Trustee compensation and expenses in the Statement of assets and liabilities. The Trustees have terminated the Pension Plan with respect to any Trustee first elected after 2003.
The fund has adopted distribution plans (the Plans) with respect to its class A, class B, class C, class M and class R shares pursuant to Rule 12b–1 under the Investment Company Act of 1940. The purpose of the Plans is to compensate Putnam Retail Management Limited Partnership, an indirect wholly-owned subsidiary of Putnam Investments, LLC, for services provided and expenses incurred in distributing shares of the fund. The Plans provide for payments by the fund to Putnam Retail Management Limited Partnership at an annual rate of up to 0.35%, 1.00%, 1.00%, 1.00% and 1.00% of the average net assets attributable to class A, class B, class C, class M and class R shares, respectively. The Trustees have approved payment by the fund at an annual rate of 0.25%, 1.00%, 1.00%, 0.75% and 0.50% of the average net assets attributable to class A, class B, class C, class M and class R shares, respectively. During the reporting period, the class specific expenses related to distribution fees were as follows:
| Class A | $1,043,963 | Class M | 46,318 | |
|
|
| |||
| Class B | 98,871 | Class R | 3,250 | |
|
|
| |||
| Class C | 77,308 | Total | $1,269,710 | |
|
|
| |||
For the reporting period, Putnam Retail Management Limited Partnership, acting as underwriter, received net commissions of $46,359 and $318 from the sale of class A and class M shares, respectively, and received $5,286 and $604 in contingent deferred sales charges from redemptions of class B and class C shares, respectively.
A deferred sales charge of up to 1.00% and 0.65% is assessed on certain redemptions of class A and class M shares, respectively. For the reporting period, Putnam Retail Management Limited Partnership, acting as underwriter, received no monies on class A and class M redemptions.
Note 3: Purchases and sales of securities
During the reporting period, cost of purchases and proceeds from sales of investment securities other than short-term investments aggregated $360,208,208 and $377,458,266, respectively. There were no purchases or proceeds from sales of long-term U.S. government securities.
| Global Equity Fund | 39 |
Note 4: Capital shares
At the close of the reporting period, there was an unlimited number of shares of beneficial interest authorized. Transactions in capital shares were as follows:
| Six months ended 4/30/14 | Year ended 10/31/13 | |||
|
| ||||
| Class A | Shares | Amount | Shares | Amount |
|
| ||||
| Shares sold | 1,986,072 | $24,859,620 | 2,474,644 | $26,506,070 |
|
| ||||
| Shares issued in connection with | ||||
| reinvestment of distributions | 274,442 | 3,419,553 | 537,482 | 5,143,706 |
|
| ||||
| 2,260,514 | 28,279,173 | 3,012,126 | 31,649,776 | |
|
| ||||
| Shares repurchased | (3,771,251) | (47,093,291) | (9,564,072) | (101,071,439) |
|
| ||||
| Net decrease | (1,510,737) | $(18,814,118) | (6,551,946) | $(69,421,663) |
|
| ||||
| Six months ended 4/30/14 | Year ended 10/31/13 | |||
|
| ||||
| Class B | Shares | Amount | Shares | Amount |
|
| ||||
| Shares sold | 94,482 | $1,063,442 | 210,403 | $2,044,424 |
|
| ||||
| Shares issued in connection with | ||||
| reinvestment of distributions | — | — | 1,800 | 15,588 |
|
| ||||
| 94,482 | 1,063,442 | 212,203 | 2,060,012 | |
|
| ||||
| Shares repurchased | (326,191) | (3,663,885) | (713,616) | (6,806,457) |
|
| ||||
| Net decrease | (231,709) | $(2,600,443) | (501,413) | $(4,746,445) |
|
| ||||
| Six months ended 4/30/14 | Year ended 10/31/13 | |||
|
| ||||
| Class C | Shares | Amount | Shares | Amount |
|
| ||||
| Shares sold | 318,854 | $3,772,041 | 112,260 | $1,182,535 |
|
| ||||
| Shares issued in connection with | ||||
| reinvestment of distributions | — | — | 918 | 8,370 |
|
| ||||
| 318,854 | 3,772,041 | 113,178 | 1,190,905 | |
|
| ||||
| Shares repurchased | (96,637) | (1,146,249) | (226,940) | (2,284,634) |
|
| ||||
| Net increase (decrease) | 222,217 | $2,625,792 | (113,762) | $(1,093,729) |
|
| ||||
| Six months ended 4/30/14 | Year ended 10/31/13 | |||
|
| ||||
| Class M | Shares | Amount | Shares | Amount |
|
| ||||
| Shares sold | 10,459 | $124,977 | 21,398 | $220,704 |
|
| ||||
| Shares issued in connection with | ||||
| reinvestment of distributions | — | — | 3,625 | 33,319 |
|
| ||||
| 10,459 | 124,977 | 25,023 | 254,023 | |
|
| ||||
| Shares repurchased | (71,444) | (863,987) | (200,906) | (2,035,657) |
|
| ||||
| Net decrease | (60,985) | $(739,010) | (175,883) | $(1,781,634) |
|
| ||||
| Six months ended 4/30/14 | Year ended 10/31/13 | |||
|
| ||||
| Class R | Shares | Amount | Shares | Amount |
|
| ||||
| Shares sold | 33,192 | $415,874 | 18,237 | $192,314 |
|
| ||||
| Shares issued in connection with | ||||
| reinvestment of distributions | 228 | 2,818 | 480 | 4,559 |
|
| ||||
| 33,420 | 418,692 | 18,717 | 196,873 | |
|
| ||||
| Shares repurchased | (30,064) | (371,429) | (15,255) | (157,922) |
|
| ||||
| Net increase | 3,356 | $47,263 | 3,462 | $38,951 |
|
| ||||
| 40 | Global Equity Fund |
| Six months ended 4/30/14 | Year ended 10/31/13 | |||
|
| ||||
| Class R5 | Shares | Amount | Shares | Amount |
|
| ||||
| Shares sold | — | $— | — | $— |
|
| ||||
| Shares issued in connection with | ||||
| reinvestment of distributions | 8 | 107 | 10 | 96 |
|
| ||||
| 8 | 107 | 10 | 96 | |
|
| ||||
| Shares repurchased | — | — | — | — |
|
| ||||
| Net increase | 8 | $107 | 10 | $96 |
|
| ||||
| Six months ended 4/30/14 | Year ended 10/31/13 | |||
|
| ||||
| Class R6 | Shares | Amount | Shares | Amount |
|
| ||||
| Shares sold | 49,527 | $640,894 | 812,784 | $8,953,449 |
|
| ||||
| Shares issued in connection with | ||||
| reinvestment of distributions | 6,337 | 81,621 | 10 | 101 |
|
| ||||
| 55,864 | 722,515 | 812,794 | 8,953,550 | |
|
| ||||
| Shares repurchased | (18,984) | (243,509) | (62,906) | (750,282) |
|
| ||||
| Net increase | 36,880 | $479,006 | 749,888 | $8,203,268 |
|
| ||||
| Six months ended 4/30/14 | Year ended 10/31/13 | |||
|
| ||||
| Class Y | Shares | Amount | Shares | Amount |
|
| ||||
| Shares sold | 602,741 | $7,759,737 | 627,422 | $7,031,460 |
|
| ||||
| Shares issued in connection with | ||||
| reinvestment of distributions | 14,941 | 191,998 | 26,862 | 265,131 |
|
| ||||
| 617,682 | 7,951,735 | 654,284 | 7,296,591 | |
|
| ||||
| Shares repurchased | (275,514) | (3,584,286) | (1,175,513) | (12,822,959) |
|
| ||||
| Net increase (decrease) | 342,168 | $4,367,449 | (521,229) | $(5,526,368) |
|
| ||||
At the close of the reporting period, Putnam Investments, LLC owned the following class shares of the fund:
| Shares owned | Percentage of ownership | Value | |
|
| |||
| Class R5 | 1,139 | 100.0% | $15,066 |
|
| |||
| Class R6 | 1,141 | 0.1 | 15,095 |
|
| |||
Note 5: Affiliated transactions
Transactions during the reporting period with Putnam Short Term Investment Fund, which is under common ownership and control, were as follows:
| Fair value at the | Fair value at | ||||
| beginning of | the end of | ||||
| the reporting | Investment | the reporting | |||
| Name of affiliate | period | Purchase cost | Sale proceeds | income | period |
|
| |||||
| Putnam Short Term | |||||
| Investment Fund* | $13,240,517 | $142,104,474 | $153,612,889 | $3,448 | $1,732,102 |
|
| |||||
* Management fees charged to Putnam Short Term Investment Fund have been waived by Putnam Management.
| Global Equity Fund | 41 |
Note 6: Market, credit and other risks
In the normal course of business, the fund trades financial instruments and enters into financial transactions where risk of potential loss exists due to changes in the market (market risk) or failure of the contracting party to the transaction to perform (credit risk). The fund may be exposed to additional credit risk that an institution or other entity with which the fund has unsettled or open transactions will default. Investments in foreign securities involve certain risks, including those related to economic instability, unfavorable political developments, and currency fluctuations.
Note 7: Summary of derivative activity
The volume of activity for the reporting period for any derivative type that was held during the period is listed below and was as follows based on an average of the holdings at the end of each fiscal quarter:
| Forward currency contracts (contract amount) | $266,400,000 |
|
| |
The following is a summary of the fair value of derivative instruments as of the close of the reporting period:
Fair value of derivative instruments as of the close of the reporting period
| Asset derivatives | Liability derivatives | |||
|
| ||||
| Derivatives not | ||||
| accounted for as | Statement of | Statement of | ||
| hedging instruments | assets and | assets and | ||
| under ASC 815 | liabilities location | Fair value | liabilities location | Fair value |
|
| ||||
| Foreign exchange | ||||
| contracts | Receivables | $769,612 | Payables | $1,010,712 |
|
| ||||
| Total | $769,612 | $1,010,712 | ||
|
| ||||
The following is a summary of realized and change in unrealized gains or losses of derivative instruments on the Statement of operations for the reporting period (see Note 1):
Amount of realized gain or (loss) on derivatives recognized in net gain or (loss) on investments
| Derivatives not accounted for as hedging | Forward currency | |
| instruments under ASC 815 | contracts | Total |
|
| ||
| Foreign exchange contracts | $(1,882,893) | $(1,882,893) |
|
| ||
| Total | $(1,882,893) | $(1,882,893) |
|
| ||
Change in unrealized appreciation or (depreciation) on derivatives recognized in net gain or (loss) on investments
| Derivatives not accounted for as hedging | Forward currency | |
| instruments under ASC 815 | contracts | Total |
|
| ||
| Foreign exchange contracts | $(413,762) | $(413,762) |
|
| ||
| Total | $(413,762) | $(413,762) |
|
| ||
| 42 | Global Equity Fund |
Note 8: Offsetting of financial and derivative assets and liabilities
The following table summarizes any derivatives, repurchase agreements and reverse repurchase agreements, at the end of the reporting period, that are subject to an enforceable master netting agreement or similar agreement. For securities lending transactions or borrowing transactions associated with securities sold short, see Note 1, if any. For financial reporting purposes, the fund does not offset financial assets and financial liabilities that are subject to the master netting agreements in the Statement of assets and liabilities.
| Barclays Bank PLC | Citibank, N.A. | Credit Suisse International | Deutsche Bank AG | Goldman Sachs International | HSBC Bank USA, National Association | JPMorgan Chase Bank N.A. | State Street Bank and Trust Co. | UBS AG | WestPac Banking Corp. | Total | |||||||||||
|
| |||||||||||||||||||||
| Assets: | |||||||||||||||||||||
|
| |||||||||||||||||||||
| Forward | |||||||||||||||||||||
| currency contracts# | $151,781 | $98,234 | $213,603 | $17,480 | $7,014 | $— | $105,245 | $78,066 | $80,058 | $18,131 | $769,612 | ||||||||||
|
| |||||||||||||||||||||
| Total Assets | $151,781 | $98,234 | $213,603 | $17,480 | $7,014 | $— | $105,245 | $78,066 | $80,058 | $18,131 | $769,612 | ||||||||||
|
| |||||||||||||||||||||
| Liabilities: | |||||||||||||||||||||
|
| |||||||||||||||||||||
| Forward | |||||||||||||||||||||
| currency contracts# | $139,418 | $125,766 | $— | $259,743 | $— | $60,347 | $20,808 | $169,135 | $73,570 | $161,925 | $1,010,712 | ||||||||||
|
| |||||||||||||||||||||
| Total Liabilities | $139,418 | $125,766 | $— | $259,743 | $— | $60,347 | $20,808 | $169,135 | $73,570 | $161,925 | $1,010,712 | ||||||||||
|
| |||||||||||||||||||||
| Total Financial | |||||||||||||||||||||
| and Derivative | |||||||||||||||||||||
| Net Assets | $12,363 | $(27,532) | $213,603 | $(242,263) | $7,014 | $(60,347) | $84,437 | $(91,069) | $6,488 | $(143,794) | $(241,100) | ||||||||||
|
| |||||||||||||||||||||
| Total collateral | |||||||||||||||||||||
| received (pledged)†## | $— | $— | $193,909 | $(139,944) | $— | $— | $— | $— | $— | $— | $53,965 | ||||||||||
|
| |||||||||||||||||||||
| Net amount | $12,363 | $(27,532) | $19,694 | $(102,319) | $7,014 | $(60,347) | $84,437 | $(91,069) | $6,488 | $(143,794) | $(295,065) | ||||||||||
|
| |||||||||||||||||||||
†Additional collateral may be required from certain brokers based on individual agreements.
#Covered by master netting agreement. (Note 1)
##Any over-collateralization of total financial and derivative net assets is not shown. Collateral may include amounts related to unsettled agreements.
| 43 | Fund Equity Global |
Shareholder meeting results (Unaudited)
February 27, 2014 special meeting
At the meeting, each of the nominees for Trustees was elected as follows:
| Votes for | Votes withheld | |
|
| ||
| Liaquat Ahamed | 48,602,247 | 2,041,015 |
|
| ||
| Ravi Akhoury | 48,625,024 | 2,018,238 |
|
| ||
| Barbara M. Baumann | 48,806,374 | 1,836,888 |
|
| ||
| Jameson A. Baxter | 48,767,089 | 1,876,173 |
|
| ||
| Charles B. Curtis | 48,726,006 | 1,917,256 |
|
| ||
| Robert J. Darretta | 48,789,304 | 1,853,958 |
|
| ||
| Katinka Domotorffy | 48,729,289 | 1,913,973 |
|
| ||
| John A. Hill | 48,674,008 | 1,969,254 |
|
| ||
| Paul L. Joskow | 48,834,167 | 1,809,095 |
|
| ||
| Kenneth R. Leibler | 48,788,558 | 1,854,704 |
|
| ||
| Robert E. Patterson | 48,803,906 | 1,839,356 |
|
| ||
| George Putnam, III | 48,739,505 | 1,903,757 |
|
| ||
| Robert L. Reynolds | 48,789,353 | 1,853,909 |
|
| ||
| W. Thomas Stephens | 48,735,910 | 1,907,352 |
|
| ||
A proposal to approve a new management contract between the fund and Putnam Management was approved as follows:
| Votes | Votes | Broker | |
| for | against | Abstentions | non-votes |
|
| |||
| 40,347,600 | 1,260,031 | 2,300,230 | 6,735,401 |
|
| |||
A proposal to adopt an Amended and Restated Declaration of Trust was approved as follows:
| Votes | Votes | Broker | |
| for | against | Abstentions | non-votes |
|
| |||
| 40,101,741 | 1,372,346 | 2,433,774 | 6,735,401 |
|
| |||
All tabulations are rounded to the nearest whole number.
| 44 | Global Equity Fund |
Fund information
Founded over 75 years ago, Putnam Investments was built around the concept that a balance between risk and reward is the hallmark of a well-rounded financial program. We manage over 100 funds across income, value, blend, growth, asset allocation, absolute return, and global sector categories.
| Investment Manager | Trustees | Robert T. Burns |
| Putnam Investment | Jameson A. Baxter, Chair | Vice President and |
| Management, LLC | Liaquat Ahamed | Chief Legal Officer |
| One Post Office Square | Ravi Akhoury | |
| Boston, MA 02109 | Barbara M. Baumann | Robert R. Leveille |
| Charles B. Curtis | Vice President and | |
| Investment Sub-Manager | Robert J. Darretta | Chief Compliance Officer |
| Putnam Investments Limited | Katinka Domotorffy | |
| 57–59 St James’s Street | John A. Hill | Michael J. Higgins |
| London, England SW1A 1LD | Paul L. Joskow | Vice President, Treasurer, |
| Kenneth R. Leibler | and Clerk | |
| Investment Sub-Advisor | Robert E. Patterson | |
| The Putnam Advisory | George Putnam, III | Janet C. Smith |
| Company, LLC | Robert L. Reynolds | Vice President, |
| One Post Office Square | W. Thomas Stephens | Principal Accounting Officer, |
| Boston, MA 02109 | and Assistant Treasurer | |
| Officers | ||
| Marketing Services | Robert L. Reynolds | Susan G. Malloy |
| Putnam Retail Management | President | Vice President and |
| One Post Office Square | Assistant Treasurer | |
| Boston, MA 02109 | Jonathan S. Horwitz | |
| Executive Vice President, | James P. Pappas | |
| Custodian | Principal Executive Officer, and | Vice President |
| State Street Bank | Compliance Liaison | |
| and Trust Company | Mark C. Trenchard | |
| Steven D. Krichmar | Vice President and | |
| Legal Counsel | Vice President and | BSA Compliance Officer |
| Ropes & Gray LLP | Principal Financial Officer | |
| Nancy E. Florek | ||
| Vice President, Director of | ||
| Proxy Voting and Corporate | ||
| Governance, Assistant Clerk, | ||
| and Associate Treasurer |
This report is for the information of shareholders of Putnam Global Equity Fund. It may also be used as sales literature when preceded or accompanied by the current prospectus, the most recent copy of Putnam’s Quarterly Performance Summary, and Putnam’s Quarterly Ranking Summary. For more recent performance, please visit putnam.com. Investors should carefully consider the investment objectives, risks, charges, and expenses of a fund, which are described in its prospectus. For this and other information or to request a prospectus or summary prospectus, call 1-800-225-1581 toll free. Please read the prospectus carefully before investing. The fund’s Statement of Additional Information contains additional information about the fund’s Trustees and is available without charge upon request by calling 1-800-225-1581.

| Item 2. Code of Ethics: |
| Not applicable |
| Item 3. Audit Committee Financial Expert: |
| Not applicable |
| Item 4. Principal Accountant Fees and Services: |
| Not applicable |
| Item 5. Audit Committee of Listed Registrants |
| Not applicable |
| Item 6. Schedule of Investments: |
| The registrant’s schedule of investments in unaffiliated issuers is included in the report to shareholders in Item 1 above. |
| Item 7. Disclosure of Proxy Voting Policies and Procedures For Closed-End Management Investment Companies: |
| Not applicable |
| Item 8. Portfolio Managers of Closed-End Investment Companies |
| Not Applicable |
| Item 9. Purchases of Equity Securities by Closed-End Management Investment Companies and Affiliated Purchasers: |
| Not applicable |
| Item 10. Submission of Matters to a Vote of Security Holders: |
| Not applicable |
| Item 11. Controls and Procedures: |
| (a) The registrant’s principal executive officer and principal financial officer have concluded, based on their evaluation of the effectiveness of the design and operation of the registrant’s disclosure controls and procedures as of a date within 90 days of the filing date of this report, that the design and operation of such procedures are generally effective to provide reasonable assurance that information required to be disclosed by the registrant in this report is recorded, processed, summarized and reported within the time periods specified in the Commission’s rules and forms. |
| (b) Changes in internal control over financial reporting: Not applicable |
| Item 12. Exhibits: |
| (a)(1) Not applicable |
| (a)(2) Separate certifications for the principal executive officer and principal financial officer of the registrant as required by Rule 30a-2(a) under the Investment Company Act of 1940, as amended, are filed herewith. |
| (b) The certifications required by Rule 30a-2(b) under the Investment Company Act of 1940, as amended, are filed herewith. |
| Putnam Global Equity Fund |
| By (Signature and Title): |
| /s/Janet C. Smith Janet C. Smith Principal Accounting Officer |
| Date: June 26, 2014 |
| Pursuant to the requirements of the Securities Exchange Act of 1934 and the Investment Company Act of 1940, this report has been signed below by the following persons on behalf of the registrant and in the capacities and on the dates indicated. |
| By (Signature and Title): |
| /s/Jonathan S. Horwitz Jonathan S. Horwitz Principal Executive Officer |
| Date: June 26, 2014 |
| By (Signature and Title): |
| /s/Steven D. Krichmar Steven D. Krichmar Principal Financial Officer |
| Date: June 26, 2014 |