UNITED STATES
SECURITIES AND EXCHANGE COMMISSION
Washington, D.C. 20549
FORM N-CSR
CERTIFIED SHAREHOLDER REPORT OF REGISTERED
MANAGEMENT INVESTMENT COMPANIES
Investment Company Act file number 811-05099
Pioneer Money Market Trust
(Exact name of registrant as specified in charter)
60 State Street, Boston, MA 02109
(Address of principal executive offices) (ZIP code)
Terrence J. Cullen, Amundi Pioneer Asset Management, Inc.,
60 State Street, Boston, MA 02109
(Name and address of agent for service)
Registrant’s telephone number, including area code: (617) 742-7825
Date of fiscal year end: December 31, 2020
Date of reporting period: January 1, 2020 through June 30, 2020
Form N-CSR is to be used by management investment companies to file reports with the Commission not later than 10 days after the transmission to stockholders of any report that is
required to be transmitted to stockholders under Rule 30e-1 under the Investment Company Act of 1940 (17 CFR 270.30e-1). The Commission may use the information provided on Form N-CSR in its regulatory, disclosure review, inspection, and
policymaking roles.
A registrant is required to disclose the information specified by Form N-CSR, and the Commission will make this information public. A registrant is not required to respond to the
collection of information contained in Form N-CSR unless the Form displays a currently valid Office of Management and Budget (“OMB”) control number. Please direct comments concerning the accuracy of the information collection burden estimate and
any suggestions for reducing the burden to Secretary, Securities and Exchange Commission, 450 Fifth Street, NW, Washington, DC 20549-0609. The OMB has reviewed this collection of information under the clearance requirements of 44 U.S.C. ss. 3507.
Pioneer U.S. Government
Money Market Fund
Semiannual Report | June 30, 2020
|
Ticker Symbols:
|
|
Class A
|
PMTXX
|
|
Class R
|
PRXXX
|
|
Class Y
|
PRYXX
|
Beginning in February 2021, as permitted by regulations adopted by the Securities and Exchange Commission, paper copies of the Fund’s shareholder reports like this one will no longer be sent by mail,
unless you specifically request paper copies of the reports from the Fund or from your financial intermediary, such as a broker-dealer, bank or insurance company. Instead, the reports will be made available on the Fund’s website, and you will be
notified by mail each time a report is posted and provided with a website link to access the report.
If you already elected to receive shareholder reports electronically, you will not be affected by this change and you need not take any action. You may elect to receive shareholder reports and other
communications electronically by contacting your financial intermediary or, if you invest directly with the Fund, by calling 1-800-225-6292.
You may elect to receive all future reports in paper free of charge. If you invest directly with the Fund, you can inform the Fund that you wish to continue receiving paper copies of your shareholder
reports by calling 1-800-225-6292. If you invest through a financial intermediary, you can contact your financial intermediary to request that you continue to receive paper copies of your shareholder reports. Your election to receive reports in paper
will apply to all funds held in your account if you invest through your financial intermediary or all funds held within the Pioneer Fund complex if you invest directly.

visit us: www.amundipioneer.com/us
|
|
|
|
|
|
|
2
|
|
|
4
|
|
|
7
|
|
|
8
|
|
|
10
|
|
|
12
|
|
|
16
|
|
|
23
|
|
|
31
|
|
Pioneer U.S. Government Money Market Fund | Semiannual Report | 6/30/20 1
President’s Letter
Dear Shareholders,
The new decade has arrived delivering a half-year that will go down in the history books. The beginning of 2020 seemed to extend the positive market environment of 2019. Then, March roared in like a
lion and the COVID-19 pandemic became a global crisis impacting lives and life as we know it. The long-term impact on the global economy from the COVID-19 virus pandemic, while currently unknown, is likely to be considerable. It is clear that several
industries have already felt greater effects than others. And the markets, which do not thrive on uncertainty, have been volatile, delivering significantly negative performance in the first quarter, and then staging a strong rally in the opening
weeks of the second quarter. Our business continuity plan was implemented given the new COVID-19 guidelines, and most of our employees are working remotely. To date, our operating environment has faced no interruption. I am proud of the careful
planning that has taken place and confident we can maintain this environment for as long as is prudent. History in the making for a company that first opened its doors way back in 1928.
Since 1928, Amundi Pioneer’s investment process has been built on a foundation of fundamental research and active management, principles which have guided our investment decisions for more than 90
years. We believe active management – that is, making active investment decisions – can help mitigate the potential risks during periods of market volatility. As the first several months of 2020 have reminded us, investment risk can arise from a
number of factors in today’s global economy, including slower or stagnating growth, changing U.S. Federal Reserve policy, oil price shocks, political and geopolitical factors and, unfortunately, major public health concerns such as a viral pandemic.
At Amundi Pioneer, active management begins with our own fundamental, bottom-up research process. Our team of dedicated research analysts and portfolio managers analyzes each security under
consideration, communicating directly with the management teams of the companies issuing the securities and working together to identify those securities that best meet our investment criteria for our family of funds. Our risk management approach
begins with each and every security, as we strive to carefully understand the potential opportunity, while considering any and all risk factors.
2 Pioneer U.S. Government Money Market Fund | Semiannual Report | 6/30/20
Today, as investors, we have many options. It is our view that active management can serve shareholders well, not only when markets are thriving, but also during periods of market stress. As you
consider your long-term investment goals, we encourage you to work with your financial advisor to develop an investment plan that paves the way for you to pursue both your short-term and long-term goals.
We remain confident that the current crisis, like others in human history, will pass, and we greatly appreciate the trust you have placed in us and look forward to continuing to serve you in the
future.
Sincerely,

Lisa M. Jones
Head of the Americas, President and CEO of U.S.
Amundi Pioneer Asset Management USA, Inc.
June 30, 2020
Any information in this shareowner report regarding market or economic trends or the factors influencing the Fund’s historical or future performance are statements of opinion as of the date of this
report. Past performance is no guarantee of future results.
Pioneer U.S. Government Money Market Fund | Semiannual Report | 6/30/20 3
During the six-month period ended June 30, 2020, dramatic, negative economic effects from the COVID-19 outbreak led the U.S. Federal Reserve (Fed) to lower the target range of the
federal funds rate to near zero in March. At the same time, the U.S. Treasury Department issued massive amounts of debt to fund federal aid to businesses and individuals, which nudged Treasury bill rates higher at times. In the following discussion,
Seth Roman reviews the factors that affected the performance of Pioneer U.S. Government Money Market Fund during the six-month period ended June 30, 2020. Mr. Roman, a vice president and a portfolio manager at Amundi Pioneer Asset Management, Inc.
(Amundi Pioneer), is responsible for the day-to-day management of the Fund.
Q How did the Fund perform during the six-month period ended June 30, 2020?
A Pioneer U.S. Government Money Market Fund’s Class A shares returned 0.19% at net asset value during the six-month
period ended June 30, 2020.
Q How would you describe the investment environment during the six-month period ended June 30, 2020?
A At the start of the period, with the U.S. economy showing solid data as the new calendar year got underway,
short-term interest rates remained steady in the wake of the Fed’s three reductions in the federal funds rate target range during 2019, and financial markets posted favorable performance. Beginning in late February/early March, however, the rapid
spread of the COVID-19 virus from China to Western Europe, and the emerging “hot spots” of virus infections within portions of the United States and elsewhere caught the attention of market participants and raised alarm bells.
As the World Health Organization declared COVID-19 a global pandemic in March, many U.S. states began to order lockdowns and the closure of businesses deemed non-essential in an
attempt to limit the spread of COVID-19. In turn, the lockdowns dramatically curtailed U.S. economic activity, hitting the transportation, retail sales, manufacturing, and services industries hardest. Financial markets reacted swiftly and negatively
to the reductions in economic activity, as investors grew wary about the near-term and longer-term prospects for overall economic activity and corporate earnings. In some areas of the financial markets, a “liquidity squeeze” occurred in March, driven
by panic selling of risky assets as investors fled into so-called “safe havens” such as U.S. Treasuries.
In response to the burgeoning crisis, the Fed as well as the U.S. government took immediate action and implemented a large number of monetary and fiscal stimulus measures in an
attempt to restore market liquidity and ease the financial pain caused by COVID-19. The Fed reduced the federal funds target range to near zero, restored lending facilities it had established during the 2008/2009 financial crisis, instituted new
lending facilities, and re-started quantitative easing (large-scale bond purchases). Soon after,
4 Pioneer U.S. Government Money Market Fund | Semiannual Report | 6/30/20
Congress and the White House approved two large aid packages in the form of loans and grants to individuals, small businesses, medical systems, and other key areas of the economy in
light of the sudden freeze-up in activity and continuously rising unemployment figures.
By the end of March, the stimulus measures had combined to calm conditions in the financial markets considerably, and helped to restore normal levels of liquidity to the money
markets. In response, both the equity and fixed-income markets rebounded from their lows before the end of the first calendar quarter of 2020. The rally persisted for most of the second calendar quarter, before a surge in new virus cases in some
states that had re-opened earlier than others contributed to an increase in market volatility during June, the final month of the six-month period.
Q How did you manage the Fund’s portfolio during the six-month period ended June 30, 2020?
A We continued to pursue a very conservative investment policy for the portfolio during the six-month period, and
kept our focus on our primary objective in managing the Fund: protecting shareholders’ capital rather than taking undue risk in search of slightly higher total returns. We generally kept the average maturity of the Fund’s portfolio relatively low
during the six-month period, at between 20 and 25 days’ weighted average maturity.
Our overall intention has been to maintain the portfolio’s liquidity at a high level, and so the Fund’s largest investment concentrations during the six-month period were in
Treasury bills and notes as well as fully collateralized repurchase agreements. To gain the opportunity to pick up some yield, we also invested the Fund in low-duration, floating-rate Treasury and government-agency securities, which we believe may
potentially experience increases in yield if there is a rise in money market interest rates. As the U.S. Treasury ramped up its issuance during the six-month period in order to fund the massive amount of government stimulus in response to the
COVID-19 situation, the Fund was able to benefit from slightly higher yields of new-issue Treasury bills. (Duration is a measure of the sensitivity of the price, or the value of principal, of a fixed-income investment to a change in interest rates,
expressed as a number of years.)
Q What is your investment outlook?
A Going forward, we will continue to monitor the Fed’s statements and actions very closely. The Fed has repeatedly
stated that as part of its response to the economic effects of the COVID-19 outbreak, it will keep the federal funds rate target range at near zero for the foreseeable future.
Entering the second half of the Fund’s fiscal year, we view the U.S. economic outlook as clouded by uncertainty as to when at least somewhat normal levels of activity may resume.
Manufacturing indices had returned to neutral levels as of the end of June, and investors had already begun to anticipate a strong spike in manufacturing demand and other typical
Pioneer U.S. Government Money Market Fund | Semiannual Report | 6/30/20 5
economic activities. Even so, huge unemployment figures and a lack of visibility with regard to when health officials may deem the virus sufficiently under control – or at least
begin to view it as a reduced threat to the general population – have continued to overhang the overall outlook.
In terms of portfolio positioning, though it seems likely that the Fed will remain “on hold” with regard to interest rates, we will endeavor to add incremental yield to the Fund by
taking advantage of heavy Treasury supply whenever possible, but we will continue to be cautious.
We anticipate maintaining a conservative positioning in the Fund’s portfolio, and emphasizing stability of principal, first and foremost.
Please refer to the Schedule of Investments on pages 12–15 for a full listing of Fund securities.
You could lose money by investing in the Fund. Although the Fund seeks to preserve the value of your investment at $1.00 per share, it cannot guarantee it will do so. An investment
in the Fund is not insured or guaranteed by the Federal Deposit Insurance Corporation or any other government agency. The Fund’s sponsor has no legal obligation to provide financial support to the Fund, and you should not expect that the sponsor will
provide financial support to the Fund at any time.
All investments are subject to risk, including the possible loss of principal. In the past several years, financial markets have experienced increased volatility and heightened
uncertainty. The market prices of securities may go up or down, sometimes rapidly or unpredictably, due to general market conditions, such as real or perceived adverse economic, political, or regulatory conditions, recessions, inflation, changes in
interest or currency rates, lack of liquidity in the bond markets, the spread of infectious illness or other public health issues or adverse investor sentiment. These conditions may continue, recur, worsen or spread.
The securities issued by U.S. Government-sponsored entities (e.g., FNMA, Freddie Mac) are neither guaranteed nor issued by the U.S. Government.
At times, the Fund’s investments may represent industries or industry sectors that are interrelated or have common risks, making it more susceptible to any economic, political, or
regulatory developments or other risks affecting those industries and sectors.
These risks may increase share price volatility.
Before investing, consider the product’s investment objectives, risks, charges and expenses. Contact your advisor or Amundi Pioneer Asset Management, Inc., for a
prospectus or summary prospectus containing this information. Read it carefully.
Any information in this shareholder report regarding market or economic trends or the factors influencing the Fund’s historical or future performance are statements of opinion as of
the date of this report. Past performance is no guarantee of future results.
6 Pioneer U.S. Government Money Market Fund | Semiannual Report | 6/30/20
|
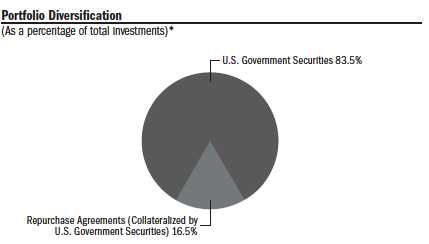
10 Largest Holdings
|
|
|
|
(As a percentage of total investments)*
|
|
|
|
1.
|
U.S. Treasury Floating Rate Notes, 0.193% (3 Month U.S. Treasury Bill Money Market
|
|
|
|
Yield + 4 bps), 7/31/20
|
14.97%
|
|
2.
|
U.S. Treasury Bills, 9/3/20
|
5.10
|
|
3.
|
U.S. Treasury Floating Rate Notes, 0.195% (3 Month U.S. Treasury Bill Money Market
|
|
|
|
Yield + 5 bps), 10/31/20
|
4.93
|
|
4.
|
U.S. Treasury Bills, 7/14/20
|
4.93
|
|
5.
|
U.S. Treasury Floating Rate Notes, 0.265% (3 Month U.S. Treasury Bill Money Market
|
|
|
|
Yield + 12 bps), 1/31/21
|
4.85
|
|
6.
|
U.S. Treasury Floating Rate Notes, 0.37% (3 Month U.S. Treasury Bill Money Market
|
|
|
|
Yield + 22 bps), 7/31/21
|
4.55
|
|
7.
|
U.S. Treasury Bills, 8/27/20
|
3.40
|
|
8.
|
U.S. Treasury Floating Rate Notes, 0.45% (3 Month U.S. Treasury Bill Money Market
|
|
|
|
Yield + 30 bps), 10/31/21
|
3.36
|
|
9.
|
U.S. Treasury Bills, 7/23/20
|
3.06
|
|
10.
|
U.S. Treasury Bills, 7/7/20
|
2.67
|
|
*
|
Excludes derivative contracts except for options purchased. The Fund is actively managed, and current holdings may be different. The holdings listed should not be considered recommendations to buy or sell any securities.
|
Pioneer U.S. Government Money Market Fund | Semiannual Report | 6/30/20 7
|
|
||
|
|
||
|
Net Asset Value per Share
|
|
|
|
|
||
|
Class
|
6/30/20
|
12/31/19
|
|
A
|
$1.00
|
$1.00
|
|
R
|
$1.00
|
$1.00
|
|
Y
|
$1.00
|
$1.00
|
|
Distributions per Share: 1/1/20 – 6/30/20
|
|
||
|
|
|||
|
|
Net Investment
|
Short-Term
|
Long-Term
|
|
Class
|
Income
|
Capital Gains
|
Capital Gains
|
|
A
|
$0.0019
|
$ —
|
$ —
|
|
R
|
$0.0011
|
$ —
|
$ —
|
|
Y
|
$0.0022
|
$ —
|
$ —
|
|
Yields
|
|
|
|
Class
|
7-Day Annualized*
|
7-Day Effective**
|
|
A
|
0.01%
|
0.01%
|
|
R
|
0.01%
|
0.01%
|
|
Y
|
0.01%
|
0.01%
|
|
*
|
The 7-day annualized net yield describes the annualized income earned over a 7-day period.
|
|
**
|
The 7-day effective yield describes the amount one is expected to earn over a 1-year period assuming that dividends are reinvested at the average rate of the last 7-days.
|
8 Pioneer U.S. Government Money Market Fund | Semiannual Report | 6/30/20
Expense Ratio (Per prospectus dated May 1, 2020)
|
Class
|
Gross
|
|
A
|
0.84%
|
|
R
|
1.12%
|
|
Y
|
0.52%
|
Call 1-800-225-6292 or visit www.amundipioneer.com/us for the most recent month-end performance results. Current performance may be lower or higher than the performance data quoted.
The performance data quoted represents past performance, which is no guarantee of future results.
Investment return and principal value will fluctuate, and shares, when redeemed, may be worth more or less than their original cost.
Amundi Pioneer has agreed to limit the Fund’s expenses for any class of shares or waive a portion of its management fee in an effort to maintain a net asset value of $1.00 per share. From time to
time, Amundi Pioneer and its affiliates may limit the expenses of one or more classes for the purpose of avoiding a negative yield or increasing its yield during the period of the limitation. These expense limitation policies are voluntary and
temporary and may be revised or terminated by Amundi Pioneer at any time without notice.
Please refer to the financial highlights for a more current expense ratio.
Performance does not reflect the deduction of taxes that a shareowner would pay on Fund distributions or the redemption of Fund shares.
Pioneer U.S. Government Money Market Fund | Semiannual Report | 6/30/20 9
As a shareowner in the Fund, you incur two types of costs:
|
(1)
|
ongoing costs, including management fees, distribution and/or service (12b-1) fees, and other Fund expenses; and
|
|
(2)
|
transaction costs, including sales charges (loads) on purchase payments.
|
This example is intended to help you understand your ongoing expenses (in dollars) of investing in the Fund and to compare these costs with the ongoing costs of investing in other mutual funds. The
example is based on an investment of $1,000 at the beginning of the Fund’s latest six-month period and held throughout the six months.
Using the Tables
Actual Expenses
The first table below provides information about actual account values and actual expenses.You may use the information in this table, together with the amount you invested, to estimate the expenses
that you paid over the period as follows:
|
(1)
|
Divide your account value by $1,000
|
|
|
Example: an $8,600 account value ÷ $1,000 = 8.6
|
|
(2)
|
Multiply the result in (1) above by the corresponding share class’s number in the third row under the heading entitled “Expenses Paid During Period” to estimate the expenses you paid on your account during this period.
|
Expenses Paid on a $1,000 Investment in Pioneer U.S. Government Money Market Fund
Based on actual returns from January 1, 2020 through June 30, 2020.
|
Share Class
|
A
|
R
|
Y
|
|
Beginning Account
|
$1,000.00
|
$1,000.00
|
$1,000.00
|
|
Value on 1/1/20
|
|
|
|
|
Ending Account
|
$1,001.90
|
$1,001.10
|
$1,002.20
|
|
Value on 6/30/20
|
|
|
|
|
Expenses Paid
|
$1.94
|
$2.54
|
$1.69
|
|
During Period*
|
|
|
|
* Expenses are equal to the Fund’s annualized expense ratio of 0.39%, 0.51%, and 0.34% for Class A, Class R, and Class Y shares, respectively, multiplied by
the average account value over the period, multiplied by 182/366 (to reflect the one-half year period).
10 Pioneer U.S. Government Money Market Fund | Semiannual Report | 6/30/20
Hypothetical Example for Comparison Purposes
The table below provides information about hypothetical account values and hypothetical expenses based on the Fund’s actual expense ratio and an assumed rate of return of 5% per year before expenses,
which is not the Fund’s actual return. The hypothetical account values and expenses may not be used to estimate the actual ending account balance or expenses you paid for the period.
You may use this information to compare the ongoing costs of investing in the Fund and other funds. To do so, compare this 5% hypothetical example with the 5% hypothetical examples that appear in the
shareholder reports of the other funds.
Please note that the expenses shown in the tables are meant to highlight your ongoing costs only and do not reflect any transaction costs, such as sales charges (loads) that are charged at the time of
the transaction. Therefore, the table below is useful in comparing ongoing costs only and will not help you determine the relative total costs of owning different funds. In addition, if these transaction costs were included, your costs would have
been higher.
Expenses Paid on a $1,000 Investment in Pioneer U.S. Government Money Market Fund
Based on a hypothetical 5% per year return before expenses, reflecting the period from January 1, 2020 through June 30, 2020.
|
Share Class
|
A
|
R
|
Y
|
|
Beginning Account
|
$1,000.00
|
$1,000.00
|
$1,000.00
|
|
Value on 1/1/20
|
|
|
|
|
Ending Account
|
$1,022.92
|
$1,022.33
|
$1,023.17
|
|
Value on 6/30/20
|
|
|
|
|
Expenses Paid
|
$1.96
|
$2.56
|
$1.71
|
|
During Period*
|
|
|
|
|
*
|
Expenses are equal to the Fund’s annualized expense ratio of 0.39%, 0.51%, and 0.34% for Class A, Class R, and Class Y shares, respectively, multiplied by the average account value over the period, multiplied by 182/366 (to reflect the
one-half year period).
|
Pioneer U.S. Government Money Market Fund | Semiannual Report | 6/30/20 11
|
Principal
|
|
|
|
|
Amount ($)
|
|
Value
|
|
|
|
UNAFFILIATED ISSUERS — 99.6%
|
|
|
|
|
U.S. GOVERNMENT AND AGENCY
|
|
|
|
|
OBLIGATIONS — 83.2% of Net Assets
|
|
|
|
2,000,000(a)
|
Federal Farm Credit Banks, 0.156% (1 Month USD LIBOR -
|
|
|
|
|
2 bps), 9/1/20
|
$ 2,000,501
|
|
|
3,005,000(a)
|
Federal Farm Credit Banks, 0.185% (1 Month USD LIBOR +
|
|
|
|
|
0 bps), 9/25/20
|
3,004,947
|
|
|
3,620,000(a)
|
Federal Farm Credit Banks, 0.188% (1 Month USD LIBOR +
|
|
|
|
|
1 bps), 7/30/20
|
3,619,995
|
|
|
1,000,000(a)
|
Federal Farm Credit Banks, 0.193% (1 Month USD LIBOR +
|
|
|
|
|
1 bps), 7/2/20
|
1,000,002
|
|
|
835,000(a)
|
Federal Farm Credit Banks, 0.194% (1 Month USD LIBOR +
|
|
|
|
|
0 bps), 10/18/21
|
834,999
|
|
|
1,315,000(a)
|
Federal Farm Credit Banks, 0.195% (1 Month USD LIBOR +
|
|
|
|
|
1 bps), 8/24/20
|
1,315,079
|
|
|
1,500,000(a)
|
Federal Farm Credit Banks, 0.224% (1 Month USD LIBOR +
|
|
|
|
|
4 bps), 1/28/21
|
1,501,840
|
|
|
1,000,000(a)
|
Federal Farm Credit Banks, 0.339% (1 Month USD LIBOR +
|
|
|
|
|
16 bps), 10/4/21
|
1,003,260
|
|
|
512,000(b)
|
Federal Home Loan Bank Discount Notes, 7/20/20
|
511,962
|
|
|
500,000(a)
|
Federal Home Loan Banks, 0.11% (SOFRRATE + 3 bps),
|
|
|
|
|
9/4/20
|
499,938
|
|
|
2,400,000(a)
|
Federal Home Loan Banks, 0.12% (SOFRRATE +
|
|
|
|
|
4 bps), 8/25/20
|
2,399,582
|
|
|
2,000,000(a)
|
Federal Home Loan Banks, 0.125% (SOFRRATE +
|
|
|
|
|
5 bps), 9/28/20
|
2,000,114
|
|
|
1,950,000(a)
|
Federal Home Loan Banks, 0.13% (SOFRRATE +
|
|
|
|
|
5 bps), 1/22/21
|
1,949,557
|
|
|
1,500,000(a)
|
Federal Home Loan Banks, 0.161% (1 Month USD LIBOR -
|
|
|
|
|
3 bps), 8/12/20
|
1,500,037
|
|
|
1,215,000(a)
|
Federal Home Loan Banks, 0.18% (SOFRRATE +
|
|
|
|
|
10 bps), 12/23/20
|
1,214,924
|
|
|
500,000(a)
|
Federal Home Loan Banks, 0.2% (SOFRRATE +
|
|
|
|
|
12 bps), 10/7/20
|
500,120
|
|
|
755,000(a)
|
Federal Home Loan Banks, 0.24% (SOFRRATE +
|
|
|
|
|
16 bps), 5/7/21
|
755,391
|
|
|
6,855,000(a)
|
Federal Home Loan Banks, 0.334% (1 Month USD LIBOR +
|
|
|
|
|
15 bps), 9/28/20
|
6,859,177
|
|
|
1,135,000(a)
|
Federal Home Loan Banks, 1.15% (3 Month USD LIBOR -
|
|
|
|
|
17 bps), 1/8/21
|
1,136,497
|
|
|
250,000(a)
|
Federal Home Loan Banks, 1.558% (3 Month USD LIBOR +
|
|
|
|
|
13 bps), 7/1/20
|
250,000
|
|
|
1,255,000
|
Federal Home Loan Banks, 1.83%, 7/29/20
|
1,256,650
|
|
|
1,065,000
|
Federal Home Loan Banks, 2.625%, 10/1/20
|
1,071,521
|
|
|
2,000,000
|
Federal Home Loan Banks, 2.875%, 9/11/20
|
2,010,577
|
|
|
5,562,000
|
Federal Home Loan Mortgage Corp., 1.625%, 9/29/20
|
5,576,881
|
|
|
1,718,000
|
Federal Home Loan Mortgage Corp., 2.375%, 2/16/21
|
1,741,515
|
The accompanying notes are an integral part of these financial statements.
12 Pioneer U.S. Government Money Market Fund | Semiannual Report | 6/30/20
|
Principal
|
|
|
|
|
Amount ($)
|
|
Value
|
|
|
|
U.S. GOVERNMENT AND AGENCY
|
|
|
|
|
OBLIGATIONS — (continued)
|
|
|
|
3,300,000(a)
|
Federal National Mortgage Association, 0.12%
|
|
|
|
|
(SOFRRATE + 4 bps), 1/29/21
|
$ 3,297,034
|
|
|
1,000,000(a)
|
Federal National Mortgage Association, 0.155%
|
|
|
|
|
(SOFRRATE + 8 bps), 10/30/20
|
1,000,081
|
|
|
2,500,000(a)
|
Federal National Mortgage Association, 0.16%
|
|
|
|
|
(SOFRRATE + 8 bps), 9/16/20
|
2,500,000
|
|
|
2,285,000(a)
|
Federal National Mortgage Association, 0.31%
|
|
|
|
|
(SOFRRATE + 23 bps), 7/6/21
|
2,284,581
|
|
|
2,758,000
|
Federal National Mortgage Association, 1.5%, 11/30/20
|
2,773,077
|
|
|
1,005,000
|
Federal National Mortgage Association, 1.875%, 12/28/20
|
1,013,306
|
|
|
870,000
|
Federal National Mortgage Association, 2.5%, 4/13/21
|
885,724
|
|
|
470,000
|
Federal National Mortgage Association, 2.75%, 6/22/21
|
481,658
|
|
|
1,840,000
|
Federal National Mortgage Association, 2.875%, 10/30/20
|
1,852,589
|
|
|
7,860,000(b)
|
U.S. Treasury Bills, 7/7/20
|
7,859,862
|
|
|
3,070,000(b)
|
U.S. Treasury Bills, 7/9/20
|
3,069,914
|
|
|
14,500,000(b)
|
U.S. Treasury Bills, 7/14/20
|
14,499,379
|
|
|
9,000,000(b)
|
U.S. Treasury Bills, 7/23/20
|
8,999,134
|
|
|
6,000,000(b)
|
U.S. Treasury Bills, 8/13/20
|
5,999,176
|
|
|
5,000,000(b)
|
U.S. Treasury Bills, 8/25/20
|
4,998,995
|
|
|
10,000,000(b)
|
U.S. Treasury Bills, 8/27/20
|
9,997,942
|
|
|
15,000,000(b)
|
U.S. Treasury Bills, 9/3/20
|
14,996,341
|
|
|
750,000(b)
|
U.S. Treasury Bills, 9/29/20
|
749,734
|
|
|
4,000,000(b)
|
U.S. Treasury Bills, 10/27/20
|
3,997,686
|
|
|
44,050,000(a)
|
U.S. Treasury Floating Rate Notes, 0.193% (3 Month U.S.
|
|
|
|
|
Treasury Bill Money Market Yield +
|
|
|
|
|
4 bps), 7/31/20
|
44,050,241
|
|
|
14,525,000(a)
|
U.S. Treasury Floating Rate Notes, 0.195% (3 Month U.S.
|
|
|
|
|
Treasury Bill Money Market Yield +
|
|
|
|
|
5 bps), 10/31/20
|
14,524,157
|
|
|
4,400,000(a)
|
U.S. Treasury Floating Rate Notes, 0.264% (3 Month U.S.
|
|
|
|
|
Treasury Bill Money Market Yield +
|
|
|
|
|
11 bps), 4/30/22
|
4,402,819
|
|
|
14,275,000(a)
|
U.S. Treasury Floating Rate Notes, 0.265% (3 Month U.S.
|
|
|
|
|
Treasury Bill Money Market Yield +
|
|
|
|
|
12 bps), 1/31/21
|
14,272,829
|
|
|
5,620,000(a)
|
U.S. Treasury Floating Rate Notes, 0.289% (3 Month U.S.
|
|
|
|
|
Treasury Bill Money Market Yield +
|
|
|
|
|
14 bps), 4/30/21
|
5,617,708
|
|
|
2,915,000(a)
|
U.S. Treasury Floating Rate Notes, 0.304% (3 Month U.S.
|
|
|
|
|
Treasury Bill Money Market Yield +
|
|
|
|
|
15 bps), 1/31/22
|
2,915,099
|
|
|
13,385,000(a)
|
U.S. Treasury Floating Rate Notes, 0.37% (3 Month U.S.
|
|
|
|
|
Treasury Bill Money Market Yield +
|
|
|
|
|
22 bps), 7/31/21
|
13,394,267
|
The accompanying notes are an integral part of these financial statements.
Pioneer U.S. Government Money Market Fund | Semiannual Report | 6/30/20 13
|
Schedule of Investments | 6/30/20 (unaudited) (continued)
|
|
|
Principal
|
|
|
|
|
Amount ($)
|
|
Value
|
|
|
|
U.S. GOVERNMENT AND AGENCY
|
|
|
|
|
OBLIGATIONS — (continued)
|
|
|
|
9,870,000(a)
|
U.S. Treasury Floating Rate Notes, 0.45% (3 Month U.S.
|
|
|
|
|
Treasury Bill Money Market Yield + 30 bps), 10/31/21
|
$ 9,885,558
|
|
|
|
TOTAL U.S. GOVERNMENT AND AGENCY OBLIGATIONS
|
|
|
|
|
(Cost $245,833,957)
|
$245,833,957
|
|
|
TEMPORARY CASH INVESTMENTS — 16.4%
|
|||
|
|
of Net Assets
|
|
|
|
|
REPURCHASE AGREEMENTS — 16.4%
|
|
|
|
12,120,000
|
$12,120,000 Merrill Lynch, Pierce, Fenner & Smith, 0.09%,
|
|
|
|
dated 6/30/20 plus accrued interest on 7/1/20,
|
|||
|
|
collateralized by $12,362,400 Federal Home Loan Bank,
|
|
|
|
|
0.15%-0.20%, 12/14/20-8/16/21.
|
$ 12,120,000
|
|
|
12,120,000
|
$12,120,000 RBC Capital Markets LLC, 0.09%, dated
|
|
|
|
|
6/30/20 plus accrued interest on 7/1/20, collateralized by
|
|
|
|
|
$12,362,524 U.S. Treasury Notes, 2.375%, 5/15/29.
|
12,120,000
|
|
|
12,120,000
|
$12,120,000 ScotiaBank, 0.09%, dated 6/30/20 plus
|
|
|
|
|
accrued interest on 7/1/20, collateralized by the following:
|
|
|
|
|
$3,524,007 Federal National Mortgage Association,
|
|
|
|
|
2.4%-3.0%, 9/1/39-10/1/46
|
|
|
|
|
$8,838,426 U.S. Treasury Notes, 2.125, 2/29/24.
|
12,120,000
|
|
|
6,060,000
|
$6,060,000 TD Securities USA LLC, 0.07%,
|
|
|
|
dated 6/30/20 plus accrued interest on 7/1/20,
|
|||
|
|
collateralized by the following:
|
|
|
|
|
$4,398,622 Federal National Mortgage Association,
|
|
|
|
|
3.0-5.0%, 4/1/33-7/1/49
|
|
|
|
$899,270 Freddie Mac Giant, 4.5%, 9/1/43
|
|||
|
|
$883,308 Government National Mortgage Association,
|
|
|
|
|
3.5%, 8/20/49.
|
6,060,000
|
|
|
6,060,000
|
$6,060,000 TD Securities USA LLC, 0.09%, dated 6/30/20
|
|
|
|
plus accrued interest on 7/1/20, collateralized by
|
|||
|
|
$6,181,230 U.S. Treasury Notes, 0.27%, 4/30/22.
|
6,060,000
|
|
|
|
|
$ 48,480,000
|
|
|
|
TOTAL TEMPORARY CASH INVESTMENTS
|
|
|
|
|
(Cost $48,480,000)
|
$ 48,480,000
|
|
|
|
TOTAL INVESTMENT IN SECURITIES OF
|
|
|
|
|
UNAFFILIATED ISSUERS — 99.6%
|
|
|
|
|
(Cost $294,313,957)
|
$294,313,957
|
|
|
|
OTHER ASSETS & LIABILITIES — 0.4%
|
$ 1,077,606
|
|
|
|
NET ASSETS — 100.0%
|
$295,391,563
|
bps Basis Points.
LIBOR London Interbank Offered Rate.
SOFRRATE Secured Overnight Financing Rate.
The accompanying notes are an integral part of these financial statements.
14 Pioneer U.S. Government Money Market Fund | Semiannual Report | 6/30/20
|
(a)
|
Floating rate note. Coupon rate, reference index and spread shown at June 30, 2020.
|
|
(b)
|
Security issued with a zero coupon. Income is recognized through accretion of discount.
|
At June 30, 2020, the net unrealized appreciation on investments based on cost for federal tax purposes of $294,313,957 was as follows:
|
Aggregate gross unrealized appreciation for all investments in which
|
|
|
there is an excess of value over tax cost
|
$ —
|
|
Aggregate gross unrealized depreciation for all investments in which
|
|
|
there is an excess of tax cost over value
|
—
|
|
Net unrealized appreciation
|
$ —
|
Various inputs are used in determining the value of the Fund’s investments. These inputs are summarized in the three broad levels below.
Level 1 – quoted prices in active markets for identical securities.
Level 2 – other significant observable inputs (including quoted prices for similar securities, interest rates, prepayment speeds, credit risks, etc.). See Notes to Financial
Statements — Note 1A.
Level 3 – significant unobservable inputs (including the Fund’s own assumptions in determining fair value of investments). See Notes to Financial Statements — Note 1A.
The following is a summary of the inputs used as of June 30, 2020, in valuing the Fund’s investments.
|
|
Level 1
|
Level 2
|
Level 3
|
Total
|
||||||||||||
|
U.S. Government and
|
||||||||||||||||
|
Agency Obligations
|
$
|
—
|
$
|
245,833,957
|
$
|
—
|
$
|
245,833,957
|
||||||||
|
Repurchase Agreements
|
—
|
48,480,000
|
—
|
48,480,000
|
||||||||||||
|
Total
|
$
|
—
|
$
|
294,313,957
|
$
|
—
|
$
|
294,313,957
|
||||||||
During the six months ended June 30, 2020, there were no transfers between Levels 1, 2 and 3.
The accompanying notes are an integral part of these financial statements.
Pioneer U.S. Government Money Market Fund | Semiannual Report | 6/30/20 15
|
|
|
|
|
|
|
ASSETS:
|
||||
|
Investments in unaffiliated issuers, at value (cost $294,313,957)
|
$
|
294,313,957
|
||
|
Cash
|
669,948
|
|||
|
Receivables —
|
||||
|
Fund shares sold
|
775,448
|
|||
|
Interest
|
146,214
|
|||
|
Due from the Adviser
|
137,091
|
|||
|
Other assets
|
39,274
|
|||
|
Total assets
|
$
|
296,081,932
|
||
|
LIABILITIES:
|
||||
|
Payables —
|
||||
|
Fund shares repurchased
|
$
|
415,412
|
||
|
Distributions
|
14,725
|
|||
|
Administrative fees
|
16,779
|
|||
|
Professional fees
|
33,540
|
|||
|
Transfer agent fees
|
48,098
|
|||
|
Shareowner communications expense
|
41,771
|
|||
|
Due to affiliates
|
||||
|
Management fees
|
92,345
|
|||
|
Other due to affiliates
|
2,924
|
|||
|
Accrued expenses
|
24,775
|
|||
|
Total liabilities
|
$
|
690,369
|
||
|
NET ASSETS:
|
||||
|
Paid-in capital
|
$
|
295,368,349
|
||
|
Distributable earnings
|
23,214
|
|||
|
Net assets
|
$
|
295,391,563
|
||
|
NET ASSET VALUE PER SHARE:
|
||||
|
No par value (unlimited number of shares authorized)
|
||||
|
Class A (based on $244,573,567/244,709,132 shares)
|
$
|
1.00
|
||
|
Class R (based on $1,223,667/1,223,720 shares)
|
$
|
1.00
|
||
|
Class Y (based on $49,594,329/49,603,634 shares)
|
$
|
1.00
|
||
The accompanying notes are an integral part of these financial statements.
16 Pioneer U.S. Government Money Market Fund | Semiannual Report | 6/30/20
|
Statement of Operations (unaudited)
|
|
|
|
FOR THE SIX MONTHS ENDED 6/30/20
|
|
|
|
INVESTMENT INCOME:
|
||||||||
|
Interest from unaffiliated issuers
|
$
|
991,842
|
||||||
|
Total investment income
|
$
|
991,842
|
||||||
|
EXPENSES:
|
||||||||
|
Management fees
|
$
|
479,462
|
||||||
|
Administrative expense
|
98,224
|
|||||||
|
Transfer agent fees
|
||||||||
|
Class A
|
77,575
|
|||||||
|
Class R
|
250
|
|||||||
|
Class Y
|
203
|
|||||||
|
Distribution fees
|
||||||||
|
Class A
|
169,089
|
|||||||
|
Class R
|
2,937
|
|||||||
|
Shareowner communications expense
|
45,000
|
|||||||
|
Custodian fees
|
17,429
|
|||||||
|
Registration fees
|
42,150
|
|||||||
|
Professional fees
|
28,904
|
|||||||
|
Printing expense
|
13,561
|
|||||||
|
Trustees’ fees
|
3,850
|
|||||||
|
Insurance expense
|
295
|
|||||||
|
Miscellaneous
|
23,202
|
|||||||
|
Total expenses
|
$
|
1,002,131
|
||||||
|
Less waiver of Class A distribution fees and expenses reimbursed by the Adviser
|
(480,307
|
)
|
||||||
|
Net expenses
|
$
|
521,824
|
||||||
|
Net investment income
|
$
|
470,018
|
||||||
|
REALIZED AND UNREALIZED GAIN (LOSS) ON INVESTMENTS:
|
||||||||
|
Net realized gain (loss) on investments
|
$
|
16,029
|
||||||
|
Net increase in net assets resulting from operations
|
$
|
486,047
|
||||||
The accompanying notes are an integral part of these financial statements.
Pioneer U.S. Government Money Market Fund | Semiannual Report | 6/30/20 17
|
Statements of Changes in Net Assets
|
|
|
|
|
Six Months
|
|||||||
|
|
Ended
|
|||||||
|
|
6/30/20
|
Year Ended
|
||||||
|
|
(unaudited)
|
12/31/19
|
||||||
|
FROM OPERATIONS:
|
||||||||
|
Net investment income (loss)
|
$
|
470,018
|
$
|
3,705,966
|
||||
|
Net realized gain (loss) on investments
|
16,029
|
18,029
|
||||||
|
Net increase in net assets resulting
|
||||||||
|
from operations
|
$
|
486,047
|
$
|
3,723,995
|
||||
|
DISTRIBUTIONS TO SHAREOWNERS:
|
||||||||
|
Class A ($0.0019 and $0.0151 per share, respectively)
|
$
|
(382,497
|
)
|
$
|
(2,991,125
|
)
|
||
|
Class R ($0.0011 and $0.0109 per share, respectively)
|
(1,126
|
)
|
(7,147
|
)
|
||||
|
Class Y ($0.0022 and $0.0168 per share, respectively)
|
(92,130
|
)
|
(708,789
|
)
|
||||
|
Total distributions to shareowners
|
$
|
(475,753
|
)
|
$
|
(3,707,061
|
)
|
||
|
FROM FUND SHARE TRANSACTIONS:
|
||||||||
|
Net proceeds from sales of shares
|
$
|
162,665,354
|
$
|
105,386,701
|
||||
|
Reinvestment of distributions
|
384,385
|
2,934,217
|
||||||
|
Cost of shares repurchased
|
(107,928,660
|
)
|
(116,276,176
|
)
|
||||
|
Net increase (decrease) in net assets resulting from
|
||||||||
|
Fund share transactions
|
$
|
55,121,079
|
$
|
(7,955,258
|
)
|
|||
|
Net increase (decrease) in net assets
|
$
|
55,131,373
|
$
|
(7,938,324
|
)
|
|||
|
NET ASSETS:
|
||||||||
|
Beginning of period
|
$
|
240,260,190
|
$
|
248,198,514
|
||||
|
End of period
|
$
|
295,391,563
|
$
|
240,260,190
|
||||
The accompanying notes are an integral part of these financial statements.
18 Pioneer U.S. Government Money Market Fund | Semiannual Report | 6/30/20
|
|
Six Months
|
Six Months
|
||||||||||||||
|
|
Ended
|
Ended
|
||||||||||||||
|
|
6/30/20
|
6/30/20
|
Year Ended
|
Year Ended
|
||||||||||||
|
|
Shares
|
Amount
|
12/31/19
|
12/31/19
|
||||||||||||
|
|
(unaudited)
|
(unaudited)
|
Shares
|
Amount
|
||||||||||||
|
Class A
|
||||||||||||||||
|
Shares sold
|
141,330,182
|
$
|
141,330,182
|
88,943,432
|
$
|
88,943,432
|
||||||||||
|
Reinvestment of distributions
|
382,497
|
382,497
|
2,923,124
|
2,923,124
|
||||||||||||
|
Less shares repurchased
|
(94,179,975
|
)
|
(94,179,975
|
)
|
(105,137,764
|
)
|
(105,137,768
|
)
|
||||||||
|
Net increase/(decrease)
|
47,532,704
|
$
|
47,532,704
|
(13,271,208
|
)
|
$
|
(13,271,212
|
)
|
||||||||
|
Class R
|
||||||||||||||||
|
Shares sold
|
936,823
|
$
|
936,823
|
867,473
|
$
|
867,473
|
||||||||||
|
Reinvestment of distributions
|
1,126
|
1,126
|
6,606
|
6,606
|
||||||||||||
|
Less shares repurchased
|
(599,091
|
)
|
(599,091
|
)
|
(542,581
|
)
|
(542,581
|
)
|
||||||||
|
Net increase
|
338,858
|
$
|
338,858
|
331,498
|
$
|
331,498
|
||||||||||
|
Class Y
|
||||||||||||||||
|
Shares sold
|
20,398,349
|
$
|
20,398,349
|
15,575,796
|
$
|
15,575,796
|
||||||||||
|
Reinvestment of distributions
|
762
|
762
|
4,487
|
4,487
|
||||||||||||
|
Less shares repurchased
|
(13,149,594
|
)
|
(13,149,594
|
)
|
(10,595,827
|
)
|
(10,595,827
|
)
|
||||||||
|
Net increase
|
7,249,517
|
$
|
7,249,517
|
4,984,456
|
$
|
4,984,456
|
||||||||||
The accompanying notes are an integral part of these financial statements.
Pioneer U.S. Government Money Market Fund | Semiannual Report | 6/30/20 19
|
Financial Highlights
|
|
|
|
|
|
|
|
|
|
|
|
|
|
Six Months
|
|
||||||||||||||||||||||
|
|
Ended
|
Year
|
Year
|
Year
|
Year
|
Year
|
||||||||||||||||||
|
|
6/30/20
|
Ended
|
Ended
|
Ended
|
Ended
|
Ended
|
||||||||||||||||||
|
|
(unaudited)
|
12/31/19
|
12/31/18
|
12/31/17
|
12/31/16*
|
12/31/15*
|
||||||||||||||||||
|
Class A
|
|
|||||||||||||||||||||||
|
Net asset value, beginning of period
|
$
|
1.00
|
$
|
1.00
|
$
|
1.00
|
$
|
1.00
|
$
|
1.00
|
$
|
1.00
|
||||||||||||
|
Increase (decrease) from investment operations:
|
||||||||||||||||||||||||
|
Net investment income (loss) (a)
|
$
|
0.002
|
$
|
0.015
|
$
|
0.012
|
$
|
0.003
|
$
|
0.000
|
(b)
|
$
|
0.000
|
(b)
|
||||||||||
|
Distributions to shareowners:
|
||||||||||||||||||||||||
|
Net investment income
|
$
|
(0.002
|
)(c) |
$
|
(0.015
|
)(c) |
$
|
(0.012
|
)(c)
|
$
|
(0.003
|
)
|
$
|
(0.000
|
)(b)(c)
|
$
|
(0.000
|
)(b)
|
||||||
|
Net increase (decrease) in net asset value
|
$
|
0.00
|
$
|
0.00
|
$
|
0.00
|
$
|
0.00
|
$
|
0.00
|
$
|
0.00
|
||||||||||||
|
Net asset value, end of period
|
$
|
1.00
|
$
|
1.00
|
$
|
1.00
|
$
|
1.00
|
$
|
1.00
|
$
|
1.00
|
||||||||||||
|
Total return (d)
|
0.19
|
%(e)
|
1.50
|
%
|
1.21
|
%
|
0.27
|
%
|
0.01
|
%
|
0.01
|
%
|
||||||||||||
|
Ratio of net expenses to average net assets
|
0.39
|
%(f)
|
0.69
|
%
|
0.66
|
%
|
0.62
|
%
|
0.34
|
%
|
0.10
|
%
|
||||||||||||
|
Ratio of net investment income (loss) to average net assets
|
0.33
|
%(f)
|
1.50
|
%
|
1.20
|
%
|
0.26
|
%
|
0.01
|
%
|
0.01
|
%
|
||||||||||||
|
Net assets, end of period (in thousands)
|
$
|
244,574
|
$
|
197,032
|
$
|
210,290
|
$
|
217,256
|
$
|
251,143
|
$
|
261,928
|
||||||||||||
|
Ratios with no waiver of fees and assumption of expenses by
|
||||||||||||||||||||||||
|
the Adviser and no reduction for fees paid indirectly:
|
||||||||||||||||||||||||
|
Total expenses to average net assets
|
0.77
|
%(f)
|
0.84
|
%
|
0.81
|
%
|
0.80
|
%
|
0.82
|
%
|
0.71
|
%
|
||||||||||||
|
Net investment income (loss) to average net assets
|
(0.05
|
)%(f)
|
1.35
|
%
|
1.05
|
%
|
0.08
|
%
|
(0.46
|
)%
|
(0.60
|
)%
|
||||||||||||
|
*
|
The Fund was audited by an independent registered public accounting firm other than Ernst & Young LLP.
|
|
(a)
|
The per-share data presented above is based on the average shares outstanding for the period presented.
|
|
(b)
|
Amount rounds to less than $0.001 or $(0.001) per share.
|
|
(c)
|
The amount of distributions made to shareowners during the period were in excess of the net investment income earned by the Fund during the period. A portion of the accumulated net investment income was distributed to shareowners during
the period.
|
|
(d)
|
Assumes initial investment at net asset value at the beginning of each period, reinvestment of all distributions, the complete redemption of the investment at net asset value at the end of each period and no sales charges. Total return
would be reduced if sales charges were taken into account.
|
|
(e)
|
Not annualized.
|
|
(f)
|
Annualized.
|
The accompanying notes are an integral part of these financial statements.
20 Pioneer U.S. Government Money Market Fund | Semiannual Report | 6/30/20
|
|
Six Months
|
|||||||||||||||
|
|
Ended
|
Year
|
Year
|
|||||||||||||
|
|
6/30/20
|
Ended
|
Ended
|
8/1/17* to
|
||||||||||||
|
|
(unaudited)
|
12/31/19
|
12/31/18
|
12/31/17
|
||||||||||||
|
Class R
|
||||||||||||||||
|
Net asset value, beginning of period
|
$
|
1.00
|
$
|
1.00
|
$
|
1.00
|
$
|
1.00
|
||||||||
|
Increase (decrease) from investment operations:
|
||||||||||||||||
|
Net investment income (loss) (a)
|
$
|
0.001
|
$
|
0.010
|
$
|
0.009
|
$
|
0.000
|
(b)
|
|||||||
|
Net realized and unrealized gain (loss) on investments
|
0.000
|
0.001
|
(0.001
|
)
|
0.000
|
|||||||||||
|
Net increase (decrease) from investment operations
|
$
|
0.001
|
$
|
0.011
|
$
|
0.008
|
$
|
0.000
|
||||||||
|
Distributions to shareowners:
|
||||||||||||||||
|
Net investment income
|
$
|
(0.001
|
)(c) |
$
|
(0.011
|
)(c) |
$
|
(0.008
|
)(c) |
$
|
(0.000
|
)(b) |
||||
|
Net increase (decrease) in net asset value
|
$
|
0.00
|
$
|
0.00
|
$
|
0.00
|
$
|
0.00
|
||||||||
|
Net asset value, end of period
|
$
|
1.00
|
$
|
1.00
|
$
|
1.00
|
$
|
1.00
|
||||||||
|
Total return (d)
|
0.11
|
%(e)
|
1.08
|
%
|
0.78
|
%
|
0.03
|
%(e)
|
||||||||
|
Ratio of net expenses to average net assets
|
0.51
|
%(f)
|
1.12
|
%
|
1.08
|
%
|
1.02
|
%(f)
|
||||||||
|
Ratio of net investment income (loss) to average net assets
|
0.19
|
%(f)
|
1.03
|
%
|
0.85
|
%
|
0.10
|
%(f)
|
||||||||
|
Net assets, end of period (in thousands)
|
$
|
1,224
|
$
|
885
|
$
|
553
|
$
|
151
|
||||||||
|
Ratios with no waiver of fees and assumption of expenses by
|
||||||||||||||||
|
the Adviser and no reduction for fees paid indirectly:
|
||||||||||||||||
|
Total expenses to average net assets
|
1.06
|
%(f)
|
1.12
|
%
|
1.08
|
%
|
1.03
|
%(f)
|
||||||||
|
Net investment income (loss) to average net assets
|
(0.36
|
)%(f)
|
1.03
|
%
|
0.85
|
%
|
0.09
|
%(f)
|
||||||||
|
*
|
Class R shares commenced operations on August 1, 2017.
|
|
(a)
|
The per-share data presented above is based on the average shares outstanding for the period presented.
|
|
(b)
|
Amount rounds to less than $0.001 or $(0.001) per share.
|
|
(c)
|
The amount of distributions made to shareowners during the period were in excess of the net investment income earned by the Fund during the period. A portion of the accumulated net investment income was distributed to shareowners during
the period.
|
|
(d)
|
Assumes initial investment at net asset value at the beginning of each period, reinvestment of all distributions and the complete redemption of the investment at net asset value at the end of each period.
|
|
(e)
|
Not annualized.
|
|
(f)
|
Annualized.
|
The accompanying notes are an integral part of these financial statements.
Pioneer U.S. Government Money Market Fund | Semiannual Report | 6/30/20 21
Financial Highlights (continued)
|
|
Six Months
|
|
||||||||||||||||||||||
|
|
Ended
|
Year
|
Year
|
Year
|
Year
|
Year
|
||||||||||||||||||
|
|
6/30/20
|
Ended
|
Ended
|
Ended
|
Ended
|
Ended
|
||||||||||||||||||
|
|
(unaudited)
|
12/31/19
|
12/31/18
|
12/31/17
|
12/31/16*
|
12/31/15*
|
||||||||||||||||||
|
Class Y
|
|
|||||||||||||||||||||||
|
Net asset value, beginning of period
|
$
|
1.00
|
$
|
1.00
|
$
|
1.00
|
$
|
1.00
|
$
|
1.00
|
$
|
1.00
|
||||||||||||
|
Increase (decrease) from investment operations:
|
||||||||||||||||||||||||
|
Net investment income (loss) (a)
|
$
|
0.002
|
$
|
0.017
|
$
|
0.013
|
$
|
0.004
|
$
|
0.000
|
(b)
|
$
|
0.000
|
(b)
|
||||||||||
|
Net realized and unrealized gain (loss) on investments
|
0.000
|
0.000
|
0.001
|
0.000
|
0.000
|
0.000
|
||||||||||||||||||
|
Net increase (decrease) from investment operations
|
$
|
0.002
|
$
|
0.017
|
$
|
0.014
|
$
|
0.004
|
$
|
0.000
|
$
|
0.000
|
||||||||||||
|
Distributions to shareowners:
|
||||||||||||||||||||||||
|
Net investment income
|
$
|
(0.002
|
)(c) |
$
|
(0.017
|
)(c) |
$
|
(0.014
|
)(c) |
$
|
(0.004
|
)
|
$
|
(0.000)
|
(b)(c)
|
$ | (0.000 | )(b) | ||||||
|
Net increase (decrease) in net asset value
|
$
|
0.00
|
$
|
0.00
|
$
|
0.00
|
$
|
0.00
|
$
|
0.00
|
$
|
0.00
|
||||||||||||
|
Net asset value, end of period
|
$
|
1.00
|
$
|
1.00
|
$
|
1.00
|
$
|
1.00
|
$
|
1.00
|
$
|
1.00
|
||||||||||||
|
Total return (d)
|
0.22
|
%(e)
|
1.67
|
%
|
1.34
|
%
|
0.37
|
%
|
0.01
|
%
|
0.01
|
%
|
||||||||||||
|
Ratio of net expenses to average net assets
|
0.34
|
%(f)
|
0.52
|
%
|
0.54
|
%
|
0.51
|
%
|
0.34
|
%
|
0.10
|
%
|
||||||||||||
|
Ratio of net investment income (loss) to average net assets
|
0.38
|
%(f)
|
1.66
|
%
|
1.30
|
%
|
0.36
|
%
|
0.01
|
%
|
0.01
|
%
|
||||||||||||
|
Net assets, end of period (in thousands)
|
$
|
49,549
|
$
|
42,343
|
$
|
37,356
|
$
|
49,178
|
$
|
63,703
|
$
|
63,553
|
||||||||||||
|
Ratios with no waiver of fees and assumption of expenses by
|
||||||||||||||||||||||||
|
the Adviser and no reduction for fees paid indirectly:
|
||||||||||||||||||||||||
|
Total expenses to average net assets
|
0.51
|
%(f)
|
0.52
|
%
|
0.54
|
%
|
0.51
|
%
|
0.50
|
%
|
0.46
|
%
|
||||||||||||
|
Net investment income (loss) to average net assets
|
0.21
|
%(f)
|
1.66
|
%
|
1.30
|
%
|
0.36
|
%
|
(0.15
|
)%
|
(0.35
|
)%
|
||||||||||||
|
*
|
The Fund was audited by an independent registered public accounting firm other than Ernst & Young LLP.
|
|
(a)
|
The per-share data presented above is based on the average shares outstanding for the period presented.
|
|
(b)
|
Amount rounds to less than $0.001 or $(0.001) per share.
|
|
(c)
|
The amount of distributions made to shareowners during the period were in excess of the net investment income earned by the Fund during the period. A portion of the accumulated net investment income was distributed to shareowners during
the period.
|
|
(d)
|
Assumes initial investment at net asset value at the beginning of each period, reinvestment of all distributions and the complete redemption of the investment at net asset value at the end of each period.
|
|
(e)
|
Not annualized.
|
|
(f)
|
Annualized.
|
The accompanying notes are an integral part of these financial statements.
22 Pioneer U.S. Government Money Market Fund | Semiannual Report | 6/30/20
1. Organization and Significant Accounting Policies
Pioneer U.S. Government Money Market Fund (the “Fund”) is a series of Pioneer Money Market Trust, a Delaware statutory trust. The Fund is registered under the Investment Company Act of 1940 as a
diversified, open-end management investment company. The investment objective of the Fund is to provide high current income, preservation of capital, and liquidity through investments in high-quality short-term securities.
The Fund offers three classes of shares designated as Class A, Class R and Class Y shares. Class R shares commenced operations on August 1, 2017. Each class of shares represents an interest in the
same portfolio of investments of the Fund and has identical rights (based on relative net asset values) to assets and liquidation proceeds. Share classes can bear different rates of class-specific fees and expenses, such as transfer agent and
distribution fees. Differences in class-specific fees and expenses will result in differences in net investment income and, therefore, the payment of different dividends from net investment income earned by each class. The Amended and Restated
Declaration of Trust of the Fund gives the Board of Trustees the flexibility to specify either per-share voting or dollar-weighted voting when submitting matters for shareowner approval. Under per-share voting, each share of a class of the Fund is
entitled to one vote. Under dollar-weighted voting, a shareowner’s voting power is determined not by the number of shares owned, but by the dollar value of the shares on the record date. Each share class has exclusive voting rights with respect to
matters affecting only that class, including with respect to the distribution plan for that class. There is no distribution plan for Class Y shares.
Amundi Pioneer Asset Management, Inc., an indirect, wholly owned subsidiary of Amundi and Amundi’s wholly owned subsidiary, Amundi USA, Inc., serves as the Fund’s investment adviser (the “Adviser”).
Amundi Pioneer Distributor, Inc., an affiliate of Amundi Pioneer Asset Management, Inc., serves as the Fund’s distributor (the “Distributor”).
In August 2018, the Securities and Exchange Commission (“SEC”) released a Disclosure Update and Simplification Final Rule. The Final Rule amends Regulation S-X disclosures requirements to conform them
to U.S. Generally Accepted Accounting Principles (“U.S. GAAP”) for investment companies. The Fund’s financial statements were prepared in compliance with the new amendments to Regulation S-X.
During March 2017, the Financial Accounting Standards Board (FASB) issued an Accounting Standard Update, ASU 2017-08, Receivables-Nonrefundable Fees and Other Costs (Subtopic 310-20), Premium
Amortization on Purchased Callable Debt Securities (“ASU 2017-08”), which shortens the amortization
Pioneer U.S. Government Money Market Fund | Semiannual Report | 6/30/20 23
period for purchased non-contingently callable debt securities held at a premium. ASU 2017-08 specifies that the premium amortization period ends at the earliest call date, for certain purchased
non-contingently callable debt securities. ASU 2017-08 is effective for fiscal years, and interim periods within those fiscal years, beginning after December 15, 2018. The Fund adopted ASU 2017-08 as of January 1, 2019 for the Fund’s period ended
June 30, 2020. The implementation of ASU 2017-08 did not have a material impact on the Fund’s Financial Statements.
The Fund is an investment company and follows investment company accounting and reporting guidance under U.S. GAAP. U.S. GAAP requires the management of the Fund to make estimates and assumptions that
affect the reported amounts of assets and liabilities, the disclosure of contingent assets and liabilities at the date of the financial statements, and the reported amounts of income, expenses and gain or loss on investments during the reporting
period. Actual results could differ from those estimates.
The following is a summary of significant accounting policies followed by the Fund in the preparation of its financial statements:
A. Security Valuation
The net asset value of the Fund is computed twice daily, on each day the New York Stock Exchange (“NYSE”) is open, at 1:00 p.m. Eastern time and as of the close of regular trading
on the NYSE (normally 4:00 p.m. Eastern time).
The Fund generally values its securities using the amortized cost method, which approximates fair market value, in accordance with Rule 2a-7 under the 1940 Act. This valuation
method assumes a steady rate of amortization of any premium or discount from the date of purchase until the maturity of each security. This valuation method is designed to permit a money market fund to maintain a constant net asset value of $1.00 per
share, but there is no guarantee that it will do so.
Shares of open-end registered investment companies (including money market mutual funds) are valued at such funds’ net asset value.
Repurchase agreements are valued at par. Cash may included overnight time deposits at approved financial institutions.
B. Investment Income and Transactions
Investments purchased at a discount or premium are valued by amortizing the difference between the original purchase price and maturity value of the issue over the period to
maturity.
Interest income, including interest on income-bearing cash accounts, is recorded on the accrual basis.
24 Pioneer U.S. Government Money Market Fund | Semiannual Report | 6/30/20
Security transactions are recorded as of trade date. Gains and losses on sales of investments are calculated on the identified cost method for both financial reporting and federal
income tax purposes.
C. Federal Income Taxes
It is the Fund’s policy to comply with the requirements of the Internal Revenue Code applicable to regulated investment companies and to distribute all of its net taxable income and
net realized capital gains, if any, to its shareowners. Therefore, no provision for federal income taxes is required. As of December 31, 2019, the Fund did not accrue any interest or penalties with respect to uncertain tax positions, which, if
applicable, would be recorded as an income tax expense on the Statement of Operations. Tax returns filed within the prior three years remain subject to examination by federal and state tax authorities.
The amount and character of income and capital gain distributions to shareowners are determined in accordance with federal income tax rules, which may differ from U.S. GAAP.
Distributions in excess of net investment income or net realized gains are temporary over distributions for financial statement purposes resulting from differences in the recognition or classification of income or distributions for financial
statement and tax purposes. Capital accounts within the financial statements are adjusted for permanent book/tax differences to reflect tax character, but are not adjusted for temporary differences.
The tax character of current year distributions payable will be determined at the end of the current taxable year. The tax character of distributions paid during the year ended
December 31, 2019 was as follows:
|
|
2019
|
|||
|
Distributions paid from:
|
||||
|
Ordinary income
|
$
|
3,707,061
|
||
|
Total
|
$
|
3,707,061
|
||
The following shows the components of distributable earnings (loss) on a federal income tax basis at December 31, 2019:
|
|
2019
|
|||
|
Distributable earnings (loss):
|
||||
|
Undistributed ordinary income
|
$
|
12,920
|
||
|
Total
|
$
|
12,920
|
||
The difference between book-basis and tax-basis net unrealized appreciation/(depreciation) are attributable to the tax deferral of losses on wash sales.
Pioneer U.S. Government Money Market Fund | Semiannual Report | 6/30/20 25
D. Fund Shares
The Fund records sales and repurchases of its shares as of trade date. The Fund declares as daily dividends substantially all of its net investment income. All dividends are paid on
a monthly basis. Short-term capital gain distributions, if any, may be declared with the daily dividends.
E. Class Allocations
Income, common expenses and realized and unrealized gains and losses are calculated at the Fund level and allocated daily to each class of shares based on its respective percentage
of adjusted net assets at the beginning of the day.
Distribution fees are calculated based on the average daily net asset value attributable to Class A and Class R shares of the Fund, respectively (see Note 4). Class Y shares do not
pay distribution fees. All expenses and fees paid to the Fund’s transfer agent for its services are allocated among the classes of shares based on the number of accounts in each class and the ratable allocation of related out-of-pocket expenses (see
Note 3).
Distributions to shareowners are recorded as of the ex-dividend date. Distributions paid by the Fund with respect to each class of shares are calculated in the same manner and at
the same time, except that net investment income dividends to Class A, Class R and Class Y shares can reflect different transfer agent and distribution expense rates.
F. Risks
Although the Fund seeks to preserve the value of your investment at $1.00 per share, it cannot guarantee it will do so. It is possible to lose money by investing in the Fund. Fund
shares are not federally insured by the Federal Deposit Insurance Corporation or any other government agency. The Fund’s sponsor has no legal obligation to provide financial support to the Fund, and you should not expect that the sponsor will provide
financial support at any time.
At times, the Fund’s investments may represent industries or industry sectors that are interrelated or have common risks, making the Fund more susceptible to any economic,
political, or regulatory developments or other risks affecting those industries and sectors.
With the increased use of technologies such as the Internet to conduct business, the Fund is susceptible to operational, information security and related risks. While the Fund’s
Adviser has established business continuity plans in the event of, and risk management systems to prevent, limit or mitigate, such cyber-attacks, there are inherent limitations in such plans and systems, including the possibility that certain risks
have not been identified. Furthermore, the Fund cannot control the cybersecurity plans and systems
26 Pioneer U.S. Government Money Market Fund | Semiannual Report | 6/30/20
put in place by service providers to the Fund such as Brown Brothers Harriman & Co., the Fund’s custodian and accounting agent, and DST Asset Manager Solutions, Inc., the Fund’s
transfer agent. In addition, many beneficial owners of Fund shares hold them through accounts at broker-dealers, retirement platforms and other financial market participants over which neither the Fund nor Amundi Pioneer exercises control. Each of
these may in turn rely on service providers to them, which are also subject to the risk of cyber-attacks. Cybersecurity failures or breaches at Amundi Pioneer or the Fund’s service providers or intermediaries have the ability to cause disruptions and
impact business operations, potentially resulting in financial losses, interference with the Fund’s ability to calculate its net asset value, impediments to trading, the inability of Fund shareowners to effect share purchases, redemptions or
exchanges or receive distributions, loss of or unauthorized access to private shareowner information and violations of applicable privacy and other laws, regulatory fines, penalties, reputational damage, or additional compliance costs. Such costs and
losses may not be covered under any insurance. In addition, maintaining vigilance against cyber-attacks may involve substantial costs over time, and system enhancements may themselves be subject to cyber-attacks.
COVID-19
The respiratory illness COVID-19 caused by a novel coronavirus has resulted in a global pandemic and major disruption to economies and markets around the world, including the United
States. Global financial markets have experienced extreme volatility and severe losses, and trading in many instruments has been disrupted. Liquidity for many instruments has been greatly reduced for periods of time. Some interest rates are very low
and in some cases yields are negative. Some sectors of the economy and individual issuers have experienced particularly large losses. These circumstances may continue for an extended period of time, and may continue to affect adversely the value and
liquidity of the Fund’s investments. The ultimate economic fallout from the pandemic, and the long-term impact on economies, markets, industries and individual issuers, are not known. Governments and central banks, including the Federal Reserve in
the U.S., have taken extraordinary and unprecedented actions to support local and global economies and the financial markets. These actions have resulted in significant expansion of public debt, including in the U.S. The impact of these measures, and
whether they will be effective to mitigate the economic and market disruption, will not be known for some time. The consequences of high public debt, including its future impact on the economy and securities markets, likewise may not be known for
some time.
Pioneer U.S. Government Money Market Fund | Semiannual Report | 6/30/20 27
The Fund’s prospectus contains unaudited information regarding the Fund’s principal risks. Please refer to that document when considering the Fund’s principal risks.
G. Repurchase Agreements
Repurchase agreements are arrangements under which the Fund purchases securities from a broker-dealer or a bank, called the counterparty, upon the agreement of the counterparty to
repurchase the securities from the Fund at a later date, and at a specific price, which is typically higher than the purchase price paid by the Fund. The securities purchased serve as the Fund’s collateral for the obligation of the counterparty to
repurchase the securities. The value of the collateral, including accrued interest, is required to be equal to or in excess of the repurchase price. The collateral for all repurchase agreements is held in safekeeping in the customer-only account of
the Fund’s custodian or a sub-custodian of the Fund. The Adviser is responsible for determining that the value of the collateral remains at least equal to the repurchase price. In the event of a default by the counterparty, the Fund is entitled to
sell the securities, but the Fund may not be able to sell them for the price at which they were purchased, thus causing a loss to the Fund. Additionally, if the counterparty becomes insolvent, there is some risk that the Fund will not have a right to
the securities, or the immediate right to sell the securities.
Open repurchase agreements at June 30, 2020, are disclosed in the Schedule of Investments.
2. Management Agreement
The Adviser manages the Fund’s portfolio. Management fees are calculated daily and paid monthly at the annual rate of 0.35% of the Fund’s average daily net assets up to $1 billion and 0.30% of the
Fund’s average daily net assets over $1 billion. For the six months ended June 30, 2020, the net management fee (excluding waivers and/or reimbursement of expenses) was equivalent to 0.35% (annualized) of the Fund’s average daily net assets.
The Adviser has agreed to limit the Fund’s expenses for any class of shares or waive a portion of its management fee in an effort to maintain a net asset value of $1.00 per share. From time to time,
the Adviser and its affiliates may limit the expenses of one or more classes for the purpose of avoiding a negative yield or increasing its yield during the period of the limitation. Additionally, the Distributor has voluntarily agreed to waive
distribution fees payable by Class A shares. These expense limitation policies are voluntary and temporary and may
28 Pioneer U.S. Government Money Market Fund | Semiannual Report | 6/30/20
be revised or terminated by the Adviser, at any time without notice. Fees waived and expenses reimbursed during the six months ended June 30, 2020 are reflected on the Statement of Operations.
In addition, under the management and administration agreements, certain other services and costs, including accounting, regulatory reporting and insurance premiums, are paid by the Fund as
administrative reimbursements. Included in “Due to affiliates” reflected on the Statement of Assets and Liabilities is $95,221 in management fees, administrative costs and certain other reimbursements payable to the Adviser at June 30, 2020.
3. Transfer Agent
DST Asset Manager Solutions, Inc. serves as the transfer agent to the Fund at negotiated rates. Transfer agent fees and payables shown on the Statement of Operations and the Statement of Assets and
Liabilities, respectively, include sub-transfer agent expenses incurred through the Fund’s omnibus relationship contracts.
In addition, the Fund reimbursed the transfer agent for out-of-pocket expenses incurred by the transfer agent related to shareowner communications activities such as proxy and statement mailings, and
outgoing phone calls. For the six months ended June 30, 2020, such out-of-pocket expenses by class of shares were as follows:
|
Shareowner Communications:
|
||||
|
Class A
|
$
|
45,000
|
||
|
Total
|
$
|
45,000
|
||
4. Distribution and Service Plans
The Fund has adopted a distribution plan (the “Plan”) pursuant to Rule 12b-1 of the Investment Company Act of 1940 with respect to its Class A and Class R shares. Pursuant to the Plan, the Fund pays
the Distributor 0.15% of the average daily net assets attributable to Class A shares as compensation for personal services and/or account maintenance services or distribution services with regard to Class A shares. The Distributor has voluntarily
agreed to waive distribution fees payable by Class A shares. Pursuant to the Plan, the Fund further pays the Distributor 0.50% of the average daily net assets attributable to Class R shares for distribution services. Included in “Due to affiliates”
reflected on the Statement of Assets and Liabilities is $48 in distribution fees payable to the Distributor, at June 30, 2020.
Pioneer U.S. Government Money Market Fund | Semiannual Report | 6/30/20 29
The Fund also has adopted a separate service plan for Class R shares (the “Service Plan”). The Service Plan authorizes the Fund to pay securities dealers, plan administrators or other service
organizations that agree to provide certain services to retirement plans or plan participants holding shares of the Fund a service fee of up to 0.25% of the Fund’s average daily net assets attributable to Class R shares held by such plans.
30 Pioneer U.S. Government Money Market Fund | Semiannual Report | 6/30/20
|
Trustees
|
Officers
|
|
Thomas J. Perna, Chairman
|
Lisa M. Jones, President and
|
|
John E. Baumgardner, Jr.
|
Chief Executive Officer
|
|
Diane Durnin
|
Mark E. Bradley, Treasurer and
|
|
Benjamin M. Friedman
|
Chief Financial and
|
|
Lisa M. Jones
|
Accounting Officer
|
|
Lorraine H. Monchak
|
Christopher J. Kelley, Secretary and
|
|
Marguerite A. Piret
|
Chief Legal Officer
|
|
Fred J. Ricciardi
|
|
|
Kenneth J. Taubes
|
|
Investment Adviser and Administrator
Amundi Pioneer Asset Management, Inc.
Custodian and Sub-Administrator
Brown Brothers Harriman & Co.Principal Underwriter
Amundi Pioneer Distributor, Inc.
Legal Counsel
Morgan, Lewis & Bockius LLP
Transfer Agent
DST Asset Manager Solutions, Inc.
Proxy Voting Policies and Procedures of the Fund are available without charge, upon request, by calling our toll free number (1-800-225-6292). Information
regarding how the Fund voted proxies relating to portfolio securities during the most recent 12-month period ended June 30 is publicly available to shareowners at www.amundipioneer.com/us. This information is also available on the Securities and
Exchange Commission’s web site at www.sec.gov.
Pioneer U.S. Government Money Market Fund | Semiannual Report | 6/30/20 31
This page was intentionally left blank.
32 Pioneer U.S. Government Money Market Fund | Semiannual Report | 6/30/20
This page was intentionally left blank.
Pioneer U.S. Government Money Market Fund | Semiannual Report | 6/30/20 33
This page was intentionally left blank.
34 Pioneer U.S. Government Money Market Fund | Semiannual Report | 6/30/20
This page was intentionally left blank.
Pioneer U.S. Government Money Market Fund | Semiannual Report | 6/30/20 35
This page was intentionally left blank.
36 Pioneer U.S. Government Money Market Fund | Semiannual Report | 6/30/20
How to Contact Amundi Pioneer
We are pleased to offer a variety of convenient ways for you to contact us for assistance or information.
|
Call us for:
|
|
|
|
Account Information, including existing accounts,
|
|
|
|
new accounts, prospectuses, applications
|
|
|
|
and service forms
|
|
1-800-225-6292
|
|
FactFoneSM for automated fund yields, prices,
|
|
|
|
account information and transactions
|
1-800-225-4321
|
|
|
Retirement plans information
|
1-800-622-0176
|
|
|
|
||
|
Write to us:
|
|
|
|
Amundi Pioneer
|
|
|
|
P.O. Box 219427
|
|
|
|
Kansas City, MO 64121-9427
|
|
|
|
Our toll-free fax
|
|
1-800-225-4240
|
|
Our internet e-mail address
|
us.askamundipioneer@amundipioneer.com
|
|
|
(for general questions about Amundi Pioneer only)
|
|
|
|
|
||
|
Visit our web site: www.amundipioneer.com/us
|
|
|
This report must be preceded or accompanied by a prospectus.
The Fund files a complete schedule of portfolio holdings with the Securities and Exchange Commission for the first and third quarters of each fiscal year as an exhibit to its
reports on Form N-PORT. Shareholders may view the filed Form N-PORT by visiting the Commission’s web site at https://www.sec.gov.
Amundi Pioneer Asset Management, Inc.
60 State Street
Boston, MA 02109
www.amundipioneer.com/us
Securities offered through Amundi Pioneer Distributor, Inc.
60 State Street, Boston, MA 02109
Underwriter of Pioneer Mutual Funds, Member SIPC
Underwriter of Pioneer Mutual Funds, Member SIPC
© 2020 Amundi Pioneer Asset Management 19399-14-0820
ITEM 2. CODE OF ETHICS.
(a) Disclose whether, as of the end of the period covered by the report, the registrant has adopted a code of ethics that applies to the registrant’s principal executive officer,
principal financial officer, principal accounting officer or controller, or persons performing similar functions, regardless of whether these individuals are employed by the registrant or a third party. If the registrant has not adopted such a
code of ethics, explain why it has not done so.
The registrant has adopted, as of the end of the period covered by this report, a code of ethics that applies to the registrant’s principal executive officer, principal financial
officer, principal accounting officer and controller.
(b) For purposes of this Item, the term “code of ethics” means written standards that are reasonably designed to deter wrongdoing and to promote:
(1) Honest and ethical conduct, including the ethical handling of actual or apparent conflicts of interest between personal and professional relationships;
(2) Full, fair, accurate, timely, and understandable disclosure in reports and documents that a registrant files with, or submits to, the Commission and in other
public communications made by the registrant;
(3) Compliance with applicable governmental laws, rules, and regulations;
(4) The prompt internal reporting of violations of the code to an appropriate person or persons identified in the code; and
(5) Accountability for adherence to the code.
(c) The registrant must briefly describe the nature of any amendment, during the period covered by the report, to a provision of its code of ethics that applies to the registrant’s
principal executive officer, principal financial officer, principal accounting officer or controller, or persons performing similar functions, regardless of whether these individuals are employed by the registrant or a third party, and that relates
to any element of the code of ethics definition enumerated in paragraph (b) of this Item. The registrant must file a copy of any such amendment as an exhibit pursuant to Item 10(a), unless the registrant has elected to satisfy paragraph (f) of this
Item by posting its code of ethics on its website pursuant to paragraph (f)(2) of this Item, or by undertaking to provide its code of ethics to any person without charge, upon request, pursuant to paragraph (f)(3) of this Item.
The registrant has made no amendments to the code of ethics during the period covered by this report.
(d) If the registrant has, during the period covered by the report, granted a waiver, including an implicit waiver, from a provision of the code of ethics to the registrant’s
principal executive officer, principal financial officer, principal accounting officer or controller, or persons performing similar functions, regardless of whether these individuals are employed by the registrant or a third party, that relates to
one or more of the items set forth in paragraph (b) of this Item, the registrant must briefly describe the nature of the waiver, the name of the person to whom the waiver was granted, and the date of the waiver.
Not applicable.
(e) If the registrant intends to satisfy the disclosure requirement under paragraph (c) or (d) of this Item regarding an amendment to, or a waiver from, a provision of its code of
ethics that applies to the registrant’s principal executive officer, principal financial officer, principal accounting officer or controller, or persons performing similar functions and that relates to any element of the code of ethics definition
enumerated in paragraph (b) of this Item by posting such information on its Internet website, disclose the registrant’s Internet address and such intention.
Not applicable.
(f) The registrant must:
(1) File with the Commission, pursuant to Item 12(a)(1), a copy of its code of ethics that applies to the registrant’s principal executive officer, principal
financial officer, principal accounting officer or controller, or persons performing similar functions, as an exhibit to its annual report on this Form N-CSR (see attachment);
(2) Post the text of such code of ethics on its Internet website and disclose, in its most recent report on this Form N-CSR, its Internet address and the fact that
it has posted such code of ethics on its Internet website; or
(3) Undertake in its most recent report on this Form N-CSR to provide to any person without charge, upon request, a copy of such code of ethics and explain the
manner in which such request may be made. See Item 10(2)
ITEM 3. AUDIT COMMITTEE FINANCIAL EXPERT.
(a) (1) Disclose that the registrant’s board of trustees has determined that the registrant either:
(i) Has at least one audit committee financial expert serving on its audit committee; or
(ii) Does not have an audit committee financial expert serving on its audit committee.
The registrant’s Board of Trustees has determined that the registrant has at least one audit committee financial expert.
(2) If the registrant provides the disclosure required by paragraph (a)(1)(i) of this Item, it must disclose the name of the audit committee financial expert and whether that
person is “independent.” In order to be considered “independent” for purposes of this Item, a member of an audit committee may not, other than in his or her capacity as a member of the audit committee, the board of trustees, or any other board
committee:
(i) Accept directly or indirectly any consulting, advisory, or other compensatory fee from the issuer; or
(ii) Be an “interested person” of the investment company as defined in Section 2(a)(19) of the Act (15 U.S.C. 80a-2(a)(19)).
Mr. Fred J. Ricciardi, an independent trustee, is such an audit committee financial expert.
(3) If the registrant provides the disclosure required by paragraph (a)(1) (ii) of this Item, it must explain why it does not have an audit committee financial
expert.
Not applicable.
ITEM 4. PRINCIPAL ACCOUNTANT FEES AND SERVICES.
(a) Disclose, under the caption AUDIT FEES, the aggregate fees billed for each of the last two fiscal years for professional services rendered by the principal accountant for the
audit of the registrant’s annual financial statements or services that are normally provided by the accountant in connection with statutory and regulatory filings or engagements for those fiscal years.
N/A
(b) Disclose, under the caption AUDIT-RELATED FEES, the aggregate fees billed in each of the last two fiscal years for assurance and related services by the principal accountant that
are reasonably related to the performance of the audit of the registrant’s financial statements and are not reported under paragraph (a) of this Item. Registrants shall describe the nature of the services comprising the fees disclosed under this
category.
N/A
(c) Disclose, under the caption TAX FEES, the aggregate fees billed in each of the last two fiscal years for professional services rendered by the principal accountant for tax
compliance, tax advice, and tax planning. Registrants shall describe the nature of the services comprising the fees disclosed under this category.
N/A
(d) Disclose, under the caption ALL OTHER FEES, the aggregate fees billed in each of the last two fiscal years for products and services provided by the principal accountant, other
than the services reported in paragraphs (a) through (c) of this Item. Registrants shall describe the nature of the services comprising the fees disclosed under this category.
N/A
(e) (1) Disclose the audit committee’s pre-approval policies and procedures described in paragraph (c)(7) of Rule 2-01 of Regulation S-X.
PIONEER FUNDS
APPROVAL OF AUDIT, AUDIT-RELATED, TAX AND OTHER SERVICES
PROVIDED BY THE INDEPENDENT AUDITOR
SECTION I - POLICY PURPOSE AND APPLICABILITY
The Pioneer Funds recognize the importance of maintaining the independence of their outside auditors. Maintaining independence is a shared responsibility involving Amundi Pioneer
Asset Management, Inc, the audit committee and the independent auditors.
The Funds recognize that a Fund’s independent auditors: 1) possess knowledge of the Funds, 2) are able to incorporate certain services into the scope of the audit, thereby avoiding
redundant work, cost and disruption of Fund personnel and processes, and 3) have expertise that has value to the Funds. As a result, there are situations where it is desirable to use the Fund’s independent auditors for services in addition to the
annual audit and where the potential for conflicts of interests are minimal. Consequently, this policy, which is intended to comply with Rule 210.2-01(C)(7), sets forth guidelines and procedures to be followed by the Funds when retaining the
independent audit firm to perform audit, audit-related tax and other services under those circumstances, while also maintaining independence.
Approval of a service in accordance with this policy for a Fund shall also constitute approval for any other Fund whose pre-approval is required pursuant to Rule 210.2-01(c)(7)(ii).
In addition to the procedures set forth in this policy, any non-audit services that may be provided consistently with Rule 210.2-01 may be approved by the Audit Committee itself and
any pre-approval that may be waived in accordance with Rule 210.2-01(c)(7)(i)(C) is hereby waived.
Selection of a Fund’s independent auditors and their compensation shall be determined by the Audit Committee and shall not be subject to this policy.
|
SECTION II - POLICY
|
|||
|
SERVICE CATEGORY
|
SERVICE CATEGORY DESCRIPTION
|
SPECIFIC PRE-APPROVED SERVICE SUBCATEGORIES
|
|
|
I. AUDIT SERVICES
|
Services that are directly
|
o Accounting research assistance
|
|
|
related to performing the
|
o SEC consultation, registration
|
||
|
independent audit of the Funds
|
statements, and reporting
|
||
|
o Tax accrual related matters
|
|||
|
o Implementation of new accounting standards
|
|||
|
o Compliance letters (e.g. rating agency letters)
|
|||
|
o Regulatory reviews and assistance
|
|||
|
regarding financial matters
|
|||
|
o Semi-annual reviews (if requested)
|
|||
|
o Comfort letters for closed end offerings
|
|||
|
II. AUDIT-RELATED
|
Services which are not
|
o AICPA attest and agreed-upon procedures
|
|
|
SERVICES
|
prohibited under Rule
|
o Technology control assessments
|
|
|
210.2-01(C)(4) (the “Rule”)
|
o Financial reporting control assessments
|
||
|
and are related extensions of
|
o Enterprise security architecture
|
||
|
the audit services support the
|
assessment
|
||
|
audit, or use the knowledge/expertise
|
|||
|
gained from the audit procedures as a
|
|||
|
foundation to complete the project.
|
|||
|
In most cases, if the Audit-Related
|
|||
|
Services are not performed by the
|
|||
|
Audit firm, the scope of the Audit
|
|||
|
Services would likely increase.
|
|||
|
The Services are typically well-defined
|
|||
|
and governed by accounting
|
|||
|
professional standards (AICPA,
|
|||
|
SEC, etc.)
|
|||
|
AUDIT COMMITTEE APPROVAL POLICY
|
AUDIT COMMITTEE REPORTING POLICY
|
||
|
o “One-time” pre-approval
|
o A summary of all such
|
||
|
for the audit period for all
|
services and related fees
|
||
|
pre-approved specific service
|
reported at each regularly
|
||
|
subcategories. Approval of the
|
scheduled Audit Committee
|
||
|
independent auditors as
|
meeting.
|
||
|
auditors for a Fund shall
|
|||
|
constitute pre approval for
|
|||
|
these services.
|
|||
|
o “One-time” pre-approval
|
o A summary of all such
|
||
|
for the fund fiscal year within
|
services and related fees
|
||
|
a specified dollar limit
|
(including comparison to
|
||
|
for all pre-approved
|
specified dollar limits)
|
||
|
specific service subcategories
|
reported quarterly.
|
||
|
o Specific approval is
|
|||
|
needed to exceed the
|
|||
|
pre-approved dollar limit for
|
|||
|
these services (see general
|
|||
|
Audit Committee approval policy
|
|||
|
below for details on obtaining
|
|||
|
specific approvals)
|
|||
|
o Specific approval is
|
|||
|
needed to use the Fund’s
|
|||
|
auditors for Audit-Related
|
|||
|
Services not denoted as
|
|||
|
“pre-approved”, or
|
|||
|
to add a specific service
|
|||
|
subcategory as “pre-approved”
|
|||
SECTION III - POLICY DETAIL, CONTINUED
|
SERVICE CATEGORY
|
SERVICE CATEGORY DESCRIPTION
|
SPECIFIC PRE-APPROVED SERVICE
|
|
SUBCATEGORIES
|
||
|
III. TAX SERVICES
|
Services which are not
|
o Tax planning and support
|
|
prohibited by the Rule,
|
o Tax controversy assistance
|
|
|
if an officer of the Fund
|
o Tax compliance, tax returns, excise
|
|
|
determines that using the
|
tax returns and support
|
|
|
Fund’s auditor to provide
|
o Tax opinions
|
|
|
these services creates
|
||
|
significant synergy in
|
||
|
the form of efficiency,
|
||
|
minimized disruption, or
|
||
|
the ability to maintain a
|
||
|
desired level of
|
||
|
confidentiality.
|
||
|
AUDIT COMMITTEE APPROVAL POLICY
|
AUDIT COMMITTEE REPORTING POLICY
|
|
o “One-time” pre-approval
|
o A summary of
|
|
for the fund fiscal year
|
all such services and
|
|
within a specified dollar limit
|
related fees
|
|
(including comparison
|
|
|
to specified dollar
|
|
|
limits) reported
|
|
|
quarterly.
|
|
|
o Specific approval is
|
|
|
needed to exceed the
|
|
|
pre-approved dollar limits for
|
|
|
these services (see general
|
|
|
Audit Committee approval policy
|
|
|
below for details on obtaining
|
|
|
specific approvals)
|
|
|
o Specific approval is
|
|
|
needed to use the Fund’s
|
|
|
auditors for tax services not
|
|
|
denoted as pre-approved, or to
|
|
|
add a specific service subcategory as
|
|
|
“pre-approved”
|
|
SECTION III - POLICY DETAIL, CONTINUED
|
SERVICE CATEGORY
|
SERVICE CATEGORY DESCRIPTION
|
SPECIFIC PRE-APPROVED SERVICE
|
|
SUBCATEGORIES
|
||
|
IV. OTHER SERVICES
|
Services which are not
|
o Business Risk Management support
|
|
prohibited by the Rule,
|
o Other control and regulatory
|
|
|
A. SYNERGISTIC,
|
if an officer of the Fund
|
compliance projects
|
|
UNIQUE QUALIFICATIONS
|
determines that using the
|
|
|
Fund’s auditor to provide
|
||
|
these services creates
|
||
|
significant synergy in
|
||
|
the form of efficiency,
|
||
|
minimized disruption,
|
||
|
the ability to maintain a
|
||
|
desired level of
|
||
|
confidentiality, or where
|
||
|
the Fund’s auditors
|
||
|
posses unique or superior
|
||
|
qualifications to provide
|
||
|
these services, resulting
|
||
|
in superior value and
|
||
|
results for the Fund.
|
||
|
AUDIT COMMITTEE APPROVAL POLICY
|
AUDIT COMMITTEE REPORTING POLICY
|
|
o “One-time” pre-approval
|
o A summary of
|
|
for the fund fiscal year within
|
all such services and
|
|
a specified dollar limit
|
related fees
|
|
(including comparison
|
|
|
to specified dollar
|
|
|
limits) reported
|
|
|
quarterly.
|
|
|
o Specific approval is
|
|
|
needed to exceed the
|
|
|
pre-approved dollar limits for
|
|
|
these services (see general
|
|
|
Audit Committee approval policy
|
|
|
below for details on obtaining
|
|
|
specific approvals)
|
|
|
o Specific approval is
|
|
|
needed to use the Fund’s
|
|
|
auditors for “Synergistic” or
|
|
|
“Unique Qualifications” Other
|
|
|
Services not denoted as
|
|
|
pre-approved to the left, or to
|
|
|
add a specific service
|
|
|
subcategory as “pre-approved”
|
|
SECTION III - POLICY DETAIL, CONTINUED
|
SERVICE CATEGORY
|
SERVICE CATEGORY DESCRIPTION
|
SPECIFIC PROHIBITED SERVICE
|
|
SUBCATEGORIES
|
||
|
PROHIBITED SERVICES
|
Services which result
|
1. Bookkeeping or other services
|
|
in the auditors losing
|
related to the accounting records or
|
|
|
independence status
|
financial statements of the audit
|
|
|
under the Rule.
|
client*
|
|
|
2. Financial information systems design
|
||
|
and implementation*
|
||
|
3. Appraisal or valuation services,
|
||
|
fairness* opinions, or
|
||
|
contribution-in-kind reports
|
||
|
4. Actuarial services (i.e., setting
|
||
|
actuarial reserves versus actuarial
|
||
|
audit work)*
|
||
|
5. Internal audit outsourcing services*
|
||
|
6. Management functions or human
|
||
|
resources
|
||
|
7. Broker or dealer, investment
|
||
|
advisor, or investment banking services
|
||
|
8. Legal services and expert services
|
||
|
unrelated to the audit
|
||
|
9. Any other service that the Public
|
||
|
Company Accounting Oversight Board
|
||
|
determines, by regulation, is
|
||
|
impermissible
|
||
|
AUDIT COMMITTEE APPROVAL POLICY
|
AUDIT COMMITTEE REPORTING POLICY
|
|
o These services are not to be
|
o A summary of all
|
|
performed with the exception of the(*)
|
services and related
|
|
services that may be permitted
|
fees reported at each
|
|
if they would not be subject to audit
|
regularly scheduled
|
|
procedures at the audit client (as
|
Audit Committee meeting
|
|
defined in rule 2-01(f)(4)) level
|
will serve as continual
|
|
the firm providing the service.
|
confirmation that has
|
|
not provided any
|
|
|
restricted services.
|
GENERAL AUDIT COMMITTEE APPROVAL POLICY:
o For all projects, the officers of the Funds and the Fund’s auditors will each make an assessment to determine that any proposed projects will not impair independence.
o Potential services will be classified into the four non-restricted service categories and the “Approval of Audit, Audit-Related, Tax and Other Services” Policy above will be
applied. Any services outside the specific pre-approved service subcategories set forth above must be specifically approved by the Audit Committee.
o At least quarterly, the Audit Committee shall review a report summarizing the services by service category, including fees, provided by the Audit firm as set forth in the above
policy.
(2) Disclose the percentage of services described in each of paragraphs (b) through (d) of this Item that were approved by the audit committee pursuant to
paragraph (c)(7)(i)(C) of Rule 2-01 of Regulation S-X.
N/A
(f) If greater than 50 percent, disclose the percentage of hours expended on the principal accountants engagement to audit the registrant’s financial statements for the most recent
fiscal year that were attributed to work performed by persons other than the principal accountant’s full-time, permanent employees.
N/A
(g) Disclose the aggregate non-audit fees billed by the registrants accountant for services rendered to the registrant, and rendered to the registrants investment adviser (not
including any sub-adviser whose role is primarily portfolio management and is subcontracted with or overseen by another investment adviser), and any entity controlling, controlled by, or under common control with the adviser that provides ongoing
services to the registrant for each of the last two fiscal years of the registrant.
N/A
(h) Disclose whether the registrants audit committee of the board of trustees has considered whether the provision of non-audit services that were rendered to the registrants
investment adviser (not including any subadviser whose role is primarily portfolio management and is subcontracted with or overseen by another investment adviser), and any entity controlling, controlled by, or under common control with the
investment adviser that provides ongoing services to the registrant that were not pre-approved pursuant to paragraph (c)(7)(ii) of Rule 2-01 of Regulation S-X is compatible with maintaining the principal accountant’s independence.
The Fund’s audit committee of the Board of Trustees has considered whether the provision of non-audit services that were rendered to the Affiliates (as defined) that were not pre-
approved pursuant to paragraph (c)(7)(ii) of Rule 2-01 of Regulation S-X is compatible with maintaining the principal accountant’s independence.
ITEM 5. AUDIT COMMITTEE OF LISTED REGISTRANTS
(a) If the registrant is a listed issuer as defined in Rule 10A-3 under the Exchange Act (17 CFR 240.10A-3), state whether or not the registrant has a separately-designated standing
audit committee established in accordance with Section 3(a)(58)(A) of the Exchange Act (15 U.S.C. 78c(a)(58)(A)). If the registrant has such a committee, however designated, identify each committee member. If the entire board of directors is acting
as the registrant’s audit committee as specified in Section 3(a)(58)(B) of the Exchange Act (15 U.S.C. 78c(a)(58)(B)), so state.
N/A
(b) If applicable, provide the disclosure required by Rule 10A-3(d) under the Exchange Act (17 CFR 240.10A-3(d)) regarding an exemption from the listing standards for audit
committees.
N/A
ITEM 6. SCHEDULE OF INVESTMENTS.
File Schedule of Investments in securities of unaffiliated issuers as of the close of the reporting period as set forth in 210.1212 of Regulation S-X [17 CFR 210.12-12], unless the
schedule is included as part of the report to shareholders filed under Item 1 of this Form.
Included in Item 1
ITEM 7. DISCLOSURE OF PROXY VOTING POLICIES AND PROCEDURES FOR CLOSED-END MANAGEMENT INVESTMENT COMPANIES.
A closed-end management investment company that is filing an annual report on this Form N-CSR must, unless it invests exclusively in non-voting securities, describe the policies and
procedures that it uses to determine how to vote proxies relating to portfolio securities, including the procedures that the company uses when a vote presents a conflict between the interests of its shareholders, on the one hand, and those of the
company’s investment adviser; principal underwriter; or any affiliated person (as defined in Section 2(a)(3) of the Investment Company Act of 1940 (15 U.S.C. 80a-2(a)(3)) and the rules thereunder) of the company, its investment adviser, or its
principal underwriter, on the other. Include any policies and procedures of the company’s investment adviser, or any other third party, that the company uses, or that are used on the company’s behalf, to determine how to vote proxies relating to
portfolio securities.
N/A
ITEM 8. PORTFOLIO MANAGERS OF CLOSED-END MANAGEMENT INVESTMENT COMPANIES.
(a) If the registrant is a closed-end management investment company that is filing an annual report on this Form N-CSR, provide the following information:
(1) State the name, title, and length of service of the person or persons employed by or associated with the registrant or an investment adviser of the registrant who are primarily
responsible for the day-to-day management of the registrant’s portfolio (“Portfolio Manager”). Also state each Portfolio Manager’s business experience during the past 5 years.
N/A
ITEM 9. PURCHASES OF EQUITY SECURITIES BY CLOSED-END MANAGEMENT INVESTMENT COMPANY AND AFFILIATED PURCHASERS.
(a) If the registrant is a closed-end management investment company, in the following tabular format, provide the information specified in paragraph (b) of this Item with respect to
any purchase made by or on behalf of the registrant or any affiliated purchaser, as defined in Rule 10b-18(a)(3) under the Exchange Act (17 CFR 240.10b-18(a)(3)), of shares or other units of any class of the registrant’s equity securities that is
registered by the registrant pursuant to Section 12 of the Exchange Act (15 U.S.C. 781).
N/A
ITEM 10. SUBMISSION OF MATTERS TO A VOTE OF SECURITY HOLDERS.
Describe any material changes to the procedures by which shareholders may recommend nominees to the registrant’s board of directors, where those changes were implemented after the
registrant last provided disclosure in response to the requirements of Item 407(c)(2)(iv) of Regulation S-R(17 CFR 229.407)(as required by Item 22(b)(15)) of Schedule 14A (17 CFR 240.14a-101), or this Item.
There have been no material changes to the procedures by which the shareholders may recommend nominees to the registrant’s board of directors since the registrant last provided
disclosure in response to the requirements of Item 407(c)(2)(iv) of Regulation S-R of Schedule 14(A) in its definitive proxy statement, or this item.
ITEM 11. CONTROLS AND PROCEDURES.
(a) Disclose the conclusions of the registrant’s principal executive and principal financials officers, or persons performing similar functions, regarding the effectiveness of the
registrant’s disclosure controls and procedures (as defined in Rule 30a-3(c) under the Act (17 CFR 270.30a-3(c))) as of a date within 90 days of the filing date of the report that includes the disclosure required by this paragraph, based on the
evaluation of these controls and procedures required by Rule 30a-3(b) under the Act (17 CFR 270.30(a)-3(b) and Rules 13a-15(b) or 15d-15(b) under the Exchange Act (17 CFR 240.13a-15(b) or 240.15d-15(b)).
The registrant’s principal executive officer and principal financial officer have concluded that the registrant’s disclosure controls and procedures are effective based on the
evaluation of these controls and procedures as of a date within 90 days of the filing date of this report.
(b) Disclose any change in the registrant’s internal control over financial reporting (as defined in Rule 30a-3(d) under the Act (17CFR 270.30a-3(d)) that occured during the second
fiscal quarter of the period covered by this report that has materially affected, or is reasonably likely to materially affect, the registrant’s internal control over financial reporting.
There were no significant changes in the registrant’s internal control over financial reporting that occurred during the second fiscal quarter of the period covered by this report
that have materially affected, or are reasonably likely to materially affect, the registrant’s internal control over financial reporting.
Item 12. Disclosure of Securities Lending Activities for Closed-End Management Investment Companies.
(a) If the registrant is a closed-end management investment company, provide the following dollar amounts of income and compensation related to the securities lending activities of
the registrant during its most recent fiscal year:
N/A
(1) Gross income from securities lending activities;
N/A
(2) All fees and/or compensation for each of the following securities lending activities and related services: any share of revenue generated by the securities lending program paid
to the securities lending agent(s) (revenue split); fees paid for cash collateral management services (including fees deducted from a pooled cash collateral reinvestment vehicle) that are not included in the revenue split; administrative fees that
are not included in the revenue split; fees for indemnification that are not included in the revenue split; rebates paid to borrowers; and any other fees relating to the securities lending program that are not included in the revenue split,
including a description of those other fees;
N/A
(3) The aggregate fees/compensation disclosed pursuant to paragraph (2); and
N/A
(4) Net income from securities lending activities (i.e., the dollar amount in paragraph (1) minus the dollar amount in paragraph (3)).
If a fee for a service is included in the revenue split, state that the fee is included in the revenue split.
N/A
(b) If the registrant is a closed-end management investment company, describe the services provided to the registrant by the securities lending agent in the registrants most recent
fiscal year.
N/A
ITEM 13. EXHIBITS.
(a) File the exhibits listed below as part of this Form. Letter or number the exhibits in the sequence indicated.
SIGNATURES
[See General Instruction F]
Pursuant to the requirements of the Securities Exchange Act of 1934 and the Investment Company Act of 1940, the registrant has duly caused this report to be signed on its behalf by
the undersigned, thereunto duly authorized.
(Registrant) Pioneer Money Market Trust
By (Signature and Title)* /s/ Lisa M. Jones
Lisa M. Jones, President & Chief Executive Officer
Date September 4, 2020
Pursuant to the requirements of the Securities Exchange Act of 1934 and the Investment Company Act of 1940, this report has been signed below by the following persons on behalf of
the registrant and in the capacities and on the dates indicated.
By (Signature and Title)* /s/ Lisa M. Jones
Lisa M. Jones, President & Chief Executive Officer
Date September 4, 2020
By (Signature and Title)* /s/ Mark E. Bradley
Mark E. Bradley, Treasurer & Chief Accounting & Financial Officer
Date September 4, 2020
* Print the name and title of each signing officer under his or her signature.