
Santander Holdings USA, Inc.Fixed Income Investor UpdateData as of December 31, 2014April 8, 2015
* Disclaimer Santander Holdings USA, Inc. (“SHUSA”), and Santander Bank, N.A. (“Santander Bank”) caution that this presentation may contain forward-looking statements within the meaning of the U.S. Private Securities Litigation Reform Act of 1995. These forward-looking statements are found in various places throughout this presentation and include, without limitation, statements concerning our future business development and economic performance. While these forward-looking statements represent our judgment and future expectations concerning the development of our business, a number of risks, uncertainties, and other important factors could cause actual developments and results to differ materially from our expectations. These factors include, but are not limited to: (1) increased regulation and regulatory developments; (2) domestic and international market, macro-economic, governmental, regulatory conditions and trends; (3) movements in local and international securities markets, currency exchange rates, and interest rates; (4) competitive pressures; (5) technological developments; and (6) changes in the financial position or creditworthiness of our customers, obligors, and counterparties. The risk factors and other key factors that we have indicated in our past and future filings and reports, including our Annual Report on Form 10-K for the year ended December 31, 2014 and other filings and reports with the Securities and Exchange Commission (the “SEC”), could adversely affect our business and financial performance. Other factors could cause actual results to differ materially from those in the forward-looking statements.The information contained in this presentation is not complete. It is subject to, and must be read in conjunction with, all other publicly available information, including reports filed with or furnished to the SEC, press releases, and other relevant information. Because this information is intended only to assist investors, it does not constitute investment advice or an offer to invest, and in making this presentation available, SHUSA and Santander Bank give no advice and make no recommendation to buy, sell, or otherwise deal in shares or other securities of Banco Santander, S.A. (“Santander”), SHUSA, or Santander Bank or in any other securities or investments.This presentation is subject to correction, completion, and amendment without notice. It is not our intention to state, indicate, or imply in any manner that current or past results are indicative of future results or expectations. As with all investments, there are associated risks, and you could lose money investing. Prior to making any investment, a prospective investor should consult with its own investment, accounting, legal, and tax advisers to evaluate independently the risks, consequences, and suitability of that investment. The information in this presentation is not intended to constitute “research” as that term is defined by applicable regulations. No offering of securities shall be made in the United States except pursuant to registration under the U.S. Securities Act of 1933, as amended, or an exemption therefrom. In this presentation, we may sometimes refer to certain non-GAAP figures or financial ratios to help illustrate certain concepts. These ratios, each of which is defined in this document, if utilized, may include Pre-Tax Pre-Provision Income, the Tangible Common Equity to Tangible Assets Ratio, and the Texas Ratio. This information supplements our results as reported in accordance with GAAP and should not be viewed in isolation from, or as a substitute for, our GAAP results, among others. We believe that this additional information and the reconciliations we provide may be useful to investors, analysts, regulators and others as they evaluate the impact of these items on our results for the periods presented due to the extent to which the items are indicative of our ongoing operations. Where applicable, we provide GAAP reconciliations for such additional information.This presentation is provided for information purposes only.

* * Santander Holdings USA, Inc. (SHUSA) SHUSA is a Bank Holding Company (“BHC”) headquartered in Boston, MAWholly-owned by Banco Santander, S.A. (NYSE: SAN)Regulated by the Federal Reserve Bank SEC registeredSHUSA’s primary operating subsidiaries are Santander Bank, N.A. (“SBNA”) and Santander Consumer USA Holdings Inc. (“SCUSA”)
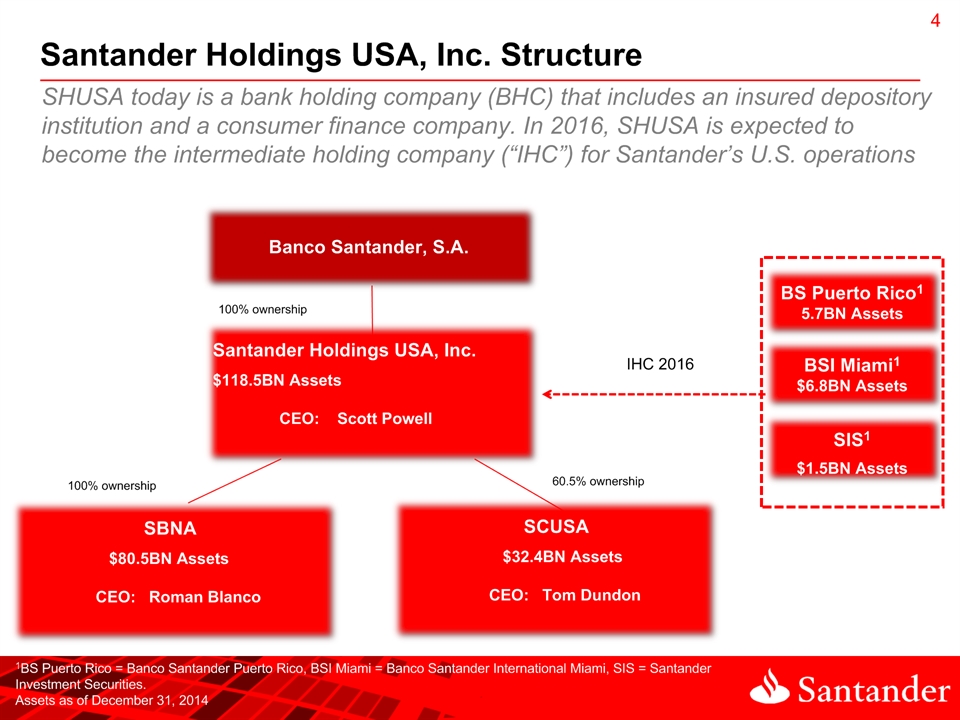
* * Santander Holdings USA, Inc. Structure Santander Holdings USA, Inc.$118.5BN Assets CEO: Scott Powell SBNA $80.5BN Assets CEO: Roman Blanco SCUSA $32.4BN Assets CEO: Tom Dundon SHUSA today is a bank holding company (BHC) that includes an insured depository institution and a consumer finance company. In 2016, SHUSA is expected to become the intermediate holding company (“IHC”) for Santander’s U.S. operations 1BS Puerto Rico = Banco Santander Puerto Rico, BSI Miami = Banco Santander International Miami, SIS = Santander Investment Securities. Assets as of December 31, 2014 60.5% ownership Banco Santander, S.A. BS Puerto Rico15.7BN Assets BSI Miami1$6.8BN Assets SIS1$1.5BN Assets IHC 2016 100% ownership 100% ownership
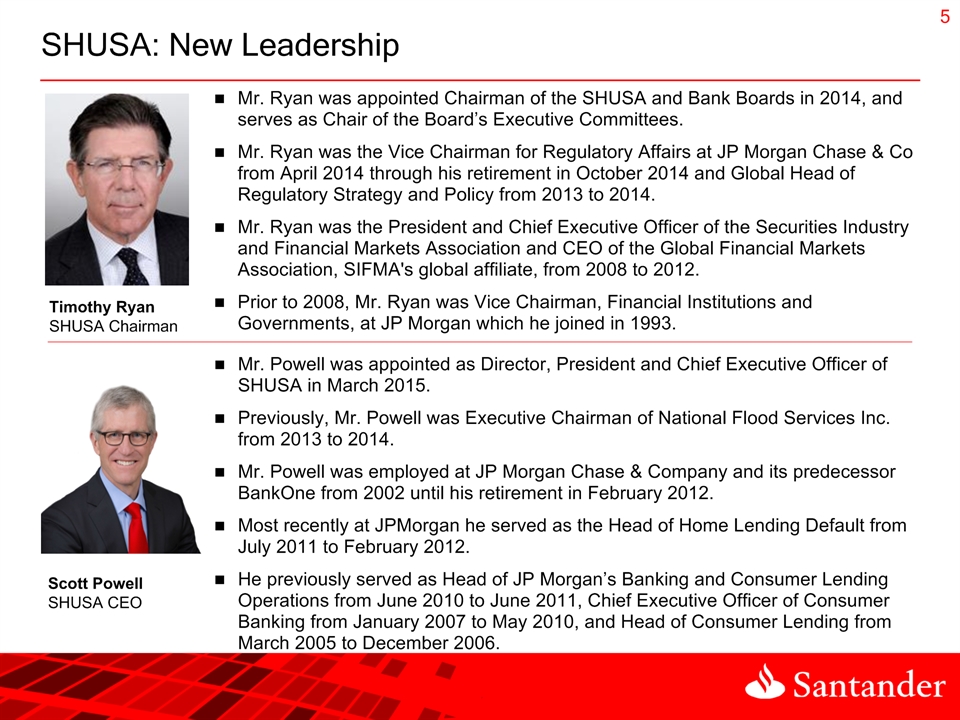
* SHUSA: New Leadership Timothy RyanSHUSA Chairman Mr. Powell was appointed as Director, President and Chief Executive Officer of SHUSA in March 2015.Previously, Mr. Powell was Executive Chairman of National Flood Services Inc. from 2013 to 2014. Mr. Powell was employed at JP Morgan Chase & Company and its predecessor BankOne from 2002 until his retirement in February 2012.Most recently at JPMorgan he served as the Head of Home Lending Default from July 2011 to February 2012.He previously served as Head of JP Morgan’s Banking and Consumer Lending Operations from June 2010 to June 2011, Chief Executive Officer of Consumer Banking from January 2007 to May 2010, and Head of Consumer Lending from March 2005 to December 2006. Scott PowellSHUSA CEO Mr. Ryan was appointed Chairman of the SHUSA and Bank Boards in 2014, and serves as Chair of the Board’s Executive Committees.Mr. Ryan was the Vice Chairman for Regulatory Affairs at JP Morgan Chase & Co from April 2014 through his retirement in October 2014 and Global Head of Regulatory Strategy and Policy from 2013 to 2014.Mr. Ryan was the President and Chief Executive Officer of the Securities Industry and Financial Markets Association and CEO of the Global Financial Markets Association, SIFMA's global affiliate, from 2008 to 2012.Prior to 2008, Mr. Ryan was Vice Chairman, Financial Institutions and Governments, at JP Morgan which he joined in 1993.

* * SHUSA: 2014 Highlights1 Balance Sheet TrendsGrowth in commercial loan portfolios and reduction in residential real estate loans SCUSA continued to produce healthy origination volumes Strong Profitability4Q14 Net Income $232MM; YTD 2014 Net Income $2.71BN2 Credit Metrics SBNA NPLs and Criticized Balances have declined 38% and 16% respectively YOYSCUSA portfolio performance consistent with retained mix and typical seasonal patterns Capital Ratios and LiquidityTier 1 common 10.82%; projected Common Equity Tier 1 under U.S. Basel III 11.05%3SHUSA Holdco has $2.1BN cash; stand alone liquidity horizon of 229 monthsIn 2014 SCUSA completed seven ABS securitizations totaling $8.6BNIn January 2015 SBNA completed its inaugural senior debt issuance for $1BN4 1Data as of 12/31/14 unless noted otherwise2YTD income includes $2.4BN pre-tax gain in 1Q14 SCUSA IPO. See SHUSA 2014 Form 10-K. Available at www.sec.gov3See SHUSA 2014 Form 10-K4See Subsequent Events section in SHUSA 2014 Form 10-K
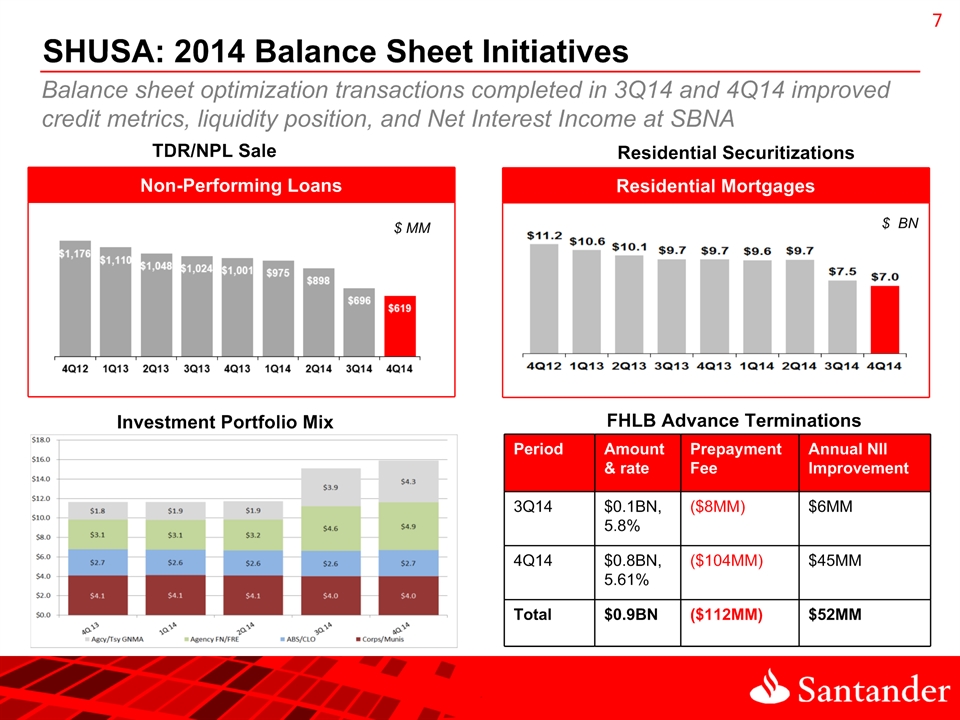
* * SHUSA: 2014 Balance Sheet Initiatives Balance sheet optimization transactions completed in 3Q14 and 4Q14 improved credit metrics, liquidity position, and Net Interest Income at SBNA Non-Performing Loans TDR/NPL Sale Residential Securitizations Investment Portfolio Mix FHLB Advance Terminations Period Amount & rate Prepayment Fee Annual NII Improvement 3Q14 $0.1BN, 5.8% ($8MM) $6MM 4Q14 $0.8BN, 5.61% ($104MM) $45MM Total $0.9BN ($112MM) $52MM $ MM $ BN Residential Mortgages

* * SHUSA: Quarterly Profitability 2 See Appendix for Non-GAAP-to-GAAP reconciliation of Pre-Tax Pre-Provision Income 1 See SHUSA 2014 Form 10-K for additional information on the SCUSA consolidation2 Represents net income including noncontrolling interest beginning in 1Q14 1Q14 SCUSA IPO generated a pre-tax gain of $2.4BN and led to the consolidation of SCUSA into SHUSA1
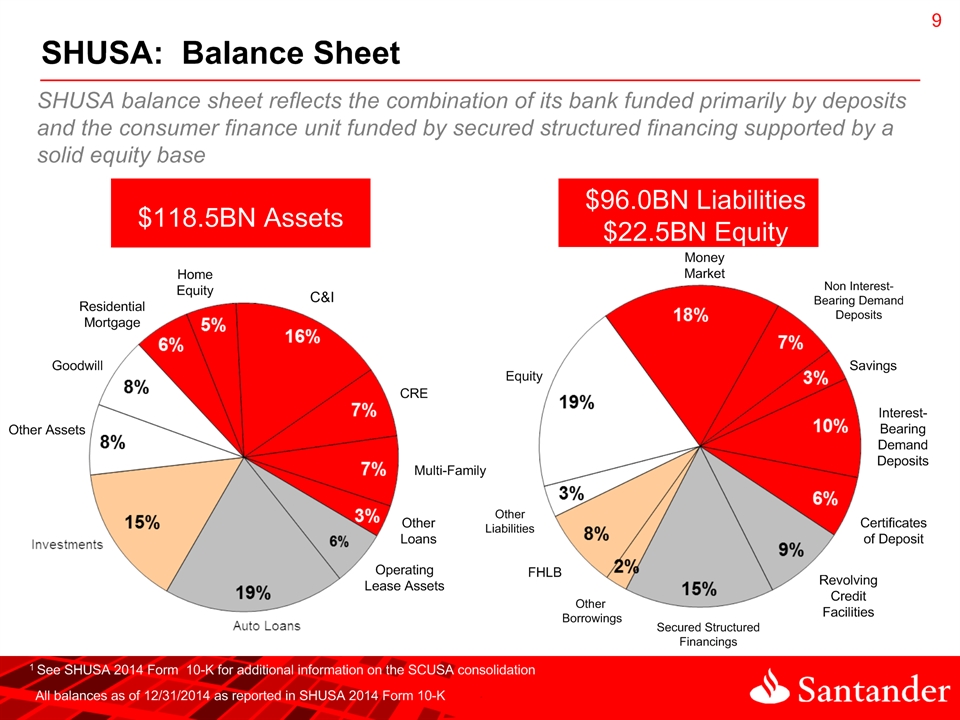
* * SHUSA: Balance Sheet Non Interest-Bearing Demand Deposits Interest-Bearing Demand Deposits Secured Structured Financings Equity OtherLiabilities FHLB Money Market Certificates of Deposit Savings All balances as of 12/31/2014 as reported in SHUSA 2014 Form 10-K Revolving Credit Facilities Other Borrowings 1 See SHUSA 2014 Form 10-K for additional information on the SCUSA consolidation SHUSA balance sheet reflects the combination of its bank funded primarily by deposits and the consumer finance unit funded by secured structured financing supported by a solid equity base

* * SHUSA: Wholesale Funding Profile1 TrustPref$150 SrDebt4.625% SrDebt3.0% SrDebt3.45% Committed2 Debt issuances at SHUSA Holdco are structured to manage liquidity buffer and horizon Wholesale debt at SBNA primarily consists of secured FHLB Advances FHLB Bank Debt HoldCo Debt Secured Structured Santander2 TrustPref PrefStock7.30% SrDebt4.62% SrDebt3.0% SrDebt3.45% REITPref12.2% FHLB0.6% FHLB5.3% FHLB3.4% $0.18 $1.0 $1.0 $1.98 $5.97 SHUSA’s wholesale funding consists mostly of secured borrowings Revolving $34.3 $0.6 $0.5 $0.5 $0.22 $0.2 1As of December 31, 2014. Dollars in billions. Does not reflect SBNA $1BN senior unsecured debt issuance in January 20152$0.3BN difference in Santander balance between SHUSA and SCUSA charts reflects $0.3BN facility between SHUSA and SCUSA that eliminates at the consolidated level $37.4 $39.7

* * SBNA: Funding - Deposits 1Represents average quarterly balances Continued growth in deposits and shift in mix from time to non-maturity deposits
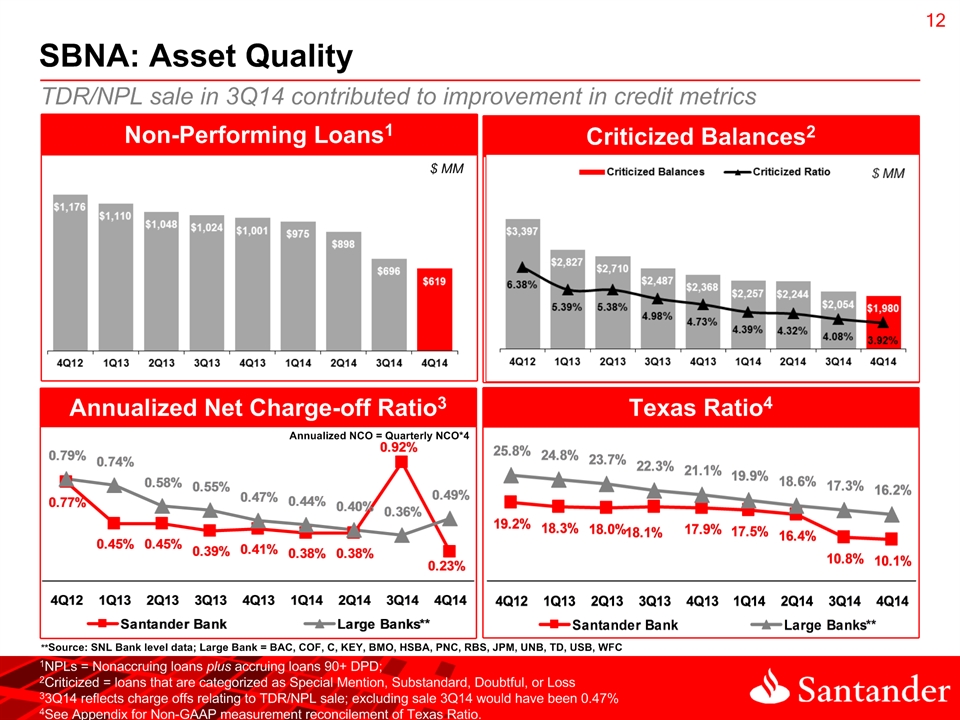
* * Criticized Balances2 Non-Performing Loans1 Texas Ratio4 Annualized Net Charge-off Ratio3 SBNA: Asset Quality $ MM TDR/NPL sale in 3Q14 contributed to improvement in credit metrics $ MM Annualized NCO = Quarterly NCO*4 **Source: SNL Bank level data; Large Bank = BAC, COF, C, KEY, BMO, HSBA, PNC, RBS, JPM, UNB, TD, USB, WFC 1NPLs = Nonaccruing loans plus accruing loans 90+ DPD; 2Criticized = loans that are categorized as Special Mention, Substandard, Doubtful, or Loss33Q14 reflects charge offs relating to TDR/NPL sale; excluding sale 3Q14 would have been 0.47%4See Appendix for Non-GAAP measurement reconcilement of Texas Ratio.

* * Delinquency1 Reserve Coverage (ALLL/NPL2) Non-Performing Loan Ratio SBNA: Asset Quality (cont.) **Source: SNL Bank level data; Large Bank = BAC, COF, C, KEY, BMO, HSBA, PNC, RBS, JPM, UNB, TD, USB, WFC ALLL to Total Loans 1Delinquency = accruing laons 30-89 DPD plus accruing loans 90+ DPD loans2NPLs= Nonaccruing loans plus accruing loans 90+ DPD Coverage ratios improved from 3Q14 to 4Q14

Current portfolio performance consistent with retained mix and typical seasonal patterns in the second half of the year. ($ in millions) Delinquency Trends Provision Expense and Net Charge-offs SCUSA: Asset Quality *
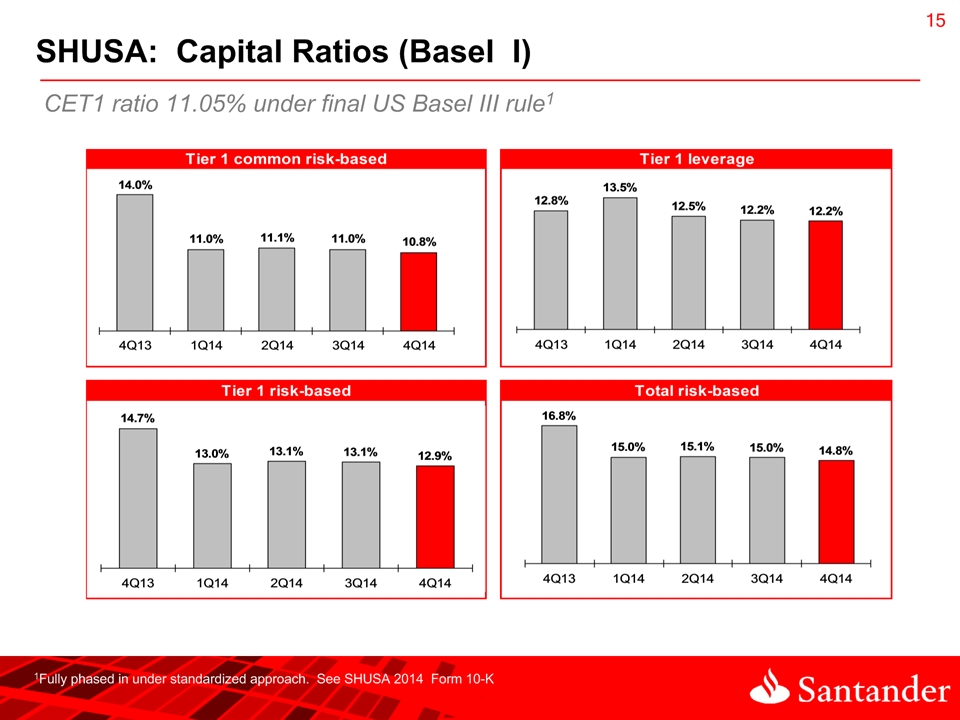
* * SHUSA: Capital Ratios (Basel I) 1Fully phased in under standardized approach. See SHUSA 2014 Form 10-K CET1 ratio 11.05% under final US Basel III rule1

* * SHUSA: 2015 CCAR results1 1Federal Reserve and Company DFAST results published on 3/5/15, FRB CCAR results published 3/11/15 Tier 1 Common % Money Center/Securities Regional Custodian Card Fed projections BHC projections Regulatory Min.- 5% FRB Median 7.9% 9.4% *BHC in SHUSA peer group SHUSA’s ending capital ratios exceeded the required minimum as measured by the Federal Reserve who objected to SHUSA’s capital plan on qualitative grounds due to deficiencies across SHUSA’s capital planning processes

* * SHUSA: Regulatory Disclosures Federal Reserve Written Agreement On September 18, the Federal Reserve published a written agreement between SHUSA and the Federal Reserve Bank of Boston. In summary, this agreement: 1) requires that SHUSA and its subsidiaries will not declare dividends or undertake other capital actions without prior written approval by the Federal Reserve, and 2) commits SHUSA to strengthen procedures to assure SHUSA’s Board of Directors vets capital decisions by the subsidiaries’ Boards and to act as a source of strength for Santander Bank, N.A. Released September 18, 2014 “Santander Holdings USA, Inc. (the “Company”) expects to become subject to a public enforcement action (the “Regulatory Action”) with the Federal Reserve Bank of Boston (the “Federal Reserve”) in the near future. Although the Company has not yet received a draft of such Regulatory Action, the Company believes that the Regulatory Action will require the Company to make enhancements with respect to, among other matters, board and senior management oversight of the consolidated organization, risk management, and new business initiatives” November 7, 2014 SHUSA 8-K – Future Public Enforcement Action
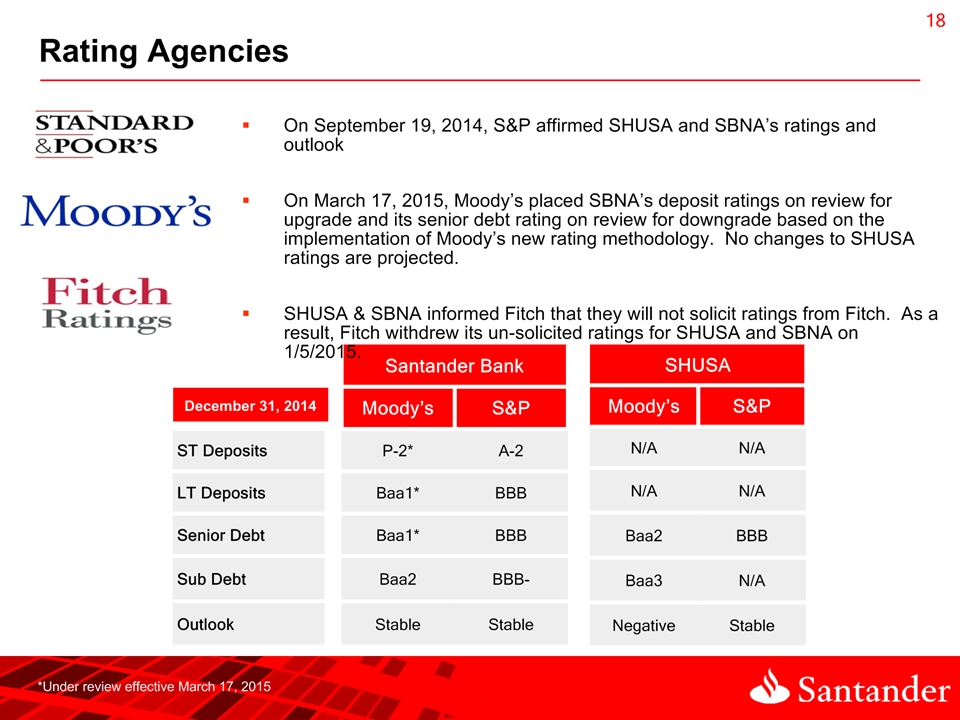
* * Rating Agencies Santander Bank Santander Bank Te Moody’s S&P ST Deposits P-2* A-2 LT Deposits Baa1* BBB Senior Debt Baa1* BBB Sub Debt Baa2 BBB- Outlook Stable Stable SHUSA SHUSA Moody’s S&P N/A N/A N/A N/A Baa2 BBB Baa3 N/A Negative Stable On September 19, 2014, S&P affirmed SHUSA and SBNA’s ratings and outlook On March 17, 2015, Moody’s placed SBNA’s deposit ratings on review for upgrade and its senior debt rating on review for downgrade based on the implementation of Moody’s new rating methodology. No changes to SHUSA ratings are projected.SHUSA & SBNA informed Fitch that they will not solicit ratings from Fitch. As a result, Fitch withdrew its un-solicited ratings for SHUSA and SBNA on 1/5/2015. December 31, 2014 *Under review effective March 17, 2015

Appendix

* SHUSA: Quarterly Trended Statement of Operations 1 Represents net income including noncontrolling interest beginning in 1Q14

* SHUSA: Annually Trended Statement of Operations 1 Represents net income including noncontrolling interest beginning in 1Q14
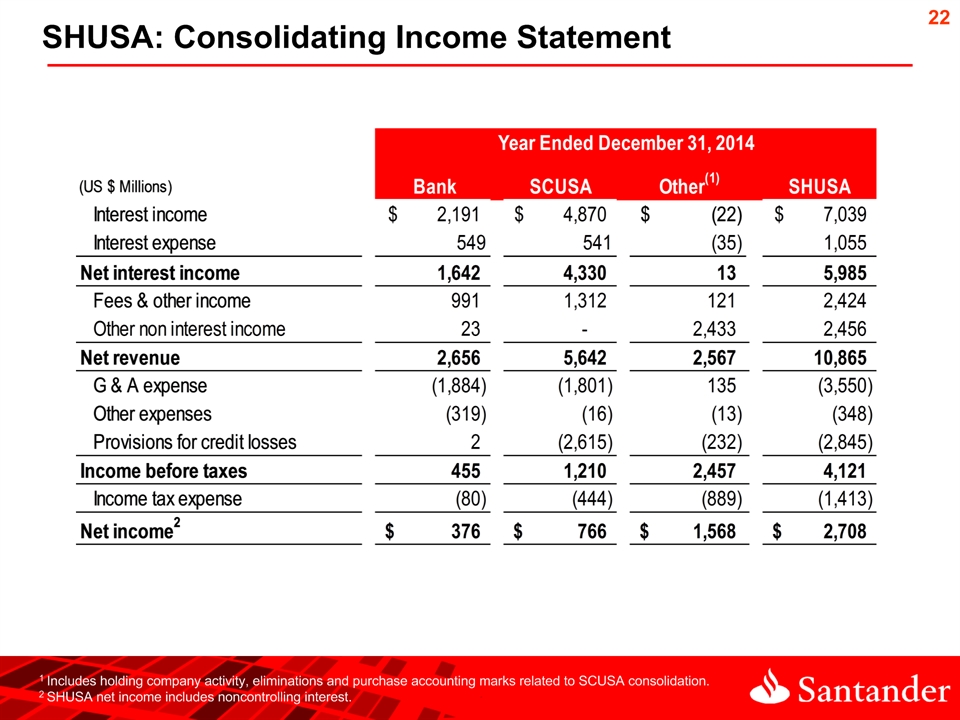
* SHUSA: Consolidating Income Statement 1 Includes holding company activity, eliminations and purchase accounting marks related to SCUSA consolidation.2 SHUSA net income includes noncontrolling interest.

* SHUSA: Average Balance Sheet Quarterly Averages
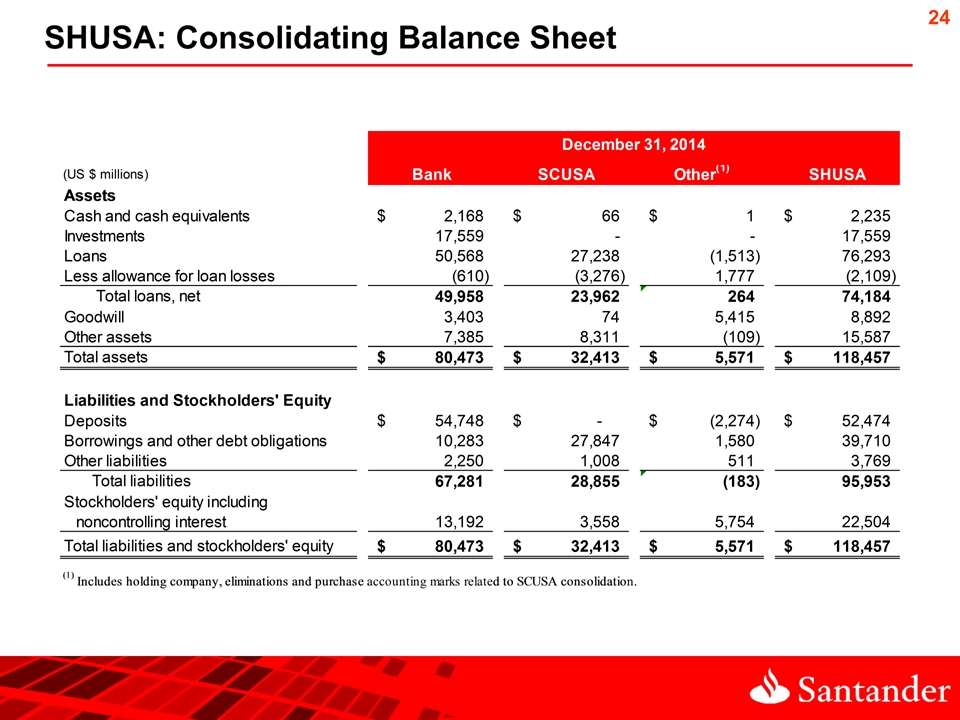
* SHUSA: Consolidating Balance Sheet
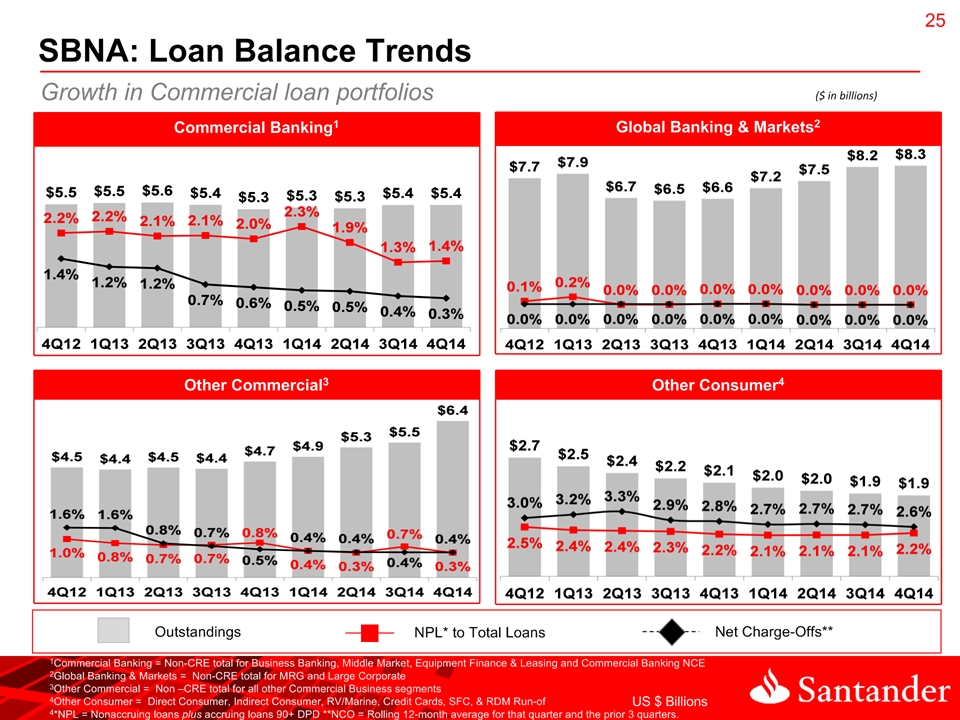
* Global Banking & Markets2 Commercial Banking1 Other Consumer4 Other Commercial3 Outstandings NPL* to Total Loans Net Charge-Offs** SBNA: Loan Balance Trends US $ Billions 1Commercial Banking = Non-CRE total for Business Banking, Middle Market, Equipment Finance & Leasing and Commercial Banking NCE 2Global Banking & Markets = Non-CRE total for MRG and Large Corporate 3Other Commercial = Non –CRE total for all other Commercial Business segments4Other Consumer = Direct Consumer, Indirect Consumer, RV/Marine, Credit Cards, SFC, & RDM Run-of4*NPL = Nonaccruing loans plus accruing loans 90+ DPD **NCO = Rolling 12-month average for that quarter and the prior 3 quarters. Growth in Commercial loan portfolios ($ in billions)

* Commercial Real Estate1 Home Equity Mortgages Multifamily Outstandings NPL* to Total Loans Net Charge-Offs** SBNA: Loan Balance Trends (cont.) US $ Billions 1Commercial Real Estate is comprised of the commercial real estate, continuing care retirement communities and non-owner occupied real estate secured commercial loans (Multifamly segment included in separate graph)*NPL = Nonaccruing loans plus accruing loans 90+ DPD**NCO = Rolling 12-month average for that quarter and the prior 3 quarters. Reduction in residential real estate related loans ($ in billions)
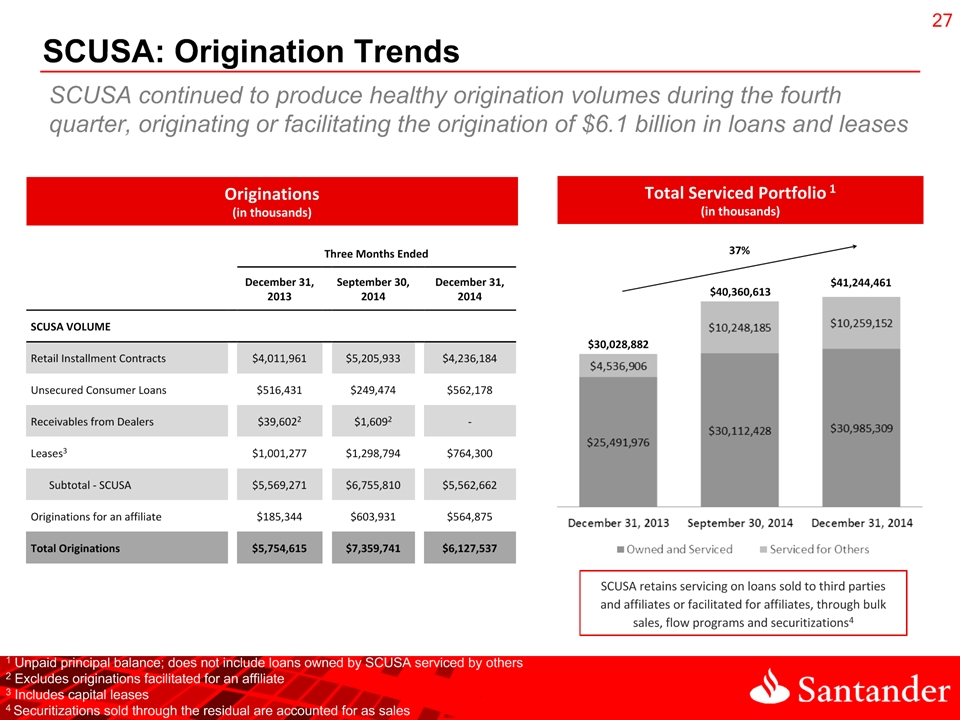
* * SCUSA: Origination Trends Total Serviced Portfolio 1 (in thousands) Originations(in thousands) SCUSA retains servicing on loans sold to third parties and affiliates or facilitated for affiliates, through bulk sales, flow programs and securitizations4 Three Months Ended Three Months Ended Three Months Ended Three Months Ended Three Months Ended December 31, 2013 September 30, 2014 December 31, 2014 SCUSA VOLUME Retail Installment Contracts $4,011,961 $5,205,933 $4,236,184 Unsecured Consumer Loans $516,431 $249,474 $562,178 Receivables from Dealers $39,6022 $1,6092 - Leases3 $1,001,277 $1,298,794 $764,300 Subtotal - SCUSA $5,569,271 $6,755,810 $5,562,662 Originations for an affiliate $185,344 $603,931 $564,875 Total Originations $5,754,615 $7,359,741 $6,127,537 SCUSA continued to produce healthy origination volumes during the fourth quarter, originating or facilitating the origination of $6.1 billion in loans and leases $40,360,613 37% $41,244,461 $30,028,882 1 Unpaid principal balance; does not include loans owned by SCUSA serviced by others2 Excludes originations facilitated for an affiliate3 Includes capital leases4 Securitizations sold through the residual are accounted for as sales

* * SHUSA: 2015 DFAST and CCAR results - Ratios 1 SHUSA DFAST results published on Form 8-K on 3/5/152 FRB DFAST and CCAR results published on 3/5/15 and 3/11/15, respectively Capital SHUSA1 SHUSA1 Federal Reserve2 DFAST Severely Adverse Scenario Stressed Capital Ratios Minimum Stressed Capital Ratios Minimum Stressed Capital Ratios Minimum Tier 1 common ratio (%) 7.9% 7.9% 9.4% Common equity tier 1 ratio (%) 10.1% 10.1% 10.3% Tier 1 risk-based capital ratio (%) 10.5% 10.5% 10.7% Total risk-based capital ratio (%) 12.4% 12.4% 12.5% Tier 1 leverage ratio (%) 9.7% 9.7% 9.6% DFAST Adverse Scenario Stressed Capital Ratios Minimum Stressed Capital Ratios Minimum Stressed Capital Ratios Minimum Tier 1 common ratio (%) 10.4% 11.5% 11.5% Common equity tier 1 ratio (%) 11.0% 12.2% 12.2% Tier 1 risk-based capital ratio (%) 12.2% 13.0% 13.0% Total risk-based capital ratio (%) 14.2% 14.9% 14.9% Tier 1 leverage ratio (%) 11.6% 11.5% 11.5% SHUSA Tier 1 Common ratio remains above 5% minimum under Supervisory Severely Adverse Scenario

* * SHUSA: 2015 DFAST and CCAR results – Loan Losses 1 SHUSA DFAST results published on Form 8-K on 3/5/152 FRB DFAST and CCAR results published on 3/5/15 and 3/11/15, respectively Loan Cateogory SHUSA1 Federal Reserve2 SHUSA1 Federal Reserve2 Adverse Adverse Severely Adverse Severely Adverse Total Losses 10.0% 6.8% 12.3% 9.6% First-Lien Mortgage 2.7% 3.6% 4.1% 4.5% Junior Liens & HELOCs 1.8% 3.2% 3.1% 4.5% Commercial and Industrial 2.2% 2.2% 4.2% 3.6% Commercial Real Estate 1.7% 5.3% 3.4% 9.0% Credit Cards 32.7% 11.9% 37.9% 14.7% Other Consumer 25.5% 13.2% 31.1% 17.2% Other Loans 1.4% 2.2% 3.2% 3.8% SHUSA projected loan losses were more conservative than the Federal Reserve’s loan loss projections
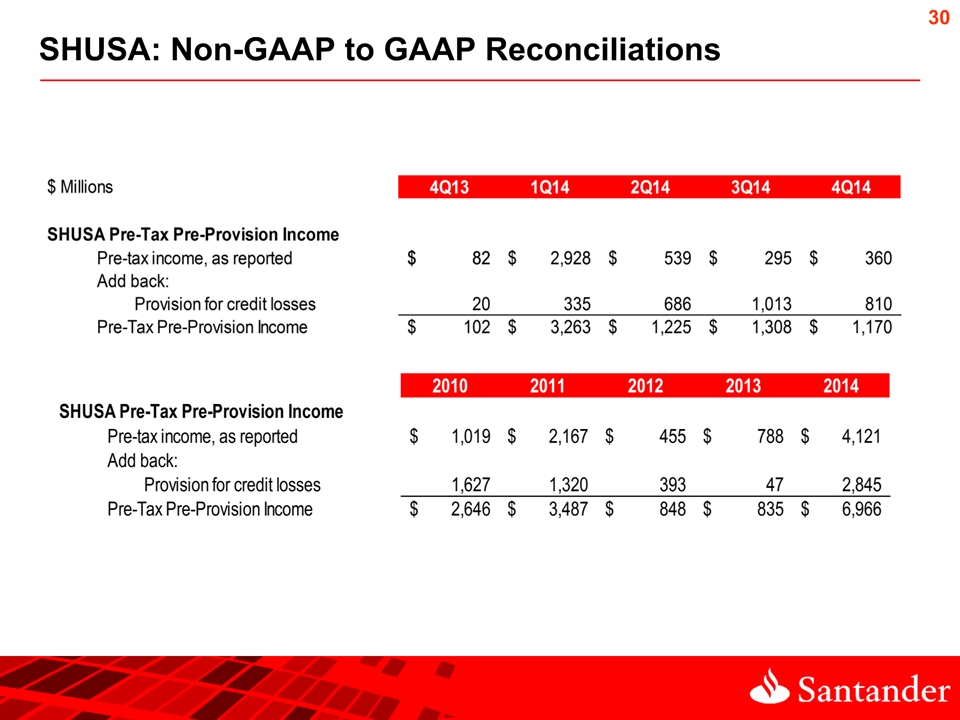
* SHUSA: Non-GAAP to GAAP Reconciliations
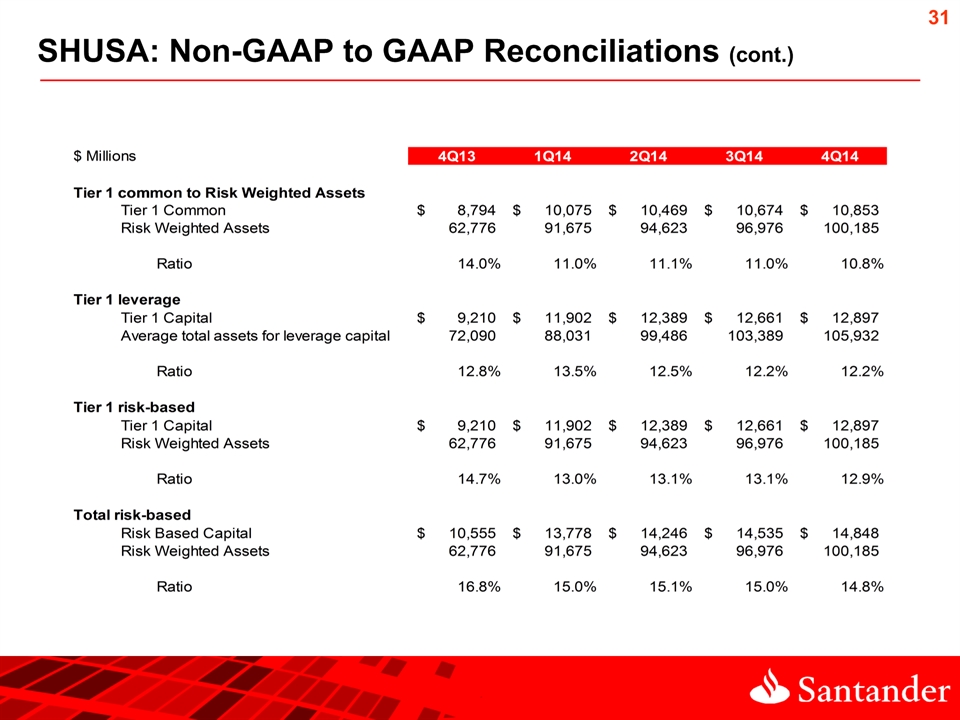
* SHUSA: Non-GAAP to GAAP Reconciliations (cont.)

* Non-GAAP to GAAP Reconciliations (cont.)
