1 May 6, 2024 SANTANDER HOLDINGS USA, INC. First Quarter 2024 Fixed Income Investor Presentation
2 This presentation of Santander Holdings USA, Inc. (“SHUSA”) contains “forward-looking statements” within the meaning of the Private Securities Litigation Reform Act of 1995 regarding the financial condition, results of operations, business plans and future performance of SHUSA. Words such as “may,” “could,” “should,” “will,” “believe,” “expect,” “anticipate,” “estimate,” “intend,” “plan,” “goal” or similar expressions are intended to indicate forward-looking statements. Although SHUSA believes that the expectations reflected in these forward-looking statements are reasonable as of the date on which the statements are made, factors such as the risks and uncertainties described in SHUSA’s filings with the Securities and Exchange Commission from time to time may cause SHUSA’s performance to differ materially from that suggested by the forward-looking statements. If one or more of the factors affecting SHUSA’s forward-looking statements renders those statements incorrect, SHUSA’s actual results, performance or achievements could differ materially from those expressed in or implied by the forward-looking statements. Readers should not consider these factors to be a complete set of all potential risks or uncertainties as new factors emerge from time to time. In this presentation, we may sometimes refer to certain non-GAAP figures or financial ratios to help illustrate certain concepts. These ratios, each of which is defined in this document, if utilized, may include Pre- Tax Pre- Provision Income, the Tangible Common Equity to Tangible Assets Ratio, and the Texas Ratio. This information supplements our results as reported in accordance with generally accepted accounting principles (“GAAP”) and should not be viewed in isolation from, or as a substitute for, our GAAP results. We believe that this additional information and the reconciliations we provide may be useful to investors, analysts, regulators and others as they evaluate the impact of these items on our results for the periods presented due to the extent to which the items are indicative of our ongoing operations. Where applicable, we provide GAAP reconciliations for such additional information. SHUSA’s subsidiaries include Santander Consumer USA Inc. (“SC”), Santander Bank, N.A. (“SBNA”), Banco Santander International (“BSI”), Santander Securities LLC (“SSLLC”), Santander US Capital Markets LLC (“SanCap”), as well as several other subsidiaries. The information in this presentation is intended only to assist investors and does not constitute legal, tax, accounting, financial or investment advice or an offer to invest. In making this presentation available, SHUSA gives no advice and makes no recommendation to buy, sell, or otherwise deal in shares or other securities of Banco Santander, S.A. (“Santander”), SHUSA, SBNA, SC or any other securities or investments. It is not our intention to state, indicate, or imply in any manner that current or past results are indicative of future results or expectations. As with all investments, there are associated risks, and you could lose money investing. Prior to making any investment, a prospective investor should consult with its own investment, accounting, legal, and financial advisors and independently evaluate the risks, consequences, and suitability of that investment. No offering of securities shall be made in the United States except pursuant to registration under the Securities Act of 1933, as amended, or an exemption therefrom. Important Information
3 1 At a Glance 2 Appendix 3 Results 4 Index Capital & Liquidity
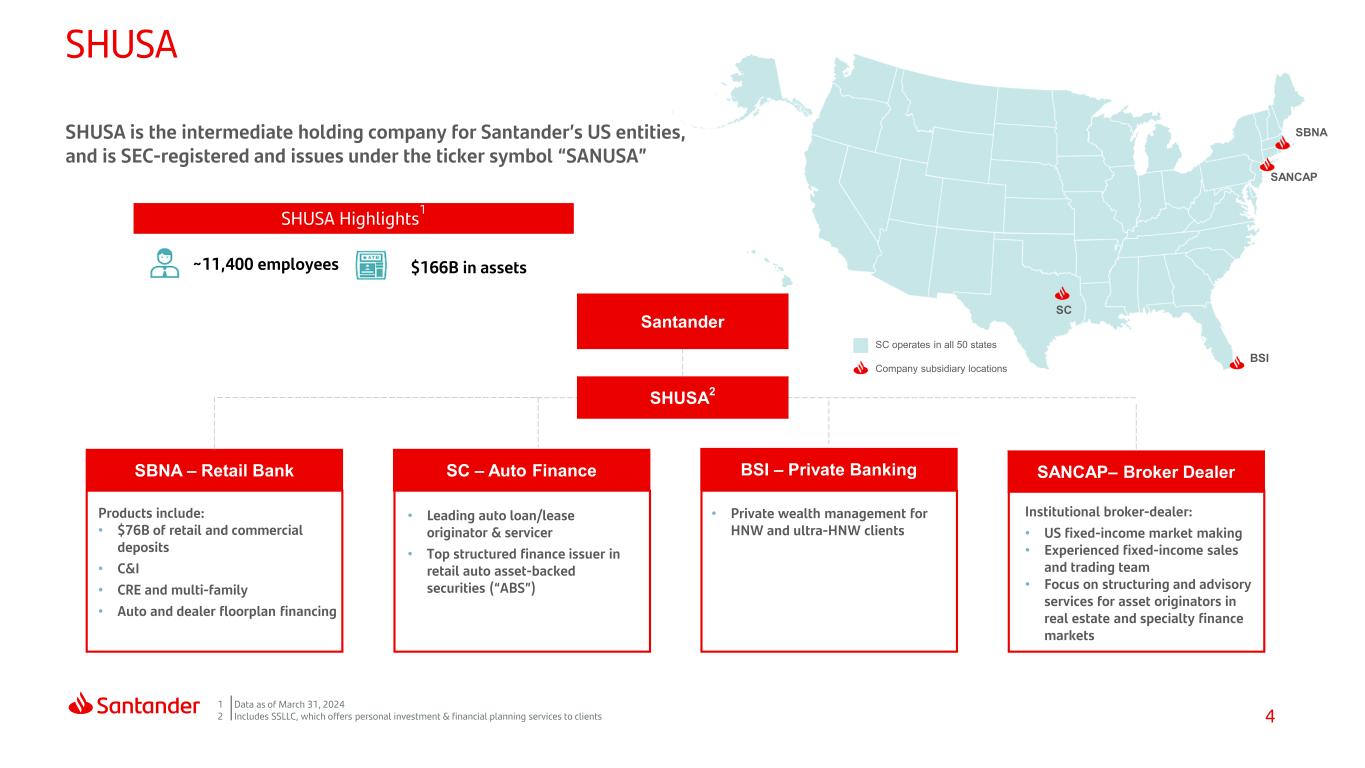
4 SHUSA Highlights1 ~13,200 employees $166B in assets SHUSA is the intermediate holding company for Santander’s US entities, and is SEC-registered and issues under the ticker symbol “SANUSA” SBNA – Retail Bank SC – Auto Finance BSI – Private Banking SANCAP– Broker Dealer Products include: • $76B of retail and commercial deposits • C&I • CRE and multi-family • Auto and dealer floorplan financing • Leading auto loan/lease originator & servicer • Top structured finance issuer in retail auto asset-backed securities (“ABS”) • Private wealth management for HNW and ultra-HNW clients Institutional broker-dealer: • US fixed-income market making • Experienced fixed-income sales and trading team • Focus on structuring and advisory services for asset originators in real estate and specialty finance markets 1 2 Data as of March 31, 2024 Includes SSLLC, which offers personal investment & financial planning services to clients SHUSA2 Santander SC operates in all 50 states Company subsidiary locations SC BSI SBNA SANCAP 1 4 SHUSA
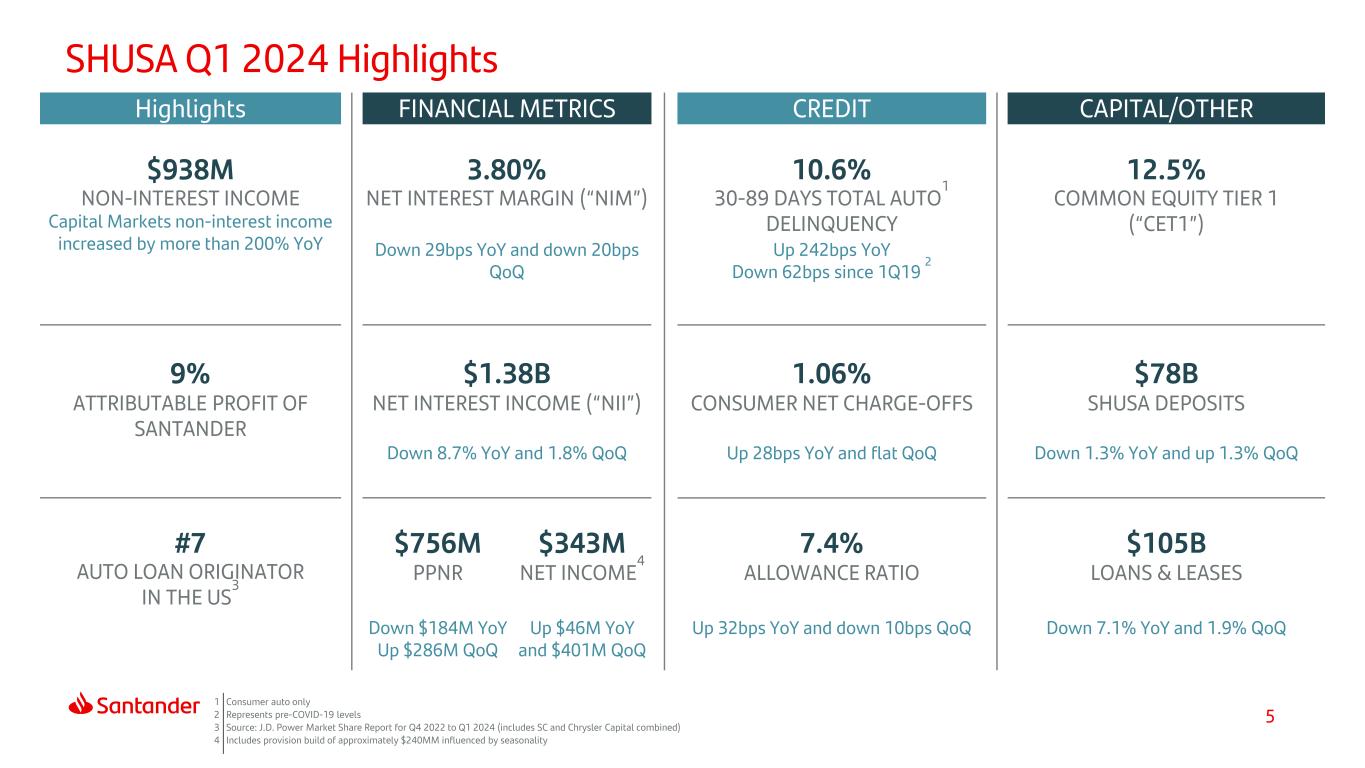
5 SHUSA Q1 2024 Highlights Highlights FINANCIAL METRICS CREDIT CAPITAL/OTHER $938M NON-INTEREST INCOME Capital Markets non-interest income increased by more than 200% YoY 3.80% NET INTEREST MARGIN (“NIM”) 10.6% 30-89 DAYS TOTAL AUTO1 DELINQUENCY 12.5% COMMON EQUITY TIER 1 (“CET1”) Down 29bps YoY and down 20bps QoQ Up 242bps YoY Down 62bps since 1Q19 2 9% $1.38B 1.06% $78B ATTRIBUTABLE PROFIT OF SANTANDER NET INTEREST INCOME (“NII”) CONSUMER NET CHARGE-OFFS SHUSA DEPOSITS Down 8.7% YoY and 1.8% QoQ Up 28bps YoY and flat QoQ Down 1.3% YoY and up 1.3% QoQ #7 AUTO LOAN ORIGINATOR IN THE US3 $756M $343M 7.4% $105B PPNR NET INCOME4 ALLOWANCE RATIO LOANS & LEASES Down $184M YoY Up $286M QoQ Up $46M YoY and $401M QoQ Up 32bps YoY and down 10bps QoQ Down 7.1% YoY and 1.9% QoQ 1 Consumer auto only 2 Represents pre-COVID-19 levels 3 Source: J.D. Power Market Share Report for Q4 2022 to Q1 2024 (includes SC and Chrysler Capital combined) 4 Includes provision build of approximately $240MM influenced by seasonality
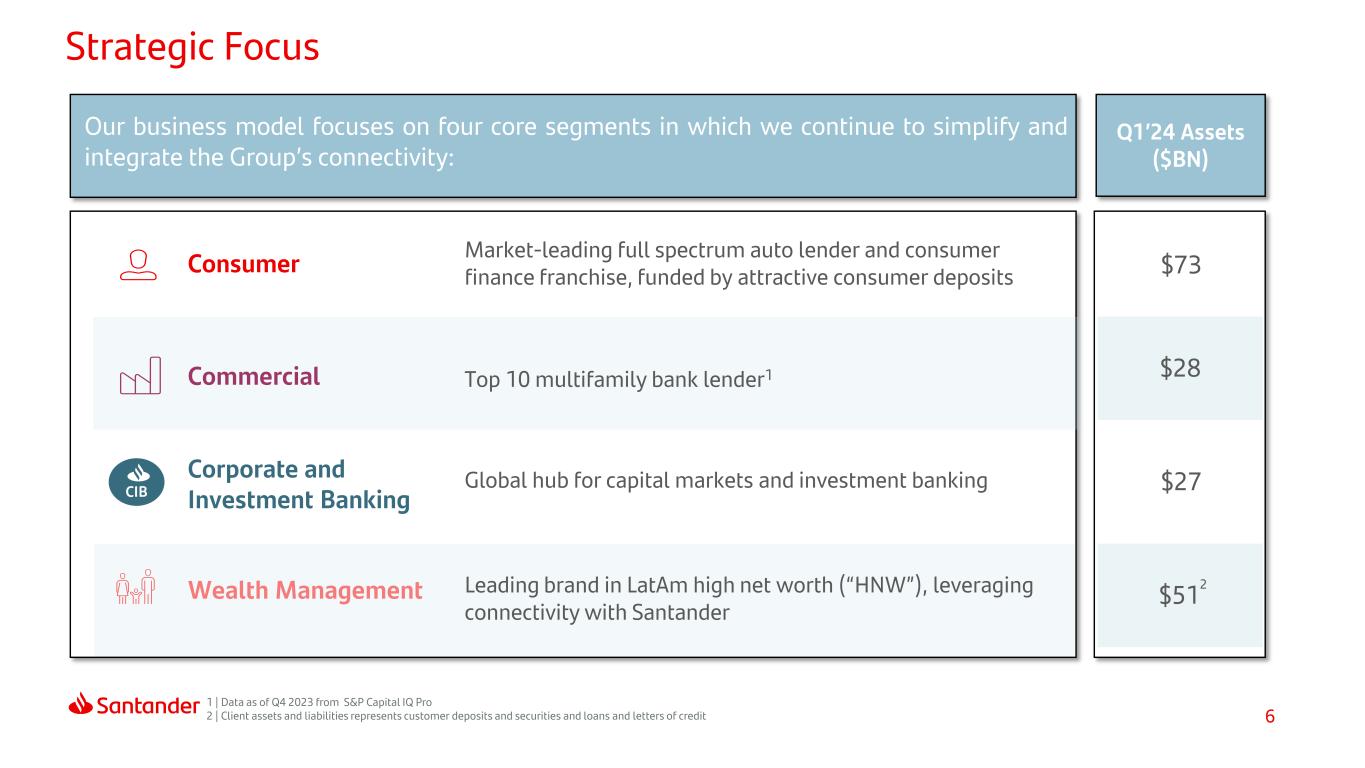
6 Our business model focuses on four core segments in which we continue to simplify and integrate the Group’s connectivity: CIB Consumer Commercial Corporate and Investment Banking Wealth Management Market-leading full spectrum auto lender and consumer finance franchise, funded by attractive consumer deposits Top 10 multifamily bank lender1 Global hub for capital markets and investment banking Leading brand in LatAm high net worth (“HNW”), leveraging connectivity with Santander Q1’24 Assets ($BN) $512 $73 $27 $28 Strategic Focus 1 | Data as of Q4 2023 from S&P Capital IQ Pro 2 | Client assets and liabilities represents customer deposits and securities and loans and letters of credit
7 1 At a Glance 2 Appendix 3 Results 4 Index Capital & Liquidity
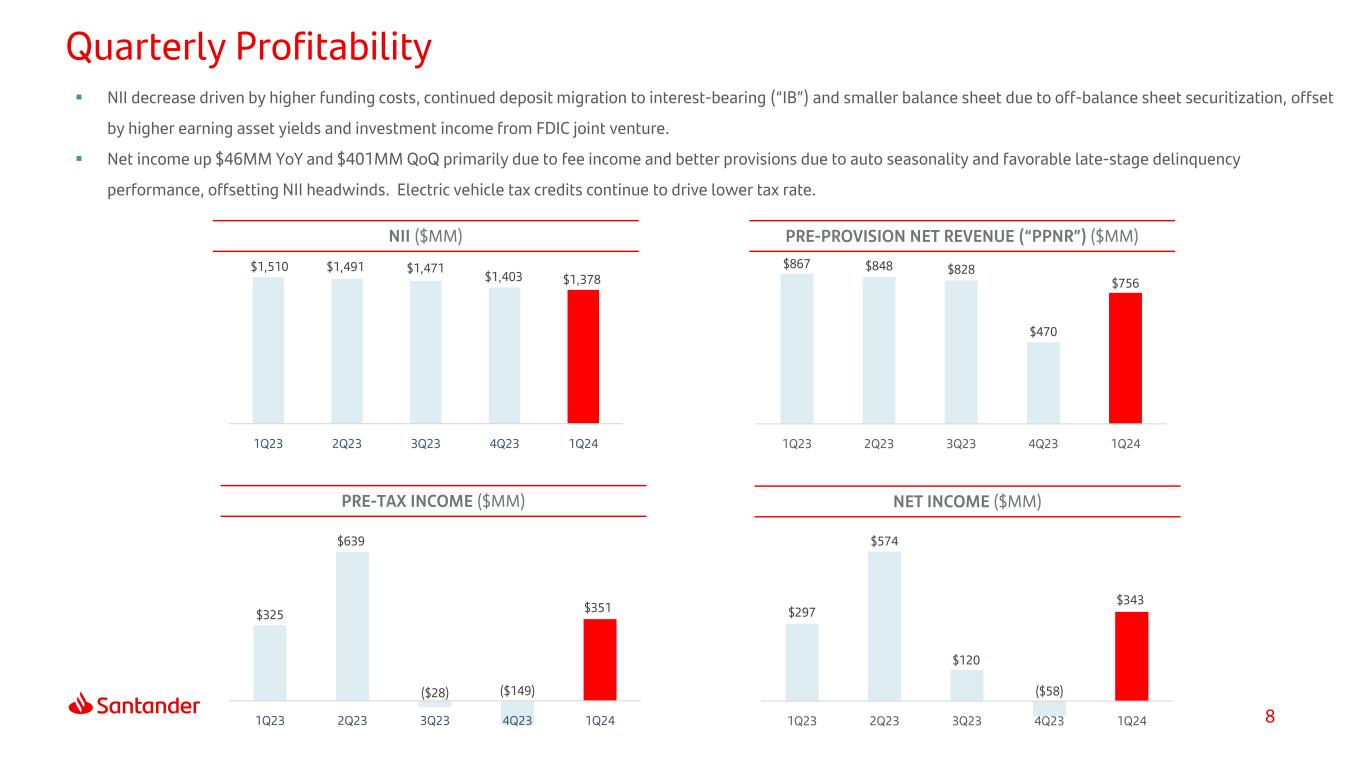
8 NET INCOME ($MM) $297 $574 $120 ($58) $343 1Q23 2Q23 3Q23 4Q23 1Q24 $325 $639 ($28) ($149) $351 1Q23 2Q23 3Q23 4Q23 1Q24 NII ($MM) PRE-TAX INCOME ($MM) PRE-PROVISION NET REVENUE (“PPNR”) ($MM) NII decrease driven by higher funding costs, continued deposit migration to interest-bearing (“IB”) and smaller balance sheet due to off-balance sheet securitization, offset by higher earning asset yields and investment income from FDIC joint venture. Net income up $46MM YoY and $401MM QoQ primarily due to fee income and better provisions due to auto seasonality and favorable late-stage delinquency performance, offsetting NII headwinds. Electric vehicle tax credits continue to drive lower tax rate. Quarterly Profitability $1,510 $1,491 $1,471 $1,403 $1,378 1Q23 2Q23 3Q23 4Q23 1Q24 $867 $848 $828 $470 $756 1Q23 2Q23 3Q23 4Q23 1Q24
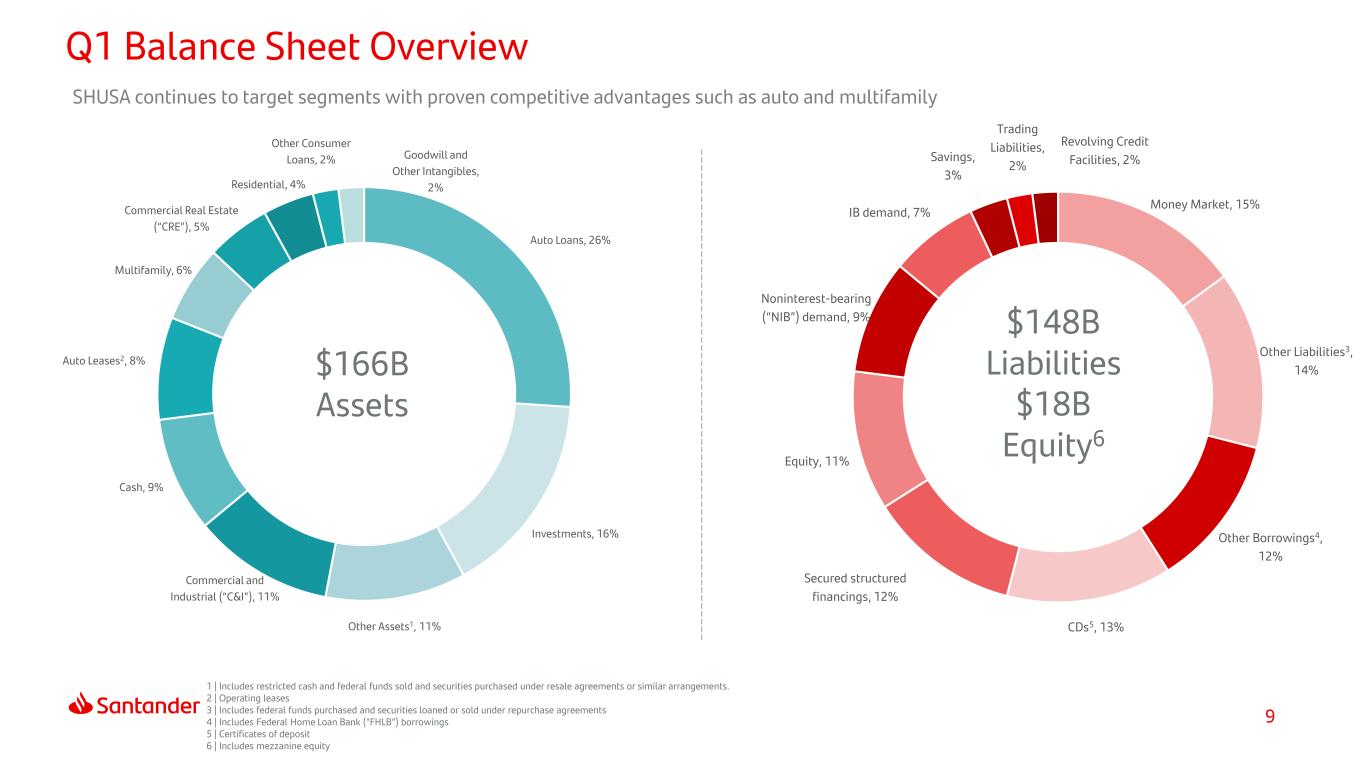
9 Money Market, 15% Other Liabilities3, 14% Other Borrowings4, 12% CDs5, 13% Secured structured financings, 12% Equity, 11% Noninterest-bearing (“NIB”) demand, 9% IB demand, 7% Savings, 3% Trading Liabilities, 2% Revolving Credit Facilities, 2% Auto Loans, 26% Investments, 16% Other Assets1, 11% Commercial and Industrial (“C&I”), 11% Cash, 9% Auto Leases2, 8% Multifamily, 6% Commercial Real Estate (“CRE”), 5% Residential, 4% Other Consumer Loans, 2% Goodwill and Other Intangibles, 2% $166B Assets $148B Liabilities $18B Equity6 Q1 Balance Sheet Overview 1 | Includes restricted cash and federal funds sold and securities purchased under resale agreements or similar arrangements. 2 | Operating leases 3 | Includes federal funds purchased and securities loaned or sold under repurchase agreements 4 | Includes Federal Home Loan Bank (“FHLB”) borrowings 5 | Certificates of deposit 6 | Includes mezzanine equity SHUSA continues to target segments with proven competitive advantages such as auto and multifamily
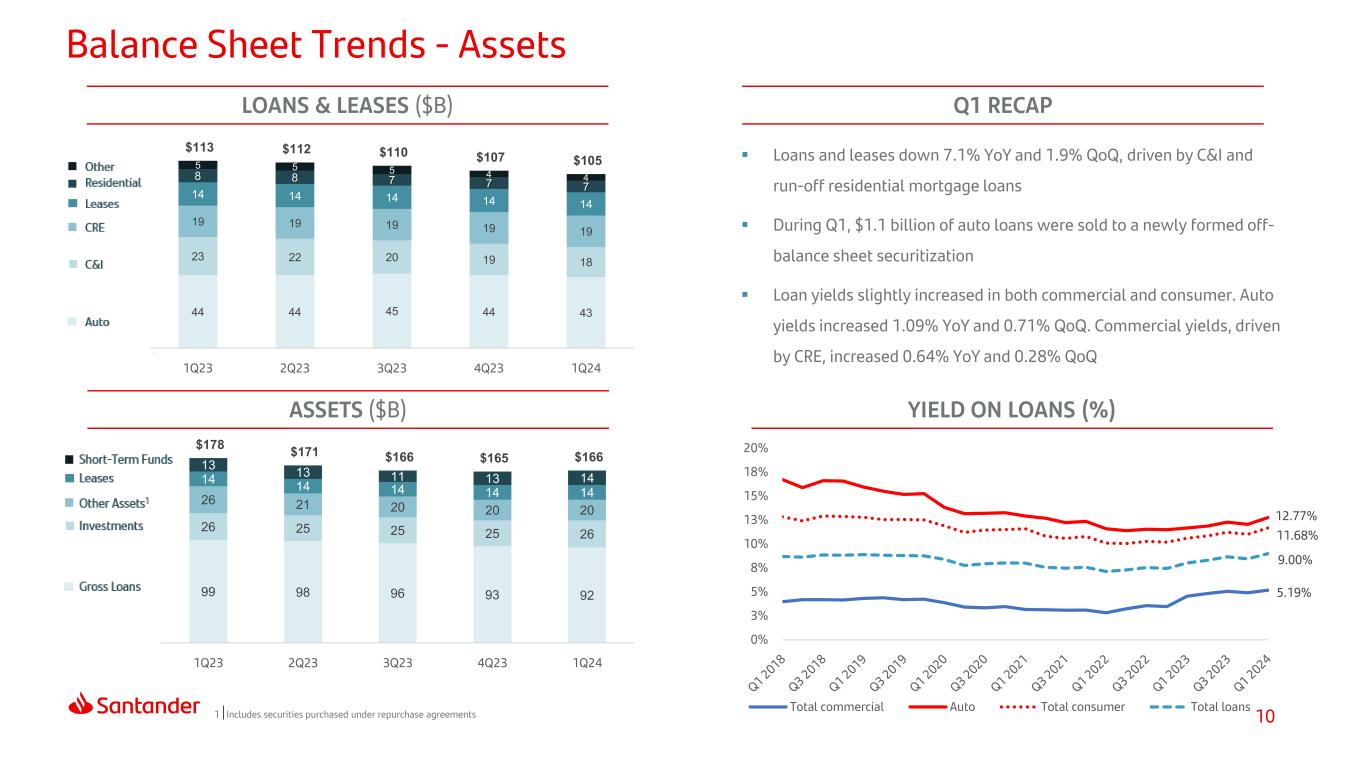
10 99 98 96 93 92 26 25 25 25 26 26 21 20 20 20 14 14 14 14 14 13 13 11 13 14 $178 $171 $166 $165 $166 1Q23 2Q23 3Q23 4Q23 1Q24 LOANS & LEASES ($B) ASSETS ($B) 1 Includes securities purchased under repurchase agreements YIELD ON LOANS (%) Loans and leases down 7.1% YoY and 1.9% QoQ, driven by C&I and run-off residential mortgage loans During Q1, $1.1 billion of auto loans were sold to a newly formed off- balance sheet securitization Loan yields slightly increased in both commercial and consumer. Auto yields increased 1.09% YoY and 0.71% QoQ. Commercial yields, driven by CRE, increased 0.64% YoY and 0.28% QoQ Q1 RECAP Balance Sheet Trends - Assets 44 44 45 44 43 23 22 20 19 18 19 19 19 19 19 14 14 14 14 14 8 8 7 7 7 5 5 5 4 4 $113 $112 $110 $107 $105 1Q23 2Q23 3Q23 4Q23 1Q24 5.19% 12.77% 11.68% 9.00% 0% 3% 5% 8% 10% 13% 15% 18% 20% Total commercial Auto Total consumer Total loans
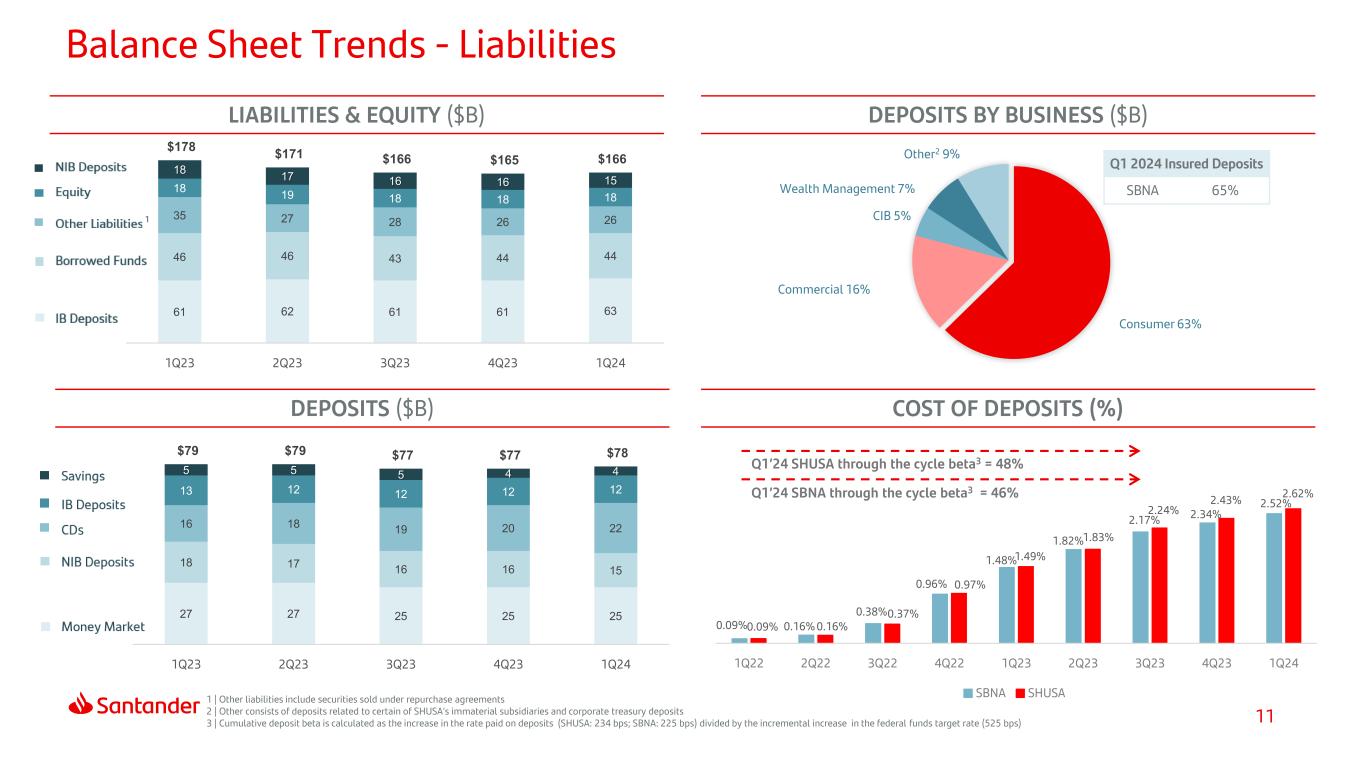
11 61 62 61 61 63 46 46 43 44 44 35 27 28 26 26 18 19 18 18 18 18 17 16 16 15 $178 $171 $166 $165 $166 1Q23 2Q23 3Q23 4Q23 1Q24 Consumer 63% Commercial 16% CIB 5% Wealth Management 7% Other2 9% 0.09% 0.16% 0.38% 0.96% 1.48% 1.82% 2.17% 2.34% 2.52% 0.09% 0.16% 0.37% 0.97% 1.49% 1.83% 2.24% 2.43% 2.62% 1Q22 2Q22 3Q22 4Q22 1Q23 2Q23 3Q23 4Q23 1Q24 SBNA SHUSA LIABILITIES & EQUITY ($B) DEPOSITS ($B) COST OF DEPOSITS (%) DEPOSITS BY BUSINESS ($B) Q1 2024 Insured Deposits SBNA 65% Q1’24 SBNA through the cycle beta3 = 46% Q1’24 SHUSA through the cycle beta3 = 48% Balance Sheet Trends - Liabilities 1 | Other liabilities include securities sold under repurchase agreements 2 | Other consists of deposits related to certain of SHUSA’s immaterial subsidiaries and corporate treasury deposits 3 | Cumulative deposit beta is calculated as the increase in the rate paid on deposits (SHUSA: 234 bps; SBNA: 225 bps) divided by the incremental increase in the federal funds target rate (525 bps) 27 27 25 25 25 18 17 16 16 15 16 18 19 20 22 13 12 12 12 12 5 5 5 4 4 $79 $79 $77 $77 $78 1Q23 2Q23 3Q23 4Q23 1Q24 s 1
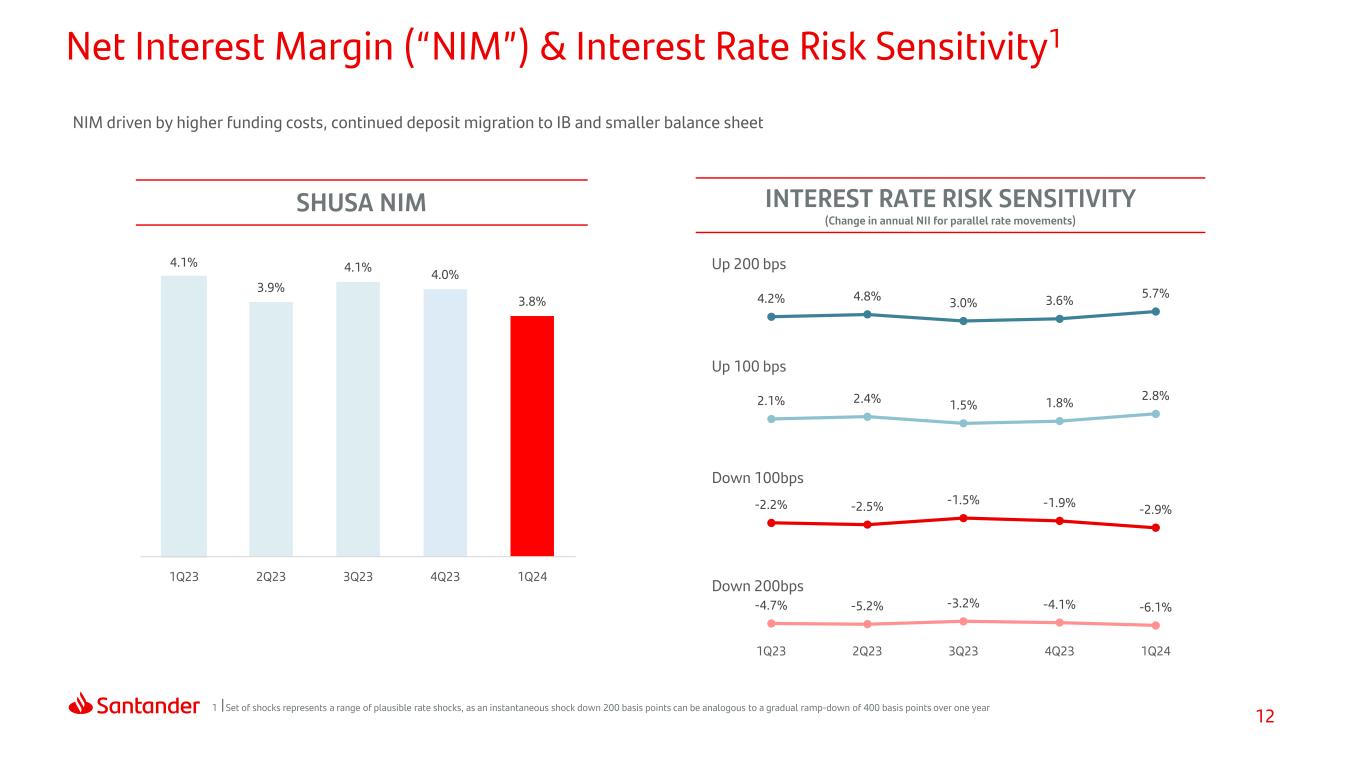
12 NIM driven by higher funding costs, continued deposit migration to IB and smaller balance sheet SHUSA NIM INTEREST RATE RISK SENSITIVITY (Change in annual NII for parallel rate movements) 1 Set of shocks represents a range of plausible rate shocks, as an instantaneous shock down 200 basis points can be analogous to a gradual ramp-down of 400 basis points over one year Net Interest Margin (“NIM”) & Interest Rate Risk Sensitivity1 4.1% 3.9% 4.1% 4.0% 3.8% 1Q23 2Q23 3Q23 4Q23 1Q24 4.2% 4.8% 3.0% 3.6% 5.7% Up 200 bps 2.1% 2.4% 1.5% 1.8% 2.8% Up 100 bps -2.2% -2.5% -1.5% -1.9% -2.9% Down 100bps -4.7% -5.2% -3.2% -4.1% -6.1% 1Q23 2Q23 3Q23 4Q23 1Q24 Down 200bps
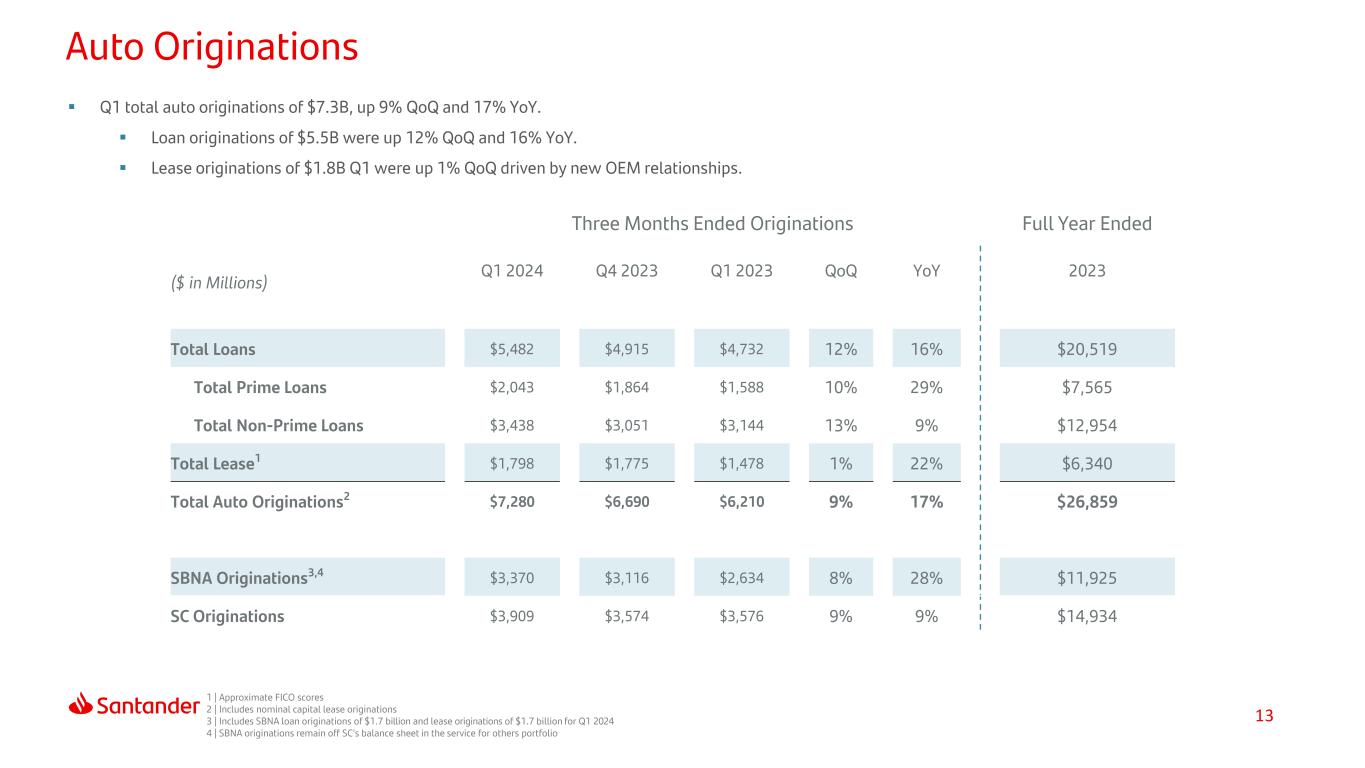
13 Q1 total auto originations of $7.3B, up 9% QoQ and 17% YoY. Loan originations of $5.5B were up 12% QoQ and 16% YoY. Lease originations of $1.8B Q1 were up 1% QoQ driven by new OEM relationships. Auto Originations Three Months Ended Originations Full Year Ended ($ in Millions) Q1 2024 Q4 2023 Q1 2023 QoQ YoY 2023 Total Loans $5,482 $4,915 $4,732 12% 16% $20,519 Total Prime Loans $2,043 $1,864 $1,588 10% 29% $7,565 Total Non-Prime Loans $3,438 $3,051 $3,144 13% 9% $12,954 Total Lease1 $1,798 $1,775 $1,478 1% 22% $6,340 Total Auto Originations2 $7,280 $6,690 $6,210 9% 17% $26,859 SBNA Originations3,4 $3,370 $3,116 $2,634 8% 28% $11,925 SC Originations $3,909 $3,574 $3,576 9% 9% $14,934 1 | Approximate FICO scores 2 | Includes nominal capital lease originations 3 | Includes SBNA loan originations of $1.7 billion and lease originations of $1.7 billion for Q1 2024 4 | SBNA originations remain off SC’s balance sheet in the service for others portfolio
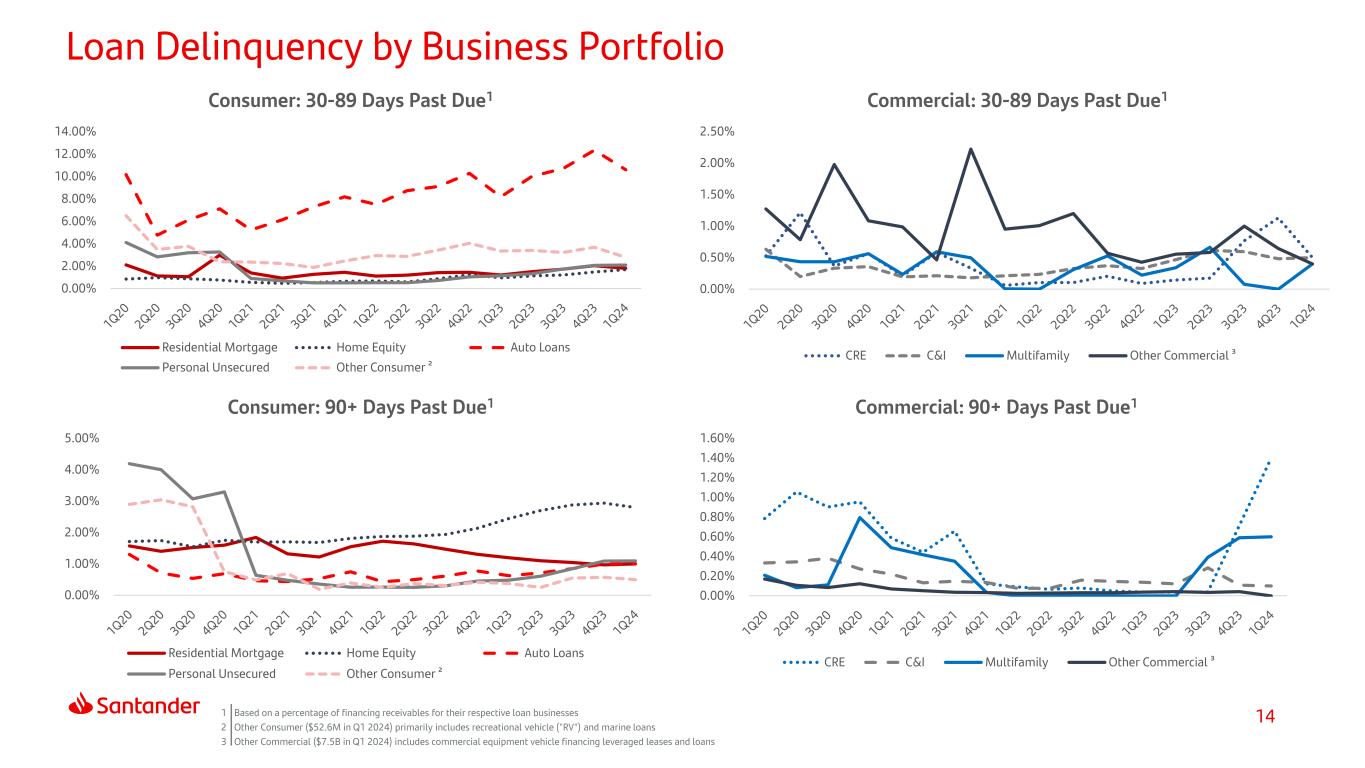
141 Based on a percentage of financing receivables for their respective loan businesses 2 Other Consumer ($52.6M in Q1 2024) primarily includes recreational vehicle ("RV") and marine loans 3 Other Commercial ($7.5B in Q1 2024) includes commercial equipment vehicle financing leveraged leases and loans Loan Delinquency by Business Portfolio 0.00% 0.50% 1.00% 1.50% 2.00% 2.50% Commercial: 30-89 Days Past Due1 CRE C&I Multifamily Other Commercial ³ 0.00% 2.00% 4.00% 6.00% 8.00% 10.00% 12.00% 14.00% Consumer: 30-89 Days Past Due1 Residential Mortgage Home Equity Auto Loans Personal Unsecured Other Consumer ² 0.00% 1.00% 2.00% 3.00% 4.00% 5.00% Consumer: 90+ Days Past Due1 Residential Mortgage Home Equity Auto Loans Personal Unsecured Other Consumer ² 0.00% 0.20% 0.40% 0.60% 0.80% 1.00% 1.20% 1.40% 1.60% Commercial: 90+ Days Past Due1 CRE C&I Multifamily Other Commercial ³
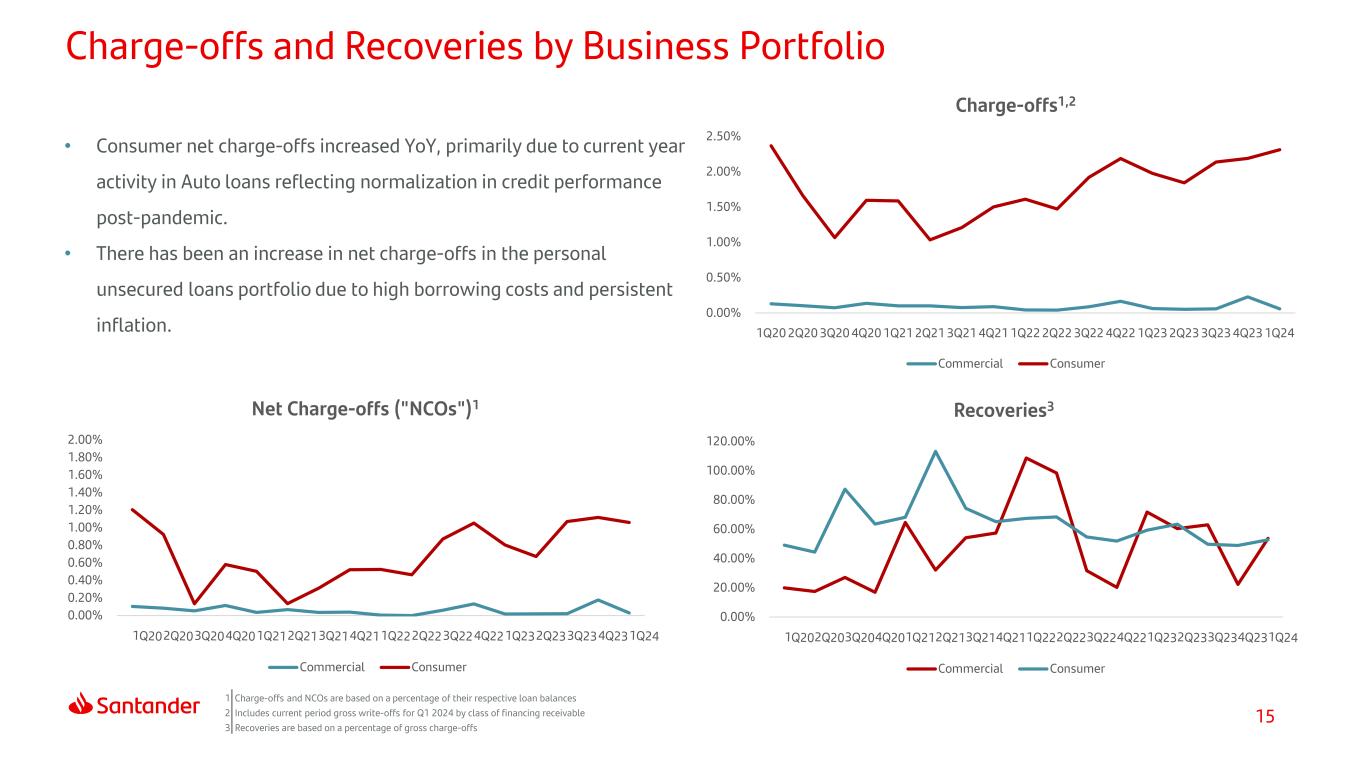
15 1 Charge-offs and NCOs are based on a percentage of their respective loan balances 2 Includes current period gross write-offs for Q1 2024 by class of financing receivable 3 Recoveries are based on a percentage of gross charge-offs • Consumer net charge-offs increased YoY, primarily due to current year activity in Auto loans reflecting normalization in credit performance post-pandemic. • There has been an increase in net charge-offs in the personal unsecured loans portfolio due to high borrowing costs and persistent inflation. Charge-offs and Recoveries by Business Portfolio 0.00% 0.50% 1.00% 1.50% 2.00% 2.50% 1Q20 2Q20 3Q20 4Q20 1Q21 2Q21 3Q21 4Q21 1Q22 2Q22 3Q22 4Q22 1Q23 2Q23 3Q23 4Q23 1Q24 Charge-offs1,2 Commercial Consumer 0.00% 20.00% 40.00% 60.00% 80.00% 100.00% 120.00% Recoveries3 Commercial Consumer 0.00% 0.20% 0.40% 0.60% 0.80% 1.00% 1.20% 1.40% 1.60% 1.80% 2.00% Net Charge-offs ("NCOs")1 Commercial Consumer
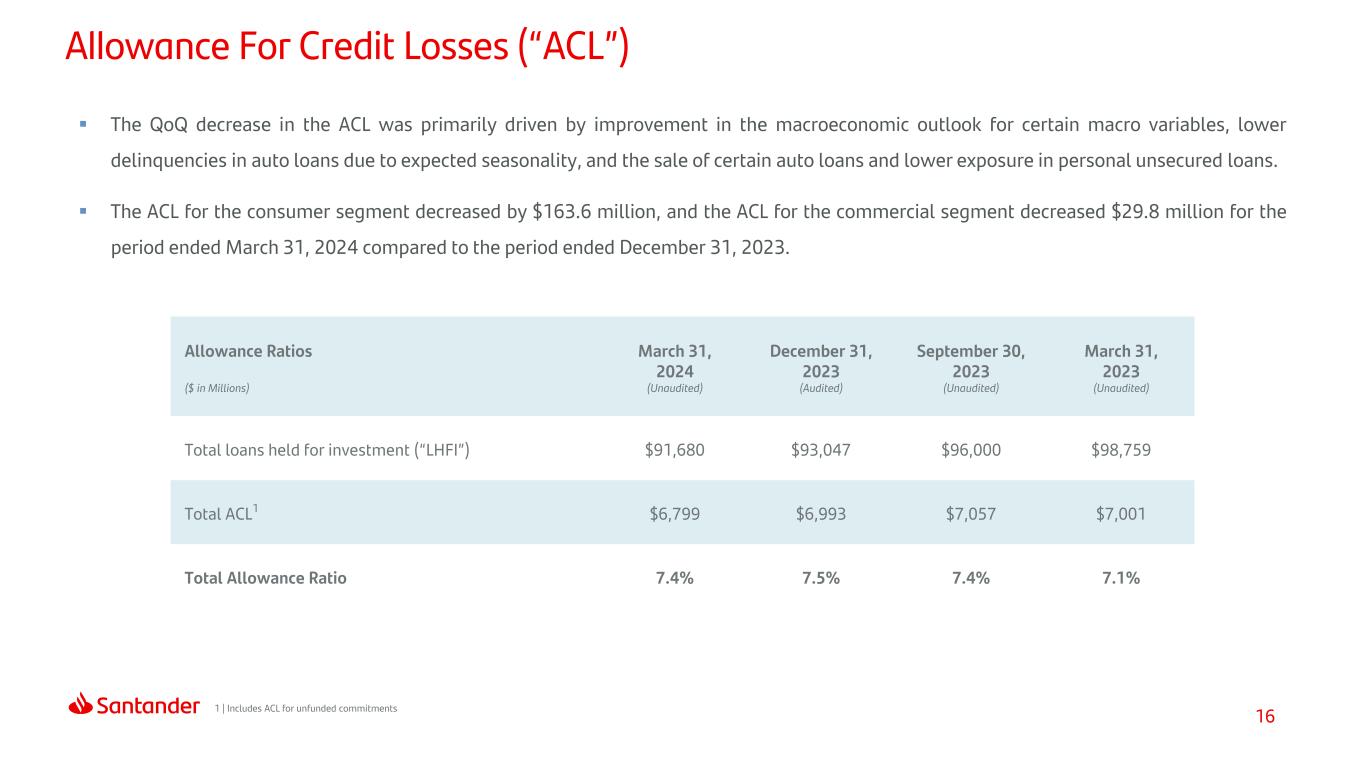
16 The QoQ decrease in the ACL was primarily driven by improvement in the macroeconomic outlook for certain macro variables, lower delinquencies in auto loans due to expected seasonality, and the sale of certain auto loans and lower exposure in personal unsecured loans. The ACL for the consumer segment decreased by $163.6 million, and the ACL for the commercial segment decreased $29.8 million for the period ended March 31, 2024 compared to the period ended December 31, 2023. Allowance For Credit Losses (“ACL”) Allowance Ratios ($ in Millions) March 31, 2024 (Unaudited) December 31, 2023 (Audited) September 30, 2023 (Unaudited) March 31, 2023 (Unaudited) Total loans held for investment (“LHFI”) $91,680 $93,047 $96,000 $98,759 Total ACL1 $6,799 $6,993 $7,057 $7,001 Total Allowance Ratio 7.4% 7.5% 7.4% 7.1% 1 | Includes ACL for unfunded commitments
17 1 At a Glance 2 Appendix 3 Results 4 Index Capital & Liquidity
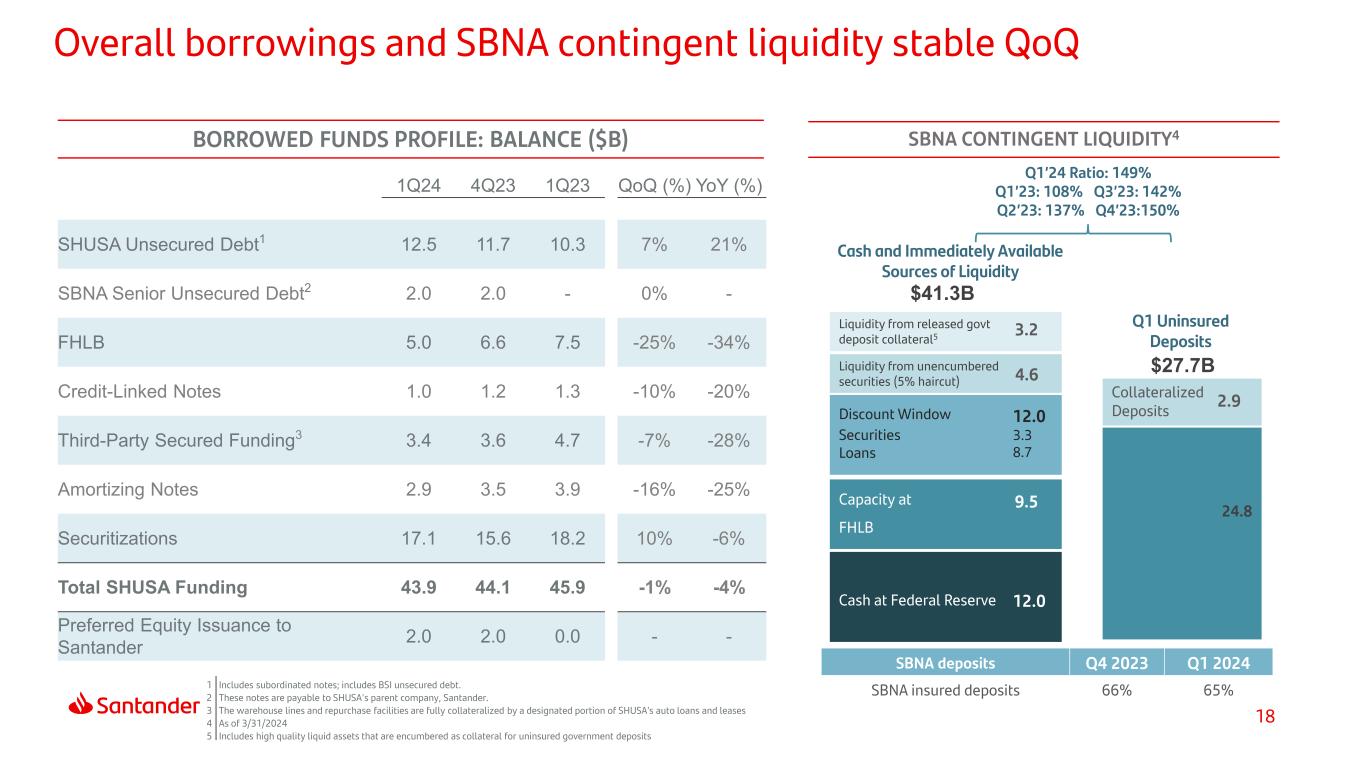
18 Overall borrowings and SBNA contingent liquidity stable QoQ 1 Includes subordinated notes; includes BSI unsecured debt. 2 These notes are payable to SHUSA's parent company, Santander. 3 The warehouse lines and repurchase facilities are fully collateralized by a designated portion of SHUSA’s auto loans and leases 4 As of 3/31/2024 5 Includes high quality liquid assets that are encumbered as collateral for uninsured government deposits BORROWED FUNDS PROFILE: BALANCE ($B) SBNA CONTINGENT LIQUIDITY4 24.8 Collateralized Deposits 2.9 $27.7B Q1 Uninsured Deposits Q1’24 Ratio: 149% Q1’23: 108% Q3’23: 142% Q2’23: 137% Q4’23:150% SBNA deposits Q4 2023 Q1 2024 SBNA insured deposits 66% 65% Cash at Federal Reserve Capacity at FHLB Liquidity from unencumbered securities (5% haircut) Liquidity from released govt deposit collateral5 3.2 4.6 9.5 12.0 $41.3B Discount Window Securities Loans 12.0 3.3 8.7 Cash and Immediately Available Sources of Liquidity 1Q24 4Q23 1Q23 QoQ (%) YoY (%) SHUSA Unsecured Debt1 12.5 11.7 10.3 7% 21% SBNA Senior Unsecured Debt2 2.0 2.0 - 0% - FHLB 5.0 6.6 7.5 -25% -34% Credit-Linked Notes 1.0 1.2 1.3 -10% -20% Third-Party Secured Funding3 3.4 3.6 4.7 -7% -28% Amortizing Notes 2.9 3.5 3.9 -16% -25% Securitizations 17.1 15.6 18.2 10% -6% Total SHUSA Funding 43.9 44.1 45.9 -1% -4% Preferred Equity Issuance to Santander 2.0 2.0 0.0 - -
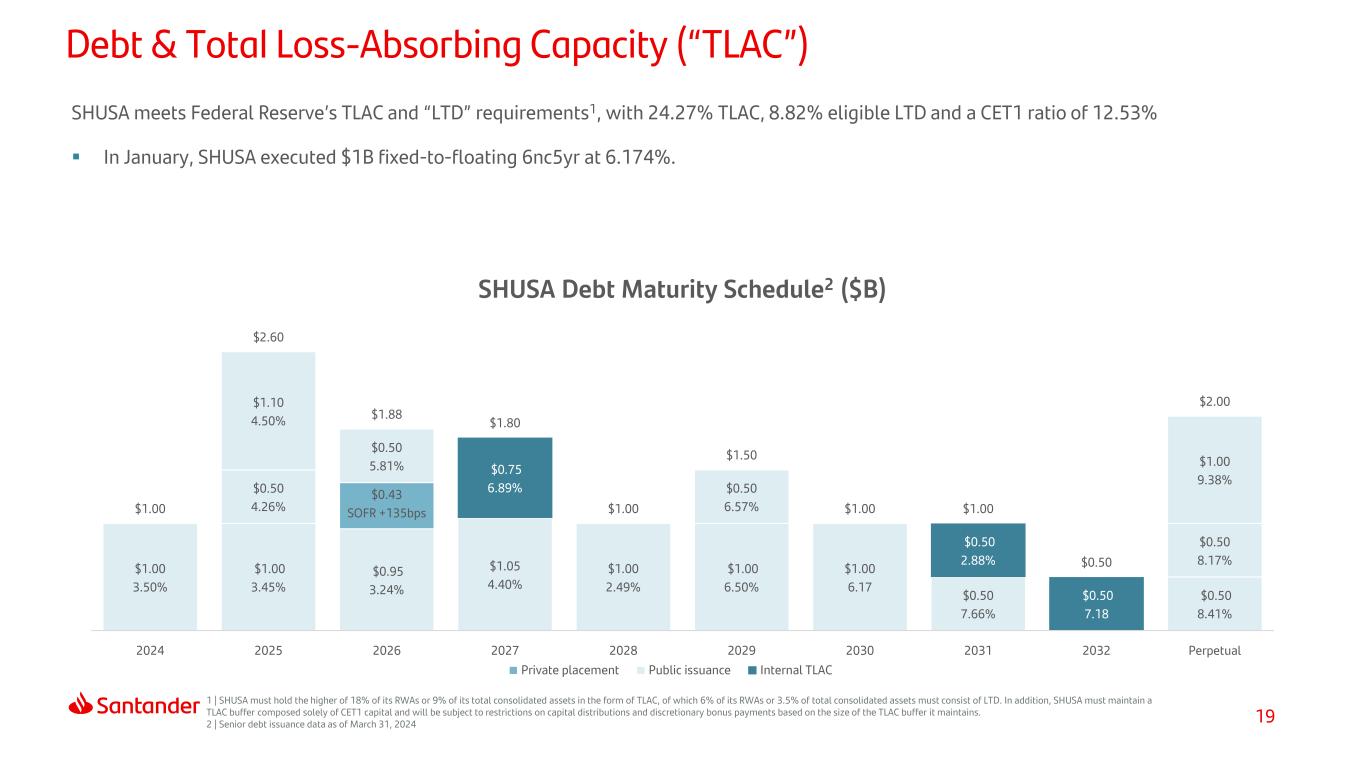
19 $1.00 3.45% $0.95 3.24% $1.00 6.50% $0.50 8.41% $0.50 4.26% $0.43 SOFR +135bps $0.50 8.17%$1.00 3.50% $1.10 4.50% $0.50 5.81% $1.05 4.40% $1.00 2.49% $0.50 6.57% $1.00 6.17 $0.50 7.66% $1.00 9.38% $0.75 6.89% $0.50 2.88% $0.50 7.18 $1.00 $2.60 $1.88 $1.80 $1.00 $1.50 $1.00 $1.00 $0.50 $2.00 2024 2025 2026 2027 2028 2029 2030 2031 2032 Perpetual SHUSA Debt Maturity Schedule2 ($B) Private placement Public issuance Internal TLAC Debt & Total Loss-Absorbing Capacity (“TLAC”) SHUSA meets Federal Reserve’s TLAC and “LTD” requirements1, with 24.27% TLAC, 8.82% eligible LTD and a CET1 ratio of 12.53% In January, SHUSA executed $1B fixed-to-floating 6nc5yr at 6.174%. 1 | SHUSA must hold the higher of 18% of its RWAs or 9% of its total consolidated assets in the form of TLAC, of which 6% of its RWAs or 3.5% of total consolidated assets must consist of LTD. In addition, SHUSA must maintain a TLAC buffer composed solely of CET1 capital and will be subject to restrictions on capital distributions and discretionary bonus payments based on the size of the TLAC buffer it maintains. 2 | Senior debt issuance data as of March 31, 2024
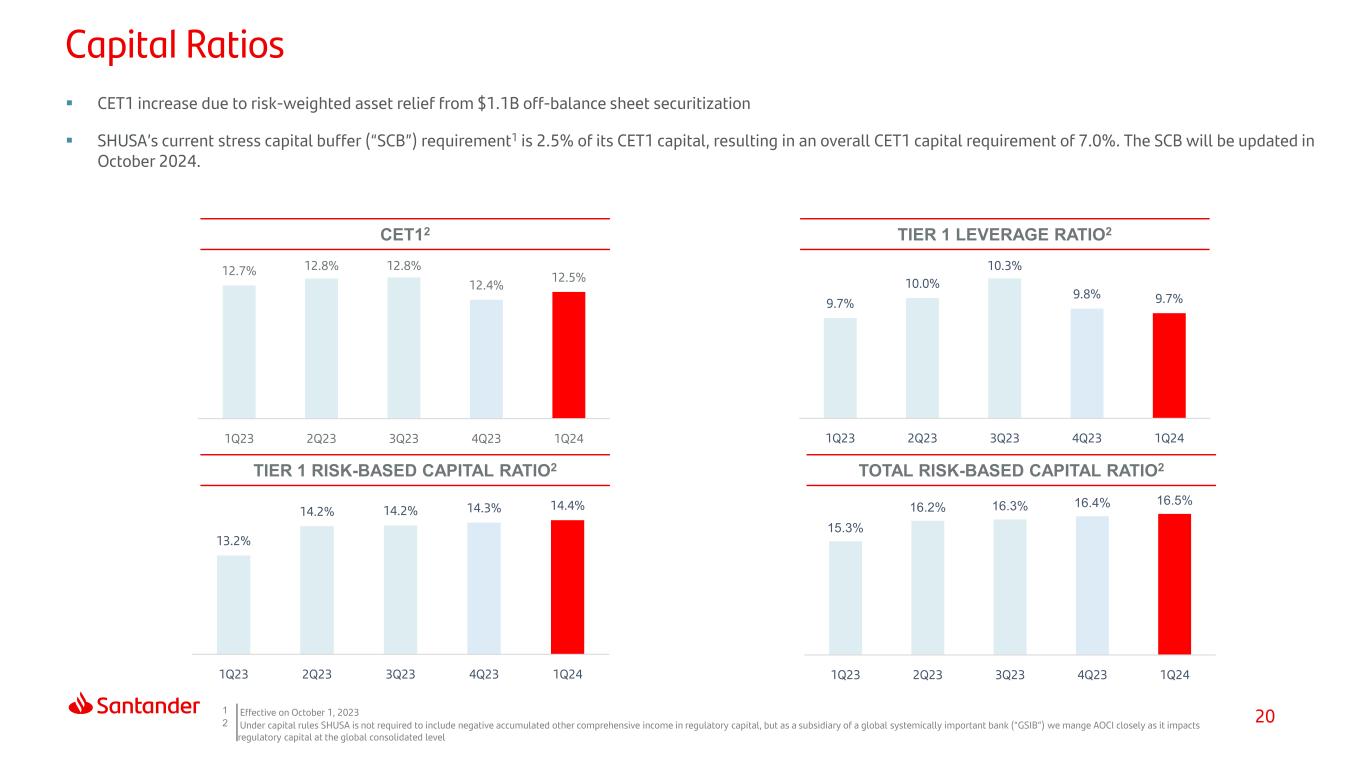
20 CET1 increase due to risk-weighted asset relief from $1.1B off-balance sheet securitization SHUSA’s current stress capital buffer (“SCB”) requirement1 is 2.5% of its CET1 capital, resulting in an overall CET1 capital requirement of 7.0%. The SCB will be updated in October 2024. CET12 TIER 1 RISK-BASED CAPITAL RATIO2 TOTAL RISK-BASED CAPITAL RATIO2 TIER 1 LEVERAGE RATIO2 1 Effective on October 1, 2023 2 Under capital rules SHUSA is not required to include negative accumulated other comprehensive income in regulatory capital, but as a subsidiary of a global systemically important bank (“GSIB”) we mange AOCI closely as it impacts regulatory capital at the global consolidated level Capital Ratios 12.7% 12.8% 12.8% 12.4% 12.5% 1Q23 2Q23 3Q23 4Q23 1Q24 9.7% 10.0% 10.3% 9.8% 9.7% 1Q23 2Q23 3Q23 4Q23 1Q24 13.2% 14.2% 14.2% 14.3% 14.4% 1Q23 2Q23 3Q23 4Q23 1Q24 15.3% 16.2% 16.3% 16.4% 16.5% 1Q23 2Q23 3Q23 4Q23 1Q24
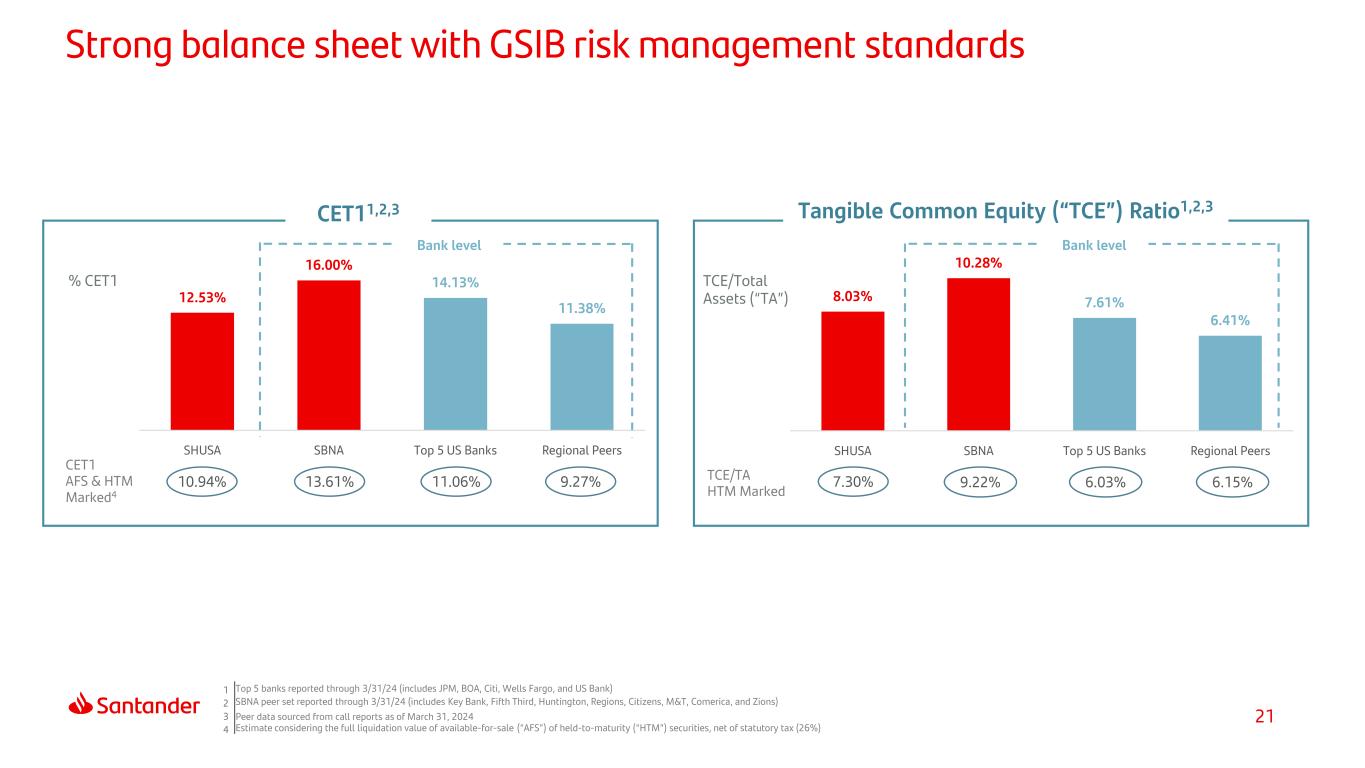
21 Tangible Common Equity (“TCE”) Ratio1,2,3 TCE/TA HTM Marked 9.22% TCE/Total Assets (“TA”) CET11,2,3 6.15%6.03% % CET1 7.30%9.27%11.06%13.61%10.94% Bank level Bank level CET1 AFS & HTM Marked4 1 Top 5 banks reported through 3/31/24 (includes JPM, BOA, Citi, Wells Fargo, and US Bank) 2 SBNA peer set reported through 3/31/24 (includes Key Bank, Fifth Third, Huntington, Regions, Citizens, M&T, Comerica, and Zions) 3 Peer data sourced from call reports as of March 31, 2024 4 Estimate considering the full liquidation value of available-for-sale (“AFS”) of held-to-maturity (“HTM”) securities, net of statutory tax (26%) Strong balance sheet with GSIB risk management standards 12.53% 16.00% 14.13% 11.38% SHUSA SBNA Top 5 US Banks Regional Peers 8.03% 10.28% 7.61% 6.41% SHUSA SBNA Top 5 US Banks Regional Peers
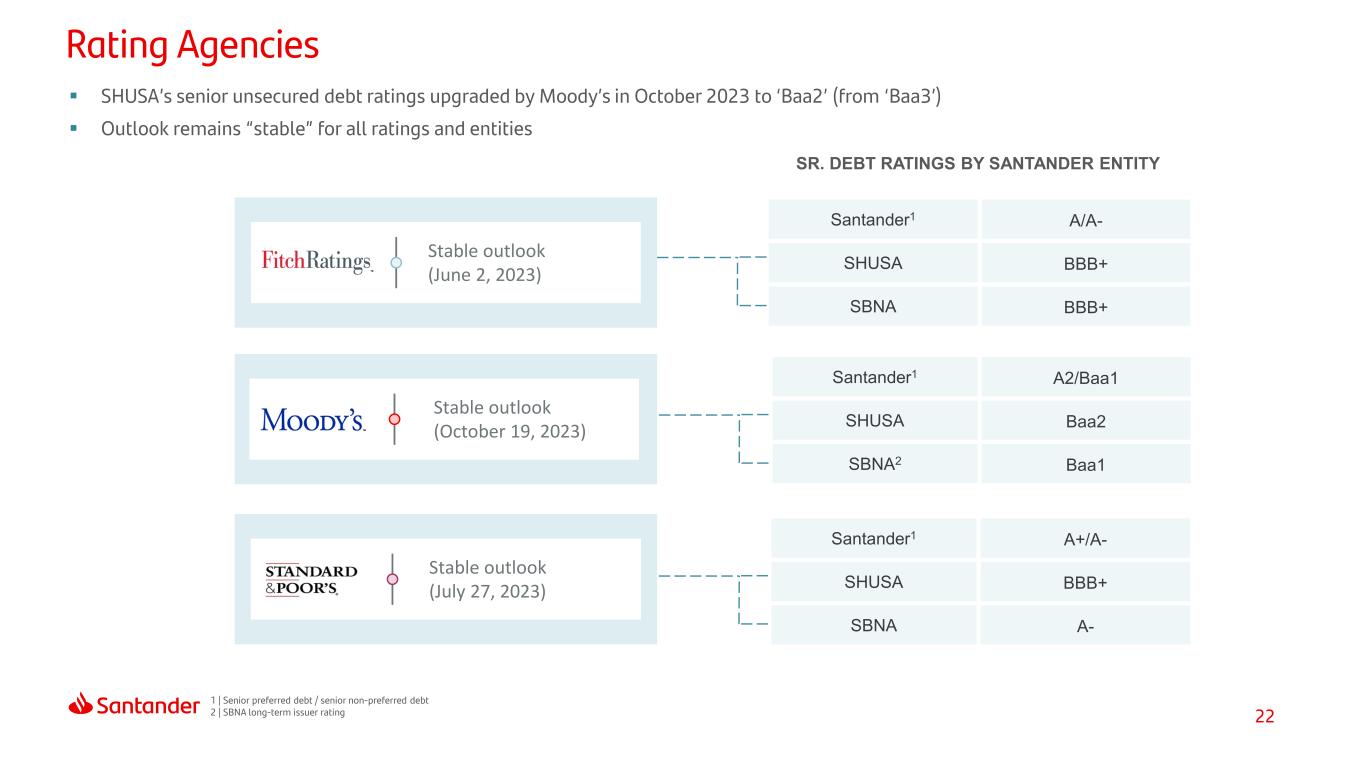
22 Santander1 A2/Baa1 SHUSA Baa2 SBNA2 Baa1 Santander1 A+/A- SHUSA BBB+ SBNA A- Stable outlook (June 2, 2023) SHUSA’s senior unsecured debt ratings upgraded by Moody’s in October 2023 to ‘Baa2’ (from ‘Baa3’) Outlook remains “stable” for all ratings and entities SR. DEBT RATINGS BY SANTANDER ENTITY Santander1 A/A- SHUSA BBB+ SBNA BBB+ Stable outlook (October 19, 2023) Stable outlook (July 27, 2023) Rating Agencies 1 | Senior preferred debt / senior non-preferred debt 2 | SBNA long-term issuer rating
23 1 At a Glance 2 3 Results Appendix Index 4 Capital & Liquidity
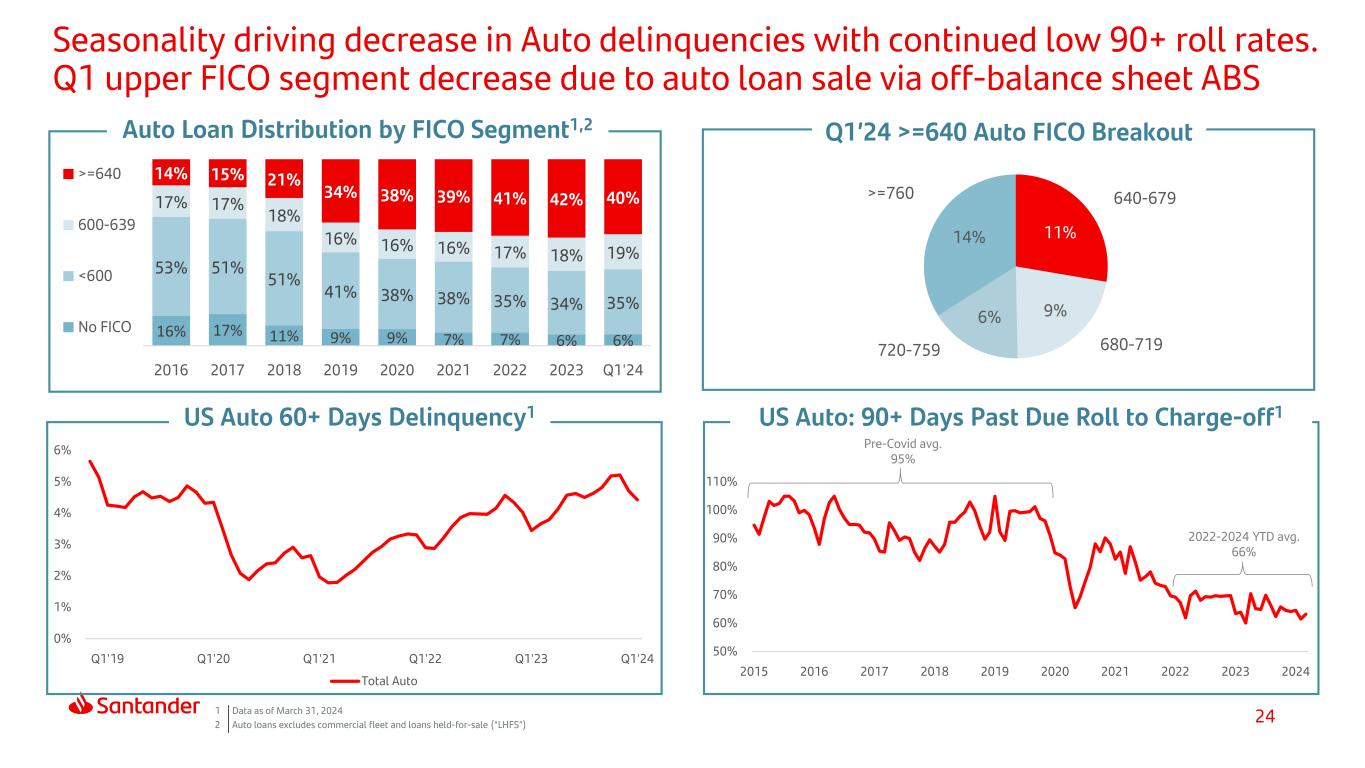
24 50% 60% 70% 80% 90% 100% 110% 2015 2016 2017 2018 2019 2020 2021 2022 2023 2024 Pre-Covid avg. 95% 2022-2024 YTD avg. 66% Seasonality driving decrease in Auto delinquencies with continued low 90+ roll rates. Q1 upper FICO segment decrease due to auto loan sale via off-balance sheet ABS Auto Loan Distribution by FICO Segment1,2 US Auto: 90+ Days Past Due Roll to Charge-off1US Auto 60+ Days Delinquency1 1 Data as of March 31, 2024 2 Auto loans excludes commercial fleet and loans held-for-sale (“LHFS”) 16% 17% 11% 9% 9% 7% 7% 6% 6% 53% 51% 51% 41% 38% 38% 35% 34% 35% 17% 17% 18% 16% 16% 16% 17% 18% 19% 14% 15% 21% 34% 38% 39% 41% 42% 40% 2016 2017 2018 2019 2020 2021 2022 2023 Q1'24 >=640 600-639 <600 No FICO 640-679 680-719720-759 >=760 55% 65% 75% 85% 95% 105 % 115 % 0% 1% 2% 3% 4% 5% 6% Q1'19 Q1'20 Q1'21 Q1'22 Q1'23 Q1'24 Total Auto Q1’24 >=640 Auto FICO Breakout 14% 6% 11% 9%
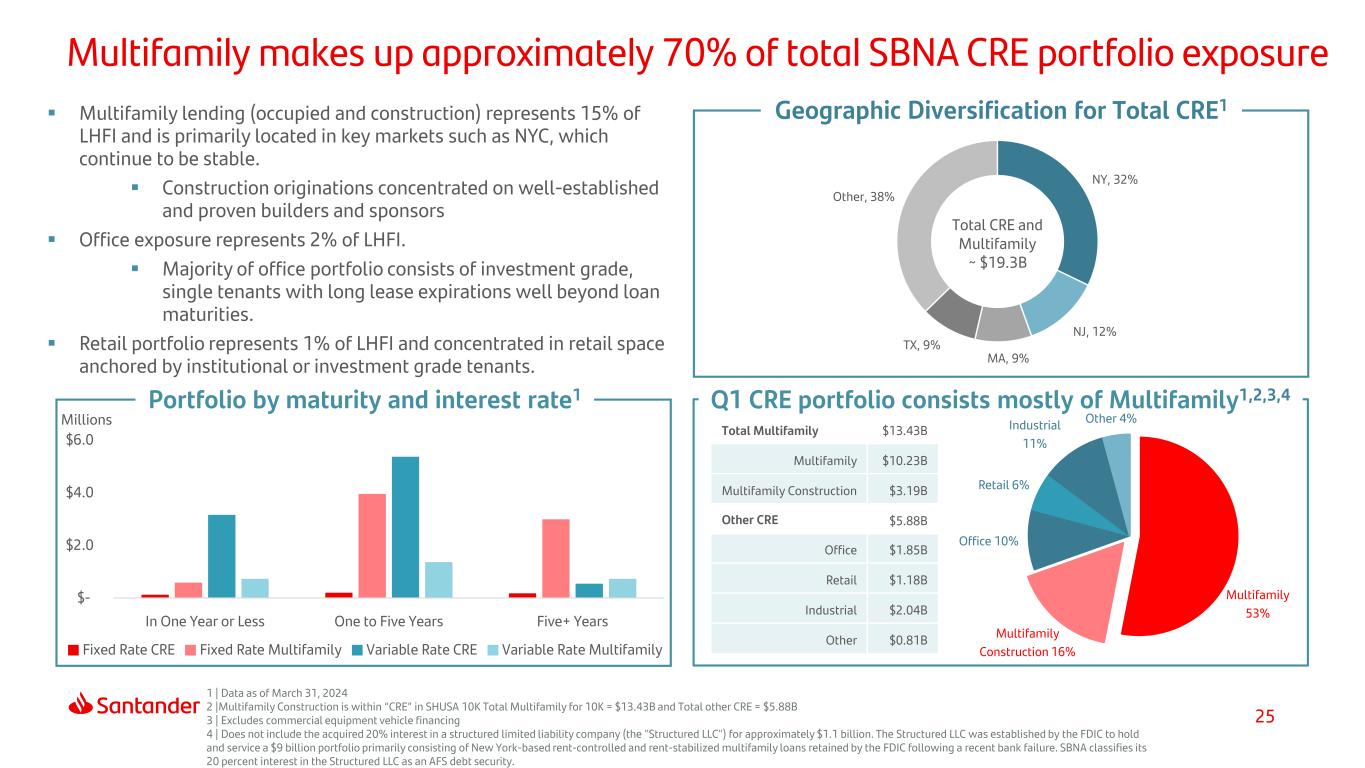
25 Portfolio by maturity and interest rate1 Multifamily lending (occupied and construction) represents 15% of LHFI and is primarily located in key markets such as NYC, which continue to be stable. Construction originations concentrated on well-established and proven builders and sponsors Office exposure represents 2% of LHFI. Majority of office portfolio consists of investment grade, single tenants with long lease expirations well beyond loan maturities. Retail portfolio represents 1% of LHFI and concentrated in retail space anchored by institutional or investment grade tenants. Q1 CRE portfolio consists mostly of Multifamily1,2,3,4 Multifamily makes up approximately 70% of total SBNA CRE portfolio exposure $- $2.0 $4.0 $6.0 In One Year or Less One to Five Years Five+ Years Millions Fixed Rate CRE Fixed Rate Multifamily Variable Rate CRE Variable Rate Multifamily Geographic Diversification for Total CRE1 Total Multifamily $13.43B Multifamily $10.23B Multifamily Construction $3.19B Other CRE $5.88B Office $1.85B Retail $1.18B Industrial $2.04B Other $0.81B Multifamily 53% Multifamily Construction 16% Office 10% Retail 6% Industrial 11% Other 4% 1 | Data as of March 31, 2024 2 |Multifamily Construction is within “CRE” in SHUSA 10K Total Multifamily for 10K = $13.43B and Total other CRE = $5.88B 3 | Excludes commercial equipment vehicle financing 4 | Does not include the acquired 20% interest in a structured limited liability company (the "Structured LLC") for approximately $1.1 billion. The Structured LLC was established by the FDIC to hold and service a $9 billion portfolio primarily consisting of New York-based rent-controlled and rent-stabilized multifamily loans retained by the FDIC following a recent bank failure. SBNA classifies its 20 percent interest in the Structured LLC as an AFS debt security. NY, 32% NJ, 12% MA, 9% TX, 9% Other, 38% Total CRE and Multifamily ~ $19.3B
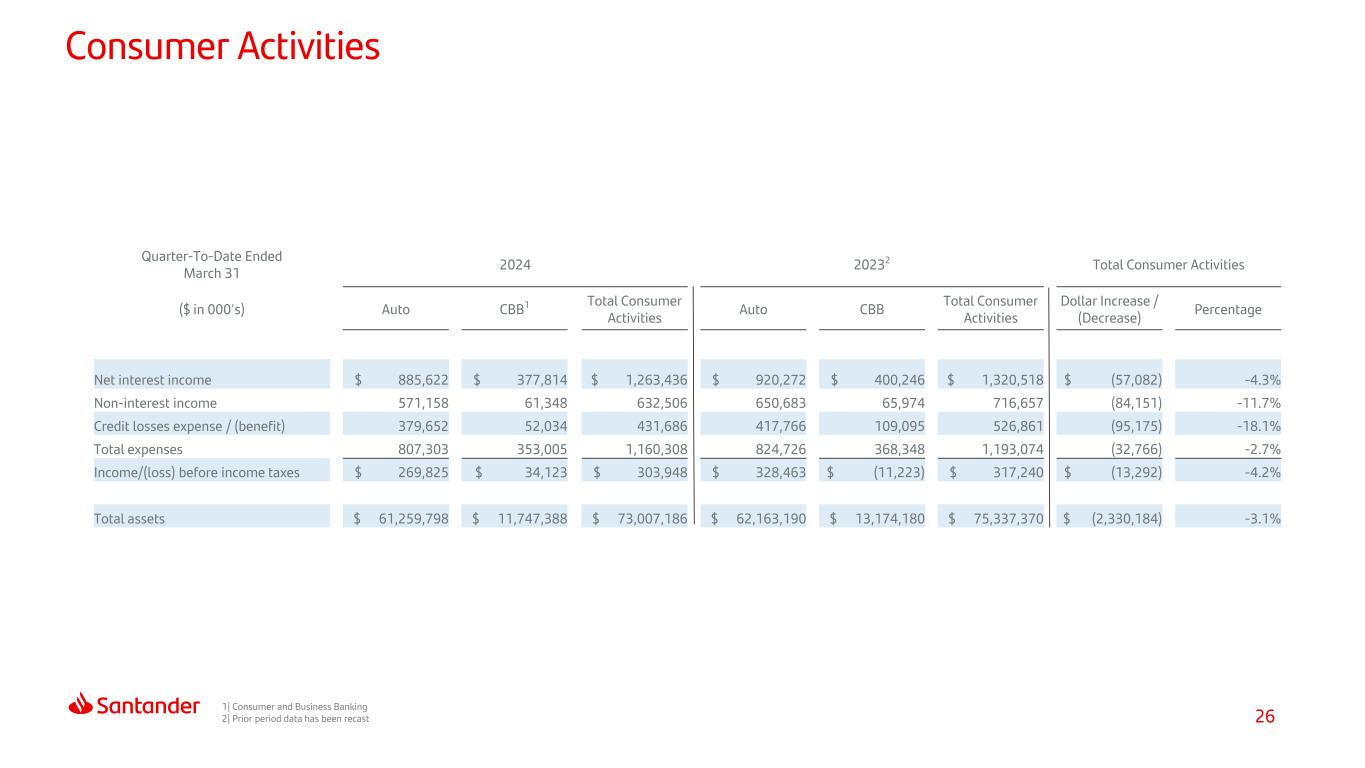
26 Consumer Activities 1| Consumer and Business Banking 2| Prior period data has been recast Quarter-To-Date Ended March 31 2024 20232 Total Consumer Activities ($ in 000's) Auto CBB1 Total Consumer Activities Auto CBB Total Consumer Activities Dollar Increase / (Decrease) Percentage Net interest income $ 885,622 $ 377,814 $ 1,263,436 $ 920,272 $ 400,246 $ 1,320,518 $ (57,082) -4.3% Non-interest income 571,158 61,348 632,506 650,683 65,974 716,657 (84,151) -11.7% Credit losses expense / (benefit) 379,652 52,034 431,686 417,766 109,095 526,861 (95,175) -18.1% Total expenses 807,303 353,005 1,160,308 824,726 368,348 1,193,074 (32,766) -2.7% Income/(loss) before income taxes $ 269,825 $ 34,123 $ 303,948 $ 328,463 $ (11,223) $ 317,240 $ (13,292) -4.2% Total assets $ 61,259,798 $ 11,747,388 $ 73,007,186 $ 62,163,190 $ 13,174,180 $ 75,337,370 $ (2,330,184) -3.1%
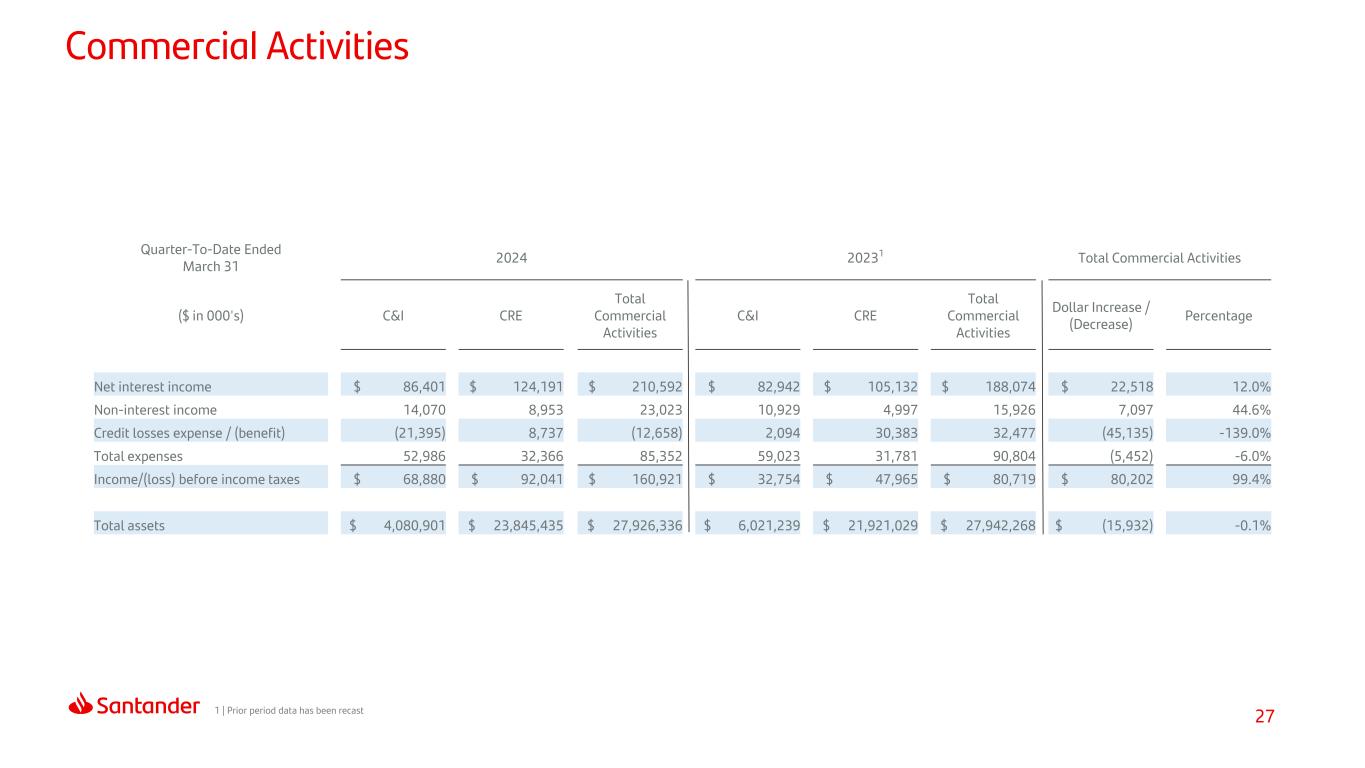
27 Commercial Activities 1 | Prior period data has been recast Quarter-To-Date Ended March 31 2024 20231 Total Commercial Activities ($ in 000's) C&I CRE Total Commercial Activities C&I CRE Total Commercial Activities Dollar Increase / (Decrease) Percentage Net interest income $ 86,401 $ 124,191 $ 210,592 $ 82,942 $ 105,132 $ 188,074 $ 22,518 12.0% Non-interest income 14,070 8,953 23,023 10,929 4,997 15,926 7,097 44.6% Credit losses expense / (benefit) (21,395) 8,737 (12,658) 2,094 30,383 32,477 (45,135) -139.0% Total expenses 52,986 32,366 85,352 59,023 31,781 90,804 (5,452) -6.0% Income/(loss) before income taxes $ 68,880 $ 92,041 $ 160,921 $ 32,754 $ 47,965 $ 80,719 $ 80,202 99.4% Total assets $ 4,080,901 $ 23,845,435 $ 27,926,336 $ 6,021,239 $ 21,921,029 $ 27,942,268 $ (15,932) -0.1%
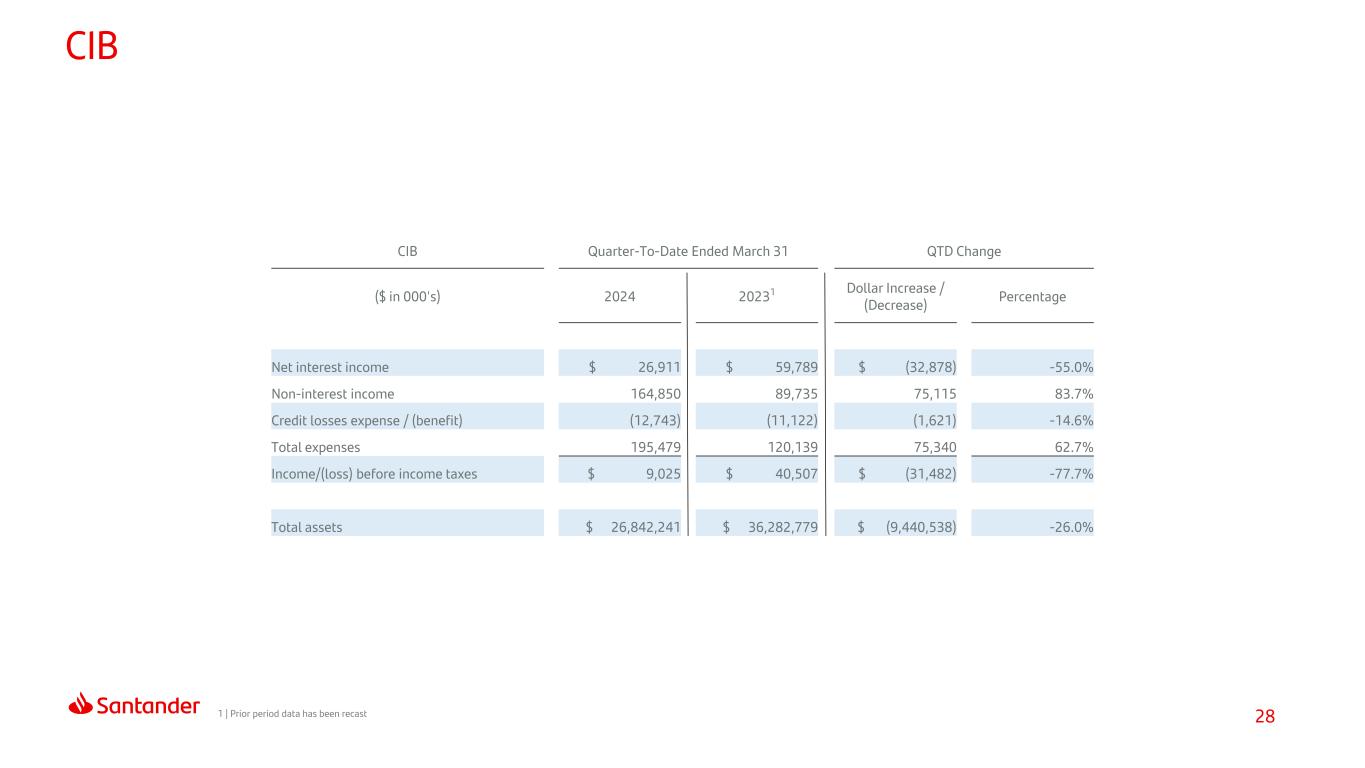
28 CIB 1 | Prior period data has been recast CIB Quarter-To-Date Ended March 31 QTD Change ($ in 000's) 2024 20231 Dollar Increase / (Decrease) Percentage Net interest income $ 26,911 $ 59,789 $ (32,878) -55.0% Non-interest income 164,850 89,735 75,115 83.7% Credit losses expense / (benefit) (12,743) (11,122) (1,621) -14.6% Total expenses 195,479 120,139 75,340 62.7% Income/(loss) before income taxes $ 9,025 $ 40,507 $ (31,482) -77.7% Total assets $ 26,842,241 $ 36,282,779 $ (9,440,538) -26.0%
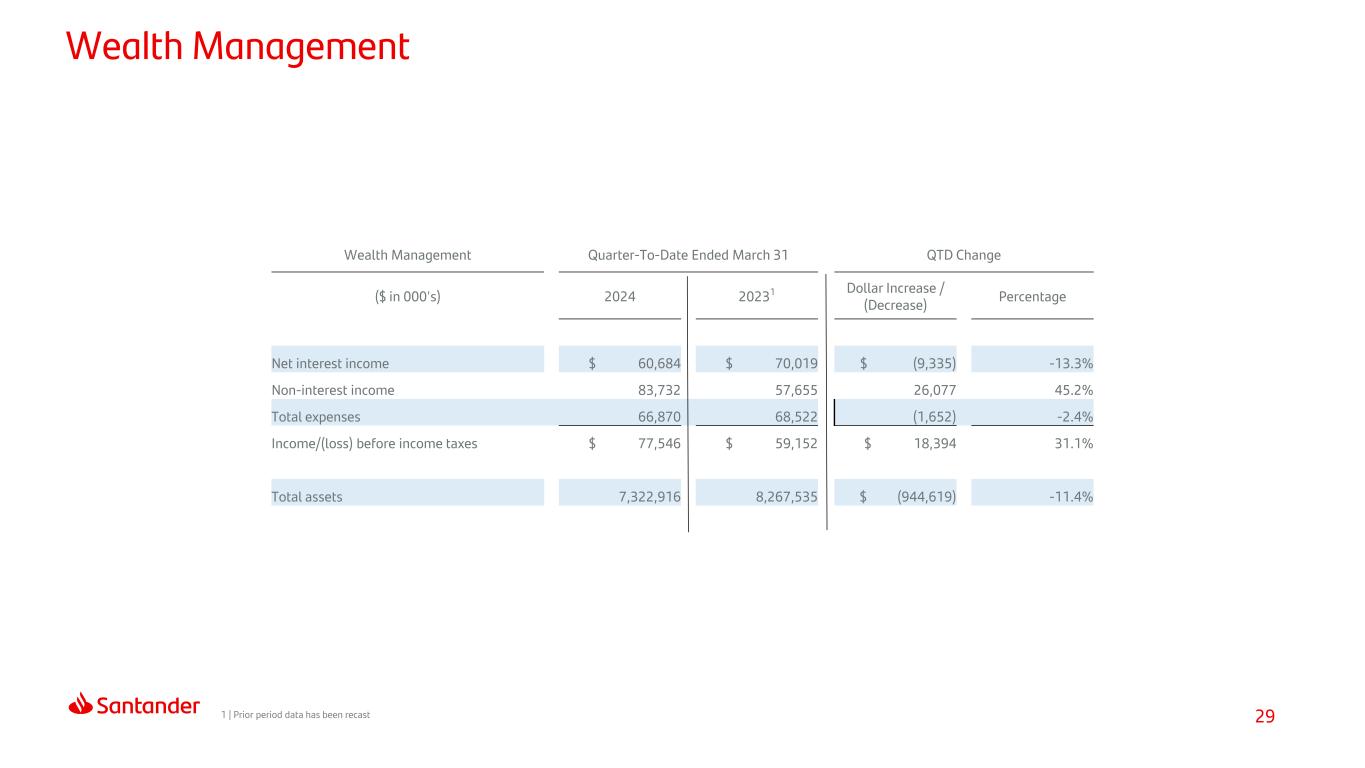
29 Wealth Management 1 | Prior period data has been recast Wealth Management Quarter-To-Date Ended March 31 QTD Change ($ in 000's) 2024 20231 Dollar Increase / (Decrease) Percentage Net interest income $ 60,684 $ 70,019 $ (9,335) -13.3% Non-interest income 83,732 57,655 26,077 45.2% Total expenses 66,870 68,522 (1,652) -2.4% Income/(loss) before income taxes $ 77,546 $ 59,152 $ 18,394 31.1% Total assets 7,322,916 8,267,535 $ (944,619) -11.4%
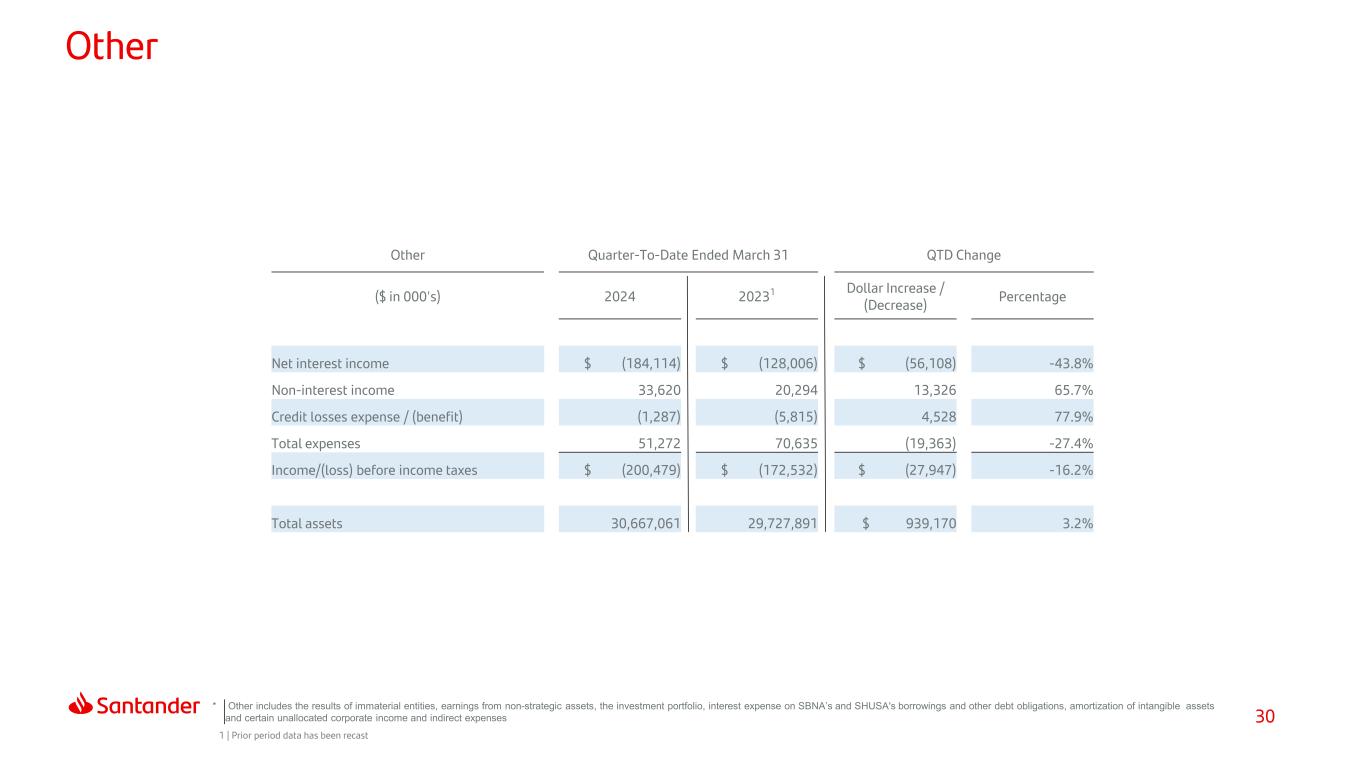
30 * Other includes the results of immaterial entities, earnings from non-strategic assets, the investment portfolio, interest expense on SBNA’s and SHUSA's borrowings and other debt obligations, amortization of intangible .assets and certain unallocated corporate income and indirect expenses Other 1 | Prior period data has been recast Other Quarter-To-Date Ended March 31 QTD Change ($ in 000's) 2024 20231 Dollar Increase / (Decrease) Percentage Net interest income $ (184,114) $ (128,006) $ (56,108) -43.8% Non-interest income 33,620 20,294 13,326 65.7% Credit losses expense / (benefit) (1,287) (5,815) 4,528 77.9% Total expenses 51,272 70,635 (19,363) -27.4% Income/(loss) before income taxes $ (200,479) $ (172,532) $ (27,947) -16.2% Total assets 30,667,061 29,727,891 $ 939,170 3.2%
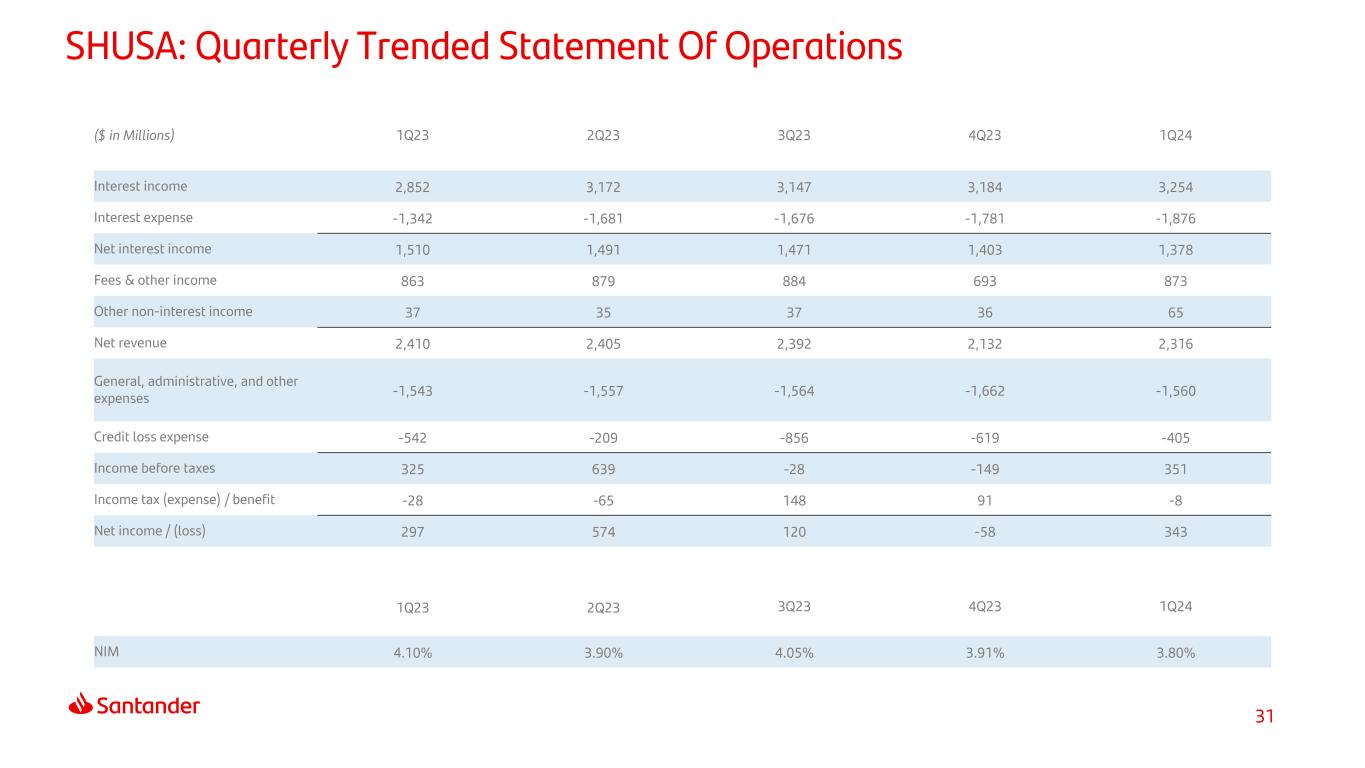
31 SHUSA: Quarterly Trended Statement Of Operations ($ in Millions) 1Q23 2Q23 3Q23 4Q23 1Q24 Interest income 2,852 3,172 3,147 3,184 3,254 Interest expense -1,342 -1,681 -1,676 -1,781 -1,876 Net interest income 1,510 1,491 1,471 1,403 1,378 Fees & other income 863 879 884 693 873 Other non-interest income 37 35 37 36 65 Net revenue 2,410 2,405 2,392 2,132 2,316 General, administrative, and other expenses -1,543 -1,557 -1,564 -1,662 -1,560 Credit loss expense -542 -209 -856 -619 -405 Income before taxes 325 639 -28 -149 351 Income tax (expense) / benefit -28 -65 148 91 -8 Net income / (loss) 297 574 120 -58 343 1Q23 2Q23 3Q23 4Q23 1Q24 NIM 4.10% 3.90% 4.05% 3.91% 3.80%
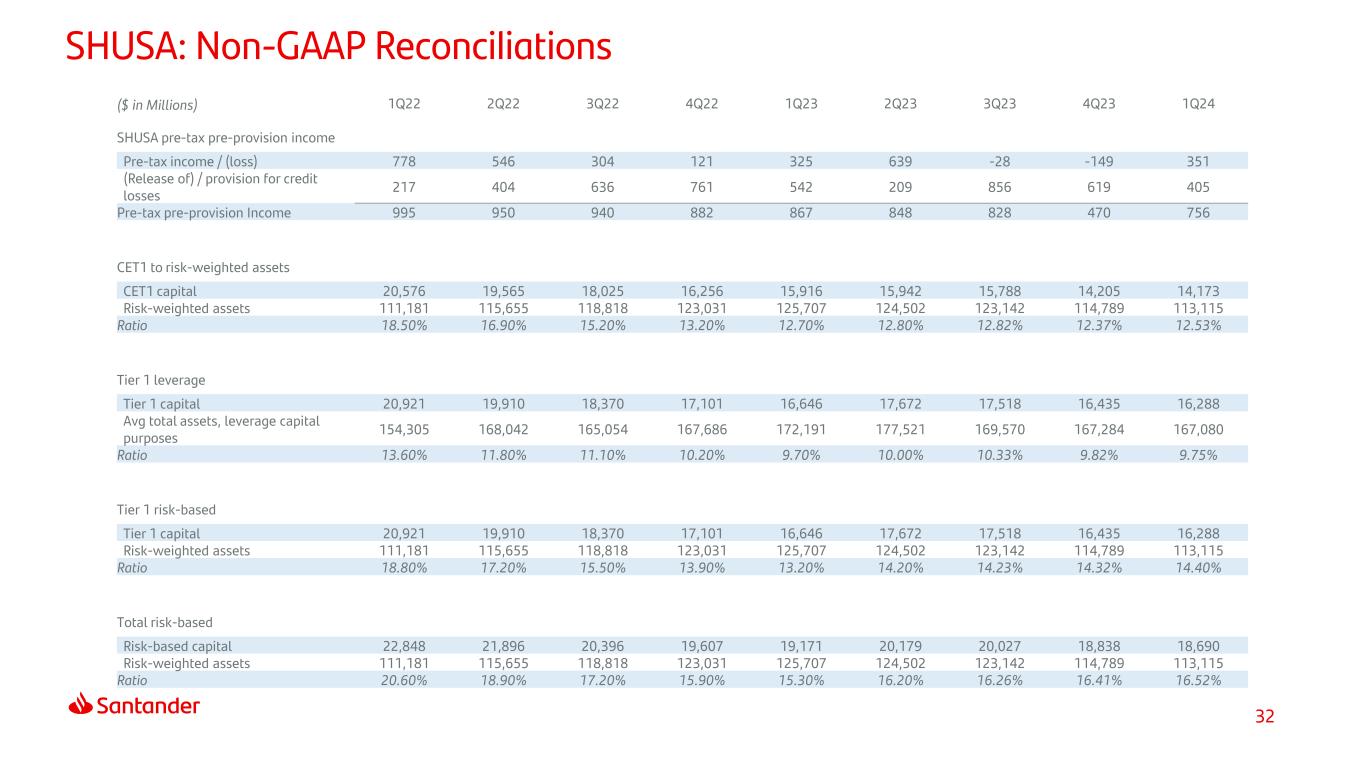
32 SHUSA: Non-GAAP Reconciliations ($ in Millions) 1Q22 2Q22 3Q22 4Q22 1Q23 2Q23 3Q23 4Q23 1Q24 SHUSA pre-tax pre-provision income Pre-tax income / (loss) 778 546 304 121 325 639 -28 -149 351 (Release of) / provision for credit losses 217 404 636 761 542 209 856 619 405 Pre-tax pre-provision Income 995 950 940 882 867 848 828 470 756 CET1 to risk-weighted assets CET1 capital 20,576 19,565 18,025 16,256 15,916 15,942 15,788 14,205 14,173 Risk-weighted assets 111,181 115,655 118,818 123,031 125,707 124,502 123,142 114,789 113,115 Ratio 18.50% 16.90% 15.20% 13.20% 12.70% 12.80% 12.82% 12.37% 12.53% Tier 1 leverage Tier 1 capital 20,921 19,910 18,370 17,101 16,646 17,672 17,518 16,435 16,288 Avg total assets, leverage capital purposes 154,305 168,042 165,054 167,686 172,191 177,521 169,570 167,284 167,080 Ratio 13.60% 11.80% 11.10% 10.20% 9.70% 10.00% 10.33% 9.82% 9.75% Tier 1 risk-based Tier 1 capital 20,921 19,910 18,370 17,101 16,646 17,672 17,518 16,435 16,288 Risk-weighted assets 111,181 115,655 118,818 123,031 125,707 124,502 123,142 114,789 113,115 Ratio 18.80% 17.20% 15.50% 13.90% 13.20% 14.20% 14.23% 14.32% 14.40% Total risk-based Risk-based capital 22,848 21,896 20,396 19,607 19,171 20,179 20,027 18,838 18,690 Risk-weighted assets 111,181 115,655 118,818 123,031 125,707 124,502 123,142 114,789 113,115 Ratio 20.60% 18.90% 17.20% 15.90% 15.30% 16.20% 16.26% 16.41% 16.52%

Thank You. Our purpose is to help people and businesses prosper. Our culture is based on believing that everything we do should be: