UNITED STATES
SECURITIES AND EXCHANGE COMMISSION
Washington, D.C. 20549
SECURITIES AND EXCHANGE COMMISSION
Washington, D.C. 20549
FORM N-CSR
CERTIFIED SHAREHOLDER REPORT OF REGISTERED
MANAGEMENT INVESTMENT COMPANIES
Investment Company Act file number (811-05037)
Professionally Managed Portfolios
(Exact name of registrant as specified in charter)
(Exact name of registrant as specified in charter)
615 East Michigan Street
Milwaukee, WI 53202
(Address of principal executive offices) (Zip code)
(Address of principal executive offices) (Zip code)
Jason Hadler
Professionally Managed Portfolios
c/o U.S. Bank Global Fund Services
777 E. Wisconsin Ave.
777 E. Wisconsin Ave.
Milwaukee, WI 53202
(Name and address of agent for service)
(Name and address of agent for service)
(414) 516-1523
Registrant's telephone number, including area code
Date of fiscal year end: October 31
Date of reporting period: April 30, 2023
Item 1. Report to Stockholders.
(a)
Becker Value Equity Fund
Retail Class: BVEFX
Institutional Class: BVEIX
Semi-Annual Report
April 30, 2023
This report is intended for shareholders and may not be used as sales literature unless preceded or accompanied by a current prospectus.
TABLE OF CONTENTS
|
Investment Results & Returns - Retail Class
|
2
|
||
|
Investment Results & Returns - Institutional Class
|
3
|
||
|
Sector Allocation
|
4
|
||
|
Schedule of Investments
|
5
|
||
|
Statement of Assets and Liabilities
|
8
|
||
|
Statement of Operations
|
9
|
||
|
Statements of Changes in Net Assets
|
10
|
||
|
Financial Highlights
|
12
|
||
|
Notes to Financial Statements
|
14
|
||
|
Expense Examples
|
22
|
||
|
Additional Information
|
24
|
||
|
Privacy Notice
|
25
|
Becker Value Equity Fund
|
INVESTMENT RESULTS (Unaudited)
|
Comparison of the Growth of a $10,000 Investment in the Becker Value
Equity Fund – Retail Class and Russell 1000® Value Index
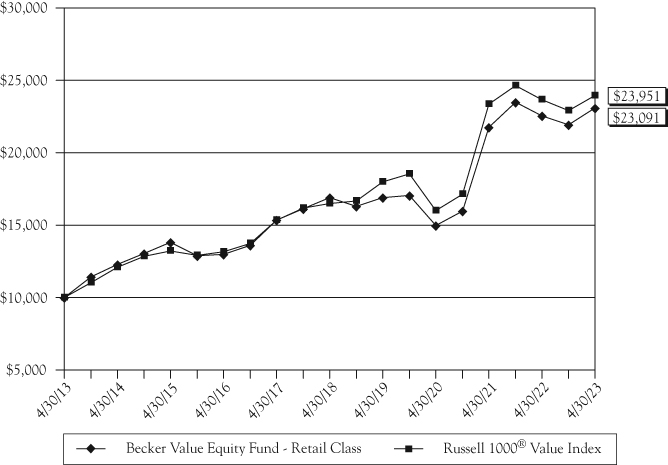
Average Annual Returns for the periods ended April 30, 2023
|
One Year
|
Five Years
|
Ten Years
|
|
|
Becker Value Equity Fund – Retail Class
|
2.42%
|
6.44%
|
8.73%
|
|
Russell 1000® Value Index
|
1.21%
|
7.75%
|
9.13%
|
Gross Expense Ratio as of 10/31/2022: 0.93%
This chart illustrates the performance of a hypothetical $10,000 investment made on April 30, 2013, and is not intended to imply any future performance. The returns shown do not reflect the deduction of taxes that a
shareholder would pay on Fund distributions or the redemption of Fund shares. The returns reflect fee waivers in effect. In the absence of such waivers, total return would be reduced. The chart assumes reinvestment of capital gains, dividends, and
return of capital, if applicable, for the Fund and dividends for an index.
Performance data quoted represents past performance and does not guarantee future results. The investment return and principal value of an investment will
fluctuate so that an investor’s shares, when redeemed, may be worth more or less than their original cost. Current performance of the Fund may be lower or higher than the performance quoted. Performance data current to the most recent month end may
be obtained by calling (800) 551-3998.
The Russell 1000® Value Index is a widely recognized unmanaged index of common stock prices and is representative of
a broader market and range of securities than are found in the Fund’s portfolio. Individuals cannot invest directly in the Index; however, an individual can invest in exchange-traded funds or other investment vehicles that attempt to track the
performance of a benchmark index. The index returns do not include expenses, which have been deducted from the Fund’s return. These performance figures include the change in value of the stocks in the index plus the reinvestment of dividends.
2
Becker Value Equity Fund
|
INVESTMENT RESULTS (Unaudited) (Continued)
|
Comparison of the Growth of a $100,000 Investment in the Becker Value
Equity Fund – Institutional Class and Russell 1000® Value Index
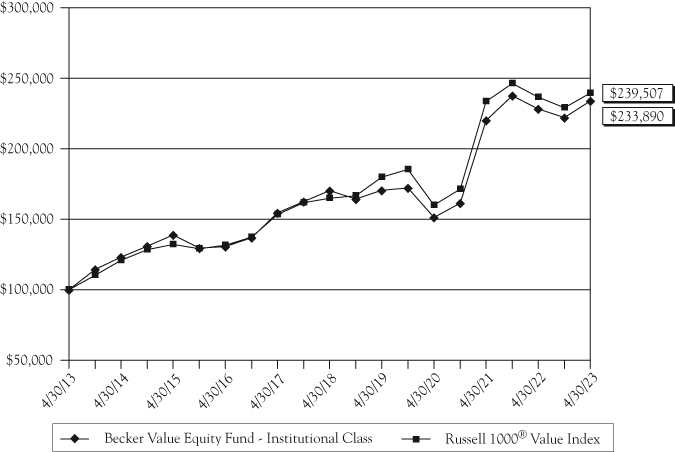
Average Annual Returns for the periods ended April 30, 2023
|
One Year
|
Five Years
|
Ten Years
|
|
|
Becker Value Equity Fund – Institutional Class
|
2.47%
|
6.55%
|
8.87%
|
|
Russell 1000® Value Index
|
1.21%
|
7.75%
|
9.13%
|
Gross Expense Ratio as of 10/31/2022: 0.82%
This chart illustrates the performance of a hypothetical $100,000 investment made on April 30, 2013, and is not intended to imply any future performance. The returns shown do not reflect the deduction of taxes that a
shareholder would pay on Fund distributions or the redemption of Fund shares. The returns reflect fee waivers in effect. In the absence of such waivers, total return would be reduced. The chart assumes reinvestment of capital gains and dividends for
the Fund and dividends for an index.
Performance data quoted represents past performance and does not guarantee future results. The investment return and principal value of an investment will
fluctuate so that an investor’s shares, when redeemed, may be worth more or less than their original cost. Current performance of the Fund may be lower or higher than the performance quoted. Performance data current to the most recent month end may
be obtained by calling (800) 551-3998.
The Russell 1000® Value Index is a widely recognized unmanaged index of common stock prices and is representative of
a broader market and range of securities than are found in the Fund’s portfolio. Individuals cannot invest directly in the Index; however, an individual can invest in exchange-traded funds or other investment vehicles that attempt to track the
performance of a benchmark index. The index returns do not include expenses, which have been deducted from the Fund’s return. These performance figures include the change in value of the stocks in the index plus the reinvestment of dividends.
3
Becker Value Equity Fund
|
SECTOR ALLOCATION at April 30, 2023 (Unaudited)
|
|
Sector
|
% of Net Assets
|
|||
|
|
||||
|
Health Care
|
17.5
|
%
|
||
|
Information Technology
|
16.4
|
%
|
||
|
Financials
|
14.2
|
%
|
||
|
Industrials
|
10.3
|
%
|
||
|
Consumer Staples
|
7.5
|
%
|
||
|
Energy
|
7.4
|
%
|
||
|
Communication Services
|
6.9
|
%
|
||
|
Materials
|
5.0
|
%
|
||
|
Consumer Discretionary
|
4.5
|
%
|
||
|
Cash 1
|
4.5
|
%
|
||
|
Utilities
|
4.3
|
%
|
||
|
Real Estate
|
1.5
|
%
|
||
|
Total
|
100.0
|
%
|
||
|
1
|
Represents short-term investments, cash and other assets in excess of liabilities.
|
The Global Industry Classification Standard (GICS®) was developed by and/or is the exclusive property of MSCI, Inc.
and Standard & Poor’s Financial Services LLC (“S&P”). GICS® is a service mark of MSCI, Inc. and S&P and has been licensed for use by the Becker Value Equity
Fund (the “Fund”).
4
Becker Value Equity Fund
|
SCHEDULE OF INVESTMENTS at April 30, 2023 (Unaudited)
|
|
Shares
|
Value
|
||||||
|
COMMON STOCKS: 95.5%
|
|||||||
|
Communication Services: 6.9%
|
|||||||
|
10,015
|
Alphabet, Inc. -
|
||||||
|
Class A 1
|
$
|
1,075,010
|
|||||
|
7,735
|
Meta Platforms,
|
||||||
|
Inc. - Class A 1
|
1,858,875
|
||||||
|
10,065
|
The Walt
|
||||||
|
Disney Co. 1
|
1,031,663
|
||||||
|
37,795
|
Verizon
|
||||||
|
Communications,
|
|||||||
|
Inc.
|
1,467,580
|
||||||
|
66,535
|
Warner Bros
|
||||||
|
Discovery, Inc. 1
|
905,541
|
||||||
|
6,338,669
|
|||||||
|
Consumer Discretionary: 4.5%
|
|||||||
|
9,505
|
Amazon.com, Inc. 1
|
1,002,302
|
|||||
|
550
|
AutoZone, Inc. 1
|
1,464,821
|
|||||
|
2,844
|
The Home
|
||||||
|
Depot, Inc.
|
854,736
|
||||||
|
7,490
|
Starbucks Corp.
|
856,032
|
|||||
|
4,177,891
|
|||||||
|
Consumer Staples: 7.5%
|
|||||||
|
16,380
|
Lamb Weston
|
||||||
|
Holdings, Inc.
|
1,831,448
|
||||||
|
13,545
|
The Procter &
|
||||||
|
Gamble Co.
|
2,118,167
|
||||||
|
14,800
|
Tyson Foods,
|
||||||
|
Inc. - Class A
|
924,852
|
||||||
|
13,378
|
Walmart, Inc.
|
2,019,676
|
|||||
|
6,894,143
|
|||||||
|
Energy: 7.4%
|
|||||||
|
40,117
|
Baker Hughes Co.
|
1,173,021
|
|||||
|
7,827
|
Chevron Corp.
|
1,319,475
|
|||||
|
11,455
|
Exxon Mobil Corp.
|
1,355,585
|
|||||
|
67,535
|
Kinder Morgan, Inc.
|
1,158,225
|
|||||
|
29,306
|
Shell PLC - ADR
|
1,816,386
|
|||||
|
6,822,692
|
|||||||
|
Financials: 14.2%
|
|||||||
|
8,860
|
Berkshire Hathaway,
|
||||||
|
Inc. - Class B 1
|
2,910,953
|
||||||
|
4,095
|
BlackRock, Inc.
|
2,748,564
|
|||||
|
35,730
|
The Charles
|
||||||
|
Schwab Corp.
|
|
1,866,535
|
|||||
|
9,310
|
Chubb Ltd.
|
1,876,524
|
|||||
|
5,150
|
The Goldman
|
||||||
|
Sachs Group, Inc.
|
1,768,716
|
||||||
|
13,050
|
JPMorgan
|
||||||
|
Chase & Co.
|
1,804,032
|
||||||
|
12,975,324
|
|||||||
|
Health Care: 17.5%
|
|||||||
|
12,875
|
Johnson & Johnson
|
2,107,638
|
|||||
|
134,595
|
Koninklijke
|
||||||
|
Philips NV
|
2,842,646
|
||||||
|
6,030
|
McKesson Corp.
|
2,196,367
|
|||||
|
16,520
|
Medtronic PLC
|
1,502,494
|
|||||
|
14,685
|
Merck & Co., Inc.
|
1,695,677
|
|||||
|
40,405
|
Pfizer, Inc.
|
1,571,351
|
|||||
|
13,427
|
Quest
|
||||||
|
Diagnostics, Inc.
|
1,863,802
|
||||||
|
43,805
|
Sanofi - ADR
|
2,350,138
|
|||||
|
16,130,113
|
|||||||
|
Industrials: 10.3%
|
|||||||
|
26,335
|
Alaska Air
|
||||||
|
Group, Inc. 1
|
1,144,519
|
||||||
|
38,685
|
Carrier Global Corp.
|
1,617,807
|
|||||
|
11,155
|
Eaton Corp PLC
|
1,864,224
|
|||||
|
109,060
|
Embraer
|
||||||
|
SA - ADR 1
|
1,684,977
|
||||||
|
5,710
|
General
|
||||||
|
Dynamics Corp.
|
1,246,721
|
||||||
|
18,721
|
Raytheon
|
||||||
|
Technologies Corp.
|
1,870,228
|
||||||
|
9,428,476
|
|||||||
|
Information Technology: 16.4%
|
|||||||
|
16,580
|
Apple, Inc.
|
2,813,295
|
|||||
|
22,260
|
Blackbaud, Inc. 1
|
1,543,842
|
|||||
|
54,045
|
Cisco Systems, Inc.
|
2,553,626
|
|||||
|
12,430
|
Microsoft Corp.
|
3,819,242
|
|||||
|
18,625
|
PayPal
|
||||||
|
Holdings, Inc. 1
|
1,415,500
|
||||||
|
14,305
|
QUALCOMM, Inc.
|
1,670,824
|
|||||
|
6,495
|
salesforce.com, Inc. 1
|
1,288,413
|
|||||
|
15,104,742
|
|||||||
The accompanying notes are an integral part of these financial statements.
5
Becker Value Equity Fund
|
SCHEDULE OF INVESTMENTS at April 30, 2023 (Unaudited)
(Continued)
|
|
Shares
|
Value
|
||||||
|
Materials: 5.0%
|
|||||||
|
6,425
|
Air Products and
|
||||||
|
Chemicals, Inc.
|
$
|
1,891,263
|
|||||
|
24,680
|
Methanex Corp.
|
1,105,417
|
|||||
|
32,945
|
Newmont
|
||||||
|
Goldcorp Corp.
|
1,561,593
|
||||||
|
4,558,273
|
|||||||
|
Real Estate: 1.5%
|
|||||||
|
22,345
|
Realty Income
|
||||||
|
Corp. - REIT
|
1,404,160
|
||||||
|
Utilities: 4.3%
|
|||||||
|
51,475
|
FirstEnergy Corp.
|
2,048,705
|
|||||
|
25,715
|
The Southern Co.
|
1,891,338
|
|||||
|
3,940,043
|
|||||||
|
TOTAL COMMON STOCKS
|
|||||||
|
(Cost $61,145,532)
|
87,774,526
|
||||||
|
SHORT-TERM INVESTMENTS: 4.4%
|
|||||||
|
4,040,397
|
First American
|
||||||
|
Government
|
|||||||
|
Obligations
|
|||||||
|
Fund - Class X,
|
|||||||
|
4.725% 2
|
|
4,040,397
|
|||||
|
TOTAL SHORT-TERM
|
|||||||
|
INVESTMENTS
|
|||||||
|
(Cost $4,040,397)
|
4,040,397
|
||||||
|
TOTAL INVESTMENTS
|
|||||||
|
IN SECURITIES: 99.9%
|
|||||||
|
(Cost $65,185,929)
|
91,814,923
|
||||||
|
Other Assets in Excess
|
|||||||
|
of Liabilities: 0.1%
|
85,695
|
||||||
|
TOTAL NET ASSETS: 100.0%
|
$
|
91,900,618
|
|||||
ADR – American Depositary Receipt
REIT – Real Estate Investment Trust
|
1
|
Non-income producing security.
|
|
2
|
Annualized seven-day effective yield as of April 30, 2023.
|
The accompanying notes are an integral part of these financial statements.
6
(This Page Intentionally Left Blank.)
7
Becker Value Equity Fund
|
STATEMENT OF ASSETS AND LIABILITIES at April 30, 2023 (Unaudited)
|
|
ASSETS
|
||||
|
Investments in securities, at value (cost $65,185,929)
|
$
|
91,814,923
|
||
|
Cash
|
13,050
|
|||
|
Receivables:
|
||||
|
Fund shares sold
|
14,210
|
|||
|
Dividends and interest
|
158,735
|
|||
|
Prepaid expenses
|
25,630
|
|||
|
Total assets
|
92,026,548
|
|||
|
LIABILITIES
|
||||
|
Payables
|
||||
|
Fund shares redeemed
|
35,186
|
|||
|
Service fees - Retail class
|
29,226
|
|||
|
Investment advisory fees, net
|
22,915
|
|||
|
Audit fees
|
12,587
|
|||
|
Accounting fees
|
5,363
|
|||
|
Transfer agent fees
|
5,248
|
|||
|
Administration fees
|
5,139
|
|||
|
Reports to shareholders
|
5,004
|
|||
|
Trustee fees
|
2,952
|
|||
|
Chief Compliance Officer fees
|
1,234
|
|||
|
Custody fees
|
729
|
|||
|
Registration fees
|
347
|
|||
|
Total liabilities
|
125,930
|
|||
|
NET ASSETS
|
$
|
91,900,618
|
||
|
Commitments and contingencies (Note 3)
|
$
|
—
|
||
|
COMPONENTS OF NET ASSETS
|
||||
|
Paid-in capital
|
$
|
58,684,508
|
||
|
Total distributable (accumulated) earnings (losses)
|
33,216,110
|
|||
|
Total net assets
|
$
|
91,900,618
|
||
|
COMPONENTS OF NET ASSET VALUE
|
||||
|
RETAIL CLASS
|
||||
|
Net assets
|
$
|
28,270,836
|
||
|
Shares of beneficial interest issued and outstanding
|
1,485,867
|
|||
|
Net asset value, offering and redemption price per share
|
$
|
19.03
|
||
|
INSTITUTIONAL CLASS
|
||||
|
Net assets
|
$
|
63,629,782
|
||
|
Shares of beneficial interest issued and outstanding
|
3,328,810
|
|||
|
Net asset value, offering and redemption price per share
|
$
|
19.11
|
||
The accompanying notes are an integral part of these financial statements.
8
Becker Value Equity Fund
|
STATEMENT OF OPERATIONS For the Six Months Ended April
30, 2023 (Unaudited)
|
|
INVESTMENT INCOME
|
||||
|
Income:
|
||||
|
Dividends from investments
|
||||
|
(net of foreign withholding tax and issuance fees of $5,151)
|
$
|
757,007
|
||
|
Interest
|
59,086
|
|||
|
Total investment income
|
816,093
|
|||
|
EXPENSES
|
||||
|
Investment advisory fees
|
258,117
|
|||
|
Administration fees
|
37,454
|
|||
|
Transfer agent fees
|
28,680
|
|||
|
Accounting fees
|
21,584
|
|||
|
Registration fees
|
16,757
|
|||
|
Miscellaneous expenses
|
14,229
|
|||
|
Service fees – Retail Class
|
14,114
|
|||
|
Audit fees
|
12,522
|
|||
|
Trustees fees
|
9,517
|
|||
|
Chief Compliance Officer fees
|
7,443
|
|||
|
Reports to shareholders
|
5,166
|
|||
|
Legal fees
|
4,622
|
|||
|
Insurance expenses
|
2,827
|
|||
|
Custody fees
|
3,373
|
|||
|
Interest expenses
|
1,091
|
|||
|
Total expenses
|
437,496
|
|||
|
Less: fees waived
|
(104,257
|
)
|
||
|
Net expenses
|
333,239
|
|||
|
Net investment income (loss)
|
482,854
|
|||
|
REALIZED AND UNREALIZED GAIN (LOSS) ON INVESTMENTS
|
||||
|
Net realized gain (loss) on investments
|
6,338,821
|
|||
|
Net change in unrealized appreciation/depreciation on investments
|
(1,578,527
|
)
|
||
|
Net realized and unrealized gain (loss) on investments
|
4,760,294
|
|||
|
Net increase (decrease) in net assets resulting from operations
|
$
|
5,243,148
|
||
The accompanying notes are an integral part of these financial statements.
9
Becker Value Equity Fund
|
STATEMENTS OF CHANGES IN NET ASSETS
|
|
Six Months
|
||||||||
|
Ended
|
||||||||
|
April 30,
|
Year Ended
|
|||||||
|
2023
|
October 31,
|
|||||||
|
(Unaudited)
|
2022
|
|||||||
|
INCREASE (DECREASE) IN NET ASSETS FROM:
|
||||||||
|
OPERATIONS
|
||||||||
|
Net investment income (loss)
|
$
|
482,854
|
$
|
1,515,715
|
||||
|
Net realized gain (loss) on investments
|
6,338,821
|
9,408,480
|
||||||
|
Net change in unrealized appreciation/depreciation
|
||||||||
|
on investments
|
(1,578,527
|
)
|
(19,730,340
|
)
|
||||
|
Net increase (decrease) in net assets
|
||||||||
|
resulting from operations
|
5,243,148
|
(8,806,145
|
)
|
|||||
|
DISTRIBUTIONS TO SHAREHOLDERS
|
||||||||
|
Distributions to shareholders – Retail Class
|
(2,229,878
|
)
|
(3,731,079
|
)
|
||||
|
Distributions to shareholders – Institutional Class
|
(5,207,768
|
)
|
(12,686,201
|
)
|
||||
|
Total distributions to shareholders
|
(7,437,646
|
)
|
(16,417,280
|
)
|
||||
|
CAPITAL SHARE TRANSACTIONS
|
||||||||
|
Increase (decrease) in net assets derived from net change
|
||||||||
|
in outstanding shares – Retail Class 1
|
293,941
|
870,544
|
||||||
|
Increase (decrease) in net assets derived from net change
|
||||||||
|
in outstanding shares – Institutional Class 1
|
(8,683,348
|
)
|
(23,564,982
|
)
|
||||
|
Total increase (decrease) in net assets
|
||||||||
|
from capital share transactions
|
(8,389,407
|
)
|
(22,694,438
|
)
|
||||
|
Total increase (decrease) in net assets
|
(10,583,905
|
)
|
(47,917,863
|
)
|
||||
|
NET ASSETS
|
||||||||
|
Beginning of period/year
|
$
|
102,484,523
|
$
|
150,402,386
|
||||
|
End of period/year
|
$
|
91,900,618
|
$
|
102,484,523
|
||||
The accompanying notes are an integral part of these financial statements.
10
Becker Value Equity Fund
|
STATEMENTS OF CHANGES IN NET ASSETS (Continued)
|
|
1
|
Summary of share transactions is as follows:
|
|
Six Months Ended
|
|||||||||||||||||
|
April 30, 2023
|
Year Ended
|
||||||||||||||||
|
(Unaudited)
|
October 31, 2022
|
||||||||||||||||
|
Shares
|
Amount
|
Shares
|
Amount
|
||||||||||||||
|
Retail Class:
|
|||||||||||||||||
|
Shares sold
|
24,935
|
$
|
473,813
|
127,564
|
$
|
2,638,142
|
|||||||||||
|
Shares issued
|
|||||||||||||||||
|
in reinvestment
|
|||||||||||||||||
|
of distributions
|
119,030
|
2,200,857
|
173,620
|
3,680,736
|
|||||||||||||
|
Shares redeemed
|
(123,948
|
)
|
(2,380,729
|
)
|
(265,025
|
)
|
(5,448,334
|
)
|
|||||||||
|
Net increase (decrease)
|
20,017
|
$
|
293,941
|
36,159
|
$
|
870,544
|
|||||||||||
|
Beginning of year
|
1,465,850
|
1,429,691
|
|||||||||||||||
|
End of year
|
1,485,867
|
1,465,850
|
|||||||||||||||
|
Six Months Ended
|
|||||||||||||||||
|
April 30, 2023
|
Year Ended
|
||||||||||||||||
|
(Unaudited)
|
October 31, 2022
|
||||||||||||||||
|
Shares
|
Amount
|
Shares
|
Amount
|
||||||||||||||
|
Institutional Class:
|
|||||||||||||||||
|
Shares sold
|
61,718
|
$
|
1,163,936
|
272,673
|
$
|
5,759,865
|
|||||||||||
|
Shares issued
|
|||||||||||||||||
|
in reinvestment
|
|||||||||||||||||
|
of distributions
|
273,854
|
5,085,467
|
587,478
|
12,495,664
|
|||||||||||||
|
Shares redeemed
|
(752,773
|
)
|
(14,932,751
|
)
|
(2,043,414
|
)
|
(41,820,511
|
)
|
|||||||||
|
Net increase (decrease)
|
(417,201
|
)
|
$
|
(8,683,348
|
)
|
(1,183,263
|
)
|
$
|
(23,564,982
|
)
|
|||||||
|
Beginning of year
|
3,746,011
|
4,929,274
|
|||||||||||||||
|
End of year
|
3,328,810
|
3,746,011
|
|||||||||||||||
The accompanying notes are an integral part of these financial statements.
11
Becker Value Equity Fund
|
FINANCIAL HIGHLIGHTS For a capital share outstanding throughout each period/year
|
Retail Class
|
Six Months
|
||||||||||||||||||||||||
|
Ended
|
||||||||||||||||||||||||
|
April 30,
|
||||||||||||||||||||||||
|
2023
|
Year Ended October 31,
|
|||||||||||||||||||||||
|
(Unaudited)
|
2022
|
2021
|
2020
|
2019
|
2018
|
|||||||||||||||||||
|
Net asset value,
|
||||||||||||||||||||||||
|
beginning of period/year
|
$
|
19.61
|
$
|
23.59
|
$
|
16.43
|
$
|
17.94
|
$
|
18.66
|
$
|
19.42
|
||||||||||||
|
INCOME (LOSS) FROM INVESTMENT OPERATIONS:
|
||||||||||||||||||||||||
|
Net investment
|
||||||||||||||||||||||||
|
income (loss) 1
|
0.09
|
0.23
|
0.31
|
0.33
|
0.34
|
0.33
|
||||||||||||||||||
|
Net realized and unrealized
|
||||||||||||||||||||||||
|
gain (loss) on investments
|
0.89
|
(1.60
|
)
|
7.31
|
(1.43
|
)
|
0.36
|
(0.10
|
)
|
|||||||||||||||
|
Total from
|
||||||||||||||||||||||||
|
investment operations
|
0.98
|
(1.37
|
)
|
7.62
|
(1.10
|
)
|
0.70
|
0.23
|
||||||||||||||||
|
LESS DISTRIBUTIONS:
|
||||||||||||||||||||||||
|
Distributions from net
|
||||||||||||||||||||||||
|
investment income
|
(0.29
|
)
|
(0.28
|
)
|
(0.46
|
)
|
(0.41
|
)
|
(0.36
|
)
|
(0.28
|
)
|
||||||||||||
|
Distributions from net
|
||||||||||||||||||||||||
|
realized gain (loss)
|
(1.27
|
)
|
(2.33
|
)
|
—
|
—
|
(1.06
|
)
|
(0.71
|
)
|
||||||||||||||
|
Total distributions
|
(1.56
|
)
|
(2.61
|
)
|
(0.46
|
)
|
(0.41
|
)
|
(1.42
|
)
|
(0.99
|
)
|
||||||||||||
|
Proceeds from
|
||||||||||||||||||||||||
|
redemption fees
|
—
|
—
|
0.00
|
2
|
0.00
|
2
|
0.00
|
2
|
0.00
|
2
|
||||||||||||||
|
Net asset value,
|
||||||||||||||||||||||||
|
end of period/year
|
$
|
19.03
|
$
|
19.61
|
$
|
23.59
|
$
|
16.43
|
$
|
17.94
|
$
|
18.66
|
||||||||||||
|
Total return
|
5.29
|
%3
|
(6.63
|
)%
|
47.10
|
%
|
(6.36
|
)%
|
4.64
|
%
|
0.99
|
%
|
||||||||||||
|
SUPPLEMENTAL DATA:
|
||||||||||||||||||||||||
|
Net assets, end of period/
|
||||||||||||||||||||||||
|
year (000’s omitted)
|
$
|
28,271
|
$
|
28,743
|
$
|
33,722
|
$
|
25,880
|
$
|
55,948
|
$
|
94,554
|
||||||||||||
|
Portfolio turnover rate
|
15
|
%3
|
28
|
%
|
28
|
%
|
34
|
%
|
37
|
%
|
38
|
%
|
||||||||||||
|
Ratios to average net assets:
|
||||||||||||||||||||||||
|
Expenses before
|
||||||||||||||||||||||||
|
fees waived
|
1.00
|
%4
|
0.93
|
%
|
0.88
|
%
|
0.88
|
%
|
0.80
|
%
|
0.78
|
%
|
||||||||||||
|
Expenses after
|
||||||||||||||||||||||||
|
fees waived
|
0.78
|
%4
|
0.78
|
%
|
0.78
|
%
|
0.78
|
%
|
0.78
|
%
|
0.78
|
%
|
||||||||||||
|
Net investment
|
||||||||||||||||||||||||
|
income (loss)
|
0.94
|
%4
|
1.13
|
%
|
1.48
|
%
|
1.94
|
%
|
1.99
|
%
|
1.69
|
%
|
||||||||||||
|
1
|
Calculated using the average shares outstanding method.
|
|
2
|
Does not round to $0.01 or $(0.01), as applicable.
|
|
3
|
Not annualized.
|
|
4
|
Annualized.
|
The accompanying notes are an integral part of these financial statements.
12
Becker Value Equity Fund
|
FINANCIAL HIGHLIGHTS For a capital share outstanding throughout each period/year
|
Institutional Class
|
Six Months
|
||||||||||||||||||||||||
|
Ended
|
||||||||||||||||||||||||
|
April 30,
|
||||||||||||||||||||||||
|
2023
|
Year Ended October 31,
|
|||||||||||||||||||||||
|
(Unaudited)
|
2022
|
2021
|
2020
|
2019
|
2018
|
|||||||||||||||||||
|
Net asset value,
|
||||||||||||||||||||||||
|
beginning of period/year
|
$
|
19.69
|
$
|
23.67
|
$
|
16.49
|
$
|
18.01
|
$
|
18.73
|
$
|
19.49
|
||||||||||||
|
INCOME (LOSS) FROM INVESTMENT OPERATIONS:
|
||||||||||||||||||||||||
|
Net investment income 1
|
0.10
|
0.25
|
0.33
|
0.35
|
0.36
|
0.35
|
||||||||||||||||||
|
Net realized and unrealized
|
||||||||||||||||||||||||
|
gain (loss) on investments
|
0.89
|
(1.59
|
)
|
7.33
|
(1.43
|
)
|
0.37
|
(0.10
|
)
|
|||||||||||||||
|
Total from
|
||||||||||||||||||||||||
|
investment operations
|
0.99
|
(1.34
|
)
|
7.66
|
(1.08
|
)
|
0.73
|
0.25
|
||||||||||||||||
|
LESS DISTRIBUTIONS:
|
||||||||||||||||||||||||
|
Distributions from net
|
||||||||||||||||||||||||
|
investment income
|
(0.30
|
)
|
(0.31
|
)
|
(0.48
|
)
|
(0.44
|
)
|
(0.39
|
)
|
(0.30
|
)
|
||||||||||||
|
Distributions from
|
||||||||||||||||||||||||
|
net realized gain
|
(1.27
|
)
|
(2.33
|
)
|
—
|
—
|
(1.06
|
)
|
(0.71
|
)
|
||||||||||||||
|
Total distributions
|
(1.57
|
)
|
(2.64
|
)
|
(0.48
|
)
|
(0.44
|
)
|
(1.45
|
)
|
(1.01
|
)
|
||||||||||||
|
Proceeds from
|
||||||||||||||||||||||||
|
redemption fees
|
—
|
—
|
0.00
|
2
|
0.00
|
2
|
0.00
|
2
|
0.00
|
2
|
||||||||||||||
|
Net asset value,
|
||||||||||||||||||||||||
|
end of period/year
|
$
|
19.11
|
$
|
19.69
|
$
|
23.67
|
$
|
16.49
|
$
|
18.01
|
$
|
18.73
|
||||||||||||
|
Total return
|
5.28
|
%3
|
(6.51
|
)%
|
47.22
|
%
|
(6.27
|
)%
|
4.76
|
%
|
1.11
|
%
|
||||||||||||
|
SUPPLEMENTAL DATA:
|
||||||||||||||||||||||||
|
Net assets, end of period/
|
||||||||||||||||||||||||
|
year (000’s omitted)
|
$
|
63,630
|
$
|
73,741
|
$
|
116,680
|
$
|
84,483
|
$
|
226,701
|
$
|
280,779
|
||||||||||||
|
Portfolio turnover rate
|
15
|
%3
|
28
|
%
|
28
|
%
|
34
|
%
|
37
|
%
|
38
|
%
|
||||||||||||
|
Ratios to average net assets:
|
||||||||||||||||||||||||
|
Expenses before
|
||||||||||||||||||||||||
|
fees waived
|
0.90
|
%4
|
0.82
|
%
|
0.78
|
%
|
0.78
|
%
|
0.70
|
%
|
0.68
|
%
|
||||||||||||
|
Expenses after
|
||||||||||||||||||||||||
|
fees waived
|
0.68
|
%4
|
0.68
|
%
|
0.68
|
%
|
0.68
|
%
|
0.68
|
%
|
0.68
|
%
|
||||||||||||
|
Net investment
|
||||||||||||||||||||||||
|
income (loss)
|
1.07
|
%4
|
1.23
|
%
|
1.57
|
%
|
2.03
|
%
|
2.09
|
%
|
1.78
|
%
|
||||||||||||
|
1
|
Calculated using the average shares outstanding method.
|
|
2
|
Does not round to $0.01 or $(0.01), as applicable.
|
|
3
|
Not annualized.
|
|
4
|
Annualized.
|
The accompanying notes are an integral part of these financial statements.
13
Becker Value Equity Fund
|
NOTES TO FINANCIAL STATEMENTS April 30, 2023 (Unaudited)
|
|
NOTE 1 – ORGANIZATION
|
The Becker Value Equity Fund (the “Fund”) is a diversified series of shares of beneficial interest of Professionally Managed Portfolios
(the “Trust”), which is registered under the Investment Company Act of 1940, as amended (the “1940 Act”) as an open-end investment management company. The Fund is an investment company and accordingly follows the investment company accounting and
reporting guidance of the Financial Accounting Standards Board (FASB) Accounting Standard Codification Topic 946 “Financial Services-Investment Companies.”
The Fund commenced operations on November 3, 2003 with the investment objective to provide long-term capital appreciation. The Fund
currently offers Retail and Institutional Class shares, which were first offered to the public on November 3, 2003 and on September 2, 2011, respectively. Both class of shares hold equal rights as to earnings and assets with Retail Class shares
bearing shareholder service fees. Each class of shares has exclusive voting rights with respect to matters affecting that individual class. Income, expenses (other than expenses attributable to a specific class), and realized and unrealized gains or
losses on investments are allocated to each class of shares based on its relative net assets.
|
NOTE 2 – SIGNIFICANT ACCOUNTING POLICIES
|
The following is a summary of significant accounting policies consistently followed by the Fund. These policies are in conformity with
accounting principles generally accepted in the United States of America (U.S. GAAP).
|
A.
|
Security Valuation. All equity securities, which may include Real Estate Investment Trusts (“REITs”), Business Development Companies (“BDCs”) and Master Limited
Partnerships (“MLPs”), that are traded on U.S. or foreign national securities exchanges, are valued at the last reported sale price on the exchange on which the security is principally traded or the exchange’s official closing price, if
applicable. If, on a particular day, an exchange-traded security does not trade, then the mean between the most recent quoted bid and asked prices will be used. All equity securities, which may include REITs, BDCs and MLPs that are not traded
on a listed exchange are valued at the last sale price in the over-the-counter market. If a non-exchange traded security does not trade on a particular day, then the mean between the last quoted closing bid and asked price will be used.
|
14
Becker Value Equity Fund
|
NOTES TO FINANCIAL STATEMENTS April 30, 2023 (Unaudited) (Continued)
|
|
Pursuant to Rule 2a-5 under the 1940 Act, the Board of Trustees (the “Board”) has adopted a Valuation Policy designating Becker Capital Management, Inc. (the “Advisor”) as the Fund's Valuation Designee. Under
Rule 2a-5, the Valuation Designee shall determine the fair value of securities for which readily available market quotes are not available in accordance with procedures approved by the Board.
|
||
|
As described above, the Fund utilizes various methods to measure the fair value of its investments on a recurring basis. U.S. GAAP establishes a hierarchy that prioritizes inputs to valuation methods.
|
||
|
The three levels of inputs are:
|
|
Level 1 –
|
Unadjusted quoted prices in active markets for identical assets or liabilities that the Fund has the ability to access.
|
||
|
Level 2 –
|
Observable inputs other than quoted prices included in Level 1 that are observable for the asset or liability, either directly or indirectly. These inputs may include quoted prices for the identical instrument
on an inactive market, prices for similar instruments, interest rates, prepayment speeds, credit risk, yield curves, default rates, and similar data.
|
||
|
Level 3 –
|
Unobservable inputs for the asset or liability, to the extent relevant observable inputs are not available; representing the Fund’s own assumptions about the assumptions a market participant would use in
valuing the asset or liability; and would be based on the best information available.
|
|
The availability of observable inputs can vary from security to security and is affected by a wide variety of factors, including, for example, the type of security, whether the security is new and not yet
established in the marketplace, the liquidity of markets, and other characteristics particular to the security. To the extent that valuation is based on models or inputs that are less observable or unobservable in the market, the
determination of fair value requires more judgment. Accordingly, the degree of judgment exercised in determining fair value is greatest for instruments categorized in Level 3.
|
||
|
The inputs used to measure fair value may fall into different levels of the fair value hierarchy. In such cases, for disclosure purposes, the level in the fair value hierarchy within which the fair value
measurements fall in its entirety, is determined based on the lowest level input that is significant to the fair value measurement in its entirety.
|
15
Becker Value Equity Fund
|
NOTES TO FINANCIAL STATEMENTS April 30, 2023 (Unaudited)
(Continued)
|
|
The following is a summary of the inputs used to value the Fund’s investments as of April 30, 2023. See the Schedule of Investments for sector breakouts.
|
|
Description
|
Level 1
|
Level 2
|
Level 3
|
Total
|
||||||||||||||
|
Common Stocks
|
$
|
87,774,526
|
$
|
—
|
$
|
—
|
$
|
87,774,526
|
||||||||||
|
Short-Term
|
||||||||||||||||||
|
Investments
|
4,040,397
|
—
|
—
|
4,040,397
|
||||||||||||||
|
Total Investments
|
||||||||||||||||||
|
in Securities
|
$
|
91,814,923
|
$
|
—
|
$
|
—
|
$
|
91,814,923
|
||||||||||
|
B.
|
Foreign Currency. Investment securities and other assets and liabilities denominated in foreign currencies are translated into U.S. dollar amounts at the date of
valuation. Purchases and sales of investment securities and income and expense items denominated in foreign currencies are translated into U.S. dollar amounts on the respective dates of such transactions. The Fund does not isolate that
portion of the results of operations resulting from changes in foreign exchange rates on investments from the fluctuations arising from changes in market prices of securities held. Such fluctuations are included with the net realized and
unrealized gain or loss from investments. The Fund reports net realized foreign exchange gains or losses that arise from sales of foreign currencies, currency gains or losses realized between the trade and settlement dates on securities
transactions, and the difference between the amounts of dividends, interest, and foreign withholding taxes recorded on the Fund’s books and the U.S. dollar equivalent of the amounts actually received or paid. Net unrealized foreign exchange
gains and losses arise from changes in the fair values of assets and liabilities, other than investments in securities, at fiscal period end, resulting from changes in exchange rates.
|
|
|
C.
|
Federal Income Taxes. The Fund has elected to be taxed as a “regulated investment company” and intends to distribute substantially all taxable income to its
shareholders and otherwise comply with the provisions of the Internal Revenue Code applicable to regulated investment companies. Therefore, no provision for federal income taxes or excise taxes has been made.
|
|
|
In order to avoid imposition of the excise tax applicable to regulated investment companies, the Fund intends to declare each year as dividends in each calendar year at least 98.0% of its net investment income
(earned during the calendar year) and at least 98.2% of its net
|
16
Becker Value Equity Fund
|
NOTES TO FINANCIAL STATEMENTS April 30, 2023 (Unaudited) (Continued)
|
|
realized capital gains (earned during the twelve months ended October 31) plus undistributed amounts, if any, from prior years.
|
||
|
Net capital losses incurred after October 31, and within the taxable year, are deemed to arise on the first business day of the Fund’s next taxable year. Net investment losses incurred after December 31, and
within the taxable year, are deemed to arise on the first business day of the Fund’s next taxable year. As of the most recent fiscal year end October 31, 2022, the Fund had no late year losses or capital loss carry-forwards.
|
||
|
As of April 30, 2023, the Fund did not have any tax positions that did not meet the “more likely-than-not” threshold of being sustained by the applicable tax authority. Generally, tax authorities can examine
all the tax returns filed for the last three years. The Fund identifies its major tax jurisdictions as U.S. Federal and the Commonwealth of Massachusetts. As of April 30, 2023, the Fund was not aware of any tax positions for which it is
reasonably possible that the total amounts of unrecognized tax benefits will change materially.
|
||
|
D.
|
Security Transactions and Investment Income. Investment securities transactions are accounted for on the trade date. Gains and losses realized on sales of securities
are determined on a specific identification basis. Discounts/premiums on debt securities purchased are accreted/amortized over the life of the respective securities using the effective interest method. Dividend income is recorded on the ex-
dividend date. Dividends received from REITs and MLPs are generally comprised of ordinary income, capital gains and may include return of capital. Interest income is recorded on an accrual basis. Other non- cash dividends are recognized as
investment income at the fair value of the property received. Withholding taxes on foreign dividends have been provided for in accordance with the Trust’s understanding of the applicable country’s tax rules and rates.
|
|
|
E.
|
Distributions to Shareholders. Distributions to shareholders from net investment income and net realized gains on securities for the Fund normally are declared and paid
on an annual basis. Distributions are recorded on the ex-dividend date.
|
|
|
F.
|
Use of Estimates. The preparation of financial statements in conformity with U.S. GAAP requires management to make estimates and assumptions that affect the reported
amounts of assets and liabilities at the date of the financial statements, as well as the reported amounts of revenues and expenses during the period. Actual results could differ from those estimates.
|
17
Becker Value Equity Fund
|
NOTES TO FINANCIAL STATEMENTS April 30, 2023 (Unaudited)
(Continued)
|
|
G.
|
Share Valuation. The net asset value (“NAV”) per share of the Fund is calculated by dividing the sum of the value of the securities held by the Fund, plus cash and
other assets, minus all liabilities (including estimated accrued expenses) by the total number of shares outstanding of the Fund, rounded to the nearest cent. The Fund’s shares will not be priced on the days on which the New York Stock
Exchange is closed for trading. The offering and redemption price per share for the Fund is equal to the Fund’s net asset value per share. The Fund charges a 1.00% redemption fee on shares held less than 30 days. These fees are deducted from
the redemption proceeds otherwise payable to the shareholder. The Fund will retain the fee charged as paid-in capital and such fees become part of the Fund’s daily NAV calculation.
|
|
|
H.
|
Guarantees and Indemnifications. In the normal course of business, the Fund enters into contracts with service providers that contain general indemnification clauses.
The Fund’s maximum exposure under these arrangements is unknown as this would involve future claims that may be made against the Fund that have not yet occurred. However, based on experience, the Fund expects the risk of loss to be remote.
|
|
|
I.
|
Illiquid Securities. Pursuant to Rule 22e-4 under the 1940 Act, the Fund has adopted a Board approved Liquidity Risk Management Program (“LRMP”) that requires, among
other things, that the Fund limits its illiquid investments that are assets to no more than 15% of net assets. An illiquid investment is any security which may not reasonably be expected to be sold or disposed of in current market conditions
in seven calendar days or less without the sale or disposition significantly changing the market value of the investment.
|
|
|
J.
|
Recently Issued Accounting Pronouncements. In June 2022, the FASB issued Accounting Standards Update 2022-03, which amends Fair Value Measurement (Topic 820): Fair
Value Measurement of Equity Securities Subject to Contractual Sale Restrictions (“ASU 2022-03”). ASU 2022-03 clarifies guidance for fair value measurement of an equity security subject to a contractual sale restriction and establishes new
disclosure requirements for such equity securities. ASU 2022-03 is effective for fiscal years beginning after December 15, 2023 and for interim periods within those fiscal years, with early adoption permitted. Management is currently
evaluating the impact of these amendments on the financial statements.
|
18
Becker Value Equity Fund
|
NOTES TO FINANCIAL STATEMENTS April 30, 2023 (Unaudited)
(Continued)
|
|
K.
|
Subsequent Events. In preparing these financial statements, the Fund have evaluated events and transactions for potential recognition or disclosure through the date the
financial statements were issued. The Fund has determined that there were no subsequent events that would need to be disclosed in the Fund’s financial statements.
|
NOTE 3 – COMMITMENTS AND OTHER RELATED PARTY TRANSACTIONS
The Advisor provides the Fund with investment management services under an Investment Advisory Agreement (the “Advisory Agreement”).
Under the Advisory Agreement, the Advisor furnishes all investment advice, office space, facilities and certain administrative services, and provides most of the personnel needed by the Fund. As compensation for its services, the Advisor is entitled
to receive a monthly fee at the annual rate of 0.55% based upon the average daily net assets of the Fund. For the six months ended April 30, 2023, the advisory fees incurred by the Fund are disclosed in the Statement of Operations. The investment
advisory fees incurred are paid monthly to the Advisor, net of any monthly waiver or reimbursement discussed below.
The Advisor has contractually agreed to limit the annual ratio of expenses of the Fund’s average daily net assets (“Expense Cap”) to
0.68% (excluding Rule 12b-1 fees and any other class-specific expenses). The Operating Expenses Limitation Agreement has an indefinite term and may be terminated at any time, and without payment of any penalty, by the Board, on behalf of the Fund,
upon sixty (60) days written notice to the Advisor. The Advisor is permitted to be reimbursed for fee reductions and/or expense payments made in the prior three years. The Fund must pay its current ordinary operating expenses before the Advisor is
entitled to any reimbursement of fees and/or expenses. Any reimbursement is subject to the Board’s review and approval. This reimbursement may be requested by the Advisor if the aggregate amount actually paid by the Fund toward operating expenses for
such period (taking into account any reimbursement) does not exceed the lesser of the Expense Caps in place at the time of waiver or at the time of reimbursement. At April 30, 2023, the remaining cumulative unreimbursed amount waived by the Advisor
on behalf of the Fund that may be reimbursed was $540,653. The Advisor may recapture a portion of the above amount no later than the dates stated below:
|
Year of Expiration
|
Amount
|
||||
|
October 31, 2023
|
$
|
116,783
|
|||
|
October 31, 2024
|
143,772
|
||||
|
October 31, 2025
|
175,841
|
||||
|
April 30, 2026
|
104,257
|
||||
19
Becker Value Equity Fund
|
NOTES TO FINANCIAL STATEMENTS April 30, 2023 (Unaudited)
(Continued)
|
The amount of fees and expenses waived and reimbursed by the Advisor during the six months ended April 30, 2023 are disclosed in the
Statement of Operations. Any amount due from the Advisor is paid monthly to the Fund, if applicable.
U.S. Bancorp Fund Services, LLC, doing business as U.S. Bank Global Fund Services (“Fund Services”), acts as the Fund’s administrator,
fund accountant and transfer agent. In those capacities, Fund Services maintains the Fund’s books and records, calculates the Fund’s NAV, prepares various federal and state regulatory filings, coordinates the payment of Fund expenses, reviews expense
accruals and prepares materials supplied to the Board. The officers of the Trust and the Chief Compliance Officer are also employees of Fund Services. Fees paid by the Fund to Fund Services for these services for the six months ended April 30, 2023,
are disclosed in the Statement of Operations.
Quasar Distributors, LLC acts as the Fund’s principal underwriter in a continuous public offering of the Fund’s shares. U.S. Bank N.A.
serves as custodian to the Fund. U.S. Bank N.A. is an affiliate of Fund Services.
|
NOTE 4 – PURCHASES AND SALES OF SECURITIES
|
For the six months ended April 30, 2023, the cost from purchases of securities, excluding short-term securities, for the Fund was
$13,936,938. The proceeds from sales and maturities of securities, excluding short-term securities, for the Fund were $26,242,393. There were no reportable purchases or sales of U.S. Government obligations for the six months ended April 30, 2023.
|
NOTE 5 – DISTRIBUTIONS TO SHAREHOLDERS
|
The tax character of distributions paid by the Fund during the six months ended April 30, 2023 (estimated) and the year ended October 31,
2022 were as follows:
|
2023
|
2022
|
|||||||
|
Ordinary Income
|
$
|
1,412,584
|
$
|
5,028,753
|
||||
|
Long-term capital gain
|
6,025,062
|
11,388,527
|
||||||
20
Becker Value Equity Fund
|
NOTES TO FINANCIAL STATEMENTS April 30, 2023 (Unaudited) (Continued)
|
As of October 31, 2022, the components of distributable earnings on a tax basis were as follows:
|
Cost of investments
|
$
|
74,275,172
|
||
|
Gross tax unrealized appreciation
|
29,625,441
|
|||
|
Gross tax unrealized depreciation
|
(1,417,920
|
)
|
||
|
Gross tax unrealized appreciation/depreciation
|
28,207,521
|
|||
|
Undistributed ordinary income
|
1,178,071
|
|||
|
Undistributed long-term capital gain
|
6,025,016
|
|||
|
Total distributable earnings
|
7,203,087
|
|||
|
Other accumulated gain (loss)
|
—
|
|||
|
Total distributable (accumulated) earnings (losses)
|
$
|
35,410,608
|
|
NOTE 6 – CREDIT FACILITY
|
U.S. Bank N.A. has made available to the Fund a credit facility pursuant to a separate Loan and Security Agreement for temporary or
extraordinary purposes. Credit facility activity for the six months ended April 30, 2023 was as follows:
|
Maximum available credit
|
$
|
8,000,000
|
||
|
Largest amount outstanding on an individual day
|
2,164,000
|
|||
|
Average balance when in use
|
884,333
|
|||
|
Credit facility outstanding as of April 30, 2023
|
—
|
|||
|
Average interest rate when in use
|
7.00
|
%
|
Interest expense for the six months ended April 30, 2023, is disclosed in the Statement of Operations, if applicable.
21
Becker Value Equity Fund
|
EXPENSE EXAMPLES For the Six Months Ended April 30, 2023
(Unaudited)
|
As a shareholder of the Fund, you incur two types of costs: (1) transaction costs and (2) ongoing costs, including investment advisory
fees, shareholder service fees, and other Fund expenses. This example is intended to help you understand your ongoing costs (in dollars) of investing in the Fund and to compare these costs with the ongoing costs of investing in other mutual funds.
The example is based on an investment of $1,000 invested at the beginning of the period and held for the entire period (November 1, 2022 – April 30, 2023).
Actual Expenses
The “Actual” line of the following table provides information about actual account values based on actual returns and actual expenses.
Although the Fund charges no sales load, you will be assessed fees for outgoing wire transfers, returned checks and stop payment orders at prevailing rates charged by U.S. Bancorp Fund Services, LLC, the Fund’s transfer agent. If you request a
redemption be made by wire transfer, the Fund’s transfer agent currently charges a $15.00 fee. You will be charged a redemption fee equal to 1.00% of the net amount of the redemption if you redeem shares within 30 calendar days after you purchase
them. An Individual Retirement Account will be charged a $15.00 annual maintenance fee. In addition to the Fund’s expenses, you will indirectly bear your proportionate share of any fees and expenses charged by the underlying funds of other investment
companies in which the Fund has shares. Actual expenses of the underlying funds may vary. These expenses are not included in the example.
The following example includes, but is not limited to, investment advisory fees, shareholder servicing fees, fund accounting fees,
administration fees, custody fees and transfer agent fees. However, the following example does not include portfolio trading commissions and related expenses and other extraordinary expenses as determined under generally accepted accounting
principles. You may use the information in this line, together with the amount you invested, to estimate the expenses that you paid over the period. Simply divide your account value by $1,000 (for example, an $8,600 account value divided by $1,000 =
8.6), then multiply the result by the number in the first line under the heading entitled “Expenses Paid During the Period” to estimate the expenses you paid on your account during this period.
Hypothetical Example for Comparison Purposes
The “Hypothetical” line of the following table provides information about hypothetical account values and hypothetical expenses based on
the Fund’s actual expense ratio and an assumed rate of return of 5% per year before expenses, which is not the Fund’s actual return. The hypothetical account
22
Becker Value Equity Fund
|
EXPENSE EXAMPLES For the Six Months Ended April 30, 2023
(Unaudited) (Continued)
|
values and expenses may not be used to estimate the actual ending account balance or expenses you paid for the period. You may use this information to
compare the ongoing costs of investing in the Fund and other funds. To do so, compare this 5% hypothetical example with the 5% hypothetical examples that appear in the shareholder reports of the other funds. Please note that the expenses shown in the
table are meant to highlight your ongoing costs only and do not reflect any transaction costs, such as redemption fees. Therefore, the second line of the table is useful in comparing ongoing costs only and will not help you determine the relative
total costs of owning different funds. In addition, if these transactional costs were included, your costs would have been higher.
|
Beginning
|
Ending
|
Expenses Paid
|
|
|
Account Value
|
Account Value
|
During the Period
|
|
|
Class
|
11/1/22
|
4/30/23
|
11/1/22 - 4/30/23*
|
|
Retail
|
|||
|
Actual
|
$1,000.00
|
$1,052.90
|
$3.97
|
|
Hypothetical (5% return
|
|||
|
before expenses)
|
1,000.00
|
1,020.93
|
3.91
|
|
Institutional
|
|||
|
Actual
|
1,000.00
|
1,052.80
|
3.46
|
|
Hypothetical (5% return
|
|||
|
before expenses)
|
1,000.00
|
1,021.42
|
3.41
|
|
*
|
The calculations are based on expenses incurred during the most recent six-month period for the Fund. The annualized expense ratios for the most recent six-month period for the Fund’s Retail Class and
Institutional Class were 0.78% and 0.68% (reflecting fee waivers in effect), respectively. The dollar amounts shown as expenses paid for the Fund are equal to the annualized six-month expense ratio multiplied by the average account value
during the period, multiplied by 181 (the number of days in the most recent six-month period) and divided by 365 (the number of days in the fiscal year).
|
23
Becker Value Equity Fund
|
INFORMATION ABOUT THE FUND’S TRUSTEES (Unaudited)
|
The Statement of Additional Information (“SAI”) includes additional information about the Fund’s Trustees and is available without
charge, upon request, by calling (800) 551-3998. Furthermore, you can obtain the SAI on the SEC’s website at www.sec.gov or the Fund’s website at www.beckercap.com/mutual-fund.
|
INFORMATION ABOUT PROXY VOTING (Unaudited)
|
A description of the policies and procedures the Fund uses to determine how to vote proxies relating to portfolio securities is available
without charge upon request by calling toll-free at (800) 551-3998 or by accessing the SEC’s website at www.sec.gov.
Information regarding how the Fund voted proxies relating to portfolio securities during the most recent twelve months ending June 30 is
available without charge, upon request by calling (800) 551-3998 or by accessing the SEC’s website at www.sec.gov.
|
INFORMATION ABOUT THE PORTFOLIO HOLDINGS (Unaudited)
|
The Fund’s quarterly holdings for the most recent fiscal year can be obtained by accessing the Fund’s website at
www.beckercap.com/mutual-fund. The Fund files its complete schedule of portfolio holdings with the SEC for the first and third quarters of each fiscal year as an exhibit to their reports on Form N-PORT. The Fund’s Form N-PORT is available on the
SEC’s website at www.sec.gov. The Fund’s Form N-PORT may also be obtained by calling (800) 551-3998.
|
INFORMATION ABOUT HOUSEHOLDING (Unaudited)
|
Each year, you are automatically sent an updated prospectus as well as annual and semi-annual reports for the Fund, if applicable. In an
effort to decrease costs, the Fund intends to reduce the number of duplicate prospectuses, proxy statements, and annual and semi-annual reports you receive by sending only one copy of each to those addresses shared by two or more accounts and to
shareholders we reasonably believe are from the same family or household. Please call the Fund’s transfer agent without charge at (800) 551-3998 (or contact your financial institution) to request individual copies of these documents. The Fund will
begin sending individual copies 30 days after receiving your request. This policy does not apply to account statements.
24
Becker Value Equity Fund
|
PRIVACY NOTICE (Unaudited)
|
The Fund collects non-public information about you from the following sources:
|
•
|
Information we receive about you on applications or other forms;
|
|
|
•
|
Information you give us orally; and
|
|
|
•
|
Information about your transactions with us or others.
|
We do not disclose any non-public personal information about our shareholders or former shareholders without the
shareholder’s authorization, except as permitted by law or in response to inquiries from governmental authorities. We may share information with affiliated parties and unaffiliated third parties with whom we have contracts for servicing the Fund. We
will provide unaffiliated third parties with only the information necessary to carry out their assigned responsibilities. All shareholder records will be disposed of in accordance with applicable law. We maintain physical, electronic and procedural
safeguards to protect your non-public personal information and require third parties to treat your non-public information with the same high degree of confidentiality.
In the event that you hold shares of the Fund through a financial intermediary, including, but not limited to, a
broker-dealer, bank, or trust company, the privacy policy of your financial intermediary would govern how your nonpublic personal information would be shared with unaffiliated third parties.
25
Investment Advisor
BECKER CAPITAL MANAGEMENT, INC.
1211 SW Fifth Avenue, Suite 2185
Portland, OR 97204
Distributor
QUASAR DISTRIBUTORS, LLC
111 East Kilbourn Avenue, Suite 2200
Milwaukee, WI 53202
Custodian
U.S. BANK N.A.
Custody Operations
1555 North RiverCenter Drive, Suite 302
Milwaukee, WI 53212
Transfer Agent, Fund Accountant and Fund Administrator
U.S. BANCORP FUND SERVICES, LLC
615 East Michigan Street
Milwaukee, WI 53202
Independent Registered Public Accounting Firm
TAIT, WELLER & BAKER LLP
Two Liberty Place
50 South 16th Street, Suite 2900
Philadelphia, PA 19102
Legal Counsel
SULLIVAN & WORCESTER LLP
1633 Broadway, 32nd Floor
New York, NY 10019
Becker Value Equity Fund
|
Ticker
|
CUSIP
|
|
|
Retail Class
|
BVEFX
|
74316J516
|
|
Institutional Class
|
BVEIX
|
74316J490
|
(b) Not applicable.
Item 2. Code of Ethics.
Not applicable for semi-annual reports.
Item 3. Audit Committee Financial Expert.
Not applicable for semi-annual reports.
Item 4. Principal Accountant Fees and Services.
Not applicable for semi-annual reports.
Item 5. Audit Committee of Listed Registrants.
Not applicable to registrants who are not listed issuers (as defined in Rule 10A-3 under the Securities Exchange Act of 1934).
Item 6. Investments.
(a) Schedule of Investments is included as part of the report to shareholders filed under Item 1 of this Form.
(b) Not applicable.
Item 7. Disclosure of Proxy Voting Policies and Procedures for Closed-End Management Investment Companies.
Not applicable to open-end investment companies.
Item 8. Portfolio Managers of Closed-End Management Investment Companies.
Not applicable to open-end investment companies.
Item 9. Purchases of Equity Securities by Closed‑End Management Investment Company and Affiliated Purchasers.
Not applicable to open-end investment companies.
Item 10. Submission of Matters to a Vote of Security Holders.
The registrant has adopted a nominating committee charter that contains the procedures by which shareholders may recommend nominees to the registrant’s board of trustees. There have been no material changes to the procedures by which
shareholders may recommend nominees to the registrant’s board of trustees for the period.
Item 11. Controls and Procedures.
|
(a)
|
The Registrant’s President and Treasurer have reviewed the Registrant's disclosure controls and procedures (as defined in Rule 30a-3(c) under the Investment Company Act of 1940 (the “Act”)) as of a date within 90 days of the filing of
this report, as required by Rule 30a-3(b) under the Act and Rules 13a-15(b) or 15d‑15(b) under the Securities Exchange Act of 1934. Based on their review, such officers have concluded that the disclosure controls and procedures are
effective in ensuring that information required to be disclosed in this report is appropriately recorded, processed, summarized and reported and made known to them by others within the Registrant and by the Registrant’s service provider.
|
|
(b)
|
There were no changes in the Registrant's internal control over financial reporting (as defined in Rule 30a-3(d) under the Act) that occurred during the fiscal period covered by this report that has materially affected, or is
reasonably likely to materially affect, the Registrant's internal control over financial reporting.
|
Item 12. Disclosure of Securities Lending Activities for Closed-End Management Investment Companies
Not applicable to open-end investment companies.
Item 13. Exhibits.
|
(a)
|
(1) Any code of ethics or amendment thereto, that is subject of the disclosure required by Item 2, to the extent that the registrant intends to satisfy Item 2 requirements through filing an exhibit.
Incorporated by reference to previous Form N-CSR filing.
|
(3) Any written solicitation to purchase securities under Rule 23c‑1 under the Act sent or given during the period covered by the report by or on behalf of the registrant to 10 or
more persons. Not applicable to open-end investment companies.
(4) Change in the registrant’s independent public accountant. There was no change in the registrant’s independent public accountant for the period covered by this report.
SIGNATURES
Pursuant to the requirements of the Securities Exchange Act of 1934 and the Investment Company Act of 1940, the registrant has duly caused this report to be signed on its behalf by the undersigned, thereunto duly
authorized.
(Registrant) Professionally Managed Portfolios
By (Signature and Title) /s/ Jason Hadler
Jason Hadler, President/Principal Executive Officer
Date July 6, 2023
Pursuant to the requirements of the Securities Exchange Act of 1934 and the Investment Company Act of 1940, this report has been signed below by the following persons on behalf of the registrant and in the capacities
and on the dates indicated.
By (Signature and Title) /s/ Jason Hadler
Jason Hadler, President/Principal Executive Officer
Date July 6, 2023
By (Signature and Title) /s/ Craig Benton
Craig Benton, Treasurer/Principal Financial Officer
Date July 6, 2023
* Print the name and title of each signing officer under his or her signature.