UNITED STATES
SECURITIES AND EXCHANGE COMMISSION
Washington, D.C. 20549
FORM N-CSR
CERTIFIED SHAREHOLDER REPORT OF REGISTERED
MANAGEMENT INVESTMENT COMPANIES
Investment Company Act file number: 811-05009
COLORADO BONDSHARES —
A TAX-EXEMPT FUND
(Exact name of registrant as specified in its charter)
1200 17TH STREET, SUITE 850
DENVER, COLORADO 80202-5808
(Address of principal executive offices) (Zip code)
FRED R. KELLY, JR.
1200 17TH STREET, SUITE 850
DENVER, COLORADO 80202-5808
(Name and address of agent for service)
Registrant’s telephone number, including area code: 303-572-6990
Date of fiscal year end: 09/30
Date of reporting period: 09/30/2023
| ITEM 1. | REPORTS TO STOCKHOLDERS | |
| ITEM 2. | CODE OF ETHICS | |
| ITEM 3. | AUDIT COMMITTEE FINANCIAL EXPERT | |
| ITEM 4. | PRINCIPAL ACCOUNTANT FEES AND SERVICES | |
| ITEM 5. | AUDIT COMMITTEE OF LISTED REGISTRANTS | |
| ITEM 6. | INVESTMENTS | |
| ITEM 7. | DISCLOSURE OF PROXY VOTING POLICIES AND PROCEDURES FOR CLOSED-END MANAGEMENT INVESTMENT COMPANIES | |
| ITEM 8. | PORTFOLIO MANAGERS OF CLOSED-END MANAGEMENT INVESTMENT COMPANIES | |
| ITEM 9. | PURCHASES OF EQUITY SECURITIES BY CLOSED-END MANAGEMENT INVESTMENT COMPANY AND AFFILIATED PURCHASERS | |
| ITEM 10. | SUBMISSION OF MATTERS TO A VOTE OF SECURITY HOLDERS | |
| ITEM 11. | CONTROLS AND PROCEDURES | |
| ITEM 12. | DISCLOSURE OF SECURITIES LENDING ACTIVITIES FOR CLOSED-END MANAGEMENT INVESTMENT COMPANIES | |
| ITEM 13. | EXHIBITS | |
| (a)(2)(i) | ||
| (99.302) Interim President’s (Principal Executive Officer) Section 302 Certification | ||
| (a)(2)(ii) | ||
| (99.302) Interim Treasurer’s (Principal Financial Officer) Section 302 Certification | ||
| (b) | ||
ITEM 1. REPORT S TO STOCKHOLDERS.

November 22, 2023
Dear Shareholders:
Almost every penny I have ever made in investing resulted from taking the opposing view. Common wisdom though changing right now says bonds are bad. Turn the clock back as little as just 2 years and you will remember that the most distasteful thing was to leave your money in cash yielding nothing. With the benefit of hindsight, we now know that though it was punitive at the time, cash was precisely the wisest thing to do. It’s easy to see it now, not so easy then. Most felt the need to make their money work a little harder.
Today, we have the mirror image. The safe, reassuring thing to do is to invest short, protect principal and temporarily lock in returns that we have not seen for years. It’s the easy choice which makes me think it’s not the lucrative thing to do. What will the world look like just a couple of years down the road? My view is that it’s better to now take the longer view and lock in to an already established income stream which will endure beyond next week, next month, next year. I might be just a little biased but the best one I know of is Colorado BondShares.
At this stage, we are already in the longest, deepest downturn in the bond market history. Never before have we seen three bad years in a row. Weigh the odds — do you think that such an anomaly already “long in the tooth” continues forever or do you think that at some point it returns to a more normal configuration? No one knows the exact timing of the change but every day that passes, gets us closer to paydirt with potential gains. While you are waiting, you get a dividend approximating 5% (mostly tax exempt) meaning you get to keep most of what you earn and don’t have to share it with anybody. Those of you who are reinvesting your dividends are benefitting from buying more shares at a cheaper cost thereby averaging down and building equity for the future. BondShares was never intended as a get rich quick investment. Instead, it is a time honored, patient method of investing based on potentially generating good income and participating in some healthy gains and the miracle of compounding. It is not well suited for short term analysis and needs time to work best.
Think about the standard thirty-year mortgage on your house. You borrow the purchase price and if you don’t pay it off early you end up paying three times the original amount with two thirds going to interest. Wouldn’t it be nice to be on the other side of that transaction where you more or less put up a
third and prospectively get two times your investment in interest earnings over the years? Looking at it this way, the price paid initially becomes less significant over time because it is the smallest piece of the overall results. Plus, you will get your principal back upon the maturity of the bonds even if there are times when the current market price is listed at less than par. In short, that’s what BondShares offers. The fund has seen some spectacular snap backs in price in the past not that history always repeats or adequately predicts.
Now, please review at your leisure the details of our operations for the fiscal year ended September 30th. I wish they were better with regard to the price but they were positive in most other respects and managed to rank us as #1 in our peer group according to Lipper.
Thank you for hanging in there with us. We value you more than you will ever know.
Sincerely,

Fred R. Kelly, Jr.
Portfolio Manager
Officers and Trustees
George N. Donnelly, Chairman of the Board of Trustees, Interim President, Secretary, Treasurer and Trustee
Bruce G. Ely, Trustee
James R. Madden, Trustee
Fred R. Kelly, Jr., Portfolio Manager
Investment Adviser
Freedom Funds Management Company
Transfer, Shareholder Servicing, and Dividend Disbursing Agent
Freedom Funds Management Company
Distributor
Colorado Financial Service Corporation
Custodian of Portfolio Securities
UMB Bank, N.A.
Independent Registered Public Accounting Firm
Plante & Moran, PLLC
Special Legal Counsel
Kutak Rock LLP
This report is submitted for the general information of the shareholders of Colorado BondShares — A Tax-Exempt Fund. This report must be preceded or accompanied by a Prospectus of the Fund. The prospectus contains information concerning the investment policies and expenses of the portfolio in addition to other pertinent information. Shares of Colorado BondShares — A Tax-Exempt Fund are not deposits or obligations of any bank, are not guaranteed by any bank, are not insured by the FDIC or any other agency, and involve investment risks, including possible loss of the principal amount invested.
FEDERAL INCOME TAX INFORMATION
(unaudited)
The Fund hereby designates the following amount for the Fund’s fiscal year ended September 30, 2023:
Exempt interest dividends: 94.10%
In early 2024, shareholders will receive information regarding all dividends and distributions paid to them by the Fund during calendar year 2023. Regulations of the U.S. Treasury Department require the Fund to report this information to the Internal Revenue Service.
Individual shareholders should refer to their Form 1099s or other tax information to determine the calendar year amounts to be included on their 2023 tax returns. Shareholders should consult their tax advisers.
MANAGEMENT’S DISCUSSION OF FUND PERFORMANCE
The fiscal year ended September 30, 2023 marked the second year of the Federal Reserve’s campaign to slow inflation by increasing interest rates. Although the outcomes of higher rates did not materialize immediately, many parts of economy and financial markets are now feeling their effects. Economic activity is slowing in the US and the valuations of many financial assets have declined. Fortunately, inflation has decreased off its highs too. Colorado BondShares — A Tax Exempt Fund (“Fund”) has not been immune to these policies, as reflected by the price of the Fund, which is hovering around an all-time low. Even though the interest rate hikes have pushed down the Fund’s price from its high, the fundamentals of the Fund’s underlying investments are still robust, highlighting the merits of the Fund’s strategy to focus on conservatively positioned investments.
As of September 2023, inflation in the US had declined notably from its peak. However, it is still too high from the perspective of the policymakers, motivating them to continue to keep rates at an elevated level. Additionally, the strength of the US labor market is supporting their position that the economy can handle high rates for the time being. Since there is a lag in the transmission of interest rate changes, the trick will be properly timing when to adjust the policy. High rates have already had a notable effect on banks, one of the economy’s most important asset classes. Rising interest rates have adversely impacted the value of their long-term holdings, causing some to collapse (Silicon Valley Bank), others to be forced into a fire-sale (First Republic Bank), and the remaining ones to tighten their lending standards. The repercussions of these events are reducing the availability of credit, a pivotal ingredient of economic growth. Engineering a soft landing is a difficult task, especially when the economies of China and Europe are slowing as well, and one should not be surprised if the Federal Reserve overshoots on the downside. The possibility of this scenario is accounted for in the Fund’s current positioning, and the Fund will look to capitalize on this situation, if it arises, by buying attractively priced bonds.
Like the US economy, Colorado’s economy continues to expand but at a slower pace. Although the state was not the recipient of as many corporate relocations this year as in years past, it was successful in one very important one. At the end of July, the federal government announced that the headquarters of Space Command will remain in Colorado Springs instead of moving to Huntsville, Alabama. Not only does Space Command currently employ a large number of individuals, but it also has the potential to grow markedly in the future. Furthermore, the growth of Space Command should benefit the private industries that serve it, particularly aerospace companies. Since Colorado has the second largest aerospace economy in the US, this decision will further strengthen this cluster, which is one of the state’s economic pillars along with technology, energy, and finance. Colorado should benefit tremendously from this.
A large portion of the Fund’s investments are secured by property taxes connected to residential real estate. As mortgage rates have increased to levels not seen in over 20 years, home sales have declined significantly. However, existing home sales have fallen by much more than new homes sales, and it is important to highlight why. First, most of the largest homebuilders operating in Colorado are publicly traded companies that use low amounts of debt. Additionally, their business models are based on turnover rather than margin, which motivates them to discount the selling price of new homes to drive/maintain the pace of sales. Recently, this discount has been expressed through interest rate buy-downs, which has lowered the overall price of a new home, thereby driving demand. Second, most existing homeowners have already locked in a low mortgage rate. Consequently, if they moved laterally, their monthly mortgage payment would increase notably as a result of the new rate. This is motivating people to remain in their existing homes, which is putting downward pressure on the existing inventory of homes and pushing homebuyers to the new
1
home sales market. This has positive ramifications for many of the bonds owned by the Fund. The proceeds of these bonds are usually used to finance the infrastructure of large residential developments — roads, water, and utilities — and they are repaid with a portion of the property taxes on the homes that are eventually built within that development. Therefore, their financial health is more closely tied to the new home sales market than the existing home sales market, which is larger and often drives many of the statistics cited across the media. The resilience of the new home sales market is supporting the fundamentals of these investments.
Some of the Fund’s investments are secured by property taxes connected to commercial real estate. The interest rate increases have affected the valuation of these asset classes as well but not uniformly across all sectors. Office valuations have been the most adversely impacted of all the commercial real estate sectors, stemming from high vacancy rates and limited financing options. These trends have been especially pronounced in class B buildings. Fortunately, the Fund has very limited exposure to the office market, allowing it to avoid the fallout that is occurring. The fundamentals of the industrial market have slowed from their frenzied high but are still strong, driven by the change in the retail distribution channel from in person at stores to online through warehouses. As a result of the strong industrial fundamentals over the past few years, a record-breaking amount of supply was completed or started construction, increasing the risk of investing in the sector. To mitigate risk, the Fund only invested in a handful of deals backed by industrial buildings that were conservatively structured and that had sizable pre-leasing already in place. Apartment rents surged after COVID lockdowns were lifted, motivating developers to start numerous projects. Denver’s development pipeline is currently greater than 30,000 units. Although this level of supply is very high from a historical perspective, it will most likely only cause indigestion. Most of the US, including Denver, is dealing with a housing shortage, and this added supply should be absorbed as a result of that situation, even if in a choppy manner. Finally, even though the COVID lockdowns created a very difficult environment for retail real estate, the sector’s fundamentals have been improving of late, supported by a dearth of new supply. Most of the Fund’s exposure to retail real estate is focused on convenience retail situated near large residential housing developments, which is benefiting from the current environment.
The Fund also has a notable allocation to bonds secured by charter schools. This sector has many favorable characteristics. Charter schools receive funding on a per pupil basis. In order to boost/maintain funding, the school’s administrators need to increase/sustain enrollment, which is often correlated to their students achieving high test scores. This creates accountability with the teachers and school administrators, which drives them to excel at teaching while being mindful of costs. Additionally, these bonds are typically collateralized by real estate, providing another layer of downside protection. The administrators of the charter schools backing the Fund’s investments showed their talents over recent years as they were able to maintain enrollment levels despite the turbulent environment, thereby supporting the credit of the underlying bonds.
For most of the year, yields in the municipal bond market were range-bound, resulting in the majority of the return of these bonds being driven by their coupon rather than fluctuations in the value of their principal. A similar situation unfolded within many other parts of the bond market, such as investment grade and high yield bonds. However, towards the end of the fiscal year, the yields of long-dated Treasuries began to rise. These increases adversely affected the value of the municipal and overall bond markets. If the yields in the Treasury market continue to rise, they could have a negative impact on the prices in the municipal bond market. However, the Fund capitalized on the recent rate increases by purchasing new bonds at discounted prices, which then increased the Fund’s dividend. The Fund will likely execute similar strategy if rates continue rising in the future.
2
For the year ending September 30, 2023, the Fund produced a total return of 4.21%, when excluding its sales charge. Although the Fund produced a positive total return for the year, its price still remains at a subdued level versus where it has traded historically. This has been driven by the elevated yields in the Treasury market, which have been influenced by the interest rate increases implemented by the Federal Reserve. The credit profiles of the Fund’s underlying investments remain strong, and these investments continue to produce a stable stream of cash flows, which have been used to support the Fund’s dividend. During the year, the Fund distributed $0.45 versus $0.38 last year, an increase of 18%. The rise of the dividend was driven by using the Fund’s large cash balance to opportunistically buy attractively priced bonds over the last two years. Finally, the Fund continues to perform well versus its competitors. According to Lipper Inc., the Fund was ranked as the number one performing municipal bond fund in its class. This outperformance was driven by a handful of factors, such as creating a diversified portfolio with a sizeable allocation to variable rate securities and cash, not using leverage to augment returns, and diligently underwriting and monitoring all investments to ensure that the Fund only acquires and owns bonds with robust credit profiles.
3
PERFORMANCE SUMMARY (Unaudited)
COMPARISON OF CHANGE IN VALUE OF A $10,000 INVESTMENT IN
COLORADO BONDSHARES(1)
THE LIPPER GENERAL MUNICIPAL DEBT FUND INDEX(4)
AND THE BLOOMBERG BARCLAY MUNICIPAL BOND TOTAL RETURN INDEX(5)
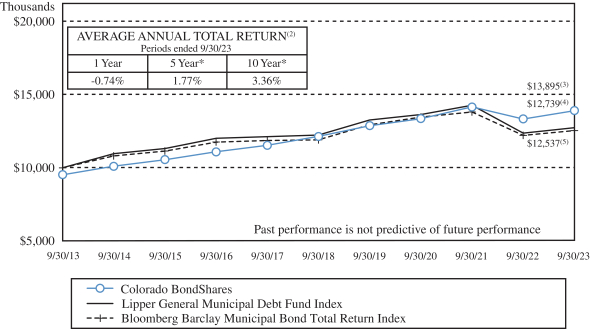
| (1) | Total return is the percentage change in the value of a hypothetical investment that has occurred in the indicated period of time, taking into account the imposition of the sales charge and other fees and assuming the reinvestment of all dividends and distributions. Past performance is not indicative of future performance. The graph does not reflect the deduction of taxes that a shareholder would pay on Fund distributions or the redemption of shares of the Fund. |
| * | Fiscal year ended September 30, 2016 includes a principal write down of approximately $14.5 million due to an adverse decision by the Colorado State Court of Appeal on the Marin Metropolitan District bonds that is a non-recurring event outside of the control of the Fund. |
| (2) | Average annual total return reflects the hypothetical annually compounded return that would have produced the same cumulative total return if the Fund’s performance had been constant over the entire period. Average annual total returns for the one-year, five-year and ten-year periods ended September 30, 2023 are -0.74%, 1.77%, and 3.36%, respectively. Average annual total includes the imposition of the sales charge and assumes the reinvestment of all dividends and distributions. Past |
4
| performance is not indicative of future performance. The table does not reflect the deduction of taxes that a shareholder would pay on Fund distributions or the redemption of shares of the Fund. |
| (3) | Includes reinvestment of dividends and adjustment for the maximum sales charge of 4.75%. |
| (4) | The Lipper General Municipal Debt Fund Index is a non-weighted index of the 30 largest funds that invest at least 65% of assets in municipal debt issues in the top four credit ratings. The Lipper General Municipal Debt Fund Index reflects no deductions for fees, expenses or taxes, includes reinvestment of dividends but does not reflect any adjustment for sales charge. |
| (5) | The Bloomberg Barclay Municipal Bond Total Return Index which replaced the Barclays Capital Municipal Bond Total Return Index (the “Barclay Index”) is considered representative of the broad market for investment grade, tax-exempt and fixed-rate bonds with long-term maturities (greater than two years) selected from issues larger than $50 million. You cannot invest directly in this index. This index is not professionally managed and does not pay any commissions, expenses or taxes. If this index did pay commissions, expenses or taxes, its returns would be lower. The Fund selected the Bloomberg Barclay Index to compare the returns of the Fund to an appropriate broad-based securities market index. You should note, however, that there are some fundamental differences between the portfolio of securities invested in by the Fund and the securities represented by the Bloomberg Barclay Index. Unlike the Fund which invests primarily in not rated securities on issues of any size, the Bloomberg Barclay Index only includes securities with a rating of at least “Baa” by Moody’s Investor Services, Inc. from an issue size of no less than $50 million. Some of these differences between the portfolio of the Fund and the securities represented by the Bloomberg Barclay Index may cause the performance of the Fund to differ from the performance of the Bloomberg Barclay Index. |
5
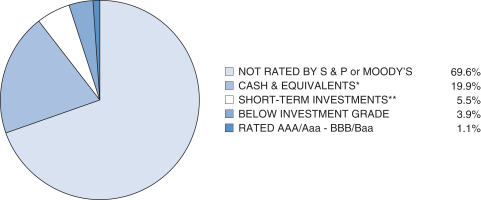
CREDIT QUALITY (unaudited)
Colorado BondShares — A Tax-Exempt Fund
Based on a Percentage of Total Net Assets as of September 30, 2023
SECTOR BREAKDOWN (unaudited)
Colorado BondShares — A Tax-Exempt Fund
Based on a Percentage of Total Net Assets as of September 30, 2023
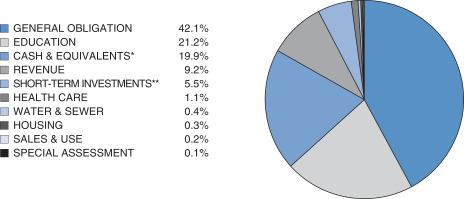
* Cash & equivalents include cash and receivables less liabilities.
** Short-term investments include securities with a maturity date or redemption feature of one year or less, as identified in the Schedule of Investments.
6
Officers and Trustees of the Fund
The following tables list the trustees and officers of the Fund, together with their address, age, positions held with the Fund, the term of each office held and the length of time served in each office, principal business occupations during the past five years and other directorships, if any, held by each trustee and officer. Each trustee and officer has served in that capacity for the Fund continuously since originally elected or appointed. The Board of Trustees supervises the business activities of the Fund. Each trustee serves as a trustee until termination of the Fund unless the trustee dies, resigns, retires, or is removed. The Statement of Additional Information of the Fund includes additional information about Fund trustees and is available, without charge, upon request. Shareholders may call (800) 572-0069 to request the Statement of Additional Information.
| Name, Address and Age |
Position held with the Fund and Length of Time Served |
Principal Occupation During the Past Five Years: |
Other Directorships Held By Director | |||
| Non-Interested Trustees | ||||||
| Bruce G. Ely 1200 17th Street, Suite 850 Denver CO 80202 Age: 72 |
Trustee since July 2002 | Mr. Ely was a Regional Director for Cutwater Asset Management, a wholly owned subsidiary of MBIA, Inc., until his retirement in September 2013. | None | |||
| James R. Madden 1200 17th Street, Suite 850 Denver CO 80202 Age: 79 |
Trustee since September 2004 | Mr. Madden has owned Madden Enterprises, a real estate company that owns and leases commercial buildings and real estate, for the past thirty years. He is also a stockholder and director of The Community Bank in western Kansas. He has been a bank director for 25 years. | None | |||
| Interested Trustees* | ||||||
| George N. Donnelly 1200 17th Street, Suite 850 Denver CO 80202 Age: 76 |
Chairman of the Board of Trustees, Trustee since inception of the Fund in 1987 and Interim President, Secretary and Treasurer of the Fund since September 26, 2008 | Mr. Donnelly was a Senior Regional Vice President for Phoenix Life Insurance Company until his retirement in January 2010. | None | |||
*George N. Donnelly is an “interested person” of the Fund as defined in the Investment Company Act of 1940 (the “1940 Act”) by virtue of his position as both an officer and a trustee of the Fund as described in the table above. None of the trustees nor the officers of the Fund have any position with the Investment Adviser, the principal underwriter of the Fund, the distribution agent of the Fund, the service agent of the Fund or the custodian of the Fund, or any affiliates thereof. There is no family relationship between any officers and trustees of the Fund.
7
Compensation
The Board met two times during the fiscal year ended September 30, 2023. The following tables show the compensation paid by the Fund to each of the trustees during that year:
| Name of Person, Position(s) with the Fund |
Aggregate Compensation from Fund |
Pension or Retirement Benefits Accrued As Part of Fund Expenses |
Total Compensation from Fund Paid to Such Person |
|||||||||
| Non-Interested Trustees |
||||||||||||
| Bruce G. Ely, Trustee |
$ | 2,000 | N/A | $ | 2,000 | |||||||
| James R. Madden, Trustee |
2,000 | N/A | 2,000 | |||||||||
| Interested Trustees |
||||||||||||
| George N. Donnelly, Trustee, Interim President, Secretary and Treasurer |
1,000 | N/A | 1,000 | |||||||||
No officer or trustee of the Fund received remuneration from the Fund in excess of $60,000 for services to the Fund during the fiscal year ended September 30, 2023. The officers and trustees of the Fund, as a group, received $5,000 in compensation from the Fund for services to the Fund during the 2023 fiscal year.
Other Information
Proxy Voting Record
The Fund does not invest in equity securities. Accordingly, there were no matters relating to a portfolio security considered during the 12 months ended June 30, 2023 with respect to which the Fund was entitled to vote. Applicable regulations require us to inform you that the foregoing proxy voting information is available on the SEC website at http://www.sec.gov or you may call us at 1-800-572-0069.
Quarterly Statement of Investments
The Fund files a complete schedule of investments with the Securities and Exchange Commission for the first and third quarters of each fiscal year. For periods ending prior to March 31, 2019, this information was filed on Form N-Q. For periods ending on or after March 31, 2019, the Fund will file on Form N-PORT. Shareholders may view the filed Form N-Q and N-PORT by visiting the Commission’s website at http://www.sec.gov. The filed form may also be viewed and copied at the Commission’s Public Reference Room in Washington, DC. Information regarding the operations of the Public Reference Room may be obtained by calling 1-800-732-0330 or you may call us at 1-800-572-0069.
8
Trustees Approve Advisory Agreement
The Board of Trustees (the “Trustees”) of Colorado BondShares — A Tax-Exempt Fund unanimously approved the continuance of the Fund’s Investment Advisory and Service Agreement with Freedom Funds Management Company (“Freedom Funds”) at a meeting held on October 5, 2023. In approving the Advisory Agreement, the Trustees, including the disinterested trustees, considered the reasonableness of the advisory fee in light of the extent and quality of the advisory services provided and any additional benefits received by Freedom Funds or its affiliates in connection with providing services to the Fund, compared the fees charged by Freedom Funds to those paid by similar funds, and analyzed the expenses incurred by Freedom Funds with respect to the Fund. The Trustees also considered the Fund’s performance relative to a selected peer group, the expense ratio of the Fund in comparison to other funds of comparable size, and other factors. The Trustees determined that the Fund’s advisory fee structure was fair and reasonable in relation to the services provided and that approving the agreement was in the best interests of the Fund and its shareholders. Matters considered by the Trustees in connection with its consideration of the Advisory Agreement included, among other things, the following:
1. Investment Adviser Services
Freedom Funds manages the assets of the Fund, including making purchases and sales of portfolio securities consistent with the Fund’s investment objectives and policies. In addition, Freedom Funds administers the Fund’s daily business affairs such as providing accurate accounting records, computing accrued income and expenses of the Fund, computing the daily net asset value of the Fund, assuring proper dividend disbursements, proper financial information to investors, and notices of all shareholders’ meetings, and providing sufficient office space, storage, telephone services, and personnel to accomplish these responsibilities. In considering the nature, extent and quality of the services provided by Freedom Funds, the Trustees believe that the services provided by Freedom Funds have provided the Fund with superior results. At the same time, Freedom Fund’s fee structure is equal to or lower than the comparable funds. The Trustees noted the Fund’s focus is inherently more labor intensive. Under the circumstances, the Trustees found the fee structure to be justified.
2. Investment Performance
The Trustees reviewed the performance of the Fund compared to other similar funds, and reported that the current (as of September 30, 2023) net asset value was $8.41 per share and the current distribution yield (based on net asset value) was 5.54% (also as of September 30, 2023). Since the overall structure of the portfolio was satisfactory and the performance of the Fund, measured in terms of distribution yield and total return, was comparable amongst its peer group, no changes to either the type of assets or manner of operations were recommended.
3. Expense Ratios
The Trustees reviewed the performance (measured by distribution yield), fees and expense ratios of all municipal bond funds in our peer group. The Trustees considered the fact that the Fund’s unique focus on non-rated bonds, while geared toward producing superior investment results, often required additional expenses. While expenses can vary with non-rated bonds (principally as a result of litigation with respect to defaulted issues and higher monitoring costs occasioned by less readily available information), the Trustees noted the Fund’s performance for the current year.
9
4. Management Fees and Expenses
The Trustees reviewed the investment advisory fee rates payable by the Fund to Freedom Funds. As part of its review, the Trustees considered the estimated advisory fees and the Fund’s estimated total expense ratio for the one-year period as of October 2023 as compared to other municipal bonds in its peer group identified by Freedom Funds. After reviewing the foregoing information, and in light of the nature, extent and quality of the services provided by Freedom Funds, the Trustees concluded that the advisory fees charged by Freedom Funds for the advisory and related services to the Fund and the Fund’s total expense ratio are reasonable. The management fee is one half of one percent of total net assets managed. Such fee is payable to Freedom Funds on a monthly basis. This fee is comparable to other municipal bond funds identified by Freedom Funds and is consistent with national funds many times the Fund’s size.
5. Profitability
The Trustees reviewed the level of profits realized by Freedom Funds and relevant affiliates thereof in providing investment and administrative services to the Fund. The Trustees considered the level of profits realized without regard to revenue sharing or other payments by Freedom Funds and its affiliates to third parties in respect to distribution of the Fund’s securities. The Trustees also considered other direct or indirect benefits received by Freedom Funds and its affiliates in connection with its relationship with the Fund and found that there were none. The Trustees concluded that, in light of the foregoing factors and the nature, extent and quality of the services provided by Freedom Funds, the profits realized by Freedom Funds are reasonable.
6. Economies of Scale
In reviewing advisory fees and profitability, the Trustees also considered the extent to which Freedom Funds and its affiliates, on the one hand, and the Fund, on the other hand, can expect to realize benefits from economies of scale as the assets of the Fund increase. The Trustees acknowledged the difficulty in accurately measuring the benefits resulting from the economies of scale with respect to the management of any specific fund or group of funds, particularly in an environment where costs are rising due to changing regulations. The Trustees reviewed data summarizing the increases and decreases in the assets of the Fund over various time periods, and evaluated the extent to which the total expense ratio of the Fund and Freedom Fund’s profitability may have been affected by such increases or decreases. Between October 2022 and September 30, 2023, total net assets of the Fund under management by Freedom Funds decreased from $1,675.7 billion to $1,646.1 billion. The number of shares of the Fund that have been redeemed has been less than the number of new shares issued by the Fund, and as a result the Fund continues to grow at what the Trustees determined was a healthy level.
Based upon the foregoing, the Trustees concluded that the benefits from the economies of scale are currently being shared equitably by Freedom Funds and the Fund. The Trustees also concluded that the structure of the advisory fee can be expected to cause Freedom Funds, its affiliates and the Fund to continue to share such benefits equitably and that breakpoints need not be instituted at this time.
After requesting and reviewing these and other factors that they deemed relevant, the Trustees concluded that the continuation of the Advisory Agreement was in the best interest of the Fund and its shareholders.
10
Freedom Funds also serves as the transfer agent, shareholder servicing agent and dividend disbursing agent for the Fund, pursuant to a Transfer Agency and Service Agreement (the “Service Agreement”).
Freedom Funds’ duties under the Service Agreement include processing purchase and redemption transactions, establishing and maintaining shareholder accounts and records, disbursing dividends declared by the Fund and all other customary services of a transfer agent, shareholder servicing agent and dividend disbursing agent. As compensation for these services, the Fund may pay Freedom Funds at a rate intended to represent Freedom Funds’ cost of providing such services. This fee would be in addition to the investment advisory fee payable to Freedom Funds under the Advisory Agreement.
11
FUND EXPENSES (unaudited)
The following examples are intended to help you understand the ongoing costs (in dollars) of investing in the Fund and compare these costs with those of other mutual funds. The examples (actual and hypothetical 5% return) are based on an investment of $1,000 made at the beginning of the period shown and held for the entire period.
As a shareholder of Colorado BondShares — A Tax-Exempt Fund (the “Fund’) you can incur two types of costs:
| • | Sales charges (front loads) on fund purchases and |
| • | Ongoing fund costs, including management fees, administrative services, and other fund expenses. All mutual funds have operating expenses. Operating expenses, which are deducted from the Fund’s gross income, directly reduce the investment return of the Fund. |
Actual Fund Expenses
The first line of the table below provides information about actual account values and actual expenses. You may use the information in this line, together with the amount you invested, to estimate the expenses that you paid over the period. Simply divide your account value by $1,000 (for example, an $8,600 account value divided by $1,000 = 8.6), then multiply the result by the number in the first line under the heading entitled “Expenses Paid During Period” to estimate the expenses you paid on your account during this period.
Hypothetical Example for Comparison Purposes
The second line of the table below provides information about hypothetical account values and hypothetical expenses based on the Fund’s actual expense ratio and an assumed rate of return of 5% per year before expenses, which is not the Fund’s actual return. The hypothetical account values and expenses may not be used to estimate the actual ending account balance or expenses you paid for the period. You may use this information to compare the ongoing cost of investing in the Fund and other funds. To do so, compare this 5% hypothetical example with the 5% hypothetical examples that appear in shareholder reports of other funds.
Six Months Ended September 30, 2023
| Colorado BondShares — A Tax- Exempt Fund |
Beginning Account Value 04/01/23 |
Ending Account Value 09/30/23 |
Expenses Paid During Period(1) | ||||||||||||
| Based on Actual Fund Return |
$ | 1,000.00 | $ | 995.21 | $ | 3.05 | |||||||||
| Based on Hypothetical 5% Annual Return Before Expenses |
$ | 1,000.00 | $ | 1,021.95 | $ | 3.09 | |||||||||
| (1) | The expenses shown in this table are equal to the Fund’s annualized expense ratio of 0.61% for fiscal year ended September 30, 2023, multiplied by the average account value over the period, multiplied by 183/365 to reflect the one-half year period. |
Please note that expenses shown in the table are meant to highlight your ongoing costs only and do not reflect any transactional costs, such as sales charges (loads), redemption fees or exchange fees. Therefore, the second line of the table is useful in comparing ongoing costs only, and will not help you determine the relative total costs of owning different funds. In addition, if transactional costs were included, your costs would have been higher. You can find more information about the Fund’s expenses in the Financial Statements section of this report. For additional information on operating costs please see the Fund’s prospectus.
12
Report of Independent Registered Public Accounting Firm
To the Shareholders and Board of Trustees of
Colorado BondShares — A Tax-Exempt Fund
Opinion on the Financial Statements
We have audited the accompanying statement of assets and liabilities, including the schedule of investments, of Colorado BondShares — A Tax-Exempt Fund (the “Fund”) as of September 30, 2023, and the related statement of operations for the year then ended, the statements of changes in net assets for each of the two years ended September 30, 2023 and 2022, and the related notes (collectively referred to as the “financial statements”) and the financial highlights for each of the five years ended September 30, 2023. In our opinion, the financial statements and financial highlights referred to above present fairly, in all material respects, the financial position of Colorado BondShares — A Tax-Exempt Fund as of September 30, 2023, the results of its operations for the year then ended, the changes in net assets for each of the two years ended September 30, 2023 and 2022, and the financial highlights for each of the five years ended September 30, 2023, in conformity with accounting principles generally accepted in the United States of America.
Basis for Opinion
The Fund’s management is responsible for these financial statements and financial highlights. Our responsibility is to express an opinion on the Fund’s financial statements and financial highlights based on our audits. We are a public accounting firm registered with the Public Company Accounting Oversight Board (United States) (“PCAOB”) and are required to be independent with respect to the Fund in accordance with the U.S. federal securities laws and the applicable rules and regulations of the Securities and Exchange Commission and the PCAOB.
We conducted our audits in accordance with the standards of the PCAOB. Those standards require that we plan and perform the audits to obtain reasonable assurance about whether the financial statements are free of material misstatement, whether due to error or fraud. The Fund is not required to have, nor were we engaged to perform, an audit of its internal control over financial reporting. As part of our audits, we are required to obtain an understanding of internal control over financial reporting but not for the purpose of expressing an opinion on the effectiveness of the Fund’s internal control over financial reporting. Accordingly, we express no such opinion.
Our audits included performing procedures to assess the risks of material misstatement of the financial statements and financial highlights, whether due to error or fraud, and performing procedures that respond to those risks. Such procedures included examining, on a test basis, evidence regarding the amounts and disclosures in the financial statements and financial highlights. Our audits also included evaluating the
13
accounting principles used and significant estimates made by management, as well as evaluating the overall presentation of the financial statements and financial highlights. Our procedures included confirmation of securities owned as of September 30, 2023 by correspondence with the custodian and the transfer agent. We believe that our audits provide a reasonable basis for our opinion.

We have served as the Fund’s auditor since 2014.
Grand Rapids, Michigan
November 27, 2023
14
Colorado BondShares
A Tax-Exempt Fund
Schedule of Investments
September 30, 2023
| Colorado Municipal Bonds 67.3% | Maturity |
Coupon |
Principal |
Value |
||||||||||||||
| Colorado 100.0% | ||||||||||||||||||
| Aberdeen MD #1 – Series A – 2035 |
12/1/2035 | 7.50% | $ | 1,600,000 | $ | 476,000 | ||||||||||||
| Anthology West MD #4 – Series A – 2041(g) |
12/15/2041 | 6.25% | 1,100,000 | 977,273 | ||||||||||||||
| Anthology West MD #5 – Series A – 2049 |
12/1/2049 | 4.88% | 4,630,000 | 3,658,533 | ||||||||||||||
| Anthology West MD #5 – Series B – 2049(g) |
12/15/2049 | 7.63% | 698,000 | 607,658 | ||||||||||||||
| Aspen Street MD – Series A – 2050(g) |
12/1/2050 | 5.13% | 4,300,000 | 3,227,322 | ||||||||||||||
| Banning Lewis Ranch Regional MD – Series A – 2048 |
12/1/2048 | 5.38% | 2,500,000 | 2,255,925 | ||||||||||||||
| Banning Lewis Ranch Regional MD – Series B – 2041(g) |
12/15/2041 | 7.75% | 625,000 | 573,775 | ||||||||||||||
| Base Village MD #2 – Series B – 2048(g) |
12/15/2048 | 6.50% | 3,500,000 | 2,223,410 | ||||||||||||||
| Belford North MD – Series A – 2050 |
12/1/2050 | 5.50% | 4,000,000 | 3,352,560 | ||||||||||||||
| Belford North MD – Series B – 2050(g) |
12/15/2050 | 8.50% | 3,475,000 | 3,094,661 | ||||||||||||||
| Bennett Crossing MD #1 – Series A – 2049 |
12/1/2049 | 6.13% | 6,160,000 | 5,636,708 | ||||||||||||||
| Bennett Ranch MD #1 – Series A – 2051 |
12/1/2051 | 5.00% | 3,000,000 | 2,405,430 | ||||||||||||||
| Bennett Ranch MD #1 – Series B – 2051(g) |
12/15/2051 | 7.50% | 1,221,000 | 1,044,553 | ||||||||||||||
| Bent Grass MD – Series A – 2049 |
12/1/2049 | 5.25% | 1,690,000 | 1,473,494 | ||||||||||||||
| Bradburn MD #2 – Series C – 2051(g) |
12/15/2051 | 7.50% | 3,271,000 | 2,789,542 | ||||||||||||||
| Bramming Farm MD #1 – Series A – 2044 |
12/1/2044 | 6.00% | 1,910,000 | 1,731,740 | ||||||||||||||
| Brighton Crossing MD #4 – Series A – 2037 |
12/1/2037 | 5.00% | 1,050,000 | 981,866 | ||||||||||||||
| Brighton Crossing MD #4 – Series A – 2047 |
12/1/2047 | 5.00% | 4,685,000 | 4,103,498 | ||||||||||||||
| Brighton Crossing MD #4 – Series B – 2047(g) |
12/1/2047 | 7.00% | 670,000 | 586,840 | ||||||||||||||
| Brighton Crossing MD #6 – Series A – 2035 |
12/1/2035 | 5.00% | 525,000 | 477,136 | ||||||||||||||
| Brighton Crossing MD #6 – Series A – 2040 |
12/1/2040 | 5.00% | 1,545,000 | 1,321,547 | ||||||||||||||
| Brighton Crossing MD #6 – Series A – 2050 |
12/1/2050 | 5.00% | 9,020,000 | 7,255,417 | ||||||||||||||
| Broomfield Village MD #2 – Series A – 2049 |
12/1/2049 | 5.00% | 1,480,000 | 1,266,688 | ||||||||||||||
| Buckley Yard MD #2 – Series A – 2052 |
12/1/2052 | 6.25% | 6,800,000 | 6,199,900 | ||||||||||||||
| Buckley Yard MD #2 – Series B – 2052(g) |
12/15/2052 | 9.25% | 1,569,000 | 1,471,691 | ||||||||||||||
| Castleview MD #2 – Series A – 2050 |
12/1/2050 | 5.00% | 3,435,000 | 2,770,843 | ||||||||||||||
| Castleview MD #1 – Series A – 2050(g) |
12/1/2050 | 5.00% | 4,727,000 | 3,553,806 | ||||||||||||||
| Cherry Creek South MD #5 – Series A – 2051(g) |
12/1/2051 | 6.00% | 22,500,000 | 17,240,400 | ||||||||||||||
| Cherry Hills City MD – Series A – 2047(g) |
12/1/2047 | 5.00% | 1,380,000 | 1,134,760 | ||||||||||||||
| Cielo MD – Series A – 2050(g) |
12/1/2050 | 5.25% | 12,442,000 | 9,506,683 | ||||||||||||||
| City Center West Residential MD #2 – Series A – 2049 |
12/1/2049 | 5.00% | 2,080,000 | 1,749,155 | ||||||||||||||
| City Center West Residential MD #2 – Series B – |
12/15/2049 | 7.75% | 1,425,000 | 1,244,339 | ||||||||||||||
| Cityset MD #2 – Series A – 2030 |
12/1/2030 | 3.50% | 5,625,000 | 4,838,681 | ||||||||||||||
| Cityset MD #2 – Series A – 2040 |
12/1/2040 | 4.38% | 8,360,000 | 6,824,602 | ||||||||||||||
| Cityset MD #2 – Series A – 2045 |
12/1/2045 | 4.50% | 3,180,000 | 2,510,006 | ||||||||||||||
15
Colorado BondShares
A Tax-Exempt Fund
Schedule of Investments — (Continued)
| Colorado Municipal Bonds (Continued) | Maturity |
Coupon |
Principal |
Value |
||||||||||||||
| Colorado (Continued) | ||||||||||||||||||
| Clear Creek Transit MD #2 – Series A – 2050 |
12/1/2050 | 5.00% | $ | 2,000,000 | $ | 1,617,180 | ||||||||||||
| Cloverleaf MD – Series A – 2051 |
12/1/2051 | 6.00% | 2,330,000 | 2,166,853 | ||||||||||||||
| Cloverleaf MD – Series B – 2051(g) |
12/15/2051 | 9.25% | 1,034,000 | 999,402 | ||||||||||||||
| Colliers Hill MD #3 – Series A – 2040 |
12/1/2040 | 5.25% | 8,300,000 | 7,455,641 | ||||||||||||||
| Colliers Hill MD #3 – Series A – 2048 |
12/1/2048 | 5.50% | 18,250,000 | 16,060,183 | ||||||||||||||
| Colliers Hill MD #3 – Series B – 2043(g) |
12/15/2043 | 8.50% | 2,213,000 | 1,922,610 | ||||||||||||||
| Colorado Centre MD – Series B – 2032(g)(i) |
1/1/2032 | 0.00% | 6,592,306 | 3,427,999 | ||||||||||||||
| Colorado Centre MD – Series A – 2027(e)(i) |
1/1/2027 | 0.00% | 2,074,674 | 1,778,037 | ||||||||||||||
| Colorado Centre MD – Series A – 2027(f)(i) |
1/1/2027 | 9.00% | 2,131,449 | 1,428,071 | ||||||||||||||
| CECFA Swallow Academy – Series A – 2027(m) |
11/15/2027 | 5.35% | 3,245,000 | 3,053,870 | ||||||||||||||
| CECFA Addenbrooke Classical Academy – Series A – 2027(m) |
6/1/2027 | 4.50% | 24,385,000 | 23,561,031 | ||||||||||||||
| CECFA Imagine Charter School at Firestone – Series A – 2027(m) |
6/1/2027 | 4.50% | 17,380,000 | 16,792,730 | ||||||||||||||
| CECFA Monarch Montessori – Series A – 2025(m) |
5/15/2025 | 4.75% | 8,325,000 | 8,068,507 | ||||||||||||||
| CECFA Academy Of Advanced Learning – Series A – 2027(m) |
6/1/2027 | 4.38% | 8,420,000 | 7,809,718 | ||||||||||||||
| CECFA Chavez/Huerta Preparatory – Series A – |
7/1/2027 | 4.38% | 36,520,000 | 34,588,092 | ||||||||||||||
| CECFA Swallows Charter Academy – Series A – |
11/15/2027 | 4.38% | 6,560,000 | 5,953,856 | ||||||||||||||
| CECFA Vanguard Classical School – Series A – |
7/1/2027 | 4.38% | 24,045,000 | 21,998,530 | ||||||||||||||
| CECFA Third Future School – Series A – 2029(m) |
7/1/2029 | 4.25% | 5,645,000 | 4,867,401 | ||||||||||||||
| CECFA Grand Peak Academy – Series A – 2031(m) |
7/1/2031 | 4.00% | 2,150,000 | 1,782,823 | ||||||||||||||
| CECFA Grand Peak Academy – Series A – 2041(m) |
7/1/2041 | 4.25% | 5,040,000 | 3,579,005 | ||||||||||||||
| CECFA Grand Peak Academy – Series A – 2051(m) |
7/1/2051 | 4.50% | 13,070,000 | 8,639,924 | ||||||||||||||
| CECFA Doral Academy – Series A – 2028(m) |
7/15/2028 | 4.50% | 19,405,000 | 17,613,919 | ||||||||||||||
| CECFA Civica Career & Collegiate Academy – Series A – 2029(m) |
7/15/2029 | 4.75% | 7,790,000 | 7,088,121 | ||||||||||||||
| CECFA Chavez/Huerta Academy – Series A – 2027(m) |
7/1/2027 | 4.50% | 8,220,000 | 7,819,193 | ||||||||||||||
| CECFA Mountain Sage Community School – Series A – 2029(m) |
7/1/2029 | 4.75% | 8,760,000 | 8,266,286 | ||||||||||||||
| CECFA Mountain Song Community School – Series A – 2029(m) |
7/1/2029 | 4.75% | 5,810,000 | 5,487,952 | ||||||||||||||
| CECFA CEC / Aurora Charter School – Series A – |
7/1/2032 | 5.00% | 80,470,000 | 75,622,487 | ||||||||||||||
16
Colorado BondShares
A Tax-Exempt Fund
Schedule of Investments — (Continued)
| Colorado Municipal Bonds (Continued) | Maturity |
Coupon |
Principal |
Value |
||||||||||||||
| Colorado (Continued) | ||||||||||||||||||
| CECFA CEC / CSEC BC Project – Series A – 2032(m) |
1/1/2032 | 4.88% | $ | 4,060,000 | $ | 3,825,170 | ||||||||||||
| CECFA CEC / CSEC BC Project – Series A – 2037(m) |
1/1/2037 | 5.00% | 3,595,000 | 3,309,485 | ||||||||||||||
| CECFA CEC / CSEC BC Project – Series A – 2042(m) |
1/1/2042 | 5.13% | 40,335,000 | 36,511,645 | ||||||||||||||
| CECFA Global Village Academy – Senior Bonds – |
6/15/2029 | 5.85% | 11,630,000 | 11,457,643 | ||||||||||||||
| CECFA Fort Collins Montessori School – Series A – 2029(m) |
7/1/2029 | 6.13% | 17,790,000 | 17,728,447 | ||||||||||||||
| Colorado Crossing MD #2 – Series A – 2047 |
12/1/2047 | 5.00% | 4,000,000 | 2,860,080 | ||||||||||||||
| Colorado Crossing MD #2 – Series A – 2050 |
12/1/2050 | 5.00% | 4,000,000 | 2,815,000 | ||||||||||||||
| 700 Kalamath LLC – Series A – 2013(a)(j) |
12/1/2013 | 0.00% | 3,755,000 | 4,000,000 | ||||||||||||||
| CHFA / Casey’s Pond Living – Series A – 2032(l) |
6/1/2032 | 0.00% | 8,110,000 | 4,055,000 | ||||||||||||||
| CHFA / Casey’s Pond Living – Series A – 2042(l) |
6/1/2042 | 0.00% | 10,665,000 | 5,332,500 | ||||||||||||||
| CHFA / Casey’s Pond Living – Series A – 2047(l) |
6/1/2047 | 0.00% | 8,600,000 | 4,300,000 | ||||||||||||||
| Colorado International Center MD #3 – Series A – 2031 |
12/1/2031 | 4.63% | 586,000 | 537,005 | ||||||||||||||
| Conestoga MD #2 – Series A – 2051(g) |
12/1/2051 | 5.25% | 1,625,000 | 1,339,569 | ||||||||||||||
| Conifer MD – Series A – 2030(j) |
12/1/2030 | 0.00% | 10,000,000 | 4,163,366 | ||||||||||||||
| Conifer MD – Series A – 2032(j) |
12/1/2032 | 0.00% | 1,450,000 | 603,688 | ||||||||||||||
| Conifer MD – Series A – 2033(j) |
12/1/2033 | 0.00% | 1,550,000 | 645,322 | ||||||||||||||
| Constitution Heights MD – Series A – 2049 |
12/1/2049 | 5.00% | 1,765,000 | 1,508,581 | ||||||||||||||
| Copperleaf MD #9 – Series A – 2051(g) |
12/1/2051 | 4.88% | 8,175,000 | 5,998,897 | ||||||||||||||
| Country Club Highlands MD – Series A – 2037 |
12/1/2037 | 7.25% | 1,030,000 | 947,600 | ||||||||||||||
| Dacono Urban Renewal Authority – Series A – 2039(g) |
12/1/2039 | 6.25% | 2,969,000 | 2,680,384 | ||||||||||||||
| Dakota Ridge MD – Series A – 2052(g) |
12/1/2052 | 6.00% | 2,339,000 | 1,987,448 | ||||||||||||||
| Deer Creek Villas MD – Series A – 2055 |
12/1/2055 | 5.00% | 6,085,000 | 4,799,422 | ||||||||||||||
| Denver Intl Business Center MD #1 – Series B – 2048(g) |
12/1/2048 | 6.00% | 4,585,000 | 4,327,415 | ||||||||||||||
| Denver West Promenade MD – Series A – 2031 |
12/1/2031 | 5.13% | 500,000 | 482,985 | ||||||||||||||
| Denver West Promenade MD – Series B – 2046(g) |
12/15/2046 | 6.00% | 500,000 | 451,665 | ||||||||||||||
| E86 MD – Series A – 2051(g) |
12/1/2051 | 5.13% | 4,060,000 | 3,126,890 | ||||||||||||||
| Eagle Brook MD – Series A – 2051(g) |
12/1/2051 | 5.00% | 1,600,000 | 1,284,624 | ||||||||||||||
| Erie Highlands MD #2 – Series A – 2048 |
12/1/2048 | 5.25% | 6,000,000 | 5,250,360 | ||||||||||||||
| Erie Highlands MD #2 – Series B – 2048(g) |
12/15/2048 | 7.63% | 1,819,000 | 1,599,247 | ||||||||||||||
| Fitzsimons Village MD #1 – Series A – 2049 |
12/1/2049 | 5.00% | 1,042,000 | 854,325 | ||||||||||||||
| Fitzsimons Village MD #1 – Series B – 2049(g) |
12/15/2049 | 7.00% | 611,000 | 518,953 | ||||||||||||||
| Fitzsimons Village MD #3 – Series A – 2026 |
12/1/2026 | 4.00% | 1,640,000 | 1,530,546 | ||||||||||||||
| Fitzsimons Village MD #3 – Series A – 2031 |
12/1/2031 | 4.00% | 500,000 | 424,210 | ||||||||||||||
| Fitzsimons Village MD #3 – Series A – 2041 |
12/1/2041 | 4.00% | 4,445,000 | 3,144,615 | ||||||||||||||
| Fitzsimons Village MD #3 – Series A – 2055 |
12/1/2055 | 4.25% | 9,660,000 | 6,279,483 | ||||||||||||||
17
Colorado BondShares
A Tax-Exempt Fund
Schedule of Investments — (Continued)
| Colorado Municipal Bonds (Continued) | Maturity |
Coupon |
Principal |
Value |
||||||||||||||
| Colorado (Continued) | ||||||||||||||||||
| Flying Horse MD #2 – Series B – 2050(g)(m) |
12/15/2050 | 7.25% | $ | 15,405,000 | $ | 13,335,492 | ||||||||||||
| Flying Horse MD #3 – Series A – 2049(g) |
12/1/2049 | 6.00% | 2,965,000 | 2,648,842 | ||||||||||||||
| Golden Eagle Acres MD #2 – Series A – 2051(g) |
12/1/2051 | 4.50% | 3,325,000 | 2,341,332 | ||||||||||||||
| Green Gables MD #2 – Series B – 2048(g) |
12/15/2048 | 8.25% | 1,689,000 | 1,528,055 | ||||||||||||||
| Green Valley Ranch East MD #6 – Series A – 2050 |
12/1/2050 | 5.88% | 3,325,000 | 3,045,833 | ||||||||||||||
| Greenspire MD #1 – Series A – 2051 |
12/1/2051 | 5.13% | 1,925,000 | 1,590,185 | ||||||||||||||
| Greenways MD #1 – Series A – 2051(g) |
12/1/2051 | 4.63% | 6,845,000 | 4,532,280 | ||||||||||||||
| Hess Ranch MD #6 – Series A – 2049 |
12/1/2049 | 5.00% | 5,000,000 | 4,126,700 | ||||||||||||||
| Hidden Creek MD – Series A – 2045(g) |
12/1/2045 | 4.63% | 3,430,000 | 2,548,936 | ||||||||||||||
| Highlands Mead MD – Series A – 2050 |
12/1/2050 | 5.13% | 1,395,000 | 1,155,771 | ||||||||||||||
| Hogback MD – Series A – 2041 |
12/1/2041 | 5.00% | 725,000 | 626,531 | ||||||||||||||
| Hogback MD – Series A – 2051 |
12/1/2051 | 5.00% | 1,550,000 | 1,252,834 | ||||||||||||||
| Horizon MD #2 – Series A – 2051(g) |
12/1/2051 | 4.50% | 11,657,000 | 7,632,770 | ||||||||||||||
| Hunter’s Overlook MD #5 – Series B – 2049(g) |
12/15/2049 | 8.50% | 1,827,000 | 1,627,601 | ||||||||||||||
| Hunter’s Overlook MD #7 – Series A – 2051(g) |
12/1/2051 | 5.50% | 3,525,000 | 2,961,247 | ||||||||||||||
| Hyland Village MD – Series A – 2027 |
12/1/2027 | 10.00% | 4,770,000 | 2,623,500 | ||||||||||||||
| Indy Oak Tod MD – Series A – 2050 |
12/1/2050 | 5.50% | 1,075,000 | 1,093,920 | ||||||||||||||
| Indy Oak Tod MD – Series B – 2050(g) |
12/15/2050 | 8.00% | 736,000 | 791,428 | ||||||||||||||
| Inspiration MD – Series B – 2036(g) |
12/15/2036 | 5.00% | 788,000 | 670,359 | ||||||||||||||
| Iron Works Village MD – Series A – 2048 |
12/1/2048 | 5.88% | 1,500,000 | 1,548,780 | ||||||||||||||
| Jay Grove MD – Series A – 2051(g) |
12/1/2051 | 4.25% | 2,450,000 | 1,702,554 | ||||||||||||||
| Jefferson Center MD #1 – Series B – 2050(g) |
12/15/2050 | 5.75% | 14,414,000 | 13,039,769 | ||||||||||||||
| Karl’s Farm MD #2 – Series A – 2040 |
12/1/2040 | 5.38% | 1,155,000 | 1,031,889 | ||||||||||||||
| Karl’s Farm MD #2 – Series A – 2050 |
12/1/2050 | 5.63% | 3,030,000 | 2,627,798 | ||||||||||||||
| The Lakes MD #4 – Series A – 2061(g) |
12/1/2061 | 5.50% | 20,080,000 | 15,317,426 | ||||||||||||||
| Lanterns MD #2 – Series A – 2050(g) |
12/1/2050 | 4.50% | 12,492,000 | 8,490,563 | ||||||||||||||
| Legato Community Authority – Series A – 2036 |
12/1/2036 | 4.00% | 2,130,000 | 1,684,574 | ||||||||||||||
| Legato Community Authority – Series A – 2046 |
12/1/2046 | 5.00% | 1,000,000 | 805,220 | ||||||||||||||
| Legato Community Authority – Series A – 2051 |
12/1/2051 | 5.00% | 2,500,000 | 1,956,500 | ||||||||||||||
| Lincoln Meadows MD – Series A – 2031 |
12/1/2031 | 8.00% | 6,775,000 | 7,039,293 | ||||||||||||||
| Littleton Village MD #2 – Series A – 2045 |
12/1/2045 | 5.38% | 1,624,000 | 1,494,486 | ||||||||||||||
| Littleton Village MD #2 – Series B – 2028(g) |
12/15/2028 | 7.63% | 1,140,000 | 1,103,497 | ||||||||||||||
| Loretto Heights Community Authority – Series A – |
12/1/2051 | 4.88% | 12,750,000 | 9,270,398 | ||||||||||||||
| Marin MD – Series A – 2028(a)(j) |
12/1/2028 | 0.00% | 17,485,000 | 1,573,650 | ||||||||||||||
| Mayfield MD – Series A – 2050 |
12/1/2050 | 5.75% | 1,190,000 | 1,086,875 | ||||||||||||||
| Mayfield MD – Series B – 2050(g) |
12/15/2050 | 8.25% | 622,000 | 566,113 | ||||||||||||||
18
Colorado BondShares
A Tax-Exempt Fund
Schedule of Investments — (Continued)
| Colorado Municipal Bonds (Continued) | Maturity |
Coupon |
Principal |
Value |
||||||||||||||
| Colorado (Continued) | ||||||||||||||||||
| Mayfield MD – Series C – 2050 |
12/15/2050 | 3.00% | $ | 766,000 | $ | 268,667 | ||||||||||||
| Meadows MD #1 – Series A – 2029(k) |
6/1/2029 | 8.00% | 30,730,000 | 29,426,433 | ||||||||||||||
| Meadows MD #2 – Series A – 2029(k) |
6/1/2029 | 8.00% | 23,830,000 | 22,819,131 | ||||||||||||||
| Meadows MD #7 – Series A – 2029(k) |
6/1/2029 | 8.00% | 15,440,000 | 14,785,035 | ||||||||||||||
| Meadowlark MD – Series A – 2040 |
12/1/2040 | 4.88% | 1,045,000 | 868,176 | ||||||||||||||
| Meadowlark MD – Series A – 2050 |
12/1/2050 | 5.13% | 1,505,000 | 1,247,495 | ||||||||||||||
| Mirabelle MD #2 – Series A – 2049 |
12/1/2049 | 5.00% | 1,250,000 | 1,051,838 | ||||||||||||||
| Mirabelle MD #2 – Series B – 2049(g) |
12/15/2049 | 7.38% | 1,473,000 | 1,273,143 | ||||||||||||||
| Monument Junction MD #1 – Series A – 2051(g) |
12/1/2051 | 5.75% | 12,258,000 | 9,935,967 | ||||||||||||||
| Mount Carbon MD – Series C – 2043 |
6/1/2043 | 0.00% | 521,078 | 521,078 | ||||||||||||||
| Mountain Brook MD – Series A – 2051 |
12/1/2051 | 4.75% | 7,740,000 | 5,533,945 | ||||||||||||||
| Mountain Brook MD – Series A – 2041 |
12/1/2041 | 4.50% | 1,000,000 | 761,240 | ||||||||||||||
| Mountain Shadows MD – Series A – 2035 |
12/1/2035 | 5.00% | 500,000 | 467,050 | ||||||||||||||
| Mountain Shadows MD – Series B – 2046(g) |
12/15/2046 | 7.50% | 1,800,000 | 1,602,828 | ||||||||||||||
| Mountain Shadows MD – Series C – 2040(g) |
12/15/2040 | 10.00% | 1,994,000 | 1,835,577 | ||||||||||||||
| Muegge Farms MD #1 – Series A – 2051(g) |
12/1/2051 | 5.00% | 6,300,000 | 4,875,003 | ||||||||||||||
| Muegge Farms MD #3 – Series A – 2051(g) |
12/1/2051 | 5.50% | 10,431,000 | 8,375,884 | ||||||||||||||
| Murphy Creek MD #3 – Series A – 2026 |
12/1/2026 | 6.00% | 2,540,000 | 2,540,000 | ||||||||||||||
| Murphy Creek MD #3 – Series A – 2035 |
12/1/2035 | 6.13% | 1,880,000 | 1,880,000 | ||||||||||||||
| Murphy Creek MD #5 – Series A – 2052 |
12/1/2052 | 6.00% | 2,645,000 | 2,413,245 | ||||||||||||||
| Nine Mile MD – Series A – 2030 |
12/1/2030 | 4.63% | 1,125,000 | 1,036,553 | ||||||||||||||
| Nine Mile MD – Series A – 2040 |
12/1/2040 | 5.13% | 2,500,000 | 2,227,925 | ||||||||||||||
| North Range MD #3 – Series A – 2040 |
12/1/2040 | 5.00% | 2,000,000 | 1,750,400 | ||||||||||||||
| Painted Prairie Improvement Authority – Series A – 2029 |
12/1/2029 | 4.00% | 1,000,000 | 913,620 | ||||||||||||||
| Palisade Park North MD #2 – Series A – 2047 |
12/1/2047 | 5.63% | 1,740,000 | 1,602,610 | ||||||||||||||
| Parkdale Community Authority – Series A – 2040 |
12/1/2040 | 5.00% | 3,140,000 | 2,778,460 | ||||||||||||||
| Parkdale Community Authority – Series A – 2050 |
12/1/2050 | 5.25% | 5,620,000 | 4,710,178 | ||||||||||||||
| Parkdale Community Authority – Series B – |
12/15/2050 | 7.75% | 2,424,000 | 2,111,813 | ||||||||||||||
| Parker Automotive MD – Series A – 2045 |
12/1/2045 | 5.00% | 1,906,000 | 1,680,253 | ||||||||||||||
| Parker Automotive MD – Series B – 2032(g) |
12/15/2032 | 8.00% | 3,785,000 | 3,575,311 | ||||||||||||||
| Pioneer Community Authority – Series B – |
12/15/2050 | 6.75% | 24,592,000 | 21,188,959 | ||||||||||||||
| The Plaza MD #1 – Series A – 2040(m) |
12/1/2040 | 5.00% | 7,850,000 | 7,069,082 | ||||||||||||||
| Powhaton Community Authority – Series A – |
12/1/2051 | 5.00% | 7,450,000 | 5,871,345 | ||||||||||||||
19
Colorado BondShares
A Tax-Exempt Fund
Schedule of Investments — (Continued)
| Colorado Municipal Bonds (Continued) | Maturity |
Coupon |
Principal |
Value |
||||||||||||||
| Colorado (Continued) | ||||||||||||||||||
| Pronghorn Valley MD – Series A – 2041 |
12/1/2041 | 3.75% | $ | 515,000 | $ | 374,663 | ||||||||||||
| Pronghorn Valley MD – Series A – 2051 |
12/1/2051 | 4.00% | 4,400,000 | 3,055,756 | ||||||||||||||
| PFA / Colorado Skies Academy – Series A – |
7/1/2025 | 5.63% | 10,290,000 | 9,940,552 | ||||||||||||||
| PFA / Monument Academy – Series A – 2026(m) |
6/1/2026 | 5.00% | 28,570,000 | 27,535,480 | ||||||||||||||
| Ravenna MD – Series A – 2046 |
12/1/2046 | 5.00% | 33,685,000 | 28,857,940 | ||||||||||||||
| Ravenna MD – Series B – 2056(g) |
12/15/2056 | 7.50% | 8,000,000 | 6,931,200 | ||||||||||||||
| Reata Ridge Village MD #2 – Series A – 2049 |
12/1/2049 | 5.00% | 1,803,000 | 1,542,521 | ||||||||||||||
| Rendezvous MD #4 – Series B – 2048(g) |
10/15/2048 | 8.00% | 1,189,000 | 1,048,044 | ||||||||||||||
| Remuda Ridge MD – Series A – 2051(g) |
12/1/2051 | 5.63% | 5,520,000 | 4,475,892 | ||||||||||||||
| Reserve MD #2 – Series A – 2045 |
12/1/2045 | 5.00% | 500,000 | 433,055 | ||||||||||||||
| Rex Ranch MD – Series B – 2047(g) |
12/15/2047 | 7.88% | 445,000 | 461,349 | ||||||||||||||
| Ritoro MD – Series B – 2049(g) |
12/15/2049 | 8.50% | 2,190,000 | 2,210,805 | ||||||||||||||
| Riverdale Peaks II MD – Series A – 2025 |
12/1/2025 | 6.40% | 930,000 | 762,600 | ||||||||||||||
| Riverdale Peaks II MD – Series A – 2035 |
12/1/2035 | 6.50% | 1,135,000 | 930,700 | ||||||||||||||
| Riverview MD – Series A – 2041 |
12/1/2041 | 5.00% | 1,105,000 | 935,968 | ||||||||||||||
| Riverview MD – Series A – 2051 |
12/1/2051 | 5.00% | 2,075,000 | 1,659,938 | ||||||||||||||
| Rock Creek MD – Series A – 2041 |
12/1/2041 | 4.50% | 2,230,000 | 1,706,062 | ||||||||||||||
| Rock Creek MD – Series A – 2050 |
12/1/2050 | 4.75% | 3,880,000 | 2,788,478 | ||||||||||||||
| Rock Creek MD – Series A – 2031(g) |
12/1/2031 | 4.00% | 3,432,000 | 2,943,420 | ||||||||||||||
| Rose Hill Acres MD – Series A – 2050 |
12/1/2050 | 5.00% | 2,990,000 | 2,453,863 | ||||||||||||||
| Rose Hill Acres MD – Series B – 2050(g) |
12/15/2050 | 8.75% | 910,000 | 812,566 | ||||||||||||||
| Roxborough Village MD – Series A – 2042(f)(i) |
12/31/2042 | 0.00% | 242,645 | 26,691 | ||||||||||||||
| RRC MD #2 – Series A – 2051(g) |
12/1/2051 | 5.25% | 5,625,000 | 4,432,275 | ||||||||||||||
| Sabell MD – Series A – 2050(g) |
12/1/2050 | 5.00% | 1,055,000 | 868,107 | ||||||||||||||
| Sabell MD – Series B – 2050(g) |
12/15/2050 | 8.25% | 605,000 | 534,929 | ||||||||||||||
| Silver Peaks East MD – Series A – 2051(g) |
12/1/2051 | 5.00% | 5,410,000 | 4,190,261 | ||||||||||||||
| 64th Avenue ARI Authority – Series A – 2043(g) |
12/1/2043 | 6.50% | 5,000,000 | 4,537,850 | ||||||||||||||
| Solitude MD – Series A – 2026(j) |
12/1/2026 | 7.00% | 3,520,000 | 2,486,263 | ||||||||||||||
| Southglenn MD – Series A – 2030 |
12/1/2030 | 5.00% | 2,285,000 | 2,216,381 | ||||||||||||||
| Southglenn MD – Series A – 2046 |
12/1/2046 | 5.00% | 2,100,000 | 1,819,965 | ||||||||||||||
| Southlands MD #1 – Series A – 2037 |
12/1/2037 | 5.00% | 500,000 | 468,615 | ||||||||||||||
| Southlands MD #1 – Series A – 2047 |
12/1/2047 | 5.00% | 3,000,000 | 2,633,460 | ||||||||||||||
| Southshore MD #2 – Series B – 2041(g) |
12/15/2041 | 4.13% | 9,690,000 | 8,824,295 | ||||||||||||||
| Spring Hill MD #3 – Series A – 2052 |
12/1/2052 | 6.75% | 10,305,000 | 9,947,932 | ||||||||||||||
| Spring Valley MD #4 – Series A – 2040 |
12/1/2040 | 5.00% | 1,410,000 | 1,217,944 | ||||||||||||||
| Spring Valley MD #4 – Series A – 2050 |
12/1/2050 | 5.12% | 1,775,000 | 1,430,987 | ||||||||||||||
20
Colorado BondShares
A Tax-Exempt Fund
Schedule of Investments — (Continued)
| Colorado Municipal Bonds (Continued) | Maturity |
Coupon |
Principal |
Value |
||||||||||||||
| Colorado (Continued) | ||||||||||||||||||
| Spring Valley MD #4 – Series B – 2050(g) |
12/15/2050 | 7.63% | $ | 2,811,000 | $ | 2,408,437 | ||||||||||||
| St Vrain Lakes MD #2 – Series A – 2037 |
12/1/2037 | 5.00% | 4,000,000 | 3,726,320 | ||||||||||||||
| St Vrain Lakes MD #2 – Series A – 2047 |
12/1/2047 | 5.13% | 3,050,000 | 2,690,314 | ||||||||||||||
| St Vrain Lakes MD #2 – Series B – 2047(g) |
12/15/2047 | 7.63% | 1,083,000 | 1,017,164 | ||||||||||||||
| STC MD #2 – Series A – 2025 |
12/1/2025 | 3.00% | 555,000 | 525,602 | ||||||||||||||
| STC MD #2 – Series A – 2029 |
12/1/2029 | 4.00% | 1,615,000 | 1,466,759 | ||||||||||||||
| STC MD #2 – Series A – 2038 |
12/1/2038 | 5.00% | 15,160,000 | 13,425,241 | ||||||||||||||
| STC MD #2 – Series B – 2049(g) |
12/15/2049 | 8.00% | 3,954,000 | 3,490,908 | ||||||||||||||
| Sterling Ranch MD #2 – Series A – 2032 |
12/1/2032 | 5.25% | 1,340,000 | 1,275,332 | ||||||||||||||
| Sterling Ranch MD #2 – Series A – 2042 |
12/1/2042 | 5.50% | 5,645,000 | 5,146,490 | ||||||||||||||
| Sterling Ranch MD #2 – Series A – 2051 |
12/1/2051 | 5.75% | 11,750,000 | 10,616,478 | ||||||||||||||
| Stetson Ridge MD #3 – Series B – 2042(g)(m) |
12/15/2042 | 7.50% | 301,000 | 265,687 | ||||||||||||||
| Stone Ridge MD #2 – Series A – 2031 |
12/1/2031 | 0.00% | 11,896,000 | 1,903,360 | ||||||||||||||
| Tallyn’s Reach MD #3 – Series A – 2038 |
11/1/2038 | 5.13% | 2,070,000 | 2,072,650 | ||||||||||||||
| Third Creek MD #1 – Series A – 2037 |
12/1/2037 | 4.50% | 1,130,000 | 924,329 | ||||||||||||||
| Third Creek MD #1 – Series A – 2042 |
12/1/2042 | 4.50% | 3,140,000 | 2,376,635 | ||||||||||||||
| Third Creek MD #1 – Series A – 2051 |
12/1/2051 | 4.75% | 7,390,000 | 5,318,953 | ||||||||||||||
| Thompson Crossing MD #4 – Series A – 2039 |
12/1/2039 | 5.00% | 1,410,000 | 1,273,399 | ||||||||||||||
| Thompson Crossing MD #4 – Series A – 2049 |
12/1/2049 | 5.00% | 1,315,000 | 1,089,806 | ||||||||||||||
| Trails At Crowfoot MD #3 – Series B – 2049(g) |
12/15/2049 | 9.00% | 3,135,000 | 2,817,613 | ||||||||||||||
| Valagua MD – Series A – 2037 |
12/1/2037 | 0.00% | 11,500,000 | 2,300,000 | ||||||||||||||
| Villages At Murphy Creek MD #1 – Series A – 2051(g) |
12/1/2051 | 5.50% | 12,358,000 | 9,836,474 | ||||||||||||||
| Vincent Village MD – Series A – 2051 |
12/1/2051 | 5.00% | 1,970,000 | 1,552,242 | ||||||||||||||
| Waterfall MD #1 – Series A – 2052 |
12/1/2052 | 5.25% | 2,295,000 | 1,961,468 | ||||||||||||||
| Westcreek MD #2 – Series A – 2048 |
12/1/2048 | 5.38% | 1,300,000 | 1,152,866 | ||||||||||||||
| Westerly MD #4 – Series A – 2031 |
12/1/2031 | 4.13% | 600,000 | 519,414 | ||||||||||||||
| Westerly MD #4 – Series A – 2040 |
12/1/2040 | 5.00% | 2,255,000 | 1,958,513 | ||||||||||||||
| Westerly MD #4 – Series A – 2050 |
12/1/2050 | 5.00% | 5,250,000 | 4,222,943 | ||||||||||||||
| White Buffalo MD #3 – Series A – 2050 |
12/1/2050 | 5.50% | 4,780,000 | 4,145,885 | ||||||||||||||
| Wild Plum MD – Series A – 2049 |
12/1/2049 | 5.00% | 595,000 | 617,069 | ||||||||||||||
| Willow Springs MD – Series B – 2049(g) |
12/15/2049 | 7.75% | 650,000 | 564,779 | ||||||||||||||
| Woodmen Heights MD #2 – Series B – 2040(g) |
12/15/2040 | 7.50% | 3,358,000 | 2,963,166 | ||||||||||||||
| Wyndham Hill MD #2 – Series B – 2049(g) |
12/15/2049 | 7.63% | 9,600,000 | 8,476,992 | ||||||||||||||
|
|
|
|
|
|||||||||||||||
| Colorado (amortized cost $1,254,667,894) |
1,330,071,152 | 1,107,768,764 | ||||||||||||||||
|
|
|
|
|
|||||||||||||||
| Colorado Municipal Bonds |
$ | 1,330,071,152 | $ | 1,107,768,764 | ||||||||||||||
|
|
|
|
|
|||||||||||||||
21
Colorado BondShares
A Tax-Exempt Fund
Schedule of Investments — (Continued)
| Short-Term Municipal Bonds 5.5% | Maturity |
Coupon |
Principal |
Value |
||||||||||||||
| Colorado 73.9% | ||||||||||||||||||
| Boulder Housing Authority / Broadway East – Series A – 2037(LOC 1) |
9/1/2037 | 4.03% | $ | 1,440,000 | $ | 1,440,000 | ||||||||||||
| Boulder College of Massage – Series A – |
10/15/2031 | 0.00% | 4,315,000 | 2,337,500 | ||||||||||||||
| Broomfield URA / Event Center – Series A – 2030(LOC 2) |
12/1/2030 | 3.95% | 7,185,000 | 7,185,000 | ||||||||||||||
| CHFA / Ready Foods – Series A – 2032(LOC 1) |
1/1/2032 | 4.03% | 4,470,000 | 4,470,000 | ||||||||||||||
| Colorado Springs Utilities – Series A – |
11/1/2041 | 4.05% | 1,100,000 | 1,100,000 | ||||||||||||||
| ECCV Water & Sanitation District – Series A – 2023(c) |
11/15/2023 | 5.00% | 1,011,000 | 1,009,686 | ||||||||||||||
| Jeffco Business Center MD #1 – Series A – |
5/1/2024 | 8.00% | 1,006,000 | 1,013,564 | ||||||||||||||
| Ravenna MD – Series A CABs – 2023(d) |
12/1/2023 | 5.00% | 325,000 | 321,805 | ||||||||||||||
| Rockinghorse MD #2 – Series A CABs – 2024 |
1/1/2024 | 6.00% | 3,565,000 | 3,580,579 | ||||||||||||||
| Rockinghorse MD #2 – Series B – 2024 |
1/1/2024 | 6.50% | 3,885,000 | 3,906,134 | ||||||||||||||
| Inspiration MD – Series C CABs – 2024(b) |
6/1/2024 | 5.00% | 1,115,000 | 1,109,960 | ||||||||||||||
| Sheridan Redevelopment Agency / Santa Fe – |
12/1/2029 | 4.00% | 39,195,000 | 39,195,000 | ||||||||||||||
|
|
|
|
|
|||||||||||||||
| Colorado (amortized cost $68,195,833) |
68,612,000 | 66,669,228 | ||||||||||||||||
|
|
|
|
|
|||||||||||||||
| Multi-State 18.0% | ||||||||||||||||||
| Freddie Mac VR – 2045(LOC 4) |
12/15/2045 | 4.01% | 16,280,000 | 16,280,000 | ||||||||||||||
|
|
|
|
|
|||||||||||||||
| Multi-State (amortized cost $16,280,000) |
16,280,000 | 16,280,000 | ||||||||||||||||
|
|
|
|
|
|||||||||||||||
| Oregon 6.4% | ||||||||||||||||||
| Multnomah County Hospital – Series A – 2023(m) |
10/1/2024 | 5.45% | 5,815,000 | 5,815,000 | ||||||||||||||
|
|
|
|
|
|||||||||||||||
| Oregon (amortized cost $5,815,000) |
5,815,000 | 5,815,000 | ||||||||||||||||
|
|
|
|
|
|||||||||||||||
| South Dakota 1.0% | ||||||||||||||||||
| Flandreau Santee Sioux Tribe / Gaming – Series A – 2024(m) |
1/1/2024 | 8.28% | 950,000 | 940,918 | ||||||||||||||
|
|
|
|
|
|||||||||||||||
| South Dakota (amortized cost $950,000) |
950,000 | 940,918 | ||||||||||||||||
|
|
|
|
|
|||||||||||||||
| Oklahoma 0.5% | ||||||||||||||||||
| Haskell County Public Facilities – Series B – |
4/1/2024 | 5.25% | 450,000 | 447,282 | ||||||||||||||
|
|
|
|
|
|||||||||||||||
| Oklahoma (amortized cost $450,000) |
450,000 | 447,282 | ||||||||||||||||
|
|
|
|
|
|||||||||||||||
22
Colorado BondShares
A Tax-Exempt Fund
Schedule of Investments — (Continued)
| Short-Term Municipal Bonds (Continued) | Maturity |
Coupon |
Principal |
Value |
||||||||||||||
| Puerto Rico 0.1% | ||||||||||||||||||
| Puerto Rico – Series A – 2024 |
7/1/2024 | 3.20% | $ | 15,095 | $ | 14,582 | ||||||||||||
| Puerto Rico / Sales Tax – Series A – 2024 |
7/1/2024 | 4.79% | 55,000 | 53,244 | ||||||||||||||
|
|
|
|
|
|||||||||||||||
| Puerto Rico (amortized cost $66,645) |
70,095 | 67,826 | ||||||||||||||||
|
|
|
|
|
|||||||||||||||
| Short-Term Municipal Bonds |
$ | 92,177,095 | $ | 90,220,254 | ||||||||||||||
|
|
|
|
|
|||||||||||||||
| Other Municipal Bonds 5.1% | ||||||||||||||||||
| South Dakota 86.9% | ||||||||||||||||||
| Flandreau Santee Sioux Tribe / Healthcare – Series A – 2036(m) |
1/1/2036 | 5.75% | $ | 6,055,000 | $ | 4,424,207 | ||||||||||||
| Flandreau Santee Sioux Tribe / Healthcare – Series A – 2026(m) |
1/1/2026 | 5.00% | 1,740,000 | 1,620,010 | ||||||||||||||
| Flandreau Santee Sioux Tribe / Healthcare – Series A – 2031(m) |
1/1/2031 | 5.50% | 3,565,000 | 2,886,188 | ||||||||||||||
| Flandreau Santee Sioux Tribe / Gaming – Series B – 2038(g)(m) |
1/1/2038 | 6.00% | 6,120,000 | 5,000,040 | ||||||||||||||
| Flandreau Santee Sioux Tribe / Gaming – Series C – 2038(m) |
1/1/2038 | 6.00% | 5,450,000 | 4,452,650 | ||||||||||||||
| Flandreau Santee Sioux Tribe / Gaming – Series A – 2025(m) |
1/1/2025 | 8.28% | 1,030,000 | 989,027 | ||||||||||||||
| Flandreau Santee Sioux Tribe / Gaming – Series A – 2026(m) |
1/1/2026 | 8.28% | 1,115,000 | 1,050,464 | ||||||||||||||
| Flandreau Santee Sioux Tribe / Gaming – Series A – 2027(m) |
1/1/2027 | 8.28% | 1,205,000 | 1,121,771 | ||||||||||||||
| Flandreau Santee Sioux Tribe / Gaming – Series A – 2028(m) |
1/1/2028 | 8.28% | 1,305,000 | 1,204,228 | ||||||||||||||
| Flandreau Santee Sioux Tribe / Gaming – Series A – 2033(m) |
1/1/2033 | 8.28% | 8,670,000 | 7,774,649 | ||||||||||||||
| Flandreau Santee Sioux Tribe / Healthcare NH – Series A – 2025(m) |
7/1/2025 | 5.75% | 740,000 | 707,085 | ||||||||||||||
| Flandreau Santee Sioux Tribe / Healthcare NH – Series A – 2026(m) |
7/1/2026 | 5.75% | 785,000 | 735,930 | ||||||||||||||
| Flandreau Santee Sioux Tribe / Healthcare NH – Series A – 2027(m) |
7/1/2027 | 5.75% | 830,000 | 761,965 | ||||||||||||||
| Flandreau Santee Sioux Tribe / Healthcare NH – Series A – 2028(m) |
7/1/2028 | 5.75% | 875,000 | 789,163 | ||||||||||||||
| Flandreau Santee Sioux Tribe / Healthcare NH – Series A – 2029(m) |
7/1/2029 | 5.75% | 930,000 | 823,655 | ||||||||||||||
23
Colorado BondShares
A Tax-Exempt Fund
Schedule of Investments — (Continued)
| Other Municipal Bonds (Continued) | Maturity |
Coupon |
Principal |
Value |
||||||||||||||
| South Dakota (Continued) | ||||||||||||||||||
| Flandreau Santee Sioux Tribe / Healthcare NH – Series A – 2030(m) |
7/1/2030 | 5.75% | $ | 980,000 | $ | 853,247 | ||||||||||||
| Flandreau Santee Sioux Tribe / Healthcare NH – Series A – 2031(m) |
7/1/2031 | 5.75% | 1,040,000 | 891,124 | ||||||||||||||
| Flandreau Santee Sioux Tribe / Healthcare NH – Series A – 2032(m) |
7/1/2032 | 5.75% | 1,095,000 | 923,698 | ||||||||||||||
| Flandreau Santee Sioux Tribe / Healthcare NH – Series A – 2033(m) |
7/1/2033 | 5.75% | 1,160,000 | 964,865 | ||||||||||||||
| Flandreau Santee Sioux Tribe / Healthcare NH – Series A – 2034(m) |
7/1/2034 | 5.75% | 1,225,000 | 1,005,627 | ||||||||||||||
| Flandreau Santee Sioux Tribe / Healthcare NH – Series A – 2035(m) |
7/1/2035 | 5.75% | 1,300,000 | 1,054,170 | ||||||||||||||
| Flandreau Santee Sioux Tribe / Healthcare NH – Series A – 2040(m) |
7/1/2040 | 6.00% | 7,730,000 | 5,991,368 | ||||||||||||||
| Flandreau Santee Sioux Tribe / Healthcare NH – Series A – 2045(m) |
7/1/2045 | 6.25% | 10,395,000 | 7,844,899 | ||||||||||||||
| Lower Brule Sioux Tribe – Series A – 2025(m) |
3/1/2025 | 5.88% | 945,000 | 892,449 | ||||||||||||||
| Oglala Sioux Tribe / Healthcare – Series A – |
7/1/2028 | 5.50% | 2,200,000 | 1,995,004 | ||||||||||||||
| Oglala Sioux Tribe / Healthcare – Series A – |
7/1/2037 | 6.00% | 9,270,000 | 7,204,088 | ||||||||||||||
| Oglala Sioux Tribe / Healthcare – Series B – |
9/1/2041 | 6.50% | 5,880,000 | 4,592,633 | ||||||||||||||
| Oglala Sioux Tribe – Series A – 2024(m) |
10/1/2024 | 5.50% | 1,985,000 | 1,946,908 | ||||||||||||||
| Oglala Sioux Tribe – Series C – 2026(m) |
10/1/2026 | 8.00% | 800,000 | 770,280 | ||||||||||||||
| Oglala Sioux Tribe – Series A – 2027(m) |
10/1/2027 | 4.50% | 2,370,000 | 2,130,772 | ||||||||||||||
|
|
|
|
|
|||||||||||||||
| South Dakota (amortized cost $88,786,301) |
88,790,000 | 73,402,160 | ||||||||||||||||
|
|
|
|
|
|||||||||||||||
| Puerto Rico 10.6% | ||||||||||||||||||
| Puerto Rico – Series A – 2025 |
7/1/2025 | 5.38% | 103,109 | 104,168 | ||||||||||||||
| Puerto Rico – Series A – 2027 |
7/1/2027 | 5.63% | 102,175 | 104,848 | ||||||||||||||
| Puerto Rico – Series A – 2029 |
7/1/2029 | 5.63% | 100,517 | 103,865 | ||||||||||||||
| Puerto Rico – Series A – 2031 |
7/1/2031 | 5.75% | 97,632 | 101,959 | ||||||||||||||
| Puerto Rico – Series A – 2033 |
7/1/2033 | 4.00% | 92,580 | 82,982 | ||||||||||||||
| Puerto Rico – Series A – 2035 |
7/1/2035 | 4.00% | 83,217 | 72,320 | ||||||||||||||
| Puerto Rico – Series A – 2037 |
7/1/2037 | 4.00% | 71,422 | 59,954 | ||||||||||||||
| Puerto Rico – Series A – 2041 |
7/1/2041 | 4.00% | 97,107 | 78,075 | ||||||||||||||
| Puerto Rico – Series A – 2046 |
7/1/2046 | 4.00% | 100,990 | 77,861 | ||||||||||||||
24
Colorado BondShares
A Tax-Exempt Fund
Schedule of Investments — (Continued)
| Other Municipal Bonds (Continued) | Maturity |
Coupon |
Principal |
Value |
||||||||||||||
| Puerto Rico (Continued) | ||||||||||||||||||
| Puerto Rico – Series A – 2033 |
7/1/2033 | 4.64% | $ | 119,142 | $ | 70,219 | ||||||||||||
| Puerto Rico – Series A – 2043 |
7/1/2043 | 3.00% | 438,347 | 227,392 | ||||||||||||||
| Puerto Rico / Sales Tax – Series A – 2034 |
7/1/2034 | 4.50% | 277,000 | 266,668 | ||||||||||||||
| Puerto Rico / Sales Tax – Series A – 2040 |
7/1/2040 | 4.55% | 140,000 | 128,811 | ||||||||||||||
| Puerto Rico / Sales Tax – Series A – 2053 |
7/1/2053 | 4.75% | 1,028,000 | 908,814 | ||||||||||||||
| Puerto Rico / Sales Tax – Series A – 2058 |
7/1/2058 | 5.00% | 2,600,000 | 2,351,908 | ||||||||||||||
| Puerto Rico / Sales Tax – Series A – 2027 |
7/1/2027 | 4.41% | 267,000 | 227,348 | ||||||||||||||
| Puerto Rico / Sales Tax – Series A – 2029 |
7/1/2029 | 4.69% | 260,000 | 202,160 | ||||||||||||||
| Puerto Rico / Sales Tax – Series A – 2031 |
7/1/2031 | 4.96% | 336,000 | 238,032 | ||||||||||||||
| Puerto Rico / Sales Tax – Series A – 2033 |
7/1/2033 | 5.20% | 378,000 | 242,204 | ||||||||||||||
| Puerto Rico / Sales Tax – Series A – 2046 |
7/1/2046 | 5.97% | 3,597,000 | 927,271 | ||||||||||||||
| Puerto Rico / Sales Tax – Series A – 2051 |
7/1/2051 | 6.02% | 2,930,000 | 542,812 | ||||||||||||||
| Puerto Rico / Sales Tax – Series A – 2040 |
7/1/2040 | 4.33% | 1,424,000 | 1,275,420 | ||||||||||||||
| Puerto Rico / Sales Tax – Series A – 2053 |
7/1/2053 | 4.54% | 43,000 | 36,680 | ||||||||||||||
| Puerto Rico / Sales Tax – Series A – 2058 |
7/1/2058 | 4.78% | 571,000 | 498,392 | ||||||||||||||
|
|
|
|
|
|||||||||||||||
| Puerto Rico (amortized cost $8,923,830) |
15,257,238 | 8,930,162 | ||||||||||||||||
|
|
|
|
|
|||||||||||||||
| Washington 2.2% | ||||||||||||||||||
| Tacoma / Local Improvement District #65 – Series A – 2043 |
4/1/2043 | 5.75% | 2,040,000 | 1,860,174 | ||||||||||||||
|
|
|
|
|
|||||||||||||||
| Washington (amortized cost $1,910,174) |
2,040,000 | 1,860,174 | ||||||||||||||||
|
|
|
|
|
|||||||||||||||
| California 0.3% | ||||||||||||||||||
| Freddie Mac – 2035(g)(j) |
8/15/2035 | 6.50% | 261,537 | 273,893 | ||||||||||||||
|
|
|
|
|
|||||||||||||||
| California (amortized cost $261,537) |
261,537 | 273,893 | ||||||||||||||||
|
|
|
|
|
|||||||||||||||
| Other Municipal Bonds (amortized cost $99,881,842) |
$ | 106,348,775 | $ | 84,466,389 | ||||||||||||||
|
|
|
|
|
|||||||||||||||
| Colorado Capital Appreciation and Zero Coupon Bonds 1.7% | ||||||||||||||||||
| Colorado 100.0% | ||||||||||||||||||
| Bella Mesa MD – Series A CABs – 2049(m) |
12/1/2049 | 6.75% | $ | 7,565,000 | $ | 6,258,373 | ||||||||||||
| Colorado International Center MD #7 – Series A CABs – 2027 |
12/1/2027 | 5.25% | 21,285,000 | 11,017,967 | ||||||||||||||
| Conifer MD – Series B – 2031(a)(j) |
12/1/2031 | 0.00% | 7,470,000 | 2,239,428 | ||||||||||||||
| PV ERU Holding Trust – Series A CABs – 2039(a)(j)(m) |
2/14/2039 | 0.00% | 710,000 | 149,100 | ||||||||||||||
| PV ERU Holding Trust – Series A CABs – 2039(a)(j)(m) |
2/14/2039 | 0.00% | 3,122,000 | 655,620 | ||||||||||||||
| PV ERU Holding Trust – Series A CABs – 2039(a)(j)(m) |
2/14/2039 | 0.00% | 13,168,000 | 2,765,280 | ||||||||||||||
25
Colorado BondShares
A Tax-Exempt Fund
Schedule of Investments — (Continued)
| Colorado Capital Appreciation and Zero Coupon Bonds (Continued) |
Maturity |
Coupon |
Principal |
Value |
||||||||||||||||
| Colorado (Continued) | ||||||||||||||||||||
| PV ERU Holding Trust – Series A CABs – 2039(a)(j)(m) |
|
12/15/2037 | 0.00% | $ | 14,000,000 | $ | 2,940,000 | |||||||||||||
| Ravenna MD – Series A CABs – 2024(d) |
|
12/1/2024 | 5.00% | 490,000 | 456,567 | |||||||||||||||
| Ravenna MD – Series A CABs – 2025(d) |
|
12/1/2025 | 5.00% | 585,000 | 512,577 | |||||||||||||||
| Third Creek MD #1 – Series A CABs – 2026 |
|
12/1/2026 | 5.25% | 2,285,000 | 1,378,381 | |||||||||||||||
| Westerly MD #4 – Series A CABs – 2050 |
|
12/1/2026 | 5.20% | 1,000,000 | 638,310 | |||||||||||||||
|
|
|
|
|
|||||||||||||||||
| Colorado (amortized cost $42,895,928) |
|
71,680,000 | 29,011,604 | |||||||||||||||||
|
|
|
|
|
|||||||||||||||||
| Colorado Capital Appreciation and Zero Coupon Bonds (amortized cost $42,895,928) |
|
$ | 71,680,000 | $ | 29,011,604 | |||||||||||||||
|
|
|
|
|
|||||||||||||||||
| Colorado Taxable Certificates/Notes/Bonds 0.5% | ||||||||||||||||||||
| Colorado 100.0% | ||||||||||||||||||||
| Colliers Hill MD #2 / Taxable – Series B – 2047(g) |
|
12/15/2047 | 6.00% | $ | 2,250,000 | $ | 1,991,858 | |||||||||||||
| CECFA CEC / Aurora Charter School / Taxable – Series B – 2029(m) |
|
7/1/2029 | 6.00% | 2,270,000 | 2,150,961 | |||||||||||||||
| CECFA CEC / Aurora Charter School / Taxable – Series A – 2031(m) |
|
7/1/2031 | 6.13% | 1,960,000 | 1,787,932 | |||||||||||||||
| Woodmen Heights MD #2 / Taxable – Series B – 2040(g) |
|
12/15/2040 | 6.25% | 1,804,000 | 1,595,385 | |||||||||||||||
| Tabernash Pole Creek Note – 2022(a)(j) |
|
12/31/2023 | 0.00% | 227,347 | 200,000 | |||||||||||||||
|
|
|
|
|
|||||||||||||||||
| Colorado (amortized cost $8,511,347) |
|
8,511,347 | 7,726,136 | |||||||||||||||||
|
|
|
|
|
|||||||||||||||||
| Colorado Taxable Certificates/Notes/Bonds |
|
$ | 8,511,347 | $ | 7,726,136 | |||||||||||||||
|
|
|
|
|
|||||||||||||||||
| Total investments, at value |
80.1% | $ | 1,319,193,147 | |||||||||||||||||
| Other assets net of liabilities |
19.9% | 326,983,905 | ||||||||||||||||||
|
|
|
|
|
|||||||||||||||||
| Net Assets |
100.0% | $ | 1,646,177,052 | |||||||||||||||||
|
|
|
|
|
|||||||||||||||||
26
Colorado BondShares
A Tax-Exempt Fund
Schedule of Investments — (Continued)
| (a) | Defaulted or non-income producing based upon the financial condition of the issuer (see note 2 in notes to financial statements). |
| (b) | Originally issued as general obligation bonds but are now pre-refunded and are secured by an escrow fund consisting entirely of direct U.S. Government obligations. |
| (c) | Represents securities whose blended characteristics are reflective of a zero coupon bond and a step rate bond. Interest rate shown represents effective yield at acquisition. |
| (d) | Interest rate shown for capital appreciation and zero coupon bonds represents the effective yield at the date of acquisition. |
| (e) | Principal-only certificate represents the right to receive the principal payments on the underlying debt security upon maturity. The price of this security is typically more volatile than that of coupon-bearing bonds of the same maturity. |
| (f) | Interest-only certificate represents the right to receive semi-annual interest payments on the underlying debt security. The principal amount of the underlying security represents the notional amount on which current interest is calculated. The interest rate shown represents the effective yield at the date of acquisition. |
| (g) | Interest rate disclosed for cash flow bond represents the effective yield at September 30, 2023. Income on this security is derived from the cash flow of the issuer. |
| (h) | Represents current interest rate for a step rate bond. No step rate bonds were owned by the Fund at September 30, 2023. |
| (i) | Terms of security have been restructured since the original issuance. The total face amount of all such restructured securities approximates $11,041,074 and a value of $6,660,798 or less than 1.0% of net assets, as of September 30, 2023. |
| (j) | Securities valued at fair value (see note 2 in notes to financial statements). |
| (k) | See note 7 in notes to financial statements for further information on purchase accrued interest related to these bonds. |
| (l) | The Fund has entered into a forbearance agreement under which it agrees that the issuer may pay a reduced rate of interest in lieu of the contract rate for a period of time (see note 2 in notes to financial statements). |
| (m) | Security exempt from registration under Rule 144A of the Securities Act of 1933. Such securities may be sold in transactions exempt from registration, normally to qualified institutional buyers. At September 30, 2023, the aggregate value was $490,437,471 representing 29.79% of net assets. |
See accompanying notes to financial statements.
27
Colorado BondShares
A Tax-Exempt Fund
Schedule of Investments — (Continued)
| (LOC) | These securities are Variable Rate Demand Obligations (“VRDO”) with scheduled principal and interest payments that have a guaranteed liquidity provider in the form of a letter of credit. These obligations bear interest at a rate that resets daily or weekly (see note 2 in notes to financial statements). The numbered list below corresponds to the liquidity provider associated with the respective LOC. |
1. US Bank, N.A.
2. BNP Paribas
3. JP Morgan Chase Bank N.A.
4. Freddie Mac
The following abbreviations are used in the descriptions of securities included in the Schedule of Investments:
CABs — Capital Appreciation Bonds
CONV — Convertible
I/O — Interest Only
L/D — Local Improvement District
MD — Metropolitan District
P/O — Principal Only
See accompanying notes to financial statements.
28
Colorado BondShares
A Tax-Exempt Fund
Statement of Assets and Liabilities
September 30, 2023
| ASSETS |
| |||
| Investments, at value (amortized cost 1,497,714,489) |
$ | 1,319,193,147 | ||
| — see accompanying schedule |
||||
| Cash |
76,849,731 | |||
| Interest receivable |
163,660,222 | |||
| Purchase accrued interest (note 7) |
92,156,671 | |||
| Receivable for shares of beneficial interest sold |
116,795 | |||
|
|
|
|||
| TOTAL ASSETS |
1,651,976,566 | |||
|
|
|
|||
| LIABILITIES |
| |||
| Payables and other liabilities: |
||||
| Dividends payable |
4,193,684 | |||
| Payable for shares of beneficial interest redeemed |
38,010 | |||
| Management fees payable |
688,877 | |||
| Accrued expenses payable |
878,943 | |||
|
|
|
|||
| TOTAL LIABILITIES |
5,799,514 | |||
|
|
|
|||
| NET ASSETS |
$ | 1,646,177,052 | ||
|
|
|
|||
| COMPOSITION OF NET ASSETS |
||||
| Paid-in capital |
$ | 1,822,853,769 | ||
| Accumulated net realized gain |
1,844,625 | |||
| Net unrealized depreciation of investments |
(178,521,342 | ) | ||
|
|
|
|||
| NET ASSETS |
$ | 1,646,177,052 | ||
|
|
|
|||
| NET ASSET PRICE AND REDEMPTION PRICE PER SHARE |
$ | 8.41 | ||
|
|
|
|||
| MAXIMUM OFFERING PRICE PER SHARE |
$ | 8.83 | ||
|
|
|
|||
See accompanying notes to financial statements.
29
Colorado BondShares
A Tax-Exempt Fund
Statement of Operations
For the Fiscal Year Ended September 30, 2023
| INVESTMENT INCOME |
| |||
| Interest |
$ | 94,853,382 | ||
| EXPENSES |
| |||
| Management fees (note 4) |
8,489,161 | |||
| Custodian fees (note 5) |
111,212 | |||
| Legal and auditing fees |
790,278 | |||
| Portfolio pricing fees |
65,677 | |||
| Registration fees |
44,917 | |||
| Shareholders’ reports |
99,305 | |||
| Transfer agency expenses (note 4) |
320,392 | |||
| Trustees’ fees |
12,045 | |||
| Other |
532,287 | |||
|
|
|
|||
| Total expenses |
10,465,274 | |||
| Custody credits (note 5) |
(84,260 | ) | ||
|
|
|
|||
| Net expenses |
10,381,014 | |||
|
|
|
|||
| NET INVESTMENT INCOME |
84,472,368 | |||
|
|
|
|||
| REALIZED AND UNREALIZED GAIN ON INVESTMENTS |
| |||
| Net realized gain on investments |
948,317 | |||
| Net unrealized appreciation (depreciation) on investments |
(15,174,705 | ) | ||
|
|
|
|||
| NET REALIZED AND UNREALIZED GAIN (LOSS) ON INVESTMENTS |
(14,226,388 | ) | ||
|
|
|
|||
| NET INCREASE (DECREASE) IN NET ASSETS RESULTING FROM OPERATIONS |
$ | 70,245,980 | ||
|
|
|
|||
See accompanying notes to financial statements.
30
Colorado BondShares
A Tax-Exempt Fund
Statements of Changes in Net Assets
For the Fiscal Year Ended September 30
| 2023 | 2022 | |||||||
| FROM OPERATIONS: |
||||||||
| Net investment income |
$ | 84,472,368 | $ | 70,666,017 | ||||
| Net realized gain on investments |
948,317 | 3,609,083 | ||||||
| Unrealized appreciation (depreciation) on investments |
(15,174,705 | ) | (177,996,082 | ) | ||||
|
|
|
|
|
|||||
| Net increase (decrease) in net assets resulting from operations |
70,245,980 | (103,720,982 | ) | |||||
|
|
|
|
|
|||||
| FROM DISTRIBUTIONS TO SHAREHOLDERS: (note 2) |
||||||||
| Dividends to shareholders from net investment income |
(84,472,368 | ) | (70,666,017 | ) | ||||
| Net realized gain to shareholders from investment transactions |
(3,499,687 | ) | (1,463,919 | ) | ||||
|
|
|
|
|
|||||
| Total distributions to shareholders |
(87,972,055 | ) | (72,129,936 | ) | ||||
|
|
|
|
|
|||||
| FROM BENEFICIAL INTEREST TRANSACTIONS: |
||||||||
| Proceeds from sale of shares |
114,662,292 | 199,577,871 | ||||||
| Reinvested dividends and distributions |
60,880,851 | 51,464,533 | ||||||
| Redemption of shares |
(187,309,859 | ) | (167,665,085 | ) | ||||
|
|
|
|
|
|||||
| Increase (decrease) in net assets derived from beneficial interest transactions |
(11,766,716 | ) | 83,377,319 | |||||
|
|
|
|
|
|||||
| Net increase (decrease) in net assets |
(29,492,791 | ) | (92,473,599 | ) | ||||
| NET ASSETS: |
||||||||
| Beginning of period |
1,675,669,843 | 1,768,143,442 | ||||||
|
|
|
|
|
|||||
| End of period |
$ | 1,646,177,052 | $ | 1,675,669,843 | ||||
|
|
|
|
|
|||||
See accompanying notes to financial statements.
31
Colorado BondShares
A Tax-Exempt Fund
Financial Highlights
The financial highlights table is intended to help you understand the Fund’s financial performance. Certain information reflects financial results for a single Fund share. The total returns in the table represent the rate that an investor would have earned (or lost) on an investment in the Fund (assuming reinvestment of all dividends and distributions). Sales charges are not reflected in the total returns.
| For the Fiscal Year Ended September 30 | ||||||||||||||||||||
| For a share outstanding throughout the period | 2023 | 2022 | 2021 | 2020 | 2019 | |||||||||||||||
| Net asset value, beginning of period |
$ | 8.50 | $ | 9.39 | $ | 9.22 | $ | 9.25 | $ | 9.13 | ||||||||||
|
|
|
|
|
|
|
|
|
|
|
|||||||||||
| Income From Investment Operations |
||||||||||||||||||||
| Net investment income(1) |
0.43 | 0.37 | 0.37 | 0.37 | 0.37 | |||||||||||||||
| Net gain or (loss) on investments (both realized and unrealized) |
(0.07 | ) | (0.88 | ) | 0.19 | (0.03 | ) | 0.17 | ||||||||||||
|
|
|
|
|
|
|
|
|
|
|
|||||||||||
| Increase (decrease) from investment operations |
0.36 | (0.51 | ) | 0.56 | 0.34 | 0.54 | ||||||||||||||
| Less Distributions |
||||||||||||||||||||
| Dividends to shareholders from net investment income |
(0.43 | ) | (0.37 | ) | (0.37 | ) | (0.37 | ) | (0.37 | ) | ||||||||||
| Distributions from realized capital gains |
$ | (0.02 | ) | $ | (0.01 | ) | $ | (0.02 | ) | $ | — | $ | (0.05 | ) | ||||||
|
|
|
|
|
|
|
|
|
|
|
|||||||||||
| Total Distributions |
(0.45 | ) | (0.38 | ) | (0.39 | ) | (0.37 | ) | (0.42 | ) | ||||||||||
|
|
|
|
|
|
|
|
|
|
|
|||||||||||
| Net increase (decrease) in net asset value |
(0.09 | ) | (0.89 | ) | 0.17 | (0.03 | ) | 0.12 | ||||||||||||
|
|
|
|
|
|
|
|
|
|
|
|||||||||||
| Net Asset Value, end of period |
$ | 8.41 | $ | 8.50 | $ | 9.39 | $ | 9.22 | $ | 9.25 | ||||||||||
|
|
|
|
|
|
|
|
|
|
|
|||||||||||
| Total Return, at Net Asset Value(2) |
4.21 | % | -5.72 | % | 5.91 | % | 3.83 | % | 6.09 | % | ||||||||||
|
|
|
|
|
|
|
|
|
|
|
|||||||||||
| Ratios/Supplemental Data: |
||||||||||||||||||||
| Ratios to average net assets: |
||||||||||||||||||||
| Net investment income |
4.99 | % | 4.01 | % | 3.92 | % | 4.02 | % | 4.02 | % | ||||||||||
| Total expenses |
0.61 | % | 0.55 | % | 0.61 | % | 0.58 | % | 0.55 | % | ||||||||||
| Net expenses |
0.61 | % | 0.55 | % | 0.61 | % | 0.57 | % | 0.55 | % | ||||||||||
| Net assets, end of period (000s) |
$ | 1,646,177 | $ | 1,675,670 | $ | 1,768,143 | $ | 1,494,477 | $ | 1,422,697 | ||||||||||
|
|
|
|
|
|
|
|
|
|
|
|||||||||||
| Portfolio turnover rate(3) |
6.23 | % | 9.94 | % | 10.66 | % | 22.54 | % | 9.62 | % | ||||||||||
|
|
|
|
|
|
|
|
|
|
|
|||||||||||
| (1) | Net investment income per share was calculated using an average shares method. |
| (2) | Assumes a hypothetical initial investment on the business day before the first day of the fiscal period, with all dividends reinvested in additional shares on the reinvestment date, and redemption at the net asset value calculated on the last business day of the fiscal period. Sales charges are not reflected in the total returns. |
| (3) | The portfolio turnover rate is computed by dividing the lesser of purchases or sales of portfolio securities for a period by the monthly average of the value of portfolio securities owned during the period. Sales of securities include the proceeds of securities that have been called or for which payment has been made through redemption or maturity. Securities with a maturity date of one year or less at the time of acquisition are excluded from the calculation. Cost of purchases and proceeds from sales of investment securities (excluding short-term securities) for the period ended September 30, 2023 were $88,771,672 and $79,459,008 respectively. |
See accompanying notes to financial statements.
32
Colorado BondShares
A Tax-Exempt Fund
Notes to Financial Statements
| (1) | Organization |
Colorado BondShares — A Tax-Exempt Fund (the “Fund”) is registered under the Investment Company Act of 1940, as amended, as a diversified, open-end management company. The Fund’s investment objectives are to maximize income exempt from federal income taxes and from personal income taxes of the State of Colorado to the extent consistent with the preservation of capital and to seek opportunities for capital appreciation. The Fund’s investment adviser is Freedom Funds Management Company (“Freedom Funds”).
| (2) | Summary of Significant Accounting Policies |
These financial statements have been prepared in conformity with accounting principles generally accepted in the United States of America. This requires management to make estimates and assumptions that affect the reported amounts of assets and liabilities and disclosure of contingent assets and liabilities at the date of the financial statements and the reported amounts of income and expenses during the reporting period. Actual results could differ from those estimates. These financial statements reflect all adjustments which are, in the opinion of management, necessary to a fair statement of financial position and results of operations for the reporting period. The following summarizes the significant accounting policies of the Fund:
| (a) | Investment Valuation and Risk |
The fair value of securities for which there is no last sales price is determined either by an independent pricing service or management, considering market transactions and dealer quotes of comparable securities as well as proprietary pricing models.
Securities for which market quotations are not readily available (or management considers otherwise are no longer valid or reliable) are valued at fair value determined in accordance with procedures approved by the Board of Trustees. This can occur in the event of, among other things, natural disasters, acts of terrorism, market disruptions, intra-day trading halts, and extreme market volatility. The determination of fair value involves subjective judgments. As a result, using fair value to price a security may result in a price materially different from the prices used by other mutual funds to determine net asset value or the price that may be realized upon the actual sale of the security. Short-term holdings are valued at current market quotations or amortized cost, whichever management believes best approximates fair value.
Fixed-income securities owned by the Fund are subject to interest-rate risk, credit risk, prepayment risk and market risk. The Fund invests in non-rated securities which may be subject to a greater degree of credit risk and risk of loss of income and principal and may be more sensitive to economic conditions than lower yielding, higher rated fixed income securities. The Fund concentrates its investments in Colorado and, therefore, may be impacted by specific events, issuers or factors affecting Colorado. The Fund has more credit risk related to the economic conditions of Colorado than a portfolio with a broader geographical
33
Colorado BondShares
A Tax-Exempt Fund
Notes to Financial Statements — (Continued)
diversification. The Fund concentrates its investments in and the majority of the Fund’s shareholders are located within Colorado and, therefore, may be impacted by specific events, issuers or factors affecting Colorado. The Company does not have any significant concentrations within any one shareholder.
Accounting Standards Codification (“ASC”) 820 Fair Value Measurements and Disclosures establishes a fair value hierarchy that classifies securities based on valuation techniques used to measure fair value and distinguish between observable inputs (market data obtained from independent sources) and the reporting entities own assumptions, which are not readily observable to market participants. The fair value hierarchy gives the highest priority to quoted prices (unadjusted) in active markets for identical assets or liabilities (Level 1) and the lowest priority to unobservable inputs (Level 3).
Level 1 Inputs: Quoted prices (unadjusted) in active markets for identical assets or liabilities that the reporting entity has the ability to access at the measurement date.
Level 2 Inputs: Inputs other than quoted prices included within Level 1 that are observable for the asset or liability, either directly or indirectly. If the asset or liability has a specified (contractual) term, a Level 2 input must be observable for substantially the full term of the asset or liability.
Level 3 Inputs: Significant unobservable inputs for the asset or liability including management’s own assumptions. Unobservable inputs shall be used to measure fair value to the extent that observable inputs are not available.
The following table summarizes the valuation of the Fund’s investments as defined by ASC 820 hierarchy levels as of September 30, 2023:
Valuation Inputs Summary
| Colorado Municipal Bonds |
Short-Term Municipal Bonds |
Other Municipal Bonds |
Colorado Capital Appreciation and Zero Coupon Bonds |
Colorado Taxable Certificates/ Notes/ Bonds |
Total Securities September 30, 2023 |
|||||||||||||||||||
| Level 1 Securities |
$ | — | $ | — | $ | — | $ | — | $ | — | $ | — | ||||||||||||
| Level 2 Securities |
1,094,296,475 | 86,869,190 | 84,192,496 | 20,262,176 | 7,526,136 | 1,293,146,473 | ||||||||||||||||||
| Level 3 Securities |
13,472,289 | 3,351,064 | 273,893 | 8,749,428 | 200,000 | 26,046,674 | ||||||||||||||||||
|
|
|
|
|
|
|
|
|
|
|
|
|
|||||||||||||
| Totals |
$ | 1,107,768,764 | $ | 90,220,254 | $ | 84,466,389 | $ | 29,011,604 | $ | 7,726,136 | $ | 1,319,193,147 | ||||||||||||
|
|
|
|
|
|
|
|
|
|
|
|
|
|||||||||||||
34
Colorado BondShares
A Tax-Exempt Fund
Notes to Financial Statements — (Continued)
| Colorado Municipal Bonds |
Short-Term Municipal Bonds |
Other Municipal Bonds |
Colorado Capital Appreciation and Zero Coupon Bonds |
Colorado Taxable Certificates/ Notes/Bonds |
Totals | |||||||||||||||||||
| Level 3 Beginning Balance September 30, 2022 |
$ | 7,616,650 | $ | 5,321,000 | $ | 273,160 | $ | 2,988,000 | $ | 88,199 | $ | 16,287,009 | ||||||||||||
| Unrealized Losses |
— | (1,977,500 | ) | — | (748,572 | ) | — | (2,726,072 | ) | |||||||||||||||
| Unrealized Gains |
655,639 | 7,564 | 12,356 | — | 111,801 | 787,359 | ||||||||||||||||||
| Realized Losses |
— | — | — | — | — | — | ||||||||||||||||||
| Realized Gains |
— | — | — | — | — | — | ||||||||||||||||||
| Purchases |
— | — | — | — | — | — | ||||||||||||||||||
| Sales |
— | — | (11,623 | ) | — | — | (11,623 | ) | ||||||||||||||||
| Transfers In to Level 3* |
5,200,000 | — | — | 6,510,000 | — | 11,710,000 | ||||||||||||||||||
| Transfers Out of Level 3* |
— | — | — | — | — | — | ||||||||||||||||||
|
|
|
|
|
|
|
|
|
|
|
|
|
|||||||||||||
| Balance as of September 30, 2023 |
$ | 13,472,289 | $ | 3,351,064 | $ | 273,893 | $ | 8,749,428 | $ | 200,000 | $ | 26,046,674 | ||||||||||||
|
|
|
|
|
|
|
|
|
|
|
|
|
|||||||||||||
* Transfers from Level 2 to Level 3 are because of a lack, or change of observable inputs or reduced market data reliability. Transfers from Level 3 to Level 2 are the result of observable inputs becoming available or increased market data reliability. The Fund’s policy is to recognize transfers into and out of Level 3 when management becomes aware of a change to significant observable input or market data reliability.
From September 30, 2022 to September 30, 2023, there were no Level 1 Securities.
Significant Unobservable Inputs Quantitative Disclosure
| Level 3 Securities* |
Fair Value as of September 30, 2023 |
Valuation |
Unobservable |
Low | High | Weighted Average |
||||||||||||||
| Colorado Municipal Bonds |
$ | 13,472,289 | discounted cash flow | probability of default | 5.00% | 100.00% | 33.21% | |||||||||||||
| consensus pricing | Bond Dealer #1 | 9.00% | 106.53% | 62.44% | ||||||||||||||||
| Short-Term Municipal Bonds |
3,351,064 | discounted cash flow | probability of default | 5.00% | 106.53% | 6.51% | ||||||||||||||
| consensus pricing | Bond Dealer #1 | 55.00% | 100.75% | 68.84% | ||||||||||||||||
| Other Municipal Bonds |
273,893 | discounted cash flow | probability of default | 1.00% | 1.00% | 1.00% | ||||||||||||||
| consensus pricing | Bond Dealer #1 | 104.72% | 104.72% | 104.72% | ||||||||||||||||
| Colorado Capital Appreciation and Zero Coupon Bonds |
8,749,428 | discounted cash flow | probability of default | 5.00% | 100.00% | 98.38% | ||||||||||||||
| consensus pricing | Bond Dealer #1 | 21.00% | 29.98% | 23.30% | ||||||||||||||||
| Colorado Taxable Certificates/Notes/Bonds |
200,000 | discounted cash flow | probability of default | 100.00% | 100.00% | 100.00% | ||||||||||||||
| consensus pricing | Bond Dealer #1 | 87.97% | 87.97% | 87.97% | ||||||||||||||||
|
|
|
|||||||||||||||||||
| Total Level 3 Securities at September 30, 2023 |
$ | 26,046,674 | ||||||||||||||||||
|
|
|
|||||||||||||||||||
35
Colorado BondShares
A Tax-Exempt Fund
Notes to Financial Statements — (Continued)
The significant unobservable inputs used in the fair value measurement of the Fund’s securities are collateral value, probability of default, and loss severity in the event of default. Any changes in unobservable inputs may result in substantial changes to fair value measurements.
* The inputs for these securities are not readily available or cannot be reasonably estimated and are generally those inputs described in Note 2(a). The appropriateness of fair values for these securities is based on results of back testing, broker due diligence, unchanged price review and consideration of macro or security specific events.
** Other unobservable inputs used in the discounted cash flow technique include collateral value and loss severity. These unobservable inputs are specific to the characteristics of each security being valued.
| (b) | Cash |
The Fund continually monitors its positions with, and the credit quality of, the financial institutions with which it invests. As of September 30, 2023, and periodically throughout the year, the Fund has maintained balances in various operating accounts in excess of federally insured limits. The Fund’s balances are covered up to $250,000 per institution.
| (c) | Income Tax Information and Distributions to Shareholders |
The Fund intends to comply with the requirements of Subchapter M of the Internal Revenue Code, as amended, applicable to regulated investment companies and to distribute all its net investment income and any net realized gain on investments not offset by capital loss carryforwards to shareholders. The Fund distributes investment income monthly and due to the tax-exempt nature of its investments, the income is generally non-taxable to the shareholders. The Fund distributes net realized capital gains, if any, to its shareholders at least annually. Income distributions and capital gain distributions are determined in accordance with income tax regulations, which may differ from generally accepted accounting principles. These differences are primarily due to the differing treatment of tax allocations.
Management has reviewed the Fund’s tax position for all open tax years. As of September 30, 2023, the Fund did not have a liability for any unrecognized tax obligations. The Fund recognizes interest and penalties, if any, related to unrecognized tax obligations as income tax expense in the Statement of Operations. The Fund has no examinations in progress.
The tax components of undistributed net tax-exempt income, net ordinary income and net long-term capital gains were as follows during the Fund’s tax years ended September 30, 2023 and September 30, 2022:
| 2023 | 2022 | |||||||
| Undistributed net tax-exempt income |
$ | — | $ | — | ||||
| Undistributed net ordinary income* |
426,088 | 26,286 | ||||||
| Undistributed net long-term capital gain |
455,824 | 3,460,617 | ||||||
* Net ordinary income consists of taxable market discount income and net short-term capital gains, if any.
36
Colorado BondShares
A Tax-Exempt Fund
Notes to Financial Statements — (Continued)
The tax character of distributions paid during the Fund’s tax years ended September 30, 2023 and September 30, 2022 was designated for purposes of the dividends paid deduction as follows:
| 2023 | 2022 | |||||||
| Distributions from net tax-exempt income* |
$ | 81,646,609 | $ | 68,586,926 | ||||
| Distributions from net ordinary income** |
1,655,012 | 1,800,941 | ||||||
| Distributions from net long-term capital gain |
3,460,620 | 1,329,417 | ||||||
* The Fund hereby designates this amount paid during the fiscal year ended September 30, 2023, as Exempt Interest Dividends.
** Net ordinary income consists of taxable market discount income, taxable interest income and net short-term gains, if any.
At September 30, 2023, the cost and unrealized appreciation (depreciation) of investments, as determined on a federal income tax basis, were as follows:
| Cost of investments |
$ | 1,497,714,489 | ||
|
|
|
|||
| Gross unrealized appreciation |
$ | 10,400,234 | ||
| Gross unrealized depreciation |
(188,921,576 | ) | ||
|
|
|
|||
| Net unrealized appreciation (depreciation) of investments |
$ | (178,521,342 | ) | |
|
|
|
For tax purposes, capital losses may be carried over to offset future capital gains, if any. Under the Regulated Investment Company Modernization Act of 2010, capital losses incurred by the Fund in taxable years beginning after December 22, 2010 are not subject to expiration and such losses retain their character as either short-term or long-term, rather than being considered short-term as under previous law. Post-enactment capital losses must be fully utilized prior to utilizing any losses incurred in pre-enactment tax years. At September 30, 2023, the Fund did not have any capital loss carryforwards.
| (d) | Defaulted or Non-income Producing Investments |
The Fund discontinues the accrual of interest income on municipal bonds when the securities become delinquent as to payment of principal or interest, or when the Fund’s investment adviser determines that an uncertainty exists as to the realization of all or a portion of the principal balance. The face amount of bonds for which the accrual of interest income has been discontinued approximates $64,252,347 and such bonds have a value of $16,860,578 or 1.02% of net assets, as of September 30, 2023. These securities have been identified in the accompanying Schedule of Investments.
The Fund has entered into forbearance agreements with one district under which it agrees that the issuer may pay a reduced rate of interest in lieu of the contract rate for a period of time. Face amount of the bonds for which the Fund has entered into forbearance agreements total $27,375,000 and have a value of $13,687,500 or 0.83% of net assets, as of September 30, 2023. These securities have been identified in the Schedule of Investments.
37
Colorado BondShares
A Tax-Exempt Fund
Notes to Financial Statements — (Continued)
| (e) | Investment Transactions and Revenue Recognition |
Investment transactions are accounted for on the date the investments are purchased or sold (trade date). Purchases and sales of securities, other than short-term securities, aggregated to $88,771,672 and $79,459,008 respectively.
Dividends to shareholders are declared each business day and paid monthly. Distributions to shareholders are recorded on the ex-dividend date. Realized gains and losses from investment transactions are calculated using the identified-cost basis, which is the same basis the Fund uses for federal income tax purposes. Interest income is recorded on the accrual basis.
Variable Rate Demand Obligations (“VRDO”) purchased by the Fund are floating rate obligations that have a nominal long-term maturity but have a coupon rate that is reset periodically (e.g., daily or weekly). The investor has the option to put the issue back to the trustee or tender agent at any time with specified (e.g., seven days) notice; accordingly the Fund treats these obligations as short-term holdings. On September 30, 2023, the interest rates paid on these obligations ranged from 3.95% to 4.05%.
| (f) | Classification of Distributions to Shareholders |
The character of distributions made during the year from net investment income or net realized gains may differ from its ultimate characterization for federal income tax purposes. Also, due to timing of dividend distributions, the fiscal year in which amounts are distributed may differ from the fiscal year in which the income or realized gain was recorded by the Fund.
| (g) | Securities Purchased on a When-Issued Basis |
The Fund may purchase securities on a when-issued basis with payment and delivery scheduled for a future date. These transactions are subject to market fluctuations and may increase or decrease in value prior to the delivery date. The Fund maintains segregated assets with a value equal to or greater than the amount of its purchase commitments. The Fund did not have any when-issued securities at September 30, 2023.
38
Colorado BondShares
A Tax-Exempt Fund
Notes to Financial Statements — (Continued)
| (3) | Shares of Beneficial Interest |
The Fund has an unlimited number of no par value shares of beneficial interest authorized. Transactions in shares of beneficial interest were as follows:
| Years Ended September 30, | ||||||||||||||||
| 2023 | 2022 | |||||||||||||||
| Shares | Amount | Shares | Amount | |||||||||||||
| Shares sold |
13,268,616 | $ | 114,662,292 | 21,909,934 | $ | 199,577,871 | ||||||||||
| Dividends reinvested |
7,036,312 | 60,878,716 | 5,699,446 | 51,464,533 | ||||||||||||
|
|
|
|
|
|
|
|
|
|||||||||
| 20,304,928 | 175,541,008 | 27,609,380 | 251,042,404 | |||||||||||||
| Shares redeemed |
(21,751,488 | ) | (187,307,725 | ) | (18,689,664 | ) | (167,665,085 | ) | ||||||||
|
|
|
|
|
|
|
|
|
|||||||||
| Net increase (decrease) in shares outstanding |
(1,446,560 | ) | $ | (11,766,717 | ) | 8,919,716 | $ | 83,377,319 | ||||||||
|
|
|
|
|
|
|
|
|
|||||||||
| (4) | Management Fees and Other Transactions with Affiliates |
Management fees paid to Freedom Funds were in accordance with the investment advisory agreement with the Fund which provides for an annual fee equivalent to 0.5% of the net assets of the Fund. Freedom Funds pays all expense associated with advertising, marketing, and distributing the Fund’s shares and serves as the transfer agent, dividend disbursing agent, and registrar for the Fund. Freedom Funds provided certain transfer agency and shareholder services as part of the management fee arrangement for the period ended September 30, 2023. Transfer agency expenses on the Statement of Operations represent direct expenses charged to the Fund by third parties.
Crest Insurance, an affiliate of the investment adviser, acted as agent for the Fidelity Bond and the Errors and Omissions insurance policy maintained by the Fund and as a result received compensation in the form of commissions. The policies were provided by Traveler’s Insurance Company and all the commissions referred to above were paid by Travelers. Crest Insurance received no compensation directly from the assets of the Fund.
The Fund does not have any Trustees who are affiliated with the Adviser or Distributor. The Board of Trustees appointed a Chief Compliance Officer to the Fund in accordance with federal securities regulations. The Fund does not reimburse the Adviser for any compensation or fees associated with the Chief Compliance Officer.
| (5) | Custody Credits |
Expenses paid indirectly by the Fund represent earnings credits on cash balances maintained with the Fund’s custodian bank, UMB Bank, N.A. The earnings credits resulted in offsetting custodian fees of $84,260 for the period ended September 30, 2023.
39
Colorado BondShares
A Tax-Exempt Fund
Notes to Financial Statements — (Continued)
| (6) | Indemnification |
From time to time the Fund may be involved in certain disputes and legal actions arising in the ordinary course of its business. While it is not feasible to predict or determine the outcome of these proceedings, in management’s opinion, based on a review with legal counsel, none of these disputes and legal actions is expected to have a material impact on its financial position or results of operations. However, litigation is subject to inherent uncertainties, and an adverse result in these matters may arise from time to time that may harm the Fund’s business.
In the normal course of business, the Fund enters into contracts that contain a variety of representations which provide general indemnifications. The Fund’s maximum exposure under these arrangements is unknown, as this would involve future claims that may be made against the Fund that have not yet occurred. However, based on experience, the Fund expects the risk of loss to be remote.
| (7) | Purchase Accrued Interest |
Purchase accrued interest is typically a component of a municipal bond purchase and is paid on settlement date. The accrual period begins on the last interest payment date (or original issue date) and runs through the day immediately preceding the settlement date. The Fund has purchased three bonds from the Meadows Metropolitan Districts No. 1, 2 and 7 with an aggregate balance of purchase accrued of $90,436,317 (98.1% of the September 30, 2023 balance of $92,156,671). Approximately $235,826,455 of additional interest has accrued on the purchase accrued interest since its purchase in 2007. This additional accrued interest has been fair valued in accordance with ASC 820 at approximately $93,329,792 and is included in other assets net of liabilities in the Schedule of Investments. This amount bears interest at the rate of 7.999% and will be received over an uncertain period of years. The value of the Meadows bonds is contained within three separate line items of the financial statements which all relate to a single set of bonds that cannot be sold separately.
| (8) | Litigation |
The Fund is periodically involved in various legal proceedings. As of September 30, 2023, the Fund has a litigation payable of $486,757 for all pending litigation matters primarily for the purpose of paying lawyer fees. Possible additional amounts cannot be currently estimated but will be set aside as needed. Although there can be no assurances, based on information available, management believes that it is probable that the ultimate outcome of the action described below and other matters that are pending or threatened will not have a material effect on the Fund’s financial condition.
| (a) | Marin Metropolitan District LTD Tax G.O. Series 2008 Bond |
The Fund is the beneficial owner of bonds issued in 2008 (the “Bonds”) by Marin Metropolitan District (the “District”) as described more fully in the Fund’s most recent schedule of portfolio holdings for the period ended June 30,2023, on Form NPORT-EX filed with the Securities and Exchange Commission (“SEC”) on August 29, 2023. The Bonds were issued in 2008 pursuant to a trust indenture (the “Trust Indenture”)
40
Colorado BondShares
A Tax-Exempt Fund
Notes to Financial Statements — (Continued)
between the District, as issuer and UMB Bank, N.A. (“UMB”), as trustee (the “Trustee”). The original principal amount of Bonds was $30,485,000. The current principal amount of the Bond s is $17,485,000. The valuation of these Bonds as of September 30, 2023 is set forth in the schedule of investments.
On about June 24, 2022, the District filed an Amended Complaint for Declaratory and Injunctive Relief (the “Complaint”) against the Fund and the Trustee with the District Court, Arapahoe County, Colorado (the “Court”). The Complaint also names Century at Landmark, LLC, a Colorado limited liability company (“Century”) as an “Interested Party” in the Complaint on the grounds that Century is the owner of the real property remaining in the District. In the Complaint, the District has asserted a single claim for relief for declaratory judgment. In essence, based on the rulings in Landmark Towers Association, Inc. v. UMB Bank, N.A. and Colorado BondShares (District Court, Arapahoe County, Colorado Case No. 11CV1076) (the “Landmark Litigation”), the District has requested that the Court declare that the Fund and the Trustee cannot compel the District to impose a tax levy on Century’s parcel of real property within the District and that, further, the Court enjoin the Fund and the Trustee from attempting to compel the District to impose the Required Mill Levy on Century’s parcel of real property within the District. In response, the Fund and the Trustee filed Amended Counterclaims for breach of the District’s resolution authorizing public debt in accordance with, and as required by, the Colorado Constitution (the “Bond Resolution”), declaratory judgment for breach of the Bond Resolution, declaratory judgment that the District has violated Colo. Const. art. XI, section 6 and the Bond Resolution, breach of the Trust Indenture, declaratory judgment that the District has violated the Trust Indenture, promissory estoppel and unjust enrichment (the “Counterclaims”). The Counterclaims seek a judgment in the full amount due and owing on the Bonds with accrued interest along with a declaration that the District is obligated to impose the Required Mill Levy under the terms of the Trust Indenture.
The District filed two motions for summary judgment on the claims in the Complaint and the Counterclaims (“MSJ”). The Fund and UMB opposed the District’s MSJ and filed a cross motion for summary judgment (“Cross MSJ”). The Court denied the District’s MSJ, except it held that the Landmark Litigation was binding on the parties on the issue that the Required Mill Levy approved and imposed by the District was a special assessment and restricted the Fund and UMB from presenting evidence to the contrary at trial. The Court also denied the Cross MSJ.
The Court has scheduled a trial on all remaining issues presented in the Complaint and the Counterclaims on October 16, 2023. At this point, it is impossible to determine the direction, cost, duration, or ultimate outcome of these matters.
| (9) | Subsequent Events |
Management has evaluated the possibility of subsequent events in the Fund’s financial statements through the date of issuance. Management has determined that there are no material events that would require disclosure in the Fund’s financial statements through this date.
41
(This page intentionally left blank)
(This page intentionally left blank)

A Tax-Exempt Fund
ANNUAL REPORT
September 30, 2023
(a) The registrant, as of the end of the period covered by this report, has adopted a code of ethics (as defined in Item 2 of Form N-CSR), that applies to its President (Principal Executive Officer) and Treasurer (Principal Financial Officer).
(c) There have been no amendments to the code of ethics during the period covered by this report.
(d) The registrant has not granted, during the period covered by this report, any waivers, including an implicit waiver, from the code of ethics.
(f)(3) A copy of the registrant’s code of ethics is available upon request and without charge by calling or writing the registrant at 1200 Seventeenth Street, Suite 850, Denver, Colorado 80202, telephone (303) 572-6990 or (800) 572-0069 (outside Denver).
ITEM 3. AUDIT COMMITTEE FINANCIAL EXPERT.
(a) The registrant’s board of trustees has determined that the registrant does not have an “audit committee financial expert” as such term is defined by the Securities and Exchange Commission pursuant to Item 3 of Form N-CSR, as no single individual appears to meet all of the independence and the financial training/experience qualifications outlined in the instructions to Form N-CSR. The board of trustees, which serves as the audit committee, has determined that it collectively has experience evaluating financial statements and understanding internal control over financial reporting and the audit committee function and has sufficient financial expertise to adequately perform its duties without the addition of an expert.
ITEM 4. PRINCIPAL ACCOUNTANT FEES AND SERVICES.
The following table shows the amount of fees and reimbursable expenses that Plante & Moran, PLLC, the registrant’s independent registered public accounting firm, billed to the registrant during the registrant’s last two fiscal years. For the reporting periods, the audit committee approved in advance all services that Plante & Moran, PLLC provided to the registrant.
The aggregate fees billed by the registrant’s independent registered public accounting firm, for professional services in the registrant’s fiscal years ended September 30, 2023 and 2022 are as follows:
| 2023 | 2022 | |||||||
| (a) Audit Fees |
$ | 131,250 | $ | 125,000 | ||||
| (b) Audit-Related Fees |
$ | 0 | $ | 0 | ||||
| (c) Tax Fees |
$ | 0 | $ | 0 | ||||
| (d) All Other Fees |
$ | 0 | $ | 0 | ||||
The above “Audit Fees” were billed for amounts related to the audit of the registrant’s financial statements and services normally provided by the accountant in connection with statutory and regulatory filings.
(e)(1) The board of trustees serves as the audit committee and pre-approves all audit and non-audit services to be provided by the registrant’s independent registered public accounting firm.
(e)(2) Not applicable.
(f) Not applicable.
(g) No non-audit fees were billed by the registrant’s independent registered public accounting firm for services rendered to the registrant and the registrant’s investment adviser and any entity controlling, controlled by, or under common control with the adviser that provides ongoing services to the registrant for the fiscal years ended September 30, 2023 and 2022.
(h) The registrant’s independent registered public accounting firm did not provide any non-audit services to the registrant in the registrant’s fiscal years ended September 30, 2023 and 2022.
ITEM 5. AUDIT COMMITTEE OF LISTED REGISTRANTS.
Not applicable.
(a) Please see the Schedule of Investments contained in the Annual Report included under Item 1 of this Form N-CSR.
(b) Not applicable.
ITEM 7. DISCLOSURE OF PROXY VOTING POLICIES AND PROCEDURES FOR CLOSED-END MANAGEMENT INVESTMENT COMPANIES.
Not applicable.
ITEM 8. PORTFOLIO MANAGERS OF CLOSED-END MANAGEMENT INVESTMENT COMPANIES.
Not applicable.
ITEM 9. PURCHASES OF EQUITY SECURITIES BY CLOSED-END MANAGEMENT INVESTMENT COMPANY AND AFFILIATED PURCHASERS.
Not applicable.
ITEM 10. SUBMISSION OF MATTERS TO A VOTE OF SECURITY HOLDERS.
The registrant has not adopted procedures by which shareholders may recommend nominees to the registrant’s board of trustees.
ITEM 11. CONTROLS AND PROCEDURES.
(a) The registrant has adopted and maintained disclosure controls and procedures (as such term is defined in Rules 30a-3(c) under the Investment Company Act of 1940, as amended (the “Act”)) that are designed to ensure that information required to be disclosed in the registrant’s reports under the Act, is recorded, processed, summarized and reported within the time periods required under the SEC’s rules and forms and that the information is accumulated and communicated to the registrant’s management, including its principal executive officer and principal financial officer to allow for timely decisions regarding required disclosure.
As required by Rule 30a-3(b) of the Act, the registrant carried out an evaluation under the supervision and with the participation of its management, including its principal executive officer and principal financial officer, of the effectiveness of the design and operation of the registrant’s disclosure controls and procedures within the 90-day period prior to the filing date of this report. Based on the foregoing, the registrant’s principal executive officer and principal financial officer have concluded that the registrant’s disclosure controls and procedures were effective, as of that date.
(b) There were no changes in the registrant’s internal control over financial reporting (as defined in Rule 30a-3(d) under the Act) during the period covered by this report that has materially affected, or is reasonably likely to materially affect, the registrant’s internal control over financial reporting.
ITEM 12. DISCLOSURE OF SECURITIES LENDING ACTIVITIES FOR CLOSED-END MANAGEMENT INVESTMENT COMPANIES.
Not applicable.
| (a)(1) |
Not applicable (See Item 2(f)(3) of this report). | |
| (a)(2)(i) |
||
| (99.302) |
Interim President’s (Principal Executive Officer) Section 302 Certification | |
| (a)(2)(ii) |
||
| (99.302) |
Interim Treasurer’s (Principal Financial Officer) Section 302 Certification | |
| (b) |
||
| (99.906) |
Combined Interim President & Treasurer (Principal Executive Officer and Principal Financial Officer) Section 906 Certification |
Signatures
Pursuant to the requirements of the Securities Exchange Act of 1934 and the Investment Company Act of 1940, the registrant has duly caused this report to be signed on its behalf by the undersigned, thereunto duly authorized.
(Registrant) Colorado BondShares — A Tax-Exempt Fund
| By (Signature and Title) | /s/ George N. Donnelly | |
| George N. Donnelly Interim President, Secretary and Treasurer |
Date: December 5, 2023
Pursuant to the requirements of the Securities Exchange Act of 1934 and the Investment Company Act of 1940, this report has been signed below by the following persons on behalf of the registrant and in the capacities and on the dates indicated.
| /s/ George N. Donnelly |
| George N. Donnelly Interim President, Secretary and Treasurer (Principal Executive Officer and Principal Financial Officer) Date: December 5, 2023 |