EXHIBIT 99

|
Investor News | NYSE: PEG |
For further information, contact:
| • Kathleen A. Lally, Vice President – Investor Relations |
Phone: 973-430-6565 | |||
| • Carlotta Chan Lane, Manager – Investor Relations |
Phone: 973-430-6596 |
PSEG ANNOUNCES 2013 THIRD QUARTER RESULTS
$0.77 PER SHARE FROM CONTINUING OPERATIONS
Operating Earnings of $0.76 Per Share
Operating Earnings Guidance Increased to $2.40 - $2.55 Per Share
October 30, 2013 (Newark, NJ) (NYSE – PEG) Public Service Enterprise Group (PSEG) today reported third quarter 2013 Income from Continuing Operations and Net Income of $390 million or $0.77 per share as compared to Net Income and Income from Continuing Operations of $347 million or $0.68 per share for the third quarter of 2012. Operating earnings for the third quarter of 2013 were $385 million or $0.76 per share compared to the third quarter of 2012 operating earnings of $382 million or $0.75 per share.
“Our company delivered solid results in the third quarter consistent with our objectives,” said Ralph Izzo, chairman, president and chief executive officer of PSEG. “PSE&G is on track to provide double-digit growth in earnings driven by increased investment in transmission, and PSEG Power’s results benefit from its strong locational advantages. Based on our performance through the third quarter, we are raising our full year operating earnings guidance to $2.40 - $2.55 per share from $2.25 - $2.50 per share.”
PSEG believes that the non-GAAP financial measure of “Operating Earnings” provides a consistent and comparable measure of performance of its businesses to help shareholders understand performance trends. Operating Earnings exclude the impact of returns/(losses) associated with Nuclear Decommissioning Trust (NDT), certain Mark-to-Market (MTM) accounting and other material one-time items. The table below provides a reconciliation of PSEG’s Net Income to Operating Earnings (a non-GAAP measure) for the third quarter. See Attachment 12 for a complete list of items excluded from Income from Continuing Operations in the determination of Operating Earnings.
PSEG CONSOLIDATED EARNINGS (unaudited)
Third Quarter Comparative Results
2013 and 2012
| Income | Diluted Earnings | |||||||||||||||
| ($ millions) | Per Share | |||||||||||||||
| 2013 | 2012 | 2013 | 2012 | |||||||||||||
| Operating Earnings |
$ | 385 | $ | 382 | $ | 0.76 | $ | 0.75 | ||||||||
|
|
|
|
|
|
|
|
|
|||||||||
| Reconciling Items |
5 | (35 | ) | 0.01 | (0.07 | ) | ||||||||||
| Income from Continuing Operations* |
$ | 390 | $ | 347 | $ | 0.77 | $ | 0.68 | ||||||||
|
|
|
|
|
|
|
|
|
|||||||||
| Average Shares |
508M | 507M | ||||||||||||||
| * | Income from Continuing Operations is equal to Net Income in both years. |
Mr. Izzo went on to say, “A year ago, we were responding to the devastation to our system caused by Superstorm Sandy. It’s only due to the tireless efforts of a dedicated work-force that we are on track to meet our near and long-term targets for capital investment and can raise our full year guidance for operating earnings. The ability of our workforce to meet customer needs has been recognized with an enhancement to our original contract to operate the Long Island Power Authority’s transmission and distribution system. We remain focused on securing approval for PSE&G’s ‘Energy Strong’ proposal, and are well positioned to meet the needs of our customers and perform for our shareholders.”
Our revised Operating Earnings guidance by company for the full year is as follows:
Operating Earnings
($ millions, except EPS)
| 2013E | 2012A | |||||||
| PSEG Power |
$ | 630 - $ 685 | $ | 644 | ||||
| PSE&G |
$ | 585 - $ 600 | $ | 528 | ||||
| PSEG Energy Holdings/ |
||||||||
| Parent |
$ | 0 - $ 10 | $ | 64 | ||||
|
|
|
|
|
|||||
| Total |
$ | 1,215 - $ 1,295 | $ | 1,236 | ||||
|
|
|
|
|
|||||
| Earnings Per Share |
$ | 2.40 - $ 2.55 | $ | 2.44 | ||||
|
|
|
|
|
|||||
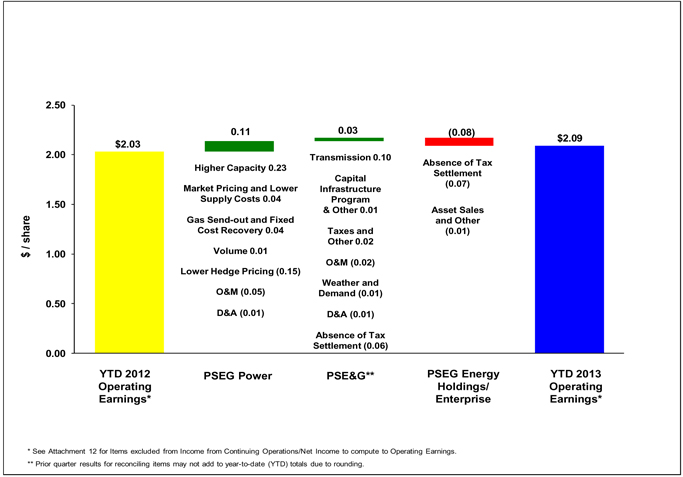
Operating Earnings Review and Outlook by Operating Subsidiary
See Attachment 6 for detail regarding the quarter-over-quarter reconciliations for each of PSEG’s businesses.
PSEG Power
PSEG Power reported operating earnings of $216 million ($0.43 per share) for the third quarter of 2013 compared with operating earnings of $217 million ($0.43 per share) for the third quarter of 2012.
Power’s third quarter earnings benefited from higher PJM capacity prices, an improvement in the market price of energy and a decline in the supply cost of gas.
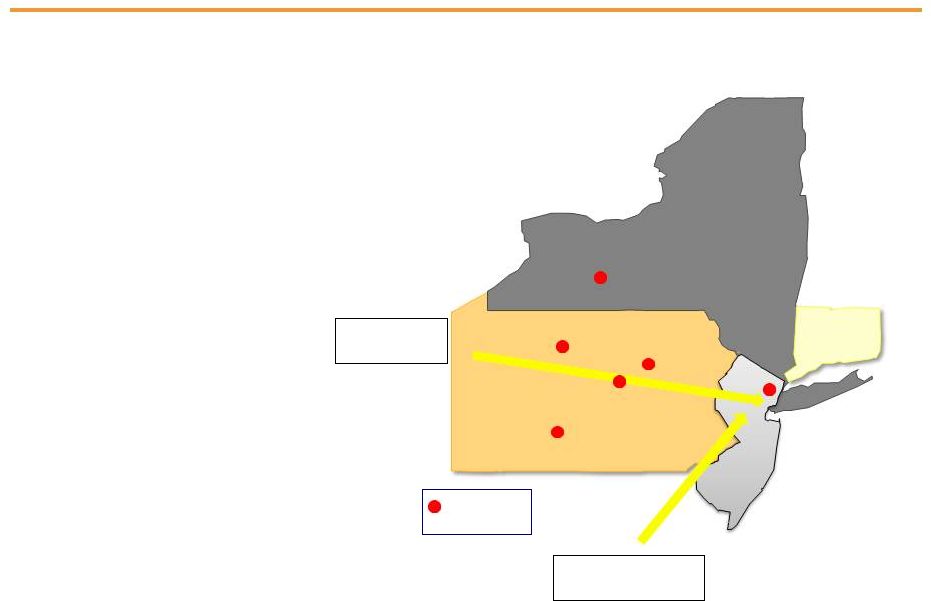
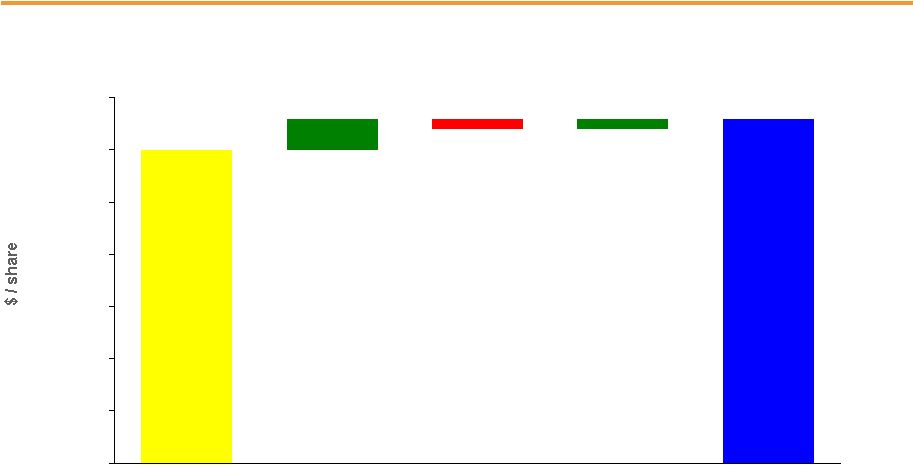
An increase in capacity prices improved Power’s quarter-over-quarter earnings by $0.11 per share. Higher overall market prices for natural gas and an improvement in basis in the PS-zone had a favorable influence on spot market prices for energy. In addition, Power’s results benefited from its firm gas transportation contracts which provide it with access to low-cost gas from the Marcellus Basin. The improvement in the wholesale price of energy and decline in fuel cost combined to add $0.04 per share to earnings quarter-over-quarter. The improvement in capacity revenue and wholesale energy margins more than offset the impact on earnings from a reduction in the average price on hedged volumes. The decline in the average price of energy hedges reduced quarter-over-quarter earnings by $0.10 per share. A reduction in generation volumes, as a result of more normal weather and a maintenance related outage, reduced Power’s quarter-over-quarter earnings comparisons by $0.02 per share.
PSEG Power initiated a planned major maintenance program at the Bethlehem Energy Center in the third quarter. The maintenance work, which concluded in October, resulted in an increase in Power’s operating and maintenance (O&M) expense (exclusive of storm-related restoration activity) and reduced quarter-over-quarter earnings comparisons by $0.04 per share.
Power’s output declined by 5.4% in the quarter from year-ago levels. More normal weather conditions and the maintenance outage at Bethlehem combined to reduce output from the fossil fleet by 10% in the quarter. The nuclear fleet operated at an average capacity factor of 91% in the quarter versus 92% in the year-ago quarter resulting in a capacity factor of 93.2% for the nine months ended September 30, 2013.
Power continues to forecast output for 2013 of 53 – 55 TWh. Output for the fourth quarter of approximately 13 – 14 TWh is 70% - 75% hedged at an average price of $50 per MWh. For 2014, forecast output of 53 – 55 TWh is approximately 65% - 70% hedged at an average price of $48 per MWh. Power has hedged approximately 35% - 40% of its forecast generation in 2015 of 52 – 54 TWh at an average price of $48 per MWh. Power’s forecast of total output in each of the next two years remains unchanged from prior guidance. The increase in the percentage of Power’s generation hedged for 2014 – 2015 reflects an upward adjustment to the forecast of BGS related hedges as well as an increase in the percentage of energy hedged through other PJM-West hedges. The hedge data for 2014 now assumes BGS volumes of 11 TWh versus the prior guidance of 10 TWh. Power continues to assume BGS related load and hedges in 2013 will represent approximately 12 TWh of generation for the year.
The forecast range of Power’s operating earnings for 2013 has been increased to $630 - $685 million from $535 - $600 million.
PSE&G
PSE&G reported operating earnings of $168 million ($0.33 per share) for the third quarter of 2013 compared with operating earnings of $155 million ($0.30 per share) for the third quarter of 2012.
PSE&G’s third quarter earnings reflect increased revenue associated with a greater level of investment.
An increase in PSE&G’s transmission revenue, effective on January 1, 2013, increased quarter-over-quarter earnings by $0.04 per share. Revenue from investments made under PSE&G’s distribution capital infrastructure investment program contributed $0.01 per share to earnings in the third quarter.
Electric demand in the third quarter was influenced by weather which was hotter than normal, but cooler than the weather conditions experienced in the year-ago period. Also, demand for electricity continues to be impacted by customer conservation in a slowly improving economic environment. Weather normalized sales – led by a decline in the residential sector – are estimated to have declined by 2.3% in the third quarter. Sales of gas, although not as important in the third quarter as demand for electricity, increased 10.4% from year-ago levels reflective of customer adjustment of use to a lower cost of gas.
The net impact on earnings from weather and the change in sales was a reduction in quarter-over-quarter earnings of $0.02 per share. A slight increase in distribution related O&M and depreciation expense was offset by a decline in interest expense and other items.
PSE&G announced on October 23 that it would be providing a two-month bill credit for its residential gas customers that will reduce the typical monthly bill by approximately 33% in both November and December. The credit is driven by our access to low-cost shale gas supply.
PSE&G is investing $3.4 billion in transmission related programs over the period 2013 – 2015. This program, which includes five major transmission lines, remains on time and on budget. All five transmission projects are expected to be operational during 2014 – 2015. PSE&G filed its annual update of revenue requirements associated with its transmission investment program with the Federal Energy Regulatory Commission (FERC) in mid-October. If accepted, transmission revenue in 2014 would increase by $176 million at the start of the New Year.
The forecast of PSE&G’s operating earnings for 2013 has been adjusted to $585 million - $600 million from $580 - $635 million.
PSEG Energy Holdings/Enterprise
PSEG Energy Holdings/Enterprise reported operating earnings of $1 million for the third quarter of 2013 versus operating earnings of $10 million ($0.02 per share) during the third quarter of 2012. Results for the quarter reflect the continued monetization of assets within Holdings’ portfolio and the absence of gains on an asset sale in the year-ago quarter.
NRG Energy recently announced that it has entered into an agreement to acquire Edison Mission Energy (EME) as part of an EME Chapter 11 plan of re-organization sponsored by NRG. In connection with the transaction, NRG has agreed to certain financial conditions with the lessors of the Powerton and Joliet facilities (including PSEG Energy Holdings) which would cure all monetary defaults at closing and protect the lessors’ equity value in the leveraged leases.
The forecast of PSEG Energy Holdings/Enterprise full year operating earnings for 2013 has been adjusted to $0 - $10 million from $25 - $35 million. The updated guidance reflects the impact of revised estimates for the legacy Holdings’ portfolio and related taxes (separate from the merchant energy leases) which are expected to more than offset the impact on operating earnings from the commercial operation of Holdings’ sixth solar facility, a 19MW solar facility ($50 million investment) located in Arizona.
PSEG – Long Island
The Board of Directors for the Long Island Power Authority (LIPA) has approved amendments to PSEG – Long Island’s original operating services agreement for LIPA’s transmission and distribution system. The amendments recognize an increase in PSEG – Long Island management responsibility to operate and maintain LIPA’s system, expand the length of the contract by 2 years to 12 years effective January 1, 2014, increase PSEG – Long Island’s compensation effective in 2016 and, in 2015, provide PSEG Power’s Energy Resources and Trade group with the contract to procure LIPA’s fuel requirements. The agreements’ effectiveness is contingent upon LIPA’s receipt of a Private Letter Ruling from the IRS on the continued tax-exempt status of certain LIPA debt securities and LIPA’s approval of the proposed 2014 and 2015 operating and capital pass-through budgets.
FORWARD-LOOKING STATEMENTS
Certain of the matters discussed in this communication about us and our subsidiaries future performance, including, without limitation, future revenues, earnings, strategies, prospects, consequences and all other statements that are not purely historical constitute “forward-looking statements” within the meaning of the Private Securities Litigation Reform Act of 1995. Such forward-looking statements are subject to risks and uncertainties, which could cause actual results to differ materially from those anticipated. Such statements are based on management’s beliefs as well as assumptions made by and information currently available to management. When used herein, the words “anticipate,” “intend,” “estimate,” “believe,” “expect,” “plan,” “should,” “hypothetical,” “potential,” “forecast,” “project,” variations of such words and similar expressions are intended to identify forward-looking statements. Factors that may cause actual results to differ are often presented with the forward-looking statements themselves. Other factors that could cause actual results to differ materially from those contemplated in any forward- looking statements made by us herein are discussed in filings we make with the United States Securities and Exchange Commission (SEC), including our Annual Report on Form 10-K and subsequent reports on Form 10-Q and Form 8-K and available on our website: http://www.pseg.com. These factors include, but are not limited to:
| • | adverse changes in the demand for or the price of the capacity and energy that we sell into wholesale electricity markets, |
| • | adverse changes in energy industry law, policies and regulation, including market structures and a potential shift away from competitive markets toward subsidized market mechanisms, transmission planning and cost allocation rules, including rules regarding how transmission is planned and who is permitted to build transmission in the future, and reliability standards, |
| • | any inability of our transmission and distribution businesses to obtain adequate and timely rate relief and regulatory approvals from federal and state regulators, |
| • | changes in federal and state environmental regulations that could increase our costs or limit our operations, |
| • | changes in nuclear regulation and/or general developments in the nuclear power industry, including various impacts from any accidents or incidents experienced at our facilities or by others in the industry, that could limit operations of our nuclear generating units, |
| • | actions or activities at one of our nuclear units located on a multi-unit site that might adversely affect our ability to continue to operate that unit or other units located at the same site, |
| • | any inability to balance our energy obligations, available supply and risks, |
| • | any deterioration in our credit quality or the credit quality of our counterparties, including in our leveraged leases, |
| • | availability of capital and credit at commercially reasonable terms and conditions and our ability to meet cash needs, |
| • | changes in the cost of, or interruption in the supply of, fuel and other commodities necessary to the operation of our generating units, |
| • | delays in receipt of necessary permits and approvals for our construction and development activities, |
| • | delays or unforeseen cost escalations in our construction and development activities, |
| • | any inability to achieve, or continue to sustain, our expected levels of operating performance, |
| • | any equipment failures, accidents, severe weather events or other incidents that impact our ability to provide safe and reliable service to our customers, and any inability to obtain sufficient coverage or recover proceeds of insurance on such matters, |
| • | increases in competition in energy supply markets as well as competition from certain rate-based transmission projects, |
| • | any inability to realize anticipated tax benefits or retain tax credits, |
| • | challenges associated with recruitment and/or retention of a qualified workforce, |
| • | adverse performance of our decommissioning and defined benefit plan trust fund investments and changes in funding requirements, and |
| • | changes in technology, such as distributed generation and microgrids, and resultant changes in customer usage patterns, including energy efficiency and demand response. |
All of the forward-looking statements made in this report are qualified by these cautionary statements and we cannot assure you that the results or developments anticipated by management will be realized or even if realized, will have the expected consequences to, or effects on, us or our business prospects, financial condition or results of operations. Readers are cautioned not to place undue reliance on these forward-looking statements in making any investment decision. Forward-looking statements made in this report apply only as of the date of this report. While we may elect to update forward-looking statements from time to time, we specifically disclaim any obligation to do so, even if internal estimates change, unless otherwise required by applicable securities laws.
The forward-looking statements contained in this report are intended to qualify for the safe harbor provisions of Section 27A of the Securities Act of 1933, as amended, and Section 21E of the Securities Exchange Act of 1934, as amended.
Attachment 1
PUBLIC SERVICE ENTERPRISE GROUP INCORPORATED
Operating Earnings and Per Share Results by Subsidiary
(Unaudited)
| Three Months Ended | Nine Months Ended | |||||||||||||||
| September 30, | September 30, | |||||||||||||||
| 2013 | 2012 | 2013 | 2012 | |||||||||||||
| Earnings Results ($ Millions) | ||||||||||||||||
| PSEG Power |
$ | 216 | $ | 217 | $ | 580 | $ | 523 | ||||||||
| PSE&G |
168 | 155 | 468 | 453 | ||||||||||||
| PSEG Energy Holdings/Enterprise |
1 | 10 | 13 | 53 | ||||||||||||
|
|
|
|
|
|
|
|
|
|||||||||
| Operating Earnings |
$ | 385 | $ | 382 | $ | 1,061 | $ | 1,029 | ||||||||
|
|
|
|
|
|
|
|
|
|||||||||
| Reconciling Items(a) |
5 | (35 | ) | (18 | ) | 22 | ||||||||||
|
|
|
|
|
|
|
|
|
|||||||||
| Income from Continuing Operations/Net Income |
$ | 390 | $ | 347 | $ | 1,043 | $ | 1,051 | ||||||||
|
|
|
|
|
|
|
|
|
|||||||||
| Fully Diluted Average Shares Outstanding (in Millions) |
508 | 507 | 507 | 507 | ||||||||||||
|
|
|
|
|
|
|
|
|
|||||||||
| Per Share Results (Diluted) | ||||||||||||||||
| PSEG Power |
$ | 0.43 | $ | 0.43 | $ | 1.14 | $ | 1.03 | ||||||||
| PSE&G |
0.33 | 0.30 | 0.92 | 0.89 | ||||||||||||
| PSEG Energy Holdings/Enterprise |
— | 0.02 | 0.03 | 0.11 | ||||||||||||
|
|
|
|
|
|
|
|
|
|||||||||
| Operating Earnings |
$ | 0.76 | $ | 0.75 | $ | 2.09 | $ | 2.03 | ||||||||
|
|
|
|
|
|
|
|
|
|||||||||
| Reconciling Items(a) |
0.01 | (0.07 | ) | (0.03 | ) | 0.04 | ||||||||||
|
|
|
|
|
|
|
|
|
|||||||||
| Income from Continuing Operations/Net Income |
$ | 0.77 | $ | 0.68 | $ | 2.06 | $ | 2.07 | ||||||||
|
|
|
|
|
|
|
|
|
|||||||||
| (a) | See attachment 12 for details of items excluded from Income from Continuing Operations/Net Income to compute Operating Earnings. |
Attachment 2
PUBLIC SERVICE ENTERPRISE GROUP INCORPORATED
Consolidating Statements of Operations
(Unaudited, $ Millions)
| Three Months Ended September 30, 2013 | ||||||||||||||||
| PSEG | ||||||||||||||||
| Energy Holdings/ | PSEG | |||||||||||||||
| PSEG | Enterprise (a) | POWER | PSE&G | |||||||||||||
| OPERATING REVENUES |
$ | 2,554 | $ | (281 | ) | $ | 1,169 | $ | 1,666 | |||||||
| OPERATING EXPENSES |
||||||||||||||||
| Energy Costs |
801 | (290 | ) | 430 | 661 | |||||||||||
| Operation and Maintenance |
713 | 1 | 304 | 408 | ||||||||||||
| Depreciation and Amortization |
313 | 11 | 66 | 236 | ||||||||||||
| Taxes Other Than Income Taxes |
15 | — | — | 15 | ||||||||||||
|
|
|
|
|
|
|
|
|
|||||||||
| Total Operating Expenses |
1,842 | (278 | ) | 800 | 1,320 | |||||||||||
|
|
|
|
|
|
|
|
|
|||||||||
| OPERATING INCOME |
712 | (3 | ) | 369 | 346 | |||||||||||
| Income from Equity Method Investments |
4 | 4 | — | — | ||||||||||||
| Other Income and (Deductions) |
47 | 1 | 34 | 12 | ||||||||||||
| Other-Than-Temporary Impairments |
(3 | ) | — | (3 | ) | — | ||||||||||
| Interest Expense |
(100 | ) | 1 | (26 | ) | (75 | ) | |||||||||
|
|
|
|
|
|
|
|
|
|||||||||
| INCOME FROM CONTINUING OPERATIONS BEFORE INCOME TAXES |
660 | 3 | 374 | 283 | ||||||||||||
| Income Tax Benefit (Expense) |
(270 | ) | (2 | ) | (153 | ) | (115 | ) | ||||||||
|
|
|
|
|
|
|
|
|
|||||||||
| INCOME FROM CONTINUING OPERATIONS/NET INCOME |
$ | 390 | $ | 1 | $ | 221 | $ | 168 | ||||||||
|
|
|
|
|
|
|
|
|
|||||||||
| OPERATING EARNINGS |
$ | 385 | $ | 1 | $ | 216 | $ | 168 | ||||||||
| Reconciling Items Excluded from Continuing Operations/Net Income (b) |
5 | — | 5 | — | ||||||||||||
|
|
|
|
|
|
|
|
|
|||||||||
| INCOME FROM CONTINUING OPERATIONS/NET INCOME |
$ | 390 | $ | 1 | $ | 221 | $ | 168 | ||||||||
|
|
|
|
|
|
|
|
|
|||||||||
| Three Months Ended September 30, 2012 | ||||||||||||||||
| PSEG | ||||||||||||||||
| Energy Holdings/ | PSEG | |||||||||||||||
| PSEG | Enterprise (a) | POWER | PSE&G | |||||||||||||
| OPERATING REVENUES |
$ | 2,402 | $ | (319 | ) | $ | 1,038 | $ | 1,683 | |||||||
| OPERATING EXPENSES |
||||||||||||||||
| Energy Costs |
879 | (333 | ) | 456 | 756 | |||||||||||
| Operation and Maintenance |
619 | (2 | ) | 255 | 366 | |||||||||||
| Depreciation and Amortization |
286 | 10 | 60 | 216 | ||||||||||||
| Taxes Other Than Income Taxes |
24 | — | — | 24 | ||||||||||||
|
|
|
|
|
|
|
|
|
|||||||||
| Total Operating Expenses |
1,808 | (325 | ) | 771 | 1,362 | |||||||||||
|
|
|
|
|
|
|
|
|
|||||||||
| OPERATING INCOME |
594 | 6 | 267 | 321 | ||||||||||||
| Income from Equity Method Investments |
7 | 7 | — | — | ||||||||||||
| Other Income and (Deductions) |
95 | 1 | 84 | 10 | ||||||||||||
| Other-Than-Temporary Impairments |
(2 | ) | — | (2 | ) | — | ||||||||||
| Interest Expense |
(106 | ) | 2 | (35 | ) | (73 | ) | |||||||||
|
|
|
|
|
|
|
|
|
|||||||||
| INCOME FROM CONTINUING OPERATIONS BEFORE INCOME TAXES |
588 | 16 | 314 | 258 | ||||||||||||
| Income Tax Benefit (Expense) |
(241 | ) | (5 | ) | (133 | ) | (103 | ) | ||||||||
|
|
|
|
|
|
|
|
|
|||||||||
| INCOME FROM CONTINUING OPERATIONS/NET INCOME |
$ | 347 | $ | 11 | $ | 181 | $ | 155 | ||||||||
|
|
|
|
|
|
|
|
|
|||||||||
| OPERATING EARNINGS |
$ | 382 | $ | 10 | $ | 217 | $ | 155 | ||||||||
| Reconciling Items Excluded from Continuing Operations/Net Income (b) |
(35 | ) | 1 | (36 | ) | — | ||||||||||
|
|
|
|
|
|
|
|
|
|||||||||
| INCOME FROM CONTINUING OPERATIONS/NET INCOME |
$ | 347 | $ | 11 | $ | 181 | $ | 155 | ||||||||
|
|
|
|
|
|
|
|
|
|||||||||
| (a) | Includes activities at Energy Holdings and the Parent as well as intercompany eliminations. |
| (b) | See attachment 12 for details of items excluded from Income from Continuing Operations/Net Income to compute Operating Earnings. |
Attachment 3
PUBLIC SERVICE ENTERPRISE GROUP INCORPORATED
Consolidating Statements of Operations
(Unaudited, $ Millions)
| Nine Months Ended September 30, 2013 | ||||||||||||||||
| PSEG | PSEG Energy Holdings/ Enterprise (a) |
PSEG POWER |
PSE&G | |||||||||||||
| OPERATING REVENUES |
$ | 7,650 | $ | (1,240 | ) | $ | 3,806 | $ | 5,084 | |||||||
| OPERATING EXPENSES |
||||||||||||||||
| Energy Costs |
2,711 | (1,283 | ) | 1,786 | 2,208 | |||||||||||
| Operation and Maintenance |
2,069 | (1 | ) | 866 | 1,204 | |||||||||||
| Depreciation and Amortization |
886 | 33 | 195 | 658 | ||||||||||||
| Taxes Other Than Income Taxes |
50 | — | — | 50 | ||||||||||||
|
|
|
|
|
|
|
|
|
|||||||||
| Total Operating Expenses |
5,716 | (1,251 | ) | 2,847 | 4,120 | |||||||||||
|
|
|
|
|
|
|
|
|
|||||||||
| OPERATING INCOME |
1,934 | 11 | 959 | 964 | ||||||||||||
| Income from Equity Method Investments |
9 | 9 | — | — | ||||||||||||
| Other Income and (Deductions) |
118 | 2 | 78 | 38 | ||||||||||||
| Other-Than-Temporary Impairments |
(7 | ) | — | (7 | ) | — | ||||||||||
| Interest Expense |
(303 | ) | 5 | (85 | ) | (223 | ) | |||||||||
|
|
|
|
|
|
|
|
|
|||||||||
| INCOME FROM CONTINUING OPERATIONS BEFORE INCOME TAXES |
1,751 | 27 | 945 | 779 | ||||||||||||
| Income Tax Benefit (Expense) |
(708 | ) | (14 | ) | (383 | ) | (311 | ) | ||||||||
|
|
|
|
|
|
|
|
|
|||||||||
| INCOME FROM CONTINUING OPERATIONS/NET INCOME |
$ | 1,043 | $ | 13 | $ | 562 | $ | 468 | ||||||||
|
|
|
|
|
|
|
|
|
|||||||||
| OPERATING EARNINGS |
$ | 1,061 | $ | 13 | $ | 580 | $ | 468 | ||||||||
| Reconciling Items Excluded from Continuing Operations/Net Income (b) |
(18 | ) | — | (18 | ) | — | ||||||||||
|
|
|
|
|
|
|
|
|
|||||||||
| INCOME FROM CONTINUING OPERATIONS/NET INCOME |
$ | 1,043 | $ | 13 | $ | 562 | $ | 468 | ||||||||
|
|
|
|
|
|
|
|
|
|||||||||
| Nine Months Ended September 30, 2012 | ||||||||||||||||
| PSEG | PSEG Energy Holdings/ Enterprise (a) |
PSEG POWER |
PSE&G | |||||||||||||
| OPERATING REVENUES |
$ | 7,375 | $ | (1,238 | ) | $ | 3,584 | $ | 5,029 | |||||||
| OPERATING EXPENSES |
||||||||||||||||
| Energy Costs |
2,819 | (1,286 | ) | 1,725 | 2,380 | |||||||||||
| Operation and Maintenance |
1,876 | 4 | 780 | 1,092 | ||||||||||||
| Depreciation and Amortization |
797 | 28 | 175 | 594 | ||||||||||||
| Taxes Other Than Income Taxes |
73 | — | — | 73 | ||||||||||||
|
|
|
|
|
|
|
|
|
|||||||||
| Total Operating Expenses |
5,565 | (1,254 | ) | 2,680 | 4,139 | |||||||||||
|
|
|
|
|
|
|
|
|
|||||||||
| OPERATING INCOME |
1,810 | 16 | 904 | 890 | ||||||||||||
| Income from Equity Method Investments |
9 | 9 | — | — | ||||||||||||
| Other Income and (Deductions) |
155 | 5 | 119 | 31 | ||||||||||||
| Other-Than-Temporary Impairments |
(14 | ) | — | (14 | ) | — | ||||||||||
| Interest Expense |
(310 | ) | 7 | (97 | ) | (220 | ) | |||||||||
|
|
|
|
|
|
|
|
|
|||||||||
| INCOME FROM CONTINUING OPERATIONS BEFORE INCOME TAXES |
1,650 | 37 | 912 | 701 | ||||||||||||
| Income Tax Benefit (Expense) |
(599 | ) | 23 | (374 | ) | (248 | ) | |||||||||
|
|
|
|
|
|
|
|
|
|||||||||
| INCOME FROM CONTINUING OPERATIONS/NET INCOME |
$ | 1,051 | $ | 60 | $ | 538 | $ | 453 | ||||||||
|
|
|
|
|
|
|
|
|
|||||||||
| OPERATING EARNINGS |
$ | 1,029 | $ | 53 | $ | 523 | $ | 453 | ||||||||
| Reconciling Items Excluded from Continuing Operations/Net Income (b) |
22 | 7 | 15 | — | ||||||||||||
|
|
|
|
|
|
|
|
|
|||||||||
| INCOME FROM CONTINUING OPERATIONS/NET INCOME |
$ | 1,051 | $ | 60 | $ | 538 | $ | 453 | ||||||||
|
|
|
|
|
|
|
|
|
|||||||||
| (a) | Includes activities at Energy Holdings and the Parent as well as intercompany eliminations. |
| (b) | See attachment 12 for details of items excluded from Income from Continuing Operations/Net Income to compute Operating Earnings. |
Attachment 4
PUBLIC SERVICE ENTERPRISE GROUP INCORPORATED
Capitalization Schedule
(Unaudited, $ Millions)
| September 30, | December 31, | |||||||
| 2013 | 2012 | |||||||
| DEBT |
||||||||
| Long-Term Debt |
$ | 7,909 | $ | 7,173 | ||||
| Securitization Debt |
561 | 722 | ||||||
| Project Level, Non-Recourse Debt |
16 | 44 | ||||||
|
|
|
|
|
|||||
| Total Debt |
8,486 | 7,939 | ||||||
| STOCKHOLDERS’ EQUITY |
||||||||
| Common Stock |
4,852 | 4,833 | ||||||
| Treasury Stock |
(615 | ) | (607 | ) | ||||
| Retained Earnings |
7,439 | 6,942 | ||||||
| Accumulated Other Comprehensive Loss |
(338 | ) | (388 | ) | ||||
|
|
|
|
|
|||||
| Total Common Stockholders’ Equity |
11,338 | 10,780 | ||||||
| Noncontrolling Interests - Equity Investments |
1 | 1 | ||||||
|
|
|
|
|
|||||
| Total Equity |
11,339 | 10,781 | ||||||
|
|
|
|
|
|||||
| Total Capitalization |
$ | 19,825 | $ | 18,720 | ||||
|
|
|
|
|
|||||
Attachment 5
PUBLIC SERVICE ENTERPRISE GROUP INCORPORATED
Condensed Consolidated Statements Of Cash Flows
(Unaudited, $ Millions)
| Nine Months Ended September 30, | ||||||||
| 2013 | 2012 | |||||||
| CASH FLOWS FROM OPERATING ACTIVITIES |
||||||||
| Net Income |
$ | 1,043 | $ | 1,051 | ||||
| Adjustments to Reconcile Net Income to Net Cash Flows From Operating Activities |
1,392 | 1,260 | ||||||
|
|
|
|
|
|||||
| NET CASH PROVIDED BY OPERATING ACTIVITIES |
2,435 | 2,311 | ||||||
|
|
|
|
|
|||||
| NET CASH USED IN INVESTING ACTIVITIES |
(2,088 | ) | (2,051 | ) | ||||
|
|
|
|
|
|||||
| NET CASH USED IN FINANCING ACTIVITIES |
(278 | ) | (314 | ) | ||||
|
|
|
|
|
|||||
| Net Change in Cash and Cash Equivalents |
69 | (54 | ) | |||||
| Cash and Cash Equivalents at Beginning of Period |
379 | 834 | ||||||
|
|
|
|
|
|||||
| Cash and Cash Equivalents at End of Period |
$ | 448 | $ | 780 | ||||
|
|
|
|
|
|||||
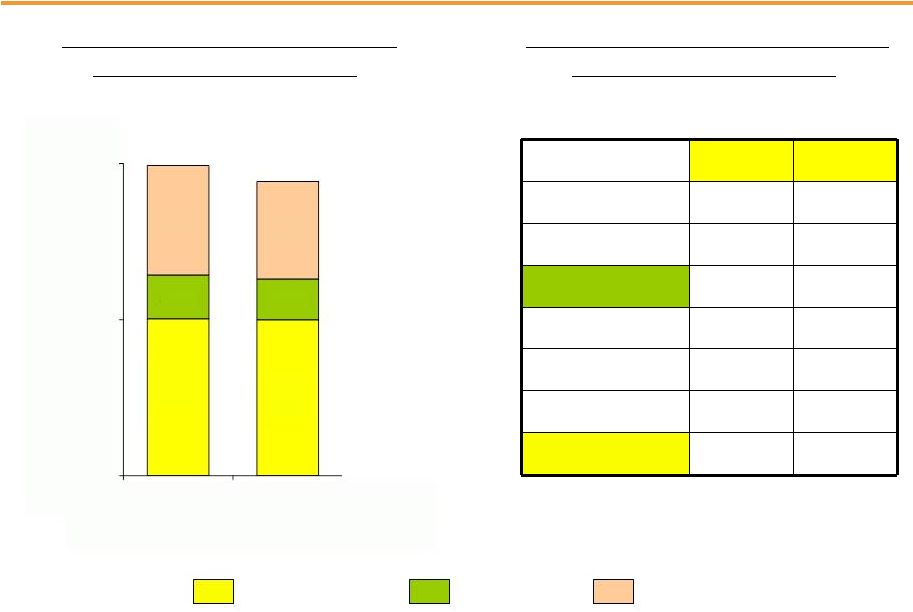
Attachment 6
PUBLIC SERVICE ENTERPRISE GROUP INCORPORATED
Quarter-over-Quarter EPS Reconciliation
September 30, 2013 vs. September 30, 2012
(Unaudited)

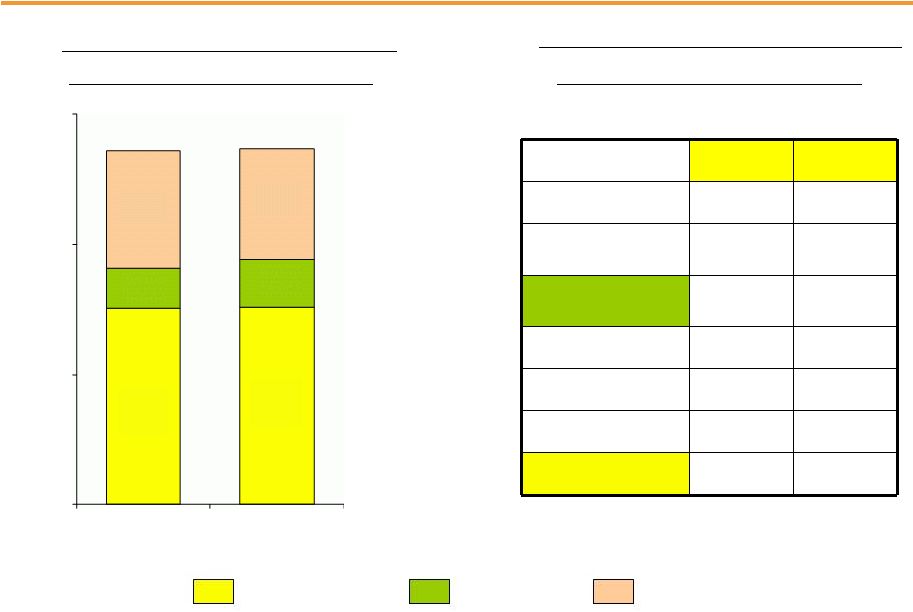
Attachment 7
PUBLIC SERVICE ENTERPRISE GROUP INCORPORATED
Year-over-Year EPS Reconciliation
September 30, 2013 vs. September 30, 2012
(Unaudited)
Attachment 8
PSEG POWER LLC
Generation Measures
(Unaudited)
| GWhr Breakdown | GWhr Breakdown | |||||||||||||||
| Three Months Ended | Nine Months Ended | |||||||||||||||
| September 30, | September 30, | |||||||||||||||
| 2013 | 2012 | 2013 | 2012 | |||||||||||||
| Nuclear - NJ |
5,408 | 5,490 | 15,635 | 15,525 | ||||||||||||
| Nuclear - PA |
2,090 | 2,069 | 7,148 | 7,079 | ||||||||||||
|
|
|
|
|
|
|
|
|
|||||||||
| Total Nuclear |
7,498 | 7,559 | 22,783 | 22,604 | ||||||||||||
| Fossil - Coal/Natural Gas - NJ* |
420 | 694 | 1,086 | 1,101 | ||||||||||||
| Fossil - Coal - PA |
1,413 | 1,344 | 4,006 | 3,477 | ||||||||||||
| Fossil - Coal - CT |
103 | 33 | 434 | 78 | ||||||||||||
|
|
|
|
|
|
|
|
|
|||||||||
| Total Coal |
1,936 | 2,071 | 5,526 | 4,656 | ||||||||||||
| Fossil - Oil & Natural Gas - NJ |
3,691 | 3,874 | 9,579 | 9,711 | ||||||||||||
| Fossil - Oil & Natural Gas - NY |
952 | 1,344 | 3,020 | 3,719 | ||||||||||||
| Fossil - Oil & Natural Gas - CT |
34 | 71 | 78 | 79 | ||||||||||||
|
|
|
|
|
|
|
|
|
|||||||||
| Total Oil & Natural Gas |
4,677 | 5,289 | 12,677 | 13,509 | ||||||||||||
|
|
|
|
|
|
|
|
|
|||||||||
| 14,111 | 14,919 | 40,986 | 40,769 | |||||||||||||
| % Generation by Fuel Type | % Generation by Fuel Type | |||||||||||||||
| Three Months Ended | Nine Months Ended | |||||||||||||||
| September 30, | September 30, | |||||||||||||||
| 2013 | 2012 | 2013 | 2012 | |||||||||||||
| Nuclear - NJ |
38 | % | 37 | % | 38 | % | 38 | % | ||||||||
| Nuclear - PA |
15 | % | 14 | % | 17 | % | 17 | % | ||||||||
|
|
|
|
|
|
|
|
|
|||||||||
| Total Nuclear |
53 | % | 51 | % | 55 | % | 55 | % | ||||||||
| Fossil - Coal/Natural Gas - NJ* |
3 | % | 5 | % | 3 | % | 3 | % | ||||||||
| Fossil - Coal - PA |
10 | % | 9 | % | 10 | % | 9 | % | ||||||||
| Fossil - Coal - CT |
1 | % | 0 | % | 1 | % | 0 | % | ||||||||
|
|
|
|
|
|
|
|
|
|||||||||
| Total Coal |
14 | % | 14 | % | 14 | % | 12 | % | ||||||||
| Fossil - Oil & Natural Gas - NJ |
26 | % | 26 | % | 24 | % | 24 | % | ||||||||
| Fossil - Oil & Natural Gas - NY |
7 | % | 9 | % | 7 | % | 9 | % | ||||||||
| Fossil - Oil & Natural Gas - CT |
0 | % | 0 | % | 0 | % | 0 | % | ||||||||
|
|
|
|
|
|
|
|
|
|||||||||
| Total Oil & Natural Gas |
33 | % | 35 | % | 31 | % | 33 | % | ||||||||
|
|
|
|
|
|
|
|
|
|||||||||
| 100 | % | 100 | % | 100 | % | 100 | % | |||||||||
| * | Includes Pumped Storage. Pumped Storage accounted for <1% of total generation for the three and nine months ended September 30, 2013 and 2012. Generation includes natural gas fuel switching intervals. |
Attachment 9
PUBLIC SERVICE ELECTRIC & GAS COMPANY
Retail Sales and Revenues
(Unaudited)
September 30, 2013
Electric Sales and Revenues
| Three Months | Change vs. | Nine Months | Change vs. | |||||||||||||
| Ended | 2012 | Ended | 2012 | |||||||||||||
| Sales (millions kwh) |
||||||||||||||||
| Residential |
4,320 | -6.9 | % | 10,527 | -1.4 | % | ||||||||||
| Commercial & Industrial |
7,604 | -2.9 | % | 20,880 | -2.6 | % | ||||||||||
| Street Lighting |
73 | 7.0 | % | 232 | 9.0 | % | ||||||||||
| Interdepartmental |
3 | -2.2 | % | 7 | -1.6 | % | ||||||||||
|
|
|
|
|
|||||||||||||
| Total |
12,000 | -4.4 | % | 31,646 | -2.2 | % | ||||||||||
|
|
|
|
|
|||||||||||||
| Revenue ($ millions) |
||||||||||||||||
| Residential |
$ | 677 | -4.5 | % | $ | 1,627 | -3.2 | % | ||||||||
| Commercial & Industrial |
649 | 0.6 | % | 1,595 | -4.2 | % | ||||||||||
| Street Lighting |
17 | -2.8 | % | 51 | -6.4 | % | ||||||||||
| Other Operating Revenues* |
109 | 9.0 | % | 321 | 17.0 | % | ||||||||||
|
|
|
|
|
|||||||||||||
| Total |
$ | 1,452 | -1.3 | % | $ | 3,594 | -2.2 | % | ||||||||
|
|
|
|
|
|||||||||||||
| Three Months | Change vs. | Nine Months | Change vs. | |||||||||||||
| Ended | 2012 | Ended | 2012 | |||||||||||||
| Weather Data |
||||||||||||||||
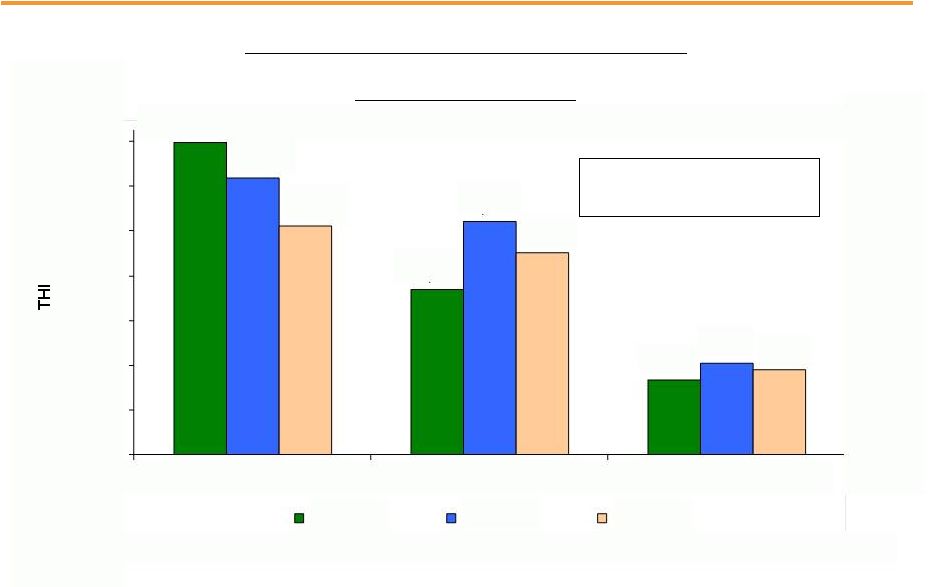
| THI Hours - Actual |
12,355 | -8.0 | % | 17,011 | -4.1 | % | ||||||||||
| THI Hours - Normal |
11,508 | 15,472 | ||||||||||||||
| * | Primarily sales of Non-Utility Generator energy to PJM and Transmission-related revenues. |
Attachment 10
PUBLIC SERVICE ELECTRIC & GAS COMPANY
Retail Sales and Revenues
(Unaudited)
September 30, 2013
Gas Sold and Transported
| Three Months | Change vs. | Nine Months | Change vs. | |||||||||||||
| Ended | 2012 | Ended | 2012 | |||||||||||||
| Sales (millions therms) |
||||||||||||||||
| Firm Sales |
||||||||||||||||
| Residential Sales |
99 | 10.8 | % | 984 | 21.5 | % | ||||||||||
| Commercial & Industrial |
97 | 10.0 | % | 685 | 17.4 | % | ||||||||||
|
|
|
|
|
|||||||||||||
| Total Firm Sales |
196 | 10.4 | % | 1,669 | 19.8 | % | ||||||||||
| Non-Firm Sales |
||||||||||||||||
| Commercial & Industrial |
338 | -27.6 | % | 870 | -17.4 | % | ||||||||||
|
|
|
|
|
|||||||||||||
| Total Non-Firm Sales |
338 | 870 | ||||||||||||||
|
|
|
|
|
|||||||||||||
| Total Sales |
534 | -17.1 | % | 2,539 | 3.8 | % | ||||||||||
|
|
|
|
|
|||||||||||||
| Revenue ($ millions) |
||||||||||||||||
| Residential Sales - Firm |
$ | 45 | -2.1 | % | $ | 440 | 9.8 | % | ||||||||
| Commercial & Industrial - Firm Sales |
18 | 9.8 | % | 173 | 27.9 | % | ||||||||||
| Non-Firm Sales |
9 | -8.0 | % | 31 | 14.2 | % | ||||||||||
| Other Operating Revenues* |
41 | 3.9 | % | 124 | 5.8 | % | ||||||||||
|
|
|
|
|
|||||||||||||
| Total |
$ | 113 | 1.3 | % | $ | 768 | 12.9 | % | ||||||||
|
|
|
|
|
|||||||||||||
| Gas Transported |
$ | 101 | 2.1 | % | $ | 722 | 7.4 | % | ||||||||
| Three Months | Change vs. | Nine Months | Change vs. | |||||||||||||
| Ended | 2012 | Ended | 2012 | |||||||||||||
| Weather Data |
||||||||||||||||
| Degree Days - Actual |
49 | 168.0 | % | 3,118 | 28.5 | % | ||||||||||
| Degree Days - Normal |
30 | 3,078 | ||||||||||||||
| * | Primarily Appliance Service. |
Attachment 11
PUBLIC SERVICE ENTERPRISE GROUP INCORPORATED
Statistical Measures
(Unaudited)
| Three Months Ended | Nine Months Ended | |||||||||||||||
| September 30, | September 30, | |||||||||||||||
| 2013 | 2012 | 2013 | 2012 | |||||||||||||
| Weighted Average Common Shares Outstanding (000’s) |
||||||||||||||||
| Basic |
505,858 | 505,914 | 505,900 | 505,942 | ||||||||||||
| Diluted |
507,694 | 507,111 | 507,433 | 507,037 | ||||||||||||
| Stock Price at End of Period |
$ | 32.93 | $ | 32.18 | ||||||||||||
| Dividends Paid per Share of Common Stock |
$ | 0.3600 | $ | 0.3550 | $ | 1.0800 | $ | 1.0650 | ||||||||
| Dividend Payout Ratio* |
57.6 | % | 56.8 | % | ||||||||||||
| Dividend Yield |
4.4 | % | 4.4 | % | ||||||||||||
| Price/Earnings Ratio* |
13.2 | 12.9 | ||||||||||||||
| Rate of Return on Average Common Equity* |
11.6 | % | 12.1 | % | ||||||||||||
| Book Value per Common Share |
$ | 22.41 | $ | 21.36 | ||||||||||||
| Market Price as a Percent of Book Value |
147 | % | 151 | % | ||||||||||||
| Total Shareholder Return |
2.0 | % | 0.1 | % | 11.2 | % | 0.9 | % | ||||||||
| * | Calculation based on Operating Earnings for the 12 month period ended. |
Attachment 12
PUBLIC SERVICE ENTERPRISE GROUP INCORPORATED
Reconciling Items Excluded from Income from Continuing Operations/Net Income to Compute Operating Earnings
(Unaudited)
| Three Months Ended | Nine Months Ended | Year Ended | ||||||||||||||||||||||
| September 30, | September 30, | December 31, | ||||||||||||||||||||||
| Pro-forma Adjustments, net of tax |
2013 | 2012 | 2013 | 2012 | 2012 | 2011 | ||||||||||||||||||
| Earnings Impact ($ Millions) | ||||||||||||||||||||||||
| Operating Earnings |
$ | 385 | $ | 382 | $ | 1,061 | $ | 1,029 | $ | 1,236 | $ | 1,389 | ||||||||||||
| Gain (Loss) on Nuclear Decommissioning Trust (NDT) |
||||||||||||||||||||||||
| Fund Related Activity (PSEG Power) |
12 | 40 | 29 | 49 | 52 | 50 | ||||||||||||||||||
| Gain (Loss) on Mark-to-Market (MTM)(a) (PSEG Power) |
3 | (76 | ) | (22 | ) | (34 | ) | (10 | ) | 107 | ||||||||||||||
| Lease Related Activity (PSEG Energy Holdings) |
— | 1 | — | 7 | 36 | (173 | ) | |||||||||||||||||
| Storm O&M, net of insurance recoveries (PSEG Power) |
(10 | ) | — | (25 | ) | — | (39 | ) | — | |||||||||||||||
| Gain on Sale of Asset (PSEG Energy Holdings) |
— | — | — | — | — | 34 | ||||||||||||||||||
|
|
|
|
|
|
|
|
|
|
|
|
|
|||||||||||||
| Income from Continuing Operations |
$ | 390 | $ | 347 | $ | 1,043 | $ | 1,051 | $ | 1,275 | $ | 1,407 | ||||||||||||
| Discontinued Operations |
— | — | — | — | — | 96 | ||||||||||||||||||
|
|
|
|
|
|
|
|
|
|
|
|
|
|||||||||||||
| Net Income |
$ | 390 | $ | 347 | $ | 1,043 | $ | 1,051 | $ | 1,275 | $ | 1,503 | ||||||||||||
|
|
|
|
|
|
|
|
|
|
|
|
|
|||||||||||||
| Fully Diluted Average Shares Outstanding (in Millions) |
508 | 507 | 507 | 507 | 507 | 507 | ||||||||||||||||||
|
|
|
|
|
|
|
|
|
|
|
|
|
|||||||||||||
| Per Share Impact (Diluted) | ||||||||||||||||||||||||
| Operating Earnings |
$ | 0.76 | $ | 0.75 | $ | 2.09 | $ | 2.03 | $ | 2.44 | $ | 2.74 | ||||||||||||
| Gain (Loss) on NDT Fund Related Activity (PSEG Power) |
0.02 | 0.08 | 0.06 | 0.10 | 0.10 | 0.10 | ||||||||||||||||||
| Gain (Loss) on MTM(a) (PSEG Power) |
0.01 | (0.15 | ) | (0.04 | ) | (0.07 | ) | (0.02 | ) | 0.21 | ||||||||||||||
| Lease Related Activity (PSEG Energy Holdings) |
— | — | — | 0.01 | 0.07 | (0.34 | ) | |||||||||||||||||
| Storm O&M, net of insurance recoveries (PSEG Power) |
(0.02 | ) | — | (0.05 | ) | — | (0.08 | ) | — | |||||||||||||||
| Gain on Sale of Asset (PSEG Energy Holdings) |
— | — | — | — | — | 0.06 | ||||||||||||||||||
|
|
|
|
|
|
|
|
|
|
|
|
|
|||||||||||||
| Income from Continuing Operations |
$ | 0.77 | $ | 0.68 | $ | 2.06 | $ | 2.07 | $ | 2.51 | $ | 2.77 | ||||||||||||
| Discontinued Operations |
— | — | — | — | — | 0.19 | ||||||||||||||||||
|
|
|
|
|
|
|
|
|
|
|
|
|
|||||||||||||
| Net Income |
$ | 0.77 | $ | 0.68 | $ | 2.06 | $ | 2.07 | $ | 2.51 | $ | 2.96 | ||||||||||||
|
|
|
|
|
|
|
|
|
|
|
|
|
|||||||||||||
| (a) | Includes the financial impact from positions with forward delivery months. |