EXHIBIT 99

|
Investor News | NYSE:PEG |
For further information, contact:
| • Kathleen A. Lally, Vice President – Investor Relations |
Phone: 973-430-6565 | |
| • Carlotta Chan Lane, Manager – Investor Relations |
Phone: 973-430-6596 |
August 3, 2011
PSEG ANNOUNCES 2011 SECOND QUARTER RESULTS
$0.63 PER SHARE INCOME FROM CONTINUING OPERATIONS
$0.59 PER SHARE OF OPERATING EARNINGS
Company Maintains 2011 Operating Earnings Guidance of $2.50—$2.75 Per Share
Announces Expansion in Capital Investment Program
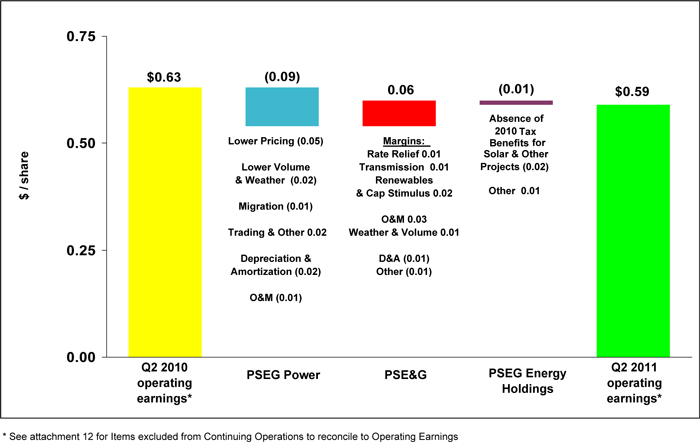
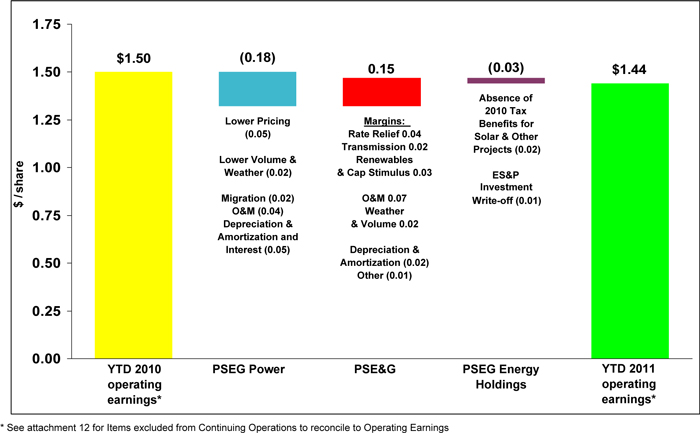
Public Service Enterprise Group (PSEG) reported today Second Quarter 2011 Income from Continuing Operations of $320 million or $0.63 per share as compared to $222 million or $0.44 per share for the Second Quarter of 2010. Including Income from Discontinued Operations, PSEG reported Net Income for the Second Quarter 2011 of $323 million ($0.63 per share) versus $224 million ($0.44 per share) for the Second Quarter of 2010. Operating Earnings for the second quarter of 2011 were $301 million or $0.59 per share compared to the Second Quarter of 2010 Operating Earnings of $321 million or $0.63 per share.
PSEG believes that the non-GAAP financial measure of “Operating Earnings” provides a consistent and comparable measure of performance of its businesses to help shareholders understand performance trends. Operating Earnings exclude the impact of returns/(losses) associated with Nuclear Decommissioning Trust (NDT), Mark-to-Market (MTM) accounting and other material one time items. The table below provides a reconciliation of PSEG’s Net Income to Operating Earnings for the second quarter. See Attachment 12 for a complete list of items excluded from Income from Continuing Operations in the determination of Operating Earnings.
PSEG CONSOLIDATED EARNINGS (unaudited)
Second Quarter Comparative Results
2011 and 2010
| Income ($millions) |
Diluted Earnings Per Share |
|||||||||||||||
| 2011 | 2010 | 2011 | 2010 | |||||||||||||
| Operating Earnings |
$ | 301 | $ | 321 | $ | 0.59 | $ | 0.63 | ||||||||
| Reconciling Items |
19 | (99 | ) | 0.04 | (0.19 | ) | ||||||||||
| Income from Continuing Operations |
$ | 320 | 222 | 0.63 | $ | 0.44 | ||||||||||
| Income from Discontinued Operations |
$ | 3 | $ | 2 | — | — | ||||||||||
| Net Income |
$ | 323 | $ | 224 | $ | 0.63 | $ | 0.44 | ||||||||
| Avg. Shares | 507M | 507M | ||||||||||||||
“We have achieved significant operational and regulatory success during the past quarter. Our investment program, a strong balance sheet and the operational focus of a dedicated workforce position PSEG to be a reliable supplier of low-cost, clean energy for the long-term” said Ralph Izzo, chairman, president and chief executive officer of PSEG.
He went on to say, “our results for the first half of 2011 continue to support our forecast of operating earnings for the full year of $2.50—$2.75 per share.”
Operating Earnings guidance by company for the full year is as follows:
Operating Earnings
($ million, except EPS)
| 2011E | 2010A | |||
| PSEG Power |
$765-$855 | $1,091 | ||
| PSE&G |
$495-$520 | $430 | ||
| PSEG Energy Holdings |
$0-$5 | $49 | ||
| Parent |
$5-$15 | $14 | ||
| Total |
$1,265-$1,395 | $1,584 | ||
| Earnings Per Share |
$2.50-$2.75 | $3.12 |
Ralph Izzo also announced an increase in PSEG’s capital investment program to approximately $6.9 billion over 2011-2013 compared to its prior forecast level of spending of $6.7 billion during this period. As part of the increase in spending, PSE&G’s capital budget is forecast to increase 15% from previously forecast levels to $5.2 billion. PSEG Energy Holdings’ forecast level of capital spending during this period has been reduced to $40 million from $570 million as PSEG Power’s forecast level of spending remains unchanged at approximately $1.5 billion.
“Our increased spending program”, said Ralph Izzo, “aligns the interests of PSEG with those of our customers, employees and shareholders. Supportive regulation at the state and federal level has been a foundation of our investments. The BPU’s recent approval of programs accelerating our investment in electric and gas infrastructure and energy efficiency provides the continued opportunity to support jobs and the economic growth of the state. FERC’s approval of incentive rate making treatment on major transmission projects supports system reliability. Our strong balance sheet provides the foundation to finance this growth. A program of continuous engagement with our employees has led to the resolution of labor contracts which has been an important contributor in our ability to control the growth in costs, provide the returns required by the market and support growth from our investment program.”
Operating Earnings Review and Outlook by Operating Subsidiary
See Attachment 6 for detail regarding the quarter-over-quarter reconciliations for each of PSEG’s businesses.
PSEG Power
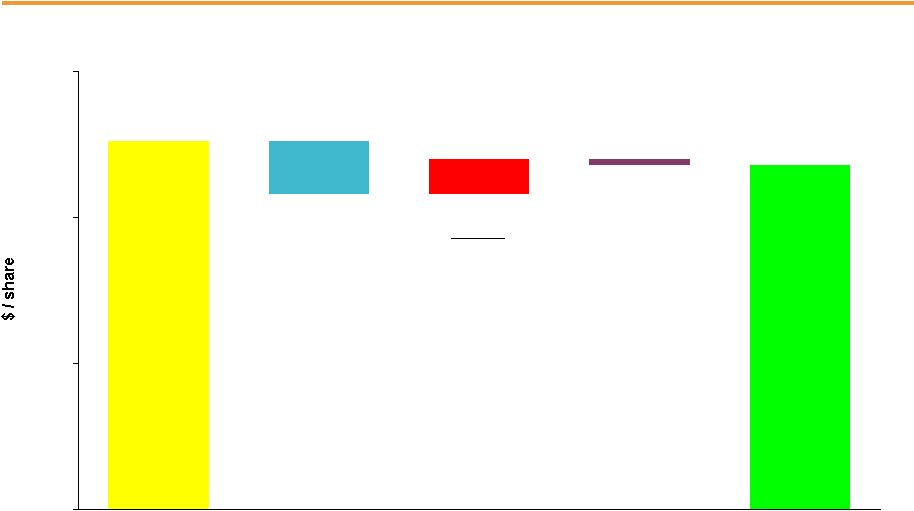
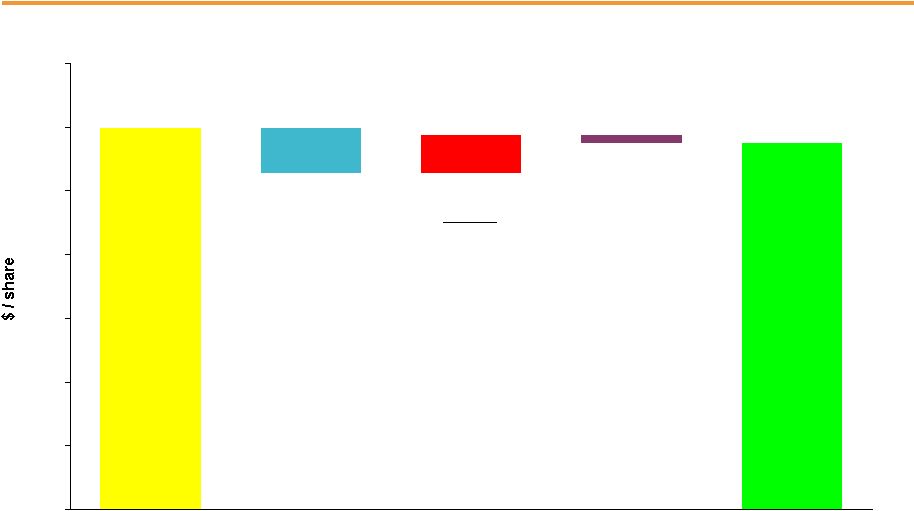
PSEG Power reported operating earnings of $186 million ($0.36 per share) for the second quarter of 2011 compared with operating earnings of $229 million ($0.45 per share) for the second quarter of 2010.
2
Power’s earnings were affected by a quarter-over-quarter decline in realized energy and capacity prices. A decline in capacity prices to $110 MW/Day from $174 MW/Day on June 1, 2011 reduced Power’s earnings by $0.02 per share. A decline in energy prices under the Basic Generation Service (BGS) contract, also effective on June 1, 2011, to $94.30/MWh from $111.50/Mwh and other hedges reduced earnings by $0.03 per share. A 6% decline in volume in comparison to abnormally warm conditions during the year ago period reduced earnings by $0.02 per share. An increase in customer migration from the BGS contract reduced earnings by $0.01 per share. Higher depreciation expense coupled with a decline in capitalized interest associated with the commercial operation of the back-end technology at Hudson and Mercer reduced Power’s earnings by $0.02 per share. An increase in operation and maintenance expense on the fossil stations reduced earnings by $0.01 per share. A decline in trading related losses and other miscellaneous items improved Power’s earnings by $0.02 per share.
PSEG Power’s nuclear fleet operated at an average capacity factor of 90.3% during the second quarter of 2011 compared to an average capacity factor of 92.6% in the year ago quarter. The performance for the quarter resulted in a capacity factor for the first half of 2011 of approximately 94.6% compared with a capacity factor of 95% for the year ago period. Availability in the quarter was mainly affected by a 29-day refueling outage at Salem 2. A decline in weather-related demand and higher costs reduced the dispatch of PSEG Power’s fossil fleet which resulted in a 10% reduction in generation from the fossil fleet during the quarter.
The Nuclear Regulatory Commission (NRC) approved PSEG Nuclear’s request to extend the operating license of the Hope Creek Generating Station and both Salem units an additional 20 years. Hope Creek’s operating license has been extended through 2046. Salem units 1 and 2 are now licensed through 2036 and 2040, respectively. The license renewal of these important assets will support the availability of low-cost, carbon-free energy.
We have lowered our full-year estimate of customer migration to an average of 34% from 35%. Our updated estimate assumes year-end customer migration levels of 37% -39%. The reduction in estimated levels of customer migration has not had a major impact on Power’s hedge profile. For the balance of 2011, Power’s base load output is fully hedged at an average price of $68 per MWh; with additional hedges in place on intermediate and peaking generation, approximately 70% -75% of total expected generation for that period is hedged at an average price of $68 per MWh. Power continues to forecast total generation for 2011 of 55 TWh. For 2012, hedges are in place for approximately 75% -80% of expected base-load generation of 36 TWh at an average price of $64 per MWh resulting in approximately 45% -50% of expected total 2012 generation of 56 TWh hedged at an average price of $64 per MWh. For 2013, approximately 35% -40% of anticipated base-load output of 36 TWh is hedged at an average price of $63 per MWh which results in hedges on approximately 20% -25% of expected total generation of 56 -58 TWh at an average price of $63 per MWh.
PSE&G
PSE&G reported operating earnings of $105 million ($0.21 per share) for the second quarter of 2011 compared with operating earnings of $75 million ($0.15 per share) for the second quarter of 2010.
PSE&G’s results were driven by rate relief and improved returns on higher levels of capital investment. An increase in electric and gas rates that went into effect on June 7, 2010 and July 9, 2010, respectively, improved earnings by $0.01 per share. An annualized increase in transmission
3
revenue of $45 million effective on January 1, 2011 added $0.01 per share to results. A return on investments made under capital adjustment clauses supporting renewables and electric and gas infrastructure programs added $0.02 per share to earnings. Quarter-over-quarter earnings comparisons were also aided by the implementation, as part of the rate case settlement, of the gas weather normalization clause and warmer than normal weather in the prior quarter. Together, these items added $0.02 per share to earnings. Lower volumes quarter over quarter reduced earnings by $0.01 per share. A reduction in operating and maintenance expense as a result of a decline in pension costs and the absence of a write-off in the second quarter of 2010 combined to add $0.03 per share to earnings. An increase in depreciation expense as a result of higher levels of capital spending reduced earnings by $0.01 per share. Other miscellaneous items combined to reduce earnings by $0.01 per share.
The Federal Energy Regulatory Commission (FERC) granted approval for incentive rate treatment effective on June 14, 2011 for three of five 230-kv projects with a total capital investment of about $1.0 billion. The incentive rate treatment covers approximately 80% of our request, and provides for recovery of Construction Work In Progress and 100% recovery of prudently-incurred abandonment costs.
PSE&G has increased its capital spending for 2011-2013 to $5.2 billion from $4.6 billion. The adjusted forecast reflects the NJ Board of Public Utilities’ recent decision to approve $368 million of increased spending on energy efficiency programs and electric and gas infrastructure. The forecast also includes an additional $96 million of spending on electric and gas distribution, and an update of forecast spending on certain transmission projects. The revised capital program will provide the opportunity for annual rate base growth of 11.5% from year-end 2010 over this period.
PSEG Energy Holdings
PSEG Energy Holdings reported operating earnings of $5 million ($0.01 per share) for the second quarter of 2011 versus operating earnings of $12 million ($0.02 per share) during the second quarter of 2010. The decline in operating earnings for the quarter reflects the absence of tax benefits recognized in the second quarter of 2010 associated with the start-up of solar projects in Ohio and Florida.
Roseton OL, LLC and Danskammer OL, LLC, indirect subsidiaries of PSEG (the “PSEG Entities”), are the owner-lessors of the Roseton and Danskammer electric generating facilities, which are leased to indirect subsidiaries of Dynegy and Dynegy Holdings Inc. (“DHI”). DHI has guaranteed the payment obligations of the lessees to the PSEG entities. As a result of DHI’s proposed transfer of substantially all of its coal and natural gas-fired generation assets, other than the Roseton and Danskammer facilities, to new “bankruptcy remote” subsidiaries, the PSEG entities filed suit against DHI in the Delaware Court of Chancery to halt DHI’s proposed transfer and protect is rights under the DHI guarantees. The PSEG Entities request for a temporary restraining order was denied on Friday, July 29, 2011 and they have since sought review with the Delaware Supreme Court. As of June 30, 2011, the PSEG Entities had a gross equity investment at risk in the Roseton and Danskammer leases of $264 million. A foreclosure event could result in an after-tax charge of $170—$180 million. As part of this potential foreclosure event, PSEG could be required to pay approximately $100 million to satisfy income tax obligations. This potential cash tax obligation is fully reflected in the overall estimate of the aggregate after-tax charge noted above.
4
Other Items
PSEG Power LLC closed on the sale of its 1,000 MW Odessa gas-fired generating plant on July 18, 2011 for approximately $335 million, subject to final adjustments for working capital. The closing of the Odessa sale completed the Texas asset sale process announced by PSEG Power in early 2011. In March 2011, PSEG Power closed the sale of the 1,000 MW Guadalupe plant for approximately $352 million.
# # # #
Forward-Looking Statement
Readers are cautioned that statements contained in this presentation about our and our subsidiaries’ future performance, including future revenues, earnings, strategies, prospects, consequences and all other statements that are not purely historical, are forward-looking statements for purposes of the safe harbor provisions under The Private Securities Litigation Reform Act of 1995. When used herein, the words “anticipate”, “intend”, “estimate”, “believe”, “expect”, “plan”, “should”, “hypothetical”, “potential”, “forecast”, “project”, variations of such words and similar expressions are intended to identify forward-looking statements. Although we believe that our expectations are based on reasonable assumptions, they are subject to risks and uncertainties and we can give no assurance they will be achieved. The results or developments projected or predicted in these statements may differ materially from what may actually occur. Factors which could cause results or events to differ from current expectations include, but are not limited to:
| • | adverse changes in energy industry law, policies and regulation, including market structures and a potential shift away from competitive markets toward subsidized market mechanisms, transmission planning and cost allocation rules, including rules regarding how transmission is planned and who is permitted to build transmission in the future, and reliability standards, |
| • | any inability of our transmission and distribution businesses to obtain adequate and timely rate relief and regulatory approvals from federal and state regulators, |
| • | changes in federal and state environmental regulations that could increase our costs or limit operations of our generating units, |
| • | changes in nuclear regulation and/or general developments in the nuclear power industry, including various impacts from any accidents or incidents experienced at our facilities or by others in the industry that could limit operations of our nuclear generating units, |
| • | actions or activities at one of our nuclear units located on a multi-unit site that might adversely affect our ability to continue to operate that unit or other units located at the same site, |
| • | any inability to balance our energy obligations, available supply and trading risks, |
| • | any deterioration in our credit quality, or the credit quality of our counterparties, |
| • | availability of capital and credit at commercially reasonable terms and conditions and our ability to meet cash needs, |
| • | any inability to realize anticipated tax benefits or retain tax credits, |
| • | changes in the cost of, or interruption in the supply of, fuel and other commodities necessary to the operation of our generating units, |
| • | delays in receipt of necessary permits and approvals for our construction and development activities, |
| • | delays or unforeseen cost escalations in our construction and development activities, |
| • | adverse changes in the demand for or price of the capacity and energy that we sell into wholesale electricity markets, |
| • | increase in competition in energy markets in which we compete, |
| • | challenges associated with recruitment and/or retention of a qualified workforce, |
| • | adverse performance of our decommissioning and defined benefit plan trust fund investments and changes in discount rates and funding requirements, and |
| • | changes in technology and customer usage patterns. |
For further information, please refer to our Annual Report on Form 10-K, including Item 1A. Risk Factors, and subsequent reports on Form 10-Q and Form 8-K filed with the Securities and Exchange Commission. These documents address in further detail our business, industry issues and other factors that could cause actual results to differ materially from those indicated in this presentation. In addition, any forward-looking statements included herein represent our estimates only as of today and should not be relied upon as representing our estimates as of any subsequent date. While we may elect to update forward-looking statements from time to time, we specifically disclaim any obligation to do so, even if our internal estimates change, unless otherwise required by applicable securities laws.
5
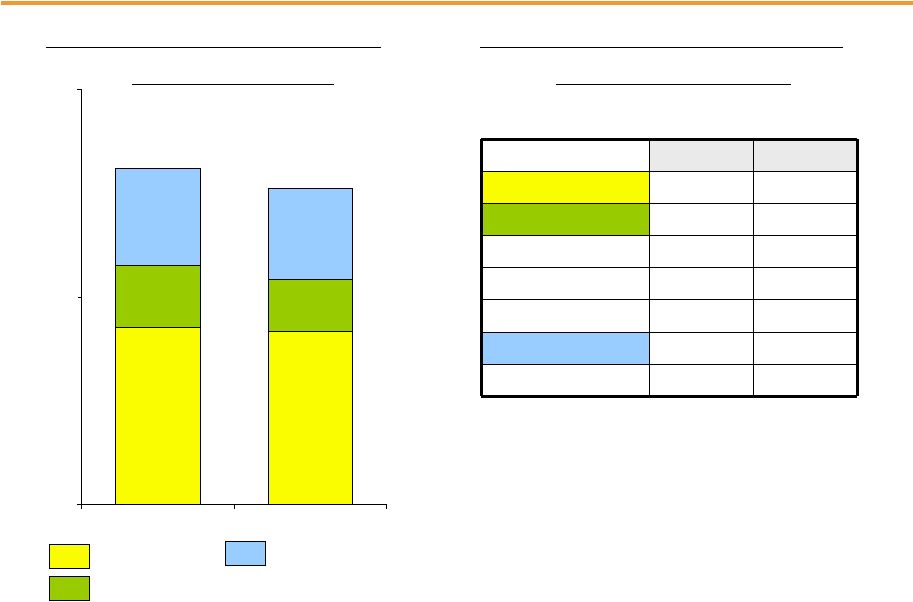
Attachment 1
PUBLIC SERVICE ENTERPRISE GROUP INCORPORATED
Operating Earnings and Per Share Results by Subsidiary
(Unaudited)
| For the Three Months Ended June 30, |
For the Six Months Ended June 30, |
|||||||||||||||
| 2011 | 2010 | 2011 | 2010 | |||||||||||||
| Earnings Results ($ Millions) | ||||||||||||||||
| PSEG Power |
$ | 186 | $ | 229 | $ | 452 | $ | 541 | ||||||||
| PSE&G |
105 | 75 | 268 | 192 | ||||||||||||
| PSEG Energy Holdings |
5 | 12 | 2 | 19 | ||||||||||||
| PSEG |
5 | 5 | 10 | 8 | ||||||||||||
|
|
|
|
|
|
|
|
|
|||||||||
| Operating Earnings |
$ | 301 | $ | 321 | $ | 732 | $ | 760 | ||||||||
|
|
|
|
|
|
|
|
|
|||||||||
| Reconciling Items(a) |
19 | (99 | ) | 50 | (40 | ) | ||||||||||
|
|
|
|
|
|
|
|
|
|||||||||
| Income from Continuing Operations |
$ | 320 | $ | 222 | $ | 782 | $ | 720 | ||||||||
|
|
|
|
|
|
|
|
|
|||||||||
| Discontinued Operations |
3 | 2 | 67 | (5 | ) | |||||||||||
|
|
|
|
|
|
|
|
|
|||||||||
| Net Income |
$ | 323 | $ | 224 | $ | 849 | $ | 715 | ||||||||
|
|
|
|
|
|
|
|
|
|||||||||
| Fully Diluted Average Shares Outstanding (in Millions) |
507 | 507 | 507 | 507 | ||||||||||||
|
|
|
|
|
|
|
|
|
|||||||||
| Per Share Results (Diluted) | ||||||||||||||||
| PSEG Power |
$ | 0.36 | $ | 0.45 | $ | 0.89 | $ | 1.07 | ||||||||
| PSE&G |
0.21 | 0.15 | 0.53 | 0.38 | ||||||||||||
| PSEG Energy Holdings |
0.01 | 0.02 | — | 0.03 | ||||||||||||
| PSEG |
0.01 | 0.01 | 0.02 | 0.02 | ||||||||||||
|
|
|
|
|
|
|
|
|
|||||||||
| Operating Earnings |
$ | 0.59 | $ | 0.63 | $ | 1.44 | $ | 1.50 | ||||||||
|
|
|
|
|
|
|
|
|
|||||||||
| Reconciling Items(a) |
0.04 | (0.19 | ) | 0.10 | (0.08 | ) | ||||||||||
|
|
|
|
|
|
|
|
|
|||||||||
| Income from Continuing Operations |
$ | 0.63 | $ | 0.44 | $ | 1.54 | $ | 1.42 | ||||||||
|
|
|
|
|
|
|
|
|
|||||||||
| Discontinued Operations |
— | — | 0.13 | (0.01 | ) | |||||||||||
|
|
|
|
|
|
|
|
|
|||||||||
| Net Income |
$ | 0.63 | $ | 0.44 | $ | 1.67 | $ | 1.41 | ||||||||
|
|
|
|
|
|
|
|
|
|||||||||
| (a) | See attachment 12 for details of items excluded from Income from Continuing Operations to compute Operating Earnings. |
Note:
Income from Continuing Operations includes preferred stock dividends relating to PSE&G of $1 million for the six months ended June 30, 2010.
Attachment 2
PUBLIC SERVICE ENTERPRISE GROUP INCORPORATED
Consolidating Statements of Operations
(Unaudited, $ Millions)
| For the Three Months Ended June 30, 2011 | ||||||||||||||||||||
| PSEG | OTHER (a) | PSEG POWER |
PSE&G | PSEG ENERGY HOLDINGS |
||||||||||||||||
| OPERATING REVENUES |
$ | 2,469 | $ | (408 | ) | $ | 1,285 | $ | 1,571 | $ | 21 | |||||||||
| OPERATING EXPENSES |
||||||||||||||||||||
| Energy Costs |
1,010 | (408 | ) | 603 | 815 | — | ||||||||||||||
| Operation and Maintenance |
575 | (8 | ) | 271 | 304 | 8 | ||||||||||||||
| Depreciation and Amortization |
235 | 3 | 56 | 172 | 4 | |||||||||||||||
| Taxes Other Than Income Taxes |
28 | — | — | 28 | — | |||||||||||||||
|
|
|
|
|
|
|
|
|
|
|
|||||||||||
| Total Operating Expenses |
1,848 | (413 | ) | 930 | 1,319 | 12 | ||||||||||||||
|
|
|
|
|
|
|
|
|
|
|
|||||||||||
| OPERATING INCOME |
621 | 5 | 355 | 252 | 9 | |||||||||||||||
| Income from Equity Method Investments |
4 | — | — | — | 4 | |||||||||||||||
| Other Income and Deductions |
40 | 1 | 35 | 4 | — | |||||||||||||||
| Other Than Temporary Impairments |
(1 | ) | — | (1 | ) | — | — | |||||||||||||
| Interest Expense |
(117 | ) | 3 | (41 | ) | (78 | ) | (1 | ) | |||||||||||
|
|
|
|
|
|
|
|
|
|
|
|||||||||||
| INCOME FROM CONTINUING OPERATIONS BEFORE INCOME TAXES |
547 | 9 | 348 | 178 | 12 | |||||||||||||||
| Income Tax Expense |
(227 | ) | (4 | ) | (143 | ) | (73 | ) | (7 | ) | ||||||||||
|
|
|
|
|
|
|
|
|
|
|
|||||||||||
| INCOME FROM CONTINUING OPERATIONS |
320 | 5 | 205 | 105 | 5 | |||||||||||||||
| Discontinued Operations, net of tax |
3 | — | 3 | — | — | |||||||||||||||
|
|
|
|
|
|
|
|
|
|
|
|||||||||||
| NET INCOME |
$ | 323 | $ | 5 | $ | 208 | $ | 105 | $ | 5 | ||||||||||
|
|
|
|
|
|
|
|
|
|
|
|||||||||||
| Income from Continuing Operations |
$ | 320 | $ | 5 | $ | 205 | $ | 105 | $ | 5 | ||||||||||
| Less: Reconciling Items Excluded from Continuing Operations (a) |
19 | — | 19 | — | — | |||||||||||||||
|
|
|
|
|
|
|
|
|
|
|
|||||||||||
| OPERATING EARNINGS |
$ | 301 | $ | 5 | $ | 186 | $ | 105 | $ | 5 | ||||||||||
|
|
|
|
|
|
|
|
|
|
|
|||||||||||
| For the Three Months Ended June 30, 2010 | ||||||||||||||||||||
| PSEG | OTHER (a) | PSEG POWER |
PSE&G | PSEG ENERGY HOLDINGS |
||||||||||||||||
| OPERATING REVENUES |
$ | 2,361 | $ | (459 | ) | $ | 1,264 | $ | 1,536 | $ | 20 | |||||||||
| OPERATING EXPENSES |
||||||||||||||||||||
| Energy Costs |
1,072 | (457 | ) | 612 | 917 | — | ||||||||||||||
| Operation and Maintenance |
601 | (11 | ) | 260 | 343 | 9 | ||||||||||||||
| Depreciation and Amortization |
229 | 5 | 44 | 177 | 3 | |||||||||||||||
| Taxes Other Than Income Taxes |
28 | — | 28 | — | ||||||||||||||||
|
|
|
|
|
|
|
|
|
|
|
|||||||||||
| Total Operating Expenses |
1,930 | (463 | ) | 916 | 1,465 | 12 | ||||||||||||||
|
|
|
|
|
|
|
|
|
|
|
|||||||||||
| OPERATING INCOME |
431 | 4 | 348 | 71 | 8 | |||||||||||||||
| Income from Equity Method Investments |
5 | — | — | — | 5 | |||||||||||||||
| Other Income and Deductions |
35 | 1 | 30 | 3 | 1 | |||||||||||||||
| Other Than Temporary Impairments |
(5 | ) | — | (5 | ) | — | — | |||||||||||||
| Interest Expense |
(120 | ) | 4 | (42 | ) | (80 | ) | (2 | ) | |||||||||||
|
|
|
|
|
|
|
|
|
|
|
|||||||||||
| INCOME FROM CONTINUING OPERATIONS BEFORE INCOME TAXES |
346 | 9 | 331 | (6 | ) | 12 | ||||||||||||||
| Income Tax Expense |
(124 | ) | (4 | ) | (129 | ) | 9 | — | ||||||||||||
|
|
|
|
|
|
|
|
|
|
|
|||||||||||
| INCOME FROM CONTINUING OPERATIONS |
222 | 5 | 202 | 3 | 12 | |||||||||||||||
| Discontinued Operations, net of tax |
2 | — | 2 | — | — | |||||||||||||||
|
|
|
|
|
|
|
|
|
|
|
|||||||||||
| NET INCOME |
$ | 224 | $ | 5 | $ | 204 | $ | 3 | $ | 12 | ||||||||||
|
|
|
|
|
|
|
|
|
|
|
|||||||||||
| Income from Continuing Operations |
$ | 222 | $ | 5 | $ | 202 | $ | 3 | $ | 12 | ||||||||||
| Less: Reconciling Items Excluded from Continuing Operations (a) |
(99 | ) | — | (27 | ) | (72 | ) | — | ||||||||||||
|
|
|
|
|
|
|
|
|
|
|
|||||||||||
| OPERATING EARNINGS |
$ | 321 | $ | 5 | $ | 229 | $ | 75 | $ | 12 | ||||||||||
|
|
|
|
|
|
|
|
|
|
|
|||||||||||
| (a) | See attachment 12 for details of items excluded from Income from Continuing Operations to compute Operating Earnings. |
Attachment 3
PUBLIC SERVICE ENTERPRISE GROUP INCORPORATED
Consolidating Statements of Operations
(Unaudited, $ Millions)
| For the Six Months Ended June 30, 2011 | ||||||||||||||||||||
| PSEG | OTHER (a) | PSEG POWER |
PSE&G | PSEG ENERGY HOLDINGS |
||||||||||||||||
| OPERATING REVENUES |
$ | 5,823 | $ | (1,347 | ) | $ | 3,252 | $ | 3,877 | $ | 41 | |||||||||
| OPERATING EXPENSES |
||||||||||||||||||||
| Energy Costs |
2,573 | (1,346 | ) | 1,738 | 2,181 | — | ||||||||||||||
| Operation and Maintenance |
1,226 | (18 | ) | 548 | 672 | 24 | ||||||||||||||
| Depreciation and Amortization |
476 | 7 | 110 | 351 | 8 | |||||||||||||||
| Taxes Other Than Income Taxes |
71 | — | — | 71 | — | |||||||||||||||
|
|
|
|
|
|
|
|
|
|
|
|||||||||||
| Total Operating Expenses |
4,346 | (1,357 | ) | 2,396 | 3,275 | 32 | ||||||||||||||
|
|
|
|
|
|
|
|
|
|
|
|||||||||||
| OPERATING INCOME |
1,477 | 10 | 856 | 602 | 9 | |||||||||||||||
| Income from Equity Method Investments |
7 | — | — | — | 7 | |||||||||||||||
| Other Income and Deductions |
103 | 1 | 93 | 8 | 1 | |||||||||||||||
| Other Than Temporary Impairments |
(5 | ) | (1 | ) | (3 | ) | (1 | ) | — | |||||||||||
| Interest Expense |
(244 | ) | 7 | (92 | ) | (157 | ) | (2 | ) | |||||||||||
|
|
|
|
|
|
|
|
|
|
|
|||||||||||
| INCOME FROM CONTINUING OPERATIONS BEFORE INCOME TAXES |
1,338 | 17 | 854 | 452 | 15 | |||||||||||||||
| Income Tax Expense |
(556 | ) | (7 | ) | (352 | ) | (184 | ) | (13 | ) | ||||||||||
|
|
|
|
|
|
|
|
|
|
|
|||||||||||
| INCOME FROM CONTINUING OPERATIONS |
782 | 10 | 502 | 268 | 2 | |||||||||||||||
| Discontinued Operations, net of tax |
67 | — | 67 | — | — | |||||||||||||||
|
|
|
|
|
|
|
|
|
|
|
|||||||||||
| NET INCOME |
$ | 849 | $ | 10 | $ | 569 | $ | 268 | $ | 2 | ||||||||||
|
|
|
|
|
|
|
|
|
|
|
|||||||||||
| Income from Continuing Operations |
$ | 782 | $ | 10 | $ | 502 | $ | 268 | $ | 2 | ||||||||||
| Less: Reconciling Items Excluded from Continuing Operations (a) |
50 | — | 50 | — | — | |||||||||||||||
|
|
|
|
|
|
|
|
|
|
|
|||||||||||
| OPERATING EARNINGS |
$ | 732 | $ | 10 | $ | 452 | $ | 268 | $ | 2 | ||||||||||
|
|
|
|
|
|
|
|
|
|
|
|||||||||||
| For the Six Months Ended June 30, 2010 | ||||||||||||||||||||
| PSEG | OTHER (a) | PSEG POWER |
PSE&G | PSEG ENERGY HOLDINGS |
||||||||||||||||
| OPERATING REVENUES |
$ | 5,934 | $ | (1,562 | ) | $ | 3,460 | $ | 3,980 | $ | 56 | |||||||||
| OPERATING EXPENSES |
||||||||||||||||||||
| Energy Costs |
2,760 | (1,560 | ) | 1,863 | 2,457 | — | ||||||||||||||
| Operation and Maintenance |
1,271 | (19 | ) | 511 | 757 | 22 | ||||||||||||||
| Depreciation and Amortization |
456 | 9 | 87 | 354 | 6 | |||||||||||||||
| Taxes Other Than Income Taxes |
70 | — | — | 70 | — | |||||||||||||||
|
|
|
|
|
|
|
|
|
|
|
|||||||||||
| Total Operating Expenses |
4,557 | (1,570 | ) | 2,461 | 3,638 | 28 | ||||||||||||||
|
|
|
|
|
|
|
|
|
|
|
|||||||||||
| OPERATING INCOME |
1,377 | 8 | 999 | 342 | 28 | |||||||||||||||
| Income from Equity Method Investments |
8 | — | — | — | 8 | |||||||||||||||
| Other Income and Deductions |
62 | (2 | ) | 55 | 7 | 2 | ||||||||||||||
| Other Than Temporary Impairments |
(6 | ) | — | (6 | ) | — | — | |||||||||||||
| Interest Expense |
(236 | ) | 7 | (82 | ) | (157 | ) | (4 | ) | |||||||||||
| Preferred Stock Dividends |
— | 1 | — | (1 | ) | — | ||||||||||||||
|
|
|
|
|
|
|
|
|
|
|
|||||||||||
| INCOME FROM CONTINUING OPERATIONS BEFORE INCOME TAXES (b) |
1,205 | 14 | 966 | 191 | 34 | |||||||||||||||
| Income Tax Expense |
(485 | ) | (6 | ) | (393 | ) | (71 | ) | (15 | ) | ||||||||||
|
|
|
|
|
|
|
|
|
|
|
|||||||||||
| INCOME FROM CONTINUING OPERATIONS |
720 | 8 | 573 | 120 | 19 | |||||||||||||||
| Discontinued Operations, net of tax |
(5 | ) | — | (5 | ) | — | — | |||||||||||||
|
|
|
|
|
|
|
|
|
|
|
|||||||||||
| NET INCOME |
$ | 715 | $ | 8 | $ | 568 | $ | 120 | $ | 19 | ||||||||||
|
|
|
|
|
|
|
|
|
|
|
|||||||||||
| Income from Continuing Operations |
$ | 720 | $ | 8 | $ | 573 | $ | 120 | $ | 19 | ||||||||||
| Less: Reconciling Items Excluded from Continuing Operations (a) |
(40 | ) | — | 32 | (72 | ) | — | |||||||||||||
|
|
|
|
|
|
|
|
|
|
|
|||||||||||
| OPERATING EARNINGS |
$ | 760 | $ | 8 | $ | 541 | $ | 192 | $ | 19 | ||||||||||
|
|
|
|
|
|
|
|
|
|
|
|||||||||||
| (a) | See attachment 12 for details of items excluded from Income from Continuing Operations to compute Operating Earnings. |
| (b) | Income from Continuing Operations before Income Taxes includes preferred stock dividends relating to PSE&G of $1 million for the six months ended June 30, 2010. |
Attachment 4
PUBLIC SERVICE ENTERPRISE GROUP INCORPORATED
Capitalization Schedule
(Unaudited, $ Millions)
| June 30, 2011 |
December 31, 2010 |
|||||||
| DEBT |
||||||||
| Commercial Paper and Loans |
$ | 298 | $ | 64 | ||||
| Long-Term Debt |
7,155 | 7,748 | ||||||
| Securitization Debt |
1,049 | 1,145 | ||||||
| Project Level, Non-Recourse Debt |
46 | 47 | ||||||
|
|
|
|
|
|||||
| Total Debt |
8,548 | 9,004 | ||||||
| STOCKHOLDERS’ EQUITY |
||||||||
| Common Stock |
4,812 | 4,807 | ||||||
| Treasury Stock |
(601 | ) | (593 | ) | ||||
| Retained Earnings |
6,077 | 5,575 | ||||||
| Accumulated Other Comprehensive Loss |
(179 | ) | (156 | ) | ||||
|
|
|
|
|
|||||
| Total Common Stockholders’ Equity |
10,109 | 9,633 | ||||||
| Noncontrolling Interests - Equity Investments |
2 | 8 | ||||||
|
|
|
|
|
|||||
| Total Equity |
10,111 | 9,641 | ||||||
|
|
|
|
|
|||||
| Total Capitalization |
$ | 18,659 | $ | 18,645 | ||||
|
|
|
|
|
|||||
Attachment 5
PUBLIC SERVICE ENTERPRISE GROUP INCORPORATED
CONDENSED CONSOLIDATED STATEMENTS OF CASH FLOWS
(Unaudited, $ Millions)
| For the Six Months Ended June 30, | ||||||||
| 2011 | 2010 | |||||||
| CASH FLOWS FROM OPERATING ACTIVITIES |
||||||||
| Net Income |
$ | 849 | $ | 715 | ||||
| Adjustments to Reconcile Net Income to Net Cash Flows From Operating Activities |
546 | (195 | ) | |||||
|
|
|
|
|
|||||
| NET CASH PROVIDED BY OPERATING ACTIVITIES |
1,395 | 520 | ||||||
|
|
|
|
|
|||||
| NET CASH USED IN INVESTING ACTIVITIES |
(673 | ) | (755 | ) | ||||
|
|
|
|
|
|||||
| NET CASH USED IN FINANCING ACTIVITIES |
(843 | ) | (58 | ) | ||||
|
|
|
|
|
|||||
| Net Increase (Decrease) in Cash and Cash Equivalents |
(121 | ) | (293 | ) | ||||
| Cash and Cash Equivalents at Beginning of Period |
280 | 350 | ||||||
|
|
|
|
|
|||||
| Cash and Cash Equivalents at End of Period |
$ | 159 | $ | 57 | ||||
|
|
|
|
|
|||||
Attachment 6
PUBLIC SERVICE ENTERPRISE GROUP INCORPORATED
Quarter-over-Quarter EPS Reconciliation
June 30, 2011 vs. June 30, 2010
(Unaudited)
Attachment 7
PUBLIC SERVICE ENTERPRISE GROUP INCORPORATED
Year-over-Year EPS Reconciliation
June 30, 2011 vs. June 30, 2010
(Unaudited)
Attachment 8
PSEG POWER LLC
Generation Measures
(Unaudited)
| GWhr Breakdown | GWhr Breakdown | |||||||||||||||
| Three Months Ended June 30, |
Six Months Ended June 30, |
|||||||||||||||
| 2011 | 2010 | 2011 | 2010 | |||||||||||||
| Nuclear - NJ |
4,842 | 5,027 | 10,307 | 10,371 | ||||||||||||
| Nuclear - PA |
2,465 | 2,460 | 4,929 | 4,897 | ||||||||||||
|
|
|
|
|
|
|
|
|
|||||||||
| Total Nuclear |
7,307 | 7,487 | 15,236 | 15,268 | ||||||||||||
| Fossil - Coal - NJ* |
845 | 1,044 | 1,572 | 2,172 | ||||||||||||
| Fossil - Coal - PA |
1,289 | 1,335 | 2,666 | 2,766 | ||||||||||||
| Fossil - Coal - CT |
57 | 216 | 265 | 577 | ||||||||||||
|
|
|
|
|
|
|
|
|
|||||||||
| Total Coal |
2,191 | 2,595 | 4,503 | 5,515 | ||||||||||||
| Fossil - Oil & Natural Gas - NJ |
2,879 | 2,834 | 5,632 | 5,505 | ||||||||||||
| Fossil - Oil & Natural Gas - NY |
944 | 1,239 | 1,970 | 2,094 | ||||||||||||
| Fossil - Oil & Natural Gas - CT |
1 | 17 | 12 | 21 | ||||||||||||
|
|
|
|
|
|
|
|
|
|||||||||
| Total Oil & Natural Gas |
3,824 | 4,090 | 7,614 | 7,620 | ||||||||||||
|
|
|
|
|
|
|
|
|
|||||||||
| 13,322 | 14,172 | 27,353 | 28,403 | |||||||||||||
| % Generation by Fuel Type | % Generation by Fuel Type | |||||||||||||||
| Three Months Ended June 30, |
Six Months Ended June 30, |
|||||||||||||||
| 2011 | 2010 | 2011 | 2010 | |||||||||||||
| Nuclear - NJ |
36 | % | 36 | % | 38 | % | 37 | % | ||||||||
| Nuclear - PA |
19 | % | 17 | % | 18 | % | 17 | % | ||||||||
|
|
|
|
|
|
|
|
|
|||||||||
| Total Nuclear |
55 | % | 53 | % | 56 | % | 54 | % | ||||||||
| Fossil - Coal - NJ* |
6 | % | 7 | % | 5 | % | 7 | % | ||||||||
| Fossil - Coal - PA |
10 | % | 9 | % | 10 | % | 10 | % | ||||||||
| Fossil - Coal - CT |
0 | % | 2 | % | 1 | % | 2 | % | ||||||||
|
|
|
|
|
|
|
|
|
|||||||||
| Total Coal |
16 | % | 18 | % | 16 | % | 19 | % | ||||||||
| Fossil - Oil & Natural Gas - NJ |
22 | % | 20 | % | 21 | % | 20 | % | ||||||||
| Fossil - Oil & Natural Gas - NY |
7 | % | 9 | % | 7 | % | 7 | % | ||||||||
| Fossil - Oil & Natural Gas - CT |
0 | % | 0 | % | 0 | % | 0 | % | ||||||||
|
|
|
|
|
|
|
|
|
|||||||||
| Total Oil & Natural Gas |
29 | % | 29 | % | 28 | % | 27 | % | ||||||||
|
|
|
|
|
|
|
|
|
|||||||||
| 100 | % | 100 | % | 100 | % | 100 | % | |||||||||
| * | Includes Pumped Storage. Pumped Storage accounted for <1% of total generation for the three and six months ended June 30, 2011 and 2010. |
Attachment 9
PUBLIC SERVICE ELECTRIC & GAS COMPANY
Retail Sales and Revenues
(Unaudited)
June 30, 2011
Electric Sales and Revenues
| Three Months Ended |
Change vs. 2010 |
Six Months Ended |
Change vs. 2010 |
|||||||||||||
| Sales (millions kwh) |
||||||||||||||||
| Residential |
3,207 | -4.7 | % | 6,435 | -1.5 | % | ||||||||||
| Commercial & Industrial |
6,987 | -1.5 | % | 13,994 | -0.5 | % | ||||||||||
| Street Lighting |
76 | -7.0 | % | 179 | -3.4 | % | ||||||||||
| Interdepartmental |
2 | 1.8 | % | 5 | 2.3 | % | ||||||||||
|
|
|
|
|
|
|
|
|
|||||||||
| Total |
10,272 | -2.5 | % | 20,613 | -0.8 | % | ||||||||||
|
|
|
|
|
|
|
|
|
|||||||||
| Revenue (in millions) |
||||||||||||||||
| Residential |
$ | 523 | -1.0 | % | $ | 1,075 | 0.8 | % | ||||||||
| Commercial & Industrial |
581 | 1.8 | % | 1,107 | -3.4 | % | ||||||||||
| Street Lighting |
17 | -5.8 | % | 37 | -3.1 | % | ||||||||||
| Other Operating Revenues* |
99 | 33.9 | % | 188 | 11.9 | % | ||||||||||
|
|
|
|
|
|
|
|
|
|||||||||
| Total |
$ | 1,220 | 2.3 | % | $ | 2,407 | -0.5 | % | ||||||||
|
|
|
|
|
|
|
|
|
|||||||||
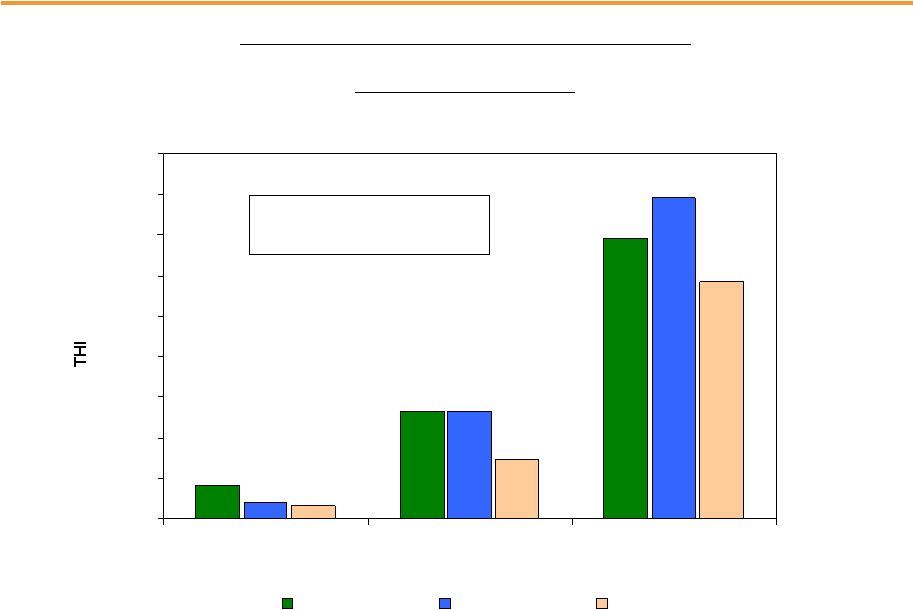
| Weather Data | Three Months Ended |
Change vs. 2010 |
Six Months Ended |
Change vs. 2010 |
||||||||||||
| THI Hours - Actual |
5,187 | -5.6 | % | 5,207 | -5.2 | % | ||||||||||
| THI Hours - Normal |
3,813 | 3,845 | ||||||||||||||
| * | Primarily sales of Non-Utility Generator energy to PJM and Transmission related revenues. |
Attachment 10
PUBLIC SERVICE ELECTRIC & GAS COMPANY
Retail Sales and Revenues
(Unaudited)
June 30, 2011
Gas Sold and Transported
| Three Months Ended |
Change vs. 2010 |
Six Months Ended |
Change vs. 2010 |
|||||||||||||
| Sales (millions therms) |
||||||||||||||||
| Residential Sales |
177 | 13.1 | % | 847 | 5.7 | % | ||||||||||
| Commercial & Industrial - Firm Sales |
65 | 11.9 | % | 311 | 3.5 | % | ||||||||||
| Commercial & Industrial - Interr. & Cogen |
43 | 5.6 | % | 78 | 2.8 | % | ||||||||||
|
|
|
|
|
|
|
|
|
|||||||||
| Total |
285 | 11.6 | % | 1,236 | 5.0 | % | ||||||||||
|
|
|
|
|
|
|
|
|
|||||||||
| Gas Transported - Firm Sales |
89 | 25.8 | % | 328 | 21.8 | % | ||||||||||
| Gas Transported - Non-Firm |
201 | -16.3 | % | 429 | -2.8 | % | ||||||||||
| Revenue (in millions) |
||||||||||||||||
| Residential Sales |
$ | 110 | -14.9 | % | $ | 527 | -20.4 | % | ||||||||
| Commercial & Industrial - Firm Sales |
40 | 16.7 | % | $ | 198 | -7.9 | % | |||||||||
| Commercial & Industrial - Interr. & Cogen |
23 | 10.4 | % | $ | 44 | -1.4 | % | |||||||||
| Other Operating Revenues* |
38 | 2.2 | % | $ | 75 | -0.7 | % | |||||||||
|
|
|
|
|
|
|
|
|
|||||||||
| Total |
$ | 211 | -4.7 | % | $ | 844 | -15.3 | % | ||||||||
|
|
|
|
|
|
|
|
|
|||||||||
| Gas Transported |
140 | 14.9 | % | 626 | 10.8 | % | ||||||||||
| Weather Data |
Three Months Ended |
Change vs. 2010 |
Six Months Ended |
Change vs. 2010 |
||||||||||||
| Degree Days - Actual |
416 | 25.8 | % | 2,975 | 8.0 | % | ||||||||||
| Degree Days - Normal |
519 | 3,033 | ||||||||||||||
| * | Primarily Appliance Service. |
Attachment 11
PUBLIC SERVICE ENTERPRISE GROUP INCORPORATED
Statistical Measures
(Unaudited)
| For the Three Months Ended June 30 |
For the Six Months Ended June 30 |
|||||||||||||||
| 2011 | 2010 | 2011 | 2010 | |||||||||||||
| Weighted Average Common Shares Outstanding (000’s) |
||||||||||||||||
| Basic |
505,988 | 506,109 | 505,984 | 506,030 | ||||||||||||
| Diluted |
506,761 | 507,091 | 506,945 | 507,119 | ||||||||||||
| Stock Price at End of Period |
$ | 32.64 | $ | 31.33 | ||||||||||||
| Dividends Paid per Share of Common Stock |
$ | 0.3425 | $ | 0.3425 | $ | 0.6850 | $ | 0.6850 | ||||||||
| Dividend Payout Ratio* |
44.6 | % | 44.6 | % | ||||||||||||
| Dividend Yield |
4.2 | % | 4.3 | % | ||||||||||||
| Price/Earnings Ratio* |
10.6 | 10.3 | ||||||||||||||
| Rate of Return on Average Common Equity* |
16.1 | % | 17.4 | % | ||||||||||||
| Book Value per Common Share |
$ | 19.98 | $ | 18.04 | ||||||||||||
| Market Price as a Percent of Book Value |
163 | % | 174 | % | ||||||||||||
| Total Shareholder Return |
4.7 | % | 7.3 | % | 4.8 | % | -3.7 | % | ||||||||
| * | Calculation based on Operating Earnings for the 12 month period ended. |
Attachment 12
PUBLIC SERVICE ENTERPRISE GROUP INCORPORATED
Reconciling Items Excluded from Continuing Operations to Compute Operating Earnings
(Unaudited)
| For the Three Months Ended June 30, |
For the Six Months Ended June 30, |
|||||||||||||||
| Pro-forma Adjustments, net of tax |
2011 | 2010 | 2011 | 2010 | ||||||||||||
| Earnings Impact ($ Millions) | ||||||||||||||||
| Gain (Loss) on Nuclear Decommissioning Trust (NDT) Fund Related Activity (PSEG Power) |
$ | 15 | $ | 10 | $ | 42 | $ | 20 | ||||||||
| Gain (Loss) on Mark-to-Market (MTM) (PSEG Power) |
4 | (37 | ) | 8 | 12 | |||||||||||
| Market Transition Charge Refund (PSE&G) |
— | (72 | ) | — | (72 | ) | ||||||||||
|
|
|
|
|
|
|
|
|
|||||||||
| Total Pro-forma adjustments |
$ | 19 | $ | (99 | ) | $ | 50 | $ | (40 | ) | ||||||
|
|
|
|
|
|
|
|
|
|||||||||
| Fully Diluted Average Shares Outstanding (in Millions) |
507 | 507 | 507 | 507 | ||||||||||||
|
|
|
|
|
|
|
|
|
|||||||||
| Per Share Impact (Diluted) | ||||||||||||||||
| Gain (Loss) on NDT Fund Related Activity (PSEG Power) |
$ | 0.03 | $ | 0.02 | $ | 0.08 | $ | 0.04 | ||||||||
| Gain (Loss) on MTM (PSEG Power) |
0.01 | (0.07 | ) | 0.02 | 0.02 | |||||||||||
| Market Transition Charge Refund (PSE&G) |
— | (0.14 | ) | — | (0.14 | ) | ||||||||||
|
|
|
|
|
|
|
|
|
|||||||||
| Total Pro-forma adjustments |
$ | 0.04 | $ | (0.19 | ) | $ | 0.10 | $ | (0.08 | ) | ||||||