| Ivy Funds VIP Micro Cap Growth | ||||||||||||||||||||
| Ivy Funds VIP Micro Cap Growth | ||||||||||||||||||||
| Objective | ||||||||||||||||||||
| To seek to provide growth of capital. | ||||||||||||||||||||
| Fees and Expenses |
||||||||||||||||||||
| This table describes the fees and expenses that you may pay if you buy and hold shares of the Portfolio. The table below does not reflect any fees and expenses imposed under the variable life insurance policies and variable annuity contracts (collectively, Policies) through which this Portfolio is offered. See the Policy prospectus for a description of those fees and expenses. | ||||||||||||||||||||
| Shareholder Fees (fees paid directly from your investment) |
||||||||||||||||||||
|
||||||||||||||||||||
| Annual Portfolio Operating Expenses (expenses that you pay each year as a % of the value of your investment) |
||||||||||||||||||||
|
||||||||||||||||||||
| Example | ||||||||||||||||||||
| This example is intended to help you compare the cost of investing in the shares of the Portfolio with the cost of investing in other portfolios. This example does not reflect any fees and expenses imposed under the Policies. The example assumes that you invest $10,000 in the shares of the Portfolio for the time periods indicated. The example also assumes that your investment has a 5% return each year and that the Portfolio’s operating expenses remain the same. The costs are the same for each time period if you continue to hold your shares or if you redeem all your shares at the end of those periods. Although your actual costs may be higher or lower, based on these assumptions, your costs would be: |
||||||||||||||||||||
|
||||||||||||||||||||
|
||||||||||||||||||||
| Portfolio Turnover | ||||||||||||||||||||
| The Portfolio pays transaction costs, such as commissions, when it buys and sells securities (or “turns over” its portfolio). A higher portfolio turnover rate may indicate higher transaction costs. These costs, which are not reflected in annual portfolio operating expenses or in the example, affect the Portfolio’s performance. During the most recent fiscal year, the Portfolio’s portfolio turnover rate was 52% of the average value of its portfolio. | ||||||||||||||||||||
| Principal Investment Strategies | ||||||||||||||||||||
| Ivy Funds VIP Micro Cap Growth seeks to achieve its objective by investing, under normal circumstances, at least 80% of its net assets in equity securities of micro cap companies. Micro cap companies typically are companies with float-adjusted market capitalizations below $1 billion at the time of acquisition. The Portfolio primarily invests in common stock, which may include common stocks that are offered in initial public offerings (IPOs). In selecting equity securities for the Portfolio, Wall Street Associates, LLC (WSA), the Portfolio’s investment subadviser, utilizes a bottom-up stock selection process and seeks to invest in securities of companies that it believes exhibit extraordinary earnings growth, earnings surprise potential, fundamental strength and management vision. Generally, in determining whether to sell a security, WSA uses the same type of analysis that it uses in buying securities. For example, WSA may sell a security if it determines that the issuer’s growth and/or profitability characteristics are deteriorating or the issuer no longer maintains a competitive advantage, when more attractive investment opportunities arise, when WSA believes a company’s valuation has become unattractive relative to industry leaders and industry-specific metrics, to reduce the Portfolio’s holding in that security or its exposure to a particular sector, or to raise cash. |
||||||||||||||||||||
| Principal Investment Risks | ||||||||||||||||||||
| As with any mutual fund, the value of the Portfolio’s shares will change, and you could lose money on your investment. The Portfolio is not intended as a complete investment program. A variety of factors can affect the investment performance of the Portfolio and prevent it from achieving its objective. These include:
|
||||||||||||||||||||
| Performance | ||||||||||||||||||||
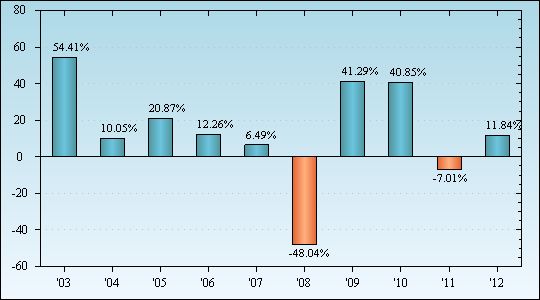
| The chart and table below provide some indication of the risks of investing in the Portfolio. The chart shows how performance has varied from year to year for the Portfolio. The table shows the average annual total returns for the Portfolio and also compares the performance with those of two broad-based securities market indices and a Lipper peer group (a universe of mutual funds with investment objectives similar to that of the Portfolio). The performance results do not reflect any Policy-related fees and expenses, which would reduce the performance results. Performance prior to September 22, 2003, reflects the performance of the Advantus Micro-Cap Growth Portfolio (predecessor fund) which was reorganized as the Portfolio on September 22, 2003. The Portfolio would have had substantially similar annual returns and would have differed from the predecessor fund only to the extent that the Portfolio had different expenses. Performance prior to September 22, 2003 has not been restated to reflect the estimated annual operating expenses of the Portfolio. If those expenses were reflected, performance of the Portfolio would differ. Performance results include the effect of expense reduction arrangements for some or all of the periods shown. If those arrangements had not been in place, the performance results for those periods would have been lower. Prior to April 30, 2012, the Portfolio’s investment objective was to seek long-term capital appreciation. Effective as of April 30, 2012, the Portfolio changed its investment objective to seeking to provide growth of capital. The Portfolio’s past performance does not necessarily indicate how it will perform in the future. Current performance may be lower or higher. Please call 888.WADDELL for the Portfolio’s updated performance. |
||||||||||||||||||||
| Chart of Year-by-Year Returns as of December 31 each year |
||||||||||||||||||||
 |
||||||||||||||||||||
| In the period shown in the chart, the highest quarterly return was 38.37% (the second quarter of 2003) and the lowest quarterly return was -30.17% (the fourth quarter of 2008). | ||||||||||||||||||||
| Average Annual Total Returns as of December 31, 2012 |
||||||||||||||||||||
|