UNITED STATES SECURITIES AND EXCHANGE COMMISSION
Washington, D.C. 20549
FORM N-CSR
CERTIFIED SHAREHOLDER
REPORT OF REGISTERED MANAGEMENT
INVESTMENT COMPANIES
| Investment Company Act file number: | 811-04997 |
| Exact name of registrant as specified in charter: | Delaware Group® Equity Funds V |
| Address of principal executive offices: | 2005 Market Street |
| Philadelphia, PA 19103 | |
| Name and address of agent for service: | David F. Connor, Esq. |
| 2005 Market Street | |
| Philadelphia, PA 19103 | |
| Registrant’s telephone number, including area code: | (800) 523-1918 |
| Date of fiscal year end: | November 30 |
| Date of reporting period: | November 30, 2014 |
Item 1. Reports to Stockholders
Table of Contents

Annual report
Income and growth mutual fund
Delaware Dividend Income Fund
November 30, 2014
Carefully consider the Fund’s investment objectives, risk factors, charges, and expenses before investing. This and other information can be found in the Fund’s prospectus and its summary prospectus, which may be obtained by visiting delawareinvestments.com or calling 800 523-1918. Investors should read the prospectus and the summary prospectus carefully before investing.
You can obtain shareholder reports and prospectuses online instead of in the mail.
Visit delawareinvestments.com/edelivery.
Table of Contents
Experience Delaware Investments
Delaware Investments is committed to the pursuit of consistently superior asset management and unparalleled client service. We believe in our investment processes, which seek to deliver consistent results, and in convenient services that help add value for our clients.
If you are interested in learning more about creating an investment plan, contact your financial advisor.
You can learn more about Delaware Investments or obtain a prospectus for Delaware Dividend Income Fund at delawareinvestments.com.
Table of Contents
| Portfolio management review | ||||
| Delaware Dividend Income Fund | December 9, 2014 |
| Performance preview (for the year ended November 30, 2014) | ||||||
| Delaware Dividend Income Fund (Class A shares) |
1-year return | +9.74% | ||||
| S&P 500® Index (benchmark) |
1-year return | +16.86% | ||||
| Lipper Flexible Portfolio Funds Average |
1-year return | +5.49% | ||||
Past performance does not guarantee future results.
For complete, annualized performance for Delaware Dividend Income Fund, please see the table on page 4.
The performance of Class A shares excludes the applicable sales charge and reflects the reinvestment of all distributions.
The Lipper Flexible Portfolio Funds Average compares funds that allocate their investments across various asset classes, including domestic common stocks, bonds, and money market instruments, with a focus on total return.
For a description of the index. please see page 6.
Index performance returns do not reflect any management fees, transaction costs, or expenses. Indices are unmanaged and one cannot invest directly in an index.
1
Table of Contents
Portfolio management review
Delaware Dividend Income Fund
2
Table of Contents
3
Table of Contents
| Performance summary | ||||
| Delaware Dividend Income Fund | November 30, 2014 |
The performance data quoted represent past performance; past performance does not guarantee future results. Investment return and principal value will fluctuate so your shares, when redeemed, may be worth more or less than their original cost. Please obtain the performance data current for the most recent month end by calling 800 523-1918 or visiting our website at delawareinvestments.com/performance. Current performance may be lower or higher than the performance data quoted.
| Fund and benchmark performance1,2 | Average annual total returns through November 30, 2014 | |||||
| 1 year | 5 years | 10 years | ||||
| Class A (Est. Dec. 2, 1996) |
||||||
| Excluding sales charge |
+9.74% | +11.95% | +6.64% | |||
| Including sales charge |
+3.44% | +10.64% | +6.01% | |||
| Class C (Est. Oct. 1, 2003) |
||||||
| Excluding sales charge |
+8.90% | +11.12% | +5.85% | |||
| Including sales charge |
+7.90% | +11.12% | +5.85% | |||
| Class R (Est. Oct. 1, 2003) |
||||||
| Excluding sales charge |
+9.46% | +11.67% | +6.37% | |||
| Including sales charge |
+9.46% | +11.67% | +6.37% | |||
| Institutional Class (Est. Dec. 2, 1996) |
||||||
| Excluding sales charge |
+10.01% | +12.24% | +6.91% | |||
| Including sales charge |
+10.01% | +12.24% | +6.91% | |||
| S&P 500 Index |
+16.86% | +15.96% | +8.06% | |||
4
Table of Contents
2 The Fund’s expense ratios, as described in the most recent prospectus, are disclosed in the following “Fund expense ratios” table.
| Fund expense ratios | Class A | Class C | Class R | Institutional Class | ||||
| Total annual operating expenses |
1.12% | 1.87% | 1.37% | 0.87% | ||||
| (without fee waivers) |
||||||||
| Net expenses |
1.12% | 1.87% | 1.37% | 0.87% | ||||
| (including fee waivers, if any) |
||||||||
| Type of waiver |
n/a | n/a | n/a | n/a |
5
Table of Contents
Performance summary
Delaware Dividend Income Fund
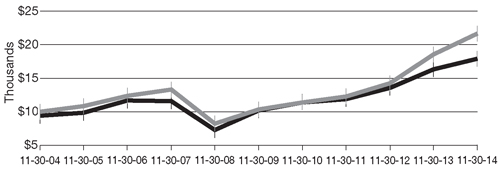
Performance of a $10,000 investment1
Average annual total returns from Nov. 30, 2004, through Nov. 30, 2014
|
For the period beginning Nov. 30, 2004, through Nov. 30, 2014 |
Starting value | Ending value | ||||||
|
|
$10,000 | $21,713 | ||||||
|
|
|
$9,425
|
|
|
$17,933
|
| ||
 S&P 500 Index
 Delaware Dividend Income Fund — Class A shares
6
Table of Contents
|
| ||||||||
|
Nasdaq symbols |
CUSIPs |
|||||||
| Class A | DDIAX |
24610B107 | ||||||
| Class C | DDICX |
24610B305 | ||||||
| Class R | DDDRX |
24610B842 | ||||||
| Institutional Class | DDIIX |
24610B404 | ||||||
|
| ||||||||
7
Table of Contents
For the six-month period from June 1, 2014 to November 30, 2014 (Unaudited)
As a shareholder of the Fund, you incur two types of costs: (1) transaction costs, including sales charges (loads) on purchase payments, reinvested dividends, or other distributions; redemption fees; and exchange fees; and (2) ongoing costs, including management fees; distribution and/or service (12b-1) fees; and other Fund expenses. This example is intended to help you understand your ongoing costs (in dollars) of investing in the Fund and to compare these costs with the ongoing costs of investing in other mutual funds.
The example is based on an investment of $1,000 invested at the beginning of the period and held for the entire six-month period from June 1, 2014 to Nov. 30, 2014.
Actual expenses
The first section of the table shown, “Actual Fund return,” provides information about actual account values and actual expenses. You may use the information in this section of the table, together with the amount you invested, to estimate the expenses that you paid over the period. Simply divide your account value by $1,000 (for example, an $8,600 account value divided by $1,000 = 8.6), then multiply the result by the number in the first section under the heading entitled “Expenses Paid During Period” to estimate the expenses you paid on your account during this period.
Hypothetical example for comparison purposes
The second section of the table shown, “Hypothetical 5% return,” provides information about hypothetical account values and hypothetical expenses based on the Fund’s actual expense ratio and an assumed rate of return of 5% per year before expenses, which is not the Fund’s actual return. The hypothetical account values and expenses may not be used to estimate the actual ending account balance or expenses you paid for the period. You may use this information to compare the ongoing costs of investing in the Fund and other funds. To do so, compare this 5% hypothetical example with the 5% hypothetical examples that appear in the shareholder reports of the other funds.
Please note that the expenses shown in the table are meant to highlight your ongoing costs only and do not reflect any transactional costs, such as sales charges (loads), redemption fees, or exchange fees. Therefore, the second section of the table is useful in comparing ongoing costs only, and will not help you determine the relative total costs of owning different funds. In addition, if these transactional costs were included, your costs would have been higher. The Fund’s expenses shown in the table reflect fee waivers in effect. The expenses shown in the table assume reinvestment of all dividends and distributions.
8
Table of Contents
Delaware Dividend Income Fund
Expense analysis of an investment of $1,000
| Beginning
Account Value
6/1/14 |
Ending
Account Value
11/30/14 |
Annualized
Expense Ratio |
Expenses
Paid During Period
6/1/14 to 11/30/14* | |||||||||||||||||
| Actual Fund return† |
||||||||||||||||||||
| Class A |
$1,000.00 | $1,030.10 | 1.10% | $5.60 | ||||||||||||||||
| Class C |
1,000.00 | 1,026.10 | 1.85% | 9.40 | ||||||||||||||||
| Class R |
1,000.00 | 1,028.80 | 1.35% | 6.87 | ||||||||||||||||
| Institutional Class |
1,000.00 | 1,031.40 | 0.85% | 4.33 | ||||||||||||||||
| Hypothetical 5% return (5% return before expenses) |
| |||||||||||||||||||
| Class A |
$1,000.00 | $1,019.55 | 1.10% | $5.57 | ||||||||||||||||
| Class C |
1,000.00 | 1,015.79 | 1.85% | 9.35 | ||||||||||||||||
| Class R |
1,000.00 | 1,018.30 | 1.35% | 6.83 | ||||||||||||||||
| Institutional Class |
1,000.00 | 1,020.81 | 0.85% | 4.31 | ||||||||||||||||
| * | “Expenses Paid During Period” are equal to the Fund’s annualized expense ratio, multiplied by the average account value over the period, multiplied by 183/365 (to reflect the one-half year period). |
| † | Because actual returns reflect only the most recent six-month period, the returns shown may differ significantly from fiscal year returns. |
9
Table of Contents
| Security type / sector allocation and top 10 equity holdings | ||
| Delaware Dividend Income Fund | As of November 30, 2014 (Unaudited) | |
Sector designations may be different than the sector designations presented in other Fund materials. The sector designations may represent the investment manager’s internal sector classifications, which may result in the sector designations for one fund being different than another fund’s sector designations.
| Security type / sector | Percentage of net assets | |
| Common Stock |
59.10% | |
| Consumer Discretionary |
5.11% | |
| Consumer Staples |
6.22% | |
| Diversified REITs |
0.64% | |
| Energy |
5.76% | |
| Financials |
6.72% | |
| Healthcare |
8.76% | |
| Healthcare REITs |
0.42% | |
| Hotel REITs |
0.94% | |
| Industrial REITs |
0.45% | |
| Industrials |
5.26% | |
| Information Technology |
8.25% | |
| Mall REITs |
0.57% | |
| Manufactured Housing REITs |
0.20% | |
| Materials |
1.55% | |
| Mixed REIT |
0.17% | |
| Multifamily REITs |
1.44% | |
| Office REITs |
0.60% | |
| Shopping Center REITs |
0.94% | |
| Single Tenant REITs |
0.45% | |
| Specialty |
0.16% | |
| Telecommunication Services |
2.84% | |
| Utilities |
1.65% | |
| Exchange-Traded Funds |
0.50% | |
| Convertible Preferred Stock |
3.37% | |
| Commercial Mortgage-Backed Security |
0.12% | |
| Convertible Bonds |
9.63% | |
| Basic Industry |
0.36% | |
| Brokerage |
0.27% | |
| Capital Goods |
0.62% | |
| Communications |
1.15% | |
| Consumer Cyclical |
0.97% | |
| Consumer Non-Cyclical |
1.62% | |
| Energy |
0.74% | |
| Financials |
0.78% | |
| Industrials |
0.26% |
10
Table of Contents
| Security type / sector | Percentage of net assets | |
| REITs |
0.87% | |
| Technology |
1.99% | |
| Corporate Bonds |
14.22% | |
| Automotive |
0.46% | |
| Banking |
1.12% | |
| Basic Industry |
1.55% | |
| Capital Goods |
0.99% | |
| Communications |
0.05% | |
| Consumer Cyclical |
0.72% | |
| Consumer Non-Cyclical |
0.27% | |
| Energy |
2.01% | |
| Financials |
0.22% | |
| Healthcare |
1.08% | |
| Insurance |
0.31% | |
| Media |
1.70% | |
| Services |
0.86% | |
| Technology & Electronics |
0.80% | |
| Telecommunications |
1.53% | |
| Utilities |
0.55% | |
| Leveraged Non-Recourse Security |
0.00% | |
| Municipal Bonds |
1.06% | |
| Regional Bond |
0.00% | |
| Senior Secured Loans |
0.92% | |
| Sovereign Bonds |
0.57% | |
| Supranational Bank |
0.13% | |
| Preferred Stock |
0.37% | |
| Warrant |
0.00% | |
| Short-Term Investments |
9.16% | |
| Total Value of Securities |
99.15% | |
| Receivables and Other Assets Net of Liabilities |
0.85% | |
| Total Net Assets |
100.00% |
11
Table of Contents
Security type / sector allocation and top 10
equity holdings
Delaware Dividend Income Fund
Holdings are for informational purposes only and are subject to change at any time. They are not a recommendation to buy, sell, or hold any security.
| Top 10 equity holdings | Percentage of net assets | |
|
| ||
| Microsoft |
1.72% | |
| Intel |
1.53% | |
| Archer-Daniels-Midland |
1.53% | |
| Lowe’s |
1.51% | |
| Broadcom Class A |
1.49% | |
| CVS Health |
1.48% | |
| Northrop Grumman |
1.48% | |
| Johnson Controls |
1.47% | |
| Cardinal Health |
1.47% | |
| Cisco Systems |
1.45% | |
|
| ||
12
Table of Contents
| Schedule of investments | ||
| Delaware Dividend Income Fund | November 30, 2014 |
| Number of Shares |
Value (U.S. $) | |||||||
|
|
||||||||
| Common Stock – 59.10% |
||||||||
|
|
||||||||
| Consumer Discretionary – 5.11% |
||||||||
| Asian Pay Television Trust |
5,369,000 | $ | 3,604,600 | |||||
| Bayerische Motoren Werke |
1,867 | 213,653 | ||||||
| General Motors |
72,000 | 2,406,960 | ||||||
| Johnson Controls |
229,400 | 11,470,000 | ||||||
| Kering |
1,607 | 332,199 | ||||||
| Lowe’s |
183,500 | 11,712,805 | ||||||
| Nitori Holdings |
9,586 | 531,479 | ||||||
| Publicis Groupe |
5,191 | 381,555 | ||||||
| Rexel |
12,216 | 226,379 | ||||||
| Sumitomo Rubber Industries |
24,200 | 368,669 | ||||||
| Target |
94,100 | 6,963,400 | ||||||
| Techtronic Industries |
96,000 | 307,006 | ||||||
| Toyota Motor |
11,700 | 721,046 | ||||||
| Yue Yuen Industrial Holdings |
134,500 | 482,160 | ||||||
|
|
|
|||||||
| 39,721,911 | ||||||||
|
|
|
|||||||
| Consumer Staples – 6.22% |
||||||||
| Archer-Daniels-Midland |
225,400 | 11,874,072 | ||||||
| Aryzta † |
7,967 | 636,139 | ||||||
| Carlsberg Class B |
4,762 | 424,354 | ||||||
| Coca-Cola |
34,793 | 1,559,770 | ||||||
| Coca-Cola Amatil |
37,954 | 295,316 | ||||||
| CVS Health |
126,400 | 11,547,904 | ||||||
| Kraft Foods Group |
182,200 | 10,962,974 | ||||||
| Mondelez International Class A |
282,600 | 11,077,920 | ||||||
|
|
|
|||||||
| 48,378,449 | ||||||||
|
|
|
|||||||
| Diversified REITs – 0.64% |
||||||||
| Gramercy Property Trust |
372,000 | 2,194,800 | ||||||
| Mapletree Commercial Trust |
759,000 | 824,050 | ||||||
| Washington Real Estate Investment Trust |
74,100 | 1,991,067 | ||||||
|
|
|
|||||||
| 5,009,917 | ||||||||
|
|
|
|||||||
| Energy – 5.76% |
||||||||
| Chevron |
87,500 | 9,526,125 | ||||||
| CNOOC |
255,000 | 372,887 | ||||||
| ConocoPhillips |
143,200 | 9,461,224 | ||||||
| Halliburton |
180,600 | 7,621,320 | ||||||
| Marathon Oil |
277,800 | 8,033,976 | ||||||
| Occidental Petroleum |
110,900 | 8,846,493 | ||||||
| Saipem † |
17,650 | 252,832 | ||||||
| Subsea 7 |
3,940 | 39,156 | ||||||
| Suncor Energy |
9,100 | 287,314 | ||||||
13
Table of Contents
Schedule of investments
Delaware Dividend Income Fund
| Number of Shares |
Value (U.S. $) | |||||||
|
|
||||||||
| Common Stock (continued) |
||||||||
|
|
||||||||
| Energy (continued) |
||||||||
| Total |
6,152 | $ | 344,465 | |||||
|
|
|
|||||||
| 44,785,792 | ||||||||
|
|
|
|||||||
| Financials – 6.72% |
||||||||
| Allstate |
162,400 | 11,067,560 | ||||||
| Apollo Investment |
548,700 | 4,521,288 | ||||||
| AXA |
30,229 | 730,421 | ||||||
| Bank of New York Mellon |
273,700 | 10,956,211 | ||||||
| Bank Rakyat Indonesia Persero |
295,398 | 278,963 | ||||||
| BB&T |
271,400 | 10,201,926 | ||||||
| ING Groep CVA † |
33,866 | 496,503 | ||||||
| Marsh & McLennan |
193,000 | 10,921,870 | ||||||
| Mitsubishi UFJ Financial Group |
124,100 | 717,747 | ||||||
| Nordea Bank |
58,180 | 726,782 | ||||||
| Och-Ziff Capital Management Group |
58,506 | 693,296 | ||||||
| Standard Chartered |
39,012 | 571,806 | ||||||
| UniCredit |
56,213 | 415,911 | ||||||
|
|
|
|||||||
| 52,300,284 | ||||||||
|
|
|
|||||||
| Healthcare – 8.76% |
||||||||
| Baxter International |
147,900 | 10,796,700 | ||||||
| Cardinal Health |
138,900 | 11,416,191 | ||||||
| Johnson & Johnson |
99,600 | 10,781,700 | ||||||
| Merck |
171,700 | 10,370,680 | ||||||
| Novartis |
9,174 | 888,327 | ||||||
| Pfizer |
353,138 | 11,000,249 | ||||||
| Quest Diagnostics |
166,900 | 10,900,239 | ||||||
| Sanofi |
7,321 | 709,410 | ||||||
| Stada Arzneimittel |
8,666 | 312,341 | ||||||
| Teva Pharmaceutical Industries ADR |
17,557 | 1,000,398 | ||||||
|
|
|
|||||||
| 68,176,235 | ||||||||
|
|
|
|||||||
| Healthcare REITs – 0.42% |
||||||||
| Health Care REIT |
10,200 | 751,332 | ||||||
| Healthcare Realty Trust |
42,100 | 1,111,861 | ||||||
| Healthcare Trust of America Class A |
107,800 | 1,375,528 | ||||||
|
|
|
|||||||
| 3,238,721 | ||||||||
|
|
|
|||||||
| Hotel REITs – 0.94% |
||||||||
| Concentradora Fibra Hotelera Mexicana |
737,685 | 1,197,652 | ||||||
| DiamondRock Hospitality |
77,700 | 1,160,061 | ||||||
| Pebblebrook Hotel Trust |
27,400 | 1,182,858 | ||||||
| RLJ Lodging Trust |
40,300 | 1,327,079 | ||||||
| Strategic Hotels & Resorts † |
183,300 | 2,434,224 | ||||||
|
|
|
|||||||
| 7,301,874 | ||||||||
|
|
|
|||||||
14
Table of Contents
| Number of Shares |
Value (U.S. $) | |||||||
|
|
||||||||
| Common Stock (continued) |
||||||||
|
|
||||||||
| Industrial REITs – 0.45% |
||||||||
| DCT Industrial Trust |
15,900 | $ | 542,667 | |||||
| First Industrial Realty Trust |
117,200 | 2,326,420 | ||||||
| Terreno Realty |
28,600 | 595,166 | ||||||
|
|
|
|||||||
| 3,464,253 | ||||||||
|
|
|
|||||||
| Industrials – 5.26% |
||||||||
| Deutsche Post |
15,792 | 525,055 | ||||||
| East Japan Railway |
6,246 | 468,239 | ||||||
| General Electric |
163,000 | 4,317,870 | ||||||
| ITOCHU |
44,689 | 514,368 | ||||||
| Koninklijke Philips |
16,416 | 495,542 | ||||||
| Meggitt |
40,980 | 322,407 | ||||||
| Northrop Grumman |
81,800 | 11,528,074 | ||||||
| Raytheon |
104,600 | 11,160,820 | ||||||
| Vinci |
8,012 | 433,504 | ||||||
| Waste Management |
222,800 | 10,857,044 | ||||||
| WestJet Airlines @ |
9,256 | 261,405 | ||||||
|
|
|
|||||||
| 40,884,328 | ||||||||
|
|
|
|||||||
| Information Technology – 8.25% |
||||||||
| Apple |
28,100 | 3,341,933 | ||||||
| Broadcom Class A |
267,900 | 11,554,527 | ||||||
| CGI Group Class A † |
27,146 | 989,285 | ||||||
| Cisco Systems |
407,900 | 11,274,356 | ||||||
| Intel |
319,300 | 11,893,925 | ||||||
| Microsoft |
280,100 | 13,391,581 | ||||||
| Playtech |
18,335 | 184,111 | ||||||
| Teleperformance |
9,565 | 668,416 | ||||||
| Xerox |
782,400 | 10,922,304 | ||||||
|
|
|
|||||||
| 64,220,438 | ||||||||
|
|
|
|||||||
| Mall REITs – 0.57% |
||||||||
| Simon Property Group |
18,863 | 3,410,430 | ||||||
| Taubman Centers |
12,500 | 993,625 | ||||||
|
|
|
|||||||
| 4,404,055 | ||||||||
|
|
|
|||||||
| Manufactured Housing REITs – 0.20% |
||||||||
| Equity Lifestyle Properties |
10,127 | 502,400 | ||||||
| Sun Communities |
18,043 | 1,062,552 | ||||||
|
|
|
|||||||
| 1,564,952 | ||||||||
|
|
|
|||||||
| Materials – 1.55% |
||||||||
| AuRico Gold |
31,862 | 106,699 | ||||||
| duPont (E.I.) deNemours |
150,900 | 10,774,260 | ||||||
| Lafarge |
5,080 | 361,510 | ||||||
15
Table of Contents
Schedule of investments
Delaware Dividend Income Fund
| Number of Shares |
Value (U.S. $) | |||||||
|
|
||||||||
| Common Stock (continued) |
||||||||
|
|
||||||||
| Materials (continued) |
||||||||
| Rexam |
49,436 | $ | 349,808 | |||||
| Rio Tinto |
7,448 | 348,609 | ||||||
| Yamana Gold |
30,313 | 109,463 | ||||||
|
|
|
|||||||
| 12,050,349 | ||||||||
|
|
|
|||||||
| Mixed REIT – 0.17% |
||||||||
| Duke Realty |
70,100 | 1,362,744 | ||||||
|
|
|
|||||||
| 1,362,744 | ||||||||
|
|
|
|||||||
| Multifamily REITs – 1.44% |
||||||||
| American Campus Communities |
28,300 | 1,132,000 | ||||||
| American Residential Properties † |
149,600 | 2,658,392 | ||||||
| AvalonBay Communities |
12,800 | 2,058,112 | ||||||
| Equity Residential |
15,500 | 1,098,020 | ||||||
| Essex Property Trust |
7,813 | 1,581,429 | ||||||
| Post Properties |
45,700 | 2,677,106 | ||||||
|
|
|
|||||||
| 11,205,059 | ||||||||
|
|
|
|||||||
| Office REITs – 0.60% |
||||||||
| alstria office REIT † |
73,600 | 922,859 | ||||||
| Brandywine Realty Trust |
31,200 | 482,352 | ||||||
| Douglas Emmett |
1,456 | 40,535 | ||||||
| Equity Commonwealth |
48,700 | 1,238,441 | ||||||
| First Potomac Realty Trust |
47,400 | 586,812 | ||||||
| Highwoods Properties |
32,600 | 1,407,016 | ||||||
|
|
|
|||||||
| 4,678,015 | ||||||||
|
|
|
|||||||
| Shopping Center REITs – 0.94% |
||||||||
| DDR |
97,700 | 1,790,841 | ||||||
| First Capital Realty |
45,403 | 743,153 | ||||||
| Kite Realty Group Trust |
35,900 | 979,352 | ||||||
| Lippo Malls Indonesia Retail Trust |
2,593,000 | 736,139 | ||||||
| Ramco-Gershenson Properties Trust |
110,500 | 1,977,950 | ||||||
| Wheeler Real Estate Investment Trust @ |
263,480 | 1,117,155 | ||||||
|
|
|
|||||||
| 7,344,590 | ||||||||
|
|
|
|||||||
| Single Tenant REITs – 0.45% |
||||||||
| Agree Realty |
37,500 | 1,155,375 | ||||||
| Spirit Realty Capital |
201,600 | 2,360,736 | ||||||
|
|
|
|||||||
| 3,516,111 | ||||||||
|
|
|
|||||||
| Specialty – 0.16% |
||||||||
| AMC Entertainment Holdings |
48,000 | 1,258,560 | ||||||
|
|
|
|||||||
| 1,258,560 | ||||||||
|
|
|
|||||||
| Telecommunication Services – 2.84% |
||||||||
| AT&T |
291,500 | 10,313,270 | ||||||
16
Table of Contents
| Number of Shares |
Value (U.S. $) | |||||||
|
|
||||||||
| Common Stock (continued) |
||||||||
|
|
||||||||
| Telecommunication Services (continued) |
||||||||
| Century Communications =† |
1,625,000 | $ | 0 | |||||
| Mobile Telesystems ADR |
24,562 | 300,148 | ||||||
| Nippon Telegraph & Telephone |
10,337 | 553,171 | ||||||
| Tele2 Class B |
34,998 | 453,151 | ||||||
| Verizon Communications |
206,400 | 10,441,776 | ||||||
|
|
|
|||||||
| 22,061,516 | ||||||||
|
|
|
|||||||
| Utilities – 1.65% |
||||||||
| Abengoa Yield |
21,600 | 609,120 | ||||||
| Edison International |
167,700 | 10,659,012 | ||||||
| GDF Suez |
53,273 | 1,313,752 | ||||||
| National Grid |
18,802 | 273,496 | ||||||
|
|
|
|||||||
| 12,855,380 | ||||||||
|
|
|
|||||||
| Total Common Stock (cost $350,778,334) |
459,783,533 | |||||||
|
|
|
|||||||
|
|
||||||||
| Exchange-Traded Funds – 0.50% |
||||||||
|
|
||||||||
| Aberdeen Asia-Pacific Income Fund |
304,262 | 1,764,720 | ||||||
| Market Vectors High Yield Municipal Index |
69,400 | 2,150,706 | ||||||
|
|
|
|||||||
| Total Exchange-Traded Funds (cost $3,934,933) |
3,915,426 | |||||||
|
|
|
|||||||
|
|
||||||||
| Convertible Preferred Stock – 3.37% |
||||||||
|
|
||||||||
| ArcelorMittal 6.00% exercise price $20.36, expiration date 12/21/15 |
70,950 | 1,402,369 | ||||||
| Chesapeake Energy 144A 5.75% exercise price $26.14, expiration date 12/31/49 # |
865 | 920,684 | ||||||
| Dynegy 5.375% exercise price $38.75, expiration date 11/1/17 @ |
16,230 | 1,745,374 | ||||||
| El Paso Energy Capital Trust I 4.75% exercise price $34.49, expiration date 3/31/28 |
39,900 | 2,394,000 | ||||||
| Exelon 6.50% exercise price $43.75, expiration date 6/1/17 |
41,750 | 2,178,933 | ||||||
| Halcon Resources 5.75% exercise price $6.16, expiration date 12/31/49 |
1,141 | 597,171 | ||||||
| HealthSouth 6.50% exercise price $29.70, expiration date 12/31/49 |
2,175 | 3,101,278 | ||||||
| Huntington Bancshares 8.50% exercise price $11.95, expiration date 12/31/49 |
1,282 | 1,717,880 | ||||||
| Intelsat 5.75% exercise price $22.05, expiration date 5/1/16 |
51,310 | 2,439,021 | ||||||
| Laclede Group 6.75% exercise price $57.81, expiration date 4/1/17 |
13,235 | 734,939 | ||||||
| Maiden Holdings 7.25% exercise price $15.39, expiration date 9/15/16 |
56,425 | 2,793,037 | ||||||
17
Table of Contents
Schedule of investments
Delaware Dividend Income Fund
| Number of Shares |
Value (U.S. $) | |||||||
|
|
||||||||
| Convertible Preferred Stock (continued) |
||||||||
|
|
||||||||
| SandRidge Energy |
||||||||
| 7.00% exercise price $7.76, expiration date 12/31/49 |
1,500 | $ | 103,969 | |||||
| 8.50% exercise price $8.01, expiration date 12/31/49 |
14,890 | 1,049,745 | ||||||
| Wells Fargo 7.50% exercise price $156.71, expiration date 12/31/49 |
1,489 | 1,827,785 | ||||||
| Weyerhaeuser 6.375% exercise price $33.13, expiration date 7/1/16 |
33,413 | 1,961,343 | ||||||
| Wheeler REIT |
||||||||
| 9.00% exercise price $5.00, expiration date 12/31/49 |
35,990 | 820,212 | ||||||
| 9.00% exercise price $5.00, expiration date 12/31/49 @= |
414 | 431,930 | ||||||
|
|
|
|||||||
| Total Convertible Preferred Stock (cost $25,991,532) |
26,219,670 | |||||||
|
|
|
|||||||
| Principal amount° | ||||||||
|
|
||||||||
| Commercial Mortgage-Backed Security – 0.12% |
||||||||
|
|
||||||||
| BAML Commercial Mortgage |
||||||||
| Series 2006-4 A4 5.634% 7/10/46 |
929,041 | 976,727 | ||||||
|
|
|
|||||||
| Total Commercial Mortgage-Backed Security (cost $942,612) |
976,727 | |||||||
|
|
|
|||||||
|
|
||||||||
| Convertible Bonds – 9.63% |
| |||||||
| Basic Industry – 0.36% |
||||||||
| Peabody Energy 4.75% exercise price $57.62, expiration date 12/15/41 |
788,000 | 484,127 | ||||||
| RTI International Metals 1.625% exercise price $40.72, expiration date 10/10/19 |
2,450,000 | 2,338,219 | ||||||
|
|
|
|||||||
| 2,822,346 | ||||||||
|
|
|
|||||||
| Brokerage – 0.27% |
||||||||
| Gain Capital Holdings 4.125% exercise price $12.00, expiration date 11/30/18 |
2,024,000 | 2,116,345 | ||||||
|
|
|
|||||||
| 2,116,345 | ||||||||
|
|
|
|||||||
| Capital Goods – 0.62% |
||||||||
| Owens-Brockway Glass Container 144A 3.00% exercise price $47.47, expiration date 5/28/15 # |
2,517,000 | 2,556,341 | ||||||
| Titan Machinery 3.75% exercise price $43.17, expiration date 4/30/19 |
2,973,000 | 2,287,352 | ||||||
|
|
|
|||||||
| 4,843,693 | ||||||||
|
|
|
|||||||
| Communications – 1.15% |
||||||||
| Alaska Communications Systems Group 6.25% exercise price $10.28, expiration date 4/27/18 |
1,810,000 | 1,524,925 | ||||||
| Clearwire Communications 144A 8.25% exercise price $7.08, expiration date 11/30/40 # |
2,181,000 | 2,410,005 | ||||||
| Liberty Interactive 0.75% exercise price $1,000.00, expiration date 3/30/43 |
1,464,000 | 2,066,070 | ||||||
18
Table of Contents
| Principal amount° | Value (U.S. $) | |||||||
|
|
||||||||
| Convertible Bonds (continued) |
||||||||
|
|
||||||||
| Communications (continued) |
||||||||
| Liberty Interactive 144A 1.00% exercise price $74.31, expiration date 9/28/43 # |
2,662,000 | $ | 2,931,527 | |||||
|
|
|
|||||||
| 8,932,527 | ||||||||
|
|
|
|||||||
| Consumer Cyclical – 0.97% |
||||||||
| Huron Consulting Group 144A 1.25% exercise price $79.89, expiration date 9/27/19 # |
1,642,000 | 1,710,759 | ||||||
| Iconix Brand Group 2.50% exercise price $30.75, expiration date 5/31/16 |
1,245,000 | 1,692,422 | ||||||
| Live Nation Entertainment 144A 2.50% exercise price $34.68, expiration date 5/13/19 # |
802,000 | 859,143 | ||||||
| Meritor 4.00% exercise price $26.73, expiration date 2/12/27 f |
3,072,000 | 3,277,440 | ||||||
|
|
|
|||||||
| 7,539,764 | ||||||||
|
|
|
|||||||
| Consumer Non-Cyclical – 1.62% |
||||||||
| BioMarin Pharmaceutical 1.50% exercise price $94.15, expiration date 10/13/20 |
1,035,000 | 1,274,344 | ||||||
| Hologic 2.00% exercise price $31.17, expiration date 2/27/42 f |
1,168,000 | 1,300,130 | ||||||
| Hologic 2.00% exercise price $38.59, expiration date 12/15/43 |
1,666,000 | 1,838,847 | ||||||
| NuVasive 2.75% exercise price $42.13, expiration date 6/30/17 |
2,636,000 | 3,238,985 | ||||||
| Spectrum Pharmaceuticals 144A 2.75% exercise price $10.53, expiration date 12/13/18 # |
2,017,000 | 1,967,836 | ||||||
| Vector Group 1.75% exercise price $25.87, expiration date 4/15/20 |
1,845,000 | 1,968,384 | ||||||
| Vector Group 2.50% exercise price $16.78, expiration date 1/14/19 — |
739,000 | 1,048,645 | ||||||
|
|
|
|||||||
| 12,637,171 | ||||||||
|
|
|
|||||||
| Energy – 0.74% |
||||||||
| Chesapeake Energy 2.50% exercise price $47.77, expiration date 5/15/37 |
683,000 | 673,609 | ||||||
| Energy XXI 144A 3.00% exercise price $40.40, expiration date 12/13/18 # |
2,792,000 | 1,828,760 | ||||||
| Helix Energy Solutions Group 3.25% exercise price $25.02, expiration date 3/12/32 |
1,387,000 | 1,634,926 | ||||||
| Vantage Drilling 144A 5.50% exercise price $2.39, expiration date 7/15/43 # |
1,786,000 | 1,604,051 | ||||||
|
|
|
|||||||
| 5,741,346 | ||||||||
|
|
|
|||||||
| Financials – 0.78% |
||||||||
| Ares Capital 5.75% exercise price $19.13, expiration date 2/1/16 |
1,558,000 | 1,622,267 | ||||||
19
Table of Contents
Schedule of investments
Delaware Dividend Income Fund
| Principal amount° | Value (U.S. $) | |||||||
|
|
||||||||
| Convertible Bonds (continued) |
||||||||
|
|
||||||||
| Financials (continued) |
||||||||
| BGC Partners 4.50% exercise price $9.84, expiration date 7/13/16 |
2,293,000 | $ | 2,457,809 | |||||
| New Mountain Finance 144A 5.00% exercise price $15.93, expiration date 6/14/19 # |
1,943,000 | 1,998,861 | ||||||
|
|
|
|||||||
| 6,078,937 | ||||||||
|
|
|
|||||||
| Industrials – 0.26% |
||||||||
| General Cable 4.50% exercise price $34.88, expiration date 11/15/29 f |
2,946,000 | 2,005,121 | ||||||
|
|
|
|||||||
| 2,005,121 | ||||||||
|
|
|
|||||||
| REITs – 0.87% |
||||||||
| Blackstone Mortgage Trust 5.25% exercise price $28.66, expiration date 12/1/18 |
2,762,000 | 2,888,016 | ||||||
| Campus Crest Communities Operating Partnership 144A 4.75% exercise price $12.56, expiration date 10/11/18 # |
2,005,000 | 1,917,281 | ||||||
| Forest City Enterprises 3.625% exercise price $24.21, expiration date 8/14/20 |
1,808,000 | 1,941,340 | ||||||
|
|
|
|||||||
| 6,746,637 | ||||||||
|
|
|
|||||||
| Technology – 1.99% |
||||||||
| Blucora 4.25% exercise price $21.66, expiration date 3/29/19 |
1,247,000 | 1,215,046 | ||||||
| Cardtronics 1.00% exercise price $52.35, expiration date 11/27/20 |
3,115,000 | 3,107,228 | ||||||
| Ciena 144A 3.75% exercise price $20.17, expiration date 10/15/18 # |
1,583,000 | 1,831,333 | ||||||
| Electronics For Imaging 144A 0.75% exercise price $52.72, expiration date 8/29/19 # |
1,100,000 | 1,146,750 | ||||||
| Equinix 4.75% exercise price $81.48, expiration date 6/13/16 |
180,000 | 508,500 | ||||||
| j2 Global 3.25% exercise price $69.37, expiration date 6/14/29 |
2,269,000 | 2,378,196 | ||||||
| Nuance Communications 2.75% exercise price $32.30, expiration date 11/1/31 |
1,574,000 | 1,551,374 | ||||||
| SanDisk 1.50% exercise price $51.36, expiration date 8/11/17 |
1,081,000 | 2,197,808 | ||||||
| VeriSign 4.086% exercise price $34.37, expiration date 8/15/37 |
856,000 | 1,544,545 | ||||||
|
|
|
|||||||
| 15,480,780 | ||||||||
|
|
|
|||||||
| Total Convertible Bonds (cost $72,211,795) |
74,944,667 | |||||||
|
|
|
|||||||
|
|
||||||||
| Corporate Bonds – 14.22% |
||||||||
|
|
||||||||
| Automotive – 0.46% |
||||||||
| Gates Global 144A 6.00% 7/15/22 # |
940,000 | 918,850 | ||||||
20
Table of Contents
| Principal amount° | Value (U.S. $) | |||||||
|
|
||||||||
| Corporate Bonds (continued) |
||||||||
|
|
||||||||
| Automotive (continued) |
||||||||
| General Motors |
||||||||
| 4.875% 10/2/23 |
255,000 | $ | 271,575 | |||||
| 6.25% 10/2/43 |
330,000 | 385,275 | ||||||
| International Automotive Components Group 144A |
||||||||
| 9.125% 6/1/18 # |
628,000 | 667,250 | ||||||
| Lear 5.25% 1/15/25 |
375,000 | 376,875 | ||||||
| Meritor |
||||||||
| 6.25% 2/15/24 |
180,000 | 185,400 | ||||||
| 6.75% 6/15/21 |
325,000 | 342,875 | ||||||
| Tupy Overseas 144A 6.625% 7/17/24 # |
400,000 | 402,000 | ||||||
|
|
|
|||||||
| 3,550,100 | ||||||||
|
|
|
|||||||
| Banking – 1.12% |
||||||||
| Australia & New Zealand Banking Group |
||||||||
| 5.412% 6/20/22 — |
AUD | 1,090,000 | 968,969 | |||||
| Bank of America |
||||||||
| 4.145% 8/23/18 — |
AUD | 1,100,000 | 951,068 | |||||
| 6.50% 10/29/49 — |
625,000 | 644,531 | ||||||
| Barclays Bank 7.625% 11/21/22 |
550,000 | 608,094 | ||||||
| Credit Suisse Group 144A 7.50% 12/29/49 #— |
520,000 | 551,200 | ||||||
| Goldman Sachs Group |
||||||||
| 4.035% 8/21/19 — |
AUD | 720,000 | 619,348 | |||||
| 4.468% 8/8/18 — |
AUD | 770,000 | 672,345 | |||||
| HSBC Holdings 6.375% 12/29/49 — |
570,000 | 583,823 | ||||||
| JPMorgan Chase |
||||||||
| 3.825% 5/17/18 — |
AUD | 1,100,000 | 944,478 | |||||
| 6.75% 1/29/49 — |
605,000 | 647,350 | ||||||
| Lloyds Banking Group 7.50% 4/30/49 — |
615,000 | 633,450 | ||||||
| Popular 7.00% 7/1/19 |
915,000 | 924,150 | ||||||
|
|
|
|||||||
| 8,748,806 | ||||||||
|
|
|
|||||||
| Basic Industry – 1.55% |
||||||||
| AK Steel |
||||||||
| 7.625% 5/15/20 |
593,000 | 566,315 | ||||||
| 7.625% 10/1/21 |
285,000 | 269,325 | ||||||
| ArcelorMittal 6.125% 6/1/18 |
474,000 | 503,625 | ||||||
| Arch Coal 144A 8.00% 1/15/19 # |
510,000 | 349,350 | ||||||
| Builders FirstSource 144A 7.625% 6/1/21 # |
684,000 | 709,650 | ||||||
| Cemex 144A 7.25% 1/15/21 # |
665,000 | 704,900 | ||||||
| CPG Merger Sub 144A 8.00% 10/1/21 # |
540,000 | 569,700 | ||||||
| First Quantum Minerals |
||||||||
| 144A 6.75% 2/15/20 # |
223,000 | 215,195 | ||||||
| 144A 7.00% 2/15/21 # |
223,000 | 217,425 | ||||||
| 144A 7.25% 5/15/22 # |
405,000 | 391,837 | ||||||
21
Table of Contents
Schedule of investments
Delaware Dividend Income Fund
| Principal amount° | Value (U.S. $) | |||||||
|
|
||||||||
| Corporate Bonds (continued) |
||||||||
|
|
||||||||
| Basic Industry (continued) |
||||||||
| FMG Resources August 2006 144A 6.875% 4/1/22 # |
574,000 | $ | 515,883 | |||||
| Grace (W.R.) |
||||||||
| 144A 5.125% 10/1/21 # |
225,000 | 234,000 | ||||||
| 144A 5.625% 10/1/24 # |
230,000 | 243,800 | ||||||
| Hardwoods Acquisition 144A 7.50% 8/1/21 # |
380,000 | 383,800 | ||||||
| HD Supply 11.50% 7/15/20 |
425,000 | 494,594 | ||||||
| JMC Steel Group 144A 8.25% 3/15/18 # |
417,000 | 419,606 | ||||||
| Kissner Milling 144A 7.25% 6/1/19 # |
450,000 | 460,125 | ||||||
| LSB Industries 7.75% 8/1/19 |
410,000 | 436,650 | ||||||
| Lundin Mining 144A 7.875% 11/1/22 # |
600,000 | 621,000 | ||||||
| New Gold 144A 6.25% 11/15/22 # |
394,000 | 384,150 | ||||||
| Nortek 8.50% 4/15/21 |
375,000 | 405,000 | ||||||
| NOVA Chemicals 144A 5.00% 5/1/25 # |
340,000 | 352,325 | ||||||
| Polymer Group 144A 6.875% 6/1/19 # |
695,000 | 681,969 | ||||||
| Ryerson |
||||||||
| 9.00% 10/15/17 |
277,000 | 283,233 | ||||||
| 11.25% 10/15/18 |
74,000 | 78,810 | ||||||
| Steel Dynamics 144A 5.50% 10/1/24 # |
355,000 | 373,637 | ||||||
| TPC Group 144A 8.75% 12/15/20 # |
733,000 | 764,153 | ||||||
| Wise Metals Group 144A 8.75% 12/15/18 # |
235,000 | 252,625 | ||||||
| Wise Metals Intermediate Holdings 144A 9.75% 6/15/19 # |
160,000 | 173,800 | ||||||
|
|
|
|||||||
| 12,056,482 | ||||||||
|
|
|
|||||||
| Capital Goods – 0.99% |
||||||||
| Accudyne Industries 144A 7.75% 12/15/20 # |
620,000 | 629,300 | ||||||
| Ardagh Packaging Finance 144A 6.00% 6/30/21 # |
600,000 | 595,500 | ||||||
| BWAY Holding 144A 9.125% 8/15/21 # |
960,000 | 993,600 | ||||||
| Consolidated Container 144A 10.125% 7/15/20 # |
419,000 | 383,385 | ||||||
| Gardner Denver 144A 6.875% 8/15/21 # |
712,000 | 710,220 | ||||||
| KLX 144A 5.875% 12/1/22 # |
590,000 | 601,800 | ||||||
| Milacron 144A 7.75% 2/15/21 # |
435,000 | 455,663 | ||||||
| Owens-Brockway Glass Container |
||||||||
| 144A 5.00% 1/15/22 # |
175,000 | 177,406 | ||||||
| 144A 5.375% 1/15/25 # |
115,000 | 116,581 | ||||||
| Plastipak Holdings 144A 6.50% 10/1/21 # |
405,000 | 409,050 | ||||||
| Reynolds Group Issuer 8.25% 2/15/21 |
720,000 | 755,100 | ||||||
| Sealed Air 144A 5.125% 12/1/24 # |
175,000 | 175,875 | ||||||
| Signode Industrial Group 144A 6.375% 5/1/22 # |
515,000 | 505,987 | ||||||
| TransDigm |
||||||||
| 6.00% 7/15/22 |
650,000 | 659,750 | ||||||
| 6.50% 7/15/24 |
525,000 | 538,125 | ||||||
|
|
|
|||||||
| 7,707,342 | ||||||||
|
|
|
|||||||
22
Table of Contents
| Principal amount° | Value (U.S. $) | |||||||
|
|
||||||||
| Corporate Bonds (continued) |
||||||||
|
|
||||||||
| Communications – 0.05% |
||||||||
| VimpelCom Holdings 144A 5.95% 2/13/23 # |
500,000 | $ | 421,500 | |||||
|
|
|
|||||||
| 421,500 | ||||||||
|
|
|
|||||||
| Consumer Cyclical – 0.72% |
||||||||
| DBP Holding 144A 7.75% 10/15/20 # |
358,000 | 323,990 | ||||||
| K. Hovnanian Enterprises 144A 8.00% 11/1/19 # |
315,000 | 316,575 | ||||||
| Landry’s 144A 9.375% 5/1/20 # |
1,121,000 | 1,198,069 | ||||||
| Men’s Wearhouse 144A 7.00% 7/1/22 # |
305,000 | 314,913 | ||||||
| MGM Resorts International 6.00% 3/15/23 |
585,000 | 596,700 | ||||||
| Michaels Stores 144A 5.875% 12/15/20 # |
425,000 | 430,313 | ||||||
| Midas Intermediate Holdco II 144A 7.875% 10/1/22 # |
395,000 | 393,025 | ||||||
| Pantry 8.375% 8/1/20 |
406,000 | 430,360 | ||||||
| Party City Holdings 8.875% 8/1/20 |
450,000 | 487,125 | ||||||
| PC Nextco Holdings 8.75% 8/15/19 |
315,000 | 321,300 | ||||||
| PF Chang’s China Bistro 144A 10.25% 6/30/20 # |
377,000 | 381,713 | ||||||
| Rite Aid 6.75% 6/15/21 |
390,000 | 410,475 | ||||||
|
|
|
|||||||
| 5,604,558 | ||||||||
|
|
|
|||||||
| Consumer Non-Cyclical – 0.27% |
||||||||
| Avis Budget Car Rental 144A 5.50% 4/1/23 # |
175,000 | 177,625 | ||||||
| Crestview DS Merger Sub II 10.00% 9/1/21 |
330,000 | 391,050 | ||||||
| JBS Investments 144A 7.75% 10/28/20 # |
565,000 | 615,850 | ||||||
| Prestige Brands 144A 5.375% 12/15/21 # |
395,000 | 391,050 | ||||||
| Spectrum Brands |
||||||||
| 6.375% 11/15/20 |
77,000 | 81,813 | ||||||
| 6.625% 11/15/22 |
291,000 | 311,370 | ||||||
| SUPERVALU 7.75% 11/15/22 |
110,000 | 109,725 | ||||||
|
|
|
|||||||
| 2,078,483 | ||||||||
|
|
|
|||||||
| Energy – 2.01% |
||||||||
| Baytex Energy |
||||||||
| 144A 5.125% 6/1/21 # |
110,000 | 101,750 | ||||||
| 144A 5.625% 6/1/24 # |
515,000 | 462,856 | ||||||
| California Resources |
||||||||
| 144A 5.50% 9/15/21 # |
635,000 | 573,087 | ||||||
| 144A 6.00% 11/15/24 # |
365,000 | 327,359 | ||||||
| Calumet Specialty Products Partners 7.625% 1/15/22 |
790,000 | 805,800 | ||||||
| Chaparral Energy |
||||||||
| 7.625% 11/15/22 |
379,000 | 348,680 | ||||||
| 8.25% 9/1/21 |
236,000 | 227,740 | ||||||
| CHC Helicopter 9.375% 6/1/21 |
367,250 | 374,595 | ||||||
| Chesapeake Energy 4.875% 4/15/22 |
1,000,000 | 995,000 | ||||||
| Compressco Partners 144A 7.25% 8/15/22 # |
615,000 | 565,800 | ||||||
| Energy Transfer Equity 5.875% 1/15/24 |
252,000 | 268,380 | ||||||
| Energy XXI Gulf Coast 144A 6.875% 3/15/24 # |
550,000 | 413,875 | ||||||
23
Table of Contents
Schedule of investments
Delaware Dividend Income Fund
| Principal amount° | Value (U.S. $) | |||||||
|
|
||||||||
| Corporate Bonds (continued) |
||||||||
|
|
||||||||
| Energy (continued) |
||||||||
| Exterran Partners 6.00% 4/1/21 |
460,000 | $ | 418,600 | |||||
| FTS International 144A 6.25% 5/1/22 # |
350,000 | 290,500 | ||||||
| Genesis Energy 5.75% 2/15/21 |
530,000 | 525,363 | ||||||
| Halcon Resources |
||||||||
| 8.875% 5/15/21 |
417,000 | 323,175 | ||||||
| 9.75% 7/15/20 |
825,000 | 635,250 | ||||||
| Key Energy Services 6.75% 3/1/21 |
780,000 | 608,400 | ||||||
| Laredo Petroleum |
||||||||
| 5.625% 1/15/22 |
550,000 | 522,500 | ||||||
| 7.375% 5/1/22 |
98,000 | 99,470 | ||||||
| Midstates Petroleum 9.25% 6/1/21 |
1,035,000 | 864,225 | ||||||
| Murphy Oil USA 6.00% 8/15/23 |
540,000 | 573,750 | ||||||
| Northern Blizzard Resources 144A 7.25% 2/1/22 # |
353,000 | 328,290 | ||||||
| Northern Oil & Gas 8.00% 6/1/20 |
430,000 | 382,700 | ||||||
| NuStar Logistics 6.75% 2/1/21 |
315,000 | 342,950 | ||||||
| Oasis Petroleum 6.875% 3/15/22 |
880,000 | 831,600 | ||||||
| Ocean Rig UDW 144A 7.25% 4/1/19 # |
900,000 | 711,000 | ||||||
| PDC Energy 7.75% 10/15/22 |
450,000 | 455,063 | ||||||
| Pioneer Energy Services 6.125% 3/15/22 |
625,000 | 512,500 | ||||||
| Regency Energy Partners 5.875% 3/1/22 |
550,000 | 569,250 | ||||||
| SandRidge Energy 8.125% 10/15/22 |
849,000 | 687,690 | ||||||
| Triangle USA Petroleum 144A 6.75% 7/15/22 # |
230,000 | 188,600 | ||||||
| Warren Resources 144A 9.00% 8/1/22 # |
350,000 | 293,125 | ||||||
|
|
|
|||||||
| 15,628,923 | ||||||||
|
|
|
|||||||
| Financials – 0.22% |
||||||||
| Consolidated Energy Finance 144A 6.75% 10/15/19 # |
708,000 | 711,540 | ||||||
| e*trade Financial 5.375% 11/15/22 |
385,000 | 389,813 | ||||||
| Infinity Acquisition 144A 7.25% 8/1/22 # |
680,000 | 625,600 | ||||||
|
|
|
|||||||
| 1,726,953 | ||||||||
|
|
|
|||||||
| Healthcare – 1.08% |
||||||||
| Air Medical Group Holdings 9.25% 11/1/18 |
318,000 | 334,297 | ||||||
| Amsurg 144A 5.625% 7/15/22 # |
305,000 | 314,150 | ||||||
| Community Health Systems |
||||||||
| 6.875% 2/1/22 |
985,000 | 1,047,794 | ||||||
| 7.125% 7/15/20 |
142,000 | 150,343 | ||||||
| 8.00% 11/15/19 |
53,000 | 56,843 | ||||||
| Crimson Merger Sub 144A 6.625% 5/15/22 # |
400,000 | 373,500 | ||||||
| DaVita HealthCare Partners 5.125% 7/15/24 |
925,000 | 950,437 | ||||||
| Immucor 11.125% 8/15/19 |
555,000 | 607,725 | ||||||
| Kinetic Concepts |
||||||||
| 10.50% 11/1/18 |
334,000 | 370,740 | ||||||
| 12.50% 11/1/19 |
245,000 | 271,950 | ||||||
24
Table of Contents
| Principal amount° | Value (U.S. $) | |||||||
|
|
||||||||
| Corporate Bonds (continued) |
||||||||
|
|
||||||||
| Healthcare (continued) |
||||||||
| Mallinckrodt International Finance 4.75% 4/15/23 |
305,000 | $ | 290,513 | |||||
| MPH Acquisition Holdings 144A 6.625% 4/1/22 # |
265,000 | 276,925 | ||||||
| Omnicare |
||||||||
| 4.75% 12/1/22 |
120,000 | 122,400 | ||||||
| 5.00% 12/1/24 |
325,000 | 333,125 | ||||||
| Par Pharmaceutical 7.375% 10/15/20 |
1,092,000 | 1,154,790 | ||||||
| Salix Pharmaceuticals 144A 6.00% 1/15/21 # |
430,000 | 439,675 | ||||||
| Tenet Healthcare |
||||||||
| 144A 5.00% 3/1/19 # |
420,000 | 414,750 | ||||||
| 6.00% 10/1/20 |
250,000 | 266,563 | ||||||
| 8.125% 4/1/22 |
315,000 | 352,800 | ||||||
| Valeant Pharmaceuticals International 144A |
||||||||
| 6.375% 10/15/20 # |
237,000 | 246,779 | ||||||
|
|
|
|||||||
| 8,376,099 | ||||||||
|
|
|
|||||||
| Insurance – 0.31% |
||||||||
| American International Group 8.175% 5/15/58 — |
480,000 | 660,000 | ||||||
| Hockey Merger Sub 2 144A 7.875% 10/1/21 # |
575,000 | 599,437 | ||||||
| USI 144A 7.75% 1/15/21 # |
446,000 | 453,805 | ||||||
| XL Group 6.50% 10/29/49 — |
758,000 | 733,365 | ||||||
|
|
|
|||||||
| 2,446,607 | ||||||||
|
|
|
|||||||
| Media – 1.70% |
||||||||
| Altice 144A 7.75% 5/15/22 # |
605,000 | 626,931 | ||||||
| CBS Outdoor Americas Capital 144A 5.875% 3/15/25 # |
375,000 | 389,063 | ||||||
| CCO Holdings 5.25% 9/30/22 |
447,000 | 446,441 | ||||||
| CCOH Safari |
||||||||
| 5.50% 12/1/22 |
380,000 | 385,225 | ||||||
| 5.75% 12/1/24 |
675,000 | 680,906 | ||||||
| Columbus International 144A 7.375% 3/30/21 # |
835,000 | 892,406 | ||||||
| CSC Holdings 144A 5.25% 6/1/24 # |
790,000 | 785,063 | ||||||
| DISH DBS 144A 5.875% 11/15/24 # |
425,000 | 429,250 | ||||||
| Gannett |
||||||||
| 144A 4.875% 9/15/21 # |
115,000 | 115,863 | ||||||
| 144A 5.50% 9/15/24 # |
400,000 | 406,500 | ||||||
| Gray Television 7.50% 10/1/20 |
910,000 | 946,400 | ||||||
| iHeartCommunications |
||||||||
| 144A 9.00% 9/15/22 # |
645,000 | 630,487 | ||||||
| PIK 14.00% 2/1/21 ✤ |
475,450 | 391,652 | ||||||
| MDC Partners 144A 6.75% 4/1/20 # |
585,000 | 606,206 | ||||||
| Media General Financing 144A 5.875% 11/15/22 # |
600,000 | 604,500 | ||||||
| Mediacom Broadband 5.50% 4/15/21 |
345,000 | 351,469 | ||||||
| Numericable Group |
||||||||
| 144A 6.00% 5/15/22 # |
605,000 | 615,297 | ||||||
25
Table of Contents
Schedule of investments
Delaware Dividend Income Fund
| Principal amount° | Value (U.S. $) | |||||||
|
|
||||||||
| Corporate Bonds (continued) |
||||||||
|
|
||||||||
| Media (continued) |
||||||||
| Numericable Group |
||||||||
| 144A 6.25% 5/15/24 # |
200,000 | $ | 204,000 | |||||
| RCN Telecom Services 144A 8.50% 8/15/20 # |
435,000 | 467,625 | ||||||
| Sinclair Television Group 144A 5.625% 8/1/24 # |
410,000 | 401,800 | ||||||
| Unitymedia KabelBW 144A 6.125% 1/15/25 # |
665,000 | 697,419 | ||||||
| Virgin Media Finance |
||||||||
| 144A 6.00% 10/15/24 # |
440,000 | 462,550 | ||||||
| 144A 6.375% 4/15/23 # |
580,000 | 620,600 | ||||||
| VTR Finance 144A 6.875% 1/15/24 # |
975,000 | 1,028,625 | ||||||
|
|
|
|||||||
| 13,186,278 | ||||||||
|
|
|
|||||||
| Services – 0.86% |
||||||||
| AECOM Technology |
||||||||
| 144A 5.75% 10/15/22 # |
230,000 | 241,500 | ||||||
| 144A 5.875% 10/15/24 # |
275,000 | 291,500 | ||||||
| Algeco Scotsman Global Finance 144A 10.75% 10/15/19 # |
894,000 | 840,360 | ||||||
| Caesars Growth Properties Holdings 144A |
||||||||
| 9.375% 5/1/22 # |
390,000 | 346,613 | ||||||
| Covanta Holding 5.875% 3/1/24 |
585,000 | 602,550 | ||||||
| Geo Group |
||||||||
| 5.125% 4/1/23 |
245,000 | 241,325 | ||||||
| 5.875% 10/15/24 |
385,000 | 394,625 | ||||||
| Mattamy Group 144A 6.50% 11/15/20 # |
677,000 | 683,770 | ||||||
| Navios South American Logistics 144A 7.25% 5/1/22 # |
530,000 | 544,575 | ||||||
| Pinnacle Entertainment |
||||||||
| 6.375% 8/1/21 |
210,000 | 219,975 | ||||||
| 7.75% 4/1/22 |
163,000 | 176,040 | ||||||
| Stena 144A 7.00% 2/1/24 # |
240,000 | 235,800 | ||||||
| United Rentals North America 5.75% 11/15/24 |
1,010,000 | 1,050,400 | ||||||
| Watco 144A 6.375% 4/1/23 # |
220,000 | 224,950 | ||||||
| West 144A 5.375% 7/15/22 # |
635,000 | 608,013 | ||||||
|
|
|
|||||||
| 6,701,996 | ||||||||
|
|
|
|||||||
| Technology & Electronics – 0.80% |
||||||||
| BMC Software Finance 144A 8.125% 7/15/21 # |
315,000 | 296,887 | ||||||
| CDW 5.50% 12/1/24 |
275,000 | 275,000 | ||||||
| CommScope 144A 5.50% 6/15/24 # |
590,000 | 590,000 | ||||||
| Entegris 144A 6.00% 4/1/22 # |
580,000 | 601,924 | ||||||
| Equinix |
||||||||
| 5.375% 1/1/22 |
220,000 | 222,200 | ||||||
| 5.75% 1/1/25 |
385,000 | 389,813 | ||||||
| First Data |
||||||||
| 11.25% 1/15/21 |
445,000 | 508,413 | ||||||
| 11.75% 8/15/21 |
811,000 | 942,787 | ||||||
26
Table of Contents
| Principal amount° | Value (U.S. $) | |||||||
|
|
||||||||
| Corporate Bonds (continued) |
||||||||
|
|
||||||||
| Technology & Electronics (continued) |
||||||||
| First Data Holdings 144A PIK 14.50% 9/24/19 #✥ |
36,260 | $ | 38,277 | |||||
| Infor Software Parent 144A PIK 7.125% 5/1/21 #T |
945,000 | 947,363 | ||||||
| j2 Global 8.00% 8/1/20 |
578,000 | 627,130 | ||||||
| NCR 6.375% 12/15/23 |
415,000 | 433,675 | ||||||
| Viasystems 144A 7.875% 5/1/19 # |
295,000 | 312,700 | ||||||
|
|
|
|||||||
| 6,186,169 | ||||||||
|
|
|
|||||||
| Telecommunications – 1.53% |
||||||||
| CenturyLink 6.75% 12/1/23 |
350,000 | 389,813 | ||||||
| Cogent Communications Finance 144A 5.625% 4/15/21 # |
530,000 | 522,050 | ||||||
| Digicel Group |
||||||||
| 144A 7.125% 4/1/22 # |
1,450,000 | 1,421,000 | ||||||
| 144A 8.25% 9/30/20 # |
925,000 | 952,750 | ||||||
| Hughes Satellite Systems 7.625% 6/15/21 |
368,000 | 410,320 | ||||||
| Intelsat Luxembourg |
||||||||
| 7.75% 6/1/21 |
416,000 | 432,640 | ||||||
| 8.125% 6/1/23 |
1,405,000 | 1,475,250 | ||||||
| Level 3 Communications 144A 5.75% 12/1/22 # |
550,000 | 555,500 | ||||||
| Level 3 Escrow II 144A 5.375% 8/15/22 # |
625,000 | 632,813 | ||||||
| Sprint |
||||||||
| 7.125% 6/15/24 |
900,000 | 894,375 | ||||||
| 7.25% 9/15/21 |
450,000 | 461,250 | ||||||
| 7.875% 9/15/23 |
730,000 | 768,325 | ||||||
| T-Mobile USA |
||||||||
| 6.00% 3/1/23 |
215,000 | 218,763 | ||||||
| 6.125% 1/15/22 |
160,000 | 163,400 | ||||||
| 6.25% 4/1/21 |
210,000 | 216,037 | ||||||
| 6.375% 3/1/25 |
375,000 | 381,563 | ||||||
| Wind Acquisition Finance |
||||||||
| 144A 4.75% 7/15/20 # |
270,000 | 260,550 | ||||||
| 144A 7.375% 4/23/21 # |
515,000 | 496,975 | ||||||
| Windstream |
||||||||
| 7.50% 6/1/22 |
348,000 | 358,875 | ||||||
| 7.75% 10/1/21 |
300,000 | 315,375 | ||||||
| Zayo Group 10.125% 7/1/20 |
524,000 | 591,465 | ||||||
|
|
|
|||||||
| 11,919,089 | ||||||||
|
|
|
|||||||
| Utilities – 0.55% |
||||||||
| Abengoa Yield 144A 7.00% 11/15/19 # |
585,000 | 583,537 | ||||||
| AES 7.375% 7/1/21 |
129,000 | 148,350 | ||||||
| AES Gener 144A 8.375% 12/18/73 #— |
200,000 | 223,400 | ||||||
| Calpine 5.375% 1/15/23 |
510,000 | 517,650 | ||||||
| DPL 144A 6.75% 10/1/19 # |
495,000 | 512,325 | ||||||
| Dynegy 5.875% 6/1/23 |
345,000 | 340,687 | ||||||
27
Table of Contents
Schedule of investments
Delaware Dividend Income Fund
| Principal amount° | Value (U.S. $) | |||||||
|
|
||||||||
| Corporate Bonds (continued) |
||||||||
|
|
||||||||
| Utilities (continued) |
||||||||
| Dynegy Finance I/II |
||||||||
| 144A 6.75% 11/1/19 # |
190,000 | $ | 197,837 | |||||
| 144A 7.375% 11/1/22 # |
315,000 | 331,931 | ||||||
| 144A 7.625% 11/1/24 # |
300,000 | 317,625 | ||||||
| Elwood Energy 8.159% 7/5/26 |
389,399 | 427,366 | ||||||
| Enel 144A 8.75% 9/24/73 #— |
600,000 | 702,312 | ||||||
|
|
|
|||||||
| 4,303,020 | ||||||||
|
|
|
|||||||
| Total Corporate Bonds (cost $111,678,120) |
110,642,405 | |||||||
|
|
|
|||||||
|
|
||||||||
| Leveraged Non-Recourse Security – 0.00% |
||||||||
|
|
||||||||
| JPMorgan Fixed Income Pass Through Trust |
||||||||
| Series 2007-B 144A 8.845% 1/15/87 #@¿ |
1,300,000 | 0 | ||||||
|
|
|
|||||||
| Total Leveraged Non-Recourse Security (cost $1,105,000) |
0 | |||||||
|
|
|
|||||||
|
|
||||||||
| Municipal Bonds – 1.06% |
||||||||
|
|
||||||||
| California State |
||||||||
| (Various Purposes) 5.00% 11/1/43 |
1,000,000 | 1,130,890 | ||||||
| California Statewide Communities Development Authority |
||||||||
| (California Baptist University) Series A 6.375% 11/1/43 |
1,000,000 | 1,132,460 | ||||||
| Colorado Health Facilities Authority Revenue |
||||||||
| (Catholic Health Initiatives) Series A 5.25% 1/1/45 |
1,250,000 | 1,402,013 | ||||||
| Dallas/Fort Worth International Airport |
||||||||
| Series H 5.00% 11/1/42 (AMT) |
1,000,000 | 1,069,610 | ||||||
| Golden State, California Tobacco Securitization |
||||||||
| 5.75% 6/1/47 |
650,000 | 548,489 | ||||||
| New York State Thruway Authority |
||||||||
| Series J 5.00% 1/1/41 |
1,000,000 | 1,119,630 | ||||||
| Palm Beach County Health Facilities Authority |
||||||||
| 7.25% 6/1/34 |
65,000 | 73,870 | ||||||
| Series A 7.50% 6/1/49 |
325,000 | 370,162 | ||||||
| Texas Private Activity Bond Surface Transportation (Senior Lien NTC Mobility) |
||||||||
| 6.75% 6/30/43 (AMT) |
450,000 | 545,837 | ||||||
| Utility Debt Securitization Authority, New York |
||||||||
| (Restructuring) Series TE 5.00% 12/15/41 |
750,000 | 866,460 | ||||||
|
|
|
|||||||
| Total Municipal Bonds (cost $7,382,432) |
8,259,421 | |||||||
|
|
|
|||||||
28
Table of Contents
| Principal amount° | Value (U.S. $) | |||||||
|
|
||||||||
| Regional Bond – 0.00%D |
||||||||
|
|
||||||||
| Australia – 0.00% |
||||||||
| New South Wales Treasury 4.00% 5/20/26 |
AUD | 12,000 | $ | 10,588 | ||||
|
|
|
|||||||
| Total Regional Bond (cost $10,632) |
10,588 | |||||||
|
|
|
|||||||
|
|
||||||||
| Senior Secured Loans – 0.92%« |
||||||||
|
|
||||||||
| Applied Systems 2nd Lien 7.50% 1/15/22 |
758,000 | 760,843 | ||||||
| Ashland Water 2nd Lien 7.75% 7/2/22 |
220,000 | 216,810 | ||||||
| Atkore International 2nd Lien 7.75% 9/27/21 |
295,000 | 291,128 | ||||||
| Azure Midstream Tranche B 6.50% 10/21/18 |
120,434 | 118,327 | ||||||
| BJ’s Wholesale Club 2nd Lien 8.50% 3/31/20 |
590,000 | 592,729 | ||||||
| Borgata Tranche B 1st Lien 6.75% 8/15/18 |
498,292 | 502,590 | ||||||
| Clear Channel Communications Tranche D 6.91% 1/30/19 |
335,000 | 315,558 | ||||||
| Flint Group 2nd Lien 8.25% 5/2/22 |
615,000 | 590,400 | ||||||
| Gentiva Health Services Tranche B 6.50% 10/10/19 |
421,813 | 423,328 | ||||||
| Hostess Brands 1st Lien 6.75% 3/12/20 |
582,075 | 596,263 | ||||||
| LTS Buyer 2nd Lien 8.00% 3/15/21 |
82,225 | 82,842 | ||||||
| Mauser Holdings 2nd Lien 8.25% 6/30/22 |
630,000 | 619,763 | ||||||
| Moxie Liberty Tranche B 7.50% 8/21/20 |
295,000 | 300,900 | ||||||
| Moxie Patriot (Panda Power Fund) Tranche B1 |
||||||||
| 6.75% 12/19/20 |
290,000 | 292,900 | ||||||
| Otterbox Tranche B 5.75% 5/30/20 |
448,875 | 445,228 | ||||||
| Panda Stonewall Tranche B 6.50% 11/12/21 |
205,000 | 207,434 | ||||||
| Rite Aid 2nd Lien 5.75% 8/3/20 |
220,000 | 221,833 | ||||||
| Samson Investment 2nd Lien 5.00% 9/25/18 |
275,000 | 251,338 | ||||||
| Vantage Drilling Tranche B 1st Lien 5.75% 3/28/19 |
367,204 | 306,615 | ||||||
|
|
|
|||||||
| Total Senior Secured Loans (cost $7,277,792) |
7,136,829 | |||||||
|
|
|
|||||||
|
|
||||||||
| Sovereign Bonds – 0.57%D |
||||||||
|
|
||||||||
| Brazil – 0.20% |
||||||||
| Brazil Notas do Tesouro Nacional Series F 10.00% 1/1/17 |
BRL | 4,200,000 | 1,575,182 | |||||
|
|
|
|||||||
| 1,575,182 | ||||||||
|
|
|
|||||||
| Mexico – 0.30% |
||||||||
| Mexican Bonos 10.00% 12/5/24 |
MXN | 24,301,000 | 2,303,819 | |||||
|
|
|
|||||||
| 2,303,819 | ||||||||
|
|
|
|||||||
| South Africa – 0.07% |
||||||||
| South Africa Government International Bond |
||||||||
| 5.375% 7/24/44 |
500,000 | 531,497 | ||||||
|
|
|
|||||||
| 531,497 | ||||||||
|
|
|
|||||||
| Total Sovereign Bonds (cost $4,487,340) |
4,410,498 | |||||||
|
|
|
|||||||
29
Table of Contents
Schedule of investments
Delaware Dividend Income Fund
| Principal amount° | Value (U.S. $) | |||||||
|
|
||||||||
| Supranational Bank – 0.13%D |
||||||||
|
|
||||||||
| Inter-American Development Bank 7.25% 7/17/17 |
IDR | 11,950,000,000 | $ | 986,482 | ||||
|
|
|
|||||||
| Total Supranational Bank (cost $996,733) |
986,482 | |||||||
|
|
|
|||||||
| Number of | ||||||||
| Shares | ||||||||
|
|
||||||||
| Preferred Stock – 0.37% |
||||||||
|
|
||||||||
| Ally Financial 144A 7.00% # |
1,100 | 1,109,659 | ||||||
| Freddie Mac 6.02% |
40,000 | 130,800 | ||||||
| GMAC Capital Trust I 8.125% — |
17,000 | 449,480 | ||||||
| Regions Financial 6.375% |
17,000 | 425,510 | ||||||
| Vornado Realty Trust 6.625% |
28,600 | 734,734 | ||||||
|
|
|
|||||||
| Total Preferred Stock (cost $3,472,469) |
2,850,183 | |||||||
|
|
|
|||||||
|
|
||||||||
| Warrant – 0.00% |
||||||||
|
|
||||||||
| Wheeler Real Estate Investment Trust strike price $5.50, |
43,188 | 14,468 | ||||||
|
|
|
|||||||
| Total Warrant (cost $358) |
14,468 | |||||||
|
|
|
|||||||
| Principal amount° | ||||||||
|
|
||||||||
| Short-Term Investments – 9.16% |
||||||||
|
|
||||||||
| Discount Notes – 4.26%≠ |
||||||||
| Federal Home Loan Bank |
||||||||
| 0.065% 1/14/15 |
4,938,891 | 4,938,718 | ||||||
| 0.065% 1/21/15 |
3,188,891 | 3,188,760 | ||||||
| 0.065% 2/25/15 |
7,041,706 | 7,041,030 | ||||||
| 0.065% 3/5/15 |
7,957,903 | 7,956,757 | ||||||
| 0.068% 1/16/15 |
3,309,475 | 3,309,352 | ||||||
| 0.08% 2/20/15 |
6,658,067 | 6,657,468 | ||||||
|
|
|
|||||||
| 33,092,085 | ||||||||
|
|
|
|||||||
| Repurchase Agreements – 3.76% |
||||||||
| Bank of America Merrill Lynch |
||||||||
| 0.05%, dated 11/28/14, to be repurchased on 12/1/14, repurchase price $10,314,731 (collateralized by U.S. government obligations 0.00%–1.375% 4/15/16–2/15/43 market value $10,520,983) |
10,314,688 | 10,314,688 | ||||||
| Bank of Montreal |
||||||||
| 0.08%, dated 11/28/14, to be repurchased on 12/1/14, repurchase price $3,438,252 (collateralized by U.S. government obligations 0.25%–11.25% 11/30/14–2/15/22 market value $3,506,997) |
3,438,229 | 3,438,229 | ||||||
30
Table of Contents
| Principal amount° | Value (U.S. $) | |||||||
|
|
||||||||
| Short-Term Investments (continued) |
||||||||
|
|
||||||||
| Repurchase Agreements (continued) |
||||||||
| BNP Paribas |
||||||||
| 0.09%, dated 11/28/14, to be repurchased on 12/1/14, repurchase price $15,502,199 (collateralized by U.S. government obligations 0.00%–3.625% 12/26/14–2/15/21 market value $15,812,126) |
15,502,083 | $ | 15,502,083 | |||||
|
|
|
|||||||
| 29,255,000 | ||||||||
|
|
|
|||||||
| U.S. Treasury Obligation – 1.14%≠ |
||||||||
| U.S. Treasury Bill 0.005% 12/26/14 |
8,882,805 | 8,882,565 | ||||||
|
|
|
|||||||
| 8,882,565 | ||||||||
|
|
|
|||||||
| Total Short-Term Investments (cost $71,228,095) |
71,229,650 | |||||||
|
|
|
|||||||
| Total Value of Securities – 99.15% |
$771,380,547 | |||||||
|
|
|
|||||||
| # | Security exempt from registration under Rule 144A of the Securities Act of 1933, as amended. At Nov. 30, 2014, the aggregate value of Rule 144A securities was $80,281,635, which represents 10.32% of the Fund’s net assets. See Note 11 in “Notes to financial statements.” |
| @ | Illiquid security. At Nov. 30, 2014, the aggregate value of illiquid securities was $3,570,332, which represents 0.46% of the Fund’s net assets. See Note 11 in “Notes to financial statements.” |
| ¿ | Pass Through Agreement. Security represents the contractual right to receive a proportionate amount of underlying payments due to the counterparty pursuant to various agreements related to the rescheduling of obligations and the exchange of certain notes. |
| ✤ | 86% of the income received was in the form of cash and 14% of the income received was in the form of additional par. |
| ✥ | 100% of the income received was in the form of additional par. |
| T | 100% of the income received was in the form of additional cash. |
| = | Security is being fair valued in accordance with the Fund’s fair valuation policy. At Nov. 30, 2014, the aggregate value of fair valued securities was $431,930, which represents 0.06% of the Fund’s net assets. See Note 1 in “Notes to financial statements.” |
| ≠ | The rate shown is the effective yield at the time of purchase. |
| ° | Principal amount shown is stated in U.S. dollars unless noted that the security is denominated in another currency. |
| † | Non-income-producing security. |
| — | Variable rate security. The rate shown is the rate as of Nov. 30, 2014. Interest rates reset periodically. |
| D | Securities have been classified by country of origin. |
| « | Senior secured loans generally pay interest at rates which are periodically redetermined by reference to a base lending rate plus a premium. These base lending rates are generally: (i) the prime rate |
31
Table of Contents
Schedule of investments
Delaware Dividend Income Fund
| offered by one or more United States banks, (ii) the lending rate offered by one or more European banks such as the London Inter-Bank Offered Rate (LIBOR), and (iii) the certificate of deposit rate. Senior secured loans may be subject to restrictions on resale. Stated rate in effect at Nov. 30, 2014. |
| f | Step coupon bond. Coupon increases or decreases periodically based on a predetermined schedule. Stated rate in effect at Nov. 30, 2014. |
The following futures contracts and swap contracts were outstanding at Nov. 30, 2014:1
Futures Contracts
| Contracts to Buy (Sell) |
Notional Cost (Proceeds) |
Notional Value |
Expiration Date |
Unrealized Appreciation (Depreciation) |
||||||||||||
| (52) |
E-mini S&P 500 Index | $ | (5,139,143) | $ | (5,372,380) | 12/22/14 | $ | (233,237) | ||||||||
Swap Contracts
CDS Contracts2
| Swap Referenced |
Notional | Annual Protection |
Termination | Unrealized Appreciation |
||||||||||||||||||||
| Counterparty |
Obligation |
Value |
Payments |
Date |
(Depreciation) |
|||||||||||||||||||
| Protection Purchased: | ||||||||||||||||||||||||
| BCLY |
ICE-CDX.NA.HY.23 | $ | 9,000,000 | 5.00% | 12/20/19 | $ | (66,016 | ) | ||||||||||||||||
The use of futures contracts and swap contracts involves elements of market risk and risks in excess of the amounts disclosed in the financial statements. The notional values presented above represent the Fund’s total exposure in such contracts, whereas only the net unrealized appreciation (depreciation) is reflected in the Fund’s net assets.
1See Note 8 in “Notes to financial statements.”
2A CDS contract is a risk-transfer instrument through which one party (purchaser of protection) transfers to another party (seller of protection) the financial risk of a credit event (as defined in the CDS agreement), as it relates to a particular reference security or basket of securities (such as an index). Periodic payments (receipts) on such contracts are accrued daily and recorded as unrealized losses (gains) on swap contracts. Upon payment (receipt), such amounts are recorded as realized losses (gains) on swap contracts. Upfront payments made or received in connection with CDS contracts are amortized over the expected life of the CDS contracts as unrealized losses (gains) on swap contracts. The change in value of CDS contracts is recorded as unrealized appreciation or depreciation daily. A realized gain or loss is recorded upon a credit event (as defined in the CDS agreement) or the maturity or termination of the agreement.
32
Table of Contents
Summary of abbreviations:
ADR – American Depositary Receipt
AMT – Subject to Alternative Minimum Tax
AUD – Australian Dollar
BCLY – Barclays Bank
BRL – Brazilian Real
CDS – Credit Default Swap
CDX.NA.HY – Credit Default Swap Index North America High Yield
ICE – IntercontinentalExchange, Inc.
IDR – Indonesian Rupiah
MXN – Mexican Peso
PIK – Pay-in-kind
REIT – Real Estate Investment Trust
See accompanying notes, which are an integral part of the financial statements.
33
Table of Contents
| Statement of assets and liabilities | ||
| Delaware Dividend Income Fund | November 30, 2014 |
| Assets: |
||||
| Investments, at value1 |
$ | 700,150,897 | ||
| Short-term investments, at value2 |
71,229,650 | |||
| Cash collateral due from brokers |
1,271,165 | |||
| Foreign currencies, at value3 |
69,568 | |||
| Cash |
1,006,666 | |||
| Dividends and interest receivable |
4,265,550 | |||
| Receivable for securities sold |
3,676,821 | |||
| Receivable for fund shares sold |
1,775,471 | |||
| Variation margin receivable on futures contracts |
15,600 | |||
|
|
|
|||
| Total assets |
783,461,388 | |||
|
|
|
|||
| Liabilities: |
||||
| Payable for securities purchased |
2,665,300 | |||
| Due to brokers |
705,847 | |||
| Payable for fund shares redeemed |
265,720 | |||
| Swap payments payable |
87,500 | |||
| Investment management fees payable |
401,282 | |||
| Other accrued expenses |
337,952 | |||
| Distribution fees payable |
317,920 | |||
| Other affiliates payable |
49,494 | |||
| Trustees’ fees and expenses payable |
4,400 | |||
| Upfront payments paid on credit default swap contracts |
588,442 | |||
| Unrealized loss on credit default swap contracts |
66,016 | |||
| Other liabilities |
1,635 | |||
|
|
|
|||
| Total liabilities |
5,491,508 | |||
|
|
|
|||
| Total Net Assets |
$ | 777,969,880 | ||
|
|
|
|||
| Net Assets Consist of: |
||||
| Paid-in capital |
$ | 777,789,174 | ||
| Undistributed net investment income |
683,874 | |||
| Accumulated net realized loss on investments |
(110,023,052 | ) | ||
| Net unrealized appreciation of investments, foreign currencies, and derivatives |
109,519,884 | |||
|
|
|
|||
| Total Net Assets |
$ | 777,969,880 | ||
|
|
|
|||
34
Table of Contents
| Net Asset Value |
||||
| Class A: |
||||
| Net assets |
$ | 315,097,720 | ||
| Shares of beneficial interest outstanding, unlimited authorization, no par |
22,951,250 | |||
| Net asset value per share |
$ | 13.73 | ||
| Sales charge |
5.75 | % | ||
| Offering price per share, equal to net asset value per share / (1 – sales charge) |
$ | 14.57 | ||
| Class C: |
||||
| Net assets |
$ | 308,975,167 | ||
| Shares of beneficial interest outstanding, unlimited authorization, no par |
22,473,241 | |||
| Net asset value per share |
$ | 13.75 | ||
| Class R: |
||||
| Net assets |
$ | 3,982,719 | ||
| Shares of beneficial interest outstanding, unlimited authorization, no par |
290,107 | |||
| Net asset value per share |
$ | 13.73 | ||
| Institutional Class: |
||||
| Net assets |
$ | 149,914,274 | ||
| Shares of beneficial interest outstanding, unlimited authorization, no par |
10,919,310 | |||
| Net asset value per share |
$ | 13.73 | ||
|
1 Investments, at cost |
$ | 590,270,082 | ||
| 2 Short-term investments, at cost |
71,228,095 | |||
| 3 Foreign currencies, at cost |
70,983 | |||
See accompanying notes, which are an integral part of the financial statements.
35
Table of Contents
| Statement of operations | ||
| Delaware Dividend Income Fund | Year ended November 30, 2014 |
| Investment Income: |
||||
| Dividends |
$ | 13,841,108 | ||
| Interest |
10,603,758 | |||
| Foreign tax withheld |
(99,981 | ) | ||
|
|
|
|||
| 24,344,885 | ||||
|
|
|
|||
| Expenses: |
||||
| Management fees |
4,488,341 | |||
| Distribution expenses – Class A |
775,348 | |||
| Distribution expenses – Class B |
63,423 | |||
| Distribution expenses – Class C |
2,851,177 | |||
| Distribution expenses – Class R |
17,816 | |||
| Dividend disbursing and transfer agent fees and expenses |
819,266 | |||
| Accounting and administration expenses |
238,081 | |||
| Reports and statements to shareholders |
114,810 | |||
| Registration fees |
110,318 | |||
| Audit and tax |
52,176 | |||
| Legal fees |
50,536 | |||
| Custodian fees |
50,410 | |||
| Trustees’ fees and expenses |
32,604 | |||
| Other |
43,632 | |||
|
|
|
|||
| 9,707,938 | ||||
| Less waived distribution expenses – Class B |
(26,043 | ) | ||
| Less expense paid indirectly |
(292 | ) | ||
|
|
|
|||
| Total operating expenses |
9,681,603 | |||
|
|
|
|||
| Net Investment Income |
14,663,282 | |||
|
|
|
36
Table of Contents
| Net Realized and Unrealized Gain (Loss): |
||||
| Net realized gain (loss) on: |
||||
| Investments |
$ | 31,634,134 | ||
| Foreign currencies |
(503,508 | ) | ||
| Foreign currency exchange contracts |
(91,754 | ) | ||
| Futures contracts |
(883,528 | ) | ||
| Options written |
334,147 | |||
| Swap contracts |
(990,615 | ) | ||
|
|
|
|||
| Net realized gain |
29,498,876 | |||
|
|
|
|||
| Net change in unrealized appreciation (depreciation) of: |
||||
| Investments |
18,515,919 | |||
| Foreign currencies |
(12,433 | ) | ||
| Foreign currency exchange contracts |
6,785 | |||
| Futures contracts |
37,059 | |||
| Options written |
6,788 | |||
| Swap contracts |
254,745 | |||
|
|
|
|||
| Net change in unrealized appreciation (depreciation) |
18,808,863 | |||
|
|
|
|||
| Net Realized and Unrealized Gain |
48,307,739 | |||
|
|
|
|||
| Net Increase in Net Assets Resulting from Operations |
$ | 62,971,021 | ||
|
|
|
|||
See accompanying notes, which are an integral part of the financial statements.
37
Table of Contents
Statements of changes in net assets
Delaware Dividend Income Fund
| Year ended | ||||||||
| 11/30/14 | 11/30/13 | |||||||
| Increase in Net Assets from Operations: |
||||||||
| Net investment income |
$ | 14,663,282 | $ | 11,127,325 | ||||
| Net realized gain |
29,498,876 | 17,291,247 | ||||||
| Net change in unrealized appreciation (depreciation) |
18,808,863 | 59,142,315 | ||||||
|
|
|
|
|
|||||
| Net increase in net assets resulting from operations |
62,971,021 | 87,560,887 | ||||||
|
|
|
|
|
|||||
| Dividends and Distributions to Shareholders from: |
||||||||
| Net investment income: |
||||||||
| Class A |
(7,317,367 | ) | (6,053,997 | ) | ||||
| Class B |
(130,696 | ) | (235,428 | ) | ||||
| Class C |
(4,581,895 | ) | (3,338,842 | ) | ||||
| Class R |
(75,505 | ) | (71,763 | ) | ||||
| Institutional Class |
(2,655,964 | ) | (1,226,175 | ) | ||||
|
|
|
|
|
|||||
| (14,761,427 | ) | (10,926,205 | ) | |||||
|
|
|
|
|
|||||
| Capital Share Transactions: |
||||||||
| Proceeds from shares sold: |
||||||||
| Class A |
87,227,442 | 96,741,474 | ||||||
| Class B |
12,087 | 205,221 | ||||||
| Class C |
65,462,355 | 90,858,443 | ||||||
| Class R |
1,900,495 | 1,189,004 | ||||||
| Institutional Class |
97,952,473 | 38,525,198 | ||||||
| Net asset value of shares based upon reinvestment of dividends and distributions: |
||||||||
| Class A |
6,744,169 | 5,604,764 | ||||||
| Class B |
123,159 | 217,686 | ||||||
| Class C |
4,163,166 | 3,003,745 | ||||||
| Class R |
70,986 | 71,517 | ||||||
| Institutional Class |
2,279,362 | 1,057,730 | ||||||
|
|
|
|
|
|||||
| 265,935,694 | 237,474,782 | |||||||
|
|
|
|
|
|||||
38
Table of Contents
| Year ended | ||||||||
| 11/30/14 | 11/30/13 | |||||||
| Capital Share Transactions (continued): |
||||||||
| Cost of shares redeemed: |
||||||||
| Class A |
$ | (97,579,843 | ) | $ | (46,311,215 | ) | ||
| Class B |
(10,736,134 | ) | (9,382,458 | ) | ||||
| Class C |
(35,216,011 | ) | (25,556,412 | ) | ||||
| Class R |
(1,255,241 | ) | (1,884,594 | ) | ||||
| Institutional Class |
(18,465,880 | ) | (14,947,724 | ) | ||||
|
|
|
|
|
|||||
| (163,253,109 | ) | (98,082,403 | ) | |||||
|
|
|
|
|
|||||
| Increase in net assets derived from capital share transactions |
102,682,585 | 139,392,379 | ||||||
|
|
|
|
|
|||||
| Net Increase in Net Assets |
150,892,179 | 216,027,061 | ||||||
| Net Assets: |
||||||||
| Beginning of year |
627,077,701 | 411,050,640 | ||||||
|
|
|
|
|
|||||
| End of year |
$ | 777,969,880 | $ | 627,077,701 | ||||
|
|
|
|
|
|||||
| Undistributed net investment income |
$ | 683,874 | $ | 207,449 | ||||
|
|
|
|
|
|||||
See accompanying notes, which are an integral part of the financial statements.
39
Table of Contents
Delaware Dividend Income Fund Class A
Selected data for each share of the Fund outstanding throughout each period were as follows:
| Net asset value, beginning of period |
| Income from investment operations: |
| Net investment income1 |
| Net realized and unrealized gain |
| Total from investment operations |
| Less dividends and distributions from: |
| Net investment income |
| Total dividends and distributions |
| Net asset value, end of period |
| Total return2 |
| Ratios and supplemental data: |
| Net assets, end of period (000 omitted) |
| Ratio of expenses to average net assets |
| Ratio of expenses to average net assets |
| Ratio of net investment income to average net assets |
| Ratio of net investment income to average net assets |
| Portfolio turnover |
| 1 | The average shares outstanding method has been applied for per share information. |
| 2 | Total investment return is based on the change in net asset value of a share during the period and assumes reinvestment of dividends and distributions at net asset value and does not reflect the impact of a sales charge. Total investment return during some of the periods shown reflects waivers by the manager and/or distributor. Performance would have been lower had the waivers not been in effect. |
See accompanying notes, which are an integral part of the financial statements.
40
Table of Contents
| Year ended | ||||||||||||||||||||
| 11/30/14 | 11/30/13 | 11/30/12 | 11/30/11 | 11/30/10 | ||||||||||||||||
|
|
||||||||||||||||||||
| $ | 12.810 | $ | 10.940 | $ | 9.890 | $ | 9.810 | $ | 9.190 | |||||||||||
| 0.312 | 0.316 | 0.348 | 0.351 | 0.373 | ||||||||||||||||
| 0.923 | 1.854 | 1.045 | 0.086 | 0.695 | ||||||||||||||||
|
|
|
|
|
|
|
|
|
|
|
|||||||||||
| 1.235 | 2.170 | 1.393 | 0.437 | 1.068 | ||||||||||||||||
|
|
|
|
|
|
|
|
|
|
|
|||||||||||
| (0.315 | ) | (0.300 | ) | (0.343 | ) | (0.357 | ) | (0.448 | ) | |||||||||||
|
|
|
|
|
|
|
|
|
|
|
|||||||||||
| (0.315 | ) | (0.300 | ) | (0.343 | ) | (0.357 | ) | (0.448 | ) | |||||||||||
|
|
|
|
|
|
|
|
|
|
|
|||||||||||
| $ | 13.730 | $ | 12.810 | $ | 10.940 | $ | 9.890 | $ | 9.810 | |||||||||||
|
|
|
|
|
|
|
|
|
|
|
|||||||||||
| 9.74% | 20.07% | 14.25% | 4.39% | 11.91% | ||||||||||||||||
| $ | 315,098 | $ | 297,117 | $ | 203,819 | $ | 189,313 | $ | 192,876 | |||||||||||
| 1.10% | 1.12% | 1.16% | 1.19% | 1.26% | ||||||||||||||||
| 1.10% | 1.16% | 1.21% | 1.24% | 1.31% | ||||||||||||||||
| 2.35% | 2.62% | 3.28% | 3.41% | 3.93% | ||||||||||||||||
| 2.35% | 2.58% | 3.23% | 3.36% | 3.88% | ||||||||||||||||
| 56% | 51% | 47% | 110% | 109% | ||||||||||||||||
|
|
||||||||||||||||||||
41
Table of Contents
Financial highlights
Delaware Dividend Income Fund Class C
Selected data for each share of the Fund outstanding throughout each period were as follows:
| Net asset value, beginning of period |
| Income from investment operations: |
| Net investment income1 |
| Net realized and unrealized gain |
| Total from investment operations |
| Less dividends and distributions from: |
| Net investment income |
| Total dividends and distributions |
| Net asset value, end of period |
| Total return2 |
| Ratios and supplemental data: |
| Net assets, end of period (000 omitted) |
| Ratio of expenses to average net assets |
| Ratio of net investment income to average net assets |
| Portfolio turnover |
| 1 | The average shares outstanding method has been applied for per share information. |
| 2 | Total investment return is based on the change in net asset value of a share during the period and assumes reinvestment of dividends and distributions at net asset value and does not reflect the impact of a sales charge. |
See accompanying notes, which are an integral part of the financial statements.
42
Table of Contents
| Year ended | ||||||||||||||||||||
| 11/30/14 | 11/30/13 | 11/30/12 | 11/30/11 | 11/30/10 | ||||||||||||||||
|
|
||||||||||||||||||||
| $ | 12.830 | $ | 10.960 | $ | 9.900 | $ | 9.820 | $ | 9.190 | |||||||||||
| 0.213 | 0.226 | 0.268 | 0.274 | 0.302 | ||||||||||||||||
| 0.921 | 1.853 | 1.056 | 0.086 | 0.694 | ||||||||||||||||
|
|
|
|
|
|
|
|
|
|
|
|||||||||||
| 1.134 | 2.079 | 1.324 | 0.360 | 0.996 | ||||||||||||||||
|
|
|
|
|
|
|
|
|
|
|
|||||||||||
| (0.214 | ) | (0.209 | ) | (0.264 | ) | (0.280 | ) | (0.366 | ) | |||||||||||
|
|
|
|
|
|
|
|
|
|
|
|||||||||||
| (0.214 | ) | (0.209 | ) | (0.264 | ) | (0.280 | ) | (0.366 | ) | |||||||||||
|
|
|
|
|
|
|
|
|
|
|
|||||||||||
| $ | 13.750 | $ | 12.830 | $ | 10.960 | $ | 9.900 | $ | 9.820 | |||||||||||
|
|
|
|
|
|
|
|
|
|
|
|||||||||||
| 8.90% | 19.13% | 13.50% | 3.61% | 11.06% | ||||||||||||||||
| $ | 308,975 | $ | 254,961 | $ | 156,758 | $ | 151,107 | $ | 152,009 | |||||||||||
| 1.85% | 1.87% | 1.91% | 1.94% | 2.01% | ||||||||||||||||
| 1.60% | 1.87% | 2.53% | 2.66% | 3.18% | ||||||||||||||||
| 56% | 51% | 47% | 110% | 109% | ||||||||||||||||
|
|
||||||||||||||||||||
43
Table of Contents
Financial highlights
Delaware Dividend Income Fund Class R
Selected data for each share of the Fund outstanding throughout each period were as follows:
| Net asset value, beginning of period |
| Income from investment operations: |
| Net investment income1 |
| Net realized and unrealized gain |
| Total from investment operations |
| Less dividends and distributions from: |
| Net investment income |
| Total dividends and distributions |
| Net asset value, end of period |
| Total return2 |
| Ratios and supplemental data: |
| Net assets, end of period (000 omitted) |
| Ratio of expenses to average net assets |
| Ratio of expenses to average net assets |
| Ratio of net investment income to average net assets |
| Ratio of net investment income to average net assets |
| Portfolio turnover |
| 1 | The average shares outstanding method has been applied for per share information. |
| 2 | Total investment return is based on the change in net asset value of a share during the period and assumes reinvestment of dividends and distributions at net asset value. Total investment return during some of the periods shown reflects waivers by the manager and/or distributor. Performance would have been lower had the waivers not been in effect. |
See accompanying notes, which are an integral part of the financial statements.
44
Table of Contents
| Year ended | ||||||||||||||||||||
| 11/30/14 | 11/30/13 | 11/30/12 | 11/30/11 | 11/30/10 | ||||||||||||||||
|
|
||||||||||||||||||||
| $ | 12.810 | $ | 10.940 | $ | 9.890 | $ | 9.810 | $ | 9.190 | |||||||||||
| 0.280 | 0.284 | 0.321 | 0.325 | 0.349 | ||||||||||||||||
| 0.921 | 1.856 | 1.046 | 0.086 | 0.693 | ||||||||||||||||
|
|
|
|
|
|
|
|
|
|
|
|||||||||||
| 1.201 | 2.140 | 1.367 | 0.411 | 1.042 | ||||||||||||||||
|
|
|
|
|
|
|
|
|
|
|
|||||||||||
| (0.281 | ) | (0.270 | ) | (0.317 | ) | (0.331 | ) | (0.422 | ) | |||||||||||
|
|
|
|
|
|
|
|
|
|
|
|||||||||||
| (0.281 | ) | (0.270 | ) | (0.317 | ) | (0.331 | ) | (0.422 | ) | |||||||||||
|
|
|
|
|
|
|
|
|
|
|
|||||||||||
| $ | 13.730 | $ | 12.810 | $ | 10.940 | $ | 9.890 | $ | 9.810 | |||||||||||
|
|
|
|
|
|
|
|
|
|
|
|||||||||||
| 9.46% | 19.77% | 13.97% | 4.13% | 11.60% | ||||||||||||||||
| $ | 3,983 | $ | 3,030 | $ | 3,151 | $ | 3,340 | $ | 3,069 | |||||||||||
| 1.35% | 1.37% | 1.41% | 1.44% | 1.51% | ||||||||||||||||
| 1.35% | 1.46% | 1.51% | 1.54% | 1.61% | ||||||||||||||||
| 2.10% | 2.37% | 3.03% | 3.16% | 3.68% | ||||||||||||||||
| 2.10% | 2.28% | 2.93% | 3.06% | 3.58% | ||||||||||||||||
| 56% | 51% | 47% | 110% | 109% | ||||||||||||||||
|
|
||||||||||||||||||||
45
Table of Contents
Financial highlights
Delaware Dividend Income Fund Institutional Class
Selected data for each share of the Fund outstanding throughout each period were as follows:
| Net asset value, beginning of period |
| Income from investment operations: |
| Net investment income1 |
| Net realized and unrealized gain |
| Total from investment operations |
| Less dividends and distributions from: |
| Net investment income |
| Total dividends and distributions |
| Net asset value, end of period |
| Total return2 |
| Ratios and supplemental data: |
| Net assets, end of period (000 omitted) |
| Ratio of expenses to average net assets |
| Ratio of net investment income to average net assets |
| Portfolio turnover |
| 1 | The average shares outstanding method has been applied for per share information. |
| 2 | Total investment return is based on the change in net asset value of a share during the period and assumes reinvestment of dividends and distributions at net asset value. |
See accompanying notes, which are an integral part of the financial statements.
46
Table of Contents
| Year ended | ||||||||||||||||||||
| 11/30/14 | 11/30/13 | 11/30/12 | 11/30/11 | 11/30/10 | ||||||||||||||||
|
|
||||||||||||||||||||
| $ 12.810 | $ 10.940 | $ 9.890 | $ 9.810 | $ 9.190 | ||||||||||||||||
| 0.348 | 0.347 | 0.375 | 0.375 | 0.399 | ||||||||||||||||
| 0.920 | 1.853 | 1.045 | 0.088 | 0.697 | ||||||||||||||||
| 1.268 | 2.200 | 1.420 | 0.463 | 1.096 | ||||||||||||||||
| (0.348 | ) | (0.330 | ) | (0.370 | ) | (0.383 | ) | (0.476 | ) | |||||||||||
| (0.348 | ) | (0.330 | ) | (0.370 | ) | (0.383 | ) | (0.476 | ) | |||||||||||
| $ 13.730 | $ 12.810 | $ 10.940 | $ 9.890 | $ 9.810 | ||||||||||||||||
| 10.01% | 20.37% | 14.66% | 4.55% | 12.24% | ||||||||||||||||
| $149,914 | $ 61,809 | $ 30,449 | $24,986 | $ 12,766 | ||||||||||||||||
| 0.85% | 0.87% | 0.91% | 0.94% | 1.01% | ||||||||||||||||
| 2.60% | 2.87% | 3.53% | 3.66% | 4.18% | ||||||||||||||||
| 56% | 51% | 47% | 110% | 109% | ||||||||||||||||
|
|
||||||||||||||||||||
47
Table of Contents
| Notes to financial statements | ||||
| Delaware Dividend Income Fund | November 30, 2014 |
Delaware Group® Equity Funds V (Trust) is organized as a Delaware statutory trust and offers three series: Delaware Dividend Income Fund, Delaware Small Cap Core Fund, and Delaware Small Cap Value Fund. These financial statements and the related notes pertain to Delaware Dividend Income Fund (Fund). The Trust is an open-end investment company. The Fund is considered diversified under the Investment Company Act of 1940, as amended, and offers Class A, Class C, Class R, and Institutional Class shares. Class A shares are sold with a maximum front-end sales charge of 5.75%. Class A share purchases of $1,000,000 or more will incur a contingent deferred sales charge (CDSC) of 1.00% if redeemed during the first year and 0.50% during the second year, provided that Delaware Distributors, L.P. (DDLP) paid a financial advisor a commission on the purchase of those shares. Effective Sept. 25, 2014, all remaining shares of Class B were converted to Class A shares. Between June 1, 2007 and Sept. 25, 2014, Class B shares could be purchased only through dividend reinvestment and certain permitted exchanges. Prior to June 1, 2007, Class B shares were sold with a CDSC that declined from 4.00% to zero depending upon the period of time the shares were held. Class B shares automatically converted to Class A shares on a quarterly basis approximately eight years after purchase. Class C shares are sold with a CDSC of 1.00%, if redeemed during the first 12 months. Class R and Institutional Class shares are not subject to a sales charge and are offered for sale exclusively to certain eligible investors.
The investment objective of the Fund is to seek to provide high current income and an investment that has the potential for capital appreciation.
1. Significant Accounting Policies
The following accounting policies are in accordance with U.S. generally accepted accounting principles (U.S. GAAP) and are consistently followed by the Fund.
Security Valuation – Equity securities and exchange-traded funds (ETFs), except those traded on the Nasdaq Stock Market, Inc. (Nasdaq), are valued at the last quoted sales price as of the time of the regular close of the New York Stock Exchange on the valuation date. Securities and ETFs traded on the Nasdaq are valued in accordance with the Nasdaq Official Closing Price, which may not be the last sales price. If, on a particular day, an equity security or ETF does not trade, then the mean between the bid and ask prices will be used, which approximates fair value. Securities listed on a foreign exchange are normally valued at the last quoted sales price on the valuation date. Debt securities and credit default swap (CDS) contracts are valued based upon valuations provided by an independent pricing service or counterparty and reviewed by management. To the extent current market prices are not available, the pricing service may take into account developments related to the specific security, as well as transactions in comparable securities. U.S. government and agency securities are valued at the mean between the bid and ask prices, which approximates fair value. For asset-backed securities, collateralized mortgage obligations, commercial mortgage securities and U.S. government agency mortgage securities, pricing vendors utilize matrix pricing which considers prepayment speed; attributes of the collateral; yield or price of bonds of comparable quality, coupon, maturity, and type as well as broker/dealer-supplied prices. Swap prices are derived using daily swap curves and models that incorporate a number of market data factors, such as discounted cash flows, trades, and values of the underlying reference instruments. Foreign currency exchange contracts are valued at the mean between the bid and ask prices, which approximates fair value. Interpolated values are derived when the
48
Table of Contents
settlement date of the contract is an interim date for which quotations are not available. Futures contracts and options on futures contracts are valued at the daily quoted settlement prices. Exchange-traded options are valued at the last reported sale price or, if no sales are reported, at the mean between the last reported bid and ask prices, which approximates fair value. Generally, other securities and assets for which market quotations are not readily available are valued at fair value as determined in good faith under the direction of the Fund’s Board of Trustees (Board). In determining whether market quotations are readily available or fair valuation will be used, various factors will be taken into consideration, such as market closures or suspension of trading in a security. The Fund may use fair value pricing more frequently for securities traded primarily in non-U.S. markets because, among other things, most foreign markets close well before the Fund values its securities, generally as of 4:00 p.m. Eastern time. The earlier close of these foreign markets gives rise to the possibility that significant events, including broad market moves, government actions or pronouncements, aftermarket trading, or news events may have occurred in the interim. Whenever such a significant event occurs, the Fund may value foreign securities using fair value prices based on third-party vendor modeling tools (international fair value pricing).
Federal and Foreign Income Taxes – No provision for federal income taxes has been made as the Fund intends to continue to qualify for federal income tax purposes as a regulated investment company under Subchapter M of the Internal Revenue Code of 1986, as amended, and make the requisite distributions to shareholders. The Fund evaluates tax positions taken or expected to be taken in the course of preparing the Fund’s tax returns to determine whether the tax positions are “more-likely-than-not” of being sustained by the applicable tax authority. Tax positions not deemed to meet the “more-likely-than-not” threshold are recorded as a tax benefit or expense in the current year. Management has analyzed the Fund’s tax positions taken for all open federal income tax years (Nov. 30, 2011–Nov. 30, 2014), and has concluded that no provision for federal income tax is required in the Fund’s financial statements. In regard to foreign taxes only, the Fund has open tax years in certain foreign countries in which it invests that may date back to the inception of the Fund.
Class Accounting – Investment income, common expenses, and realized and unrealized gain (loss) on investments are allocated to the various classes of the Fund on the basis of daily net assets of each class. Distribution expenses relating to a specific class are charged directly to that class.
Repurchase Agreements – The Fund may purchase certain U.S. government securities subject to the counterparty’s agreement to repurchase them at an agreed upon date and price. The counterparty will be required on a daily basis to maintain the value of the collateral subject to the agreement at not less than the repurchase price (including accrued interest). The agreements are conditioned upon the collateral being deposited under the Federal Reserve book-entry system with the Fund’s custodian or a third party sub-custodian. In the event of default or bankruptcy by the other party to the agreement, retention of the collateral may be subject to legal proceedings. All open repurchase agreements as of the date of this report were entered into on Nov. 28, 2014.
Foreign Currency Transactions – Transactions denominated in foreign currencies are recorded at the prevailing exchange rates on the valuation date in accordance with the Fund’s prospectus. The value of all assets and liabilities denominated in foreign currencies is translated daily into U.S. dollars at the
49
Table of Contents
Notes to financial statements
Delaware Dividend Income Fund
1. Significant Accounting Policies (continued)
exchange rate of such currencies against the U.S. dollar. Transaction gains or losses resulting from changes in exchange rates during the reporting period or upon settlement of the foreign currency transaction are reported in operations for the current period. The Fund generally bifurcates that portion of realized gains and losses on investments in debt securities which is due to changes in foreign exchange rates from that which is due to changes in market prices of debt securities. That portion of gains (losses) is included on the “Statement of operations” under “Net realized gain (loss) on foreign currencies.” For foreign equity securities, these changes are included in net realized and unrealized gain or loss on investments. The Fund reports certain foreign currency related transactions as components of realized gains (losses) for financial reporting purposes, whereas such components are treated as ordinary income (loss) for federal income tax purposes.
Use of Estimates – The preparation of financial statements in conformity with U.S. GAAP requires management to make estimates and assumptions that affect the fair value of investments, the reported amounts of assets and liabilities and disclosure of contingent assets and liabilities at the date of the financial statements, and the reported amounts of revenues and expenses during the reporting period. Actual results could differ from those estimates and the differences could be material.
Other – Expenses directly attributable to the Fund are charged directly to the Fund. Other expenses common to various funds within the Delaware Investments® Family of Funds are generally allocated among such funds on the basis of average net assets. Management fees and some other expenses are paid monthly. Security transactions are recorded on the date the securities are purchased or sold (trade date) for financial reporting purposes. Costs used in calculating realized gains and losses on the sale of investment securities are those of the specific securities sold. Dividend income is recorded on the ex-dividend date and interest income is recorded on the accrual basis. Discounts and premiums on debt securities are amortized to interest income over the lives of the respective securities using the effective interest method. Distributions received from investments in Real Estate Investment Trusts (REITs) are recorded as dividend income on ex-dividend date, subject to reclassification upon notice of the character of such distributions by the issuer. The financial statements reflect an estimate of the reclassification of the distribution character. Foreign dividends are also recorded on the ex-dividend date or as soon after the ex-dividend date that the Fund is aware of such dividends, net of all tax withholdings, a portion of which may be reclaimable. Withholding taxes and reclaims on foreign dividends have been recorded in accordance with the Fund’s understanding of the applicable country’s tax rules and rates. The Fund declares and pays dividends from net investment income monthly and distributions from net realized gain on investments, if any, annually. The Fund may distribute more frequently, if necessary for tax purposes. Dividends and distributions, if any, are recorded on the ex-dividend date.
Subject to seeking best execution, the Fund may direct certain security trades to brokers who have agreed to rebate a portion of the related brokerage commission to the Fund in cash. In general, best execution refers to many factors, including the price paid or received for a security, the commission charged, the promptness and reliability of execution, the confidentiality and placement accorded the order, and other factors affecting the overall benefit obtained by the Fund on the transaction. There were no commission rebates for the year ended Nov. 30, 2014.
50
Table of Contents
The Fund may receive earnings credits from its custodian when positive cash balances are maintained, which may be used to offset custody fees. There were no earnings credits for the year ended Nov. 30, 2014.
The Fund receives earnings credits from its transfer agent when positive cash balances are maintained, which may be used to offset transfer agent fees. If the amount earned is greater than one dollar, the expense paid under this arrangement is included on the “Statement of operations” under “Dividend disbursing and transfer agent fees and expenses” with the corresponding expense offset shown under “Less expense paid indirectly.” For the year ended Nov. 30, 2014, the Fund earned $292 under this agreement.
2. Investment Management, Administration Agreements and Other Transactions with Affiliates
In accordance with the terms of its investment management agreement, the Fund pays Delaware Management Company (DMC), a series of Delaware Management Business Trust and the investment manager, an annual fee which is calculated daily at the rate of 0.65% on the first $500 million of average daily net assets of the Fund, 0.60% on the next $500 million, 0.55% on the next $1.5 billion, and 0.50% on average daily net assets in excess of $2.5 billion.
Effective Nov. 1, 2014, Delaware Investments Fund Services Company (DIFSC), an affiliate of DMC, provides fund accounting and financial administrative oversight services to the Fund. Prior to this time, Delaware Service Company, Inc. (DSC), an affiliate of DMC, provided fund accounting and financial administrative oversight services to the Fund. For these services, the Fund pays DIFSC fees based on the aggregate daily net assets of the Delaware Investments® Family of Funds at the following annual rate: 0.0050% of the first $30 billion; 0.0045% of the next $10 billion; 0.0040% of the next $10 billion; and 0.0025% of aggregate average daily net assets in excess of $50 billion. The fees payable to DIFSC under the service agreement described above are allocated among all Funds in the Delaware Investments Family of Funds on a relative net asset value basis. For the year ended Nov. 30, 2014, the Fund was charged $33,856 for these services. This amount is included on the “Statement of operations” under “Accounting and administration expenses.”
Effective Nov. 1, 2014, DIFSC is also the transfer agent and dividend disbursing agent of the Fund. Prior to this time, DSC was the transfer agent and dividend disbursing agent of the Fund. For these services, the Fund pays DIFSC fees based on the aggregate daily net assets of the retail funds within the Delaware Investments Family of Funds at the following annual rate: 0.025% of the first $20 billion; 0.020% of the next $5 billion; 0.015% of the next $5 billion; and 0.013% on average daily net assets in excess of $30 billion. This amount is included on the “Statement of operations” under “Dividend disbursing and transfer agent fees and expenses.” For the year ended Nov. 30, 2014, the Fund was charged $152,524 for these services. Pursuant to a sub-transfer agency agreement between DIFSC and BNY Mellon Investment Servicing (US) Inc. (BNYMIS), BNYMIS provides certain sub-transfer agency services to the Fund. Sub-transfer agency fees are passed on to and paid directly by the Fund.
Pursuant to a distribution agreement and distribution plan, the Fund pays DDLP, the distributor and an affiliate of DMC, an annual distribution and service fee not to exceed 0.25% of the average daily net assets of the Class A shares, 1.00% of the average daily net assets of the Class C shares, and 0.50% of the average daily net assets of Class R shares. The Fund’s Class B shares paid DDLP 1.00% of the
51
Table of Contents
Notes to financial statements
Delaware Dividend Income Fund
2. Investment Management, Administration Agreements and Other Transactions with Affiliates (continued)
average daily net assets for the period Dec. 1, 2013 through Sept. 25, 2014. DDLP had contracted to limit the Fund’s Class B 12b-1 fees from March 28, 2014 through Sept. 25, 2014 to 0.25% of average daily net assets. Institutional Class shares pay no distribution and service expenses.
As provided in the investment management agreement, the Fund bears a portion of the cost of certain resources shared with DMC, including the cost of internal personnel of DMC and/or its affiliates that provide legal, tax, and regulatory reporting services to the Fund. For the year ended Nov. 30, 2014, the Fund was charged $19,423 for internal legal, tax, and regulatory reporting services provided by DMC and/or its affiliates’ employees. This amount is included on the “Statement of operations” under “Legal fees.”
For the year ended Nov. 30, 2014, DDLP earned $120,712 for commissions on sales of the Fund’s Class A shares. For the year ended Nov. 30, 2014, DDLP received gross CDSC commissions of $27 and $3,453 on redemptions of the Fund’s Class A and Class C shares, respectively, and these commissions were entirely used to offset upfront commissions previously paid by DDLP to broker/dealers on sales of those shares.
Trustees’ fees include expenses accrued by the Fund for each Trustee’s retainer and meeting fees. Certain officers of DMC, DIFSC, and DDLP are officers and/or Trustees of the Trust. These officers and Trustees are paid no compensation by the Fund.
3. Investments
For the year ended Nov. 30, 2014, the Fund made purchases and sales of investment securities other than U.S. government securities and short-term investments as follows:
| Purchases |
$ | 421,299,683 | ||
| Sales |
$ | 367,484,157 |
At Nov. 30, 2014, the cost of investments and unrealized appreciation (depreciation) for federal income tax purposes were as follows:
| Cost of investments |
$ | 669,170,357 | ||
|
|
|
|||
| Aggregate unrealized appreciation |
$ | 126,830,468 | ||
| Aggregate unrealized depreciation |
(24,620,278 | ) | ||
|
|
|
|||
| Net unrealized appreciation |
$ | 102,210,190 | ||
|
|
|
U.S. GAAP defines fair value as the price that the Fund would receive to sell an asset or pay to transfer a liability in an orderly transaction between market participants at the measurement date under current market conditions. A three-level hierarchy for fair value measurements has been established based upon the transparency of inputs to the valuation of an asset or liability. Inputs may be observable or unobservable and refer broadly to the assumptions that market participants would use in pricing the asset or liability. Observable inputs reflect the assumptions market participants would use in pricing the asset or liability based on market data obtained from sources independent of the reporting entity. Unobservable inputs reflect the reporting entity’s own assumptions about the assumptions that market participants would use in pricing the asset or liability based on the best information available under the
52
Table of Contents
circumstances. The Fund’s investment in its entirety is assigned a level based upon the observability of the inputs which are significant to the overall valuation. The three-level hierarchy of inputs is summarized below.
| Level 1 | – | Inputs are quoted prices in active markets for identical investments. (Examples: equity securities, open-end investment companies, futures contracts, exchange-traded options contracts) | ||
| Level 2 | – | Other observable inputs, including, but not limited to: quoted prices for similar assets or liabilities in markets that are active, quoted prices for identical or similar assets or liabilities in markets that are not active, inputs other than quoted prices that are observable for the assets or liabilities (such as interest rates, yield curves, volatilities, prepayment speeds, loss severities, credit risks, and default rates), or other market-corroborated inputs. (Examples: debt securities, government securities, swap contracts, foreign currency exchange contracts, foreign securities utilizing international fair value pricing, broker-quoted securities, fair valued securities) | ||
| Level 3 | – | Significant unobservable inputs, including the Fund’s own assumptions used to determine the fair value of investments. (Examples: broker-quoted securities, fair valued securities) | ||
Level 3 investments are valued using significant unobservable inputs. The Fund may also use an income-based valuation approach in which the anticipated future cash flows of the investment are discounted to calculate fair value. Discounts may also be applied due to the nature or duration of any restrictions on the disposition of the investments. Valuations may also be based upon current market prices of securities that are comparable in coupon, rating, maturity, and industry. The derived value of a Level 3 investment may not represent the value which is received upon disposition and this could impact the results of operations.
53
Table of Contents
Notes to financial statements
Delaware Dividend Income Fund
3. Investments (Continued)
The following table summarizes the valuation of the Fund’s investments by fair value hierarchy levels as of Nov. 30, 2014:
| Level 1 | Level 2 | Level 3 | Total | |||||||||||||
| Agency, Asset- & Mortgage-Backed |
$ | — | $ | 976,727 | $ | — | $ | 976,727 | ||||||||
| Corporate Debt |
— | 185,587,072 | — | 185,587,072 | ||||||||||||
| Foreign Debt |
— | 5,407,568 | — | 5,407,568 | ||||||||||||
| Senior Secured Loans1 |
— | 5,621,005 | 1,515,824 | 7,136,829 | ||||||||||||
| Municipal Bonds |
— | 8,259,421 | — | 8,259,421 | ||||||||||||
| Common Stock |
459,783,533 | — | — | 459,783,533 | ||||||||||||
| Convertible Preferred Stock1 |
17,877,585 | 7,910,155 | 431,930 | 26,219,670 | ||||||||||||
| Preferred Stock1 |
1,609,724 | 1,240,459 | — | 2,850,183 | ||||||||||||
| Warrant |
14,468 | — | — | 14,468 | ||||||||||||
| Exchange-Traded Funds |
3,915,426 | — | — | 3,915,426 | ||||||||||||
| Short-Term Investments |
— | 71,229,650 | — | 71,229,650 | ||||||||||||
|
|
|
|
|
|
|
|
|
|||||||||
| Total |
$ | 483,200,736 | $ | 286,232,057 | $ | 1,947,754 | $ | 771,380,547 | ||||||||
|
|
|
|
|
|
|
|
|
|||||||||
| Futures Contracts |
$ | (233,237 | ) | $ | — | $ | — | $ | (233,237 | ) | ||||||
| Swap Contracts |
— | (66,016 | ) | — | (66,016 | ) | ||||||||||
1Security type is valued across multiple levels. Level 1 investments represent exchange-traded investments, Level 2 investments represent investments with observable input or matrix-price investments, and Level 3 investments represent investments without observable inputs. The amounts attributed to Level 1 investments, Level 2 investments, and Level 3 investments represent the following percentages of the total market value of these security types:
| Level 1 | Level 2 | Level 3 | Total | |||||||||||||
| Convertible Preferred Stock |
68.18 | % | 30.17 | % | 1.65 | % | 100.00 | % | ||||||||
| Preferred Stock |
56.48 | % | 43.52 | % | — | 100.00 | % | |||||||||
| Senior Secured Loans |
— | 78.76 | % | 21.24 | % | 100.00 | % | |||||||||
The securities that have been deemed worthless on the “Schedule of investments” are considered to be Level 3 investments in this table.
During the year ended Nov. 30, 2014, there were no transfers between Level 1 investments, Level 2 investments, and Level 3 investments that had a significant impact to the Fund. The Fund’s policy is to recognize transfers between levels at the beginning of the reporting period.
A reconciliation of Level 3 investments is presented when the Fund has a significant amount of Level 3 investments at the beginning, interim, or end of the period in relation to net assets. Management has determined not to provide additional disclosure on Level 3 inputs under ASU No. 2011-04 since the Level 3 investments are not considered significant to the Fund’s net assets at the end of the year.
54
Table of Contents
4. Dividend and Distribution Information
Income and long-term capital gain distributions are determined in accordance with federal income tax regulations, which may differ from U.S. GAAP. Additionally, distributions from net gains on foreign currency transactions and net short-term gains on sales of investment securities are treated as ordinary income for federal income tax purposes. The tax character of dividends and distributions paid during the years ended Nov. 30, 2014 and 2013 was as follows:
| Year ended | ||||||||
| 11/30/14 | 11/30/13 | |||||||
| Ordinary income |
$ | 14,761,427 | $ | 10,926,205 | ||||
5. Components of Net Assets on a Tax Basis
As of Nov. 30, 2014, the components of net assets on a tax basis were as follows:
| Shares of beneficial interest |
$ | 777,789,174 | ||
| Undistributed ordinary income |
2,211,903 | |||
| Capital loss carryforwards |
(104,228,154 | ) | ||
| Unrealized appreciation and foreign currencies |
102,196,957 | |||
|
|
|
|||
| Net assets |
$ | 777,969,880 | ||
|
|
|
The differences between book basis and tax basis components of net assets are primarily attributable to tax deferral of losses on wash sales, tax treatment of market discount and premium on debt instruments, mark-to-market on futures and options contracts, tax treatment of CDS contracts, trust preferred securities, tax treatment of partnership income, tax recognition of unrealized gain on passive foreign investment companies, and contingent payment debt instruments.
For financial reporting purposes, capital accounts are adjusted to reflect the tax character of permanent book/tax differences. Reclassifications are primarily due to tax treatment of gain (loss) on foreign currency transactions, market discount and premium on certain debt instruments, CDS contracts, contingent payment debt instruments, disallowed expenses for excise tax paid, paydowns, and partnership income. Results of operations and net assets were not affected by these reclassifications. For the year ended Nov. 30, 2014, the Fund recorded the following reclassifications:
| Undistributed net investment income |
$ | 574,570 | ||
| Accumulated net realized loss |
(564,926 | ) | ||
| Paid in capital |
(9,644 | ) |
For federal income tax purposes, capital loss carryforwards may be carried forward and applied against future capital gains. $26,908,546 was utilized in 2014. Capital loss carryforwards remaining at Nov. 30, 2014 will expire as follows: $49,479,104 expires in 2016 and $54,749,050 expires in 2017.
On Dec. 22, 2010, the Regulated Investment Company Modernization Act of 2010 (Act) was enacted, which changed various technical rules governing the tax treatment of regulated investment companies. The changes were generally effective for taxable years beginning after the date of enactment. Under the Act, the Fund is permitted to carry forward capital losses incurred in taxable years beginning after the date of enactment for an unlimited period. However, any losses incurred during those future taxable years will be required to be utilized prior to the losses incurred in pre-enactment taxable years, which carry an expiration date. As a result of this ordering rule, pre-enactment capital loss carryforwards may
55
Table of Contents
Notes to financial statements
Delaware Dividend Income Fund
5. Components of Net Assets on a Tax Basis (continued)
be more likely to expire unused. Additionally, post-enactment capital loss carryforwards will retain their character as either short-term or long-term capital losses rather than being considered all short-term as permitted under previous regulation. At Nov. 30, 2014, there were no capital loss carryforwards incurred that will be carried forward under the Act.
6. Capital Shares
Transactions in capital shares were as follows:
| Year ended | ||||||||
| 11/30/14 | 11/30/13 | |||||||
| Shares sold: |
||||||||
| Class A |
6,568,466 | 7,963,286 | ||||||
| Class B |
867 | 17,010 | ||||||
| Class C |
4,927,542 | 7,445,097 | ||||||
| Class R |
142,656 | 99,301 | ||||||
| Institutional Class |
7,307,070 | 3,182,591 | ||||||
| Shares issued upon reinvestment of dividends and |
||||||||
| Class A |
505,623 | 467,743 | ||||||
| Class B |
9,242 | 18,398 | ||||||
| Class C |
311,250 | 250,979 | ||||||
| Class R |
5,312 | 6,010 | ||||||
| Institutional Class |
169,625 | 87,786 | ||||||
| 19,947,653 | 19,538,201 | |||||||
| Shares redeemed: |
||||||||
| Class A |
(7,315,562 | ) | (3,863,148 | ) | ||||
| Class B |
(802,596 | ) | (783,456 | ) | ||||
| Class C |
(2,640,980 | ) | (2,126,944 | ) | ||||
| Class R |
(94,374 | ) | (156,755 | ) | ||||
| Institutional Class |
(1,382,130 | ) | (1,228,075 | ) | ||||
| (12,235,642 | ) | (8,158,378 | ) | |||||
| Net increase |
7,712,011 | 11,379,823 | ||||||
For the years ended Nov. 30, 2014 and 2013, 117,065 Class B shares were converted to 117,213 Class A shares valued at $1,571,284 and 105,064 Class B shares were converted to 105,126 Class A shares valued at $1,249,804, respectively. The respective amounts are included in Class B redemptions and Class A subscriptions in the table above and the “Statements of changes in net assets.”
56
Table of Contents
Certain shareholders may exchange shares of one class of shares for another class in the same Fund. For the year ended Nov. 30, 2014, exchange transactions were as follows:
| Exchange Redemptions
|
Exchange Subscriptions
|
|||||||||||
| Class A Shares |
Class C Shares |
Institutional Class Shares |
Class A Shares |
Institutional Class Shares |
Value | |||||||
|
1,931 |
653 | — | — | 2,585 | $ | 34,197 | ||||||
These exchange transactions are included as subscriptions and redemptions in the table above and the “Statements of changes in net assets.”
7. Line of Credit
The Fund, along with certain other funds in the Delaware Investments® Family of Funds (Participants), was a participant in a $225,000,000 revolving line of credit intended to be used for temporary or emergency purposes as an additional source of liquidity to fund redemptions of investor shares. Under the agreement, the Participants were charged an annual commitment fee of 0.08%, which was allocated across the Participants on the basis of each Participant’s allocation of the entire facility. The Participants were permitted to borrow up to a maximum of one third of their net assets under the agreement. Each Participant was individually, and not jointly, liable for its particular advances, if any, under the line of credit. The line of credit under the agreement expired on Nov. 10, 2014.
On Nov. 10, 2014, the Fund, along with the other Participants, entered into an amendment to the agreement for a $275,000,000 revolving line of credit to be used as described above and to be operated in substantially the same manner as the original agreement. The line of credit under the agreement expires on Nov. 9, 2015.
The Fund had no amounts outstanding as of Nov. 30, 2014 or at any time during the year then ended.
8. Derivatives
U.S. GAAP requires disclosures that enable investors to understand: (1) how and why an entity uses derivatives; (2) how they are accounted for; and (3) how they affect an entity’s results of operations and financial position.
Foreign Currency Exchange Contracts – The Fund may enter into foreign currency exchange contracts and foreign cross currency exchange contracts as a way of managing foreign exchange rate risk. The Fund may enter into these contracts to fix the U.S. dollar value of a security that it has agreed to buy or sell for the period between the date the trade was entered into and the date the security is delivered and paid for. The Fund may also use these contracts to hedge the U.S. dollar value of securities it already owns that are denominated in foreign currencies. In addition, the Fund may enter into these contracts to facilitate or expedite the settlement of portfolio transactions. The change in value is recorded as an unrealized gain or loss. When the contract is closed, a realized gain or loss is recorded equal to the difference between the value of the contract at the time it was opened and the value at the time it was closed.
57
Table of Contents
Notes to financial statements
Delaware Dividend Income Fund
8. Derivatives (continued)
The use of foreign currency exchange contracts and foreign cross currency exchange contracts does not eliminate fluctuations in the underlying prices of the securities, but does establish a rate of exchange that can be achieved in the future. Although foreign currency exchange contracts and foreign cross currency exchange contracts limit the risk of loss due to an unfavorable change in the value of the hedged currency, they also limit any potential gain that might result should the value of the currency change favorably. In addition, the Fund could be exposed to risks if the counterparties to the contracts are unable to meet the terms of their contracts. The Fund’s maximum risk of loss from counterparty credit risk is the value of its currency exchanged with the counterparty. The risk is generally mitigated by having a netting arrangement between the Fund and the counterparty and by the posting of collateral by the counterparty to the Fund to cover the Fund’s exposure to the counterparty.
During the year ended Nov. 30, 2014, the Fund entered into foreign currency exchange contracts to hedge the U.S. dollar value of securities it already owns that are denominated in foreign currencies.
Futures Contracts – A futures contract is an agreement in which the writer (or seller) of the contract agrees to deliver to the buyer an amount of cash or securities equal to a specific dollar amount times the difference between the value of a specific security or index at the close of the last trading day of the contract and the price at which the agreement is made. The Fund may use futures in the normal course of pursuing its investment objective. The Fund may invest in futures contracts to hedge its existing portfolio securities against fluctuations in fair value caused by changes in interest rates, or market conditions. Upon entering into a futures contract, the Fund deposits cash or pledges U.S. government securities to a broker, equal to the minimum “initial margin” requirements of the exchange on which the contract is traded. Subsequent payments are received from the broker or paid to the broker each day, based on the daily fluctuation in the market value of the contract. These receipts or payments are known as “variation margin” and are recorded daily by the Fund as unrealized gains or losses until the contracts are closed. When the contracts are closed, the Fund records a realized gain or loss equal to the difference between the value of the contract at the time it was opened and the value at the time it was closed. Risks of entering into futures contracts include potential imperfect correlation between the futures contracts and the underlying securities and the possibility of an illiquid secondary market for these instruments. When investing in futures, there is reduced counterparty credit risk to the Fund because futures are exchange-traded and the exchange’s clearinghouse, as counterparty to all exchange-traded futures, guarantees against default. The Fund posted $240,000 cash collateral for open futures contracts, which is presented as “Cash collateral due from brokers” on the “Statement of assets and liabilities.”
During the year ended Nov. 30, 2014, the Fund used futures contracts to hedge the Fund’s existing portfolio securities against fluctuations in value caused by changes in interest rates or market conditions and to hedge currency risks associated with the Fund’s investments.
Options Contracts – During the year ended Nov. 30, 2014, the Fund entered into options contracts in the normal course of pursuing its investment objective. The Fund may buy or write options contracts for any number of reasons, including without limitation: to manage the Fund’s exposure to changes in securities prices caused by interest rate or market conditions and foreign currencies; to earn income; as an efficient means of adjusting the Fund’s overall exposure to certain markets; to protect the value of
58
Table of Contents
portfolio securities; and as a cash management tool. The Fund may buy or write call or put options on securities, financial indices, and foreign currencies. When the Fund buys an option, a premium is paid and an asset is recorded and adjusted on a daily basis to reflect the current market value of the option purchased. When the Fund writes an option, a premium is received and a liability is recorded and adjusted on a daily basis to reflect the current market value of the options written. Premiums received from writing options that expire unexercised are treated by the Fund on the expiration date as realized gains. The difference between the premium received and the amount paid on effecting a closing purchase transaction, including brokerage commissions, is treated as realized gain or loss. If a call option is exercised, the premium is added to the proceeds from the sale of the underlying security in determining whether the Fund has a realized gain or loss. If a put option is exercised, the premium reduces the cost basis of the securities purchased by the Fund. The Fund, as writer of an option, bears the market risk of an unfavorable change in the price of the security underlying the written option. When writing options, the Fund is subject to minimal counterparty risk because the counterparty is only obligated to pay premiums and does not bear the market risk of an unfavorable market change.
Transactions in options written during the year ended Nov. 30, 2014 for the Fund were as follows:
| Number of Contracts |
Premiums | |||||||
| Options outstanding at Nov. 30, 2013 |
416 | $ | 46,460 | |||||
| Options written |
4,018 | 435,265 | ||||||
| Options expired |
(2,568) | (305,583 | ) | |||||
| Options terminated in closing purchase transactions |
(1,866) | (176,142 | ) | |||||
|
|
|
|
|
|||||
| Options outstanding at Nov. 30, 2014 |
— | $ | — | |||||
|
|
|
|
|
|||||
During the year ended Nov. 30, 2014, the Fund used options contracts to receive premiums for writing options.
Swap Contracts – The Fund may enter into CDS contracts in the normal course of pursuing its investment objective. The Fund may enter into CDS contracts in order to hedge against a credit event, to enhance total return or to gain exposure to certain securities or markets. The Fund will not be permitted to enter into any swap transactions unless, at the time of entering into such transactions, the unsecured long-term debt of the actual counterparty, combined with any credit enhancements, is rated at least BBB- by Standard & Poor’s Financial Services LLC (S&P) or Baa3 by Moody’s Investors Service, Inc. (Moody’s) or is determined to be of equivalent quality by DMC.
Credit Default Swaps. A CDS contract is a risk-transfer instrument through which one party (purchaser of protection) transfers to another party (seller of protection) the financial risk of a credit event (as defined in the CDS agreement), as it relates to a particular reference security or basket of securities (such as an index). In exchange for the protection offered by the seller of protection, the purchaser of protection agrees to pay the seller of protection a periodic amount at a stated rate that is applied to the notional amount of the CDS contract. In addition, an upfront payment may be made or received by the Fund in connection with an unwinding or assignment of a CDS contract. Upon the occurrence of a credit event, the seller of protection would pay the par (or other agreed-upon) value of the reference security (or basket of securities) to the counterparty. Credit events generally include, among others, bankruptcy, failure to pay, and obligation default.
59
Table of Contents
Notes to financial statements
Delaware Dividend Income Fund
8. Derivatives (continued)
During the year ended Nov. 30, 2014, the Fund entered into CDS contracts as a purchaser and seller of protection. Periodic payments (receipts) on such contracts are accrued daily and recorded as unrealized losses (gains) on swap contracts. Upon payment (receipt), such amounts are recorded as realized losses (gains) on swap contracts. Upfront payments made or received in connection with CDS contracts are amortized over the expected life of the CDS contracts as unrealized losses (gains) on swap contracts. The change in value of CDS contracts is recorded daily as unrealized appreciation or depreciation. A realized gain or loss is recorded upon a credit event (as defined in the CDS agreement) or the maturity or termination of the agreement. Initial margin and variation margin is posted to central counterparties for CDS basket trades, as determined by the applicable central counterparty.
CDS contracts may involve greater risks than if the Fund had invested in the reference obligation directly. CDS contracts are subject to general market risk, liquidity risk, counterparty risk, and credit risk. The Fund’s maximum risk of loss from counterparty credit risk, either as the seller of protection or the buyer of protection, is the fair value of the contract. This risk is mitigated by (1) for bilateral swap contracts, having a netting arrangement between the Fund and the counterparty and by the posting of collateral by the counterparty to the Fund to cover the Fund’s exposure to the counterparty or (2) for cleared swaps, trading these instruments through a central counterparty.
During the year ended Nov. 30, 2014, the Fund used CDS contracts to hedge against a credit event and to enhance total return.
Swaps Generally. The value of open swaps may differ from that which would be realized in the event the Fund terminated its position in the contract on a given day. Risks of entering into these contracts include the potential inability of the counterparty to meet the terms of the contracts. This type of risk is generally limited to the amount of favorable movement in the value of the underlying security, instrument, or basket of instruments, if any, at the day of default. Risks also arise from potential losses from adverse market movements and such losses could exceed the unrealized amounts that would be shown on the “Schedule of investments.”
At Nov. 30, 2014, the Fund posted $1,031,165 in cash collateral for centrally cleared swap contracts, which is presented as “Cash collateral due from brokers” on the “Statement of assets and liabilities.”
60
Table of Contents
Fair values of derivative instruments as of Nov. 30, 2014 were as follows:
| Asset Derivatives | Liability Derivatives | |||||||||||
| Statement of Assets and |
Fair Value | Statement of Assets and |
Fair Value | |||||||||
| Interest rate contracts (Futures contracts) |
Variation margin receivable on futures contracts |
— | Variation margin receivable on futures contracts |
(233,237 | )* | |||||||
| Credit contracts (Swap contracts) |
Unrealized gain of credit default swap contracts |
— | Unrealized loss of credit default swap contracts |
(66,016 | ) | |||||||
| Total |
$— | $(299,253 | ) | |||||||||
*Includes cumulative appreciation (depreciation) of futures contracts from the date the contracts are opened through Nov. 30, 2014. Only current day variation margin is reported on the “Statement of assets and liabilities.”
The effect of derivative instruments on the “Statement of operations” for the year ended Nov. 30, 2014 was as follows:
| Net Realized Gain (Loss) on: | ||||||||||||||||||||
| Foreign Currency Exchange Contracts |
Futures Contracts |
Options | Swap Contracts |
Total | ||||||||||||||||
| Forward currency exchange contracts |
$ | (91,754 | ) | $ | — | $ | — | $ — | $ | (91,754 | ) | |||||||||
| Interest rate contracts |
— | (883,528 | ) | 334,147 | — | (549,381 | ) | |||||||||||||
| Credit contracts |
— | — | — | (990,615 | ) | (990,615 | ) | |||||||||||||
|
|
|
|
|
|
|
|
|
|
|
|||||||||||
| Total |
$ | (91,754 | ) | $ | (883,528 | ) | $ | 334,147 | $(990,615 | ) | $ | (1,631,750 | ) | |||||||
|
|
|
|
|
|
|
|
|
|
|
|||||||||||
| Net Change in Unrealized Appreciation of: | ||||||||||||||||||||
| Foreign Currency Exchange Contracts |
Futures Contracts |
Options | Swap Contracts |
Total | ||||||||||||||||
| Forward currency exchange contracts |
$6,785 | $ — | $ — | $ — | $ 6,785 | |||||||||||||||
| Interest rate contracts |
— | 37,059 | 6,788 | — | 43,847 | |||||||||||||||
| Credit contracts |
— | — | — | 254,745 | 254,745 | |||||||||||||||
|
|
|
|
|
|
|
|
|
|
|
|||||||||||
| Total |
$6,785 | $37,059 | $6,788 | $254,745 | $305,377 | |||||||||||||||
|
|
|
|
|
|
|
|
|
|
|
|||||||||||
61
Table of Contents
Notes to financial statements
Delaware Dividend Income Fund
8. Derivatives (continued)
Derivatives Generally. The table below summarizes the average balance of derivative holdings by the Fund during the year ended Nov. 30, 2014.
| Long Derivative Volume |
Short Derivative Volume |
|||||||
| Foreign currency exchange contracts (average cost) |
USD | 225,589 | USD | 334,510 | ||||
| Futures contracts (average notional value) |
— | 9,025,426 | ||||||
| Options contracts (average notional value) |
— | 18,523 | ||||||
| CDS contracts (average notional value)* |
9,245,992 | 138,889 | ||||||
* Long represents buying protection and short represents selling protection.
9. Offsetting
In December 2011, the Financial Accounting Standards Board (FASB) issued guidance that expands disclosure requirements on the offsetting of certain assets and liabilities. The disclosures are required for investments and derivative financial instruments subject to master netting or similar agreements which are eligible for offset on the “Statement of assets and liabilities” and requires an entity to disclose both gross and net information about such investments and transactions in the financial statements. In January 2013, the FASB issued guidance that clarifies which investments and transactions are subject to the offsetting disclosure requirements. The scope of the disclosure requirements for offsetting is limited to derivative instruments, repurchase agreements and reverse repurchase agreements, and securities borrowing. The guidance is effective for financial statements with fiscal years beginning on or after Jan. 1, 2013, and interim periods within those fiscal years. The Fund adopted the disclosure provisions on offsetting during the current reporting period.
In order to better define its contractual rights and to secure rights that will help the Fund mitigate its counterparty risk, the Fund entered into an International Swaps and Derivatives Association, Inc. Master Agreement (ISDA Master Agreement) or a similar agreement with each of its derivative contract counterparties. An ISDA Master Agreement is a bilateral agreement between the Fund and a counterparty that governs certain over-the-counter (OTC) derivatives and foreign exchange contracts and typically contains, among other things, collateral posting items and netting provisions in the event of a default and/or termination event. Under an ISDA Master Agreement, the Fund may, under certain circumstances, offset with the counterparty certain derivative financial instruments’ payables and/or receivables with collateral held and/or posted and create one single net payment. The provisions of the ISDA Master Agreement typically permit a single net payment in the event of default (close-out), including the bankruptcy or insolvency of the counterparty. However, bankruptcy or insolvency laws of a particular jurisdiction may impose restrictions on or prohibitions against the right of offset in bankruptcy, insolvency, or other events.
For financial reporting purposes, the Fund does not offset derivative assets and derivative liabilities that are subject to netting arrangements on the “Statement of assets and liabilities.”
62
Table of Contents
At Nov. 30, 2014, the Fund had the following assets and liabilities subject to offsetting provisions:
Offsetting of Financial Assets and Liabilities and Derivative Assets and Liabilities
| Counterparty |
Gross Value of Derivative Asset |
Gross Value of Derivative Liability |
Net Position |
|||||
| Barclays Bank |
$— | $(66,016) | $ | (66,016) | ||||
| Counterparty |
Net Position |
Fair Value of Non-Cash Collateral Received |
Cash Collateral Received |
Fair Value of Non-Cash Collateral Pledged |
Cash Collateral Pledged |
Net | ||||||||
| Barclays Bank |
$ | (66,016) | $— | $— | $— | $66,016 | $— | |||||||
Master Repurchase Agreements
| Counterparty |
Repurchase Agreements |
Fair Value of Non-Cash Collateral Received |
Cash Collateral Received |
Net Amount(a) | ||||||||||||||||
| Bank of America |
$10,314,688 | $(10,314,688) | $— | $— | ||||||||||||||||
| Bank of Montreal |
3,438,229 | (3,438,229) | — | — | ||||||||||||||||
| BNP Paribas |
15,502,083 | (15,502,083) | — | — | ||||||||||||||||
| Total |
$29,255,000 | $(29,255,000) | $— | $— | ||||||||||||||||
(a)Net amount represents the receivable/(payable) that would be due from/(to) the counterparty in the event of default.
10. Securities Lending
The Fund, along with other funds in the Delaware Investments® Family of Funds, may lend its securities pursuant to a security lending agreement (Lending Agreement) with The Bank of New York Mellon (BNY Mellon). At the time a security is loaned, the borrower must post collateral equal to the required percentage of the market value of the loaned security, including any accrued interest. The required percentage is: (1) 102% with respect to U.S. securities and foreign securities that are denominated and payable in U.S. dollars; and (2) 105% with respect to foreign securities. With respect to each loan, if on any business day the aggregate market value of securities collateral plus cash collateral held is less than the aggregate market value of the securities which are the subject of such loan, the borrower will be notified to provide additional collateral by the end of the following business day which, together with the collateral already held, will be not less than the applicable initial collateral requirements for such security loan. If the aggregate market value of securities collateral and cash collateral held with respect to a security loan exceeds the applicable initial collateral requirement, upon request of the borrower, BNY Mellon must return enough collateral to the borrower by the end of the following business day to reduce the value of the remaining collateral to the applicable initial collateral requirement for such security loan. As a result of the foregoing, the value of the collateral held with respect to a loaned security on any particular day may be more or less than the value of the security on loan.
Cash collateral received is generally invested in the Delaware Investments Collateral Fund No. 1 (Collective Trust) established by BNY Mellon for the purpose of investment on behalf of funds managed by DMC that participate in BNY Mellon’s securities lending program. The Collective Trust may invest in U.S. government securities and high-quality corporate debt, asset-backed and other money market
63
Table of Contents
Notes to financial statements
Delaware Dividend Income Fund
10. Securities Lending (continued)
securities, and in repurchase agreements collateralized by such securities, provided that the Collective Trust will generally have a dollar-weighted average portfolio maturity of 60 days or less. The Fund can also accept U.S. government securities and letters of credit (non-cash collateral) in connection with securities loans. In the event of default or bankruptcy by the lending agent, realization and/or retention of the collateral may be subject to legal proceedings. In the event the borrower fails to return loaned securities and the collateral received is insufficient to cover the value of the loaned securities and provided such collateral shortfall is not the result of investment losses, the lending agent has agreed to pay the amount of the shortfall to the Fund or, at the discretion of the lending agent, replace the loaned securities. The Fund continues to record dividends or interest, as applicable, on the securities loaned and is subject to changes in value of the securities loaned that may occur during the term of the loan. The Fund has the right under the Lending Agreement to recover the securities from the borrower on demand. With respect to security loans collateralized by non-cash collateral, the Fund receives loan premiums paid by the borrower. With respect to security loans collateralized by cash collateral, the earnings from the collateral investments are shared among the Fund, the security lending agent, and the borrower. The Fund records security lending income net of allocations to the security lending agent and the borrower.
The Collective Trust used for the investment of cash collateral received from borrowers of securities seeks to maintain a net asset value per unit of $1.00, but there can be no assurance that it will always be able to do so. The Fund may incur investment losses as a result of investing securities lending collateral in the Collective Trust. This could occur if an investment in the Collective Trust defaulted or if it were necessary to liquidate assets in the Collective Trust to meet returns on outstanding security loans at a time when the Collective Trust’s net asset value per unit was less than $1.00. Under those circumstances, the Fund may not receive an amount from the Collective Trust that is equal in amount to the collateral the Fund would be required to return to the borrower of the securities and the Fund would be required to make up for this shortfall.
During the year ended Nov. 30, 2014, the Fund had no securities out on loan.
11. Credit and Market Risk
The Fund invests a portion of its assets in high yield fixed income securities, which are securities rated lower than BBB- by S&P and Baa3 by Moody’s, or similarly rated by another nationally recognized statistical rating organization. Investments in these higher yielding securities are generally accompanied by a greater degree of credit risk than higher rated securities. Additionally, lower rated securities may be more susceptible to adverse economic and competitive industry conditions than investment-grade securities.
The Fund invests in fixed income securities whose value is derived from an underlying pool of mortgages or consumer loans. The value of these securities is sensitive to changes in economic conditions, including delinquencies and/or defaults, and may be adversely affected by shifts in the market’s perception of the issuers and changes in interest rates. Investors receive principal and interest payments as the underlying mortgages and consumer loans are paid back. Some of these securities are collateralized mortgage obligations (CMOs). CMOs are debt securities issued by U.S. government agencies or by financial institutions and other mortgage lenders, which are collateralized by a pool of
64
Table of Contents
mortgages held under an indenture. Prepayment of mortgages may shorten the stated maturity of the obligations and can result in a loss of premium, if any has been paid. Certain of these securities may be stripped (securities which provide only the principal or interest feature of the underlying security). The yield to maturity on an interest-only CMO is extremely sensitive not only to changes in prevailing interest rates, but also to the rate of principal payments (including prepayments) on the related underlying mortgage assets. A rapid rate of principal payments may have a material adverse effect on the Fund’s yield to maturity. If the underlying mortgage assets experience greater than anticipated prepayments of principal, the Fund may fail to fully recoup its initial investment in these securities even if the securities are rated in the highest rating categories.
The Fund invests in REITs and is subject to the risks associated with that industry. If the Fund holds real estate directly as a result of defaults or receives rental income directly from real estate holdings, its tax status as a regulated investment company may be jeopardized. There were no direct real estate holdings during the year ended Nov. 30, 2014. The Fund’s REIT holdings are also affected by interest rate changes, particularly if the REITs it holds use floating rate debt to finance their ongoing operations.
The Fund invests in certain obligations that may have liquidity protection designed to ensure that the receipt of payments due on the underlying security is timely. Such protection may be provided through guarantees, insurance policies, or letters of credit obtained by the issuer or sponsor through third parties, through various means of structuring the transaction, or through a combination of such approaches. The Fund will not pay any additional fees for such credit support, although the existence of credit support may increase the price of a security.
The Fund invests in bank loans and other securities that may subject it to direct indebtedness risk, the risk that the Fund will not receive payment of principal, interest, and other amounts due in connection with these investments and will depend primarily on the financial condition of the borrower. Loans that are fully secured offer the Fund more protection than unsecured loans in the event of nonpayment of scheduled interest or principal, although there is no assurance that the liquidation of collateral from a secured loan would satisfy the corporate borrower’s obligation, or that the collateral can be liquidated. Some loans or claims may be in default at the time of purchase. Certain of the loans and the other direct indebtedness acquired by the Fund may involve revolving credit facilities or other standby financing commitments that obligate the Fund to pay additional cash on a certain date or on demand. These commitments may require the Fund to increase its investment in a company at a time when the Fund might not otherwise decide to do so (including at a time when the company’s financial condition makes it unlikely that such amounts will be repaid). To the extent that the Fund is committed to advance additional funds, it will at all times hold and maintain cash or other high grade debt obligations in an amount sufficient to meet such commitments. As the Fund may be required to rely upon another lending institution to collect and pass on to the Fund amounts payable with respect to the loan and to enforce the Fund’s rights under the loan and other direct indebtedness, an insolvency, bankruptcy, or reorganization of the lending institution may delay or prevent the Fund from receiving such amounts. The highly leveraged nature of many loans may make them especially vulnerable to adverse changes in economic or market conditions. Investments in such loans and other direct indebtedness may involve additional risk to the Fund.
65
Table of Contents
Notes to financial statements
Delaware Dividend Income Fund
11. Credit and Market Risk (continued)
The Fund may invest up to 15% of its net assets in illiquid securities, which may include securities with contractual restrictions on resale, securities exempt from registration under Rule 144A of the Securities Act of 1933, as amended, and other securities which may not be readily marketable. The relative illiquidity of these securities may impair the Fund from disposing of them in a timely manner and at a fair price when it is necessary or desirable to do so. While maintaining oversight, the Fund’s Board has delegated to DMC the day-to-day functions of determining whether individual securities are liquid for purposes of the Fund’s limitation on investments in illiquid securities. Securities eligible for resale pursuant to Rule 144A, which are determined to be liquid, are not subject to the Fund’s 15% limit on investments in illiquid securities. Rule 144A and illiquid securities held by the Fund have been identified on the “Schedule of investments.”
12. Contractual Obligations
The Fund enters into contracts in the normal course of business that contain a variety of indemnifications. The Fund’s maximum exposure under these arrangements is unknown. However, the Fund has not had prior claims or losses pursuant to these contracts. Management has reviewed the Fund’s existing contracts and expects the risk of loss to be remote.
13. Recent Accounting Pronouncements
In June 2014, the Financial Accounting Standards Board issued guidance to improve the financial reporting of reverse repurchase agreements and other similar transactions. The guidance includes expanded disclosure requirements for entities that enter into reverse repurchase agreements and similar transactions accounted for as secured borrowings. The guidance is effective for financial statements with fiscal years beginning on or after Dec. 15, 2014 and interim periods within those fiscal years. Management is evaluating the impact, if any, of this guidance on the Funds’ financial statement disclosures.
14. Subsequent Events
Management has determined that no material events or transactions occurred subsequent to Nov. 30, 2014 that would require recognition or disclosure in the Fund’s financial statements.
66
Table of Contents
registered public accounting firm
To the Board of Trustees of Delaware Group® Equity Funds V
and Shareholders of Delaware Dividend Income Fund:
In our opinion, the accompanying statement of assets and liabilities, including the schedule of investments, and the related statements of operations and of changes in net assets and the financial highlights present fairly, in all material respects, the financial position of Delaware Dividend Income Fund (one of the series constituting Delaware Group® Equity Funds V, hereafter referred to as the “Fund”) at Nov. 30, 2014, the results of its operations for the year then ended, the changes in its net assets for each of the two years in the period then ended and the financial highlights for each of the five years in the period then ended, in conformity with accounting principles generally accepted in the United States of America. These financial statements and financial highlights (hereafter referred to as “financial statements”) are the responsibility of the Fund’s management. Our responsibility is to express an opinion on these financial statements based on our audits. We conducted our audits of these financial statements in accordance with the standards of the Public Company Accounting Oversight Board (United States). Those standards require that we plan and perform the audit to obtain reasonable assurance about whether the financial statements are free of material misstatement. An audit includes examining, on a test basis, evidence supporting the amounts and disclosures in the financial statements, assessing the accounting principles used and significant estimates made by management, and evaluating the overall financial statement presentation. We believe that our audits, which included confirmation of securities at Nov. 30, 2014 by correspondence with the custodian and brokers, and the application of alternative auditing procedures where confirmations of security purchases had not been received, provide a reasonable basis for our opinion.
PricewaterhouseCoopers LLP
Philadelphia, Pennsylvania
January 22, 2015
67
Table of Contents
Other Fund information (Unaudited)
Delaware Dividend Income Fund
Tax Information
The information set forth below is for the Fund’s fiscal year as required by federal income tax laws. Shareholders, however, must report distributions on a calendar year basis for income tax purposes, which may include distributions for portions of two fiscal years of the Fund. Accordingly, the information needed by shareholders for income tax purposes will be sent to them in January of each year. Please consult your tax advisor for proper treatment of this information.
All disclosures are based on financial information available as of the date of this annual report and, accordingly are subject to change. For any and all items requiring reporting, it is the intention of the Fund to report the maximum amount permitted under the Internal Revenue Code and the regulations thereunder.
For the fiscal year ended Nov. 30, 2014, the Fund reports distributions paid during the year as follows:
| (A) Ordinary Income Distributions (Tax Basis)* |
100.00 | % | ||
| (B) Qualified Dividends1 |
64.44 | % |
(A) is based on a percentage of the Fund’s total distributions.
(B) is based on the Fund’s ordinary income distributions.
| 1 | Qualified dividends represent dividends which qualify for the corporate dividends received deduction. |
| * | For the fiscal year ended Nov. 30, 2014, certain dividends paid by the Fund may be subject to a maximum tax rate of 20%. The percentage of dividends paid by the Fund from ordinary income reported as qualified dividend income is 73.95%. Complete information will be computed and reported in conjunction with your 2014 Form 1099-DIV, as applicable. |
For the fiscal year ended Nov. 30, 2014, certain interest income paid by the Fund, determined to be Qualified Interest Income may be subject to relief from U.S. withholding for foreign shareholders, as provided by the American Jobs Creation Act of 2004, and by Tax Relief Unemployment Insurance Reauthorization and Job Creations Act of 2010 and as extended by the American Taxpayer Relief Act of 2012. For the fiscal year ended Nov. 30, 2014, the Fund has reported maximum distributions of Qualified Interest Income of $6,643,869.
Board consideration of Delaware Dividend Income Fund’s investment advisory agreement
At a meeting held on Aug. 19–21, 2014 (the “Annual Meeting”), the Board of Trustees (the “Board”), including a majority of disinterested or independent Trustees, approved the renewal of the Investment Management Agreement for Delaware Dividend Income Fund (the “Fund”). In making its decision, the Board considered information furnished at regular quarterly Board meetings, including reports detailing Fund performance, investment strategies and expenses, as well as information prepared specifically in connection with the renewal of the investment advisory and sub-advisory contracts. Information furnished specifically in connection with the renewal of the Investment Management Agreement with Delaware Management Company (“DMC”) included materials provided by DMC and its affiliates (“Delaware Investments”) concerning, among other things, the nature, extent, and quality of services provided to the Fund, the costs of such services to the Fund, economies of scale, and the financial condition and profitability of Delaware Investments. In addition, in connection with the Annual Meeting,
68
Table of Contents
reports were provided to the Trustees in May 2014 and included reports provided by Lipper, Inc., an independent statistical compilation organization (“Lipper”). The Lipper reports compared the Fund’s investment performance and expenses with those of other comparable mutual funds. The Independent Trustees reviewed and discussed the Lipper reports with independent legal counsel to the Independent Trustees. The Board requested and received information regarding DMC’s policy with respect to advisory fee levels and its breakpoint philosophy; the structure of portfolio manager compensation; the investment manager’s profitability; comparative client fee information; and any constraints or limitations on the availability of securities for certain investment styles, which had in the past year inhibited, or which were likely in the future to inhibit, DMC’s ability to invest fully in accordance with Fund policies.
In considering information relating to the approval of the Fund’s advisory agreement, the Independent Trustees received assistance and advice from and met separately with independent legal counsel to the Independent Trustees. Although the Board gave attention to all information furnished, the following discussion identifies, under separate headings, the primary factors taken into account by the Board during its contract renewal considerations.
Nature, Extent, and Quality of Service. The Board considered the services provided by Delaware Investments to the Fund and its shareholders. In reviewing the nature, extent, and quality of services, the Board considered reports furnished to it throughout the year, which covered matters such as the relative performance of the Fund, compliance of portfolio managers with the investment policies, strategies and restrictions for the Fund, compliance by DMC and Delaware Distributors, L.P. (together, “Management”) personnel with the Code of Ethics adopted throughout the Delaware Investments® Family of Funds complex, and adherence to fair value pricing procedures as established by the Board. The Board was pleased with the current staffing of the Fund’s investment manager and the emphasis placed on research in the investment process. The Board recognized DMC’s receipt of several industry distinctions. The Board gave favorable consideration to DMC’s efforts to control expenditures while maintaining service levels committed to Fund matters. The Board noted that, in the third and fourth quarters of 2013, Management reduced the maximum 12b-1 fee for certain funds; and in November 2013 Management negotiated a substantial reduction in fees for fund accounting services provided to the Funds. The Board noted the benefits provided to Fund shareholders through each shareholder’s ability to exchange an investment in one Delaware Investments fund for the same class of shares in another Delaware Investments fund without a sales charge, to reinvest Fund dividends into additional shares of the Fund or into additional shares of other Delaware Investments funds, and the privilege to combine holdings in other Delaware Investments funds to obtain a reduced sales charge. The Board was satisfied with the nature, extent, and quality of the overall services provided by Delaware Investments.
Investment Performance. The Board placed significant emphasis on the investment performance of the Fund in view of the importance of investment performance to shareholders. Although the Board gave appropriate consideration to performance reports and discussions with portfolio managers at Investment Committee meetings throughout the year, the Board gave particular weight to the Lipper reports furnished for the Annual Meeting. The Lipper reports prepared for the Fund showed the investment performance of its Class A shares in comparison to a group of similar funds as selected by Lipper (the “Performance Universe”). A fund with the best performance ranked first, and a fund with the poorest performance ranked last. The highest/best performing 25% of funds in the Performance Universe make
69
Table of Contents
Other Fund information (Unaudited)
Delaware Dividend Income Fund
up the first quartile; the next 25%, the second quartile; the next 25%, the third quartile; and the poorest/ worst performing 25% of funds in the Performance Universe make up the fourth quartile. Comparative annualized performance for the Fund was shown for the past 1-, 3-, 5-, and 10-year periods, to the extent applicable, ended March 31, 2014. The Board’s objective is that the Fund’s performance for the periods considered be at or above the median of its Performance Universe. The following paragraph summarizes the performance results for the Fund and the Board’s view of such performance.
The Performance Universe for the Fund consisted of the Fund and all retail and institutional mixed asset target allocation moderate funds as selected by Lipper. The Lipper report comparison showed that the Fund’s total return for the 1-, 3-, and 5-year periods was in the first quartile of its Performance Universe. The report further showed that the Fund’s total return for the 10-year period was in the second quartile of its Performance Universe. The Board was satisfied with performance.
Comparative Expenses. The Board considered expense comparison data for the Delaware Investments® Family of Funds. Management provided the Board with information on pricing levels and fee structures for the Fund as of its most recently completed fiscal year. The Board also focused on the comparative analysis of effective management fees and total expense ratios of the Fund versus effective management fees and expense ratios of a group of similar funds as selected by Lipper (the “Expense Group”). In reviewing comparative costs, the Fund’s contractual management fee and the actual management fee incurred by the Fund were compared with the contractual management fees (assuming all funds in the Expense Group were similar in size to the Fund) and actual management fees (as reported by each fund) within the Expense Group, taking into account any applicable breakpoints and fee waivers. The Fund’s total expenses were also compared with those of its Expense Group. The Lipper total expenses, for comparative consistency, were shown by Lipper for Class A shares and comparative total expenses including 12b-1 and non 12b-1 service fees. The Board considered fees paid to Delaware Investments for non-management services. The Board’s objective is to limit the Fund’s total expense ratio to be competitive with that of the Expense Group. The following paragraph summarizes the expense results for the Fund and the Board’s view of such expenses.
The expense comparisons for the Fund showed that its actual management fee was in the quartile with the second lowest expenses of its Expense Group and its total expenses were in the quartile with the lowest expenses of its Expense Group. The Board was satisfied with the management fee and total expenses of the Fund in comparison to those of its Expense Group as shown in the Lipper report.
Management Profitability. The Board considered the level of profits realized by Delaware Investments in connection with the operation of the Fund. In this respect, the Board reviewed the Investment Management Profitability Analysis that addressed the overall profitability of Delaware Investments’ business in providing management and other services to each of the individual funds and the Delaware Investments Family of Funds as a whole. Specific attention was given to the methodology followed in allocating costs for the purpose of determining profitability. Management stated that the level of profits of Delaware Investments, to a certain extent, reflects recent operational cost savings and efficiencies initiated by Delaware Investments. The Board considered Delaware Investments’ efforts to improve services provided to fund shareholders and to meet additional regulatory and compliance requirements resulting from recent industry-wide Securities and Exchange Commission initiatives. The Board also
70
Table of Contents
considered the extent to which Delaware Investments might derive ancillary benefits from fund operations, including the potential for procuring additional business as a result of the prestige and visibility associated with its role as service provider to the Delaware Investments Family of Funds and the benefits from allocation of fund brokerage to improve trading efficiencies. The Board found that the management fees were reasonable in light of the services rendered and the level of profitability of Delaware Investments.
Economies of Scale. The Trustees considered whether economies of scale are realized by Delaware Investments as the Fund’s assets increase and the extent to which any economies of scale are reflected in the level of management fees charged. The Trustees reviewed the standardized advisory fee pricing and structure, approved by the Board and shareholders, which includes breakpoints. Breakpoints in the advisory fee occur when the advisory fee rate is reduced on assets in excess of specified levels. Breakpoints result in a lower advisory fee than would otherwise be the case on all assets when the asset levels specified are exceeded. The Board noted that the fee under the Fund’s management contract fell within the standard structure. The Board also noted that the Fund’s assets exceeded the first breakpoint level. The Board believed that, given the extent to which economics of scale might be realized by the advisor and its affiliates, the schedule of fees under the Investment Management Agreement provides a sharing of benefits with the Fund and its shareholders.
71
Table of Contents
Board of trustees / directors and officers addendum
Delaware Investments® Family of Funds
A mutual fund is governed by a Board of Trustees/Directors (“Trustees”), which has oversight responsibility for the management of a fund’s business affairs. Trustees establish procedures and oversee and review the performance of the investment manager, the distributor, and others who perform services for the fund. The independent fund trustees, in particular, are advocates
| Name, Address, and Birth Date |
Position(s) Held with Fund(s) |
Length of Time Served |
||||
|
Interested Trustee
|
||||||
| Patrick P. Coyne1 2005 Market Street Philadelphia, PA 19103 April 1963 |
Chairman, President, Chief Executive Officer, and Trustee |
Chairman and Trustee since August 16, 2006
President and Chief Executive Officer since August 1, 2006
|
||||
|
Independent Trustees
|
||||||
| Thomas L. Bennett 2005 Market Street Philadelphia, PA 19103 October 1947
|
Trustee | Since March 2005 | ||||
| Joseph W. Chow 2005 Market Street Philadelphia, PA 19103 January 1953
|
Trustee | Since January 2013 | ||||
| John A. Fry 2005 Market Street Philadelphia, PA 19103 May 1960
|
Trustee | Since January 2001 |
| 1 | Patrick P. Coyne is considered to be an “Interested Trustee” because he is an executive officer of the Fund’s(s’) investment advisor. |
72
Table of Contents
for shareholder interests. Each trustee has served in that capacity since he or she was elected to or appointed to the Board of Trustees, and will continue to serve until his or her retirement or the election of a new trustee in his or her place. The following is a list of the Trustees and Officers with certain background and related information.
| Principal Occupation(s) During the Past Five Years |
Number of Portfolios in Fund Complex Overseen by Trustee or Officer |
Other Directorships Held by Trustee or Officer | ||
| Patrick P. Coyne has served in |
65 | Board of Governors Member
Director and Audit | ||
| Private Investor (March 2004–Present) |
65 | Director
| ||
| Executive Vice President (Emerging Economies (July 2004–March 2011)
|
65 | Director and Audit Committee Member — Hercules Technology Growth Capital, Inc. (2004-2014) | ||
| President Drexel University
President Franklin & Marshall College (July 2002–July 2010)
|
65 | Director — Hershey Trust
Director, Audit Committee, |
| 2 | Delaware Investments is the marketing name for Delaware Management Holdings, Inc. and its subsidiaries, including the Fund’s(s’) investment advisor, principal underwriter, and its transfer agent. |
73
Table of Contents
Board of trustees / directors and officers addendum
Delaware Investments® Family of Funds
| Name, Address, and Birth Date |
Position(s) Held with Fund(s) |
Length of Time Served |
||||
|
Independent Trustees (continued)
|
||||||
| Lucinda S. Landreth |
Trustee | Since March 2005 | ||||
| 2005 Market Street |
||||||
| Philadelphia, PA 19103 |
||||||
| June 1947
|
||||||
| Frances A. Sevilla-Sacasa |
Trustee | Since September 2011 | ||||
| 2005 Market Street |
||||||
| Philadelphia, PA 19103 |
||||||
| January 1956 |
||||||
| Thomas K. Whitford |
Trustee | Since January 2013 | ||||
| 2005 Market Street |
||||||
| Philadelphia, PA 19103 |
||||||
| March 1956 |
||||||
74
Table of Contents
| Principal Occupation(s) During the Past Five Years |
Number of Portfolios in Fund Complex Overseen by Trustee or Officer |
Other Directorships Held by Trustee or Officer | ||
| Private Investor |
65 | None | ||
| (2004–Present)
|
||||
| Chief Executive Officer — |
65 | Trust Manager and | ||
| Banco Itaú |
Audit Committee | |||
| International |
Member — Camden | |||
| (April 2012–Present) |
Property Trust | |||
|
Executive Advisor to Dean |
||||
| (August 2011–March 2012) and Interim Dean |
||||
| (January 2011–July 2011) — |
||||
| University of Miami School of |
||||
| Business Administration |
||||
|
President — U.S. Trust, |
||||
| Bank of America Private |
||||
| Wealth Management |
||||
| (Private Banking) |
||||
| (July 2007–December 2008)
|
||||
| Vice Chairman |
65 | Director — HSBC Finance | ||
| (2010–April 2013) |
Corporation and HSBC | |||
| Chief Administrative |
North America Holdings Inc. | |||
| Officer (2008–2010) and Executive Vice |
||||
| President and Chief |
||||
| Administrative Officer |
||||
| (2007–2009) — |
||||
| PNC Financial |
||||
| Services Group
|
75
Table of Contents
Board of trustees / directors and officers addendum
Delaware Investments® Family of Funds
| Name, Address, and Birth Date |
Position(s) Held with Fund(s) |
Length of Time Served | ||
|
Independent Trustees (continued)
|
||||
| Janet L. Yeomans |
Trustee | Since April 1999 | ||
| 2005 Market Street |
||||
| Philadelphia, PA 19103 |
||||
| July 1948
|
||||
| J. Richard Zecher |
Trustee | Since March 2005 | ||
| 2005 Market Street |
||||
| Philadelphia, PA 19103 |
||||
| July 1940 |
76
Table of Contents
| Principal Occupation(s) During the Past Five Years |
Number of Portfolios in Fund Complex Overseen by Trustee or Officer |
Other Directorships Held by Trustee or Officer | ||
| Vice President and Treasurer (January 2006–July 2012) Vice President — Mergers & Acquisitions (January 2003–January 2006), and Vice President and Treasurer (July 1995–January 2003) 3M Corporation
|
65 | Director, Audit and Compliance Committee Chair, Investment Committee Member and Governance Committee Member Okabena Company
Chair — 3M Investment Management Company (2005–2012) | ||
| Founder Investor Analytics (Risk Management) (May 1999–Present)
Founder P/E Investments (Hedge Fund) (September 1996–Present)
|
65 | Director and Compensation Committee Chairman Investor Analytics
Director — P/E Investments |
77
Table of Contents
Board of trustees / directors and officers addendum
Delaware Investments® Family of Funds
| Name, Address, and Birth Date |
Position(s) Held with Fund(s) |
Length of Time Served |
||||
|
Officers
|
||||||
| David F. Connor 2005 Market Street Philadelphia, PA 19103 December 1963 |
Senior Vice President, Deputy General Counsel, and Secretary |
Senior Vice President, Deputy General Counsel since May 2013; Vice President, Deputy General Counsel September 2000 – May 2013; Secretary since October 2005
|
||||
| Daniel V. Geatens 2005 Market Street Philadelphia, PA 19103 October 1972
|
Vice President and Treasurer |
Treasurer since October 2007 | ||||
| David P. O’Connor |
Executive Vice President, | Executive Vice President | ||||
| 2005 Market Street |
General Counsel | since February 2012; | ||||
| Philadelphia, PA 19103 |
and Chief Legal Officer | Senior Vice President | ||||
| February 1966 |
October 2005 – | |||||
| February 2012; | ||||||
| General Counsel and | ||||||
| Chief Legal Officer | ||||||
| since October 2005
|
||||||
| Richard Salus |
Senior Vice President | Chief Financial Officer | ||||
| 2005 Market Street |
and Chief Financial Officer | since November 2006 | ||||
| Philadelphia, PA 19103 |
||||||
| October 1963
|
The Statement of Additional Information for the Fund(s) includes additional information about the Trustees and Officers and is available, without charge, upon request by calling 800 523-1918.
78
Table of Contents
| Principal Occupation(s) During the Past Five Years |
Number of Portfolios in Fund Complex Overseen by Trustee or Officer |
Other Directorships Held by Trustee or Officer | ||
| David F. Connor has served as |
65 | None3 | ||
| Deputy General Counsel of |
||||
| Delaware Investments since 2000.
|
||||
| Daniel V. Geatens has served |
65 | None3 | ||
| in various capacities at different times at |
||||
| Delaware Investments.
|
||||
| David P. O’Connor has served |
65 | None3 | ||
| in various executive and legal capacities at different times at Delaware Investments.
|
||||
| Richard Salus has served in |
65 | None3 | ||
| various executive capacities at different times at |
||||
| Delaware Investments.
|
| 3 | David F. Connor, Daniel V. Geatens, David P. O’Connor, and Richard Salus serve in similar capacities for the six portfolios of the Optimum Fund Trust, which have the same investment advisor, principal underwriter, and transfer agent as the registrant. |
79
Table of Contents
| Board of trustees | ||||||
| Patrick P. Coyne | Joseph W. Chow | Lucinda S. Landreth | Thomas K. Whitford | |||
| Chairman, President, and Chief Executive Officer Delaware Investments® Family of Funds Philadelphia, PA
Thomas L. Bennett Private Investor Rosemont, PA |
Former Executive Vice President State Street Corporation Brookline, MA
John A. Fry President Drexel University Philadelphia, PA |
Former Chief Investment Officer Assurant, Inc. Philadelphia, PA
Frances A. Sevilla-Sacasa Chief Executive Officer Banco Itaú International Miami, FL |
Former Vice Chairman PNC Financial Services Group Pittsburgh, PA
Janet L. Yeomans Former Vice President and Treasurer 3M Corporation St. Paul, MN | |||
|
J. Richard Zecher Founder Investor Analytics | ||||||
| Scottsdale, AZ | ||||||
|
Affiliated officers |
||||||
|
David F. Connor Senior Vice President, Deputy General Counsel, and Secretary Delaware Investments Family of Funds Philadelphia, PA |
Daniel V. Geatens Vice President and Treasurer Delaware Investments Family of Funds Philadelphia, PA |
David P. O’Connor Executive Vice President, General Counsel, and Chief Legal Officer Delaware Investments Family of Funds Philadelphia, PA |
Richard Salus Senior Vice President and Chief Financial Officer Delaware Investments Family of Funds Philadelphia, PA | |||
This annual report is for the information of Delaware Dividend Income Fund shareholders, but it may be used with prospective investors when preceded or accompanied by the Delaware Investments Fund fact sheet for the most recently completed calendar quarter. These documents are available at delawareinvestments.com.
Delaware Investments is the marketing name of Delaware Management Holdings, Inc. and its subsidiaries.
The Fund files its complete schedule of portfolio holdings with the Securities and Exchange Commission (SEC) for the first and third quarters of each fiscal year on Form N-Q. The Fund’s Forms N-Q, as well as a description of the policies and procedures that the Fund uses to determine how to vote proxies (if any) relating to portfolio securities are available without charge (i) upon request, by calling 800 523-1918; and (ii) on the SEC’s website at sec.gov. In addition, a description of the policies and procedures that the Fund uses to determine how to vote proxies (if any) relating to portfolio securities and the Fund’s Schedule of Investments are available without charge on the Fund’s website at delawareinvestments.com. The Fund’s Forms N-Q may be reviewed and copied at the SEC’s Public Reference Room in Washington, D.C.; information on the operation of the Public Reference Room may be obtained by calling 800 SEC-0330.
Information (if any) regarding how the Fund voted proxies relating to portfolio securities during the most recently disclosed 12-month period ended June 30 is available without charge (i) through the Fund’s website at delawareinvestments.com; and (ii) on the SEC’s website at sec.gov.
80
Table of Contents

Annual report
U.S. core equity mutual fund
Delaware Small Cap Core Fund
November 30, 2014
Carefully consider the Fund’s investment objectives, risk factors, charges, and expenses before investing. This and other information can be found in the Fund’s prospectus and its summary prospectus, which may be obtained by visiting delawareinvestments.com or calling 800 523-1918. Investors should read the prospectus and the summary prospectus carefully before investing.
You can obtain shareholder reports and prospectuses online instead of in the mail.
Visit delawareinvestments.com/edelivery.
Table of Contents
Experience Delaware Investments
Delaware Investments is committed to the pursuit of consistently superior asset management and unparalleled client service. We believe in our investment processes, which seek to deliver consistent results, and in convenient services that help add value for our clients.
If you are interested in learning more about creating an investment plan, contact your financial advisor.
You can learn more about Delaware Investments or obtain a prospectus for Delaware Small Cap Core Fund at delawareinvestments.com.
Table of Contents
|
Delaware Small Cap Core Fund
|
December 9, 2014
|
| Performance preview (for the year ended November 30, 2014) |
||||
| Delaware Small Cap Core Fund (Class A shares) |
1-year return | +7.28% | ||
| Russell 2000® Index (benchmark) |
1-year return | +3.99% |
Past performance does not guarantee future results.
For complete, annualized performance for Delaware Small Cap Core Fund, please see the table on page 3.
The performance of Class A shares excludes the applicable sales charge and reflects the reinvestment of all distributions. For a description of the index, please see page 5. Index performance returns do not reflect any management fees, transaction costs, or expenses. Indices are unmanaged and one cannot invest directly in an index.
| 1 |
Table of Contents
| Portfolio management review
Delaware Small Cap Core Fund
|
| 2 |
Table of Contents
|
Delaware Small Cap Core Fund
|
November 30, 2014
|
The performance data quoted represent past performance; past performance does not guarantee future results. Investment return and principal value will fluctuate so your shares, when redeemed, may be worth more or less than their original cost. Please obtain the performance data current for the most recent month end by calling 800 523-1918 or visiting our website at delawareinvestments.com/performance. Current performance may be lower or higher than the performance data quoted.
| Fund and benchmark performance1,2 | Average annual total returns through November 30, 2014 | |||||||
| 1 year | 5 years | 10 years | Lifetime | |||||
|
| ||||||||
| Class A (Est. Dec. 29, 1998) |
||||||||
| Excluding sales charge |
+7.28% | +19.22% | +8.30% | n/a | ||||
| Including sales charge |
+1.12% | +17.83% | +7.66% | n/a | ||||
|
| ||||||||
| Class C (Est. Aug. 1, 2005) |
||||||||
| Excluding sales charge |
+6.44% | +18.32% | n/a | +6.90% | ||||
| Including sales charge |
+5.44% | +18.32% | n/a | +6.90% | ||||
|
| ||||||||
| Class R (Est. Aug. 1, 2005) |
||||||||
| Excluding sales charge |
+7.03% | +18.93% | n/a | +7.45% | ||||
| Including sales charge |
+7.03% | +18.93% | n/a | +7.45% | ||||
|
| ||||||||
| Institutional Class (Est. Dec. 29, 1998) |
||||||||
| Excluding sales charge |
+7.51% | +19.50% | +8.55% | n/a | ||||
| Including sales charge |
+7.51% | +19.50% | +8.55% | n/a | ||||
|
| ||||||||
| Russell 2000 Index |
+3.99% | +16.69% | +7.78% | n/a | ||||
|
| ||||||||
| 3 |
Table of Contents
| Performance summary
Delaware Small Cap Core Fund
|
2 The Fund’s expense ratios, as described in the most recent prospectus, are disclosed in the following “Fund expense ratios” table.
| Fund expense ratios | Class A | Class C | Class R | Institutional Class | ||||
|
| ||||||||
| Total annual operating expenses |
1.31% | 2.06% | 1.56% | 1.06% | ||||
| (without fee waivers) |
||||||||
| Net expenses |
1.31% | 2.06% | 1.56% | 1.06% | ||||
| (including fee waivers, if any) |
||||||||
| Type of waiver |
n/a | n/a | n/a | n/a | ||||
|
| ||||||||
| 4 |
Table of Contents
|
|
Performance of a $10,000 investment1
Average annual total returns from Nov. 30, 2004, through Nov. 30, 2014

|
|
||||||||
| For the period beginning Nov. 30, 2004, through Nov. 30, 2014 | Starting value | Ending value | ||||||
|
|
||||||||
|
|
$10,000 | $21,147 | ||||||
|
|
$9,425 | $20,923 | ||||||
|
|
||||||||
 Russell 2000 Index
 Delaware Small Cap Core Fund — Class A shares
| Nasdaq symbols | CUSIPs | |||
| Class A |
DCCAX | 24610B883 | ||
| Class C |
DCCCX | 24610B867 | ||
| Class R |
DCCRX | 24610B834 | ||
| Institutional Class |
DCCIX | 24610B859 |
| 5 |
Table of Contents
|
For the six-month period from June 1, 2014 to November 30, 2014 (Unaudited)
|
As a shareholder of the Fund, you incur two types of costs: (1) transaction costs, including sales charges (loads) on purchase payments, reinvested dividends, or other distributions; redemption fees; and exchange fees; and (2) ongoing costs, including management fees; distribution and/or service (12b-1) fees; and other Fund expenses. This example is intended to help you understand your ongoing costs (in dollars) of investing in the Fund and to compare these costs with the ongoing costs of investing in other mutual funds.
The example is based on an investment of $1,000 invested at the beginning of the period and held for the entire six-month period from June 1, 2014 to Nov. 30, 2014.
Actual expenses
The first section of the table shown, “Actual Fund return,” provides information about actual account values and actual expenses. You may use the information in this section of the table, together with the amount you invested, to estimate the expenses that you paid over the period. Simply divide your account value by $1,000 (for example, an $8,600 account value divided by $1,000 = 8.6), then multiply the result by the number in the first section under the heading entitled “Expenses Paid During Period” to estimate the expenses you paid on your account during this period.
Hypothetical example for comparison purposes
The second section of the table shown, “Hypothetical 5% return,” provides information about hypothetical account values and hypothetical expenses based on the Fund’s actual expense ratio and an assumed rate of return of 5% per year before expenses, which is not the Fund’s actual return. The hypothetical account values and expenses may not be used to estimate the actual ending account balance or expenses you paid for the period. You may use this information to compare the ongoing costs of investing in the Fund and other funds. To do so, compare this 5% hypothetical example with the 5% hypothetical examples that appear in the shareholder reports of the other funds.
Please note that the expenses shown in the table are meant to highlight your ongoing costs only and do not reflect any transactional costs, such as sales charges (loads), redemption fees, or exchange fees. Therefore, the second section of the table is useful in comparing ongoing costs only, and will not help you determine the relative total costs of owning different funds. In addition, if these transactional costs were included, your costs would have been higher. The expenses shown in the table assume reinvestment of all dividends and distributions.
| 6 |
Table of Contents
Delaware Small Cap Core Fund
Expense analysis of an investment of $1,000
| Beginning Account Value 6/1/14 |
Ending Account Value 11/30/14 |
Annualized Expense Ratio |
Expenses Paid During Period 6/1/14 to 11/30/14* | |||||
| Actual Fund return† |
||||||||
| Class A |
$1,000.00 | $1,064.60 | 1.36% | $7.04 | ||||
| Class C |
1,000.00 | 1,060.50 | 2.11% | 10.90 | ||||
| Class R |
1,000.00 | 1,063.10 | 1.61% | 8.33 | ||||
| Institutional Class |
1,000.00 | 1,066.00 | 1.11% | 5.75 | ||||
|
Hypothetical 5% return (5% return before expenses) |
||||||||
| Class A |
$1,000.00 | $1,018.25 | 1.36% | $6.88 | ||||
| Class C |
1,000.00 | 1,014.49 | 2.11% | 10.66 | ||||
| Class R |
1,000.00 | 1,017.00 | 1.61% | 8.14 | ||||
| Institutional Class |
1,000.00 | 1,019.50 | 1.11% | 5.62 | ||||
| * | “Expenses Paid During Period” are equal to the Fund’s annualized expense ratio, multiplied by the average account value over the period, multiplied by 183/365 (to reflect the one-half year period). |
| † | Because actual returns reflect only the most recent six-month period, the returns shown may differ significantly from fiscal year returns. |
| 7 |
Table of Contents
| Security type / sector allocation and top 10 equity holdings
Delaware Small Cap Core Fund
|
As of November 30, 2014 (Unaudited)
|
Sector designations may be different than the sector designations presented in other Fund materials. The sector designations may represent the investment manager’s internal sector classifications, which may result in the sector designations for one fund being different than another fund’s sector designations.
| Security type / sector | Percentage of net assets | |||
| Common Stock |
97.46% | |||
| Basic Materials |
6.65% | |||
| Business Services |
6.31% | |||
| Capital Goods |
8.63% | |||
| Communications Services |
2.04% | |||
| Consumer Discretionary |
3.86% | |||
| Consumer Services |
4.89% | |||
| Consumer Staples |
2.57% | |||
| Credit Cyclicals |
0.99% | |||
| Energy |
3.42% | |||
| Financials |
16.47% | |||
| Healthcare |
14.05% | |||
| Industrials |
1.08% | |||
| Materials |
0.52% | |||
| Media |
0.55% | |||
| Real Estate |
6.92% | |||
| Technology |
15.00% | |||
| Transportation |
1.53% | |||
| Utilities |
1.98% | |||
| Short-Term Investments |
2.10% | |||
| Total Value of Securities |
99.56% | |||
| Receivables and Other Assets Net of Liabilities |
0.44% | |||
| Total Net Assets |
100.00% |
| 8 |
Table of Contents
Holdings are for informational purposes only and are subject to change at any time. They are not a recommendation to buy, sell, or hold any security.
| Top 10 equity holdings | Percentage of net assets | |||
| West Pharmaceutical Services |
1.31% | |||
| Cepheid |
1.26% | |||
| Casey’s General Stores |
1.26% | |||
| Proofpoint |
1.22% | |||
| NPS Pharmaceuticals |
1.18% | |||
| Buffalo Wild Wings |
1.18% | |||
| XPO Logistics |
1.14% | |||
| LaSalle Hotel Properties |
1.12% | |||
| DexCom |
1.08% | |||
| G-III Apparel Group
|
1.08%
|
| 9 |
Table of Contents
|
Delaware Small Cap Core Fund
|
November 30, 2014
|
| Number of shares | Value (U.S. $) | |||||||
|
|
||||||||
| Common Stock – 97.46% |
||||||||
|
|
||||||||
| Basic Materials – 6.65% |
||||||||
| Axiall |
78,900 | $ | 3,414,792 | |||||
| Boise Cascade † |
112,665 | 4,021,014 | ||||||
| Chemtura † |
119,300 | 2,779,690 | ||||||
| Innophos Holdings |
44,600 | 2,411,968 | ||||||
| Kaiser Aluminum |
42,700 | 3,107,706 | ||||||
| Materion |
62,600 | 2,176,602 | ||||||
| Neenah Paper |
61,400 | 3,514,536 | ||||||
| Quaker Chemical |
36,300 | 2,955,909 | ||||||
| Taminco † |
56,305 | 1,458,863 | ||||||
| Worthington Industries |
70,300 | 2,651,013 | ||||||
|
|
|
|||||||
| 28,492,093 | ||||||||
|
|
|
|||||||
| Business Services – 6.31% |
||||||||
| Convergys |
154,100 | 3,212,985 | ||||||
| Cross Country Healthcare † |
222,500 | 2,374,075 | ||||||
| Kforce |
194,475 | 4,539,047 | ||||||
| McGrath RentCorp |
106,480 | 3,754,485 | ||||||
| TeleTech Holdings † |
113,100 | 2,643,147 | ||||||
| U.S. Ecology |
70,280 | 2,798,550 | ||||||
| United Stationers |
101,400 | 4,163,484 | ||||||
| WageWorks † |
60,593 | 3,539,843 | ||||||
|
|
|
|||||||
| 27,025,616 | ||||||||
|
|
|
|||||||
| Capital Goods – 8.63% |
||||||||
| AAON |
147,830 | 3,063,038 | ||||||
| Applied Industrial Technologies |
87,240 | 4,090,684 | ||||||
| Barnes Group |
112,400 | 4,128,452 | ||||||
| Chart Industries † |
19,034 | 755,840 | ||||||
| Columbus McKinnon |
131,220 | 3,504,886 | ||||||
| ESCO Technologies |
60,300 | 2,172,006 | ||||||
| Esterline Technologies † |
20,200 | 2,400,366 | ||||||
| Granite Construction |
98,341 | 3,525,525 | ||||||
| Kadant |
91,667 | 3,657,513 | ||||||
| MasTec † |
54,900 | 1,323,090 | ||||||
| MYR Group † |
75,800 | 1,967,010 | ||||||
| Rofin-Sinar Technologies † |
132,900 | 3,577,668 | ||||||
| Tetra Tech |
104,300 | 2,834,874 | ||||||
|
|
|
|||||||
| 37,000,952 | ||||||||
|
|
|
|||||||
| Communications Services – 2.04% |
||||||||
| Atlantic Tele-Network |
38,984 | 2,650,132 | ||||||
| InterXion Holding † |
110,991 | 3,093,319 | ||||||
| RigNet † |
73,801 | 3,022,151 | ||||||
|
|
|
|||||||
| 8,765,602 | ||||||||
|
|
|
|||||||
| 10 |
Table of Contents
|
|
| Number of shares | Value (U.S. $) | |||||||
|
|
||||||||
| Common Stock (continued) |
||||||||
|
|
||||||||
| Consumer Discretionary – 3.86% |
||||||||
| Coupons.com † |
98,900 | $ | 1,510,203 | |||||
| Express † |
124,000 | 1,853,800 | ||||||
| G-III Apparel Group † |
52,200 | 4,619,178 | ||||||
| Iconix Brand Group † |
97,600 | 3,944,016 | ||||||
| Madden (Steven) † |
134,850 | 4,598,385 | ||||||
|
|
|
|||||||
| 16,525,582 | ||||||||
|
|
|
|||||||
| Consumer Services – 4.89% |
||||||||
| Buffalo Wild Wings † |
29,720 | 5,058,641 | ||||||
| Cheesecake Factory |
83,300 | 4,034,219 | ||||||
| Del Frisco’s Restaurant Group † |
149,500 | 3,321,890 | ||||||
| Jack in the Box |
58,680 | 4,371,660 | ||||||
| Popeyes Louisiana Kitchen † |
75,400 | 4,165,096 | ||||||
|
|
|
|||||||
| 20,951,506 | ||||||||
|
|
|
|||||||
| Consumer Staples – 2.57% |
||||||||
| Casey’s General Stores |
64,500 | 5,399,940 | ||||||
| J&J Snack Foods |
32,686 | 3,433,664 | ||||||
| Prestige Brands Holdings † |
64,800 | 2,167,560 | ||||||
|
|
|
|||||||
| 11,001,164 | ||||||||
|
|
|
|||||||
| Credit Cyclicals – 0.99% |
||||||||
| Tenneco † |
78,200 | 4,250,170 | ||||||
|
|
|
|||||||
| 4,250,170 | ||||||||
|
|
|
|||||||
| Energy – 3.42% |
||||||||
| Bonanza Creek Energy † |
25,900 | 704,998 | ||||||
| Bristow Group |
26,350 | 1,689,035 | ||||||
| C&J Energy Services † |
87,400 | 1,324,110 | ||||||
| Carrizo Oil & Gas † |
50,900 | 2,008,514 | ||||||
| Diamondback Energy † |
24,710 | 1,393,644 | ||||||
| Jones Energy Class A @† |
115,130 | 1,168,570 | ||||||
| Kodiak Oil & Gas † |
214,700 | 1,573,751 | ||||||
| Parsley Energy Class A † |
66,100 | 835,504 | ||||||
| Pioneer Energy Services † |
74,800 | 451,792 | ||||||
| Rosetta Resources † |
79,200 | 2,330,064 | ||||||
| RSP Permian † |
55,015 | 1,197,126 | ||||||
|
|
|
|||||||
| 14,677,108 | ||||||||
|
|
|
|||||||
| Financials – 16.47% |
||||||||
| American Equity Investment Life Holding |
163,100 | 4,403,700 | ||||||
| AMERISAFE |
61,000 | 2,543,090 | ||||||
| BBCN Bancorp |
187,800 | 2,614,176 | ||||||
| Bryn Mawr Bank |
34,600 | 1,018,278 | ||||||
| Cardinal Financial |
177,200 | 3,237,444 | ||||||
| City Holding |
69,350 | 3,032,675 | ||||||
| Evercore Partners Class A |
67,300 | 3,398,650 | ||||||
| 11 |
Table of Contents
| Schedule of investments
Delaware Small Cap Core Fund
|
| Number of shares | Value (U.S. $) | |||||||
|
|
||||||||
| Common Stock (continued) |
||||||||
|
|
||||||||
| Financials (continued) |
||||||||
| Fidelity & Guaranty Life |
121,635 | $ | 3,044,524 | |||||
| First NBC Bank Holding † |
82,200 | 2,992,080 | ||||||
| Flushing Financial |
123,700 | 2,377,514 | ||||||
| Greenhill |
45,000 | 1,994,400 | ||||||
| Independent Bank @ |
81,500 | 3,229,845 | ||||||
| Infinity Property & Casualty @ |
37,700 | 2,739,282 | ||||||
| Primerica |
62,200 | 3,261,146 | ||||||
| Prosperity Bancshares |
63,900 | 3,589,902 | ||||||
| Selective Insurance Group @ |
117,900 | 3,156,183 | ||||||
| Sterling Bancorp |
285,300 | 3,817,314 | ||||||
| Stifel Financial † |
75,200 | 3,649,456 | ||||||
| Susquehanna Bancshares |
204,900 | 2,698,533 | ||||||
| Texas Capital Bancshares † |
71,700 | 3,952,821 | ||||||
| United Fire Group |
81,500 | 2,271,405 | ||||||
| Webster Financial |
115,200 | 3,625,344 | ||||||
| Western Alliance Bancorp † |
149,100 | 3,940,713 | ||||||
|
|
|
|||||||
| 70,588,475 | ||||||||
|
|
|
|||||||
| Healthcare – 14.05% |
||||||||
| Acorda Therapeutics † |
102,900 | 3,750,705 | ||||||
| Air Methods † |
85,700 | 3,803,366 | ||||||
| Akorn † |
106,100 | 4,251,427 | ||||||
| Auxilium Pharmaceuticals † |
90,300 | 3,120,768 | ||||||
| Cepheid † |
98,200 | 5,408,856 | ||||||
| CONMED |
89,640 | 3,803,425 | ||||||
| CryoLife |
216,305 | 2,184,681 | ||||||
| DexCom † |
90,100 | 4,636,546 | ||||||
| ICON † |
67,300 | 3,737,842 | ||||||
| Isis Pharmaceuticals † |
59,100 | 3,060,789 | ||||||
| Medicines † |
57,600 | 1,544,256 | ||||||
| Merit Medical Systems † |
123,687 | 1,830,568 | ||||||
| NPS Pharmaceuticals † |
152,600 | 5,063,268 | ||||||
| Quidel † |
123,200 | 3,432,352 | ||||||
| Spectrum Pharmaceuticals † |
226,900 | 1,635,949 | ||||||
| WellCare Health Plans † |
45,600 | 3,362,544 | ||||||
| West Pharmaceutical Services |
107,820 | 5,607,718 | ||||||
|
|
|
|||||||
| 60,235,060 | ||||||||
|
|
|
|||||||
| Industrials – 1.08% |
||||||||
| Continental Building Products † |
133,800 | 2,234,460 | ||||||
| Swift Transportation † |
82,000 | 2,383,740 | ||||||
|
|
|
|||||||
| 4,618,200 | ||||||||
|
|
|
|||||||
| 12 |
Table of Contents
|
|
| Number of shares | Value (U.S. $) | |||||||
|
|
||||||||
| Common Stock (continued) |
||||||||
|
|
||||||||
| Materials – 0.52% |
||||||||
| Minerals Technologies |
30,100 | $ | 2,234,323 | |||||
|
|
|
|||||||
| 2,234,323 | ||||||||
|
|
|
|||||||
| Media – 0.55% |
||||||||
| National CineMedia |
167,250 | 2,368,260 | ||||||
|
|
|
|||||||
| 2,368,260 | ||||||||
|
|
|
|||||||
| Real Estate – 6.92% |
||||||||
| DCT Industrial Trust |
110,550 | 3,773,071 | ||||||
| DuPont Fabros Technology |
115,900 | 3,777,181 | ||||||
| EastGroup Properties |
50,400 | 3,387,888 | ||||||
| EPR Properties |
60,900 | 3,409,791 | ||||||
| Kite Realty Group Trust |
141,400 | 3,857,392 | ||||||
| LaSalle Hotel Properties |
119,100 | 4,808,067 | ||||||
| Ramco-Gershenson Properties Trust |
178,400 | 3,193,360 | ||||||
| Sovran Self Storage |
40,730 | 3,462,865 | ||||||
|
|
|
|||||||
| 29,669,615 | ||||||||
|
|
|
|||||||
| Technology – 15.00% |
||||||||
| Anixter International |
41,450 | 3,602,005 | ||||||
| Applied Micro Circuits † |
403,600 | 2,385,276 | ||||||
| Callidus Software † |
105,600 | 1,686,432 | ||||||
| ExlService Holdings † |
50,590 | 1,418,038 | ||||||
| FARO Technologies † |
76,290 | 4,190,610 | ||||||
| GrubHub † |
64,900 | 2,388,320 | ||||||
| Guidewire Software † |
67,500 | 3,406,725 | ||||||
| inContact † |
347,770 | 2,872,580 | ||||||
| j2 Global @ |
79,700 | 4,506,238 | ||||||
| KEYW Holding † |
280,182 | 3,028,767 | ||||||
| NETGEAR † |
87,410 | 3,034,875 | ||||||
| Plantronics |
59,600 | 3,109,332 | ||||||
| Proofpoint † |
120,000 | 5,210,400 | ||||||
| Rally Software Development † |
137,800 | 1,453,790 | ||||||
| SciQuest † |
177,800 | 2,650,998 | ||||||
| Semtech † |
141,900 | 3,612,774 | ||||||
| Shutterfly † |
69,300 | 2,963,268 | ||||||
| SS&C Technologies Holdings |
77,232 | 3,904,078 | ||||||
| Synaptics † |
51,320 | 3,232,647 | ||||||
| Tyler Technologies † |
27,900 | 3,029,382 | ||||||
| WNS Holdings ADR † |
127,398 | 2,602,741 | ||||||
|
|
|
|||||||
| 64,289,276 | ||||||||
|
|
|
|||||||
| Transportation – 1.53% |
||||||||
| Roadrunner Transportation Systems † |
73,600 | 1,656,736 | ||||||
| XPO Logistics † |
126,300 | 4,885,284 | ||||||
|
|
|
|||||||
| 6,542,020 | ||||||||
|
|
|
|||||||
| 13 |
Table of Contents
| Schedule of investments
Delaware Small Cap Core Fund
|
| Number of shares | Value (U.S. $) | |||||||
|
|
||||||||
| Common Stock (continued) |
||||||||
|
|
||||||||
| Utilities – 1.98% |
||||||||
| Cleco |
69,600 | $ | 3,739,608 | |||||
| NorthWestern |
66,300 | 3,529,149 | ||||||
| South Jersey Industries |
21,300 | 1,215,804 | ||||||
|
|
|
|||||||
| 8,484,561 | ||||||||
|
|
|
|||||||
| Total Common Stock (cost $372,144,465) |
417,719,583 | |||||||
|
|
|
|||||||
| Principal amount° | Value (U.S. $) | |||||||
|
|
||||||||
| Short-Term Investments – 2.10% |
||||||||
|
|
||||||||
| Discount Notes – 0.95%≠ |
||||||||
| Federal Home Loan Bank |
||||||||
| 0.065% 1/14/15 |
387,996 | 387,982 | ||||||
| 0.065% 1/21/15 |
444,103 | 444,084 | ||||||
| 0.065% 2/25/15 |
1,327,574 | 1,327,447 | ||||||
| 0.065% 3/5/15 |
1,108,262 | 1,108,102 | ||||||
| 0.067% 1/16/15 |
259,990 | 259,980 | ||||||
| 0.08% 2/20/15 |
549,652 | 549,602 | ||||||
|
|
|
|||||||
| 4,077,197 | ||||||||
|
|
|
|||||||
| Repurchase Agreements – 0.91% |
||||||||
| Bank of America Merrill Lynch |
||||||||
| 0.05%, dated 11/28/14, to be repurchased on 12/1/14, repurchase price $1,364,485 (collateralized by U.S. government obligations 0.00%–1.375% 4/15/16–2/15/43 market value $1,391,769) |
1,364,479 | 1,364,479 | ||||||
| Bank of Montreal |
||||||||
| 0.08%, dated 11/28/14, to be repurchased on 12/1/14, repurchase price $454,829 (collateralized by U.S. government obligations 0.25%–11.25% 11/30/14–2/15/22 market value $463,923) |
454,827 | 454,827 | ||||||
| BNP Paribas |
||||||||
| 0.09%, dated 11/28/14, to be repurchased on 12/1/14, repurchase price $2,050,710 (collateralized by U.S. government obligations 0.00%–3.625% 12/26/14–2/15/21 market value $2,091,708) |
2,050,694 | 2,050,694 | ||||||
|
|
|
|||||||
| 3,870,000 | ||||||||
|
|
|
|||||||
| U.S. Treasury Obligation – 0.24%≠ |
||||||||
| U.S. Treasury Bill 0.005% 12/26/14 |
1,027,936 | 1,027,908 | ||||||
|
|
|
|||||||
| 1,027,908 | ||||||||
|
|
|
|||||||
| Total Short-Term Investments (cost $8,974,922) |
8,975,105 | |||||||
|
|
|
|||||||
| Total Value of Securities – 99.56% |
$ | 426,694,688 | ||||||
|
|
|
|||||||
| 14 |
Table of Contents
|
|
| @ | Illiquid security. At Nov. 30, 2014, the aggregate value of illiquid securities was $14,800,118, which represents 3.45% of the Fund’s net assets. See Note 10 in “Notes to financial statements.” |
| ≠ | The rate shown is the effective yield at the time of purchase. |
| ° | Principal amount shown is stated in U.S. dollars unless noted that the security is denominated in another currency. |
| † | Non-income-producing security. |
ADR – American Depositary Receipt
See accompanying notes, which are an integral part of the financial statements.
| 15 |
Table of Contents
| Statement of assets and liabilities
Delaware Small Cap Core Fund
|
November 30, 2014
|
| Assets: |
||||
| Investments, at value1 |
$ | 417,719,583 | ||
| Short-term investments, at value2 |
8,975,105 | |||
| Cash |
177,093 | |||
| Receivable for fund shares sold |
2,250,233 | |||
| Dividends and interest receivable |
270,476 | |||
| Receivables for securities sold |
241,088 | |||
|
|
|
|||
| Total assets |
429,633,578 | |||
|
|
|
|||
| Liabilities: |
||||
| Payable for fund shares redeemed |
286,140 | |||
| Payable for securities purchased |
140,120 | |||
| Investment management fees payable |
257,919 | |||
| Other accrued expenses |
232,875 | |||
| Distribution fees payable to affiliates |
75,816 | |||
| Other affiliates payable |
41,661 | |||
| Trustees’ fees and expenses payable |
2,335 | |||
|
|
|
|||
| Total liabilities |
1,036,866 | |||
|
|
|
|||
| Total Net Assets |
$ | 428,596,712 | ||
|
|
|
|||
| Net Assets Consist of: |
||||
| Paid-in capital |
$ | 360,706,700 | ||
| Accumulated net realized gain on investments |
22,314,711 | |||
| Net unrealized appreciation of investments |
45,575,301 | |||
|
|
|
|||
| Total Net Assets |
$ | 428,596,712 | ||
|
|
|
|||
| 16 |
Table of Contents
|
|
| Net Asset Value |
||||
| Class A: |
||||
| Net assets |
$ | 136,070,400 | ||
| Shares of beneficial interest outstanding, unlimited authorization, no par |
6,661,459 | |||
| Net asset value per share |
$ | 20.43 | ||
| Sales charge |
5.75 | % | ||
| Offering price per share, equal to net asset value per share / (1 – sales charge) |
$ | 21.68 | ||
| Class C: |
||||
| Net assets |
$ | 51,922,484 | ||
| Shares of beneficial interest outstanding, unlimited authorization, no par |
2,716,524 | |||
| Net asset value per share |
$ | 19.11 | ||
| Class R: |
||||
| Net assets |
$ | 15,833,179 | ||
| Shares of beneficial interest outstanding, unlimited authorization, no par |
790,114 | |||
| Net asset value per share |
$ | 20.04 | ||
| Institutional Class: |
||||
| Net assets |
$ | 224,770,649 | ||
| Shares of beneficial interest outstanding, unlimited authorization, no par |
10,862,742 | |||
| Net asset value per share |
$ | 20.69 | ||
|
1 Investments, at cost |
$ | 372,144,465 | ||
| 2 Short-term investments, at cost |
8,974,922 | |||
See accompanying notes, which are an integral part of the financial statements.
| 17 |
Table of Contents
|
Delaware Small Cap Core Fund
|
Year ended November 30, 2014
|
| Investment Income: |
||||
| Dividends |
$ | 2,865,109 | ||
| Interest |
4,823 | |||
|
|
|
|||
| 2,869,932 | ||||
|
|
|
|||
| Expenses: |
||||
| Management fees |
2,126,040 | |||
| Distribution expenses – Class A |
248,187 | |||
| Distribution expenses – Class C |
388,903 | |||
| Distribution expenses – Class R |
71,360 | |||
| Dividend disbursing and transfer agent fees and expenses |
536,220 | |||
| Registration fees |
101,045 | |||
| Accounting and administration expenses |
95,078 | |||
| Reports and statements to shareholders |
59,204 | |||
| Audit and tax |
31,067 | |||
| Custodian fees |
23,862 | |||
| Legal fees |
19,508 | |||
| Trustees’ fees and expenses |
12,843 | |||
| Other |
16,432 | |||
|
|
|
|||
| 3,729,749 | ||||
| Less expense paid indirectly |
(118 | ) | ||
|
|
|
|||
| Total operating expenses |
3,729,631 | |||
|
|
|
|||
| Net Investment Loss |
(859,699 | ) | ||
|
|
|
|||
| Net Realized and Unrealized Gain (Loss): |
||||
| Net realized gain on investments |
24,458,446 | |||
| Net change in unrealized appreciation (depreciation) of investments |
(431,013 | ) | ||
|
|
|
|||
| Net Realized and Unrealized Gain |
24,027,433 | |||
|
|
|
|||
| Net Increase in Net Assets Resulting from Operations |
$ | 23,167,734 | ||
|
|
|
|||
See accompanying notes, which are an integral part of the financial statements.
| 18 |
Table of Contents
This page intentionally left blank.
Table of Contents
| Statements of changes in net assets
Delaware Small Cap Core Fund
| ||
| Year ended | ||||||||
| 11/30/14 | 11/30/13 | |||||||
| Increase (Decrease) in Net Assets from Operations: |
||||||||
| Net investment loss |
$ | (859,699 | ) | $ | (267,756 | ) | ||
| Net realized gain |
24,458,446 | 12,854,496 | ||||||
| Net change in unrealized appreciation (depreciation) |
(431,013 | ) | 33,855,724 | |||||
|
|
|
|
|
|||||
| Net increase in net assets resulting from operations |
23,167,734 | 46,442,464 | ||||||
|
|
|
|
|
|||||
| Dividends and Distributions to Shareholders from: |
||||||||
| Net investment income: |
||||||||
| Class A |
— | (22,899 | ) | |||||
| Institutional Class |
— | (133,052 | ) | |||||
| Net realized gain: |
||||||||
| Class A |
(1,836,861 | ) | — | |||||
| Class C |
(741,927 | ) | — | |||||
| Class R |
(340,355 | ) | — | |||||
| Institutional Class |
(2,110,959 | ) | — | |||||
|
|
|
|
|
|||||
| (5,030,102 | ) | (155,951 | ) | |||||
|
|
|
|
|
|||||
| Capital Share Transactions: |
||||||||
| Proceeds from shares sold: |
||||||||
| Class A |
89,996,368 | 38,621,136 | ||||||
| Class C |
28,493,872 | 11,670,310 | ||||||
| Class R |
6,283,013 | 4,701,991 | ||||||
| Institutional Class |
153,026,330 | 29,676,984 | ||||||
| Net asset value of shares issued upon reinvestment of dividends and distributions: |
||||||||
| Class A |
1,789,684 | 22,424 | ||||||
| Class C |
717,211 | — | ||||||
| Class R |
340,354 | — | ||||||
| Institutional Class |
2,073,221 | 131,836 | ||||||
|
|
|
|
|
|||||
| 282,720,053 | 84,824,681 | |||||||
|
|
|
|
|
|||||
| 20 |
Table of Contents
|
|
| Year ended | ||||||||
| 11/30/14 | 11/30/13 | |||||||
| Capital Share Transactions (continued): |
||||||||
| Cost of shares redeemed: |
||||||||
| Class A |
$ | (30,740,706 | ) | $ | (10,033,078 | ) | ||
| Class C |
(5,111,025 | ) | (1,587,669 | ) | ||||
| Class R |
(4,234,053 | ) | (2,037,193 | ) | ||||
| Institutional Class |
(22,031,878 | ) | (10,705,047 | ) | ||||
|
|
|
|
|
|||||
| (62,117,662 | ) | (24,362,987 | ) | |||||
|
|
|
|
|
|||||
| Increase in net assets derived from capital share transactions |
220,602,391 | 60,461,694 | ||||||
|
|
|
|
|
|||||
| Net Increase in Net Assets |
238,740,023 | 106,748,207 | ||||||
| Net Assets: |
||||||||
| Beginning of year |
189,856,689 | 83,108,482 | ||||||
|
|
|
|
|
|||||
| End of year |
$ | 428,596,712 | $ | 189,856,689 | ||||
|
|
|
|
|
|||||
| Accumulated net investment loss |
$ | — | $ | 355,911 | ||||
|
|
|
|
|
|||||
See accompanying notes, which are an integral part of the financial statements.
| 21 |
Table of Contents
|
Delaware Small Cap Core Fund Class A |
Selected data for each share of the Fund outstanding throughout each period were as follows:
|
|
| Net asset value, beginning of period |
| Income (loss) from investment operations: |
| Net investment income (loss)1 |
| Net realized and unrealized gain |
| Total from investment operations |
| Less dividends and distributions from: |
| Net investment income |
| Net realized gain |
| Total dividends and distributions |
| Net asset value, end of period |
| Total return2 |
| Ratios and supplemental data: |
| Net assets, end of period (000 omitted) |
| Ratio of expenses to average net assets |
| Ratio of expenses to average net assets prior to fees waived |
| Ratio of net investment income (loss) to average net assets |
| Ratio of net investment income (loss) to average net assets prior to fees waived |
| Portfolio turnover |
|
|
| 1 | The average shares outstanding method has been applied for per share information. |
| 2 | Total investment return is based on the change in net asset value of a share during the period and assumes reinvestment of dividends and distributions at net asset value and does not reflect the impact of a sales charge. Total investment return during some of the periods shown reflects waivers by the manager and/or distributor. Performance would have been lower had the waivers not been in effect. |
See accompanying notes, which are an integral part of the financial statements.
| 22 |
Table of Contents
|
|
| Year ended | ||||||||||||||||||||
| 11/30/14 | 11/30/13 | 11/30/12 | 11/30/11 | 11/30/10 | ||||||||||||||||
|
|
||||||||||||||||||||
| $ | 19.540 | $ | 13.560 | $ | 12.010 | $ | 11.150 | $ | 8.740 | |||||||||||
| (0.059 | ) | (0.036 | ) | (0.022 | ) | (0.024 | ) | 0.034 | ||||||||||||
| 1.447 | 6.027 | 1.572 | 0.928 | 2.376 | ||||||||||||||||
|
|
|
|
|
|
|
|
|
|
|
|||||||||||
| 1.388 | 5.991 | 1.550 | 0.904 | 2.410 | ||||||||||||||||
|
|
|
|
|
|
|
|
|
|
|
|||||||||||
| — | (0.011 | ) | — | (0.044 | ) | — | ||||||||||||||
| (0.498 | ) | — | — | — | — | |||||||||||||||
|
|
|
|
|
|
|
|
|
|
|
|||||||||||
| (0.498 | ) | (0.011 | ) | — | (0.044 | ) | — | |||||||||||||
|
|
|
|
|
|
|
|
|
|
|
|||||||||||
| $ | 20.430 | $ | 19.540 | $ | 13.560 | $ | 12.010 | $ | 11.150 | |||||||||||
|
|
|
|
|
|
|
|
|
|
|
|||||||||||
| 7.28% | 44.21% | 12.91% | 8.10% | 27.57% | ||||||||||||||||
| $ | 136,070 | $ | 69,386 | $ | 25,084 | $ | 24,242 | $ | 23,191 | |||||||||||
| 1.32% | 1.31% | 1.36% | 1.39% | 1.40% | ||||||||||||||||
| 1.32% | 1.35% | 1.41% | 1.45% | 1.54% | ||||||||||||||||
| (0.30% | ) | (0.22% | ) | (0.17% | ) | (0.20% | ) | 0.35% | ||||||||||||
| (0.30% | ) | (0.26% | ) | (0.22% | ) | (0.26% | ) | 0.21% | ||||||||||||
| 30% | 38% | 37% | 42% | 37% | ||||||||||||||||
|
|
||||||||||||||||||||
| 23 |
Table of Contents
| Financial highlights
Delaware Small Cap Core Fund Class C |
Selected data for each share of the Fund outstanding throughout each period were as follows:
|
|
| Net asset value, beginning of period |
| Income (loss) from investment operations: |
| Net investment loss1 |
| Net realized and unrealized gain |
| Total from investment operations |
| Less dividends and distributions from: |
| Net realized gain |
| Total dividends and distributions |
| Net asset value, end of period |
| Total return2 |
| Ratios and supplemental data: |
| Net assets, end of period (000 omitted) |
| Ratio of expenses to average net assets |
| Ratio of expenses to average net assets prior to fees waived |
| Ratio of net investment loss to average net assets |
| Ratio of net investment loss to average net assets prior to fees waived |
| Portfolio turnover |
|
|
| 1 | The average shares outstanding method has been applied for per share information. |
| 2 | Total investment return is based on the change in net asset value of a share during the period and assumes reinvestment of dividends and distributions at net asset value and does not reflect the impact of a sales charge. Total investment return during some of the periods shown reflects a waiver by the manager. Performance would have been lower had the waiver not been in effect. |
See accompanying notes, which are an integral part of the financial statements.
| 24 |
Table of Contents
|
|
| Year ended | ||||||||||||||||||||
| 11/30/14 | 11/30/13 | 11/30/12 | 11/30/11 | 11/30/10 | ||||||||||||||||
|
|
||||||||||||||||||||
| $ | 18.450 | $ | 12.890 | $ | 11.510 | $ | 10.720 | $ | 8.470 | |||||||||||
| (0.193 | ) | (0.152 | ) | (0.115 | ) | (0.112 | ) | (0.039 | ) | |||||||||||
| 1.351 | 5.712 | 1.495 | 0.902 | 2.289 | ||||||||||||||||
|
|
|
|
|
|
|
|
|
|
|
|||||||||||
| 1.158 | 5.560 | 1.380 | 0.790 | 2.250 | ||||||||||||||||
|
|
|
|
|
|
|
|
|
|
|
|||||||||||
| (0.498 | ) | — | — | — | — | |||||||||||||||
|
|
|
|
|
|
|
|
|
|
|
|||||||||||
| (0.498 | ) | — | — | — | — | |||||||||||||||
|
|
|
|
|
|
|
|
|
|
|
|||||||||||
| $ | 19.110 | $ | 18.450 | $ | 12.890 | $ | 11.510 | $ | 10.720 | |||||||||||
|
|
|
|
|
|
|
|
|
|
|
|||||||||||
| 6.44% | 43.14% | 11.99% | 7.37% | 26.56% | ||||||||||||||||
| $ | 51,923 | $ | 25,828 | $ | 10,051 | $ | 7,702 | $ | 8,285 | |||||||||||
| 2.07% | 2.06% | 2.11% | 2.14% | 2.15% | ||||||||||||||||
| 2.07% | 2.06% | 2.11% | 2.15% | 2.24% | ||||||||||||||||
| (1.05% | ) | (0.97% | ) | (0.92% | ) | (0.95% | ) | (0.40% | ) | |||||||||||
| (1.05% | ) | (0.97% | ) | (0.92% | ) | (0.96% | ) | (0.49% | ) | |||||||||||
| 30% | 38% | 37% | 42% | 37% | ||||||||||||||||
|
|
||||||||||||||||||||
| 25 |
Table of Contents
| Financial highlights
Delaware Small Cap Core Fund Class R |
Selected data for each share of the Fund outstanding throughout each period were as follows:
|
|
| Net asset value, beginning of period |
| Income (loss) from investment operations: |
| Net investment income (loss)1 |
| Net realized and unrealized gain |
| Total from investment operations |
| Less dividends and distributions from: |
| Net investment income |
| Net realized gain |
| Total dividends and distributions |
| Net asset value, end of period |
| Total return2 |
| Ratios and supplemental data: |
| Net assets, end of period (000 omitted) |
| Ratio of expenses to average net assets |
| Ratio of expenses to average net assets prior to fees waived |
| Ratio of net investment income (loss) to average net assets |
| Ratio of net investment loss to average net assets prior to fees waived |
| Portfolio turnover |
|
|
| 1 | The average shares outstanding method has been applied for per share information. |
| 2 | Total investment return is based on the change in net asset value of a share during the period and assumes reinvestment of dividends and distributions at net asset value. Total investment return during some of the periods shown reflects waivers by the manager and/or distributor. Performance would have been lower had the waivers not been in effect. |
See accompanying notes, which are an integral part of the financial statements.
| 26 |
Table of Contents
|
|
| Year ended | ||||||||||||||||||||
| 11/30/14 | 11/30/13 | 11/30/12 | 11/30/11 | 11/30/10 | ||||||||||||||||
|
|
||||||||||||||||||||
| $ | 19.220 | $ | 13.360 | $ | 11.870 | $ | 11.030 | $ | 8.660 | |||||||||||
| (0.106 | ) | (0.076 | ) | (0.054 | ) | (0.054 | ) | 0.009 | ||||||||||||
| 1.424 | 5.936 | 1.544 | 0.913 | 2.361 | ||||||||||||||||
|
|
|
|
|
|
|
|
|
|
|
|||||||||||
| 1.318 | 5.860 | 1.490 | 0.859 | 2.370 | ||||||||||||||||
|
|
|
|
|
|
|
|
|
|
|
|||||||||||
| — | — | — | (0.019 | ) | — | |||||||||||||||
| (0.498 | ) | — | — | — | — | |||||||||||||||
|
|
|
|
|
|
|
|
|
|
|
|||||||||||
| (0.498 | ) | — | — | (0.019 | ) | — | ||||||||||||||
|
|
|
|
|
|
|
|
|
|
|
|||||||||||
| $ | 20.040 | $ | 19.220 | $ | 13.360 | $ | 11.870 | $ | 11.030 | |||||||||||
|
|
|
|
|
|
|
|
|
|
|
|||||||||||
| 7.03% | 43.86% | 12.55% | 7.79% | 27.37% | ||||||||||||||||
| $ | 15,833 | $ | 12,785 | $ | 6,809 | $ | 5,786 | $ | 5,322 | |||||||||||
| 1.57% | 1.56% | 1.61% | 1.64% | 1.65% | ||||||||||||||||
| 1.57% | 1.64% | 1.71% | 1.75% | 1.84% | ||||||||||||||||
| (0.55% | ) | (0.47% | ) | (0.42% | ) | (0.45% | ) | 0.10% | ||||||||||||
| (0.55% | ) | (0.55% | ) | (0.52% | ) | (0.56% | ) | (0.09% | ) | |||||||||||
| 30% | 38% | 37% | 42% | 37% | ||||||||||||||||
|
|
||||||||||||||||||||
| 27 |
Table of Contents
| Financial highlights
Delaware Small Cap Core Fund Institutional Class |
Selected data for each share of the Fund outstanding throughout each period were as follows:
|
|
| Net asset value, beginning of period |
| Income (loss) from investment operations: |
| Net investment income (loss)1 |
| Net realized and unrealized gain |
| Total from investment operations |
| Less dividends and distributions from: |
| Net investment income |
| Net realized gain |
| Total dividends and distributions |
| Net asset value, end of period |
| Total return2 |
| Ratios and supplemental data: |
| Net assets, end of period (000 omitted) |
| Ratio of expenses to average net assets |
| Ratio of expenses to average net assets prior to fees waived |
| Ratio of net investment income (loss) to average net assets |
| Ratio of net investment income (loss) to average net assets prior to fees waived |
| Portfolio turnover |
|
|
| 1 | The average shares outstanding method has been applied for per share information. |
| 2 | Total investment return is based on the change in net asset value of a share during the period and assumes reinvestment of dividends and distributions at net asset value. Total investment return during some of the periods shown reflects a waiver by the manager. Performance would have been lower had the waiver not been in effect. |
See accompanying notes, which are an integral part of the financial statements.
| 28 |
Table of Contents
|
|
| Year ended | ||||||||||||||||||||
| 11/30/14 | 11/30/13 | 11/30/12 | 11/30/11 | 11/30/10 | ||||||||||||||||
|
|
||||||||||||||||||||
| $ | 19.740 | $ | 13.690 | $ | 12.100 | $ | 11.230 | $ | 8.790 | |||||||||||
| (0.011 | ) | 0.005 | 0.011 | 0.006 | 0.060 | |||||||||||||||
| 1.459 | 6.089 | 1.579 | 0.934 | 2.385 | ||||||||||||||||
|
|
|
|
|
|
|
|
|
|
|
|||||||||||
| 1.448 | 6.094 | 1.590 | 0.940 | 2.445 | ||||||||||||||||
|
|
|
|
|
|
|
|
|
|
|
|||||||||||
| — | (0.044 | ) | — | (0.070 | ) | (0.005 | ) | |||||||||||||
| (0.498 | ) | — | — | — | — | |||||||||||||||
|
|
|
|
|
|
|
|
|
|
|
|||||||||||
| (0.498 | ) | (0.044 | ) | — | (0.070 | ) | (0.005 | ) | ||||||||||||
|
|
|
|
|
|
|
|
|
|
|
|||||||||||
| $ | 20.690 | $ | 19.740 | $ | 13.690 | $ | 12.100 | $ | 11.230 | |||||||||||
|
|
|
|
|
|
|
|
|
|
|
|||||||||||
| 7.51% | 44.64% | 13.14% | 8.37% | 27.83% | ||||||||||||||||
| $ | 224,771 | $ | 81,858 | $ | 41,164 | $ | 30,923 | $ | 33,877 | |||||||||||
| 1.07% | 1.06% | 1.11% | 1.14% | 1.15% | ||||||||||||||||
| 1.07% | 1.06% | 1.11% | 1.15% | 1.24% | ||||||||||||||||
| (0.05% | ) | 0.03% | 0.08% | 0.05% | 0.60% | |||||||||||||||
| (0.05% | ) | 0.03% | 0.08% | 0.04% | 0.51% | |||||||||||||||
| 30% | 38% | 37% | 42% | 37% | ||||||||||||||||
|
|
||||||||||||||||||||
| 29 |
Table of Contents
|
Delaware Small Cap Core Fund
|
November 30, 2014
|
Delaware Group® Equity Funds V (Trust) is organized as a Delaware statutory trust and offers three series: Delaware Dividend Income Fund, Delaware Small Cap Core Fund, and Delaware Small Cap Value Fund. These financial statements and the related notes pertain to Delaware Small Cap Core Fund (Fund). The Trust is an open-end investment company. The Fund is considered diversified under the Investment Company Act of 1940, as amended, and offers Class A, Class C, Class R, and Institutional Class shares. Class A shares are sold with a maximum front-end sales charge of 5.75%. Class A share purchases of $1,000,000 or more will incur a contingent deferred sales charge (CDSC) of 1.00% if redeemed during the first year and 0.50% during the second year, provided that Delaware Distributors, L.P. (DDLP) paid a financial advisor a commission on the purchase of those shares. Class C shares are sold with a CDSC of 1.00%, if redeemed during the first 12 months. Class R and Institutional Class shares are not subject to a sales charge and are offered for sale exclusively to certain eligible investors.
The investment objective of the Fund is to seek long-term capital appreciation.
1. Significant Accounting Policies
The following accounting policies are in accordance with U.S. generally accepted accounting principles (U.S. GAAP) and are consistently followed by the Fund.
Security Valuation – Equity securities, except those traded on the Nasdaq Stock Market, Inc. (Nasdaq), are valued at the last quoted sales price as of the time of the regular close of the New York Stock Exchange on the valuation date. Securities traded on the Nasdaq are valued in accordance with the Nasdaq Official Closing Price, which may not be the last sales price. If, on a particular day an equity security does not trade, then the mean between the bid and ask prices will be used, which approximates fair value. U.S. government and agency securities are valued at the mean between the bid and ask prices, which approximates fair value. Generally, other securities and assets for which market quotations are not readily available are valued at fair value as determined in good faith under the direction of the Fund’s Board of Trustees (Board). In determining whether market quotations are readily available or fair valuation will be used, various factors will be taken into consideration, such as market closures or suspension of trading in a security.
Federal Income Taxes – No provision for federal income taxes has been made as the Fund intends to continue to qualify for federal income tax purposes as a regulated investment company under Subchapter M of the Internal Revenue Code of 1986, as amended, and make the requisite distributions to shareholders. The Fund evaluates tax positions taken or expected to be taken in the course of preparing the Fund’s tax returns to determine whether the tax positions are “more-likely-than-not” of being sustained by the applicable tax authority. Tax positions not deemed to meet the “more-likely-than-not” threshold are recorded as a tax benefit or expense in the current year. Management has analyzed the Fund’s tax positions taken for all open federal income tax years (Nov. 30, 2011–Nov. 30, 2014), and has concluded that no provision for federal income tax is required in the Fund’s financial statements.
Class Accounting – Investment income, common expenses, and realized and unrealized gain (loss) on investments are allocated to the various classes of the Fund on the basis of daily net assets of each class. Distribution expenses relating to a specific class are charged directly to that class.
| 30 |
Table of Contents
|
|
Repurchase Agreements – The Fund may purchase certain U.S. government securities subject to the counterparty’s agreement to repurchase them at an agreed upon date and price. The counterparty will be required on a daily basis to maintain the value of the collateral subject to the agreement at not less than the repurchase price (including accrued interest). The agreements are conditioned upon the collateral being deposited under the Federal Reserve book-entry system with the Fund’s custodian or a third-party sub-custodian. In the event of default or bankruptcy by the other party to the agreement, retention of the collateral may be subject to legal proceedings. All open repurchase agreements as of the date of this report were entered into on Nov. 28, 2014.
Use of Estimates – The preparation of financial statements in conformity with U.S. GAAP requires management to make estimates and assumptions that affect the fair value of investments, the reported amounts of assets and liabilities and disclosure of contingent assets and liabilities at the date of the financial statements, and the reported amounts of revenues and expenses during the reporting period. Actual results could differ from those estimates and the differences could be material.
Other – Expenses directly attributable to the Fund are charged directly to the Fund. Other expenses common to various funds within the Delaware Investments® Family of Funds are generally allocated among such funds on the basis of average net assets. Management fees and some other expenses are paid monthly. Security transactions are recorded on the date the securities are purchased or sold (trade date) for financial reporting purposes. Costs used in calculating realized gains and losses on the sale of investment securities are those of the specific securities sold. Dividend income is recorded on the ex-dividend date and interest income is recorded on the accrual basis. Distributions received from investments in Real Estate Investment Trusts (REITs) are recorded as dividend income on the ex-dividend date, subject to reclassification upon notice of the character of such distributions by the issuer. The Fund declares and pays distributions from net investment income and net realized gain on investments, if any, annually. The Fund may distribute more frequently, if necessary for tax purposes. Dividends and distributions, if any, are recorded on the ex-dividend date.
Subject to seeking best execution, the Fund may direct certain security trades to brokers who have agreed to rebate a portion of the related brokerage commission to the Fund in cash. In general, best execution refers to many factors, including the price paid or received for a security, the commission charged, the promptness and reliability of execution, the confidentiality and placement accorded the order, and other factors affecting the overall benefit obtained by the Fund on the transaction. There were no commission rebates for the year ended Nov. 30, 2014.
The Fund may receive earnings credits from its custodian when positive cash balances are maintained, which may be used to offset custody fees. There were no earnings credits for the year ended Nov. 30, 2014.
The Fund receives earnings credits from its transfer agent when positive cash balances are maintained, which may be used to offset transfer agent fees. If the amount earned is greater than one dollar, the expense paid under this arrangement is included on the “Statement of operations” under “Dividend disbursing and transfer agent fees and expenses” with the corresponding expense offset shown under “Less expense paid indirectly.” For the year ended Nov. 30, 2014, the Fund earned $118 under this agreement.
| 31 |
Table of Contents
| Notes to financial statements
Delaware Small Cap Core Fund
|
2. Investment Management, Administration Agreements and Other Transactions with Affiliates
In accordance with the terms of its investment management agreement, the Fund pays Delaware Management Company (DMC), a series of Delaware Management Business Trust and the investment manager, an annual fee which is calculated daily at the rate of 0.75% on the first $500 million of average daily net assets of the Fund, 0.70% on the next $500 million, 0.65% on the next $1.5 billion, and 0.60% on average daily net assets in excess of $2.5 billion.
Prior to March 28, 2014, DMC had contractually agreed to waive that portion, if any, of its management fee and reimburse the Fund to the extent necessary to ensure that total annual operating expenses (excluding any 12b-1 plan, taxes, interest, inverse floater program expenses, short sale and dividend interest expenses, brokerage fees, certain insurance costs, acquired fund fees and expenses, and nonroutine expenses or costs, including, but not limited to, those relating to reorganizations, litigation, conducting shareholder meetings, and liquidations, (collectively, nonroutine expenses)) did not exceed 1.15% of the Fund’s average daily net assets. For purposes of this waiver and reimbursement, nonroutine expenses may also include such additional costs and expenses as may be agreed upon from time to time by the Fund’s Board and DMC. This expense waiver and reimbursement applied only to expenses paid directly by the Fund.
Effective Nov. 1, 2014, Delaware Investments Fund Services Company (DIFSC), an affiliate of DMC, provides fund accounting and financial administration oversight services to the Fund. Prior to this time, Delaware Service Company, Inc. (DSC), an affiliate of DMC, provided fund accounting and financial administration oversight services to the Fund. For these services, the Fund pays DIFSC fees based on the aggregate daily net assets of the Delaware Investments® Family of Funds at the following annual rate: 0.0050% of the first $30 billion; 0.0045% of the next $10 billion; 0.0040% of the next $10 billion; and 0.0025% of aggregate average daily net assets in excess of $50 billion. The fees payable to DIFSC under the service agreement described above are allocated among all Funds in the Delaware Investments Family of Funds on a relative net asset value basis. For the year ended Nov. 30, 2014, the Fund was charged $13,575 for these services. This amount is included on the “Statement of operations” under “Accounting and administration expenses.”
Effective Nov 1, 2014, DIFSC is the transfer agent and dividend disbursing agent of the Fund. Prior to this time, DSC was the transfer agent and dividend disbursing agent of the Fund. For these services, the Fund pays DIFSC fees based on the aggregate daily net assets of the retail funds within the Delaware Investments Family of Funds at the following annual rate: 0.025% of the first $20 billion; 0.020% of the next $5 billion; 0.015% of the next $5 billion; and 0.013% on average daily net assets in excess of $30 billion. This amount is included on the “Statement of operations” under “Dividend disbursing and transfer agent fees and expenses.” For the year ended Nov. 30, 2014, the Fund was charged $61,063 for these services. Pursuant to a sub-transfer agency agreement between DIFSC and BNY Mellon Investment Servicing (US) Inc. (BNYMIS), BNYMIS provides certain sub-transfer agency services to the Fund. Sub-transfer agency fees are passed on to and paid directly by the Fund.
Pursuant to a distribution agreement and distribution plan, the Fund pays DDLP, the distributor and an affiliate of DMC, an annual distribution and service fee of 0.25% of the average daily net assets of the Class A shares, 1.00% of the average daily net assets of the Class C shares, and 0.50% of the average daily net assets of the R shares. Institutional Class shares pay no distribution and service expenses.
| 32 |
Table of Contents
|
|
As provided in the investment management agreement, the Fund bears a portion of the cost of resources shared with DMC, including the cost of internal personnel of DMC and/or its affiliates that provide legal, tax, and regulatory reporting services to the Fund. For the year ended Nov. 30, 2014, the Fund was charged $7,872 for internal legal, tax, and regulatory reporting services provided by DMC and/or its affiliates’ employees. This amount is included on the “Statement of operations” under “Legal fees.”
For the year ended Nov. 30, 2014, DDLP earned $60,142 for commissions on sales of the Fund’s Class A shares. For the year ended Nov. 30, 2014, DDLP received gross CDSC commissions of $40 and $1,594 on redemptions of the Fund’s Class A and Class C shares, respectively, and these commissions were entirely used to offset upfront commissions previously paid by DDLP to broker/dealers on sales of those shares.
Trustees’ fees include expenses accrued by the Fund for each Trustee’s retainer and meeting fees. Certain officers of DMC, DIFSC, and DDLP are officers and/or Trustees of the Trust. These officers and Trustees are paid no compensation by the Fund.
3. Investments
For the year ended Nov. 30, 2014, the Fund made purchases and sales of investment securities other than short-term investments as follows:
| Purchases |
$ | 296,453,498 | ||
| Sales |
84,246,855 |
At Nov. 30, 2014, the cost of investments and unrealized appreciation (depreciation) for federal income tax purposes were as follows:
| Cost of investments |
$ | 381,984,753 | ||
|
|
|
|||
| Aggregate unrealized appreciation |
$ | 56,405,829 | ||
| Aggregate unrealized depreciation |
(11,695,894 | ) | ||
|
|
|
|||
| Net unrealized appreciation |
$ | 44,709,935 | ||
|
|
|
U.S. GAAP defines fair value as the price that the Fund would receive to sell an asset or pay to transfer a liability in an orderly transaction between market participants at the measurement date under current market conditions. A three-level hierarchy for fair value measurements has been established based upon the transparency of inputs to the valuation of an asset or liability. Inputs may be observable or unobservable and refer broadly to the assumptions that market participants would use in pricing the asset or liability. Observable inputs reflect the assumptions market participants would use in pricing the asset or liability based on market data obtained from sources independent of the reporting entity. Unobservable inputs reflect the reporting entity’s own assumptions about the assumptions that market participants would use in pricing the asset or liability based on the best information available under the circumstances. The Fund’s investment in its entirety is assigned a level based upon the observability of the inputs which are significant to the overall valuation. The three-level hierarchy of inputs is summarized below.
| Level 1 – | Inputs are quoted prices in active markets for identical investments. (Examples: equity securities, open-end investment companies, futures contracts, exchange-traded options contracts) |
| 33 |
Table of Contents
| Notes to financial statements
Delaware Small Cap Core Fund
|
3. Investments (continued)
| Level 2 – | Other observable inputs, including, but not limited to: quoted prices for similar assets or liabilities in markets that are active, quoted prices for identical or similar assets or liabilities in markets that are not active, inputs other than quoted prices that are observable for the assets or liabilities (such as interest rates, yield curves, volatilities, prepayment speeds, loss severities, credit risks, and default rates), or other market-corroborated inputs. (Examples: debt securities, government securities, swap contracts, foreign currency exchange contracts, foreign securities utilizing international fair value pricing, broker-quoted securities, fair valued securities) | |
| Level 3 – | Significant unobservable inputs, including the Fund’s own assumptions used to determine the fair value of investments. (Examples: broker-quoted securities, fair valued securities) | |
Level 3 investments are valued using significant unobservable inputs. The Fund may also use an income-based valuation approach in which the anticipated future cash flows of the investment are discounted to calculate fair value. Discounts may also be applied due to the nature or duration of any restrictions on the disposition of the investments. Valuations may also be based upon current market prices of securities that are comparable in coupon, rating, maturity, and industry. The derived value of a Level 3 investment may not represent the value which is received upon disposition and this could impact the results of operations.
The following table summarizes the valuation of the Fund’s investments by fair value hierarchy levels as of Nov. 30, 2014:
| Level 1 | Level 2 | Total | ||||||||||
| Common Stock |
$ | 417,719,583 | $ | — | $ | 417,719,583 | ||||||
| Short-Term Investments |
— | 8,975,105 | 8,975,105 | |||||||||
|
|
|
|
|
|
|
|||||||
| Total |
$ | 417,719,583 | $ | 8,975,105 | $ | 426,694,688 | ||||||
|
|
|
|
|
|
|
|||||||
During the year ended Nov. 30, 2014, there were no transfers between Level 1 investments, Level 2 investments, or Level 3 investments that had a significant impact to the Fund. The Fund’s policy is to recognize transfers between levels at the beginning of the reporting period.
A reconciliation of Level 3 investments is presented when the Fund has a significant amount of Level 3 investments at the beginning, interim, or end of the period in relation to net assets. At Nov. 30, 2014, there were no Level 3 investments.
| 34 |
Table of Contents
|
|
4. Dividend and Distribution Information
Income and long-term capital gain distributions are determined in accordance with federal income tax regulations, which may differ from U.S. GAAP. Additionally, distributions from net short-term gains on sales of investment securities are treated as ordinary income for federal income tax purposes. The tax character of dividends and distributions paid during the years ended Nov. 30, 2014 and 2013 was as follows:
| Year ended | ||||||||
| 11/30/14 | 11/30/13 | |||||||
| Long-term capital gain |
$ | 5,030,102 | $ | 155,951 | ||||
5. Components of Net Assets on a Tax Basis
As of Nov. 30, 2014, the components of net assets on a tax basis were as follows:
| Shares of beneficial interest |
$ | 360,706,700 | ||
| Undistributed ordinary income |
2,417,350 | |||
| Undistributed long-term capital gain |
20,762,727 | |||
| Unrealized appreciation |
44,709,935 | |||
|
|
|
|||
| Net assets |
$ | 428,596,712 | ||
|
|
|
The differences between book basis and tax basis components of net assets are primarily attributable to tax deferral of losses on wash sales.
For financial reporting purposes, capital accounts are adjusted to reflect the tax character of permanent book/tax differences. Reclassifications are primarily due to net operating losses. Results of operations and net assets were not affected by these reclassifications. For the year ended Nov. 30, 2014, the Fund recorded the following reclassifications:
| Distributions in excess of net investment income |
$ | 1,215,610 | ||
| Accumulated net realized loss |
(1,215,610 | ) |
| 35 |
Table of Contents
| Notes to financial statements
Delaware Small Cap Core Fund
|
6. Capital Shares
Transactions in capital shares were as follows:
| Year ended | ||||||||
| 11/30/14 | 11/30/13 | |||||||
| Shares sold: |
||||||||
| Class A |
4,608,007 | 2,308,325 | ||||||
| Class C |
1,557,859 | 724,461 | ||||||
| Class R |
328,816 | 283,583 | ||||||
| Institutional Class |
7,723,938 | 1,783,487 | ||||||
| Shares issued upon reinvestment of dividends and distributions: |
||||||||
| Class A |
93,554 | 1,609 | ||||||
| Class C |
39,779 | — | ||||||
| Class R |
18,094 | — | ||||||
| Institutional Class |
107,254 | 9,390 | ||||||
|
|
|
|
|
|||||
| 14,477,301 | 5,110,855 | |||||||
|
|
|
|
|
|||||
| Shares redeemed: |
||||||||
| Class A |
(1,591,486 | ) | (608,787 | ) | ||||
| Class C |
(281,153 | ) | (104,432 | ) | ||||
| Class R |
(221,884 | ) | (128,048 | ) | ||||
| Institutional Class |
(1,116,020 | ) | (651,586 | ) | ||||
|
|
|
|
|
|||||
| (3,210,543 | ) | (1,492,853 | ) | |||||
|
|
|
|
|
|||||
| Net increase |
11,266,758 | 3,618,002 | ||||||
|
|
|
|
|
|||||
Certain shareholders may exchange shares of one class for shares of another class. For the year ended Nov. 30, 2014, exchange transactions were as follows:
| Exchange Redemptions | Exchange Subscriptions | |||
| Class C Shares |
Institutional Class Shares |
Value | ||
| 686 |
634 | $13,073 |
These exchange transactions are included as subscriptions and redemptions in the table above and on the “Statements of changes in net assets.”
7. Line of Credit
The Fund, along with certain other funds in the Delaware Investments® Family of Funds (Participants), was a participant in a $225,000,000 revolving line of credit intended to be used for temporary or emergency purposes as an additional source of liquidity to fund redemptions of investor shares. Under the agreement, the Participants were charged an annual commitment fee of 0.08%, which was allocated across the Participants on the basis of each Participant’s allocation of the entire facility. The Participants were permitted to borrow up to a maximum of one third of their net assets under the agreement. Each
| 36 |
Table of Contents
|
|
Participant was individually, and not jointly, liable for its particular advances, if any, under the line of credit. The line of credit available under the agreement expired on Nov. 10, 2014.
On Nov. 10, 2014, each Fund, along with the other Participants, entered into an amendment to the agreement for a $275,000,000 revolving line of credit. The line of credit is to be used as described above and operates in substantially the same manner as the original agreement. The line of credit available under the agreement expires on Nov. 9, 2015.
The Fund had no amounts outstanding as of Nov. 30, 2014 or at any time during the period then ended.
8. Offsetting
In December 2011, the Financial Accounting Standards Board (FASB) issued guidance that expands current disclosure requirements on the offsetting of certain assets and liabilities. The new disclosures are required for investments and derivative financial instruments subject to master netting or similar agreements which are eligible for offset in the “Statement of assets and liabilities” and require an entity to disclose both gross and net information about such investments and transactions in the financial statements. In January 2013, the FASB issued guidance that clarifies which investments and transactions are subject to the offsetting disclosure requirements. The scope of the disclosure requirements for offsetting is limited to derivative instruments, repurchase agreements and reverse repurchase agreements, and securities borrowing. The guidance is effective for financial statements with fiscal years beginning on or after Jan. 1, 2013, and interim periods within those fiscal years. The Fund adopted the disclosure provisions on offsetting during the current reporting period.
In order to better define its contractual rights and to secure rights that will help the Fund mitigate its counterparty risk, the Fund entered into an International Swaps and Derivatives Association, Inc. Master Agreement (ISDA Master Agreement) or a similar agreement with each of its derivative contract counterparties. An ISDA Master Agreement is a bilateral agreement between the Fund and a counterparty that governs certain over-the-counter (OTC) derivatives and foreign exchange contracts and typically contains, among other things, collateral posting items and netting provisions in the event of a default and/or termination event. Under an ISDA Master Agreement, the Fund may, under certain circumstances, offset with the counterparty certain derivative financial instruments’ payables and/or receivables with collateral held and/or posted and create one single net payment. The provisions of the ISDA Master Agreement typically permit a single net payment in the event of default (close-out) including the bankruptcy or insolvency of the counterparty. However, bankruptcy or insolvency laws of a particular jurisdiction may impose restrictions on or prohibitions against the right of offset in bankruptcy, insolvency or other events.
For financial reporting purposes, the Fund does not offset derivative assets and derivative liabilities that are subject to netting arrangements on the “Statement of assets and liabilities.”
| 37 |
Table of Contents
| Notes to financial statements
Delaware Small Cap Core Fund
|
8. Offsetting (continued)
At Nov. 30, 2014, the Fund had the following assets and liabilities subject to offsetting provisions:
Master Repurchase Agreements
| Counterparty |
Repurchase Agreements | Fair Value of Non-Cash Collateral Received |
Cash Collateral Received |
Net Amount(a) | ||||||||||||||||
| Bank of America |
$ | 1,364,479 | $ | (1,364,479 | ) | $ | — | $ | — | |||||||||||
| Bank of Montreal |
454,827 | (454,827 | ) | — | — | |||||||||||||||
| BNP Paribas |
2,050,694 | (2,050,694 | ) | — | — | |||||||||||||||
|
|
|
|
|
|
|
|
|
|||||||||||||
| Total |
$ | 3,870,000 | $ | (3,870,000 | ) | $ | — | $ | — | |||||||||||
|
|
|
|
|
|
|
|
|
|||||||||||||
(a) Net amount represents the receivable/(payable) that would be due from/(to) the counterparty in the event of default.
9. Securities Lending
The Fund, along with other funds in the Delaware Investments® Family of Funds, may lend its securities pursuant to a security lending agreement (Lending Agreement) with The Bank of New York Mellon (BNY Mellon). At the time a security is loaned, the borrower must post collateral equal to the required percentage of the market value of the loaned security, including any accrued interest. The required percentage is: (1) 102% with respect to U.S. securities and foreign securities that are denominated and payable in U.S. dollars; and (2) 105% with respect to foreign securities. With respect to each loan, if on any business day the aggregate market value of securities collateral plus cash collateral held is less than the aggregate market value of the securities which are the subject of such loan, the borrower will be notified to provide additional collateral by the end of the following business day which, together with the collateral already held, will be not less than the applicable initial collateral requirements for such security loan. If the aggregate market value of securities collateral and cash collateral held with respect to a security loan exceeds the applicable initial collateral requirement, upon the request of the borrower, BNY Mellon must return enough collateral to the borrower by the end of the following business day to reduce the value of the remaining collateral to the applicable initial collateral requirement for such security loan. As a result of the foregoing, the value of the collateral held with respect to a loaned security on any particular day may be more or less than the value of the security on loan.
Cash collateral received is generally invested in the Delaware Investments Collateral Fund No. 1 (Collective Trust) established by BNY Mellon for the purpose of investment on behalf of funds managed by DMC that participate in BNY Mellon’s securities lending program. The Collective Trust may invest in U.S. government securities and high-quality corporate debt, asset-backed and other money market securities, and in repurchase agreements collateralized by such securities, provided that the Collective Trust will generally have a dollar-weighted average portfolio maturity of 60 days or less. The Fund can also accept U.S. government securities and letters of credit (non-cash collateral) in connection with securities loans. In the event of default or bankruptcy by the lending agent, realization and/or retention of the collateral may be subject to legal proceedings. In the event the borrower fails to return loaned securities and the collateral received is insufficient to cover the value of the loaned securities and provided such collateral shortfall is not the result of investment losses, the lending agent has agreed to
| 38 |
Table of Contents
|
|
pay the amount of the shortfall to the Fund or, at the discretion of the lending agent, replace the loaned securities. The Fund continues to record dividends or interest, as applicable, on the securities loaned and is subject to changes in value of the securities loaned that may occur during the term of the loan. The Fund has the right under the Lending Agreement to recover the securities from the borrower on demand. With respect to security loans collateralized by non-cash collateral, the Fund receives loan premiums paid by the borrower. With respect to security loans collateralized by cash collateral, the earnings from the collateral investments are shared among the Fund, the security lending agent, and the borrower. The Fund records security lending income net of allocations to the security lending agent and the borrower.
The Collective Trust used for the investment of cash collateral received from borrowers of securities seeks to maintain a net asset value per unit of $1.00, but there can be no assurance that it will always be able to do so. The Fund may incur investment losses as a result of investing securities lending collateral in the Collective Trust. This could occur if an investment in the Collective Trust defaulted or if it were necessary to liquidate assets in the Collective Trust to meet returns on outstanding security loans at a time when the Collective Trust’s net asset value per unit was less than $1.00. Under those circumstances, the Fund may not receive an amount from the Collective Trust that is equal in amount to the collateral the Fund would be required to return to the borrower of the securities and the Fund would be required to make up for this shortfall.
During the year ended Nov. 30, 2014, the Fund had no securities out on loan.
10. Credit and Market Risk
The Fund invests a significant portion of its assets in small-sized companies and may be subject to certain risks associated with ownership of securities of such companies. Investments in small-sized companies may be more volatile than investments in larger companies for a number of reasons, which include more limited financial resources or a dependence on narrow product lines.
The Fund invests in REITs and is subject to the risks associated with that industry. If the Fund holds real estate directly as a result of defaults or receives rental income directly from real estate holdings, its tax status as a regulated investment company may be jeopardized. There were no direct real estate holdings during the year ended Nov. 30, 2014. The Fund’s REIT holdings are also affected by interest rate changes, particularly if the REITs it holds use floating rate debt to finance their ongoing operations.
The Fund may invest up to 15% of its net assets in illiquid securities, which may include securities with contractual restrictions on resale, securities exempt from registration under Rule 144A of the Securities Act of 1933, as amended, and other securities which may not be readily marketable. The relative illiquidity of these securities may impair the Fund from disposing of them in a timely manner and at a fair price when it is necessary or desirable to do so. While maintaining oversight, the Fund’s Board has delegated to DMC the day-to-day functions of determining whether individual securities are liquid for purposes of the Fund’s limitation on investments in illiquid securities. Securities eligible for resale pursuant to Rule 144A, which are determined to be liquid, are not subject to the Fund’s 15% limit on investments in illiquid securities. As of Nov. 30, 2014, there were no Rule 144A securities held by the Fund. Illiquid securities have been identified on the “Schedule of investments.”
| 39 |
Table of Contents
| Notes to financial statements
Delaware Small Cap Core Fund
|
11. Contractual Obligations
The Fund enters into contracts in the normal course of business that contain a variety of indemnifications. The Fund’s maximum exposure under these arrangements is unknown. However, the Fund has not had prior claims or losses pursuant to these contracts. Management has reviewed the Fund’s existing contracts and expects the risk of loss to be remote.
12. Recent Accounting Pronouncements
In June 2014, the Financial Accounting Standards Board issued guidance to improve the financial reporting of reverse repurchase agreements and other similar transactions. The guidance includes expanded disclosure requirements for entities that enter into reverse repurchase agreements and similar transactions accounted for as secured borrowings. The guidance is effective for financial statements with fiscal years beginning on or after December 15, 2014 and interim periods within those fiscal years. Management is evaluating the impact, if any, of this guidance on the Fund’s financial statement disclosures.
13. Subsequent Events
Management has determined that no material events or transactions occurred subsequent to Nov. 30, 2014 that would require recognition or disclosure in the Fund’s financial statements.
| 40 |
Table of Contents
registered public accounting firm
To the Board of Trustees of Delaware Group® Equity Funds V
and Shareholders of Delaware Small Cap Core Fund:
In our opinion, the accompanying statement of assets and liabilities, including the schedule of investments, and the related statements of operations and of changes in net assets and the financial highlights present fairly, in all material respects, the financial position of Delaware Small Cap Core Fund (one of the series constituting Delaware Group Equity Funds V, hereafter referred to as the “Fund”) at November 30, 2014, the results of its operations for the year then ended, the changes in its net assets for each of the two years in the period then ended and the financial highlights for each of the five years in the period then ended, in conformity with accounting principles generally accepted in the United States of America. These financial statements and financial highlights (hereafter referred to as “financial statements”) are the responsibility of the Fund’s management. Our responsibility is to express an opinion on these financial statements based on our audits. We conducted our audits of these financial statements in accordance with the standards of the Public Company Accounting Oversight Board (United States). Those standards require that we plan and perform the audit to obtain reasonable assurance about whether the financial statements are free of material misstatement. An audit includes examining, on a test basis, evidence supporting the amounts and disclosures in the financial statements, assessing the accounting principles used and significant estimates made by management, and evaluating the overall financial statement presentation. We believe that our audits, which included confirmation of securities at November 30, 2014 by correspondence with the custodian and brokers, and the application of alternative auditing procedures where confirmations of security purchases had not been received, provide a reasonable basis for our opinion.
PricewaterhouseCoopers LLP
Philadelphia, Pennsylvania
January 22, 2015
41
Table of Contents
| Other Fund information (Unaudited)
Delaware Small Cap Core Fund
|
Tax Information
The information set forth below is for the Fund’s fiscal year as required by federal income tax laws. Shareholders, however, must report distributions on a calendar year basis for income tax purposes, which may include distributions for portions of two fiscal years of the Fund. Accordingly, the information needed by shareholders for income tax purposes will be sent to them in January of each year. Please consult your tax advisor for proper treatment of this information.
All disclosures are based on financial information available as of the date of this annual report and, accordingly are subject to change. For any and all items requiring reporting, it is the intention of the Fund to report the maximum amount permitted under the Internal Revenue Code and the regulations thereunder.
For the fiscal year ended Nov. 30, 2014, the Fund reports distributions paid during the year as follows:
| (A) Long-Term Capital Gain Distributions (Tax Basis) |
100.00 | % |
Board consideration of Delaware Small Cap Core Fund investment management agreement
At a meeting held on Aug. 19–21, 2014 (the “Annual Meeting”), the Board of Trustees (the “Board”), including a majority of disinterested or independent Trustees, approved the renewal of the Investment Management Agreement for Delaware Small Cap Core Fund (the “Fund”). In making its decision, the Board considered information furnished at regular quarterly Board meetings, including reports detailing Fund performance, investment strategies and expenses, as well as information prepared specifically in connection with the renewal of the investment advisory and sub-advisory contracts. Information furnished specifically in connection with the renewal of the Investment Management Agreement with Delaware Management Company (“DMC”) included materials provided by DMC and its affiliates (“Delaware Investments”) concerning, among other things, the nature, extent and quality of services provided to the Fund, the costs of such services to the Fund, economies of scale and the financial condition and profitability of Delaware Investments. In addition, in connection with the Annual Meeting, reports were provided to the Trustees in May 2014 and included reports provided by Lipper, Inc., an independent statistical compilation organization (“Lipper”). The Lipper reports compared the Fund’s investment performance and expenses with those of other comparable mutual funds. The Independent Trustees reviewed and discussed the Lipper reports with independent legal counsel to the Independent Trustees. The Board requested and received information regarding DMC’s policy with respect to advisory fee levels and its breakpoint philosophy; the structure of portfolio manager compensation; the investment manager’s profitability; comparative client fee information; and any constraints or limitations on the availability of securities for certain investment styles, which had in the past year inhibited, or which were likely in the future to inhibit, DMC’s ability to invest fully in accordance with Fund policies.
In considering information relating to the approval of the Fund’s advisory agreement, the Independent Trustees received assistance and advice from and met separately with independent legal counsel to the Independent Trustees. Although the Board gave attention to all information furnished, the following discussion identifies, under separate headings, the primary factors taken into account by the Board during its contract renewal considerations.
| 42 |
Table of Contents
|
|
Nature, Extent and Quality of Service. The Board considered the services provided by Delaware Investments to the Fund and its shareholders. In reviewing the nature, extent and quality of services, the Board considered reports furnished to it throughout the year, which covered matters such as the relative performance of the Fund, compliance of portfolio managers with the investment policies, strategies and restrictions for the Fund, compliance by DMC and Delaware Distributors, L.P. (together, “Management”) personnel with the Code of Ethics adopted throughout the Delaware Investments® Family of Funds complex and adherence to fair value pricing procedures as established by the Board. The Board was pleased with the current staffing of the Fund’s investment manager and the emphasis placed on research in the investment process. The Board recognized DMC’s receipt of several industry distinctions. The Board gave favorable consideration to DMC’s efforts to control expenditures while maintaining service levels committed to Fund matters. The Board noted that, in the third and fourth quarters of 2013, Management reduced the maximum 12b-1 fee for certain funds; and in November 2013 Management negotiated a substantial reduction in fees for fund accounting services provided to the Funds. The Board noted the benefits provided to Fund shareholders through each shareholder’s ability to exchange an investment in one Delaware Investments fund for the same class of shares in another Delaware Investments fund without a sales charge, to reinvest Fund dividends into additional shares of the Fund or into additional shares of other Delaware Investments funds and the privilege to combine holdings in other Delaware Investments funds to obtain a reduced sales charge. The Board was satisfied with the nature, extent and quality of the overall services provided by Delaware Investments.
Investment Performance. The Board placed significant emphasis on the investment performance of the Fund in view of the importance of investment performance to shareholders. Although the Board gave appropriate consideration to performance reports and discussions with portfolio managers at Investment Committee meetings throughout the year, the Board gave particular weight to the Lipper reports furnished for the Annual Meeting. The Lipper reports prepared for the Fund showed the investment performance of its Class A shares in comparison to a group of similar funds as selected by Lipper (the “Performance Universe”). A fund with the best performance ranked first, and a fund with the poorest performance ranked last. The highest/best performing 25% of funds in the Performance Universe make up the first quartile; the next 25%, the second quartile; the next 25%, the third quartile; and the poorest/ worst performing 25% of funds in the Performance Universe make up the fourth quartile. Comparative annualized performance for the Fund was shown for the past 1-, 3-, 5- and 10-year periods, to the extent applicable, ended March 31, 2014. The Board’s objective is that the Fund’s performance for the periods considered be at or above the median of its Performance Universe. The following paragraph summarizes the performance results for the Fund and the Board’s view of such performance.
The Performance Universe for the Fund consisted of the Fund and all retail and institutional small-cap core funds as selected by Lipper. The Lipper report comparison showed that the Fund’s total return for the 1-, 3- and 5-year periods was in the first quartile of its Performance Universe. The report further showed that the Fund’s total return for the 10-year period was in the second quartile of its Performance Universe. The Board was satisfied with performance.
Comparative Expenses. The Board considered expense comparison data for the Delaware Investments Family of Funds. Management provided the Board with information on pricing levels and fee structures for the Fund as of its most recently completed fiscal year. The Board also focused on the comparative
| 43 |
Table of Contents
| Other Fund information (Unaudited)
Delaware Small Cap Core Fund
|
Board consideration of Delaware Small Cap Core Fund investment management agreement (continued)
analysis of effective management fees and total expense ratios of the Fund versus effective management fees and expense ratios of a group of similar funds as selected by Lipper (the “Expense Group”). In reviewing comparative costs, the Fund’s contractual management fee and the actual management fee incurred by the Fund were compared with the contractual management fees (assuming all funds in the Expense Group were similar in size to the Fund) and actual management fees (as reported by each fund) within the Expense Group, taking into account any applicable breakpoints and fee waivers. The Fund’s total expenses were also compared with those of its Expense Group. The Lipper total expenses, for comparative consistency, were shown by Lipper for Class A shares and comparative total expenses including 12b-1 and non 12b-1 service fees. The Board considered fees paid to Delaware Investments for non-management services. The Board’s objective is to limit the Fund’s total expense ratio to be competitive with that of the Expense Group. The following paragraph summarizes the expense results for the Fund and the Board’s view of such expenses.
The expense comparisons for the Fund showed that its actual management fee was in the quartile with the second lowest expenses of its Expense Group and its total expenses were in the quartile with the lowest expenses of its Expense Group. The Board was satisfied with the management fee and total expenses of the Fund in comparison to those of its Expense Group as shown in the Lipper report.
Management Profitability. The Board considered the level of profits realized by Delaware Investments in connection with the operation of the Fund. In this respect, the Board reviewed the Investment Management Profitability Analysis that addressed the overall profitability of Delaware Investments’ business in providing management and other services to each of the individual funds and the Delaware Investments® Family of Funds as a whole. Specific attention was given to the methodology followed in allocating costs for the purpose of determining profitability. Management stated that the level of profits of Delaware Investments, to a certain extent, reflects recent operational cost savings and efficiencies initiated by Delaware Investments. The Board considered Delaware Investments’ efforts to improve services provided to fund shareholders and to meet additional regulatory and compliance requirements resulting from recent industry-wide Securities and Exchange Commission initiatives. The Board also considered the extent to which Delaware Investments might derive ancillary benefits from fund operations, including the potential for procuring additional business as a result of the prestige and visibility associated with its role as service provider to the Delaware Investments® Family of Funds and the benefits from allocation of fund brokerage to improve trading efficiencies. The Board found that the management fees were reasonable in light of the services rendered and the level of profitability of Delaware Investments.
Economies of Scale. The Trustees considered whether economies of scale are realized by Delaware Investments as the Fund’s assets increase and the extent to which any economies of scale are reflected in the level of management fees charged. The Trustees reviewed the standardized advisory fee pricing and structure, approved by the Board and shareholders, which includes breakpoints. Breakpoints in the advisory fee occur when the advisory fee rate is reduced on assets in excess of specified levels. Breakpoints result in a lower advisory fee than would otherwise be the case on all assets when the asset levels specified are exceeded. The Board noted that the fee under the Fund’s management contract fell
| 44 |
Table of Contents
|
|
within the standard structure. Although the Fund has not reached a size at which it can take advantage of breakpoints, the Board recognized that the fee was structured so that when the Fund grows, economies of scale may be shared.
| 45 |
Table of Contents
Board of trustees / directors and officers addendum
Delaware Investments® Family of Funds
A mutual fund is governed by a Board of Trustees / Directors (“Trustees”), which has oversight responsibility for the management of a fund’s business affairs. Trustees establish procedures and oversee and review the performance of the investment manager, the distributor, and others who perform services for the fund. The independent fund trustees, in particular, are advocates
| Name, Address, and Birth Date |
Position(s) Held with Fund(s) |
Length of Time Served | ||
| Interested Trustee | ||||
| Patrick P. Coyne1 | Chairman, President, | Chairman and Trustee | ||
| 2005 Market Street | Chief Executive Officer, | since August 16, 2006 | ||
| Philadelphia, PA 19103 | and Trustee | |||
| April 1963 | President and | |||
| Chief Executive Officer | ||||
| since August 1, 2006
| ||||
| Independent Trustees | ||||
| Thomas L. Bennett | Trustee | Since March 2005 | ||
| 2005 Market Street | ||||
| Philadelphia, PA 19103 | ||||
| October 1947
|
||||
|
Joseph W. Chow |
Trustee | Since January 2013 | ||
| 2005 Market Street | ||||
| Philadelphia, PA 19103 | ||||
| January 1953
|
||||
|
John A. Fry |
Trustee | Since January 2001 | ||
| 2005 Market Street | ||||
| Philadelphia, PA 19103 | ||||
| May 1960
|
||||
| 1 | Patrick P. Coyne is considered to be an “Interested Trustee” because he is an executive officer of the Fund’s(s’) investment advisor. |
46
Table of Contents
|
|
for shareholder interests. Each trustee has served in that capacity since he or she was elected to or appointed to the Board of Trustees, and will continue to serve until his or her retirement or the election of a new trustee in his or her place. The following is a list of the Trustees and Officers with certain background and related information.
| Principal Occupation(s) During the Past Five Years |
Number of Portfolios in by Trustee or Officer |
Other Directorships Held by Trustee or Officer | ||
| Patrick P. Coyne has served in | 65 | Board of Governors Member | ||
| various executive capacities | Investment Company | |||
| at different times at | Institute (ICI) | |||
| Delaware Investments.2 | ||||
| Director and Audit | ||||
| Committee Member | ||||
| Kaydon Corp. | ||||
| (2007–2013) | ||||
| Private Investor | 65 | Director | ||
| (March 2004–Present) | Bryn Mawr Bank Corp. (BMTC) | |||
| (2007–2011)
| ||||
|
Executive Vice President |
65 | Director and Audit Committee | ||
| (Emerging Economies | Member — Hercules | |||
| Strategies, Risk and | Technology Growth | |||
| Corporate Administration) | Capital, Inc. | |||
| State Street Corporation | (2004-2014) | |||
| (July 2004–March 2011)
|
||||
|
President |
65 | Director — Hershey Trust | ||
| Drexel University | Company | |||
| (August 2010–Present) | ||||
| Director, Audit Committee, | ||||
| President | and Governance Committee | |||
| Franklin & Marshall College | Member Community | |||
| (July 2002–July 2010)
|
Health Systems |
| 2 | Delaware Investments is the marketing name for Delaware Management Holdings, Inc. and its subsidiaries, including the Fund’s(s’) investment advisor, principal underwriter, and its transfer agent. |
| 47 |
Table of Contents
| Board of trustees / directors and officers addendum
Delaware Investments® Family of Funds
|
| Name, Address, and Birth Date |
Position(s) Held with Fund(s) |
Length of Time Served | ||
| Independent Trustees (continued) | ||||
| Lucinda S. Landreth | Trustee | Since March 2005 | ||
| 2005 Market Street | ||||
| Philadelphia, PA 19103 | ||||
| June 1947
|
||||
|
Frances A. Sevilla-Sacasa |
Trustee | Since September 2011 | ||
| 2005 Market Street | ||||
| Philadelphia, PA 19103 | ||||
| January 1956
|
||||
| Thomas K. Whitford | Trustee | Since January 2013 | ||
| 2005 Market Street | ||||
| Philadelphia, PA 19103 | ||||
| March 1956
|
||||
| 48 |
Table of Contents
|
|
| Number of Portfolios in | ||||
| Principal Occupation(s) | Fund Complex Overseen | Other Directorships | ||
| During the Past Five Years | by Trustee or Officer | Held by Trustee or Officer | ||
| Private Investor | 65 | None | ||
| (2004–Present)
|
||||
|
Chief Executive Officer — |
65 | Trust Manager and | ||
| Banco Itaú | Audit Committee | |||
| International | Member — Camden | |||
| (April 2012–Present)
|
Property Trust | |||
| Executive Advisor to Dean | ||||
| (August 2011–March 2012) and Interim Dean |
||||
| (January 2011–July 2011) — | ||||
| University of Miami School of | ||||
| Business Administration
|
||||
| President — U.S. Trust, | ||||
| Bank of America Private | ||||
| Wealth Management | ||||
| (Private Banking) | ||||
| (July 2007–December 2008)
|
||||
|
Vice Chairman |
65 | Director — HSBC Finance | ||
| (2010–April 2013) | Corporation and HSBC | |||
| Chief Administrative | North America Holdings Inc. | |||
| Officer (2008–2010) and Executive Vice |
||||
| President and Chief | ||||
| Administrative Officer | ||||
| (2007–2009) — | ||||
| PNC Financial | ||||
| Services Group
|
||||
| 49 |
Table of Contents
| Board of trustees / directors and officers addendum
Delaware Investments® Family of Funds
|
| Name, Address, | Position(s) | Length of | ||
| and Birth Date | Held with Fund(s) | Time Served | ||
| Independent Trustees (continued) | ||||
| Janet L. Yeomans | Trustee | Since April 1999 | ||
| 2005 Market Street | ||||
| Philadelphia, PA 19103 | ||||
| July 1948
|
||||
| J. Richard Zecher | Trustee | Since March 2005 | ||
| 2005 Market Street | ||||
| Philadelphia, PA 19103 | ||||
| July 1940
|
||||
| 50 |
Table of Contents
|
|
| Number of Portfolios in | ||||
| Principal Occupation(s) | Fund Complex Overseen | Other Directorships | ||
| During the Past Five Years | by Trustee or Officer | Held by Trustee or Officer | ||
| Vice President and Treasurer | 65 | Director, Audit and | ||
| (January 2006–July 2012) | Compliance Committee Chair, | |||
| Vice President — | Investment Committee | |||
| Mergers & Acquisitions | Member and Governance | |||
| (January 2003–January 2006), | Committee Member | |||
| and Vice President | Okabena Company | |||
| and Treasurer | ||||
| (July 1995–January 2003) | Chair — 3M | |||
| 3M Corporation | Investment Management | |||
| Company | ||||
| (2005–2012)
| ||||
|
Founder |
65 |
Director and Compensation | ||
| Investor Analytics | Committee Chairman | |||
| (Risk Management) | Investor Analytics | |||
| (May 1999–Present) | ||||
| Director — P/E Investments | ||||
| Founder | ||||
| P/E Investments | ||||
| (Hedge Fund) | ||||
| (September 1996–Present)
|
||||
| 51 |
Table of Contents
| Board of trustees / directors and officers addendum
Delaware Investments® Family of Funds
|
| Name, Address, | Position(s) | Length of | ||
| and Birth Date | Held with Fund(s) | Time Served | ||
| Officers | ||||
| David F. Connor | Senior Vice President, | Senior Vice President, | ||
| 2005 Market Street | Deputy General | Deputy General Counsel | ||
| Philadelphia, PA 19103 | Counsel, and Secretary | since May 2013; | ||
| December 1963 | Vice President, Deputy | |||
| General Counsel | ||||
| September 2000 – | ||||
| May 2013; Secretary since | ||||
| October 2005 | ||||
| Daniel V. Geatens | Vice President | Treasurer since October 2007 | ||
| 2005 Market Street | and Treasurer | |||
| Philadelphia, PA 19103 | ||||
| October 1972 | ||||
| David P. O’Connor | Executive Vice President, | Executive Vice President | ||
| 2005 Market Street | General Counsel | since February 2012; | ||
| Philadelphia, PA 19103 | and Chief Legal Officer | Senior Vice President | ||
| February 1966 | October 2005 – | |||
| February 2012; | ||||
| General Counsel and | ||||
| Chief Legal Officer | ||||
| since October 2005
| ||||
| Richard Salus | Senior Vice President | Chief Financial Officer | ||
| 2005 Market Street | and Chief Financial Officer | since November 2006 | ||
| Philadelphia, PA 19103 | ||||
| October 1963
|
||||
The Statement of Additional Information for the Fund(s) includes additional information about the Trustees and Officers and is available, without charge, upon request by calling 800 523-1918.
| 52 |
Table of Contents
|
|
| Number of Portfolios in | ||||
| Principal Occupation(s) | Fund Complex Overseen | Other Directorships | ||
| During the Past Five Years | by Trustee or Officer | Held by Trustee or Officer | ||
| David F. Connor has served as | 65 | None3 | ||
| Deputy General Counsel of | ||||
| Delaware Investments since 2000. |
||||
| Daniel V. Geatens has served | 65 | None3 | ||
| in various capacities at different times at |
||||
| Delaware Investments. | ||||
| David P. O’Connor has served | 65 | None3 | ||
| in various executive and legal capacities at different times at Delaware Investments. |
||||
| Richard Salus has served in | 65 | None3 | ||
| various executive capacities at different times at |
||||
| Delaware Investments.
|
||||
| 3 | David F. Connor, Daniel V. Geatens, David P. O’Connor, and Richard Salus serve in similar capacities for the six portfolios of the Optimum Fund Trust, which have the same investment advisor, principal underwriter, and transfer agent as the registrant. |
| 53 |
Table of Contents
| Board of trustees
|
||||||
| Patrick P. Coyne | Joseph W. Chow | Lucinda S. Landreth | Thomas K. Whitford | |||
| Chairman, President, and | Former Executive Vice | Former Chief Investment | Former Vice Chairman | |||
| Chief Executive Officer | President | Officer | PNC Financial Services Group | |||
| Delaware Investments® | State Street Corporation | Assurant, Inc. | Pittsburgh, PA | |||
| Family of Funds | Brookline, MA | Philadelphia, PA | ||||
| Philadelphia, PA | Janet L. Yeomans | |||||
| John A. Fry | Frances A. | Former Vice President | ||||
| Thomas L. Bennett | President | Sevilla-Sacasa | and Treasurer | |||
| Private Investor | Drexel University | Chief Executive Officer | 3M Corporation | |||
| Rosemont, PA | Philadelphia, PA | Banco Itaú | St. Paul, MN | |||
| International Miami, FL |
J. Richard Zecher Founder | |||||
| Investor Analytics | ||||||
| Scottsdale, AZ | ||||||
| Affiliated officers | ||||||
| David F. Connor | Daniel V. Geatens | David P. O’Connor | Richard Salus | |||
| Senior Vice President, | Vice President and | Executive Vice President, | Senior Vice President and | |||
| Deputy General Counsel, | Treasurer | General Counsel, | Chief Financial Officer | |||
| and Secretary | Delaware Investments | and Chief Legal Officer | Delaware Investments | |||
| Delaware Investments | Family of Funds | Delaware Investments | Family of Funds | |||
| Family of Funds | Philadelphia, PA | Family of Funds | Philadelphia, PA | |||
| Philadelphia, PA | Philadelphia, PA | |||||
This annual report is for the information of Delaware Small Cap Core Fund shareholders, but it may be used with prospective investors when preceded or accompanied by the Delaware Investments Fund fact sheet for the most recently completed calendar quarter. These documents are available at delawareinvestments.com.
Delaware Investments is the marketing name of Delaware Management Holdings, Inc. and its subsidiaries.
The Fund files its complete schedule of portfolio holdings with the Securities and Exchange Commission (SEC) for the first and third quarters of each fiscal year on Form N-Q. The Fund’s Forms N-Q, as well as a description of the policies and procedures that the Fund uses to determine how to vote proxies (if any) relating to portfolio securities are available without charge (i) upon request, by calling 800 523-1918; and (ii) on the SEC’s website at sec.gov. In addition, a description of the policies and procedures that the Fund uses to determine how to vote proxies (if any) relating to portfolio securities and the Fund’s Schedule of Investments are available without charge on the Fund’s website at delawareinvestments.com. The Fund’s Forms N-Q may be reviewed and copied at the SEC’s Public Reference Room in Washington, D.C.; information on the operation of the Public Reference Room may be obtained by calling 800 SEC-0330.
Information (if any) regarding how the Fund voted proxies relating to portfolio securities during the most recently disclosed 12-month period ended June 30 is available without charge (i) through the Fund’s website at delawareinvestments.com; and (ii) on the SEC’s website at sec.gov.
| 54 |
Table of Contents

|
|

Annual report
U.S. value equity mutual fund
Delaware Small Cap Value Fund
November 30, 2014
Carefully consider the Fund’s investment objectives, risk factors, charges, and expenses before investing. This and other information can be found in the Fund’s prospectus and its summary prospectus, which may be obtained by visiting delawareinvestments.com or calling 800 523-1918. Investors should read the prospectus and the summary prospectus carefully before investing.
You can obtain shareholder reports and prospectuses online instead of in the mail.
Visit delawareinvestments.com/edelivery.
Table of Contents
Experience Delaware Investments
Delaware Investments is committed to the pursuit of consistently superior asset management and unparalleled client service. We believe in our investment processes, which seek to deliver consistent results, and in convenient services that help add value for our clients.
If you are interested in learning more about creating an investment plan, contact your financial advisor.
You can learn more about Delaware Investments or obtain a prospectus for Delaware Small Cap Value Fund at delawareinvestments.com.
Table of Contents
|
Delaware Small Cap Value Fund
|
December 9, 2014
|
| Performance preview (for the year ended November 30, 2014) |
||||
| Delaware Small Cap Value Fund (Class A shares) |
1-year return | +7.12% | ||
| Russell 2000® Value Index (benchmark) |
1-year return | +3.36% |
Past performance does not guarantee future results.
For complete, annualized performance for Delaware Small Cap Value Fund, please see the table on page 4.
The performance of Class A shares excludes the applicable sales charge and reflects the reinvestment of all distributions. For a description of the index, please see page 6. Index performance returns do not reflect any management fees, transaction costs, or expenses. Indices are unmanaged and one cannot invest directly in an index
| 1 |
Table of Contents
| Portfolio management review
Delaware Small Cap Value Fund
|
| 2 |
Table of Contents
|
|
| 3 |
Table of Contents
|
Delaware Small Cap Value Fund
|
November 30, 2014
|
The performance data quoted represent past performance; past performance does not guarantee future results. Investment return and principal value will fluctuate so your shares, when redeemed, may be worth more or less than their original cost. Please obtain the performance data current for the most recent month end by calling 800 523-1918 or visiting our website at delawareinvestments.com/performance. Current performance may be lower or higher than the performance data quoted.
| Fund and benchmark performance1,2 | Average annual total returns through November 30, 2014 | |||||
| 1 year | 5 years | 10 years | ||||
| Class A (Est. June 24, 1987) |
||||||
| Excluding sales charge |
+7.12% | +16.72% | +8.26% | |||
| Including sales charge |
+0.97% | +15.35% | +7.62% | |||
| Class C (Est. Nov. 29, 1995) |
||||||
| Excluding sales charge |
+6.30% | +15.85% | +7.46% | |||
| Including sales charge |
+5.30% | +15.85% | +7.46% | |||
| Class R (Est. June 2, 2003) |
||||||
| Excluding sales charge |
+6.85% | +16.43% | +7.99% | |||
| Including sales charge |
+6.85% | +16.43% | +7.99% | |||
| Institutional Class (Est. Nov. 9, 1992) |
||||||
| Excluding sales charge |
+7.38% | +17.01% | +8.54% | |||
| Including sales charge |
+7.38% | +17.01% | +8.54% | |||
| Russell 2000 Value Index |
+3.36% | +15.31% | +6.85% | |||
| 4 |
Table of Contents
|
|
2 The Fund’s expense ratios, as described in the most recent prospectus, are disclosed in the following “Fund expense ratios” table.
| Fund expense ratios
|
Class A
|
Class C
|
Class R
|
Institutional Class
| ||||
| Total annual operating expenses |
1.25% | 2.00% | 1.50% | 1.00% | ||||
| (without fee waivers) |
||||||||
| Net expenses |
1.25% | 2.00% | 1.50% | 1.00% | ||||
| (including fee waivers, if any) |
||||||||
| Type of waiver |
n/a | n/a | n/a | n/a |
| 5 |
Table of Contents
| Performance summary
Delaware Small Cap Value Fund
|
Performance of a $10,000 investment1
Average annual total returns from Nov. 30, 2004, through Nov. 30, 2014
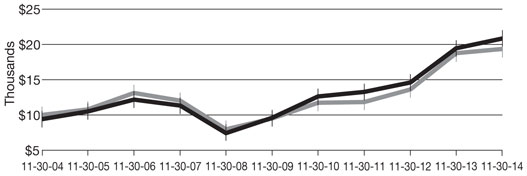
| For the period beginning Nov. 30, 2004, through Nov. 30, 2014 | Starting value | Ending value | ||||||
|
|
$9,425 | $20,842 | ||||||
|
|
$10,000 | $19,398 | ||||||
 Delaware Small Cap Value Fund — Class A shares
 Russell 2000 Value Index
| Nasdaq symbols | CUSIPs | |||
| Class A |
DEVLX | 246097109 | ||
| Class C |
DEVCX | 246097406 | ||
| Class R |
DVLRX | 246097505 | ||
| Institutional Class |
DEVIX | 246097208 |
| 6 |
Table of Contents
|
For the six-month period from June 1, 2014 to November 30, 2014 (Unaudited)
|
As a shareholder of the Fund, you incur two types of costs: (1) transaction costs, including sales charges (loads) on purchase payments, reinvested dividends, or other distributions; redemption fees; and exchange fees; and (2) ongoing costs, including management fees; distribution and/or service (12b-1) fees; and other Fund expenses. This example is intended to help you understand your ongoing costs (in dollars) of investing in the Fund and to compare these costs with the ongoing costs of investing in other mutual funds.
The example is based on an investment of $1,000 invested at the beginning of the period and held for the entire six-month period from June 1, 2014 to Nov. 30, 2014.
Actual expenses
The first section of the table shown, “Actual Fund return,” provides information about actual account values and actual expenses. You may use the information in this section of the table, together with the amount you invested, to estimate the expenses that you paid over the period. Simply divide your account value by $1,000 (for example, an $8,600 account value divided by $1,000 = 8.6), then multiply the result by the number in the first section under the heading entitled “Expenses Paid During Period” to estimate the expenses you paid on your account during this period.
Hypothetical example for comparison purposes
The second section of the table shown, “Hypothetical 5% return,” provides information about hypothetical account values and hypothetical expenses based on the Fund’s actual expense ratio and an assumed rate of return of 5% per year before expenses, which is not the Fund’s actual return. The hypothetical account values and expenses may not be used to estimate the actual ending account balance or expenses you paid for the period. You may use this information to compare the ongoing costs of investing in the Fund and other funds. To do so, compare this 5% hypothetical example with the 5% hypothetical examples that appear in the shareholder reports of the other funds.
Please note that the expenses shown in the table are meant to highlight your ongoing costs only and do not reflect any transactional costs, such as sales charges (loads), redemption fees, or exchange fees. Therefore, the second section of the table is useful in comparing ongoing costs only, and will not help you determine the relative total costs of owning different funds. In addition, if these transactional costs were included, your costs would have been higher. The expenses shown in the table assume reinvestment of all dividends and distributions.
| 7 |
Table of Contents
| Disclosure of Fund expenses
For the six-month period from June 1, 2014 to November 30, 2014 (Unaudited)
|
Delaware Small Cap Value Fund
Expense analysis of an investment of $1,000
| Beginning Account Value 6/1/14 |
Ending Account Value 11/30/14 |
Annualized Expense Ratio |
Expenses Paid During Period 6/1/14 to 11/30/14* | |||||||||||||||||
| Actual Fund return† |
||||||||||||||||||||
| Class A |
$1,000.00 | $1,021.60 | 1.21 | % | $6.13 | |||||||||||||||
| Class C |
1,000.00 | 1,017.80 | 1.96 | % | 9.91 | |||||||||||||||
| Class R |
1,000.00 | 1,020.40 | 1.46 | % | 7.39 | |||||||||||||||
| Institutional Class |
1,000.00 | 1,022.90 | 0.96 | % | 4.87 | |||||||||||||||
| Hypothetical 5% return (5% return before expenses) |
| |||||||||||||||||||
| Class A |
$1,000.00 | $1,019.00 | 1.21 | % | $6.12 | |||||||||||||||
| Class C |
1,000.00 | 1,015.24 | 1.96 | % | 9.90 | |||||||||||||||
| Class R |
1,000.00 | 1,017.75 | 1.46 | % | 7.39 | |||||||||||||||
| Institutional Class |
1,000.00 | 1,020.26 | 0.96 | % | 4.86 | |||||||||||||||
| * | “Expenses Paid During Period” are equal to the Fund’s annualized expense ratio, multiplied by the average account value over the period, multiplied by 183/365 (to reflect the one-half year period). |
| † | Because actual returns reflect only the most recent six-month period, the returns shown may differ significantly from fiscal year returns. |
| 8 |
Table of Contents
| Security type / sector allocation and top 10 equity holdings
Delaware Small Cap Value Fund |
As of November 30, 2014 (Unaudited) |
Sector designations may be different than the sector designations presented in other Fund materials. The sector designations may represent the investment manager’s internal sector classifications, which may result in the sector designations for one fund being different than another fund’s sector designations.
| Security type / sector | Percentage of net assets | |||||||||
| Common Stock |
95.97% | |||||||||
| Basic Industry |
9.76% | |||||||||
| Business Services |
0.95% | |||||||||
| Capital Spending |
9.53% | |||||||||
| Consumer Cyclical |
3.81% | |||||||||
| Consumer Services |
8.67% | |||||||||
| Consumer Staples |
1.99% | |||||||||
| Energy |
5.35% | |||||||||
| Financial Services |
23.29% | |||||||||
| Healthcare |
6.84% | |||||||||
| Real Estate |
6.76% | |||||||||
| Technology |
13.52% | |||||||||
| Transportation |
3.11% | |||||||||
| Utilities |
2.39% | |||||||||
| Short-Term Investments |
3.76% | |||||||||
| Total Value of Securities |
99.73% | |||||||||
| Receivables and Other Assets Net of Liabilities |
0.27% | |||||||||
| Total Net Assets |
100.00% | |||||||||
Holdings are for informational purposes only and are subject to change at any time. They are not a recommendation to buy, sell, or hold any security.
| Top 10 equity holdings | Percentage of net assets | |||
| East West Bancorp |
2.48% | |||
| ITT |
1.86% | |||
| Synopsys |
1.77% | |||
| Platinum Underwriters Holdings |
1.74% | |||
| Chemtura |
1.60% | |||
| Helix Energy Solutions Group |
1.51% | |||
| Fuller (H.B.) |
1.46% | |||
| Hancock Holding |
1.41% | |||
| Webster Financial |
1.37% | |||
| STERIS
|
1.34%
|
| 9 |
Table of Contents
|
Delaware Small Cap Value Fund
|
November 30, 2014
|
| Number of shares | Value (U.S. $) | |||||||
| Common Stock – 95.97% |
||||||||
| Basic Industry – 9.76% |
||||||||
| Albemarle |
437,900 | $ | 25,853,616 | |||||
| Berry Plastics Group † |
1,239,000 | 35,856,660 | ||||||
| Chemtura † |
1,876,300 | 43,717,790 | ||||||
| Cytec Industries |
754,900 | 36,310,690 | ||||||
| Fuller (H.B.) |
927,100 | 40,041,449 | ||||||
| Glatfelter |
996,400 | 25,228,848 | ||||||
| Kaiser Aluminum |
473,227 | 34,441,461 | ||||||
| Olin |
661,600 | 16,645,856 | ||||||
| Ryerson Holding † |
816,700 | 8,812,193 | ||||||
|
|
|
|||||||
| 266,908,563 | ||||||||
|
|
|
|||||||
| Business Services – 0.95% |
||||||||
| Brink’s |
467,900 | 10,153,430 | ||||||
| United Stationers |
385,618 | 15,833,475 | ||||||
|
|
|
|||||||
| 25,986,905 | ||||||||
|
|
|
|||||||
| Capital Spending – 9.53% |
||||||||
| Actuant Class A |
626,600 | 18,396,976 | ||||||
| Altra Holdings |
811,731 | 24,863,321 | ||||||
| CIRCOR International |
193,100 | 12,928,045 | ||||||
| EnPro Industries † |
278,600 | 17,975,272 | ||||||
| H&E Equipment Services |
1,022,200 | 35,777,000 | ||||||
| ITT |
1,230,400 | 50,938,560 | ||||||
| MasTec † |
1,442,000 | 34,752,200 | ||||||
| Primoris Services |
829,300 | 21,686,195 | ||||||
| Regal-Beloit |
333,900 | 24,147,648 | ||||||
| Thermon Group Holdings † |
794,300 | 19,214,117 | ||||||
|
|
|
|||||||
| 260,679,334 | ||||||||
|
|
|
|||||||
| Consumer Cyclical – 3.81% |
||||||||
| Barnes Group |
620,900 | 22,805,657 | ||||||
| Knoll |
674,800 | 12,504,044 | ||||||
| Meritage Homes † |
794,900 | 31,175,978 | ||||||
| Standard Motor Products |
442,540 | 16,882,901 | ||||||
| Tenneco † |
381,000 | 20,707,350 | ||||||
|
|
|
|||||||
| 104,075,930 | ||||||||
|
|
|
|||||||
| Consumer Services – 8.67% |
||||||||
| Asbury Automotive Group † |
183,800 | 13,915,498 | ||||||
| Brinker International |
301,400 | 16,977,862 | ||||||
| Cato Class A |
536,144 | 21,510,097 | ||||||
| Cheesecake Factory |
550,600 | 26,665,558 | ||||||
| Cinemark Holdings |
370,131 | 13,439,457 | ||||||
| Finish Line Class A |
697,900 | 19,918,066 | ||||||
| Genesco † |
199,981 | 16,272,454 | ||||||
| 10 |
Table of Contents
|
|
| Number of shares | Value (U.S. $) | |||||||
| Common Stock (continued) |
||||||||
| Consumer Services (continued) |
||||||||
| Hanesbrands |
149,900 | $ | 17,346,428 | |||||
| Madden (Steven) † |
545,550 | 18,603,255 | ||||||
| Meredith |
364,518 | 19,239,260 | ||||||
| Stage Stores |
554,300 | 11,357,607 | ||||||
| Texas Roadhouse |
732,500 | 24,216,450 | ||||||
| Wolverine World Wide |
581,000 | 17,726,310 | ||||||
|
|
|
|||||||
| 237,188,302 | ||||||||
|
|
|
|||||||
| Consumer Staples – 1.99% |
||||||||
| Core-Mark Holding |
84,300 | 5,067,273 | ||||||
| J&J Snack Foods |
141,700 | 14,885,585 | ||||||
| Pinnacle Foods |
486,600 | 16,558,998 | ||||||
| Scotts Miracle-Gro Class A |
294,900 | 17,997,747 | ||||||
|
|
|
|||||||
| 54,509,603 | ||||||||
|
|
|
|||||||
| Energy – 5.35% |
||||||||
| Helix Energy Solutions Group † |
1,800,400 | 41,175,148 | ||||||
| Jones Energy Class A † |
437,100 | 4,436,565 | ||||||
| Parsley Energy Class A † |
21,709 | 274,402 | ||||||
| Patterson-UTI Energy |
1,268,000 | 22,430,920 | ||||||
| Southwest Gas |
569,700 | 32,979,933 | ||||||
| Stone Energy † |
1,152,563 | 18,210,495 | ||||||
| Whiting Petroleum † |
641,500 | 26,795,455 | ||||||
|
|
|
|||||||
| 146,302,918 | ||||||||
|
|
|
|||||||
| Financial Services – 23.29% |
||||||||
| Bank of Hawaii |
636,100 | 36,658,443 | ||||||
| Boston Private Financial Holdings |
1,627,700 | 20,769,452 | ||||||
| Community Bank System |
894,400 | 33,083,856 | ||||||
| CVB Financial |
684,300 | 10,380,831 | ||||||
| East West Bancorp |
1,847,323 | 67,926,067 | ||||||
| First Financial Bancorp |
1,298,600 | 22,998,206 | ||||||
| First Midwest Bancorp |
1,159,400 | 19,396,762 | ||||||
| Hancock Holding |
1,181,200 | 38,637,052 | ||||||
| Independent Bank @ |
742,100 | 29,409,423 | ||||||
| Infinity Property & Casualty @ |
293,082 | 21,295,338 | ||||||
| Main Street Capital |
586,000 | 19,027,420 | ||||||
| NBT Bancorp @ |
1,097,800 | 26,687,518 | ||||||
| Platinum Underwriters Holdings |
640,100 | 47,476,217 | ||||||
| ProAssurance |
579,000 | 26,107,110 | ||||||
| S&T Bancorp @ |
607,356 | 16,690,143 | ||||||
| Selective Insurance Group @ |
1,279,200 | 34,244,184 | ||||||
| StanCorp Financial Group |
224,300 | 14,826,230 | ||||||
| Stifel Financial † |
570,400 | 27,681,512 | ||||||
| Susquehanna Bancshares |
982,200 | 12,935,574 | ||||||
| 11 |
Table of Contents
| Schedule of investments
Delaware Small Cap Value Fund
|
| Number of shares | Value (U.S. $) | |||||||
| Common Stock (continued) |
||||||||
| Financial Services (continued) |
||||||||
| Validus Holdings |
544,984 | $ | 22,616,836 | |||||
| Valley National Bancorp |
2,680,700 | 26,110,018 | ||||||
| Webster Financial |
1,192,600 | 37,531,122 | ||||||
| WesBanco @ |
742,300 | 24,651,783 | ||||||
|
|
|
|||||||
| 637,141,097 | ||||||||
|
|
|
|||||||
| Healthcare – 6.84% |
||||||||
| Cooper |
157,700 | 26,635,530 | ||||||
| Haemonetics † |
388,600 | 14,350,998 | ||||||
| Owens & Minor |
661,500 | 22,629,915 | ||||||
| Service Corp. International |
1,408,500 | 31,832,100 | ||||||
| STERIS |
575,580 | 36,693,225 | ||||||
| Teleflex |
191,900 | 22,864,885 | ||||||
| VCA Antech † |
680,200 | 32,193,866 | ||||||
|
|
|
|||||||
| 187,200,519 | ||||||||
|
|
|
|||||||
| Real Estate – 6.76% |
||||||||
| Alexander & Baldwin |
535,800 | 20,403,264 | ||||||
| Brandywine Realty Trust |
1,633,437 | 25,252,936 | ||||||
| Education Realty Trust |
1,174,000 | 13,665,360 | ||||||
| Healthcare Realty Trust |
751,700 | 19,852,397 | ||||||
| Highwoods Properties |
646,800 | 27,915,888 | ||||||
| Lexington Realty Trust |
2,305,800 | 25,363,800 | ||||||
| Ramco-Gershenson Properties Trust |
939,889 | 16,824,013 | ||||||
| Summit Hotel Properties |
1,262,700 | 14,647,320 | ||||||
| Washington Real Estate Investment Trust |
781,100 | 20,988,157 | ||||||
|
|
|
|||||||
| 184,913,135 | ||||||||
|
|
|
|||||||
| Technology – 13.52% |
||||||||
| Black Box |
223,813 | 5,187,985 | ||||||
| Brocade Communications Systems |
2,693,300 | 30,461,223 | ||||||
| Cirrus Logic † |
675,600 | 12,356,724 | ||||||
| CommScope Holding † |
1,047,100 | 23,245,620 | ||||||
| Electronics for Imaging † |
607,200 | 26,990,040 | ||||||
| Netscout Systems † |
609,500 | 23,252,425 | ||||||
| ON Semiconductor † |
3,277,500 | 29,595,825 | ||||||
| Premiere Global Services † |
962,850 | 10,158,067 | ||||||
| PTC † |
859,300 | 33,572,851 | ||||||
| RF Micro Devices † |
2,499,200 | 36,513,312 | ||||||
| Synopsys † |
1,116,200 | 48,431,918 | ||||||
| Tech Data † |
461,400 | 28,759,062 | ||||||
| Teradyne |
1,471,500 | 29,209,275 | ||||||
| Vishay Intertechnology |
2,319,300 | 32,168,691 | ||||||
|
|
|
|||||||
| 369,903,018 | ||||||||
|
|
|
|||||||
| 12 |
Table of Contents
|
|
| Number of shares | Value (U.S. $) | |||||||
| Common Stock (continued) |
||||||||
| Transportation – 3.11% |
||||||||
| Kirby † |
173,800 | $ | 16,709,132 | |||||
| Matson |
507,700 | 17,876,117 | ||||||
| Saia † |
400,150 | 22,196,321 | ||||||
| Werner Enterprises |
914,200 | 28,358,484 | ||||||
|
|
|
|||||||
| 85,140,054 | ||||||||
|
|
|
|||||||
| Utilities – 2.39% |
||||||||
| Black Hills |
391,900 | 21,166,519 | ||||||
| El Paso Electric |
512,400 | 19,384,092 | ||||||
| NorthWestern |
464,100 | 24,704,043 | ||||||
|
|
|
|||||||
| 65,254,654 | ||||||||
|
|
|
|||||||
| Total Common Stock (cost $2,048,804,311) |
2,625,204,032 | |||||||
|
|
|
|||||||
| Principal amount° | ||||||||
| Short-Term Investments – 3.76% |
||||||||
| Discount Notes – 1.92%≠ |
||||||||
| Federal Home Loan Bank |
||||||||
| 0.065% 1/14/15 |
7,675,139 | 7,674,871 | ||||||
| 0.065% 1/21/15 |
5,668,581 | 5,668,349 | ||||||
| 0.065% 2/25/15 |
10,484,138 | 10,483,132 | ||||||
| 0.065% 3/5/15 |
14,145,990 | 14,143,953 | ||||||
| 0.067% 1/16/15 |
5,142,993 | 5,142,802 | ||||||
| 0.08% 2/20/15 |
9,308,257 | 9,307,419 | ||||||
|
|
|
|||||||
| 52,420,526 | ||||||||
|
|
|
|||||||
| Repurchase Agreements – 1.11% |
||||||||
| Bank of America Merrill Lynch |
||||||||
| 0.05%, dated 11/28/14, to be repurchased on 12/1/14, repurchase price $10,673,658 (collateralized by U.S. government obligations 0.00%–1.375% 4/15/16–2/15/43 market value $10,887,087) |
10,673,613 | 10,673,613 | ||||||
| Bank of Montreal |
||||||||
| 0.08%, dated 11/28/14, to be repurchased on 12/1/14, repurchase price $3,557,895 (collateralized by U.S. government obligations 0.25%–11.25% 11/30/14–2/15/22 market value $3,629,032) |
3,557,871 | 3,557,871 | ||||||
| BNP Paribas |
||||||||
| 0.09%, dated 11/28/14, to be repurchased on 12/1/14, repurchase price $16,041,636 (collateralized by U.S. government obligations 0.00%–3.625% 12/26/14–2/15/21 market value $16,362,348) |
16,041,516 | 16,041,516 | ||||||
|
|
|
|||||||
| 30,273,000 | ||||||||
|
|
|
|||||||
| 13 |
Table of Contents
|
Schedule of investments
Delaware Small Cap Value Fund
|
|
|
Principal amount° | Value (U.S. $) | ||||||
| Short-Term Investments (continued) |
||||||||
| U.S. Treasury Obligation – 0.73%≠ |
||||||||
| U.S. Treasury Bill 0.005% 12/26/14 |
20,064,230 | $ | 20,063,688 | |||||
|
|
|
|||||||
| 20,063,688 | ||||||||
|
|
|
|||||||
| Total Short-Term Investments (cost $102,754,981) |
102,757,214 | |||||||
|
|
|
|||||||
| Total Value of Securities – 99.73% |
||||||||
| (cost $2,151,559,292) |
$ | 2,727,961,246 | ||||||
|
|
|
|||||||
| @ | Illiquid security. At Nov. 30, 2014, the aggregate value of illiquid securities was $152,978,389, which represents 5.59% of the Fund’s net assets. See Note 10 in “Notes to financial statements.” |
| ≠ | The rate shown is the effective yield at the time of purchase. |
| ° | Principal amount shown is stated in U.S. dollars unless noted that the security is denominated in another currency. |
| † | Non-income-producing security. |
See accompanying notes, which are an integral part of the financial statements.
| 14 |
Table of Contents
This page intentionally left blank.
Table of Contents
| Statement of assets and liabilities
Delaware Small Cap Value Fund
|
November 30, 2014
|
| Assets: |
||||
| Investments, at value1 |
$ | 2,625,204,032 | ||
| Short-term investments, at value2 |
102,757,214 | |||
| Cash |
488,101 | |||
| Receivable for fund shares sold |
8,200,502 | |||
| Dividends and interest receivable |
3,570,764 | |||
| Receivable for securities sold |
838,129 | |||
|
|
|
|||
| Total assets |
2,741,058,742 | |||
|
|
|
|||
| Liabilities: |
||||
| Payable for fund shares redeemed |
1,907,723 | |||
| Other accrued expenses |
1,650,558 | |||
| Investment management fees payable |
1,512,027 | |||
| Distribution fees payable to affiliates |
283,044 | |||
| Other affiliates payable |
249,031 | |||
| Trustees’ fees and expenses payable |
15,546 | |||
|
|
|
|||
| Total liabilities |
5,617,929 | |||
|
|
|
|||
| Total Net Assets |
$ | 2,735,440,813 | ||
|
|
|
|||
| Net Assets Consist of: |
||||
| Paid-in capital |
$ | 2,023,045,323 | ||
| Undistributed net investment income |
7,924,429 | |||
| Accumulated net realized gain on investments |
128,069,107 | |||
| Net unrealized appreciation of investments |
576,401,954 | |||
|
|
|
|||
| Total Net Assets |
$ | 2,735,440,813 | ||
|
|
|
|||
| 16 |
Table of Contents
|
|
| Net Asset Value |
||||
| Class A: |
||||
| Net assets |
$ | 775,076,101 | ||
| Shares of beneficial interest outstanding, unlimited authorization, no par |
14,124,994 | |||
| Net asset value per share |
$ | 54.87 | ||
| Sales charge |
5.75 | % | ||
| Offering price per share, equal to net asset value per share / (1 – sales charge) |
$ | 58.22 | ||
| Class C: |
||||
| Net assets |
$ | 109,367,824 | ||
| Shares of beneficial interest outstanding, unlimited authorization, no par |
2,337,249 | |||
| Net asset value per share |
$ | 46.79 | ||
| Class R: |
||||
| Net assets |
$ | 82,577,089 | ||
| Shares of beneficial interest outstanding, unlimited authorization, no par |
1,546,718 | |||
| Net asset value per share |
$ | 53.39 | ||
| Institutional Class: |
||||
| Net assets |
$ | 1,768,419,799 | ||
| Shares of beneficial interest outstanding, unlimited authorization, no par |
30,742,412 | |||
| Net asset value per share |
$ | 57.52 | ||
|
1 Investments, at cost |
$ | 2,048,804,311 | ||
| 2 Short-term investments, at cost |
102,754,981 | |||
See accompanying notes, which are an integral part of the financial statements.
| 17 |
Table of Contents
|
Delaware Small Cap Value Fund
|
Year ended November 30, 2014
|
| Investment Income: |
||||
| Dividends |
$ | 37,563,003 | ||
| Interest |
32,271 | |||
| Foreign tax withheld |
(2,186 | ) | ||
|
|
|
|||
| 37,593,088 | ||||
|
|
|
|||
| Expenses: |
||||
| Management fees |
17,071,705 | |||
| Distribution expenses – Class A |
2,129,593 | |||
| Distribution expenses – Class B |
13,160 | |||
| Distribution expenses – Class C |
1,044,581 | |||
| Distribution expenses – Class R |
401,810 | |||
| Dividend disbursing and transfer agent fees and expenses |
5,481,971 | |||
| Accounting and administration expenses |
848,359 | |||
| Reports and statements to shareholders |
390,163 | |||
| Legal fees |
182,877 | |||
| Registration fees |
158,378 | |||
| Trustees’ fees and expenses |
115,788 | |||
| Custodian fees |
101,880 | |||
| Audit and tax |
31,006 | |||
| Other |
75,765 | |||
|
|
|
|||
| 28,047,036 | ||||
| Less waived distribution expenses – Class B |
(9,883 | ) | ||
| Less expense paid indirectly |
(770 | ) | ||
|
|
|
|||
| Total operating expenses |
28,036,383 | |||
|
|
|
|||
| Net Investment Income |
9,556,705 | |||
|
|
|
|||
| Net Realized and Unrealized Gain: |
||||
| Net realized gain on investments |
129,268,108 | |||
| Net change in unrealized appreciation (depreciation) of investments |
32,303,289 | |||
|
|
|
|||
| Net Realized and Unrealized Gain |
161,571,397 | |||
|
|
|
|||
| Net Increase in Net Assets Resulting from Operations |
$ | 171,128,102 | ||
|
|
|
|||
See accompanying notes, which are an integral part of the financial statements.
| 18 |
Table of Contents
This page intentionally left blank.
Table of Contents
| Statements of changes in net assets
Delaware Small Cap Value Fund | ||
| Year ended | ||||||||
| 11/30/14 | 11/30/13 | |||||||
| Increase in Net Assets from Operations: |
||||||||
| Net investment income |
$ | 9,556,705 | $ | 5,195,670 | ||||
| Net realized gain |
129,268,108 | 46,586,853 | ||||||
| Net change in unrealized appreciation (depreciation) |
32,303,289 | 392,175,103 | ||||||
|
|
|
|
|
|||||
| Net increase in net assets resulting from operations |
171,128,102 | 443,957,626 | ||||||
|
|
|
|
|
|||||
| Dividends and Distributions to Shareholders from: |
||||||||
| Net investment income: |
||||||||
| Class A |
(933,389 | ) | (1,279,159 | ) | ||||
| Institutional Class |
(3,846,782 | ) | (1,785,939 | ) | ||||
| Net realized gain: |
||||||||
| Class A |
(18,684,386 | ) | (3,531,372 | ) | ||||
| Class B |
(57,082 | ) | (42,667 | ) | ||||
| Class C |
(2,419,192 | ) | (493,148 | ) | ||||
| Class R |
(1,637,404 | ) | (302,813 | ) | ||||
| Institutional Class |
(24,481,657 | ) | (2,388,692 | ) | ||||
|
|
|
|
|
|||||
| (52,059,892 | ) | (9,823,790 | ) | |||||
|
|
|
|
|
|||||
| Capital Share Transactions: |
||||||||
| Proceeds from shares sold: |
||||||||
| Class A |
244,270,963 | 360,137,117 | ||||||
| Class B |
19,761 | 38,348 | ||||||
| Class C |
22,133,681 | 25,678,037 | ||||||
| Class R |
25,151,148 | 35,157,866 | ||||||
| Institutional Class |
806,723,199 | 845,588,890 | ||||||
| Net asset value of shares issued upon reinvestment of dividends and distributions: |
||||||||
| Class A |
19,373,779 | 4,730,881 | ||||||
| Class B |
56,684 | 41,272 | ||||||
| Class C |
2,330,338 | 468,386 | ||||||
| Class R |
1,637,197 | 302,736 | ||||||
| Institutional Class |
27,825,139 | 3,993,286 | ||||||
|
|
|
|
|
|||||
| 1,149,521,889 | 1,276,136,819 | |||||||
|
|
|
|
|
|||||
| 20 |
Table of Contents
|
|
| Year ended | ||||||||
| 11/30/14 | 11/30/13 | |||||||
| Capital Share Transactions (continued): |
||||||||
| Cost of shares redeemed: |
||||||||
| Class A |
$ | (412,973,803 | ) | $ | (199,410,980 | ) | ||
| Class B |
(3,608,169 | ) | (4,431,904 | ) | ||||
| Class C |
(18,107,340 | ) | (15,414,318 | ) | ||||
| Class R |
(24,371,953 | ) | (20,699,591 | ) | ||||
| Institutional Class |
(351,687,599 | ) | (180,684,573 | ) | ||||
|
|
|
|
|
|||||
| (810,748,864 | ) | (420,641,366 | ) | |||||
|
|
|
|
|
|||||
| Increase in net assets derived from capital share transactions |
338,773,025 | 855,495,453 | ||||||
|
|
|
|
|
|||||
| Net Increase in Net Assets |
457,841,235 | 1,289,629,289 | ||||||
| Net Assets: |
||||||||
| Beginning of year |
2,277,599,578 | 987,970,289 | ||||||
|
|
|
|
|
|||||
| End of year |
$ | 2,735,440,813 | $ | 2,277,599,578 | ||||
|
|
|
|
|
|||||
| Undistributed net investment income |
$ | 7,924,429 | $ | 3,147,895 | ||||
|
|
|
|
|
|||||
See accompanying notes, which are an integral part of the financial statements.
| 21 |
Table of Contents
|
Delaware Small Cap Value Fund Class A |
Selected data for each share of the Fund outstanding throughout each period were as follows:
|
|
| Net asset value, beginning of period |
| Income (loss) from investment operations: |
| Net investment income (loss)1 |
| Net realized and unrealized gain |
| Total from investment operations |
| Less dividends and distributions from: |
| Net investment income |
| Net realized gain |
| Total dividends and distributions |
| Net asset value, end of period |
| Total return2 |
| Ratios and supplemental data: |
| Net assets, end of period (000 omitted) |
| Ratio of expenses to average net assets |
| Ratio of expenses to average net assets prior to fees waived |
| Ratio of net investment income (loss) to average net assets |
| Ratio of net investment income (loss) to average net assets prior to fees waived |
| Portfolio turnover |
|
|
| 1 | The average shares outstanding method has been applied for per share information. |
| 2 | Total investment return is based on the change in net asset value of a share during the period and assumes reinvestment of dividends and distributions at net asset value and does not reflect the impact of a sales charge. Total investment return during some of the periods shown reflects waivers by the manager and/or distributor. Performance would have been lower had the waivers not been in effect. |
See accompanying notes, which are an integral part of the financial statements.
| 22 |
Table of Contents
|
|
| Year ended | ||||||||||||||||||||
| 11/30/14 | 11/30/13 | 11/30/12 | 11/30/11 | 11/30/10 | ||||||||||||||||
|
|
||||||||||||||||||||
| $ | 52.370 | $ | 39.750 | $ | 37.860 | $ | 36.190 | $ | 27.530 | |||||||||||
| 0.148 | 0.119 | 0.074 | (0.008 | ) | (0.003 | ) | ||||||||||||||
| 3.508 | 12.847 | 3.622 | 1.818 | 8.680 | ||||||||||||||||
|
|
|
|
|
|
|
|
|
|
|
|||||||||||
| 3.656 | 12.966 | 3.696 | 1.810 | 8.677 | ||||||||||||||||
|
|
|
|
|
|
|
|
|
|
|
|||||||||||
| (0.055 | ) | (0.092 | ) | — | — | (0.017 | ) | |||||||||||||
| (1.101 | ) | (0.254 | ) | (1.806 | ) | (0.140 | ) | — | ||||||||||||
|
|
|
|
|
|
|
|
|
|
|
|||||||||||
| (1.156 | ) | (0.346 | ) | (1.806 | ) | (0.140 | ) | (0.017 | ) | |||||||||||
|
|
|
|
|
|
|
|
|
|
|
|||||||||||
| $ | 54.870 | $ | 52.370 | $ | 39.750 | $ | 37.860 | $ | 36.190 | |||||||||||
|
|
|
|
|
|
|
|
|
|
|
|||||||||||
| 7.12% | 32.87% | 10.21% | 4.99% | 31.53% | ||||||||||||||||
| $ | 775,076 | $ | 884,026 | $ | 522,403 | $ | 375,299 | $ | 301,747 | |||||||||||
| 1.22% | 1.25% | 1.32% | 1.37% | 1.43% | ||||||||||||||||
| 1.22% | 1.29% | 1.37% | 1.42% | 1.49% | ||||||||||||||||
| 0.27% | 0.26% | 0.19% | (0.02% | ) | (0.01% | ) | ||||||||||||||
| 0.27% | 0.22% | 0.14% | (0.07% | ) | (0.07% | ) | ||||||||||||||
| 17% | 28% | 11% | 29% | 12% | ||||||||||||||||
|
|
||||||||||||||||||||
| 23 |
Table of Contents
| Financial highlights
Delaware Small Cap Value Fund Class C |
Selected data for each share of the Fund outstanding throughout each period were as follows:
|
|
| Net asset value, beginning of period |
| Income (loss) from investment operations: |
| Net investment loss1 |
| Net realized and unrealized gain |
| Total from investment operations |
| Less dividends and distributions from: |
| Net realized gain |
| Total dividends and distributions |
| Net asset value, end of period |
| Total return2 |
| Ratios and supplemental data: |
| Net assets, end of period (000 omitted) |
| Ratio of expenses to average net assets |
| Ratio of expenses to average net assets prior to fees waived |
| Ratio of net investment loss to average net assets |
| Ratio of net investment loss to average net assets prior to fees waived |
| Portfolio turnover |
|
|
| 1 | The average shares outstanding method has been applied for per share information. |
| 2 | Total investment return is based on the change in net asset value of a share during the period and assumes reinvestment of dividends and distributions at net asset value and does not reflect the impact of a sales charge. Total investment return during some of the periods shown reflects a waiver by the manager. Performance would have been lower had the waiver not been in effect. |
See accompanying notes, which are an integral part of the financial statements.
| 24 |
Table of Contents
|
|
| Year ended | ||||||||||||||||||||
| 11/30/14 | 11/30/13 | 11/30/12 | 11/30/11 | 11/30/10 | ||||||||||||||||
|
|
||||||||||||||||||||
| $ | 45.110 | $ | 34.450 | $ | 33.280 | $ | 32.070 | $ | 24.560 | |||||||||||
| (0.219 | ) | (0.196 | ) | (0.188 | ) | (0.260 | ) | (0.215 | ) | |||||||||||
| 3.000 | 11.110 | 3.164 | 1.610 | 7.725 | ||||||||||||||||
|
|
|
|
|
|
|
|
|
|
|
|||||||||||
| 2.781 | 10.914 | 2.976 | 1.350 | 7.510 | ||||||||||||||||
|
|
|
|
|
|
|
|
|
|
|
|||||||||||
| (1.101 | ) | (0.254 | ) | (1.806 | ) | (0.140 | ) | — | ||||||||||||
|
|
|
|
|
|
|
|
|
|
|
|||||||||||
| (1.101 | ) | (0.254 | ) | (1.806 | ) | (0.140 | ) | — | ||||||||||||
|
|
|
|
|
|
|
|
|
|
|
|||||||||||
| $ | 46.790 | $ | 45.110 | $ | 34.450 | $ | 33.280 | $ | 32.070 | |||||||||||
|
|
|
|
|
|
|
|
|
|
|
|||||||||||
| 6.30% | 31.93% | 9.37% | 4.20% | 30.58% | ||||||||||||||||
| $ | 109,368 | $ | 99,099 | $ | 66,231 | $ | 52,648 | $ | 49,706 | |||||||||||
| 1.97% | 2.00% | 2.07% | 2.12% | 2.18% | ||||||||||||||||
| 1.97% | 2.00% | 2.07% | 2.12% | 2.19% | ||||||||||||||||
| (0.48% | ) | (0.49% | ) | (0.56% | ) | (0.77% | ) | (0.76% | ) | |||||||||||
| (0.48% | ) | (0.49% | ) | (0.56% | ) | (0.77% | ) | (0.77% | ) | |||||||||||
| 17% | 28% | 11% | 29% | 12% | ||||||||||||||||
|
|
||||||||||||||||||||
| 25 |
Table of Contents
| Financial highlights
Delaware Small Cap Value Fund Class R |
Selected data for each share of the Fund outstanding throughout each period were as follows:
|
|
| Net asset value, beginning of period |
| Income (loss) from investment operations: |
| Net investment income (loss)1 |
| Net realized and unrealized gain |
| Total from investment operations |
| Less dividends and distributions from: |
| Net realized gain |
| Total dividends and distributions |
| Net asset value, end of period |
| Total return2 |
| Ratios and supplemental data: |
| Net assets, end of period (000 omitted) |
| Ratio of expenses to average net assets |
| Ratio of expenses to average net assets prior to fees waived |
| Ratio of net investment income (loss) to average net assets |
| Ratio of net investment income (loss) to average net assets prior to fees waived |
| Portfolio turnover |
|
|
| 1 | The average shares outstanding method has been applied for per share information. |
| 2 | Total investment return is based on the change in net asset value of a share during the period and assumes reinvestment of dividends and distributions at net asset value. Total investment return during some of the periods shown reflects waivers by the manager and/or distributor. Performance would have been lower had the waivers not been in effect. |
See accompanying notes, which are an integral part of the financial statements.
| 26 |
Table of Contents
|
|
| Year ended | ||||||||||||||||||||
| 11/30/14 | 11/30/13 | 11/30/12 | 11/30/11 | 11/30/10 | ||||||||||||||||
|
|
||||||||||||||||||||
| $ | 51.060 | $ | 38.770 | $ | 37.050 | $ | 35.510 | $ | 27.070 | |||||||||||
| 0.012 | 0.004 | (0.022 | ) | (0.102 | ) | (0.081 | ) | |||||||||||||
| 3.419 | 12.540 | 3.548 | 1.782 | 8.521 | ||||||||||||||||
|
|
|
|
|
|
|
|
|
|
|
|||||||||||
| 3.431 | 12.544 | 3.526 | 1.680 | 8.440 | ||||||||||||||||
|
|
|
|
|
|
|
|
|
|
|
|||||||||||
| (1.101 | ) | (0.254 | ) | (1.806 | ) | (0.140 | ) | — | ||||||||||||
|
|
|
|
|
|
|
|
|
|
|
|||||||||||
| (1.101 | ) | (0.254 | ) | (1.806 | ) | (0.140 | ) | — | ||||||||||||
|
|
|
|
|
|
|
|
|
|
|
|||||||||||
| $ | 53.390 | $ | 51.060 | $ | 38.770 | $ | 37.050 | $ | 35.510 | |||||||||||
|
|
|
|
|
|
|
|
|
|
|
|||||||||||
| 6.85% | 32.55% | 9.96% | 4.72% | 31.18% | ||||||||||||||||
| $ | 82,577 | $ | 76,501 | $ | 44,379 | $ | 28,303 | $ | 20,757 | |||||||||||
| 1.47% | 1.50% | 1.57% | 1.62% | 1.68% | ||||||||||||||||
| 1.47% | 1.58% | 1.67% | 1.72% | 1.79% | ||||||||||||||||
| 0.02% | 0.01% | (0.06% | ) | (0.27% | ) | (0.26% | ) | |||||||||||||
| 0.02% | (0.07% | ) | (0.16% | ) | (0.37% | ) | (0.37% | ) | ||||||||||||
| 17% | 28% | 11% | 29% | 12% | ||||||||||||||||
|
|
||||||||||||||||||||
| 27 |
Table of Contents
| Financial highlights
Delaware Small Cap Value Fund Institutional Class |
Selected data for each share of the Fund outstanding throughout each period were as follows:
|
|
| Net asset value, beginning of period |
| Income from investment operations: |
| Net investment income1 |
| Net realized and unrealized gain |
| Total from investment operations |
| Less dividends and distributions from: |
| Net investment income |
| Net realized gain |
| Total dividends and distributions |
| Net asset value, end of period |
| Total return2 |
| Ratios and supplemental data: |
| Net assets, end of period (000 omitted) |
| Ratio of expenses to average net assets |
| Ratio of expenses to average net assets prior to fees waived |
| Ratio of net investment income to average net assets |
| Ratio of net investment income to average net assets prior to fees waived |
| Portfolio turnover |
|
|
| 1 | The average shares outstanding method has been applied for per share information. |
| 2 | Total investment return is based on the change in net asset value of a share during the period and assumes reinvestment of dividends and distributions at net asset value. Total investment return during some of the periods shown reflects a waiver by the manager. Performance would have been lower had the waiver not been in effect. |
See accompanying notes, which are an integral part of the financial statements.
| 28 |
Table of Contents
|
|
| Year ended | ||||||||||||||||||||
| 11/30/14 | 11/30/13 | 11/30/12 | 11/30/11 | 11/30/10 | ||||||||||||||||
|
|
||||||||||||||||||||
| $ | 54.830 | $ | 41.590 | $ | 39.430 | $ | 37.590 | $ | 28.580 | |||||||||||
| 0.292 | 0.250 | 0.180 | 0.090 | 0.081 | ||||||||||||||||
| 3.672 | 13.434 | 3.786 | 1.890 | 9.005 | ||||||||||||||||
|
|
|
|
|
|
|
|
|
|
|
|||||||||||
| 3.964 | 13.684 | 3.966 | 1.980 | 9.086 | ||||||||||||||||
|
|
|
|
|
|
|
|
|
|
|
|||||||||||
| (0.173 | ) | (0.190 | ) | — | — | (0.076 | ) | |||||||||||||
| (1.101 | ) | (0.254 | ) | (1.806 | ) | (0.140 | ) | — | ||||||||||||
|
|
|
|
|
|
|
|
|
|
|
|||||||||||
| (1.274 | ) | (0.444 | ) | (1.806 | ) | (0.140 | ) | (0.076 | ) | |||||||||||
|
|
|
|
|
|
|
|
|
|
|
|||||||||||
| $ | 57.520 | $ | 54.830 | $ | 41.590 | $ | 39.430 | $ | 37.590 | |||||||||||
|
|
|
|
|
|
|
|
|
|
|
|||||||||||
| 7.38% | 33.22% | 10.49% | 5.26% | 31.85% | ||||||||||||||||
| $ | 1,768,420 | $ | 1,214,512 | $ | 348,533 | $ | 91,442 | $ | 48,996 | |||||||||||
| 0.97% | 1.00% | 1.07% | 1.12% | 1.18% | ||||||||||||||||
| 0.97% | 1.00% | 1.07% | 1.12% | 1.19% | ||||||||||||||||
| 0.52% | 0.51% | 0.44% | 0.23% | 0.24% | ||||||||||||||||
| 0.52% | 0.51% | 0.44% | 0.23% | 0.23% | ||||||||||||||||
| 17% | 28% | 11% | 29% | 12% | ||||||||||||||||
|
|
||||||||||||||||||||
| 29 |
Table of Contents
|
Delaware Small Cap Value Fund |
November 30, 2014 |
Delaware Group® Equity Funds V (Trust) is organized as a Delaware statutory trust and offers three series: Delaware Dividend Income Fund, Delaware Small Cap Core Fund, and Delaware Small Cap Value Fund. These financial statements and the related notes pertain to Delaware Small Cap Value Fund (Fund). The Trust is an open-end investment company. The Fund is considered diversified under the Investment Company Act of 1940, as amended and offers Class A, Class C, Class R, and Institutional Class shares. Class A shares are sold with a maximum front-end sales charge of 5.75%. Class A share purchases of $1,000,000 or more will incur a contingent deferred sales charge (CDSC) of 1.00% if redeemed during the first year and 0.50% during the second year, provided that Delaware Distributors, L.P. (DDLP) paid a financial advisor a commission on the purchase of those shares. Effective Sept. 25, 2014, all remaining shares of Class B were converted to Class A shares. Between June 1, 2007 and Sept. 25, 2014, Class B shares could be purchased only through dividend reinvestment and certain permitted exchanges. Prior to June 1, 2007, Class B shares were sold with a CDSC that declined from 4.00% to zero depending upon the period of time the shares were held. Class B shares automatically converted to Class A shares on a quarterly basis approximately eight years after purchase. Class C shares are sold with a CDSC of 1.00%, if redeemed during the first 12 months. Class R and Institutional Class shares are not subject to a sales charge and are offered for sale exclusively to certain eligible investors.
The investment objective of the Fund is to seek capital appreciation.
1. Significant Accounting Policies
The following accounting policies are in accordance with U.S. generally accepted accounting principles (U.S. GAAP) and are consistently followed by the Fund.
Security Valuation – Equity securities and exchange-traded funds (ETFs), except those traded on the Nasdaq Stock Market, Inc. (Nasdaq), are valued at the last quoted sales price as of the time of the regular close of the New York Stock Exchange on the valuation date. Securities and ETFs traded on the Nasdaq are valued in accordance with the Nasdaq Official Closing Price, which may not be the last sales price. If, on a particular day, an equity security or ETF does not trade, then the mean between the bid and ask prices will be used, which approximates fair value. U.S. government and agency securities are valued at the mean between the bid and ask prices, which approximates fair value. Generally, other securities and assets for which market quotations are not readily available are valued at fair value as determined in good faith under the direction of the Fund’s Board of Trustees (Board). In determining whether market quotations are readily available or fair valuation will be used, various factors will be taken into consideration, such as market closures or suspension of trading in a security.
Federal and Foreign Income Taxes – No provision for federal income taxes has been made as the Fund intends to continue to qualify for federal income tax purposes as a regulated investment company under Subchapter M of the Internal Revenue Code of 1986, as amended, and make the requisite distributions to shareholders. The Fund evaluates tax positions taken or expected to be taken in the course of preparing the Fund’s tax returns to determine whether the tax positions are “more-likely-than-not” of being sustained by the applicable tax authority. Tax positions not deemed to meet the “more-likely-than-not” threshold are recorded as a tax benefit or expense in the current year. Management has analyzed the Fund’s tax positions taken for all open federal income tax years (Nov. 30, 2011–Nov. 30, 2014), and has concluded that no provision for federal income tax is required in
30
Table of Contents
the Fund’s financial statements. In regard to foreign taxes only, the Fund has open tax years in certain foreign countries in which it invests that may date back to the inception of the Fund.
Class Accounting – Investment income, common expenses, and realized and unrealized gain (loss) on investments are allocated to the various classes of the Fund on the basis of daily net assets of each class. Distribution expenses relating to a specific class are charged directly to that class.
Repurchase Agreements – The Fund may purchase certain U.S. government securities subject to the counterparty’s agreement to repurchase them at an agreed upon date and price. The counterparty will be required on a daily basis to maintain the value of the collateral subject to the agreement at not less than the repurchase price (including accrued interest). The agreements are conditioned upon the collateral being deposited under the Federal Reserve book-entry system with the Fund’s custodian or a third-party sub-custodian. In the event of default or bankruptcy by the other party to the agreement, retention of the collateral may be subject to legal proceedings. All open repurchase agreements as of the date of this report were entered into on Nov. 28, 2014.
Use of Estimates – The preparation of financial statements in conformity with U.S. GAAP requires management to make estimates and assumptions that affect the fair value of investments, the reported amounts of assets and liabilities and disclosure of contingent assets and liabilities at the date of the financial statements, and the reported amounts of revenues and expenses during the reporting period. Actual results could differ from those estimates and the differences could be material.
Other – Expenses directly attributable to the Fund are charged directly to the Fund. Other expenses common to various funds within the Delaware Investments® Family of Funds are generally allocated among such funds on the basis of average net assets. Management fees and some other expenses are paid monthly. Security transactions are recorded on the date the securities are purchased or sold (trade date) for financial reporting purposes. Costs used in calculating realized gains and losses on the sale of investment securities are those of the specific securities sold. Dividend income is recorded on the ex-dividend date and interest income is recorded on the accrual basis. Distributions received from investments in Real Estate Investment Trusts (REITs) are recorded as dividend income on the ex-dividend date, subject to reclassification upon notice of the character of such distributions by the issuer. Foreign dividends are also recorded on the ex-dividend date or as soon after the ex-dividend date that the Fund is aware of such dividends, net of all tax withholdings, a portion of which may be reclaimable. Withholding taxes and reclaims on foreign dividends have been recorded in accordance with the Fund’s understanding of the applicable country’s tax rules and rates. The Fund declares and pays distributions from net investment income and net realized gain on investments, if any, annually. The Fund may distribute more frequently, if necessary for tax purposes. Dividends and distributions, if any, are recorded on the ex-dividend date.
Subject to seeking best execution, the Fund may direct certain security trades to brokers who have agreed to rebate a portion of the related brokerage commission to the Fund in cash. Such commission rebates are included on the “Statement of operations” under “Net realized gain on investments” and totaled $76 for the year ended Nov. 30, 2014. In general, best execution refers to many factors, including the price paid or received for a security, the commission charged, the promptness and reliability of execution, the confidentiality and placement accorded the order, and other factors affecting the overall benefit obtained by the Fund on the transaction.
| 31 |
Table of Contents
| Notes to financial statements
Delaware Small Cap Value Fund
|
1. Significant Accounting Policies (continued)
The Fund may receive earnings credits from its custodian when positive cash balances are maintained, which may be used to offset custody fees. There were no earnings credits for the year ended Nov. 30, 2014.
The Fund receives earnings credits from its transfer agent when positive cash balances are maintained, which may be used to offset transfer agent fees. If the amount earned is greater than one dollar, the expense paid under this arrangement is included on the “Statement of operations” under “Dividend disbursing and transfer agent fees and expenses” with the corresponding expense offset shown under “Less expense paid indirectly.” For the year ended Nov. 30, 2014, the Fund earned $770 under this agreement.
2. Investment Management, Administration Agreements and Other Transactions with Affiliates
In accordance with the terms of its investment management agreement, the Fund pays Delaware Management Company (DMC), a series of Delaware Management Business Trust and the investment manager, an annual fee which is calculated daily at the rate of 0.75% on the first $500 million of average daily net assets of the Fund, 0.70% on the next $500 million, 0.65% on the next $1.5 billion, and 0.60% on the average daily net assets in excess $2.5 billion.
Effective Nov. 1, 2014, Delaware Investments Fund Services Company (DIFSC), an affiliate of DMC, provides fund accounting and financial administration oversight services to the Fund. Prior to this time, Delaware Service Company, Inc. (DSC), an affiliate of DMC, provided fund accounting and financial administration oversight services to the Fund. For these services, the Fund pays DIFSC fees based on the aggregate daily net assets of the Delaware Investments® Family of Funds at the following annual rate: 0.0050% of the first $30 billion; 0.0045% of the next $10 billion; 0.0040% of the next $10 billion; and 0.0025% of aggregate average daily net assets in excess of $50 billion. The fees payable to DIFSC under the service agreement described above are allocated among all Funds in the Delaware Investments Family of Funds on a relative net asset value basis. For the year ended Nov. 30, 2014, the Fund was charged $120,617 for these services. This amount is included on the “Statement of operations” under “Accounting and administrative expenses.”
Effective Nov. 1, 2014, DIFSC is the transfer agent and dividend disbursing agent of the Fund. Prior to this time, DSC was the transfer agent and dividend disbursing agent of the Fund. For these services, the Fund pays DIFSC fees based on the aggregate daily net assets of the retail funds within the Delaware Investments Family of Funds at the following annual rate: 0.025% of the first $20 billion; 0.020% of the next $5 billion; 0.015% of the next $5 billion; and 0.013% on average daily net assets in excess of $30 billion. This amount is included on the “Statement of operations” under “Dividend disbursing and transfer agent fees and expenses.” For the year ended Nov. 30, 2014, the Fund was charged $543,436 for these services. Pursuant to a sub-transfer agency agreement between DIFSC and BNY Mellon Investment Servicing (US) Inc. (BNYMIS), BNYMIS provides certain sub-transfer agency services to the Fund. Sub-transfer agency fees are passed on to and paid directly by the Fund.
Pursuant to a distribution agreement and distribution plan, the Fund pays DDLP, the distributor and an affiliate of DMC, an annual distribution and service fee of 0.25% of the Class A shares, 1.00% of the average daily net assets of the Class C shares, and 0.50% of the average daily net assets of the Class R
| 32 |
Table of Contents
shares. Institutional Class shares pay no distribution and service expenses. The Fund’s Class B shares paid DDLP 1.00% of the average daily net assets for the period Nov. 1, 2013 through Sept. 25, 2014. DDLP contracted to limit the Fund’s Class B 12b-1 fees from Nov. 1, 2013 through Sept. 25, 2014* to 0.25% of average daily net assets.
As provided in the investment management agreement, the Fund bears a portion of the cost of resources shared with DMC, including the cost of internal personnel of DMC and/or its affiliates that provide legal, tax, and regulatory reporting services to the Fund. For the year ended Nov. 30, 2014, the Fund was charged $69,700 for internal legal, tax, and regulatory reporting services provided by DMC and/or its affiliates’ employees. This amount is included on the “Statement of operations” under “Legal fees.”
For the year ended Nov. 30, 2014, DDLP earned $63,616 for commissions on sales of the Fund’s Class A shares. For the year ended, Nov. 30, 2014, DDLP received gross CDSC commissions of $38 and $1,294, on redemption of the Fund’s Class A and Class C shares, respectively, and these commissions were entirely used to offset upfront commissions previously paid by DDLP to broker/dealers on sales of those shares.
Trustees’ fees include expenses accrued by the Fund for each Trustee’s retainer and meeting fees. Certain officers of DMC, DSC, and DDLP are officers and/or Trustees of the Trust. These officers and Trustees are paid no compensation by the Fund.
* The contractual waiver period was Nov. 1, 2013 through Sept. 25, 2014.
3. Investments
For the year ended Nov. 30, 2014, the Fund made purchases and sales of investment securities other than short-term investments as follows:
| Purchases |
$ | 662,492,687 | ||
| Sales |
417,728,948 |
At Nov. 30, 2014, the cost of investments and unrealized appreciation (depreciation) for federal income tax purposes were as follows:
| Cost of investments |
$ | 2,152,002,705 | ||
|
|
|
|||
| Aggregate unrealized appreciation |
$ | 622,616,886 | ||
| Aggregate unrealized depreciation |
(46,658,345 | ) | ||
|
|
|
|||
| Net unrealized appreciation |
$ | 575,958,541 | ||
|
|
|
U.S. GAAP defines fair value as the price that the Fund would receive to sell an asset or pay to transfer a liability in an orderly transaction between market participants at the measurement date under current market conditions. A three-level hierarchy for fair value measurements has been established based upon the transparency of inputs to the valuation of an asset or liability. Inputs may be observable or unobservable and refer broadly to the assumptions that market participants would use in pricing the asset or liability. Observable inputs reflect the assumptions market participants would use in pricing the asset or liability based on market data obtained from sources independent of the reporting entity. Unobservable inputs reflect the reporting entity’s own assumptions about the assumptions that market participants would use in pricing the asset or liability based on the best information available under the
| 33 |
Table of Contents
| Notes to financial statements
Delaware Small Cap Value Fund
|
3. Investments (continued)
circumstances. The Fund’s investment in its entirety is assigned a level based upon the observability of the inputs which are significant to the overall valuation. The three-level hierarchy of inputs is summarized below.
| Level 1 – | Inputs are quoted prices in active markets for identical investments. (Examples: equity securities, open-end investment companies, futures contracts, exchange-traded options contracts) | |
| Level 2 – | Other observable inputs, including, but not limited to: quoted prices for similar assets or liabilities in markets that are active, quoted prices for identical or similar assets or liabilities in markets that are not active, inputs other than quoted prices that are observable for the assets or liabilities (such as interest rates, yield curves, volatilities, prepayment speeds, loss severities, credit risks, and default rates), or other market-corroborated inputs. (Examples: debt securities, government securities, swap contracts, foreign currency exchange contracts, foreign securities utilizing international fair value pricing, broker-quoted securities, fair valued securities) | |
| Level 3 – | Significant unobservable inputs, including the Fund’s own assumptions used to determine the fair value of investments. (Examples: broker-quoted securities, fair valued securities) | |
Level 3 investments are valued using significant unobservable inputs. The Fund may also use an income-based valuation approach in which the anticipated future cash flows of the investment are discounted to calculate fair value. Discounts may also be applied due to the nature or duration of any restrictions on the disposition of the investments. Valuations may also be based upon current market prices of securities that are comparable in coupon, rating, maturity, and industry. The derived value of a Level 3 investment may not represent the value which is received upon disposition and this could impact the results of operations.
The following table summarizes the valuation of the Fund’s investments by fair value hierarchy levels as of Nov. 30, 2014:
| Level 1 | Level 2 | Total | ||||||||||
| Common Stock |
$ | 2,625,204,032 | $ | — | $ | 2,625,204,032 | ||||||
| Short-Term Investments |
— | 102,757,214 | 102,757,214 | |||||||||
|
|
|
|
|
|
|
|||||||
| Total |
$ | 2,625,204,032 | $ | 102,757,214 | $ | 2,727,961,246 | ||||||
|
|
|
|
|
|
|
|||||||
During the year ended Nov. 30, 2014, there were no transfers between Level 1 investments, Level 2 investments, or Level 3 investments that had a significant impact to the Fund. The Fund’s policy is to recognize transfers between levels at the beginning of the reporting period.
A reconciliation of Level 3 investments is presented when the Fund has a significant amount of Level 3 investments at the beginning, interim, or end of the period in relation to net assets. At Nov. 30, 2014, there were no Level 3 investments.
| 34 |
Table of Contents
|
|
4. Dividend and Distribution Information
Income and long-term capital gain distributions are determined in accordance with federal income tax regulations, which may differ from U.S. GAAP. Additionally, distributions from net short-term gains on sales of investment securities are treated as ordinary income for federal income tax purposes. The tax character of dividends and distributions paid during the years ended Nov. 30, 2014 and 2013 were as follows:
| Year Ended | ||||||||
| 11/30/14 | 11/30/13 | |||||||
| Ordinary income |
$ | 15,687,573 | $ | 3,065,098 | ||||
| Long-term capital gain |
36,372,319 | 6,758,692 | ||||||
|
|
|
|
|
|||||
| Total |
$ | 52,059,892 | $ | 9,823,790 | ||||
|
|
|
|
|
|||||
5. Components of Net Assets on a Tax Basis
As of Nov. 30, 2014, the components of net assets on a tax basis were as follows:
| Shares of beneficial interest |
$ | 2,023,045,323 | ||
| Undistributed ordinary income |
27,506,367 | |||
| Undistributed long-term capital gains |
108,930,582 | |||
| Unrealized appreciation |
575,958,541 | |||
|
|
|
|||
| Net assets |
$ | 2,735,440,813 | ||
|
|
|
The differences between book basis and tax basis components of net assets are primarily attributable to tax deferral of losses on wash sales.
| 35 |
Table of Contents
| Notes to financial statements
Delaware Small Cap Value Fund
|
6. Capital Shares
Transactions in capital shares were as follows:
| Year Ended | ||||||||
| 11/30/14 | 11/30/13 | |||||||
| Shares sold: |
||||||||
| Class A |
4,575,040 | 7,956,581 | ||||||
| Class B |
442 | 961 | ||||||
| Class C |
484,338 | 649,744 | ||||||
| Class R |
482,799 | 803,908 | ||||||
| Institutional Class |
14,369,342 | 17,365,329 | ||||||
| Shares issued upon reinvestment of dividends and distributions: |
||||||||
| Class A |
375,243 | 116,899 | ||||||
| Class B |
1,276 | 1,176 | ||||||
| Class C |
52,556 | 13,344 | ||||||
| Class R |
32,516 | 7,655 | ||||||
| Institutional Class |
515,280 | 94,471 | ||||||
|
|
|
|
|
|||||
| 20,888,832 | 27,010,068 | |||||||
|
|
|
|
|
|||||
| Shares redeemed: |
||||||||
| Class A |
(7,704,858 | ) | (4,336,760 | ) | ||||
| Class B |
(78,398 | ) | (111,867 | ) | ||||
| Class C |
(396,701 | ) | (388,826 | ) | ||||
| Class R |
(466,913 | ) | (458,041 | ) | ||||
| Institutional Class |
(6,292,453 | ) | (3,689,734 | ) | ||||
|
|
|
|
|
|||||
| (14,939,323 | ) | (8,985,228 | ) | |||||
|
|
|
|
|
|||||
| Net increase |
5,949,509 | 18,024,840 | ||||||
|
|
|
|
|
|||||
For the years ended Nov. 30, 2014 and 2013, 25,653 Class B shares were converted to 22,073 Class A shares valued at $1,188,044 and 26,366 Class B shares were converted to 22,814 Class A shares valued at $1,034,574, respectively. The respective amounts are included in Class B redemptions and Class A subscriptions in the table above and the “Statements of changes in net assets.”
Certain shareholders may exchange shares of one class for shares of another class. For the year ended Nov. 30, 2014, exchange transactions were as follows:
| Exchange Redemptions | Exchange Subscriptions | |||||||||
| Class A Shares |
Class C Shares |
Institutional Class Shares |
Class A Shares |
Institutional Class Shares |
Value | |||||
| 33,683 | 2,494 | — | 93 | 34,114 | $1,978,114 | |||||
| 36 |
Table of Contents
|
|
These exchange transactions are included as subscriptions and redemptions in the tables on the previous page and the “Statements of changes in net assets.”
7. Line of Credit
The Fund, along with certain other funds in the Delaware Investments® Family of Funds (Participants), was a participant in a $225,000,000 revolving line of credit intended to be used for temporary or emergency purposes as an additional source of liquidity to fund redemptions of investor shares. Under the agreement, the Participants were charged an annual commitment fee of 0.08%, which was allocated across the Participants on the basis of each Participant’s allocation of the entire facility. The Participants were permitted to borrow up to a maximum of one third of their net assets under the agreement. Each Participant was individually, and not jointly, liable for its particular advances, if any, under the line of credit. The line of credit available under the agreement expired on Nov. 10, 2014.
On Nov. 10, 2014, the Fund, along with the other Participants, entered into an amendment to the agreement for a $275,000,000 revolving line of credit. The line of credit is to be used as described above and operates in substantially the same manner as the original agreement. The line of credit available under the agreement expires on Nov. 9, 2015.
The Fund had no amounts outstanding as of Nov. 30, 2014 or at any time during the period then ended.
8. Offsetting
In December 2011, the Financial Accounting Standards Board (FASB) issued guidance that expands current disclosure requirements on the offsetting of certain assets and liabilities. The new disclosures are required for investments and derivative financial instruments subject to master netting or similar agreements which are eligible for offset in the “Statement of assets and liabilities” and require an entity to disclose both gross and net information about such investments and transactions in the financial statements. In January 2013, the FASB issued guidance that clarifies which investments and transactions are subject to the offsetting disclosure requirements. The scope of the disclosure requirements for offsetting is limited to derivative instruments, repurchase agreements and reverse repurchase agreements, and securities borrowing. The guidance is effective for financial statements with fiscal years beginning on or after Jan. 1, 2013, and interim periods within those fiscal years. The Fund adopted the disclosure provisions on offsetting during the current reporting period.
In order to better define its contractual rights and to secure rights that will help the Fund mitigate its counterparty risk, the Fund entered into an International Swaps and Derivatives Association, Inc. Master Agreement (ISDA Master Agreement) or similar agreement with its derivative contract counterparties. An ISDA Master Agreement is a bilateral agreement between the Fund and a counterparty that governs certain over-the-counter (OTC) derivatives and foreign exchange contracts and typically contains, among other things, collateral posting items and netting provisions in the event of a default and/or termination event. Under an ISDA Master Agreement, the Fund may, under certain circumstances, offset with the counterparty certain derivative financial instruments’ payables and/or receivables with collateral held and/or posted and create one single net payment. The provisions of the ISDA Master Agreement typically permit a single net payment in the event of default (close-out) including the bankruptcy or
| 37 |
Table of Contents
| Notes to financial statements
Delaware Small Cap Value Fund
|
8. Offsetting (continued)
insolvency of the counterparty. However, bankruptcy or insolvency laws of a particular jurisdiction may impose restrictions on or prohibitions against the right of offset in bankruptcy, insolvency, or other events.
For financial reporting purposes, the Fund does not offset derivative assets and derivative liabilities that are subject to netting arrangements in the “Statement of assets and liabilities.”
At Nov. 30, 2014, the Fund had the following assets and liabilities subject to offsetting provisions:
Master Repurchase Agreements
| Counterparty |
Repurchase Agreements |
Fair Value of Non-Cash Collateral Received |
Cash Collateral Received |
Net Amount(a) | ||||||||||||||||
| Bank of America |
$ | 10,673,613 | $ | (10,673,613 | ) | $ | — | $ | — | |||||||||||
| Bank of Montreal |
3,557,871 | (3,557,871 | ) | — | — | |||||||||||||||
| BNP Paribas |
16,041,516 | (16,041,516 | ) | — | — | |||||||||||||||
|
|
|
|
|
|
|
|
|
|||||||||||||
| Total |
$ | 30,273,000 | $ | (30,273,000 | ) | $ | — | $ | — | |||||||||||
|
|
|
|
|
|
|
|
|
|||||||||||||
(a)Net amount represents the receivable/(payable) that would be due from/(to) the counterparty in the event of default.
9. Securities Lending
The Fund, along with other funds in the Delaware Investments® Family of Funds, may lend its securities pursuant to a security lending agreement (Lending Agreement) with The Bank of New York Mellon (BNY Mellon). At the time a security is loaned, the borrower must post collateral equal to the required percentage of the market value of the loaned security, including any accrued interest. The required percentage is: (1) 102% with respect to U.S. securities and foreign securities that are denominated and payable in U.S. dollars; and (2) 105% with respect to foreign securities. With respect to each loan, if on any business day the aggregate market value of securities collateral plus cash collateral held is less than the aggregate market value of the securities which are the subject of such loan, the borrower will be notified to provide additional collateral by the end of the following business day which, together with the collateral already held, will be not less than the applicable initial collateral requirements for such security loan. If the aggregate market value of securities collateral and cash collateral held with respect to a security loan exceeds the applicable initial collateral requirement, upon the request of the borrower, BNY Mellon must return enough collateral to the borrower by the end of the following business day to reduce the value of the remaining collateral to the applicable initial collateral requirement for such security loan. As a result of the foregoing, the value of the collateral held with respect to a loaned security may be more or less than the value of the security on loan.
Cash collateral received is generally invested in the Delaware Investments Collateral Fund No. 1 (Collective Trust) established by BNY Mellon for the purpose of investment on behalf of funds managed by DMC that participate in BNY Mellon’s securities lending program. The Collective Trust may invest in
| 38 |
Table of Contents
|
|
U.S. government securities and high-quality corporate debt, asset-backed and other money market securities, and in repurchase agreements collateralized by such securities, provided that the Collective Trust will generally have a dollar-weighted average portfolio maturity of 60 days or less. The Fund can also accept U.S. government securities and letters of credit (non-cash collateral) in connection with securities loans. In the event of default or bankruptcy by the lending agent, realization, and/or retention of the collateral may be subject to legal proceedings. In the event the borrower fails to return loaned securities and the collateral received is insufficient to cover the value of the loaned securities and provided such collateral shortfall is not the result of investment losses, the lending agent has agreed to pay the amount of the shortfall to the Fund or, at the discretion of the lending agent, replace the loaned securities. The Fund continues to record dividends or interest, as applicable, on the securities loaned and is subject to changes in value of the securities loaned that may occur during the term of the loan. The Fund has the right under the Lending Agreement to recover the securities from the borrower on demand. With respect to security loans collateralized by non-cash collateral, the Fund receives loan premiums paid by the borrower. With respect to security loans collateralized by cash collateral, the earnings from the collateral investments are shared among the Fund, the security lending agent, and the borrower. The Fund records security lending income net of allocations to the security lending agent and the borrower.
The Collective Trust used for the investment of cash collateral received from borrowers of securities seeks to maintain a net asset value per unit of $1.00, but there can be no assurance that it will always be able to do so. The Fund may incur investment losses as a result of investing securities lending collateral in the Collective Trust. This could occur if an investment in a Collective Trust defaulted or if it were necessary to liquidate assets in the Collective Trust to meet returns on outstanding security loans at a time when the Collective Trust’s net asset value per unit was less than $1.00. Under those circumstances, the Fund may not receive an amount from the Collective Trust that is equal in amount to the collateral the Fund would be required to return to the borrower of the securities and the Fund would be required to make up for this shortfall.
During the year ended Nov. 30, 2014, the Fund had no securities out on loan.
10. Credit and Market Risk
The Fund invests a significant portion of its assets in small companies and may be subject to certain risks associated with ownership of securities of such companies. Investments in small-sized companies may be more volatile than investments in larger companies for a number of reasons, which include limited financial resources or a dependence on narrow product lines.
The Fund invests in REITs and is subject to the risks associated with that industry. If the Fund holds real estate directly as a result of defaults or receives rental income directly from real estate holdings, its tax status as a regulated investment company may be jeopardized. There were no direct real estate holdings during the year ended Nov. 30, 2014. The Fund’s REIT holdings are also affected by interest rate changes, particularly if the REITs it holds use floating rate debt to finance their ongoing operations.
The Fund may invest up to 15% of its net assets in illiquid securities, which may include securities with contractual restrictions on resale, securities exempt from registration under Rule 144A of the Securities Act of 1933, as amended, and other securities which may not be readily marketable. The relative
| 39 |
Table of Contents
| Notes to financial statements
Delaware Small Cap Value Fund |
10. Credit and Market Risk (continued)
illiquidity of these securities may impair the Fund from disposing of them in a timely manner and at a fair price when it is necessary or desirable to do so. While maintaining oversight, the Fund’s Board has delegated to DMC the day-to-day functions of determining whether individual securities are liquid for purposes of the Fund’s limitation on investments in illiquid securities. Securities eligible for resale pursuant to Rule 144A, which are determined to be liquid, are not subject to the Fund’s 15% limit on investments in illiquid securities. As of Nov. 30, 2014, there were no Rule 144A securities held by the Fund. Illiquid securities have been identified on the “Schedule of investments.”
11. Contractual Obligations
The Fund enters into contracts in the normal course of business that contain a variety of indemnifications. The Fund’s maximum exposure under these arrangements is unknown. However, the Fund has not had prior claims or losses pursuant to these contracts. Management has reviewed the Fund’s existing contracts and expects the risk of loss to be remote.
12. Recent Accounting Pronouncements
In June 2014, the Financial Accounting Standards Board issued guidance to improve the financial reporting of reverse repurchase agreements and other similar transactions. The guidance includes expanded disclosure requirements for entities that enter into reverse repurchase agreements and similar transactions accounted for as secured borrowings. The guidance is effective for financial statements with fiscal years beginning on or after December 15, 2014 and interim periods within those fiscal years. Management is evaluating the impact, if any, of this guidance on the Fund’s financial statement disclosures.
13. Subsequent Events
Management has determined that no material events or transactions occurred subsequent to Nov. 30, 2014 that would require recognition or disclosure in the Fund’s financial statements.
| 40 |
Table of Contents
registered public accounting firm
To the Board of Trustees of Delaware Group® Equity Funds V
and Shareholders of Delaware Small Cap Value Fund:
In our opinion, the accompanying statement of assets and liabilities, including the schedule of investments, and the related statements of operations and of changes in net assets and the financial highlights present fairly, in all material respects, the financial position of Delaware Small Cap Value Fund (one of the series constituting Delaware Group Equity Funds V, hereafter referred to as the “Fund”) at November 30, 2014, the results of its operations for the year then ended, the changes in its net assets for each of the two years in the period then ended and the financial highlights for each of the five years in the period then ended, in conformity with accounting principles generally accepted in the United States of America. These financial statements and financial highlights (hereafter referred to as “financial statements”) are the responsibility of the Fund’s management. Our responsibility is to express an opinion on these financial statements based on our audits. We conducted our audits of these financial statements in accordance with the standards of the Public Company Accounting Oversight Board (United States). Those standards require that we plan and perform the audit to obtain reasonable assurance about whether the financial statements are free of material misstatement. An audit includes examining, on a test basis, evidence supporting the amounts and disclosures in the financial statements, assessing the accounting principles used and significant estimates made by management, and evaluating the overall financial statement presentation. We believe that our audits, which included confirmation of securities at November 30, 2014 by correspondence with the custodian and brokers, provide a reasonable basis for our opinion.
PricewaterhouseCoopers LLP
Philadelphia, Pennsylvania
January 22, 2015
41
Table of Contents
| Other Fund information (Unaudited)
Delaware Small Cap Value Fund
|
Tax Information
The information set forth below is for the Fund’s fiscal year as required by federal income tax laws. Shareholders, however, must report distributions on a calendar year basis for income tax purposes, which may include distributions for portions of two fiscal years of the Fund. Accordingly, the information needed by shareholders for income tax purposes will be sent to them in January of each year. Please consult your tax advisor for proper treatment of this information.
All disclosures are based on financial information available as of the date of this annual report and, accordingly are subject to change. For any and all items requiring reporting, it is the intention of the Fund to report the maximum amount permitted under the Internal Revenue Code and the regulations thereunder.
For the fiscal year ended Nov. 30, 2014, the Fund reports distributions paid during the year as follows:
| (A) Long-Term Capital Gain Distributions (Tax Basis) |
69.87 | % | ||
| (B) Ordinary Income Distributions (Tax Basis)* |
30.13 | % | ||
| Total Distributions (Tax Basis) |
100.00 | % | ||
| (C) Qualifying Dividends(1) |
99.96 | % |
(A) and (B) is based on a percentage of the Fund’s total distributions.
(C) is based on a percentage of the Fund’s ordinary income distributions.
(1) Qualifying dividends represent dividends which qualify for the corporate dividends received deduction.
| * | For the fiscal year ended Nov. 30, 2014, certain dividends paid by the Fund may be subject to a maximum tax rate of 20%. The percentage of dividends paid by the Fund from ordinary income reported as qualified dividend income is 100.00%. Complete information will be computed and reported in conjunction with your 2014 Form 1099-DIV. |
For the fiscal year ended Nov. 30, 2014, certain interest income paid by the Fund, determined to be Qualified Interest Income and Short-Term Capital Gains, may be subject to relief from U.S. withholding for foreign shareholders, as provided by the American Jobs Creation Act of 2004 and as extended by Tax Relief Unemployment Insurance Reauthorization, and Job Creations Act of 2010, and by the American Taxpayer Relief Act of 2012. For the fiscal year ended Nov. 30, 2014, the Fund has reported maximum distributions of Qualified Interest Income and Short-Term Capital Gains of $16,442 and $19,595,006, respectively.
Board consideration of Delaware Small Cap Value Fund investment management agreement
At a meeting held on Aug. 19–21, 2014 (the “Annual Meeting”), the Board of Trustees (the “Board”), including a majority of disinterested or independent Trustees, approved the renewal of the Investment Management Agreement for Delaware Small Cap Value Fund (the “Fund”). In making its decision, the Board considered information furnished at regular quarterly Board meetings, including reports detailing Fund performance, investment strategies and expenses, as well as information prepared specifically in connection with the renewal of the investment advisory and sub-advisory contracts. Information furnished specifically in connection with the renewal of the Investment Management Agreement with Delaware Management Company (“DMC”) included materials provided by DMC and its affiliates (“Delaware Investments”) concerning, among other things, the nature, extent and quality of services provided to the Fund, the costs of such services to the Fund, economies of scale and the financial condition and profitability of Delaware Investments. In addition, in connection with the Annual Meeting,
| 42 |
Table of Contents
|
|
reports were provided to the Trustees in May 2014 and included reports provided by Lipper, Inc., an independent statistical compilation organization (“Lipper”). The Lipper reports compared the Fund’s investment performance and expenses with those of other comparable mutual funds. The Independent Trustees reviewed and discussed the Lipper reports with independent legal counsel to the Independent Trustees. The Board requested and received information regarding DMC’s policy with respect to advisory fee levels and its breakpoint philosophy; the structure of portfolio manager compensation; the investment manager’s profitability; comparative client fee information; and any constraints or limitations on the availability of securities for certain investment styles, which had in the past year inhibited, or which were likely in the future to inhibit, DMC’s ability to invest fully in accordance with Fund policies.
In considering information relating to the approval of the Fund’s advisory agreement, the Independent Trustees received assistance and advice from and met separately with independent legal counsel to the Independent Trustees. Although the Board gave attention to all information furnished, the following discussion identifies, under separate headings, the primary factors taken into account by the Board during its contract renewal considerations.
Nature, Extent and Quality of Service. The Board considered the services provided by Delaware Investments to the Fund and its shareholders. In reviewing the nature, extent and quality of services, the Board considered reports furnished to it throughout the year, which covered matters such as the relative performance of the Fund, compliance of portfolio managers with the investment policies, strategies and restrictions for the Fund, compliance by DMC and Delaware Distributors, L.P. (together, “Management”) personnel with the Code of Ethics adopted throughout the Delaware Investments® Family of Funds complex and adherence to fair value pricing procedures as established by the Board. The Board was pleased with the current staffing of the Fund’s investment manager and the emphasis placed on research in the investment process. The Board recognized DMC’s receipt of several industry distinctions. The Board gave favorable consideration to DMC’s efforts to control expenditures while maintaining service levels committed to Fund matters. The Board noted that, in the third and fourth quarters of 2013, Management reduced the maximum 12b-1 fee for certain funds; and in November 2013 Management negotiated a substantial reduction in fees for fund accounting services provided to the Funds. The Board noted the benefits provided to Fund shareholders through each shareholder’s ability to exchange an investment in one Delaware Investments fund for the same class of shares in another Delaware Investments fund without a sales charge, to reinvest Fund dividends into additional shares of the Fund or into additional shares of other Delaware Investments funds and the privilege to combine holdings in other Delaware Investments funds to obtain a reduced sales charge. The Board was satisfied with the nature, extent and quality of the overall services provided by Delaware Investments.
Investment Performance. The Board placed significant emphasis on the investment performance of the Fund in view of the importance of investment performance to shareholders. Although the Board gave appropriate consideration to performance reports and discussions with portfolio managers at Investment Committee meetings throughout the year, the Board gave particular weight to the Lipper reports furnished for the Annual Meeting. The Lipper reports prepared for the Fund showed the investment performance of its Class A shares in comparison to a group of similar funds as selected by Lipper (the “Performance Universe”). A fund with the best performance ranked first, and a fund with the poorest
| 43 |
Table of Contents
| Other Fund information (Unaudited)
Delaware Small Cap Value Fund
|
Board consideration of Delaware Small Cap Value Fund investment management agreement (continued)
performance ranked last. The highest/best performing 25% of funds in the Performance Universe make up the first quartile; the next 25%, the second quartile; the next 25%, the third quartile; and the poorest/ worst performing 25% of funds in the Performance Universe make up the fourth quartile. Comparative annualized performance for the Fund was shown for the past 1-, 3-, 5- and 10-year periods, to the extent applicable, ended March 31, 2014. The Board’s objective is that the Fund’s performance for the periods considered be at or above the median of its Performance Universe. The following paragraph summarizes the performance results for the Fund and the Board’s view of such performance.
Lipper currently classifies the Fund as a small-cap core fund. However, Management believes that it would be more appropriate to include the Fund in the small-cap value funds category. Accordingly, the Lipper report prepared for the Fund compares the Fund’s performance to two separate Performance Universes — one consisting of the Fund and all retail and institutional small-cap core funds and the other consisting of the Fund and all retail and institutional small-cap value funds. When compared to other small-cap core funds, the Lipper report comparison showed that the Fund’s total return for the 1- and 3-year periods was in the third quartile of its Performance Universe and the Fund’s total return for the 5- and 10-year periods was in the second quartile of its Performance Universe. When compared to other small-cap value funds, the Lipper report comparison showed that the Fund’s total return for the 1-year period was in the fourth quartile of the Performance Universe. The report further showed that the Fund’s total return for the 3- and 5-year periods was in the third quartile of its Performance Universe and the Fund’s total return for the 10-year period was in the second quartile of its Performance Universe. The Fund’s performance results were mixed but tended toward median, which was acceptable.
Comparative Expenses. The Board considered expense comparison data for the Delaware Investments® Family of Funds. Management provided the Board with information on pricing levels and fee structures for the Fund as of its most recently completed fiscal year. The Board also focused on the comparative analysis of effective management fees and total expense ratios of the Fund versus effective management fees and expense ratios of a group of similar funds as selected by Lipper (the “Expense Group”). In reviewing comparative costs, the Fund’s contractual management fee and the actual management fee incurred by the Fund were compared with the contractual management fees (assuming all funds in the Expense Group were similar in size to the Fund) and actual management fees (as reported by each fund) within the Expense Group, taking into account any applicable breakpoints and fee waivers. The Fund’s total expenses were also compared with those of its Expense Group. The Lipper total expenses, for comparative consistency, were shown by Lipper for Class A shares and comparative total expenses including 12b-1 and non 12b-1 service fees. The Board considered fees paid to Delaware Investments for non-management services. The Board’s objective is to limit the Fund’s total expense ratio to be competitive with that of the Expense Group. The following paragraph summarizes the expense results for the Fund and the Board’s view of such expenses.
When compared to other small-cap core funds, the expense comparisons for the Fund showed that its actual management fee and total expenses were in the quartile with the second lowest expenses of the Expense Group. When compared to other small-cap value funds, the expense comparisons for the Fund
| 44 |
Table of Contents
|
|
showed that its actual management fee was in the quartile with the second lowest expenses of its Expense Group and its total expenses were in the quartile with the second highest expenses of the Expense. The Board noted that, when compared to other small-cap value funds, the Fund’s total expenses were not in line with the Board’s objective. In evaluating the total expenses, the Board considered various initiatives implemented by Management, such as the outsourcing of certain transfer agency services and a negotiation of lower fees for fund accounting services, which had created an opportunity for a further reduction in expenses. The Board was satisfied with Management’s efforts to improve the Fund’s total expense ratio and to bring it in line with the Board’s objective.
Management Profitability. The Board considered the level of profits realized by Delaware Investments in connection with the operation of the Fund. In this respect, the Board reviewed the Investment Management Profitability Analysis that addressed the overall profitability of Delaware Investments’ business in providing management and other services to each of the individual funds and the Delaware Investments® Family of Funds as a whole. Specific attention was given to the methodology followed in allocating costs for the purpose of determining profitability. Management stated that the level of profits of Delaware Investments, to a certain extent, reflects recent operational cost savings and efficiencies initiated by Delaware Investments. The Board considered Delaware Investments’ efforts to improve services provided to fund shareholders and to meet additional regulatory and compliance requirements resulting from recent industry-wide Securities and Exchange Commission initiatives. The Board also considered the extent to which Delaware Investments might derive ancillary benefits from fund operations, including the potential for procuring additional business as a result of the prestige and visibility associated with its role as service provider to the Delaware Investments Family of Funds and the benefits from allocation of fund brokerage to improve trading efficiencies. The Board found that the management fees were reasonable in light of the services rendered and the level of profitability of Delaware Investments.
Economies of Scale. The Trustees considered whether economies of scale are realized by Delaware Investments as the Fund’s assets increase and the extent to which any economies of scale are reflected in the level of management fees charged. The Trustees reviewed the standardized advisory fee pricing and structure, approved by the Board and shareholders, which includes breakpoints. Breakpoints in the advisory fee occur when the advisory fee rate is reduced on assets in excess of specified levels. Breakpoints result in a lower advisory fee than would otherwise be the case on all assets when the asset levels specified are exceeded. The Board noted that the fee under the Fund’s management contract fell within the standard structure. Although the Fund has not reached a size at which it can take advantage of breakpoints, the Board recognized that the fee was structured so that when the Fund grows, economies of scale may be shared.
| 45 |
Table of Contents
| Board of trustees / directors and officers addendum
Delaware Investments® Family of Funds |
A mutual fund is governed by a Board of Trustees/Directors (“Trustees”), which has oversight responsibility for the management of a fund’s business affairs. Trustees establish procedures and oversee and review the performance of the investment manager, the distributor, and others who perform services for the fund. The independent fund trustees, in particular, are advocates
| Name, Address, and Birth Date |
Position(s) Held with Fund(s) |
Length of Time Served | ||
| Interested Trustee | ||||
| Patrick P. Coyne1 | Chairman, President, | Chairman and Trustee | ||
| 2005 Market Street | Chief Executive Officer, | since August 16, 2006 | ||
| Philadelphia, PA 19103 | and Trustee | |||
| April 1963 | President and | |||
| Chief Executive Officer | ||||
| since August 1, 2006 | ||||
| Independent Trustees | ||||
| Thomas L. Bennett | Trustee | Since March 2005 | ||
| 2005 Market Street | ||||
| Philadelphia, PA 19103 | ||||
| October 1947 | ||||
| Joseph W. Chow | Trustee | Since January 2013 | ||
| 2005 Market Street | ||||
| Philadelphia, PA 19103 | ||||
| January 1953 | ||||
| John A. Fry | Trustee | Since January 2001 | ||
| 2005 Market Street | ||||
| Philadelphia, PA 19103 | ||||
| May 1960 | ||||
| 1 | Patrick P. Coyne is considered to be an “Interested Trustee“ because he is an executive officer of the Fund’s(s’) investment advisor. |
| 46 |
Table of Contents
|
|
for shareholder interests. Each trustee has served in that capacity since he or she was elected to or appointed to the Board of Trustees, and will continue to serve until his or her retirement or the election of a new trustee in his or her place. The following is a list of the Trustees and Officers with certain background and related information.
| Principal Occupation(s) During the Past Five Years |
Number of Portfolios in Fund Complex Overseen by Trustee or Officer |
Other Directorships Held by Trustee or Officer | ||
| Patrick P. Coyne has served in | 65 | Board of Governors Member | ||
| various executive capacities | Investment Company | |||
| at different times at | Institute (ICI) | |||
| Delaware Investments.2 | ||||
| Director and Audit | ||||
| Committee Member | ||||
| Kaydon Corp. | ||||
| (2007–2013) | ||||
| Private Investor | 65 | Director | ||
| (March 2004–Present) | Bryn Mawr Bank Corp. (BMTC) | |||
| (2007–2011) | ||||
| Executive Vice President | 65 | Director and Audit Committee | ||
| (Emerging Economies | Member — Hercules | |||
| Strategies, Risk and | Technology Growth | |||
| Corporate Administration) | Capital, Inc. | |||
| State Street Corporation | (2004-2014) | |||
| (July 2004–March 2011) | ||||
| President | 65 | Director — Hershey Trust | ||
| Drexel University | Company | |||
| (August 2010–Present) | ||||
| Director, Audit Committee, | ||||
| President | and Governance Committee | |||
| Franklin & Marshall College | Member Community | |||
| (July 2002–July 2010) | Health Systems |
| 2 | Delaware Investments is the marketing name for Delaware Management Holdings, Inc. and its subsidiaries, including the Fund’s(s’) investment advisor, principal underwriter, and its transfer agent. |
| 47 |
Table of Contents
| Board of trustees / directors and officers addendum
Delaware Investments® Family of Funds
|
| Name, Address, and Birth Date |
Position(s) Held with Fund(s) |
Length of Time Served | ||
|
Independent Trustees (continued)
|
||||
| Lucinda S. Landreth | Trustee | Since March 2005 | ||
| 2005 Market Street | ||||
| Philadelphia, PA 19103 | ||||
| June 1947 | ||||
| Frances A. Sevilla-Sacasa | Trustee | Since September 2011 | ||
| 2005 Market Street | ||||
| Philadelphia, PA 19103 | ||||
| January 1956 | ||||
| Thomas K. Whitford | Trustee | Since January 2013 | ||
| 2005 Market Street | ||||
| Philadelphia, PA 19103 | ||||
| March 1956 | ||||
| 48 |
Table of Contents
|
|
| Principal Occupation(s) During the Past Five Years |
Number of Portfolios in Fund Complex Overseen by Trustee or Officer |
Other Directorships Held by Trustee or Officer | ||
|
|
||||
| Private Investor | 65 | None | ||
| (2004-Present) | ||||
|
Chief Executive Officer — |
65 | Trust Manager and | ||
| Banco Itaú | Audit Committee | |||
| International | Member — Camden | |||
| (April 2012–Present) | Property Trust | |||
| Executive Advisor to Dean | ||||
| (August 2011–March 2012) and Interim Dean |
||||
| (January 2011–July 2011) — | ||||
| University of Miami School of | ||||
| Business Administration | ||||
| President — U.S. Trust, | ||||
| Bank of America Private | ||||
| Wealth Management | ||||
| (Private Banking) | ||||
| (July 2007–December 2008)
|
||||
|
Vice Chairman |
65 | Director — HSBC Finance | ||
| (2010–April 2013) | Corporation and HSBC | |||
| Chief Administrative | North America Holdings Inc. | |||
| Officer (2008–2010) and Executive Vice |
||||
| President and Chief | ||||
| Administrative Officer | ||||
| (2007–2009) — | ||||
| PNC Financial | ||||
| Services Group
|
| 49 |
Table of Contents
| Board of trustees / directors and officers addendum
Delaware Investments® Family of Funds |
| Name, Address, and Birth Date |
Position(s) Held with Fund(s) |
Length of Time Served | ||
|
Independent Trustees (continued)
|
||||
| Janet L. Yeomans | Trustee | Since April 1999 | ||
| 2005 Market Street | ||||
| Philadelphia, PA 19103 | ||||
| July 1948 | ||||
|
J. Richard Zecher |
Trustee | Since March 2005 | ||
| 2005 Market Street | ||||
| Philadelphia, PA 19103 | ||||
| July 1940 | ||||
| 50 |
Table of Contents
|
|
| Principal Occupation(s) During the Past Five Years |
Number of Portfolios in Fund Complex Overseen by Trustee or Officer |
Other Directorships Held by Trustee or Officer | ||
|
|
||||
| Vice President and Treasurer | 65 | Director, Audit and | ||
| (January 2006–July 2012) | Compliance Committee Chair, | |||
| Vice President — | Investment Committee | |||
| Mergers & Acquisitions | Member and Governance | |||
| (January 2003–January 2006), | Committee Member | |||
| and Vice President | Okabena Company | |||
| and Treasurer | ||||
| (July 1995–January 2003) | Chair — 3M | |||
| 3M Corporation | Investment Management | |||
| Company | ||||
| (2005–2012) | ||||
|
Founder |
65 | Director and Compensation | ||
| Investor Analytics | Committee Chairman | |||
| (Risk Management) | Investor Analytics | |||
| (May 1999–Present) | ||||
| Director — P/E Investments | ||||
| Founder | ||||
| P/E Investments | ||||
| (Hedge Fund) | ||||
| (September 1996–Present)
|
| 51 |
Table of Contents
| Board of trustees / directors and officers addendum
Delaware Investments® Family of Funds |
| Name, Address, and Birth Date |
Position(s) Held with Fund(s) |
Length of Time Served | ||
|
Officers
|
||||
| David F. Connor | Senior Vice President, | Senior Vice President, | ||
| 2005 Market Street | Deputy General | Deputy General Counsel | ||
| Philadelphia, PA 19103 | Counsel, and Secretary | since May 2013; | ||
| December 1963 | Vice President, Deputy | |||
| General Counsel | ||||
| September 2000 – | ||||
| May 2013; Secretary since | ||||
| October 2005
| ||||
| Daniel V. Geatens |
Vice President |
Treasurer since October 2007 | ||
| 2005 Market Street | and Treasurer | |||
| Philadelphia, PA 19103 | ||||
| October 1972
|
||||
|
David P. O’Connor |
Executive Vice President, | Executive Vice President | ||
| 2005 Market Street | General Counsel | since February 2012; | ||
| Philadelphia, PA 19103 | and Chief Legal Officer | Senior Vice President | ||
| February 1966 | October 2005 – | |||
| February 2012; | ||||
| General Counsel and | ||||
| Chief Legal Officer | ||||
| since October 2005
| ||||
| Richard Salus | Senior Vice President |
Chief Financial Officer | ||
| 2005 Market Street | and Chief Financial Officer | since November 2006 | ||
| Philadelphia, PA 19103 | ||||
| October 1963
|
The Statement of Additional Information for the Fund(s) includes additional information about the Trustees and Officers and is available, without charge, upon request by calling 800 523-1918.
| 52 |
Table of Contents
|
|
| Principal Occupation(s) During the Past Five Years |
Number of Portfolios in Fund Complex Overseen by Trustee or Officer |
Other Directorships Held by Trustee or Officer | ||
|
|
||||
| David F. Connor has served as | 65 | None3 | ||
| Deputy General Counsel of | ||||
| Delaware Investments since 2000. |
||||
|
Daniel V. Geatens has served |
65 | None3 | ||
| in various capacities at different times at |
||||
| Delaware Investments.
|
||||
|
David P. O’Connor has served |
65 | None3 | ||
| in various executive and legal capacities at different times at Delaware Investments. |
||||
|
Richard Salus has served in |
65 | None3 | ||
| various executive capacities at different times at |
||||
| Delaware Investments.
|
| 3 | David F. Connor, Daniel V. Geatens, David P. O’Connor, and Richard Salus serve in similar capacities for the six portfolios of the Optimum Fund Trust, which have the same investment advisor, principal underwriter, and transfer agent as the registrant. |
| 53 |
Table of Contents
| Board of trustees |
||||||
| Patrick P. Coyne | Joseph W. Chow | Lucinda S. Landreth | Thomas K. Whitford | |||
| Chairman, President, and | Former Executive Vice | Former Chief Investment | Former Vice Chairman | |||
| Chief Executive Officer | President | Officer | PNC Financial Services Group | |||
| Delaware Investments® | State Street Corporation | Assurant, Inc. | Pittsburgh, PA | |||
| Family of Funds | Brookline, MA | Philadelphia, PA | ||||
| Philadelphia, PA | Janet L. Yeomans | |||||
| John A. Fry | Frances A. | Former Vice President | ||||
| Thomas L. Bennett | President | Sevilla-Sacasa | and Treasurer | |||
| Private Investor | Drexel University | Chief Executive Officer | 3M Corporation | |||
| Rosemont, PA | Philadelphia, PA | Banco Itaú | St. Paul, MN | |||
| International Miami, FL |
J. Richard Zecher Founder | |||||
| Investor Analytics | ||||||
| Scottsdale, AZ | ||||||
| Affiliated officers | ||||||
| David F. Connor | Daniel V. Geatens | David P. O’Connor | Richard Salus | |||
| Senior Vice President, | Vice President and | Executive Vice President, | Senior Vice President and | |||
| Deputy General Counsel, | Treasurer | General Counsel, | Chief Financial Officer | |||
| and Secretary | Delaware Investments | and Chief Legal Officer | Delaware Investments | |||
| Delaware Investments | Family of Funds | Delaware Investments | Family of Funds | |||
| Family of Funds | Philadelphia, PA | Family of Funds | Philadelphia, PA | |||
| Philadelphia, PA | Philadelphia, PA | |||||
This annual report is for the information of Delaware Small Cap Value Fund shareholders, but it may be used with prospective investors when preceded or accompanied by the Delaware Investments Fund fact sheet for the most recently completed calendar quarter. These documents are available at delawareinvestments.com.
Delaware Investments is the marketing name of Delaware Management Holdings, Inc. and its subsidiaries.
The Fund files its complete schedule of portfolio holdings with the Securities and Exchange Commission (SEC) for the first and third quarters of each fiscal year on Form N-Q. The Fund’s Forms N-Q, as well as a description of the policies and procedures that the Fund uses to determine how to vote proxies (if any) relating to portfolio securities are available without charge (i) upon request, by calling 800 523-1918; and (ii) on the SEC’s website at sec.gov. In addition, a description of the policies and procedures that the Fund uses to determine how to vote proxies (if any) relating to portfolio securities and the Fund’s Schedule of Investments are available without charge on the Fund’s website at delawareinvestments.com. The Fund’s Forms N-Q may be reviewed and copied at the SEC’s Public Reference Room in Washington, D.C.; information on the operation of the Public Reference Room may be obtained by calling 800 SEC-0330.
Information (if any) regarding how the Fund voted proxies relating to portfolio securities during the most recently disclosed 12-month period ended June 30 is available without charge (i) through the Fund’s website at delawareinvestments.com; and (ii) on the SEC’s website at sec.gov.
54
Item 2. Code of Ethics
The registrant has adopted a code of ethics that applies to the registrant’s principal executive officer, principal financial officer, principal accounting officer or controller, or persons performing similar functions, regardless of whether these individuals are employed by the registrant or a third party. A copy of the registrant’s Code of Business Ethics has been posted on the Delaware Investments Internet Web site at www.delawareinvestments.com. Any amendments to the Code of Business Ethics, and information on any waiver from its provisions granted by the registrant, will also be posted on this Web site within five business days of such amendment or waiver and will remain on the Web site for at least 12 months.
Item 3. Audit Committee Financial Expert
The registrant’s Board of Trustees/Directors has determined that certain members of the registrant’s Audit Committee are audit committee financial experts, as defined below. For purposes of this item, an “audit committee financial expert” is a person who has the following attributes:
a. An understanding of generally accepted accounting principles and financial statements;
b. The ability to assess the general application of such principles in connection with the accounting for estimates, accruals, and reserves;
c. Experience preparing, auditing, analyzing, or evaluating financial statements that present a breadth and level of complexity of accounting issues that are generally comparable to the breadth and complexity of issues that can reasonably be expected to be raised by the registrant’s financial statements, or experience actively supervising one or more persons engaged in such activities;
d. An understanding of internal controls and procedures for financial reporting; and
e. An understanding of audit committee functions.
An “audit committee financial expert” shall have acquired such attributes through:
a. Education and experience as a principal financial officer, principal accounting officer, controller, public accountant, or auditor or experience in one or more positions that involve the performance of similar functions;
b. Experience actively supervising a principal financial officer, principal accounting officer, controller, public accountant, auditor, or person performing similar functions;
c. Experience overseeing or assessing the performance of companies or public accountants with respect to the preparation, auditing, or evaluation of financial statements; or
d. Other relevant experience.
The registrant’s Board of Trustees/Directors has also determined that each member of the registrant’s Audit Committee is independent. In order to be “independent” for purposes of this item, the Audit Committee member may not: (i) other than in his or her capacity as a member of the Board of Trustees/Directors or any committee thereof, accept directly or indirectly any consulting, advisory or other compensatory fee from the issuer; or (ii) be an “interested person” of the registrant as defined in Section 2(a)(19) of the Investment Company Act of 1940.
The names of the audit committee financial experts on the registrant’s Audit Committee are set forth below:
Joseph W. Chow
Lucinda S.
Landreth1
Frances A. Sevilla-Sacasa
Janet L. Yeomans
Item 4. Principal Accountant Fees and Services
(a) Audit fees.
The aggregate fees billed for services provided to the registrant by its independent auditors for the audit of the registrant’s annual financial statements and for services normally provided by the independent auditors in connection with statutory and regulatory filings or engagements were $87,790 for the fiscal year ended November 30, 2014.
The aggregate fees billed for services provided to the registrant by its independent auditors for the audit of the registrant’s annual financial statements and for services normally provided by the independent auditors in connection with statutory and regulatory filings or engagements were $77,405 for the fiscal year ended November 30, 2013.
(b) Audit-related fees.
The aggregate fees billed by the registrant’s independent auditors for services relating to the performance of the audit of the registrant’s financial statements and not reported under paragraph (a) of this Item were $0 for the fiscal year ended November 30, 2014.
The aggregate fees billed by the registrant’s independent auditors for services relating to the performance of the audit of the financial statements of the registrant’s investment adviser and other service providers under common control with the adviser and that relate directly to the operations or financial reporting of the registrant were $618,000 for the registrant’s fiscal year ended November 30, 2014. The percentage of these fees relating to services approved by the registrant’s Audit Committee pursuant to the de minimis exception from the pre-approval requirement in Rule 2-01(c)(7)(i)(C) of Regulation S-X was 0%. These audit-related services were as follows: year-end audit procedures; group reporting and subsidiary statutory audits.
The aggregate fees billed by
the registrant’s independent auditors for services relating to the performance
of the audit of the registrant’s financial statements and not reported under
paragraph (a) of this Item were $0 for the fiscal year ended November 30, 2013.
____________________
1 The instructions to Form N-CSR require disclosure on the relevant experience of persons who qualify as audit committee financial experts based on “other relevant experience.” The Board of Trustees/Directors has determined that Ms. Landreth qualifies as an audit committee financial expert by virtue of her experience as a financial analyst, her Chartered Financial Analyst (CFA) designation and her service as an audit committee chairperson for a non-profit organization.
The aggregate fees billed by the registrant’s independent auditors for services relating to the performance of the audit of the financial statements of the registrant’s investment adviser and other service providers under common control with the adviser and that relate directly to the operations or financial reporting of the registrant were $618,000 for the registrant’s fiscal year ended November 30, 2013. The percentage of these fees relating to services approved by the registrant’s Audit Committee pursuant to the de minimis exception from the pre-approval requirement in Rule 2-01(c)(7)(i)(C) of Regulation S-X was 0%. These audit-related services were as follows: year-end audit procedures; group reporting and subsidiary statutory audits.
(c) Tax fees.
The aggregate fees billed by the registrant’s independent auditors for tax-related services provided to the registrant were $14,223 for the fiscal year ended November 30, 2014. The percentage of these fees relating to services approved by the registrant’s Audit Committee pursuant to the de minimis exception from the pre-approval requirement in Rule 2-01(c)(7)(i)(C) of Regulation S-X was 0%. These tax-related services were as follows: review of income tax returns and review of annual excise distribution calculations.
The aggregate fees billed by the registrant’s independent auditors for tax-related services provided to the registrant’s investment adviser and other service providers under common control with the adviser and that relate directly to the operations or financial reporting of the registrant were $0 for the registrant’s fiscal year ended November 30, 2014.
The aggregate fees billed by the registrant’s independent auditors for tax-related services provided to the registrant were $13,500 for the fiscal year ended November 30, 2013. The percentage of these fees relating to services approved by the registrant’s Audit Committee pursuant to the de minimis exception from the pre-approval requirement in Rule 2-01(c)(7)(i)(C) of Regulation S-X was 0%. These tax-related services were as follows: review of income tax returns and review of annual excise distribution calculations.
The aggregate fees billed by the registrant’s independent auditors for tax-related services provided to the registrant’s investment adviser and other service providers under common control with the adviser and that relate directly to the operations or financial reporting of the registrant were $0 for the registrant’s fiscal year ended November 30, 2013.
(d) All other fees.
The aggregate fees billed for all services provided by the independent auditors to the registrant other than those set forth in paragraphs (a), (b) and (c) of this Item were $0 for the fiscal year ended November 30, 2014.
The aggregate fees billed for all services other than those set forth in paragraphs (b) and (c) of this Item provided by the registrant’s independent auditors to the registrant’s adviser and other service providers under common control with the adviser and that relate directly to the operations or financial reporting of the registrant were $0 for the registrant’s fiscal year ended November 30, 2014. The percentage of these fees relating to services approved by the registrant’s Audit Committee pursuant to the de minimis exception from the pre-approval requirement in Rule 2-01(c)(7)(i)(C) of Regulation S-X was 0%.
The aggregate fees billed for all services provided by the independent auditors to the registrant other than those set forth in paragraphs (a), (b) and (c) of this Item were $0 for the fiscal year ended November 30, 2013.
The aggregate fees billed for all services other than those set forth in paragraphs (b) and (c) of this Item provided by the registrant’s independent auditors to the registrant’s adviser and other service providers under common control with the adviser and that relate directly to the operations or financial reporting of the registrant were $0 for the registrant’s fiscal year ended November 30, 2013. The percentage of these fees relating to services approved by the registrant’s Audit Committee pursuant to the de minimis exception from the pre-approval requirement in Rule 2-01(c)(7)(i)(C) of Regulation S-X was 0%.
(e) The registrant’s Audit Committee has established pre-approval policies and procedures as permitted by Rule 2-01(c)(7)(i)(B) of Regulation S-X (the “Pre-Approval Policy”) with respect to services provided by the registrant’s independent auditors. Pursuant to the Pre-Approval Policy, the Audit Committee has pre-approved the services set forth in the table below with respect to the registrant up to the specified fee limits. Certain fee limits are based on aggregate fees to the registrant and other registrants within the Delaware Investments Family of Funds.
| Service | Range of Fees |
| Audit Services | |
|
Statutory audits or financial audits for new Funds |
up to $40,000 per Fund |
|
Services associated with SEC registration statements (e.g., Form N-1A, Form N-14, etc.), periodic reports and other documents filed with the SEC or other documents issued in connection with securities offerings (e.g., comfort letters for closed-end Fund offerings, consents), and assistance in responding to SEC comment letters |
up to $10,000 per Fund |
|
Consultations by Fund management as to the accounting or disclosure treatment of transactions or events and/or the actual or potential impact of final or proposed rules, standards or interpretations by the SEC, FASB, or other regulatory or standard-setting bodies (Note: Under SEC rules, some consultations may be considered “audit-related services” rather than “audit services”) |
up to $25,000 in the aggregate |
|
Audit-Related Services |
|
|
Consultations by Fund management as to the accounting or disclosure treatment of transactions or events and/or the actual or potential impact of final or proposed rules, standards or interpretations by the SEC, FASB, or other regulatory or standard-setting bodies (Note: Under SEC rules, some consultations may be considered “audit services” rather than “audit-related services”) |
up to $25,000 in the aggregate |
|
Tax Services |
|
|
U.S. federal, state and local and international tax planning and advice (e.g., consulting on statutory, regulatory or administrative developments, evaluation of Funds’ tax compliance function, etc.) |
up to $25,000 in the aggregate |
|
U.S. federal, state and local tax compliance (e.g., excise distribution reviews, etc.) |
up to $5,000 per Fund |
|
Review of federal, state, local and international income, franchise and other tax returns |
up to $5,000 per Fund |
Under the Pre-Approval Policy, the Audit Committee has also pre-approved the services set forth in the table below with respect to the registrant’s investment adviser and other entities controlling, controlled by or under common control with the investment adviser that provide ongoing services to the registrant (the “Control Affiliates”) up to the specified fee limit. This fee limit is based on aggregate fees to the investment adviser and its Control Affiliates.
| Service | Range of Fees |
| Non-Audit Services | |
| Services associated with periodic reports and other documents filed with the SEC and assistance in responding to SEC comment letters | up to $10,000 in the aggregate |
The Pre-Approval Policy requires the registrant’s independent auditors to report to the Audit Committee at each of its regular meetings regarding all services initiated since the last such report was rendered, including those services authorized by the Pre-Approval Policy.
(f) Not applicable.
(g) The aggregate non-audit fees billed by the registrant’s independent auditors for services rendered to the registrant and to its investment adviser and other service providers under common control with the adviser were $5,653,375 and $7,732,970 for the registrant’s fiscal years ended November 30, 2014 and November 30, 2013, respectively.
(h) In connection with its selection of the independent auditors, the registrant’s Audit Committee has considered the independent auditors’ provision of non-audit services to the registrant’s investment adviser and other service providers under common control with the adviser that were not required to be pre-approved pursuant to Rule 2-01(c)(7)(ii) of Regulation S-X. The Audit Committee has determined that the independent auditors’ provision of these services is compatible with maintaining the auditors’ independence.
Item 5. Audit Committee of Listed Registrants
Not applicable.
Item 6. Investments
(a) Included as part of report to shareholders filed under Item 1 of this Form N-CSR.
(b) Divestment of securities in accordance with Section 13(c) of the Investment Company Act of 1940.
Not applicable.
Item 7. Disclosure of Proxy Voting Policies and Procedures for Closed-End Management Investment Companies
Not applicable.
Item 8. Portfolio Managers of Closed-End Management Investment Companies
Not applicable.
Item 9. Purchases of Equity Securities by Closed-End Management Investment Company and Affiliated Purchasers
Not applicable.
Item 10. Submission of Matters to a Vote of Security Holders
Not applicable.
Item 11. Controls and Procedures
The registrant’s principal executive officer and principal financial officer have evaluated the registrant’s disclosure controls and procedures within 90 days of the filing of this report and have concluded that they are effective in providing reasonable assurance that the information required to be disclosed by the registrant in its reports or statements filed under the Securities Exchange Act of 1934 is recorded, processed, summarized and reported within the time periods specified in the rules and forms of the Securities and Exchange Commission.
There were no significant changes in the registrant’s internal control over financial reporting that occurred during the second fiscal quarter of the period covered by the report to stockholders included herein (i.e., the registrant’s fourth fiscal quarter) that have materially affected, or are reasonably likely to materially affect, the registrant’s internal control over financial reporting.
Item 12. Exhibits
(a) (1) Code of Ethics
Not applicable.
(2) Certifications of Principal Executive Officer and Principal Financial Officer pursuant to Rule 30a-2 under the Investment Company Act of 1940 are attached hereto as Exhibit 99.CERT.
(3) Written solicitations to purchase securities pursuant to Rule 23c-1 under the Securities Exchange Act of 1934.
Not applicable.
(b) Certifications pursuant to Section 906 of the Sarbanes-Oxley Act of 2002 are furnished herewith as Exhibit 99.906CERT.
SIGNATURES
Pursuant to the requirements of the Securities Exchange Act of 1934 and the Investment Company Act of 1940, the registrant has duly caused this report to be signed on its behalf, by the undersigned, thereunto duly authorized.
DELAWARE GROUP® EQUITY FUNDS V
| /s/ PATRICK P. COYNE | |
| By: | Patrick P. Coyne |
| Title: | Chief Executive Officer |
| Date: | February 3, 2015 |
Pursuant to the requirements of the Securities Exchange Act of 1934 and the Investment Company Act of 1940, this report has been signed below by the following persons on behalf of the registrant and in the capacities and on the dates indicated.
| /s/ PATRICK P. COYNE | |
| By: | Patrick P. Coyne |
| Title: | Chief Executive Officer |
| Date: | February 3, 2015 |
| /s/ RICHARD SALUS | |
| By: | Richard Salus |
| Title: | Chief Financial Officer |
| Date: | February 3, 2015 |