UNITED STATES
SECURITIES AND EXCHANGE COMMISSION
Washington, D.C. 20549
FORM N-CSR
CERTIFIED SHAREHOLDER REPORT OF REGISTERED
MANAGEMENT INVESTMENT COMPANIES
Investment Company Act file number: 811-4984
AMERICAN BEACON FUNDS
(Exact name of registrant as specified in charter)
220 East Las Colinas Boulevard, Suite 1200
Irving, Texas 75039
(Address of principal executive offices)-(Zip code)
GENE L. NEEDLES, JR., PRESIDENT
220 East Las Colinas Boulevard, Suite 1200
Irving, Texas 75039
(Name and address of agent for service)
Registrant’s telephone number, including area code: (817) 391-6100
Date of fiscal year end: December 31, 2021
Date of reporting period: December 31, 2021
Form N-CSR is to be used by management investment companies to file reports with the Commission not later than 10 days after the transmission to stockholders of any report that is required to be transmitted to stockholders under Rule 30e-1 under the Investment Company Act of 1940 (17 CFR 270.30e-1). The Commission may use the information provided on Form N-CSR in its regulatory, disclosure review, inspection, and policymaking roles.
A registrant is required to disclose the information specified by Form N-CSR, and the Commission will make this information public. A registrant is not required to respond to the collection of information contained in Form N-CSR unless the Form displays a currently valid Office of Management and Budget (“OMB”) control number. Please direct comments concerning the accuracy of the information collection burden estimate and any suggestions for reducing the burden to Secretary, Securities and Exchange Commission, 450 Fifth Street, NW, Washington, DC 20549-0609. The OMB has reviewed this collection of information under the clearance requirements of 44 U.S.C. § 3507.
ITEM 1. REPORTS TO STOCKHOLDERS.

About American Beacon Advisors
Since 1986, American Beacon Advisors, Inc. has offered a variety of products and investment advisory services to numerous institutional and retail clients, including a variety of mutual funds, corporate cash management, and separate account management.
Our clients include defined benefit plans, defined contribution plans, foundations, endowments, corporations, financial planners, and other institutional investors. With American Beacon Advisors, you can put the experience of a multi-billion dollar asset management firm to work for your company.
AHL MANAGED FUTURES STRATEGY FUND
Investing in derivative instruments involves liquidity, credit, interest rate and market risks. The use of quantitative models may lead to high levels of trading and concentration among certain investments, resulting in higher trading costs and return volatility. Investing in foreign and emerging market securities may involve heightened risk due to currency fluctuations and economic and political risks. Regulatory changes may impair the Fund’s ability to qualify for federal income tax treatment as a regulated investment company, which could result in the Fund and shareholders incurring significant income tax expense. The Fund may have high portfolio turnover risk, which could increase the Fund’s transaction costs and possibly have a negative impact on performance. Because the Fund may invest in fewer issuers than a more diversified portfolio, the fluctuating value of a single holding may have a greater effect on the value of the Fund.
AHL TARGETRISK FUND
Investing in derivative instruments involves liquidity, credit, interest rate and market risks. The use of quantitative models may lead to high levels of trading and concentration among certain investments, resulting in higher trading costs and return volatility. The Fund’s investments in high-yield or junk-rated securities are subject to greater levels of credit, interest rate, market and liquidity risks than investment-grade securities. In a period of sustained deflation, inflation index-linked securities may not pay any income and may suffer a loss. Investing in foreign and emerging market securities may involve heightened risk due to currency fluctuations and economic and political risks. Regulatory changes may impair the Fund’s ability to qualify for federal income tax treatment as a regulated investment company, which could result in the Fund and shareholders incurring significant income tax expense. The Fund may have high portfolio turnover risk, which could increase the Fund’s transaction costs and possibly have a negative impact on performance. Because the Fund may invest in fewer issuers than a more diversified portfolio, the fluctuating value of a single holding may have a greater effect on the value of the Fund.
AHL TARGETRISK CORE FUND
Investing in derivative instruments involves liquidity, credit, interest rate and market risks. The use of quantitative models may lead to high levels of trading and concentration among certain investments, resulting in higher trading costs and return volatility. Investing in foreign and emerging market securities may involve heightened risk due to currency fluctuations and economic and political risks. The Fund may have high portfolio turnover risk, which could increase the Fund’s transaction costs and possibly have a negative impact on performance. Because the Fund may invest in fewer issuers than a more diversified portfolio, the fluctuating value of a single holding may have a greater effect on the value of the Fund.
Any opinions herein, including forecasts, reflect our judgment as of the end of the reporting period and are subject to change. Each advisor’s strategies and the Fund’s portfolio composition will change depending on economic and market conditions. This report is not a complete analysis of market conditions and therefore, should not be relied upon as investment advice. Although economic and market information has been compiled from reliable sources, American Beacon Advisors, Inc. makes no representation as to the completeness or accuracy of the statements contained herein.
| American Beacon Funds |
December 31, 2021 |
| 1 | ||||
| 2 | ||||
| 12 | ||||
| Report of Independent Registered Public Accounting Firm |
15 | |||
| 16 | ||||
| 38 | ||||
| 44 | ||||
| 47 | ||||
| 52 | ||||
| 89 | ||||
| 94 | ||||
| 99 | ||||
| 103 | ||||
| 104 | ||||
| 105 | ||||
| 112 | ||||
| Back Cover | ||||

|
Dear Shareholders,
As Warren E. Buffett, the “Oracle of Omaha” and billionaire chairman and CEO of Berkshire Hathaway, once said, “Someone’s sitting in the shade today because someone planted a tree a long time ago.”
That is to say, before we can enjoy the fruits of our labor, we must first devote our attention to the careful planning and cultivation of our estates. To achieve a strong yield requires time, diligence and patience – and there are no guarantees the seeds we plant today will thrive or result in a plentiful harvest. This can be said not only about the actions we undertake in our gardening or landscaping, but also those we initiate in our investment portfolios – especially as we take into account the potential for harm caused by natural disasters and other catastrophes, such as the COVID-19 pandemic. |
Because none of us – not even the Oracle of Omaha – has a crystal ball, to help give your investment portfolio the greatest chance for success over the long term, we encourage you to work with financial professionals to develop your personal savings plan, conduct annual plan reviews, and make thoughtful, purposeful plan adjustments to help manage your evolving financial needs and goals. By investing in different investment styles and asset classes, you may be able to help mitigate financial risks across your portfolio. By allocating your portfolio according to your risk-tolerance level, you may be better positioned to withstand short-term crises. With continuous nurturing, you will be better positioned to achieve enduring financial success.
Since 1986, American Beacon has endeavored to provide investors with a disciplined approach to realizing long-term financial goals. As a manager of managers, we strive to provide investment products that may enable investors to participate during market upswings while potentially insulating against market downswings. The investment teams behind our mutual funds seek to produce consistent, long-term results rather than focus only on short-term movements in the markets. In managing our investment products, we emphasize identifying opportunities that offer the potential for long-term financial rewards.
Thank you for entrusting your financial success with American Beacon. For additional information about our investment products or to access your account information, please visit our website at www.americanbeaconfunds.com.
Best Regards,

Gene L. Needles, Jr.
President
American Beacon Funds
1
Alternative Investments Market Overview
December 31, 2021 (Unaudited)
Mass vaccinations, eased restrictions, reopened borders and additional waves of school, business and country closures: 2021 was dominated by the COVID-19 pandemic as variants swept around the globe.
After a shaky start in some places, vaccine rollouts in the developed world were, by and large, a success, and helped curb hospitalizations and deaths. As 2021 progressed, lockdowns came to an end and many travel restrictions for land, sea and air were eased, delighting a beleaguered travel industry. However, anti-vaccine movements in Europe and the U.S. grew stronger and, combined with the emergence of the omicron variant at the end of the year, may threaten global efforts to maintain low infection rates and hospitalizations.
On the geopolitical front, following U.S. President Joe Biden’s swift removal of American troops from Afghanistan, the Afghan government collapsed more quickly than American officials anticipated.
Despite the aforementioned weighty situations, investors struggled most with making sense of a rapidly rising inflation rate. Supply disruptions and high energy costs were significant factors driving price increases; for example, Brent crude oil started the year at $50 per barrel and reached $85 per barrel in October.
Central banks also pivoted from believing inflation is transitory to projecting the Federal Reserve would increase the U.S. federal funds rate three times during 2022 and making comments that inflation may be more persistent. The Bank of England was the first of the major central banks to pull the trigger, raising its rate for the first time in three years to 0.25%. Other central banks are considering similar measures.
This macro backdrop led to solid performance over the period as risk assets performed well overall despite some bumps along the way. For context, the Morningstar Systematic Trend Category returned 5.02% for the 12-month period. Additionally, the Morningstar Tactical Allocation Category returned 13.36% for the same period.
2
American Beacon AHL Managed Futures Strategy FundSM
Performance Overview
December 31, 2021 (Unaudited)
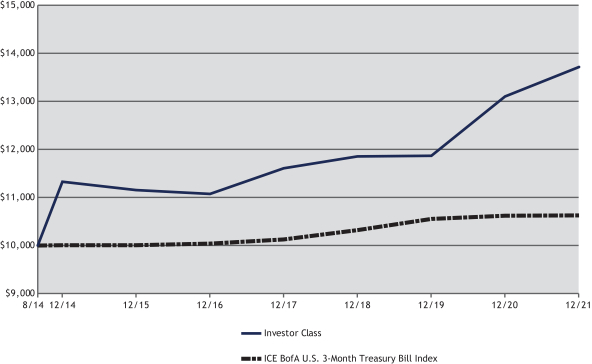
The Investor Class of the American Beacon AHL Managed Futures Strategy Fund (the “Fund”) returned 4.69% for the twelve months ended December 31, 2021.
Comparison of Change in Value of a $10,000 Investment for the period from 8/19/2014 through 12/31/2021
| Total Returns for the Period Ended December 31, 2021 |
|
|||||||||||||||||||||||||||||||
|
Ticker |
1 Year |
3 Years |
5 Years |
Since Inception |
Value of $10,000 8/19/2014- 12/31/2021 | |||||||||||||||||||||||||||
| R5 Class (1,4) |
AHLIX | 5.12 | % | 5.36 | % | 4.75 | % | 4.78 | % | $ | 14,103 | |||||||||||||||||||||
| Y Class (1,4) |
AHLYX | 5.14 | % | 5.31 | % | 4.70 | % | 4.70 | % | $ | 14,028 | |||||||||||||||||||||
| Investor Class (1,4) |
AHLPX | 4.69 | % | 4.98 | % | 4.37 | % | 4.38 | % | $ | 13,713 | |||||||||||||||||||||
| A without Sales Charge (1,2,4) |
AHLAX | 4.88 | % | 5.00 | % | 4.37 | % | 4.38 | % | $ | 13,713 | |||||||||||||||||||||
| A with Sales Charge (1,2,4) |
AHLAX | -1.11 | % | 2.95 | % | 3.14 | % | 3.54 | % | $ | 12,925 | |||||||||||||||||||||
| C without Sales Charge (1,2,4) |
AHLCX | 4.01 | % | 4.20 | % | 3.60 | % | 3.60 | % | $ | 12,979 | |||||||||||||||||||||
| C with Sales Charge (1,2,4) |
AHLCX | 3.01 | % | 4.20 | % | 3.60 | % | 3.60 | % | $ | 12,979 | |||||||||||||||||||||
| ICE BofA U.S. 3-Month Treasury Bill Index (3) |
0.05 | % | 0.99 | % | 1.14 | % | 0.83 | % | $ | 10,626 | ||||||||||||||||||||||
| 1. | Performance shown is historical and is not indicative of future returns. Investment returns and principal value will vary, and shares may be worth more or less at redemption than at original purchase. Performance shown is calculated based on the published end-of-day net asset values as of date indicated, and current performance may be lower or higher than the performance data quoted. To obtain performance as of the most recent month end, please visit www.americanbeaconfunds.com or call 1-800-967-9009. Fund performance in the table above does not reflect the deduction of taxes a shareholder would pay on distributions or the redemption of shares. Generally accepted accounting principles require adjustments to be made to the net assets of the Fund at period end for financial reporting purposes only; and as such, the total return based on the unadjusted net asset value per share may differ from the total return reported in the financial highlights. A portion of the fees charged to the R5 and Investor Class of the Fund has been waived since Fund inception. A portion of the fees charged to the Y Class of the Fund was waived from Fund inception, partially recovered in 2019 and waived in 2020 and 2021. Performance prior to waiving fees was lower than actual returns shown for periods when fees were waived. |
| 2. | A Class shares have a maximum sales charge of 5.75%. The maximum contingent deferred sales charge for the C Class is 1.00% for shares redeemed within one year of the date of purchase. A portion of the fees charged to the A and C Class of the Fund was waived from Fund inception, partially recovered in 2019 and waived in 2020 and 2021. Performance prior to waiving fees was lower than actual returns shown for periods when fees were waived. |
3
American Beacon AHL Managed Futures Strategy FundSM
Performance Overview
December 31, 2021 (Unaudited)
| 3. | ICE BofA 3-Month U.S. Treasury Bill Index is an index of U.S. Treasury securities maturing in less than 3 months that assumes reinvestment of all income and is intended to track the daily performance of 3-month U.S. Treasury bills. One cannot directly invest in an index. |
| 4. | The Total Annual Fund Operating Expense ratios set forth in the most recent Fund prospectus for the R5, Y, Investor, A, and C Class shares were 1.59%, 1.64%, 1.97%, 1.91%, and 2.65%, respectively. The expense ratios above may vary from the expense ratios presented in other sections of this report that are based on expenses incurred during the period covered by this report. |
During the period, two asset classes contributed positively while two asset classes detracted. The top contributing asset class was Commodities as energy broadly rallied during the first three quarters. Within Commodities, the top performers were the long positions the Fund held most of the year in Natural Gas and Aluminum. The Equities asset class within the Fund also contributed positively to performance during the year due to its long positions in the S&P 500 and S&P TSX60 indices.
The two asset classes that detracted from performance during the period were Currencies and Fixed-Income. The largest detractors within Currencies were positions in the Brazilian real and Mexican peso. Within the Fixed-Income asset class, rising global yields hurt performance during the period with the Eurodollar and U.S. 2-Year Treasury Notes being the top detractors.
Looking forward, the Fund’s sub-advisor will continue to implement its trading strategy designed to capitalize on price trends (up or down) in a broad range of global equities, fixed-income, currency, and commodity futures markets; seeking to achieve the Fund’s goal of capital growth.
4
American Beacon AHL Managed Futures Strategy FundSM
Performance Overview
December 31, 2021
| Top Active Exposures By Asset Class |
| |||||||
| Commodities | % of VaR | * | ||||||
| Crude Oil | Long | 3.86 | ||||||
| Aluminium | Long | 2.67 | ||||||
| Copper | Long | 2.67 | ||||||
| Coffee | Long | 2.37 | ||||||
| Corn | Long | 2.37 | ||||||
| Currencies | % of VaR | * | ||||||
| JPY/USD | Short | 6.23 | ||||||
| EUR/USD | Short | 5.34 | ||||||
| AUD/USD | Short | 3.56 | ||||||
| CAD/USD | Short | 2.67 | ||||||
| MXN/USD | Long | 2.37 | ||||||
| Equities | % of VaR | * | ||||||
| S&P 500 Index | Long | 3.56 | ||||||
| Australian SPI 200 Index | Long | 2.97 | ||||||
| H-Shares Index | Short | 2.97 | ||||||
| Taiwan MSCI Index | Long | 2.97 | ||||||
| Hang-Seng Index | Short | 2.67 | ||||||
| Fixed-Income | % of VaR | * | ||||||
| Euro-BUXL | Long | 0.89 | ||||||
| Euribor | Long | 0.59 | ||||||
| U.S. Treasuries | Long | 0.59 | ||||||
| Australian Bonds | Long | 0.30 | ||||||
| Euro-BOBL | Short | 0.30 | ||||||
| Asset Class Exposure | % of VaR | * | ||||||
| Equities | 36.20 | |||||||
| Currencies | 32.60 | |||||||
| Commodities | 27.60 | |||||||
| Fixed-Income | 3.60 | |||||||
| Top 10 Exposures | ||||||||
| JPY/USD | Short | 6.20 | ||||||
| EUR/USD | Short | 5.30 | ||||||
| Crude Oil | Long | 3.90 | ||||||
| AUD/USD | Short | 3.60 | ||||||
| S&P 500 Index | Long | 3.60 | ||||||
| Australian SPI 200 Index | Long | 3.00 | ||||||
| H-Shares Index | Short | 3.00 | ||||||
| Taiwan MSCI Index | Long | 3.00 | ||||||
| Aluminium | Long | 2.70 | ||||||
| CAD/USD | Short | 2.70 | ||||||
| * | Value at Risk (“VaR”) is a measure of the potential loss in value of a portfolio over a defined period for a given confidence interval. A one-day VaR at the 95% confidence level represents that there is a 5% probability that the mark-to-market loss on the portfolio over a one day horizon will exceed this value (assuming normal markets and no trading in the portfolio). |
5
American Beacon AHL TargetRisk FundSM
Performance Overview
December 31, 2021 (Unaudited)
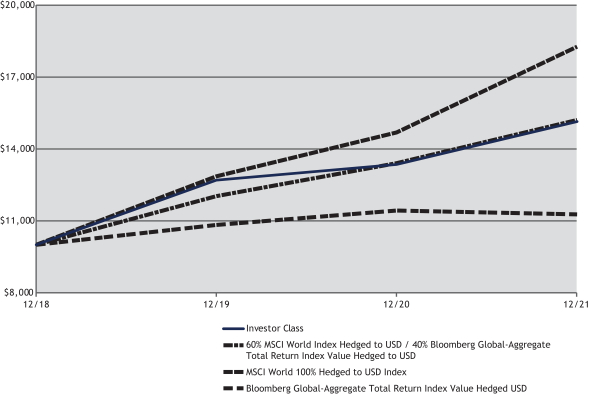
The Investor Class of the American Beacon AHL TargetRisk Fund (the “Fund”) returned 13.43% for the twelve months ended December 31, 2021.
Comparison of Change in Value of a $10,000 Investment for the period from 12/31/2018 through 12/31/2021
| Total Returns for the Period Ended December 31, 2021 |
| |||||||||||||||||
| Ticker |
1 Year |
3 Years |
Since Inception |
Value of $10,000 12/31/2018- 12/31/2021 |
||||||||||||||
| R5 Class (1,3) |
AHTIX | 13.78 | % | 15.18 | % | 15.18 | % | $ | 15,279 | |||||||||
| Y Class (1,3) |
AHTYX | 13.75 | % | 15.12 | % | 15.12 | % | $ | 15,255 | |||||||||
| Investor Class (1,3) |
AHTPX | 13.43 | % | 14.81 | % | 14.81 | % | $ | 15,134 | |||||||||
| A without Sales Charge (1,2,3) |
AHTAX | 13.56 | % | 14.87 | % | 14.87 | % | $ | 15,157 | |||||||||
| A with Sales Charge (1,2,3) |
AHTAX | 7.06 | % | 12.63 | % | 12.63 | % | $ | 14,286 | |||||||||
| C without Sales Charge (1,2,3) |
AHACX | 12.70 | % | 14.12 | % | 14.12 | % | $ | 14,863 | |||||||||
| C with Sales Charge (1,2,3) |
AHACX | 11.70 | % | 14.12 | % | 14.12 | % | $ | 14,863 | |||||||||
| 60% MSCI World 100% Hedged to USD Index / 40% Bloomberg Global-Aggregate Total Return Index Value Hedged USD (4) |
13.52 | % | 14.98 | % | 14.98 | % | $ | 15,201 | ||||||||||
| MSCI World 100% Hedged to USD Index (4) |
24.38 | % | 22.21 | % | 22.21 | % | $ | 18,253 | ||||||||||
| Bloomberg Global-Aggregate Total Return Index Value Hedged USD (4) |
-1.39 | % | 4.06 | % | 4.06 | % | $ | 11,267 | ||||||||||
| 1. | Performance shown is historical and is not indicative of future returns. Investment returns and principal value will vary, and shares may be worth more or less at redemption than at original purchase. Performance shown is calculated based on the published end-of-day net asset values as of date indicated, and current performance may be lower or higher than the performance data quoted. To obtain performance as of the most recent month end, please visit www.americanbeaconfunds.com or call 1-800-967-9009. Fund performance in the table above does not reflect the deduction of taxes a shareholder would pay on distributions or the redemption of shares. Generally accepted accounting principles require adjustments to be made to the net assets of the Fund at period end for financial reporting purposes only, and as such, the total return based on the unadjusted net asset value per share may differ from the total |
6
American Beacon AHL TargetRisk FundSM
Performance Overview
December 31, 2021 (Unaudited)
| return reported in the financial highlights. A portion of the fees charged to the R5 Class of the Fund has been waived since Fund inception. A portion of the fees charged to the A, C, Y and Investor Class of the Fund was waived from Fund inception through 2020. Performance prior to waiving fees was lower than actual returns shown for periods when fees were waived. |
| 2. | A Class shares have a maximum sales charge of 5.75%. The maximum contingent deferred sales charge for the C Class is 1.00% for shares redeemed within one year of the date of purchase. Fund performance represents the returns achieved by the Investor Class from 12/31/2018 up to the 4/30/2019, inception date of the A and C Classes and returns of the A and C Classes since 4/30/2019, Expenses of the A and C Classes are higher than those of the Investor Class. Therefore, total returns shown may be higher than they would have been had the A and C Classes been in existence since 12/31/2018. |
| 3. | The Total Annual Fund Operating Expense ratios set forth in the most recent Fund prospectus for the R5, Y, Investor, A, and C Class shares were 1.09%, 1.14%, 1.46%, 1.46%, and 2.21%, respectively. The expense ratios above may vary from the expense ratios presented in other sections of this report that are based on expenses incurred during the period covered by this report. |
| 4. | The AHL TargetRisk Fund’s annual total return is compared to the TargetRisk Composite Index, which combines the returns of the MSCI World 100% Index Hedged to U.S. Dollars (USD) and the Bloomberg Global-Aggregate Total Return Index Value Hedged USD in a 60%/40% proportion. The MSCI World 100% Index Hedged to USD represents a close estimation of the performance that can be achieved by hedging the currency exposures of its parent index, the MSCI World Index, to the USD, the “home” currency for the hedged index. The index is 100% hedged to the USD by selling each foreign currency forward at the one-month forward weight. The parent index is composed of large and mid-cap stocks across 23 Developed Markets (DM) countries and its local performance is calculated in 13 different currencies, including the Euro. The MSCI© information contained herein: (1) is provided “as is,” (2) is proprietary to MSCI and/or its content providers, (3) may not be used to create any financial instruments or products or any indexes and (4) may not be copied or distributed without MSCI’s express written consent. MSCI disclaims all warranties with respect to the information. Neither MSCI nor its content providers are responsible for any damages or losses arising from any use of this information. The Bloomberg Global-Aggregate Total Return Index Value Hedged USD is a flagship measure of global investment grade debt from 24 local currency markets. This multi-currency benchmark includes treasury, government-related, corporate and securitized fixed-rate bonds from both developed and emerging markets issuers. BLOOMBERG® is a trademark and service mark of Bloomberg Finance L.P. and its affiliates (collectively, “Bloomberg”). Bloomberg or Bloomberg’s licensors own all proprietary rights in the Bloomberg Indices. Bloomberg does not approve or endorse this material, or guarantee the accuracy or completeness of any information herein, or make any warranty, express or implied, as to the results to be obtained therefrom and, to the maximum extent allowed by law, shall not have any liability or responsibility for injury or damages arising in connection therewith. One cannot directly invest in an index. |
During the period, three asset classes contributed positively while only one asset class detracted from performance. The top contributing asset class was the Inflation bucket within the Fund which was driven by Commodities and U.S. Treasury Inflation-Protected Securities. The next top contributor during the period were Stocks, specifically the S&P 500 and Nasdaq 100 indices. Additionally, the Credit bucket within the Fund was also additive during the period with all markets posting positive returns. Lastly, Bonds were negative for the period with U.S. 10-Year Treasuries and German Bunds lagging significantly. The correlation and volatility overlays within the Fund remained inactive at the end of the period, while the momentum overlay on Bonds, Stocks, and Commodities reduced exposure slightly.
Looking forward, the Fund’s sub-advisor will continue to implement its trading strategy designed to maintain its targeted risk profile, by investing in a broad range of global equities, fixed-income, credit, and commodity markets; seeking to achieve the Fund’s goal of capital growth.
7
American Beacon AHL TargetRisk FundSM
Performance Overview
December 31, 2021
| Top Ten Exposures | % of VaR | * | ||||||
| BBG Commodity ex-Agriculturals Index | 15.61 | |||||||
| U.S. Treasuries | 14.87 | |||||||
| S&P 500 Index | 5.95 | |||||||
| U.K. Gilts | 4.83 | |||||||
| Tokyo Stock Exchange Index | 4.83 | |||||||
| Euro-BUND | 4.46 | |||||||
| NASDAQ 100 Index | 3.72 | |||||||
| Nikkei Index | 3.72 | |||||||
| Euro-STOXX | 3.35 | |||||||
| French Bonds | 2.97 | |||||||
| 3-Year Risk Summary | Fund | |||||||
| Sharpe Ratio | 1.75 | |||||||
| Standard Deviation | 8.11 | |||||||
| Asset Class Exposure | Net (%) | % of VaR | * | |||||
| Bonds | 103.8 | 0.8 | ||||||
| Credits | 72.0 | 0.3 | ||||||
| Inflation | 46.7 | 0.7 | ||||||
| Stock Indices | 60.3 | 1.1 |
| * | Value at Risk (“VaR”) is a measure of the potential loss in value of a portfolio over a defined period for a given confidence interval. A one-day VaR at the 95% confidence level represents that there is a 5% probability that the mark-to-market loss on the portfolio over a one day horizon will exceed this value (assuming normal markets and no trading in the portfolio). |
8
American Beacon AHL TargetRisk Core FundSM
Performance Overview
December 31, 2021 (Unaudited)
The Y Class of the American Beacon AHL TargetRisk Core Fund (the “Fund”) returned 6.75% for the twelve months ended December 31, 2021.
Comparison of Change in Value of a $100,000 Investment for the period from 12/16/2020 through 12/31/2021

|
Ticker |
1 Year |
Since Inception |
Value of $100,000 12/16/2020- 12/31/2021 | |||||||||||||||||||
| R6 Class (1,3) |
AHTRX | 6.85 | % | 7.08 | % | $ | 107,383 | |||||||||||||||
| Y Class (1,3) |
AABYX | 6.75 | % | 6.99 | % | $ | 107,283 | |||||||||||||||
| A without Sales Charge (1,2,3) |
AAHAX | 6.46 | % | 6.60 | % | $ | 106,883 | |||||||||||||||
| A with Sales Charge (1,2,3) |
AAHAX | 0.36 | % | 0.71 | % | $ | 100,738 | |||||||||||||||
| C without Sales Charge (1,2,3) |
AAECX | 5.66 | % | 5.84 | % | $ | 106,083 | |||||||||||||||
| C with Sales Charge (1,2,3) |
AAECX | 4.66 | % | 5.84 | % | $ | 106,083 | |||||||||||||||
| 60% MSCI World 100% Hedged to USD Index / 40% Bloomberg Global-Aggregate Total Return Index Value Hedged USD (4) |
13.52 | % | 14.00 | % | $ | 114,658 | ||||||||||||||||
| Bloomberg Global-Aggregate Total Return Index Value Hedged USD (4) |
-1.39 | % | -1.15 | % | $ | 98,800 | ||||||||||||||||
| MSCI World 100% Hedged to USD Index (4) |
24.38 | % | 25.07 | % | $ | 126,294 | ||||||||||||||||
| 1. | Performance shown is historical and is not indicative of future returns. Investment returns and principal value will vary, and shares may be worth more or less at redemption than at original purchase. Performance shown is calculated based on the published end-of-day net asset values as of date indicated, and current performance may be lower or higher than the performance data quoted. To obtain performance as of the most recent month end, please visit www.americanbeaconfunds.com or call 1-800-967-9009. Fund performance in the table above does not reflect the deduction of taxes a shareholder would pay on distributions or the redemption of shares. Generally accepted accounting principles require adjustments to be made to the net assets of the Fund at period end for financial reporting purposes only, and as such, the total return based on the unadjusted net asset value per share may differ from the total return reported in the financial highlights. A portion of the fees charged to each Class of the Fund has been waived since Fund inception. Performance prior to waiving fees was lower than actual returns shown since inception. |
9
American Beacon AHL TargetRisk Core FundSM
Performance Overview
December 31, 2021 (Unaudited)
| 2. | A Class shares have a maximum sales charge of 5.75%. The maximum contingent deferred sales charge for the C Class is 1.00% for shares redeemed within one year of the date of purchase. |
| 3. | The Total Annual Fund Operating Expense ratios set forth in the most recent Fund prospectus for the Y, A, C, and R6 Class shares were 1.85%, 2.15%, 2.90%, and 1.75%, respectively. The expense ratios above may vary from the expense ratios presented in other sections of this report that are based on expenses incurred during the period covered by this report. |
| 4. | The AHL TargetRisk Core Fund’s annual total return is compared to the TargetRisk Composite Index, which combines the returns of the MSCI World 100% Index Hedged to U.S. Dollars (USD) and the Bloomberg Global-Aggregate Total Return Index Value Hedged USD in a 60%/40% proportion. The MSCI World 100% Index Hedged to USD represents a close estimation of the performance that can be achieved by hedging the currency exposures of its parent index, the MSCI World Index, to the USD, the “home” currency for the hedged index. The index is 100% hedged to the USD by selling each foreign currency forward at the one-month forward weight. The parent index is composed of large and mid-cap stocks across 23 Developed Markets (DM) countries and its local performance is calculated in 13 different currencies, including the Euro. The MSCI© information contained herein: (1) is provided “as is,” (2) is proprietary to MSCI and/or its content providers, (3) may not be used to create any financial instruments or products or any indexes and (4) may not be copied or distributed without MSCI’s express written consent. MSCI disclaims all warranties with respect to the information. Neither MSCI nor its content providers are responsible for any damages or losses arising from any use of this information. The Bloomberg Global-Aggregate Total Return Index Value Hedged USD is a flagship measure of global investment grade debt from 24 local currency markets. This multi-currency benchmark includes treasury, government-related, corporate and securitized fixed-rate bonds from both developed and emerging markets issuers. BLOOMBERG® is a trademark and service mark of Bloomberg Finance L.P. and its affiliates (collectively, “Bloomberg”). Bloomberg or Bloomberg’s licensors own all proprietary rights in the Bloomberg Indices. Bloomberg does not approve or endorse this material, or guarantee the accuracy or completeness of any information herein, or make any warranty, express or implied, as to the results to be obtained therefrom and, to the maximum extent allowed by law, shall not have any liability or responsibility for injury or damages arising in connection therewith. One cannot directly invest in an index. |
Stocks contributed positively to the performance during the period, while Bonds slightly detracted. The performance in Stocks was led by profits experienced in the S&P 500 Index as the benchmark hit a record of 70 all-time highs during the year while S&P TSX60 also contributed postively. The performance in Bonds was driven by losses in U.S. 10-Year Treasuries and U.K. 10-Year Gilts. There were some slight gains in longer duration U.S. and German Bunds but not enough to offset the negative performance. By the end of the period, the momentum overlay continued to slightly constrain both equity and bond exposure. The correlation and volatility overlays were quiet to end the year. However, looking at the entirety of the year, the Fund did see the correlation overlay utilized for most of first quarter and again for a brief time in late October. The momentum overlay saw some activity in Bonds in both the first and fourth quarters. Finally, the volatility overlay engaged in Stocks at various points across the first, second and fourth quarters.
Looking forward, the Fund’s sub-advisor will continue to implement its trading strategy designed to maintain its targeted risk profile, by investing in a broad range of global equities and fixed-income instruments while seeking to achieve the Fund’s goal of capital growth.
10
American Beacon AHL TargetRisk Core FundSM
Performance Overview
December 31, 2021
| Top Ten Exposures | % of VaR | * | ||||||
| U.S. Treasuries | 18.2 | |||||||
| S&P 500 Index | 7.0 | |||||||
| Tokyo Stock Exchange Index | 7.0 | |||||||
| Euro-BUND | 4.8 | |||||||
| Euro-STOXX | 4.8 | |||||||
| NASDAQ 100 Index | 4.8 | |||||||
| Nikkei Index | 4.8 | |||||||
| S&P TSX 60 Index | 4.0 | |||||||
| FTSE 100 Index | 3.7 | |||||||
| U.K Gilts | 3.3 | |||||||
| Asset Class Exposure | Net (%) | % of VaR | * | |||||
| Bonds | 143.1 | 1.2 | ||||||
| Stock Indices | 84.2 | 1.6 |
| * | Value at Risk (“VaR”) is a measure of the potential loss in value of a portfolio over a defined period for a given confidence interval. A one-day VaR at the 95% confidence level represents that there is a 5% probability that the mark-to-market loss on the portfolio over a one day horizon will exceed this value (assuming normal markets and no trading in the portfolio). |
11
American Beacon FundsSM
December 31, 2021 (Unaudited)
Fund Expense Example
As a shareholder of a Fund, you incur two types of costs: (1) transaction costs, including sales charges (loads) on purchase payments and redemption fees, if applicable, and (2) ongoing costs, including management fees, distribution (12b-1) fees, sub-transfer agent fees, and other Fund expenses. The Examples are intended to help you understand the ongoing cost (in dollars) of investing in the Funds and to compare these costs with the ongoing costs of investing in other mutual funds. The Examples are based on an investment of $1,000 invested at the beginning of the period in each Class and held for the entire period from July 1, 2021 through December 31, 2021.
Actual Expenses
The “Actual” lines of the tables provide information about actual account values and actual expenses. You may use the information on this page, together with the amount you invested, to estimate the expenses that you paid over the period. Simply divide your account value by $1,000 (for example, an $8,600 account value divided by $1,000 = $8.60), then multiply the result by the “Expenses Paid During Period” to estimate the expenses you paid on your account during this period. Shareholders of the Investor and R5 Classes that invest in the Fund through an IRA or Roth IRA may be subject to a custodial IRA fee of $15 that is typically deducted each December. If your account was subject to a custodial IRA fee during the period, your costs would have been $15 higher.
Hypothetical Example for Comparison Purposes
The “Hypothetical” lines of the tables provide information about hypothetical account values and hypothetical expenses based on the Fund’s actual expense ratio and an assumed 5% per year rate of return before expenses (not the Fund’s actual return). You may compare the ongoing costs of investing in the Funds with other funds by contrasting this 5% hypothetical example and the 5% hypothetical examples that appear in the shareholder reports of the other funds. The hypothetical account values and expenses may not be used to estimate the actual ending account balance or expenses you paid for the period. Shareholders of the Investor and R5 Classes that invest in the Funds through an IRA or Roth IRA may be subject to a custodial IRA fee of $15 that is typically deducted each December. If your account was subject to a custodial IRA fee during the period, your costs would have been $15 higher.
You should also be aware that the expenses shown in the table highlight only your ongoing costs and do not reflect any transaction costs charged by the Funds, such as sales charges (loads) or redemption fees, as applicable. Similarly, the expense examples for other funds do not reflect any transaction costs charged by those funds, such as sales charges (loads), redemption fees or exchange fees. Therefore, the “Hypothetical” lines of the tables are useful in comparing ongoing costs only and will not help you determine the relative total costs of owning different funds. If you were subject to any transaction costs during the period, your costs would have been higher.
12
American Beacon FundsSM
Expense Examples
December 31, 2021 (Unaudited)
| American Beacon AHL Managed Futures Strategy Fund |
| ||||||||||||||
| Beginning Account Value 7/1/2021 |
Ending Account Value 12/31/2021 |
Expenses Paid During Period 7/1/2021-12/31/2021* | |||||||||||||
| R5 Class | |||||||||||||||
| Actual | $1,000.00 | $964.00 | $7.62 | ||||||||||||
| Hypothetical** | $1,000.00 | $1,017.44 | $7.83 | ||||||||||||
| Y Class | |||||||||||||||
| Actual | $1,000.00 | $963.70 | $7.47 | ||||||||||||
| Hypothetical** | $1,000.00 | $1,017.59 | $7.68 | ||||||||||||
| Investor Class | |||||||||||||||
| Actual | $1,000.00 | $963.00 | $9.50 | ||||||||||||
| Hypothetical** | $1,000.00 | $1,015.53 | $9.75 | ||||||||||||
| A Class | |||||||||||||||
| Actual | $1,000.00 | $963.10 | $8.76 | ||||||||||||
| Hypothetical** | $1,000.00 | $1,016.28 | $9.00 | ||||||||||||
| C Class | |||||||||||||||
| Actual | $1,000.00 | $959.70 | $12.30 | ||||||||||||
| Hypothetical** | $1,000.00 | $1,012.65 | $12.63 | ||||||||||||
| * | Expenses are equal to the Fund’s annualized expense ratios for the six-month period of 1.54%, 1.51%, 1.92%, 1.77%, and 2.49% for the R5, Y, Investor, A, and C Classes, respectively, multiplied by the average account value over the period, multiplied by the number derived by dividing the number of days in the most recent fiscal half-year (184) by days in the year (365) to reflect the half-year period. |
| ** | 5% return before expenses. |
| American Beacon AHL TargetRisk Fund |
| ||||||||||||||
| Beginning Account Value 7/1/2021 |
Ending Account Value 12/31/2021 |
Expenses Paid During Period 7/1/2021-12/31/2021* | |||||||||||||
| R5 Class | |||||||||||||||
| Actual | $1,000.00 | $1070.60 | $5.43 | ||||||||||||
| Hypothetical** | $1,000.00 | $1,019.96 | $5.30 | ||||||||||||
| Y Class | |||||||||||||||
| Actual | $1,000.00 | $1070.20 | $5.53 | ||||||||||||
| Hypothetical** | $1,000.00 | $1,019.86 | $5.40 | ||||||||||||
| Investor Class | |||||||||||||||
| Actual | $1,000.00 | $1067.70 | $7.40 | ||||||||||||
| Hypothetical** | $1,000.00 | $1,018.05 | $7.22 | ||||||||||||
| A Class | |||||||||||||||
| Actual | $1,000.00 | $1068.90 | $6.78 | ||||||||||||
| Hypothetical** | $1,000.00 | $1,018.65 | $6.61 | ||||||||||||
| C Class | |||||||||||||||
| Actual | $1,000.00 | $1064.90 | $10.72 | ||||||||||||
| Hypothetical** | $1,000.00 | $1,014.82 | $10.46 | ||||||||||||
| * | Expenses are equal to the Fund’s annualized expense ratios for the six-month period of 1.04%, 1.06%, 1.42%, 1.30%, and 2.06% for the R5, Y, Investor, A, and C Classes, respectively, multiplied by the average account value over the period, multiplied by the number derived by dividing the number of days in the most recent fiscal half-year (184) by days in the year (365) to reflect the half-year period. |
| ** | 5% return before expenses. |
13
American Beacon FundsSM
Expense Examples
December 31, 2021 (Unaudited)
| American Beacon AHL TargetRisk Core Fund |
| ||||||||||||||
| Beginning Account Value 7/1/2021 |
Ending Account Value 12/31/2021 |
Expenses Paid During Period 7/1/2021-12/31/2021* | |||||||||||||
| Y Class | |||||||||||||||
| Actual | $1,000.00 | $1,038.60 | $5.60 | ||||||||||||
| Hypothetical** | $1,000.00 | $1,019.71 | $5.55 | ||||||||||||
| A Class | |||||||||||||||
| Actual | $1,000.00 | $1,035.70 | $7.13 | ||||||||||||
| Hypothetical** | $1,000.00 | $1,018.20 | $7.07 | ||||||||||||
| C Class | |||||||||||||||
| Actual | $1,000.00 | $1,032.90 | $10.97 | ||||||||||||
| Hypothetical** | $1,000.00 | $1,014.42 | $10.87 | ||||||||||||
| R6 Class | |||||||||||||||
| Actual | $1,000.00 | $1,038.50 | $5.09 | ||||||||||||
| Hypothetical** | $1,000.00 | $1,020.22 | $5.04 | ||||||||||||
| * | Expenses are equal to the Fund’s annualized expense ratios for the six-month period of 1.09%, 1.39%, 2.14%, and 0.99% for the Y, A, C, and R6 Classes, respectively, multiplied by the average account value over the period, multiplied by the number derived by dividing the number of days in the most recent fiscal half-year (184) by days in the year (365) to reflect the half-year period. |
| ** | 5% return before expenses. |
14
American Beacon FundsSM
Report of Independent Registered Public Accounting Firm
To the Shareholders of American Beacon AHL Managed Futures Strategy Fund, American Beacon AHL TargetRisk Fund, and American Beacon AHL TargetRisk Core Fund and the Board of Trustees of American Beacon Funds
Opinion on the Financial Statements
We have audited the accompanying statements of assets and liabilities of American Beacon AHL Managed Futures Strategy Fund (consolidated), American Beacon AHL TargetRisk Fund (consolidated), and American Beacon AHL TargetRisk Core Fund (collectively referred to as the “Funds”), (three of the funds constituting American Beacon Funds (the “Trust”)), including the (consolidated) schedules of investments, as of December 31, 2021, and the related (consolidated) statements of operations, changes in net assets, and financial highlights for each of the periods indicated in the table below and the related notes (collectively referred to as the “financial statements”). In our opinion, the financial statements present fairly, in all material respects, the (consolidated) financial position of each of the Funds (three of the funds constituting American Beacon Funds) at December 31, 2021, and the (consolidated) results of their operations, changes in net assets and financial highlights for each of the periods indicated in the table below, in conformity with U.S. generally accepted accounting principles.
| Individual fund constituting the |
Statement of operations |
Statements of changes in net assets |
Financial highlights | |||
| American Beacon AHL Managed Futures Strategy Fund | For the year ended December 31, 2021 | For each of the two years in the period ended December 31, 2021 | For each of the five years in the period ended December 31, 2021 | |||
| American Beacon AHL TargetRisk Fund | For the year ended December 31, 2021 | For each of the two years in the period ended December 31, 2021 | For each of the three years in the period ended December 31, 2021 and for the day of December 31, 2018 (commencement of operations) | |||
| American Beacon AHL TargetRisk Core Fund | For the year ended December 31, 2021 | For the year ended December 31, 2021 and the period from December 16, 2020 (commencement of operations) through December 31, 2020 | ||||
Basis for Opinion
These financial statements are the responsibility of the Trust’s management. Our responsibility is to express an opinion on the Funds’ financial statements based on our audits. We are a public accounting firm registered with the Public Company Accounting Oversight Board (United States) (“PCAOB”) and are required to be independent with respect to the Trust in accordance with the U.S. federal securities laws and the applicable rules and regulations of the Securities and Exchange Commission and the PCAOB.
We conducted our audits in accordance with the standards of the PCAOB. Those standards require that we plan and perform the audit to obtain reasonable assurance about whether the financial statements are free of material misstatement, whether due to error or fraud. The Trust is not required to have, nor were we engaged to perform, an audit of the Trust’s internal control over financial reporting. As part of our audits, we are required to obtain an understanding of internal control over financial reporting, but not for the purpose of expressing an opinion on the effectiveness of the Trust’s internal control over financial reporting. Accordingly, we express no such opinion.
Our audits included performing procedures to assess the risks of material misstatement of the financial statements, whether due to error or fraud, and performing procedures that respond to those risks. Such procedures included examining, on a test basis, evidence regarding the amounts and disclosures in the financial statements. Our procedures included confirmation of securities owned as of December 31, 2021, by correspondence with the custodian and brokers or by other appropriate auditing procedures where replies from brokers were not received. Our audits also included evaluating the accounting principles used and significant estimates made by management, as well as evaluating the overall presentation of the financial statements. We believe that our audits provide a reasonable basis for our opinion.

We have served as the auditor of one or more American Beacon investment companies since 1987.
Dallas, Texas
February 28, 2022
15
American Beacon AHL Managed Futures Strategy FundSM
Consolidated Schedule of Investments
December 31, 2021
| Principal Amount | Fair Value | ||||||||||||||||
| SHORT-TERM INVESTMENTS - 83.00% | |||||||||||||||||
| U.S. Treasury Obligations - 83.00% | |||||||||||||||||
| U.S. Treasury Bills, | |||||||||||||||||
| 0.045%, Due 1/13/2022 |
$ | 50,000,000 | $ | 49,999,791 | |||||||||||||
| 0.047%, Due 1/20/2022 |
50,000,000 | 49,999,705 | |||||||||||||||
| 0.025%, Due 1/27/2022 |
50,000,000 | 49,999,083 | |||||||||||||||
| 0.048%, Due 2/3/2022A |
95,000,000 | 94,997,546 | |||||||||||||||
| 0.043%, Due 2/10/2022 |
50,000,000 | 49,998,285 | |||||||||||||||
| 0.044%, Due 2/17/2022A |
95,000,000 | 94,996,437 | |||||||||||||||
| 0.096%, Due 2/24/2022A |
95,000,000 | 94,996,227 | |||||||||||||||
| 0.046%, Due 3/3/2022A |
95,000,000 | 94,992,604 | |||||||||||||||
| 0.032%, Due 3/10/2022 |
100,000,000 | 99,992,208 | |||||||||||||||
| 0.056%, Due 3/24/2022 |
100,000,000 | 99,987,556 | |||||||||||||||
| 0.056%, Due 4/7/2022 |
100,000,000 | 99,980,939 | |||||||||||||||
| 0.051%, Due 4/14/2022 |
85,000,000 | 84,982,114 | |||||||||||||||
| 0.105%, Due 4/21/2022A |
135,000,000 | 134,970,131 | |||||||||||||||
| 0.061%, Due 4/28/2022A |
100,000,000 | 99,975,642 | |||||||||||||||
| 0.079%, Due 5/5/2022 |
50,000,000 | 49,986,656 | |||||||||||||||
| 0.051%, Due 5/12/2022A |
100,000,000 | 99,967,750 | |||||||||||||||
| 0.150%, Due 5/19/2022A |
140,000,000 | 139,948,301 | |||||||||||||||
| 0.153%, Due 5/26/2022A |
100,000,000 | 99,962,662 | |||||||||||||||
| 0.104%, Due 6/2/2022 |
50,000,000 | 49,977,865 | |||||||||||||||
| 0.112%, Due 6/9/2022A |
140,000,000 | 139,932,839 | |||||||||||||||
|
|
|
||||||||||||||||
| Total Short-Term Investments (Cost $1,779,687,396) |
1,779,644,341 | ||||||||||||||||
|
|
|
||||||||||||||||
| TOTAL INVESTMENTS - 83.00% (Cost $1,779,687,396) |
1,779,644,341 | ||||||||||||||||
| OTHER ASSETS, NET OF LIABILITIES - 17.00% |
364,632,375 | ||||||||||||||||
|
|
|
||||||||||||||||
| TOTAL NET ASSETS - 100.00% |
$ | 2,144,276,716 | |||||||||||||||
|
|
|
||||||||||||||||
| Percentages are stated as a percent of net assets. |
|
||||||||||||||||
A All or a portion represents positions held by the American Beacon Cayman Managed Futures Strategy Fund, Ltd.
| Long Futures Contracts Open on December 31, 2021: |
| |||||||||||||||
| Commodity Futures Contracts | ||||||||||||||||
| Description | Number of Contracts |
Expiration Date | Notional Amount | Contract Value | Unrealized Appreciation (Depreciation) |
|||||||||||
| Brent CrudeA | 341 | January 2022 | $ | 25,702,623 | $ | 26,522,980 | $ | 820,357 | ||||||||
| CoffeeA | 316 | March 2022 | 24,819,841 | 26,792,850 | 1,973,009 | |||||||||||
| CornA | 1,749 | March 2022 | 51,338,831 | 51,879,712 | 540,881 | |||||||||||
| Gasoline RBOBA | 306 | January 2022 | 27,593,447 | 28,590,559 | 997,112 | |||||||||||
| Gold 100ozA | 336 | February 2022 | 61,380,235 | 61,440,960 | 60,725 | |||||||||||
| Henry Hub Natural GasA | 72 | March 2022 | 641,920 | 631,260 | (10,660 | ) | ||||||||||
| Henry Hub Natural GasA | 72 | April 2022 | 641,920 | 634,500 | (7,420 | ) | ||||||||||
| Henry Hub Natural GasA | 72 | May 2022 | 641,920 | 644,220 | 2,300 | |||||||||||
| Henry Hub Natural GasA | 72 | June 2022 | 641,920 | 654,840 | 12,920 | |||||||||||
| Henry Hub Natural GasA | 72 | July 2022 | 641,920 | 658,260 | 16,340 | |||||||||||
| Henry Hub Natural GasA | 72 | August 2022 | 641,920 | 656,100 | 14,180 | |||||||||||
| Henry Hub Natural GasA | 72 | September 2022 | 641,920 | 661,680 | 19,760 | |||||||||||
| Henry Hub Natural GasA | 104 | October 2022 | 1,099,490 | 984,360 | (115,130 | ) | ||||||||||
| Henry Hub Natural GasA | 104 | November 2022 | 1,099,490 | 1,035,580 | (63,910 | ) | ||||||||||
| Henry Hub Natural GasA | 104 | December 2022 | 1,099,490 | 1,063,400 | (36,090 | ) | ||||||||||
| Henry Hub Natural GasA | 104 | January 2023 | 1,099,490 | 1,034,800 | (64,690 | ) | ||||||||||
| Henry Hub Natural GasA | 104 | February 2023 | 1,099,490 | 958,360 | (141,130 | ) | ||||||||||
| Kansas City Hard Red Winter WheatA | 502 | March 2022 | 21,874,397 | 20,117,650 | (1,756,747 | ) | ||||||||||
| LME CopperA | 195 | January 2022 | 48,171,438 | 47,519,062 | (652,376 | ) | ||||||||||
| LME CopperA | 16 | February 2022 | 3,904,560 | 3,895,800 | (8,760 | ) | ||||||||||
| LME CopperA | 48 | March 2022 | 11,603,469 | 11,677,800 | 74,331 | |||||||||||
| LME CopperA | 208 | March 2022 | 23,081,045 | 23,210,200 | 129,155 | |||||||||||
See accompanying notes
16
American Beacon AHL Managed Futures Strategy FundSM
Consolidated Schedule of Investments
December 31, 2021
| Commodity Futures Contracts (continued) | ||||||||||||||||
| Description | Number of Contracts |
Expiration Date | Notional Amount | Contract Value | Unrealized Appreciation (Depreciation) |
|||||||||||
| LME LeadA | 314 | January 2022 | $ | 18,589,746 | $ | 18,272,837 | $ | (316,909 | ) | |||||||
| LME LeadA | 110 | February 2022 | 6,462,831 | 6,378,625 | (84,206 | ) | ||||||||||
| LME NickelA | 90 | January 2022 | 10,735,539 | 11,271,690 | 536,151 | |||||||||||
| LME NickelA | 75 | February 2022 | 8,952,882 | 9,375,075 | 422,193 | |||||||||||
| LME NickelA | 34 | March 2022 | 4,181,839 | 4,241,874 | 60,035 | |||||||||||
| LME Primary AluminiumA | 99 | January 2022 | 7,449,283 | 6,937,425 | (511,858 | ) | ||||||||||
| LME Primary AluminiumA | 70 | February 2022 | 4,595,603 | 4,908,750 | 313,147 | |||||||||||
| LME Primary AluminiumA | 505 | March 2022 | 34,330,190 | 35,451,000 | 1,120,810 | |||||||||||
| LME ZincA | 88 | January 2022 | 7,240,255 | 7,876,000 | 635,745 | |||||||||||
| LME ZincA | 99 | February 2022 | 8,157,034 | 8,817,188 | 660,154 | |||||||||||
| LME ZincA | 137 | March 2022 | 11,852,656 | 12,151,900 | 299,244 | |||||||||||
| Low Sulphur GasoilA | 142 | January 2022 | 8,662,554 | 9,471,400 | 808,846 | |||||||||||
| Low Sulphur GasoilA | 131 | February 2022 | 8,732,008 | 8,727,875 | (4,133 | ) | ||||||||||
| NY Harbor ULSDA | 201 | January 2022 | 19,133,516 | 19,630,183 | 496,667 | |||||||||||
| SoybeanA | 210 | March 2022 | 14,189,050 | 14,062,125 | (126,925 | ) | ||||||||||
| Sugar #11 WorldA | 715 | February 2022 | 16,124,660 | 15,119,104 | (1,005,556 | ) | ||||||||||
| WTI CrudeA | 363 | January 2022 | 26,728,518 | 27,301,230 | 572,712 | |||||||||||
|
|
|
|
|
|
|
|||||||||||
| $ | 525,578,940 | $ | 531,259,214 | $ | 5,680,274 | |||||||||||
|
|
|
|
|
|
|
|||||||||||
| Currency Futures Contracts | ||||||||||||||||
| Description | Number of Contracts |
Expiration Date | Notional Amount | Contract Value | Unrealized Appreciation (Depreciation) |
|||||||||||
| Mexican Peso | 4,381 | March 2022 | $ | 104,517,806 | $ | 105,713,530 | $ | 1,195,724 | ||||||||
| Swiss Franc Currency | 149 | March 2022 | 20,394,875 | 20,472,600 | 77,725 | |||||||||||
| U.S. Dollar Index | 2,346 | March 2022 | 225,448,563 | 224,261,178 | (1,187,385 | ) | ||||||||||
|
|
|
|
|
|
|
|||||||||||
| $ | 350,361,244 | $ | 350,447,308 | $ | 86,064 | |||||||||||
|
|
|
|
|
|
|
|||||||||||
| Equity Futures Contracts | ||||||||||||||||
| Description | Number of Contracts |
Expiration Date | Notional Amount | Contract Value | Unrealized Appreciation (Depreciation) |
|||||||||||
| Amsterdam Index | 147 | January 2022 | $ | 26,330,695 | $ | 26,700,191 | $ | 369,496 | ||||||||
| CAC40 Index | 508 | January 2022 | 40,326,856 | 41,312,098 | 985,242 | |||||||||||
| DAX Index | 62 | March 2022 | 27,993,449 | 27,980,677 | (12,772 | ) | ||||||||||
| Euro Stoxx 50 Index | 1,244 | March 2022 | 59,588,651 | 60,723,585 | 1,134,934 | |||||||||||
| FTSE 100 Index | 993 | March 2022 | 96,521,290 | 98,440,061 | 1,918,771 | |||||||||||
| FTSE Taiwan Index | 1,545 | January 2022 | 98,135,219 | 99,096,300 | 961,081 | |||||||||||
| FTSE/JSE Top 40 Index | 1,909 | March 2022 | 78,179,973 | 80,255,869 | 2,075,896 | |||||||||||
| FTSE/MIB Index | 366 | March 2022 | 55,698,476 | 56,769,962 | 1,071,486 | |||||||||||
| KOSPI 200 Index | 1,132 | March 2022 | 94,002,137 | 93,857,203 | (144,934 | ) | ||||||||||
| MSCI EAFE Index | 325 | March 2022 | 37,852,127 | 37,729,250 | (122,877 | ) | ||||||||||
| NASDAQ 100 E-Mini | 212 | March 2022 | 69,351,444 | 69,199,980 | (151,464 | ) | ||||||||||
| Nikkei 225 (SGX) | 38 | March 2022 | 4,770,376 | 4,750,413 | (19,963 | ) | ||||||||||
| OMXS30 Index | 1,713 | January 2022 | 44,853,604 | 45,861,925 | 1,008,321 | |||||||||||
| S&P 500 E-Mini Index | 572 | March 2022 | 134,941,681 | 136,093,100 | 1,151,419 | |||||||||||
| S&P/TSX 60 Index | 320 | March 2022 | 63,995,170 | 64,806,989 | 811,819 | |||||||||||
| SPI 200 | 1,256 | March 2022 | 165,918,932 | 167,842,727 | 1,923,795 | |||||||||||
| TOPIX Index | 68 | March 2022 | 11,805,310 | 11,775,711 | (29,599 | ) | ||||||||||
|
|
|
|
|
|
|
|||||||||||
| $ | 1,110,265,390 | $ | 1,123,196,041 | $ | 12,930,651 | |||||||||||
|
|
|
|
|
|
|
|||||||||||
See accompanying notes
17
American Beacon AHL Managed Futures Strategy FundSM
Consolidated Schedule of Investments
December 31, 2021
| Interest Rate Futures Contracts | ||||||||||||||||
| Description | Number of Contracts |
Expiration Date | Notional Amount | Contract Value | Unrealized Appreciation (Depreciation) |
|||||||||||
| 3-Month Euro Euribor | 3,506 | December 2022 | $ | 1,001,687,502 | $ | 1,001,038,283 | $ | (649,219 | ) | |||||||
| Australian 10-Year Bond | 212 | March 2022 | 21,621,426 | 21,465,252 | (156,174 | ) | ||||||||||
| Euro-Buxl 30-Year Bond | 152 | March 2022 | 37,533,311 | 35,776,759 | (1,756,552 | ) | ||||||||||
| Euro-Schatz | 2,218 | March 2022 | 283,336,378 | 282,897,277 | (439,101 | ) | ||||||||||
| Japanese 10-Year Government Bond | 98 | March 2022 | 129,467,948 | 129,147,353 | (320,595 | ) | ||||||||||
| U.S. Long Bond | 314 | March 2022 | 49,999,244 | 50,377,375 | 378,131 | |||||||||||
| U.S. Ultra Bond | 117 | March 2022 | 22,687,031 | 23,063,625 | 376,594 | |||||||||||
|
|
|
|
|
|
|
|||||||||||
| $ | 1,546,332,840 | $ | 1,543,765,924 | $ | (2,566,916 | ) | ||||||||||
|
|
|
|
|
|
|
|||||||||||
| Short Futures Contracts Open on December 31, 2021: |
| |||||||||||||||
| Commodity Futures Contracts | ||||||||||||||||
| Description | Number of Contracts |
Expiration Date | Notional Amount | Contract Value | Unrealized Appreciation (Depreciation) |
|||||||||||
| CocoaA | 271 | March 2022 | $ | (6,430,037 | ) | $ | (6,829,200 | ) | $ | (399,163 | ) | |||||
| LME CopperA | 120 | January 2022 | (28,410,785 | ) | (29,242,500 | ) | (831,715 | ) | ||||||||
| LME LeadA | 246 | January 2022 | (13,827,690 | ) | (14,315,663 | ) | (487,973 | ) | ||||||||
| LME NickelA | 40 | January 2022 | (4,663,280 | ) | (5,009,640 | ) | (346,360 | ) | ||||||||
| LME Primary AluminiumA | 6 | January 2022 | (422,390 | ) | (420,450 | ) | 1,940 | |||||||||
| LME ZincA | 6 | January 2022 | (518,736 | ) | (537,000 | ) | (18,264 | ) | ||||||||
| Natural GasA | 265 | January 2022 | (10,064,589 | ) | (9,884,500 | ) | 180,089 | |||||||||
| SilverA | 361 | March 2022 | (40,076,426 | ) | (42,150,360 | ) | (2,073,934 | ) | ||||||||
|
|
|
|
|
|
|
|||||||||||
| $ | (104,413,933 | ) | $ | (108,389,313 | ) | $ | (3,975,380 | ) | ||||||||
|
|
|
|
|
|
|
|||||||||||
| Currency Futures Contracts | ||||||||||||||||
| Description | Number of Contracts |
Expiration Date | Notional Amount | Contract Value | Unrealized Appreciation (Depreciation) |
|||||||||||
| Austrailian Dollar Currency | 2,786 | March 2022 | $ | (196,001,170 | ) | $ | (202,765,080 | ) | $ | (6,763,910 | ) | |||||
| British Pound Currency | 1,714 | March 2022 | (141,959,662 | ) | (144,950,838 | ) | (2,991,176 | ) | ||||||||
| Canadian Dollar Currency | 2,473 | March 2022 | (193,465,568 | ) | (195,490,650 | ) | (2,025,082 | ) | ||||||||
| Euro Currency | 3,902 | March 2022 | (552,391,072 | ) | (556,156,938 | ) | (3,765,866 | ) | ||||||||
| Japanese Yen Currency | 5,009 | March 2022 | (549,704,037 | ) | (544,603,525 | ) | 5,100,512 | |||||||||
| New Zealand Dollar Currency | 1,273 | March 2022 | (85,896,615 | ) | (87,117,755 | ) | (1,221,140 | ) | ||||||||
|
|
|
|
|
|
|
|||||||||||
| $ | (1,719,418,124 | ) | $ | (1,731,084,786 | ) | $ | (11,666,662 | ) | ||||||||
|
|
|
|
|
|
|
|||||||||||
| Equity Futures Contracts | ||||||||||||||||
| Description | Number of Contracts |
Expiration Date | Notional Amount | Contract Value | Unrealized Appreciation (Depreciation) |
|||||||||||
| Hang Seng China Enterprises Index | 1,075 | January 2022 | $ | (56,607,665 | ) | $ | (56,986,008 | ) | $ | (378,343 | ) | |||||
| Hang Seng Index | 413 | January 2022 | (61,653,401 | ) | (62,104,526 | ) | (451,125 | ) | ||||||||
| MSCI Emerging Markets Index | 295 | March 2022 | (17,894,464 | ) | (18,087,925 | ) | (193,461 | ) | ||||||||
| Russell 2000 E-Mini Index | 8 | March 2022 | (849,099 | ) | (897,120 | ) | (48,021 | ) | ||||||||
|
|
|
|
|
|
|
|||||||||||
| $ | (137,004,629 | ) | $ | (138,075,579 | ) | $ | (1,070,950 | ) | ||||||||
|
|
|
|
|
|
|
|||||||||||
| Interest Rate Futures Contracts | ||||||||||||||||
| Description | Number of Contracts |
Expiration Date | Notional Amount | Contract Value | Unrealized Appreciation (Depreciation) |
|||||||||||
| 3-Month Euro Euribor | 946 | September 2023 | $ | (269,436,298 | ) | $ | (269,255,160 | ) | $ | 181,138 | ||||||
| 3-Month Euro Euribor | 1,729 | June 2024 | (491,558,934 | ) | (491,279,862 | ) | 279,072 | |||||||||
| 3-Month SOFR | 543 | June 2023 | (134,391,728 | ) | (134,399,287 | ) | (7,559 | ) | ||||||||
| 3-Month SOFR | 701 | March 2024 | (172,849,267 | ) | (172,919,175 | ) | (69,908 | ) | ||||||||
| 3-Month SOFR | 780 | December 2024 | (192,154,580 | ) | (192,240,750 | ) | (86,170 | ) | ||||||||
| 3-Month Sonia | 1,085 | March 2023 | (363,418,235 | ) | (362,836,408 | ) | 581,827 | |||||||||
See accompanying notes
18
American Beacon AHL Managed Futures Strategy FundSM
Consolidated Schedule of Investments
December 31, 2021
| Interest Rate Futures Contracts (continued) | ||||||||||||||
| Description | Number of Contracts |
Expiration Date | Notional Amount |
Contract Value | Unrealized Appreciation (Depreciation) |
|||||||||
| 3-Month Sonia | 1,427 | December 2023 | $ (477,908,979) | $ | (476,553,232 | ) | $ | 1,355,747 | ||||||
| Euro-Bobl | 443 | March 2022 | (67,280,552) | (67,200,304 | ) | 80,248 | ||||||||
| Euro-Bund | 263 | March 2022 | (51,485,802) | (51,312,530 | ) | 173,272 | ||||||||
| Long GILT | 75 | March 2022 | (12,665,218) | (12,679,379 | ) | (14,161 | ) | |||||||
| U.S. Treasury 10-Year Note | 595 | March 2022 | (77,573,973) | (77,628,906 | ) | (54,933 | ) | |||||||
| U.S. Treasury 2-Year Note | 313 | March 2022 | (68,260,660) | (68,287,797 | ) | (27,137 | ) | |||||||
| U.S. Treasury 5-Year Note | 827 | March 2022 | (99,959,203) | (100,047,618 | ) | (88,415 | ) | |||||||
|
|
|
|
|
|
||||||||||
| $(2,478,943,429) | $ | (2,476,640,408 | ) | $ | 2,303,021 | |||||||||
|
|
|
|
|
|
||||||||||
A All or a portion represents positions held by the American Beacon Cayman Managed Futures Strategy Fund, Ltd.
| Forward Foreign Currency Contracts Open on December 31, 2021: |
|
|||||||||||||||||||||||||||
| Currency Purchased* | Currency Sold* | Settlement Date |
Counterparty | Unrealized Appreciation |
Unrealized (Depreciation) |
Net Unrealized Appreciation (Depreciation) |
||||||||||||||||||||||
| INR | 503,725 | USD | 494,814 | 1/18/2022 | CBK | $ | 8,911 | $ | - | $ | 8,911 | |||||||||||||||||
| INR | 537,307 | USD | 527,795 | 1/18/2022 | CBK | 9,512 | - | 9,512 | ||||||||||||||||||||
| INR | 604,470 | USD | 593,777 | 1/18/2022 | CBK | 10,693 | - | 10,693 | ||||||||||||||||||||
| INR | 638,052 | USD | 627,054 | 1/18/2022 | CBK | 10,998 | - | 10,998 | ||||||||||||||||||||
| INR | 638,052 | USD | 626,723 | 1/18/2022 | CBK | 11,329 | - | 11,329 | ||||||||||||||||||||
| INR | 772,379 | USD | 758,670 | 1/18/2022 | CBK | 13,709 | - | 13,709 | ||||||||||||||||||||
| INR | 1,041,032 | USD | 1,023,147 | 1/18/2022 | CBK | 17,885 | - | 17,885 | ||||||||||||||||||||
| INR | 1,712,666 | USD | 1,690,354 | 1/18/2022 | CBK | 22,312 | - | 22,312 | ||||||||||||||||||||
| INR | 2,082,065 | USD | 2,045,368 | 1/18/2022 | CBK | 36,697 | - | 36,697 | ||||||||||||||||||||
| INR | 2,082,065 | USD | 2,045,341 | 1/18/2022 | CBK | 36,724 | - | 36,724 | ||||||||||||||||||||
| INR | 3,089,515 | USD | 3,033,536 | 1/18/2022 | CBK | 55,979 | - | 55,979 | ||||||||||||||||||||
| INR | 3,123,097 | USD | 3,068,497 | 1/18/2022 | CBK | 54,600 | - | 54,600 | ||||||||||||||||||||
| INR | 5,238,743 | USD | 5,156,820 | 1/18/2022 | CBK | 81,923 | - | 81,923 | ||||||||||||||||||||
| INR | 5,977,540 | USD | 5,899,275 | 1/18/2022 | CBK | 78,265 | - | 78,265 | ||||||||||||||||||||
| INR | 6,649,174 | USD | 6,554,598 | 1/18/2022 | CBK | 94,576 | - | 94,576 | ||||||||||||||||||||
| INR | 6,716,337 | USD | 6,626,764 | 1/18/2022 | CBK | 89,573 | - | 89,573 | ||||||||||||||||||||
| INR | 7,589,461 | USD | 7,505,114 | 1/18/2022 | CBK | 84,347 | - | 84,347 | ||||||||||||||||||||
| INR | 8,764,820 | USD | 8,668,050 | 1/18/2022 | CBK | 96,770 | - | 96,770 | ||||||||||||||||||||
| INR | 54,771,731 | USD | 54,018,070 | 1/18/2022 | CBK | 753,661 | - | 753,661 | ||||||||||||||||||||
| USD | 9,393,262 | INR | 9,604,362 | 1/18/2022 | CBK | - | (211,100 | ) | (211,100 | ) | ||||||||||||||||||
| USD | 7,025,682 | INR | 7,186,481 | 1/18/2022 | CBK | - | (160,799 | ) | (160,799 | ) | ||||||||||||||||||
| USD | 6,814,828 | INR | 6,984,991 | 1/18/2022 | CBK | - | (170,163 | ) | (170,163 | ) | ||||||||||||||||||
| USD | 6,583,559 | INR | 6,749,919 | 1/18/2022 | CBK | - | (166,360 | ) | (166,360 | ) | ||||||||||||||||||
| USD | 6,567,496 | INR | 6,749,919 | 1/18/2022 | CBK | - | (182,423 | ) | (182,423 | ) | ||||||||||||||||||
| USD | 5,891,584 | INR | 6,011,122 | 1/18/2022 | CBK | - | (119,538 | ) | (119,538 | ) | ||||||||||||||||||
| USD | 5,653,141 | INR | 5,809,632 | 1/18/2022 | CBK | - | (156,491 | ) | (156,491 | ) | ||||||||||||||||||
| USD | 4,091,696 | INR | 4,197,711 | 1/18/2022 | CBK | - | (106,015 | ) | (106,015 | ) | ||||||||||||||||||
| USD | 3,974,575 | INR | 4,063,384 | 1/18/2022 | CBK | - | (88,809 | ) | (88,809 | ) | ||||||||||||||||||
| USD | 3,318,308 | INR | 3,391,750 | 1/18/2022 | CBK | - | (73,442 | ) | (73,442 | ) | ||||||||||||||||||
| USD | 3,199,410 | INR | 3,257,424 | 1/18/2022 | CBK | - | (58,014 | ) | (58,014 | ) | ||||||||||||||||||
| USD | 3,093,678 | INR | 3,179,066 | 1/18/2022 | CBK | - | (85,388 | ) | (85,388 | ) | ||||||||||||||||||
| USD | 3,049,890 | INR | 3,134,291 | 1/18/2022 | CBK | - | (84,401 | ) | (84,401 | ) | ||||||||||||||||||
| USD | 2,836,856 | INR | 2,888,025 | 1/18/2022 | CBK | - | (51,169 | ) | (51,169 | ) | ||||||||||||||||||
| USD | 2,511,042 | INR | 2,552,208 | 1/18/2022 | CBK | - | (41,166 | ) | (41,166 | ) | ||||||||||||||||||
| USD | 2,448,720 | INR | 2,496,239 | 1/18/2022 | CBK | - | (47,519 | ) | (47,519 | ) | ||||||||||||||||||
| USD | 2,396,590 | INR | 2,445,673 | 1/18/2022 | CBK | - | (49,083 | ) | (49,083 | ) | ||||||||||||||||||
| USD | 2,216,168 | INR | 2,256,689 | 1/18/2022 | CBK | - | (40,521 | ) | (40,521 | ) | ||||||||||||||||||
| USD | 2,208,845 | INR | 2,249,973 | 1/18/2022 | CBK | - | (41,128 | ) | (41,128 | ) | ||||||||||||||||||
| USD | 2,079,713 | INR | 2,115,646 | 1/18/2022 | CBK | - | (35,933 | ) | (35,933 | ) | ||||||||||||||||||
| USD | 1,997,982 | INR | 2,048,483 | 1/18/2022 | CBK | - | (50,501 | ) | (50,501 | ) | ||||||||||||||||||
| USD | 1,979,756 | INR | 2,014,901 | 1/18/2022 | CBK | - | (35,145 | ) | (35,145 | ) | ||||||||||||||||||
| USD | 1,965,929 | INR | 2,014,901 | 1/18/2022 | CBK | - | (48,972 | ) | (48,972 | ) | ||||||||||||||||||
| USD | 1,962,143 | INR | 2,001,005 | 1/18/2022 | CBK | - | (38,862 | ) | (38,862 | ) | ||||||||||||||||||
See accompanying notes
19
American Beacon AHL Managed Futures Strategy FundSM
Consolidated Schedule of Investments
December 31, 2021
| Forward Foreign Currency Contracts Open on December 31, 2021 (continued): | ||||||||||||||||||||||||||||
| Currency Purchased* | Currency Sold* | Settlement Date |
Counterparty | Unrealized Appreciation |
Unrealized (Depreciation) |
Net Unrealized Appreciation (Depreciation) |
||||||||||||||||||||||
| USD | 1,962,117 | INR | 2,001,005 | 1/18/2022 | CBK | $ | - | $ | (38,888 | ) | $ | (38,888 | ) | |||||||||||||||
| USD | 1,635,787 | INR | 1,679,084 | 1/18/2022 | CBK | - | (43,297 | ) | (43,297 | ) | ||||||||||||||||||
| USD | 1,609,132 | INR | 1,645,503 | 1/18/2022 | CBK | - | (36,371 | ) | (36,371 | ) | ||||||||||||||||||
| USD | 1,450,702 | INR | 1,477,594 | 1/18/2022 | CBK | - | (26,892 | ) | (26,892 | ) | ||||||||||||||||||
| USD | 1,277,613 | INR | 1,309,686 | 1/18/2022 | CBK | - | (32,073 | ) | (32,073 | ) | ||||||||||||||||||
| USD | 915,565 | INR | 940,287 | 1/18/2022 | CBK | - | (24,722 | ) | (24,722 | ) | ||||||||||||||||||
| USD | 883,459 | INR | 906,706 | 1/18/2022 | CBK | - | (23,247 | ) | (23,247 | ) | ||||||||||||||||||
| USD | 825,059 | INR | 839,542 | 1/18/2022 | CBK | - | (14,483 | ) | (14,483 | ) | ||||||||||||||||||
| USD | 823,832 | INR | 839,542 | 1/18/2022 | CBK | - | (15,710 | ) | (15,710 | ) | ||||||||||||||||||
| USD | 785,598 | INR | 805,960 | 1/18/2022 | CBK | - | (20,362 | ) | (20,362 | ) | ||||||||||||||||||
| USD | 757,077 | INR | 772,379 | 1/18/2022 | CBK | - | (15,302 | ) | (15,302 | ) | ||||||||||||||||||
| USD | 756,998 | INR | 772,379 | 1/18/2022 | CBK | - | (15,381 | ) | (15,381 | ) | ||||||||||||||||||
| USD | 724,256 | INR | 738,797 | 1/18/2022 | CBK | - | (14,541 | ) | (14,541 | ) | ||||||||||||||||||
| USD | 658,358 | INR | 671,634 | 1/18/2022 | CBK | - | (13,276 | ) | (13,276 | ) | ||||||||||||||||||
| USD | 560,154 | INR | 570,889 | 1/18/2022 | CBK | - | (10,735 | ) | (10,735 | ) | ||||||||||||||||||
| USD | 395,350 | INR | 402,980 | 1/18/2022 | CBK | - | (7,630 | ) | (7,630 | ) | ||||||||||||||||||
| USD | 318,498 | INR | 324,623 | 1/18/2022 | CBK | - | (6,125 | ) | (6,125 | ) | ||||||||||||||||||
| USD | 230,354 | INR | 235,072 | 1/18/2022 | CBK | - | (4,718 | ) | (4,718 | ) | ||||||||||||||||||
| USD | 164,057 | INR | 167,908 | 1/18/2022 | CBK | - | (3,851 | ) | (3,851 | ) | ||||||||||||||||||
| USD | 26,382 | INR | 26,865 | 1/18/2022 | CBK | - | (483 | ) | (483 | ) | ||||||||||||||||||
| USD | 16,715,366 | AUD | 16,820,230 | 1/20/2022 | CBK | - | (104,864 | ) | (104,864 | ) | ||||||||||||||||||
| TWD | 722,863 | USD | 726,435 | 1/25/2022 | CBK | - | (3,572 | ) | (3,572 | ) | ||||||||||||||||||
| TWD | 903,579 | USD | 904,323 | 1/25/2022 | CBK | - | (744 | ) | (744 | ) | ||||||||||||||||||
| TWD | 903,579 | USD | 905,600 | 1/25/2022 | CBK | - | (2,021 | ) | (2,021 | ) | ||||||||||||||||||
| TWD | 993,937 | USD | 994,252 | 1/25/2022 | CBK | - | (315 | ) | (315 | ) | ||||||||||||||||||
| TWD | 993,937 | USD | 995,656 | 1/25/2022 | CBK | - | (1,719 | ) | (1,719 | ) | ||||||||||||||||||
| TWD | 993,937 | USD | 995,295 | 1/25/2022 | CBK | - | (1,358 | ) | (1,358 | ) | ||||||||||||||||||
| TWD | 993,937 | USD | 998,338 | 1/25/2022 | CBK | - | (4,401 | ) | (4,401 | ) | ||||||||||||||||||
| TWD | 1,174,652 | USD | 1,179,848 | 1/25/2022 | CBK | - | (5,196 | ) | (5,196 | ) | ||||||||||||||||||
| TWD | 1,355,368 | USD | 1,361,700 | 1/25/2022 | CBK | - | (6,332 | ) | (6,332 | ) | ||||||||||||||||||
| TWD | 1,445,726 | USD | 1,452,960 | 1/25/2022 | CBK | - | (7,234 | ) | (7,234 | ) | ||||||||||||||||||
| TWD | 1,626,442 | USD | 1,630,004 | 1/25/2022 | CBK | - | (3,562 | ) | (3,562 | ) | ||||||||||||||||||
| TWD | 1,716,800 | USD | 1,719,520 | 1/25/2022 | CBK | - | (2,720 | ) | (2,720 | ) | ||||||||||||||||||
| TWD | 1,807,158 | USD | 1,816,043 | 1/25/2022 | CBK | - | (8,885 | ) | (8,885 | ) | ||||||||||||||||||
| TWD | 2,349,305 | USD | 2,359,047 | 1/25/2022 | CBK | - | (9,742 | ) | (9,742 | ) | ||||||||||||||||||
| TWD | 2,891,452 | USD | 2,903,706 | 1/25/2022 | CBK | - | (12,254 | ) | (12,254 | ) | ||||||||||||||||||
| TWD | 3,343,241 | USD | 3,352,712 | 1/25/2022 | CBK | - | (9,471 | ) | (9,471 | ) | ||||||||||||||||||
| TWD | 3,433,599 | USD | 3,449,565 | 1/25/2022 | CBK | - | (15,966 | ) | (15,966 | ) | ||||||||||||||||||
| TWD | 3,523,957 | USD | 3,541,325 | 1/25/2022 | CBK | - | (17,368 | ) | (17,368 | ) | ||||||||||||||||||
| TWD | 4,517,894 | USD | 4,539,271 | 1/25/2022 | CBK | - | (21,377 | ) | (21,377 | ) | ||||||||||||||||||
| USD | 14,282,409 | TWD | 14,276,545 | 1/25/2022 | CBK | 5,864 | - | 5,864 | ||||||||||||||||||||
| USD | 2,702,118 | TWD | 2,710,736 | 1/25/2022 | CBK | - | (8,618 | ) | (8,618 | ) | ||||||||||||||||||
| USD | 2,612,989 | TWD | 2,620,378 | 1/25/2022 | CBK | - | (7,389 | ) | (7,389 | ) | ||||||||||||||||||
| USD | 2,612,186 | TWD | 2,620,378 | 1/25/2022 | CBK | - | (8,192 | ) | (8,192 | ) | ||||||||||||||||||
| USD | 2,526,380 | TWD | 2,530,021 | 1/25/2022 | CBK | - | (3,641 | ) | (3,641 | ) | ||||||||||||||||||
| USD | 2,522,732 | TWD | 2,530,021 | 1/25/2022 | CBK | - | (7,289 | ) | (7,289 | ) | ||||||||||||||||||
| USD | 2,343,491 | TWD | 2,349,305 | 1/25/2022 | CBK | - | (5,814 | ) | (5,814 | ) | ||||||||||||||||||
| USD | 2,160,535 | TWD | 2,168,589 | 1/25/2022 | CBK | - | (8,054 | ) | (8,054 | ) | ||||||||||||||||||
| USD | 1,980,532 | TWD | 1,987,873 | 1/25/2022 | CBK | - | (7,341 | ) | (7,341 | ) | ||||||||||||||||||
| USD | 1,621,973 | TWD | 1,626,442 | 1/25/2022 | CBK | - | (4,469 | ) | (4,469 | ) | ||||||||||||||||||
| USD | 1,441,481 | TWD | 1,445,726 | 1/25/2022 | CBK | - | (4,245 | ) | (4,245 | ) | ||||||||||||||||||
| USD | 1,350,324 | TWD | 1,355,368 | 1/25/2022 | CBK | - | (5,044 | ) | (5,044 | ) | ||||||||||||||||||
| USD | 1,259,363 | TWD | 1,265,010 | 1/25/2022 | CBK | - | (5,647 | ) | (5,647 | ) | ||||||||||||||||||
| USD | 1,171,975 | TWD | 1,174,652 | 1/25/2022 | CBK | - | (2,677 | ) | (2,677 | ) | ||||||||||||||||||
| USD | 1,171,846 | TWD | 1,174,652 | 1/25/2022 | CBK | - | (2,806 | ) | (2,806 | ) | ||||||||||||||||||
| USD | 1,169,451 | TWD | 1,174,652 | 1/25/2022 | CBK | - | (5,201 | ) | (5,201 | ) | ||||||||||||||||||
| USD | 991,038 | TWD | 993,937 | 1/25/2022 | CBK | - | (2,899 | ) | (2,899 | ) | ||||||||||||||||||
| USD | 811,425 | TWD | 813,221 | 1/25/2022 | CBK | - | (1,796 | ) | (1,796 | ) | ||||||||||||||||||
See accompanying notes
20
American Beacon AHL Managed Futures Strategy FundSM
Consolidated Schedule of Investments
December 31, 2021
| Forward Foreign Currency Contracts Open on December 31, 2021 (continued): | ||||||||||||||||||||||||||||
| Currency Purchased* | Currency Sold* | Settlement Date |
Counterparty | Unrealized Appreciation |
Unrealized (Depreciation) |
Net Unrealized Appreciation (Depreciation) |
||||||||||||||||||||||
| USD | 630,319 | TWD | 632,505 | 1/25/2022 | CBK | $ | - | $ | (2,186 | ) | $ | (2,186 | ) | |||||||||||||||
| USD | 539,957 | TWD | 542,147 | 1/25/2022 | CBK | - | (2,190 | ) | (2,190 | ) | ||||||||||||||||||
| USD | 539,801 | TWD | 542,147 | 1/25/2022 | CBK | - | (2,346 | ) | (2,346 | ) | ||||||||||||||||||
| USD | 450,434 | TWD | 451,789 | 1/25/2022 | CBK | - | (1,355 | ) | (1,355 | ) | ||||||||||||||||||
| USD | 360,123 | TWD | 361,432 | 1/25/2022 | CBK | - | (1,309 | ) | (1,309 | ) | ||||||||||||||||||
| USD | 269,920 | TWD | 271,074 | 1/25/2022 | CBK | - | (1,154 | ) | (1,154 | ) | ||||||||||||||||||
| USD | 180,252 | TWD | 180,716 | 1/25/2022 | CBK | - | (464 | ) | (464 | ) | ||||||||||||||||||
| USD | 90,047 | TWD | 90,358 | 1/25/2022 | CBK | - | (311 | ) | (311 | ) | ||||||||||||||||||
| USD | 90,038 | TWD | 90,358 | 1/25/2022 | CBK | - | (320 | ) | (320 | ) | ||||||||||||||||||
| INR | 100,431 | USD | 99,284 | 2/16/2022 | CBK | 1,147 | - | 1,147 | ||||||||||||||||||||
| INR | 1,830,349 | USD | 1,828,508 | 2/16/2022 | CBK | 1,841 | - | 1,841 | ||||||||||||||||||||
| INR | 2,309,924 | USD | 2,296,403 | 2/16/2022 | CBK | 13,521 | - | 13,521 | ||||||||||||||||||||
| INR | 2,343,401 | USD | 2,322,600 | 2/16/2022 | CBK | 20,801 | - | 20,801 | ||||||||||||||||||||
| INR | 2,427,094 | USD | 2,434,291 | 2/16/2022 | CBK | - | (7,197 | ) | (7,197 | ) | ||||||||||||||||||
| INR | 2,427,094 | USD | 2,434,425 | 2/16/2022 | CBK | - | (7,331 | ) | (7,331 | ) | ||||||||||||||||||
| INR | 2,510,787 | USD | 2,491,807 | 2/16/2022 | CBK | 18,980 | - | 18,980 | ||||||||||||||||||||
| INR | 2,745,127 | USD | 2,728,241 | 2/16/2022 | CBK | 16,886 | - | 16,886 | ||||||||||||||||||||
| INR | 2,799,890 | USD | 2,804,577 | 2/16/2022 | CBK | - | (4,687 | ) | (4,687 | ) | ||||||||||||||||||
| INR | 3,046,421 | USD | 3,015,517 | 2/16/2022 | CBK | 30,904 | - | 30,904 | ||||||||||||||||||||
| INR | 3,091,057 | USD | 3,094,280 | 2/16/2022 | CBK | - | (3,223 | ) | (3,223 | ) | ||||||||||||||||||
| INR | 3,091,057 | USD | 3,093,803 | 2/16/2022 | CBK | - | (2,746 | ) | (2,746 | ) | ||||||||||||||||||
| INR | 3,091,057 | USD | 3,093,741 | 2/16/2022 | CBK | - | (2,684 | ) | (2,684 | ) | ||||||||||||||||||
| INR | 3,169,687 | USD | 3,174,758 | 2/16/2022 | CBK | - | (5,071 | ) | (5,071 | ) | ||||||||||||||||||
| INR | 3,169,687 | USD | 3,175,453 | 2/16/2022 | CBK | - | (5,766 | ) | (5,766 | ) | ||||||||||||||||||
| INR | 3,197,068 | USD | 3,177,021 | 2/16/2022 | CBK | 20,047 | - | 20,047 | ||||||||||||||||||||
| INR | 3,197,068 | USD | 3,177,994 | 2/16/2022 | CBK | 19,074 | - | 19,074 | ||||||||||||||||||||
| INR | 3,325,133 | USD | 3,322,499 | 2/16/2022 | CBK | 2,634 | - | 2,634 | ||||||||||||||||||||
| INR | 3,548,578 | USD | 3,525,342 | 2/16/2022 | CBK | 23,236 | - | 23,236 | ||||||||||||||||||||
| INR | 3,749,441 | USD | 3,715,114 | 2/16/2022 | CBK | 34,327 | - | 34,327 | ||||||||||||||||||||
| INR | 3,816,396 | USD | 3,773,531 | 2/16/2022 | CBK | 42,865 | - | 42,865 | ||||||||||||||||||||
| INR | 4,597,529 | USD | 4,572,839 | 2/16/2022 | CBK | 24,690 | - | 24,690 | ||||||||||||||||||||
| INR | 4,597,529 | USD | 4,572,656 | 2/16/2022 | CBK | 24,873 | - | 24,873 | ||||||||||||||||||||
| INR | 4,597,529 | USD | 4,572,047 | 2/16/2022 | CBK | 25,482 | - | 25,482 | ||||||||||||||||||||
| INR | 5,155,482 | USD | 5,097,144 | 2/16/2022 | CBK | 58,338 | - | 58,338 | ||||||||||||||||||||
| INR | 6,159,796 | USD | 6,118,328 | 2/16/2022 | CBK | 41,468 | - | 41,468 | ||||||||||||||||||||
| INR | 6,461,091 | USD | 6,418,213 | 2/16/2022 | CBK | 42,878 | - | 42,878 | ||||||||||||||||||||
| INR | 6,963,248 | USD | 6,886,043 | 2/16/2022 | CBK | 77,205 | - | 77,205 | ||||||||||||||||||||
| INR | 7,967,563 | USD | 7,885,427 | 2/16/2022 | CBK | 82,136 | - | 82,136 | ||||||||||||||||||||
| INR | 8,235,380 | USD | 8,207,292 | 2/16/2022 | CBK | 28,088 | - | 28,088 | ||||||||||||||||||||
| INR | 9,775,329 | USD | 9,773,729 | 2/16/2022 | CBK | 1,600 | - | 1,600 | ||||||||||||||||||||
| INR | 11,248,324 | USD | 11,222,055 | 2/16/2022 | CBK | 26,269 | - | 26,269 | ||||||||||||||||||||
| INR | 12,185,684 | USD | 12,163,554 | 2/16/2022 | CBK | 22,130 | - | 22,130 | ||||||||||||||||||||
| BRL | 17,953 | USD | 17,642 | 1/4/2022 | HUS | 311 | - | 311 | ||||||||||||||||||||
| BRL | 17,953 | USD | 17,639 | 1/4/2022 | HUS | 314 | - | 314 | ||||||||||||||||||||
| BRL | 17,953 | USD | 17,754 | 1/4/2022 | HUS | 199 | - | 199 | ||||||||||||||||||||
| BRL | 35,907 | USD | 35,486 | 1/4/2022 | HUS | 421 | - | 421 | ||||||||||||||||||||
| BRL | 35,907 | USD | 35,579 | 1/4/2022 | HUS | 328 | - | 328 | ||||||||||||||||||||
| BRL | 35,907 | USD | 35,563 | 1/4/2022 | HUS | 344 | - | 344 | ||||||||||||||||||||
| BRL | 35,907 | USD | 35,492 | 1/4/2022 | HUS | 415 | - | 415 | ||||||||||||||||||||
| BRL | 35,907 | USD | 35,610 | 1/4/2022 | HUS | 297 | - | 297 | ||||||||||||||||||||
| BRL | 53,860 | USD | 53,171 | 1/4/2022 | HUS | 689 | - | 689 | ||||||||||||||||||||
| BRL | 53,860 | USD | 53,361 | 1/4/2022 | HUS | 499 | - | 499 | ||||||||||||||||||||
| BRL | 53,860 | USD | 53,362 | 1/4/2022 | HUS | 498 | - | 498 | ||||||||||||||||||||
| BRL | 53,860 | USD | 53,330 | 1/4/2022 | HUS | 530 | - | 530 | ||||||||||||||||||||
| BRL | 53,860 | USD | 53,364 | 1/4/2022 | HUS | 496 | - | 496 | ||||||||||||||||||||
| BRL | 53,860 | USD | 53,208 | 1/4/2022 | HUS | 652 | - | 652 | ||||||||||||||||||||
| BRL | 71,813 | USD | 71,134 | 1/4/2022 | HUS | 679 | - | 679 | ||||||||||||||||||||
| BRL | 71,813 | USD | 71,076 | 1/4/2022 | HUS | 737 | - | 737 | ||||||||||||||||||||
See accompanying notes
21
American Beacon AHL Managed Futures Strategy FundSM
Consolidated Schedule of Investments
December 31, 2021
| Forward Foreign Currency Contracts Open on December 31, 2021 (continued): | ||||||||||||||||||||||||||||
| Currency Purchased* | Currency Sold* | Settlement Date |
Counterparty | Unrealized Appreciation |
Unrealized (Depreciation) |
Net Unrealized Appreciation (Depreciation) |
||||||||||||||||||||||
| BRL | 71,813 | USD | 71,067 | 1/4/2022 | HUS | $ | 746 | $ | - | $ | 746 | |||||||||||||||||
| BRL | 71,813 | USD | 71,014 | 1/4/2022 | HUS | 799 | - | 799 | ||||||||||||||||||||
| BRL | 71,813 | USD | 71,122 | 1/4/2022 | HUS | 691 | - | 691 | ||||||||||||||||||||
| BRL | 89,767 | USD | 88,326 | 1/4/2022 | HUS | 1,441 | - | 1,441 | ||||||||||||||||||||
| BRL | 179,533 | USD | 177,733 | 1/4/2022 | HUS | 1,800 | - | 1,800 | ||||||||||||||||||||
| BRL | 233,393 | USD | 231,919 | 1/4/2022 | HUS | 1,474 | - | 1,474 | ||||||||||||||||||||
| BRL | 233,393 | USD | 231,938 | 1/4/2022 | HUS | 1,455 | - | 1,455 | ||||||||||||||||||||
| BRL | 233,393 | USD | 231,160 | 1/4/2022 | HUS | 2,233 | - | 2,233 | ||||||||||||||||||||
| BRL | 269,300 | USD | 267,497 | 1/4/2022 | HUS | 1,803 | - | 1,803 | ||||||||||||||||||||
| BRL | 305,206 | USD | 303,218 | 1/4/2022 | HUS | 1,988 | - | 1,988 | ||||||||||||||||||||
| BRL | 377,020 | USD | 377,133 | 1/4/2022 | HUS | - | (113 | ) | (113 | ) | ||||||||||||||||||
| BRL | 377,020 | USD | 374,569 | 1/4/2022 | HUS | 2,451 | - | 2,451 | ||||||||||||||||||||
| BRL | 394,973 | USD | 395,207 | 1/4/2022 | HUS | - | (234 | ) | (234 | ) | ||||||||||||||||||
| BRL | 412,926 | USD | 413,169 | 1/4/2022 | HUS | - | (243 | ) | (243 | ) | ||||||||||||||||||
| BRL | 412,926 | USD | 413,348 | 1/4/2022 | HUS | - | (422 | ) | (422 | ) | ||||||||||||||||||
| BRL | 412,926 | USD | 413,238 | 1/4/2022 | HUS | - | (312 | ) | (312 | ) | ||||||||||||||||||
| BRL | 466,786 | USD | 467,298 | 1/4/2022 | HUS | - | (512 | ) | (512 | ) | ||||||||||||||||||
| BRL | 484,740 | USD | 480,875 | 1/4/2022 | HUS | 3,865 | - | 3,865 | ||||||||||||||||||||
| BRL | 538,600 | USD | 539,041 | 1/4/2022 | HUS | - | (441 | ) | (441 | ) | ||||||||||||||||||
| BRL | 538,600 | USD | 537,409 | 1/4/2022 | HUS | 1,191 | - | 1,191 | ||||||||||||||||||||
| BRL | 574,506 | USD | 574,987 | 1/4/2022 | HUS | - | (481 | ) | (481 | ) | ||||||||||||||||||
| BRL | 574,506 | USD | 574,675 | 1/4/2022 | HUS | - | (169 | ) | (169 | ) | ||||||||||||||||||
| BRL | 592,460 | USD | 591,033 | 1/4/2022 | HUS | 1,427 | - | 1,427 | ||||||||||||||||||||
| BRL | 628,366 | USD | 624,104 | 1/4/2022 | HUS | 4,262 | - | 4,262 | ||||||||||||||||||||
| BRL | 628,366 | USD | 624,256 | 1/4/2022 | HUS | 4,110 | - | 4,110 | ||||||||||||||||||||
| BRL | 646,320 | USD | 646,436 | 1/4/2022 | HUS | - | (116 | ) | (116 | ) | ||||||||||||||||||
| BRL | 664,273 | USD | 664,805 | 1/4/2022 | HUS | - | (532 | ) | (532 | ) | ||||||||||||||||||
| BRL | 664,273 | USD | 664,537 | 1/4/2022 | HUS | - | (264 | ) | (264 | ) | ||||||||||||||||||
| BRL | 664,273 | USD | 664,619 | 1/4/2022 | HUS | - | (346 | ) | (346 | ) | ||||||||||||||||||
| BRL | 664,273 | USD | 659,571 | 1/4/2022 | HUS | 4,702 | - | 4,702 | ||||||||||||||||||||
| BRL | 754,040 | USD | 752,338 | 1/4/2022 | HUS | 1,702 | - | 1,702 | ||||||||||||||||||||
| BRL | 825,853 | USD | 826,163 | 1/4/2022 | HUS | - | (310 | ) | (310 | ) | ||||||||||||||||||
| BRL | 825,853 | USD | 820,813 | 1/4/2022 | HUS | 5,040 | - | 5,040 | ||||||||||||||||||||
| BRL | 843,806 | USD | 841,712 | 1/4/2022 | HUS | 2,094 | - | 2,094 | ||||||||||||||||||||
| BRL | 915,619 | USD | 916,211 | 1/4/2022 | HUS | - | (592 | ) | (592 | ) | ||||||||||||||||||
| BRL | 969,479 | USD | 970,089 | 1/4/2022 | HUS | - | (610 | ) | (610 | ) | ||||||||||||||||||
| BRL | 1,005,386 | USD | 1,003,120 | 1/4/2022 | HUS | 2,266 | - | 2,266 | ||||||||||||||||||||
| BRL | 1,113,106 | USD | 1,111,032 | 1/4/2022 | HUS | 2,074 | - | 2,074 | ||||||||||||||||||||
| BRL | 1,328,546 | USD | 1,325,334 | 1/4/2022 | HUS | 3,212 | - | 3,212 | ||||||||||||||||||||
| BRL | 2,962,298 | USD | 2,946,828 | 1/4/2022 | HUS | 15,470 | - | 15,470 | ||||||||||||||||||||
| BRL | 4,631,957 | USD | 4,609,365 | 1/4/2022 | HUS | 22,592 | - | 22,592 | ||||||||||||||||||||
| BRL | 6,481,149 | USD | 6,459,893 | 1/4/2022 | HUS | 21,256 | - | 21,256 | ||||||||||||||||||||
| BRL | 27,486,535 | USD | 26,696,524 | 1/4/2022 | HUS | 790,011 | - | 790,011 | ||||||||||||||||||||
| USD | 4,748,069 | BRL | 4,811,490 | 1/4/2022 | HUS | - | (63,421 | ) | (63,421 | ) | ||||||||||||||||||
| USD | 3,897,868 | BRL | 3,985,637 | 1/4/2022 | HUS | - | (87,769 | ) | (87,769 | ) | ||||||||||||||||||
| USD | 1,561,872 | BRL | 1,597,846 | 1/4/2022 | HUS | - | (35,974 | ) | (35,974 | ) | ||||||||||||||||||
| USD | 1,283,020 | BRL | 1,310,592 | 1/4/2022 | HUS | - | (27,572 | ) | (27,572 | ) | ||||||||||||||||||
| USD | 1,200,472 | BRL | 1,220,826 | 1/4/2022 | HUS | - | (20,354 | ) | (20,354 | ) | ||||||||||||||||||
| USD | 1,182,244 | BRL | 1,202,873 | 1/4/2022 | HUS | - | (20,629 | ) | (20,629 | ) | ||||||||||||||||||
| USD | 1,163,734 | BRL | 1,184,919 | 1/4/2022 | HUS | - | (21,185 | ) | (21,185 | ) | ||||||||||||||||||
| USD | 1,041,134 | BRL | 1,059,246 | 1/4/2022 | HUS | - | (18,112 | ) | (18,112 | ) | ||||||||||||||||||
| USD | 1,022,914 | BRL | 1,041,293 | 1/4/2022 | HUS | - | (18,379 | ) | (18,379 | ) | ||||||||||||||||||
| USD | 919,719 | BRL | 933,573 | 1/4/2022 | HUS | - | (13,854 | ) | (13,854 | ) | ||||||||||||||||||
| USD | 899,677 | BRL | 915,619 | 1/4/2022 | HUS | - | (15,942 | ) | (15,942 | ) | ||||||||||||||||||
| USD | 884,956 | BRL | 897,666 | 1/4/2022 | HUS | - | (12,710 | ) | (12,710 | ) | ||||||||||||||||||
| USD | 760,060 | BRL | 771,993 | 1/4/2022 | HUS | - | (11,933 | ) | (11,933 | ) | ||||||||||||||||||
| USD | 736,868 | BRL | 754,040 | 1/4/2022 | HUS | - | (17,172 | ) | (17,172 | ) | ||||||||||||||||||
| USD | 673,384 | BRL | 682,226 | 1/4/2022 | HUS | - | (8,842 | ) | (8,842 | ) | ||||||||||||||||||
See accompanying notes
22
American Beacon AHL Managed Futures Strategy FundSM
Consolidated Schedule of Investments
December 31, 2021
| Forward Foreign Currency Contracts Open on December 31, 2021 (continued): | ||||||||||||||||||||||||||||
| Currency Purchased* | Currency Sold* | Settlement Date |
Counterparty | Unrealized Appreciation |
Unrealized (Depreciation) |
Net Unrealized Appreciation (Depreciation) |
||||||||||||||||||||||
| USD | 634,545 | BRL | 646,320 | 1/4/2022 | HUS | $ | - | $ | (11,775 | ) | $ | (11,775 | ) | |||||||||||||||
| USD | 617,134 | BRL | 628,366 | 1/4/2022 | HUS | - | (11,232 | ) | (11,232 | ) | ||||||||||||||||||
| USD | 568,289 | BRL | 574,506 | 1/4/2022 | HUS | - | (6,217 | ) | (6,217 | ) | ||||||||||||||||||
| USD | 547,800 | BRL | 556,553 | 1/4/2022 | HUS | - | (8,753 | ) | (8,753 | ) | ||||||||||||||||||
| USD | 543,844 | BRL | 556,553 | 1/4/2022 | HUS | - | (12,709 | ) | (12,709 | ) | ||||||||||||||||||
| USD | 531,807 | BRL | 538,600 | 1/4/2022 | HUS | - | (6,793 | ) | (6,793 | ) | ||||||||||||||||||
| USD | 512,465 | BRL | 520,646 | 1/4/2022 | HUS | - | (8,181 | ) | (8,181 | ) | ||||||||||||||||||
| USD | 498,123 | BRL | 502,693 | 1/4/2022 | HUS | - | (4,570 | ) | (4,570 | ) | ||||||||||||||||||
| USD | 498,297 | BRL | 502,693 | 1/4/2022 | HUS | - | (4,396 | ) | (4,396 | ) | ||||||||||||||||||
| USD | 496,671 | BRL | 502,693 | 1/4/2022 | HUS | - | (6,022 | ) | (6,022 | ) | ||||||||||||||||||
| USD | 479,537 | BRL | 484,740 | 1/4/2022 | HUS | - | (5,203 | ) | (5,203 | ) | ||||||||||||||||||
| USD | 480,501 | BRL | 484,740 | 1/4/2022 | HUS | - | (4,239 | ) | (4,239 | ) | ||||||||||||||||||
| USD | 476,493 | BRL | 484,740 | 1/4/2022 | HUS | - | (8,247 | ) | (8,247 | ) | ||||||||||||||||||
| USD | 444,403 | BRL | 448,833 | 1/4/2022 | HUS | - | (4,430 | ) | (4,430 | ) | ||||||||||||||||||
| USD | 441,858 | BRL | 448,833 | 1/4/2022 | HUS | - | (6,975 | ) | (6,975 | ) | ||||||||||||||||||
| USD | 426,704 | BRL | 430,880 | 1/4/2022 | HUS | - | (4,176 | ) | (4,176 | ) | ||||||||||||||||||
| USD | 424,787 | BRL | 430,880 | 1/4/2022 | HUS | - | (6,093 | ) | (6,093 | ) | ||||||||||||||||||
| USD | 408,204 | BRL | 412,926 | 1/4/2022 | HUS | - | (4,722 | ) | (4,722 | ) | ||||||||||||||||||
| USD | 403,608 | BRL | 412,926 | 1/4/2022 | HUS | - | (9,318 | ) | (9,318 | ) | ||||||||||||||||||
| USD | 388,396 | BRL | 394,973 | 1/4/2022 | HUS | - | (6,577 | ) | (6,577 | ) | ||||||||||||||||||
| USD | 371,642 | BRL | 377,020 | 1/4/2022 | HUS | - | (5,378 | ) | (5,378 | ) | ||||||||||||||||||
| USD | 371,060 | BRL | 377,020 | 1/4/2022 | HUS | - | (5,960 | ) | (5,960 | ) | ||||||||||||||||||
| USD | 371,842 | BRL | 377,020 | 1/4/2022 | HUS | - | (5,178 | ) | (5,178 | ) | ||||||||||||||||||
| USD | 353,504 | BRL | 359,066 | 1/4/2022 | HUS | - | (5,562 | ) | (5,562 | ) | ||||||||||||||||||
| USD | 336,715 | BRL | 341,113 | 1/4/2022 | HUS | - | (4,398 | ) | (4,398 | ) | ||||||||||||||||||
| USD | 319,642 | BRL | 323,160 | 1/4/2022 | HUS | - | (3,518 | ) | (3,518 | ) | ||||||||||||||||||
| USD | 302,221 | BRL | 305,206 | 1/4/2022 | HUS | - | (2,985 | ) | (2,985 | ) | ||||||||||||||||||
| USD | 300,422 | BRL | 305,206 | 1/4/2022 | HUS | - | (4,784 | ) | (4,784 | ) | ||||||||||||||||||
| USD | 300,512 | BRL | 305,206 | 1/4/2022 | HUS | - | (4,694 | ) | (4,694 | ) | ||||||||||||||||||
| USD | 300,226 | BRL | 305,206 | 1/4/2022 | HUS | - | (4,980 | ) | (4,980 | ) | ||||||||||||||||||
| USD | 298,702 | BRL | 305,206 | 1/4/2022 | HUS | - | (6,504 | ) | (6,504 | ) | ||||||||||||||||||
| USD | 284,088 | BRL | 287,253 | 1/4/2022 | HUS | - | (3,165 | ) | (3,165 | ) | ||||||||||||||||||
| USD | 281,334 | BRL | 287,253 | 1/4/2022 | HUS | - | (5,919 | ) | (5,919 | ) | ||||||||||||||||||
| USD | 281,128 | BRL | 287,253 | 1/4/2022 | HUS | - | (6,125 | ) | (6,125 | ) | ||||||||||||||||||
| USD | 266,375 | BRL | 269,300 | 1/4/2022 | HUS | - | (2,925 | ) | (2,925 | ) | ||||||||||||||||||
| USD | 266,369 | BRL | 269,300 | 1/4/2022 | HUS | - | (2,931 | ) | (2,931 | ) | ||||||||||||||||||
| USD | 266,388 | BRL | 269,300 | 1/4/2022 | HUS | - | (2,912 | ) | (2,912 | ) | ||||||||||||||||||
| USD | 263,708 | BRL | 269,300 | 1/4/2022 | HUS | - | (5,592 | ) | (5,592 | ) | ||||||||||||||||||
| USD | 263,798 | BRL | 269,300 | 1/4/2022 | HUS | - | (5,502 | ) | (5,502 | ) | ||||||||||||||||||
| USD | 263,984 | BRL | 269,300 | 1/4/2022 | HUS | - | (5,316 | ) | (5,316 | ) | ||||||||||||||||||
| USD | 265,353 | BRL | 269,300 | 1/4/2022 | HUS | - | (3,947 | ) | (3,947 | ) | ||||||||||||||||||
| USD | 265,425 | BRL | 269,300 | 1/4/2022 | HUS | - | (3,875 | ) | (3,875 | ) | ||||||||||||||||||
| USD | 265,070 | BRL | 269,300 | 1/4/2022 | HUS | - | (4,230 | ) | (4,230 | ) | ||||||||||||||||||
| USD | 246,240 | BRL | 251,346 | 1/4/2022 | HUS | - | (5,106 | ) | (5,106 | ) | ||||||||||||||||||
| USD | 246,063 | BRL | 251,346 | 1/4/2022 | HUS | - | (5,283 | ) | (5,283 | ) | ||||||||||||||||||
| USD | 246,245 | BRL | 251,346 | 1/4/2022 | HUS | - | (5,101 | ) | (5,101 | ) | ||||||||||||||||||
| USD | 246,270 | BRL | 251,346 | 1/4/2022 | HUS | - | (5,076 | ) | (5,076 | ) | ||||||||||||||||||
| USD | 245,875 | BRL | 251,346 | 1/4/2022 | HUS | - | (5,471 | ) | (5,471 | ) | ||||||||||||||||||
| USD | 247,586 | BRL | 251,346 | 1/4/2022 | HUS | - | (3,760 | ) | (3,760 | ) | ||||||||||||||||||
| USD | 247,269 | BRL | 251,346 | 1/4/2022 | HUS | - | (4,077 | ) | (4,077 | ) | ||||||||||||||||||
| USD | 247,003 | BRL | 251,346 | 1/4/2022 | HUS | - | (4,343 | ) | (4,343 | ) | ||||||||||||||||||
| USD | 228,504 | BRL | 233,393 | 1/4/2022 | HUS | - | (4,889 | ) | (4,889 | ) | ||||||||||||||||||
| USD | 228,526 | BRL | 233,393 | 1/4/2022 | HUS | - | (4,867 | ) | (4,867 | ) | ||||||||||||||||||
| USD | 228,597 | BRL | 233,393 | 1/4/2022 | HUS | - | (4,796 | ) | (4,796 | ) | ||||||||||||||||||
| USD | 228,537 | BRL | 233,393 | 1/4/2022 | HUS | - | (4,856 | ) | (4,856 | ) | ||||||||||||||||||
| USD | 228,499 | BRL | 233,393 | 1/4/2022 | HUS | - | (4,894 | ) | (4,894 | ) | ||||||||||||||||||
| USD | 228,344 | BRL | 233,393 | 1/4/2022 | HUS | - | (5,049 | ) | (5,049 | ) | ||||||||||||||||||
| USD | 228,363 | BRL | 233,393 | 1/4/2022 | HUS | - | (5,030 | ) | (5,030 | ) | ||||||||||||||||||
See accompanying notes
23
American Beacon AHL Managed Futures Strategy FundSM
Consolidated Schedule of Investments
December 31, 2021
| Forward Foreign Currency Contracts Open on December 31, 2021 (continued): | ||||||||||||||||||||||||||||
| Currency Purchased* | Currency Sold* | Settlement Date |
Counterparty | Unrealized Appreciation |
Unrealized (Depreciation) |
Net Unrealized Appreciation (Depreciation) |
||||||||||||||||||||||
| USD | 227,583 | BRL | 233,393 | 1/4/2022 | HUS | $ | - | $ | (5,810 | ) | $ | (5,810 | ) | |||||||||||||||
| USD | 227,667 | BRL | 233,393 | 1/4/2022 | HUS | - | (5,726 | ) | (5,726 | ) | ||||||||||||||||||
| USD | 227,376 | BRL | 233,393 | 1/4/2022 | HUS | - | (6,017 | ) | (6,017 | ) | ||||||||||||||||||
| USD | 210,937 | BRL | 215,440 | 1/4/2022 | HUS | - | (4,503 | ) | (4,503 | ) | ||||||||||||||||||
| USD | 211,087 | BRL | 215,440 | 1/4/2022 | HUS | - | (4,353 | ) | (4,353 | ) | ||||||||||||||||||
| USD | 211,190 | BRL | 215,440 | 1/4/2022 | HUS | - | (4,250 | ) | (4,250 | ) | ||||||||||||||||||
| USD | 211,190 | BRL | 215,440 | 1/4/2022 | HUS | - | (4,250 | ) | (4,250 | ) | ||||||||||||||||||
| USD | 211,019 | BRL | 215,440 | 1/4/2022 | HUS | - | (4,421 | ) | (4,421 | ) | ||||||||||||||||||
| USD | 212,368 | BRL | 215,440 | 1/4/2022 | HUS | - | (3,072 | ) | (3,072 | ) | ||||||||||||||||||
| USD | 210,490 | BRL | 215,440 | 1/4/2022 | HUS | - | (4,950 | ) | (4,950 | ) | ||||||||||||||||||
| USD | 210,125 | BRL | 215,440 | 1/4/2022 | HUS | - | (5,315 | ) | (5,315 | ) | ||||||||||||||||||
| USD | 210,141 | BRL | 215,440 | 1/4/2022 | HUS | - | (5,299 | ) | (5,299 | ) | ||||||||||||||||||
| USD | 209,915 | BRL | 215,440 | 1/4/2022 | HUS | - | (5,525 | ) | (5,525 | ) | ||||||||||||||||||
| USD | 209,897 | BRL | 215,440 | 1/4/2022 | HUS | - | (5,543 | ) | (5,543 | ) | ||||||||||||||||||
| USD | 195,690 | BRL | 197,487 | 1/4/2022 | HUS | - | (1,797 | ) | (1,797 | ) | ||||||||||||||||||
| USD | 193,598 | BRL | 197,487 | 1/4/2022 | HUS | - | (3,889 | ) | (3,889 | ) | ||||||||||||||||||
| USD | 193,480 | BRL | 197,487 | 1/4/2022 | HUS | - | (4,007 | ) | (4,007 | ) | ||||||||||||||||||
| USD | 193,452 | BRL | 197,487 | 1/4/2022 | HUS | - | (4,035 | ) | (4,035 | ) | ||||||||||||||||||
| USD | 193,013 | BRL | 197,487 | 1/4/2022 | HUS | - | (4,474 | ) | (4,474 | ) | ||||||||||||||||||
| USD | 193,591 | BRL | 197,487 | 1/4/2022 | HUS | - | (3,896 | ) | (3,896 | ) | ||||||||||||||||||
| USD | 193,601 | BRL | 197,487 | 1/4/2022 | HUS | - | (3,886 | ) | (3,886 | ) | ||||||||||||||||||
| USD | 193,136 | BRL | 197,487 | 1/4/2022 | HUS | - | (4,351 | ) | (4,351 | ) | ||||||||||||||||||
| USD | 193,205 | BRL | 197,487 | 1/4/2022 | HUS | - | (4,282 | ) | (4,282 | ) | ||||||||||||||||||
| USD | 193,135 | BRL | 197,487 | 1/4/2022 | HUS | - | (4,352 | ) | (4,352 | ) | ||||||||||||||||||
| USD | 193,198 | BRL | 197,487 | 1/4/2022 | HUS | - | (4,289 | ) | (4,289 | ) | ||||||||||||||||||
| USD | 194,463 | BRL | 197,487 | 1/4/2022 | HUS | - | (3,024 | ) | (3,024 | ) | ||||||||||||||||||
| USD | 192,604 | BRL | 197,487 | 1/4/2022 | HUS | - | (4,883 | ) | (4,883 | ) | ||||||||||||||||||
| USD | 192,056 | BRL | 197,487 | 1/4/2022 | HUS | - | (5,431 | ) | (5,431 | ) | ||||||||||||||||||
| USD | 192,419 | BRL | 197,487 | 1/4/2022 | HUS | - | (5,068 | ) | (5,068 | ) | ||||||||||||||||||
| USD | 177,691 | BRL | 179,533 | 1/4/2022 | HUS | - | (1,842 | ) | (1,842 | ) | ||||||||||||||||||
| USD | 175,835 | BRL | 179,533 | 1/4/2022 | HUS | - | (3,698 | ) | (3,698 | ) | ||||||||||||||||||
| USD | 175,814 | BRL | 179,533 | 1/4/2022 | HUS | - | (3,719 | ) | (3,719 | ) | ||||||||||||||||||
| USD | 175,805 | BRL | 179,533 | 1/4/2022 | HUS | - | (3,728 | ) | (3,728 | ) | ||||||||||||||||||
| USD | 175,821 | BRL | 179,533 | 1/4/2022 | HUS | - | (3,712 | ) | (3,712 | ) | ||||||||||||||||||
| USD | 175,788 | BRL | 179,533 | 1/4/2022 | HUS | - | (3,745 | ) | (3,745 | ) | ||||||||||||||||||
| USD | 175,867 | BRL | 179,533 | 1/4/2022 | HUS | - | (3,666 | ) | (3,666 | ) | ||||||||||||||||||
| USD | 175,602 | BRL | 179,533 | 1/4/2022 | HUS | - | (3,931 | ) | (3,931 | ) | ||||||||||||||||||
| USD | 175,482 | BRL | 179,533 | 1/4/2022 | HUS | - | (4,051 | ) | (4,051 | ) | ||||||||||||||||||
| USD | 174,537 | BRL | 179,533 | 1/4/2022 | HUS | - | (4,996 | ) | (4,996 | ) | ||||||||||||||||||
| USD | 175,051 | BRL | 179,533 | 1/4/2022 | HUS | - | (4,482 | ) | (4,482 | ) | ||||||||||||||||||
| USD | 174,924 | BRL | 179,533 | 1/4/2022 | HUS | - | (4,609 | ) | (4,609 | ) | ||||||||||||||||||
| USD | 174,932 | BRL | 179,533 | 1/4/2022 | HUS | - | (4,601 | ) | (4,601 | ) | ||||||||||||||||||
| USD | 174,877 | BRL | 179,533 | 1/4/2022 | HUS | - | (4,656 | ) | (4,656 | ) | ||||||||||||||||||
| USD | 158,177 | BRL | 161,580 | 1/4/2022 | HUS | - | (3,403 | ) | (3,403 | ) | ||||||||||||||||||
| USD | 158,198 | BRL | 161,580 | 1/4/2022 | HUS | - | (3,382 | ) | (3,382 | ) | ||||||||||||||||||
| USD | 158,237 | BRL | 161,580 | 1/4/2022 | HUS | - | (3,343 | ) | (3,343 | ) | ||||||||||||||||||
| USD | 158,063 | BRL | 161,580 | 1/4/2022 | HUS | - | (3,517 | ) | (3,517 | ) | ||||||||||||||||||
| USD | 158,364 | BRL | 161,580 | 1/4/2022 | HUS | - | (3,216 | ) | (3,216 | ) | ||||||||||||||||||
| USD | 159,687 | BRL | 161,580 | 1/4/2022 | HUS | - | (1,893 | ) | (1,893 | ) | ||||||||||||||||||
| USD | 159,226 | BRL | 161,580 | 1/4/2022 | HUS | - | (2,354 | ) | (2,354 | ) | ||||||||||||||||||
| USD | 157,562 | BRL | 161,580 | 1/4/2022 | HUS | - | (4,018 | ) | (4,018 | ) | ||||||||||||||||||
| USD | 157,118 | BRL | 161,580 | 1/4/2022 | HUS | - | (4,462 | ) | (4,462 | ) | ||||||||||||||||||
| USD | 157,178 | BRL | 161,580 | 1/4/2022 | HUS | - | (4,402 | ) | (4,402 | ) | ||||||||||||||||||
| USD | 157,236 | BRL | 161,580 | 1/4/2022 | HUS | - | (4,344 | ) | (4,344 | ) | ||||||||||||||||||
| USD | 142,467 | BRL | 143,627 | 1/4/2022 | HUS | - | (1,160 | ) | (1,160 | ) | ||||||||||||||||||
| USD | 142,223 | BRL | 143,627 | 1/4/2022 | HUS | - | (1,404 | ) | (1,404 | ) | ||||||||||||||||||
| USD | 140,664 | BRL | 143,627 | 1/4/2022 | HUS | - | (2,963 | ) | (2,963 | ) | ||||||||||||||||||
| USD | 140,680 | BRL | 143,627 | 1/4/2022 | HUS | - | (2,947 | ) | (2,947 | ) | ||||||||||||||||||
See accompanying notes
24
American Beacon AHL Managed Futures Strategy FundSM
Consolidated Schedule of Investments
December 31, 2021
| Forward Foreign Currency Contracts Open on December 31, 2021 (continued): | ||||||||||||||||||||||||||||
| Currency Purchased* | Currency Sold* | Settlement Date |
Counterparty | Unrealized Appreciation |
Unrealized (Depreciation) |
Net Unrealized Appreciation (Depreciation) |
||||||||||||||||||||||
| USD | 140,668 | BRL | 143,627 | 1/4/2022 | HUS | $ | - | $ | (2,959 | ) | $ | (2,959 | ) | |||||||||||||||
| USD | 140,406 | BRL | 143,627 | 1/4/2022 | HUS | - | (3,221 | ) | (3,221 | ) | ||||||||||||||||||
| USD | 140,470 | BRL | 143,627 | 1/4/2022 | HUS | - | (3,157 | ) | (3,157 | ) | ||||||||||||||||||
| USD | 140,709 | BRL | 143,627 | 1/4/2022 | HUS | - | (2,918 | ) | (2,918 | ) | ||||||||||||||||||
| USD | 140,739 | BRL | 143,627 | 1/4/2022 | HUS | - | (2,888 | ) | (2,888 | ) | ||||||||||||||||||
| USD | 140,435 | BRL | 143,627 | 1/4/2022 | HUS | - | (3,192 | ) | (3,192 | ) | ||||||||||||||||||
| USD | 140,490 | BRL | 143,627 | 1/4/2022 | HUS | - | (3,137 | ) | (3,137 | ) | ||||||||||||||||||
| USD | 140,491 | BRL | 143,627 | 1/4/2022 | HUS | - | (3,136 | ) | (3,136 | ) | ||||||||||||||||||
| USD | 140,622 | BRL | 143,627 | 1/4/2022 | HUS | - | (3,005 | ) | (3,005 | ) | ||||||||||||||||||
| USD | 141,497 | BRL | 143,627 | 1/4/2022 | HUS | - | (2,130 | ) | (2,130 | ) | ||||||||||||||||||
| USD | 141,554 | BRL | 143,627 | 1/4/2022 | HUS | - | (2,073 | ) | (2,073 | ) | ||||||||||||||||||
| USD | 139,629 | BRL | 143,627 | 1/4/2022 | HUS | - | (3,998 | ) | (3,998 | ) | ||||||||||||||||||
| USD | 139,977 | BRL | 143,627 | 1/4/2022 | HUS | - | (3,650 | ) | (3,650 | ) | ||||||||||||||||||
| USD | 140,014 | BRL | 143,627 | 1/4/2022 | HUS | - | (3,613 | ) | (3,613 | ) | ||||||||||||||||||
| USD | 140,050 | BRL | 143,627 | 1/4/2022 | HUS | - | (3,577 | ) | (3,577 | ) | ||||||||||||||||||
| USD | 140,051 | BRL | 143,627 | 1/4/2022 | HUS | - | (3,576 | ) | (3,576 | ) | ||||||||||||||||||
| USD | 140,057 | BRL | 143,627 | 1/4/2022 | HUS | - | (3,570 | ) | (3,570 | ) | ||||||||||||||||||
| USD | 139,654 | BRL | 143,627 | 1/4/2022 | HUS | - | (3,973 | ) | (3,973 | ) | ||||||||||||||||||
| USD | 140,039 | BRL | 143,627 | 1/4/2022 | HUS | - | (3,588 | ) | (3,588 | ) | ||||||||||||||||||
| USD | 140,112 | BRL | 143,627 | 1/4/2022 | HUS | - | (3,515 | ) | (3,515 | ) | ||||||||||||||||||
| USD | 139,900 | BRL | 143,627 | 1/4/2022 | HUS | - | (3,727 | ) | (3,727 | ) | ||||||||||||||||||
| USD | 124,658 | BRL | 125,673 | 1/4/2022 | HUS | - | (1,015 | ) | (1,015 | ) | ||||||||||||||||||
| USD | 123,152 | BRL | 125,673 | 1/4/2022 | HUS | - | (2,521 | ) | (2,521 | ) | ||||||||||||||||||
| USD | 123,059 | BRL | 125,673 | 1/4/2022 | HUS | - | (2,614 | ) | (2,614 | ) | ||||||||||||||||||
| USD | 122,842 | BRL | 125,673 | 1/4/2022 | HUS | - | (2,831 | ) | (2,831 | ) | ||||||||||||||||||
| USD | 122,873 | BRL | 125,673 | 1/4/2022 | HUS | - | (2,800 | ) | (2,800 | ) | ||||||||||||||||||
| USD | 122,954 | BRL | 125,673 | 1/4/2022 | HUS | - | (2,719 | ) | (2,719 | ) | ||||||||||||||||||
| USD | 122,869 | BRL | 125,673 | 1/4/2022 | HUS | - | (2,804 | ) | (2,804 | ) | ||||||||||||||||||
| USD | 123,049 | BRL | 125,673 | 1/4/2022 | HUS | - | (2,624 | ) | (2,624 | ) | ||||||||||||||||||
| USD | 123,749 | BRL | 125,673 | 1/4/2022 | HUS | - | (1,924 | ) | (1,924 | ) | ||||||||||||||||||
| USD | 123,688 | BRL | 125,673 | 1/4/2022 | HUS | - | (1,985 | ) | (1,985 | ) | ||||||||||||||||||
| USD | 122,568 | BRL | 125,673 | 1/4/2022 | HUS | - | (3,105 | ) | (3,105 | ) | ||||||||||||||||||
| USD | 122,549 | BRL | 125,673 | 1/4/2022 | HUS | - | (3,124 | ) | (3,124 | ) | ||||||||||||||||||
| USD | 122,586 | BRL | 125,673 | 1/4/2022 | HUS | - | (3,087 | ) | (3,087 | ) | ||||||||||||||||||
| USD | 122,586 | BRL | 125,673 | 1/4/2022 | HUS | - | (3,087 | ) | (3,087 | ) | ||||||||||||||||||
| USD | 122,581 | BRL | 125,673 | 1/4/2022 | HUS | - | (3,092 | ) | (3,092 | ) | ||||||||||||||||||
| USD | 122,226 | BRL | 125,673 | 1/4/2022 | HUS | - | (3,447 | ) | (3,447 | ) | ||||||||||||||||||
| USD | 122,436 | BRL | 125,673 | 1/4/2022 | HUS | - | (3,237 | ) | (3,237 | ) | ||||||||||||||||||
| USD | 122,469 | BRL | 125,673 | 1/4/2022 | HUS | - | (3,204 | ) | (3,204 | ) | ||||||||||||||||||
| USD | 122,452 | BRL | 125,673 | 1/4/2022 | HUS | - | (3,221 | ) | (3,221 | ) | ||||||||||||||||||
| USD | 105,483 | BRL | 107,720 | 1/4/2022 | HUS | - | (2,237 | ) | (2,237 | ) | ||||||||||||||||||
| USD | 105,462 | BRL | 107,720 | 1/4/2022 | HUS | - | (2,258 | ) | (2,258 | ) | ||||||||||||||||||
| USD | 105,395 | BRL | 107,720 | 1/4/2022 | HUS | - | (2,325 | ) | (2,325 | ) | ||||||||||||||||||
| USD | 105,308 | BRL | 107,720 | 1/4/2022 | HUS | - | (2,412 | ) | (2,412 | ) | ||||||||||||||||||
| USD | 105,604 | BRL | 107,720 | 1/4/2022 | HUS | - | (2,116 | ) | (2,116 | ) | ||||||||||||||||||
| USD | 105,345 | BRL | 107,720 | 1/4/2022 | HUS | - | (2,375 | ) | (2,375 | ) | ||||||||||||||||||
| USD | 105,376 | BRL | 107,720 | 1/4/2022 | HUS | - | (2,344 | ) | (2,344 | ) | ||||||||||||||||||
| USD | 106,132 | BRL | 107,720 | 1/4/2022 | HUS | - | (1,588 | ) | (1,588 | ) | ||||||||||||||||||
| USD | 105,051 | BRL | 107,720 | 1/4/2022 | HUS | - | (2,669 | ) | (2,669 | ) | ||||||||||||||||||
| USD | 105,038 | BRL | 107,720 | 1/4/2022 | HUS | - | (2,682 | ) | (2,682 | ) | ||||||||||||||||||
| USD | 105,084 | BRL | 107,720 | 1/4/2022 | HUS | - | (2,636 | ) | (2,636 | ) | ||||||||||||||||||
| USD | 104,699 | BRL | 107,720 | 1/4/2022 | HUS | - | (3,021 | ) | (3,021 | ) | ||||||||||||||||||
| USD | 105,024 | BRL | 107,720 | 1/4/2022 | HUS | - | (2,696 | ) | (2,696 | ) | ||||||||||||||||||
| USD | 105,083 | BRL | 107,720 | 1/4/2022 | HUS | - | (2,637 | ) | (2,637 | ) | ||||||||||||||||||
| USD | 105,056 | BRL | 107,720 | 1/4/2022 | HUS | - | (2,664 | ) | (2,664 | ) | ||||||||||||||||||
| USD | 104,674 | BRL | 107,720 | 1/4/2022 | HUS | - | (3,046 | ) | (3,046 | ) | ||||||||||||||||||
| USD | 104,714 | BRL | 107,720 | 1/4/2022 | HUS | - | (3,006 | ) | (3,006 | ) | ||||||||||||||||||
| USD | 104,769 | BRL | 107,720 | 1/4/2022 | HUS | - | (2,951 | ) | (2,951 | ) | ||||||||||||||||||
See accompanying notes
25
American Beacon AHL Managed Futures Strategy FundSM
Consolidated Schedule of Investments
December 31, 2021
| Forward Foreign Currency Contracts Open on December 31, 2021 (continued): | ||||||||||||||||||||||||||||
| Currency Purchased* | Currency Sold* | Settlement Date |
Counterparty | Unrealized Appreciation |
Unrealized (Depreciation) |
Net Unrealized Appreciation (Depreciation) |
||||||||||||||||||||||
| USD | 104,849 | BRL | 107,720 | 1/4/2022 | HUS | $ | - | $ | (2,871 | ) | $ | (2,871 | ) | |||||||||||||||
| USD | 105,030 | BRL | 107,720 | 1/4/2022 | HUS | - | (2,690 | ) | (2,690 | ) | ||||||||||||||||||
| USD | 104,974 | BRL | 107,720 | 1/4/2022 | HUS | - | (2,746 | ) | (2,746 | ) | ||||||||||||||||||
| USD | 89,058 | BRL | 89,767 | 1/4/2022 | HUS | - | (709 | ) | (709 | ) | ||||||||||||||||||
| USD | 87,821 | BRL | 89,767 | 1/4/2022 | HUS | - | (1,946 | ) | (1,946 | ) | ||||||||||||||||||
| USD | 87,955 | BRL | 89,767 | 1/4/2022 | HUS | - | (1,812 | ) | (1,812 | ) | ||||||||||||||||||
| USD | 88,282 | BRL | 89,767 | 1/4/2022 | HUS | - | (1,485 | ) | (1,485 | ) | ||||||||||||||||||
| USD | 87,571 | BRL | 89,767 | 1/4/2022 | HUS | - | (2,196 | ) | (2,196 | ) | ||||||||||||||||||
| USD | 87,517 | BRL | 89,767 | 1/4/2022 | HUS | - | (2,250 | ) | (2,250 | ) | ||||||||||||||||||
| USD | 87,532 | BRL | 89,767 | 1/4/2022 | HUS | - | (2,235 | ) | (2,235 | ) | ||||||||||||||||||
| USD | 87,570 | BRL | 89,767 | 1/4/2022 | HUS | - | (2,197 | ) | (2,197 | ) | ||||||||||||||||||
| USD | 87,506 | BRL | 89,767 | 1/4/2022 | HUS | - | (2,261 | ) | (2,261 | ) | ||||||||||||||||||
| USD | 87,479 | BRL | 89,767 | 1/4/2022 | HUS | - | (2,288 | ) | (2,288 | ) | ||||||||||||||||||
| USD | 87,449 | BRL | 89,767 | 1/4/2022 | HUS | - | (2,318 | ) | (2,318 | ) | ||||||||||||||||||
| USD | 70,262 | BRL | 71,813 | 1/4/2022 | HUS | - | (1,551 | ) | (1,551 | ) | ||||||||||||||||||
| USD | 70,840 | BRL | 71,813 | 1/4/2022 | HUS | - | (973 | ) | (973 | ) | ||||||||||||||||||
| USD | 71,027 | BRL | 71,813 | 1/4/2022 | HUS | - | (786 | ) | (786 | ) | ||||||||||||||||||
| USD | 69,830 | BRL | 71,813 | 1/4/2022 | HUS | - | (1,983 | ) | (1,983 | ) | ||||||||||||||||||
| USD | 70,052 | BRL | 71,813 | 1/4/2022 | HUS | - | (1,761 | ) | (1,761 | ) | ||||||||||||||||||
| USD | 69,885 | BRL | 71,813 | 1/4/2022 | HUS | - | (1,928 | ) | (1,928 | ) | ||||||||||||||||||
| USD | 70,016 | BRL | 71,813 | 1/4/2022 | HUS | - | (1,797 | ) | (1,797 | ) | ||||||||||||||||||
| USD | 53,175 | BRL | 53,860 | 1/4/2022 | HUS | - | (685 | ) | (685 | ) | ||||||||||||||||||
| USD | 52,523 | BRL | 53,860 | 1/4/2022 | HUS | - | (1,337 | ) | (1,337 | ) | ||||||||||||||||||
| USD | 52,523 | BRL | 53,860 | 1/4/2022 | HUS | - | (1,337 | ) | (1,337 | ) | ||||||||||||||||||
| USD | 52,501 | BRL | 53,860 | 1/4/2022 | HUS | - | (1,359 | ) | (1,359 | ) | ||||||||||||||||||
| USD | 52,533 | BRL | 53,860 | 1/4/2022 | HUS | - | (1,327 | ) | (1,327 | ) | ||||||||||||||||||
| USD | 35,401 | BRL | 35,907 | 1/4/2022 | HUS | - | (506 | ) | (506 | ) | ||||||||||||||||||
| USD | 17,656 | BRL | 17,953 | 1/4/2022 | HUS | - | (297 | ) | (297 | ) | ||||||||||||||||||
| CLP | 205,002 | USD | 208,465 | 1/19/2022 | HUS | - | (3,463 | ) | (3,463 | ) | ||||||||||||||||||
| CLP | 351,431 | USD | 354,191 | 1/19/2022 | HUS | - | (2,760 | ) | (2,760 | ) | ||||||||||||||||||
| CLP | 351,431 | USD | 353,640 | 1/19/2022 | HUS | - | (2,209 | ) | (2,209 | ) | ||||||||||||||||||
| CLP | 410,003 | USD | 412,872 | 1/19/2022 | HUS | - | (2,869 | ) | (2,869 | ) | ||||||||||||||||||
| CLP | 468,575 | USD | 459,765 | 1/19/2022 | HUS | 8,810 | - | 8,810 | ||||||||||||||||||||
| CLP | 468,575 | USD | 471,542 | 1/19/2022 | HUS | - | (2,967 | ) | (2,967 | ) | ||||||||||||||||||
| CLP | 468,575 | USD | 471,298 | 1/19/2022 | HUS | - | (2,723 | ) | (2,723 | ) | ||||||||||||||||||
| CLP | 527,147 | USD | 531,030 | 1/19/2022 | HUS | - | (3,883 | ) | (3,883 | ) | ||||||||||||||||||
| CLP | 585,719 | USD | 574,554 | 1/19/2022 | HUS | 11,165 | - | 11,165 | ||||||||||||||||||||
| CLP | 644,291 | USD | 632,133 | 1/19/2022 | HUS | 12,158 | - | 12,158 | ||||||||||||||||||||
| CLP | 644,291 | USD | 631,959 | 1/19/2022 | HUS | 12,332 | - | 12,332 | ||||||||||||||||||||
| CLP | 644,291 | USD | 648,723 | 1/19/2022 | HUS | - | (4,432 | ) | (4,432 | ) | ||||||||||||||||||
| CLP | 644,291 | USD | 648,058 | 1/19/2022 | HUS | - | (3,767 | ) | (3,767 | ) | ||||||||||||||||||
| CLP | 644,291 | USD | 650,788 | 1/19/2022 | HUS | - | (6,497 | ) | (6,497 | ) | ||||||||||||||||||
| CLP | 644,291 | USD | 650,580 | 1/19/2022 | HUS | - | (6,289 | ) | (6,289 | ) | ||||||||||||||||||
| CLP | 702,863 | USD | 707,694 | 1/19/2022 | HUS | - | (4,831 | ) | (4,831 | ) | ||||||||||||||||||
| CLP | 702,863 | USD | 710,303 | 1/19/2022 | HUS | - | (7,440 | ) | (7,440 | ) | ||||||||||||||||||
| CLP | 702,863 | USD | 707,996 | 1/19/2022 | HUS | - | (5,133 | ) | (5,133 | ) | ||||||||||||||||||
| CLP | 761,435 | USD | 747,350 | 1/19/2022 | HUS | 14,085 | - | 14,085 | ||||||||||||||||||||
| CLP | 761,435 | USD | 746,775 | 1/19/2022 | HUS | 14,660 | - | 14,660 | ||||||||||||||||||||
| CLP | 820,007 | USD | 825,752 | 1/19/2022 | HUS | - | (5,745 | ) | (5,745 | ) | ||||||||||||||||||
| CLP | 820,007 | USD | 828,569 | 1/19/2022 | HUS | - | (8,562 | ) | (8,562 | ) | ||||||||||||||||||
| CLP | 937,150 | USD | 943,298 | 1/19/2022 | HUS | - | (6,148 | ) | (6,148 | ) | ||||||||||||||||||
| CLP | 2,547,878 | USD | 2,588,451 | 1/19/2022 | HUS | - | (40,573 | ) | (40,573 | ) | ||||||||||||||||||
| USD | 3,517,150 | CLP | 3,338,598 | 1/19/2022 | HUS | 178,552 | - | 178,552 | ||||||||||||||||||||
| USD | 3,449,402 | CLP | 3,338,598 | 1/19/2022 | HUS | 110,804 | - | 110,804 | ||||||||||||||||||||
| USD | 3,155,600 | CLP | 3,104,311 | 1/19/2022 | HUS | 51,289 | - | 51,289 | ||||||||||||||||||||
| USD | 2,408,553 | CLP | 2,369,993 | 1/19/2022 | HUS | 38,560 | - | 38,560 | ||||||||||||||||||||
| USD | 2,325,084 | CLP | 2,267,822 | 1/19/2022 | HUS | 57,262 | - | 57,262 | ||||||||||||||||||||
| USD | 2,042,849 | CLP | 2,009,342 | 1/19/2022 | HUS | 33,507 | - | 33,507 | ||||||||||||||||||||
See accompanying notes
26
American Beacon AHL Managed Futures Strategy FundSM
Consolidated Schedule of Investments
December 31, 2021
| Forward Foreign Currency Contracts Open on December 31, 2021 (continued): | ||||||||||||||||||||||||||||
| Currency Purchased* | Currency Sold* | Settlement Date |
Counterparty | Unrealized Appreciation |
Unrealized (Depreciation) |
Net Unrealized Appreciation (Depreciation) |
||||||||||||||||||||||
| USD | 2,040,827 | CLP | 1,986,996 | 1/19/2022 | HUS | $ | 53,831 | $ | - | $ | 53,831 | |||||||||||||||||
| USD | 1,992,457 | CLP | 1,937,321 | 1/19/2022 | HUS | 55,136 | - | 55,136 | ||||||||||||||||||||
| USD | 1,883,752 | CLP | 1,862,586 | 1/19/2022 | HUS | 21,166 | - | 21,166 | ||||||||||||||||||||
| USD | 1,824,791 | CLP | 1,781,562 | 1/19/2022 | HUS | 43,229 | - | 43,229 | ||||||||||||||||||||
| USD | 1,806,776 | CLP | 1,761,733 | 1/19/2022 | HUS | 45,043 | - | 45,043 | ||||||||||||||||||||
| USD | 1,714,714 | CLP | 1,698,585 | 1/19/2022 | HUS | 16,129 | - | 16,129 | ||||||||||||||||||||
| USD | 1,713,462 | CLP | 1,698,585 | 1/19/2022 | HUS | 14,877 | - | 14,877 | ||||||||||||||||||||
| USD | 1,496,450 | CLP | 1,459,722 | 1/19/2022 | HUS | 36,728 | - | 36,728 | ||||||||||||||||||||
| USD | 1,444,084 | CLP | 1,435,285 | 1/19/2022 | HUS | 8,799 | - | 8,799 | ||||||||||||||||||||
| USD | 1,446,095 | CLP | 1,421,173 | 1/19/2022 | HUS | 24,922 | - | 24,922 | ||||||||||||||||||||
| USD | 1,385,127 | CLP | 1,353,987 | 1/19/2022 | HUS | 31,140 | - | 31,140 | ||||||||||||||||||||
| USD | 1,295,203 | CLP | 1,273,134 | 1/19/2022 | HUS | 22,069 | - | 22,069 | ||||||||||||||||||||
| USD | 1,257,101 | CLP | 1,241,724 | 1/19/2022 | HUS | 15,377 | - | 15,377 | ||||||||||||||||||||
| USD | 1,222,231 | CLP | 1,216,872 | 1/19/2022 | HUS | 5,359 | - | 5,359 | ||||||||||||||||||||
| USD | 1,202,588 | CLP | 1,184,996 | 1/19/2022 | HUS | 17,592 | - | 17,592 | ||||||||||||||||||||
| USD | 1,256,645 | CLP | 1,171,438 | 1/19/2022 | HUS | 85,207 | - | 85,207 | ||||||||||||||||||||
| USD | 1,166,917 | CLP | 1,140,200 | 1/19/2022 | HUS | 26,717 | - | 26,717 | ||||||||||||||||||||
| USD | 1,174,276 | CLP | 1,112,866 | 1/19/2022 | HUS | 61,410 | - | 61,410 | ||||||||||||||||||||
| USD | 1,132,474 | CLP | 1,054,294 | 1/19/2022 | HUS | 78,180 | - | 78,180 | ||||||||||||||||||||
| USD | 1,041,034 | CLP | 1,015,442 | 1/19/2022 | HUS | 25,592 | - | 25,592 | ||||||||||||||||||||
| USD | 1,010,173 | CLP | 995,722 | 1/19/2022 | HUS | 14,451 | - | 14,451 | ||||||||||||||||||||
| USD | 965,978 | CLP | 956,674 | 1/19/2022 | HUS | 9,304 | - | 9,304 | ||||||||||||||||||||
| USD | 950,736 | CLP | 947,337 | 1/19/2022 | HUS | 3,399 | - | 3,399 | ||||||||||||||||||||
| USD | 988,878 | CLP | 937,150 | 1/19/2022 | HUS | 51,728 | - | 51,728 | ||||||||||||||||||||
| USD | 988,423 | CLP | 937,150 | 1/19/2022 | HUS | 51,273 | - | 51,273 | ||||||||||||||||||||
| USD | 891,547 | CLP | 861,007 | 1/19/2022 | HUS | 30,540 | - | 30,540 | ||||||||||||||||||||
| USD | 850,733 | CLP | 820,007 | 1/19/2022 | HUS | 30,726 | - | 30,726 | ||||||||||||||||||||
| USD | 832,864 | CLP | 812,354 | 1/19/2022 | HUS | 20,510 | - | 20,510 | ||||||||||||||||||||
| USD | 834,879 | CLP | 812,354 | 1/19/2022 | HUS | 22,525 | - | 22,525 | ||||||||||||||||||||
| USD | 792,550 | CLP | 789,447 | 1/19/2022 | HUS | 3,103 | - | 3,103 | ||||||||||||||||||||
| USD | 773,111 | CLP | 765,339 | 1/19/2022 | HUS | 7,772 | - | 7,772 | ||||||||||||||||||||
| USD | 773,248 | CLP | 761,435 | 1/19/2022 | HUS | 11,813 | - | 11,813 | ||||||||||||||||||||
| USD | 789,755 | CLP | 761,435 | 1/19/2022 | HUS | 28,320 | - | 28,320 | ||||||||||||||||||||
| USD | 748,765 | CLP | 702,863 | 1/19/2022 | HUS | 45,902 | - | 45,902 | ||||||||||||||||||||
| USD | 689,731 | CLP | 686,441 | 1/19/2022 | HUS | 3,290 | - | 3,290 | ||||||||||||||||||||
| USD | 634,465 | CLP | 631,558 | 1/19/2022 | HUS | 2,907 | - | 2,907 | ||||||||||||||||||||
| USD | 634,794 | CLP | 631,558 | 1/19/2022 | HUS | 3,236 | - | 3,236 | ||||||||||||||||||||
| USD | 634,070 | CLP | 631,558 | 1/19/2022 | HUS | 2,512 | - | 2,512 | ||||||||||||||||||||
| USD | 636,608 | CLP | 615,005 | 1/19/2022 | HUS | 21,603 | - | 21,603 | ||||||||||||||||||||
| USD | 636,226 | CLP | 615,005 | 1/19/2022 | HUS | 21,221 | - | 21,221 | ||||||||||||||||||||
| USD | 625,218 | CLP | 609,265 | 1/19/2022 | HUS | 15,953 | - | 15,953 | ||||||||||||||||||||
| USD | 625,406 | CLP | 609,265 | 1/19/2022 | HUS | 16,141 | - | 16,141 | ||||||||||||||||||||
| USD | 624,493 | CLP | 609,265 | 1/19/2022 | HUS | 15,228 | - | 15,228 | ||||||||||||||||||||
| USD | 617,648 | CLP | 585,719 | 1/19/2022 | HUS | 31,929 | - | 31,929 | ||||||||||||||||||||
| USD | 605,779 | CLP | 585,719 | 1/19/2022 | HUS | 20,060 | - | 20,060 | ||||||||||||||||||||
| USD | 628,986 | CLP | 585,719 | 1/19/2022 | HUS | 43,267 | - | 43,267 | ||||||||||||||||||||
| USD | 624,150 | CLP | 585,719 | 1/19/2022 | HUS | 38,431 | - | 38,431 | ||||||||||||||||||||
| USD | 624,009 | CLP | 585,719 | 1/19/2022 | HUS | 38,290 | - | 38,290 | ||||||||||||||||||||
| USD | 579,114 | CLP | 574,005 | 1/19/2022 | HUS | 5,109 | - | 5,109 | ||||||||||||||||||||
| USD | 579,491 | CLP | 574,005 | 1/19/2022 | HUS | 5,486 | - | 5,486 | ||||||||||||||||||||
| USD | 535,275 | CLP | 527,147 | 1/19/2022 | HUS | 8,128 | - | 8,128 | ||||||||||||||||||||
| USD | 523,670 | CLP | 518,136 | 1/19/2022 | HUS | 5,534 | - | 5,534 | ||||||||||||||||||||
| USD | 524,036 | CLP | 518,136 | 1/19/2022 | HUS | 5,900 | - | 5,900 | ||||||||||||||||||||
| USD | 523,667 | CLP | 518,136 | 1/19/2022 | HUS | 5,531 | - | 5,531 | ||||||||||||||||||||
| USD | 488,919 | CLP | 488,099 | 1/19/2022 | HUS | 820 | - | 820 | ||||||||||||||||||||
| USD | 489,355 | CLP | 488,099 | 1/19/2022 | HUS | 1,256 | - | 1,256 | ||||||||||||||||||||
| USD | 488,718 | CLP | 488,099 | 1/19/2022 | HUS | 619 | - | 619 | ||||||||||||||||||||
| USD | 489,011 | CLP | 488,099 | 1/19/2022 | HUS | 912 | - | 912 | ||||||||||||||||||||
See accompanying notes
27
American Beacon AHL Managed Futures Strategy FundSM
Consolidated Schedule of Investments
December 31, 2021
| Forward Foreign Currency Contracts Open on December 31, 2021 (continued): | ||||||||||||||||||||||||||||||
| Currency Purchased* | Currency Sold* | Settlement Date |
Counterparty | Unrealized Appreciation |
Unrealized (Depreciation) |
Net Unrealized Appreciation (Depreciation) |
||||||||||||||||||||||||
| USD | 475,969 | CLP | 468,575 | 1/19/2022 | HUS | $ | 7,394 | $ | - | $ | 7,394 | |||||||||||||||||||
| USD | 499,207 | CLP | 468,575 | 1/19/2022 | HUS | 30,632 | - | 30,632 | ||||||||||||||||||||||
| USD | 499,207 | CLP | 468,575 | 1/19/2022 | HUS | 30,632 | - | 30,632 | ||||||||||||||||||||||
| USD | 486,015 | CLP | 468,575 | 1/19/2022 | HUS | 17,440 | - | 17,440 | ||||||||||||||||||||||
| USD | 420,664 | CLP | 414,509 | 1/19/2022 | HUS | 6,155 | - | 6,155 | ||||||||||||||||||||||
| USD | 419,094 | CLP | 414,509 | 1/19/2022 | HUS | 4,585 | - | 4,585 | ||||||||||||||||||||||
| USD | 391,149 | CLP | 390,479 | 1/19/2022 | HUS | 670 | - | 670 | ||||||||||||||||||||||
| USD | 381,742 | CLP | 369,003 | 1/19/2022 | HUS | 12,739 | - | 12,739 | ||||||||||||||||||||||
| USD | 364,447 | CLP | 351,431 | 1/19/2022 | HUS | 13,016 | - | 13,016 | ||||||||||||||||||||||
| USD | 374,480 | CLP | 351,431 | 1/19/2022 | HUS | 23,049 | - | 23,049 | ||||||||||||||||||||||
| USD | 371,521 | CLP | 351,431 | 1/19/2022 | HUS | 20,090 | - | 20,090 | ||||||||||||||||||||||
| USD | 371,452 | CLP | 351,431 | 1/19/2022 | HUS | 20,021 | - | 20,021 | ||||||||||||||||||||||
| USD | 371,471 | CLP | 351,431 | 1/19/2022 | HUS | 20,040 | - | 20,040 | ||||||||||||||||||||||
| USD | 314,656 | CLP | 310,882 | 1/19/2022 | HUS | 3,774 | - | 3,774 | ||||||||||||||||||||||
| USD | 303,918 | CLP | 292,859 | 1/19/2022 | HUS | 11,059 | - | 11,059 | ||||||||||||||||||||||
| USD | 293,392 | CLP | 292,859 | 1/19/2022 | HUS | 533 | - | 533 | ||||||||||||||||||||||
| USD | 292,860 | CLP | 292,859 | 1/19/2022 | HUS | 1 | - | 1 | ||||||||||||||||||||||
| USD | 293,138 | CLP | 292,859 | 1/19/2022 | HUS | 279 | - | 279 | ||||||||||||||||||||||
| USD | 309,563 | CLP | 292,859 | 1/19/2022 | HUS | 16,704 | - | 16,704 | ||||||||||||||||||||||
| USD | 309,589 | CLP | 292,859 | 1/19/2022 | HUS | 16,730 | - | 16,730 | ||||||||||||||||||||||
| USD | 309,578 | CLP | 292,859 | 1/19/2022 | HUS | 16,719 | - | 16,719 | ||||||||||||||||||||||
| USD | 310,024 | CLP | 292,860 | 1/19/2022 | HUS | 17,164 | - | 17,164 | ||||||||||||||||||||||
| USD | 234,481 | CLP | 234,288 | 1/19/2022 | HUS | 193 | - | 193 | ||||||||||||||||||||||
| USD | 234,250 | CLP | 234,288 | 1/19/2022 | HUS | - | (38 | ) | (38 | ) | ||||||||||||||||||||
| USD | 234,387 | CLP | 234,288 | 1/19/2022 | HUS | 99 | - | 99 | ||||||||||||||||||||||
| USD | 234,470 | CLP | 234,288 | 1/19/2022 | HUS | 182 | - | 182 | ||||||||||||||||||||||
| USD | 248,019 | CLP | 234,288 | 1/19/2022 | HUS | 13,731 | - | 13,731 | ||||||||||||||||||||||
| USD | 175,914 | CLP | 175,716 | 1/19/2022 | HUS | 198 | - | 198 | ||||||||||||||||||||||
| USD | 175,850 | CLP | 175,716 | 1/19/2022 | HUS | 134 | - | 134 | ||||||||||||||||||||||
| USD | 185,738 | CLP | 175,716 | 1/19/2022 | HUS | 10,022 | - | 10,022 | ||||||||||||||||||||||
| USD | 117,169 | CLP | 117,144 | 1/19/2022 | HUS | 25 | - | 25 | ||||||||||||||||||||||
| USD | 117,151 | CLP | 117,144 | 1/19/2022 | HUS | 7 | - | 7 | ||||||||||||||||||||||
| USD | 117,099 | CLP | 117,144 | 1/19/2022 | HUS | - | (45 | ) | (45 | ) | ||||||||||||||||||||
| USD | 117,213 | CLP | 117,144 | 1/19/2022 | HUS | 69 | - | 69 | ||||||||||||||||||||||
| USD | 117,234 | CLP | 117,144 | 1/19/2022 | HUS | 90 | - | 90 | ||||||||||||||||||||||
| USD | 117,207 | CLP | 117,144 | 1/19/2022 | HUS | 63 | - | 63 | ||||||||||||||||||||||
| USD | 123,902 | CLP | 117,144 | 1/19/2022 | HUS | 6,758 | - | 6,758 | ||||||||||||||||||||||
| USD | 123,961 | CLP | 117,144 | 1/19/2022 | HUS | 6,817 | - | 6,817 | ||||||||||||||||||||||
| USD | 58,565 | CLP | 58,572 | 1/19/2022 | HUS | - | (7 | ) | (7 | ) | ||||||||||||||||||||
| USD | 58,585 | CLP | 58,572 | 1/19/2022 | HUS | 13 | - | 13 | ||||||||||||||||||||||
| USD | 58,608 | CLP | 58,572 | 1/19/2022 | HUS | 36 | - | 36 | ||||||||||||||||||||||
| USD | 58,606 | CLP | 58,572 | 1/19/2022 | HUS | 34 | - | 34 | ||||||||||||||||||||||
| USD | 58,606 | CLP | 58,572 | 1/19/2022 | HUS | 34 | - | 34 | ||||||||||||||||||||||
| KRW | 336,362 | USD | 337,652 | 1/20/2022 | HUS | - | (1,290 | ) | (1,290 | ) | ||||||||||||||||||||
| KRW | 504,544 | USD | 505,272 | 1/20/2022 | HUS | - | (728 | ) | (728 | ) | ||||||||||||||||||||
| KRW | 1,513,631 | USD | 1,518,616 | 1/20/2022 | HUS | - | (4,985 | ) | (4,985 | ) | ||||||||||||||||||||
| KRW | 1,597,721 | USD | 1,602,296 | 1/20/2022 | HUS | - | (4,575 | ) | (4,575 | ) | ||||||||||||||||||||
| KRW | 2,102,265 | USD | 2,111,344 | 1/20/2022 | HUS | - | (9,079 | ) | (9,079 | ) | ||||||||||||||||||||
| USD | 23,055,194 | EUR | 23,264,664 | 1/20/2022 | HUS | - | (209,470 | ) | (209,470 | ) | ||||||||||||||||||||
| USD | 16,611,095 | HKD | 16,623,224 | 1/20/2022 | HUS | - | (12,129 | ) | (12,129 | ) | ||||||||||||||||||||
| USD | 10,738,880 | KRW | 10,763,595 | 1/20/2022 | HUS | - | (24,715 | ) | (24,715 | ) | ||||||||||||||||||||
| USD | 10,231,134 | KRW | 10,259,052 | 1/20/2022 | HUS | - | (27,918 | ) | (27,918 | ) | ||||||||||||||||||||
| USD | 8,896,251 | KRW | 8,913,602 | 1/20/2022 | HUS | - | (17,351 | ) | (17,351 | ) | ||||||||||||||||||||
| USD | 6,547,918 | KRW | 6,559,066 | 1/20/2022 | HUS | - | (11,148 | ) | (11,148 | ) | ||||||||||||||||||||
| USD | 5,700,825 | KRW | 5,718,160 | 1/20/2022 | HUS | - | (17,335 | ) | (17,335 | ) | ||||||||||||||||||||
| USD | 5,558,597 | KRW | 5,549,979 | 1/20/2022 | HUS | 8,618 | - | 8,618 | ||||||||||||||||||||||
| USD | 5,533,895 | KRW | 5,549,979 | 1/20/2022 | HUS | - | (16,084 | ) | (16,084 | ) | ||||||||||||||||||||
| USD | 5,376,977 | KRW | 5,381,798 | 1/20/2022 | HUS | - | (4,821 | ) | (4,821 | ) | ||||||||||||||||||||
See accompanying notes
28
American Beacon AHL Managed Futures Strategy FundSM
Consolidated Schedule of Investments
December 31, 2021
| Forward Foreign Currency Contracts Open on December 31, 2021 (continued): | ||||||||||||||||||||||||||||
| Currency Purchased* | Currency Sold* | Settlement Date |
Counterparty | Unrealized Appreciation |
Unrealized (Depreciation) |
Net Unrealized Appreciation (Depreciation) |
||||||||||||||||||||||
| USD | 3,787,926 | KRW | 3,784,076 | 1/20/2022 | HUS | $ | 3,850 | $ | - | $ | 3,850 | |||||||||||||||||
| USD | 2,448,973 | KRW | 2,438,627 | 1/20/2022 | HUS | 10,346 | - | 10,346 | ||||||||||||||||||||
| USD | 2,361,812 | KRW | 2,354,536 | 1/20/2022 | HUS | 7,276 | - | 7,276 | ||||||||||||||||||||
| USD | 2,359,820 | KRW | 2,354,536 | 1/20/2022 | HUS | 5,284 | - | 5,284 | ||||||||||||||||||||
| USD | 2,279,924 | KRW | 2,270,446 | 1/20/2022 | HUS | 9,478 | - | 9,478 | ||||||||||||||||||||
| USD | 2,216,382 | KRW | 2,219,991 | 1/20/2022 | HUS | - | (3,609 | ) | (3,609 | ) | ||||||||||||||||||
| USD | 2,191,707 | KRW | 2,186,355 | 1/20/2022 | HUS | 5,352 | - | 5,352 | ||||||||||||||||||||
| USD | 2,111,647 | KRW | 2,102,265 | 1/20/2022 | HUS | 9,382 | - | 9,382 | ||||||||||||||||||||
| USD | 1,859,589 | KRW | 1,849,993 | 1/20/2022 | HUS | 9,596 | - | 9,596 | ||||||||||||||||||||
| USD | 1,845,669 | KRW | 1,849,993 | 1/20/2022 | HUS | - | (4,324 | ) | (4,324 | ) | ||||||||||||||||||
| USD | 1,677,656 | KRW | 1,681,812 | 1/20/2022 | HUS | - | (4,156 | ) | (4,156 | ) | ||||||||||||||||||
| USD | 1,604,907 | KRW | 1,597,721 | 1/20/2022 | HUS | 7,186 | - | 7,186 | ||||||||||||||||||||
| USD | 1,509,992 | KRW | 1,513,631 | 1/20/2022 | HUS | - | (3,639 | ) | (3,639 | ) | ||||||||||||||||||
| USD | 1,426,893 | KRW | 1,429,540 | 1/20/2022 | HUS | - | (2,647 | ) | (2,647 | ) | ||||||||||||||||||
| USD | 1,421,132 | KRW | 1,424,115 | 1/20/2022 | HUS | - | (2,983 | ) | (2,983 | ) | ||||||||||||||||||
| USD | 1,421,287 | KRW | 1,424,115 | 1/20/2022 | HUS | - | (2,828 | ) | (2,828 | ) | ||||||||||||||||||
| USD | 1,421,621 | KRW | 1,424,115 | 1/20/2022 | HUS | - | (2,494 | ) | (2,494 | ) | ||||||||||||||||||
| USD | 1,292,890 | KRW | 1,294,995 | 1/20/2022 | HUS | - | (2,105 | ) | (2,105 | ) | ||||||||||||||||||
| USD | 1,293,603 | KRW | 1,294,039 | 1/20/2022 | HUS | - | (436 | ) | (436 | ) | ||||||||||||||||||
| USD | 1,268,295 | KRW | 1,261,359 | 1/20/2022 | HUS | 6,936 | - | 6,936 | ||||||||||||||||||||
| USD | 1,263,354 | KRW | 1,261,359 | 1/20/2022 | HUS | 1,995 | - | 1,995 | ||||||||||||||||||||
| USD | 1,259,785 | KRW | 1,261,359 | 1/20/2022 | HUS | - | (1,574 | ) | (1,574 | ) | ||||||||||||||||||
| USD | 1,177,402 | KRW | 1,177,268 | 1/20/2022 | HUS | 134 | - | 134 | ||||||||||||||||||||
| USD | 1,176,441 | KRW | 1,177,268 | 1/20/2022 | HUS | - | (827 | ) | (827 | ) | ||||||||||||||||||
| USD | 1,108,629 | KRW | 1,109,996 | 1/20/2022 | HUS | - | (1,367 | ) | (1,367 | ) | ||||||||||||||||||
| USD | 1,015,733 | KRW | 1,017,225 | 1/20/2022 | HUS | - | (1,492 | ) | (1,492 | ) | ||||||||||||||||||
| USD | 1,014,915 | KRW | 1,017,225 | 1/20/2022 | HUS | - | (2,310 | ) | (2,310 | ) | ||||||||||||||||||
| USD | 1,014,513 | KRW | 1,009,087 | 1/20/2022 | HUS | 5,426 | - | 5,426 | ||||||||||||||||||||
| USD | 924,160 | KRW | 924,996 | 1/20/2022 | HUS | - | (836 | ) | (836 | ) | ||||||||||||||||||
| USD | 758,041 | KRW | 756,815 | 1/20/2022 | HUS | 1,226 | - | 1,226 | ||||||||||||||||||||
| USD | 507,720 | KRW | 504,544 | 1/20/2022 | HUS | 3,176 | - | 3,176 | ||||||||||||||||||||
| USD | 506,351 | KRW | 504,544 | 1/20/2022 | HUS | 1,807 | - | 1,807 | ||||||||||||||||||||
| USD | 422,047 | KRW | 420,453 | 1/20/2022 | HUS | 1,594 | - | 1,594 | ||||||||||||||||||||
| USD | 168,802 | KRW | 168,181 | 1/20/2022 | HUS | 621 | - | 621 | ||||||||||||||||||||
| USD | 135,384 | KRW | 135,501 | 1/20/2022 | HUS | - | (117 | ) | (117 | ) | ||||||||||||||||||
| PHP | 48,991 | USD | 49,516 | 1/21/2022 | HUS | - | (525 | ) | (525 | ) | ||||||||||||||||||
| PHP | 48,991 | USD | 49,579 | 1/21/2022 | HUS | - | (588 | ) | (588 | ) | ||||||||||||||||||
| PHP | 48,991 | USD | 49,572 | 1/21/2022 | HUS | - | (581 | ) | (581 | ) | ||||||||||||||||||
| PHP | 48,991 | USD | 50,069 | 1/21/2022 | HUS | - | (1,078 | ) | (1,078 | ) | ||||||||||||||||||
| PHP | 97,982 | USD | 99,022 | 1/21/2022 | HUS | - | (1,040 | ) | (1,040 | ) | ||||||||||||||||||
| PHP | 146,972 | USD | 148,494 | 1/21/2022 | HUS | - | (1,522 | ) | (1,522 | ) | ||||||||||||||||||
| PHP | 146,972 | USD | 148,506 | 1/21/2022 | HUS | - | (1,534 | ) | (1,534 | ) | ||||||||||||||||||
| PHP | 146,972 | USD | 148,517 | 1/21/2022 | HUS | - | (1,545 | ) | (1,545 | ) | ||||||||||||||||||
| PHP | 195,963 | USD | 198,161 | 1/21/2022 | HUS | - | (2,198 | ) | (2,198 | ) | ||||||||||||||||||
| PHP | 195,963 | USD | 198,020 | 1/21/2022 | HUS | - | (2,057 | ) | (2,057 | ) | ||||||||||||||||||
| PHP | 244,954 | USD | 247,859 | 1/21/2022 | HUS | - | (2,905 | ) | (2,905 | ) | ||||||||||||||||||
| PHP | 244,954 | USD | 247,628 | 1/21/2022 | HUS | - | (2,674 | ) | (2,674 | ) | ||||||||||||||||||
| PHP | 244,954 | USD | 247,701 | 1/21/2022 | HUS | - | (2,747 | ) | (2,747 | ) | ||||||||||||||||||
| PHP | 391,926 | USD | 396,520 | 1/21/2022 | HUS | - | (4,594 | ) | (4,594 | ) | ||||||||||||||||||
| PHP | 587,889 | USD | 594,106 | 1/21/2022 | HUS | - | (6,217 | ) | (6,217 | ) | ||||||||||||||||||
| PHP | 4,948,070 | USD | 5,034,594 | 1/21/2022 | HUS | - | (86,524 | ) | (86,524 | ) | ||||||||||||||||||
| PHP | 28,708,603 | USD | 28,942,285 | 1/21/2022 | HUS | - | (233,682 | ) | (233,682 | ) | ||||||||||||||||||
| USD | 4,841,549 | PHP | 4,850,088 | 1/21/2022 | HUS | - | (8,539 | ) | (8,539 | ) | ||||||||||||||||||
| USD | 2,800,487 | PHP | 2,792,475 | 1/21/2022 | HUS | 8,012 | - | 8,012 | ||||||||||||||||||||
| USD | 2,625,434 | PHP | 2,631,505 | 1/21/2022 | HUS | - | (6,071 | ) | (6,071 | ) | ||||||||||||||||||
| USD | 2,131,745 | PHP | 2,139,264 | 1/21/2022 | HUS | - | (7,519 | ) | (7,519 | ) | ||||||||||||||||||
| USD | 1,968,137 | PHP | 1,973,629 | 1/21/2022 | HUS | - | (5,492 | ) | (5,492 | ) | ||||||||||||||||||
| USD | 1,119,178 | PHP | 1,126,788 | 1/21/2022 | HUS | - | (7,610 | ) | (7,610 | ) | ||||||||||||||||||
See accompanying notes
29
American Beacon AHL Managed Futures Strategy FundSM
Consolidated Schedule of Investments
December 31, 2021
| Forward Foreign Currency Contracts Open on December 31, 2021 (continued): | ||||||||||||||||||||||||||||
| Currency Purchased* | Currency Sold* | Settlement Date |
Counterparty | Unrealized Appreciation |
Unrealized (Depreciation) |
Net Unrealized Appreciation (Depreciation) |
||||||||||||||||||||||
| USD | 388,138 | PHP | 391,926 | 1/21/2022 | HUS | $ | - | $ | (3,788 | ) | $ | (3,788 | ) | |||||||||||||||
| USD | 291,251 | PHP | 293,945 | 1/21/2022 | HUS | - | (2,694 | ) | (2,694 | ) | ||||||||||||||||||
| USD | 49,567 | PHP | 48,991 | 1/21/2022 | HUS | 576 | - | 576 | ||||||||||||||||||||
| USD | 49,205 | PHP | 48,991 | 1/21/2022 | HUS | 214 | - | 214 | ||||||||||||||||||||
| USD | 16,264 | PHP | 16,330 | 1/21/2022 | HUS | - | (66 | ) | (66 | ) | ||||||||||||||||||
| CNY | 78,314 | USD | 78,169 | 1/26/2022 | HUS | 145 | - | 145 | ||||||||||||||||||||
| CNY | 156,629 | USD | 156,358 | 1/26/2022 | HUS | 271 | - | 271 | ||||||||||||||||||||
| CNY | 156,629 | USD | 156,347 | 1/26/2022 | HUS | 282 | - | 282 | ||||||||||||||||||||
| CNY | 156,629 | USD | 156,384 | 1/26/2022 | HUS | 245 | - | 245 | ||||||||||||||||||||
| CNY | 156,629 | USD | 156,409 | 1/26/2022 | HUS | 220 | - | 220 | ||||||||||||||||||||
| CNY | 156,629 | USD | 156,561 | 1/26/2022 | HUS | 68 | - | 68 | ||||||||||||||||||||
| CNY | 234,943 | USD | 234,830 | 1/26/2022 | HUS | 113 | - | 113 | ||||||||||||||||||||
| CNY | 234,943 | USD | 234,860 | 1/26/2022 | HUS | 83 | - | 83 | ||||||||||||||||||||
| CNY | 313,258 | USD | 313,107 | 1/26/2022 | HUS | 151 | - | 151 | ||||||||||||||||||||
| CNY | 313,258 | USD | 313,303 | 1/26/2022 | HUS | - | (45 | ) | (45 | ) | ||||||||||||||||||
| CNY | 313,258 | USD | 313,219 | 1/26/2022 | HUS | 39 | - | 39 | ||||||||||||||||||||
| CNY | 469,887 | USD | 469,190 | 1/26/2022 | HUS | 697 | - | 697 | ||||||||||||||||||||
| CNY | 548,201 | USD | 547,619 | 1/26/2022 | HUS | 582 | - | 582 | ||||||||||||||||||||
| CNY | 48,006,754 | USD | 48,036,875 | 1/26/2022 | HUS | - | (30,121 | ) | (30,121 | ) | ||||||||||||||||||
| USD | 940,160 | CNY | 939,773 | 1/26/2022 | HUS | 387 | - | 387 | ||||||||||||||||||||
| USD | 548,039 | CNY | 548,201 | 1/26/2022 | HUS | - | (162 | ) | (162 | ) | ||||||||||||||||||
| USD | 469,933 | CNY | 469,887 | 1/26/2022 | HUS | 46 | - | 46 | ||||||||||||||||||||
| USD | 234,668 | CNY | 234,943 | 1/26/2022 | HUS | - | (275 | ) | (275 | ) | ||||||||||||||||||
| USD | 78,179 | CNY | 78,314 | 1/26/2022 | HUS | - | (135 | ) | (135 | ) | ||||||||||||||||||
| COP | 1,765,909 | USD | 1,913,423 | 1/27/2022 | HUS | - | (147,514 | ) | (147,514 | ) | ||||||||||||||||||
| COP | 2,452,652 | USD | 2,554,148 | 1/27/2022 | HUS | - | (101,496 | ) | (101,496 | ) | ||||||||||||||||||
| USD | 2,611,635 | COP | 2,501,705 | 1/27/2022 | HUS | 109,930 | - | 109,930 | ||||||||||||||||||||
| USD | 2,338,824 | COP | 2,256,439 | 1/27/2022 | HUS | 82,385 | - | 82,385 | ||||||||||||||||||||
| USD | 2,380,164 | COP | 2,256,439 | 1/27/2022 | HUS | 123,725 | - | 123,725 | ||||||||||||||||||||
| USD | 1,442,421 | COP | 1,385,027 | 1/27/2022 | HUS | 57,394 | - | 57,394 | ||||||||||||||||||||
| USD | 1,009,421 | COP | 969,519 | 1/27/2022 | HUS | 39,902 | - | 39,902 | ||||||||||||||||||||
| USD | 765,247 | COP | 732,792 | 1/27/2022 | HUS | 32,455 | - | 32,455 | ||||||||||||||||||||
| USD | 564,755 | COP | 540,584 | 1/27/2022 | HUS | 24,171 | - | 24,171 | ||||||||||||||||||||
| USD | 564,179 | COP | 540,584 | 1/27/2022 | HUS | 23,595 | - | 23,595 | ||||||||||||||||||||
| USD | 564,636 | COP | 540,584 | 1/27/2022 | HUS | 24,052 | - | 24,052 | ||||||||||||||||||||
| KRW | 84,075 | USD | 85,131 | 1/28/2022 | HUS | - | (1,056 | ) | (1,056 | ) | ||||||||||||||||||
| KRW | 126,113 | USD | 127,357 | 1/28/2022 | HUS | - | (1,244 | ) | (1,244 | ) | ||||||||||||||||||
| KRW | 168,151 | USD | 170,265 | 1/28/2022 | HUS | - | (2,114 | ) | (2,114 | ) | ||||||||||||||||||
| KRW | 252,226 | USD | 255,369 | 1/28/2022 | HUS | - | (3,143 | ) | (3,143 | ) | ||||||||||||||||||
| KRW | 420,376 | USD | 422,425 | 1/28/2022 | HUS | - | (2,049 | ) | (2,049 | ) | ||||||||||||||||||
| KRW | 420,376 | USD | 422,203 | 1/28/2022 | HUS | - | (1,827 | ) | (1,827 | ) | ||||||||||||||||||
| KRW | 504,452 | USD | 509,585 | 1/28/2022 | HUS | - | (5,133 | ) | (5,133 | ) | ||||||||||||||||||
| KRW | 1,008,903 | USD | 1,013,453 | 1/28/2022 | HUS | - | (4,550 | ) | (4,550 | ) | ||||||||||||||||||
| KRW | 1,177,054 | USD | 1,182,303 | 1/28/2022 | HUS | - | (5,249 | ) | (5,249 | ) | ||||||||||||||||||
| KRW | 2,101,882 | USD | 2,112,918 | 1/28/2022 | HUS | - | (11,036 | ) | (11,036 | ) | ||||||||||||||||||
| KRW | 2,354,108 | USD | 2,383,710 | 1/28/2022 | HUS | - | (29,602 | ) | (29,602 | ) | ||||||||||||||||||
| KRW | 2,438,183 | USD | 2,460,818 | 1/28/2022 | HUS | - | (22,635 | ) | (22,635 | ) | ||||||||||||||||||
| KRW | 2,522,258 | USD | 2,555,344 | 1/28/2022 | HUS | - | (33,086 | ) | (33,086 | ) | ||||||||||||||||||
| KRW | 2,774,484 | USD | 2,810,544 | 1/28/2022 | HUS | - | (36,060 | ) | (36,060 | ) | ||||||||||||||||||
| KRW | 2,787,759 | USD | 2,816,196 | 1/28/2022 | HUS | - | (28,437 | ) | (28,437 | ) | ||||||||||||||||||
| KRW | 2,900,597 | USD | 2,938,847 | 1/28/2022 | HUS | - | (38,250 | ) | (38,250 | ) | ||||||||||||||||||
| KRW | 2,900,597 | USD | 2,938,897 | 1/28/2022 | HUS | - | (38,300 | ) | (38,300 | ) | ||||||||||||||||||
| KRW | 3,097,510 | USD | 3,129,001 | 1/28/2022 | HUS | - | (31,491 | ) | (31,491 | ) | ||||||||||||||||||
| KRW | 3,110,785 | USD | 3,152,155 | 1/28/2022 | HUS | - | (41,370 | ) | (41,370 | ) | ||||||||||||||||||
| KRW | 3,110,785 | USD | 3,149,472 | 1/28/2022 | HUS | - | (38,687 | ) | (38,687 | ) | ||||||||||||||||||
| KRW | 3,278,935 | USD | 3,312,383 | 1/28/2022 | HUS | - | (33,448 | ) | (33,448 | ) | ||||||||||||||||||
| KRW | 3,909,500 | USD | 3,946,631 | 1/28/2022 | HUS | - | (37,131 | ) | (37,131 | ) | ||||||||||||||||||
| KRW | 4,119,688 | USD | 4,154,500 | 1/28/2022 | HUS | - | (34,812 | ) | (34,812 | ) | ||||||||||||||||||
See accompanying notes
30
American Beacon AHL Managed Futures Strategy FundSM
Consolidated Schedule of Investments
December 31, 2021
| Forward Foreign Currency Contracts Open on December 31, 2021 (continued): | ||||||||||||||||||||||||||||
| Currency Purchased* | Currency Sold* | Settlement Date |
Counterparty | Unrealized Appreciation |
Unrealized (Depreciation) |
Net Unrealized Appreciation (Depreciation) |
||||||||||||||||||||||
| KRW | 4,119,688 | USD | 4,159,451 | 1/28/2022 | HUS | $ | - | $ | (39,763 | ) | $ | (39,763 | ) | |||||||||||||||
| KRW | 4,203,763 | USD | 4,239,443 | 1/28/2022 | HUS | - | (35,680 | ) | (35,680 | ) | ||||||||||||||||||
| KRW | 4,455,989 | USD | 4,493,810 | 1/28/2022 | HUS | - | (37,821 | ) | (37,821 | ) | ||||||||||||||||||
| KRW | 4,708,215 | USD | 4,753,913 | 1/28/2022 | HUS | - | (45,698 | ) | (45,698 | ) | ||||||||||||||||||
| KRW | 4,792,290 | USD | 4,840,764 | 1/28/2022 | HUS | - | (48,474 | ) | (48,474 | ) | ||||||||||||||||||
| KRW | 4,792,290 | USD | 4,833,361 | 1/28/2022 | HUS | - | (41,071 | ) | (41,071 | ) | ||||||||||||||||||
| USD | 77,464,949 | KRW | 77,265,172 | 1/28/2022 | HUS | 199,777 | - | 199,777 | ||||||||||||||||||||
| BRL | 17,831 | USD | 17,483 | 2/2/2022 | HUS | 348 | - | 348 | ||||||||||||||||||||
| BRL | 106,987 | USD | 105,756 | 2/2/2022 | HUS | 1,231 | - | 1,231 | ||||||||||||||||||||
| BRL | 106,987 | USD | 106,519 | 2/2/2022 | HUS | 468 | - | 468 | ||||||||||||||||||||
| BRL | 124,819 | USD | 123,365 | 2/2/2022 | HUS | 1,454 | - | 1,454 | ||||||||||||||||||||
| BRL | 124,819 | USD | 122,998 | 2/2/2022 | HUS | 1,821 | - | 1,821 | ||||||||||||||||||||
| BRL | 142,650 | USD | 141,023 | 2/2/2022 | HUS | 1,627 | - | 1,627 | ||||||||||||||||||||
| BRL | 160,481 | USD | 158,285 | 2/2/2022 | HUS | 2,196 | - | 2,196 | ||||||||||||||||||||
| BRL | 160,481 | USD | 158,321 | 2/2/2022 | HUS | 2,160 | - | 2,160 | ||||||||||||||||||||
| BRL | 160,481 | USD | 159,912 | 2/2/2022 | HUS | 569 | - | 569 | ||||||||||||||||||||
| BRL | 178,312 | USD | 176,094 | 2/2/2022 | HUS | 2,218 | - | 2,218 | ||||||||||||||||||||
| BRL | 178,312 | USD | 175,850 | 2/2/2022 | HUS | 2,462 | - | 2,462 | ||||||||||||||||||||
| BRL | 178,312 | USD | 175,795 | 2/2/2022 | HUS | 2,517 | - | 2,517 | ||||||||||||||||||||
| BRL | 178,312 | USD | 176,312 | 2/2/2022 | HUS | 2,000 | - | 2,000 | ||||||||||||||||||||
| BRL | 178,312 | USD | 176,097 | 2/2/2022 | HUS | 2,215 | - | 2,215 | ||||||||||||||||||||
| BRL | 196,143 | USD | 193,713 | 2/2/2022 | HUS | 2,430 | - | 2,430 | ||||||||||||||||||||
| BRL | 196,143 | USD | 193,478 | 2/2/2022 | HUS | 2,665 | - | 2,665 | ||||||||||||||||||||
| BRL | 213,975 | USD | 211,039 | 2/2/2022 | HUS | 2,936 | - | 2,936 | ||||||||||||||||||||
| BRL | 213,975 | USD | 211,012 | 2/2/2022 | HUS | 2,963 | - | 2,963 | ||||||||||||||||||||
| BRL | 213,975 | USD | 211,503 | 2/2/2022 | HUS | 2,472 | - | 2,472 | ||||||||||||||||||||
| BRL | 213,975 | USD | 210,875 | 2/2/2022 | HUS | 3,100 | - | 3,100 | ||||||||||||||||||||
| BRL | 231,806 | USD | 228,566 | 2/2/2022 | HUS | 3,240 | - | 3,240 | ||||||||||||||||||||
| BRL | 231,806 | USD | 229,183 | 2/2/2022 | HUS | 2,623 | - | 2,623 | ||||||||||||||||||||
| BRL | 231,806 | USD | 229,106 | 2/2/2022 | HUS | 2,700 | - | 2,700 | ||||||||||||||||||||
| BRL | 231,806 | USD | 229,092 | 2/2/2022 | HUS | 2,714 | - | 2,714 | ||||||||||||||||||||
| BRL | 231,806 | USD | 228,461 | 2/2/2022 | HUS | 3,345 | - | 3,345 | ||||||||||||||||||||
| BRL | 249,637 | USD | 246,719 | 2/2/2022 | HUS | 2,918 | - | 2,918 | ||||||||||||||||||||
| BRL | 249,637 | USD | 246,198 | 2/2/2022 | HUS | 3,439 | - | 3,439 | ||||||||||||||||||||
| BRL | 249,637 | USD | 246,808 | 2/2/2022 | HUS | 2,829 | - | 2,829 | ||||||||||||||||||||
| BRL | 267,468 | USD | 264,060 | 2/2/2022 | HUS | 3,408 | - | 3,408 | ||||||||||||||||||||
| BRL | 267,468 | USD | 264,437 | 2/2/2022 | HUS | 3,031 | - | 3,031 | ||||||||||||||||||||
| BRL | 267,468 | USD | 264,321 | 2/2/2022 | HUS | 3,147 | - | 3,147 | ||||||||||||||||||||
| BRL | 267,468 | USD | 264,288 | 2/2/2022 | HUS | 3,180 | - | 3,180 | ||||||||||||||||||||
| BRL | 267,468 | USD | 263,859 | 2/2/2022 | HUS | 3,609 | - | 3,609 | ||||||||||||||||||||
| BRL | 267,468 | USD | 263,809 | 2/2/2022 | HUS | 3,659 | - | 3,659 | ||||||||||||||||||||
| BRL | 267,468 | USD | 264,562 | 2/2/2022 | HUS | 2,906 | - | 2,906 | ||||||||||||||||||||
| BRL | 267,468 | USD | 266,354 | 2/2/2022 | HUS | 1,114 | - | 1,114 | ||||||||||||||||||||
| BRL | 285,300 | USD | 281,890 | 2/2/2022 | HUS | 3,410 | - | 3,410 | ||||||||||||||||||||
| BRL | 285,300 | USD | 281,056 | 2/2/2022 | HUS | 4,244 | - | 4,244 | ||||||||||||||||||||
| BRL | 303,131 | USD | 299,040 | 2/2/2022 | HUS | 4,091 | - | 4,091 | ||||||||||||||||||||
| BRL | 303,131 | USD | 299,285 | 2/2/2022 | HUS | 3,846 | - | 3,846 | ||||||||||||||||||||
| BRL | 303,131 | USD | 299,587 | 2/2/2022 | HUS | 3,544 | - | 3,544 | ||||||||||||||||||||
| BRL | 303,131 | USD | 299,601 | 2/2/2022 | HUS | 3,530 | - | 3,530 | ||||||||||||||||||||
| BRL | 303,131 | USD | 299,631 | 2/2/2022 | HUS | 3,500 | - | 3,500 | ||||||||||||||||||||
| BRL | 320,962 | USD | 316,881 | 2/2/2022 | HUS | 4,081 | - | 4,081 | ||||||||||||||||||||
| BRL | 338,793 | USD | 334,954 | 2/2/2022 | HUS | 3,839 | - | 3,839 | ||||||||||||||||||||
| BRL | 338,793 | USD | 334,473 | 2/2/2022 | HUS | 4,320 | - | 4,320 | ||||||||||||||||||||
| BRL | 356,624 | USD | 351,211 | 2/2/2022 | HUS | 5,413 | - | 5,413 | ||||||||||||||||||||
| BRL | 356,624 | USD | 350,986 | 2/2/2022 | HUS | 5,638 | - | 5,638 | ||||||||||||||||||||
| BRL | 374,456 | USD | 370,354 | 2/2/2022 | HUS | 4,102 | - | 4,102 | ||||||||||||||||||||
| BRL | 374,456 | USD | 369,928 | 2/2/2022 | HUS | 4,528 | - | 4,528 | ||||||||||||||||||||
| BRL | 374,456 | USD | 368,684 | 2/2/2022 | HUS | 5,772 | - | 5,772 | ||||||||||||||||||||
See accompanying notes
31
American Beacon AHL Managed Futures Strategy FundSM
Consolidated Schedule of Investments
December 31, 2021
| Forward Foreign Currency Contracts Open on December 31, 2021 (continued): | ||||||||||||||||||||||||||||
| Currency Purchased* | Currency Sold* | Settlement Date |
Counterparty | Unrealized Appreciation |
Unrealized (Depreciation) |
Net Unrealized Appreciation (Depreciation) |
||||||||||||||||||||||
| BRL | 374,456 | USD | 368,614 | 2/2/2022 | HUS | $ | 5,842 | $ | - | $ | 5,842 | |||||||||||||||||
| BRL | 392,287 | USD | 386,554 | 2/2/2022 | HUS | 5,733 | - | 5,733 | ||||||||||||||||||||
| BRL | 410,118 | USD | 405,158 | 2/2/2022 | HUS | 4,960 | - | 4,960 | ||||||||||||||||||||
| BRL | 410,118 | USD | 403,581 | 2/2/2022 | HUS | 6,537 | - | 6,537 | ||||||||||||||||||||
| BRL | 838,067 | USD | 827,194 | 2/2/2022 | HUS | 10,873 | - | 10,873 | ||||||||||||||||||||
| BRL | 838,067 | USD | 827,284 | 2/2/2022 | HUS | 10,783 | - | 10,783 | ||||||||||||||||||||
| BRL | 1,657,550 | USD | 1,637,087 | 2/2/2022 | HUS | 20,463 | - | 20,463 | ||||||||||||||||||||
| BRL | 1,873,031 | USD | 1,850,087 | 2/2/2022 | HUS | 22,944 | - | 22,944 | ||||||||||||||||||||
| BRL | 5,527,678 | USD | 5,517,286 | 2/2/2022 | HUS | 10,392 | - | 10,392 | ||||||||||||||||||||
| BRL | 6,472,732 | USD | 6,457,559 | 2/2/2022 | HUS | 15,173 | - | 15,173 | ||||||||||||||||||||
| BRL | 7,310,800 | USD | 7,298,618 | 2/2/2022 | HUS | 12,182 | - | 12,182 | ||||||||||||||||||||
| BRL | 7,756,580 | USD | 7,743,567 | 2/2/2022 | HUS | 13,013 | - | 13,013 | ||||||||||||||||||||
| USD | 26,518,496 | BRL | 27,299,596 | 2/2/2022 | HUS | - | (781,100 | ) | (781,100 | ) | ||||||||||||||||||
| USD | 4,122,083 | BRL | 4,243,830 | 2/2/2022 | HUS | - | (121,747 | ) | (121,747 | ) | ||||||||||||||||||
| USD | 3,617,620 | BRL | 3,726,725 | 2/2/2022 | HUS | - | (109,105 | ) | (109,105 | ) | ||||||||||||||||||
| USD | 2,727,821 | BRL | 2,817,333 | 2/2/2022 | HUS | - | (89,512 | ) | (89,512 | ) | ||||||||||||||||||
| USD | 1,940,233 | BRL | 1,997,096 | 2/2/2022 | HUS | - | (56,863 | ) | (56,863 | ) | ||||||||||||||||||
| USD | 1,677,968 | BRL | 1,729,628 | 2/2/2022 | HUS | - | (51,660 | ) | (51,660 | ) | ||||||||||||||||||
| USD | 535,716 | BRL | 552,768 | 2/2/2022 | HUS | - | (17,052 | ) | (17,052 | ) | ||||||||||||||||||
| USD | 518,737 | BRL | 534,937 | 2/2/2022 | HUS | - | (16,200 | ) | (16,200 | ) | ||||||||||||||||||
| USD | 504,242 | BRL | 517,105 | 2/2/2022 | HUS | - | (12,863 | ) | (12,863 | ) | ||||||||||||||||||
| USD | 485,992 | BRL | 499,274 | 2/2/2022 | HUS | - | (13,282 | ) | (13,282 | ) | ||||||||||||||||||
| USD | 482,770 | BRL | 499,274 | 2/2/2022 | HUS | - | (16,504 | ) | (16,504 | ) | ||||||||||||||||||
| USD | 483,120 | BRL | 499,274 | 2/2/2022 | HUS | - | (16,154 | ) | (16,154 | ) | ||||||||||||||||||
| USD | 468,628 | BRL | 481,443 | 2/2/2022 | HUS | - | (12,815 | ) | (12,815 | ) | ||||||||||||||||||
| USD | 466,704 | BRL | 481,443 | 2/2/2022 | HUS | - | (14,739 | ) | (14,739 | ) | ||||||||||||||||||
| USD | 466,695 | BRL | 481,443 | 2/2/2022 | HUS | - | (14,748 | ) | (14,748 | ) | ||||||||||||||||||
| USD | 465,799 | BRL | 481,443 | 2/2/2022 | HUS | - | (15,644 | ) | (15,644 | ) | ||||||||||||||||||
| USD | 450,646 | BRL | 463,612 | 2/2/2022 | HUS | - | (12,966 | ) | (12,966 | ) | ||||||||||||||||||
| USD | 449,073 | BRL | 463,612 | 2/2/2022 | HUS | - | (14,539 | ) | (14,539 | ) | ||||||||||||||||||
| USD | 432,295 | BRL | 445,780 | 2/2/2022 | HUS | - | (13,485 | ) | (13,485 | ) | ||||||||||||||||||
| USD | 432,302 | BRL | 445,780 | 2/2/2022 | HUS | - | (13,478 | ) | (13,478 | ) | ||||||||||||||||||
| USD | 431,600 | BRL | 445,780 | 2/2/2022 | HUS | - | (14,180 | ) | (14,180 | ) | ||||||||||||||||||
| USD | 415,858 | BRL | 427,949 | 2/2/2022 | HUS | - | (12,091 | ) | (12,091 | ) | ||||||||||||||||||
| USD | 416,515 | BRL | 427,949 | 2/2/2022 | HUS | - | (11,434 | ) | (11,434 | ) | ||||||||||||||||||
| USD | 398,646 | BRL | 410,118 | 2/2/2022 | HUS | - | (11,472 | ) | (11,472 | ) | ||||||||||||||||||
| USD | 398,768 | BRL | 410,118 | 2/2/2022 | HUS | - | (11,350 | ) | (11,350 | ) | ||||||||||||||||||
| USD | 398,310 | BRL | 410,118 | 2/2/2022 | HUS | - | (11,808 | ) | (11,808 | ) | ||||||||||||||||||
| USD | 399,680 | BRL | 410,118 | 2/2/2022 | HUS | - | (10,438 | ) | (10,438 | ) | ||||||||||||||||||
| USD | 398,952 | BRL | 410,118 | 2/2/2022 | HUS | - | (11,166 | ) | (11,166 | ) | ||||||||||||||||||
| USD | 399,798 | BRL | 410,118 | 2/2/2022 | HUS | - | (10,320 | ) | (10,320 | ) | ||||||||||||||||||
| USD | 397,143 | BRL | 410,118 | 2/2/2022 | HUS | - | (12,975 | ) | (12,975 | ) | ||||||||||||||||||
| USD | 381,231 | BRL | 392,287 | 2/2/2022 | HUS | - | (11,056 | ) | (11,056 | ) | ||||||||||||||||||
| USD | 381,878 | BRL | 392,287 | 2/2/2022 | HUS | - | (10,409 | ) | (10,409 | ) | ||||||||||||||||||
| USD | 379,743 | BRL | 392,287 | 2/2/2022 | HUS | - | (12,544 | ) | (12,544 | ) | ||||||||||||||||||
| USD | 364,076 | BRL | 374,456 | 2/2/2022 | HUS | - | (10,380 | ) | (10,380 | ) | ||||||||||||||||||
| USD | 364,012 | BRL | 374,456 | 2/2/2022 | HUS | - | (10,444 | ) | (10,444 | ) | ||||||||||||||||||
| USD | 364,958 | BRL | 374,456 | 2/2/2022 | HUS | - | (9,498 | ) | (9,498 | ) | ||||||||||||||||||
| USD | 362,357 | BRL | 374,456 | 2/2/2022 | HUS | - | (12,099 | ) | (12,099 | ) | ||||||||||||||||||
| USD | 362,062 | BRL | 374,456 | 2/2/2022 | HUS | - | (12,394 | ) | (12,394 | ) | ||||||||||||||||||
| USD | 346,548 | BRL | 356,624 | 2/2/2022 | HUS | - | (10,076 | ) | (10,076 | ) | ||||||||||||||||||
| USD | 346,344 | BRL | 356,624 | 2/2/2022 | HUS | - | (10,280 | ) | (10,280 | ) | ||||||||||||||||||
| USD | 347,168 | BRL | 356,624 | 2/2/2022 | HUS | - | (9,456 | ) | (9,456 | ) | ||||||||||||||||||
| USD | 329,227 | BRL | 338,793 | 2/2/2022 | HUS | - | (9,566 | ) | (9,566 | ) | ||||||||||||||||||
| USD | 329,804 | BRL | 338,793 | 2/2/2022 | HUS | - | (8,989 | ) | (8,989 | ) | ||||||||||||||||||
| USD | 330,337 | BRL | 338,793 | 2/2/2022 | HUS | - | (8,456 | ) | (8,456 | ) | ||||||||||||||||||
| USD | 328,860 | BRL | 338,793 | 2/2/2022 | HUS | - | (9,933 | ) | (9,933 | ) | ||||||||||||||||||
| USD | 327,828 | BRL | 338,793 | 2/2/2022 | HUS | - | (10,965 | ) | (10,965 | ) | ||||||||||||||||||
See accompanying notes
32
American Beacon AHL Managed Futures Strategy FundSM
Consolidated Schedule of Investments
December 31, 2021
| Forward Foreign Currency Contracts Open on December 31, 2021 (continued): | ||||||||||||||||||||||||||||
| Currency Purchased* | Currency Sold* | Settlement Date |
Counterparty | Unrealized Appreciation |
Unrealized (Depreciation) |
Net Unrealized Appreciation (Depreciation) |
||||||||||||||||||||||
| USD | 327,791 | BRL | 338,793 | 2/2/2022 | HUS | $ | - | $ | (11,002 | ) | $ | (11,002 | ) | |||||||||||||||
| USD | 311,872 | BRL | 320,962 | 2/2/2022 | HUS | - | (9,090 | ) | (9,090 | ) | ||||||||||||||||||
| USD | 310,544 | BRL | 320,962 | 2/2/2022 | HUS | - | (10,418 | ) | (10,418 | ) | ||||||||||||||||||
| USD | 310,592 | BRL | 320,962 | 2/2/2022 | HUS | - | (10,370 | ) | (10,370 | ) | ||||||||||||||||||
| USD | 294,497 | BRL | 303,131 | 2/2/2022 | HUS | - | (8,634 | ) | (8,634 | ) | ||||||||||||||||||
| USD | 294,720 | BRL | 303,131 | 2/2/2022 | HUS | - | (8,411 | ) | (8,411 | ) | ||||||||||||||||||
| USD | 294,674 | BRL | 303,131 | 2/2/2022 | HUS | - | (8,457 | ) | (8,457 | ) | ||||||||||||||||||
| USD | 295,499 | BRL | 303,131 | 2/2/2022 | HUS | - | (7,632 | ) | (7,632 | ) | ||||||||||||||||||
| USD | 296,024 | BRL | 303,131 | 2/2/2022 | HUS | - | (7,107 | ) | (7,107 | ) | ||||||||||||||||||
| USD | 294,242 | BRL | 303,131 | 2/2/2022 | HUS | - | (8,889 | ) | (8,889 | ) | ||||||||||||||||||
| USD | 293,825 | BRL | 303,131 | 2/2/2022 | HUS | - | (9,306 | ) | (9,306 | ) | ||||||||||||||||||
| USD | 277,314 | BRL | 285,299 | 2/2/2022 | HUS | - | (7,985 | ) | (7,985 | ) | ||||||||||||||||||
| USD | 277,305 | BRL | 285,299 | 2/2/2022 | HUS | - | (7,994 | ) | (7,994 | ) | ||||||||||||||||||
| USD | 277,387 | BRL | 285,299 | 2/2/2022 | HUS | - | (7,912 | ) | (7,912 | ) | ||||||||||||||||||
| USD | 277,298 | BRL | 285,299 | 2/2/2022 | HUS | - | (8,001 | ) | (8,001 | ) | ||||||||||||||||||
| USD | 278,304 | BRL | 285,299 | 2/2/2022 | HUS | - | (6,995 | ) | (6,995 | ) | ||||||||||||||||||
| USD | 278,158 | BRL | 285,299 | 2/2/2022 | HUS | - | (7,141 | ) | (7,141 | ) | ||||||||||||||||||
| USD | 278,243 | BRL | 285,299 | 2/2/2022 | HUS | - | (7,056 | ) | (7,056 | ) | ||||||||||||||||||
| USD | 276,581 | BRL | 285,299 | 2/2/2022 | HUS | - | (8,718 | ) | (8,718 | ) | ||||||||||||||||||
| USD | 259,941 | BRL | 267,468 | 2/2/2022 | HUS | - | (7,527 | ) | (7,527 | ) | ||||||||||||||||||
| USD | 259,865 | BRL | 267,468 | 2/2/2022 | HUS | - | (7,603 | ) | (7,603 | ) | ||||||||||||||||||
| USD | 259,963 | BRL | 267,468 | 2/2/2022 | HUS | - | (7,505 | ) | (7,505 | ) | ||||||||||||||||||
| USD | 260,806 | BRL | 267,468 | 2/2/2022 | HUS | - | (6,662 | ) | (6,662 | ) | ||||||||||||||||||
| USD | 260,945 | BRL | 267,468 | 2/2/2022 | HUS | - | (6,523 | ) | (6,523 | ) | ||||||||||||||||||
| USD | 261,890 | BRL | 267,468 | 2/2/2022 | HUS | - | (5,578 | ) | (5,578 | ) | ||||||||||||||||||
| USD | 260,425 | BRL | 267,468 | 2/2/2022 | HUS | - | (7,043 | ) | (7,043 | ) | ||||||||||||||||||
| USD | 260,246 | BRL | 267,468 | 2/2/2022 | HUS | - | (7,222 | ) | (7,222 | ) | ||||||||||||||||||
| USD | 259,646 | BRL | 267,468 | 2/2/2022 | HUS | - | (7,822 | ) | (7,822 | ) | ||||||||||||||||||
| USD | 259,723 | BRL | 267,468 | 2/2/2022 | HUS | - | (7,745 | ) | (7,745 | ) | ||||||||||||||||||
| USD | 258,883 | BRL | 267,468 | 2/2/2022 | HUS | - | (8,585 | ) | (8,585 | ) | ||||||||||||||||||
| USD | 258,790 | BRL | 267,468 | 2/2/2022 | HUS | - | (8,678 | ) | (8,678 | ) | ||||||||||||||||||
| USD | 242,549 | BRL | 249,637 | 2/2/2022 | HUS | - | (7,088 | ) | (7,088 | ) | ||||||||||||||||||
| USD | 242,555 | BRL | 249,637 | 2/2/2022 | HUS | - | (7,082 | ) | (7,082 | ) | ||||||||||||||||||
| USD | 242,651 | BRL | 249,637 | 2/2/2022 | HUS | - | (6,986 | ) | (6,986 | ) | ||||||||||||||||||
| USD | 243,368 | BRL | 249,637 | 2/2/2022 | HUS | - | (6,269 | ) | (6,269 | ) | ||||||||||||||||||
| USD | 242,058 | BRL | 249,637 | 2/2/2022 | HUS | - | (7,579 | ) | (7,579 | ) | ||||||||||||||||||
| USD | 241,613 | BRL | 249,637 | 2/2/2022 | HUS | - | (8,024 | ) | (8,024 | ) | ||||||||||||||||||
| USD | 225,357 | BRL | 231,806 | 2/2/2022 | HUS | - | (6,449 | ) | (6,449 | ) | ||||||||||||||||||
| USD | 225,655 | BRL | 231,806 | 2/2/2022 | HUS | - | (6,151 | ) | (6,151 | ) | ||||||||||||||||||
| USD | 225,710 | BRL | 231,806 | 2/2/2022 | HUS | - | (6,096 | ) | (6,096 | ) | ||||||||||||||||||
| USD | 224,290 | BRL | 231,806 | 2/2/2022 | HUS | - | (7,516 | ) | (7,516 | ) | ||||||||||||||||||
| USD | 208,045 | BRL | 213,975 | 2/2/2022 | HUS | - | (5,930 | ) | (5,930 | ) | ||||||||||||||||||
| USD | 207,950 | BRL | 213,975 | 2/2/2022 | HUS | - | (6,025 | ) | (6,025 | ) | ||||||||||||||||||
| USD | 207,969 | BRL | 213,975 | 2/2/2022 | HUS | - | (6,006 | ) | (6,006 | ) | ||||||||||||||||||
| USD | 207,915 | BRL | 213,975 | 2/2/2022 | HUS | - | (6,060 | ) | (6,060 | ) | ||||||||||||||||||
| USD | 208,013 | BRL | 213,975 | 2/2/2022 | HUS | - | (5,962 | ) | (5,962 | ) | ||||||||||||||||||
| USD | 208,560 | BRL | 213,975 | 2/2/2022 | HUS | - | (5,415 | ) | (5,415 | ) | ||||||||||||||||||
| USD | 208,762 | BRL | 213,975 | 2/2/2022 | HUS | - | (5,213 | ) | (5,213 | ) | ||||||||||||||||||
| USD | 208,580 | BRL | 213,975 | 2/2/2022 | HUS | - | (5,395 | ) | (5,395 | ) | ||||||||||||||||||
| USD | 208,437 | BRL | 213,975 | 2/2/2022 | HUS | - | (5,538 | ) | (5,538 | ) | ||||||||||||||||||
| USD | 207,122 | BRL | 213,975 | 2/2/2022 | HUS | - | (6,853 | ) | (6,853 | ) | ||||||||||||||||||
| USD | 191,188 | BRL | 196,143 | 2/2/2022 | HUS | - | (4,955 | ) | (4,955 | ) | ||||||||||||||||||
| USD | 191,188 | BRL | 196,143 | 2/2/2022 | HUS | - | (4,955 | ) | (4,955 | ) | ||||||||||||||||||
| USD | 191,440 | BRL | 196,143 | 2/2/2022 | HUS | - | (4,703 | ) | (4,703 | ) | ||||||||||||||||||
| USD | 189,663 | BRL | 196,143 | 2/2/2022 | HUS | - | (6,480 | ) | (6,480 | ) | ||||||||||||||||||
| USD | 173,317 | BRL | 178,312 | 2/2/2022 | HUS | - | (4,995 | ) | (4,995 | ) | ||||||||||||||||||
| USD | 173,203 | BRL | 178,312 | 2/2/2022 | HUS | - | (5,109 | ) | (5,109 | ) | ||||||||||||||||||
| USD | 173,299 | BRL | 178,312 | 2/2/2022 | HUS | - | (5,013 | ) | (5,013 | ) | ||||||||||||||||||
See accompanying notes
33
American Beacon AHL Managed Futures Strategy FundSM
Consolidated Schedule of Investments
December 31, 2021
| Forward Foreign Currency Contracts Open on December 31, 2021 (continued): | ||||||||||||||||||||||||||||
| Currency Purchased* | Currency Sold* | Settlement Date |
Counterparty | Unrealized Appreciation |
Unrealized (Depreciation) |
Net Unrealized Appreciation (Depreciation) |
||||||||||||||||||||||
| USD | 174,322 | BRL | 178,312 | 2/2/2022 | HUS | $ | - | $ | (3,990 | ) | $ | (3,990 | ) | |||||||||||||||
| USD | 174,339 | BRL | 178,312 | 2/2/2022 | HUS | - | (3,973 | ) | (3,973 | ) | ||||||||||||||||||
| USD | 174,301 | BRL | 178,312 | 2/2/2022 | HUS | - | (4,011 | ) | (4,011 | ) | ||||||||||||||||||
| USD | 174,339 | BRL | 178,312 | 2/2/2022 | HUS | - | (3,973 | ) | (3,973 | ) | ||||||||||||||||||
| USD | 173,286 | BRL | 178,312 | 2/2/2022 | HUS | - | (5,026 | ) | (5,026 | ) | ||||||||||||||||||
| USD | 173,267 | BRL | 178,312 | 2/2/2022 | HUS | - | (5,045 | ) | (5,045 | ) | ||||||||||||||||||
| USD | 173,861 | BRL | 178,312 | 2/2/2022 | HUS | - | (4,451 | ) | (4,451 | ) | ||||||||||||||||||
| USD | 173,971 | BRL | 178,312 | 2/2/2022 | HUS | - | (4,341 | ) | (4,341 | ) | ||||||||||||||||||
| USD | 173,963 | BRL | 178,312 | 2/2/2022 | HUS | - | (4,349 | ) | (4,349 | ) | ||||||||||||||||||
| USD | 173,602 | BRL | 178,312 | 2/2/2022 | HUS | - | (4,710 | ) | (4,710 | ) | ||||||||||||||||||
| USD | 173,100 | BRL | 178,312 | 2/2/2022 | HUS | - | (5,212 | ) | (5,212 | ) | ||||||||||||||||||
| USD | 173,143 | BRL | 178,312 | 2/2/2022 | HUS | - | (5,169 | ) | (5,169 | ) | ||||||||||||||||||
| USD | 155,908 | BRL | 160,481 | 2/2/2022 | HUS | - | (4,573 | ) | (4,573 | ) | ||||||||||||||||||
| USD | 155,855 | BRL | 160,481 | 2/2/2022 | HUS | - | (4,626 | ) | (4,626 | ) | ||||||||||||||||||
| USD | 155,895 | BRL | 160,481 | 2/2/2022 | HUS | - | (4,586 | ) | (4,586 | ) | ||||||||||||||||||
| USD | 155,936 | BRL | 160,481 | 2/2/2022 | HUS | - | (4,545 | ) | (4,545 | ) | ||||||||||||||||||
| USD | 156,864 | BRL | 160,481 | 2/2/2022 | HUS | - | (3,617 | ) | (3,617 | ) | ||||||||||||||||||
| USD | 156,726 | BRL | 160,481 | 2/2/2022 | HUS | - | (3,755 | ) | (3,755 | ) | ||||||||||||||||||
| USD | 156,435 | BRL | 160,481 | 2/2/2022 | HUS | - | (4,046 | ) | (4,046 | ) | ||||||||||||||||||
| USD | 156,574 | BRL | 160,481 | 2/2/2022 | HUS | - | (3,907 | ) | (3,907 | ) | ||||||||||||||||||
| USD | 156,331 | BRL | 160,481 | 2/2/2022 | HUS | - | (4,150 | ) | (4,150 | ) | ||||||||||||||||||
| USD | 156,489 | BRL | 160,481 | 2/2/2022 | HUS | - | (3,992 | ) | (3,992 | ) | ||||||||||||||||||
| USD | 157,118 | BRL | 160,481 | 2/2/2022 | HUS | - | (3,363 | ) | (3,363 | ) | ||||||||||||||||||
| USD | 157,087 | BRL | 160,481 | 2/2/2022 | HUS | - | (3,394 | ) | (3,394 | ) | ||||||||||||||||||
| USD | 156,205 | BRL | 160,481 | 2/2/2022 | HUS | - | (4,276 | ) | (4,276 | ) | ||||||||||||||||||
| USD | 155,762 | BRL | 160,481 | 2/2/2022 | HUS | - | (4,719 | ) | (4,719 | ) | ||||||||||||||||||
| USD | 155,771 | BRL | 160,481 | 2/2/2022 | HUS | - | (4,710 | ) | (4,710 | ) | ||||||||||||||||||
| USD | 155,814 | BRL | 160,481 | 2/2/2022 | HUS | - | (4,667 | ) | (4,667 | ) | ||||||||||||||||||
| USD | 138,550 | BRL | 142,650 | 2/2/2022 | HUS | - | (4,100 | ) | (4,100 | ) | ||||||||||||||||||
| USD | 138,622 | BRL | 142,650 | 2/2/2022 | HUS | - | (4,028 | ) | (4,028 | ) | ||||||||||||||||||
| USD | 139,555 | BRL | 142,650 | 2/2/2022 | HUS | - | (3,095 | ) | (3,095 | ) | ||||||||||||||||||
| USD | 138,961 | BRL | 142,650 | 2/2/2022 | HUS | - | (3,689 | ) | (3,689 | ) | ||||||||||||||||||
| USD | 139,079 | BRL | 142,650 | 2/2/2022 | HUS | - | (3,571 | ) | (3,571 | ) | ||||||||||||||||||
| USD | 139,153 | BRL | 142,650 | 2/2/2022 | HUS | - | (3,497 | ) | (3,497 | ) | ||||||||||||||||||
| USD | 139,590 | BRL | 142,650 | 2/2/2022 | HUS | - | (3,060 | ) | (3,060 | ) | ||||||||||||||||||
| USD | 121,305 | BRL | 124,819 | 2/2/2022 | HUS | - | (3,514 | ) | (3,514 | ) | ||||||||||||||||||
| USD | 121,298 | BRL | 124,819 | 2/2/2022 | HUS | - | (3,521 | ) | (3,521 | ) | ||||||||||||||||||
| USD | 121,284 | BRL | 124,819 | 2/2/2022 | HUS | - | (3,535 | ) | (3,535 | ) | ||||||||||||||||||
| USD | 122,060 | BRL | 124,819 | 2/2/2022 | HUS | - | (2,759 | ) | (2,759 | ) | ||||||||||||||||||
| USD | 121,565 | BRL | 124,819 | 2/2/2022 | HUS | - | (3,254 | ) | (3,254 | ) | ||||||||||||||||||
| USD | 121,755 | BRL | 124,819 | 2/2/2022 | HUS | - | (3,064 | ) | (3,064 | ) | ||||||||||||||||||
| USD | 122,199 | BRL | 124,819 | 2/2/2022 | HUS | - | (2,620 | ) | (2,620 | ) | ||||||||||||||||||
| USD | 103,942 | BRL | 106,987 | 2/2/2022 | HUS | - | (3,045 | ) | (3,045 | ) | ||||||||||||||||||
| USD | 104,577 | BRL | 106,987 | 2/2/2022 | HUS | - | (2,410 | ) | (2,410 | ) | ||||||||||||||||||
| USD | 104,346 | BRL | 106,987 | 2/2/2022 | HUS | - | (2,641 | ) | (2,641 | ) | ||||||||||||||||||
| USD | 104,337 | BRL | 106,987 | 2/2/2022 | HUS | - | (2,650 | ) | (2,650 | ) | ||||||||||||||||||
| USD | 104,683 | BRL | 106,987 | 2/2/2022 | HUS | - | (2,304 | ) | (2,304 | ) | ||||||||||||||||||
| USD | 86,481 | BRL | 89,156 | 2/2/2022 | HUS | - | (2,675 | ) | (2,675 | ) | ||||||||||||||||||
| USD | 86,778 | BRL | 89,156 | 2/2/2022 | HUS | - | (2,378 | ) | (2,378 | ) | ||||||||||||||||||
| USD | 69,196 | BRL | 71,325 | 2/2/2022 | HUS | - | (2,129 | ) | (2,129 | ) | ||||||||||||||||||
| USD | 69,709 | BRL | 71,325 | 2/2/2022 | HUS | - | (1,616 | ) | (1,616 | ) | ||||||||||||||||||
| USD | 69,749 | BRL | 71,325 | 2/2/2022 | HUS | - | (1,576 | ) | (1,576 | ) | ||||||||||||||||||
| USD | 52,076 | BRL | 53,494 | 2/2/2022 | HUS | - | (1,418 | ) | (1,418 | ) | ||||||||||||||||||
| USD | 52,076 | BRL | 53,494 | 2/2/2022 | HUS | - | (1,418 | ) | (1,418 | ) | ||||||||||||||||||
| USD | 34,612 | BRL | 35,662 | 2/2/2022 | HUS | - | (1,050 | ) | (1,050 | ) | ||||||||||||||||||
| USD | 34,729 | BRL | 35,662 | 2/2/2022 | HUS | - | (933 | ) | (933 | ) | ||||||||||||||||||
| USD | 34,688 | BRL | 35,662 | 2/2/2022 | HUS | - | (974 | ) | (974 | ) | ||||||||||||||||||
| USD | 17,420 | BRL | 17,831 | 2/2/2022 | HUS | - | (411 | ) | (411 | ) | ||||||||||||||||||
See accompanying notes
34
American Beacon AHL Managed Futures Strategy FundSM
Consolidated Schedule of Investments
December 31, 2021
| Forward Foreign Currency Contracts Open on December 31, 2021 (continued): | ||||||||||||||||||||||||||||
| Currency Purchased* | Currency Sold* | Settlement Date |
Counterparty | Unrealized Appreciation |
Unrealized (Depreciation) |
Net Unrealized Appreciation (Depreciation) |
||||||||||||||||||||||
| USD | 17,336 | BRL | 17,831 | 2/2/2022 | HUS | $ | - | $ | (495 | ) | $ | (495 | ) | |||||||||||||||
| USD | 17,345 | BRL | 17,831 | 2/2/2022 | HUS | - | (486 | ) | (486 | ) | ||||||||||||||||||
| USD | 17,336 | BRL | 17,831 | 2/2/2022 | HUS | - | (495 | ) | (495 | ) | ||||||||||||||||||
| USD | 17,341 | BRL | 17,831 | 2/2/2022 | HUS | - | (490 | ) | (490 | ) | ||||||||||||||||||
| USD | 6,982,299 | CLP | 6,658,423 | 2/7/2022 | HUS | 323,876 | - | 323,876 | ||||||||||||||||||||
| USD | 1,305,455 | COP | 1,287,321 | 2/10/2022 | HUS | 18,134 | - | 18,134 | ||||||||||||||||||||
| USD | 978,772 | COP | 965,490 | 2/10/2022 | HUS | 13,282 | - | 13,282 | ||||||||||||||||||||
| PHP | 48,930 | USD | 49,821 | 2/18/2022 | HUS | - | (891 | ) | (891 | ) | ||||||||||||||||||
| PHP | 48,930 | USD | 49,722 | 2/18/2022 | HUS | - | (792 | ) | (792 | ) | ||||||||||||||||||
| PHP | 48,930 | USD | 49,711 | 2/18/2022 | HUS | - | (781 | ) | (781 | ) | ||||||||||||||||||
| PHP | 97,860 | USD | 99,653 | 2/18/2022 | HUS | - | (1,793 | ) | (1,793 | ) | ||||||||||||||||||
| PHP | 97,860 | USD | 99,637 | 2/18/2022 | HUS | - | (1,777 | ) | (1,777 | ) | ||||||||||||||||||
| PHP | 97,860 | USD | 99,447 | 2/18/2022 | HUS | - | (1,587 | ) | (1,587 | ) | ||||||||||||||||||
| PHP | 195,721 | USD | 199,227 | 2/18/2022 | HUS | - | (3,506 | ) | (3,506 | ) | ||||||||||||||||||
| PEN | 125,159 | USD | 125,363 | 1/24/2022 | RBS | - | (204 | ) | (204 | ) | ||||||||||||||||||
| PEN | 187,739 | USD | 188,036 | 1/24/2022 | RBS | - | (297 | ) | (297 | ) | ||||||||||||||||||
| PEN | 187,739 | USD | 187,867 | 1/24/2022 | RBS | - | (128 | ) | (128 | ) | ||||||||||||||||||
| PEN | 187,739 | USD | 188,008 | 1/24/2022 | RBS | - | (269 | ) | (269 | ) | ||||||||||||||||||
| PEN | 187,739 | USD | 188,055 | 1/24/2022 | RBS | - | (316 | ) | (316 | ) | ||||||||||||||||||
| PEN | 250,318 | USD | 250,733 | 1/24/2022 | RBS | - | (415 | ) | (415 | ) | ||||||||||||||||||
| PEN | 312,898 | USD | 313,338 | 1/24/2022 | RBS | - | (440 | ) | (440 | ) | ||||||||||||||||||
| PEN | 312,898 | USD | 313,331 | 1/24/2022 | RBS | - | (433 | ) | (433 | ) | ||||||||||||||||||
| PEN | 312,898 | USD | 313,417 | 1/24/2022 | RBS | - | (519 | ) | (519 | ) | ||||||||||||||||||
| PEN | 375,477 | USD | 376,232 | 1/24/2022 | RBS | - | (755 | ) | (755 | ) | ||||||||||||||||||
| PEN | 500,636 | USD | 501,391 | 1/24/2022 | RBS | - | (755 | ) | (755 | ) | ||||||||||||||||||
| PEN | 500,636 | USD | 501,366 | 1/24/2022 | RBS | - | (730 | ) | (730 | ) | ||||||||||||||||||
| PEN | 563,216 | USD | 564,009 | 1/24/2022 | RBS | - | (793 | ) | (793 | ) | ||||||||||||||||||
| PEN | 1,063,853 | USD | 1,065,822 | 1/24/2022 | RBS | - | (1,969 | ) | (1,969 | ) | ||||||||||||||||||
| PEN | 1,251,591 | USD | 1,259,826 | 1/24/2022 | RBS | - | (8,235 | ) | (8,235 | ) | ||||||||||||||||||
| PEN | 1,251,591 | USD | 1,259,427 | 1/24/2022 | RBS | - | (7,836 | ) | (7,836 | ) | ||||||||||||||||||
| USD | 1,790,565 | PEN | 1,814,807 | 1/24/2022 | RBS | - | (24,242 | ) | (24,242 | ) | ||||||||||||||||||
| USD | 1,502,332 | PEN | 1,564,489 | 1/24/2022 | RBS | - | (62,157 | ) | (62,157 | ) | ||||||||||||||||||
| USD | 1,058,887 | PEN | 1,063,853 | 1/24/2022 | RBS | - | (4,966 | ) | (4,966 | ) | ||||||||||||||||||
| USD | 612,070 | PEN | 625,796 | 1/24/2022 | RBS | - | (13,726 | ) | (13,726 | ) | ||||||||||||||||||
| USD | 612,295 | PEN | 625,796 | 1/24/2022 | RBS | - | (13,501 | ) | (13,501 | ) | ||||||||||||||||||
| USD | 601,044 | PEN | 625,796 | 1/24/2022 | RBS | - | (24,752 | ) | (24,752 | ) | ||||||||||||||||||
| USD | 489,584 | PEN | 500,636 | 1/24/2022 | RBS | - | (11,052 | ) | (11,052 | ) | ||||||||||||||||||
| USD | 432,227 | PEN | 438,057 | 1/24/2022 | RBS | - | (5,830 | ) | (5,830 | ) | ||||||||||||||||||
| USD | 306,065 | PEN | 312,898 | 1/24/2022 | RBS | - | (6,833 | ) | (6,833 | ) | ||||||||||||||||||
| USD | 183,599 | PEN | 187,739 | 1/24/2022 | RBS | - | (4,140 | ) | (4,140 | ) | ||||||||||||||||||
|
|
|
|
|
|
|
|||||||||||||||||||||||
| $ | 6,864,218 | $ | (8,498,721 | ) | $ | (1,634,503 | ) | |||||||||||||||||||||
|
|
|
|
|
|
|
|||||||||||||||||||||||
| * | All values denominated in USD. |
| Glossary: | ||
| Counterparty Abbreviations: | ||
| CBK | Citibank, N.A. | |
| HUS | HSBC Bank (USA) | |
| RBS | Royal Bank of Scotland PLC | |
See accompanying notes
35
American Beacon AHL Managed Futures Strategy FundSM
Consolidated Schedule of Investments
December 31, 2021
| Currency Abbreviations: | ||
| AUD | Australian Dollar | |
| BRL | Brazilian Real | |
| CLP | Chilean Peso | |
| CNY | Chinese Yuan | |
| COP | Colombian Peso | |
| EUR | Euro | |
| HKD | Hong Kong Dollar | |
| INR | Indian Rupee | |
| KRW | South Korean Won | |
| PEN | Peruvian Nuevo Sol | |
| PHP | Philippine Peso | |
| TWD | Taiwan Dollar | |
| USD | United States Dollar | |
| Index Abbreviations: | ||
| CAC40 | Euronet Paris—French Stock Market Index. | |
| DAX | Deutsche Boerse AG German Stock Index. | |
| Euro Stoxx 50 | Eurozone Blue-chip Index. | |
| FTSE 100 | Financial Times Stock Exchange 100 Index. | |
| FTSE/JSE Top 40 | Largest 40 companies ranked by full market value in the FTSE/JSE All-Share Index. | |
| FTSE/MIB | Borsa Italiana-Italian Stock Market Index. | |
| Hang Seng | Hong Kong Stock Market Index. | |
| KOSPI | South Korean Stock Market Index. | |
| MSCI | Morgan Stanley Capital International. | |
| MSCI EAFE | Morgan Stanley Capital International—Europe, Australasia, and Far East. | |
| NASDAQ | National Association of Securities Dealers Automated Quotations. | |
| NIKKEI 225 | Nikkei Stock Average. | |
| OMXS30 | Stockholm Stock Exchange’s leading share index. | |
| Russell 2000 | U.S. Small-Cap Stock Market Index. | |
| S&P 500 | S&P 500 Index—U.S. Equity Large-Cap Index. | |
| S&P/TSX | Canadian Equity Market Index. | |
| SPI 200 | Australian Equity Market Index Future. | |
| TOPIX | Tokyo Stock Exchange Tokyo Price Index. | |
| Exchange Abbreviations: | ||
| JSE | Johannesburg Stock Exchange. | |
| LME | London Metal Exchange. | |
| SGX | Singapore Stock Exchange. | |
| Other Abbreviations: | ||
| Bobl | Medium term debt that is issued by the Federal Republic of Germany. | |
| Bund | German Federal Government Bond. | |
| Buxl | Long term debt that is issued by the Federal Republic of Germany. | |
| Euribor | Euro Interbank Offered Rate. | |
| GILT | Bank of England Bonds. | |
| RBOB | Reformulated Gasoline Blendstock for Oxygen Blending. | |
| Schatz | Short-dated equivalent of the Bobl and Bund futures. | |
| SOFR | Secured Overnight Financing Rate | |
| Sonia | Sterling Overnight Index Rate. | |
| Sugar #11 | World Benchmark for raw sugar. | |
| ULSD | Ultra-low-sulfur diesel. | |
| WTI | West Texas Intermediate. | |
See accompanying notes
36
American Beacon AHL Managed Futures Strategy FundSM
Consolidated Schedule of Investments
December 31, 2021
The Fund’s investments are summarized by level based on the inputs used to determine their values. As of December 31, 2021, the investments were classified as described below:
| AHL Managed Futures Strategy Fund |
Level 1 | Level 2 | Level 3 | Total | ||||||||||||||||||||||||
| Assets |
||||||||||||||||||||||||||||
| Short-Term Investments |
$ | - | $ | 1,779,644,341 | $ | - | $ | 1,779,644,341 | ||||||||||||||||||||
|
|
|
|
|
|
|
|
|
|||||||||||||||||||||
| Total Investments in Securities - Assets |
$ | - | $ | 1,779,644,341 | $ | - | $ | 1,779,644,341 | ||||||||||||||||||||
|
|
|
|
|
|
|
|
|
|||||||||||||||||||||
| Financial Derivative Instruments - Assets |
||||||||||||||||||||||||||||
| Futures Contracts |
$ | 33,961,053 | $ | - | $ | - | $ | 33,961,053 | ||||||||||||||||||||
| Forward Foreign Currency Contracts |
- | 6,864,218 | - | 6,864,218 | ||||||||||||||||||||||||
|
|
|
|
|
|
|
|
|
|||||||||||||||||||||
| Total Financial Derivative Instruments - Assets |
$ | 33,961,053 | $ | 6,864,218 | $ | - | $ | 40,825,271 | ||||||||||||||||||||
|
|
|
|
|
|
|
|
|
|||||||||||||||||||||
| Financial Derivative Instruments - Liabilities |
||||||||||||||||||||||||||||
| Futures Contracts |
$ | (32,240,951 | ) | $ | - | $ | - | $ | (32,240,951 | ) | ||||||||||||||||||
| Forward Foreign Currency Contracts |
- | (8,498,721 | ) | - | (8,498,721 | ) | ||||||||||||||||||||||
|
|
|
|
|
|
|
|
|
|||||||||||||||||||||
| Total Financial Derivative Instruments - Liabilities |
$ | (32,240,951 | ) | $ | (8,498,721 | ) | $ | - | $ | (40,739,672 | ) | |||||||||||||||||
|
|
|
|
|
|
|
|
|
|||||||||||||||||||||
U.S. GAAP requires transfers between all levels to/from level 3 be disclosed. During the year ended December 31, 2021, there were no transfers into or out of Level 3.
See accompanying notes
37
American Beacon AHL TargetRisk FundSM
Consolidated Schedule of Investments
December 31, 2021
| Principal Amount* | Fair Value | ||||||||||||||
| FOREIGN SOVEREIGN OBLIGATIONS - 24.56% | |||||||||||||||
| Deutsche Bundesrepublik Inflation-Linked Bond, 0.500%, Due 4/15/2030, Series I/LA B C |
EUR 51,647,980 | $ | 72,750,263 | ||||||||||||
| French Republic Government Bond OAT, 0.700%, Due 7/25/2030, Series OATEB C D |
EUR 46,348,145 | 65,048,839 | |||||||||||||
| United Kingdom Gilt Inflation-Linked, 0.125%, Due 3/22/2029, Series 3MOB C |
GBP 51,232,740 | 87,358,882 | |||||||||||||
|
|
|
||||||||||||||
| Total Foreign Sovereign Obligations (Cost $228,039,671) |
225,157,984 | ||||||||||||||
|
|
|
||||||||||||||
| U.S. TREASURY OBLIGATIONS - 19.09% | |||||||||||||||
| United States Treasury Inflation-Protected Security, 0.125%, Due 4/15/2026C |
$ | 69,590,400 | 75,112,779 | ||||||||||||
| 0.125%, Due 1/15/2031C |
89,227,320 | 99,943,312 | |||||||||||||
|
|
|
||||||||||||||
| Total U.S. Treasury Obligations (Cost $174,249,228) |
175,056,091 | ||||||||||||||
|
|
|
||||||||||||||
| SHORT-TERM INVESTMENTS - 41.43% | |||||||||||||||
| U.S. Treasury Obligations - 41.43% | |||||||||||||||
| U.S. Treasury Bills, |
|||||||||||||||
| 0.052%, Due 2/24/2022A |
5,000,000 | 4,999,801 | |||||||||||||
| 0.049%, Due 3/3/2022A |
25,000,000 | 24,998,054 | |||||||||||||
| 0.051%, Due 4/14/2022 |
25,000,000 | 24,994,740 | |||||||||||||
| 0.055%, Due 4/21/2022 |
50,000,000 | 49,988,937 | |||||||||||||
| 0.111%, Due 4/28/2022A |
80,000,000 | 79,980,514 | |||||||||||||
| 0.159%, Due 5/12/2022A |
70,000,000 | 69,977,425 | |||||||||||||
| 0.063%, Due 5/19/2022 |
50,000,000 | 49,981,536 | |||||||||||||
| 0.211%, Due 6/9/2022A |
75,000,000 | 74,964,021 | |||||||||||||
|
|
|
||||||||||||||
| Total Short-Term Investments (Cost $379,907,713) |
379,885,028 | ||||||||||||||
|
|
|
||||||||||||||
| TOTAL INVESTMENTS - 85.08% (Cost $782,196,612) |
780,099,103 | ||||||||||||||
| OTHER ASSETS, NET OF LIABILITIES - 14.92% |
136,814,349 | ||||||||||||||
|
|
|
||||||||||||||
| TOTAL NET ASSETS - 100.00% |
$ | 916,913,452 | |||||||||||||
|
|
|
||||||||||||||
| Percentages are stated as a percent of net assets. *In U.S. Dollars unless otherwise noted. |
|||||||||||||||
A All or a portion represents positions held by the American Beacon Cayman TargetRisk Co., Ltd.
B Reg S - Security purchased under the Securities Act of 1933, which exempts from registration securities offered and sold outside of the United States. Such a security cannot be sold in the United States without either an effective registration statement filed pursuant to the Securities Act of 1933, or pursuant to an exemption from registration.
C Inflation-Indexed Note.
D Security exempt from registration under the Securities Act of 1933. These securities may be resold to qualified institutional buyers pursuant to Rule 144A. At the period end, the value of these securities amounted to $65,048,839 or 7.09% of net assets. The Fund has no right to demand registration of these securities.
| Long Futures Contracts Open on December 31, 2021: |
| |||||||||||||||
| Equity Futures Contracts | ||||||||||||||||
| Description | Number of Contracts |
Expiration Date | Notional Amount | Contract Value | Unrealized Appreciation (Depreciation) |
|||||||||||
| Amsterdam Index | 100 | January 2022 | $ | 17,937,629 | $ | 18,163,395 | $ | 225,766 | ||||||||
| CAC40 Index | 226 | January 2022 | 17,965,608 | 18,379,004 | 413,396 | |||||||||||
| DAX Index | 51 | March 2022 | 22,649,448 | 23,016,364 | 366,916 | |||||||||||
| Euro Stoxx 50 Index | 747 | March 2022 | 35,563,686 | 36,463,439 | 899,753 | |||||||||||
| FTSE 100 Index | 405 | March 2022 | 39,589,071 | 40,149,269 | 560,198 | |||||||||||
| FTSE China A50 Index | 993 | January 2022 | 15,774,744 | 15,589,107 | (185,637 | ) | ||||||||||
| FTSE Taiwan Index | 161 | January 2022 | 10,225,906 | 10,326,540 | 100,634 | |||||||||||
| FTSE/JSE Top 40 Index | 100 | March 2022 | 4,110,503 | 4,204,079 | 93,576 | |||||||||||
| FTSE/MIB Index | 111 | March 2022 | 16,796,087 | 17,217,120 | 421,033 | |||||||||||
| Hang Seng China Enterprises Index | 242 | January 2022 | 12,744,928 | 12,828,478 | 83,550 | |||||||||||
| Hang Seng Index | 94 | January 2022 | 14,037,205 | 14,135,171 | 97,966 | |||||||||||
| iShares STOXX Europe 600 UCITS ETF | 46 | March 2022 | 920,867 | 953,676 | 32,809 | |||||||||||
| KOSPI 200 Index | 254 | March 2022 | 21,065,692 | 21,059,832 | (5,860 | ) | ||||||||||
See accompanying notes
38
American Beacon AHL TargetRisk FundSM
Consolidated Schedule of Investments
December 31, 2021
| Equity Futures Contracts (continued) | ||||||||||||||||
| Description | Number of Contracts |
Expiration Date | Notional Amount | Contract Value | Unrealized Appreciation (Depreciation) |
|||||||||||
| MSCI SING IX ETS | 266 | January 2022 | $ | 6,660,378 | $ | 6,714,151 | $ | 53,773 | ||||||||
| NASDAQ 100 E-Mini | 135 | March 2022 | 43,811,618 | 44,066,025 | 254,407 | |||||||||||
| Nikkei 225 (SGX) | 265 | March 2022 | 32,902,946 | 33,127,880 | 224,934 | |||||||||||
| OMXS30 Index | 801 | January 2022 | 20,621,025 | 21,445,068 | 824,043 | |||||||||||
| S&P 500 E-Mini Index | 366 | March 2022 | 85,727,372 | 87,080,550 | 1,353,178 | |||||||||||
| S&P 500 E-Mini Index | 10 | March 2022 | 2,033,394 | 2,070,400 | 37,006 | |||||||||||
| S&P/TSX 60 Index | 249 | March 2022 | 49,675,961 | 50,427,938 | 751,977 | |||||||||||
| SGX NIFTY 50 Index | 66 | January 2022 | 2,269,246 | 2,302,014 | 32,768 | |||||||||||
| SPI 200 | 226 | March 2022 | 29,855,046 | 30,201,000 | 345,954 | |||||||||||
| TOPIX Index | 299 | March 2022 | 51,586,806 | 51,778,492 | 191,686 | |||||||||||
|
|
|
|
|
|
|
|||||||||||
| $ | 554,525,166 | $ | 561,698,992 | $ | 7,173,826 | |||||||||||
|
|
|
|
|
|
|
|||||||||||
| Interest Rate Futures Contracts | ||||||||||||||||
| Description | Number of Contracts |
Expiration Date | Notional Amount |
Contract Value | Unrealized Appreciation (Depreciation) |
|||||||||||
| Australian 10-Year Bond | 633 | March 2022 | $ | 64,246,406 | $ | 64,092,003 | $ | (154,403 | ) | |||||||
| Australian 3-Year Bond | 16 | March 2022 | 1,328,269 | 1,328,799 | 530 | |||||||||||
| Canadian 10-Year Bond | 345 | March 2022 | 38,059,421 | 38,897,901 | 838,480 | |||||||||||
| Euro OAT | 410 | March 2022 | 77,256,253 | 76,155,947 | (1,100,306 | ) | ||||||||||
| Euro-Bobl | 25 | March 2022 | 3,824,379 | 3,792,342 | (32,037 | ) | ||||||||||
| Euro-BTP | 343 | March 2022 | 58,463,497 | 57,408,194 | (1,055,303 | ) | ||||||||||
| Euro-Bund | 727 | March 2022 | 143,922,872 | 141,841,102 | (2,081,770 | ) | ||||||||||
| Euro-Buxl 30-Year Bond | 64 | March 2022 | 15,743,731 | 15,063,898 | (679,833 | ) | ||||||||||
| Japanese 10-Year Government Bond | 106 | March 2022 | 140,065,648 | 139,689,994 | (375,654 | ) | ||||||||||
| Korea 10-Year Government Bond | 382 | March 2022 | 40,239,759 | 39,936,875 | (302,884 | ) | ||||||||||
| Korea 3-Year Government Bond | 16 | March 2022 | 1,467,075 | 1,468,568 | 1,493 | |||||||||||
| Long GILT | 434 | March 2022 | 73,484,795 | 73,371,341 | (113,454 | ) | ||||||||||
| U.S. Long Bond | 416 | March 2022 | 65,835,522 | 66,742,000 | 906,478 | |||||||||||
| U.S. Treasury 10-Year Note | 1,763 | March 2022 | 227,844,009 | 230,016,406 | 2,172,397 | |||||||||||
| U.S. Treasury 2-Year Note | 15 | March 2022 | 3,275,496 | 3,272,578 | (2,918 | ) | ||||||||||
| U.S. Treasury 5-Year Note | 36 | March 2022 | 4,339,707 | 4,355,156 | 15,449 | |||||||||||
| U.S. Ultra Bond | 424 | March 2022 | 81,812,094 | 83,581,000 | 1,768,906 | |||||||||||
|
|
|
|
|
|
|
|||||||||||
| $ | 1,041,208,933 | $ | 1,041,014,104 | $ | (194,829 | ) | ||||||||||
|
|
|
|
|
|
|
|||||||||||
| Centrally Cleared Swap Agreements Outstanding on December 31, 2021: |
| |||||||||||||||||||||||||||
| Credit Default Swaps on Credit Indices - Buy Protection(1) | ||||||||||||||||||||||||||||
| Index/Tranches | Fixed Rate (%) |
Payment Frequency |
Expiration Date |
Implied Credit Spread at 12/31/2021(3) (%) |
Curr | Notional Amount(4) (000s) |
Premiums Paid (Received) |
Fair Value(5) | Unrealized Appreciation (Depreciation) |
|||||||||||||||||||
| iTraxx Europe Senior Financials | 1.00 | Quarterly | 12/20/2026 | 0.4768 | EUR | 15,000 | $ | (420,878 | ) | $ | (450,609 | ) | $ | (29,731 | ) | |||||||||||||
| iTraxx Europe Senior Financials | 5.00 | Quarterly | 12/20/2026 | 2.4210 | EUR | 5,000 | (640,124 | ) | (684,320 | ) | (44,196 | ) | ||||||||||||||||
|
|
|
|
|
|
|
|||||||||||||||||||||||
| $ | (1,061,002 | ) | $ | (1,134,929 | ) | $ | (73,927 | ) | ||||||||||||||||||||
|
|
|
|
|
|
|
|||||||||||||||||||||||
| Credit Default Swaps on Credit Indices - Sell Protection(2) | ||||||||||||||||||||||||||||
| Index/Tranches | Fixed Rate (%) |
Payment Frequency |
Expiration Date |
Implied Credit Spread at 12/31/2021(3) (%) |
Curr | Notional Amount(4) (000s) |
Premiums Paid (Received) |
Fair Value(5) | Unrealized Appreciation (Depreciation) |
|||||||||||||||||||
| iTraxx Europe Senior Financials | 5.00 | Quarterly | 12/20/2026 | 2.4210 | EUR | 90,000 | $ | 11,136,582 | $ | 12,317,753 | $ | 1,181,171 | ||||||||||||||||
| iTraxx Europe Senior Financials | 1.00 | Quarterly | 12/20/2026 | 0.4768 | EUR | 205,000 | 5,746,886 | 6,158,326 | 411,440 | |||||||||||||||||||
See accompanying notes
39
American Beacon AHL TargetRisk FundSM
Consolidated Schedule of Investments
December 31, 2021
| Credit Default Swaps on Credit Indices - Sell Protection(2) (continued) | ||||||||||||||||||||||||||||
| Index/Tranches | Fixed Rate (%) |
Payment Frequency |
Expiration Date |
Implied Credit Spread at 12/31/2021(3) (%) |
Curr | Notional Amount(4) (000s) |
Premiums Paid (Received) |
Fair Value(5) | Unrealized Appreciation (Depreciation) |
|||||||||||||||||||
| Markit CDX NA.HY-31 5-Year Index Version 1 | 5.00 | Quarterly | 12/20/2026 | 2.9186 | USD | 85,000 | $ | 7,670,483 | $ | 7,958,719 | $ | 288,236 | ||||||||||||||||
| Markit CDX NA.HY-31 5-Year Index Version 1 | 1.00 | Quarterly | 12/20/2026 | 0.4932 | USD | 235,000 | 5,578,389 | 5,820,340 | 241,951 | |||||||||||||||||||
|
|
|
|
|
|
|
|||||||||||||||||||||||
| $ | 30,132,340 | $ | 32,255,138 | $ | 2,122,798 | |||||||||||||||||||||||
|
|
|
|
|
|
|
|||||||||||||||||||||||
| OTC Swap Agreements Outstanding on December 31, 2021: |
|
|||||||||||||||||||||||||||||||
| Total Return Swap Agreements | ||||||||||||||||||||||||||||||||
| Pay/Receive Floating Rate |
Description | Reference Entity |
Counter- party |
Floating Rate |
Payment Frequency |
Expiration Date |
Reference Quantity |
Notional Amount |
Premiums Paid (Received) |
Unrealized Appreciation (Depreciation) |
||||||||||||||||||||||
| Pay | 1-Month USD-LIBOR | BBUXALC INDEX |
JPM | 0.000% | Monthly | 1/5/2022 | 989,000 | 121,223,553 | $ | 452 | $ | 5,164,063 | ||||||||||||||||||||
|
|
|
|
|
|||||||||||||||||||||||||||||
| $ | 452 | $ | 5,164,063 | |||||||||||||||||||||||||||||
|
|
|
|
|
|||||||||||||||||||||||||||||
(1) If the Fund is a buyer of protection and a credit event occurs, as defined under the terms of that particular swap agreement, the Fund will either (i) receive from the seller of protection an amount equal to the notional amount of the swap and deliver the referenced obligation or underlying securities comprising the referenced index or (ii) receive a net settlement amount in the form of cash or securities equal to the notional amount of the swap less the recovery value of the referenced obligation or underlying securities comprising the referenced index.
(2) If the Fund is a seller of protection and a credit event occurs, as defined under the terms of that particular swap agreement, the Fund will either (i) pay to the buyer of protection an amount equal to the notional amount of the swap and take delivery of the referenced obligation or underlying securities comprising the referenced index or (ii) pay a net settlement amount in the form of cash or securities equal to the notional amount of the swap less the recovery value of the referenced obligation or underlying securities comprising the referenced index.
(3) Implied credit spreads, represented in absolute terms, utilized in determining the fair value of credit default swaps agreements on corporate issues and sovereign issues of an emerging country as of period end serve as an indicator of the current status of the payment/performance risk and represent the likelihood or risk of default for the credit derivative. The implied credit spread of a particular referenced entity reflects the cost of buying/selling protection and may include upfront payments required to be made to enter into the agreement. Wider credit spreads represent a deterioration of the referenced entity’s credit soundness and a greater likelihood or risk of default or other credit event occurring as defined under the terms of the agreement.
(4) The maximum potential amount the Fund could be required to pay as a seller of credit protection or receive as a buyer of credit protection if a credit event occurs as defined under the terms of that particular swap agreement.
(5) The quoted market prices and resulting values for credit default swaps on asset-backed securities and credit indices serve as an indicator of the current status of the payment/performance risk and represent the likelihood of an expected liability (or profit) for the credit derivative should the notional amount of the swap agreement be closed/ sold as of the period end. Increasing fair values, in absolute terms when compared to the notional amount of the swap, represent a deterioration of the referenced entity’s credit soundness and greater likelihood or risk of default or other credit event occurring as defined under the terms of the agreement.
| Forward Foreign Currency Contracts Open on December 31, 2021: | ||||||||||||||||||||||||||||
| Currency Purchased* | Currency Sold* | Settlement Date |
Counterparty | Unrealized Appreciation |
Unrealized (Depreciation) |
Net Unrealized Appreciation (Depreciation) |
||||||||||||||||||||||
| CAD | 1,893,959 | USD | 1,867,542 | 1/20/2022 | SSB | $ | 26,417 | $ | - | $ | 26,417 | |||||||||||||||||
| AUD | 2,005,437 | USD | 2,002,934 | 1/20/2022 | SSB | 2,503 | - | 2,503 | ||||||||||||||||||||
| JPY | 2,123,855 | USD | 2,137,566 | 1/20/2022 | SSB | - | (13,711 | ) | (13,711 | ) | ||||||||||||||||||
| JPY | 2,312,145 | USD | 2,347,949 | 1/20/2022 | SSB | - | (35,804 | ) | (35,804 | ) | ||||||||||||||||||
| EUR | 3,840,772 | USD | 3,810,868 | 1/20/2022 | SSB | 29,904 | - | 29,904 | ||||||||||||||||||||
| JPY | 4,190,639 | USD | 4,241,576 | 1/20/2022 | SSB | - | (50,937 | ) | (50,937 | ) | ||||||||||||||||||
| EUR | 4,431,895 | USD | 4,389,855 | 1/20/2022 | SSB | 42,040 | - | 42,040 | ||||||||||||||||||||
| EUR | 5,408,047 | USD | 5,365,940 | 1/20/2022 | SSB | 42,107 | - | 42,107 | ||||||||||||||||||||
| EUR | 6,253,112 | USD | 6,218,433 | 1/20/2022 | SSB | 34,679 | - | 34,679 | ||||||||||||||||||||
| GBP | 9,310,101 | USD | 9,204,773 | 1/20/2022 | SSB | 105,328 | - | 105,328 | ||||||||||||||||||||
| USD | 101,055,912 | GBP | 103,548,458 | 1/20/2022 | SSB | - | (2,492,546 | ) | (2,492,546 | ) | ||||||||||||||||||
| USD | 97,171,498 | EUR | 98,070,563 | 1/20/2022 | SSB | - | (899,065 | ) | (899,065 | ) | ||||||||||||||||||
| USD | 73,009,900 | EUR | 73,685,414 | 1/20/2022 | SSB | - | (675,514 | ) | (675,514 | ) | ||||||||||||||||||
See accompanying notes
40
American Beacon AHL TargetRisk FundSM
Consolidated Schedule of Investments
December 31, 2021
| Forward Foreign Currency Contracts Open on December 31, 2021 (continued): |
|
|||||||||||||||||||||||||||
| Currency Purchased* | Currency Sold* | Settlement Date |
Counterparty | Unrealized Appreciation |
Unrealized (Depreciation) |
Net Unrealized Appreciation (Depreciation) |
||||||||||||||||||||||
| USD | 9,089,576 | JPY | 8,980,933 | 1/20/2022 | SSB | $ | 108,643 | $ | - | $ | 108,643 | |||||||||||||||||
| USD | 2,475,181 | GBP | 2,518,844 | 1/20/2022 | SSB | - | (43,663 | ) | (43,663 | ) | ||||||||||||||||||
| USD | 1,988,684 | JPY | 1,968,241 | 1/20/2022 | SSB | 20,443 | - | 20,443 | ||||||||||||||||||||
| USD | 1,637,283 | EUR | 1,652,284 | 1/20/2022 | SSB | - | (15,001 | ) | (15,001 | ) | ||||||||||||||||||
| USD | 1,551,868 | EUR | 1,561,009 | 1/20/2022 | SSB | - | (9,141 | ) | (9,141 | ) | ||||||||||||||||||
| USD | 1,546,492 | EUR | 1,556,211 | 1/20/2022 | SSB | - | (9,719 | ) | (9,719 | ) | ||||||||||||||||||
| USD | 1,544,196 | EUR | 1,554,794 | 1/20/2022 | SSB | - | (10,598 | ) | (10,598 | ) | ||||||||||||||||||
| USD | 1,565,618 | JPY | 1,545,916 | 1/20/2022 | SSB | 19,702 | - | 19,702 | ||||||||||||||||||||
| USD | 1,539,793 | EUR | 1,545,585 | 1/20/2022 | SSB | - | (5,792 | ) | (5,792 | ) | ||||||||||||||||||
| USD | 1,534,409 | EUR | 1,539,501 | 1/20/2022 | SSB | - | (5,092 | ) | (5,092 | ) | ||||||||||||||||||
| USD | 1,511,680 | JPY | 1,491,881 | 1/20/2022 | SSB | 19,799 | - | 19,799 | ||||||||||||||||||||
| USD | 1,218,052 | EUR | 1,224,798 | 1/20/2022 | SSB | - | (6,746 | ) | (6,746 | ) | ||||||||||||||||||
| USD | 840,468 | EUR | 848,746 | 1/20/2022 | SSB | - | (8,278 | ) | (8,278 | ) | ||||||||||||||||||
| USD | 764,652 | HKD | 765,036 | 1/20/2022 | SSB | - | (384 | ) | (384 | ) | ||||||||||||||||||
| USD | 664,486 | AUD | 666,328 | 1/20/2022 | SSB | - | (1,842 | ) | (1,842 | ) | ||||||||||||||||||
| USD | 555,755 | HKD | 555,882 | 1/20/2022 | SSB | - | (127 | ) | (127 | ) | ||||||||||||||||||
| USD | 452,751 | GBP | 458,960 | 1/20/2022 | SSB | - | (6,209 | ) | (6,209 | ) | ||||||||||||||||||
| USD | 458,126 | HKD | 458,310 | 1/20/2022 | SSB | - | (184 | ) | (184 | ) | ||||||||||||||||||
| USD | 328,884 | HKD | 328,996 | 1/20/2022 | SSB | - | (112 | ) | (112 | ) | ||||||||||||||||||
| USD | 289,039 | EUR | 290,172 | 1/20/2022 | SSB | - | (1,133 | ) | (1,133 | ) | ||||||||||||||||||
| USD | 270,878 | CAD | 274,105 | 1/20/2022 | SSB | - | (3,227 | ) | (3,227 | ) | ||||||||||||||||||
| USD | 270,048 | SEK | 270,646 | 1/20/2022 | SSB | - | (598 | ) | (598 | ) | ||||||||||||||||||
| USD | 255,597 | GBP | 260,516 | 1/20/2022 | SSB | - | (4,919 | ) | (4,919 | ) | ||||||||||||||||||
| USD | 252,669 | CAD | 256,819 | 1/20/2022 | SSB | - | (4,150 | ) | (4,150 | ) | ||||||||||||||||||
| USD | 168,157 | GBP | 171,699 | 1/20/2022 | SSB | - | (3,542 | ) | (3,542 | ) | ||||||||||||||||||
| USD | 155,741 | EUR | 156,172 | 1/20/2022 | SSB | - | (431 | ) | (431 | ) | ||||||||||||||||||
| USD | 130,881 | CAD | 133,689 | 1/20/2022 | SSB | - | (2,808 | ) | (2,808 | ) | ||||||||||||||||||
| USD | 131,203 | EUR | 132,251 | 1/20/2022 | SSB | - | (1,048 | ) | (1,048 | ) | ||||||||||||||||||
| USD | 110,769 | SGD | 112,392 | 1/20/2022 | SSB | - | (1,623 | ) | (1,623 | ) | ||||||||||||||||||
| USD | 111,908 | EUR | 112,279 | 1/20/2022 | SSB | - | (371 | ) | (371 | ) | ||||||||||||||||||
| USD | 102,127 | AUD | 103,835 | 1/20/2022 | SSB | - | (1,708 | ) | (1,708 | ) | ||||||||||||||||||
| USD | 91,680 | SGD | 92,846 | 1/20/2022 | SSB | - | (1,166 | ) | (1,166 | ) | ||||||||||||||||||
| USD | 76,540 | SEK | 77,407 | 1/20/2022 | SSB | - | (867 | ) | (867 | ) | ||||||||||||||||||
| USD | 73,848 | SGD | 74,725 | 1/20/2022 | SSB | - | (877 | ) | (877 | ) | ||||||||||||||||||
| USD | 67,974 | ZAR | 68,002 | 1/20/2022 | SSB | - | (28 | ) | (28 | ) | ||||||||||||||||||
| USD | 64,203 | SGD | 65,176 | 1/20/2022 | SSB | - | (973 | ) | (973 | ) | ||||||||||||||||||
| USD | 46,109 | SEK | 46,483 | 1/20/2022 | SSB | - | (374 | ) | (374 | ) | ||||||||||||||||||
| USD | 36,459 | AUD | 37,233 | 1/20/2022 | SSB | - | (774 | ) | (774 | ) | ||||||||||||||||||
| USD | 19,333 | ZAR | 19,179 | 1/20/2022 | SSB | 154 | - | 154 | ||||||||||||||||||||
| USD | 19,122 | ZAR | 19,152 | 1/20/2022 | SSB | - | (30 | ) | (30 | ) | ||||||||||||||||||
| USD | 2,064 | ZAR | 2,059 | 1/20/2022 | SSB | 5 | - | 5 | ||||||||||||||||||||
|
|
|
|
|
|
|
|||||||||||||||||||||||
| $ | 451,724 | $ | (4,321,112 | ) | $ | (3,869,388 | ) | |||||||||||||||||||||
|
|
|
|
|
|
|
|||||||||||||||||||||||
| * | All values denominated in USD. |
| Glossary: | ||
| Counterparty Abbreviations: | ||
| JPM | JPMorgan Chase Bank, N.A. | |
| SSB | State Street Bank & Trust Co. | |
| Currency Abbreviations: | ||
| AUD | Australian Dollar | |
| CAD | Canadian Dollar | |
| EUR | Euro | |
| GBP | Pound Sterling | |
| HKD | Hong Kong Dollar | |
See accompanying notes
41
American Beacon AHL TargetRisk FundSM
Consolidated Schedule of Investments
December 31, 2021
| Currency Abbreviations (continued): | ||
| JPY | Japanese Yen | |
| SEK | Swedish Krona | |
| SGD | Singapore Dollar | |
| USD | United States Dollar | |
| ZAR | South African Rand | |
| Index Abbreviations: | ||
| BBUXALC | Bloomberg Commodity ex-Agriculture and Livestock Capped Index. | |
| CAC40 | Euronet Paris—French Stock Market Index. | |
| DAX | Deutsche Boerse AG German Stock Index. | |
| ETF | Exchange-Traded Fund. | |
| Euro Stoxx 50 | Eurozone Blue-chip Index. | |
| FTSE 100 | Financial Times Stock Exchange 100 Index. | |
| FTSE China A50 | Financial Times Stock Exchange China A50 Index. | |
| FTSE/JSE Top 40 | Largest 40 companies ranked by full market value in the FTSE/JSE All-Share Index. | |
| FTSE/MIB | Borsa Italiana-Italian Stock Market Index. | |
| Hang Seng | Hong Kong Stock Market Index. | |
| KOSPI | South Korean Stock Market Index. | |
| MSCI | Morgan Stanley Capital International. | |
| MSCI SING IX ETS | Morgan Stanley Capital International Singapore Exchange-Traded Funds. | |
| NASDAQ | National Association of Securities Dealers Automated Quotations. | |
| NIKKEI 225 | Nikkei Stock Average. | |
| OMXS30 | Stockholm Stock Exchange’s leading share index. | |
| S&P 500 | S&P 500 Index—U.S. Equity Large-Cap Index. | |
| S&P/TSX | Canadian Equity Market Index. | |
| SGX NIFTY | Singapore Stock Exchange NIFTY. | |
| SPI 200 | Australian Equity Market Index Future. | |
| TOPIX | Tokyo Stock Exchange Tokyo Price Index. | |
| UCITS | Undertaking for Collective Investments in Transferable Securities. | |
| Exchange Abbreviations: | ||
| JSE | Johannesburg Stock Exchange. | |
| SGX | Singapore Stock Exchange. | |
| OTC | Over-the-Counter. | |
| Other Abbreviations: | ||
| BTP | Buoni del Tesoro Poliennali. | |
| Bobl | Medium term debt that is issued by the Federal Republic of Germany. | |
| Bund | German Federal Government Bond. | |
| Buxl | Long term debt that is issued by the Federal Republic of Germany. | |
| CDX | Credit Default Swap Index. | |
| GILT | Bank of England Bonds. | |
| iTraxx | Credit Default Swap Index. | |
| LIBOR | London Interbank Offered Rate. | |
| OAT | Obligations Assimilables du Trésor. | |
See accompanying notes
42
American Beacon AHL TargetRisk FundSM
Consolidated Schedule of Investments
December 31, 2021
The Fund’s investments are summarized by level based on the inputs used to determine their values. As of December 31, 2021, the investments were classified as described below:
| AHL TargetRisk Fund |
Level 1 | Level 2 | Level 3 | Total | ||||||||||||||||||||||||
| Assets |
| |||||||||||||||||||||||||||
| Foreign Sovereign Obligations |
$ | - | $ | 225,157,984 | $ | - | $ | 225,157,984 | ||||||||||||||||||||
| U.S. Treasury Obligations |
- | 175,056,091 | - | 175,056,091 | ||||||||||||||||||||||||
| Short-Term Investments |
- | 379,885,028 | - | 379,885,028 | ||||||||||||||||||||||||
|
|
|
|
|
|
|
|
|
|||||||||||||||||||||
| Total Investments in Securities - Assets |
$ | - | $ | 780,099,103 | $ | - | $ | 780,099,103 | ||||||||||||||||||||
|
|
|
|
|
|
|
|
|
|||||||||||||||||||||
| Financial Derivative Instruments - Assets |
| |||||||||||||||||||||||||||
| Futures Contracts |
$ | 13,069,056 | $ | - | $ | - | $ | 13,069,056 | ||||||||||||||||||||
| Swap Contract Agreements |
- | 7,286,861 | - | 7,286,861 | ||||||||||||||||||||||||
| Forward Foreign Currency Contracts |
- | 451,724 | - | 451,724 | ||||||||||||||||||||||||
|
|
|
|
|
|
|
|
|
|||||||||||||||||||||
| Total Financial Derivative Instruments - Assets |
$ | 13,069,056 | $ | 7,738,585 | $ | - | $ | 20,807,641 | ||||||||||||||||||||
|
|
|
|
|
|
|
|
|
|||||||||||||||||||||
| Financial Derivative Instruments - Liabilities |
| |||||||||||||||||||||||||||
| Futures Contracts |
$ | (6,090,059 | ) | $ | - | $ | - | $ | (6,090,059 | ) | ||||||||||||||||||
| Swap Contract Agreements |
- | (73,927 | ) | - | (73,927 | ) | ||||||||||||||||||||||
| Forward Foreign Currency Contracts |
- | (4,321,112 | ) | - | (4,321,112 | ) | ||||||||||||||||||||||
|
|
|
|
|
|
|
|
|
|||||||||||||||||||||
| Total Financial Derivative Instruments - Liabilities |
$ | (6,090,059 | ) | $ | (4,395,039 | ) | $ | - | $ | (10,485,098 | ) | |||||||||||||||||
|
|
|
|
|
|
|
|
|
|||||||||||||||||||||
U.S. GAAP requires transfers between all levels to/from level 3 be disclosed. During the year ended December 31, 2021, there were no transfers into or out of Level 3.
See accompanying notes
43
American Beacon AHL TargetRisk Core FundSM
Schedule of Investments
December 31, 2021
| Principal Amount | Fair Value | ||||||||||||||
| SHORT-TERM INVESTMENTS - 90.69% | |||||||||||||||
| U.S. Treasury Obligations - 90.69% | |||||||||||||||
| U.S. Treasury Bills, | |||||||||||||||
| 0.031%, Due 1/6/2022 |
$ | 1,450,000 | $ | 1,449,999 | |||||||||||
| 0.043%, Due 1/13/2022 |
1,500,000 | 1,499,994 | |||||||||||||
| 0.044%, Due 2/17/2022 |
1,500,000 | 1,499,944 | |||||||||||||
| 0.054%, Due 4/7/2022 |
2,000,000 | 1,999,619 | |||||||||||||
| 0.055%, Due 4/28/2022 |
1,600,000 | 1,599,610 | |||||||||||||
| 0.076%, Due 5/26/2022 |
1,500,000 | 1,499,440 | |||||||||||||
|
|
|
||||||||||||||
| Total Short-Term Investments (Cost $9,548,864) |
9,548,606 | ||||||||||||||
|
|
|
||||||||||||||
| TOTAL INVESTMENTS - 90.69% (Cost $9,548,864) |
9,548,606 | ||||||||||||||
| OTHER ASSETS, NET OF LIABILITIES - 9.31% |
980,312 | ||||||||||||||
|
|
|
||||||||||||||
| TOTAL NET ASSETS - 100.00% |
$ | 10,528,918 | |||||||||||||
|
|
|
||||||||||||||
| Percentages are stated as a percent of net assets. | |||||||||||||||
| Long Futures Contracts Open on December 31, 2021: |
| |||||||||||||||
| Equity Futures Contracts | ||||||||||||||||
| Description | Number of Contracts |
Expiration Date | Notional Amount | Contract Value | Unrealized Appreciation (Depreciation) |
|||||||||||
| Amsterdam Index | 2 | January 2022 | $ | 360,071 | $ | 363,268 | $ | 3,197 | ||||||||
| CAC40 Index | 4 | January 2022 | 317,501 | 325,292 | 7,791 | |||||||||||
| DAX Index | 1 | March 2022 | 443,929 | 451,301 | 7,372 | |||||||||||
| Euro Stoxx 50 Index | 13 | March 2022 | 619,543 | 634,571 | 15,028 | |||||||||||
| FTSE 100 Index | 8 | March 2022 | 782,747 | 793,072 | 10,325 | |||||||||||
| FTSE China A50 Index | 13 | January 2022 | 206,641 | 204,087 | (2,554 | ) | ||||||||||
| FTSE Taiwan Index | 2 | January 2022 | 127,641 | 128,280 | 639 | |||||||||||
| FTSE/JSE Top 40 Index | 2 | March 2022 | 81,915 | 84,082 | 2,167 | |||||||||||
| FTSE/MIB Index | 2 | March 2022 | 302,755 | 310,218 | 7,463 | |||||||||||
| Hang Seng China Enterprises Index | 3 | January 2022 | 158,101 | 159,031 | 930 | |||||||||||
| Hang Seng Index | 1 | January 2022 | 149,393 | 150,374 | 981 | |||||||||||
| iShares STOXX Europe 600 UCITS ETF | 1 | March 2022 | 19,958 | 20,732 | 774 | |||||||||||
| KOSPI 200 Index | 3 | March 2022 | 247,895 | 248,738 | 843 | |||||||||||
| MSCI SING IX ETS | 4 | January 2022 | 100,104 | 100,965 | 861 | |||||||||||
| NASDAQ 100 E-Mini | 2 | March 2022 | 646,044 | 652,830 | 6,786 | |||||||||||
| Nikkei 225 (SGX) | 4 | March 2022 | 492,376 | 500,043 | 7,667 | |||||||||||
| OMXS30 Index | 17 | January 2022 | 437,751 | 455,139 | 17,388 | |||||||||||
| S&P 500 E-Mini Index | 5 | March 2022 | 1,168,643 | 1,189,626 | 20,983 | |||||||||||
| S&P/TSX 60 Index | 4 | March 2022 | 796,692 | 810,087 | 13,395 | |||||||||||
| SGX NIFTY 50 Index | 1 | January 2022 | 34,315 | 34,879 | 564 | |||||||||||
| SPI 200 | 3 | March 2022 | 394,987 | 400,898 | 5,911 | |||||||||||
| TOPIX Index | 5 | March 2022 | 864,978 | 865,861 | 883 | |||||||||||
|
|
|
|
|
|
|
|||||||||||
| $ | 8,753,980 | $ | 8,883,374 | $ | 129,394 | |||||||||||
|
|
|
|
|
|
|
|||||||||||
| Interest Rate Futures Contracts | ||||||||||||||||
| Description | Number of Contracts |
Expiration Date | Notional Amount | Contract Value | Unrealized Appreciation (Depreciation) |
|||||||||||
| Australian 10-Year Bond | 9 | March 2022 | $ | 913,151 | $ | 911,261 | $ | (1,890 | ) | |||||||
| Canadian 10-Year Bond | 5 | March 2022 | 551,342 | 563,738 | 12,396 | |||||||||||
| Euro OAT | 7 | March 2022 | 1,318,872 | 1,300,223 | (18,649 | ) | ||||||||||
| Euro-BTP | 7 | March 2022 | 1,192,806 | 1,171,596 | (21,210 | ) | ||||||||||
| Euro-Bund | 12 | March 2022 | 2,375,935 | 2,341,256 | (34,679 | ) | ||||||||||
| Euro-Buxl 30-Year Bond | 1 | March 2022 | 245,939 | 235,374 | (10,565 | ) | ||||||||||
| Japanese 10-Year Government Bond | 1 | March 2022 | 1,320,916 | 1,317,830 | (3,086 | ) | ||||||||||
| Korea 10-Year Government Bond | 5 | March 2022 | 526,444 | 522,734 | (3,710 | ) | ||||||||||
| Long GILT | 8 | March 2022 | 1,355,743 | 1,352,467 | (3,276 | ) | ||||||||||
| U.S. Long Bond | 7 | March 2022 | 1,106,375 | 1,123,063 | 16,688 | |||||||||||
See accompanying notes
44
American Beacon AHL TargetRisk Core FundSM
Schedule of Investments
December 31, 2021
| Interest Rate Futures Contracts (continued) | ||||||||||||||||
| Description | Number of Contracts |
Expiration Date |
Notional Amount | Contract Value | Unrealized Appreciation (Depreciation) |
|||||||||||
| U.S. Treasury 10-Year Note | 29 | March 2022 | $ | 3,748,134 | $ | 3,783,594 | $ | 35,460 | ||||||||
| U.S. Treasury 5-Year Note | 1 | March 2022 | 121,109 | 120,976 | (133 | ) | ||||||||||
| U.S. Ultra Bond | 7 | March 2022 | 1,348,211 | 1,379,875 | 31,664 | |||||||||||
|
|
|
|
|
|
|
|||||||||||
| $ | 16,124,977 | $ | 16,123,987 | $ | (990 | ) | ||||||||||
|
|
|
|
|
|
|
|||||||||||
| Forward Foreign Currency Contracts Open on December 31, 2021: |
| |||||||||||||||||||||||||
| Currency Purchased* | Currency Sold* | Settlement Date | Counterparty | Unrealized Appreciation |
Unrealized (Depreciation) |
Net Unrealized Appreciation (Depreciation) |
||||||||||||||||||||
| USD | 139,925 | EUR | 141,219 | 1/20/2022 | SSB | $ | - | $ | (1,294 | ) | $ | (1,294 | ) | |||||||||||||
| USD | 112,279 | GBP | 115,048 | 1/20/2022 | SSB | - | (2,769 | ) | (2,769 | ) | ||||||||||||||||
| USD | 111,860 | EUR | 112,747 | 1/20/2022 | SSB | - | (887 | ) | (887 | ) | ||||||||||||||||
| USD | 95,897 | JPY | 94,751 | 1/20/2022 | SSB | 1,146 | - | 1,146 | ||||||||||||||||||
| USD | 86,900 | HKD | 86,952 | 1/20/2022 | SSB | - | (52 | ) | (52 | ) | ||||||||||||||||
|
|
|
|
|
|
|
|||||||||||||||||||||
| $ | 1,146 | $ | (5,002 | ) | $ | (3,856 | ) | |||||||||||||||||||
|
|
|
|
|
|
|
|||||||||||||||||||||
| * | All values denominated in USD. |
| Glossary: | ||
| Counterparty Abbreviations: | ||
| SSB | State Street Bank & Trust Co. | |
| Currency Abbreviations: | ||
| EUR | Euro | |
| GBP | Pound Sterling | |
| HKD | Hong Kong Dollar | |
| JPY | Japanese Yen | |
| USD | United States Dollar | |
| Index Abbreviations: | ||
| CAC40 | Euronet Paris—French Stock Market Index. | |
| DAX | Deutsche Boerse AG German Stock Index. | |
| ETF | Exchange-Traded Fund. | |
| Euro Stoxx 50 | Eurozone Blue-chip Index. | |
| FTSE 100 | Financial Times Stock Exchange 100 Index. | |
| FTSE China A50 | Financial Times Stock Exchange China A50 Index. | |
| FTSE/MIB | Borsa Italiana-Italian Stock Market Index. | |
| Hang Seng | Hong Kong Stock Market Index. | |
| KOSPI | South Korean Stock Market Index. | |
| MSCI SING IX ETS | Morgan Stanley Capital International Singapore Exchange-Traded Funds. | |
| NASDAQ | National Association of Securities Dealers Automated Quotations. | |
| NIKKEI 225 | Nikkei Stock Average. | |
| OMXS30 | Stockholm Stock Exchange’s leading share index. | |
| S&P 500 | S&P 500 Index— U.S. Equity Large-Cap Index. | |
| SPI 200 | Australian Equity Market Index Future. | |
| TOPIX | Tokyo Stock Exchange Tokyo Price Index. | |
| UCITS | Undertaking for Collective Investments in Transferable Securities. | |
| Exchange Abbreviations: | ||
| JSE | Johannesburg Stock Exchange. | |
| SGX | Singapore Stock Exchange. | |
| SGX NIFTY | Singapore Stock Exchange NIFTY. | |
| Other Abbreviations: | ||
| BTP | Buoni del Tesoro Poliennali. | |
| Bund | German Federal Government Bond. | |
| Buxl | Long term debt that is issued by the Federal Republic of Germany. | |
| GILT | Bank of England Bonds. | |
| OAT | Obligations Assimilables du Trésor. | |
See accompanying notes
45
American Beacon AHL TargetRisk Core FundSM
Schedule of Investments
December 31, 2021
The Fund’s investments are summarized by level based on the inputs used to determine their values. As of December 31, 2021, the investments were classified as described below:
| AHL TargetRisk Core Fund |
Level 1 | Level 2 | Level 3 | Total | ||||||||||||||||||||||||
| Assets |
||||||||||||||||||||||||||||
| Short-Term Investments |
$ | - | $ | 9,548,606 | $ | - | $ | 9,548,606 | ||||||||||||||||||||
|
|
|
|
|
|
|
|
|
|||||||||||||||||||||
| Total Investments in Securities - Assets |
$ | - | $ | 9,548,606 | $ | - | $ | 9,548,606 | ||||||||||||||||||||
|
|
|
|
|
|
|
|
|
|||||||||||||||||||||
| Financial Derivative Instruments - Assets |
| |||||||||||||||||||||||||||
| Futures Contracts |
$ | 228,156 | $ | - | $ | - | $ | 228,156 | ||||||||||||||||||||
| Forward Foreign Currency Contracts |
- | 1,146 | - | 1,146 | ||||||||||||||||||||||||
|
|
|
|
|
|
|
|
|
|||||||||||||||||||||
| Total Financial Derivative Instruments - Assets |
$ | 228,156 | $ | 1,146 | $ | - | $ | 229,302 | ||||||||||||||||||||
|
|
|
|
|
|
|
|
|
|||||||||||||||||||||
| Financial Derivative Instruments - Liabilities |
| |||||||||||||||||||||||||||
| Futures Contracts |
$ | (99,752 | ) | $ | - | $ | - | $ | (99,752 | ) | ||||||||||||||||||
| Forward Foreign Currency Contracts |
- | (5,002 | ) | - | (5,002 | ) | ||||||||||||||||||||||
|
|
|
|
|
|
|
|
|
|||||||||||||||||||||
| Total Financial Derivative Instruments - Liabilities |
$ | (99,752 | ) | $ | (5,002 | ) | $ | - | $ | (104,754 | ) | |||||||||||||||||
|
|
|
|
|
|
|
|
|
|||||||||||||||||||||
U.S. GAAP requires transfers between all levels to/from level 3 be disclosed. During the year ended December 31, 2021, there were no transfers into or out of Level 3.
See accompanying notes
46
American Beacon FundsSM
Statements of Assets and Liabilities
December 31, 2021
| AHL Managed Futures Strategy FundA |
AHL TargetRisk FundA |
|
AHL TargetRisk Core Fund |
|||||||||||||||||
| Assets: |
| |||||||||||||||||||
| Investments in unaffiliated securities, at fair value† |
$ | 1,779,644,341 | $ | 780,099,103 | $ | 9,548,606 | ||||||||||||||
| Foreign currency, at fair value^ |
- | 4,132,112 | - | |||||||||||||||||
| Foreign currency deposits with brokers for futures and swap contracts, at fair value¤ |
71,885,942 | 27,144,885 | 589,435 | |||||||||||||||||
| Cash |
45,649,900 | 37,510,392 | 253,903 | |||||||||||||||||
| Cash collateral held at broker |
25,580,000 | 10,800,000 | - | |||||||||||||||||
| Cash collateral held at custodian for the benefit of the broker |
- | 16,550,000 | - | |||||||||||||||||
| Dividends and interest receivable |
- | 470,373 | - | |||||||||||||||||
| Deposits with broker for futures and swap contracts |
105,052,647 | 2,988,319 | 115,368 | |||||||||||||||||
| Receivable for fund shares sold |
125,729,193 | 4,759,714 | - | |||||||||||||||||
| Receivable for expense reimbursement (Note 2) |
- | 79,259 | - | |||||||||||||||||
| Unrealized appreciation from forward foreign currency contracts |
6,864,218 | 451,724 | 1,146 | |||||||||||||||||
| Receivable for variation margin on open futures contracts (Note 5) |
1,719,263 | 6,941,033 | 130,675 | |||||||||||||||||
| Receivable for variation margin on open centally cleared swap agreements (Note 5) |
- | 31,118,689 | - | |||||||||||||||||
| OTC swap agreements, at fair value |
- | 5,164,515 | - | |||||||||||||||||
| Prepaid expenses |
116,433 | 41,647 | 46,374 | |||||||||||||||||
|
|
|
|
|
|
|
|||||||||||||||
| Total assets |
2,162,241,937 | 928,251,765 | 10,685,507 | |||||||||||||||||
|
|
|
|
|
|
|
|||||||||||||||
| Liabilities: |
| |||||||||||||||||||
| Payable for investments purchased |
- | 2,775,333 | - | |||||||||||||||||
| Payable for fund shares redeemed |
6,146,571 | 3,191,939 | - | |||||||||||||||||
| Payable to Adviser (Note 2) |
126,097 | - | 65,237 | |||||||||||||||||
| Management and sub-advisory fees payable (Note 2) |
2,381,494 | 688,771 | 7,881 | |||||||||||||||||
| Service fees payable (Note 2) |
27,102 | 25,776 | 156 | |||||||||||||||||
| Transfer agent fees payable (Note 2) |
120,668 | 57,004 | 43 | |||||||||||||||||
| Custody and fund accounting fees payable |
458,321 | 160,070 | 13,911 | |||||||||||||||||
| Professional fees payable |
89,028 | 85,119 | 61,224 | |||||||||||||||||
| Payable for prospectus and shareholder reports |
86,670 | 25,268 | 391 | |||||||||||||||||
| Unrealized depreciation from forward foreign currency contracts |
8,498,721 | 4,321,112 | 5,002 | |||||||||||||||||
| Other liabilities |
30,549 | 7,921 | 2,744 | |||||||||||||||||
|
|
|
|
|
|
|
|||||||||||||||
| Total liabilities |
17,965,221 | 11,338,313 | 156,589 | |||||||||||||||||
|
|
|
|
|
|
|
|||||||||||||||
| Net assets |
$ | 2,144,276,716 | $ | 916,913,452 | $ | 10,528,918 | ||||||||||||||
|
|
|
|
|
|
|
|||||||||||||||
| Analysis of net assets: |
| |||||||||||||||||||
| Paid-in-capital |
$ | 2,348,930,140 | $ | 949,614,219 | $ | 10,381,693 | ||||||||||||||
| Total distributable earnings (deficits) |
(204,653,424 | ) | (32,700,767 | ) | 147,225 | |||||||||||||||
|
|
|
|
|
|
|
|||||||||||||||
| Net assets |
$ | 2,144,276,716 | $ | 916,913,452 | $ | 10,528,918 | ||||||||||||||
|
|
|
|
|
|
|
|||||||||||||||
See accompanying notes
47
American Beacon FundsSM
Statements of Assets and Liabilities
December 31, 2021
| AHL Managed Futures Strategy FundA |
AHL TargetRisk FundA |
|
AHL TargetRisk Core Fund |
|||||||||||||||||
| Shares outstanding at no par value (unlimited shares authorized): |
| |||||||||||||||||||
| R5 Class |
45,129,038 | 9,562,901 | N/A | |||||||||||||||||
|
|
|
|
|
|
|
|||||||||||||||
| Y Class |
154,175,947 | 62,212,174 | 10,166 | |||||||||||||||||
|
|
|
|
|
|
|
|||||||||||||||
| Investor Class |
3,626,165 | 1,514,645 | N/A | |||||||||||||||||
|
|
|
|
|
|
|
|||||||||||||||
| A Class |
938,250 | 445,522 | 10,582 | |||||||||||||||||
|
|
|
|
|
|
|
|||||||||||||||
| C Class |
1,504,945 | 1,730,241 | 10,168 | |||||||||||||||||
|
|
|
|
|
|
|
|||||||||||||||
| R6 Class |
N/A | N/A | 1,006,768 | |||||||||||||||||
|
|
|
|
|
|
|
|||||||||||||||
| Net assets: |
| |||||||||||||||||||
| R5 Class |
$ | 473,334,156 | $ | 116,339,052 | N/A | |||||||||||||||
|
|
|
|
|
|
|
|||||||||||||||
| Y Class |
$ | 1,608,801,856 | $ | 756,225,072 | $ | 103,053 | ||||||||||||||
|
|
|
|
|
|
|
|||||||||||||||
| Investor Class |
$ | 37,408,089 | $ | 18,344,072 | N/A | |||||||||||||||
|
|
|
|
|
|
|
|||||||||||||||
| A Class |
$ | 9,680,124 | $ | 5,381,597 | $ | 106,920 | ||||||||||||||
|
|
|
|
|
|
|
|||||||||||||||
| C Class |
$ | 15,052,491 | $ | 20,623,659 | $ | 101,889 | ||||||||||||||
|
|
|
|
|
|
|
|||||||||||||||
| R6 Class |
N/A | N/A | $ | 10,217,056 | ||||||||||||||||
|
|
|
|
|
|
|
|||||||||||||||
| Net asset value, offering and redemption price per share: |
| |||||||||||||||||||
| R5 Class |
$ | 10.49 | $ | 12.17 | N/A | |||||||||||||||
|
|
|
|
|
|
|
|||||||||||||||
| Y Class |
$ | 10.43 | $ | 12.16 | $ | 10.14 | ||||||||||||||
|
|
|
|
|
|
|
|||||||||||||||
| Investor Class |
$ | 10.32 | $ | 12.11 | N/A | |||||||||||||||
|
|
|
|
|
|
|
|||||||||||||||
| A Class |
$ | 10.32 | $ | 12.08 | $ | 10.10 | ||||||||||||||
|
|
|
|
|
|
|
|||||||||||||||
| A Class (offering price) |
$ | 10.95 | $ | 12.82 | $ | 10.72 | ||||||||||||||
|
|
|
|
|
|
|
|||||||||||||||
| C Class |
$ | 10.00 | $ | 11.92 | $ | 10.02 | ||||||||||||||
|
|
|
|
|
|
|
|||||||||||||||
| R6 Class |
N/A | N/A | $ | 10.15 | ||||||||||||||||
|
|
|
|
|
|
|
|||||||||||||||
| † Cost of investments in unaffiliated securities |
$ | 1,779,687,396 | $ | 782,196,612 | $ | 9,548,864 | ||||||||||||||
| ¤ Cost of foreign currency deposits with broker for futures contracts |
$ | 71,756,433 | $ | 27,033,085 | $ | 588,456 | ||||||||||||||
| ^ Cost of foreign currency |
$ | - | $ | 4,120,941 | $ | - | ||||||||||||||
| A Consolidated financial statement. See Note 1 in the Notes to Financial Statements for additional information. |
| |||||||||||||||||||
See accompanying notes
48
American Beacon FundsSM
Statements of Operations
For the year ended December 31, 2021
| AHL Managed Futures Strategy FundA |
AHL TargetRisk FundA |
AHL TargetRisk Core Fund |
||||||||||||||||||
| Investment income: |
| |||||||||||||||||||
| Interest income (net of foreign taxes) |
$ | 360,267 | $ | 14,743,955 | $ | 1,903 | ||||||||||||||
|
|
|
|
|
|
|
|||||||||||||||
| Total investment income |
360,267 | 14,743,955 | 1,903 | |||||||||||||||||
|
|
|
|
|
|
|
|||||||||||||||
| Expenses: |
| |||||||||||||||||||
| Management and sub-advisory fees (Note 2) |
22,889,310 | 7,778,531 | 90,607 | |||||||||||||||||
| Transfer agent fees: |
||||||||||||||||||||
| R5 Class (Note 2) |
25,877 | 51,245 | - | |||||||||||||||||
| Y Class (Note 2) |
1,174,446 | 586,100 | 1,358 | |||||||||||||||||
| Investor Class |
2,669 | 1,784 | - | |||||||||||||||||
| A Class |
590 | - | 1,332 | |||||||||||||||||
| C Class |
745 | 448 | 1,332 | |||||||||||||||||
| R6 Class |
- | - | 1,520 | |||||||||||||||||
| Custody and fund accounting fees |
888,535 | 291,961 | 21,311 | |||||||||||||||||
| Professional fees |
177,640 | 155,108 | 155,796 | |||||||||||||||||
| Registration fees and expenses |
142,118 | 128,574 | 78,722 | |||||||||||||||||
| Service fees (Note 2): |
||||||||||||||||||||
| Investor Class |
137,105 | 61,612 | - | |||||||||||||||||
| A Class |
6,512 | 3,151 | 56 | |||||||||||||||||
| C Class |
8,484 | 13,317 | 56 | |||||||||||||||||
| Distribution fees (Note 2): |
||||||||||||||||||||
| A Class |
18,917 | 11,541 | 258 | |||||||||||||||||
| C Class |
133,904 | 180,196 | 1,029 | |||||||||||||||||
| Prospectus and shareholder report expenses |
176,220 | 79,177 | 8,999 | |||||||||||||||||
| Trustee fees (Note 2) |
110,903 | 60,429 | 628 | |||||||||||||||||
| Dividends and interest on securities sold short |
- | 7,105 | - | |||||||||||||||||
| Loan expense (Note 9) |
7,259 | 4,111 | 37 | |||||||||||||||||
| Other expenses |
527,446 | 318,560 | 14,914 | |||||||||||||||||
|
|
|
|
|
|
|
|||||||||||||||
| Total expenses |
26,428,680 | 9,732,950 | 377,955 | |||||||||||||||||
|
|
|
|
|
|
|
|||||||||||||||
| Net fees waived and expenses (reimbursed) (Note 2) |
(160,764 | ) | (41,004 | ) | (273,746 | ) | ||||||||||||||
|
|
|
|
|
|
|
|||||||||||||||
| Net expenses |
26,267,916 | 9,691,946 | 104,209 | |||||||||||||||||
|
|
|
|
|
|
|
|||||||||||||||
| Net investment income (loss) |
(25,907,649 | ) | 5,052,009 | (102,306 | ) | |||||||||||||||
|
|
|
|
|
|
|
|||||||||||||||
| Realized and unrealized gain (loss) from investments: |
| |||||||||||||||||||
| Net realized gain (loss) from: |
||||||||||||||||||||
| Investments in unaffiliated securities B |
(134,550 | ) | 14,830,501 | 360 | ||||||||||||||||
| Foreign currency transactions |
(2,105,555 | ) | 7,841,464 | (35,210 | ) | |||||||||||||||
| Forward foreign currency contracts |
(13,933,128 | ) | 6,944,422 | 38,983 | ||||||||||||||||
| Futures contracts |
125,828,582 | 45,866,113 | 711,204 | |||||||||||||||||
| Swap agreements |
- | 39,313,700 | - | |||||||||||||||||
| Change in net unrealized appreciation (depreciation) of: |
||||||||||||||||||||
| Investments in unaffiliated securities C |
(87,604 | ) | (14,224,424 | ) | (416 | ) | ||||||||||||||
| Foreign currency transactions |
(1,492,217 | ) | (149,952 | ) | (373 | ) | ||||||||||||||
| Forward foreign currency contracts |
(4,894,737 | ) | (1,158,675 | ) | (3,518 | ) | ||||||||||||||
| Futures contracts |
(39,473,623 | ) | 1,841,855 | 79,671 | ||||||||||||||||
| Swap agreements |
- | 5,208,748 | - | |||||||||||||||||
|
|
|
|
|
|
|
|||||||||||||||
| Net gain from investments |
63,707,168 | 106,313,752 | 790,701 | |||||||||||||||||
|
|
|
|
|
|
|
|||||||||||||||
| Net increase in net assets resulting from operations |
$ | 37,799,519 | $ | 111,365,761 | $ | 688,395 | ||||||||||||||
|
|
|
|
|
|
|
|||||||||||||||
| A Consolidated financial statement. See Note 1 in the Notes to Financial Statements for additional information. |
| |||||||||||||||||||
| B The Fund did not recognize net realized gains (losses) from the sale of investments in affiliated securities. |
| |||||||||||||||||||
| C The Fund’s investments in affiliated securities did not have a change in unrealized appreciation (depreciation) at year end. |
| |||||||||||||||||||
See accompanying notes
49
American Beacon FundsSM
Statements of Changes in Net Assets
| AHL Managed Futures Strategy FundA | AHL TargetRisk FundA | |||||||||||||||||||||||||||
| Year Ended December 31, 2021 |
Year Ended December 31, 2020 |
Year Ended December 31, 2021 |
Year Ended December 31, 2020 |
|||||||||||||||||||||||||
| Increase (decrease) in net assets: |
||||||||||||||||||||||||||||
| Operations: |
||||||||||||||||||||||||||||
| Net investment income (loss) |
$ | (25,907,649 | ) | $ | (11,952,822 | ) | $ | 5,052,009 | $ | (5,597,096 | ) | |||||||||||||||||
| Net realized gain from investments in unaffiliated securities, foreign currency transactions, forward foreign currency contracts, futures contracts, and swap agreements |
109,655,349 | 83,918,246 | 114,796,200 | 37,764,248 | ||||||||||||||||||||||||
| Change in net unrealized appreciation (depreciation) of investments in unaffiliated securities, foreign currency transactions, forward foreign currency contracts, futures contracts, and swap agreements |
(45,948,181 | ) | 36,509,176 | (8,482,448 | ) | 13,852,299 | ||||||||||||||||||||||
|
|
|
|
|
|
|
|
|
|||||||||||||||||||||
| Net increase in net assets resulting |
37,799,519 | 108,474,600 | 111,365,761 | 46,019,451 | ||||||||||||||||||||||||
|
|
|
|
|
|
|
|
|
|||||||||||||||||||||
| Distributions to shareholders: |
| |||||||||||||||||||||||||||
| Total retained earnings: |
||||||||||||||||||||||||||||
| R5 Class |
(27,150,217 | ) | (10,319,534 | ) | (19,576,511 | ) | (704,133 | ) | ||||||||||||||||||||
| Y Class |
(112,909,191 | ) | (45,702,856 | ) | (116,008,135 | ) | (4,839,711 | ) | ||||||||||||||||||||
| Investor Class |
(2,533,907 | ) | (1,396,467 | ) | (2,940,718 | ) | (85,306 | ) | ||||||||||||||||||||
| A Class |
(678,519 | ) | (218,099 | ) | (915,654 | ) | (21,661 | ) | ||||||||||||||||||||
| C Class |
(963,588 | ) | (430,491 | ) | (3,253,798 | ) | (80,640 | ) | ||||||||||||||||||||
|
|
|
|
|
|
|
|
|
|||||||||||||||||||||
| Net distributions to shareholders |
(144,235,422 | ) | (58,067,447 | ) | (142,694,816 | ) | (5,731,451 | ) | ||||||||||||||||||||
|
|
|
|
|
|
|
|
|
|||||||||||||||||||||
| Capital share transactions (Note 10): |
| |||||||||||||||||||||||||||
| Proceeds from sales of shares |
1,452,616,600 | 861,775,166 | 443,462,329 | 700,961,229 | ||||||||||||||||||||||||
| Reinvestment of dividends and distributions |
118,790,601 | 49,170,797 | 137,920,118 | 5,665,439 | ||||||||||||||||||||||||
| Cost of shares redeemed |
(450,638,252 | ) | (842,324,846 | ) | (428,585,980 | ) | (98,168,209 | ) | ||||||||||||||||||||
|
|
|
|
|
|
|
|
|
|||||||||||||||||||||
| Net increase in net assets from capital |
1,120,768,949 | 68,621,117 | 152,796,467 | 608,458,459 | ||||||||||||||||||||||||
|
|
|
|
|
|
|
|
|
|||||||||||||||||||||
| Net increase in net assets |
1,014,333,046 | 119,028,270 | 121,467,412 | 648,746,459 | ||||||||||||||||||||||||
|
|
|
|
|
|
|
|
|
|||||||||||||||||||||
| Net assets: |
| |||||||||||||||||||||||||||
| Beginning of year |
1,129,943,670 | 1,010,915,400 | 795,446,040 | 146,699,581 | ||||||||||||||||||||||||
|
|
|
|
|
|
|
|
|
|||||||||||||||||||||
| End of year |
$ | 2,144,276,716 | $ | 1,129,943,670 | $ | 916,913,452 | $ | 795,446,040 | ||||||||||||||||||||
|
|
|
|
|
|
|
|
|
|||||||||||||||||||||
| A Consolidated financial statement. See Note 1 in the Notes to Financial Statements for additional information. |
|
|||||||||||||||||||||||||||
See accompanying notes
50
American Beacon FundsSM
Statements of Changes in Net Assets
| AHL TargetRisk Core Fund | ||||||||||||
| Year Ended December 31, 2021 |
December 16, 2020A to December 31, 2020 |
|||||||||||
| Increase (decrease) in net assets: |
| |||||||||||
| Operations: |
| |||||||||||
| Net investment income (loss) |
$ | (102,306 | ) | $ | (3,990 | ) | ||||||
| Net realized gain from investments in unaffiliated securities, foreign currency transactions, forward foreign currency contracts and futures contracts |
715,337 | 15 | ||||||||||
| Change in net unrealized appreciation of investments in unaffiliated securities, foreign currency transactions, forward foreign currency contracts and futures contracts |
75,364 | 49,905 | ||||||||||
|
|
|
|
|
|||||||||
| Net increase in net assets resulting from operations |
688,395 | 45,930 | ||||||||||
|
|
|
|
|
|||||||||
| Distributions to shareholders: |
| |||||||||||
| Total retained earnings: |
||||||||||||
| Y Class |
(5,871 | ) | - | |||||||||
| A Class |
(5,871 | ) | - | |||||||||
| C Class |
(5,871 | ) | - | |||||||||
| R6 Class |
(569,487 | ) | - | |||||||||
|
|
|
|
|
|||||||||
| Net distributions to shareholders |
(587,100 | ) | - | |||||||||
|
|
|
|
|
|||||||||
| Capital share transactions (Note 10): |
| |||||||||||
| Proceeds from sales of shares |
- | 5,000,001 | ||||||||||
| Reinvestment of dividends and distributions |
381,692 | - | ||||||||||
| Cost of shares redeemed |
- | - | ||||||||||
|
|
|
|
|
|||||||||
| Net increase in net assets from capital share transactions |
381,692 | 5,000,001 | ||||||||||
|
|
|
|
|
|||||||||
| Net increase in net assets |
482,987 | 5,045,931 | ||||||||||
|
|
|
|
|
|||||||||
| Net assets: |
| |||||||||||
| Beginning of period |
10,045,931 | 5,000,000 | B | |||||||||
|
|
|
|
|
|||||||||
| End of period |
$ | 10,528,918 | $ | 10,045,931 | ||||||||
|
|
|
|
|
|||||||||
| A Commencement of operations. |
| |||||||||||
| B Seed capital. |
||||||||||||
See accompanying notes
51
American Beacon FundsSM
December 31, 2021
1. Organization and Significant Accounting Policies
American Beacon Funds (the “Trust”) is organized as a Massachusetts business trust. The Funds, each a series within the Trust, are registered under the Investment Company Act of 1940, as amended (the “Act”), as non-diversified, open-end management investment companies. As of December 31, 2021, the Trust consists of twenty-eight active series, three of which are presented in this filing: American Beacon AHL Managed Futures Strategy Fund, American Beacon AHL TargetRisk Fund and American Beacon AHL TargetRisk Core Fund (collectively, the “Funds” and each individually a “Fund”). The remaining twenty-five active series are reported in separate filings.
American Beacon Advisors, Inc. (the “Manager”) is a Delaware corporation and a wholly-owned subsidiary of Resolute Investment Managers, Inc. (“RIM”) organized in 1986 to provide business management, advisory, administrative, and asset management consulting services to the Trust and other investors. The Manager is registered as an investment advisor under the Investment Advisers Act of 1940, as amended (the “Advisers Act”). RIM is, in turn, a wholly-owned subsidiary of Resolute Acquisition, Inc., which is a wholly-owned subsidiary of Resolute Topco, Inc., a wholly-owned subsidiary of Resolute Investment Holdings, LLC (“RIH”). RIH is owned primarily by Kelso Investment Associates VIII, L.P., KEP VI, LLC and Estancia Capital Partners L.P., investment funds affiliated with Kelso & Company, L.P. (“Kelso”) or Estancia Capital Management, LLC (“Estancia”), which are private equity firms.
Recently Adopted Accounting Pronouncements
In March 2020, the Financial Accounting Standards Board (“FASB”) issued Accounting Standards Update (“ASU”) 2020-04, which provides optional expedients and exceptions for contracts, hedging relationships and other transactions affected by the transitioning away from the London Interbank Offered Rate (“LIBOR”) and other reference rates that are expected to be discontinued. The amendments in this ASU are effective for all entities as of March 12, 2020 through December 31, 2022. At this time, management is evaluating the implications of these changes on the financial statements.
In October 2020, the U.S. Securities and Exchange Commission (“SEC”) adopted new regulations governing the use of derivatives by registered investment companies. Rule 18f-4 will impose limits on the amount of derivatives a fund could enter into, eliminate the asset segregation framework currently used by funds to comply with Section 18 of the Act, and require funds whose use of derivatives is more than a limited specified exposure to establish and maintain a derivatives risk management program and appoint a derivatives risk manager. While the new rule became effective February 19, 2021, funds will not be required to fully comply with the new rule until August 19, 2022. It is not currently clear what impact, if any, the new rule will have on the availability, liquidity or performance of derivatives. When fully implemented, the new rule may require changes in how a fund will use derivatives, may adversely affect a fund’s performance and may increase costs related to a fund’s use of derivatives.
On December 3, 2020, the SEC adopted new rule 2a-5 (Valuation Rule) under the Investment Company Act of 1940, establishing an updated regulatory framework for fund valuation. The Valuation Rule, in part, provides a framework for good faith fair value determination and permits a Board to designate fair value determinations to a fund’s investment adviser. Further, the SEC is rescinding previously issued guidance on related issues. The Valuation Rule became effective on March 8, 2021, with a compliance date of September 8, 2022. Management is currently evaluating the Valuation Rule and its effect on the Funds.
52
American Beacon FundsSM
Notes to Financial Statements
December 31, 2021
Class Disclosure
Each Fund has multiple classes of shares designed to meet the needs of different groups of investors; however, not all of the Funds offer all classes. The following table sets forth the differences amongst the classes:
| Class |
Eligible Investors |
Minimum Initial Investments |
||||
| R5 Class | Large institutional investors - sold directly or through intermediary channels. | $ | 250,000 | |||
| Y Class | Large institutional retirement plan investors - sold directly or through intermediary channels. | $ | 100,000 | |||
| Investor Class | All investors using intermediary organizations, such as broker-dealers or retirement plan sponsors. | $ | 2,500 | |||
| A Class | All investors who invest through intermediary organizations, such as broker-dealers or third party administrator. Retail investors who invest directly through a financial intermediary such as a broker, bank, or registered investment advisor which may include a front-end sales charge and a contingent deferred sales charge (“CDSC”). | $ | 2,500 | |||
| C Class | Retail investors who invest directly through a financial intermediary, such as a broker or through employee directed benefit plans with applicable sales charges which may include CDSC. | $ | 1,000 | |||
| R6 Class | Large institutional retirement plan investors - sold through retirement plan sponsors. | None | ||||
Each class offered by the Trust has equal rights as to assets and voting privileges. Income and non-class specific expenses are allocated daily to each class based on the relative net assets. Realized and unrealized capital gains and losses of each class are allocated daily based on the relative net assets of each class of the respective Fund. Class specific expenses, where applicable, currently include service, distribution, transfer agent fees, and sub-transfer agent fees that vary amongst the classes as described more fully in Note 2.
Consolidation of Subsidiaries
The Schedules of Investments of the AHL Managed Futures Strategy Fund and the AHL TargetRisk Fund are consolidated to include the accounts of the American Beacon Cayman Managed Futures Strategy Fund, Ltd. and American Beacon Cayman TargetRisk Company, Ltd., respectively, each of which are wholly-owned and controlled subsidiaries (the “Subsidiaries”) of the AHL Managed Futures Strategy Fund and the AHL TargetRisk Fund. All intercompany accounts and transactions have been eliminated in consolidation for the AHL Managed Futures Strategy Fund and the AHL TargetRisk Fund.
For Federal tax purposes, taxable income for each Fund and its Subsidiary are calculated separately. The Subsidiaries are classified as controlled foreign corporations under the Internal Revenue Code of 1986 (the “Code”) and each Subsidiary’s taxable income is included in the calculation of the applicable Fund’s taxable income. Net losses of the Subsidiaries are not deductible by the AHL Managed Futures Strategy Fund and the AHL TargetRisk Fund either in the current period or future periods. The Subsidiaries have a fiscal year end of December 31st for financial statement consolidation purposes and a nonconforming tax year end of November 30th.
Each Fund may invest up to 25% of its total assets in its Subsidiary, which acts as an investment vehicle in order to effect certain investments consistent with the Fund’s investment objectives and policies. The AHL Managed Futures Strategy Fund and the AHL TargetRisk Fund expect to achieve a significant portion of their exposure to commodities and commodities-related investments through investment in the Subsidiaries. Unlike the AHL Managed Futures Strategy Fund and the AHL TargetRisk Fund, the Subsidiaries may invest without limitation in commodities and commodities-related investments.
53
American Beacon FundsSM
Notes to Financial Statements
December 31, 2021
| Fund |
Inception Date of Subsidiary |
Subsidiary Net Assets at December 31, 2021 |
% of Total Net Assets of the Fund at December 31, 2021 |
|||||||||
| American Beacon Cayman Managed Futures Strategy |
August 19, 2014 | $ | 490,073,407 | 22.9 | % | |||||||
| American Beacon Cayman TargetRisk Company, Ltd. |
December 31, 2018 | 202,655,431 | 22.1 | % | ||||||||
CFTC Regulation
On August 13, 2013, the Commodity Futures Trading Commission (“CFTC”) adopted rules to harmonize conflicting SEC and CFTC disclosure, reporting and recordkeeping requirements for registered investment companies that do not meet an exemption from the definition of commodity pool. The harmonization rules provide that the CFTC will accept the SEC’s disclosure, reporting, and recordkeeping regime as substituted compliance for substantially all of the otherwise applicable CFTC regulations as long as such investment companies meet the applicable SEC requirements.
The Funds are commodity pools, as defined in the regulation of the CFTC and operated by the Manager, a commodity pool operator regulated by the CFTC.
Significant Accounting Policies
The following is a summary of significant accounting policies, consistently followed by the Funds in preparation of the financial statements. The Funds are considered investment companies and accordingly, follow the investment company accounting and reporting guidance of the FASB Accounting Standards Codification Topic 946, Financial Services – Investment Companies, a part of Generally Accepted Accounting Principles (“U.S. GAAP”).
Security Transactions and Investment Income
Security transactions are recorded as of the trade date for financial reporting purposes. Securities purchased or sold on a when-issued or delayed-delivery basis may be settled beyond a standard settlement period for the security after the trade date.
Dividend income, net of foreign taxes, is recorded on the ex-dividend date, except certain dividends from foreign securities which are recorded as soon as the information is available to the Funds. Interest income, net of foreign taxes, is earned from settlement date, recorded on the accrual basis, and adjusted, if necessary, for accretion of discounts and amortization of premiums. Realized gains (losses) from securities sold are determined based on specific lot identification.
Distributions to Shareholders
The Funds distribute most or all of their net earnings and realized gains, if any, each taxable year in the form of dividends from net investment income and distributions of realized net capital gains and net gains from foreign currency transactions on an annual basis. The Funds do not have a fixed dividend rate and do not guarantee that they will pay any distributions in any particular period. Dividends to shareholders are determined in accordance with federal income tax regulations, which may differ in amount and character from net investment income and realized gains recognized for purposes of U.S. GAAP. To the extent necessary to fully distribute capital gains, the Funds may designate earnings and profits distributed to shareholders on the redemption of shares.
Allocation of Income, Trust Expenses, Gains, and Losses
Investment income, realized and unrealized gains and losses from investments of the Funds are allocated daily to each class of shares based upon the relative proportion of net assets of each class to the total net assets of the Funds. Expenses directly charged or attributable to a Fund will be paid from the assets of a Fund. Generally,
54
American Beacon FundsSM
Notes to Financial Statements
December 31, 2021
expenses of the Trust will be allocated among and charged to the assets of the Funds on a basis that the Trust’s Board of Trustees (the “Board”) deems fair and equitable, which may be based on the relative net assets of the Funds or nature of the services performed and relative applicability to the Funds.
Organization and Offering Costs
Organizational costs consist of the costs of forming the AHL TargetRisk Core Fund, drafting the by laws, administration, custody and transfer agency agreements, and legal services in connection with the initial meeting of trustees, and were expensed immediately as incurred. Offering costs consist of the costs of preparation, review and filing with the SEC the Funds’ registration statement (including the Prospectus and the Statement of Additional Information (“SAI”)), the costs of preparation, the costs associated with the printing, mailing or other distribution of the Prospectus, SAI and the amounts of associated filing fees and legal fees associated with the offering. Organizational costs and offering costs are subject to the Funds’ expense limitation agreement discussed in Note 2 and offering costs require amortization over twelve months on a straight-line basis from the commencement of operations. For the period ended December 31, 2021, the Fund recorded $67,218 of amortized offering costs.
Use of Estimates
The preparation of financial statements in conformity with U.S. GAAP requires management to make estimates and assumptions that affect the amounts reported in the financial statements and accompanying notes. Actual results may differ from those estimated.
Other
Under the Trust’s organizational documents, its officers and trustees are indemnified against certain liabilities arising out of the performance of their duties to the Trust. In the normal course of business, the Trust enters into contracts that provide indemnification to the other party or parties against potential costs or liabilities. The Trust’s maximum exposure under these arrangements is dependent on claims that may be made in the future and, therefore, cannot be estimated. The Trust has had no prior claims or losses pursuant to any such agreement.
2. Transactions with Affiliates
Management and Investment Sub-Advisory Agreements
The AHL Managed Futures Strategy Fund and the Manager are parties to a Management Agreement that obligates the Manager to provide the AHL Managed Futures Strategy Fund with investment advisory and administrative services. As compensation for performing the duties under the Management Agreement, the Manager will receive an annualized management fee based on a percentage of the AHL Managed Futures Strategy Fund’s average daily net assets that is calculated and accrued daily, equal to 0.35%.
The AHL TargetRisk Fund and the AHL TargetRisk Core Fund (together, the “TargetRisk Funds”), and the Manager are parties to a Management Agreement that obligates the Manager to provide the TargetRisk Funds with investment advisory and administrative services. As compensation for preforming the duties under the Management Agreement, the Manager will receive an annualized management fee based on a percentage of each of the TargetRisk Funds’ average daily net assets that is calculated and accrued daily according to the following schedule:
| First $5 billion |
0.35 | % | ||
| Next $5 billion |
0.325 | % | ||
| Next $10 billion |
0.30 | % | ||
| Over $20 billion |
0.275 | % |
55
American Beacon FundsSM
Notes to Financial Statements
December 31, 2021
The Trust, on behalf of the Funds, and the Manager have entered into Investment Advisory Agreement with AHL Partners LLP (the “Sub-Advisor”), pursuant to which each Fund has agreed to pay an annualized sub-advisory fee that is calculated and accrued daily based on the Funds’ average daily net assets according to the following schedules:
AHL Managed Futures Strategy Fund
| All Assets |
1.00 | % |
AHL TargetRisk Fund
| First $500 million |
0.55 | % | ||
| Next $500 million |
0.50 | % | ||
| Next $500 million |
0.45 | % | ||
| Over $1.5 billion |
0.40 | % |
AHL TargetRisk Core Fund
| First $500 million |
0.525 | % | ||
| Next $500 million |
0.50 | % | ||
| Next $500 million |
0.45 | % | ||
| Over $1.5 billion |
0.40 | % |
The Management and Sub-Advisory Fees paid by the Funds for the year ended December 31, 2021 were as follows:
AHL Managed Futures Strategy Fund
| Effective Fee Rate | Amount of Fees Paid | |||||||||||
| Management Fees |
0.35 | % | $ | 5,924,218 | ||||||||
| Sub-Advisor Fees |
1.00 | % | 16,965,092 | |||||||||
|
|
|
|
|
|||||||||
| Total |
1.35 | % | $ | 22,889,310 | ||||||||
|
|
|
|
|
|||||||||
AHL TargetRisk Fund
| Effective Fee Rate | Amount of Fees Paid | |||||||||||
| Management Fees |
0.35 | % | $ | 3,098,005 | ||||||||
| Sub-Advisor Fees |
0.55 | % | 4,680,526 | |||||||||
|
|
|
|
|
|||||||||
| Total |
0.90 | % | $ | 7,778,531 | ||||||||
|
|
|
|
|
|||||||||
AHL TargetRisk Core Fund
| Effective Fee Rate | Amount of Fees Paid | |||||||||||
| Management Fees |
0.35 | % | $ | 36,240 | ||||||||
| Sub-Advisor Fees |
0.53 | % | 54,367 | |||||||||
|
|
|
|
|
|||||||||
| Total |
0.88 | % | $ | 90,607 | ||||||||
|
|
|
|
|
|||||||||
Distribution Plans
Separate Distribution Plans (the “Distribution Plans”) have been adopted pursuant to Rule 12b-1 under the Act for the A and C Classes of the Funds. Under the Distribution Plans, as compensation for distribution and shareholder servicing assistance, the Manager receives an annual fee of 0.25% of the average daily net assets of the A Class and 1.00% of the average daily net assets of the C Class. The fee will be payable without regard to whether the amount of the fee is more or less than the actual expenses incurred in a particular month by the Manager for distribution assistance.
56
American Beacon FundsSM
Notes to Financial Statements
December 31, 2021
Service Plans
The Manager and the Trust entered into Service Plans that obligate the Manager to oversee additional shareholder servicing of the Investor, A and C Classes of the Funds. As compensation for performing the duties required under the Service Plans, the Manager receives an annualized fee up to 0.25% of the average daily net assets of the A and C Classes and up to 0.375% of the average daily net assets of the Investor Class of the Funds.
Sub-Transfer Agent Fees
The Manager has entered into agreements, which include servicing agreements, with financial intermediaries that provide recordkeeping, processing, shareholder communications and other services to customers of the intermediaries that hold positions in the R5 and Y Classes of the Funds and has agreed to compensate the intermediaries for providing these services. Intermediaries transact with the Funds primarily through the use of omnibus accounts on behalf of their customers who hold positions in the Funds. Certain services would have been provided by the Funds’ transfer agent and other service providers if the shareholders’ accounts were maintained directly by the Funds’ transfer agent. Accordingly, the Funds, pursuant to Board approval, have agreed to reimburse the Manager for certain non-distribution shareholder services provided by financial intermediaries for the R5 and Y Classes. The reimbursement amounts (sub-transfer agent fees) paid to the Manager are subject to a fee limit of up to 0.10% of an intermediary’s average net assets in the R5 and Y Classes on an annual basis. During the year ended December 31, 2021, the sub-transfer agent fees, as reflected in “Transfer agent fees” on the Statements of Operations, were as follows:
| Fund |
Sub-Transfer Agent Fees | |||
| AHL Managed Futures Strategy |
$ | 1,143,412 | ||
| AHL TargetRisk |
605,681 | |||
| AHL TargetRisk Core |
23 | |||
As of December 31, 2021, the Funds owed the Manager the following reimbursement of sub-transfer agent fees, as reflected in “Transfer agent fees payable” on the Statements of Assets and Liabilities:
| Fund |
Reimbursement Sub-Transfer Agent Fees |
|||
| AHL Managed Futures Strategy |
$ | 116,583 | ||
| AHL TargetRisk |
54,090 | |||
| AHL TargetRisk Core |
9 | |||
Interfund Credit Facility
Pursuant to an exemptive order issued by the SEC, the Funds, along with other registered investment companies having management contracts with the Manager, may participate in a credit facility whereby each fund, under certain conditions, is permitted to lend money directly to and borrow directly from other participating funds for temporary purposes. The interfund credit facility is advantageous to the funds because it provides added liquidity and eliminates the need to maintain higher cash balances to meet redemptions. This situation could arise when shareholder redemptions exceed anticipated volumes and certain funds have insufficient cash on hand to satisfy such redemptions or when sales of securities do not settle as expected, resulting in a cash shortfall for a fund. When a fund liquidates portfolio securities to meet redemption requests, they often do not receive payment in settlement for up to two days (or longer for certain foreign transactions). Redemption requests normally are satisfied on the next business day. The credit facility provides a source of immediate, short-term liquidity pending settlement of the sale of portfolio securities. The credit facility is administered by a credit facility team consisting of professionals from the Manager’s asset management, compliance, and accounting areas who report the activities of the credit facility to the Board. During the year ended December 31, 2021, the Funds did not utilize the credit facility.
57
American Beacon FundsSM
Notes to Financial Statements
December 31, 2021
Expense Reimbursement Plan
The Manager contractually agreed to reduce fees and/or reimburse expenses for the classes of the Funds, through April 30, 2022, to the extent that total operating expenses (excluding taxes, interest, brokerage commissions, acquired fund fees and expenses, securities lending fees, expenses associated with securities sold short, litigation, and other extraordinary expenses) exceed the Funds’ expense cap. During the year ended December 31, 2021, the Manager waived and/or reimbursed expenses as follows:
| Expense Cap | Expiration of Reimbursed Expenses |
|||||||||||||||||||||
| Fund |
Class | 1/1/2021 - 4/30/2021 |
5/1/2021 - 12/31/2021 |
Reimbursed Expenses |
(Recouped) Expenses |
|||||||||||||||||
| AHL Managed Futures Strategy |
R5 | 1.54 | % | 1.54 | % | $ | 30,252 | ** | $ | (304,105 | )* | 2024 | ||||||||||
| AHL Managed Futures Strategy |
Y | 1.61 | % | 1.61 | % | 124,946 | ** | (78,137 | )* | 2024 | ||||||||||||
| AHL Managed Futures Strategy |
Investor | 1.92 | % | 1.92 | % | 3,575 | ** | (41,911 | )* | 2024 | ||||||||||||
| AHL Managed Futures Strategy |
A | 1.87 | % | 1.87 | % | 719 | ** | (2,041 | )* | 2024 | ||||||||||||
| AHL Managed Futures Strategy |
C | 2.62 | % | 2.62 | % | 1,272 | ** | (4,501 | )* | 2024 | ||||||||||||
| AHL TargetRisk |
R5 | 1.04 | % | 1.04 | % | 12,160 | ** | (31,422 | )* | 2024 | ||||||||||||
| AHL TargetRisk |
Y | 1.11 | % | 1.11 | % | 27,342 | ** | (129,709 | )* | 2024 | ||||||||||||
| AHL TargetRisk |
Investor | 1.42 | % | 1.42 | % | 659 | ** | (15,710 | )* | 2024 | ||||||||||||
| AHL TargetRisk |
A | 1.44 | % | 1.44 | % | 172 | ** | (162 | )* | 2024 | ||||||||||||
| AHL TargetRisk |
C | 2.19 | % | 2.19 | % | 671 | ** | (1,469 | )* | 2024 | ||||||||||||
| AHL TargetRisk Core |
Y | 1.09 | % | 1.09 | % | 3,954 | - | 2024 | ||||||||||||||
| AHL TargetRisk Core |
A | 1.39 | % | 1.39 | % | 3,898 | - | 2024 | ||||||||||||||
| AHL TargetRisk Core |
C | 2.14 | % | 2.14 | % | 3,923 | - | 2024 | ||||||||||||||
| AHL TargetRisk Core |
R6 | 0.99 | % | 0.99 | % | 261,971 | - | 2024 | ||||||||||||||
| * | These amounts represent Recouped Expenses from prior fiscal years and is reflected in Total Expenses on the Statements of Operations. |
| ** | Includes voluntary fees waived and expenses reimbursed at the American Beacon Cayman Managed Futures Strategy Fund, Ltd. and the American Beacon Cayman TargetRisk Company, Ltd. |
Of the above amounts, $79,259 was disclosed as a Receivable for expense reimbursement on the Statements of Assets and Liabilities at December 31, 2021 for the AHL TargetRisk Fund and $126,097 and $65,237 were disclosed as a Payable to Adviser on the Statements of Assets and Liabilities at December 31, 2021 for the AHL Managed Futures Strategy Fund and AHL TargetRisk Core Fund, respectively.
The Funds have adopted an Expense Reimbursement Plan whereby the Manager may seek repayment of such fee or voluntary reductions and expense reimbursements. Under the policy, the Manager can be reimbursed by the Funds for any contractual or voluntary fee reductions or expense reimbursements if reimbursement to the Manager (a) occurs within three years from the date of the Manager’s waiver/reimbursement and (b) does not cause the Funds’ annual operating expenses to exceed the lesser of the contractual percentage limit in effect at the time of the waiver/reimbursement or time of recoupment. The reimbursed expenses listed above will expire in 2024. The Funds did not record a liability for potential reimbursements due to the current assessment that a reimbursements are uncertain. The carryover of excess expenses potentially reimbursable to the Manager, but not recorded as a liability are as follows:
| Fund |
Recouped Expenses |
Excess Expense Carryover |
Expired Expense Carryover |
Expiration of Reimbursed Expenses |
||||||||||||
| AHL Managed Futures Strategy |
$ | 210,823 | $ | - | $ | 746,936 | 2021 | |||||||||
| AHL Managed Futures Strategy |
174,916 | 261,995 | - | 2022 | ||||||||||||
| AHL Managed Futures Strategy |
44,956 | 281,675 | - | 2023 | ||||||||||||
| AHL TargetRisk |
132,130 | 144,753 | - | 2022 | ||||||||||||
| AHL TargetRisk |
46,342 | 45,709 | - | 2023 | ||||||||||||
| AHL TargetRisk Core |
- | 56,263 | - | 2023 | ||||||||||||
58
American Beacon FundsSM
Notes to Financial Statements
December 31, 2021
Concentration of Ownership
From time to time, the Funds may have a concentration of one or more accounts constituting a significant percentage of shares outstanding. Investment activities by holders of accounts that represent a significant ownership of more than 5% of the Funds’ outstanding shares could have a material impact on the Funds. As of December 31, 2021, based on management’s evaluation of the shareholder account base, one account has been identified as representing an affiliated significant ownership of approximately 46% for the AHL TargetRisk Core Fund.
Sales Commissions
The Funds’ Distributor, Resolute Investment Distributors, Inc. (“RID” or “Distributor”), may receive a portion of Class A sales charges from broker dealers which may be used to offset distribution related expenses. During the year ended December 31, 2021, RID collected $8,324 and $2,490 for AHL Managed Futures Strategy Fund and AHL TargetRisk Fund, respectively, from the sale of Class A Shares. There were no Class A sales charges collected for AHL TargetRisk Core Fund.
A CDSC of 0.50% will be deducted with respect to Class A Shares on certain purchases of $1,000,000 or more that are redeemed in whole or part within 18 months of purchase, unless waived as discussed in the Funds’ Prospectus. Any applicable CDSC will be 0.50% of the lesser of the original purchase price or the value of the redemption of the Class A Shares redeemed. During the year ended December 31, 2021, CDSC fees of $11 was collected for the Class A Shares of AHL TargetRisk Fund. There were no CDSC fees collected for the Class A Shares of the AHL Managed Futures Strategy Fund and AHL TargetRisk Core Fund.
A CDSC of 1.00% will be deducted with respect to Class C Shares redeemed within 12 months of purchase, unless waived as discussed in the Funds’ Prospectus. Any applicable CDSC will be 1.00% of the lesser of the original purchase price or the value of the redemption of the Class C Shares redeemed. During the year ended December 31, 2021, CDSC fees of $374 and $5,289 were collected for the Class C Shares of AHL Managed Futures Strategy Fund and AHL TargetRisk Fund, respectively. There were no CDSC fees collected for the Class C Shares of AHL TargetRisk Core Fund.
Trustee Fees and Expenses
Effective January 1, 2021, as compensation for their service to the American Beacon Funds Complex, including the Trust (collectively, the “Trusts”), each Trustee is compensated from the Trusts as follows: (1) an annual retainer of $120,000; (2) meeting attendance fee (for attendance in-person or via teleconference) of (a) $12,000 for in person attendance, or $5,000 for telephonic attendance, by Board members for each regularly scheduled or special Board meeting, (b) $2,500 for attendance by Committee members at meetings of the Audit and Compliance Committee and the Investment Committee, (c) $1,000 for attendance by Committee members at meetings of the Nominating and Governance Committee; and (d) $2,500 for attendance by Board members for each special telephonic Board meeting; and (3) reimbursement of reasonable expenses incurred in attending Board meetings, Committee meetings, and relevant educational seminars. For this purpose, the Board considers attendance at regular meetings held by video conference to constitute in-person attendance at a Board meeting. The Trustees also may be compensated for attendance at special Board and/or Committee meetings from time to time. For her service as Board Chair, Ms. Cline receives an additional annual retainer of $50,000. Although she attends several committee meetings at each quarterly Board meeting, she receives only a single $2,500 fee each quarter for her attendance at those meetings. The chairpersons of the Audit and Compliance Committee and the Investment Committee each receive an additional annual retainer of $25,000 and the Chair of the Nominating and Governance Committee receives an additional annual retainer of $10,000.
59
American Beacon FundsSM
Notes to Financial Statements
December 31, 2021
3. Security Valuation and Fair Value Measurements
The price of a Fund’s shares is based on its net asset value (“NAV”) per share. A Fund’s NAV is computed by adding total assets, subtracting all the Fund’s liabilities, and dividing the result by the total number of shares outstanding.
The NAV of each class of a Fund’s shares is determined based on a pro rata allocation of a Fund’s investment income, expenses and total capital gains and losses. A Fund’s NAV per share is determined each business day as of the regular close of trading on the New York Stock Exchange (“NYSE” or “Exchange”), which is typically 4:00 p.m. Eastern Time (“ET”). However, if trading on the NYSE closes at a time other than 4:00 p.m. ET, a Fund’s NAV per share typically would still be determined as of the regular close of trading on the NYSE. The Funds do not price their shares on days that the NYSE is closed. Foreign exchanges may permit trading in foreign securities on days when a Fund is not open for business, which may result in the value of a Fund’s portfolio investments being affected at a time when you are unable to buy or sell shares.
Equity securities, including shares of closed-end funds and exchange-traded funds (“ETFs”), are valued at the last sale price or official closing price taken from the primary exchange in which each security trades. Investments in other mutual funds are valued at the closing NAV per share on the day of valuation. Debt securities are valued at bid quotes from broker/dealers or evaluated bid prices from pricing services, who may consider a number of inputs and factors, such as prices of comparable securities, yield curves, spreads, credit ratings, coupon rates, maturity, default rates, and underlying collateral. Futures are valued based on their daily settlement prices. Exchange-traded and over-the-counter (“OTC”) options are valued at the last sale price. Options with no last sale for the day are priced at mid quote. Swaps are valued at evaluated mid prices from pricing services.
The valuation of securities traded on foreign markets and certain fixed-income securities will generally be based on prices determined as of the earlier closing time of the markets on which they primarily trade unless a significant event has occurred. When a Fund holds securities or other assets that are denominated in a foreign currency, a Fund will normally use the currency exchange rates as of 4:00 p.m. ET.
Securities may be valued at fair value, as determined in good faith and pursuant to procedures approved by the Board, under certain limited circumstances. For example, fair value pricing will be used when market quotations are not readily available or reliable, as determined by the Manager, such as when (i) trading for a security is restricted or stopped; (ii) a security’s trading market is closed (other than customary closings); or (iii) a security has been de-listed from a national exchange. A security with limited market liquidity may require fair value pricing if the Manager determines that the available price does not reflect the security’s true market value. In addition, if a significant event that the Manager determines to affect the value of one or more securities held by a Fund occurs after the close of a related exchange but before the determination of a Fund’s NAV, fair value pricing may be used on the affected security or securities. Securities of small-capitalization companies are also more likely to require a fair value determination using these procedures because they are more thinly traded and less liquid than the securities of larger-capitalization companies. The Funds may fair value securities as a result of significant events occurring after the close of the foreign markets in which a Fund invests as described below. In addition, the Funds may invest in illiquid securities requiring these procedures.
A Fund may use fair value pricing for securities primarily traded in non-U.S. markets because most foreign markets close well before a Fund’s pricing time of 4:00 p.m. ET. The earlier close of these foreign markets gives rise to the possibility that significant events, including broad market moves, may have occurred in the interim and may materially affect the value of those securities. If the Manager determines that the last quoted prices of non-U.S. securities will, in its judgment, materially affect the value of some or all its portfolio securities, the Manager can adjust the previous closing prices to reflect what it believes to be the fair value of the securities as of the close of the Exchange. In deciding whether it is necessary to adjust closing prices to reflect fair value, the Manager reviews a variety of factors, including developments in foreign markets, the performance of U.S. securities markets, and the performance of instruments trading in U.S. markets that represent foreign securities
60
American Beacon FundsSM
Notes to Financial Statements
December 31, 2021
and baskets of foreign securities. These securities are fair valued using a pricing service, using methods approved by the Board, that considers the correlation of the trading patterns of the foreign security to intraday trading in the U.S. markets, based on indices of domestic securities and other appropriate indicators such as prices of relevant American Depositary Receipts (“ADRs”) and futures contracts. The Valuation Committee, established by the Board, may also fair value securities in other situations, such as when a particular foreign market is closed but a Fund is open. A Fund uses outside pricing services to provide closing prices and information to evaluate and/or adjust those prices. As a means of evaluating its security valuation process, the Valuation Committee routinely compares closing prices, the next day’s opening prices in the same markets and adjusted prices.
Attempts to determine the fair value of securities introduce an element of subjectivity to the pricing of securities. As a result, the price of a security determined through fair valuation techniques may differ from the price quoted or published by other sources and may not accurately reflect the market value of the security when trading resumes. If a reliable market quotation becomes available for a security formerly valued through fair valuation techniques, the Manager compares the new market quotation to the fair value price to evaluate the effectiveness of a Fund’s fair valuation procedures. If any significant discrepancies are found, the Manager may adjust a Fund’s fair valuation procedures.
Valuation Inputs
Various inputs may be used to determine the fair value of the Funds’ investments. These inputs are summarized in three broad levels for financial statement purposes. The inputs or methodologies used to value securities are not necessarily an indication of the risk associated with investing in those securities.
| Level 1 | - | Quoted prices in active markets for identical securities. | ||
| Level 2 | - | Prices determined using other significant observable inputs. These may include quoted prices for similar securities, interest rates, prepayment speeds, credit risk, and others. | ||
| Level 3 | - | Prices determined using other significant unobservable inputs. Unobservable inputs reflect a Fund’s own assumptions about the factors market participants would use in pricing an investment. | ||
Level 1 and Level 2 trading assets and trading liabilities, at fair value
Common stocks, ETFs, preferred securities, and financial derivative instruments, such as futures contracts or options that are traded on a national securities exchange, are stated at the last reported sale or settlement price on the day of valuation. To the extent these securities are actively traded and valuation adjustments are not applied, they are categorized as Level 1 of the fair value hierarchy. Valuation adjustments may be applied to certain securities that are solely traded on a foreign exchange to account for the market movement between the close of the foreign market and the close of the Exchange. These securities are valued using pricing service providers that consider the correlation of the trading patterns of the foreign security to the intraday trading in the U.S. markets for investments. Securities using these valuation adjustments are categorized as Level 2 of the fair value hierarchy. Preferred securities and other equities traded on inactive markets or valued by reference to similar instruments are generally categorized as Level 2 of the fair value hierarchy.
Fixed-income securities including corporate, convertible and municipal bonds and notes, U.S. government agencies, U.S. Treasury obligations, sovereign issues, bank loans, convertible preferred securities, and non-U.S. bonds are normally valued by pricing service providers that use broker dealer quotations, reported trades or valuation estimates from their internal pricing models. The service providers’ internal models use inputs that are observable such as issuer details, interest rates, yield curves, prepayment speeds, credit risks/spreads, default rates, and quoted prices for similar assets. Securities that use similar valuation techniques and inputs as described above are categorized as Level 2 of the fair value hierarchy. Fixed-income securities purchased on a delayed-delivery basis are marked-to-market daily until settlement at the forward settlement date and are categorized as Level 2 of the fair value hierarchy.
61
American Beacon FundsSM
Notes to Financial Statements
December 31, 2021
Mortgage-related and asset-backed securities (“ABS”) are usually issued as separate tranches, or classes, of securities within each deal. These securities are also normally valued by pricing service providers that use broker-dealer quotations or valuation estimates from their internal pricing models. The pricing models for these securities usually consider tranche-level attributes, current market data, estimated cash flows, and market-based yield spreads for each tranche, and incorporates deal collateral performance, as available. Mortgage-related and ABS that use similar valuation techniques and inputs as described above are categorized as Level 2 of the fair value hierarchy.
Investments in registered open-end investment management companies will be valued based upon the NAVs of such investments and are categorized as Level 1 of the fair value hierarchy.
OTC financial derivative instruments, such as forward foreign currency contracts derive their value from underlying asset prices, indices, reference rates, and other inputs or a combination of these factors. These contracts are normally valued on the basis of broker dealer quotations or pricing service providers. Depending on the product and the terms of the transaction, the fair value of the financial derivative contracts can be estimated by a pricing service provider using a series of techniques, including simulation pricing models. The pricing models use inputs that are observed from actively quoted markets such as issuer details, indices, spreads, interest rates, curves, dividends, and exchange rates. Financial derivatives that use similar valuation techniques and inputs as described above are categorized as Level 2 of the fair value hierarchy.
4. Securities and Other Investments
Commodity Instruments
Exposure to physical commodities may subject the AHL Managed Futures Strategy Fund and the AHL TargetRisk Fund to greater volatility than investments in traditional securities. The value of such investments may be affected by overall market movements, commodity index volatility, changes in interest rates, or factors affecting a particular industry or commodity, such as supply and demand, drought, floods, weather, embargoes, tariffs and international economic, political and regulatory developments. Their value may also respond to investor perception of instability in the national or international economy, whether or not justified by the facts. However, these investments may help to moderate fluctuations in the value of a Fund’s other holdings, because these investments may not correlate with investments in traditional securities. Economic and other events (whether real or perceived) can reduce the demand for commodities, which may reduce market prices and cause the value of a Fund’s shares to fall. No active trading market may exist for certain commodities investments, which may impair the ability of the Fund to sell or realize the full value of such investments in the event of the need to liquidate such investments. Certain commodities are subject to limited pricing flexibility because of supply and demand factors. Others are subject to broad price fluctuations as a result of the volatility of the prices for certain raw materials and the instability of supplies of other materials. These additional variables may create additional investment risks and result in greater volatility than investments in traditional securities. Because physical commodities do not generate investment income, the return on such investments will be derived solely from the appreciation or depreciation on such investments. Certain types of commodities instruments (such as commodity-linked swaps and commodity-linked structured notes) are subject to the risk that the counterparty to the instrument will not perform or will be unable to perform in accordance with the terms of the instrument.
Fixed-Income Investments
The Funds’ exposure to fixed-income instruments may include:
| • | Emerging Markets Debt. The Funds may invest a significant portion of their assets in a particular geographic region or country, including emerging markets. The Funds may consider a country to be an emerging market country based on a number of factors including, but not limited to, if the country is classified as an emerging or developing economy by any supranational organization such as the World |
62
American Beacon FundsSM
Notes to Financial Statements
December 31, 2021
| Bank, International Finance Corporation or the United Nations, or related entities, or if the country is considered an emerging market country for purposes of constructing emerging market indices. |
| • | High-Yield Bonds. High-yield, non-investment grade bonds (also known as “junk bonds”) are low-quality, high-risk corporate bonds that generally offer a high level of current income. These bonds are considered speculative by rating organizations. For example, Moody’s, S&P Global Ratings and Fitch, Inc. rate them below Baa 3 and BBB-, respectively. High-yield bonds are often issued as a result of corporate restructurings, such as leveraged buyouts, mergers, acquisitions, or other similar events. They may also be issued by smaller, less creditworthy companies or by highly leveraged firms, which are generally less able to make scheduled payments of interest and principal than more financially stable firms. Because of their low credit quality, high-yield bonds must pay higher interest to compensate investors for the substantial credit risk they assume. Lower-rated securities are subject to certain risks that may not be present with investments in higher-grade securities. Investors should consider carefully their ability to assume the risks associated with lower-rated securities before investing in the Fund. The lower rating of certain high yielding corporate income securities reflects a greater possibility that the financial condition of the issuer or adverse changes in general economic conditions may impair the ability of the issuer to pay income and principal. Changes by rating agencies in their ratings of a fixed-income security also may affect the value of these investments. However, allocating investments in the Fund among securities of different issuers should reduce the risks of owning any such securities separately. The prices of these high yielding securities tend to be less sensitive to interest rate changes than higher-rated investments, but more sensitive to adverse economic changes or individual corporate developments. During economic downturns, highly leveraged issuers may experience financial stress that adversely affects their ability to service principal and interest payment obligations, to meet projected business goals or to obtain additional financing, and the markets for their securities may be more volatile. If an issuer defaults, a Fund may incur additional expenses to seek recovery. Additionally, accruals of interest income for a Fund may have to be adjusted in the event of default. In the event of an issuer’s default, a Fund may write off prior income accruals for that issuer, resulting in a reduction in a Fund’s current dividend payment. Frequently, the higher yields of high-yielding securities may not reflect the value of the income stream that holders of such securities may expect, but rather the risk that such securities may lose a substantial portion of their value as a result of their issuer’s financial restructuring or default. Additionally, an economic downturn or an increase in interest rates could have a negative effect on the high-yield securities market and on the market value of the high-yield securities held by a Fund, as well as on the ability of the issuers of such securities to repay principal and interest on their borrowings. |
| • | Inflation Index Linked Securities. Inflation-indexed securities, also known as inflation-protected securities, are fixed-income instruments structured such that their interest and principal payments are adjusted to keep up with inflation. In periods of deflation when the inflation rate is declining, the principal value of an inflation-indexed security will be adjusted downward. This will result in a decrease in the interest payments. |
| • | Investment Grade Securities. Investment grade securities that the Funds may purchase, either as part of its principal investment strategy or to implement a temporary defensive policy, include securities issued or guaranteed by the U.S. Government, its agencies and instrumentalities, as well as securities rated in one of the four highest rating categories by a rating organization rating that security (such as S&P Global Ratings, Moody’s Investors Service, Inc., or Fitch, Inc.) or comparably rated by the sub-advisor if unrated by a rating organization. The Funds, at the discretion of the sub-advisor, may retain a security that has been downgraded below the initial investment criteria. |
| • | Sovereign Debt. Sovereign debt securities are typically issued or guaranteed by national governments in order to finance the issuing country’s growth and/or budget. Investing in foreign sovereign debt securities will expose funds investing in such securities to the direct or indirect consequences of political, social or economic changes in the countries that issue the debt securities. |
63
American Beacon FundsSM
Notes to Financial Statements
December 31, 2021
| • | U.S. Government Securities. U.S. Government securities may include U.S. Treasury securities or debt obligations of U.S. Government-sponsored enterprises. |
Illiquid and Restricted Securities
Generally, an illiquid asset is an asset that the Funds reasonably expect cannot be sold or disposed of in current market conditions in seven calendar days or less without the sale or disposition significantly changing the market value of the investment, as determined pursuant to Rule 22e-4 under the Investment Company Act or as otherwise permitted or required by SEC rules and interpretations. Historically, illiquid securities have included securities that have not been registered under the Securities Act, securities that are otherwise not readily marketable, and repurchase agreements having a remaining maturity of longer than seven calendar days. Securities that have not been registered under the Securities Act are referred to as private placements or restricted securities and are purchased directly from the issuer or in the secondary market. These securities may be sold only in a privately negotiated transaction or pursuant to an exemption from registration. A large institutional market exists for certain securities that are not registered under the Securities Act, including repurchase agreements, commercial paper, foreign securities, municipal securities and corporate bonds and notes. Institutional investors depend on an efficient institutional market in which the unregistered security can be readily resold or on an issuer’s ability to honor a demand for repayment. However, the fact that there are contractual or legal restrictions on resale of such investments to the general public or to certain institutions may not be indicative of their liquidity.
Limitations on resale may have an adverse effect on the marketability of portfolio securities, and a Fund might be unable to dispose of restricted or other illiquid securities promptly or at reasonable prices and might thereby experience difficulty satisfying redemptions within seven calendar days. In addition, a Fund may get only limited information about an issuer, so it may be less able to predict a loss. A Fund also might have to register such restricted securities in order to dispose of them resulting in additional expense and delay. Adverse market conditions could impede such a public offering of securities.
In recognition of the increased size and liquidity of the institutional market for unregistered securities and the importance of institutional investors in the formation of capital, the SEC adopted Rule 144A under the Securities Act. Rule 144A is designed to facilitate efficient trading among institutional investors by permitting the sale of certain unregistered securities to qualified institutional buyers. To the extent privately placed securities held by a Fund qualify under Rule 144A and an institutional market develops for those securities, a Fund likely will be able to dispose of the securities without registering them under the Securities Act. To the extent that institutional buyers become, for a time, uninterested in purchasing these securities, investing in Rule 144A securities could increase the level of a Fund’s illiquidity. The Manager or the Sub-Advisor, as applicable, may determine that certain securities qualified for trading under Rule 144A are liquid. Regulation S under the Securities Act permits the sale abroad of securities that are not registered for sale in the United States and includes a provision for U.S. investors, such as a Fund, to purchase such unregistered securities if certain conditions are met.
Securities sold in private placement offerings made in reliance on the “private placement” exemption from registration afforded by Section 4(a)(2) of the Securities Act and resold to qualified institutional buyers under Rule 144A under the Securities Act (“Section 4(a)(2) securities”) are restricted as to disposition under the federal securities laws, and generally are sold to institutional investors, such as a Fund, that agree they are purchasing the securities for investment and not with an intention to distribute to the public. Any resale by the purchaser must be pursuant to an exempt transaction and may be accomplished in accordance with Rule 144A. Section 4(a)(2) securities normally are resold to other institutional investors through or with the assistance of the issuer or dealers that make a market in the Section 4(a)(2) securities, thus providing liquidity.
Restricted securities outstanding during the year ended December 31, 2021 are disclosed in the Notes to the Schedules of Investments.
64
American Beacon FundsSM
Notes to Financial Statements
December 31, 2021
Other Investment Company Securities and Other Exchange-Traded Products
The Funds may invest in shares of other investment companies, including open-end funds, closed-end funds, ETFs, unit investment trusts, and other investment companies of the Trust. The Funds may invest in securities of an investment company advised by the Manager or a Sub-Advisor. Investments in the securities of other investment companies may involve duplication of advisory fees and certain other expenses. By investing in another investment company, the Funds become a shareholder of that investment company. As a result, the Funds’ shareholders indirectly will bear the Funds’ proportionate share of the fees and expenses paid by shareholders of the other investment company, in addition to the fees and expenses the Funds’ shareholders directly bear in connection with the Funds’ own operations. These other fees and expenses, are reflected as Acquired Fund Fees and Expenses and are included in the Fees and Expenses Table for the Funds in their Prospectus, if applicable. Investments in other investment companies may involve the payment of substantial premiums above the value of such issuer’s portfolio securities.
The Funds can invest free cash balances in registered open-end investment companies regulated as money market funds under the Act, to provide liquidity or for defensive purposes. The Funds could invest in money market funds rather than purchasing individual short-term investments. If the Funds invests in money market funds, shareholders will bear their proportionate share of the expenses, including for example, advisory and administrative fees, of the money market funds in which the Funds invest, including advisory fees charged by the Manager to any applicable money market funds advised by the Manager.
U.S. Treasury Obligations
U.S. Treasury obligations include bills (initial maturities of one year or less), notes (initial maturities between two and ten years), and bonds (initial maturities over ten years) issued by the U.S. Treasury, Separately Traded Registered Interest and Principal component parts of such obligations (known as “STRIPS”) and inflation-indexed securities. The prices of these securities (like all debt securities) change between issuance and maturity in response to fluctuating market interest rates. U.S. Treasury obligations are subject to credit risk and interest rate risk.
5. Financial Derivative Instruments
The Funds may utilize derivative instruments to gain market exposure on cash balances or reduce market exposure in anticipation of liquidity needs. When considering the Funds’ use of derivatives, it is important to note that the Funds do not use derivatives for the purpose of creating financial leverage.
Forward Foreign Currency Contracts
The Funds may have exposure to foreign currencies for investment or hedging purposes by purchasing or selling forward currency exchange contracts in non-U.S. currencies and by purchasing securities denominated in non-U.S. currencies. Foreign currencies may decline in value relative to the U.S. dollar and affect the Fund’s investments in securities that trade in, and receive revenues in, or in derivatives that provide exposure to, foreign (non-U.S.) currencies. Not all forward contracts require a counterparty to post collateral, which may expose the Fund to greater losses in the event of a default by a counterparty.
Forward contracts are two-party contracts pursuant to which one party agrees to pay the counterparty a fixed price for an agreed upon amount of commodities or securities, or the cash value of commodities, securities or a securities index, at an agreed upon future date. A forward currency contract is an obligation to buy or sell a specific currency at a future date, which may be any fixed number of days from the date of the contract agreed upon by the parties, at a price set at the time of the contract. An NDF is a forward contract where there is no physical settlement of the two currencies at maturity. Rather, on the contract settlement date, a net cash settlement will be made by one party to the other based on the difference between the contracted forward rate
65
American Beacon FundsSM
Notes to Financial Statements
December 31, 2021
and the prevailing spot rate, on an agreed notional amount. Not all forward contracts require a counterparty to post collateral, which may expose the Fund to greater losses in the event of a default by a counterparty.
During the year ended December 31, 2021, the Funds entered into forward foreign currency contracts primarily for taking exposure to foreign currencies or hedging foreign currency fluctuations.
The Funds’ forward foreign currency contract notional dollar values outstanding fluctuate throughout the operating year as required to meet strategic requirements. The following table illustrates the average quarterly volume of forward foreign currency contracts. For the purpose of this disclosure, volume is measured by the amounts bought and sold in USD at each quarter end.
| Average Forward
Foreign Currency Notional Amounts Outstanding |
||||||||||||
| Fund |
Purchased Contracts |
|
Sold Contracts | |||||||||
| AHL Managed Futures Strategy |
$ | 567,272,065 | $ | 572,420,249 | ||||||||
| AHL TargetRisk |
19,303,629 | 304,755,422 | ||||||||||
| AHL TargetRisk Core |
52,520 | 512,296 | ||||||||||
Futures Contracts
A futures contract is a contract to purchase or sell a particular security, or the cash value of an asset, such as securities, indices, or currencies, at a specified future date at a price agreed upon when the contract is made. Under many such contracts, no delivery of the actual underlying asset is required. Rather, upon the expiration of the contract, settlement is made by exchanging cash in an amount equal to the difference between the contract price and the closing price of the asset (e.g., a security or an index) at expiration, net of the initial and variation margin that was previously paid. A Treasury futures contract is a contract for the future delivery of a U.S. Treasury security. An equity index futures contract is based on the value of an underlying index. A Fund may, from time to time, use futures positions to equitize cash and expose its portfolio to changes in securities prices or index prices. This can magnify gains and losses in a Fund. A Fund also may have to sell assets at inopportune times to satisfy its settlement or collateral obligations. The risks associated with the use of futures contracts also include that there may be an imperfect correlation between the changes in market value of the prices of futures contracts and the assets underlying such contracts and that there may not be a liquid secondary market for a futures contract.
During the year ended December 31, 2021, the Funds entered into futures contracts primarily for investing and/or hedging purposes.
The Funds’ average futures contracts outstanding fluctuate throughout the operating year as required to meet strategic requirements. The following table illustrates the average quarterly volume of futures contracts. For the purpose of this disclosure, volume is measured by contracts outstanding at each quarter end.
| Average Futures Contracts Outstanding |
||||
| Fund |
Year Ended December 31, 2021 | |||
| AHL Managed Futures Strategy |
48,266 | |||
| AHL TargetRisk |
11,530 | |||
| AHL TargetRisk Core |
184 | |||
Swap Agreements
A swap is a transaction in which a Fund and a counterparty agree to pay or receive payments at specified dates based upon or calculated by reference to changes in specified prices or rates (e.g., interest rates in the case of interest rate swaps) or the performance of specified securities or indices based on a specified amount (the “notional” amount). Nearly any type of derivative, including forward contracts, can be structured as a swap.
66
American Beacon FundsSM
Notes to Financial Statements
December 31, 2021
Swap agreements can be structured to provide exposure to a variety of different types of investments or market factors. For example, in an interest rate swap, fixed-rate payments may be exchanged for floating rate payments; in a currency swap, U.S. dollar-denominated payments may be exchanged for payments denominated in a foreign currency; and in a total return swap, payments tied to the investment return on a particular asset, group of assets or index may be exchanged for payments that are effectively equivalent to interest payments or for payments tied to the return on another asset, group of assets, or index. Swaps may have a leverage component, and adverse changes in the value or level of the underlying asset, reference rate or index can result in gains or losses that are substantially greater than the amount invested in the swap itself.
Some swaps currently are, and more in the future will be, centrally cleared. Swaps that are centrally-cleared are exposed to the creditworthiness of the clearing organizations (and, consequently, that of their members—generally, banks and broker-dealers) involved in the transaction. For example, an investor could lose margin payments it has deposited with the clearing organization as well as the net amount of gains not yet paid by the clearing organization if it breaches its agreement with the investor or becomes insolvent or goes into bankruptcy. In the event of bankruptcy of the clearing organization, the investor may be able to recover only a portion of the net amount of gains on its transactions and of the margin owed to it, potentially resulting in losses to the investor.
Swaps that are not centrally cleared, involve the risk that a loss may be sustained as a result of the insolvency or bankruptcy of the counterparty or the failure of the counterparty to make required payments or otherwise comply with the terms of the agreement. To mitigate this risk, a Fund will only enter into swap agreements with counterparties considered by a sub-advisor to present minimum risk of default and a Fund normally obtains collateral to secure its exposure. Changing conditions in a particular market area, whether or not directly related to the referenced assets that underlie the swap agreement, may have an adverse impact on the creditworthiness of a counterparty.
The centrally cleared and OTC swap agreements into which a Fund enters normally provide for the obligations of a Fund and its counterparty in the event of a default or other early termination to be determined on a net basis. Similarly, periodic payments on a swap transaction that are due by each party on the same day normally are netted. To the extent that a swap agreement is subject to netting, a Fund’s cover and asset segregation responsibilities will normally be with respect to the net amount owed by a Fund. However, a Fund may be required to segregate liquid assets equal to the full notional amount of certain swaps, such as written credit default swaps on physically settled forwards or written options. The amount that a Fund must segregate may be reduced by the value of any collateral that it has pledged to secure its own obligations under the swap.
Credit Default Swap Agreements
Credit default swap agreements involve one party making a stream of payments (referred to as the buyer of protection) to another party (the seller of protection) in exchange for the right to receive a specified return in the event of a default or other credit event for the referenced entity, obligation or index. As a seller of protection on credit default swap agreements, a Fund will generally receive from the buyer of protection a fixed rate of periodic premiums throughout the term of the swap provided that there is no credit event. As the seller, a Fund would effectively add leverage to its portfolio because, in addition to its total net assets, a Fund would be subject to investment exposure up to the notional amount of the swap.
If a Fund is a seller of protection and a credit event occurs, as defined under the terms of that particular swap agreement, a Fund will either (i) pay to the buyer of protection an amount equal to the notional amount of the swap and take delivery of the referenced obligation, other deliverable obligations or underlying securities comprising the referenced index or (ii) pay a net settlement amount in the form of cash or securities equal to the notional amount of the swap less the recovery value of the referenced obligation or underlying securities comprising the referenced index. If a Fund is a buyer of protection and a credit event occurs, as defined under the terms of that particular swap agreement, a Fund will either (i) receive from the seller of protection an amount
67
American Beacon FundsSM
Notes to Financial Statements
December 31, 2021
equal to the notional amount of the swap and deliver the referenced obligation, other deliverable obligations or underlying securities comprising the referenced index or (ii) receive a net settlement amount in the form of cash or securities equal to the notional amount of the swap less the recovery value of the referenced obligation or underlying securities comprising the referenced index. Recovery values are estimated by market makers considering either industry standard recovery rates or entity specific factors and considerations until a credit event occurs. If a credit event has occurred, the recovery value is determined by a facilitated auction whereby a minimum number of allowable broker bids, together with a specified valuation method, are used to calculate the settlement value.
Credit default swap agreements on corporate issues, sovereign issues of an emerging country or U.S. municipal issues involve one party making a stream of payments to another party in exchange for the right to receive a specified return in the event of a default or other credit event. If a credit event occurs and cash settlement is not elected, a variety of other deliverable obligations may be delivered in lieu of the specific referenced obligation. The ability to deliver other obligations may result in a cheapest-to-deliver option (the buyer of protection’s right to choose the deliverable obligation with the lowest value following a credit event). A Fund may use credit default swaps on corporate issues, sovereign issues of an emerging country or U.S. municipal issues to provide a measure of protection against defaults of the issuers (i.e., to reduce risk where a Fund owns or has exposure to the referenced obligation) or to take an active long or short position with respect to the likelihood of a particular issuer’s default.
Credit default swap agreements on asset-backed securities involve one party making a stream of payments to another party in exchange for the right to receive a specified return in the event of a default or other credit event. Unlike credit default swaps on corporate issues, sovereign issues of an emerging country or U.S. municipal issues, deliverable obligations in most instances would be limited to the specific referenced obligation as performance for asset-backed securities can vary across deals. Prepayments, principal paydowns, and other writedown or loss events on the underlying mortgage loans will reduce the outstanding principal balance of the referenced obligation. These reductions may be temporary or permanent as defined under the terms of the swap agreement and the notional amount for the swap agreement will be adjusted by corresponding amounts. A Fund may use credit default swaps on asset-backed securities to provide a measure of protection against defaults of the referenced obligation that a Fund owns or to take an active long or short position with respect to the likelihood of a particular referenced obligation’s default that a Fund does not own.
Credit default swap agreements on credit indices involve one party making a stream of payments to another party in exchange for the right to receive a specified return in the event of a write-down, principal shortfall, interest shortfall or default of all or part of the referenced entities comprising the credit index. A credit index is a basket of credit instruments or exposures designed to be representative of some part of the credit market as a whole. These indices are made up of reference credits that are judged by a poll of dealers to be the most liquid entities in the credit default swap market based on the sector of the index. Components of the indices may include, but are not limited to, investment grade securities, high yield securities, asset-backed securities, emerging markets, and/or various credit ratings within each sector. Credit indices are traded using credit default swaps with standardized terms including a fixed spread and standard maturity dates. An index credit default swap references all the names in the index, and if there is a default, the credit event is settled based on that name’s weight in the index. The composition of the indices changes periodically, usually every six months, and for most indices, each name has an equal weight in the index. A Fund may use credit default swaps on credit indices to hedge a portfolio of credit default swaps or bonds, which is less expensive than it would be to buy many credit default swaps to achieve a similar effect. Credit default swaps on indices are benchmarks for protecting investors owning bonds against default, and traders use them to speculate on changes in credit quality.
Implied credit spreads, represented in absolute terms, utilized in determining the market value of credit default swap agreements on corporate issues, sovereign issues of an emerging country or U.S. municipal issues as of period end are disclosed in the Notes to the Schedule of Investments and serve as an indicator of the current status
68
American Beacon FundsSM
Notes to Financial Statements
December 31, 2021
of the payment/performance risk and represent a market participant view of the likelihood or risk of default for the underlying referenced security to credit derivative. The implied credit spread of a particular referenced entity reflects the cost of buying/selling protection and may include upfront payments required to be made to enter into the agreement. For credit default swap agreements on asset-backed securities and credit indices, the quoted market prices and resulting values serve as the indicator of the current status of the payment/performance risk. Wider credit spreads represent a deterioration of the referenced entity’s credit soundness and a greater likelihood or risk of default or other credit event occurring as defined under the terms of the agreement.
The maximum potential amount of future payments (undiscounted) that a Fund as a seller of protection could be required to make under a credit default swap agreement would be an amount equal to the notional amount of the agreement. Notional amounts of each individual credit default swap agreement outstanding as of December 31, 2021, for which a Fund is the seller of protection is disclosed in the Notes to the Schedule of Investments. These potential amounts would be partially offset by any recovery values of the respective referenced obligations, upfront payments received upon entering into the agreement, or net amounts received from the settlement of buy protection credit default swap agreements entered into by a Fund for the same referenced entity or entities.
During the year ended December 31, 2021, the AHL TargetRisk Fund entered into credit default swaps primarily for return enhancement and hedging.
The Fund’s credit default swap contract notional amounts outstanding fluctuate throughout the operating year as required to meet the strategic requirements. The following table illustrates the average quarterly volume of credit default swap contracts. For the purpose of this disclosure, the volume is measure by the notional amounts outstanding at each quarter end.
| Average Credit Default Swap Notional Amounts Outstanding |
||||
| Fund |
Year Ended December 31, 2021 | |||
| AHL TargetRisk |
557,500,000 | |||
Total Return Swap Agreements
The AHL TargetRisk Fund may enter into total return swaps in order to take a “long” or “short” position with respect to an underlying referenced asset. The Fund is subject to market price volatility of the underlying referenced asset. A total return swap involves commitments to pay interest in exchange for a market linked return based on a notional amount. To the extent that the total return of the security, group of securities or index underlying the transaction exceeds or falls short of the offsetting interest obligation, the Fund will receive a payment from or make a payment to the counterparty.
The Fund’s total return swap contracts outstanding fluctuate throughout the operating year as required to meet strategic requirements. The following table illustrates the average quarterly volume of total return swap contracts. For the purpose of this disclosure, volume is measured by notional amounts outstanding at each quarter end:
| Average Total Return Swap Notional Amounts Outstanding |
||||
| Fund |
Year Ended December 31, 2021 | |||
| AHL TargetRisk |
131,971,080 | |||
The following is a summary of the fair valuations of the Funds’ derivative instruments categorized by risk exposure(1):
69
American Beacon FundsSM
Notes to Financial Statements
December 31, 2021
AHL Managed Futures Strategy Fund
| Fair values of financial instruments on the Statements of Assets and Liabilities as of December 31, 2021: |
| ||||||||||||||||||||||||||||||||||||||||||||||||||||||
| Derivatives not accounted for as hedging instruments | |||||||||||||||||||||||||||||||||||||||||||||||||||||||
| Assets: |
Credit contracts | Foreign exchange contracts |
Commodity contracts |
Interest rate contracts |
Equity contracts | Total | |||||||||||||||||||||||||||||||||||||||||||||||||
| Unrealized appreciation of forward foreign currency contracts | $ | - | $ | 6,864,218 | $ | - | $ | - | $ | - | $ | 6,864,218 | |||||||||||||||||||||||||||||||||||||||||||
| Receivable for variation margin from open futures contracts(2) | 6,373,961 | 10,768,803 | 3,406,029 | 13,412,260 | 33,961,053 | ||||||||||||||||||||||||||||||||||||||||||||||||||
| Liabilities: |
Credit contracts | Foreign exchange contracts |
Commodity contracts |
Interest rate contracts |
Equity contracts | Total | |||||||||||||||||||||||||||||||||||||||||||||||||
| Unrealized depreciation of forward foreign currency contracts | $ | - | $ | (8,498,721 | ) | $ | - | $ | - | $ | - | $ | (8,498,721 | ) | |||||||||||||||||||||||||||||||||||||||||
| Payable for variation margin from open futures contracts(2) | - | (17,954,559 | ) | (9,063,909 | ) | (3,669,924 | ) | (1,552,559 | ) | (32,240,951 | ) | ||||||||||||||||||||||||||||||||||||||||||||
| The effect of financial derivative instruments on the Statements of Operations as of December 31, 2021: |
| ||||||||||||||||||||||||||||||||||||||||||||||||||||||
| Derivatives not accounted for as hedging instruments | |||||||||||||||||||||||||||||||||||||||||||||||||||||||
| Realized gain (loss) from |
Credit contracts | Foreign exchange contracts |
Commodity contracts |
Interest rate contracts |
Equity contracts | Total | |||||||||||||||||||||||||||||||||||||||||||||||||
| Forward foreign currency contracts | $ | $ | (13,933,128 | ) | $ | - | $ | - | $ | - | $ | (13,933,128 | ) | ||||||||||||||||||||||||||||||||||||||||||
| Futures contracts | - | (11,837,081 | ) | 103,755,686 | (15,975,899 | ) | 49,885,876 | 125,828,582 | |||||||||||||||||||||||||||||||||||||||||||||||
| Net change in unrealized |
Credit contracts | Foreign exchange contracts |
Commodity contracts |
Interest rate contracts |
Equity contracts | Total | |||||||||||||||||||||||||||||||||||||||||||||||||
| Forward foreign currency contracts | $ | - | $ | (4,894,737 | ) | $ | - | $ | - | $ | - | $ | (4,894,737 | ) | |||||||||||||||||||||||||||||||||||||||||
| Futures contracts | - | (21,737,968 | ) | (17,417,191 | ) | (1,020,156 | ) | 701,692 | (39,473,623 | ) | |||||||||||||||||||||||||||||||||||||||||||||
AHL TargetRisk Fund
| Fair values of financial instruments on the Statements of Assets and Liabilities as of December 31, 2021: |
| ||||||||||||||||||||||||||||||||||||||||||||||||||||||
| Derivatives not accounted for as hedging instruments | |||||||||||||||||||||||||||||||||||||||||||||||||||||||
| Assets: |
Credit contracts | Foreign exchange contracts |
Commodity contracts |
Interest rate contracts |
Equity contracts | Total | |||||||||||||||||||||||||||||||||||||||||||||||||
| Unrealized appreciation of forward foreign currency contracts | $ | - | $ | 451,724 | $ | - | $ | - | $ | - | $ | 451,724 | |||||||||||||||||||||||||||||||||||||||||||
| Receivable for variation margin from open futures contracts(2) | - | - | - | 5,703,733 | 7,365,323 | 13,069,056 | |||||||||||||||||||||||||||||||||||||||||||||||||
| Unrealized appreciation from swap agreements | 2,122,798 | - | - | - | 5,164,063 | 7,286,861 | |||||||||||||||||||||||||||||||||||||||||||||||||
| Liabilities: |
Credit contracts | Foreign exchange contracts |
Commodity contracts |
Interest rate contracts |
Equity contracts | Total | |||||||||||||||||||||||||||||||||||||||||||||||||
| Unrealized depreciation of forward foreign currency contracts | $ | - | $ | (4,321,112 | ) | $ | - | $ | - | $ | - | $ | (4,321,112 | ) | |||||||||||||||||||||||||||||||||||||||||
| Payable for variation margin from open futures contracts(2) | - | - | - | (5,898,562 | ) | (191,497 | ) | (6,090,059 | ) | ||||||||||||||||||||||||||||||||||||||||||||||
| Unrealized depreciation from swap agreements | (73,927 | ) | - | - | - | - | (73,927 | ) | |||||||||||||||||||||||||||||||||||||||||||||||
70
American Beacon FundsSM
Notes to Financial Statements
December 31, 2021
| The effect of financial derivative instruments on the Statements of Operations as of December 31, 2021: |
| ||||||||||||||||||||||||||||||||||||||||||||||||||||||
| Derivatives not accounted for as hedging instruments | |||||||||||||||||||||||||||||||||||||||||||||||||||||||
| Realized gain (loss) from derivatives |
Credit contracts | Foreign exchange contracts |
Commodity contracts |
Interest rate contracts |
Equity contracts | Total | |||||||||||||||||||||||||||||||||||||||||||||||||
| Forward foreign currency contracts | $ | - | $ | 6,944,422 | $ | - | $ | - | $ | - | $ | 6,944,422 | |||||||||||||||||||||||||||||||||||||||||||
| Futures contracts | - | - | - | (6,533,906 | ) | 52,400,019 | 45,866,113 | ||||||||||||||||||||||||||||||||||||||||||||||||
| Swap contracts | 9,687,836 | - | - | - | 29,625,864 | 39,313,700 | |||||||||||||||||||||||||||||||||||||||||||||||||
| Net change in unrealized appreciation |
Credit contracts | Foreign exchange contracts |
Commodity contracts |
Interest rate contracts |
Equity contracts | Total | |||||||||||||||||||||||||||||||||||||||||||||||||
| Forward foreign currency contracts | $ | - | $ | (1,158,675 | ) | $ | - | $ | - | $ | - | $ | (1,158,675 | ) | |||||||||||||||||||||||||||||||||||||||||
| Futures contracts | - | - | - | (859,164 | ) | 2,701,019 | 1,841,855 | ||||||||||||||||||||||||||||||||||||||||||||||||
| Swap contracts | 1,491,323 | - | - | - | 3,717,425 | 5,208,748 | |||||||||||||||||||||||||||||||||||||||||||||||||
AHL TargetRisk Core Fund
| Fair values of financial instruments on the Statements of Assets and Liabilities as of December 31, 2021: |
| ||||||||||||||||||||||||||||||||||||||||||||||||||||||
| Derivatives not accounted for as hedging instruments | |||||||||||||||||||||||||||||||||||||||||||||||||||||||
| Assets: |
Credit contracts | Foreign exchange contracts |
Commodity contracts |
Interest rate contracts |
Equity contracts | Total | |||||||||||||||||||||||||||||||||||||||||||||||||
| Unrealized appreciation of forward foreign currency contracts | $ | - | $ | 1,146 | $ | - | $ | - | $ | - | $ | 1,146 | |||||||||||||||||||||||||||||||||||||||||||
| Receivable for variation margin from open futures contracts(2) | - | - | - | 96,208 | 131,948 | 228,156 | |||||||||||||||||||||||||||||||||||||||||||||||||
| Liabilities: |
Credit contracts | Foreign exchange contracts |
Commodity contracts |
Interest rate contracts |
Equity contracts | Total | |||||||||||||||||||||||||||||||||||||||||||||||||
| Unrealized depreciation of forward foreign currency contracts | $ | - | $ | (5,002 | ) | $ | - | $ | - | $ | - | $ | (5,002 | ) | |||||||||||||||||||||||||||||||||||||||||
| Payable for variation margin on futures contracts(2) | - | - | - | (97,198 | ) | (2,554 | ) | (99,752 | ) | ||||||||||||||||||||||||||||||||||||||||||||||
| The effect of financial derivative instruments on the Statements of Operations as of December 31, 2021: |
| ||||||||||||||||||||||||||||||||||||||||||||||||||||||
| Derivatives not accounted for as hedging instruments | |||||||||||||||||||||||||||||||||||||||||||||||||||||||
| Realized gain (loss) from derivatives |
Credit contracts | Foreign exchange contracts |
Commodity contracts |
Interest rate contracts |
Equity contracts | Total | |||||||||||||||||||||||||||||||||||||||||||||||||
| Forward foreign currency contracts | $ | - | $ | 38,983 | $ | - | $ | - | $ | - | $ | 38,983 | |||||||||||||||||||||||||||||||||||||||||||
| Futures contracts | - | - | - | (111,469 | ) | 822,673 | 711,204 | ||||||||||||||||||||||||||||||||||||||||||||||||
| Net change in unrealized appreciation |
Credit contracts | Foreign exchange contracts |
Commodity contracts |
Interest rate contracts |
Equity contracts | Total | |||||||||||||||||||||||||||||||||||||||||||||||||
| Forward foreign currency contracts | $ | - | $ | (3,518 | ) | $ | - | $ | - | $ | - | $ | (3,518 | ) | |||||||||||||||||||||||||||||||||||||||||
| Futures contracts | - | - | - | (23,831 | ) | 103,502 | 79,671 | ||||||||||||||||||||||||||||||||||||||||||||||||
(1) See Note 3 in the Notes to Financial Statements for additional information.
(2) Includes cumulative appreciation (depreciation) of futures contracts as reported in the Fund’s Schedule of Investments footnotes. Only current day’s variation margin is reported within the Statements of Assets and Liabilities.
Master Agreements
International Swaps and Derivatives Association, Inc. Master Agreements (“ISDA Master Agreements”) with counterparties govern transactions in OTC derivative and foreign exchange contracts entered into by the Funds and those counterparties. The ISDA Master Agreements contain provisions for general obligations, representations, agreements, collateral and events of default or termination. Events of termination include conditions that may entitle counterparties to elect to terminate early and cause settlement of all outstanding transactions under the
71
American Beacon FundsSM
Notes to Financial Statements
December 31, 2021
applicable ISDA Master Agreement. Any election to terminate early could be material to the financial statements. Since different types of forward and OTC financial derivative transactions have different mechanics and are sometimes traded out of different legal entities of a particular counterparty organization, each type of transaction may be covered by a different Master Agreement, resulting in the need for multiple agreements with a single counterparty.
As the ISDA Master Agreements are specific to unique operations of different asset types, they allow a Fund to net its total exposure to a counterparty in the event of a default with respect to all the transactions governed under a single agreement with a counterparty.
Master Securities Forward Transaction Agreements (“Master Forward Agreements”) govern the considerations and factors surrounding the settlement of certain forward settling transactions, such as delayed delivery or sale-buyback financing transactions by and between a Fund and select counterparties. The Master Forward Agreements maintain provisions for, among other things, initiation and confirmation, payment and transfer, events of default, termination, and maintenance of collateral.
Offsetting Assets and Liabilities
The Funds are parties to enforceable master netting agreements between brokers and counterparties which provide for the right to offset under certain circumstances. The Funds employ multiple money managers and counterparties and have elected not to offset qualifying financial and derivative instruments on the Statements of Assets and Liabilities, as such all financial and derivative instruments are presented on a gross basis. The impacts of netting arrangements that provide the right to offset are detailed below, if applicable. The net amount represents the net receivable or payable that would be due from or to the counterparty in the event of default. Exposure from borrowings and other financing agreements such as repurchase agreements can only be netted across transactions governed by the same Master Agreement with the same legal entity. All amounts reported below represent the balance as of the report date, December 31, 2021.
AHL Managed Futures Strategy Fund
| Offsetting of Financial and Derivative Assets as of December 31, 2021: |
| |||||||||||
|
|
Assets | Liabilities | ||||||||||
| Futures Contracts(1)(2) | $ | 33,961,053 | $ | 32,240,951 | ||||||||
| Forward Foreign Currency Contracts | 6,864,218 | 8,498,721 | ||||||||||
|
|
|
|
|
|||||||||
| Total derivative assets and liabilities in the Statement of Assets and Liabilities | $ | 40,825,271 | $ | 40,739,672 | ||||||||
|
|
|
|
|
|||||||||
| Derivatives not subject to a Master Netting Agreement or similar agreement (“MNA”) | $ | (33,961,053 | ) | $ | (32,240,951 | ) | ||||||
|
|
|
|
|
|||||||||
| Total derivative assets and liabilities subject to an MNA | $ | 6,864,218 | $ | 8,498,721 | ||||||||
|
|
|
|
|
|||||||||
| Financial Assets, Derivatives, and Collateral Received/(Pledged) by Counterparty as of December 31, 2021: |
| |||||||||||||||||||||||||||||||||||
| Gross Amounts of Assets Presented in the Statements of Assets and Liabilities |
Derivatives Available for Offset |
Gross Amounts Not Offset in the Statements of Assets and Liabilities |
Net Amount | |||||||||||||||||||||||||||||||||
| Counterparty |
Non-Cash
Collateral Pledged(2) |
Cash Collateral Pledged(2) |
||||||||||||||||||||||||||||||||||
| Citibank, N.A. |
$ | 2,275,748 | $ | (2,275,748 | ) | $ | - | $ | - | $ | - | |||||||||||||||||||||||||
| HSBC Bank (USA) |
4,588,470 | (4,588,470 | ) | - | - | - | ||||||||||||||||||||||||||||||
|
|
|
|
|
|
|
|
|
|
|
|||||||||||||||||||||||||||
| Total |
$ | 6,864,218 | $ | (6,864,218 | ) | $ | - | $ | - | $ | - | |||||||||||||||||||||||||
|
|
|
|
|
|
|
|
|
|
|
|||||||||||||||||||||||||||
| Gross Amounts of Liabilities Presented in the Statements of Assets and Liabilities |
Derivatives Available for Offset |
Gross Amounts Not Offset in the Statements of Assets and Liabilities |
Net Amount | |||||||||||||||||||||||||||||||||
| Counterparty |
Non-Cash
Collateral Received(2) |
Cash Collateral Received(2) |
||||||||||||||||||||||||||||||||||
| Citibank, N.A. |
$ | 2,891,592 | $ | (2,275,748 | ) | $ | - | $ | - | $ | 615,844 | |||||||||||||||||||||||||
| HSBC Bank (USA) |
5,411,836 | (4,588,470 | ) | - | - | 823,366 | ||||||||||||||||||||||||||||||
| Royal Bank of Scotland PLC |
195,293 | - | - | - | 195,293 | |||||||||||||||||||||||||||||||
|
|
|
|
|
|
|
|
|
|
|
|||||||||||||||||||||||||||
| Total |
$ | 8,498,721 | $ | (6,864,218 | ) | $ | - | $ | - | $ | 1,634,503 | |||||||||||||||||||||||||
|
|
|
|
|
|
|
|
|
|
|
|||||||||||||||||||||||||||
72
American Beacon FundsSM
Notes to Financial Statements
December 31, 2021
AHL TargetRisk Fund
| Offsetting of Financial and Derivative Assets as of December 31, 2021: |
| |||||||||||
|
|
Assets | Liabilities | ||||||||||
| Futures Contracts(1)(2) |
$ | 13,069,056 | $ | 6,090,059 | ||||||||
| Swap Agreement - Centrally cleared(2) |
2,122,798 | 73,927 | ||||||||||
| Swap Agreement - OTC |
5,164,063 | - | ||||||||||
| Forward Foreign Currency Contracts |
451,724 | 4,321,112 | ||||||||||
|
|
|
|
|
|||||||||
| Total derivative assets and liabilities in the Statement of Assets and Liabilities |
$ | 20,807,641 | $ | 10,485,098 | ||||||||
|
|
|
|
|
|||||||||
| Derivatives not subject to a Master Netting Agreement or similar agreement (“MNA”) |
$ | (15,191,854 | ) | $ | (6,163,986 | ) | ||||||
|
|
|
|
|
|||||||||
| Total derivative assets and liabilities subject to an MNA |
$ | 5,615,787 | $ | 4,321,112 | ||||||||
|
|
|
|
|
|||||||||
| Financial Assets, Derivatives, and Collateral Received/(Pledged) by Counterparty as of December 31, 2021: |
| |||||||||||||||||||||||||||||||||||
| Gross Amounts of Assets Presented in the Statements of Assets and Liabilities |
Derivatives Available for Offset |
Gross Amounts Not Offset in the Statements of Assets and Liabilities |
Net Amount | |||||||||||||||||||||||||||||||||
| Counterparty |
Non-Cash
Collateral Pledged(2) |
Cash Collateral Pledged(2) |
||||||||||||||||||||||||||||||||||
| JPMorgan Chase Bank, N.A. |
$ | 5,164,063 | $ | - | $ | - | $ | - | $ | 5,164,063 | ||||||||||||||||||||||||||
| State Street Bank & Trust Co. |
451,724 | (451,724 | ) | - | - | - | ||||||||||||||||||||||||||||||
|
|
|
|
|
|
|
|
|
|
|
|||||||||||||||||||||||||||
| Total |
$ | 5,615,787 | $ | (451,724 | ) | $ | - | $ | - | $ | 5,164,063 | |||||||||||||||||||||||||
|
|
|
|
|
|
|
|
|
|
|
|||||||||||||||||||||||||||
| Gross Amounts of Liabilities Presented in the Statements of Assets and Liabilities |
Derivatives Available for Offset |
Gross Amounts Not Offset in the Statements of Assets and Liabilities |
Net Amount | |||||||||||||||||||||||||||||||||
| Counterparty |
Non-Cash
Collateral Received(2) |
Cash Collateral Received(2) |
||||||||||||||||||||||||||||||||||
| State Street Bank & Trust Co. |
$ | 4,321,112 | $ | (451,724 | ) | $ | - | $ | - | $ | 3,869,388 | |||||||||||||||||||||||||
AHL TargetRisk Core Fund
| Offsetting of Financial and Derivative Assets as of December 31, 2021: |
| |||||||||||
|
|
Assets | Liabilities | ||||||||||
| Futures Contracts(1)(2) | $ | 228,156 | $ | 99,752 | ||||||||
| Forward Foreign Currency Contracts | 1,146 | 5,002 | ||||||||||
|
|
|
|
|
|||||||||
| Total derivative assets and liabilities in the Statement of Assets and Liabilities | $ | 229,302 | $ | 104,754 | ||||||||
|
|
|
|
|
|||||||||
| Derivatives not subject to a Master Netting Agreement or similar agreement (“MNA”) | $ | (228,156 | ) | $ | (99,752 | ) | ||||||
|
|
|
|
|
|||||||||
| Total derivative assets and liabilities subject to an MNA | $ | 1,146 | $ | 5,002 | ||||||||
|
|
|
|
|
|||||||||
| Financial Assets, Derivatives, and Collateral Received/(Pledged) by Counterparty as of December 31, 2021: |
| |||||||||||||||||||||||||||||||||||
| Gross Amounts of Assets Presented in the Statements of Assets and Liabilities |
Derivatives Available for Offset |
Gross Amounts Not Offset in the Statements of Assets and Liabilities |
Net Amount | |||||||||||||||||||||||||||||||||
| Counterparty |
Non-Cash
Collateral Pledged(2) |
Cash Collateral Pledged(2) |
||||||||||||||||||||||||||||||||||
| State Street Bank & Trust Co. |
$ | 1,146 | $ | (1,146 | ) | $ | - | $ | - | $ | - | |||||||||||||||||||||||||
| Gross Amounts of Liabilities Presented in the Statements of Assets and Liabilities |
Derivatives Available for Offset |
Gross Amounts Not Offset in the Statements of Assets and Liabilities |
Net Amount | |||||||||||||||||||||||||||||||||
| Counterparty |
Non-Cash
Collateral Received(2) |
Cash Collateral Received(2) |
||||||||||||||||||||||||||||||||||
| State Street Bank & Trust Co. |
$ | 5,002 | $ | (1,146 | ) | $ | - | $ | - | $ | 3,856 | |||||||||||||||||||||||||
(1) Includes cumulative appreciation or (depreciation) of futures contracts as reported in the Schedule of Investments footnotes. Only current day’s variation margin is reported within the Statements of Assets and Liabilities.
(2) The securities presented here within are not subject to master netting agreements. As such, this is disclosed for informational purposes only.
73
American Beacon FundsSM
Notes to Financial Statements
December 31, 2021
6. Principal Risks
Investing in the Funds may involve certain risks including, but not limited to, those described below.
Commodities Risk
The Funds’ investments in commodity-linked derivative instruments may subject the Funds to greater volatility than investments in traditional securities. The value of commodity-linked derivative instruments may be affected by changes in overall market movements, commodity index volatility, changes in interest rates, or factors affecting a particular industry or commodity, such as changes in supply and demand, drought, floods, weather, livestock disease, embargoes, tariffs, war, acts of terrorism and international economic, political and regulatory developments. The Funds and the Subsidiaries each may concentrate its assets in a particular sector of the commodities market (such as oil, metal or agricultural products). As a result, the Funds and the Subsidiaries may be more susceptible to risks associated with those sectors. The Funds’ investments in commodity-related instruments may lead to losses in excess of the Funds’ investment in such products. Such losses can significantly and adversely affect the NAV of the Funds and, consequently, a shareholder’s interest in the Funds.
Counterparty Risk
There are two separate categories of counterparty risk that arise out of a Fund’s investments in derivatives. The first relates to the risk that its swap counterparty defaults, and the second category relates to the risk that a futures commission merchant (“FCM”) would default on an obligation set forth in an agreement between a Fund and the FCM. As for the first category of risk, entering into derivatives in the OTC market involves counterparty risk, which is the risk that the dealer providing the derivative or other product will fail to timely perform its payment and other obligations or experience financial difficulties, which may include filing for bankruptcy. Therefore, to the extent that a Fund engages in trading in OTC markets, a Fund could be exposed to greater risk of loss through default than if it confined its trading to transactions that are centrally cleared. The second category of risk exists at and from the time that a Fund enters into derivatives transactions that are centrally cleared. In such cases, a clearing organization becomes a Fund’s counterparty and the principal counterparty risk is that the clearing organization itself will default. In addition, the FCM may hold margin posted in connection with those contracts and that margin may be rehypothecated (or re-pledged) by the FCM and lost or its return delayed due to a default by the FCM or other customer of the FCM. The FCM may itself file for bankruptcy, which would either delay the return of, or jeopardize altogether the assets posted by the FCM as margin in response to margin calls relating to cleared positions. If a counterparty fails to meet its contractual obligations, goes bankrupt, or otherwise experiences a business interruptions, a Fund could miss investment opportunities or otherwise hold investments it would prefer to sell, resulting in losses for a Fund.
Credit Risk
The Funds are subject to the risk that the issuer or guarantor of a debt security, or the counterparty to a derivatives contract or a loan will fail to make timely payment of interest or principal or otherwise honor its obligations or default completely. A decline in the credit rating of an individual security held by the Funds may have an adverse impact on its price and make it difficult for the Funds to sell it. Ratings represent a rating agency’s opinion regarding the quality of the security and are not a guarantee of quality. Rating agencies might not always change their credit rating on an issuer or security in a timely manner to reflect events that could affect the issuer’s ability to make timely payments on its obligations. Credit risk is typically greater for securities with ratings that are below investment grade. Since the Funds can invest significantly in high-yield investments considered speculative in nature, this risk may be substantial.
Currency Risk
The Funds may have exposure to foreign currencies by making direct investments in non-U.S. currencies or in securities denominated in non-U.S. currencies, or by purchasing or selling forward currency exchange contracts
74
American Beacon FundsSM
Notes to Financial Statements
December 31, 2021
in non-U.S. currencies. Foreign currencies may decline in value relative to the U.S. dollar, or, in the case of hedging positions, the U.S. dollar may decline in value relative to the currency being hedged, and thereby affect the Funds’ investments in foreign (non-U.S.) currencies or in securities that trade in, and receive revenues in, or in derivatives that provide exposure to, foreign (non-U.S.) currencies. Currency exchange rates may fluctuate significantly over short periods of time for a number of reasons, including changes in interest rates, intervention (or the failure to intervene) by U.S. or foreign governments, central banks or supranational entities such as the International Monetary Fund, or by the imposition of currency controls or other political developments in the United States or abroad. As a result, the Funds’ investments in foreign currency denominated securities may reduce the returns of the Funds. Currency futures, forwards, options or swaps may not always work as intended, and in specific cases, the Funds may be worse off than if it had not used such instrument(s). There may not always be suitable hedging instruments available. Even where suitable hedging instruments are available, the Funds may choose to not hedge its currency risks.
Derivatives Risk
Derivatives may involve significant risk. The use of derivative instruments may expose the Funds to additional risks that it would not be subject to if it invested directly in the securities or other instruments underlying those derivatives, including the high degree of leverage often embedded in such instruments, and potential material and prolonged deviations between the theoretical value and realizable value of a derivative. Some derivatives have the potential for unlimited loss, regardless of the size of the initial investment. Derivatives may at times be illiquid, and the Funds may not be able to close out or sell a derivative at a particular time or at an anticipated price. Certain derivatives may be difficult to value, and valuation may be more difficult in times of market turmoil.
Derivatives may also be more volatile than other types of investments. The Funds may buy or sell derivatives not traded on an exchange, which may be subject to heightened liquidity and valuation risk. Derivative investments can increase portfolio turnover and transaction costs. Derivatives also are subject to counterparty risk and credit risk. As a result, the Funds may not recover their investment or may only obtain a limited recovery, and any recovery may be delayed. Not all derivative transactions require a counterparty to post collateral, which may expose the Funds to greater losses in the event of a default by a counterparty. Ongoing changes to the regulation of the derivatives markets and potential changes in the regulation of funds using derivative instruments could limit a Fund’s ability to pursue its investment strategies. New regulation of derivatives may make them more costly, or may otherwise adversely affect their liquidity, value or performance.
Foreign Investing and Emerging Markets Risk
Non-U.S. investments carry potential risks not associated with U.S. investments. Such risks include, but are not limited to: (1) currency exchange rate fluctuations, (2) political and financial instability, (3) less liquidity, (4) lack of uniform accounting, auditing and financial reporting standards, (5) increased price volatility, (6) less government regulation and supervision of foreign stock exchanges, brokers and listed companies, and (7) delays in transaction settlement in some foreign markets. To the extent the Funds invest a significant portion of its assets in securities of a single country or region, it is more likely to be affected by events or conditions of that country or region. In addition, the economies and political environments of emerging market countries tend to be more unstable than those of developed countries, resulting in more volatile rates of return than the developed markets and substantially greater risk to investors. There may be very limited oversight of certain foreign banks or securities depositories that hold foreign securities and currency and the laws of certain countries may limit the ability to recover such assets if a foreign bank or depository or their agents goes bankrupt. When investing in emerging markets, the risks of investing in foreign securities are heightened. Emerging markets have unique risks that are greater than, or in addition to, investing in developed markets because emerging markets are generally smaller, less developed, less liquid and more volatile than the securities markets of the U.S. and other developed markets. There are also risks of: greater political uncertainties; an economy’s dependence on revenues from particular commodities or on international aid or development assistance; currency transfer restrictions; a limited
75
American Beacon FundsSM
Notes to Financial Statements
December 31, 2021
number of potential buyers for such securities, resulting in increased volatility and limited liquidity for emerging market securities; trading suspensions; and delays and disruptions in securities settlement procedures. In addition, there may be less information available to make investment decisions and more volatile rates of return.
Forward Foreign Currency Contracts Risk
Forward foreign currency contracts, including non-deliverable forwards, are derivative instruments pursuant to a contract with a counterparty to pay a fixed price for an agreed amount of securities or other underlying assets at an agreed date or to buy or sell a specific currency at a future date at a price set at the time of the contract. The use of forward foreign currency contracts may expose the Funds to additional risks that it would not be subject to if it invested directly in the securities or currencies underlying the forward foreign currency contract.
Futures Contracts Risk
Futures contracts are derivative instruments where one party pays a fixed price for an agreed amount of securities or other underlying assets at an agreed date. The use of such derivative instruments may expose the Funds to additional risks that they would not be subject to if they invested directly in the securities underlying those derivatives. There may at times be an imperfect correlation between the movement in the prices of futures contracts and the value of their underlying instruments or indexes. There can be no assurance that any strategy used will succeed. There also can be no assurance that, at all times, a liquid market will exist for offsetting a futures contract that a Fund has previously bought or sold and this may result in the inability to close a futures contract when desired. Futures contracts may experience potentially dramatic price changes, which will increase the volatility of a Fund and may involve a small investment of cash (the amount of initial and variation margin) relative to the magnitude of the risk assumed (the potential increase or decrease in the price of the futures contract).
Hedging Risk
If the Funds use a hedging instrument at the wrong time or judges the market conditions incorrectly, or the hedged instrument does not correlate to the risk sought to be hedged, the hedge might be unsuccessful, reduce the Funds’ return, or create a loss.
High Portfolio Turnover Risk
Portfolio turnover is a measure of a Fund’s trading activity over a one-year period. A portfolio turnover rate of 100% would indicate that a Fund sold and replaced the entire value of its securities holdings during the period. High portfolio turnover could increase a Fund’s transaction costs because of increased broker commissions resulting from such transactions. These costs are not reflected in the Funds’ annual operating expenses or in the expense example, but they can have a negative impact on performance. Frequent trading by the Funds could also result in increased realized net capital gains, distributions of which are taxable to the Funds’ shareholders (including net short-term capital gain distributions, which are taxable to them as ordinary income).
High-Yield Securities Risk
Exposure to high-yield, below investment-grade securities (commonly referred to as “junk bonds”) generally involves significantly greater risks than an investment in investment grade securities. High-yield debt securities may fluctuate more widely in price and yield and may fall in price when the economy is weak or expected to become weak. These securities also may be difficult to sell at the time and price a Fund desires. High-yield securities are considered to be speculative with respect to an issuer’s ability to pay interest and principal and carry a greater risk that the issuers of lower-rated securities will default on the timely payment of principal and interest. High-yield securities may experience greater price volatility and less liquidity than investment grade securities. Issuers of securities that are in default or have defaulted may fail to resume principal or interest payments, in which case the Funds may lose its entire investment.
76
American Beacon FundsSM
Notes to Financial Statements
December 31, 2021
Interest Rate Risk
Generally, the value of investments with interest rate risk, such as fixed-income securities or derivatives, will move in the opposite direction to movements in interest rates. The prices of fixed income securities or derivatives are also affected by their durations. Fixed income securities or derivatives with longer durations generally have greater sensitivity to changes in interest rates. For example, if a bond has a duration of eight years, a 1% increase in interest rates could be expected to result in an 8% decrease in the value of the bond. An increase in interest rates can impact markets broadly as well. Extremely low or negative interest rates may become more prevalent among U.S. and foreign issuers. To the extent a Fund holds an investment with a negative interest rate to maturity, a Fund may generate a negative return on that investment. Conversely, in the future, interest rates may rise, perhaps significantly and/or rapidly, potentially resulting in substantial losses to a Fund.
Leverage Risk
Financial leverage magnifies the exposure to the movement in prices of an asset or class of assets underlying a derivative instrument and results in increased volatility, which means that a Fund will have the potential for greater losses than if a Fund does not use the derivative instruments that have a leveraging effect. Leverage tends to magnify, sometimes significantly, the effect of any increase or decrease in a Fund’s exposure to an asset or class of assets and may cause a Fund’s NAV to be volatile.
A Fund may experience leveraging risk in connection with investments in derivatives because its investments in derivatives may be purchased with a fraction of the assets that would be needed to purchase the securities directly, so that the remainder of the assets may be invested in other investments. Such investments may have the effect of leveraging a Fund because a Fund may experience gains or losses not only on its investments in derivatives, but also on the investments purchased with the remainder of the assets. If the value of a Fund’s investments in derivatives is increasing, this could be offset by declining values of a Fund’s other investments. Conversely, it is possible that the rise in the value of a Fund’s non-derivative investments could be offset by a decline in the value of a Fund’s investments in derivatives. In either scenario, a Fund may experience losses. In a market where the value of a Fund’s investments in derivatives is declining and the value of its other investments is declining, a Fund may experience substantial losses. The use of leverage may cause a Fund to liquidate portfolio positions when it may not be advantageous to do so to satisfy its obligations or to meet any required asset segregation requirements. In addition, the costs that a Fund pays to engage in these practices are additional costs borne by a Fund and could reduce or eliminate any net investment profits.
LIBOR Risk
Certain of the instruments identified in the Fund’s principal investment strategies have variable or floating coupon rates that are based on the ICE LIBOR (“LIBOR”), Euro Interbank Offered Rate and other similar types of reference rates (each, a “Reference Rate”). On July 27, 2017, the Chief Executive of the UK Financial Conduct Authority (“FCA”), which regulates LIBOR, announced that the FCA will no longer persuade nor require banks to submit rates for the calculation of LIBOR and certain other Reference Rates after 2021. Such announcement indicates that the continuation of LIBOR and other Reference Rates on the current basis cannot and will not be guaranteed after 2021. This announcement and any additional regulatory or market changes may have an adverse impact on the Fund or its investments, including increased volatility or illiquidity in markets for instruments that rely on LIBOR.
Regulators and market participants are working together to identify or develop successor Reference Rates. Additionally, it is expected that market participants will focus on the transition mechanisms by which the Reference Rates in existing contracts or instruments may be amended, whether through marketwide protocols, fallback contractual provisions, bespoke negotiations or amendments or otherwise. Nonetheless, there remains uncertainty regarding the nature of any replacement rate and the impact of the transition from LIBOR on the Fund and the financial markets generally, and the termination of certain Reference Rates presents risks to the
77
American Beacon FundsSM
Notes to Financial Statements
December 31, 2021
Fund. Financial industry groups have begun planning for a transition to the use of a different Reference Rate or benchmark rate, but there are obstacles to converting certain securities and transactions to a new Reference Rate or benchmark rate. The transition process, or the failure of an industry to transition, could lead to increased volatility and illiquidity in markets for instruments that currently rely on LIBOR to determine interest rates and a reduction in the values of some LIBOR-based investments, all of which would impact the Fund. While some LIBOR based instruments may contemplate a scenario where LIBOR becomes unavailable by providing for an alternative rate-setting methodology, not all may have such provisions and there may be significant uncertainty regarding the effectiveness of any such methodologies. In addition, the alternative reference or benchmark rate may be an ineffective substitute, potentially resulting in prolonged adverse market conditions for the Fund. The elimination of a Reference Rate or any other changes or reforms to the determination or supervision of Reference Rates could have an adverse impact on the market for or value of any securities or payments linked to those Reference Rates and other financial obligations held by the Fund or on its overall financial condition or results of operations. Any substitute Reference Rate and any pricing adjustments imposed by a regulator or by counterparties or otherwise may adversely affect the Fund’s performance and/or NAV. Recently, the administrator of ICE LIBOR and the UK’s Financial Conduct Authority announced that LIBOR for most tenors and currencies would cease immediately after final values are announced for December 31, 2021, with the remaining tenors and currencies (including one-month U.S. Dollar LIBOR) to cease immediately after final values are announced for June 30, 2023. This announcement has been confirmed by the Alternative Reference Rates Committee (ARRC) of the Federal Reserve Bank of New York as constituting a “benchmark transition event” and establishing “benchmark replacement dates” in ARRC standard LIBOR transition provisions that exist in many U.S. law contracts using LIBOR. Other contracts may or may not adhere to the ARRC’s standard provisions. At this time, it is not possible to completely identify or predict the effect of any such changes, any establishment of alternative Reference Rates or any other reforms to Reference Rates that may be enacted in the UK or elsewhere. Because the usefulness of LIBOR as a benchmark could deteriorate during the transition period, any of the effects described above could occur prior to the official phasing out of LIBOR.
Liquidity Risk
When there is little or no active trading market for a specific type of security, it can become more difficult to purchase or sell the securities at or near their perceived value. During such periods, certain investments held by a Fund may be difficult to sell or other investments may be difficult to purchase at favorable times or prices. As a result, a Fund may have to lower the price on certain securities that it is trying to sell, sell other securities instead or forgo an investment opportunity, any of which could have a negative effect on Fund management or performance. Additionally, the market for certain investments may become illiquid under adverse market or economic conditions independent of any specific adverse changes in the conditions of a particular issuer.
Market Direction Risk
Since the Funds will typically hold both long and short positions, an investment in the Funds will involve market risks associated with different types of investment decisions than those made for a typical “long only” fund. The Funds’ results could suffer both when there is a general market advance and the Funds hold significant “short” positions, and when there is a general market decline and the Funds hold significant “long” positions. In recent years, the markets have shown considerable volatility from day to day and even in intra-day trading.
Market Timing Risk
The Funds are subject to the risk of market timing activities by investors due to the Funds’ investments in high yield, and foreign securities, or its exposure to foreign securities through the derivatives it holds. If the Funds trade foreign securities, it generally prices these foreign securities using their closing prices from the foreign markets in which they trade, which typically is prior to the Funds’ calculation of its net asset value (“NAV”). These prices may be affected by events that occur after the close of a foreign market but before the Fund prices its shares. In such instances, the Funds may fair value high yield and foreign securities. However, some investors may
78
American Beacon FundsSM
Notes to Financial Statements
December 31, 2021
engage in frequent short-term trading in the Funds to take advantage of any price differentials that may be reflected in the NAV of the Funds’ shares. Frequent trading by Funds shareholders poses risks to other shareholders in the Funds, including (i) the dilution of the Funds’ NAV, (ii) an increase in the Funds’ expenses, and (iii) interference with the portfolio manager’s ability to execute efficient investment strategies. While the Manager monitors trading in the Funds, there is no guarantee that it can detect all market timing activities.
Market Risk
The Funds are subject to the risk that the securities markets will move down, sometimes rapidly and unpredictably, based on overall economic conditions and other factors, which may negatively affect the Funds’ performance. Equity securities generally have greater price volatility than fixed-income securities, although under certain market conditions fixed-income securities may have comparable or greater price volatility. During a general downturn in the securities markets, multiple assets may decline in value simultaneously. In some cases, traditional market participants have been less willing to make a market in some types of debt instruments, which has affected the liquidity of those instruments. During times of market turmoil, investors tend to look to the safety of securities issued or backed by the U.S. Treasury, causing the prices of these securities to rise and the yields to decline. Reduced liquidity in fixed-income and credit markets may negatively affect many issuers worldwide. Prices in many financial markets have increased significantly over the last decade, but there have also been periods of adverse market and financial developments and cyclical change during that timeframe, which have resulted in unusually high levels of volatility in domestic and foreign financial markets that has caused losses for investors and may occur again in the future, particularly if markets enter a period of uncertainty or economic weakness. The value of a security may decline due to adverse issuer-specific conditions, general market conditions unrelated to a particular issuer, or factors that affect a particular industry or industries. Changes in the financial condition of a single issuer or market segment also can impact the market as a whole.
Geopolitical and other events, including war, terrorism, economic uncertainty, trade disputes, pandemics, public health crises, natural disasters and related events have led, and in the future may continue to lead, to instability in world economies and markets generally and reduced liquidity in equity, credit and fixed-income markets, which may disrupt economies and markets and adversely affect the value of your investment. Adverse market events may also lead to increased shareholder redemptions, which could cause a Fund to experience a loss or difficulty in selling investments to meet redemption requests by shareholders and may increase a Fund’s portfolio turnover, which will increase the costs that a Fund incurs and lower a Fund’s performance. Even when securities markets perform well, there is no assurance that the investments held by a Fund will increase in value along with the broader market.
Policy changes by the U.S. government and/or Federal Reserve and political events within the U.S. and abroad, including the U.S. presidential election, the U.S. government’s inability at times to agree on a long-term budget and deficit reduction plan, the threat of a federal government shutdown and threats not to increase the federal government’s debt limit, may affect investor and consumer confidence and may adversely impact financial markets and the broader economy, perhaps suddenly and to a significant degree. The severity or duration of adverse economic conditions may also be affected by policy changes made by governments or quasi-governmental organizations. Global economies and financial markets are becoming increasingly interconnected, which increases the possibility of many markets being affected by events in a single country or events affecting a single or small number of issuers.
Markets and market participants are increasingly reliant upon both publicly available and proprietary information data systems. Data imprecision, software or other technology malfunctions, programming inaccuracies, unauthorized use or access, and similar circumstances may impair the performance of these systems and may have an adverse impact upon a single issuer, a group of issuers, or the market at large. In certain cases, an exchange or market may close or issue trading halts on either specific securities or even the entire market, which may result in a Fund being, among other things, unable to buy or sell certain securities or financial instruments or accurately price its investments. These fluctuations in securities prices could be a sustained trend or a drastic movement. The financial markets generally move in cycles, with periods of rising prices followed by periods of declining prices. The value of your investment may reflect these fluctuations.
79
American Beacon FundsSM
Notes to Financial Statements
December 31, 2021
Non-Diversification Risk
The Funds are non-diversified, which means the Funds may focus their investments in the securities of a comparatively small number of issuers. Investments in securities of a limited number of issuers exposes the Funds to greater market risk and potential losses than if assets were diversified among the securities of a greater number of issuers.
Obsolescence Risk
The Funds are unlikely to be successful in its quantitative trading strategies unless the assumptions underlying the models are realistic and either remain realistic and relevant in the future or are adjusted to account for changes in the overall market environment. If such assumptions are inaccurate or become inaccurate and are not promptly adjusted, it is likely that profitable trading signals will not be generated. If and to the extent that the models do not reflect certain factors, and the sub-advisor does not successfully address such omission through its testing and evaluation and modify the models accordingly, major losses may result – all of which will be borne by the Funds. The sub-advisor will continue to test, evaluate and add new Models, which may lead to the Models being modified from time to time. Any modification of the Models or strategies will not be subject to any requirement that shareholders receive notice of the change or that they consent to it. There can be no assurance as to the effects (positive or negative) of any modification to the Models or strategies on a Fund’s performance.
Other Investment Companies Risk
The Funds may invest in shares of other registered investment companies, including money market funds and ETFs. To the extent that the Funds invest in shares of other registered investment companies, the Funds will indirectly bear the fees and expenses, including for example, advisory and administrative fees, charged by those investment companies in addition to the Funds’ direct fees and expenses and will be subject to the risks associated with investments in those companies. For example, the Funds’ investments in money market funds are subject to interest rate risk, credit risk, and market risk. The Funds must rely on the investment company in which it invests to achieve its investment objective. If the investment company fails to achieve its investment objective, the value of the Funds’ investment may decline, adversely affecting the Funds’ performance. ETFs are subject to the following risks that do not apply to conventional funds: (1) the market price of an ETF’s shares may trade at a discount or premium to its NAV; (2) an active trading market for an ETF’s shares may not develop or be maintained; or (3) trading of an ETF’s shares may be halted if the listing exchange’s officials deem such action appropriate, the shares are delisted from the exchange, or the activation of market-wide “circuit breakers” (which are tied to large decreases in stock prices) halts stock trading generally. An ETF that tracks an index may not precisely replicate the returns of its benchmark index. To the extent the Funds invest in other investment companies that invest in equity securities, fixed-income securities and/or foreign securities, or that track an index, the Funds are subject to the risks associated with the underlying investments held by the investment company or the index fluctuations to which the investment company is subject. ETFs have expenses associated with their operation, typically including advisory fees.
Recent Market Events Risk
An outbreak of infectious respiratory illness caused by a novel coronavirus, known as COVID-19, was first detected in China in December 2019 and has subsequently spread globally. Transmission of COVID-19 and efforts to contain its spread have resulted, and may continue to result, in significant disruptions to business operations, widespread business closures and layoffs, travel restrictions, closed international, national and local borders, prolonged quarantines and stay-at-home orders, disruption of and delays in healthcare service preparation and delivery, service and event cancellations, and lower consumer demand, as well as general concern and uncertainty that has negatively affected the global economy. The impact of the COVID-19 pandemic may last for an extended period of time and may result in a sustained economic downturn or recession. The U.S. Federal Reserve and the U.S. federal government have taken numerous measures to address the economic impact of the COVID-19 pandemic and stimulate the U.S. economy. The ultimate effects of these and other efforts that may be taken may not be known for some time.
80
American Beacon FundsSM
Notes to Financial Statements
December 31, 2021
The pandemic has accelerated trends toward working remotely and shopping on-line, which may negatively affect the value of office and commercial real estate and companies that have been slow to transition to an on-line business model and has disrupted the supply chains that many businesses depend on. The travel, hospitality and public transit industries may suffer long-term negative effects from the pandemic and resulting changes to public behavior. Both U.S. and international markets have experienced significant volatility in recent months and years. As a result of such volatility, investment returns may fluctuate significantly. Moreover, the risks discussed herein associated with an investment in the Fund may be increased.
The Federal Reserve has spent hundreds of billions of dollars to keep credit flowing through the economy. However, the Federal Reserve recently began to reduce its interventions as the economy improved and inflation accelerated. Concerns about the markets’ dependence on the Federal Reserve’s provision of liquidity have grown as a result. High public debt in the U.S. and other countries creates ongoing systemic and market risks and policymaking uncertainty, and there may be a further increase in public debt due to the economic effects of the COVID-19 pandemic and ensuing economic relief and public health measures. Governments’ efforts to limit potential negative economic effects of the pandemic may be altered, delayed, or eliminated at inopportune times for political, policy or other reasons.
Interest rates have been unusually low in recent years in the U.S. and abroad, and central banks reduced rates further in an effort to combat the economic effects of the COVID-19 pandemic. Because there is little precedent for this situation, it is difficult to predict the impact on various markets of a significant rate increase or other significant policy changes. The U.S. Federal Reserve is anticipated to raise interest rates beginning in 2022, in part to address an increase in the annual inflation rate in the U.S. Over the longer term, rising interest rates may present a greater risk than has historically been the case due to the current period of relatively low rates and the effect of government fiscal and monetary policy initiatives and potential market reaction to those initiatives or their alteration or cessation.
Slowing global economic growth, risks associated with the United Kingdom’s departure from the European Union on December 31, 2020, commonly referred to as “Brexit,” and a trade agreement between the United Kingdom and the European Union, the risks associated with ongoing trade negotiations with China, the possibility of changes to some international trade agreements, tensions or open conflict between nations, such as between Russia and Ukraine, or political or economic dysfunction within some nations that are major producers of oil could affect the economies of many nations, including the United States, in ways that cannot necessarily be foreseen at the present time.
Economists and others have expressed increasing concern about the potential effects of global climate change on property and security values. Certain issuers, industries and regions may be adversely affected by the impacts of climate change, including on the demand for and the development of goods and services and related production costs, and the impacts of legislation, regulation and international accords related to climate change, as well as any indirect consequences of regulation or business trends driven by climate change.
Short Position Risk
The Funds’ losses are potentially unlimited in a short position transaction because there is potentially no limit on the amount that the security that the Funds are required to purchase may have appreciated. Because the Funds may invest the proceeds of a short sale, another effect of short selling on the Funds is similar to the effect of leverage, in that it amplifies changes in the Funds’ NAV since it increases the exposure of the Funds to the market.
Sovereign and Quasi Sovereign Debt Risk
An investment in sovereign and quasi-sovereign debt obligations involves special risks not present in corporate debt obligations. Sovereign and quasi-sovereign debt securities. These investments are issued or guaranteed by a sovereign government or entity affiliated with or backed by a sovereign government. The issuer of the sovereign or quasi-sovereign debt that controls the repayment of the debt may be unable or unwilling to repay principal or interest when due, and the Funds may have limited recourse in the event of a default. In addition,
81
American Beacon FundsSM
Notes to Financial Statements
December 31, 2021
these investments are subject to risk of payment delays or defaults due to (1) country cash flow problems, (2) insufficient foreign currency reserves, (3) political considerations, (4) large debt positions relative to the country’s economy, (5) policies toward foreign lenders or investors, (6) the failure to implement economic reforms required by the International Monetary Fund or other multilateral agencies, or (7) an inability or unwillingness to repay debts. It may be particularly difficult to enforce the rights of debt holders in frontier and emerging markets. A governmental entity that defaults on an obligation may request additional time in which to pay or receive further loans or may seek to restructure its obligations to reduce interest rates or outstanding principal. There is no legal process for collecting sovereign and quasi-sovereign debt that a government does not pay nor are there bankruptcy proceedings through which all or part of the sovereign debt that a governmental entity has not repaid may be collected. Sovereign and quasi-sovereign debt risk is increased for emerging and frontier markets issuers, which are among the largest debtors to commercial banks and foreign governments. At times, certain emerging market countries have declared moratoria on the payment of principal and interest on external debt. Certain emerging market countries have experienced difficulty in servicing their sovereign debt on a timely basis, which has led to defaults and the restructuring of certain indebtedness.
Subsidiaries Risk
There can be no assurance that the investment objective of a Subsidiary will be achieved. The Subsidiaries are not registered under the Act, and are not subject to all the investor protections of the Act. However, the AHL Managed Futures Strategy Fund and the AHL TargetRisk Fund wholly own and control its respective Subsidiary, and each Fund and its respective Subsidiary are both managed by the Manager and the sub-advisor pursuant to separate agreements, making it unlikely that a Subsidiary will take action contrary to the interests of its respective Fund and its shareholders. The Board has oversight responsibility for the investment activities of the Funds, including its investment in the Subsidiaries, and each Fund’s role as sole shareholder of its respective Subsidiary. Changes in the laws of the United States and/or the Cayman Islands, under which the Funds and Subsidiaries, respectively, are organized, could result in the inability of the Funds and/or Subsidiaries to operate as described in the Prospectus and could negatively affect the Funds and their respective shareholders. For example, the Cayman Islands government has undertaken not to impose any income, corporate or capital gains tax, estate duty, inheritance tax, gift tax or withholding tax on the Subsidiaries. If Cayman Islands law changes such that the Subsidiaries must pay Cayman Islands taxes, Fund shareholders would likely suffer decreased investment returns. Rulemaking by the CFTC or other regulatory initiatives may affect the Funds’ ability to use its respective Subsidiary to pursue its investment strategies.
Swap Agreement Risk
Swaps can involve greater risks than a direct investment in an underlying asset, because swaps typically include a certain amount of embedded leverage and as such are subject to leveraging risk. If swaps are used as a hedging strategy, the Funds are subject to the risk that the hedging strategy may not eliminate the risk that is intended to offset, due to, among other reasons, the occurrence of unexpected price movements or the non-occurrence of expected price movements. Swaps also may be difficult to value. Interest rate swaps, total return swaps, currency swaps, credit default swaps and commodities swaps are subject to counterparty risk, credit risk and liquidity risk. In addition, interest rate swaps are subject to interest rate risk, total return swaps are subject to market risk, and interest rate risk if the underlying securities are bonds or other debt obligations, currency swaps are subject to currency risk, and commodities swaps are subject to commodities risk.
Tax Risk
To qualify as a “regulated investment company” under Subchapter M of the Internal Revenue Code of 1986, as amended (the “Internal Revenue Code”) (“RIC”), the Funds must, among other requirements, derive at least 90% of their gross income for each taxable year from “qualifying income.” Income from certain commodity-linked derivative instruments in which the AHL Managed Futures Strategy and AHL TargetRisk Funds invest is not considered qualifying income. These Funds will therefore restrict their income from direct investments in those instruments, such as commodity-linked swaps, to a maximum of 10% of their gross income for each taxable year.
82
American Beacon FundsSM
Notes to Financial Statements
December 31, 2021
Each of these Fund’s investment in its Subsidiary is expected to provide the Funds with exposure to the commodities markets within the limitations of the federal tax requirements of Subchapter M. The Internal Revenue Service (“IRS”) issued a large number of private letter rulings (“PLRs”) (which the Funds may not cite as precedent) from 2006 to 2011 that income a RIC derives from a wholly owned foreign subsidiary (a “controlled foreign corporation” or “CFC”) (such as the Subsidiary) that earns income derived from commodity-linked derivative instruments is qualifying income. Treasury regulations published on March 19, 2019, provide that income inclusions of a RIC from a CFC are qualifying income for the RIC whether or not the CFC makes distributions to the RIC out of its associated earnings and profits for the applicable taxable year. The federal income tax treatment of a Fund’s commodity-linked investments and income from its Subsidiary may be materially adversely affected by future legislation, other Treasury regulations, and/or guidance issued by the IRS that could affect whether income from such investments is qualifying income under Subchapter M or otherwise materially affect the character, timing or recognition, and/or amount of a Fund’s taxable income and/or net capital gains and, therefore, the distributions the Funds make.
Valuation Risk
This is the risk that a Fund has valued a security at a price different from the price at which it can be sold. This risk may be especially pronounced for investments, such as derivatives, which may be illiquid or which may become illiquid and for securities that trade in relatively thin markets and/or markets that experience extreme volatility. If market conditions make it difficult to value certain investments, a Fund may value these investments using more subjective methods, such as fair-value methodologies. Investors who purchase or redeem Fund shares on days when a Fund is holding fair-valued securities may receive fewer or more shares, or lower or higher redemption proceeds, than they would have received if the Fund had not fair-valued the securities or had used a different valuation methodology. The value of foreign securities, certain fixed-income securities and currencies, as applicable, may be materially affected by events after the close of the markets on which they are traded, but before a Fund determines its NAV. A Fund’s ability to value its investments in an accurate and timely manner may be impacted by technological issues and/or errors by third-party service providers, such as pricing services or accounting agents.
Volatility Risk
The Funds may have investments that appreciate or decrease significantly in value over short periods of time. This may cause the Funds’ NAV per share to experience significant increases or declines in value over short periods of time. Market interest rate changes may also cause the Funds’ NAV per share to experience volatility. This is because the value of an obligation asset in the Funds is partially a function of whether it is paying what the market perceives to be a market rate of interest for the particular obligation given its individual credit and other characteristics. If market interest rates change, an obligation’s value could be affected to the extent the interest rate paid on that obligation does not reset at the same time.
7. Federal Income and Excise Taxes
It is the policy of each Fund to qualify as a regulated investment company (“RIC”), by complying with all applicable provisions of Subchapter M of the Internal Revenue Code, as amended, and to make distributions of taxable income sufficient to relieve it from substantially all federal income and excise taxes. For federal income tax purposes, each Fund is treated as a single entity for the purpose of determining such qualification.
The Funds do not have any unrecorded tax liabilities in the accompanying financial statements. Each of the tax years in the four year period ended December 31, 2021 for AHL Managed Futures Strategy Fund and AHL TargetRisk Fund, and the tax years in the two year period ended December 31, 2021 for AHL TargetRisk Core Fund remain subject to examination by the Internal Revenue Service. If applicable, the Funds recognize interest accrued related to unrecognized tax benefits in interest expense and penalties in “Other expenses” on the Statements of Operations.
83
American Beacon FundsSM
Notes to Financial Statements
December 31, 2021
The Funds may be subject to taxes imposed by countries in which it invests. Such taxes are generally based on returns of income earned or gains realized or repatriated. Taxes are accrued and applied to net investment income, net realized capital gains and net unrealized appreciation (depreciation), as applicable, as the income is earned or capital gains are recorded.
Dividends are categorized in accordance with income tax regulations which may treat certain transactions differently than U.S. GAAP. Accordingly, the character of distributions and composition of net assets for tax purposes may differ from those reflected in the accompanying financial statements. The Funds also utilize earnings and profits distributed to shareholders on redemptions of shares as part of the dividends paid deduction.
The tax character of distributions paid were as follows:
| AHL Managed Futures Strategy Fund | AHL TargetRisk Fund | |||||||||||||||||||||||||||
| Year Ended December 31, 2021 |
Year Ended December 31, 2020 |
Year Ended December 31, 2021 |
Year Ended December 31, 2020 |
|||||||||||||||||||||||||
| Distributions paid from: |
| |||||||||||||||||||||||||||
| Ordinary income* |
| |||||||||||||||||||||||||||
| R5 Class |
$ | 21,843,523 | $ | 7,226,741 | $ | 16,517,233 | $ | 563,870 | ||||||||||||||||||||
| Y Class |
90,829,013 | 31,971,972 | 97,838,548 | 3,811,853 | ||||||||||||||||||||||||
| Investor Class |
2,009,635 | 955,098 | 2,470,685 | 60,415 | ||||||||||||||||||||||||
| A Class |
541,837 | 149,153 | 770,861 | 15,396 | ||||||||||||||||||||||||
| C Class |
748,629 | 276,834 | 2,716,822 | 57,110 | ||||||||||||||||||||||||
| Long-term capital gains |
| |||||||||||||||||||||||||||
| R5 Class |
5,306,694 | 3,092,793 | 3,059,278 | 140,263 | ||||||||||||||||||||||||
| Y Class |
22,080,178 | 13,730,884 | 18,169,587 | 1,027,858 | ||||||||||||||||||||||||
| Investor Class |
524,272 | 441,369 | 470,033 | 24,891 | ||||||||||||||||||||||||
| A Class |
136,682 | 68,946 | 144,793 | 6,265 | ||||||||||||||||||||||||
| C Class |
214,959 | 153,657 | 536,976 | 23,530 | ||||||||||||||||||||||||
| R6 Class |
- | - | - | - | ||||||||||||||||||||||||
|
|
|
|
|
|
|
|
|
|||||||||||||||||||||
| Total distributions paid |
$ | 144,235,422 | $ | 58,067,447 | $ | 142,694,816 | $ | 5,731,451 | ||||||||||||||||||||
|
|
|
|
|
|
|
|
|
|||||||||||||||||||||
| AHL TargetRisk Core Fund | ||||||||||||
| Year Ended December 31, 2021 |
From December 16, 2020A to December 31, 2020 |
|||||||||||
| Distributions paid from: |
||||||||||||
| Ordinary income* |
||||||||||||
| R5 Class |
$ | - | $ | |||||||||
| Y Class |
4,162 | - | ||||||||||
| Investor Class |
- | - | ||||||||||
| A Class |
4,162 | - | ||||||||||
| C Class |
4,162 | - | ||||||||||
| R6 Class |
403,689 | |||||||||||
| Long-term capital gains |
||||||||||||
| R5 Class |
- | - | ||||||||||
| Y Class |
1,709 | - | ||||||||||
| Investor Class |
- | - | ||||||||||
| A Class |
1,709 | - | ||||||||||
| C Class |
1,709 | - | ||||||||||
| R6 Class |
165,798 | - | ||||||||||
|
|
|
|
|
|||||||||
| Total distributions paid |
$ | 587,100 | $ | - | ||||||||
|
|
|
|
|
|||||||||
A Commencement of operations.
* For tax purposes, short-term capital gains are considered ordinary income distributions.
84
American Beacon FundsSM
Notes to Financial Statements
December 31, 2021
As of December 31, 2021, the components of distributable earnings (deficits) on a tax basis were as follows:
| Fund |
Tax Cost | Unrealized Appreciation |
Unrealized (Depreciation) |
Net Unrealized Appreciation (Depreciation) |
||||||||||||||||||||||||
| AHL Managed Futures Strategy | $ |
2,018,076,952 |
|
$ | 7,262,206 | $ | (204,592,932 | ) | $ | (197,330,726 | ) | |||||||||||||||||
| AHL TargetRisk | 847,708,618 | 14,501,744 | (65,364,596 | ) | (50,862,852 | ) | ||||||||||||||||||||||
| AHL TargetRisk Core | 9,551,442 | 132,518 | (55,931 | ) | 76,587 | |||||||||||||||||||||||
| Fund |
Net Unrealized Appreciation (Depreciation) |
Undistributed Ordinary Income |
Undistributed Long-Term Capital Gains |
Accumulated Capital and Other (Losses) |
Other Temporary Differences |
Distributable Earnings |
||||||||||||||||||||||||||||
| AHL Managed Futures Strategy | $ | (197,330,726 | ) | $ | - | $ | - | $ | (47,023,958 | ) | $ | 39,701,260 | $ | (204,653,424 | ) | |||||||||||||||||||
| AHL TargetRisk | (50,862,852 | ) | 3,022,915 | 4,871,755 | - | 10,267,415 | (32,700,767 | ) | ||||||||||||||||||||||||||
| AHL TargetRisk Core | 76,587 | - | 70,637 | - | 1 | 147,225 | ||||||||||||||||||||||||||||
Financial reporting records are adjusted for permanent book/tax differences to reflect tax character. Financial records are not adjusted for temporary differences. The temporary differences between financial reporting and tax-basis reporting of unrealized appreciation (depreciation) are attributable primarily to the tax deferral of losses from wash sales, the tax deferral of late year losses, the tax deferral of losses related to straddles and the realization for tax purposes of unrealized gains (losses) on certain derivative instruments.
Due to inherent differences in the recognition of income, expenses, and realized gains (losses) under U.S. GAAP and federal income tax regulations, permanent differences between book and tax reporting have been identified and appropriately reclassified on the Statements of Assets and Liabilities. Accordingly, the following amounts represent current year permanent differences derived from the reclassification of income from investment subsidiary as of December 31, 2021:
| Fund |
Paid-In-Capital | Distributable Earnings/(Deficits) |
||||||||||
| AHL Managed Futures Strategy | $ | 101,564,975 | $ | (101,564,975 | ) | |||||||
| AHL TargetRisk | 41,261,287 | (41,261,287 | ) | |||||||||
| AHL TargetRisk Core | - | - | ||||||||||
For federal income tax purposes, the Funds measure their capital loss carryforwards annually at December 31, their fiscal year end. Capital loss carryforwards retain their character as short-term and/or long-term and may be carried forward and applied against future realized capital gains with no expiration date.
As of December 31, 2021, the Funds did not have any capital loss carryforwards.
The Funds are permitted for tax purposes to defer into the next fiscal year qualified late year losses. Qualified late year capital losses are net losses incurred after October 31 through the Fund’s fiscal year end, December 31, 2021. Qualified late year ordinary losses are specified losses generally incurred after October 31 through the end of the Fund’s fiscal year end, December 31, 2021. For the period ending December 31, 2021, AHL Managed Futures Strategy deferred $15,827,899 short-term capital loss and $27,205,436 long-term capital loss to January 1, 2022. AHL Managed Futures Strategy also deferred $3,990,623 ordinary loss to January 1, 2022.
8. Investment Transactions
The aggregate cost of purchases and proceeds from sales and maturities of investments, other than short-term obligations, for the year ended December 31, 2021 were as follows:
| Fund |
Purchases (non-U.S. Government Securities) |
Purchases of U.S. Government Securities |
Sales (non-U.S. Government Securities) |
Sales of U.S. Government Securities |
||||||||||||||||||||||||
| AHL Managed Futures Strategy | $ | - | $ | - | $ | - | $ | - | ||||||||||||||||||||
| AHL TargetRisk | 499,089,566 | 442,436,482 | 465,079,319 | 403,092,730 | ||||||||||||||||||||||||
| AHL TargetRisk Core | - | - | - | - | ||||||||||||||||||||||||
85
American Beacon FundsSM
Notes to Financial Statements
December 31, 2021
9. Borrowing Arrangements
Effective November 11, 2021 (the “Effective Date”), the Funds, along with certain other funds managed by the Manager (“Participating Funds”), renewed a committed revolving line of credit (the “Committed Line”) agreement with State Street Bank and Trust Company (the “Bank”) to be used to facilitate portfolio liquidity. The maximum borrowing amount under the Committed Line is $100 million with interest at a rate equal to the higher of (a) Overnight Bank Funding Rate (“OBFR”) daily fluctuating rate per annum equal to 1.25% plus the sum of 0.10% or (b) the Federal Funds daily fluctuating rate per annum on amounts borrowed. Each of the Participating Funds paid a proportional amount of a quarterly commitment fee at a rate of 0.25% per annum on the unused portion of the Committed Line amount. The Committed Line expires November 10, 2022, unless extended by the Bank or terminated by the Participating Funds in accordance with the agreement. Prior to the Effective Date, the maximum borrowing amount under the Committed Line was $150 million with an expiration date November 10, 2021.
On the Effective Date, the Funds, along with certain other Participating Funds managed by the Manager, also renewed an uncommitted discretionary demand revolving line of credit (the “Uncommitted Line”) agreement with the Bank to be used to facilitate portfolio liquidity. The maximum borrowing amount under the Uncommitted Line is $100 million with interest at a rate equal to the higher of (a) OBFR daily fluctuating rate per annum equal to 1.25% plus the sum of 0.10% or (b) the Federal Funds daily fluctuating rate per annum on amounts borrowed on each outstanding loan. Each of the Participating Funds paid a proportional amount of a closing fee of $35,000 on the Effective Date. The Uncommitted Line expires November 10, 2022 unless extended by the Bank or terminated by the Participating Funds in accordance with the agreement. Prior to the Effective Date, the maximum borrowing amount under the Uncommitted Line was $50 million with an expiration date of November 10, 2021.
The Participating Funds paid administration, legal and arrangement fees, which are recognized as a component of “Loan expense” on the Statements of Operations, along with commitment fees, that have been allocated among the Participating Funds based on average daily net assets.
During the year ended December 31, 2021, the Funds did not utilize these facilities.
10. Capital Share Transactions
The tables below summarize the activity in capital shares for each Class of the Funds:
| R5 Class | ||||||||||||||||||||||||||||
| Year Ended December 31, 2021 |
Year Ended December 31, 2020 |
|||||||||||||||||||||||||||
| AHL Managed Futures Strategy Fund |
Shares |
Amount |
Shares |
Amount |
||||||||||||||||||||||||
| Shares sold | 31,530,869 | $ | 350,947,948 | 21,105,054 | $ | 226,220,493 | ||||||||||||||||||||||
| Reinvestment of dividends | 683,349 | 7,188,837 | 386,143 | 4,012,021 | ||||||||||||||||||||||||
| Shares redeemed | (5,362,859 | ) | (60,424,440 | ) | (37,240,997 | ) | (397,272,145 | ) | ||||||||||||||||||||
|
|
|
|
|
|
|
|
|
|||||||||||||||||||||
| Net increase (decrease) in shares outstanding | 26,851,359 | $ | 297,712,345 | (15,749,800 | ) | $ | (167,039,631 | ) | ||||||||||||||||||||
|
|
|
|
|
|
|
|
|
|||||||||||||||||||||
| Y Class | ||||||||||||||||||||||||||||
| Year Ended December 31, 2021 |
Year Ended December 31, 2020 |
|||||||||||||||||||||||||||
| AHL Managed Futures Strategy Fund |
Shares |
Amount |
Shares |
Amount |
||||||||||||||||||||||||
| Shares sold | 93,659,608 | $ | 1,065,101,186 | 56,516,359 | $ | 603,507,640 | ||||||||||||||||||||||
| Reinvestment of dividends | 10,277,214 | 107,602,430 | 4,180,306 | 43,224,363 | ||||||||||||||||||||||||
| Shares redeemed | (33,066,916 | ) | (368,914,674 | ) | (39,737,169 | ) | (425,621,784 | ) | ||||||||||||||||||||
|
|
|
|
|
|
|
|
|
|||||||||||||||||||||
| Net increase in shares outstanding | 70,869,906 | $ | 803,788,942 | 20,959,496 | $ | 221,110,219 | ||||||||||||||||||||||
|
|
|
|
|
|
|
|
|
|||||||||||||||||||||
86
American Beacon FundsSM
Notes to Financial Statements
December 31, 2021
| Investor Class | ||||||||||||||||||||||||||||
| Year Ended December 31, 2021 |
Year Ended December 31, 2020 |
|||||||||||||||||||||||||||
| AHL Managed Futures Strategy Fund |
Shares |
Amount |
Shares |
Amount |
||||||||||||||||||||||||
| Shares sold | 1,304,903 | $ | 14,720,072 | 1,995,500 | $ | 21,056,649 | ||||||||||||||||||||||
| Reinvestment of dividends | 240,564 | 2,489,835 | 134,857 | 1,379,592 | ||||||||||||||||||||||||
| Shares redeemed | (876,800 | ) | (9,821,086 | ) | (1,031,123 | ) | (10,919,214 | ) | ||||||||||||||||||||
|
|
|
|
|
|
|
|
|
|||||||||||||||||||||
| Net increase in shares outstanding | 668,667 | $ | 7,388,821 | 1,099,234 | $ | 11,517,027 | ||||||||||||||||||||||
|
|
|
|
|
|
|
|
|
|||||||||||||||||||||
| A Class | ||||||||||||||||||||||||||||
| Year Ended December 31, 2021 |
Year Ended December 31, 2020 |
|||||||||||||||||||||||||||
| AHL Managed Futures Strategy Fund |
Shares |
Amount |
Shares |
Amount |
||||||||||||||||||||||||
| Shares sold | 1,220,407 | $ | 13,775,450 | 666,950 | $ | 7,014,864 | ||||||||||||||||||||||
| Reinvestment of dividends | 60,458 | 625,740 | 18,757 | 192,070 | ||||||||||||||||||||||||
| Shares redeemed | (783,136 | ) | (8,799,722 | ) | (664,912 | ) | (6,987,904 | ) | ||||||||||||||||||||
|
|
|
|
|
|
|
|
|
|||||||||||||||||||||
| Net increase in shares outstanding | 497,729 | $ | 5,601,468 | 20,795 | $ | 219,030 | ||||||||||||||||||||||
|
|
|
|
|
|
|
|
|
|||||||||||||||||||||
| C Class | ||||||||||||||||||||||||||||
| Year Ended December 31, 2021 |
Year Ended December 31, 2020 |
|||||||||||||||||||||||||||
| AHL Managed Futures Strategy Fund |
Shares |
Amount |
Shares |
Amount |
||||||||||||||||||||||||
| Shares sold | 739,611 | $ | 8,071,944 | 389,949 | $ | 3,975,520 | ||||||||||||||||||||||
| Reinvestment of dividends | 88,024 | 883,759 | 36,421 | 362,751 | ||||||||||||||||||||||||
| Shares redeemed | (246,178 | ) | (2,678,330 | ) | (149,524 | ) | (1,523,799 | ) | ||||||||||||||||||||
|
|
|
|
|
|
|
|
|
|||||||||||||||||||||
| Net increase in shares outstanding | 581,457 | $ | 6,277,373 | 276,846 | $ | 2,814,472 | ||||||||||||||||||||||
|
|
|
|
|
|
|
|
|
|||||||||||||||||||||
| R5 Class | ||||||||||||||||||||||||||||
| Year Ended December 31, 2021 |
Year Ended December 31, 2020 |
|||||||||||||||||||||||||||
| AHL TargetRisk Fund |
Shares |
Amount |
Shares |
Amount |
||||||||||||||||||||||||
| Shares sold | 2,368,476 | $ | 31,703,259 | 6,832,761 | $ | 83,359,042 | ||||||||||||||||||||||
| Reinvestment of dividends | 1,580,727 | 19,221,646 | 54,549 | 688,955 | ||||||||||||||||||||||||
| Shares redeemed | (1,865,226 | ) | (24,660,834 | ) | (451,831 | ) | (5,553,418 | ) | ||||||||||||||||||||
|
|
|
|
|
|
|
|
|
|||||||||||||||||||||
| Net increase in shares outstanding | 2,083,977 | $ | 26,264,071 | 6,435,479 | $ | 78,494,579 | ||||||||||||||||||||||
|
|
|
|
|
|
|
|
|
|||||||||||||||||||||
| Y Class | ||||||||||||||||||||||||||||
| Year Ended December 31, 2021 |
Year Ended December 31, 2020 |
|||||||||||||||||||||||||||
| AHL TargetRisk Fund |
Shares |
Amount |
Shares |
Amount |
||||||||||||||||||||||||
| Shares sold | 29,952,811 | $ | 392,728,468 | 48,720,779 | $ | 588,325,950 | ||||||||||||||||||||||
| Reinvestment of dividends | 9,190,748 | 111,667,590 | 379,265 | 4,790,119 | ||||||||||||||||||||||||
| Shares redeemed | (29,147,384 | ) | (389,682,187 | ) | (6,617,816 | ) | (80,786,212 | ) | ||||||||||||||||||||
|
|
|
|
|
|
|
|
|
|||||||||||||||||||||
| Net increase in shares outstanding | 9,996,175 | $ | 114,713,871 | 42,482,228 | $ | 512,329,857 | ||||||||||||||||||||||
|
|
|
|
|
|
|
|
|
|||||||||||||||||||||
| Investor Class | ||||||||||||||||||||||||||||
| Year Ended December 31, 2021 |
Year Ended December 31, 2020 |
|||||||||||||||||||||||||||
| AHL TargetRisk Fund |
Shares |
Amount |
Shares |
Amount |
||||||||||||||||||||||||
| Shares sold | 651,869 | $ | 8,912,966 | 1,050,194 | $ | 12,578,538 | ||||||||||||||||||||||
| Reinvestment of dividends | 241,370 | 2,922,989 | 6,711 | 84,490 | ||||||||||||||||||||||||
| Shares redeemed | (639,362 | ) | (8,558,885 | ) | (493,908 | ) | (6,006,978 | ) | ||||||||||||||||||||
|
|
|
|
|
|
|
|
|
|||||||||||||||||||||
| Net increase in shares outstanding | 253,877 | $ | 3,277,070 | 562,997 | $ | 6,656,050 | ||||||||||||||||||||||
|
|
|
|
|
|
|
|
|
|||||||||||||||||||||
| A Class | ||||||||||||||||||||||||||||
| Year Ended December 31, 2021 |
Year Ended December 31, 2020 |
|||||||||||||||||||||||||||
| AHL TargetRisk Fund |
Shares |
Amount |
Shares |
Amount |
||||||||||||||||||||||||
| Shares sold | 259,315 | $ | 3,574,782 | 295,029 | $ | 3,557,666 | ||||||||||||||||||||||
| Reinvestment of dividends | 75,010 | 906,127 | 1,713 | 21,523 | ||||||||||||||||||||||||
| Shares redeemed | (204,831 | ) | (2,751,865 | ) | (101,923 | ) | (1,244,875 | ) | ||||||||||||||||||||
|
|
|
|
|
|
|
|
|
|||||||||||||||||||||
| Net increase in shares outstanding | 129,494 | $ | 1,729,044 | 194,819 | $ | 2,334,314 | ||||||||||||||||||||||
|
|
|
|
|
|
|
|
|
|||||||||||||||||||||
87
American Beacon FundsSM
Notes to Financial Statements
December 31, 2021
| C Class | ||||||||||||||||||||||||||||
| Year Ended December 31, 2021 |
Year Ended December 31, 2020 |
|||||||||||||||||||||||||||
| AHL TargetRisk Fund |
Shares |
Amount |
Shares |
Amount |
||||||||||||||||||||||||
| Shares sold | 496,603 | $ | 6,542,854 | 1,096,527 | $ | 13,140,033 | ||||||||||||||||||||||
| Reinvestment of dividends | 268,605 | 3,201,766 | 6,459 | 80,352 | ||||||||||||||||||||||||
| Shares redeemed | (227,925 | ) | (2,932,209 | ) | (381,813 | ) | (4,576,726 | ) | ||||||||||||||||||||
|
|
|
|
|
|
|
|
|
|||||||||||||||||||||
| Net increase in shares outstanding | 537,283 | $ | 6,812,411 | 721,173 | $ | 8,643,659 | ||||||||||||||||||||||
|
|
|
|
|
|
|
|
|
|||||||||||||||||||||
| Y Class | ||||||||||||||||||||||||||||
| Year Ended December 31, 2021 |
December 16, 2020A to December 31, 2020 |
|||||||||||||||||||||||||||
| AHL TargetRisk Core Fund |
Shares |
Amount |
Shares |
Amount |
||||||||||||||||||||||||
| Shares sold | - | $ | - | – | B | $ | – | B | ||||||||||||||||||||
| Reinvestment of dividends | 166 | 1,679 | - | - | ||||||||||||||||||||||||
| Shares redeemed | - | - | - | - | ||||||||||||||||||||||||
|
|
|
|
|
|
|
|
|
|||||||||||||||||||||
| Net increase in shares outstanding | 166 | $ | 1,679 | - | $ | - | ||||||||||||||||||||||
|
|
|
|
|
|
|
|
|
|||||||||||||||||||||
| A Class | ||||||||||||||||||||||||||||
| Year Ended December 31, 2021 |
December 16, 2020A to December 31, 2020 |
|||||||||||||||||||||||||||
| AHL TargetRisk Core Fund |
Shares |
Amount |
Shares |
Amount |
||||||||||||||||||||||||
| Shares sold | - | $ | - | – | B | $ | – | B | ||||||||||||||||||||
| Reinvestment of dividends | 582 | 5,871 | - | - | ||||||||||||||||||||||||
| Shares redeemed | - | - | - | - | ||||||||||||||||||||||||
|
|
|
|
|
|
|
|
|
|||||||||||||||||||||
| Net increase in shares outstanding | 582 | $ | 5,871 | - | $ | - | ||||||||||||||||||||||
|
|
|
|
|
|
|
|
|
|||||||||||||||||||||
| C Class | ||||||||||||||||||||||||||||
| Year Ended December 31, 2021 |
December 16, 2020A to December 31, 2020 |
|||||||||||||||||||||||||||
| AHL TargetRisk Core Fund |
Shares |
Amount |
Shares |
Amount |
||||||||||||||||||||||||
| Shares sold | - | $ | - | – | B | $ | – | B | ||||||||||||||||||||
| Reinvestment of dividends | 168 | 1,679 | - | - | ||||||||||||||||||||||||
| Shares redeemed | - | - | - | - | ||||||||||||||||||||||||
|
|
|
|
|
|
|
|
|
|||||||||||||||||||||
| Net increase in shares outstanding | 168 | $ | 1,679 | - | $ | - | ||||||||||||||||||||||
|
|
|
|
|
|
|
|
|
|||||||||||||||||||||
| R6 Class | ||||||||||||||||||||||||||||
| Year Ended December 31, 2021 |
December 16, 2020A to December 31, 2020 |
|||||||||||||||||||||||||||
| AHL TargetRisk Core Fund |
Shares |
Amount |
Shares |
Amount |
||||||||||||||||||||||||
| Shares sold | - | $ | - | 500,000 | B | $ | 5,000,001 | C | ||||||||||||||||||||
| Reinvestment of dividends | 36,768 | 372,463 | - | - | ||||||||||||||||||||||||
| Shares redeemed | - | - | - | - | ||||||||||||||||||||||||
|
|
|
|
|
|
|
|
|
|||||||||||||||||||||
| Net increase in shares outstanding | 36,768 | $ | 372,463 | 500,000 | $ | 5,000,001 | ||||||||||||||||||||||
|
|
|
|
|
|
|
|
|
|||||||||||||||||||||
A Commencement of operations.
B Seed capital was received on December 16, 2020 in the amount of $100,000 for the Y Class, $100,000 for the A Class, $100,000 for the C class and $4,700,000 for the R6 Class. As a result, shares were issued in the amount of 10,000 for the Y Class, 10,000 for the A Class, 10,000 for the C class and 470,000 for the R6 Class.
11. Subsequent Events
Management has evaluated subsequent events for possible recognition or disclosure in the financial statements through the date the financial statements are issued. Management has determined that there are no material events that would require disclosure in the Funds’ financial statements through this date.
88
American Beacon AHL Managed Futures Strategy FundSM
Financial Highlights
(For a share outstanding throughout the period)
| R5 ClassA | ||||||||||||||||||||||||||||||||||||
| Year Ended December 31, | ||||||||||||||||||||||||||||||||||||
| 2021 | 2020 | 2019 | 2018 | 2017 | ||||||||||||||||||||||||||||||||
|
|
|
|||||||||||||||||||||||||||||||||||
| Net asset value, beginning of period |
$ | 10.72 | $ | 10.22 | $ | 10.63 | $ | 10.57 | $ | 10.44 | ||||||||||||||||||||||||||
|
|
|
|
|
|
|
|
|
|
|
|||||||||||||||||||||||||||
| Income (loss) from investment operations: |
||||||||||||||||||||||||||||||||||||
| Net investment income (loss) |
(0.18 | )B | (1.03 | ) | 0.04 | (0.02 | ) | (0.08 | ) | |||||||||||||||||||||||||||
| Net gains on investments (both realized and unrealized) |
0.74 | 2.10 | 0.01 | 0.28 | 0.63 | |||||||||||||||||||||||||||||||
|
|
|
|
|
|
|
|
|
|
|
|||||||||||||||||||||||||||
| Total income (loss) from investment operations |
0.56 | 1.07 | 0.05 | 0.26 | 0.55 | |||||||||||||||||||||||||||||||
|
|
|
|
|
|
|
|
|
|
|
|||||||||||||||||||||||||||
| Less distributions: |
||||||||||||||||||||||||||||||||||||
| Dividends from net investment income |
(0.47 | ) | (0.34 | ) | (0.27 | ) | (0.14 | ) | - | |||||||||||||||||||||||||||
| Distributions from net realized gains |
(0.32 | ) | (0.23 | ) | (0.19 | ) | (0.06 | ) | (0.42 | ) | ||||||||||||||||||||||||||
|
|
|
|
|
|
|
|
|
|
|
|||||||||||||||||||||||||||
| Total distributions |
(0.79 | ) | (0.57 | ) | (0.46 | ) | (0.20 | ) | (0.42 | ) | ||||||||||||||||||||||||||
|
|
|
|
|
|
|
|
|
|
|
|||||||||||||||||||||||||||
| Net asset value, end of period |
$ | 10.49 | $ | 10.72 | $ | 10.22 | $ | 10.63 | $ | 10.57 | ||||||||||||||||||||||||||
|
|
|
|
|
|
|
|
|
|
|
|||||||||||||||||||||||||||
| Total returnC |
5.12 | % | 10.67 | % | 0.43 | % | 2.42 | % | 5.31 | % | ||||||||||||||||||||||||||
|
|
|
|
|
|
|
|
|
|
|
|||||||||||||||||||||||||||
| Ratios and supplemental data: |
||||||||||||||||||||||||||||||||||||
| Net assets, end of period |
$ | 473,334,156 | $ | 195,920,482 | $ | 347,611,671 | $ | 396,044,490 | $ | 391,617,624 | ||||||||||||||||||||||||||
| Ratios to average net assets: |
||||||||||||||||||||||||||||||||||||
| Expenses, before reimbursements and/or recoupments |
1.55 | % | 1.59 | % | 1.60 | % | 1.71 | % | 1.98 | % | ||||||||||||||||||||||||||
| Expenses, net of reimbursements and/or recoupments |
1.54 | % | 1.54 | % | 1.54 | % | 1.54 | % | 1.54 | % | ||||||||||||||||||||||||||
| Net investment income (loss), before expense reimbursements and/or recoupments |
(1.58 | )% | (3.19 | )% | 0.52 | % | (0.40 | )% | (1.20 | )% | ||||||||||||||||||||||||||
| Net investment income (loss), net of reimbursements and/or recoupments |
(1.57 | )% | (3.14 | )% | 0.58 | % | (0.23 | )% | (0.77 | )% | ||||||||||||||||||||||||||
| Portfolio turnover rateD |
– | % | – | % | - | % | – | % | – | % | ||||||||||||||||||||||||||
| A | Prior to February 28, 2020, the R5 Class was known as Institutional Class. |
| B | Per share amounts have been calculated using the average shares method. |
| C | Based on net asset value, which does not reflect the sales charge, redemption fee, or contingent deferred sales charge, if applicable. May include adjustments in accordance with U.S. GAAP and as such, the net asset value for reporting purposes and the returns based upon those net asset values may differ from the net asset value and returns for shareholder transactions. |
| D | Portfolio turnover is based on the lesser of long-term purchases or sales divided by the average long-term fair value during the period. The Fund did not invest in any long-term securities during the reporting period. |
See accompanying notes
89
American Beacon AHL Managed Futures Strategy FundSM
Financial Highlights
(For a share outstanding throughout the period)
| Y Class | ||||||||||||||||||||||||||||||||||||
| Year Ended December 31, | ||||||||||||||||||||||||||||||||||||
| 2021 | 2020 | 2019 | 2018 | 2017 | ||||||||||||||||||||||||||||||||
|
|
|
|||||||||||||||||||||||||||||||||||
| Net asset value, beginning of period |
$ | 10.67 | $ | 10.17 | $ | 10.58 | $ | 10.53 | $ | 10.41 | ||||||||||||||||||||||||||
|
|
|
|
|
|
|
|
|
|
|
|||||||||||||||||||||||||||
| Income (loss) from investment operations: |
||||||||||||||||||||||||||||||||||||
| Net investment income (loss) |
(0.17 | )A | 0.08 | 0.08 | 0.10 | (0.07 | ) | |||||||||||||||||||||||||||||
| Net gains (losses) on investments (both realized and unrealized) |
0.72 | 0.99 | (0.05 | ) | 0.14 | 0.61 | ||||||||||||||||||||||||||||||
|
|
|
|
|
|
|
|
|
|
|
|||||||||||||||||||||||||||
| Total income (loss) from investment operations |
0.55 | 1.07 | 0.03 | 0.24 | 0.54 | |||||||||||||||||||||||||||||||
|
|
|
|
|
|
|
|
|
|
|
|||||||||||||||||||||||||||
| Less distributions: |
||||||||||||||||||||||||||||||||||||
| Dividends from net investment income |
(0.47 | ) | (0.34 | ) | (0.25 | ) | (0.13 | ) | - | |||||||||||||||||||||||||||
| Distributions from net realized gains |
(0.32 | ) | (0.23 | ) | (0.19 | ) | (0.06 | ) | (0.42 | ) | ||||||||||||||||||||||||||
|
|
|
|
|
|
|
|
|
|
|
|||||||||||||||||||||||||||
| Total distributions |
(0.79 | ) | (0.57 | ) | (0.44 | ) | (0.19 | ) | (0.42 | ) | ||||||||||||||||||||||||||
|
|
|
|
|
|
|
|
|
|
|
|||||||||||||||||||||||||||
| Net asset value, end of period |
$ | 10.43 | $ | 10.67 | $ | 10.17 | $ | 10.58 | $ | 10.53 | ||||||||||||||||||||||||||
|
|
|
|
|
|
|
|
|
|
|
|||||||||||||||||||||||||||
| Total returnB |
5.04 | % | 10.71 | % | 0.34 | % | 2.28 | % | 5.23 | % | ||||||||||||||||||||||||||
|
|
|
|
|
|
|
|
|
|
|
|||||||||||||||||||||||||||
| Ratios and supplemental data: |
||||||||||||||||||||||||||||||||||||
| Net assets, end of period |
$ | 1,608,801,856 | $ | 888,669,539 | $ | 634,005,786 | $ | 500,530,112 | $ | 101,513,775 | ||||||||||||||||||||||||||
| Ratios to average net assets: |
||||||||||||||||||||||||||||||||||||
| Expenses, before reimbursements and/or recoupments |
1.54 | % | 1.64 | % | 1.63 | % | 1.72 | % | 2.04 | % | ||||||||||||||||||||||||||
| Expenses, net of reimbursements and/or recoupments |
1.53 | % | 1.62 | % | 1.64 | % | 1.64 | % | 1.64 | % | ||||||||||||||||||||||||||
| Net investment income (loss), before expense reimbursements and/or recoupments |
(1.48 | )% | 0.02 | % | 0.48 | % | 0.71 | % | (1.25 | )% | ||||||||||||||||||||||||||
| Net investment income (loss), net of reimbursements and/or recoupments |
(1.47 | )% | 0.04 | % | 0.47 | % | 0.79 | % | (0.84 | )% | ||||||||||||||||||||||||||
| Portfolio turnover rateC |
- | % | - | % | - | % | - | % | - | % | ||||||||||||||||||||||||||
| A | Per share amounts have been calculated using the average shares method. |
| B | Based on net asset value, which does not reflect the sales charge, redemption fee, or contingent deferred sales charge, if applicable. May include adjustments in accordance with U.S. GAAP and as such, the net asset value for reporting purposes and the returns based upon those net asset values may differ from the net asset value and returns for shareholder transactions. |
| C | Portfolio turnover is based on the lesser of long-term purchases or sales divided by the average long-term fair value during the period. The Fund did not invest in any long-term securities during the reporting period. |
See accompanying notes
90
American Beacon AHL Managed Futures Strategy FundSM
Financial Highlights
(For a share outstanding throughout the period)
| Investor Class | ||||||||||||||||||||||||||||||||||||
| Year Ended December 31, | ||||||||||||||||||||||||||||||||||||
| 2021 | 2020 | 2019 | 2018 | 2017 | ||||||||||||||||||||||||||||||||
|
|
|
|||||||||||||||||||||||||||||||||||
| Net asset value, beginning of period |
$ | 10.56 | $ | 10.07 | $ | 10.48 | $ | 10.44 | $ | 10.35 | ||||||||||||||||||||||||||
|
|
|
|
|
|
|
|
|
|
|
|||||||||||||||||||||||||||
| Income (loss) from investment operations: |
||||||||||||||||||||||||||||||||||||
| Net investment income (loss) |
(0.17 | ) | (0.04 | )A | 0.06 | (0.12 | ) | (0.11 | ) | |||||||||||||||||||||||||||
| Net gains (losses) on investments (both realized and unrealized) |
0.67 | 1.07 | (0.05 | ) | 0.31 | 0.62 | ||||||||||||||||||||||||||||||
|
|
|
|
|
|
|
|
|
|
|
|||||||||||||||||||||||||||
| Total income (loss) from investment operations |
0.50 | 1.03 | 0.01 | 0.19 | 0.51 | |||||||||||||||||||||||||||||||
|
|
|
|
|
|
|
|
|
|
|
|||||||||||||||||||||||||||
| Less distributions: |
||||||||||||||||||||||||||||||||||||
| Dividends from net investment income |
(0.42 | ) | (0.31 | ) | (0.23 | ) | (0.09 | ) | - | |||||||||||||||||||||||||||
| Distributions from net realized gains |
(0.32 | ) | (0.23 | ) | (0.19 | ) | (0.06 | ) | (0.42 | ) | ||||||||||||||||||||||||||
|
|
|
|
|
|
|
|
|
|
|
|||||||||||||||||||||||||||
| Total distributions |
(0.74 | ) | (0.54 | ) | (0.42 | ) | (0.15 | ) | (0.42 | ) | ||||||||||||||||||||||||||
|
|
|
|
|
|
|
|
|
|
|
|||||||||||||||||||||||||||
| Net asset value, end of period |
$ | 10.32 | $ | 10.56 | $ | 10.07 | $ | 10.48 | $ | 10.44 | ||||||||||||||||||||||||||
|
|
|
|
|
|
|
|
|
|
|
|||||||||||||||||||||||||||
| Total returnB |
4.69 | % | 10.42 | % | 0.08 | % | 1.85 | % | 4.98 | % | ||||||||||||||||||||||||||
|
|
|
|
|
|
|
|
|
|
|
|||||||||||||||||||||||||||
| Ratios and supplemental data: |
||||||||||||||||||||||||||||||||||||
| Net assets, end of period |
$ | 37,408,089 | $ | 31,217,881 | $ | 18,716,672 | $ | 17,292,936 | $ | 20,241,387 | ||||||||||||||||||||||||||
| Ratios to average net assets: |
||||||||||||||||||||||||||||||||||||
| Expenses, before reimbursements and/or recoupments |
1.93 | % | 1.97 | % | 1.94 | % | 1.97 | % | 2.20 | % | ||||||||||||||||||||||||||
| Expenses, net of reimbursements and/or recoupments |
1.92 | % | 1.92 | % | 1.92 | % | 1.92 | % | 1.92 | % | ||||||||||||||||||||||||||
| Net investment income (loss), before expense reimbursements and/or recoupments |
(2.84 | )% | (0.44 | )% | 0.17 | % | (0.95 | )% | (1.48 | )% | ||||||||||||||||||||||||||
| Net investment income (loss), net of reimbursements and/or recoupments |
(2.83 | )% | (0.39 | )% | 0.19 | % | (0.90 | )% | (1.20 | )% | ||||||||||||||||||||||||||
| Portfolio turnover rateC |
- | % | - | % | - | % | - | % | - | % | ||||||||||||||||||||||||||
| A | Per share amounts have been calculated using the average shares method. |
| B | Based on net asset value, which does not reflect the sales charge, redemption fee, or contingent deferred sales charge, if applicable. May include adjustments in accordance with U.S. GAAP and as such, the net asset value for reporting purposes and the returns based upon those net asset values may differ from the net asset value and returns for shareholder transactions. |
| C | Portfolio turnover is based on the lesser of long-term purchases or sales divided by the average long-term fair value during the period. The Fund did not invest in any long-term securities during the reporting period. |
See accompanying notes
91
American Beacon AHL Managed Futures Strategy FundSM
Financial Highlights
(For a share outstanding throughout the period)
| A Class | ||||||||||||||||||||||||||||||||||||
| Year Ended December 31, | ||||||||||||||||||||||||||||||||||||
| 2021 | 2020 | 2019 | 2018 | 2017 | ||||||||||||||||||||||||||||||||
|
|
|
|||||||||||||||||||||||||||||||||||
| Net asset value, beginning of period |
$ | 10.56 | $ | 10.08 | $ | 10.49 | $ | 10.53 | $ | 10.36 | ||||||||||||||||||||||||||
|
|
|
|
|
|
|
|
|
|
|
|||||||||||||||||||||||||||
| Income (loss) from investment operations: |
||||||||||||||||||||||||||||||||||||
| Net investment income (loss) |
(0.16 | )A | (0.01 | ) | 0.04 | (0.06 | )A | (0.41 | ) | |||||||||||||||||||||||||||
| Net gains (losses) on investments (both realized and unrealized) |
0.68 | 1.03 | (0.03 | ) | 0.18 | 1.00 | ||||||||||||||||||||||||||||||
|
|
|
|
|
|
|
|
|
|
|
|||||||||||||||||||||||||||
| Total income (loss) from investment operations |
0.52 | 1.02 | 0.01 | 0.12 | 0.59 | |||||||||||||||||||||||||||||||
|
|
|
|
|
|
|
|
|
|
|
|||||||||||||||||||||||||||
| Less distributions: |
||||||||||||||||||||||||||||||||||||
| Dividends from net investment income |
(0.44 | ) | (0.31 | ) | (0.23 | ) | (0.10 | ) | - | |||||||||||||||||||||||||||
| Distributions from net realized gains |
(0.32 | ) | (0.23 | ) | (0.19 | ) | (0.06 | ) | (0.42 | ) | ||||||||||||||||||||||||||
|
|
|
|
|
|
|
|
|
|
|
|||||||||||||||||||||||||||
| Total distributions |
(0.76 | ) | (0.54 | ) | (0.42 | ) | (0.16 | ) | (0.42 | ) | ||||||||||||||||||||||||||
|
|
|
|
|
|
|
|
|
|
|
|||||||||||||||||||||||||||
| Net asset value, end of period |
$ | 10.32 | $ | 10.56 | $ | 10.08 | $ | 10.49 | $ | 10.53 | ||||||||||||||||||||||||||
|
|
|
|
|
|
|
|
|
|
|
|||||||||||||||||||||||||||
| Total returnB |
4.88 | % | 10.31 | % | 0.06 | % | 1.14 | % | 5.77 | % | ||||||||||||||||||||||||||
|
|
|
|
|
|
|
|
|
|
|
|||||||||||||||||||||||||||
| Ratios and supplemental data: |
||||||||||||||||||||||||||||||||||||
| Net assets, end of period |
$ | 9,680,124 | $ | 4,653,583 | $ | 4,229,124 | $ | 4,303,787 | $ | 3,408,861 | ||||||||||||||||||||||||||
| Ratios to average net assets: |
||||||||||||||||||||||||||||||||||||
| Expenses, before reimbursements and/or recoupments |
1.82 | % | 1.91 | % | 1.89 | % | 2.05 | % | 2.35 | % | ||||||||||||||||||||||||||
| Expenses, net of reimbursements and/or recoupments |
1.81 | % | 1.90 | % | 1.94 | % | 1.94 | % | 1.94 | % | ||||||||||||||||||||||||||
| Net investment income (loss), before expense reimbursements and/or recoupments |
(1.44 | )% | (0.69 | )% | 0.22 | % | (0.72 | )% | (1.62 | )% | ||||||||||||||||||||||||||
| Net investment income (loss), net of reimbursements and/or recoupments |
(1.43 | )% | (0.68 | )% | 0.17 | % | (0.61 | )% | (1.21 | )% | ||||||||||||||||||||||||||
| Portfolio turnover rateC |
– | % | – | % | - | % | – | % | – | % | ||||||||||||||||||||||||||
| A | Per share amounts have been calculated using the average shares method. |
| B | Based on net asset value, which does not reflect the sales charge, redemption fee, or contingent deferred sales charge, if applicable. May include adjustments in accordance with U.S. GAAP and as such, the net asset value for reporting purposes and the returns based upon those net asset values may differ from the net asset value and returns for shareholder transactions. |
| C | Portfolio turnover is based on the lesser of long-term purchases or sales divided by the average long-term fair value during the period. The Fund did not invest in any long-term securities during the reporting period. |
92
American Beacon AHL Managed Futures Strategy FundSM
Financial Highlights
(For a share outstanding throughout the period)
| C Class | ||||||||||||||||||||||||||||||||||||
| Year Ended December 31, | ||||||||||||||||||||||||||||||||||||
| 2021 | 2020 | 2019 | 2018 | 2017 | ||||||||||||||||||||||||||||||||
|
|
|
|||||||||||||||||||||||||||||||||||
| Net asset value, beginning of period |
$ | 10.27 | $ | 9.82 | $ | 10.25 | $ | 10.19 | $ | 10.20 | ||||||||||||||||||||||||||
|
|
|
|
|
|
|
|
|
|
|
|||||||||||||||||||||||||||
| Income (loss) from investment operations: |
||||||||||||||||||||||||||||||||||||
| Net investment (loss) |
(0.33 | )A | (0.11 | )A | (0.06 | )A | (0.17 | ) | (0.17 | ) | ||||||||||||||||||||||||||
| Net gains (losses) on investments (both realized and unrealized) |
0.75 | 1.04 | (0.02 | ) | 0.30 | 0.58 | ||||||||||||||||||||||||||||||
|
|
|
|
|
|
|
|
|
|
|
|||||||||||||||||||||||||||
| Total income (loss) from investment operations |
0.42 | 0.93 | (0.08 | ) | 0.13 | 0.41 | ||||||||||||||||||||||||||||||
|
|
|
|
|
|
|
|
|
|
|
|||||||||||||||||||||||||||
| Less distributions: |
||||||||||||||||||||||||||||||||||||
| Dividends from net investment income |
(0.37 | ) | (0.25 | ) | (0.16 | ) | (0.01 | ) | - | |||||||||||||||||||||||||||
| Distributions from net realized gains |
(0.32 | ) | (0.23 | ) | (0.19 | ) | (0.06 | ) | (0.42 | ) | ||||||||||||||||||||||||||
|
|
|
|
|
|
|
|
|
|
|
|||||||||||||||||||||||||||
| Total distributions |
(0.69 | ) | (0.48 | ) | (0.35 | ) | (0.07 | ) | (0.42 | ) | ||||||||||||||||||||||||||
|
|
|
|
|
|
|
|
|
|
|
|||||||||||||||||||||||||||
| Net asset value, end of period |
$ | 10.00 | $ | 10.27 | $ | 9.82 | $ | 10.25 | $ | 10.19 | ||||||||||||||||||||||||||
|
|
|
|
|
|
|
|
|
|
|
|||||||||||||||||||||||||||
| Total returnB |
4.01 | % | 9.62 | % | (0.78 | )% | 1.30 | % | 4.06 | % | ||||||||||||||||||||||||||
|
|
|
|
|
|
|
|
|
|
|
|||||||||||||||||||||||||||
| Ratios and supplemental data: |
||||||||||||||||||||||||||||||||||||
| Net assets, end of period |
$ | 15,052,491 | $ | 9,482,185 | $ | 6,352,147 | $ | 5,088,250 | $ | 5,702,799 | ||||||||||||||||||||||||||
| Ratios to average net assets: |
||||||||||||||||||||||||||||||||||||
| Expenses, before reimbursements and/or recoupments |
2.55 | % | 2.65 | % | 2.64 | % | 2.78 | % | 3.10 | % | ||||||||||||||||||||||||||
| Expenses, net of reimbursements and/or recoupments |
2.54 | % | 2.64 | % | 2.69 | % | 2.69 | % | 2.69 | % | ||||||||||||||||||||||||||
| Net investment (loss), before expense reimbursements and/or recoupments |
(3.06 | )% | (1.07 | )% | (0.53 | )% | (1.61 | )% | (2.31 | )% | ||||||||||||||||||||||||||
| Net investment (loss), net of reimbursements and/or recoupments |
(3.05 | )% | (1.06 | )% | (0.58 | )% | (1.52 | )% | (1.90 | )% | ||||||||||||||||||||||||||
| Portfolio turnover rateC |
- | % | - | % | - | % | - | % | - | % | ||||||||||||||||||||||||||
| A | Per share amounts have been calculated using the average shares method. |
| B | Based on net asset value, which does not reflect the sales charge, redemption fee, or contingent deferred sales charge, if applicable. May include adjustments in accordance with U.S. GAAP and as such, the net asset value for reporting purposes and the returns based upon those net asset values may differ from the net asset value and returns for shareholder transactions. |
| C | Portfolio turnover is based on the lesser of long-term purchases or sales divided by the average long-term fair value during the period. The Fund did not invest in any long-term securities during the reporting period. |
93
American Beacon AHL TargetRisk FundSM
Financial Highlights
(For a share outstanding throughout the period)
| R5 ClassA | ||||||||||||||||||||||||||||
| Year Ended December 31, | ||||||||||||||||||||||||||||
| 2021 | 2020 | 2019 | 2018B | |||||||||||||||||||||||||
|
|
|
|||||||||||||||||||||||||||
| Net asset value, beginning of period |
$ | 12.75 | $ | 12.16 | $ | 10.00 | $ | 10.00 | ||||||||||||||||||||
|
|
|
|
|
|
|
|
|
|||||||||||||||||||||
| Income (loss) from investment operations: |
||||||||||||||||||||||||||||
| Net investment income (loss) |
0.21 | (0.05 | ) | 0.02 | - | |||||||||||||||||||||||
| Net gains on investments (both realized and unrealized) |
1.53 | 0.74 | 2.69 | - | ||||||||||||||||||||||||
|
|
|
|
|
|
|
|
|
|||||||||||||||||||||
| Total income (loss) from investment operations |
1.74 | 0.69 | 2.71 | - | ||||||||||||||||||||||||
|
|
|
|
|
|
|
|
|
|||||||||||||||||||||
| Less distributions: |
||||||||||||||||||||||||||||
| Dividends from net investment income |
(0.97 | ) | (0.03 | ) | (0.02 | ) | - | |||||||||||||||||||||
| Distributions from net realized gains |
(1.35 | ) | (0.07 | ) | (0.53 | ) | - | |||||||||||||||||||||
|
|
|
|
|
|
|
|
|
|||||||||||||||||||||
| Total distributions |
(2.32 | ) | (0.10 | ) | (0.55 | ) | - | |||||||||||||||||||||
|
|
|
|
|
|
|
|
|
|||||||||||||||||||||
| Net asset value, end of period |
$ | 12.17 | $ | 12.75 | $ | 12.16 | $ | 10.00 | ||||||||||||||||||||
|
|
|
|
|
|
|
|
|
|||||||||||||||||||||
| Total returnC |
13.69 | % | 5.68 | % | 27.06 | % | - | % | ||||||||||||||||||||
|
|
|
|
|
|
|
|
|
|||||||||||||||||||||
| Ratios and supplemental data: |
||||||||||||||||||||||||||||
| Net assets, end of period |
$ | 116,339,052 | $ | 95,337,373 | $ | 12,692,260 | $ | 24,800,000 | ||||||||||||||||||||
| Ratios to average net assets: |
||||||||||||||||||||||||||||
| Expenses, before reimbursements and/or recoupments |
1.05 | % | 1.08 | % | 1.59 | % | 89.10 | %D | ||||||||||||||||||||
| Expenses, net of reimbursements and/or recoupments |
1.04 | % | 1.04 | % | 1.04 | % | 0.00 | %E | ||||||||||||||||||||
| Net investment income (loss), before expense reimbursements and/or recoupments |
0.62 | % | (0.97 | )% | (0.44 | )% | (89.10 | )%D | ||||||||||||||||||||
| Net investment income (loss), net of reimbursements and/or recoupments |
0.63 | % | (0.93 | )% | 0.11 | % | 0.00 | % | ||||||||||||||||||||
| Portfolio turnover rate |
195 | % | 197 | % | 77 | % | - | % | ||||||||||||||||||||
| A | Prior to February 28, 2020, the R5 Class was known as Institutional Class. |
| B | Commenced operations on December 31, 2018. |
| C | Based on net asset value, which does not reflect the sales charge, redemption fee, or contingent deferred sales charge, if applicable. May include adjustments in accordance with U.S. GAAP and as such, the net asset value for reporting purposes and the returns based upon those net asset values may differ from the net asset value and returns for shareholder transactions. |
| D | Annualized. |
| E | The Manager agreed to voluntarily waive expenses as of 12/31/18, despite expense caps being in place, due to the one day of operations on the Fund. |
94
American Beacon AHL TargetRisk FundSM
Financial Highlights
(For a share outstanding throughout the period)
| Y Class | ||||||||||||||||||||||||||||
| Year Ended December 31, | ||||||||||||||||||||||||||||
| 2021 | 2020 | 2019 | 2018A | |||||||||||||||||||||||||
|
|
|
|||||||||||||||||||||||||||
| Net asset value, beginning of period |
$ | 12.74 | $ | 12.16 | $ | 10.00 | $ | 10.00 | ||||||||||||||||||||
|
|
|
|
|
|
|
|
|
|||||||||||||||||||||
| Income (loss) from investment operations: |
||||||||||||||||||||||||||||
| Net investment income (loss) |
0.28 | (0.05 | ) | (0.02 | ) | - | ||||||||||||||||||||||
| Net gains on investments (both realized and unrealized) |
1.46 | 0.73 | 2.73 | - | ||||||||||||||||||||||||
|
|
|
|
|
|
|
|
|
|||||||||||||||||||||
| Total income (loss) from investment operations |
1.74 | 0.68 | 2.71 | - | ||||||||||||||||||||||||
|
|
|
|
|
|
|
|
|
|||||||||||||||||||||
| Less distributions: |
||||||||||||||||||||||||||||
| Dividends from net investment income |
(0.97 | ) | (0.03 | ) | (0.02 | ) | - | |||||||||||||||||||||
| Distributions from net realized gains |
(1.35 | ) | (0.07 | ) | (0.53 | ) | - | |||||||||||||||||||||
|
|
|
|
|
|
|
|
|
|||||||||||||||||||||
| Total distributions |
(2.32 | ) | (0.10 | ) | (0.55 | ) | - | |||||||||||||||||||||
|
|
|
|
|
|
|
|
|
|||||||||||||||||||||
| Net asset value, end of period |
$ | 12.16 | $ | 12.74 | $ | 12.16 | $ | 10.00 | ||||||||||||||||||||
|
|
|
|
|
|
|
|
|
|||||||||||||||||||||
| Total returnB |
13.66% | 5.55% | 27.06% | -% | ||||||||||||||||||||||||
|
|
|
|
|
|
|
|
|
|||||||||||||||||||||
| Ratios and supplemental data: |
||||||||||||||||||||||||||||
| Net assets, end of period |
$ | 756,225,072 | $ | 665,119,502 | $ | 118,366,001 | $ | 100,000 | ||||||||||||||||||||
| Ratios to average net assets: |
||||||||||||||||||||||||||||
| Expenses, before reimbursements and/or recoupments |
1.07% | 1.13% | 1.62% | 241.64% | C | |||||||||||||||||||||||
| Expenses, net of reimbursements and/or recoupments |
1.07% | 1.11% | 1.14% | 0.00% | D | |||||||||||||||||||||||
| Net investment income (loss), before expense reimbursements and/or recoupments |
0.58% | (1.18 | )% | (1.13 | )% | (241.64 | )%C | |||||||||||||||||||||
| Net investment income (loss), net of reimbursements and/or recoupments |
0.58% | (1.16 | )% | (0.65 | )% | 0.00% | ||||||||||||||||||||||
| Portfolio turnover rate |
195% | 197% | 77% | -% | ||||||||||||||||||||||||
| A | Commenced operations on December 31, 2018. |
| B | Based on net asset value, which does not reflect the sales charge, redemption fee, or contingent deferred sales charge, if applicable. May include adjustments in accordance with U.S. GAAP and as such, the net asset value for reporting purposes and the returns based upon those net asset values may differ from the net asset value and returns for shareholder transactions. |
| C | Annualized. |
| D | The Manager agreed to voluntarily waive expenses as of 12/31/18, despite expense caps being in place, due to the one day of operations on the Fund. |
95
American Beacon AHL TargetRisk FundSM
Financial Highlights
(For a share outstanding throughout the period)
| Investor Class | ||||||||||||||||||||||||||||
| Year Ended December 31, | ||||||||||||||||||||||||||||
| 2021 | 2020 | 2019 | 2018A | |||||||||||||||||||||||||
|
|
|
|||||||||||||||||||||||||||
| Net asset value, beginning of period |
$ | 12.70 | $ | 12.14 | $ | 10.00 | $ | 10.00 | ||||||||||||||||||||
|
|
|
|
|
|
|
|
|
|||||||||||||||||||||
| Income (loss) from investment operations: |
||||||||||||||||||||||||||||
| Net investment income (loss) |
0.21 | (0.13 | ) | (0.07 | ) | - | ||||||||||||||||||||||
| Net gains on investments (both realized and unrealized) |
1.47 | 0.76 | 2.76 | - | ||||||||||||||||||||||||
|
|
|
|
|
|
|
|
|
|||||||||||||||||||||
| Total income (loss) from investment operations |
1.68 | 0.63 | 2.69 | - | ||||||||||||||||||||||||
|
|
|
|
|
|
|
|
|
|||||||||||||||||||||
| Less distributions: |
||||||||||||||||||||||||||||
| Dividends from net investment income |
(0.92 | ) | - | (0.02 | ) | - | ||||||||||||||||||||||
| Distributions from net realized gains |
(1.35 | ) | (0.07 | ) | (0.53 | ) | - | |||||||||||||||||||||
|
|
|
|
|
|
|
|
|
|||||||||||||||||||||
| Total distributions |
(2.27 | ) | (0.07 | ) | (0.55 | ) | - | |||||||||||||||||||||
|
|
|
|
|
|
|
|
|
|||||||||||||||||||||
| Net asset value, end of period |
12.11 | $ | 12.70 | $ | 12.14 | $ | 10.00 | |||||||||||||||||||||
|
|
|
|
|
|
|
|
|
|||||||||||||||||||||
| Total returnB |
13.24 | % | 5.18 | % | 26.85 | % | - | % | ||||||||||||||||||||
|
|
|
|
|
|
|
|
|
|||||||||||||||||||||
| Ratios and supplemental data: |
| |||||||||||||||||||||||||||
| Net assets, end of period |
$ | 18,344,072 | $ | 16,012,197 | $ | 8,469,551 | $ | 100,010 | ||||||||||||||||||||
| Ratios to average net assets: |
||||||||||||||||||||||||||||
| Expenses, before reimbursements and/or recoupments |
1.42 | % | 1.45 | % | 1.93 | % | 241.89 | %C | ||||||||||||||||||||
| Expenses, net of reimbursements and/or recoupments |
1.42 | % | 1.42 | % | 1.42 | % | 0.00 | %D | ||||||||||||||||||||
| Net investment income (loss), before expense reimbursements and/or recoupments |
0.29 | % | (1.70 | )% | (1.49 | )% | (241.89 | )%C | ||||||||||||||||||||
| Net investment income (loss), net of reimbursements and/or recoupments |
0.29 | % | (1.67 | )% | (0.98 | )% | 0.00 | % | ||||||||||||||||||||
| Portfolio turnover rate |
195 | % | 197 | % | 77 | % | - | % | ||||||||||||||||||||
| A | Commenced operations on December 31, 2018. |
| B | Based on net asset value, which does not reflect the sales charge, redemption fee, or contingent deferred sales charge, if applicable. May include adjustments in accordance with U.S. GAAP and as such, the net asset value for reporting purposes and the returns based upon those net asset values may differ from the net asset value and returns for shareholder transactions. |
| C | Annualized. |
| D | The Manager agreed to voluntarily waive expenses as of 12/31/18, despite expense caps being in place, due to the one day of operations on the Fund. |
See accompanying notes
96
American Beacon AHL TargetRisk FundSM
Financial Highlights
(For a share outstanding throughout the period)
| A Class | ||||||||||||||||||||
| Year Ended December 31, | ||||||||||||||||||||
| 2021 | 2020 | 2019A | ||||||||||||||||||
|
|
|
|||||||||||||||||||
| Net asset value, beginning of period |
$ | 12.68 | $ | 12.12 | $ | 11.32 | ||||||||||||||
|
|
|
|
|
|
|
|||||||||||||||
| Income (loss) from investment operations: |
||||||||||||||||||||
| Net investment income (loss) |
0.25 | (0.10 | ) | (0.03 | ) | |||||||||||||||
| Net gains on investments (both realized and unrealized) |
1.45 | 0.73 | 1.38 | |||||||||||||||||
|
|
|
|
|
|
|
|||||||||||||||
| Total income (loss) from investment operations |
1.70 | 0.63 | 1.35 | |||||||||||||||||
|
|
|
|
|
|
|
|||||||||||||||
| Less distributions: |
||||||||||||||||||||
| Dividends from net investment income |
(0.95 | ) | (0.00 | )B | (0.02 | ) | ||||||||||||||
| Distributions from net realized gains |
(1.35 | ) | (0.07 | ) | (0.53 | ) | ||||||||||||||
|
|
|
|
|
|
|
|||||||||||||||
| Total distributions |
(2.30 | ) | (0.07 | ) | (0.55 | ) | ||||||||||||||
|
|
|
|
|
|
|
|||||||||||||||
| Net asset value, end of period |
$ | 12.08 | $ | 12.68 | $ | 12.12 | ||||||||||||||
|
|
|
|
|
|
|
|||||||||||||||
| Total returnC |
13.38 | % | 5.19 | % | 11.89 | %D | ||||||||||||||
|
|
|
|
|
|
|
|||||||||||||||
| Ratios and supplemental data: |
| |||||||||||||||||||
| Net assets, end of period |
$ | 5,381,597 | $ | 4,007,021 | $ | 1,469,217 | ||||||||||||||
| Ratios to average net assets: |
||||||||||||||||||||
| Expenses, before reimbursements and/or recoupments |
1.30 | % | 1.45 | % | 2.33 | %E | ||||||||||||||
| Expenses, net of reimbursements and/or recoupments |
1.30 | % | 1.44 | % | 1.44 | %E | ||||||||||||||
| Net investment income (loss), before expense reimbursements and/or recoupments |
1.06 | % | (1.57 | )% | (1.73 | )%E | ||||||||||||||
| Net investment income (loss), net of reimbursements and/or recoupments |
1.06 | % | (1.56 | )% | (0.84 | )%E | ||||||||||||||
| Portfolio turnover rate |
195 | % | 197 | % | 77 | %D | ||||||||||||||
| A | Commenced operations on April 30, 2019. |
| B | Amount represents less than $0.01 per share. |
| C | Based on net asset value, which does not reflect the sales charge, redemption fee, or contingent deferred sales charge, if applicable. May include adjustments in accordance with U.S. GAAP and as such, the net asset value for reporting purposes and the returns based upon those net asset values may differ from the net asset value and returns for shareholder transactions. |
| D | Not annualized. |
| E | Annualized. |
See accompanying notes
97
American Beacon AHL TargetRisk FundSM
Financial Highlights
(For a share outstanding throughout the period)
| C Class | ||||||||||||||||||||
| Year Ended December 31, | ||||||||||||||||||||
| 2021 | 2020 | 2019A | ||||||||||||||||||
|
|
|
|||||||||||||||||||
| Net asset value, beginning of period |
$ | 12.55 | $ | 12.09 | $ | 11.32 | ||||||||||||||
|
|
|
|
|
|
|
|||||||||||||||
| Income (loss) from investment operations: |
||||||||||||||||||||
| Net investment (loss) |
(0.02 | )B | (0.17 | ) | (0.06 | ) | ||||||||||||||
| Net gains on investments (both realized and unrealized) |
1.59 | 0.70 | 1.36 | |||||||||||||||||
|
|
|
|
|
|
|
|||||||||||||||
| Total income (loss) from investment operations |
1.57 | 0.53 | 1.30 | |||||||||||||||||
|
|
|
|
|
|
|
|||||||||||||||
| Less distributions: |
||||||||||||||||||||
| Dividends from net investment income |
(0.85 | ) | - | - | ||||||||||||||||
| Distributions from net realized gains |
(1.35 | ) | (0.07 | ) | (0.53 | ) | ||||||||||||||
|
|
|
|
|
|
|
|||||||||||||||
| Total distributions |
(2.20 | ) | (0.07 | ) | (0.53 | ) | ||||||||||||||
|
|
|
|
|
|
|
|||||||||||||||
| Net asset value, end of period |
$ | 11.92 | $ | 12.55 | $ | 12.09 | ||||||||||||||
|
|
|
|
|
|
|
|||||||||||||||
| Total returnC |
12.51 | % | 4.37 | % | 11.42 | %D | ||||||||||||||
|
|
|
|
|
|
|
|||||||||||||||
| Ratios and supplemental data: |
| |||||||||||||||||||
| Net assets, end of period |
$ | 20,623,659 | $ | 14,969,947 | $ | 5,702,552 | ||||||||||||||
| Ratios to average net assets: |
||||||||||||||||||||
| Expenses, before reimbursements and/or recoupments |
2.06 | % | 2.20 | % | 2.76 | %E | ||||||||||||||
| Expenses, net of reimbursements and/or recoupments |
2.06 | % | 2.19 | % | 2.19 | %E | ||||||||||||||
| Net investment (loss), before expense reimbursements and/or recoupments |
(0.15 | )% | (2.34 | )% | (2.28 | )%E | ||||||||||||||
| Net investment (loss), net of reimbursements and/or recoupments |
(0.15 | )% | (2.33 | )% | (1.71 | )%E | ||||||||||||||
| Portfolio turnover rate |
195 | % | 197 | % | 77 | %D | ||||||||||||||
| A | Commenced operations on April 30, 2019. |
| B | Per share amounts have been calculated using the average shares method. |
| C | Based on net asset value, which does not reflect the sales charge, redemption fee, or contingent deferred sales charge, if applicable. May include adjustments in accordance with U.S. GAAP and as such, the net asset value for reporting purposes and the returns based upon those net asset values may differ from the net asset value and returns for shareholder transactions. |
| D | Not annualized. |
| E | Annualized. |
See accompanying notes
98
American Beacon AHL TargetRisk Core FundSM
Financial Highlights
(For a share outstanding throughout the period)
| Y Class | ||||||||||||
| Year Ended December 31, 2021 |
December 16, 2020A to December 31, 2020 |
|||||||||||
|
|
|
|||||||||||
| Net asset value, beginning of period |
$ | 10.05 | $ | 10.00 | ||||||||
|
|
|
|
|
|||||||||
| Income (loss) from investment operations: |
||||||||||||
| Net investment (loss) |
(0.11 | ) | (0.00 | )B | ||||||||
| Net gains on investments (both realized and unrealized) |
0.79 | 0.05 | ||||||||||
|
|
|
|
|
|||||||||
| Total income from investment operations |
0.68 | 0.05 | ||||||||||
|
|
|
|
|
|||||||||
| Less distributions: |
||||||||||||
| Distributions from net realized gains |
(0.59 | ) | – | |||||||||
|
|
|
|
|
|||||||||
| Total distributions |
(0.59 | ) | – | |||||||||
|
|
|
|
|
|||||||||
| Net asset value, end of period |
$ | 10.14 | $ | 10.05 | ||||||||
|
|
|
|
|
|||||||||
| Total returnC |
6.75 | % | 0.50 | %D | ||||||||
|
|
|
|
|
|||||||||
| Ratios and supplemental data: |
| |||||||||||
| Net assets, end of period |
$ | 103,053 | $ | 100,456 | ||||||||
| Ratios to average net assets: |
||||||||||||
| Expenses, before reimbursements and/or recoupmentsF |
4.91 | % | 19.25 | %E | ||||||||
| Expenses, net of reimbursements and/or recoupments |
1.09 | % | 1.09 | % E | ||||||||
| Net investment (loss), before expense reimbursements and/or recoupmentsF |
(4.89 | )% | (19.22 | )%E | ||||||||
| Net investment (loss), net of reimbursements and/or recoupments |
(1.07 | )% | (1.06 | )% E | ||||||||
| Portfolio turnover rateG |
- | % | - | % | ||||||||
| A | Commencement of operations. |
| B | Amount is less than $0.01 per share. |
| C | Based on net asset value, which does not reflect the sales charge, redemption fee, or contingent deferred sales charge, if applicable. May include adjustments in accordance with U.S. GAAP and as such, the net asset value for reporting purposes and the returns based upon those net asset values may differ from the net asset value and returns for shareholder transactions. |
| D | Not annualized. |
| E | Annualized. |
| F | Includes non-recurring organization and offering costs. |
| G | Portfolio turnover is based on the lesser of long-term purchases or sales divided by the average long-term fair value during the period. The Fund did not invest in any long-term securities during the reporting period. |
See accompanying notes
99
American Beacon AHL TargetRisk Core FundSM
Financial Highlights
(For a share outstanding throughout the period)
| A Class | ||||||||||||
| December 31, |
December 16, 2020A to December 31, 2020 |
|||||||||||
|
|
|
|||||||||||
| Net asset value, beginning of period |
$ | 10.04 | $ | 10.00 | ||||||||
|
|
|
|
|
|||||||||
| Income (loss) from investment operations: |
||||||||||||
| Net investment (loss) |
(0.13 | ) | (0.01 | ) | ||||||||
| Net gains on investments (both realized and unrealized) |
0.78 | 0.05 | ||||||||||
|
|
|
|
|
|||||||||
| Total income from investment operations |
0.65 | 0.04 | ||||||||||
|
|
|
|
|
|||||||||
| Less distributions: |
||||||||||||
| Distributions from net realized gains |
(0.59 | ) | – | |||||||||
|
|
|
|
|
|||||||||
| Total distributions |
(0.59 | ) | - | |||||||||
|
|
|
|
|
|||||||||
| Net asset value, end of period |
$ | 10.10 | $ | 10.04 | ||||||||
|
|
|
|
|
|||||||||
| Total returnB |
6.46 | % | 0.40 | %C | ||||||||
|
|
|
|
|
|||||||||
| Ratios and supplemental data: |
| |||||||||||
| Net assets, end of period |
$ | 106,920 | $ | 100,443 | ||||||||
| Ratios to average net assets: |
||||||||||||
| Expenses, before reimbursements and/or recoupmentsE |
5.16 | % | 19.65 | %D | ||||||||
| Expenses, net of reimbursements and/or recoupments |
1.39 | % | 1.39 | % D | ||||||||
| Net investment (loss), before expense reimbursements and/or recoupmentsE |
(5.14 | )% | (19.62 | )%D | ||||||||
| Net investment (loss), net of reimbursements and/or recoupments |
(1.37 | )% | (1.36 | )% D | ||||||||
| Portfolio turnover rateF |
- | % | - | % | ||||||||
| A | Commencement of operations. |
| B | Based on net asset value, which does not reflect the sales charge, redemption fee, or contingent deferred sales charge, if applicable. May include adjustments in accordance with U.S. GAAP and as such, the net asset value for reporting purposes and the returns based upon those net asset values may differ from the net asset value and returns for shareholder transactions. |
| C | Not annualized. |
| D | Annualized. |
| E | Includes non-recurring organization and offering costs. |
| F | Portfolio turnover is based on the lesser of long-term purchases or sales divided by the average long-term fair value during the period. The Fund did not invest in any long-term securities during the reporting period. |
See accompanying notes
100
American Beacon AHL TargetRisk Core FundSM
Financial Highlights
(For a share outstanding throughout the period)
| C Class | ||||||||||||
| Year Ended December 31, 2021 |
December 16, 2020A to December 31, 2020 |
|||||||||||
|
|
|
|||||||||||
| Net asset value, beginning of period |
$ | 10.04 | $ | 10.00 | ||||||||
|
|
|
|
|
|||||||||
| Income (loss) from investment operations: |
||||||||||||
| Net investment (loss) |
(0.21 | ) | (0.01 | ) | ||||||||
| Net gains on investments (both realized and unrealized) |
0.78 | 0.05 | ||||||||||
|
|
|
|
|
|||||||||
| Total income from investment operations |
0.57 | 0.04 | ||||||||||
|
|
|
|
|
|||||||||
| Less distributions: |
||||||||||||
| Distributions from net realized gains |
(0.59 | ) | - | |||||||||
|
|
|
|
|
|||||||||
| Total distributions |
(0.59 | ) | - | |||||||||
|
|
|
|
|
|||||||||
| Net asset value, end of period |
$ | 10.02 | $ | 10.04 | ||||||||
|
|
|
|
|
|||||||||
| Total returnB |
5.66 | % | 0.40 | %C | ||||||||
|
|
|
|
|
|||||||||
| Ratios and supplemental data: |
| |||||||||||
| Net assets, end of period |
$ | 101,889 | $ | 100,413 | ||||||||
| Ratios to average net assets: |
||||||||||||
| Expenses, before reimbursements and/or recoupmentsE |
5.96 | % | 20.40 | %D | ||||||||
| Expenses, net of reimbursements and/or recoupments |
2.14 | % | 2.14 | %D | ||||||||
| Net investment (loss), before expense reimbursements and/or recoupmentsE |
(5.94 | )% | (20.37 | )%D | ||||||||
| Net investment (loss), net of reimbursements and/or recoupments |
(2.12 | )% | (2.11 | )%D | ||||||||
| Portfolio turnover rateF |
- | % | - | % | ||||||||
| A | Commencement of operations. |
| B | Based on net asset value, which does not reflect the sales charge, redemption fee, or contingent deferred sales charge, if applicable. May include adjustments in accordance with U.S. GAAP and as such, the net asset value for reporting purposes and the returns based upon those net asset values may differ from the net asset value and returns for shareholder transactions. |
| C | Not annualized. |
| D | Annualized. |
| E | Includes non-recurring organization and offering costs. |
| F | Portfolio turnover is based on the lesser of long-term purchases or sales divided by the average long-term fair value during the period. The Fund did not invest in any long-term securities during the reporting period. |
See accompanying notes
101
American Beacon AHL TargetRisk Core FundSM
Financial Highlights
(For a share outstanding throughout the period)
| R6 Class | ||||||||||||
| Year Ended December 31, 2021 |
December 16, 2020A to December 31, 2020 |
|||||||||||
|
|
|
|||||||||||
| Net asset value, beginning of period |
$ | 10.05 | $ | 10.00 | ||||||||
|
|
|
|
|
|||||||||
| Income from investment operations: |
||||||||||||
| Net investment (loss) |
(0.10 | ) | (0.00 | )B | ||||||||
| Net gains on investments (both realized and unrealized) |
0.79 | 0.05 | ||||||||||
|
|
|
|
|
|||||||||
| Total income from investment operations |
0.69 | 0.05 | ||||||||||
|
|
|
|
|
|||||||||
| Less distributions: |
||||||||||||
| Distributions from net realized gains |
(0.59 | ) | - | |||||||||
|
|
|
|
|
|||||||||
| Total distributions |
(0.59 | ) | - | |||||||||
|
|
|
|
|
|||||||||
| Net asset value, end of period |
$ | 10.15 | $ | 10.05 | ||||||||
|
|
|
|
|
|||||||||
| Total returnC |
6.85 | % | 0.50 | %D | ||||||||
|
|
|
|
|
|||||||||
| Ratios and supplemental data: |
| |||||||||||
| Net assets, end of period |
$ | 10,217,056 | $ | 9,744,619 | ||||||||
| Ratios to average net assets: |
||||||||||||
| Expenses, before reimbursements and/or recoupmentsF |
3.60 | % | 14.61 | %E | ||||||||
| Expenses, net of reimbursements and/or recoupments |
0.99 | % | 0.99 | %E | ||||||||
| Net investment (loss), before expense reimbursements and/or recoupmentsF |
(3.58 | )% | (14.58 | )%E | ||||||||
| Net investment (loss), net of reimbursements and/or recoupments |
(0.97 | )% | (0.96 | )%E | ||||||||
| Portfolio turnover rateG |
- | % | - | % | ||||||||
| A | Commencement of operations. |
| B | Amount represents less than $0.01 per share. |
| C | Based on net asset value, which does not reflect the sales charge, redemption fee, or contingent deferred sales charge, if applicable. May include adjustments in accordance with U.S. GAAP and as such, the net asset value for reporting purposes and the returns based upon those net asset values may differ from the net asset value and returns for shareholder transactions. |
| D | Not annualized. |
| E | Annualized. |
| F | Includes non-recurring organization and offering costs. |
| G | Portfolio turnover is based on the lesser of long-term purchases or sales divided by the average long-term fair value during the period. The Fund did not invest in any long-term securities during the reporting period. |
See accompanying notes
102
American Beacon FundsSM
Affirmation of the Commodity Pool Operator
December 31, 2021 (Unaudited)
To the best of my knowledge and belief, the information contained in the attached financial statements for the American Beacon AHL Managed Futures Strategy Fund, American Beacon AHL TargetRisk Fund and American Beacon AHL TargetRisk Core Fund for the period from January 1, 2021 to December 31, 2021, is accurate and complete.

Sonia L. Bates, Treasurer
American Beacon Advisors, Inc.
Commodity Pool Operator for the
American Beacon AHL Managed Futures Strategy Fund,
American Beacon AHL TargetRisk Fund and
American Beacon AHL TargetRisk Core Fund
103
American Beacon FundsSM
December 31, 2021 (Unaudited)
Certain tax information regarding the Funds is required to be provided to shareholders based upon the Funds’ income and distributions for the taxable year ended December 31, 2021. The information and distributions reported herein may differ from information and distributions taxable to the shareholders for the calendar year ended December 31, 2021.
The Funds designated the following items with regard to distributions paid during the fiscal year ended December 31, 2021. All designations are based on financial information available as of this annual report and, accordingly, are subject to change. For each item, it is the intention of the Funds to designate the maximum amount permitted under the Internal Revenue Code of 1986, as amended, and the regulations there under.
Corporate Dividends-Received Deduction:
| AHL Managed Futures Strategy |
0.00 | % | ||
| AHL TargetRisk |
0.00 | % | ||
| AHL TargetRisk Core |
0.00 | % |
Qualified Dividend Income:
| AHL Managed Futures Strategy |
0.00 | % | ||
| AHL TargetRisk |
0.00 | % | ||
| AHL TargetRisk Core |
0.00 | % |
Long-Term Capital Gain Distributions:
| AHL Managed Futures Strategy |
$ | 28,262,785 | ||
| AHL TargetRisk |
22,380,667 | |||
| AHL TargetRisk Core |
170,925 |
Short-Term Capital Gain Distributions:
| AHL Managed Futures Strategy |
$ | 30,143,103 | ||
| AHL TargetRisk |
61,442,374 | |||
| AHL TargetRisk Core |
416,175 |
Shareholders received notification in January 2022 of the applicable tax information necessary to prepare their 2021 income tax returns.
104
Trustees and Officers of the American Beacon FundsSM (Unaudited)
The Trustees and officers of the American Beacon Funds (the “Trust”) are listed below, together with their principal occupations during the past five years. The address of each person listed below is 220 Las Colinas Boulevard East, Suite 1200, Irving, Texas 75039. Each Trustee oversees thirty funds in the fund complex that includes the Trust, the American Beacon Select Funds, and the American Beacon Institutional Funds Trust. The Trust’s Statement of Additional Information contains additional information about the Trustees and is available without charge by calling 1-800-658-5811.
| Name, Age |
Position, Term of Office and Length of Time Served with the Trust |
Principal Occupation(s) During Past 5 Years and Current Directorships | ||
| INTERESTED TRUSTEES | Term |
|||
| Lifetime of Trust until removal, resignation or retirement* | ||||
| Eugene J. Duffy (67)** | Trustee since 2008 | Managing Director, Global Investment Management Distribution, Mesirow Financial Administrative Corporation (2016-Present); Managing Director, Institutional Services, Intercontinental Real Estate Corporation (2014-2016); Trustee, American Beacon Select Funds (2008-Present); Trustee, American Beacon Institutional Funds Trust (2017-Present); Trustee, American Beacon Sound Point Enhanced Income Fund (2018–2021); Trustee, American Beacon Apollo Total Return Fund (2018–2021). | ||
| NON-INTERESTED TRUSTEES | Term |
|||
| Lifetime of Trust until removal, resignation or retirement* | ||||
| Gilbert G. Alvarado (52) | Trustee since 2015 | President, SJVIIF, LLC, Impact Investment Fund (2018-Present); Director, Kura MD, Inc. (local telehealth organization) (2015-2017); Senior Vice President & CFO, Sierra Health Foundation (health conversion private foundation) (2006-Present); Senior Vice President & CFO, Sierra Health Foundation: Center for Health Program Management (California public benefit corporation) (2012-Present); Director, Innovative North State (2012-2015); Director, Sacramento Regional Technology Alliance (2011-2016); Director, Valley Healthcare Staffing (2017–2018); Trustee, American Beacon Select Funds (2015-Present); Trustee, American Beacon Institutional Funds Trust (2017-Present); Trustee, American Beacon Sound Point Enhanced Income Fund (2018–2021); Trustee, American Beacon Apollo Total Return Fund (2018–2021). | ||
| Joseph B. Armes (59) | Trustee since 2015 | Director, Switchback Energy Acquisition (2019-2021); Chairman & CEO, CSW Industrials f/k/a Capital Southwest Corporation (investment company) (2015-Present); Chairman of the Board of Capital Southwest Corporation, predecessor to CSW Industrials, Inc. (2014-2017) (investment company); President & CEO, JBA Investment Partners (family investment vehicle) (2010-Present); Director and Chair of Audit Committee, RSP Permian (oil and gas producer) (2013-2018); Trustee, American Beacon Select Funds (2015-Present); Trustee, American Beacon Institutional Funds Trust (2017-Present); Trustee, American Beacon Sound Point Enhanced Income Fund (2018–2021); Trustee, American Beacon Apollo Total Return Fund (2018–2021). | ||
| Gerard J. Arpey (63) | Trustee since 2012 | Partner, Emerald Creek Group (private equity firm) (2011-Present); Director, S.C. Johnson & Son, Inc. (privately held company) (2008-present); Director, The Home Depot, Inc. (2015-Present); Trustee, American Beacon Select Funds (2012-Present); Trustee, American Beacon Institutional Funds Trust (2017-Present); Trustee, American Beacon Sound Point Enhanced Income Fund (2018–2021); Trustee, American Beacon Apollo Total Return Fund (2018–2021). | ||
105
Trustees and Officers of the American Beacon FundsSM (Unaudited)
| Name, Age |
Position, Term of Office and Length of Time Served with the Trust |
Principal Occupation(s) During Past 5 Years and Current Directorships | ||
| NON-INTERESTED TRUSTEES (CONT.) | Term |
|||
| Lifetime of Trust until removal, resignation or retirement* | ||||
| Brenda A. Cline (61) | Trustee since 2004 Chair since 2019 Vice Chair 2018 |
Chief Financial Officer, Treasurer and Secretary, Kimbell Art Foundation (1993-Present); Director, Tyler Technologies, Inc. (public sector software solutions company) (2014-Present); Director, Range Resources Corporation (oil and natural gas company) (2015-Present); Trustee, Cushing Closed-End and Open-End Funds (2017-Present); Trustee, American Beacon Select Funds (2004-Present); Trustee, American Beacon Institutional Funds Trust (2017-Present); Trustee, American Beacon Sound Point Enhanced Income Fund (2018–2021); Trustee, American Beacon Apollo Total Return Fund (2018–2021). | ||
| Claudia A. Holz (64) | Trustee since 2018 | Partner, KPMG LLP (1990 – 2017); Independent Director, Blue Owl Capital Inc. (2021-Present); Trustee, American Beacon Select Funds (2018-Present); Trustee, American Beacon Institutional Funds Trust (2018-Present); Trustee, American Beacon Sound Point Enhanced Income Fund (2018–2021); Trustee, American Beacon Apollo Total Return Fund (2018–2021). | ||
| Douglas A. Lindgren (60) | Trustee since 2018 | CEO North America, Carne Global Financial Services (2016-2017); Consultant, Carne Financial Services (2017-2019); Managing Director, IPS Investment Management and Global Head, Content Management, UBS Wealth Management (2010-2016); Trustee, American Beacon Select Funds (2018-Present); Trustee, American Beacon Institutional Funds Trust (2018-Present); Trustee, American Beacon Sound Point Enhanced Income Fund (2018–2021); Trustee, American Beacon Apollo Total Return Fund (2018–2021). | ||
| Barbara J. McKenna, CFA (58) | Trustee since 2012 | President/Managing Principal, Longfellow Investment Management Company (2005-Present); Trustee, American Beacon Select Funds (2012-Present); Trustee, American Beacon Institutional Funds Trust (2017-Present); Trustee, American Beacon Sound Point Enhanced Income Fund (2018–2021); Trustee, American Beacon Apollo Total Return Fund (2018–2021). | ||
106
Trustees and Officers of the American Beacon FundsSM (Unaudited)
| Name, Age |
Position, Term of Office and Length of Time Served with the Trust |
Principal Occupation(s) During Past 5 Years and Current Directorships | ||
| OFFICERS | Term |
|||
| One Year | ||||
| Gene L. Needles, Jr. (67) | President since 2009 | President (2009-2018), CEO and Director (2009–Present), and Chairman (2018-Present), American Beacon Advisors, Inc., President (2015-2018), Director and CEO (2015–Present), and Chairman (2018-Present), Resolute Investment Holdings, LLC; President (2015-2018), Director and CEO (2015-Present), and Chairman (2018-Present),Resolute Topco, Inc.; President (2015-2018); Director, and CEO (2015-Present), and Chairman (2018-Present), Resolute Acquisition, Inc.; President (2015-2018), Director and CEO (2015-Present), Chairman (2018-Present), Resolute Investment Managers, Inc.; Director, Chairman, President and CEO, Resolute Investment Distributors (2017-Present); Director, Chairman, President and CEO; Resolute Investment Services, Inc. (2017-Present); Manager, President and CEO, American Private Equity Management, LLC (2012-Present); Director, Chairman, President and CEO, Alpha Quant Advisors, LLC (2016-2020); Director, ARK Investment Management LLC (2016-2020); Director, Shapiro Capital Management LLC (2017-Present); Director, Chairman and CEO, Continuous Capital, LLC (2018-Present); Director, Green Harvest Asset Management (2019-2021); Director, National Investment Services of America, LLC (2019 – Present); Director, RSW Investments Holdings LLC, (2019-Present); Manager, SSI Investment Management, LLC (2019-Present); President, American Beacon Cayman Managed Futures Strategy Fund, Ltd. (2014-Present); Director and President, American Beacon Cayman Transformational Innovation Company, LTD., (2017-2018); President, American Beacon Delaware Transformational Innovation Corporation (2017-2018); President, American Beacon Cayman TargetRisk Company, Ltd. (2018-Present); Member, Investment Advisory Committee, Employees Retirement System of Texas (2017-Present); Trustee, American Beacon NextShares Trust (2015-2020); President, American Beacon Select Funds (2009-Present); President, American Beacon Institutional Funds Trust (2017-Present); President, American Beacon Sound Point Enhanced Income Fund (2018-2021); President, American Beacon Apollo Total Return Fund (2018-2021). | ||
| Rosemary K. Behan (62) | VP, Secretary and Chief Legal Officer since 2006 |
Senior Vice President (2021-Present), Vice President (2006-2021), Secretary and General Counsel (2006-Present), American Beacon Advisors, Inc.; Secretary, Resolute Investment Holdings, LLC (2015-Present); Secretary, Resolute Topco, Inc. (2015-Present); Secretary, Resolute Acquisition, Inc. (2015–Present); Senior Vice President (2021-Present), Vice President (2015-2021), Secretary and General Counsel (2015-Present), Resolute Investment Managers, Inc.; Secretary, Resolute Investment Distributors, Inc. (2017-Present); Senior Vice President (2021-Present), Vice President(2017-2021), Secretary and General Counsel (2017-Present), Resolute Investment Services, Inc.; Secretary, American Private Equity Management, LLC (2008-Present); Secretary and General Counsel, Alpha Quant Advisors, LLC (2016-2020); Vice President and Secretary, Continuous Capital, LLC (2018-Present); Secretary, Green Harvest Asset Management (2019-2021); Secretary, American Beacon Delaware Transformational Innovation Corporation (2017-2018); Secretary, American Beacon Cayman Transformational Innovation Company, Ltd. (2017-2018); Secretary, American Beacon Cayman Managed Futures Strategy Fund, Ltd. (2014-Present); Secretary, American Beacon Cayman TargetRisk Company, Ltd (2018-Present); Chief Legal Officer, Vice President and Secretary, American Beacon Select Funds (2006-Present); Chief Legal Officer, Vice President and Secretary, American Beacon Institutional Funds Trust (2017-Present); Chief Legal Officer, Vice President and Secretary, American Beacon Sound Point Enhanced Income Fund (2018-2021); Chief Legal Officer, Vice President and Secretary, American Beacon Apollo Total Return Fund (2018-2021). | ||
107
Trustees and Officers of the American Beacon FundsSM (Unaudited)
| Name, Age |
Position, Term of Office and Length of Time Served with the Trust |
Principal Occupation(s) During Past 5 Years and Current Directorships | ||
| OFFICERS (CONT.) | Term |
|||
| One Year | ||||
| Brian E. Brett (61) | VP since 2004 | Senior Vice President, Head of Distribution (2012-Present), American Beacon Advisors, Inc.; Senior Vice President, Resolute Investment Managers, Inc. (2017-Present); Senior Vice President, Resolute Investment Distributors, Inc. (2018-Present); Senior Vice President, Resolute Investment Services, Inc. (2018-Present); Vice President, American Beacon Select Funds (2004-Present); Vice President, American Beacon Institutional Funds Trust (2017-Present); Vice President, American Beacon Sound Point Enhanced Income Fund (2018-2021); Vice President, American Beacon Apollo Total Return Fund (2018-2021). | ||
| Paul B. Cavazos (52) | VP since 2016 | Chief Investment Officer and Senior Vice President, American Beacon Advisors, Inc. (2016-Present); Chief Investment Officer, DTE Energy (2007-2016); Vice President, American Private Equity Management, L.L.C. (2017–Present); Vice President, American Beacon Select Funds (2016-Present); Vice President, American Beacon Institutional Funds Trust (2017-Present); Vice President, American Beacon Sound Point Enhanced Income Fund (2018-2021); Vice President, American Beacon Apollo Total Return Fund (2018-2021). | ||
| Erica Duncan (51) | VP since 2011 | Vice President, American Beacon Advisors, Inc. (2011-Present); Vice President, Resolute Investment Managers (2018-Present); Vice President, Resolute Investment Services, Inc. (2018-Present); Vice President, American Beacon Select Funds (2011-Present); Vice President, American Beacon Institutional Funds Trust (2017-Present); Vice President, American Beacon Sound Point Enhanced Income Fund (2018-2021); Vice President, American Beacon Apollo Total Return Fund (2018-2021). | ||
| Melinda G. Heika (60) | VP since 2021 Principal Accounting Officer and Treasurer (2010-2021) |
Senior Vice President (2021-Present), Treasurer and CFO (2010-Present), American Beacon Advisors, Inc.; Treasurer, Resolute Topco, Inc. (2015-Present); Treasurer, Resolute Investment Holdings, LLC. (2015-Present); Treasurer, Resolute Acquisition, Inc. (2015-Present); Senior Vice President (2021-Present), Treasurer and CFO, Resolute Investment Managers, Inc. (2017-Present); Treasurer, Resolute Investment Distributors, Inc. (2017); Senior Vice President (2021-Present); Treasurer and CFO, Resolute Investment Services, Inc. (2015-Present); Treasurer, American Private Equity Management, LLC (2012-Present); Treasurer and CFO, Alpha Quant Advisors, LLC (2016-2020); Treasurer and CFO, Continuous Capital, LLC (2018-Present); Treasurer, American Beacon Cayman Transformational Innovation, Ltd. (2017-2018); Treasurer, American Beacon Delaware Transformational Innovation Corporation (2017-2018); Director and Treasurer, American Beacon Cayman Managed Futures Strategy Fund, Ltd. (2014-Present); Treasurer, American Beacon Cayman TargetRisk Company, Ltd. (2018-Present); Vice President (2021-Present), Principal Accounting Officer (2017-2021) and Treasurer (2010-2021), American Beacon Select Funds; Vice President (2021–Present), Principal Accounting Officer and Treasurer (2017-2021), American Beacon Institutional Funds Trust; Vice President (2021), Principal Accounting Officer and Treasurer (2018-2021), American Beacon Sound Point Enhanced Income Fund; Vice President (2021), Principal Accounting Officer and Treasurer, American Beacon Apollo Total Return Fund (2018-2021). | ||
108
Trustees and Officers of the American Beacon FundsSM (Unaudited)
| Name, Age |
Position, Term of Office and Length of Time Served with the Trust |
Principal Occupation(s) During Past 5 Years and Current Directorships | ||
| OFFICERS (CONT.) | Term |
|||
| One Year | ||||
| Terri L. McKinney (58) | VP since 2010 | Senior Vice President (2021-Present), Vice President (2009-2021), American Beacon Advisors, Inc.; Senior Vice President (2021–Present); Vice President (2017-2021), Resolute Investment Managers, Inc.; Senior Vice President (2021-Present), Vice President (2018-Present), Resolute Investment Services, Inc; Vice President, Alpha Quant Advisors, LLC (2016-2020); Vice President, Continuous Capital, LLC (2018-Present); Vice President, American Beacon Select Funds (2010-Present); Vice President, American Beacon Institutional Funds Trust (2017-Present); Vice President, American Beacon Sound Point Enhanced Income Fund (2018-2021); Vice President, American Beacon Apollo Total Return Fund (2018-2021). | ||
| Jeffrey K. Ringdahl (46) | VP since 2010 | Director (2015-Present), President (2018-Present), Chief Operating Officer (2010-Present), Senior Vice President (2013-2018), American Beacon Advisors, Inc.; Director (2015-Present), President (2018-Present), Senior Vice President (2015-2018), Resolute Investment Holdings, LLC; Director (2015-Present), President (2018-Present), Senior Vice President (2015-2018), Resolute Topco, Inc.; Director (2015-Present), President (2018-Present), Senior Vice President (2015-2018), Resolute Acquisition, Inc.; Director (2015-Present), President & COO (2018-Present), Senior Vice President (2015-2018), Resolute Investment Managers, Inc.; Director and Executive Vice President (2017-Present), Resolute Investment Distributors, Inc.; Director (2017-Present), President & COO (2018-Present), Executive Vice President (2017-2018), Resolute Investment Services, Inc.; Senior Vice President (2017-Present), Vice President (2012-2017), Manager (2015-Present), American Private Equity Management, LLC; Trustee, American Beacon NextShares Trust (2015-2020); Director, Executive Vice President & COO, Alpha Quant Advisors, LLC (2016-2020); Director, Shapiro Capital Management, LLC (2017-Present); Director, Executive Vice President & COO, Continuous Capital, LLC (2018- Present); Director, RSW Investments Holdings LLC, (2019-Present); Manager, SSI Investment Management, LLC (2019-Present); Director, National Investment Services of America, LLC (2019-Present); Director and Vice President, American Beacon Cayman Transformational Innovation Company, Ltd., (2017-Present); Vice President, American Beacon Delaware Transformational Innovation Corporation (2017-2018); Director and Vice President, American Beacon Cayman Managed Futures Strategy Fund, Ltd. (2014-Present); Vice President, American Beacon Cayman TargetRisk Company, Ltd (2018-Present); Vice President, American Beacon Select Funds (2010-2018); Vice President, American Beacon Institutional Funds Trust (2017-Present); Vice President, American Beacon Sound Point Enhanced Income Fund (2018-2021); Vice President, American Beacon Apollo Total Return Fund (2018-2021). | ||
| Samuel J. Silver (58) | VP since 2011 | Vice President (2011-Present), Chief Fixed Income Officer (2016-Present), American Beacon Advisors, Inc. (2011-Present); Vice President, American Beacon Select Funds (2011-Present); Vice President, American Beacon Institutional Funds Trust (2017-Present); Vice President, American Beacon Sound Point Enhanced Income Fund (2018-2021); Vice President, American Beacon Apollo Total Return Fund (2018-2021). | ||
109
Trustees and Officers of the American Beacon FundsSM (Unaudited)
| Name, Age |
Position, Term of Office and Length of Time Served with the Trust |
Principal Occupation(s) During Past 5 Years and Current Directorships | ||
| OFFICERS (CONT.) | Term |
|||
| One Year | ||||
| Christina E. Sears (50) | Chief Compliance Officer since 2004 and Asst. Secretary since 1999 |
Vice President, American Beacon Advisors, Inc. (2019-Present); Chief Compliance Officer, American Beacon Advisors, Inc. (2004-Present); Vice President, Resolute Investment Managers, Inc. (2017-Present); Vice President, Resolute Investment Distributors (2017-Present); Vice President, Resolute Investment Services, Inc. (2019-Present); Chief Compliance Officer, American Private Equity Management, LLC (2012-Present); Chief Compliance Officer, Green Harvest Asset Management, LLC (2019-2021); Chief Compliance Officer, RSW Investments Holdings, LLC (2019-Present); Chief Compliance Officer (2016-2019) and Vice President, Alpha Quant Advisors, LLC (2016-2020); Vice President, Continuous Capital, LLC (2018-Present); Chief Compliance Officer (2004-Present) and Assistant Secretary (1999-Present), American Beacon Select Funds; Chief Compliance Officer and Assistant Secretary, American Beacon Institutional Funds Trust (2017-Present); Chief Compliance Officer and Assistant Secretary, American Beacon Sound Point Enhanced Income Fund (2018-2021); Chief Compliance Officer and Assistant Secretary, American Beacon Apollo Total Return Fund (2018-2021). | ||
| Sonia L. Bates (65) | Principal Accounting Officer and Treasurer since 2021 Assistant Treasurer (2011-2021) |
Assistant Treasurer, American Beacon Advisors, Inc. (2011-2018); Assistant Treasurer, American Private Equity Management, LLC (2012-Present); Assistant Treasurer, American Beacon Cayman Transformational Innovation Company, Ltd. (2017-Present); Assistant Treasurer, American Beacon Cayman TargetRisk Company, Ltd. (2018-Present); Principal Accounting Officer and Treasurer (2021-Present), Assistant Treasurer (2011-2021), American Beacon Select Funds; Principal Accounting Officer and Treasurer (2021-Present), Assistant Treasurer (2017-2021), American Beacon Institutional Funds Trust; Principal Accounting Officer and Treasurer (2021), Assistant Treasurer (2018-2021), American Beacon Sound Point Enhanced Income Fund; Principal Accounting Officer and Treasurer (2021), Assistant Treasurer (2018-2021), American Beacon Apollo Total Return Fund. | ||
| Shelley L. Dyson (52) | Assistant Treasurer since 2021 | Assistant Treasurer, American Beacon Select Funds (2021-Present); Assistant Treasurer, American Beacon Institutional Funds Trust (2021-Present); Assistant Treasurer, American Beacon Sound Point Enhanced Income Fund (2021); Assistant Treasurer, American Beacon Apollo Total Return Fund (2021). | ||
| Shelley D. Abrahams (47) | Assistant Secretary since 2008 | Assistant Secretary, American Beacon Select Funds (2008-Present); Assistant Secretary, American Beacon Institutional Funds Trust (2017-Present); Assistant Secretary, American Beacon Sound Point Enhanced Income Fund (2018-2021); Assistant Secretary, American Beacon Apollo Total Return Fund (2018-2021). | ||
| Rebecca L. Harris (55) | Assistant Secretary since 2010 | Senior Vice President (2021-Present), Vice President (2011-Present), American Beacon Advisors, Inc.; Senior Vice President (2021-Present), Vice President (2017-Present), Resolute Investment Managers, Inc.; Senior Vice President (2021-Present), Vice President (2015-Present), Resolute Investment Services; Vice President, Alpha Quant Advisors, LLC (2016-2020); Vice President, Continuous Capital, LLC (2018-Present); Assistant Secretary, American Beacon Select Funds (2010-Present); Assistant Secretary, American Beacon Institutional Funds Trust (2017-Present); Assistant Secretary, American Beacon Sound Point Enhanced Income Fund (2018-2021); Assistant Secretary, American Beacon Apollo Total Return Fund (2018-2021). | ||
110
Trustees and Officers of the American Beacon FundsSM (Unaudited)
| Name, Age |
Position, Term of Office and Length of Time Served with the Trust |
Principal Occupation(s) During Past 5 Years and Current Directorships | ||
| OFFICERS (CONT.) | Term |
|||
| One Year | ||||
| Teresa A. Oxford (63) | Assistant Secretary since 2015 | Assistant Secretary, American Beacon Advisors, Inc. (2015-Present); Assistant Secretary, Resolute Investment Distributors (2018-2021); Assistant Secretary, Resolute Investment Managers, Inc. (2017-Present); Assistant Secretary, Resolute Investment Services (2018-Present); Assistant Secretary, Alpha Quant Advisors, LLC (2016-2020); Assistant Secretary, Continuous Capital, LLC (2020-Present); Assistant Secretary, American Beacon Select Funds (2015-Present); Assistant Secretary, American Beacon Institutional Funds Trust (2017-Present); Assistant Secretary, American Beacon Sound Point Enhanced Income Fund (2018-2021); Assistant Secretary, American Beacon Apollo Total Return Fund (2018-2021). | ||
| Michael D. Jiang (37) | Assistant Secretary since 2021 | Assistant Secretary (2021-Present), Resolute Investment Distributors, Inc.; Associate General Counsel (2021-Present), Resolute Investment Services, Inc.; Vice President (2018-2021), The Northern Trust Company; Second Vice President (2015-2018), The Northern Trust Company. Assistant Secretary, American Beacon Select Funds (2021-Present); Assistant Secretary, American Beacon Institutional Funds Trust (2021-Present); Assistant Secretary, American Beacon Sound Point Enhanced Income Fund (2021); Assistant Secretary, American Beacon Apollo Total Return Fund (2021). | ||
* As of 11/12/2014, the Board adopted a retirement plan that requires Trustees to retire no later than the last day of the calendar year in which they reach the age of 75.
** Mr. Duffy is being deemed to be an “interested person” of the Trust, as defined by the Investment Company Act of 1940, as amended, by virtue of his position with Mesirow Financial, Inc., a broker-dealer.
111
American Beacon FundsSM
December 31, 2021 (Unaudited)
The American Beacon Funds recognize and respect the privacy of our shareholders. We are providing this notice to you, so you will understand how shareholder information may be collected and used.
We may collect nonpublic personal information about you from one or more of the following sources:
| • | information we receive from you on applications or other forms; |
| • | information about your transactions with us or our service providers; and |
| • | information we receive from third parties. |
We do not disclose any nonpublic personal information about our customers or former customers to anyone, except as permitted by law.
We restrict access to your nonpublic personal information to those employees or service providers who need to know that information to provide products or services to you. To ensure the confidentiality of your nonpublic personal information, we maintain safeguards that comply with federal standards.
112

Shareholder reports are available online at www.americanbeaconfunds.com/reports. Please be advised that reports are no longer sent by mail. Instead, the reports are made available online, and you will be notified by mail each time a report is posted online. You will be provided with a website link to access the report. You may elect to receive all future reports in paper free of charge. You can request to continue receiving paper copies by calling 1-866-345-5954, or you may directly inform your financial intermediary. Detailed instructions are also included in your report notifications.
If you invest in the Fund through a financial institution, you may be able to receive the Fund’s regulatory mailings, such as the Prospectus, Annual Report and Semi-Annual Report, by e-mail. If you are interested in this option, please go to www.icsdelivery.com and search for your financial institution’s name or contact your financial institution directly.
To obtain more information about the Fund:

|

| |
| By E-mail: | On the Internet: | |
| american_beacon.funds@ambeacon.com | Visit our website at www.americanbeaconfunds.com | |
|
By Telephone: Call (800) 658-5811 |
By Mail: American Beacon Funds P.O. Box 219643 Kansas City, MO 64121-9643 | |
| Availability of Quarterly Portfolio Schedules | Availability of Proxy Voting Policy and Records | |
| In addition to the Schedule of Investments provided in each semi-annual and annual report, the Fund files a complete schedule of its portfolio holdings with the Securities and Exchange Commission (“SEC”) on Form N-PORT as of the end of each fiscal quarter. The Fund’s Forms N-PORT are available on the SEC’s website at www.sec.gov. The Forms N-PORT may also be reviewed and copied at the SEC’s Public Reference Section, 100 F Street, NE, Washington, D.C. 20549-2736. Information regarding the operation of the SEC’s Public Reference Room may be obtained by calling (800)-SEC-0330. A complete schedule of the Funds’ portfolio holdings is also available at www.americanbeaconfunds.com approximately sixty days after the end of each calendar quarter. | A description of the policies and procedures the Fund uses to determine how to vote proxies relating to portfolio securities is available in the Fund’s Statement of Additional Information, is available free of charge on the Fund’s website www.americanbeaconfunds.com and by calling 1-800-967-9009 or by accessing the SEC’s website at www.sec.gov. The Fund’s proxy voting record for the most recent year ended June 30 is filed annually with the SEC on Form N-PX. The Fund’s Forms N-PX are available on the SEC’s website at www.sec.gov. The Fund’s proxy voting record may also be obtained by calling 1-800-967-9009. | |


Fund Service Providers:
| CUSTODIAN State Street Bank and Trust Company Boston, Massachusetts |
TRANSFER AGENT DST Asset Managers Solutions, Inc. Quincy, Massachusetts |
INDEPENDENT REGISTERED PUBLIC ACCOUNTING FIRM Ernst & Young LLP Dallas, Texas |
DISTRIBUTOR Resolute Investment Distributors, Inc. Irving, Texas |
This report is prepared for shareholders of the American Beacon Funds and may be distributed to others only if preceded or accompanied by a current Prospectus or Summary Prospectus.
American Beacon Funds, American Beacon AHL Managed Futures Strategy Fund, American Beacon AHL TargetRisk Fund and American Beacon AHL TargetRisk Core Fund are service marks of American Beacon Advisors, Inc.
AR 12/21

About American Beacon Advisors
Since 1986, American Beacon Advisors, Inc. has offered a variety of products and investment advisory services to numerous institutional and retail clients, including a variety of mutual funds, corporate cash management, and separate account management.
Our clients include defined benefit plans, defined contribution plans, foundations, endowments, corporations, financial planners, and other institutional investors. With American Beacon Advisors, you can put the experience of a multi-billion dollar asset management firm to work for your company.
BAHL & GAYNOR SMALL CAP GROWTH FUND
Investing in small-capitalization stocks may involve greater volatility and lower liquidity than larger company stocks. Investing in foreign securities may involve heightened risk due to currency fluctuations and economic and political risks. Growth stocks typically are more volatile than value stocks; however, value stocks have a lower expected growth rate in earnings and sales. The use of futures contracts for cash management may subject the Fund to losing more money than invested. The Fund participates in a securities lending program. Please see the prospectus for a complete discussion of the Fund’s risks. There can be no assurances that the investment objectives of this Fund will be met.
Any opinions herein, including forecasts, reflect our judgment as of the end of the reporting period and are subject to change. Each advisor’s strategies and each Fund’s portfolio composition will change depending on economic and market conditions. This report is not a complete analysis of market conditions, and, therefore, should not be relied upon as investment advice. Although economic and market information has been compiled from reliable sources, American Beacon Advisors, Inc. makes no representation as to the completeness or accuracy of the statements contained herein.
| American Beacon Funds |
December 31, 2021 |
| 1 | ||||
| 2 | ||||
| 6 | ||||
| 8 | ||||
| Schedule of Investments: |
||||
| 9 | ||||
| 12 | ||||
| 15 | ||||
| Financial Highlights: |
||||
| 34 | ||||
| 39 | ||||
| 40 | ||||
| 47 | ||||
| Back Cover | ||||

|
Dear Shareholders,
As Warren E. Buffett, the “Oracle of Omaha” and billionaire chairman and CEO of Berkshire Hathaway, once said, “Someone’s sitting in the shade today because someone planted a tree a long time ago.”
That is to say, before we can enjoy the fruits of our labor, we must first devote our attention to the careful planning and cultivation of our estates. To achieve a strong yield requires time, diligence and patience – and there are no guarantees the seeds we plant today will thrive or result in a plentiful harvest. This can be said not only about the actions we undertake in our gardening or landscaping, but also those we initiate in our investment portfolios – especially as we take into account the potential for harm caused by natural disasters and other catastrophes, such as the COVID-19 pandemic. |
Because none of us – not even the Oracle of Omaha – has a crystal ball, to help give your investment portfolio the greatest chance for success over the long term, we encourage you to work with financial professionals to develop your personal savings plan, conduct annual plan reviews, and make thoughtful, purposeful plan adjustments to help manage your evolving financial needs and goals. By investing in different investment styles and asset classes, you may be able to help mitigate financial risks across your portfolio. By allocating your portfolio according to your risk-tolerance level, you may be better positioned to withstand short-term crises. With continuous nurturing, you will be better positioned to achieve enduring financial success.
Since 1986, American Beacon has endeavored to provide investors with a disciplined approach to realizing long-term financial goals. As a manager of managers, we strive to provide investment products that may enable investors to participate during market upswings while potentially insulating against market downswings. The investment teams behind our mutual funds seek to produce consistent, long-term results rather than focus only on short-term movements in the markets. In managing our investment products, we emphasize identifying opportunities that offer the potential for long-term financial rewards.
Thank you for entrusting your financial success with American Beacon. For additional information about our investment products or to access your account information, please visit our website at www.americanbeaconfunds.com.
Best Regards,

Gene L. Needles, Jr.
President
American Beacon Funds
1
Domestic Equity Market Overview
December 31, 2021 (Unaudited)
U.S. equity markets continued the momentum of calendar year 2020, reaching record highs in 2021 despite the ongoing COVID-19 pandemic. The year started with domestic equity markets gaining momentum during the early months of 2021 and rising to near-record levels by the end of the first quarter. This was driven, in part, by a social media-driven run-up in share prices for so-called “meme” stocks. After a short sell-off in January, stocks rebounded through February and March as COVID-19 vaccine distribution progress spurred optimism for a post-pandemic economic recovery. Investors responded by rotating out of the Information Technology sector and into the beleaguered Financials and Energy sectors.
During the second quarter of 2021, U.S. markets again recorded strong gains. The successful push for COVID-19 vaccinations and the continued reopening of the economy provided a strong basis for investor optimism in April. However, concerns about rising inflation temporarily slowed market growth in May. Investors regained confidence in June and began rotating back into Growth-oriented stocks, particularly large technology names.
Markets rose steadily through July and August as investors welcomed the continued reopening of the economy and strong corporate earnings. Investor sentiment shifted in September, however, amid worries over a variety of economic uncertainties – including the delta variant, inflation, signs of potential weakening in the U.S. economy and fears of disruptions in the Chinese economy. September’s declines erased nearly all of the gains in large-cap stocks from the previous two months and hit small-cap stocks particularly hard, even erasing some returns from the prior quarter.
Strong third-quarter earnings reports in October and continuing positive underlying economic data drove gains through the first half of the fourth quarter of 2021. Except for a brief period of volatility in late November and early December, driven by the emergence of the omicron variant, equity markets maintained steady growth through the end of the year. Following the stumble of stock prices at the end of November, the subsequent December recovery helped produce another year of double-digit returns for most major U.S. equity indexes.
2
American Beacon Bahl & Gaynor Small Cap Growth FundSM
Performance Overview
December 31, 2021 (Unaudited)
The Investor Class of the American Beacon Bahl & Gaynor Small Cap Growth Fund (the “Fund”) returned 15.35% for the twelve months ended December 31, 2021. The Fund outperformed the Russell 2000® Growth Index (the “Index”) return of 2.83% for the same period.
Comparison of Change in Value of a $10,000 Investment for the period from 7/15/2014 through 12/31/2021
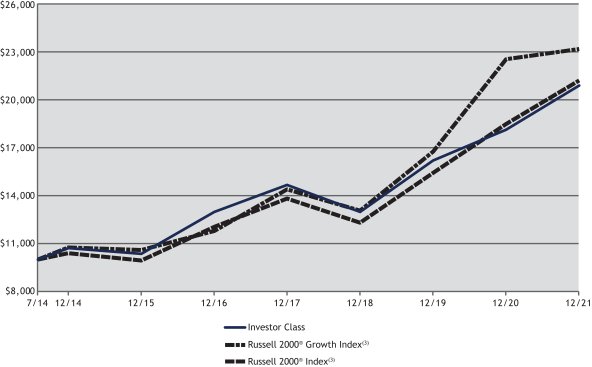
| Total Returns for the Period Ended December 31, 2021 |
|
|||||||||||||||||||||||||||||||
|
Ticker |
1 Year |
3 Years |
5 Years |
Since Inception |
Value of $10,000 7/15/2014- 12/31/2021 | |||||||||||||||||||||||||||
| R5 Class (1,4) |
GBSIX | 15.77 | % | 17.64 | % | 10.42 | % | 10.81 | % | $ | 21,512 | |||||||||||||||||||||
| Y Class (1,4) |
GBSYX | 15.69 | % | 17.51 | % | 10.30 | % | 10.71 | % | $ | 21,363 | |||||||||||||||||||||
| Investor Class (1,4) |
GBSPX | 15.35 | % | 17.29 | % | 10.05 | % | 10.42 | % | $ | 20,959 | |||||||||||||||||||||
| A without Sales Charge (1,2,4) |
GBSAX | 15.39 | % | 17.19 | % | 9.98 | % | 10.37 | % | $ | 20,890 | |||||||||||||||||||||
| A with Sales Charge (1,2,4) |
GBSAX | 8.78 | % | 14.89 | % | 8.69 | % | 9.50 | % | $ | 19,689 | |||||||||||||||||||||
| C without Sales Charge (1,2,4) |
GBSCX | 14.44 | % | 16.29 | % | 9.17 | % | 9.54 | % | $ | 19,746 | |||||||||||||||||||||
| C with Sales Charge (1,2,4) |
GBSCX | 13.44 | % | 16.29 | % | 9.17 | % | 9.54 | % | $ | 19,746 | |||||||||||||||||||||
| Russell 2000® Growth Index (3) |
2.83 | % | 21.17 | % | 14.53 | % | 11.97 | % | $ | 23,258 | ||||||||||||||||||||||
| Russell 2000® Index (3) |
14.82 | % | 20.02 | % | 12.02 | % | 10.64 | % | $ | 21,272 | ||||||||||||||||||||||
| 1. | Performance shown is historical and is not indicative of future returns. Investment returns and principal value will vary, and shares may be worth more or less at redemption than at original purchase. Performance shown is calculated based on the published end-of-day net asset values as of date indicated, and current performance may be lower or higher than the performance data quoted. To obtain performance as of the most recent month end, please visit www.americanbeaconfunds.com or call 1-800-967-9009. Fund performance in the table above does not reflect the deduction of taxes a shareholder would pay on distributions or the redemption of shares. Generally accepted accounting principles require adjustments to be made to the net assets of the Fund at period end for financial reporting purposes only; and as such, the total return based on the unadjusted net asset value per share may differ from the total return reported in the financial highlights. A portion of the fees charged to each Class of the Fund has been waived since Fund inception. Performance prior to waiving fees was lower than actual returns shown since inception. Please note that the recent performance of the securities market has helped produce short-term returns that are not typical and may not continue in the future. |
| 2. | A Class shares have a maximum sales charge of 5.75%. The maximum contingent deferred sales charge for the C Class is 1.00% for shares redeemed within one year of the date of purchase. |
3
American Beacon Bahl & Gaynor Small Cap Growth FundSM
Performance Overview
December 31, 2021 (Unaudited)
| 3. | The Russell 2000® Growth Index is an unmanaged index of those stocks in the Russell 2000® Index with higher price-to-book ratios and higher forecasted growth values. The Russell 2000 Index is an unmanaged index of approximately 2000 smaller-capitalization stocks from various industrial sectors. The Russell 2000 Growth Index and the Russell 2000 Index are registered trademarks of Frank Russell Company. American Beacon Funds is not promoted, sponsored or endorsed by, nor in any way affiliated with the London Stock Exchange Group plc and its group undertakings (collectively, the “LSE Group”). FTSE Russell is a trading name of certain of the LSE Group companies. LSE Group is not responsible for and has not reviewed the American Beacon Bahl & Gaynor Small Cap Growth Fund nor any associated literature or publications and LSE Group makes no representation or warranty, express or implied, as to their accuracy, or completeness, or otherwise. All rights in the Russell 2000 Growth Index and the Russell 2000 Index (the “Indexes”) vest in the relevant LSE Group company which owns the Indexes. Russell 2000® is a trademark of the relevant LSE Group company and is used by any other LSE Group company under license. The Indexes are calculated by or on behalf of FTSE International Limited or its affiliate, agent or partner. The LSE Group does not accept any liability whatsoever to any person arising out of (a) the use of, reliance on or any error in the Indexes or (b) investment in or operation of the Fund. The LSE Group makes no claim, prediction, warranty or representation either as to the results to be obtained from the Fund or the suitability of the Indexes for the purpose to which they are being put by the Manager. One cannot directly invest in an index. |
| 4. | The Total Annual Fund Operating Expense ratios set forth in the most recent Fund prospectus for the R5, Y, Investor, A, and C, Class shares were 1.35%, 1.40%, 1.75%, 1.64%, and 2.45%, respectively. The expense ratios above may vary from the expense ratios presented in other sections of this report that are based on expenses incurred during the period covered by this report. |
The Fund outperformed the Index due to both security selection and sector allocation.
From a security selection perspective, the Fund’s holdings in the Health Care, Industrials, and Real Estate sectors contributed the most to relative performance. In the Health Care sector, the Fund’s positions in Luminex Corp. (up 55.2%), CONMED Corp. (up 27.4%) and LeMaitre Vascular, Inc. (up 25.1%) positively impacted relative returns. In the Industrials sector, contributors included Tetra Tech, Inc. (up 47.9%) and UFP Industries, Inc. (up 63.7%). Within the Real Estate sector, Terreno Realty Corp. (up 48.3%) and Rexford Industrial Realty, Inc. (up 59.3%) contributed to performance relative to the Index. The aforementioned performance was offset slightly by security selection in the Consumer Staples sector; detractors included Utz Brands, Inc. (down 40.4%) and Lancaster Colony Corp. (down 8.6%).
4
American Beacon Bahl & Gaynor Small Cap Growth FundSM
Performance Overview
December 31, 2021 (Unaudited)
From a sector allocation perspective, the Fund’s significant underweight allocation to the Health Care sector, the worst performing sector of the Index, and overweight allocations to the Industrials and Financials sectors contributed positively to relative performance. Conversely, an underweight allocation to the Consumer Discretionary sector detracted slightly from relative returns.
The Fund’s basic philosophy remains focused on investing in companies using a fundamental investment approach that seeks price appreciation, capital preservation and income.
| Top Ten Holdings (% Net Assets) | ||||||||
| Ensign Group, Inc. | 3.8 | |||||||
| Progress Software Corp. | 3.8 | |||||||
| Tetra Tech, Inc. | 3.8 | |||||||
| US Physical Therapy, Inc. | 3.7 | |||||||
| LeMaitre Vascular, Inc. | 3.5 | |||||||
| Evercore, Inc., Class A | 3.4 | |||||||
| CSG Systems International, Inc. | 3.3 | |||||||
| Avient Corp. | 3.2 | |||||||
| CONMED Corp. | 3.2 | |||||||
| TTEC Holdings, Inc. | 3.1 | |||||||
| Total Fund Holdings | 46 | |||||||
| Sector Allocation (% Equities) | ||||
| Industrials | 22.9 | |||
| Health Care | 18.0 | |||
| Information Technology | 16.3 | |||
| Financials | 12.9 | |||
| Materials | 8.8 | |||
| Consumer Discretionary | 7.8 | |||
| Real Estate | 4.9 | |||
| Consumer Staples | 4.5 | |||
| Utilities | 2.7 | |||
| Communication Services | 0.7 | |||
| Energy | 0.5 |
5
American Beacon Bahl & Gaynor Small Cap Growth FundSM
Expense Examples
December 31, 2021 (Unaudited)
Fund Expense Example
As a shareholder of a Fund, you incur two types of costs: (1) transaction costs, including sales charges (loads) on purchase payments and redemption fees, if applicable, and (2) ongoing costs, including management fees, distribution (12b-1) fees, sub-transfer agent fees, and other Fund expenses. The Examples are intended to help you understand the ongoing cost (in dollars) of investing in the Funds and to compare these costs with the ongoing costs of investing in other mutual funds. The Examples are based on an investment of $1,000 invested at the beginning of the period in each Class and held for the entire period from July 1, 2021 through December 31, 2021.
Actual Expenses
The “Actual” lines of the tables provide information about actual account values and actual expenses. You may use the information on this page, together with the amount you invested, to estimate the expenses that you paid over the period. Simply divide your account value by $1,000 (for example, an $8,600 account value divided by $1,000 = $8.60), then multiply the result by the “Expenses Paid During Period” to estimate the expenses you paid on your account during this period. Shareholders of the Investor and R5 Classes that invest in the Fund through an IRA or Roth IRA may be subject to a custodial IRA fee of $15 that is typically deducted each December. If your account was subject to a custodial IRA fee during the period, your costs would have been $15 higher.
Hypothetical Example for Comparison Purposes
The “Hypothetical” lines of the tables provide information about hypothetical account values and hypothetical expenses based on the Fund’s actual expense ratio and an assumed 5% per year rate of return before expenses (not the Fund’s actual return). You may compare the ongoing costs of investing in the Funds with other funds by contrasting this 5% hypothetical example and the 5% hypothetical examples that appear in the shareholder reports of the other funds. The hypothetical account values and expenses may not be used to estimate the actual ending account balance or expenses you paid for the period. Shareholders of the Investor and R5 Classes that invest in the Funds through an IRA or Roth IRA may be subject to a custodial IRA fee of $15 that is typically deducted each December. If your account was subject to a custodial IRA fee during the period, your costs would have been $15 higher.
You should also be aware that the expenses shown in the table highlight only your ongoing costs and do not reflect any transaction costs charged by the Funds, such as sales charges (loads) or redemption fees, as applicable. Similarly, the expense examples for other funds do not reflect any transaction costs charged by those funds, such as sales charges (loads), redemption fees or exchange fees. Therefore, the “Hypothetical” lines of the tables are useful in comparing ongoing costs only and will not help you determine the relative total costs of owning different funds. If you were subject to any transaction costs during the period, your costs would have been higher.
6
American Beacon Bahl & Gaynor Small Cap Growth FundSM
Expense Examples
December 31, 2021 (Unaudited)
| American Beacon Bahl & Gaynor Small Cap Growth Fund |
| ||||||||||||||
| Beginning Account Value 7/1/2021 |
Ending Account Value 12/31/2021 |
Expenses Paid During Period 7/1/2021-12/31/2021* | |||||||||||||
| R5 Class | |||||||||||||||
| Actual | $1,000.00 | $1,053.00 | $5.07 | ||||||||||||
| Hypothetical** | $1,000.00 | $1,020.27 | $4.99 | ||||||||||||
| Y Class | |||||||||||||||
| Actual | $1,000.00 | $1,052.80 | $5.59 | ||||||||||||
| Hypothetical** | $1,000.00 | $1,019.76 | $5.50 | ||||||||||||
| Investor Class | |||||||||||||||
| Actual | $1,000.00 | $1,051.30 | $7.03 | ||||||||||||
| Hypothetical** | $1,000.00 | $1,018.35 | $6.92 | ||||||||||||
| A Class | |||||||||||||||
| Actual | $1,000.00 | $1,051.50 | $6.83 | ||||||||||||
| Hypothetical** | $1,000.00 | $1,018.55 | $6.72 | ||||||||||||
| C Class | |||||||||||||||
| Actual | $1,000.00 | $1,047.50 | $10.99 | ||||||||||||
| Hypothetical** | $1,000.00 | $1,014.47 | $10.82 | ||||||||||||
| * | Expenses are equal to the Fund’s annualized expense ratios for the six-month period of 0.98%, 1.08%, 1.36%, 1.32%, and 2.13% for the R5, Y, Investor, A, and C Classes, respectively, multiplied by the average account value over the period, multiplied by the number derived by dividing the number of days in the most recent fiscal half-year (184) by days in the year (365) to reflect the half-year period. |
| ** | 5% return before expenses. |
7
American Beacon Bahl & Gaynor Small Cap Growth FundSM
Report of Independent Registered Public Accounting Firm
To the Shareholders and the Board of Trustees of American Beacon Bahl & Gaynor Small Cap Growth Fund
Opinion on the Financial Statements
We have audited the accompanying statement of assets and liabilities of American Beacon Bahl & Gaynor Small Cap Growth Fund (the “Fund”) (one of the funds constituting American Beacon Funds (the “Trust”)), including the schedule of investments, as of December 31, 2021, and the related statement of operations for the year then ended, the statements of changes in net assets for each of the two years in the period then ended, the financial highlights for each of the five years in the period then ended and the related notes (collectively referred to as the “financial statements”). In our opinion, the financial statements present fairly, in all material respects, the financial position of the Fund (one of the funds constituting American Beacon Funds) at December 31, 2021, the results of its operations for the year then ended, the changes in its net assets for each of the two years in the period then ended and its financial highlights for each of the five years in the period then ended, in conformity with U.S. generally accepted accounting principles.
Basis for Opinion
These financial statements are the responsibility of the Trust’s management. Our responsibility is to express an opinion on the Fund’s financial statements based on our audits. We are a public accounting firm registered with the Public Company Accounting Oversight Board (United States) (“PCAOB”) and are required to be independent with respect to the Trust in accordance with the U.S. federal securities laws and the applicable rules and regulations of the Securities and Exchange Commission and the PCAOB.
We conducted our audits in accordance with the standards of the PCAOB. Those standards require that we plan and perform the audit to obtain reasonable assurance about whether the financial statements are free of material misstatement, whether due to error or fraud. The Trust is not required to have, nor were we engaged to perform, an audit of the Trust’s internal control over financial reporting. As part of our audits, we are required to obtain an understanding of internal control over financial reporting, but not for the purpose of expressing an opinion on the effectiveness of the Trust’s internal control over financial reporting. Accordingly, we express no such opinion.
Our audits included performing procedures to assess the risks of material misstatement of the financial statements, whether due to error or fraud, and performing procedures that respond to those risks. Such procedures included examining, on a test basis, evidence regarding the amounts and disclosures in the financial statements. Our procedures included confirmation of securities owned as of December 31, 2021, by correspondence with the custodian. Our audits also included evaluating the accounting principles used and significant estimates made by management, as well as evaluating the overall presentation of the financial statements. We believe that our audits provide a reasonable basis for our opinion.

We have served as the auditor of one or more American Beacon investment companies since 1987.
Dallas, Texas
February 28, 2022
8
American Beacon Bahl & Gaynor Small Cap Growth FundSM
Schedule of Investments
December 31, 2021
| Shares | Fair Value | ||||||||||||||
| COMMON STOCKS - 99.48% | |||||||||||||||
| Communication Services - 0.67% | |||||||||||||||
| Media - 0.67% | |||||||||||||||
| Nexstar Media Group, Inc., Class A | 2,057 | $ | 310,566 | ||||||||||||
|
|
|
||||||||||||||
| Consumer Discretionary - 7.80% | |||||||||||||||
| Household Durables - 2.54% | |||||||||||||||
| MDC Holdings, Inc. | 21,190 | 1,183,038 | |||||||||||||
|
|
|
||||||||||||||
| Leisure Products - 2.92% | |||||||||||||||
| Brunswick Corp. | 6,750 | 679,927 | |||||||||||||
| Johnson Outdoors, Inc., Class A | 7,259 | 680,096 | |||||||||||||
|
|
|
||||||||||||||
| 1,360,023 | |||||||||||||||
|
|
|
||||||||||||||
| Specialty Retail - 2.34% | |||||||||||||||
| Rent-A-Center, Inc. | 22,670 | 1,089,067 | |||||||||||||
|
|
|
||||||||||||||
| Total Consumer Discretionary |
3,632,128 | ||||||||||||||
|
|
|
||||||||||||||
| Consumer Staples - 4.44% | |||||||||||||||
| Food Products - 4.44% | |||||||||||||||
| John B Sanfilippo & Son, Inc. | 4,621 | 416,629 | |||||||||||||
| Lancaster Colony Corp. | 6,557 | 1,085,839 | |||||||||||||
| Utz Brands, Inc.A | 35,542 | 566,895 | |||||||||||||
|
|
|
||||||||||||||
| 2,069,363 | |||||||||||||||
|
|
|
||||||||||||||
| Total Consumer Staples |
2,069,363 | ||||||||||||||
|
|
|
||||||||||||||
| Energy - 0.55% | |||||||||||||||
| Oil, Gas & Consumable Fuels - 0.55% | |||||||||||||||
| World Fuel Services Corp. | 9,630 | 254,906 | |||||||||||||
|
|
|
||||||||||||||
| Financials - 12.85% | |||||||||||||||
| Banks - 5.72% | |||||||||||||||
| First Financial Bancorp | 30,413 | 741,469 | |||||||||||||
| First Interstate BancSystem, Inc., Class A | 20,348 | 827,553 | |||||||||||||
| Home BancShares, Inc. | 44,881 | 1,092,852 | |||||||||||||
|
|
|
||||||||||||||
| 2,661,874 | |||||||||||||||
|
|
|
||||||||||||||
| Capital Markets - 3.41% | |||||||||||||||
| Evercore, Inc., Class A | 11,686 | 1,587,543 | |||||||||||||
|
|
|
||||||||||||||
| Insurance - 3.72% | |||||||||||||||
| Horace Mann Educators Corp. | 15,073 | 583,325 | |||||||||||||
| Kinsale Capital Group, Inc. | 4,839 | 1,151,150 | |||||||||||||
|
|
|
||||||||||||||
| 1,734,475 | |||||||||||||||
|
|
|
||||||||||||||
| Total Financials |
5,983,892 | ||||||||||||||
|
|
|
||||||||||||||
| Health Care - 17.92% | |||||||||||||||
| Health Care Equipment & Supplies - 7.62% | |||||||||||||||
| CONMED Corp. | 10,573 | 1,498,829 | |||||||||||||
| LeMaitre Vascular, Inc. | 32,784 | 1,646,740 | |||||||||||||
| Mesa Laboratories, Inc. | 1,234 | 404,863 | |||||||||||||
|
|
|
||||||||||||||
| 3,550,432 | |||||||||||||||
|
|
|
||||||||||||||
| Health Care Providers & Services - 10.30% | |||||||||||||||
| Chemed Corp. | 2,516 | 1,331,064 | |||||||||||||
| Ensign Group, Inc. | 20,928 | 1,757,115 | |||||||||||||
| US Physical Therapy, Inc. | 17,856 | 1,706,141 | |||||||||||||
|
|
|
||||||||||||||
| 4,794,320 | |||||||||||||||
|
|
|
||||||||||||||
| Total Health Care |
8,344,752 | ||||||||||||||
|
|
|
||||||||||||||
See accompanying notes
9
American Beacon Bahl & Gaynor Small Cap Growth FundSM
Schedule of Investments
December 31, 2021
| Shares | Fair Value | ||||||||||||||
| COMMON STOCKS - 99.48% (continued) | |||||||||||||||
| Industrials - 22.75% | |||||||||||||||
| Aerospace & Defense - 1.84% | |||||||||||||||
| BWX Technologies, Inc. | 9,484 | $ | 454,094 | ||||||||||||
| Curtiss-Wright Corp. | 2,928 | 406,026 | |||||||||||||
|
|
|
||||||||||||||
| 860,120 | |||||||||||||||
|
|
|
||||||||||||||
| Building Products - 5.32% | |||||||||||||||
| AAON, Inc. | 6,775 | 538,138 | |||||||||||||
| Simpson Manufacturing Co., Inc. | 4,162 | 578,809 | |||||||||||||
| UFP Industries, Inc. | 14,783 | 1,360,184 | |||||||||||||
|
|
|
||||||||||||||
| 2,477,131 | |||||||||||||||
|
|
|
||||||||||||||
| Commercial Services & Supplies - 8.13% | |||||||||||||||
| MSA Safety, Inc. | 6,170 | 931,423 | |||||||||||||
| Ritchie Bros Auctioneers, Inc. | 17,832 | 1,091,497 | |||||||||||||
| Tetra Tech, Inc. | 10,380 | 1,762,524 | |||||||||||||
|
|
|
||||||||||||||
| 3,785,444 | |||||||||||||||
|
|
|
||||||||||||||
| Machinery - 2.42% | |||||||||||||||
| Federal Signal Corp. | 26,034 | 1,128,314 | |||||||||||||
|
|
|
||||||||||||||
| Professional Services - 5.04% | |||||||||||||||
| Exponent, Inc. | 9,920 | 1,157,962 | |||||||||||||
| ManTech International Corp., Class A | 16,307 | 1,189,269 | |||||||||||||
|
|
|
||||||||||||||
| 2,347,231 | |||||||||||||||
|
|
|
||||||||||||||
| Total Industrials |
10,598,240 | ||||||||||||||
|
|
|
||||||||||||||
| Information Technology - 16.21% | |||||||||||||||
| Electronic Equipment, Instruments & Components - 1.93% | |||||||||||||||
| Littelfuse, Inc. | 2,855 | 898,411 | |||||||||||||
|
|
|
||||||||||||||
| IT Services - 6.44% | |||||||||||||||
| CSG Systems International, Inc. | 26,977 | 1,554,415 | |||||||||||||
| TTEC Holdings, Inc. | 15,944 | 1,443,729 | |||||||||||||
|
|
|
||||||||||||||
| 2,998,144 | |||||||||||||||
|
|
|
||||||||||||||
| Semiconductors & Semiconductor Equipment - 4.00% | |||||||||||||||
| Power Integrations, Inc. | 13,162 | 1,222,618 | |||||||||||||
| Universal Display Corp. | 3,895 | 642,792 | |||||||||||||
|
|
|
||||||||||||||
| 1,865,410 | |||||||||||||||
|
|
|
||||||||||||||
| Software - 3.84% | |||||||||||||||
| Progress Software Corp. | 37,018 | 1,786,859 | |||||||||||||
|
|
|
||||||||||||||
| Total Information Technology |
7,548,824 | ||||||||||||||
|
|
|
||||||||||||||
| Materials - 8.72% | |||||||||||||||
| Chemicals - 8.72% | |||||||||||||||
| Avient Corp. | 26,566 | 1,486,368 | |||||||||||||
| Balchem Corp. | 6,145 | 1,036,047 | |||||||||||||
| Scotts Miracle-Gro Co. | 3,895 | 627,095 | |||||||||||||
| Stepan Co. | 7,331 | 911,170 | |||||||||||||
|
|
|
||||||||||||||
| 4,060,680 | |||||||||||||||
|
|
|
||||||||||||||
| Total Materials |
4,060,680 | ||||||||||||||
|
|
|
||||||||||||||
| Real Estate - 4.89% | |||||||||||||||
| Equity Real Estate Investment Trusts (REITs) - 4.89% | |||||||||||||||
| Innovative Industrial Properties, Inc.A | 1,790 | 470,609 | |||||||||||||
| Rexford Industrial Realty, Inc. | 5,420 | 439,616 | |||||||||||||
| Terreno Realty Corp. | 16,041 | 1,368,137 | |||||||||||||
|
|
|
||||||||||||||
| 2,278,362 | |||||||||||||||
|
|
|
||||||||||||||
| Total Real Estate |
2,278,362 | ||||||||||||||
|
|
|
||||||||||||||
See accompanying notes
10
American Beacon Bahl & Gaynor Small Cap Growth FundSM
Schedule of Investments
December 31, 2021
| Shares | Fair Value | ||||||||||||||
| COMMON STOCKS - 99.48% (continued) | |||||||||||||||
| Utilities - 2.68% | |||||||||||||||
| Gas Utilities - 2.68% | |||||||||||||||
| Chesapeake Utilities Corp. | 8,565 | $ | 1,248,863 | ||||||||||||
|
|
|
||||||||||||||
| Total Common Stocks (Cost $32,773,575) |
46,330,576 | ||||||||||||||
|
|
|
||||||||||||||
| SHORT-TERM INVESTMENTS - 0.49% (Cost $228,422) | |||||||||||||||
| Investment Companies - 0.49% | |||||||||||||||
| American Beacon U.S. Government Money Market Select Fund, 0.01%B C | 228,422 | 228,422 | |||||||||||||
|
|
|
||||||||||||||
| TOTAL INVESTMENTS - 99.97% (Cost $33,001,997) |
46,558,998 | ||||||||||||||
| OTHER ASSETS, NET OF LIABILITIES - 0.03% |
13,055 | ||||||||||||||
|
|
|
||||||||||||||
| TOTAL NET ASSETS - 100.00% |
$ | 46,572,053 | |||||||||||||
|
|
|
||||||||||||||
| Percentages are stated as a percent of net assets. | |||||||||||||||
A All or a portion of this security is on loan, collateralized by either cash and/or U.S. Treasuries, at December 31, 2021 (Note 9).
B The Fund is affiliated by having the same investment advisor.
C 7-day yield.
| Long Futures Contracts Open on December 31, 2021: |
|
|||||||||||||||
| Equity Futures Contracts | ||||||||||||||||
| Description | Number of Contracts |
Expiration Date | Notional Amount | Contract Value | Unrealized Appreciation (Depreciation) |
|||||||||||
| Russell 2000 E-Mini Index | 2 | March 2022 | $ | 224,732 | $ | 224,280 | $ | (452 | ) | |||||||
|
|
|
|
|
|
|
|||||||||||
| $ | 224,732 | $ | 224,280 | $ | (452 | ) | ||||||||||
|
|
|
|
|
|
|
|||||||||||
The Fund’s investments are summarized by level based on the inputs used to determine their values. As of December 31, 2021, the investments were classified as described below:
| Bahl & Gaynor Small Cap Growth Fund |
Level 1 | Level 2 | Level 3 | Total | ||||||||||||||||||||||||
| Assets |
||||||||||||||||||||||||||||
| Common Stocks |
$ | 46,330,576 | $ | - | $ | - | $ | 46,330,576 | ||||||||||||||||||||
| Short-Term Investments |
228,422 | - | - | 228,422 | ||||||||||||||||||||||||
|
|
|
|
|
|
|
|
|
|||||||||||||||||||||
| Total Investments in Securities - Assets |
$ | 46,558,998 | $ | - | $ | - | $ | 46,558,998 | ||||||||||||||||||||
|
|
|
|
|
|
|
|
|
|||||||||||||||||||||
| Financial Derivative Instruments - Liabilities |
| |||||||||||||||||||||||||||
| Futures Contracts |
$ | (452 | ) | $ | - | $ | - | $ | (452 | ) | ||||||||||||||||||
|
|
|
|
|
|
|
|
|
|||||||||||||||||||||
| Total Financial Derivative Instruments - Liabilities |
$ | (452 | ) | $ | - | $ | - | $ | (452 | ) | ||||||||||||||||||
|
|
|
|
|
|
|
|
|
|||||||||||||||||||||
U.S. GAAP requires transfers between all levels to/from level 3 be disclosed. During the year ended December 31, 2021, there were no transfers into or out of Level 3.
See accompanying notes
11
American Beacon Bahl & Gaynor Small Cap Growth FundSM
Statement of Assets and Liabilities
December 31, 2021
| Assets: |
| |||
| Investments in unaffiliated securities, at fair value† |
$ | 46,330,576 | ||
| Investments in affiliated securities, at fair value‡ |
228,422 | |||
| Cash collateral held at broker for futures contracts |
21,000 | |||
| Dividends and interest receivable |
38,170 | |||
| Deposits with broker for futures contracts |
38 | |||
| Receivable for fund shares sold |
32,667 | |||
| Receivable for expense reimbursement (Note 2) |
27,753 | |||
| Prepaid expenses |
24,313 | |||
|
|
|
|||
| Total assets |
46,702,939 | |||
|
|
|
|||
| Liabilities: |
||||
| Payable for fund shares redeemed |
15,524 | |||
| Management and sub-advisory fees payable (Note 2) |
34,321 | |||
| Service fees payable (Note 2) |
1,623 | |||
| Transfer agent fees payable (Note 2) |
2,884 | |||
| Custody and fund accounting fees payable |
18,150 | |||
| Professional fees payable |
45,708 | |||
| Payable for prospectus and shareholder reports |
11,321 | |||
| Payable for variation margin from open futures contracts (Note 5) |
416 | |||
| Other liabilities |
939 | |||
|
|
|
|||
| Total liabilities |
130,886 | |||
|
|
|
|||
| Net assets |
$ | 46,572,053 | ||
|
|
|
|||
| Analysis of net assets: |
||||
| Paid-in-capital |
$ | 32,543,693 | ||
| Total distributable earnings (deficits)A |
14,028,360 | |||
|
|
|
|||
| Net assets |
$ | 46,572,053 | ||
|
|
|
|||
| Shares outstanding at no par value (unlimited shares authorized): |
| |||
| R5 Class |
1,139,467 | |||
|
|
|
|||
| Y Class |
1,240,093 | |||
|
|
|
|||
| Investor Class |
197,872 | |||
|
|
|
|||
| A Class |
76,005 | |||
|
|
|
|||
| C Class |
17,721 | |||
|
|
|
|||
| Net assets: |
| |||
| R5 Class |
$ | 20,011,026 | ||
|
|
|
|||
| Y Class |
$ | 21,596,567 | ||
|
|
|
|||
| Investor Class |
$ | 3,379,147 | ||
|
|
|
|||
| A Class |
$ | 1,296,534 | ||
|
|
|
|||
| C Class |
$ | 288,779 | ||
|
|
|
|||
| Net asset value, offering and redemption price per share: |
| |||
| R5 Class |
$ | 17.56 | ||
|
|
|
|||
| Y Class |
$ | 17.42 | ||
|
|
|
|||
| Investor Class |
$ | 17.08 | ||
|
|
|
|||
| A Class |
$ | 17.06 | ||
|
|
|
|||
| A Class (offering price) |
$ | 18.10 | ||
|
|
|
|||
| C Class |
$ | 16.30 | ||
|
|
|
|||
| † Cost of investments in unaffiliated securities |
$ | 32,773,575 | ||
| ‡ Cost of investments in affiliated securities |
$ | 228,422 | ||
| § Fair value of securities on loan |
$ | 960,505 | ||
| A The Fund’s investments in affiliated securities did not have unrealized appreciation (depreciation) at year end. |
| |||
See accompanying notes
12
American Beacon Bahl & Gaynor Small Cap Growth FundSM
Statement of Operations
For the year ended December 31, 2021
| Investment income: |
| |||
| Dividend income from unaffiliated securities (net of foreign taxes)† |
$ | 613,402 | ||
| Dividend income from affiliated securities (Note 2) |
39 | |||
| Income derived from securities lending (Note 9) |
362 | |||
|
|
|
|||
| Total investment income |
613,803 | |||
|
|
|
|||
| Expenses: |
||||
| Management and sub-advisory fees (Note 2) |
398,498 | |||
| Transfer agent fees: |
||||
| R5 Class (Note 2) |
9,576 | |||
| Y Class (Note 2) |
22,363 | |||
| Investor Class |
1,425 | |||
| A Class |
151 | |||
| C Class |
41 | |||
| Custody and fund accounting fees |
35,101 | |||
| Professional fees |
72,976 | |||
| Registration fees and expenses |
67,133 | |||
| Service fees (Note 2): |
||||
| Investor Class |
13,109 | |||
| A Class |
1,063 | |||
| C Class |
380 | |||
| Distribution fees (Note 2): |
||||
| A Class |
3,412 | |||
| C Class |
3,087 | |||
| Prospectus and shareholder report expenses |
19,106 | |||
| Trustee fees (Note 2) |
3,033 | |||
| Loan expense (Note 10) |
276 | |||
| Other expenses |
22,564 | |||
|
|
|
|||
| Total expenses |
673,294 | |||
|
|
|
|||
| Net fees waived and expenses (reimbursed) (Note 2) |
(182,474 | ) | ||
|
|
|
|||
| Net expenses |
490,820 | |||
|
|
|
|||
| Net investment income |
122,983 | |||
|
|
|
|||
| Realized and unrealized gain (loss) from investments: |
||||
| Net realized gain from: |
||||
| Investments in unaffiliated securitiesA |
5,498,481 | |||
| Futures contracts |
74,291 | |||
| Change in net unrealized appreciation (depreciation) of: |
||||
| Investments in unaffiliated securitiesB |
841,234 | |||
| Futures contracts |
(3,046 | ) | ||
|
|
|
|||
| Net gain from investments |
6,410,960 | |||
|
|
|
|||
| Net increase in net assets resulting from operations |
$ | 6,533,943 | ||
|
|
|
|||
| † Foreign taxes |
$ | 2,421 | ||
| A The Fund did not recognize net realized gains (losses) from the sale of investments in affiliated securities. |
| |||
| B The Fund’s investments in affiliated securities did not have a change in unrealized appreciation (depreciation) at year end. |
| |||
See accompanying notes
13
American Beacon Bahl & Gaynor Small Cap Growth FundSM
Statement of Changes in Net Assets
| Year Ended December 31, 2021 |
Year Ended December 31, 2020 |
|||||||||||
| Increase (decrease) in net assets: |
| |||||||||||
| Operations: |
| |||||||||||
| Net investment income |
$ | 122,983 | $ | 208,362 | ||||||||
| Net realized gain from investments in unaffiliated securities and futures contracts |
5,572,772 | 70,414 | ||||||||||
| Change in net unrealized appreciation of investments in unaffiliated securities and futures contracts |
838,188 | 3,588,274 | ||||||||||
|
|
|
|
|
|||||||||
| Net increase in net assets resulting from operations |
6,533,943 | 3,867,050 | ||||||||||
|
|
|
|
|
|||||||||
| Distributions to shareholders: |
| |||||||||||
| Total retained earnings: |
||||||||||||
| R5 Class |
(1,241,910 | ) | (85,585 | ) | ||||||||
| Y Class |
(1,413,879 | ) | (97,396 | ) | ||||||||
| Investor Class |
(211,168 | ) | (14,820 | ) | ||||||||
| A Class |
(85,291 | ) | (6,476 | ) | ||||||||
| C Class |
(19,400 | ) | – | |||||||||
|
|
|
|
|
|||||||||
| Net distributions to shareholders |
(2,971,648 | ) | (204,277 | ) | ||||||||
|
|
|
|
|
|||||||||
| Capital share transactions (Note 11): |
||||||||||||
| Proceeds from sales of shares |
3,901,960 | 3,765,505 | ||||||||||
| Reinvestment of dividends and distributions |
2,933,914 | 201,044 | ||||||||||
| Cost of shares redeemed |
(5,948,081 | ) | (10,503,998 | ) | ||||||||
|
|
|
|
|
|||||||||
| Net increase (decrease) in net assets from capital share transactions |
887,793 | (6,537,449 | ) | |||||||||
|
|
|
|
|
|||||||||
| Net increase (decrease) in net assets |
4,450,088 | (2,874,676 | ) | |||||||||
|
|
|
|
|
|||||||||
| Net assets: |
||||||||||||
| Beginning of year |
42,121,965 | 44,996,641 | ||||||||||
|
|
|
|
|
|||||||||
| End of year |
$ | 46,572,053 | $ | 42,121,965 | ||||||||
|
|
|
|
|
|||||||||
See accompanying notes
14
American Beacon Bahl & Gaynor Small Cap Growth FundSM
Notes to Financial Statements
December 31, 2021
1. Organization and Significant Accounting Policies
American Beacon Funds (the “Trust”) is organized as a Massachusetts business trust. The Fund, a series within the Trust, is registered under the Investment Company Act of 1940, as amended (the “Act”), as a diversified, open-end management investment company. As of December 31, 2021, the Trust consists of twenty-eight active series, one of which is presented in this filing: American Beacon Bahl & Gaynor Small Cap Growth Fund (the “Fund”). The remaining twenty-seven active series are reported in separate filings.
American Beacon Advisors, Inc. (the “Manager”) is a Delaware corporation and a wholly-owned subsidiary of Resolute Investment Managers, Inc. (“RIM”) organized in 1986 to provide business management, advisory, administrative, and asset management consulting services to the Trust and other investors. The Manager is registered as an investment advisor under the Investment Advisers Act of 1940, as amended (the “Advisers Act”). RIM is, in turn, a wholly-owned subsidiary of Resolute Acquisition, Inc., which is a wholly-owned subsidiary of Resolute Topco, Inc., a wholly-owned subsidiary of Resolute Investment Holdings, LLC (“RIH”). RIH is owned primarily by Kelso Investment Associates VIII, L.P., KEP VI, LLC and Estancia Capital Partners L.P., investment funds affiliated with Kelso & Company, L.P. (“Kelso”) or Estancia Capital Management, LLC (“Estancia”), which are private equity firms.
Recently Adopted Accounting Pronouncements
In March 2020, the Financial Accounting Standards Board (“FASB”) issued Accounting Standards Update (“ASU”) 2020-04, which provides optional expedients and exceptions for contracts, hedging relationships and other transactions affected by the transitioning away from the London Interbank Offered Rate (“LIBOR”) and other reference rates that are expected to be discontinued. The amendments in this ASU are effective for all entities as of March 12, 2020 through December 31, 2022. At this time, management is evaluating the implications of these changes on the financial statements.
In October 2020, the U.S. Securities and Exchange Commission (“SEC”) adopted new regulations governing the use of derivatives by registered investment companies. Rule 18f-4 will impose limits on the amount of derivatives the fund could enter into, eliminate the asset segregation framework currently used by funds to comply with Section 18 of the Act, and require funds whose use of derivatives is more than a limited specified exposure to establish and maintain a derivatives risk management program and appoint a derivatives risk manager. While the new rule became effective February 19, 2021, funds will not be required to fully comply with the new rule until August 19, 2022. It is not currently clear what impact, if any, the new rule will have on the availability, liquidity or performance of derivatives. When fully implemented, the new rule may require changes in how the fund will use derivatives, may adversely affect the fund’s performance and may increase costs related to the fund’s use of derivatives.
On December 3, 2020, the SEC adopted new rule 2a-5 (Valuation Rule) under the Investment Company Act of 1940, establishing an updated regulatory framework for fund valuation. The Valuation Rule, in part, provides a framework for good faith fair value determination and permits a Board to designate fair value determinations to a fund’s investment adviser. Further, the SEC is rescinding previously issued guidance on related issues. The Valuation Rule became effective on March 8, 2021, with a compliance date of September 8, 2022. Management is currently evaluating the Valuation Rule and its effect on the Funds.
15
American Beacon Bahl & Gaynor Small Cap Growth FundSM
Notes to Financial Statements
December 31, 2021
Class Disclosure
The Fund has multiple classes of shares designed to meet the needs of different groups of investors. The following table sets forth the differences amongst the classes:
| Class |
Eligible Investors |
Minimum Initial Investments |
||||
| R5 Class | Large institutional investors - sold directly or through intermediary channels. | $ | 250,000 | |||
| Y Class | Large institutional retirement plan investors - sold directly or through intermediary channels. | $ | 100,000 | |||
| Investor Class | All investors using intermediary organizations, such as broker-dealers or retirement plan sponsors. | $ | 2,500 | |||
| A Class | All investors who invest through intermediary organizations, such as broker-dealers or third party administrator. Retail investors who invest directly through a financial intermediary such as a broker, bank, or registered investment advisor which may include a front-end sales charge and a contingent deferred sales charge (“CDSC”). | $ | 2,500 | |||
| C Class | Retail investors who invest directly through a financial intermediary, such as a broker or through employee directed benefit plans with applicable sales charges which may include CDSC. | $ | 1,000 | |||
Each class offered by the Trust has equal rights as to assets and voting privileges. Income and non-class specific expenses are allocated daily to each class based on the relative net assets. Realized and unrealized capital gains and losses of each class are allocated daily based on the relative net assets of each class of the respective Fund. Class specific expenses, where applicable, currently include service, distribution, transfer agent fees, and sub-transfer agent fees that vary amongst the classes as described more fully in Note 2.
Significant Accounting Policies
The following is a summary of significant accounting policies, consistently followed by the Fund in preparation of the financial statements. The Fund is considered an investment company and accordingly, follows the investment company accounting and reporting guidance of the FASB Accounting Standards Codification Topic 946, Financial Services – Investment Companies, a part of Generally Accepted Accounting Principles (“U.S. GAAP”).
Security Transactions and Investment Income
Security transactions are recorded as of the trade date for financial reporting purposes. Securities purchased or sold on a when-issued or delayed-delivery basis may be settled beyond a standard settlement period for the security after the trade date.
Dividend income, net of foreign taxes, is recorded on the ex-dividend date, except certain dividends from foreign securities which are recorded as soon as the information is available to the Fund. Interest income, net of foreign taxes, is earned from settlement date, recorded on the accrual basis, and adjusted, if necessary, for accretion of discounts and amortization of premiums. Realized gains (losses) from securities sold are determined based on specific lot identification.
Distributions to Shareholders
The Fund distributes most or all of its net earnings and realized gains, if any, each taxable year in the form of dividends from net investment income and distributions of realized net capital gains and net gains from foreign currency transactions on an annual basis. The Fund does not have a fixed dividend rate and does not guarantee that it will pay any distributions in any particular period. Dividends to shareholders are determined in accordance with federal income tax regulations, which may differ in amount and character from net investment income and realized gains recognized for purposes of U.S. GAAP. To the extent necessary to fully distribute capital gains, the Fund may designate earnings and profits distributed to shareholders on the redemption of shares.
16
American Beacon Bahl & Gaynor Small Cap Growth FundSM
Notes to Financial Statements
December 31, 2021
Commission Recapture
The Fund has established brokerage commission recapture arrangements with certain brokers or dealers. If the Fund’s investment advisor chooses to execute a transaction through a participating broker, the broker rebates a portion of the commission back to the Fund. Any collateral benefit received through participation in the commission recapture program is directed exclusively to the Fund. This amount is reported with the net realized gain (loss) in the Fund’s Statement of Operations, if applicable.
Allocation of Income, Trust Expenses, Gains, and Losses
Investment income, realized and unrealized gains and losses from investments of the Fund is allocated daily to each class of shares based upon the relative proportion of net assets of each class to the total net assets of the Fund. Expenses directly charged or attributable to the Fund will be paid from the assets of the Fund. Generally, expenses of the Trust will be allocated among and charged to the assets of the Fund on a basis that the Trust’s Board of Trustees (the “Board”) deems fair and equitable, which may be based on the relative net assets of the Fund or nature of the services performed and relative applicability to the Fund.
Use of Estimates
The preparation of financial statements in conformity with U.S. GAAP requires management to make estimates and assumptions that affect the amounts reported in the financial statements and accompanying notes. Actual results may differ from those estimated.
Other
Under the Trust’s organizational documents, its officers and trustees are indemnified against certain liabilities arising out of the performance of their duties to the Trust. In the normal course of business, the Trust enters into contracts that provide indemnification to the other party or parties against potential costs or liabilities. The Trust’s maximum exposure under these arrangements is dependent on claims that may be made in the future and, therefore, cannot be estimated. The Trust has had no prior claims or losses pursuant to any such agreement.
2. Transactions with Affiliates
Management and Investment Sub-Advisory Agreements
The Fund and the Manager are parties to a Management Agreement that obligates the Manager to provide the Fund with investment advisory and administrative services. As compensation for performing the duties under the Management Agreement, the Manager will receive an annualized management fee based on a percentage of the Fund’s average daily net assets that is calculated and accrued daily according to the following schedule:
| First $5 billion |
0.35 | % | ||
| Next $5 billion |
0.325 | % | ||
| Next $10 billion |
0.30 | % | ||
| Over $20 billion |
0.275 | % |
The Trust, on behalf of the Fund, and the Manager have entered into an Investment Advisory Agreement with Bahl & Gaynor, Inc. (the “Sub-Advisor”) pursuant to which the Fund has agreed to pay an annualized sub-advisory fee that is calculated and accrued daily based on the Fund’s average daily net assets according to the following schedule:
| First $500 million |
0.525 | % | ||
| Over $500 million |
0.50 | % |
17
American Beacon Bahl & Gaynor Small Cap Growth FundSM
Notes to Financial Statements
December 31, 2021
The Management and Sub-Advisory Fees paid by the Fund for the year ended December 31, 2021 were as follows:
| Effective Fee Rate | Amount of Fees Paid | |||||||||||
| Management Fees |
0.350 | % | $ | 159,975 | ||||||||
| Sub-Advisor Fees |
0.525 | % | 238,523 | |||||||||
|
|
|
|
|
|||||||||
| Total |
0.875 | % | $ | 398,498 | ||||||||
|
|
|
|
|
|||||||||
As compensation for services provided by the Manager in connection with securities lending activities conducted by the Fund, the lending Fund pays to the Manager, with respect to cash collateral posted by borrowers, a fee of 10% of the net monthly interest income (the gross interest income earned by the investment of cash collateral, less the amount paid to borrowers and related expenses) from such activities and, with respect to loan fees paid by borrowers, a fee of 10% of such loan fees. Securities lending income is generated from the demand premium (if any) paid by the borrower to borrow a specific security and from the return on investment of cash collateral, reduced by negotiated rebate fees paid to the borrower and transaction costs. To the extent that a loan is secured by non-cash collateral, securities lending income is generated as a demand premium reduced by transaction costs. These fees are included in “Income derived from securities lending” and “Management and sub-advisory fees” on the Statement of Operations. During the year ended December 31, 2021, the Manager received securities lending fees of $49 for the securities lending activities of the Fund.
Distribution Plans
Separate Distribution Plans (the “Distribution Plans”) have been adopted pursuant to Rule 12b-1 under the Act for the A and C Classes of the Fund. Under the Distribution Plans, as compensation for distribution and shareholder servicing assistance, the Manager receives an annual fee of 0.25% of the average daily net assets of the A Class and 1.00% of the average daily net assets of the C Class. The fee will be payable without regard to whether the amount of the fee is more or less than the actual expenses incurred in a particular month by the Manager for distribution assistance.
Service Plans
The Manager and the Trust entered into a Service Plan that obligates the Manager to oversee additional shareholder servicing of the Investor, A and C Classes of the Fund. As compensation for performing the duties required under the Service Plan, the Manager receives an annualized fee up to 0.25% of the average daily net assets of the A and C Classes and up to 0.375% of the average daily net assets of the Investor Class of the Fund.
Sub-Transfer Agent Fees
The Manager has entered into agreements, which include servicing agreements, with financial intermediaries that provide recordkeeping, processing, shareholder communications and other services to customers of the intermediaries that hold positions in the R5 and Y Classes of the Fund and has agreed to compensate the intermediaries for providing these services. Intermediaries transact with the Fund primarily through the use of omnibus accounts on behalf of its customers who hold positions in the Fund. Certain services would have been provided by the Fund’s transfer agent and other service providers if the shareholders’ accounts were maintained directly by the Fund’s transfer agent. Accordingly, the Fund, pursuant to Board approval, has agreed to reimburse the Manager for certain non-distribution shareholder services provided by financial intermediaries for the R5 and Y Classes. The reimbursement amounts (sub-transfer agent fees) paid to the Manager are subject to a fee limit of up to 0.10% of an intermediary’s average net assets in the R5 and Y Classes on an annual basis. During the year ended December 31, 2021, the sub-transfer agent fees, as reflected in “Transfer agent fees” on the Statement of Operations, were as follows:
| Fund |
Sub-Transfer Agent Fees | |||
| Bahl & Gaynor Small Cap Growth |
$ | 30,212 | ||
18
American Beacon Bahl & Gaynor Small Cap Growth FundSM
Notes to Financial Statements
December 31, 2021
As of December 31, 2021, the Fund owed the Manager the following reimbursement of sub-transfer agent fees, as reflected in “Transfer agent fees payable” on the Statement of Assets and Liabilities:
| Fund |
Reimbursement Sub- Transfer Agent Fees |
|||
| Bahl & Gaynor Small Cap Growth |
$ | 2,590 | ||
Investments in Affiliated Funds
The Fund may invest in the American Beacon U.S. Government Money Market Select Fund (the “USG Select Fund”). Cash collateral received by the Fund in connection with securities lending may also be invested in the USG Select Fund. The Fund listed below held the following shares with a December 31, 2021 fair value and dividend income earned from the investment in the USG Select Fund.
| Affiliated Security |
Type of Transaction |
Fund | December 31, 2021 Shares/Principal |
Change in Unrealized Gain (Loss) |
Realized Gain (Loss) |
Dividend Income |
|
December 31, 2021 Fair Value |
||||||||||||||||||||||||||||||||||||||||||
| U.S. Government Money Market Select | Direct | |
Bahl & Gaynor Small Cap Growth |
|
$ | 228,422 | $ | – | $ | – | $ | 39 | $ | 228,422 | ||||||||||||||||||||||||||||||||||||
The Fund and the USG Select Fund have the same investment advisor and therefore, are considered to be affiliated. The Manager serves as investment advisor to the USG Select Fund and receives management fees and administrative fees totaling 0.10% of the average daily net assets of the USG Select Fund. During the year ended December 31, 2021, the Manager earned fees on the Fund’s direct investments and securities lending collateral investments in the USG Select Fund as shown below:
| Fund |
Direct Investments in USG Select Fund |
|||
| Bahl & Gaynor Small Cap Growth |
$ | 471 | ||
Interfund Credit Facility
Pursuant to an exemptive order issued by the SEC, the Fund, along with other registered investment companies having management contracts with the Manager, may participate in a credit facility whereby each fund, under certain conditions, is permitted to lend money directly to and borrow directly from other participating funds for temporary purposes. The interfund credit facility is advantageous to the funds because it provides added liquidity and eliminates the need to maintain higher cash balances to meet redemptions. This situation could arise when shareholder redemptions exceed anticipated volumes and certain funds have insufficient cash on hand to satisfy such redemptions or when sales of securities do not settle as expected, resulting in a cash shortfall for the fund. When the fund liquidates portfolio securities to meet redemption requests, they often do not receive payment in settlement for up to two days (or longer for certain foreign transactions). Redemption requests normally are satisfied on the next business day. The credit facility provides a source of immediate, short-term liquidity pending settlement of the sale of portfolio securities. The credit facility is administered by a credit facility team consisting of professionals from the Manager’s asset management, compliance, and accounting areas who report the activities of the credit facility to the Board. During the year ended December 31, 2021, the Fund borrowed on average $316,451 for 3 days at an average interest rate of 0.85% with interest charges of $23. These amounts are recorded as “Other expenses” in the Statement of Operations.
Expense Reimbursement Plan
The Manager contractually agreed to reduce fees and/or reimburse expenses for the classes of the Fund, through April 30, 2022, to the extent that total operating expenses (excluding taxes, interest, brokerage commissions, acquired fund fees and expenses, securities lending fees, expenses associated with securities sold
19
American Beacon Bahl & Gaynor Small Cap Growth FundSM
Notes to Financial Statements
December 31, 2021
short, litigation, and other extraordinary expenses) exceed the Fund’s expense cap. During the year ended December 31, 2021, the Manager waived and/or reimbursed expenses as follows:
| Expense Cap | Expiration of Reimbursed Expenses |
|||||||||||||||||||||
| Fund |
Class | 1/1/2021 - 4/30/2021 |
5/1/2021 - 12/31/2021 |
Reimbursed Expenses |
(Recouped) Expenses |
|||||||||||||||||
| Bahl & Gaynor Small Cap Growth |
R5 | 0.98 | % | 0.98 | % | $ | 81,084 | $ | - | 2024 | ||||||||||||
| Bahl & Gaynor Small Cap Growth |
Y | 1.08 | % | 1.08 | % | 80,998 | - | 2024 | ||||||||||||||
| Bahl & Gaynor Small Cap Growth |
Investor | 1.36 | % | 1.36 | % | 14,296 | - | 2024 | ||||||||||||||
| Bahl & Gaynor Small Cap Growth |
A | 1.34 | % | 1.32 | % | 4,986 | - | 2024 | ||||||||||||||
| Bahl & Gaynor Small Cap Growth |
C | 2.13 | % | 2.13 | % | 1,110 | - | 2024 | ||||||||||||||
Of the above amounts, $27,753 was disclosed as a Receivable for expense reimbursement on the Statement of Assets and Liabilities at December 31, 2021.
The Fund has adopted an Expense Reimbursement Plan whereby the Manager may seek repayment of such fee or voluntary reductions and expense reimbursements. Under the policy, the Manager can be reimbursed by the Fund for any contractual or voluntary fee reductions or expense reimbursements if reimbursement to the Manager (a) occurs within three years from the date of the Manager’s waiver/reimbursement and (b) does not cause the Fund’s annual operating expenses to exceed the lesser of the contractual percentage limit in effect at the time of the waiver/reimbursement or time of recoupment. The reimbursed expenses listed above will expire in 2024. The Fund did not record a liability for potential reimbursement due to the current assessment that a reimbursement is uncertain. The carryover of excess expenses potentially reimbursable to the Manager, but not recorded as a liability are as follows:
| Fund |
Recouped Expenses |
Excess Expense Carryover |
Expired Expense Carryover |
Expiration of Reimbursed Expenses |
||||||||||||
| Bahl & Gaynor Small Cap Growth |
$ | - | $ | - | $ | 118,073 | 2021 | |||||||||
| Bahl & Gaynor Small Cap Growth |
- | 141,101 | - | 2022 | ||||||||||||
| Bahl & Gaynor Small Cap Growth |
- | 134,708 | - | 2023 | ||||||||||||
Sales Commissions
The Fund’s Distributor, Resolute Investment Distributors, Inc. (“RID” or “Distributor”), may receive a portion of Class A sales charges from broker dealers which may be used to offset distribution related expenses. During the year ended December 31, 2021, RID collected $337 from the sale of Class A Shares of the Fund.
A CDSC of 0.50% will be deducted with respect to Class A Shares on certain purchases of $1,000,000 or more that are redeemed in whole or part within 18 months of purchase, unless waived as discussed in the Fund’s Prospectus. Any applicable CDSC will be 0.50% of the lesser of the original purchase price or the value of the redemption of the Class A Shares redeemed. During the year ended December 31, 2021, there were no CDSC fees collected for the Class A Shares of the Fund.
A CDSC of 1.00% will be deducted with respect to Class C Shares redeemed within 12 months of purchase, unless waived as discussed in the Fund’s Prospectus. Any applicable CDSC will be 1.00% of the lesser of the original purchase price or the value of the redemption of the Class C Shares redeemed. During the year ended December 31, 2021, there were no CDSC fees collected for Class C Shares of the Fund.
Trustee Fees and Expenses
Effective January 1, 2021, as compensation for their service to the American Beacon Funds Complex, including the Trust (collectively, the “Trusts”), each Trustee is compensated from the Trusts as follows: (1) an annual retainer of $120,000; (2) meeting attendance fee (for attendance in-person or via teleconference) of
20
American Beacon Bahl & Gaynor Small Cap Growth FundSM
Notes to Financial Statements
December 31, 2021
(a) $12,000 for in person attendance, or $5,000 for telephonic attendance, by Board members for each regularly scheduled or special Board meeting, (b) $2,500 for attendance by Committee members at meetings of the Audit and Compliance Committee and the Investment Committee, (c) $1,000 for attendance by Committee members at meetings of the Nominating and Governance Committee; and (d) $2,500 for attendance by Board members for each special telephonic Board meeting; and (3) reimbursement of reasonable expenses incurred in attending Board meetings, Committee meetings, and relevant educational seminars. For this purpose, the Board considers attendance at regular meetings held by video conference to constitute in-person attendance at a Board meeting. The Trustees also may be compensated for attendance at special Board and/or Committee meetings from time to time. For her service as Board Chair, Ms. Cline receives an additional annual retainer of $50,000. Although she attends several committee meetings at each quarterly Board meeting, she receives only a single $2,500 fee each quarter for her attendance at those meetings. The chairpersons of the Audit and Compliance Committee and the Investment Committee each receive an additional annual retainer of $25,000 and the Chair of the Nominating and Governance Committee receives an additional annual retainer of $10,000.
3. Security Valuation and Fair Value Measurements
The price of the Fund’s shares is based on its net asset value (“NAV”) per share. The Fund’s NAV is computed by adding total assets, subtracting all the Fund’s liabilities, and dividing the result by the total number of shares outstanding.
The NAV of each class of the Fund’s shares is determined based on a pro rata allocation of the Fund’s investment income, expenses and total capital gains and losses. The Fund’s NAV per share is determined each business day as of the regular close of trading on the New York Stock Exchange (“NYSE” or “Exchange”), which is typically 4:00 p.m. Eastern Time (“ET”). However, if trading on the NYSE closes at a time other than 4:00 p.m. ET, the Fund’s NAV per share typically would still be determined as of the regular close of trading on the NYSE. The Fund does not price its shares on days that the NYSE is closed. Foreign exchanges may permit trading in foreign securities on days when the Fund is not open for business, which may result in the value of the Fund’s portfolio investments being affected at a time when you are unable to buy or sell shares.
Equity securities, including shares of closed-end funds and exchange-traded funds (“ETFs”), are valued at the last sale price or official closing price taken from the primary exchange in which each security trades. Investments in other mutual funds are valued at the closing NAV per share on the day of valuation. Debt securities are valued at bid quotes from broker/dealers or evaluated bid prices from pricing services, who may consider a number of inputs and factors, such as prices of comparable securities, yield curves, spreads, credit ratings, coupon rates, maturity, default rates, and underlying collateral. Futures are valued based on their daily settlement prices. Exchange-traded and over-the-counter (“OTC”) options are valued at the last sale price. Options with no last sale for the day are priced at mid quote. Swaps are valued at evaluated mid prices from pricing services.
The valuation of securities traded on foreign markets and certain fixed-income securities will generally be based on prices determined as of the earlier closing time of the markets on which they primarily trade unless a significant event has occurred. When the Fund holds securities or other assets that are denominated in a foreign currency, the Fund will normally use the currency exchange rates as of 4:00 p.m. ET.
Securities may be valued at fair value, as determined in good faith and pursuant to procedures approved by the Board, under certain limited circumstances. For example, fair value pricing will be used when market quotations are not readily available or reliable, as determined by the Manager, such as when (i) trading for a security is restricted or stopped; (ii) a security’s trading market is closed (other than customary closings); or (iii) a security has been de-listed from a national exchange. A security with limited market liquidity may require fair value pricing if the Manager determines that the available price does not reflect the security’s true market value. In addition, if a significant event that the Manager determines to affect the value of one or more securities held by the Fund occurs after the close of a related exchange but before the determination of the Fund’s NAV, fair value pricing may be used on the affected security or securities. Securities of small-capitalization companies are also
21
American Beacon Bahl & Gaynor Small Cap Growth FundSM
Notes to Financial Statements
December 31, 2021
more likely to require a fair value determination using these procedures because they are more thinly traded and less liquid than the securities of larger-capitalization companies. The Fund may fair value securities as a result of significant events occurring after the close of the foreign markets in which the Fund invests as described below. In addition, the Fund may invest in illiquid securities requiring these procedures.
The Fund may use fair value pricing for securities primarily traded in non-U.S. markets because most foreign markets close well before the Fund’s pricing time of 4:00 p.m. ET. The earlier close of these foreign markets gives rise to the possibility that significant events, including broad market moves, may have occurred in the interim and may materially affect the value of those securities. If the Manager determines that the last quoted prices of non-U.S. securities will, in its judgment, materially affect the value of some or all its portfolio securities, the Manager can adjust the previous closing prices to reflect what it believes to be the fair value of the securities as of the close of the Exchange. In deciding whether it is necessary to adjust closing prices to reflect fair value, the Manager reviews a variety of factors, including developments in foreign markets, the performance of U.S. securities markets, and the performance of instruments trading in U.S. markets that represent foreign securities and baskets of foreign securities. These securities are fair valued using a pricing service, using methods approved by the Board, that considers the correlation of the trading patterns of the foreign security to intraday trading in the U.S. markets, based on indices of domestic securities and other appropriate indicators such as prices of relevant American Depositary Receipts (“ADRs”) and futures contracts. The Valuation Committee, established by the Board, may also fair value securities in other situations, such as when a particular foreign market is closed but the Fund is open. The Fund uses outside pricing services to provide closing prices and information to evaluate and/or adjust those prices. As a means of evaluating its security valuation process, the Valuation Committee routinely compares closing prices, the next day’s opening prices in the same markets and adjusted prices.
Attempts to determine the fair value of securities introduce an element of subjectivity to the pricing of securities. As a result, the price of a security determined through fair valuation techniques may differ from the price quoted or published by other sources and may not accurately reflect the market value of the security when trading resumes. If a reliable market quotation becomes available for a security formerly valued through fair valuation techniques, the Manager compares the new market quotation to the fair value price to evaluate the effectiveness of the Fund’s fair valuation procedures. If any significant discrepancies are found, the Manager may adjust the Fund’s fair valuation procedures.
Investments in open-end mutual funds are valued at the closing NAV per share of the mutual fund on the day of valuation.
Securities for which the market prices are not readily available or are not reflective of the fair value of the security, as determined by the Manager, will be priced at fair value following procedures approved by the Board.
Futures contracts are valued based upon their quoted daily settlement prices. Upon entering into a futures contract, the Fund is required to deposit with their futures broker, an amount of cash or U.S. Government and Agency Obligations in accordance with the initial margin requirements of the broker or exchange. Futures contracts are marked-to-market daily and an appropriate payable or receivable for the change in value (“variation margin”) is recorded by the Fund. Gains or losses are recognized, but not considered realized until the contracts expire or are closed. Futures contracts involve, to varying degrees, risk of loss in excess of the variation margin disclosed on the Statement of Assets and Liabilities.
Other investments for which the above valuation procedures are inappropriate or are deemed not to reflect fair value, are stated at fair value as determined in good faith by the Manager’s Valuation Committee, pursuant to procedures established by the Board.
22
American Beacon Bahl & Gaynor Small Cap Growth FundSM
Notes to Financial Statements
December 31, 2021
Valuation Inputs
Various inputs may be used to determine the fair value of the Fund’s investments. These inputs are summarized in three broad levels for financial statement purposes. The inputs or methodologies used to value securities are not necessarily an indication of the risk associated with investing in those securities.
| Level 1 | - | Quoted prices in active markets for identical securities. | ||
| Level 2 | - | Prices determined using other significant observable inputs. These may include quoted prices for similar securities, interest rates, prepayment speeds, credit risk, and others. | ||
| Level 3 | - | Prices determined using other significant unobservable inputs. Unobservable inputs reflect the Fund’s own assumptions about the factors market participants would use in pricing an investment. | ||
Level 1 and Level 2 trading assets and trading liabilities, at fair value
Common stocks, preferred securities, ETFs and financial derivative instruments, such as futures contracts that are traded on a national securities exchange, are stated at the last reported sale or settlement price on the day of valuation. To the extent these securities are actively traded and valuation adjustments are not applied, they are categorized as Level 1 of the fair value hierarchy. Preferred securities and other equities traded on inactive markets or valued by reference to similar instruments are generally categorized as Level 2 of the fair value hierarchy.
Investments in registered open-end investment management companies will be valued based upon the NAVs of such investments and are categorized as Level 1 of the fair value hierarchy.
4. Securities and Other Investments
Common Stock
Common stock generally takes the form of shares in a corporation which represent an ownership interest. It ranks below preferred stock and debt securities in claims for dividends and for assets of the company in a liquidation or bankruptcy. The value of a company’s common stock may fall as a result of factors directly relating to that company, such as decisions made by its management or decreased demand for the company’s products or services. A stock’s value may also decline because of factors affecting not just the company, but also companies in the same industry or sector. The price of a company’s stock may also be affected by changes in financial markets that are relatively unrelated to the company, such as changes in interest rates, currency exchange rates or industry regulation. Companies that elect to pay dividends on their common stock generally only do so after they invest in their own business and make required payments to bondholders and on other debt and preferred stock. Therefore, the value of a company’s common stock will usually be more volatile than its bonds, other debt and preferred stock. Common stock may be exchange-traded or OTC. OTC stock may be less liquid than exchange-traded stock.
Depositary Receipts and U.S. Dollar-Denominated Foreign Stocks Traded on U.S. Exchanges
ADRs are U.S. dollar-denominated receipts issued generally by domestic banks and represent the deposit with the bank of a security of a foreign issuer. Depositary receipts may not be denominated in the same currency as the securities into which they may be converted. Investing in depositary receipts entails substantially the same risks as direct investment in foreign securities. There is generally less publicly available information about foreign companies and there may be less governmental regulation and supervision of foreign stock exchanges, brokers, and listed companies. In addition, such companies may use different accounting and financial standards (and certain currencies may become unavailable for transfer from a foreign currency), resulting in the Funds’ possible inability to convert immediately into U.S. currency proceeds realized upon the sale of portfolio securities of the affected foreign companies. In addition, the Funds may invest in unsponsored depositary receipts, the issuers of which are
23
American Beacon Bahl & Gaynor Small Cap Growth FundSM
Notes to Financial Statements
December 31, 2021
not obligated to disclose material information about the underlying securities to investors in the United States. Ownership of unsponsored depositary receipts may not entitle the Funds to the same benefits and rights as ownership of a sponsored depositary receipt or the underlying security.
Other Investment Company Securities and Other Exchange-Traded Products
The Fund may invest in shares of other investment companies, including open-end funds, closed-end funds, business development companies (“BDCs”), ETFs, unit investment trusts, and other investment companies of the Trust. The Fund may invest in securities of an investment company advised by the Manager or the Sub-Advisor. Investments in the securities of other investment companies may involve duplication of advisory fees and certain other expenses. By investing in another investment company, the Fund becomes a shareholder of that investment company. As a result, the Fund shareholders indirectly will bear the Fund’s proportionate share of the fees and expenses paid by shareholders of the other investment company, in addition to the fees and expenses the Fund shareholders directly bear in connection with the Fund’s own operations. These other fees and expenses are reflected as Acquired Fund Fees and Expenses and are included in the Fees and Expenses Table for the Fund in its Prospectus, if applicable. Investments in other investment companies may involve the payment of substantial premiums above the value of such issuer’s portfolio securities.
Real Estate Investment Trusts (“REITs”)
The Fund may own shares of REITs which report information on the source of their distributions annually. The Fund re-characterizes distributions received from REIT investments based on information provided by the REITs into the following categories: ordinary income, long-term capital gains, and return of capital. If information is not available on a timely basis from the REITs, the re-characterization will be estimated based on available information, which may include the previous year allocation. If new or additional information becomes available from the REITs at a later date, a re-characterization will be made the following year.
5. Financial Derivative Instruments
The Fund may utilize derivative instruments to gain market exposure on cash balances. When considering the Fund’s use of derivatives, it is important to note that the Fund does not use derivatives for the purpose of creating financial leverage.
Futures Contracts
A futures contract is a contract to purchase or sell a particular security, or the cash value of an asset, such as securities, indices, or currencies, at a specified future date at a price agreed upon when the contract is made. Under many such contracts, no delivery of the actual underlying asset is required. Rather, upon the expiration of the contract, settlement is made by exchanging cash in an amount equal to the difference between the contract price and the closing price of the asset (e.g., a security or an index) at expiration, net of the initial and variation margin that was previously paid. A Treasury futures contract is a contract for the future delivery of a U.S. Treasury security. An equity index futures contract is based on the value of an underlying index. The Fund may, from time to time, use futures positions to equitize cash and expose its portfolio to changes in securities prices or index prices. This can magnify gains and losses in the Fund. The Fund also may have to sell assets at inopportune times to satisfy its settlement or collateral obligations. The risks associated with the use of futures contracts also include that there may be an imperfect correlation between the changes in market value of the futures contracts and the assets underlying such contracts and that there may not be a liquid secondary market for a futures contract.
During the year ended December 31, 2021, the Fund entered into futures contracts primarily for exposing cash to markets.
24
American Beacon Bahl & Gaynor Small Cap Growth FundSM
Notes to Financial Statements
December 31, 2021
The Fund’s average futures contracts outstanding fluctuate throughout the operating year as required to meet strategic requirements. The following table illustrates the average quarterly volume of futures contracts. For the purpose of this disclosure, volume is measured by contracts outstanding at each quarter end.
| Average Futures Contracts Outstanding |
||||
| Fund |
Year Ended December 31, 2021 | |||
| Bahl & Gaynor Small Cap Growth |
4 | |||
The following is a summary of the fair valuations of the Fund’s derivative instruments categorized by risk exposure(1):
| Fair values of financial instruments on the Statement of Assets and Liabilities as of December 31, 2021: |
| ||||||||||||||||||||||||||||||||||||||||||||||||||||||
| Derivatives not accounted for as hedging instruments | |||||||||||||||||||||||||||||||||||||||||||||||||||||||
| Liabilities: |
Credit contracts | Foreign exchange contracts |
Commodity contracts |
Interest rate contracts |
Equity contracts | Total | |||||||||||||||||||||||||||||||||||||||||||||||||
| Payable for variation margin from open futures contracts(2) | $ | - | $ | - | $ | - | $ | - | $ | (452 | ) | $ | (452 | ) | |||||||||||||||||||||||||||||||||||||||||
| The effect of financial derivative instruments on the Statement of Operations as of December 31, 2021: |
| |||||||||||||||||||||||||||||||||||||||||||||||||||||||||||||
| Derivatives not accounted for as hedging instruments | ||||||||||||||||||||||||||||||||||||||||||||||||||||||||||||||
| Realized gain (loss) from derivatives |
Credit contracts | Foreign exchange contracts |
Commodity contracts |
Interest rate contracts |
Equity contracts | Total | ||||||||||||||||||||||||||||||||||||||||||||||||||||||||
| Futures contracts | $ | - | $ | - | $ | - | $ | - | $ | 74,291 | $ | 74,291 | ||||||||||||||||||||||||||||||||||||||||||||||||||
| Net change in unrealized appreciation |
Credit contracts | Foreign exchange contracts |
Commodity contracts |
Interest rate contracts |
Equity contracts | Total | ||||||||||||||||||||||||||||||||||||||||||||||||||||||||
| Futures contracts | $ | - | $ | - | $ | - | $ | - | $ | (3,046 | ) | $ | (3,046 | ) | ||||||||||||||||||||||||||||||||||||||||||||||||
(1) See Note 3 in the Notes to Financial Statements for additional information.
(2) Includes cumulative appreciation (depreciation) of futures contracts as reported in the Fund’s Schedule of Investments footnotes. Only current day’s variation margin is reported within the Statement of Assets and Liabilities.
Offsetting Assets and Liabilities
The Fund is a party to enforceable master netting agreements between brokers and counterparties which provide for the right to offset under certain circumstances. The Fund employs multiple counterparties and has elected not to offset qualifying financial and derivative instruments on the Statement of Assets and Liabilities, as such all financial and derivative instruments are presented on a gross basis. The impacts of netting arrangements that provide the right to offset are detailed below, if applicable. The net amount represents the net receivable or payable that would be due from or to the counterparty in the event of default. Exposure from borrowings and other financing agreements such as repurchase agreements can only be netted across transactions governed by the same Master Agreement with the same legal entity. All amounts reported below represent the balance as of the report date, December 31, 2021.
| Offsetting of Financial and Derivative Assets as of December 31, 2021: | ||||||||||||
|
|
Assets | Liabilities | ||||||||||
| Futures Contracts(1) | $ | - | $ | 452 | ||||||||
|
|
|
|
|
|||||||||
| Total derivative assets and liabilities in the Statement of Assets and Liabilities | $ | - | $ | 452 | ||||||||
|
|
|
|
|
|||||||||
| Derivatives not subject to a Master Netting Agreement or similar agreement (“MNA”) | $ | - | $ | (452 | ) | |||||||
|
|
|
|
|
|||||||||
(1) Includes cumulative appreciation (depreciation) of futures contracts as reported in the Fund’s Schedule of Investments footnotes. Only current day’s variation margin is reported within the Statement of Assets and Liabilities.
25
American Beacon Bahl & Gaynor Small Cap Growth FundSM
Notes to Financial Statements
December 31, 2021
6. Principal Risks
Investing in the Fund may involve certain risks including, but not limited to, those described below.
Dividend Risk
The Fund’s focus on dividend-paying stocks could cause the Fund to underperform funds that invest without consideration of a company’s track record of paying dividends. An issuer of stock held by the Fund may choose not to declare a dividend or the dividend rate might not remain at current levels. Dividend paying stocks might not experience the same level of earnings growth or capital appreciation as non-dividend paying stocks. In addition, stocks of companies with a history of paying dividends may not participate in a broad market advance to the same degree as most other stocks, and a sharp rise in interest rates or an economic downturn could cause a company to unexpectedly reduce or eliminate its dividend. Securities that pay dividends may be sensitive to changes in interest rates, and as interest rates rise, the prices of such securities may fall. At times, the Fund may not be able to identify dividend-paying stocks that are attractive investments. The income received by the Fund will also fluctuate due to the amount of dividends that companies elect to pay.
Equity Investments Risk
Equity securities are subject to market risk. The Fund’s investments in equity securities may include common stocks, preferred stocks, securities convertible into or exchangeable for common stocks, REITs, depositary receipts, and U.S. dollar-denominated foreign stocks traded on U.S. exchanges. Such investments may expose the Fund to additional risk. The value of a company’s common stock may fall as a result of factors affecting the company, companies in the same industry or sector, or the financial markets overall. Common stock generally is subordinate to preferred stock upon the liquidation or bankruptcy of the issuing company. Preferred stocks and convertible securities are sensitive to movements in interest rates. Preferred stocks may be less liquid than common stocks and, unlike common stocks, participation in the growth of an issuer may be limited. Distributions on preferred stocks generally are payable at the discretion of an issuer and after required payments to bond holders. Convertible securities are subject to the risk that the credit standing of the issuer may have an effect on the convertible securities’ investment value. Investments in REITs are subject to the risks associated with investing in the real estate industry such as adverse developments affecting the real estate industry and real property values. Depositary receipts and U.S. dollar-denominated foreign stocks traded on U.S. exchanges are subject to certain of the risks associated with investing directly in foreign securities, including, but not limited to, currency exchange rate fluctuations, political and financial instability in the home country of a particular depositary receipt, less liquidity and more volatility, less government regulation and supervision and delays in transaction settlement.
Foreign Investing Risk
Non-U.S. investments carry potential risks not associated with U.S. investments. Such risks include, but are not limited to: (1) currency exchange rate fluctuations, (2) political and financial instability, (3) less liquidity, (4) lack of uniform accounting, auditing and financial reporting standards, (5) increased price volatility, (6) less government regulation and supervision of foreign stock exchanges, brokers and listed companies, and (7) delays in transaction settlement in some foreign markets. There may be very limited oversight of certain foreign banks or securities depositories that hold foreign securities and currency and the laws of certain countries may limit the ability to recover such assets if a foreign bank, depository, or their agents goes bankrupt. To the extent the Fund invests a significant portion of its assets in securities of a single country or region, it is more likely to be affected by events or conditions of that country or region.
Futures Contracts Risk
Futures contracts are derivative instruments where one party pays a fixed price for an agreed amount of securities or other underlying assets at an agreed date. The use of such derivative instruments may expose the
26
American Beacon Bahl & Gaynor Small Cap Growth FundSM
Notes to Financial Statements
December 31, 2021
Fund to additional risks that it would not be subject to if it invested directly in the securities underlying those derivatives. There may at times be an imperfect correlation between the movement in the prices of futures contracts and the value of their underlying instruments or indexes. There can be no assurance that any strategy used will succeed. There also can be no assurance that, at all times, a liquid market will exist for offsetting a futures contract that the Fund has previously bought or sold and this may result in the inability to close a futures contract when desired. Futures contracts may experience potentially dramatic price changes, which will increase the volatility of the Fund and may involve a small investment of cash (the amount of initial and variation margin) relative to the magnitude of the risk assumed (the potential increase or decrease in the price of the futures contract).
Investment Risk
An investment in the Fund is not a deposit with a bank and is not insured or guaranteed by the Federal Deposit Insurance Corporation or any other government agency. When you sell your shares of the Fund, they could be worth less than what you paid for them. Therefore, you may lose money by investing in the Fund.
Market Risk
The Fund is subject to the risk that the securities markets will move down, sometimes rapidly and unpredictably, based on overall economic conditions and other factors, which may negatively affect the Fund’s performance. Equity securities generally have greater price volatility than fixed income securities, although under certain market conditions fixed income securities may have comparable or greater price volatility. During a general downturn in the securities markets, multiple assets may decline in value simultaneously. In some cases, traditional market participants have been less willing to make a market in some types of debt instruments, which has affected the liquidity of those instruments. During times of market turmoil, investors tend to look to the safety of securities issued or backed by the U.S. Treasury, causing the prices of these securities to rise and the yields to decline. Reduced liquidity in fixed income and credit markets may negatively affect many issuers worldwide. Prices in many financial markets have increased significantly over the last decade, but there have also been periods of adverse market and financial developments and cyclical change during that timeframe, which have resulted in unusually high levels of volatility in domestic and foreign financial markets that has caused losses for investors and may occur again in the future, particularly if markets enter a period of uncertainty or economic weakness. The value of a security may decline due to adverse issuer-specific conditions, general market conditions unrelated to a particular issuer, or factors that affect a particular industry or industries. Changes in the financial condition of a single issuer or market segment also can impact the market as a whole.
Geopolitical and other events, including war, terrorism, economic uncertainty, trade disputes, pandemics, public health crises, natural disasters and related events have led, and in the future may continue to lead, to instability in world economies and markets generally and reduced liquidity in equity, credit and fixed-income markets, which may disrupt economies and markets and adversely affect the value of your investment. Adverse market events may also lead to increased shareholder redemptions, which could cause the Fund to experience a loss or difficulty in selling investments to meet redemption requests by shareholders and may increase the Fund’s portfolio turnover, which will increase the costs that the Fund incurs and lower the Fund’s performance. Even when securities markets perform well, there is no assurance that the investments held by the Fund will increase in value along with the broader market.
Policy changes by the U.S. government and/or Federal Reserve and political events within the U.S. and abroad, including the U.S. presidential election, the U.S. government’s inability at times to agree on a long-term budget and deficit reduction plan, the threat of a federal government shutdown and threats not to increase the federal government’s debt limit, may affect investor and consumer confidence and may adversely impact financial markets and the broader economy, perhaps suddenly and to a significant degree. The severity or duration of adverse economic conditions may also be affected by policy changes made by governments or quasi-governmental organizations. Global economies and financial markets are becoming increasingly interconnected, which increases the possibility of many markets being affected by events in a single country or events affecting a single or small number of issuers.
27
American Beacon Bahl & Gaynor Small Cap Growth FundSM
Notes to Financial Statements
December 31, 2021
Markets and market participants are increasingly reliant upon both publicly available and proprietary information data systems. Data imprecision, software or other technology malfunctions, programming inaccuracies, unauthorized use or access, and similar circumstances may impair the performance of these systems and may have an adverse impact upon a single issuer, a group of issuers, or the market at large. In certain cases, an exchange or market may close or issue trading halts on either specific securities or even the entire market, which may result in the Fund being, among other things, unable to buy or sell certain securities or financial instruments or accurately price its investments. These fluctuations in securities prices could be a sustained trend or a drastic movement. The financial markets generally move in cycles, with periods of rising prices followed by periods of declining prices. The value of your investment may reflect these fluctuations.
Other Investment Companies Risk
The Fund may invest in shares of other registered investment companies, including money market funds that are advised by the Manager. To the extent that the Fund invests in shares of other registered investment companies, the Fund will indirectly bear the fees and expenses, including for example advisory and administrative fees, charged by those investment companies in addition to the Fund’s direct fees and expenses and will be subject to the risks associated with investments in those companies. For example, the Fund’s investments in money market funds are subject to interest rate risk, credit risk, and market risk. The Fund must rely on the investment company in which it invests to achieve its investment objective. If the investment company fails to achieve its investment objective, the value of the Fund’s investment will decline, adversely affecting the Fund’s performance. To the extent the Fund invests in other investment companies that invest in equity securities, fixed-income securities and/or foreign securities, or that track an index, the Fund is subject to the risks associated with the underlying investments held by the investment company or the index fluctuations to which the investment company is subject.
Recent Market Events Risk
An outbreak of infectious respiratory illness caused by a novel coronavirus, known as COVID-19, was first detected in China in December 2019 and has subsequently spread globally. Transmission of COVID-19 and efforts to contain its spread have resulted, and may continue to result, in significant disruptions to business operations, widespread business closures and layoffs, travel restrictions, closed international, national and local borders, prolonged quarantines and stay-at-home orders, disruption of and delays in healthcare service preparation and delivery, service and event cancellations, and lower consumer demand, as well as general concern and uncertainty that has negatively affected the global economy. The impact of the COVID-19 pandemic may last for an extended period of time and may result in a sustained economic downturn or recession. The U.S. Federal Reserve and the U.S. federal government have taken numerous measures to address the economic impact of the COVID-19 pandemic and stimulate the U.S. economy. The ultimate effects of these and other efforts that may be taken may not be known for some time.
The pandemic has accelerated trends toward working remotely and shopping on-line, which may negatively affect the value of office and commercial real estate and companies that have been slow to transition to an on-line business model and has disrupted the supply chains that many businesses depend on. The travel, hospitality and public transit industries may suffer long-term negative effects from the pandemic and resulting changes to public behavior. Both U.S. and international markets have experienced significant volatility in recent months and years. As a result of such volatility, investment returns may fluctuate significantly. Moreover, the risks discussed herein associated with an investment in the Fund may be increased.
The Federal Reserve has spent hundreds of billions of dollars to keep credit flowing through the economy. However, the Federal Reserve recently began to reduce its interventions as the economy improved and inflation accelerated. Concerns about the markets’ dependence on the Federal Reserve’s provision of liquidity have grown as a result. High public debt in the U.S. and other countries creates ongoing systemic and market risks and policymaking uncertainty, and there may be a further increase in public debt due to the economic effects of the
28
American Beacon Bahl & Gaynor Small Cap Growth FundSM
Notes to Financial Statements
December 31, 2021
COVID-19 pandemic and ensuing economic relief and public health measures. Governments’ efforts to limit potential negative economic effects of the pandemic may be altered, delayed, or eliminated at inopportune times for political, policy or other reasons.
Interest rates have been unusually low in recent years in the U.S. and abroad, and central banks reduced rates further in an effort to combat the economic effects of the COVID-19 pandemic. Because there is little precedent for this situation, it is difficult to predict the impact on various markets of a significant rate increase or other significant policy changes. The U.S. Federal Reserve is anticipated to raise interest rates beginning in 2022, in part to address an increase in the annual inflation rate in the U.S. Over the longer term, rising interest rates may present a greater risk than has historically been the case due to the current period of relatively low rates and the effect of government fiscal and monetary policy initiatives and potential market reaction to those initiatives or their alteration or cessation.
Slowing global economic growth, risks associated with the United Kingdom’s departure from the European Union on December 31, 2020, commonly referred to as “Brexit,” and a trade agreement between the United Kingdom and the European Union, the risks associated with ongoing trade negotiations with China, the possibility of changes to some international trade agreements, tensions or open conflict between nations, such as between Russia and Ukraine, or political or economic dysfunction within some nations that are major producers of oil could affect the economies of many nations, including the United States, in ways that cannot necessarily be foreseen at the present time.
Economists and others have expressed increasing concern about the potential effects of global climate change on property and security values. Certain issuers, industries and regions may be adversely affected by the impacts of climate change, including on the demand for and the development of goods and services and related production costs, and the impacts of legislation, regulation and international accords related to climate change, as well as any indirect consequences of regulation or business trends driven by climate change.
Securities Lending Risk
The Fund may lend its portfolio securities to brokers, dealers and financial institutions in order to obtain additional income. Borrowers of the Fund’s securities provide collateral either in the form of cash, which the Fund reinvests in securities or in the form of non-cash collateral consisting of securities issued or guaranteed by the U.S. government or one of its agencies or instrumentalities. The Fund will be responsible for the risks associated with the investment of cash collateral, including any collateral invested in an affiliated money market fund. The Fund may lose money on its investment of cash collateral or may fail to earn sufficient income on its investment to cover its payment to the borrower of a pre-negotiated fee or “rebate” for the use of that cash collateral in connection with the loan. The Fund could also lose money due to a decline in the value of non-cash collateral. In addition, delays may occur in the recovery of securities from borrowers, which could interfere with the Fund’s ability to vote proxies or to settle transactions or could result in increased costs. Moreover, if the borrower becomes subject to insolvency or similar proceedings, the Fund could incur delays in its ability to enforce its rights in its collateral. There also is a risk that a borrower may default on its obligation to return loaned securities at a time when the value of the Fund’s collateral is inadequate. Although the Fund’s securities lending agent may indemnify the Fund against that risk, it is also possible that the securities lending agent will be unable to satisfy its indemnification obligations. In any case in which the loaned securities are not returned to the Fund before an ex-dividend date, whether or not due to a default by the borrower, the payment in lieu of the dividend that the Fund receives from the securities’ borrower would not be treated as a dividend for federal income tax purposes and thus would not qualify for treatment as “qualified dividend income.”
7. Federal Income and Excise Taxes
It is the policy of the Fund to qualify as a regulated investment company (“RIC”), by complying with all applicable provisions of Subchapter M of the Internal Revenue Code, as amended, and to make distributions of taxable income sufficient to relieve it from substantially all federal income and excise taxes. For federal income tax purposes, the Fund is treated as a single entity for the purpose of determining such qualification.
29
American Beacon Bahl & Gaynor Small Cap Growth FundSM
Notes to Financial Statements
December 31, 2021
The Fund does not have any unrecorded tax liabilities in the accompanying financial statements. Each of the tax years in the four year period ended December 31, 2021 remain subject to examination by the Internal Revenue Service. If applicable, the Fund recognizes interest accrued related to unrecognized tax benefits in interest expense and penalties in “Other expenses” on the Statement of Operations.
The Fund may be subject to taxes imposed by countries in which it invests. Such taxes are generally based on returns of income earned or gains realized or repatriated. Taxes are accrued and applied to net investment income, net realized capital gains and net unrealized appreciation (depreciation), as applicable, as the income is earned or capital gains are recorded.
Dividends are categorized in accordance with income tax regulations which may treat certain transactions differently than U.S. GAAP. Accordingly, the character of distributions and composition of net assets for tax purposes may differ from those reflected in the accompanying financial statements.
The tax character of distributions paid were as follows:
| Year Ended December 31, 2021 |
Year Ended December 31, 2020 |
|||||||||||
| Distributions paid from: |
||||||||||||
| Ordinary income |
||||||||||||
| R5 Class |
$ | 41,737 | $ | 85,585 | ||||||||
| Y Class |
47,517 | 97,396 | ||||||||||
| Investor Class |
6,693 | 14,820 | ||||||||||
| A Class |
2,866 | 6,476 | ||||||||||
| Long-term capital gains |
||||||||||||
| R5 Class |
1,200,173 | - | ||||||||||
| Y Class |
1,366,362 | - | ||||||||||
| Investor Class |
204,475 | - | ||||||||||
| A Class |
82,425 | - | ||||||||||
| C Class |
19,400 | - | ||||||||||
|
|
|
|
|
|||||||||
| Total distributions paid |
$ | 2,971,648 | $ | 204,277 | ||||||||
|
|
|
|
|
|||||||||
*For tax purposes, short-term capital gains are considered ordinary income distributions.
As of December 31, 2021, the components of distributable earnings (deficits) on a tax basis were as follows:
| Fund |
Tax Cost |
|
Unrealized Appreciation |
|
Unrealized (Depreciation) |
|
Net Unrealized Appreciation (Depreciation) |
|||||||||||||||||||||
| Bahl & Gaynor Small Cap Growth |
$ | 33,379,031 | $ | 13,922,846 | $ | (742,879 | ) | $ | 13,179,967 | |||||||||||||||||||
| Fund |
Net Unrealized Appreciation (Depreciation) |
|
Undistributed Ordinary Income |
|
Undistributed Long-Term Capital Gains |
|
Accumulated Capital and Other (Losses) |
|
Other Temporary Differences |
|
Distributable Earnings |
|||||||||||||||||||||||||||||||||
| Bahl & Gaynor Small Cap Growth |
$ | 13,179,967 | $ | - | $ | 848,393 | $ | - | $ | - | $ | 14,028,360 | ||||||||||||||||||||||||||||||||
Financial reporting records are adjusted for permanent book/tax differences to reflect tax character. Financial records are not adjusted for temporary differences. The temporary differences between financial reporting and tax-basis reporting of unrealized appreciation (depreciation) are attributable primarily to the tax deferral of losses from wash sales and the realization for tax purposes of unrealized gains (losses) on certain derivative instruments.
Due to inherent differences in the recognition of income, expenses, and realized gains (losses) under U.S. GAAP and federal income tax regulations, permanent differences between book and tax reporting have been identified and appropriately reclassified on the Statement of Assets and Liabilities.
30
American Beacon Bahl & Gaynor Small Cap Growth FundSM
Notes to Financial Statements
December 31, 2021
There were no permanent differences as of December 31, 2021.
For federal income tax purposes, the Fund measures its capital loss carryforwards annually at December 31, its fiscal year end. Capital loss carryforwards retain their character as short-term and/or long-term and may be carried forward and applied against future realized capital gains with no expiration date.
The Fund utilized $770,153 short-term and $1,063,896 long-term capital loss carryforwards and did not have any remaining capital loss carryforwards as of December 31, 2021.
8. Investment Transactions
The aggregate cost of purchases and proceeds from sales and maturities of investments, other than short-term obligations, for the year ended December 31, 2021 were as follows:
| Fund |
Purchases (non-U.S. Government Securities) |
Sales (non-U.S. Government Securities) |
||||||||||
| Bahl & Gaynor Small Cap Growth | $ | 12,725,003 | $ | 14,291,041 | ||||||||
A summary of the Fund’s transactions in the USG Select Fund for the year ended December 31, 2021 were as follows:
| Fund |
Type of Transaction |
December 31, 2020 Shares/Fair Value |
Purchases | Sales | December 31, 2021 Shares/Fair Value |
|||||||||||||||||||||||||||||
| Bahl & Gaynor Small Cap Growth | Direct | $ | 562,884 | $ | 6,912,420 | $ | 7,246,882 | $ | 228,422 | |||||||||||||||||||||||||
9. Securities Lending
The Fund may lend its securities to qualified financial institutions, such as certain broker-dealers, to earn additional income. The borrowers are required to secure their loans continuously with collateral in an amount at least equal to the fair value of the securities loaned, initially in an amount at least equal to 102% of the fair value of domestic securities loaned and 105% of the fair value of international securities loaned. Collateral is monitored and marked-to-market daily. Daily mark-to-market amounts are required to be paid to the borrower or received from the borrower by the end of the following business day. This one day settlement for mark-to-market amounts may result in the collateral being temporarily less than the value of the securities on loan or temporarily more than the required minimum collateral.
To the extent that a loan is collateralized by cash, such cash collateral shall be invested by the securities lending agent (the “Agent”) in money market mutual funds and other short-term investments, provided the investments meet certain quality and diversification requirements. Securities purchased with cash collateral proceeds are listed in the Fund’s Schedule of Investments and the collateral is shown on the Statement of Assets and Liabilities as a payable.
Securities lending income is generated from the demand premium (if any) paid by the borrower to borrow a specific security and from the return on investment of cash collateral, reduced by negotiated rebate fees paid to the borrower and transaction costs. To the extent that a loan is secured by non-cash collateral, securities lending income is generated as a demand premium reduced by transaction costs. The Fund, the Agent, and the Manager retained 80%, 10%, and 10%, respectively, of the income generated from securities lending.
While securities are on loan, the Fund continues to receive certain income associated with that security and any gain or loss in the market price that may occur during the term of the loan. In the case of domestic equities,
31
American Beacon Bahl & Gaynor Small Cap Growth FundSM
Notes to Financial Statements
December 31, 2021
the value of any dividend is received in the form of a substitute payment approximately equal to the dividend. In the case of foreign securities, a negotiated amount is received that is less than the actual dividend, but higher than the dividend amount minus the foreign tax that the Fund would be subject to on the dividend.
Securities lending transactions pose certain risks to the Fund, including that the borrower may not provide additional collateral when required or return the securities when due, that the value of the short-term investments will be less than the amount of cash collateral required to be returned to the borrower, that non-cash collateral may be subject to legal constraints in the event of a borrower bankruptcy, and that the cash collateral investments could become illiquid and unable to be used to return collateral to the borrower. The Fund could also experience delays and costs in gaining access to the collateral. The Fund bears the risk of any deficiency in the amount of the cash collateral available for return to the borrower and any action which impairs its ability to liquidate non-cash collateral to satisfy a borrower default.
As of December 31, 2021, the value of outstanding securities on loan and the value of collateral were as follows:
| Fund |
Fair Value of Securities on Loan |
Cash Collateral Received |
Non-Cash Collateral Received |
Total Collateral Received |
||||||||||||||||||||||
| Bahl & Gaynor Small Cap Growth | $960,505 | $ | - | $ | 976,268 | $ | 976,268 | |||||||||||||||||||
Cash collateral is listed on the Fund’s Schedule of Investments and is shown on the Statement of Assets and Liabilities. Income earned on these investments is included in “Income derived from securities lending” on the Statement of Operations.
Non-cash collateral received by the Fund may not be sold or re-pledged except to satisfy a borrower default. Therefore, non-cash collateral is not included on the Fund’s Schedule of Investments or Statement of Assets and Liabilities.
10. Borrowing Arrangements
Effective November 11, 2021 (the “Effective Date”), the Fund, along with certain other funds managed by the Manager (“Participating Funds”), renewed a committed revolving line of credit (the “Committed Line”) agreement with State Street Bank and Trust Company (the “Bank”) to be used to facilitate portfolio liquidity. The maximum borrowing amount under the Committed Line is $100 million with interest at a rate equal to the higher of (a) Overnight Bank Funding Rate (“OBFR”) daily fluctuating rate per annum equal to 1.25% plus the sum of 0.10% or (b) the Federal Funds daily fluctuating rate per annum on amounts borrowed. Each of the Participating Funds paid a proportional amount of a quarterly commitment fee at a rate of 0.25% per annum on the unused portion of the Committed Line amount. The Committed Line expires November 10, 2022, unless extended by the Bank or terminated by the Participating Funds in accordance with the agreement. Prior to the Effective Date, the maximum borrowing amount under the Committed Line was $150 million with an expiration date November 10, 2021.
On the Effective Date, the Fund, along with certain other Participating Funds managed by the Manager, also renewed an uncommitted discretionary demand revolving line of credit (the “Uncommitted Line”) agreement with the Bank to be used to facilitate portfolio liquidity. The maximum borrowing amount under the Uncommitted Line is $100 million with interest at a rate equal to the higher of (a) OBFR daily fluctuating rate per annum equal to 1.25% plus the sum of 0.10% or (b) the Federal Funds daily fluctuating rate per annum on amounts borrowed on each outstanding loan. Each of the Participating Funds paid a proportional amount of a closing fee of $35,000 on the Effective Date. The Uncommitted Line expires November 10, 2022, unless extended by the Bank or terminated by the Participating Funds in accordance with the agreement. Prior to the Effective Date, the maximum borrowing amount under the Uncommitted Line was $50 million with an expiration date of November 10, 2021.
32
American Beacon Bahl & Gaynor Small Cap Growth FundSM
Notes to Financial Statements
December 31, 2021
The Participating Funds paid administration, legal and arrangement fees, which are recognized as a component of “Loan expense” on the Statement of Operations, along with commitment fees, that have been allocated among the Participating Funds based on average daily net assets.
During the year ended December 31, 2021, the Fund did not utilize these facilities.
11. Capital Share Transactions
The tables below summarize the activity in capital shares for each Class of the Fund:
| R5 Class | ||||||||||||||||||||||||||||
| Year Ended December 31, | ||||||||||||||||||||||||||||
| 2021 | 2020 | |||||||||||||||||||||||||||
| Bahl & Gaynor Small Cap Growth Fund |
Shares |
Amount |
Shares |
Amount |
||||||||||||||||||||||||
| Shares sold | 16,177 | $ | 282,485 | 41,600 | $ | 498,818 | ||||||||||||||||||||||
| Reinvestment of dividends | 72,162 | 1,241,910 | 5,339 | 85,585 | ||||||||||||||||||||||||
| Shares redeemed | (21,760 | ) | (379,708 | ) | (202,445 | ) | (2,733,663 | ) | ||||||||||||||||||||
|
|
|
|
|
|
|
|
|
|||||||||||||||||||||
| Net increase (decrease) in shares outstanding | 66,579 | $ | 1,144,687 | (155,506 | ) | $ | (2,149,260 | ) | ||||||||||||||||||||
|
|
|
|
|
|
|
|
|
|||||||||||||||||||||
| Y Class | ||||||||||||||||||||||||||||
| Year Ended December 31, | ||||||||||||||||||||||||||||
| 2021 | 2020 | |||||||||||||||||||||||||||
| Bahl & Gaynor Small Cap Growth Fund |
Shares |
Amount |
Shares |
Amount |
||||||||||||||||||||||||
| Shares sold | 147,997 | $ | 2,639,424 | 200,131 | $ | 2,487,401 | ||||||||||||||||||||||
| Reinvestment of dividends | 80,752 | 1,378,434 | 5,915 | 94,163 | ||||||||||||||||||||||||
| Shares redeemed | (216,001 | ) | (3,801,325 | ) | (505,161 | ) | (6,363,513 | ) | ||||||||||||||||||||
|
|
|
|
|
|
|
|
|
|||||||||||||||||||||
| Net increase (decrease) in shares outstanding | 12,748 | $ | 216,533 | (299,115 | ) | $ | (3,781,949 | ) | ||||||||||||||||||||
|
|
|
|
|
|
|
|
|
|||||||||||||||||||||
| Investor Class | ||||||||||||||||||||||||||||
| Year Ended December 31, | ||||||||||||||||||||||||||||
| 2021 | 2020 | |||||||||||||||||||||||||||
| Bahl & Gaynor Small Cap Growth Fund |
Shares |
Amount |
Shares |
Amount |
||||||||||||||||||||||||
| Shares sold | 52,470 | $ | 907,301 | 60,656 | $ | 753,862 | ||||||||||||||||||||||
| Reinvestment of dividends | 12,615 | 211,168 | 945 | 14,820 | ||||||||||||||||||||||||
| Shares redeemed | (74,782 | ) | (1,316,885 | ) | (80,383 | ) | (1,059,922 | ) | ||||||||||||||||||||
|
|
|
|
|
|
|
|
|
|||||||||||||||||||||
| Net (decrease) in shares outstanding | (9,697 | ) | $ | (198,416 | ) | (18,782 | ) | $ | (291,240 | ) | ||||||||||||||||||
|
|
|
|
|
|
|
|
|
|||||||||||||||||||||
| A Class | ||||||||||||||||||||||||||||
| Year Ended December 31, | ||||||||||||||||||||||||||||
| 2021 | 2020 | |||||||||||||||||||||||||||
| Bahl & Gaynor Small Cap Growth Fund |
Shares |
Amount |
Shares |
Amount |
||||||||||||||||||||||||
| Shares sold | 2,665 | $ | 47,550 | 1,981 | $ | 22,924 | ||||||||||||||||||||||
| Reinvestment of dividends | 4,971 | 83,123 | 413 | 6,476 | ||||||||||||||||||||||||
| Shares redeemed | (21,566 | ) | (370,745 | ) | (23,475 | ) | (299,467 | ) | ||||||||||||||||||||
|
|
|
|
|
|
|
|
|
|||||||||||||||||||||
| Net (decrease) in shares outstanding | (13,930 | ) | $ | (240,072 | ) | (21,081 | ) | $ | (270,067 | ) | ||||||||||||||||||
|
|
|
|
|
|
|
|
|
|||||||||||||||||||||
| C Class | ||||||||||||||||||||||||||||
| Year Ended December 31, | ||||||||||||||||||||||||||||
| 2021 | 2020 | |||||||||||||||||||||||||||
| Bahl & Gaynor Small Cap Growth Fund |
Shares |
Amount |
Shares |
Amount |
||||||||||||||||||||||||
| Shares sold | 1,483 | $ | 25,200 | 181 | $ | 2,500 | ||||||||||||||||||||||
| Reinvestment of dividends | 1,207 | 19,279 | - | - | ||||||||||||||||||||||||
| Shares redeemed | (4,772 | ) | (79,418 | ) | (3,966 | ) | (47,433 | ) | ||||||||||||||||||||
|
|
|
|
|
|
|
|
|
|||||||||||||||||||||
| Net (decrease) in shares outstanding | (2,082 | ) | $ | (34,939 | ) | (3,785 | ) | $ | (44,933 | ) | ||||||||||||||||||
|
|
|
|
|
|
|
|
|
|||||||||||||||||||||
12. Subsequent Events
Management has evaluated subsequent events for possible recognition or disclosure in the financial statements through the date the financial statements are issued. Management has determined that there are no material events that would require disclosure in the Fund’s financial statements through this date.
33
American Beacon Bahl & Gaynor Small Cap Growth FundSM
Financial Highlights
(For a share outstanding throughout the period)
| R5 ClassA | ||||||||||||||||||||||||||||||||||||
| Year Ended December 31, | ||||||||||||||||||||||||||||||||||||
| 2021 | 2020 | 2019 | 2018 | 2017 | ||||||||||||||||||||||||||||||||
|
|
|
|||||||||||||||||||||||||||||||||||
| Net asset value, beginning of period |
$ | 16.19 | $ | 14.52 | $ | 11.62 | $ | 13.93 | $ | 12.77 | ||||||||||||||||||||||||||
|
|
|
|
|
|
|
|
|
|
|
|||||||||||||||||||||||||||
| Income (loss) from investment operations: |
||||||||||||||||||||||||||||||||||||
| Net investment income |
0.06 | 0.10 | 0.07 | 0.07 | 0.04 | |||||||||||||||||||||||||||||||
| Net gains (losses) on investments (both realized and unrealized) |
2.47 | 1.65 | 2.89 | (1.66 | ) | 1.71 | ||||||||||||||||||||||||||||||
|
|
|
|
|
|
|
|
|
|
|
|||||||||||||||||||||||||||
| Total income (loss) from investment operations |
2.53 | 1.75 | 2.96 | (1.59 | ) | 1.75 | ||||||||||||||||||||||||||||||
|
|
|
|
|
|
|
|
|
|
|
|||||||||||||||||||||||||||
| Less distributions: |
||||||||||||||||||||||||||||||||||||
| Dividends from net investment income |
(0.04 | ) | (0.08 | ) | (0.06 | ) | (0.05 | ) | (0.05 | ) | ||||||||||||||||||||||||||
| Distributions from net realized gains |
(1.12 | ) | - | - | (0.67 | ) | (0.54 | ) | ||||||||||||||||||||||||||||
| Tax return of capitalB |
- | - | - | (0.00 | )c | - | ||||||||||||||||||||||||||||||
|
|
|
|
|
|
|
|
|
|
|
|||||||||||||||||||||||||||
| Total distributions |
(1.16 | ) | (0.08 | ) | (0.06 | ) | (0.72 | ) | (0.59 | ) | ||||||||||||||||||||||||||
|
|
|
|
|
|
|
|
|
|
|
|||||||||||||||||||||||||||
| Net asset value, end of period |
$ | 17.56 | $ | 16.19 | $ | 14.52 | $ | 11.62 | $ | 13.93 | ||||||||||||||||||||||||||
|
|
|
|
|
|
|
|
|
|
|
|||||||||||||||||||||||||||
| Total returnD |
15.77 | % | 12.06 | % | 25.49 | % | (11.27 | )% | 13.65 | % | ||||||||||||||||||||||||||
|
|
|
|
|
|
|
|
|
|
|
|||||||||||||||||||||||||||
| Ratios and supplemental data: |
||||||||||||||||||||||||||||||||||||
| Net assets, end of period |
$ | 20,011,026 | $ | 17,373,228 | $ | 17,837,496 | $ | 13,875,243 | $ | 16,498,344 | ||||||||||||||||||||||||||
| Ratios to average net assets: |
||||||||||||||||||||||||||||||||||||
| Expenses, before reimbursements and/or recoupments |
1.40 | % | 1.35 | % | 1.33 | % | 1.26 | % | 1.32 | % | ||||||||||||||||||||||||||
| Expenses, net of reimbursements and/or recoupments |
0.98 | % | 0.98 | % | 0.98 | % | 0.98 | % | 0.98 | % | ||||||||||||||||||||||||||
| Net investment income (loss), before expense reimbursements and/or recoupments |
(0.05 | )% | 0.26 | % | 0.18 | % | 0.17 | % | 0.18 | % | ||||||||||||||||||||||||||
| Net investment income, net of reimbursements and/or recoupments |
0.37 | % | 0.63 | % | 0.53 | % | 0.45 | % | 0.52 | % | ||||||||||||||||||||||||||
| Portfolio turnover rate |
28 | % | 38 | % | 35 | % | 42 | % | 38 | % | ||||||||||||||||||||||||||
| A | Prior to February 28, 2020, the R5 Class was known as Institutional Class. |
| B | Tax return of capital is calculated based on outstanding shares at the time of distribution. |
| C | Amount represents less than $0.01 per share. |
| D | Based on net asset value, which does not reflect the sales charge, redemption fee, or contingent deferred sales charge, if applicable. May include adjustments in accordance with U.S. GAAP and as such, the net asset value for reporting purposes and the returns based upon those net asset values may differ from the net asset value and returns for shareholder transactions. |
See accompanying notes
34
American Beacon Bahl & Gaynor Small Cap Growth FundSM
Financial Highlights
(For a share outstanding throughout the period)
| Y Class | ||||||||||||||||||||||||||||||||||||
| Year Ended December 31, | ||||||||||||||||||||||||||||||||||||
| 2021 | 2020 | 2019 | 2018 | 2017 | ||||||||||||||||||||||||||||||||
|
|
|
|||||||||||||||||||||||||||||||||||
| Net asset value, beginning of period |
$ | 16.08 | $ | 14.44 | $ | 11.57 | $ | 13.89 | $ | 12.75 | ||||||||||||||||||||||||||
|
|
|
|
|
|
|
|
|
|
|
|||||||||||||||||||||||||||
| Income (loss) from investment operations: |
||||||||||||||||||||||||||||||||||||
| Net investment income |
0.05 | 0.08 | 0.06 | 0.05 | 0.05 | |||||||||||||||||||||||||||||||
| Net gains (losses) on investments (both realized and unrealized) |
2.45 | 1.64 | 2.87 | (1.65 | ) | 1.68 | ||||||||||||||||||||||||||||||
|
|
|
|
|
|
|
|
|
|
|
|||||||||||||||||||||||||||
| Total income (loss) from investment operations |
2.50 | 1.72 | 2.93 | (1.60 | ) | 1.73 | ||||||||||||||||||||||||||||||
|
|
|
|
|
|
|
|
|
|
|
|||||||||||||||||||||||||||
| Less distributions: |
||||||||||||||||||||||||||||||||||||
| Dividends from net investment income |
(0.04 | ) | (0.08 | ) | (0.06 | ) | (0.05 | ) | (0.05 | ) | ||||||||||||||||||||||||||
| Distributions from net realized gains |
(1.12 | ) | - | - | (0.67 | ) | (0.54 | ) | ||||||||||||||||||||||||||||
| Tax return of capitalA |
- | - | - | (0.00 | )B | - | ||||||||||||||||||||||||||||||
|
|
|
|
|
|
|
|
|
|
|
|||||||||||||||||||||||||||
| Total distributions |
(1.16 | ) | (0.08 | ) | (0.06 | ) | (0.72 | ) | (0.59 | ) | ||||||||||||||||||||||||||
|
|
|
|
|
|
|
|
|
|
|
|||||||||||||||||||||||||||
| Net asset value, end of period |
$ | 17.42 | $ | 16.08 | $ | 14.44 | $ | 11.57 | $ | 13.89 | ||||||||||||||||||||||||||
|
|
|
|
|
|
|
|
|
|
|
|||||||||||||||||||||||||||
| Total returnC |
15.69 | % | 11.92 | % | 25.34 | % | (11.37 | )% | 13.52 | % | ||||||||||||||||||||||||||
|
|
|
|
|
|
|
|
|
|
|
|||||||||||||||||||||||||||
| Ratios and supplemental data: |
||||||||||||||||||||||||||||||||||||
| Net assets, end of period |
$ | 21,596,567 | $ | 19,738,717 | $ | 22,038,090 | $ | 17,879,581 | $ | 15,114,316 | ||||||||||||||||||||||||||
| Ratios to average net assets: |
||||||||||||||||||||||||||||||||||||
| Expenses, before reimbursements and/or recoupments |
1.46 | % | 1.40 | % | 1.38 | % | 1.34 | % | 1.38 | % | ||||||||||||||||||||||||||
| Expenses, net of reimbursements and/or recoupments |
1.08 | % | 1.08 | % | 1.08 | % | 1.08 | % | 1.08 | % | ||||||||||||||||||||||||||
| Net investment income (loss), before expense reimbursements and/or recoupments |
(0.12 | )% | 0.22 | % | 0.13 | % | 0.13 | % | 0.12 | % | ||||||||||||||||||||||||||
| Net investment income, net of reimbursements and/or recoupments |
0.26 | % | 0.54 | % | 0.43 | % | 0.39 | % | 0.42 | % | ||||||||||||||||||||||||||
| Portfolio turnover rate |
28 | % | 38 | % | 35 | % | 42 | % | 38 | % | ||||||||||||||||||||||||||
| A | Tax return of capital is calculated based on outstanding shares at the time of distribution. |
| B | Amount represents less than $0.01 per share. |
| C | Based on net asset value, which does not reflect the sales charge, redemption fee, or contingent deferred sales charge, if applicable. May include adjustments in accordance with U.S. GAAP and as such, the net asset value for reporting purposes and the returns based upon those net asset values may differ from the net asset value and returns for shareholder transactions. |
See accompanying notes
35
American Beacon Bahl & Gaynor Small Cap Growth FundSM
Financial Highlights
(For a share outstanding throughout the period)
| Investor Class | ||||||||||||||||||||||||||||||||||||
| Year Ended December 31, | ||||||||||||||||||||||||||||||||||||
| 2021 | 2020 | 2019 | 2018 | 2017 | ||||||||||||||||||||||||||||||||
|
|
|
|||||||||||||||||||||||||||||||||||
| Net asset value, beginning of period |
$ | 15.83 | $ | 14.21 | $ | 11.41 | $ | 13.75 | $ | 12.65 | ||||||||||||||||||||||||||
|
|
|
|
|
|
|
|
|
|
|
|||||||||||||||||||||||||||
| Income (loss) from investment operations: |
||||||||||||||||||||||||||||||||||||
| Net investment income (loss) |
(0.01 | ) | 0.02 | 0.01 | (0.00 | )A | 0.02 | |||||||||||||||||||||||||||||
| Net gains (losses) on investments (both realized and unrealized) |
2.42 | 1.67 | 2.84 | (1.62 | ) | 1.66 | ||||||||||||||||||||||||||||||
|
|
|
|
|
|
|
|
|
|
|
|||||||||||||||||||||||||||
| Total income (loss) from investment operations |
2.41 | 1.69 | 2.85 | (1.62 | ) | 1.68 | ||||||||||||||||||||||||||||||
|
|
|
|
|
|
|
|
|
|
|
|||||||||||||||||||||||||||
| Less distributions: |
||||||||||||||||||||||||||||||||||||
| Dividends from net investment income |
(0.04 | ) | (0.07 | ) | (0.05 | ) | (0.05 | ) | (0.04 | ) | ||||||||||||||||||||||||||
| Distributions from net realized gains |
(1.12 | ) | - | - | (0.67 | ) | (0.54 | ) | ||||||||||||||||||||||||||||
| Tax return of capitalB |
- | - | - | (0.00 | )A | - | ||||||||||||||||||||||||||||||
|
|
|
|
|
|
|
|
|
|
|
|||||||||||||||||||||||||||
| Total distributions |
(1.16 | ) | (0.07 | ) | (0.05 | ) | (0.72 | ) | (0.58 | ) | ||||||||||||||||||||||||||
|
|
|
|
|
|
|
|
|
|
|
|||||||||||||||||||||||||||
| Net asset value, end of period |
$ | 17.08 | $ | 15.83 | $ | 14.21 | $ | 11.41 | $ | 13.75 | ||||||||||||||||||||||||||
|
|
|
|
|
|
|
|
|
|
|
|||||||||||||||||||||||||||
| Total returnC |
15.35 | % | 11.91 | % | 24.99 | % | (11.64 | )% | 13.23 | % | ||||||||||||||||||||||||||
|
|
|
|
|
|
|
|
|
|
|
|||||||||||||||||||||||||||
| Ratios and supplemental data: |
||||||||||||||||||||||||||||||||||||
| Net assets, end of period |
$ | 3,379,147 | $ | 3,286,176 | $ | 3,217,039 | $ | 2,736,498 | $ | 4,344,476 | ||||||||||||||||||||||||||
| Ratios to average net assets: |
||||||||||||||||||||||||||||||||||||
| Expenses, before reimbursements and/or recoupments |
1.77 | % | 1.75 | % | 1.71 | % | 1.53 | % | 1.57 | % | ||||||||||||||||||||||||||
| Expenses, net of reimbursements and/or recoupments |
1.36 | % | 1.36 | % | 1.36 | % | 1.36 | % | 1.36 | % | ||||||||||||||||||||||||||
| Net investment (loss), before expense reimbursements and/or recoupments |
(0.43 | )% | (0.14 | )% | (0.20 | )% | (0.14 | )% | (0.09 | )% | ||||||||||||||||||||||||||
| Net investment income (loss), net of reimbursements and/or recoupments |
(0.02 | )% | 0.25 | % | 0.15 | % | 0.03 | % | 0.12 | % | ||||||||||||||||||||||||||
| Portfolio turnover rate |
28 | % | 38 | % | 35 | % | 42 | % | 38 | % | ||||||||||||||||||||||||||
| A | Amount represents less than $0.01 per share. |
| B | Tax return of capital is calculated based on outstanding shares at the time of distribution. |
| C | Based on net asset value, which does not reflect the sales charge, redemption fee, or contingent deferred sales charge, if applicable. May include adjustments in accordance with U.S. GAAP and as such, the net asset value for reporting purposes and the returns based upon those net asset values may differ from the net asset value and returns for shareholder transactions. |
See accompanying notes
36
American Beacon Bahl & Gaynor Small Cap Growth FundSM
Financial Highlights
(For a share outstanding throughout the period)
| A Class | ||||||||||||||||||||||||||||||||||||
| Year Ended December 31, | ||||||||||||||||||||||||||||||||||||
| 2021 | 2020 | 2019 | 2018 | 2017 | ||||||||||||||||||||||||||||||||
|
|
|
|||||||||||||||||||||||||||||||||||
| Net asset value, beginning of period |
$ | 15.81 | $ | 14.23 | $ | 11.42 | $ | 13.75 | $ | 12.64 | ||||||||||||||||||||||||||
|
|
|
|
|
|
|
|
|
|
|
|||||||||||||||||||||||||||
| Income (loss) from investment operations: |
||||||||||||||||||||||||||||||||||||
| Net investment income |
(0.00 | )A | 0.03 | B | 0.01 | B | 0.02 | 0.03 | ||||||||||||||||||||||||||||
| Net gains (losses) on investments (both realized and unrealized) |
2.41 | 1.62 | 2.84 | (1.64 | ) | 1.65 | ||||||||||||||||||||||||||||||
|
|
|
|
|
|
|
|
|
|
|
|||||||||||||||||||||||||||
| Total income (loss) from investment operations |
2.41 | 1.65 | 2.85 | (1.62 | ) | 1.68 | ||||||||||||||||||||||||||||||
|
|
|
|
|
|
|
|
|
|
|
|||||||||||||||||||||||||||
| Less distributions: |
||||||||||||||||||||||||||||||||||||
| Dividends from net investment income |
(0.04 | ) | (0.07 | ) | (0.04 | ) | (0.04 | ) | (0.03 | ) | ||||||||||||||||||||||||||
| Distributions from net realized gains |
(1.12 | ) | - | - | (0.67 | ) | (0.54 | ) | ||||||||||||||||||||||||||||
| Tax return of capitalC |
- | - | - | (0.00 | )A | - | ||||||||||||||||||||||||||||||
|
|
|
|
|
|
|
|
|
|
|
|||||||||||||||||||||||||||
| Total distributions |
(1.16 | ) | (0.07 | ) | (0.04 | ) | (0.71 | ) | (0.57 | ) | ||||||||||||||||||||||||||
|
|
|
|
|
|
|
|
|
|
|
|||||||||||||||||||||||||||
| Net asset value, end of period |
$ | 17.06 | $ | 15.81 | $ | 14.23 | $ | 11.42 | $ | 13.75 | ||||||||||||||||||||||||||
|
|
|
|
|
|
|
|
|
|
|
|||||||||||||||||||||||||||
| Total returnD |
15.39 | % | 11.62 | % | 24.97 | % | (11.70 | )% | 13.30 | % | ||||||||||||||||||||||||||
|
|
|
|
|
|
|
|
|
|
|
|||||||||||||||||||||||||||
| Ratios and supplemental data: |
||||||||||||||||||||||||||||||||||||
| Net assets, end of period |
$ | 1,296,534 | $ | 1,422,125 | $ | 1,579,622 | $ | 3,958,224 | $ | 3,955,277 | ||||||||||||||||||||||||||
| Ratios to average net assets: |
||||||||||||||||||||||||||||||||||||
| Expenses, before reimbursements and/or recoupments |
1.69 | % | 1.64 | % | 1.64 | % | 1.61 | % | 1.69 | % | ||||||||||||||||||||||||||
| Expenses, net of reimbursements and/or recoupments |
1.33 | % | 1.35 | % | 1.38 | % | 1.38 | % | 1.38 | % | ||||||||||||||||||||||||||
| Net investment (loss), before expense reimbursements and/or recoupments |
(0.36 | )% | (0.04 | )% | (0.18 | )% | (0.16 | )% | (0.20 | )% | ||||||||||||||||||||||||||
| Net investment income, net of reimbursements and/or recoupments |
(0.00 | )%E | 0.25 | % | 0.08 | % | 0.07 | % | 0.11 | % | ||||||||||||||||||||||||||
| Portfolio turnover rate |
28 | % | 38 | % | 35 | % | 42 | % | 38 | % | ||||||||||||||||||||||||||
| A | Amount represents less than $0.01 per share. |
| B | Per share amounts have been calculated using the average shares method. |
| C | Tax return of capital is calculated based on outstanding shares at the time of distribution. |
| D | Based on net asset value, which does not reflect the sales charge, redemption fee, or contingent deferred sales charge, if applicable. May include adjustments in accordance with U.S. GAAP and as such, the net asset value for reporting purposes and the returns based upon those net asset values may differ from the net asset value and returns for shareholder transactions. |
| E | Amount represents less than 0.005% of average net assets. |
See accompanying notes
37
American Beacon Bahl & Gaynor Small Cap Growth FundSM
Financial Highlights
(For a share outstanding throughout the period)
| C Class | ||||||||||||||||||||||||||||||||||||
| Year Ended December 31, | ||||||||||||||||||||||||||||||||||||
| 2021 | 2020 | 2019 | 2018 | 2017 | ||||||||||||||||||||||||||||||||
|
|
|
|||||||||||||||||||||||||||||||||||
| Net asset value, beginning of period |
$ | 15.24 | $ | 13.75 | $ | 11.09 | $ | 13.42 | $ | 12.42 | ||||||||||||||||||||||||||
|
|
|
|
|
|
|
|
|
|
|
|||||||||||||||||||||||||||
| Income (loss) from investment operations: |
||||||||||||||||||||||||||||||||||||
| Net investment (loss) |
(0.23 | ) | (0.18 | ) | (0.14 | ) | (0.21 | ) | (0.06 | ) | ||||||||||||||||||||||||||
| Net gains (losses) on investments (both realized and unrealized) |
2.41 | 1.67 | 2.80 | (1.45 | ) | 1.60 | ||||||||||||||||||||||||||||||
|
|
|
|
|
|
|
|
|
|
|
|||||||||||||||||||||||||||
| Total income (loss) from investment operations |
2.18 | 1.49 | 2.66 | (1.66 | ) | 1.54 | ||||||||||||||||||||||||||||||
|
|
|
|
|
|
|
|
|
|
|
|||||||||||||||||||||||||||
| Less distributions: |
||||||||||||||||||||||||||||||||||||
| Dividends from net investment income |
- | - | - | - | - | |||||||||||||||||||||||||||||||
| Distributions from net realized gains |
(1.12 | ) | - | - | (0.67 | ) | (0.54 | ) | ||||||||||||||||||||||||||||
| Tax return of capitalA |
- | - | - | (0.00 | )B | - | ||||||||||||||||||||||||||||||
|
|
|
|
|
|
|
|
|
|
|
|||||||||||||||||||||||||||
| Total distributions |
(1.12 | ) | - | - | (0.67 | ) | (0.54 | ) | ||||||||||||||||||||||||||||
|
|
|
|
|
|
|
|
|
|
|
|||||||||||||||||||||||||||
| Net asset value, end of period |
$ | 16.30 | $ | 15.24 | $ | 13.75 | $ | 11.09 | $ | 13.42 | ||||||||||||||||||||||||||
|
|
|
|
|
|
|
|
|
|
|
|||||||||||||||||||||||||||
| Total returnC |
14.44 | % | 10.84 | % | 23.99 | % | (12.26 | )% | 12.38 | % | ||||||||||||||||||||||||||
|
|
|
|
|
|
|
|
|
|
|
|||||||||||||||||||||||||||
| Ratios and supplemental data: |
||||||||||||||||||||||||||||||||||||
| Net assets, end of period |
$ | 288,779 | $ | 301,719 | $ | 324,394 | $ | 297,668 | $ | 520,113 | ||||||||||||||||||||||||||
| Ratios to average net assets: |
||||||||||||||||||||||||||||||||||||
| Expenses, before reimbursements and/or recoupments |
2.49 | % | 2.45 | % | 2.47 | % | 2.35 | % | 2.44 | % | ||||||||||||||||||||||||||
| Expenses, net of reimbursements and/or recoupments |
2.13 | % | 2.13 | % | 2.13 | % | 2.13 | % | 2.13 | % | ||||||||||||||||||||||||||
| Net investment (loss), before expense reimbursements and/or recoupments |
(1.15 | )% | (0.84 | )% | (0.97 | )% | (0.92 | )% | (0.96 | )% | ||||||||||||||||||||||||||
| Net investment (loss), net of reimbursements and/or recoupments |
(0.79 | )% | (0.52 | )% | (0.63 | )% | (0.70 | )% | (0.65 | )% | ||||||||||||||||||||||||||
| Portfolio turnover rate |
28 | % | 38 | % | 35 | % | 42 | % | 38 | % | ||||||||||||||||||||||||||
| A | Tax return of capital is calculated based on outstanding shares at the time of distribution. |
| B | Amount represents less than $0.01 per share. |
| C | Based on net asset value, which does not reflect the sales charge, redemption fee, or contingent deferred sales charge, if applicable. May include adjustments in accordance with U.S. GAAP and as such, the net asset value for reporting purposes and the returns based upon those net asset values may differ from the net asset value and returns for shareholder transactions. |
See accompanying notes
38
American Beacon Bahl & Gaynor Small Cap Growth FundSM
Federal Tax Information
December 31, 2021 (Unaudited)
Certain tax information regarding the Fund is required to be provided to shareholders based upon the Fund’s income and distributions for the taxable year ended December 31, 2021. The information and distributions reported herein may differ from information and distributions taxable to the shareholders for the calendar year ended December 31, 2021.
The Fund designated the following items with regard to distributions paid during the fiscal year ended December 31, 2021. All designations are based on financial information available as of this annual report and, accordingly, are subject to change. For each item, it is the intention of the Fund to designate the maximum amount permitted under the Internal Revenue Code of 1986, as amended, and the regulations there under.
Corporate Dividends-Received Deduction:
| Bahl & Gaynor Small Cap Growth |
100 | % |
Qualified Dividend Income:
| Bahl & Gaynor Small Cap Growth |
100 | % |
Long-Term Capital Gain Distributions:
| Bahl & Gaynor Small Cap Growth |
$ | 2,872,835 |
Short-Term Capital Gain Distributions:
| Bahl & Gaynor Small Cap Growth |
$ | 0 |
Shareholders received notification in January 2022 of the applicable tax information necessary to prepare their 2021 income tax returns.
39
Trustees and Officers of the American Beacon FundsSM (Unaudited)
The Trustees and officers of the American Beacon Funds (the “Trust”) are listed below, together with their principal occupations during the past five years. The address of each person listed below is 220 Las Colinas Boulevard East, Suite 1200, Irving, Texas 75039. Each Trustee oversees thirty funds in the fund complex that includes the Trust, the American Beacon Select Funds, and the American Beacon Institutional Funds Trust. The Trust’s Statement of Additional Information contains additional information about the Trustees and is available without charge by calling 1-800-658-5811.
| Name, Age |
Position, Term of Office and Length of Time Served with the Trust |
Principal Occupation(s) During Past 5 Years and Current Directorships | ||
| INTERESTED TRUSTEES | Term |
|||
| Lifetime of Trust until removal, resignation or retirement* |
||||
| Eugene J. Duffy (67)** | Trustee since 2008 | Managing Director, Global Investment Management Distribution, Mesirow Financial Administrative Corporation (2016-Present); Managing Director, Institutional Services, Intercontinental Real Estate Corporation (2014-2016); Trustee, American Beacon Select Funds (2008-Present); Trustee, American Beacon Institutional Funds Trust (2017-Present); Trustee, American Beacon Sound Point Enhanced Income Fund (2018-2021); Trustee, American Beacon Apollo Total Return Fund (2018-2021). | ||
| NON-INTERESTED TRUSTEES | Term |
|||
| Lifetime of Trust until removal, resignation or retirement* |
||||
| Gilbert G. Alvarado (52) | Trustee since 2015 | President, SJVIIF, LLC, Impact Investment Fund (2018-Present); Director, Kura MD, Inc. (local telehealth organization) (2015-2017); Senior Vice President & CFO, Sierra Health Foundation (health conversion private foundation) (2006-Present); Senior Vice President & CFO, Sierra Health Foundation: Center for Health Program Management (California public benefit corporation) (2012-Present); Director, Innovative North State (2012-2015); Director, Sacramento Regional Technology Alliance (2011-2016); Director, Valley Healthcare Staffing (2017-2018); Trustee, American Beacon Select Funds (2015-Present); Trustee, American Beacon Institutional Funds Trust (2017-Present); Trustee, American Beacon Sound Point Enhanced Income Fund (2018-2021); Trustee, American Beacon Apollo Total Return Fund (2018-2021). | ||
| Joseph B. Armes (59) | Trustee since 2015 | Director, Switchback Energy Acquisition (2019-2021); Chairman & CEO, CSW Industrials f/k/a Capital Southwest Corporation (investment company) (2015-Present); Chairman of the Board of Capital Southwest Corporation, predecessor to CSW Industrials, Inc. (2014-2017) (investment company); President & CEO, JBA Investment Partners (family investment vehicle) (2010-Present); Director and Chair of Audit Committee, RSP Permian (oil and gas producer) (2013-2018); Trustee, American Beacon Select Funds (2015-Present); Trustee, American Beacon Institutional Funds Trust (2017-Present); Trustee, American Beacon Sound Point Enhanced Income Fund (2018-2021); Trustee, American Beacon Apollo Total Return Fund (2018-2021). | ||
| Gerard J. Arpey (63) | Trustee since 2012 | Partner, Emerald Creek Group (private equity firm) (2011-Present); Director, S.C. Johnson & Son, Inc. (privately held company) (2008-present); Director, The Home Depot, Inc. (2015-Present); Trustee, American Beacon Select Funds (2012-Present); Trustee, American Beacon Institutional Funds Trust (2017-Present); Trustee, American Beacon Sound Point Enhanced Income Fund (2018-2021); Trustee, American Beacon Apollo Total Return Fund (2018-2021). | ||
40
Trustees and Officers of the American Beacon FundsSM (Unaudited)
| Name, Age |
Position, Term of Office and Length of Time Served with the Trust |
Principal Occupation(s) During Past 5 Years and Current Directorships | ||
| NON-INTERESTED TRUSTEES (CONT.) | Term |
|||
| Lifetime of Trust until removal, resignation or retirement* |
||||
| Brenda A. Cline (61) | Trustee since 2004 Chair since 2019 Vice Chair 2018 |
Chief Financial Officer, Treasurer and Secretary, Kimbell Art Foundation (1993-Present); Director, Tyler Technologies, Inc. (public sector software solutions company) (2014-Present); Director, Range Resources Corporation (oil and natural gas company) (2015-Present); Trustee, Cushing Closed-End and Open-End Funds (2017-Present); Trustee, American Beacon Select Funds (2004-Present); Trustee, American Beacon Institutional Funds Trust (2017-Present); Trustee, American Beacon Sound Point Enhanced Income Fund (2018-2021); Trustee, American Beacon Apollo Total Return Fund (2018-2021). | ||
| Claudia A. Holz (64) | Trustee since 2018 | Partner, KPMG LLP (1990-2017); Independent Director, Blue Owl Capital Inc. (2021-Present); Trustee, American Beacon Select Funds (2018-Present); Trustee, American Beacon Institutional Funds Trust (2018-Present); Trustee, American Beacon Sound Point Enhanced Income Fund (2018-2021); Trustee, American Beacon Apollo Total Return Fund (2018-2021). | ||
| Douglas A. Lindgren (60) | Trustee since 2018 | CEO North America, Carne Global Financial Services (2016-2017); Consultant, Carne Financial Services (2017-2019); Managing Director, IPS Investment Management and Global Head, Content Management, UBS Wealth Management (2010-2016); Trustee, American Beacon Select Funds (2018-Present); Trustee, American Beacon Institutional Funds Trust (2018-Present); Trustee, American Beacon Sound Point Enhanced Income Fund (2018-2021); Trustee, American Beacon Apollo Total Return Fund (2018-2021). | ||
| Barbara J. McKenna, CFA (58) | Trustee since 2012 | President/Managing Principal, Longfellow Investment Management Company (2005-Present); Trustee, American Beacon Select Funds (2012-Present); Trustee, American Beacon Institutional Funds Trust (2017-Present); Trustee, American Beacon Sound Point Enhanced Income Fund (2018-2021); Trustee, American Beacon Apollo Total Return Fund (2018-2021). | ||
41
Trustees and Officers of the American Beacon FundsSM (Unaudited)
| Name, Age |
Position, Term of Office and Length of Time Served with the Trust |
Principal Occupation(s) During Past 5 Years and Current Directorships | ||
| OFFICERS | Term |
|||
| One Year | ||||
| Gene L. Needles, Jr. (67) | President since 2009 | President (2009-2018), CEO and Director (2009-Present), and Chairman (2018-Present), American Beacon Advisors, Inc., President (2015-2018), Director and CEO (2015-Present), and Chairman (2018-Present), Resolute Investment Holdings, LLC; President (2015-2018), Director and CEO (2015-Present), and Chairman (2018-Present), Resolute Topco, Inc.; President (2015-2018); Director, and CEO (2015-Present), and Chairman (2018-Present), Resolute Acquisition, Inc.; President (2015-2018), Director and CEO (2015-Present), Chairman (2018-Present), Resolute Investment Managers, Inc.; Director, Chairman, President and CEO, Resolute Investment Distributors (2017-Present); Director, Chairman, President and CEO; Resolute Investment Services, Inc. (2017-Present); Manager, President and CEO, American Private Equity Management, LLC (2012-Present); Director, Chairman, President and CEO, Alpha Quant Advisors, LLC (2016-2020); Director, ARK Investment Management LLC (2016-2020); Director, Shapiro Capital Management LLC (2017-Present); Director, Chairman and CEO, Continuous Capital, LLC (2018-Present); Director, Green Harvest Asset Management (2019-2021); Director, National Investment Services of America, LLC (2019-Present); Director, RSW Investments Holdings LLC, (2019-Present); Manager, SSI Investment Management, LLC (2019-Present); President, American Beacon Cayman Managed Futures Strategy Fund, Ltd. (2014-Present); Director and President, American Beacon Cayman Transformational Innovation Company, LTD., (2017-2018); President, American Beacon Delaware Transformational Innovation Corporation (2017-2018); President, American Beacon Cayman TargetRisk Company, Ltd. (2018-Present); Member, Investment Advisory Committee, Employees Retirement System of Texas (2017-Present); Trustee, American Beacon NextShares Trust (2015-2020); President, American Beacon Select Funds (2009-Present); President, American Beacon Institutional Funds Trust (2017-Present); President, American Beacon Sound Point Enhanced Income Fund (2018-2021); President, American Beacon Apollo Total Return Fund (2018-2021). | ||
| Rosemary K. Behan (62) | VP, Secretary and Chief Legal Officer since 2006 |
Senior Vice President (2021-Present), Vice President (2006-2021), Secretary and General Counsel (2006-Present), American Beacon Advisors, Inc.; Secretary, Resolute Investment Holdings, LLC (2015-Present); Secretary, Resolute Topco, Inc. (2015-Present); Secretary, Resolute Acquisition, Inc. (2015-Present); Senior Vice President (2021-Present), Vice President (2015-2021), Secretary and General Counsel (2015-Present), Resolute Investment Managers, Inc.; Secretary, Resolute Investment Distributors, Inc. (2017-Present); Senior Vice President (2021-Present), Vice President (2017-2021), Secretary and General Counsel (2017-Present), Resolute Investment Services, Inc.; Secretary, American Private Equity Management, LLC (2008-Present); Secretary and General Counsel, Alpha Quant Advisors, LLC (2016-2020); Vice President and Secretary, Continuous Capital, LLC (2018-Present); Secretary, Green Harvest Asset Management (2019-2021); Secretary, American Beacon Delaware Transformational Innovation Corporation (2017-2018); Secretary, American Beacon Cayman Transformational Innovation Company, Ltd. (2017-2018); Secretary, American Beacon Cayman Managed Futures Strategy Fund, Ltd. (2014-Present); Secretary, American Beacon Cayman TargetRisk Company, Ltd (2018-Present); Chief Legal Officer, Vice President and Secretary, American Beacon Select Funds (2006-Present); Chief Legal Officer, Vice President and Secretary, American Beacon Institutional Funds Trust (2017-Present); Chief Legal Officer, Vice President and Secretary, American Beacon Sound Point Enhanced Income Fund (2018-2021); Chief Legal Officer, Vice President and Secretary, American Beacon Apollo Total Return Fund (2018-2021). | ||
42
Trustees and Officers of the American Beacon FundsSM (Unaudited)
| Name, Age |
Position, Term of Office and Length of Time Served with the Trust |
Principal Occupation(s) During Past 5 Years and Current Directorships | ||
| OFFICERS (CONT.) | Term |
|||
| One Year | ||||
| Brian E. Brett (61) | VP since 2004 | Senior Vice President, Head of Distribution (2012-Present), American Beacon Advisors, Inc.; Senior Vice President, Resolute Investment Managers, Inc. (2017-Present); Senior Vice President, Resolute Investment Distributors, Inc. (2018-Present); Senior Vice President, Resolute Investment Services, Inc. (2018-Present); Vice President, American Beacon Select Funds (2004-Present); Vice President, American Beacon Institutional Funds Trust (2017-Present); Vice President, American Beacon Sound Point Enhanced Income Fund (2018-2021); Vice President, American Beacon Apollo Total Return Fund (2018-2021). | ||
| Paul B. Cavazos (52) | VP since 2016 | Chief Investment Officer and Senior Vice President, American Beacon Advisors, Inc. (2016-Present); Chief Investment Officer, DTE Energy (2007-2016); Vice President, American Private Equity Management, L.L.C. (2017-Present); Vice President, American Beacon Select Funds (2016-Present); Vice President, American Beacon Institutional Funds Trust (2017-Present); Vice President, American Beacon Sound Point Enhanced Income Fund (2018-2021); Vice President, American Beacon Apollo Total Return Fund (2018-2021). | ||
| Erica Duncan (51) | VP since 2011 | Vice President, American Beacon Advisors, Inc. (2011-Present); Vice President, Resolute Investment Managers (2018-Present); Vice President, Resolute Investment Services, Inc. (2018-Present); Vice President, American Beacon Select Funds (2011-Present); Vice President, American Beacon Institutional Funds Trust (2017-Present); Vice President, American Beacon Sound Point Enhanced Income Fund (2018-2021); Vice President, American Beacon Apollo Total Return Fund (2018-2021). | ||
| Melinda G. Heika (60) | VP since 2021 Principal Accounting Officer and Treasurer (2010-2021) |
Senior Vice President (2021-Present), Treasurer and CFO (2010-Present), American Beacon Advisors, Inc.; Treasurer, Resolute Topco, Inc. (2015-Present); Treasurer, Resolute Investment Holdings, LLC. (2015-Present); Treasurer, Resolute Acquisition, Inc. (2015-Present); Senior Vice President (2021-Present), Treasurer and CFO, Resolute Investment Managers, Inc. (2017-Present); Treasurer, Resolute Investment Distributors, Inc. (2017); Senior Vice President (2021-Present); Treasurer and CFO, Resolute Investment Services, Inc. (2015-Present); Treasurer, American Private Equity Management, LLC (2012-Present); Treasurer and CFO, Alpha Quant Advisors, LLC (2016-2020); Treasurer and CFO, Continuous Capital, LLC (2018-Present); Treasurer, American Beacon Cayman Transformational Innovation, Ltd. (2017-2018); Treasurer, American Beacon Delaware Transformational Innovation Corporation (2017-2018); Director and Treasurer, American Beacon Cayman Managed Futures Strategy Fund, Ltd. (2014-Present); Treasurer, American Beacon Cayman TargetRisk Company, Ltd. (2018-Present); Vice President (2021-Present), Principal Accounting Officer (2017-2021) and Treasurer (2010-2021), American Beacon Select Funds; Vice President (2021-Present), Principal Accounting Officer and Treasurer (2017-2021), American Beacon Institutional Funds Trust; Vice President (2021), Principal Accounting Officer and Treasurer (2018-2021), American Beacon Sound Point Enhanced Income Fund; Vice President (2021), Principal Accounting Officer and Treasurer, American Beacon Apollo Total Return Fund (2018-2021). | ||
43
Trustees and Officers of the American Beacon FundsSM (Unaudited)
| Name, Age |
Position, Term of Office and Length of Time Served with the Trust |
Principal Occupation(s) During Past 5 Years and Current Directorships | ||
| OFFICERS (CONT.) | Term |
|||
| One Year | ||||
| Terri L. McKinney (58) | VP since 2010 | Senior Vice President (2021-Present), Vice President (2009-2021), American Beacon Advisors, Inc.; Senior Vice President (2021-Present); Vice President (2017-2021), Resolute Investment Managers, Inc.; Senior Vice President (2021-Present), Vice President (2018-Present), Resolute Investment Services, Inc; Vice President, Alpha Quant Advisors, LLC (2016-2020); Vice President, Continuous Capital, LLC (2018-Present); Vice President, American Beacon Select Funds (2010-Present); Vice President, American Beacon Institutional Funds Trust (2017-Present); Vice President, American Beacon Sound Point Enhanced Income Fund (2018-2021); Vice President, American Beacon Apollo Total Return Fund (2018-2021). | ||
| Jeffrey K. Ringdahl (46) | VP since 2010 | Director (2015-Present), President (2018-Present), Chief Operating Officer (2010-Present), Senior Vice President (2013-2018), American Beacon Advisors, Inc.; Director (2015-Present), President (2018-Present), Senior Vice President (2015-2018), Resolute Investment Holdings, LLC; Director (2015-Present), President (2018-Present), Senior Vice President (2015-2018), Resolute Topco, Inc.; Director (2015-Present), President (2018-Present), Senior Vice President (2015-2018), Resolute Acquisition, Inc.; Director (2015-Present), President & COO (2018-Present), Senior Vice President (2015-2018), Resolute Investment Managers, Inc.; Director and Executive Vice President (2017-Present), Resolute Investment Distributors, Inc.; Director (2017-Present), President & COO (2018-Present), Executive Vice President (2017-2018), Resolute Investment Services, Inc.; Senior Vice President (2017-Present), Vice President (2012-2017), Manager (2015-Present), American Private Equity Management, LLC; Trustee, American Beacon NextShares Trust (2015-2020); Director, Executive Vice President & COO, Alpha Quant Advisors, LLC (2016-2020); Director, Shapiro Capital Management, LLC (2017-Present); Director, Executive Vice President & COO, Continuous Capital, LLC (2018-Present); Director, RSW Investments Holdings LLC, (2019-Present); Manager, SSI Investment Management, LLC (2019-Present); Director, National Investment Services of America, LLC (2019-Present); Director and Vice President, American Beacon Cayman Transformational Innovation Company, Ltd., (2017-Present); Vice President, American Beacon Delaware Transformational Innovation Corporation (2017-2018); Director and Vice President, American Beacon Cayman Managed Futures Strategy Fund, Ltd. (2014-Present); Vice President, American Beacon Cayman TargetRisk Company, Ltd (2018-Present); Vice President, American Beacon Select Funds (2010-2018); Vice President, American Beacon Institutional Funds Trust (2017-Present); Vice President, American Beacon Sound Point Enhanced Income Fund (2018-2021); Vice President, American Beacon Apollo Total Return Fund (2018-2021). | ||
| Samuel J. Silver (58) | VP since 2011 | Vice President (2011-Present), Chief Fixed Income Officer (2016-Present), American Beacon Advisors, Inc. (2011-Present); Vice President, American Beacon Select Funds (2011-Present); Vice President, American Beacon Institutional Funds Trust (2017-Present); Vice President, American Beacon Sound Point Enhanced Income Fund (2018-2021); Vice President, American Beacon Apollo Total Return Fund (2018-2021). | ||
44
Trustees and Officers of the American Beacon FundsSM (Unaudited)
| Name, Age |
Position, Term of Office and Length of Time Served with the Trust |
Principal Occupation(s) During Past 5 Years and Current Directorships | ||
| OFFICERS (CONT.) | Term |
|||
| One Year | ||||
| Christina E. Sears (50) | Chief Compliance Officer since 2004 and Asst. Secretary since 1999 |
Vice President, American Beacon Advisors, Inc. (2019-Present); Chief Compliance Officer, American Beacon Advisors, Inc. (2004-Present); Vice President, Resolute Investment Managers, Inc. (2017-Present); Vice President, Resolute Investment Distributors (2017-Present); Vice President, Resolute Investment Services, Inc. (2019-Present); Chief Compliance Officer, American Private Equity Management, LLC (2012-Present); Chief Compliance Officer, Green Harvest Asset Management, LLC (2019-2021); Chief Compliance Officer, RSW Investments Holdings, LLC (2019-Present); Chief Compliance Officer (2016-2019) and Vice President, Alpha Quant Advisors, LLC (2016-2020); Vice President, Continuous Capital, LLC (2018-Present); Chief Compliance Officer (2004-Present) and Assistant Secretary (1999-Present), American Beacon Select Funds; Chief Compliance Officer and Assistant Secretary, American Beacon Institutional Funds Trust (2017-Present); Chief Compliance Officer and Assistant Secretary, American Beacon Sound Point Enhanced Income Fund (2018-2021); Chief Compliance Officer and Assistant Secretary, American Beacon Apollo Total Return Fund (2018-2021). | ||
| Sonia L. Bates (65) | Principal Accounting Officer and Treasurer since 2021 Assistant Treasurer (2011-2021) |
Assistant Treasurer, American Beacon Advisors, Inc. (2011-2018); Assistant Treasurer, American Private Equity Management, LLC (2012-Present); Assistant Treasurer, American Beacon Cayman Transformational Innovation Company, Ltd. (2017-Present); Assistant Treasurer, American Beacon Cayman TargetRisk Company, Ltd. (2018-Present); Principal Accounting Officer and Treasurer (2021-Present), Assistant Treasurer (2011-2021), American Beacon Select Funds; Principal Accounting Officer and Treasurer (2021-Present), Assistant Treasurer (2017-2021), American Beacon Institutional Funds Trust; Principal Accounting Officer and Treasurer (2021), Assistant Treasurer (2018-2021), American Beacon Sound Point Enhanced Income Fund; Principal Accounting Officer and Treasurer (2021), Assistant Treasurer (2018-2021), American Beacon Apollo Total Return Fund. | ||
| Shelley L. Dyson (52) | Assistant Treasurer since 2021 | Assistant Treasurer, American Beacon Select Funds (2021-Present); Assistant Treasurer, American Beacon Institutional Funds Trust (2021-Present); Assistant Treasurer, American Beacon Sound Point Enhanced Income Fund (2021); Assistant Treasurer, American Beacon Apollo Total Return Fund (2021). | ||
| Shelley D. Abrahams (47) | Assistant Secretary since 2008 | Assistant Secretary, American Beacon Select Funds (2008-Present); Assistant Secretary, American Beacon Institutional Funds Trust (2017-Present); Assistant Secretary, American Beacon Sound Point Enhanced Income Fund (2018-2021); Assistant Secretary, American Beacon Apollo Total Return Fund (2018-2021). | ||
| Rebecca L. Harris (55) | Assistant Secretary since 2010 | Senior Vice President (2021-Present), Vice President (2011-Present), American Beacon Advisors, Inc.; Senior Vice President (2021-Present), Vice President (2017-Present), Resolute Investment Managers, Inc.; Senior Vice President (2021-Present), Vice President (2015-Present), Resolute Investment Services; Vice President, Alpha Quant Advisors, LLC (2016-2020); Vice President, Continuous Capital, LLC (2018-Present); Assistant Secretary, American Beacon Select Funds (2010-Present); Assistant Secretary, American Beacon Institutional Funds Trust (2017-Present); Assistant Secretary, American Beacon Sound Point Enhanced Income Fund (2018-2021); Assistant Secretary, American Beacon Apollo Total Return Fund (2018-2021). | ||
45
Trustees and Officers of the American Beacon FundsSM (Unaudited)
| Name, Age |
Position, Term of Office and Length of Time Served with the Trust |
Principal Occupation(s) During Past 5 Years and Current Directorships | ||
| OFFICERS (CONT.) | Term |
|||
| One Year | ||||
| Teresa A. Oxford (63) | Assistant Secretary since 2015 | Assistant Secretary, American Beacon Advisors, Inc. (2015-Present); Assistant Secretary, Resolute Investment Distributors (2018-2021); Assistant Secretary, Resolute Investment Managers, Inc. (2017-Present); Assistant Secretary, Resolute Investment Services (2018-Present); Assistant Secretary, Alpha Quant Advisors, LLC (2016-2020); Assistant Secretary, Continuous Capital, LLC (2020-Present); Assistant Secretary, American Beacon Select Funds (2015-Present); Assistant Secretary, American Beacon Institutional Funds Trust (2017-Present); Assistant Secretary, American Beacon Sound Point Enhanced Income Fund (2018-2021); Assistant Secretary, American Beacon Apollo Total Return Fund (2018-2021). | ||
| Michael D. Jiang (37) | Assistant Secretary since 2021 | Assistant Secretary (2021-Present), Resolute Investment Distributors, Inc.; Associate General Counsel (2021-Present), Resolute Investment Services, Inc.; Vice President (2018-2021), The Northern Trust Company; Second Vice President (2015-2018), The Northern Trust Company. Assistant Secretary, American Beacon Select Funds (2021-Present); Assistant Secretary, American Beacon Institutional Funds Trust (2021-Present); Assistant Secretary, American Beacon Sound Point Enhanced Income Fund (2021); Assistant Secretary, American Beacon Apollo Total Return Fund (2021). | ||
* As of 11/12/2014, the Board adopted a retirement plan that requires Trustees to retire no later than the last day of the calendar year in which they reach the age of 75.
** Mr. Duffy is being deemed to be an “interested person” of the Trust, as defined by the Investment Company Act of 1940, as amended, by virtue of his position with Mesirow Financial, Inc., a broker-dealer.
46
Privacy Policy
December 31, 2020 (Unaudited)
The American Beacon Funds recognize and respect the privacy of our shareholders. We are providing this notice to you, so you will understand how shareholder information may be collected and used.
We may collect nonpublic personal information about you from one or more of the following sources:
| • | information we receive from you on applications or other forms; |
| • | information about your transactions with us or our service providers; and |
| • | information we receive from third parties. |
We do not disclose any nonpublic personal information about our customers or former customers to anyone, except as permitted by law.
We restrict access to your nonpublic personal information to those employees or service providers who need to know that information to provide products or services to you. To ensure the confidentiality of your nonpublic personal information, we maintain safeguards that comply with federal standards.
47
This page intentionally left blank.
48

Delivery of Documents
Shareholder reports are available online at www.americanbeaconfunds.com/reports. Please be advised that reports are no longer sent by mail. Instead, the reports are made available online, and you will be notified by mail each time a report is posted online. You will be provided with a website link to access the report. You may elect to receive all future reports in paper free of charge. You can request to continue receiving paper copies by calling 1-866-345-5954, or you may directly inform your financial intermediary. Detailed instructions are also included in your report notifications.
If you invest in the Fund through a financial institution, you may be able to receive the Fund’s regulatory mailings, such as the Prospectus, Annual Report and Semi-Annual Report, by e-mail. If you are interested in this option, please go to www.icsdelivery.com and search for your financial institution’s name or contact your financial institution directly.
To obtain more information about the Fund:

|

| |
| By E-mail: | On the Internet: | |
| american_beacon.funds@ambeacon.com | Visit our website at www.americanbeaconfunds.com | |
|
By Telephone: Call (800) 658-5811 |
By Mail: American Beacon Funds P.O. Box 219643 Kansas City, MO 64121-9643 | |
| Availability of Quarterly Portfolio Schedules | Availability of Proxy Voting Policy and Records | |
| In addition to the Schedule of Investments provided in each semi-annual and annual report, the Fund files a complete schedule of its portfolio holdings with the Securities and Exchange Commission (“SEC”) on Form N-PORT as of the end of each fiscal quarter. The Fund’s Forms N-PORT are available on the SEC’s website at www.sec.gov. The Forms N-PORT may also be reviewed and copied at the SEC’s Public Reference Section, 100 F Street, NE, Washington, D.C. 20549-2736. Information regarding the operation of the SEC’s Public Reference Room may be obtained by calling (800)-SEC-0330. A complete schedule of the Fund’s portfolio holdings is also available at www.americanbeaconfunds.com approximately twenty days after the end of each month. | A description of the policies and procedures the Fund uses to determine how to vote proxies relating to portfolio securities is available in the Fund’s Statement of Additional Information, is available free of charge on the Fund’s website www.americanbeaconfunds.com and by calling 1-800-967-9009 or by accessing the SEC’s website at www.sec.gov. The Fund’s proxy voting record for the most recent year ended June 30 is filed annually with the SEC on Form N-PX. The Fund’s Forms N-PX are available on the SEC’s website at www.sec.gov. The Fund’s proxy voting record may also be obtained by calling 1-800-967-9009. | |


Fund Service Providers:
| CUSTODIAN State Street Bank and Trust Company Boston, Massachusetts |
TRANSFER AGENT DST Asset Manager Solutions, Inc. Quincy, Massachusetts |
INDEPENDENT REGISTERED PUBLIC ACCOUNTING FIRM Ernst & Young LLP Dallas, Texas |
DISTRIBUTOR Resolute Investment Distributors, Inc. Irving, Texas |
This report is prepared for shareholders of the American Beacon Funds and may be distributed to others only if preceded or accompanied by a current Prospectus or Summary Prospectus.
American Beacon Funds and American Beacon Bahl & Gaynor Small Cap Growth Fund are service marks of American Beacon Advisors, Inc.
AR 12/21
About American Beacon Advisors
Since 1986, American Beacon Advisors, Inc. has offered a variety of products and investment advisory services to numerous institutional and retail clients, including a variety of mutual funds, corporate cash management, and separate account management.
Our clients include defined benefit plans, defined contribution plans, foundations, endowments, corporations, financial planners, and other institutional investors. With American Beacon Advisors, you can put the experience of a multi-billion dollar asset management firm to work for your company.
BRIDGEWAY LARGE CAP GROWTH FUND
Growth stocks typically are more volatile than value stocks; however, value stocks have a lower expected growth rate in earnings and sales. Investing in foreign securities may involve heightened risk due to currency fluctuations and economic and political risks. While the Fund is managed pursuant to a tax management strategy, the Fund’s investments could create capital gains. The use of futures contracts for cash management may subject the Fund to losing more money than invested. The Fund’s incorporation of environmental, social and/or governance (ESG) considerations in its investment strategy may cause it to underperform funds that do not incorporate these considerations. Please see the prospectus for a complete discussion of the Fund’s risks. There can be no assurances that the investment objectives of this Fund will be met.
BRIDGEWAY LARGE CAP VALUE FUND
Investing in value stocks may limit downside risk over time; however, the Fund may produce more modest gains than riskier stock funds as a trade-off for this potentially lower risk. Investing in foreign securities may involve heightened risk due to currency fluctuations and economic and political risks. While the Fund is managed pursuant to a tax management strategy, the Fund’s investments could create capital gains. The use of futures contracts for cash management may subject the Fund to losing more money than invested. The Fund’s incorporation of environmental, social and/or governance (ESG) considerations in its investment strategy may cause it to underperform funds that do not incorporate these considerations. Please see the prospectus for a complete discussion of the Fund’s risks. There can be no assurances that the investment objectives of this Fund will be met.
Any opinions herein, including forecasts, reflect our judgment as of the end of the reporting period and are subject to change. Each advisor’s strategies and each Fund’s portfolio composition will change depending on economic and market conditions. This report is not a complete analysis of market conditions, and, therefore, should not be relied upon as investment advice. Although economic and market information has been compiled from reliable sources, American Beacon Advisors, Inc. makes no representation as to the completeness or accuracy of the statements contained herein.
| American Beacon Funds |
December 31, 2021 |
Contents
| 1 | ||||
| 2 | ||||
| 9 | ||||
| 11 | ||||
| 12 | ||||
| 16 | ||||
| 21 | ||||
| 25 | ||||
| 46 | ||||
| 52 | ||||
| 58 | ||||
| 59 | ||||
| 66 | ||||
| Back Cover |

|
Dear Shareholders,
As Warren E. Buffett, the “Oracle of Omaha” and billionaire chairman and CEO of Berkshire Hathaway, once said, “Someone’s sitting in the shade today because someone planted a tree a long time ago.”
That is to say, before we can enjoy the fruits of our labor, we must first devote our attention to the careful planning and cultivation of our estates. To achieve a strong yield requires time, diligence and patience – and there are no guarantees the seeds we plant today will thrive or result in a plentiful harvest. This can be said not only about the actions we undertake in our gardening or landscaping, but also those we initiate in our investment portfolios – especially as we take into account the potential for harm caused by natural disasters and other catastrophes, such as the COVID-19 pandemic. |
Because none of us – not even the Oracle of Omaha – has a crystal ball, to help give your investment portfolio the greatest chance for success over the long term, we encourage you to work with financial professionals to develop your personal savings plan, conduct annual plan reviews, and make thoughtful, purposeful plan adjustments to help manage your evolving financial needs and goals. By investing in different investment styles and asset classes, you may be able to help mitigate financial risks across your portfolio. By allocating your portfolio according to your risk-tolerance level, you may be better positioned to withstand short-term crises. With continuous nurturing, you will be better positioned to achieve enduring financial success.
Since 1986, American Beacon has endeavored to provide investors with a disciplined approach to realizing long-term financial goals. As a manager of managers, we strive to provide investment products that may enable investors to participate during market upswings while potentially insulating against market downswings. The investment teams behind our mutual funds seek to produce consistent, long-term results rather than focus only on short-term movements in the markets. In managing our investment products, we emphasize identifying opportunities that offer the potential for long-term financial rewards.
Thank you for entrusting your financial success with American Beacon. For additional information about our investment products or to access your account information, please visit our website at www.americanbeaconfunds.com.
Best Regards,

Gene L. Needles, Jr. President
American Beacon Funds
1
Domestic Equity Market Overview
December 31, 2021 (Unaudited)
U.S. equity markets continued the momentum of calendar year 2020, reaching record highs in 2021 despite the ongoing COVID-19 pandemic. The year started with domestic equity markets gaining momentum during the early months of 2021 and rising to near-record levels by the end of the first quarter. This was driven, in part, by a social media-driven run-up in share prices for so-called “meme” stocks. After a short sell-off in January, stocks rebounded through February and March as COVID-19 vaccine distribution progress spurred optimism for a post-pandemic economic recovery. Investors responded by rotating out of the Information Technology sector and into the beleaguered Financials and Energy sectors.
During the second quarter of 2021, U.S. markets again recorded strong gains. The successful push for COVID-19 vaccinations and the continued reopening of the economy provided a strong basis for investor optimism in April. However, concerns about rising inflation temporarily slowed market growth in May. Investors regained confidence in June and began rotating back into Growth-oriented stocks, particularly large technology names.
Markets rose steadily through July and August as investors welcomed the continued reopening of the economy and strong corporate earnings. Investor sentiment shifted in September, however, amid worries over a variety of economic uncertainties – including the delta variant, inflation, signs of potential weakening in the U.S. economy and fears of disruptions in the Chinese economy. September’s declines erased nearly all of the gains in large-cap stocks from the previous two months and hit small-cap stocks particularly hard, even erasing some returns from the prior quarter.
Strong third-quarter earnings reports in October and continuing positive underlying economic data drove gains through the first half of the fourth quarter of 2021. Except for a brief period of volatility in late November and early December, driven by the emergence of the omicron variant, equity markets maintained steady growth through the end of the year. Following the stumble of stock prices at the end of November, the subsequent December recovery helped produce another year of double-digit returns for most major U.S. equity indexes.
2
American Beacon Bridgeway Large Cap Growth FundSM
Performance Overview
December 31, 2021 (Unaudited)
The Investor Class of the American Beacon Bridgeway Large Cap Growth Fund (the “Fund”) returned 21.48% for the twelve months ended December 31, 2021, compared to the Russell 1000® Growth Index (the “Index”) return of 27.60% for the same period.
Comparison of Change in Value of a $10,000 Investment for the period from 12/31/2011 through 12/31/2021
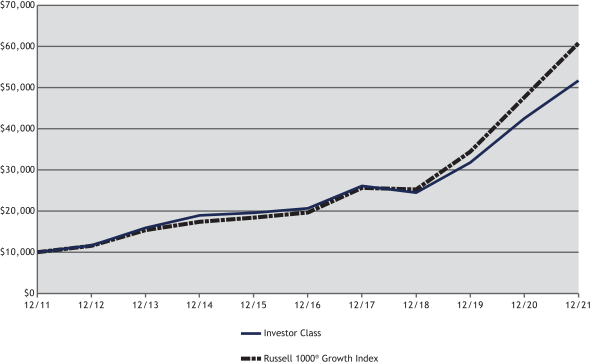
| Total Returns for the Period Ended December 31, 2021 |
|
|||||||||||||||||||||||||||||||
|
Ticker |
1 Year |
3 Years |
5 Years |
10 Years |
Value of $10,000 12/31/2011- 12/31/2021 | |||||||||||||||||||||||||||
| R5 Class (1,8) |
BRLGX | 21.82 | % | 28.72 | % | 20.59 | % | 18.10 | % | $ | 52,791 | |||||||||||||||||||||
| Y Class (1,2,8) |
BLYYX | 21.77 | % | 28.63 | % | 20.50 | % | 18.05 | % | $ | 52,554 | |||||||||||||||||||||
| Investor Class (1,3,8) |
BLYPX | 21.48 | % | 28.29 | % | 20.17 | % | 17.85 | % | $ | 51,691 | |||||||||||||||||||||
| A without Sales Charge (1,4,8) |
BLYAX | 21.47 | % | 28.33 | % | 20.20 | % | 17.87 | % | $ | 51,777 | |||||||||||||||||||||
| A with Sales Charge (1,4,8) |
BLYAX | 14.49 | % | 25.82 | % | 18.79 | % | 17.17 | % | $ | 48,787 | |||||||||||||||||||||
| C without Sales Charge (1,5,8) |
BLYCX | 20.58 | % | 27.35 | % | 19.30 | % | 17.34 | % | $ | 49,492 | |||||||||||||||||||||
| C with Sales Charge (1,5,8) |
BLYCX | 19.58 | % | 27.35 | % | 19.30 | % | 17.34 | % | $ | 49,492 | |||||||||||||||||||||
| R6 Class (1,6,8) |
BLYRX | 21.90 | % | 28.82 | % | 20.65 | % | 18.13 | % | $ | 52,909 | |||||||||||||||||||||
| Russell 1000® Growth Index (7) |
27.60 | % | 34.08 | % | 25.32 | % | 19.79 | % | $ | 60,825 | ||||||||||||||||||||||
| 1. | Performance shown is historical and is not indicative of future returns. Investment returns and principal value will vary, and shares may be worth more or less at redemption than at original purchase. Performance shown is calculated based on the published end-of-day net asset values as of date indicated, and current performance may be lower or higher than the performance data quoted. To obtain performance as of the most recent month end, please visit www.americanbeaconfunds.com or call 1-800-967-9009. Fund performance in the table above does not reflect the deduction of taxes a shareholder would pay on distributions or the redemption of shares. Generally accepted accounting principles require adjustments to be made to the net assets of the Fund at period end for financial reporting purposes only; and as such, the total return based on the unadjusted net asset value per share may differ from the total return reported in the financial highlights. A portion of fees charged to the R5 Class of the Fund has been waived since Fund inception. Performance prior to waiving fees was lower than actual returns shown since inception. Please note that the recent performance of the securities market has helped produce short-term returns that are not typical and may not continue in the future. |
| 2. | Fund performance for the ten-year period represent the returns achieved by the R5 Class from 12/31/2011 up to 2/5/2016, the inception date of the Y Class, and the returns of the Y Class since its inception. Expenses of the Y Class are higher than those of the R5 Class. As a result, total returns shown may be |
3
American Beacon Bridgeway Large Cap Growth FundSM
Performance Overview
December 31, 2021 (Unaudited)
| higher than they would have been had the Y Class been in existence since 12/31/2011. A portion of the fees charged to the Y Class has been waived since Fund inception. Performance prior to waiving fees was lower than actual returns shown since inception. |
| 3. | Fund performance for the ten-year period represent the returns achieved by the R5 Class from 12/31/2011 up to 2/5/2016, the inception date of the Investor Class, and the returns of the Investor Class since its inception. Expenses of the Investor Class are higher than those of the R5 Class. Therefore, total returns shown may be higher than they would have been had the Investor Class been in existence since 12/31/2011. A portion of the fees charged to the Investor Class of the Fund has been waived since Fund inception. Performance prior to waiving fees was higher than actual returns shown since inception. |
| 4. | Fund performance for the ten-year period represent the returns achieved by the R5 Class from 12/31/2011 through 2/5/2016, the inception date of the A Class, and the returns of the A Class since its inception. Expenses of the A Class are higher than those of the R5 Class. As a result, total returns shown may be higher than they would have been had the A Class been in existence since 12/31/2011. A portion of the fees charged to the A Class of the Fund was waived from Fund inception through 2018, partially recovered in 2019 and waived in 2020 and 2021. Performance prior to waiving fees was lower than actual returns shown for periods when fees were waived. A Class shares have a maximum sales charge of 5.75%. |
| 5. | Fund performance for the ten-year period represent the returns achieved by the R5 Class from 12/31/2011 through 2/5/2016, the inception date of the C Class, and the returns of the C Class since its inception. Expenses of the C Class are higher than those of the R5 Class. As a result, total returns shown may be higher than they would have been had the C Class been in existence since 12/31/2011. A portion of fees charged to the C Class of the Fund was waived from Fund inception through 2017, partially recovered in 2018 and 2019 and waived in 2020 and 2021. Performance prior to waiving fees was lower than actual returns shown for periods when fees were waived. The maximum contingent deferred sales charge for the C Class is 1.00% for shares redeemed within one year of the date of purchase. |
| 6. | Fund performance for the five-year and ten-year periods represent the returns achieved by the R5 Class from 12/31/2011 through 4/30/2018, the inception date of the R6 Class and the returns of the R6 Class since its inception. Expenses of the R6 Class are lower than the R5 Class. As a result, total returns shown may be lower than they would have been had the R6 Class been in existence since 12/31/2011. A portion of fees charged to the R6 Class of the Fund has been waived since Fund inception. Performance prior to waiving fees was lower than actual returns shown since inception. |
| 7. | The Russell 1000® Growth Index measures the performance of the large-cap growth segment of the U.S. equity universe. It includes those Russell 1000 Index companies with higher price-to-book ratios and higher forecasted growth values. The Russell 1000 Growth Index and Russell 1000 Index are registered trademarks of Frank Russell Company. American Beacon Funds is not promoted, sponsored or endorsed by, nor in any way affiliated with the London Stock Exchange Group plc and its group undertakings (collectively, the “LSE Group”). FTSE Russell is a trading name of certain of the LSE Group companies. LSE Group is not responsible for and has not reviewed the American Beacon Bridgeway Large Cap Growth Fund nor any associated literature or publications and LSE Group makes no representation or warranty, express or implied, as to their accuracy, or completeness, or otherwise. All rights in the Russell 1000 Growth Index (the “Index”) vest in the relevant LSE Group company which owns the Index. Russell 1000® is a trademark of the relevant LSE Group company and is used by any other LSE Group company under license. The Index is calculated by or on behalf of FTSE International Limited or its affiliate, agent or partner. The LSE Group does not accept any liability whatsoever to any person arising out of (a) the use of, reliance on or any error in the Index or (b) investment in or operation of the Fund. The LSE Group makes no claim, prediction, warranty or representation either as to the results to be obtained from the Fund or the suitability of the Index for the purpose to which it is being put by the Manager. One cannot directly invest in an index. |
| 8. | The Total Annual Fund Operating Expense ratios set forth in the most recent Fund prospectus for the R5, Y, Investor, A, C, and R6 Class shares were 0.93%, 0.98%, 1.27%, 1.23%, 1.97%, and 0.87%, respectively. The expense ratios above may vary from the expense ratios presented in other sections of this report that are based on expenses incurred during the period covered by this report. |
The Fund trailed the Index for the period due to security selection, while sector allocation contributed to performance relative to the Index.
Most of the Fund’s underperformance related to security selection was attributed to holdings in the Communication Services and Consumer Discretionary sectors. Within Communication Services sector, positions in Altice USA, Inc., Class A and Match Group, Inc. (down 57.3% and 12.5%, respectively) hurt performance. In the Consumer Discretionary sector, an underweight position in Tesla, Inc. (up 49.8% for the Index) and a position in Chegg, Inc. (down 34.6%) detracted from relative performance. This performance was modestly offset by positions in the Information Technology sector. Within this sector, positions in Nvidia Corp. (up 128.5%) and Fortinet, Inc. (up 142.0%) contributed to the Fund’s relative performance.
From a sector allocation perspective, the Fund’s underweighting to Communication Services and Industrials contributed to relative performance. In contrast, a slight overweighting to the Health Care sector modestly reduced performance for the period.
The sub-advisor continues to invest in a broadly diversified portfolio of companies they believe have attractive valuations and above-average earnings growth potential. This approach should allow the Fund to benefit over the longer term.
4
American Beacon Bridgeway Large Cap Growth FundSM
Performance Overview
December 31, 2021 (Unaudited)
| Top Ten Holdings (% Net Assets) |
| |||||||
| Apple, Inc. | 6.0 | |||||||
| NVIDIA Corp. | 5.5 | |||||||
| Microsoft Corp. | 4.9 | |||||||
| Amazon.com, Inc. | 3.7 | |||||||
| Advanced Micro Devices, Inc. | 3.3 | |||||||
| HubSpot, Inc. | 3.1 | |||||||
| Cadence Design Systems, Inc. | 2.8 | |||||||
| Fortinet, Inc. | 2.6 | |||||||
| IDEXX Laboratories, Inc. | 2.4 | |||||||
| Procter & Gamble Co. | 2.4 | |||||||
| Total Fund Holdings | 65 | |||||||
| Sector Allocation (% Equities) |
| |||||||
| Information Technology | 46.2 | |||||||
| Consumer Discretionary | 15.2 | |||||||
| Health Care | 12.0 | |||||||
| Consumer Staples | 8.0 | |||||||
| Communication Services | 5.9 | |||||||
| Real Estate | 3.0 | |||||||
| Financials | 2.9 | |||||||
| Materials | 2.9 | |||||||
| Industrials | 2.0 | |||||||
| Energy | 1.9 | |||||||
5
American Beacon Bridgeway Large Cap Value FundSM
Performance Overview
December 31, 2021 (Unaudited)
The Investor Class of the American Beacon Bridgeway Large Cap Value Fund (the “Fund”) returned 22.51% for the twelve months ended December 31, 2021. The Fund underperformed the Russell 1000® Value Index (the “Index”) return of 25.16% for the same period.
Comparison of Change in Value of a $10,000 Investment for the period from 12/31/2011 through 12/31/2021
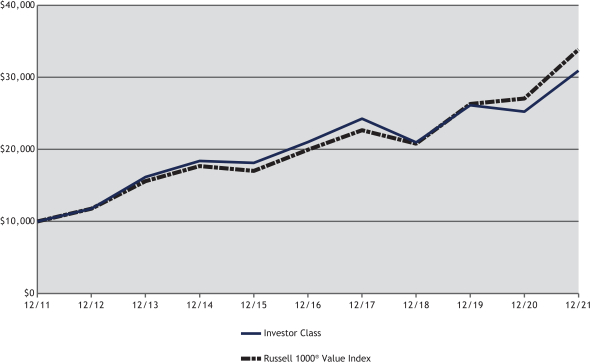
| Total Returns for the Period Ended December 31, 2021 |
| |||||||||||||||||||||||||||||||
|
Ticker |
1 Year |
3 Years |
5 Years |
10 Years |
Value of $10,000 12/31/2011- 12/31/2021 | |||||||||||||||||||||||||||
| R5 Class (1,8) |
BRLVX | 22.88 | % | 14.24 | % | 8.42 | % | 12.32 | % | $ | 31,944 | |||||||||||||||||||||
| Y Class (1,2,8) |
BWLYX | 22.84 | % | 14.16 | % | 8.35 | % | 12.24 | % | $ | 31,730 | |||||||||||||||||||||
| Investor Class (1,3,8) |
BWLIX | 22.51 | % | 13.86 | % | 8.07 | % | 11.95 | % | $ | 30,932 | |||||||||||||||||||||
| A without Sales Charge (1,4,8) |
BWLAX | 22.51 | % | 13.86 | % | 8.05 | % | 11.89 | % | $ | 30,750 | |||||||||||||||||||||
| A with Sales Charge (1,4,8) |
BWLAX | 15.47 | % | 11.63 | % | 6.77 | % | 11.23 | % | $ | 28,990 | |||||||||||||||||||||
| C without Sales Charge (1,5,8) |
BWLCX | 21.58 | % | 13.02 | % | 7.25 | % | 11.09 | % | $ | 28,622 | |||||||||||||||||||||
| C with Sales Charge (1,5,8) |
BWLCX | 20.58 | % | 13.02 | % | 7.25 | % | 11.09 | % | $ | 28,622 | |||||||||||||||||||||
| R6 Class (1,6,8) |
BWLRX | 22.99 | % | 14.29 | % | 8.44 | % | 12.33 | % | $ | 31,975 | |||||||||||||||||||||
| Russell 1000® Value Index (7) |
25.16 | % | 17.64 | % | 11.16 | % | 12.97 | % | $ | 33,846 | ||||||||||||||||||||||
| 1. | Performance shown is historical and is not indicative of future returns. Investment returns and principal value will vary, and shares may be worth more or less at redemption than at original purchase. Performance shown is calculated based on the published end-of-day net asset values as of date indicated, and current performance may be lower or higher than the performance data quoted. To obtain performance as of the most recent month end, please visit www.americanbeaconfunds.com or call 1-800-967-9009. Fund performance in the table above does not reflect the deduction of taxes a shareholder would pay on distributions or the redemption of shares. Generally accepted accounting principles require adjustments to be made to the net assets of the Fund at period end for financial reporting purposes only, and as such, the total returns based on the unadjusted net asset value per share may differ from the total return reported in the financial highlights. A portion of the fees charged to the R5 Class was waived through 2013, partially recovered in 2014, fully recovered in 2015 and waived in 2021. Performance prior to waiving fees was lower than the actual returns shown for periods when fees were waived. Please note that the recent performance of the securities market has helped produce short-term returns that are not typical and may not continue in the future. |
| 2. | Fund performance for the ten-year period represents the returns achieved by the R5 Class from 12/31/2011 up to 2/3/2012, the inception date of the Y Class, and the returns of the Y Class since its inception. Expenses of the Y Class are higher than those of the R5 Class. As a result, total returns shown may be higher than they would have been had the Y Class been in existence since 12/31/2011 A portion of the fees charged to the Y Class was waived in 2012, partially recovered in 2013 and fully recovered in 2014. Performance prior to waiving fees was lower than the actual returns shown for the ten-year period. |
6
American Beacon Bridgeway Large Cap Value FundSM
Performance Overview
December 31, 2021 (Unaudited)
| 3. | Fund performance for the ten-year period represents the returns achieved by the R5 Class from 12/31/2011 up to 2/3/2012, the inception date of the Investor Class, and the returns of the Investor Class since its inception. Expenses of the Investor Class are higher than those of the R5 Class. Therefore, total returns shown may be higher than they would have been had the Investor Class been in existence since 12/31/2011. A portion of the fees charged to the Investor Class was waived in 2012 and fully recovered in 2013. Performance prior to waiving fees was lower than the actual returns shown for the ten-year period. |
| 4. | Fund performance for the ten-year period represents the returns achieved by the R5 Class from 12/31/2011 through 2/3/2012, the inception date of the A Class, and the returns of the A Class since its inception. Expenses of the A Class are higher than those of the R5 Class. As a result, total returns shown may be higher than they would have been had the A Class been in existence since 12/31/2011. A portion of the fees charged to the A Class was waived in 2012 and 2013, fully recovered in 2014 and waived in 2021. Performance prior to waiving fees was lower than the actual returns shown for periods when fees were waived. A Class shares have a maximum sales charge of 5.75%. |
| 5. | Fund performance for the ten-year period represents the returns achieved by the R5 Class from 12/31/2011 through 2/3/2012, the inception date of the C Class, and the returns of the C Class since its inception. Expenses of the C Class are higher than those of the R5 Class. As a result, total returns shown may be higher than they would have been had the C Class been in existence since 12/31/2011. A portion of the fees charged to the C Class was waived in 2012 and 2013, fully recovered in 2014 and waived in 2021. Performance prior to waiving fees was lower than the actual returns shown for periods when fees were waived. The maximum contingent deferred sales charge for the C Class is 1.00% for shares redeemed within one year of the date of purchase. |
| 6. | Fund performance for the five-year and ten-year periods represent the returns achieved by the R5 Class from 12/31/2011 through 4/28/2017, the inception date of the R6 Class, and the returns of the R6 Class since its inception. Expenses of the R6 Class are lower than the R5 Class. As a result, total returns shown may be lower than they would have been had the R6 Class been in existence since 12/31/2011. A portion of the fees charged to the R6 Class of the Fund was waived in 2017. Performance prior to waiving fees was lower than actual returns shown for the five-year and ten-year periods. |
| 7. | The Russell 1000® Value Index is an unmanaged index of those stocks in the Russell 1000 Index with lower price-to-book ratios and lower forecasted growth values. The Russell 1000 Index measures the performance of the 1,000 largest U.S. companies based on total market capitalization. Russell 1000 Value Index and Russell 1000 Index are registered trademarks of the Frank Russell Company. American Beacon Funds is not promoted, sponsored or endorsed by, nor in any way affiliated with the London Stock Exchange Group plc and its group undertakings (collectively, the “LSE Group”). FTSE |
| Russell | is a trading name of certain of the LSE Group companies. LSE Group is not responsible for and has not reviewed the American Beacon Bridgeway Large Cap Value Fund nor any associated literature or publications and LSE Group makes no representation or warranty, express or implied, as to their accuracy, or completeness, or otherwise. All rights in the Russell 1000 Value Index (the “Index”) vest in the relevant LSE Group company which owns the Index. Russell 1000® is a trademark of the relevant LSE Group company and is used by any other LSE Group company under license. The Index is calculated by or on behalf of FTSE International Limited or its affiliate, agent or partner. The LSE Group does not accept any liability whatsoever to any person arising out of (a) the use of, reliance on or any error in the Index or (b) investment in or operation of the Fund. The LSE Group makes no claim, prediction, warranty or representation either as to the results to be obtained from the Fund or the suitability of the Index for the purpose to which it is being put by the Manager. One cannot directly invest in an index. |
| 8. | The Total Annual Fund Operating Expense ratios set forth in the most recent Fund prospectus for the R5, Y, Investor, A, C, and R6 Class shares were 0.75%, 0.83%, 1.10%, 1.10%, 1.83%, and 0.73%, respectively. The expense ratios above may vary from the expense ratios presented in other sections of this report that are based on expenses incurred during the period covered by this report. |
The Fund trailed the Index as both sector allocation and security selection detracted value relative to the Index.
The Fund’s overweight allocation to the Consumer Staples sector and underweight allocation to the Real Estate sector, the second worst and second-best performing sectors in the Index, respectively, detracted from relative performance. Somewhat offsetting this underperformance was a slightly underweight allocation to the Energy sector.
From a security selection perspective, positions in the Health Care and Consumer Discretionary sectors detracted the most relative value. Within the Health Care sector, the Fund’s positions in Teladoc Health, Inc. and Viatris, Inc. (down 54.1% and 21.1%, respectively) hampered performance. Security selection in the Consumer Discretionary sector, such as Wayfair, Inc., Class A (down 36.5%) and Best Buy Co., Inc. (up 3.0%) also detracted from relative returns. This was somewhat offset by stock selection in the Information Technology sector including HP, Inc. (up 56.8%) and Paychex, Inc. (up 46.7%) which helped performance.
The sub-advisor continues to invest in a broadly diversified portfolio of companies they believe have attractive valuations and above-average earnings growth potential. This approach should allow the Fund to benefit over the longer term.
7
American Beacon Bridgeway Large Cap Value FundSM
Performance Overview
December 31, 2021 (Unaudited)
| Top Ten Holdings (% Net Assets) |
| |||||||
| Johnson Controls International PLC | 2.6 | |||||||
| Waters Corp. | 2.3 | |||||||
| Costco Wholesale Corp. | 1.9 | |||||||
| Texas Instruments, Inc. | 1.9 | |||||||
| HP, Inc. | 1.8 | |||||||
| Cummins, Inc. | 1.6 | |||||||
| Paychex, Inc. | 1.6 | |||||||
| Bank of America Corp. | 1.5 | |||||||
| Bank of New York Mellon Corp. | 1.5 | |||||||
| Oracle Corp. | 1.5 | |||||||
| Total Fund Holdings | 91 | |||||||
| Sector Allocation (% Equities) |
| |||||||
| Financials | 24.3 | |||||||
| Health Care | 17.8 | |||||||
| Industrials | 14.3 | |||||||
| Information Technology | 11.0 | |||||||
| Consumer Staples | 9.4 | |||||||
| Consumer Discretionary | 7.7 | |||||||
| Communication Services | 6.3 | |||||||
| Energy | 3.7 | |||||||
| Materials | 3.0 | |||||||
| Real Estate | 2.5 | |||||||
8
American Beacon FundsSM
December 31, 2021 (Unaudited)
Fund Expense Example
As a shareholder of a Fund, you incur two types of costs: (1) transaction costs, including sales charges (loads) on purchase payments and redemption fees, if applicable, and (2) ongoing costs, including management fees, distribution (12b-1) fees, sub-transfer agent fees, and other Fund expenses. The Examples are intended to help you understand the ongoing cost (in dollars) of investing in the Funds and to compare these costs with the ongoing costs of investing in other mutual funds. The Examples are based on an investment of $1,000 invested at the beginning of the period in each Class and held for the entire period from July 1, 2021 through December 31, 2021.
Actual Expenses
The “Actual” lines of the tables provide information about actual account values and actual expenses. You may use the information on this page, together with the amount you invested, to estimate the expenses that you paid over the period. Simply divide your account value by $1,000 (for example, an $8,600 account value divided by $1,000 = $8.60), then multiply the result by the “Expenses Paid During Period” to estimate the expenses you paid on your account during this period. Shareholders of the Investor and R5 Classes that invest in the Fund through an IRA or Roth IRA may be subject to a custodial IRA fee of $15 that is typically deducted each December. If your account was subject to a custodial IRA fee during the period, your costs would have been $15 higher.
Hypothetical Example for Comparison Purposes
The “Hypothetical” lines of the tables provide information about hypothetical account values and hypothetical expenses based on the Fund’s actual expense ratio and an assumed 5% per year rate of return before expenses (not the Fund’s actual return). You may compare the ongoing costs of investing in the Funds with other funds by contrasting this 5% hypothetical example and the 5% hypothetical examples that appear in the shareholder reports of the other funds. The hypothetical account values and expenses may not be used to estimate the actual ending account balance or expenses you paid for the period. Shareholders of the Investor and R5 Classes that invest in the Funds through an IRA or Roth IRA may be subject to a custodial IRA fee of $15 that is typically deducted each December. If your account was subject to a custodial IRA fee during the period, your costs would have been $15 higher.
You should also be aware that the expenses shown in the table highlight only your ongoing costs and do not reflect any transaction costs charged by the Funds, such as sales charges (loads) or redemption fees, as applicable. Similarly, the expense examples for other funds do not reflect any transaction costs charged by those funds, such as sales charges (loads), redemption fees or exchange fees. Therefore, the “Hypothetical” lines of the tables are useful in comparing ongoing costs only and will not help you determine the relative total costs of owning different funds. If you were subject to any transaction costs during the period, your costs would have been higher.
9
American Beacon FundsSM
Expense Examples
December 31, 2021 (Unaudited)
| American Beacon Bridgeway Large Cap Growth Fund |
| ||||||||||||||
| Beginning Account Value 7/1/2021 |
Ending Account Value 12/31/2021 |
Expenses Paid
During Period 7/1/2021-12/31/2021* | |||||||||||||
| R5 Class | |||||||||||||||
| Actual | $1,000.00 | $1,085.00 | $4.26 | ||||||||||||
| Hypothetical** | $1,000.00 | $1,021.12 | $4.13 | ||||||||||||
| Y Class | |||||||||||||||
| Actual | $1,000.00 | $1,084.70 | $4.52 | ||||||||||||
| Hypothetical** | $1,000.00 | $1,020.87 | $4.38 | ||||||||||||
| Investor Class | |||||||||||||||
| Actual | $1,000.00 | $1,083.40 | $5.88 | ||||||||||||
| Hypothetical** | $1,000.00 | $1,019.56 | $5.70 | ||||||||||||
| A Class | |||||||||||||||
| Actual | $1,000.00 | $1,083.20 | $5.78 | ||||||||||||
| Hypothetical** | $1,000.00 | $1,019.66 | $5.60 | ||||||||||||
| C Class | |||||||||||||||
| Actual | $1,000.00 | $1,079.30 | $9.64 | ||||||||||||
| Hypothetical** | $1,000.00 | $1,015.93 | $9.35 | ||||||||||||
| R6 Class | |||||||||||||||
| Actual | $1,000.00 | $1,085.40 | $3.99 | ||||||||||||
| Hypothetical** | $1,000.00 | $1,021.37 | $3.87 | ||||||||||||
| * | Expenses are equal to the Fund’s annualized expense ratios for the six-month period of 0.81%, 0.86%, 1.12%, 1.10%, 1.84%, and 0.76% for the R5, Y, Investor, A, C, and R6 Classes, respectively, multiplied by the average account value over the period, multiplied by the number derived by dividing the number of days in the most recent fiscal half-year (184) by days in the year (365) to reflect the half-year period. |
| ** | 5% return before expenses. |
| American Beacon Bridgeway Large Cap Value Fund |
| ||||||||||||||
| Beginning Account Value 7/1/2021 |
Ending Account Value 12/31/2021 |
Expenses Paid During Period 7/1/2021-12/31/2021* | |||||||||||||
| R5 Class | |||||||||||||||
| Actual | $1,000.00 | $1,044.80 | $3.66 | ||||||||||||
| Hypothetical** | $1,000.00 | $1,021.63 | $3.62 | ||||||||||||
| Y Class | |||||||||||||||
| Actual | $1,000.00 | $1,044.50 | $3.97 | ||||||||||||
| Hypothetical** | $1,000.00 | $1,021.32 | $3.92 | ||||||||||||
| Investor Class | |||||||||||||||
| Actual | $1,000.00 | $1,043.10 | $5.30 | ||||||||||||
| Hypothetical** | $1,000.00 | $1,020.01 | $5.24 | ||||||||||||
| A Class | |||||||||||||||
| Actual | $1,000.00 | $1,043.10 | $5.36 | ||||||||||||
| Hypothetical** | $1,000.00 | $1,019.96 | $5.30 | ||||||||||||
| C Class | |||||||||||||||
| Actual | $1,000.00 | $1,039.20 | $9.15 | ||||||||||||
| Hypothetical** | $1,000.00 | $1,016.23 | $9.05 | ||||||||||||
| R6 Class | |||||||||||||||
| Actual | $1,000.00 | $1,045.20 | $3.51 | ||||||||||||
| Hypothetical** | $1,000.00 | $1,021.78 | $3.47 | ||||||||||||
| * | Expenses are equal to the Fund’s annualized expense ratios for the six-month period of 0.71%, 0.77%, 1.03%, 1.04%, 1.78%, and 0.68% for the R5, Y, Investor, A, C, and R6 Classes, respectively, multiplied by the average account value over the period, multiplied by the number derived by dividing the number of days in the most recent fiscal half-year (184) by days in the year (365) to reflect the half-year period. |
| ** | 5% return before expenses. |
10
American Beacon FundsSM
Report of Independent Registered Public Accounting Firm
To the Shareholders of American Beacon Bridgeway Large Cap Growth Fund and American Beacon Bridgeway Large Cap Value Fund and the Board of Trustees of American Beacon Funds
Opinion on the Financial Statements
We have audited the accompanying statements of assets and liabilities of American Beacon Bridgeway Large Cap Growth Fund and American Beacon Bridgeway Large Cap Value Fund (collectively referred to as the “Funds”), (two of the funds constituting American Beacon Funds (the “Trust”)), including the schedules of investments, as of December 31, 2021, and the related statements of operations for the year then ended, the statements of changes in net assets for each of the two years in the period then ended, the financial highlights for each of the five years in the period then ended and the related notes (collectively referred to as the “financial statements”). In our opinion, the financial statements present fairly, in all material respects, the financial position of each of the Funds (two of the funds constituting American Beacon Funds) at December 31, 2021, the results of their operations for the year then ended, the changes in their net assets for each of the two years in the period then ended and their financial highlights for each of the five years in the period then ended, in conformity with U.S. generally accepted accounting principles.
Basis for Opinion
These financial statements are the responsibility of the Trust’s management. Our responsibility is to express an opinion on the Funds’ financial statements based on our audits. We are a public accounting firm registered with the Public Company Accounting Oversight Board (United States) (“PCAOB”) and are required to be independent with respect to the Trust in accordance with the U.S. federal securities laws and the applicable rules and regulations of the Securities and Exchange Commission and the PCAOB.
We conducted our audits in accordance with the standards of the PCAOB. Those standards require that we plan and perform the audit to obtain reasonable assurance about whether the financial statements are free of material misstatement, whether due to error or fraud. The Trust is not required to have, nor were we engaged to perform, an audit of the Trust’s internal control over financial reporting. As part of our audits, we are required to obtain an understanding of internal control over financial reporting, but not for the purpose of expressing an opinion on the effectiveness of the Trust’s internal control over financial reporting. Accordingly, we express no such opinion.
Our audits included performing procedures to assess the risks of material misstatement of the financial statements, whether due to error or fraud, and performing procedures that respond to those risks. Such procedures included examining, on a test basis, evidence regarding the amounts and disclosures in the financial statements. Our procedures included confirmation of securities owned as of December 31, 2021, by correspondence with the custodian. Our audits also included evaluating the accounting principles used and significant estimates made by management, as well as evaluating the overall presentation of the financial statements. We believe that our audits provide a reasonable basis for our opinion.

We have served as the auditor of one or more American Beacon investment companies since 1987.
Dallas, Texas
February 28, 2022
11
American Beacon Bridgeway Large Cap Growth FundSM
December 31, 2021
| Shares | Fair Value | ||||||||||||||
| COMMON STOCKS - 99.14% | |||||||||||||||
| Communication Services - 5.87% | |||||||||||||||
| Diversified Telecommunication Services - 0.83% | |||||||||||||||
| Lumen Technologies, Inc. | 153,500 | $ | 1,926,425 | ||||||||||||
|
|
|
||||||||||||||
| Entertainment - 1.86% | |||||||||||||||
| Netflix, Inc.A | 7,200 | 4,337,568 | |||||||||||||
|
|
|
||||||||||||||
| Interactive Media & Services - 1.82% | |||||||||||||||
| Match Group, Inc.A | 32,100 | 4,245,225 | |||||||||||||
|
|
|
||||||||||||||
| Media - 1.36% | |||||||||||||||
| Altice USA, Inc., Class AA | 75,000 | 1,213,500 | |||||||||||||
| Discovery, Inc., Class AA | 83,300 | 1,960,882 | |||||||||||||
|
|
|
||||||||||||||
| 3,174,382 | |||||||||||||||
|
|
|
||||||||||||||
| Total Communication Services |
13,683,600 | ||||||||||||||
|
|
|
||||||||||||||
| Consumer Discretionary - 15.11% | |||||||||||||||
| Hotels, Restaurants & Leisure - 1.63% | |||||||||||||||
| Expedia Group, Inc.A | 6,700 | 1,210,824 | |||||||||||||
| Marriott International, Inc., Class AA | 15,600 | 2,577,744 | |||||||||||||
|
|
|
||||||||||||||
| 3,788,568 | |||||||||||||||
|
|
|
||||||||||||||
| Internet & Direct Marketing Retail - 5.68% | |||||||||||||||
| Amazon.com, Inc.A | 2,600 | 8,669,284 | |||||||||||||
| DoorDash, Inc., Class AA | 10,700 | 1,593,230 | |||||||||||||
| Etsy, Inc.A | 13,600 | 2,977,584 | |||||||||||||
|
|
|
||||||||||||||
| 13,240,098 | |||||||||||||||
|
|
|
||||||||||||||
| Multiline Retail - 0.86% | |||||||||||||||
| Target Corp. | 8,700 | 2,013,528 | |||||||||||||
|
|
|
||||||||||||||
| Specialty Retail - 5.72% | |||||||||||||||
| Best Buy Co., Inc. | 39,600 | 4,023,360 | |||||||||||||
| Lowe’s Companies, Inc. | 11,500 | 2,972,520 | |||||||||||||
| TJX Companies, Inc. | 33,600 | 2,550,912 | |||||||||||||
| Williams-Sonoma, Inc. | 22,400 | 3,788,512 | |||||||||||||
|
|
|
||||||||||||||
| 13,335,304 | |||||||||||||||
|
|
|
||||||||||||||
| Textiles, Apparel & Luxury Goods - 1.22% | |||||||||||||||
| NIKE, Inc., Class B | 17,000 | 2,833,390 | |||||||||||||
|
|
|
||||||||||||||
| Total Consumer Discretionary |
35,210,888 | ||||||||||||||
|
|
|
||||||||||||||
| Consumer Staples - 7.99% | |||||||||||||||
| Food & Staples Retailing - 2.51% | |||||||||||||||
| Albertsons Companies, Inc., Class AB | 84,500 | 2,551,055 | |||||||||||||
| Costco Wholesale Corp. | 5,800 | 3,292,660 | |||||||||||||
|
|
|
||||||||||||||
| 5,843,715 | |||||||||||||||
|
|
|
||||||||||||||
| Food Products - 1.95% | |||||||||||||||
| Kellogg Co. | 70,700 | 4,554,494 | |||||||||||||
|
|
|
||||||||||||||
| Household Products - 3.53% | |||||||||||||||
| Colgate-Palmolive Co. | 30,500 | 2,602,870 | |||||||||||||
| Procter & Gamble Co. | 34,300 | 5,610,794 | |||||||||||||
|
|
|
||||||||||||||
| 8,213,664 | |||||||||||||||
|
|
|
||||||||||||||
| Total Consumer Staples |
18,611,873 | ||||||||||||||
|
|
|
||||||||||||||
See accompanying notes
12
American Beacon Bridgeway Large Cap Growth FundSM
Schedule of Investments
December 31, 2021
| Shares | Fair Value | ||||||||||||||
| COMMON STOCKS - 99.14% (continued) | |||||||||||||||
| Energy - 1.89% | |||||||||||||||
| Oil, Gas & Consumable Fuels - 1.89% | |||||||||||||||
| Cheniere Energy, Inc. | 21,200 | $ | 2,150,104 | ||||||||||||
| Continental Resources, Inc. | 50,100 | 2,242,476 | |||||||||||||
|
|
|
||||||||||||||
| 4,392,580 | |||||||||||||||
|
|
|
||||||||||||||
| Total Energy |
4,392,580 | ||||||||||||||
|
|
|
||||||||||||||
| Financials - 2.84% | |||||||||||||||
| Consumer Finance - 1.98% | |||||||||||||||
| Discover Financial Services | 19,700 | 2,276,532 | |||||||||||||
| Synchrony Financial | 50,600 | 2,347,334 | |||||||||||||
|
|
|
||||||||||||||
| 4,623,866 | |||||||||||||||
|
|
|
||||||||||||||
| Insurance - 0.86% | |||||||||||||||
| Allstate Corp. | 17,000 | 2,000,050 | |||||||||||||
|
|
|
||||||||||||||
| Total Financials |
6,623,916 | ||||||||||||||
|
|
|
||||||||||||||
| Health Care - 11.86% | |||||||||||||||
| Biotechnology - 2.19% | |||||||||||||||
| Biogen, Inc.A | 9,200 | 2,207,264 | |||||||||||||
| Seagen, Inc.A | 18,700 | 2,891,020 | |||||||||||||
|
|
|
||||||||||||||
| 5,098,284 | |||||||||||||||
|
|
|
||||||||||||||
| Health Care Equipment & Supplies - 4.65% | |||||||||||||||
| Baxter International, Inc. | 28,300 | 2,429,272 | |||||||||||||
| Hologic, Inc.A | 35,900 | 2,748,504 | |||||||||||||
| IDEXX Laboratories, Inc.A | 8,600 | 5,662,756 | |||||||||||||
|
|
|
||||||||||||||
| 10,840,532 | |||||||||||||||
|
|
|
||||||||||||||
| Life Sciences Tools & Services - 4.16% | |||||||||||||||
| Agilent Technologies, Inc. | 16,000 | 2,554,400 | |||||||||||||
| Thermo Fisher Scientific, Inc. | 3,700 | 2,468,788 | |||||||||||||
| Waters Corp.A | 12,500 | 4,657,500 | |||||||||||||
|
|
|
||||||||||||||
| 9,680,688 | |||||||||||||||
|
|
|
||||||||||||||
| Pharmaceuticals - 0.86% | |||||||||||||||
| Bristol-Myers Squibb Co. | 32,300 | 2,013,905 | |||||||||||||
|
|
|
||||||||||||||
| Total Health Care |
27,633,409 | ||||||||||||||
|
|
|
||||||||||||||
| Industrials - 2.00% | |||||||||||||||
| Professional Services - 0.98% | |||||||||||||||
| Robert Half International, Inc. | 20,400 | 2,275,008 | |||||||||||||
|
|
|
||||||||||||||
| Trading Companies & Distributors - 1.02% | |||||||||||||||
| SiteOne Landscape Supply, Inc.A | 9,800 | 2,374,344 | |||||||||||||
|
|
|
||||||||||||||
| Total Industrials |
4,649,352 | ||||||||||||||
|
|
|
||||||||||||||
| Information Technology - 45.76% | |||||||||||||||
| Communications Equipment - 0.89% | |||||||||||||||
| Ubiquiti, Inc.B | 6,800 | 2,085,560 | |||||||||||||
|
|
|
||||||||||||||
| IT Services - 2.32% | |||||||||||||||
| Block, Inc., Class AA | 9,800 | 1,582,798 | |||||||||||||
| Cloudflare, Inc., Class AA | 8,300 | 1,091,450 | |||||||||||||
See accompanying notes
13
American Beacon Bridgeway Large Cap Growth FundSM
Schedule of Investments
December 31, 2021
| Shares | Fair Value | ||||||||||||||
| COMMON STOCKS - 99.14% (continued) | |||||||||||||||
| Information Technology - 45.76% (continued) | |||||||||||||||
| IT Services - 2.32% (continued) | |||||||||||||||
| Mastercard, Inc., Class A | 7,600 | $ | 2,730,832 | ||||||||||||
|
|
|
||||||||||||||
| 5,405,080 | |||||||||||||||
|
|
|
||||||||||||||
| Semiconductors & Semiconductor Equipment - 17.04% | |||||||||||||||
| Advanced Micro Devices, Inc.A | 53,700 | 7,727,430 | |||||||||||||
| Applied Materials, Inc. | 31,500 | 4,956,840 | |||||||||||||
| Lam Research Corp. | 7,000 | 5,034,050 | |||||||||||||
| NVIDIA Corp. | 43,600 | 12,823,196 | |||||||||||||
| QUALCOMM, Inc. | 16,100 | 2,944,207 | |||||||||||||
| Teradyne, Inc. | 17,000 | 2,780,010 | |||||||||||||
| Texas Instruments, Inc. | 18,300 | 3,449,001 | |||||||||||||
|
|
|
||||||||||||||
| 39,714,734 | |||||||||||||||
|
|
|
||||||||||||||
| Software - 18.28% | |||||||||||||||
| Atlassian Corp. PLC, Class AA | 4,000 | 1,525,160 | |||||||||||||
| Cadence Design Systems, Inc.A | 35,500 | 6,615,425 | |||||||||||||
| DocuSign, Inc.A | 4,100 | 624,471 | |||||||||||||
| Fair Isaac Corp.A | 4,700 | 2,038,249 | |||||||||||||
| Fortinet, Inc.A | 16,600 | 5,966,040 | |||||||||||||
| HubSpot, Inc.A | 11,000 | 7,250,650 | |||||||||||||
| Intuit, Inc. | 3,600 | 2,315,592 | |||||||||||||
| Microsoft Corp. | 33,700 | 11,333,984 | |||||||||||||
| Palo Alto Networks, Inc.A | 6,300 | 3,507,588 | |||||||||||||
| Zendesk, Inc.A | 13,500 | 1,407,915 | |||||||||||||
|
|
|
||||||||||||||
| 42,585,074 | |||||||||||||||
|
|
|
||||||||||||||
| Technology Hardware, Storage & Peripherals - 7.23% | |||||||||||||||
| Apple, Inc. | 78,400 | 13,921,488 | |||||||||||||
| HP, Inc. | 77,400 | 2,915,658 | |||||||||||||
|
|
|
||||||||||||||
| 16,837,146 | |||||||||||||||
|
|
|
||||||||||||||
| Total Information Technology |
106,627,594 | ||||||||||||||
|
|
|
||||||||||||||
| Materials - 2.87% | |||||||||||||||
| Chemicals - 1.87% | |||||||||||||||
| Dow, Inc. | 41,200 | 2,336,864 | |||||||||||||
| Olin Corp. | 35,000 | 2,013,200 | |||||||||||||
|
|
|
||||||||||||||
| 4,350,064 | |||||||||||||||
|
|
|
||||||||||||||
| Metals & Mining - 1.00% | |||||||||||||||
| Steel Dynamics, Inc. | 37,600 | 2,333,832 | |||||||||||||
|
|
|
||||||||||||||
| Total Materials |
6,683,896 | ||||||||||||||
|
|
|
||||||||||||||
| Real Estate - 2.95% | |||||||||||||||
| Equity Real Estate Investment Trusts (REITs) - 2.95% | |||||||||||||||
| American Tower Corp. | 9,900 | 2,895,750 | |||||||||||||
| Crown Castle International Corp. | 19,100 | 3,986,934 | |||||||||||||
|
|
|
||||||||||||||
| 6,882,684 | |||||||||||||||
|
|
|
||||||||||||||
| Total Real Estate |
6,882,684 | ||||||||||||||
|
|
|
||||||||||||||
| Total Common Stocks (Cost $153,412,991) |
230,999,792 | ||||||||||||||
|
|
|
||||||||||||||
| SHORT-TERM INVESTMENTS - 0.88% (Cost $2,050,582) | |||||||||||||||
| Investment Companies - 0.88% | |||||||||||||||
| American Beacon U.S. Government Money Market Select Fund, 0.01%C D | 2,050,582 | 2,050,582 | |||||||||||||
|
|
|
||||||||||||||
See accompanying notes
14
American Beacon Bridgeway Large Cap Growth FundSM
Schedule of Investments
December 31, 2021
| Shares | Fair Value | ||||||||||||||
| SECURITIES LENDING COLLATERAL - 0.11% (Cost $259,780) | |||||||||||||||
| Investment Companies - 0.11% | |||||||||||||||
| American Beacon U.S. Government Money Market Select Fund, 0.01%C D | 259,780 | $ | 259,780 | ||||||||||||
|
|
|
||||||||||||||
| TOTAL INVESTMENTS - 100.13% (Cost $155,723,353) |
233,310,154 | ||||||||||||||
| LIABILITIES, NET OF OTHER ASSETS - (0.13%) |
(294,494 | ) | |||||||||||||
|
|
|
||||||||||||||
| TOTAL NET ASSETS - 100.00% |
$ | 233,015,660 | |||||||||||||
|
|
|
||||||||||||||
| Percentages are stated as a percent of net assets. | |||||||||||||||
A Non-income producing security.
B All or a portion of this security is on loan, collateralized by either cash and/or U.S. Treasuries, at December 31, 2021 (Note 9).
C The Fund is affiliated by having the same investment advisor.
D 7-day yield.
PLC - Public Limited Company.
| Long Futures Contracts Open on December 31, 2021: |
|
|||||||||||||||
| Equity Futures Contracts | ||||||||||||||||
| Description | Number of Contracts |
Expiration Date | Notional Amount | Contract Value | Unrealized Appreciation (Depreciation) |
|||||||||||
| S&P 500 E-Mini Index | 9 | March 2022 | $ | 2,072,014 | $ | 2,141,325 | $ | 69,311 | ||||||||
|
|
|
|
|
|
|
|||||||||||
| $ | 2,072,014 | $ | 2,141,325 | $ | 69,311 | |||||||||||
|
|
|
|
|
|
|
|||||||||||
| Index Abbreviations: | ||
| S&P 500 | S&P 500 Index - U.S. Equity Large-Cap Index. | |
The Fund’s investments are summarized by level based on the inputs used to determine their values. As of December 31, 2021, the investments were classified as described below:
| Bridgeway Large Cap Growth Fund |
Level 1 | Level 2 | Level 3 | Total | ||||||||||||||||||||||||
| Assets |
||||||||||||||||||||||||||||
| Common Stocks |
$ | 230,999,792 | $ | - | $ | - | $ | 230,999,792 | ||||||||||||||||||||
| Short-Term Investments |
2,050,582 | - | - | 2,050,582 | ||||||||||||||||||||||||
| Securities Lending Collateral |
259,780 | - | - | 259,780 | ||||||||||||||||||||||||
|
|
|
|
|
|
|
|
|
|||||||||||||||||||||
| Total Investments in Securities - Assets |
$ | 233,310,154 | $ | - | $ | - | $ | 233,310,154 | ||||||||||||||||||||
|
|
|
|
|
|
|
|
|
|||||||||||||||||||||
| Financial Derivative Instruments - Assets |
||||||||||||||||||||||||||||
| Futures Contracts |
$ | 69,311 | $ | - | $ | - | $ | 69,311 | ||||||||||||||||||||
|
|
|
|
|
|
|
|
|
|||||||||||||||||||||
| Total Financial Derivative Instruments - Assets |
$ | 69,311 | $ | - | $ | - | $ | 69,311 | ||||||||||||||||||||
|
|
|
|
|
|
|
|
|
|||||||||||||||||||||
U.S. GAAP requires transfers between all levels to/from level 3 be disclosed. During the year ended December 31, 2021, there were no transfers into or out of Level 3.
See accompanying notes
15
American Beacon Bridgeway Large Cap Value FundSM
Schedule of Investments
December 31, 2021
| Shares | Fair Value | ||||||||||||||
| COMMON STOCKS - 97.52% | |||||||||||||||
| Communication Services - 6.11% | |||||||||||||||
| Diversified Telecommunication Services - 3.47% | |||||||||||||||
| AT&T, Inc. | 343,600 | $ | 8,452,560 | ||||||||||||
| Lumen Technologies, Inc. | 657,300 | 8,249,115 | |||||||||||||
| Verizon Communications, Inc. | 200,000 | 10,392,000 | |||||||||||||
|
|
|
||||||||||||||
| 27,093,675 | |||||||||||||||
|
|
|
||||||||||||||
| Media - 2.64% | |||||||||||||||
| Discovery, Inc., Class AAB | 235,800 | 5,550,732 | |||||||||||||
| Fox Corp., Class A | 217,100 | 8,010,990 | |||||||||||||
| Sirius XM Holdings, Inc.A | 1,107,100 | 7,030,085 | |||||||||||||
|
|
|
||||||||||||||
| 20,591,807 | |||||||||||||||
|
|
|
||||||||||||||
| Total Communication Services |
47,685,482 | ||||||||||||||
|
|
|
||||||||||||||
| Consumer Discretionary - 7.55% | |||||||||||||||
| Hotels, Restaurants & Leisure - 1.13% | |||||||||||||||
| McDonald’s Corp. | 32,900 | 8,819,503 | |||||||||||||
|
|
|
||||||||||||||
| Household Durables - 1.98% | |||||||||||||||
| PulteGroup, Inc. | 145,600 | 8,322,496 | |||||||||||||
| Whirlpool Corp. | 30,400 | 7,133,664 | |||||||||||||
|
|
|
||||||||||||||
| 15,456,160 | |||||||||||||||
|
|
|
||||||||||||||
| Internet & Direct Marketing Retail - 1.05% | |||||||||||||||
| eBay, Inc. | 52,900 | 3,517,850 | |||||||||||||
| Wayfair, Inc., Class AAB | 24,500 | 4,654,265 | |||||||||||||
|
|
|
||||||||||||||
| 8,172,115 | |||||||||||||||
|
|
|
||||||||||||||
| Multiline Retail - 0.99% | |||||||||||||||
| Target Corp. | 33,500 | 7,753,240 | |||||||||||||
|
|
|
||||||||||||||
| Specialty Retail - 2.40% | |||||||||||||||
| Best Buy Co., Inc. | 94,800 | 9,631,680 | |||||||||||||
| Williams-Sonoma, Inc. | 53,600 | 9,065,368 | |||||||||||||
|
|
|
||||||||||||||
| 18,697,048 | |||||||||||||||
|
|
|
||||||||||||||
| Total Consumer Discretionary |
58,898,066 | ||||||||||||||
|
|
|
||||||||||||||
| Consumer Staples - 9.13% | |||||||||||||||
| Food & Staples Retailing - 2.25% | |||||||||||||||
| Costco Wholesale Corp. | 25,600 | 14,533,120 | |||||||||||||
| Walgreens Boots Alliance, Inc. | 57,900 | 3,020,064 | |||||||||||||
|
|
|
||||||||||||||
| 17,553,184 | |||||||||||||||
|
|
|
||||||||||||||
| Food Products - 2.19% | |||||||||||||||
| Hormel Foods Corp. | 164,300 | 8,019,483 | |||||||||||||
| JM Smucker Co. | 66,766 | 9,068,158 | |||||||||||||
|
|
|
||||||||||||||
| 17,087,641 | |||||||||||||||
|
|
|
||||||||||||||
| Household Products - 3.77% | |||||||||||||||
| Colgate-Palmolive Co. | 105,900 | 9,037,506 | |||||||||||||
| Kimberly-Clark Corp. | 64,200 | 9,175,464 | |||||||||||||
| Procter & Gamble Co. | 68,600 | 11,221,588 | |||||||||||||
|
|
|
||||||||||||||
| 29,434,558 | |||||||||||||||
|
|
|
||||||||||||||
See accompanying notes
16
American Beacon Bridgeway Large Cap Value FundSM
Schedule of Investments
December 31, 2021
| Shares | Fair Value | ||||||||||||||
| COMMON STOCKS - 97.52% (continued) | |||||||||||||||
| Consumer Staples - 9.13% (continued) | |||||||||||||||
| Personal Products - 0.92% | |||||||||||||||
| Estee Lauder Cos., Inc., Class A | 19,400 | $ | 7,181,880 | ||||||||||||
|
|
|
||||||||||||||
| Total Consumer Staples |
71,257,263 | ||||||||||||||
|
|
|
||||||||||||||
| Energy - 3.64% | |||||||||||||||
| Oil, Gas & Consumable Fuels - 3.64% | |||||||||||||||
| ConocoPhillips | 79,900 | 5,767,182 | |||||||||||||
| Continental Resources, Inc. | 172,300 | 7,712,148 | |||||||||||||
| EOG Resources, Inc. | 63,100 | 5,605,173 | |||||||||||||
| Exxon Mobil Corp. | 152,000 | 9,300,880 | |||||||||||||
|
|
|
||||||||||||||
| 28,385,383 | |||||||||||||||
|
|
|
||||||||||||||
| Total Energy |
28,385,383 | ||||||||||||||
|
|
|
||||||||||||||
| Financials - 23.68% | |||||||||||||||
| Banks - 8.91% | |||||||||||||||
| Bank of America Corp. | 270,100 | 12,016,749 | |||||||||||||
| Citigroup, Inc. | 140,700 | 8,496,873 | |||||||||||||
| Huntington Bancshares, Inc. | 520,600 | 8,027,652 | |||||||||||||
| JPMorgan Chase & Co. | 31,400 | 4,972,190 | |||||||||||||
| KeyCorp | 400,500 | 9,263,565 | |||||||||||||
| Regions Financial Corp. | 358,200 | 7,808,760 | |||||||||||||
| US Bancorp | 167,100 | 9,386,007 | |||||||||||||
| Wells Fargo & Co. | 199,000 | 9,548,020 | |||||||||||||
|
|
|
||||||||||||||
| 69,519,816 | |||||||||||||||
|
|
|
||||||||||||||
| Capital Markets - 4.15% | |||||||||||||||
| Ameriprise Financial, Inc. | 36,900 | 11,131,254 | |||||||||||||
| Bank of New York Mellon Corp. | 205,200 | 11,918,016 | |||||||||||||
| Charles Schwab Corp. | 111,500 | 9,377,150 | |||||||||||||
|
|
|
||||||||||||||
| 32,426,420 | |||||||||||||||
|
|
|
||||||||||||||
| Consumer Finance - 2.87% | |||||||||||||||
| Ally Financial, Inc. | 173,700 | 8,269,857 | |||||||||||||
| Capital One Financial Corp. | 49,700 | 7,210,973 | |||||||||||||
| Synchrony Financial | 148,600 | 6,893,554 | |||||||||||||
|
|
|
||||||||||||||
| 22,374,384 | |||||||||||||||
|
|
|
||||||||||||||
| Insurance - 7.75% | |||||||||||||||
| Aflac, Inc. | 147,500 | 8,612,525 | |||||||||||||
| Allstate Corp. | 76,445 | 8,993,754 | |||||||||||||
| American Financial Group, Inc. | 54,300 | 7,456,476 | |||||||||||||
| Fidelity National Financial, Inc. | 165,000 | 8,609,700 | |||||||||||||
| MetLife, Inc. | 164,000 | 10,248,360 | |||||||||||||
| Prudential Financial, Inc. | 69,400 | 7,511,856 | |||||||||||||
| Travelers Cos., Inc. | 57,800 | 9,041,654 | |||||||||||||
|
|
|
||||||||||||||
| 60,474,325 | |||||||||||||||
|
|
|
||||||||||||||
| Total Financials |
184,794,945 | ||||||||||||||
|
|
|
||||||||||||||
| Health Care - 17.33% | |||||||||||||||
| Biotechnology - 2.09% | |||||||||||||||
| Amgen, Inc. | 37,600 | 8,458,872 | |||||||||||||
| Biogen, Inc.B | 32,800 | 7,869,376 | |||||||||||||
|
|
|
||||||||||||||
| 16,328,248 | |||||||||||||||
|
|
|
||||||||||||||
See accompanying notes
17
American Beacon Bridgeway Large Cap Value FundSM
Schedule of Investments
December 31, 2021
| Shares | Fair Value | ||||||||||||||
| COMMON STOCKS - 97.52% (continued) | |||||||||||||||
| Health Care - 17.33% (continued) | |||||||||||||||
| Health Care Equipment & Supplies - 2.97% | |||||||||||||||
| Baxter International, Inc. | 95,800 | $ | 8,223,472 | ||||||||||||
| Becton Dickinson & Co. | 34,800 | 8,751,504 | |||||||||||||
| Cooper Cos., Inc. | 14,700 | 6,158,418 | |||||||||||||
|
|
|
||||||||||||||
| 23,133,394 | |||||||||||||||
|
|
|
||||||||||||||
| Health Care Providers & Services - 5.36% | |||||||||||||||
| AmerisourceBergen Corp. | 60,900 | 8,093,001 | |||||||||||||
| Cigna Corp. | 38,500 | 8,840,755 | |||||||||||||
| HCA Healthcare, Inc. | 16,200 | 4,162,104 | |||||||||||||
| McKesson Corp. | 45,500 | 11,309,935 | |||||||||||||
| Quest Diagnostics, Inc. | 54,500 | 9,429,045 | |||||||||||||
|
|
|
||||||||||||||
| 41,834,840 | |||||||||||||||
|
|
|
||||||||||||||
| Health Care Technology - 0.47% | |||||||||||||||
| Teladoc Health, Inc.B | 40,200 | 3,691,164 | |||||||||||||
|
|
|
||||||||||||||
| Life Sciences Tools & Services - 5.01% | |||||||||||||||
| Agilent Technologies, Inc. | 53,700 | 8,573,205 | |||||||||||||
| Mettler-Toledo International, Inc.B | 2,400 | 4,073,304 | |||||||||||||
| Thermo Fisher Scientific, Inc. | 12,800 | 8,540,672 | |||||||||||||
| Waters Corp.B | 48,100 | 17,922,060 | |||||||||||||
|
|
|
||||||||||||||
| 39,109,241 | |||||||||||||||
|
|
|
||||||||||||||
| Pharmaceuticals - 1.43% | |||||||||||||||
| Bristol-Myers Squibb Co. | 139,000 | 8,666,650 | |||||||||||||
| Eli Lilly & Co. | 9,000 | 2,485,980 | |||||||||||||
|
|
|
||||||||||||||
| 11,152,630 | |||||||||||||||
|
|
|
||||||||||||||
| Total Health Care |
135,249,517 | ||||||||||||||
|
|
|
||||||||||||||
| Industrials - 13.99% | |||||||||||||||
| Aerospace & Defense - 1.67% | |||||||||||||||
| L3Harris Technologies, Inc. | 46,300 | 9,873,012 | |||||||||||||
| Northrop Grumman Corp. | 8,100 | 3,135,267 | |||||||||||||
|
|
|
||||||||||||||
| 13,008,279 | |||||||||||||||
|
|
|
||||||||||||||
| Building Products - 4.61% | |||||||||||||||
| Johnson Controls International PLC | 254,000 | 20,652,740 | |||||||||||||
| Masco Corp. | 123,500 | 8,672,170 | |||||||||||||
| Owens Corning | 73,800 | 6,678,900 | |||||||||||||
|
|
|
||||||||||||||
| 36,003,810 | |||||||||||||||
|
|
|
||||||||||||||
| Commercial Services & Supplies - 0.73% | |||||||||||||||
| Rollins, Inc. | 166,850 | 5,707,939 | |||||||||||||
|
|
|
||||||||||||||
| Machinery - 3.61% | |||||||||||||||
| Caterpillar, Inc. | 40,200 | 8,310,948 | |||||||||||||
| Cummins, Inc. | 57,500 | 12,543,050 | |||||||||||||
| Pentair PLC | 100,000 | 7,303,000 | |||||||||||||
|
|
|
||||||||||||||
| 28,156,998 | |||||||||||||||
|
|
|
||||||||||||||
| Professional Services - 0.97% | |||||||||||||||
| Robert Half International, Inc. | 68,000 | 7,583,360 | |||||||||||||
|
|
|
||||||||||||||
See accompanying notes
18
American Beacon Bridgeway Large Cap Value FundSM
Schedule of Investments
December 31, 2021
| Shares | Fair Value | ||||||||||||||
| COMMON STOCKS - 97.52% (continued) | |||||||||||||||
| Industrials - 13.99% (continued) | |||||||||||||||
| Road & Rail - 1.18% | |||||||||||||||
| Norfolk Southern Corp. | 31,100 | $ | 9,258,781 | ||||||||||||
|
|
|
||||||||||||||
| Trading Companies & Distributors - 1.22% | |||||||||||||||
| Fastenal Co. | 148,200 | 9,493,692 | |||||||||||||
|
|
|
||||||||||||||
| Total Industrials |
109,212,859 | ||||||||||||||
|
|
|
||||||||||||||
| Information Technology - 10.76% | |||||||||||||||
| Communications Equipment - 0.74% | |||||||||||||||
| Ubiquiti, Inc. | 18,900 | 5,796,630 | |||||||||||||
|
|
|
||||||||||||||
| IT Services - 1.55% | |||||||||||||||
| Paychex, Inc. | 88,700 | 12,107,550 | |||||||||||||
|
|
|
||||||||||||||
| Semiconductors & Semiconductor Equipment - 3.65% | |||||||||||||||
| Advanced Micro Devices, Inc.B | 41,200 | 5,928,680 | |||||||||||||
| Intel Corp. | 154,600 | 7,961,900 | |||||||||||||
| Texas Instruments, Inc. | 77,400 | 14,587,578 | |||||||||||||
|
|
|
||||||||||||||
| 28,478,158 | |||||||||||||||
|
|
|
||||||||||||||
| Software - 1.92% | |||||||||||||||
| Autodesk, Inc.B | 11,800 | 3,318,042 | |||||||||||||
| Oracle Corp. | 133,300 | 11,625,093 | |||||||||||||
|
|
|
||||||||||||||
| 14,943,135 | |||||||||||||||
|
|
|
||||||||||||||
| Technology Hardware, Storage & Peripherals - 2.90% | |||||||||||||||
| HP, Inc. | 377,600 | 14,224,192 | |||||||||||||
| NetApp, Inc. | 91,600 | 8,426,284 | |||||||||||||
|
|
|
||||||||||||||
| 22,650,476 | |||||||||||||||
|
|
|
||||||||||||||
| Total Information Technology |
83,975,949 | ||||||||||||||
|
|
|
||||||||||||||
| Materials - 2.92% | |||||||||||||||
| Chemicals - 2.06% | |||||||||||||||
| DuPont de Nemours, Inc. | 102,100 | 8,247,638 | |||||||||||||
| LyondellBasell Industries NV, Class A | 85,000 | 7,839,550 | |||||||||||||
|
|
|
||||||||||||||
| 16,087,188 | |||||||||||||||
|
|
|
||||||||||||||
| Metals & Mining - 0.86% | |||||||||||||||
| Steel Dynamics, Inc. | 107,700 | 6,684,939 | |||||||||||||
|
|
|
||||||||||||||
| Total Materials |
22,772,127 | ||||||||||||||
|
|
|
||||||||||||||
| Real Estate - 2.41% | |||||||||||||||
| Equity Real Estate Investment Trusts (REITs) - 2.41% | |||||||||||||||
| American Homes 4 Rent, Class A | 222,700 | 9,711,947 | |||||||||||||
| Crown Castle International Corp. | 15,300 | 3,193,722 | |||||||||||||
| Realty Income Corp. | 83,000 | 5,941,970 | |||||||||||||
|
|
|
||||||||||||||
| 18,847,639 | |||||||||||||||
|
|
|
||||||||||||||
| Total Real Estate |
18,847,639 | ||||||||||||||
|
|
|
||||||||||||||
| Total Common Stocks (Cost $642,682,276) |
761,079,230 | ||||||||||||||
|
|
|
||||||||||||||
| SHORT-TERM INVESTMENTS - 2.53% (Cost $19,739,236) | |||||||||||||||
| Investment Companies - 2.53% | |||||||||||||||
| American Beacon U.S. Government Money Market Select Fund, 0.01%C D | 19,739,236 | 19,739,236 | |||||||||||||
|
|
|
||||||||||||||
See accompanying notes
19
American Beacon Bridgeway Large Cap Value FundSM
Schedule of Investments
December 31, 2021
| Shares | Fair Value | ||||||||||||||
| SECURITIES LENDING COLLATERAL - 0.67% (Cost $5,209,250) | |||||||||||||||
| Investment Companies - 0.67% | |||||||||||||||
| American Beacon U.S. Government Money Market Select Fund, 0.01%C D | 5,209,250 | $ | 5,209,250 | ||||||||||||
|
|
|
||||||||||||||
| TOTAL INVESTMENTS - 100.72% (Cost $667,630,762) |
786,027,716 | ||||||||||||||
| LIABILITIES, NET OF OTHER ASSETS - (0.72%) |
(5,601,969 | ) | |||||||||||||
|
|
|
||||||||||||||
| TOTAL NET ASSETS - 100.00% |
$ | 780,425,747 | |||||||||||||
|
|
|
||||||||||||||
| Percentages are stated as a percent of net assets. | |||||||||||||||
A All or a portion of this security is on loan, collateralized by either cash and/or U.S. Treasuries, at December 31, 2021 (Note 9).
B Non-income producing security.
C The Fund is affiliated by having the same investment advisor.
D 7-day yield.
PLC - Public Limited Company.
| Long Futures Contracts Open on December 31, 2021: |
|
|||||||||||||||
| Equity Futures Contracts | ||||||||||||||||
| Description | Number of Contracts |
Expiration Date | Notional Amount | Contract Value | Unrealized Appreciation (Depreciation) |
|||||||||||
| S&P 500 E-Mini Index | 80 | March 2022 | $ | 19,141,138 | $ | 19,034,000 | $ | (107,138 | ) | |||||||
|
|
|
|
|
|
|
|||||||||||
| $ | 19,141,138 | $ | 19,034,000 | $ | (107,138 | ) | ||||||||||
|
|
|
|
|
|
|
|||||||||||
| Index Abbreviations: | ||
| S&P 500 | S&P 500 Index - U.S. Equity Large-Cap Index. | |
The Fund’s investments are summarized by level based on the inputs used to determine their values. As of December 31, 2021, the investments were classified as described below:
| Bridgeway Large Cap Value Fund |
Level 1 | Level 2 | Level 3 | Total | ||||||||||||||||||||||||
| Assets |
||||||||||||||||||||||||||||
| Common Stocks |
$ | 761,079,230 | $ | - | $ | - | $ | 761,079,230 | ||||||||||||||||||||
| Short-Term Investments |
19,739,236 | - | - | 19,739,236 | ||||||||||||||||||||||||
| Securities Lending Collateral |
5,209,250 | - | - | 5,209,250 | ||||||||||||||||||||||||
|
|
|
|
|
|
|
|
|
|||||||||||||||||||||
| Total Investments in Securities - Assets |
$ | 786,027,716 | $ | - | $ | - | $ | 786,027,716 | ||||||||||||||||||||
|
|
|
|
|
|
|
|
|
|||||||||||||||||||||
| Financial Derivative Instruments - Liabilities |
||||||||||||||||||||||||||||
| Futures Contracts |
$ | (107,138 | ) | $ | - | $ | - | $ | (107,138 | ) | ||||||||||||||||||
|
|
|
|
|
|
|
|
|
|||||||||||||||||||||
| Total Financial Derivative Instruments - Liabilities |
$ | (107,138 | ) | $ | - | $ | - | $ | (107,138 | ) | ||||||||||||||||||
|
|
|
|
|
|
|
|
|
|||||||||||||||||||||
U.S. GAAP requires transfers between all levels to/from level 3 be disclosed. During the year ended December 31, 2021, there were no transfers into or out of Level 3.
See accompanying notes
20
American Beacon FundsSM
Statements of Assets and Liabilities
December 31, 2021
| Bridgeway Large Cap Growth Fund |
Bridgeway Large Cap Value Fund |
|||||||||||
| Assets: |
| |||||||||||
| Investments in unaffiliated securities, at fair value†§ |
$ | 230,999,792 | $ | 761,079,230 | ||||||||
| Investments in affiliated securities, at fair value† |
2,310,362 | 24,948,486 | ||||||||||
| Cash |
170 | 56,721 | ||||||||||
| Cash collateral held at broker for futures contracts |
120,000 | 731,000 | ||||||||||
| Dividends and interest receivable |
103,774 | 757,260 | ||||||||||
| Deposits with broker for futures contracts |
- | 50,908 | ||||||||||
| Receivable for fund shares sold |
34,010 | 501,566 | ||||||||||
| Receivable for expense reimbursement (Note 2) |
171,701 | 6,542 | ||||||||||
| Receivable for variation margin on open futures contracts (Note 5) |
69,362 | - | ||||||||||
| Prepaid expenses |
21,815 | 16,494 | ||||||||||
|
|
|
|
|
|||||||||
| Total assets |
233,830,986 | 788,148,207 | ||||||||||
|
|
|
|
|
|||||||||
| Liabilities: |
| |||||||||||
| Payable for fund shares redeemed |
194,623 | 1,625,873 | ||||||||||
| Cash due to broker for futures contracts |
75,518 | - | ||||||||||
| Management and sub-advisory fees payable (Note 2) |
135,971 | 439,061 | ||||||||||
| Service fees payable (Note 2) |
25,804 | 35,852 | ||||||||||
| Transfer agent fees payable (Note 2) |
9,478 | 38,741 | ||||||||||
| Payable upon return of securities loaned (Note 9)§ |
259,780 | 5,209,250 | ||||||||||
| Custody and fund accounting fees payable |
27,954 | 67,567 | ||||||||||
| Professional fees payable |
59,768 | 58,823 | ||||||||||
| Payable for prospectus and shareholder reports |
10,403 | 90,205 | ||||||||||
| Payable for variation margin from open futures contracts (Note 5) |
- | 106,967 | ||||||||||
| Other liabilities |
16,027 | 50,121 | ||||||||||
|
|
|
|
|
|||||||||
| Total liabilities |
815,326 | 7,722,460 | ||||||||||
|
|
|
|
|
|||||||||
| Net assets |
$ | 233,015,660 | $ | 780,425,747 | ||||||||
|
|
|
|
|
|||||||||
| Analysis of net assets: |
| |||||||||||
| Paid-in-capital |
$ | 148,059,591 | $ | 652,525,723 | ||||||||
| Total distributable earnings (deficits)A |
84,956,069 | 127,900,024 | ||||||||||
|
|
|
|
|
|||||||||
| Net assets |
$ | 233,015,660 | $ | 780,425,747 | ||||||||
|
|
|
|
|
|||||||||
See accompanying notes
21
American Beacon FundsSM
Statements of Assets and Liabilities
December 31, 2021
| Bridgeway Large Cap Growth Fund |
Bridgeway Large Cap Value Fund |
|||||||||||
| Shares outstanding at no par value (unlimited shares authorized): |
| |||||||||||
| R5 Class |
3,062,338 | 13,720,981 | ||||||||||
|
|
|
|
|
|||||||||
| Y Class |
61,239 | 7,243,114 | ||||||||||
|
|
|
|
|
|||||||||
| Investor Class |
2,666,919 | 3,675,017 | ||||||||||
|
|
|
|
|
|||||||||
| A Class |
54,204 | 1,009,764 | ||||||||||
|
|
|
|
|
|||||||||
| C Class |
62,396 | 1,167,368 | ||||||||||
|
|
|
|
|
|||||||||
| R6 Class |
497,805 | 2,713,272 | ||||||||||
|
|
|
|
|
|||||||||
| Net assets: |
| |||||||||||
| R5 Class |
$ | 112,640,010 | $ | 364,332,529 | ||||||||
|
|
|
|
|
|||||||||
| Y Class |
$ | 2,237,130 | $ | 191,459,312 | ||||||||
|
|
|
|
|
|||||||||
| Investor Class |
$ | 95,710,995 | $ | 96,839,009 | ||||||||
|
|
|
|
|
|||||||||
| A Class |
$ | 1,955,909 | $ | 26,438,159 | ||||||||
|
|
|
|
|
|||||||||
| C Class |
$ | 2,109,687 | $ | 29,384,166 | ||||||||
|
|
|
|
|
|||||||||
| R6 Class |
$ | 18,361,929 | $ | 71,972,572 | ||||||||
|
|
|
|
|
|||||||||
| Net asset value, offering and redemption price per share: |
| |||||||||||
| R5 Class |
$ | 36.78 | $ | 26.55 | ||||||||
|
|
|
|
|
|||||||||
| Y Class |
$ | 36.53 | $ | 26.43 | ||||||||
|
|
|
|
|
|||||||||
| Investor Class |
$ | 35.89 | $ | 26.35 | ||||||||
|
|
|
|
|
|||||||||
| A Class |
$ | 36.08 | $ | 26.18 | ||||||||
|
|
|
|
|
|||||||||
| A Class (offering price) |
$ | 38.28 | $ | 27.78 | ||||||||
|
|
|
|
|
|||||||||
| C Class |
$ | 33.81 | $ | 25.17 | ||||||||
|
|
|
|
|
|||||||||
| R6 Class |
$ | 36.89 | $ | 26.53 | ||||||||
|
|
|
|
|
|||||||||
| † Cost of investments in unaffiliated securities |
$ | 153,412,991 | $ | 642,682,276 | ||||||||
| ‡ Cost of investments in affiliated securities |
$ | 2,310,362 | $ | 24,948,486 | ||||||||
| § Fair value of securities on loan |
$ | 563,066 | $ | 16,005,162 | ||||||||
| A The Fund’s investments in affiliated securities did not have unrealized appreciation (depreciation) at year end. |
| |||||||||||
See accompanying notes
22
American Beacon FundsSM
Statements of Operations
For the year ended December 31, 2021
| Bridgeway Large Cap Growth Fund |
Bridgeway Large Cap Value Fund |
|||||||||||
| Investment income: |
| |||||||||||
| Dividend income from unaffiliated securities |
$ | 1,884,997 | $ | 19,103,302 | ||||||||
| Dividend income from affiliated securities (Note 2) |
286 | 3,915 | ||||||||||
| Interest income |
213 | 17 | ||||||||||
| Income derived from securities lending (Note 9) |
19,714 | 60,208 | ||||||||||
|
|
|
|
|
|||||||||
| Total investment income |
1,905,210 | 19,167,442 | ||||||||||
|
|
|
|
|
|||||||||
| Expenses: |
| |||||||||||
| Management and sub-advisory fees (Note 2) |
1,746,082 | 6,027,308 | ||||||||||
| Transfer agent fees: |
||||||||||||
| R5 Class (Note 2) |
55,381 | 127,062 | ||||||||||
| Y Class (Note 2) |
1,967 | 230,741 | ||||||||||
| Investor Class |
7,941 | 6,716 | ||||||||||
| A Class |
- | 2,367 | ||||||||||
| C Class |
- | 2,859 | ||||||||||
| R6 Class |
245 | 2,888 | ||||||||||
| Custody and fund accounting fees |
52,498 | 107,839 | ||||||||||
| Professional fees |
84,155 | 81,414 | ||||||||||
| Registration fees and expenses |
86,561 | 113,768 | ||||||||||
| Service fees (Note 2): |
||||||||||||
| Investor Class |
315,364 | 396,590 | ||||||||||
| A Class |
1,784 | 26,887 | ||||||||||
| C Class |
1,574 | 33,471 | ||||||||||
| Distribution fees (Note 2): |
||||||||||||
| A Class |
5,396 | 67,093 | ||||||||||
| C Class |
22,117 | 307,422 | ||||||||||
| Prospectus and shareholder report expenses |
21,942 | - | ||||||||||
| Trustee fees (Note 2) |
15,493 | 54,289 | ||||||||||
| Loan expense (Note 10) |
1,824 | 5,363 | ||||||||||
| Other expenses |
36,899 | 114,456 | ||||||||||
|
|
|
|
|
|||||||||
| Total expenses |
2,457,223 | 7,708,533 | ||||||||||
|
|
|
|
|
|||||||||
| Net fees waived and expenses (reimbursed) / recouped (Note 2) |
(267,082 | ) | - | |||||||||
| Net sub-advisory fees waived (Note 2) |
- | (42,997 | ) | |||||||||
|
|
|
|
|
|||||||||
| Net expenses |
2,190,141 | 7,665,536 | ||||||||||
|
|
|
|
|
|||||||||
| Net investment income (loss) |
(284,931 | ) | 11,501,906 | |||||||||
|
|
|
|
|
|||||||||
| Realized and unrealized gain (loss) from investments: |
| |||||||||||
| Net realized gain from: |
||||||||||||
| Investments in unaffiliated securitiesA |
41,884,465 | 144,959,326 | ||||||||||
| Futures contracts |
847,320 | 15,495,765 | ||||||||||
| Change in net unrealized appreciation (depreciation) of: |
||||||||||||
| Investments in unaffiliated securitiesB |
2,509,499 | 21,352,186 | ||||||||||
| Futures contracts |
42,501 | (766,731 | ) | |||||||||
|
|
|
|
|
|||||||||
| Net gain from investments |
45,283,785 | 181,040,546 | ||||||||||
|
|
|
|
|
|||||||||
| Net increase in net assets resulting from operations |
$ | 44,998,854 | $ | 192,542,452 | ||||||||
|
|
|
|
|
|||||||||
| A The Fund did not recognize net realized gains (losses) from the sale of investments in affiliated securities. |
| |||||||||||
| B The Fund’s investments in affiliated securities did not have a change in unrealized appreciation (depreciation) at year end. |
| |||||||||||
See accompanying notes
23
American Beacon FundsSM
Statements of Changes in Net Assets
| Bridgeway Large Cap Growth Fund | Bridgeway Large Cap Value Fund | |||||||||||||||||||||||||||
| Year Ended December 31, 2021 |
Year Ended December 31, 2020 |
Year Ended December 31, 2021 |
Year Ended December 31, 2020 |
|||||||||||||||||||||||||
| Increase (decrease) in net assets: |
| |||||||||||||||||||||||||||
| Operations: |
| |||||||||||||||||||||||||||
| Net investment income (loss) |
$ | (284,931 | ) | $ | (132,329 | ) | $ | 11,501,906 | $ | 32,072,676 | ||||||||||||||||||
| Net realized gain (loss) from investments in unaffiliated securities and futures contracts |
42,731,785 | 20,094,641 | 160,455,091 | (81,060,263 | ) | |||||||||||||||||||||||
| Change in net unrealized appreciation (depreciation) of investments in unaffiliated securities and futures contracts |
2,552,000 | 37,995,310 | 20,585,455 | (369,629,307 | ) | |||||||||||||||||||||||
|
|
|
|
|
|
|
|
|
|||||||||||||||||||||
| Net increase (decrease) in net assets resulting from operations |
44,998,854 | 57,957,622 | 192,542,452 | (418,616,894 | ) | |||||||||||||||||||||||
|
|
|
|
|
|
|
|
|
|||||||||||||||||||||
| Distributions to shareholders: |
| |||||||||||||||||||||||||||
| Total retained earnings: |
||||||||||||||||||||||||||||
| R5 Class |
(19,164,375 | ) | (11,290,573 | ) | (34,314,210 | ) | (44,306,858 | ) | ||||||||||||||||||||
| Y Class |
(374,350 | ) | (310,789 | ) | (17,122,508 | ) | (28,312,156 | ) | ||||||||||||||||||||
| Investor Class |
(16,159,278 | ) | (8,140,966 | ) | (8,547,850 | ) | (12,433,778 | ) | ||||||||||||||||||||
| A Class |
(330,734 | ) | (212,602 | ) | (2,313,681 | ) | (2,676,140 | ) | ||||||||||||||||||||
| C Class |
(374,665 | ) | (260,226 | ) | (2,451,430 | ) | (3,079,893 | ) | ||||||||||||||||||||
| R6 Class |
(3,012,487 | ) | (1,629,151 | ) | (6,358,125 | ) | (7,627,906 | ) | ||||||||||||||||||||
|
|
|
|
|
|
|
|
|
|||||||||||||||||||||
| Net distributions to shareholders |
(39,415,889 | ) | (21,844,307 | ) | (71,107,804 | ) | (98,436,731 | ) | ||||||||||||||||||||
|
|
|
|
|
|
|
|
|
|||||||||||||||||||||
| Capital share transactions (Note 11): |
| |||||||||||||||||||||||||||
| Proceeds from sales of shares |
17,948,289 | 37,770,155 | 220,967,359 | 466,619,482 | ||||||||||||||||||||||||
| Reinvestment of dividends and distributions |
39,137,671 | 21,372,868 | 69,292,001 | 96,482,344 | ||||||||||||||||||||||||
| Cost of shares redeemed |
(52,271,918 | ) | (68,657,706 | ) | (634,890,130 | ) | (2,636,995,103 | ) | ||||||||||||||||||||
|
|
|
|
|
|
|
|
|
|||||||||||||||||||||
| Net increase (decrease) in net assets from capital share transactions |
4,814,042 | (9,514,683 | ) | (344,630,770 | ) | (2,073,893,277 | ) | |||||||||||||||||||||
|
|
|
|
|
|
|
|
|
|||||||||||||||||||||
| Net increase (decrease) in net assets |
10,397,007 | 26,598,632 | (223,196,122 | ) | (2,590,946,902 | ) | ||||||||||||||||||||||
|
|
|
|
|
|
|
|
|
|||||||||||||||||||||
| Net assets: |
| |||||||||||||||||||||||||||
| Beginning of year |
222,618,653 | 196,020,021 | 1,003,621,869 | 3,594,568,771 | ||||||||||||||||||||||||
|
|
|
|
|
|
|
|
|
|||||||||||||||||||||
| End of year |
$ | 233,015,660 | $ | 222,618,653 | $ | 780,425,747 | $ | 1,003,621,869 | ||||||||||||||||||||
|
|
|
|
|
|
|
|
|
|||||||||||||||||||||
See accompanying notes
24
American Beacon FundsSM
December 31, 2021
1. Organization and Significant Accounting Policies
American Beacon Funds (the “Trust”) is organized as a Massachusetts business trust. The Funds, each a series within the Trust, are registered under the Investment Company Act of 1940, as amended (the “Act”), as diversified, open-end management investment companies. As of December 31, 2021, the Trust consists of twenty-eight active series, two of which are presented in this filing: American Beacon Bridgeway Large Cap Growth Fund and American Beacon Bridgeway Large Cap Value Fund (collectively, the “Funds” and each individually a “Fund”). The remaining twenty-six active series are reported in separate filings.
American Beacon Advisors, Inc. (the “Manager”) is a Delaware corporation and a wholly-owned subsidiary of Resolute Investment Managers, Inc. (“RIM”) organized in 1986 to provide business management, advisory, administrative, and asset management consulting services to the Trust and other investors. The Manager is registered as an investment advisor under the Investment Advisers Act of 1940, as amended (the “Advisers Act”). RIM is, in turn, a wholly-owned subsidiary of Resolute Acquisition, Inc., which is a wholly-owned subsidiary of Resolute Topco, Inc., a wholly-owned subsidiary of Resolute Investment Holdings, LLC (“RIH”). RIH is owned primarily by Kelso Investment Associates VIII, L.P., KEP VI, LLC and Estancia Capital Partners L.P., investment funds affiliated with Kelso & Company, L.P. (“Kelso”) or Estancia Capital Management, LLC (“Estancia”), which are private equity firms.
Recently Adopted Accounting Pronouncements
In March 2020, the Financial Accounting Standards Board (“FASB”) issued Accounting Standards Update (“ASU”) 2020-04, which provides optional expedients and exceptions for contracts, hedging relationships and other transactions affected by the transitioning away from the London Interbank Offered Rate (“LIBOR”) and other reference rates that are expected to be discontinued. The amendments in this ASU are effective for all entities as of March 12, 2020 through December 31, 2022. At this time, management is evaluating the implications of these changes on the financial statements.
In October 2020, the U.S. Securities and Exchange Commission (“SEC”) adopted new regulations governing the use of derivatives by registered investment companies. Rule 18f-4 will impose limits on the amount of derivatives a fund could enter into, eliminate the asset segregation framework currently used by funds to comply with Section 18 of the Act, and require funds whose use of derivatives is more than a limited specified exposure to establish and maintain a derivatives risk management program and appoint a derivatives risk manager. While the new rule became effective February 19, 2021, funds will not be required to fully comply with the new rule until August 19, 2022. It is not currently clear what impact, if any, the new rule will have on the availability, liquidity or performance of derivatives. When fully implemented, the new rule may require changes in how a fund will use derivatives, may adversely affect a fund’s performance and may increase costs related to a fund’s use of derivatives.
On December 3, 2020, the SEC adopted new rule 2a-5 (Valuation Rule) under the Investment Company Act of 1940, establishing an updated regulatory framework for fund valuation. The Valuation Rule, in part, provides a framework for good faith fair value determination and permits a Board to designate fair value determinations to a fund’s investment adviser. Further, the SEC is rescinding previously issued guidance on related issues. The Valuation Rule became effective on March 8, 2021, with a compliance date of September 8, 2022. Management is currently evaluating the Valuation Rule and its effect on the Funds.
Class Disclosure
Each Fund has multiple classes of shares designed to meet the needs of different groups of investors; however, not all of the Funds offer all classes. The following table sets forth the differences amongst the classes:
| Class |
Eligible Investors |
Minimum Initial Investments |
||||
| R5 Class | Large institutional investors - sold directly or through intermediary channels. | $ | 250,000 | |||
| Y Class | Large institutional retirement plan investors - sold directly or through intermediary channels. | $ | 100,000 | |||
25
American Beacon FundsSM
Notes to Financial Statements
December 31, 2021
| Class |
Eligible Investors |
Minimum Initial Investments |
||||
| Investor Class | All investors using intermediary organizations, such as broker-dealers or retirement plan sponsors. | $ | 2,500 | |||
| A Class | All investors who invest through intermediary organizations, such as broker-dealers or third party administrator. Retail investors who invest directly through a financial intermediary such as a broker, bank, or registered investment advisor which may include a front-end sales charge and a contingent deferred sales charge (“CDSC”). | $ | 2,500 | |||
| C Class | Retail investors who invest directly through a financial intermediary, such as a broker or through employee directed benefit plans with applicable sales charges which may include CDSC. | $ | 1,000 | |||
| R6 Class | Large institutional retirement plan investors - sold through retirement plan sponsors. | None | ||||
Each class offered by the Trust has equal rights as to assets and voting privileges. Income and non-class specific expenses are allocated daily to each class based on the relative net assets. Realized and unrealized capital gains and losses of each class are allocated daily based on the relative net assets of each class of the respective Fund. Class specific expenses, where applicable, currently include service, distribution, transfer agent fees, and sub-transfer agent fees that vary amongst the classes as described more fully in Note 2.
Significant Accounting Policies
The following is a summary of significant accounting policies, consistently followed by the Funds in preparation of the financial statements. The Funds are considered investment companies and accordingly, follow the investment company accounting and reporting guidance of the FASB Accounting Standards Codification Topic 946, Financial Services - Investment Companies, a part of Generally Accepted Accounting Principles (“U.S. GAAP”).
Security Transactions and Investment Income
Security transactions are recorded as of the trade date for financial reporting purposes. Securities purchased or sold on a when-issued or delayed-delivery basis may be settled beyond a standard settlement period for the security after the trade date.
Dividend income, net of foreign taxes, is recorded on the ex-dividend date, except certain dividends from foreign securities which are recorded as soon as the information is available to the Funds. Interest income, net of foreign taxes, is earned from settlement date, recorded on the accrual basis, and adjusted, if necessary, for accretion of discounts and amortization of premiums. Realized gains (losses) from securities sold are determined based on specific lot identification.
Distributions to Shareholders
The Funds distribute most or all of their net earnings and realized gains, if any, each taxable year in the form of dividends from net investment income and distributions of realized net capital gains and net gains from foreign currency transactions on an annual basis. The Funds do not have a fixed dividend rate and do not guarantee that they will pay any distributions in any particular period. Dividends to shareholders are determined in accordance with federal income tax regulations, which may differ in amount and character from net investment income and realized gains recognized for purposes of U.S. GAAP. To the extent necessary to fully distribute capital gains, the Funds may designate earnings and profits distributed to shareholders on the redemption of shares.
Commission Recapture
The Funds have established brokerage commission recapture arrangements with certain brokers or dealers. If the Funds’ investment advisor chooses to execute a transaction through a participating broker, the broker rebates a portion of the commission back to the Funds. Any collateral benefit received through participation in the commission recapture program is directed exclusively to the Funds. This amount is reported with the net realized gain (loss) in the Funds’ Statements of Operations, if applicable.
26
American Beacon FundsSM
Notes to Financial Statements
December 31, 2021
Allocation of Income, Trust Expenses, Gains, and Losses
Investment income, realized and unrealized gains and losses from investments of the Funds are allocated daily to each class of shares based upon the relative proportion of net assets of each class to the total net assets of the Funds. Expenses directly charged or attributable to a Fund will be paid from the assets of a Fund. Generally, expenses of the Trust will be allocated among and charged to the assets of the Funds on a basis that the Trust’s Board of Trustees (the “Board”) deems fair and equitable, which may be based on the relative net assets of the Funds or nature of the services performed and relative applicability to the Funds.
Use of Estimates
The preparation of financial statements in conformity with U.S. GAAP requires management to make estimates and assumptions that affect the amounts reported in the financial statements and accompanying notes. Actual results may differ from those estimated.
Other
Under the Trust’s organizational documents, its officers and trustees are indemnified against certain liabilities arising out of the performance of their duties to the Trust. In the normal course of business, the Trust enters into contracts that provide indemnification to the other party or parties against potential costs or liabilities. The Trust’s maximum exposure under these arrangements is dependent on claims that may be made in the future and, therefore, cannot be estimated. The Trust has had no prior claims or losses pursuant to any such agreement.
2. Transactions with Affiliates
Management and Investment Sub-Advisory Agreements
The Funds and the Manager are parties to a Management Agreement that obligates the Manager to provide the Funds with investment advisory and administrative services. As compensation for performing the duties under the Management Agreement, the Manager will receive an annualized management fee based on a percentage of each Fund’s average daily net assets that is calculated and accrued daily according to the following schedule:
| First $5 billion |
0.35 | % | ||
| Next $5 billion |
0.325 | % | ||
| Next $10 billion |
0.30 | % | ||
| Over $20 billion |
0.275 | % |
The Trust, on behalf of the Funds, and the Manager have entered into Investment Advisory Agreements with Bridgeway Capital Management, LLC (the “Sub-Advisor”) pursuant to which each Fund has agreed to pay an annualized sub-advisory fee that is calculated and accrued daily based on each Fund’s average daily net assets according to the following schedule:
| First $250 million |
0.40 | % | ||
| Next $250 million |
0.35 | % | ||
| Over $500 million |
0.30 | % |
The Sub-Advisor has contractually agreed to waive a portion of its sub-advisory fee equal to 0.05% of the Bridgeway Large Cap Value Fund’s average daily net assets managed by the Sub-Advisor on amounts that exceed $750 million through April 30, 2022. The contractual fee waiver by the Sub-Advisor can be changed or terminated only in the discretion and with the approval of a majority of the Board. For the year ended December 31, 2021, the Sub-Advisor waived $42,997 of its sub-advisory fee.
27
American Beacon FundsSM
Notes to Financial Statements
December 31, 2021
The Management and Sub-Advisory Fees paid by the Funds for the year ended December 31, 2021 were as follows:
Bridgeway Large Cap Growth Fund
| Effective Fee Rate | Amount of Fees Paid | |||||||||||
| Management Fees |
0.35 | % | $ | 818,565 | ||||||||
| Sub-Advisor Fees |
0.40 | % | 927,517 | |||||||||
|
|
|
|
|
|||||||||
| Total |
0.75 | % | $ | 1,746,082 | ||||||||
|
|
|
|
|
|||||||||
Bridgeway Large Cap Value Fund
| Effective Fee Rate | Amount of Fees Paid | |||||||||||
| Management Fees |
0.35 | % | $ | 3,170,277 | ||||||||
| Sub-Advisor Fees |
0.33 | % | 2,857,031 | |||||||||
|
|
|
|
|
|||||||||
| Total |
0.68 | % | $ | 6,027,308 | ||||||||
|
|
|
|
|
|||||||||
As compensation for services provided by the Manager in connection with securities lending activities conducted by the Funds, the lending Fund pays to the Manager, with respect to cash collateral posted by borrowers, a fee of 10% of the net monthly interest income (the gross interest income earned by the investment of cash collateral, less the amount paid to borrowers and related expenses) from such activities and, with respect to loan fees paid by borrowers, a fee of 10% of such loan fees. Securities lending income is generated from the demand premium (if any) paid by the borrower to borrow a specific security and from the return on investment of cash collateral, reduced by negotiated rebate fees paid to the borrower and transaction costs. To the extent that a loan is secured by non-cash collateral, securities lending income is generated as a demand premium reduced by transaction costs. These fees are included in “Income derived from securities lending” and “Management and sub-advisory fees” on the Statements of Operations. During the year ended December 31, 2021, the Manager received securities lending fees of $2,546 and $7,550 for the securities lending activities of Bridgeway Large Cap Growth Fund and Bridgeway Large Cap Value Fund, respectively.
Distribution Plans
Separate Distribution Plans (the “Distribution Plans”) have been adopted pursuant to Rule 12b-1 under the Act for the A and C Classes of the Funds. Under the Distribution Plans, as compensation for distribution and shareholder servicing assistance, the Manager receives an annual fee of 0.25% of the average daily net assets of the A Class and 1.00% of the average daily net assets of the C Class. The fee will be payable without regard to whether the amount of the fee is more or less than the actual expenses incurred in a particular month by the Manager for distribution assistance.
Service Plans
The Manager and the Trust entered into Service Plans that obligate the Manager to oversee additional shareholder servicing of the Investor, A and C Classes of the Funds. As compensation for performing the duties required under the Service Plans, the Manager receives an annualized fee up to 0.25% of the average daily net assets of the A and C Classes and up to 0.375% of the average daily net assets of the Investor Class of the Funds.
Sub-Transfer Agent Fees
The Manager has entered into agreements, which include servicing agreements, with financial intermediaries that provide recordkeeping, processing, shareholder communications and other services to customers of the intermediaries that hold positions in the R5 and Y Classes of the Funds and has agreed to compensate the intermediaries for providing these services. Intermediaries transact with the Funds primarily
28
American Beacon FundsSM
Notes to Financial Statements
December 31, 2021
through the use of omnibus accounts on behalf of their customers who hold positions in the Funds. Certain services would have been provided by the Funds’ transfer agent and other service providers if the shareholders’ accounts were maintained directly by the Funds’ transfer agent. Accordingly, the Funds, pursuant to Board approval, have agreed to reimburse the Manager for certain non-distribution shareholder services provided by financial intermediaries for the R5 and Y Classes. The reimbursement amounts (sub-transfer agent fees) paid to the Manager are subject to a fee limit of up to 0.10% of an intermediary’s average net assets in the R5 and Y Classes on an annual basis. During the year ended December 31, 2021, the sub-transfer agent fees, as reflected in “Transfer agent fees” on the Statements of Operations, were as follows:
| Fund |
Sub-Transfer Agent Fees | |||
| Bridgeway Large Cap Growth |
$ | 40,112 | ||
| Bridgeway Large Cap Value |
320,720 | |||
As of December 31, 2021, the Funds owed the Manager the following reimbursement of sub-transfer agent fees, as reflected in “Transfer agent fees payable” on the Statements of Assets and Liabilities:
| Fund |
Reimbursement Sub-Transfer Agent Fees |
|||
| Bridgeway Large Cap Growth |
$ | 3,283 | ||
| Bridgeway Large Cap Value |
34,345 | |||
Investments in Affiliated Funds
The Funds may invest in the American Beacon U.S. Government Money Market Select Fund (the “USG Select Fund”). Cash collateral received by the Funds in connection with securities lending may also be invested in the USG Select Fund. The Funds listed below held the following shares with a December 31, 2021 fair value and dividend income earned from the investment in the USG Select Fund.
| Affiliated Security |
Type of Transaction |
Fund | December 31, 2021 Shares/Principal |
Change in Unrealized Gain (Loss) |
Realized Gain (Loss) |
Dividend Income |
December 31, 2021 Fair Value |
|||||||||||||||||||||||||||||||||||||||||
| U.S. Government Money Market Select | Direct | Bridgeway Large Cap Growth |
$ | 2,050,582 | $ | - | $ | - | $ | 286 | $ | 2,050,582 | ||||||||||||||||||||||||||||||||||||
| U.S. Government Money Market Select | Securities Lending | Bridgeway Large Cap Growth |
259,780 | - | - | N/A | 259,780 | |||||||||||||||||||||||||||||||||||||||||
| U.S. Government Money Market Select | Direct | Bridgeway Large Cap Value |
19,739,236 | - | - | 3,915 | 19,739,236 | |||||||||||||||||||||||||||||||||||||||||
| U.S. Government Money Market Select | Securities Lending | Bridgeway Large Cap Value |
5,209,250 | - | - | N/A | 5,209,250 | |||||||||||||||||||||||||||||||||||||||||
The Funds and the USG Select Fund have the same investment advisor and therefore, are considered to be affiliated. The Manager serves as investment advisor to the USG Select Fund and receives management fees and administrative fees totaling 0.10% of the average daily net assets of the USG Select Fund. During the year ended December 31, 2021, the Manager earned fees on the Funds’ direct investments and securities lending collateral investments in the USG Select Fund as shown below:
| Fund |
Direct Investments in USG Select Fund |
Securities Lending Collateral Investments in USG Select Fund |
Total | |||||||||
| Bridgeway Large Cap Growth |
$ | 2,934 | $ | 1,449 | $ | 4,383 | ||||||
| Bridgeway Large Cap Value |
47,931 | 2,105 | 50,036 | |||||||||
29
American Beacon FundsSM
Notes to Financial Statements
December 31, 2021
Interfund Credit Facility
Pursuant to an exemptive order issued by the SEC, the Funds, along with other registered investment companies having management contracts with the Manager, may participate in a credit facility whereby each fund, under certain conditions, is permitted to lend money directly to and borrow directly from other participating funds for temporary purposes. The interfund credit facility is advantageous to the funds because it provides added liquidity and eliminates the need to maintain higher cash balances to meet redemptions. This situation could arise when shareholder redemptions exceed anticipated volumes and certain funds have insufficient cash on hand to satisfy such redemptions or when sales of securities do not settle as expected, resulting in a cash shortfall for a fund. When a fund liquidates portfolio securities to meet redemption requests, they often do not receive payment in settlement for up to two days (or longer for certain foreign transactions). Redemption requests normally are satisfied on the next business day. The credit facility provides a source of immediate, short-term liquidity pending settlement of the sale of portfolio securities. The credit facility is administered by a credit facility team consisting of professionals from the Manager’s asset management, compliance, and accounting areas who report the activities of the credit facility to the Board. During the year ended December 31, 2021, the Bridgeway Large Cap Growth Fund borrowed on average 8,735,884 for 2 days at an average interest rate of 0.82% with interest charges of $393 and the Bridgeway Large Cap Value Fund borrowed on average $4,348,395 for 4 days at an average interest rate of 0.88% with interest charges of $419. These amounts are recorded as “Other expenses” in the Statements of Operations.
Expense Reimbursement Plan
The Manager contractually agreed to reduce fees and/or reimburse expenses for the classes of the Funds, through April 30, 2022, to the extent that total operating expenses (excluding taxes, interest, brokerage commissions, acquired fund fees and expenses, securities lending fees, expenses associated with securities sold short, litigation, and other extraordinary expenses) exceed the Funds’ expense cap. During the year ended December 31, 2021, the Manager waived and/or reimbursed expenses as follows:
| Expense Cap | Expiration of Reimbursed Expenses |
|||||||||||||||||||||
| Fund |
Class | 1/1/2021 - 4/30/2021 |
5/1/2021 - 12/31/2021 |
Reimbursed Expenses |
(Recouped) Expenses |
|||||||||||||||||
| Bridgeway Large Cap Growth |
R5 | 0.81 | % | 0.81 | % | $ | 133,874 | $ | (4,162 | )* | 2024 | |||||||||||
| Bridgeway Large Cap Growth |
Y | 0.87 | % | 0.86 | % | 2,279 | (116 | )* | 2024 | |||||||||||||
| Bridgeway Large Cap Growth |
Investor | 1.12 | % | 1.12 | % | 105,800 | (4,665 | )* | 2024 | |||||||||||||
| Bridgeway Large Cap Growth |
A | 1.10 | % | 1.10 | % | 2,383 | (128 | )* | 2024 | |||||||||||||
| Bridgeway Large Cap Growth |
C | 1.84 | % | 1.84 | % | 2,467 | (141 | )* | 2024 | |||||||||||||
| Bridgeway Large Cap Growth |
R6 | 0.76 | % | 0.76 | % | 20,279 | (577 | )* | 2024 | |||||||||||||
| Bridgeway Large Cap Value |
R5 | N/A | N/A | 20,332 | ** | - | ||||||||||||||||
| Bridgeway Large Cap Value |
Y | N/A | N/A | 10,822 | ** | - | ||||||||||||||||
| Bridgeway Large Cap Value |
Investor | N/A | N/A | 5,324 | ** | - | ||||||||||||||||
| Bridgeway Large Cap Value |
A | N/A | N/A | 1,276 | ** | - | ||||||||||||||||
| Bridgeway Large Cap Value |
C | N/A | N/A | 1,462 | ** | - | ||||||||||||||||
| Bridgeway Large Cap Value |
R6 | N/A | N/A | 3,781 | ** | - | ||||||||||||||||
| * | These amounts represent Recouped Expenses from prior fiscal years and are reflected in Other expenses on the Statements of Operations. |
| ** | Waiver relates to Sub-Advisory Fee and are not subject to recoupment. |
Of the above amounts, $171,701 and $6,542 were disclosed as a Receivable for expense reimbursement on the Statements of Assets and Liabilities at December 31, 2021 for the Bridgeway Large Cap Growth Fund and Bridgeway Large Cap Value Fund, respectively.
The Funds have adopted an Expense Reimbursement Plan whereby the Manager may seek repayment of such fee or voluntary reductions and expense reimbursements. Under the policy, the Manager can be reimbursed by the Funds for any contractual or voluntary fee reductions or expense reimbursements if reimbursement to the Manager (a) occurs within three years from the date of the Manager’s waiver/reimbursement and (b) does not cause the Funds’ annual operating expenses to exceed the lesser of the contractual percentage limit in effect at
30
American Beacon FundsSM
Notes to Financial Statements
December 31, 2021
the time of the waiver/reimbursement or time of recoupment. The reimbursed expenses listed above will expire in 2024. The Funds did not record a liability for potential reimbursements due to the current assessment that reimbursements are uncertain. The carryover of excess expenses potentially reimbursable to the Manager, but not recorded as a liability are as follows:
| Fund |
Recouped Expenses |
Excess Expense Carryover |
Expired Expense Carryover |
Expiration of Reimbursed Expenses |
||||||||||||
| Bridgeway Large Cap Growth |
$ | 9,789 | $ | - | $ | 333,482 | 2021 | |||||||||
| Bridgeway Large Cap Growth |
- | 161,557 | - | 2022 | ||||||||||||
| Bridgeway Large Cap Growth |
- | 306,167 | - | 2023 | ||||||||||||
| Bridgeway Large Cap Value |
- | 4,871 | - | 2022 | ||||||||||||
Sales Commissions
The Funds’ Distributor, Resolute Investment Distributors, Inc. (“RID” or “Distributor”), may receive a portion of Class A sales charges from broker dealers which may be used to offset distribution related expenses. During the year ended December 31, 2021, RID collected $412 and $1,225 for Bridgeway Large Cap Growth Fund and Bridgeway Large Cap Value Fund, respectively, from the sale of Class A Shares.
A CDSC of 0.50% will be deducted with respect to Class A Shares on certain purchases of $1,000,000 or more that are redeemed in whole or part within 18 months of purchase, unless waived as discussed in the Funds’ Prospectus. Any applicable CDSC will be 0.50% of the lesser of the original purchase price or the value of the redemption of the Class A Shares redeemed. During the year ended December 31, 2021, CDSC fees of $452 were collected for the Class A Shares of Bridgeway Large Cap Value Fund. There were no CDSC fees collected for the Class A Shares of Bridgeway Large Cap Growth Fund.
A CDSC of 1.00% will be deducted with respect to Class C Shares redeemed within 12 months of purchase, unless waived as discussed in the Funds’ Prospectus. Any applicable CDSC will be 1.00% of the lesser of the original purchase price or the value of the redemption of the Class C Shares redeemed. During the year ended December 31, 2021, CDSC fees of $678 were collected for the Class C Shares of Bridgeway Large Cap Value Fund. There were no CDSC fees collected for the Class C Shares of the Bridgeway Large Cap Growth Fund.
Trustee Fees and Expenses
Effective January 1, 2021, as compensation for their service to the American Beacon Funds Complex, including the Trust (collectively, the “Trusts”), each Trustee is compensated from the Trusts as follows: (1) an annual retainer of $120,000; (2) meeting attendance fee (for attendance in-person or via teleconference) of (a) $12,000 for in person attendance, or $5,000 for telephonic attendance, by Board members for each regularly scheduled or special Board meeting, (b) $2,500 for attendance by Committee members at meetings of the Audit and Compliance Committee and the Investment Committee, (c) $1,000 for attendance by Committee members at meetings of the Nominating and Governance Committee; and (d) $2,500 for attendance by Board members for each special telephonic Board meeting; and (3) reimbursement of reasonable expenses incurred in attending Board meetings, Committee meetings, and relevant educational seminars. For this purpose, the Board considers attendance at regular meetings held by video conference to constitute in-person attendance at a Board meeting. The Trustees also may be compensated for attendance at special Board and/or Committee meetings from time to time. For her service as Board Chair, Ms. Cline receives an additional annual retainer of $50,000. Although she attends several committee meetings at each quarterly Board meeting, she receives only a single $2,500 fee each quarter for her attendance at those meetings. The chairpersons of the Audit and Compliance Committee and the Investment Committee each receive an additional annual retainer of $25,000 and the Chair of the Nominating and Governance Committee receives an additional annual retainer of $10,000.
31
American Beacon FundsSM
Notes to Financial Statements
December 31, 2021
3. Security Valuation and Fair Value Measurements
The price of each Fund’s shares is based on its net asset value (“NAV”) per share. Each Fund’s NAV is computed by adding total assets, subtracting all the Fund’s liabilities, and dividing the result by the total number of shares outstanding.
The NAV of each class of a Fund’s shares is determined based on a pro rata allocation of a Fund’s investment income, expenses and total capital gains and losses. A Fund’s NAV per share is determined each business day as of the regular close of trading on the New York Stock Exchange (“NYSE” or “Exchange”), which is typically 4:00 p.m. Eastern Time (“ET”). However, if trading on the NYSE closes at a time other than 4:00 p.m. ET, a Fund’s NAV per share typically would still be determined as of the regular close of trading on the NYSE. The Funds do not price their shares on days that the NYSE is closed. Foreign exchanges may permit trading in foreign securities on days when a Fund is not open for business, which may result in the value of a Fund’s portfolio investments being affected at a time when you are unable to buy or sell shares.
Equity securities, including shares of closed-end funds and exchange-traded funds (“ETFs”), are valued at the last sale price or official closing price taken from the primary exchange in which each security trades. Investments in other mutual funds are valued at the closing NAV per share on the day of valuation. Debt securities are valued at bid quotes from broker/dealers or evaluated bid prices from pricing services, who may consider a number of inputs and factors, such as prices of comparable securities, yield curves, spreads, credit ratings, coupon rates, maturity, default rates, and underlying collateral. Futures are valued based on their daily settlement prices. Exchange-traded and over-the-counter (“OTC”) options are valued at the last sale price. Options with no last sale for the day are priced at mid quote. Swaps are valued at evaluated mid prices from pricing services.
The valuation of securities traded on foreign markets and certain fixed-income securities will generally be based on prices determined as of the earlier closing time of the markets on which they primarily trade unless a significant event has occurred. When a Fund holds securities or other assets that are denominated in a foreign currency, a Fund will normally use the currency exchange rates as of 4:00 p.m. ET.
Securities may be valued at fair value, as determined in good faith and pursuant to procedures approved by the Board, under certain limited circumstances. For example, fair value pricing will be used when market quotations are not readily available or reliable, as determined by the Manager, such as when (i) trading for a security is restricted or stopped; (ii) a security’s trading market is closed (other than customary closings); or (iii) a security has been de-listed from a national exchange. A security with limited market liquidity may require fair value pricing if the Manager determines that the available price does not reflect the security’s true market value. In addition, if a significant event that the Manager determines to affect the value of one or more securities held by a Fund occurs after the close of a related exchange but before the determination of a Fund’s NAV, fair value pricing may be used on the affected security or securities. Securities of small-capitalization companies are also more likely to require a fair value determination using these procedures because they are more thinly traded and less liquid than the securities of larger-capitalization companies. The Funds may fair value securities as a result of significant events occurring after the close of the foreign markets in which a Fund invests as described below. In addition, the Funds may invest in illiquid securities requiring these procedures.
A Fund may use fair value pricing for securities primarily traded in non-U.S. markets because most foreign markets close well before a Fund’s pricing time of 4:00 p.m. ET. The earlier close of these foreign markets gives rise to the possibility that significant events, including broad market moves, may have occurred in the interim and may materially affect the value of those securities. If the Manager determines that the last quoted prices of non-U.S. securities will, in its judgment, materially affect the value of some or all its portfolio securities, the Manager can adjust the previous closing prices to reflect what it believes to be the fair value of the securities as of the close of the Exchange. In deciding whether it is necessary to adjust closing prices to reflect fair value, the Manager reviews a variety of factors, including developments in foreign markets, the performance of U.S. securities markets, and the performance of instruments trading in U.S. markets that represent foreign securities and baskets of foreign securities. These securities are fair valued using a pricing service, using methods approved
32
American Beacon FundsSM
Notes to Financial Statements
December 31, 2021
by the Board, that considers the correlation of the trading patterns of the foreign security to intraday trading in the U.S. markets, based on indices of domestic securities and other appropriate indicators such as prices of relevant American Depositary Receipts (“ADRs”) and futures contracts. The Valuation Committee, established by the Board, may also fair value securities in other situations, such as when a particular foreign market is closed but a Fund is open. A Fund uses outside pricing services to provide closing prices and information to evaluate and/or adjust those prices. As a means of evaluating its security valuation process, the Valuation Committee routinely compares closing prices, the next day’s opening prices in the same markets and adjusted prices.
Attempts to determine the fair value of securities introduce an element of subjectivity to the pricing of securities. As a result, the price of a security determined through fair valuation techniques may differ from the price quoted or published by other sources and may not accurately reflect the market value of the security when trading resumes. If a reliable market quotation becomes available for a security formerly valued through fair valuation techniques, the Manager compares the new market quotation to the fair value price to evaluate the effectiveness of a Fund’s fair valuation procedures. If any significant discrepancies are found, the Manager may adjust a Fund’s fair valuation procedures.
Valuation Inputs
Various inputs may be used to determine the fair value of the Funds’ investments. These inputs are summarized in three broad levels for financial statement purposes. The inputs or methodologies used to value securities are not necessarily an indication of the risk associated with investing in those securities.
| Level 1 | - | Quoted prices in active markets for identical securities. | ||
| Level 2 | - | Prices determined using other significant observable inputs. These may include quoted prices for similar securities, interest rates, prepayment speeds, credit risk, and others. | ||
| Level 3 | - | Prices determined using other significant unobservable inputs. Unobservable inputs reflect a Fund’s own assumptions about the factors market participants would use in pricing an investment. | ||
Level 1 and Level 2 trading assets and trading liabilities, at fair value
Common stocks, preferred securities, ETFs, and financial derivative instruments, such as futures contracts that are traded on a national securities exchange, are stated at the last reported sale or settlement price on the day of valuation. To the extent these securities are actively traded and valuation adjustments are not applied, they are categorized as Level 1 of the fair value hierarchy. Preferred securities and other equities traded on inactive markets or valued by reference to similar instruments are generally categorized as Level 2 of the fair value hierarchy.
Investments in registered open-end investment management companies will be valued based upon the NAVs of such investments and are categorized as Level 1 of the fair value hierarchy.
4. Securities and Other Investments
Common Stock
Common stock generally takes the form of shares in a corporation which represent an ownership interest. It ranks below preferred stock and debt securities in claims for dividends and for assets of the company in a liquidation or bankruptcy. The value of a company’s common stock may fall as a result of factors directly relating to that company, such as decisions made by its management or decreased demand for the company’s products or services. A stock’s value may also decline because of factors affecting not just the company, but also companies in the same industry or sector. The price of a company’s stock may also be affected by changes in financial markets that are relatively unrelated to the company, such as changes in interest rates, currency exchange rates or industry
33
American Beacon FundsSM
Notes to Financial Statements
December 31, 2021
regulation. Companies that elect to pay dividends on their common stock generally only do so after they invest in their own business and make required payments to bondholders and on other debt and preferred stock. Therefore, the value of a company’s common stock will usually be more volatile than its bonds, other debt and preferred stock. Common stock may be exchange-traded or OTC. OTC stock may be less liquid than exchange-traded stock.
Other Investment Company Securities and Other Exchange-Traded Products
The Funds may invest in shares of other investment companies, including open-end funds, closed-end funds, business development companies (“BDCs”), ETFs, unit investment trusts, and other investment companies of the Trust. The Funds may invest in securities of an investment company advised by the Manager or the Sub-Advisor. Investments in the securities of other investment companies may involve duplication of advisory fees and certain other expenses. By investing in another investment company, the Funds become a shareholder of that investment company. As a result, the Funds’ shareholders indirectly will bear the Funds’ proportionate share of the fees and expenses paid by shareholders of the other investment company, in addition to the fees and expenses the Funds’ shareholders directly bear in connection with the Funds’ own operations. These other fees and expenses are reflected as Acquired Fund Fees and Expenses and are included in the Fees and Expenses Table for the Funds in their Prospectus, if applicable. Investments in other investment companies may involve the payment of substantial premiums above the value of such issuer’s portfolio securities.
Real Estate Investment Trusts (“REITs”)
The Funds may own shares of REITs which report information on the source of their distributions annually. The Funds re-characterize distributions received from REIT investments based on information provided by the REITs into the following categories: ordinary income, long-term capital gains, and return of capital. If information is not available on a timely basis from the REITs, the re-characterization will be estimated based on available information, which may include the previous year allocation. If new or additional information becomes available from the REITs at a later date, a re-characterization will be made the following year.
5. Financial Derivative Instruments
The Funds may utilize derivative instruments to gain market exposure on cash balances. When considering the Funds’ use of derivatives, it is important to note that the Funds do not use derivatives for the purpose of creating financial leverage.
Futures Contracts
A futures contract is a contract to purchase or sell a particular security, or the cash value of an asset, such as securities, indices, or currencies, at a specified future date at a price agreed upon when the contract is made. Under many such contracts, no delivery of the actual underlying asset is required. Rather, upon the expiration of the contract, settlement is made by exchanging cash in an amount equal to the difference between the contract price and the closing price of the asset (e.g., a security or an index) at expiration, net of the initial and variation margin that was previously paid. A Treasury futures contract is a contract for the future delivery of a U.S. Treasury security. An equity index futures contract is based on the value of an underlying index. A Fund may, from time to time, use futures positions to equitize cash and expose its portfolio to changes in securities prices or index prices. This can magnify gains and losses in a Fund. A Fund also may have to sell assets at inopportune times to satisfy its settlement or collateral obligations. The risks associated with the use of futures contracts also include that there may be an imperfect correlation between the changes in market value of the futures contracts and the assets underlying such contracts and that there may not be a liquid secondary market for a futures contract.
During the year ended December 31, 2021, the Funds entered into futures contracts primarily for exposing cash to markets.
34
American Beacon FundsSM
Notes to Financial Statements
December 31, 2021
The Funds’ average futures contracts outstanding fluctuate throughout the operating year as required to meet strategic requirements. The following table illustrates the average quarterly volume of futures contracts. For the purpose of this disclosure, volume is measured by contracts outstanding at each quarter end.
| Average Futures Contracts Outstanding |
||||
| Fund |
Year Ended December 31, 2021 | |||
| Bridgeway Large Cap Growth |
17 | |||
| Bridgeway Large Cap Value |
209 | |||
The following is a summary of the fair valuations of the Funds’ derivative instruments categorized by risk exposure(1):
Bridgeway Large Cap Growth Fund
| Fair values of financial instruments on the Statements of Assets and Liabilities as of December 31, 2021: |
| ||||||||||||||||||||||||||||||||||||||||||||||||||||||
| Derivatives not accounted for as hedging instruments | |||||||||||||||||||||||||||||||||||||||||||||||||||||||
| Assets: |
Credit contracts | Foreign exchange contracts |
Commodity contracts |
Interest rate contracts |
Equity contracts | Total | |||||||||||||||||||||||||||||||||||||||||||||||||
| Receivable for variation margin from open futures contracts(2) | $ | - | $ | - | $ | - | $ | - | $ | 69,311 | $ | 69,311 | |||||||||||||||||||||||||||||||||||||||||||
| The effect of financial derivative instruments on the Statements of Operations as of December 31, 2021: |
| ||||||||||||||||||||||||||||||||||||||||||||||||||||||
| Derivatives not accounted for as hedging instruments | |||||||||||||||||||||||||||||||||||||||||||||||||||||||
| Realized gain (loss) from derivatives |
Credit contracts | Foreign exchange contracts |
Commodity contracts |
Interest rate contracts |
Equity contracts | Total | |||||||||||||||||||||||||||||||||||||||||||||||||
| Futures contracts | $ | - | $ | - | $ | - | $ | - | $ | 847,320 | $ | 847,320 | |||||||||||||||||||||||||||||||||||||||||||
| Net change in unrealized appreciation |
Credit contracts | Foreign exchange contracts |
Commodity contracts |
Interest rate contracts |
Equity contracts | Total | |||||||||||||||||||||||||||||||||||||||||||||||||
| Futures contracts | $ | - | $ | - | $ | - | $ | - | $ | 42,501 | $ | 42,501 | |||||||||||||||||||||||||||||||||||||||||||
Bridgeway Large Cap Value Fund
| Fair values of financial instruments on the Statements of Assets and Liabilities as of December 31, 2021: |
| ||||||||||||||||||||||||||||||||||||||||||||||||||||||
| Derivatives not accounted for as hedging instruments | |||||||||||||||||||||||||||||||||||||||||||||||||||||||
| Liabilities: |
Credit contracts | Foreign exchange contracts |
Commodity contracts |
Interest rate contracts |
Equity contracts | Total | |||||||||||||||||||||||||||||||||||||||||||||||||
| Payable for variation margin from open futures contracts(2) | $ | - | $ | - | $ | - | $ | - | $ | (107,138 | ) | $ | (107,138 | ) | |||||||||||||||||||||||||||||||||||||||||
| The effect of financial derivative instruments on the Statements of Operations as of December 31, 2021: |
| ||||||||||||||||||||||||||||||||||||||||||||||||||||||
| Derivatives not accounted for as hedging instruments | |||||||||||||||||||||||||||||||||||||||||||||||||||||||
| Realized gain (loss) from derivatives |
Credit contracts | Foreign exchange contracts |
Commodity contracts |
Interest rate contracts |
Equity contracts | Total | |||||||||||||||||||||||||||||||||||||||||||||||||
| Futures contracts | $ | - | $ | - | $ | - | $ | - | $ | 15,495,765 | $ | 15,495,765 | |||||||||||||||||||||||||||||||||||||||||||
| Net change in unrealized appreciation |
Credit contracts | Foreign exchange contracts |
Commodity contracts |
Interest rate contracts |
Equity contracts | Total | |||||||||||||||||||||||||||||||||||||||||||||||||
| Futures contracts | $ | - | $ | - | $ | - | $ | - | $ | (766,731 | ) | $ | (766,731 | ) | |||||||||||||||||||||||||||||||||||||||||
(1) See Note 3 in the Notes to Financial Statements for additional information.
(2) Includes cumulative appreciation (depreciation) of futures contracts as reported in the Fund’s Schedule of Investments footnotes. Only current day’s variation margin is reported within the Statements of Assets and Liabilities.
35
American Beacon FundsSM
Notes to Financial Statements
December 31, 2021
Offsetting Assets and Liabilities
The Funds are parties to enforceable master netting agreements between brokers and counterparties which provide for the right to offset under certain circumstances. The Funds employ multiple counterparties and have elected not to offset qualifying financial and derivative instruments on the Statements of Assets and Liabilities, as such all financial and derivative instruments are presented on a gross basis. The impacts of netting arrangements that provide the right to offset are detailed below, if applicable. The net amount represents the net receivable or payable that would be due from or to the counterparty in the event of default. Exposure from borrowings and other financing agreements such as repurchase agreements can only be netted across transactions governed by the same Master Agreement with the same legal entity. All amounts reported below represent the balance as of the report date, December 31, 2021.
Bridgeway Large Cap Growth Fund
| Offsetting of Financial and Derivative Assets as of December 31, 2021: |
| |||||||||||
|
|
Assets | Liabilities | ||||||||||
| Futures Contracts(1) | $ | 69,311 | $ | - | ||||||||
|
|
|
|
|
|||||||||
| Total derivative assets and liabilities in the Statement of Assets and Liabilities | $ | 69,311 | $ | - | ||||||||
|
|
|
|
|
|||||||||
| Derivatives not subject to a Master Netting Agreement or similar agreement (“MNA”) | $ | (69,311 | ) | $ | - | |||||||
|
|
|
|
|
|||||||||
| Remaining Contractual Maturity of the Agreements As of December 31, 2021 |
||||||||||||||||||||||||||||||||||||
| Overnight and Continuous |
<30 days | Between 30 & 90 days |
>90 days | Total | ||||||||||||||||||||||||||||||||
| Securities Lending Transactions |
| |||||||||||||||||||||||||||||||||||
| Common Stocks |
$ | 259,780 | $ | - | $ | - | $ | - | $ | 259,780 | ||||||||||||||||||||||||||
|
|
|
|
|
|
|
|
|
|
|
|||||||||||||||||||||||||||
| Total Borrowings |
$ | 259,780 | $ | - | $ | - | $ | - | $ | 259,780 | ||||||||||||||||||||||||||
|
|
|
|
|
|
|
|
|
|
|
|||||||||||||||||||||||||||
| Gross amount of recognized liabilities for securities lending transactions |
|
$ | 259,780 | |||||||||||||||||||||||||||||||||
|
|
|
|||||||||||||||||||||||||||||||||||
Bridgeway Large Cap Value Fund
| Offsetting of Financial and Derivative Assets as of December 31, 2021: |
| |||||||||||
|
|
Assets | Liabilities | ||||||||||
| Futures Contracts(1) | $ | - | $ | 107,138 | ||||||||
|
|
|
|
|
|||||||||
| Total derivative assets and liabilities in the Statement of Assets and Liabilities | $ | - | $ | 107,138 | ||||||||
|
|
|
|
|
|||||||||
| Derivatives not subject to a Master Netting Agreement or similar agreement (“MNA”) | $ | - | $ | (107,138 | ) | |||||||
|
|
|
|
|
|||||||||
| Remaining Contractual Maturity of the Agreements As of December 31, 2021 |
||||||||||||||||||||||||||||||||||||
| Overnight and Continuous |
<30 days | Between 30 & 90 days |
>90 days | Total | ||||||||||||||||||||||||||||||||
| Securities Lending Transactions |
| |||||||||||||||||||||||||||||||||||
| Common Stocks |
$ | 5,209,250 | $ | - | $ | - | $ | - | $ | 5,209,250 | ||||||||||||||||||||||||||
|
|
|
|
|
|
|
|
|
|
|
|||||||||||||||||||||||||||
| Total Borrowings |
$ | 5,209,250 | $ | - | $ | - | $ | - | $ | 5,209,250 | ||||||||||||||||||||||||||
|
|
|
|
|
|
|
|
|
|
|
|||||||||||||||||||||||||||
| Gross amount of recognized liabilities for securities lending transactions |
|
$ | 5,209,250 | |||||||||||||||||||||||||||||||||
|
|
|
|||||||||||||||||||||||||||||||||||
(1) Includes cumulative appreciation or (depreciation) of futures contracts as reported in the Schedule of Investments footnotes. Only current day’s variation margin is reported within the Statements of Assets and Liabilities.
36
American Beacon FundsSM
Notes to Financial Statements
December 31, 2021
6. Principal Risks
Investing in the Funds may involve certain risks including, but not limited to, those described below.
Equity Investments Risk
Equity securities are subject to investment risk and market risk. The Funds’ investments in equity securities may include common stocks, preferred stocks, securities convertible into or exchangeable for common stocks, REITs, depositary receipts, and U.S. dollar-denominated foreign stocks traded on U.S. exchanges. Such investments may expose the Funds to additional risk. The value of a company’s common stock may fall as a result of factors affecting the company, companies in the same industry or sector, or the financial markets overall. Common stock generally is subordinate to preferred stock upon the liquidation or bankruptcy of the issuing company. Preferred stocks and convertible securities are sensitive to movements in interest rates. Preferred stocks may be less liquid than common stocks and, unlike common stocks, participation in the growth of an issuer may be limited. Distributions on preferred stocks generally are payable at the discretion of an issuer and after required payments to bond holders. Convertible securities are subject to the risk that the credit standing of the issuer may have an effect on the convertible securities’ investment value. Investments in REITs are subject to the risks associated with investing in the real estate industry such as adverse developments affecting the real estate industry and real property values. Depositary receipts and U.S. dollar-denominated foreign stocks traded on U.S. exchanges are subject to certain of the risks associated with investing directly in foreign securities, including, but not limited to, currency fluctuations and political and financial instability in the home country of a particular depositary receipt or foreign stock.
Futures Contracts Risk
Futures contracts are derivative instruments where one party pays a fixed price for an agreed amount of securities or other underlying assets at an agreed date. The use of such derivative instruments may expose the Funds to additional risks that they would not be subject to if they invested directly in the securities underlying those derivatives. There may at times be an imperfect correlation between the movement in the prices of futures contracts and the value of their underlying instruments or indexes. There can be no assurance that any strategy used will succeed. There also can be no assurance that, at all times, a liquid market will exist for offsetting a futures contract that a Fund has previously bought or sold and this may result in the inability to close a futures contract when desired. Futures contracts may experience potentially dramatic price changes, which will increase the volatility of a Fund and may involve a small investment of cash (the amount of initial and variation margin) relative to the magnitude of the risk assumed (the potential increase or decrease in the price of the futures contract).
Investment Risk
An investment in the Funds is not a deposit with a bank and is not insured or guaranteed by the Federal Deposit Insurance Corporation or any other government agency. When you sell your shares of the Funds, they could be worth less than what you paid for them. Therefore, you may lose money by investing in the Funds.
Market Risk
The Funds are subject to the risk that the securities markets will move down, sometimes rapidly and unpredictably, based on overall economic conditions and other factors, which may negatively affect a Fund’s performance. Equity securities generally have greater price volatility than fixed income securities, although under certain market conditions fixed income securities may have comparable or greater price volatility. During a general downturn in the securities markets, multiple assets may decline in value simultaneously. In some cases, traditional market participants have been less willing to make a market in some types of debt instruments, which has affected the liquidity of those instruments. During times of market turmoil, investors tend to look to the safety of securities
37
American Beacon FundsSM
Notes to Financial Statements
December 31, 2021
issued or backed by the U.S. Treasury, causing the prices of these securities to rise and the yields to decline. Reduced liquidity in fixed income and credit markets may negatively affect many issuers worldwide. Prices in many financial markets have increased significantly over the last decade, but there have also been periods of adverse market and financial developments and cyclical change during that timeframe, which have resulted in unusually high levels of volatility in domestic and foreign financial markets that has caused losses for investors and may occur again in the future, particularly if markets enter a period of uncertainty or economic weakness. The value of a security may decline due to adverse issuer-specific conditions, general market conditions unrelated to a particular issuer, or factors that affect a particular industry or industries. Changes in the financial condition of a single issuer or market segment also can impact the market as a whole.
Geopolitical and other events, including war, terrorism, economic uncertainty, trade disputes, pandemics, public health crises, natural disasters and related events have led, and in the future may continue to lead, to instability in world economies and markets generally and reduced liquidity in equity, credit and fixed-income markets, which may disrupt economies and markets and adversely affect the value of your investment. Adverse market events may also lead to increased shareholder redemptions, which could cause a Fund to experience a loss or difficulty in selling investments to meet redemption requests by shareholders and may increase a Fund’s portfolio turnover, which will increase the costs that a Fund incurs and lower a Fund’s performance. Even when securities markets perform well, there is no assurance that the investments held by a Fund will increase in value along with the broader market.
Policy changes by the U.S. government and/or Federal Reserve and political events within the U.S. and abroad, including the U.S. presidential election, the U.S. government’s inability at times to agree on a long-term budget and deficit reduction plan, the threat of a federal government shutdown and threats not to increase the federal government’s debt limit, may affect investor and consumer confidence and may adversely impact financial markets and the broader economy, perhaps suddenly and to a significant degree. The severity or duration of adverse economic conditions may also be affected by policy changes made by governments or quasi-governmental organizations. Global economies and financial markets are becoming increasingly interconnected, which increases the possibility of many markets being affected by events in a single country or events affecting a single or small number of issuers.
Markets and market participants are increasingly reliant upon both publicly available and proprietary information data systems. Data imprecision, software or other technology malfunctions, programming inaccuracies, unauthorized use or access, and similar circumstances may impair the performance of these systems and may have an adverse impact upon a single issuer, a group of issuers, or the market at large. In certain cases, an exchange or market may close or issue trading halts on either specific securities or even the entire market, which may result in a Fund being, among other things, unable to buy or sell certain securities or financial instruments or accurately price its investments. These fluctuations in securities prices could be a sustained trend or a drastic movement. The financial markets generally move in cycles, with periods of rising prices followed by periods of declining prices. The value of your investment may reflect these fluctuations.
Other Investment Companies Risk
The Funds may invest in shares of other registered investment companies, including money market funds that are advised by the Manager. To the extent that the Funds invest in shares of other registered investment companies, the Funds will indirectly bear the fees and expenses, including for example advisory and administrative fees, charged by those investment companies in addition to the Funds’ direct fees and expenses and will be subject to the risks associated with investments in those companies. For example, the Funds’ investments in money market funds are subject to interest rate risk, credit risk, and market risk. The Funds must rely on the investment company in which it invests to achieve its investment objective. If the investment company fails to achieve its investment objective, the value of the Funds’ investment will decline, adversely affecting the Funds’ performance. To the extent the Funds invest in other investment companies that invest in equity securities, fixed-income securities and/or foreign securities, or that track an index, the Funds are subject to the risks associated with the underlying investments held by the investment company or the index fluctuations to which the investment company is subject.
38
American Beacon FundsSM
Notes to Financial Statements
December 31, 2021
Recent Market Events Risk
An outbreak of infectious respiratory illness caused by a novel coronavirus, known as COVID-19, was first detected in China in December 2019 and has subsequently spread globally. Transmission of COVID-19 and efforts to contain its spread have resulted, and may continue to result, in significant disruptions to business operations, widespread business closures and layoffs, travel restrictions, closed international, national and local borders, prolonged quarantines and stay-at-home orders, disruption of and delays in healthcare service preparation and delivery, service and event cancellations, and lower consumer demand, as well as general concern and uncertainty that has negatively affected the global economy. The impact of the COVID-19 pandemic may last for an extended period of time and may result in a sustained economic downturn or recession. The U.S. Federal Reserve and the U.S. federal government have taken numerous measures to address the economic impact of the COVID-19 pandemic and stimulate the U.S. economy. The ultimate effects of these and other efforts that may be taken may not be known for some time.
The pandemic has accelerated trends toward working remotely and shopping on-line, which may negatively affect the value of office and commercial real estate and companies that have been slow to transition to an on-line business model and has disrupted the supply chains that many businesses depend on. The travel, hospitality and public transit industries may suffer long-term negative effects from the pandemic and resulting changes to public behavior. Both U.S. and international markets have experienced significant volatility in recent months and years. As a result of such volatility, investment returns may fluctuate significantly. Moreover, the risks discussed herein associated with an investment in the Fund may be increased.
The Federal Reserve has spent hundreds of billions of dollars to keep credit flowing through the economy. However, the Federal Reserve recently began to reduce its interventions as the economy improved and inflation accelerated. Concerns about the markets’ dependence on the Federal Reserve’s provision of liquidity have grown as a result. High public debt in the U.S. and other countries creates ongoing systemic and market risks and policymaking uncertainty, and there may be a further increase in public debt due to the economic effects of the COVID-19 pandemic and ensuing economic relief and public health measures. Governments’ efforts to limit potential negative economic effects of the pandemic may be altered, delayed, or eliminated at inopportune times for political, policy or other reasons.
Interest rates have been unusually low in recent years in the U.S. and abroad, and central banks reduced rates further in an effort to combat the economic effects of the COVID-19 pandemic. Because there is little precedent for this situation, it is difficult to predict the impact on various markets of a significant rate increase or other significant policy changes. The U.S. Federal Reserve is anticipated to raise interest rates beginning in 2022, in part to address an increase in the annual inflation rate in the U.S. Over the longer term, rising interest rates may present a greater risk than has historically been the case due to the current period of relatively low rates and the effect of government fiscal and monetary policy initiatives and potential market reaction to those initiatives or their alteration or cessation.
Slowing global economic growth, risks associated with the United Kingdom’s departure from the European Union on December 31, 2020, commonly referred to as “Brexit,” and a trade agreement between the United Kingdom and the European Union, the risks associated with ongoing trade negotiations with China, the possibility of changes to some international trade agreements, tensions or open conflict between nations, such as between Russia and Ukraine, or political or economic dysfunction within some nations that are major producers of oil could affect the economies of many nations, including the United States, in ways that cannot necessarily be foreseen at the present time.
Economists and others have expressed increasing concern about the potential effects of global climate change on property and security values. Certain issuers, industries and regions may be adversely affected by the impacts of climate change, including on the demand for and the development of goods and services and related production costs, and the impacts of legislation, regulation and international accords related to climate change, as well as any indirect consequences of regulation or business trends driven by climate change.
39
American Beacon FundsSM
Notes to Financial Statements
December 31, 2021
Securities Lending Risk
A Fund may lend its portfolio securities to brokers, dealers and financial institutions in order to obtain additional income. Borrowers of a Fund’s securities provide collateral either in the form of cash, which a Fund reinvests in securities or in the form of non-cash collateral consisting of securities issued or guaranteed by the U.S. government or one of its agencies or instrumentalities. A Fund will be responsible for the risks associated with the investment of cash collateral, including any collateral invested in an affiliated money market fund. A Fund may lose money on its investment of cash collateral or may fail to earn sufficient income on its investment to cover its payment to the borrower of a pre-negotiated fee or “rebate” for the use of that cash collateral in connection with the loan. A Fund could also lose money due to a decline in the value of non-cash collateral. In addition, delays may occur in the recovery of securities from borrowers, which could interfere with a Fund’s ability to vote proxies or to settle transactions or could result in increased costs. Moreover, if the borrower becomes subject to insolvency or similar proceedings, a Fund could incur delays in its ability to enforce its rights in its collateral. There also is a risk that a borrower may default on its obligation to return loaned securities at a time when the value of a Fund’s collateral is inadequate. Although a Fund’s securities lending agent may indemnify a Fund against that risk, it is also possible that the securities lending agent will be unable to satisfy its indemnification obligations. In any case in which the loaned securities are not returned to a Fund before an ex-dividend date, whether or not due to a default by the borrower, the payment in lieu of the dividend that a Fund receives from the securities’ borrower would not be treated as a dividend for federal income tax purposes and thus would not qualify for treatment as “qualified dividend income.”
7. Federal Income and Excise Taxes
It is the policy of each Fund to qualify as a regulated investment company (“RIC”), by complying with all applicable provisions of Subchapter M of the Internal Revenue Code, as amended, and to make distributions of taxable income sufficient to relieve it from substantially all federal income and excise taxes. For federal income tax purposes, each Fund is treated as a single entity for the purpose of determining such qualification.
The Funds do not have any unrecorded tax liabilities in the accompanying financial statements. Each of the tax years in the four year period ended December 31, 2021 remain subject to examination by the Internal Revenue Service. If applicable, the Funds recognize interest accrued related to unrecognized tax benefits in interest expense and penalties in “Other expenses” on the Statements of Operations.
The Funds may be subject to taxes imposed by countries in which it invests. Such taxes are generally based on returns of income earned or gains realized or repatriated. Taxes are accrued and applied to net investment income, net realized capital gains and net unrealized appreciation (depreciation), as applicable, as the income is earned or capital gains are recorded.
Dividends are categorized in accordance with income tax regulations which may treat certain transactions differently than U.S. GAAP. Accordingly, the character of distributions and composition of net assets for tax purposes may differ from those reflected in the accompanying financial statements.
40
American Beacon FundsSM
Notes to Financial Statements
December 31, 2021
The tax character of distributions paid were as follows:
| Bridgeway Large Cap Growth Fund | Bridgeway Large Cap Value Fund | |||||||||||||||||||||||||||
| Year Ended December 31, 2021 |
Year Ended December 31, 2020 |
Year Ended December 31, 2021 |
Year Ended December 31, 2020 |
|||||||||||||||||||||||||
| Distributions paid from: |
| |||||||||||||||||||||||||||
| Ordinary income* |
| |||||||||||||||||||||||||||
| R5 Class |
$ | 2,207,838 | $ | 3,479,748 | $ | 26,949,918 | $ | 6,519,374 | ||||||||||||||||||||
| Y Class |
43,127 | 95,785 | 13,412,004 | 4,146,756 | ||||||||||||||||||||||||
| Investor Class |
1,861,636 | 2,406,105 | 6,633,800 | 1,820,700 | ||||||||||||||||||||||||
| A Class |
38,103 | 62,836 | 1,798,336 | 391,872 | ||||||||||||||||||||||||
| C Class |
43,163 | 76,911 | 1,853,708 | 450,992 | ||||||||||||||||||||||||
| R6 Class |
347,055 | 502,104 | 4,997,976 | 1,140,363 | ||||||||||||||||||||||||
| Long-term capital gains |
| |||||||||||||||||||||||||||
| R5 Class |
16,956,537 | 7,810,825 | 7,364,292 | 37,787,484 | ||||||||||||||||||||||||
| Y Class |
331,223 | 215,004 | 3,710,504 | 24,165,400 | ||||||||||||||||||||||||
| Investor Class |
14,297,642 | 5,734,861 | 1,914,050 | 10,613,078 | ||||||||||||||||||||||||
| A Class |
292,631 | 149,766 | 515,345 | 2,284,268 | ||||||||||||||||||||||||
| C Class |
331,502 | 183,315 | 597,722 | 2,628,901 | ||||||||||||||||||||||||
| R6 Class |
2,665,432 | 1,127,047 | 1,360,149 | 6,487,543 | ||||||||||||||||||||||||
|
|
|
|
|
|
|
|
|
|||||||||||||||||||||
| Total distributions paid |
$ | 39,415,889 | $ | 21,844,307 | $ | 71,107,804 | $ | 98,436,731 | ||||||||||||||||||||
|
|
|
|
|
|
|
|
|
|||||||||||||||||||||
* For tax purposes, short-term capital gains are considered ordinary income distributions.
As of December 31, 2021, the components of distributable earnings (deficits) on a tax basis were as follows:
| Fund |
Tax Cost | Unrealized Appreciation |
Unrealized (Depreciation) |
Net Unrealized Appreciation (Depreciation) |
||||||||||||||||||||||||
| Bridgeway Large Cap Growth |
$ | 155,723,367 | $ | 82,152,340 | $ | (4,565,553 | ) | $ | 77,586,787 | |||||||||||||||||||
| Bridgeway Large Cap Value |
667,635,195 | 141,141,272 | (22,748,751 | ) | 118,392,521 | |||||||||||||||||||||||
| Fund |
Net Unrealized Appreciation (Depreciation) |
Undistributed Ordinary Income |
Undistributed Long-Term Capital Gains |
Accumulated Capital and Other (Losses) |
Other Temporary Differences |
Distributable Earnings |
||||||||||||||||||||||||||||||||||||||
| Bridgeway Large Cap Growth |
$ | 77,586,787 | $ | 474,370 | $ | 6,894,912 | $ | - | $ | - | $ | 84,956,069 | ||||||||||||||||||||||||||||||||
| Bridgeway Large Cap Value |
118,392,521 | $ | 1,183,125 | $ | 8,324,378 | - | - | 127,900,024 | ||||||||||||||||||||||||||||||||||||
Financial reporting records are adjusted for permanent book/tax differences to reflect tax character. Financial records are not adjusted for temporary differences. The temporary differences between financial reporting and tax-basis reporting of unrealized appreciation (depreciation) are attributable primarily to the tax deferral of losses from wash sales and the realization for tax purposes of unrealized gains (losses) on certain derivative instruments.
Due to inherent differences in the recognition of income, expenses, and realized gains (losses) under U.S. GAAP and federal income tax regulations, permanent differences between book and tax reporting have been identified and appropriately reclassified on the Statements of Assets and Liabilities.
Accordingly, the following amounts represent current year permanent differences derived from equalization as of December 31, 2021:
| Fund |
Paid-In-Capital | Distributable Earnings/(Deficits) |
||||||||||
| Bridgeway Large Cap Growth | $ | - | $ | - | ||||||||
| Bridgeway Large Cap Value | 42,163,035 | (42,163,035 | ) | |||||||||
For federal income tax purposes, the Funds measure their capital loss carryforwards annually at December 31, their fiscal year end. Capital loss carryforwards retain their character as short-term and/or long-term and may be carried forward and applied against future realized capital gains with no expiration date.
41
American Beacon FundsSM
Notes to Financial Statements
December 31, 2021
Bridgeway Large Cap Value utilized $23,110,397 short-term and $56,843,101 long-term capital loss carryforwards, and both Bridgeway Large Cap Value and Bridgeway Large Cap Growth did not have any remaining capital loss carryforwards as of December 31, 2021.
8. Investment Transactions
The aggregate cost of purchases and proceeds from sales and maturities of investments, other than short-term obligations, for the year ended December 31, 2021 were as follows:
| Fund |
Purchases (non-U.S. Government Securities) |
Sales (non-U.S. Government Securities) |
||||||||||
| Bridgeway Large Cap Growth | $ | 130,810,636 | $ | 164,267,318 | ||||||||
| Bridgeway Large Cap Value | 428,066,781 | 781,188,661 | ||||||||||
A summary of the Funds’ transactions in the USG Select Fund for the year ended December 31, 2021 were as follows:
| Fund |
Type of Transaction |
December 31, 2020 Shares/Fair Value |
Purchases | Sales | December 31, 2021 Shares/Fair Value |
|||||||||||||||||||||||||||||
| Bridgeway Large Cap Growth | Direct | $ | 2,381,088 | $ | 103,128,556 | $ | 103,459,062 | $ | 2,050,582 | |||||||||||||||||||||||||
| Bridgeway Large Cap Growth | Securities Lending | - | 16,229,391 | 15,969,611 | 259,780 | |||||||||||||||||||||||||||||
| Bridgeway Large Cap Value | Direct | 34,927,126 | 742,797,342 | 757,985,232 | 19,739,236 | |||||||||||||||||||||||||||||
| Bridgeway Large Cap Value | Securities Lending | - | 23,782,403 | 18,573,153 | 5,209,250 | |||||||||||||||||||||||||||||
9. Securities Lending
The Funds may lend their securities to qualified financial institutions, such as certain broker-dealers, to earn additional income. The borrowers are required to secure their loans continuously with collateral in an amount at least equal to the fair value of the securities loaned, initially in an amount at least equal to 102% of the fair value of domestic securities loaned and 105% of the fair value of international securities loaned. Collateral is monitored and marked-to-market daily. Daily mark-to-market amounts are required to be paid to the borrower or received from the borrower by the end of the following business day. This one day settlement for mark-to-market amounts may result in the collateral being temporarily less than the value of the securities on loan or temporarily more than the required minimum collateral.
To the extent that a loan is collateralized by cash, such cash collateral shall be invested by the securities lending agent (the “Agent”) in money market mutual funds and other short-term investments, provided the investments meet certain quality and diversification requirements. Securities purchased with cash collateral proceeds are listed in the Funds’ Schedule of Investments and the collateral is shown on the Statements of Assets and Liabilities as a payable.
Securities lending income is generated from the demand premium (if any) paid by the borrower to borrow a specific security and from the return on investment of cash collateral, reduced by negotiated rebate fees paid to the borrower and transaction costs. To the extent that a loan is secured by non-cash collateral, securities lending income is generated as a demand premium reduced by transaction costs. The Funds, the Agent, and the Manager retained 80%, 10%, and 10%, respectively, of the income generated from securities lending.
While securities are on loan, the Funds continue to receive certain income associated with that security and any gain or loss in the market price that may occur during the term of the loan. In the case of domestic equities, the value of any dividend is received in the form of a substitute payment approximately equal to the dividend. In the case of foreign securities, a negotiated amount is received that is less than the actual dividend, but higher than the dividend amount minus the foreign tax that the Funds would be subject to on the dividend.
42
American Beacon FundsSM
Notes to Financial Statements
December 31, 2021
Securities lending transactions pose certain risks to the Funds, including that the borrower may not provide additional collateral when required or return the securities when due, that the value of the short-term investments will be less than the amount of cash collateral required to be returned to the borrower, that non-cash collateral may be subject to legal constraints in the event of a borrower bankruptcy, and that the cash collateral investments could become illiquid and unable to be used to return collateral to the borrower. The Funds could also experience delays and costs in gaining access to the collateral. The Funds bear the risk of any deficiency in the amount of the cash collateral available for return to the borrower and any action which impairs its ability to liquidate non-cash collateral to satisfy a borrower default.
As of December 31, 2021, the value of outstanding securities on loan and the value of collateral were as follows:
| Fund |
Fair Value of Securities on Loan |
Cash Collateral Received |
Non-Cash Collateral Received |
Total Collateral Received |
||||||||||||||||||||||||
| Bridgeway Large Cap Growth | $ | 563,066 | $ | 259,780 | $ | 319,982 | $ | 579,762 | ||||||||||||||||||||
| Bridgeway Large Cap Value | 16,005,162 | 5,209,250 | 11,678,635 | 16,887,885 | ||||||||||||||||||||||||
Cash collateral is listed on the Funds’ Schedules of Investments and is shown on the Statements of Assets and Liabilities. Income earned on these investments is included in “Income derived from securities lending” on the Statements of Operations.
Non-cash collateral received by the Funds may not be sold or re-pledged except to satisfy a borrower default. Therefore, non-cash collateral is not included on the Funds’ Schedules of Investments or Statements of Assets and Liabilities.
10. Borrowing Arrangements
Effective November 11, 2021 (the “Effective Date”), the Funds, along with certain other funds managed by the Manager (“Participating Funds”), renewed a committed revolving line of credit (the “Committed Line”) agreement with State Street Bank and Trust Company (the “Bank”) to be used to facilitate portfolio liquidity. The maximum borrowing amount under the Committed Line is $100 million with interest at a rate equal to the higher of (a) Overnight Bank Funding Rate (“OBFR”) daily fluctuating rate per annum equal to 1.25% plus the sum of 0.10% or (b) the Federal Funds daily fluctuating rate per annum on amounts borrowed. Each of the Participating Funds paid a proportional amount of a quarterly commitment fee at a rate of 0.25% per annum on the unused portion of the Committed Line amount. The Committed Line expires November 10, 2022, unless extended by the Bank or terminated by the Participating Funds in accordance with the agreement. Prior to the Effective Date, the maximum borrowing amount under the Committed Line was $150 million with an expiration date November 10, 2021.
On the Effective Date, the Funds, along with certain other Participating Funds managed by the Manager, also renewed an uncommitted discretionary demand revolving line of credit (the “Uncommitted Line”) agreement with the Bank to be used to facilitate portfolio liquidity. The maximum borrowing amount under the Uncommitted Line is $100 million with interest at a rate equal to the higher of (a) OBFR daily fluctuating rate per annum equal to 1.25% plus the sum of 0.10% or (b) the Federal Funds daily fluctuating rate per annum on amounts borrowed on each outstanding loan. Each of the Participating Funds paid a proportional amount of a closing fee of $35,000 on the Effective Date. The Uncommitted Line expires November 10, 2022, unless extended by the Bank or terminated by the Participating Funds in accordance with the agreement. Prior to the Effective Date, the maximum borrowing amount under the Uncommitted Line was $50 million with an expiration date of November 10, 2021.
The Participating Funds paid administration, legal and arrangement fees, which are recognized as a component of “Loan expense” on the Statements of Operations, along with commitment fees, that have been allocated among the Participating Funds based on average daily net assets.
During the year ended December 31, 2021, the Funds did not utilize these facilities.
43
American Beacon FundsSM
Notes to Financial Statements
December 31, 2021
11. Capital Share Transactions
The tables below summarize the activity in capital shares for each Class of the Funds:
| R5 Class | ||||||||||||||||||||||||||||
| Year Ended December 31, | ||||||||||||||||||||||||||||
| 2021 | 2020 | |||||||||||||||||||||||||||
| Bridgeway Large Cap Growth Fund |
Shares |
Amount |
Shares |
Amount |
||||||||||||||||||||||||
| Shares sold | 80,633 | $ | 3,180,405 | 507,690 | $ | 15,419,904 | ||||||||||||||||||||||
| Reinvestment of dividends | 518,918 | 18,893,815 | 298,366 | 10,833,656 | ||||||||||||||||||||||||
| Shares redeemed | (689,743 | ) | (27,327,290 | ) | (1,636,489 | ) | (52,215,029 | ) | ||||||||||||||||||||
|
|
|
|
|
|
|
|
|
|||||||||||||||||||||
| Net (decrease) in shares outstanding | (90,192 | ) | $ | (5,253,070 | ) | (830,433 | ) | $ | (25,961,469 | ) | ||||||||||||||||||
|
|
|
|
|
|
|
|
|
|||||||||||||||||||||
| Y Class | ||||||||||||||||||||||||||||
| Year Ended December 31, | ||||||||||||||||||||||||||||
| 2021 | 2020 | |||||||||||||||||||||||||||
| Bridgeway Large Cap Growth Fund |
Shares |
Amount |
Shares |
Amount |
||||||||||||||||||||||||
| Shares sold | 18,051 | $ | 679,977 | 75,159 | $ | 2,162,207 | ||||||||||||||||||||||
| Reinvestment of dividends | 10,353 | 374,350 | 8,604 | 310,789 | ||||||||||||||||||||||||
| Shares redeemed | (55,035 | ) | (2,157,889 | ) | (64,428 | ) | (2,086,718 | ) | ||||||||||||||||||||
|
|
|
|
|
|
|
|
|
|||||||||||||||||||||
| Net increase (decrease) in shares outstanding | (26,631 | ) | $ | (1,103,562 | ) | 19,335 | $ | 386,278 | ||||||||||||||||||||
|
|
|
|
|
|
|
|
|
|||||||||||||||||||||
| Investor Class | ||||||||||||||||||||||||||||
| Year Ended December 31, | ||||||||||||||||||||||||||||
| 2021 | 2020 | |||||||||||||||||||||||||||
| Bridgeway Large Cap Growth Fund |
Shares |
Amount |
Shares |
Amount |
||||||||||||||||||||||||
| Shares sold | 151,440 | $ | 5,819,914 | 67,308 | $ | 2,224,132 | ||||||||||||||||||||||
| Reinvestment of dividends | 454,591 | 16,151,621 | 228,150 | 8,140,412 | ||||||||||||||||||||||||
| Shares redeemed | (300,799 | ) | (11,734,890 | ) | (378,907 | ) | (11,327,990 | ) | ||||||||||||||||||||
|
|
|
|
|
|
|
|
|
|||||||||||||||||||||
| Net increase (decrease) in shares outstanding | 305,232 | $ | 10,236,645 | (83,449 | ) | $ | (963,446 | ) | ||||||||||||||||||||
|
|
|
|
|
|
|
|
|
|||||||||||||||||||||
| A Class | ||||||||||||||||||||||||||||
| Year Ended December 31, | ||||||||||||||||||||||||||||
| 2021 | 2020 | |||||||||||||||||||||||||||
| Bridgeway Large Cap Growth Fund |
Shares |
Amount |
Shares |
Amount |
||||||||||||||||||||||||
| Shares sold | 2,115 | $ | 83,424 | 3,843 | $ | 132,756 | ||||||||||||||||||||||
| Reinvestment of dividends | 9,259 | 330,733 | 5,932 | 212,602 | ||||||||||||||||||||||||
| Shares redeemed | (19,016 | ) | (765,716 | ) | (16,692 | ) | (470,148 | ) | ||||||||||||||||||||
|
|
|
|
|
|
|
|
|
|||||||||||||||||||||
| Net (decrease) in shares outstanding | (7,642 | ) | $ | (351,559 | ) | (6,917 | ) | $ | (124,790 | ) | ||||||||||||||||||
|
|
|
|
|
|
|
|
|
|||||||||||||||||||||
| C Class | ||||||||||||||||||||||||||||
| Year Ended December 31, | ||||||||||||||||||||||||||||
| 2021 | 2020 | |||||||||||||||||||||||||||
| Bridgeway Large Cap Growth Fund |
Shares |
Amount |
Shares |
Amount |
||||||||||||||||||||||||
| Shares sold | 2,866 | $ | 107,956 | 41,743 | $ | 1,184,215 | ||||||||||||||||||||||
| Reinvestment of dividends | 11,191 | 374,665 | 7,605 | 260,226 | ||||||||||||||||||||||||
| Shares redeemed | (27,071 | ) | (990,827 | ) | (12,035 | ) | (390,020 | ) | ||||||||||||||||||||
|
|
|
|
|
|
|
|
|
|||||||||||||||||||||
| Net increase (decrease) in shares outstanding | (13,014 | ) | $ | (508,206 | ) | 37,313 | $ | 1,054,421 | ||||||||||||||||||||
|
|
|
|
|
|
|
|
|
|||||||||||||||||||||
| R6 Class | ||||||||||||||||||||||||||||
| Year Ended December 31, | ||||||||||||||||||||||||||||
| 2021 | 2020 | |||||||||||||||||||||||||||
| Bridgeway Large Cap Growth Fund |
Shares |
Amount |
Shares |
Amount |
||||||||||||||||||||||||
| Shares sold | 205,025 | $ | 8,076,613 | 461,299 | $ | 16,646,941 | ||||||||||||||||||||||
| Reinvestment of dividends | 82,511 | 3,012,487 | 44,410 | 1,615,183 | ||||||||||||||||||||||||
| Shares redeemed | (238,898 | ) | (9,295,306 | ) | (60,139 | ) | (2,167,801 | ) | ||||||||||||||||||||
|
|
|
|
|
|
|
|
|
|||||||||||||||||||||
| Net increase in shares outstanding | 48,638 | $ | 1,793,794 | 445,570 | $ | 16,094,323 | ||||||||||||||||||||||
|
|
|
|
|
|
|
|
|
|||||||||||||||||||||
44
American Beacon FundsSM
Notes to Financial Statements
December 31, 2021
| R5 Class | ||||||||||||||||||||||||||||
| Year Ended December 31, | ||||||||||||||||||||||||||||
| 2021 | 2020 | |||||||||||||||||||||||||||
| Bridgeway Large Cap Value Fund |
Shares |
Amount |
Shares |
Amount |
||||||||||||||||||||||||
| Shares sold | 5,762,457 | $ | 154,950,266 | 6,010,683 | $ | 134,342,037 | ||||||||||||||||||||||
| Reinvestment of dividends | 1,282,662 | 33,413,349 | 1,881,123 | 43,660,873 | ||||||||||||||||||||||||
| Shares redeemed | (12,073,394 | ) | (323,710,273 | ) | (33,561,839 | ) | (762,700,736 | ) | ||||||||||||||||||||
|
|
|
|
|
|
|
|
|
|||||||||||||||||||||
| Net (decrease) in shares outstanding | (5,028,275 | ) | $ | (135,346,658 | ) | (25,670,033 | ) | $ | (584,697,826 | ) | ||||||||||||||||||
|
|
|
|
|
|
|
|
|
|||||||||||||||||||||
| Y Class | ||||||||||||||||||||||||||||
| Year Ended December 31, | ||||||||||||||||||||||||||||
| 2021 | 2020 | |||||||||||||||||||||||||||
| Bridgeway Large Cap Value Fund |
Shares |
Amount |
Shares |
Amount |
||||||||||||||||||||||||
| Shares sold | 1,124,702 | $ | 30,077,380 | 8,883,564 | $ | 198,516,821 | ||||||||||||||||||||||
| Reinvestment of dividends | 638,600 | 16,558,911 | 1,188,000 | 27,454,668 | ||||||||||||||||||||||||
| Shares redeemed | (6,546,850 | ) | (172,882,040 | ) | (51,843,932 | ) | (1,176,692,536 | ) | ||||||||||||||||||||
|
|
|
|
|
|
|
|
|
|||||||||||||||||||||
| Net (decrease) in shares outstanding | (4,783,548 | ) | $ | (126,245,749 | ) | (41,772,368 | ) | $ | (950,721,047 | ) | ||||||||||||||||||
|
|
|
|
|
|
|
|
|
|||||||||||||||||||||
| Investor Class | ||||||||||||||||||||||||||||
| Year Ended December 31, | ||||||||||||||||||||||||||||
| 2021 | 2020 | |||||||||||||||||||||||||||
| Bridgeway Large Cap Value Fund |
Shares |
Amount |
Shares |
Amount |
||||||||||||||||||||||||
| Shares sold | 224,246 | $ | 5,961,577 | 3,739,265 | $ | 80,817,046 | ||||||||||||||||||||||
| Reinvestment of dividends | 329,275 | 8,511,756 | 536,487 | 12,360,665 | ||||||||||||||||||||||||
| Shares redeemed | (2,043,619 | ) | (54,430,095 | ) | (20,841,551 | ) | (490,262,559 | ) | ||||||||||||||||||||
|
|
|
|
|
|
|
|
|
|||||||||||||||||||||
| Net (decrease) in shares outstanding | (1,490,098 | ) | $ | (39,956,762 | ) | (16,565,799 | ) | $ | (397,084,848 | ) | ||||||||||||||||||
|
|
|
|
|
|
|
|
|
|||||||||||||||||||||
| A Class | ||||||||||||||||||||||||||||
| Year Ended December 31, | ||||||||||||||||||||||||||||
| 2021 | 2020 | |||||||||||||||||||||||||||
| Bridgeway Large Cap Value Fund |
Shares |
Amount |
Shares |
Amount |
||||||||||||||||||||||||
| Shares sold | 212,727 | $ | 5,650,749 | 251,951 | $ | 5,727,622 | ||||||||||||||||||||||
| Reinvestment of dividends | 81,297 | 2,088,535 | 108,580 | 2,488,657 | ||||||||||||||||||||||||
| Shares redeemed | (339,832 | ) | (9,080,814 | ) | (1,483,009 | ) | (32,276,083 | ) | ||||||||||||||||||||
|
|
|
|
|
|
|
|
|
|||||||||||||||||||||
| Net (decrease) in shares outstanding | (45,808 | ) | $ | (1,341,530 | ) | (1,122,478 | ) | $ | (24,059,804 | ) | ||||||||||||||||||
|
|
|
|
|
|
|
|
|
|||||||||||||||||||||
| C Class | ||||||||||||||||||||||||||||
| Year Ended December 31, | ||||||||||||||||||||||||||||
| 2021 | 2020 | |||||||||||||||||||||||||||
| Bridgeway Large Cap Value Fund |
Shares |
Amount |
Shares |
Amount |
||||||||||||||||||||||||
| Shares sold | 47,168 | $ | 1,219,277 | 70,980 | $ | 1,518,046 | ||||||||||||||||||||||
| Reinvestment of dividends | 95,601 | 2,361,325 | 132,564 | 2,930,997 | ||||||||||||||||||||||||
| Shares redeemed | (311,149 | ) | (7,984,566 | ) | (1,131,031 | ) | (24,639,507 | ) | ||||||||||||||||||||
|
|
|
|
|
|
|
|
|
|||||||||||||||||||||
| Net (decrease) in shares outstanding | (168,380 | ) | $ | (4,403,964 | ) | (927,487 | ) | $ | (20,190,464 | ) | ||||||||||||||||||
|
|
|
|
|
|
|
|
|
|||||||||||||||||||||
| R6 Class | ||||||||||||||||||||||||||||
| Year Ended December 31, | ||||||||||||||||||||||||||||
| 2021 | 2020 | |||||||||||||||||||||||||||
| Bridgeway Large Cap Value Fund |
Shares |
Amount |
Shares |
Amount |
||||||||||||||||||||||||
| Shares sold | 840,901 | $ | 23,108,110 | 1,993,609 | $ | 45,697,910 | ||||||||||||||||||||||
| Reinvestment of dividends | 244,356 | 6,358,125 | 327,145 | 7,586,484 | ||||||||||||||||||||||||
| Shares redeemed | (2,496,073 | ) | (66,802,342 | ) | (6,588,491 | ) | (150,423,682 | ) | ||||||||||||||||||||
|
|
|
|
|
|
|
|
|
|||||||||||||||||||||
| Net (decrease) in shares outstanding | (1,410,816 | ) | $ | (37,336,107 | ) | (4,267,737 | ) | $ | (97,139,288 | ) | ||||||||||||||||||
|
|
|
|
|
|
|
|
|
|||||||||||||||||||||
12. Subsequent Events
Management has evaluated subsequent events for possible recognition or disclosure in the financial statements through the date the financial statements are issued. Management has determined that there are no material events that would require disclosure in the Funds’ financial statements through this date.
45
American Beacon Bridgeway Large Cap Growth FundSM
(For a share outstanding throughout the period)
| R5 ClassA | ||||||||||||||||||||||||||||||||||||
| Year Ended December 31, | ||||||||||||||||||||||||||||||||||||
| 2021 | 2020 | 2019 | 2018 | 2017B | ||||||||||||||||||||||||||||||||
|
|
|
|||||||||||||||||||||||||||||||||||
| Net asset value, beginning of period |
$ | 36.24 | $ | 29.84 | $ | 25.27 | $ | 29.88 | $ | 24.47 | ||||||||||||||||||||||||||
|
|
|
|
|
|
|
|
|
|
|
|||||||||||||||||||||||||||
| Income (loss) from investment operations: |
||||||||||||||||||||||||||||||||||||
| Net investment income |
0.01 | 0.07 | 0.10 | 0.13 | 0.10 | |||||||||||||||||||||||||||||||
| Net gains (losses) on investments (both realized and unrealized) |
7.82 | 10.21 | 7.55 | (1.99 | ) | 6.56 | ||||||||||||||||||||||||||||||
|
|
|
|
|
|
|
|
|
|
|
|||||||||||||||||||||||||||
| Total income (loss) from investment operations |
7.83 | 10.28 | 7.65 | (1.86 | ) | 6.66 | ||||||||||||||||||||||||||||||
|
|
|
|
|
|
|
|
|
|
|
|||||||||||||||||||||||||||
| Less distributions: |
||||||||||||||||||||||||||||||||||||
| Dividends from net investment income |
- | (0.07 | ) | - | (0.11 | ) | (0.08 | ) | ||||||||||||||||||||||||||||
| Distributions from net realized gains |
(7.29 | ) | (3.81 | ) | (3.08 | ) | (2.64 | ) | (1.17 | ) | ||||||||||||||||||||||||||
|
|
|
|
|
|
|
|
|
|
|
|||||||||||||||||||||||||||
| Total distributions |
(7.29 | ) | (3.88 | ) | (3.08 | ) | (2.75 | ) | (1.25 | ) | ||||||||||||||||||||||||||
|
|
|
|
|
|
|
|
|
|
|
|||||||||||||||||||||||||||
| Net asset value, end of period |
$ | 36.78 | $ | 36.24 | $ | 29.84 | $ | 25.27 | $ | 29.88 | ||||||||||||||||||||||||||
|
|
|
|
|
|
|
|
|
|
|
|||||||||||||||||||||||||||
| Total returnC |
21.82 | % | 34.44 | % | 30.27 | % | (6.03 | )% | 27.21 | % | ||||||||||||||||||||||||||
|
|
|
|
|
|
|
|
|
|
|
|||||||||||||||||||||||||||
| Ratios and supplemental data: |
| |||||||||||||||||||||||||||||||||||
| Net assets, end of period |
$ | 112,640,010 | $ | 114,246,613 | $ | 118,831,764 | $ | 151,163,119 | $ | 178,062,388 | ||||||||||||||||||||||||||
| Ratios to average net assets: |
||||||||||||||||||||||||||||||||||||
| Expenses, before reimbursements and/or recoupments |
0.92 | % | 0.97 | % | 0.90 | % | 0.93 | % | 1.06 | % | ||||||||||||||||||||||||||
| Expenses, net of reimbursements and/or recoupments |
0.81 | % | 0.82 | %D | 0.81 | % | 0.81 | % | 0.81 | % | ||||||||||||||||||||||||||
| Net investment income (loss), before expense reimbursements and/or recoupments |
(0.10 | )% | (0.08 | )% | 0.19 | % | 0.26 | % | 0.15 | % | ||||||||||||||||||||||||||
| Net investment income, net of reimbursements and/or recoupments |
0.01 | % | 0.07 | % | 0.28 | % | 0.38 | % | 0.40 | % | ||||||||||||||||||||||||||
| Portfolio turnover rate |
57 | % | 58 | % | 77 | % | 60 | % | 78 | % | ||||||||||||||||||||||||||
| A | Prior to February 28, 2020, the R5 Class was known as Institutional Class. |
| B | On December 15, 2017, pursuant to a plan of Reorganization on termination, the American Beacon Bridgeway Large Cap Growth II Fund (“Target Fund”) transferred all of its property and assets to the American Beacon Bridgeway Large Cap Growth Fund (“Acquiring Fund”) in exchange solely for voting shares of the Acquiring Fund and the assumption of the Target Fund’s liabilities. |
| C | Based on net asset value, which does not reflect the sales charge, redemption fee, or contingent deferred sales charge, if applicable. May include adjustments in accordance with U.S. GAAP and as such, the net asset value for reporting purposes and the returns based upon those net asset values may differ from the net asset value and returns for shareholder transactions. |
| D | Expense ratios may exceed stated expense caps in Note 2 due to security lending expenses, which are not reimbursable under the agreement with the Manager. |
See accompanying notes
46
American Beacon Bridgeway Large Cap Growth FundSM
Financial Highlights
(For a share outstanding throughout the period)
| Y Class | ||||||||||||||||||||||||||||||||||||
| Year Ended December 31, | ||||||||||||||||||||||||||||||||||||
| 2021 | 2020 | 2019 | 2018 | 2017A | ||||||||||||||||||||||||||||||||
|
|
|
|||||||||||||||||||||||||||||||||||
| Net asset value, beginning of period |
$ | 36.05 | $ | 29.72 | $ | 25.21 | $ | 29.82 | $ | 24.45 | ||||||||||||||||||||||||||
|
|
|
|
|
|
|
|
|
|
|
|||||||||||||||||||||||||||
| Income (loss) from investment operations: |
||||||||||||||||||||||||||||||||||||
| Net investment income (loss) |
(0.04 | ) | 0.00 | B | 0.05 | 0.12 | 0.05 | |||||||||||||||||||||||||||||
| Net gains (losses) on investments (both realized and unrealized) |
7.81 | 10.21 | 7.54 | (1.98 | ) | 6.57 | ||||||||||||||||||||||||||||||
|
|
|
|
|
|
|
|
|
|
|
|||||||||||||||||||||||||||
| Total income (loss) from investment operations |
7.77 | 10.21 | 7.59 | (1.86 | ) | 6.62 | ||||||||||||||||||||||||||||||
|
|
|
|
|
|
|
|
|
|
|
|||||||||||||||||||||||||||
| Less distributions: |
||||||||||||||||||||||||||||||||||||
| Dividends from net investment income |
- | (0.07 | ) | - | (0.11 | ) | (0.08 | ) | ||||||||||||||||||||||||||||
| Distributions from net realized gains |
(7.29 | ) | (3.81 | ) | (3.08 | ) | (2.64 | ) | (1.17 | ) | ||||||||||||||||||||||||||
|
|
|
|
|
|
|
|
|
|
|
|||||||||||||||||||||||||||
| Total distributions |
(7.29 | ) | (3.88 | ) | (3.08 | ) | (2.75 | ) | (1.25 | ) | ||||||||||||||||||||||||||
|
|
|
|
|
|
|
|
|
|
|
|||||||||||||||||||||||||||
| Net asset value, end of period |
$ | 36.53 | $ | 36.05 | $ | 29.72 | $ | 25.21 | $ | 29.82 | ||||||||||||||||||||||||||
|
|
|
|
|
|
|
|
|
|
|
|||||||||||||||||||||||||||
| Total returnC |
21.77 | % | 34.34 | % | 30.11 | % | (6.04 | )% | 27.06 | % | ||||||||||||||||||||||||||
|
|
|
|
|
|
|
|
|
|
|
|||||||||||||||||||||||||||
| Ratios and supplemental data: |
| |||||||||||||||||||||||||||||||||||
| Net assets, end of period |
$ | 2,237,130 | $ | 3,168,012 | $ | 2,036,785 | $ | 2,306,982 | $ | 2,016,161 | ||||||||||||||||||||||||||
| Ratios to average net assets: |
||||||||||||||||||||||||||||||||||||
| Expenses, before reimbursements and/or recoupments |
0.95 | % | 1.02 | % | 0.95 | % | 0.97 | % | 1.13 | % | ||||||||||||||||||||||||||
| Expenses, net of reimbursements and/or recoupments |
0.86 | % | 0.89 | %D | 0.91 | % | 0.91 | % | 0.91 | % | ||||||||||||||||||||||||||
| Net investment income (loss), before expense reimbursements and/or recoupments |
(0.15 | )% | (0.14 | )% | 0.12 | % | 0.27 | % | 0.08 | % | ||||||||||||||||||||||||||
| Net investment income (loss), net of reimbursements and/or recoupments |
(0.06 | )% | (0.01 | )% | 0.16 | % | 0.33 | % | 0.30 | % | ||||||||||||||||||||||||||
| Portfolio turnover rate |
57 | % | 58 | % | 77 | % | 60 | % | 78 | % | ||||||||||||||||||||||||||
| A | On December 15, 2017, pursuant to a plan of Reorganization on termination, the American Beacon Bridgeway Large Cap Growth II Fund (“Target Fund”) transferred all of its property and assets to the American Beacon Bridgeway Large Cap Growth Fund (“Acquiring Fund”) in exchange solely for voting shares of the Acquiring Fund and the assumption of the Target Fund’s liabilities. |
| B | Amount represents less than $0.01 per share. |
| C | Based on net asset value, which does not reflect the sales charge, redemption fee, or contingent deferred sales charge, if applicable. May include adjustments in accordance with U.S. GAAP and as such, the net asset value for reporting purposes and the returns based upon those net asset values may differ from the net asset value and returns for shareholder transactions. |
| D | Expense ratios may exceed stated expense caps in Note 2 due to security lending expenses, which are not reimbursable under the agreement with the Manager. |
See accompanying notes
47
American Beacon Bridgeway Large Cap Growth FundSM
Financial Highlights
(For a share outstanding throughout the period)
| Investor Class | ||||||||||||||||||||||||||||||||||||
| Year Ended December 31, | ||||||||||||||||||||||||||||||||||||
| 2021 | 2020 | 2019 | 2018 | 2017A | ||||||||||||||||||||||||||||||||
|
|
|
|||||||||||||||||||||||||||||||||||
| Net asset value, beginning of period |
$ | 35.61 | $ | 29.42 | $ | 25.05 | $ | 29.65 | $ | 24.38 | ||||||||||||||||||||||||||
|
|
|
|
|
|
|
|
|
|
|
|||||||||||||||||||||||||||
| Income (loss) from investment operations: |
||||||||||||||||||||||||||||||||||||
| Net investment income (loss) |
(0.08 | ) | (0.08 | ) | (0.04 | ) | 0.01 | (0.01 | ) | |||||||||||||||||||||||||||
| Net gains (losses) on investments (both realized and unrealized) |
7.65 | 10.08 | 7.49 | (1.94 | ) | 6.53 | ||||||||||||||||||||||||||||||
|
|
|
|
|
|
|
|
|
|
|
|||||||||||||||||||||||||||
| Total income (loss) from investment operations |
7.57 | 10.00 | 7.45 | (1.93 | ) | 6.52 | ||||||||||||||||||||||||||||||
|
|
|
|
|
|
|
|
|
|
|
|||||||||||||||||||||||||||
| Less distributions: |
||||||||||||||||||||||||||||||||||||
| Dividends from net investment income |
- | - | - | (0.03 | ) | (0.08 | ) | |||||||||||||||||||||||||||||
| Distributions from net realized gains |
(7.29 | ) | (3.81 | ) | (3.08 | ) | (2.64 | ) | (1.17 | ) | ||||||||||||||||||||||||||
|
|
|
|
|
|
|
|
|
|
|
|||||||||||||||||||||||||||
| Total distributions |
(7.29 | ) | (3.81 | ) | (3.08 | ) | (2.67 | ) | (1.25 | ) | ||||||||||||||||||||||||||
|
|
|
|
|
|
|
|
|
|
|
|||||||||||||||||||||||||||
| Net asset value, end of period |
$ | 35.89 | $ | 35.61 | $ | 29.42 | $ | 25.05 | $ | 29.65 | ||||||||||||||||||||||||||
|
|
|
|
|
|
|
|
|
|
|
|||||||||||||||||||||||||||
| Total returnB |
21.48 | % | 33.98 | % | 29.74 | % | (6.33 | )% | 26.72 | % | ||||||||||||||||||||||||||
|
|
|
|
|
|
|
|
|
|
|
|||||||||||||||||||||||||||
| Ratios and supplemental data: |
| |||||||||||||||||||||||||||||||||||
| Net assets, end of period |
$ | 95,710,995 | $ | 84,109,027 | $ | 71,928,098 | $ | 65,869,325 | $ | 71,273,896 | ||||||||||||||||||||||||||
| Ratios to average net assets: |
||||||||||||||||||||||||||||||||||||
| Expenses, before reimbursements and/or recoupments |
1.24 | % | 1.31 | % | 1.20 | % | 1.20 | % | 1.40 | % | ||||||||||||||||||||||||||
| Expenses, net of reimbursements and/or recoupments |
1.12 | % | 1.15 | %C | 1.19 | % | 1.19 | % | 1.19 | % | ||||||||||||||||||||||||||
| Net investment (loss), before expense reimbursements and/or recoupments |
(0.42 | )% | (0.43 | )% | (0.11 | )% | (0.01 | )% | (0.66 | )% | ||||||||||||||||||||||||||
| Net investment income (loss), net of reimbursements and/or recoupments |
(0.30 | )% | (0.27 | )% | (0.10 | )% | 0.00 | %D | (0.45 | )% | ||||||||||||||||||||||||||
| Portfolio turnover rate |
57 | % | 58 | % | 77 | % | 60 | % | 78 | % | ||||||||||||||||||||||||||
| A | On December 15, 2017, pursuant to a plan of Reorganization on termination, the American Beacon Bridgeway Large Cap Growth II Fund (“Target Fund”) transferred all of its property and assets to the American Beacon Bridgeway Large Cap Growth Fund (“Acquiring Fund”) in exchange solely for voting shares of the Acquiring Fund and the assumption of the Target Fund’s liabilities. |
| B | Based on net asset value, which does not reflect the sales charge, redemption fee, or contingent deferred sales charge, if applicable. May include adjustments in accordance with U.S. GAAP and as such, the net asset value for reporting purposes and the returns based upon those net asset values may differ from the net asset value and returns for shareholder transactions. |
| C | Expense ratios may exceed stated expense caps in Note 2 due to security lending expenses, which are not reimbursable under the agreement with the Manager. |
| D | Amount represents less than 0.005% of average net assets. |
See accompanying notes
48
American Beacon Bridgeway Large Cap Growth FundSM
Financial Highlights
(For a share outstanding throughout the period)
| A Class | ||||||||||||||||||||||||||||||||||||
| Year Ended December 31, | ||||||||||||||||||||||||||||||||||||
| 2021 | 2020 | 2019 | 2018 | 2017A | ||||||||||||||||||||||||||||||||
|
|
|
|||||||||||||||||||||||||||||||||||
| Net asset value, beginning of period |
$ | 35.77 | $ | 29.51 | $ | 25.12 | $ | 29.70 | $ | 24.39 | ||||||||||||||||||||||||||
|
|
|
|
|
|
|
|
|
|
|
|||||||||||||||||||||||||||
| Income (loss) from investment operations: |
||||||||||||||||||||||||||||||||||||
| Net investment income (loss) |
(0.16 | ) | (0.10 | ) | (0.03 | ) | (0.11 | ) | 0.00 | B | ||||||||||||||||||||||||||
| Net gains (losses) on investments (both realized and unrealized) |
7.76 | 10.17 | 7.50 | (1.83 | ) | 6.54 | ||||||||||||||||||||||||||||||
|
|
|
|
|
|
|
|
|
|
|
|||||||||||||||||||||||||||
| Total income (loss) from investment operations |
7.60 | 10.07 | 7.47 | (1.94 | ) | 6.54 | ||||||||||||||||||||||||||||||
|
|
|
|
|
|
|
|
|
|
|
|||||||||||||||||||||||||||
| Less distributions: |
||||||||||||||||||||||||||||||||||||
| Dividends from net investment income |
- | - | - | - | (0.06 | ) | ||||||||||||||||||||||||||||||
| Distributions from net realized gains |
(7.29 | ) | (3.81 | ) | (3.08 | ) | (2.64 | ) | (1.17 | ) | ||||||||||||||||||||||||||
|
|
|
|
|
|
|
|
|
|
|
|||||||||||||||||||||||||||
| Total distributions |
(7.29 | ) | (3.81 | ) | (3.08 | ) | (2.64 | ) | (1.23 | ) | ||||||||||||||||||||||||||
|
|
|
|
|
|
|
|
|
|
|
|||||||||||||||||||||||||||
| Net asset value, end of period |
$ | 36.08 | $ | 35.77 | $ | 29.51 | $ | 25.12 | $ | 29.70 | ||||||||||||||||||||||||||
|
|
|
|
|
|
|
|
|
|
|
|||||||||||||||||||||||||||
| Total returnC |
21.47 | % | 34.11 | % | 29.74 | % | (6.35 | )% | 26.79 | % | ||||||||||||||||||||||||||
|
|
|
|
|
|
|
|
|
|
|
|||||||||||||||||||||||||||
| Ratios and supplemental data: |
| |||||||||||||||||||||||||||||||||||
| Net assets, end of period |
$ | 1,955,909 | $ | 2,212,193 | $ | 2,029,102 | $ | 1,700,188 | $ | 4,625,607 | ||||||||||||||||||||||||||
| Ratios to average net assets: |
||||||||||||||||||||||||||||||||||||
| Expenses, before reimbursements and/or recoupments |
1.21 | % | 1.27 | % | 1.18 | % | 1.25 | % | 1.44 | % | ||||||||||||||||||||||||||
| Expenses, net of reimbursements and/or recoupments |
1.10 | % | 1.14 | % | 1.21 | % | 1.21 | % | 1.21 | % | ||||||||||||||||||||||||||
| Net investment (loss), before expense reimbursements and/or recoupments |
(0.40 | )% | (0.39 | )% | (0.09 | )% | (0.09 | )% | (0.23 | )% | ||||||||||||||||||||||||||
| Net investment income (loss), net of reimbursements and/or recoupments |
(0.29 | )% | (0.26 | )% | (0.12 | )% | (0.05 | )% | 0.00 | %D | ||||||||||||||||||||||||||
| Portfolio turnover rate |
57 | % | 58 | % | 77 | % | 60 | % | 78 | % | ||||||||||||||||||||||||||
| A | On December 15, 2017, pursuant to a plan of Reorganization on termination, the American Beacon Bridgeway Large Cap Growth II Fund (“Target Fund”) transferred all of its property and assets to the American Beacon Bridgeway Large Cap Growth Fund (“Acquiring Fund”) in exchange solely for voting shares of the Acquiring Fund and the assumption of the Target Fund’s liabilities. |
| B | Amount represents less than $0.01 per share. |
| C | Based on net asset value, which does not reflect the sales charge, redemption fee, or contingent deferred sales charge, if applicable. May include adjustments in accordance with U.S. GAAP and as such, the net asset value for reporting purposes and the returns based upon those net asset values may differ from the net asset value and returns for shareholder transactions. |
| D | Amount rounds to less than 0.005%. |
See accompanying notes
49
American Beacon Bridgeway Large Cap Growth FundSM
Financial Highlights
(For a share outstanding throughout the period)
| C Class | ||||||||||||||||||||||||||||||||||||
| Year Ended December 31, | ||||||||||||||||||||||||||||||||||||
| 2021 | 2020 | 2019 | 2018 | 2017A | ||||||||||||||||||||||||||||||||
|
|
|
|||||||||||||||||||||||||||||||||||
| Net asset value, beginning of period |
$ | 34.15 | $ | 28.53 | $ | 24.55 | $ | 29.30 | $ | 24.22 | ||||||||||||||||||||||||||
|
|
|
|
|
|
|
|
|
|
|
|||||||||||||||||||||||||||
| Income (loss) from investment operations: |
||||||||||||||||||||||||||||||||||||
| Net investment (loss) |
(0.46 | ) | (0.01 | ) | (0.20 | ) | (0.17 | ) | (0.10 | ) | ||||||||||||||||||||||||||
| Net gains (losses) on investments (both realized and unrealized) |
7.41 | 9.44 | 7.26 | (1.94 | ) | 6.35 | ||||||||||||||||||||||||||||||
|
|
|
|
|
|
|
|
|
|
|
|||||||||||||||||||||||||||
| Total income (loss) from investment operations |
6.95 | 9.43 | 7.06 | (2.11 | ) | 6.25 | ||||||||||||||||||||||||||||||
|
|
|
|
|
|
|
|
|
|
|
|||||||||||||||||||||||||||
| Less distributions: |
||||||||||||||||||||||||||||||||||||
| Dividends from net investment income |
- | - | - | - | - | |||||||||||||||||||||||||||||||
| Distributions from net realized gains |
(7.29 | ) | (3.81 | ) | (3.08 | ) | (2.64 | ) | (1.17 | ) | ||||||||||||||||||||||||||
|
|
|
|
|
|
|
|
|
|
|
|||||||||||||||||||||||||||
| Total distributions |
(7.29 | ) | (3.81 | ) | (3.08 | ) | (2.64 | ) | (1.17 | ) | ||||||||||||||||||||||||||
|
|
|
|
|
|
|
|
|
|
|
|||||||||||||||||||||||||||
| Net asset value, end of period |
$ | 33.81 | $ | 34.15 | $ | 28.53 | $ | 24.55 | $ | 29.30 | ||||||||||||||||||||||||||
|
|
|
|
|
|
|
|
|
|
|
|||||||||||||||||||||||||||
| Total returnB |
20.58 | % | 33.04 | % | 28.75 | % | (7.02 | )% | 25.78 | % | ||||||||||||||||||||||||||
|
|
|
|
|
|
|
|
|
|
|
|||||||||||||||||||||||||||
| Ratios and supplemental data: |
| |||||||||||||||||||||||||||||||||||
| Net assets, end of period |
$ | 2,109,687 | $ | 2,575,041 | $ | 1,086,848 | $ | 798,319 | $ | 769,559 | ||||||||||||||||||||||||||
| Ratios to average net assets: |
||||||||||||||||||||||||||||||||||||
| Expenses, before reimbursements and/or recoupments |
1.95 | % | 2.01 | % | 1.92 | % | 1.95 | % | 2.09 | % | ||||||||||||||||||||||||||
| Expenses, net of reimbursements and/or recoupments |
1.84 | % | 1.87 | %C | 1.96 | % | 1.96 | % | 1.96 | % | ||||||||||||||||||||||||||
| Net investment (loss), before expense reimbursements and/or recoupments |
(1.14 | )% | (1.14 | )% | (0.83 | )% | (0.76 | )% | (0.90 | )% | ||||||||||||||||||||||||||
| Net investment (loss), net of reimbursements and/or recoupments |
(1.03 | )% | (1.00 | )% | (0.87 | )% | (0.77 | )% | (0.77 | )% | ||||||||||||||||||||||||||
| Portfolio turnover rate |
57 | % | 58 | % | 77 | % | 60 | % | 78 | % | ||||||||||||||||||||||||||
| A | On December 15, 2017, pursuant to a plan of Reorganization on termination, the American Beacon Bridgeway Large Cap Growth II Fund (“Target Fund”) transferred all of its property and assets to the American Beacon Bridgeway Large Cap Growth Fund (“Acquiring Fund”) in exchange solely for voting shares of the Acquiring Fund and the assumption of the Target Fund’s liabilities. |
| B | Based on net asset value, which does not reflect the sales charge, redemption fee, or contingent deferred sales charge, if applicable. May include adjustments in accordance with U.S. GAAP and as such, the net asset value for reporting purposes and the returns based upon those net asset values may differ from the net asset value and returns for shareholder transactions. |
| C | Expense ratios may exceed stated expense caps in Note 2 due to security lending expenses, which are not reimbursable under the agreement with the Manager. |
See accompanying notes
50
American Beacon Bridgeway Large Cap Growth FundSM
Financial Highlights
(For a share outstanding throughout the period)
| R6 Class | ||||||||||||||||||||||||||||
| Year Ended December 31, | April 30, 2018A to December 31, |
|||||||||||||||||||||||||||
| 2021 | 2020 | 2019 | 2018 | |||||||||||||||||||||||||
|
|
|
|||||||||||||||||||||||||||
| Net asset value, beginning of period |
$ | 36.31 | $ | 29.86 | $ | 25.28 | $ | 30.89 | ||||||||||||||||||||
|
|
|
|
|
|
|
|
|
|||||||||||||||||||||
| Income (loss) from investment operations: |
||||||||||||||||||||||||||||
| Net investment income |
0.03 | 0.04 | B | 0.10 | 0.12 | |||||||||||||||||||||||
| Net gains (losses) on investments (both realized and unrealized) |
7.84 | 10.29 | 7.56 | (2.98 | ) | |||||||||||||||||||||||
|
|
|
|
|
|
|
|
|
|||||||||||||||||||||
| Total income (loss) from investment operations |
7.87 | 10.33 | 7.66 | (2.86 | ) | |||||||||||||||||||||||
|
|
|
|
|
|
|
|
|
|||||||||||||||||||||
| Less distributions: |
||||||||||||||||||||||||||||
| Dividends from net investment income |
- | (0.07 | ) | - | (0.11 | ) | ||||||||||||||||||||||
| Distributions from net realized gains |
(7.29 | ) | (3.81 | ) | (3.08 | ) | (2.64 | ) | ||||||||||||||||||||
|
|
|
|
|
|
|
|
|
|||||||||||||||||||||
| Total distributions |
(7.29 | ) | (3.88 | ) | (3.08 | ) | (2.75 | ) | ||||||||||||||||||||
|
|
|
|
|
|
|
|
|
|||||||||||||||||||||
| Net asset value, end of period |
$ | 36.89 | $ | 36.31 | $ | 29.86 | $ | 25.28 | ||||||||||||||||||||
|
|
|
|
|
|
|
|
|
|||||||||||||||||||||
| Total returnC |
21.90 | % | 34.58 | % | 30.30% | (9.07)% | D | |||||||||||||||||||||
|
|
|
|
|
|
|
|
|
|||||||||||||||||||||
| Ratios and supplemental data: |
| |||||||||||||||||||||||||||
| Net assets, end of period |
$ | 18,361,929 | $ | 16,307,767 | $ | 107,424 | $ | 90,943 | ||||||||||||||||||||
| Ratios to average net assets: |
||||||||||||||||||||||||||||
| Expenses, before reimbursements and/or recoupments |
0.88 | % | 0.91 | % | 0.84 | % | 4.15 | %E | ||||||||||||||||||||
| Expenses, net of reimbursements and/or recoupments |
0.76 | % | 0.76 | % | 0.76 | % | 0.76 | % E | ||||||||||||||||||||
| Net investment income (loss), before expense reimbursements and/or recoupments |
(0.06 | )% | (0.05 | )% | 0.25 | % | (2.85 | )%E | ||||||||||||||||||||
| Net investment income, net of reimbursements and/or recoupments |
0.06 | % | 0.10 | % | 0.33 | % | 0.54 | %E | ||||||||||||||||||||
| Portfolio turnover rate |
57 | % | 58 | % | 77 | % | 60 | %F | ||||||||||||||||||||
| A | Commencement of operations. |
| B | Per share amounts have been calculated using the average shares method. |
| C | Based on net asset value, which does not reflect the sales charge, redemption fee, or contingent deferred sales charge, if applicable. May include adjustments in accordance with U.S. GAAP and as such, the net asset value for reporting purposes and the returns based upon those net asset values may differ from the net asset value and returns for shareholder transactions. |
| D | Not annualized. |
| E | Annualized. |
| F | Portfolio turnover rate is for the period from April 30, 2018 through December 31, 2018 and is not annualized. |
See accompanying notes
51
American Beacon Bridgeway Large Cap Value FundSM
Financial Highlights
(For a share outstanding throughout the period)
| R5 ClassA | ||||||||||||||||||||||||||||||||||||
| Year Ended December 31, | ||||||||||||||||||||||||||||||||||||
| 2021 | 2020 | 2019 | 2018 | 2017 | ||||||||||||||||||||||||||||||||
|
|
|
|||||||||||||||||||||||||||||||||||
| Net asset value, beginning of period |
$ | 23.73 | $ | 27.14 | $ | 22.61 | $ | 28.57 | $ | 26.08 | ||||||||||||||||||||||||||
|
|
|
|
|
|
|
|
|
|
|
|||||||||||||||||||||||||||
| Income (loss) from investment operations: |
||||||||||||||||||||||||||||||||||||
| Net investment income |
0.69 | 0.59 | 0.55 | 0.45 | 0.37 | |||||||||||||||||||||||||||||||
| Net gains (losses) on investments (both realized and unrealized) |
4.71 | (1.48 | ) | 5.13 | (4.28 | ) | 3.78 | |||||||||||||||||||||||||||||
|
|
|
|
|
|
|
|
|
|
|
|||||||||||||||||||||||||||
| Total income (loss) from investment operations |
5.40 | (0.89 | ) | 5.68 | (3.83 | ) | 4.15 | |||||||||||||||||||||||||||||
|
|
|
|
|
|
|
|
|
|
|
|||||||||||||||||||||||||||
| Less distributions: |
||||||||||||||||||||||||||||||||||||
| Dividends from net investment income |
(1.59 | ) | (0.00 | )B | (0.54 | ) | (0.47 | ) | (0.39 | ) | ||||||||||||||||||||||||||
| Distributions from net realized gains |
(0.99 | ) | (2.52 | ) | (0.61 | ) | (1.66 | ) | (1.27 | ) | ||||||||||||||||||||||||||
|
|
|
|
|
|
|
|
|
|
|
|||||||||||||||||||||||||||
| Total distributions |
(2.58 | ) | (2.52 | ) | (1.15 | ) | (2.13 | ) | (1.66 | ) | ||||||||||||||||||||||||||
|
|
|
|
|
|
|
|
|
|
|
|||||||||||||||||||||||||||
| Net asset value, end of period |
$ | 26.55 | $ | 23.73 | $ | 27.14 | $ | 22.61 | $ | 28.57 | ||||||||||||||||||||||||||
|
|
|
|
|
|
|
|
|
|
|
|||||||||||||||||||||||||||
| Total returnC |
22.93 | % | (3.05 | )% | 25.11 | % | (13.28 | )% | 15.88 | % | ||||||||||||||||||||||||||
|
|
|
|
|
|
|
|
|
|
|
|||||||||||||||||||||||||||
| Ratios and supplemental data: |
| |||||||||||||||||||||||||||||||||||
| Net assets, end of period |
$ | 364,332,529 | $ | 445,009,590 | $ | 1,205,569,140 | $ | 1,442,789,043 | $ | 1,547,760,278 | ||||||||||||||||||||||||||
| Ratios to average net assets: |
||||||||||||||||||||||||||||||||||||
| Expenses, before reimbursements and/or recoupments |
0.75 | % | 0.75 | % | 0.73 | % | 0.72 | % | 0.72 | % | ||||||||||||||||||||||||||
| Expenses, net of reimbursements and/or recoupments |
0.74 | % | 0.75 | % | 0.73 | % | 0.72 | % | 0.72 | % | ||||||||||||||||||||||||||
| Net investment income, before expense reimbursements and/or recoupments |
1.37 | % | 1.76 | % | 1.71 | % | 1.63 | % | 1.41 | % | ||||||||||||||||||||||||||
| Net investment income, net of reimbursements and/or recoupments |
1.38 | % | 1.76 | % | 1.71 | % | 1.63 | % | 1.41 | % | ||||||||||||||||||||||||||
| Portfolio turnover rate |
51 | % | 43 | % | 44 | % | 49 | % | 48 | % | ||||||||||||||||||||||||||
| A | Prior to February 28, 2020, the R5 Class was known as Institutional Class. |
| B | Amount represents less than $0.01 per share. |
| C | Based on net asset value, which does not reflect the sales charge, redemption fee, or contingent deferred sales charge, if applicable. May include adjustments in accordance with U.S. GAAP and as such, the net asset value for reporting purposes and the returns based upon those net asset values may differ from the net asset value and returns for shareholder transactions. |
See accompanying notes
52
American Beacon Bridgeway Large Cap Value FundSM
Financial Highlights
(For a share outstanding throughout the period)
| Y Class | ||||||||||||||||||||||||||||||||||||
| Year Ended December 31, | ||||||||||||||||||||||||||||||||||||
| 2021 | 2020 | 2019 | 2018 | 2017 | ||||||||||||||||||||||||||||||||
|
|
|
|||||||||||||||||||||||||||||||||||
| Net asset value, beginning of period |
$ | 23.63 | $ | 27.06 | $ | 22.54 | $ | 28.49 | $ | 26.01 | ||||||||||||||||||||||||||
|
|
|
|
|
|
|
|
|
|
|
|||||||||||||||||||||||||||
| Income (loss) from investment operations: |
||||||||||||||||||||||||||||||||||||
| Net investment income |
0.89 | 0.67 | 0.46 | 0.44 | 0.33 | |||||||||||||||||||||||||||||||
| Net gains (losses) on investments (both realized and unrealized) |
4.46 | (1.58 | ) | 5.19 | (4.28 | ) | 3.79 | |||||||||||||||||||||||||||||
|
|
|
|
|
|
|
|
|
|
|
|||||||||||||||||||||||||||
| Total income (loss) from investment operations |
5.35 | (0.91 | ) | 5.65 | (3.84 | ) | 4.12 | |||||||||||||||||||||||||||||
|
|
|
|
|
|
|
|
|
|
|
|||||||||||||||||||||||||||
| Less distributions: |
||||||||||||||||||||||||||||||||||||
| Dividends from net investment income |
(1.56 | ) | (0.00 | )A | (0.52 | ) | (0.45 | ) | (0.37 | ) | ||||||||||||||||||||||||||
| Distributions from net realized gains |
(0.99 | ) | (2.52 | ) | (0.61 | ) | (1.66 | ) | (1.27 | ) | ||||||||||||||||||||||||||
|
|
|
|
|
|
|
|
|
|
|
|||||||||||||||||||||||||||
| Total distributions |
(2.55 | ) | (2.52 | ) | (1.13 | ) | (2.11 | ) | (1.64 | ) | ||||||||||||||||||||||||||
|
|
|
|
|
|
|
|
|
|
|
|||||||||||||||||||||||||||
| Net asset value, end of period |
$ | 26.43 | $ | 23.63 | $ | 27.06 | $ | 22.54 | $ | 28.49 | ||||||||||||||||||||||||||
|
|
|
|
|
|
|
|
|
|
|
|||||||||||||||||||||||||||
| Total returnB |
22.84 | % | (3.14 | )% | 25.06 | % | (13.35 | )% | 15.82 | % | ||||||||||||||||||||||||||
|
|
|
|
|
|
|
|
|
|
|
|||||||||||||||||||||||||||
| Ratios and supplemental data: |
| |||||||||||||||||||||||||||||||||||
| Net assets, end of period |
$ | 191,459,312 | $ | 284,218,555 | $ | 1,455,648,440 | $ | 1,502,519,807 | $ | 1,547,228,114 | ||||||||||||||||||||||||||
| Ratios to average net assets: |
||||||||||||||||||||||||||||||||||||
| Expenses, before reimbursements and/or recoupments |
0.82 | % | 0.83 | % | 0.80 | % | 0.79 | % | 0.79 | % | ||||||||||||||||||||||||||
| Expenses, net of reimbursements and/or recoupments |
0.82 | % | 0.83 | % | 0.80 | % | 0.79 | % | 0.79 | % | ||||||||||||||||||||||||||
| Net investment income, before expense reimbursements and/or recoupments |
1.29 | % | 1.66 | % | 1.65 | % | 1.57 | % | 1.35 | % | ||||||||||||||||||||||||||
| Net investment income, net of reimbursements and/or recoupments |
1.29 | % | 1.66 | % | 1.65 | % | 1.57 | % | 1.35 | % | ||||||||||||||||||||||||||
| Portfolio turnover rate |
51 | % | 43 | % | 44 | % | 49 | % | 48 | % | ||||||||||||||||||||||||||
| A | Amount represents less than $0.01 per share. |
| B | Based on net asset value, which does not reflect the sales charge, redemption fee, or contingent deferred sales charge, if applicable. May include adjustments in accordance with U.S. GAAP and as such, the net asset value for reporting purposes and the returns based upon those net asset values may differ from the net asset value and returns for shareholder transactions. |
See accompanying notes
53
American Beacon Bridgeway Large Cap Value FundSM
Financial Highlights
(For a share outstanding throughout the period)
| Investor Class | ||||||||||||||||||||||||||||||||||||
| Year Ended December 31, | ||||||||||||||||||||||||||||||||||||
| 2021 | 2020 | 2019 | 2018 | 2017 | ||||||||||||||||||||||||||||||||
|
|
|
|||||||||||||||||||||||||||||||||||
| Net asset value, beginning of period |
$ | 23.56 | $ | 27.05 | $ | 22.50 | $ | 28.41 | $ | 25.93 | ||||||||||||||||||||||||||
|
|
|
|
|
|
|
|
|
|
|
|||||||||||||||||||||||||||
| Income (loss) from investment operations: |
||||||||||||||||||||||||||||||||||||
| Net investment income |
1.39 | 2.12 | 0.62 | 0.43 | 0.32 | |||||||||||||||||||||||||||||||
| Net gains (losses) on investments (both realized and unrealized) |
3.87 | (3.09 | ) | 4.95 | (4.33 | ) | 3.71 | |||||||||||||||||||||||||||||
|
|
|
|
|
|
|
|
|
|
|
|||||||||||||||||||||||||||
| Total income (loss) from investment operations |
5.26 | (0.97 | ) | 5.57 | (3.90 | ) | 4.03 | |||||||||||||||||||||||||||||
|
|
|
|
|
|
|
|
|
|
|
|||||||||||||||||||||||||||
| Less distributions: |
||||||||||||||||||||||||||||||||||||
| Dividends from net investment income |
(1.48 | ) | - | (0.41 | ) | (0.35 | ) | (0.28 | ) | |||||||||||||||||||||||||||
| Distributions from net realized gains |
(0.99 | ) | (2.52 | ) | (0.61 | ) | (1.66 | ) | (1.27 | ) | ||||||||||||||||||||||||||
|
|
|
|
|
|
|
|
|
|
|
|||||||||||||||||||||||||||
| Total distributions |
(2.47 | ) | (2.52 | ) | (1.02 | ) | (2.01 | ) | (1.55 | ) | ||||||||||||||||||||||||||
|
|
|
|
|
|
|
|
|
|
|
|||||||||||||||||||||||||||
| Net asset value, end of period |
$ | 26.35 | $ | 23.56 | $ | 27.05 | $ | 22.50 | $ | 28.41 | ||||||||||||||||||||||||||
|
|
|
|
|
|
|
|
|
|
|
|||||||||||||||||||||||||||
| Total returnA |
22.51 | % | (3.36 | )% | 24.74 | % | (13.60 | )% | 15.52 | % | ||||||||||||||||||||||||||
|
|
|
|
|
|
|
|
|
|
|
|||||||||||||||||||||||||||
| Ratios and supplemental data: |
| |||||||||||||||||||||||||||||||||||
| Net assets, end of period |
$ | 96,839,009 | $ | 121,683,174 | $ | 587,724,123 | $ | 886,572,501 | $ | 1,387,184,369 | ||||||||||||||||||||||||||
| Ratios to average net assets: |
||||||||||||||||||||||||||||||||||||
| Expenses, before reimbursements and/or recoupments |
1.08 | % | 1.10 | % | 1.08 | % | 1.05 | % | 1.06 | % | ||||||||||||||||||||||||||
| Expenses, net of reimbursements and/or recoupments |
1.08 | % | 1.10 | % | 1.08 | % | 1.05 | % | 1.06 | % | ||||||||||||||||||||||||||
| Net investment income, before expense reimbursements and/or recoupments |
1.04 | % | 1.44 | % | 1.37 | % | 1.26 | % | 1.04 | % | ||||||||||||||||||||||||||
| Net investment income, net of reimbursements and/or recoupments |
1.04 | % | 1.44 | % | 1.37 | % | 1.26 | % | 1.04 | % | ||||||||||||||||||||||||||
| Portfolio turnover rate |
51 | % | 43 | % | 44 | % | 49 | % | 48 | % | ||||||||||||||||||||||||||
| A | Based on net asset value, which does not reflect the sales charge, redemption fee, or contingent deferred sales charge, if applicable. May include adjustments in accordance with U.S. GAAP and as such, the net asset value for reporting purposes and the returns based upon those net asset values may differ from the net asset value and returns for shareholder transactions. |
See accompanying notes
54
American Beacon Bridgeway Large Cap Value FundSM
Financial Highlights
(For a share outstanding throughout the period)
| A Class | ||||||||||||||||||||||||||||||||||||
| Year Ended December 31, | ||||||||||||||||||||||||||||||||||||
| 2021 | 2020 | 2019 | 2018 | 2017 | ||||||||||||||||||||||||||||||||
|
|
|
|||||||||||||||||||||||||||||||||||
| Net asset value, beginning of period |
$ | 23.43 | $ | 26.92 | $ | 22.41 | $ | 28.32 | $ | 25.82 | ||||||||||||||||||||||||||
|
|
|
|
|
|
|
|
|
|
|
|||||||||||||||||||||||||||
| Income (loss) from investment operations: |
||||||||||||||||||||||||||||||||||||
| Net investment income |
0.45 | 0.84 | 0.58 | 0.36 | 0.42 | |||||||||||||||||||||||||||||||
| Net gains (losses) on investments (both realized and unrealized) |
4.78 | (1.81 | ) | 4.95 | (4.25 | ) | 3.58 | |||||||||||||||||||||||||||||
|
|
|
|
|
|
|
|
|
|
|
|||||||||||||||||||||||||||
| Total income (loss) from investment operations |
5.23 | (0.97 | ) | 5.53 | (3.89 | ) | 4.00 | |||||||||||||||||||||||||||||
|
|
|
|
|
|
|
|
|
|
|
|||||||||||||||||||||||||||
| Less distributions: |
||||||||||||||||||||||||||||||||||||
| Dividends from net investment income |
(1.49 | ) | - | (0.41 | ) | (0.36 | ) | (0.23 | ) | |||||||||||||||||||||||||||
| Distributions from net realized gains |
(0.99 | ) | (2.52 | ) | (0.61 | ) | (1.66 | ) | (1.27 | ) | ||||||||||||||||||||||||||
|
|
|
|
|
|
|
|
|
|
|
|||||||||||||||||||||||||||
| Total distributions |
(2.48 | ) | (2.52 | ) | (1.02 | ) | (2.02 | ) | (1.50 | ) | ||||||||||||||||||||||||||
|
|
|
|
|
|
|
|
|
|
|
|||||||||||||||||||||||||||
| Net asset value, end of period |
$ | 26.18 | $ | 23.43 | $ | 26.92 | $ | 22.41 | $ | 28.32 | ||||||||||||||||||||||||||
|
|
|
|
|
|
|
|
|
|
|
|||||||||||||||||||||||||||
| Total returnA |
22.51 | % | (3.38 | )% | 24.70 | % | (13.60 | )% | 15.46 | % | ||||||||||||||||||||||||||
|
|
|
|
|
|
|
|
|
|
|
|||||||||||||||||||||||||||
| Ratios and supplemental data: |
| |||||||||||||||||||||||||||||||||||
| Net assets, end of period |
$ | 26,438,159 | $ | 24,734,491 | $ | 58,637,332 | $ | 79,610,028 | $ | 96,229,248 | ||||||||||||||||||||||||||
| Ratios to average net assets: |
||||||||||||||||||||||||||||||||||||
| Expenses, before reimbursements and/or recoupments |
1.08 | % | 1.10 | % | 1.10 | % | 1.07 | % | 1.08 | % | ||||||||||||||||||||||||||
| Expenses, net of reimbursements and/or recoupments |
1.07 | % | 1.10 | % | 1.10 | % | 1.07 | % | 1.08 | % | ||||||||||||||||||||||||||
| Net investment income, before expense reimbursements and/or recoupments |
1.05 | % | 1.40 | % | 1.35 | % | 1.28 | % | 1.01 | % | ||||||||||||||||||||||||||
| Net investment income, net of reimbursements and/or recoupments |
1.06 | % | 1.40 | % | 1.35 | % | 1.28 | % | 1.01 | % | ||||||||||||||||||||||||||
| Portfolio turnover rate |
51 | % | 43 | % | 44 | % | 49 | % | 48 | % | ||||||||||||||||||||||||||
| A | Based on net asset value, which does not reflect the sales charge, redemption fee, or contingent deferred sales charge, if applicable. May include adjustments in accordance with U.S. GAAP and as such, the net asset value for reporting purposes and the returns based upon those net asset values may differ from the net asset value and returns for shareholder transactions. |
See accompanying notes
55
American Beacon Bridgeway Large Cap Value FundSM
Financial Highlights
(For a share outstanding throughout the period)
| C Class | ||||||||||||||||||||||||||||||||||||
| Year Ended December 31, | ||||||||||||||||||||||||||||||||||||
| 2021 | 2020 | 2019 | 2018 | 2017 | ||||||||||||||||||||||||||||||||
|
|
|
|||||||||||||||||||||||||||||||||||
| Net asset value, beginning of period |
$ | 22.60 | $ | 26.25 | $ | 21.86 | $ | 27.63 | $ | 25.27 | ||||||||||||||||||||||||||
|
|
|
|
|
|
|
|
|
|
|
|||||||||||||||||||||||||||
| Income (loss) from investment operations: |
||||||||||||||||||||||||||||||||||||
| Net investment income |
0.21 | 0.22 | 0.21 | 0.16 | 0.08 | |||||||||||||||||||||||||||||||
| Net gains (losses) on investments (both realized and unrealized) |
4.63 | (1.35 | ) | 4.99 | (4.12 | ) | 3.62 | |||||||||||||||||||||||||||||
|
|
|
|
|
|
|
|
|
|
|
|||||||||||||||||||||||||||
| Total income (loss) from investment operations |
4.84 | (1.13 | ) | 5.20 | (3.96 | ) | 3.70 | |||||||||||||||||||||||||||||
|
|
|
|
|
|
|
|
|
|
|
|||||||||||||||||||||||||||
| Less distributions: |
||||||||||||||||||||||||||||||||||||
| Dividends from net investment income |
(1.28 | ) | - | (0.20 | ) | (0.15 | ) | (0.07 | ) | |||||||||||||||||||||||||||
| Distributions from net realized gains |
(0.99 | ) | (2.52 | ) | (0.61 | ) | (1.66 | ) | (1.27 | ) | ||||||||||||||||||||||||||
|
|
|
|
|
|
|
|
|
|
|
|||||||||||||||||||||||||||
| Total distributions |
(2.27 | ) | (2.52 | ) | (0.81 | ) | (1.81 | ) | (1.34 | ) | ||||||||||||||||||||||||||
|
|
|
|
|
|
|
|
|
|
|
|||||||||||||||||||||||||||
| Net asset value, end of period |
$ | 25.17 | $ | 22.60 | $ | 26.25 | $ | 21.86 | $ | 27.63 | ||||||||||||||||||||||||||
|
|
|
|
|
|
|
|
|
|
|
|||||||||||||||||||||||||||
| Total returnA |
21.58 | % | (4.08 | )% | 23.79 | % | (14.23 | )% | 14.62 | % | ||||||||||||||||||||||||||
|
|
|
|
|
|
|
|
|
|
|
|||||||||||||||||||||||||||
| Ratios and supplemental data: |
| |||||||||||||||||||||||||||||||||||
| Net assets, end of period |
$ | 29,384,166 | $ | 30,186,523 | $ | 59,409,216 | $ | 75,231,917 | $ | 102,553,616 | ||||||||||||||||||||||||||
| Ratios to average net assets: |
||||||||||||||||||||||||||||||||||||
| Expenses, before reimbursements and/or recoupments |
1.84 | % | 1.83 | % | 1.81 | % | 1.79 | % | 1.83 | % | ||||||||||||||||||||||||||
| Expenses, net of reimbursements and/or recoupments |
1.83 | % | 1.83 | % | 1.81 | % | 1.79 | % | 1.83 | % | ||||||||||||||||||||||||||
| Net investment income, before expense reimbursements and/or recoupments |
0.28 | % | 0.69 | % | 0.63 | % | 0.54 | % | 0.28 | % | ||||||||||||||||||||||||||
| Net investment income, net of reimbursements and/or recoupments |
0.29 | % | 0.69 | % | 0.63 | % | 0.54 | % | 0.28 | % | ||||||||||||||||||||||||||
| Portfolio turnover rate |
51 | % | 43 | % | 44 | % | 49 | % | 48 | % | ||||||||||||||||||||||||||
| A | Based on net asset value, which does not reflect the sales charge, redemption fee, or contingent deferred sales charge, if applicable. May include adjustments in accordance with U.S. GAAP and as such, the net asset value for reporting purposes and the returns based upon those net asset values may differ from the net asset value and returns for shareholder transactions. |
See accompanying notes
56
American Beacon Bridgeway Large Cap Value FundSM
Financial Highlights
(For a share outstanding throughout the period)
| R6 Class | ||||||||||||||||||||||||||||||||||||
| Year Ended December 31, | April 28, 2017A to December 31, |
|||||||||||||||||||||||||||||||||||
| 2021 | 2020 | 2019 | 2018 | 2017 | ||||||||||||||||||||||||||||||||
|
|
|
|||||||||||||||||||||||||||||||||||
| Net asset value, beginning of period |
$ | 23.71 | $ | 27.12 | $ | 22.59 | $ | 28.55 | $ | 26.73 | ||||||||||||||||||||||||||
|
|
|
|
|
|
|
|
|
|
|
|||||||||||||||||||||||||||
| Income from investment operations: |
||||||||||||||||||||||||||||||||||||
| Net investment income |
0.53 | 0.24 | 0.49 | 0.54 | 0.11 | |||||||||||||||||||||||||||||||
| Net gains (losses) on investments (both realized and unrealized) |
4.87 | (1.12 | ) | 5.20 | (4.37 | ) | 3.37 | |||||||||||||||||||||||||||||
|
|
|
|
|
|
|
|
|
|
|
|||||||||||||||||||||||||||
| Total income (loss) from investment operations |
5.40 | (0.88 | ) | 5.69 | (3.83 | ) | 3.48 | |||||||||||||||||||||||||||||
|
|
|
|
|
|
|
|
|
|
|
|||||||||||||||||||||||||||
| Less distributions: |
||||||||||||||||||||||||||||||||||||
| Dividends from net investment income |
(1.59 | ) | (0.01 | ) | (0.55 | ) | (0.47 | ) | (0.39 | ) | ||||||||||||||||||||||||||
| Distributions from net realized gains |
(0.99 | ) | (2.52 | ) | (0.61 | ) | (1.66 | ) | (1.27 | ) | ||||||||||||||||||||||||||
|
|
|
|
|
|
|
|
|
|
|
|||||||||||||||||||||||||||
| Total distributions |
(2.58 | ) | (2.53 | ) | (1.16 | ) | (2.13 | ) | (1.66 | ) | ||||||||||||||||||||||||||
|
|
|
|
|
|
|
|
|
|
|
|||||||||||||||||||||||||||
| Net asset value, end of period |
$ | 26.53 | $ | 23.71 | $ | 27.12 | $ | 22.59 | $ | 28.55 | ||||||||||||||||||||||||||
|
|
|
|
|
|
|
|
|
|
|
|||||||||||||||||||||||||||
| Total returnB |
22.99 | % | (3.03 | )% | 25.17 | % | (13.27 | )% | 13.01 | %C | ||||||||||||||||||||||||||
|
|
|
|
|
|
|
|
|
|
|
|||||||||||||||||||||||||||
| Ratios and supplemental data: |
| |||||||||||||||||||||||||||||||||||
| Net assets, end of period |
$ | 71,972,572 | $ | 97,789,536 | $ | 227,580,520 | $ | 147,107,520 | $ | 91,521,786 | ||||||||||||||||||||||||||
| Ratios to average net assets: |
||||||||||||||||||||||||||||||||||||
| Expenses, before reimbursements and/or recoupments |
0.72 | % | 0.73 | % | 0.70 | % | 0.70 | % | 0.75 | %D | ||||||||||||||||||||||||||
| Expenses, net of reimbursements and/or recoupments |
0.72 | % | 0.73 | % | 0.70 | % | 0.70 | % | 0.71 | %D | ||||||||||||||||||||||||||
| Net investment income, before expense reimbursements and/or recoupments |
1.39 | % | 1.77 | % | 1.76 | % | 1.69 | % | 1.44 | %D | ||||||||||||||||||||||||||
| Net investment income, net of reimbursements and/or recoupments |
1.39 | % | 1.77 | % | 1.76 | % | 1.69 | % | 1.48 | %D | ||||||||||||||||||||||||||
| Portfolio turnover rate |
51 | % | 43 | % | 44 | % | 49 | % | 48 | %E | ||||||||||||||||||||||||||
| A | Commencement of operations. |
| B | Based on net asset value, which does not reflect the sales charge, redemption fee, or contingent deferred sales charge, if applicable. May include adjustments in accordance with U.S. GAAP and as such, the net asset value for reporting purposes and the returns based upon those net asset values may differ from the net asset value and returns for shareholder transactions. |
| C | Not annualized. |
| D | Annualized. |
| E | Portfolio turnover rate is for the period from April 28, 2017 through December 31, 2017 and is not annualized. |
See accompanying notes
57
American Beacon FundsSM
December 31, 2021 (Unaudited)
Certain tax information regarding the Funds is required to be provided to shareholders based upon the Funds’ income and distributions for the taxable year ended December 31, 2021. The information and distributions reported herein may differ from information and distributions taxable to the shareholders for the calendar year ended December 31, 2021.
The Funds designated the following items with regard to distributions paid during the fiscal year ended December 31, 2021. All designations are based on financial information available as of this annual report and, accordingly, are subject to change. For each item, it is the intention of the Funds to designate the maximum amount permitted under the Internal Revenue Code of 1986, as amended, and the regulations there under.
Corporate Dividends-Received Deduction:
| Bridgeway Large Cap Growth |
37.64 | % | ||
| Bridgeway Large Cap Value |
32.01 | % |
Qualified Dividend Income:
| Bridgeway Large Cap Growth |
37.50 | % | ||
| Bridgeway Large Cap Value |
33.25 | % |
Long-Term Capital Gain Distributions:
| Bridgeway Large Cap Growth |
$ | 34,874,967 | ||
| Bridgeway Large Cap Value |
57,625,097 |
Short-Term Capital Gain Distributions:
| Bridgeway Large Cap Growth |
$ | 4,540,922 | ||
| Bridgeway Large Cap Value |
12,662,186 |
Shareholders received notification in January 2022 of the applicable tax information necessary to prepare their 2021 income tax returns.
58
Trustees and Officers of the American Beacon FundsSM (Unaudited)
The Trustees and officers of the American Beacon Funds (the “Trust”) are listed below, together with their principal occupations during the past five years. The address of each person listed below is 220 Las Colinas Boulevard East, Suite 1200, Irving, Texas 75039. Each Trustee oversees thirty funds in the fund complex that includes the Trust, the American Beacon Select Funds, and the American Beacon Institutional Funds Trust. The Trust’s Statement of Additional Information contains additional information about the Trustees and is available without charge by calling 1-800-658-5811.
| Name, Age |
Position, Term of Office and Length of Time Served with the Trust |
Principal Occupation(s) During Past 5 Years and Current Directorships | ||
| INTERESTED TRUSTEES | Term |
|||
| Lifetime of Trust until removal, resignation or retirement* | ||||
| Eugene J. Duffy (67)** | Trustee since 2008 | Managing Director, Global Investment Management Distribution, Mesirow Financial Administrative Corporation (2016-Present); Managing Director, Institutional Services, Intercontinental Real Estate Corporation (2014-2016); Trustee, American Beacon Select Funds (2008-Present); Trustee, American Beacon Institutional Funds Trust (2017-Present); Trustee, American Beacon Sound Point Enhanced Income Fund (2018-2021); Trustee, American Beacon Apollo Total Return Fund (2018-2021). | ||
| NON-INTERESTED TRUSTEES | Term |
|||
| Lifetime of Trust until removal, resignation or retirement* | ||||
| Gilbert G. Alvarado (52) | Trustee since 2015 | President, SJVIIF, LLC, Impact Investment Fund (2018-Present); Director, Kura MD, Inc. (local telehealth organization) (2015-2017); Senior Vice President & CFO, Sierra Health Foundation (health conversion private foundation) (2006-Present); Senior Vice President & CFO, Sierra Health Foundation: Center for Health Program Management (California public benefit corporation) (2012-Present); Director, Innovative North State (2012-2015); Director, Sacramento Regional Technology Alliance (2011-2016); Director, Valley Healthcare Staffing (2017-2018); Trustee, American Beacon Select Funds (2015-Present); Trustee, American Beacon Institutional Funds Trust (2017-Present); Trustee, American Beacon Sound Point Enhanced Income Fund (2018-2021); Trustee, American Beacon Apollo Total Return Fund (2018-2021). | ||
| Joseph B. Armes (59) | Trustee since 2015 | Director, Switchback Energy Acquisition (2019-2021); Chairman & CEO, CSW Industrials f/k/a Capital Southwest Corporation (investment company) (2015-Present); Chairman of the Board of Capital Southwest Corporation, predecessor to CSW Industrials, Inc. (2014-2017) (investment company); President & CEO, JBA Investment Partners (family investment vehicle) (2010-Present); Director and Chair of Audit Committee, RSP Permian (oil and gas producer) (2013-2018); Trustee, American Beacon Select Funds (2015-Present); Trustee, American Beacon Institutional Funds Trust (2017-Present); Trustee, American Beacon Sound Point Enhanced Income Fund (2018-2021); Trustee, American Beacon Apollo Total Return Fund (2018-2021). | ||
| Gerard J. Arpey (63) | Trustee since 2012 | Partner, Emerald Creek Group (private equity firm) (2011-Present); Director, S.C. Johnson & Son, Inc. (privately held company) (2008-present); Director, The Home Depot, Inc. (2015-Present); Trustee, American Beacon Select Funds (2012-Present); Trustee, American Beacon Institutional Funds Trust (2017-Present); Trustee, American Beacon Sound Point Enhanced Income Fund (2018-2021); Trustee, American Beacon Apollo Total Return Fund (2018-2021). | ||
59
Trustees and Officers of the American Beacon FundsSM (Unaudited)
| Name, Age |
Position, Term of Office and Length of Time Served with the Trust |
Principal Occupation(s) During Past 5 Years and Current Directorships | ||
| NON-INTERESTED TRUSTEES (CONT.) | Term |
|||
| Lifetime of Trust until removal, resignation or retirement* | ||||
| Brenda A. Cline (61) | Trustee since 2004 Chair since 2019 Vice Chair 2018 | Chief Financial Officer, Treasurer and Secretary, Kimbell Art Foundation (1993-Present); Director, Tyler Technologies, Inc. (public sector software solutions company) (2014-Present); Director, Range Resources Corporation (oil and natural gas company) (2015-Present); Trustee, Cushing Closed-End and Open-End Funds (2017-Present); Trustee, American Beacon Select Funds (2004-Present); Trustee, American Beacon Institutional Funds Trust (2017-Present); Trustee, American Beacon Sound Point Enhanced Income Fund (2018-2021); Trustee, American Beacon Apollo Total Return Fund (2018-2021). | ||
| Claudia A. Holz (64) | Trustee since 2018 | Partner, KPMG LLP (1990-2017); Independent Director, Blue Owl Capital Inc. (2021-Present); Trustee, American Beacon Select Funds (2018-Present); Trustee, American Beacon Institutional Funds Trust (2018-Present); Trustee, American Beacon Sound Point Enhanced Income Fund (2018-2021); Trustee, American Beacon Apollo Total Return Fund (2018-2021). | ||
| Douglas A. Lindgren (60) | Trustee since 2018 | CEO North America, Carne Global Financial Services (2016-2017); Consultant, Carne Financial Services (2017-2019); Managing Director, IPS Investment Management and Global Head, Content Management, UBS Wealth Management (2010-2016); Trustee, American Beacon Select Funds (2018-Present); Trustee, American Beacon Institutional Funds Trust (2018-Present); Trustee, American Beacon Sound Point Enhanced Income Fund (2018-2021); Trustee, American Beacon Apollo Total Return Fund (2018-2021). | ||
| Barbara J. McKenna, CFA (58) | Trustee since 2012 | President/Managing Principal, Longfellow Investment Management Company (2005-Present); Trustee, American Beacon Select Funds (2012-Present); Trustee, American Beacon Institutional Funds Trust (2017-Present); Trustee, American Beacon Sound Point Enhanced Income Fund (2018-2021); Trustee, American Beacon Apollo Total Return Fund (2018-2021). | ||
60
Trustees and Officers of the American Beacon FundsSM (Unaudited)
| Name, Age |
Position, Term of Office and Length of Time Served with the Trust |
Principal Occupation(s) During Past 5 Years and Current Directorships | ||
| OFFICERS | Term |
|||
| One Year | ||||
| Gene L. Needles, Jr. (67) | President since 2009 | President (2009-2018), CEO and Director (2009-Present), and Chairman (2018-Present), American Beacon Advisors, Inc., President (2015-2018), Director and CEO (2015-Present), and Chairman (2018-Present), Resolute Investment Holdings, LLC; President (2015-2018), Director and CEO (2015-Present), and Chairman (2018-Present), Resolute Topco, Inc.; President (2015-2018); Director, and CEO (2015-Present), and Chairman (2018-Present), Resolute Acquisition, Inc.; President (2015-2018), Director and CEO (2015-Present), Chairman (2018-Present), Resolute Investment Managers, Inc.; Director, Chairman, President and CEO, Resolute Investment Distributors (2017-Present); Director, Chairman, President and CEO; Resolute Investment Services, Inc. (2017-Present); Manager, President and CEO, American Private Equity Management, LLC (2012-Present); Director, Chairman, President and CEO, Alpha Quant Advisors, LLC (2016-2020); Director, ARK Investment Management LLC (2016-2020); Director, Shapiro Capital Management LLC (2017-Present); Director, Chairman and CEO, Continuous Capital, LLC (2018-Present); Director, Green Harvest Asset Management (2019-2021); Director, National Investment Services of America, LLC (2019-Present); Director, RSW Investments Holdings LLC, (2019-Present); Manager, SSI Investment Management, LLC (2019-Present); President, American Beacon Cayman Managed Futures Strategy Fund, Ltd. (2014-Present); Director and President, American Beacon Cayman Transformational Innovation Company, LTD., (2017-2018); President, American Beacon Delaware Transformational Innovation Corporation (2017-2018); President, American Beacon Cayman TargetRisk Company, Ltd. (2018-Present); Member, Investment Advisory Committee, Employees Retirement System of Texas (2017-Present); Trustee, American Beacon NextShares Trust (2015-2020); President, American Beacon Select Funds (2009-Present); President, American Beacon Institutional Funds Trust (2017-Present); President, American Beacon Sound Point Enhanced Income Fund (2018-2021); President, American Beacon Apollo Total Return Fund (2018-2021). | ||
| Rosemary K. Behan (62) | VP, Secretary and Chief Legal Officer since 2006 | Senior Vice President (2021-Present), Vice President(2006-2021), Secretary and General Counsel (2006-Present), American Beacon Advisors, Inc.; Secretary, Resolute Investment Holdings, LLC (2015-Present); Secretary, Resolute Topco, Inc. (2015-Present); Secretary, Resolute Acquisition, Inc. (2015-Present); Senior Vice President (2021-Present), Vice President(2015-2021), Secretary and General Counsel (2015-Present), Resolute Investment Managers, Inc.; Secretary, Resolute Investment Distributors, Inc. (2017-Present); Senior Vice President (2021-Present), Vice President(2017-2021), Secretary and General Counsel (2017-Present), Resolute Investment Services, Inc.; Secretary, American Private Equity Management, LLC (2008-Present); Secretary and General Counsel, Alpha Quant Advisors, LLC (2016-2020); Vice President and Secretary, Continuous Capital, LLC (2018-Present); Secretary, Green Harvest Asset Management (2019-2021); Secretary, American Beacon Delaware Transformational Innovation Corporation (2017-2018); Secretary, American Beacon Cayman Transformational Innovation Company, Ltd. (2017-2018); Secretary, American Beacon Cayman Managed Futures Strategy Fund, Ltd. (2014-Present); Secretary, American Beacon Cayman TargetRisk Company, Ltd (2018-Present); Chief Legal Officer, Vice President and Secretary, American Beacon Select Funds (2006-Present); Chief Legal Officer, Vice President and Secretary, American Beacon Institutional Funds Trust (2017-Present); Chief Legal Officer, Vice President and Secretary, American Beacon Sound Point Enhanced Income Fund (2018-2021); Chief Legal Officer, Vice President and Secretary, American Beacon Apollo Total Return Fund (2018-2021). | ||
61
Trustees and Officers of the American Beacon FundsSM (Unaudited)
| Name, Age |
Position, Term of Office and Length of Time Served with the Trust |
Principal Occupation(s) During Past 5 Years and Current Directorships | ||
| OFFICERS (CONT.) | Term |
|||
| One Year | ||||
| Brian E. Brett (61) | VP since 2004 | Senior Vice President, Head of Distribution (2012-Present), American Beacon Advisors, Inc.; Senior Vice President, Resolute Investment Managers, Inc. (2017-Present); Senior Vice President, Resolute Investment Distributors, Inc. (2018-Present); Senior Vice President, Resolute Investment Services, Inc. (2018-Present); Vice President, American Beacon Select Funds (2004-Present); Vice President, American Beacon Institutional Funds Trust (2017-Present); Vice President, American Beacon Sound Point Enhanced Income Fund (2018-2021); Vice President, American Beacon Apollo Total Return Fund (2018-2021). | ||
| Paul B. Cavazos (52) | VP since 2016 | Chief Investment Officer and Senior Vice President, American Beacon Advisors, Inc. (2016-Present); Chief Investment Officer, DTE Energy (2007-2016); Vice President, American Private Equity Management, L.L.C. (2017-Present); Vice President, American Beacon Select Funds (2016-Present); Vice President, American Beacon Institutional Funds Trust (2017-Present); Vice President, American Beacon Sound Point Enhanced Income Fund (2018-2021); Vice President, American Beacon Apollo Total Return Fund (2018-2021). | ||
| Erica Duncan (51) | VP since 2011 | Vice President, American Beacon Advisors, Inc. (2011-Present); Vice President, Resolute Investment Managers (2018-Present); Vice President, Resolute Investment Services, Inc. (2018-Present); Vice President, American Beacon Select Funds (2011-Present); Vice President, American Beacon Institutional Funds Trust (2017-Present); Vice President, American Beacon Sound Point Enhanced Income Fund (2018-2021); Vice President, American Beacon Apollo Total Return Fund (2018-2021). | ||
| Melinda G. Heika (60) | VP since 2021 Principal Accounting Officer and Treasurer (2010-2021) | Senior Vice President (2021-Present), Treasurer and CFO (2010-Present), American Beacon Advisors, Inc.; Treasurer, Resolute Topco, Inc. (2015-Present); Treasurer, Resolute Investment Holdings, LLC. (2015-Present); Treasurer, Resolute Acquisition, Inc. (2015-Present); Senior Vice President (2021-Present), Treasurer and CFO, Resolute Investment Managers, Inc. (2017-Present); Treasurer, Resolute Investment Distributors, Inc. (2017); Senior Vice President (2021-Present); Treasurer and CFO, Resolute Investment Services, Inc. (2015-Present); Treasurer, American Private Equity Management, LLC (2012-Present); Treasurer and CFO, Alpha Quant Advisors, LLC (2016-2020); Treasurer and CFO, Continuous Capital, LLC (2018-Present); Treasurer, American Beacon Cayman Transformational Innovation, Ltd. (2017-2018); Treasurer, American Beacon Delaware Transformational Innovation Corporation (2017-2018); Director and Treasurer, American Beacon Cayman Managed Futures Strategy Fund, Ltd. (2014-Present); Treasurer, American Beacon Cayman TargetRisk Company, Ltd. (2018-Present); Vice President (2021-Present), Principal Accounting Officer (2017-2021) and Treasurer (2010-2021), American Beacon Select Funds; Vice President (2021-Present), Principal Accounting Officer and Treasurer (2017-2021), American Beacon Institutional Funds Trust; Vice President (2021), Principal Accounting Officer and Treasurer (2018-2021), American Beacon Sound Point Enhanced Income Fund; Vice President (2021), Principal Accounting Officer and Treasurer, American Beacon Apollo Total Return Fund (2018-2021). | ||
62
Trustees and Officers of the American Beacon FundsSM (Unaudited)
| Name, Age |
Position, Term of Office and Length of Time Served with the Trust |
Principal Occupation(s) During Past 5 Years and Current Directorships | ||
| OFFICERS (CONT.) | Term |
|||
| One Year | ||||
| Terri L. McKinney (58) | VP since 2010 | Senior Vice President (2021-Present), Vice President (2009-2021), American Beacon Advisors, Inc.; Senior Vice President (2021-Present); Vice President (2017-2021), Resolute Investment Managers, Inc.; Senior Vice President (2021-Present), Vice President (2018-Present), Resolute Investment Services, Inc; Vice President, Alpha Quant Advisors, LLC (2016-2020); Vice President, Continuous Capital, LLC (2018-Present); Vice President, American Beacon Select Funds (2010-Present); Vice President, American Beacon Institutional Funds Trust (2017-Present); Vice President, American Beacon Sound Point Enhanced Income Fund (2018-2021); Vice President, American Beacon Apollo Total Return Fund (2018-2021). | ||
| Jeffrey K. Ringdahl (46) | VP since 2010 | Director (2015-Present), President (2018-Present), Chief Operating Officer (2010-Present), Senior Vice President (2013-2018), American Beacon Advisors, Inc.; Director (2015-Present), President (2018-Present), Senior Vice President (2015-2018), Resolute Investment Holdings, LLC; Director (2015-Present), President (2018-Present), Senior Vice President (2015-2018), Resolute Topco, Inc.; Director (2015-Present), President (2018-Present), Senior Vice President (2015-2018), Resolute Acquisition, Inc.; Director (2015-Present), President & COO (2018-Present), Senior Vice President (2015-2018), Resolute Investment Managers, Inc.; Director and Executive Vice President (2017-Present), Resolute Investment Distributors, Inc.; Director (2017-Present), President & COO (2018-Present), Executive Vice President (2017-2018), Resolute Investment Services, Inc.; Senior Vice President (2017-Present), Vice President (2012-2017), Manager (2015-Present), American Private Equity Management, LLC; Trustee, American Beacon NextShares Trust (2015-2020); Director, Executive Vice President & COO, Alpha Quant Advisors, LLC (2016-2020); Director, Shapiro Capital Management, LLC (2017-Present); Director, Executive Vice President & COO, Continuous Capital, LLC (2018- Present); Director, RSW Investments Holdings LLC, (2019-Present); Manager, SSI Investment Management, LLC (2019-Present); Director, National Investment Services of America, LLC (2019-Present); Director and Vice President, American Beacon Cayman Transformational Innovation Company, Ltd., (2017-Present); Vice President, American Beacon Delaware Transformational Innovation Corporation (2017-2018); Director and Vice President, American Beacon Cayman Managed Futures Strategy Fund, Ltd. (2014-Present); Vice President, American Beacon Cayman TargetRisk Company, Ltd (2018-Present); Vice President, American Beacon Select Funds (2010-2018); Vice President, American Beacon Institutional Funds Trust (2017-Present); Vice President, American Beacon Sound Point Enhanced Income Fund (2018-2021); Vice President, American Beacon Apollo Total Return Fund (2018-2021). | ||
| Samuel J. Silver (58) | VP since 2011 | Vice President (2011-Present), Chief Fixed Income Officer (2016-Present), American Beacon Advisors, Inc. (2011-Present); Vice President, American Beacon Select Funds (2011-Present); Vice President, American Beacon Institutional Funds Trust (2017-Present); Vice President, American Beacon Sound Point Enhanced Income Fund (2018-2021); Vice President, American Beacon Apollo Total Return Fund (2018-2021). | ||
63
Trustees and Officers of the American Beacon FundsSM (Unaudited)
| Name, Age |
Position, Term of Office and Length of Time Served with the Trust |
Principal Occupation(s) During Past 5 Years and Current Directorships | ||
| OFFICERS (CONT.) | Term |
|||
| One Year | ||||
| Christina E. Sears (50) | Chief Compliance Officer since 2004 and Asst. Secretary since 1999 | Vice President, American Beacon Advisors, Inc. (2019-Present); Chief Compliance Officer, American Beacon Advisors, Inc. (2004-Present); Vice President, Resolute Investment Managers, Inc. (2017-Present); Vice President, Resolute Investment Distributors (2017-Present); Vice President, Resolute Investment Services, Inc. (2019-Present); Chief Compliance Officer, American Private Equity Management, LLC (2012-Present); Chief Compliance Officer, Green Harvest Asset Management, LLC (2019-2021); Chief Compliance Officer, RSW Investments Holdings, LLC (2019-Present); Chief Compliance Officer (2016-2019) and Vice President, Alpha Quant Advisors, LLC (2016-2020); Vice President, Continuous Capital, LLC (2018-Present); Chief Compliance Officer (2004-Present) and Assistant Secretary (1999-Present), American Beacon Select Funds; Chief Compliance Officer and Assistant Secretary, American Beacon Institutional Funds Trust (2017-Present); Chief Compliance Officer and Assistant Secretary, American Beacon Sound Point Enhanced Income Fund (2018-2021); Chief Compliance Officer and Assistant Secretary, American Beacon Apollo Total Return Fund (2018-2021). | ||
| Sonia L. Bates (65) | Principal Accounting Officer and Treasurer since 2021 Assistant Treasurer (2011-2021) | Assistant Treasurer, American Beacon Advisors, Inc. (2011-2018); Assistant Treasurer, American Private Equity Management, LLC (2012-Present); Assistant Treasurer, American Beacon Cayman Transformational Innovation Company, Ltd. (2017-Present); Assistant Treasurer, American Beacon Cayman TargetRisk Company, Ltd. (2018-Present); Principal Accounting Officer and Treasurer (2021-Present), Assistant Treasurer (2011-2021), American Beacon Select Funds; Principal Accounting Officer and Treasurer (2021-Present), Assistant Treasurer (2017-2021), American Beacon Institutional Funds Trust; Principal Accounting Officer and Treasurer (2021), Assistant Treasurer (2018-2021), American Beacon Sound Point Enhanced Income Fund; Principal Accounting Officer and Treasurer (2021), Assistant Treasurer (2018-2021), American Beacon Apollo Total Return Fund. | ||
| Shelley L. Dyson (52) | Assistant Treasurer since 2021 | Assistant Treasurer, American Beacon Select Funds (2021-Present); Assistant Treasurer, American Beacon Institutional Funds Trust (2021-Present); Assistant Treasurer, American Beacon Sound Point Enhanced Income Fund (2021); Assistant Treasurer, American Beacon Apollo Total Return Fund (2021). | ||
| Shelley D. Abrahams (47) | Assistant Secretary since 2008 | Assistant Secretary, American Beacon Select Funds (2008-Present); Assistant Secretary, American Beacon Institutional Funds Trust (2017-Present); Assistant Secretary, American Beacon Sound Point Enhanced Income Fund (2018-2021); Assistant Secretary, American Beacon Apollo Total Return Fund (2018-2021). | ||
| Rebecca L. Harris (55) | Assistant Secretary since 2010 | Senior Vice President (2021-Present), Vice President (2011-Present), American Beacon Advisors, Inc.; Senior Vice President (2021-Present), Vice President (2017-Present), Resolute Investment Managers, Inc.; Senior Vice President (2021-Present), Vice President (2015-Present), Resolute Investment Services; Vice President, Alpha Quant Advisors, LLC (2016-2020); Vice President, Continuous Capital, LLC (2018-Present); Assistant Secretary, American Beacon Select Funds (2010-Present); Assistant Secretary, American Beacon Institutional Funds Trust (2017-Present); Assistant Secretary, American Beacon Sound Point Enhanced Income Fund (2018-2021); Assistant Secretary, American Beacon Apollo Total Return Fund (2018-2021). | ||
64
Trustees and Officers of the American Beacon FundsSM (Unaudited)
| Name, Age |
Position, Term of Office and Length of Time Served with the Trust |
Principal Occupation(s) During Past 5 Years and Current Directorships | ||
| OFFICERS (CONT.) | Term |
|||
| One Year | ||||
| Teresa A. Oxford (63) | Assistant Secretary since 2015 | Assistant Secretary, American Beacon Advisors, Inc. (2015-Present); Assistant Secretary, Resolute Investment Distributors (2018-2021); Assistant Secretary, Resolute Investment Managers, Inc. (2017-Present); Assistant Secretary, Resolute Investment Services (2018-Present); Assistant Secretary, Alpha Quant Advisors, LLC (2016-2020); Assistant Secretary, Continuous Capital, LLC (2020-Present); Assistant Secretary, American Beacon Select Funds (2015-Present); Assistant Secretary, American Beacon Institutional Funds Trust (2017-Present); Assistant Secretary, American Beacon Sound Point Enhanced Income Fund (2018-2021); Assistant Secretary, American Beacon Apollo Total Return Fund (2018-2021). | ||
| Michael D. Jiang (37) | Assistant Secretary since 2021 | Assistant Secretary (2021-Present), Resolute Investment Distributors, Inc.; Associate General Counsel (2021-Present), Resolute Investment Services, Inc.; Vice President (2018-2021), The Northern Trust Company; Second Vice President (2015-2018), The Northern Trust Company. Assistant Secretary, American Beacon Select Funds (2021-Present); Assistant Secretary, American Beacon Institutional Funds Trust (2021-Present); Assistant Secretary, American Beacon Sound Point Enhanced Income Fund (2021); Assistant Secretary, American Beacon Apollo Total Return Fund (2021). | ||
* As of 11/12/2014, the Board adopted a retirement plan that requires Trustees to retire no later than the last day of the calendar year in which they reach the age of 75.
** Mr. Duffy is being deemed to be an “interested person” of the Trust, as defined by the Investment Company Act of 1940, as amended, by virtue of his position with Mesirow Financial, Inc., a broker-dealer.
65
American Beacon FundsSM
December 31, 2021 (Unaudited)
The American Beacon Funds recognize and respect the privacy of our shareholders. We are providing this notice to you, so you will understand how shareholder information may be collected and used.
We may collect nonpublic personal information about you from one or more of the following sources:
| • | information we receive from you on applications or other forms; |
| • | information about your transactions with us or our service providers; and |
| • | information we receive from third parties. |
We do not disclose any nonpublic personal information about our customers or former customers to anyone, except as permitted by law.
We restrict access to your nonpublic personal information to those employees or service providers who need to know that information to provide products or services to you. To ensure the confidentiality of your nonpublic personal information, we maintain safeguards that comply with federal standards.
66
This page intentionally left blank.
67
This page intentionally left blank.
68

Delivery of Documents
Shareholder reports are available online at www.americanbeaconfunds.com/reports. Please be advised that reports are no longer sent by mail. Instead, the reports are made available online, and you will be notified by mail each time a report is posted online. You will be provided with a website link to access the report. You may elect to receive all future reports in paper free of charge. You can request to continue receiving paper copies by calling 1-866-345-5954, or you may directly inform your financial intermediary. Detailed instructions are also included in your report notifications.
If you invest in the Fund through a financial institution, you may be able to receive the Fund’s regulatory mailings, such as the Prospectus, Annual Report and Semi-Annual Report, by e-mail. If you are interested in this option, please go to www.icsdelivery.com and search for your financial institution’s name or contact your financial institution directly.
To obtain more information about the Fund:

|

| |
| By E-mail: | On the Internet: | |
| american_beacon.funds@ambeacon.com | Visit our website at www.americanbeaconfunds.com | |
|
By Telephone: Call (800) 658-5811 |
By Mail: American Beacon Funds P.O. Box 219643 Kansas City, MO 64121-9643 | |
| Availability of Quarterly Portfolio Schedules | Availability of Proxy Voting Policy and Records | |
| In addition to the Schedule of Investments provided in each semi-annual and annual report, the Fund files a complete schedule of its portfolio holdings with the Securities and Exchange Commission (“SEC”) on Form N-PORT as of the end of each fiscal quarter. The Fund’s Forms N-PORT are available on the SEC’s website at www.sec.gov. The Forms N-PORT may also be reviewed and copied at the SEC’s Public Reference Section, 100 F Street, NE, Washington, D.C. 20549-2736. Information regarding the operation of the SEC’s Public Reference Room may be obtained by calling (800)-SEC-0330. A complete schedule of the Fund’s portfolio holdings is also available at www.americanbeaconfunds.com approximately sixty days after the end of each calendar quarter. | A description of the policies and procedures the Fund uses to determine how to vote proxies relating to portfolio securities is available in the Fund’s Statement of Additional Information, is available free of charge on the Fund’s website www.americanbeaconfunds.com and by calling 1-800-967-9009 or by accessing the SEC’s website at www.sec.gov. The Fund’s proxy voting record for the most recent year ended June 30 is filed annually with the SEC on Form N-PX. The Fund’s Forms N-PX are available on the SEC’s website at www.sec.gov. The Fund’s proxy voting record may also be obtained by calling 1-800-967-9009. | |


Fund Service Providers:
| CUSTODIAN State Street Bank and Trust Company Boston, Massachusetts |
TRANSFER AGENT DST Asset Manager Solutions, Inc. Quincy, Massachusetts |
INDEPENDENT REGISTERED PUBLIC ACCOUNTING FIRM Ernst & Young LLP Dallas, Texas |
DISTRIBUTOR Resolute Investment Distributors, Inc. Irving, Texas |
This report is prepared for shareholders of the American Beacon Funds and may be distributed to others only if preceded or accompanied by a current Prospectus or Summary Prospectus.
American Beacon Funds, American Beacon Bridgeway Large Cap Growth Fund, and American Beacon Bridgeway Large Cap Value Fund are service marks of American Beacon Advisors, Inc.
AR 12/21
About American Beacon Advisors
Since 1986, American Beacon Advisors, Inc. has offered a variety of products and investment advisory services to numerous institutional and retail clients, including a variety of mutual funds, corporate cash management, and separate account management.
Our clients include defined benefit plans, defined contribution plans, foundations, endowments, corporations, financial planners, and other institutional investors. With American Beacon Advisors, you can put the experience of a multi-billion dollar asset management firm to work for your company.
STEPHENS MID-CAP GROWTH FUND
Growth stocks typically are more volatile than value stocks; however, value stocks have a lower expected growth rate in earnings and sales. Investing in medium-capitalization stocks may involve greater volatility and lower liquidity than larger company stocks. Investing in foreign securities may involve heightened risk due to currency fluctuations and economic and political risks. The use of futures contracts for cash management may subject the Fund to losing more money than invested. The Fund participates in a securities lending program. Please see the prospectus for a complete discussion of the Fund’s risks. There can be no assurances that the investment objectives of this Fund will be met.
STEPHENS SMALL CAP GROWTH FUND
Growth stocks typically are more volatile than value stocks; however, value stocks have a lower expected growth rate in earnings and sales. Investing in small-capitalization stocks may involve greater volatility and lower liquidity than larger company stocks. Investing in foreign securities may involve heightened risk due to currency fluctuations and economic and political risks. The use of futures contracts for cash management may subject the Fund to losing more money than invested. The Fund participates in a securities lending program. Please see the prospectus for a complete discussion of the Fund’s risks. There can be no assurances that the investment objectives of this Fund will be met.
Any opinions herein, including forecasts, reflect our judgment as of the end of the reporting period and are subject to change. Each advisor’s strategies and each Fund’s portfolio composition will change depending on economic and market conditions. This report is not a complete analysis of market conditions, and, therefore, should not be relied upon as investment advice. Although economic and market information has been compiled from reliable sources, American Beacon Advisors, Inc. makes no representation as to the completeness or accuracy of the statements contained herein.
| American Beacon Funds |
December 31, 2021 |
| 1 | ||||
| 2 | ||||
| 11 | ||||
| 13 | ||||
| Schedules of Investments: |
||||
| 14 | ||||
| 19 | ||||
| 24 | ||||
| 28 | ||||
| Financial Highlights: |
||||
| 46 | ||||
| 52 | ||||
| 58 | ||||
| 59 | ||||
| 66 | ||||
| Back Cover |

|
Dear Shareholders,
As Warren E. Buffett, the “Oracle of Omaha” and billionaire chairman and CEO of Berkshire Hathaway, once said, “Someone’s sitting in the shade today because someone planted a tree a long time ago.”
That is to say, before we can enjoy the fruits of our labor, we must first devote our attention to the careful planning and cultivation of our estates. To achieve a strong yield requires time, diligence and patience – and there are no guarantees the seeds we plant today will thrive or result in a plentiful harvest. This can be said not only about the actions we undertake in our gardening or landscaping, but also those we initiate in our investment portfolios – especially as we take into account the potential for harm caused by natural disasters and other catastrophes, such as the COVID-19 pandemic. |
Because none of us – not even the Oracle of Omaha – has a crystal ball, to help give your investment portfolio the greatest chance for success over the long term, we encourage you to work with financial professionals to develop your personal savings plan, conduct annual plan reviews, and make thoughtful, purposeful plan adjustments to help manage your evolving financial needs and goals. By investing in different investment styles and asset classes, you may be able to help mitigate financial risks across your portfolio. By allocating your portfolio according to your risk-tolerance level, you may be better positioned to withstand short-term crises. With continuous nurturing, you will be better positioned to achieve enduring financial success.
Since 1986, American Beacon has endeavored to provide investors with a disciplined approach to realizing long-term financial goals. As a manager of managers, we strive to provide investment products that may enable investors to participate during market upswings while potentially insulating against market downswings. The investment teams behind our mutual funds seek to produce consistent, long-term results rather than focus only on short-term movements in the markets. In managing our investment products, we emphasize identifying opportunities that offer the potential for long-term financial rewards.
Thank you for entrusting your financial success with American Beacon. For additional information about our investment products or to access your account information, please visit our website at www.americanbeaconfunds.com.
Best Regards,

Gene L. Needles, Jr.
President
American Beacon Funds
1
Domestic Equity Market Overview
December 31, 2021 (Unaudited)
U.S. equity markets continued the momentum of calendar year 2020, reaching record highs in 2021 despite the ongoing COVID-19 pandemic. The year started with domestic equity markets gaining momentum during the early months of 2021 and rising to near-record levels by the end of the first quarter. This was driven, in part, by a social media-driven run-up in share prices for so-called “meme” stocks. After a short sell-off in January, stocks rebounded through February and March as COVID-19 vaccine distribution progress spurred optimism for a post-pandemic economic recovery. Investors responded by rotating out of the Information Technology sector and into the beleaguered Financials and Energy sectors.
During the second quarter of 2021, U.S. markets again recorded strong gains. The successful push for COVID-19 vaccinations and the continued reopening of the economy provided a strong basis for investor optimism in April. However, concerns about rising inflation temporarily slowed market growth in May. Investors regained confidence in June and began rotating back into Growth-oriented stocks, particularly large technology names.
Markets rose steadily through July and August as investors welcomed the continued reopening of the economy and strong corporate earnings. Investor sentiment shifted in September, however, amid worries over a variety of economic uncertainties – including the delta variant, inflation, signs of potential weakening in the U.S. economy and fears of disruptions in the Chinese economy. September’s declines erased nearly all of the gains in large-cap stocks from the previous two months and hit small-cap stocks particularly hard, even erasing some returns from the prior quarter.
Strong third-quarter earnings reports in October and continuing positive underlying economic data drove gains through the first half of the fourth quarter of 2021. Except for a brief period of volatility in late November and early December, driven by the emergence of the omicron variant, equity markets maintained steady growth through the end of the year. Following the stumble of stock prices at the end of November, the subsequent December recovery helped produce another year of double-digit returns for most major U.S. equity indexes.
2
American Beacon Stephens Mid-Cap Growth FundSM
Performance Overview
December 31, 2021 (Unaudited)
The Investor Class of the American Beacon Stephens Mid-Cap Growth Fund (the “Fund”) returned 12.20% for the twelve months ended December 31, 2021. The Fund underperformed the Russell Midcap® Growth Index (the “Index”) return of 12.73% for the same period.
Comparison of Change in Value of a $10,000 Investment for the period from 12/31/2011 through 12/31/2021
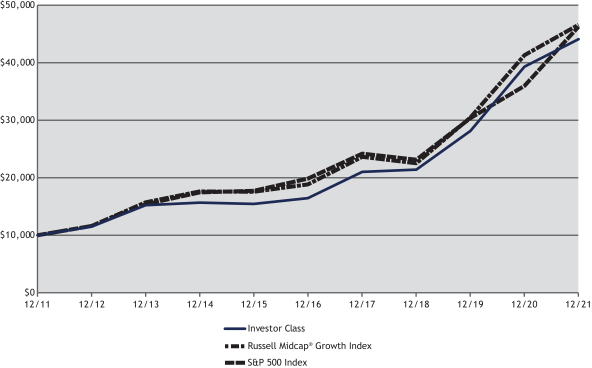
| Total Returns for the Period Ended December 31, 2021 |
| |||||||||||||||||||||||||||||||
|
Ticker |
1 Year |
3 Years |
5 Years |
10 Years |
Value of $10,000 12/31/2011- 12/31/2021 | |||||||||||||||||||||||||||
| R5 Class (1,2,8) |
SFMIX | 12.46 | % | 27.64 | % | 22.23 | % | 16.39 | % | $ | 45,624 | |||||||||||||||||||||
| Y Class (1,3,8) |
SMFYX | 12.41 | % | 27.54 | % | 22.12 | % | 16.29 | % | $ | 45,239 | |||||||||||||||||||||
| Investor Class (1,8) |
STMGX | 12.20 | % | 27.22 | % | 21.84 | % | 15.99 | % | $ | 44,081 | |||||||||||||||||||||
| A without Sales Charge (1,4,8) |
SMFAX | 12.17 | % | 27.21 | % | 21.80 | % | 15.94 | % | $ | 43,885 | |||||||||||||||||||||
| A with Sales Charge (1,4,8) |
SMFAX | 5.71 | % | 24.72 | % | 20.37 | % | 15.25 | % | $ | 41,360 | |||||||||||||||||||||
| C without Sales Charge (1,5,8) |
SMFCX | 11.29 | % | 26.27 | % | 20.90 | % | 15.10 | % | $ | 40,806 | |||||||||||||||||||||
| C with Sales Charge (1,5,8) |
SMFCX | 10.29 | % | 26.27 | % | 20.90 | % | 15.10 | % | $ | 40,806 | |||||||||||||||||||||
| R6 Class (1,6,8) |
SFMRX | 12.47 | % | 27.68 | % | 22.25 | % | 16.40 | % | $ | 45,667 | |||||||||||||||||||||
| Russell Midcap® Growth Index (7) |
12.73 | % | 27.46 | % | 19.83 | % | 16.63 | % | $ | 46,550 | ||||||||||||||||||||||
| S&P 500 Index (7) |
28.71 | % | 26.07 | % | 18.47 | % | 16.55 | % | $ | 46,257 | ||||||||||||||||||||||
| 1. | Performance shown is historical and is not indicative of future returns. Investment returns and principal value will vary, and shares may be worth more or less at redemption than at original purchase. Performance shown is calculated based on the published end-of-day net asset values as of date indicated, and current performance may be lower or higher than the performance data quoted. To obtain performance as of the most recent month end, please visit www.americanbeaconfunds.com or call 1-800-9687-9009. Fund performance in the table above does not reflect the deduction of taxes a shareholder would pay on distributions or the redemption of shares. Generally accepted accounting principles require adjustments to be made to the net assets of the Fund at period end for financial reporting purposes only; and as such, the total return based on the unadjusted net asset value per share may differ from the total return reported in the financial highlights. A portion of the fees charged to the Investor Class was waived from 2007 through 2013, partially recovered in 2014, fully recovered in 2015, and waived in 2018 and 2019. Performance prior to waiving fees was lower than the actual returns shown for periods when fees were waived. Please note that the recent performance of the securities market has helped produce short-term returns that are not typical and may not continue in the future. |
3
American Beacon Stephens Mid-Cap Growth FundSM
Performance Overview
December 31, 2021 (Unaudited)
| 2. | A portion of the fees charged to the R5 Class has been waived since Class inception (August 31, 2006). Performance prior to waiving fees was lower than the actual returns shown. |
| 3. | Fund performance for the ten-year period represents the returns achieved by the Investor Class from 12/31/2011 up to 2/24/2012, the inception date of the Y Class, and the returns of the Y Class since its inception. Expenses of the Y Class are lower than those of the Investor Class. Therefore, total returns shown may be lower than they would have been had the Y Class been in existence since 12/31/2011. A portion of the fees charged to the Y Class was waived in 2012 and 2013, partially recovered in 2014, fully recovered in 2015, and waived from 2017 through 2021. Performance prior to waiving fees was lower than the actual returns shown in periods when fees were waived. |
| 4. | Fund performance for the ten-year period represents the returns achieved by the Investor Class from 12/31/2011 up to 2/24/2012, the inception date of the A Class, and the returns of the A Class since its inception. Expenses of the A Class are higher than those of the Investor Class. Therefore, total returns shown may be higher than they would have been had the A Class been in existence since 12/31/2011. A portion of the fees charged to the A Class was waived in 2012 and 2013, fully recovered in 2015, waived in 2016 and 2018, partially recovered in 2019 and waived in 2020 and 2021. Performance prior to waiving fees was lower than the actual returns shown in periods when fees were waived. A Class shares have a maximum sales charge of 5.75%. |
| 5. | Fund performance for the ten-year period represents the returns achieved by the Investor Class from 12/31/2011 up to 2/24/2012, the inception date of the C Class, and the returns of the C Class since its inception. Expenses of the C Class are higher than those of the Investor Class. Therefore, total returns shown may be higher than they would have been had the C Class been in existence since 12/31/2011. A portion of the fees charged to the C Class was waived from 2012 through 2014, fully recovered in 2015, waived in 2016 through 2018, partially recovered in 2019, and waived in 2020 and 2021. Performance prior to waiving fees was lower than actual returns shown for periods when fees were waived. The maximum contingent deferred sales charge for the C Class is 1.00% for shares redeemed within one year of the date of purchase. |
| 6. | Fund performance for the five-year and ten-year periods represents the returns achieved by the R5 Class from 12/31/2011 up to 12/31/2018, the inception date of the R6 Class, and the returns of the R6 Class since its inception. Expenses of the R6 Class are lower than those of the R5 Class. Therefore, total returns shown may be lower than they would have been had the R6 Class been in existence since 12/31/2011. A portion of the fees charged to the R6 Class has been waived since Fund inception. Performance prior to waiving fees was lower than actual returns shown since inception. |
| 7. | The Russell Midcap® Growth Index is an unmanaged index of those stocks in the Russell Midcap Index with higher price-to-book ratios and higher forecasted growth values. Russell Midcap Index measures the performance of the 800 smallest companies in the Russell 1000 Index. Russell Midcap Index, Russell Midcap Growth Index and Russell 1000 Index are registered trademarks of Frank Russell Company. American Beacon Funds is not promoted, sponsored or endorsed by, nor in any way affiliated with the London Stock Exchange Group plc and its group undertakings (collectively, the “LSE Group”). FTSE Russell is a trading name of certain of the LSE Group companies. LSE Group is not responsible for and has not reviewed the American Beacon Stephens Mid-Cap Growth Fund nor any associated literature or publications and LSE Group makes no representation or warranty, express or implied, as to their accuracy, or completeness, or otherwise. All rights in the Russell MidCap Growth Index (the “Index”) vest in the relevant LSE Group company which owns the Index. Russell 1000® is a trademark of the relevant LSE Group company and is used by any other LSE Group company under license. The Index is calculated by or on behalf of FTSE International Limited or its affiliate, agent or partner. The LSE Group does not accept any liability whatsoever to any person arising out of (a) the use of, reliance on or any error in the Index or (b) investment in or operation of the Fund. The LSE Group makes no claim, prediction, warranty or representation either as to the results to be obtained from the Fund or the suitability of the Index for the purpose to which it is being put by the Manager. The S&P 500 Index is an unmanaged index of common stocks publicly traded in the United States. The S&P 500 Index is a product of S&P Dow Jones Indices LLC, a division of S&P Global or its affiliates (“SPDJI”) and has been licensed for use by American Beacon Advisors. Standard & Poor’s® and S&P® are registered trademarks of Standard & Poor’s Financial Services LLC, a division of S&P Global (“S&P”). Dow Jones® is a registered trademark of Dow Jones Trademark Holdings LLC (“Dow Jones”). The American Beacon Stephens Mid-Cap Growth Fund is not sponsored, endorsed, sold or promoted by SPDJI, Dow Jones, S&P or their respective affiliates, and none of such parties make any representation regarding the advisability of investing in such product(s) nor do they have any liability for any errors, omissions or interruptions of the S&P 500 Index. One cannot directly invest in an index. |
| 8. | The Total Annual Fund Operating Expense ratios set forth in the most recent Fund prospectus for the R5, Y, Investor, A, C, and R6 Class shares were 0.91%, 1.00%, 1.23%, 1.24%, 1.96%, and 0.90%, respectively. The expense ratios above may vary from the expense ratios presented in other sections of this report that are based on expenses incurred during the period covered by this report. |
The Fund underperformed the Index primarily due to negative sector allocation during the year, while stock selection within the Fund was positive for the same period.
From a sector allocation standpoint, the Fund’s overweight to the Communication Services sector detracted the most from relative returns for the period. The Fund’s lack of allocation to the Real Estate sector and underweight to the Industrials sector were also detractors. Offsetting a portion of this underperformance was the Fund’s underweight position to Consumer Staples and lack of exposure to Materials which were positive contributors to the Fund’s annual relative performance.
4
American Beacon Stephens Mid-Cap Growth FundSM
Performance Overview
December 31, 2021 (Unaudited)
From a stock selection standpoint, stocks within both Communication Services and Health Care sectors provided positive contributions to the Fund’s relative returns during the period. Within the Communication Services sector, not owning Pinterest, Inc., Class A (down 44.8% for the Index) and owning Live Nation Entertainment, Inc. (up 64.5%) added relative value during the period. Within the Health Care sector, owning ICON PLC (up 56.9%) and Bio-Techne Corp. (up 61.9%) were positive contributors. Also benefitting relative returns within this sector was not owning Novocure Ltd. (down 56.6% for the Index). Offsetting some of this good performance was poor security selection in the Information Technology sector. Holding WEX, Inc. (down 31.3%) and RingCentral, Inc., Class A (down 51.1%) detracted the most from relative performance within the sector.
Looking forward, the Fund’s sub-advisor will continue to maintain a disciplined, long-term approach to equity investing in medium capitalization stocks with above-average growth potential.
5
American Beacon Stephens Mid-Cap Growth FundSM
Performance Overview
December 31, 2021 (Unaudited)
| Top Ten Holdings (% Net Assets) |
| |||||||
| Cadence Design Systems, Inc. | 2.4 | |||||||
| ICON PLC | 2.4 | |||||||
| Copart, Inc. | 1.9 | |||||||
| Fortinet, Inc. | 1.9 | |||||||
| IDEXX Laboratories, Inc. | 1.9 | |||||||
| Palo Alto Networks, Inc. | 1.8 | |||||||
| Tradeweb Markets, Inc., Class A | 1.8 | |||||||
| Microchip Technology, Inc. | 1.7 | |||||||
| SVB Financial Group | 1.7 | |||||||
| Verisk Analytics, Inc. | 1.7 | |||||||
| Total Fund Holdings | 99 | |||||||
| Sector Allocation (% Equities) |
| |||||||
| Information Technology | 32.8 | |||||||
| Health Care | 20.0 | |||||||
| Consumer Discretionary | 14.3 | |||||||
| Industrials | 12.2 | |||||||
| Communication Services | 9.8 | |||||||
| Financials | 7.7 | |||||||
| Consumer Staples | 2.0 | |||||||
| Energy | 1.2 | |||||||
6
American Beacon Stephens Small Cap Growth FundSM
Performance Overview
December 31, 2021 (Unaudited)
The Investor Class of the American Beacon Stephens Small Cap Growth Fund (the “Fund”) returned 13.93% for the twelve months ended December 31, 2021. The Fund outperformed the Russell 2000® Growth Index (the “Index”) return of 2.83% for the same period.
Comparison of Change in Value of a $10,000 Investment for the period from 12/31/2011 through 12/31/2021
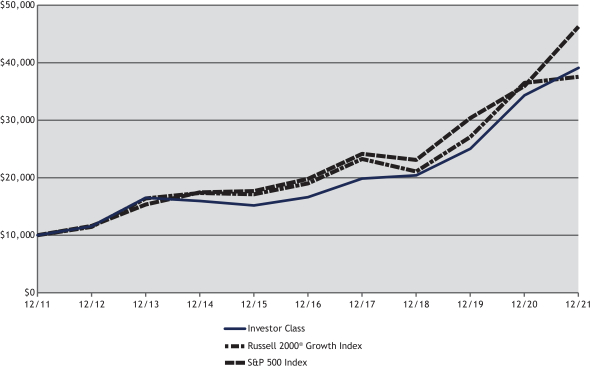
| Total Returns for the Period Ended December 31, 2021 |
| |||||||||||||||||||||||||||||||
|
Ticker |
1 Year |
3 Years |
5 Years |
10 Years |
Value of
$10,000 | |||||||||||||||||||||||||||
| R5 Class (1,2,8) |
STSIX | 14.34 | % | 24.57 | % | 18.98 | % | 14.94 | % | $ | 40,243 | |||||||||||||||||||||
| Y Class (1,3,8) |
SPWYX | 14.23 | % | 24.51 | % | 18.92 | % | 14.86 | % | $ | 39,966 | |||||||||||||||||||||
| Investor Class (1,8) |
STSGX | 13.93 | % | 24.17 | % | 18.63 | % | 14.61 | % | $ | 39,111 | |||||||||||||||||||||
| A without Sales Charge (1,4,8) |
SPWAX | 13.99 | % | 24.21 | % | 18.64 | % | 14.53 | % | $ | 38,835 | |||||||||||||||||||||
| A with Sales Charge (1,4,8) |
SPWAX | 7.45 | % | 21.78 | % | 17.25 | % | 13.85 | % | $ | 36,596 | |||||||||||||||||||||
| C without Sales Charge (1,5,8) |
SPWCX | 16.85 | % | 24.59 | % | 18.50 | % | 14.04 | % | $ | 37,211 | |||||||||||||||||||||
| C with Sales Charge (1,5,8) |
SPWCX | 15.85 | % | 24.59 | % | 18.50 | % | 14.04 | % | $ | 37,211 | |||||||||||||||||||||
| R6 Class (1,6,8) |
STSRX | 14.30 | % | 24.62 | % | 19.01 | % | 14.95 | % | $ | 40,288 | |||||||||||||||||||||
| Russell 2000® Growth Index (7) |
2.83 | % | 21.17 | % | 14.53 | % | 14.14 | % | $ | 37,519 | ||||||||||||||||||||||
| S&P 500 Index (7) |
28.71 | % | 26.07 | % | 18.47 | % | 16.55 | % | $ | 46,257 | ||||||||||||||||||||||
| 1. | Performance shown is historical and is not indicative of future returns. Investment returns and principal value will vary, and shares may be worth more or less at redemption than at original purchase. Performance shown is calculated based on the published end-of-day net asset values as of date indicated, and current performance may be lower or higher than the performance data quoted. To obtain performance as of the most recent month end, please visit www.americanbeaconfunds.com or call 1-800-967-9009. Fund performance in the table above does not reflect the deduction of taxes a shareholder would pay on distributions or the redemption of shares. Generally accepted accounting principles require adjustments to be made to the net assets of the Fund at period end for financial reporting purposes only; and as such, the total return based on the unadjusted net asset value per share may differ from the total return reported in the financial highlights. Please note that the recent performance of the securities market has helped produce short-term returns that are not typical and may not continue in the future. A portion of the fees charged to the Investor Class was waived from 2005 through 2013, fully recovered in 2014, waived in 2015, fully recovered in 2017, and waived in 2020 and 2021. Performance prior to waiving fees was lower than actual returns shown for periods when fees were waived. |
7
American Beacon Stephens Small Cap Growth FundSM
Performance Overview
December 31, 2021 (Unaudited)
| 2. | A portion of the fees charged to the R5 Class was waived from 2006 through 2013 fully recovered in 2014 and waived in 2020 and 2021. Performance prior to waiving fees was lower than actual returns shown for periods when fees were waived. |
| 3. | Fund performance for the ten-year period represents the returns achieved by the Investor Class from 12/31/2011 up to 2/24/2012, the inception date of the Y Class, and the returns of the Y Class since its inception. Expenses of the Y Class are lower than those of the Investor Class. Therefore, total returns shown may be lower than they would have been had the Y Class been in existence since 12/31/2011. A portion of the fees charged to the Y Class was waived in 2012 and 2013, fully recovered in 2014, and waived in 2020 and 2021. Performance prior to waiving fees was lower than actual returns shown for periods when fees were waived. |
| 4. | Fund performance for the ten-year period represents the returns achieved by the Investor Class from 12/31/2011 up to 2/24/2012, the inception date of the A Class, and the returns of the A Class since its inception. Expenses of the A Class are higher than those of the Investor Class. As a result, total returns shown may be higher than they would have been had the A Class been in existence since 12/31/2011. A portion of the fees charged to the A Class was waived in 2012, partially recovered in 2013 and 2014, fully recovered in 2015, and waived in 2020 and 2021. Performance prior to waiving fees was lower than actual returns shown for periods when fees were waived. A Class shares have a maximum sales charge of 5.75%. |
| 5. | Fund performance for the ten-year period represents the returns achieved by the Investor Class from 12/31/2011 up to 2/24/2012, the inception date of the C Class, and the returns of the C Class since its inception. Expenses of the C Class are higher than those of the Investor Class. As a result, total returns shown may be higher than they would have been had the C Class been in existence since 12/31/2011. A portion of the fees charged to the C Class was waived in 2012, partially recovered in 2013 and 2014, and fully recovered in 2015 and waived from 2019 to 2021. Performance prior to waiving fees was lower than actual returns shown for periods when fees were waived. The maximum contingent deferred sales charge for the C Class is 1.00% for shares redeemed within one year of the date of purchase. |
| 6. | Fund performance represents the returns achieved by the R5 Class from 12/31/2011 up to 4/30/2019, the inception date of the R6 Class, and the returns of the R6 Class since its inception. Expenses of the R6 Class are lower than those of the R5 Class. Therefore, total returns shown may be lower than they would have been had the R6 Class been in existence since 12/31/2011. A portion of the fees charged to the R6 Class has been waived since Fund inception. Performance prior to waiving fees was lower than actual returns shown since inception. |
| 7. | The Russell 2000® Growth Index is an unmanaged index of those stocks in the Russell 2000 Index with higher price-to-book ratios and higher forecasted growth values. Russell 2000 Index is an unmanaged index of approximately 2000 smaller-capitalization stocks from various industrial sectors. Russell 2000 Index and Russell 2000 Growth Index are registered trademarks of Frank Russell Company. American Beacon Funds is not promoted, sponsored or endorsed by, nor in any way affiliated with the London Stock Exchange Group plc and its group undertakings (collectively, the “LSE Group”). FTSE Russell is a trading name of certain of the LSE Group companies. LSE Group is not responsible for and has not reviewed the American Beacon Stephens Small Cap Growth Fund nor any associated literature or publications and LSE Group makes no representation or warranty, express or implied, as to their accuracy, or completeness, or otherwise. All rights in the Russell Small Cap Growth Index (the “Index”) vest in the relevant LSE Group company which owns the Index. Russell 2000® is a trademark of the relevant LSE Group company and is used by any other LSE Group company under license. The Index is calculated by or on behalf of FTSE International Limited or its affiliate, agent or partner. The LSE Group does not accept any liability whatsoever to any person arising out of (a) the use of, reliance on or any error in the Index or (b) investment in or operation of the Fund. The LSE Group makes no claim, prediction, warranty or representation either as to the results to be obtained from the Fund or the suitability of the Index for the purpose to which it is being put by the Manager. The S&P 500 Index is an unmanaged index of common stocks publicly traded in the United States. The S&P 500 Index is a product of S&P Dow Jones Indices LLC, a division of S&P Global or its affiliates (“SPDJI”) and has been licensed for use by American Beacon Advisors. Standard & Poor’s® and S&P® are registered trademarks of Standard & Poor’s Financial Services LLC, a division of S&P Global (“S&P”). Dow Jones® is a registered trademark of Dow Jones Trademark Holdings LLC (“Dow Jones”). The American Beacon Stephens Small Cap Growth Fund is not sponsored, endorsed, sold or promoted by SPDJI, Dow Jones, S&P or their respective affiliates, and none of such parties make any representation regarding the advisability of investing in such product(s) nor do they have any liability for any errors, omissions or interruptions of the S&P 500 Index. One cannot directly invest in an index. |
| 8. | The Total Annual Fund Operating Expense ratios set forth in the most recent Fund prospectus for the R5, Y, Investor, A, C, and R6 Class shares were 1.05%, 1.12%, 1.39%, 1.35%, 2.15%, and 1.02%, respectively. The expense ratios above may vary from the expense ratios presented in other sections of this report that are based on expenses incurred during the period covered by this report. |
The Fund outperformed the Index for the period primarily due to positive security selection followed by positive sector allocation.
From a stock selection standpoint, stocks within the Health Care, Industrials and Materials sectors contributed the most to relative returns. In the Health Care sector, contributing stocks for the period were ICON PLC (up 56.3%), Tandem Diabetes Care, Inc. (up 56.2%), and Repligen Corp. (up 38.1%). Within the Industrials sector, stocks held in the Fund that added to relative performance were Kornit Digital Ltd. (up 72.6%), Montrose Environmental Group, Inc. (up 126.2%), and SiteOne Landscape Supply, Inc. (up 55.5%). Within the Materials sector, a contributing stock held in the Fund was Balchem Corp. (up 46.8%). Additionally, not owning Novagold Resources,
8
American Beacon Stephens Small Cap Growth FundSM
Performance Overview
December 31, 2021 (Unaudited)
Inc. (down 29.1%) within the Materials sector also benefited the Fund. In contrast, stock selection in the Information Technology sector detracted from the Fund’s relative returns. Within this sector, the largest negative detractor for the period was not owning Synaptics, Inc. (up 200.3% for the Index).
From a sector allocation standpoint, the Fund’s underweight to the Health Care sector and overweight positions to both the Information Technology and Industrials sectors contributed to the Fund’s relative performance during the period. The Fund’s lack of exposure to the Real Estate sector was a detractor to the Fund’s relative performance
Looking forward, the Fund’s sub-advisor will continue to maintain a disciplined, long-term approach to equity investing in small capitalization stocks with above-average growth potential.
9
American Beacon Stephens Small Cap Growth FundSM
Performance Overview
December 31, 2021 (Unaudited)
| Top Ten Holdings (% Net Assets) |
| |||||||
| Globant SA | 2.1 | |||||||
| Omnicell, Inc. | 2.1 | |||||||
| Tandem Diabetes Care, Inc. | 2.1 | |||||||
| ICON PLC | 2.0 | |||||||
| Kornit Digital Ltd. | 2.0 | |||||||
| Manhattan Associates, Inc. | 2.0 | |||||||
| Repligen Corp. | 2.0 | |||||||
| SiteOne Landscape Supply, Inc. | 2.0 | |||||||
| MGP Ingredients, Inc. | 1.9 | |||||||
| Trex Co., Inc. | 1.8 | |||||||
| Total Fund Holdings | 98 | |||||||
| Sector Allocation (% Equities) |
| |||||||
| Information Technology | 30.4 | |||||||
| Health Care | 22.6 | |||||||
| Industrials | 17.0 | |||||||
| Consumer Discretionary | 12.2 | |||||||
| Financials | 8.7 | |||||||
| Consumer Staples | 5.5 | |||||||
| Energy | 1.7 | |||||||
| Materials | 1.1 | |||||||
| Communication Services | 0.8 | |||||||
10
Expense Examples
December 31, 2021 (Unaudited)
Fund Expense Example
As a shareholder of a Fund, you incur two types of costs: (1) transaction costs, including sales charges (loads) on purchase payments and redemption fees, if applicable, and (2) ongoing costs, including management fees, distribution (12b-1) fees, sub-transfer agent fees, and other Fund expenses. The Examples are intended to help you understand the ongoing cost (in dollars) of investing in the Funds and to compare these costs with the ongoing costs of investing in other mutual funds. The Examples are based on an investment of $1,000 invested at the beginning of the period in each Class and held for the entire period from July 1, 2021 through December 31, 2021.
Actual Expenses
The “Actual” lines of the tables provide information about actual account values and actual expenses. You may use the information on this page, together with the amount you invested, to estimate the expenses that you paid over the period. Simply divide your account value by $1,000 (for example, an $8,600 account value divided by $1,000 = $8.60), then multiply the result by the “Expenses Paid During Period” to estimate the expenses you paid on your account during this period. Shareholders of the Investor and R5 Classes that invest in the Fund through an IRA or Roth IRA may be subject to a custodial IRA fee of $15 that is typically deducted each December. If your account was subject to a custodial IRA fee during the period, your costs would have been $15 higher.
Hypothetical Example for Comparison Purposes
The “Hypothetical” lines of the tables provide information about hypothetical account values and hypothetical expenses based on the Fund’s actual expense ratio and an assumed 5% per year rate of return before expenses (not the Fund’s actual return). You may compare the ongoing costs of investing in the Funds with other funds by contrasting this 5% hypothetical example and the 5% hypothetical examples that appear in the shareholder reports of the other funds. The hypothetical account values and expenses may not be used to estimate the actual ending account balance or expenses you paid for the period. Shareholders of the Investor and R5 Classes that invest in the Funds through an IRA or Roth IRA may be subject to a custodial IRA fee of $15 that is typically deducted each December. If your account was subject to a custodial IRA fee during the period, your costs would have been $15 higher.
You should also be aware that the expenses shown in the table highlight only your ongoing costs and do not reflect any transaction costs charged by the Funds, such as sales charges (loads) or redemption fees, as applicable. Similarly, the expense examples for other funds do not reflect any transaction costs charged by those funds, such as sales charges (loads), redemption fees or exchange fees. Therefore, the “Hypothetical” lines of the tables are useful in comparing ongoing costs only and will not help you determine the relative total costs of owning different funds. If you were subject to any transaction costs during the period, your costs would have been higher.
11
American Beacon FundsSM
Expense Examples
December 31, 2021 (Unaudited)
| American Beacon Stephens Mid-Cap Growth Fund |
| ||||||||||||||
| Beginning Account Value 7/1/2021 |
Ending Account Value 12/31/2021 |
Expenses Paid During Period 7/1/2021-12/31/2021* | |||||||||||||
| R5 Class | |||||||||||||||
| Actual | $1,000.00 | $1,051.40 | $4.60 | ||||||||||||
| Hypothetical** | $1,000.00 | $1,020.72 | $4.53 | ||||||||||||
| Y Class | |||||||||||||||
| Actual | $1,000.00 | $1,051.40 | $4.91 | ||||||||||||
| Hypothetical** | $1,000.00 | $1,020.42 | $4.84 | ||||||||||||
| Investor Class | |||||||||||||||
| Actual | $1,000.00 | $1,050.40 | $6.00 | ||||||||||||
| Hypothetical** | $1,000.00 | $1,019.36 | $5.90 | ||||||||||||
| A Class | |||||||||||||||
| Actual | $1,000.00 | $1,050.00 | $6.15 | ||||||||||||
| Hypothetical** | $1,000.00 | $1,019.21 | $6.06 | ||||||||||||
| C Class | |||||||||||||||
| Actual | $1,000.00 | $1,046.40 | $10.01 | ||||||||||||
| Hypothetical** | $1,000.00 | $1,015.43 | $9.86 | ||||||||||||
| R6 Class | |||||||||||||||
| Actual | $1,000.00 | $1,051.60 | $4.55 | ||||||||||||
| Hypothetical** | $1,000.00 | $1,020.77 | $4.48 | ||||||||||||
| * | Expenses are equal to the Fund’s annualized expense ratios for the six-month period of 0.89%, 0.95%, 1.16%, 1.19%, 1.94%, and 0.88% for the R5, Y, Investor, A, C, and R6 Classes, respectively, multiplied by the average account value over the period, multiplied by the number derived by dividing the number of days in the most recent fiscal half-year (184) by days in the year (365) to reflect the half-year period. |
| ** | 5% return before expenses. |
| American Beacon Stephens Small Cap Growth Fund |
| ||||||||||||||
| Beginning Account Value 7/1/2021 |
Ending Account Value 12/31/2021 |
Expenses Paid During Period 7/1/2021-12/31/2021* | |||||||||||||
| R5 Class | |||||||||||||||
| Actual | $1,000.00 | $1,042.70 | $5.10 | ||||||||||||
| Hypothetical** | $1,000.00 | $1,020.22 | $5.04 | ||||||||||||
| Y Class | |||||||||||||||
| Actual | $1,000.00 | $1,042.20 | $5.40 | ||||||||||||
| Hypothetical** | $1,000.00 | $1,019.91 | $5.35 | ||||||||||||
| Investor Class | |||||||||||||||
| Actual | $1,000.00 | $1,040.70 | $6.69 | ||||||||||||
| Hypothetical** | $1,000.00 | $1,018.65 | $6.61 | ||||||||||||
| A Class | |||||||||||||||
| Actual | $1,000.00 | $1,041.40 | $6.59 | ||||||||||||
| Hypothetical** | $1,000.00 | $1,018.75 | $6.51 | ||||||||||||
| C Class | |||||||||||||||
| Actual | $1,000.00 | $1,035.00 | $10.57 | ||||||||||||
| Hypothetical** | $1,000.00 | $1,014.82 | $10.46 | ||||||||||||
| R6 Class | |||||||||||||||
| Actual | $1,000.00 | $1,042.60 | $4.94 | ||||||||||||
| Hypothetical** | $1,000.00 | $1,020.37 | $4.89 | ||||||||||||
| * | Expenses are equal to the Fund’s annualized expense ratios for the six-month period of 0.99%, 1.05%, 1.30%, 1.28%, 2.06%, and 0.96% for the R5, Y, Investor, A, C, and R6 Classes, respectively, multiplied by the average account value over the period, multiplied by the number derived by dividing the number of days in the most recent fiscal half-year (184) by days in the year (365) to reflect the half-year period. |
| ** | 5% return before expenses. |
12
Report of Independent Registered Public Accounting Firm
To the Shareholders of American Beacon Stephens Mid-Cap Growth Fund and American Beacon Stephens Small Cap Growth Fund and the Board of Trustees of American Beacon Funds
Opinion on the Financial Statements
We have audited the accompanying statements of assets and liabilities of American Beacon Stephens Mid-Cap Growth Fund and American Beacon Stephens Small Cap Growth Fund (collectively referred to as the “Funds”), (two of the funds constituting American Beacon Funds (the “Trust”)), including the schedules of investments, as of December 31, 2021, and the related statements of operations for the year then ended, the statements of changes in net assets for each of the two years in the period then ended, the financial highlights for each of the five years in the period then ended and the related notes (collectively referred to as the “financial statements”). In our opinion, the financial statements present fairly, in all material respects, the financial position of each of the Funds (two of the funds constituting American Beacon Funds) at December 31, 2021, the results of their operations for the year then ended, the changes in their net assets for each of the two years in the period then ended and their financial highlights for each of the five years in the period then ended, in conformity with U.S. generally accepted accounting principles.
Basis for Opinion
These financial statements are the responsibility of the Trust’s management. Our responsibility is to express an opinion on the Funds’ financial statements based on our audits. We are a public accounting firm registered with the Public Company Accounting Oversight Board (United States) (“PCAOB”) and are required to be independent with respect to the Trust in accordance with the U.S. federal securities laws and the applicable rules and regulations of the Securities and Exchange Commission and the PCAOB.
We conducted our audits in accordance with the standards of the PCAOB. Those standards require that we plan and perform the audit to obtain reasonable assurance about whether the financial statements are free of material misstatement, whether due to error or fraud. The Trust is not required to have, nor were we engaged to perform, an audit of the Trust’s internal control over financial reporting. As part of our audits, we are required to obtain an understanding of internal control over financial reporting, but not for the purpose of expressing an opinion on the effectiveness of the Trust’s internal control over financial reporting. Accordingly, we express no such opinion.
Our audits included performing procedures to assess the risks of material misstatement of the financial statements, whether due to error or fraud, and performing procedures that respond to those risks. Such procedures included examining, on a test basis, evidence regarding the amounts and disclosures in the financial statements. Our procedures included confirmation of securities owned as of December 31, 2021, by correspondence with the custodian and brokers or by other appropriate auditing procedures where replies from brokers were not received. Our audits also included evaluating the accounting principles used and significant estimates made by management, as well as evaluating the overall presentation of the financial statements. We believe that our audits provide a reasonable basis for our opinion.

We have served as the auditor of one or more American Beacon investment companies since 1987.
Dallas, Texas
February 28, 2022
13
American Beacon Stephens Mid-Cap Growth FundSM
December 31, 2021
| Shares | Fair Value | ||||||||||||||
| COMMON STOCKS - 99.01% | |||||||||||||||
| Communication Services - 9.69% | |||||||||||||||
| Entertainment - 7.05% | |||||||||||||||
| Electronic Arts, Inc. | 75,466 | $ | 9,953,965 | ||||||||||||
| Live Nation Entertainment, Inc.A | 99,572 | 11,917,773 | |||||||||||||
| Roku, Inc.A | 28,880 | 6,590,416 | |||||||||||||
| Spotify Technology SAA | 35,168 | 8,230,367 | |||||||||||||
| Take-Two Interactive Software, Inc.A | 65,070 | 11,564,241 | |||||||||||||
| Warner Music Group Corp., Class A | 151,330 | 6,534,429 | |||||||||||||
|
|
|
||||||||||||||
| 54,791,191 | |||||||||||||||
|
|
|
||||||||||||||
| Interactive Media & Services - 2.64% | |||||||||||||||
| IAC/InterActiveCorpA | 53,137 | 6,945,537 | |||||||||||||
| Match Group, Inc.A | 70,077 | 9,267,683 | |||||||||||||
| ZoomInfo Technologies, Inc., Class AA | 67,265 | 4,318,413 | |||||||||||||
|
|
|
||||||||||||||
| 20,531,633 | |||||||||||||||
|
|
|
||||||||||||||
| Total Communication Services |
75,322,824 | ||||||||||||||
|
|
|
||||||||||||||
| Consumer Discretionary - 14.18% | |||||||||||||||
| Distributors - 1.14% | |||||||||||||||
| Pool Corp. | 15,659 | 8,862,994 | |||||||||||||
|
|
|
||||||||||||||
| Diversified Consumer Services - 0.73% | |||||||||||||||
| Bright Horizons Family Solutions, Inc.A | 45,054 | 5,671,397 | |||||||||||||
|
|
|
||||||||||||||
| Hotels, Restaurants & Leisure - 2.71% | |||||||||||||||
| Domino’s Pizza, Inc. | 20,534 | 11,587,952 | |||||||||||||
| Wingstop, Inc. | 55,061 | 9,514,541 | |||||||||||||
|
|
|
||||||||||||||
| 21,102,493 | |||||||||||||||
|
|
|
||||||||||||||
| Household Durables - 0.82% | |||||||||||||||
| Garmin Ltd. | 46,849 | 6,379,428 | |||||||||||||
|
|
|
||||||||||||||
| Internet & Direct Marketing Retail - 0.75% | |||||||||||||||
| Farfetch Ltd., Class AA | 173,858 | 5,812,073 | |||||||||||||
|
|
|
||||||||||||||
| Multiline Retail - 1.80% | |||||||||||||||
| Dollar Tree, Inc.A | 66,226 | 9,306,078 | |||||||||||||
| Ollie’s Bargain Outlet Holdings, Inc.A B | 92,296 | 4,724,632 | |||||||||||||
|
|
|
||||||||||||||
| 14,030,710 | |||||||||||||||
|
|
|
||||||||||||||
| Specialty Retail - 4.65% | |||||||||||||||
| Burlington Stores, Inc.A | 31,316 | 9,128,927 | |||||||||||||
| Five Below, Inc.A | 26,727 | 5,529,549 | |||||||||||||
| Floor & Decor Holdings, Inc., Class AA | 36,968 | 4,806,210 | |||||||||||||
| Ross Stores, Inc. | 64,561 | 7,378,031 | |||||||||||||
| Ulta Beauty, Inc.A | 22,590 | 9,314,761 | |||||||||||||
|
|
|
||||||||||||||
| 36,157,478 | |||||||||||||||
|
|
|
||||||||||||||
| Textiles, Apparel & Luxury Goods - 1.58% | |||||||||||||||
| Lululemon Athletica, Inc.A | 18,098 | 7,084,462 | |||||||||||||
| Ralph Lauren Corp. | 43,515 | 5,172,193 | |||||||||||||
|
|
|
||||||||||||||
| 12,256,655 | |||||||||||||||
|
|
|
||||||||||||||
| Total Consumer Discretionary |
110,273,228 | ||||||||||||||
|
|
|
||||||||||||||
See accompanying notes
14
American Beacon Stephens Mid-Cap Growth FundSM
Schedule of Investments
December 31, 2021
| Shares | Fair Value | ||||||||||||||
| COMMON STOCKS - 99.01% (continued) | |||||||||||||||
| Consumer Staples - 1.93% | |||||||||||||||
| Beverages - 1.93% | |||||||||||||||
| Brown-Forman Corp., Class B | 92,927 | $ | 6,770,661 | ||||||||||||
| Monster Beverage Corp.A | 85,738 | 8,234,278 | |||||||||||||
|
|
|
||||||||||||||
| 15,004,939 | |||||||||||||||
|
|
|
||||||||||||||
| Total Consumer Staples |
15,004,939 | ||||||||||||||
|
|
|
||||||||||||||
| Energy - 1.23% | |||||||||||||||
| Oil, Gas & Consumable Fuels - 1.23% | |||||||||||||||
| Coterra Energy, Inc. | 170,485 | 3,239,215 | |||||||||||||
| Pioneer Natural Resources Co. | 34,913 | 6,349,976 | |||||||||||||
|
|
|
||||||||||||||
| 9,589,191 | |||||||||||||||
|
|
|
||||||||||||||
| Total Energy |
9,589,191 | ||||||||||||||
|
|
|
||||||||||||||
| Financials - 7.59% | |||||||||||||||
| Banks - 2.98% | |||||||||||||||
| Signature Bank | 30,547 | 9,881,038 | |||||||||||||
| SVB Financial GroupA | 19,637 | 13,318,599 | |||||||||||||
|
|
|
||||||||||||||
| 23,199,637 | |||||||||||||||
|
|
|
||||||||||||||
| Capital Markets - 3.02% | |||||||||||||||
| MarketAxess Holdings, Inc. | 22,461 | 9,237,536 | |||||||||||||
| Tradeweb Markets, Inc., Class A | 142,458 | 14,265,744 | |||||||||||||
|
|
|
||||||||||||||
| 23,503,280 | |||||||||||||||
|
|
|
||||||||||||||
| Consumer Finance - 0.93% | |||||||||||||||
| PROG Holdings, Inc. | 160,311 | 7,231,629 | |||||||||||||
|
|
|
||||||||||||||
| Insurance - 0.66% | |||||||||||||||
| Ryan Specialty Group Holdings, Inc., Class AA | 126,822 | 5,117,268 | |||||||||||||
|
|
|
||||||||||||||
| Total Financials |
59,051,814 | ||||||||||||||
|
|
|
||||||||||||||
| Health Care - 19.84% | |||||||||||||||
| Biotechnology - 0.93% | |||||||||||||||
| Exelixis, Inc.A | 396,858 | 7,254,564 | |||||||||||||
|
|
|
||||||||||||||
| Health Care Equipment & Supplies - 9.97% | |||||||||||||||
| ABIOMED, Inc.A | 15,916 | 5,716,550 | |||||||||||||
| Align Technology, Inc.A | 13,476 | 8,856,158 | |||||||||||||
| Dexcom, Inc.A | 23,357 | 12,541,541 | |||||||||||||
| Hologic, Inc.A | 93,183 | 7,134,090 | |||||||||||||
| IDEXX Laboratories, Inc.A | 22,074 | 14,534,846 | |||||||||||||
| Insulet Corp.A | 21,179 | 5,635,096 | |||||||||||||
| Intuitive Surgical, Inc.A | 7,960 | 2,860,028 | |||||||||||||
| ResMed, Inc. | 47,872 | 12,469,699 | |||||||||||||
| Tandem Diabetes Care, Inc.A | 51,982 | 7,824,331 | |||||||||||||
|
|
|
||||||||||||||
| 77,572,339 | |||||||||||||||
|
|
|
||||||||||||||
| Health Care Providers & Services - 1.35% | |||||||||||||||
| Acadia Healthcare Co., Inc.A | 90,618 | 5,500,512 | |||||||||||||
| Henry Schein, Inc.A | 64,951 | 5,035,651 | |||||||||||||
|
|
|
||||||||||||||
| 10,536,163 | |||||||||||||||
|
|
|
||||||||||||||
| Health Care Technology - 1.87% | |||||||||||||||
| Cerner Corp. | 76,241 | 7,080,502 | |||||||||||||
| Veeva Systems, Inc., Class AA | 29,136 | 7,443,665 | |||||||||||||
|
|
|
||||||||||||||
| 14,524,167 | |||||||||||||||
|
|
|
||||||||||||||
See accompanying notes
15
American Beacon Stephens Mid-Cap Growth FundSM
Schedule of Investments
December 31, 2021
| Shares | Fair Value | ||||||||||||||
| COMMON STOCKS - 99.01% (continued) | |||||||||||||||
| Health Care - 19.84% (continued) | |||||||||||||||
| Life Sciences Tools & Services - 5.26% | |||||||||||||||
| Bio-Techne Corp. | 20,278 | $ | 10,490,620 | ||||||||||||
| ICON PLCA | 60,703 | 18,799,719 | |||||||||||||
| Illumina, Inc.A | 15,274 | 5,810,841 | |||||||||||||
| Repligen Corp.A | 21,821 | 5,779,074 | |||||||||||||
|
|
|
||||||||||||||
| 40,880,254 | |||||||||||||||
|
|
|
||||||||||||||
| Pharmaceuticals - 0.46% | |||||||||||||||
| Pacira BioSciences, Inc.A | 59,310 | 3,568,683 | |||||||||||||
|
|
|
||||||||||||||
| Total Health Care |
154,336,170 | ||||||||||||||
|
|
|
||||||||||||||
| Industrials - 12.10% | |||||||||||||||
| Aerospace & Defense - 1.50% | |||||||||||||||
| Axon Enterprise, Inc.A | 31,448 | 4,937,336 | |||||||||||||
| HEICO Corp., Class A | 52,111 | 6,697,306 | |||||||||||||
|
|
|
||||||||||||||
| 11,634,642 | |||||||||||||||
|
|
|
||||||||||||||
| Air Freight & Logistics - 0.65% | |||||||||||||||
| CH Robinson Worldwide, Inc. | 47,237 | 5,084,118 | |||||||||||||
|
|
|
||||||||||||||
| Commercial Services & Supplies - 2.34% | |||||||||||||||
| Copart, Inc.A | 95,741 | 14,516,251 | |||||||||||||
| IAA, Inc.A | 72,147 | 3,652,081 | |||||||||||||
|
|
|
||||||||||||||
| 18,168,332 | |||||||||||||||
|
|
|
||||||||||||||
| Electrical Equipment - 1.21% | |||||||||||||||
| Rockwell Automation, Inc. | 26,953 | 9,402,554 | |||||||||||||
|
|
|
||||||||||||||
| Industrial Conglomerates - 0.84% | |||||||||||||||
| Roper Technologies, Inc. | 13,349 | 6,565,839 | |||||||||||||
|
|
|
||||||||||||||
| Machinery - 1.09% | |||||||||||||||
| Kornit Digital Ltd.A | 27,087 | 4,123,996 | |||||||||||||
| RBC Bearings, Inc.A | 21,694 | 4,381,537 | |||||||||||||
|
|
|
||||||||||||||
| 8,505,533 | |||||||||||||||
|
|
|
||||||||||||||
| Professional Services - 2.57% | |||||||||||||||
| CoStar Group, Inc.A | 83,429 | 6,593,394 | |||||||||||||
| Verisk Analytics, Inc. | 58,524 | 13,386,194 | |||||||||||||
|
|
|
||||||||||||||
| 19,979,588 | |||||||||||||||
|
|
|
||||||||||||||
| Road & Rail - 0.99% | |||||||||||||||
| JB Hunt Transport Services, Inc. | 37,606 | 7,686,666 | |||||||||||||
|
|
|
||||||||||||||
| Trading Companies & Distributors - 0.91% | |||||||||||||||
| Fastenal Co. | 110,126 | 7,054,672 | |||||||||||||
|
|
|
||||||||||||||
| Total Industrials |
94,081,944 | ||||||||||||||
|
|
|
||||||||||||||
| Information Technology - 32.45% | |||||||||||||||
| Communications Equipment - 1.02% | |||||||||||||||
| Ciena Corp.A | 103,321 | 7,952,617 | |||||||||||||
|
|
|
||||||||||||||
| Electronic Equipment, Instruments & Components - 3.72% | |||||||||||||||
| Cognex Corp. | 91,643 | 7,126,160 | |||||||||||||
| IPG Photonics Corp.A | 30,678 | 5,280,911 | |||||||||||||
| Keysight Technologies, Inc.A | 49,669 | 10,257,145 | |||||||||||||
| National Instruments Corp. | 142,989 | 6,244,330 | |||||||||||||
|
|
|
||||||||||||||
| 28,908,546 | |||||||||||||||
|
|
|
||||||||||||||
See accompanying notes
16
American Beacon Stephens Mid-Cap Growth FundSM
Schedule of Investments
December 31, 2021
| Shares | Fair Value | ||||||||||||||
| COMMON STOCKS - 99.01% (continued) | |||||||||||||||
| Information Technology - 32.45% (continued) | |||||||||||||||
| IT Services - 2.11% | |||||||||||||||
| Globant SAA | 19,837 | $ | 6,230,604 | ||||||||||||
| Toast, Inc., Class AA | 128,231 | 4,450,898 | |||||||||||||
| WEX, Inc.A | 40,947 | 5,748,549 | |||||||||||||
|
|
|
||||||||||||||
| 16,430,051 | |||||||||||||||
|
|
|
||||||||||||||
| Semiconductors & Semiconductor Equipment - 5.19% | |||||||||||||||
| Azenta, Inc. | 46,211 | 4,764,816 | |||||||||||||
| KLA Corp. | 13,478 | 5,797,023 | |||||||||||||
| Microchip Technology, Inc. | 155,421 | 13,530,952 | |||||||||||||
| NXP Semiconductors N.V. | 38,513 | 8,772,491 | |||||||||||||
| Xilinx, Inc. | 35,169 | 7,456,883 | |||||||||||||
|
|
|
||||||||||||||
| 40,322,165 | |||||||||||||||
|
|
|
||||||||||||||
| Software - 20.41% | |||||||||||||||
| ANSYS, Inc.A | 18,354 | 7,362,157 | |||||||||||||
| Aspen Technology, Inc.A | 30,422 | 4,630,228 | |||||||||||||
| Autodesk, Inc.A | 38,759 | 10,898,643 | |||||||||||||
| Cadence Design Systems, Inc.A | 101,000 | 18,821,350 | |||||||||||||
| Coupa Software, Inc.A | 22,337 | 3,530,363 | |||||||||||||
| DocuSign, Inc.A | 33,758 | 5,141,681 | |||||||||||||
| Dropbox, Inc., Class AA | 180,224 | 4,422,697 | |||||||||||||
| Envestnet, Inc.A | 91,770 | 7,281,032 | |||||||||||||
| Five9, Inc.A | 52,367 | 7,191,037 | |||||||||||||
| Fortinet, Inc.A | 40,170 | 14,437,098 | |||||||||||||
| Guidewire Software, Inc.A | 62,763 | 7,125,483 | |||||||||||||
| Mandiant, Inc.A | 342,327 | 6,004,416 | |||||||||||||
| Manhattan Associates, Inc.A | 51,084 | 7,943,051 | |||||||||||||
| Nice Ltd., ADRA B | 22,077 | 6,702,577 | |||||||||||||
| Palo Alto Networks, Inc.A | 24,770 | 13,790,945 | |||||||||||||
| PTC, Inc.A | 58,016 | 7,028,638 | |||||||||||||
| RingCentral, Inc., Class AA | 26,571 | 4,978,077 | |||||||||||||
| Splunk, Inc.A | 40,435 | 4,679,138 | |||||||||||||
| Tyler Technologies, Inc.A | 19,637 | 10,563,724 | |||||||||||||
| Unity Software, Inc.A | 43,513 | 6,221,924 | |||||||||||||
|
|
|
||||||||||||||
| 158,754,259 | |||||||||||||||
|
|
|
||||||||||||||
| Total Information Technology |
252,367,638 | ||||||||||||||
|
|
|
||||||||||||||
| Total Common Stocks (Cost $517,279,944) |
770,027,748 | ||||||||||||||
|
|
|
||||||||||||||
| SHORT-TERM INVESTMENTS - 1.02% (Cost $7,961,825) | |||||||||||||||
| Investment Companies - 1.02% | |||||||||||||||
| American Beacon U.S. Government Money Market Select Fund, 0.01%C D | 7,961,825 | 7,961,825 | |||||||||||||
|
|
|
||||||||||||||
| TOTAL INVESTMENTS - 100.03% (Cost $525,241,769) |
777,989,573 | ||||||||||||||
| LIABILITIES, NET OF OTHER ASSETS - (0.03%) |
(253,877 | ) | |||||||||||||
|
|
|
||||||||||||||
| TOTAL NET ASSETS - 100.00% |
$ | 777,735,696 | |||||||||||||
|
|
|
||||||||||||||
| Percentages are stated as a percent of net assets. | |||||||||||||||
A Non-income producing security.
B All or a portion of this security is on loan, collateralized by either cash and/or U.S. Treasuries, at December 31, 2021 (Note 8).
C The Fund is affiliated by having the same investment advisor.
D 7-day yield.
ADR - American Depositary Receipt.
PLC - Public Limited Company.
See accompanying notes
17
American Beacon Stephens Mid-Cap Growth FundSM
Schedule of Investments
December 31, 2021
The Fund’s investments are summarized by level based on the inputs used to determine their values. As of December 31, 2021, the investments were classified as described below:
| Stephens Mid-Cap Growth Fund |
Level 1 | Level 2 | Level 3 | Total | ||||||||||||||||||||||||
| Assets |
||||||||||||||||||||||||||||
| Common Stocks |
$ | 770,027,748 | $ | - | $ | - | $ | 770,027,748 | ||||||||||||||||||||
| Short-Term Investments |
7,961,825 | - | - | 7,961,825 | ||||||||||||||||||||||||
|
|
|
|
|
|
|
|
|
|||||||||||||||||||||
| Total Investments in Securities - Assets |
$ | 777,989,573 | $ | - | $ | - | $ | 777,989,573 | ||||||||||||||||||||
|
|
|
|
|
|
|
|
|
|||||||||||||||||||||
U.S. GAAP requires transfers between all levels to/from level 3 be disclosed. During the year ended December 31, 2021, there were no transfers into or out of Level 3.
See accompanying notes
18
American Beacon Stephens Small Cap Growth FundSM
Schedule of Investments
December 31, 2021
| Shares | Fair Value | ||||||||||||||
| COMMON STOCKS - 99.81% | |||||||||||||||
| Communication Services - 0.82% | |||||||||||||||
| Interactive Media & Services - 0.82% | |||||||||||||||
| Angi, Inc., Class AA | 393,699 | $ | 3,625,968 | ||||||||||||
|
|
|
||||||||||||||
| Consumer Discretionary - 12.13% | |||||||||||||||
| Auto Components - 0.86% | |||||||||||||||
| Fox Factory Holding Corp.A | 22,474 | 3,822,828 | |||||||||||||
|
|
|
||||||||||||||
| Diversified Consumer Services - 0.88% | |||||||||||||||
| Bright Horizons Family Solutions, Inc.A | 31,098 | 3,914,616 | |||||||||||||
|
|
|
||||||||||||||
| Hotels, Restaurants & Leisure - 4.01% | |||||||||||||||
| NEOGAMES SAA | 74,785 | 2,077,527 | |||||||||||||
| Papa John’s International, Inc. | 58,539 | 7,813,200 | |||||||||||||
| Wingstop, Inc. | 46,002 | 7,949,146 | |||||||||||||
|
|
|
||||||||||||||
| 17,839,873 | |||||||||||||||
|
|
|
||||||||||||||
| Household Durables - 0.40% | |||||||||||||||
| Traeger, Inc.A | 146,715 | 1,784,054 | |||||||||||||
|
|
|
||||||||||||||
| Internet & Direct Marketing Retail - 1.88% | |||||||||||||||
| aka Brands Holding Corp.A | 363,961 | 3,366,640 | |||||||||||||
| Revolve Group, Inc.A | 89,454 | 5,013,002 | |||||||||||||
|
|
|
||||||||||||||
| 8,379,642 | |||||||||||||||
|
|
|
||||||||||||||
| Leisure Products - 0.79% | |||||||||||||||
| YETI Holdings, Inc.A | 42,300 | 3,503,709 | |||||||||||||
|
|
|
||||||||||||||
| Multiline Retail - 0.89% | |||||||||||||||
| Ollie’s Bargain Outlet Holdings, Inc.A B | 76,944 | 3,938,763 | |||||||||||||
|
|
|
||||||||||||||
| Specialty Retail - 2.42% | |||||||||||||||
| Floor & Decor Holdings, Inc., Class AA | 41,761 | 5,429,347 | |||||||||||||
| Leslie’s, Inc.A | 224,695 | 5,316,284 | |||||||||||||
|
|
|
||||||||||||||
| 10,745,631 | |||||||||||||||
|
|
|
||||||||||||||
| Total Consumer Discretionary |
53,929,116 | ||||||||||||||
|
|
|
||||||||||||||
| Consumer Staples - 5.52% | |||||||||||||||
| Beverages - 1.95% | |||||||||||||||
| MGP Ingredients, Inc. | 101,885 | 8,659,206 | |||||||||||||
|
|
|
||||||||||||||
| Food & Staples Retailing - 1.28% | |||||||||||||||
| Chefs’ Warehouse, Inc.A | 171,476 | 5,710,151 | |||||||||||||
|
|
|
||||||||||||||
| Food Products - 1.53% | |||||||||||||||
| Limoneira Co. | 150,863 | 2,262,945 | |||||||||||||
| Mission Produce, Inc.A | 290,479 | 4,560,521 | |||||||||||||
|
|
|
||||||||||||||
| 6,823,466 | |||||||||||||||
|
|
|
||||||||||||||
| Personal Products - 0.76% | |||||||||||||||
| BellRing Brands, Inc., Class AA | 117,755 | 3,359,550 | |||||||||||||
|
|
|
||||||||||||||
| Total Consumer Staples |
24,552,373 | ||||||||||||||
|
|
|
||||||||||||||
See accompanying notes
19
American Beacon Stephens Small Cap Growth FundSM
Schedule of Investments
December 31, 2021
| Shares | Fair Value | ||||||||||||||
| COMMON STOCKS - 99.81% (continued) | |||||||||||||||
| Energy - 1.72% | |||||||||||||||
| Oil, Gas & Consumable Fuels - 1.72% | |||||||||||||||
| Magnolia Oil & Gas Corp., Class A | 155,728 | $ | 2,938,587 | ||||||||||||
| Viper Energy Partners LP | 221,403 | 4,718,098 | |||||||||||||
|
|
|
||||||||||||||
| 7,656,685 | |||||||||||||||
|
|
|
||||||||||||||
| Total Energy |
7,656,685 | ||||||||||||||
|
|
|
||||||||||||||
| Financials - 8.68% | |||||||||||||||
| Banks - 1.30% | |||||||||||||||
| Silvergate Capital Corp., Class AA | 39,037 | 5,785,283 | |||||||||||||
|
|
|
||||||||||||||
| Capital Markets - 2.18% | |||||||||||||||
| MarketAxess Holdings, Inc. | 6,966 | 2,864,907 | |||||||||||||
| Open Lending Corp., Class AA | 55,157 | 1,239,929 | |||||||||||||
| Piper Sandler Companies | 31,369 | 5,599,680 | |||||||||||||
|
|
|
||||||||||||||
| 9,704,516 | |||||||||||||||
|
|
|
||||||||||||||
| Consumer Finance - 3.48% | |||||||||||||||
| Encore Capital Group, Inc.A B | 40,901 | 2,540,361 | |||||||||||||
| PRA Group, Inc.A | 133,983 | 6,727,287 | |||||||||||||
| PROG Holdings, Inc. | 136,799 | 6,171,003 | |||||||||||||
|
|
|
||||||||||||||
| 15,438,651 | |||||||||||||||
|
|
|
||||||||||||||
| Insurance - 1.72% | |||||||||||||||
| Palomar Holdings, Inc.A | 63,897 | 4,138,609 | |||||||||||||
| Ryan Specialty Group Holdings, Inc., Class AA | 86,735 | 3,499,757 | |||||||||||||
|
|
|
||||||||||||||
| 7,638,366 | |||||||||||||||
|
|
|
||||||||||||||
| Total Financials |
38,566,816 | ||||||||||||||
|
|
|
||||||||||||||
| Health Care - 22.58% | |||||||||||||||
| Biotechnology - 3.04% | |||||||||||||||
| Exelixis, Inc.A | 237,759 | 4,346,235 | |||||||||||||
| Halozyme Therapeutics, Inc.A | 97,797 | 3,932,417 | |||||||||||||
| Ligand Pharmaceuticals, Inc.A | 33,916 | 5,238,665 | |||||||||||||
|
|
|
||||||||||||||
| 13,517,317 | |||||||||||||||
|
|
|
||||||||||||||
| Health Care Equipment & Supplies - 5.33% | |||||||||||||||
| BioLife Solutions, Inc.A | 43,613 | 1,625,456 | |||||||||||||
| Insulet Corp.A | 9,811 | 2,610,413 | |||||||||||||
| iRhythm Technologies, Inc.A | 26,785 | 3,152,327 | |||||||||||||
| Neogen Corp.A | 94,880 | 4,308,501 | |||||||||||||
| NuVasive, Inc.A | 53,191 | 2,791,464 | |||||||||||||
| Tandem Diabetes Care, Inc.A | 61,235 | 9,217,092 | |||||||||||||
|
|
|
||||||||||||||
| 23,705,253 | |||||||||||||||
|
|
|
||||||||||||||
| Health Care Providers & Services - 2.18% | |||||||||||||||
| Acadia Healthcare Co., Inc.A | 100,832 | 6,120,503 | |||||||||||||
| HealthEquity, Inc.A | 80,910 | 3,579,458 | |||||||||||||
|
|
|
||||||||||||||
| 9,699,961 | |||||||||||||||
|
|
|
||||||||||||||
| Health Care Technology - 3.07% | |||||||||||||||
| HealthStream, Inc.A | 99,945 | 2,634,550 | |||||||||||||
| Omnicell, Inc.A | 50,975 | 9,197,929 | |||||||||||||
| Schrodinger, Inc.A | 52,207 | 1,818,370 | |||||||||||||
|
|
|
||||||||||||||
| 13,650,849 | |||||||||||||||
|
|
|
||||||||||||||
See accompanying notes
20
American Beacon Stephens Small Cap Growth FundSM
Schedule of Investments
December 31, 2021
| Shares | Fair Value | ||||||||||||||
| COMMON STOCKS - 99.81% (continued) | |||||||||||||||
| Health Care - 22.58% (continued) | |||||||||||||||
| Life Sciences Tools & Services - 7.03% | |||||||||||||||
| Alpha Teknova, Inc.A | 73,016 | $ | 1,495,368 | ||||||||||||
| Bio-Techne Corp. | 11,759 | 6,083,401 | |||||||||||||
| ICON PLCA | 29,288 | 9,070,493 | |||||||||||||
| Medpace Holdings, Inc.A | 14,703 | 3,199,961 | |||||||||||||
| Repligen Corp.A | 32,821 | 8,692,314 | |||||||||||||
| Syneos Health, Inc.A | 26,121 | 2,682,104 | |||||||||||||
|
|
|
||||||||||||||
| 31,223,641 | |||||||||||||||
|
|
|
||||||||||||||
| Pharmaceuticals - 1.93% | |||||||||||||||
| Pacira BioSciences, Inc.A | 81,793 | 4,921,485 | |||||||||||||
| Supernus Pharmaceuticals, Inc.A | 125,417 | 3,657,159 | |||||||||||||
|
|
|
||||||||||||||
| 8,578,644 | |||||||||||||||
|
|
|
||||||||||||||
| Total Health Care |
100,375,665 | ||||||||||||||
|
|
|
||||||||||||||
| Industrials - 16.99% | |||||||||||||||
| Aerospace & Defense - 3.60% | |||||||||||||||
| AeroVironment, Inc.A | 50,551 | 3,135,679 | |||||||||||||
| Axon Enterprise, Inc.A | 36,649 | 5,753,893 | |||||||||||||
| HEICO Corp., Class A | 32,526 | 4,180,241 | |||||||||||||
| Kratos Defense & Security Solutions, Inc.A | 150,265 | 2,915,141 | |||||||||||||
|
|
|
||||||||||||||
| 15,984,954 | |||||||||||||||
|
|
|
||||||||||||||
| Air Freight & Logistics - 1.18% | |||||||||||||||
| Hub Group, Inc., Class AA | 62,436 | 5,259,609 | |||||||||||||
|
|
|
||||||||||||||
| Building Products - 2.71% | |||||||||||||||
| AZEK Co., Inc.A | 86,783 | 4,012,846 | |||||||||||||
| Trex Co., Inc.A | 59,394 | 8,019,972 | |||||||||||||
|
|
|
||||||||||||||
| 12,032,818 | |||||||||||||||
|
|
|
||||||||||||||
| Commercial Services & Supplies - 1.42% | |||||||||||||||
| Montrose Environmental Group, Inc.A | 89,556 | 6,314,593 | |||||||||||||
|
|
|
||||||||||||||
| Construction & Engineering - 1.07% | |||||||||||||||
| Ameresco, Inc., Class AA | 58,188 | 4,738,831 | |||||||||||||
|
|
|
||||||||||||||
| Machinery - 4.31% | |||||||||||||||
| Hydrofarm Holdings Group, Inc.A | 64,250 | 1,817,633 | |||||||||||||
| Kornit Digital Ltd.A | 59,596 | 9,073,491 | |||||||||||||
| Lindsay Corp. | 21,495 | 3,267,240 | |||||||||||||
| RBC Bearings, Inc.A | 24,764 | 5,001,585 | |||||||||||||
|
|
|
||||||||||||||
| 19,159,949 | |||||||||||||||
|
|
|
||||||||||||||
| Professional Services - 0.68% | |||||||||||||||
| ICF International, Inc. | 29,482 | 3,023,379 | |||||||||||||
|
|
|
||||||||||||||
| Trading Companies & Distributors - 2.02% | |||||||||||||||
| SiteOne Landscape Supply, Inc.A | 37,108 | 8,990,526 | |||||||||||||
|
|
|
||||||||||||||
| Total Industrials |
75,504,659 | ||||||||||||||
|
|
|
||||||||||||||
| Information Technology - 30.30% | |||||||||||||||
| Electronic Equipment, Instruments & Components - 2.52% | |||||||||||||||
| Cognex Corp. | 41,832 | 3,252,856 | |||||||||||||
| National Instruments Corp. | 84,315 | 3,682,036 | |||||||||||||
| nLight, Inc.A | 177,085 | 4,241,186 | |||||||||||||
|
|
|
||||||||||||||
| 11,176,078 | |||||||||||||||
|
|
|
||||||||||||||
See accompanying notes
21
American Beacon Stephens Small Cap Growth FundSM
Schedule of Investments
December 31, 2021
| Shares | Fair Value | ||||||||||||||
| COMMON STOCKS - 99.81% (continued) | |||||||||||||||
| Information Technology - 30.30% (continued) | |||||||||||||||
| IT Services - 3.80% | |||||||||||||||
| Globant SAA | 29,850 | $ | 9,375,587 | ||||||||||||
| Maximus, Inc. | 52,525 | 4,184,667 | |||||||||||||
| WEX, Inc.A | 23,614 | 3,315,169 | |||||||||||||
|
|
|
||||||||||||||
| 16,875,423 | |||||||||||||||
|
|
|
||||||||||||||
| Semiconductors & Semiconductor Equipment - 7.04% | |||||||||||||||
| Ambarella, Inc.A | 9,010 | 1,828,039 | |||||||||||||
| Azenta, Inc. | 48,913 | 5,043,419 | |||||||||||||
| Lattice Semiconductor Corp.A | 29,583 | 2,279,666 | |||||||||||||
| Onto Innovation, Inc.A | 43,783 | 4,432,153 | |||||||||||||
| Power Integrations, Inc. | 43,965 | 4,083,909 | |||||||||||||
| Semtech Corp.A | 78,469 | 6,978,248 | |||||||||||||
| Silicon Laboratories, Inc.A | 32,229 | 6,652,710 | |||||||||||||
|
|
|
||||||||||||||
| 31,298,144 | |||||||||||||||
|
|
|
||||||||||||||
| Software - 16.94% | |||||||||||||||
| 8x8, Inc.A | 122,815 | 2,058,379 | |||||||||||||
| Aspen Technology, Inc.A | 18,188 | 2,768,214 | |||||||||||||
| CyberArk Software Ltd.A | 41,563 | 7,202,037 | |||||||||||||
| Descartes Systems Group, Inc.A | 26,059 | 2,154,558 | |||||||||||||
| Envestnet, Inc.A | 77,892 | 6,179,951 | |||||||||||||
| GTY Technology Holdings, Inc.A | 314,660 | 2,108,222 | |||||||||||||
| Guidewire Software, Inc.A | 14,583 | 1,655,608 | |||||||||||||
| Mandiant, Inc.A | 275,986 | 4,840,794 | |||||||||||||
| Manhattan Associates, Inc.A | 57,487 | 8,938,654 | |||||||||||||
| Mimecast Ltd.A | 33,254 | 2,646,021 | |||||||||||||
| Ping Identity Holding Corp.A | 108,007 | 2,471,200 | |||||||||||||
| PROS Holdings, Inc.A | 110,619 | 3,815,249 | |||||||||||||
| Q2 Holdings, Inc.A | 46,779 | 3,716,124 | |||||||||||||
| Qualys, Inc.A | 31,917 | 4,379,651 | |||||||||||||
| Rapid7, Inc.A | 47,437 | 5,582,860 | |||||||||||||
| SPS Commerce, Inc.A | 52,291 | 7,443,624 | |||||||||||||
| Tyler Technologies, Inc.A | 4,581 | 2,464,349 | |||||||||||||
| Varonis Systems, Inc.A | 100,179 | 4,886,732 | |||||||||||||
|
|
|
||||||||||||||
| 75,312,227 | |||||||||||||||
|
|
|
||||||||||||||
| Total Information Technology |
134,661,872 | ||||||||||||||
|
|
|
||||||||||||||
| Materials - 1.07% | |||||||||||||||
| Chemicals - 1.07% | |||||||||||||||
| Balchem Corp. | 28,169 | 4,749,294 | |||||||||||||
|
|
|
||||||||||||||
| Total Common Stocks (Cost $237,480,814) |
443,622,448 | ||||||||||||||
|
|
|
||||||||||||||
| SHORT-TERM INVESTMENTS - 0.61% (Cost $2,727,123) | |||||||||||||||
| Investment Companies - 0.61% | |||||||||||||||
| American Beacon U.S. Government Money Market Select Fund, 0.01%C D | 2,727,123 | 2,727,123 | |||||||||||||
|
|
|
||||||||||||||
| TOTAL INVESTMENTS - 100.42% (Cost $240,207,937) |
446,349,571 | ||||||||||||||
| LIABILITIES, NET OF OTHER ASSETS - (0.42%) |
(1,856,178 | ) | |||||||||||||
|
|
|
||||||||||||||
| TOTAL NET ASSETS - 100.00% |
$ | 444,493,393 | |||||||||||||
|
|
|
||||||||||||||
| Percentages are stated as a percent of net assets. | |||||||||||||||
A Non-income producing security.
B All or a portion of this security is on loan, collateralized by either cash and/or U.S. Treasuries, at December 31, 2021 (Note 8).
C The Fund is affiliated by having the same investment advisor.
D 7-day yield.
See accompanying notes
22
American Beacon Stephens Small Cap Growth FundSM
Schedule of Investments
December 31, 2021
LP - Limited Partnership.
PLC - Public Limited Company.
The Fund’s investments are summarized by level based on the inputs used to determine their values. As of December 31, 2021, the investments were classified as described below:
| Stephens Small Cap Growth Fund |
Level 1 | Level 2 | Level 3 | Total | ||||||||||||||||||||||||
| Assets |
||||||||||||||||||||||||||||
| Common Stocks |
$ | 443,622,448 | $ | - | $ | - | $ | 443,622,448 | ||||||||||||||||||||
| Short-Term Investments |
2,727,123 | - | - | 2,727,123 | ||||||||||||||||||||||||
|
|
|
|
|
|
|
|
|
|||||||||||||||||||||
| Total Investments in Securities - Assets |
$ | 446,349,571 | $ | - | $ | - | $ | 446,349,571 | ||||||||||||||||||||
|
|
|
|
|
|
|
|
|
|||||||||||||||||||||
U.S. GAAP requires transfers between all levels to/from level 3 be disclosed. During the year ended December 31, 2021, there were no transfers into or out of Level 3.
See accompanying notes
23
Statements of Assets and Liabilities
December 31, 2021
| Stephens Mid-Cap Growth Fund |
Stephens Small Cap Growth Fund |
|||||||||||
| Assets: |
| |||||||||||
| Investments in unaffiliated securities, at fair value†§ |
$ | 770,027,748 | $ | 443,622,448 | ||||||||
| Investments in affiliated securities, at fair value‡ |
7,961,825 | 2,727,123 | ||||||||||
| Cash |
318 | 370 | ||||||||||
| Dividends and interest receivable |
117,443 | 34,887 | ||||||||||
| Receivable for fund shares sold |
2,719,940 | 248,796 | ||||||||||
| Receivable for expense reimbursement (Note 2) |
40,107 | 20,359 | ||||||||||
| Prepaid expenses |
30,411 | 42,965 | ||||||||||
|
|
|
|
|
|||||||||
| Total assets |
780,897,792 | 446,696,948 | ||||||||||
|
|
|
|
|
|||||||||
| Liabilities: |
| |||||||||||
| Payable for investments purchased |
– | 91,926 | ||||||||||
| Payable for fund shares redeemed |
2,481,664 | 1,626,893 | ||||||||||
| Management and sub-advisory fees payable (Note 2) |
517,512 | 341,150 | ||||||||||
| Service fees payable (Note 2) |
7,959 | 26,541 | ||||||||||
| Transfer agent fees payable (Note 2) |
15,757 | 7,586 | ||||||||||
| Custody and fund accounting fees payable |
50,564 | 40,854 | ||||||||||
| Professional fees payable |
45,774 | 43,654 | ||||||||||
| Payable for prospectus and shareholder reports |
35,678 | 19,431 | ||||||||||
| Other liabilities |
7,188 | 5,520 | ||||||||||
|
|
|
|
|
|||||||||
| Total liabilities |
3,162,096 | 2,203,555 | ||||||||||
|
|
|
|
|
|||||||||
| Net assets |
$ | 777,735,696 | $ | 444,493,393 | ||||||||
|
|
|
|
|
|||||||||
| Analysis of net assets: |
| |||||||||||
| Paid-in-capital |
$ | 514,427,349 | $ | 228,196,649 | ||||||||
| Total distributable earnings (deficits)A |
263,308,347 | 216,296,744 | ||||||||||
|
|
|
|
|
|||||||||
| Net assets |
$ | 777,735,696 | $ | 444,493,393 | ||||||||
|
|
|
|
|
|||||||||
See accompanying notes
24
American Beacon FundsSM
Statements of Assets and Liabilities
December 31, 2021
| Stephens Mid-Cap Growth Fund |
Stephens Small Cap Growth Fund |
|||||||||||
| Shares outstanding at no par value (unlimited shares authorized): |
| |||||||||||
| R5 Class |
15,331,040 | 15,324,826 | ||||||||||
|
|
|
|
|
|||||||||
| Y Class |
2,100,135 | 3,095,353 | ||||||||||
|
|
|
|
|
|||||||||
| Investor Class |
523,301 | 5,075,884 | ||||||||||
|
|
|
|
|
|||||||||
| A Class |
229,673 | 474,036 | ||||||||||
|
|
|
|
|
|||||||||
| C Class |
102,022 | 43,839 | ||||||||||
|
|
|
|
|
|||||||||
| R6 Class |
1,394,483 | 1,173,148 | ||||||||||
|
|
|
|
|
|||||||||
| Net assets: |
| |||||||||||
| R5 Class |
$ | 611,720,453 | $ | 280,613,603 | ||||||||
|
|
|
|
|
|||||||||
| Y Class |
$ | 82,970,930 | $ | 55,841,696 | ||||||||
|
|
|
|
|
|||||||||
| Investor Class |
$ | 16,964,278 | $ | 78,747,464 | ||||||||
|
|
|
|
|
|||||||||
| A Class |
$ | 7,400,729 | $ | 7,203,359 | ||||||||
|
|
|
|
|
|||||||||
| C Class |
$ | 2,977,572 | $ | 566,124 | ||||||||
|
|
|
|
|
|||||||||
| R6 Class |
$ | 55,701,734 | $ | 21,521,147 | ||||||||
|
|
|
|
|
|||||||||
| Net asset value, offering and redemption price per share: |
| |||||||||||
| R5 Class |
$ | 39.90 | $ | 18.31 | ||||||||
|
|
|
|
|
|||||||||
| Y Class |
$ | 39.51 | $ | 18.04 | ||||||||
|
|
|
|
|
|||||||||
| Investor Class |
$ | 32.42 | $ | 15.51 | ||||||||
|
|
|
|
|
|||||||||
| A Class |
$ | 32.22 | $ | 15.20 | ||||||||
|
|
|
|
|
|||||||||
| A Class (offering price) |
$ | 34.19 | $ | 16.13 | ||||||||
|
|
|
|
|
|||||||||
| C Class |
$ | 29.19 | $ | 12.91 | ||||||||
|
|
|
|
|
|||||||||
| R6 Class |
$ | 39.94 | $ | 18.34 | ||||||||
|
|
|
|
|
|||||||||
| † Cost of investments in unaffiliated securities |
$ | 517,279,944 | $ | 237,480,814 | ||||||||
| ‡ Cost of investments in affiliated securities |
$ | 7,961,825 | $ | 2,727,123 | ||||||||
| § Fair value of securities on loan |
$ | 10,855,793 | $ | 2,448,759 | ||||||||
| A The Fund’s investments in affiliated securities did not have unrealized appreciation (depreciation) at year end. |
| |||||||||||
See accompanying notes
25
American Beacon FundsSM
Statements of Operations
For the year ended December 31, 2021
| Stephens Mid-Cap Growth Fund |
Stephens Small Cap Growth Fund |
|||||||||||
| Investment income: |
| |||||||||||
| Dividend income from unaffiliated securities (net of foreign taxes)† |
$ | 2,616,549 | $ | 833,666 | ||||||||
| Dividend income from affiliated securities (Note 2) |
944 | 732 | ||||||||||
| Income derived from securities lending (Note 8) |
14,608 | 25,333 | ||||||||||
|
|
|
|
|
|||||||||
| Total investment income |
2,632,101 | 859,731 | ||||||||||
|
|
|
|
|
|||||||||
| Expenses: |
| |||||||||||
| Management and sub-advisory fees (Note 2) |
5,949,160 | 4,057,728 | ||||||||||
| Transfer agent fees: |
||||||||||||
| R5 Class (Note 2) |
92,591 | 68,182 | ||||||||||
| Y Class (Note 2) |
82,263 | 52,459 | ||||||||||
| Investor Class |
2,305 | 4,523 | ||||||||||
| A Class |
455 | 458 | ||||||||||
| C Class |
276 | 81 | ||||||||||
| R6 Class |
1,714 | 368 | ||||||||||
| Custody and fund accounting fees |
91,987 | 69,156 | ||||||||||
| Professional fees |
95,032 | 80,547 | ||||||||||
| Registration fees and expenses |
124,606 | 95,146 | ||||||||||
| Service fees (Note 2): |
||||||||||||
| Investor Class |
42,394 | 256,251 | ||||||||||
| A Class |
– | 4,474 | ||||||||||
| C Class |
1,898 | 657 | ||||||||||
| Distribution fees (Note 2): |
||||||||||||
| A Class |
19,502 | 17,650 | ||||||||||
| C Class |
29,454 | 6,384 | ||||||||||
| Prospectus and shareholder report expenses |
58,838 | 27,661 | ||||||||||
| Trustee fees (Note 2) |
50,016 | 29,372 | ||||||||||
| Loan expense (Note 9) |
3,936 | 2,506 | ||||||||||
| Other expenses |
152,142 | 79,860 | ||||||||||
|
|
|
|
|
|||||||||
| Total expenses |
6,798,569 | 4,853,463 | ||||||||||
|
|
|
|
|
|||||||||
| Net fees waived and expenses (reimbursed) (Note 2) |
(60,198 | ) | (206,061 | ) | ||||||||
|
|
|
|
|
|||||||||
| Net expenses |
6,738,371 | 4,647,402 | ||||||||||
|
|
|
|
|
|||||||||
| Net investment (loss) |
(4,106,270 | ) | (3,787,671 | ) | ||||||||
|
|
|
|
|
|||||||||
| Realized and unrealized gain (loss) from investments: |
| |||||||||||
| Net realized gain from: |
||||||||||||
| Investments in unaffiliated securitiesA |
55,417,923 | 83,083,093 | ||||||||||
| Change in net unrealized appreciation (depreciation) of: |
||||||||||||
| Investments in unaffiliated securitiesB |
35,579,930 | (21,463,461 | ) | |||||||||
|
|
|
|
|
|||||||||
| Net gain from investments |
90,997,853 | 61,619,632 | ||||||||||
|
|
|
|
|
|||||||||
| Net increase in net assets resulting from operations |
$ | 86,891,583 | $ | 57,831,961 | ||||||||
|
|
|
|
|
|||||||||
| † Foreign taxes |
$ | 12,998 | $ | – | ||||||||
| A The Fund did not recognize net realized gains (losses) from the sale of investments in affiliated securities. |
| |||||||||||
| B The Fund’s investments in affiliated securities did not have a change in unrealized appreciation (depreciation) at year end. |
| |||||||||||
See accompanying notes
26
American Beacon FundsSM
Statements of Changes in Net Assets
| Stephens Mid-Cap Growth Fund | Stephens Small Cap Growth Fund | |||||||||||||||||||||||||||
| Year Ended December 31, 2021 |
Year Ended December 31, 2020 |
Year Ended December 31, 2021 |
Year Ended December 31, 2020 |
|||||||||||||||||||||||||
| Increase (decrease) in net assets: |
| |||||||||||||||||||||||||||
| Operations: |
| |||||||||||||||||||||||||||
| Net investment (loss) |
$ | (4,106,270 | ) | $ | (2,166,131 | ) | $ | (3,787,671 | ) | $ | (2,907,218 | ) | ||||||||||||||||
| Net realized gain from investments in unaffiliated securities |
55,417,923 | 11,253,224 | 83,083,093 | 51,889,194 | ||||||||||||||||||||||||
| Change in net unrealized appreciation (depreciation) of investments in unaffiliated securities |
35,579,930 | 149,332,454 | (21,463,461 | ) | 67,775,468 | |||||||||||||||||||||||
|
|
|
|
|
|
|
|
|
|||||||||||||||||||||
| Net increase in net assets resulting from operations |
86,891,583 | 158,419,547 | 57,831,961 | 116,757,444 | ||||||||||||||||||||||||
|
|
|
|
|
|
|
|
|
|||||||||||||||||||||
| Distributions to shareholders: |
| |||||||||||||||||||||||||||
| Total retained earnings: |
||||||||||||||||||||||||||||
| R5 Class |
(35,903,414 | ) | (5,534,575 | ) | (48,200,672 | ) | (24,212,368 | ) | ||||||||||||||||||||
| Y Class |
(4,933,630 | ) | (823,490 | ) | (9,740,825 | ) | (5,438,426 | ) | ||||||||||||||||||||
| Investor Class |
(1,192,798 | ) | (245,834 | ) | (15,364,561 | ) | (8,061,059 | ) | ||||||||||||||||||||
| A Class |
(514,914 | ) | (117,516 | ) | (1,415,395 | ) | (688,632 | ) | ||||||||||||||||||||
| C Class |
(231,787 | ) | (47,791 | ) | (129,727 | ) | (78,788 | ) | ||||||||||||||||||||
| R6 Class |
(3,068,283 | ) | (426,238 | ) | (3,598,004 | ) | (1,546,235 | ) | ||||||||||||||||||||
|
|
|
|
|
|
|
|
|
|||||||||||||||||||||
| Net distributions to shareholders |
(45,844,826 | ) | (7,195,444 | ) | (78,449,184 | ) | (40,025,508 | ) | ||||||||||||||||||||
|
|
|
|
|
|
|
|
|
|||||||||||||||||||||
| Capital share transactions (Note 10): |
| |||||||||||||||||||||||||||
| Proceeds from sales of shares |
278,153,892 | 221,967,584 | 82,416,657 | 77,363,934 | ||||||||||||||||||||||||
| Reinvestment of dividends and distributions |
27,287,971 | 4,600,565 | 75,121,961 | 38,026,150 | ||||||||||||||||||||||||
| Cost of shares redeemed |
(179,888,403 | ) | (116,912,065 | ) | (115,642,463 | ) | (150,423,464 | ) | ||||||||||||||||||||
|
|
|
|
|
|
|
|
|
|||||||||||||||||||||
| Net increase (decrease) in net assets from capital share transactions |
125,553,460 | 109,656,084 | 41,896,155 | (35,033,380 | ) | |||||||||||||||||||||||
|
|
|
|
|
|
|
|
|
|||||||||||||||||||||
| Net increase in net assets |
166,600,217 | 260,880,187 | 21,278,932 | 41,698,556 | ||||||||||||||||||||||||
|
|
|
|
|
|
|
|
|
|||||||||||||||||||||
| Net assets: |
| |||||||||||||||||||||||||||
| Beginning of year |
611,135,479 | 350,255,292 | 423,214,461 | 381,515,905 | ||||||||||||||||||||||||
|
|
|
|
|
|
|
|
|
|||||||||||||||||||||
| End of year |
$ | 777,735,696 | $ | 611,135,479 | $ | 444,493,393 | $ | 423,214,461 | ||||||||||||||||||||
|
|
|
|
|
|
|
|
|
|||||||||||||||||||||
See accompanying notes
27
Notes to Financial Statements
December 31, 2021
1. Organization and Significant Accounting Policies
American Beacon Funds (the “Trust”) is organized as a Massachusetts business trust. The Funds, each a series within the Trust, are registered under the Investment Company Act of 1940, as amended (the “Act”), as diversified, open-end management investment companies. As of December 31, 2021, the Trust consists of twenty-eight active series, two of which are presented in this filing: American Beacon Stephens Mid-Cap Growth Fund and American Beacon Stephens Small Cap Growth Fund (collectively, the “Funds” and each individually a “Fund”). The remaining twenty-six active series are reported in separate filings.
American Beacon Advisors, Inc. (the “Manager”) is a Delaware corporation and a wholly-owned subsidiary of Resolute Investment Managers, Inc. (“RIM”) organized in 1986 to provide business management, advisory, administrative, and asset management consulting services to the Trust and other investors. The Manager is registered as an investment advisor under the Investment Advisers Act of 1940, as amended (the “Advisers Act”). RIM is, in turn, a wholly-owned subsidiary of Resolute Acquisition, Inc., which is a wholly-owned subsidiary of Resolute Topco, Inc., a wholly-owned subsidiary of Resolute Investment Holdings, LLC (“RIH”). RIH is owned primarily by Kelso Investment Associates VIII, L.P., KEP VI, LLC and Estancia Capital Partners L.P., investment funds affiliated with Kelso & Company, L.P. (“Kelso”) or Estancia Capital Management, LLC (“Estancia”), which are private equity firms.
Recently Adopted Accounting Pronouncements
In March 2020, the Financial Accounting Standards Board (“FASB”) issued Accounting Standards Update (“ASU”) 2020-04, which provides optional expedients and exceptions for contracts, hedging relationships and other transactions affected by the transitioning away from the London Interbank Offered Rate (“LIBOR”) and other reference rates that are expected to be discontinued. The amendments in this ASU are effective for all entities as of March 12, 2020 through December 31, 2022. At this time, management is evaluating the implications of these changes on the financial statements.
In October 2020, the U.S. Securities and Exchange Commission (“SEC”) adopted new regulations governing the use of derivatives by registered investment companies. Rule 18f-4 will impose limits on the amount of derivatives a fund could enter into, eliminate the asset segregation framework currently used by funds to comply with Section 18 of the Act, and require funds whose use of derivatives is more than a limited specified exposure to establish and maintain a derivatives risk management program and appoint a derivatives risk manager. While the new rule became effective February 19, 2021, funds will not be required to fully comply with the new rule until August 19, 2022. It is not currently clear what impact, if any, the new rule will have on the availability, liquidity or performance of derivatives. When fully implemented, the new rule may require changes in how a fund will use derivatives, may adversely affect a fund’s performance and may increase costs related to a fund’s use of derivatives.
On December 3, 2020, the SEC adopted new rule 2a-5 (Valuation Rule) under the Investment Company Act of 1940, establishing an updated regulatory framework for fund valuation. The Valuation Rule, in part, provides a framework for good faith fair value determination and permits a Board to designate fair value determinations to a fund’s investment adviser. Further, the SEC is rescinding previously issued guidance on related issues. The Valuation Rule became effective on March 8, 2021, with a compliance date of September 8, 2022. Management is currently evaluating the Valuation Rule and its effect on the Funds.
Class Disclosure
Each Fund has multiple classes of shares designed to meet the needs of different groups of investors. The following table sets forth the differences amongst the classes:
| Class |
Eligible Investors |
Minimum Initial Investments |
||||
| R5 Class | Large institutional investors - sold directly or through intermediary channels. | $ | 250,000 | |||
| Y Class | Large institutional retirement plan investors - sold directly or through intermediary channels. | $ | 100,000 | |||
28
American Beacon FundsSM
Notes to Financial Statements
December 31, 2021
| Class |
Eligible Investors |
Minimum Initial Investments |
||||
| Investor Class | All investors using intermediary organizations, such as broker-dealers or retirement plan sponsors. | $ | 2,500 | |||
| A Class | All investors who invest through intermediary organizations, such as broker-dealers or third party administrator. Retail investors who invest directly through a financial intermediary such as a broker, bank, or registered investment advisor which may include a front-end sales charge and a contingent deferred sales charge (“CDSC”). | $ | 2,500 | |||
| C Class | Retail investors who invest directly through a financial intermediary, such as a broker or through employee directed benefit plans with applicable sales charges which may include CDSC. | $ | 1,000 | |||
| R6 Class | Large institutional retirement plan investors - sold through retirement plan sponsors. | None | ||||
Each class offered by the Trust has equal rights as to assets and voting privileges. Income and non-class specific expenses are allocated daily to each class based on the relative net assets. Realized and unrealized capital gains and losses of each class are allocated daily based on the relative net assets of each class of the respective Fund. Class specific expenses, where applicable, currently include service, distribution, transfer agent fees, and sub-transfer agent fees that vary amongst the classes as described more fully in Note 2.
Significant Accounting Policies
The following is a summary of significant accounting policies, consistently followed by the Funds in preparation of the financial statements. The Funds are considered investment companies and accordingly, follow the investment company accounting and reporting guidance of the FASB Accounting Standards Codification Topic 946, Financial Services – Investment Companies, a part of Generally Accepted Accounting Principles (“U.S. GAAP”).
Security Transactions and Investment Income
Security transactions are recorded as of the trade date for financial reporting purposes. Securities purchased or sold on a when-issued or delayed-delivery basis may be settled beyond a standard settlement period for the security after the trade date.
Dividend income, net of foreign taxes, is recorded on the ex-dividend date, except certain dividends from foreign securities which are recorded as soon as the information is available to the Funds. Interest income, net of foreign taxes, is earned from settlement date, recorded on the accrual basis, and adjusted, if necessary, for accretion of discounts and amortization of premiums. Realized gains (losses) from securities sold are determined based on specific lot identification.
Distributions to Shareholders
The Funds distribute most or all of their net earnings and realized gains, if any, each taxable year in the form of dividends from net investment income and distributions of realized net capital gains and net gains from foreign currency transactions on an annual basis. The Funds do not have a fixed dividend rate and do not guarantee that they will pay any distributions in any particular period. Dividends to shareholders are determined in accordance with federal income tax regulations, which may differ in amount and character from net investment income and realized gains recognized for purposes of U.S. GAAP. To the extent necessary to fully distribute capital gains, the Funds may designate earnings and profits distributed to shareholders on the redemption of shares.
Allocation of Income, Trust Expenses, Gains, and Losses
Investment income, realized and unrealized gains and losses from investments of the Funds are allocated daily to each class of shares based upon the relative proportion of net assets of each class to the total net assets of the Funds. Expenses directly charged or attributable to a Fund will be paid from the assets of a Fund. Generally, expenses of the Trust will be allocated among and charged to the assets of the Funds on a basis that the Trust’s
29
American Beacon FundsSM
Notes to Financial Statements
December 31, 2021
Board of Trustees (the “Board”) deems fair and equitable, which may be based on the relative net assets of the Funds or nature of the services performed and relative applicability to the Funds.
Use of Estimates
The preparation of financial statements in conformity with U.S. GAAP requires management to make estimates and assumptions that affect the amounts reported in the financial statements and accompanying notes. Actual results may differ from those estimated.
Other
Under the Trust’s organizational documents, its officers and trustees are indemnified against certain liabilities arising out of the performance of their duties to the Trust. In the normal course of business, the Trust enters into contracts that provide indemnification to the other party or parties against potential costs or liabilities. The Trust’s maximum exposure under these arrangements is dependent on claims that may be made in the future and, therefore, cannot be estimated. The Trust has had no prior claims or losses pursuant to any such agreement.
2. Transactions with Affiliates
Management and Investment Sub-Advisory Agreements
The Funds and the Manager are parties to a Management Agreement that obligates the Manager to provide the Funds with investment advisory and administrative services. As compensation for performing the duties under the Management Agreement, the Manager will receive an annualized management fee based on a percentage of each Fund’s average daily net assets that is calculated and accrued daily according to the following schedule:
| First $5 billion |
0.35 | % | ||
| Next $5 billion |
0.325 | % | ||
| Next $10 billion |
0.30 | % | ||
| Over $20 billion |
0.275 | % |
The Trust, on behalf of the Funds, and the Manager have entered into Investment Advisory Agreement with Stephens Investment Management Group LLC (the “Sub-Advisor”) pursuant to which each Fund has agreed to pay an annualized sub-advisory fee that is calculated and accrued daily based on each Fund’s average daily net assets according to the following schedule:
Stephens Mid-Cap Growth
| All assets |
0.45 | % |
Stephens Small Cap Growth
| First $200 million |
0.60 | % | ||
| Over $200 million |
0.55 | % |
The Management and Sub-Advisory Fees paid by the Funds for the year ended December 31, 2021 were as follows:
Stephens Mid-Cap Growth Fund
| Effective Fee Rate | Amount of Fees Paid | |||||||||||
| Management Fees |
0.35 | % | $ | 2,600,172 | ||||||||
| Sub-Advisor Fees |
0.45 | % | 3,348,988 | |||||||||
|
|
|
|
|
|||||||||
| Total |
0.80 | % | $ | 5,949,160 | ||||||||
|
|
|
|
|
|||||||||
30
American Beacon FundsSM
Notes to Financial Statements
December 31, 2021
Stephens Small Cap Growth Fund
| Effective Fee Rate | Amount of Fees Paid | |||||||||||
| Management Fees |
0.35 | % | $ | 1,538,110 | ||||||||
| Sub-Advisor Fees |
0.57 | % | 2,519,618 | |||||||||
|
|
|
|
|
|||||||||
| Total |
0.92 | % | $ | 4,057,728 | ||||||||
|
|
|
|
|
|||||||||
As compensation for services provided by the Manager in connection with securities lending activities conducted by the Funds, the lending Fund pays to the Manager, with respect to cash collateral posted by borrowers, a fee of 10% of the net monthly interest income (the gross interest income earned by the investment of cash collateral, less the amount paid to borrowers and related expenses) from such activities and, with respect to loan fees paid by borrowers, a fee of 10% of such loan fees. Securities lending income is generated from the demand premium (if any) paid by the borrower to borrow a specific security and from the return on investment of cash collateral, reduced by negotiated rebate fees paid to the borrower and transaction costs. To the extent that a loan is secured by non-cash collateral, securities lending income is generated as a demand premium reduced by transaction costs. These fees are included in “Income derived from securities lending” and “Management and sub-advisory fees” on the Statements of Operations. During the year ended December 31, 2021, the Manager received securities lending fees of $1,658 and $1,936 for the securities lending activities of Stephens Mid-Cap Growth Fund and Stephens Small Cap Growth Fund, respectively.
Distribution Plans
Separate Distribution Plans (the “Distribution Plans”) have been adopted pursuant to Rule 12b-1 under the Act for the A and C Classes of the Funds. Under the Distribution Plans, as compensation for distribution and shareholder servicing assistance, the Manager receives an annual fee of 0.25% of the average daily net assets of the A Class and 1.00% of the average daily net assets of the C Class. The fee will be payable without regard to whether the amount of the fee is more or less than the actual expenses incurred in a particular month by the Manager for distribution assistance.
Service Plans
The Manager and the Trust entered into Service Plans that obligate the Manager to oversee additional shareholder servicing of the Investor, A and C Classes of the Funds. As compensation for performing the duties required under the Service Plans, the Manager receives an annualized fee up to 0.25% of the average daily net assets of the A and C Classes and up to 0.375% of the average daily net assets of the Investor Class of the Funds.
Sub-Transfer Agent Fees
The Manager has entered into agreements, which include servicing agreements, with financial intermediaries that provide recordkeeping, processing, shareholder communications and other services to customers of the intermediaries that hold positions in the R5 and Y Classes of the Funds and has agreed to compensate the intermediaries for providing these services. Intermediaries transact with the Funds primarily through the use of omnibus accounts on behalf of their customers who hold positions in the Funds. Certain services would have been provided by the Funds’ transfer agent and other service providers if the shareholders’ accounts were maintained directly by the Funds’ transfer agent. Accordingly, the Funds, pursuant to Board approval, have agreed to reimburse the Manager for certain non-distribution shareholder services provided by financial intermediaries for the R5 and Y Classes. The reimbursement amounts (sub-transfer agent fees) paid to the Manager are subject to a fee limit of up to 0.10% of an intermediary’s average net assets in the R5 and Y Classes on an annual basis. During the year ended December 31, 2021, the sub-transfer agent fees, as reflected in “Transfer agent fees” on the Statements of Operations, were as follows:
| Fund |
Sub-Transfer Agent Fees | |||
| Stephens Mid-Cap Growth |
$ | 152,217 | ||
| Stephens Small Cap Growth |
113,982 | |||
31
American Beacon FundsSM
Notes to Financial Statements
December 31, 2021
As of December 31, 2021, the Funds owed the Manager the following reimbursement of sub-transfer agent fees, as reflected in “Transfer agent fees payable” on the Statements of Assets and Liabilities:
| Fund |
Reimbursement Sub-Transfer Agent Fees |
|||
| Stephens Mid-Cap Growth |
$ | 13,404 | ||
| Stephens Small Cap Growth |
10,856 | |||
Investments in Affiliated Funds
The Funds may invest in the American Beacon U.S. Government Money Market Select Fund (the “USG Select Fund”). Cash collateral received by the Funds in connection with securities lending may also be invested in the USG Select Fund. The Funds listed below held the following shares with a December 31, 2021 fair value and dividend income earned from the investment in the USG Select Fund.
| Affiliated Security |
Type of Transaction |
Fund | December 31, 2021 Shares/Principal |
Change in Unrealized Gain (Loss) |
Realized Gain (Loss) |
Dividend Income |
December 31, 2021 Fair Value |
|||||||||||||||||||||||||||||||||||||||||
| U.S. Government Money Market Select | Direct | Stephens Mid-Cap Growth |
$ | 7,961,825 | $ | - | $ | - | $ | 944 | $ | 7,961,825 | ||||||||||||||||||||||||||||||||||||
| U.S. Government Money Market Select | Direct | Stephens Small Cap Growth |
2,727,123 | - | - | 732 | 2,727,123 | |||||||||||||||||||||||||||||||||||||||||
The Funds and the USG Select Fund have the same investment advisor and therefore, are considered to be affiliated. The Manager serves as investment advisor to the USG Select Fund and receives management fees and administrative fees totaling 0.10% of the average daily net assets of the USG Select Fund. During the year ended December 31, 2021, the Manager earned fees on the Funds’ direct investments and securities lending collateral investments in the USG Select Fund as shown below:
| Fund |
Direct Investments in USG Select Fund |
Securities Lending Collateral Investments in USG Select Fund |
Total | |||||||||
| Stephens Mid-Cap Growth |
$ | 11,821 | $ | 274 | $ | 12,095 | ||||||
| Stephens Small Cap Growth |
7,154 | 461 | 7,615 | |||||||||
Interfund Credit Facility
Pursuant to an exemptive order issued by the SEC, the Funds, along with other registered investment companies having management contracts with the Manager, may participate in a credit facility whereby each fund, under certain conditions, is permitted to lend money directly to and borrow directly from other participating funds for temporary purposes. The interfund credit facility is advantageous to the funds because it provides added liquidity and eliminates the need to maintain higher cash balances to meet redemptions. This situation could arise when shareholder redemptions exceed anticipated volumes and certain funds have insufficient cash on hand to satisfy such redemptions or when sales of securities do not settle as expected, resulting in a cash shortfall for a fund. When a fund liquidates portfolio securities to meet redemption requests, they often do not receive payment in settlement for up to two days (or longer for certain foreign transactions). Redemption requests normally are satisfied on the next business day. The credit facility provides a source of immediate, short-term liquidity pending settlement of the sale of portfolio securities. The credit facility is administered by a credit facility team consisting of professionals from the Manager’s asset management, compliance, and accounting areas who report the activities of the credit facility to the Board. During the year ended December 31, 2021, the Stephens Mid-Cap Growth Fund borrowed on average $1,570,526 for 10 days at an average interest rate of 0.82% with interest charges of $353 and the Stephens Small Cap Growth Fund borrowed on average $924,347 for 10 days at an average interest rate of 0.84% with interest charges of $212. These amounts are recorded as “Other expenses” in the Statements of Operations.
32
American Beacon FundsSM
Notes to Financial Statements
December 31, 2021
Expense Reimbursement Plan
The Manager contractually agreed to reduce fees and/or reimburse expenses for the classes of the Funds, through April 30, 2022, to the extent that total operating expenses (excluding taxes, interest, brokerage commissions, acquired fund fees and expenses, securities lending fees, expenses associated with securities sold short, litigation, and other extraordinary expenses) exceed the Funds’ expense cap. During the year ended December 31, 2021, the Manager waived and/or reimbursed expenses as follows:
| Expense Cap | Expiration of Reimbursed Expenses |
|||||||||||||||||||||
| Fund |
Class | 1/1/2021 - 4/30/2021 |
5/1/2021 – 12/31/2021 |
Reimbursed Expenses |
(Recouped) Expenses |
|||||||||||||||||
| Stephens Mid-Cap Growth |
R5 | 0.89 | % | 0.89 | % | $ | 34,983 | $ | (74,356 | )* | 2024 | |||||||||||
| Stephens Mid-Cap Growth |
Y | 0.95 | % | 0.95 | % | 17,640 | - | 2024 | ||||||||||||||
| Stephens Mid-Cap Growth |
Investor | 1.22 | % | 1.15 | % | - | (640 | )* | 2024 | |||||||||||||
| Stephens Mid-Cap Growth*** |
A | 1.21 | % | 1.20 | % | - | (1,562 | )* | 2024 | |||||||||||||
| Stephens Mid-Cap Growth |
C | 1.94 | % | 1.94 | % | 1,263 | (1,225 | )* | 2024 | |||||||||||||
| Stephens Mid-Cap Growth |
R6 | 0.84 | % | 0.88 | % | 5,624 | (4,769 | )* | 2024 | |||||||||||||
| Stephens Small Cap Growth |
R5 | 0.99 | % | 0.99 | % | 121,500 | (11,288 | )** | 2024 | |||||||||||||
| Stephens Small Cap Growth |
Y | 1.05 | % | 1.05 | % | 25,886 | - | 2024 | ||||||||||||||
| Stephens Small Cap Growth |
Investor | 1.30 | % | 1.30 | % | 40,597 | (14,331 | )** | 2024 | |||||||||||||
| Stephens Small Cap Growth |
A | 1.28 | % | 1.28 | % | 6,714 | (4,124 | )** | 2024 | |||||||||||||
| Stephens Small Cap Growth |
C | 2.06 | % | 2.06 | % | 1,139 | (1,001 | )** | 2024 | |||||||||||||
| Stephens Small Cap Growth |
R6 | 0.95 | % | 0.96 | % | 10,225 | - | 2024 | ||||||||||||||
| * | Of these amounts, $81,883 represents Recouped Expenses from prior fiscal years and are reflected in Other expenses on the Statements of Operations. |
| ** | Of these amounts, $29,890 represents Recouped Expenses from prior fiscal years and are reflected in Other expenses on the Statements of Operations. |
| *** | Includes voluntarily reimbursed service fees in the amount of $688 for the Stephens Mid-Cap Growth Fund. These fees are not subject to recoupment. |
Of the above amounts, $40,107 and $20,359 was disclosed as a Receivable for expense reimbursement on the Statements of Assets and Liabilities at December 31, 2021 for the Stephens Mid-Cap Growth Fund and Stephens Small Cap Growth Fund, respectively.
The Funds have adopted an Expense Reimbursement Plan whereby the Manager may seek repayment of such fee or voluntary reductions and expense reimbursements. Under the policy, the Manager can be reimbursed by the Funds for any contractual or voluntary fee reductions or expense reimbursements if reimbursement to the Manager (a) occurs within three years from the date of the Manager’s waiver/reimbursement and (b) does not cause the Funds’ annual operating expenses to exceed the lesser of the contractual percentage limit in effect at the time of the waiver/reimbursement or time of recoupment. The reimbursed expenses listed above will expire in 2024. The Funds did not record a liability for potential reimbursements due to the current assessment that reimbursements are uncertain. The carryover of excess expenses potentially reimbursable to the Manager, but not recorded as a liability are as follows:
| Fund |
Recouped Expenses |
Excess Expense Carryover |
Expired Expense Carryover |
Expiration of Reimbursed Expenses |
||||||||||||
| Stephens Mid-Cap Growth |
$ | 74,356 | $ | - | $ | 18,963 | 2021 | |||||||||
| Stephens Mid-Cap Growth |
5,857 | 138,509 | - | 2022 | ||||||||||||
| Stephens Mid-Cap Growth |
1,670 | 83,047 | - | 2023 | ||||||||||||
| Stephens Small Cap Growth |
11,774 | 6,151 | - | 2022 | ||||||||||||
| Stephens Small Cap Growth |
18,116 | 211,158 | - | 2023 | ||||||||||||
Sales Commissions
The Funds’ Distributor, Resolute Investment Distributors, Inc. (“RID” or “Distributor”), may receive a portion of Class A sales charges from broker dealers which may be used to offset distribution related expenses. During the year ended December 31, 2021, RID collected $2,542 and $1,209 for the Class A Shares of Stephens Mid-Cap Growth Fund and Stephens Small Cap Growth Fund, respectively.
33
American Beacon FundsSM
Notes to Financial Statements
December 31, 2021
A CDSC of 0.50% will be deducted with respect to Class A Shares on certain purchases of $1,000,000 or more that are redeemed in whole or part within 18 months of purchase, unless waived as discussed in the Funds’ Prospectus. Any applicable CDSC will be 0.50% of the lesser of the original purchase price or the value of the redemption of the Class A Shares redeemed. During the year ended December 31, 2021, there were no CDSC fees collected for the Class A Shares of the Funds.
A CDSC of 1.00% will be deducted with respect to Class C Shares redeemed within 12 months of purchase, unless waived as discussed in the Funds’ Prospectus. Any applicable CDSC will be 1.00% of the lesser of the original purchase price or the value of the redemption of the Class C Shares redeemed. During the year ended December 31, 2021, CDSC fees of $229 and $100 were collected for the Class C Shares of Stephens Mid-Cap Growth Fund and Stephens Small Cap Growth Fund, respectively.
Trustee Fees and Expenses
Effective January 1, 2021, as compensation for their service to the American Beacon Funds Complex, including the Trust (collectively, the “Trusts”), each Trustee is compensated from the Trusts as follows: (1) an annual retainer of $120,000; (2) meeting attendance fee (for attendance in-person or via teleconference) of (a) $12,000 for in person attendance, or $5,000 for telephonic attendance, by Board members for each regularly scheduled or special Board meeting, (b) $2,500 for attendance by Committee members at meetings of the Audit and Compliance Committee and the Investment Committee, (c) $1,000 for attendance by Committee members at meetings of the Nominating and Governance Committee; and (d) $2,500 for attendance by Board members for each special telephonic Board meeting; and (3) reimbursement of reasonable expenses incurred in attending Board meetings, Committee meetings, and relevant educational seminars. For this purpose, the Board considers attendance at regular meetings held by video conference to constitute in-person attendance at a Board meeting. The Trustees also may be compensated for attendance at special Board and/or Committee meetings from time to time. For her service as Board Chair, Ms. Cline receives an additional annual retainer of $50,000. Although she attends several committee meetings at each quarterly Board meeting, she receives only a single $2,500 fee each quarter for her attendance at those meetings. The chairpersons of the Audit and Compliance Committee and the Investment Committee each receive an additional annual retainer of $25,000 and the Chair of the Nominating and Governance Committee receives an additional annual retainer of $10,000.
3. Security Valuation and Fair Value Measurements
The price of the Fund’s shares is based on its net asset value (“NAV”) per share. The Fund’s NAV is computed by adding total assets, subtracting all the Fund’s liabilities, and dividing the result by the total number of shares outstanding of the Fund or class.
Investments are valued at the close of the New York Stock Exchange (the “Exchange”), normally at 4:00 p.m. Eastern Time, each day that the Exchange is open for business. Equity securities, including exchange-traded funds (“ETFs”) for which market quotations are available are valued at the last sale price or official closing price (closing bid price or last evaluated quote if no sale has occurred) on the primary market or exchange on which they trade.
Investments in open-end mutual funds are valued at the closing NAV per share of the mutual fund on the day of valuation.
Securities for which the market prices are not readily available or are not reflective of the fair value of the security, as determined by the Manager, will be priced at fair value following procedures approved by the Board.
Other investments, including restricted securities and those financial instruments for which the above valuation procedures are inappropriate or are deemed not to reflect fair value, are stated at fair value, as determined in good faith by the Manager’s Valuation Committee, pursuant to procedures established by the Board.
34
American Beacon FundsSM
Notes to Financial Statements
December 31, 2021
Valuation Inputs
Various inputs may be used to determine the fair value of the Funds’ investments. These inputs are summarized in three broad levels for financial statement purposes. The inputs or methodologies used to value securities are not necessarily an indication of the risk associated with investing in those securities.
| Level 1 | - | Quoted prices in active markets for identical securities. | ||
| Level 2 | - | Prices determined using other significant observable inputs. These may include quoted prices for similar securities, interest rates, prepayment speeds, credit risk, and others. | ||
| Level 3 | - | Prices determined using other significant unobservable inputs. Unobservable inputs reflect a Fund’s own assumptions about the factors market participants would use in pricing an investment. | ||
Level 1 and Level 2 trading assets and trading liabilities, at fair value
Common stocks, preferred securities, ETFs and financial derivative instruments, such as futures contracts that are traded on a national securities exchange, are stated at the last reported sale or settlement price on the day of valuation. To the extent these securities are actively traded and valuation adjustments are not applied, they are categorized as Level 1 of the fair value hierarchy. Preferred securities and other equities traded on inactive markets or valued by reference to similar instruments are generally categorized as Level 2 of the fair value hierarchy.
Investments in registered open-end investment management companies will be valued based upon the NAVs of such investments and are categorized as Level 1 of the fair value hierarchy.
4. Securities and Other Investments
Common Stock
Common stock generally takes the form of shares in a corporation which represent an ownership interest. It ranks below preferred stock and debt securities in claims for dividends and for assets of the company in a liquidation or bankruptcy. The value of a company’s common stock may fall as a result of factors directly relating to that company, such as decisions made by its management or decreased demand for the company’s products or services. A stock’s value may also decline because of factors affecting not just the company, but also companies in the same industry or sector. The price of a company’s stock may also be affected by changes in financial markets that are relatively unrelated to the company, such as changes in interest rates, currency exchange rates or industry regulation. Companies that elect to pay dividends on their common stock generally only do so after they invest in their own business and make required payments to bondholders and on other debt and preferred stock. Therefore, the value of a company’s common stock will usually be more volatile than its bonds, other debt and preferred stock. Common stock may be exchange-traded or over-the-counter (“OTC”). OTC stock may be less liquid than exchange-traded stock.
Depositary Receipts and U.S. Dollar-Denominated Foreign Stocks Traded on U.S. Exchanges
ADRs are U.S. dollar-denominated receipts issued generally by domestic banks and represent the deposit with the bank of a security of a foreign issuer. Depositary receipts may not be denominated in the same currency as the securities into which they may be converted. Investing in depositary receipts entails substantially the same risks as direct investment in foreign securities. There is generally less publicly available information about foreign companies and there may be less governmental regulation and supervision of foreign stock exchanges, brokers, and listed companies. In addition, such companies may use different accounting and financial standards (and certain currencies may become unavailable for transfer from a foreign currency), resulting in the Funds’ possible inability to convert immediately into U.S. currency proceeds realized upon the sale of portfolio securities of the affected
35
American Beacon FundsSM
Notes to Financial Statements
December 31, 2021
foreign companies. In addition, the Funds may invest in unsponsored depositary receipts, the issuers of which are not obligated to disclose material information about the underlying securities to investors in the United States. Ownership of unsponsored depositary receipts may not entitle the Funds to the same benefits and rights as ownership of a sponsored depositary receipt or the underlying security.
Other Investment Company Securities and Other Exchange-Traded Products
The Funds may invest in shares of other investment companies, including open-end funds, closed-end funds, business development companies (“BDCs”), ETFs, unit investment trusts, and other investment companies of the Trust. The Funds may invest in securities of an investment company advised by the Manager or the Sub-Advisor. Investments in the securities of other investment companies may involve duplication of advisory fees and certain other expenses. By investing in another investment company, the Funds become a shareholder of that investment company. As a result, the Funds’ shareholders indirectly will bear the Funds’ proportionate share of the fees and expenses paid by shareholders of the other investment company, in addition to the fees and expenses the Funds’ shareholders directly bear in connection with the Funds’ own operations. These other fees and expenses are reflected as Acquired Fund Fees and Expenses and are included in the Fees and Expenses Table for the Funds in their Prospectus, if applicable. Investments in other investment companies may involve the payment of substantial premiums above the value of such issuer’s portfolio securities.
Publicly Traded Partnerships/Master Limited Partnerships (“MLPs”)
The Funds may invest in publicly traded partnerships such as MLPs. MLPs issue units that are registered with the SEC and are freely tradable on a securities exchange or in the OTC market. An MLP may have one or more general partners, who conduct the business, and one or more limited partners, who contribute capital. The general partner or partners are jointly and severally responsible for the liabilities of the MLP. (An MLP also may be an entity similar to a limited partnership, such as an LLC, which has one or more managers or managing members and non-managing members (who are like limited partners)). The Fund invests in an MLP as a limited partner and normally would not be liable for the debts of an MLP beyond the amount a Fund has invested therein, but it would not be shielded to the same extent that a shareholder of a corporation would be. In certain instances, creditors of an MLP would have the right to seek a return of capital that had been distributed to a limited partner. The right of an MLP’s creditors would continue even after a Fund had sold its investment in the partnership. MLPs typically invest in real estate and oil and gas equipment leasing assets, but they also finance entertainment, research and development, and other projects.
5. Principal Risks
Investing in the Funds may involve certain risks including, but not limited to, those described below.
Equity Investments Risk
Equity securities are subject to investment risk and market risk. The Funds’ investments in equity securities may include common stocks, preferred stocks, securities convertible into or exchangeable for common stocks, real estate investment trusts (“REITs”), depositary receipts, and U.S. dollar-denominated foreign stocks traded on U.S. exchanges. Such investments may expose the Funds to additional risk. The value of a company’s common stock may fall as a result of factors affecting the company, companies in the same industry or sector, or the financial markets overall. Common stock generally is subordinate to preferred stock upon the liquidation or bankruptcy of the issuing company. Preferred stocks and convertible securities are sensitive to movements in interest rates. Preferred stocks may be less liquid than common stocks and, unlike common stocks, participation in the growth of an issuer may be limited. Distributions on preferred stocks generally are payable at the discretion of an issuer and after required payments to bond holders. Convertible securities are subject to the risk that the credit standing of the issuer may have an effect on the convertible securities’ investment value. Investments in REITs are subject to the risks associated with investing in the real estate industry such as adverse developments affecting the real
36
American Beacon FundsSM
Notes to Financial Statements
December 31, 2021
estate industry and real property values. Depositary receipts and U.S. dollar-denominated foreign stocks traded on U.S. exchanges are subject to certain of the risks associated with investing directly in foreign securities, including, but not limited to, currency fluctuations and political and financial instability in the home country of a particular depositary receipt or foreign stock.
Foreign Investing Risk
Non-U.S. investments carry potential risks not associated with U.S. investments. Such risks include, but are not limited to: (1) currency exchange rate fluctuations, (2) political and financial instability, (3) less liquidity, (4) lack of uniform accounting, auditing and financial reporting standards, (5) increased price volatility, (6) less government regulation and supervision of foreign stock exchanges, brokers and listed companies, and (7) delays in transaction settlement in some foreign markets.
Investment Risk
An investment in the Funds is not a deposit with a bank and is not insured or guaranteed by the Federal Deposit Insurance Corporation or any other government agency. When you sell your shares of the Funds, they could be worth less than what you paid for them. Therefore, you may lose money by investing in the Funds.
Market Risk
The Funds are subject to the risk that the securities markets will move down, sometimes rapidly and unpredictably, based on overall economic conditions and other factors, which may negatively affect a Fund’s performance. Equity securities generally have greater price volatility than fixed income securities, although under certain market conditions fixed income securities may have comparable or greater price volatility. During a general downturn in the securities markets, multiple assets may decline in value simultaneously. In some cases, traditional market participants have been less willing to make a market in some types of debt instruments, which has affected the liquidity of those instruments. During times of market turmoil, investors tend to look to the safety of securities issued or backed by the U.S. Treasury, causing the prices of these securities to rise and the yields to decline. Reduced liquidity in fixed income and credit markets may negatively affect many issuers worldwide. Prices in many financial markets have increased significantly over the last decade, but there have also been periods of adverse market and financial developments and cyclical change during that timeframe, which have resulted in unusually high levels of volatility in domestic and foreign financial markets that has caused losses for investors and may occur again in the future, particularly if markets enter a period of uncertainty or economic weakness. The value of a security may decline due to adverse issuer-specific conditions, general market conditions unrelated to a particular issuer, or factors that affect a particular industry or industries. Changes in the financial condition of a single issuer or market segment also can impact the market as a whole.
Geopolitical and other events, including war, terrorism, economic uncertainty, trade disputes, pandemics, public health crises, natural disasters and related events have led, and in the future may continue to lead, to instability in world economies and markets generally and reduced liquidity in equity, credit and fixed-income markets, which may disrupt economies and markets and adversely affect the value of your investment. Adverse market events may also lead to increased shareholder redemptions, which could cause a Fund to experience a loss or difficulty in selling investments to meet redemption requests by shareholders and may increase a Fund’s portfolio turnover, which will increase the costs that a Fund incurs and lower a Fund’s performance. Even when securities markets perform well, there is no assurance that the investments held by a Fund will increase in value along with the broader market.
Policy changes by the U.S. government and/or Federal Reserve and political events within the U.S. and abroad, including the U.S. presidential election, the U.S. government’s inability at times to agree on a long-term budget and deficit reduction plan, the threat of a federal government shutdown and threats not to increase the federal government’s debt limit, may affect investor and consumer confidence and may adversely impact financial
37
American Beacon FundsSM
Notes to Financial Statements
December 31, 2021
markets and the broader economy, perhaps suddenly and to a significant degree. The severity or duration of adverse economic conditions may also be affected by policy changes made by governments or quasi-governmental organizations. Global economies and financial markets are becoming increasingly interconnected, which increases the possibility of many markets being affected by events in a single country or events affecting a single or small number of issuers.
Markets and market participants are increasingly reliant upon both publicly available and proprietary information data systems. Data imprecision, software or other technology malfunctions, programming inaccuracies, unauthorized use or access, and similar circumstances may impair the performance of these systems and may have an adverse impact upon a single issuer, a group of issuers, or the market at large. In certain cases, an exchange or market may close or issue trading halts on either specific securities or even the entire market, which may result in a Fund being, among other things, unable to buy or sell certain securities or financial instruments or accurately price its investments. These fluctuations in securities prices could be a sustained trend or a drastic movement. The financial markets generally move in cycles, with periods of rising prices followed by periods of declining prices. The value of your investment may reflect these fluctuations.
Other Investment Companies Risk
The Funds may invest in shares of other registered investment companies, including money market funds and ETFs. To the extent that the Funds invest in shares of other registered investment companies, the Funds will indirectly bear the fees and expenses, including for example, advisory and administrative fees, charged by those investment companies in addition to the Funds’ direct fees and expenses and will be subject to the risks associated with investments in those companies. For example, the Funds’ investments in money market funds are subject to interest rate risk, credit risk, and market risk. The Funds must rely on the investment company in which it invests to achieve its investment objective. If the investment company fails to achieve its investment objective, the value of the Funds’ investment may decline, adversely affecting the Funds’ performance. ETFs are subject to the following risks that do not apply to conventional funds: (1) the market price of an ETF’s shares may trade at a discount or premium to its NAV; (2) an active trading market for an ETF’s shares may not develop or be maintained; or (3) trading of an ETF’s shares may be halted if the listing exchange’s officials deem such action appropriate, the shares are delisted from the exchange, or the activation of market-wide “circuit breakers” (which are tied to large decreases in stock prices) halts stock trading generally. An ETF that tracks an index may not precisely replicate the returns of its benchmark index. To the extent the Funds invest in other investment companies that invest in equity securities, fixed-income securities and/or foreign securities, or that track an index, the Funds are subject to the risks associated with the underlying investments held by the investment company or the index fluctuations to which the investment company is subject. ETFs have expenses associated with their operation, typically including advisory fees.
Recent Market Events Risk
An outbreak of infectious respiratory illness caused by a novel coronavirus, known as COVID-19, was first detected in China in December 2019 and has subsequently spread globally. Transmission of COVID-19 and efforts to contain its spread have resulted, and may continue to result, in significant disruptions to business operations, widespread business closures and layoffs, travel restrictions, closed international, national and local borders, prolonged quarantines and stay-at-home orders, disruption of and delays in healthcare service preparation and delivery, service and event cancellations, and lower consumer demand, as well as general concern and uncertainty that has negatively affected the global economy. The impact of the COVID-19 pandemic may last for an extended period of time and may result in a sustained economic downturn or recession. The U.S. Federal Reserve and the U.S. federal government have taken numerous measures to address the economic impact of the COVID-19 pandemic and stimulate the U.S. economy. The ultimate effects of these and other efforts that may be taken may not be known for some time.
38
American Beacon FundsSM
Notes to Financial Statements
December 31, 2021
The pandemic has accelerated trends toward working remotely and shopping on-line, which may negatively affect the value of office and commercial real estate and companies that have been slow to transition to an on-line business model and has disrupted the supply chains that many businesses depend on. The travel, hospitality and public transit industries may suffer long-term negative effects from the pandemic and resulting changes to public behavior. Both U.S. and international markets have experienced significant volatility in recent months and years. As a result of such volatility, investment returns may fluctuate significantly. Moreover, the risks discussed herein associated with an investment in the Fund may be increased.
The Federal Reserve has spent hundreds of billions of dollars to keep credit flowing through the economy. However, the Federal Reserve recently began to reduce its interventions as the economy improved and inflation accelerated. Concerns about the markets’ dependence on the Federal Reserve’s provision of liquidity have grown as a result. High public debt in the U.S. and other countries creates ongoing systemic and market risks and policymaking uncertainty, and there may be a further increase in public debt due to the economic effects of the COVID-19 pandemic and ensuing economic relief and public health measures. Governments’ efforts to limit potential negative economic effects of the pandemic may be altered, delayed, or eliminated at inopportune times for political, policy or other reasons.
Interest rates have been unusually low in recent years in the U.S. and abroad, and central banks reduced rates further in an effort to combat the economic effects of the COVID-19 pandemic. Because there is little precedent for this situation, it is difficult to predict the impact on various markets of a significant rate increase or other significant policy changes. The U.S. Federal Reserve is anticipated to raise interest rates beginning in 2022, in part to address an increase in the annual inflation rate in the U.S. Over the longer term, rising interest rates may present a greater risk than has historically been the case due to the current period of relatively low rates and the effect of government fiscal and monetary policy initiatives and potential market reaction to those initiatives or their alteration or cessation.
Slowing global economic growth, risks associated with the United Kingdom’s departure from the European Union on December 31, 2020, commonly referred to as “Brexit,” and a trade agreement between the United Kingdom and the European Union, the risks associated with ongoing trade negotiations with China, the possibility of changes to some international trade agreements, tensions or open conflict between nations, such as between Russia and Ukraine, or political or economic dysfunction within some nations that are major producers of oil could affect the economies of many nations, including the United States, in ways that cannot necessarily be foreseen at the present time.
Economists and others have expressed increasing concern about the potential effects of global climate change on property and security values. Certain issuers, industries and regions may be adversely affected by the impacts of climate change, including on the demand for and the development of goods and services and related production costs, and the impacts of legislation, regulation and international accords related to climate change, as well as any indirect consequences of regulation or business trends driven by climate change.
Sector Risk
Sector risk is the risk associated with a Fund holding a significant amount of investments in similar businesses, which would be similarly affected by particular economic or market events, which may, in certain circumstances, cause the value of the equity and debt securities of companies in a particular sector of the market to change. To the extent a Fund has substantial holdings within a particular sector, the risks to a Fund associated with that sector increase.
To the extent a Fund invests significantly in the information technology sector, the value of the Fund’s shares may be particularly vulnerable to factors affecting that sector, such as a greater degree of market risk and sharp price fluctuations than other types of securities. These securities may fall in and out of favor with investors rapidly, which may cause sudden selling and dramatically lower market prices. The value of a Fund’s shares could experience significantly greater volatility than investment companies investing more broadly.
39
American Beacon FundsSM
Notes to Financial Statements
December 31, 2021
Securities Lending Risk
A Fund may lend its portfolio securities to brokers, dealers and financial institutions in order to obtain additional income. Borrowers of a Fund’s securities provide collateral either in the form of cash, which a Fund reinvests in securities or in the form of non-cash collateral consisting of securities issued or guaranteed by the U.S. government or one of its agencies or instrumentalities. A Fund will be responsible for the risks associated with the investment of cash collateral, including any collateral invested in an affiliated money market fund. A Fund may lose money on its investment of cash collateral or may fail to earn sufficient income on its investment to cover its payment to the borrower of a pre-negotiated fee or “rebate” for the use of that cash collateral in connection with the loan. A Fund could also lose money due to a decline in the value of non-cash collateral. In addition, delays may occur in the recovery of securities from borrowers, which could interfere with a Fund’s ability to vote proxies or to settle transactions or could result in increased costs. Moreover, if the borrower becomes subject to insolvency or similar proceedings, a Fund could incur delays in its ability to enforce its rights in its collateral. There also is a risk that a borrower may default on its obligation to return loaned securities at a time when the value of a Fund’s collateral is inadequate. Although a Fund’s securities lending agent may indemnify a Fund against that risk, it is also possible that the securities lending agent will be unable to satisfy its indemnification obligations. In any case in which the loaned securities are not returned to a Fund before an ex-dividend date, whether or not due to a default by the borrower, the payment in lieu of the dividend that a Fund receives from the securities’ borrower would not be treated as a dividend for federal income tax purposes and thus would not qualify for treatment as “qualified dividend income.”
Offsetting Assets and Liabilities
The Funds are parties to enforceable master netting agreements between brokers and counterparties which provide for the right to offset under certain circumstances. The Funds employ multiple counterparties and have elected not to offset qualifying financial and derivative instruments on the Statements of Assets and Liabilities, as such all financial and derivative instruments are presented on a gross basis. The impacts of netting arrangements that provide the right to offset are detailed below, if applicable. The net amount represents the net receivable or payable that would be due from or to the counterparty in the event of default. Exposure from borrowings and other financing agreements such as repurchase agreements can only be netted across transactions governed by the same Master Agreement with the same legal entity.
6. Federal Income and Excise Taxes
It is the policy of each Fund to qualify as a regulated investment company (“RIC”), by complying with all applicable provisions of Subchapter M of the Internal Revenue Code, as amended, and to make distributions of taxable income sufficient to relieve it from substantially all federal income and excise taxes. For federal income tax purposes, each Fund is treated as a single entity for the purpose of determining such qualification.
The Funds do not have any unrecorded tax liabilities in the accompanying financial statements. Each of the tax years in the four year period ended December 31, 2021 remain subject to examination by the Internal Revenue Service. If applicable, the Funds recognize interest accrued related to unrecognized tax benefits in interest expense and penalties in “Other expenses” on the Statements of Operations.
The Funds may be subject to taxes imposed by countries in which it invests. Such taxes are generally based on returns of income earned or gains realized or repatriated. Taxes are accrued and applied to net investment income, net realized capital gains and net unrealized appreciation (depreciation), as applicable, as the income is earned or capital gains are recorded.
40
American Beacon FundsSM
Notes to Financial Statements
December 31, 2021
The tax character of distributions paid were as follows:
| Stephens Mid-Cap Growth Fund | Stephens Small Cap Growth Fund | |||||||||||||||||||||||||||
| Year Ended December 31, 2021 |
Year Ended December 31, 2020 |
Year Ended December 31, 2021 |
Year Ended December 31, 2020 |
|||||||||||||||||||||||||
| Distributions paid from: |
||||||||||||||||||||||||||||
| Long-term capital gains* |
||||||||||||||||||||||||||||
| R5 Class |
$ | 35,903,414 | $ | 5,534,575 | $ | 48,200,672 | $ | 24,212,368 | ||||||||||||||||||||
| Y Class |
4,933,630 | 823,490 | 9,740,825 | 5,438,426 | ||||||||||||||||||||||||
| Investor Class |
1,192,798 | 245,834 | 15,364,561 | 8,061,059 | ||||||||||||||||||||||||
| A Class |
514,914 | 117,516 | 1,415,395 | 688,632 | ||||||||||||||||||||||||
| C Class |
231,787 | 47,791 | 129,727 | 78,788 | ||||||||||||||||||||||||
| R6 Class |
3,068,283 | 426,238 | 3,598,004 | 1,546,235 | ||||||||||||||||||||||||
|
|
|
|
|
|
|
|
|
|||||||||||||||||||||
| Total distributions paid |
$ | 45,844,826 | $ | 7,195,444 | $ | 78,449,184 | $ | 40,025,508 | ||||||||||||||||||||
|
|
|
|
|
|
|
|
|
|||||||||||||||||||||
* For tax purposes, short-term capital gains are considered ordinary income distributions.
As of December 31, 2021, the components of distributable earnings (deficits) on a tax basis were as follows:
| Fund |
Tax Cost | Unrealized Appreciation |
Unrealized (Depreciation) |
Net Unrealized Appreciation (Depreciation) |
||||||||||||||||||||||||
| Stephens Mid-Cap Growth |
$ | 526,382,309 | $ | 261,796,594 | $ | (10,189,330 | ) | $ | 251,607,264 | |||||||||||||||||||
| Stephens Small Cap Growth |
242,057,842 | 213,222,140 | (8,930,411 | ) | 204,291,729 | |||||||||||||||||||||||
| Fund |
Net Unrealized Appreciation (Depreciation) |
Undistributed Ordinary Income |
Undistributed Long-Term Capital Gains |
Accumulated Capital and Other (Losses) |
Other Temporary Differences |
Distributable Earnings |
||||||||||||||||||||||||||||||||||||||
| Stephens Mid-Cap Growth |
$ | 251,607,264 | $ | - | $ | 13,207,728 | $ | (1,506,645 | ) | $ | - | $ | 263,308,347 | |||||||||||||||||||||||||||||||
| Stephens Small Cap Growth |
204,291,729 | 2,672 | 12,002,343 | - | - | 216,296,744 | ||||||||||||||||||||||||||||||||||||||
Financial reporting records are adjusted for permanent book/tax differences to reflect tax character. Financial records are not adjusted for temporary differences. The temporary differences between financial reporting and tax-basis reporting of unrealized appreciation (depreciation) are attributable primarily to the tax deferral of losses from wash sales and the tax deferral of post-October capital losses.
Due to inherent differences in the recognition of income, expenses, and realized gains (losses) under U.S. GAAP and federal income tax regulations, permanent differences between book and tax reporting have been identified and appropriately reclassified on the Statements of Assets and Liabilities.
Accordingly, the following amounts represent current year permanent differences derived from non-utilization of net operating losses as of December 31, 2021:
| Fund |
Paid-In-Capital | Distributable Earnings/ (Deficits) |
||||||||||
| Stephens Mid-Cap Growth |
$ | (1,949,878 | ) | $ | 1,949,878 | |||||||
| Stephens Small Cap Growth |
- | - | ||||||||||
For federal income tax purposes, the Funds measure their capital loss carryforwards annually at December 31, their fiscal year end. Capital loss carryforwards retain their character as short-term and/or long-term and may be carried forward and applied against future realized capital gains with no expiration date.
During the year ended December 31, 2021, the Funds did not have any capital loss carryforwards.
41
American Beacon FundsSM
Notes to Financial Statements
December 31, 2021
The Funds are permitted for tax purposes to defer into the next fiscal year qualified late year losses. Qualified late year capital losses are net losses incurred after October 31 through the Fund’s fiscal year end, December 31, 2021. Qualified late year ordinary losses are specified losses generally incurred after October 31 through the end of the Fund’s fiscal year end, December 31, 2021. For the period ending December 31, 2021, Stephens Mid-Cap Growth deferred $1,506,645 short-term capital loss to January 1, 2022.
7. Investment Transactions
The aggregate cost of purchases and proceeds from sales and maturities of investments, other than short-term obligations, for the year ended December 31, 2021 were as follows:
| Fund |
Purchases (non-U.S. Government Securities) |
Sales (non-U.S. Government Securities) |
||||||||||
| Stephens Mid-Cap Growth |
$ | 282,728,926 | $ | 199,223,337 | ||||||||
| Stephens Small Cap Growth |
120,543,300 | 155,502,402 | ||||||||||
A summary of the Funds’ transactions in the USG Select Fund for the year ended December 31, 2021 were as follows:
| Fund |
Type of Transaction |
December 31, 2020 Shares/Fair Value |
Purchases | Sales | December 31, 2021 Shares/Fair Value |
|||||||||||||||||||||||||||||
| Stephens Mid-Cap Growth | Direct | $ | 22,209,703 | $ | 214,822,228 | $ | 229,070,106 | $ | 7,961,825 | |||||||||||||||||||||||||
| Stephens Mid-Cap Growth | Securities Lending | 1,154,190 | 13,188,106 | 14,342,296 | - | |||||||||||||||||||||||||||||
| Stephens Small Cap Growth | Direct | 3,370,450 | 79,666,194 | 80,309,521 | 2,727,123 | |||||||||||||||||||||||||||||
| Stephens Small Cap Growth | Securities Lending | 573,716 | 7,021,033 | 7,594,749 | - | |||||||||||||||||||||||||||||
8. Securities Lending
The Funds may lend their securities to qualified financial institutions, such as certain broker-dealers, to earn additional income. The borrowers are required to secure their loans continuously with collateral in an amount at least equal to the fair value of the securities loaned, initially in an amount at least equal to 102% of the fair value of domestic securities loaned and 105% of the fair value of international securities loaned. Collateral is monitored and marked-to-market daily. Daily mark-to-market amounts are required to be paid to the borrower or received from the borrower by the end of the following business day. This one day settlement for mark-to-market amounts may result in the collateral being temporarily less than the value of the securities on loan or temporarily more than the required minimum collateral.
To the extent that a loan is collateralized by cash, such cash collateral shall be invested by the securities lending agent (the “Agent”) in money market mutual funds and other short-term investments, provided the investments meet certain quality and diversification requirements. Securities purchased with cash collateral proceeds are listed in the Funds’ Schedule of Investments and the collateral is shown on the Statements of Assets and Liabilities as a payable.
Securities lending income is generated from the demand premium (if any) paid by the borrower to borrow a specific security and from the return on investment of cash collateral, reduced by negotiated rebate fees paid to the borrower and transaction costs. To the extent that a loan is secured by non-cash collateral, securities lending income is generated as a demand premium reduced by transaction costs. The Funds, the Agent, and the Manager retained 80%, 10%, and 10%, respectively, of the income generated from securities lending.
While securities are on loan, the Funds continue to receive certain income associated with that security and any gain or loss in the market price that may occur during the term of the loan. In the case of domestic equities, the value of any dividend is received in the form of a substitute payment approximately equal to the dividend. In
42
American Beacon FundsSM
Notes to Financial Statements
December 31, 2021
the case of foreign securities, a negotiated amount is received that is less than the actual dividend, but higher than the dividend amount minus the foreign tax that the Funds would be subject to on the dividend.
Securities lending transactions pose certain risks to the Funds, including that the borrower may not provide additional collateral when required or return the securities when due, that the value of the short-term investments will be less than the amount of cash collateral required to be returned to the borrower, that non-cash collateral may be subject to legal constraints in the event of a borrower bankruptcy, and that the cash collateral investments could become illiquid and unable to be used to return collateral to the borrower. The Funds could also experience delays and costs in gaining access to the collateral. The Funds bear the risk of any deficiency in the amount of the cash collateral available for return to the borrower and any action which impairs its ability to liquidate non-cash collateral to satisfy a borrower default.
As of December 31, 2021, the value of outstanding securities on loan and the value of collateral were as follows:
| Fund |
Fair Value of Securities on Loan |
Cash Collateral Received |
Non-Cash Collateral Received |
Total Collateral Received |
||||||||||||
| Stephens Mid-Cap Growth |
$ | 10,855,793 | $ | - | $ | 11,211,642 | $ | 11,211,642 | ||||||||
| Stephens Small Cap Growth |
2,448,759 | - | 2,426,312 | 2,426,312 | ||||||||||||
Cash collateral is listed on the Funds’ Schedules of Investments and is shown on the Statements of Assets and Liabilities. Income earned on these investments is included in “Income derived from securities lending” on the Statements of Operations.
Non-cash collateral received by the Funds may not be sold or re-pledged except to satisfy a borrower default. Therefore, non-cash collateral is not included on the Funds’ Schedules of Investments or Statements of Assets and Liabilities.
9. Borrowing Arrangements
Effective November 11, 2021 (the “Effective Date”), the Funds, along with certain other funds managed by the Manager (“Participating Funds”), renewed a committed revolving line of credit (the “Committed Line”) agreement with State Street Bank and Trust Company (the “Bank”) to be used to facilitate portfolio liquidity. The maximum borrowing amount under the Committed Line is $100 million with interest at a rate equal to the higher of (a) Overnight Bank Funding Rate (“OBFR”) daily fluctuating rate per annum equal to 1.25% plus the sum of 0.10% or (b) the Federal Funds daily fluctuating rate per annum on amounts borrowed. Each of the Participating Funds paid a proportional amount of a quarterly commitment fee at a rate of 0.25% per annum on the unused portion of the Committed Line amount. The Committed Line expires November 10, 2022, unless extended by the Bank or terminated by the Participating Funds in accordance with the agreement. Prior to the Effective Date, the maximum borrowing amount under the Committed Line was $150 million with an expiration date November 10, 2021.
On the Effective Date, the Funds, along with certain other Participating Funds managed by the Manager, also renewed an uncommitted discretionary demand revolving line of credit (the “Uncommitted Line”) agreement with the Bank to be used to facilitate portfolio liquidity. The maximum borrowing amount under the Uncommitted Line is $100 million with interest at a rate equal to the higher of (a) OBFR daily fluctuating rate per annum equal to 1.25% plus the sum of 0.10% or (b) the Federal Funds daily fluctuating rate per annum on amounts borrowed on each outstanding loan. Each of the Participating Funds paid a proportional amount of a closing fee of $35,000 on the Effective Date. The Uncommitted Line expires November 10, 2022, unless extended by the Bank or terminated by the Participating Funds in accordance with the agreement. Prior to the Effective Date, the maximum borrowing amount under the Uncommitted Line was $50 million with an expiration date of November 10, 2021.
43
American Beacon FundsSM
Notes to Financial Statements
December 31, 2021
The Participating Funds paid administration, legal and arrangement fees, which are recognized as a component of “Loan expense” on the Statements of Operations, along with commitment fees, that have been allocated among the Participating Funds based on average daily net assets.
During the year ended December 31, 2021, the Funds did not utilize these facilities.
10. Capital Share Transactions
The tables below summarize the activity in capital shares for each Class of the Funds:
| R5 Class | ||||||||||||||||||||||||||||
| Year Ended December 31, | ||||||||||||||||||||||||||||
| 2021 | 2020 | |||||||||||||||||||||||||||
| Stephens Mid-Cap Growth Fund |
Shares |
Amount |
Shares |
Amount |
||||||||||||||||||||||||
| Shares sold | 5,801,352 | $ | 228,110,298 | 5,617,954 | $ | 166,249,719 | ||||||||||||||||||||||
| Reinvestment of dividends | 452,384 | 17,805,838 | 80,608 | 3,041,338 | ||||||||||||||||||||||||
| Shares redeemed | (3,562,517 | ) | (143,371,174 | ) | (3,298,052 | ) | (92,821,944 | ) | ||||||||||||||||||||
|
|
|
|
|
|
|
|
|
|||||||||||||||||||||
| Net increase in shares outstanding | 2,691,219 | $ | 102,544,962 | 2,400,510 | $ | 76,469,113 | ||||||||||||||||||||||
|
|
|
|
|
|
|
|
|
|||||||||||||||||||||
| Y Class | ||||||||||||||||||||||||||||
| Year Ended December 31, | ||||||||||||||||||||||||||||
| 2021 | 2020 | |||||||||||||||||||||||||||
| Stephens Mid-Cap Growth Fund |
Shares |
Amount |
Shares |
Amount |
||||||||||||||||||||||||
| Shares sold | 569,170 | $ | 22,212,416 | 1,121,635 | $ | 34,246,597 | ||||||||||||||||||||||
| Reinvestment of dividends | 121,659 | 4,741,069 | 20,660 | 772,688 | ||||||||||||||||||||||||
| Shares redeemed | (441,968 | ) | (17,308,176 | ) | (424,235 | ) | (12,189,092 | ) | ||||||||||||||||||||
|
|
|
|
|
|
|
|
|
|||||||||||||||||||||
| Net increase in shares outstanding | 248,861 | $ | 9,645,309 | 718,060 | $ | 22,830,193 | ||||||||||||||||||||||
|
|
|
|
|
|
|
|
|
|||||||||||||||||||||
| Investor Class | ||||||||||||||||||||||||||||
| Year Ended December 31, | ||||||||||||||||||||||||||||
| 2021 | 2020 | |||||||||||||||||||||||||||
| Stephens Mid-Cap Growth Fund |
Shares |
Amount |
Shares |
Amount |
||||||||||||||||||||||||
| Shares sold | 75,821 | $ | 2,425,074 | 97,711 | $ | 2,386,694 | ||||||||||||||||||||||
| Reinvestment of dividends | 29,031 | 928,402 | 6,321 | 196,886 | ||||||||||||||||||||||||
| Shares redeemed | (134,847 | ) | (4,332,549 | ) | (206,994 | ) | (4,482,169 | ) | ||||||||||||||||||||
|
|
|
|
|
|
|
|
|
|||||||||||||||||||||
| Net (decrease) in shares outstanding | (29,995 | ) | $ | (979,073 | ) | (102,962 | ) | $ | (1,898,589 | ) | ||||||||||||||||||
|
|
|
|
|
|
|
|
|
|||||||||||||||||||||
| A Class | ||||||||||||||||||||||||||||
| Year Ended December 31, | ||||||||||||||||||||||||||||
| 2021 | 2020 | |||||||||||||||||||||||||||
| Stephens Mid-Cap Growth Fund |
Shares |
Amount |
Shares |
Amount |
||||||||||||||||||||||||
| Shares sold | 22,100 | $ | 718,332 | 23,604 | $ | 571,957 | ||||||||||||||||||||||
| Reinvestment of dividends | 16,167 | 513,934 | 3,743 | 115,930 | ||||||||||||||||||||||||
| Shares redeemed | (72,739 | ) | (2,390,878 | ) | (51,508 | ) | (1,074,309 | ) | ||||||||||||||||||||
|
|
|
|
|
|
|
|
|
|||||||||||||||||||||
| Net (decrease) in shares outstanding | (34,472 | ) | $ | (1,158,612 | ) | (24,161 | ) | $ | (386,422 | ) | ||||||||||||||||||
|
|
|
|
|
|
|
|
|
|||||||||||||||||||||
| C Class | ||||||||||||||||||||||||||||
| Year Ended December 31, | ||||||||||||||||||||||||||||
| 2021 | 2020 | |||||||||||||||||||||||||||
| Stephens Mid-Cap Growth Fund |
Shares |
Amount |
Shares |
Amount |
||||||||||||||||||||||||
| Shares sold | 13,954 | $ | 424,290 | 25,291 | $ | 559,570 | ||||||||||||||||||||||
| Reinvestment of dividends | 8,002 | 230,445 | 1,667 | 47,485 | ||||||||||||||||||||||||
| Shares redeemed | (29,217 | ) | (856,963 | ) | (71,151 | ) | (1,526,362 | ) | ||||||||||||||||||||
|
|
|
|
|
|
|
|
|
|||||||||||||||||||||
| Net (decrease) in shares outstanding | (7,261 | ) | $ | (202,228 | ) | (44,193 | ) | $ | (919,307 | ) | ||||||||||||||||||
|
|
|
|
|
|
|
|
|
|||||||||||||||||||||
| R6 Class | ||||||||||||||||||||||||||||
| Year Ended December 31, | ||||||||||||||||||||||||||||
| 2021 | 2020 | |||||||||||||||||||||||||||
| Stephens Mid-Cap Growth Fund |
Shares |
Amount |
Shares |
Amount |
||||||||||||||||||||||||
| Shares sold | 616,251 | $ | 24,263,482 | 515,407 | $ | 17,953,047 | ||||||||||||||||||||||
| Reinvestment of dividends | 77,875 | 3,068,283 | 11,288 | 426,238 | ||||||||||||||||||||||||
| Shares redeemed | (290,953 | ) | (11,628,663 | ) | (163,648 | ) | (4,818,189 | ) | ||||||||||||||||||||
|
|
|
|
|
|
|
|
|
|||||||||||||||||||||
| Net increase in shares outstanding | 403,173 | $ | 15,703,102 | 363,047 | $ | 13,561,096 | ||||||||||||||||||||||
|
|
|
|
|
|
|
|
|
|||||||||||||||||||||
44
American Beacon FundsSM
Notes to Financial Statements
December 31, 2021
| R5 Class | ||||||||||||||||||||||||||||
| Year Ended December 31, | ||||||||||||||||||||||||||||
| 2021 | 2020 | |||||||||||||||||||||||||||
| Stephens Small Cap Growth Fund |
Shares |
Amount |
Shares |
Amount |
||||||||||||||||||||||||
| Shares sold | 2,620,716 | $ | 54,758,727 | 3,329,875 | $ | 49,093,988 | ||||||||||||||||||||||
| Reinvestment of dividends | 2,499,098 | 45,183,694 | 1,149,562 | 22,278,506 | ||||||||||||||||||||||||
| Shares redeemed | (3,386,664 | ) | (69,375,236 | ) | (6,761,864 | ) | (104,135,516 | ) | ||||||||||||||||||||
|
|
|
|
|
|
|
|
|
|||||||||||||||||||||
| Net increase (decrease) in shares outstanding | 1,733,150 | $ | 30,567,185 | (2,282,427 | ) | $ | (32,763,022 | ) | ||||||||||||||||||||
|
|
|
|
|
|
|
|
|
|||||||||||||||||||||
| Y Class | ||||||||||||||||||||||||||||
| Year Ended December 31, | ||||||||||||||||||||||||||||
| 2021 | 2020 | |||||||||||||||||||||||||||
| Stephens Small Cap Growth Fund |
Shares |
Amount |
Shares |
Amount |
||||||||||||||||||||||||
| Shares sold | 590,953 | $ | 12,386,889 | 770,192 | $ | 10,988,055 | ||||||||||||||||||||||
| Reinvestment of dividends | 546,138 | 9,732,183 | 283,599 | 5,433,756 | ||||||||||||||||||||||||
| Shares redeemed | (1,104,555 | ) | (22,328,607 | ) | (1,893,741 | ) | (27,731,637 | ) | ||||||||||||||||||||
|
|
|
|
|
|
|
|
|
|||||||||||||||||||||
| Net increase (decrease) in shares outstanding | 32,536 | $ | (209,535 | ) | (839,950 | ) | $ | (11,309,826 | ) | |||||||||||||||||||
|
|
|
|
|
|
|
|
|
|||||||||||||||||||||
| Investor Class | ||||||||||||||||||||||||||||
| Year Ended December 31, | ||||||||||||||||||||||||||||
| 2021 | 2020 | |||||||||||||||||||||||||||
| Stephens Small Cap Growth Fund |
Shares |
Amount |
Shares |
Amount |
||||||||||||||||||||||||
| Shares sold | 634,552 | $ | 11,525,869 | 773,434 | $ | 11,261,475 | ||||||||||||||||||||||
| Reinvestment of dividends | 984,371 | 15,080,561 | 471,643 | 8,008,499 | ||||||||||||||||||||||||
| Shares redeemed | (1,200,101 | ) | (21,603,622 | ) | (1,245,153 | ) | (16,983,024 | ) | ||||||||||||||||||||
|
|
|
|
|
|
|
|
|
|||||||||||||||||||||
| Net increase (decrease) in shares outstanding | 418,822 | $ | 5,002,808 | (76 | ) | $ | 2,286,950 | |||||||||||||||||||||
|
|
|
|
|
|
|
|
|
|||||||||||||||||||||
| A Class | ||||||||||||||||||||||||||||
| Year Ended December 31, | ||||||||||||||||||||||||||||
| 2021 | 2020 | |||||||||||||||||||||||||||
| Stephens Small Cap Growth Fund |
Shares |
Amount |
Shares |
Amount |
||||||||||||||||||||||||
| Shares sold | 18,481 | $ | 323,049 | 26,408 | $ | 385,838 | ||||||||||||||||||||||
| Reinvestment of dividends | 93,124 | 1,397,792 | 40,765 | 680,366 | ||||||||||||||||||||||||
| Shares redeemed | (33,761 | ) | (597,978 | ) | (34,197 | ) | (498,089 | ) | ||||||||||||||||||||
|
|
|
|
|
|
|
|
|
|||||||||||||||||||||
| Net increase in shares outstanding | 77,844 | $ | 1,122,863 | 32,976 | $ | 568,115 | ||||||||||||||||||||||
|
|
|
|
|
|
|
|
|
|||||||||||||||||||||
| C Class | ||||||||||||||||||||||||||||
| Year Ended December 31, | ||||||||||||||||||||||||||||
| 2021 | 2020 | |||||||||||||||||||||||||||
| Stephens Small Cap Growth Fund |
Shares |
Amount |
Shares |
Amount |
||||||||||||||||||||||||
| Shares sold | 2,959 | $ | 46,299 | 4,754 | $ | 62,250 | ||||||||||||||||||||||
| Reinvestment of dividends | 9,865 | 129,727 | 5,352 | 78,788 | ||||||||||||||||||||||||
| Shares redeemed | (15,117 | ) | (236,046 | ) | (30,515 | ) | (375,121 | ) | ||||||||||||||||||||
|
|
|
|
|
|
|
|
|
|||||||||||||||||||||
| Net (decrease) in shares outstanding | (2,293 | ) | $ | (60,020 | ) | (20,409 | ) | $ | (234,083 | ) | ||||||||||||||||||
|
|
|
|
|
|
|
|
|
|||||||||||||||||||||
| R6 Class | ||||||||||||||||||||||||||||
| Year Ended December 31, | ||||||||||||||||||||||||||||
| 2021 | 2020 | |||||||||||||||||||||||||||
| Stephens Small Cap Growth Fund |
Shares |
Amount |
Shares |
Amount |
||||||||||||||||||||||||
| Shares sold | 163,626 | $ | 3,375,824 | 313,602 | $ | 5,572,328 | ||||||||||||||||||||||
| Reinvestment of dividends | 198,565 | 3,598,004 | 79,662 | 1,546,235 | ||||||||||||||||||||||||
| Shares redeemed | (71,914 | ) | (1,500,974 | ) | (38,372 | ) | (700,077 | ) | ||||||||||||||||||||
|
|
|
|
|
|
|
|
|
|||||||||||||||||||||
| Net increase in shares outstanding | 290,277 | $ | 5,472,854 | 354,892 | $ | 6,418,486 | ||||||||||||||||||||||
|
|
|
|
|
|
|
|
|
|||||||||||||||||||||
11. Subsequent Events
Management has evaluated subsequent events for possible recognition or disclosure in the financial statements through the date the financial statements are issued. Management has determined that there are no material events that would require disclosure in the Funds’ financial statements through this date.
45
American Beacon Stephens Mid-Cap Growth FundSM
(For a share outstanding throughout the period)
| R5 ClassA | ||||||||||||||||||||||||||||||||||||
| Year Ended December 31, | ||||||||||||||||||||||||||||||||||||
| 2021 | 2020 | 2019 | 2018 | 2017 | ||||||||||||||||||||||||||||||||
|
|
|
|||||||||||||||||||||||||||||||||||
| Net asset value, beginning of period |
$ | 37.67 | $ | 27.17 | $ | 21.23 | $ | 22.45 | $ | 18.29 | ||||||||||||||||||||||||||
|
|
|
|
|
|
|
|
|
|
|
|||||||||||||||||||||||||||
| Income (loss) from investment operations: |
||||||||||||||||||||||||||||||||||||
| Net investment (loss) |
(0.14 | ) | (0.07 | ) | (0.12 | )B | (0.12 | )B | (0.07 | ) | ||||||||||||||||||||||||||
| Net gains on investments (both realized and unrealized) |
4.80 | 11.02 | 6.87 | 0.57 | 5.26 | |||||||||||||||||||||||||||||||
|
|
|
|
|
|
|
|
|
|
|
|||||||||||||||||||||||||||
| Total income (loss) from investment operations |
4.66 | 10.95 | 6.75 | 0.45 | 5.19 | |||||||||||||||||||||||||||||||
|
|
|
|
|
|
|
|
|
|
|
|||||||||||||||||||||||||||
| Less distributions: |
||||||||||||||||||||||||||||||||||||
| Dividends from net investment income |
- | - | - | - | - | |||||||||||||||||||||||||||||||
| Distributions from net realized gains |
(2.43 | ) | (0.45 | ) | (0.81 | ) | (1.67 | ) | (1.03 | ) | ||||||||||||||||||||||||||
|
|
|
|
|
|
|
|
|
|
|
|||||||||||||||||||||||||||
| Total distributions |
(2.43 | ) | (0.45 | ) | (0.81 | ) | (1.67 | ) | (1.03 | ) | ||||||||||||||||||||||||||
|
|
|
|
|
|
|
|
|
|
|
|||||||||||||||||||||||||||
| Net asset value, end of period |
$ | 39.90 | $ | 37.67 | $ | 27.17 | $ | 21.23 | $ | 22.45 | ||||||||||||||||||||||||||
|
|
|
|
|
|
|
|
|
|
|
|||||||||||||||||||||||||||
| Total returnC |
12.46 | % | 40.30 | % | 31.79 | % | 2.20 | % | 28.38 | % | ||||||||||||||||||||||||||
|
|
|
|
|
|
|
|
|
|
|
|||||||||||||||||||||||||||
| Ratios and supplemental data: |
| |||||||||||||||||||||||||||||||||||
| Net assets, end of period |
$ | 611,720,453 | $ | 476,150,642 | $ | 278,175,115 | $ | 74,603,963 | $ | 60,933,913 | ||||||||||||||||||||||||||
| Ratios to average net assets: |
||||||||||||||||||||||||||||||||||||
| Expenses, before reimbursements and/or recoupments |
0.90 | % | 0.91 | % | 0.96 | % | 1.04 | % | 1.07 | % | ||||||||||||||||||||||||||
| Expenses, net of reimbursements and/or recoupmentsD |
0.89 | % | 0.89 | % | 0.89 | % | 0.94 | %E | 0.99 | % | ||||||||||||||||||||||||||
| Net investment (loss), before expense reimbursements and/or recoupments |
(0.54 | )% | (0.52 | )% | (0.52 | )% | (0.60 | )% | (0.36 | )% | ||||||||||||||||||||||||||
| Net investment (loss), net of reimbursements and/or recoupments |
(0.53 | )% | (0.50 | )% | (0.45 | )% | (0.50 | )% | (0.28 | )% | ||||||||||||||||||||||||||
| Portfolio turnover rate |
28 | % | 22 | % | 15 | % | 38 | % | 24 | % | ||||||||||||||||||||||||||
| A | Prior to February 28, 2020, the R5 Class was known as Institutional Class. |
| B | Per share amounts have been calculated using the average shares method. |
| C | Based on net asset value, which does not reflect the sales charge, redemption fee, or contingent deferred sales charge, if applicable. May include adjustments in accordance with U.S. GAAP and as such, the net asset value for reporting purposes and the returns based upon those net asset values may differ from the net asset value and returns for shareholder transactions. |
| D | Expense ratios may exceed stated expense caps in Note 2 due to security lending expenses, which are not reimbursable under the agreement with the Manager. |
| E | Expense ratios may exceed stated expense caps in Note 2 due to the change in the contractual expense caps on July 1, 2018. |
See accompanying notes
46
American Beacon Stephens Mid-Cap Growth FundSM
Financial Highlights
(For a share outstanding throughout the period)
| Y Class | ||||||||||||||||||||||||||||||||||||
| Year Ended December 31, | ||||||||||||||||||||||||||||||||||||
| 2021 | 2020 | 2019 | 2018 | 2017 | ||||||||||||||||||||||||||||||||
|
|
|
|||||||||||||||||||||||||||||||||||
| Net asset value, beginning of period |
$ | 37.34 | $ | 26.95 | $ | 21.09 | $ | 22.34 | $ | 18.22 | ||||||||||||||||||||||||||
|
|
|
|
|
|
|
|
|
|
|
|||||||||||||||||||||||||||
| Income (loss) from investment operations: |
||||||||||||||||||||||||||||||||||||
| Net investment income (loss) |
(0.20 | ) | (0.04 | ) | (0.14 | )A | (0.15 | )A | 0.12 | |||||||||||||||||||||||||||
| Net gains on investments (both realized and unrealized) |
4.80 | 10.88 | 6.81 | 0.57 | 5.03 | |||||||||||||||||||||||||||||||
|
|
|
|
|
|
|
|
|
|
|
|||||||||||||||||||||||||||
| Total income (loss) from investment operations |
4.60 | 10.84 | 6.67 | 0.42 | 5.15 | |||||||||||||||||||||||||||||||
|
|
|
|
|
|
|
|
|
|
|
|||||||||||||||||||||||||||
| Less distributions: |
||||||||||||||||||||||||||||||||||||
| Dividends from net investment income |
- | - | - | - | - | |||||||||||||||||||||||||||||||
| Distributions from net realized gains |
(2.43 | ) | (0.45 | ) | (0.81 | ) | (1.67 | ) | (1.03 | ) | ||||||||||||||||||||||||||
|
|
|
|
|
|
|
|
|
|
|
|||||||||||||||||||||||||||
| Total distributions |
(2.43 | ) | (0.45 | ) | (0.81 | ) | (1.67 | ) | (1.03 | ) | ||||||||||||||||||||||||||
|
|
|
|
|
|
|
|
|
|
|
|||||||||||||||||||||||||||
| Net asset value, end of period |
$ | 39.51 | $ | 37.34 | $ | 26.95 | $ | 21.09 | $ | 22.34 | ||||||||||||||||||||||||||
|
|
|
|
|
|
|
|
|
|
|
|||||||||||||||||||||||||||
| Total returnB |
12.41 | % | 40.22 | % | 31.62 | % | 2.08 | % | 28.27 | % | ||||||||||||||||||||||||||
|
|
|
|
|
|
|
|
|
|
|
|||||||||||||||||||||||||||
| Ratios and supplemental data: |
| |||||||||||||||||||||||||||||||||||
| Net assets, end of period |
$ | 82,970,930 | $ | 69,132,838 | $ | 30,544,300 | $ | 10,252,661 | $ | 5,639,207 | ||||||||||||||||||||||||||
| Ratios to average net assets: |
||||||||||||||||||||||||||||||||||||
| Expenses, before reimbursements and/or recoupments |
0.97 | % | 1.00 | % | 1.01 | % | 1.08 | % | 1.11 | % | ||||||||||||||||||||||||||
| Expenses, net of reimbursements and/or recoupmentsC |
0.95 | % | 0.96 | % | 0.99 | % | 1.03 | %D | 1.09 | % | ||||||||||||||||||||||||||
| Net investment (loss), before expense reimbursements and/or recoupments |
(0.64 | )% | (0.61 | )% | (0.57 | )% | (0.64 | )% | (0.42 | )% | ||||||||||||||||||||||||||
| Net investment (loss), net of reimbursements and/or recoupments |
(0.62 | )% | (0.57 | )% | (0.55 | )% | (0.59 | )% | (0.40 | )% | ||||||||||||||||||||||||||
| Portfolio turnover rate |
28 | % | 22 | % | 15 | % | 38 | % | 24 | % | ||||||||||||||||||||||||||
| A | Per share amounts have been calculated using the average shares method. |
| B | Based on net asset value, which does not reflect the sales charge, redemption fee, or contingent deferred sales charge, if applicable. May include adjustments in accordance with U.S. GAAP and as such, the net asset value for reporting purposes and the returns based upon those net asset values may differ from the net asset value and returns for shareholder transactions. |
| C | Expense ratios may exceed stated expense caps in Note 2 due to security lending expenses, which are not reimbursable under the agreement with the Manager. |
| D | Expense ratios may exceed stated expense caps in Note 2 due to the change in the contractual expense caps on July 1, 2018. |
See accompanying notes
47
American Beacon Stephens Mid-Cap Growth FundSM
Financial Highlights
(For a share outstanding throughout the period)
| Investor Class | ||||||||||||||||||||||||||||||||||||
| Year Ended December 31, | ||||||||||||||||||||||||||||||||||||
| 2021 | 2020 | 2019 | 2018 | 2017 | ||||||||||||||||||||||||||||||||
|
|
|
|||||||||||||||||||||||||||||||||||
| Net asset value, beginning of period |
$ | 31.09 | $ | 22.56 | $ | 17.80 | $ | 19.15 | $ | 15.77 | ||||||||||||||||||||||||||
|
|
|
|
|
|
|
|
|
|
|
|||||||||||||||||||||||||||
| Income (loss) from investment operations: |
||||||||||||||||||||||||||||||||||||
| Net investment (loss) |
(0.41 | ) | (0.61 | ) | (0.55 | ) | (0.12 | ) | (0.21 | ) | ||||||||||||||||||||||||||
| Net gains on investments (both realized and unrealized) |
4.17 | 9.59 | 6.12 | 0.44 | 4.62 | |||||||||||||||||||||||||||||||
|
|
|
|
|
|
|
|
|
|
|
|||||||||||||||||||||||||||
| Total income (loss) from investment operations |
3.76 | 8.98 | 5.57 | 0.32 | 4.41 | |||||||||||||||||||||||||||||||
|
|
|
|
|
|
|
|
|
|
|
|||||||||||||||||||||||||||
| Less distributions: |
||||||||||||||||||||||||||||||||||||
| Dividends from net investment income |
- | - | - | - | - | |||||||||||||||||||||||||||||||
| Distributions from net realized gains |
(2.43 | ) | (0.45 | ) | (0.81 | ) | (1.67 | ) | (1.03 | ) | ||||||||||||||||||||||||||
|
|
|
|
|
|
|
|
|
|
|
|||||||||||||||||||||||||||
| Total distributions |
(2.43 | ) | (0.45 | ) | (0.81 | ) | (1.67 | ) | (1.03 | ) | ||||||||||||||||||||||||||
|
|
|
|
|
|
|
|
|
|
|
|||||||||||||||||||||||||||
| Net asset value, end of period |
$ | 32.42 | $ | 31.09 | $ | 22.56 | $ | 17.80 | $ | 19.15 | ||||||||||||||||||||||||||
|
|
|
|
|
|
|
|
|
|
|
|||||||||||||||||||||||||||
| Total returnA |
12.20 | % | 39.80 | % | 31.28 | % | 1.91 | % | 27.97 | % | ||||||||||||||||||||||||||
|
|
|
|
|
|
|
|
|
|
|
|||||||||||||||||||||||||||
| Ratios and supplemental data: |
||||||||||||||||||||||||||||||||||||
| Net assets, end of period |
$ | 16,964,278 | $ | 17,203,402 | $ | 14,802,058 | $ | 14,330,547 | $ | 14,749,984 | ||||||||||||||||||||||||||
| Ratios to average net assets: |
||||||||||||||||||||||||||||||||||||
| Expenses, before reimbursements and/or recoupments |
1.14 | % | 1.23 | % | 1.28 | % | 1.28 | % | 1.29 | % | ||||||||||||||||||||||||||
| Expenses, net of reimbursements and/or recoupmentsB |
1.14 | % | 1.23 | % | 1.25 | % | 1.25 | %C | 1.29 | % | ||||||||||||||||||||||||||
| Net investment (loss), before expense reimbursements and/or recoupments |
(0.79 | )% | (0.85 | )% | (0.84 | )% | (0.86 | )% | (0.58 | )% | ||||||||||||||||||||||||||
| Net investment (loss), net of reimbursements and/or recoupments |
(0.79 | )% | (0.85 | )% | (0.81 | )% | (0.83 | )% | (0.58 | )% | ||||||||||||||||||||||||||
| Portfolio turnover rate |
28 | % | 22 | % | 15 | % | 38 | % | 24 | % | ||||||||||||||||||||||||||
| A | Based on net asset value, which does not reflect the sales charge, redemption fee, or contingent deferred sales charge, if applicable. May include adjustments in accordance with U.S. GAAP and as such, the net asset value for reporting purposes and the returns based upon those net asset values may differ from the net asset value and returns for shareholder transactions. |
| B | Expense ratios may exceed stated expense caps in Note 2 due to security lending expenses, which are not reimbursable under the agreement with the Manager. |
| C | Expense ratios may exceed stated expense caps in Note 2 due to the change in the contractual expense caps on July 1, 2018. |
See accompanying notes
48
American Beacon Stephens Mid-Cap Growth FundSM
Financial Highlights
(For a share outstanding throughout the period)
| A Class | ||||||||||||||||||||||||||||||||||||
| Year Ended December 31, | ||||||||||||||||||||||||||||||||||||
| 2021 | 2020 | 2019 | 2018 | 2017 | ||||||||||||||||||||||||||||||||
|
|
|
|||||||||||||||||||||||||||||||||||
| Net asset value, beginning of period |
$ | 30.92 | $ | 22.43 | $ | 17.71 | $ | 19.08 | $ | 15.72 | ||||||||||||||||||||||||||
|
|
|
|
|
|
|
|
|
|
|
|||||||||||||||||||||||||||
| Income (loss) from investment operations: |
||||||||||||||||||||||||||||||||||||
| Net investment (loss) |
(0.80 | ) | (0.49 | ) | (1.94 | ) | (0.24 | ) | (0.28 | ) | ||||||||||||||||||||||||||
| Net gains on investments (both realized and unrealized) |
4.53 | 9.43 | 7.47 | 0.54 | 4.67 | |||||||||||||||||||||||||||||||
|
|
|
|
|
|
|
|
|
|
|
|||||||||||||||||||||||||||
| Total income (loss) from investment operations |
3.73 | 8.94 | 5.53 | 0.30 | 4.39 | |||||||||||||||||||||||||||||||
|
|
|
|
|
|
|
|
|
|
|
|||||||||||||||||||||||||||
| Less distributions: |
||||||||||||||||||||||||||||||||||||
| Dividends from net investment income |
- | - | - | - | - | |||||||||||||||||||||||||||||||
| Distributions from net realized gains |
(2.43 | ) | (0.45 | ) | (0.81 | ) | (1.67 | ) | (1.03 | ) | ||||||||||||||||||||||||||
|
|
|
|
|
|
|
|
|
|
|
|||||||||||||||||||||||||||
| Total distributions |
(2.43 | ) | (0.45 | ) | (0.81 | ) | (1.67 | ) | (1.03 | ) | ||||||||||||||||||||||||||
|
|
|
|
|
|
|
|
|
|
|
|||||||||||||||||||||||||||
| Net asset value, end of period |
$ | 32.22 | $ | 30.92 | $ | 22.43 | $ | 17.71 | $ | 19.08 | ||||||||||||||||||||||||||
|
|
|
|
|
|
|
|
|
|
|
|||||||||||||||||||||||||||
| Total returnA |
12.17 | % | 39.85 | % | 31.22 | % | 1.81 | % | 27.93 | % | ||||||||||||||||||||||||||
|
|
|
|
|
|
|
|
|
|
|
|||||||||||||||||||||||||||
| Ratios and supplemental data: |
||||||||||||||||||||||||||||||||||||
| Net assets, end of period |
$ | 7,400,729 | $ | 8,166,847 | $ | 6,467,469 | $ | 12,293,695 | $ | 13,854,727 | ||||||||||||||||||||||||||
| Ratios to average net assets: |
||||||||||||||||||||||||||||||||||||
| Expenses, before reimbursements and/or recoupments |
1.14 | % | 1.24 | % | 1.27 | % | 1.33 | % | 1.39 | % | ||||||||||||||||||||||||||
| Expenses, net of reimbursements and/or recoupmentsB |
1.13 | % | 1.23 | % | 1.29 | % | 1.31 | %C | 1.39 | % | ||||||||||||||||||||||||||
| Net investment (loss), before expense reimbursements and/or recoupments |
(0.75 | )% | (0.86 | )% | (0.84 | )% | (0.91 | )% | (0.67 | )% | ||||||||||||||||||||||||||
| Net investment (loss), net of reimbursements and/or recoupments |
(0.74 | )% | (0.85 | )% | (0.86 | )% | (0.89 | )% | (0.67 | )% | ||||||||||||||||||||||||||
| Portfolio turnover rate |
28 | % | 22 | % | 15 | % | 38 | % | 24 | % | ||||||||||||||||||||||||||
| A | Based on net asset value, which does not reflect the sales charge, redemption fee, or contingent deferred sales charge, if applicable. May include adjustments in accordance with U.S. GAAP and as such, the net asset value for reporting purposes and the returns based upon those net asset values may differ from the net asset value and returns for shareholder transactions. |
| B | Expense ratios may exceed stated expense caps in Note 2 due to security lending expenses, which are not reimbursable under the agreement with the Manager. |
| C | Expense ratios may exceed stated expense caps in Note 2 due to the change in the contractual expense caps on July 1, 2018. |
See accompanying notes
49
American Beacon Stephens Mid-Cap Growth FundSM
Financial Highlights
(For a share outstanding throughout the period)
| C Class | ||||||||||||||||||||||||||||||||||||
| Year Ended December 31, | ||||||||||||||||||||||||||||||||||||
| 2021 | 2020 | 2019 | 2018 | 2017 | ||||||||||||||||||||||||||||||||
|
|
|
|||||||||||||||||||||||||||||||||||
| Net asset value, beginning of period |
$ | 28.44 | $ | 20.81 | $ | 16.59 | $ | 18.11 | $ | 15.08 | ||||||||||||||||||||||||||
|
|
|
|
|
|
|
|
|
|
|
|||||||||||||||||||||||||||
| Income (loss) from investment operations: |
||||||||||||||||||||||||||||||||||||
| Net investment (loss) |
(0.63 | ) | (0.94 | ) | (0.25 | ) | (0.33 | )A | (0.11 | ) | ||||||||||||||||||||||||||
| Net gains on investments (both realized and unrealized) |
3.81 | 9.02 | 5.28 | 0.48 | 4.17 | |||||||||||||||||||||||||||||||
|
|
|
|
|
|
|
|
|
|
|
|||||||||||||||||||||||||||
| Total income (loss) from investment operations |
3.18 | 8.08 | 5.03 | 0.15 | 4.06 | |||||||||||||||||||||||||||||||
|
|
|
|
|
|
|
|
|
|
|
|||||||||||||||||||||||||||
| Less distributions: |
||||||||||||||||||||||||||||||||||||
| Dividends from net investment income |
- | - | - | - | - | |||||||||||||||||||||||||||||||
| Distributions from net realized gains |
(2.43 | ) | (0.45 | ) | (0.81 | ) | (1.67 | ) | (1.03 | ) | ||||||||||||||||||||||||||
|
|
|
|
|
|
|
|
|
|
|
|||||||||||||||||||||||||||
| Total distributions |
(2.43 | ) | (0.45 | ) | (0.81 | ) | (1.67 | ) | (1.03 | ) | ||||||||||||||||||||||||||
|
|
|
|
|
|
|
|
|
|
|
|||||||||||||||||||||||||||
| Net asset value, end of period |
$ | 29.19 | $ | 28.44 | $ | 20.81 | $ | 16.59 | $ | 18.11 | ||||||||||||||||||||||||||
|
|
|
|
|
|
|
|
|
|
|
|||||||||||||||||||||||||||
| Total returnB |
11.29 | % | 38.82 | % | 30.31 | % | 1.07 | % | 26.93 | % | ||||||||||||||||||||||||||
|
|
|
|
|
|
|
|
|
|
|
|||||||||||||||||||||||||||
| Ratios and supplemental data: |
||||||||||||||||||||||||||||||||||||
| Net assets, end of period |
$ | 2,977,572 | $ | 3,107,948 | $ | 3,193,238 | $ | 2,414,400 | $ | 1,862,472 | ||||||||||||||||||||||||||
| Ratios to average net assets: |
||||||||||||||||||||||||||||||||||||
| Expenses, before reimbursements and/or recoupments |
1.98 | % | 1.96 | % | 2.00 | % | 2.07 | % | 2.11 | % | ||||||||||||||||||||||||||
| Expenses, net of reimbursements and/or recoupmentsC |
1.94 | % | 1.94 | % | 2.01 | % | 2.06 | %D | 2.11 | % | ||||||||||||||||||||||||||
| Net investment (loss), before expense reimbursements and/or recoupments |
(1.65 | )% | (1.57 | )% | (1.56 | )% | (1.64 | )% | (1.40 | )% | ||||||||||||||||||||||||||
| Net investment (loss), net of reimbursements and/or recoupments |
(1.61 | )% | (1.55 | )% | (1.57 | )% | (1.63 | )% | (1.39 | )% | ||||||||||||||||||||||||||
| Portfolio turnover rate |
28 | % | 22 | % | 15 | % | 38 | % | 24 | % | ||||||||||||||||||||||||||
| A | Per share amounts have been calculated using the average shares method. |
| B | Based on net asset value, which does not reflect the sales charge, redemption fee, or contingent deferred sales charge, if applicable. May include adjustments in accordance with U.S. GAAP and as such, the net asset value for reporting purposes and the returns based upon those net asset values may differ from the net asset value and returns for shareholder transactions. |
| C | Expense ratios may exceed stated expense caps in Note 2 due to security lending expenses, which are not reimbursable under the agreement with the Manager. |
| D | Expense ratios may exceed stated expense caps in Note 2 due to the change in the contractual expense caps on July 1, 2018. |
See accompanying notes
50
American Beacon Stephens Mid-Cap Growth FundSM
Financial Highlights
(For a share outstanding throughout the period)
| R6 Class | ||||||||||||||||||||||||||||
| Year Ended December 31, | December 31, 2018A to December 31, |
|||||||||||||||||||||||||||
| 2021 | 2020 | 2019 | 2018 | |||||||||||||||||||||||||
|
|
|
|||||||||||||||||||||||||||
| Net asset value, beginning of period |
$ | 37.70 | $ | 27.18 | $ | 21.23 | $ | 21.23 | ||||||||||||||||||||
|
|
|
|
|
|
|
|
|
|||||||||||||||||||||
| Income (loss) from investment operations: |
||||||||||||||||||||||||||||
| Net investment income (loss) |
(0.14 | ) | (0.06 | ) | (0.05 | ) | - | |||||||||||||||||||||
| Net gains on investments (both realized and unrealized) |
4.81 | 11.03 | 6.81 | - | ||||||||||||||||||||||||
|
|
|
|
|
|
|
|
|
|||||||||||||||||||||
| Total income from investment operations |
4.67 | 10.97 | 6.76 | - | ||||||||||||||||||||||||
|
|
|
|
|
|
|
|
|
|||||||||||||||||||||
| Less distributions: |
||||||||||||||||||||||||||||
| Dividends from net investment income |
- | - | - | - | ||||||||||||||||||||||||
| Distributions from net realized gains |
(2.43 | ) | (0.45 | ) | (0.81 | ) | - | |||||||||||||||||||||
|
|
|
|
|
|
|
|
|
|||||||||||||||||||||
| Total distributions |
(2.43 | ) | (0.45 | ) | (0.81 | ) | - | |||||||||||||||||||||
|
|
|
|
|
|
|
|
|
|||||||||||||||||||||
| Net asset value, end of period |
$ | 39.94 | $ | 37.70 | $ | 27.18 | $ | 21.23 | ||||||||||||||||||||
|
|
|
|
|
|
|
|
|
|||||||||||||||||||||
| Total returnB |
12.47 | % | 40.36 | % | 31.84 | % | 0.00 | % | ||||||||||||||||||||
|
|
|
|
|
|
|
|
|
|||||||||||||||||||||
| Ratios and supplemental data: |
||||||||||||||||||||||||||||
| Net assets, end of period |
$ | 55,701,734 | $ | 37,373,802 | $ | 17,073,112 | $ | 100,000 | ||||||||||||||||||||
| Ratios to average net assets: |
||||||||||||||||||||||||||||
| Expenses, before reimbursements and/or recoupments |
0.88 | % | 0.90 | % | 0.92 | % | 0.00 | % | ||||||||||||||||||||
| Expenses, net of reimbursements and/or recoupmentsC |
0.87 | % | 0.84 | % | 0.84 | % | 0.00 | % | ||||||||||||||||||||
| Net investment income (loss), before expense reimbursements and/or recoupments |
(0.50 | )% | (0.49 | )% | (0.50 | )% | 0.00 | % | ||||||||||||||||||||
| Net investment income (loss), net of reimbursements and/or recoupments |
(0.49 | )% | (0.43 | )% | (0.42 | )% | 0.00 | % | ||||||||||||||||||||
| Portfolio turnover rate |
28 | % | 22 | % | 15 | % | 38 | %D | ||||||||||||||||||||
| A | Class launched on December 31, 2018 and commenced operations on January 2, 2019. |
| B | Based on net asset value, which does not reflect the sales charge, redemption fee, or contingent deferred sales charge, if applicable. May include adjustments in accordance with U.S. GAAP and as such, the net asset value for reporting purposes and the returns based upon those net asset values may differ from the net asset value and returns for shareholder transactions. |
| C | Expense ratios may exceed stated expense caps in Note 2 due to security lending expenses, which are not reimbursable under the agreement with the Manager. |
| D | Not annualized. |
See accompanying notes
51
American Beacon Stephens Small Cap Growth FundSM
Financial Highlights
(For a share outstanding throughout the period)
| R5 ClassA | ||||||||||||||||||||||||||||||||||||
| Year Ended December 31, | ||||||||||||||||||||||||||||||||||||
| 2021 | 2020 | 2019 | 2018 | 2017 | ||||||||||||||||||||||||||||||||
|
|
|
|||||||||||||||||||||||||||||||||||
| Net asset value, beginning of period |
$ | 19.27 | $ | 15.40 | $ | 13.83 | $ | 19.01 | $ | 16.45 | ||||||||||||||||||||||||||
|
|
|
|
|
|
|
|
|
|
|
|||||||||||||||||||||||||||
| Income (loss) from investment operations: |
||||||||||||||||||||||||||||||||||||
| Net investment (loss) |
(0.17 | )B | (0.31 | )C | (0.26 | ) | (0.33 | )D | (0.23 | ) | ||||||||||||||||||||||||||
| Net gains on investments (both realized and unrealized) |
2.89 | 6.11 | 3.44 | 0.80 | 3.44 | |||||||||||||||||||||||||||||||
|
|
|
|
|
|
|
|
|
|
|
|||||||||||||||||||||||||||
| Total income (loss) from investment operations |
2.72 | 5.80 | 3.18 | 0.47 | 3.21 | |||||||||||||||||||||||||||||||
|
|
|
|
|
|
|
|
|
|
|
|||||||||||||||||||||||||||
| Less distributions: |
||||||||||||||||||||||||||||||||||||
| Dividends from net investment income |
- | - | - | - | - | |||||||||||||||||||||||||||||||
| Distributions from net realized gains |
(3.68 | ) | (1.93 | ) | (1.61 | ) | (5.65 | ) | (0.65 | ) | ||||||||||||||||||||||||||
| Tax return of capital |
- | - | - | - | 0.00 | E | ||||||||||||||||||||||||||||||
|
|
|
|
|
|
|
|
|
|
|
|||||||||||||||||||||||||||
| Total distributions |
(3.68 | ) | (1.93 | ) | (1.61 | ) | (5.65 | ) | (0.65 | ) | ||||||||||||||||||||||||||
|
|
|
|
|
|
|
|
|
|
|
|||||||||||||||||||||||||||
| Net asset value, end of period |
$ | 18.31 | $ | 19.27 | $ | 15.40 | $ | 13.83 | $ | 19.01 | ||||||||||||||||||||||||||
|
|
|
|
|
|
|
|
|
|
|
|||||||||||||||||||||||||||
| Total returnF |
14.34 | % | 37.56 | % | 22.92 | % | 3.26 | % | 19.52 | % | ||||||||||||||||||||||||||
|
|
|
|
|
|
|
|
|
|
|
|||||||||||||||||||||||||||
| Ratios and supplemental data: |
||||||||||||||||||||||||||||||||||||
| Net assets, end of period |
$ | 280,613,603 | $ | 261,976,294 | $ | 244,394,530 | $ | 246,845,478 | $ | 433,520,624 | ||||||||||||||||||||||||||
| Ratios to average net assets: |
||||||||||||||||||||||||||||||||||||
| Expenses, before reimbursements and/or recoupments |
1.04 | % | 1.05 | % | 1.08 | % | 1.09 | % | 1.08 | % | ||||||||||||||||||||||||||
| Expenses, net of reimbursements and/or recoupmentsG |
0.99 | % | 0.99 | % | 1.08 | %H | 1.09 | % | 1.08 | % | ||||||||||||||||||||||||||
| Net investment (loss), before expense reimbursements and/or recoupments |
(0.86 | )% | (0.82 | )% | (0.83 | )% | (0.76 | )% | (0.79 | )% | ||||||||||||||||||||||||||
| Net investment (loss), net of reimbursements and/or recoupments |
(0.81 | )% | (0.76 | )% | (0.83 | )% | (0.76 | )% | (0.79 | )% | ||||||||||||||||||||||||||
| Portfolio turnover rate |
28 | % | 18 | % | 20 | % | 16 | % | 22 | % | ||||||||||||||||||||||||||
| A | Prior to February 28, 2020, the R5 Class was known as Institutional Class. |
| B | Per share amounts have been calculated using the average shares method. |
| C | Net investment income includes significant dividend payment from Wingstop, Inc. amounting to $0.0083. |
| D | Includes non-recurring dividends. Without these dividends, net investment loss per share would have been $(0.36). |
| E | Tax return of capital is calculated based on outstanding shares at the time of distribution. Amounts are less than $0.01 per share. |
| F | Based on net asset value, which does not reflect the sales charge, redemption fee, or contingent deferred sales charge, if applicable. May include adjustments in accordance with U.S. GAAP and as such, the net asset value for reporting purposes and the returns based upon those net asset values may differ from the net asset value and returns for shareholder transactions. |
| G | Expense ratios may exceed stated expense caps in Note 2 due to security lending expenses, which are not reimbursable under the agreement with the Manager. |
| H | Expense ratios may exceed the expense cap in effect at the time as a result of the change in the contractual expense caps on August 23, 2019. |
See accompanying notes
52
American Beacon Stephens Small Cap Growth FundSM
Financial Highlights
(For a share outstanding throughout the period)
| Y Class | ||||||||||||||||||||||||||||||||||||
| Year Ended December 31, | ||||||||||||||||||||||||||||||||||||
| 2021 | 2020 | 2019 | 2018 | 2017 | ||||||||||||||||||||||||||||||||
|
|
|
|||||||||||||||||||||||||||||||||||
| Net asset value, beginning of period |
$ | 19.05 | $ | 15.24 | $ | 13.72 | $ | 18.91 | $ | 16.38 | ||||||||||||||||||||||||||
|
|
|
|
|
|
|
|
|
|
|
|||||||||||||||||||||||||||
| Income (loss) from investment operations: |
||||||||||||||||||||||||||||||||||||
| Net investment (loss) |
(0.13 | ) | (0.56 | )A | (0.14 | )B | (0.49 | )C | (0.28 | ) | ||||||||||||||||||||||||||
| Net gains on investments (both realized and unrealized) |
2.80 | 6.30 | 3.27 | 0.95 | 3.46 | |||||||||||||||||||||||||||||||
|
|
|
|
|
|
|
|
|
|
|
|||||||||||||||||||||||||||
| Total income (loss) from investment operations |
2.67 | 5.74 | 3.13 | 0.46 | 3.18 | |||||||||||||||||||||||||||||||
|
|
|
|
|
|
|
|
|
|
|
|||||||||||||||||||||||||||
| Less distributions: |
||||||||||||||||||||||||||||||||||||
| Dividends from net investment income |
- | - | - | - | - | |||||||||||||||||||||||||||||||
| Distributions from net realized gains |
(3.68 | ) | (1.93 | ) | (1.61 | ) | (5.65 | ) | (0.65 | ) | ||||||||||||||||||||||||||
| Tax return of capital |
- | - | - | - | 0.00 | D | ||||||||||||||||||||||||||||||
|
|
|
|
|
|
|
|
|
|
|
|||||||||||||||||||||||||||
| Total distributions |
(3.68 | ) | (1.93 | ) | (1.61 | ) | (5.65 | ) | (0.65 | ) | ||||||||||||||||||||||||||
|
|
|
|
|
|
|
|
|
|
|
|||||||||||||||||||||||||||
| Net asset value, end of period |
$ | 18.04 | $ | 19.05 | $ | 15.24 | $ | 13.72 | $ | 18.91 | ||||||||||||||||||||||||||
|
|
|
|
|
|
|
|
|
|
|
|||||||||||||||||||||||||||
| Total returnE |
14.23 | % | 37.56 | % | 22.74 | % | 3.25 | % | 19.42 | % | ||||||||||||||||||||||||||
|
|
|
|
|
|
|
|
|
|
|
|||||||||||||||||||||||||||
| Ratios and supplemental data: |
||||||||||||||||||||||||||||||||||||
| Net assets, end of period |
$ | 55,841,696 | $ | 58,341,053 | $ | 59,481,096 | $ | 46,998,050 | $ | 82,072,563 | ||||||||||||||||||||||||||
| Ratios to average net assets: |
||||||||||||||||||||||||||||||||||||
| Expenses, before reimbursements and/or recoupments |
1.10 | % | 1.12 | % | 1.14 | % | 1.15 | % | 1.14 | % | ||||||||||||||||||||||||||
| Expenses, net of reimbursements and/or recoupmentsF |
1.05 | % | 1.06 | % | 1.14 | %G | 1.15 | % | 1.14 | % | ||||||||||||||||||||||||||
| Net investment (loss), before expense reimbursements |
(0.88 | )% | (0.89 | )% | (0.89 | )% | (0.83 | )% | (0.85 | )% | ||||||||||||||||||||||||||
| Net investment (loss), net of reimbursements |
(0.83 | )% | (0.83 | )% | (0.89 | )% | (0.83 | )% | (0.85 | )% | ||||||||||||||||||||||||||
| Portfolio turnover rate |
28 | % | 18 | % | 20 | % | 16 | % | 22 | % | ||||||||||||||||||||||||||
| A | Net investment income includes significant dividend payment from Wingstop, Inc. amounting to $0.0081. |
| B | Per share amounts have been calculated using the average shares method. |
| C | Includes non-recurring dividends. Without these dividends, net investment loss per share would have been $(0.52). |
| D | Tax return of capital is calculated based on outstanding shares at the time of distribution. Amounts are less than $0.01 per share. |
| E | Based on net asset value, which does not reflect the sales charge, redemption fee, or contingent deferred sales charge, if applicable. May include adjustments in accordance with U.S. GAAP and as such, the net asset value for reporting purposes and the returns based upon those net asset values may differ from the net asset value and returns for shareholder transactions. |
| F | Expense ratios may exceed stated expense caps in Note 2 due to security lending expenses, which are not reimbursable under the agreement with the Manager. |
| G | Expense ratios may exceed the expense cap in effect at the time as a result of the change in the contractual expense caps on August 23, 2019. |
See accompanying notes
53
American Beacon Stephens Small Cap Growth FundSM
Financial Highlights
(For a share outstanding throughout the period)
| Investor Class | ||||||||||||||||||||||||||||||||||||
| Year Ended December 31, | ||||||||||||||||||||||||||||||||||||
| 2021 | 2020 | 2019 | 2018 | 2017 | ||||||||||||||||||||||||||||||||
|
|
|
|||||||||||||||||||||||||||||||||||
| Net asset value, beginning of period |
$ | 16.88 | $ | 13.70 | $ | 12.49 | $ | 17.77 | $ | 15.45 | ||||||||||||||||||||||||||
|
|
|
|
|
|
|
|
|
|
|
|||||||||||||||||||||||||||
| Income (loss) from investment operations: |
||||||||||||||||||||||||||||||||||||
| Net investment (loss) |
(0.04 | ) | (0.14 | )A | (0.17 | )B | (0.21 | )BC | (0.37 | ) | ||||||||||||||||||||||||||
| Net gains on investments (both realized and unrealized) |
2.35 | 5.25 | 2.99 | 0.58 | 3.34 | |||||||||||||||||||||||||||||||
|
|
|
|
|
|
|
|
|
|
|
|||||||||||||||||||||||||||
| Total income (loss) from investment operations |
2.31 | 5.11 | 2.82 | 0.37 | 2.97 | |||||||||||||||||||||||||||||||
|
|
|
|
|
|
|
|
|
|
|
|||||||||||||||||||||||||||
| Less distributions: |
||||||||||||||||||||||||||||||||||||
| Dividends from net investment income |
- | - | - | - | - | |||||||||||||||||||||||||||||||
| Distributions from net realized gains |
(3.68 | ) | (1.93 | ) | (1.61 | ) | (5.65 | ) | (0.65 | ) | ||||||||||||||||||||||||||
| Tax return of capital |
- | - | - | - | 0.00 | D | ||||||||||||||||||||||||||||||
|
|
|
|
|
|
|
|
|
|
|
|||||||||||||||||||||||||||
| Total distributions |
(3.68 | ) | (1.93 | ) | (1.61 | ) | (5.65 | ) | (0.65 | ) | ||||||||||||||||||||||||||
|
|
|
|
|
|
|
|
|
|
|
|||||||||||||||||||||||||||
| Net asset value, end of period |
$ | 15.51 | $ | 16.88 | $ | 13.70 | $ | 12.49 | $ | 17.77 | ||||||||||||||||||||||||||
|
|
|
|
|
|
|
|
|
|
|
|||||||||||||||||||||||||||
| Total returnE |
13.93 | % | 37.18 | % | 22.49 | % | 2.93 | % | 19.23 | % | ||||||||||||||||||||||||||
|
|
|
|
|
|
|
|
|
|
|
|||||||||||||||||||||||||||
| Ratios and supplemental data: |
||||||||||||||||||||||||||||||||||||
| Net assets, end of period |
$ | 78,747,464 | $ | 78,610,201 | $ | 63,799,443 | $ | 52,359,859 | $ | 51,839,469 | ||||||||||||||||||||||||||
| Ratios to average net assets: |
||||||||||||||||||||||||||||||||||||
| Expenses, before reimbursements and/or recoupments |
1.35 | % | 1.39 | % | 1.38 | % | 1.38 | % | 1.29 | % | ||||||||||||||||||||||||||
| Expenses, net of reimbursements and/or recoupmentsF |
1.30 | % | 1.31 | % | 1.38 | %G | 1.38 | % | 1.31 | % | ||||||||||||||||||||||||||
| Net investment (loss), before expense reimbursements and/or recoupments |
(1.13 | )% | (1.15 | )% | (1.13 | )% | (1.05 | )% | (1.01 | )% | ||||||||||||||||||||||||||
| Net investment (loss), net of reimbursements and/or recoupments |
(1.08 | )% | (1.07 | )% | (1.13 | )% | (1.05 | )% | (1.03 | )% | ||||||||||||||||||||||||||
| Portfolio turnover rate |
28 | % | 18 | % | 20 | % | 16 | % | 22 | % | ||||||||||||||||||||||||||
| A | Net investment income includes significant dividend payment from Wingstop, Inc. amounting to $0.0074. |
| B | Per share amounts have been calculated using the average shares method. |
| C | Includes non-recurring dividends. Without these dividends, net investment loss per share would have been $(0.24). |
| D | Tax return of capital is calculated based on outstanding shares at the time of distribution. Amounts are less than $0.01 per share. |
| E | Based on net asset value, which does not reflect the sales charge, redemption fee, or contingent deferred sales charge, if applicable. May include adjustments in accordance with U.S. GAAP and as such, the net asset value for reporting purposes and the returns based upon those net asset values may differ from the net asset value and returns for shareholder transactions. |
| F | Expense ratios may exceed stated expense caps in Note 2 due to security lending expenses, which are not reimbursable under the agreement with the Manager. |
| G | Expense ratios may exceed the expense cap in effect at the time as a result of the change in the contractual expense caps on August 23, 2019. |
See accompanying notes
54
American Beacon Stephens Small Cap Growth FundSM
Financial Highlights
(For a share outstanding throughout the period)
| A Class | ||||||||||||||||||||||||||||||||||||
| Year Ended December 31, | ||||||||||||||||||||||||||||||||||||
| 2021 | 2020 | 2019 | 2018 | 2017 | ||||||||||||||||||||||||||||||||
|
|
|
|||||||||||||||||||||||||||||||||||
| Net asset value, beginning of period |
$ | 16.60 | $ | 13.49 | $ | 12.32 | $ | 17.59 | $ | 15.32 | ||||||||||||||||||||||||||
|
|
|
|
|
|
|
|
|
|
|
|||||||||||||||||||||||||||
| Income (loss) from investment operations: |
||||||||||||||||||||||||||||||||||||
| Net investment (loss) |
(0.19 | )A | (0.15 | )AB | (0.39 | ) | (0.22 | )AC | (0.62 | ) | ||||||||||||||||||||||||||
| Net gains on investments (both realized and unrealized) |
2.47 | 5.19 | 3.17 | 0.60 | 3.54 | |||||||||||||||||||||||||||||||
|
|
|
|
|
|
|
|
|
|
|
|||||||||||||||||||||||||||
| Total income (loss) from investment operations |
2.28 | 5.04 | 2.78 | 0.38 | 2.92 | |||||||||||||||||||||||||||||||
|
|
|
|
|
|
|
|
|
|
|
|||||||||||||||||||||||||||
| Less distributions: |
||||||||||||||||||||||||||||||||||||
| Dividends from net investment income |
- | - | - | - | - | |||||||||||||||||||||||||||||||
| Distributions from net realized gains |
(3.68 | ) | (1.93 | ) | (1.61 | ) | (5.65 | ) | (0.65 | ) | ||||||||||||||||||||||||||
| Tax return of capital |
- | - | - | - | 0.00 | D | ||||||||||||||||||||||||||||||
|
|
|
|
|
|
|
|
|
|
|
|||||||||||||||||||||||||||
| Total distributions |
(3.68 | ) | (1.93 | ) | (1.61 | ) | (5.65 | ) | (0.65 | ) | ||||||||||||||||||||||||||
|
|
|
|
|
|
|
|
|
|
|
|||||||||||||||||||||||||||
| Net asset value, end of period |
$ | 15.20 | $ | 16.60 | $ | 13.49 | $ | 12.32 | $ | 17.59 | ||||||||||||||||||||||||||
|
|
|
|
|
|
|
|
|
|
|
|||||||||||||||||||||||||||
| Total returnE |
13.99 | % | 37.25 | % | 22.48 | % | 3.03 | % | 19.06 | % | ||||||||||||||||||||||||||
|
|
|
|
|
|
|
|
|
|
|
|||||||||||||||||||||||||||
| Ratios and supplemental data: |
||||||||||||||||||||||||||||||||||||
| Net assets, end of period |
$ | 7,203,359 | $ | 6,575,393 | $ | 4,899,301 | $ | 5,293,719 | $ | 5,553,261 | ||||||||||||||||||||||||||
| Ratios to average net assets: |
||||||||||||||||||||||||||||||||||||
| Expenses, before reimbursements and/or recoupments |
1.38 | % | 1.35 | % | 1.37 | % | 1.38 | % | 1.40 | % | ||||||||||||||||||||||||||
| Expenses, net of reimbursements and/or recoupmentsF |
1.28 | % | 1.28 | % | 1.37 | %G | 1.38 | % | 1.40 | % | ||||||||||||||||||||||||||
| Net investment (loss), before expense reimbursements and/or recoupments |
(1.18 | )% | (1.11 | )% | (1.12 | )% | (1.09 | )% | (1.11 | )% | ||||||||||||||||||||||||||
| Net investment (loss), net of reimbursements and/or recoupments |
(1.08 | )% | (1.04 | )% | (1.12 | )% | (1.09 | )% | (1.11 | )% | ||||||||||||||||||||||||||
| Portfolio turnover rate |
28 | % | 18 | % | 20 | % | 16 | % | 22 | % | ||||||||||||||||||||||||||
| A | Per share amounts have been calculated using the average shares method. |
| B | Net investment income includes significant dividend payment from Wingstop, Inc. amounting to $0.0078. |
| C | Includes non-recurring dividends. Without these dividends, net investment loss per share would have been $(0.25). |
| D | Tax return of capital is calculated based on outstanding shares at the time of distribution. Amounts are less than $0.01 per share. |
| E | Based on net asset value, which does not reflect the sales charge, redemption fee, or contingent deferred sales charge, if applicable. May include adjustments in accordance with U.S. GAAP and as such, the net asset value for reporting purposes and the returns based upon those net asset values may differ from the net asset value and returns for shareholder transactions. |
| F | Expense ratios may exceed stated expense caps in Note 2 due to security lending expenses, which are not reimbursable under the agreement with the Manager. |
| G | Expense ratios may exceed the expense cap in effect at the time as a result of the change in the contractual expense caps on August 23, 2019. |
See accompanying notes
55
American Beacon Stephens Small Cap Growth FundSM
Financial Highlights
(For a share outstanding throughout the period)
| C Class | ||||||||||||||||||||||||||||||||||||
| Year Ended December 31, | ||||||||||||||||||||||||||||||||||||
| 2021 | 2020 | 2019 | 2018 | 2017 | ||||||||||||||||||||||||||||||||
|
|
|
|||||||||||||||||||||||||||||||||||
| Net asset value, beginning of period |
$ | 14.63 | $ | 12.15 | $ | 11.31 | $ | 16.74 | $ | 14.71 | ||||||||||||||||||||||||||
|
|
|
|
|
|
|
|
|
|
|
|||||||||||||||||||||||||||
| Income (loss) from investment operations: |
||||||||||||||||||||||||||||||||||||
| Net investment income (loss) |
(0.53 | ) | (1.69 | )A | (1.19 | ) | (0.35 | )BC | (1.25 | ) | ||||||||||||||||||||||||||
| Net gains on investments (both realized and unrealized) |
2.49 | 6.10 | 3.64 | 0.57 | 3.93 | |||||||||||||||||||||||||||||||
|
|
|
|
|
|
|
|
|
|
|
|||||||||||||||||||||||||||
| Total income (loss) from investment operations |
1.96 | 4.41 | 2.45 | 0.22 | 2.68 | |||||||||||||||||||||||||||||||
|
|
|
|
|
|
|
|
|
|
|
|||||||||||||||||||||||||||
| Less distributions: |
||||||||||||||||||||||||||||||||||||
| Dividends from net investment income |
- | - | - | - | - | |||||||||||||||||||||||||||||||
| Distributions from net realized gains |
(3.68 | ) | (1.93 | ) | (1.61 | ) | (5.65 | ) | (0.65 | ) | ||||||||||||||||||||||||||
|
|
|
|
|
|
|
|
|
|
|
|||||||||||||||||||||||||||
| Total distributions |
(3.68 | ) | (1.93 | ) | (1.61 | ) | (5.65 | ) | (0.65 | ) | ||||||||||||||||||||||||||
|
|
|
|
|
|
|
|
|
|
|
|||||||||||||||||||||||||||
| Net asset value, end of period |
$ | 12.91 | $ | 14.63 | $ | 12.15 | $ | 11.31 | $ | 16.74 | ||||||||||||||||||||||||||
|
|
|
|
|
|
|
|
|
|
|
|||||||||||||||||||||||||||
| Total returnD |
12.91 | % | 36.16 | % | 21.56 | % | 2.19 | % | 18.22 | % | ||||||||||||||||||||||||||
|
|
|
|
|
|
|
|
|
|
|
|||||||||||||||||||||||||||
| Ratios and supplemental data: |
||||||||||||||||||||||||||||||||||||
| Net assets, end of period |
$ | 566,124 | $ | 675,112 | $ | 808,661 | $ | 1,076,006 | $ | 977,321 | ||||||||||||||||||||||||||
| Ratios to average net assets: |
||||||||||||||||||||||||||||||||||||
| Expenses, before reimbursements and/or recoupments |
2.24 | % | 2.15 | % | 2.17 | % | 2.15 | % | 2.14 | % | ||||||||||||||||||||||||||
| Expenses, net of reimbursements and/or recoupmentsE |
2.06 | % | 2.06 | % | 2.14 | %F | 2.15 | % | 2.14 | % | ||||||||||||||||||||||||||
| Net investment income (loss), before expense reimbursements and/or recoupments |
(2.04 | )% | (1.93 | )% | (1.92 | )% | (1.84 | )% | (1.86 | )% | ||||||||||||||||||||||||||
| Net investment income (loss), net of reimbursements and/or recoupments |
(1.86 | )% | (1.84 | )% | (1.89 | )% | (1.84 | )% | (1.86 | )% | ||||||||||||||||||||||||||
| Portfolio turnover rate |
28 | % | 18 | % | 20 | % | 16 | % | 22 | % | ||||||||||||||||||||||||||
| A | Net investment income includes significant dividend payment from Wingstop, Inc. amounting to $0.0063. |
| B | Per share amounts have been calculated using the average shares method. |
| C | Includes non-recurring dividends. Without these dividends, net investment loss per share would have been $(0.38). |
| D | Based on net asset value, which does not reflect the sales charge, redemption fee, or contingent deferred sales charge, if applicable. May include adjustments in accordance with U.S. GAAP and as such, the net asset value for reporting purposes and the returns based upon those net asset values may differ from the net asset value and returns for shareholder transactions. |
| E | Expense ratios may exceed stated expense caps in Note 2 due to security lending expenses, which are not reimbursable under the agreement with the Manager. |
| F | Expense ratios may exceed the expense cap in effect at the time as a result of the change in the contractual expense caps on August 23, 2019. |
See accompanying notes
56
American Beacon Stephens Small Cap Growth FundSM
Financial Highlights
(For a share outstanding throughout the period)
| R6 Class | ||||||||||||||||||||
| Year Ended December 31, | Year EndedA December 31, |
|||||||||||||||||||
| 2021 | 2020 | 2019 | ||||||||||||||||||
|
|
|
|||||||||||||||||||
| Net asset value, beginning of period |
$ | 19.30 | $ | 15.40 | $ | 16.91 | ||||||||||||||
|
|
|
|
|
|
|
|||||||||||||||
| Income (loss) from investment operations: |
||||||||||||||||||||
| Net investment (loss) |
(0.11 | ) | (0.08 | )B | (0.01 | ) | ||||||||||||||
| Net gains on investments (both realized and unrealized) |
2.83 | 5.91 | 0.11 | |||||||||||||||||
|
|
|
|
|
|
|
|||||||||||||||
| Total income from investment operations |
2.72 | 5.83 | 0.10 | |||||||||||||||||
|
|
|
|
|
|
|
|||||||||||||||
| Less distributions: |
||||||||||||||||||||
| Dividends from net investment income |
- | - | - | |||||||||||||||||
| Distributions from net realized gains |
(3.68 | ) | (1.93 | ) | (1.61 | ) | ||||||||||||||
|
|
|
|
|
|
|
|||||||||||||||
| Total distributions |
(3.68 | ) | (1.93 | ) | (1.61 | ) | ||||||||||||||
|
|
|
|
|
|
|
|||||||||||||||
| Net asset value, end of period |
$ | 18.34 | $ | 19.30 | $ | 15.40 | ||||||||||||||
|
|
|
|
|
|
|
|||||||||||||||
| Total returnC |
14.30 | % | 37.76 | % | 0.53 | %D | ||||||||||||||
|
|
|
|
|
|
|
|||||||||||||||
| Ratios and supplemental data: |
||||||||||||||||||||
| Net assets, end of period |
$ | 21,521,147 | $ | 17,036,408 | $ | 8,132,874 | ||||||||||||||
| Ratios to average net assets: |
||||||||||||||||||||
| Expenses, before reimbursements and/or recoupments |
1.01 | % | 1.02 | % | 1.41 | %E | ||||||||||||||
| Expenses, net of reimbursements and/or recoupmentsF |
0.96 | % | 0.95 | % | 0.96 | %EG | ||||||||||||||
| Net investment (loss), before expense reimbursements and/or recoupments |
(0.80 | )% | (0.76 | )% | (1.18 | )%E | ||||||||||||||
| Net investment (loss), net of reimbursements and/or recoupments |
(0.75 | )% | (0.69 | )% | (0.73 | )%E | ||||||||||||||
| Portfolio turnover rate |
28 | % | 18 | % | 20 | %D | ||||||||||||||
| A | Class launched on April 30, 2019 and commenced operations on May 1, 2019 (Note 1). |
| B | Net investment income includes significant dividend payment from Wingstop, Inc. amounting to $0.0084. |
| C | Based on net asset value, which does not reflect the sales charge, redemption fee, or contingent deferred sales charge, if applicable. May include adjustments in accordance with U.S. GAAP and as such, the net asset value for reporting purposes and the returns based upon those net asset values may differ from the net asset value and returns for shareholder transactions. |
| D | Not annualized. |
| E | Annualized. |
| F | Expense ratios may exceed stated expense caps in Note 2 due to security lending expenses, which are not reimbursable under the agreement with the Manager. |
| G | Expense ratios may the expense cap in effect at the time as a result of the change in the contractual expense caps on August 23, 2019. |
See accompanying notes
57
Federal Tax Information
December 31, 2021 (Unaudited)
Certain tax information regarding the Funds is required to be provided to shareholders based upon the Funds’ income and distributions for the taxable year ended December 31, 2021. The information and distributions reported herein may differ from information and distributions taxable to the shareholders for the calendar year ended December 31, 2021.
The Funds designated the following items with regard to distributions paid during the fiscal year ended December 31, 2021. All designations are based on financial information available as of this annual report and, accordingly, are subject to change. For each item, it is the intention of the Funds to designate the maximum amount permitted under the Internal Revenue Code of 1986, as amended, and the regulations there under.
Corporate Dividends-Received Deduction:
| Stephens Mid-Cap Growth |
0.00 | % | ||
| Stephens Small Cap Growth |
0.00 | % |
Qualified Dividend Income:
| Stephens Mid-Cap Growth |
0.00 | % | ||
| Stephens Small Cap Growth |
0.00 | % |
Long-Term Capital Gain Distributions:
| Stephens Mid-Cap Growth |
$ | 45,844,826 | ||
| Stephens Small Cap Growth |
78,449,184 |
Short-Term Capital Gain Distributions:
| Stephens Mid-Cap Growth |
$ | 0 | ||
| Stephens Small Cap Growth |
0 |
Shareholders received notification in January 2022 of the applicable tax information necessary to prepare their 2021 income tax returns.
58
Trustees and Officers of the American Beacon FundsSM (Unaudited)
The Trustees and officers of the American Beacon Funds (the “Trust”) are listed below, together with their principal occupations during the past five years. The address of each person listed below is 220 Las Colinas Boulevard East, Suite 1200, Irving, Texas 75039. Each Trustee oversees thirty funds in the fund complex that includes the Trust, the American Beacon Select Funds, and the American Beacon Institutional Funds Trust. The Trust’s Statement of Additional Information contains additional information about the Trustees and is available without charge by calling 1-800-658-5811.
| Name, Age |
Position, Term of Office and Length of Time Served with the Trust |
Principal Occupation(s) During Past 5 Years and Current Directorships | ||
| INTERESTED TRUSTEES | Term |
|||
| Lifetime of Trust until removal, resignation or retirement* |
||||
| Eugene J. Duffy (67)** | Trustee since 2008 | Managing Director, Global Investment Management Distribution, Mesirow Financial Administrative Corporation (2016-Present); Managing Director, Institutional Services, Intercontinental Real Estate Corporation (2014-2016); Trustee, American Beacon Select Funds (2008-Present); Trustee, American Beacon Institutional Funds Trust (2017-Present); Trustee, American Beacon Sound Point Enhanced Income Fund (2018–2021); Trustee, American Beacon Apollo Total Return Fund (2018–2021). | ||
| NON-INTERESTED TRUSTEES | Term |
|||
| Lifetime of Trust until removal, resignation or retirement* |
||||
| Gilbert G. Alvarado (52) | Trustee since 2015 | President, SJVIIF, LLC, Impact Investment Fund (2018-Present); Director, Kura MD, Inc. (local telehealth organization) (2015-2017); Senior Vice President & CFO, Sierra Health Foundation (health conversion private foundation) (2006-Present); Senior Vice President & CFO, Sierra Health Foundation: Center for Health Program Management (California public benefit corporation) (2012-Present); Director, Innovative North State (2012-2015); Director, Sacramento Regional Technology Alliance (2011-2016); Director, Valley Healthcare Staffing (2017–2018); Trustee, American Beacon Select Funds (2015-Present); Trustee, American Beacon Institutional Funds Trust (2017-Present); Trustee, American Beacon Sound Point Enhanced Income Fund (2018–2021); Trustee, American Beacon Apollo Total Return Fund (2018–2021). | ||
| Joseph B. Armes (59) | Trustee since 2015 | Director, Switchback Energy Acquisition (2019-2021); Chairman & CEO, CSW Industrials f/k/a Capital Southwest Corporation (investment company) (2015-Present); Chairman of the Board of Capital Southwest Corporation, predecessor to CSW Industrials, Inc. (2014-2017) (investment company); President & CEO, JBA Investment Partners (family investment vehicle) (2010-Present); Director and Chair of Audit Committee, RSP Permian (oil and gas producer) (2013-2018); Trustee, American Beacon Select Funds (2015-Present); Trustee, American Beacon Institutional Funds Trust (2017-Present); Trustee, American Beacon Sound Point Enhanced Income Fund (2018–2021); Trustee, American Beacon Apollo Total Return Fund (2018–2021). | ||
| Gerard J. Arpey (63) | Trustee since 2012 | Partner, Emerald Creek Group (private equity firm) (2011-Present); Director, S.C. Johnson & Son, Inc. (privately held company) (2008-present); Director, The Home Depot, Inc. (2015-Present); Trustee, American Beacon Select Funds (2012-Present); Trustee, American Beacon Institutional Funds Trust (2017-Present); Trustee, American Beacon Sound Point Enhanced Income Fund (2018–2021); Trustee, American Beacon Apollo Total Return Fund (2018–2021). | ||
59
Trustees and Officers of the American Beacon FundsSM (Unaudited)
| Name, Age |
Position, Term of Office and Length of Time Served with the Trust |
Principal Occupation(s) During Past 5 Years and Current Directorships | ||
| NON-INTERESTED TRUSTEES (CONT.) | Term |
|||
| Lifetime of Trust until removal, resignation or retirement* |
||||
| Brenda A. Cline (61) | Trustee since 2004 Chair since 2019 Vice Chair 2018 |
Chief Financial Officer, Treasurer and Secretary, Kimbell Art Foundation (1993-Present); Director, Tyler Technologies, Inc. (public sector software solutions company) (2014-Present); Director, Range Resources Corporation (oil and natural gas company) (2015-Present); Trustee, Cushing Closed-End and Open-End Funds (2017-Present); Trustee, American Beacon Select Funds (2004-Present); Trustee, American Beacon Institutional Funds Trust (2017-Present); Trustee, American Beacon Sound Point Enhanced Income Fund (2018–2021); Trustee, American Beacon Apollo Total Return Fund (2018–2021). | ||
| Claudia A. Holz (64) | Trustee since 2018 | Partner, KPMG LLP (1990 – 2017); Independent Director, Blue Owl Capital Inc. (2021-Present); Trustee, American Beacon Select Funds (2018-Present); Trustee, American Beacon Institutional Funds Trust (2018-Present); Trustee, American Beacon Sound Point Enhanced Income Fund (2018–2021); Trustee, American Beacon Apollo Total Return Fund (2018–2021). | ||
| Douglas A. Lindgren (60) | Trustee since 2018 | CEO North America, Carne Global Financial Services (2016-2017); Consultant, Carne Financial Services (2017-2019); Managing Director, IPS Investment Management and Global Head, Content Management, UBS Wealth Management (2010-2016); Trustee, American Beacon Select Funds (2018-Present); Trustee, American Beacon Institutional Funds Trust (2018-Present); Trustee, American Beacon Sound Point Enhanced Income Fund (2018–2021); Trustee, American Beacon Apollo Total Return Fund (2018–2021). | ||
| Barbara J. McKenna, CFA (58) | Trustee since 2012 | President/Managing Principal, Longfellow Investment Management Company (2005-Present); Trustee, American Beacon Select Funds (2012-Present); Trustee, American Beacon Institutional Funds Trust (2017-Present); Trustee, American Beacon Sound Point Enhanced Income Fund (2018–2021); Trustee, American Beacon Apollo Total Return Fund (2018–2021). | ||
60
Trustees and Officers of the American Beacon FundsSM (Unaudited)
| Name, Age |
Position, Term of Office and Length of Time Served with the Trust |
Principal Occupation(s) During Past 5 Years and Current Directorships | ||
| OFFICERS | Term |
|||
| One Year | ||||
| Gene L. Needles, Jr. (67) | President since 2009 | President (2009-2018), CEO and Director (2009–Present), and Chairman (2018-Present), American Beacon Advisors, Inc., President (2015-2018), Director and CEO (2015–Present), and Chairman (2018-Present), Resolute Investment Holdings, LLC; President (2015-2018), Director and CEO (2015-Present), and Chairman (2018-Present), Resolute Topco, Inc.; President (2015-2018); Director, and CEO (2015-Present), and Chairman (2018-Present), Resolute Acquisition, Inc.; President (2015-2018), Director and CEO (2015-Present), Chairman (2018-Present), Resolute Investment Managers, Inc.; Director, Chairman, President and CEO, Resolute Investment Distributors (2017-Present); Director, Chairman, President and CEO; Resolute Investment Services, Inc. (2017-Present); Manager, President and CEO, American Private Equity Management, LLC (2012-Present); Director, Chairman, President and CEO, Alpha Quant Advisors, LLC (2016-2020); Director, ARK Investment Management LLC (2016-2020); Director, Shapiro Capital Management LLC (2017-Present); Director, Chairman and CEO, Continuous Capital, LLC (2018-Present); Director, Green Harvest Asset Management (2019-2021); Director, National Investment Services of America, LLC (2019 – Present); Director, RSW Investments Holdings LLC, (2019-Present); Manager, SSI Investment Management, LLC (2019-Present); President, American Beacon Cayman Managed Futures Strategy Fund, Ltd. (2014-Present); Director and President, American Beacon Cayman Transformational Innovation Company, LTD., (2017-2018); President, American Beacon Delaware Transformational Innovation Corporation (2017-2018); President, American Beacon Cayman TargetRisk Company, Ltd. (2018-Present); Member, Investment Advisory Committee, Employees Retirement System of Texas (2017-Present); Trustee, American Beacon NextShares Trust (2015-2020); President, American Beacon Select Funds (2009-Present); President, American Beacon Institutional Funds Trust (2017-Present); President, American Beacon Sound Point Enhanced Income Fund (2018-2021); President, American Beacon Apollo Total Return Fund (2018-2021). | ||
| Rosemary K. Behan (62) | VP, Secretary and Chief Legal Officer since 2006 |
Senior Vice President (2021- Present), Vice President (2006-2021), Secretary and General Counsel (2006-Present), American Beacon Advisors, Inc.; Secretary, Resolute Investment Holdings, LLC (2015-Present); Secretary, Resolute Topco, Inc. (2015-Present); Secretary, Resolute Acquisition, Inc. (2015–Present); Senior Vice President (2021-Present), Vice President (2015-2021), Secretary and General Counsel (2015-Present), Resolute Investment Managers, Inc.; Secretary, Resolute Investment Distributors, Inc. (2017-Present); Senior Vice President (2021-Present), Vice President (2017-2021), Secretary and General Counsel (2017-Present), Resolute Investment Services, Inc.; Secretary, American Private Equity Management, LLC (2008-Present); Secretary and General Counsel, Alpha Quant Advisors, LLC (2016-2020); Vice President and Secretary, Continuous Capital, LLC (2018-Present); Secretary, Green Harvest Asset Management (2019-2021); Secretary, American Beacon Delaware Transformational Innovation Corporation (2017-2018); Secretary, American Beacon Cayman Transformational Innovation Company, Ltd. (2017-2018); Secretary, American Beacon Cayman Managed Futures Strategy Fund, Ltd. (2014-Present); Secretary, American Beacon Cayman TargetRisk Company, Ltd (2018-Present); Chief Legal Officer, Vice President and Secretary, American Beacon Select Funds (2006-Present); Chief Legal Officer, Vice President and Secretary, American Beacon Institutional Funds Trust (2017-Present); Chief Legal Officer, Vice President and Secretary, American Beacon Sound Point Enhanced Income Fund (2018-2021); Chief Legal Officer, Vice President and Secretary, American Beacon Apollo Total Return Fund (2018-2021). | ||
61
Trustees and Officers of the American Beacon FundsSM (Unaudited)
| Name, Age |
Position, Term of Office and Length of Time Served with the Trust |
Principal Occupation(s) During Past 5 Years and Current Directorships | ||
| OFFICERS (CONT.) | Term |
|||
| One Year | ||||
| Brian E. Brett (61) | VP since 2004 | Senior Vice President, Head of Distribution (2012-Present), American Beacon Advisors, Inc.; Senior Vice President, Resolute Investment Managers, Inc. (2017-Present); Senior Vice President, Resolute Investment Distributors, Inc. (2018-Present); Senior Vice President, Resolute Investment Services, Inc. (2018-Present); Vice President, American Beacon Select Funds (2004-Present); Vice President, American Beacon Institutional Funds Trust (2017-Present); Vice President, American Beacon Sound Point Enhanced Income Fund (2018-2021); Vice President, American Beacon Apollo Total Return Fund (2018-2021). | ||
| Paul B. Cavazos (52) | VP since 2016 | Chief Investment Officer and Senior Vice President, American Beacon Advisors, Inc. (2016-Present); Chief Investment Officer, DTE Energy (2007-2016); Vice President, American Private Equity Management, L.L.C. (2017–Present); Vice President, American Beacon Select Funds (2016-Present); Vice President, American Beacon Institutional Funds Trust (2017-Present); Vice President, American Beacon Sound Point Enhanced Income Fund (2018-2021); Vice President, American Beacon Apollo Total Return Fund (2018-2021). | ||
| Erica Duncan (51) | VP since 2011 | Vice President, American Beacon Advisors, Inc. (2011-Present); Vice President, Resolute Investment Managers (2018-Present); Vice President, Resolute Investment Services, Inc. (2018-Present); Vice President, American Beacon Select Funds (2011-Present); Vice President, American Beacon Institutional Funds Trust (2017-Present); Vice President, American Beacon Sound Point Enhanced Income Fund (2018-2021); Vice President, American Beacon Apollo Total Return Fund (2018-2021). | ||
| Melinda G. Heika (60) | VP since 2021 Principal Accounting Officer and Treasurer (2010-2021) |
Senior Vice President (2021-Present), Treasurer and CFO (2010-Present), American Beacon Advisors, Inc.; Treasurer, Resolute Topco, Inc. (2015-Present); Treasurer, Resolute Investment Holdings, LLC. (2015-Present); Treasurer, Resolute Acquisition, Inc. (2015-Present); Senior Vice President (2021-Present), Treasurer and CFO, Resolute Investment Managers, Inc. (2017-Present); Treasurer, Resolute Investment Distributors, Inc. (2017); Senior Vice President (2021-Present); Treasurer and CFO, Resolute Investment Services, Inc. (2015-Present); Treasurer, American Private Equity Management, LLC (2012-Present); Treasurer and CFO, Alpha Quant Advisors, LLC (2016-2020); Treasurer and CFO, Continuous Capital, LLC (2018-Present); Treasurer, American Beacon Cayman Transformational Innovation, Ltd. (2017-2018); Treasurer, American Beacon Delaware Transformational Innovation Corporation (2017-2018); Director and Treasurer, American Beacon Cayman Managed Futures Strategy Fund, Ltd. (2014-Present); Treasurer, American Beacon Cayman TargetRisk Company, Ltd. (2018-Present); Vice President (2021-Present), Principal Accounting Officer (2017-2021) and Treasurer (2010-2021), American Beacon Select Funds; Vice President (2021–Present), Principal Accounting Officer and Treasurer (2017-2021), American Beacon Institutional Funds Trust; Vice President (2021), Principal Accounting Officer and Treasurer (2018-2021), American Beacon Sound Point Enhanced Income Fund; Vice President (2021), Principal Accounting Officer and Treasurer, American Beacon Apollo Total Return Fund (2018-2021). | ||
62
Trustees and Officers of the American Beacon FundsSM (Unaudited)
| Name, Age |
Position, Term of Office and Length of Time Served with the Trust |
Principal Occupation(s) During Past 5 Years and Current Directorships | ||
| OFFICERS (CONT.) | Term |
|||
| One Year | ||||
| Terri L. McKinney (58) | VP since 2010 | Senior Vice President (2021-Present), Vice President (2009-2021), American Beacon Advisors, Inc.; Senior Vice President (2021–Present); Vice President (2017-2021), Resolute Investment Managers, Inc.; Senior Vice President (2021-Present), Vice President (2018-Present), Resolute Investment Services, Inc; Vice President, Alpha Quant Advisors, LLC (2016-2020); Vice President, Continuous Capital, LLC (2018-Present); Vice President, American Beacon Select Funds (2010-Present); Vice President, American Beacon Institutional Funds Trust (2017-Present); Vice President, American Beacon Sound Point Enhanced Income Fund (2018-2021); Vice President, American Beacon Apollo Total Return Fund (2018-2021). | ||
| Jeffrey K. Ringdahl (46) | VP since 2010 | Director (2015-Present), President (2018-Present), Chief Operating Officer (2010-Present), Senior Vice President (2013-2018), American Beacon Advisors, Inc.; Director (2015-Present), President (2018-Present), Senior Vice President (2015-2018), Resolute Investment Holdings, LLC; Director (2015-Present), President (2018-Present), Senior Vice President (2015-2018), Resolute Topco, Inc.; Director (2015-Present), President (2018-Present), Senior Vice President (2015-2018), Resolute Acquisition, Inc.; Director (2015-Present), President & COO (2018-Present), Senior Vice President (2015-2018), Resolute Investment Managers, Inc.; Director and Executive Vice President (2017-Present), Resolute Investment Distributors, Inc.; Director (2017-Present), President & COO (2018-Present), Executive Vice President (2017-2018), Resolute Investment Services, Inc.; Senior Vice President (2017-Present), Vice President (2012-2017), Manager (2015-Present), American Private Equity Management, LLC; Trustee, American Beacon NextShares Trust (2015-2020); Director, Executive Vice President & COO, Alpha Quant Advisors, LLC (2016-2020); Director, Shapiro Capital Management, LLC (2017-Present); Director, Executive Vice President & COO, Continuous Capital, LLC (2018- Present); Director, RSW Investments Holdings LLC, (2019-Present); Manager, SSI Investment Management, LLC (2019-Present); Director, National Investment Services of America, LLC (2019-Present); Director and Vice President, American Beacon Cayman Transformational Innovation Company, Ltd., (2017-Present); Vice President, American Beacon Delaware Transformational Innovation Corporation (2017-2018); Director and Vice President, American Beacon Cayman Managed Futures Strategy Fund, Ltd. (2014-Present); Vice President, American Beacon Cayman TargetRisk Company, Ltd (2018-Present); Vice President, American Beacon Select Funds (2010-2018); Vice President, American Beacon Institutional Funds Trust (2017-Present); Vice President, American Beacon Sound Point Enhanced Income Fund (2018-2021); Vice President, American Beacon Apollo Total Return Fund (2018-2021). | ||
| Samuel J. Silver (58) | VP since 2011 | Vice President (2011-Present), Chief Fixed Income Officer (2016-Present), American Beacon Advisors, Inc. (2011-Present); Vice President, American Beacon Select Funds (2011-Present); Vice President, American Beacon Institutional Funds Trust (2017-Present); Vice President, American Beacon Sound Point Enhanced Income Fund (2018-2021); Vice President, American Beacon Apollo Total Return Fund (2018-2021). | ||
63
Trustees and Officers of the American Beacon FundsSM (Unaudited)
| Name, Age |
Position, Term of Office and Length of Time Served with the Trust |
Principal Occupation(s) During Past 5 Years and Current Directorships | ||
| OFFICERS (CONT.) | Term |
|||
| One Year | ||||
| Christina E. Sears (50) | Chief Compliance Officer since 2004 and Asst. Secretary since 1999 |
Vice President, American Beacon Advisors, Inc. (2019-Present); Chief Compliance Officer, American Beacon Advisors, Inc. (2004-Present); Vice President, Resolute Investment Managers, Inc. (2017-Present); Vice President, Resolute Investment Distributors (2017-Present); Vice President, Resolute Investment Services, Inc. (2019-Present); Chief Compliance Officer, American Private Equity Management, LLC (2012-Present); Chief Compliance Officer, Green Harvest Asset Management, LLC (2019-2021); Chief Compliance Officer, RSW Investments Holdings, LLC (2019-Present); Chief Compliance Officer (2016-2019) and Vice President, Alpha Quant Advisors, LLC (2016-2020); Vice President, Continuous Capital, LLC (2018-Present); Chief Compliance Officer (2004-Present) and Assistant Secretary (1999-Present), American Beacon Select Funds; Chief Compliance Officer and Assistant Secretary, American Beacon Institutional Funds Trust (2017-Present); Chief Compliance Officer and Assistant Secretary, American Beacon Sound Point Enhanced Income Fund (2018-2021); Chief Compliance Officer and Assistant Secretary, American Beacon Apollo Total Return Fund (2018-2021). | ||
| Sonia L. Bates (65) | Principal Accounting Officer and Treasurer since 2021 Assistant Treasurer (2011-2021) |
Assistant Treasurer, American Beacon Advisors, Inc. (2011-2018); Assistant Treasurer, American Private Equity Management, LLC (2012-Present); Assistant Treasurer, American Beacon Cayman Transformational Innovation Company, Ltd. (2017-Present); Assistant Treasurer, American Beacon Cayman TargetRisk Company, Ltd. (2018-Present); Principal Accounting Officer and Treasurer (2021-Present), Assistant Treasurer (2011-2021), American Beacon Select Funds; Principal Accounting Officer and Treasurer (2021-Present), Assistant Treasurer (2017-2021), American Beacon Institutional Funds Trust; Principal Accounting Officer and Treasurer (2021), Assistant Treasurer (2018-2021), American Beacon Sound Point Enhanced Income Fund; Principal Accounting Officer and Treasurer (2021), Assistant Treasurer (2018-2021), American Beacon Apollo Total Return Fund. | ||
| Shelley L. Dyson (52) | Assistant Treasurer since 2021 | Assistant Treasurer, American Beacon Select Funds (2021-Present); Assistant Treasurer, American Beacon Institutional Funds Trust (2021-Present); Assistant Treasurer, American Beacon Sound Point Enhanced Income Fund (2021); Assistant Treasurer, American Beacon Apollo Total Return Fund (2021). | ||
| Shelley D. Abrahams (47) | Assistant Secretary since 2008 | Assistant Secretary, American Beacon Select Funds (2008-Present); Assistant Secretary, American Beacon Institutional Funds Trust (2017-Present); Assistant Secretary, American Beacon Sound Point Enhanced Income Fund (2018-2021); Assistant Secretary, American Beacon Apollo Total Return Fund (2018-2021). | ||
| Rebecca L. Harris (55) | Assistant Secretary since 2010 | Senior Vice President (2021-Present), Vice President (2011-Present), American Beacon Advisors, Inc.; Senior Vice President (2021-Present), Vice President (2017-Present), Resolute Investment Managers, Inc.; Senior Vice President (2021-Present), Vice President (2015-Present), Resolute Investment Services; Vice President, Alpha Quant Advisors, LLC (2016-2020); Vice President, Continuous Capital, LLC (2018-Present); Assistant Secretary, American Beacon Select Funds (2010-Present); Assistant Secretary, American Beacon Institutional Funds Trust (2017-Present); Assistant Secretary, American Beacon Sound Point Enhanced Income Fund (2018-2021); Assistant Secretary, American Beacon Apollo Total Return Fund (2018-2021). | ||
64
Trustees and Officers of the American Beacon FundsSM (Unaudited)
| Name, Age |
Position, Term of Office and Length of Time Served with the Trust |
Principal Occupation(s) During Past 5 Years and Current Directorships | ||
| OFFICERS (CONT.) | Term |
|||
| One Year | ||||
| Teresa A. Oxford (63) | Assistant Secretary since 2015 | Assistant Secretary, American Beacon Advisors, Inc. (2015-Present); Assistant Secretary, Resolute Investment Distributors (2018-2021); Assistant Secretary, Resolute Investment Managers, Inc. (2017-Present); Assistant Secretary, Resolute Investment Services (2018-Present); Assistant Secretary, Alpha Quant Advisors, LLC (2016-2020); Assistant Secretary, Continuous Capital, LLC (2020-Present); Assistant Secretary, American Beacon Select Funds (2015-Present); Assistant Secretary, American Beacon Institutional Funds Trust (2017-Present); Assistant Secretary, American Beacon Sound Point Enhanced Income Fund (2018-2021); Assistant Secretary, American Beacon Apollo Total Return Fund (2018-2021). | ||
| Michael D. Jiang (37) | Assistant Secretary since 2021 | Assistant Secretary (2021-Present), Resolute Investment Distributors, Inc.; Associate General Counsel (2021-Present), Resolute Investment Services, Inc.; Vice President (2018-2021), The Northern Trust Company; Second Vice President (2015-2018), The Northern Trust Company. Assistant Secretary, American Beacon Select Funds (2021-Present); Assistant Secretary, American Beacon Institutional Funds Trust (2021-Present); Assistant Secretary, American Beacon Sound Point Enhanced Income Fund (2021); Assistant Secretary, American Beacon Apollo Total Return Fund (2021). | ||
* As of 11/12/2014, the Board adopted a retirement plan that requires Trustees to retire no later than the last day of the calendar year in which they reach the age of 75.
** Mr. Duffy is being deemed to be an “interested person” of the Trust, as defined by the Investment Company Act of 1940, as amended, by virtue of his position with Mesirow Financial, Inc., a broker-dealer.
65
Privacy Policy
December 31, 2021 (Unaudited)
The American Beacon Funds recognize and respect the privacy of our shareholders. We are providing this notice to you, so you will understand how shareholder information may be collected and used.
We may collect nonpublic personal information about you from one or more of the following sources:
| • | information we receive from you on applications or other forms; |
| • | information about your transactions with us or our service providers; and |
| • | information we receive from third parties. |
We do not disclose any nonpublic personal information about our customers or former customers to anyone, except as permitted by law.
We restrict access to your nonpublic personal information to those employees or service providers who need to know that information to provide products or services to you. To ensure the confidentiality of your nonpublic personal information, we maintain safeguards that comply with federal standards.
66
This page intentionally left blank.
67
This page intentionally left blank.
68

Delivery of Documents
Shareholder reports are available online at www.americanbeaconfunds.com/reports. Please be advised that reports are no longer sent by mail. Instead, the reports are made available online, and you will be notified by mail each time a report is posted online. You will be provided with a website link to access the report. You may elect to receive all future reports in paper free of charge. You can request to continue receiving paper copies by calling 1-866-345-5954, or you may directly inform your financial intermediary. Detailed instructions are also included in your report notifications.
If you invest in the Fund through a financial institution, you may be able to receive the Fund’s regulatory mailings, such as the Prospectus, Annual Report and Semi-Annual Report, by e-mail. If you are interested in this option, please go to www.icsdelivery.com and search for your financial institution’s name or contact your financial institution directly.
To obtain more information about the Fund:

|

| |
| By E-mail: | On the Internet: | |
| american_beacon.funds@ambeacon.com | Visit our website at www.americanbeaconfunds.com | |
|
By Telephone: Call (800) 658-5811 |
By Mail: American Beacon Funds P.O. Box 219643 Kansas City, MO 64121-9643 | |
| Availability of Quarterly Portfolio Schedules | Availability of Proxy Voting Policy and Records | |
| In addition to the Schedule of Investments provided in each semi-annual and annual report, the Fund files a complete schedule of its portfolio holdings with the Securities and Exchange Commission (“SEC”) on Form N-PORT as of the end of each fiscal quarter. The Fund’s Forms N-PORT are available on the SEC’s website at www.sec.gov. The Forms N-PORT may also be reviewed and copied at the SEC’s Public Reference Section, 100 F Street, NE, Washington, D.C. 20549-2736. Information regarding the operation of the SEC’s Public Reference Room may be obtained by calling (800)-SEC-0330. A complete schedule of the Fund’s portfolio holdings is also available at www.americanbeaconfunds.com approximately twenty days after the end of each month. | A description of the policies and procedures the Fund uses to determine how to vote proxies relating to portfolio securities is available in the Fund’s Statement of Additional Information, is available free of charge on the Fund’s website www.americanbeaconfunds.com and by calling 1-800-967-9009 or by accessing the SEC’s website at www.sec.gov. The Fund’s proxy voting record for the most recent year ended June 30 is filed annually with the SEC on Form N-PX. The Fund’s Forms N-PX are available on the SEC’s website at www.sec.gov. The Fund’s proxy voting record may also be obtained by calling 1-800-967-9009. | |


Fund Service Providers:
| CUSTODIAN State Street Bank and Trust Company Boston, Massachusetts |
TRANSFER AGENT DST Asset Manager Solutions, Inc. Quincy, Massachusetts |
INDEPENDENT REGISTERED PUBLIC ACCOUNTING FIRM Ernst & Young LLP Dallas, Texas |
DISTRIBUTOR Resolute Investment Distributors, Inc. Irving, Texas |
This report is prepared for shareholders of the American Beacon Funds and may be distributed to others only if preceded or accompanied by a current Prospectus or Summary Prospectus.
American Beacon Funds, American Beacon Stephens Mid-Cap Growth Fund and American Beacon Stephens Small Cap Growth Fund are service marks of American Beacon Advisors, Inc.
AR 12/21
ITEM 2. CODE OF ETHICS.
The Trust adopted a code of ethics that applies to its principal executive and financial officers (the “Code”). The Trust amended its code July 6, 2021 to remove two terminated investment companies and update the Principal Financial Officer. The Trust did not grant any waivers to the provisions of the Code during the period covered by the shareholder reports presented in Item 1. The Code is filed herewith as Exhibit 99.CODE ETH.
ITEM 3. AUDIT COMMITTEE FINANCIAL EXPERT.
The Trust’s Board of Trustees has determined that Gilbert G. Alvarado and Claudia Holz, members of the Trust’s Audit and Compliance Committee, are “audit committee financial experts” as defined in Form N-CSR. Mr. Gilbert Alvarado and Ms. Claudia Holz are “independent” as defined in Form N-CSR.
ITEM 4. PRINCIPAL ACCOUNTANT FEES AND SERVICES.
| (a) |
||||
| Audit Fees |
Fiscal Year Ended | |||
| $289,962 |
12/31/2020 | |||
| $320,834 |
12/31/2021 | |||
| (b)1 |
||||
| Audit Related Fees |
Fiscal Year Ended | |||
| $0 | 12/31/2020 | |||
| $0 | 12/31/2021 | |||
| (c)2 |
||||
| Tax Fees |
Fiscal Year Ended | |||
| $70,610 |
12/31/2020 | |||
| $58,879 |
12/31/2021 | |||
| (d) |
||||
| All Other Fees |
Fiscal Year Ended | |||
| $0 |
12/31/2020 | |||
| $0 |
12/31/2021 | |||
| 1 | “Audit-Related Fees” are the aggregate fees billed for assurance and related services reasonably related to the performance of the audit or review of financial statements that are not reported under “Audit Fees”. These fees include accounting consultations and consents, if applicable. |
| 2 | “Tax Fees” are the aggregate fees billed for professional services for tax advice, tax compliance, and tax planning. These fees include federal and state tax reviews, excise tax reviews, and PFIC analysis reviews. |
(e)(1) Pursuant to its charter, the Trust’s Audit and Compliance Committee shall have the following duties and powers pertaining to pre-approval of audit and non-audit services provided by the Trust’s principal accountant:
| • | to approve, prior to appointment, the engagement of auditors to annually audit and provide their opinion on the Trusts’ financial statements, and, in connection therewith, reviewing and evaluating matters potentially affecting the independence and capabilities of the auditors; |
| • | to approve, prior to appointment, the engagement of the auditors to provide non-audit services to the Trusts, an investment adviser to any series of the Trusts or any entity controlling, controlled by, or under common control with an investment adviser (“adviser affiliate”) that provides ongoing services to the Trusts, if the engagement relates directly to the operations and financial reporting of the Trusts; |
| • | to consider whether the non-audit services provided by a Trust’s auditor to an investment adviser or any adviser affiliate that provides ongoing services to a series of the Trusts, which services were not pre-approved by the Committee, are compatible with maintaining the auditor’s independence; |
| • | to review the arrangements for and scope of the annual audit and any special audits; and |
| • | to review and approving the fees proposed to be charged to the Trusts by the auditors for each audit and non-audit service. |
The Audit and Compliance Committee may delegate any portion of its authority, including the authority to grant pre-approvals of audit and permitted non-audit services, to a subcommittee of one or more members. Any decisions of the subcommittee to grant pre-approvals shall be presented to the full audit committee at its next regularly scheduled meeting.
(e)(2) None of the fees disclosed in paragraphs (b) through (d) above were approved by the audit committee pursuant to paragraph (c)(7)(i)(C) of Rule 2-01 of Regulation S-X.
(f) Not applicable.
(g) Aggregate Non-Audit Fees for Services Rendered to the:
| Registrant |
Adviser | Adviser’s Affiliates Providing Ongoing Services to Registrant |
Fiscal Year Ended | |||||||
| $ 70,610 |
$163,506 | N/A | 12/31/2020 | |||||||
| $ 58,879 |
$273,503 | N/A | 12/31/2021 | |||||||
| (h) | Not applicable. |
ITEM 5. AUDIT COMMITTEE OF LISTED REGISTRANTS.
Not applicable.
ITEM 6. SCHEDULE OF INVESTMENTS.
The schedules of investments for each series of the Trust are included in the shareholder reports presented in Item 1.
| ITEM | 7. DISCLOSURE OF PROXY VOTING POLICIES AND PROCEDURES FOR CLOSED-END MANAGEMENT INVESTMENT COMPANIES. |
Not applicable.
ITEM 8. PORTFOLIO MANAGERS OF CLOSED-END MANAGEMENT INVESTMENT COMPANIES.
Not applicable.
| ITEM | 9. PURCHASES OF EQUITY SECURITIES BY CLOSED-END MANAGEMENT INVESTMENT COMPANY AND AFFILIATED PURCHASERS. |
Not applicable.
ITEM 10. SUBMISSION OF MATTERS TO A VOTE OF SECURITY HOLDERS.
The Trust has made no material changes to the procedures by which shareholders may recommend nominees to the Trust’s Board of Trustees since the Trust last disclosed such procedures in Schedule 14A.
ITEM 11. CONTROLS AND PROCEDURES.
(a) Based upon an evaluation within 90 days of the filing date of this report, the principal executive and financial officers concluded that the disclosure controls and procedures of the Trust are effective.
(b) There were no changes in the Trust’s internal control over financial reporting during the second fiscal quarter of the period covered by this report that has materially affected, or is reasonably likely to materially affect, the Trust’s internal control over financial reporting.
ITEM 12 DISCLOSURE OF SECURITIES LENDING ACTIVITIES FOR CLOSED-END MANAGMENT INVESTMENT COMPANIES.
Not Applicable.
ITEM 13. EXHIBITS.
| (a)(1) |
| (a)(2) |
| (a)(3) | Not applicable. |
| (b) |
SIGNATURES
Pursuant to the requirements of the Securities Exchange Act of 1934 and the Investment Company Act of 1940, the registrant has duly caused this report to be signed on its behalf by the undersigned, thereunto duly authorized.
(Registrant): American Beacon Funds
| By /s/ Gene L. Needles, Jr. | ||
| Gene L. Needles, Jr. | ||
| President | ||
| American Beacon Funds | ||
| Date: March 7, 2022 |
Pursuant to the requirements of the Securities Exchange Act of 1934 and the Investment Company Act of 1940, this report has been signed below by the following persons on behalf of the registrant and in the capacities and on the dates indicated.
| By /s/ Gene L. Needles, Jr. | ||
| Gene L. Needles, Jr. | ||
| President | ||
| American Beacon Funds | ||
| Date: March 7, 2022 |
| By /s/ Sonia L. Bates | ||
| Sonia L. Bates | ||
| Treasurer | ||
| American Beacon Funds | ||
| Date: March 7, 2022 |