UNITED STATES
SECURITIES AND EXCHANGE COMMISSION
Washington, D.C. 20549
FORM N-CSR
CERTIFIED SHAREHOLDER REPORT OF REGISTERED
MANAGEMENT INVESTMENT COMPANIES
Investment Company Act file number: 811-4984
AMERICAN BEACON FUNDS
(Exact name of registrant as specified in charter)
220 East Las Colinas Boulevard, Suite 1200
Irving, Texas 75039
(Address of principal executive offices)-(Zip code)
GENE L. NEEDLES, JR., PRESIDENT
220 East Las Colinas Boulevard, Suite 1200
Irving, Texas 75039
(Name and address of agent for service)
Registrant’s telephone number, including area code: (817) 391-6100
Date of fiscal year end: December 31, 2016
Date of reporting period: December 31, 2016
Form N-CSR is to be used by management investment companies to file reports with the Commission not later than 10 days after the transmission to stockholders of any report that is required to be transmitted to stockholders under Rule 30e-1 under the Investment Company Act of 1940 (17 CFR 270.30e-1). The Commission may use the information provided on Form N-CSR in its regulatory, disclosure review, inspection, and policymaking roles.
A registrant is required to disclose the information specified by Form N-CSR, and the Commission will make this information public. A registrant is not required to respond to the collection of information contained in Form N-CSR unless the Form displays a currently valid Office of Management and Budget (“OMB”) control number. Please direct comments concerning the accuracy of the information collection burden estimate and any suggestions for reducing the burden to Secretary, Securities and Exchange Commission, 450 Fifth Street, NW, Washington, DC 20549-0609. The OMB has reviewed this collection of information under the clearance requirements of 44 U.S.C. § 3507.
ITEM 1. REPORTS TO STOCKHOLDERS.
About American Beacon Advisors
Since 1986, American Beacon Advisors has offered a variety of products and investment advisory services to numerous institutional and retail clients, including a variety of mutual funds, corporate cash management, and separate account management.
Our clients include defined benefit plans, defined contribution plans, foundations, endowments, corporations, financial planners, and other institutional investors. With American Beacon Advisors, you can put the experience of a multi-billion dollar asset management firm to work for your company.
BAHL & GAYNOR SMALL CAP GROWTH FUND
Investing in small-capitalization stocks may involve greater volatility and lower liquidity than larger company stocks. Investing in foreign securities may involve heightened risk due to currency fluctuations and economic and political risks. Growth stocks typically are more volatile than value stocks; however, value stocks have a lower expected growth rate in earnings and sales. The use of futures contracts for cash management may subject the Fund to losing more money than invested. The Fund may participate in a securities lending program. Please see the prospectus for a complete discussion of the Fund’s risks. There can be no assurances that the investment objectives of this Fund will be met.
HOLLAND LARGE CAP GROWTH FUND
Growth stocks typically are more volatile than value stocks; however, value stocks have a lower expected growth rate in earnings and sales. Investing in foreign securities may involve heightened risk due to currency fluctuations and economic and political risks. The use of futures contracts for cash management may subject the Fund to losing more money than invested. Please see the prospectus for a complete discussion of the Fund’s risks. There can be no assurances that the investment objectives of this Fund will be met
Any opinions herein, including forecasts, reflect our judgment as of the end of the reporting period and are subject to change. Each advisor’s strategies and each Fund’s portfolio composition will change depending on economic and market conditions. This report is not a complete analysis of market conditions, and, therefore, should not be relied upon as investment advice. Although economic and market information has been compiled from reliable sources, American Beacon Advisors, Inc. makes no representation as to the completeness or accuracy of the statements contained herein.
| American Beacon Funds | December 31, 2016 |
| 1 | ||||
| 2 | ||||
| 7 | ||||
| 9 | ||||
| 10 | ||||
| 13 | ||||
| 16 | ||||
| 19 | ||||
| 35 | ||||
| 38 | ||||
| 41 | ||||
| 42 | ||||
| 43 | ||||
| 46 | ||||
| Back Cover | ||||

|
Dear Shareholders, | |
| During the 12-month period ended December 31, 2016, China’s slowing growth escalated concerns for global markets, and many of the world’s central banks – the Federal Reserve (the “Fed”) included – responded by either continuing or expanding their economic stimulation policies. In the first half of 2016, international stocks declined while U.S. and emerging-market stocks made modest gains. Falling global interest rates supported bond returns during the period. | ||
| On June 24, 2016, the U.K. announced that the Brexit referendum to leave the European Union passed with a 52% majority vote, further shaking up global markets. By the end of that month, however, the U.S. stock market and some global markets had rebounded to near pre-Brexit levels as investors took opportunistic risks following the historic vote. After Theresa May’s succession as the U.K.’s prime minister on July 13, 2016, many central banks put their Brexit concerns on hold and turned their attention to their own economies. |
In the weeks ahead of the U.S. presidential election on November 8, 2016, uncertainty about the outcome caused many investors to stay on the sidelines. Some investors questioned whether the election’s result would have negative consequences for their portfolios, but elections rarely have a lasting effect on the market. Historically speaking, from August 1 to October 31 during 19 of the last 22 election years - or approximately 86% of the time - the S&P 500 rallied for an average gain of approximately 6%.
On December 14, 2016, the Fed announced that it increased short-term interest rates by 0.25% to a range of 0.50% and 0.75%, signifying the Federal Open Market Committee’s confidence in an improving economy. It was the second rate increase in a decade; the first rate increase occurred in December 2015.
Although U.S. bonds and international investments largely declined in fourth quarter, domestic stocks reached new highs by the end of 2016. Markets responded positively to aspects of the incoming administration’s proposed plans for economic growth; i.e., repatriating jobs from overseas, relaxing regulations, lowering taxes and increasing infrastructure spending. For the year, the Dow Jones Industrial Average gained 16.50%, the S&P 500 Index gained 11.96%, the Nasdaq Composite gained 7.5% and the Russell 2000 gained 21.31%.
For the 12 months ended December 31, 2016:
| • | American Beacon Bahl & Gaynor Small Cap Growth Fund (Investor Class) returned 25.31%. |
| • | American Beacon Holland Large Cap Growth Fund (Investor Class) returned 1.87%. |
American Beacon Advisors identifies and partners with experienced asset managers from across all asset classes to help protect our shareholders’ portfolios over the long term. We are proud to offer a variety of funds that allow investors to invest in the asset classes best aligned with their long-term goals.
Thank you for your continued investment in the American Beacon Funds. For additional information about the Funds or to access your account information, please visit www.americanbeaconfunds.com.
Best Regards,

Gene L. Needles, Jr.
President
American Beacon Funds
1
Domestic Equity Market Overview
December 31, 2016 (Unaudited)
Domestic equity markets came back with a roar from 2015’s modestly positive performance and continued the long-running, eight-year bull market. The S&P 500 Index, a broad measure of stock performance, was up 11.96%. The Russell 1000 Index, another largely followed market index, was up 12.05% for the year. Looking at the various Russell-style indexes for the year, small-cap stocks outpaced large- and mid-cap stocks and value stocks far outpaced growth stocks. In 2016, the markets continued to demonstrate that macroeconomic events such as the Brexit vote and uncertainty around the U.S. election can influence performance in the short term.
The first quarter of 2016 was marked by significant domestic equity market volatility with negative performance in January nearly matching positive performance in March (with flat performance in between). The month of January was highlighted by a broad market sell-off because of continued weakness in China’s economy despite a rebound by stocks at the end of the month. Healthier economic indicators in February kept the markets from entering correction territory, with most broad domestic equity markets ending the month close to flat. March was characterized by strong market performance led by job gains, a strengthening labor market, and some stability to oil prices. The Federal Reserve (the “Fed”) took a cautious tone following the Federal Open Market Committee (“FOMC”) meeting in March and held the federal funds rate steady. “Global economic and financial developments” were cited as reasons to keep the rate steady. To wit, the surprise move by the European Central Bank for further quantitative easing underscored weakness in Europe’s economy. The quarter ended with most domestic markets in modestly positive territory - the exceptions being the small-cap core/growth space.
The second quarter’s hot topics - Brexit and the lackluster May jobs report - did little to dampen the period’s positive momentum. The first two months of the quarter had positive returns that initially seemed to be threatened by the underwhelming May jobs report released in the first week of June. The weak report put the prospect of the Fed raising interest rates at the June meeting in doubt, which was later realized. Later in the month came the unexpected vote in the United Kingdom to leave the European Union, or Brexit. However, the domestic equity markets’ short-lived reaction to the Brexit vote was followed by a quick rebound and the month of June was relatively flat across most U.S. indexes. The second quarter ended with U.S. equity markets posting positive numbers across the board.
The third quarter was buoyed initially by lessening fear surrounding the Brexit vote and a significant positive revision to the June jobs report, but the Fed’s discussion of whether (and when) they should raise interest rates remained a key theme. This carried into August as U.S. markets were lifted by continued signs of job creation, wage growth and a lower unemployment rate. Gross domestic product (“GDP”) metrics for the period registered +3.5% annualized - the highest observation in two years. Meanwhile, international markets were mixed, particularly as growth in China continued to slow. Weaker markets in September recovered toward the end of month thanks in part to oil prices rising in the wake of OPEC’s announcement of a tentative agreement on production cutbacks. Despite that and concerns about inflation remaining below its target of 2%, the Fed indicated that the case for raising interest rates before the end of the year had strengthened, though they noted they would wait before doing so and continue monitoring the environment. Once again, U.S. equity markets had a positive quarter across the board and particularly in the small-cap space.
The fourth quarter began weakly in October due to the uncertainty of the fast-approaching U.S. presidential election and despite goods and services indicating an increase to real GDP during the same time period. In November, despite predictions of a sharp, negative response to the election results, the U.S. markets went on to achieve new highs later in the month. Notwithstanding generally positive market conditions, the Fed made no interest rate changes in November given the proximity of the FOMC’s meeting to the election. At that time, Federal Reserve Board Chair Janet Yellen foreshadowed a potential rate increase, saying the timing could be appropriate “relatively soon.” On December 14, the Fed met and voted to increase interest rates by 0.25% - the first time in 2016 and only the second time in the past 12 months. As another positive note, consumer confidence rose during the month of December to its highest level in more than 15 years. The fourth quarter was a good period for the U.S. equity markets - especially small-cap stocks and value stocks, which significantly outpaced their large and growth counterparts - and wrapped a big bow around the end of a year that seemed surprising (i.e., U.S. markets leading globally).
2
American Beacon Bahl & Gaynor Small Cap Growth FundSM
Performance Overview
December 31, 2016 (Unaudited)
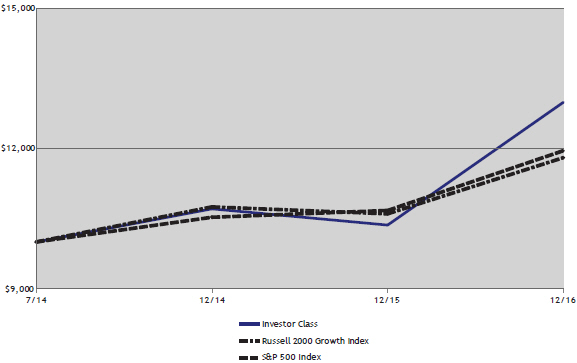
The Investor Class of the Bahl & Gaynor Small Cap Growth Fund (the “Fund”) returned 25.31% for the twelve months ended December 31, 2016. The Fund outperformed the Russell 2000 Growth Index (the “Index”) return of 11.32% for the same period.
Comparison of Change in Value of a $10,000 Investment for the period from 7/15/2014 through 12/31/2016
Total Returns for the Period Ended December 31, 2016
| Value of $10,000 | ||||||||||||||||
| Since Inception | 7/15/2014- | |||||||||||||||
| Ticker | 1 Year | (7/15/2014) | 12/31/2016 | |||||||||||||
| Institutional Class (1,5) |
GBSIX | 25.88 | % | 11.60 | % | $ | 13,104 | |||||||||
| Y Class (1,5) |
GBSYX | 25.80 | % | 11.53 | % | $ | 13,084 | |||||||||
| Investor Class (1,5) |
GBSPX | 25.31 | % | 11.18 | % | $ | 12,983 | |||||||||
| A without Sales Charge (1,2,5) |
GBSAX | 25.44 | % | 11.18 | % | $ | 12,983 | |||||||||
| A with Sales Charge (1,2,5) |
GBSAX | 18.19 | % | 8.54 | % | $ | 12,237 | |||||||||
| C without Sales Charge (1,3,5) |
GBSCX | 24.35 | % | 10.31 | % | $ | 12,734 | |||||||||
| C with Sales Charge (1,3,5) |
GBSCX | 23.35 | % | 10.31 | % | $ | 12,734 | |||||||||
| Russell 2000 Growth Index (4) |
11.32 | % | 6.95 | % | $ | 11,801 | ||||||||||
| S&P 500 Index (4) |
11.96 | % | 7.52 | % | $ | 11,950 | ||||||||||
| 1. | Performance shown is historical and is not indicative of future returns. Investment returns and principal value will vary, and shares may be worth more or less at redemption than at original purchase. Performance shown is calculated based on the published end of day net asset values as of date indicated, and current performance may be lower or higher than the performance data quoted. To obtain performance as of the most recent month end, please visit www. americanbeaconfunds.com or call 1-800-967-9009. Fund performance in the table above does not reflect the deduction of taxes a shareholder would pay on distributions or the redemption of shares. A portion of the fees charged to each Class of the Fund has been waived since Fund inception. Performance prior to waiving fees was lower than actual returns shown. |
| 2. | A Class shares have a maximum sales charge of 5.75%. |
| 3. | C Class shares have a maximum contingent deferred sales charge of 1.00% for shares redeemed within one year of the date of purchase. |
3
American Beacon Bahl & Gaynor Small Cap Growth FundSM
Performance Overview
December 31, 2016 (Unaudited)
| 4. | The S&P 500 Index is a market capitalization weighted index of common stocks publicly traded in the United States. The Russell 2000 Growth Index and the Russell 2000 Index are registered trademarks of Frank Russell Company. The Russell 2000 Growth Index is an unmanaged index of those stocks in the Russell 2000 Index with higher price-to-book ratios and higher forecasted growth values. The Russell 2000 Index is an unmanaged index of approximately 2000 smaller-capitalization stocks from various industrial sectors. One cannot directly invest in an index. |
| 5. | The total annual Fund operating expense ratio set forth in the most recent Fund prospectus for the Institutional, Y, Investor, A, and C Class shares was 3.05%, 2.77%, 3.20%, 2.89%, and 3.85%, respectively. The expense ratios above may vary from the expense ratios presented in other sections of this report that are based on expenses incurred during the period covered by this report. |
The Fund outperformed the Index primarily due to superior stock selection relative to the Index. From a stock selection standpoint, the Fund’s holdings in the Health Care, Information Technology and Consumer Discretionary sectors contributed the most to relative performance. In the Health Care sector, positions in West Pharmaceutical Services (up 42.1%), LeMaitre Vascular (up 71.9%) and Cantel Medical Corp (up 25.8%) were the largest contributors. Within the Information Technology sector, holdings in Monolithic Power (up 44.2%), FEI Company (up 36.7%), Synnex Corp (up 50.7%) and Silicon Motion Technol ADR (up 38.8%) were favorable to performance. Companies in the Consumer Discretionary sector that contributed to relative performance were Thor Industries (up 80.7%), Texas Roadhouse (up 38.1%) and Flexsteel (up 40.2%).
Sector allocation also added to relative returns during the period, as the Fund was underweight to Health Care and held an overweight to Financials relative to the benchmark.
The Fund’s basic philosophy remains focused on investing in companies using a fundamental investment approach that seeks price appreciation, capital preservation and income.
| Top Ten Holdings (% Net Assets) |
||||
| Evercore Partners, Inc. |
3.1 | |||
| Thor Industries, Inc. |
3.0 | |||
| Monolithic Power Systems, Inc. |
2.8 | |||
| Cantel Medical Corp. |
2.7 | |||
| Texas Roadhouse, Inc. |
2.7 | |||
| West Pharmaceutical Services, Inc. |
2.5 | |||
| Methode Electronics, Inc. |
2.4 | |||
| Watsco, Inc. |
2.3 | |||
| Flexsteel Industries, Inc. |
2.2 | |||
| Pegasystems, Inc. |
2.2 |
Total Fund Holdings 68
| Sector Allocation (% Equities) |
||||
| Information Technology |
26.4 | |||
| Consumer Discretionary |
17.0 | |||
| Industrials |
16.9 | |||
| Health Care |
15.3 | |||
| Financials |
12.7 | |||
| Materials |
4.3 | |||
| Consumer Staples |
4.2 | |||
| Real Estate |
2.1 | |||
| Energy |
1.1 |
4
American Beacon Holland Large Cap Growth FundSM
Performance Overview
December 31, 2016 (Unaudited)
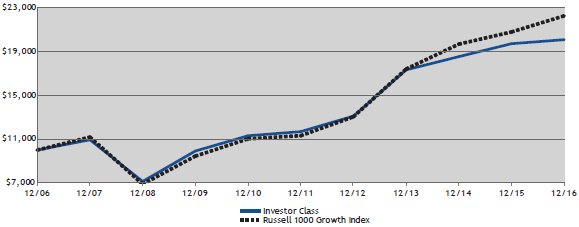
The Investor Class of the American Beacon Holland Large Cap Growth Fund (the “Fund”) returned 1.87% for the twelve months ended December 31, 2016. The Fund underperformed the Russell 1000® Growth Index (the “Index”) return of 7.08%.
Comparison of Change in Value of a $10,000 Investment for the period from 12/31/2006 through 12/31/2016
Total Returns for the Period Ended December 31, 2016
| Value of $10,000 | ||||||||||||||||||||||||
| 12/31/2006- | ||||||||||||||||||||||||
| Ticker | 1 Year | 3 Years | 5 Years | 10 Years | 12/31/2016 | |||||||||||||||||||
| Institutional Class (1,2,7) |
LHGIX | 2.25 | % | 5.41 | % | 11.84 | % | 7.44 | % | $ | 20,502 | |||||||||||||
| Y Class (1,3,7) |
LHGYX | 2.22 | % | 5.27 | % | 11.70 | % | 7.37 | % | $ | 20,371 | |||||||||||||
| Investor Class (1,7) |
LHGFX | 1.87 | % | 5.05 | % | 11.45 | % | 7.22 | % | $ | 20,085 | |||||||||||||
| A without Sales Charge (1,4,7) |
LHGAX | 1.85 | % | 4.98 | % | 11.35 | % | 7.17 | % | $ | 18,836 | |||||||||||||
| A with Sales Charge (1,4,7) |
LHGAX | -3.99 | % | 2.93 | % | 10.04 | % | 6.54 | % | $ | 18,836 | |||||||||||||
| C without Sales Charge (1,5,7) |
LHGCX | 1.10 | % | 4.20 | % | 10.55 | % | 6.79 | % | $ | 19,281 | |||||||||||||
| C with Sales Charge (1,5,7) |
LHGCX | 0.10 | % | 4.20 | % | 10.55 | % | 6.79 | % | $ | 19,281 | |||||||||||||
| Russell 1000 Growth Index (6) |
7.08 | % | 8.55 | % | 14.50 | % | 8.33 | % | $ | 22,266 | ||||||||||||||
| 1. | Performance shown is historical and is not indicative of future returns. Investment returns and principal value will vary, and shares may be worth more or less at redemption than at original purchase. Performance shown is calculated based on the published end of day net asset values as of date indicated, and current performance may be lower or higher than the performance data quoted. To obtain performance as of the most recent month end, please visit www. americanbeaconfunds.com or call 1-800-967-9009. Fund performance in the table above does not reflect the deduction of taxes a shareholder would pay on distributions or the redemption of shares. A portion of the fees charged to the Investor Class was waived from 2002 through 2012, partially recovered in 2013, and fully recovered in 2014. Performance prior to waiving fees was lower than the actual returns shown from 2002 through 2012. |
| 2. | Fund performance for the ten-year period represents the returns achieved by the Investor Class from 12/31/06 up to 3/1/10, the inception date of the Institutional Class, and the returns of the Institutional Class since its inception. Expenses of the Institutional Class are lower than those of the Investor Class. As a result, total returns shown may be lower than they would have been had the Institutional Class been in existence since 12/31/06. A portion of the fees charged to the Institutional Class was waived from 2010 through 2012 and partially recovered in 2013 and 2015. Performance prior to waiving fees was lower than the actual returns shown from 2010 through 2012. |
| 3. | Fund performance for the five-year and ten-year periods represent the returns achieved by the Investor Class from 12/31/06 up to 3/1/10, the Institutional Class from 3/1/10 to 3/23/12, the inception date of the Y Class, and the returns of the Y Class since its inception. Expenses of the Y Class are lower than those of the Investor Class. As a result, total returns shown may be lower than they would have been had the Y Class been in existence since 12/31/06. A portion of the fees charged to the Y Class was waived in 2012, partially recovered in 2013 and waived in 2014 and 2015. Performance prior to waiving fees was lower than the actual returns shown in 2012, 2014, and 2015. |
| 4. | Fund performance for the ten-year period represents the returns achieved by the Investor Class from 12/31/06 through 2/1/10, the inception date of the A Class, and the returns of the A Class since its inception. Expenses of the A Class are higher than those of the Investor Class. As a result, total returns shown may be higher than they would have been had the A Class been in existence since 12/31/06. A portion of the fees charged to the A Class was waived from |
5
American Beacon Holland Large Cap Growth FundSM
Performance Overview
December 31, 2016 (Unaudited)
| 2010 through 2014. Performance prior to waiving fees was lower than the actual returns shown from 2010 through 2014. A Class shares have a maximum sales charge of 5.75%. |
| 5. | Fund performance for the five-year and ten-year periods represent the returns achieved by the Investor Class from 12/31/06 through 3/23/12, the inception date of the C Class, and the returns of the C Class since its inception. Expenses of the C Class are higher than those of the Investor Class. As a result, total returns shown may be higher than they would have been had the C Class been in existence since 12/31/06. A portion of the fees charged to the C Class has been waived since 2012. Performance prior to waiving fees was lower than the actual returns shown since 2012. C Class has a maximum contingent deferred sales charge of 1.00% for shares redeemed within one year of the date of purchase. |
| 6. | The Russell 1000 Growth Index is an unmanaged index of those stocks in the Russell 1000 Index with higher price-to-book ratios and higher forecasted growth values. Russell 1000 Growth Index and Russell 1000 Index are registered trademarks of the Frank Russell Company. One cannot directly invest in an index. |
| 7. | The total annual Fund operating expense ratio set forth in the most recent Fund prospectus for the Institutional, Y, Investor, A, and C Class shares was 0.89%, 1.09%, 1.25%, 1.30%, and 2.06%, respectively. The expense ratios above may vary from the expense ratios presented in other sections of this report that are based on expenses incurred during the period covered by this report. |
The Fund lagged the Index primarily due to poor stock selection as sector allocation added minimal value relative to the Index.
From a stock selection perspective, holdings in the Consumer Discretionary, Consumer Staples and Information Technology sectors detracted most from performance. Companies in the Consumer Discretionary sector detracting from the Fund’s return included Under Armour (down 28.9%), Restoration Hardware (down 47.1%) and Nike (down 17.1%). In the Consumer Staples sector, CVS Health (down 18.0%), Monster Beverage (down 11.3%) and Mead Johnson Nutrition (down 9.6%) detracted from performance. Not owning NVIDIA detracted relative value in the Information Technology sector. The Fund’s allocation in Tyler Technologies (down 7.3%) also detracted from performance in the Information Technology sector.
The Fund’s underweight position in Health Care, the worst performing sector in the Index, added relative value through sector allocation. An overweight in the Industrials sector also contributed to performance. The aforementioned good performance was mostly negated by the Fund’s absence from the Telecommunication Services sector and an average overweight in the Consumer Staples sector, which detracted relative value.
Looking forward, the Fund’s sub-advisor will continue to maintain a disciplined, long-term approach to equity investing in larger stocks with above-average growth potential.
| Top Ten Holdings (% Net Assets) | ||||
| Alphabet, Inc. |
4.6 | |||
| Apple, Inc. |
4.5 | |||
| Visa, Inc. |
4.4 | |||
| Amazon.com, Inc. |
4.3 | |||
| Microsoft Corp. |
3.7 | |||
| Adobe Systems, Inc. |
3.5 | |||
| Priceline.com, Inc. |
3.4 | |||
| Honeywell International, Inc. |
2.9 | |||
| Southwest Airlines Co. |
2.8 | |||
| United Parcel Service Inc. |
2.8 |
Total Fund Holdings 51
| Sector Allocation (% Equities) | ||||
| Information Technology |
34.3 | |||
| Consumer Discretionary |
22.8 | |||
| Health Care |
14.9 | |||
| Industrials |
12.4 | |||
| Consumer Staples |
10.3 | |||
| Financials |
4.1 | |||
| Materials |
1.3 | |||
6
American Beacon FundsSM
December 31, 2016 (Unaudited)
Fund Expense Example
As a shareholder of a Fund, you incur two types of costs: (1) transaction costs, including sales charges (loads) on purchase payments and redemption fees if applicable, and (2) ongoing costs, including management fees, administrative service fees, distribution (12b-1) fees, and other Fund expenses. The Examples are intended to help you understand the ongoing costs (in dollars) of investing in the Funds and to compare these costs with the ongoing costs of investing in other mutual funds. The Examples are based on an investment of $1,000 invested at the beginning of the period in each Class and held for the entire period from July 1, 2016 through December 31, 2016.
Actual Expenses
The “Actual” lines of the tables provide information about actual account values and actual expenses. You may use the information in this line, together with the amount you invested, to estimate the expenses that you paid over the period. Simply divide your account value by $1,000 (for example, an $8,600 account value divided by $1,000 = $8.60), then multiply the result by the “Expenses Paid During Period” for the applicable Fund to estimate the expenses you paid on your account during this period. Shareholders of the Institutional and Investor Classes that invest in the Funds through an IRA or Roth IRA may be subject to a custodial IRA fee of $15 that is typically deducted each December. If your account was subject to a custodial IRA fee during the period, your costs would have been $15 higher.
Hypothetical Example for Comparison Purposes
The “Hypothetical” lines of the tables provide information about hypothetical account values and hypothetical expenses based on the Fund’s actual expense ratio and an assumed 5% per year rate of return before expenses (not the Fund’s actual return). You may compare the ongoing costs of investing in the Funds with other funds by contrasting this 5% hypothetical example and the 5% hypothetical examples that appear in the shareholder reports of the other funds. The hypothetical account values and expenses may not be used to estimate the actual ending account balance or expenses you paid for the period. Shareholders of the Institutional and Investor Classes that invest in the Fund through an IRA or Roth IRA may be subject to a custodial IRA fee of $15 that is typically deducted each December. If your account was subject to a custodial IRA fee during the period, your costs would have been $15 higher.
You should also be aware that the expenses shown in the table highlight only your ongoing costs and do not reflect any transaction costs charged by the Fund, such as sales charges (loads). Similarly, the expense examples for other funds do not reflect any transaction costs charged by those funds, such as sales charges (loads), redemption fees or exchange fees. Therefore, the “Hypothetical” lines of the tables are useful in comparing ongoing costs only and will not help you determine the relative total costs of owning different funds. If you were subject to any transaction costs during the period, your costs would have been higher.
7
American Beacon FundsSM
Expense Examples
December 31, 2016 (Unaudited)
Bahl & Gaynor Small Cap Growth Fund
| Expenses Paid During | ||||||||||||
| Beginning Account Value | Ending Account Value | Period | ||||||||||
| 7/1/2016 | 12/31/2016 | 7/1/2016-12/31/2016* | ||||||||||
| Institutional Class |
||||||||||||
| Actual |
$ | 1,000.00 | $ | 1,176.64 | $ | 5.36 | ||||||
| Hypothetical** |
$ | 1,000.00 | $ | 1,020.21 | $ | 4.98 | ||||||
| Y Class |
||||||||||||
| Actual |
$ | 1,000.00 | $ | 1,176.95 | $ | 5.91 | ||||||
| Hypothetical** |
$ | 1,000.00 | $ | 1,019.71 | $ | 5.48 | ||||||
| Investor Class |
||||||||||||
| Actual |
$ | 1,000.00 | $ | 1,174.25 | $ | 7.43 | ||||||
| Hypothetical** |
$ | 1,000.00 | $ | 1,018.30 | $ | 6.90 | ||||||
| A Class |
||||||||||||
| Actual |
$ | 1,000.00 | $ | 1,175.32 | $ | 7.55 | ||||||
| Hypothetical** |
$ | 1,000.00 | $ | 1,018.19 | $ | 7.00 | ||||||
| C Class |
||||||||||||
| Actual |
$ | 1,000.00 | $ | 1,169.83 | $ | 11.62 | ||||||
| Hypothetical** |
$ | 1,000.00 | $ | 1,014.41 | $ | 10.79 | ||||||
| * | Expenses are equal to the Fund’s annualized expense ratios for the six-month period of 0.98%, 1.08%, 1.36%, 1.38% and 2.13% for the Institutional, Y, Investor, A and C Classes respectively, multiplied by the average account value over the period, multiplied by the number derived by dividing the number of days in the most recent fiscal half-year (184) by days in the year (366) to reflect the half-year period. |
| ** | 5% return before expenses. |
Holland Large Cap Growth Fund
| Expenses Paid During | ||||||||||||
| Beginning Account Value | Ending Account Value | Period | ||||||||||
| 7/1/2016 | 12/31/2016 | 7/1/2016-12/31/2016* | ||||||||||
| Institutional Class |
||||||||||||
| Actual |
$ | 1,000.00 | $ | 1,032.00 | $ | 4.49 | ||||||
| Hypothetical** |
$ | 1,000.00 | $ | 1,020.69 | $ | 4.47 | ||||||
| Y Class |
||||||||||||
| Actual |
$ | 1,000.00 | $ | 1,032.24 | $ | 5.01 | ||||||
| Hypothetical** |
$ | 1,000.00 | $ | 1,020.22 | $ | 4.98 | ||||||
| Investor Class |
||||||||||||
| Actual |
$ | 1,000.00 | $ | 1,030.16 | $ | 6.43 | ||||||
| Hypothetical** |
$ | 1,000.00 | $ | 1,018.82 | $ | 6.39 | ||||||
| A Class |
||||||||||||
| Actual |
$ | 1,000.00 | $ | 1,030.01 | $ | 6.63 | ||||||
| Hypothetical** |
$ | 1,000.00 | $ | 1,018.60 | $ | 6.60 | ||||||
| C Class |
||||||||||||
| Actual |
$ | 1,000.00 | $ | 1,026.46 | $ | 10.39 | ||||||
| Hypothetical** |
$ | 1,000.00 | $ | 1,014.86 | $ | 10.33 | ||||||
| * | Expenses are equal to the Fund’s annualized expense ratios for the six-month period of 0.88%, 0.98%, 1.26%, 1.30% and 2.04% for the Institutional, Y, Investor, A and C Classes respectively, multiplied by the average account value over the period, multiplied by the number derived by dividing the number of days in the most recent fiscal half-year (184) by days in the year (366) to reflect the half-year period. |
| ** | 5% return before expenses. |
8
American Beacon FundsSM
Report of Independent Registered Public Accounting Firm
The Board of Trustees and Shareholders of
American Beacon Bahl & Gaynor Small Cap Growth Fund and American Beacon Holland Large Cap Growth Fund
We have audited the accompanying statements of assets and liabilities, including the schedules of investments, of American Beacon Bahl & Gaynor Small Cap Growth Fund and American Beacon Holland Large Cap Growth Fund (two of the funds constituting the American Beacon Funds) (collectively, the Funds), as of December 31, 2016, and the related statements of operations for the year then ended, the statements of changes in net assets for each of the two years in the period then ended and the financial highlights for each of the periods indicated therein. These financial statements and financial highlights are the responsibility of the Funds’ management. Our responsibility is to express an opinion on these financial statements and financial highlights based on our audits.
We conducted our audits in accordance with the standards of the Public Company Accounting Oversight Board
(United States). Those standards require that we plan and perform the audit to obtain reasonable assurance about whether the financial statements and financial highlights are free of material misstatement. We were not engaged to perform an audit of the Funds’ internal control over financial reporting. Our audits included consideration of internal control over financial reporting as a basis for designing audit procedures that are appropriate in the circumstances, but not for the purpose of expressing an opinion on the effectiveness of the Funds’ internal control over financial reporting. Accordingly, we express no such opinion. An audit also includes examining, on a test basis, evidence supporting the amounts and disclosures in the financial statements and financial highlights, assessing the accounting principles used and significant estimates made by management, and evaluating the overall financial statement presentation. Our procedures included confirmation of securities owned as of December 31, 2016, by correspondence with the custodian and brokers or by other appropriate auditing procedures where replies from brokers were not received. We believe that our audits provide a reasonable basis for our opinion.
In our opinion, the financial statements and financial highlights referred to above present fairly, in all material respects, the financial position of American Beacon Bahl & Gaynor Small Cap Growth Fund and American Beacon Holland Large Cap Growth Fund at December 31, 2016, the results of their operations for the year then ended, the changes in their net assets for each of the two years in the period then ended and the financial highlights for each of the periods indicated therein in conformity with U.S. generally accepted accounting principles.

Dallas, Texas
February 28, 2017
9
American Beacon Bahl & Gaynor Small Cap Growth FundSM
December 31, 2016
| Shares | Fair Value | |||||||
| COMMON STOCK - 98.02% |
||||||||
| CONSUMER DISCRETIONARY - 16.63% |
||||||||
| Auto Components - 2.15% |
||||||||
| Gentex Corp. |
22,700 | $ | 446,963 | |||||
|
|
|
|||||||
| Automobiles - 3.75% |
||||||||
| Hyster-Yale Materials Handling, Inc. |
2,520 | 160,700 | ||||||
| Thor Industries, Inc. |
6,150 | 615,308 | ||||||
|
|
|
|||||||
| 776,008 | ||||||||
|
|
|
|||||||
| Hotels, Restaurants & Leisure - 4.97% |
||||||||
| Brinker International, Inc. |
2,050 | 101,537 | ||||||
| Marriott Vacations Worldwide Corp. |
4,265 | 361,885 | ||||||
| Texas Roadhouse, Inc. |
11,735 | 566,095 | ||||||
|
|
|
|||||||
| 1,029,517 | ||||||||
|
|
|
|||||||
| Household Durables - 3.54% |
||||||||
| Flexsteel Industries, Inc. |
7,565 | 466,534 | ||||||
| Matthews International Corp., Class A |
3,485 | 267,822 | ||||||
|
|
|
|||||||
| 734,356 | ||||||||
|
|
|
|||||||
| Multiline Retail -1.36% |
||||||||
| Pricesmart, Inc. |
3,395 | 283,483 | ||||||
|
|
|
|||||||
| Specialty Retail - 0.86% |
||||||||
| Monro Muffler Brake, Inc. |
3,130 | 179,036 | ||||||
|
|
|
|||||||
| Total Consumer Discretionary |
3,449,363 | |||||||
|
|
|
|||||||
| CONSUMER STAPLES - 4.08% |
||||||||
| Food & Drug Retailing -0.68% |
||||||||
| B&G Foods, Inc. |
3,220 | 141,036 | ||||||
|
|
|
|||||||
| Food Products - 1.96% |
||||||||
| J&J Snack Foods Corp. |
3,045 | 406,294 | ||||||
|
|
|
|||||||
| Personal Products - 1.44% |
||||||||
| Inter Parfums, Inc. |
9,135 | 299,171 | ||||||
|
|
|
|||||||
| Total Consumer Staples |
846,501 | |||||||
|
|
|
|||||||
| ENERGY - 1.07% |
||||||||
| Oil & Gas - 1.07% |
||||||||
| GasLog Ltd. |
13,830 | 222,663 | ||||||
|
|
|
|||||||
| FINANCIALS - 12.47% |
||||||||
| Banks - 8.98% |
||||||||
| Bank of the Ozarks, Inc. |
3,505 | 184,327 | ||||||
| Evercore Partners, Inc., Class A |
9,220 | 633,414 | ||||||
| Glacier Bancorp, Inc. |
3,920 | 142,022 | ||||||
| MainSource Financial Group, Inc. |
4,940 | 169,936 | ||||||
| PacWest Bancorp. |
5,095 | 277,372 | ||||||
| S&T Bancorp, Inc. |
6,000 | 234,240 | ||||||
| Virtu Financial, Inc., Class A |
13,920 | 222,024 | ||||||
|
|
|
|||||||
| 1,863,335 | ||||||||
|
|
|
|||||||
| Diversified Financials - 1.78% |
||||||||
| MarketAxess Holdings, Inc. |
2,520 | 370,238 | ||||||
|
|
|
|||||||
| Insurance - 1.71% |
||||||||
| Horace Mann Educators Corp. |
8,270 | 353,956 | ||||||
|
|
|
|||||||
| Total Financials |
2,587,529 | |||||||
|
|
|
|||||||
See accompanying notes
10
American Beacon Bahl & Gaynor Small Cap Growth FundSM
Schedule of Investments
December 31, 2016
| Shares | Fair Value | |||||||
| HEALTH CARE - 14.99% |
||||||||
| Health Care Equipment & Supplies - 9.70% |
||||||||
| Abaxis, Inc. |
6,520 | $ | 344,060 | |||||
| Atrion Corp. |
345 | 174,984 | ||||||
| Bio-Techne Corp. |
1,650 | 169,670 | ||||||
| LeMaitre Vascular, Inc. |
9,920 | 251,373 | ||||||
| Mesa Laboratories, Inc. |
2,000 | 245,500 | ||||||
| Patterson Cos., Inc. |
7,435 | 305,058 | ||||||
| West Pharmaceutical Services, Inc. |
6,175 | 523,825 | ||||||
|
|
|
|||||||
| 2,014,470 | ||||||||
|
|
|
|||||||
| Health Care Providers & Services - 5.29% |
||||||||
| Cantel Medical Corp. |
7,215 | 568,181 | ||||||
| Omnicell, Inc.A |
10,175 | 344,933 | ||||||
| U.S. Physical Therapy, Inc. |
2,615 | 183,573 | ||||||
|
|
|
|||||||
| 1,096,687 | ||||||||
|
|
|
|||||||
| Total Health Care |
3,111,157 | |||||||
|
|
|
|||||||
| INDUSTRIALS - 16.54% |
||||||||
| Aerospace & Defense - 0.51% |
||||||||
| HEICO Corp. |
1,365 | 105,310 | ||||||
|
|
|
|||||||
| Building Products - 6.02% |
||||||||
| Apogee Enterprises, Inc. |
6,605 | 353,764 | ||||||
| Simpson Manufacturing Co., Inc. |
4,870 | 213,063 | ||||||
| Universal Forest Products, Inc. |
2,000 | 204,360 | ||||||
| Watsco, Inc. |
3,245 | 480,649 | ||||||
|
|
|
|||||||
| 1,251,836 | ||||||||
|
|
|
|||||||
| Commercial Services & Supplies - 4.60% |
||||||||
| CSG Systems International, Inc. |
3,220 | 155,848 | ||||||
| Healthcare Services Group, Inc. |
6,695 | 262,243 | ||||||
| Monotype Imaging Holdings, Inc. |
11,480 | 227,878 | ||||||
| MSA Safety, Inc. |
4,440 | 307,825 | ||||||
|
|
|
|||||||
| 953,794 | ||||||||
|
|
|
|||||||
| Electrical Equipment - 0.96% |
||||||||
| II-VI, Inc. |
6,695 | 198,507 | ||||||
|
|
|
|||||||
| Machinery - 4.45% |
||||||||
| Applied Industrial Technologies, Inc. |
6,085 | 361,449 | ||||||
| Raven Industries, Inc. |
10,175 | 256,410 | ||||||
| Valmont Industries, Inc. |
2,170 | 305,753 | ||||||
|
|
|
|||||||
| 923,612 | ||||||||
|
|
|
|||||||
| Total Industrials |
3,433,059 | |||||||
|
|
|
|||||||
| INFORMATION TECHNOLOGY - 25.98% |
||||||||
| Electronic Equipment & Instruments - 4.68% |
||||||||
| Analogic Corp. |
2,170 | 180,002 | ||||||
| Littelfuse, Inc. |
1,130 | 171,500 | ||||||
| Methode Electronics, Inc. |
12,175 | 503,436 | ||||||
| NVE Corp. |
1,625 | 116,074 | ||||||
|
|
|
|||||||
| 971,012 | ||||||||
|
|
|
|||||||
| Internet Software & Services - 2.88% |
||||||||
| GrubHub, Inc.A |
3,850 | 144,837 | ||||||
| NIC, Inc. |
14,090 | 336,751 | ||||||
| Reis, Inc. |
5,165 | 114,921 | ||||||
|
|
|
|||||||
| 596,509 | ||||||||
|
|
|
|||||||
See accompanying notes
11
American Beacon Bahl & Gaynor Small Cap Growth FundSM
Schedule of Investments
December 31, 2016
| Shares | Fair Value | |||||||
| INFORMATION TECHNOLOGY - 25.98% (continued) |
||||||||
| IT Consulting & Services - 5.81% |
||||||||
| Forrester Research, Inc. |
2,480 | $ | 106,516 | |||||
| Hackett Group, Inc. |
18,445 | 325,739 | ||||||
| Ritchie Bros Auctioneers, Inc. |
13,135 | 446,590 | ||||||
| SYNNEX Corp. |
2,700 | 326,754 | ||||||
|
|
|
|||||||
| 1,205,599 | ||||||||
|
|
|
|||||||
| Semiconductor Equipment & Products - 7.73% |
||||||||
| Cirrus Logic, Inc.A |
7,300 | 412,742 | ||||||
| Monolithic Power Systems, Inc. |
7,045 | 577,197 | ||||||
| Power Integrations, Inc. |
4,005 | 271,739 | ||||||
| Silicon Motion Technology Corp. ADRB |
8,090 | 343,663 | ||||||
|
|
|
|||||||
| 1,605,341 | ||||||||
|
|
|
|||||||
| Software - 4.88% |
||||||||
| Blackbaud, Inc. |
4,955 | 317,120 | ||||||
| National Instruments Corp. |
7,835 | 241,475 | ||||||
| Pegasystems, Inc. |
12,610 | 453,960 | ||||||
|
|
|
|||||||
| 1,012,555 | ||||||||
|
|
|
|||||||
| Total Information Technology |
5,391,016 | |||||||
|
|
|
|||||||
| MATERIALS - 4.17% |
||||||||
| Chemicals - 4.17% |
||||||||
| Balchem Corp. |
4,090 | 343,233 | ||||||
| PolyOne Corp. |
11,650 | 373,266 | ||||||
| Stepan Co. |
1,825 | 148,701 | ||||||
|
|
|
|||||||
| Total Materials |
865,200 | |||||||
|
|
|
|||||||
| REAL ESTATE - 2.09% |
||||||||
| Real Estate Management & Development - 2.09% |
||||||||
| RE/MAX Holdings, Inc., Class A |
7,745 | 433,720 | ||||||
|
|
|
|||||||
| Total Common Stock (Cost $17,406,037) |
20,340,208 | |||||||
|
|
|
|||||||
| SHORT TERM INVESTMENTS - 3.03% (Cost $628,203) |
||||||||
| American Beacon U.S. Government Money Market Select Fund, Select ClassC |
628,203 | 628,203 | ||||||
|
|
|
|||||||
| TOTAL INVESTMENTS - 101.05% (Cost $18,034,240) |
20,968,411 | |||||||
| LIABILITIES, NET OF OTHER ASSETS - (1.05%) |
(218,394 | ) | ||||||
|
|
|
|||||||
| TOTAL NET ASSETS - 100.00% |
$ | 20,750,017 | ||||||
|
|
|
|||||||
| Percentages are stated as a percent of net assets. |
||||||||
| A | Non-income producing security. |
| B | ADR - American Depositary Receipt. |
| C | The Fund is affiliated by having the same investment advisor. |
Futures Contracts Open on December 31, 2016:
| Description |
Type | Number of Contracts |
Expiration Date | Contract Value | Unrealized Appreciation (Depreciation) |
|||||||||||||||
| Russell 2000 Mini Index Futures |
Long | 4 | March 2017 | $ | 271,380 | $ | (2,785 | ) | ||||||||||||
|
|
|
|
|
|||||||||||||||||
| $ | 271,380 | $ | (2,785 | ) | ||||||||||||||||
|
|
|
|
|
|||||||||||||||||
See accompanying notes
12
American Beacon Holland Large Cap Growth FundSM
Schedule of Investments
December 31, 2016
| Shares | Fair Value | |||||||
| COMMON STOCK - 97.25% |
||||||||
| CONSUMER DISCRETIONARY - 22.13% |
||||||||
| Auto Components - 1.08% |
||||||||
| Delphi Automotive PLCA |
15,482 | $ | 1,042,713 | |||||
|
|
|
|||||||
| Home Builders - 0.98% |
||||||||
| D.R. Horton, Inc. |
34,676 | 947,695 | ||||||
|
|
|
|||||||
| Hotels, Restaurants &Leisure - 1.69% |
||||||||
| Starbucks Corp. |
29,522 | 1,639,061 | ||||||
|
|
|
|||||||
| Internet & Catalog Retail - 7.74% |
||||||||
| Amazon.com, Inc.B |
5,568 | 4,175,276 | ||||||
| priceline.com, Inc.B |
2,268 | 3,325,024 | ||||||
|
|
|
|||||||
| 7,500,300 | ||||||||
|
|
|
|||||||
| Media - 1.69% |
||||||||
| Twenty-First Century Fox, Inc., Class A |
58,273 | 1,633,975 | ||||||
|
|
|
|||||||
| Multiline Retail - 1.40% |
||||||||
| Dollar General Corp. |
18,253 | 1,352,000 | ||||||
|
|
|
|||||||
| Specialty Retail - 4.38% |
||||||||
| Advance Auto Parts, Inc. |
11,475 | 1,940,652 | ||||||
| Lowe’s Cos., Inc. |
32,274 | 2,295,327 | ||||||
|
|
|
|||||||
| 4,235,979 | ||||||||
|
|
|
|||||||
| Textiles & Apparel - 3.17% |
||||||||
| NIKE, Inc., Class B |
38,696 | 1,966,918 | ||||||
| Under Armour, Inc., Class A |
37,948 | 1,102,389 | ||||||
|
|
|
|||||||
| 3,069,307 | ||||||||
|
|
|
|||||||
| Total Consumer Discretionary |
21,421,030 | |||||||
|
|
|
|||||||
| CONSUMER STAPLES - 10.03% |
||||||||
| Beverages - 2.91% |
||||||||
| Monster Beverage Corp.B |
42,405 | 1,880,238 | ||||||
| PepsiCo, Inc. |
8,979 | 939,472 | ||||||
|
|
|
|||||||
| 2,819,710 | ||||||||
|
|
|
|||||||
| Food & Drug Retailing - 7.12% |
||||||||
| Costco Wholesale Corp. |
11,551 | 1,849,431 | ||||||
| CVS Caremark Corp. |
29,684 | 2,342,364 | ||||||
| Mead Johnson Nutrition Co., Class A |
16,204 | 1,146,595 | ||||||
| Whole Foods Market, Inc. |
50,552 | 1,554,980 | ||||||
|
|
|
|||||||
| 6,893,370 | ||||||||
|
|
|
|||||||
| Total Consumer Staples |
9,713,080 | |||||||
|
|
|
|||||||
| FINANCIALS - 3.96% |
||||||||
| Diversified Financials - 3.96% |
||||||||
| BlackRock, Inc., Class A |
5,109 | 1,944,179 | ||||||
| TD Ameritrade Holding Corp. |
43,443 | 1,894,115 | ||||||
|
|
|
|||||||
| Total Financials |
3,838,294 | |||||||
|
|
|
|||||||
| HEALTH CARE - 14.46% |
||||||||
| Biotechnology - 4.65% |
||||||||
| Biogen Idec, Inc.B |
2,173 | 616,219 | ||||||
| Gilead Sciences, Inc. |
27,238 | 1,950,513 | ||||||
| Quintiles IMS Holdings, Inc.B |
14,792 | 1,124,932 | ||||||
| Vertex Pharmaceuticals, Inc.B |
11,000 | 810,370 | ||||||
|
|
|
|||||||
| 4,502,034 | ||||||||
|
|
|
|||||||
See accompanying notes
13
American Beacon Holland Large Cap Growth FundSM
Schedule of Investments
December 31, 2016
| Shares | Fair Value | |||||||
| HEALTH CARE - 14.46% (continued) |
||||||||
| Health Care Equipment & Supplies - 2.54% |
||||||||
| Hologic, Inc.B |
25,007 | $ | 1,003,281 | |||||
| Medtronic PLCA |
20,470 | 1,458,078 | ||||||
|
|
|
|||||||
| 2,461,359 | ||||||||
|
|
|
|||||||
| Health Care Providers & Services - 4.55% |
||||||||
| Cerner Corp.B |
25,496 | 1,207,746 | ||||||
| DaVita HealthCare Partners, Inc.B |
15,234 | 978,023 | ||||||
| Envision Healthcare Corp.B |
9,951 | 629,799 | ||||||
| UnitedHealth Group, Inc. |
9,915 | 1,586,796 | ||||||
|
|
|
|||||||
| 4,402,364 | ||||||||
|
|
|
|||||||
| Pharmaceuticals - 2.72% |
||||||||
| Bristol-Myers Squibb Co. |
22,596 | 1,320,510 | ||||||
| Zoetis, Inc. |
24,466 | 1,309,665 | ||||||
|
|
|
|||||||
| 2,630,175 | ||||||||
|
|
|
|||||||
| Total Health Care |
13,995,932 | |||||||
|
|
|
|||||||
| INDUSTRIALS - 12.02% |
||||||||
| Aerospace &Defense - 1.74% |
||||||||
| Boeing Co. |
10,840 | 1,687,571 | ||||||
|
|
|
|||||||
| Air Freight & Couriers - 2.80% |
||||||||
| United Parcel Service, Inc., Class B |
23,676 | 2,714,217 | ||||||
|
|
|
|||||||
| Airlines - 2.78% |
||||||||
| Southwest Airlines Co. |
53,920 | 2,687,373 | ||||||
|
|
|
|||||||
| Electrical Equipment - 1.78% |
||||||||
| Roper Industries, Inc. |
9,427 | 1,725,895 | ||||||
|
|
|
|||||||
| Industrial Conglomerates - 2.92% |
||||||||
| Honeywell International, Inc. |
24,335 | 2,819,210 | ||||||
|
|
|
|||||||
| Total Industrials |
11,634,266 | |||||||
|
|
|
|||||||
| INFORMATION TECHNOLOGY - 33.37% |
||||||||
| Communications - 1.90% |
||||||||
| Facebook, Inc., Class AB |
15,969 | 1,837,233 | ||||||
|
|
|
|||||||
| Communications Equipment - 1.42% |
||||||||
| Cisco Systems, Inc. |
45,625 | 1,378,788 | ||||||
|
|
|
|||||||
| Computers & Peripherals - 5.68% |
||||||||
| Apple, Inc. |
37,782 | 4,375,911 | ||||||
| International Business Machines Corp. |
6,752 | 1,120,764 | ||||||
|
|
|
|||||||
| 5,496,675 | ||||||||
|
|
|
|||||||
| Internet Software & Services - 4.59% |
||||||||
| Alphabet, Inc., Class CB |
5,760 | 4,445,683 | ||||||
|
|
|
|||||||
| IT Consulting & Services - 7.18% |
||||||||
| Automatic Data Processing, Inc. |
15,667 | 1,610,254 | ||||||
| Tyler Technologies, Inc. |
7,341 | 1,048,075 | ||||||
| Visa, Inc., Class A |
55,023 | 4,292,894 | ||||||
|
|
|
|||||||
| 6,951,223 | ||||||||
|
|
|
|||||||
| Semiconductor Equipment & Products - 1.83% |
||||||||
| NXP Semiconductors N.V.B |
18,074 | 1,771,433 | ||||||
|
|
|
|||||||
| Software - 10.77% |
||||||||
| Adobe Systems, Inc.B |
32,586 | 3,354,729 | ||||||
| Check Point Software Technologies Ltd.B |
14,574 | 1,230,920 | ||||||
See accompanying notes
14
American Beacon Holland Large Cap Growth FundSM
Schedule of Investments
December 31, 2016
| Shares | Fair Value | |||||||
| INFORMATION TECHNOLOGY - 33.37% (continued) |
||||||||
| Software - 10.77% (continued) |
||||||||
| Citrix Systems, Inc.B |
10,843 | $ | 968,388 | |||||
| Intuit, Inc. |
11,111 | 1,273,432 | ||||||
| Microsoft Corp. |
57,885 | 3,596,974 | ||||||
|
|
|
|||||||
| 10,424,443 | ||||||||
|
|
|
|||||||
| Total Information Technology |
32,305,478 | |||||||
|
|
|
|||||||
| MATERIALS - 1.28% |
||||||||
| Chemicals - 1.28% |
||||||||
| Ecolab, Inc. |
10,551 | 1,236,788 | ||||||
|
|
|
|||||||
| Total Common Stock (Cost $68,968,529) |
94,144,868 | |||||||
|
|
|
|||||||
| SHORT-TERM INVESTMENTS - 2.69% (Cost $2,600,481) |
||||||||
| American Beacon U.S. Government Money Market Select Fund, Select ClassC |
2,600,481 | 2,600,481 | ||||||
|
|
|
|||||||
| TOTAL INVESTMENTS - 99.94% (Cost $71,569,010) |
96,745,349 | |||||||
| OTHER ASSETS, NET OF LIABILITIES - 0.06% |
54,475 | |||||||
|
|
|
|||||||
| TOTAL NET ASSETS - 100.00% |
$ | 96,799,824 | ||||||
|
|
|
|||||||
Percentages are stated as a percent of net assets.
| A | PLC - Public Limited Company. |
| B | Non-income producing security. |
| C | The Fund is affiliated by having the same investment advisor. |
Futures Contracts Open on December 31, 2016:
| Description |
Type | Number of Contracts |
Expiration Date | Contract Value | Unrealized Appreciation (Depreciation) |
|||||||||||||||
| S&P 500 E-Mini Index Futures |
Long | 22 | March 2017 | $ | 2,459,820 | $ | (16,479 | ) | ||||||||||||
|
|
|
|
|
|||||||||||||||||
| $ | 2,459,820 | $ | (16,479 | ) | ||||||||||||||||
|
|
|
|
|
|||||||||||||||||
See accompanying notes
15
American Beacon FundsSM
Statements of Assets and Liabilities
December 31, 2016
| Bahl & Gaynor Small | Holland Large Cap | |||||||
| Cap Growth Fund | Growth Fund | |||||||
| Assets: |
||||||||
| Investments in unaffiliated securities, at fair value A |
$ | 20,340,208 | $ | 94,144,868 | ||||
| Investments in affiliated securities, at fair value B |
628,203 | 2,600,481 | ||||||
| Deposit with brokers for futures contracts |
26,565 | 111,138 | ||||||
| Dividends and interest receivable |
18,453 | 54,996 | ||||||
| Receivable for fund shares sold |
87,007 | 18,527 | ||||||
| Receivable for expense reimbursement (Note 2) |
12,182 | 28 | ||||||
| Prepaid expenses |
16,885 | 12,199 | ||||||
|
|
|
|
|
|||||
| Total assets |
21,129,503 | 96,942,237 | ||||||
|
|
|
|
|
|||||
| Liabilities: |
||||||||
| Payable for investments purchased |
322,592 | — | ||||||
| Payable for fund shares redeemed |
2,387 | 363 | ||||||
| Payable for variation margin from open futures contracts (Note 5) |
2,780 | 16,430 | ||||||
| Management and investment advisory fees payable |
15,251 | 69,185 | ||||||
| Administrative service and service fees payable |
2,344 | 15,958 | ||||||
| Transfer agent fees payable |
412 | 1,660 | ||||||
| Custody and fund accounting fees payable |
2,019 | 2,740 | ||||||
| Professional fees payable |
29,397 | 29,960 | ||||||
| Trustee fees payable |
1 | 11 | ||||||
| Payable for prospectus and shareholder reports |
1,538 | 1,719 | ||||||
| Other liabilities |
765 | 4,387 | ||||||
|
|
|
|
|
|||||
| Total liabilities |
379,486 | 142,413 | ||||||
|
|
|
|
|
|||||
| Net Assets |
$ | 20,750,017 | $ | 96,799,824 | ||||
|
|
|
|
|
|||||
| Analysis of Net Assets: |
||||||||
| Paid-in-capital |
$ | 17,952,792 | $ | 71,200,795 | ||||
| Undistributed net investment income |
— | 5,036 | ||||||
| Accumulated net realized gain (loss) |
(134,162 | ) | 434,133 | |||||
| Unrealized appreciation of investments |
2,934,172 | 25,176,339 | ||||||
| Unrealized (depreciation) of futures contracts |
(2,785 | ) | (16,479 | ) | ||||
|
|
|
|
|
|||||
| Net assets |
$ | 20,750,017 | $ | 96,799,824 | ||||
|
|
|
|
|
|||||
| Shares outstanding at no par value (unlimited shares authorized): |
||||||||
| Institutional Class |
592,267 | 1,043,477 | ||||||
|
|
|
|
|
|||||
| Y Class |
538,005 | 16,497 | ||||||
|
|
|
|
|
|||||
| Investor Class |
284,154 | 2,845,775 | ||||||
|
|
|
|
|
|||||
| A Class |
183,587 | 55,348 | ||||||
|
|
|
|
|
|||||
| C Class |
33,193 | 14,909 | ||||||
|
|
|
|
|
|||||
| Net assets: |
||||||||
| Institutional Class |
$ | 7,563,970 | $ | 25,818,864 | ||||
|
|
|
|
|
|||||
| Y Class |
$ | 6,856,954 | $ | 405,410 | ||||
|
|
|
|
|
|||||
| Investor Class |
$ | 3,595,277 | $ | 68,905,910 | ||||
|
|
|
|
|
|||||
| A Class |
$ | 2,321,426 | $ | 1,327,798 | ||||
|
|
|
|
|
|||||
| C Class |
$ | 412,390 | $ | 341,842 | ||||
|
|
|
|
|
|||||
| Net asset value, offering and redemption price per share: |
||||||||
| Institutional Class |
$ | 12.77 | $ | 24.74 | ||||
|
|
|
|
|
|||||
| Y Class |
$ | 12.75 | $ | 24.57 | ||||
|
|
|
|
|
|||||
| Investor Class |
$ | 12.65 | $ | 24.21 | ||||
|
|
|
|
|
|||||
| A Class |
$ | 12.64 | $ | 23.99 | ||||
|
|
|
|
|
|||||
| A Class (offering price) |
$ | 13.41 | $ | 25.45 | ||||
|
|
|
|
|
|||||
| C Class |
$ | 12.42 | $ | 22.93 | ||||
|
|
|
|
|
|||||
| A Cost of investments in unaffiliated securities |
$ | 17,406,037 | $ | 68,968,529 | ||||
| B Cost of investments in affiliated securities |
$ | 628,203 | $ | 2,600,481 | ||||
See accompanying notes
16
American Beacon FundsSM
Statements of Operations
For the year ended December 31, 2016
| Bahl & Gaynor | ||||||||
| Small Cap | Holland Large | |||||||
| Growth Fund | Cap Growth Fund | |||||||
| Investment income: |
||||||||
| Dividend income from unaffiliated securities (net of foreign taxes) A |
$ | 178,586 | $ | 1,069,273 | ||||
| Dividend income from affiliated securities |
933 | 8,894 | ||||||
|
|
|
|
|
|||||
| Total investment income |
179,519 | 1,078,167 | ||||||
|
|
|
|
|
|||||
| Expenses: |
||||||||
| Management and investment advisory fees (Note 2) |
86,130 | 605,211 | ||||||
| Administrative service fees (Note 2): |
||||||||
| Institutional Class |
5,866 | 21,055 | ||||||
| Y Class |
5,190 | 385 | ||||||
| Investor Class |
1,550 | 90,164 | ||||||
| A Class |
1,323 | 1,980 | ||||||
| C Class |
394 | 741 | ||||||
| Transfer agent fees: |
||||||||
| Institutional Class |
542 | 1,607 | ||||||
| Y Class |
200 | 18 | ||||||
| Investor Class |
1,322 | 8,282 | ||||||
| A Class |
147 | 216 | ||||||
| C Class |
30 | 46 | ||||||
| Custody and fund accounting fees |
11,563 | 17,850 | ||||||
| Professional fees |
26,170 | 29,985 | ||||||
| Registration fees and expenses |
63,387 | 65,852 | ||||||
| Service fees (Note 2): |
||||||||
| Y Class |
4,183 | 389 | ||||||
| Investor Class |
3,112 | 255,414 | ||||||
| A Class |
1,593 | 2,497 | ||||||
| C Class |
477 | 760 | ||||||
| Distribution fees (Note 2): |
||||||||
| A Class |
2,655 | 4,161 | ||||||
| C Class |
3,182 | 5,064 | ||||||
| Prospectus and shareholder report expenses |
5,336 | 6,328 | ||||||
| Trustee fees |
672 | 6,444 | ||||||
| Other expenses |
4,668 | 8,132 | ||||||
|
|
|
|
|
|||||
| Total expenses |
229,692 | 1,132,581 | ||||||
|
|
|
|
|
|||||
| Net fees waived and expenses reimbursed (Note 2) |
(99,554 | ) | (143 | ) | ||||
|
|
|
|
|
|||||
| Net expenses |
130,138 | 1,132,438 | ||||||
|
|
|
|
|
|||||
| Net investment income (loss) |
49,381 | (54,271 | ) | |||||
|
|
|
|
|
|||||
| Realized and unrealized gain (loss) from investments: |
||||||||
| Net realized gain from: |
||||||||
| Investments |
73,137 | 3,087,628 | ||||||
| Commission recapture (Note 1) |
— | 3,092 | ||||||
| Futures contracts |
19,965 | 424,669 | ||||||
| Change in net unrealized appreciation (depreciation) of: |
||||||||
| Investments |
2,936,525 | (1,741,977 | ) | |||||
| Futures contracts |
(3,753 | ) | (37,112 | ) | ||||
|
|
|
|
|
|||||
| Net gain from investments |
3,025,874 | 1,736,300 | ||||||
|
|
|
|
|
|||||
| Net increase in net assets resulting from operations |
$ | 3,075,255 | $ | 1,682,029 | ||||
|
|
|
|
|
|||||
| A Foreign taxes |
$ | 852 | $ | — | ||||
See accompanying notes
17
American Beacon FundsSM
Statements of Changes in Net Assets
| Bahl & Gaynor Small Cap Growth | ||||||||||||||||
| Fund | Holland Large Cap Growth Fund | |||||||||||||||
| Year Ended | Year Ended | Year Ended | Year Ended | |||||||||||||
| December 31, | December 31, | December 31, | December 31, | |||||||||||||
| 2016 | 2015 | 2016 | 2015 | |||||||||||||
| Increase (Decrease) in Net Assets: |
||||||||||||||||
| Operations: |
||||||||||||||||
| Net investment income (loss) |
$ | 49,381 | $ | 39,587 | $ | (54,271 | ) | $ | (38,964 | ) | ||||||
| Net realized gain (loss) from investments, commission recapture, and futures contracts |
93,102 | (122,070 | ) | 3,515,389 | 8,294,079 | |||||||||||
| Change in net unrealized appreciation (depreciation) from investments and futures contracts |
2,932,772 | (233,970 | ) | (1,779,089 | ) | (1,934,166 | ) | |||||||||
|
|
|
|
|
|
|
|
|
|||||||||
| Net increase (decrease) in net assets resulting from operations |
3,075,255 | (316,453 | ) | 1,682,029 | 6,320,949 | |||||||||||
|
|
|
|
|
|
|
|
|
|||||||||
| Distributions to Shareholders: |
||||||||||||||||
| Net investment income: |
||||||||||||||||
| Institutional Class |
(18,862 | ) | (17,671 | ) | — | — | ||||||||||
| Y Class |
(16,961 | ) | (14,934 | ) | — | — | ||||||||||
| Investor Class |
(8,783 | ) | (2,743 | ) | — | — | ||||||||||
| A Class |
(5,812 | ) | (3,164 | ) | — | — | ||||||||||
| C Class |
(497 | ) | (1,728 | ) | — | — | ||||||||||
| Net realized gain from investments: |
||||||||||||||||
| Institutional Class |
— | (51,523 | ) | (646,655 | ) | (1,831,892 | ) | |||||||||
| Y Class |
— | (43,542 | ) | (10,980 | ) | (34,744 | ) | |||||||||
| Investor Class |
— | (7,997 | ) | (1,766,034 | ) | (8,194,511 | ) | |||||||||
| A Class |
— | (9,223 | ) | (34,342 | ) | (136,161 | ) | |||||||||
| C Class |
— | (5,037 | ) | (9,316 | ) | (83,671 | ) | |||||||||
|
|
|
|
|
|
|
|
|
|||||||||
| Net distributions to shareholders |
(50,915 | ) | (157,562 | ) | (2,467,327 | ) | (10,280,979 | ) | ||||||||
|
|
|
|
|
|
|
|
|
|||||||||
| Capital Share Transactions: |
||||||||||||||||
| Proceeds from sales of shares |
11,394,900 | 5,715,997 | 13,225,448 | 6,242,514 | ||||||||||||
| Reinvestment of dividends and distributions |
49,550 | 157,455 | 2,467,141 | 10,280,143 | ||||||||||||
| Cost of shares redeemed |
(923,263 | ) | (2,230,601 | ) | (17,992,253 | ) | (13,612,879 | ) | ||||||||
|
|
|
|
|
|
|
|
|
|||||||||
| Net increase (decrease) in net assets from Capital share transactions |
10,521,187 | 3,642,851 | (2,299,664 | ) | 2,909,778 | |||||||||||
|
|
|
|
|
|
|
|
|
|||||||||
| Net increase (decrease) in net assets |
13,545,527 | 3,168,836 | (3,084,962 | ) | (1,050,252 | ) | ||||||||||
|
|
|
|
|
|
|
|
|
|||||||||
| Net Assets: |
||||||||||||||||
| Beginning of period |
7,204,490 | 4,035,654 | 99,884,786 | 100,935,038 | ||||||||||||
|
|
|
|
|
|
|
|
|
|||||||||
| End of Period* |
$ | 20,750,017 | $ | 7,204,490 | $ | 96,799,824 | $ | 99,884,786 | ||||||||
|
|
|
|
|
|
|
|
|
|||||||||
| *Includes undistributed net investment income |
$ | — | $ | — | $ | 5,036 | $ | — | ||||||||
|
|
|
|
|
|
|
|
|
|||||||||
See accompanying notes
18
American Beacon FundsSM
December 31, 2016
1. Organization
American Beacon Funds (the “Trust”), is organized as a Massachusetts business trust and is registered under the Investment Company Act of 1940, as amended (the “Act”), as a diversified, open-end management investment company. As of December 31, 2016, the Trust consists of twenty-six active series, two of which are presented in this filing (collectively, the “Funds” and each individually a “Fund”): the American Beacon Bahl & Gaynor Small Cap Growth Fund and American Beacon Holland Large Cap Growth Fund. The remaining twenty-four active series are reported in separate filings.
American Beacon Advisors, Inc. (the “Manager”) is a wholly-owned subsidiary of Astro AB Borrower, Inc., which is indirectly owned by investment funds affiliated with Kelso & Company, L.P. and Estancia Capital Management, LLC, and was organized in 1986 to provide business management, advisory, administrative and asset management consulting services to the Trust and other investors.
Class Disclosure
The Funds have multiple classes of shares designed to meet the needs of different groups of investors. The following table sets forth the differences amongst the classes:
| Class |
Eligible Investors |
Minimum Initial Investments |
||||
| Institutional |
Large institutional investors - sold directly or through intermediary channels. | $ | 250,000 | |||
| Y Class |
Large institutional retirement plan investors - sold directly or through intermediary channels. | $ | 100,000 | |||
| Investor |
All investors using intermediary organizations such as broker-dealers or retirement plan sponsors - sold directly through intermediary channels. | $ | 2,500 | |||
| A Class |
All investors who invest through intermediary organizations, such as broker-dealers or third party administrator. Retail investors who invest directly through a financial intermediary such as a broker, bank, or registered investment advisor, which may include a front-end sales charge and a contingent deferred sales charge (“CDSC”). | $ | 2,500 | |||
| C Class |
Retail investors who invest directly through a financial intermediary such as a broker or employee directed benefit plans with applicable sales charges, which may include CDSC. | $ | 1,000 | |||
Each class offered by the Trust has equal rights as to assets and voting privileges. Income and non-class specific expenses are allocated daily to each class on the basis of the relative net assets. Realized and unrealized capital gains and losses of each class are allocated daily based on the relative net assets of each class of the respective Funds. Class specific expenses, where applicable, currently include administrative service fees, service fees, and distribution fees and vary amongst the classes as described more fully in Note 2.
The following is a summary of significant accounting policies, consistently followed by the Funds in preparation of the financial statements. The Funds are considered investment companies and accordingly, follow the investment company accounting and reporting guidance of the Financial Accounting Standards Board Accounting Standard Codification Topic 946, Financial Services - Investment Companies, which is part of U.S. Generally Accepted Accounting Principles (“U.S. GAAP”).
Security Transactions and Investment Income
Security transactions are recorded on the trade date of the security purchase or sale. The Funds may purchase securities with delivery or payment to occur at a later date. At the time the Funds enter into a commitment to purchase a security, the transaction is recorded, and the value of the security is reflected in the net asset value (“NAV”). The value of the security may vary with market fluctuations.
Dividend income, net of foreign taxes, is recorded on the ex-dividend date, except certain dividends from foreign securities which are recorded as soon as the information is available to the Funds. Interest income is earned from settlement date, recorded on the accrual basis, and adjusted, if necessary, for accretion of discounts and amortization of premiums. For financial and tax reporting purposes, realized gains and losses are determined on the basis of specific lot identification.
19
American Beacon FundsSM
Notes to Financial Statements
December 31, 2016
Dividends to Shareholders
Dividends from net investment income of the Funds normally will be declared and paid at least annually. Distributions, if any, of net realized capital gains are generally paid at least annually and recorded on the ex-dividend date. Dividends to shareholders are determined in accordance with federal income tax regulations, which may differ in amount and character from net investment income and realized gains recognized for purposes of U.S. GAAP. To the extent necessary to fully distribute capital gains, the Funds also designates earnings and profits distributed to shareholders on the redemption of shares.
Commission Recapture
The Funds have established brokerage commission recapture arrangements with certain brokers or dealers. If the Funds’ investment advisor chooses to execute a transaction through a participating broker, the broker rebates a portion of the commission back to the Funds. Any collateral benefit received through participation in the commission recapture program is directed exclusively to the Funds. This amount is reported with the net realized gain on the Funds’ Statement of Operations.
Allocation of Income, Expenses, Gains, and Losses
Income, expenses (other than those attributable to a specific class), gains, and losses are allocated daily to each class of shares based upon the relative proportion of net assets represented by such class. Operating expenses directly attributable to a specific class are charged against the operations of that class.
Use of Estimates
The preparation of financial statements in conformity with U.S. GAAP requires management to make estimates and assumptions that affect the amounts reported in the financial statements and accompanying notes. Actual results may differ from those estimated.
Other
Under the Trust’s organizational documents, its officers and trustees are indemnified against certain liability arising out of the performance of their duties to the Trust. In the normal course of business, the Trust enters into contracts that provide indemnification to the other party or parties against potential costs or liabilities. The Trust’s maximum exposure under these arrangements is dependent on claims that may be made in the future and, therefore, cannot be estimated. The Trust has had no prior claims or losses pursuant to any such agreement.
2. Transactions with Affiliates
Management Agreement
From January 1, 2016 to May 29, 2016, the Trust and the Manager were parties to a Management Agreement that obligated the Manager to provide or oversee the provision of all investment advisory, Funds management, and securities lending services. As compensation for performing the duties required under the Management Agreement, the Manager received from the Funds an annualized fee equal to 0.05% of the average daily net assets. Effective May 29, 2016, the Funds and the Manager entered a Management Agreement that obligates the Manager to provide investment advisory, Funds management, and administrative services to the Funds. As compensation for performing the duties under the Management Agreement, the Manager receives from the Funds an annualized fee at the following annual rates as a percentage of average daily net assets: 0.35% of the first $5 billion, 0.325% of the next $5 billion, 0.30% of the next $10 billion, and 0.275% over $20 billion. The Funds also pay the unaffiliated investment advisors hired to direct investment activities of the Funds an annualized investment advisory fee based on a percentage of the Funds’ average daily assets. Management fees paid by the Funds during the year ended December 31, 2016 were as follows:
20
American Beacon FundsSM
Notes to Financial Statements
December 31, 2016
| Fund |
Management Fee Rate |
Management Fee |
Amounts paid to Investment Advisors |
Amounts Paid to Manager |
||||||||||||
| Bahl & Gaynor Small Cap Growth |
0.86 | % | $ | 86,130 | $ | 60,124 | $ | 26,006 | ||||||||
| Holland Large Cap Growth.. |
0.75 | % | 605,211 | 382,841 | 222,370 | |||||||||||
Administration Agreement
From January 1, 2016 to May 29, 2016, the Manager and the Trust were parties to an Administrative Agreement which obligated the Manager to provide or oversee administrative services to the Funds. As compensation for performing the duties required under the Administrative Agreement, the Manager received an annualized fee of 0.30% of the average daily net assets of the Institutional, Y, Investor, A, and C Classes of the Funds.
Distribution Plans
The Funds, except for the A and C Classes, have adopted a “defensive” Distribution Plan (the “Plan”) in accordance with Rule 12b-1 under the Act, pursuant to which no separate fees will be charged to the Funds for distribution purposes. However, the Plan authorizes the management and administrative service fees received by the Manager and the investment advisors hired by the Manager to be used for distribution purposes. Under this Plan, the Funds do not intend to separately compensate the Manager or any other party, either directly or indirectly, for the distribution of Fund shares.
Separate Distribution Plans (the “Distribution Plans”) have been adopted pursuant to Rule 12b-1 under the Act for the A and C Classes of the Funds. Under the Distribution Plans, as compensation for distribution assistance, the Manager receives an annual fee of 0.25% of the average daily net assets of the A Class and 1.00% of the average daily net assets of the C Class. The fee will be payable without regard to whether the amount of the fee is more or less than the actual expenses incurred in a particular month by the Manager for distribution assistance.
Service Plans
The Manager and the Trust entered into Service Plans that obligate the Manager to oversee additional shareholder servicing of the Investor, advisor, A and C Classes of the Funds. As compensation for performing the duties required under the Service Plans, the Manager receives 0.10% of the average daily net assets of the Y Class, 0.15% of the average daily net assets of the A and C Classes, 0.25% of the average daily net assets of the Advisor Class, and up to 0.375% of the average daily net assets of the Investor Class of the Funds.
Sub-Transfer Agent Fees
The Manager has entered into agreements, which include servicing agreements, with financial intermediaries that provide recordkeeping, processing, shareholder communications and other services to customers of the intermediaries that hold positions in the Institutional Class of the Funds and has agreed to compensate the intermediaries for providing these services. Intermediaries transact with the Funds primarily through the use of omnibus accounts on behalf of its customers who hold positions in the Funds. Certain services would have been provided by the Funds’ transfer agent and other service providers if the shareholders’ accounts were maintained directly by the Funds’ transfer agent. Accordingly, the Funds, pursuant to the Trust’s Board of Trustees (the “Board”) approval, have agreed to reimburse the Manager for all or a portion of the servicing fees paid to these intermediaries for the Institutional Class. The reimbursement amounts (sub-transfer agent fees) paid to the Manager are subject to a fee limit of up to 0.10% of an intermediaries average net assets in the Institutional Class on an annual basis.
21
American Beacon FundsSM
Notes to Financial Statements
December 31, 2016
For the year ended December 31, 2016, the sub-transfer agent fees, as included in “Transfer agent fees” in the Statements of Operations, were as follows:
| Fund |
Sub-Transfer Agent Fees |
|||
| Bahl & Gaynor Small Cap Growth |
$ | 338 | ||
| Holland Large Cap Growth |
324 | |||
As of December 31, 2016, the Funds owe the Manager the following reimbursement of sub-transfer agent fees, as included in “Transfer agent fees payable” in the Statements of Assets and Liabilities.
| Reimbursement of | ||||
| Fund |
Sub-Transfer Agent Fees | |||
| Bahl & Gaynor Small Cap Growth |
$ | 106 | ||
| Holland Large Cap Growth |
129 | |||
Investment in Affiliated Funds
The Funds may invest in the American Beacon U.S. Government Money Market Select Fund (the “USG Select Fund”). The Funds and the USG Select Fund have the same investment advisor and therefore, are considered to be affiliated. The Manager serves as investment advisor to the USG Select Fund and receives management and administration fees totaling 0.10% of its average daily net assets of the USG Select Fund. During the year ended December 31, 2016, the Manager earned $385 and $3,865, respectively, from the Bahl & Gaynor Small Cap Growth and Holland Large Cap Growth Funds’ direct investment in the USG Select Funds.
Interfund Lending Program
Pursuant to an exemptive order issued by the Securities and Exchange Commission (“SEC”), the Funds, along with other registered investment companies having management contracts with the Manager, may participate in an interfund lending program. This program provides an alternative credit facility allowing the Funds to borrow from other participating Funds. During the year ended December 31, 2016, the Funds did not utilize the credit facility.
Expense Reimbursement Plan
The Manager contractually agreed to reimburse the Funds to the extent that total annual fund operating expenses exceeded the Funds’ expense caps. For the year ended December 31, 2016, the Manager waived or reimbursed expenses as follows:
| Expense Cap | ||||||||||||||||||||||
| Fund |
Class | 1/1/16 - 4/30/16 |
5/1/16 - 12/31/16 |
Reimbursed Expenses |
(Recovered) Expenses |
Expiration | ||||||||||||||||
| Bahl & Gaynor Small Cap Growth |
Institutional | 0.98 | % | 0.98 | % | $ | 41,080 | $ | — | 2019 | ||||||||||||
| Bahl & Gaynor Small Cap Growth |
Y | 1.08 | % | 1.08 | % | 37,716 | — | 2019 | ||||||||||||||
| Bahl & Gaynor Small Cap Growth |
Investor | 1.36 | % | 1.36 | % | 9,224 | — | 2019 | ||||||||||||||
| Bahl & Gaynor Small Cap Growth |
A | 1.38 | % | 1.38 | % | 8,494 | — | 2019 | ||||||||||||||
| Bahl & Gaynor Small Cap Growth |
C | 2.13 | % | 2.13 | % | 3,040 | — | 2019 | ||||||||||||||
| Holland Large Cap Growth |
C | 2.04 | % | 2.04 | % | 143 | — | 2019 | ||||||||||||||
Of these amounts, $12,182 and $28 are disclosed as a receivable from the Manager at December 31, 2016 for the Bahl & Gaynor Small Cap Growth Fund and Holland Large Cap Growth Fund, respectively. The Funds have adopted an Expense Reimbursement Plan whereby the Manager may seek repayment of fees waived or expenses reimbursed for a period of up to three years. However, reimbursement will occur only if the Class’ average net assets have grown or expenses have declined sufficiently to allow reimbursement without causing its expense ratio to exceed the previously agreed upon contractual expense limit. The reimburseable expenses listed above will expire in 2019. The Funds did not record a liability for potential reimbursements due to the current assessment that reimbursements are unlikely.
22
American Beacon FundsSM
Notes to Financial Statements
December 31, 2016
The carryover of excess expenses potentially reimbursable to the Manager are as follows:
| Fund |
Recovered Expenses |
Excess Expense Carryover |
Expired Expense Carryover |
Expiration of Reimbursed Expenses |
||||||||||||
| Bahl & Gaynor Small Cap Growth |
$ | — | $ | 132,904 | $ | — | 2017 | |||||||||
| Bahl & Gaynor Small Cap Growth |
— | 123,829 | — | 2018 | ||||||||||||
| Holland Large Cap Growth |
— | 156 | — | 2017 | ||||||||||||
| Holland Large Cap Growth |
299 | — | — | 2018 | ||||||||||||
Sales Commissions
The Funds’ distributor, Foreside Fund Services, LLC (“Foreside”), may receive a portion of A Class sales charges from broker dealers and it may be used to offset distribution related expenses. During the year ended December 31, 2016, Foreside collected $5,805 and $331, for Bahl & Gaynor Small Cap Growth and Holland Large Cap Growth Funds, respectively, from the sale of Class A Shares.
A CDSC of 0.50% will be deducted with respect to Class A Shares on certain purchases of $1,000,000 or more that are redeemed in whole or part within 18 months of purchase, unless waived as discussed in the Funds’ Prospectus. Any applicable CDSC will be 0.50% of the lesser of the original purchase price or the value of the redemption of the Class A Shares redeemed. During the year ended December 31, 2016, no CDSC fees were collected for the Class A Shares of the Funds.
A CDSC of 1.00% will be deducted with respect to Class C Shares redeemed within 12 months of purchase, unless waived as discussed in the Funds’ Prospectus. Any applicable CDSC will be 1.00% of the lesser of the original purchase price or the value of the redemption of the Class C Shares redeemed. During the year ended December 31, 2016, CDSC fees of $205 were collected for the Class C Class Shares of the Bahl & Gaynor Small Cap Growth Fund.
Trustee Fees and Expenses
As compensation for their service to the Trust and the American Beacon Select Funds Trust, each Trustee receives an annual retainer of $120,000, plus $5,000 for each Board meeting attended in person or via teleconference, $2,500 for attendance by Committee members at meetings of the Audit Committee and the Investment Committee, and $1,500 for attendance by Committee members at meetings of the Nominating and Governance Committee, plus reimbursement of reasonable expenses incurred in attending Board meetings, Committee meetings, and relevant educational seminars. The Trustees also may be compensated for attendance at special Board and/or Committee meetings from time to time. The Board Chairman receives an additional annual retainer of $50,000 as well as a single $5,000 fee each quarter for his attendance at the committee meetings. The chairpersons of the Audit Committee and the Investment Committee each receive an additional annual retainer of $25,000 and the Chairman of the Nominating and Governance Committee receives an additional annual retainer of $10,000. These expenses are allocated on a prorated basis to each Fund of the Trust according to its respective net assets.
3. Security Valuation and Fair Value Measurements
Investments are valued at the close of the New York Stock Exchange (the “Exchange”), normally at 4:00 p.m. Eastern Time, each day that the Exchange is open for business. Equity securities, including exchange-traded funds (“ETFs”) for which market quotations are available are valued at the last sale price or official closing price (closing bid price or last evaluated quote if no sale has occurred) on the primary market or exchange on which they trade.
Investments in open-end mutual funds are valued at the closing NAV per share of the mutual fund on the day of valuation.
23
American Beacon FundsSM
Notes to Financial Statements
December 31, 2016
Securities for which the market prices are not readily available or are not reflective of the fair value of the security, as determined by the Manager, will be priced at fair value following procedures approved by the Board.
Futures contracts are valued based upon their quoted daily settlement prices. Upon entering into a futures contract, the Fund is required to deposit with its futures broker, an amount of cash or U.S. Government and Agency Obligations in accordance with the initial margin requirements of the broker or exchange. Futures contracts are marked-to-market daily and an appropriate payable or receivable for the change in value (“variation margin”) is recorded by the Fund. Gains or losses are recognized, but not considered realized until the contracts expire or are closed. Futures contracts involve, to varying degrees, risk of loss in excess of the variation margin disclosed on the Statements of Assets and Liabilities.
Other investments, including restricted securities, and those financial instruments for which the above valuation procedures are inappropriate or are deemed not to reflect fair value are stated at fair value as determined in good faith by the Valuation Committee, established by the Board.
Valuation Inputs
Various inputs may be used to determine the fair value of the Funds’ investments. These inputs are summarized in three broad levels for financial statement purposes. The inputs or methodologies used to value securities are not necessarily an indication of the risk associated with investing in those securities.
| Level 1 - | Quoted prices in active markets for identical securities. |
| Level 2 - | Prices determined using other significant observable inputs. These may include quoted prices for similar securities, interest rates, prepayment speeds, credit risk, and others. Fixed-income securities are considered Level 2 as they are valued using observable inputs. |
| Level 3 - | Prices determined using other significant unobservable inputs. Unobservable inputs reflect the Fund’s own assumptions about the factors market participants would use in pricing an investment. |
Level 1 and Level 2 trading assets and trading liabilities, at fair value
Common stocks and financial derivative instruments, such as futures contracts that are traded on a national securities exchange, are stated at the last reported sale or settlement price on the day of valuation. To the extent these securities are actively traded and valuation adjustments are not applied, they are categorized as Level 1 of the fair value hierarchy. Preferred securities and other equities traded on inactive markets or valued by reference to similar instruments are also categorized as Level 2 of the fair value hierarchy.
Investments in registered open-end investment management companies will be valued based upon the NAVs of such investments and are categorized as Level 1 of the fair value hierarchy.
The Funds’ investments are summarized by level based on the inputs used to determine their values. As of December 31, 2016, the investments were classified as described below:
| Bahl & Gaynor Small Cap Growth Fund(1) |
Level 1 | Level 2 | Level 3 | Total | ||||||||||||
| Common Stock |
$ | 20,340,208 | $ | — | $ | — | $ | 20,340,208 | ||||||||
| Short-Term Investments - Money Market Funds |
628,203 | — | — | 628,203 | ||||||||||||
|
|
|
|
|
|
|
|
|
|||||||||
| Total Investments in Securities |
$ | 20,968,411 | $ | — | $ | — | $ | 20,968,411 | ||||||||
|
|
|
|
|
|
|
|
|
|||||||||
| Financial Derivative Instruments - Liabilities |
||||||||||||||||
| Futures Contracts |
$ | (2,785 | ) | $ | — | — | $ | (2,785 | ) | |||||||
|
|
|
|
|
|
|
|
|
|||||||||
| Total Other Financial Instruments |
$ | (2,785 | ) | $ | — | $ | — | $ | (2,785 | ) | ||||||
|
|
|
|
|
|
|
|
|
|||||||||
24
American Beacon FundsSM
Notes to Financial Statements
December 31, 2016
| Holland Large Cap Growth Fund(1) |
Level 1 | Level 2 | Level 3 | Total | ||||||||||||
| Common Stock |
$ | 94,144,868 | $ | — | $ | — | $ | 94,144,868 | ||||||||
| Short-Term Investments - Money Market Funds |
2,600,481 | — | — | 2,600,481 | ||||||||||||
|
|
|
|
|
|
|
|
|
|||||||||
| Total Investments in Securities |
$ | 96,745,349 | $ | — | $ | — | $ | 96,745,349 | ||||||||
|
|
|
|
|
|
|
|
|
|||||||||
| Financial Derivative Instruments - Liabilities |
||||||||||||||||
| Futures Contracts |
$ | (16,479 | ) | $ | — | — | $ | (16,479 | ) | |||||||
|
|
|
|
|
|
|
|
|
|||||||||
| Total Other Financial Instruments |
$ | (16,479 | ) | $ | — | $ | — | $ | (16,479 | ) | ||||||
|
|
|
|
|
|
|
|
|
|||||||||
| (1) | Refer to the Schedule of Investments for industry information. |
U.S. GAAP requires all transfers between any levels to be disclosed. The end of period timing recognition has been adopted for the transfers between levels the Funds’ assets and liabilities. During the year ended December 31, 2016, there were no transfers between levels.
4. Securities and Other Investments
American Depositary Receipts (“ADRs”)
ADRs are depositary receipts for foreign issuers in registered form traded in U.S. securities markets. Depositary receipts may not be denominated in the same currency as the securities into which they may be converted. Investing in depositary receipts entails substantially the same risks as direct investment in foreign securities. There is generally less publicly available information about foreign companies and there may be less governmental regulation and supervision of foreign stock exchanges, brokers and listed companies. In addition, such companies may use different accounting and financial standards (and certain currencies may become unavailable for transfer from a foreign currency), resulting in the Funds’ possible inability to convert immediately into U.S. currency proceeds realized upon the sale of portfolio securities of the affected foreign companies. In addition, the Funds may invest in unsponsored depositary receipts, the issuers of which are not obligated to disclose material information about the underlying securities to investors in the United States. Ownership of unsponsored depositary receipts may not entitle the Funds to the same benefits and rights as ownership of a sponsored depositary receipt or the underlying security.
Real Estate Investment Trusts
The Funds may own shares of real estate investment trusts (“REITs”) which report information on the source of their distributions annually. The Funds re-characterize distributions received from REIT investments based on information provided by the REITs into the following categories: ordinary income, long-term capital gains, and return of capital. If information is not available on a timely basis from the REITs, the re-characterization will be estimated based on available information which may include the previous year allocation. If new or additional information becomes available from the REITs at a later date, a re-characterization will be made the following year.
Other Investment Company Securities and Other Exchange-traded Products
The Funds may invest in shares of other investment companies, including open-end funds, closed-end funds, business development companies, exchange-traded Funds, unit investment trusts, and other investment companies of the Trust. The Funds may invest in investment company securities advised by the Manager or a sub-advisor. Investments in the securities of other investment companies may involve duplication of advisory fees and certain other expenses. By investing in another investment company, the Funds become a shareholder of that investment company. As a result, the Funds shareholders indirectly will bear a Funds’ proportionate share of the fees and expenses paid by shareholders of the other investment company, in addition to the fees and expenses the Funds’ shareholders directly bear in connection with the Funds’ own operations. These other fees and expenses are reflected as Acquired s Fees and Expenses and are included in the Fees and Expenses Table for the Funds in
25
American Beacon FundsSM
Notes to Financial Statements
December 31, 2016
its Prospectus, if applicable. Investments in other investment companies may involve the payment of substantial premiums above the value of such issuer’s portfolio securities.
5. Financial Derivative Instruments
The Funds may utilize derivative instruments to gain market exposure on cash balances or reduce market exposure in anticipation of liquidity needs. When considering the Funds’ use of derivatives, it is important to note that the Funds do not use derivatives for the purpose of creating financial leverage.
Futures Contracts
Futures contracts are contracts to buy or sell a standard quantity of securities at a specified price on a future date. The Funds may enter into financial futures contracts as a method for keeping assets readily convertible to cash if needed to meet shareholder redemptions or for other needs while maintaining exposure to the stock or bond market, as applicable. The primary risks associated with the use of futures contracts are the possibility of illiquid markets or imperfect correlation between the values of the contracts and the underlying securities, or that the counterparty will fail to perform its obligations.
Upon entering into a futures contract, the Funds are required to set aside or deposit with a broker an amount, termed the initial margin, which typically represents a portion of the face value of the futures contract. The Funds usually reflect this amount on the Schedules of Investments as a U.S. Treasury Bill held as collateral for futures contracts or as cash deposited with broker on the Statements of Assets and Liabilities. Payments to and from the broker, known as variation margin, are required to be made on a daily basis as the price of the futures contract fluctuates. Changes in initial settlement values are accounted for as unrealized appreciation (depreciation) until the contracts are terminated, at which time realized gains and losses are recognized. Futures contracts are valued at the most recent settlement price established each day by the exchange on which they are traded.
For the year ended December 31, 2016, the Funds entered into futures contracts primarily for exposing cash to markets.
The Funds’ average futures contracts outstanding fluctuate throughout the operating year as required to meet strategic requirements. The following table illustrates the quarterly volume of futures contracts. For purpose of this disclosure, volume is measured by contracts outstanding at each quarter end.
| Average Futures Contracts Outstanding |
||||
| Fund |
Year ended December 31, 2016 | |||
| Bahl & Gaynor Small Cap Growth |
3 | |||
| Holland Large Cap Growth |
30 | |||
The following is a summary of the Funds’ derivative financial instruments categorized by risk exposure(1)(2):
Fair Values of financial derivative instruments not accounted for as hedging instruments as of December 31, 2016:
| Statement of Assets and Liabilities: |
Derivatives | Bahl & Gaynor Small Cap Growth Fund |
Holland Large Cap Growth Fund |
|||||||||
| Payable for variation margin from open futures contracts (2) |
Equity Contracts | $ | (2,785 | ) | $ | (16,479 | ) | |||||
26
American Beacon FundsSM
Notes to Financial Statements
December 31, 2016
The effect financial derivative instruments not accounted for as hedging instruments during the year ended December 31, 2016:
| Statement of Operations: |
Derivatives | Bahl & Gaynor Small Cap Growth Fund |
Holland Large Cap Growth Fund |
|||||||||
| Net realized gain (loss) from futures contracts |
Equity Contracts | $ | 19,965 | $ | 424,669 | |||||||
| Change in net unrealized appreciation (depreciation) of futures contracts |
Equity Contracts | (3,753 | ) | (37,112 | ) | |||||||
| (1) | See Note 3 in the Notes to Financial Statements for additional information. |
| (2) | Includes cumulative appreciation (depreciation) of futures contracts as reported in the Schedule of Investments Footnotes. Only current day’s variation margin is reported within the Statement of Assets and Liabilities. |
6. Principal Risks
Investing in the Funds may involve certain risks including, but not limited to, those described below.
Equity Investment Risk
Equity securities are subject to market risk. The Funds’ investments in equity securities may include common stocks, preferred stocks, securities convertible into or exchangeable for common stocks, REITs, depositary receipts, and U.S. dollar-denominated foreign stocks traded on U.S. exchanges. Such investments may expose the Funds to additional risk. The value of a company’s common stock may fall as a result of factors affecting the company, companies in the same industry or sector, or the financial markets overall. Common stock generally is subordinate to preferred stock upon the liquidation or bankruptcy of the issuing company. Preferred stocks and convertible securities are sensitive to movements in interest rates. Preferred stocks may be less liquid than common stocks and, unlike common stocks, participation in the growth of an issuer may be limited. Distributions on preferred stocks generally are payable at the discretion of an issuer and after required payments to bond holders. Convertible securities are subject to the risk that the credit standing of the issuer may have an effect on the convertible securities’ investment value. Investments in REITs are subject to the risks associated with investing in the real estate industry such as adverse developments affecting the real estate industry and real property values. Depositary receipts and U.S. dollar-denominated foreign stocks traded on U.S. exchanges are subject to certain of the risks associated with investing directly in foreign securities, including, but not limited to, currency fluctuations and political and financial instability in the home country of a particular depositary receipt or foreign stock.
Dividend Risk
An issuer of stock held by the Funds may choose not to declare a dividend or the dividend rate might not remain at current levels. Dividend paying stocks might not experience the same level of earnings growth or capital appreciation as non-dividend paying stocks.
Foreign Investing Risk
Non U.S. investments carry potential risks not associated with U.S. investments. Such risks include, but are not limited to: (1) currency exchange rate fluctuations,(2) political and financial instability, (3) less liquidity and greater volatility, (4) lack of uniform accounting, auditing and financial reporting standards; (5) increased price volatility; (6) less government regulation and supervision of foreign stock exchanges, brokers and listed companies; and (7) delays in transaction settlement in some foreign markets.
Futures Contract Risk
Futures contracts are derivative investments pursuant to a contract with a counterparty to pay a fixed price for an agreed amount of securities or other underlying assets at an agreed date. The use of such derivative
27
American Beacon FundsSM
Notes to Financial Statements
December 31, 2016
instruments may expose the Funds to additional risks that it would not be subject to if it invested directly in the securities underlying those derivatives. Futures contracts may experience dramatic price changes (losses) and imperfect correlation between the price of the contract and the underlying security or index which will increase the volatility of the Funds and may involve a small investment of cash (the amount of initial and variation margin) relative to the magnitude of the risk assumed (the potential increase or decrease in the price of the futures contract).
Growth Companies Risk
Growth companies are expected to increase their earnings at a certain rate. When these expectations are not met, the prices of these stocks may go down, even if earnings showed an absolute increase. Growth company stocks may lack the dividend yield that can cushion stock prices in market downturns.
Investment Risk
An investment in the Funds is not a deposit with a bank and is not insured or guaranteed by the Federal Deposit Insurance Corporation or any other government agency. When you sell your shares of the Funds, they could be worth less than what you paid for them. Therefore, you may lose money by investing in the Funds.
Issuer Risk
The value of, and/or the return generated by, a security may decline for a number of reasons which directly relate to the issuer, such as management performance, financial leverage and reduced demand for the issuer’s goods or services, as well as the historical and prospective earnings of the issuer and the value of its assets.
Large Capitalization Companies Risk
The securities of large market capitalization companies may underperform other segments of the market because such companies may be less responsive to competitive challenges and opportunities and may be unable to attain high growth rates during periods of economic expansion.
Small Capitalization Companies Risk
Investing in the securities of small capitalization companies involves greater risk and the possibility of greater price volatility than investing in larger capitalization and more established companies. Since smaller companies may have limited operating history, product lines, and financial resources, the securities of these companies may lack sufficient market liquidity, and they can be particularly sensitive to expected changes in interest rates, borrowing costs and earnings.
Market Risk
Since the financial crisis that started in 2008, the U.S. and many foreign economies continue to experience its after-effects, which have resulted, and may continue to result, in an unusually high degree of volatility in the financial markets, both domestic and foreign. In addition, global economies and financial markets are becoming increasingly interconnected, which increases the possibilities that conditions in one country or region might adversely impact issuers in a different country or region. The severity or duration of adverse economic conditions may also be affected by policy changes made by governments or quasi-governmental organizations. In addition, political events within the U.S. and abroad may affect investor and consumer confidence and may adversely impact financial markets and the broader economy, perhaps suddenly and to a significant degree. High public debt in the U.S. and other countries creates ongoing systemic and market risks and policymaking uncertainty. Because the impact on the markets has been widespread, it may be difficult to identify both risks and opportunities using past models of the interplay of market forces, or to predict the duration of these market conditions. Interest rates have been unusually low in recent years in the U.S. and abroad. Because there is little precedent for this situation, it
28
American Beacon FundsSM
Notes to Financial Statements
December 31, 2016
is difficult to predict the impact of a rate increase on various markets. In addition, there is a risk that the prices of goods and services in the U.S. and many foreign economies may decline over time, known as deflation (the opposite of inflation). Deflation may have an adverse effect on stock prices and creditworthiness and may make defaults on debt more likely.
Model and Data Risk
Models and data are used to screen potential investments for the Funds. When models or data prove to be incorrect or incomplete, any decisions made in reliance thereon expose the Funds to potential risks. Some of the models used by the sub-advisor are predictive in nature. The use of predictive models has inherent risks. Because predictive models are usually constructed based on historical data supplied by third parties, the success of relying on such models may depend heavily on the accuracy and reliability of the supplied historical data.
Other Investment Companies Risk
The Funds may invest in shares of other registered investment companies, including money market funds. To the extent that the Funds invest in shares of other registered investment companies, the Funds will indirectly bear the fees and expenses charged by the underlying funds in addition to the Funds’ direct fees and expenses and will be subject to the risks associated with investments in those funds. For example, money market funds are subject to interest rate risk, credit risk, and market risk.
Offsetting Assets and Liabilities
The Funds are parties to enforceable master netting agreements between brokers and counterparties, which provides for the right to offset under certain circumstances. The Funds employ multiple money managers and counterparties and have elected not to offset qualifying financial and derivative instruments on the Statements of Assets and Liabilities, as such all financial and derivative instruments are presented on a gross basis. The impacts of netting arrangements that provide the right to offset are detailed below. The net amount represents the net receivable or payable that would be due from or to the counterparty in the event of default. Exposure from borrowings and other financing agreements can only be netted across transactions governed by the same Master Agreement with the same legal entity. All amounts reported below represent the balance as of December 31, 2016.
Bahl & Gaynor Small Cap Growth Fund
Offsetting of Financial Liabilities and Derivative Liabilities as of December 31, 2016:
| Description |
Gross Amounts of Recognized Liabilities |
Gross Amounts Offset in the Statements of Assets and Liabilities |
Net Amount of Liabilities Presented in the Statements of Assets and Liabilities |
|||||||||
| Futures contracts(1) |
$ | (2,785 | ) | $ | — | $ | (2,785 | ) | ||||
Financial Liabilities, Derivative Liabilities, and Collateral Pledged by Counterparty as of December 31, 2016:
| Net Amount of Liabilities Presented in the Statement of Assets and Liabilities |
Gross Amounts Offset in the Statements of Assets and Liabilities |
|||||||||||||||
| Counterparty |
Financial Instruments |
Cash Collateral Received |
Net Amount | |||||||||||||
| Deutsche Bank AG(1) |
$ | (2,785 | ) | $ | — | $ | — | $ | (2,785 | ) | ||||||
29
American Beacon FundsSM
Notes to Financial Statements
December 31, 2016
Holland Large Cap Growth Fund
Offsetting of Financial Liabilities and Derivative Liabilities as of December 31, 2016:
| Description |
Gross Amounts of Recognized Liabilities |
Gross Amounts Offset in the Statements of Assets and Liabilities |
Net Amount of Liabilities Presented in the Statements of Assets and Liabilities |
|||||||||
| Futures contracts(1) |
$ | (16,479 | ) | $ | — | $ | (16,479 | ) | ||||
Financial Liabilities, Derivative Liabilities, and Collateral Pledged by Counterparty as of December 31, 2016:
| Net Amountof Liabilities Presented in the Statement of Assets and Liabilities |
Gross Amounts Offset in the Statements of Assets and Liabilities |
|||||||||||||||
| Counterparty |
Financial Instruments |
Cash Collateral Received |
Net Amount | |||||||||||||
| Goldman Sachs & Co.(1) |
$ | (16,479 | ) | $ | — | $ | — | $ | (16,479 | ) | ||||||
| (1) | The securities presented here within are not subject to Master Netting Agreements. As such, this is disclosed for informational purposes only. |
7. Federal Income and Excise Taxes
It is the policy of the Funds to qualify as a regulated investment company (“RIC”), by complying with all applicable provisions of Subchapter M of the Internal Revenue Code, as amended, and to make distribution of taxable income sufficient to relieve it from substantially all federal income and excise taxes. For federal income tax purposes, the Funds are treated as a single entity for the purpose of determining such qualification.
The Funds do not have any unrecognized tax benefits in the accompanying financial statements. Each of the tax years in the four year period ended December 31, 2016 remain subject to examination by the Internal Revenue Service. If applicable, the Funds recognize interest accrued related to unrecognized tax benefits in interest expense and penalties in “Other expenses” on the Statements of Operations.
The Funds may be subject to taxes imposed by countries in which it invests. Such taxes are generally based on returns of income earned or gains realized or repatriated. Taxes are accrued and applied to net investment income, net realized capital gains and net unrealized appreciation (depreciation), as applicable, as the income is earned or capital gains are recorded.
Dividends are categorized in accordance with income tax regulations which may treat certain transactions differently than U.S. GAAP. Accordingly, the character of distributions and composition of net assets for tax purposes may differ from those reflected in the accompanying financial statements.
30
American Beacon FundsSM
Notes to Financial Statements
December 31, 2016
The tax character of distributions paid are as follows:
| Bahl & Gaynor Small Cap Growth Fund | Holland Large Cap Growth Fund | |||||||||||||||
| Year Ended December 31, 2016 |
Year Ended December 31, 2015 |
Year Ended December 31, 2016 |
Year Ended December 31, 2015 |
|||||||||||||
| Distributions paid from: |
||||||||||||||||
| Ordinary Income* |
||||||||||||||||
| Institutional Class |
$ | 18,188 | $ | 21,120 | $ | — | $ | — | ||||||||
| Y Class |
16,392 | 17,850 | — | — | ||||||||||||
| Investor Class |
8,679 | 3,279 | — | — | ||||||||||||
| A Class |
5,691 | 3,780 | — | — | ||||||||||||
| C Class |
431 | 2,065 | — | — | ||||||||||||
| Long-term capital gains |
— | — | ||||||||||||||
| Institutional Class |
674 | 44,502 | 646,655 | 1,831,892 | ||||||||||||
| Y Class |
569 | 37,608 | 10,980 | 34,744 | ||||||||||||
| Investor Class |
104 | 6,907 | 1,766,034 | 8,194,511 | ||||||||||||
| A Class |
121 | 7,966 | 34,342 | 136,161 | ||||||||||||
| C Class |
66 | 4,351 | 9,316 | 83,671 | ||||||||||||
| Return of capital |
— | — | ||||||||||||||
| Institutional Class |
— | 3,572 | — | — | ||||||||||||
| Y Class |
— | 3,019 | — | — | ||||||||||||
| Investor Class |
— | 554 | — | — | ||||||||||||
| A Class |
— | 640 | — | — | ||||||||||||
| C Class |
— | 349 | — | — | ||||||||||||
|
|
|
|
|
|
|
|
|
|||||||||
| Total distributions paid |
$ | 50,915 | $ | 157,562 | $ | 2,467,327 | $ | 10,280,979 | ||||||||
|
|
|
|
|
|
|
|
|
|||||||||
| * | For tax purposes, short-term capital gains are considered ordinary income distributions. |
As of December 31, 2016, the components of distributable earnings (deficits) on a tax basis are as follows:
| Bahl & Gaynor Small Cap Growth Fund |
Holland Large Cap Growth Fund |
|||||||
| Cost basis of investments for federal income tax purposes |
$ | 18,178,399 | $ | 71,832,449 | ||||
| Unrealized appreciation |
2,989,707 | 27,056,711 | ||||||
| Unrealized depreciation |
(199,695 | ) | (2,143,811 | ) | ||||
|
|
|
|
|
|||||
| Net unrealized appreciation (depreciation) |
2,790,012 | 24,912,900 | ||||||
| Undistributed ordinary income |
— | — | ||||||
| Undistributed long-term capital gains |
7,213 | 686,129 | ||||||
| Accumulated capital and other losses |
— | — | ||||||
| Other temporary differences |
— | — | ||||||
|
|
|
|
|
|||||
| Distributable earnings (deficits) |
$ | 2,797,225 | $ | 25,599,029 | ||||
|
|
|
|
|
|||||
Financial reporting records are adjusted for permanent book/tax differences to reflect tax character. Financial records are not adjusted for temporary differences. The temporary differences between financial reporting and tax-basis reporting of unrealized appreciation (depreciation) are attributable primarily to the tax deferral of losses from wash sales and the realization for tax purposes of unrealized gains (losses) on certain derivative instruments.
Due to inherent differences in the recognition of income, expenses and realized gains (losses) under U.S. GAAP and federal income tax regulations, permanent differences between book and tax reporting have been identified and appropriately reclassified on the Statements of Assets and Liabilities.
Accordingly, the following amounts represent current year permanent differences derived from non-utilization of net operating losses as of December 31, 2016:
31
American Beacon FundsSM
Notes to Financial Statements
December 31, 2016
| Bahl & Gaynor Small Cap Growth Fund |
Holland Large Cap Growth Fund |
|||||||
| Paid-in-capital |
$ | — | $ | (63,299 | ) | |||
| Undistributed (overdistribution of) net investment income |
1,534 | 59,307 | ||||||
| Accumulated net realized gain (loss) |
(1,535 | ) | 3,993 | |||||
| Unrealized appreciation (depreciation) of investments in futures contracts |
1 | (1 | ) | |||||
Under the Regulated Investment Company Modernization Act of 2010 (the “RICMOD”), net capital losses recognized by the Fund in taxable years beginning after December 22, 2010 are carried forward indefinitely and retain their character as short-term and/or long-term losses. For the year ended December 31, 2016, the Funds did not have capital loss carryforwards.
8. Investment Transactions
The aggregate cost of purchases and proceeds from sales and maturities of long-term investments, excluding short-term obligations, for the year ended December 31, 2016 were as follows:
| Bahl & Gaynor Small Cap Growth Fund |
Holland Large Cap Growth Fund |
|||||||
| Purchases (excluding U.S. government securities) |
$ | 12,892,557 | $ | 31,694,220 | ||||
| Sales and Maturities (excluding U.S. government securities) |
2,571,674 | 34,288,962 | ||||||
A summary of the Funds’ direct transactions in the USG Select Fund for the year ended December 31, 2016 are as follows:
| Fund |
December31, 2015 Shares/Fair Value |
Purchases | Sales | December 31, 2016 Shares/Fair Value |
Dividend Income |
|||||||||||||||
| Bahl & Gaynor Small Cap Growth |
$ | — | $ | 13,628,249 | $ | 13,000,046 | $ | 628,203 | $ | 993 | ||||||||||
| Holland Large Cap Growth |
— | 40,569,376 | 37,968,895 | 2,600,481 | 8,894 | |||||||||||||||
9. Capital Share Transactions
The tables below summarize the activity in capital shares for each Class of the Funds:
| Institutional Class | ||||||||||||||||
| Year Ended December 31, | ||||||||||||||||
| 2016 | 2015 | |||||||||||||||
| Bahl & Gaynor Small Cap Growth Fund |
Shares | Amount | Shares | Amount | ||||||||||||
| Shares sold |
279,042 | $ | 3,182,952 | 26,744 | $ | 291,372 | ||||||||||
| Reinvestment of dividends |
1,466 | 18,862 | 6,810 | 69,193 | ||||||||||||
| Shares redeemed |
(5,890 | ) | (66,509 | ) | (5,570 | ) | (59,399 | ) | ||||||||
|
|
|
|
|
|
|
|
|
|||||||||
| Net increase in shares outstanding |
274,618 | $ | 3,135,305 | 27,984 | $ | 301,166 | ||||||||||
|
|
|
|
|
|
|
|
|
|||||||||
| Y Class | ||||||||||||||||
| Year Ended December 31, | ||||||||||||||||
| 2016 | 2015 | |||||||||||||||
| Bahl & Gaynor Small Cap Growth Fund |
Shares | Amount | Shares | Amount | ||||||||||||
| Shares sold |
290,672 | $ | 3,267,497 | 254,524 | $ | 2,732,833 | ||||||||||
| Reinvestment of dividends |
1,225 | 15,718 | 5,761 | 58,476 | ||||||||||||
| Shares redeemed |
(20,725 | ) | (219,124 | ) | (29,466 | ) | (313,981 | ) | ||||||||
|
|
|
|
|
|
|
|
|
|||||||||
| Net increase in shares outstanding |
271,172 | $ | 3,064,091 | 230,819 | $ | 2,477,328 | ||||||||||
|
|
|
|
|
|
|
|
|
|||||||||
32
American Beacon FundsSM
Notes to Financial Statements
December 31, 2016
| Investor Class | ||||||||||||||||
| Year Ended December 31, | ||||||||||||||||
| 2016 | 2015 | |||||||||||||||
| Bahl & Gaynor Small Cap Growth Fund |
Shares | Amount | Shares | Amount | ||||||||||||
| Shares sold |
251,437 | $ | 2,931,223 | 175,925 | $ | 1,814,132 | ||||||||||
| Reinvestment of dividends |
686 | 8,739 | 1,052 | 10,635 | ||||||||||||
| Shares redeemed |
(17,200 | ) | (202,363 | ) | (150,111 | ) | (1,481,869 | ) | ||||||||
|
|
|
|
|
|
|
|
|
|||||||||
| Net increase in shares outstanding |
234,923 | $ | 2,737,599 | 26,866 | $ | 342,898 | ||||||||||
|
|
|
|
|
|
|
|
|
|||||||||
| A Class | ||||||||||||||||
| Year Ended December 31, | ||||||||||||||||
| 2016 | 2015 | |||||||||||||||
| Bahl & Gaynor Small Cap Growth Fund |
Shares | Amount | Shares | Amount | ||||||||||||
| Shares sold |
169,878 | $ | 1,935,789 | 63,916 | $ | 685,792 | ||||||||||
| Reinvestment of dividends |
454 | 5,785 | 1,226 | 12,386 | ||||||||||||
| Shares redeemed |
(31,702 | ) | (391,741 | ) | (35,498 | ) | (363,673 | ) | ||||||||
|
|
|
|
|
|
|
|
|
|||||||||
| Net increase in shares outstanding |
138,630 | $ | 1,549,833 | 29,644 | $ | 334,505 | ||||||||||
|
|
|
|
|
|
|
|
|
|||||||||
| C Class | ||||||||||||||||
| Year Ended December 31, | ||||||||||||||||
| 2016 | 2015 | |||||||||||||||
| Bahl & Gaynor Small Cap Growth Fund |
Shares | Amount | Shares | Amount | ||||||||||||
| Shares sold |
6,362 | $ | 77,439 | 18,009 | $ | 191,868 | ||||||||||
| Reinvestment of dividends |
36 | 446 | 677 | 6,765 | ||||||||||||
| Shares redeemed |
(4,090 | ) | (43,526 | ) | (1,173 | ) | (11,679 | ) | ||||||||
|
|
|
|
|
|
|
|
|
|||||||||
| Net increase in shares outstanding |
2,308 | $ | 34,359 | 17,513 | $ | 186,954 | ||||||||||
|
|
|
|
|
|
|
|
|
|||||||||
| Institutional Class | ||||||||||||||||
| Year Ended December 31, | ||||||||||||||||
| 2016 | 2015 | |||||||||||||||
| Holland Large Cap Growth Fund |
Shares | Amount | Shares | Amount | ||||||||||||
| Shares sold |
375,247 | $ | 9,486,080 | 40,504 | $ | 1,045,131 | ||||||||||
| Reinvestment of dividends |
25,815 | 646,655 | 73,956 | 1,831,892 | ||||||||||||
| Shares redeemed |
(107,464 | ) | (2,632,755 | ) | (63,945 | ) | (1,773,828 | ) | ||||||||
|
|
|
|
|
|
|
|
|
|||||||||
| Net increase in shares outstanding |
293,598 | $ | 7,499,980 | 50,515 | $ | 1,103,195 | ||||||||||
|
|
|
|
|
|
|
|
|
|||||||||
| Y Class | ||||||||||||||||
| Year Ended December 31, | ||||||||||||||||
| 2016 | 2015 | |||||||||||||||
| Holland Large Cap Growth Fund |
Shares | Amount | Shares | Amount | ||||||||||||
| Shares sold |
7,193 | $ | 178,500 | 10,179 | $ | 281,495 | ||||||||||
| Reinvestment of dividends |
441 | 10,980 | 1,411 | 34,744 | ||||||||||||
| Shares redeemed |
(4,667 | ) | (112,646 | ) | (942 | ) | (24,074 | ) | ||||||||
|
|
|
|
|
|
|
|
|
|||||||||
| Net increase in shares outstanding |
2,967 | $ | 76,834 | 10,648 | $ | 292,165 | ||||||||||
|
|
|
|
|
|
|
|
|
|||||||||
| Investor Class | ||||||||||||||||
| Year Ended December 31, | ||||||||||||||||
| 2016 | 2015 | |||||||||||||||
| Holland Large Cap Growth Fund |
Shares | Amount | Shares | Amount | ||||||||||||
| Shares sold |
114,264 | $ | 2,666,451 | 157,069 | $ | 4,211,087 | ||||||||||
| Reinvestment of dividends |
72,016 | 1,765,848 | 336,496 | 8,193,675 | ||||||||||||
| Shares redeemed |
(578,060 | ) | (13,930,498 | ) | (429,291 | ) | (11,433,171 | ) | ||||||||
|
|
|
|
|
|
|
|
|
|||||||||
| Net increase (decrease) in shares outstanding |
(391,780 | ) | $ | (9,498,199 | ) | 64,274 | $ | 971,591 | ||||||||
|
|
|
|
|
|
|
|
|
|||||||||
33
American Beacon FundsSM
Notes to Financial Statements
December 31, 2016
| A Class | ||||||||||||||||
| Year Ended December 31, | ||||||||||||||||
| 2016 | 2015 | |||||||||||||||
| Holland Large Cap Growth Fund |
Shares | Amount | Shares | Amount | ||||||||||||
| Shares sold |
38,168 | $ | 869,417 | 16,926 | $ | 454,849 | ||||||||||
| Reinvestment of dividends |
1,414 | 34,342 | 5,640 | 136,161 | ||||||||||||
| Shares redeemed |
(36,839 | ) | (885,200 | ) | (9,823 | ) | (260,924 | ) | ||||||||
|
|
|
|
|
|
|
|
|
|||||||||
| Net increase in shares outstanding |
2,743 | $ | 18,559 | 12,743 | $ | 330,086 | ||||||||||
|
|
|
|
|
|
|
|
|
|||||||||
| C Class | ||||||||||||||||
| Year Ended December 31, | ||||||||||||||||
| 2016 | 2015 | |||||||||||||||
| Holland Large Cap Growth Fund |
Shares | Amount | Shares | Amount | ||||||||||||
| Shares sold |
1,090 | $ | 25,000 | 9,760 | $ | 249,952 | ||||||||||
| Reinvestment of dividends |
401 | 9,316 | 3,596 | 83,671 | ||||||||||||
| Shares redeemed |
(19,093 | ) | (431,154 | ) | (4,767 | ) | (120,882 | ) | ||||||||
|
|
|
|
|
|
|
|
|
|||||||||
| Net increase (decrease) in shares outstanding |
(17,602 | ) | $ | (396,838 | ) | 8,589 | $ | 212,741 | ||||||||
|
|
|
|
|
|
|
|
|
|||||||||
10. Subsequent Events
Management has evaluated subsequent events for possible recognition or disclosure in the financial statements through the date the financial statements are issued. Management has determined that there are no material events that would require disclosure in the Funds financial statements through this date.
34
American Beacon Bahl & Gaynor Small Cap Growth FundSM
(For a share outstanding throughout the period)
| Institutional Class | ||||||||||||
| Year Ended December 31, | July 15A to December 31, 2014 |
|||||||||||
| 2016 | 2015 | |||||||||||
| Net asset value, beginning of period |
$ | 10.17 | $ | 10.71 | $ | 10.00 | ||||||
|
|
|
|
|
|
|
|||||||
| Income from investment operations: |
||||||||||||
| Net investment income |
0.03 | 0.08 | 0.02 | |||||||||
| Net gains (losses) on investments (both realized and unrealized) |
2.60 | (0.39 | ) | 0.71 | ||||||||
|
|
|
|
|
|
|
|||||||
| Total income (loss) from investment operations |
2.63 | (0.31 | ) | 0.73 | ||||||||
|
|
|
|
|
|
|
|||||||
| Less distributions: |
||||||||||||
| Dividends from net investment income |
(0.03 | ) | (0.06 | ) | (0.02 | ) | ||||||
| Distributions from net realized gains |
— | (0.16 | ) | — | ||||||||
| Distributions from return of capital |
— | (0.01 | )F | — | ||||||||
|
|
|
|
|
|
|
|||||||
| Total distributions |
(0.03 | ) | (0.23 | ) | (0.02 | ) | ||||||
|
|
|
|
|
|
|
|||||||
| Net asset value, end of period |
$ | 12.77 | $ | 10.17 | $ | 10.71 | ||||||
|
|
|
|
|
|
|
|||||||
| Total return B |
25.88 | % | (2.96 | )% | 7.28 | %C | ||||||
|
|
|
|
|
|
|
|||||||
| Ratios and supplemental data: |
||||||||||||
| Net assets, end of period |
$ | 7,563,970 | $ | 3,231,461 | $ | 3,102,721 | ||||||
| Ratios to average net assets: |
||||||||||||
| Expenses, before reimbursements |
1.85 | % | 3.04 | % | 8.98 | %D | ||||||
| Expenses, net of reimbursements |
0.98 | % | 0.98 | % | 0.98 | %D | ||||||
| Net investment (loss), before expense reimbursements |
(0.30 | )% | (1.33 | )% | (7.51 | )%D | ||||||
| Net investment income, net of reimbursements |
0.57 | % | 0.72 | % | 0.49 | %D | ||||||
| Portfolio turnover rate |
23 | % | 54 | % | 12 | % E | ||||||
| Y Class | ||||||||||||
| Year Ended December 31, | July 15A to December 31, 2014 |
|||||||||||
| 2016 | 2015 | |||||||||||
| Net asset value, beginning of period |
$ | 10.16 | $ | 10.71 | $ | 10.00 | ||||||
|
|
|
|
|
|
|
|||||||
| Income from investment operations: |
||||||||||||
| Net investment income |
0.04 | 0.06 | 0.01 | |||||||||
| Net gains (losses) on investments (both realized and unrealized) |
2.58 | (0.38 | ) | 0.72 | ||||||||
|
|
|
|
|
|
|
|||||||
| Total income (loss) from investment operations |
2.62 | (0.32 | ) | 0.73 | ||||||||
|
|
|
|
|
|
|
|||||||
| Less distributions: |
||||||||||||
| Dividends from net investment income |
(0.03 | ) | (0.06 | ) | (0.02 | ) | ||||||
| Distributions from net realized gains |
— | (0.16 | ) | — | ||||||||
| Distributions from return of capital |
— | (0.01 | )F | — | ||||||||
|
|
|
|
|
|
|
|||||||
| Total distributions |
(0.03 | ) | (0.23 | ) | (0.02 | ) | ||||||
|
|
|
|
|
|
|
|||||||
| Net asset value, end of period |
$ | 12.75 | $ | 10.16 | $ | 10.71 | ||||||
|
|
|
|
|
|
|
|||||||
| Total return B |
25.80 | % | (3.05 | )% | 7.28 | %C | ||||||
|
|
|
|
|
|
|
|||||||
| Ratios and supplemental data: |
||||||||||||
| Net assets, end of period |
$ | 6,856,954 | $ | 2,711,465 | $ | 387,622 | ||||||
| Ratios to average net assets: |
||||||||||||
| Expenses, before reimbursements |
1.98 | % | 2.76 | % | 11.71 | %D | ||||||
| Expenses, net of reimbursements |
1.08 | % | 1.08 | % | 1.08 | %D | ||||||
| Net investment (loss), before expense reimbursements |
(0.43 | )% | (0.98 | )% | (10.06 | )%D | ||||||
| Net investment income, net of reimbursements |
0.47 | % | 0.70 | % | 0.57 | %D | ||||||
| Portfolio turnover rate |
23 | % | 54 | % | 12 | %E | ||||||
| A | Commencement of operations. |
| B | Based on net asset value, which does not reflect the sales charge, redemption fee, or contingent deferred sales charge, if applicable. May include adjustments in accordance with U.S. GAAP and as such, the net asset value for reporting purposes and the returns based upon those net asset values may differ from the net asset value and returns for shareholder transactions. |
| C | Not annualized. |
| D | Annualized. |
| E | Portfolio turnover rate is for the period from July 15, 2014 to December 31, 2014, and is not annualized. |
| F | Amount represents less than $0.01 per share. |
35
American Beacon Bahl & Gaynor Small Cap Growth FundSM
Financial Highlights
(For a share outstanding throughout the period)
| Investor Class | ||||||||||||
| Year Ended December 31, | July 15A to December 31, 2014 |
|||||||||||
| 2016 | 2015 | |||||||||||
| Net asset value, beginning of period |
$ | 10.12 | $ | 10.69 | $ | 10.00 | ||||||
|
|
|
|
|
|
|
|||||||
| Income from investment operations: |
||||||||||||
| Net investment income |
0.03 | 0.05 | 0.01 | |||||||||
| Net gains (losses) on investments (both realized and unrealized) |
2.53 | (0.39 | ) | 0.70 | ||||||||
|
|
|
|
|
|
|
|||||||
| Total income (loss) from investment operations |
2.56 | (0.34 | ) | 0.71 | ||||||||
|
|
|
|
|
|
|
|||||||
| Less distributions: |
||||||||||||
| Dividends from net investment income |
(0.03 | ) | (0.06 | ) | (0.02 | ) | ||||||
| Distributions from net realized gains |
— | (0.16 | ) | — | ||||||||
| Distributions from return of capital |
— | (0.01 | )F | — | ||||||||
|
|
|
|
|
|
|
|||||||
| Total distributions |
(0.03 | ) | (0.23 | ) | (0.02 | ) | ||||||
|
|
|
|
|
|
|
|||||||
| Net asset value, end of period |
$ | 12.65 | $ | 10.12 | $ | 10.69 | ||||||
|
|
|
|
|
|
|
|||||||
| Total return B |
25.31 | % | (3.25 | )% | 7.08 | %C | ||||||
|
|
|
|
|
|
|
|||||||
| Ratios and supplemental data: |
||||||||||||
| Net assets, end of period |
$ | 3,595,277 | $ | 498,128 | $ | 239,138 | ||||||
| Ratios to average net assets: |
||||||||||||
| Expenses, before reimbursements |
2.09 | % | 3.19 | % | 12.62 | %D | ||||||
| Expenses, net of reimbursements |
1.36 | % | 1.36 | % | 1.36 | %D | ||||||
| Net investment (loss), before expense reimbursements |
(0.51 | )% | (1.47 | )% | (11.12 | )%D | ||||||
| Net investment income, net of reimbursements |
0.23 | % | 0.35 | % | 0.14 | %D | ||||||
| Portfolio turnover rate |
23 | % | 54 | % | 12 | %E | ||||||
| A Class | ||||||||||||
| Year Ended December 31, | July 15A to December 31, 2014 |
|||||||||||
| 2016 | 2015 | |||||||||||
| Net asset value, beginning of period |
$ | 10.11 | $ | 10.69 | $ | 10.00 | ||||||
|
|
|
|
|
|
|
|||||||
| Income from investment operations: |
||||||||||||
| Net investment income |
0.04 | 0.03 | 0.00 | |||||||||
| Net gains (losses) on investments (both realized and unrealized) |
2.52 | (0.38 | ) | 0.71 | ||||||||
|
|
|
|
|
|
|
|||||||
| Total income (loss) from investment operations |
2.56 | (0.35 | ) | 0.71 | ||||||||
|
|
|
|
|
|
|
|||||||
| Less distributions: |
||||||||||||
| Dividends from net investment income |
(0.03 | ) | (0.06 | ) | (0.02 | ) | ||||||
| Distributions from net realized gains |
— | (0.16 | ) | — | ||||||||
| Distributions from return of capital |
— | (0.01 | )F | — | ||||||||
|
|
|
|
|
|
|
|||||||
| Total distributions |
(0.03 | ) | (0.23 | ) | (0.02 | ) | ||||||
|
|
|
|
|
|
|
|||||||
| Net asset value, end of period |
$ | 12.64 | $ | 10.11 | $ | 10.69 | ||||||
|
|
|
|
|
|
|
|||||||
| Total return B |
25.34 | % | (3.34 | )% | 7.08 | %C | ||||||
|
|
|
|
|
|
|
|||||||
| Ratios and supplemental data: |
||||||||||||
| Net assets, end of period |
$ | 2,321,426 | $ | 454,614 | $ | 163,704 | ||||||
| Ratios to average net assets: |
||||||||||||
| Expenses, before reimbursements |
2.18 | % | 2.88 | % | 13.84 | %D | ||||||
| Expenses, net of reimbursements |
1.38 | % | 1.38 | % | 1.38 | %D | ||||||
| Net investment (loss), before expense reimbursements |
(0.61 | )% | (1.08 | )% | (12.35 | )%D | ||||||
| Net investment income, net of reimbursements |
0.18 | % | 0.41 | % | 0.10 | %D | ||||||
| Portfolio turnover rate |
23 | % | 54 | % | 12 | %E | ||||||
| A | Commencement of operations. |
| B | Based on net asset value, which does not reflect the sales charge, redemption fee, or contingent deferred sales charge, if applicable. May include adjustments in accordance with U.S. GAAP and as such, the net asset value for reporting purposes and the returns based upon those net asset values may differ from the net asset value and returns for shareholder transactions. |
| C | Not annualized. |
| D | Annualized. |
| E | Portfolio turnover rate is for the period from July 15, 2014 to December 31, 2014, and is not annualized. |
| F | Amount represents less than $0.01 per share. |
36
American Beacon Bahl & Gaynor Small Cap Growth FundSM
Financial Highlights
(For a share outstanding throughout the period)
| C Class | ||||||||||||
| Year Ended December 31, | July 15A to December 31, 2014 |
|||||||||||
| 2016 | 2015 | |||||||||||
| Net asset value, beginning of period |
$ | 10.00 | $ | 10.65 | $ | 10.00 | ||||||
|
|
|
|
|
|
|
|||||||
| Income from investment operations: |
||||||||||||
| Net investment (loss) |
(0.05 | ) | (0.01 | ) | (0.02 | ) | ||||||
| Net gains (losses) on investments (both realized and unrealized) |
2.49 | (0.41 | ) | 0.69 | ||||||||
|
|
|
|
|
|
|
|||||||
| Total income (loss) from investment operations |
2.44 | (0.42 | ) | 0.67 | ||||||||
|
|
|
|
|
|
|
|||||||
| Less distributions: |
||||||||||||
| Dividends from net investment income |
(0.02 | ) | (0.06 | ) | (0.02 | ) | ||||||
| Distributions from net realized gains |
— | (0.16 | ) | — | ||||||||
| Distributions from return of capital |
— | (0.01 | )F | — | ||||||||
|
|
|
|
|
|
|
|||||||
| Total distributions |
(0.02 | ) | (0.23 | ) | (0.02 | ) | ||||||
|
|
|
|
|
|
|
|||||||
| Net asset value, end of period |
$ | 12.42 | $ | 10.00 | $ | 10.65 | ||||||
|
|
|
|
|
|
|
|||||||
| Total return B |
24.35 | % | (4.01 | )% | 6.68 | %C | ||||||
|
|
|
|
|
|
|
|||||||
| Ratios and supplemental data: |
||||||||||||
| Net assets, end of period |
$ | 412,390 | $ | 308,822 | $ | 142,469 | ||||||
| Ratios to average net assets: |
||||||||||||
| Expenses, before reimbursements |
3.09 | % | 3.84 | % | 13.72 | %D | ||||||
| Expenses, net of reimbursements |
2.13 | % | 2.13 | % | 2.13 | %D | ||||||
| Net investment (loss), before expense reimbursements |
(1.56 | )% | (2.09 | )% | (12.23 | )%D | ||||||
| Net investment (loss), net of reimbursements |
(0.60 | )% | (0.38 | )% | (0.64 | )%D | ||||||
| Portfolio turnover rate |
23 | % | 54 | % | 12 | %E | ||||||
| A | Commencement of operations. |
| B | Based on net asset value, which does not reflect the sales charge, redemption fee, or contingent deferred sales charge, if applicable. May include adjustments in accordance with U.S. GAAP and as such, the net asset value for reporting purposes and the returns based upon those net asset values may differ from the net asset value and returns for shareholder transactions. |
| C | Not annualized. |
| D | Annualized. |
| E | Portfolio turnover rate is for the period from July 15, 2014 to December 31, 2014, and is not annualized. |
| F | Amount represents less than $0.01 per share. |
37
American Beacon Holland Large Cap Growth FundSM
Financial Highlights
(For a share outstanding throughout the period)
| Institutional Class | ||||||||||||||||||||
| Year Ended December 31, | ||||||||||||||||||||
| 2016 | 2015 | 2014 | 2013 | 2012 | ||||||||||||||||
| Net asset value, beginning of period |
$ | 24.80 | $ | 25.88 | $ | 26.57 | $ | 21.60 | $ | 20.30 | ||||||||||
|
|
|
|
|
|
|
|
|
|
|
|||||||||||
| Income from investment operations: |
||||||||||||||||||||
| Net investment income |
0.02 | 0.06 | 0.03 | 0.02 | 0.09 | |||||||||||||||
| Net gains (losses) on securities (both realized and unrealized) |
0.56 | 1.67 | 1.94 | 7.02 | 2.47 | |||||||||||||||
|
|
|
|
|
|
|
|
|
|
|
|||||||||||
| Total income (loss) from investment operations |
0.58 | 1.73 | 1.97 | 7.04 | 2.56 | |||||||||||||||
|
|
|
|
|
|
|
|
|
|
|
|||||||||||
| Less distributions: |
||||||||||||||||||||
| Dividends from net investment income |
— | — | — | (0.01 | ) | (0.08 | ) | |||||||||||||
| Distributions from net realized gains |
(0.64 | ) | (2.81 | ) | (2.66 | ) | (2.06 | ) | (1.18 | ) | ||||||||||
|
|
|
|
|
|
|
|
|
|
|
|||||||||||
| Total distributions |
(0.64 | ) | (2.81 | ) | (2.66 | ) | (2.07 | ) | (1.26 | ) | ||||||||||
|
|
|
|
|
|
|
|
|
|
|
|||||||||||
| Net asset value, end of period |
$ | 24.74 | $ | 24.80 | $ | 25.88 | $ | 26.57 | $ | 21.60 | ||||||||||
|
|
|
|
|
|
|
|
|
|
|
|||||||||||
| Total return A |
2.29 | % | 6.70 | % | 7.31 | % | 32.73 | % | 12.57 | % | ||||||||||
|
|
|
|
|
|
|
|
|
|
|
|||||||||||
| Ratios and supplemental data: |
||||||||||||||||||||
| Net assets, end of period |
$ | 25,818,864 | $ | 18,600,679 | $ | 18,102,557 | $ | 16,292,016 | $ | 1,619,305 | ||||||||||
| Ratios to average net assets: |
||||||||||||||||||||
| Expenses, before reimbursements or recoupments |
0.88 | % | 0.88 | % | 0.89 | % | 0.86 | % | 1.32 | % | ||||||||||
| Expenses, net of reimbursements or recoupments |
0.88 | % | 0.89 | % | 0.89 | % | 0.89 | % | 0.96 | % | ||||||||||
| Net investment income, before expense reimbursements or recoupments |
0.25 | % | 0.26 | % | 0.14 | % | 0.24 | % | 0.07 | % | ||||||||||
| Net investment income, net of reimbursements or recoupments |
0.25 | % | 0.25 | % | 0.13 | % | 0.21 | % | 0.43 | % | ||||||||||
| Portfolio turnover rate |
34 | % | 24 | % | 27 | % | 29 | % | 18 | % | ||||||||||
| Y Class | ||||||||||||||||||||
| Year Ended December 31, | March 23B to | |||||||||||||||||||
| December 31, | ||||||||||||||||||||
| 2016 | 2015 | 2014 | 2013 | 2012 | ||||||||||||||||
| Net asset value, beginning of period |
$ | 24.66 | $ | 25.79 | $ | 26.53 | $ | 21.59 | $ | 23.00 | ||||||||||
|
|
|
|
|
|
|
|
|
|
|
|||||||||||
| Income from investment operations: |
||||||||||||||||||||
| Net investment income (loss) |
0.03 | (0.02 | ) | (0.02 | ) | 0.02 | 0.09 | |||||||||||||
| Net gains (losses) on securities (both realized and unrealized) |
0.52 | 1.70 | 1.94 | 6.98 | (0.26 | ) | ||||||||||||||
|
|
|
|
|
|
|
|
|
|
|
|||||||||||
| Total income (loss) from investment operations |
0.55 | 1.68 | 1.92 | 7.00 | (0.17 | ) | ||||||||||||||
|
|
|
|
|
|
|
|
|
|
|
|||||||||||
| Less distributions: |
||||||||||||||||||||
| Dividends from net investment income |
— | — | — | 0.00 | (0.06 | ) | ||||||||||||||
| Distributions from net realized gains |
(0.64 | ) | (2.81 | ) | (2.66 | ) | (2.06 | ) | (1.18 | ) | ||||||||||
|
|
|
|
|
|
|
|
|
|
|
|||||||||||
| Total distributions |
(0.64 | ) | (2.81 | ) | (2.66 | ) | (2.06 | ) | (1.24 | ) | ||||||||||
|
|
|
|
|
|
|
|
|
|
|
|||||||||||
| Net asset value, end of period |
$ | 24.57 | $ | 24.66 | $ | 25.79 | $ | 26.53 | $ | 21.59 | ||||||||||
|
|
|
|
|
|
|
|
|
|
|
|||||||||||
| Total return A |
2.18 | % | 6.53 | % | 7.13 | % | 32.59 | % | (0.79 | )%C | ||||||||||
|
|
|
|
|
|
|
|
|
|
|
|||||||||||
| Ratios and supplemental data: |
||||||||||||||||||||
| Net assets, end of period |
$ | 405,410 | $ | 333,682 | $ | 74,361 | $ | 78,575 | $ | 23,113 | ||||||||||
| Ratios to average net assets: |
||||||||||||||||||||
| Expenses, before reimbursements or recoupments |
0.98 | % | 1.08 | % | 1.11 | % | 0.97 | % | 10.18 | %D | ||||||||||
| Expenses, net of reimbursements or recoupments |
0.98 | % | 1.02 | % | 1.08 | % | 0.99 | % | 0.98 | %D | ||||||||||
| Net investment income (loss), before expense reimbursements or recoupments |
0.14 | % | 0.00 | % | (0.10 | )% | 0.15 | % | (8.77 | )%D | ||||||||||
| Net investment income (loss), net of reimbursements or recoupments |
0.14 | % | 0.06 | % | (0.06 | )% | 0.12 | % | 0.43 | %D | ||||||||||
| Portfolio turnover rate |
34 | % | 24 | % | 27 | % | 29 | % | 18 | %E | ||||||||||
| A | Based on net asset value, which does not reflect the sales charge, redemption fee, or contingent deferred sales charge, if applicable. May include adjustments in accordance with U.S. GAAP and as such, the net asset value for reporting purposes and the returns based upon those net asset values may differ from the net asset value and returns for shareholder transactions. |
| B | Commencement of operations. |
| C | Not annualized. |
| D | Annualized. |
| E | Portfolio turnover rate is for the period from March 23, 2012 to December 31, 2012, and is not annualized. |
38
American Beacon Holland Large Cap Growth FundSM
Financial Highlights
(For a share outstanding throughout the period)
| Investor Class | ||||||||||||||||||||
| Year Ended December 31, | ||||||||||||||||||||
| 2016 | 2015 | 2014 | 2013 | 2012 | ||||||||||||||||
| Net asset value, beginning of period |
$ | 24.38 | $ | 25.57 | $ | 26.36 | $ | 21.52 | $ | 20.24 | ||||||||||
|
|
|
|
|
|
|
|
|
|
|
|||||||||||
| Income from investment operations: |
||||||||||||||||||||
| Net investment income (loss) |
(0.05 | ) | (0.02 | ) | (0.04 | ) | (0.05 | ) | 0.02 | |||||||||||
| Net gains (losses) on securities (both realized and unrealized) |
0.52 | 1.64 | 1.91 | 6.95 | 2.45 | |||||||||||||||
|
|
|
|
|
|
|
|
|
|
|
|||||||||||
| Total income (loss) from investment operations |
0.47 | 1.62 | 1.87 | 6.90 | 2.47 | |||||||||||||||
|
|
|
|
|
|
|
|
|
|
|
|||||||||||
| Less distributions: |
||||||||||||||||||||
| Dividends from net investment income |
— | — | — | 0.00 | (0.01 | ) | ||||||||||||||
| Distributions from net realized gains |
(0.64 | ) | (2.81 | ) | (2.66 | ) | (2.06 | ) | (1.18 | ) | ||||||||||
|
|
|
|
|
|
|
|
|
|
|
|||||||||||
| Total distributions |
(0.64 | ) | (2.81 | ) | (2.66 | ) | (2.06 | ) | (1.19 | ) | ||||||||||
|
|
|
|
|
|
|
|
|
|
|
|||||||||||
| Net asset value, end of period |
$ | 24.21 | $ | 24.38 | $ | 25.57 | $ | 26.36 | $ | 21.52 | ||||||||||
|
|
|
|
|
|
|
|
|
|
|
|||||||||||
| Total return A |
1.87 | % | 6.35 | % | 6.99 | % | 32.21 | % | 12.18 | % | ||||||||||
|
|
|
|
|
|
|
|
|
|
|
|||||||||||
| Ratios and supplemental data: |
||||||||||||||||||||
| Net assets, end of period |
$ | 68,905,910 | $ | 78,921,674 | $ | 81,153,971 | $ | 77,426,294 | $ | 66,567,656 | ||||||||||
| Ratios to average net assets: |
||||||||||||||||||||
| Expenses, before reimbursements or recoupments |
1.26 | % | 1.24 | % | 1.15 | % | 1.26 | % | 1.44 | % | ||||||||||
| Expenses, net of reimbursements or recoupments |
1.26 | % | 1.24 | % | 1.21 | % | 1.27 | % | 1.29 | % | ||||||||||
| Net investment (loss), before expense reimbursements or recoupments |
(0.14 | )% | (0.10 | )% | (0.13 | )% | (0.17 | )% | (0.08 | )% | ||||||||||
| Net investment income (loss), net of reimbursements or recoupments |
(0.14 | )% | (0.10 | )% | (0.19 | )% | (0.18 | )% | 0.07 | % | ||||||||||
| Portfolio turnover rate |
34 | % | 24 | % | 27 | % | 29 | % | 18 | % | ||||||||||
| A Class | ||||||||||||||||||||
| Year Ended December 31, | ||||||||||||||||||||
| 2016 | 2015 | 2014 | 2013 | 2012 | ||||||||||||||||
| Net asset value, beginning of period |
$ | 24.17 | $ | 25.39 | $ | 26.22 | $ | 21.43 | $ | 20.23 | ||||||||||
|
|
|
|
|
|
|
|
|
|
|
|||||||||||
| Income from investment operations: |
||||||||||||||||||||
| Net investment income (loss) |
(0.04 | ) | 0.00 | (0.08 | ) | (0.03 | ) | 0.03 | ||||||||||||
| Net gains (losses) on securities (both realized and unrealized) |
0.50 | 1.59 | 1.91 | 6.88 | 2.41 | |||||||||||||||
|
|
|
|
|
|
|
|
|
|
|
|||||||||||
| Total income (loss) from investment operations |
0.46 | 1.59 | 1.83 | 6.85 | 2.44 | |||||||||||||||
|
|
|
|
|
|
|
|
|
|
|
|||||||||||
| Less distributions: |
||||||||||||||||||||
| Dividends from net investment income |
— | — | — | 0.00 | (0.06 | ) | ||||||||||||||
| Distributions from net realized gains |
(0.64 | ) | (2.81 | ) | (2.66 | ) | (2.06 | ) | (1.18 | ) | ||||||||||
|
|
|
|
|
|
|
|
|
|
|
|||||||||||
| Total distributions |
(0.64 | ) | (2.81 | ) | (2.66 | ) | (2.06 | ) | (1.24 | ) | ||||||||||
|
|
|
|
|
|
|
|
|
|
|
|||||||||||
| Net asset value, end of period |
$ | 23.99 | $ | 24.17 | $ | 25.39 | $ | 26.22 | $ | 21.43 | ||||||||||
|
|
|
|
|
|
|
|
|
|
|
|||||||||||
| Total return A |
1.85 | % | 6.28 | % | 6.88 | % | 32.11 | % | 11.99 | % | ||||||||||
|
|
|
|
|
|
|
|
|
|
|
|||||||||||
| Ratios and supplemental data: |
||||||||||||||||||||
| Net assets, end of period |
$ | 1,327,798 | $ | 1,271,340 | $ | 1,011,971 | $ | 1,028,434 | $ | 466,796 | ||||||||||
| Ratios to average net assets: |
||||||||||||||||||||
| Expenses, before reimbursements or recoupments |
1.30 | % | 1.29 | % | 1.35 | % | 1.40 | % | 2.73 | % | ||||||||||
| Expenses, net of reimbursements or recoupments |
1.30 | % | 1.29 | % | 1.34 | % | 1.39 | % | 1.38 | % | ||||||||||
| Net investment (loss), before expense reimbursements or recoupments |
(0.16 | )% | (0.15 | )% | (0.32 | )% | (0.28 | )% | (0.97 | )% | ||||||||||
| Net investment income (loss), net of reimbursements or recoupments |
(0.16 | )% | (0.15 | )% | (0.31 | )% | (0.27 | )% | 0.37 | % | ||||||||||
| Portfolio turnover rate |
34 | % | 24 | % | 27 | % | 29 | % | 18 | % | ||||||||||
| A | Based on net asset value, which does not reflect the sales charge, redemption fee, or contingent deferred sales charge, if applicable. May include adjustments in accordance with U.S. GAAP and as such, the net asset value for reporting purposes and the returns based upon those net asset values may differ from the net asset value and returns for shareholder transactions. |
39
American Beacon Holland Large Cap Growth FundSM
Financial Highlights
(For a share outstanding throughout the period)
| C Class | ||||||||||||||||||||
| Year Ended December 31, | March 23A to December 31, |
|||||||||||||||||||
| 2016 | 2015 | 2014 | 2013 | 2012 | ||||||||||||||||
| Net asset value, beginning of period |
$ | 23.30 | $ | 24.75 | $ | 25.82 | $ | 21.29 | $ | 22.90 | ||||||||||
|
|
|
|
|
|
|
|
|
|
|
|||||||||||
| Income from investment operations: |
||||||||||||||||||||
| Net investment income (loss) |
(1.04 | ) | (0.04 | ) | (0.36 | ) | (0.17 | ) | 0.01 | |||||||||||
| Net gains (losses) on securities (both realized and unrealized) |
1.31 | 1.40 | 1.95 | 6.76 | (0.38 | ) | ||||||||||||||
|
|
|
|
|
|
|
|
|
|
|
|||||||||||
| Total income (loss) from investment operations |
0.27 | 1.36 | 1.59 | 6.59 | (0.37 | ) | ||||||||||||||
|
|
|
|
|
|
|
|
|
|
|
|||||||||||
| Less distributions: |
||||||||||||||||||||
| Dividends from net investment income |
— | — | — | 0.00 | (0.06 | ) | ||||||||||||||
| Distributions from net realized gains |
(0.64 | ) | (2.81 | ) | (2.66 | ) | (2.06 | ) | (1.18 | ) | ||||||||||
|
|
|
|
|
|
|
|
|
|
|
|||||||||||
| Total distributions |
(0.64 | ) | (2.81 | ) | (2.66 | ) | (2.06 | ) | (1.24 | ) | ||||||||||
|
|
|
|
|
|
|
|
|
|
|
|||||||||||
| Net asset value, end of period |
$ | 22.93 | $ | 23.30 | $ | 24.75 | $ | 25.82 | $ | 21.29 | ||||||||||
|
|
|
|
|
|
|
|
|
|
|
|||||||||||
| Total return B |
1.10 | % | 5.51 | % | 6.05 | % | 31.10 | % | (1.65 | )%C | ||||||||||
|
|
|
|
|
|
|
|
|
|
|
|||||||||||
| Ratios and supplemental data: |
||||||||||||||||||||
| Net assets, end of period |
$ | 341,842 | $ | 757,411 | $ | 592,178 | $ | 702,642 | $ | 281,415 | ||||||||||
| Ratios to average net assets: |
||||||||||||||||||||
| Expenses, before reimbursements or recoupments |
2.07 | % | 2.05 | % | 2.10 | % | 2.15 | % | 6.17 | %D | ||||||||||
| Expenses, net of reimbursements or recoupments |
2.04 | % | 2.04 | % | 2.09 | % | 2.14 | % | 2.12 | %D | ||||||||||
| Net investment (loss), before expense reimbursements or recoupments |
(0.95 | )% | (0.91 | )% | (1.07 | )% | (1.04 | )% | (3.85 | )%D | ||||||||||
| Net investment income (loss), net of reimbursements or recoupments |
(0.92 | )% | (0.90 | )% | (1.07 | )% | (1.03 | )% | 0.20 | %D | ||||||||||
| Portfolio turnover rate |
34 | % | 24 | % | 27 | % | 29 | % | 18 | %E | ||||||||||
| A | Commencement of operations. |
| B | Based on net asset value, which does not reflect the sales charge, redemption fee, or contingent deferred sales charge, if applicable. May include adjustments in accordance with U.S. GAAP and as such, the net asset value for reporting purposes and the returns based upon those net asset values may differ from the net asset value and returns for shareholder transactions. |
| C | Not annualized. |
| D | Annualized. |
| E | Portfolio turnover rate is for the period from March 23, 2012 to December 31, 2012, and is not annualized. |
40
American Beacon FundsSM
December 31, 2016 (Unaudited)
Certain tax information regarding the Funds are required to be provided to shareholders based upon the Funds’ income and distribution for the taxable year ended December 31, 2016. The information and distributions reported herein may differ from information and distributions taxable to the shareholders for the calendar year ended December 31, 2016.
The Funds designated the following items with regard to distributions paid during the year ended December 31, 2016. All designations are based on financial information available as of this annual report and, accordingly, are subject to change. For each item, it is the intention of the Fund to designate the maximum amount permitted under the Internal Revenue Code of 1986, as amended, and the regulations there under.
| Bahl & Gaynor Small Cap Growth Fund |
Holland Large Cap Growth Fund |
|||||||
| Corporate Dividends Received Deduction |
91.98 | % | 93.53 | % | ||||
| Qualified Dividend Income |
100.00 | % | 0.00 | % | ||||
The Bahl & Gaynor Small Cap Growth Fund designated $1,534 as long-term capital gains distributions and the Holland Large Cap Growth Fund designated $2,467,327 as long-term capital gains distributions for the year ended December 31, 2016.
Shareholders received notification in January 2017 of the appropriate tax information necessary to prepare their 2016 income tax return.
41
American Beacon FundsSM
December 31, 2016 (Unaudited)
American Beacon Advisors, Inc. (“American Beacon”) is a wholly-owned subsidiary of Astro AB Borrower, Inc. (“Borrower”). On January 31, 2017, the Board of Borrower and its sole shareholder, Astro AB Acquisition (“Acquisition”), approved an amendment to Borrower’s Certificate of Incorporation to change the name of Borrower to Resolute Investment Managers, Inc. Simultaneously with the name change of Borrower, the shareholders and the Boards of each of American Beacon’s indirect owners approved similar name changes, as follows: Astro AB Holdings, LLC (“Holdings”) became Resolute Investment Holdings, LLC; Astro AB Topco, Inc. became Resolute Topco, Inc.; and Astro AB Acquisition, Inc. became Resolute Acquisition, Inc. Amendments to each of the entities’ Articles of Incorporation, or, in the case of Holdings, the Certificate of Formation, were filed with the Delaware Secretary of State.
A summary of the name changes for the Astro Entities is set forth below:
Astro AB Holdings, LLC - Resolute Investment Holdings, LLC
Astro AB Topco, Inc. - Resolute Topco, Inc.
Astro AB Acquisiton, Inc. - Resolute Acquisiton, Inc.
Astro AB Borrower, Inc. - Resolute Investment Managers, Inc.
42
Trustees and Officers of the American Beacon FundsSM (Unaudited)
The Trustees and officers of the American Beacon Funds (the “Trust”) are listed below, together with their principal occupations during the past five years. Unless otherwise indicated, the address of each person listed below is 220 Las Colinas Boulevard East, Suite 1200, Irving, Texas 75039. Each Trustee oversees twenty-seven funds in the fund complex that includes the Trust and the American Beacon Select Funds. The Trust’s Statement of Additional Information contains additional information about the Trustees and is available without charge by calling 1-800-658-5811.
| Name, Age and Address |
Position, Term of Office and Length of Time Served with the Trust |
Principal Occupation(s) During Past 5 Years and Current Directorships | ||
| INTERESTED TRUSTEES | ||||
| Lifetime of Trust until removal, resignation or retirement* |
||||
| Alan D. Feld** (80) | Trustee since 1996 | Sole Shareholder of a professional corporation which is a Partner in the law firm of Akin, Gump, Strauss, Hauer & Feld, LLP (law firm) (1960-Present); Trustee, American Beacon Mileage Funds (1996-2012); Trustee, American Beacon Select Funds (1999-Present); Trustee, American Beacon Master Trust (1996-2012). | ||
| NON-INTERESTED TRUSTEES | Term | |||
| Lifetime of Trust until removal resignation or retirement* | ||||
| Gilbert G. Alvarado (47) | Trustee since 2015 | Director, Kura MD, Inc. (local telehealth organization) (2015-present); Vice President & CFO, Sierra Health Foundation (health conversion private foundation) (2006-Present) Vice President & CFO, Sierra Health Foundation: Center for Health Program Management (California public benefit corporation) (2012-Present); Director, Innovative North State (2012-Present); Director, Sacramento Regional Technology Alliance (2011-Present); Director, Women’s Empowerment (2009-2014); Trustee, American Beacon Select Funds (2015-Present). | ||
| Josephe B. Armes (54) | Trustee since 2015 | Chairman & CEO, CSW Industrials f/k/a Capital Southwest Corporation (investment company) (2013-Present); President & CEO, JBA Investment Partners (family investment vehicle) (2010-Present); Chief Operating Officer, Hicks Holdings, LLC (Hicks Family assets and investments) (2005-2010); Trustee, Baylor University Board of Regents (2001-2010); Director and Chair of Audit Committee, RSP Permian (oil and gas producer) (2013-Present); Trustee, American Beacon Select Funds (2015-Present). | ||
| Gerard J. Arpey (58) | Trustee since 2012 | Director, The Home Depot, Inc. (2015-Present); Partner, Emerald Creek Group (private equity firm) (2011-Present); Chairman and Chief Executive Officer, AMR Corp. and American Airlines; Inc. (2003- 2011); Director, S. C. Johnson & Son, Inc. (privately held company) (2008-present); Trustee, American Beacon Select Funds (2012-Present). | ||
| Brenda A. Cline (56) | Trustee since 2004 | Executive Vice President, Chief Financial Officer, Treasurer and Secretary, Kimbell Art Foundation (1993-Present); Director, Range Resources Corporation (oil and natural gas company) (2015-Present); Director, Tyler Technologies, Inc.(public sector software solutions company) (2014-Present); Trustee, American Beacon Mileage Funds (2004-2012); Trustee, American Beacon Select Funds (2004-Present); Trustee, American Beacon Master Trust (2004-2012). | ||
| Eugene J. Duffy (62) | Trustee since 2008 | Managing Director, Institutional Services, Intercontinental Real Estate Corporation (2014-Present); Principal and Executive Vice President, Paradigm Asset Management (1994-2014); Director, Sunrise Bank of Atlanta (2008-2013); Trustee, American Beacon Mileage Funds (2008- 2012); Trustee, American Beacon Select Funds (2008-Present); Trustee, American Beacon Master Trust (2008-2012). | ||
43
Trustees and Officers of the American Beacon FundsSM (Unaudited)
| Name, Age and Address |
Position, Term of Office and Length of Time Served with the Trust |
Principal Occupation(s) During Past 5 Years and Current Directorships | ||
| TRUSTEES (CONT.) | Term | |||
| M. Dunning (74) | Trustee since 2008 | Chairman Emeritus (2008-Present); Lockton Dunning Benefits (consulting firm in employee benefits); Board Director, Oncor Electric Delivery Company LLC (2007-Present); Board Member, BancTec (2010-Present) (software consulting); Trustee, American Beacon Mileage Funds (2008-2012); Trustee, American Beacon Select Funds (2008-Present); Trustee, American Beacon Master Trust (2008-2012). | ||
| Richard M. Massman (73) | Trustee since 2004 Chairman since 2008 | Consultant and General Counsel Emeritus (2009-Present) and Senior Vice President and General Counsel (1994-2009), Hunt Consolidated, Inc. (holding company engaged in oil and gas exploration and production, refining, real estate, farming, ranching and venture capital activities); Trustee, American Beacon Mileage Funds (2004- 2012); Trustee, American Beacon Select Funds (2004-Present); Trustee, American Beacon Master Trust (2004-2012). | ||
| Barbara J. McKenna, CFA (53) | Trustee since 2012 | Managing Principal, Longfellow Investment Management Company (2005- Present); Trustee, American Beacon Select Funds (2012-Present). | ||
| R. Gerald Turner (71) 225 Perkins Admin. Bldg. Southern Methodist Univ. Dallas, Texas 75275 |
Trustee since 2001 | President, Southern Methodist University (1995-Present); Director, J.C. Penney Company, Inc. (1996-Present); Director, Kronus Worldwide Inc. (chemical manufacturing) (2003-Present); Trustee, American Beacon Mileage Funds (2001- 2012); Trustee, American Beacon Select Funds (2001-Present); Trustee, American Beacon Master Trust (2001-2012). | ||
| OFFICERS | ||||
| Gene. L. Needles, Jr. (62) | President since 2009 Executive Vice President since 2009 |
President, CEO and Director, American Beacon Advisors, Inc. (2009-Present); President, CEO and Director, Astro AB Borrower, Inc. (2015-Present); President, CEO and Director, Astro AB Acquisition, Inc.(2015-Present); President, CEO and Director, Astro AB Topco, Inc. (2015-Present), President, CEO and Director, Astro AB Holdings, LLC. (2015-Present); President, CEO and Director, Lighthouse Holdings, Inc.; (2009-2015); President and CEO, Lighthouse Holdings Parent, Inc. (2009-2015); Manager, President and CEO, American Private Equity Management, L.L.C. (2012-Present); President, American Beacon Cayman Managed Futures Strategy Fund, Ltd. (2014-Present). | ||
| Rosemary K. Behan (57) | VP, Secretary and Chief Legal Officer since 2006 |
Secretary, American Beacon Advisors, Inc. (2006-Present); Secretary, Astro AB Borrower, Inc. (2015-Present); Secretary, Astro AB Acquisition, Inc. (2015- Present); Secretary, Astro AB Topco, Inc. (2015-Present); Secretary, Astro AB Holdings, LLC. (2015-Present); Secretary, Lighthouse Holdings, Inc. (2008- 2015); Secretary, Lighthouse Holdings Parent, Inc. (2008-2015); Secretary, American Private Equity Management, L.L.C. (2008-Present); Secretary, American Beacon Cayman Managed Futures Strategy Fund, Ltd. (2014-Present). | ||
| Brian E. Brett (56) | VP since 2004 | Vice President, Director of Sales, American Beacon Advisors, Inc. (2004-Present). | ||
| Paul B. Cavazos (47) | VP since 2016 | Chief Investment Officer and Vice President, Asset Management, American Beacon Advisors, Inc. (2016-Present); Chief Investment Officer and Assistant Treasurer, DTE Energy (2007-2016); | ||
| Erica Duncan (46) | VP since 2011 | Vice President, Marketing and Client Services, American Beacon Advisors, Inc. (2011-Present); Supervisor, Brand Marketing, Invesco (2010-2011); | ||
44
Trustees and Officers of the American Beacon FundsSM (Unaudited)
| Name, Age and Address |
Position, Term of Office and Length of Time Served with the Trust |
Principal Occupation(s) During Past 5 Years and Current Directorships | ||
| OFFICERS | Term | |||
| Melinda G. Heika (55) | Treasurer since 2010 | Treasurer, American Beacon Advisors, Inc. (2010-Present); Treasurer, Astro AB Borrower, Inc. (2015-Present); Treasurer, Astro AB Acquisition, Inc. (2015-Present); Treasurer, Astro AB Topco, Inc. (2015-Present); Treasurer, Astro AB Holdings, LLC. (2015-Present); Treasurer, Lighthouse Holdings, Inc. (2010-2015); Treasurer, Lighthouse Holdings Parent Inc., (2010-2015); Treasurer, American Private Equity Management, L.L.C. (2012-Present); Director and Treasurer, American Beacon Cayman Managed Futures Strategy Fund, Ltd. (2014-Present). | ||
| One Year | ||||
| Terri L. McKinney (53) | VP since 2010 | Vice President, Enterprise Services (2009-Present) and Managing Director (2003-2009), American Beacon Advisors, Inc. | ||
| Jeffrey K. Ringdahl (41) | VP since 2010 | Chief Operating Officer, American Beacon Advisors, Inc. (2010-Present); Manager and Senior Vice President, American Private Equity Management, L.L.C. (2012-Present); Senior Vice President and Director, Astro AB Borrower, Inc. (2015-Present); Senior Vice President and Director, Astro AB Acquisition, Inc. (2015-Present); Senior Vice President and Director, Astro AB Topco, Inc. (2015-Present), Senior Vice President and Director, Astro AB Holdings, LLC.(2015-Present); Senior Vice President, Lighthouse Holdings, Inc. (2013-2015); Senior Vice President, Lighthouse Holdings Parent, Inc. (2013-2015); Director and Vice President, American Beacon Cayman Managed Futures Strategy Fund, Ltd. (2014-Present); Vice President, Product Management, Touchstone Advisors, Inc. (2007-2010). | ||
| Samuel J. Silver (53) | VP since 2011 | Chief Fixed Income Officer (2016–Present), Vice President, Fixed Income Investments (2011-2016) and Senior Portfolio Manager, Fixed Income Investments (1999-2011), American Beacon Advisors, Inc. | ||
| Christina E. Sears (45) | Chief Compliance Officer since 2004 and Asst. Secretary since 1999 |
Chief Compliance Officer, American Beacon Advisors, Inc. (2004-Present); Chief Compliance Officer, American Private Equity Management, L.L.C. (2012-Present). | ||
| Sonia L. Bates (60) | Asst. Treasurer since 2011 | Director, Tax and Financial Reporting (2011-Present), Manager, Tax and Financial Reporting (2005-2010), American Beacon Advisors, Inc.; Asst. Treasurer, Astro AB Borrower, Inc. (2015-Present); Asst. Treasurer, Astro AB Acquisition, Inc.(2015-Present); Asst. Treasurer, Astro AB Topco, Inc. (2015-Present); Asst. Treasurer, Astro AB Holdings, LLC.;Asst. Treasurer, Lighthouse Holdings, Inc. (2011-2015); Asst. Treasurer, Lighthouse Holdings Parent Inc. (2011-2015); Asst. Treasurer, American Private Equity Management, L.L.C. (2012-Present). | ||
| Shelley D. Abrahams (42) | Assistant Secretary since 2008 | Assistant Secretary, American Beacon Advisors, Inc. (2008-Present) | ||
| Rebecca L. Harris (50) | Assistant Secretary since 2011 | Assistant Secretary, American Beacon Advisors, Inc. (2011-Present) | ||
| Diana N. Lai (41) | Assistant Secretary since 2012 | Assistant Secretary, American Beacon Advisors, Inc. (2012-Present) | ||
| Teresa A. Oxford (58) | Assistant Secretary since 2015 | Assistant Secretary, American Beacon Advisors, Inc. (2015-Present) | ||
| * | As of 11/12/2014, the Board adopted a retirement plan that requires Trustees to retire no later than the last day of the calendar year in which they reach the age of 75. |
| ** | Mr. Feld is deemed to be an “interested person” of the Trusts, as defined by the 1940 Act. Mr. Feld’s law firm of Akin, Gump, Strauss, Hauer & Feld LLP has provided legal services within the past two fiscal years to one or more of the Trust’s sub-advisors. |
45
American Beacon FundsSM
December 31, 2016 (Unaudited)
The American Beacon Funds recognize and respect the privacy of our shareholders. We are providing this notice to you so you will understand how shareholder information may be collected and used.
We may collect nonpublic personal information about you from one or more of the following sources:
| • | information we receive from you on applications or other forms; |
| • | information about your transactions with us or our service providers; and |
| • | information we receive from third parties. |
We do not disclose any nonpublic personal information about our customers or former customers to anyone, except as permitted by law.
We restrict access to your nonpublic personal information to those employees or service providers who need to know that information to provide products or services to you. To ensure the confidentiality of your nonpublic personal information, we maintain safeguards that comply with federal standards.
46
This page intentionally left blank.
47
This page intentionally left blank.
48

Delivery of Documents
eDelivery is NOW AVAILABLE - Stop traditional mail delivery and receive your
shareholder reports and summary prospectus on-line. Sign up at
www.americanbeaconfunds.com
If you invest in the Fund through a financial institution, you may be able to receive the Fund’s regulatory mailings, such as the Prospectus, Annual Report and Semi-Annual Report, by e-mail. If you are interested in this option, please go to www.icsdelivery.com and search for your financial institution’s name or contact your financial institution directly.
To obtain more information about the Fund:
|
|
| |
| By E-mail: american_beacon.funds@ambeacon.com
|
On the Internet: Visit our website at www.americanbeaconfunds.com | |
|
| ||

|

| |
| By Telephone: Institutional, Y, and Investor Classes Call (800) 658-5811 |
By Mail: American Beacon Funds P.O. Box 219643 Kansas City, MO 64121-9643
| |
|
| ||
|
Availability of Quarterly Portfolio Schedules
In addition to the Schedule of Investments provided in each semi-annual and annual report, the Fund files a complete schedule of its portfolio holdings with the Securities and Exchange Commission (“SEC”) on Form N-Q as of the first and third fiscal quarters. The Fund’s Forms N-Q are available on the SEC’s website at www.sec.gov. The Forms N-Q may also be reviewed and copied at the SEC’s Public Reference Section, 100 F Street, NE, Washington, D.C. 20549-2736. Information regarding the operation of the SEC’s Public Reference Room may be obtained by calling (800)-SEC-0330. A complete schedule of the Fund’s portfolio holdings is also available at www.americanbeaconfunds.com approximately twenty days after the end of each month. |
Availability of Proxy Voting Policy and Records
A description of the policies and procedures the Fund uses to determine how to vote proxies relating to portfolio securities is available in the Fund’s Statement of Additional Information, is available free of charge on the Fund’s website www.americanbeaconfunds.com and by calling 1-800-967-9009 or by accessing the SEC’s website at www. sec.gov. The Fund’s proxy voting record for the most recent year ended June 30 is filed annually with the SEC on Form N-PX. The Fund’s Forms N-PX are available on the SEC’s website at www.sec.gov. The Fund’s proxy voting record may also be obtained by calling 1-800-967-9009. | |


Fund Service Providers:
| CUSTODIAN |
TRANSFER AGENT | INDEPENDENT REGISTERED | DISTRIBUTOR | |||
| State Street Bank and Trust |
Boston Financial Data Services | PUBLIC ACCOUNTING FIRM Ernst & Young LLP |
Foreside Fund Services, LLC | |||
| Boston, Massachusetts |
Kansas City, Missouri | Dallas, Texas | Portland, Maine |
This report is prepared for shareholders of the American Beacon Funds and may be distributed to others only if preceded or accompanied by a current Prospectus or Summary Prospectus.
American Beacon Funds, American Beacon Bahl & Gaynor Small Cap Growth and American Beacon Holland Large Cap Growth Funds are service marks of American Beacon Advisors, Inc.
AR 12/16
About American Beacon Advisors
Since 1986, American Beacon Advisors has offered a variety of products and investment advisory services to numerous institutional and retail clients, including a variety of mutual funds, corporate cash management, and separate account management.
Our clients include defined benefit plans, defined contribution plans, foundations, endowments, corporations, financial planners, and other institutional investors. With American Beacon Advisors, you can put the experience of a multi-billion dollar asset management firm to work for your company.
BRIDGEWAY LARGE CAP GROWTH FUND
Growth stocks typically are more volatile than value stocks; however, value stocks have a lower expected growth rate in earnings and sales. Investing in foreign securities may involve heightened risk due to currency fluctuations and economic and political risks. The use of futures contracts for cash management may subject the Fund to losing more money than invested. Please see the prospectus for a complete discussion of the Fund’s risks. There can be no assurances that the investment objectives of this Fund will be met.
BRIDGEWAY LARGE CAP VALUE FUND
Investing in value stocks may limit downside risk over time; however, the Fund may produce more modest gains than riskier stock funds as a trade-off for this potentially lower risk. Investing in foreign securities may involve heightened risk due to currency fluctuations and economic and political risks. While the Fund is managed pursuant to a tax management strategy, the Fund’s investments could create capital gains. The use of futures contracts for cash management may subject the Fund to losing more money than invested. Please see the prospectus for a complete discussion of the Fund’s risks. There can be no assurances that the investment objectives of this Fund will be met.
Any opinions herein, including forecasts, reflect our judgment as of the end of the reporting period and are subject to change. Each advisor’s strategies and each Fund’s portfolio composition will change depending on economic and market conditions. This report is not a complete analysis of market conditions, and, therefore, should not be relied upon as investment advice. Although economic and market information has been compiled from reliable sources, American Beacon Advisors, Inc. makes no representation as to the completeness or accuracy of the statements contained herein.
| American Beacon Funds | December 31, 2016 |
| 1 | ||||
| 2 | ||||
| 9 | ||||
| 11 | ||||
| Schedules of Investments: |
||||
| 12 | ||||
| 16 | ||||
| 21 | ||||
| 25 | ||||
| Financial Highlights: |
||||
| 42 | ||||
| 44 | ||||
| 47 | ||||
| 48 | ||||
| 49 | ||||
| 52 | ||||
| Back Cover | ||||

|
Dear Shareholders,
During the 12-month period ended December 31, 2016, China’s slowing growth escalated concerns for global markets, and many of the world’s central banks – the Federal Reserve (the “Fed”) included – responded by either continuing or expanding their economic stimulation policies. In the first half of 2016, international stocks declined while U.S. and emerging-market stocks made modest gains. Falling global interest rates supported bond returns during the period.
On June 24, 2016, the U.K. announced that the Brexit referendum to leave the European Union passed with a 52% majority vote, further shaking up global markets. By the end of that month, however, the U.S. stock market and some global markets had rebounded to near pre-Brexit levels as investors took opportunistic risks following the historic vote. After Theresa May’s succession as the U.K.’s prime minister on July 13, 2016, many central banks put their Brexit concerns on hold and turned their attention to their own economies. |
In the weeks ahead of the U.S. presidential election on November 8, 2016, uncertainty about the outcome caused many investors to stay on the sidelines. Some investors questioned whether the election’s result would have negative consequences for their portfolios, but elections rarely have a lasting effect on the market. Historically speaking, from August 1 to October 31 during 19 of the last 22 election years – or approximately 86% of the time – the S&P 500 rallied for an average gain of approximately 6%.
On December 14, 2016, the Fed announced that it increased short-term interest rates by 0.25% to a range of 0.50% and 0.75%, signifying the Federal Open Market Committee’s confidence in an improving economy. It was the second rate increase in a decade; the first rate increase occurred in December 2015.
Although U.S. bonds and international investments largely declined in fourth quarter, domestic stocks reached new highs by the end of 2016. Markets responded positively to aspects of the incoming administration’s proposed plans for economic growth; i.e., repatriating jobs from overseas, relaxing regulations, lowering taxes and increasing infrastructure spending. For the year, the Dow Jones Industrial Average gained 16.50%, the S&P 500 Index gained 11.96% and the Nasdaq Composite gained 7.5%.
For the 12 months ended December 31, 2016:
| • | American Beacon Bridgeway Large Cap Growth Fund (Investor Class) returned 5.21%. |
| • | American Beacon Bridgeway Large Cap Value Fund (Investor Class) returned 15.81%. |
American Beacon Advisors identifies and partners with experienced asset managers from across all asset classes to help protect our shareholders’ portfolios over the long term. We are proud to offer a variety of funds that allow investors to invest in the asset classes best aligned with their long-term goals.
Thank you for your continued investment in the American Beacon Funds. For additional information about the Funds or to access your account information, please visit www.americanbeaconfunds.com.
| Best Regards, |

|
| Gene L. Needles, Jr. |
| President |
| American Beacon Funds |
1
Domestic Equity Market Overview
December 31, 2016 (Unaudited)
Domestic equity markets came back with a roar from 2015’s modestly positive performance and continued the long-running, eight-year bull market. The S&P 500 Index, a broad measure of stock performance, was up 11.96%. The Russell 1000 Index, another largely followed market index, was up 12.05% for the year. Looking at the various Russell-style indexes for the year, small-cap stocks outpaced large- and mid-cap stocks and value stocks far outpaced growth stocks. In 2016, the markets continued to demonstrate that macroeconomic events such as the Brexit vote and uncertainty around the U.S. election can influence performance in the short term.
The first quarter of 2016 was marked by significant domestic equity market volatility with negative performance in January nearly matching positive performance in March (with flat performance in between). The month of January was highlighted by a broad market sell-off because of continued weakness in China’s economy despite a rebound by stocks at the end of the month. Healthier economic indicators in February kept the markets from entering correction territory, with most broad domestic equity markets ending the month close to flat. March was characterized by strong market performance led by job gains, a strengthening labor market, and some stability to oil prices. The Federal Reserve (the “Fed”) took a cautious tone following the Federal Open Market Committee (“FOMC”) meeting in March and held the federal funds rate steady. “Global economic and financial developments” were cited as reasons to keep the rate steady. To wit, the surprise move by the European Central Bank for further quantitative easing underscored weakness in Europe’s economy. The quarter ended with most domestic markets in modestly positive territory – the exceptions being the small-cap core/growth space.
The second quarter’s hot topics – Brexit and the lackluster May jobs report – did little to dampen the period’s positive momentum. The first two months of the quarter had positive returns that initially seemed to be threatened by the underwhelming May jobs report released in the first week of June. The weak report put the prospect of the Fed raising interest rates at the June meeting in doubt, which was later realized. Later in the month came the unexpected vote in the United Kingdom to leave the European Union, or Brexit. However, the domestic equity markets’ short-lived reaction to the Brexit vote was followed by a quick rebound and the month of June was relatively flat across most U.S. indexes. The second quarter ended with U.S. equity markets posting positive numbers across the board.
The third quarter was buoyed initially by lessening fear surrounding the Brexit vote and a significant positive revision to the June jobs report, but the Fed’s discussion of whether (and when) they should raise interest rates remained a key theme. This carried into August as U.S. markets were lifted by continued signs of job creation, wage growth and a lower unemployment rate. Gross domestic product (“GDP”) metrics for the period registered +3.5% annualized – the highest observation in two years. Meanwhile, international markets were mixed, particularly as growth in China continued to slow. Weaker markets in September recovered toward the end of month thanks in part to oil prices rising in the wake of OPEC’s announcement of a tentative agreement on production cutbacks. Despite that and concerns about inflation remaining below its target of 2%, the Fed indicated that the case for raising interest rates before the end of the year had strengthened, though they noted they would wait before doing so and continue monitoring the environment. Once again, U.S. equity markets had a positive quarter across the board and particularly in the small-cap space.
The fourth quarter began weakly in October due to the uncertainty of the fast-approaching U.S. presidential election and despite goods and services indicating an increase to real GDP during the same time period. In November, despite predictions of a sharp, negative response to the election results, the U.S. markets went on to achieve new highs later in the month. Notwithstanding generally positive market conditions, the Fed made no interest rate changes in November given the proximity of the FOMC’s meeting to the election. At that time, Federal Reserve Board Chair Janet Yellen foreshadowed a potential rate increase, saying the timing could be appropriate “relatively soon.” On December 14, the Fed met and voted to increase interest rates by 0.25% – the first time in 2016 and only the second time in the past 12 months. As another positive note, consumer confidence rose during the month of December to its highest level in more than 15 years. The fourth quarter was a good period for the U.S. equity markets – especially small-cap stocks and value stocks, which significantly outpaced their large and growth counterparts – and wrapped a big bow around the end of a year that seemed surprising (i.e., U.S. markets leading globally).
2
American Beacon Bridgeway Large Cap Growth FundSM
Performance Overview
December 31, 2016 (Unaudited)
The Investor Class of the American Beacon Bridgeway Large Cap Growth Fund (the “Fund”) returned 7.90% for the six months ended December 31, 2016, the Fund’s new fiscal year-end. The Fund outperformed the Russell 1000® Growth Index (the “Index”) return of 5.64% for the same period.
Comparison of Change in Value of a $10,000 Investment for the period from 12/31/2006 through 12/31/2016
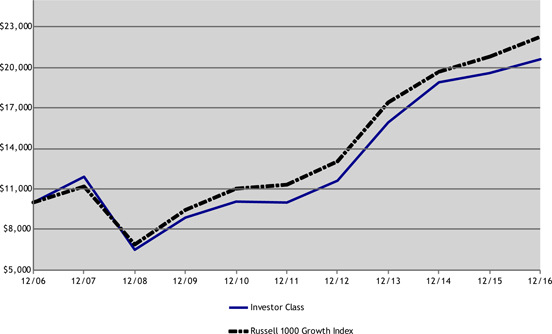
Total Returns for the Period Ended December 31, 2016
| Ticker | 6 Months | 1 Year | 3 Years | 5 Years | 10 Years | Value of $10,000 12/31/2006- 12/31/2016 |
||||||||||||||||||||||
| Institutional Class (1,7) |
BRLGX | 8.15 | % | 5.60 | % | 9.09 | % | 15.66 | % | 7.53 | % | $ | 20,676 | |||||||||||||||
| Y Class (1,2,7) |
BLYYX | 8.06 | % | 5.51 | % | 9.06 | % | 15.64 | % | 7.53 | % | $ | 20,660 | |||||||||||||||
| Investor Class (1,3,7) |
BLYPX | 7.90 | % | 5.21 | % | 8.96 | % | 15.58 | % | 7.50 | % | $ | 20,601 | |||||||||||||||
| A without Sales Charge (1,4,7) |
BLYAX | 7.89 | % | 5.26 | % | 8.98 | % | 15.59 | % | 7.50 | % | $ | 20,609 | |||||||||||||||
| A with Sales Charge (1,4,7) |
BLYAX | 1.68 | % | -0.79 | % | 6.84 | % | 14.22 | % | 6.87 | % | $ | 19,425 | |||||||||||||||
| C without Sales Charge (1,5,7) |
BLYCX | 7.43 | % | 4.49 | % | 8.71 | % | 15.42 | % | 7.42 | % | $ | 20,458 | |||||||||||||||
| C with Sales Charge (1,5,7) |
BLYCX | 6.43 | % | 3.49 | % | 8.71 | % | 15.42 | % | 7.42 | % | $ | 20,458 | |||||||||||||||
| Russell 1000 Growth Index (6) |
5.64 | % | 7.08 | % | 8.55 | % | 14.50 | % | 8.33 | % | $ | 22,266 | ||||||||||||||||
| 1. | Performance shown is historical and is not indicative of future returns. Investment returns and principal value will vary, and shares may be worth more or less at redemption than at original purchase. Performance shown is calculated based on the published end of day net asset values as of date indicated, and current performance may be lower or higher than the performance data quoted. To obtain performance as of the most recent month end, please visit www. americanbeaconfunds.com or call 1-800-967-9009. Fund performance in the table above does not reflect the deduction of taxes a shareholder would pay on distributions or the redemption of shares. A portion of the fees charged to each class of the Fund has been waived since Fund inception. Performance prior to waiving fees was lower than the actual returns shown since inception. |
| 2. | Fund performance for the five-year and ten-year periods represent the returns achieved by the Institutional Class from 12/31/06 up to 2/5/16, the inception date of the Y Class, and the returns of the Y Class since its inception. Expenses of the Y Class are higher than those of the Institutional Class. As a result, total returns shown may be higher than they would have been had the Y Class been in existence since 12/31/06. |
3
American Beacon Bridgeway Large Cap Growth FundSM
Performance Overview
December 31, 2016 (Unaudited)
| 3. | Fund performance for the five-year and ten-year periods represent the returns achieved by the Institutional Class from 12/31/06 up to 2/5/16, the inception date of the Investor Class, and the returns of the Investor Class since its inception. Expenses of the Investor Class are higher than those of the Institutional Class. Therefore, total returns shown may be higher than they would have been had the Investor Class been in existence since 12/31/06. |
| 4. | Fund performance for the five-year and ten-year periods represent the returns achieved by the Institutional Class from 12/31/06 through 2/5/16, the inception date of the A Class, and the returns of the A Class since its inception. Expenses of the A Class are higher than those of the Institutional Class. As a result, total returns shown may be higher than they would have been had the A Class been in existence since 12/31/06. A Class shares have a maximum sales charge of 5.75%. |
| 5. | Fund performance for the five-year and ten-year periods represent the returns achieved by the Institutional Class from 12/31/06 through 2/5/16, the inception date of the C Class, and the returns of the C Class since its inception. Expenses of the C Class are higher than those of the Institutional Class. As a result, total returns shown may be higher than they would have been had the C Class been in existence since 12/31/06. C Class has a maximum contingent deferred sales charge of 1.00% for shares redeemed within one year of the date of purchase. |
| 6. | The Russell 1000 Growth Index is an unmanaged index of those stocks in the Russell 1000 Index with higher price-to-book ratios and higher forecasted growth values. Russell 1000 Growth Index and Russell 1000 Index are registered trademarks of the Frank Russell Company. One cannot directly invest in an index. |
| 7. | The total annual Fund operating expense ratio set forth in the most recent Fund prospectus for the Institutional, Y, Investor, A, and C Class shares was 1.00%, 1.10%, 1.37%, 1.40%, and 2.15%, respectively. The expense ratios above may vary from the expense ratios presented in other sections of this report that are based on expenses incurred during the period covered by this report. |
The Fund outperformed the Index for the six-month period entirely due to stock selection as sector allocation detracted value relative to the Index.
Most of the Fund’s excess performance related to security selection was attributed to holdings in the Industrials, Information Technology and Financials sectors. In the Industrials sector, United Continental (up 80.6%) and American Airlines Group (up 65.8%) were the largest contributors. Companies contributing to the Fund’s performance within the Information Technology sector included NVIDIA (up 129.8%), Micron Technology (up 57.5%) and CDW (up 30.7%). Reinsurance Group of America (up 32.3%) and Santander Consumer USA (up 33.6%) added relative value in the Financials sector.
The Fund’s underweight position in Information Technology, the second best performing sector in the Index, detracted from performance through sector allocation. An overweight in Consumer Staples, one of the poorer performing sectors, also detracted relative value.
The sub-advisor continues to invest in a broadly diversified portfolio of companies that they believe have attractive valuations and above-average earnings growth potential. This approach should allow the Fund to benefit over the longer term.
| Top Ten Holdings (% Net Assets) | ||||||||
| NVIDIA Corp. |
2.5 | |||||||
| Amazon.com, Inc. |
2.1 | |||||||
| Ulta Salon Cosmetics & Fragrance, Inc. |
2.1 | |||||||
| CDW Corp. |
1.9 | |||||||
| Aetna, Inc. |
1.8 | |||||||
| Lam Research Corp. |
1.8 | |||||||
| Lockheed Martin Corp. |
1.7 | |||||||
| UnitedHealth Group, Inc. |
1.6 | |||||||
| Edwards Lifesciences Corp. |
1.5 | |||||||
| Texas Instruments, Inc. |
1.5 | |||||||
| Total Fund Holdings |
87 | |||||||
4
American Beacon Bridgeway Large Cap Growth FundSM
Performance Overview
December 31, 2016 (Unaudited)
| Sector Allocation (% Equities) | ||||
| Information Technology |
25.8 | |||
| Consumer Discretionary |
21.4 | |||
| Health Care |
17.4 | |||
| Industrials |
12.3 | |||
| Consumer Staples |
8.7 | |||
| Financials |
6.2 | |||
| Energy |
2.7 | |||
| Materials |
2.4 | |||
| Real Estate |
1.8 | |||
| Telecommunication Services |
1.3 | |||
5
American Beacon Bridgeway Large Cap Value FundSM
Performance Overview
December 31, 2016 (Unaudited)
The Investor Class of the American Beacon Bridgeway Large Cap Value Fund (the “Fund”) returned 15.81% for the twelve months ended December 31, 2016. The Fund underperformed the Russell 1000® Value Index (the “Index”) return of 17.34% for the same period.
Comparison of Change in Value of a $10,000 Investment for the period from 12/31/2006 through 12/31/2016
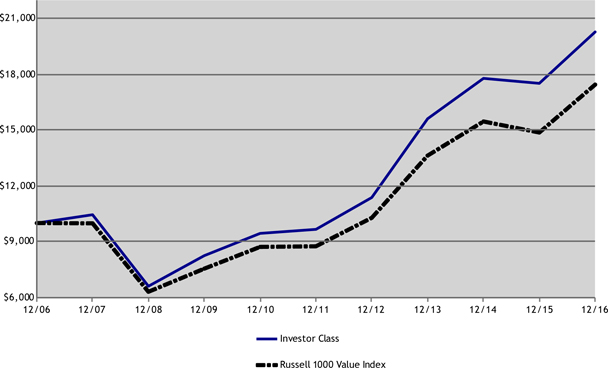
Total Returns for the Period Ended December 31, 2016
| Ticker | 1 Year | 3 Years | 5 Years | 10 Years | Value of $10,000 12/31/2006- 12/31/2016 |
|||||||||||||||||||
| Institutional Class (1,7) |
BRLVX | 16.24 | % | 9.44 | % | 16.35 | % | 7.49 | % | $ | 20,599 | |||||||||||||
| Y Class (1,2,7) |
BWLYX | 16.17 | % | 9.40 | % | 16.27 | % | 7.46 | % | $ | 20,530 | |||||||||||||
| Investor Class(1,3,7) |
BWLIX | 15.81 | % | 9.11 | % | 15.98 | % | 7.32 | % | $ | 20,276 | |||||||||||||
| A without Sales Charge (1,4,7) |
BWLAX | 15.79 | % | 9.05 | % | 15.87 | % | 7.27 | % | $ | 20,174 | |||||||||||||
| A with Sales Charge (1,4,7) |
BWLAX | 9.15 | % | 6.92 | % | 14.51 | % | 6.64 | % | $ | 19,015 | |||||||||||||
| C without Sales Charge (1,5,7) |
BWLCX | 14.91 | % | 8.23 | % | 15.06 | % | 6.90 | % | $ | 19,483 | |||||||||||||
| C with Sales Charge (1,5,7) |
BWLCX | 13.91 | % | 8.23 | % | 15.06 | % | 6.90 | % | $ | 19,483 | |||||||||||||
| Russell 1000 Value Index (6) |
17.34 | % | 8.59 | % | 14.80 | % | 5.72 | % | $ | 17,445 | ||||||||||||||
| 1. | Performance shown is historical and is not indicative of future returns. Investment returns and principal value will vary, and shares may be worth more or less at redemption than at original purchase. Performance shown is calculated based on the published end of day net asset values as of date indicated, and current performance may be lower or higher than the performance data quoted. To obtain performance as of the most recent month end, please visit www. americanbeaconfunds.com or call 1-800-967-9009. Fund performance in the table above does not reflect the deduction of taxes a shareholder would pay on distributions or the redemption of shares. A portion of the fees charged to the Institutional Class was waived from 2008 through 2013 and recovered in 2014 and 2015. Performance prior to waiving fees was lower than the actual returns shown from 2008 through 2013. |
| 2. | Fund performance for the five-year and ten-year periods represent the returns achieved by the Institutional Class from 12/31/06 up to 2/3/12, the inception date of the Y Class, and the returns of the Y Class since its inception. Expenses of the Y Class are higher than those of the Institutional Class. As a result, total returns shown may be higher than they would have been had the Y Class been in existence since 12/31/06. A portion of the fees charged to the Y Class was waived in 2012 and partially recovered in 2013 and fully recovered in 2014. Performance prior to waiving fees was lower than the actual returns shown in 2012. |
6
American Beacon Bridgeway Large Cap Value FundSM
Performance Overview
December 31, 2016 (Unaudited)
| 3. | Fund performance for the five-year and ten-year periods represent the returns achieved by the Institutional Class from 12/31/06 up to 2/3/12, the inception date of the Investor Class, and the returns of the Investor Class since its inception. Expenses of the Investor Class are higher than those of the Institutional Class. Therefore, total returns shown may be higher than they would have been had the Investor Class been in existence since 12/31/06. A portion of the fees charged to the Investor Class was waived in 2012 and fully recovered in 2013. Performance prior to waiving fees was lower than the actual returns shown in 2012. |
| 4. | Fund performance for the five-year and ten-year periods represent the returns achieved by the Institutional Class from 12/31/06 through 2/3/12, the inception date of the A Class, and the returns of the A Class since its inception. Expenses of the A Class are higher than those of the Institutional Class. As a result, total returns shown may be higher than they would have been had the A Class been in existence since 12/31/06. A portion of the fees charged to the A Class was waived in 2012 and 2013 and fully recovered in 2014. Performance prior to waiving fees was lower than the actual returns shown in 2012 and 2013. A Class shares have a maximum sales charge of 5.75%. |
| 5. | Fund performance for the five-year and ten-year periods represent the returns achieved by the Institutional Class from 12/31/06 through 2/3/12, the inception date of the C Class, and the returns of the C Class since its inception. Expenses of the C Class are higher than those of the Institutional Class. As a result, total returns shown may be higher than they would have been had the C Class been in existence since 12/31/06. A portion of the fees charged to the C Class was waived in 2012 and 2013 and fully recovered in 2014. Performance prior to waiving fees was lower than the actual returns shown in 2012 and 2013. C Class has a maximum contingent deferred sales charge of 1.00% for shares redeemed within one year of the date of purchase. |
| 6. | The Russell 1000 Value Index is an unmanaged index of those stocks in the Russell 1000 Index with lower price-to-book ratios and lower forecasted growth values. Russell 1000 Value Index and Russell 1000 Index are registered trademarks of the Frank Russell Company. One cannot directly invest in an index. |
| 7. | The total annual Fund operating expense ratio set forth in the most recent Fund prospectus for the Institutional, Y, Investor, A, and C Class shares was 0.75%, 0.81%, 1.09%, 1.12%, and 1.87%, respectively. The expense ratios above may vary from the expense ratios presented in other sections of this report that are based on expenses incurred during the period covered by this report. |
The Fund trailed the Index entirely due to sector allocation as stock selection added value relative to the Index.
From a sector allocation perspective, the Fund’s overweight positions in the Consumer Discretionary and Consumer Staples sectors detracted from performance. An underweight in Energy, the second best performing sector in the Index, also detracted relative value. The Fund’s average underweight positions in the Utilities and Health Care sectors added relative value.
From a stock selection standpoint, the Fund’s Information Technology and Materials sectors added the most value relative to the Index. Within the Information Technology sector, NVIDIA (up 223.6%) contributed most to performance. The Fund’s smaller allocation versus the Index to Microsoft (down 4.9%) also positively impacted performance. In the Materials sector, Newmont Mining (up 87.0%) and Ashland (up 11.9%) were the largest contributors. The aforementioned good performance was somewhat offset by poor stock selection in the Energy sector. In the Energy sector, Tesoro (down 12.8%) detracted the most relative value. The Fund’s absence from Chevron, which was up 36.6% in the Index, also hurt performance.
The sub-advisor continues to invest in a broadly diversified portfolio of companies that they believe have attractive valuations and above-average earnings growth potential. This approach should allow the Fund to benefit over the longer term.
| Top Ten Holdings (% Net Assets) | ||||||||
| Bank of America Corp. |
1.6 | |||||||
| Citigroup |
1.6 | |||||||
| General Electric Co. |
1.5 | |||||||
| Johnson & Johnson |
1.5 | |||||||
| Qualcomm, Inc. |
1.5 | |||||||
| Valero Energy Corp. |
1.5 | |||||||
| AT&T, Inc. |
1.4 | |||||||
| General Motors Co. |
1.4 | |||||||
| T-Mobile US, Inc. |
1.3 | |||||||
| United Continental Holdings, Inc. |
1.3 | |||||||
| Total Fund Holdings |
100 | |||||||
7
American Beacon Bridgeway Large Cap Value FundSM
Performance Overview
December 31, 2016 (Unaudited)
| Sector Allocation (% Equities) | ||||
| Financials |
24.7 | |||
| Industrials |
12.3 | |||
| Consumer Discretionary |
11.4 | |||
| Energy |
10.5 | |||
| Information Technology |
10.3 | |||
| Health Care |
9.7 | |||
| Consumer Staples |
7.7 | |||
| Telecommunication Services |
4.4 | |||
| Materials |
4.4 | |||
| Utilities |
3.8 | |||
| Real Estate |
0.8 | |||
8
Expense Examples
December 31, 2016 (Unaudited)
Fund Expense Example
As a shareholder of a Fund, you incur two types of costs: (1) transaction costs, including sales charges (loads) on purchase payments and redemption fees if applicable, and (2) ongoing costs, including management fees, administrative service fees, distribution (12b-1) fees, and other Fund expenses. The Examples are intended to help you understand the ongoing costs (in dollars) of investing in the Funds and to compare these costs with the ongoing costs of investing in other mutual funds. The Examples are based on an investment of $1,000 invested at the beginning of the period in each Class and held for the entire period from July 1, 2016 through December 31, 2016.
Actual Expenses
The “Actual” lines of the tables provide information about actual account values and actual expenses. You may use the information in this line, together with the amount you invested, to estimate the expenses that you paid over the period. Simply divide your account value by $1,000 (for example, an $8,600 account value divided by $1,000 = $8.60), then multiply the result by the “Expenses Paid During Period” for the applicable Fund to estimate the expenses you paid on your account during this period. Shareholders of the Institutional and Investor Classes that invest in the Funds through an IRA or Roth IRA may be subject to a custodial IRA fee of $15 that is typically deducted each December. If your account was subject to a custodial IRA fee during the period, your costs would have been $15 higher.
Hypothetical Example for Comparison Purposes
The “Hypothetical” lines of the tables provide information about hypothetical account values and hypothetical expenses based on the Fund’s actual expense ratio and an assumed 5% per year rate of return before expenses (not the Fund’s actual return). You may compare the ongoing costs of investing in the Funds with other funds by contrasting this 5% hypothetical example and the 5% hypothetical examples that appear in the shareholder reports of the other funds. The hypothetical account values and expenses may not be used to estimate the actual ending account balance or expenses you paid for the period. Shareholders of the Institutional and Investor Classes that invest in the Fund through an IRA or Roth IRA may be subject to a custodial IRA fee of $15 that is typically deducted each December. If your account was subject to a custodial IRA fee during the period, your costs would have been $15 higher.
You should also be aware that the expenses shown in the table highlight only your ongoing costs and do not reflect any transaction costs charged by the Fund, such as sales charges (loads). Similarly, the expense examples for other funds do not reflect any transaction costs charged by those funds, such as sales charges (loads), redemption fees or exchange fees. Therefore, the “Hypothetical” lines of the tables are useful in comparing ongoing costs only and will not help you determine the relative total costs of owning different funds. If you were subject to any transaction costs during the period, your costs would have been higher.
9
American Beacon FundsSM
Expense Examples
December 31, 2016 (Unaudited)
Bridgeway Large Cap Growth Fund
| Beginning Account Value | Ending Account Value | Expenses Paid During Period |
||||||||||
| 7/1/2016 | 12/31/2016 | 7/1/2016-12/31/2016* | ||||||||||
| Institutional Class |
||||||||||||
| Actual |
$ | 1,000.00 | $ | 1,081.48 | $ | 4.24 | ||||||
| Hypothetical** |
$ | 1,000.00 | $ | 1,021.05 | $ | 4.11 | ||||||
| Y Class |
||||||||||||
| Actual |
$ | 1,000.00 | $ | 1,080.62 | $ | 4.76 | ||||||
| Hypothetical** |
$ | 1,000.00 | $ | 1,020.55 | $ | 4.62 | ||||||
| Investor Class |
||||||||||||
| Actual |
$ | 1,000.00 | $ | 1,078.96 | $ | 6.22 | ||||||
| Hypothetical** |
$ | 1,000.00 | $ | 1,019.18 | $ | 6.04 | ||||||
| A Class |
||||||||||||
| Actual |
$ | 1,000.00 | $ | 1,078.94 | $ | 6.32 | ||||||
| Hypothetical** |
$ | 1,000.00 | $ | 1,019.04 | $ | 6.14 | ||||||
| C Class |
||||||||||||
| Actual |
$ | 1,000.00 | $ | 1,074.32 | $ | 10.22 | ||||||
| Hypothetical** |
$ | 1,000.00 | $ | 1,015.30 | $ | 9.93 | ||||||
| * | Expenses are equal to the Fund’s annualized expense ratios for the six-month period of 0.81%, 0.91%, 1.19%, 1.21% and 1.96% for the Institutional, Y, Investor, A and C Classes respectively, multiplied by the average account value over the period, multiplied by the number derived by dividing the number of days in the most recent fiscal half-year (184) by days in the year (366) to reflect the half-year period. |
| ** | 5% return before expenses. |
Bridgeway Large Cap Value Fund
| Beginning Account Value | Ending Account Value | Expenses Paid During Period |
||||||||||
| 7/1/2016 | 12/31/2016 | 7/1/2016-12/31/2016* | ||||||||||
| Institutional Class |
||||||||||||
| Actual |
$ | 1,000.00 | $ | 1,108.84 | $ | 3.87 | ||||||
| Hypothetical** |
$ | 1,000.00 | $ | 1,021.47 | $ | 3.71 | ||||||
| Y Class |
||||||||||||
| Actual |
$ | 1,000.00 | $ | 1,108.00 | $ | 4.24 | ||||||
| Hypothetical** |
$ | 1,000.00 | $ | 1,021.10 | $ | 4.06 | ||||||
| Investor Class |
||||||||||||
| Actual |
$ | 1,000.00 | $ | 1,106.28 | $ | 5.72 | ||||||
| Hypothetical** |
$ | 1,000.00 | $ | 1,019.71 | $ | 5.48 | ||||||
| A Class |
||||||||||||
| Actual |
$ | 1,000.00 | $ | 1,106.36 | $ | 5.93 | ||||||
| Hypothetical** |
$ | 1,000.00 | $ | 1,019.52 | $ | 5.69 | ||||||
| C Class |
||||||||||||
| Actual |
$ | 1,000.00 | $ | 1,102.18 | $ | 9.83 | ||||||
| Hypothetical** |
$ | 1,000.00 | $ | 1,015.77 | $ | 9.42 | ||||||
| * | Expenses are equal to the Fund’s annualized expense ratios for the six-month period of 0.73%, 0.80%, 1.08%, 1.12% and 1.86% for the Institutional, Y, Investor, A and C Classes respectively, multiplied by the average account value over the period, multiplied by the number derived by dividing the number of days in the most recent fiscal half-year (184) by days in the year (366) to reflect the half-year period. |
| ** | 5% return before expenses. |
10
Report of Independent Registered Public Accounting Firm
The Board of Trustees and Shareholders of
American Beacon Bridgeway Large Cap Growth Fund and American Beacon Bridgeway Large Cap Value Fund
We have audited the accompanying statements of assets and liabilities, including the schedules of investments, of American Beacon Bridgeway Large Cap Growth Fund and American Beacon Bridgeway Large Cap Value Fund (two of the funds constituting the American Beacon Funds) (collectively, the Funds), as of December 31, 2016, and the related statements of operations, the statements of changes in net assets and the financial highlights for the periods indicated therein. These financial statements and financial highlights are the responsibility of the Funds’ management. Our responsibility is to express an opinion on these financial statements and financial highlights based on our audits.
We conducted our audits in accordance with the standards of the Public Company Accounting Oversight Board (United States). Those standards require that we plan and perform the audit to obtain reasonable assurance about whether the financial statements and financial highlights are free of material misstatement. We were not engaged to perform an audit of the Funds’ internal control over financial reporting. Our audits included consideration of internal control over financial reporting as a basis for designing audit procedures that are appropriate in the circumstances, but not for the purpose of expressing an opinion on the effectiveness of the Funds’ internal control over financial reporting. Accordingly, we express no such opinion. An audit also includes examining, on a test basis, evidence supporting the amounts and disclosures in the financial statements and financial highlights, assessing the accounting principles used and significant estimates made by management, and evaluating the overall financial statement presentation. Our procedures included confirmation of securities owned as of December 31, 2016, by correspondence with the custodian and brokers or by other appropriate auditing procedures where replies from brokers were not received. We believe that our audits provide a reasonable basis for our opinion.
In our opinion, the financial statements and financial highlights referred to above present fairly, in all material respects, the financial position of American Beacon Bridgeway Large Cap Growth Fund and American Beacon Bridgeway Large Cap Value Fund at December 31, 2016, the results of their operations, the changes in their net assets and the financial highlights for the periods indicated therein in conformity with U.S. generally accepted accounting principles.

Dallas, Texas
February 28, 2017
11
American Beacon Bridgeway Large Cap Growth FundSM
Schedule of Investments
December 31, 2016
| Shares | Fair Value | |||||||
| COMMON STOCK—98.41% |
||||||||
| CONSUMER DISCRETIONARY—21.09% |
||||||||
| Auto Components—0.99% |
||||||||
| Lear Corp. |
10,100 | $ | 1,336,937 | |||||
|
|
|
|||||||
| Hotels, Restaurants & Leisure—1.23% |
||||||||
| Darden Restaurants, Inc. |
22,800 | 1,658,016 | ||||||
|
|
|
|||||||
| Internet & Catalog Retail—2.06% |
||||||||
| Amazon.com, Inc.A |
3,700 | 2,774,519 | ||||||
|
|
|
|||||||
| Media—4.41% |
||||||||
| Netflix, Inc.A |
14,000 | 1,733,200 | ||||||
| Nielsen Holdings PLCB |
28,200 | 1,182,990 | ||||||
| Omnicom Group, Inc. |
15,800 | 1,344,738 | ||||||
| Scripps Networks Interactive, Inc., Class A |
23,800 | 1,698,606 | ||||||
|
|
|
|||||||
| 5,959,534 | ||||||||
|
|
|
|||||||
| Multiline Retail—0.44% |
||||||||
| Michael Kors Holdings Ltd.A |
13,800 | 593,124 | ||||||
|
|
|
|||||||
| Specialty Retail—9.03% |
||||||||
| AutoZone, Inc.A |
2,400 | 1,895,496 | ||||||
| Foot Locker, Inc. |
26,900 | 1,906,941 | ||||||
| Home Depot, Inc. |
13,600 | 1,823,488 | ||||||
| L Brands, Inc. |
17,200 | 1,132,448 | ||||||
| Lowe’s Cos., Inc. |
10,100 | 718,312 | ||||||
| O’Reilly Automotive, Inc.A |
6,900 | 1,921,029 | ||||||
| Ulta Salon Cosmetics & Fragrance, Inc. |
11,000 | 2,804,340 | ||||||
|
|
|
|||||||
| 12,202,054 | ||||||||
|
|
|
|||||||
| Textiles & Apparel—2.93% |
||||||||
| NIKE, Inc., Class B |
30,100 | 1,529,983 | ||||||
| Skechers U.S.A., Inc., Class AA |
55,100 | 1,354,358 | ||||||
| Under Armour, Inc., Class AA |
25,300 | 734,965 | ||||||
| Under Armour, Inc., Class CA |
13,379 | 336,749 | ||||||
|
|
|
|||||||
| 3,956,055 | ||||||||
|
|
|
|||||||
| Total Consumer Discretionary |
28,480,239 | |||||||
|
|
|
|||||||
| CONSUMER STAPLES—8.55% |
||||||||
| Beverages—2.06% |
||||||||
| Constellation Brands, Inc., Class A |
10,200 | 1,563,762 | ||||||
| PepsiCo, Inc. |
11,600 | 1,213,708 | ||||||
|
|
|
|||||||
| 2,777,470 | ||||||||
|
|
|
|||||||
| Food & Drug Retailing—2.65% |
||||||||
| Kroger Co. |
47,000 | 1,621,970 | ||||||
| Sysco Corp. |
35,500 | 1,965,635 | ||||||
|
|
|
|||||||
| 3,587,605 | ||||||||
|
|
|
|||||||
| Food Products—2.04% |
||||||||
| Hershey Co. |
13,100 | 1,354,933 | ||||||
| Kellogg Co. |
18,900 | 1,393,119 | ||||||
|
|
|
|||||||
| 2,748,052 | ||||||||
|
|
|
|||||||
| Household Products—1.36% |
||||||||
| Clorox Co. |
5,100 | 612,102 | ||||||
| Colgate-Palmolive Co. |
18,800 | 1,230,272 | ||||||
|
|
|
|||||||
| 1,842,374 | ||||||||
|
|
|
|||||||
See accompanying notes
12
American Beacon Bridgeway Large Cap Growth FundSM
Schedule of Investments
December 31, 2016
| Shares | Fair Value | |||||||
| CONSUMER STAPLES—8.55% (continued) |
||||||||
| Personal Products—0.44% |
||||||||
| Estee Lauder Cos., Inc., Class A |
7,700 | $ | 588,973 | |||||
|
|
|
|||||||
| Total Consumer Staples |
11,544,474 | |||||||
|
|
|
|||||||
| ENERGY—2.61% |
||||||||
| Oil & Gas—2.61% |
||||||||
| Continental Resources, Inc.A |
17,700 | 912,258 | ||||||
| ONEOK, Inc. |
29,000 | 1,664,890 | ||||||
| Tesoro Corp. |
10,900 | 953,205 | ||||||
|
|
|
|||||||
| Total Energy |
3,530,353 | |||||||
|
|
|
|||||||
| FINANCIALS—6.06% |
||||||||
| Diversified Financials—4.03% |
||||||||
| Ally Financial, Inc. |
81,500 | 1,550,130 | ||||||
| Discover Financial Services |
17,800 | 1,283,202 | ||||||
| Jack Henry & Associates, Inc. |
21,000 | 1,864,380 | ||||||
| Santander Consumer USA Holdings, Inc. |
54,600 | 737,100 | ||||||
|
|
|
|||||||
| 5,434,812 | ||||||||
|
|
|
|||||||
| Insurance—2.03% |
||||||||
| Lincoln National Corp. |
25,100 | 1,663,377 | ||||||
| Reinsurance Group of America, Inc. |
8,600 | 1,082,138 | ||||||
|
|
|
|||||||
| 2,745,515 | ||||||||
|
|
|
|||||||
| Total Financials |
8,180,327 | |||||||
|
|
|
|||||||
| HEALTH CARE—17.12% |
||||||||
| Biotechnology—3.44% |
||||||||
| Gilead Sciences, Inc. |
23,300 | 1,668,513 | ||||||
| Ionis Pharmaceuticals, Inc.A |
29,800 | 1,425,334 | ||||||
| Mettler-Toledo International, Inc.A |
3,700 | 1,548,672 | ||||||
|
|
|
|||||||
| 4,642,519 | ||||||||
|
|
|
|||||||
| Health Care Equipment & Supplies—5.60% |
||||||||
| Align Technology, Inc.A |
12,900 | 1,240,077 | ||||||
| DexCom, Inc.A |
20,500 | 1,223,850 | ||||||
| Edwards Lifesciences Corp.A |
21,600 | 2,023,920 | ||||||
| Idexx Laboratories, Inc.A |
15,400 | 1,805,958 | ||||||
| Intuitive Surgical, Inc.A |
2,000 | 1,268,340 | ||||||
|
|
|
|||||||
| 7,562,145 | ||||||||
|
|
|
|||||||
| Health Care Providers & Services—6.97% |
||||||||
| Aetna, Inc. |
19,600 | 2,430,596 | ||||||
| Cardinal Health, Inc. |
17,600 | 1,266,672 | ||||||
| HCA Holdings, Inc. |
18,700 | 1,384,174 | ||||||
| Henry Schein, Inc.A |
7,800 | 1,183,338 | ||||||
| McKesson Corp. |
7,100 | 997,195 | ||||||
| UnitedHealth Group, Inc. |
13,400 | 2,144,536 | ||||||
|
|
|
|||||||
| 9,406,511 | ||||||||
|
|
|
|||||||
| Pharmaceuticals—1.11% |
||||||||
| Johnson & Johnson |
13,000 | 1,497,730 | ||||||
|
|
|
|||||||
| Total Health Care |
23,108,905 | |||||||
|
|
|
|||||||
| INDUSTRIALS—12.09% |
||||||||
| Aerospace & Defense—3.41% |
||||||||
| Huntington Ingalls Industries, Inc. |
7,600 | 1,399,844 | ||||||
| Lockheed Martin Corp. |
9,000 | 2,249,460 | ||||||
See accompanying notes
13
American Beacon Bridgeway Large Cap Growth FundSM
Schedule of Investments
December 31, 2016
| Shares | Fair Value | |||||||
| INDUSTRIALS—12.09% (continued) |
||||||||
| Aerospace & Defense—3.41% (continued) |
||||||||
| Spirit Aerosystems Holdings, Inc., Class A |
16,300 | $ | 951,105 | |||||
|
|
|
|||||||
| 4,600,409 | ||||||||
|
|
|
|||||||
| Airlines—5.21% |
||||||||
| American Airlines Group, Inc. |
36,100 | 1,685,509 | ||||||
| Delta Air Lines, Inc. |
38,900 | 1,913,491 | ||||||
| Southwest Airlines Co. |
39,700 | 1,978,648 | ||||||
| United Continental Holdings, Inc. |
20,000 | 1,457,600 | ||||||
|
|
|
|||||||
| 7,035,248 | ||||||||
|
|
|
|||||||
| Machinery—1.03% |
||||||||
| Illinois Tool Works, Inc. |
11,400 | 1,396,044 | ||||||
|
|
|
|||||||
| Rental Auto/Equipment—1.36% |
||||||||
| United Rentals, Inc.A |
17,400 | 1,837,092 | ||||||
|
|
|
|||||||
| Road & Rail—1.08% |
||||||||
| Union Pacific Corp. |
14,000 | 1,451,520 | ||||||
|
|
|
|||||||
| Total Industrials |
16,320,313 | |||||||
|
|
|
|||||||
| INFORMATION TECHNOLOGY—25.40% |
||||||||
| Communications—0.94% |
||||||||
| Facebook, Inc., Class AA |
11,000 | 1,265,550 | ||||||
|
|
|
|||||||
| Communications Equipment—2.67% |
||||||||
| F5 Networks, Inc.A |
12,800 | 1,852,416 | ||||||
| Juniper Networks, Inc. |
61,900 | 1,749,294 | ||||||
|
|
|
|||||||
| 3,601,710 | ||||||||
|
|
|
|||||||
| Electronic Equipment & Instruments—2.48% |
||||||||
| NVIDIA Corp. |
31,400 | 3,351,636 | ||||||
|
|
|
|||||||
| Internet Software & Services—2.19% |
||||||||
| Alphabet, Inc., Class CA |
1,900 | 1,466,458 | ||||||
| Zillow Group, Inc., Class CA |
40,900 | 1,491,623 | ||||||
|
|
|
|||||||
| 2,958,081 | ||||||||
|
|
|
|||||||
| IT Consulting & Services—6.42% |
||||||||
| Accenture PLC, Class AB |
9,500 | 1,112,735 | ||||||
| Alliance Data Systems Corp. |
2,900 | 662,650 | ||||||
| Automatic Data Processing, Inc. |
15,200 | 1,562,256 | ||||||
| Broadridge Financial Solutions, Inc. |
20,100 | 1,332,630 | ||||||
| CDW Corp. |
48,900 | 2,547,201 | ||||||
| Fiserv, Inc.A |
13,600 | 1,445,408 | ||||||
|
|
|
|||||||
| 8,662,880 | ||||||||
|
|
|
|||||||
| Semiconductor Equipment & Products—7.25% |
||||||||
| Lam Research Corp. |
22,800 | 2,410,644 | ||||||
| Micron Technology, Inc.A |
73,300 | 1,606,736 | ||||||
| Qualcomm, Inc. |
27,500 | 1,793,000 | ||||||
| Skyworks Solutions, Inc. |
26,200 | 1,956,092 | ||||||
| Texas Instruments, Inc. |
27,800 | 2,028,566 | ||||||
|
|
|
|||||||
| 9,795,038 | ||||||||
|
|
|
|||||||
| Software—3.45% |
||||||||
| Cadence Design Systems, Inc.A |
62,100 | 1,566,162 | ||||||
| Electronic Arts, Inc.A |
24,400 | 1,921,744 | ||||||
See accompanying notes
14
American Beacon Bridgeway Large Cap Growth FundSM
Schedule of Investments
December 31, 2016
| Shares | Fair Value | |||||||
| INFORMATION TECHNOLOGY—25.40% (continued) |
||||||||
| Software—3.45% (continued) |
||||||||
| Splunk, Inc.A |
23,000 | $ | 1,176,450 | |||||
|
|
|
|||||||
| 4,664,356 | ||||||||
|
|
|
|||||||
| Total Information Technology |
34,299,251 | |||||||
|
|
|
|||||||
| MATERIALS—2.37% |
||||||||
| Chemicals—1.36% |
||||||||
| LyondellBasell Industries N.V., Class A |
21,300 | 1,827,114 | ||||||
|
|
|
|||||||
| Metals & Mining—1.01% |
||||||||
| Southern Copper Corp. |
42,800 | 1,367,032 | ||||||
|
|
|
|||||||
| Total Materials |
3,194,146 | |||||||
|
|
|
|||||||
| REAL ESTATE—1.78% |
||||||||
| Equity Real Estate Investment Trusts—1.78% |
||||||||
| Digital Realty Trust, Inc.C |
10,800 | 1,061,208 | ||||||
| Public Storage, Inc.C |
6,000 | 1,341,000 | ||||||
|
|
|
|||||||
| Total Real Estate |
2,402,208 | |||||||
|
|
|
|||||||
| TELECOMMUNICATION SERVICES—1.34% |
||||||||
| Wireless Telecommunication Services—1.34% |
||||||||
| T-Mobile US, Inc. |
31,500 | 1,811,565 | ||||||
|
|
|
|||||||
| Total Common Stock (Cost $120,290,811) |
132,871,781 | |||||||
|
|
|
|||||||
| SHORT TERM INVESTMENTS—1.31% (Cost $1,766,715) |
||||||||
| American Beacon U.S. Government Money Market Select Fund, Select ClassD |
1,766,715 | 1,766,715 | ||||||
|
|
|
|||||||
| TOTAL INVESTMENTS—99.72% (Cost $122,057,526) |
134,638,496 | |||||||
| OTHER ASSETS, NET OF LIABILITIES—0.28% |
380,849 | |||||||
|
|
|
|||||||
| TOTAL NET ASSETS—100.00% |
$ | 135,019,345 | ||||||
|
|
|
|||||||
Percentages are stated as a percent of net assets.
| A | Non-income producing security. |
| B | PLC—Public Limited Company. |
| C | REIT—Real Estate Investment Trust. |
| D | The Fund is affiliated by having the same investment advisor. |
Futures Contracts Open on December 31, 2016:
| Description |
Type | Number of Contracts |
Expiration Date | Contract Value | Unrealized Appreciation (Depreciation) |
|||||||||||||||
| S&P 500 E-Mini Index Futures |
Long | 18 | March 2017 | $ | 2,012,580 | $ | (1,282 | ) | ||||||||||||
|
|
|
|
|
|||||||||||||||||
| $ | 2,012,580 | $ | (1,282 | ) | ||||||||||||||||
|
|
|
|
|
|||||||||||||||||
See accompanying notes
15
American Beacon Bridgeway Large Cap Value FundSM
Schedule of Investments
December 31, 2016
| Shares | Fair Value | |||||||
| COMMON STOCK—98.04% |
||||||||
| CONSUMER DISCRETIONARY—11.21% |
||||||||
| Auto Components—1.77% |
||||||||
| Goodyear Tire & Rubber Co. |
928,600 | $ | 28,665,882 | |||||
| Lear Corp. |
304,700 | 40,333,139 | ||||||
|
|
|
|||||||
| 68,999,021 | ||||||||
|
|
|
|||||||
| Automobiles—2.33% |
||||||||
| Ford Motor Co. |
2,983,940 | 36,195,192 | ||||||
| General Motors Co. |
1,574,480 | 54,854,883 | ||||||
|
|
|
|||||||
| 91,050,075 | ||||||||
|
|
|
|||||||
| Hotels, Restaurants & Leisure—0.85% |
||||||||
| Dick’s Sporting Goods, Inc. |
625,900 | 33,235,290 | ||||||
|
|
|
|||||||
| Media—2.04% |
||||||||
| Nielsen Holdings PLCA |
703,200 | 29,499,240 | ||||||
| Twenty-First Century Fox, Inc., Class A |
1,793,200 | 50,281,328 | ||||||
|
|
|
|||||||
| 79,780,568 | ||||||||
|
|
|
|||||||
| Multiline Retail—2.93% |
||||||||
| Kohl’s Corp. |
796,900 | 39,350,922 | ||||||
| Macy’s, Inc. |
895,600 | 32,071,436 | ||||||
| Target Corp. |
587,600 | 42,442,348 | ||||||
|
|
|
|||||||
| 113,864,706 | ||||||||
|
|
|
|||||||
| Specialty Retail—1.29% |
||||||||
| Best Buy Co., Inc. |
1,180,800 | 50,384,736 | ||||||
|
|
|
|||||||
| Total Consumer Discretionary |
437,314,396 | |||||||
|
|
|
|||||||
| CONSUMER STAPLES—7.50% |
||||||||
| Beverages—1.27% |
||||||||
| PepsiCo, Inc. |
474,500 | 49,646,935 | ||||||
|
|
|
|||||||
| Food Products—3.38% |
||||||||
| Aramark |
899,300 | 32,122,996 | ||||||
| Ingredion, Inc. |
276,800 | 34,588,928 | ||||||
| JM Smucker Co. |
243,600 | 31,195,416 | ||||||
| Kellogg Co. |
462,300 | 34,076,133 | ||||||
|
|
|
|||||||
| 131,983,473 | ||||||||
|
|
|
|||||||
| Household Products—2.85% |
||||||||
| Clorox Co. |
282,000 | 33,845,640 | ||||||
| Colgate-Palmolive Co. |
511,796 | 33,491,930 | ||||||
| Procter & Gamble Co. |
520,800 | 43,788,864 | ||||||
|
|
|
|||||||
| 111,126,434 | ||||||||
|
|
|
|||||||
| Total Consumer Staples |
292,756,842 | |||||||
|
|
|
|||||||
| ENERGY—10.27% |
||||||||
| Energy Equipment & Services—1.07% |
||||||||
| National Oilwell Varco, Inc. |
1,115,700 | 41,771,808 | ||||||
|
|
|
|||||||
| Oil & Gas—9.20% |
||||||||
| Antero Resources Corp.B |
1,325,400 | 31,345,710 | ||||||
| Chesapeake Energy Corp.B |
6,893,900 | 48,395,178 | ||||||
| Continental Resources, Inc.B |
921,200 | 47,478,648 | ||||||
| Kinder Morgan, Inc. |
1,952,200 | 40,430,062 | ||||||
| Marathon Oil Corp. |
2,165,600 | 37,486,536 | ||||||
| Marathon Petroleum Corp. |
299,740 | 15,091,909 | ||||||
| Tesoro Corp. |
476,600 | 41,678,670 | ||||||
| Valero Energy Corp. |
858,900 | 58,680,048 | ||||||
See accompanying notes
16
American Beacon Bridgeway Large Cap Value FundSM
Schedule of Investments
December 31, 2016
| Shares | Fair Value | |||||||
| ENERGY—10.27% (continued) |
||||||||
| Oil & Gas—9.20% (continued) |
||||||||
| Williams Cos., Inc. |
1,229,000 | $ | 38,271,060 | |||||
|
|
|
|||||||
| 358,857,821 | ||||||||
|
|
|
|||||||
| Total Energy |
400,629,629 | |||||||
|
|
|
|||||||
| FINANCIALS—24.20% |
||||||||
| Banks—2.05% |
||||||||
| CIT Group, Inc. |
908,500 | 38,774,780 | ||||||
| Fifth Third Bancorp |
1,528,400 | 41,220,948 | ||||||
|
|
|
|||||||
| 79,995,728 | ||||||||
|
|
|
|||||||
| Diversified Financials—7.78% |
||||||||
| Ally Financial, Inc. |
1,540,600 | 29,302,212 | ||||||
| Bank of America Corp. |
2,889,100 | 63,849,110 | ||||||
| Capital One Financial Corp. |
528,100 | 46,071,444 | ||||||
| Citigroup, Inc. |
1,041,500 | 61,896,345 | ||||||
| CME Group, Inc. |
311,600 | 35,943,060 | ||||||
| Discover Financial Services |
287,600 | 20,733,084 | ||||||
| Morgan Stanley |
1,083,500 | 45,777,875 | ||||||
|
|
|
|||||||
| 303,573,130 | ||||||||
|
|
|
|||||||
| Insurance—14.37% |
||||||||
| Aflac, Inc. |
430,600 | 29,969,760 | ||||||
| Allstate Corp. |
476,800 | 35,340,416 | ||||||
| American International Group, Inc. |
678,400 | 44,306,304 | ||||||
| Arch Capital Group Ltd.B |
310,000 | 26,749,900 | ||||||
| Berkshire Hathaway, Inc., Class BB |
241,800 | 39,408,564 | ||||||
| Cincinnati Financial Corp. |
260,600 | 19,740,450 | ||||||
| Everest Re Group Ltd. |
171,500 | 37,112,600 | ||||||
| Hartford Financial Services Group, Inc. |
692,000 | 32,973,800 | ||||||
| Lincoln National Corp. |
711,000 | 47,117,970 | ||||||
| Loews Corp. |
706,200 | 33,071,346 | ||||||
| MetLife, Inc. |
557,700 | 30,054,453 | ||||||
| Prudential Financial, Inc. |
476,900 | 49,626,214 | ||||||
| Travelers Cos., Inc. |
301,800 | 36,946,356 | ||||||
| Voya Financial, Inc. |
1,061,600 | 41,635,952 | ||||||
| WR Berkley Corp. |
424,900 | 28,260,099 | ||||||
| XL Group Ltd. |
757,500 | 28,224,450 | ||||||
|
|
|
|||||||
| 560,538,634 | ||||||||
|
|
|
|||||||
| Total Financials |
944,107,492 | |||||||
|
|
|
|||||||
| HEALTH CARE—9.53% |
||||||||
| Biotechnology—0.50% |
||||||||
| United Therapeutics Corp.B |
135,600 | 19,449,108 | ||||||
|
|
|
|||||||
| Health Care Equipment & Supplies—1.23% |
||||||||
| Dentsply Sirona, Inc. |
833,000 | 48,089,090 | ||||||
|
|
|
|||||||
| Health Care Providers & Services—5.51% |
||||||||
| Aetna, Inc. |
184,000 | 22,817,840 | ||||||
| HCA Holdings, Inc. |
616,500 | 45,633,330 | ||||||
| Humana, Inc. |
88,000 | 17,954,640 | ||||||
| Quest Diagnostics, Inc. |
546,800 | 50,250,920 | ||||||
| UnitedHealth Group, Inc. |
274,700 | 43,962,988 | ||||||
| WellCare Health Plans, Inc.B |
248,200 | 34,023,256 | ||||||
|
|
|
|||||||
| 214,642,974 | ||||||||
|
|
|
|||||||
| Pharmaceuticals—2.29% |
||||||||
| Johnson & Johnson |
493,900 | 56,902,219 | ||||||
See accompanying notes
17
American Beacon Bridgeway Large Cap Value FundSM
Schedule of Investments
December 31, 2016
| Shares | Fair Value | |||||||
| HEALTH CARE—9.53% (continued) |
||||||||
| Pharmaceuticals—2.29% (continued) |
||||||||
| Mallinckrodt PLCA B |
653,500 | $ | 32,557,370 | |||||
|
|
|
|||||||
| 89,459,589 | ||||||||
|
|
|
|||||||
| Total Health Care |
371,640,761 | |||||||
|
|
|
|||||||
| INDUSTRIALS—12.04% |
||||||||
| Aerospace & Defense—2.71% |
||||||||
| Northrop Grumman Corp. |
164,900 | 38,352,442 | ||||||
| Raytheon Co. |
249,900 | 35,485,800 | ||||||
| Spirit Aerosystems Holdings, Inc., Class A |
549,200 | 32,045,820 | ||||||
|
|
|
|||||||
| 105,884,062 | ||||||||
|
|
|
|||||||
| Airlines—2.74% |
||||||||
| Delta Air Lines, Inc. |
455,400 | 22,401,126 | ||||||
| JetBlue Airways Corp.B |
1,429,800 | 32,056,116 | ||||||
| United Continental Holdings, Inc. |
717,800 | 52,313,264 | ||||||
|
|
|
|||||||
| 106,770,506 | ||||||||
|
|
|
|||||||
| Commercial Services & Supplies—1.02% |
||||||||
| Republic Services, Inc. |
697,400 | 39,786,670 | ||||||
|
|
|
|||||||
| Construction & Engineering—0.73% |
||||||||
| Fluor Corp. |
543,800 | 28,560,376 | ||||||
|
|
|
|||||||
| Industrial Conglomerates—2.32% |
||||||||
| Carlisle Cos., Inc. |
290,300 | 32,017,187 | ||||||
| General Electric Co. |
1,846,600 | 58,352,560 | ||||||
|
|
|
|||||||
| 90,369,747 | ||||||||
|
|
|
|||||||
| Machinery—1.57% |
||||||||
| Ingersoll-Rand PLCA |
549,400 | 41,226,976 | ||||||
| Xylem, Inc. |
403,700 | 19,991,224 | ||||||
|
|
|
|||||||
| 61,218,200 | ||||||||
|
|
|
|||||||
| Transportation & Logistics—0.95% |
||||||||
| Norfolk Southern Corp. |
344,700 | 37,251,729 | ||||||
|
|
|
|||||||
| Total Industrials |
469,841,290 | |||||||
|
|
|
|||||||
| INFORMATION TECHNOLOGY—10.07% |
||||||||
| Communications Equipment—1.98% |
||||||||
| Corning, Inc. |
1,964,000 | 47,666,280 | ||||||
| Juniper Networks, Inc. |
1,047,900 | 29,613,654 | ||||||
|
|
|
|||||||
| 77,279,934 | ||||||||
|
|
|
|||||||
| Computers & Peripherals—1.07% |
||||||||
| HP, Inc. |
2,816,000 | 41,789,440 | ||||||
|
|
|
|||||||
| Electronic Equipment & Instruments—1.27% |
||||||||
| NVIDIA Corp. |
465,300 | 49,666,122 | ||||||
|
|
|
|||||||
| Office Electronics—0.98% |
||||||||
| Xerox Corp. |
4,389,800 | 38,322,954 | ||||||
|
|
|
|||||||
| Semiconductor Equipment & Products—3.57% |
||||||||
| Applied Materials, Inc. |
1,234,200 | 39,827,634 | ||||||
| Lam Research Corp. |
393,400 | 41,594,182 | ||||||
| Qualcomm, Inc. |
881,800 | 57,493,360 | ||||||
|
|
|
|||||||
| 138,915,176 | ||||||||
|
|
|
|||||||
| Software—1.20% |
||||||||
| Amdocs Ltd. |
254,600 | 14,830,450 | ||||||
See accompanying notes
18
American Beacon Bridgeway Large Cap Value FundSM
Schedule of Investments
December 31, 2016
| Shares | Fair Value | |||||||
| INFORMATION TECHNOLOGY—10.07% (continued) |
||||||||
| Software—1.20% (continued) |
||||||||
| CA, Inc. |
1,012,100 | $ | 32,154,417 | |||||
|
|
|
|||||||
| 46,984,867 | ||||||||
|
|
|
|||||||
| Total Information Technology |
392,958,493 | |||||||
|
|
|
|||||||
| MATERIALS—4.33% |
||||||||
| Chemicals—2.02% |
||||||||
| Dow Chemical Co. |
569,700 | 32,598,234 | ||||||
| LyondellBasell Industries N.V., Class A |
538,600 | 46,201,108 | ||||||
|
|
|
|||||||
| 78,799,342 | ||||||||
|
|
|
|||||||
| Metals & Mining—2.31% |
||||||||
| Freeport-McMoRan Copper & Gold, Inc.B |
3,125,500 | 41,225,345 | ||||||
| Newmont Mining Corp. |
1,439,800 | 49,053,986 | ||||||
|
|
|
|||||||
| 90,279,331 | ||||||||
|
|
|
|||||||
| Total Materials |
169,078,673 | |||||||
|
|
|
|||||||
| REAL ESTATE—0.78% |
||||||||
| Equity Real Estate Investment Trusts—0.78% |
||||||||
| Digital Realty Trust, Inc.C |
308,400 | 30,303,384 | ||||||
|
|
|
|||||||
| TELECOMMUNICATION SERVICES—4.36% |
||||||||
| Diversified Telecommunication Services—2.57% |
||||||||
| AT&T, Inc. |
1,244,749 | 52,939,175 | ||||||
| CenturyLink, Inc. |
1,985,000 | 47,203,300 | ||||||
|
|
|
|||||||
| 100,142,475 | ||||||||
|
|
|
|||||||
| Wireless Telecommunication Services—1.79% |
||||||||
| Sprint Corp.B |
2,285,100 | 19,240,542 | ||||||
| T-Mobile US, Inc. |
882,100 | 50,729,571 | ||||||
|
|
|
|||||||
| 69,970,113 | ||||||||
|
|
|
|||||||
| Total Telecommunication Services |
170,112,588 | |||||||
|
|
|
|||||||
| UTILITIES—3.75% |
||||||||
| Electric—1.76% |
||||||||
| CMS Energy Corp. |
845,900 | 35,206,358 | ||||||
| Exelon Corp. |
937,800 | 33,282,522 | ||||||
|
|
|
|||||||
| 68,488,880 | ||||||||
|
|
|
|||||||
| Gas—1.25% |
||||||||
| Sempra Energy |
484,600 | 48,770,144 | ||||||
|
|
|
|||||||
| Multi-Utilities—0.74% |
||||||||
| SCANA Corp. |
395,100 | 28,952,929 | ||||||
|
|
|
|||||||
| Total Utilities |
146,211,953 | |||||||
|
|
|
|||||||
| Total Common Stock (Cost $3,405,323,741) |
3,824,955,501 | |||||||
|
|
|
|||||||
| SHORT-TERM INVESTMENTS—2.43% (Cost $94,937,593) |
||||||||
| American Beacon U.S. Government Money Market Select Fund, Select ClassD |
94,937,593 | 94,937,593 | ||||||
|
|
|
|||||||
| TOTAL INVESTMENTS—100.47% (Cost $3,500,261,334) |
3,919,893,094 | |||||||
| LIABILITIES, NET OF OTHER ASSETS—(0.47%) |
(18,204,534 | ) | ||||||
|
|
|
|||||||
| TOTAL NET ASSETS—100.00% |
$ | 3,901,688,560 | ||||||
|
|
|
|||||||
Percentages are stated as a percent of net assets.
| A | PLC—Public Limited Company. |
| B | Non-income producing security. |
| C | REIT—Real Estate Investment Trust. |
| D | The Fund is affiliated by having the same investment advisor. |
See accompanying notes
19
American Beacon Bridgeway Large Cap Value FundSM
Schedule of Investments
December 31, 2016
Futures Contracts Open on December 31, 2016:
| Description |
Type | Number of Contracts |
Expiration Date | Contract Value | Unrealized Appreciation (Depreciation) |
|||||||||||||||
| S&P 500 E-Mini Index Futures |
Long | 388 | March 2017 | $ | 43,382,280 | $ | (227,682 | ) | ||||||||||||
|
|
|
|
|
|||||||||||||||||
| $ | 43,382,280 | $ | (227,682 | ) | ||||||||||||||||
|
|
|
|
|
|||||||||||||||||
See accompanying notes
20
Statements of Assets and Liabilities
December 31, 2016
| Bridgeway Large Cap Growth Fund |
Bridgeway Large Cap Value Fund |
|||||||
| Assets: |
||||||||
| Investments in unaffiliated securities, at fair value A |
$ | 132,871,781 | $ | 3,824,955,501 | ||||
| Investments in affiliated securities, at fair value B |
1,766,715 | 94,937,593 | ||||||
| Foreign currency, at fair value |
— | 219,760 | ||||||
| Deposit with brokers for futures contracts |
22,951 | 2,352,148 | ||||||
| Dividends and interest receivable |
79,718 | 5,660,689 | ||||||
| Receivable for investments sold |
3,984,859 | — | ||||||
| Receivable for fund shares sold |
69,660 | 36,378,315 | ||||||
| Receivable for expense reimbursement (Note 2) |
57,765 | — | ||||||
| Prepaid expenses |
37,022 | 123,240 | ||||||
|
|
|
|
|
|||||
| Total assets |
138,890,471 | 3,964,627,246 | ||||||
|
|
|
|
|
|||||
| Liabilities: |
||||||||
| Payable for investments purchased |
3,468,868 | 50,296,780 | ||||||
| Payable for fund shares redeemed |
228,679 | 9,253,242 | ||||||
| Payable for variation margin from open futures contracts |
1,245 | 226,882 | ||||||
| Management and investment advisory fees payable |
83,343 | 2,217,027 | ||||||
| Administrative service and service fees payable |
331 | 686,298 | ||||||
| Transfer agent fees payable |
17,991 | 61,165 | ||||||
| Custody and fund accounting fees payable |
3,004 | 46,554 | ||||||
| Professional fees payable |
35,733 | 52,459 | ||||||
| Trustee fees payable |
8 | 211 | ||||||
| Payable for prospectus and shareholder reports |
5,462 | 73,630 | ||||||
| Other liabilities |
26,462 | 24,438 | ||||||
|
|
|
|
|
|||||
| Total liabilities |
3,871,126 | 62,938,686 | ||||||
|
|
|
|
|
|||||
| Net Assets |
$ | 135,019,345 | $ | 3,901,688,560 | ||||
|
|
|
|
|
|||||
| Analysis of Net Assets: |
||||||||
| Paid-in-capital |
$ | 130,364,952 | $ | 3,434,966,047 | ||||
| Undistributed (overdistribution of) net investment income |
4,804 | 257,260 | ||||||
| Accumulated net realized gain (loss) |
(7,930,099 | ) | 47,061,175 | |||||
| Unrealized appreciation of investments |
12,580,970 | 419,631,760 | ||||||
| Unrealized (depreciation) of futures contracts |
(1,282 | ) | (227,682 | ) | ||||
|
|
|
|
|
|||||
| Net assets |
$ | 135,019,345 | $ | 3,901,688,560 | ||||
|
|
|
|
|
|||||
| Shares outstanding at no par value (unlimited shares authorized): |
||||||||
| Institutional Class |
5,461,791 | 45,444,458 | ||||||
|
|
|
|
|
|||||
| Y Class |
27,385 | 33,824,587 | ||||||
|
|
|
|
|
|||||
| Investor Class |
16,401 | 61,070,812 | ||||||
|
|
|
|
|
|||||
| A Class |
5,565 | 5,907,805 | ||||||
|
|
|
|
|
|||||
| C Class |
7,263 | 3,974,854 | ||||||
|
|
|
|
|
|||||
| Net assets: |
||||||||
| Institutional Class |
$ | 133,638,400 | $ | 1,185,013,905 | ||||
|
|
|
|
|
|||||
| Y Class |
$ | 669,530 | $ | 879,852,983 | ||||
|
|
|
|
|
|||||
| Investor Class |
$ | 399,798 | $ | 1,583,853,257 | ||||
|
|
|
|
|
|||||
| A Class |
$ | 135,710 | $ | 152,520,884 | ||||
|
|
|
|
|
|||||
| C Class |
$ | 175,907 | $ | 100,447,531 | ||||
|
|
|
|
|
|||||
| Net asset value, offering and redemption price per share: |
||||||||
| Institutional Class |
$ | 24.47 | $ | 26.08 | ||||
|
|
|
|
|
|||||
| Y Class |
$ | 24.45 | $ | 26.01 | ||||
|
|
|
|
|
|||||
| Investor Class |
$ | 24.38 | $ | 25.93 | ||||
|
|
|
|
|
|||||
| A Class |
$ | 24.39 | $ | 25.82 | ||||
|
|
|
|
|
|||||
| A Class (offering price) |
$ | 25.88 | $ | 27.40 | ||||
|
|
|
|
|
|||||
| C Class |
$ | 24.22 | $ | 25.27 | ||||
|
|
|
|
|
|||||
| A Cost of investments in unaffiliated securities |
$ | 120,290,811 | $ | 3,405,323,741 | ||||
| B Cost of investments in affiliated securities |
$ | 1,766,715 | $ | 94,937,593 | ||||
See accompanying notes
21
American Beacon FundsSM
Statements of Operations
For the periods ended December 31, 2016
| Bridgeway Large Cap Growth Fund |
Bridgeway Large Cap Value Fund |
|||||||||||
| Six Months Ended December 31, 2016 |
Year Ended June 30, 2016 |
Year Ended December 31, 2016 |
||||||||||
| Investment income: |
||||||||||||
| Dividend income from unaffiliated securities |
$ | 787,095 | $ | 1,769,680 | $ | 73,548,579 | ||||||
| Dividend income from affiliated securities |
3,113 | 956 | 126,346 | |||||||||
| Interest income |
— | 838 | — | |||||||||
| Income derived from securities lending |
— | 52,008 | — | |||||||||
|
|
|
|
|
|
|
|||||||
| Total investment income |
790,208 | 1,823,482 | 73,674,925 | |||||||||
|
|
|
|
|
|
|
|||||||
| Expenses: |
||||||||||||
| Management and investment advisory fees (Note 2) |
519,411 | 767,695 | 16,349,786 | |||||||||
| Administrative service fees (Note 2): |
||||||||||||
| Institutional Class A |
— | 142,277 | 1,181,127 | |||||||||
| Y Class |
— | 196 | 670,368 | |||||||||
| Investor Class |
— | 94 | 1,577,780 | |||||||||
| A Class |
— | 204 | 178,465 | |||||||||
| C Class |
— | 112 | 113,824 | |||||||||
| Transfer agent fees: |
||||||||||||
| Institutional Class A |
34,444 | 50,097 | 291,005 | |||||||||
| Y Class |
53 | 3,398 | 21,760 | |||||||||
| Investor Class |
370 | 3,582 | 49,277 | |||||||||
| A Class |
49 | 3,396 | 23,358 | |||||||||
| C Class |
49 | 3,396 | 10,321 | |||||||||
| Custody and fund accounting fees |
9,712 | 72,179 | 236,405 | |||||||||
| Professional fees |
67,524 | 69,911 | 141,027 | |||||||||
| Registration fees and expenses |
48,726 | 71,654 | 239,592 | |||||||||
| Service fees (Note 2): |
||||||||||||
| Institutional Class A |
— | 84,742 | — | |||||||||
| Y Class |
308 | 115 | 571,089 | |||||||||
| Investor Class |
304 | 123 | 4,716,686 | |||||||||
| A Class |
121 | 130 | 215,089 | |||||||||
| C Class |
148 | 97 | 136,955 | |||||||||
| Distribution fees (Note 2): |
||||||||||||
| A Class |
201 | 216 | 358,482 | |||||||||
| C Class |
978 | 656 | 913,035 | |||||||||
| Prospectus and shareholder report expenses |
16,857 | 35,581 | 275,903 | |||||||||
| Trustee fees |
4,760 | 12,415 | 193,929 | |||||||||
| Other expenses |
5,052 | 62,581 | 131,572 | |||||||||
|
|
|
|
|
|
|
|||||||
| Total expenses |
709,067 | 1,384,847 | 28,596,835 | |||||||||
|
|
|
|
|
|
|
|||||||
| Net fees waived and expenses reimbursed (Note 2) |
(146,138 | ) | (103,417 | ) | — | |||||||
|
|
|
|
|
|
|
|||||||
| Net expenses |
562,929 | 1,281,430 | 28,596,835 | |||||||||
|
|
|
|
|
|
|
|||||||
| Net investment income |
227,279 | 542,052 | 45,078,090 | |||||||||
|
|
|
|
|
|
|
|||||||
| Realized and unrealized gain (loss) from investments: |
||||||||||||
| Net realized gain (loss) from: |
||||||||||||
| Investments |
4,299,017 | 477,817 | 64,159,819 | |||||||||
| Futures contracts |
34,720 | 22,964 | 6,825,813 | |||||||||
| Change in net unrealized appreciation (depreciation) of: |
||||||||||||
| Investments |
6,152,163 | (8,627,925 | ) | 384,100,339 | ||||||||
| Futures contracts |
(8,107 | ) | 6,825 | (221,871 | ) | |||||||
|
|
|
|
|
|
|
|||||||
| Net gain (loss) from investments |
10,477,793 | (8,120,319 | ) | 454,864,100 | ||||||||
|
|
|
|
|
|
|
|||||||
| Net increase (decrease) in net assets resulting from operations |
$ | 10,705,072 | $ | (7,578,267 | ) | $ | 499,942,190 | |||||
|
|
|
|
|
|
|
|||||||
| A | Formerly known as Class N |
See accompanying notes
22
American Beacon FundsSM
Statements of Changes in Net Assets
| Bridgeway Large Cap Growth Fund | ||||||||||||
| Six Months Ended December 31, 2016 |
Year Ended June 30, 2016 |
Year Ended June 30, 2015 |
||||||||||
| Increase (Decrease) in Net Assets: |
||||||||||||
| Operations: |
||||||||||||
| Net investment income |
$ | 227,279 | $ | 542,052 | $ | 678,230 | ||||||
| Net realized gain (loss) from investments and futures contracts |
4,333,737 | 500,781 | 7,237,893 | |||||||||
| Change in net unrealized appreciation (depreciation) of investments and futures contracts |
6,144,056 | (8,621,100 | ) | 1,817,428 | ||||||||
|
|
|
|
|
|
|
|||||||
| Net increase (decrease) in net assets resulting from operations |
10,705,072 | (7,578,267 | ) | 9,733,551 | ||||||||
|
|
|
|
|
|
|
|||||||
| Distributions to Shareholders: |
||||||||||||
| Net investment income: |
||||||||||||
| Institutional Class A |
(860,039 | ) | (775,100 | ) | (330,018 | ) | ||||||
| Y Class |
(4,225 | ) | — | — | ||||||||
| Investor Class |
(2,556 | ) | — | — | ||||||||
| A Class |
(872 | ) | — | — | ||||||||
| C Class |
(1,137 | ) | — | — | ||||||||
| Net realized gain from investments: |
||||||||||||
| Institutional Class |
— | — | — | |||||||||
| Y Class |
— | — | — | |||||||||
| Investor Class |
— | — | — | |||||||||
| A Class |
— | — | — | |||||||||
| C Class |
— | — | — | |||||||||
|
|
|
|
|
|
|
|||||||
| Net distributions to shareholders |
(868,829 | ) | (775,100 | ) | (330,018 | ) | ||||||
|
|
|
|
|
|
|
|||||||
| Capital Share Transactions: |
||||||||||||
| Proceeds from sales of shares |
9,041,296 | 39,701,829 | 101,191,213 | |||||||||
| Reinvestment of dividends and distributions |
841,538 | 753,120 | 316,957 | |||||||||
| Cost of shares redeemed |
(22,099,149 | ) | (51,195,470 | ) | (10,761,992 | ) | ||||||
|
|
|
|
|
|
|
|||||||
| Net increase (decrease) in net assets from capital share transactions |
(12,216,315 | ) | (10,740,521 | ) | 90,746,178 | |||||||
|
|
|
|
|
|
|
|||||||
| Net increase (decrease) in net assets |
(2,380,072 | ) | (19,093,888 | ) | 100,149,711 | |||||||
|
|
|
|
|
|
|
|||||||
| Net Assets: |
||||||||||||
| Beginning of period |
137,399,417 | 156,493,305 | 56,343,594 | |||||||||
|
|
|
|
|
|
|
|||||||
| End of Period * |
$ | 135,019,345 | $ | 137,399,417 | $ | 156,493,305 | ||||||
|
|
|
|
|
|
|
|||||||
| *Includes undistributed (overdistribution of) net investment income |
$ | 4,804 | $ | 305,886 | $ | 538,934 | ||||||
|
|
|
|
|
|
|
|||||||
| A | Formerly known as Class N. |
See accompanying notes
23
American Beacon FundsSM
Statements of Changes in Net Assets
| Bridgeway Large Cap Value Fund | ||||||||
| Year Ended December 31, 2016 |
Year Ended December 31, 2015 |
|||||||
| Increase (Decrease) in Net Assets: |
||||||||
| Operations: |
||||||||
| Net investment income |
$ | 45,078,090 | $ | 24,426,421 | ||||
| Net realized gain (loss) from investments and futures contracts |
70,985,632 | 29,878,823 | ||||||
| Change in net unrealized appreciation (depreciation) of investments and futures contracts |
383,878,468 | (85,627,871 | ) | |||||
|
|
|
|
|
|||||
| Net increase (decrease) in net assets resulting from operations |
499,942,190 | (31,322,807 | ) | |||||
|
|
|
|
|
|||||
| Distributions to Shareholders: |
||||||||
| Net investment income: |
||||||||
| Institutional Class |
(15,314,069 | ) | (8,276,518 | ) | ||||
| Y Class |
(10,949,276 | ) | (5,057,080 | ) | ||||
| Investor Class |
(16,243,795 | ) | (9,026,788 | ) | ||||
| A Class |
(1,480,352 | ) | (1,293,798 | ) | ||||
| C Class |
(320,550 | ) | (392,062 | ) | ||||
| Net realized gain from investments: |
||||||||
| Institutional Class |
(1,014,762 | ) | (15,841,589 | ) | ||||
| Y Class |
(761,516 | ) | (9,510,165 | ) | ||||
| Investor Class |
(1,387,328 | ) | (23,035,277 | ) | ||||
| A Class |
(137,125 | ) | (3,477,855 | ) | ||||
| C Class |
(91,127 | ) | (2,016,062 | ) | ||||
| Return of capital: |
||||||||
| Institutional Class |
— | (76,243 | ) | |||||
| Y Class |
— | (46,585 | ) | |||||
| Investor Class |
— | (83,153 | ) | |||||
| A Class |
— | (11,918 | ) | |||||
| C Class |
— | (3,612 | ) | |||||
|
|
|
|
|
|||||
| Net distributions to shareholders |
(47,699,900 | ) | (78,148,705 | ) | ||||
|
|
|
|
|
|||||
| Capital Share Transactions: |
||||||||
| Proceeds from sales of shares |
2,035,885,045 | 1,721,211,070 | ||||||
| Reinvestment of dividends and distributions |
45,900,960 | 75,997,213 | ||||||
| Cost of shares redeemed |
(939,299,165 | ) | (619,512,009 | ) | ||||
|
|
|
|
|
|||||
| Net increase (decrease) in net assets from capital share transactions |
1,142,486,840 | 1,177,696,274 | ||||||
|
|
|
|
|
|||||
| Net increase (decrease) in net assets |
1,594,729,130 | 1,068,224,762 | ||||||
|
|
|
|
|
|||||
| Net Assets: |
||||||||
| Beginning of period |
2,306,959,430 | 1,238,734,668 | ||||||
|
|
|
|
|
|||||
| End of Period * |
$ | 3,901,688,560 | $ | 2,306,959,430 | ||||
|
|
|
|
|
|||||
| * Includes undistributed (overdistribution of) net investment income |
$ | 257,260 | $ | — | ||||
|
|
|
|
|
|||||
See accompanying notes
24
Notes to Financial Statements
December 31, 2016
1. Organization
American Beacon Funds (the “Trust”), is organized as a Massachusetts business trust and is registered under the Investment Company Act of 1940, as amended (the “Act”), as a diversified, open-end management investment company. As of December 31, 2016, the Trust consists of twenty-six active series, two of which are presented in this filing (collectively, the “Funds” and each individually a “Fund”): American Beacon Bridgeway Large Cap Growth Fund and American Beacon Bridgeway Large Cap Value Fund. The remaining twenty-four active series are reported in separate filings.
American Beacon Advisors, Inc. (the “Manager”) is a wholly-owned subsidiary of Astro AB Borrower, Inc., which is indirectly owned by investment funds affiliated with Kelso & Company, L.P. and Estancia Capital Management, LLC, and was organized in 1986 to provide business management, advisory, administrative, and asset management consulting services to the Trust and other investors.
Change in Fiscal Year End
On August 6, 2015, the Board of Trustees (“the Board”) approved a change in the fiscal year-end of the American Beacon Bridgeway Large Cap Growth Fund from June 30 to December 31 of each year. The first full cycle of the calendar year reporting will begin January 1, 2017. As a result of the change, the American Beacon Bridgeway Large Cap Growth Fund will have a December 2016 fiscal six month transition period, the results of which are reported in this Annual Report for the calendar year ended December 31, 2016.
Class Disclosure
Each Fund has multiple classes of shares designed to meet the needs of different groups of investors. The following table sets forth the differences amongst the classes:
| Class |
Eligible Investors |
Minimum Initial Investments |
||||
| Institutional |
Large institutional investors—sold directly or through intermediary channels. | $ | 250,000 | |||
| Y Class |
Large institutional retirement plan investors—sold directly or through intermediary channels. | $ | 100,000 | |||
| Investor |
All investors using intermediary organizations such as broker-dealers or retirement plan sponsors—sold directly through intermediary channels. | $ | 2,500 | |||
| A Class |
All investors who invest through intermediary organizations, such as broker-dealers or third party administrator. Retail investors who invest directly through a financial intermediary such as a broker, bank, or registered investment advisor, which may include a front-end sales charge and a contingent deferred sales charge (“CDSC”). | $ | 2,500 | |||
| C Class |
Retail investors who invest directly through a financial intermediary such as a broker or employee directed benefit plans with applicable sales charges, which may include CDSC. | $ | 1,000 | |||
Each class offered by the Trust has equal rights as to assets and voting privileges. Income and non-class specific expenses are allocated daily to each class on the basis of the relative net assets. Realized and unrealized capital gains and losses of each class are allocated daily based on the relative net assets of each class of the respective Fund. Class specific expenses, where applicable, currently include administrative service fees, service fees, and distribution fees and vary amongst the classes as described more fully in Note 2.
The following is a summary of significant accounting policies, consistently followed by the Funds in preparation of the financial statements. The Funds are considered an investment company and accordingly, follow the investment company accounting and reporting guidance of the Financial Accounting Standards Board Accounting Standard Codification Topic 946, Financial Services—Investment Companies, which is part of U.S. Generally Accepted Accounting Principles (“U.S. GAAP”).
25
American Beacon FundsSM
Notes to Financial Statements
December 31, 2016
Security Transactions and Investment Income
Security transactions are recorded on the trade date of the security purchase or sale. The Funds may purchase securities with delivery or payment to occur at a later date. At the time the Funds enter into a commitment to purchase a security, the transaction is recorded, and the value of the security is reflected in the net asset value (“NAV”). The value of the security may vary with market fluctuations.
Dividend income, net of foreign taxes, is recorded on the ex-dividend date, except certain dividends from foreign securities which are recorded as soon as the information is available to the Funds. Interest income is earned from settlement date, recorded on the accrual basis, and adjusted, if necessary, for accretion of discounts and amortization of premiums. For financial and tax reporting purposes, realized gains and losses are determined on the basis of specific lot identification.
Dividends to Shareholders
Dividends from net investment income of the Funds will normally be declared and paid at least annually. Distributions, if any, of net realized capital gains are generally paid at least annually and recorded on the ex-dividend date. Dividends to shareholders are determined in accordance with federal income tax regulations, which may differ in amount and character from net investment income and realized gains recognized for purposes of U.S. GAAP. To the extent necessary to fully distribute capital gains, the Funds also designates earnings and profits distributed to shareholders on the redemption of shares.
Commission Recapture
The Funds have established brokerage commission recapture arrangements with certain brokers or dealers. If the Fund’s investment advisor chooses to execute a transaction through a participating broker, the broker rebates a portion of the commission back to the Funds. Any collateral benefit received through participation in the commission recapture program is directed exclusively to the Fund. This amount is reported with the net realized gain on the Funds’ Statement of Operations.
Allocation of Income, Expenses, Gains, and Losses
Income, expenses (other than those attributable to a specific class), gains, and losses are allocated daily to each class of shares based upon the relative proportion of net assets represented by such class. Operating expenses directly attributable to a specific class are charged against the operations of that class.
Use of Estimates
The preparation of financial statements in conformity with U.S. GAAP requires management to make estimates and assumptions that affect the amounts reported in the financial statements and accompanying notes. Actual results may differ from those estimated.
Other
Under the Trust’s organizational documents, its officers and trustees are indemnified against certain liability arising out of the performance of their duties to the Trust. In the normal course of business, the Trust enters into contracts that provide indemnification to the other party or parties against potential costs or liabilities. The Trust’s maximum exposure under these arrangements is dependent on claims that may be made in the future and, therefore, cannot be estimated. The Trust has had no prior claims or losses pursuant to any such agreement.
26
American Beacon FundsSM
Notes to Financial Statements
December 31, 2016
2. Transactions with Affiliates
Management Agreement
From January 1, 2016 to May 29, 2016 for the Bridgeway Large Cap Value Fund, the Trust and the Manager were parties to a Management Agreement that obligated the Manager to provide or oversee the provision of all investment advisory, fund management, and securities lending services. As compensation for performing the duties required under the Management Agreement, the Manager received from the Funds an annualized fee equal to 0.05% of the average daily net assets. Effective May 29, 2016, the Funds and the Manager entered a Management Agreement that obligates the Manager to provide investment advisory, fund management, and administrative services to the Funds. As compensation for performing the duties under the Management Agreement, the Manager receives from the Fund an annualized fee at the following annual rates as a percentage of average daily net assets: 0.35% of the first $5 billion, 0.325% of the next $5 billion, 0.30% of the next $10 billion, and 0.275% over $20 billion. The Funds also paid the unaffiliated investment advisors hired to direct investment activities of the Funds an annualized investment advisory fee based on a percentage of the Funds’ average daily assets. Management fees paid by the Funds during the year ended December 31, 2016 were as follows:
| Fund |
Management Fee Rate |
Management Fee |
Amounts paid to Investment Advisors |
Amounts Paid to Manager |
||||||||||||
| Bridgeway Large Cap Growth |
0.75 | % | $ | 519,355 | $ | 276,416 | $ | 242,939 | ||||||||
| Bridgeway Large Cap Value |
0.67 | % | 16,318,786 | 9,441,964 | 6,876,822 | |||||||||||
Administration Agreement
From January 1, 2016 to May 29, 2016 for the Bridgeway Large Cap Value Fund, the Manager and the Trust were parties to an Administrative Agreement which obligated the Manager to provide or oversee administrative services to the Funds. As compensation for performing the duties required under the Administrative Agreement, the Manager received an annualized fee of 0.30% of the average daily net assets of the Institutional, Y, Investor, A, and C Classes of the Funds.
Distribution Plans
The Funds, except for the A and C Classes, have adopted a “defensive” Distribution Plan (the “Plan”) in accordance with Rule 12b-1 under the Act, pursuant to which no separate fees will be charged to the Funds for distribution purposes. However, the Plan authorizes the management and administrative service fees received by the Manager and the investment advisors hired by the Manager to be used for distribution purposes. Under this Plan, the Funds do not intend to separately compensate the Manager or any other party, either directly or indirectly, for the distribution of Fund shares.
Separate Distribution Plans (the “Distribution Plans”) have been adopted pursuant to Rule 12b-1 under the Act for the A and C Classes of the Funds. Under the Distribution Plans, as compensation for distribution assistance, the Manager receives an annual fee of 0.25% of the average daily net assets of the A Class and 1.00% of the average daily net assets of the C Class. The fee will be payable without regard to whether the amount of the fee is more or less than the actual expenses incurred in a particular month by the Manager for distribution assistance.
Service Plans
The Manager and the Trust entered into Service Plans that obligate the Manager to oversee additional shareholder servicing of the Y, Investor, A, and C Classes of the Funds. As compensation for performing the duties required under the Service Plans, the Manager receives an annualized fee of 0.10% of the average daily net assets of the Y Class, 0.15% of the average daily net assets of the A and C Classes, and up to 0.375% of the average daily net assets of the Investor Class of the Funds.
27
American Beacon FundsSM
Notes to Financial Statements
December 31, 2016
Sub-Transfer Agent Fees
The Manager has entered into agreements, which include servicing agreements, with financial intermediaries that provide recordkeeping, processing, shareholder communications and other services to customers of the intermediaries that hold positions in the Institutional Class of the Funds and has agreed to compensate the intermediaries for providing these services. Intermediaries transact with the Funds primarily through the use of omnibus accounts on behalf of its customers who hold positions in the Funds. Certain services would have been provided by the Funds’ transfer agent and other service providers if the shareholders’ accounts were maintained directly by the Funds’ transfer agent. Accordingly, the Funds, pursuant to the Board approval, have agreed to reimburse the Manager for all or a portion of the servicing fees paid to these intermediaries for the Institutional Class. The reimbursement amounts (sub-transfer agent fees) paid to the Manager are subject to a fee limit of up to 0.10% of an intermediaries average net assets in the Institutional Class on an annual basis.
For the year ended December 31, 2016, the sub-transfer agent fees, as included in “Transfer agent fees” in the Statements of Operations, were as follows:
| Fund |
Sub-Transfer Agent Fees | |||
| Bridgeway Large Cap Growth |
$ | 21,757 | ||
| Bridgeway Large Cap Value |
234,564 | |||
As of December 31, 2016, the Fund owes the Manager the following reimbursement of sub-transfer agent fees, as included in “Transfer agent fees payable” in the Statements of Assets and Liabilities.
| Fund |
Reimbursement of Sub-Transfer Agent Fees |
|||
| Bridgeway Large Cap Growth |
$ | 6,461 | ||
| Bridgeway Large Cap Value |
32,694 | |||
Investment in Affiliated Funds
The Funds may invest in the American Beacon U.S. Government Money Market Select Fund (the “USG Select Fund”). The Funds and the USG Select Fund have the same investment advisor and therefore, are considered to be affiliated. The Manager serves as investment advisor to the USG Select Fund and receives management fees totaling 0.10% of its average daily net assets of the USG Select Fund. During the year ended December 31, 2016, the Manager earned $1,741 and $56,617 from Bridgeway Large Cap Growth and Bridgeway Large Cap Value Funds’ direct investments in the USG Select Fund.
Interfund Lending Program
Pursuant to an exemptive order issued by the Securities and Exchange Commission (“SEC”), the Funds, along with other registered investment companies having management contracts with the Manager, may participate in an interfund lending program. This program provides an alternative credit facility allowing the Funds to borrow from other participating Funds. During the period from July 1, 2016 to December 31, 2016, the Bridgeway Large Cap Growth Fund borrowed on average $1,610,271 for 3 days at an average rate of 0.99% with interest charges of $130. These amounts are recorded as “Other expenses” in the Statements of Operations. During the year ended December 31, 2016, the Bridgeway Large Cap Value Fund did not use the credit facility.
Expense Reimbursement Plan
The Manager contractually agreed to reimburse the Funds to the extent that total annual fund operating expenses exceeded the Funds’ expense caps. For the period ended December 31, 2016, the Manager waived or reimbursed expenses as follows:
28
American Beacon FundsSM
Notes to Financial Statements
December 31, 2016
| Expense Cap | ||||||||||||||
| Fund |
Class | 2/5/16 – 4/30/16 |
5/1/16 – 12/31/16 |
Reimbursed Expenses |
(Recovered) Expenses |
Expiration | ||||||||
| Bridgeway Large Cap Growth |
Institutional | 0.81% | 0.81% | $144,752 | $ | — | 2019 | |||||||
| Bridgeway Large Cap Growth |
Y | 0.91% | 0.91% | 546 | — | 2019 | ||||||||
| Bridgeway Large Cap Growth |
Investor | 1.19% | 1.19% | 451 | — | 2019 | ||||||||
| Bridgeway Large Cap Growth |
A | 1.21% | 1.21% | 173 | — | 2019 | ||||||||
| Bridgeway Large Cap Growth |
C | 1.96% | 1.96% | 216 | — | 2019 | ||||||||
Of these amounts, $57,765 is disclosed as a receivable from the Manager at December 31, 2016 for the Bridgeway Large Cap Growth Fund. The Funds have adopted an Expense Reimbursement Plan whereby the Manager may seek repayment of fees waived or expenses reimbursed for a period of up to three years. However, reimbursement will occur only if the Class’ average net assets have grown or expenses have declined sufficiently to allow reimbursement without causing its expense ratio to exceed the previously agreed upon contractual expense limit. The reimbursed expenses listed above will expire in 2019. The Funds did not record a liability for potential reimbursements due to the current assessment that reimbursements are unlikely.
The carryover of excess expenses potentially reimbursable to the Manager are as follows:
| Fund |
Recovered Expenses |
Excess Expense Carryover |
Expired Expense Carryover |
Expiration of Reimbursed Expenses | ||||||||||
| Bridgeway Large Cap Growth |
$ | — | $ | 91,941 | $ | — | 2019 | |||||||
| Bridgeway Large Cap Value |
76,230 | — | — | 2016 | ||||||||||
The Manager recovered expenses from various classes of the Bridgeway Large Cap Value Fund during the year ended December 31, 2016 as follows:
| Fund |
Class | Excess Expense Carryover |
Expiration | |||
| Bridgeway Large Cap Value |
Institutional | $76,230 | 2016 |
Sales Commissions
The Funds’ distributor, Foreside Fund Services, LLC (“Foreside”), may receive a portion of A Class sales charges from broker dealers and it may be used to offset distribution related expenses. During the period from July 1, 2016 to December 31, 2016, Foreside collected $378 for the Bridgeway Large Cap Growth Fund from the sale of Class A shares. During the year ended December 31, 2016, Foreside collected $48,963 for the Bridgeway Large Cap Value Fund from the sale of Class A Shares.
A CDSC of 0.50% will be deducted with respect to Class A Shares on certain purchases of $1,000,000 or more that are redeemed in whole or part within 18 months of purchase, unless waived as discussed in the Funds’ Prospectus. Any applicable CDSC will be 0.50% of the lesser of the original purchase price or the value of the redemption of the Class A Shares redeemed. During the year ended December 31, 2016, CDSC fees of $974 were collected for the Class A Shares of the Bridgeway Large Cap Value Fund.
A CDSC of 1.00% will be deducted with respect to Class C Shares redeemed within 12 months of purchase, unless waived as discussed in the Funds’ Prospectus. Any applicable CDSC will be 1.00% of the lesser of the original purchase price or the value of the redemption of the Class C Shares redeemed. During the year ended December 31, 2016, CDSC fees of $21,378 were collected for the Class C Shares of the Bridgeway Large Cap Value Fund.
Trustee Fees and Expenses
As compensation for their service to the Trust and the American Beacon Select Funds Trust, each Trustee receives an annual retainer of $120,000, plus $5,000 for each Board of Trustee meeting attended in person or
29
American Beacon FundsSM
Notes to Financial Statements
December 31, 2016
via teleconference, $2,500 for attendance by Committee members at meetings of the Audit Committee and the Investment Committee, and $1,500 for attendance by Committee members at meetings of the Nominating and Governance Committee, plus reimbursement of reasonable expenses incurred in attending Board meetings, Committee meetings, and relevant educational seminars. The Trustees also may be compensated for attendance at special Board and/or Committee meetings from time to time. The Board Chairman receives an additional annual retainer of $50,000 as well as a single $5,000 fee each quarter for his attendance at the committee meetings. The chairpersons of the Audit Committee and the Investment Committee each receive an additional annual retainer of $25,000 and the Chairman of the Nominating and Governance Committee receives an additional annual retainer of $10,000. These expenses are allocated on a prorated basis to each Fund of the Trust according to its respective net assets.
3. Security Valuation and Fair Value Measurements
Investments are valued at the close of the New York Stock Exchange (the “Exchange”), normally 4:00 p.m. Eastern Time, each day that the Exchange is open for business. Equity securities, including exchange-traded funds (“ETFs”) for which market quotations are available are valued at the last sale price or official closing price (closing bid price or last evaluated quote if no sale has occurred) on the primary market or exchange on which they trade.
Investments in open-end mutual funds are valued at the closing net asset value (“NAV”) per share of the mutual fund on the day of valuation.
Securities for which market prices are not readily available or are not reflective of the fair value of the security, as determined by the Manager, will be priced at fair value following procedures approved by the Trust’s Board.
Futures contracts are valued based upon their quoted daily settlement prices. Upon entering into a futures contract, the Fund is required to deposit with its futures broker, an amount of cash or U.S. Government and Agency Obligations in accordance with the initial margin requirements of the broker or exchange. Futures contracts are marked-to-market daily and an appropriate payable or receivable for the change in value (“variation margin”) is recorded by the Fund. Gains or losses are recognized, but not considered realized until the contracts expire or are closed. Futures contracts involve, to varying degrees, risk of loss in excess of the variation margin disclosed on the Statements of Assets and Liabilities.
Other investments, including restricted securities, and those financial instruments for which the above valuation procedures are inappropriate or are deemed not to reflect fair value are stated at fair value as determined in good faith by the Valuation Committee, established by the Board.
Valuation Inputs
Various inputs may be used to determine the fair value of the Funds’ investments. These inputs are summarized in three broad levels for financial statement purposes. The inputs or methodologies used to value securities are not necessarily an indication of the risk associated with investing in those securities.
| Level 1 |
- | Quoted prices in active markets for identical securities. | ||
| Level 2 |
- | Prices determined using other significant observable inputs. These may include quoted prices for similar securities, interest rates, prepayment speeds, credit risk, and others. Fixed-income securities are considered Level 2 as they are valued using observable inputs. | ||
| Level 3 |
- | Prices determined using other significant unobservable inputs. Unobservable inputs reflect the Fund’s own assumptions about the factors market participants would use in pricing an investment. | ||
30
American Beacon FundsSM
Notes to Financial Statements
December 31, 2016
Level 1 and Level 2 trading assets and trading liabilities, at fair value
Common stocks and financial derivative instruments, such as futures contracts that are traded on a national securities exchange, are stated at the last reported sale or settlement price on the day of valuation. To the extent these securities are actively traded and valuation adjustments are not applied, they are categorized as Level 1 of the fair value hierarchy. Preferred securities and other equities traded on inactive markets or valued by reference to similar instruments are categorized as Level 2 of the fair value hierarchy.
Investments in registered open-end investment management companies will be valued based upon the NAVs of such investments and are categorized as Level 1 of the fair value hierarchy.
The Funds’ investments are summarized by level based on the inputs used to determine their values. As of December 31, 2016, the investments were classified as described below:
| Bridgeway Large Cap Growth Fund(1) |
Level 1 | Level 2 | Level 3 | Total | ||||||||||||
| Common Stock |
$ | 132,871,781 | $ | — | $ | — | $ | 132,871,781 | ||||||||
| Short-Term Investments—Money Market Funds |
1,766,715 | — | 1,766,715 | |||||||||||||
|
|
|
|
|
|
|
|
|
|||||||||
| Total Investments in Securities |
$ | 134,638,496 | $ | — | $ | — | $ | 134,638,496 | ||||||||
|
|
|
|
|
|
|
|
|
|||||||||
| Financial Derivative Instruments—Liabilities |
||||||||||||||||
| Futures Contracts |
$ | (1,282 | ) | $ | — | $ | — | $ | (1,282 | ) | ||||||
|
|
|
|
|
|
|
|
|
|||||||||
| Total Other Financial Instruments |
$ | (1,282 | ) | $ | — | $ | $ | (1,282 | ) | |||||||
|
|
|
|
|
|
|
|
|
|||||||||
| Bridgeway Large Cap Value Fund(1) |
Level 1 | Level 2 | Level 3 | Total | ||||||||||||
| Common Stock |
$ | 3,824,955,501 | $ | — | $ | — | $ | 3,824,955,501 | ||||||||
| Short-Term Investments—Money Market Funds |
94,937,593 | — | — | 94,937,593 | ||||||||||||
|
|
|
|
|
|
|
|
|
|||||||||
| Total Investments in Securities |
$ | 3,919,893,094 | $ | — | $ | — | $ | 3,919,893,094 | ||||||||
|
|
|
|
|
|
|
|
|
|||||||||
| Financial Derivative Instruments—Liabilities |
||||||||||||||||
| Futures Contracts |
$ | (227,682 | ) | $ | — | $ | — | $ | (227,682 | ) | ||||||
|
|
|
|
|
|
|
|
|
|||||||||
| Total Other Financial Instruments |
$ | (227,682 | ) | $ | — | $ | — | $ | (227,682 | ) | ||||||
|
|
|
|
|
|
|
|
|
|||||||||
| (1) | Refer to the Schedule of Investments for industry information. |
U.S. GAAP requires all transfers between any levels to be disclosed. The end of period timing recognition has been adopted for the transfers between levels the Funds’ assets and liabilities. During the year ended December 31, 2016, there were no transfers between levels.
4. Securities and Other Investments
American Depositary Receipts (“ADRs”)
ADRs are depositary receipts for foreign issuers in registered form traded in U.S. securities markets. Depositary receipts may not be denominated in the same currency as the securities into which they may be converted. Investing in depositary receipts entails substantially the same risks as direct investment in foreign securities. There is generally less publicly available information about foreign companies and there may be less governmental regulation and supervision of foreign stock exchanges, brokers and listed companies. In addition, such companies may use different accounting and financial standards (and certain currencies may become unavailable for transfer from a foreign currency), resulting in the Fund’s possible inability to convert immediately into U.S. currency proceeds realized upon the sale of portfolio securities of the affected foreign companies. In addition, the Funds may invest in unsponsored depositary receipts, the issuers of which are not obligated to disclose material information about the underlying securities to investors in the United States. Ownership of unsponsored depositary receipts may not entitle the Fund to the same benefits and rights as ownership of a sponsored depositary receipt or the underlying security.
31
American Beacon FundsSM
Notes to Financial Statements
December 31, 2016
Real Estate Investment Trusts
The Funds may own shares of real estate investment trusts (“REITs”) which report information on the source of their distributions annually. The Funds re-characterize distributions received from REIT investments based on information provided by the REITs into the following categories: ordinary income, long-term capital gains, and return of capital. If information is not available on a timely basis from the REITs, the re-characterization will be estimated based on available information which may include the previous year allocation. If new or additional information becomes available from the REITs at a later date, a re-characterization will be made the following year.
Other Investment Company Securities and Other Exchange Traded Products
The Funds may invest in shares of other investment companies, including open-end funds, closed-end funds, business development companies, exchange-traded funds, unit investment trusts, and other investment companies of the Trust. The Funds may invest in investment company securities advised by the Manager or a sub-advisor. Investments in the securities of other investment companies may involve duplication of advisory fees and certain other expenses. By investing in another investment company, the Funds become a shareholder of that investment company. As a result, the Funds shareholders indirectly will bear a Fund’s proportionate share of the fees and expenses paid by shareholders of the other investment company, in addition to the fees and expenses the Funds’ shareholders directly bear in connection with the Funds’ own operations. These other fees and expenses are reflected as Acquired Fund Fees and Expenses and are included in the Fees and Expenses Table for the Fund in its Prospectus, if applicable. Investments in other investment companies may involve the payment of substantial premiums above the value of such issuer’s portfolio securities.
5. Financial Derivative Instruments
The Funds may utilize derivative instruments to gain market exposure on cash balances or reduce market exposure in anticipation of liquidity needs. When considering the Funds’ use of derivatives, it is important to note that the Funds do not use derivatives for the purpose of creating financial leverage.
Futures Contracts
Futures contracts are contracts to buy or sell a standard quantity of securities at a specified price on a future date. The Funds may enter into financial futures contracts as a method for keeping assets readily convertible to cash if needed to meet shareholder redemptions or for other needs while maintaining exposure to the stock or bond market, as applicable. The primary risks associated with the use of futures contracts are the possibility of illiquid markets or imperfect correlation between the values of the contracts and the underlying securities, or that the counterparty will fail to perform its obligations.
Upon entering into a futures contract, the Funds are required to set aside or deposit with a broker an amount, termed the initial margin, which typically represents a portion of the face value of the futures contract. The Funds usually reflect this amount on the Schedules of Investments as a U.S. Treasury Bill held as collateral for futures contracts or as cash deposited with broker on the Statements of Assets and Liabilities. Payments to and from the broker, known as variation margin, are required to be made on a daily basis as the price of the futures contract fluctuates. Changes in initial settlement values are accounted for as unrealized appreciation (depreciation) until the contracts are terminated, at which time realized gains and losses are recognized. Futures contracts are valued at the most recent settlement price established each day by the exchange on which they are traded.
During the periods ended December 31, 2016, the Funds entered into futures contracts primarily for exposing cash to markets.
32
American Beacon FundsSM
Notes to Financial Statements
December 31, 2016
The Funds’ average futures contracts outstanding fluctuate throughout the period as required to meet strategic requirements. The following table illustrates the quarterly volume of futures contracts. For purpose of this disclosure, volume is measured by contracts outstanding at each quarter end.
| Average Futures Contracts Outstanding |
||||
| Fund |
Periods ended December 31, 2016 | |||
| Bridgeway Large Cap Growth |
19 | |||
| Bridgeway Large Cap Value |
537 | |||
The following is a summary of the Funds’ derivative financial instruments categorized by risk exposure(1)(2):
Fair Values of financial derivative instruments not accounted for as hedging instruments as of December 31, 2016:
| Statement of Assets and Liabilities: |
Derivatives | Bridgeway Large Cap Growth Fund |
Bridgeway Large Cap Value Fund |
|||||||||
| Payable for variation margin from open futures contracts |
Equity Contracts | $ | (1,282 | ) | $ | (227,682 | ) | |||||
The effect of financial derivative instruments not accounted for as hedging instruments during the period ended December 31, 2016:
| Statement of Operations: |
||||||||||||
| Net realized gain (loss) from futures contracts |
Equity Contracts | $ | 34,720 | $ | 6,825,813 | |||||||
| Change in net unrealized appreciation (depreciation) of futures contracts |
Equity Contracts | (8,107 | ) | (221,871 | ) | |||||||
| (1) | See Note 3 in the Notes to Financial Statements for additional information. |
| (2) | Includes cumulative appreciation (depreciation) of futures contracts as reported in the Schedule of Investments Footnotes. Only current day’s variation margin is reported within the Statement of Assets and Liabilities. |
6. Principal Risks
Investing in the Funds may involve certain risks including, but not limited to, those described below.
Allocation Risk
The sub-advisor’s judgments about, and allocations among, asset classes and market exposures may adversely affect the Fund’s performance.
Equity Investments Risk
Equity securities are subject to market risk. The Funds’ investments in equity securities may include common stocks, preferred stocks, securities convertible into or exchangeable for common stocks, REITs, depositary receipts, and U.S. dollar-denominated foreign stocks traded on U.S. exchanges. Such investments may expose the Fund to additional risks.
Common Stock
The value of a company’s common stock may fall as a result of factors affecting the company, companies in the same industry or sector, or the financial markets overall. Common stock generally is subordinate to preferred stock upon the liquidation or bankruptcy of the issuing company.
Preferred Stock
Preferred stocks and convertible securities are sensitive to movements in interest rates. Preferred stocks may be less liquid than common stocks and, unlike common stocks, participation in the growth of an issuer may be limited. Distributions on preferred stocks generally are payable at the discretion of an issuer and after required payments to bond holders.
33
American Beacon FundsSM
Notes to Financial Statements
December 31, 2016
Convertible Securities
Convertible securities are subject to the risk that the credit standing of the issuer may have an effect on the convertible securities’ investment value.
REITs
Investments in REITs are subject to the risks associated with investing in the real estate industry such as adverse developments affecting the real estate industry and real property values.
Depositary Receipts
Depositary receipts and U.S. dollar-denominated foreign stocks traded on U.S. exchanges are subject to certain of the risks associated with investing directly in foreign securities, including, but not limited to, currency exchange rate fluctuations, political and financial instability in the home country of a particular depositary receipt or foreign stock, less liquidity and more volatility, less government regulation and supervision and delays in transaction settlement.
Foreign Investing Risk
Non-U.S. investments carry potential risks not associated with U.S. investments. Such risks include, but are not limited to: (1) currency exchange rate fluctuations, (2) political and financial instability, (3) less liquidity and greater volatility, (4) lack of uniform accounting, auditing and financial reporting standards, (5) increased price volatility, (6) less government regulation and supervision of foreign stock exchanges, brokers and listed companies; and (7) delays in transaction settlement in some foreign markets.
Futures Contracts Risk
Futures contracts are derivative instruments where one party pays a fixed price for an agreed amount of securities or other underlying assets at an agreed date. The use of such derivative instruments may expose the Funds to additional risk that it would not be subject to if it invested directly in the securities underlying those derivatives. Futures contracts may experience dramatic price changes (losses) and imperfect correlation between the price of the contract and the underlying security or index, which will increase the volatility of the Funds and may involve a small investment of cash (the amount of initial and variation margin) relative to the magnitude of the risk assumed (the potential increase or decrease in the price of the futures contract).
Growth Companies Risk
Growth companies are expected to increase their earnings at a certain rate. When these expectations are not met, the prices of these stocks may go down, even if earnings showed an absolute increase. Growth company stocks may lack the dividend yield that can cushion stock prices in market downturns.
Investment Risk
An investment in the Funds is not a deposit with a bank and is not insured or guaranteed by the Federal Deposit Insurance Corporation or any other government agency. When you sell your shares of the Funds, they could be worth less than what you paid for them. Therefore, you may lose money by investing in the Funds.
Issuer Risk
The value of, and/or the return generated by, a security may decline for a number of reasons which directly relate to the issuer, such as management performance, financial leverage and reduced demand for the issuer’s goods or services, as well as the historical and prospective earnings of the issuer and the value of its assets.
34
American Beacon FundsSM
Notes to Financial Statements
December 31, 2016
Large Capitalization Companies Risk
The securities of large market capitalization companies may underperform other segments of the market because such companies may be less responsive to competitive challenges and opportunities and may be unable to attain high growth rates during periods of economic expansion.
Market Risk
Since the financial crisis that started in 2008, the U.S. and many foreign economies continue to experience its after-effects, which have resulted, and may continue to result, in an unusually high degree of volatility in the financial markets, both domestic and foreign. In addition, global economies and financial markets are becoming increasingly interconnected, which increases the possibilities that conditions in one country or region might adversely impact issuers in a different country or region. The severity or duration of adverse economic conditions may also be affected by policy changes made by governments or quasi-governmental organizations. In addition, political events within the U.S. and abroad may affect investor and consumer confidence and may adversely impact financial markets and the broader economy, perhaps suddenly and to a significant degree. High public debt in the U.S. and other countries creates ongoing systemic and market risks and policymaking uncertainty. Because the impact on the markets has been widespread, it may be difficult to identify both risks and opportunities using past models of the interplay of market forces, or to predict the duration of these market conditions. Interest rates have been unusually low in recent years in the U.S. and abroad. Because there is little precedent for this situation, it is difficult to predict the impact of a rate increase on various markets. In addition, there is a risk that the prices of goods and services in the U.S. and many foreign economies may decline over time, known as deflation (the opposite of inflation). Deflation may have an adverse effect on stock prices and creditworthiness and may make defaults on debt more likely.
Mid-Capitalization Companies Risk
Investing in the securities of medium capitalization companies involves greater risk and the possibility of greater price volatility than investing in larger capitalization companies and more established companies. These companies may also have narrower commercial markets and more limited operating history, product lines, and managerial and financial resources than larger, more established companies. The securities of these companies may lack sufficient market liquidity, and can be sensitive to expected changes in interest rates, borrowing costs and earnings.
Model and Data Risk
Models and data are used to screen potential investments for the Funds. When models or data prove to be incorrect or incomplete, any decisions made in reliance thereon expose the Funds to potential risks. Some of the models used by the sub-advisor are predictive in nature. The use of predictive models has inherent risks. Because predictive models are usually constructed based on historical data supplied by third parties, the success of relying on such models may depend heavily on the accuracy and reliability of the supplied historical data.
Other Investment Companies Risk
The Funds may invest in shares of other registered investment companies, including money market funds. To the extent that the Funds invest in shares of other registered investment companies, you will indirectly bear fees and expenses charged by the underlying funds in addition to the Funds’ direct fees and expenses and will be subject to the risks associated with investments in those funds. For example, money market funds are subject to interest rate risk, credit risk, and market risk.
35
American Beacon FundsSM
Notes to Financial Statements
December 31, 2016
Redemption Risk
The Funds may experience periods of high levels of redemptions that could cause the Funds to sell assets at inopportune times or at a loss or depressed value. The sale of assets to meet redemption requests may create net capital gains, which could cause the Funds to have to distribute substantial capital gains.
Risk of Programming and Modeling Error
The success of the sub-advisor’s investment strategy depends largely on the effectiveness of its quantitative research models and investment programs. The programs may not react as expected to market events resulting in losses for the Funds. Additionally, programs may become outdated or experience malfunctions which may not be identified by the sub-advisor and therefore may also result in losses to the Funds.
Sector Risk
Sector risk is the risk associated with the Funds holding a significant amount of investments in similar businesses, which could be affected by the same economic or market conditions.
Securities Selection Risk
Securities selected by the sub-advisor or the Manager for the Funds may not perform to expectations. This could result in the Funds’ underperformance compared to other funds with similar investment objectives.
Value Stocks Risk
Value stocks are subject to the risk that their intrinsic value may never be realized by the market or that their prices may decline. While the Funds’ investments in value stocks may limit its downside risk over time the Funds may produce more modest gains than riskier stock funds as a trade-off for this potentially lower risk. Different investment styles tend to shift in and out of favor, depending on market conditions and investor sentiment. The Funds’ value style could cause the Funds to underperform funds that use a growth or non-value approach to investing or have a broader investment style.
Offsetting Assets and Liabilities
The Funds are parties to enforceable master netting agreements between brokers and counterparties, which provides for the right to offset under certain circumstances. The Funds employ multiple money managers and counterparties and have elected not to offset qualifying financial and derivative instruments on the Statements of Assets and Liabilities, as such all financial and derivative instruments are presented on a gross basis. The impacts of netting arrangements that provide the right to offset are detailed below. The net amount represents the net receivable or payable that would be due from or to the counterparty in the event of default. Exposure from borrowings and other financing agreements can only be netted across transactions governed by the same Master Agreement with the same legal entity. All amounts reported below represent the balance as of December 31, 2016.
Bridgeway Large Cap Growth Fund
Offsetting of Financial Liabilities and Derivative Liabilities as of December 31, 2016:
| Description |
Gross Amounts of Recognized Liabilities |
Gross Amounts Offset in the Statements of Assets and Liabilities |
Net Amount of Liabilities Presented in the Statements of Assets and Liabilities |
|||||||||
| Futures Contracts(1) |
$ | (1,282 | ) | $ | — | $ | (1,282 | ) | ||||
36
American Beacon FundsSM
Notes to Financial Statements
December 31, 2016
Financial Liabilities, Derivative Liabilities, and Collateral Pledged by Counterparty as of December 31, 2016:
| Gross Amounts Offset in the Statements of Assets and Liabilities |
||||||||||||||||
| Counterparty |
Net Amount of Liabilities Presented in the Statement of Assets and Liabilities |
Financial Instruments |
Cash Collateral Received |
Net Amount | ||||||||||||
| Goldman Sachs & Co.(1) |
$ | (1,282 | ) | $ | — | $ | — | $ | (1,282 | ) | ||||||
Bridgeway Large Cap Value Fund
Offsetting of Financial Liabilities and Derivative Liabilities as of December 31, 2016:
| Counterparty |
Gross Amounts of Recognized Liabilities |
Gross Amounts Offset in the Statements of Assets and Liabilities |
Net Amount of Liabilities Presented in the Statements of Assets and Liabilities |
|||||||||
| Futures Contracts(1) |
$ | (227,682 | ) | $ | — | $ | (227,682 | ) | ||||
Financial Liabilities, Derivative Liabilities, and Collateral Pledged by Counterparty as of December 31, 2016:
| Gross Amounts Offset in the Statements of Assets and Liabilities |
|
|||||||||||||||
| Counterparty |
Net Amount of Liabilities Presented in the Statement of Assets and Liabilities |
Financial Instruments |
Cash Collateral Received |
Net Amount | ||||||||||||
| Goldman Sachs & Co.(1) |
$ | (227,682 | ) | $ | — | $ | — | $ | (227,682 | ) | ||||||
| (1) | The securities presented here within are not subject to Master Netting Agreements. As such, this is disclosed for informational purposes only. |
7. Federal Income and Excise Taxes
It is the policy of each Fund to qualify as a regulated investment company (“RIC”), by complying with all applicable provisions of Subchapter M of the Internal Revenue Code, as amended, and to make distribution of taxable income sufficient to relieve it from substantially all federal income and excise taxes. For federal income tax purposes, each Fund is treated as a single entity for the purpose of determining such qualification.
The Funds do not have any unrecognized tax benefits in the accompanying financial statements. The tax years for the periods ending June 30, 2013, 2014, 2015, and the short period ending December 31, 2016 for Bridgeway Large Cap Growth Fund, and the tax years in the four year period ended December 31, 2016 for Bridgeway Large Cap Value Fund remain subject to examination by the Internal Revenue Service. If applicable, the Funds recognize interest accrued related to unrecognized tax benefits in interest expense and penalties in “Other expenses” on the Statements of Operations.
The Funds may be subject to taxes imposed by countries in which it invests. Such taxes are generally based on returns of income earned or gains realized or repatriated. Taxes are accrued and applied to net investment income, net realized capital gains and net unrealized appreciation or depreciation, as applicable, as the income is earned or capital gains are recorded.
Dividends are categorized in accordance with income tax regulations which may treat certain transactions differently than U.S. GAAP. Accordingly, the character of distributions and composition of net assets for tax purposes may differ from those reflected in the accompanying financial statements.
37
American Beacon FundsSM
Notes to Financial Statements
December 31, 2016
The tax character of distributions paid are as follows:
| Bridgeway Large Cap Growth Fund | Bridgeway Large Cap Value Fund | |||||||||||||||||||
| Six Months Ended December 31, 2016 |
Year Ended June 30, 2016 |
Year Ended June 30, 2015 |
Year Ended December 31, 2016 |
Year Ended December 31, 2015 |
||||||||||||||||
| Distributions paid from: |
||||||||||||||||||||
| Ordinary Income* |
||||||||||||||||||||
| Institutional Class |
$ | 860,039 | $ | 775,100 | $ | 330,018 | $ | 16,192,058 | $ | 8,276,518 | ||||||||||
| Y Class |
4,225 | — | — | 11,608,153 | 5,057,080 | |||||||||||||||
| Investor Class |
2,556 | — | — | 17,444,134 | 9,027,288 | |||||||||||||||
| A Class |
872 | — | — | 1,598,995 | 1,293,798 | |||||||||||||||
| C Class |
1,137 | — | — | 399,395 | 392,062 | |||||||||||||||
| Long-term capital gains |
||||||||||||||||||||
| Institutional Class |
— | — | — | 136,773 | 15,841,589 | |||||||||||||||
| Y Class |
— | — | — | 102,639 | 9,510,165 | |||||||||||||||
| Investor Class |
— | — | — | 186,988 | 23,034,777 | |||||||||||||||
| A Class |
— | — | — | 18,482 | 3,477,855 | |||||||||||||||
| C Class |
— | — | — | 12,283 | 2,016,062 | |||||||||||||||
| Return of capital |
||||||||||||||||||||
| Institutional Class |
— | — | — | — | 76,243 | |||||||||||||||
| Y Class |
— | — | — | — | 46,585 | |||||||||||||||
| Investor Class |
— | — | — | — | 83,153 | |||||||||||||||
| A Class |
— | — | — | — | 11,918 | |||||||||||||||
| C Class |
— | — | — | — | 3,612 | |||||||||||||||
|
|
|
|
|
|
|
|
|
|
|
|||||||||||
| Total distributions paid |
$ | 868,829 | $ | 775,100 | $ | 330,018 | $ | 47,699,900 | $ | 78,148,705 | ||||||||||
|
|
|
|
|
|
|
|
|
|
|
|||||||||||
| * | For tax purposes, short-term capital gains are considered ordinary income distributions. |
As of December 31, 2016, the components of distributable earnings (deficits) on a tax basis were as follows:
| Bridgeway Large Cap Growth Fund |
Bridgeway Large Cap Value Fund |
|||||||
| Cost basis of investments for federal income tax purposes |
$ | 122,052,736 | $ | 3,500,125,932 | ||||
| Unrealized appreciation |
18,012,666 | 472,638,581 | ||||||
| Unrealized depreciation |
(5,426,906 | ) | (52,871,419 | ) | ||||
|
|
|
|
|
|||||
| Net unrealized appreciation (depreciation) |
12,585,760 | 419,767,162 | ||||||
| Undistributed ordinary income |
— | 4,622,478 | ||||||
| Undistributed long-term capital gains |
— | 42,332,873 | ||||||
| Accumulated capital and other losses |
(7,931,367 | ) | — | |||||
| Other temporary differences |
— | — | ||||||
|
|
|
|
|
|||||
| Distributable earnings (deficits) |
$ | 4,654,393 | $ | 466,722,513 | ||||
|
|
|
|
|
|||||
Financial reporting records are adjusted for permanent book/tax differences to reflect tax character. Financial records are not adjusted for temporary differences. The temporary differences between financial reporting and tax-basis reporting of unrealized appreciation (depreciation) are attributable primarily to the tax deferral of losses from wash sales and the realization for tax purposes of unrealized gains (losses) on certain derivative instruments.
Due to inherent differences in the recognition of income, expenses and realized gains (losses) under U.S. GAAP and federal income tax regulations, permanent differences between book and tax reporting have been identified and appropriately reclassified on the Statements of Assets and Liabilities.
38
American Beacon FundsSM
Notes to Financial Statements
December 31, 2016
Accordingly, the following amounts represent current year permanent differences derived from the reclassifications of income from real estate investment securities and distributions in excess as of December 31, 2016:
| Bridgeway Large Cap Growth Fund |
Bridgeway Large Cap Value Fund |
|||||||
| Paid-in-capital |
$ | (341,521 | ) | 83,470 | ||||
| Undistributed (overdistribution of) net investment income |
340,468 | (512,788 | ) | |||||
| Accumulated net realized gain (loss) |
1,053 | 429,318 | ||||||
| Unrealized appreciation (depreciation) of investments in futures contracts |
— | — | ||||||
Under the Regulated Investment Company Modernization Act of 2010 (the “RICMOD”), net capital losses recognized by the Fund in taxable years beginning after December 22, 2010 are carried forward indefinitely and retain their character as short-term and/or long-term losses. Prior to RICMOD, net capital losses incurred by the Fund were carried forward for eight years and treated as short-term losses. RICMOD requires that post enactment losses be utilized before pre-enactment net capital losses. For the period ended December 31, 2016, Bridgeway Large Cap Growth Fund has $7,931,367 in pre-RICMOD capital loss carryforwards expiring December 31, 2017. The Fund utilized $4,326,697 in pre-RICMOD capital loss carryforwards in the tax year ended December 31, 2016. The Bridgeway Large Cap Value Fund did not have capital loss carryforwards.
8. Investment Transactions
The aggregate cost of purchases and proceeds from sales and maturities of long-term investments, excluding short-term obligations, for the periods ended December 31, 2016 are as follows:
| Bridgeway Large Cap Growth Fund |
Bridgeway Large Cap Value Fund |
|||||||
| Purchases (excluding U.S. government securities) |
$ | 53,972,947 | $ | 2,803,516,484 | ||||
| Sales and Maturities (excluding U.S. government securities) |
66,937,149 | 1,666,336,311 | ||||||
A summary of the Funds’ direct transactions in the USG Select Fund for the periods ended December 31, 2016 are as follows:
| Fund |
December 31, 2015 Shares/Fair Value |
Purchases | Sales | December 31, 2016 Shares/Fair Value |
Dividend Income | |||||||||||||||
| Bridgeway Large Cap Growth* |
$ | — | $ | 63,214,683 | $ | 61,447,968 | $ | 1,766,715 | $ | 3,113 | ||||||||||
| Bridgeway Large Cap Value |
— | 1,881,582,292 | 1,786,644,699 | 94,937,593 | 126,345 | |||||||||||||||
| * | For the period July 1, 2016—December 31, 2016. |
9. Capital Share Transactions
The tables below summarize the activity in capital shares for each Class of the Funds:
| Institutional Class | ||||||||||||||||||||||||
| Six Months Ended December 31, 2016 |
Year Ended June 30, 2016 | Year Ended June 30, 2015 | ||||||||||||||||||||||
| Bridgeway Large Cap Growth Fund |
Shares | Amount | Shares | Amount | Shares | Amount | ||||||||||||||||||
| Shares sold |
347,029 | $ | 8,235,900 | $ | 1,664,057 | $ | 38,562,092 | 4,302,332 | $ | 101,191,213 | ||||||||||||||
| Reinvestment of dividends |
33,619 | 832,747 | 31,858 | 753,120 | 14,681 | 316,957 | ||||||||||||||||||
| Shares redeemed |
(911,246 | ) | (21,647,448 | ) | (2,302,986 | ) | (50,942,698 | ) | (464,212 | ) | (10,761,992 | ) | ||||||||||||
|
|
|
|
|
|
|
|
|
|
|
|
|
|||||||||||||
| Net increase in shares outstanding |
(530,598 | ) | $ | (12,578,801 | ) | $ | (607,071 | ) | $ | (11,627,486 | ) | 3,852,801 | $ | 90,746,178 | ||||||||||
|
|
|
|
|
|
|
|
|
|
|
|
|
|||||||||||||
39
American Beacon FundsSM
Notes to Financial Statements
December 31, 2016
| Y Class | ||||||||||||||||
| Six Months Ended December 31, 2016 | February 5 to June 30, 2016 | |||||||||||||||
| Shares | Amount | Shares | Amount | |||||||||||||
| Bridgeway Large Cap Growth Fund |
||||||||||||||||
| Shares sold |
16,663 | $ | 391,005 | 19,831 | $ | 436,655 | ||||||||||
| Reinvestment of dividends |
171 | 4,225 | — | — | ||||||||||||
| Shares redeemed |
(7,072 | ) | (168,547 | ) | (2,209 | ) | (48,222 | ) | ||||||||
|
|
|
|
|
|
|
|
|
|||||||||
| Net increase in shares outstanding |
9,762 | $ | 226,683 | 17,622 | $ | 388,433 | ||||||||||
|
|
|
|
|
|
|
|
|
|||||||||
| Investor Class | ||||||||||||||||
| Six Months Ended December 31, 2016 | February 5 to June 30, 2016 | |||||||||||||||
| Shares | Amount | Shares | Amount | |||||||||||||
| Bridgeway Large Cap Growth Fund |
||||||||||||||||
| Shares sold |
10,944 | $ | 261,573 | 7,575 | $ | 159,910 | ||||||||||
| Reinvestment of dividends |
103 | 2,557 | — | — | ||||||||||||
| Shares redeemed |
(525 | ) | (13,045 | ) | (1,697 | ) | (38,429 | ) | ||||||||
|
|
|
|
|
|
|
|
|
|||||||||
| Net increase in shares outstanding |
10,522 | $ | 251,085 | 5,878 | $ | 121,481 | ||||||||||
|
|
|
|
|
|
|
|
|
|||||||||
| A Class | ||||||||||||||||
| Six Months Ended December 31, 2016 | February 5 to June 30, 2016 | |||||||||||||||
| Shares | Amount | Shares | Amount | |||||||||||||
| Bridgeway Large Cap Growth Fund |
||||||||||||||||
| Shares sold |
4,610 | $ | 109,611 | 14,372 | $ | 311,305 | ||||||||||
| Reinvestment of dividends |
35 | 872 | — | — | ||||||||||||
| Shares redeemed |
(6,104 | ) | (144,565 | ) | (7,349 | ) | (166,121 | ) | ||||||||
|
|
|
|
|
|
|
|
|
|||||||||
| Net increase (decrease) in shares outstanding |
(1,459 | ) | $ | (34,082 | ) | 7,023 | $ | 145,184 | ||||||||
|
|
|
|
|
|
|
|
|
|||||||||
| C Class | ||||||||||||||||
| Six Months Ended December 31, 2016 | February 5 to June 30, 2016 | |||||||||||||||
| Shares | Amount | Shares | Amount | |||||||||||||
| Bridgeway Large Cap Growth Fund |
||||||||||||||||
| Shares sold |
1,783 | $ | 43,207 | 10,768 | $ | 231,867 | ||||||||||
| Reinvestment of dividends |
46 | 1,137 | — | — | ||||||||||||
| Shares redeemed |
(5,334 | ) | (125,544 | ) | — | — | ||||||||||
|
|
|
|
|
|
|
|
|
|||||||||
| Net increase (decrease) in shares outstanding |
(3,505 | ) | $ | (81,200 | ) | 10,768 | $ | 231,867 | ||||||||
|
|
|
|
|
|
|
|
|
|||||||||
| Institutional Class | ||||||||||||||||
| Year Ended December 31, | ||||||||||||||||
| 2016 | 2015 | |||||||||||||||
| Shares | Amount | Shares | Amount | |||||||||||||
| Bridgeway Large Cap Value Fund |
||||||||||||||||
| Shares sold |
29,618,277 | $ | 702,728,158 | 20,824,174 | $ | 493,977,866 | ||||||||||
| Reinvestment of dividends |
587,707 | 15,521,344 | 1,049,686 | 23,859,356 | ||||||||||||
| Shares redeemed |
(14,779,522 | ) | (361,176,117 | ) | (4,985,605 | ) | (118,434,254 | ) | ||||||||
|
|
|
|
|
|
|
|
|
|||||||||
| Net increase in shares outstanding |
15,426,462 | $ | 357,073,385 | 16,888,255 | $ | 399,402,968 | ||||||||||
|
|
|
|
|
|
|
|
|
|||||||||
| Y Class | ||||||||||||||||
| Year Ended December 31, | ||||||||||||||||
| 2016 | 2015 | |||||||||||||||
| Shares | Amount | Shares | Amount | |||||||||||||
| Bridgeway Large Cap Value Fund |
||||||||||||||||
| Shares sold |
21,737,331 | $ | 518,148,202 | 16,260,519 | $ | 385,881,155 | ||||||||||
| Reinvestment of dividends |
418,386 | 11,024,436 | 608,298 | 13,790,118 | ||||||||||||
| Shares redeemed |
(6,598,894 | ) | (157,373,925 | ) | (3,599,091 | ) | (85,146,642 | ) | ||||||||
|
|
|
|
|
|
|
|
|
|||||||||
| Net increase in shares outstanding |
15,556,823 | $ | 371,798,713 | 13,269,726 | $ | 314,524,631 | ||||||||||
|
|
|
|
|
|
|
|
|
|||||||||
40
American Beacon FundsSM
Notes to Financial Statements
December 31, 2016
| Investor Class | ||||||||||||||||
| Year Ended December 31, | ||||||||||||||||
| 2016 | 2015 | |||||||||||||||
| Shares | Amount | Shares | Amount | |||||||||||||
| Bridgeway Large Cap Value Fund |
||||||||||||||||
| Shares sold |
31,217,772 | $ | 738,978,810 | 28,444,741 | $ | 676,886,643 | ||||||||||
| Reinvestment of dividends |
668,953 | 17,573,398 | 1,417,753 | 32,070,207 | ||||||||||||
| Shares redeemed |
(14,003,271 | ) | (332,412,565 | ) | (14,803,456 | ) | (351,505,642 | ) | ||||||||
|
|
|
|
|
|
|
|
|
|||||||||
| Net increase in shares outstanding |
17,883,454 | $ | 424,139,643 | 15,059,038 | $ | 357,451,208 | ||||||||||
|
|
|
|
|
|
|
|
|
|||||||||
| A Class | ||||||||||||||||
| Year Ended December 31, | ||||||||||||||||
| 2016 | 2015 | |||||||||||||||
| Shares | Amount | Shares | Amount | |||||||||||||
| Bridgeway Large Cap Value Fund |
||||||||||||||||
| Shares sold |
2,195,353 | $ | 51,983,617 | 4,372,806 | $ | 103,916,396 | ||||||||||
| Reinvestment of dividends |
55,177 | 1,442,871 | 192,767 | 4,339,181 | ||||||||||||
| Shares redeemed |
(2,884,469 | ) | (67,173,170 | ) | (2,407,532 | ) | (57,244,479 | ) | ||||||||
|
|
|
|
|
|
|
|
|
|||||||||
| Net increase (decrease) in shares outstanding |
(633,939 | ) | $ | (13,746,682 | ) | 2,158,041 | $ | 51,011,098 | ||||||||
|
|
|
|
|
|
|
|
|
|||||||||
| C Class | ||||||||||||||||
| Year Ended December 31, | ||||||||||||||||
| 2016 | 2015 | |||||||||||||||
| Shares | Amount | Shares | Amount | |||||||||||||
| Bridgeway Large Cap Value Fund |
||||||||||||||||
| Shares sold |
1,058,012 | $ | 24,046,258 | 2,607,078 | $ | 60,549,010 | ||||||||||
| Reinvestment of dividends |
13,238 | 338,911 | 87,867 | 1,938,351 | ||||||||||||
| Shares redeemed |
(919,457 | ) | (21,163,388 | ) | (312,918 | ) | (7,180,992 | ) | ||||||||
|
|
|
|
|
|
|
|
|
|||||||||
| Net increase in shares outstanding |
151,793 | $ | 3,221,781 | 2,382,027 | $ | 55,306,369 | ||||||||||
|
|
|
|
|
|
|
|
|
|||||||||
10. Subsequent Events
Management has evaluated subsequent events for possible recognition or disclosure in the financial statements through the date the financial statements are issued. Management has determined that there are no material events that would require disclosure in the Funds financial statements through this date.
41
American Beacon Bridgeway Large Cap Growth FundSM
Financial Highlights
(For a share outstanding throughout the period)
| Institutional Class G | ||||||||||||||||||||||||
| Six Months Ended December 31, 2016 |
Year Ended June 30, | |||||||||||||||||||||||
| 2016 | 2015 | 2014 | 2013 | 2012 | ||||||||||||||||||||
| Net asset value, beginning of period |
$ | 22.77 | $ | 23.71 | $ | 20.51 | $ | 16.18 | $ | 13.33 | $ | 13.38 | ||||||||||||
|
|
|
|
|
|
|
|
|
|
|
|
|
|||||||||||||
| Income from investment operations: |
||||||||||||||||||||||||
| Net investment income |
0.04 | 0.07 | 0.17 | E | 0.13 | E | 0.16 | E | 0.09 | E | ||||||||||||||
| Net gains (losses) on investments (both realized and unrealized) |
1.82 | (0.90 | ) | 3.14 | 4.29 | 2.88 | (0.05 | ) | ||||||||||||||||
|
|
|
|
|
|
|
|
|
|
|
|
|
|||||||||||||
| Total income (loss) from investment operations |
1.86 | (0.83 | ) | 3.31 | 4.42 | 3.04 | 0.04 | |||||||||||||||||
|
|
|
|
|
|
|
|
|
|
|
|
|
|||||||||||||
| Less distributions: |
||||||||||||||||||||||||
| Dividends from net investment income |
(0.16 | ) | (0.11 | ) | (0.11 | ) | (0.09 | ) | (0.19 | ) | (0.09 | ) | ||||||||||||
| Distributions from net realized gains |
— | — | — | — | — | — | ||||||||||||||||||
|
|
|
|
|
|
|
|
|
|
|
|
|
|||||||||||||
| Total distributions |
(0.16 | ) | (0.11 | ) | (0.11 | ) | (0.09 | ) | (0.19 | ) | (0.09 | ) | ||||||||||||
|
|
|
|
|
|
|
|
|
|
|
|
|
|||||||||||||
| Net asset value, end of period |
$ | 24.47 | $ | 22.77 | $ | 23.71 | $ | 20.51 | $ | 16.18 | $ | 13.33 | ||||||||||||
|
|
|
|
|
|
|
|
|
|
|
|
|
|||||||||||||
| Total return A |
8.15 | %B | (3.52 | )% | 16.19 | % | 27.41 | %H | 23.06 | %H | 0.37 | %H | ||||||||||||
|
|
|
|
|
|
|
|
|
|
|
|
|
|||||||||||||
| Ratios and supplemental data: |
||||||||||||||||||||||||
| Net assets, end of period |
$ | 133,638,400 | $ | 136,460,611 | $ | 156,493,513 | $ | 56,343,594 | $ | 47,966,566 | $ | 48,443,515 | ||||||||||||
| Ratios to average net assets: |
||||||||||||||||||||||||
| Expenses, before reimbursements or recoupments |
1.02 | %D | 0.89 | % | 0.81 | % | 0.87 | % | 0.90 | % | 0.92 | % | ||||||||||||
| Expenses, net of reimbursements or recoupments |
0.81 | %D | 0.83 | % | 0.81 | % | 0.84 | % | 0.84 | % | 0.84 | % | ||||||||||||
| Net investment income, before reimbursements or recoupments |
0.12 | %D | 0.30 | % | 0.75 | % | 0.70 | % | 1.10 | % | 0.74 | % | ||||||||||||
| Net investment income, net of reimbursements or recoupments |
0.33 | %D | 0.35 | % | 0.75 | % | 0.70 | % | 1.10 | % | 0.74 | % | ||||||||||||
| Portfolio turnover rate |
40 | %B | 100 | % | 48 | % | 74 | % | 49 | % | 55 | % | ||||||||||||
| Y Class | Investor Class | |||||||||||||||
| Six Months Ended December 31, 2016 |
February 5C to June 30, 2016 |
Six Months Ended December 31, 2016 |
February 5C to June 30, 2016 |
|||||||||||||
| Net asset value, beginning of period |
$ | 22.77 | $ | 20.46 | $ | 22.74 | $ | 20.46 | ||||||||
|
|
|
|
|
|
|
|
|
|||||||||
| Income from investment operations: |
||||||||||||||||
| Net investment income (loss) |
0.03 | 0.03 | (0.01 | ) | 0.01 | |||||||||||
| Net gains (losses) on investments (both realized and unrealized) |
1.81 | 2.28 | 1.81 | 2.27 | ||||||||||||
|
|
|
|
|
|
|
|
|
|||||||||
| Total income (loss) from investment operations |
1.84 | 2.31 | 1.80 | 2.28 | ||||||||||||
|
|
|
|
|
|
|
|
|
|||||||||
| Less distributions: |
||||||||||||||||
| Dividends from net investment income |
(0.16 | ) | — | (0.16 | ) | — | ||||||||||
| Distributions from net realized gains |
— | — | — | — | ||||||||||||
|
|
|
|
|
|
|
|
|
|||||||||
| Total distributions |
(0.16 | ) | — | (0.16 | ) | — | ||||||||||
|
|
|
|
|
|
|
|
|
|||||||||
| Net asset value, end of period |
$ | 24.45 | $ | 22.77 | $ | 24.38 | $ | 22.74 | ||||||||
|
|
|
|
|
|
|
|
|
|||||||||
| Total return A |
8.06 | %B | 11.29 | %B | 7.90 | %B | 11.14 | %B | ||||||||
|
|
|
|
|
|
|
|
|
|||||||||
| Ratios and supplemental data: |
||||||||||||||||
| Net assets, end of period |
$ | 669,530 | $ | 401,220 | $ | 399,798 | $ | 133,696 | ||||||||
| Ratios to average net assets: |
||||||||||||||||
| Expenses, before reimbursements or recoupments |
1.09 | %D | 4.00 | %D | 1.55 | %D | 8.43 | %D | ||||||||
| Expenses, net of reimbursements or recoupments |
0.91 | %D | 0.91 | %D | 1.19 | %D | 1.18 | %D | ||||||||
| Net investment income (loss), before reimbursements or recoupments |
0.11 | %D | (2.69 | )%D | (0.35 | )%D | (7.08 | )%D | ||||||||
| Net investment income, net of reimbursements or recoupments |
0.28 | %D | 0.40 | %D | 0.02 | %D | 0.17 | %D | ||||||||
| Portfolio turnover rate |
40 | %B | 100 | %F | 40 | %B | 100 | %F | ||||||||
| A | Based on net asset value, which does not reflect the sales charge, redemption fee, or contingent deferred sales charge, if applicable. May include adjustments in accordance with U.S. GAAP and as such, the net asset value for reporting purposes and the returns based upon those net asset values may differ from the net asset value and returns for shareholder transactions. |
| B | Not annualized. |
| C | Commencement of operations. |
| D | Annualized. |
| E | Per share amounts calculated based on the average daily shares outstanding during the period. |
| F | Portfolio turnover rate is for the period from February 5, 2016 to June 30, 2016. |
| G | Prior to the reorganization on February 5, 2016, the Institutional Class was known as Class N. |
| H | Total return would have been lower had various fees not been waived during the period. |
42
American Beacon Bridgeway Large Cap Growth FundSM
Financial Highlights
(For a share outstanding throughout the period)
| A Class | C Class | |||||||||||||||
| Six Months Ended December 31, 2016 |
February 5 C to June 30, 2016 |
Six Months Ended December 31, 2016 |
February 5 C to June 30, 2016 |
|||||||||||||
| Net asset value, beginning of period |
$ | 22.74 | $ | 20.46 | $ | 22.67 | $ | 20.46 | ||||||||
|
|
|
|
|
|
|
|
|
|||||||||
| Income from investment operations: |
||||||||||||||||
| Net investment (loss) |
0.00 | 0.00 | (0.13 | ) | (0.04 | ) | ||||||||||
| Net gains (losses) on investments (both realized and unrealized) |
1.81 | 2.28 | 1.84 | 2.25 | ||||||||||||
|
|
|
|
|
|
|
|
|
|||||||||
| Total income (loss) from investment operations |
1.81 | 2.28 | 1.71 | 2.21 | ||||||||||||
|
|
|
|
|
|
|
|
|
|||||||||
| Less distributions: |
||||||||||||||||
| Dividends from net investment income |
(0.16 | ) | — | (0.16 | ) | — | ||||||||||
| Distributions from net realized gains |
— | — | — | — | ||||||||||||
|
|
|
|
|
|
|
|
|
|||||||||
| Total distributions |
(0.16 | ) | — | (0.16 | ) | — | ||||||||||
|
|
|
|
|
|
|
|
|
|||||||||
| Net asset value, end of period |
$ | 24.39 | $ | 22.74 | $ | 24.22 | $ | 22.67 | ||||||||
|
|
|
|
|
|
|
|
|
|||||||||
| Total return A |
7.94 | %B | 11.14 | %B | 7.52 | %B | 10.80 | %B | ||||||||
|
|
|
|
|
|
|
|
|
|||||||||
| Ratios and supplemental data: |
||||||||||||||||
| Net assets, end of period |
$ | 135,710 | $ | 159,744 | $ | 175,907 | $ | 244,146 | ||||||||
| Ratios to average net assets: |
||||||||||||||||
| Expenses, before reimbursements or recoupments |
1.43 | %D | 5.25 | % D | 2.18 | % D | 7.33 | % D | ||||||||
| Expenses, net of reimbursements or recoupments |
1.21 | %D | 1.21 | % D | 1.96 | % D | 1.96 | % D | ||||||||
| Net investment (loss), before reimbursements or recoupments |
(0.26 | )%D | (4.01 | )%D | (1.04 | )% D | (5.98 | )%D | ||||||||
| Net investment income (loss), net of reimbursements or recoupments |
(0.05 | )% D | 0.02 | % D | (0.81 | )% D | (0.62 | )%D | ||||||||
| Portfolio turnover rate |
40 | %B | 100 | % F | 40 | %B | 100 | % F | ||||||||
| A | Based on net asset value, which does not reflect the sales charge, redemption fee, or contingent deferred sales charge, if applicable. May include adjustments in accordance with U.S. GAAP and as such, the net asset value for reporting purposes and the returns based upon those net asset values may differ from the net asset value and returns for shareholder transactions. |
| B | Not annualized. |
| C | Commencement of operations. |
| D | Annualized. |
| E | Per share amounts calculated based on the average daily shares outstanding during the period. |
| F | Portfolio turnover rate is for the period from February 5, 2016 to June 30, 2016. |
| G | Prior to the reorganization on February 5, 2016, the Institutional Class was known as Class N. |
| H | Total return would have been lower had various fees not been waived during the period. |
43
American Beacon Bridgeway Large Cap Value FundSM
Financial Highlights
(For a share outstanding throughout the period)
| Institutional Class | ||||||||||||||||||||||||
| Year Ended December 31, |
Six Months Ended Dec. 31, 2012 |
Year Ended June 30, 2012 |
||||||||||||||||||||||
| 2016 | 2015 | 2014 | 2013 | |||||||||||||||||||||
| Net asset value, beginning of period |
$ | 22.75 | $ | 23.89 | $ | 21.39 | $ | 15.85 | $ | 14.80 | $ | 14.62 | ||||||||||||
|
|
|
|
|
|
|
|
|
|
|
|
|
|||||||||||||
| Income from investment operations: |
||||||||||||||||||||||||
| Net investment income |
0.38 | 0.28 | 0.10 | 0.11 | 0.20 | 0.24 | ||||||||||||||||||
| Net gains (losses) on investments (both realized and unrealized) |
3.32 | (0.58 | ) | 2.94 | 5.87 | 1.14 | 0.12 | |||||||||||||||||
|
|
|
|
|
|
|
|
|
|
|
|
|
|||||||||||||
| Total income (loss) from investment operations |
3.70 | (0.30 | ) | 3.04 | 5.98 | 1.34 | 0.36 | |||||||||||||||||
|
|
|
|
|
|
|
|
|
|
|
|
|
|||||||||||||
| Less distributions: |
||||||||||||||||||||||||
| Dividends from net investment income |
(0.35 | ) | (0.29 | ) | (0.17 | ) | (0.11 | ) | (0.29 | ) | (0.18 | ) | ||||||||||||
| Distributions from net realized gains |
(0.02 | ) | (0.55 | ) | (0.37 | ) | (0.33 | ) | — | — | ||||||||||||||
| Distributions from return of capital F |
— | (0.00 | ) | — | — | — | — | |||||||||||||||||
|
|
|
|
|
|
|
|
|
|
|
|
|
|||||||||||||
| Total distributions |
(0.37 | ) | (0.84 | ) | (0.54 | ) | (0.44 | ) | (0.29 | ) | (0.18 | ) | ||||||||||||
|
|
|
|
|
|
|
|
|
|
|
|
|
|||||||||||||
| Net asset value, end of period |
$ | 26.08 | $ | 22.75 | $ | 23.89 | $ | 21.39 | $ | 15.85 | $ | 14.80 | ||||||||||||
|
|
|
|
|
|
|
|
|
|
|
|
|
|||||||||||||
| Total return A |
16.24 | % | (1.23 | )% | 14.18 | % | 37.77 | % | 9.04 | %B | 2.60 | % | ||||||||||||
|
|
|
|
|
|
|
|
|
|
|
|
|
|||||||||||||
| Ratios and supplemental data: |
||||||||||||||||||||||||
| Net assets, end of period |
$ | 1,185,013,905 | $ | 682,849,171 | $ | 313,660,568 | $ | 79,889,063 | $ | 26,669,248 | $ | 26,949,818 | ||||||||||||
| Ratios to average net assets: |
||||||||||||||||||||||||
| Expenses, before reimbursements or recoupments |
0.73 | % | 0.75 | % | 0.79 | % | 1.01 | % | 1.73 | %C | 1.30 | % | ||||||||||||
| Expenses, net of reimbursements or recoupments |
0.73 | % | 0.79 | % | 0.84 | % | 0.84 | % | 0.84 | %C | 0.82 | % | ||||||||||||
| Net investment income, before reimbursements or recoupments |
1.69 | % | 1.61 | % | 1.08 | % | 0.98 | % | 1.38 | %C | 1.17 | % | ||||||||||||
| Net investment income, net of reimbursements or recoupments |
1.69 | % | 1.57 | % | 1.04 | % | 1.16 | % | 2.27 | %C | 1.66 | % | ||||||||||||
| Portfolio turnover rate |
56 | % | 43 | % | 31 | % | 38 | % | 21 | % | 36 | % | ||||||||||||
| Y Class | ||||||||||||||||||||||||
| Year Ended December 31, |
Six Months Ended Dec. 31, 2012 |
February 3D to June 30, 2012 |
||||||||||||||||||||||
| 2016 | 2015 | 2014 | 2013 | |||||||||||||||||||||
| Net asset value, beginning of period |
$ | 22.69 | $ | 23.84 | $ | 21.35 | $ | 15.84 | $ | 14.80 | $ | 14.46 | ||||||||||||
|
|
|
|
|
|
|
|
|
|
|
|
|
|||||||||||||
| Income from investment operations: |
||||||||||||||||||||||||
| Net investment income |
0.32 | 0.27 | 0.13 | 0.22 | 0.07 | 0.09 | ||||||||||||||||||
| Net gains (losses) on investments (both realized and unrealized) |
3.35 | (0.57 | ) | 2.90 | 5.72 | 1.26 | 0.25 | |||||||||||||||||
|
|
|
|
|
|
|
|
|
|
|
|
|
|||||||||||||
| Total income (loss) from investment operations |
3.67 | (0.30 | ) | 3.03 | 5.94 | 1.33 | 0.34 | |||||||||||||||||
|
|
|
|
|
|
|
|
|
|
|
|
|
|||||||||||||
| Less distributions: |
||||||||||||||||||||||||
| Dividends from net investment income |
(0.33 | ) | (0.30 | ) | (0.17 | ) | (0.10 | ) | (0.29 | ) | — | |||||||||||||
| Distributions from net realized gains |
(0.02 | ) | (0.55 | ) | (0.37 | ) | (0.33 | ) | — | — | ||||||||||||||
| Distributions from return of capital F |
— | (0.00 | ) | — | — | — | — | |||||||||||||||||
|
|
|
|
|
|
|
|
|
|
|
|
|
|||||||||||||
| Total distributions |
(0.35 | ) | (0.85 | ) | (0.54 | ) | (0.43 | ) | (0.29 | ) | — | |||||||||||||
|
|
|
|
|
|
|
|
|
|
|
|
|
|||||||||||||
| Net asset value, end of period |
$ | 26.01 | $ | 22.69 | $ | 23.84 | $ | 21.35 | $ | 15.84 | $ | 14.80 | ||||||||||||
|
|
|
|
|
|
|
|
|
|
|
|
|
|||||||||||||
| Total return A |
16.17 | % | (1.26 | )% | 14.15 | % | 37.55 | % | 8.98 | %B | 2.35 | %B | ||||||||||||
|
|
|
|
|
|
|
|
|
|
|
|
|
|||||||||||||
| Ratios and supplemental data: |
||||||||||||||||||||||||
| Net assets, end of period |
$ | 879,852,983 | $ | 414,585,125 | $ | 119,162,044 | $ | 19,913,753 | $ | 36,331 | $ | 5,118 | ||||||||||||
| Ratios to average net assets: |
||||||||||||||||||||||||
| Expenses, before reimbursements or recoupments |
0.80 | % | 0.81 | % | 0.84 | % | 0.93 | % | 3.75 | %C | 144.38 | %C | ||||||||||||
| Expenses, net of reimbursements or recoupments |
0.80 | % | 0.81 | % | 0.85 | % | 0.94 | % | 0.93 | %C | 0.94 | %C | ||||||||||||
| Net investment income (loss), before reimbursements or recoupments |
1.63 | % | 1.55 | % | 1.03 | % | 1.07 | % | (0.51 | )%C | (141.90 | )%C | ||||||||||||
| Net investment income, net of reimbursements or recoupments |
1.63 | % | 1.55 | % | 1.03 | % | 1.06 | % | 2.31 | %C | 1.54 | %C | ||||||||||||
| Portfolio turnover rate |
56 | % | 43 | % | 31 | % | 38 | % | 21 | % | 36 | %E | ||||||||||||
| A | Based on net asset value, which does not reflect the sales charge, redemption fee, or contingent deferred sales charge, if applicable. May include adjustments in accordance with U.S. GAAP and as such, the net asset value for reporting purposes and the returns based upon those net asset values may differ from the net asset value and returns for shareholder transactions. |
| B | Not annualized. |
| C | Annualized. |
| D | Commencement of operations. |
| E | Portfolio turnover rate is for the period from July 1, 2011 to June 30, 2012. |
| F | The distributions from return of capital is calculated based on outstanding shares at the time of distribution. Amounts are less than $0.01 per share. |
44
American Beacon Bridgeway Large Cap Value FundSM
Financial Highlights
(For a share outstanding throughout the period)
| Investor Class | ||||||||||||||||||||||||
| Year Ended December 31, | Six Months Ended Dec. 31, 2012 |
February 3A to June 30, 2012 |
||||||||||||||||||||||
| 2016 | 2015 | 2014 | 2013 | |||||||||||||||||||||
| Net asset value, beginning of period |
$ | 22.64 | $ | 23.77 | $ | 21.28 | $ | 15.81 | $ | 14.78 | $ | 14.46 | ||||||||||||
|
|
|
|
|
|
|
|
|
|
|
|
|
|||||||||||||
| Income from investment operations: |
||||||||||||||||||||||||
| Net investment income |
0.27 | 0.25 | 0.14 | 0.21 | 0.12 | 0.03 | ||||||||||||||||||
| Net gains (losses) on investments (both realized and unrealized) |
3.31 | (0.61 | ) | 2.82 | 5.68 | 1.19 | 0.29 | |||||||||||||||||
|
|
|
|
|
|
|
|
|
|
|
|
|
|||||||||||||
| Total income (loss) from investment operations |
3.58 | (0.36 | ) | 2.96 | 5.89 | 1.31 | 0.32 | |||||||||||||||||
|
|
|
|
|
|
|
|
|
|
|
|
|
|||||||||||||
| Less distributions: |
||||||||||||||||||||||||
| Dividends from net investment income |
(0.27 | ) | (0.22 | ) | (0.10 | ) | (0.09 | ) | (0.28 | ) | — | |||||||||||||
| Distributions from net realized gains |
(0.02 | ) | (0.55 | ) | (0.37 | ) | (0.33 | ) | — | — | ||||||||||||||
| Distributions from return of capital F |
— | (0.00 | ) | — | — | — | — | |||||||||||||||||
|
|
|
|
|
|
|
|
|
|
|
|
|
|||||||||||||
| Total distributions |
(0.29 | ) | (0.77 | ) | (0.47 | ) | (0.42 | ) | (0.28 | ) | — | |||||||||||||
|
|
|
|
|
|
|
|
|
|
|
|
|
|||||||||||||
| Net asset value, end of period |
$ | 25.93 | $ | 22.64 | $ | 23.77 | $ | 21.28 | $ | 15.81 | $ | 14.78 | ||||||||||||
|
|
|
|
|
|
|
|
|
|
|
|
|
|||||||||||||
| Total return B |
15.81 | % | (1.51 | )% | 13.89 | % | 37.28 | % | 8.84 | %C | 2.21 | %C | ||||||||||||
|
|
|
|
|
|
|
|
|
|
|
|
|
|||||||||||||
| Ratios and supplemental data: |
||||||||||||||||||||||||
| Net assets, end of period |
$ | 1,583,853,257 | $ | 977,719,149 | $ | 668,659,150 | $ | 274,113,476 | $ | 488,810 | $ | 215,000 | ||||||||||||
| Ratios to average net assets: |
||||||||||||||||||||||||
| Expenses, before reimbursements or recoupments |
1.08 | % | 1.09 | % | 1.11 | % | 1.08 | % | 2.26 | %D | 18.30 | %D | ||||||||||||
| Expenses, net of reimbursements or recoupments |
1.08 | % | 1.09 | % | 1.11 | % | 1.09 | % | 1.21 | %D | 1.22 | %D | ||||||||||||
| Net investment income (loss), before reimbursements or recoupments |
1.35 | % | 1.28 | % | 0.76 | % | 0.95 | % | 1.00 | %D | (15.48 | )%D | ||||||||||||
| Net investment income, net of reimbursements or recoupments |
1.35 | % | 1.28 | % | 0.76 | % | 0.94 | % | 2.05 | %D | 1.59 | %D | ||||||||||||
| Portfolio turnover rate |
56 | % | 43 | % | 31 | % | 38 | % | 21 | %C | 36 | %E | ||||||||||||
| A Class | ||||||||||||||||||||||||
| Year Ended December 31, | Six Months Ended Dec. 31, 2012 |
February 3A to June 30, 2012 |
||||||||||||||||||||||
| 2016 | 2015 | 2014 | 2013 | |||||||||||||||||||||
| Net asset value, beginning of period |
$ | 22.53 | $ | 23.66 | $ | 21.22 | $ | 15.78 | $ | 14.77 | $ | 14.46 | ||||||||||||
|
|
|
|
|
|
|
|
|
|
|
|
|
|||||||||||||
| Income from investment operations: |
||||||||||||||||||||||||
| Net investment income |
0.32 | 0.27 | 0.09 | 0.19 | 0.15 | 0.01 | ||||||||||||||||||
| Net gains (losses) on investments (both realized and unrealized) |
3.24 | (0.64 | ) | 2.84 | 5.64 | 1.15 | 0.30 | |||||||||||||||||
|
|
|
|
|
|
|
|
|
|
|
|
|
|||||||||||||
| Total income (loss) from investment operations |
3.56 | (0.37 | ) | 2.93 | 5.83 | 1.30 | 0.31 | |||||||||||||||||
|
|
|
|
|
|
|
|
|
|
|
|
|
|||||||||||||
| Less distributions: |
||||||||||||||||||||||||
| Dividends from net investment income |
(0.25 | ) | (0.21 | ) | (0.12 | ) | (0.06 | ) | (0.29 | ) | — | |||||||||||||
| Distributions from net realized gains |
(0.02 | ) | (0.55 | ) | (0.37 | ) | (0.33 | ) | — | — | ||||||||||||||
| Distributions from return of capital F |
— | (0.00 | ) | — | — | — | — | |||||||||||||||||
|
|
|
|
|
|
|
|
|
|
|
|
|
|||||||||||||
| Total distributions |
(0.27 | ) | (0.76 | ) | (0.49 | ) | (0.39 | ) | (0.29 | ) | — | |||||||||||||
|
|
|
|
|
|
|
|
|
|
|
|
|
|||||||||||||
| Net asset value, end of period |
$ | 25.82 | $ | 22.53 | $ | 23.66 | $ | 21.22 | $ | 15.78 | $ | 14.77 | ||||||||||||
|
|
|
|
|
|
|
|
|
|
|
|
|
|||||||||||||
| Total return B |
15.79 | % | (1.56 | )% | 13.76 | % | 37.01 | % | 8.78 | %C | 2.14 | %C | ||||||||||||
|
|
|
|
|
|
|
|
|
|
|
|
|
|||||||||||||
| Ratios and supplemental data: |
||||||||||||||||||||||||
| Net assets, end of period |
$ | 152,520,884 | $ | 147,394,607 | $ | 103,716,652 | $ | 31,300,069 | $ | 310,850 | $ | 275,860 | ||||||||||||
| Ratios to average net assets: |
||||||||||||||||||||||||
| Expenses, before reimbursements or recoupments |
1.12 | % | 1.12 | % | 1.19 | % | 1.38 | % | 2.21 | %D | 15.39 | %D | ||||||||||||
| Expenses, net of reimbursements or recoupments |
1.12 | % | 1.12 | % | 1.21 | % | 1.34 | % | 1.33 | %D | 1.34 | %D | ||||||||||||
| Net investment income (loss), before reimbursements or recoupments |
1.31 | % | 1.25 | % | 0.69 | % | 0.61 | % | 0.90 | %D | (13.13 | )%D | ||||||||||||
| Net investment income, net of reimbursements or recoupments |
1.31 | % | 1.25 | % | 0.67 | % | 0.66 | % | 1.78 | %D | 0.92 | %D | ||||||||||||
| Portfolio turnover rate |
56 | % | 43 | % | 31 | % | 38 | % | 21 | %C | 36 | %E | ||||||||||||
| A | Commencement of operations. |
| B | Based on net asset value, which does not reflect the sales charge, redemption fee, or contingent deferred sales charge, if applicable. May include adjustments in accordance with U.S. GAAP and as such, the net asset value for reporting purposes and the returns based upon those net asset values may differ from the net asset value and returns for shareholder transactions. |
| C | Not annualized. |
| D | Annualized. |
| E | Portfolio turnover rate is for the period from July 1, 2011 to June 30, 2012. |
| F | The distributions from return of capital is calculated based on outstanding shares at the time of distribution. Amounts are less than $0.01 per share. |
45
American Beacon Bridgeway Large Cap Value FundSM
Financial Highlights
(For a share outstanding throughout the period)
| C Class | ||||||||||||||||||||||||
| Year Ended December 31, |
Six Months Ended Dec. 31, 2012 |
February 3A to June 30, 2012 |
||||||||||||||||||||||
| 2016 | 2015 | 2014 | 2013 | |||||||||||||||||||||
| Net asset value, beginning of period |
$ | 22.08 | $ | 23.27 | $ | 21.00 | $ | 15.70 | $ | 14.73 | $ | 14.46 | ||||||||||||
|
|
|
|
|
|
|
|
|
|
|
|
|
|||||||||||||
| Income from investment operations: |
||||||||||||||||||||||||
| Net investment income |
0.13 | 0.13 | 0.02 | 0.18 | 0.09 | 0.02 | ||||||||||||||||||
| Net gains (losses) on investments (both realized and unrealized) |
3.16 | (0.66 | ) | 2.69 | 5.47 | 1.17 | 0.25 | |||||||||||||||||
|
|
|
|
|
|
|
|
|
|
|
|
|
|||||||||||||
| Total income (loss) from investment operations |
3.29 | (0.53 | ) | 2.71 | 5.65 | 1.26 | 0.27 | |||||||||||||||||
|
|
|
|
|
|
|
|
|
|
|
|
|
|||||||||||||
| Less distributions: |
||||||||||||||||||||||||
| Dividends from net investment income |
(0.08 | ) | (0.11 | ) | (0.07 | ) | (0.02 | ) | (0.29 | ) | — | |||||||||||||
| Distributions from net realized gains |
(0.02 | ) | (0.55 | ) | (0.37 | ) | (0.33 | ) | — | — | ||||||||||||||
| Distributions from return of capital F |
— | (0.00 | ) | — | — | — | — | |||||||||||||||||
|
|
|
|
|
|
|
|
|
|
|
|
|
|||||||||||||
| Total distributions |
(0.10 | ) | (0.66 | ) | (0.44 | ) | (0.35 | ) | (0.29 | ) | — | |||||||||||||
|
|
|
|
|
|
|
|
|
|
|
|
|
|||||||||||||
| Net asset value, end of period |
$ | 25.27 | $ | 22.08 | $ | 23.27 | $ | 21.00 | $ | 15.70 | $ | 14.73 | ||||||||||||
|
|
|
|
|
|
|
|
|
|
|
|
|
|||||||||||||
| Total return B |
14.91 | % | (2.27 | )% | 12.88 | % | 36.02 | % | 8.54 | %C | 1.87 | %C | ||||||||||||
|
|
|
|
|
|
|
|
|
|
|
|
|
|||||||||||||
| Ratios and supplemental data: |
||||||||||||||||||||||||
| Net assets, end of period |
$ | 100,447,531 | $ | 84,411,378 | $ | 33,536,254 | $ | 2,346,463 | $ | 19,948 | $ | 14,147 | ||||||||||||
| Ratios to average net assets: |
||||||||||||||||||||||||
| Expenses, before reimbursements or recoupments |
1.86 | % | 1.87 | % | 1.92 | % | 2.13 | % | 6.81 | %D | 64.88 | %D | ||||||||||||
| Expenses, net of reimbursements or recoupments |
1.86 | % | 1.87 | % | 1.94 | % | 2.09 | % | 1.77 | %D | 2.09 | %D | ||||||||||||
| Net investment income (loss), before reimbursements or recoupments |
0.57 | % | 0.48 | % | (0.05 | )% | (0.13 | )% | (3.55 | )%D | (62.47 | )%D | ||||||||||||
| Net investment income (loss), net of reimbursements or recoupments |
0.57 | % | 0.48 | % | (0.08 | )% | (0.08 | )% | 1.49 | %D | 0.32 | %D | ||||||||||||
| Portfolio turnover rate |
56 | % | 43 | % | 31 | % | 38 | % | 21 | % C | 36 | %E | ||||||||||||
| A | Commencement of operations. |
| B | Based on net asset value, which does not reflect the sales charge, redemption fee, or contingent deferred sales charge, if applicable. May include adjustments in accordance with U.S. GAAP and as such, the net asset value for reporting purposes and the returns based upon those net asset values may differ from the net asset value and returns for shareholder transactions. |
| C | Not annualized. |
| D | Annualized. |
| E | Portfolio turnover rate is for the period from July 1, 2011 to June 30, 2012. |
| F | The distributions from return of capital is calculated based on outstanding shares at the time of distribution. Amounts are less than $0.01 per share. |
46
Federal Tax Information
December 31, 2016 (Unaudited)
The Funds are required to provide to Shareholders certain tax information based upon the Fund’s income and distribution for the taxable year ended December 31, 2016. The information and distributions reported herein may differ from information and distributions taxable to the shareholders for the calendar year ended December 31, 2016.
The Funds designated the following items with regard to distributions paid during the year ended December 31, 2016. All designations are based on financial information available as of this annual report and, accordingly, are subject to change. For each item, it is the intention of the Fund to designate the maximum amount permitted under the Internal Revenue Code of 1986, as amended, and the regulations there under.
| Bridgeway Large Cap Growth Fund |
Bridgeway Large Cap Value Fund |
|||||||
| Corporate Dividends Received Deduction |
84.50 | % | 100.00 | % | ||||
| Qualified Dividend Income |
92.30 | % | 100.00 | % | ||||
The Bridgeway Large Cap Value Fund designated $457,165 as long-term capital gains distributions and $2,934,693 as short-term capital gain distributions for the year ended December 31, 2016.
Shareholders received notification in January 2017 of the appropriate tax information necessary to prepare their 2016 income tax return.
47
Additional Fund Information
December 31, 2016 (Unaudited)
American Beacon Advisors, Inc. (“American Beacon”) is a wholly-owned subsidiary of Astro AB Borrower, Inc. (“Borrower”). On January 31, 2017, the Board of Borrower and its sole shareholder, Astro AB Acquisition (“Acquisition”), approved an amendment to Borrower’s Certificate of Incorporation to change the name of Borrower to Resolute Investment Managers, Inc. Simultaneously with the name change of Borrower, the shareholders and the Boards of each of American Beacon’s indirect owners approved similar name changes, as follows: Astro AB Holdings, LLC (“Holdings”) became Resolute Investment Holdings, LLC; Astro AB Topco, Inc. became Resolute Topco, Inc.; and Astro AB Acquisition, Inc. became Resolute Acquisition, Inc. Amendments to each of the entities’
Articles of Incorporation, or, in the case of Holdings, the Certificate of Formation, were filed with the Delaware Secretary of State.
A summary of the name changes for the Astro Entities is set forth below:
Astro AB Holdings, LLC—Resolute Investment Holdings, LLC
Astro AB Topco, Inc.—Resolute Topco, Inc.
Astro AB Acquisiton, Inc.—Resolute Acquisiton, Inc.
Astro AB Borrower, Inc.—Resolute Investment Managers, Inc.
48
Trustees and Officers of the American Beacon FundsSM (Unaudited)
The Trustees and officers of the American Beacon Funds (the “Trust”) are listed below, together with their principal occupations during the past five years. Unless otherwise indicated, the address of each person listed below is 220 Las Colinas Boulevard East, Suite 1200, Irving, Texas 75039. Each Trustee oversees twenty-seven funds in the fund complex that includes the Trust and the American Beacon Select Funds. The Trust’s Statement of Additional Information contains additional information about the Trustees and is available without charge by calling 1-800-658-5811.
| Name, Age and Address |
Position, Term of Office |
Principal Occupation(s) During Past 5 Years | ||
| INTERESTED TRUSTEES | ||||
| Lifetime of Trust until removal, resignation or retirement* | ||||
| Alan D. Feld** (80) | Trustee since 1996 | Sole Shareholder of a professional corporation which is a Partner in the law firm of Akin, Gump, Strauss, Hauer & Feld, LLP (law firm) (1960-Present); Trustee, American Beacon Mileage Funds (1996-2012); Trustee, American Beacon Select Funds (1999-Present); Trustee, American Beacon Master Trust (1996-2012). | ||
| Term |
||||
| NON-INTERESTED TRUSTEES | ||||
| Lifetime of Trust until removal resignation or retirement* | ||||
| Gilbert G. Alvarado (47) | Trustee since 2015 | Director, Kura MD, Inc. (local telehealth organization) (2015-present); Vice President & CFO, Sierra Health Foundation (health conversion private foundation) (2006-Present) Vice President & CFO, Sierra Health Foundation: Center for Health Program Management (California public benefit corporation) (2012-Present); Director, Innovative North State (2012-Present); Director, Sacramento Regional Technology Alliance (2011-Present); Director, Women’s Empowerment (2009-2014); Trustee, American Beacon Select Funds (2015-Present). | ||
| Josephe B. Armes (54) | Trustee since 2015 | Chairman & CEO, CSW Industrials f/k/a Capital Southwest Corporation (investment company) (2013-Present); President & CEO, JBA Investment Partners (family investment vehicle) (2010-Present); Chief Operating Officer, Hicks Holdings, LLC (Hicks Family assets and investments) (2005-2010); Trustee, Baylor University Board of Regents (2001-2010); Director and Chair of Audit Committee, RSP Permian (oil and gas producer) (2013-Present); Trustee, American Beacon Select Funds (2015-Present). | ||
| Gerard J. Arpey (58) | Trustee since 2012 | Director, The Home Depot, Inc. (2015-Present); Partner, Emerald Creek Group (private equity firm) (2011-Present); Chairman and Chief Executive Officer, AMR Corp. and American Airlines; Inc. (2003- 2011); Director, S. C. Johnson & Son, Inc. (privately held company) (2008-present); Trustee, American Beacon Select Funds (2012-Present). | ||
| Brenda A. Cline (56) | Trustee since 2004 | Executive Vice President, Chief Financial Officer, Treasurer and Secretary, Kimbell Art Foundation (1993-Present); Director, Range Resources Corporation (oil and natural gas company) (2015-Present); Director, Tyler Technologies, Inc.(public sector software solutions company) (2014-Present); Trustee, American Beacon Mileage Funds (2004-2012); Trustee, American Beacon Select Funds (2004-Present); Trustee, American Beacon Master Trust (2004-2012). | ||
| Eugene J. Duffy (62) | Trustee since 2008 | Managing Director, Institutional Services, Intercontinental Real Estate Corporation (2014-Present); Principal and Executive Vice President, Paradigm Asset Management (1994-2014); Director, Sunrise Bank of Atlanta (2008-2013); Trustee, American Beacon Mileage Funds (2008- 2012); Trustee, American Beacon Select Funds (2008-Present); Trustee, American Beacon Master Trust (2008-2012). | ||
49
Trustees and Officers of the American Beacon FundsSM (Unaudited)
| Name, Age and Address |
Position, Term of Office |
Principal Occupation(s) During Past 5 Years | ||
| Term |
||||
| TRUSTEES (CONT.) |
||||
| M. Dunning (74) | Trustee since 2008 | Chairman Emeritus (2008-Present); Lockton Dunning Benefits (consulting firm in employee benefits); Board Director, Oncor Electric Delivery Company LLC (2007-Present); Board Member, BancTec (2010-Present) (software consulting); Trustee, American Beacon Mileage Funds (2008-2012); Trustee, American Beacon Select Funds (2008-Present); Trustee, American Beacon Master Trust (2008-2012). | ||
| Richard M. Massman (73) | Trustee since 2004 Chairman since 2008 | Consultant and General Counsel Emeritus (2009-Present) and Senior Vice President and General Counsel (1994-2009), Hunt Consolidated, Inc. (holding company engaged in oil and gas exploration and production, refining, real estate, farming, ranching and venture capital activities); Trustee, American Beacon Mileage Funds (2004- 2012); Trustee, American Beacon Select Funds (2004-Present); Trustee, American Beacon Master Trust (2004-2012). | ||
| Barbara J. McKenna, CFA (53) |
Trustee since 2012 | Managing Principal, Longfellow Investment Management Company (2005- Present); Trustee, American Beacon Select Funds (2012-Present). | ||
| R. Gerald Turner (71) 225 Perkins Admin. Bldg. Southern Methodist Univ. Dallas, Texas 75275 | Trustee since 2001 | President, Southern Methodist University (1995-Present); Director, J.C. Penney Company, Inc. (1996-Present); Director, Kronus Worldwide Inc. (chemical manufacturing) (2003-Present); Trustee, American Beacon Mileage Funds (2001- 2012); Trustee, American Beacon Select Funds (2001-Present); Trustee, American Beacon Master Trust (2001-2012). | ||
| OFFICERS |
||||
| Gene. L. Needles, Jr. (62) | President since 2009 Executive Vice President since 2009 | President, CEO and Director, American Beacon Advisors, Inc. (2009-Present); President, CEO and Director, Astro AB Borrower, Inc. (2015-Present); President, CEO and Director, Astro AB Acquisition, Inc.(2015-Present); President, CEO and Director, Astro AB Topco, Inc. (2015-Present), President, CEO and Director, Astro AB Holdings, LLC. (2015-Present); President, CEO and Director, Lighthouse Holdings, Inc.; (2009-2015); President and CEO, Lighthouse Holdings Parent, Inc. (2009-2015); Manager, President and CEO, American Private Equity Management, L.L.C. (2012-Present); President, American Beacon Cayman Managed Futures Strategy Fund, Ltd. (2014-Present). | ||
| Rosemary K. Behan (57) | VP, Secretary and Chief Legal Officer since 2006 | Secretary, American Beacon Advisors, Inc. (2006-Present); Secretary, Astro AB Borrower, Inc. (2015-Present); Secretary, Astro AB Acquisition, Inc. (2015- Present); Secretary, Astro AB Topco, Inc. (2015-Present); Secretary, Astro AB Holdings, LLC. (2015-Present); Secretary, Lighthouse Holdings, Inc. (2008- 2015); Secretary, Lighthouse Holdings Parent, Inc. (2008-2015); Secretary, American Private Equity Management, L.L.C. (2008-Present); Secretary, American Beacon Cayman Managed Futures Strategy Fund, Ltd. (2014-Present). | ||
| Brian E. Brett (56) | VP since 2004 | Vice President, Director of Sales, American Beacon Advisors, Inc. (2004-Present). | ||
| Paul B. Cavazos (47) | VP since 2016 | Chief Investment Officer and Vice President, Asset Management, American Beacon Advisors, Inc. (2016-Present); Chief Investment Officer and Assistant Treasurer, DTE Energy (2007-2016); | ||
| Erica Duncan (46) | VP since 2011 | Vice President, Marketing and Client Services, American Beacon Advisors, Inc. (2011-Present); Supervisor, Brand Marketing, Invesco (2010-2011); | ||
50
Trustees and Officers of the American Beacon FundsSM (Unaudited)
| Name, Age and Address |
Position, Term of Office |
Principal Occupation(s) During Past 5 Years | ||
| Term |
||||
| OFFICERS |
||||
| Melinda G. Heika (55) |
Treasurer since 2010 | Treasurer, American Beacon Advisors, Inc. (2010-Present); Treasurer, Astro AB Borrower, Inc. (2015-Present); Treasurer, Astro AB Acquisition, Inc. (2015-Present); Treasurer, Astro AB Topco, Inc. (2015-Present); Treasurer, Astro AB Holdings, LLC. (2015-Present); Treasurer, Lighthouse Holdings, Inc. (2010-2015); Treasurer, Lighthouse Holdings Parent Inc., (2010-2015); Treasurer, American Private Equity Management, L.L.C. (2012-Present); Director and Treasurer, American Beacon Cayman Managed Futures Strategy Fund, Ltd. (2014-Present). | ||
| One Year | ||||
| Terri L. McKinney (53) |
VP since 2010 | Vice President, Enterprise Services (2009-Present) and Managing Director (2003-2009), American Beacon Advisors, Inc. | ||
| Jeffrey K. Ringdahl (41) |
VP since 2010 | Chief Operating Officer, American Beacon Advisors, Inc. (2010-Present); Manager and Senior Vice President, American Private Equity Management, L.L.C. (2012-Present); Senior Vice President and Director, Astro AB Borrower, Inc. (2015-Present); Senior Vice President and Director, Astro AB Acquisition, Inc. (2015-Present); Senior Vice President and Director, Astro AB Topco, Inc. (2015-Present), Senior Vice President and Director, Astro AB Holdings, LLC.(2015-Present); Senior Vice President, Lighthouse Holdings, Inc. (2013-2015); Senior Vice President, Lighthouse Holdings Parent, Inc. (2013-2015); Director and Vice President, American Beacon Cayman Managed Futures Strategy Fund, Ltd. (2014-Present); Vice President, Product Management, Touchstone Advisors, Inc. (2007-2010). | ||
| Samuel J. Silver (53) |
VP since 2011 | Chief Fixed Income Officer (2016–Present), Vice President, Fixed Income Investments (2011-2016) and Senior Portfolio Manager, Fixed Income Investments (1999-2011), American Beacon Advisors, Inc. | ||
| Christina E. Sears (45) |
Chief Compliance Officer since 2004 and Asst. Secretary since 1999 | Chief Compliance Officer, American Beacon Advisors, Inc. (2004-Present); Chief Compliance Officer, American Private Equity Management, L.L.C. (2012-Present). | ||
| Sonia L. Bates (60) |
Asst. Treasurer since 2011 | Director, Tax and Financial Reporting (2011-Present), Manager, Tax and Financial Reporting (2005-2010), American Beacon Advisors, Inc.; Asst. Treasurer, Astro AB Borrower, Inc. (2015-Present); Asst. Treasurer, Astro AB Acquisition, Inc.(2015-Present); Asst. Treasurer, Astro AB Topco, Inc. (2015-Present); Asst. Treasurer, Astro AB Holdings, LLC.; Asst. Treasurer, Lighthouse Holdings, Inc. (2011-2015); Asst. Treasurer, Lighthouse Holdings Parent Inc. (2011-2015); Asst. Treasurer, American Private Equity Management, L.L.C. (2012-Present). | ||
| Shelley D. Abrahams (42) |
Assistant Secretary since 2008 | Assistant Secretary, American Beacon Advisors, Inc. (2008-Present) | ||
| Rebecca L. Harris (50) |
Assistant Secretary since 2011 | Assistant Secretary, American Beacon Advisors, Inc. (2011-Present) | ||
| Diana N. Lai (41) |
Assistant Secretary since 2012 | Assistant Secretary, American Beacon Advisors, Inc. (2012-Present) | ||
| Teresa A. Oxford (58) |
Assistant Secretary since 2015 |
Assistant Secretary, American Beacon Advisors, Inc. (2015-Present) | ||
| * | As of 11/12/2014, the Board adopted a retirement plan that requires Trustees to retire no later than the last day of the calendar year in which they reach the age of 75. |
| ** | Mr. Feld is deemed to be an “interested person” of the Trusts, as defined by the 1940 Act. Mr. Feld’s law firm of Akin, Gump, Strauss, Hauer & Feld LLP has provided legal services within the past two fiscal years to one or more of the Trust’s sub-advisors. |
51
Privacy Policy
December 31, 2016 (Unaudited)
The American Beacon Funds recognize and respect the privacy of our shareholders. We are providing this notice to you so you will understand how shareholder information may be collected and used.
We may collect nonpublic personal information about you from one or more of the following sources:
| • | information we receive from you on applications or other forms; |
| • | information about your transactions with us or our service providers; and |
| • | information we receive from third parties. |
We do not disclose any nonpublic personal information about our customers or former customers to anyone, except as permitted by law.
We restrict access to your nonpublic personal information to those employees or service providers who need to know that information to provide products or services to you. To ensure the confidentiality of your nonpublic personal information, we maintain safeguards that comply with federal standards.
52
This page intentionally left blank.
53
This page intentionally left blank.
54
This page intentionally left blank.
55
This page intentionally left blank.
56

Delivery of Documents
eDelivery is NOW AVAILABLE – Stop traditional mail delivery and receive your
shareholder reports and summary prospectus on-line. Sign up at
www.americanbeaconfunds.com
If you invest in the Fund through a financial institution, you may be able to receive the Fund’s regulatory mailings, such as the Prospectus, Annual Report and Semi-Annual Report, by e-mail. If you are interested in this option, please go to www.icsdelivery.com and search for your financial institution’s name or contact your financial institution directly.
To obtain more information about the Fund:

|

|
|||||
| By E-mail: american_beacon.funds@ambeacon.com |
On the Internet: Visit our website at www.americanbeaconfunds.com |
|||||

|

|
|||||
| By Telephone: Institutional, Y, and Investor Classes Call (800) 658-5811 |
By Mail: American Beacon Funds P.O. Box 219643 Kansas City, MO 64121-9643 |
|||||
| Availability of Quarterly Portfolio Schedules | Availability of Proxy Voting Policy and Records | |||||
| In addition to the Schedule of Investments provided in each semi-annual and annual report, the Fund files a complete schedule of its portfolio holdings with the Securities and Exchange Commission (“SEC”) on Form N-Q as of the first and third fiscal quarters. The Fund’s Forms N-Q are available on the SEC’s website at www.sec.gov. The Forms N-Q may also be reviewed and copied at the SEC’s Public Reference Section, 100 F Street, NE, Washington, D.C. 20549-2736. Information regarding the operation of the SEC’s Public Reference Room may be obtained by calling (800)-SEC-0330. A complete schedule of the Fund’s portfolio holdings is also available at www.americanbeaconfunds.com approximately twenty days after the end of each month. | A description of the policies and procedures the Fund uses to determine how to vote proxies relating to portfolio securities is available in the Fund’s Statement of Additional Information, is available free of charge on the Fund’s website www.americanbeaconfunds.com and by calling 1-800-967-9009 or by accessing the SEC’s website at www.sec.gov. The Fund’s proxy voting record for the most recent year ended June 30 is filed annually with the SEC on Form N-PX. The Fund’s Forms N-PX are available on the SEC’s website at www.sec.gov. The Fund’s proxy voting record may also be obtained by calling 1-800-967-9009. | |||||
Fund Service Providers:
| CUSTODIAN Boston, Massachusetts |
TRANSFER AGENT Kansas City, Missouri |
INDEPENDENT REGISTERED PUBLIC ACCOUNTING FIRM Ernst & Young LLP Dallas, Texas |
DISTRIBUTOR Portland, Maine |
This report is prepared for shareholders of the American Beacon Funds and may be distributed to others only if preceded or accompanied by a current Prospectus of Summary Prospectus.
American Beacon Funds, American Beacon Bridgeway Large Cap Growth Fund, and American Beacon Bridgeway Large Cap Value Fund are service marks of American Beacon Advisors, Inc.
AR 12/16
About American Beacon Advisors
Since 1986, American Beacon Advisors has offered a variety of products and investment advisory services to numerous institutional and retail clients, including a variety of mutual funds, corporate cash management, and separate account management.
Our clients include defined benefit plans, defined contribution plans, foundations, endowments, corporations, financial planners, and other institutional investors. With American Beacon Advisors, you can put the experience of a multi-billion dollar asset management firm to work for your company.
AHL MANAGED FUTURES STRATEGY FUND
Investing in derivative instruments involves liquidity, credit, interest rate and market risks. The use of quantitative models may lead to high levels of trading and concentration among certain investments, resulting in higher trading costs and return volatility. Investing in foreign and emerging market securities may involve heightened risk due to currency fluctuations and economic and political risks. Because the Fund may invest in fewer issuers than a more diversified portfolio, the fluctuating value of a single holding may have a greater effect on the value of the Fund
IONIC STRATEGIC ARBITRAGE FUND
The Fund’s strategy of investing in a variety of arbitrage strategies entails certain risks including that the sub-advisor’s judgments about allocation between such strategies, as well as individual arbitrage opportunities, may not perform to expectations, resulting in the Fund’s underperformance or even losses versus other similar funds. Arbitrage is the simultaneous purchase and sale of an asset or assets to take advantage of a perceived pricing anomaly. Because the Fund may invest in fewer issuers than a more diversified portfolio, the fluctuating value of a single holding may have a greater effect on the value of the Fund. The Fund may have high portfolio turnover, which could increase the Fund’s transaction costs and possibly have a negative impact on performance. Small- or mid-capitalization stocks may involve greater volatility and lower liquidity than larger company stocks. The use of fixed-income securities, including convertible securities, entails interest rate and credit risks. In addition, the value of a convertible security could fluctuate based on the value of the underlying stock. Investing in foreign securities may involve heightened risk due to currency fluctuations and economic and political risks. Investing in derivative instruments involves liquidity, credit, interest rate and market risks. Short sales involve special risks, including greater reliance on the sub-advisor’s ability to accurately anticipate the future value of a security or instrument; the Fund’s losses are potentially unlimited in a short sale. Please see the prospectus for a complete discussion of the Funds’ risks. There can be no assurances that the investment objectives of these Funds will be met.
Any opinions herein, including forecasts, reflect our judgment as of the end of the reporting period and are subject to change. Each advisor’s strategies and the Fund’s portfolio composition will change depending on economic and market conditions. This report is not a complete analysis of market conditions and therefore, should not be relied upon as investment advice. Although economic and market information has been compiled from reliable sources, American Beacon Advisors, Inc. makes no representation as to the completeness or accuracy of the statements contained herein.
| American Beacon Funds | December 31, 2016 |
| 1 | ||||
| 2 | ||||
| 9 | ||||
| 11 | ||||
| Schedules of Investments: |
||||
| 12 | ||||
| 25 | ||||
| 41 | ||||
| 47 | ||||
| Financial Highlights: |
||||
| 77 | ||||
| 80 | ||||
| 83 | ||||
| 84 | ||||
| 85 | ||||
| 88 | ||||
| Back Cover | ||||

|
Dear Shareholders,
| |
| During the 12-month period ended December 31, 2016, China’s slowing growth escalated concerns for global markets, and many of the world’s central banks – the Federal Reserve (the “Fed”) included – responded by either continuing or expanding their economic stimulation policies. In the first half of 2016, international stocks declined while U.S. and emerging-market stocks made modest gains. Falling global interest rates supported bond returns during the period.
| ||
| On June 24, 2016, the U.K. announced that the Brexit referendum to leave the European Union passed with a 52% majority vote, further shaking up global markets. By the end of that month, however, the U.S. stock market and some global markets had rebounded to near pre-Brexit levels as investors took opportunistic risks following the historic vote. After Theresa May’s succession as the U.K.’s prime minister on July 13, 2016, many central banks put their Brexit concerns on hold and turned their attention to their own economies. |
In the weeks ahead of the U.S. presidential election on November 8, 2016, uncertainty about the outcome caused many investors to stay on the sidelines. Some investors questioned whether the election’s result would have negative consequences for their portfolios, but elections rarely have a lasting effect on the market. Historically speaking, from August 1 to October 31 during 19 of the last 22 election years – or approximately 86% of the time – the S&P 500 rallied for an average gain of approximately 6%.
On December 14, 2016, the Fed announced that it increased short-term interest rates by 0.25% to a range of 0.50% and 0.75%, signifying the Federal Open Market Committee’s confidence in an improving economy. It was the second rate increase in a decade; the first rate increase occurred in December 2015
Although U.S. bonds and international investments largely declined in fourth quarter, domestic stocks reached new highs by the end of 2016. Markets responded positively to aspects of the incoming administration’s proposed plans for economic growth; i.e., repatriating jobs from overseas, relaxing regulations, lowering taxes and increasing infrastructure spending. For the year, the Dow Jones Industrial Average gained 16.50%, the S&P 500 Index gained 11.96% and the Nasdaq Composite gained 7.5%.
For the 12-month period ended December 31, 2016:
| • | American Beacon AHL Managed Futures Strategy Fund (Investor Class) returned -0.67%. |
| • | American Beacon Ionic Strategic Arbitrage Fund (Investor Class) returned 0.98%. |
American Beacon Advisors identifies and partners with experienced asset managers from across all asset classes to help protect our shareholders’ portfolios over the long term. We are proud to offer a variety of funds that allow investors to invest in the asset classes best aligned with their long-term goals.
Thank you for your continued investment in American Beacon Funds. For additional information about the Funds or to access your account information, please visit our website at www.americanbeaconfunds.com.
Best Regards,

Gene L. Needles, Jr.
President
American Beacon Funds
1
Alternative Investments
December 31, 2016 (Unaudited)
The year 2016 started on a weak note with an uncertain economic outlook, declining energy prices and volatile stock markets. The surprise Brexit vote only added to concern and central bankers responded with a concerted effort of support. Interest rates were held low, quantitative easing was maintained and investors were encouraged to take risk. The market response was apparent during the summer as the 10-year Treasury Note yield declined to a historic low of 1.4%, record amounts of sovereign bonds traded with negative yields and equity indexes were eerily stable. The S&P Volatility Index (the “VIX”) approached all-time lows and global currencies were lulled into a similar complacency.
By September, however, changes in investor and central bank sentiment were beginning to signal an inflection point. The European and Japanese central banks underwhelmed with their quantitative easing announcements, and the Federal Reserve (the “Fed”) began to broadcast its desire to raise interest rates. The prospects of higher interest rates, central-bank divergence and the looming U.S. election caused the S&P 500 Index to undergo a mild correction (down 4%) and the VIX to rise significantly.
On the morning of November 9, the investment landscape shifted dramatically as news of Donald Trump’s presidential election victory permeated the markets. In a matter of days, the yield on the 10-year Treasury Note rose to 2.2% and eventually peaked at 2.6%. The S&P 500 Index gained 10% and proceeded to reach record highs while the U.S. dollar rallied notably. The momentum affected many asset classes. For example, the JPMorgan Global High Yield Index ended the year with an 18% total return – a hurdle not reached since 2009.
Despite the large market moves, the VIX actually declined during this period. Consistent investor optimism allowed the markets to advance with relatively little volatility. By late December, the VIX was back near all-time lows.
Declining volatility and high correlation across asset classes proved difficult for relative-value investment strategies as hedge positions detracted from performance. Diverse and more specifically priced markets are a preferred backdrop. The directional markets, however, benefited momentum trading strategies as trends lengthened and low volatility enabled longer holding periods.
Mr. Trump’s election victory and the Fed’s steps toward tightening monetary policy indicate that a shift in philosophy has occurred. While the year ended with a familiar market response to central-bank-controlled economies, the policies that investors have come to rely on are likely to change.
| 2 |
American Beacon AHL Managed Futures Strategy FundSM
Performance Overview
December 31, 2016 (Unaudited)
The Investor Class of the American Beacon AHL Managed Futures Strategy Fund (the “Fund”) returned -0.67% for the twelve months ended December 31, 2016.
Comparison of Change in Value of a $10,000 Investment for the period from 8/19/2014 through 12/31/2016
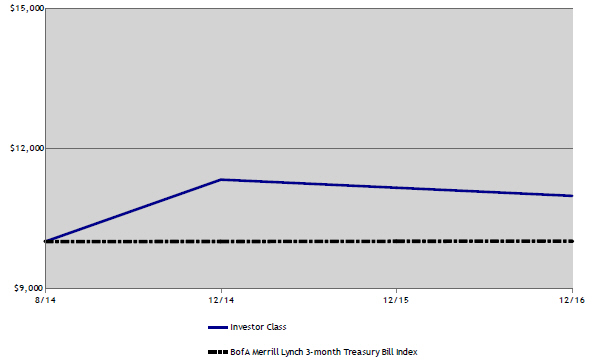
Total Returns for the Period ended December 31, 2016
| Value of $10,000 | ||||||||||||||||
| Since Inception | 8/19/2014- | |||||||||||||||
| Ticker | 1 Year | (8/19/2014) | 12/31/2016 | |||||||||||||
| Institutional Class (1,5) |
AHLIX | -0.29 | % | 4.83 | % | $ | 11,084 | |||||||||
| Y Class (1,5) |
AHLYX | -0.38 | % | 4.70 | % | $ | 11,054 | |||||||||
| Investor Class (1,5) |
AHLPX | -0.67 | % | 4.40 | % | $ | 10,977 | |||||||||
| A without Sales Charge (1,2,5) |
AHLAX | -0.67 | % | 4.40 | % | $ | 10,975 | |||||||||
| A with Sales Charge (1,2,5) |
AHLAX | -6.41 | % | 1.82 | % | $ | 10,975 | |||||||||
| C without Sales Charge (1,3,5) |
AHLCX | -1.45 | % | 3.60 | % | $ | 10,779 | |||||||||
| C with Sales Charge (1,3,5) |
AHLCX | -2.45 | % | 3.60 | % | $ | 10,779 | |||||||||
| BofA Merril Lynch 3-Month Treasury Bill Index (4) |
0.33 | % | 0.16 | % | $ | 10,011 | ||||||||||
| 1. | Performance shown is historical and is not indicative of future returns. Investment returns and principal value will vary, and shares may be worth more or less at redemption than at original purchase. Performance shown is calculated based on the published end of day net asset values as of date indicated, and current performance may be lower or higher than the performance data quoted. To obtain performance as of the most recent month end, please visit www.americanbeaconfunds.com or call 1-800-967-9009. Fund performance in the table above does not reflect the deduction of taxes a shareholder would pay on distributions or the redemption of shares. A portion of the fees charged to each Class of the Fund has been waived since Fund inception. Performance prior to waiving fees was lower than actual returns shown. |
| 2. | A Class shares have a maximum sales charge of 5.75%. |
| 3. | C Class has a maximum contingent deferred sales charge of 1.00% for shares redeemed within one year of the date of purchase. |
3
American Beacon AHL Managed Futures Strategy FundSM
Performance Overview
December 31, 2016 (Unaudited)
| 4. | The BofA Merrill Lynch 3-Month Treasury Bill Index is designed to measure the total return on cash, including price and interest income, based on short- term government Treasury Bills of about 90-day maturity. One cannot directly invest in an index. |
| 5. | The total annual Fund operating expense ratio set forth in the most recent Fund prospectus for the Institutional, Y, Investor, A, and C Class shares was 2.26%, 2.29%, 2.41%, 2.56%, and 3.33%, respectively. The expense ratios above may vary from the expense ratios presented in other sections of this report that are based on expenses incurred during the period covered by this report. |
During the period, Bonds were the best performing sector contributing approximately 3.6% to the Fund’s return. Short-Term Interest Rate positions also contributed positive returns of approximately 1.1%. The remaining sectors, including Energy, Metals, Currency, Stocks and Agriculturals, were negative.
In Bonds, the Fund was long during the first three quarters of the year as interest rates declined. The positions were then changed to shorts in the fourth quarter when rates started to rise. The consistent patterns during these two phases of the market allowed the Fund to generate profits. Ten-year Japanese and United Kingdom government bonds were the top contributors.
The Fund took similar long and short positions in the Short-Term Interest Rate markets, including Euribor and Eurodollar futures, and generated attractive returns as well.
The remaining sectors proved more challenging due to inconsistent and choppy trends. Energy positions detracted 1.3% from the Fund. Natural Gas and Crude Oil produced the greatest losses as those markets exhibited difficult trend-following patterns
Metals also detracted 1.3% as Aluminum and Gold positions underperformed for similar reasons.
While these prominent global commodities are ultimately valued according to their supply and demand fundamentals, they are particularly subject to short-term volatility caused by headlines from politicians, central banks, and other events such as the Brexit vote and U.S. elections.
The Currency sector also contributed a slight loss of 0.5%, as choppy markets caused the positions to alternate between longs and shorts in currencies such as the Mexican and Chilean pesos.
Equities and Agriculturals combined generated a loss of 0.5% as positions in the NASDAQ 100, the Korean Kospi, Corn and Cocoa underperformed.
While the year was difficult for trend-following strategies, it ended on a positive note as the Fund’s programs began to align with the markets. The months of November and December 2016 produced a cumulative return of over 3%.
As such, the Fund’s sub-advisor will continue to implement a trading strategy that is designed to capitalize on price trends (up or down) in a broad range of equity, bond, currency, commodity and short-term interest rate markets to achieve the Fund’s goal of capital growth.
| Asset Class Exposure |
% of VaR | * | ||
| Equities |
35.1 | |||
| Currencies |
30.1 | |||
| Commodities |
21.3 | |||
| Fixed Income |
13.5 | |||
| Holdings Summary |
| |||
| Number of Long Holdings |
35 | |||
| Number of Short Holdings |
16 | |||
| Number of Currency Pairs |
16 | |||
4
American Beacon AHL Managed Futures Strategy FundSM
Performance Overview
December 31, 2016 (Unaudited)
| Top Active Exposures By Asset Class | ||||||||
| Commodities |
% of VaR | * | ||||||
| Crude Oil |
Long | 5.24 | ||||||
| Gold |
Short | 3.42 | ||||||
| Natural Gas |
Long | 2.96 | ||||||
| Gas Oil |
Long | 2.28 | ||||||
| Heating Oil |
Long | 2.05 | ||||||
|
|
|
|||||||
| Currencies |
% of VaR | * | ||||||
| KRW/USD |
Short | 4.78 | ||||||
| GBP/USD |
Short | 4.56 | ||||||
| JPY/USD |
Short | 4.33 | ||||||
| EUR/USD |
Short | 3.64 | ||||||
| AUD/USD |
Short | 2.73 | ||||||
|
|
|
|||||||
| Equities |
% of VaR | * | ||||||
| S&P 500 Index |
Long | 2.96 | ||||||
| Korean Kospi |
Long | 2.96 | ||||||
| Nikkei Index |
Long | 2.28 | ||||||
| DAX Index |
Long | 2.28 | ||||||
| NASDAQ 100 Index |
Long | 2.05 | ||||||
|
|
|
|||||||
| Fixed Income |
% of VaR | * | ||||||
| U.S. Treasuries |
Short | 4.33 | ||||||
| Australian Bonds |
Short | 3.19 | ||||||
| Eurodollar |
Short | 2.05 | ||||||
| Short Sterling |
Short | 0.91 | ||||||
| Euro-BOBL |
Long | 0.91 | ||||||
| * | Value at Risk (“VaR”) is a measure of the potential loss in value of a portfolio over a defined period for a given confidence interval A one-day VaR at the 95% confidence level represents that there is a 5% probability that the mark-to-market loss on the portfolio over a one-day horizon will exceed this value (assuming normal markets and no trading in the portfolio). |
5
American Beacon Ionic Strategic Arbitrage FundSM
Performance Overview
December 31, 2016 (Unaudited)
The Investor Class of the American Beacon Ionic Strategic Arbitrage Fund (the “Fund”) returned 0.98% for the twelve months ended December 31, 2016.
Comparison of Change in Value of a $10,000 Investment for the period from 9/01/2013 through 12/31/2016
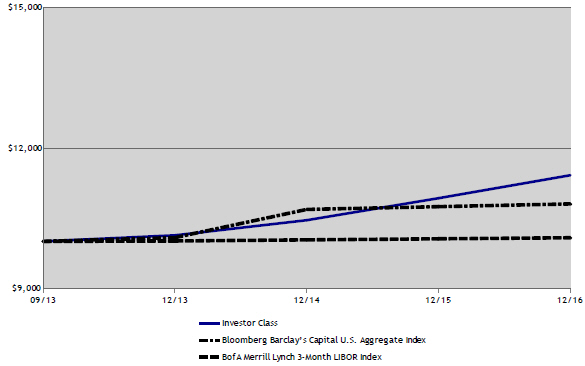
Total Returns for the Period ended December 31, 2016
| Value of $10,000 | ||||||||||||||||||||
| Since Inception | 9/1/2013- | |||||||||||||||||||
| Ticker | 1 Year | 3 Years | (9/1/2013) | 12/31/2016 | ||||||||||||||||
| Institutional Class (1,7) |
IONIX | 1.28 | % | 3.02 | % | 3.11 | % | $ | 11,436 | |||||||||||
| Y Class (1,2,7) |
IONYX | 1.28 | % | 3.05 | % | 3.14 | % | $ | 11,460 | |||||||||||
| Investor Class (1,3,7) |
IONPX | 0.98 | % | 2.88 | % | 2.98 | % | $ | 11,414 | |||||||||||
| A without Sales Charge (1,4,7) |
IONAX | 0.98 | % | 2.88 | % | 2.99 | % | $ | 11,414 | |||||||||||
| A with Sales Charge (1,4,7) |
IONAX | -3.79 | % | 1.22 | % | 1.50 | % | $ | 11,414 | |||||||||||
| C without Sales Charge (1,5,7) |
IONCX | 0.17 | % | 2.48 | % | 2.63 | % | $ | 11,333 | |||||||||||
| C with Sales Charge (1,5,7) |
IONCX | -0.83 | % | 2.48 | % | 2.63 | % | $ | 11,333 | |||||||||||
| Bloomberg Barclays Capital U.S. Aggregate Index (6) |
2.65 | % | 3.03 | % | 2.97 | % | $ | 10,801 | ||||||||||||
| BofA Merril Lynch 3-Month Libor Index (6) |
0.66 | % | 0.38 | % | 0.36 | % | $ | 10,078 | ||||||||||||
| 1. | Performance shown is historical and is not indicative of future returns. Investment returns and principal value will vary, and shares may be worth more or less at redemption than at original purchase. Performance shown is calculated based on the published end of day net asset values as of date indicated, and current performance may be lower or higher than the performance data quoted. To obtain performance as of the most recent month end, please visit www.americanbeaconfunds.com or call 1-800-967-9009. Fund performance in the table above does not reflect the deduction of taxes a shareholder would pay on distributions or the redemption of shares. Simultaneous with the commencement of the Fund’s investment operations on June 30, 2015, the Ionic Absolute Return Fund LLC (“Private Fund”), a privately offered investment fund managed by the Fund’s sub-advisor transferred its assets to the Institutional Class shares of the Fund. A portion of the fees charged to each Class of the Fund has been waived since 6/30/15. Performance prior to waiving fees was lower than actual returns shown. |
| 2. | Fund performance for the one-year, three-year, and since inception periods represents the total returns achieved by the Institutional Class from 9/1/13 up to 6/30/15, the inception date of the Y Class. Expenses of the Y Class are higher than those of the Institutional Class. As a result, total returns shown may be higher than they would have been had the Y Class been in existence since 9/1/13. |
6
American Beacon Ionic Strategic Arbitrage FundSM
Performance Overview
December 31, 2016 (Unaudited)
| 3. | Fund performance for the one-year, three-year, and since inception periods represents the total returns achieved by the Institutional Class from 9/1/13 up to 6/30/15, the inception date of the Investor Class. Expenses of the Investor Class are higher than those of the Institutional Class. As a result, total returns shown may be higher than they would have been had the Investor Class been in existence since 9/1/13. |
| 4. | Fund performance for the one-year, three-year, and since inception periods represents the total returns achieved by the Institutional Class from 9/1/13 up to 6/30/15, the inception date of the A Class. Expenses of the A Class are higher than those of the Institutional Class. As a result, total returns shown may be higher than they would have been had the A Class been in existence since 9/1/13. A Class shares have a maximum sales charge of 5.75%. |
| 5. | Fund performance for the one-year, three-year, and since inception periods represents the total returns achieved by the Institutional Class from 9/1/13 up to 6/30/15, the inception date of the C Class. Expenses of the C Class are higher than those of the Institutional Class. As a result, total returns shown may be higher than they would have been had the C Class been in existence since 9/1/13. C Class has a maximum contingent deferred sales charge of 1.00% for shares redeemed within one year of the date of purchase. |
| 6. | The BofA Merrill Lynch 3-Month LIBOR Index represents the London interbank offered rate (LIBOR) with a constant 3-month average maturity. LIBOR is a composite of the rates of interest at which banks borrow from one another in the London market, and it is a widely used benchmark for short-term interest rates. The Bloomberg Barclays Capital U.S. Aggregate Index is a market weighted index of government, corporate, mortgage-backed and asset-backed fixed-rate debt securities of all maturities. One cannot directly invest in an index. |
| 7. | The total annual Fund operating expense ratio set forth in the most recent Fund prospectus for the Institutional, Y, Investor, A, and C Class shares was 3.26%, 3.22%, 3.93%, 6.94%, and 7.73%, respectively. The expense ratios above may vary from the expense ratios presented in other sections of this report that are based on expenses incurred during the period covered by this report. |
The year began with a soft first quarter but followed with reasonable returns thereafter. Large swings in equity and currency markets were met with concerted central bank actions that reduced volatility and hindered the Fund’s strategies. Central bank involvement caused traditional asset correlations, such as equity, bond and gold, to break down and reduced the effectiveness of hedges. However, while several volatility indices ended the year near record-lows, a new divergence among central bank policies (with the U.S. tightening, Japan easing and Europe moving toward neutral) increased asset price dispersion and provided opportunity for arbitrage.
Among the Fund’s strategies, Convertible Arbitrage was the best performer for the year. By focusing on the yield component of convertible bonds, rather than the equity conversion, the Fund benefitted from strong credit markets, particularly in Energy. Spread performance more than offset losses associated with the decline in equity market volatility. In addition, a number of corporate events, including mergers, new issuance and other restructurings, benefitted the Fund. The Fund also reduced its exposure to duration mid-year, which helped as interest rates rose significantly toward year end
The second-best performing strategy was Credit Relative Value Arbitrage. The Fund added exposure to floating-rate, closed-end funds with unusually attractive net asset value discounts. These positions benefitted when interest rates rose and investors flocked to floating-rate securities. Positions in floating-rate, home-equity conversion mortgages (HECM mortgages) also helped due to their stable cash flows and low interest-rate sensitivity.
Equity Arbitrage followed with the third-best performance during the year. The Fund’s exposure to TARP bank warrants (issued during the Troubled Asset Relief Program in 2008) performed well as the implied volatility of the warrants was lower, and less expensive, than that of comparable option securities. This benefit was offset somewhat by the decline in volatility in the financial sector following the strong post-election rall .
The Volatility Arbitrage strategy generated a loss in 2016 due primarily to the general decline in market volatility. Additionally, the increase in price dispersion, while helpful for other strategies, hurt this strategy as asset correlations changed and hedges became less effective. Foreign currency positions detracted from performance, while exposures to European volatility, pre-Brexit, profited. Several single-name equity option positions, in Energy and Finance, benefitted from market movements.
The Fund’s sub-advisor continues to allocate assets among arbitrage strategies, including Convertible Bond, Credit/Interest Rate, Equity and Volatility Arbitrage, seeking capital appreciation with low volatility and low correlation to the broader equity, interest rate and currency markets.
7
American Beacon Ionic Strategic Arbitrage FundSM
Performance Overview
December 31, 2016 (Unaudited)
| Positions By Investment Strategy |
| |||
| Convertible Arbitrage |
31 | |||
| Credit/Rates Relative Value Arbitrage |
3 | |||
| Equity Arbitrage |
95 | |||
| Volatility Arbitrage |
23 | |||
| Total |
152 | |||
| Investment Strategy Exposure (%) |
LMV | * | SMV | ** | ||||
| Convertible Arbitrage |
30 | (18 | ) | |||||
| Credit/Rates Relative Value Arbitrage |
22 | — | ||||||
| Equity Arbitrage |
30 | (37 | ) | |||||
| Volatility Arbitrage |
5 | (7 | ) | |||||
| Total |
87 | 62 |
| * | Long Market Value |
| * | Short Market Value |
8
American Beacon FundsSM
December 31, 2016 (Unaudited)
Fund Expense Example
As a shareholder of a Fund, you incur two types of costs: (1) transaction costs, including sales charges (loads) on purchase payments and redemption fees if applicable, and (2) ongoing costs, including management fees, administrative service fees, distribution (12b-1) fees, and other Fund expenses. The Examples are intended to help you understand the ongoing cost (in dollars) of investing in the Funds and to compare these costs with the ongoing costs of investing in other mutual funds. The Examples are based on an investment of $1,000 invested at the beginning of the period in each Class and held for the entire period from July 1, 2016 through December 31, 2016.
Actual Expenses
The “Actual” lines on the tables provide information about actual account values and actual expenses. You may use the information on this page, together with the amount you invested, to estimate the expenses that you paid over the period. Simply divide your account value by $1,000 (for example, an $8,600 account value divided by $1,000 = $8.60), then multiply the result by the “Expenses Paid During Period” for the applicable Fund to estimate the expenses you paid on your account during this period. Shareholders of the Institutional and Investor Classes that invest in the Funds through an IRA or Roth IRA may be subject to a custodial IRA fee of $15 that is typically deducted each December. If your account was subject to a custodial IRA fee during the period, your costs would have been $15 higher.
Hypothetical Example for Comparison Purposes
The “Hypothetical” line of the tables provide information about hypothetical account values and hypothetical expenses based on the Fund’s actual expense ratio and an assumed 5% per year rate of return before expenses (not the Fund’s actual return). You may compare the ongoing costs of investing in the Funds with other funds by contrasting this 5% hypothetical example and the 5% hypothetical examples that appear in the shareholder reports of the other funds. The hypothetical account values and expenses may not be used to estimate the actual ending account balance or expenses you paid for the period. Shareholders of the Institutional and Investor Classes that invest in the Funds through an IRA or Roth IRA may be subject to a custodial IRA fee of $15 that is typically deducted each December. If your account was subject to a custodial IRA fee during the period, your costs would have been $15 higher.
You should also be aware that the expenses shown in the table highlight only your ongoing costs and do not reflect any transaction costs charged by the Funds, such as sales charges (loads) or redemption fees, as applicable. Similarly, the expense examples for other funds do not reflect any transaction costs charged by those funds, such as sales charges (loads), redemption fees or exchange fees. Therefore, the “Hypothetical” lines of the tables are useful in comparing ongoing costs only and will not help you determine the relative total costs of owning different funds. If you were subject to any transaction costs during the period, your costs would have been higher.
| 9 |
American Beacon FundsSM
Expense Examples
December 31, 2016 (Unaudited)
AHL Managed Futures Strategy Fund
| Beginning Account Value 7/1/2016 |
Ending Account Value 12/31/2016 |
Expenses Paid During Period 7/1/2016-12/31/2016* |
||||||||||
| Institutional Class |
||||||||||||
| Actual |
$ | 1,000.00 | $ | 978.43 | $ | 7.66 | ||||||
| Hypothetical** |
$ | 1,000.00 | $ | 1,017.40 | $ | 7.81 | ||||||
| Y Class |
||||||||||||
| Actual |
$ | 1,000.00 | $ | 977.44 | $ | 8.15 | ||||||
| Hypothetical** |
$ | 1,000.00 | $ | 1,016.89 | $ | 8.31 | ||||||
| Investor Class |
||||||||||||
| Actual |
$ | 1,000.00 | $ | 976.40 | $ | 9.54 | ||||||
| Hypothetical** |
$ | 1,000.00 | $ | 1,015.48 | $ | 9.73 | ||||||
| A Class |
||||||||||||
| Actual |
$ | 1,000.00 | $ | 976.44 | $ | 9.64 | ||||||
| Hypothetical** |
$ | 1,000.00 | $ | 1,015.38 | $ | 9.83 | ||||||
| C Class |
||||||||||||
| Actual |
$ | 1,000.00 | $ | 972.33 | $ | 13.34 | ||||||
| Hypothetical** |
$ | 1,000.00 | $ | 1,011.60 | $ | 13.60 | ||||||
| * | Expenses are equal to the Fund’s annualized expense ratios for the six-month period of 1.54%, 1.64%, 1.92%, 1.94% and 2.69% for the Institutional, Y, Investor, A and C Classes respectively, multiplied by the average account value over the period, multiplied by the number derived by dividing the number of days in the most recent fiscal half-year (184) by days in the year (366) to reflect the half-year period. |
| ** | 5% return before expenses. |
Ionic Strategic Arbitrage Fund
| Beginning Account Value 7/1/2016 |
Ending Account Value 12/31/2016 |
Expenses Paid During Period 7/1/2016-12/31/2016* |
||||||||||
| Institutional Class |
||||||||||||
| Actual |
$ | 1,000.00 | $ | 1,011.78 | $ | 15.68 | ||||||
| Hypothetical** |
$ | 1,000.00 | $ | 1,009.53 | $ | 15.66 | ||||||
| Y Class |
||||||||||||
| Actual |
$ | 1,000.00 | $ | 1,012.79 | $ | 16.70 | ||||||
| Hypothetical** |
$ | 1,000.00 | $ | 1,008.53 | $ | 16.66 | ||||||
| Investor Class |
||||||||||||
| Actual |
$ | 1,000.00 | $ | 1,010.80 | $ | 17.69 | ||||||
| Hypothetical** |
$ | 1,000.00 | $ | 1,007.55 | $ | 17.66 | ||||||
| A Class |
||||||||||||
| Actual |
$ | 1,000.00 | $ | 1,010.80 | $ | 18.10 | ||||||
| Hypothetical** |
$ | 1,000.00 | $ | 1,007.13 | $ | 18.06 | ||||||
| C Class |
||||||||||||
| Actual |
$ | 1,000.00 | $ | 1,006.80 | $ | 21.89 | ||||||
| Hypothetical** |
$ | 1,000.00 | $ | 1,003.32 | $ | 21.85 | ||||||
| * | Expenses are equal to the Fund’s annualized expense ratios for the six-month period of 3.10%, 3.30%, 3.50%, 3.58% and 4.34% for the Institutional, Y, Investor, A and C Classes respectively, multiplied by the average account value over the period, multiplied by the number derived by dividing the number of days in the most recent fiscal half-year (184) by days in the year (366) to reflect the half-year period. |
| ** | 5% return before expenses. |
| 10 |
American Beacon FundsSM
Report of Independent Registered Public Accounting Firm
The Board of Trustees and Shareholders of
American Beacon AHL Managed Futures Strategy Fund and American Beacon Ionic Strategic Arbitrage Fund
We have audited the accompanying consolidated statement of assets and liabilities, including the consolidated schedule of investments, of American Beacon AHL Managed Futures Strategy Fund and its subsidiary (one of the funds constituting the American Beacon Funds) (a Fund), as of December 31, 2016, and the related consolidated statement of operations for the year then ended, and the consolidated statements of changes in net assets and the financial highlights for each of the periods indicated therein. We have audited the accompanying statement of assets and liabilities, including the schedule of investments, of American Beacon Ionic Strategic Arbitrage Fund (one of the funds constituting the American Beacon Funds) (a Fund), as of December 31, 2016, and the related statement of operations for the year then ended, and the statements of changes in net assets and the financial highlights for each of the periods indicated therein. These financial statements and financial highlights are the responsibility of the Funds’ management. Our responsibility is to express an opinion on these financial statements and financial highlights based on our audits.
We conducted our audits in accordance with the standards of the Public Company Accounting Oversight Board (United States). Those standards require that we plan and perform the audit to obtain reasonable assurance about whether the financial statements and financial highlights are free of material misstatement. We were not engaged to perform an audit of the Funds’ internal control over financial reporting. Our audits included consideration of internal control over financial reporting as a basis for designing audit procedures that are appropriate in the circumstances, but not for the purpose of expressing an opinion on the effectiveness of the Funds’ internal control over financial reporting. Accordingly, we express no such opinion. An audit also includes examining, on a test basis, evidence supporting the amounts and disclosures in the financial statements and financial highlights, assessing the accounting principles used and significant estimates made by management, and evaluating the overall financial statement presentation. Our procedures included confirmation of securities owned as of December 31, 2016, by correspondence with the custodian and brokers or by other appropriate auditing procedures where replies from brokers were not received. We believe that our audits provide a reasonable basis for our opinion.
In our opinion, the financial statements and financial highlights referred to above present fairly, in all material respects, the consolidated financial position of American Beacon AHL Managed Futures Strategy Fund and its subsidiary at December 31, 2016, the consolidated results of its operations for the year then ended, and the consolidated changes in its net assets and the financial highlights for each of the periods indicated therein in conformity with U.S. generally accepted accounting principles. In our opinion, the financial statements and financial highlights referred to above present fairly, in all material respects, the financial position of American Beacon Ionic Strategic Arbitrage Fund at December 31, 2016, the results of its operations for the year then ended, and the changes in its net assets and the financial highlights for each of the periods indicated therein in conformity with U.S. generally accepted accounting principles.

Dallas, Texas
February 28, 2017
| 11 |
American Beacon AHL Managed Futures Strategy FundSM
Consolidated Schedule of Investments
December 31, 2016
| Shares | Fair Value | |||||||
| SHORT-TERM INVESTMENTS – 89.09% |
||||||||
| Money Market Funds - 1.39% |
||||||||
| American Beacon U.S. Government Money Market Select Fund, Select ClassA |
$ | 6,472,219 | $ | 6,472,219 | ||||
|
|
|
|||||||
| Par Amount | ||||||||
| U.S. Treasury Bills - 87.70% |
||||||||
| 0.307%, Due 1/5/2017 |
$ | 101,000,000 | 100,997,980 | |||||
| 0.454%, Due 2/2/2017 |
73,500,000 | 73,474,128 | ||||||
| 0.314%, Due 1/12/2017 |
11,000,000 | 10,998,900 | ||||||
| 0.335%, Due 1/19/2017 |
43,500,000 | 43,491,996 | ||||||
| 0.365%, Due 1/26/2017 |
96,500,000 | 96,474,042 | ||||||
| 0.451%, Due 2/9/2017 |
82,000,000 | 81,962,280 | ||||||
|
|
|
|||||||
| 407,399,326 | ||||||||
|
|
|
|||||||
| Total Short-Term Investments (Cost $413,867,652) |
413,871,545 | |||||||
|
|
|
|||||||
| TOTAL INVESTMENTS - 89.09% (Cost $413,867,652) |
413,871,545 | |||||||
| OTHER ASSETS, NET OF LIABILITIES – 10.91% |
50,976,965 | |||||||
|
|
|
|||||||
| TOTAL NET ASSETS - 100.00% |
$ | 464,848,510 | ||||||
|
|
|
|||||||
Percentages are stated as a percent of net assets.
| A | The Fund is affiliated by having the same investment advisor. |
Purchased Futures Contracts Open on December 31, 2016:
Commodity Futures Contracts
| Description |
Number of Contracts |
Expiration Date |
Contract Value |
Unrealized Appreciation (Depreciation) |
||||||||
| Brent Crude FuturesA |
194 | January 2017 | $ | 11,023,080 | $ | 222,687 | ||||||
| Copper FuturesA |
108 | March 2017 | 6,764,850 | (240,731 | ) | |||||||
| Gasoline RBOB FuturesA |
97 | January 2017 | 6,807,247 | 498,389 | ||||||||
| LME Copper FuturesA |
35 | January 2017 | 4,835,250 | 492,837 | ||||||||
| LME Copper FuturesA |
5 | February 2017 | 691,281 | (41,686 | ) | |||||||
| LME Lead FuturesA |
12 | January 2017 | 601,050 | (13,047 | ) | |||||||
| LME Lead FuturesA |
30 | February 2017 | 1,505,625 | (121,638 | ) | |||||||
| LME Lead FuturesA |
3 | March 2017 | 150,900 | (23,176 | ) | |||||||
| LME Nickel FuturesA |
15 | January 2017 | 897,750 | (40,558 | ) | |||||||
| LME Nickel FuturesA |
10 | February 2017 | 599,580 | (92,460 | ) | |||||||
| LME Nickel FuturesA |
19 | March 2017 | 1,141,254 | (149,924 | ) | |||||||
| LME Primary Aluminum FuturesA |
347 | January 2017 | 14,695,450 | (25,018 | ) | |||||||
| LME Primary Aluminum FuturesA |
18 | February 2017 | 760,612 | (14,444 | ) | |||||||
| LME Primary Aluminum FuturesA |
42 | March 2017 | 1,777,387 | (46,714 | ) | |||||||
| LME Zinc FuturesA |
62 | January 2017 | 3,973,425 | 397,065 | ||||||||
| LME Zinc FuturesA |
6 | February 2017 | 385,237 | (1,943 | ) | |||||||
| Low Sulphur Gasoil FuturesA |
180 | January 2017 | 9,018,000 | 486,746 | ||||||||
| Low Sulphur Gasoil FuturesA |
1 | February 2017 | 50,475 | (301 | ) | |||||||
| Natural Gas FuturesA |
172 | January 2017 | 6,405,280 | 362,085 | ||||||||
| Natural Gas Swap FuturesA |
48 | March 2017 | 427,920 | 30,004 | ||||||||
| Natural Gas Swap FuturesA |
48 | April 2017 | 425,160 | 27,243 | ||||||||
| Natural Gas Swap FuturesA |
48 | May 2017 | 427,200 | 29,284 | ||||||||
| Natural Gas Swap FuturesA |
48 | June 2017 | 430,320 | 32,405 | ||||||||
| Natural Gas Swap FuturesA |
48 | July 2017 | 429,000 | 31,085 | ||||||||
| Natural Gas Swap FuturesA |
48 | August 2017 | 426,240 | 28,323 | ||||||||
| Natural Gas Swap FuturesA |
48 | September 2017 | 428,400 | 30,484 | ||||||||
| Natural Gas Swap FuturesA |
104 | October 2017 | 937,040 | 31,519 | ||||||||
| See accompanying notes
|
||||
| 12 |
American Beacon AHL Managed Futures Strategy FundSM
Consolidated Schedule of Investments
December 31, 2016
| Description |
Number of Contracts |
Expiration Date |
Contract Value | Unrealized Appreciation (Depreciation) |
||||||||||
| Natural Gas Swap FuturesA |
104 | November 2017 | $ | 962,780 | $ | 57,274 | ||||||||
| Natural Gas Swap FuturesA |
104 | December 2017 | 982,800 | 77,305 | ||||||||||
| Natural Gas Swap FuturesA |
104 | January 2018 | 969,280 | 63,777 | ||||||||||
| Natural Gas Swap FuturesA |
104 | February 2018 | 940,160 | 34,641 | ||||||||||
| NY Harbor ULSD FuturesA |
124 | January 2017 | 9,000,466 | 363,067 | ||||||||||
| Soybean FuturesA |
115 | March 2017 | 5,773,000 | (76,321 | ) | |||||||||
| WTI Crude FuturesA |
176 | January 2017 | 9,454,720 | 228,354 | ||||||||||
| WTI Crude FuturesA |
1 | February 2017 | 54,660 | 58 | ||||||||||
|
|
|
|
|
|||||||||||
| $ | 104,152,879 | $ | 2,636,671 | |||||||||||
|
|
|
|
|
|||||||||||
| Equity Futures Contracts
|
| |||||||||||||
| Description |
Number of Contracts |
Expiration Date |
Contract Value | Unrealized Appreciation (Depreciation) |
||||||||||
| Amsterdam Index Futures |
117 | January 2017 | $ | 11,899,729 | $ | 191,666 | ||||||||
| ASX SPI 200 Index Futures |
171 | March 2017 | 17,371,941 | 258,651 | ||||||||||
| CAC40 Index Futures |
231 | January 2017 | 11,824,980 | 163,057 | ||||||||||
| DAX Index Futures |
70 | March 2017 | 21,120,115 | 301,226 | ||||||||||
| Euro Stoxx 50 Index Futures |
446 | March 2017 | 15,384,928 | 227,381 | ||||||||||
| FTSE 100 Index Futures |
236 | March 2017 | 20,504,668 | 357,990 | ||||||||||
| FTSE/MIB Index Futures |
54 | March 2017 | 5,458,361 | 77,035 | ||||||||||
| Hang Seng Index Futures |
26 | January 2017 | 3,681,811 | 63,833 | ||||||||||
| IBEX 35 Index Futures |
77 | January 2017 | 7,548,891 | 46,285 | ||||||||||
| KOSPI 200 Index Futures |
406 | March 2017 | 43,707,692 | 351,432 | ||||||||||
| Mini MSCI EAFE Index Futures |
31 | March 2017 | 2,597,180 | (5,965 | ) | |||||||||
| Mini MSCI Emerging Markets Index Futures |
17 | March 2017 | 730,065 | (13,301 | ) | |||||||||
| MSCI Taiwan Stock Index Futures |
207 | January 2017 | 7,116,660 | 71,111 | ||||||||||
| NASDAQ 100 E-Mini Futures |
304 | March 2017 | 29,573,120 | (116,720 | ) | |||||||||
| Nikkei 225 (SGX) Futures |
246 | March 2017 | 20,069,390 | 453,433 | ||||||||||
| OMXS30 Index Futures |
897 | January 2017 | 14,955,579 | (192,181 | ) | |||||||||
| Russell 2000 Mini Index Futures |
213 | March 2017 | 14,450,985 | (174,800 | ) | |||||||||
| S&P 500 E-Mini Index Futures |
432 | March 2017 | 48,301,920 | (322,327 | ) | |||||||||
| S&P/TSX 60 Index Futures |
160 | March 2017 | 21,376,234 | 3,512 | ||||||||||
| TOPIX Index Futures |
94 | March 2017 | 12,208,941 | 168,357 | ||||||||||
| U.S. Dollar Index Futures |
178 | March 2017 | 18,206,908 | 218,759 | ||||||||||
|
|
|
|
|
|||||||||||
| $ | 348,090,098 | $ | 2,128,434 | |||||||||||
|
|
|
|
|
|||||||||||
| Interest Rate Futures Contracts
|
| |||||||||||||
| Description |
Number of Contracts |
Expiration Date |
Contract Value | Unrealized Appreciation (Depreciation) |
||||||||||
| Euro-Bobl Futures |
491 | March 2017 | $ | 69,066,846 | $ | 220,234 | ||||||||
| Euro-Bund Futures |
69 | March 2017 | 11,922,687 | 6,597 | ||||||||||
| Euro-Schatz Futures |
720 | March 2017 | 85,105,523 | 128,433 | ||||||||||
| Long GILT Futures |
63 | March 2017 | 9,769,591 | 9,219 | ||||||||||
|
|
|
|
|
|||||||||||
| $ | 175,864,647 | $ | 364,483 | |||||||||||
|
|
|
|
|
|||||||||||
|
Sold Futures Contracts Open on December 31, 2016:
Commodity Futures Contracts
|
||||||||||||||
| Description |
Number of Contracts |
Expiration Date |
Contract Value | Unrealized Appreciation (Depreciation) |
||||||||||
| Cocoa FuturesA |
294 | March 2017 | $ | (6,250,440 | ) | $ | 1,164,538 | |||||||
| Coffee FuturesA |
52 | March 2017 | (2,672,475 | ) | 65,041 | |||||||||
| Corn FuturesA |
410 | March 2017 | (7,216,000 | ) | (59,212 | ) | ||||||||
| Gold 100oz FuturesA |
297 | February 2017 | (34,205,490 | ) | 909,387 | |||||||||
| See accompanying notes
|
||||
| 13 |
American Beacon AHL Managed Futures Strategy FundSM
Consolidated Schedule of Investments
December 31, 2016
| Description |
Number of Contracts |
Expiration Date |
Contract Value | Unrealized Appreciation (Depreciation) |
||||||||||
| LME Copper FuturesA |
22 | January 2017 | $ | (3,039,300 | ) | $ | (472,751 | ) | ||||||
| LME Lead FuturesA |
12 | January 2017 | (601,050 | ) | 7,456 | |||||||||
| LME Lead FuturesA |
3 | February 2017 | (150,562 | ) | (802 | ) | ||||||||
| LME Nickel FuturesA |
15 | January 2017 | (897,750 | ) | 45,965 | |||||||||
| LME Nickel FuturesA |
10 | February 2017 | (599,580 | ) | 8,437 | |||||||||
| LME Nickel FuturesA |
11 | March 2017 | (660,726 | ) | 5,527 | |||||||||
| LME Primary Aluminum FuturesA |
170 | January 2017 | (7,199,500 | ) | (98,678 | ) | ||||||||
| LME Zinc FuturesA |
25 | January 2017 | (1,602,187 | ) | 168,572 | |||||||||
| Silver FuturesA |
77 | March 2017 | (6,155,765 | ) | 179,536 | |||||||||
| Sugar #11 World FuturesA |
272 | February 2017 | (5,943,526 | ) | (185,090 | ) | ||||||||
| Wheat FuturesA |
391 | March 2017 | (7,976,400 | ) | 181,082 | |||||||||
|
|
|
|
|
|||||||||||
| $ | (85,170,751 | ) | $ | 1,919,008 | ||||||||||
|
|
|
|
|
|||||||||||
| Currency Futures Contracts
|
| |||||||||||||
| Description |
Number of Contracts |
Expiration Date |
Contract Value | Unrealized Appreciation (Depreciation) |
||||||||||
| Austrailian Dollar Currency Futures |
569 | March 2017 | $ | (40,979,380 | ) | $ | 695,225 | |||||||
| British Pound Currency Futures |
721 | March 2017 | (55,688,238 | ) | 490,637 | |||||||||
| Canadian Dollar Currency Futures |
407 | March 2017 | (30,286,905 | ) | 122,769 | |||||||||
| Euro Currency Futures |
494 | March 2017 | (65,294,450 | ) | 159,691 | |||||||||
| Japanese Yen Currency Futures |
428 | March 2017 | (45,993,950 | ) | 356,233 | |||||||||
| Mexican Peso Futures |
275 | March 2017 | (6,595,875 | ) | (16,678 | ) | ||||||||
| Swiss Franc Currency Futures |
230 | March 2017 | (28,364,750 | ) | (4,590 | ) | ||||||||
|
|
|
|
|
|||||||||||
| $ | (273,203,548 | ) | $ | 1,803,287 | ||||||||||
|
|
|
|
|
|||||||||||
| Equity Futures Contracts
|
| |||||||||||||
| Description |
Number of Contracts |
Expiration Date |
Contract Value | Unrealized Appreciation (Depreciation) |
||||||||||
| FTSE/JSE Top 40 Index Futures |
226 | March 2017 | $ | (7,290,912 | ) | $ | 59,049 | |||||||
| H-SHARES Index Futures |
11 | January 2017 | (665,859 | ) | (10,156 | ) | ||||||||
|
|
|
|
|
|||||||||||
| $ | (7,956,771 | ) | $ | 48,893 | ||||||||||
|
|
|
|
|
|||||||||||
| Interest Rate Futures Contracts
|
| |||||||||||||
| Description |
Number of Contracts |
Expiration Date |
Contract Value | Unrealized Appreciation (Depreciation) |
||||||||||
| 3-Month Euro Euribor Futures |
1,082 | March 2018 | $ | (285,439,555 | ) | $ | (55,097 | ) | ||||||
| 3-Month Euro Euribor Futures |
158 | December 2018 | (41,656,614 | ) | (18,623 | ) | ||||||||
| 3-Month Euro Euribor Futures |
390 | September 2019 | (102,710,391 | ) | (76,533 | ) | ||||||||
| 90-Day Eurodollar Futures |
506 | March 2018 | (124,425,400 | ) | 105,177 | |||||||||
| 90-Day Eurodollar Futures |
498 | December 2018 | (122,010,000 | ) | 132,953 | |||||||||
| 90-Day Eurodollar Futures |
535 | September 2019 | (130,747,312 | ) | 124,502 | |||||||||
| 90-Day Sterling Futures |
941 | March 2018 | (144,221,724 | ) | (88,880 | ) | ||||||||
| 90-Day Sterling Futures |
1,312 | December 2018 | (200,799,827 | ) | (204,647 | ) | ||||||||
| Austrailia 10-Year Bond Futures |
386 | March 2017 | (35,583,574 | ) | (162,246 | ) | ||||||||
| Austrailia 3-Year Bond Futures |
2,457 | March 2017 | (197,641,800 | ) | 413,513 | |||||||||
| Euro-Buxl 30-Year Bond Futures |
3 | March 2017 | (547,968 | ) | (21,424 | ) | ||||||||
| Japanese 10-Year Government Bond Futures |
118 | March 2017 | (151,686,160 | ) | (22,515 | ) | ||||||||
| U.S. Long Bond Futures |
66 | March 2017 | (9,943,313 | ) | 90,612 | |||||||||
| U.S. Treasury 10-Year Note Futures |
141 | March 2017 | (17,523,656 | ) | 32,324 | |||||||||
| U.S. Treasury 2-Year Note Futures |
648 | March 2017 | (140,413,500 | ) | 33,424 | |||||||||
| U.S. Treasury 5-Year Note Futures |
374 | March 2017 | (44,006,360 | ) | 134,666 | |||||||||
| U.S. Ultra Bond Futures |
94 | March 2017 | (15,063,500 | ) | 183,625 | |||||||||
|
|
|
|
|
|||||||||||
| $ | (1,764,420,654 | ) | $ | 600,831 | ||||||||||
|
|
|
|
|
|||||||||||
| See accompanying notes
|
||||
| 14 |
American Beacon AHL Managed Futures Strategy FundSM
Consolidated Schedule of Investments
December 31, 2016
Forward Currency Contracts Open on December 31, 2016:
| Type |
Currency | Principal Amount Covered by Contract |
Settlement Date | Counterparty | Unrealized Appreciation |
Unrealized (Depreciation) |
Net Unrealized Appreciation (Depreciation) |
|||||||||||||||||
| Buy |
TWD | 232,728 | 1/6/2017 | DUB | $ | — | $ | (3,768 | ) | $ | (3,768 | ) | ||||||||||||
| Buy |
TWD | 232,728 | 1/6/2017 | DUB | — | (3,792 | ) | (3,792 | ) | |||||||||||||||
| Buy |
INR | 1,509,986 | 1/6/2017 | DUB | — | (6,533 | ) | (6,533 | ) | |||||||||||||||
| Buy |
TWD | 310,304 | 1/6/2017 | DUB | — | (5,292 | ) | (5,292 | ) | |||||||||||||||
| Buy |
INR | 1,362,670 | 1/6/2017 | DUB | — | (5,633 | ) | (5,633 | ) | |||||||||||||||
| Buy |
INR | 1,730,959 | 1/6/2017 | DUB | — | (8,750 | ) | (8,750 | ) | |||||||||||||||
| Buy |
TWD | 155,152 | 1/6/2017 | DUB | — | (2,449 | ) | (2,449 | ) | |||||||||||||||
| Buy |
INR | 1,878,275 | 1/6/2017 | DUB | — | (7,820 | ) | (7,820 | ) | |||||||||||||||
| Buy |
TWD | 310,304 | 1/6/2017 | DUB | — | (5,044 | ) | (5,044 | ) | |||||||||||||||
| Buy |
TWD | 232,728 | 1/6/2017 | DUB | — | (3,405 | ) | (3,405 | ) | |||||||||||||||
| Buy |
TWD | 465,456 | 1/6/2017 | DUB | — | (6,880 | ) | (6,880 | ) | |||||||||||||||
| Buy |
TWD | 77,576 | 1/6/2017 | DUB | — | (1,122 | ) | (1,122 | ) | |||||||||||||||
| Buy |
TWD | 77,576 | 1/6/2017 | DUB | — | (1,128 | ) | (1,128 | ) | |||||||||||||||
| Buy |
TWD | 77,576 | 1/6/2017 | DUB | — | (1,109 | ) | (1,109 | ) | |||||||||||||||
| Buy |
TWD | 77,576 | 1/6/2017 | DUB | — | (1,100 | ) | (1,100 | ) | |||||||||||||||
| Buy |
TWD | 155,152 | 1/6/2017 | DUB | — | (2,378 | ) | (2,378 | ) | |||||||||||||||
| Buy |
INR | 1,325,841 | 1/6/2017 | DUB | 9,426 | — | 9,426 | |||||||||||||||||
| Buy |
INR | 1,399,499 | 1/6/2017 | DUB | 9,493 | — | 9,493 | |||||||||||||||||
| Buy |
INR | 1,730,959 | 1/6/2017 | DUB | 5,682 | — | 5,682 | |||||||||||||||||
| Buy |
INR | 736,578 | 1/6/2017 | DUB | 3,645 | — | 3,645 | |||||||||||||||||
| Buy |
INR | 1,509,986 | 1/6/2017 | DUB | — | (4,024 | ) | (4,024 | ) | |||||||||||||||
| Buy |
INR | 1,767,788 | 1/6/2017 | DUB | — | (5,130 | ) | (5,130 | ) | |||||||||||||||
| Buy |
INR | 2,136,078 | 1/6/2017 | DUB | — | (9,543 | ) | (9,543 | ) | |||||||||||||||
| Buy |
INR | 1,620,473 | 1/6/2017 | DUB | — | (3,959 | ) | (3,959 | ) | |||||||||||||||
| Buy |
INR | 3,277,774 | 1/6/2017 | DUB | — | (18,327 | ) | (18,327 | ) | |||||||||||||||
| Buy |
TWD | 77,576 | 1/6/2017 | DUB | — | (1,003 | ) | (1,003 | ) | |||||||||||||||
| Buy |
INR | 220,974 | 1/6/2017 | DUB | 457 | — | 457 | |||||||||||||||||
| Buy |
TWD | 77,576 | 1/6/2017 | DUB | — | (1,132 | ) | (1,132 | ) | |||||||||||||||
| Buy |
TWD | 465,456 | 1/6/2017 | DUB | — | (7,521 | ) | (7,521 | ) | |||||||||||||||
| Buy |
TWD | 232,728 | 1/6/2017 | DUB | — | (3,202 | ) | (3,202 | ) | |||||||||||||||
| Buy |
TWD | 155,152 | 1/6/2017 | DUB | — | (2,239 | ) | (2,239 | ) | |||||||||||||||
| Buy |
TWD | 387,880 | 1/6/2017 | DUB | — | (5,337 | ) | (5,337 | ) | |||||||||||||||
| Buy |
TWD | 232,728 | 1/6/2017 | DUB | — | (3,947 | ) | (3,947 | ) | |||||||||||||||
| Buy |
TWD | 77,576 | 1/6/2017 | DUB | — | (873 | ) | (873 | ) | |||||||||||||||
| Buy |
TWD | 155,152 | 1/6/2017 | DUB | — | (1,863 | ) | (1,863 | ) | |||||||||||||||
| Buy |
INR | 626,092 | 1/6/2017 | DUB | 4,247 | — | 4,247 | |||||||||||||||||
| Buy |
TWD | 232,728 | 1/6/2017 | DUB | — | (3,872 | ) | (3,872 | ) | |||||||||||||||
| Buy |
INR | 1,068,039 | 1/6/2017 | DUB | — | (3,400 | ) | (3,400 | ) | |||||||||||||||
| Buy |
INR | 1,289,012 | 1/6/2017 | DUB | — | (5,558 | ) | (5,558 | ) | |||||||||||||||
| Buy |
INR | 1,178,526 | 1/6/2017 | DUB | — | (4,556 | ) | (4,556 | ) | |||||||||||||||
| Buy |
INR | 1,252,183 | 1/6/2017 | DUB | — | (4,637 | ) | (4,637 | ) | |||||||||||||||
| Buy |
TWD | 155,152 | 1/6/2017 | DUB | — | (2,447 | ) | (2,447 | ) | |||||||||||||||
| Buy |
TWD | 232,728 | 1/6/2017 | DUB | — | (3,820 | ) | (3,820 | ) | |||||||||||||||
| Buy |
TWD | 1,008,489 | 1/6/2017 | DUB | — | (16,748 | ) | (16,748 | ) | |||||||||||||||
| Buy |
TWD | 2,482,435 | 1/6/2017 | DUB | — | (46,410 | ) | (46,410 | ) | |||||||||||||||
| Buy |
TWD | 2,792,739 | 1/6/2017 | DUB | — | (53,750 | ) | (53,750 | ) | |||||||||||||||
| Buy |
INR | 3,867,037 | 1/6/2017 | DUB | — | (18,456 | ) | (18,456 | ) | |||||||||||||||
| Buy |
INR | 2,946,314 | 1/6/2017 | DUB | — | (14,193 | ) | (14,193 | ) | |||||||||||||||
| Buy |
TWD | 2,715,163 | 1/6/2017 | DUB | — | (49,887 | ) | (49,887 | ) | |||||||||||||||
| Buy |
INR | 2,688,511 | 1/6/2017 | DUB | — | (11,592 | ) | (11,592 | ) | |||||||||||||||
| Buy |
INR | 773,407 | 1/6/2017 | DUB | 3,263 | — | 3,263 | |||||||||||||||||
| Buy |
INR | 2,357,051 | 1/6/2017 | DUB | 2,101 | — | 2,101 | |||||||||||||||||
| Buy |
INR | 2,025,591 | 1/6/2017 | DUB | 5,077 | — | 5,077 | |||||||||||||||||
| Buy |
INR | 2,283,393 | 1/6/2017 | DUB | 2,942 | — | 2,942 | |||||||||||||||||
| Buy |
INR | 1,804,617 | 1/6/2017 | DUB | 3,412 | — | 3,412 | |||||||||||||||||
| Buy |
INR | 1,583,644 | 1/6/2017 | DUB | 5,083 | — | 5,083 | |||||||||||||||||
| Sell |
TWD | 310,304 | 1/6/2017 | DUB | 1,242 | — | 1,242 | |||||||||||||||||
| See accompanying notes
|
||||
| 15 |
American Beacon AHL Managed Futures Strategy FundSM
Consolidated Schedule of Investments
December 31, 2016
| Type |
Currency | Principal Amount Covered by Contract |
Settlement Date | Counterparty | Unrealized Appreciation |
Unrealized (Depreciation) |
Net Unrealized Appreciation (Depreciation) |
|||||||||||||||||
| Sell |
TWD | 155,152 | 1/6/2017 | DUB | $ | 893 | $ | — | $ | 893 | ||||||||||||||
| Sell |
TWD | 310,304 | 1/6/2017 | DUB | 931 | — | 931 | |||||||||||||||||
| Sell |
INR | 1,546,815 | 1/6/2017 | DUB | — | (6,774 | ) | (6,774 | ) | |||||||||||||||
| Sell |
TWD | 155,152 | 1/6/2017 | DUB | — | (425 | ) | (425 | ) | |||||||||||||||
| Sell |
TWD | 155,152 | 1/6/2017 | DUB | — | (344 | ) | (344 | ) | |||||||||||||||
| Sell |
INR | 1,583,644 | 1/6/2017 | DUB | — | (7,378 | ) | (7,378 | ) | |||||||||||||||
| Sell |
TWD | 77,576 | 1/6/2017 | DUB | — | (129 | ) | (129 | ) | |||||||||||||||
| Sell |
TWD | 155,152 | 1/6/2017 | DUB | — | (233 | ) | (233 | ) | |||||||||||||||
| Sell |
TWD | 155,152 | 1/6/2017 | DUB | — | (181 | ) | (181 | ) | |||||||||||||||
| Sell |
TWD | 155,152 | 1/6/2017 | DUB | — | (166 | ) | (166 | ) | |||||||||||||||
| Sell |
INR | 1,436,328 | 1/6/2017 | DUB | — | (6,583 | ) | (6,583 | ) | |||||||||||||||
| Sell |
INR | 1,878,275 | 1/6/2017 | DUB | — | (9,212 | ) | (9,212 | ) | |||||||||||||||
| Sell |
TWD | 77,576 | 1/6/2017 | DUB | — | (189 | ) | (189 | ) | |||||||||||||||
| Sell |
TWD | 1,784,250 | 1/6/2017 | DUB | 14,334 | — | 14,334 | |||||||||||||||||
| Sell |
TWD | 1,784,250 | 1/6/2017 | DUB | 13,524 | — | 13,524 | |||||||||||||||||
| Sell |
TWD | 155,152 | 1/6/2017 | DUB | 986 | — | 986 | |||||||||||||||||
| Sell |
TWD | 155,152 | 1/6/2017 | DUB | 927 | — | 927 | |||||||||||||||||
| Sell |
TWD | 155,152 | 1/6/2017 | DUB | 889 | — | 889 | |||||||||||||||||
| Sell |
TWD | 543,033 | 1/6/2017 | DUB | 2,904 | — | 2,904 | |||||||||||||||||
| Sell |
TWD | 77,576 | 1/6/2017 | DUB | 500 | — | 500 | |||||||||||||||||
| Sell |
TWD | 3,025,467 | 1/6/2017 | DUB | 19,571 | — | 19,571 | |||||||||||||||||
| Sell |
TWD | 3,025,467 | 1/6/2017 | DUB | 18,269 | — | 18,269 | |||||||||||||||||
| Sell |
TWD | 232,728 | 1/6/2017 | DUB | 1,376 | — | 1,376 | |||||||||||||||||
| Sell |
TWD | 232,728 | 1/6/2017 | DUB | 1,413 | — | 1,413 | |||||||||||||||||
| Sell |
TWD | 77,576 | 1/6/2017 | DUB | 908 | — | 908 | |||||||||||||||||
| Sell |
TWD | 155,152 | 1/6/2017 | DUB | 1,661 | — | 1,661 | |||||||||||||||||
| Sell |
TWD | 15,825,520 | 1/6/2017 | DUB | 126,935 | — | 126,935 | |||||||||||||||||
| Sell |
INR | 405,118 | 1/6/2017 | DUB | — | (1,579 | ) | (1,579 | ) | |||||||||||||||
| Sell |
INR | 552,434 | 1/6/2017 | DUB | — | (2,064 | ) | (2,064 | ) | |||||||||||||||
| Sell |
INR | 1,068,039 | 1/6/2017 | DUB | — | (5,207 | ) | (5,207 | ) | |||||||||||||||
| Sell |
TWD | 2,133,342 | 1/6/2017 | DUB | — | (7,229 | ) | (7,229 | ) | |||||||||||||||
| Sell |
TWD | 2,133,342 | 1/6/2017 | DUB | — | (8,083 | ) | (8,083 | ) | |||||||||||||||
| Sell |
INR | 41,064,251 | 1/6/2017 | DUB | — | (293,445 | ) | (293,445 | ) | |||||||||||||||
| Sell |
TWD | 77,576 | 1/6/2017 | DUB | 671 | — | 671 | |||||||||||||||||
| Sell |
TWD | 387,880 | 1/6/2017 | DUB | — | (464 | ) | (464 | ) | |||||||||||||||
| Sell |
INR | 257,803 | 1/6/2017 | DUB | — | (631 | ) | (631 | ) | |||||||||||||||
| Sell |
TWD | 387,880 | 1/6/2017 | DUB | — | (644 | ) | (644 | ) | |||||||||||||||
| Sell |
TWD | 387,880 | 1/6/2017 | DUB | — | (476 | ) | (476 | ) | |||||||||||||||
| Sell |
TWD | 310,304 | 1/6/2017 | DUB | — | (573 | ) | (573 | ) | |||||||||||||||
| Sell |
TWD | 387,880 | 1/6/2017 | DUB | 379 | — | 379 | |||||||||||||||||
| Sell |
TWD | 310,304 | 1/6/2017 | DUB | 206 | — | 206 | |||||||||||||||||
| Sell |
TWD | 387,880 | 1/6/2017 | DUB | 282 | — | 282 | |||||||||||||||||
| Sell |
TWD | 1,396,369 | 1/6/2017 | DUB | 10,672 | — | 10,672 | |||||||||||||||||
| Sell |
TWD | 387,880 | 1/6/2017 | DUB | 3,417 | — | 3,417 | |||||||||||||||||
| Buy |
PHP | 301,599 | 1/18/2017 | DUB | 2,168 | — | 2,168 | |||||||||||||||||
| Buy |
PHP | 3,122,962 | 1/18/2017 | DUB | 9,089 | — | 9,089 | |||||||||||||||||
| Buy |
PHP | 582,489 | 1/18/2017 | DUB | 1,928 | — | 1,928 | |||||||||||||||||
| Buy |
PHP | 3,181,070 | 1/18/2017 | DUB | 9,894 | — | 9,894 | |||||||||||||||||
| Buy |
PHP | 251,333 | 1/18/2017 | DUB | 757 | — | 757 | |||||||||||||||||
| Buy |
PHP | 251,333 | 1/18/2017 | DUB | 581 | — | 581 | |||||||||||||||||
| Buy |
PHP | 201,066 | 1/18/2017 | DUB | 625 | — | 625 | |||||||||||||||||
| Buy |
PHP | 251,333 | 1/18/2017 | DUB | 430 | — | 430 | |||||||||||||||||
| Buy |
PHP | 150,800 | 1/18/2017 | DUB | 379 | — | 379 | |||||||||||||||||
| Buy |
PHP | 201,066 | 1/18/2017 | DUB | 505 | — | 505 | |||||||||||||||||
| Buy |
PHP | 150,800 | 1/18/2017 | DUB | 441 | — | 441 | |||||||||||||||||
| Sell |
PHP | 502,666 | 1/18/2017 | DUB | — | (5,235 | ) | (5,235 | ) | |||||||||||||||
| Sell |
PHP | 31,115,013 | 1/18/2017 | DUB | — | (143,333 | ) | (143,333 | ) | |||||||||||||||
| Buy |
EUR | 141,867 | 1/19/2017 | DUB | 758 | — | 758 | |||||||||||||||||
| Buy |
JPY | 341,745 | 1/19/2017 | DUB | 1,095 | — | 1,095 | |||||||||||||||||
| See accompanying notes
|
||||
| 16 |
American Beacon AHL Managed Futures Strategy FundSM
Consolidated Schedule of Investments
December 31, 2016
| Type |
Currency | Principal Amount Covered by Contract |
Settlement Date | Counterparty | Unrealized Appreciation |
Unrealized (Depreciation) |
Net Unrealized Appreciation (Depreciation) |
|||||||||||||||||
| Buy |
ZAR | 221,853 | 1/19/2017 | DUB | $ | 4,503 | $ | — | $ | 4,503 | ||||||||||||||
| Buy |
SEK | 58,925 | 1/19/2017 | DUB | 1,412 | — | 1,412 | |||||||||||||||||
| Buy |
EUR | 18,542 | 1/19/2017 | DUB | 101 | — | 101 | |||||||||||||||||
| Buy |
JPY | 905,521 | 1/19/2017 | DUB | 2,856 | — | 2,856 | |||||||||||||||||
| Sell |
KRW | 579,566 | 1/23/2017 | DUB | 6,017 | — | 6,017 | |||||||||||||||||
| Sell |
KRW | 248,386 | 1/23/2017 | DUB | 2,325 | — | 2,325 | |||||||||||||||||
| Sell |
KRW | 331,181 | 1/23/2017 | DUB | 3,099 | — | 3,099 | |||||||||||||||||
| Sell |
KRW | 579,566 | 1/23/2017 | DUB | 7,052 | — | 7,052 | |||||||||||||||||
| Sell |
KRW | 827,952 | 1/23/2017 | DUB | 15,492 | — | 15,492 | |||||||||||||||||
| Sell |
KRW | 662,361 | 1/23/2017 | DUB | — | (18 | ) | (18 | ) | |||||||||||||||
| Sell |
KRW | 413,976 | 1/23/2017 | DUB | 27 | — | 27 | |||||||||||||||||
| Sell |
KRW | 579,566 | 1/23/2017 | DUB | — | (19 | ) | (19 | ) | |||||||||||||||
| Sell |
KRW | 579,566 | 1/23/2017 | DUB | 10,753 | — | 10,753 | |||||||||||||||||
| Sell |
KRW | 496,771 | 1/23/2017 | DUB | 5,935 | — | 5,935 | |||||||||||||||||
| Sell |
KRW | 1,241,927 | 1/23/2017 | DUB | 13,261 | — | 13,261 | |||||||||||||||||
| Sell |
KRW | 165,590 | 1/23/2017 | DUB | 2,856 | — | 2,856 | |||||||||||||||||
| Sell |
KRW | 579,566 | 1/23/2017 | DUB | 10,394 | — | 10,394 | |||||||||||||||||
| Sell |
KRW | 82,795 | 1/23/2017 | DUB | 1,485 | — | 1,485 | |||||||||||||||||
| Sell |
KRW | 496,771 | 1/23/2017 | DUB | 8,569 | — | 8,569 | |||||||||||||||||
| Sell |
KRW | 413,976 | 1/23/2017 | DUB | 5,621 | — | 5,621 | |||||||||||||||||
| Sell |
KRW | 413,976 | 1/23/2017 | DUB | 6,715 | — | 6,715 | |||||||||||||||||
| Sell |
KRW | 496,771 | 1/23/2017 | DUB | 6,935 | — | 6,935 | |||||||||||||||||
| Sell |
KRW | 496,771 | 1/23/2017 | DUB | 6,682 | — | 6,682 | |||||||||||||||||
| Sell |
KRW | 745,157 | 1/23/2017 | DUB | 10,086 | — | 10,086 | |||||||||||||||||
| Sell |
KRW | 55,058,785 | 1/23/2017 | DUB | 779,461 | — | 779,461 | |||||||||||||||||
| Sell |
KRW | 413,976 | 1/23/2017 | DUB | — | (89 | ) | (89 | ) | |||||||||||||||
| Sell |
KRW | 579,566 | 1/23/2017 | DUB | — | (944 | ) | (944 | ) | |||||||||||||||
| Sell |
KRW | 413,976 | 1/23/2017 | DUB | — | (284 | ) | (284 | ) | |||||||||||||||
| Sell |
KRW | 662,361 | 1/23/2017 | DUB | — | (312 | ) | (312 | ) | |||||||||||||||
| Sell |
KRW | 662,361 | 1/23/2017 | DUB | 1,346 | — | 1,346 | |||||||||||||||||
| Sell |
KRW | 413,976 | 1/23/2017 | DUB | 764 | — | 764 | |||||||||||||||||
| Sell |
KRW | 496,771 | 1/23/2017 | DUB | 480 | — | 480 | |||||||||||||||||
| Sell |
KRW | 579,566 | 1/23/2017 | DUB | 2,939 | — | 2,939 | |||||||||||||||||
| Sell |
KRW | 496,771 | 1/23/2017 | DUB | 2,014 | — | 2,014 | |||||||||||||||||
| Sell |
KRW | 662,361 | 1/23/2017 | DUB | 11,505 | — | 11,505 | |||||||||||||||||
| Sell |
TWD | 77,691 | 2/10/2017 | DUB | — | (52 | ) | (52 | ) | |||||||||||||||
| Buy |
BRL | 61,450 | 1/4/2017 | HUS | 1,727 | — | 1,727 | |||||||||||||||||
| Buy |
BRL | 61,450 | 1/4/2017 | HUS | 1,755 | — | 1,755 | |||||||||||||||||
| Buy |
BRL | 30,725 | 1/4/2017 | HUS | 869 | — | 869 | |||||||||||||||||
| Buy |
BRL | 30,725 | 1/4/2017 | HUS | 917 | — | 917 | |||||||||||||||||
| Buy |
BRL | 61,450 | 1/4/2017 | HUS | 1,798 | — | 1,798 | |||||||||||||||||
| Buy |
BRL | 645,221 | 1/4/2017 | HUS | 15,592 | — | 15,592 | |||||||||||||||||
| Buy |
BRL | 92,174 | 1/4/2017 | HUS | 3,148 | — | 3,148 | |||||||||||||||||
| Buy |
BRL | 122,899 | 1/4/2017 | HUS | 4,282 | — | 4,282 | |||||||||||||||||
| Buy |
BRL | 122,899 | 1/4/2017 | HUS | 4,282 | — | 4,282 | |||||||||||||||||
| Buy |
BRL | 92,174 | 1/4/2017 | HUS | 3,016 | — | 3,016 | |||||||||||||||||
| Buy |
BRL | 92,174 | 1/4/2017 | HUS | 2,947 | — | 2,947 | |||||||||||||||||
| Buy |
BRL | 2,120,011 | 1/4/2017 | HUS | 94,650 | — | 94,650 | |||||||||||||||||
| Buy |
BRL | 1,997,112 | 1/4/2017 | HUS | 88,379 | — | 88,379 | |||||||||||||||||
| Buy |
BRL | 30,725 | 1/4/2017 | HUS | 1,324 | — | 1,324 | |||||||||||||||||
| Buy |
BRL | 92,174 | 1/4/2017 | HUS | 4,017 | — | 4,017 | |||||||||||||||||
| Buy |
BRL | 30,725 | 1/4/2017 | HUS | 1,348 | — | 1,348 | |||||||||||||||||
| Buy |
BRL | 184,349 | 1/4/2017 | HUS | 7,857 | — | 7,857 | |||||||||||||||||
| Buy |
BRL | 798,845 | 1/4/2017 | HUS | 30,907 | — | 30,907 | |||||||||||||||||
| Buy |
BRL | 122,899 | 1/4/2017 | HUS | 3,809 | — | 3,809 | |||||||||||||||||
| Buy |
BRL | 61,450 | 1/4/2017 | HUS | 1,532 | — | 1,532 | |||||||||||||||||
| Buy |
BRL | 30,725 | 1/4/2017 | HUS | 811 | — | 811 | |||||||||||||||||
| Buy |
BRL | 491,597 | 1/4/2017 | HUS | 13,956 | — | 13,956 | |||||||||||||||||
| Buy |
BRL | 61,450 | 1/4/2017 | HUS | 1,521 | — | 1,521 | |||||||||||||||||
| See accompanying notes
|
||||
| 17 |
American Beacon AHL Managed Futures Strategy FundSM
Consolidated Schedule of Investments
December 31, 2016
| Type |
Currency | Principal Amount Covered by Contract |
Settlement Date | Counterparty | Unrealized Appreciation |
Unrealized (Depreciation) |
Net Unrealized Appreciation (Depreciation) |
|||||||||||||||||
| Buy |
BRL | 92,174 | 1/4/2017 | HUS | $ | 3,140 | $ | — | $ | 3,140 | ||||||||||||||
| Buy |
BRL | 276,523 | 1/4/2017 | HUS | 14,079 | — | 14,079 | |||||||||||||||||
| Buy |
BRL | 92,174 | 1/4/2017 | HUS | 2,343 | — | 2,343 | |||||||||||||||||
| Buy |
BRL | 30,725 | 1/4/2017 | HUS | 723 | — | 723 | |||||||||||||||||
| Buy |
BRL | 645,221 | 1/4/2017 | HUS | 13,623 | — | 13,623 | |||||||||||||||||
| Buy |
BRL | 1,075,368 | 1/4/2017 | HUS | 48,493 | — | 48,493 | |||||||||||||||||
| Buy |
BRL | 952,469 | 1/4/2017 | HUS | 45,930 | — | 45,930 | |||||||||||||||||
| Buy |
BRL | 1,935,662 | 1/4/2017 | HUS | 93,449 | — | 93,449 | |||||||||||||||||
| Buy |
BRL | 1,689,864 | 1/4/2017 | HUS | 80,924 | — | 80,924 | |||||||||||||||||
| Buy |
BRL | 768,120 | 1/4/2017 | HUS | 34,789 | — | 34,789 | |||||||||||||||||
| Buy |
BRL | 798,845 | 1/4/2017 | HUS | 36,023 | — | 36,023 | |||||||||||||||||
| Buy |
BRL | 921,744 | 1/4/2017 | HUS | 41,566 | — | 41,566 | |||||||||||||||||
| Buy |
BRL | 798,845 | 1/4/2017 | HUS | 36,113 | — | 36,113 | |||||||||||||||||
| Buy |
BRL | 553,046 | 1/4/2017 | HUS | 21,282 | — | 21,282 | |||||||||||||||||
| Buy |
BRL | 61,450 | 1/4/2017 | HUS | 2,159 | — | 2,159 | |||||||||||||||||
| Buy |
BRL | 122,899 | 1/4/2017 | HUS | 5,249 | — | 5,249 | |||||||||||||||||
| Buy |
BRL | 430,147 | 1/4/2017 | HUS | 18,830 | — | 18,830 | |||||||||||||||||
| Buy |
BRL | 61,450 | 1/4/2017 | HUS | 1,593 | — | 1,593 | |||||||||||||||||
| Buy |
BRL | 30,725 | 1/4/2017 | HUS | 724 | — | 724 | |||||||||||||||||
| Buy |
BRL | 30,725 | 1/4/2017 | HUS | 766 | — | 766 | |||||||||||||||||
| Buy |
BRL | 92,174 | 1/4/2017 | HUS | 2,168 | — | 2,168 | |||||||||||||||||
| Buy |
BRL | 30,725 | 1/4/2017 | HUS | 721 | — | 721 | |||||||||||||||||
| Buy |
BRL | 30,725 | 1/4/2017 | HUS | 723 | — | 723 | |||||||||||||||||
| Buy |
BRL | 337,973 | 1/4/2017 | HUS | 16,269 | — | 16,269 | |||||||||||||||||
| Buy |
BRL | 430,147 | 1/4/2017 | HUS | 20,467 | — | 20,467 | |||||||||||||||||
| Buy |
BRL | 122,899 | 1/4/2017 | HUS | 5,875 | — | 5,875 | |||||||||||||||||
| Buy |
BRL | 215,074 | 1/4/2017 | HUS | 11,289 | — | 11,289 | |||||||||||||||||
| Buy |
BRL | 1,536,240 | 1/4/2017 | HUS | 73,567 | — | 73,567 | |||||||||||||||||
| Buy |
BRL | 768,120 | 1/4/2017 | HUS | 34,207 | — | 34,207 | |||||||||||||||||
| Buy |
BRL | 61,450 | 1/4/2017 | HUS | 1,431 | — | 1,431 | |||||||||||||||||
| Buy |
BRL | 61,450 | 1/4/2017 | HUS | 1,445 | — | 1,445 | |||||||||||||||||
| Buy |
BRL | 61,450 | 1/4/2017 | HUS | 1,395 | — | 1,395 | |||||||||||||||||
| Buy |
BRL | 30,725 | 1/4/2017 | HUS | 696 | — | 696 | |||||||||||||||||
| Buy |
BRL | 30,725 | 1/4/2017 | HUS | 803 | — | 803 | |||||||||||||||||
| Buy |
BRL | 61,450 | 1/4/2017 | HUS | 1,607 | — | 1,607 | |||||||||||||||||
| Buy |
BRL | 122,899 | 1/4/2017 | HUS | 3,763 | — | 3,763 | |||||||||||||||||
| Buy |
BRL | 61,450 | 1/4/2017 | HUS | 1,377 | — | 1,377 | |||||||||||||||||
| Buy |
BRL | 92,174 | 1/4/2017 | HUS | 2,109 | — | 2,109 | |||||||||||||||||
| Buy |
BRL | 337,973 | 1/4/2017 | HUS | 16,908 | — | 16,908 | |||||||||||||||||
| Buy |
BRL | 184,349 | 1/4/2017 | HUS | 9,238 | — | 9,238 | |||||||||||||||||
| Buy |
BRL | 1,812,763 | 1/4/2017 | HUS | 86,809 | — | 86,809 | |||||||||||||||||
| Buy |
BRL | 122,899 | 1/4/2017 | HUS | 3,887 | — | 3,887 | |||||||||||||||||
| Buy |
BRL | 61,450 | 1/4/2017 | HUS | 1,938 | — | 1,938 | |||||||||||||||||
| Buy |
BRL | 122,899 | 1/4/2017 | HUS | 4,036 | — | 4,036 | |||||||||||||||||
| Buy |
BRL | 92,174 | 1/4/2017 | HUS | 3,016 | — | 3,016 | |||||||||||||||||
| Buy |
BRL | 92,174 | 1/4/2017 | HUS | 3,016 | — | 3,016 | |||||||||||||||||
| Buy |
BRL | 768,120 | 1/4/2017 | HUS | 24,847 | — | 24,847 | |||||||||||||||||
| Buy |
BRL | 122,899 | 1/4/2017 | HUS | 4,338 | — | 4,338 | |||||||||||||||||
| Buy |
BRL | 92,174 | 1/4/2017 | HUS | 3,227 | — | 3,227 | |||||||||||||||||
| Buy |
BRL | 92,174 | 1/4/2017 | HUS | 3,965 | — | 3,965 | |||||||||||||||||
| Buy |
BRL | 891,019 | 1/4/2017 | HUS | 32,701 | — | 32,701 | |||||||||||||||||
| Buy |
BRL | 30,725 | 1/4/2017 | HUS | 881 | — | 881 | |||||||||||||||||
| Buy |
BRL | 645,221 | 1/4/2017 | HUS | 17,812 | — | 17,812 | |||||||||||||||||
| Buy |
BRL | 1,956,248 | 1/4/2017 | HUS | 55,310 | — | 55,310 | |||||||||||||||||
| Buy |
BRL | 2,959,720 | 1/4/2017 | HUS | 83,940 | — | 83,940 | |||||||||||||||||
| Buy |
BRL | 30,725 | 1/4/2017 | HUS | 911 | — | 911 | |||||||||||||||||
| Buy |
BRL | 61,450 | 1/4/2017 | HUS | 1,851 | — | 1,851 | |||||||||||||||||
| Buy |
BRL | 30,725 | 1/4/2017 | HUS | 890 | — | 890 | |||||||||||||||||
| Buy |
BRL | 30,725 | 1/4/2017 | HUS | 913 | — | 913 | |||||||||||||||||
| See accompanying notes
|
||||
| 18 |
American Beacon AHL Managed Futures Strategy FundSM
Consolidated Schedule of Investments
December 31, 2016
| Type |
Currency | Principal Amount Covered by Contract |
Settlement Date | Counterparty | Unrealized Appreciation |
Unrealized (Depreciation) |
Net Unrealized Appreciation (Depreciation) |
|||||||||||||||||
| Buy |
BRL | 92,174 | 1/4/2017 | HUS | $ | 2,606 | $ | — | $ | 2,606 | ||||||||||||||
| Buy |
BRL | 829,570 | 1/4/2017 | HUS | 39,495 | — | 39,495 | |||||||||||||||||
| Buy |
BRL | 92,174 | 1/4/2017 | HUS | 2,606 | — | 2,606 | |||||||||||||||||
| Sell |
BRL | 2,427,259 | 1/4/2017 | HUS | — | (89,635 | ) | (89,635 | ) | |||||||||||||||
| Sell |
BRL | 245,798 | 1/4/2017 | HUS | — | (11,098 | ) | (11,098 | ) | |||||||||||||||
| Sell |
BRL | 215,074 | 1/4/2017 | HUS | — | (13,368 | ) | (13,368 | ) | |||||||||||||||
| Sell |
BRL | 430,147 | 1/4/2017 | HUS | — | (29,460 | ) | (29,460 | ) | |||||||||||||||
| Sell |
BRL | 31,185,670 | 1/4/2017 | HUS | — | (1,652,813 | ) | (1,652,813 | ) | |||||||||||||||
| Sell |
TWD | 232,728 | 1/6/2017 | HUS | 358 | — | 358 | |||||||||||||||||
| Buy |
CLP | 521,708 | 1/27/2017 | HUS | — | (16,133 | ) | (16,133 | ) | |||||||||||||||
| Buy |
CLP | 968,886 | 1/27/2017 | HUS | — | (28,054 | ) | (28,054 | ) | |||||||||||||||
| Buy |
CLP | 476,990 | 1/27/2017 | HUS | — | (14,493 | ) | (14,493 | ) | |||||||||||||||
| Buy |
CLP | 852,620 | 1/27/2017 | HUS | — | (18,763 | ) | (18,763 | ) | |||||||||||||||
| Buy |
CLP | 606,672 | 1/27/2017 | HUS | — | (16,031 | ) | (16,031 | ) | |||||||||||||||
| Buy |
CLP | 605,181 | 1/27/2017 | HUS | — | (15,897 | ) | (15,897 | ) | |||||||||||||||
| Buy |
CLP | 564,935 | 1/27/2017 | HUS | — | (14,991 | ) | (14,991 | ) | |||||||||||||||
| Buy |
CLP | 447,178 | 1/27/2017 | HUS | — | (14,152 | ) | (14,152 | ) | |||||||||||||||
| Buy |
CLP | 223,589 | 1/27/2017 | HUS | — | (7,390 | ) | (7,390 | ) | |||||||||||||||
| Buy |
CLP | 526,180 | 1/27/2017 | HUS | — | (16,527 | ) | (16,527 | ) | |||||||||||||||
| Buy |
COP | 66,331 | 1/27/2017 | HUS | — | (515 | ) | (515 | ) | |||||||||||||||
| Buy |
COP | 66,331 | 1/27/2017 | HUS | — | (84 | ) | (84 | ) | |||||||||||||||
| Buy |
COP | 66,331 | 1/27/2017 | HUS | — | (230 | ) | (230 | ) | |||||||||||||||
| Buy |
COP | 994,958 | 1/27/2017 | HUS | — | (8,661 | ) | (8,661 | ) | |||||||||||||||
| Buy |
COP | 66,331 | 1/27/2017 | HUS | 138 | — | 138 | |||||||||||||||||
| Buy |
COP | 1,790,925 | 1/27/2017 | HUS | — | (19,679 | ) | (19,679 | ) | |||||||||||||||
| Buy |
COP | 1,459,272 | 1/27/2017 | HUS | — | (18,016 | ) | (18,016 | ) | |||||||||||||||
| Buy |
CLP | 1,179,060 | 1/27/2017 | HUS | — | (22,805 | ) | (22,805 | ) | |||||||||||||||
| Buy |
CLP | 1,383,271 | 1/27/2017 | HUS | — | (27,093 | ) | (27,093 | ) | |||||||||||||||
| Buy |
CLP | 693,126 | 1/27/2017 | HUS | — | (21,977 | ) | (21,977 | ) | |||||||||||||||
| Buy |
COP | 66,331 | 1/27/2017 | HUS | 106 | — | 106 | |||||||||||||||||
| Buy |
COP | 994,958 | 1/27/2017 | HUS | — | (11,495 | ) | (11,495 | ) | |||||||||||||||
| Buy |
COP | 66,331 | 1/27/2017 | HUS | — | (303 | ) | (303 | ) | |||||||||||||||
| Buy |
CLP | 453,141 | 1/27/2017 | HUS | — | (8,665 | ) | (8,665 | ) | |||||||||||||||
| Buy |
CLP | 572,388 | 1/27/2017 | HUS | — | (18,448 | ) | (18,448 | ) | |||||||||||||||
| Buy |
CLP | 621,578 | 1/27/2017 | HUS | — | (20,389 | ) | (20,389 | ) | |||||||||||||||
| Buy |
CLP | 500,840 | 1/27/2017 | HUS | — | (16,060 | ) | (16,060 | ) | |||||||||||||||
| Buy |
COP | 66,331 | 1/27/2017 | HUS | — | (206 | ) | (206 | ) | |||||||||||||||
| Buy |
COP | 66,331 | 1/27/2017 | HUS | — | (421 | ) | (421 | ) | |||||||||||||||
| Buy |
COP | 66,331 | 1/27/2017 | HUS | — | (16 | ) | (16 | ) | |||||||||||||||
| Buy |
COP | 66,331 | 1/27/2017 | HUS | — | (528 | ) | (528 | ) | |||||||||||||||
| Buy |
COP | 397,983 | 1/27/2017 | HUS | — | (1,210 | ) | (1,210 | ) | |||||||||||||||
| Buy |
COP | 66,331 | 1/27/2017 | HUS | — | (147 | ) | (147 | ) | |||||||||||||||
| Buy |
COP | 66,331 | 1/27/2017 | HUS | 57 | — | 57 | |||||||||||||||||
| Buy |
COP | 66,331 | 1/27/2017 | HUS | — | (13 | ) | (13 | ) | |||||||||||||||
| Buy |
CLP | 1,214,834 | 1/27/2017 | HUS | — | (26,150 | ) | (26,150 | ) | |||||||||||||||
| Buy |
CLP | 2,009,321 | 1/27/2017 | HUS | — | (47,702 | ) | (47,702 | ) | |||||||||||||||
| Buy |
CLP | 1,214,834 | 1/27/2017 | HUS | — | (26,392 | ) | (26,392 | ) | |||||||||||||||
| Buy |
CLP | 724,429 | 1/27/2017 | HUS | — | (18,361 | ) | (18,361 | ) | |||||||||||||||
| Buy |
CLP | 2,153,908 | 1/27/2017 | HUS | — | (42,421 | ) | (42,421 | ) | |||||||||||||||
| Buy |
CLP | 1,563,633 | 1/27/2017 | HUS | — | (30,989 | ) | (30,989 | ) | |||||||||||||||
| Buy |
CLP | 406,932 | 1/27/2017 | HUS | — | (7,794 | ) | (7,794 | ) | |||||||||||||||
| Buy |
CLP | 1,475,688 | 1/27/2017 | HUS | — | (29,018 | ) | (29,018 | ) | |||||||||||||||
| Buy |
CLP | 2,065,963 | 1/27/2017 | HUS | — | (53,633 | ) | (53,633 | ) | |||||||||||||||
| Buy |
CLP | 2,575,747 | 1/27/2017 | HUS | — | (70,704 | ) | (70,704 | ) | |||||||||||||||
| Buy |
CLP | 263,835 | 1/27/2017 | HUS | — | (8,110 | ) | (8,110 | ) | |||||||||||||||
| Buy |
CLP | 620,087 | 1/27/2017 | HUS | — | (18,787 | ) | (18,787 | ) | |||||||||||||||
| Buy |
CLP | 406,932 | 1/27/2017 | HUS | — | (13,336 | ) | (13,336 | ) | |||||||||||||||
| Buy |
CLP | 669,277 | 1/27/2017 | HUS | — | (20,918 | ) | (20,918 | ) | |||||||||||||||
| Buy |
CLP | 597,728 | 1/27/2017 | HUS | — | (19,512 | ) | (19,512 | ) | |||||||||||||||
| See accompanying notes
|
||||
| 19 |
American Beacon AHL Managed Futures Strategy FundSM
Consolidated Schedule of Investments
December 31, 2016
| Type |
Currency | Principal Amount Covered by Contract |
Settlement Date | Counterparty | Unrealized Appreciation |
Unrealized (Depreciation) |
Net Unrealized Appreciation (Depreciation) |
|||||||||||||||||
| Buy |
CLP | 311,534 | 1/27/2017 | HUS | $ | — | $ | (9,437 | ) | $ | (9,437 | ) | ||||||||||||
| Buy |
CLP | 2,384,950 | 1/27/2017 | HUS | — | (60,411 | ) | (60,411 | ) | |||||||||||||||
| Buy |
CLP | 459,103 | 1/27/2017 | HUS | — | (12,139 | ) | (12,139 | ) | |||||||||||||||
| Buy |
CLP | 819,827 | 1/27/2017 | HUS | — | (22,311 | ) | (22,311 | ) | |||||||||||||||
| Buy |
COP | 66,331 | 1/27/2017 | HUS | — | (69 | ) | (69 | ) | |||||||||||||||
| Buy |
COP | 66,331 | 1/27/2017 | HUS | — | (108 | ) | (108 | ) | |||||||||||||||
| Buy |
COP | 66,331 | 1/27/2017 | HUS | — | (315 | ) | (315 | ) | |||||||||||||||
| Buy |
CLP | 298,119 | 1/27/2017 | HUS | — | (8,366 | ) | (8,366 | ) | |||||||||||||||
| Buy |
CLP | 998,698 | 1/27/2017 | HUS | — | (19,157 | ) | (19,157 | ) | |||||||||||||||
| Sell |
CLP | 74,530 | 1/27/2017 | HUS | — | (593 | ) | (593 | ) | |||||||||||||||
| Sell |
COP | 66,331 | 1/27/2017 | HUS | — | (3,814 | ) | (3,814 | ) | |||||||||||||||
| Sell |
CLP | 663,314 | 1/27/2017 | HUS | — | (8,598 | ) | (8,598 | ) | |||||||||||||||
| Sell |
CLP | 102,851 | 1/27/2017 | HUS | — | (629 | ) | (629 | ) | |||||||||||||||
| Sell |
CLP | 223,589 | 1/27/2017 | HUS | — | (2,135 | ) | (2,135 | ) | |||||||||||||||
| Sell |
CLP | 447,178 | 1/27/2017 | HUS | — | (4,517 | ) | (4,517 | ) | |||||||||||||||
| Sell |
CLP | 195,268 | 1/27/2017 | HUS | — | (1,297 | ) | (1,297 | ) | |||||||||||||||
| Sell |
CLP | 566,426 | 1/27/2017 | HUS | — | (6,601 | ) | (6,601 | ) | |||||||||||||||
| Sell |
CLP | 11,925 | 1/27/2017 | HUS | — | (150 | ) | (150 | ) | |||||||||||||||
| Sell |
CLP | 1,110,493 | 1/27/2017 | HUS | — | (13,959 | ) | (13,959 | ) | |||||||||||||||
| Sell |
CLP | 283,213 | 1/27/2017 | HUS | — | (3,630 | ) | (3,630 | ) | |||||||||||||||
| Sell |
CLP | 74,530 | 1/27/2017 | HUS | — | (337 | ) | (337 | ) | |||||||||||||||
| Sell |
CLP | 223,589 | 1/27/2017 | HUS | — | (1,252 | ) | (1,252 | ) | |||||||||||||||
| Sell |
CLP | 745,297 | 1/27/2017 | HUS | — | (5,734 | ) | (5,734 | ) | |||||||||||||||
| Sell |
CLP | 1,280,420 | 1/27/2017 | HUS | — | (16,207 | ) | (16,207 | ) | |||||||||||||||
| Sell |
CLP | 1,185,022 | 1/27/2017 | HUS | — | (16,257 | ) | (16,257 | ) | |||||||||||||||
| Sell |
CLP | 711,013 | 1/27/2017 | HUS | — | (9,258 | ) | (9,258 | ) | |||||||||||||||
| Sell |
CLP | 618,597 | 1/27/2017 | HUS | — | (7,767 | ) | (7,767 | ) | |||||||||||||||
| Sell |
CLP | 1,326,629 | 1/27/2017 | HUS | — | (17,428 | ) | (17,428 | ) | |||||||||||||||
| Sell |
CLP | 149,059 | 1/27/2017 | HUS | — | (746 | ) | (746 | ) | |||||||||||||||
| Sell |
CLP | 74,530 | 1/27/2017 | HUS | — | (208 | ) | (208 | ) | |||||||||||||||
| Sell |
CLP | 93,907 | 1/27/2017 | HUS | — | (1,205 | ) | (1,205 | ) | |||||||||||||||
| Sell |
CLP | 521,708 | 1/27/2017 | HUS | — | (7,255 | ) | (7,255 | ) | |||||||||||||||
| Sell |
CLP | 1,296,817 | 1/27/2017 | HUS | — | (16,366 | ) | (16,366 | ) | |||||||||||||||
| Sell |
CLP | 1,110,493 | 1/27/2017 | HUS | — | (14,056 | ) | (14,056 | ) | |||||||||||||||
| Sell |
CLP | 852,620 | 1/27/2017 | HUS | — | (11,077 | ) | (11,077 | ) | |||||||||||||||
| Sell |
CLP | 584,313 | 1/27/2017 | HUS | — | (6,770 | ) | (6,770 | ) | |||||||||||||||
| Sell |
CLP | 596,238 | 1/27/2017 | HUS | — | (1,972 | ) | (1,972 | ) | |||||||||||||||
| Sell |
CLP | 74,530 | 1/27/2017 | HUS | — | (952 | ) | (952 | ) | |||||||||||||||
| Sell |
CLP | 372,649 | 1/27/2017 | HUS | — | (4,161 | ) | (4,161 | ) | |||||||||||||||
| Sell |
CLP | 123,719 | 1/27/2017 | HUS | — | (1,158 | ) | (1,158 | ) | |||||||||||||||
| Sell |
CLP | 472,518 | 1/27/2017 | HUS | — | (4,575 | ) | (4,575 | ) | |||||||||||||||
| Sell |
CLP | 316,006 | 1/27/2017 | HUS | — | (3,439 | ) | (3,439 | ) | |||||||||||||||
| Sell |
CLP | 205,702 | 1/27/2017 | HUS | — | (2,358 | ) | (2,358 | ) | |||||||||||||||
| Sell |
CLP | 131,172 | 1/27/2017 | HUS | — | (1,489 | ) | (1,489 | ) | |||||||||||||||
| Sell |
CLP | 453,141 | 1/27/2017 | HUS | — | (5,212 | ) | (5,212 | ) | |||||||||||||||
| Sell |
CLP | 3,778,656 | 1/27/2017 | HUS | — | (43,337 | ) | (43,337 | ) | |||||||||||||||
| Sell |
CLP | 660,333 | 1/27/2017 | HUS | — | (7,715 | ) | (7,715 | ) | |||||||||||||||
| Sell |
CLP | 1,851,318 | 1/27/2017 | HUS | — | (22,734 | ) | (22,734 | ) | |||||||||||||||
| Sell |
CLP | 1,114,964 | 1/27/2017 | HUS | — | (14,220 | ) | (14,220 | ) | |||||||||||||||
| Sell |
CLP | 283,213 | 1/27/2017 | HUS | — | (3,589 | ) | (3,589 | ) | |||||||||||||||
| Sell |
CLP | 1,329,610 | 1/27/2017 | HUS | — | (17,525 | ) | (17,525 | ) | |||||||||||||||
| Sell |
CLP | 982,302 | 1/27/2017 | HUS | — | (11,448 | ) | (11,448 | ) | |||||||||||||||
| Sell |
CLP | 964,414 | 1/27/2017 | HUS | — | (11,370 | ) | (11,370 | ) | |||||||||||||||
| Sell |
CLP | 532,142 | 1/27/2017 | HUS | 354 | — | 354 | |||||||||||||||||
| Sell |
CLP | 287,685 | 1/27/2017 | HUS | 264 | — | 264 | |||||||||||||||||
| Sell |
CLP | 596,238 | 1/27/2017 | HUS | — | (1,918 | ) | (1,918 | ) | |||||||||||||||
| Sell |
CLP | 74,530 | 1/27/2017 | HUS | — | (1,069 | ) | (1,069 | ) | |||||||||||||||
| Sell |
CLP | 74,530 | 1/27/2017 | HUS | — | (1,110 | ) | (1,110 | ) | |||||||||||||||
| Sell |
CLP | 74,530 | 1/27/2017 | HUS | — | (1,127 | ) | (1,127 | ) | |||||||||||||||
| See accompanying notes
|
||||
| 20 |
American Beacon AHL Managed Futures Strategy FundSM
Consolidated Schedule of Investments
December 31, 2016
| Type |
Currency | Principal Amount Covered by Contract |
Settlement Date | Counterparty | Unrealized Appreciation |
Unrealized (Depreciation) |
Net Unrealized Appreciation (Depreciation) |
|||||||||||||||||
| Sell |
CLP | 74,530 | 1/27/2017 | HUS | $ | — | $ | (1,121 | ) | $ | (1,121 | ) | ||||||||||||
| Sell |
COP | 66,331 | 1/27/2017 | HUS | — | (2,077 | ) | (2,077 | ) | |||||||||||||||
| Sell |
CLP | 149,059 | 1/27/2017 | HUS | 567 | — | 567 | |||||||||||||||||
| Sell |
CLP | 223,589 | 1/27/2017 | HUS | 341 | — | 341 | |||||||||||||||||
| Sell |
CLP | 447,178 | 1/27/2017 | HUS | 1,058 | — | 1,058 | |||||||||||||||||
| Sell |
CLP | 447,178 | 1/27/2017 | HUS | 657 | — | 657 | |||||||||||||||||
| Sell |
CLP | 1,267,005 | 1/27/2017 | HUS | 4,624 | — | 4,624 | |||||||||||||||||
| Sell |
COP | 2,719,553 | 1/27/2017 | HUS | 3,343 | — | 3,343 | |||||||||||||||||
| Sell |
CLP | 298,119 | 1/27/2017 | HUS | — | (2,755 | ) | (2,755 | ) | |||||||||||||||
| Sell |
CLP | 149,059 | 1/27/2017 | HUS | 248 | — | 248 | |||||||||||||||||
| Sell |
CLP | 74,530 | 1/27/2017 | HUS | — | (1,275 | ) | (1,275 | ) | |||||||||||||||
| Sell |
CLP | 223,589 | 1/27/2017 | HUS | — | (3,156 | ) | (3,156 | ) | |||||||||||||||
| Sell |
CLP | 223,589 | 1/27/2017 | HUS | — | (3,325 | ) | (3,325 | ) | |||||||||||||||
| Sell |
CLP | 149,059 | 1/27/2017 | HUS | — | (2,576 | ) | (2,576 | ) | |||||||||||||||
| Sell |
CLP | 474,009 | 1/27/2017 | HUS | — | (6,138 | ) | (6,138 | ) | |||||||||||||||
| Sell |
CLP | 141,606 | 1/27/2017 | HUS | — | (1,854 | ) | (1,854 | ) | |||||||||||||||
| Sell |
CLP | 147,569 | 1/27/2017 | HUS | — | (1,990 | ) | (1,990 | ) | |||||||||||||||
| Sell |
CLP | 511,274 | 1/27/2017 | HUS | — | (5,802 | ) | (5,802 | ) | |||||||||||||||
| Sell |
CLP | 113,285 | 1/27/2017 | HUS | — | (1,295 | ) | (1,295 | ) | |||||||||||||||
| Sell |
CLP | 1,185,022 | 1/27/2017 | HUS | — | (15,447 | ) | (15,447 | ) | |||||||||||||||
| Sell |
CLP | 927,150 | 1/27/2017 | HUS | — | (10,498 | ) | (10,498 | ) | |||||||||||||||
| Sell |
CLP | 533,633 | 1/27/2017 | HUS | — | (6,545 | ) | (6,545 | ) | |||||||||||||||
| Sell |
CLP | 1,301,289 | 1/27/2017 | HUS | — | (16,736 | ) | (16,736 | ) | |||||||||||||||
| Sell |
CLP | 10,434,158 | 1/27/2017 | HUS | — | (152,892 | ) | (152,892 | ) | |||||||||||||||
| Sell |
CLP | 189,305 | 1/27/2017 | HUS | — | (2,023 | ) | (2,023 | ) | |||||||||||||||
| Sell |
CLP | 223,589 | 1/27/2017 | HUS | — | (3,967 | ) | (3,967 | ) | |||||||||||||||
| Sell |
CLP | 74,530 | 1/27/2017 | HUS | — | (1,282 | ) | (1,282 | ) | |||||||||||||||
| Sell |
CLP | 74,530 | 1/27/2017 | HUS | — | (1,001 | ) | (1,001 | ) | |||||||||||||||
| Sell |
CLP | 223,589 | 1/27/2017 | HUS | — | (2,945 | ) | (2,945 | ) | |||||||||||||||
| Buy |
BRL | 2,407,396 | 2/2/2017 | HUS | 89,729 | — | 89,729 | |||||||||||||||||
| Buy |
BRL | 91,420 | 2/2/2017 | HUS | 638 | — | 638 | |||||||||||||||||
| Buy |
BRL | 548,521 | 2/2/2017 | HUS | 5,311 | — | 5,311 | |||||||||||||||||
| Buy |
BRL | 121,893 | 2/2/2017 | HUS | 813 | — | 813 | |||||||||||||||||
| Buy |
BRL | 578,994 | 2/2/2017 | HUS | 4,731 | — | 4,731 | |||||||||||||||||
| Buy |
BRL | 396,154 | 2/2/2017 | HUS | 2,751 | — | 2,751 | |||||||||||||||||
| Buy |
BRL | 91,420 | 2/2/2017 | HUS | 624 | — | 624 | |||||||||||||||||
| Buy |
BRL | 60,947 | 2/2/2017 | HUS | 407 | — | 407 | |||||||||||||||||
| Buy |
BRL | 30,473 | 2/2/2017 | HUS | 200 | — | 200 | |||||||||||||||||
| Buy |
BRL | 30,473 | 2/2/2017 | HUS | 212 | — | 212 | |||||||||||||||||
| Buy |
BRL | 60,947 | 2/2/2017 | HUS | 407 | — | 407 | |||||||||||||||||
| Buy |
BRL | 457,101 | 2/2/2017 | HUS | — | (593 | ) | (593 | ) | |||||||||||||||
| Buy |
BRL | 548,521 | 2/2/2017 | HUS | 4,564 | — | 4,564 | |||||||||||||||||
| Buy |
BRL | 1,493,195 | 2/2/2017 | HUS | 12,537 | — | 12,537 | |||||||||||||||||
| Buy |
BRL | 548,521 | 2/2/2017 | HUS | 5,288 | — | 5,288 | |||||||||||||||||
| Buy |
BRL | 761,834 | 2/2/2017 | HUS | 6,518 | — | 6,518 | |||||||||||||||||
| Buy |
BRL | 365,680 | 2/2/2017 | HUS | 717 | — | 717 | |||||||||||||||||
| Buy |
BRL | 457,101 | 2/2/2017 | HUS | 1,063 | — | 1,063 | |||||||||||||||||
| Buy |
BRL | 457,101 | 2/2/2017 | HUS | 1,205 | — | 1,205 | |||||||||||||||||
| Buy |
BRL | 91,420 | 2/2/2017 | HUS | 566 | — | 566 | |||||||||||||||||
| Buy |
BRL | 60,947 | 2/2/2017 | HUS | 381 | — | 381 | |||||||||||||||||
| Buy |
BRL | 30,473 | 2/2/2017 | HUS | 198 | — | 198 | |||||||||||||||||
| Buy |
BRL | 60,947 | 2/2/2017 | HUS | 423 | — | 423 | |||||||||||||||||
| Buy |
BRL | 91,420 | 2/2/2017 | HUS | 665 | — | 665 | |||||||||||||||||
| Sell |
BRL | 457,101 | 2/2/2017 | HUS | — | (17,682 | ) | (17,682 | ) | |||||||||||||||
| Sell |
BRL | 548,521 | 2/2/2017 | HUS | — | (21,620 | ) | (21,620 | ) | |||||||||||||||
| Sell |
BRL | 304,734 | 2/2/2017 | HUS | — | (10,858 | ) | (10,858 | ) | |||||||||||||||
| Sell |
BRL | 274,260 | 2/2/2017 | HUS | — | (9,656 | ) | (9,656 | ) | |||||||||||||||
| Sell |
BRL | 548,521 | 2/2/2017 | HUS | — | (22,313 | ) | (22,313 | ) | |||||||||||||||
| Sell |
BRL | 335,207 | 2/2/2017 | HUS | — | (13,315 | ) | (13,315 | ) | |||||||||||||||
| See accompanying notes
|
||||
| 21 |
American Beacon AHL Managed Futures Strategy FundSM
Consolidated Schedule of Investments
December 31, 2016
| Type |
Currency | Principal Amount Covered by Contract |
Settlement Date | Counterparty | Unrealized Appreciation |
Unrealized (Depreciation) |
Net Unrealized Appreciation (Depreciation) |
|||||||||||||||||
| Buy |
GBP | 246,559 | 1/19/2017 | RBS | $ | — | $ | (3,302 | ) | $ | (3,302 | ) | ||||||||||||
| Buy |
AUD | 222,608 | 1/19/2017 | RBS | — | (2,286 | ) | (2,286 | ) | |||||||||||||||
| Sell |
KRW | 568,018 | 1/19/2017 | RBS | 377 | — | 377 | |||||||||||||||||
| Sell |
HKD | 407,823 | 1/19/2017 | RBS | — | (575 | ) | (575 | ) | |||||||||||||||
| Sell |
EUR | 5,366,867 | 1/19/2017 | RBS | — | (59,275 | ) | (59,275 | ) | |||||||||||||||
| Sell |
AUD | 3,814,577 | 1/19/2017 | RBS | 16,765 | — | 16,765 | |||||||||||||||||
| Sell |
JPY | 4,069,673 | 1/19/2017 | RBS | — | (21,069 | ) | (21,069 | ) | |||||||||||||||
| Sell |
KRW | 230,246 | 1/19/2017 | RBS | 842 | — | 842 | |||||||||||||||||
| Buy |
PEN | 74,286 | 1/27/2017 | RBS | 992 | — | 992 | |||||||||||||||||
| Buy |
PEN | 148,571 | 1/27/2017 | RBS | 2,246 | — | 2,246 | |||||||||||||||||
| Buy |
PEN | 222,857 | 1/27/2017 | RBS | 3,447 | — | 3,447 | |||||||||||||||||
| Buy |
PEN | 74,286 | 1/27/2017 | RBS | 1,580 | — | 1,580 | |||||||||||||||||
| Buy |
PEN | 148,571 | 1/27/2017 | RBS | 2,426 | — | 2,426 | |||||||||||||||||
| Buy |
PEN | 148,571 | 1/27/2017 | RBS | 2,331 | — | 2,331 | |||||||||||||||||
| Buy |
PEN | 148,571 | 1/27/2017 | RBS | 1,707 | — | 1,707 | |||||||||||||||||
| Buy |
PEN | 148,571 | 1/27/2017 | RBS | 1,766 | — | 1,766 | |||||||||||||||||
| Buy |
PEN | 74,286 | 1/27/2017 | RBS | 844 | — | 844 | |||||||||||||||||
| Buy |
PEN | 148,571 | 1/27/2017 | RBS | 1,654 | — | 1,654 | |||||||||||||||||
| Buy |
PEN | 74,286 | 1/27/2017 | RBS | 1,208 | — | 1,208 | |||||||||||||||||
| Buy |
PEN | 74,286 | 1/27/2017 | RBS | 1,212 | — | 1,212 | |||||||||||||||||
| Buy |
PEN | 148,571 | 1/27/2017 | RBS | 1,980 | — | 1,980 | |||||||||||||||||
| Buy |
PEN | 148,571 | 1/27/2017 | RBS | 1,885 | — | 1,885 | |||||||||||||||||
| Buy |
PEN | 74,286 | 1/27/2017 | RBS | 1,035 | — | 1,035 | |||||||||||||||||
| Buy |
PEN | 74,286 | 1/27/2017 | RBS | 1,052 | — | 1,052 | |||||||||||||||||
| Buy |
PEN | 74,286 | 1/27/2017 | RBS | 1,041 | — | 1,041 | |||||||||||||||||
| Buy |
PEN | 222,857 | 1/27/2017 | RBS | 3,720 | — | 3,720 | |||||||||||||||||
| Buy |
PEN | 148,571 | 1/27/2017 | RBS | 2,241 | — | 2,241 | |||||||||||||||||
| Buy |
PEN | 74,286 | 1/27/2017 | RBS | 1,178 | — | 1,178 | |||||||||||||||||
| Buy |
PEN | 74,286 | 1/27/2017 | RBS | 1,157 | — | 1,157 | |||||||||||||||||
| Buy |
PEN | 74,286 | 1/27/2017 | RBS | 1,126 | — | 1,126 | |||||||||||||||||
| Buy |
PEN | 6,685,714 | 1/27/2017 | RBS | 6,183 | — | 6,183 | |||||||||||||||||
| Buy |
PEN | 222,857 | 1/27/2017 | RBS | 2,950 | — | 2,950 | |||||||||||||||||
| Buy |
PEN | 148,571 | 1/27/2017 | RBS | 2,330 | — | 2,330 | |||||||||||||||||
| Buy |
PEN | 148,571 | 1/27/2017 | RBS | 1,821 | — | 1,821 | |||||||||||||||||
| Buy |
PEN | 74,286 | 1/27/2017 | RBS | 951 | — | 951 | |||||||||||||||||
| Buy |
PEN | 74,286 | 1/27/2017 | RBS | 973 | — | 973 | |||||||||||||||||
| Buy |
PEN | 74,286 | 1/27/2017 | RBS | 981 | — | 981 | |||||||||||||||||
| Buy |
PEN | 74,286 | 1/27/2017 | RBS | 1,025 | — | 1,025 | |||||||||||||||||
| Buy |
PEN | 2,971,429 | 1/27/2017 | RBS | 26,450 | — | 26,450 | |||||||||||||||||
| Buy |
PEN | 3,268,571 | 1/27/2017 | RBS | 27,539 | — | 27,539 | |||||||||||||||||
| Buy |
PEN | 445,714 | 1/27/2017 | RBS | 2,830 | — | 2,830 | |||||||||||||||||
| Buy |
PEN | 74,286 | 1/27/2017 | RBS | 1,212 | — | 1,212 | |||||||||||||||||
| Buy |
PEN | 74,286 | 1/27/2017 | RBS | 1,056 | — | 1,056 | |||||||||||||||||
| Buy |
PEN | 148,571 | 1/27/2017 | RBS | 2,053 | — | 2,053 | |||||||||||||||||
| Buy |
PEN | 74,286 | 1/27/2017 | RBS | 1,136 | — | 1,136 | |||||||||||||||||
| Buy |
PEN | 148,571 | 1/27/2017 | RBS | 2,053 | — | 2,053 | |||||||||||||||||
| Buy |
PEN | 222,857 | 1/27/2017 | RBS | 3,628 | — | 3,628 | |||||||||||||||||
| Buy |
PEN | 222,857 | 1/27/2017 | RBS | 3,816 | — | 3,816 | |||||||||||||||||
| Buy |
PEN | 222,857 | 1/27/2017 | RBS | 4,356 | — | 4,356 | |||||||||||||||||
| Buy |
PEN | 74,286 | 1/27/2017 | RBS | 1,120 | — | 1,120 | |||||||||||||||||
| Buy |
PEN | 148,571 | 1/27/2017 | RBS | 1,992 | — | 1,992 | |||||||||||||||||
| Buy |
PEN | 148,571 | 1/27/2017 | RBS | 2,074 | — | 2,074 | |||||||||||||||||
| Buy |
PEN | 148,571 | 1/27/2017 | RBS | 1,953 | — | 1,953 | |||||||||||||||||
| Buy |
PEN | 222,857 | 1/27/2017 | RBS | 2,975 | — | 2,975 | |||||||||||||||||
| Buy |
PEN | 148,571 | 1/27/2017 | RBS | 1,962 | — | 1,962 | |||||||||||||||||
| Buy |
PEN | 371,429 | 1/27/2017 | RBS | 6,042 | — | 6,042 | |||||||||||||||||
| Sell |
PEN | 74,286 | 1/27/2017 | RBS | — | (1,767 | ) | (1,767 | ) | |||||||||||||||
| Sell |
PEN | 74,286 | 1/27/2017 | RBS | — | (1,763 | ) | (1,763 | ) | |||||||||||||||
| Sell |
PEN | 74,286 | 1/27/2017 | RBS | — | (1,600 | ) | (1,600 | ) | |||||||||||||||
| See accompanying notes
|
||||
| 22 |
American Beacon AHL Managed Futures Strategy FundSM
Consolidated Schedule of Investments
December 31, 2016
| Type |
Currency | Principal Amount Covered by Contract |
Settlement Date | Counterparty | Unrealized Appreciation |
Unrealized (Depreciation) |
Net Unrealized Appreciation (Depreciation) |
|||||||||||||||||||||
| Sell |
PEN | 74,286 | 1/27/2017 | RBS | $ | — | $ | (1,851 | ) | $ | (1,851 | ) | ||||||||||||||||
| Sell |
PEN | 222,857 | 1/27/2017 | RBS | — | (4,753 | ) | (4,753 | ) | |||||||||||||||||||
| Sell |
PEN | 74,286 | 1/27/2017 | RBS | — | (1,817 | ) | (1,817 | ) | |||||||||||||||||||
| Sell |
PEN | 148,571 | 1/27/2017 | RBS | — | (3,307 | ) | (3,307 | ) | |||||||||||||||||||
| Sell |
PEN | 148,571 | 1/27/2017 | RBS | — | (3,575 | ) | (3,575 | ) | |||||||||||||||||||
| Sell |
PEN | 9,805,714 | 1/27/2017 | RBS | — | (225,224 | ) | (225,224 | ) | |||||||||||||||||||
| Sell |
PEN | 74,286 | 1/27/2017 | RBS | — | (1,697 | ) | (1,697 | ) | |||||||||||||||||||
| Sell |
PEN | 74,286 | 1/27/2017 | RBS | — | (1,712 | ) | (1,712 | ) | |||||||||||||||||||
| Sell |
PEN | 74,286 | 1/27/2017 | RBS | — | (1,702 | ) | (1,702 | ) | |||||||||||||||||||
| Sell |
PEN | 74,286 | 1/27/2017 | RBS | — | (2,014 | ) | (2,014 | ) | |||||||||||||||||||
| Sell |
PEN | 148,571 | 1/27/2017 | RBS | — | (4,138 | ) | (4,138 | ) | |||||||||||||||||||
| Sell |
PEN | 148,571 | 1/27/2017 | RBS | — | (3,973 | ) | (3,973 | ) | |||||||||||||||||||
| Sell |
PEN | 148,571 | 1/27/2017 | RBS | — | (3,965 | ) | (3,965 | ) | |||||||||||||||||||
| Sell |
PEN | 74,286 | 1/27/2017 | RBS | — | (1,686 | ) | (1,686 | ) | |||||||||||||||||||
| Sell |
PEN | 74,286 | 1/27/2017 | RBS | — | (1,718 | ) | (1,718 | ) | |||||||||||||||||||
| Sell |
PEN | 74,286 | 1/27/2017 | RBS | — | (1,675 | ) | (1,675 | ) | |||||||||||||||||||
| Sell |
PEN | 148,571 | 1/27/2017 | RBS | — | (3,372 | ) | (3,372 | ) | |||||||||||||||||||
| Sell |
PEN | 148,571 | 1/27/2017 | RBS | — | (3,425 | ) | (3,425 | ) | |||||||||||||||||||
| Sell |
PEN | 148,571 | 1/27/2017 | RBS | — | (3,526 | ) | (3,526 | ) | |||||||||||||||||||
| Buy |
PEN | 11,881,355 | 1/30/2017 | RBS | — | (11,019 | ) | (11,019 | ) | |||||||||||||||||||
|
|
|
|
|
|
|
|||||||||||||||||||||||
| $ | 2,933,684 | $ | (4,658,677 | ) | $ | (1,724,993 | ) | |||||||||||||||||||||
|
|
|
|
|
|
|
|||||||||||||||||||||||
| A | All or a portion represents positions held by the American Beacon Cayman Managed Futures Strategy Fund, Ltd. |
Glossary:
| Counterparty Abbreviations | ||||||||||||
| DUB |
Deutsche Bank AG | HUS | HSBC Bank USA | RBS | Royal Bank of Scotland PLC | |||||||
| Currency Abbreviations: | ||||||||||||
| AUD |
Australian Dollar | HKD | Hong Kong Dollar | SEK | Swedish Krona | |||||||
| BRL |
Brazilian Real | INR | Indian Rupee | TWD | Taiwanese Dollar | |||||||
| CLP |
Chilean Peso | JPY | Japanese Yen | USD | United States Dollar | |||||||
| COP |
Colombian Peso | KRW | South Korean Won | ZAR | South African Rand | |||||||
| EUR |
Euro | PEN | Peruvian Nuevo Sol | |||||||||
| GBP |
Pound Sterling | PHP | Philippine Peso | |||||||||
| Index Abbreviations: | ||||||||||||
| ASX SPI 200 |
Australian Stock Market Index | FTSE/MIB | Borsa Italiana- Italian Stock Market Index | OMXS30 | Stockholm Stock Exchange’s leading share Index | |||||||
| CAC 40 |
Euronext Paris- French Stock Market Index | Hang Seng | Hong Kong Stock Market Index | Russell 2000 | U.S. Small-Cap Stock Market Index | |||||||
| DAX |
Deutsche Boerse AG German Stock Index | IBEX | Bolsa de Madrid- Spanish Stock Market Index | S&P 500 | Standard and Poor’s U.S. Equity Large-cap Index | |||||||
| Euro Stoxx 50 |
Eurozone Blue-chip Index | KOSPI | South Korean Stock Market Index | S&P/TSX | Canadian Equity Market Index | |||||||
| FTSE 100 |
Financial Times Stock Exchange 100 Index | MSCI EAFE | Morgan Stanley Capital International- Europe, Australasia and Far East | TOPIX | Tokyo Stock Exchange Tokyo Price Index | |||||||
| FTSE/JSE Top 40 |
largest 40 companies ranked by full market value in the FTSE/JSE All-Share Index | NASDAQ | National Association of Securities Dealers Automated Quotations | |||||||||
| Exchange Abbreviations: | ||||||||||||
| CME |
Chicago Mercantile Exchange | JSE | Johannesburg Stock Exchange | SGX | Singapore Stock Exchange | |||||||
| LME |
London Metal Exchange | |||||||||||
| See accompanying notes
|
||||
| 23 |
American Beacon AHL Managed Futures Strategy FundSM
Consolidated Schedule of Investments
December 31, 2016
| Other Abbreviations: | ||||||||||
| Bobl |
Medium term debt that is issued by the Federal Republic of Germany | Gilt | Bank of England Bonds | SPI 200 | Australian Equity Market Index Future | |||||
| Bund |
German Federal Government Bond | H-Shares | Shares of a company incorporated in the Chinese mainland | Sugar #11 | World Benchmark for raw sugar | |||||
| Buxl |
Long term debt that is issued by the Federal Republic of Germany | LIBOR | London Interbank Offer Rate | USLD | Ultra-low-sulfur diesel | |||||
| Euribor |
Euro Interbank Offer Rate | RBOB | Reformulated Gasoline Blendstock for Oxygen Blending | WTI | West Texas Intermediate | |||||
| See accompanying notes
|
||||
| 24 |
American Beacon Ionic Strategic Arbitrage FundSM
Schedule of Investments
December 31, 2016
| Shares | Fair Value | |||||||
| SECURITIES HELD LONG |
||||||||
| COMMON STOCKS—14.17% |
||||||||
| CONSUMER DISCRETIONARY—4.35% |
||||||||
| Automobiles—0.48% |
||||||||
| Blue Bird Corp.A |
53,100 | $ | 820,395 | |||||
|
|
|
|||||||
| Hotels, Restaurants & Leisure—0.64% |
||||||||
| Carnival PLC, ADRB C |
17,227 | 881,850 | ||||||
| Rezidor Hotel Group AB |
51,172 | 199,395 | ||||||
|
|
|
|||||||
| 1,081,245 | ||||||||
|
|
|
|||||||
| Media—2.43% |
||||||||
| CBS Corp |
4,308 | 278,512 | ||||||
| Comcast Corp., Class A |
2,313 | 159,713 | ||||||
| Liberty Broadband, Class AA |
13,875 | 1,005,383 | ||||||
| Liberty Global PLC, Class AA B |
3,305 | 101,100 | ||||||
| Liberty Global PLC LiLac Group, Tracking Stock CA B M |
33,898 | 717,621 | ||||||
| Liberty Media Corp-Liberty Braves, Tracking Stock AA M |
2,672 | 54,749 | ||||||
| Liberty Media Group LLC, Tracking Stock AA L M |
9,536 | 298,953 | ||||||
| Liberty SiriusXM Group, Tracking Stock AA M |
4,227 | 145,916 | ||||||
| Naspers Ltd., ADRC |
10,463 | 152,969 | ||||||
| Time Warner, Inc. |
1,559 | 150,490 | ||||||
| Twenty-First Century Fox, Inc., Class B |
31,442 | 856,795 | ||||||
| Zillow Group, Inc., Class AA |
6,784 | 247,277 | ||||||
|
|
|
|||||||
| 4,169,478 | ||||||||
|
|
|
|||||||
| Specialty Retail—0.12% |
||||||||
| Cabela’s, Inc.A |
3,582 | 209,726 | ||||||
|
|
|
|||||||
| Textiles & Apparel—0.68% |
||||||||
| Under Armour, Inc., Class CA |
46,595 | 1,172,796 | ||||||
|
|
|
|||||||
| Total Consumer Discretionary |
7,453,640 | |||||||
|
|
|
|||||||
| CONSUMER STAPLES—0.91% |
||||||||
| Beverages—0.58% |
||||||||
| Heineken N.V. |
13,279 | 996,082 | ||||||
|
|
|
|||||||
| Food Products—0.33% |
||||||||
| Herbalife Ltd.A |
434 | 20,893 | ||||||
| Unilever PLC, Sponsored ADRB C |
9,914 | 403,500 | ||||||
| Whitewaves Food Co.A |
2,590 | 144,004 | ||||||
|
|
|
|||||||
| 568,397 | ||||||||
|
|
|
|||||||
| Total Consumer Staples |
1,564,479 | |||||||
|
|
|
|||||||
| ENERGY—0.57% |
||||||||
| Oil & Gas—0.57% |
||||||||
| Royal Dutch Shell PLC, Class A, ADRB C |
17,970 | 977,209 | ||||||
|
|
|
|||||||
| FINANCIALS—3.99% |
||||||||
| Asset Management—0.54% |
||||||||
| Stellar Acquisition III Inc.A D E |
89,800 | 914,164 | ||||||
|
|
|
|||||||
| Banks—0.19% |
||||||||
| Bank of Kyoto Ltd. |
44,695 | 331,938 | ||||||
|
|
|
|||||||
| Diversified Financials—2.20% |
||||||||
| Avista Healthcare Public Acquisition Corp.A D E |
83,000 | 834,150 | ||||||
| Boulevard Acquisition Corp. IIA E |
59,358 | 587,051 | ||||||
| Boulevard Acquisition Corp. IA D E |
9,464 | 96,060 | ||||||
| Capitol Acquisition Corp. IIIA D E |
9,300 | 95,790 | ||||||
| Double Eagle Acquisition Corp.A D E |
8,011 | 84,116 | ||||||
| Double Eagle Acquisition Corp., Class A A E |
128 | 1,267 | ||||||
| See accompanying notes
|
||||
| 25 |
American Beacon Ionic Strategic Arbitrage FundSM
Schedule of Investments
December 31, 2016
| Shares | Fair Value | |||||||
| FINANCIALS—3.99% (continued) |
||||||||
| Diversified Financials—2.20% (continued) |
||||||||
| Easterly Acquisition Corp.A E |
194 | $ | 1,911 | |||||
| Electrum Special Acquisition Corp.A E |
61,028 | 604,177 | ||||||
| GP Investments Acquisition Corp.A E |
4,510 | 44,649 | ||||||
| Hennessy Capital Acquisition Corp. II A E |
50,686 | 510,407 | ||||||
| M I Acquisitions, Inc.A D E |
45,000 | 457,200 | ||||||
| Pace Holdings Corp.A E |
1 | 10 | ||||||
| Pace Holdings Corp.A D E |
8,011 | 86,118 | ||||||
| Quinpario Acquisition Corp. 2A E |
11,000 | 109,340 | ||||||
| Wells Fargo & Co. |
4,443 | 244,854 | ||||||
|
|
|
|||||||
| 3,757,100 | ||||||||
|
|
|
|||||||
| Insurance—1.06% |
||||||||
| Crawford & Co., Class A |
191,151 | 1,810,200 | ||||||
|
|
|
|||||||
| Total Financials |
6,813,402 | |||||||
|
|
|
|||||||
| HEALTH CARE—0.30% |
||||||||
| Health Care Equipment & Supplies—0.16% |
||||||||
| St. Jude Medical, Inc. |
3,400 | 272,646 | ||||||
|
|
|
|||||||
| Health Care Providers & Services—0.14% |
||||||||
| Alere, Inc.A |
6,300 | 245,511 | ||||||
|
|
|
|||||||
| Total Health Care |
518,157 | |||||||
|
|
|
|||||||
| INDUSTRIALS—1.05% |
||||||||
| Aerospace & Defense—0.23% |
||||||||
| HEICO Corp., Class A |
5,724 | 388,660 | ||||||
|
|
|
|||||||
| Machinery—0.66% |
||||||||
| Volvo AB, Class A |
94,171 | 1,108,064 | ||||||
|
|
|
|||||||
| Trading Companies & Distributors—0.16% |
||||||||
| Nexeo Solutions Inc.A |
95,147 | 66,603 | ||||||
| Rush Enterprises, Inc., Class BA |
7,002 | 216,152 | ||||||
|
|
|
|||||||
| 282,755 | ||||||||
|
|
|
|||||||
| Total Industrials |
1,779,479 | |||||||
|
|
|
|||||||
| INFORMATION TECHNOLOGY—1.42% |
||||||||
| Internet Software & Services—0.75% |
||||||||
| Global Eagle Entertainment, Inc.A |
333 | 2,151 | ||||||
| Sina Corp.A |
3,635 | 220,972 | ||||||
| Yahoo, Inc.A |
27,263 | 1,054,260 | ||||||
|
|
|
|||||||
| 1,277,383 | ||||||||
|
|
|
|||||||
| IT Consulting & Services—0.46% |
||||||||
| Dell Technologies, Class VA |
14,375 | 790,194 | ||||||
|
|
|
|||||||
| Semiconductor Equipment & Products—0.12% |
||||||||
| NXP Semiconductors N.V.A |
1,445 | 141,624 | ||||||
| SunPower Corp.A |
9,535 | 63,026 | ||||||
|
|
|
|||||||
| 204,650 | ||||||||
|
|
|
|||||||
| Software—0.09% |
||||||||
| VMware, Inc., Class AA |
1,916 | 150,847 | ||||||
|
|
|
|||||||
| Total Information Technology |
2,423,074 | |||||||
|
|
|
|||||||
| MATERIALS—0.94% |
||||||||
| Chemicals—0.27% |
||||||||
| Delta Technology Holdings Ltd.A |
17,778 | 12,978 | ||||||
| Monsanto Co. |
2,700 | 284,067 | ||||||
| See accompanying notes
|
||||
| 26 |
American Beacon Ionic Strategic Arbitrage FundSM
Schedule of Investments
December 31, 2016
| Shares |
Fair Value |
|||||||
| MATERIALS—0.94% (continued) |
||||||||
| Chemicals—0.27% (continued) |
||||||||
| Valspar Corp. |
1,408 | $ | 145,883 | |||||
|
|
|
|||||||
| 442,928 | ||||||||
|
|
|
|||||||
| Metals & Mining—0.67% |
||||||||
| Vale S.A. Sponsored ADRC |
151,073 | 1,151,176 | ||||||
|
|
|
|||||||
| Total Materials |
1,594,104 | |||||||
|
|
|
|||||||
| REAL ESTATE—0.25% |
||||||||
| Equity Real Estate Investment Trusts—0.25% |
||||||||
| Forest City Realty Trust, Inc.F |
1,330 | 35,816 | ||||||
| Weyerhaeuser Co.F |
12,800 | 385,152 | ||||||
|
|
|
|||||||
| Total Real Estate |
420,968 | |||||||
|
|
|
|||||||
| TELECOMMUNICATION SERVICES—0.19% |
||||||||
| Diversified Telecommunication Services—0.19% |
||||||||
| SFR Group S.A. |
11,568 | 326,711 | ||||||
| Telefonica S.A. |
20 | 184 | ||||||
|
|
|
|||||||
| Total Telecommunication Services |
326,895 | |||||||
|
|
|
|||||||
| UTILITIES—0.20% |
||||||||
| Electric—0.20% |
||||||||
| Centrais Eletricas Brasileiras S.A., ADRA C |
38,395 | 292,954 | ||||||
| VivoPower International PLCA B |
7,894 | 43,417 | ||||||
|
|
|
|||||||
| Total Utilities |
336,371 | |||||||
|
|
|
|||||||
| Total COMMON STOCKS (Cost $24,105,807) |
24,207,778 | |||||||
|
|
|
|||||||
| WARRANTS—10.67% |
||||||||
| CONSUMER DISCRETIONARY—1.39% |
||||||||
| Automobiles—0.40% |
||||||||
| Blue Bird Corp., 2/24/2020, Strike Price $11.50 |
316,719 | 680,946 | ||||||
|
|
|
|||||||
| Hotels, Restaurants & Leisure—0.92% |
||||||||
| Del Taco Restaurants, Inc., 6/30/2020, Strike Price $11.50 |
318,532 | 1,583,103 | ||||||
|
|
|
|||||||
| Media—0.07% |
||||||||
| Hemisphere Media Group, Inc., 4/4/2018, Strike Price $12.00 |
331,437 | 112,689 | ||||||
|
|
|
|||||||
| Retail—0.00% |
||||||||
| KBS Fashion Group Ltd., 1/22/2018, Strike Price $11.50 |
40,000 | 802 | ||||||
|
|
|
|||||||
| Total Consumer Discretionary |
2,377,540 | |||||||
|
|
|
|||||||
| ENERGY—2.54% |
||||||||
| Energy—0.03% |
||||||||
| FieldPoint Petroleum Corp., 3/23/2018, Strike Price $4.00 |
42,260 | 1,564 | ||||||
| Sunworks, Inc., 3/9/2020, Strike Price $4.15 |
73,040 | 47,476 | ||||||
|
|
|
|||||||
| 49,040 | ||||||||
|
|
|
|||||||
| Oil & Gas—2.51% |
||||||||
| Centennial Resource Development, Inc., 10/11/2021, Strike Price $11.50 |
513,786 | 4,290,113 | ||||||
| Kinder Morgan, Inc., 5/25/2017, Strike Price $40.00 |
1,173,715 | 6,455 | ||||||
|
|
|
|||||||
| 4,296,568 | ||||||||
|
|
|
|||||||
| Total Energy |
4,345,608 | |||||||
|
|
|
|||||||
| FINANCIALS—6.22% |
||||||||
| Asset Management—0.03% |
||||||||
| Hennessy Capital Acquisition Corp. II, 9/11/2020, Strike Price $11.50 |
55,986 | 47,588 | ||||||
|
|
|
|||||||
| Banks—6.15% |
||||||||
| Associated Banc-Corp., 11/21/2018, Strike Price $19.77 |
171,618 | 999,675 | ||||||
| SunTrust Banks, Inc., 11/14/2018, Strike Price $44.15 |
362,862 | 4,818,807 | ||||||
| See accompanying notes
|
||||
| 27 |
American Beacon Ionic Strategic Arbitrage FundSM
Schedule of Investments
December 31, 2016
| Shares | Fair Value | |||||||
| FINANCIALS—6.22% (continued) |
||||||||
| Banks—6.15% (continued) |
||||||||
| TCF Financial Corp., 11/14/2018, Strike Price $16.93 |
158,294 | $ | 554,029 | |||||
| Zions Bancorporation, 5/22/2020, Strike Price $36.20 |
354,211 | 4,142,498 | ||||||
|
|
|
|||||||
| 10,515,009 | ||||||||
|
|
|
|||||||
| Diversfied Financials—0.01% |
||||||||
| Global Eagle Entertainment, Inc., 1/31/2018, Strike Price $11.50 |
26,337 | 9,876 | ||||||
|
|
|
|||||||
| Specialty Finance—0.03% |
||||||||
| China Lending Corp., 7/6/2021, Strike Price $12.00 |
304,570 | 47,970 | ||||||
|
|
|
|||||||
| Total Financials |
10,620,443 | |||||||
|
|
|
|||||||
| HEALTH CARE—0.23% |
||||||||
| Biotechnology—0.17% |
||||||||
| BioTime, Inc., 10/1/2018, Strike Price $5.00 |
365,602 | 255,921 | ||||||
| Cellectar Biosciences Inc., 4/8/2021, Strike Price $3.04 |
45,853 | 19,258 | ||||||
| ContraFect Corp., 1/31/2017, Strike Price $4.80 |
48,581 | 2,293 | ||||||
|
|
|
|||||||
| 277,472 | ||||||||
|
|
|
|||||||
| Health Care Equipment & Supplies—0.01% |
||||||||
| DarioHealth Corp., 3/8/2021, Strike Price $5.63 |
35,678 | 23,191 | ||||||
|
|
|
|||||||
| Pharmaceuticals—0.05% |
||||||||
| EyeGate Pharmaceuticals, Inc., 7/31/2020, Strike Price $10.62 |
24,172 | 8,460 | ||||||
| Kitov Pharmaceuticals Holdings Ltd., 11/20/2020, Strike Price $4.13 |
47,675 | 62,931 | ||||||
| Sonoma Pharmaceuticals, Inc., 1/21/2020, Strike Price $6.50 |
58,393 | 22,189 | ||||||
|
|
|
|||||||
| 93,580 | ||||||||
|
|
|
|||||||
| Total Health Care |
394,243 | |||||||
|
|
|
|||||||
| INDUSTRIALS—0.07% |
||||||||
| Chemicals—0.05% |
||||||||
| AgroFresh Solutions, Inc., 2/19/2019, Strike Price $11.50 |
444,020 | 77,704 | ||||||
|
|
|
|||||||
| Commercial Services & Supplies—0.00% |
||||||||
| Tempus Applied Solutions Holdings, Inc., 7/31/2020, Strike Price $11.50 |
37,152 | 206 | ||||||
|
|
|
|||||||
| Construction & Engineering—0.00% |
||||||||
| Limbach Holdings, Inc., 7/20/2021, Strike Price $5.75 |
3,054 | 7,971 | ||||||
|
|
|
|||||||
| Marine—0.02% |
||||||||
| Seanergy Maritime Holdings Corp., 11/10/2021 , Strike Price $2.00 |
122,391 | 41,613 | ||||||
|
|
|
|||||||
| Total Industrials |
127,494 | |||||||
|
|
|
|||||||
| INFORMATION TECHNOLOGY—0.09% |
||||||||
| Computers & Peripherals—0.09% |
||||||||
| Applied DNA Sciences, Inc., 11/14/2019, Strike Price $3.50 |
78,635 | 39,318 | ||||||
| Eastman Kodak Co., 9/3/2018, Strike Price $16.12 |
37,493 | 112,479 | ||||||
|
|
|
|||||||
| 151,797 | ||||||||
|
|
|
|||||||
| Software & Services—0.00% |
||||||||
| RMG Networks Holding Corp., 4/8/2018, Strike Price $11.50 |
59,907 | 959 | ||||||
|
|
|
|||||||
| Total Information Technology |
152,756 | |||||||
|
|
|
|||||||
| MATERIALS—0.13% |
||||||||
| Chemicals—0.00% |
||||||||
| Delta Technology Holdings Ltd., 12/18/2017, Strike Price $10.00 |
9,990 | 1,126 | ||||||
|
|
|
|||||||
| Metals & Mining—0.13% |
||||||||
| Franco-Nevada Corp., 6/16/2017, Strike Price $75.00 |
20,104 | 202,889 | ||||||
| New Gold, Inc., 6/28/2017, Strike Price $15.00 |
62,717 | 2,569 | ||||||
| See accompanying notes
|
||||
| 28 |
American Beacon Ionic Strategic Arbitrage FundSM
Schedule of Investments
December 31, 2016
| Shares | Fair Value | |||||||
| MATERIALS—0.13% (continued) |
||||||||
| Metals & Mining—0.13% (continued) |
||||||||
| Timmins Gold Corp., 5/30/2018 , Strike Price $0.70 |
180,374 | $ | 12,091 | |||||
|
|
|
|||||||
| 217,549 | ||||||||
|
|
|
|||||||
| Total Materials |
218,675 | |||||||
|
|
|
|||||||
| Total WARRANTS (Cost $9,110,588) |
18,236,759 | |||||||
|
|
|
|||||||
| CONVERTIBLE PREFERRED STOCKS—0.98% |
||||||||
| ENERGY—0.00% |
||||||||
| SunEdison, Inc., 6.75%, Due 12/31/2029 |
500 | 2,243 | ||||||
|
|
|
|||||||
| FINANCE—0.40% |
||||||||
| Anthem, Inc., 5.25%, Due 5/1/2018 |
14,448 | 678,333 | ||||||
|
|
|
|||||||
| MANUFACTURING—0.58% |
||||||||
| William Lyon Homes, Inc., 6.50%, Due 12/01/2017 |
10,400 | 991,432 | ||||||
|
|
|
|||||||
| Total CONVERTIBLE PREFERRED STOCKS (Cost $1,676,149) |
1,672,008 | |||||||
|
|
|
|||||||
| PREFERRED STOCKS—4.39% |
||||||||
| MANUFACTURING—0.92% |
||||||||
| Chemicals—0.85% |
||||||||
| Rayonier Advanced Materials, Inc., 8.00%, Due 8/15/2019 |
12,553 | 1,452,759 | ||||||
|
|
|
|||||||
| Machinery—0.07% |
||||||||
| Rexnord Corp., 5.75%, Due 11/15/2019 |
2,329 | 114,121 | ||||||
|
|
|
|||||||
| Total Manufacturing |
1,566,880 | |||||||
|
|
|
|||||||
| SERVICE—1.63% |
||||||||
| Mandatory Exchange Trust, 5.75%, Due 6/03/2019 H |
25,500 | 2,785,875 | ||||||
|
|
|
|||||||
| UTILITIES—1.84% |
||||||||
| Electric—0.62% |
||||||||
| Great Plains Energy, Inc., 7.00%, Due 9/15/2019 |
20,829 | 1,053,947 | ||||||
|
|
|
|||||||
| Multi-Utilities—1.22% |
||||||||
| Dominion Resources, Inc., 6.75%, Due 8/15/2019 |
41,148 | 2,082,089 | ||||||
|
|
|
|||||||
| Total Utilities |
3,136,036 | |||||||
|
|
|
|||||||
| Total PREFERRED STOCKS (Cost $7,154,373) |
7,488,791 | |||||||
|
|
|
|||||||
| Principal Amount | ||||||||
| CONVERTIBLE OBLIGATIONS—23.44% |
||||||||
| Aerospace/Defense—0.24% |
||||||||
| Aerojet Rocketdyne Holdings, Inc., 2.25%, Due 12/15/2023 H |
$ | 428,000 | 416,765 | |||||
|
|
|
|||||||
| Banks—0.17% |
||||||||
| Immunogen, Inc., 4.50%, Due 7/1/2021 H |
426,000 | 286,751 | ||||||
|
|
|
|||||||
| Cable/Broadcasting/Satellite—1.18% |
||||||||
| Dish Network Corp., 3.375%, Due 8/15/2026 H |
1,775,000 | 2,020,172 | ||||||
|
|
|
|||||||
| Electric—0.51% |
||||||||
| Chugoku Electric Power Co., 0.01%, Due 3/25/2020 |
100,000,000 | 869,947 | ||||||
|
|
|
|||||||
| Electronics—4.35% |
||||||||
| Advanced Micro Devices, Inc., 2.125%, Due 9/1/2026 |
2,063,000 | 3,253,093 | ||||||
| Intel Corp., 2.95%, Due 12/15/2035 |
3,086,000 | 4,168,029 | ||||||
|
|
|
|||||||
| 7,421,122 | ||||||||
|
|
|
|||||||
| See accompanying notes
|
||||
| 29 |
American Beacon Ionic Strategic Arbitrage FundSM
Schedule of Investments
December 31, 2016
| Principal Amount |
Fair Value | |||||||
| Information / Data Technology—1.01% |
||||||||
| Unisys Corp., 5.50%, Due 3/1/2021 H |
$ | 1,000,000 | $ | 1,726,250 | ||||
|
|
|
|||||||
| Internet Tech—3.39% |
||||||||
| SINA Corp/China, 1.00%, Due 12/1/2018 |
2,638,000 | 2,613,269 | ||||||
| Yahoo, Inc., 0.01%, Due 12/1/2018 |
1,606,000 | 1,586,929 | ||||||
| Zillow Group, Inc., 2.00%, Due 12/1/2021H |
1,557,000 | 1,598,844 | ||||||
|
|
|
|||||||
| 5,799,042 | ||||||||
|
|
|
|||||||
| Oil & Gas—0.92% |
||||||||
| Chesapeake Energy Corp., 5.50%, Due 9/15/2026 H |
1,442,000 | 1,560,965 | ||||||
|
|
|
|||||||
| Pharmaceuticals—3.69% |
||||||||
| Bayer Capital Corp., 5.625%, Due 11/22/2019H |
3,900,000 | 4,478,922 | ||||||
| Depomed, Inc., 2.50%, Due 9/1/2021 |
1,606,000 | 1,828,833 | ||||||
|
|
|
|||||||
| 6,307,755 | ||||||||
|
|
|
|||||||
| Power—0.67% |
||||||||
| Green Plains, Inc., 4.125%, Due 9/1/2022 H |
972,000 | 1,150,605 | ||||||
|
|
|
|||||||
| Telecom—7.31% |
||||||||
| America Movil S.A.B. de C.V., 5.50%, Due 9/17/2018 |
3,600,000 | 3,299,933 | ||||||
| Ciena Corp., 3.75%, Due 10/15/2018H |
2,633,000 | 3,556,195 | ||||||
| InterDigital, Inc., 1.50%, Due 3/1/2020 |
1,981,000 | 2,683,017 | ||||||
| Telefonica Participacion Co., 4.90%, Due 9/25/2017H |
3,200,000 | 2,954,158 | ||||||
|
|
|
|||||||
| 12,493,303 | ||||||||
|
|
|
|||||||
| Total CONVERTIBLE OBLIGATIONS (Cost $38,304,039) |
40,052,677 | |||||||
|
|
|
|||||||
| COLLATERALIZED MORTGAGE OBLIGATIONS—18.40% |
||||||||
| Agency CMO Interest Only—0.69% |
||||||||
| Fannie Mae Interest Strip, |
||||||||
| 8.50%, Due 3/25/2023, 211 2 |
252,020 | 46,017 | ||||||
| 5.00%, Due 4/25/2034, 351 5 |
285,132 | 59,413 | ||||||
| 5.50%, Due 7/25/2035, 359 13 |
1,546,037 | 339,230 | ||||||
| 5.50%, Due 8/25/2035, 359 14 |
1,174,612 | 251,935 | ||||||
| 5.50%, Due 10/25/2035, 359 12 |
1,121,649 | 249,574 | ||||||
| 7.00%, Due 2/25/2037, 381 17 |
879,223 | 218,094 | ||||||
|
|
|
|||||||
| 1,164,263 | ||||||||
|
|
|
|||||||
| Agency CMO Interest Only Inverse Floater—5.98% |
||||||||
| Fannie Mae REMICS, |
||||||||
| 6.666%, Due 2/25/2024, 1996 45 SI (7.25%—1 x LIBOR 1 Month) |
1,379,571 | 188,867 | ||||||
| 6.50%, Due 3/25/2027, 1997 9 CL H |
865,632 | 135,689 | ||||||
| 7.450%, Due 9/17/2027, 1997 65 SI (8.00%—1 x LIBOR 1 Month)I |
1,734,612 | 339,536 | ||||||
| 7.00%, Due 10/25/2031, 2016 3 IK |
990,588 | 221,525 | ||||||
| 7.166%, Due 3/25/2032, 2002 8 SC (7.75%—1 x LIBOR 1 Month)I |
155,275 | 35,870 | ||||||
| 6.416%, Due 9/25/2032, 2002 90 DS (7.00%—1 x LIBOR 1 Month)I |
921,514 | 166,023 | ||||||
| 7.416%, Due 12/25/2032, 2002 86 US (8.00%—1 x LIBOR 1 Month)I |
607,864 | 131,692 | ||||||
| 5.50%, Due 7/25/2033, 2004 62 TP (38.50%—5.5 x LIBOR 1 Month)I |
2,123,732 | 432,770 | ||||||
| 4.50%, Due 12/25/2033, 2003 119 GI |
131,768 | 32,903 | ||||||
| 6.016%, Due 2/25/2035, 2005 2 S (6.60%—1 x LIBOR 1 Month)I |
201,393 | 40,821 | ||||||
| 6.046%, Due 7/25/2035, 2005 66 LS (6.63%—1 x LIBOR 1 Month)I |
2,273,738 | 457,606 | ||||||
| 5.546%, Due 8/25/2035, 2005 73 ST (6.13% -1 x LIBOR 1 Month) |
2,349,537 | 383,066 | ||||||
| 6.086%, Due 10/25/2035, 2005 83 SL (6.67%—1 x LIBOR 1 Month)I |
735,071 | 139,317 | ||||||
| 6.116%, Due 3/25/2036, 2006 8 HL (6.70%—1 x LIBOR 1 Month)I |
1,987,493 | 378,725 | ||||||
| 5.814%, Due 6/25/2036, 2006 44 SF (6.57%—1 x LIBOR 1 Month)I |
3,960,095 | 815,024 | ||||||
| 6.666%, Due 6/25/2036, 2006 46 ES (7.25% 1 x LIBOR 1 Month) |
1,510,528 | 308,627 | ||||||
| 6.026%, Due 7/25/2036, 2007 28 GS (6.61%—1 x LIBOR 1 Month)I |
989,078 | 176,613 | ||||||
| 5.824%, Due 10/25/2036, 2006 92 LI (6.58% -1 x LIBOR 1 Month)I |
1,398,908 | 261,784 | ||||||
| 5.466%, Due 11/25/2036, 2008 50 SA (6.05%—1 x LIBOR 1 Month)I |
191,515 | 31,484 | ||||||
| 6.006%, Due 11/25/2036, 2006 106 CS (6.59% -1 x LIBOR 1 Month)I |
2,225,766 | 412,356 | ||||||
| 6.056%, Due 12/25/2036, 2006 117 SA (6.64%—1 x LIBOR 1 Month)I |
1,530,602 | 279,314 | ||||||
| 5.916%, Due 2/25/2037, 2007 1 NI (6.50%—1 x LIBOR 1 Month)I |
1,540,403 | 241,488 | ||||||
| 5.00%, Due 3/25/2039, 2009 11 TI |
999,154 | 189,371 | ||||||
| See accompanying notes
|
||||
| 30 |
American Beacon Ionic Strategic Arbitrage FundSM
Schedule of Investments
December 31, 2016
| Principal Amount |
Fair Value |
|||||||
| Fannie Mae REMICS, (continued) |
||||||||
| 5.00%, Due 5/25/2039, 2009 50 GI |
$ | 1,074,872 | $ | 227,415 | ||||
| 5.00%, Due 2/25/2040, 2010 16 PI |
161,020 | 38,311 | ||||||
| 5.896%, Due 7/25/2040, 2010 68 SC (6.48%—1 x LIBOR 1 Month)I |
1,366,389 | 272,493 | ||||||
| 8.535%, Due 12/25/2041, 2011 130 NY (9.60%—2 x LIBOR 1 Month)I |
263,567 | 275,382 | ||||||
| 5.50%, Due 12/25/2043, 2014 38 QI |
1,764,278 | 460,150 | ||||||
| 5.00%, Due 5/25/2045, 2015 30 EI |
1,714,480 | 344,302 | ||||||
| 5.50%, Due 5/25/2045, 2015 30 IO |
2,799,491 | 692,534 | ||||||
| 5.494%, Due 9/25/2045, 2015 66 AS (6.25%—1 x LIBOR 1 Month) |
2,531,206 | 434,884 | ||||||
| 5.00%, Due 10/25/2045, 2015 70 JI |
1,443,352 | 300,200 | ||||||
| 5.50%, Due 7/25/2046, 2016 45 MI |
3,191,238 | 722,627 | ||||||
| 2.064%, Due 6/25/2055, 2015 42 AI |
3,469,174 | 230,852 | ||||||
| 1.943%, Due 9/25/2055, 2015 64 SK |
6,683,980 | 433,424 | ||||||
|
|
|
|||||||
| 10,233,045 | ||||||||
|
|
|
|||||||
| Agency CMO Interest Only—3.78% |
||||||||
| Freddie Mac REMICS, |
||||||||
| 3.00%, Due 3/15/2026, 3939 EI |
6,250,321 | 456,403 | ||||||
| 7.562%, Due 2/15/2028, 2526 SW (8.10%—1 x LIBOR 1 Month)I |
117,355 | 23,347 | ||||||
| 8.50%, Due 1/15/2030, 2206 IO |
136,619 | 33,578 | ||||||
| 7.412%, Due 2/15/2032, 2411 S (7.95%—1 x LIBOR 1 Month)I |
840,378 | 155,218 | ||||||
| 7.00%, Due 4/15/2032, 2525 IK |
131,964 | 40,567 | ||||||
| 7.262%, Due 6/15/2032, 3489 SD (7.80%—1 x LIBOR 1 Month)I |
122,441 | 25,588 | ||||||
| 5.50%, Due 3/15/2033, 2581 IL |
692,840 | 191,663 | ||||||
| 12.418%, Due 7/15/2033, 2647 IV (13.75%—1 x LIBOR 1 Month)I |
507,357 | 315,498 | ||||||
| 5.512%, Due 3/15/2035, 2950 SN (6.05%—1 x LIBOR 1 Month)I |
878,830 | 151,137 | ||||||
| 6.162%, Due 10/15/2036, 3232 ST (6.70%—1 x LIBOR 1 Month)I |
167,761 | 27,929 | ||||||
| 5.782%, Due 12/15/2036, 3257 SI (6.32%—1 x LIBOR 1 Month)I |
627,233 | 113,880 | ||||||
| 6.152%, Due 12/15/2036, 3256 S (6.69%—1 x LIBOR 1 Month)I |
1,166,994 | 207,234 | ||||||
| 5.746%, Due 1/15/2037, 3260 SA (6.45%—1 x LIBOR 1 Month)I |
2,432,530 | 423,759 | ||||||
| 5.942%, Due 7/15/2037, 3510 CI (6.48%—1 x LIBOR 1 Month)I |
2,032,461 | 364,557 | ||||||
| 6.426%, Due 7/15/2037, 3355 KI (7.13%—1 x LIBOR 1 Month)I |
4,107,180 | 580,220 | ||||||
| 5.492%, Due 9/15/2037, 3368 AI (6.03%—1 x LIBOR 1 Month)I |
1,427,266 | 222,087 | ||||||
| 5.832%, Due 10/15/2037, 3380 SI (6.37% -1 x LIBOR 1 Month)I |
1,788,934 | 313,075 | ||||||
| 1.00%, Due 3/15/2038, 3421 IO |
12,829,152 | 548,268 | ||||||
| 2.021%, Due 4/15/2039, 4314 IT (WAC—(LIBOR 1 Month + 0.35%)) |
4,345,798 | 281,125 | ||||||
| 8.024%, Due 5/15/2041, 3866 DS (9.10%—2 x LIBOR 1 Month)I |
360,950 | 388,776 | ||||||
| 6.177%, Due 9/15/2041, 3997 ES (6.93%—1.4 x LIBOR 1 Month)I |
153,531 | 161,007 | ||||||
| 1.936%, Due 10/15/2041, 4413 WI (WAC—(LIBOR 1 Month + 0.35%)) |
1,018,006 | 61,971 | ||||||
| 3.00%, Due 12/15/2042, 4594 IJ |
3,668,950 | 441,846 | ||||||
| 0.879%, Due 4/15/2043, 4517 KI (1.071%—0.3571 x LIBOR 1 Month)I |
4,437,576 | 147,240 | ||||||
| 6.00%, Due 11/15/2043, 4472 IJ |
2,093,749 | 500,438 | ||||||
| 6.00%, Due 6/15/2045, 4496 ID |
1,458,977 | 295,017 | ||||||
|
|
|
|||||||
| 6,471,428 | ||||||||
|
|
|
|||||||
| Agency CMO Interest Only Inverse Floater—7.95% |
||||||||
| Ginnie Mae REMIC Trust, |
||||||||
| 6.958%, Due 5/16/2031, 2001 22 SD (7.50%—1 x LIBOR 1 Month)I |
376,141 | 75,829 | ||||||
| 6.958%, Due 6/16/2032, 2002 41 SY (7.50%—1 x LIBOR 1 Month)I |
113,762 | 17,040 | ||||||
| 7.158%, Due 2/16/2033, 2003 11 SK (7.70%—1 x LIBOR 1 Month)I |
273,983 | 43,229 | ||||||
| 7.088%, Due 6/20/2033, 2004 56 S (7.65%—1 x LIBOR 1 Month)I |
423,019 | 84,250 | ||||||
| 5.888%, Due 10/16/2033, 2003 92 SN (6.43%—1 x LIBOR 1 Month)I |
173,519 | 28,230 | ||||||
| 6.038%, Due 11/20/2033, 2003 98 SC (6.60%—1 x LIBOR 1 Month)I |
1,176,747 | 227,094 | ||||||
| 6.588%, Due 11/20/2033, 2004 37 SM (7.15%—1 x LIBOR 1 Month)I |
1,199,745 | 77,821 | ||||||
| 6.008%, Due 5/16/2034, 2004 40 SB (6.55%—1 x LIBOR 1 Month)I |
2,464,974 | 376,733 | ||||||
| 6.361%, Due 6/20/2034, 2004 46 S (7.10%—1 x LIBOR 1 Month) |
2,772,081 | 630,107 | ||||||
| 5.538%, Due 9/20/2034, 2004 86 SP (6.10%—1 x LIBOR 1 Month)I |
164,422 | 21,681 | ||||||
| 5.538%, Due 1/20/2035, 2009 25 SB (6.10%—1 x LIBOR 1 Month)I |
2,326,319 | 88,950 | ||||||
| 5.00%, Due 6/20/2035, 2014 183 IM |
1,804,701 | 413,039 | ||||||
| 6.258%, Due 8/16/2036, 2006 47 SA (6.80%—1 x LIBOR 1 Month)I |
1,477,822 | 286,950 | ||||||
| 5.50%, Due 9/20/2036, 2016 78 TI |
6,144,679 | 475,409 | ||||||
| 6.018%, Due 11/16/2036, 2008 83 SD (6.56% -1 x LIBOR 1 Month)I |
98,289 | 18,491 | ||||||
| See accompanying notes
|
||||
| 31 |
American Beacon Ionic Strategic Arbitrage FundSM
Schedule of Investments
December 31, 2016
| Principal Amount | Fair Value | |||||||
| Ginnie Mae REMIC Trust, (continued) |
||||||||
| 5.538%, Due 5/20/2037, 2011 133 KS (6.10%—1 x LIBOR 1 Month)I |
$ | 2,577,092 | $ | 456,078 | ||||
| 5.961%, Due 6/20/2037, 2010 47 PX (6.70%—1 x LIBOR 1 Month)I |
1,213,809 | 218,913 | ||||||
| 6.088%, Due 12/20/2037, 2007 81 SP (6.65%—1 x LIBOR 1 Month)I |
2,448,483 | 443,107 | ||||||
| 5.858%, Due 5/16/2038, 2008 40 SA (6.40% -1 x LIBOR 1 Month)I |
286,701 | 48,004 | ||||||
| 5.00%, Due 9/20/2038, 2016 12 KI |
1,187,237 | 308,964 | ||||||
| 5.50%, Due 5/16/2039, 2009 776 GI |
1,156,124 | 215,165 | ||||||
| 4.50%, Due 1/16/2040, 2016 44 PI |
2,354,239 | 474,433 | ||||||
| 4.00%, Due 2/20/2040, 2015 162 LI |
1,781,152 | 270,777 | ||||||
| 5.438%, Due 5/20/2040, 2016 75 SA (6.00%—1 x LIBOR 1 Month)I |
3,831,253 | 572,011 | ||||||
| 6.00%, Due 9/20/2040, 2016 75 IO |
2,519,450 | 588,878 | ||||||
| 3.50%, Due 10/20/2041, 2013 81 PI |
4,472,086 | 597,209 | ||||||
| 3.50%, Due 5/16/2042, 2015 84 IO |
4,015,304 | 778,262 | ||||||
| 5.00%, Due 5/16/2042, 2013 44 IB |
434,440 | 105,030 | ||||||
| 5.00%, Due 6/20/2043, 2013 86 IA |
327,252 | 72,079 | ||||||
| 6.158%, Due 8/16/2043, 2013 113 SD (6.70%—1 x LIBOR 1 Month)I |
1,822,285 | 342,318 | ||||||
| 5.588%, Due 11/20/2043, 2013 165 ST (6.15%—1 x LIBOR 1 Month)I |
173,021 | 26,591 | ||||||
| 0.973%, Due 1/16/2044, 2015 80 HI |
3,200,777 | 121,629 | ||||||
| 5.50%, Due 1/20/2044, 2014 2 TI |
455,869 | 90,428 | ||||||
| 6.00%, Due 5/20/2044, 2016 1 IO |
2,193,895 | 386,030 | ||||||
| 6.267%, Due 11/20/2044, 2014 161 SL (6.80% -1 x LIBOR 1 Month)I |
170,824 | 33,607 | ||||||
| 5.00%, Due 12/16/2045, 2015 180 CI |
1,316,575 | 315,734 | ||||||
| 4.50%, Due 5/20/2046, 2016 69 WI |
2,524,023 | 530,018 | ||||||
| 3.50%, Due 7/20/2046, 2016 90 PI |
6,311,134 | 1,049,432 | ||||||
| 2.295%, Due 6/20/2065, 2015 H13 AI |
4,434,843 | 485,753 | ||||||
| 2.045%, Due 1/20/2066, 2016 H04 BI |
4,971,184 | 590,328 | ||||||
| 1.919%, Due 2/20/2066, 2016 H04 KI |
4,994,586 | 486,972 | ||||||
| 2.167%, Due 2/20/2066, 2016 H07 NI |
4,883,593 | 592,136 | ||||||
| 1.923%, Due 4/20/2066, 2016 H13 EI |
4,048,239 | 498,439 | ||||||
|
|
|
|||||||
| 13,563,178 | ||||||||
|
|
|
|||||||
| Total COLLATERALIZED MORTGAGE OBLIGATIONS (Cost $31,035,702) |
31,431,914 | |||||||
|
|
|
|||||||
| Shares | ||||||||
| INVESTMENT COMPANIES—6.40% |
||||||||
| CLOSED-END FUNDS—6.40% |
||||||||
| Adams Diversified Equity Fund, Inc |
47,087 | 598,476 | ||||||
| Adams Natural Resources Fund I |
15,000 | 302,550 | ||||||
| BlackRock Resources & Commodities Strategy Trust |
32,600 | 269,602 | ||||||
| China Fund, Inc. |
10,400 | 156,520 | ||||||
| Direxion Daily FTSE China Bull 3X Shares |
989 | 47,838 | ||||||
| Invesco Dynamic Credit Opportunities Fund |
156,734 | 1,927,828 | ||||||
| Invesco Senior Income Trust . |
244,879 | 1,136,239 | ||||||
| Liberty All Star Equity Fund |
117,601 | 606,821 | ||||||
| Morgan Stanley China A Share Fund, Inc. |
8,564 | 145,502 | ||||||
| Nuveen Credit Strategies Income Fund |
134,076 | 1,186,573 | ||||||
| Pershing Square Holdings Ltd/Fund |
25,871 | 376,164 | ||||||
| Swiss Helvetia Fund, Inc. |
40,114 | 409,564 | ||||||
| Vanguard FTSE Emerging Markets Fund |
62,000 | 1,956,100 | ||||||
| Voya Prime Rate Trust |
232,939 | 1,290,482 | ||||||
| WisdomTree Japan Hedged Equity Fund |
10,000 | 495,400 | ||||||
|
|
|
|||||||
| Total Closed-End Funds |
10,905,659 | |||||||
|
|
|
|||||||
| Total INVESTMENT COMPANIES (Cost $10,493,321) |
10,905,659 | |||||||
|
|
|
|||||||
| EXCHANGE-TRADED INSTRUMENTS—4.94% |
||||||||
| EXCHANGE-TRADED FUNDS—3.09%iShares 20+ Year Treasury Bond ETF |
487 | 58,016 | ||||||
| iShares US Preferred Stock ETF |
1,842 | 68,541 | ||||||
| PowerShares DB US Dollar Index Bullish Fund |
75,600 | 2,000,376 | ||||||
| SPDR S&P500 ETF Trust |
13,060 | 2,919,302 | ||||||
| See accompanying notes
|
||||
| 32 |
American Beacon Ionic Strategic Arbitrage FundSM
Schedule of Investments
December 31, 2016
| Shares | Fair Value | |||||||
| EXCHANGE-TRADED FUNDS—3.09% (continued) |
||||||||
| Vaneck Vectors Gold Miners ETF |
10,902 | $ | 228,070 | |||||
|
|
|
|||||||
| Total Exchange-Traded Funds |
5,274,305 | |||||||
|
|
|
|||||||
| EXCHANGE-TRADED NOTES—1.85% |
||||||||
| ETRACS Monthly Pay 2xLeveraged Closed-End Fund ETN |
44,061 | 738,022 | ||||||
| iPATH S&P 500 VIX Mid-Term Futures ETN |
21,444 | 747,323 | ||||||
| iPATH S&P 500 VIX Short-Term Futures ETN |
46,296 | 1,181,011 | ||||||
| VelocityShares Daily Inverse VIX Short Term ETN |
10,500 | 490,875 | ||||||
|
|
|
|||||||
| Total Exchange-Traded Notes |
3,157,231 | |||||||
|
|
|
|||||||
| Total EXCHANGE-TRADED INSTRUMENTS (Cost $8,131,253) |
8,431,536 | |||||||
|
|
|
|||||||
| SHORT-TERM INVESTMENTS—15.22% (Cost $26,003,015) |
||||||||
| American Beacon U.S. Government Money Market Select Fund, Select ClassG |
26,003,015 | 26,003,015 | ||||||
|
|
|
|||||||
| Total SECURITIES HELD LONG (Cost $156,014,247) |
168,430,137 | |||||||
|
|
|
|||||||
| SECURITIES SOLD SHORT |
||||||||
| COMMON STOCKS—(53.09%) |
||||||||
| CONSUMER DISCRETIONARY—(7.99%) |
||||||||
| Automobiles—(1.48%) |
||||||||
| Blue Bird Corp.A |
(163,791 | ) | (2,530,571 | ) | ||||
|
|
|
|||||||
| Homebuilders—(0.41%) |
||||||||
| William Lyon Homes, Inc., Class AA |
(36,618 | ) | (696,841 | ) | ||||
|
|
|
|||||||
| Hotels, Restaurants & Leisure—(2.36%) |
||||||||
| Carnival Corp |
(17,238 | ) | (897,411 | ) | ||||
| Chipotle Mexican Grill, Inc.A |
(194 | ) | (73,200 | ) | ||||
| Del Taco Restaurants, Inc.A |
(208,136 | ) | (2,938,880 | ) | ||||
| Restaurant Brands International, Inc. |
(2,628 | ) | (125,250 | ) | ||||
|
|
|
|||||||
| (4,034,741 | ) | |||||||
|
|
|
|||||||
| Media—(3.60%) |
||||||||
| Altice N.V., Class AA |
(33,050 | ) | (655,098 | ) | ||||
| CBS Corp., Class BJ |
(4,287 | ) | (272,739 | ) | ||||
| Dish Network Corp., Class A |
(22,305 | ) | (1,292,129 | ) | ||||
| Hemisphere Media Group, Inc.A |
(72,297 | ) | (809,726 | ) | ||||
| Liberty Braves Group, Tracking Stock CA M |
(2,704 | ) | (55,675 | ) | ||||
| Liberty Broadband, Class CA |
(13,775 | ) | (1,020,314 | ) | ||||
| Liberty Global PLC LiLac Group, Tracking Stock AA B M |
(33,620 | ) | (738,295 | ) | ||||
| Liberty Media Group LLC, Tracking Stock CA L M |
(9,524 | ) | (298,387 | ) | ||||
| Liberty SiriusXM Group, Tracking Stock CA M |
(4,309 | ) | (146,161 | ) | ||||
| Twenty-First Century Fox, Inc., Class A |
(31,442 | ) | (881,634 | ) | ||||
|
|
|
|||||||
| (6,170,158 | ) | |||||||
|
|
|
|||||||
| Specialty Retail—(0.13%) |
||||||||
| Rush Enterprises, Inc., Class AA |
(6,994 | ) | (223,109 | ) | ||||
|
|
|
|||||||
| Textiles & Apparel—(0.01%) |
||||||||
| Under Armour, Inc., Class AA |
(863 | ) | (25,070 | ) | ||||
|
|
|
|||||||
| Total Consumer Discretionary |
(13,680,490 | ) | ||||||
|
|
|
|||||||
| CONSUMER STAPLES—(0.83%) |
||||||||
| Beverages—(0.54%) |
||||||||
| Heineken Holding N.V. |
(13,265 | ) | (923,540 | ) | ||||
|
|
|
|||||||
| Food Products—(0.29%) |
||||||||
| Mondelez International, Inc., Class A |
(1,539 | ) | (68,224 | ) | ||||
| Nomad Foods Ltd.A |
(2,238 | ) | (21,417 | ) | ||||
| See accompanying notes
|
||||
| 33 |
American Beacon Ionic Strategic Arbitrage FundSM
Schedule of Investments
December 31, 2016
| Shares | Fair Value | |||||||
| CONSUMER STAPLES—(0.83%) (continued) |
||||||||
| Food Products—(0.29%) (continued) |
||||||||
| Unilever N.V |
(9,914 | ) | $ | (407,069 | ) | |||
|
|
|
|||||||
| (496,710 | ) | |||||||
|
|
|
|||||||
| Total Consumer Staples |
(1,420,250 | ) | ||||||
|
|
|
|||||||
| ENERGY—(5.97%) |
||||||||
| Energy Equipment & Services—(0.16%) |
||||||||
| McDermott International, Inc.A |
(2,000 | ) | (14,780 | ) | ||||
| Transocean Ltd.A |
(17,962 | ) | (264,760 | ) | ||||
|
|
|
|||||||
| (279,540 | ) | |||||||
|
|
|
|||||||
| Oil & Gas—(5.81%) |
||||||||
| Centennial Resource Development, Inc.A |
(365,726 | ) | (7,212,117 | ) | ||||
| Chesapeake Energy Corp.A |
(134,063 | ) | (941,122 | ) | ||||
| Green Plains Renewable Energy, Inc. |
(27,372 | ) | (762,310 | ) | ||||
| Royal Dutch Shell PLC, Class B, ADRB C |
(17,474 | ) | (1,012,968 | ) | ||||
|
|
|
|||||||
| (9,928,517 | ) | |||||||
|
|
|
|||||||
| Total Energy |
(10,208,057 | ) | ||||||
|
|
|
|||||||
| FINANCIALS—(20.91%) |
||||||||
| Banks—(19.49%) |
||||||||
| Associated Banc-Corp. |
(142,820 | ) | (3,527,654 | ) | ||||
| SunTrust Banks, Inc. |
(282,509 | ) | (15,495,619 | ) | ||||
| TCF Financial Corp |
(110,873 | ) | (2,172,002 | ) | ||||
| Zions Bancorporation |
(280,830 | ) | (12,086,923 | ) | ||||
|
|
|
|||||||
| (33,282,198 | ) | |||||||
|
|
|
|||||||
| Insurance—(1.40%) |
||||||||
| Crawford & Co., Class B |
(190,061 | ) | (2,387,166 | ) | ||||
|
|
|
|||||||
| Thrifts and Mortgage Finance—(0.02%) |
||||||||
| Federal National Mortgage AssociationA |
(7,758 | ) | (30,256 | ) | ||||
|
|
|
|||||||
| Total Financials |
(35,699,620 | ) | ||||||
|
|
|
|||||||
| HEALTH CARE—(3.10%) |
||||||||
| Biotechnology—(0.23%) |
||||||||
| BioTime, Inc.A |
(64,600 | ) | (233,206 | ) | ||||
| Immunogen, Inc.A |
(75,080 | ) | (153,163 | ) | ||||
|
|
|
|||||||
| (386,369 | ) | |||||||
|
|
|
|||||||
| Health Care Providers & Services—(0.24%) |
||||||||
| Anthem, Inc. |
(2,847 | ) | (409,313 | ) | ||||
|
|
|
|||||||
| Pharmaceuticals—(2.63%) |
||||||||
| Abbott Laboratories |
(2,961 | ) | (113,732 | ) | ||||
| Bayer AG |
(31,133 | ) | (3,248,705 | ) | ||||
| Depomed, Inc.A |
(62,467 | ) | (1,125,655 | ) | ||||
| Valeant Pharmaceuticals International, Inc. |
(1,451 | ) | (21,069 | ) | ||||
|
|
|
|||||||
| (4,509,161 | ) | |||||||
|
|
|
|||||||
| Total Health Care |
(5,304,843 | ) | ||||||
|
|
|
|||||||
| INDUSTRIALS—(1.09%) |
||||||||
| Aerospace & Defense—(0.26%) |
||||||||
| HEICO Corp. |
(5,724 | ) | (441,607 | ) | ||||
|
|
|
|||||||
| Construction & Engineering—(0.02%) |
||||||||
| Limbach Holdings, Inc.A |
(2,964 | ) | (41,792 | ) | ||||
| See accompanying notes
|
||||
| 34 |
American Beacon Ionic Strategic Arbitrage FundSM
Schedule of Investments
December 31, 2016
| Shares | Fair Value | |||||||
| INDUSTRIALS—(1.09%) (continued) |
||||||||
| Machinery—(0.70%) |
||||||||
| Rexnord Corp.A |
(3,932 | ) | $ | (77,028 | ) | |||
| Volvo AB, Class BA |
(94,833 | ) | (1,107,527 | ) | ||||
|
|
|
|||||||
| (1,184,555 | ) | |||||||
|
|
|
|||||||
| Trading Companies & Distributors—(0.11%) |
||||||||
| Nexeo Solutions Inc.A |
(19,636 | ) | (182,811 | ) | ||||
|
|
|
|||||||
| Total Industrials |
(1,850,765 | ) | ||||||
|
|
|
|||||||
| INFORMATION TECHNOLOGY—(7.46%) |
||||||||
| Communications Equipment—(2.53%) |
||||||||
| Ciena Corp.A |
(97,205 | ) | (2,372,774 | ) | ||||
| InterDigital, Inc. |
(21,271 | ) | (1,943,106 | ) | ||||
|
|
|
|||||||
| (4,315,880 | ) | |||||||
|
|
|
|||||||
| Computers & Peripherals—(0.22%) |
||||||||
| Eastman Kodak Co.A |
(23,954 | ) | (371,287 | ) | ||||
|
|
|
|||||||
| Internet Software & Services—(0.79%) |
||||||||
| Alibaba Group Holding Ltd., Sponsored ADRA C |
(2,883 | ) | (253,156 | ) | ||||
| Tencent Holdings Ltd., ADRC |
(9,416 | ) | (228,056 | ) | ||||
| Zillow Group, Inc., Class CA |
(23,925 | ) | (872,545 | ) | ||||
|
|
|
|||||||
| (1,353,757 | ) | |||||||
|
|
|
|||||||
| IT Consulting & Services—(0.81%) |
||||||||
| Unisys Corp.A |
(92,418 | ) | (1,381,649 | ) | ||||
|
|
|
|||||||
| Semiconductor Equipment & Products—(3.11%) |
||||||||
| Advanced Micro Devices, Inc. |
(217,337 | ) | (2,464,601 | ) | ||||
| Intel Corp. |
(78,407 | ) | (2,843,822 | ) | ||||
|
|
|
|||||||
| (5,308,423 | ) | |||||||
|
|
|
|||||||
| Total Information Technology |
(12,730,996 | ) | ||||||
|
|
|
|||||||
| MATERIALS—(1.36%) |
||||||||
| Chemicals—(0.79%) |
||||||||
| AgroFresh Solutions, Inc.A |
(22,793 | ) | (60,401 | ) | ||||
| Air Products & Chemicals, Inc. |
(269 | ) | (38,688 | ) | ||||
| Platform Specialty Products Corp.A |
(2,716 | ) | (26,644 | ) | ||||
| Rayonier Advanced Materials, Inc. |
(77,827 | ) | (1,203,205 | ) | ||||
|
|
|
|||||||
| (1,328,938 | ) | |||||||
|
|
|
|||||||
| Metals & Mining—(0.34%) |
||||||||
| Franco-Nevada Corp. |
(9,835 | ) | (588,056 | ) | ||||
|
|
|
|||||||
| Paper & Forest Products—(0.23%) |
||||||||
| International Paper Co. |
(7,351 | ) | (390,044 | ) | ||||
|
|
|
|||||||
| Total Materials |
(2,307,038 | ) | ||||||
|
|
|
|||||||
| REAL ESTATE—(0.04%) |
||||||||
| Forest City Realty Trust, Inc.F |
(1,742 | ) | (36,303 | ) | ||||
| Howard Hughes Corp.A |
(240 | ) | (27,384 | ) | ||||
|
|
|
|||||||
| Total Real Estate |
(63,687 | ) | ||||||
|
|
|
|||||||
| TELECOMMUNICATION SERVICES—(2.84%) |
||||||||
| Koninklijke KPN N.V.A |
(210,000 | ) | (621,169 | ) | ||||
| Koninklijke KPN N.V.A |
(629,134 | ) | (1,863,594 | ) | ||||
| Telefonica S.A. |
(255,513 | ) | (2,372,277 | ) | ||||
|
|
|
|||||||
| Total Telecommunication Services |
(4,857,040 | ) | ||||||
|
|
|
|||||||
| See accompanying notes
|
||||
| 35 |
American Beacon Ionic Strategic Arbitrage FundSM
Schedule of Investments
December 31, 2016
| Shares | Fair Value | |||||||
| UTILITIES—(1.50%) |
||||||||
| Electric—(1.39%) |
||||||||
| Centrais Eletricas Brasileiras S.A., Sponsored ADRA C |
(38,321 | ) | $ | (265,948 | ) | |||
| Dominion Resources, Inc. |
(17,693 | ) | (1,355,107 | ) | ||||
| Great Plains Energy, Inc. |
(27,794 | ) | (760,166 | ) | ||||
|
|
|
|||||||
| (2,381,221 | ) | |||||||
|
|
|
|||||||
| Multi Utilities—(0.11%) |
||||||||
| Chugoku Electric Power Co. |
(15,533 | ) | (182,210 | ) | ||||
|
|
|
|||||||
| Total Utilities |
(2,563,431 | ) | ||||||
|
|
|
|||||||
| Total COMMON STOCKS (Proceeds $(80,986,939)) |
(90,686,217 | ) | ||||||
|
|
|
|||||||
| WARRANTS—(0.13%) (Proceeds $(144,133)) |
||||||||
| FINANCIALS—(0.13%) |
||||||||
| Wells Fargo & Co., 10/28/2018, Strike Price $33.90 |
(10,544 | ) | (224,904 | ) | ||||
|
|
|
|||||||
| PREFERRED STOCKS – (0.66%) |
||||||||
| FINANCE – (0.04%) |
||||||||
| Citigroup, Inc., 7.125%, Due 12/31/2049 |
(2,465 | ) | (68,970 | ) | ||||
|
|
|
|||||||
| MATERIALS – (0.62%) |
||||||||
| Vale S.A., Sponsored ADRC K |
(152,950 | ) | (1,053,826 | ) | ||||
|
|
|
|||||||
| Total PREFERRED STOCKS (Proceeds $(1,052,787)) |
(1,122,796 | ) | ||||||
|
|
|
|||||||
| EXCHANGE-TRADED INSTRUMENTS—(3.64%) |
||||||||
| EXCHANGE-TRADED FUNDS—(3.64%) |
||||||||
| Direxion Daily Gold Miners Index Bull 3X Shares |
(50,734 | ) | (387,608 | ) | ||||
| Direxion Daily Junior Gold Miners Index Bull 3x Shares |
(50,000 | ) | (279,000 | ) | ||||
| iShares China Large-Cap Fund |
(2,900 | ) | (100,659 | ) | ||||
| iShares MSCI Emerging Markets Fund |
(3,700 | ) | (129,537 | ) | ||||
| iShares MSCI Switzerland Capped ETF |
(13,722 | ) | (404,250 | ) | ||||
| iShares MSCI USA Minimum Volatility ETF |
(10,543 | ) | (476,754 | ) | ||||
| PowerShares DB US Dollar Index Bullish Fund |
(84,074 | ) | (2,224,598 | ) | ||||
| SPDR EURO STOXX 50 ETF |
(66,244 | ) | (2,216,524 | ) | ||||
|
|
|
|||||||
| Total EXCHANGE-TRADED INSTRUMENTS (Proceeds $(6,630,556)) |
(6,218,930 | ) | ||||||
|
|
|
|||||||
| INVESTMENT COMPANIES—(1.58%) |
||||||||
| CLOSED-END FUNDS—(1.58%) |
||||||||
| Vanguard FTSE Emerging Markets Fund |
(68,505 | ) | (2,161,333 | ) | ||||
| WisdomTree Japan Hedged Equity Fund |
(10,263 | ) | (508,429 | ) | ||||
|
|
|
|||||||
| Total INVESTMENT COMPANIES (Proceeds $(2,605,849)) |
(2,669,762 | ) | ||||||
|
|
|
|||||||
| Total SECURITIES SOLD SHORT (Proceeds $(91,420,264)) |
(100,922,609 | ) | ||||||
|
|
|
|||||||
| TOTAL INVESTMENTS IN SECURITIES (excludes Securities Sold
Short)—98.61% |
168,430,137 | |||||||
| TOTAL PURCHASED OPTIONS—3.92% (Premiums Paid $10,848,724) |
6,699,506 | |||||||
| TOTAL WRITTEN OPTIONS—(0.28)% (Premiums Received $(1,609,965)) |
(482,819 | ) | ||||||
| TOTAL SECURITIES SOLD SHORT—(59.10)% (Proceeds $(91,420,264)) |
(100,922,609 | ) | ||||||
| OTHER ASSETS, NET OF LIABILITIES—56.85% |
97,126,674 | |||||||
|
|
|
|||||||
| TOTAL NET ASSETS—100.00% |
$ | 170,850,889 | ||||||
|
|
|
|||||||
Percentages are stated as a percent of net assets.
| A | Non-income producing security. |
| B | PLC - Public Limited Company. |
| C | ADR - American Depositary Receipt. |
| D | Unit - Usually consists of one common stock and/or rights and warrants. |
| E | SPAC - Special Purpose Acquisition Company. |
| See accompanying notes
|
||||
| 36 |
American Beacon Ionic Strategic Arbitrage FundSM
Schedule of Investments
December 31, 2016
| F | REIT - Real Estate Investment Trust. |
| G | The Fund is affiliated by having the same investment advisor. |
| H | Security exempt from registration under the Securities Act of 1933. These securities may be resold to qualified institutional buyers pursuant to Rule 144A. At the period end, the value of these securities amounted to $22,535,502 or 13.19% of net assets. The Fund has no right to demand registration of these securities. |
| I | The coupon rate shown on floating or adjustable rate securities represents the rate at period end. The due date on these types of securities reflects the final maturity date. |
| J | Non-voting participating shares. |
| K | A type of Preferred Stock that has no maturity date. |
| l | LLC – Limited Liability Company. |
| M | Tracking Stock - A form of common stock that is issued by a parent company and tracks the performance of a specific division of that parent company. It allows investors the chance to invest in an individual sector of a company while the parent company maintains overall control. |
| Futures Contracts Open on December 31, 2016: |
| Description |
Type | Number of Contracts |
Expiration Date |
Contract Value |
Unrealized Appreciation (Depreciation) |
|||||||||||||||
| Nikkei 225 (CME) Futures |
Long | 19 | March 2017 | $ | 1,815,451 | $ | 53,165 | |||||||||||||
| U.S. Dollar Index Futures |
Short | 65 | March 2017 | (6,648,591 | ) | 61,363 | ||||||||||||||
| U.S. Ultra Treasury 10-Year Note Futures |
Short | 5 | March 2017 | (670,313 | ) | 4,801 | ||||||||||||||
|
|
|
|
|
|||||||||||||||||
| $ | (5,503,453 | ) | $ | 119,329 | ||||||||||||||||
|
|
|
|
|
|||||||||||||||||
| Purchased Options Outstanding on December 31, 2016: |
| Equity Options |
| Description |
Exercise Price |
Expiration Date |
Curr | Number of Contracts |
Premiums Paid |
Fair Value | Net Unrealized Appreciation (Depreciation) |
|||||||||||||||||||||
| Call - Agrofresh Solutions, Inc. |
7.50 | 1/20/2017 | USD | 12 | $ | 721 | $ | 60 | $ | (661 | ) | |||||||||||||||||
| Call - Energy XXI Ltd. |
1.50 | 1/20/2017 | USD | 169 | 8,710 | 423 | (8,287 | ) | ||||||||||||||||||||
| Call - Energy XXI Ltd. |
2.00 | 1/20/2017 | USD | 5 | 178 | 13 | (165 | ) | ||||||||||||||||||||
| Call - Kinross Gold Corp. |
7.00 | 1/20/2017 | USD | 1,708 | 129,024 | 1,708 | (127,316 | ) | ||||||||||||||||||||
| Call - Linn Energy LLC |
4.00 | 1/20/2017 | USD | 1,653 | 71,090 | 4,133 | (66,957 | ) | ||||||||||||||||||||
| Call - McDermott International, Inc. |
6.00 | 1/20/2017 | USD | 20 | 802 | 2,900 | 2,098 | |||||||||||||||||||||
| Call - McDermott International, Inc. |
7.00 | 1/20/2017 | USD | 5 | 150 | 300 | 150 | |||||||||||||||||||||
| Call - Monsanto Co. |
115.00 | 1/20/2017 | USD | 440 | 70,040 | 3,960 | (66,080 | ) | ||||||||||||||||||||
| Call - Sunpower Corp. |
9.00 | 1/20/2017 | USD | 300 | 6,762 | 600 | (6,162 | ) | ||||||||||||||||||||
| Put - Alibaba Group Holding Ltd. |
105.00 | 1/20/2017 | USD | 370 | 231,666 | 641,578 | 409,912 | |||||||||||||||||||||
| Put - Bunge Ltd. |
35.00 | 1/20/2017 | USD | 130 | 7,220 | 650 | (6,570 | ) | ||||||||||||||||||||
| Put - Under Armour, Inc. |
40.00 | 1/20/2017 | USD | 400 | 360,460 | 443,998 | 83,538 | |||||||||||||||||||||
| Put - Vipshop Holdings Ltd. |
6.00 | 1/20/2017 | USD | 1,038 | 35,464 | 12,975 | (22,489 | ) | ||||||||||||||||||||
| Put - Biotime, Inc. |
3.00 | 3/17/2017 | USD | 87 | 4,068 | 1,523 | (2,545 | ) | ||||||||||||||||||||
| Put - Dish Network Corp. |
30.00 | 3/17/2017 | USD | 709 | 45,996 | 5,318 | (40,678 | ) | ||||||||||||||||||||
| Put - Sina Corp./China |
60.00 | 3/17/2017 | USD | 310 | 70,480 | 142,600 | 72,120 | |||||||||||||||||||||
| Put - SPDR S&P Oil + Gas Exploration |
31.00 | 3/17/2017 | USD | 855 | 108,680 | 12,825 | (95,855 | ) | ||||||||||||||||||||
| Put - Sunpower Corp. |
7.00 | 3/17/2017 | USD | 1,051 | 115,992 | 117,712 | 1,720 | |||||||||||||||||||||
| Put - Advanced Micro Devices, Inc. |
4.00 | 4/21/2017 | USD | 1,259 | 23,303 | 6,295 | (17,008 | ) | ||||||||||||||||||||
| Call - Transocean Ltd. |
17.00 | 5/19/2017 | USD | 722 | 87,999 | 62,453 | (25,546 | ) | ||||||||||||||||||||
| Call - William Lyon Homes |
20.00 | 5/19/2017 | USD | 50 | 14,552 | 8,500 | (6,052 | ) | ||||||||||||||||||||
| Call - Energy XXI Ltd. |
1.00 | 1/19/2018 | USD | 27 | 2,067 | 68 | (1,999 | ) | ||||||||||||||||||||
| Call - Energy XXI Ltd. |
2.00 | 1/19/2018 | USD | 559 | 27,341 | 1,398 | (25,943 | ) | ||||||||||||||||||||
| Call - Linn Energy LLC |
3.00 | 1/19/2018 | USD | 345 | 17,781 | 863 | (16,918 | ) | ||||||||||||||||||||
| Call - Wells Fargo & Co. |
40.00 | 1/19/2018 | USD | 64 | 46,115 | 100,800 | 54,685 | |||||||||||||||||||||
|
|
|
|
|
|
|
|||||||||||||||||||||||
| $ | 1,486,661 | $ | 1,573,653 | $ | 86,992 | |||||||||||||||||||||||
|
|
|
|
|
|
|
|||||||||||||||||||||||
| See accompanying notes
|
||||
| 37 |
American Beacon Ionic Strategic Arbitrage FundSM
Schedule of Investments
December 31, 2016
| ETF Options |
| Description |
Exercise Price |
Expiration Date |
Curr | Number of Contracts |
Premiums Paid |
Fair Value | Net Unrealized Appreciation (Depreciation) |
|||||||||||||||||||||
| Call - CurrencyShares British Pound ETF |
150.00 | 1/20/2017 | USD | 297 | $ | 77,561 | $ | 743 | $ | (76,818 | ) | |||||||||||||||||
| Call - CurrencyShares British Pound ETF |
140.00 | 1/20/2017 | USD | 542 | 378,936 | 1,355 | (377,581 | ) | ||||||||||||||||||||
| Call - CurrencyShares British Pound ETF |
135.00 | 1/20/2017 | USD | 240 | 17,050 | 240 | (16,810 | ) | ||||||||||||||||||||
| Call - SPDR Euro STOXX 50 ETF |
35.00 | 1/20/2017 | USD | 1,507 | 192,561 | 15,070 | (177,491 | ) | ||||||||||||||||||||
| Call - Vaneck Vectors Junior Gold Miners ETF |
34.00 | 1/20/2017 | USD | 600 | 36,324 | 48,000 | 11,676 | |||||||||||||||||||||
| Put - iShares iBoxx High Yield Corporate Bond ETF |
85.00 | 1/20/2017 | USD | 1,088 | 23,980 | 19,584 | (4,396 | ) | ||||||||||||||||||||
| Put - iShares MSCI Brazil Capped ETF |
23.00 | 1/20/2017 | USD | 264 | 71,774 | 264 | (71,510 | ) | ||||||||||||||||||||
| Put - iShares U.S. Real Estate ETF |
65.00 | 1/20/2017 | USD | 169 | 62,473 | 423 | (62,050 | ) | ||||||||||||||||||||
| Put - Wisdomtree Japan Hedged Equity ETF |
39.00 | 1/20/2017 | USD | 64 | 1,009 | 96 | (913 | ) | ||||||||||||||||||||
| Call - iShares 20+ Year Treasury Bond ETF |
124.00 | 3/17/2017 | USD | 519 | 180,633 | 66,432 | (114,201 | ) | ||||||||||||||||||||
| Call - iShares Edge MSCI Min Vol USA ETF |
48.00 | 3/17/2017 | USD | 1,295 | 112,208 | 22,663 | (89,545 | ) | ||||||||||||||||||||
| Call - iShares MSCI Emerging Markets ETF |
34.00 | 3/17/2017 | USD | 683 | 132,558 | 136,600 | 4,042 | |||||||||||||||||||||
| Call - Vaneck Vectors Gold Miners ETF |
18.00 | 3/17/2017 | USD | 750 | 169,156 | 279,000 | 109,844 | |||||||||||||||||||||
| Put - iShares 20+ Year Treasury Bond ETF |
115.00 | 3/17/2017 | USD | 519 | 148,974 | 85,116 | (63,858 | ) | ||||||||||||||||||||
| Put - iShares MSCI Emerging Markets ETF |
34.00 | 3/17/2017 | USD | 683 | 137,252 | 65,568 | (71,684 | ) | ||||||||||||||||||||
| Call - iShares China Large-Cap ETF |
37.00 | 6/16/2017 | USD | 815 | 149,342 | 103,913 | (45,429 | ) | ||||||||||||||||||||
| Put - iShares China Large-Cap ETF |
36.00 | 6/16/2017 | USD | 509 | 156,527 | 143,029 | (13,498 | ) | ||||||||||||||||||||
| Call - SPDR Euro STOXX 50 ETF |
32.00 | 1/19/2018 | USD | 769 | 174,594 | 238,390 | 63,796 | |||||||||||||||||||||
| Call - Wisdomtree Japan Hedged Equity ETF |
50.78 | 1/19/2018 | USD | 1,250 | 202,801 | 468,750 | 265,949 | |||||||||||||||||||||
| Put - SPDR Euro STOXX 50 ETF |
31.00 | 1/19/2018 | USD | 769 | 293,789 | 142,265 | (151,524 | ) | ||||||||||||||||||||
| Put - Wisdomtree Japan Hedged Equity ETF |
40.78 | 1/19/2018 | USD | 3,779 | 1,741,098 | 555,511 | (1,185,587 | ) | ||||||||||||||||||||
| Put - Wisdomtree Japan Hedged Equity ETF |
35.00 | 1/19/2018 | USD | 2,186 | 671,099 | 148,648 | (522,451 | ) | ||||||||||||||||||||
| Put - Wisdomtree Japan Hedged Equity ETF |
37.78 | 1/19/2018 | USD | 2,663 | 940,387 | 251,654 | (688,733 | ) | ||||||||||||||||||||
| Put - Wisdomtree Japan Hedged Equity ETF |
30.00 | 1/19/2018 | USD | 664 | 113,015 | 22,244 | (90,771 | ) | ||||||||||||||||||||
|
|
|
|
|
|
|
|||||||||||||||||||||||
| $ | 6,185,101 | $ | 2,815,558 | $ | (3,369,543 | ) | ||||||||||||||||||||||
|
|
|
|
|
|
|
|||||||||||||||||||||||
| ETN Options |
| Description |
Exercise Price |
Expiration Date |
Curr | Number of Contracts |
Premiums Paid |
Fair Value | Net Unrealized Appreciation (Depreciation) |
|||||||||||||||||||||
| Call - Ipath S&P 500 Vix Short-Term Futures ETN |
22.00 | 1/20/2017 | USD | 780 | $ | 358,836 | $ | 294,060 | $ | (64,776 | ) | |||||||||||||||||
| Put - Ipath S&P 500 Vix Short-Term Futures ETN |
28.00 | 3/17/2017 | USD | 936 | 588,716 | 482,040 | (106,676 | ) | ||||||||||||||||||||
| Put - Ipath S&P 500 Vix Short-Term Futures ETN |
24.00 | 3/17/2017 | USD | 788 | 259,229 | 187,544 | (71,685 | ) | ||||||||||||||||||||
| Put - Ipath S&P 500 Vix Short-Term Futures ETN |
18.00 | 6/16/2017 | USD | 1,805 | 151,499 | 200,355 | 48,856 | |||||||||||||||||||||
|
|
|
|
|
|
|
|||||||||||||||||||||||
| $ | 1,358,280 | $ | 1,163,999 | $ | (194,281 | ) | ||||||||||||||||||||||
|
|
|
|
|
|
|
|||||||||||||||||||||||
| Index Options |
| Description |
Exercise Price |
Expiration Date |
Curr | Number of Contracts |
Premiums Paid |
Fair Value | Net Unrealized Appreciation (Depreciation) |
|||||||||||||||||
| Put - Powershares DB US Dollar Index |
22.00 | 1/20/2017 | USD | 788 | $ | 7,490 | $ | 1,970 | $ | (5,520 | ) | |||||||||||||
| Put - Powershares DB US Dollar Index |
25.00 | 1/20/2017 | USD | 1,491 | 126,004 | 1,491 | (124,513 | ) | ||||||||||||||||
| Put - Powershares DB US Dollar Index |
24.00 | 1/20/2017 | USD | 1,711 | 86,024 | 856 | (85,168 | ) | ||||||||||||||||
| Put - S&P 500 Index |
2,205.00 | 1/27/2017 | USD | 22 | 22,221 | 40,920 | 18,699 | |||||||||||||||||
| Call - CBOE SPX Volatility Index |
25.00 | 2/15/2017 | USD | 336 | 18,255 | 19,488 | 1,233 | |||||||||||||||||
| Call - Powershares DB US Dollar Index |
26.00 | 3/17/2017 | USD | 2,315 | 93,990 | 166,680 | 72,690 | |||||||||||||||||
| Call - Powershares DB US Dollar Index |
25.00 | 3/17/2017 | USD | 2,664 | 124,675 | 404,928 | 280,253 | |||||||||||||||||
| Put - Powershares DB US Dollar Index |
24.00 | 3/17/2017 | USD | 4,775 | 114,879 | 7,163 | (107,716 | ) | ||||||||||||||||
| Call - Direxion Daily Gold Miners Index Bull 3x Shares |
24.00 | 1/19/2018 | USD | 300 | 227,302 | 51,750 | (175,552 | ) | ||||||||||||||||
| Call - Direxion Daily Gold Miners Index Bull 3x Shares |
25.00 | 1/19/2018 | USD | 67 | 27,791 | 10,050 | (17,741 | ) | ||||||||||||||||
| See accompanying notes
|
||||
| 38 |
American Beacon Ionic Strategic Arbitrage FundSM
Schedule of Investments
December 31, 2016
| Description |
Exercise Price |
Expiration Date |
Curr | Number of Contracts |
Premiums Paid |
Fair Value | Net Unrealized Appreciation (Depreciation) |
|||||||||||||||||||||
| Call - Direxion Daily Gold Miners Index Bull 3x Shares |
21.00 | 1/19/2018 | USD | 42 | $ | 15,419 | $ | 7,665 | $ | (7,754 | ) | |||||||||||||||||
| Put - Direxion Daily Gold Miners Index Bear 3x Shares |
4.00 | 1/19/2018 | USD | 3,006 | 576,311 | 405,809 | (170,502 | ) | ||||||||||||||||||||
| Put - Powershares DB US Dollar Index |
23.00 | 1/19/2018 | USD | 2,847 | 147,420 | 22,775 | (124,645 | ) | ||||||||||||||||||||
|
|
|
|
|
|
|
|||||||||||||||||||||||
| $ | 1,587,781 | $ | 1,141,545 | $ | (446,236 | ) | ||||||||||||||||||||||
|
|
|
|
|
|
|
|||||||||||||||||||||||
| Future Options |
| Description |
Exercise Price |
Expiration Date |
Curr | Number of Contracts |
Premiums Paid |
Fair Value | Net Unrealized Appreciation (Depreciation) |
|||||||||||||||||||||
| Put - Dollar Index Spot Option |
94.00 | 3/3/2017 | USD | 1,100 | $ | 126,900 | $ | 2,750 | $ | (124,150 | ) | |||||||||||||||||
| Put - Dollar Index Spot Option |
93.00 | 3/3/2017 | USD | 1,000 | 104,001 | 2,000 | (102,001 | ) | ||||||||||||||||||||
|
|
|
|
|
|
|
|||||||||||||||||||||||
| $ | 230,901 | $ | 4,750 | $ | (226,151 | ) | ||||||||||||||||||||||
|
|
|
|
|
|
|
|||||||||||||||||||||||
| Written Options Outstanding on December 31, 2016: |
| Equity Options |
| Description |
Exercise Price |
Expiration Date |
Curr | Number of Contracts |
Premiums Received |
Fair Value | Net Unrealized Appreciation (Depreciation) |
|||||||||||||||||||||
| Call - Alibaba Group Holding Ltd. |
110.00 | 1/20/2017 | USD | 354 | $ | (255,345 | ) | $ | (354 | ) | $ | 254,991 | ||||||||||||||||
| Call - Centennial Resource Development, Inc. |
17.50 | 1/20/2017 | USD | 205 | (4,387 | ) | (48,688 | ) | (44,301 | ) | ||||||||||||||||||
| Call - Under Armour, Inc. |
40.00 | 1/20/2017 | USD | 400 | (2,768 | ) | (2,000 | ) | 768 | |||||||||||||||||||
| Call - Vmware, Inc. |
77.50 | 1/20/2017 | USD | 162 | (53,282 | ) | (38,069 | ) | 15,213 | |||||||||||||||||||
| Put - Centennial Resource Development, Inc. |
15.00 | 1/20/2017 | USD | 205 | (20,321 | ) | (1,025 | ) | 19,296 | |||||||||||||||||||
| Put - Sunpower Corp. |
9.00 | 1/20/2017 | USD | 300 | (71,835 | ) | (71,699 | ) | 136 | |||||||||||||||||||
| Call - Adams Natural Resources Fund, Inc. |
19.32 | 2/17/2017 | USD | 10 | (745 | ) | (1,175 | ) | (430 | ) | ||||||||||||||||||
| Call - Global Eagle Entertainment, Inc. |
10.00 | 2/17/2017 | USD | 59 | (4,450 | ) | (1,328 | ) | 3,122 | |||||||||||||||||||
| Call - Applied DNA Sciences, Inc. |
5.00 | 3/17/2017 | USD | 1 | (19 | ) | (5 | ) | 14 | |||||||||||||||||||
| Call - Biotime, Inc. |
4.00 | 3/17/2017 | USD | 225 | (7,996 | ) | (5,063 | ) | 2,933 | |||||||||||||||||||
| Call - Biotime, Inc. |
3.00 | 3/17/2017 | USD | 38 | (2,453 | ) | (3,420 | ) | (967 | ) | ||||||||||||||||||
| Put - SPDR S&P Oil + Gas Exploration |
30.00 | 3/17/2017 | USD | 855 | (66,188 | ) | (9,405 | ) | 56,783 | |||||||||||||||||||
| Call - Centennial Resource Development, Inc. |
15.00 | 4/21/2017 | USD | 10 | (1,735 | ) | (5,200 | ) | (3,465 | ) | ||||||||||||||||||
| Put - Centennial Resource Development, Inc. |
12.50 | 4/21/2017 | USD | 10 | (1,085 | ) | (250 | ) | 835 | |||||||||||||||||||
| Call - William Lyon Homes |
22.50 | 5/19/2017 | USD | 101 | (17,570 | ) | (10,353 | ) | 7,217 | |||||||||||||||||||
|
|
|
|
|
|
|
|||||||||||||||||||||||
| $ | (510,179 | ) | $ | (198,034 | ) | $ | 312,145 | |||||||||||||||||||||
|
|
|
|
|
|
|
|||||||||||||||||||||||
| ETF Options |
| Description |
Exercise Price |
Expiration Date |
Curr | Number of Contracts |
Premiums Received |
Fair Value | Net Unrealized Appreciation (Depreciation) |
|||||||||||||||||||||
| Put - Vaneck Vectors Junior Gold Miners ETF |
34.00 | 1/20/2017 | USD | 600 | $ | (317,668 | ) | $ | (161,999 | ) | $ | 155,669 | ||||||||||||||||
| Put - Wisdomtree Japan Hedged Equity ETF |
44.00 | 1/20/2017 | USD | 100 | (21,756 | ) | (650 | ) | 21,106 | |||||||||||||||||||
| Put - Wisdomtree Japan Hedged Equity ETF |
35.00 | 1/20/2017 | USD | 2,823 | (380,223 | ) | (4,235 | ) | 375,988 | |||||||||||||||||||
| Put - Wisdomtree Japan Hedged Equity ETF |
40.00 | 1/20/2017 | USD | 898 | (131,176 | ) | (898 | ) | 130,278 | |||||||||||||||||||
| Put - Wisdomtree Japan Hedged Equity ETF |
30.00 | 1/20/2017 | USD | 569 | (32,523 | ) | (854 | ) | 31,669 | |||||||||||||||||||
| Put - Wisdomtree Japan Hedged Equity ETF |
37.00 | 1/20/2017 | USD | 299 | (42,374 | ) | (449 | ) | 41,925 | |||||||||||||||||||
| Call - Wisdomtree Japan Hedged Equity ETF |
51.00 | 2/17/2017 | USD | 100 | (12,136 | ) | (8,000 | ) | 4,136 | |||||||||||||||||||
| Put - Wisdomtree Japan Hedged Equity ETF |
50.00 | 2/17/2017 | USD | 100 | (10,636 | ) | (16,000 | ) | (5,364 | ) | ||||||||||||||||||
| Put - Wisdomtree Japan Hedged Equity ETF |
40.00 | 5/19/2017 | USD | 2,500 | (117,396 | ) | (80,000 | ) | 37,396 | |||||||||||||||||||
|
|
|
|
|
|
|
|||||||||||||||||||||||
| $ | (1,065,888 | ) | $ | (273,085 | ) | $ | 792,803 | |||||||||||||||||||||
|
|
|
|
|
|
|
|||||||||||||||||||||||
| See accompanying notes
|
||||
| 39 |
American Beacon Ionic Strategic Arbitrage FundSM
Schedule of Investments
December 31, 2016
| ETN Options |
| Description |
Exercise Price |
Expiration Date |
Curr | Number of Contracts |
Premiums Received |
Fair Value |
Net Unrealized Appreciation (Depreciation) |
|||||||||||||||||||||||||
| Put - Ipath S&P 500 Vix Short-Term Futures ETN |
22.00 | 1/20/2017 | USD | 780 | $ | (33,898 | ) | $ | (11,700 | ) | $ | 22,198 | ||||||||||||||||||||
|
|
|
|
|
|
|
|||||||||||||||||||||||||||
| $ | (33,898 | ) | $ | (11,700 | ) | $ | 22,198 | |||||||||||||||||||||||||
|
|
|
|
|
|
|
|||||||||||||||||||||||||||
| Glossary: |
| Other Abbreviations | ||||||||||
| CBOE |
Chicago Board Options Exchange | FTSE | Financial Times Stock Exchange | REMIC | Real Estate Mortgage Investment Conduit | |||||
| ETF |
Exchange Traded Fund | MSCI | Morgan Stanley Composite Index | SPDR | Standard & Poor’s Depositary Receipts | |||||
| ETN |
Exchange Traded Note | REIT | Real Estate Investment Trust | VIX | Volatility Index | |||||
| See accompanying notes
|
||||
| 40 |
Statements of Assets and Liabilities
December 31, 2016
| AHL Managed Futures Strategy Fund** |
Ionic Strategic Arbitrage Fund |
|||||||
| Assets: |
||||||||
| Investments in unaffiliated securities, at fair value A |
$ | 407,399,326 | $ | 142,427,122 | ||||
| Investments in affiliated securities, at fair value B |
6,472,219 | 26,003,015 | ||||||
| Foreign currency deposits with brokers for futures contracts, at fair value D |
13,633,933 | — | ||||||
| Purchased options and swaptions outstanding (premiums paid $10,848,724) |
— | 6,699,505 | ||||||
| Foreign currency, at fair value C |
— | 5,253,578 | ||||||
| Cash at broker |
14,100,055 | 92,871,491 | ||||||
| Deposit with brokers for futures contracts |
16,279,368 | 270,795 | ||||||
| Cash collateral held at custodian for the benefit of the broke |
— | 6,000,000 | ||||||
| Dividends and interest receivable |
3,681 | 945,570 | ||||||
| Receivable for investments sold |
689,654 | 3,018,966 | ||||||
| Receivable for fund shares sold |
2,506,173 | 1,168,475 | ||||||
| Receivable for tax reclaims |
— | 2,249 | ||||||
| Receivable for expense reimbursement (Note 2) |
684,669 | 13,642 | ||||||
| Receivable for variation margin on open futures contracts |
28,700,099 | 117,816 | ||||||
| Unrealized appreciation from forward currency contracts |
2,933,684 | — | ||||||
| Prepaid expenses |
29,506 | 19,544 | ||||||
|
|
|
|
|
|||||
| Total assets |
493,432,367 | 284,811,768 | ||||||
|
|
|
|
|
|||||
| Liabilities: |
||||||||
| Payable for investments purchased |
— | 3,238,916 | ||||||
| Payable for fund shares redeemed |
3,649,841 | 49,850 | ||||||
| Payable for foreign currency, at fair value C |
125,462 | — | ||||||
| Payable for variation margin from open futures contracts |
19,178,809 | — | ||||||
| Payable for foreign currency deposits with broker, at fair value F |
— | 8,782,026 | ||||||
| Securities sold short, at fair value E |
— | 100,922,609 | ||||||
| Foreign currency deposit with brokers for futures contracts, at fair value D |
— | 135,846 | ||||||
| Written options outstanding (premiums received $1,609,965) |
— | 482,819 | ||||||
| Dividend expense payable |
— | 101,517 | ||||||
| Management and investment advisory fees payable |
513,969 | 181,771 | ||||||
| Administrative service and service fees payable |
22,420 | 5,591 | ||||||
| Transfer agent fees payable |
11,516 | 2,511 | ||||||
| Custody and fund accounting fees payable |
298,874 | 3,996 | ||||||
| Professional fees payable |
67,811 | 40,012 | ||||||
| Trustee fees payable |
47 | 10 | ||||||
| Payable for prospectus and shareholder reports |
54,273 | 6,542 | ||||||
| Unrealized depreciation from forward currency contracts |
4,658,677 | — | ||||||
| Other liabilities |
2,158 | 6,863 | ||||||
|
|
|
|
|
|||||
| Total liabilities |
28,583,857 | 113,960,879 | ||||||
|
|
|
|
|
|||||
| Net Assets |
$ | 464,848,510 | $ | 170,850,889 | ||||
|
|
|
|
|
|||||
| Analysis of Net Assets: |
||||||||
| Paid-in-capital |
$ | 470,849,744 | $ | 185,449,283 | ||||
| Undistributed net investment income |
1,423,199 | 1,709,862 | ||||||
| Accumulated net realized (loss) |
(14,974,979 | ) | (16,374,249 | ) | ||||
| Unrealized appreciation of investments |
3,893 | 13,135,977 | ||||||
| Unrealized (depreciation) of currency transactions |
(1,954,954 | ) | (138,390 | ) | ||||
| Unrealized appreciation of futures contracts |
9,501,607 | 119,329 | ||||||
| Unrealized (depreciation) of options contracts |
— | (3,022,073 | ) | |||||
| Unrealized (depreciation) of short sales |
— | (10,028,850 | ) | |||||
|
|
|
|
|
|||||
| Net assets |
$ | 464,848,510 | $ | 170,850,889 | ||||
|
|
|
|
|
|||||
| See accompanying notes
|
||||
| 41 |
American Beacon FundsSM
Statements of Assets and Liabilities
December 31, 2016
| AHL Managed Futures Strategy Fund** |
Ionic Strategic Arbitrage Fund |
|||||||
| Shares outstanding at no par value (unlimited shares authorized): |
||||||||
| Institutional Class |
33,868,541 | 11,701,887 | ||||||
|
|
|
|
|
|||||
| Y Class |
5,032,434 | 6,759,861 | ||||||
|
|
|
|
|
|||||
| Investor Class |
3,017,848 | 370,402 | ||||||
|
|
|
|
|
|||||
| A Class |
2,251,064 | 12,796 | ||||||
|
|
|
|
|
|||||
| C Class |
421,714 | 17,167 | ||||||
|
|
|
|
|
|||||
| Net assets: |
||||||||
| Institutional Class |
$ | 353,601,987 | $ | 105,989,910 | ||||
|
|
|
|
|
|||||
| Y Class |
$ | 52,391,912 | $ | 61,253,803 | ||||
|
|
|
|
|
|||||
| Investor Class |
$ | 31,223,150 | $ | 3,339,009 | ||||
|
|
|
|
|
|||||
| A Class |
$ | 23,330,824 | $ | 115,308 | ||||
|
|
|
|
|
|||||
| C Class |
$ | 4,300,637 | $ | 152,859 | ||||
|
|
|
|
|
|||||
| Net asset value, offering and redemption price per share: |
||||||||
| Institutional Class |
$ | 10.44 | $ | 9.06 | ||||
|
|
|
|
|
|||||
| Y Class |
$ | 10.41 | $ | 9.06 | ||||
|
|
|
|
|
|||||
| Investor Class |
$ | 10.35 | $ | 9.01 | ||||
|
|
|
|
|
|||||
| A Class |
$ | 10.36 | $ | 9.01 | ||||
|
|
|
|
|
|||||
| A Class offering price |
$ | 10.99 | $ | 9.46 | ||||
|
|
|
|
|
|||||
| C Class |
$ | 10.20 | $ | 8.90 | ||||
|
|
|
|
|
|||||
| A Cost of investments in unaffiliated securities |
$ | 407,395,433 | $ | 130,011,232 | ||||
| B Cost of investments in affiliated securities |
$ | 6,472,219 | $ | 26,003,015 | ||||
| C Cost of foreign currency |
$ | (125,051 | ) | $ | 5,399,164 | |||
| D Cost of foreign currency deposits with broker for futures contracts |
$ | 13,864,623 | $ | (136,929 | ) | |||
| E Proceeds of securities sold short |
$ | — | $ | (91,420,264 | ) | |||
| F Cost of foreign currency deposits with broker |
$ | — | $ | (8,982,927 | ) | |||
| ** | Consolidated financial statement. See Note 1 in the Notes to Financial Statements for additional information |
| See accompanying notes
|
||||
| 42 |
American Beacon FundsSM
Statements of Operations
For the year ended December 31, 2016
| AHL Managed Futures Strategy Fund** |
Ionic Strategic Arbitrage Fund |
|||||||
| Investment income: |
||||||||
| Dividend income from unaffiliated securities (net of foreign taxes) A |
$ | 2,409 | $ | 1,830,776 | ||||
| Dividend income from affiliated securities |
18,030 | 69,121 | ||||||
| Interest income |
849,449 | 3,963,786 | ||||||
|
|
|
|
|
|||||
| Total investment income |
869,888 | 5,863,683 | ||||||
|
|
|
|
|
|||||
| Expenses: |
||||||||
| Management and investment advisory fees (Note 2) |
5,287,470 | 1,764,531 | ||||||
| Administrative service fees (Note 2): |
||||||||
| Institutional Class |
300,350 | 80,163 | ||||||
| Y Class |
63,621 | 43,635 | ||||||
| Investor Class |
33,696 | 1,982 | ||||||
| A Class |
22,335 | 109 | ||||||
| C Class |
3,627 | 151 | ||||||
| Transfer agent fees: |
||||||||
| Institutional Class |
115,216 | 33,912 | ||||||
| Y Class |
2,318 | 1,612 | ||||||
| Investor Class |
2,870 | 1,709 | ||||||
| A Class |
1,258 | 70 | ||||||
| C Class |
241 | 66 | ||||||
| Custody and fund accounting fees |
1,675,111 | 22,957 | ||||||
| Professional fees |
86,868 | 72,069 | ||||||
| Registration fees and expenses |
181,245 | 116,584 | ||||||
| Service fees (Note 2): |
||||||||
| Y Class |
61,063 | 47,523 | ||||||
| Investor Class |
86,054 | 5,179 | ||||||
| A Class |
31,992 | 172 | ||||||
| C Class |
5,675 | 239 | ||||||
| Distribution fees (Note 2): |
||||||||
| A Class |
53,319 | 287 | ||||||
| C Class |
37,836 | 1,595 | ||||||
| Prospectus and shareholder report expenses |
180,366 | 12,647 | ||||||
| Trustee fees |
27,638 | 8,528 | ||||||
| Prime broker fees |
9,909 | 754,294 | ||||||
| Dividends on securities sold short |
— | 1,493,898 | ||||||
| Other expenses |
24,701 | 27,954 | ||||||
|
|
|
|
|
|||||
| Total expenses |
8,294,779 | 4,491,866 | ||||||
|
|
|
|
|
|||||
| Net fees waived and expenses reimbursed (Note 2) |
(1,444,427 | ) | (32,760 | ) | ||||
|
|
|
|
|
|||||
| Net expenses |
6,850,352 | 4,459,106 | ||||||
|
|
|
|
|
|||||
| Net investment income |
(5,980,464 | ) | 1,404,577 | |||||
|
|
|
|
|
|||||
| See accompanying notes
|
||||
| 43 |
American Beacon FundsSM
Statements of Operations
For the year ended December 31, 2016
| AHL Managed Futures Strategy Fund** |
Ionic Strategic Arbitrage Fund |
|||||||
| Realized and unrealized gain (loss) from investments: |
||||||||
| Net realized gain (loss) from: |
||||||||
| Investments |
$ | (871 | ) | $ | 903,669 | |||
| Foreign currency transactions |
(1,251,237 | ) | 133,329 | |||||
| Futures contracts |
(26,509,515 | ) | 546,794 | |||||
| Option contracts |
— | (1,125,509 | ) | |||||
| Change in net unrealized appreciation (depreciation) of: |
||||||||
| Investments |
4,114 | 12,812,073 | ||||||
| Foreign currency transactions |
(1,489,770 | ) | (129,627 | ) | ||||
| Futures contracts |
9,085,947 | 126,518 | ||||||
| Option contracts |
— | (2,519,222 | ) | |||||
| Short sales |
— | (9,652,397 | ) | |||||
|
|
|
|
|
|||||
| Net gain (loss) from investments |
(20,161,332 | ) | 1,095,628 | |||||
|
|
|
|
|
|||||
| Net increase (decrease) in net assets resulting from operations |
$ | (26,141,796 | ) | $ | 2,500,205 | |||
|
|
|
|
|
|||||
| A Foreign taxes |
$ | — | $ | 24,528 | ||||
| ** | Consolidated financial statement. See Note 1 in the Notes to Financial Statements for additional information |
| See accompanying notes
|
||||
| 44 |
American Beacon FundsSM
Statements of Changes in Net Assets
| AHL Managed Futures
Strategy |
||||||||
| Year Ended 2016 |
Year Ended 2015 |
|||||||
| Increase (Decrease) in Net Assets: |
||||||||
| Operations: |
||||||||
| Net investment income (loss) |
$ | (5,980,464 | ) | $ | (1,251,425 | ) | ||
| Net realized gain (loss) from investments, foreign currency transactions, futures contracts, and option contracts |
(27,761,623 | ) | 320,346 | |||||
| Change in net unrealized appreciation (depreciation) from investments, foreign currency transactions, futures contracts, option contracts, and short sales |
7,600,291 | (1,739,259 | ) | |||||
|
|
|
|
|
|||||
| Net (decrease) in net assets resulting from operations |
(26,141,796 | ) | (2,670,338 | ) | ||||
|
|
|
|
|
|||||
| Distributions to Shareholders: |
||||||||
| Net investment income: |
||||||||
| Institutional Class |
— | (313,728 | ) | |||||
| Y Class |
— | (664,761 | ) | |||||
| Investor Class |
— | (702,503 | ) | |||||
| A Class |
— | (182,220 | ) | |||||
| C Class |
— | (30,954 | ) | |||||
| Net realized gain from investments: |
||||||||
| Institutional Class |
— | (230,673 | ) | |||||
| Y Class |
— | (488,774 | ) | |||||
| Investor Class |
— | (548,921 | ) | |||||
| A Class |
— | (159,063 | ) | |||||
| C Class |
— | (30,743 | ) | |||||
| Return of capital: |
||||||||
| Institutional Class |
— | (1,679 | ) | |||||
| Y Class |
— | (3,557 | ) | |||||
| Investor Class |
— | (3,759 | ) | |||||
| A Class |
— | (975 | ) | |||||
| C Class |
— | (166 | ) | |||||
|
|
|
|
|
|||||
| Net distributions to shareholders |
— | (3,362,476 | ) | |||||
|
|
|
|
|
|||||
| Capital Share Transactions: |
||||||||
| Proceeds from sales of shares |
529,925,260 | 134,234,474 | ||||||
| Reinvestment of dividends and distributions |
— | 3,333,337 | ||||||
| Cost of shares redeemed |
(142,912,043 | ) | (69,232,230 | ) | ||||
|
|
|
|
|
|||||
| Net increase in net assets from capital share transactions |
387,013,217 | 68,335,581 | ||||||
|
|
|
|
|
|||||
| Net increase in net assets |
360,871,421 | 62,302,767 | ||||||
|
|
|
|
|
|||||
| Net Assets: |
||||||||
| Beginning of period |
103,977,089 | 41,674,322 | ||||||
|
|
|
|
|
|||||
| End of Period * |
$ | 464,848,510 | $ | 103,977,089 | ||||
|
|
|
|
|
|||||
| *Includes undistributed net investment income |
$ | 1,423,199 | $ | (125,619 | ) | |||
|
|
|
|
|
|||||
| ** | Consolidated financial statement. See Note 1 in the Notes to Financial Statements for additional information |
| See accompanying notes
|
||||
| 45 |
American Beacon FundsSM
Statements of Changes in Net Assets
| Ionic Strategic Arbitrage Fund |
||||||||
| Year Ended December 31, 2016 |
From June 30, to December 31, 2015 |
|||||||
| Increase (Decrease) in Net Assets: |
||||||||
| Operations: |
||||||||
| Net investment income |
$ | 1,404,577 | $ | 62,003 | ||||
| Net realized gain (loss) from investments, foreign currency transactions, futures contracts, and option contracts |
458,283 | 664,077 | ||||||
| Change in net unrealized appreciation (depreciation) from investments, foreign currency transactions, futures contracts, option contracts, and short sales |
637,345 | (571,353 | ) | |||||
|
|
|
|
|
|||||
| Net increase in net assets resulting from operations |
2,500,205 | 154,727 | ||||||
|
|
|
|
|
|||||
| Distributions to Shareholders: |
||||||||
| Net investment income: |
||||||||
| Institutional Class |
(4,423,015 | ) | (343,517 | ) | ||||
| Y Class |
(2,709,587 | ) | (2,560 | ) | ||||
| Investor Class |
(62,954 | ) | (10,001 | ) | ||||
| A Class |
(5,200 | ) | (628 | ) | ||||
| C Class |
(7,268 | ) | (638 | ) | ||||
| Net realized gain from investments: |
||||||||
| Institutional Class |
(5,146,294 | ) | (1,251,874 | ) | ||||
| Y Class |
(3,152,676 | ) | (9,330 | ) | ||||
| Investor Class |
(73,248 | ) | (36,447 | ) | ||||
| A Class |
(6,051 | ) | (2,289 | ) | ||||
| C Class |
(8,457 | ) | (2,612 | ) | ||||
|
|
|
|
|
|||||
| Net distributions to shareholders |
(15,594,750 | ) | (1,659,896 | ) | ||||
|
|
|
|
|
|||||
| Capital Share Transactions: |
||||||||
| Proceeds from sales of shares |
151,226,921 | 93,244,373 | ||||||
| Reinvestment of dividends and distributions |
15,540,914 | 1,659,897 | ||||||
| Cost of shares redeemed |
(74,737,699 | ) | (1,483,803 | ) | ||||
|
|
|
|
|
|||||
| Net increase in net assets from capital share transactions |
92,030,136 | 93,420,467 | ||||||
|
|
|
|
|
|||||
| Net increase in net assets |
78,935,591 | 91,915,298 | ||||||
|
|
|
|
|
|||||
| Net Assets: |
||||||||
| Beginning of period |
91,915,298 | — | ||||||
|
|
|
|
|
|||||
| End of Period * |
$ | 170,850,889 | $ | 91,915,298 | ||||
|
|
|
|
|
|||||
| *Includes undistributed net investment income |
$ | 1,709,862 | $ | 117,915 | ||||
|
|
|
|
|
|||||
| See accompanying notes
|
||||
| 46 |
American Beacon FundsSM
December 31, 2016
1. Organization
American Beacon Funds (the “Trust”), is organized as a Massachusetts business trust and is registered under the Investment Company Act of 1940, as amended, (the “Act”) as a diversified, open-end management investment company. As of December 31, 2016, the Trust consists of twenty-six active series, two of which are presented in this filing (collectively, the “Funds” and each individually a “Fund”): American Beacon AHL Managed Futures Strategy Fund (“AHL Managed Futures Strategy”) and American Beacon Ionic Strategic Arbitrage Fund (“Ionic Strategic Arbitrage”). The remaining twenty-four active series are reported in separate filings
American Beacon Advisors, Inc. (the “Manager”) is a wholly-owned subsidiary of Astro AB Borrower, Inc., which is indirectly owned by investment funds affiliated with Kelso & Company, L.P. and Estancia Capital Management, LLC, and was organized in 1986 to provide business management, advisory, administrative and asset management consulting services to the Trust and other investors.
Class Disclosure
Each Fund has multiple classes of shares designed to meet the needs of different groups of investors. The following table sets forth the differences amongst the classes:
| Class |
Eligible Investors |
Minimum Initial Investments |
||||
| Institutional |
Large Institutional investors - sold directly or through intermediary channels. | $ | 250,000 | |||
| Y Class |
Large institutional retirement plan investors. | $ | 100,000 | |||
| Investor |
All investors using intermediary organizations such as broker-dealers or retirement plan sponsors. | $ | 2,500 | |||
| A Class |
All investors who invest through intermediary organizations, such as broker- dealers or third party administrator. Retail investors who invest directly through a financial intermediary such as a broke , bank, or registered investment advisor which may include a front-end sales charge and a contingent deferred sales charge (“CDSC”). | $ | 2,500 | |||
| C Class |
Retail investors who invest directly through a financial intermediary such as a broker or employee directed benefit plans with applicable sales charges which may include CDSC. | $ | 1,000 | |||
Each class offered by the Trust has equal rights as to assets and voting privileges. Income and non-class specific expenses are allocated daily to each class on the basis of the relative net assets. Realized and unrealized capital gains and losses of each class are allocated daily based on the relative net assets of each class of the respective Fund. Class specific expenses, where applicable, currently include service, distribution and sub-transfer agent fees that vary amongst the classes as described more fully in Note 2.
Consolidation of Subsidiaries
The consolidated Schedule of Investments of the AHL Managed Futures Strategy Fund (the “CFC Fund”) includes the accounts of the American Beacon Cayman Managed Futures Strategy Fund, Ltd., a wholly-owned and controlled subsidiary (the “Subsidiary”). All inter-company accounts and transactions have been eliminated in consolidation for the CFC Fund.
For federal tax purposes, taxable income for the CFC Fund and its Subsidiary are calculated separately. The Subsidiary is classified as a controlled foreign corporation under the Internal Revenue Code of 1986 (the “Code”) and the Subsidiary’s taxable income is included in the calculation of the CFC Fund’s taxable income. Net losses of the Subsidiary are not deductible by the CFC Fund either in the current period or future periods. The Subsidiary has a fiscal year end of December 31st for financial statement consolidation purposes and a nonconforming tax year end of November 30th.
| 47 |
American Beacon FundsSM
Notes to Financial Statements
December 31, 2016
The CFC Fund may invest up to 25% of its total assets in the Subsidiary, which acts as an investment vehicle in order to effect certain investments consistent with the CFC Fund’s investment objectives and policies. The CFC Fund expects to achieve a significant portion of its exposure to commodities and commodities-related investments through investment in the Subsidiary. Unlike the CFC Fund, the Subsidiary may invest without limitation in commodities and commodities-related investments.
| Fund |
Inception Date of Subsidiary |
Subsidiary Net Assets at December 31, 2016 |
% of Total Net Assets of the Fund at December 31, 2016 |
Net Realized Gain (Loss) from Investments Held in Subsidiary |
||||||||||||
| American Beacon Cayman Managed Futures Strategy Fund, Ltd. |
August 19, 2014 | $ | 107,917,508 | 23.2 | % | $ | (17,821,397 | ) | ||||||||
CFTC Regulation
On August 13, 2013, the Commodity Futures Trading Commission (“CFTC”) adopted rules to harmonize conflicting United States Securities and Exchange Commission (the “SEC’’) and CFTC disclosure, reporting and recordkeeping requirements for registered investment companies that do not meet an exemption from the definition of commodity pool. The harmonization rules provide that the CFTC will accept the SEC’s disclosure, reporting, and recordkeeping regime as substituted compliance for substantially all of the otherwise applicable CFTC regulations as long as such investment companies meet the applicable SEC requirements.
The CFC Fund is a commodity pool, as defined in the regulation of the CFTC and operated by the Manager, a commodity pool operator regulated by the CFTC.
The following is a summary of significant accounting policies, consistently followed by the Funds in preparation of the financial statements. The Funds are considered investment companies and accordingly, follow the investment company accounting and reporting guidance of the Financial Accounting Standards Board Accounting Standard Codification Topic 946, Financial Services—Investment Companies, which is part of U.S. Generally Accepted Accounting Principles (“U.S. GAAP”).
Security Transactions and Investment Income
Security transactions are recorded on the trade date of the security purchase or sale. The Funds may purchase securities with delivery or payment to occur at a later date. At the time the Funds enter into a commitment to purchase a security, the transaction is recorded, and the value of the security is reflected in the Net Asset Value (“NAV”). The value of the security may vary with market fluctuations.
Dividend income, net of foreign taxes, is recorded on the ex-dividend date, except certain dividends from foreign securities which are recorded as soon as the information is available to the Funds. Interest income is earned from settlement date, recorded on the accrual basis, and adjusted, if necessary, for accretion of discounts and amortization of premiums. For financial and tax reporting purposes, realized gains and losses are determined on the basis of specific lot identification.
Dividends to Shareholders
Dividends from net investment income of the Funds normally will be declared and paid at least annually. Distributions, if any, of net realized capital gains are generally paid at least annually and recorded on the ex-dividend date. Dividends to shareholders are determined in accordance with federal income tax regulations, which may differ in amount and character from net investment income and realized gains recognized for purposes of U.S. GAAP. To the extent necessary to fully distribute capital gains, the Funds also designate earnings and profits distributed to shareholders on the redemption of shares.
| 48 |
American Beacon FundsSM
Notes to Financial Statements
December 31, 2016
Allocation of Income, Expenses, Gains, and Losses
Income, expenses (other than those attributable to a specific class), gains, and losses are allocated daily to each class of shares based upon the relative proportion of net assets represented by such class. Operating expenses directly attributable to a specific class are charged against the operations of that class
Use of Estimates
The preparation of financial statements in conformity with U.S. GAAP requires management to make estimates and assumptions that affect the amounts reported in the financial statements and accompanying notes. Actual results may differ from those estimated.
Other
Under the Trust’s organizational documents, its officers and trustees are indemnified against certain liability arising out of the performance of their duties to the Trust. In the normal course of business, the Trust enters into contracts that provide indemnification to the other party or parties against potential costs or liabilities. The Trust’s maximum exposure under these arrangements is dependent on claims that may be made in the future and, therefore, cannot be estimated. The Trust has had no prior claims or losses pursuant to any such agreement.
2. Transactions with Affiliates
Management Agreement
From January 1, 2016 to May 29, 2016, the Trust and the Manager were parties to a Management Agreement that obligated the Manager to provide or oversee the provision of all investment advisory, fund management, and securities lending services. As compensation for performing the duties required under the Management Agreement, the Manager received from the Funds an annualized fee equal to 0.05% of the average daily net assets. Effective May 29, 2016, the Funds and the Manager entered into a management agreement that obligates the Manager to provide investment advisory, fund management, and administrative services to the Funds. As compensation for performing the duties under the Management Agreement, the Manager receives from the Funds an annualized fee of 0.35% on all average daily net assets. The Funds also pay the unaffiliated investment advisors hired to direct investment activities of the Funds an annualized investment advisory fee based on a percentage of the Funds’ average daily assets. Management fees paid by the Funds during the year ended December 31, 2016 were as follows:
| Fund |
Management Fee Rate |
Management Fee |
Amounts paid to Investment Advisors |
Amounts Paid to Manager |
||||||||||||
| AHL Managed Futures Strategy |
1.35 | % | $ | 5,287,470 | $ | 4,226,933 | $ | 1,060,537 | ||||||||
| Ionic Strategic Arbitrage |
1.35 | % | 1,764,531 | 1,398,198 | 366,333 | |||||||||||
Administration Agreement
From January 1, 2016 to May 29, 2016, the Manager and the Trust were parties to an Administrative Agreement which obligated the Manager to provide or oversee administrative services to each Fund. As compensation for performing the duties required under the Administrative Agreement, the Manager received an annualized fee of 0.30% of the average daily net assets of the Institutional, Y, Investor, A, and C Classes of the Funds.
Distribution Plans
The Funds, except for the A and C Classes, have adopted a “defensive” Distribution Plan (the “Plan”) in accordance with Rule 12b-1 under the Act, pursuant to which no separate fees will be charged to the Funds for distribution purposes. However, the Plan authorizes the management and administration fees received by the
| 49 |
American Beacon FundsSM
Notes to Financial Statements
December 31, 2016
Manager and the investment advisors hired by the Manager to be used for distribution purposes. Under this Plan, the Funds do not intend to separately compensate the Manager or any other party, either directly or indirectly, for the distribution of Fund shares.
Separate Distribution Plans (the “Distribution Plans”) have been adopted pursuant to Rule 12b-1 under the Act for the A and C Classes of the Funds. Under the Distribution Plans, as compensation for distribution assistance, the Manager receives an annualized fee of 0.25% of the average daily net assets of the A Class and 1.00% of the average daily net assets of the C Class. The fee will be payable without regard to whether the amount of the fee is more or less than the actual expenses incurred in a particular month by the Manager for distribution assistance.
Service Plans
The Manager and the Trust entered into Service Plans that obligate the Manager to oversee additional shareholder servicing of the Y, Investor, A, and C Classes. As compensation for performing the duties required under the Service Plans, the Manager receives an annualized fee of 0.10% of the average daily net assets of the Y Class, 0.15% of the average daily net assets of the A and C Classes, and up to 0.375% of the average daily net assets of the Investor Class of the Funds.
Sub-Transfer Agent Fees
The Manager has entered into agreements, which include servicing agreements, with financial intermediaries that provide recordkeeping, processing, shareholder communications and other services to customers of the intermediaries that hold positions in the Institutional Class of the Funds and has agreed to compensate the intermediaries for providing these services. Intermediaries transact with the Funds primarily through the use of omnibus accounts on behalf of their customers who hold positions in the Funds. Certain services would have been provided by the Funds’ transfer agent and other service providers if the shareholders’ accounts were maintained directly by the Funds’ transfer agent. Accordingly, the Funds, pursuant to the Trust’s Board of Trustees (the “Board”) approval, have agreed to reimburse the Manager for all or a portion of the servicing fees paid to these intermediaries for the Institutional Class. The reimbursement amounts (sub-transfer agent fees) paid to the Manager are subject to a fee limit of up to 0.10% of an intermediary’s average net assets in the Institutional Class on an annual basis. For the year ended December 31, 2016, the sub-transfer agent fees, as reported in “Transfer agent fees” on the Statements of Operations, were as follows:
| Fund |
Sub-Transfer Agent Fees | |||
| AHL Managed Futures Strategy |
$ | 104,516 | ||
| Ionic Strategic Arbitrage |
30,333 | |||
As of December 31, 2016, the Funds owe the manager the following reimbursements of sub-transfer agent fees, as reported in “Transfer agent fees payable” on the Statements of Assets and Liabilities:
| Fund |
Reimbursement of Sub-Transfer Agent Fees |
|||
| AHL Managed Futures Strategy |
$ | 8,443 | ||
| Ionic Strategic Arbitrage |
1,132 | |||
Investment in Affiliated Funds
The Funds may invest in the American Beacon U.S. Government Money Market Select Fund (the “USG Select Fund”). The Funds and the USG Select Fund have the same investment advisor and therefore, are considered to be affiliated. The Manager serves as investment advisor to the USG Select Fund and receives management and fees totaling 0.10% of the average daily net assets of the USG Select Fund. During the year ended December 31, 2016, the Manager earned fees on the Funds’ direct investments in the USG Select Fund as shown below:
| 50 |
American Beacon FundsSM
Notes to Financial Statements
December 31, 2016
| Fund |
Direct Investments in USG Select Fund |
|||
| AHL Managed Futures Strategy |
$ | 10,365 | ||
| Ionic Strategic Arbitrage |
30,155 | |||
Interfund Lending Program
Pursuant to an exemptive order by the Securities and Exchange Commission (“SEC”), the Funds, along with other registered investment companies having management contracts with the Manager, may participate in an interfund lending program. This program provides an alternative credit facility allowing the Funds to borrow from other participating Funds. For the year ended December 31, 2016, the Funds did not utilize the credit facility.
Expense Reimbursement Plan
The Manager contractually agreed to reimburse the classes of the Funds to the extent that total annual fund operating expenses exceeded each Funds’ expense cap. For the year ended December 31, 2016, the Manager waived or reimbursed expenses as follows:
| Fund |
Class | Expense Cap 1/1/16 to 12/31/16 |
Reimbursed Expenses |
Expiration of Reimbursements |
||||||||||||
| AHL Managed Futures Strategy |
Institutional | 1.54 | % | $ | 1,086,537 | 2019 | ||||||||||
| AHL Managed Futures Strategy |
Y | 1.64 | % | 199,218 | 2019 | |||||||||||
| AHL Managed Futures Strategy |
Investor | 1.92 | % | 71,588 | 2019 | |||||||||||
| AHL Managed Futures Strategy |
A | 1.94 | % | 73,773 | 2019 | |||||||||||
| AHL Managed Futures Strategy |
C | 2.69 | % | 13,311 | 2019 | |||||||||||
| Ionic Strategic Arbitrage |
Institutional | 1.54 | % | 31,523 | 2019 | |||||||||||
| Ionic Strategic Arbitrage |
Y | 1.64 | % | 1,691 | 2019 | |||||||||||
| Ionic Strategic Arbitrage |
Investor | 1.92 | % | (632 | ) | 2019 | ||||||||||
| Ionic Strategic Arbitrage |
A | 1.94 | % | 81 | 2019 | |||||||||||
| Ionic Strategic Arbitrage |
C | 2.69 | % | 97 | 2019 | |||||||||||
Of these amounts $684,669 and $13,642 were disclosed as a receivable from the Manager at December 31, 2016 for the AHL Managed Futures Strategy and Ionic Strategic Arbitrage Funds, respectively. The Funds have adopted an Expense Reimbursement Plan whereby the Manager may seek repayment of fees waived or expenses reimbursed for a period of up to three years. However, reimbursement will occur only if the Class’s average net assets have grown or expenses have declined sufficiently to allow reimbursement without causing its expense ratio to exceed the previously agreed upon contractual expense limit. The reimbursed expenses above will expire in 2019. The Funds did not record a liability for potential reimbursements due to the current assessment that reimbursements are unlikely.
The carryover of excess expenses potentially reimbursable to the Manager are as follows:
| Fund |
Excess Expense Carryover | Expiration of Reimbursed Expenses | ||||
| AHL Managed Futures Strategy |
$ | 371,247 | 2017 | |||
| AHL Managed Futures Strategy |
416,132 | 2018 | ||||
| Ionic Strategic Arbitrage |
108,786 | 2018 | ||||
Sales Commissions
The Funds’ distributor, Foreside Fund Services, LLC (“Foreside”) may receive a portion of A Class sales charges from broker dealers and it may be used to offset distribution related expenses. For the year ended December 31, 2016, Foreside collected $10,416 from the AHL Managed Futures Strategy Fund from the sale of Class A Shares.
| 51 |
American Beacon FundsSM
Notes to Financial Statements
December 31, 2016
A CDSC of 0.50% will be deducted with respect to Class A Shares on certain purchases of $1,000,000 or more that are redeemed in whole or part within 18 months of purchase, unless waived as discussed in the Prospectus. Any applicable CDSC will be 0.50% of the lesser of the original purchase price or the value of the redemption of the Class A Shares redeemed. During the year ended December 31, 2016, there were no CDSC fees collected for Class A Shares.
A CDSC of 1.00% will be deducted with respect to Class C Shares redeemed within 12 months of purchase, unless waived as discussed in the Prospectus. Any applicable CDSC will be 1.00% of the lesser of the original purchase price or the value of the redemption of the Class C Shares redeemed. During the year ended December 31, 2016, CDSC fees of $1,634 were collected from the AHL Managed Futures Strategy Fund for Class C Shares.
Trustee Fees and Expenses
As compensation for their service to the Trust and the American Beacon Select Funds, each Trustee receives an annual retainer of $120,000, plus $5,000 for each Board of Trustee meeting attended in person or via teleconference, $2,500 for attendance by Committee members at meetings of the Audit Committee and the Investment Committee, and $1,500 for attendance by Committee members at meetings of the Nominating and Governance Committee, plus reimbursement of reasonable expenses incurred in attending Board meetings, Committee meetings, and relevant educational seminars. The Trustees also may be compensated for attendance at special Board and/or Committee meetings from time to time. The Board Chairman receives an additional annual retainer of $50,000 as well as a single $5,000 fee each quarter for his attendance at the committee meetings. The chairpersons of the Audit Committee and the Investment Committee each receive an additional annual retainer of $25,000 and the Chairman of the Nominating and Governance Committee receives an additional annual retainer of $10,000. These expenses are allocated on a prorated basis to each Fund of the Trust according to its respective net assets.
3. Security Valuation and Fair Value Measurements
Investments are valued at the close of the New York Stock Exchange (the “Exchange”), normally at 4:00 p.m. Eastern Time, each day that the Exchange is open for business. Equity securities, including shares of closed-end funds and exchange-traded funds (“ETFs”) for which market quotations are available are valued at the last sale price or official closing price (closing bid price or last evaluated quote if no sale has occurred) on the primary market or exchange on which they trade.
Debt securities normally are valued on the basis of prices provided by an independent pricing service and may take into account appropriate factors such as institution-size trading in similar groups of securities, yield, quality, coupon rate, maturity, type of issue, trading characteristics, and other market data. Prices of debt securities may be determined using quotes obtained from brokers.
Investments in open-end mutual funds are valued at the closing NAV per share of the mutual fund on the day of valuation.
Securities for which market prices are not readily available or are not reflective of the fair value of the security, as determined by the Manager, will be priced at fair value following procedures approved by the Board.
For valuation purposes, the last quoted prices of non-U.S. equity securities may be adjusted under the circumstances described below. If the Manager determines that developments between the close of a foreign market and the close of the Exchange will, in its judgment, materially affect the value of some or all of its portfolio securities, the Manager will adjust the previous closing prices to reflect what it believes to be the fair value of the securities as of the close of the Exchange. In deciding whether it is necessary to adjust closing prices to reflect fair value, the Manager reviews a variety of factors, including developments in foreign markets, the performance of U.S. securities markets, and the performance of instruments trading in U.S. markets that represent
| 52 |
American Beacon FundsSM
Notes to Financial Statements
December 31, 2016
foreign securities and baskets of foreign securities. In addition, the Funds may use fair value pricing for securities primarily traded in non-U.S. markets because most foreign markets close well before the Funds’ pricing time of 4:00 p.m. Eastern time. The earlier close of these foreign markets gives rise to the possibility that significant events, including broad market moves, may have occurred in the interim and may materially affect the value of those securities. These securities are fair valued using a pricing service and are categorized as Level 2 in the fair value hierarchy. The pricing service, using methods approved by the Board, considers the correlation of the trading patterns of the foreign security to intraday trading in the U.S. markets, based on indices of domestic securities and other appropriate indicators such as prices of relevant ADRs and futures contracts. The Valuation Committee may also fair value securities in other situations, such as when a particular foreign market is closed but a Fund is open. The Funds use outside pricing services to provide closing prices and information to evaluate and/or adjust those prices. As a means of evaluating its security valuation process, the Valuation Committee routinely compares closing prices, the next day’s opening prices in the same markets, and adjusted prices.
Other investments, including restricted securities, and those financial instruments for which the above valuation procedures are inappropriate or are deemed not to reflect fair value are stated at fair value as determined by the Valuation Committee.
Futures contracts are valued based upon their quoted daily settlement prices. Upon entering into a futures contract, a Fund is required to deposit with its futures broker an amount of cash or U.S. Government and Agency Obligations in accordance with the initial margin requirements of the broker or exchange. Futures contracts are marked-to-market daily and an appropriate payable or receivable for the change in value (“variation margin”) is recorded by the Funds. Gains or losses are recognized, but not considered realized until the contracts expire or are closed. Futures contracts involve, to varying degrees, risk of loss in excess of the variation margin disclosed on the Statements of Assets and Liabilities.
Valuation Inputs
Various inputs may be used to determine the fair value of the Funds’ investments. These inputs are summarized in three broad levels for financial statement purposes. The inputs or methodologies used to value securities are not necessarily an indication of the risk associated with investing in those securities.
| Level 1 - | Quoted prices in active markets for identical securities. | |
| Level 2 - | Prices determined using other significant observable inputs. These may include quoted prices for similar securities, interest rates, prepayment speeds, credit risk, and others. Fixed-income securities are considered Level 2 as they are valued using observable inputs. | |
| Level 3 - | Prices determined using other significant unobservable inputs. Unobservable inputs reflect the Fund’s own assumptions about the factors market participants would use in pricing an investment. | |
Level 1 and Level 2 trading assets and trading liabilities, at fair value
Common stocks, ETFs and financial derivative instruments, such as futures contracts that are traded on a national securities exchange, are stated at the last reported sale or settlement price on the day of valuation. To the extent these securities are actively traded and valuation adjustments are not applied, they are categorized as Level 1 of the fair value hierarchy. Valuation adjustments may be applied to certain securities that are solely traded on a foreign exchange to account for the market movement between the close of the foreign market and the close of the Exchange. These securities are valued using pricing service providers that consider the correlation of the trading patterns of the foreign security to the intraday trading in the U.S. markets for investments. Securities using these valuation adjustments are categorized as Level 2 of the fair value hierarchy. Preferred securities and other equities traded on inactive markets or valued by reference to similar instruments are also categorized as Level 2 of the fair value hierarchy.
| 53 |
American Beacon FundsSM
Notes to Financial Statements
December 31, 2016
Fixed-income securities including corporate, U.S. government agencies, and U.S. treasury obligations are normally valued by pricing service providers that use broker dealer quotations, reported trades or valuation estimates from their internal pricing models. The service providers’ internal models use inputs that are observable such as issuer details, interest rates, yield curves, prepayment speeds, credit risks/spreads, default rates, and quoted prices for similar assets. Securities that use similar valuation techniques and inputs as described above are categorized as Level 2 of the fair value hierarchy. Fixed-income securities purchased on a delayed-delivery basis are marked-to-market daily until settlement at the forward settlement date and are categorized as Level 2 of the fair value hierarchy.
Investments in registered open-end and closed-end investment management companies will be valued based upon the NAVs of such investments and are categorized as Level 1 of the fair value hierarchy.
Over-the-counter (“OTC”) financial derivative instruments, such as foreign currency contracts, derive their value from underlying asset prices, indices, reference rates, and other inputs or a combination of these factors. These contracts are normally valued on the basis of broker dealer quotations or pricing service providers. Depending on the product and the terms of the transaction, the fair value of the financial derivative contracts can be estimated by a pricing service provider using a series of techniques, including simulation pricing models. The pricing models use inputs that are observed from actively quoted markets such as issuer details, indices, spreads, interest rates, curves, dividends, and exchange rates. Financial derivatives that use similar valuation techniques and inputs as described above are categorized as Level 2 of the fair value hierarchy.
Level 3 trading assets and trading liabilities, at fair value
The valuation techniques and significant inputs used in determining the fair values of financial instruments classified as Level 3 of the fair value hierarchy are as follows
Securities and other assets for which market quotes are not readily available are valued at fair value as determined in good faith by the Board or persons acting at their direction and may be categorized as Level 3 of the fair value hierarchy.
Market quotes are considered not readily available in circumstances where there is an absence of current or reliable market-based data (e.g., trade information or broker quotes), including where events occur after the close of the relevant market, but prior to the Exchange close, that materially affect the values of a Fund’s securities or assets. In addition, market quotes are considered not readily available when, due to extraordinary circumstances, the exchanges or markets on which the securities trade, do not open for trading for the entire day and no other market prices are available. The Board has delegated to the Manager the responsibility for monitoring significant events that may materially affect the fair values of a Fund’s securities or assets and for determining whether the value of the applicable securities or assets should be re-evaluated in light of such significant events
The Board has adopted methods for valuing securities and other assets in circumstances where market quotes are not readily available, and has delegated the responsibility for applying the valuation methods to the Manager. For instances in which daily market quotes are not readily available, investments may be valued pursuant to guidelines established by the Board. In the event that the security or asset cannot be valued pursuant to one of the valuation methods established by the Board, the fair value of the security or asset will be determined in good faith by the Valuation Committee, generally based upon recommendations provided by the Manager.
When a Fund uses fair valuation methods applied by the Manager that use significant unobservable inputs to determine its NAV, the securities priced using this methodology are categorized as Level 3 of the fair value hierarchy. These methods may require subjective determinations about the value of a security. While the Trust’s policy is intended to result in a calculation of a Fund’s NAV that fairly reflects security values as of the time of pricing, the Trust cannot guarantee that values determined by the Board or persons acting at their direction would accurately reflect the price that a Fund could obtain for a security if it were to dispose of that security as of the time of pricing (for instance, in a forced or distressed sale). The prices used by a Fund may differ from the value that would be realized if the securities were sold.
For fair valuations using significant unobservable inputs, U.S. GAAP requires a reconciliation of the beginning to ending balances for reported fair values that presents changes attributable to total realized and unrealized gains or losses, purchases and sales, and transfers in and out of the Level 3 category during the period. In accordance with the requirements of U.S. GAAP, a fair value hierarchy and Level 3 reconciliation, if any, have been included below.
| 54 |
American Beacon FundsSM
Notes to Financial Statements
December 31, 2016
The Funds’ investments are summarized by level based on the inputs used to determine their values. As of December 31, 2016, the investments were classified as described below
| AHL Managed Futures Strategy Fund (1) |
Level 1 | Level 2 | Level 3 | Total | ||||||||||||
| U.S. Treasury Obligations |
$ | — | $ | 407,399,326 | $ | — | $ | 407,399,326 | ||||||||
| Money Market Funds |
6,472,219 | — | — | 6,472,219 | ||||||||||||
|
|
|
|
|
|
|
|
|
|||||||||
| Total Investments in Securities |
$ | 6,472,219 | $ | 407,399,326 | $ | — | $ | 413,871,545 | ||||||||
|
|
|
|
|
|
|
|
|
|||||||||
| Financial Derivatives Instruments - Assets |
||||||||||||||||
| Futures Contracts |
$ | 12,712,784 | $ | — | $ | — | $ | 12,712,784 | ||||||||
| Forward Currency Contracts |
— | 2,933,684 | — | 2,933,684 | ||||||||||||
|
|
|
|
|
|
|
|
|
|||||||||
| Total Financial Derivative Instruments |
$ | 12,712,784 | $ | 2,933,684 | $ | — | $ | 15,646,468 | ||||||||
|
|
|
|
|
|
|
|
|
|||||||||
| Financial Derivatives Instruments - Liabilities |
||||||||||||||||
| Futures Contracts |
$ | (3,211,177 | ) | $ | — | $ | — | $ | (3,211,177 | ) | ||||||
| Forward Currency Contracts |
— | (4,658,677 | ) | — | (4,658,677 | ) | ||||||||||
|
|
|
|
|
|
|
|
|
|||||||||
| Total Financial Derivative Instruments |
$ | (3,211,177 | ) | $ | (4,658,677 | ) | $ | — | $ | (7,869,854 | ) | |||||
|
|
|
|
|
|
|
|
|
|||||||||
| Ionic Strategic Arbitrage Fund |
Level 1 | Level 2 | Level 3 | Total | ||||||||||||
| Assets |
||||||||||||||||
| Common Stock |
$ | 24,207,778 | $ | — | $ | — | $ | 24,207,778 | ||||||||
| Warrants |
18,236,759 | — | — | 18,236,759 | ||||||||||||
| Convertible Preferred Stocks |
1,672,008 | — | — | 1,672,008 | ||||||||||||
| Preferred Stock |
4,702,916 | 2,785,875 | — | 7,488,791 | ||||||||||||
| Convertible Obligations |
— | 40,052,677 | — | 40,052,677 | ||||||||||||
| Collateralized Mortgage Obligations |
— | 29,276,725 | 2,155,189 | 31,431,914 | ||||||||||||
| Investment Companies |
10,905,659 | — | — | 10,905,659 | ||||||||||||
| Exchange-Traded Instruments |
8,431,536 | — | — | 8,431,536 | ||||||||||||
| Short-Term Investments - Money Market Funds |
26,003,015 | — | — | 26,003,015 | ||||||||||||
|
|
|
|
|
|
|
|
|
|||||||||
| Total Investments in Securities |
$ | 94,159,671 | $ | 72,115,277 | $ | 2,155,189 | $ | 168,430,137 | ||||||||
|
|
|
|
|
|
|
|
|
|||||||||
| Liabilities |
||||||||||||||||
| Common Stock (Sold Short) |
$ | (90,686,217 | ) | $ | — | $ | — | $ | (90,686,217 | ) | ||||||
| Warrants (Sold Short) |
(224,904 | ) | — | — | (224,904 | ) | ||||||||||
| Preferred Stock (Sold Short) |
(1,122,796 | ) | — | — | (1,122,796 | ) | ||||||||||
| Exchange-Traded Instruments (Sold Short) |
(6,218,930 | ) | — | — | (6,218,930 | ) | ||||||||||
| Investment Companies (Sold Short) |
(2,669,762 | ) | — | — | (2,669,762 | ) | ||||||||||
|
|
|
|
|
|
|
|
|
|||||||||
| Total Investments in Securities - Liabilities |
(100,922,609 | ) | — | — | (100,922,609 | ) | ||||||||||
|
|
|
|
|
|
|
|
|
|||||||||
| Total Investments in Securities |
$ | (6,762,938 | ) | $ | 72,115,277 | $ | 2,155,189 | $ | 67,507,528 | |||||||
|
|
|
|
|
|
|
|
|
|||||||||
| Financial Derivatives Instruments - Assets |
||||||||||||||||
| Futures Contracts |
$ | 119,329 | $ | — | $ | — | $ | 119,329 | ||||||||
| Purchased Options |
6,699,505 | — | — | 6,699,505 | ||||||||||||
|
|
|
|
|
|
|
|
|
|||||||||
| $ | 6,818,834 | $ | — | $ | — | $ | 6,818,834 | |||||||||
|
|
|
|
|
|
|
|
|
|||||||||
| Financial Derivatives Instruments - Liabilities |
||||||||||||||||
| Written Options |
$ | (482,819 | ) | $ | — | $ | — | $ | (482,819 | ) | ||||||
|
|
|
|
|
|
|
|
|
|||||||||
| $ | (482,819 | ) | $ | — | $ | — | $ | (482,819 | ) | |||||||
|
|
|
|
|
|
|
|
|
|||||||||
| (1) | Refer to Schedules of Investments for Industry Information. |
U.S. GAAP also requires all significant transfers between any levels to be disclosed. The end of period timing recognition has been adopted for the transfers between levels of the Funds’ assets and liabilities. During the year ended December 31, 2016, the Ionic Strategic Arbitrage Fund transferred $(1,863,594) in common stock (sold short) from Level 2 to Level 1. The transfer was the result of the prior year determination made by the Valuation Committee that adjustments should be applied to certain international securities due to significant movement in the market.
| 55 |
American Beacon FundsSM
Notes to Financial Statements
December 31, 2016
The following table is a reconciliation of Level 3 assets within the Fund for which significant unobservable inputs were used to determine fair value. Transfers in or out of Level 3 represent the ending value of any security or instrument where a change in the level has occurred from the beginning to the end of the period:
| Ionic Strategic Arbitrage Fund |
Collateralized Mortgage Obligations |
|||
| Balance as of 12/31/2015 |
$ | — | ||
| Net Purchases |
— | |||
| Net Sales |
— | |||
| Realized gain (loss) |
— | |||
| Change in unrealized appreciation (depreciation) |
— | |||
| Transfer into Level 3 |
2,155,189 | |||
| Transfer out of Level 3 |
— | |||
|
|
|
|||
| Balance as of 12/31/2016 |
$ | 2,155,189 | ||
|
|
|
|||
| Change in unrealized appreciation (depreciation) at period end** |
$ | — | ||
| ** | Change in unrealized appreciation (depreciation) attributable to Level 3 securities held at period end. This balance is included in the change in unrealized appreciation (depreciation) on the Statements of Operations. |
The collateralized mortgage obligations classified as Level 3 were valued using single broker quotes. However, these securities were transferred in the Level 3 category due to limited market transparency and/or lack of corroboration to support the quoted prices.
4. Securities and Other Investments
American Depositary Receipts (“ADRs”)
ADRs are depositary receipts for foreign issuers in registered form traded in U.S. securities markets. Depositary receipts may not be denominated in the same currency as the securities into which they may be converted. Investing in depositary receipts entails substantially the same risks as direct investment in foreign securities. There is generally less publicly available information about foreign companies and there may be less governmental regulation and supervision of foreign stock exchanges, brokers and listed companies. In addition, such companies may use different accounting and financial standards (and certain currencies may become unavailable for transfer from a foreign currency), resulting in a Fund’s possible inability to convert immediately into U.S. currency proceeds realized upon the sale of portfolio securities of the affected foreign companies. In addition, the Funds may invest in unsponsored depositary receipts, the issuers of which are not obligated to disclose material information about the underlying securities to investors in the United States. Ownership of unsponsored depositary receipts may not entitle a Fund to the same benefits and rights as ownership of a sponsored depositary receipt or the underlying security.
Other Investment Company Securities and Other Exchange Traded Products
The Funds may invest in shares of other investment companies, including open-end funds, closed-end funds, ETFs, exchange-traded notes (“ETNs”), unit investment trusts, and other investment companies of the Trust. The Funds may invest in investment company securities advised by the Manager or a sub-advisor. Investments in the securities of other investment companies may involve duplication of advisory fees and certain other expenses. By investing in another investment company, the Funds become a shareholder of that investment company. As a result, the Funds’ shareholders indirectly will bear the proportionate share of the fees and expenses paid by shareholders of the other investment company, in addition to the fees and expenses the Funds’ shareholders directly bear in connection with the Funds’ own operations. These other fees and expenses are reflected as Acquired Fund Fees and Expenses and are included in the Fees and Expenses Table for the Fund in its Prospectus, if applicable. Investments in other investment companies may involve the payment of substantial premiums above the value of such issuer’s portfolio securities.
| 56 |
American Beacon FundsSM
Notes to Financial Statements
December 31, 2016
Convertible Securities
Convertible securities include corporate bonds, notes, preferred stock or other securities that may be converted into or exchanged for a prescribed amount of common stock of the same or a different issuer within a particular period of time at a specified price or formula. A convertible security entitles the holder to receive interest paid or accrued on debt or dividends paid on preferred stock until the convertible security matures or is redeemed, converted or exchanged. While no securities investment is without some risk, investments in convertible securities generally entail less risk than the issuer’s common stock, although the extent to which such risk is reduced depends in large measure upon the degree to which the convertible security sells above its value as a fixed income security. The market value of convertible securities tends to decline as interest rates increase and, conversely, to increase as interest rates decline. While convertible securities generally offer lower interest or dividend yields than non-convertible debt securities of similar quality, they do enable the investor to benefit from increases in the market price of the underlying common stock. Holders of convertible securities have a claim on the assets of the issuer prior to the common stockholders, but may be subordinated to holders of similar non-convertible securities of the same issuer. Because of the conversion feature, certain convertible securities may be considered equity equivalents.
Illiquid and Restricted Securities
Certain Funds may invest in securities that are subject to legal or contractual restrictions on resale. These securities may be sold privately, but are required to be registered or exempted from such registration before being sold to the public. Private placement securities are generally considered to be restricted except for those securities traded between qualified institutional investors under the provisions of Rule 144A of the Securities Act of 1933 (the “Securities Act”). Illiquid securities have included securities that have not been registered under the Securities Act, securities that are otherwise not readily marketable, and repurchase agreements having a remaining maturity of longer than seven calendar days. Disposal of both illiquid and restricted securities may involve time-consuming negotiations and expenses, and prompt sale at an acceptable price may be difficult to achieve. Illiquid and restricted securities outstanding at December 31, 2016 are disclosed in the Notes to the Schedules of Investments.
Rights and Warrants
Rights are short-term warrants issued in conjunction with new stock or bond issues. Warrants are options to purchase an issuer’s securities at a stated price during a stated term. If the market price of the underlying common stock does not exceed the warrant’s exercise price during the life of the warrant, the warrant will expire worthless. Warrants usually have no voting rights, pay no dividends and have no rights with respect to the assets of the corporation issuing them. The percentage increase or decrease in the value of a warrant may be greater than the percentage increase or decrease in the value of the underlying common stock. Warrants may be purchased with values that vary depending on the change in value of one or more specified indices (“index warrants”). Index warrants are generally issued by banks or other financi l institutions and give the holder the right, at any time during the term of the warrant, to receive upon exercise of the warrant a cash payment from the issuer based on the value of the underlying index at the time of the exercise. The market for warrants or rights may be very limited and it may be difficult to sell them promptly at an acceptable price. There is no specific limit on the percentage of assets the Funds may invest in rights and warrants.
Real Estate Investment Trusts
The Funds may own shares of real estate investment trusts (“REITs”) which report information on the source of their distributions annually. The Funds re-characterize distributions received from REIT investments based on information provided by the REITs into the following categories: ordinary income, long-term capital gains, and return of capital. If information is not available on a timely basis from the REITs, the re-characterization will be estimated based on available information which may include the previous year allocation. If new or additional
| 57 |
American Beacon FundsSM
Notes to Financial Statements
December 31, 2016
information becomes available from the REITs at a later date, a re-characterization will be made the following year.
Special Purpose Acquisition Company
A special purpose acquisition company (“SPAC”) is a collective investment structure that allows public stock market investors to invest in private equity type transactions, particularly leveraged buyouts. SPACs are shell or blank-check companies, governed by the SEC, that have no operations but go public with the intention of merging with or acquiring a company with the proceeds of the SPAC’s initial public offering (“IPO”). SPACs outstanding at December 31, 2016 are disclosed in the Notes to the Schedules of Investments.
Interest-Only and Principal-Only Mortgage-Backed Securities
Stripped mortgage-backed securities (“SMBS”) are derivative multi-class mortgage securities. SMBS may be issued by agencies or instrumentalities of the U.S. Government and private originators of, or investors in, mortgage loans, including savings and loan associations, mortgage banks, commercial banks, investment banks and special purpose entities of the foregoing. SMBS are usually structured with two classes that receive different proportions of the interest and principal distributions on a pool of mortgage assets. A common type of SMBS will have one class receiving some of the interest and most of the principal from the mortgage assets, while the other class will receive most of the interest and the remainder of the principal. In the most extreme case, one class will receive all of the interest (the “IO” class), while the other class will receive the entire principal (the principal-only or “PO” class). The yield to maturity on an IO class is extremely sensitive to the rate of principal payments (including pre-payments) on the related underlying mortgage assets, and a rapid rate of principal payments may have a material adverse effect on a Fund’s yield to maturity from these securities. If the underlying mortgage assets experience greater than anticipated pre-payments of principal, a Fund may fail to recoup some or all of its initial investment in these securities even if the security is in one of the highest rating categories.
Interest-only instruments generally increase in value in a rising interest rate environment, which typically results in a slower rate of prepayments on the underlying mortgages and extends the period during which interest payments are required to be made on the IO security. Interest only securities are subject to prepayment risk, which is the risk that prepayments will accelerate in a declining interest rate environment and will reduce the number of remaining interest payments even though there is no default on the underlying mortgages. Principal only instruments generally increase in value in a declining interest rate environment, which typically results in a faster rate of prepayments on the underlying mortgages. Since a PO security is usually purchased at a discount, faster prepayments result in a higher rate of return when the face value of the security is paid back sooner than expected.
Mortgage-Related and Other Asset-Backed Securities
The Funds may invest in mortgage or other asset-backed securities (“ABS”). These securities may include mortgage instruments issued by U.S. government agencies (“agency mortgages”) or those issued by private entities (“non-agency mortgages”). Specific types of instruments may include mortgage pass-through securities, collateralized mortgage obligations (“CMOs”), commercial mortgage-backed securities (“CMBS”), mortgage dollar rolls, CMO residuals, stripped mortgage-backed securities and other securities that directly or indirectly represent a participation in, or are secured by a payable from, mortgage loans on real property. The value of the Funds’ mortgage-backed securities (“MBS”) may be affected by, among other things, changes or perceived changes in interest rates, factors concerning the interests in and structure of the issuer or the originator of the mortgage, or the quality of the underlying assets. The mortgages underlying the securities may default or decline in quality or value. Through its investments in MBS, a Fund has exposure to subprime loans, Alt-A loans and non-conforming loans as well as to the mortgage and credit markets generally. Underlying collateral related to subprime, Alt-A and non-conforming mortgage loans has become increasingly susceptible to defaults and declines in quality or value,
| 58 |
American Beacon FundsSM
Notes to Financial Statements
December 31, 2016
especially in a declining residential real estate market. In addition, regulatory or tax changes may adversely affect the mortgage securities markets as a whole.
Mortgage-Backed Securities
MBS often have stated maturities of up to thirty years when they are issued, depending upon the length of the mortgages underlying the securities. In practice however, unscheduled or early payments of principal and interest on the underlying mortgages may make the securities’ effective maturity shorter than this, and the prevailing interest rates may be higher or lower than the current yield of the Fund’s portfolio at the time resulting in reinvestment risk.
Rising or high interest rates may result in slower than expected principal payments which may tend to extend the duration of MBS, making them more volatile and more sensitive to changes in interest rates. This is known as extension risk.
MBS may have less potential for capital appreciation than comparable fixed income securities due to the likelihood of increased prepayments of mortgages resulting from foreclosures or declining interest rates. These foreclosed or refinanced mortgages are paid off at face value (par) or less, causing a loss, particularly for any investor who may have purchased the security at a premium or a price above par. In such an environment, this risk limits the potential price appreciation of these securities.
Agency Mortgage-Backed Securities
Certain MBS may be issued or guaranteed by the U.S. government or a government sponsored entity, such as Fannie Mae (the Federal National Mortgage Association) or Freddie Mac (the Federal Home Loan Mortgage Corporation). Although these instruments may be guaranteed by the U.S. government or a government sponsored entity, many such MBS are not backed by the full faith and credit of the United States and are still exposed to the risk of non-payment.
Short Sales
The Funds may enter into short sale transactions. A short sale is a transaction in which a Fund sells a security it does not own in anticipation of a decline in the market price of the security. Securities sold in short sale transactions and the dividends and interest payable on such securities, if any, are reflected as a liability on the Statements of Assets and Liabilities. A Fund is obligated to deliver the security at the market price at the time the short position is closed. The risk of loss on a short sale transaction is theoretically unlimited, because there is no limit to the cost of replacing the security sold short, whereas losses from purchase transactions cannot exceed the total amount invested. As of December 31, 2016, short positions were held by the Ionic Strategic Arbitrage Fund.
Master Agreements
Each Fund is a party to International Swaps and Derivatives Association, Inc. Master Agreements (“ISDA Master Agreements”) with counterparties that govern transactions in over-the-counter (“OTC”) derivative and foreign exchange contracts entered into by the Fund and those counterparties. The ISDA Master Agreements contain provisions for general obligations, representations, agreements, collateral and events of default or termination. Events of termination include conditions that may entitle counterparties to elect to terminate early and cause settlement of all outstanding transactions under the applicable ISDA Master Agreement. Any election to terminate early could be material to the financial statements. Since different types of forward and OTC financial derivative transactions have different mechanics and are sometimes traded out of different legal entities of particular counterparty organization, each type of transaction may be covered by a different Master Agreement, resulting in the need for multiple agreements with a single counterparty. As the Master Agreements are specific to unique
| 59 |
American Beacon FundsSM
Notes to Financial Statements
December 31, 2016
operations of different asset types, they allow a Fund to net its total exposure to a counterparty in the event of a default with respect to all the transactions governed under a single agreement with a counterparty.
Master Securities Forward Transaction Agreements (“Master Forward Agreements”) govern the considerations and factors surrounding the settlement of certain forward settling transactions, such as delayed delivery or sale-buyback financing transactions by and between a Fund and select counterparties. The Master Forward Agreements maintain provisions for, among other things, initiation and confirmation, payment and transfer, events of default, termination, and maintenance of collateral.
5. Financial Derivative Instruments
Options Contracts
The Funds may write (1) call and put options on futures, swaps (“swaptions”), securities, commodities or currencies they own or in which they may invest and (2) inflation-capped options. Writing put options tends to increase the Funds’ exposure to unfavorable movements of the underlying instrument in exchange for an upfront premium. Writing call options tends to decrease the Funds’ exposure to favorable movements of the underlying instrument in exchange for an upfront premium. When the Funds write a call, put, or inflation-capped option, an amount equal to the premium received is recorded as a liability and subsequently marked to market to reflect the current value of the option written. The purpose of inflation-capped options is to protect the buyer from inflation erosion above a certain rate on a given notional exposure. A floor can be used to give downside protection to investments in inflation-linked products. These liabilities are reflected as written options outstanding on the Statements of Assets and Liabilities. Certain options may be written with premiums to be determined on a future date. Premiums received from writing options which expire are treated as realized gains. Premiums received from writing options which are exercised or closed are added to the proceeds or offset against amounts paid on the underlying futures, swap, security or currency transaction to determine the realized gain or loss when the underlying transaction is sold. A Fund, as a writer of an option, has no control over whether the underlying instrument may be sold (call) or purchased (put) and as a result bears the market risk of an unfavorable change in the price of the instrument underlying the written option. There is the risk the Funds may not be able to enter into a closing transaction because of an illiquid market.
The Funds may also purchase put and call options. Purchasing call options tends to increase the Funds’ exposure to favorable movements of the underlying instrument in exchange for paying an upfront premium. Purchasing put options tends to decrease the Fund’s exposure to unfavorable movements of the underlying instrument. The Funds pay a premium which is included on the Funds’ Statements of Assets and Liabilities as an investment and subsequently marked-to-market to reflect the current value of the option. Premiums paid for purchasing options which expire are treated as realized losses. Certain options may be purchased with premiums to be determined on a future date. The premiums for these options are based upon implied volatility parameters at specified terms. The risk associated with purchasing put and call options is limited to the premium paid. Premiums paid for purchasing options which are exercised or closed are added to the amounts paid or offset against the proceeds on the underlying investment transaction to determine the realized gain or loss when the underlying transaction is sold.
For the year ended December 31, 2016, the Ionic Strategic Arbitrage Fund purchased/sold options primarily for return enhancement, hedging and exposing cash to markets.
The Fund’s option contracts outstanding fluctuate throughout the operating year as required to meet strategic requirements. The following table illustrates the average quarterly volume of options contracts. For the purpose of this disclosure, volume is measured by contracts outstanding at each quarter end.
| 60 |
American Beacon FundsSM
Notes to Financial Statements
December 31, 2016
| Average Purchased Option Notional Amounts Outstanding |
||||
| Fund |
Year ended December 31, 2016 | |||
| Ionic Strategic Arbitrage |
$ | 8,001,550 | ||
| Average Written Option Notional Amounts Outstanding |
||||
| Fund |
Year ended December 31, 2016 | |||
| Ionic Strategic Arbitrage |
$ | 3,427,825 | ||
Straddle Options
The Funds may enter into differing forms of straddle options. A straddle is an investment strategy that uses combinations of options that allow a Fund to profit based on the future price movements of the underlying security, regardless of the direction of those movements. A written straddle involves simultaneously writing a call option and a put option on the same security with the same strike price and expiration date. The written straddle increases in value when the underlying security price has little volatility before the expiration date. A purchased straddle involves simultaneously purchasing a call option and a put option on the same security with the same strike price and expiration date. The purchased straddle increases in value when the underlying security price has high volatility, regardless of direction, before the expiration date.
Forward Currency Contracts
The Funds may enter into forward currency contracts to hedge the exchange rate risk on investment transactions or to hedge the value of the Funds’ securities denominated in foreign currencies. Forward currency contracts are valued at the forward exchange rate prevailing on the day of valuation. The Funds may also use forward currency contracts to increase exposure to a foreign currency or to shift exposure to foreign currency fluctuations from one country to another. The Funds bear the market risk that arises from changes in foreign exchange rates, and accordingly, the unrealized gain (loss) on these contracts is reflected in the accompanying financial statements. The Funds also bear the credit risk if the counterparty fails to perform under the contract.
For the year ended December 31, 2016, the AHL Managed Futures Strategy Fund entered into forward currency exchange contracts primarily for speculative purposes.
The Funds’ forward currency contract notional dollar values outstanding fluctuate throughout the operating year as required to meet strategic requirements. The following table illustrates the average quarterly volume of forward currency contracts. For the purpose of this disclosure, volume is measured by the amounts bought and sold in USD.
| Average Forward Currency Notional Amount Outstanding for the year ended December 31, 2016 |
||||||||
| Fund |
Purchased Contracts | Sold Contracts | ||||||
| AHL Managed Futures Strategy |
$ | 261,536,023 | $ | 221,416,141 | ||||
Futures Contracts
Futures contracts are contracts to buy or sell a standard quantity of securities at a specified price on a future date. The Funds may enter into financial futures contracts as a method for keeping assets readily convertible to cash if needed to meet shareholder redemptions or for other needs while maintaining exposure to the stock or bond market, as applicable. The primary risks associated with the use of futures contracts are the possibility of illiquid markets or imperfect correlation between the values of the contracts and the underlying securities, or that the counterparty will fail to perform its obligations.
Upon entering into a futures contract, the Funds are required to set aside or deposit with a broker an amount, termed the initial margin, which typically represents a portion of the face value of the futures contract.
| 61 |
American Beacon FundsSM
Notes to Financial Statements
December 31, 2016
The Funds usually reflect this amount on the Schedules of Investments as a U.S. Treasury Bill held as collateral for futures contracts or as cash deposited with broker on the Statements of Assets and Liabilities. Payments to and from the broker, known as variation margin, are required to be made on a daily basis as the price of the futures contract fluctuates. Changes in initial settlement values are accounted for as unrealized appreciation (depreciation) until the contracts are terminated, at which time realized gains and losses are recognized. Futures contracts are valued at the most recent settlement price established each day by the exchange on which they are traded.
For the year ended December 31, 2016, the Funds entered into future contracts primarily for exposing cash to markets.
The Funds’ average futures contracts outstanding fluctuate throughout the operating year as required to meet strategic requirements. The following table illustrates the average quarterly volume of futures contracts. For purpose of this disclosure, volume is measured by contracts outstanding at each quarter end.
| Average Futures Contracts Outstanding |
||||
| Fund |
Year ended December 31, 2016 | |||
| AHL Managed Futures Strategy |
18,602 | |||
| Ionic Strategic Arbitrage |
62 | |||
The following is a summary of the Funds’ derivative financial instruments categorized by risk exposure (1):
AHL Managed Futures Strategy Fund
Fair values of financial instruments on the Statements of Assets and Liabilities as of December 31, 2016:
| Derivatives not accounted for as heding instruments | ||||||||||||||||||||||||
| Foreign Exchange Contracts |
Commodity Contracts |
Currency Contracts |
Equity Contracts |
Interest Rate Contracts |
Total | |||||||||||||||||||
| Assets: |
||||||||||||||||||||||||
| Unrealized appreciation of forward currency contracts |
$ | 2,933,684 | $ | — | $ | — | $ | — | $ | — | $ | 2,933,684 | ||||||||||||
| Receivable for variation margin from open futures contracts (2) |
— | 6,260,173 | 1,824,555 | 3,012,777 | 1,615,279 | 12,712,784 | ||||||||||||||||||
| Liabilities: |
||||||||||||||||||||||||
| Unrealized depreciation of forward currency contracts |
$ | (4,658,677 | ) | $ | — | $ | — | $ | — | $ | — | (4,658,677 | ) | |||||||||||
| Payable for variation margin from open futures contracts (2) |
— | (1,704,494 | ) | (21,268 | ) | (835,451 | ) | (649,964 | ) | (3,211,177 | ) | |||||||||||||
| 62 |
American Beacon FundsSM
Notes to Financial Statements
December 31, 2016
The effect of financial derivative instruments on the Statements of Operations for the year ended December 31, 2016:
| Derivatives not accounted for as heding instruments | ||||||||||||||||||||||||
| Realized gain (loss) of derivatives recognized as a result from operations: |
Foreign Exchange Contracts |
Commodity Contracts |
Currency Contracts |
Equity Contracts |
Interest Rate Contracts |
Total | ||||||||||||||||||
| Net realized gain (loss) from foreign currency transactions |
$ | (1,373,109 | ) | $ | — | $ | — | $ | — | $ | — | $ | (1,373,109 | ) | ||||||||||
| Net realized gain (loss) from futures contracts
|
— | (17,937,634 | ) | (4,428,578 | ) | (12,058,283 | ) | 7,914,980 | (26,509,515 | ) | ||||||||||||||
| Net change in unrealized appreciation or (depreciation) of derivatives recognized as a result from operations: |
Foreign Exchange Contracts |
Commodity Contracts |
Currency Contracts |
Equity Contracts |
Interest Rate Contracts |
Total | ||||||||||||||||||
| Change in net realized appreciation or (depreciation) from foreign currency transactions |
$ | (1,262,139 | ) | $ | — | $ | — | $ | — | $ | — | $ | (1,262,139 | ) | ||||||||||
| Change in net realized appreciation or (depreciation) from futures contracts |
— | 4,009,596 | 1,432,001 | 2,459,970 | 1,184,380 | 9,085,947 | ||||||||||||||||||
Ionic Strategic Arbitrage Fund
Fair values of instruments on the Statements of Assets and Liabilities as of December 31, 2016:
| Derivatives not accounted for as hedging instruments | ||||||||||||||||
| Exchange Traded Contracts |
Currency Contracts | Interest Rate Contracts |
Total | |||||||||||||
| Assets: |
||||||||||||||||
| Purchased options outstanding |
$ | 6,699,505 | $ | — | $ | — | $ | 6,699,505 | ||||||||
| Receivable for variation margin from open futures contracts (2) |
53,165 | 61,363 | 4,801 | 119,329 | ||||||||||||
| Liabilities: |
||||||||||||||||
| Written options outstanding |
(482,819 | ) | — | — | (482,819 | ) | ||||||||||
The effect of financial derivative instruments on the Statements of Operations for the period ended December 31, 2016:
| Derivatives not accounted for as hedging instruments | ||||||||||||||||
| Realized gain (loss) of derivatives recognized as a result
from |
Exchange Traded Contracts |
Currency Contracts | Interest Rate Contracts |
Total | ||||||||||||
| Net realized gain (loss) from options contracts |
$ | (1,125,509 | ) | $ | — | $ | — | $ | (1,125,509 | ) | ||||||
| Net realized gain (loss) from futures contracts |
493,649 | 121,117 | (67,972 | ) | 546,794 | |||||||||||
| Net change in unrealized appreciation (depreciation) of |
Exchange Traded Contracts |
Currency Contracts | Interest Rate Contracts |
Total | ||||||||||||
| Change in net unrealized appreciation (depreciation) from options contracts |
$ | (2,519,222 | ) | $ | — | $ | — | $ | (2,519,222 | ) | ||||||
| Change in net unrealized appreciation (depreciation) from futures contracts |
58,244 | 61,363 | 6,911 | 126,518 | ||||||||||||
| (1) | See Note 3 in the Notes to Financial Statements for additional information. |
| (2) | Includes cumulative appreciation (depreciation) of futures contracts as reported in the Schedules of Investments footnotes. Only the current day’s variation margin is reported within the Statements of Assets and Liabilities. |
| 63 |
American Beacon FundsSM
Notes to Financial Statements
December 31, 2016
6. Principal Risks
Investing in the Funds may involve certain risks including, but not limited to, those described below.
Allocation Risk
The sub-advisor’s judgments about, and allocations among, asset classes and market exposures may adversely affect the Funds’ performance. This risk may be increased by the use of derivatives to increase allocations to various market exposures.
Asset Selection Risk
Assets selected by the sub-advisor or the Manager for the Funds may not perform to expectations. The sub-advisor’s investment models may rely in part on data derived from third parties and may not perform as intended. This could result in the Funds’ underperformance compared to other funds with similar investment objectives.
Commodities Risk
The AHL Managed Futures Strategy Fund’s investments in commodity-linked derivative instruments may subject the Fund to greater volatility than investments in traditional securities. The value of commodity-linked derivative instruments may be affected by changes in overall market movements, commodity index volatility, changes in interest rates, or factors affecting a particular industry or commodity, such as changes in supply and demand, drought, floods, weather, livestock disease, embargoes, tariffs, war, acts of terrorism and international economic, political and regulatory developments. The Fund and the Subsidiary each may concentrate its assets in a particular sector of the commodities market (such as oil, metal or agricultural products). As a result, the Fund and the Subsidiary may be more susceptible to risks associated with those sectors. The Fund’s investments in commodity-related instruments may lead to losses in excess of the Fund’s investment in such products. Such losses can significantly and adversely affect the net asset value per share (“NAV”) of the Fund and, consequently, a shareholder’s interest in the Fund.
Counterparty Risk
The Funds are subject to the risk that a party or participant to a transaction, such as a broker or derivative counterparty, will be unwilling or unable to satisfy its obligation to make timely principal, interest or settlement payments or to otherwise honor its obligations to the Funds.
Credit Risk
The Funds are subject to the risk that the issuer or guarantor of a debt security, or the counterparty to a derivatives contract or a loan will fail to make timely payment of interest or principal or otherwise honor its obligations or default completely. Credit risk is typically greater for securities with ratings that are below investment grade (commonly referred to as “junk bonds”).
Crowding/Convergence Risk
There is significant competition among quantitatively-focused managers and the ability of the sub-advisor to deliver returns that have a low correlation with global aggregate equity markets and other funds is dependent on their ability to employ models that are simultaneously profitable and differentiated from those employed by other managers. To the extent that the sub-advisor is not able to develop sufficiently differentiated models the Fund’s investment objective may not be met, irrespective of whether the models are profitable in an absolute sense.
| 64 |
American Beacon FundsSM
Notes to Financial Statements
December 31, 2016
Currency Risk
The Funds may have exposure to foreign currencies by making direct investments in non-U.S. currencies or in securities denominated in non-U.S. currencies, purchasing or selling forward currency exchange contracts in non-U.S. currencies, including both non-deliverable forwards (“NDFs”) and deliverable forwards, non-U.S. currency futures contracts, options (including non-deliverable options (“NDOs”) on non-U.S. currencies and non- U.S. currency futures) and swaps for cross-currency investments. Foreign currencies may decline in value relative to the U.S. dollar and other currencies and thereby affect the Funds’ investments in foreign (non-U.S.) currencies or in securities that trade in, and receive revenues in, or in derivatives that provide exposure to, foreign (non-U.S.) currencies.
Derivatives Risk
Derivatives may involve significant risk. The use of derivative instruments may expose the Funds to additional risks that it would not be subject to if it invested directly in the securities or other instruments underlying those derivatives, including the high degree of leverage often embedded in such instruments, and potential material and prolonged deviations between the theoretical value and realizable value of a derivative. Some derivatives have the potential for unlimited loss, regardless of the size of the Funds’ initial investment. Derivatives may be illiquid and may be more volatile than other types of investments. The Funds may buy or sell derivatives not traded on an exchange and which may be subject to heightened liquidity and valuation risk. Derivative investments can increase portfolio turnover and transaction costs. Derivatives also are subject to counterparty risk. As a result, the Funds may obtain no recovery of its investment or may only obtain a limited recovery, and any recovery may be delayed. Not all derivative transactions require a counterparty to post collateral, which may expose the Funds to greater losses in the event of a default by a counterparty. In addition, the Funds’ investments in derivatives are subject to the following risks: Futures and Forward Currency Contracts; Options; Swap Agreements; and Warrants.
Futures and Forward Currency Contracts
Futures and forward currency contracts, including non-deliverable forwards (“NDFs”), are derivative instruments pursuant to a contract where one party pays a fixed price for an agreed amount of securities or other underlying assets at an agreed date or to buy or sell a specific currency at a future date at a price set at the time of the contract. There may be an imperfect correlation between the movement in the prices of futures contracts and the value of the underlying instruments or indexes. There can be no assurance that any strategy used will succeed. Not all forward contracts, including NDFs, require a counterparty to post collateral, which may expose the Funds to greater losses in the event of a default by a counterparty. There may not be a liquid secondary market for the futures contracts. Forward currency transactions, including NDFs, and forward currency contracts include the risks associated with fluctuations in currency. Interest rate and Treasury futures contracts expose the Funds to price fluct ations resulting from changes in interest rates. The Funds could suffer a loss if interest rates rise after the funds have purchased an interest rate futures contract or fall after the Funds have sold an interest rate futures contract. Similarly, Treasury futures contracts expose the Funds to potential losses if interest rates do not move as expected.
Options
In order for a call option to be profitable, the market price of the underlying security must rise sufficiently above the exercise price to cover the premium and transaction costs. These costs will reduce any profit that might have realized had it bought the underlying security at the time it purchased the call option. For a put option to be profitable, the market price of the underlying security must decline sufficiently below the exercise price to cover the premium and transaction costs. By using put options in this manner, the Funds will reduce any profit it might otherwise have realized from appreciation of the underlying security by the premium paid for the put option and by transaction costs. If the Funds sell a put option, there is a risk that the Funds may be required to buy the underlying asset at a disadvantageous price. If the Funds sell a call option, there is a risk that the Funds may be
| 65 |
American Beacon FundsSM
Notes to Financial Statements
December 31, 2016
required to sell the underlying asset at a disadvantageous price. If the Funds sell a call option on an underlying asset that the Funds own and the underlying asset has increased in value when the call option is exercised, the Funds will be required to sell the underlying asset at the call price and will not be able to realize any of the underlying asset’s value above the call price.
Swap Agreements
Swaps can involve greater risks than a direct investment in an underlying asset, because swaps typically include a certain amount of embedded leverage and as such are subject to leveraging risk. If swaps are used as a hedging strategy, the Funds are subject to the risk that the hedging strategy may not eliminate the risk that it is intended to offset, due to, among other reasons, the occurrence of unexpected price movements or the non-occurrence of expected price movements. Swaps also may be difficult to value. Interest rate swaps, total return swaps, currency swaps, credit default swaps and commodities swaps are subject to counterparty risk, credit risk and liquidity risk. In addition, interest rate swaps are subject to interest rate risk, total return swaps are subject to market risk, and interest rate risk if the underlying securities are bonds or other debt obligations, currency swaps are subject to currency risk, and commodities swaps are subject to commodities risk.
Warrants
Warrants may be more speculative than certain other types of investments because warrants do not carry with them dividend or voting rights with respect to the underlying securities, or any rights in the assets of the issuer. In addition, the value of a warrant does not necessarily change with the value of the underlying securities, and a warrant ceases to have value if it is not exercised prior to its expiration date.
Emerging Markets Risk
When investing in emerging markets, the risks of investing in foreign securities discussed below are heightened. Emerging markets are generally smaller, less developed, less liquid and more volatile than the securities markets of the U.S. and other developed markets. There are also risks of: greater political uncertainties; an economy’s dependence on revenues from particular commodities or on international aid or development assistance; currency transfer restrictions; a limited number of potential buyers for such securities; and delays and disruptions in securities settlement procedures.
Foreign Investing Risk
Non-U.S. investments carry potential risks not associated with U.S. investments. Such risks include, but are not limited to: (1) currency exchange rate fluctuations, (2) political and financial instability, (3) less liquidity and greater volatility, (4) lack of uniform accounting, auditing and financial reporting standards, (5) increased price volatility, (6) less government regulation and supervision of foreign stock exchanges, brokers and listed companies; and (7) delays in transaction settlement in some foreign markets.
Hedging Risk
If the Funds use a hedging instrument at the wrong time or judges the market conditions incorrectly, or the hedged instrument does not correlate to the risk sought to be hedged, the hedge might be unsuccessful, reduce the Funds’ return, or create a loss.
High Portfolio Turnover Risk
Portfolio turnover is a measure of the Funds’ trading activity over a one-year period. A portfolio turnover rate of 100% would indicate that the Funds sold and replaced the entire value of its securities holdings during the period. High portfolio turnover could increase the Funds’ transaction costs, have a negative impact on performance,
| 66 |
American Beacon FundsSM
Notes to Financial Statements
December 31, 2016
and generate higher capital gain distributions to shareholders than if the Funds have a lower portfolio turnover rate.
High Yield Securities Risk
Investing in high yield, below investment-grade securities (commonly referred to as “junk bonds”) generally involves significantly greater risks of loss of your money than an investment in investment grade securities. High yield debt securities may fluctuate more widely in price and yield and may fall in price when the economy is weak or expected to become weak. High yield securities are considered to be speculative with respect to an issuer’s ability to pay interest and principal and carry a greater risk that the issuers of lower-rated securities will default on the timely payment of principal and interest. Below investment grade securities may experience greater price volatility and less liquidity than investment grade securities.
Interest Rate Risk
The Funds are subject to the risk that the market value of fixed income securities it holds will decline due to rising interest rates. As of the date of this report, interest rates are near historic lows, but may rise substantially and/or rapidly, potentially resulting in substantial losses to the Funds. Generally, the value of investments with interest rate risk, such as fixed income securities, will move in the opposite direction as movements in interest rates. The prices of fixed-i come securities are also affected by their durations. Fixed- income securities with longer duration generally have greater sensitivity to changes in interest rates. Significant upward pressure on domestic interest rates and a corresponding widening of credit spreads could negatively impact the market price of emerging debt markets. An increase in interest rates can impact markets broadly as well.
Investment Risk
An investment in the funds is not a deposit with a bank and is not insured or guaranteed by the Federal Deposit Insurance Corporation or any other government agency. When you sell your shares of the Funds, they could be worth less than what you paid for them. Therefore, you may lose money by investing in the Funds.
Issuer Risk
The value of, and/or the return generated by, a security may decline for a number of reasons which directly relate to the issuer, such as management performance, financial leverage and reduced demand for the issuer’s goods or services, as well as the historical and prospective earnings of the issuer and the value of its assets.
Leverage Risk
The Funds’ use of futures, forward currency contracts, swaps, other derivative instruments and selling securities short will have the economic effect of financial leverage. Financial leverage magnifies the exposure to the swings in prices of an asset or class of assets underlying a derivative instrument and results in increased volatility, which means that the Funds will have the potential for greater losses than if the Funds do not use the derivative instruments that have a leveraging effect. Leverage may result in losses that exceed the amount originally invested and may accelerate the rates of losses. Leverage tends to magnify, sometimes significantl , the effect of any increase or decrease in the Funds’ exposure to an asset or class of assets and may cause the Funds’ NAV to be volatile.
Liquidity Risk
The Funds are susceptible to the risk that certain investments held by the Funds may have limited marketability or be subject to restrictions on sale, and may be difficult to sell at favorable times or prices. The Funds could lose money if it is unable to dispose of an investment at a time that is most beneficial to the Funds. For
| 67 |
American Beacon FundsSM
Notes to Financial Statements
December 31, 2016
example, the Funds may be forced to sell certain investments at unfavorable prices to meet redemption requests or other cash needs.
Market Direction Risk
Since the Funds will typically hold both long and short positions, an investment in the Funds will involve market risks associated with different types of investment decisions than those made for a typical “long only” fund. The Funds’ results could suffer both when there is a general market advance and the Funds hold significant “short” positions, and when there is a general market decline and the Funds hold significant “long” positions
Market Risk
Since the financial crisis that started in 2008, the U.S. and many foreign economies continue to experience its after-effects, which have resulted, and may continue to result, in fixed-income instruments experiencing unusual liquidity issues, increased price volatility and, in some cases, credit downgrades and increased likelihood of default. These events have reduced the willingness and ability of some lenders to extend credit, and have made it more difficult for some borrowers to obtain financing on attractive terms, if at all. In addition, global economies and financial markets are becoming increasingly interconnected, which increases the possibilities that conditions in one country or region might adversely impact issuers in a different country or region. The severity or duration of adverse economic conditions may also be affected by policy changes made by governments or quasi-governmental organizations.
In addition, political events within the U.S. and abroad may affect investor and consumer confidence and may adversely impact financial markets and the broader economy, perhaps suddenly and to a significant degree. High public debt in the U.S. and other countries creates ongoing systemic and market risks and policymaking uncertainty. Because the impact on the markets has been widespread, it may be difficult to identify both risks and opportunities using past models of the interplay of market forces, or to predict the duration of these market conditions. Interest rates have been unusually low in recent years in the U.S. and abroad. Because there is little precedent for this situation, it is difficult to predict the impact on various markets of a significant rate increase, whether brought about by U.S. policy makers or by dislocations in world markets. In addition, there is a risk that the prices of goods and services in the U.S. and many foreign economies may decline over time, known as deflation (the opposite of inflation). Deflation may have an adverse effect on stock prices and creditworthiness and may make defaults on debt more likely.
Model and Data Risk
The sub-advisor relies heavily on proprietary trading models (“Models”) and both proprietary and external information and market data (“Data”) to generate investment strategies, to estimate investment values and to identify specific trade recommendations. The sub-advisor also relies on Models and Data to identify and manage investment risk and to assist in determining appropriate hedging strategies that seek to reduce certain risks.
Models and Data may be extremely complex and may have errors, omissions, imperfections and malfunctions (collectively referred to as “System Events”). More complex Models and Data typically have a higher potential for System Events and may result in investment losses in the Funds. Additionally, investments in derivative securities may increase the risks associated with System Events.
Non-Diversification Risk
The Funds are non-diversified, which means the Funds may focus their investments in the securities of a comparatively small number of issuers. Investment in securities of a limited number of issuers exposes the Funds to greater market risk and potential losses than if assets were diversified among the securities of a greater number of investments.
| 68 |
American Beacon FundsSM
Notes to Financial Statements
December 31, 2016
Obsolescence Risk
The Funds are unlikely to be successful in its quantitative trading strategies unless the assumptions underlying the Models are realistic and either remain realistic and relevant in the future or are adjusted to account for changes in the overall market environment. If such assumptions are inaccurate or become inaccurate and are not promptly adjusted, it is likely that profitable trading signals will not be generated. If and to the extent that the Models do not reflect certain factors, and the sub-advisor does not successfully address such omission through its testing and evaluation and modify the Models accordingly, major losses may result — all of which will be borne by the Funds.
Other Investment Companies Risk
The Funds may invest in shares of other registered investment companies, including exchange-traded funds (“ETFs”) and money market funds. To the extent that the Funds invest in shares of other registered investment companies, you will indirectly bear fees and expenses charged by the underlying funds in addition to the Funds’ direct fees and expenses and will be subject to the risks associated with investments in those funds. ETF shares may trade at a premium or discount to their net asset value. An ETF that tracks an index may not precisely replicate the returns of its benchmark index.
Repurchase Agreement Risk
The obligations of a counterparty to a repurchase agreement are not guaranteed. The Funds permit various forms of securities as collateral whose values fluctuate and that are not issued or guaranteed by the U.S. government. There are risks that a counterparty may default at a time when the collateral has declined in value, or a counterparty may become insolvent, which may affect the Funds’ right to control the collateral. Repurchase agreements are subject to credit risk.
Risk Management
Risk is an essential part of investing. No risk management program can eliminate the Funds’ exposure to adverse events; at best, it can only reduce the possibility that the Funds will be affected by such events, and especially those risks that are not intrinsic to the Funds’ investment program.
Risk of Programming and Modelling Error
The success of the sub-advisor’s investment strategy depends largely on the effectiveness of its quantitative research model and investment programs. The programs may not react to market events resulting in losses for the Funds. Additionally, programs may become outdated or experience malfunctions which may not be identified by the sub-advisor and therefore may also result in losses to the Funds.
Sector Risk
To the extent the Funds invest more heavily in particular sectors, their performance will be especially sensitive to developments that significantly affect those sectors. Individual sectors may move up and down more than the broader market. The industries that constitute a sector may all react in the same way to economic, political or regulatory events. Because the Funds may hold a limited number of securities, it may at times be substantially over-weighted in certain economic sectors and under-weighted in others. As such, the Funds’ performance is likely to be disproportionately affected by the factors influencing those sectors
Short Position Risk
The Funds’ losses are potentially unlimited in a short position transaction because there is potentially no limit on the amount that the security that the Funds are required to purchase may have appreciated. Because the
| 69 |
American Beacon FundsSM
Notes to Financial Statements
December 31, 2016
Funds may invest the proceeds of a short sale, another effect of short selling on the Funds is similar to the effect of leverage, in that it amplifies changes in the Funds’ net asset value since it increases the exposure of the Funds to the market.
Subsidiary Risk
By investing in the Subsidiary, the AHL Managed Futures Strategy Fund is indirectly exposed to the risks associated with the Subsidiary’s investments. The derivatives and other investments held by the Subsidiary are generally similar to those that are permitted to be held by the Fund and are subject to the same risks that apply to similar investments if held directly by the Fund. There can be no assurance that the investment objective of the Fund or the Subsidiary will be achieved.
The Subsidiary is not registered under the 1940 Act, and, unless otherwise noted in this Report, is not subject to all the investor protections of the 1940 Act. In addition, changes in the laws of the United States and/ or the Cayman Islands could result in the inability of the Fund and/or the Subsidiary to operate as described in the Fund’s Prospectus and SAI and could adversely affect the Fund’s performance.
Tax Risk
To qualify as a regulated investment company under Subchapter M (“RIC”), the Fund must derive at least 90 percent of its gross income for each taxable year from qualifying income, which is described in more detail in the SAI. Income from certain commodity-linked derivative instruments in which the AHL Managed Futures Strategy Fund invests is not considered qualifying income. The Fund will therefore restrict the income from direct investments in commodity-linked derivative instruments that do not generate qualifying income, such as commodity-linked swaps, to a maximum of 10 percent of its gross income for each taxable year. The Fund’s investment in the Subsidiary is expected to provide the Fund with exposure to the commodities markets within the limitations of the federal tax requirements of Subchapter M.
The Internal Revenue Service (“IRS”) has issued a large number of private letter rulings (which the AHL Managed Futures Fund may not cite as precedent) beginning in 2006 that income a RIC derives from a wholly owned foreign subsidiary (such as the Subsidiary) that earns income derived from commodity-linked derivative instruments is qualifying income. The IRS suspended the issuance of new such rulings in July 2011 but has not taken any actions regarding its previously issued rulings. Accordingly, the Fund has not sought to obtain such a ruling and is relying on the advice of counsel regarding the tax treatment of distributions by the Subsidiary to the Fund of such income. The tax treatment of the Fund’s commodity-linked investments may be materially adversely affected by future legislation, Treasury regulations, and/or guidance issued by the IRS that could affect whether income from such investments is qualifying income under Subchapter M, or otherwise materially affect the character, timing and/or amount of the Fund’s taxable income or any gains and distributions made by the Fund.
U.S. Government Securities and Government-Sponsored Enterprises Risk
A security backed by the U.S. Treasury or the full faith and credit of the United States is guaranteed by the applicable entity only as to the timely payment of interest and principal when held to maturity. The market prices for such securities are not guaranteed and will fluctuate. Additionally, circumstances could arise that would prevent the payment of interest or principal. This could result in losses to the Funds. Securities held by the Funds that are issued by government-sponsored enterprises, such as the Federal National Mortgage Association (‘‘Fannie Mae’’), the Federal Home Loan Mortgage Corporation (‘‘Freddie Mac’’), Federal Home Loan Banks, Federal Farm Credit Banks, and the Tennessee Valley Authority are not guaranteed by the U.S. Treasury and are not backed by the full faith and credit of the U.S. government. and no assurance can be given that the U.S. government will provide financial support if these organizations do not have the funds to meet future payment obligations. U.S. government securities and securities of government sponsored entities are also subject to credit risk, interest rate risk and market risk.
| 70 |
American Beacon FundsSM
Notes to Financial Statements
December 31, 2016
Valuation Risk
The Funds may value certain assets at a price different from the price at which they can be sold. This risk may be especially pronounced for investments, such as certain derivatives, which may be illiquid or which may become illiquid.
Offsetting Assets and Liabilities
The Funds are parties to enforceable master netting agreements between brokers and counterparties, such as ISDA Agreements, Master Repo Agreements and Master Forward Agreements, which provide for the right to offset under certain circumstances. The Funds employ multiple money managers and counterparties and has elected not to offset qualifying financial and derivative instruments on the Statements of Assets and Liabilities, as such all financial and derivative instruments are presented on a gross basis. The impacts of netting arrangements that provide the right to offset are detailed below. The net amount represents the net receivable or payable that would be due from or to the counterparty in the event of default. Exposure from borrowings and other financing agreements such as repurchase agreements can only be netted across transactions governed by the same Master Agreement with the same legal entity. All amounts reported below represent the balance as of the report date, December 31, 2016.
AHL Managed Futures Strategy Fund
Offsetting of Financial Assets and Derivative Assets as of December 31, 2016:
| Description |
Gross Amounts of Recognized Assets |
Gross Amounts Offset in the Statements of Assets and Liabilities |
Net Amount of Assets Presented in the Statements of Assets and Liabilities |
|||||||||
| Futures contracts (1) |
$ | 12,712,784 | $ | — | $ | 12,712,784 | ||||||
| Forward currency contracts |
2,933,684 | — | 2,933,684 | |||||||||
|
|
|
|
|
|
|
|||||||
| $ | 15,646,468 | $ | — | $ | 15,646,468 | |||||||
|
|
|
|
|
|
|
|||||||
Offsetting of Financial Liabilities and Derivative Liabilities as of December 31, 2016:
| Description |
Gross Amounts of Recognized Liabilities |
Gross Amounts Offset in the Statements of Assets and Liabilities |
Net Amount of Liabilities Presented in the Statements of Assets and Liabilities |
|||||||||
| Futures contracts (1) |
$ | (3,211,177 | ) | $ | — | $ | (3,211,177 | ) | ||||
| Forward currency contracts |
(4,658,677 | ) | — | (4,658,677 | ) | |||||||
|
|
|
|
|
|
|
|||||||
| $ | (7,869,854 | ) | $ | — | $ | (7,869,854 | ) | |||||
|
|
|
|
|
|
|
|||||||
Financial Assets, Derivative Assets, and Collateral Pledged by Counterparty as of December 31, 2016:
| Gross Amounts Offset in the Statements of Assets and Liabilities |
||||||||||||||||
| Counterparty |
Net Amount of Assets Presented in the Statements of Assets and Liabilities |
Financial Instruments |
Cash Collateral Received |
Net Amount |
||||||||||||
| BofA Merrill Lynch (1) |
$ | 4,642,582 | $ | — | $ | — | $ | 4,642,582 | ||||||||
| JP Morgan (1) |
3,064,436 | — | — | 3,064,436 | ||||||||||||
| Credit Suisse (1) |
1,794,588 | — | — | 1,794,588 | ||||||||||||
| Deutsche Bank AG |
361,129 | — | 2,590,000 | 2,951,129 | ||||||||||||
| HSBC Bank PLC |
(1,875,609 | ) | — | 5,047,479 | 3,171,870 | |||||||||||
| Royal Bank of Scotland PLC |
(210,512 | ) | — | 760,000 | 549,488 | |||||||||||
|
|
|
|
|
|
|
|
|
|||||||||
| $ | 7,776,614 | $ | — | $ | 8,397,479 | $ | 16,174,093 | |||||||||
|
|
|
|
|
|
|
|
|
|||||||||
| 71 |
American Beacon FundsSM
Notes to Financial Statements
December 31, 2016
Ionic Strategic Arbitrage Fund
Offsetting of Financial Assets and Derivative Assets as of December 31, 2016:
| Description |
Gross Amounts of Recognized Assets |
Gross Amounts Offset in the Statements of Assets and Liabilities |
Net Amount of Assets Presented in the Statements of Assets and Liabilities |
|||||||||
| Purchased options outstanding |
$ | 6,699,505 | $ | — | $ | 6,699,505 | ||||||
| Futures contracts(1) |
119,329 | — | 119,329 | |||||||||
|
|
|
|
|
|
|
|||||||
| $ | 6,818,834 | $ | — | $ | 6,818,834 | |||||||
|
|
|
|
|
|
|
|||||||
Offsetting of Financial Liabilities and Derivative Liabilities as of December 31, 2016:
| Description |
Gross Amounts of Recognized Liabilities |
Gross Amounts Offset in the Statements of Assets and Liabilities |
Net Amount of Liabilities Presented in the Statements of Assets and Liabilities |
|||||||||
| Written options outstanding |
$ | (482,819 | ) | $ | — | $ | (482,819 | ) | ||||
Financial Assets, Derivative Assets, and Collateral Pledged by Counterparty as of December 31, 2016:
| Gross Amounts Offset in the Statements of Assets and Liabilities |
||||||||||||||||
| Counterparty |
Net Amount of Assets Presented in the Statements of Assets and Liabilities |
Financial Instruments |
Cash Collateral Received |
Net Amount |
||||||||||||
| Deutsche Bank AG (1) |
$ | 6,336,015 | $ | — | $ | — | $ | 6,336,015 | ||||||||
| (1) | The securities presented here within are not subject to Master Netting Agreements. As such, this is disclosed for informational purposes only. |
7. Federal Income and Excise Taxes
It is the policy of each Fund to qualify as a regulated investment company (“RIC”), by complying with all applicable provisions of Subchapter M of the Internal Revenue Code, as amended, and to make distribution of taxable income sufficient to relieve it from substantially all federal income and excise taxes. For federal income tax purposes, each Fund is treated as a single entity for the purpose of determining such qualification
The Funds do not have any unrecognized tax benefits in the accompanying financial statements. Each of the tax years in the three year period ended December 31, 2016 for the AHL Managed Futures Strategy Fund remain subject to examination by the Internal Revenue Service. The tax year ended December 31, 2016 and the six-month period ended December 31, 2015 for the Ionic Strategic Arbitrage Fund remain subject to examination by the Internal Revenue Service. If applicable, the Funds recognize interest accrued related to unrecognized tax benefits in interest expense and penalties in “Other expenses” on the Statements of Operations.
The Funds may be subject to taxes imposed by countries in which it invests. Such taxes are generally based on returns of income earned or gains realized or repatriated. Taxes are accrued and applied to net investment income, net realized capital gains and net unrealized appreciation or depreciation, as applicable, as the income is earned or capital gains are recorded.
Dividends are categorized in accordance with income tax regulations which may treat certain transactions differently than U.S. GAAP. Accordingly, the character of distributions and composition of net assets for tax purposes may differ from those reflected in the accompanying financial statements. The Funds also utilize earnings and profits distributed to shareholders on redemptions of shares as part of the dividends paid deduction
| 72 |
American Beacon FundsSM
Notes to Financial Statements
December 31, 2016
The tax character of distributions paid were as follows:
| AHL Managed Futures Strategy Fund |
Ionic Strategic Arbitrage Fund | |||||||||||||||
| Year Ended | Year Ended | Year Ended | Year Ended | |||||||||||||
| December 31, 2016 |
December 31, 2015 |
December 31, 2016 |
December 31, 2015 |
|||||||||||||
| Distributions paid from: |
||||||||||||||||
| Ordinary Income* |
||||||||||||||||
| Institutional Class |
$ | — | $ | 422,140 | $ | 9,569,309 | $ | 1,497,510 | ||||||||
| Y Class |
— | 894,475 | 5,862,263 | 11,160 | ||||||||||||
| Investor Class |
— | 960,486 | 136,202 | 43,599 | ||||||||||||
| A Class |
— | 256,976 | 11,251 | 2,738 | ||||||||||||
| C Class |
— | 45,402 | 15,725 | 3,046 | ||||||||||||
| Long-term capital gains |
||||||||||||||||
| Institutional Class |
— | 122,261 | — | 97,881 | ||||||||||||
| Y Class |
— | 259,060 | — | 729 | ||||||||||||
| Investor Class |
— | 290,939 | — | 2,850 | ||||||||||||
| A Class |
— | 84,307 | — | 179 | ||||||||||||
| C Class |
— | 16,294 | — | 204 | ||||||||||||
| Return of Capital |
||||||||||||||||
| Institutional Class |
— | 1,679 | — | — | ||||||||||||
| Y Class |
— | 3,557 | — | — | ||||||||||||
| Investor Class |
— | 3,759 | — | — | ||||||||||||
| A Class |
— | 975 | — | — | ||||||||||||
| C Class |
— | 166 | — | — | ||||||||||||
|
|
|
|
|
|
|
|
|
|||||||||
| Total distributions paid |
$ | — | $ | 3,362,476 | $ | 15,594,750 | $ | 1,659,896 | ||||||||
|
|
|
|
|
|
|
|
|
|||||||||
| * | For tax purposes, short-term capital gains are considered ordinary income distributions. |
As of December 31, 2016, the components of distributable earnings (deficits) on a tax basis were as follows:
| AHL Managed Futures Strategy Fund |
Ionic Strategic Arbitrage Fund |
|||||||
| Cost basis of investments for federal income tax purposes |
$ | 413,879,328 | $ | 168,081,011 | ||||
| Unrealized appreciation |
5,683 | 13,132,180 | ||||||
| Unrealized depreciation |
(2,873 | ) | (12,783,054 | ) | ||||
|
|
|
|
|
|||||
| Net unrealized appreciation (depreciation) |
2,810 | 349,126 | ||||||
| Undistributed ordinary income |
$ | — | $ | 2,724,412 | ||||
| Undistributed long-term capital gains |
— | — | ||||||
| Accumulated capital and other losses |
(11,633,324 | ) | — | |||||
| Other temporary differences |
5,629,280 | (17,671,932 | ) | |||||
|
|
|
|
|
|||||
| Distributable earnings (deficits) |
$ | (6,001,234 | ) | $ | (14,598,394 | ) | ||
|
|
|
|
|
|||||
Financial reporting records are adjusted for permanent book/tax differences to reflect tax character. Financial records are not adjusted for temporary differences. The temporary differences between financial reporting and tax-basis reporting of unrealized appreciation (depreciation) are attributable primarily to the realization of unrealized gains (losses) from certain derivative instruments, the tax deferral of losses from wash sales, deemed distributions on convertible obligations, CPDI, unsettled short positions, straddles, and the realization for tax purposes of unrealized gain/(loss) on investments in passive foreign investment companies.
Due to inherent differences in the recognition of income, expenses, and realized gains (losses) under U.S. GAAP and federal income tax regulations, permanent differences between book and tax reporting have been identified and appropriately reclassified on the Statements of Assets and Liabilities.
Accordingly, the following amounts represent current year permanent differences derived from paydown reclasses, foreign currency reclasses, gains (losses) from sales of investment in passive foreign investment companies,
| 73 |
American Beacon FundsSM
Notes to Financial Statements
December 31, 2016
reclassifications of income from closed-end funds, reclassification of income from investment subsidiary, sales of CPDI securities, non-utilization of net operating losses, and dividends reclassed as of December 31, 2016:
| AHL Managed Futures Strategy Fund |
Ionic Strategic Arbitrage Fund |
|||||||
| Paid-in-capital |
$ | (24,476,392 | ) | $ | (1,020 | ) | ||
| Undistributed (overdistribution of) net investment income |
7,529,282 | 7,395,394 | ||||||
| Accumulated net realized gain (loss) |
16,947,110 | (7,394,375 | ) | |||||
| Unrealized appreciation (depreciation) of investments in futures contracts |
— | 1 | ||||||
Under the Regulated Investment Company Modernization Act of 2010 (the “RIC MOD”), net capital losses recognized by the Funds in taxable years beginning after December 22, 2010 are carried forward indefinitely and retain their character as short-term and/or long-term losses.
As of December 31, 2016, the AHL Managed Futures Strategy Fund has $9,365,911 of short-term and $2,267,413 of long-term post enactment capital loss carryforwards. The Ionic Strategic Arbitrage Fund did not have any capital loss carryforwards.
8. Investment Transactions
The aggregate cost of purchases and proceeds from sales and maturities of long-term investments, excluding short-term obligations, for the year ended December 31, 2016 were as follows:
| Fund |
Purchases | Sales | ||||||
| AHL Managed Futures Strategy |
$ | — | * | $ | — | * | ||
| Ionic Strategic Arbitrage |
1,040,752,117 | 831,553,598 | ||||||
| * | See footnote in Financial Highlights. |
A summary of the Funds’ direct transactions in the USG Select fund for the year ended December 31, 2016 were as follows:
| Fund |
December31, 2015 Shares/Fair Value |
Purchases | Sales | December 31, 2016 Shares/Fair Value |
Dividend Income |
|||||||||||||||
| AHL Managed Futures Strategy |
$ | — | $ | 319,404,784 | $ | 312,932,565 | $ | 6,472,219 | $ | 18,030 | ||||||||||
| Ionic Strategic Arbitrage |
— | 260,808,135 | 234,805,120 | 26,003,015 | 69,121 | |||||||||||||||
9. Option Contracts Written
The premium amount and number of options contracts written by the Ionic Strategic Arbitrage Fund during the year ended December 31, 2016 are as follows:
| Number of Contracts |
Notional Amount |
Amount of Premiums |
||||||||||
| Outstanding at December 31, 2015 |
— | $ | — | $ | — | |||||||
| Options written |
(107,320 | ) | (10,726,700 | ) | (11,945,167 | ) | ||||||
| Options expired |
27,333 | 2,733,300 | 2,222,070 | |||||||||
| Options exercised |
68,283 | 6,823,000 | 8,113,132 | |||||||||
| Options closed |
— | — | — | |||||||||
|
|
|
|
|
|
|
|||||||
| Outstanding at December 31, 2016 |
(11,704 | ) | $ | (1,170,400 | ) | $ | (1,609,965 | ) | ||||
|
|
|
|
|
|
|
|||||||
| 74 |
American Beacon FundsSM
Notes to Financial Statements
December 31, 2016
10. Capital Share Transactions
The tables below summarize the activity in capital shares for each Class of the Funds:
| Institutional Class | ||||||||||||||||
| Year Ended December 31, | ||||||||||||||||
| 2016 | 2015 | |||||||||||||||
| Shares | Amount | Shares | Amount | |||||||||||||
| AHL Managed Futures Strategy Fund |
||||||||||||||||
| Shares sold |
36,676,562 | $ | 405,489,405 | 2,166,164 | $ | 23,691,152 | ||||||||||
| Reinvestment of dividends |
— | — | 51,665 | 544,551 | ||||||||||||
| Shares redeemed |
(4,808,709 | ) | (50,573,425 | ) | (2,845,001 | ) | (32,558,411 | ) | ||||||||
|
|
|
|
|
|
|
|
|
|||||||||
| Net increase (decrease) in shares outstanding |
31,867,853 | $ | 354,915,980 | (627,172 | ) | $ | (8,322,708 | ) | ||||||||
|
|
|
|
|
|
|
|
|
|||||||||
| Y Class | ||||||||||||||||
| Year Ended December 31, | ||||||||||||||||
| 2016 | 2015 | |||||||||||||||
| Shares | Amount | Shares | Amount | |||||||||||||
| AHL Managed Futures Strategy Fund |
||||||||||||||||
| Shares sold |
7,234,887 | $ | 77,938,263 | 4,162,362 | $ | 46,682,733 | ||||||||||
| Reinvestment of dividends |
— | — | 109,956 | 1,156,735 | ||||||||||||
| Shares redeemed |
(5,440,111 | ) | (56,680,165 | ) | (1,077,126 | ) | (11,829,832 | ) | ||||||||
|
|
|
|
|
|
|
|
|
|||||||||
| Net increase in shares outstanding |
1,794,776 | $ | 21,258,098 | 3,195,192 | $ | 36,009,636 | ||||||||||
|
|
|
|
|
|
|
|
|
|||||||||
| Investor Class | ||||||||||||||||
| Year Ended December 31, | ||||||||||||||||
| 2016 | 2015 | |||||||||||||||
| Shares | Amount | Shares | Amount | |||||||||||||
| AHL Managed Futures Strategy Fund |
||||||||||||||||
| Shares sold |
1,675,967 | $ | 17,882,088 | 3,881,099 | $ | 43,556,156 | ||||||||||
| Reinvestment of dividends |
— | — | 119,602 | 1,254,624 | ||||||||||||
| Shares redeemed |
(2,228,763 | ) | (23,475,932 | ) | (706,777 | ) | (7,797,600 | ) | ||||||||
|
|
|
|
|
|
|
|
|
|||||||||
| Net increase (decrease) in shares outstanding |
(552,796 | ) | $ | (5,593,844 | ) | 3,293,924 | $ | 37,013,180 | ||||||||
|
|
|
|
|
|
|
|
|
|||||||||
| A Class | ||||||||||||||||
| Year Ended December 31, | ||||||||||||||||
| 2016 | 2015 | |||||||||||||||
| Shares | Amount | Shares | Amount | |||||||||||||
| AHL Managed Futures Strategy Fund |
||||||||||||||||
| Shares sold |
2,367,863 | $ | 25,330,655 | 1,637,841 | $ | 18,287,490 | ||||||||||
| Reinvestment of dividends |
— | — | 30,108 | 316,431 | ||||||||||||
| Shares redeemed |
(1,063,982 | ) | (11,177,116 | ) | (1,546,038 | ) | (16,861,984 | ) | ||||||||
|
|
|
|
|
|
|
|
|
|||||||||
| Net increase in shares outstanding |
1,303,881 | $ | 14,153,539 | 121,911 | $ | 1,741,937 | ||||||||||
|
|
|
|
|
|
|
|
|
|||||||||
| C Class | ||||||||||||||||
| Year Ended December 31, | ||||||||||||||||
| 2016 | 2015 | |||||||||||||||
| Shares | Amount | Shares | Amount | |||||||||||||
| AHL Managed Futures Strategy Fund |
||||||||||||||||
| Shares sold |
311,614 | $ | 3,284,849 | 181,550 | $ | 2,016,943 | ||||||||||
| Reinvestment of dividends |
— | — | 5,854 | 60,996 | ||||||||||||
| Shares redeemed |
(97,924 | ) | (1,005,405 | ) | (16,217 | ) | (184,403 | ) | ||||||||
|
|
|
|
|
|
|
|
|
|||||||||
| Net increase in shares outstanding |
213,690 | $ | 2,279,444 | 171,187 | $ | 1,893,536 | ||||||||||
|
|
|
|
|
|
|
|
|
|||||||||
| Institutional Class | ||||||||||||||||
| Year Ended December 31, | ||||||||||||||||
| 2016 | 2015* | |||||||||||||||
| Shares | Amount | Shares | Amount | |||||||||||||
| Ionic Strategic Arbitrage Fund |
||||||||||||||||
| Shares sold |
10,355,095 | $ | 101,720,394 | 6,369,018 | $ | 64,480,630 | ||||||||||
| Reinvestment of dividends |
1,059,724 | 9,569,308 | 161,640 | 1,595,391 | ||||||||||||
| Shares redeemed |
(6,125,998 | ) | (60,759,740 | ) | (117,593 | ) | (1,187,290 | ) | ||||||||
|
|
|
|
|
|
|
|
|
|||||||||
| Net increase in shares outstanding |
5,288,821 | $ | 50,529,962 | 6,413,065 | $ | 64,888,731 | ||||||||||
|
|
|
|
|
|
|
|
|
|||||||||
| 75 |
American Beacon FundsSM
Notes to Financial Statements
December 31, 2016
| Y Class | ||||||||||||||||
| Year Ended December 31, | ||||||||||||||||
| 2016 | 2015* | |||||||||||||||
| Shares | Amount | Shares | Amount | |||||||||||||
| Ionic Strategic Arbitrage Fund |
||||||||||||||||
| Shares sold |
4,591,033 | $ | 45,246,870 | 2,645,861 | $ | 26,181,006 | ||||||||||
| Reinvestment of dividends |
642,526 | 5,808,428 | 1,203 | 11,890 | ||||||||||||
| Shares redeemed |
(1,105,881 | ) | (10,870,913 | ) | (14,881 | ) | (149,915 | ) | ||||||||
|
|
|
|
|
|
|
|
|
|||||||||
| Net increase in shares outstanding |
4,127,678 | $ | 40,184,385 | 2,632,183 | $ | 26,042,981 | ||||||||||
|
|
|
|
|
|
|
|
|
|||||||||
| Investor Class | ||||||||||||||||
| Year Ended December 31, | ||||||||||||||||
| 2016 | 2015* | |||||||||||||||
| Shares | Amount | Shares | Amount | |||||||||||||
| Ionic Strategic Arbitrage Fund |
||||||||||||||||
| Shares sold |
439,879 | $ | 4,148,557 | 231,033 | $ | 2,338,979 | ||||||||||
| Reinvestment of dividends |
15,151 | 136,202 | 4,706 | 46,449 | ||||||||||||
| Shares redeemed |
(305,900 | ) | (3,016,109 | ) | (14,467 | ) | (146,311 | ) | ||||||||
|
|
|
|
|
|
|
|
|
|||||||||
| Net increase in shares outstanding |
149,130 | $ | 1,268,650 | 221,272 | $ | 2,239,117 | ||||||||||
|
|
|
|
|
|
|
|
|
|||||||||
| A Class | ||||||||||||||||
| Year Ended December 31, | ||||||||||||||||
| 2016 | 2015* | |||||||||||||||
| Shares | Amount | Shares | Amount | |||||||||||||
| Ionic Strategic Arbitrage Fund |
||||||||||||||||
| Shares sold |
— | $ | — | 11,398 | $ | 113,758 | ||||||||||
| Reinvestment of dividends |
1,251 | 11,251 | 296 | 2,917 | ||||||||||||
| Shares redeemed |
(120 | ) | (1,082 | ) | (29 | ) | (287 | ) | ||||||||
|
|
|
|
|
|
|
|
|
|||||||||
| Net increase in shares outstanding |
1,131 | $ | 10,169 | 11,665 | $ | 116,388 | ||||||||||
|
|
|
|
|
|
|
|
|
|||||||||
| C Class | ||||||||||||||||
| Year Ended December 31, | ||||||||||||||||
| 2016 | 2015* | |||||||||||||||
| Shares | Amount | Shares | Amount | |||||||||||||
| Ionic Strategic Arbitrage Fund |
||||||||||||||||
| Shares sold |
11,323 | $ | 111,100 | 13,010 | $ | 130,000 | ||||||||||
| Reinvestment of dividends |
1,771 | 15,725 | 331 | 3,250 | ||||||||||||
| Shares redeemed |
(9,268 | ) | (89,855 | ) | — | — | ||||||||||
|
|
|
|
|
|
|
|
|
|||||||||
| Net increase in shares outstanding |
3,826 | $ | 36,970 | 13,341 | $ | 133,250 | ||||||||||
|
|
|
|
|
|
|
|
|
|||||||||
| * | For the period of June 30, 2015 through December 31, 2015. |
11. Subsequent Events
Management has evaluated subsequent events for possible recognition or disclosure in the financial statements through the date the financial statements are issued. Management has determined that there are no material events that would require disclosure in the Funds’ financial statements through this date
| 76 |
American Beacon AHL Managed Futures Strategy FundSM
Financial Highlights
(For a share outstanding throughout the period)
| Institutional Class | ||||||||||||
| Year Ended December 31, |
August 19 A to December 31, 2014 |
|||||||||||
| 2016 | 2015 | |||||||||||
| Net asset value, beginning of period |
$ | 10.46 | $ | 10.95 | $ | 10.00 | ||||||
|
|
|
|
|
|
|
|||||||
| Income from investment operations: |
||||||||||||
| Net investment income (loss) |
0.20 | (0.06 | ) | 0.24 | ||||||||
| Net gains (losses) on investments (both realized and unrealized) |
(0.22 | ) | (0.07 | ) | 1.10 | |||||||
|
|
|
|
|
|
|
|||||||
| Total income (loss) from investment operations |
(0.02 | ) | (0.13 | ) | 1.34 | |||||||
|
|
|
|
|
|
|
|||||||
| Less distributions: |
||||||||||||
| Dividends from net investment income |
— | (0.21 | ) | (0.31 | ) | |||||||
| Distributions from net realized gains |
— | (0.15 | ) | (0.08 | ) | |||||||
| Distributions from return of capital |
— | (0.00 | )F | — | ||||||||
|
|
|
|
|
|
|
|||||||
| Total distributions |
— | (0.36 | ) | (0.39 | ) | |||||||
|
|
|
|
|
|
|
|||||||
| Net asset value, end of period |
$ | 10.44 | $ | 10.46 | $ | 10.95 | ||||||
|
|
|
|
|
|
|
|||||||
| Total return B |
(0.19 | )% | (1.15 | )% | 13.43 | %C | ||||||
|
|
|
|
|
|
|
|||||||
| Ratios and supplemental data: |
||||||||||||
| Net assets, end of period |
$ | 353,601,987 | $ | 20,932,502 | $ | 28,765,259 | ||||||
| Ratios to average net assets: |
||||||||||||
| Expenses, before reimbursements |
1.90 | % | 2.25 | % | 4.97 | %D | ||||||
| Expenses, net of reimbursements |
1.54 | % | 1.54 | % | 1.54 | %D | ||||||
| Net investment income (loss), before expense reimbursements |
(1.69 | )% | (2.29 | )% | 2.73 | %D | ||||||
| Net investment income (loss), net of reimbursements |
(1.33 | )% | (1.57 | )% | 6.17 | %D | ||||||
| Portfolio turnover rate |
— | %E | — | %E | — | %E | ||||||
| Y Class | ||||||||||||
| Year Ended December 31, |
August 19 A to December 31, 2014 |
|||||||||||
| 2016 | 2015 | |||||||||||
| Net asset value, beginning of period |
$ | 10.45 | $ | 10.94 | $ | 10.00 | ||||||
|
|
|
|
|
|
|
|||||||
| Income from investment operations: |
||||||||||||
| Net investment income (loss) |
(0.08 | ) | (0.05 | ) | 0.30 | |||||||
| Net gains (losses) on investments (both realized and unrealized) |
0.04 | (0.08 | ) | 1.03 | ||||||||
|
|
|
|
|
|
|
|||||||
| Total income (loss) from investment operations |
(0.04 | ) | (0.13 | ) | 1.33 | |||||||
|
|
|
|
|
|
|
|||||||
| Less distributions: |
||||||||||||
| Dividends from net investment income |
— | (0.21 | ) | (0.31 | ) | |||||||
| Distributions from net realized gains |
— | (0.15 | ) | (0.08 | ) | |||||||
| Distributions from return of capital |
— | (0.00 | )F | — | ||||||||
|
|
|
|
|
|
|
|||||||
| Total distributions |
— | (0.36 | ) | (0.39 | ) | |||||||
|
|
|
|
|
|
|
|||||||
| Net asset value, end of period |
$ | 10.41 | $ | 10.45 | $ | 10.94 | ||||||
|
|
|
|
|
|
|
|||||||
| Total return B |
(0.38 | )% | (1.15 | )% | 13.33 | %C | ||||||
|
|
|
|
|
|
|
|||||||
| Ratios and supplemental data: |
||||||||||||
| Net assets, end of period |
$ | 52,391,912 | $ | 33,817,374 | $ | 464,644 | ||||||
| Ratios to average net assets: |
||||||||||||
| Expenses, before reimbursements |
1.97 | % | 2.28 | % | 7.71 | %D | ||||||
| Expenses, net of reimbursements |
1.64 | % | 1.64 | % | 1.64 | %D | ||||||
| Net investment income (loss), before expense reimbursements |
(1.76 | )% | (1.70 | )% | 12.50 | %D | ||||||
| Net investment income (loss), net of reimbursements |
(1.44 | )% | (1.06 | )% | 18.58 | %D | ||||||
| Portfolio turnover rate |
— | %E | — | %E | — | %E | ||||||
| A | August 19, 2014 is the inception date of the AHL Managed Futures Strategy Fund. |
| B | Based on net asset value, which does not reflect the sales charge, redemption fee, or contingent deferred sales charge, if applicable. May include adjustments in accordance with U.S. GAAP and as such, the net asset value for reporting purposes and the returns based upon those net asset values may differ from the net asset value and returns for shareholder transactions. |
| C | Not annualized. |
| D | Annualized. |
| E | Portfolio turnover is based on the lesser of long-term purchases or sales divided by the average long-term fair value during the period. The Fund did not invest in any long-term securities during the reporting period. |
| F | The return of capital is based on outstanding shares at the time of distribution. Amounts are less than $0.01 per share. |
| 77 |
American Beacon AHL Managed Futures Strategy FundSM
Financial Highlights
(For a share outstanding throughout the period)
| Investor Class | ||||||||||||
| Year Ended December 31, |
August 19 A to December 31, 2014 |
|||||||||||
| 2016 | 2015 | |||||||||||
| Net asset value, beginning of period |
$ | 10.41 | $ | 10.93 | $ | 10.00 | ||||||
|
|
|
|
|
|
|
|||||||
| Income from investment operations: |
||||||||||||
| Net investment income (loss) |
(0.25 | ) | (0.09 | ) | 0.30 | |||||||
| Net gains (losses) on investments (both realized and unrealized) |
0.19 | (0.08 | ) | 1.02 | ||||||||
|
|
|
|
|
|
|
|||||||
| Total income (loss) from investment operations |
(0.06 | ) | (0.17 | ) | 1.32 | |||||||
|
|
|
|
|
|
|
|||||||
| Less distributions: |
||||||||||||
| Dividends from net investment income |
— | (0.20 | ) | (0.31 | ) | |||||||
| Distributions from net realized gains |
— | (0.15 | ) | (0.08 | ) | |||||||
| Distributions from return of capital |
— | (0.00 | )F | — | ||||||||
|
|
|
|
|
|
|
|||||||
| Total distributions |
— | (0.35 | ) | (0.39 | ) | |||||||
|
|
|
|
|
|
|
|||||||
| Net asset value, end of period |
$ | 10.35 | $ | 10.41 | $ | 10.93 | ||||||
|
|
|
|
|
|
|
|||||||
| Total return B |
(0.58 | )% | (1.54 | )% | 13.23 | %C | ||||||
|
|
|
|
|
|
|
|||||||
| Ratios and supplemental data: |
||||||||||||
| Net assets, end of period |
$ | 31,223,150 | $ | 37,185,001 | $ | 3,023,636 | ||||||
| Ratios to average net assets: |
||||||||||||
| Expenses, before reimbursements |
2.13 | % | 2.40 | % | 5.98 | %D | ||||||
| Expenses, net of reimbursements |
1.92 | % | 1.92 | % | 1.92 | %D | ||||||
| Net investment income (loss), before expense reimbursements |
(1.93 | )% | (2.07 | )% | 10.41 | %D | ||||||
| Net investment income (loss), net of reimbursements |
(1.72 | )% | (1.59 | )% | 14.47 | %D | ||||||
| Portfolio turnover rate |
— | %E | — | %E | — | %E | ||||||
| A Class | ||||||||||||
| Year Ended December 31, |
August 19 A to December 31, 2014 |
|||||||||||
| 2016 | 2015 | |||||||||||
| Net asset value, beginning of period |
$ | 10.44 | $ | 10.93 | $ | 10.00 | ||||||
|
|
|
|
|
|
|
|||||||
| Income from investment operations: |
||||||||||||
| Net investment income (loss) |
0.23 | (0.52 | ) | 0.32 | ||||||||
| Net gains (losses) on investments (both realized and unrealized) |
(0.31 | ) | 0.36 | 1.00 | ||||||||
|
|
|
|
|
|
|
|||||||
| Total income (loss) from investment operations |
(0.08 | ) | (0.16 | ) | 1.32 | |||||||
|
|
|
|
|
|
|
|||||||
| Less distributions: |
||||||||||||
| Dividends from net investment income |
— | (0.18 | ) | (0.31 | ) | |||||||
| Distributions from net realized gains |
— | (0.15 | ) | (0.08 | ) | |||||||
| Distributions from return of capital |
— | (0.00 | )F | — | ||||||||
|
|
|
|
|
|
|
|||||||
| Total distributions |
— | (0.33 | ) | (0.39 | ) | |||||||
|
|
|
|
|
|
|
|||||||
| Net asset value, end of period |
$ | 10.36 | $ | 10.44 | $ | 10.93 | ||||||
|
|
|
|
|
|
|
|||||||
| Total return B |
(0.77 | )% | (1.45 | )% | 13.23 | %C | ||||||
|
|
|
|
|
|
|
|||||||
| Ratios and supplemental data: |
||||||||||||
| Net assets, end of period |
$ | 23,330,824 | $ | 9,890,720 | $ | 9,019,308 | ||||||
| Ratios to average net assets: |
||||||||||||
| Expenses, before reimbursements |
2.29 | % | 2.55 | % | 5.31 | %D | ||||||
| Expenses, net of reimbursements |
1.94 | % | 1.94 | % | 1.94 | %D | ||||||
| Net investment income (loss), before expense reimbursements |
(2.08 | )% | (3.59 | )% | 32.48 | %D | ||||||
| Net investment income (loss), net of reimbursements |
(1.74 | )% | (2.98 | )% | 35.85 | %D | ||||||
| Portfolio turnover rate |
— | %E | — | %E | — | %E | ||||||
| A | August 19, 2014 is the inception date of the AHL Managed Futures Strategy Fund. |
| B | Based on net asset value, which does not reflect the sales charge, redemption fee, or contingent deferred sales charge, if applicable. May include adjustments in accordance with U.S. GAAP and as such, the net asset value for reporting purposes and the returns based upon those net asset values may differ from the net asset value and returns for shareholder transactions. |
| C | Not annualized. |
| D | Annualized. |
| E | Portfolio turnover is based on the lesser of long-term purchases or sales divided by the average long-term fair value during the period. The Fund did not invest in any long-term securities during the reporting period. |
| F | The return of capital is based on outstanding shares at the time of distribution. Amounts are less than $0.01 per share. |
| 78 |
American Beacon AHL Managed Futures Strategy FundSM
Financial Highlights
(For a share outstanding throughout the period)
| C Class | ||||||||||||
| Year Ended December 31, |
August 19 A to December 31, 2014 |
|||||||||||
| 2016 | 2015 | |||||||||||
| Net asset value, beginning of period |
$ | 10.34 | $ | 10.90 | $ | 10.00 | ||||||
|
|
|
|
|
|
|
|||||||
| Income from investment operations: |
||||||||||||
| Net investment income (loss) |
(0.08 | ) | (0.09 | ) | 0.27 | |||||||
| Net gains (losses) on investments (both realized and unrealized) |
(0.06 | ) | (0.16 | ) | 1.02 | |||||||
|
|
|
|
|
|
|
|||||||
| Total income (loss) from investment operations |
(0.14 | ) | (0.25 | ) | 1.29 | |||||||
|
|
|
|
|
|
|
|||||||
| Less distributions: |
||||||||||||
| Dividends from net investment income |
— | (0.16 | ) | (0.31 | ) | |||||||
| Distributions from net realized gains |
— | (0.15 | ) | (0.08 | ) | |||||||
| Distributions from return of capital |
— | (0.00 | )F | — | ||||||||
|
|
|
|
|
|
|
|||||||
| Total distributions |
— | (0.31 | ) | (0.39 | ) | |||||||
|
|
|
|
|
|
|
|||||||
| Net asset value, end of period |
$ | 10.20 | $ | 10.34 | $ | 10.90 | ||||||
|
|
|
|
|
|
|
|||||||
| Total return B |
(1.35 | )% | (2.30 | )% | 12.93 | %C | ||||||
|
|
|
|
|
|
|
|||||||
| Ratios and supplemental data: |
||||||||||||
| Net assets, end of period |
$ | 4,300,637 | $ | 2,151,492 | $ | 401,475 | ||||||
| Ratios to average net assets: |
||||||||||||
| Expenses, before reimbursements |
3.04 | % | 3.32 | % | 8.75 | %D | ||||||
| Expenses, net of reimbursements |
2.69 | % | 2.69 | % | 2.68 | %D | ||||||
| Net investment income (loss), before expense reimbursements |
(2.84 | )% | (2.88 | )% | 7.02 | %D | ||||||
| Net investment income (loss), net of reimbursements |
(2.49 | )% | (2.25 | )% | 13.09 | %D | ||||||
| Portfolio turnover rate |
— | %E | — | % E | — | %E | ||||||
| A | August 19, 2014 is the inception date of the AHL Managed Futures Strategy Fund. |
| B | Based on net asset value, which does not reflect the sales charge, redemption fee, or contingent deferred sales charge, if applicable. May include adjustments in accordance with U.S. GAAP and as such, the net asset value for reporting purposes and the returns based upon those net asset values may differ from the net asset value and returns for shareholder transactions. |
| C | Not annualized. |
| D | Annualized. |
| E | Portfolio turnover is based on the lesser of long-term purchases or sales divided by the average long-term fair value during the period. The Fund did not invest in any long-term securities during the reporting period. |
| F | The return of capital is based on outstanding shares at the time of distribution. Amounts are less than $0.01 per share. |
| 79 |
American Beacon Ionic Strategic Arbitrage FundSM
Financial Highlights
(For a share outstanding throughout the period)
| Institutional Class | Y Class | |||||||||||||||
| Year Ended December 31, 2016 |
June 30 to December 31, 2015 |
Year Ended December 31, 2016 |
June 30 D to December 31, 2015 |
|||||||||||||
| Net asset value, beginning of period |
$ | 9.89 | $ | 10.00 | $ | 9.90 | $ | 10.00 | ||||||||
|
|
|
|
|
|
|
|
|
|||||||||
| Income from investment operations: |
||||||||||||||||
| Net investment income |
0.16 | 0.04 | 0.10 | 0.06 | ||||||||||||
| Net gains (losses) on investments (both realized and unrealized) |
(0.02 | ) | 0.11 | 0.03 | 0.10 | |||||||||||
|
|
|
|
|
|
|
|
|
|||||||||
| Total income (loss) from investment operations |
0.14 | 0.15 | 0.13 | 0.16 | ||||||||||||
|
|
|
|
|
|
|
|
|
|||||||||
| Less distributions: |
||||||||||||||||
| Dividends from net investment income |
(0.45 | ) | (0.06 | ) | (0.45 | ) | (0.06 | ) | ||||||||
| Distributions from net realized gains |
(0.52 | ) | (0.20 | ) | (0.52 | ) | (0.20 | ) | ||||||||
|
|
|
|
|
|
|
|
|
|||||||||
| Total distributions |
(0.97 | ) | (0.26 | ) | (0.97 | ) | (0.26 | ) | ||||||||
|
|
|
|
|
|
|
|
|
|||||||||
| Net asset value, end of period |
$ | 9.06 | $ | 9.89 | $ | 9.06 | $ | 9.90 | ||||||||
|
|
|
|
|
|
|
|
|
|||||||||
| Total return A |
1.39 | % | 1.46 | %C | 1.28 | % | 1.56 | %C | ||||||||
|
|
|
|
|
|
|
|
|
|||||||||
| Ratios and supplemental data: |
||||||||||||||||
| Net assets, end of period |
$ | 105,989,910 | $ | 63,421,998 | $ | 61,253,803 | $ | 26,059,687 | ||||||||
| Ratios to average net assets: |
||||||||||||||||
| Expenses, before reimbursements |
3.14 | % | 3.55 | %B | 3.31 | % | 3.83 | % B | ||||||||
| Expenses, before reimbursements, excluding non-operating expenses |
1.57 | % | 2.25 | % B | 1.64 | % | 2.21 | % B | ||||||||
| Expenses, net of reimbursements |
3.10 | % | 2.84 | % B | 3.30 | % | 3.27 | % B | ||||||||
| Expenses, net of reimbursements, excluding non-operating expenses |
1.54 | % | 1.54 | % B | 1.64 | % | 1.64 | % B | ||||||||
| Net investment income (loss), before expense reimbursements |
1.05 | % | (0.31 | )% B | 0.88 | % | 0.83 | % B | ||||||||
| Net investment income, net of reimbursements . |
1.09 | % | 0.40 | % B | 0.88 | % | 1.40 | % B | ||||||||
| Portfolio turnover rate |
436 | % | 159 | % C | 436 | % | 159 | % C | ||||||||
| Investor Class | A Class | |||||||||||||||
| Year Ended December 31, 2016 |
June 30 D to December 31, 2015 |
Year Ended December 31, 2016 |
June 30 D to December 31, 2015 |
|||||||||||||
| Net asset value, beginning of period |
$ | 9.88 | $ | 10.00 | $ | 9.88 | $ | 10.00 | ||||||||
|
|
|
|
|
|
|
|
|
|||||||||
| Income from investment operations: |
||||||||||||||||
| Net investment income |
0.30 | 0.02 | 0.07 | 0.08 | ||||||||||||
| Net gains (losses) on investments (both realized and unrealized) |
(0.20 | ) | 0.12 | 0.03 | 0.06 | |||||||||||
|
|
|
|
|
|
|
|
|
|||||||||
| Total income (loss) from investment operations |
0.10 | 0.14 | 0.10 | 0.14 | ||||||||||||
|
|
|
|
|
|
|
|
|
|||||||||
| Less distributions: |
||||||||||||||||
| Dividends from net investment income |
(0.45 | ) | (0.06 | ) | (0.45 | ) | (0.06 | ) | ||||||||
| Distributions from net realized gains |
(0.52 | ) | (0.20 | ) | (0.52 | ) | (0.20 | ) | ||||||||
|
|
|
|
|
|
|
|
|
|||||||||
| Total distributions |
(0.97 | ) | (0.26 | ) | (0.97 | ) | (0.26 | ) | ||||||||
|
|
|
|
|
|
|
|
|
|||||||||
| Net asset value, end of period |
$ | 9.01 | $ | 9.88 | $ | 9.01 | $ | 9.88 | ||||||||
|
|
|
|
|
|
|
|
|
|||||||||
| Total return A |
0.98 | % | 1.36 | % C | 0.98 | % | 1.36 | % C | ||||||||
|
|
|
|
|
|
|
|
|
|||||||||
| Ratios and supplemental data: |
||||||||||||||||
| Net assets, end of period |
$ | 3,339,009 | $ | 2,186,944 | $ | 115,308 | $ | 115,261 | ||||||||
| Ratios to average net assets: |
||||||||||||||||
| Expenses, before reimbursements |
3.47 | % | 4.23 | %B | 3.65 | % | 7.35 | % B | ||||||||
| Expenses, before reimbursements, excluding non-operating expenses |
1.88 | % | 2.92 | %B | 2.01 | % | 5.93 | %B | ||||||||
| Expenses, net of reimbursements |
3.50 | % | 3.23 | %B | 3.58 | % | 3.37 | %B | ||||||||
| Expenses, net of reimbursements, excluding non-operating expenses |
1.92 | % | 1.92 | %B | 1.94 | % | 1.94 | %B | ||||||||
| Net investment income (loss), before expense reimbursements |
0.32 | % | (1.52 | )%B | 0.27 | % | (3.54 | )%B | ||||||||
| Net investment income (loss), net of reimbursements |
0.29 | % | (0.53 | )%B | 0.34 | % | 0.44 | %B | ||||||||
| Portfolio turnover rate |
436 | % | 159 | % C | 436 | % | 159 | % C | ||||||||
| A | Based on net asset value, which does not reflect the sales charge, redemption fee, or contingent deferred sales charge, if applicable. May include adjustments in accordance with U.S. GAAP and as such, the net asset value for reporting purposes and the returns based upon those net asset values may differ from the net asset value and returns for shareholder transactions. |
| B | Not Annualized. |
| C | Annualized. |
| D | Commencement of Operations. |
| 80 |
American Beacon Ionic Strategic Arbitrage FundSM
Financial Highlights
(For a share outstanding throughout the period)
| C Class | ||||||||
| Year Ended December 31, 2016 |
June 30 D to December 31, 2015 |
|||||||
| Net asset value, beginning of period |
$ | 9.85 | $ | 10.00 | ||||
|
|
|
|
|
|||||
| Income from investment operations: |
||||||||
| Net investment income |
(0.01 | ) | 0.05 | |||||
| Net gains (losses) on investments (both realized and unrealized) |
0.03 | 0.05 | ||||||
|
|
|
|
|
|||||
| Total income (loss) from investment operations |
0.02 | 0.10 | ||||||
|
|
|
|
|
|||||
| Less distributions: |
||||||||
| Dividends from net investment income |
(0.45 | ) | (0.05 | ) | ||||
| Distributions from net realized gains |
(0.52 | ) | (0.20 | ) | ||||
|
|
|
|
|
|||||
| Total distributions |
(0.97 | ) | (0.25 | ) | ||||
|
|
|
|
|
|||||
| Net asset value, end of period |
$ | 8.90 | $ | 9.85 | ||||
|
|
|
|
|
|||||
| Total return A |
0.17 | % | 1.00 | % C | ||||
|
|
|
|
|
|||||
| Ratios and supplemental data: |
||||||||
| Net assets, end of period |
$ | 152,859 | $ | 131,408 | ||||
| Ratios to average net assets: |
||||||||
| Expenses, before reimbursements |
4.40 | % | 8.14 | %B | ||||
| Expenses, before reimbursements, excluding non-operating expenses |
2.75 | % | 6.72 | %B | ||||
| Expenses, net of reimbursements |
4.34 | % | 4.11 | %B | ||||
| Expenses, net of reimbursements, excluding non-operating expenses |
2.69 | % | 2.69 | %B | ||||
| Net investment (loss), before expense reimbursements |
(0.46 | )% | (4.30 | )%B | ||||
| Net investment (loss), net of reimbursements |
(0.40 | )% | (0.28 | )%B | ||||
| Portfolio turnover rate |
436 | % | 159 | % C | ||||
| A | Based on net asset value, which does not reflect the sales charge, redemption fee, or contingent deferred sales charge, if applicable. May include adjustments in accordance with U.S. GAAP and as such, the net asset value for reporting purposes and the returns based upon those net asset values may differ from the net asset value and returns for shareholder transactions. |
| B | Not Annualized. |
| C | Annualized. |
| D | Commencement of Operations. |
| 81 |
American Beacon FundsSM
Affirmation of the Commodity Pool Operator
December 31, 2016 (Unaudited)
To the best of my knowledge and belief, the information contained in the attached financial statements for the American Beacon AHL Managed Futures Strategy Fund for the period from January 1, 2016 to December 31, 2016, is accurate and complete.

Melinda G. Heika, Treasurer
American Beacon Advisors, Inc.
Commodity Pool Operator for the American Beacon AHL Managed Futures Strategy Fund
| 82 |
American Beacon Funds SM
December 31, 2016 (Unaudited)
The Funds are requested to provide certain tax information to shareholders based upon the Funds’ income and distribution for the taxable year ended December 31, 2016. The information and distributions reported herein may differ from information and distributions taxable to the shareholders for the calendar year ended December 31, 2016.
The Funds designated the following items with regard to distributions paid during the year ended December 31, 2016. All designations are based on financial information available as of this annual report and, accordingly, are subject to change. For each item, it is the intention of the Fund to designate the maximum amount permitted under the Internal Revenue Code of 1986, as amended, and the regulations there under.
| Corporate Dividends- Received Deduction |
Qualified Dividend Income |
Long-Term Capital Gain Distributions |
Short-Term Capital Gain Distributions |
|||||||||||||
| AHL Managed Futures Strategy Fund |
38.26 | % | 78.05 | % | 6.50 | % | 6.50 | % | ||||||||
| Ionic Strategic Arbitrage Fund |
70.74 | % | 100.00 | % | 10.36 | % | 10.36 | % | ||||||||
Shareholders received notification in January 2017 of the applicable tax information necessary to prepare their 2016 income tax returns.
| 83 |
American Beacon FundsSM
December 31, 2016 (Unaudited)
American Beacon Advisors, Inc. (“American Beacon”) is a wholly-owned subsidiary of Astro AB Borrower, Inc. (“Borrower”). On January 31, 2017, the Board of Borrower and its sole shareholder, Astro AB Acquisition (“Acquisition”), approved an amendment to Borrower’s Certificate of Incorporation to change the name of Borrower to Resolute Investment Managers, Inc. Simultaneously with the name change of Borrower, the shareholders and the Boards of each of American Beacon’s indirect owners approved similar name changes, as follows: Astro AB Holdings, LLC (“Holdings”) became Resolute Investment Holdings, LLC; Astro AB Topco, Inc. became Resolute Topco, Inc.; and Astro AB Acquisition, Inc. became Resolute Acquisition, Inc. Amendments to each of the entities’ Articles of Incorporation, or, in the case of Holdings, the Certificate of Formation, were filed with the Delaware Secretary of State.
A summary of the name changes for the Astro Entities is set forth below:
Astro AB Holdings, LLC - Resolute Investment Holdings, LLC
Astro AB Topco, Inc. - Resolute Topco, Inc.
Astro AB Acquisiton, Inc. - Resolute Acquisiton, Inc.
Astro AB Borrower, Inc. - Resolute Investment Managers, Inc.
| 84 |
Trustees and Officers of the American Beacon FundsSM (Unaudited)
The Trustees and officers of the American Beacon Funds (the “Trust”) are listed below, together with their principal occupations during the past five years. Unless otherwise indicated, the address of each person listed below is 220 Las Colinas Boulevard East, Suite 1200, Irving, Texas 75039. Each Trustee oversees twenty-seven funds in the fund complex that includes the Trust and the American Beacon Select Funds. The Trust’s Statement of Additional Information contains additional information about the Trustees and is available without charge by calling 1-800-658-5811.
| Name, Age and Address |
Position, Term of Office and Length of Time Served with the Trust |
Principal Occupation(s) During Past 5 Years and Current Directorships | ||
| INTERESTED TRUSTEES | ||||
| Lifetime of Trust until removal, resignation or retirement* |
||||
| Alan D. Feld** (80) | Trustee since 1996 | Sole Shareholder of a professional corporation which is a Partner in the law firm of Akin, Gump, Strauss, Hauer & Feld, LLP (law firm) (1960-Present); Trustee, American Beacon Mileage Funds (1996-2012); Trustee, American Beacon Select Funds (1999-Present); Trustee, American Beacon Master Trust (1996-2012). | ||
| NON-INTERESTED TRUSTEES | Term | |||
| Lifetime of Trust until removal resignation or retirement* | ||||
| Gilbert G. Alvarado (47) | Trustee since 2015 | Director, Kura MD, Inc. (local telehealth organization) (2015-present); Vice President & CFO, Sierra Health Foundation (health conversion private foundation) (2006-Present) Vice President & CFO, Sierra Health Foundation: Center for Health Program Management (California public benefit corporation) (2012-Present); Director, Innovative North State (2012-Present); Director, Sacramento Regional Technology Alliance (2011-Present); Director, Women’s Empowerment (2009-2014); Trustee, American Beacon Select Funds (2015-Present). | ||
| Josephe B. Armes (54) | Trustee since 2015 | Chairman & CEO, CSW Industrials f/k/a Capital Southwest Corporation (investment company) (2013-Present); President & CEO, JBA Investment Partners (family investment vehicle) (2010-Present); Chief Operating Officer, Hicks Holdings, LLC (Hicks Family assets and investments) (2005-2010); Trustee, Baylor University Board of Regents (2001-2010); Director and Chair of Audit Committee, RSP Permian (oil and gas producer) (2013-Present); Trustee, American Beacon Select Funds (2015-Present). | ||
| Gerard J. Arpey (58) | Trustee since 2012 | Director, The Home Depot, Inc. (2015-Present); Partner, Emerald Creek Group (private equity firm) (2011-Present); Chairman and Chief Executive Officer, AMR Corp. and American Airlines; Inc. (2003- 2011); Director, S. C. Johnson & Son, Inc. (privately held company) (2008-present); Trustee, American Beacon Select Funds (2012-Present). | ||
| Brenda A. Cline (56) | Trustee since 2004 | Executive Vice President, Chief Financial Officer, Treasurer and Secretary, Kimbell Art Foundation (1993-Present); Director, Range Resources Corporation (oil and natural gas company) (2015-Present); Director, Tyler Technologies, Inc.(public sector software solutions company) (2014-Present); Trustee, American Beacon Mileage Funds (2004-2012); Trustee, American Beacon Select Funds (2004-Present); Trustee, American Beacon Master Trust (2004-2012). | ||
| Eugene J. Duffy (62) | Trustee since 2008 | Managing Director, Institutional Services, Intercontinental Real Estate Corporation (2014-Present); Principal and Executive Vice President, Paradigm Asset Management (1994-2014); Director, Sunrise Bank of Atlanta (2008-2013); Trustee, American Beacon Mileage Funds (2008- 2012); Trustee, American Beacon Select Funds (2008-Present); Trustee, American Beacon Master Trust (2008-2012). | ||
85
Trustees and Officers of the American Beacon FundsSM (Unaudited)
| Name, Age and Address |
Position, Term of Office and Length of Time Served with the Trust |
Principal Occupation(s) During Past 5 Years and Current Directorships | ||
| TRUSTEES (CONT.) | Term | |||
| M. Dunning (74) | Trustee since 2008 | Chairman Emeritus (2008-Present); Lockton Dunning Benefits (consulting firm in employee benefits); Board Director, Oncor Electric Delivery Company LLC (2007-Present); Board Member, BancTec (2010-Present) (software consulting); Trustee, American Beacon Mileage Funds (2008-2012); Trustee, American Beacon Select Funds (2008-Present); Trustee, American Beacon Master Trust (2008-2012). | ||
| Richard M. Massman (73) | Trustee since 2004 Chairman since 2008 | Consultant and General Counsel Emeritus (2009-Present) and Senior Vice President and General Counsel (1994-2009), Hunt Consolidated, Inc. (holding company engaged in oil and gas exploration and production, refining, real estate, farming, ranching and venture capital activities); Trustee, American Beacon Mileage Funds (2004- 2012); Trustee, American Beacon Select Funds (2004-Present); Trustee, American Beacon Master Trust (2004-2012). | ||
| Barbara J. McKenna, CFA (53) | Trustee since 2012 | Managing Principal, Longfellow Investment Management Company (2005- Present); Trustee, American Beacon Select Funds (2012-Present). | ||
| R. Gerald Turner (71) 225 Perkins Admin. Bldg. Southern Methodist Univ. Dallas, Texas 75275 |
Trustee since 2001 | President, Southern Methodist University (1995-Present); Director, J.C. Penney Company, Inc. (1996-Present); Director, Kronus Worldwide Inc. (chemical manufacturing) (2003-Present); Trustee, American Beacon Mileage Funds (2001- 2012); Trustee, American Beacon Select Funds (2001-Present); Trustee, American Beacon Master Trust (2001-2012). | ||
| OFFICERS | ||||
| Gene. L. Needles, Jr. (62) | President since 2009 Executive Vice President since 2009 |
President, CEO and Director, American Beacon Advisors, Inc. (2009-Present); President, CEO and Director, Astro AB Borrower, Inc. (2015-Present); President, CEO and Director, Astro AB Acquisition, Inc. (2015-Present); President, CEO and Director, Astro AB Topco, Inc. (2015-Present), President, CEO and Director, Astro AB Holdings, LLC. (2015-Present); President, CEO and Director, Lighthouse Holdings, Inc.; (2009-2015); President and CEO, Lighthouse Holdings Parent, Inc. (2009-2015); Manager, President and CEO, American Private Equity Management, L.L.C. (2012-Present); President, American Beacon Cayman Managed Futures Strategy Fund, Ltd. (2014-Present). | ||
| Rosemary K. Behan (57) | VP, Secretary and Chief Legal Officer since 2006 |
Secretary, American Beacon Advisors, Inc. (2006-Present); Secretary, Astro AB Borrower, Inc. (2015-Present); Secretary, Astro AB Acquisition, Inc. (2015- Present); Secretary, Astro AB Topco, Inc. (2015-Present); Secretary, Astro AB Holdings, LLC. (2015-Present); Secretary, Lighthouse Holdings, Inc. (2008- 2015); Secretary, Lighthouse Holdings Parent, Inc. (2008-2015); Secretary, American Private Equity Management, L.L.C. (2008-Present); Secretary, American Beacon Cayman Managed Futures Strategy Fund, Ltd. (2014-Present). | ||
| Brian E. Brett (56) | VP since 2004 | Vice President, Director of Sales, American Beacon Advisors, Inc. (2004-Present). | ||
| Paul B. Cavazos (47) | VP since 2016 | Chief Investment Officer and Vice President, Asset Management, American Beacon Advisors, Inc. (2016-Present); Chief Investment Officer and Assistant Treasurer, DTE Energy (2007-2016); | ||
| Erica Duncan (46) | VP since 2011 | Vice President, Marketing and Client Services, American Beacon Advisors, Inc. (2011-Present); Supervisor, Brand Marketing, Invesco (2010-2011); | ||
86
Trustees and Officers of the American Beacon FundsSM (Unaudited)
| Name, Age and Address |
Position, Term of Office and Length of Time Served with the Trust |
Principal Occupation(s) During Past 5 Years and Current Directorships | ||
| OFFICERS | Term | |||
| Melinda G. Heika (55) | Treasurer since 2010 | Treasurer, American Beacon Advisors, Inc. (2010-Present); Treasurer, Astro AB Borrower, Inc. (2015-Present); Treasurer, Astro AB Acquisition, Inc. (2015-Present); Treasurer, Astro AB Topco, Inc. (2015-Present); Treasurer, Astro AB Holdings, LLC. (2015-Present); Treasurer, Lighthouse Holdings, Inc. (2010-2015); Treasurer, Lighthouse Holdings Parent Inc., (2010-2015); Treasurer, American Private Equity Management, L.L.C. (2012-Present); Director and Treasurer, American Beacon Cayman Managed Futures Strategy Fund, Ltd. (2014-Present). | ||
| One Year | ||||
| Terri L. McKinney (53) | VP since 2010 | Vice President, Enterprise Services (2009-Present) and Managing Director (2003-2009), American Beacon Advisors, Inc. | ||
| Jeffrey K. Ringdahl (41) | VP since 2010 | Chief Operating Officer, American Beacon Advisors, Inc. (2010-Present); Manager and Senior Vice President, American Private Equity Management, L.L.C. (2012-Present); Senior Vice President and Director, Astro AB Borrower, Inc. (2015-Present); Senior Vice President and Director, Astro AB Acquisition, Inc. (2015-Present); Senior Vice President and Director, Astro AB Topco, Inc. (2015-Present), Senior Vice President and Director, Astro AB Holdings, LLC.(2015-Present); Senior Vice President, Lighthouse Holdings, Inc. (2013-2015); Senior Vice President, Lighthouse Holdings Parent, Inc. (2013-2015); Director and Vice President, American Beacon Cayman Managed Futures Strategy Fund, Ltd. (2014-Present); Vice President, Product Management, Touchstone Advisors, Inc. (2007-2010). | ||
| Samuel J. Silver (53) | VP since 2011 | Chief Fixed Income Officer (2016–Present), Vice President, Fixed Income Investments (2011-2016) and Senior Portfolio Manager, Fixed Income Investments (1999-2011), American Beacon Advisors, Inc. | ||
| Christina E. Sears (45) | Chief Compliance Officer since 2004 and Asst. Secretary since 1999 |
Chief Compliance Officer, American Beacon Advisors, Inc. (2004-Present); Chief Compliance Officer, American Private Equity Management, L.L.C. (2012-Present). | ||
| Sonia L. Bates (60) | Asst. Treasurer since 2011 | Director, Tax and Financial Reporting (2011-Present), Manager, Tax and Financial Reporting (2005-2010), American Beacon Advisors, Inc.; Asst. Treasurer, Astro AB Borrower, Inc. (2015-Present); Asst. Treasurer, Astro AB Acquisition, Inc.(2015-Present); Asst. Treasurer, Astro AB Topco, Inc. (2015-Present); Asst. Treasurer, Astro AB Holdings, LLC.; Asst. Treasurer, Lighthouse Holdings, Inc. (2011-2015); Asst. Treasurer, Lighthouse Holdings Parent Inc. (2011-2015); Asst. Treasurer, American Private Equity Management, L.L.C. (2012-Present). | ||
| Shelley D. Abrahams (42) | Assistant Secretary since 2008 | Assistant Secretary, American Beacon Advisors, Inc. (2008-Present) | ||
| Rebecca L. Harris (50) | Assistant Secretary since 2011 | Assistant Secretary, American Beacon Advisors, Inc. (2011-Present) | ||
| Diana N. Lai (41) | Assistant Secretary since 2012 | Assistant Secretary, American Beacon Advisors, Inc. (2012-Present) | ||
| TeresaA. Oxford (58) |
Assistant Secretary since 2015 | Assistant Secretary, American Beacon Advisors, Inc. (2015-Present) | ||
| * | As of 11/12/2014, the Board adopted a retirement plan that requires Trustees to retire no later than the last day of the calendar year in which they reach the age of 75. |
| ** | Mr. Feld is deemed to be an “interested person” of the Trusts, as defined by the 1940 Act. Mr. Feld’s law firm of Akin, Gump, Strauss, Hauer & Feld LLP has provided legal services within the past two fiscal years to one or more of the Trust’s sub-advisors. |
87
American Beacon FundsSM
December 31, 2016 (Unaudited)
The American Beacon Funds recognize and respect the privacy of our shareholders. We are providing this notice to you so you will understand how shareholder information may be collected and used.
We may collect nonpublic personal information about you from one or more of the following sources:
| • | information we receive from you on applications or other forms; |
| • | information about your transactions with us or our service providers; and |
| • | information we receive from third parties. |
We do not disclose any nonpublic personal information about our customers or former customers to anyone, except as permitted by law.
We restrict access to your nonpublic personal information to those employees or service providers who need to know that information to provide products or services to you. To ensure the confidentiality of your nonpublic personal information, we maintain safeguards that comply with federal standards.
88
This page intentionally left blank.
89
This page intentionally left blank.
90
This page intentionally left blank.
91
This page intentionally left blank.
92

eDelivery is NOW AVAILABLE - Stop traditional mail delivery and receive your
shareholder reports and summary prospectus on-line. Sign up at
www.americanbeaconfunds.com
If you invest in the Fund through a financial institution, you may be able to receive the Fund’s regulatory mailings, such as the Prospectus, Annual Report and Semi-Annual Report, by e-mail. If you are interested in this option, please go to www.icsdelivery.com and search for your financial institution’s name or contact your financial institution directly.
To obtain more information about the Fund:
|
|
| |
| By E-mail: american_beacon.funds@ambeacon.com
|
On the Internet: Visit our website at www.americanbeaconfunds.com | |
|
| ||

|

| |
| By Telephone: Institutional, Y, and Investor Classes Call (800) 658-5811 |
By Mail: American Beacon Funds P.O. Box 219643 Kansas City, MO 64121-9643
| |
|
| ||
|
Availability of Quarterly Portfolio Schedules
In addition to the Schedule of Investments provided in each semi-annual and annual report, the Fund files a complete schedule of its portfolio holdings with the Securities and Exchange Commission (“SEC”) on Form N-Q as of the first and third fiscal quarters. The Fund’s Forms N-Q are available on the SEC’s website at www.sec.gov. The Forms N-Q may also be reviewed and copied at the SEC’s Public Reference Section, 100 F Street, NE, Washington, D.C. 20549-2736. Information regarding the operation of the SEC’s Public Reference Room may be obtained by calling (800)-SEC-0330. A complete schedule of the Fund’s portfolio holdings is also available at www.americanbeaconfunds.com approximately sixty days after the end of each month. |
Availability of Proxy Voting Policy and Records
A description of the policies and procedures the Fund uses to determine how to vote proxies relating to portfolio securities is available in the Fund’s Statement of Additional Information, is available free of charge on the Fund’s website www.americanbeaconfunds.com and by calling 1-800-967-9009 or by accessing the SEC’s website at www. sec.gov. The Fund’s proxy voting record for the most recent year ended June 30 is filed annually with the SEC on Form N-PX. The Fund’s Forms N-PX are available on the SEC’s website at www.sec.gov. The Fund’s proxy voting record may also be obtained by calling 1-800-967-9009. | |


Fund Service Providers:
| CUSTODIAN | TRANSFER AGENT | INDEPENDENT REGISTERED | DISTRIBUTOR | |||||||||
| State Street Bank and Trust |
Boston Financial Data Services | PUBLIC ACCOUNTING FIRM Ernst & Young LLP |
Foreside Fund Services, LLC | |||||||||
| Boston, Massachusetts | Kansas City, Missouri | Dallas, Texas | Portland, Maine |
This report is prepared for shareholders of the American Beacon Funds and may be distributed to others only if preceded or accompanied by a current Prospectus or Summary Prospectus.
American Beacon Funds, American Beacon AHL Managed Futures Strategy Fund and American Beacon Ionic Strategic Arbitrage Fund are service marks of American Beacon Advisors, Inc.
AR 12/16
About American Beacon Advisors
Since 1986, American Beacon Advisors has offered a variety of products and investment advisory services to numerous institutional and retail clients, including a variety of mutual funds, corporate cash management, and separate account management.
Our clients include defined benefit plans, defined contribution plans, foundations, endowments, corporations, financial planners, and other institutional investors. With American Beacon Advisors, you can put the experience of a multi-billion dollar asset management firm to work for your company.
STEPHENS MID-CAP GROWTH FUND
Growth stocks typically are more volatile than value stocks; however, value stocks have a lower expected growth rate in earnings and sales. Investing in medium-capitalization stocks may involve greater volatility and lower liquidity than larger company stocks. Investing in foreign securities may involve heightened risk due to currency fluctuations and economic and political risks. The use of futures contracts for cash management may subject the Fund to losing more money than invested. The Fund may participate in a securities lending program. Please see the prospectus for a complete discussion of the Fund’s risks. There can be no assurances that the investment objectives of this Fund will be met.
STEPHENS SMALL CAP GROWTH FUND
Growth stocks typically are more volatile than value stocks; however, value stocks have a lower expected growth rate in earnings and sales. Investing in small-capitalization stocks may involve greater volatility and lower liquidity than larger company stocks. Investing in foreign securities may involve heightened risk due to currency fluctuations and economic and political risks. The use of futures contracts for cash management may subject the Fund to losing more money than invested. The Fund may participate in a securities lending program. Please see the prospectus for a complete discussion of the Fund’s risks. There can be no assurances that the investment objectives of this Fund will be met.
Any opinions herein, including forecasts, reflect our judgment as of the end of the reporting period and are subject to change. Each advisor’s strategies and each Fund’s portfolio composition will change depending on economic and market conditions. This report is not a complete analysis of market conditions, and, therefore, should not be relied upon as investment advice. Although economic and market information has been compiled from reliable sources, American Beacon Advisors, Inc. makes no representation as to the completeness or accuracy of the statements contained herein.
| American Beacon Funds | December 31, 2016 |
| 1 | ||||
| 2 | ||||
| 9 | ||||
| 11 | ||||
| 12 | ||||
| 16 | ||||
| 20 | ||||
| 23 | ||||
| 39 | ||||
| 44 | ||||
| 49 | ||||
| 50 | ||||
| 51 | ||||
| 54 | ||||
| Back Cover | ||||

|
Dear Shareholders,
During the 12-month period ended December 31, 2016, China’s slowing growth escalated concerns for global markets, and many of the world’s central banks – the Federal Reserve (the “Fed”) included – responded by either continuing or expanding their economic stimulation policies. In the first half of 2016, international stocks declined while U.S. and emerging-market stocks made modest gains. Falling global interest rates supported bond returns during the period.
On June 24, 2016, the U.K. announced that the Brexit referendum to leave the European Union passed with a 52% majority vote, further shaking up global markets. By the end of that month, however, the U.S. stock market and some global markets had rebounded to near pre-Brexit levels as investors took opportunistic risks following the historic vote. After Theresa May’s succession as the U.K.’s prime minister on July 13, 2016, many central banks put their Brexit concerns on hold and turned their attention to their own economies. |
In the weeks ahead of the U.S. presidential election on November 8, 2016, uncertainty about the outcome caused many investors to stay on the sidelines. Some investors questioned whether the election’s result would have negative consequences for their portfolios, but elections rarely have a lasting effect on the market. Historically speaking, from August 1 to October 31 during 19 of the last 22 election years – or approximately 86% of the time – the S&P 500 rallied for an average gain of approximately 6%.
On December 14, 2016, the Fed announced that it increased short-term interest rates by 0.25% to a range of 0.50% and 0.75%, signifying the Federal Open Market Committee’s confidence in an improving economy. It was the second rate increase in a decade; the first rate increase occurred in December 2015.
Although U.S. bonds and international investments largely declined in fourth quarter, domestic stocks reached new highs by the end of 2016. Markets responded positively to aspects of the incoming administration’s proposed plans for economic growth; i.e., repatriating jobs from overseas, relaxing regulations, lowering taxes and increasing infrastructure spending. For the year, the Dow Jones Industrial Average gained 16.50%, the S&P 500 Index gained 11.96% and the Nasdaq Composite gained 7.5%.
For the 12 months ended December 31, 2016:
| • | American Beacon Stephens Mid-Cap Growth Fund (Investor Class) returned 6.42%. |
| • | American Beacon Stephens Small Cap Value Fund (Investor Class) returned 9.76%. |
American Beacon Advisors identifies and partners with experienced asset managers from across all asset classes to help protect our shareholders’ portfolios over the long term. We are proud to offer a variety of funds that allow investors to invest in the asset classes best aligned with their long-term goals.
Thank you for your continued investment in the American Beacon Funds. For additional information about the Funds or to access your account information, please visit www.americanbeaconfunds.com.
Best Regards,

Gene L. Needles, Jr.
President
American Beacon Funds
1
Domestic Equity Market Overview
December 31, 2016 (Unaudited)
Domestic equity markets came back with a roar from 2015’s modestly positive performance and continued the long-running, eight-year bull market. The S&P 500 Index, a broad measure of stock performance, was up 11.96%. The Russell 1000 Index, another largely followed market index, was up 12.05% for the year. Looking at the various Russell-style indexes for the year, small-cap stocks outpaced large- and mid-cap stocks and value stocks far outpaced growth stocks. In 2016, the markets continued to demonstrate that macroeconomic events such as the Brexit vote and uncertainty around the U.S. election can influence performance in the short term.
The first quarter of 2016 was marked by significant domestic equity market volatility with negative performance in January nearly matching positive performance in March (with flat performance in between). The month of January was highlighted by a broad market sell-off because of continued weakness in China’s economy despite a rebound by stocks at the end of the month. Healthier economic indicators in February kept the markets from entering correction territory, with most broad domestic equity markets ending the month close to flat. March was characterized by strong market performance led by job gains, a strengthening labor market, and some stability to oil prices. The Federal Reserve (the “Fed”) took a cautious tone following the Federal Open Market Committee (“FOMC”) meeting in March and held the federal funds rate steady. “Global economic and financial developments” were cited as reasons to keep the rate steady. To wit, the surprise move by the European Central Bank for further quantitative easing underscored weakness in Europe’s economy. The quarter ended with most domestic markets in modestly positive territory – the exceptions being the small-cap core/growth space.
The second quarter’s hot topics - Brexit and the lackluster May jobs report - did little to dampen the period’s positive momentum. The first two months of the quarter had positive returns that initially seemed to be threatened by the underwhelming May jobs report released in the first week of June. The weak report put the prospect of the Fed raising interest rates at the June meeting in doubt, which was later realized. Later in the month came the unexpected vote in the United Kingdom to leave the European Union, or Brexit. However, the domestic equity markets’ short-lived reaction to the Brexit vote was followed by a quick rebound and the month of June was relatively flat across most U.S. indexes. The second quarter ended with U.S. equity markets posting positive numbers across the board.
The third quarter was buoyed initially by lessening fear surrounding the Brexit vote and a significant positive revision to the June jobs report, but the Fed’s discussion of whether (and when) they should raise interest rates remained a key theme. This carried into August as U.S. markets were lifted by continued signs of job creation, wage growth and a lower unemployment rate. Gross domestic product (“GDP”) metrics for the period registered +3.5% annualized – the highest observation in two years. Meanwhile, international markets were mixed, particularly as growth in China continued to slow. Weaker markets in September recovered toward the end of month thanks in part to oil prices rising in the wake of OPEC’s announcement of a tentative agreement on production cutbacks. Despite that and concerns about inflation remaining below its target of 2%, the Fed indicated that the case for raising interest rates before the end of the year had strengthened, though they noted they would wait before doing so and continue monitoring the environment. Once again, U.S. equity markets had a positive quarter across the board and particularly in the small-cap space.
The fourth quarter began weakly in October due to the uncertainty of the fast-approaching U.S. presidential election and despite goods and services indicating an increase to real GDP during the same time period. In November, despite predictions of a sharp, negative response to the election results, the U.S. markets went on to achieve new highs later in the month. Notwithstanding generally positive market conditions, the Fed made no interest rate changes in November given the proximity of the FOMC’s meeting to the election. At that time, Federal Reserve Board Chair Janet Yellen foreshadowed a potential rate increase, saying the timing could be appropriate “relatively soon.” On December 14, the Fed met and voted to increase interest rates by 0.25% - the first time in 2016 and only the second time in the past 12 months. As another positive note, consumer confidence rose during the month of December to its highest level in more than 15 years. The fourth quarter was a good period for the U.S. equity markets - especially small-cap stocks and value stocks, which significantly outpaced their large and growth counterparts - and wrapped a big bow around the end of a year that seemed surprising (i.e., U.S. markets leading globally).
2
American Beacon Stephens Mid-Cap Growth FundSM
Performance Overview
December 31, 2016 (Unaudited)
The Investor Class of the American Beacon Stephens Mid-Cap Growth Fund (the “Fund”) returned 6.42% for the twelve months ended December 31, 2016. The Fund underperformed the Russell Midcap® Growth Index (the “Index”) return of 7.33% for the same period.
Comparison of Change in Value of a $10,000 Investment for the period from 12/31/2006 through 12/31/2016
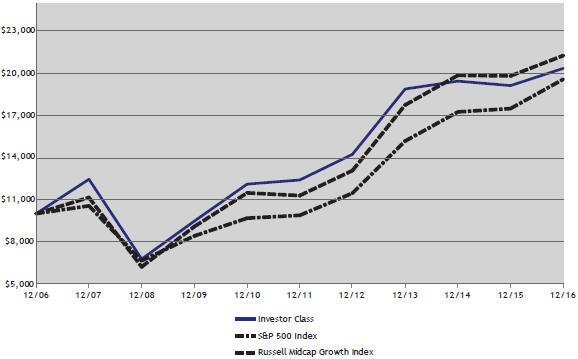
Total Returns for the Period ended December 31, 2016
| Ticker | 1 Year | 3 Years | 5 Years | 10 Years | Value of $10,000 12/31/2006- 12/31/2016 |
|||||||||||||||||||
| Institutional Class (1,2,7) |
SFMIX | 6.82 | % | 2.93 | % | 10.83 | % | 7.70 | % | $ | 20,993 | |||||||||||||
| Y Class (1,3,7) |
SMFYX | 6.67 | % | 2.81 | % | 10.74 | % | 7.51 | % | $ | 20,638 | |||||||||||||
| Investor Class (1,3,7) |
STMGX | 6.42 | % | 2.53 | % | 10.42 | % | 7.36 | % | $ | 20,342 | |||||||||||||
| A without Sales Charge (1,4,7) |
SMFAX | 6.30 | % | 2.50 | % | 10.36 | % | 7.33 | % | $ | 20,286 | |||||||||||||
| A with Sales Charge (1,4,7) |
SMFAX | 0.20 | % | 0.50 | % | 9.06 | % | 6.69 | % | $ | 19,114 | |||||||||||||
| C without Sales Charge (1,5,7) |
SMFCX | 5.59 | % | 1.73 | % | 9.58 | % | 6.95 | % | $ | 19,579 | |||||||||||||
| C with Sales Charge (1,5,7) |
SMFCX | 4.59 | % | 1.73 | % | 9.58 | % | 6.95 | % | $ | 19,579 | |||||||||||||
| Russell Midcap Growth Index (6) |
7.33 | % | 6.23 | % | 13.51 | % | 7.83 | % | $ | 21,255 | ||||||||||||||
| S&P 500 Index (6) |
11.96 | % | 8.87 | % | 14.66 | % | 6.95 | % | $ | 19,572 | ||||||||||||||
| 1. | Performance shown is historical and is not indicative of future returns. Investment returns and principal value will vary, and shares may be worth more or less at redemption than at original purchase. Performance shown is calculated based on the published end of day net asset values as of date indicated, and current performance may be lower or higher than the performance data quoted. To obtain performance as of the most recent month end, please call 1-800-9687-9009 or visit www.americanbeaconfunds.com. Fund performance in the table above does not reflect the deduction of taxes a shareholder would pay on distributions or the redemption of shares. A portion of the fees charged to the Investor Class was waived from 2006 through 2013 and partially recovered in 2014 and 2015. Performance prior to waiving fees was lower than the actual returns shown from 2006 through 2013. |
| 2. | Fund performance for the ten-year period represents the returns achieved by the Institutional Class since its inception on 8/31/06. A portion of the fees charged to the Institutional Class has been waived since 2006. Performance prior to waiving fees was lower than the actual returns shown since 2006. |
3
American Beacon Stephens Mid-Cap Growth FundSM
Performance Overview
December 31, 2016 (Unaudited)
| 3. | Fund performance for the five-year and ten-year periods represent the returns achieved by the Investor Class from 12/31/06 up to 2/14/12, the inception date of the Y Class, and the returns of the Y Class since its inception. Expenses of the Y Class are lower than those of the Investor Class. Therefore, total returns shown may be lower than they would have been had the Y Class been in existence since 12/31/06. A portion of the fees charged to the Y Class was waived in 2012 and 2013 and partially recovered in 2014 and 2015. Performance prior to waiving fees was lower than the actual returns shown in 2012 and 2013. |
| 4. | Fund performance for the five-year and ten-year periods represent the returns achieved by the Investor Class from 12/31/06 up to 2/24/12, the inception date of the A Class, and the returns of the A Class since its inception. Expenses of the A Class are higher than those of the Investor Class. Therefore, total returns shown may be higher than they would have been had the A Class been in existence since 12/31/06. A portion of the fees charged to the A Class was waived in 2012 through 2013 and partially recovered in 2015. Performance prior to waiving fees was lower than the actual returns shown from 2012 through 2013. A Class has a maximum sales charge of 5.75%. |
| 5. | Fund performance for the five-year and ten-year periods represent the returns achieved by the Investor Class from 12/31/06 up to 2/14/12, the inception date of the C Class, and the returns of the C Class since its inception. Expenses of the C Class are higher than those of the Investor Class. Therefore, total returns shown may be higher than they would have been had the C Class been in existence since 12/31/06. A portion of the fees charged to the C Class was waived in 2012 through 2014, partially recovered in 2015 and waived in 2016. Performance prior to waiving fees was lower than actual returns shown from 2012 through 2014 and in 2016. The maximum contingent deferred sales charge for C Class is 1.00% for shares redeemed within one year of the date of purchase. |
| 6. | The S&P 500 Index is a market capitalization weighted index of common stocks publicly traded in the United States. The Russell Midcap Growth Index is an unmanaged index of those stocks in the Russell Midcap Index with higher price-to-book ratios and higher forecasted growth values. Russell Midcap Index measures the performance of the 800 smallest companies in the Russell 1000 Index. Russell Midcap Index, Russell Midcap Growth Index and Russell 1000 Index are registered trademarks of Frank Russell Company. One cannot directly invest in an index. |
| 7. | The total annual Fund operating expense ratios set forth in the most recent Fund prospectus for the Institutional, Y, Investor, A, and C Class shares was 1.02%, 1.07%, 1.33%, 1.37%, and 2.12%, respectively. The expense ratios above may vary from the expense ratios presented in other sections of this report that are based on expenses incurred during the period covered by this report. |
From a stock selection standpoint, holdings in the Energy sector detracted from performance. Oceaneering Intl (down 22.9%) detracted value relative to the Index, while the Fund’s absence from Oneok Inc. (up almost 150%) negatively impacted returns for the sector. The Fund’s Industrials, Health Care and Consumer Staples sectors also detracted from relative performance. In Industrials, Stericyle was down over 35%. Within the Health Care sector, positions in Pacira Pharmaceuticals (down 58.7%), Illumina (down 35.0%) and Athena Health (down 35.3%) hurt relative performance. In Consumer Staples, Monster Beverage (down 10.6%) and Brown Forman Corp (down 8.6%) detracted from relative performance.
In contrast, good stock selection in the Consumer Discretionary sector added relative value. Papa John’s was up 55.5% and Ulta Salon Cosmetics & Fragrances was also up, at 34.8%. Not owning L Brands (down 27.3%) also contributed to relative returns in the sector. Financials also helped with performance, with investments in SVB Financial Group (up 42.8%), East West Bancorp (up 24.4%) and Marketaxess (up 31.4%) adding value over the period.
The Fund’s overweight in Health Care, the worst performing sector, and underweight in Materials had a negative impact on returns relative to the benchmark. An underweight to the Industrials sector also detracted from overall performance. In contrast, the following sectors were additive to Fund performance: an overweight to Energy, which was the best performing sector; an overweight in Information Technology; and underweights in both Consumer Discretionary and Consumer Staples. Not having an allocation to Real Estate also added value during the period.
Looking forward, the Fund’s sub-advisor will continue to maintain a disciplined, long-term approach to equity investing in medium capitalization stocks with above-average growth potential.
4
American Beacon Stephens Mid-Cap Growth FundSM
Performance Overview
December 31, 2016 (Unaudited)
| Top Ten Holdings (% Net Assets) |
||||||||
| SVB Financial Group |
2.0 | |||||||
| Idexx Laboratories, Inc. |
1.8 | |||||||
| NVIDIA Corp. |
1.8 | |||||||
| Ross Stores, Inc. |
1.8 | |||||||
| MercadoLibre, Inc. |
1.7 | |||||||
| Cognex Corp. |
1.6 | |||||||
| Flir Systems, Inc. |
1.6 | |||||||
| Microchip Technology, Inc. |
1.6 | |||||||
| Ulta Salon Cosmetics & Fragrance, Inc. |
1.6 | |||||||
| Netflix, Inc. |
1.5 | |||||||
| Total Fund Holdings |
93 | |||||||
| Sector Allocation (% Equities) |
||||||||
| Information Technology |
26.1 | |||||||
| Consumer Discretionary |
21.2 | |||||||
| Health Care |
19.5 | |||||||
| Industrials |
14.9 | |||||||
| Financials |
8.5 | |||||||
| Energy |
7.0 | |||||||
| Consumer Staples |
2.8 | |||||||
5
American Beacon Stephens Small Cap Growth FundSM
Performance Overview
December 31, 2016 (Unaudited)
The Investor Class of the American Beacon Stephens Small Cap Growth Fund (the “Fund”) returned 9.76% for the twelve months ended December 31, 2016. The Fund underperformed the Russell 2000® Growth Index (the “Index”) return of 11.32% for the same period.
Comparison of Change in Value of a $10,000 Investment for the period from 12/31/2006 through 12/31/2016
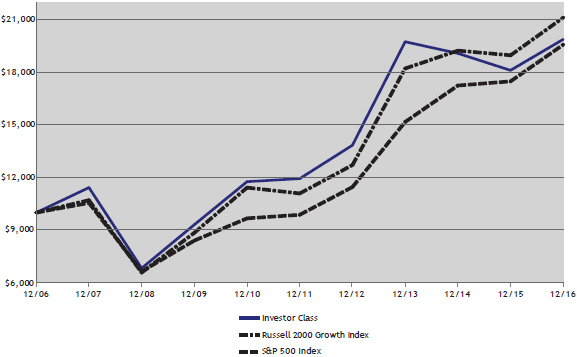
Total Returns for the Period ended December 31, 2016
| Ticker | 1 Year | 3 Years | 5 Years | 10 Years | Value of $10,000 12/31/2006- 12/31/2016 |
|||||||||||||||||||
| Institutional Class (1,2,7) |
STSIX | 10.05 | % | 0.53 | % | 11.04 | % | 7.39 | % | $ | 20,402 | |||||||||||||
| Y Class (1,3,7) |
SPWYX | 9.96 | % | 0.41 | % | 10.94 | % | 7.21 | % | $ | 20,065 | |||||||||||||
| Investor Class (1,3,7) |
STSGX | 9.76 | % | 0.23 | % | 10.73 | % | 7.11 | % | $ | 19,873 | |||||||||||||
| A without Sales Charge (1,4,7) |
SPWAX | 9.61 | % | 0.11 | % | 10.56 | % | 7.03 | % | $ | 19,724 | |||||||||||||
| A with Sales Charge (1,4,7) |
SPWAX | 3.31 | % | (1.85 | )% | 9.26 | % | 6.40 | % | $ | 18,595 | |||||||||||||
| C without Sales Charge (1,5,7) |
SPWCX | 8.76 | % | (0.65 | )% | 9.75 | % | 6.64 | % | $ | 19,013 | |||||||||||||
| C with Sales Charge (1,5,7) |
SPWCX | 7.76 | % | (0.65 | )% | 9.75 | % | 6.64 | % | $ | 19,013 | |||||||||||||
| Russell 2000 Growth Index (6) |
11.32 | % | 5.05 | % | 13.74 | % | 7.76 | % | $ | 21,108 | ||||||||||||||
| S&P 500 Index (6) |
11.96 | % | 8.87 | % | 14.66 | % | 6.95 | % | $ | 19,567 | ||||||||||||||
| 1. | Performance shown is historical and is not indicative of future returns. Investment returns and principal value will vary, and shares may be worth more or less at redemption than at original purchase. Performance shown is calculated based on the published end of day net asset values as of date indicated, and current performance may be lower or higher than the performance data quoted. To obtain performance as of the most recent month end, please visit www. americanbeaconfunds.com or call 1-800-967-9009. Fund performance in the table above does not reflect the deduction of taxes a shareholder would pay on distributions or the redemption of shares. A portion of the fees charged to the Investor Class was waived from 2005 through 2013, in 2015 and 2016, and partially recovered in 2014. Performance prior to waiving fees was lower than actual returns shown from 2003 through 2013, in 2015 and 2016. |
| 2. | Fund performance for the ten-year period represents the returns achieved by the Institutional Class since its inception of 8/31/06. A portion of the fees charged to the Institutional Class was waived from 2006 through 2013 and partially recovered in 2014 and 2015. Performance prior to waiving fees was lower than actual returns shown from 2006 through 2013. |
6
American Beacon Stephens Small Cap Growth FundSM
Performance Overview
December 31, 2016 (Unaudited)
| 3. | Fund performance for the five-year and ten-year periods represent the returns achieved by the Investor Class from 12/31/06 up to 2/24/12, the inception date of the Y Class, and the returns of the Y Class since its inception. Expenses of the Y Class are lower than those of the Investor Class. Therefore, total returns shown may be lower than they would have been had the Y Class been in existence since 12/31/06. A portion of the fees charged to the Y Class was waived in 2012 and 2013 and fully recovered in 2014. Performance prior to waiving fees was lower than actual returns shown for 2012 and 2013. |
| 4. | Fund performance for the five-year and ten-year periods represent the returns achieved by the Investor Class from 12/31/06 up to 2/24/12, the inception date of the A Class, and the returns of the A Class since its inception. Expenses of the A Class are higher than those of the Investor Class. As a result, total returns shown may be higher than they would have been had the A Class been in existence since 12/31/06. A portion of the fees charged to the A Class was waived in 2012 and partially recovered from 2013 through 2015. Performance prior to waiving fees was lower than actual returns shown for 2012. A Class has a maximum sales charge of 5.75%. |
| 5. | Fund performance for the five-year and ten-year periods represent the returns achieved by the Investor Class from 12/31/06 up to 2/24/12, the inception date of the C Class, and the returns of the C Class since its inception. Expenses of the C Class are higher than those of the Investor Class. As a result, total returns shown may be higher than they would have been had the C Class been in existence since 12/31/06. A portion of the fees charged to the C Class was waived in 2012 and partially recovered from 2013 through 2015. Performance prior to waiving fees was lower than actual returns shown for 2012. The maximum contingent deferred sales charge for C Class is 1.00% for shares redeemed within one year of the date of purchase. |
| 6. | The S&P 500 Index is a market capitalization weighted index of common stocks publicly traded in the United States. The Russell 2000 Growth Index is an unmanaged index of those stocks in the Russell 2000 Index with higher price-to-book ratios and higher forecasted growth values. The Russell 2000 Index is an unmanaged index of approximately 2000 smaller-capitalization stocks from various industrial sectors. The Russell 2000 Growth Index and the Russell 2000 Index are registered trademarks of Frank Russell Company. One cannot directly invest in an index. |
| 7. | The total annual Fund operating expense ratio set forth in the most recent Fund prospectus for the Institutional, Y, Investor, A, and C Class shares was 1.09%, 1.15%, 1.41%, 1.45% and 2.20%, respectively. The expense ratios above may vary from the expense ratios presented in other sections of this report that are based on expenses incurred during the period covered by this report. |
From a stock selection standpoint, the Fund benefitted from good stock selection in the Health Care and Consumer Staples sectors. In the Health Care sector, Healthequity Inc. (up 70.7%) and HMS Holdings (up 50.6%) were the largest contributors to performance. Staying out of Index holding Impax Laboratories, which was down almost 70%, positively affected returns relative to the benchmark. MGP Ingredients (up 48.7%), Calavo Growers (up 25.2%) and Inventure Foods (up 39.9%) contributed most to the Fund’s returns in Consumer Staples.
The aforementioned performance was somewhat offset by poor stock selection in the Fund’s Industrials and Consumer Discretionary sectors, with selections in Information Technology and Materials also having a negative impact. Companies detracting the most relative value in the Industrials sector included Advisory Board (down 33.0%) and Proto Labs (down 18.6%). Not holding Index position Clarcor Inc. (up 68.7%) also served as a drag on performance. In the Consumer Discretionary sector, Sportsmans Warehouse (down 33.6%) and Motorcar Parts of America (down 21.0%) were the largest detractors. Within Information Technology, the Fund’s positions in Pros Holdings (down 52.4%) and Manhattan Associates (down 19.1%) also affected relative returns during the period.
In sector allocation, the Fund’s significant underweight position to Materials (one of the best performing sectors for the Index) detracted from performance. This was largely offset by overweight positions in the Energy and Information Technology sectors, as well as a slight underweight to Health Care.
Looking forward, the Fund’s sub-advisor will continue to maintain a disciplined, long-term approach to equity investing in smaller capitalization stocks with above-average growth potential.
7
American Beacon Stephens Small Cap Growth FundSM
Performance Overview
December 31, 2016 (Unaudited)
| Top Ten Holdings (% Net Assets) |
||||||||
| Microsemi Corp. |
1.8 | |||||||
| WageWorks, Inc. |
1.8 | |||||||
| ICON PLC |
1.7 | |||||||
| PAREXEL International Corp. |
1.6 | |||||||
| Cognex Corp. |
1.5 | |||||||
| National CineMedia, Inc. |
1.5 | |||||||
| IMAX Corp. |
1.5 | |||||||
| Euronet Worldwide, Inc. |
1.4 | |||||||
| HealthEquity, Inc. |
1.4 | |||||||
| Hilltop Holdings, Inc. |
1.4 | |||||||
| Total Fund Holdings |
106 | |||||||
| Sector Allocation (% Equities) |
||||||||
| Information Technology |
30.2 | |||||||
| Health Care |
21.1 | |||||||
| Industrials |
15.7 | |||||||
| Consumer Discretionary |
12.7 | |||||||
| Energy |
7.3 | |||||||
| Financials |
6.5 | |||||||
| Consumer Staples |
3.6 | |||||||
| Materials |
2.9 | |||||||
8
American Beacon FundsSM
December 31, 2016 (Unaudited)
Fund Expense Example
As a shareholder of a Fund, you incur two types of costs: (1) transaction costs, including sales charges (loads) on purchase payments and redemption fees if applicable, and (2) ongoing costs, including management fees, administrative service fees, distribution (12b-1) fees, and other Fund expenses. The Examples are intended to help you understand the ongoing costs (in dollars) of investing in the Funds and to compare these costs with the ongoing costs of investing in other mutual funds. The Examples are based on an investment of $1,000 invested at the beginning of the period in each Class and held for the entire period from July 1, 2016 through December 31, 2016.
Actual Expenses
The “Actual” lines of the tables provide information about actual account values and actual expenses. You may use the information in this line, together with the amount you invested, to estimate the expenses that you paid over the period. Simply divide your account value by $1,000 (for example, an $8,600 account value divided by $1,000 = $8.60), then multiply the result by the “Expenses Paid During Period” for the applicable Fund to estimate the expenses you paid on your account during this period. Shareholders of the Institutional and Investor Classes that invest in the Funds through an IRA or Roth IRA may be subject to a custodial IRA fee of $15 that is typically deducted each December. If your account was subject to a custodial IRA fee during the period, your costs would have been $15 higher.
Hypothetical Example for Comparison Purposes
The “Hypothetical” lines of the tables provide information about hypothetical account values and hypothetical expenses based on the Fund’s actual expense ratio and an assumed 5% per year rate of return before expenses (not the Fund’s actual return). You may compare the ongoing costs of investing in the Funds with other funds by contrasting this 5% hypothetical example and the 5% hypothetical examples that appear in the shareholder reports of the other funds. The hypothetical account values and expenses may not be used to estimate the actual ending account balance or expenses you paid for the period. Shareholders of the Institutional and Investor Classes that invest in the Fund through an IRA or Roth IRA may be subject to a custodial IRA fee of $15 that is typically deducted each December. If your account was subject to a custodial IRA fee during the period, your costs would have been $15 higher.
You should also be aware that the expenses shown in the table highlight only your ongoing costs and do not reflect any transaction costs charged by the Fund, such as sales charges (loads). Similarly, the expense examples for other funds do not reflect any transaction costs charged by those funds, such as sales charges (loads), redemption fees or exchange fees. Therefore, the “Hypothetical” lines of the tables are useful in comparing ongoing costs only and will not help you determine the relative total costs of owning different funds. If you were subject to any transaction costs during the period, your costs would have been higher.
9
American Beacon FundsSM
Expense Examples
December 31, 2016 (Unaudited)
Stephens Mid-Cap Growth Fund
| Beginning Account Value 7/1/2016 |
Ending Account Value 12/31/2016 |
Expenses Paid During Period 7/1/2016-12/31/2016* |
||||||||||
| Institutional Class |
||||||||||||
| Actual |
$ | 1,000.00 | $ | 1,075.90 | $ | 5.22 | ||||||
| Hypothetical** |
$ | 1,000.00 | $ | 1,020.11 | $ | 5.08 | ||||||
| Y Class |
||||||||||||
| Actual |
$ | 1,000.00 | $ | 1,075.60 | $ | 5.84 | ||||||
| Hypothetical** |
$ | 1,000.00 | $ | 1,019.49 | $ | 5.69 | ||||||
| Investor Class |
||||||||||||
| Actual |
$ | 1,000.00 | $ | 1,074.36 | $ | 7.20 | ||||||
| Hypothetical** |
$ | 1,000.00 | $ | 1,018.19 | $ | 7.00 | ||||||
| A Class |
||||||||||||
| Actual |
$ | 1,000.00 | $ | 1,073.90 | $ | 7.35 | ||||||
| Hypothetical** |
$ | 1,000.00 | $ | 1,018.02 | $ | 7.15 | ||||||
| C Class |
||||||||||||
| Actual |
$ | 1,000.00 | $ | 1,069.91 | $ | 11.34 | ||||||
| Hypothetical** |
$ | 1,000.00 | $ | 1,014.15 | $ | 11.04 | ||||||
| * | Expenses are equal to the Fund’s annualized expense ratios for the six-month period of 1.00%, 1.12%, 1.38%, 1.41% and 2.18% for the Institutional, Y, Investor, A and C Classes respectively, multiplied by the average account value over the period, multiplied by the number derived by dividing the number of days in the most recent fiscal half-year (184) by days in the year (366) to reflect the half-year period. |
| ** | 5% return before expenses. |
Stephens Small Cap Growth Fund
| Beginning Account Value 7/1/2016 |
Ending Account Value 12/31/2016 |
Expenses Paid During Period 7/1/2016-12/31/2016* |
||||||||||
| Institutional Class |
||||||||||||
| Actual |
$ | 1,000.00 | $ | 1,088.94 | $ | 5.72 | ||||||
| Hypothetical** |
$ | 1,000.00 | $ | 1,019.63 | $ | 5.53 | ||||||
| Y Class |
||||||||||||
| Actual |
$ | 1,000.00 | $ | 1,087.96 | $ | 6.04 | ||||||
| Hypothetical** |
$ | 1,000.00 | $ | 1,019.35 | $ | 5.84 | ||||||
| Investor Class |
||||||||||||
| Actual |
$ | 1,000.00 | $ | 1,087.60 | $ | 7.08 | ||||||
| Hypothetical** |
$ | 1,000.00 | $ | 1,018.36 | $ | 6.85 | ||||||
| A Class |
||||||||||||
| Actual |
$ | 1,000.00 | $ | 1,086.86 | $ | 7.66 | ||||||
| Hypothetical** |
$ | 1,000.00 | $ | 1,017.81 | $ | 7.41 | ||||||
| C Class |
||||||||||||
| Actual |
$ | 1,000.00 | $ | 1,082.01 | $ | 11.67 | ||||||
| Hypothetical** |
$ | 1,000.00 | $ | 1,013.91 | $ | 11.29 | ||||||
| * | Expenses are equal to the Fund’s annualized expense ratios for the six-month period of 1.09%, 1.15%, 1.35%, 1.46% and 2.23% for the Institutional, Y, Investor, A and C Classes respectively, multiplied by the average account value over the period, multiplied by the number derived by dividing the number of days in the most recent fiscal half-year (184) by days in the year (366) to reflect the half-year period. |
| ** | 5% return before expenses. |
10
American Beacon FundsSM
Report of Independent Registered Public Accounting Firm
The Board of Trustees and Shareholders of
American Beacon Stephens Mid-Cap Growth Fund and American Beacon Stephens Small Cap Growth Fund
We have audited the accompanying statements of assets and liabilities, including the schedules of investments, of American Beacon Stephens Mid-Cap Growth Fund and American Beacon Stephens Small Cap Growth Fund (two of the funds constituting the American Beacon Funds) (collectively, the Funds), as of December 31, 2016, and the related statements of operations for the year then ended, the statements of changes in net assets for each of the two years in the period then ended and the financial highlights for each of the periods indicated therein. These financial statements and financial highlights are the responsibility of the Funds’ management. Our responsibility is to express an opinion on these financial statements and financial highlights based on our audits.
We conducted our audits in accordance with the standards of the Public Company Accounting Oversight Board
(United States). Those standards require that we plan and perform the audit to obtain reasonable assurance about whether the financial statements and financial highlights are free of material misstatement. We were not engaged to perform an audit of the Funds’ internal control over financial reporting. Our audits included consideration of internal control over financial reporting as a basis for designing audit procedures that are appropriate in the circumstances, but not for the purpose of expressing an opinion on the effectiveness of the Funds’ internal control over financial reporting. Accordingly, we express no such opinion. An audit also includes examining, on a test basis, evidence supporting the amounts and disclosures in the financial statements and financial highlights, assessing the accounting principles used and significant estimates made by management, and evaluating the overall financial statement presentation. Our procedures included confirmation of securities owned as of December 31, 2016, by correspondence with the custodian and brokers or by other appropriate auditing procedures where replies from brokers were not received. We believe that our audits provide a reasonable basis for our opinion.
In our opinion, the financial statements and financial highlights referred to above present fairly, in all material respects, the financial position of American Beacon Stephens Mid-Cap Growth Fund and American Beacon Stephens Small Cap Growth Fund at December 31, 2016, the results of their operations for the year then ended, the changes in their net assets for each of the two years in the period then ended and the financial highlights for the periods indicated therein in conformity with U.S. generally accepted accounting principles.

Dallas, Texas
February 28, 2017
11
American Beacon Stephens Mid-Cap Growth FundSM
December 31, 2016
| Shares | Fair Value | |||||||
| COMMON STOCK - 97.84% |
||||||||
| CONSUMER DISCRETIONARY - 20.77% |
||||||||
| Auto Components - 2.13% |
||||||||
| LKQ Corp.A |
33,700 | $ | 1,032,905 | |||||
| Mobileye N.V.A. |
18,300 | 697,596 | ||||||
|
|
|
|||||||
| 1,730,501 | ||||||||
|
|
|
|||||||
| Automobiles - 0.53% |
||||||||
| Tesla Motors, Inc.A B |
2,000 | 427,380 | ||||||
|
|
|
|||||||
| Hotels, Restaurants & Leisure - 3.28% |
||||||||
| Buffalo Wild Wings, Inc.A |
4,300 | 663,920 | ||||||
| National CineMedia, Inc. |
60,689 | 893,949 | ||||||
| Papa John’s International, Inc. |
12,950 | 1,108,261 | ||||||
|
|
|
|||||||
| 2,666,130 | ||||||||
|
|
|
|||||||
| Household Durables - 0.70% |
||||||||
| Harman International Industries, Inc. |
5,150 | 572,474 | ||||||
|
|
|
|||||||
| Internet & Catalog Retail - 1.35% |
||||||||
| Expedia, Inc. |
9,668 | 1,095,191 | ||||||
|
|
|
|||||||
| Media - 4.18% |
||||||||
| Cinemark Holdings, Inc. |
24,850 | 953,246 | ||||||
| IMAX Corp.A |
38,012 | 1,193,577 | ||||||
| Netflix, Inc.A |
10,100 | 1,250,380 | ||||||
|
|
|
|||||||
| 3,397,203 | ||||||||
|
|
|
|||||||
| Specialty Retail - 7.47% |
||||||||
| Bright Horizons Family Solutions, Inc.A |
8,500 | 595,170 | ||||||
| Copart, Inc.A |
14,600 | 808,986 | ||||||
| O’Reilly Automotive, Inc.A |
2,900 | 807,389 | ||||||
| Ross Stores, Inc. |
21,950 | 1,439,920 | ||||||
| Tractor Supply Co. |
14,900 | 1,129,569 | ||||||
| Ulta Salon Cosmetics & Fragrance, Inc. |
5,100 | 1,300,194 | ||||||
|
|
|
|||||||
| 6,081,228 | ||||||||
|
|
|
|||||||
| Textiles & Apparel - 1.13% |
||||||||
| Lululemon Athletica, Inc.A |
6,200 | 402,938 | ||||||
| Under Armour, Inc., Class CA |
20,500 | 515,985 | ||||||
|
|
|
|||||||
| 918,923 | ||||||||
|
|
|
|||||||
| Total Consumer Discretionary |
16,889,030 | |||||||
|
|
|
|||||||
| CONSUMER STAPLES - 2.75% |
||||||||
| Beverages - 2.75% |
||||||||
| Brown-Forman Corp., Class B |
22,660 | 1,017,887 | ||||||
| Monster Beverage Corp.A |
27,450 | 1,217,133 | ||||||
|
|
|
|||||||
| Total Consumer Staples |
2,235,020 | |||||||
|
|
|
|||||||
| ENERGY - 6.86% |
||||||||
| Energy Equipment & Services - 4.07% |
||||||||
| Baker Hughes, Inc. |
14,450 | 938,816 | ||||||
| Core Laboratories N.V.B |
7,450 | 894,298 | ||||||
| Oceaneering International, Inc. |
20,450 | 576,895 | ||||||
| RPC, Inc.B |
45,750 | 906,308 | ||||||
|
|
|
|||||||
| 3,316,317 | ||||||||
|
|
|
|||||||
| Oil & Gas - 2.79% |
||||||||
| Cabot Oil & Gas Corp. |
26,500 | 619,040 | ||||||
| Pioneer Natural Resources Co. |
5,850 | 1,053,409 | ||||||
| See accompanying notes
|
||||
| 12 |
American Beacon Stephens Mid-Cap Growth FundSM
Schedule of Investments
December 31, 2016
| Shares | Fair Value | |||||||
| ENERGY - 6.86% (continued) |
||||||||
| Oil & Gas - 2.79% (continued) |
||||||||
| Range Resources Corp. |
17,250 | $ | 592,710 | |||||
|
|
|
|||||||
| 2,265,159 | ||||||||
|
|
|
|||||||
| Total Energy |
5,581,476 | |||||||
|
|
|
|||||||
| FINANCIALS - 8.30% |
||||||||
| Banks - 3.46% |
||||||||
| East West Bancorp, Inc. |
23,650 | 1,202,130 | ||||||
| SVB Financial GroupA |
9,400 | 1,613,604 | ||||||
|
|
|
|||||||
| 2,815,734 | ||||||||
|
|
|
|||||||
| Diversified Financials - 3.62% |
||||||||
| Affiliated Managers Group, Inc.A |
5,230 | 759,919 | ||||||
| Euronet Worldwide, Inc.A |
14,150 | 1,024,885 | ||||||
| MarketAxess Holdings, Inc. |
7,850 | 1,153,321 | ||||||
|
|
|
|||||||
| 2,938,125 | ||||||||
|
|
|
|||||||
| Insurance - 1.22% |
||||||||
| WEX, Inc.A |
8,900 | 993,240 | ||||||
|
|
|
|||||||
| Total Financials |
6,747,099 | |||||||
|
|
|
|||||||
| HEALTH CARE - 19.11% |
||||||||
| Biotechnology - 1.53% |
||||||||
| Alexion Pharmaceuticals, Inc.A |
3,450 | 422,108 | ||||||
| QIAGEN N.V.A |
29,300 | 820,986 | ||||||
|
|
|
|||||||
| 1,243,094 | ||||||||
|
|
|
|||||||
| Health Care Equipment & Supplies - 9.81% |
||||||||
| ABIOMED, Inc.A |
4,500 | 507,060 | ||||||
| Dentsply Sirona, Inc. |
10,916 | 630,180 | ||||||
| DexCom, Inc.A |
11,450 | 683,565 | ||||||
| Hologic, Inc.A |
21,600 | 866,592 | ||||||
| Idexx Laboratories, Inc.A |
12,300 | 1,442,421 | ||||||
| Illumina, Inc.A |
6,500 | 832,260 | ||||||
| Intuitive Surgical, Inc.A |
1,150 | 729,296 | ||||||
| Medidata Solutions, Inc.A |
16,299 | 809,571 | ||||||
| ResMed, Inc. |
16,550 | 1,026,928 | ||||||
| Varian Medical Systems, Inc.A |
4,950 | 444,411 | ||||||
|
|
|
|||||||
| 7,972,284 | ||||||||
|
|
|
|||||||
| Health Care Providers & Services - 5.46% |
||||||||
| Acadia Healthcare Co., Inc.A |
16,200 | 536,220 | ||||||
| Cerner Corp.A |
20,030 | 948,821 | ||||||
| Henry Schein, Inc.A |
6,495 | 985,356 | ||||||
| PAREXEL International Corp.A |
13,950 | 916,794 | ||||||
| VCA Antech, Inc.A |
15,330 | 1,052,405 | ||||||
|
|
|
|||||||
| 4,439,596 | ||||||||
|
|
|
|||||||
| Pharmaceuticals - 2.31% |
||||||||
| Akorn, Inc.A |
27,800 | 606,874 | ||||||
| ICON PLCA C |
11,500 | 864,800 | ||||||
| Pacira Pharmaceuticals, Inc.A |
12,700 | 410,210 | ||||||
|
|
|
|||||||
| 1,881,884 | ||||||||
|
|
|
|||||||
| Total Health Care |
15,536,858 | |||||||
|
|
|
|||||||
| INDUSTRIALS - 14.55% |
||||||||
| Aerospace & Defense -1.39% |
||||||||
| Orbital ATK, Inc. |
12,900 | 1,131,717 | ||||||
|
|
|
|||||||
| See accompanying notes
|
||||
| 13 |
American Beacon Stephens Mid-Cap Growth FundSM
Schedule of Investments
December 31, 2016
| Shares | Fair Value | |||||||
| INDUSTRIALS - 14.55% (continued) |
||||||||
| Commercial Services & Supplies - 4.93% |
||||||||
| CoStar Group, Inc.A |
6,420 | $ | 1,210,105 | |||||
| HMS Holdings Corp.A |
51,962 | 943,630 | ||||||
| Verisk Analytics, Inc.A |
13,750 | 1,116,088 | ||||||
| WageWorks, Inc.A |
10,300 | 746,750 | ||||||
|
|
|
|||||||
| 4,016,573 | ||||||||
|
|
|
|||||||
| Diversified Manufacturing - 1.21% |
||||||||
| Acuity Brands, Inc. |
4,250 | 981,155 | ||||||
|
|
|
|||||||
| Electrical Equipment - 3.90% |
||||||||
| Cognex Corp. |
20,700 | 1,316,934 | ||||||
| IPG Photonics Corp. |
7,800 | 769,938 | ||||||
| Roper Industries, Inc. |
3,250 | 595,010 | ||||||
| Sensata Technologies Holding N.V.A |
12,500 | 486,875 | ||||||
|
|
|
|||||||
| 3,168,757 | ||||||||
|
|
|
|||||||
| Road & Rail - 1.06% |
||||||||
| J.B. Hunt Transport Services, Inc. |
8,900 | 863,923 | ||||||
|
|
|
|||||||
| Trading Companies & Distributors - 2.06% |
||||||||
| Fastenal Co. |
17,360 | 815,573 | ||||||
| MSC Industrial Direct Co., Inc., Class A |
9,280 | 857,379 | ||||||
|
|
|
|||||||
| 1,672,952 | ||||||||
|
|
|
|||||||
| Total Industrials |
11,835,077 | |||||||
|
|
|
|||||||
| INFORMATION TECHNOLOGY - 25.50% |
||||||||
| Communications Equipment - 1.00% |
||||||||
| Palo Alto Networks, Inc.A |
6,500 | 812,825 | ||||||
|
|
|
|||||||
| Electronic Equipment & Instruments - 3.39% |
||||||||
| FLIR Systems, Inc. |
34,950 | 1,264,841 | ||||||
| NVIDIA Corp. |
14,000 | 1,494,360 | ||||||
|
|
|
|||||||
| 2,759,201 | ||||||||
|
|
|
|||||||
| Internet Software & Services - 5.20% |
||||||||
| Akamai Technologies, Inc.A |
11,000 | 733,480 | ||||||
| Athenahealth, Inc.A |
7,977 | 838,941 | ||||||
| Fortinet, Inc.A |
22,500 | 677,700 | ||||||
| IHS Markit Ltd.A |
17,249 | 610,787 | ||||||
| MercadoLibre, Inc. |
8,750 | 1,366,225 | ||||||
|
|
|
|||||||
| 4,227,133 | ||||||||
|
|
|
|||||||
| IT Consulting & Services - 0.73% |
||||||||
| Fiserv, Inc.A |
5,600 | 595,168 | ||||||
|
|
|
|||||||
| Semiconductor Equipment & Products - 4.40% |
||||||||
| Lam Research Corp. |
6,868 | 726,154 | ||||||
| Microchip Technology, Inc. |
20,630 | 1,323,413 | ||||||
| NXP Semiconductors N.V.A |
5,650 | 553,757 | ||||||
| Xilinx, Inc. |
16,150 | 974,976 | ||||||
|
|
|
|||||||
| 3,578,300 | ||||||||
|
|
|
|||||||
| Software - 10.78% |
||||||||
| Ansys, Inc.A |
5,450 | 504,071 | ||||||
| Aspen Technology, Inc.A |
20,000 | 1,093,600 | ||||||
| Autodesk, Inc.A |
12,300 | 910,323 | ||||||
| Cadence Design Systems, Inc.A |
33,700 | 849,914 | ||||||
| Check Point Software Technologies Ltd.A |
5,150 | 434,969 | ||||||
| Electronic Arts, Inc.A |
12,350 | 972,686 | ||||||
| See accompanying notes
|
||||
| 14 |
American Beacon Stephens Mid-Cap Growth FundSM
Schedule of Investments
December 31, 2016
| Shares | Fair Value | |||||||
| INFORMATION TECHNOLOGY - 25.50% (continued) |
||||||||
| Software - 10.78% (continued) |
||||||||
| FireEye, Inc.A |
27,969 | $ | 332,831 | |||||
| National Instruments Corp. |
20,005 | 616,553 | ||||||
| Red Hat, Inc.A |
10,490 | 731,153 | ||||||
| Salesforce.com, Inc.A |
6,870 | 470,320 | ||||||
| Splunk, Inc.A |
9,900 | 506,385 | ||||||
| Tableau Software, Inc., Class AA |
8,800 | 370,920 | ||||||
| Ultimate Software Group, Inc.A |
5,350 | 975,573 | ||||||
|
|
|
|||||||
| 8,769,298 | ||||||||
|
|
|
|||||||
| Total Information Technology |
20,741,925 | |||||||
|
|
|
|||||||
| Total Common Stock (Cost $60,914,051) |
79,566,485 | |||||||
|
|
|
|||||||
| SHORT TERM INVESTMENTS - 2.15% (Cost $1,747,402) |
||||||||
| American Beacon U.S. Government Money Market Select Fund, Select ClassD |
1,747,402 | 1,747,402 | ||||||
|
|
|
|||||||
| SECURITIES LENDING COLLATERAL - 2.21% |
||||||||
| American Beacon U.S. Government Money Market Select Fund, Select Class D |
1,346,615 | 1,346,615 | ||||||
| DWS Government and Agency Securities Portfolio, Institutional Class |
448,871 | 448,871 | ||||||
|
|
|
|||||||
| Total Securities Lending Collateral (Cost $1,795,486) |
1,795,486 | |||||||
|
|
|
|||||||
| TOTAL INVESTMENTS - 102.21% (Cost $64,456,939) |
83,109,373 | |||||||
| LIABILITIES, NET OF OTHER ASSETS - (2.21%) |
(1,793,163 | ) | ||||||
|
|
|
|||||||
| TOTAL NET ASSETS - 100.00% |
$ | 81,316,210 | ||||||
|
|
|
|||||||
Percentages are stated as a percent of net assets.
| A | Non-income producing security. |
| B | All or a portion of this security is on loan at December 31, 2016. |
| C | PLC - Public Limited Company. |
| D | The Fund is affiliated by having the same investment advisor. |
| See accompanying notes
|
||||
| 15 |
American Beacon Stephens Small Cap Growth FundSM
Schedule of Investments
December 31, 2016
| Shares | Fair Value | |||||||
| COMMON STOCK - 97.84% |
||||||||
| CONSUMER DISCRETIONARY - 12.42% |
||||||||
| Auto Components - 0.53% |
||||||||
| Motorcar Parts of America, Inc.A |
117,130 | $ | 3,153,140 | |||||
|
|
|
|||||||
| Hotels, Restaurants & Leisure - 6.33% |
||||||||
| Buffalo Wild Wings, Inc.A |
34,324 | 5,299,626 | ||||||
| Chuy’s Holdings, Inc.A |
205,191 | 6,658,448 | ||||||
| National CineMedia, Inc., Acquired 12/21/2012 – 11/8/2016, Cost $9,683,241B |
606,144 | 8,928,501 | ||||||
| Papa John’s International, Inc. |
86,100 | 7,368,438 | ||||||
| Potbelly Corp.A |
220,271 | 2,841,496 | ||||||
| Wingstop, Inc.C |
209,597 | 6,201,975 | ||||||
|
|
|
|||||||
| 37,298,484 | ||||||||
|
|
|
|||||||
| Media - 1.46% |
||||||||
| IMAX Corp.A |
275,178 | 8,640,589 | ||||||
|
|
|
|||||||
| Multiline Retail - 0.89% |
||||||||
| Ollie’s Bargain Outlet Holdings, Inc.A |
185,100 | 5,266,095 | ||||||
|
|
|
|||||||
| Specialty Retail - 3.21% |
||||||||
| Aaron’s, Inc. |
139,100 | 4,449,809 | ||||||
| Boot Barn Holdings, Inc., Acquired 5/20/2016 – 12/29/2016, Cost $3,287,088A B C |
379,721 | 4,754,107 | ||||||
| Bright Horizons Family Solutions, Inc.A |
57,000 | 3,991,140 | ||||||
| Monro Muffler Brake, Inc. |
100,340 | 5,739,448 | ||||||
|
|
|
|||||||
| 18,934,504 | ||||||||
|
|
|
|||||||
| Total Consumer Discretionary |
73,292,812 | |||||||
|
|
|
|||||||
| CONSUMER STAPLES - 3.54% |
||||||||
| Beverages - 1.13% |
||||||||
| MGP Ingredients, Inc. |
133,248 | 6,659,735 | ||||||
|
|
|
|||||||
| Food Products - 2.41% |
||||||||
| Calavo Growers, Inc. |
122,142 | 7,499,519 | ||||||
| Inventure Foods, Inc., Acquired 9/12/2014 – 11/8/2016, Cost $3,079,918A B |
262,066 | 2,581,350 | ||||||
| TreeHouse Foods, Inc.A |
57,900 | 4,179,801 | ||||||
|
|
|
|||||||
| 14,260,670 | ||||||||
|
|
|
|||||||
| Total Consumer Staples |
20,920,405 | |||||||
|
|
|
|||||||
| ENERGY - 7.14% |
||||||||
| Energy Equipment & Services - 5.31% |
||||||||
| Core Laboratories N.V.C |
27,500 | 3,301,100 | ||||||
| Flotek Industries, Inc.A C |
333,823 | 3,134,598 | ||||||
| Forum Energy Technologies, Inc.A |
277,600 | 6,107,200 | ||||||
| Oceaneering International, Inc. |
129,600 | 3,656,016 | ||||||
| PDC Energy, Inc.A |
77,800 | 5,646,724 | ||||||
| RigNet, Inc., Acquired 5/9/2014 – 11/8/2016, Cost $6,207,294A B |
226,206 | 5,236,669 | ||||||
| RPC, Inc.C |
215,898 | 4,276,939 | ||||||
|
|
|
|||||||
| 31,359,246 | ||||||||
|
|
|
|||||||
| Oil & Gas - 1.83% |
||||||||
| Carrizo Oil & Gas, Inc.A. |
104,400 | 3,899,340 | ||||||
| Rice Energy, Inc.A |
322,600 | 6,887,510 | ||||||
|
|
|
|||||||
| 10,786,850 | ||||||||
|
|
|
|||||||
| Total Energy |
42,146,096 | |||||||
|
|
|
|||||||
| FINANCIALS - 6.32% |
||||||||
| Banks - 1.50% |
||||||||
| East West Bancorp, Inc. |
78,000 | 3,964,740 | ||||||
| See accompanying notes
|
||||
| 16 |
American Beacon Stephens Small Cap Growth FundSM
Schedule of Investments
December 31, 2016
| Shares | Fair Value | |||||||
| FINANCIALS - 6.32% (continued) |
||||||||
| Banks - 1.50% (continued) |
||||||||
| SVB Financial GroupA |
28,400 | $ | 4,875,144 | |||||
|
|
|
|||||||
| 8,839,884 | ||||||||
|
|
|
|||||||
| Diversified Financials - 2.57% |
||||||||
| Euronet Worldwide, Inc.A |
117,892 | 8,538,918 | ||||||
| MarketAxess Holdings, Inc. |
45,200 | 6,640,784 | ||||||
|
|
|
|||||||
| 15,179,702 | ||||||||
|
|
|
|||||||
| Insurance - 2.25% |
||||||||
| Hilltop Holdings, Inc. |
280,500 | 8,358,900 | ||||||
| WEX, Inc.A |
44,200 | 4,932,720 | ||||||
|
|
|
|||||||
| 13,291,620 | ||||||||
|
|
|
|||||||
| Total Financials |
37,311,206 | |||||||
|
|
|
|||||||
| HEALTH CARE - 20.69% |
||||||||
| Biotechnology - 2.59% |
||||||||
| MiMedx Group, Inc.A C |
417,480 | 3,698,873 | ||||||
| Neogen Corp.A |
122,450 | 8,081,700 | ||||||
| Repligen Corp.A |
114,079 | 3,515,915 | ||||||
|
|
|
|||||||
| 15,296,488 | ||||||||
|
|
|
|||||||
| Health Care Equipment & Supplies - 4.83% |
||||||||
| Abaxis, Inc. |
94,981 | 5,012,147 | ||||||
| ABIOMED, Inc.A |
49,500 | 5,577,660 | ||||||
| Bio-Techne Corp. |
32,800 | 3,372,824 | ||||||
| Medidata Solutions, Inc.A |
132,442 | 6,578,394 | ||||||
| NuVasive, Inc.A |
118,680 | 7,994,285 | ||||||
|
|
|
|||||||
| 28,535,310 | ||||||||
|
|
|
|||||||
| Health Care Providers & Services - 7.80% |
||||||||
| AAC Holdings, Inc.A C |
200,700 | 1,453,068 | ||||||
| Acadia Healthcare Co., Inc.A |
171,500 | 5,676,650 | ||||||
| HealthEquity, Inc.A |
208,472 | 8,447,285 | ||||||
| MAXIMUS, Inc. |
61,100 | 3,408,769 | ||||||
| Omnicell, Inc.A |
129,500 | 4,390,050 | ||||||
| PAREXEL International Corp.A |
146,900 | 9,654,268 | ||||||
| The Advisory Board Co.A |
171,925 | 5,716,506 | ||||||
| VCA Antech, Inc.A |
106,055 | 7,280,676 | ||||||
|
|
|
|||||||
| 46,027,272 | ||||||||
|
|
|
|||||||
| Pharmaceuticals - 5.47% |
||||||||
| Akorn, Inc.A |
219,000 | 4,780,770 | ||||||
| ICON PLCA D |
130,200 | 9,791,040 | ||||||
| Ligand Pharmaceuticals, Inc.C |
74,250 | 7,544,543 | ||||||
| Pacira Pharmaceuticals, Inc.A |
135,428 | 4,374,324 | ||||||
| Proto Labs, Inc.A |
112,505 | 5,777,132 | ||||||
|
|
|
|||||||
| 32,267,809 | ||||||||
|
|
|
|||||||
| Total Health Care |
122,126,879 | |||||||
|
|
|
|||||||
| INDUSTRIALS - 15.33% |
||||||||
| Aerospace & Defense - 3.36% |
||||||||
| Aerovironment, Inc.A |
133,328 | 3,577,190 | ||||||
| Astronics Corp. |
129,669 | 4,387,999 | ||||||
| HEICO Corp., Class A |
88,400 | 6,002,360 | ||||||
| Orbital ATK, Inc. |
66,200 | 5,807,726 | ||||||
|
|
|
|||||||
| 19,775,275 | ||||||||
|
|
|
|||||||
| Air Freight & Couriers - 1.40% |
||||||||
| Echo Global Logistics, Inc.A |
194,634 | 4,875,582 | ||||||
| See accompanying notes
|
||||
| 17 |
American Beacon Stephens Small Cap Growth FundSM
Schedule of Investments
December 31, 2016
| Shares | Fair Value | |||||||
| INDUSTRIALS - 15.33% (continued) |
||||||||
| Air Freight & Couriers - 1.40% (continued) |
||||||||
| HUB Group, Inc., Class AA |
78,100 | $ | 3,416,875 | |||||
|
|
|
|||||||
| 8,292,457 | ||||||||
|
|
|
|||||||
| Building Products - 1.19% |
||||||||
| Trex Co., Inc.A |
109,200 | 7,032,480 | ||||||
|
|
|
|||||||
| Commercial Services & Supplies - 5.16% |
||||||||
| CoStar Group, Inc.A |
42,901 | 8,086,409 | ||||||
| HMS Holdings Corp.A |
454,869 | 8,260,421 | ||||||
| SiteOne Landscape Supply, Inc.A |
89,652 | 3,113,614 | ||||||
| WageWorks, Inc.A |
150,242 | 10,892,545 | ||||||
|
|
|
|||||||
| 30,352,989 | ||||||||
|
|
|
|||||||
| Diversified Manufacturing - 0.41% |
||||||||
| Acuity Brands, Inc. |
10,600 | 2,447,116 | ||||||
|
|
|
|||||||
| Electrical Equipment - 1.48% |
||||||||
| Cognex Corp. |
137,600 | 8,754,112 | ||||||
|
|
|
|||||||
| Machinery - 1.56% |
||||||||
| Lindsay Corp.C |
40,200 | 2,999,322 | ||||||
| RBC Bearings, Inc. |
67,200 | 6,236,832 | ||||||
|
|
|
|||||||
| 9,236,154 | ||||||||
|
|
|
|||||||
| Trading Companies & Distributors - 0.77% |
||||||||
| MSC Industrial Direct Co., Inc., Class A |
49,445 | 4,568,224 | ||||||
|
|
|
|||||||
| Total Industrials |
90,458,807 | |||||||
|
|
|
|||||||
| INFORMATION TECHNOLOGY - 29.56% |
||||||||
| Electronic Equipment & Instruments - 1.53% |
||||||||
| CyberOptics Corp.A |
69,890 | 1,824,129 | ||||||
| FLIR Systems, Inc. |
104,400 | 3,778,236 | ||||||
| Taser International, Inc.A |
140,300 | 3,400,872 | ||||||
|
|
|
|||||||
| 9,003,237 | ||||||||
|
|
|
|||||||
| Internet Software & Services - 5.99% |
||||||||
| Athenahealth, Inc.A |
40,302 | 4,238,560 | ||||||
| Fortinet, Inc.A |
74,200 | 2,234,904 | ||||||
| HealthStream, Inc.A E |
185,414 | 4,644,621 | ||||||
| Mimecast Ltd.A |
171,845 | 3,076,026 | ||||||
| Proofpoint, Inc.A |
114,426 | 8,084,197 | ||||||
| Q2 Holdings, Inc.A |
144,300 | 4,163,055 | ||||||
| Shopify, Inc., Class AA |
97,900 | 4,196,973 | ||||||
| Stamps.com, Inc.C |
41,000 | 4,700,650 | ||||||
|
|
|
|||||||
| 35,338,986 | ||||||||
|
|
|
|||||||
| IT Consulting & Services - 2.46% |
||||||||
| Cardtronics PLCA D. |
141,653 | 7,730,004 | ||||||
| Tyler Technologies, Inc. |
47,484 | 6,779,291 | ||||||
|
|
|
|||||||
| 14,509,295 | ||||||||
|
|
|
|||||||
| Semiconductor Equipment & Products - 8.38% |
||||||||
| 8x8, Inc.A |
540,100 | 7,723,430 | ||||||
| Cavium, Inc.A |
90,500 | 5,650,820 | ||||||
| Integrated Device Technology, Inc.A |
182,300 | 4,294,988 | ||||||
| MACOM Technology Solutions Holdings, Inc.A |
81,200 | 3,757,936 | ||||||
| Microsemi Corp. |
193,130 | 10,423,226 | ||||||
| Power Integrations, Inc. |
108,200 | 7,341,370 | ||||||
| Rudolph Technologies, Inc.A |
192,700 | 4,499,545 | ||||||
| See accompanying notes
|
||||
| 18 |
American Beacon Stephens Small Cap Growth FundSM
Schedule of Investments
December 31, 2016
| Shares | Fair Value | |||||||
| INFORMATION TECHNOLOGY - 29.56% (continued) |
||||||||
| Semiconductor Equipment & Products - 8.38% (continued) |
||||||||
| Semtech Corp.A |
182,786 | $ | 5,766,898 | |||||
|
|
|
|||||||
| 49,458,213 | ||||||||
|
|
|
|||||||
| Software - 11.20% |
||||||||
| Aspen Technology, Inc.A |
142,348 | 7,783,589 | ||||||
| CyberArk Software Ltd.A |
102,200 | 4,650,100 | ||||||
| Envestnet, Inc.A |
219,709 | 7,744,742 | ||||||
| Globant S.A.A |
60,500 | 2,017,675 | ||||||
| Guidewire Software, Inc.A |
135,600 | 6,689,148 | ||||||
| Imperva, Inc.A |
76,100 | 2,922,240 | ||||||
| Manhattan Associates, Inc.A |
110,417 | 5,855,414 | ||||||
| National Instruments Corp. |
107,967 | 3,327,543 | ||||||
| PROS Holdings, Inc.A |
107,900 | 2,322,008 | ||||||
| Qualys, Inc.A |
172,500 | 5,459,625 | ||||||
| SPS Commerce, Inc.A |
94,318 | 6,591,885 | ||||||
| Take-Two Interactive Software, Inc. |
75,900 | 3,741,110 | ||||||
| Ultimate Software Group, Inc.A |
38,800 | 7,075,180 | ||||||
|
|
|
|||||||
| 66,180,259 | ||||||||
|
|
|
|||||||
| Total Information Technology |
174,489,990 | |||||||
|
|
|
|||||||
| MATERIALS - 2.84% |
||||||||
| Chemicals - 1.04% |
||||||||
| Balchem Corp. |
73,066 | 6,131,699 | ||||||
|
|
|
|||||||
| Construction Materials - 0.62% |
||||||||
| Forterra, Inc.A |
169,800 | 3,677,868 | ||||||
|
|
|
|||||||
| Metals & Mining - 1.18% |
||||||||
| Mueller Water Products, Inc., Class A |
521,200 | 6,937,172 | ||||||
|
|
|
|||||||
| Total Materials |
16,746,739 | |||||||
|
|
|
|||||||
| Total Common Stock (Cost $475,987,672) |
577,492,934 | |||||||
|
|
|
|||||||
| SHORT TERM INVESTMENTS - 4.78% (Cost $28,216,747) |
||||||||
| American Beacon U.S. Government Money Market Select Fund, Select ClassE |
28,216,747 | 28,216,747 | ||||||
|
|
|
|||||||
| SECURITIES LENDING COLLATERAL - 3.86% |
||||||||
| American Beacon U.S. Government Money Market Select Fund, Select ClassE |
17,065,741 | 17,065,741 | ||||||
| DWS Government and Agency Securities Portfolio, Institutional Class |
5,688,580 | 5,688,580 | ||||||
|
|
|
|||||||
| Total Securities Lending Collateral (Cost $22,754,321) |
22,754,321 | |||||||
|
|
|
|||||||
| TOTAL INVESTMENTS - 106.48% (Cost $526,958,740) |
628,464,002 | |||||||
| LIABILITIES, NET OF OTHER ASSETS - (6.48%) |
(38,252,873 | ) | ||||||
|
|
|
|||||||
| TOTAL NET ASSETS - 100.00% |
$ | 590,211,129 | ||||||
|
|
|
|||||||
| Percentages | are stated as a percent of net assets. |
| A | Non-income producing security. |
| B | Illiquid Security. At period end, the amount of illiquid securities was $21,500,627 or 3.64% of net assets. |
| C | All or a portion of this security is on loan at December 31, 2016. |
| D | PLC - Public Limited Company. |
| E | The Fund is affiliated by having the same investment advisor. |
| See accompanying notes
|
||||
| 19 |
American Beacon FundsSM
Statements of Assets and Liabilities
December 31, 2016
| Stephens Mid-Cap Growth Fund |
Stephens Small Cap Growth Fund |
|||||||
| Assets: |
||||||||
| Investments in unaffiliated securities, at fair value A C |
$ | 80,015,356 | $ | 583,181,514 | ||||
| Investments in affiliated securities, at fair value B |
3,094,017 | 45,282,488 | ||||||
| Dividends and interest receivable |
9,968 | 45,290 | ||||||
| Receivable for investments sold |
119,309 | — | ||||||
| Receivable for fund shares sold |
41,265 | 1,454,531 | ||||||
| Receivable for expense reimbursement (Note 2) |
9,836 | — | ||||||
| Prepaid expenses |
15,204 | 45,252 | ||||||
|
|
|
|
|
|||||
| Total assets |
83,304,955 | 630,009,075 | ||||||
|
|
|
|
|
|||||
| Liabilities: |
||||||||
| Payable for investments purchased |
67,077 | 15,962,420 | ||||||
| Payable for fund shares redeemed |
14,873 | 490,242 | ||||||
| Payable upon return of securities loaned |
1,795,486 | 22,754,321 | ||||||
| Management and investment advisory fees payable |
55,814 | 486,096 | ||||||
| Administrative service and service fees payable |
10,067 | 9,591 | ||||||
| Transfer agent fees payable |
4,499 | 21,381 | ||||||
| Custody and fund accounting fees payable |
2,617 | 10,566 | ||||||
| Professional fees payable |
33,866 | 37,445 | ||||||
| Trustee fees payable |
581 | 55 | ||||||
| Payable for prospectus and shareholder reports |
2,712 | 15,230 | ||||||
| Other liabilities |
1,153 | 10,599 | ||||||
|
|
|
|
|
|||||
| Total liabilities |
1,988,745 | 39,797,946 | ||||||
|
|
|
|
|
|||||
| Net Assets |
$ | 81,316,210 | $ | 590,211,129 | ||||
|
|
|
|
|
|||||
| Analysis of Net Assets: |
||||||||
|
Paid-in-capital |
$ | 64,126,096 | $ | 496,803,949 | ||||
| Accumulated net realized (loss) |
(1,462,320 | ) | (8,098,082 | ) | ||||
| Unrealized appreciation of investments |
18,652,434 | 101,505,262 | ||||||
|
|
|
|
|
|||||
| Net assets |
$81,316,210 | $590,211,129 | ||||||
|
|
|
|
|
|||||
| Shares outstanding at no par value (unlimited shares authorized): |
||||||||
| Institutional Class |
2,757,847 | 27,365,997 | ||||||
|
|
|
|
|
|||||
| Y Class |
137,788 | 4,949,079 | ||||||
|
|
|
|
|
|||||
| Investor Class |
829,247 | 3,271,551 | ||||||
|
|
|
|
|
|||||
| A Class |
883,090 | 458,916 | ||||||
|
|
|
|
|
|||||
| C Class |
92,154 | 87,066 | ||||||
|
|
|
|
|
|||||
| Net assets: |
||||||||
| Institutional Class |
$ | 50,451,447 | $ | 450,286,537 | ||||
|
|
|
|
|
|||||
| Y Class |
$ | 2,510,649 | $ | 81,069,652 | ||||
|
|
|
|
|
|||||
| Investor Class |
$ | 13,078,292 | $ | 50,544,287 | ||||
|
|
|
|
|
|||||
| A Class |
$ | 13,886,296 | $ | 7,029,682 | ||||
|
|
|
|
|
|||||
| C Class |
$ | 1,389,526 | $ | 1,280,971 | ||||
|
|
|
|
|
|||||
| Net asset value, offering and redemption price per share: |
||||||||
| Institutional Class |
$ | 18.29 | $ | 16.45 | ||||
|
|
|
|
|
|||||
| Y Class |
$ | 18.22 | $ | 16.38 | ||||
|
|
|
|
|
|||||
| Investor Class |
$ | 15.77 | $ | 15.45 | ||||
|
|
|
|
|
|||||
| A Class |
$ | 15.72 | $ | 15.32 | ||||
|
|
|
|
|
|||||
| A Class (offering price) |
$ | 16.68 | $ | 16.25 | ||||
|
|
|
|
|
|||||
| C Class |
$ | 15.08 | $ | 14.71 | ||||
|
|
|
|
|
|||||
| A Cost of investments in unaffiliated securities |
$ | 61,362,922 | $ | 481,676,252 | ||||
| B Cost of investments in affiliated securities |
$ | 3,094,017 | $ | 45,282,488 | ||||
| C Fair value of securities on loan |
$ | 1,758,789 | $ | 22,211,407 | ||||
| See accompanying notes
|
||||
| 20 |
American Beacon FundsSM
Statements of Operations
For the year ended December 31, 2016
| Stephens Mid-Cap Growth Fund |
Stephens Small Cap Growth Fund |
|||||||
| Investment income: |
||||||||
| Dividend income from unaffiliated securities (net of foreign taxes) A |
$ | 381,623 | $ | 1,177,815 | ||||
| Dividend income from affiliated securities |
2,880 | 24,127 | ||||||
| Income derived from securities lending |
44,190 | 528,365 | ||||||
|
|
|
|
|
|||||
| Total investment income |
428,693 | 1,730,307 | ||||||
|
|
|
|
|
|||||
| Expenses: |
||||||||
| Management and investment advisory fees (Note 2) |
639,335 | 4,565,749 | ||||||
| Administrative service fees (Note 2): |
||||||||
| Institutional Class |
70,543 | 405,899 | ||||||
| Y Class |
2,484 | 174,805 | ||||||
| Investor Class |
15,257 | 63,787 | ||||||
| A Class |
15,332 | 8,704 | ||||||
| C Class |
1,970 | 2,189 | ||||||
| Transfer agent fees: |
||||||||
| Institutional Class |
35,994 | 167,618 | ||||||
| Y Class |
83 | 5,359 | ||||||
| Investor Class |
2,586 | 4,585 | ||||||
| A Class |
1,226 | 581 | ||||||
| C Class |
222 | 150 | ||||||
| Custody and fund accounting fees |
13,836 | 46,568 | ||||||
| Professional fees |
35,364 | 51,618 | ||||||
| Registration fees and expenses |
71,613 | 144,329 | ||||||
| Service fees (Note 2): |
||||||||
| Y Class |
2,104 | 140,516 | ||||||
| Investor Class |
45,677 | 144,947 | ||||||
| A Class |
20,193 | 10,482 | ||||||
| C Class |
2,385 | 2,385 | ||||||
| Distribution fees (Note 2): |
||||||||
| A Class |
33,655 | 17,469 | ||||||
| C Class |
15,900 | 15,901 | ||||||
| Prospectus and shareholder report expenses |
7,139 | 35,683 | ||||||
| Trustee fees |
6,075 | 35,228 | ||||||
| Other expenses |
13,817 | 37,079 | ||||||
|
|
|
|
|
|||||
| Total expenses |
1,052,790 | 6,081,631 | ||||||
|
|
|
|
|
|||||
| Net fees waived and expenses reimbursed (Note 2) |
(54,783 | ) | — | |||||
|
|
|
|
|
|||||
| Net expenses |
998,007 | 6,081,631 | ||||||
|
|
|
|
|
|||||
| Net investment (loss) |
(569,314 | ) | (4,351,324 | ) | ||||
|
|
|
|
|
|||||
| Realized and unrealized gain (loss) from investments: |
||||||||
| Net realized (loss) from: |
||||||||
| Investments |
(1,032,123 | ) | (4,569,025 | ) | ||||
| Change in net unrealized appreciation (depreciation) of: |
||||||||
| Investments |
5,243,617 | 67,768,829 | ||||||
|
|
|
|
|
|||||
| Net gain from investments |
4,211,494 | 63,199,804 | ||||||
|
|
|
|
|
|||||
| Net increase in net assets resulting from operations |
$ | 3,642,180 | $ | 58,848,480 | ||||
|
|
|
|
|
|||||
| A Foreign taxes |
$ | 2,801 | $ | 9,367 | ||||
See accompanying notes
21
American Beacon FundsSM
Statements of Changes in Net Assets
| Stephens Mid-Cap Growth Fund | Stephens Small Cap Growth Fund | |||||||||||||||
| Year Ended December 31, 2016 |
Year Ended December 31, 2015 |
Year Ended December 31, 2016 |
Year Ended December 31, 2015 |
|||||||||||||
| Increase (Decrease) in Net Assets: |
||||||||||||||||
| Operations: |
||||||||||||||||
| Net investment (loss) |
$ | (569,314 | ) | $ | (841,052 | ) | $ | ( 4,351,324 | ) | $ | (4,765,426 | ) | ||||
| Net realized gain (loss) from investments |
(1,032,123 | ) | 8,947,108 | (4,569,025 | ) | 27,104,161 | ||||||||||
| Change in net unrealized appreciation (depreciation) from investments |
5,243,617 | (9,577,800 | ) | 67,768,829 | (48,148,316 | ) | ||||||||||
|
|
|
|
|
|
|
|
|
|||||||||
| Net increase (decrease) in net assets resulting from operations |
3,642,180 | (1,471,744 | ) | 58,848,480 | (25,809,581 | ) | ||||||||||
|
|
|
|
|
|
|
|
|
|||||||||
| Distribution to Shareholders |
||||||||||||||||
| Net realized gain from investments: |
||||||||||||||||
| Institutional Class |
(2,746,156 | ) | (3,679,297 | ) | (3,634,109 | ) | (13,631,411 | ) | ||||||||
| Y Class |
(101,600 | ) | (120,136 | ) | (676,175 | ) | (6,447,037 | ) | ||||||||
| Investor Class |
(825,119 | ) | (794,980 | ) | (440,539 | ) | (2,688,330 | ) | ||||||||
| A Class |
(878,585 | ) | (831,603 | ) | (61,811 | ) | (396,897 | ) | ||||||||
| C Class |
(90,663 | ) | (114,160 | ) | (11,705 | ) | (113,204 | ) | ||||||||
|
|
|
|
|
|
|
|
|
|||||||||
| Net distributions to shareholders |
(4,642,123 | ) | (5,540,176 | ) | (4,824,339 | ) | (23,276,879 | ) | ||||||||
|
|
|
|
|
|
|
|
|
|||||||||
| Capital Share Transactions: |
||||||||||||||||
| Proceeds from sales of shares |
23,413,554 | 24,623,153 | 351,061,950 | 96,070,205 | ||||||||||||
| Reinvestment of dividends and distributions |
4,535,561 | 5,393,253 | 4,720,165 | 22,808,654 | ||||||||||||
| Cost of shares redeemed |
(55,624,853 | ) | (41,701,499 | ) | (329,962,031 | ) | (250,985,106 | ) | ||||||||
|
|
|
|
|
|
|
|
|
|||||||||
| Net increase (decrease) in net assets from capital share transactions |
(27,675,738 | ) | (11,685,093 | ) | 25,820,084 | (132,106,247 | ) | |||||||||
|
|
|
|
|
|
|
|
|
|||||||||
| Net increase (decrease) in net assets |
(28,675,681 | ) | (18,697,013 | ) | 79,844,225 | (181,192,707 | ) | |||||||||
|
|
|
|
|
|
|
|
|
|||||||||
| Net Assets: |
||||||||||||||||
| Beginning of period |
109,991,891 | 128,688,904 | 510,366,904 | 691,559,611 | ||||||||||||
|
|
|
|
|
|
|
|
|
|||||||||
| End of Period |
$ | 81,316,210 | $ | 109,991,891 | $ | 590,211,129 | $ | 510,366,904 | ||||||||
|
|
|
|
|
|
|
|
|
|||||||||
See accompanying notes
22
American Beacon FundsSM
December 31, 2016
1. Organization
American Beacon Funds (the “Trust”), is organized as a Massachusetts business trust and is registered under the Investment Company Act of 1940, as amended (the “Act”), as a diversified, open-end management investment company. As of December 31, 2016, the Trust consists of twenty-six active series, two of which are presented in this filing (collectively, the “Funds” and each individually a “Fund”): the American Beacon Stephens Mid-Cap Growth Fund and American Beacon Stephens Small Cap Growth Fund. The remaining twenty-four active series are reported in separate filings.
American Beacon Advisors, Inc. (the “Manager”) is a wholly-owned subsidiary of Astro AB Borrower, Inc., which is indirectly owned by investment funds affiliated with Kelso & Company, L.P. and Estancia Capital
Management, LLC, and was organized in 1986 to provide business management, advisory, administrative and asset management consulting services to the Trust and other investors.
Class Disclosure
The Funds have multiple classes of shares designed to meet the needs of different groups of investors. The following table sets forth the differences amongst the classes:
| Class |
Eligible Investors |
Minimum Initial Investments |
||||
| Institutional |
Large institutional investors - sold directly or through intermediary channels. | $ | 250,000 | |||
| Y Class |
Large institutional retirement plan investors - sold directly or through intermediary channels. | $ | 100,000 | |||
| Investor |
All investors using intermediary organizations such as broker-dealers or retirement plan sponsors - sold directly through intermediary channels. | $ | 2,500 | |||
| A Class |
All investors who invest through intermediary organizations, such as broker- dealers or third party administrator. Retail investors who invest directly through a financial intermediary such as a broker, bank, or registered investment advisor, which may include a front-end sales charge and a contingent deferred sales charge (“CDSC”). | $ | 2,500 | |||
| C Class |
Retail investors who invest directly through a financial intermediary such as a broker or employee directed benefit plans with applicable sales charges, which may include CDSC. | $ | 1,000 | |||
Each class offered by the Trust has equal rights as to assets and voting privileges. Income and non-class specific expenses are allocated daily to each class on the basis of the relative net assets. Realized and unrealized capital gains and losses of each class are allocated daily based on the relative net assets of each class of the respective Fund. Class specific expenses, where applicable, currently include administrative service fees, service fees, and distribution fees and vary amongst the classes as described more fully in Note 2.
The following is a summary of significant accounting policies, consistently followed by the Funds in preparation of the financial statements. The Funds are considered investment companies and accordingly, follow the investment company accounting and reporting guidance of the Financial Accounting Standards Board Accounting Standard Codification Topic 946, Financial Services - Investment Companies, which is part of U.S. Generally Accepted Accounting Principles (“U.S. GAAP”).
Security Transactions and Investment Income
Security transactions are recorded on the trade date of the security purchase or sale. The Funds may purchase securities with delivery or payment to occur at a later date. At the time the Funds enter into a commitment to purchase a security, the transaction is recorded, and the value of the security is reflected in the net asset value (“NAV”). The value of the security may vary with market fluctuations.
Dividend income, net of foreign taxes, is recorded on the ex-dividend date, except certain dividends from foreign securities which are recorded as soon as the information is available to the Funds. Interest income is earned from settlement date, recorded on the accrual basis, and adjusted, if necessary, for accretion of discounts and amortization of premiums. For financial and tax reporting purposes, realized gains and losses are determined on the basis of specific lot identification.
23
American Beacon FundsSM
Notes to Financial Statements
December 31, 2016
Dividends to Shareholders
Dividends from net investment income of the Funds normally will be declared and paid at least annually. Distributions, if any, of net realized capital gains are generally paid at least annually and recorded on the ex-dividend date. Dividends to shareholders are determined in accordance with federal income tax regulations, which may differ in amount and character from net investment income and realized gains recognized for purposes of U.S. GAAP. To the extent necessary to fully distribute capital gains, the Funds also designates earnings and profits distributed to shareholders on the redemption of shares.
Allocation of Income, Expenses, Gains, and Losses
Income, expenses (other than those attributable to a specific class), gains, and losses are allocated daily to each class of shares based upon the relative proportion of net assets represented by such class. Operating expenses directly attributable to a specific class are charged against the operations of that class.
Use of Estimates
The preparation of financial statements in conformity with U.S. GAAP requires management to make estimates and assumptions that affect the amounts reported in the financial statements and accompanying notes.
Actual results may differ from those estimated.
Other
Under the Trust’s organizational documents, its officers and trustees are indemnified against certain liability arising out of the performance of their duties to the Trust. In the normal course of business, the Trust enters into contracts that provide indemnification to the other party or parties against potential costs or liabilities. The Trust’s maximum exposure under these arrangements is dependent on claims that may be made in the future and, therefore, cannot be estimated. The Trust has had no prior claims or losses pursuant to any such agreement.
2. Transactions with Affiliates
Management Agreement
From January 1, 2016 to May 29, 2016, the Trust and the Manager were parties to a Management Agreement that obligated the Manager to provide or oversee the provision of all investment advisory, Funds management, and securities lending services. As compensation for performing the duties required under the Management Agreement, the Manager received from the Funds an annualized fee equal to 0.05% of the average daily net assets. Effective May 29, 2016, the Funds and the Manager entered a Management Agreement that obligates the Manager to provide investment advisory, Funds management, and administrative services to the Funds. As compensation for performing the duties under the Management Agreement, the Manager receives from the Funds an annualized fee at the following annual rates as a percentage of average daily net assets: 0.35% of the first $5 billion, 0.325% of the next $5 billion, 0.30% of the next $10 billion, and 0.275% over $20 billion. The Funds also pay the unaffiliated investment advisors hired to direct investment activities of the Funds an annualized investment advisory fee based on a percentage of the Funds’ average daily assets. Management fees paid by the Funds during the year ended December 31, 2016 were as follows:
| Fund |
Management Fee Rate |
Management Fee |
Amounts paid to Investment Advisors |
Amounts Paid to Manager |
||||||||||||
| Stephens Mid-Cap Growth |
0.84 | % | $ | 639,335 | $ | 434,569 | $ | 204,766 | ||||||||
| Stephens Small Cap Growth |
0.98 | % | 4,565,749 | 3,294,653 | 1,271,096 | |||||||||||
As compensation for services provided by the Manager in connection with securities lending activities conducted by the Funds, the lending Fund pays to the Manager, with respect to cash collateral posted by borrowers,
24
American Beacon FundsSM
Notes to Financial Statements
December 31, 2016
a fee up to 10% of the net monthly interest income (the gross income earned by the investment of cash collateral, less the amount paid to borrowers and related expenses) from such activities and, with respect to loan fees paid by borrowers, a fee up to 10% of such loan fees. Currently, the Manager receives 10% of such income. This fee is included in “Management and investment advisory fees” on the Statements of Operations. During the year ended December 31, 2016, securities lending fees paid to the Manager were $4,807 and $53,612 for the Stephens Mid-Cap Growth and the Stephens Small Cap Growth Funds, respectively.
Administration Agreement
From January 1, 2016 to May 29, 2016, the Manager and the Trust were parties to an Administrative Agreement which obligated the Manager to provide or oversee administrative services to the Funds. As compensation for performing the duties required under the Administrative Agreement, the Manager received an annualized fee of 0.30% of the average daily net assets of the Institutional, Y, Investor, A, and C Classes of the Funds.
Distribution Plans
The Funds, except for the A and C Classes, have adopted a “defensive” Distribution Plan (the “Plan”) in accordance with Rule 12b-1 under the Act, pursuant to which no separate fees will be charged to the Funds for distribution purposes. However, the Plan authorizes the management and administrative service fees received by the Manager and the investment advisors hired by the Manager to be used for distribution purposes. Under this Plan, the Funds do not intend to separately compensate the Manager or any other party, either directly or indirectly, for the distribution of Fund shares.
Separate Distribution Plans (the “Distribution Plans”) have been adopted pursuant to Rule 12b-1 under the Act for the A and C Classes of the Funds. Under the Distribution Plans, as compensation for distribution assistance, the Manager receives an annual fee of 0.25% of the average daily net assets of the A Class and 1.00% of the average daily net assets of the C Class. The fee will be payable without regard to whether the amount of the fee is more or less than the actual expenses incurred in a particular month by the Manager for distribution assistance.
Service Plans
The Manager and the Trust entered into Service Plans that obligate the Manager to oversee additional shareholder servicing of the Y, Investor, A, and C Classes of the Funds. As compensation for performing the duties required under the Service Plans, the Manager receives an annualized fee of 0.10% of the average daily net assets of the Y Class, 0.15% of the average daily net assets of the A and C Classes, and up to 0.375% of the average daily net assets of the Investor Class of the Funds.
Sub-Transfer Agent Fees
The Manager has entered into agreements, which include servicing agreements, with financial intermediaries that provide recordkeeping, processing, shareholder communications and other services to customers of the intermediaries that hold positions in the Institutional Class of the Funds and has agreed to compensate the intermediaries for providing these services. Intermediaries transact with the Funds primarily through the use of omnibus accounts on behalf of its customers who hold positions in the Funds. Certain services would have been provided by the Funds’ transfer agent and other service providers if the shareholders’ accounts were maintained directly by the Funds’ transfer agent. Accordingly, the Funds, pursuant to the Trust’s Board of Trustees (the “Board”) approval, have agreed to reimburse the Manager for all or a portion of the servicing fees paid to these intermediaries for the Institutional Class. The reimbursement amounts (sub-transfer agent fees) paid to the Manager are subject to a fee limit of up to 0.10% of an intermediaries average net assets in the Institutional Class on an annual basis. For the year ended December 31, 2016, the sub-transfer agent fees, as included in “Transfer agent fees” in the Statements of Operations, were as follows:
25
American Beacon FundsSM
Notes to Financial Statements
December 31, 2016
| Fund |
Sub-Transfer Agent Fees | |||
| Stephens Mid-Cap Growth Fund |
$ | 33,185 | ||
| Stephens Small Cap Growth Fund |
154,757 | |||
As of December 31, 2016, the Fund owes the Manager the following reimbursement of sub-transfer agent fees, as included in “Transfer agent fees payable” in the Statements of Assets and Liabilities.
| Fund |
Reimbursement of Sub-Transfer Agent Fees |
|||
| Stephens Mid-Cap Growth Fund |
$ | 3,370 | ||
| Stephens Small Cap Growth Fund |
17,386 | |||
Investment in Affiliated Funds
The Funds may invest in the American Beacon U.S. Government Money Market Select Fund (the “USG Select Fund”). The Funds and the USG Select Fund have the same investment advisor and therefore, are considered to be affiliated. The Manager serves as investment advisor to the USG Select Fund and receives management and administration fees totaling 0.10% of its average daily net assets of the USG Select Fund. During the year ended December 31, 2016, the Manager earned fees from the Stephens Mid-Cap Growth Fund and Stephens Small Cap Growth Fund totaling $1,332 and $10,235, respectively, from direct investment in the USG Select fund and $3,443 and $28,806, respectively, from the securities lending collateral invested in the USG Select Fund.
Interfund Lending Program
Pursuant to an exemptive order issued by the Securities and Exchange Commission (“SEC”), the Funds, along with other registered investment companies having management contracts with the Manager, may participate in an interfund lending program. This program provides an alternative credit facility allowing the Funds to borrow from other participating Funds. During the year ended December 31, 2016, the Stephens Mid-Cap Growth Fund borrowed on average $ 2,038,164 for 32 days at 0.98% with interest charges of $1,735 and the Stephens Small Cap Growth Fund borrowed on average $7,487,229 for 4 days at 0.98% with interest charges of $825. These amounts are recorded as “Other expenses” in the Statements of Operations.
Expense Reimbursement Plan
The Manager contractually agreed to reimburse the Funds to the extent that total annual fund operating expenses exceeded the Funds’ expense caps. For the year ended December 31, 2016, the Manager waived or reimbursed expenses as follows:
| Expense Cap | ||||||||||||||||||
| Fund |
Class | 1/1/16 To 4/30/16 |
5/1/16 To 12/31/16 |
Reimbursed Expenses |
(Recovered) Expenses |
Expiration | ||||||||||||
| Stephens Mid-Cap Growth |
Institutional | 0.99% | 0.99% | $ | 54,089 | — | 2019 | |||||||||||
| Stephens Mid-Cap Growth |
A | N/A | N/A | 610 | — | 2019 | ||||||||||||
| Stephens Mid-Cap Growth |
C | N/A | N/A | 84 | — | 2019 | ||||||||||||
Of these amounts, $9,836 is disclosed as a receivable from the Manager for the Stephens Mid-Cap Growth Fund at December 31, 2016. The Funds have adopted an Expense Reimbursement Plan whereby the Manager may seek repayment of fees waived or expenses reimbursed for a period of up to three years. However, reimbursement will occur only if the Class’ average net assets have grown or expenses have declined sufficiently to allow reimbursement without causing its expense ratio to exceed the previously agreed upon contractual expense limit.
26
American Beacon FundsSM
Notes to Financial Statements
December 31, 2016
The reimbursed expenses listed above will expire in 2019. The Funds did not record a liability for potential reimbursements due to the current assessment that reimbursements are unlikely.
The carryover of excess expenses potentially reimbursable to the Manager are as follows:
| Fund |
Recovered Expenses |
Excess Expense Carryover |
Expired Expense Carryover |
Expiration of Reimbursed Expenses |
||||||||||||
| Stephens Mid-Cap Growth |
$ | — | $ | 38,647 | $ | 60,289 | 2017 | |||||||||
Sales Commissions
The Funds’ distributor, Foreside Fund Services, LLC (“Foreside”), may receive a portion of A Class sales charges from broker dealers and it may be used to offset distribution related expenses. During the year ended December 31, 2016, Foreside collected $671 and $479 for Stephens Mid-Cap Growth and Stephens Small Cap Growth Funds, respectively, from the sale of Class A Shares.
A CDSC of 0.50% will be deducted with respect to Class A Shares on certain purchases of $1,000,000 or more that are redeemed in whole or part within 18 months of purchase, unless waived as discussed in the Funds’ Prospectus. Any applicable CDSC will be 0.50% of the lesser of the original purchase price or the value of the redemption of the Class A Shares redeemed. During the year ended December 31, 2016, there were no CDSC fees for Class A Shares collected for the Funds.
A CDSC of 1.00% will be deducted with respect to Class C Shares redeemed within 12 months of purchase, unless waived as discussed in the Funds’ Prospectus. Any applicable CDSC will be 1.00% of the lesser of the original purchase price or the value of the redemption of the Class C Shares redeemed. During the year ended December 31, 2016, CDSC fees of $936 and $30 were collected for Class C Shares of the Stephens Mid-Cap Growth and
Stephens Small Cap Growth Funds, respectively.
Trustee Fees and Expenses
As compensation for their service to the Trust and the American Beacon Select Funds Trust, each Trustee receives an annual retainer of $120,000, plus $5,000 for each Board meeting attended in person or via teleconference, $2,500 for attendance by Committee members at meetings of the Audit Committee and the Investment Committee, and $1,500 for attendance by Committee members at meetings of the Nominating and Governance Committee, plus reimbursement of reasonable expenses incurred in attending Board meetings, Committee meetings, and relevant educational seminars. The Trustees also may be compensated for attendance at special Board and/or Committee meetings from time to time. The Board Chairman receives an additional annual retainer of $50,000 as well as a single $5,000 fee each quarter for his attendance at the committee meetings. The chairpersons of the Audit Committee and the Investment Committee each receive an additional annual retainer of $25,000 and the Chairman of the Nominating and Governance Committee receives an additional annual retainer of $10,000. These expenses are allocated on a prorated basis to each Fund of the Trust according to its respective net assets.
3. Security Valuation and Fair Value Measurements
Investments are valued at the close of the New York Stock Exchange (the “Exchange”), normally at 4:00 p.m. Eastern Time, each day that the Exchange is open for business. Equity securities, including exchange-traded funds (“ETFs”) for which market quotations are available are valued at the last sale price or official closing price (closing bid price or last evaluated quote if no sale has occurred) on the primary market or exchange on which they trade.
Investments in open-end mutual funds are valued at the closing net asset value NAV per share of the mutual fund on the day of valuation.
27
American Beacon FundsSM
Notes to Financial Statements
December 31, 2016
Securities for which market prices are not readily available or are not reflective of the fair value of the security, as determined by the Manager, will be priced at fair value following procedures approved by the Board.
Other investments, including restricted securities, and those financial instruments for which the above valuation procedures are inappropriate or are deemed not to reflect fair value are stated at fair value as determined in good faith by the Valuation Committee, established by the Board.
Valuation Inputs
| Level 1 - |
Quoted prices in active markets for identical securities. | |
| Level 2 - |
Prices determined using other significant observable inputs. These may include quoted prices for similar securities, interest rates, prepayment speeds, credit risk, and others. Fixed-income securities are considered Level 2 as they are valued using observable inputs. | |
| Level 3 - |
Prices determined using other significant unobservable inputs. Unobservable inputs reflect the Fund’s own assumptions about the factors market participants would use in pricing an investment. | |
Level 1 and Level 2 trading assets and trading liabilities, at fair value
Common stocks and financial derivative instruments, such as futures contracts that are traded on a national securities exchange, are stated at the last reported sale or settlement price on the day of valuation. To the extent these securities are actively traded and valuation adjustments are not applied, they are categorized as Level 1 of the fair value hierarchy. Preferred securities and other equities traded on inactive markets or valued by reference to similar instruments are also categorized as Level 2 of the fair value hierarchy.
Investments in registered open-end investment management companies will be valued based upon the NAVs of such investments and are categorized as Level 1 of the fair value hierarchy.
The Funds’ investments are summarized by level based on the inputs used to determine their values. As of December 31, 2016, the investments were classified as described below:
| Stephens Mid-Cap Growth Fund(1) |
Level 1 | Level 2 | Level 3 | Total | ||||||||||||
| Common Stock |
$ | 79,566,485 | $ | — | $ | — | $ | 79,566,485 | ||||||||
| Short-Term Investments - Money Market Funds |
1,747,402 | — | — | 1,747,402 | ||||||||||||
| Securities Lending Collateral Invested in Money Markets Funds |
1,795,486 | — | — | 1,795,486 | ||||||||||||
|
|
|
|
|
|
|
|
|
|||||||||
| Total Investments in Securities |
$ | 83,109,373 | $ | — | $ | — | $ | 83,109,373 | ||||||||
|
|
|
|
|
|
|
|
|
|||||||||
| Stephens Small Cap Growth Fund(1) |
Level 1 | Level 2 | Level 3 | Total | ||||||||||||
| Common Stock |
$ | 577,492,934 | $ | — | $ | — | $ | 577,492,934 | ||||||||
| Short-Term Investments - Money Market Funds |
28,216,747 | — | — | 28,216,747 | ||||||||||||
| Securities Lending Collateral Invested in Money Markets Funds |
22,754,321 | — | — | 22,754,321 | ||||||||||||
|
|
|
|
|
|
|
|
|
|||||||||
| Total Investments in Securities |
$ | 628,464,002 | $ | — | $ | — | $ | 628,464,002 | ||||||||
|
|
|
|
|
|
|
|
|
|||||||||
| (1) | Refer to the Schedule of Investments for industry information. |
U.S. GAAP requires all transfers between any levels to be disclosed. The end of period timing recognition has been adopted for the transfers between levels the Funds’ assets and liabilities. During the year ended December 31, 2016, there were no transfers between levels.
28
American Beacon FundsSM
Notes to Financial Statements
December 31, 2016
4. Securities and Other Investments
American Depositary Receipts (“ADRs”)
ADRs are depositary receipts for foreign issuers in registered form traded in U.S. securities markets. Depositary receipts may not be denominated in the same currency as the securities into which they may be converted. Investing in depositary receipts entails substantially the same risks as direct investment in foreign securities. There is generally less publicly available information about foreign companies and there may be less governmental regulation and supervision of foreign stock exchanges, brokers and listed companies. In addition, such companies may use different accounting and financial standards (and certain currencies may become unavailable for transfer from a foreign currency), resulting in the Funds’ possible inability to convert immediately into U.S. currency proceeds realized upon the sale of portfolio securities of the affected foreign companies. In addition, the Funds may invest in unsponsored depositary receipts, the issuers of which are not obligated to disclose material information about the underlying securities to investors in the United States. Ownership of unsponsored depositary receipts may not entitle the Funds to the same benefits and rights as ownership of a sponsored depositary receipt or the underlying security.
Real Estate Investment Trusts
The Funds may own shares of real estate investment trusts (“REITs”) which report information on the source of their distributions annually. The Funds re-characterize distributions received from REIT investments based on information provided by the REITs into the following categories: ordinary income, long-term capital gains, and return of capital. If information is not available on a timely basis from the REITs, the re-characterization will be estimated based on available information which may include the previous year allocation. If new or additional information becomes available from the REITs at a later date, a re-characterization will be made the following year.
Other Investment Company Securities and Other Exchange Traded Products
The Funds may invest in shares of other investment companies, including open-end funds, closed-end funds, business development companies, ETFs, unit investment trusts, and other investment companies of the Trust. The Funds may invest in investment company securities advised by the Manager or a sub-advisor. Investments in the securities of other investment companies may involve duplication of advisory fees and certain other expenses. By investing in another investment company, the Funds become a shareholder of that investment company. As a result, the Funds’ shareholders indirectly will bear a Fund’s proportionate share of the fees and expenses paid by shareholders of the other investment company, in addition to the fees and expenses the Funds’ shareholders directly bear in connection with the Funds’ own operations. These other fees and expenses are reflected as Acquired Fund Fees and Expenses and are included in the Fees and Expenses Table for the Fund in its Prospectus, if applicable. Investments in other investment companies may involve the payment of substantial premiums above the value of such issuer’s portfolio securities.
Illiquid and Restricted Securities
The Funds may invest in securities that are subject to legal or contractual restrictions on resale. These securities may be sold privately, but are required to be registered or exempted from such registration before being sold to the public. Private placement securities are generally considered to be restricted except for those securities traded between qualified institutional investors under the provisions of Rule 144A of the Securities Act of 1933 (the “Securities Act”). Illiquid securities have included securities that have not been registered under the Securities Act, securities that are otherwise not readily marketable, and repurchase agreements having a remaining maturity of longer than seven calendar days. Disposal of both illiquid and restricted securities may involve time-consuming negotiations and expenses, and prompt sale at an acceptable price may be difficult to
29
American Beacon FundsSM
Notes to Financial Statements
December 31, 2016
achieve. Illiquid and restricted securities outstanding at the period ended December 31, 2016 are disclosed in the Notes to the Schedules of Investments.
5. Principal Risks
Investing in the Fund may involve certain risks including, but not limited to, those described below.
Equity Investment Risk
Equity securities are subject to market risk. The Funds’ investments in equity securities may include common stocks, preferred stocks, securities convertible into or exchangeable for common stocks, REITs, depositary receipts, and U.S. dollar-denominated foreign stocks traded on U.S. exchanges. Such investments may expose the Funds to additional risk. The value of a company’s common stock may fall as a result of factors affecting the company, companies in the same industry or sector, or the financial markets overall. Common stock generally is subordinate to preferred stock upon the liquidation or bankruptcy of the issuing company. Preferred stocks and convertible securities are sensitive to movements in interest rates. Preferred stocks may be less liquid than common stocks and, unlike common stocks, participation in the growth of an issuer may be limited. Distributions on preferred stocks generally are payable at the discretion of an issuer and after required payments to bond holders. Convertible securities are subject to the risk that the credit standing of the issuer may have an effect on the convertible securities’ investment value. Investments in REITs are subject to the risks associated with investing in the real estate industry such as adverse developments affecting the real estate industry and real property values. Depositary receipts and U.S. dollar-denominated foreign stocks traded on U.S. exchanges are subject to certain of the risks associated with investing directly in foreign securities, including, but not limited to, currency fluctuations and political and financial instability in the home country of a particular depositary receipt or foreign stock.
Foreign Investing Risk
Non U.S. investments carry potential risks not associated with U.S. investments. Such risks include, but are not limited to: (1) currency exchange rate fluctuations,(2) political and financial instability, (3) less liquidity and greater volatility, (4) lack of uniform accounting, auditing and financial reporting standards; (5) increased price volatility; (6) less government regulation and supervision of foreign stock exchanges, brokers and listed companies; and (7) delays in transaction settlement in some foreign markets.
Growth Companies Risk
Growth companies are expected to increase their earnings at a certain rate. When these expectations are not met, the prices of these stocks may go down, even if earnings showed an absolute increase. Growth company stocks may lack the dividend yield that can cushion stock prices in market downturns.
Investment Risk
An investment in the Funds is not a deposit with a bank and is not insured or guaranteed by the Federal Deposit Insurance Corporation or any other government agency. When you sell your shares of the Funds, they could be worth less than what you paid for them. Therefore, you may lose money by investing in the Funds.
Issuer Risk
The value of, and/or the return generated by, a security may decline for a number of reasons which directly relate to the issuer, such as management performance, financial leverage and reduced demand for the issuer’s goods or services, as well as the historical and prospective earnings of the issuer and the value of its assets.
30
American Beacon FundsSM
Notes to Financial Statements
December 31, 2016
Market Risk
Since the financial crisis that started in 2008, the U.S. and many foreign economies continue to experience its after-effects, which have resulted, and may continue to result, in an unusually high degree of volatility in the financial markets, both domestic and foreign. In addition, global economies and financial markets are becoming increasingly interconnected, which increases the possibilities that conditions in one country or region might adversely impact issuers in a different country or region. The severity or duration of adverse economic conditions may also be affected by policy changes made by governments or quasi-governmental organizations. In addition, political events within the U.S. and abroad may affect investor and consumer confidence and may adversely impact financial markets and the broader economy, perhaps suddenly and to a significant degree. High public debt in the U.S. and other countries creates ongoing systemic and market risks and policymaking uncertainty. Because the impact on the markets has been widespread, it may be difficult to identify both risks and opportunities using past models of the interplay of market forces, or to predict the duration of these market conditions. Interest rates have been unusually low in recent years in the U.S. and abroad. Because there is little precedent for this situation, it is difficult to predict the impact of a rate increase on various markets. In addition, there is a risk that the prices of goods and services in the U.S. and many foreign economies may decline over time, known as deflation (the opposite of inflation). Deflation may have an adverse effect on stock prices and creditworthiness and may make defaults on debt more likely.
Mid-Capitalization Companies Risk
Investing in the securities of medium capitalization companies involves greater risk and the possibility of greater price volatility than investing in larger capitalization companies and more established companies. These companies may also have more limited operating history, product lines, and financial resources, the securities of these companies may lack sufficient market liquidity, and can be sensitive to expected changes in interest rates, borrowing costs and earnings.
Small Capitalization Companies Risk
Investing in the securities of small capitalization companies involves greater risk and the possibility of greater price volatility than investing in larger capitalization and more established companies. Since smaller companies may have limited operating history, product lines, and financial resources, the securities of these companies may lack sufficient market liquidity, and they can be particularly sensitive to expected changes in interest rates, borrowing costs and earnings.
Other Investment Companies Risk
The Funds may invest in shares of other registered investment companies, including money market funds. To the extent that the Funds invest in shares of other registered investment companies, the Funds will indirectly bear the fees and expenses charged by the underlying funds in addition to the Funds’ direct fees and expenses and will be subject to the risks associated with investments in those funds. For example, money market funds are subject to interest rate risk, credit risk, and market risk.
Sector Risk
Sector risk is the risk associated with the Funds holding a significant amount of investments in similar businesses, which could be affected by the same economic or market conditions.
Securities Lending Risk
To the extent the Funds lend its securities, it may be subject to the following risks. Borrowers of the Funds’ securities typically provide collateral in the form of cash that is reinvested in securities. The securities in which
31
American Beacon FundsSM
Notes to Financial Statements
December 31, 2016
the collateral is invested may not perform sufficiently to cover the return collateral payments owed to borrowers. In addition, delays may occur in the recovery of securities from borrowers, which could interfere with the Funds’ ability to vote proxies or to settle transactions.
Securities Selection Risk
Securities selected by the sub-advisor or the Manager for the Funds may not perform to expectations. This could result in the Funds’ underperformance compared to other funds with similar investment objectives.
Offsetting Assets and Liabilities
The Funds are parties to enforceable master netting agreements between brokers and counterparties, which provides for the right to offset under certain circumstances. The Funds employ multiple money managers and counterparties and have elected not to offset qualifying financial and derivative instruments on the Statements of Assets and Liabilities, as such all financial and derivative instruments are presented on a gross basis. The impacts of netting arrangements that provide the right to offset are detailed below. The net amount represents the net receivable or payable that would be due from or to the counterparty in the event of default. Exposure from borrowings and other financing agreements can only be netted across transactions governed by the same Master
Agreement with the same legal entity. All amounts reported below represent the balance as of December 31, 2016.
Stephens Mid-Cap Growth Fund
Offsetting of Financial Assets and Derivative Assets as of December 31, 2016:
| Description |
Gross Amounts of Recognized Assets |
Gross Amounts Offset in the Statements of Assets and Liabilities |
Net Amounts of Assets Presented in the Statements of Assets and Liabilities |
|||||||
| Securities on Loan |
$ | 1,758,789 | $ – | $ | 1,758,789 | |||||
Financial Assets, Derivative Assets, and Collateral Pledged by Counterparty as of December 31, 2016:
|
Gross Amounts Not Offset in the Statements of Assets and Liabilities |
||||||||||||||||
| Counterparty |
Net Amount of Assets Presented in the Statements of Assets and Liabilities |
Financial Instruments |
Cash Collateral Received(1) |
Net Amount | ||||||||||||
| Goldman Sachs & Co |
$ | 877,091 | $ | — | $ | (877,091 | ) | $ | — | |||||||
| MS Securities Services Inc |
444,316 | — | (444,316 | ) | — | |||||||||||
| National Financial Services Corp (NFS) |
29,490 | — | (29,490 | ) | — | |||||||||||
| UBS Securities LLC |
407,892 | — | (407,892 | ) | — | |||||||||||
|
|
|
|
|
|
|
|
|
|||||||||
| $ | 1,758,789 | $ | — | $ | (1,758,789 | ) | $ | — | ||||||||
|
|
|
|
|
|
|
|||||||||||
| (1) | Excess of collateral received from the individual counterparty is not shown for financial reporting purposes. Collateral with a value of $1,795,486 has been received in connection with securities lending transactions. |
Stephens Small Cap Growth Fund
Offsetting of Financial Assets and Derivative Assets as of December 31, 2016:
| Net Amounts of Assets | ||||||||||||
| Gross Amounts Offset | Presented in the | |||||||||||
| Gross Amounts of | in the Statements of | Statements of Assets | ||||||||||
| Description |
Recognized Assets | Assets and Liabilities | and Liabilities | |||||||||
| Securities on Loan |
$ | 22,211,407 | $ | — | $ | 22,211,407 | ||||||
32
American Beacon FundsSM
Notes to Financial Statements
December 31, 2016
Financial Assets, Derivative Assets, and Collateral Pledged by Counterparty as of December 31, 2016:
| Gross Amounts Not Offset in the | ||||||||||||||||
| Statements of Assets and Liabilities | ||||||||||||||||
| Counterparty |
Net Amount of Assets Presented in the Statements of Assets and Liabilities |
Financial Instruments |
Cash Collateral Received(1) |
Net Amount | ||||||||||||
| Barclays Capital, Inc. |
$ | 3,896,731 | $ | — | $ | (3,896,731 | ) | $ | — | |||||||
| Citigroup Global Markets, Inc. |
398,019 | — | (398,019 | ) | — | |||||||||||
| Goldman Sachs & Co. |
195,306 | — | (195,306 | ) | — | |||||||||||
| JPMorgan Securities LLC |
6,745,895 | — | (6,745,895 | ) | — | |||||||||||
| Merrill Lynch, Pierce, Fenner |
438,418 | — | (438,418 | ) | — | |||||||||||
| MS Securities Services Inc. |
5,443,311 | — | (5,443,311 | ) | — | |||||||||||
| National Financial Services Corp (NFS) |
3,143,199 | — | (3,143,199 | ) | — | |||||||||||
| Scotia Capital USA Inc. |
1,950,528 | — | (1,950,528 | ) | — | |||||||||||
|
|
|
|
|
|
|
|
|
|||||||||
| $ | 22,211,407 | $ | — | $ | (22,211,407 | ) | $ | — | ||||||||
|
|
|
|
|
|
|
|
|
|||||||||
| (1) | Excess of collateral received from the individual counterparty is not shown for financial reporting purposes. Collateral with a value of $22,754,321 has been received in connection with securities lending transactions. |
6. Federal Income and Excise Taxes
It is the policy of each Fund to qualify as a regulated investment company (“RIC”), by complying with all applicable provisions of Subchapter M of the Internal Revenue Code, as amended, and to make distribution of taxable income sufficient to relieve it from substantially all federal income and excise taxes. For federal income tax purposes, each Fund is treated as a single entity for the purpose of determining such qualification.
The Funds do not have any unrecognized tax benefits in the accompanying financial statements. Each of the tax years in the four year period ended December 31, 2016 remain subject to examination by the Internal Revenue Service. If applicable, the Funds recognize interest accrued related to unrecognized tax benefits in interest expense and penalties in “Other expenses” in the Statements of Operations.
The Funds may be subject to taxes imposed by countries in which it invests. Such taxes are generally based on returns of income earned or gains realized or repatriated. Taxes are accrued and applied to net investment income, net realized capital gains and net unrealized appreciation or depreciation, as applicable, as the income is earned or capital gains are recorded.
Dividends are categorized in accordance with income tax regulations which may treat certain transactions differently than U.S. GAAP. Accordingly, the character of distributions and composition of net assets for tax purposes may differ from those reflected in the accompanying financial statements. The Funds also utilize earnings and profits distributed to shareholders on redemptions of shares as part of the dividends paid deduction.
33
American Beacon FundsSM
Notes to Financial Statements
December 31, 2016
The tax character of distributions paid are as follows:
| Stephens Mid-Cap Growth Fund | Stephens Small Cap Growth Fund | |||||||||||||||||||||||||||||||
| Year Ended | Year Ended | Year Ended | Year Ended | |||||||||||||||||||||||||||||
| December 31, | December 31, | December 31, | December 31, | |||||||||||||||||||||||||||||
| Distributions paid from: | 2016 | 2015 | 2016 | 2015 | ||||||||||||||||||||||||||||
| Ordinary Income* |
||||||||||||||||||||||||||||||||
| Institutional Class |
$ | — | $ | — | $ | — | $ | — | ||||||||||||||||||||||||
| Y Class |
— | — | — | — | ||||||||||||||||||||||||||||
| Investor Class |
— | — | — | — | ||||||||||||||||||||||||||||
| A Class |
— | — | — | — | ||||||||||||||||||||||||||||
| C Class |
— | — | — | — | ||||||||||||||||||||||||||||
| Long-term capital gains |
||||||||||||||||||||||||||||||||
| Institutional Class |
$ | 2,746,156 | $ | 3,679,297 | $ | 3,634,109 | $ | 13,631,411 | ||||||||||||||||||||||||
| Y Class |
101,600 | 120,136 | 676,175 | 6,447,037 | ||||||||||||||||||||||||||||
| Investor Class |
825,119 | 794,980 | 440,539 | 2,688,330 | ||||||||||||||||||||||||||||
| A Class |
878,585 | 831,603 | 61,811 | 396,897 | ||||||||||||||||||||||||||||
| C Class |
90,663 | 114,160 | 11,705 | 113,204 | ||||||||||||||||||||||||||||
|
|
|
|
|
|
|
|
|
|||||||||||||||||||||||||
| Total distributions paid |
$ | 4,642,123 | $ | 5,540,176 | $ | 4,824,339 | $ | 23,276,879 | ||||||||||||||||||||||||
|
|
|
|
|
|
|
|
|
|||||||||||||||||||||||||
| * | For tax purposes, short-term capital gains are considered ordinary income distributions. |
As of December 31, 2016, the components of distributable earnings (deficits) on a tax basis are as follows:
| Stephens Mid-Cap | Stephens Small Cap | |||||||
| Growth Fund | Growth Fund | |||||||
| Cost basis of investments for federal income tax purposes |
$ | 66,049,449 | $ | 532,409,558 | ||||
| Unrealized appreciation |
21,346,136 | 118,290,608 | ||||||
| Unrealized depreciation |
(4,286,212 | ) | (22,236,164 | ) | ||||
|
|
|
|
|
|||||
| Net unrealized appreciation |
17,059,924 | 96,054,444 | ||||||
|
|
|
|
|
|||||
| Undistributed ordinary income |
— | — | ||||||
| Undistributed long-term capital gains |
130,190 | — | ||||||
| Accumulated capital and other losses |
— | (2,647,264 | ) | |||||
| Other temporary differences |
— | — | ||||||
|
|
|
|
|
|||||
| Distributable earnings |
$ | 17,190,114 | $ | 93,407,180 | ||||
|
|
|
|
|
|||||
Financial reporting records are adjusted for permanent book/tax differences to reflect tax character. Financial records are not adjusted for temporary differences. The temporary differences between financial reporting and tax-basis reporting of unrealized appreciation or (depreciation) are attributable primarily to the tax deferral of losses from wash sales.
Due to inherent differences in the recognition of income, expenses and realized gains or (losses) under U.S. GAAP and federal income tax regulations, permanent differences between book and tax reporting have been identified and appropriately reclassified in the Statements of Assets and Liabilities.
Accordingly, the following amounts represent current year permanent differences derived from net operating losses used to offset short-term capital gains and non-utilization of net operating losses as of December 31, 2016:
| Stephens Mid-Cap | Stephens Small Cap | |||||||
| Growth Fund | Growth Fund | |||||||
|
Paid-in-capital |
$ | (569,314 | ) | $ | (4,035,705 | ) | ||
| Undistributed (overdistribution of) net investment income |
569,314 | 4,351,324 | ||||||
| Accumulated net realized gain (loss) |
— | (315,618 | ) | |||||
| Unrealized appreciation (depreciation) of investments in futures contracts |
— | (1 | ) | |||||
34
American Beacon FundsSM
Notes to Financial Statements
December 31, 2016
Under the Regulated Investment Company Modernization Act of 2010 (the “RICMOD”), net capital losses recognized by the Fund in taxable years beginning after December 22, 2010 are carried forward indefinitely and retain their character as short-term and/or long-term losses. For the year ended December 31, 2016, the Stephens Small Cap Growth Fund has a $2,647,264 long-term capital loss carryforward. The Stephens Mid-Cap Growth Fund did not have capital loss carryforward.
7. Investment Transactions
The aggregate cost of purchases and proceeds from sales and maturities of long-term investments, excluding short-term obligations, for the year ended December 31, 2016 are as follows:
| Stephens Mid-Cap | Stephens Small Cap | |||||||
| Growth Fund | Growth Fund | |||||||
| Purchases (excluding U.S. government securities) |
$ | 18,887,140 | $ | 219,596,639 | ||||
| Sales and Maturities (excluding U.S. government securities) |
53,768,402 | 211,910,780 | ||||||
A summary of the Funds’ transactions in the USG Select Fund for the year ended December 31, 2016 are as follows:
| Type | December 31, | December 31, | ||||||||||||||||||||
| of | 2015 Shares/ | 2016 Shares/ | Dividend | |||||||||||||||||||
| Fund |
Transaction |
Fair Value | Purchases | Sales | Fair Value | Income | ||||||||||||||||
| Stephens Mid-Cap Growth |
Direct |
$ | — | $ | 24,109,699 | $ | 22,362,297 | $ | 1,747,402 | $ | 2,880 | |||||||||||
| Stephens Mid-Cap Growth |
Securities Lending |
3,611,273 | 43,143,362 | 45,408,020 | 1,346,615 | — | ||||||||||||||||
| Stephens Small Cap Growth |
Direct |
— | 138,570,728 | 110,353,981 | 28,216,747 | 24,127 | ||||||||||||||||
| Stephens Small Cap Growth |
Securities Lending |
33,025,680 | 174,120,699 | 190,080,638 | 17,065,741 | — | ||||||||||||||||
8. Securities Lending
The Funds may lend their securities to qualified financial institutions, such as certain broker-dealers, to earn additional income. The borrowers are required to secure their loans continuously with collateral in an amount at least equal to the fair value of the securities loaned, initially in an amount at least equal to 102% of the fair value of domestic securities loaned and 105% of the fair value of international securities loaned. Collateral is monitored and marked-to-market daily. Daily mark-to-market amounts are required to be paid to the borrower or received from the borrower by the end of the following business day. This one day settlement for mark-to-market amounts may result in the collateral being temporarily less than the value of the securities on loan or temporarily more than the required minimum collateral.
To the extent that a loan is collateralized by cash, such cash collateral shall be invested by the securities lending agent (the “Agent”) in money market mutual funds and other short-term investments as designated by the
Manager.
Securities lending income is generated from the demand premium (if any) paid by the borrower to borrow a specific security and from the return on investment of cash collateral, reduced by negotiated rebate fees paid to the borrower and transaction costs. To the extent that a loan is secured by non-cash collateral, securities lending income is generated as a demand premium reduced by transaction costs. The Funds, the Agent, and the Manager retain 80%, 10%, and 10%, respectively, of the income generated from securities lending.
While securities are on loan, the Funds continue to receive certain income associated with that security and any gain or loss in the market price that may occur during the term of the loan. In the case of domestic equities, the value of any dividend is received in the form of a substitute payment approximately equal to the dividend. In the case of foreign securities, a negotiated amount is received that is less than the actual dividend, but higher than the dividend amount minus the foreign tax that the Funds would be subject to on the dividend.
35
American Beacon FundsSM
Notes to Financial Statements
December 31, 2016
Securities lending transactions pose certain risks to the Funds, including that the borrower may not provide additional collateral when required or return the securities when due, that the value of the short-term investments will be less than the amount of cash collateral required to be returned to the borrower, that non-cash collateral may be subject to legal constraints in the event of a borrower bankruptcy, and that the cash collateral investments could become illiquid and unable to be used to return collateral to the borrower. The Funds could also experience delays and costs in gaining access to the collateral. The Funds bear the risk of any deficiency in the amount of the cash collateral available for return to the borrower and any action which impairs its ability to liquidate non-cash collateral to satisfy a borrower default.
As of December 31, 2016, the value of outstanding securities on loan and the value of collateral are as follows:
| Fund |
Fair Value of Securities on Loan |
Non-Cash Collateral | Cash Collateral Posted by Borrower |
|||||||||
| Stephens Mid- Cap Growth |
$ | 1,758,789 | $ | — | $ | 1,795,486 | ||||||
| Stephens Small Cap Growth |
22,211,407 | — | 22,754,321 | |||||||||
Cash collateral is listed on the Funds’ Schedules of Investments and is shown on the Statements of Assets and Liabilities. Income earned on these investments is included in “Income derived from securities lending” on the Statements of Operations.
Non-cash collateral received by the Funds may not be sold or re-pledged except to satisfy a borrower default. Therefore, non-cash collateral is not included on the Funds’ Schedules of Investments or Statements of Assets and Liabilities.
9. Capital Share Transactions
The tables below summarize the activity in capital shares for each Class of the Funds:
| Institutional Class | ||||||||||||||||
| Year Ended December 31, | ||||||||||||||||
| 2016 | 2015 | |||||||||||||||
| Stephens Mid-Cap Growth Fund |
Shares | Amount | Shares | Amount | ||||||||||||
| Shares sold |
1,177,720 | $ | 20,399,984 | 918,814 | $ | 18,186,826 | ||||||||||
| Reinvestment of dividends |
146,529 | 2,693,187 | 202,650 | 3,649,732 | ||||||||||||
| Shares redeemed |
(2,800,521 | ) | (48,457,431 | ) | (1,440,779 | ) | (28,147,690 | ) | ||||||||
|
|
|
|
|
|
|
|
|
|||||||||
| Net (decrease) in shares outstanding |
(1,476,272 | ) | $ | (25,364,260 | ) | (319,315 | ) | $ | (6,311,132 | ) | ||||||
|
|
|
|
|
|
|
|
|
|||||||||
| Y Class | ||||||||||||||||
| Year Ended December 31, | ||||||||||||||||
| 2016 | 2015 | |||||||||||||||
| Stephens Mid-Cap Growth Fund |
Shares | Amount | Shares | Amount | ||||||||||||
| Shares sold |
44,603 | $ | 820,474 | 32,288 | $ | 653,657 | ||||||||||
| Reinvestment of dividends |
5,101 | 93,381 | 6,327 | 113,702 | ||||||||||||
| Shares redeemed |
(49,219 | ) | (887,718 | ) | (63,117 | ) | (1,224,770 | ) | ||||||||
|
|
|
|
|
|
|
|
|
|||||||||
| Net increase (decrease) in shares outstanding |
485 | $ | 26,137 | (24,502 | ) | $ | (457,411 | ) | ||||||||
|
|
|
|
|
|
|
|
|
|||||||||
| Investor Class | ||||||||||||||||
| Year Ended December 31, | ||||||||||||||||
| 2016 | 2015 | |||||||||||||||
| Stephens Mid-Cap Growth Fund |
Shares | Amount | Shares | Amount | ||||||||||||
| Shares sold |
10,957 | $ | 170,834 | 29,361 | $ | 511,993 | ||||||||||
| Reinvestment of dividends |
50,612 | 802,201 | 49,457 | 777,457 | ||||||||||||
| Shares redeemed |
(169,686 | ) | (2,603,913 | ) | (293,423 | ) | (5,070,683 | ) | ||||||||
|
|
|
|
|
|
|
|
|
|||||||||
| Net (decrease) in shares outstanding |
(108,117 | ) | $ | (1,630,878 | ) | (214,605 | ) | $ | (3,781,233 | ) | ||||||
|
|
|
|
|
|
|
|
|
|||||||||
36
American Beacon FundsSM
Notes to Financial Statements
December 31, 2016
| A Class | ||||||||||||||||
| Year Ended December 31, | ||||||||||||||||
| 2016 | 2015 | |||||||||||||||
| Stephens Mid-Cap Growth Fund |
Shares | Amount | Shares | Amount | ||||||||||||
| Shares sold |
122,839 | $ | 1,906,539 | 266,811 | $ | 4,586,897 | ||||||||||
| Reinvestment of dividends |
54,477 | 860,740 | 47,518 | 745,555 | ||||||||||||
| Shares redeemed |
(176,308 | ) | (2,782,925 | ) | (406,576 | ) | (6,870,575 | ) | ||||||||
|
|
|
|
|
|
|
|
|
|||||||||
| Net increase (decrease) in shares outstanding |
1,008 | $ | (15,646 | ) | (92,247 | ) | $ | (1,538,123 | ) | |||||||
|
|
|
|
|
|
|
|
|
|||||||||
| C Class | ||||||||||||||||
| Year Ended December 31, | ||||||||||||||||
| 2016 | 2015 | |||||||||||||||
| Stephens Mid-Cap Growth Fund |
Shares | Amount | Shares | Amount | ||||||||||||
| Shares sold |
7,487 | $ | 115,723 | 40,352 | $ | 683,780 | ||||||||||
| Reinvestment of dividends |
5,675 | 86,052 | 7,027 | 106,807 | ||||||||||||
| Shares redeemed |
(60,007 | ) | (892,866 | ) | (23,171 | ) | (387,781 | ) | ||||||||
|
|
|
|
|
|
|
|
|
|||||||||
| Net increase (decrease) in shares outstanding |
(46,845 | ) | $ | (691,091 | ) | 24,208 | $ | 402,806 | ||||||||
|
|
|
|
|
|
|
|
|
|||||||||
| Institutional Class | ||||||||||||||||
| Year Ended December 31, | ||||||||||||||||
| 2016 | 2015 | |||||||||||||||
| Stephens Small Cap Growth Fund |
Shares | Amount | Shares | Amount | ||||||||||||
| Shares sold |
14,462,163 | $ | 223,106,635 | 3,368,811 | $ | 56,084,205 | ||||||||||
| Reinvestment of dividends |
215,695 | 3,556,821 | 886,567 | 13,333,970 | ||||||||||||
| Shares redeemed |
(7,271,033 | ) | (109,035,001 | ) | (6,013,468 | ) | (100,387,108 | ) | ||||||||
|
|
|
|
|
|
|
|
|
|||||||||
| Net increase (decrease) in shares outstanding |
7,406,825 | $ | 117,628,455 | (1,758,090 | ) | $ | (30,968,933 | ) | ||||||||
|
|
|
|
|
|
|
|
|
|||||||||
| Y Class | ||||||||||||||||
| Year Ended December 31, | ||||||||||||||||
| 2016 | 2015 | |||||||||||||||
| Stephens Small Cap Growth Fund |
Shares | Amount | Shares | Amount | ||||||||||||
| Shares sold |
7,449,981 | $ | 116,530,831 | 1,840,734 | $ | 30,029,312 | ||||||||||
| Reinvestment of dividends |
39,938 | 655,773 | 420,222 | 6,299,125 | ||||||||||||
| Shares redeemed |
(12,060,037 | ) | (196,540,679 | ) | (3,131,916 | ) | (51,053,314 | ) | ||||||||
|
|
|
|
|
|
|
|
|
|||||||||
| Net (decrease) in shares outstanding |
(4,570,118 | ) | $ | (79,354,075 | ) | (870,960 | ) | $ | (14,724,877 | ) | ||||||
|
|
|
|
|
|
|
|
|
|||||||||
| Investor Class | ||||||||||||||||
| Year Ended December 31, | ||||||||||||||||
| 2016 | 2015 | |||||||||||||||
| Stephens Small Cap Growth Fund |
Shares | Amount | Shares | Amount | ||||||||||||
| Shares sold |
791,664 | $ | 10,678,980 | 529,600 | $ | 8,402,434 | ||||||||||
| Reinvestment of dividends |
28,155 | 435,840 | 189,089 | 2,679,388 | ||||||||||||
| Shares redeemed |
(1,486,689 | ) | (20,770,152 | ) | (6,152,840 | ) | (96,717,419 | ) | ||||||||
|
|
|
|
|
|
|
|
|
|||||||||
| Net (decrease) in shares outstanding |
(666,870 | ) | $ | (9,655,332 | ) | (5,434,151 | ) | $ | (85,635,597 | ) | ||||||
|
|
|
|
|
|
|
|
|
|||||||||
| A Class | ||||||||||||||||
| Year Ended December 31, | ||||||||||||||||
| 2016 | 2015 | |||||||||||||||
| Stephens Small Cap Growth Fund |
Shares | Amount | Shares | Amount | ||||||||||||
| Shares sold |
46,390 | $ | 691,272 | 86,944 | $ | 1,393,326 | ||||||||||
| Reinvestment of dividends |
3,955 | 60,700 | 27,554 | 387,689 | ||||||||||||
| Shares redeemed |
(172,992 | ) | (2,427,677 | ) | (156,316 | ) | (2,401,602 | ) | ||||||||
|
|
|
|
|
|
|
|
|
|||||||||
| Net (decrease) in shares outstanding |
(122,647 | ) | $ | (1,675,705 | ) | (41,818 | ) | $ | (620,587 | ) | ||||||
|
|
|
|
|
|
|
|
|
|||||||||
| C Class | ||||||||||||||||
| Year Ended December 31, | ||||||||||||||||
| 2016 | 2015 | |||||||||||||||
| Stephens Small Cap Growth Fund |
Shares | Amount | Shares | Amount | ||||||||||||
| Shares sold |
4,104 | $ | 54,232 | 10,903 | $ | 160,928 | ||||||||||
| Reinvestment of dividends |
747 | 11,031 | 7,959 | 108,482 | ||||||||||||
| Shares redeemed |
(89,847 | ) | (1,188,522 | ) | (28,414 | ) | (425,663 | ) | ||||||||
|
|
|
|
|
|
|
|
|
|||||||||
| Net (decrease) in shares outstanding |
(84,996 | ) | $ | (1,123,259 | ) | (9,552 | ) | $ | (156,253 | ) | ||||||
|
|
|
|
|
|
|
|
|
|||||||||
37
American Beacon FundsSM
Notes to Financial Statements
December 31, 2016
10. Subsequent Events
On November 4, 2016, the Board appointed State Street Bank and Trust (“State Street”) as the securities lending agent for the Trust. The Trust is currently transitioning its securities lending arrangement away from Brown Brothers Harriman & Co. (“Brown Brothers”), the Trust’s former securities lending agent, to State Street. During this period of transition there may be loans that remain outstanding with Brown Brothers.
38
American Beacon Stephens Mid-Cap Growth FundSM
(For a share outstanding throughout the period)
| Institutional Class | ||||||||||||||||||||||||
| Year Ended December 31, | One Month Ended December 31, |
Year Ended November 30, |
||||||||||||||||||||||
| 2016 | 2015 | 2014 | 2013 | 2012 | 2012 | |||||||||||||||||||
| Net asset value, beginning of period |
$ | 18.11 | $ | 19.24 | $ | 19.76 | $ | 15.38 | $ | 15.24 | $ | 13.69 | ||||||||||||
|
|
|
|
|
|
|
|
|
|
|
|
|
|||||||||||||
| Income (loss) from investment operations: |
||||||||||||||||||||||||
| Net investment income (loss) |
(0.26 | ) | (0.13 | ) | (0.04 | ) | (0.05 | ) | 0.02 | — | D | |||||||||||||
| Net gains (losses) from investments (both realized and unrealized) |
1.49 | (0.11 | ) | 0.72 | 5.12 | 0.20 | 1.55 | |||||||||||||||||
| Total income (loss) from investment operations |
||||||||||||||||||||||||
|
|
|
|
|
|
|
|
|
|
|
|
|
|||||||||||||
| 1.23 | (0.24 | ) | 0.68 | 5.07 | 0.22 | 1.55 | ||||||||||||||||||
|
|
|
|
|
|
|
|
|
|
|
|
|
|||||||||||||
| Less distributions: |
||||||||||||||||||||||||
| Dividends from net investment income |
— | — | — | (0.01 | ) | — | — | |||||||||||||||||
| Distributions from net realized gains |
(1.05 | ) | (0.89 | ) | (1.20 | ) | (0.66 | ) | (0.08 | ) | — | |||||||||||||
| Distributions from return of capitalE |
— | — | — | (0.02 | ) | — | — | |||||||||||||||||
|
|
|
|
|
|
|
|
|
|
|
|
|
|||||||||||||
| Total distributions |
(1.05 | ) | (0.89 | ) | (1.20 | ) | (0.69 | ) | (0.08 | ) | — | |||||||||||||
|
|
|
|
|
|
|
|
|
|
|
|
|
|||||||||||||
| Net asset value, end of period |
$ | 18.29 | $ | 18.11 | $ | 19.24 | $ | 19.76 | $ | 15.38 | $ | 15.24 | ||||||||||||
|
|
|
|
|
|
|
|
|
|
|
|
|
|||||||||||||
| Total return A |
6.76 | % | (1.23 | )% | 3.41 | % | 33.14 | % | 1.43 | %B | 11.32 | % | ||||||||||||
|
|
|
|
|
|
|
|
|
|
|
|
|
|||||||||||||
| Ratios and supplemental data: |
||||||||||||||||||||||||
| Net assets, end of period |
$ | 50,451,447 | $ | 76,666,136 | $ | 87,620,400 | $ | 63,235,775 | $ | 31,005,183 | $ | 30,503,408 | ||||||||||||
| Ratios to average net assets: |
||||||||||||||||||||||||
| Expenses, before reimbursements or recoupmentsC |
1.09 | % | 1.01 | % | 1.05 | % | 1.12 | % | 1.31 | %D | 1.28 | % | ||||||||||||
| Expenses, net of reimbursements or recoupmentsC |
1.00 | % | 0.99 | % | 1.00 | % | 0.99 | % | 0.99 | %D | 1.03 | % | ||||||||||||
| Net investment income (loss), before reimbursements or recoupments |
(0.60 | )% | (0.54 | )% | (0.53 | )% | (0.70 | )% | 1.37 | %D | (0.62 | )% | ||||||||||||
| Net investment income (loss), net of reimbursements or recoupments |
(0.51 | )% | (0.53 | )% | (0.48 | )% | (0.58 | )% | 1.69 | %D | (0.37 | )% | ||||||||||||
| Portfolio turnover rate |
22 | % | 19 | % | 37 | % | 25 | % | 1 | % B | 27 | % | ||||||||||||
| A | Based on net asset value, which does not reflect the sales charge, redemption fee, or contingent deferred sales charge, if applicable. May include adjustments in accordance with U.S. GAAP and as such, the net asset value for reporting purposes and the returns based upon those net asset values may differ from the net asset value and returns for shareholder transactions. |
| B | Not annualized. |
| C | Expense ratios may exceed stated expense caps in Note 2 due in part to security lending expenses. |
| D | For purposes of this calculation, the change in undistributed net investment income per share was derived by dividing the change in undistributed net investment income by average shares outstanding for the period. |
| E | The distributions from return of capital is calculated based on outstanding shares at the time of distribution. |
39
American Beacon Stephens Mid-Cap Growth FundSM
Financial Highlights
(For a share outstanding throughout the period)
| Y Class | ||||||||||||||||||||||||
| Year Ended December 31, | Six Months December 31, |
February 24A to November 30, |
||||||||||||||||||||||
| 2016 | 2015 | 2014 | 2013 | 2012 | 2012 | |||||||||||||||||||
| Net asset value, beginning of period |
$ | 18.06 | $ | 19.22 | $ | 19.76 | $ | 15.38 | $ | 15.23 | $ | 15.09 | ||||||||||||
|
|
|
|
|
|
|
|
|
|
|
|
|
|||||||||||||
| Income (loss) from investment operations: |
||||||||||||||||||||||||
| Net investment income (loss) |
(0.10 | ) | (0.15 | ) | (0.06 | ) | (0.08 | ) | 0.02 | (0.03 | ) | |||||||||||||
| Net gains (losses) from investments (both realized and unrealized) |
1.31 | (0.12 | ) | 0.72 | 5.15 | 0.21 | 0.17 | |||||||||||||||||
| Total income (loss) from investment operations |
||||||||||||||||||||||||
|
|
|
|
|
|
|
|
|
|
|
|
|
|||||||||||||
| 1.21 | (0.27 | ) | 0.66 | 5.07 | 0.23 | 0.14 | ||||||||||||||||||
|
|
|
|
|
|
|
|
|
|
|
|
|
|||||||||||||
| Less distributions: |
||||||||||||||||||||||||
| Dividends from net investment income |
— | — | — | (0.01 | ) | — | — | |||||||||||||||||
| Distributions from net realized gains |
(1.05 | ) | (0.89 | ) | (1.20 | ) | (0.68 | ) | (0.08 | ) | — | |||||||||||||
| Distributions from return of capitalG |
— | — | — | (0.00 | ) H | — | — | |||||||||||||||||
|
|
|
|
|
|
|
|
|
|
|
|
|
|||||||||||||
| Total distributions |
(1.05 | ) | (0.89 | ) | (1.20 | ) | (0.69 | ) | (0.08 | ) | — | |||||||||||||
|
|
|
|
|
|
|
|
|
|
|
|
|
|||||||||||||
| Net asset value, end of period |
$ | 18.22 | $ | 18.06 | $ | 19.22 | $ | 19.76 | $ | 15.38 | $ | 15.23 | ||||||||||||
|
|
|
|
|
|
|
|
|
|
|
|
|
|||||||||||||
| Total return B |
6.67 | % | (1.39 | )% | 3.31 | % | 33.14 | % | 1.50 | % C | 0.93 | %C | ||||||||||||
| Ratios and supplemental data: |
||||||||||||||||||||||||
| Net assets, end of period |
$ | 2,510,649 | $ | 2,479,918 | $ | 3,109,192 | $ | 1,672,420 | $ | 373,747 | $ | 222,277 | ||||||||||||
| Ratios to average net assets: |
||||||||||||||||||||||||
| Expenses, before reimbursements or recoupmentsD |
1.12 | % | 1.06 | % | 1.10 | % | 1.14 | % | 1.53 | %E | 3.85 | %E | ||||||||||||
| Expenses, net of reimbursements or recoupmentsD |
1.12 | % | 1.09 | % | 1.10 | % | 1.09 | % | 1.09 | %E | 1.09 | %E | ||||||||||||
| Net investment income (loss), before reimbursements or recoupments |
(0.63 | )% | (0.60 | )% | (0.57 | )% | (0.73 | )% | 0.69 | %E | (3.09 | )%E | ||||||||||||
| Net investment income (loss), net of reimbursements or recoupments . |
(0.63 | )% | (0.63 | )% | (0.58 | )% | (0.68 | )% | 1.13 | %E | (0.33 | )%E | ||||||||||||
| Portfolio turnover rate |
22 | % | 19 | % | 37 | % | 25 | % | 1 | %C | 27 | %F | ||||||||||||
| A | Commencement of operations. |
| B | Based on net asset value, which does not reflect the sales charge, redemption fee, or contingent deferred sales charge, if applicable. May include adjustments in accordance with U.S. GAAP and as such, the net asset value for reporting purposes and the returns based upon those net asset values may differ from the net asset value and returns for shareholder transactions. |
| C | Not annualized. |
| D | Expense ratios may exceed stated expense caps in Note 2 due in part to security lending expenses. |
| E | Annualized. |
| F | Portfolio turnover rate is for the period from December 1, 2011 through November 30, 2012. |
| G | The distributions from return of capital is calculated based on outstanding shares at the time of distribution. |
| H | Amount represents less than $0.01 per share. |
40
American Beacon Stephens Mid-Cap Growth FundSM
Financial Highlights
(For a share outstanding throughout the period)
| Investor Class | ||||||||||||||||||||||||
| Year Ended December 31, | One Month Ended December 31, |
Year Ended November 30, |
||||||||||||||||||||||
| 2016 | 2015 | 2014 | 2013 | 2012 | 2012 | |||||||||||||||||||
| Net asset value, beginning of period |
$ | 15.80 | $ | 16.97 | $ | 17.64 | $ | 13.83 | $ | 13.72 | $ | 12.36 | ||||||||||||
|
|
|
|
|
|
|
|
|
|
|
|
|
|||||||||||||
| Income (loss) from investment operations: |
||||||||||||||||||||||||
| Net investment income (loss) |
(0.27 | ) | (0.32 | ) | (0.36 | ) | (0.08 | ) | 0.02 | (0.14 | )E | |||||||||||||
| Net gains from investments (both realized and unrealized) |
1.29 | 0.04 | 0.89 | 4.58 | 0.17 | 1.50 | ||||||||||||||||||
| Total income (loss) from investment operations |
||||||||||||||||||||||||
|
|
|
|
|
|
|
|
|
|
|
|
|
|||||||||||||
| 1.02 | (0.28 | ) | 0.53 | 4.50 | 0.19 | 1.36 | ||||||||||||||||||
|
|
|
|
|
|
|
|
|
|
|
|
|
|||||||||||||
| Less distributions: |
||||||||||||||||||||||||
| Dividends from net investment income |
— | — | — | (0.01 | ) | — | — | |||||||||||||||||
| Distributions from net realized gains |
(1.05 | ) | (0.89 | ) | (1.20 | ) | (0.68 | ) | (0.08 | ) | — | |||||||||||||
| Distributions from return of capitalF |
— | — | — | (0.00 | ) G | — | — | |||||||||||||||||
|
|
|
|
|
|
|
|
|
|
|
|
|
|||||||||||||
| Total distributions |
(1.05 | ) | (0.89 | ) | (1.20 | ) | (0.69 | ) | (0.08 | ) | — | |||||||||||||
|
|
|
|
|
|
|
|
|
|
|
|
|
|||||||||||||
| Net asset value, end of period |
$ | 15.77 | $ | 15.80 | $ | 16.97 | $ | 17.64 | $ | 13.83 | $ | 13.72 | ||||||||||||
|
|
|
|
|
|
|
|
|
|
|
|
|
|||||||||||||
| Total return A |
6.42 | % | (1.63 | )% | 2.97 | % | 32.71 | % | 1.37 | % | 11.00 | % | ||||||||||||
|
|
|
|
|
|
|
|
|
|
|
|
|
|||||||||||||
| Ratios and supplemental data: |
||||||||||||||||||||||||
| Net assets, end of period |
$ | 13,078,292 | $ | 14,814,940 | $ | 19,551,562 | $ | 31,912,432 | $ | 18,584,733 | $ | 18,091,662 | ||||||||||||
| Ratios to average net assets: |
||||||||||||||||||||||||
| Expenses, before reimbursements or recoupmentsC |
1.38 | % | 1.32 | % | 1.27 | % | 1.38 | % | 1.68 | %D | 1.67 | % | ||||||||||||
| Expenses, net of reimbursements or recoupmentsC |
1.38 | % | 1.35 | % | 1.38 | % | 1.37 | % | 1.37 | %D | 1.40 | % | ||||||||||||
| Net investment income (loss), before reimbursements or recoupments |
(0.89 | )% | (0.85 | )% | (0.77 | )% | (0.98 | )% | 0.94 | %D | (1.04 | )% | ||||||||||||
| Net investment income (loss), net of. .reimbursements or recoupments |
(0.89 | )% | (0.89 | )% | (0.88 | )% | (0.97 | )% | 1.26 | %D | (0.76 | )% | ||||||||||||
| Portfolio turnover rate |
22 | % | 19 | % | 37 | % | 25 | % | 1 | %B | 27 | % | ||||||||||||
| A | Based on net asset value, which does not reflect the sales charge, redemption fee, or contingent deferred sales charge, if applicable. May include adjustments in accordance with U.S. GAAP and as such, the net asset value for reporting purposes and the returns based upon those net asset values may differ from the net asset value and returns for shareholder transactions. |
| B | Not annualized. |
| C | Expense ratios may exceed stated expense caps in Note 2 due in part to security lending expenses. |
| D | Annualized. |
| E | For purposes of this calculation, the change in undistributed net investment income per share was derived by dividing the change in undistributed net investment income by average shares outstanding for the period. |
| F | The distributions from return of capital is calculated based on outstanding shares at the time of distribution. |
| G | Amount represents less than $0.01 per share. |
41
American Beacon Stephens Mid-Cap Growth FundSM
Financial Highlights
(For a share outstanding throughout the period)
| A Class | ||||||||||||||||||||||||
| Year Ended December 31, | One Month Ended December 31, |
February 24A to November 30, |
||||||||||||||||||||||
| 2016 | 2015 | 2014 | 2013 | 2012 | 2012 | |||||||||||||||||||
| Net asset value, beginning of period |
$15.77 | $16.94 | $17.61 | $13.83 | $13.72 | $13.62 | ||||||||||||||||||
|
|
|
|
|
|
|
|
|
|
|
|
|
|||||||||||||
| Income (loss) from investment operations: |
||||||||||||||||||||||||
| Net investment income (loss) |
(0.14 | ) | (0.20 | ) | (0.19 | ) | (0.10 | ) | 0.02 | (0.05 | ) | |||||||||||||
| Net gains (losses) from investments (both realized and unrealized) |
1.14 | (0.08 | ) | 0.72 | 4.57 | 0.17 | 0.15 | |||||||||||||||||
|
|
|
|
|
|
|
|
|
|
|
|
|
|||||||||||||
| Total income (loss) from investment operations |
1.00 | (0.28 | ) | 0.53 | 4.47 | 0.19 | 0.10 | |||||||||||||||||
|
|
|
|
|
|
|
|
|
|
|
|
|
|||||||||||||
| Less distributions: |
||||||||||||||||||||||||
| Dividends from net investment income |
— | — | — | (0.01 | ) | — | — | |||||||||||||||||
| Distributions from net realized gains |
(1.05 | ) | (0.89 | ) | (1.20 | ) | (0.68 | ) | (0.08 | ) | — | |||||||||||||
| Distributions from return of capitalG |
— | — | — | (0.00 | ) H | — | — | |||||||||||||||||
|
|
|
|
|
|
|
|
|
|
|
|
|
|||||||||||||
| Total distributions |
(1.05 | ) | (0.89 | ) | (1.20 | ) | (0.69 | ) | (0.08 | ) | — | |||||||||||||
|
|
|
|
|
|
|
|
|
|
|
|
|
|||||||||||||
| Net asset value, end of period |
$ | 15.72 | $ | 15.77 | $ | 16.94 | $ | 17.61 | $ | 13.83 | $ | 13.72 | ||||||||||||
|
|
|
|
|
|
|
|
|
|
|
|
|
|||||||||||||
| Total return B |
6.30 | % | (1.63 | )% | 2.97 | % | 32.49 | % | 1.37 | % | 0.73 | %C | ||||||||||||
|
|
|
|
|
|
|
|
|
|
|
|
|
|||||||||||||
| Ratios and supplemental data: |
||||||||||||||||||||||||
| Net assets, end of period |
$ | 13,886,296 | $ | 13,907,563 | $ | 16,505,844 | $ | 18,395,962 | $ | 7,302,012 | $ | 7,062,772 | ||||||||||||
| Ratios to average net assets: |
||||||||||||||||||||||||
| Expenses, before reimbursements or recoupmentsD |
1.42 | % | 1.36 | % | 1.45 | % | 1.57 | % | 1.81 | %E | 1.83 | %E | ||||||||||||
| Expenses, net of reimbursements or recoupmentsD |
1.41 | % | 1.39 | % | 1.45 | % | 1.49 | % | 1.49 | %E | 1.49 | %E | ||||||||||||
| Net investment income (loss), before reimbursements or recoupments |
(0.92 | )% | (0.90 | )% | (0.94 | )% | (1.16 | )% | 0.86 | %E | (1.04 | )%E | ||||||||||||
| Net investment income (loss), net of reimbursements or recoupments |
(0.92 | )% | (0.93 | )% | (0.94 | )% | (1.09 | )% | 1.18 | %E | (0.70 | )%E | ||||||||||||
| Portfolio turnover rate |
22 | % | 19 | % | 37 | % | 25 | % | 1 | %C | 27 | %F | ||||||||||||
| A | Commencement of operations. |
| B | Based on net asset value, which does not reflect the sales charge, redemption fee, or contingent deferred sales charge, if applicable. May include adjustments in accordance with U.S. GAAP and as such, the net asset value for reporting purposes and the returns based upon those net asset values may differ from the net asset value and returns for shareholder transactions. |
| C | Not annualized. |
| D | Expense ratios may exceed stated expense caps in Note 2 due in part to security lending expenses. |
| E | Annualized. |
| F | Portfolio turnover rate is for the period from December 1, 2011 through November 30, 2012. |
| G | The distributions from return of capital is calculated based on outstanding shares at the time of distribution. |
| H | Amount represents less than $0.01 per share. |
42
American Beacon Stephens Mid-Cap Growth FundSM
Financial Highlights
(For a share outstanding throughout the period)
| C Class | ||||||||||||||||||||||||
| Year Ended December 31, | One Month Ended December 31, |
February 24A November 30, |
||||||||||||||||||||||
| 2016 | 2015 | 2014 | 2013 | 2012 | 2012 | |||||||||||||||||||
| Net asset value, beginning of period |
$ | 15.28 | $ | 16.57 | $ | 17.38 | $ | 13.75 | $ | 13.63 | $ | 13.62 | ||||||||||||
|
|
|
|
|
|
|
|
|
|
|
|
|
|||||||||||||
| Income (loss) from investment operations: |
||||||||||||||||||||||||
| Net investment income (loss) |
(0.60 | ) | (0.17 | ) | (0.27 | ) | (0.16 | ) | 0.02 | (0.04 | ) | |||||||||||||
| Net gains (losses) from investments (both realized and unrealized) |
1.45 | (0.23 | ) | 0.66 | 4.47 | 0.18 | 0.05 | |||||||||||||||||
|
|
|
|
|
|
|
|
|
|
|
|
|
|||||||||||||
| Total income (loss) from investment operations |
0.85 | (0.40 | ) | 0.39 | 4.31 | 0.20 | 0.01 | |||||||||||||||||
|
|
|
|
|
|
|
|
|
|
|
|
|
|||||||||||||
| Less distributions: |
||||||||||||||||||||||||
| Dividends from net investment income |
— | — | — | (0.00 | ) H | — | — | |||||||||||||||||
| Distributions from net realized gains |
(1.05 | ) | (0.89 | ) | (1.20 | ) | (0.68 | ) | (0.08 | ) | — | |||||||||||||
| Distributions from return of capitalG |
— | — | — | (0.00 | ) H | — | — | |||||||||||||||||
|
|
|
|
|
|
|
|
|
|
|
|
|
|||||||||||||
| Total distributions |
(1.05 | ) | (0.89 | ) | (1.20 | ) | (0.68 | ) | (0.08 | ) | — | |||||||||||||
|
|
|
|
|
|
|
|
|
|
|
|
|
|||||||||||||
| Net asset value, end of period |
$ | 15.08 | $ | 15.28 | $ | 16.57 | $ | 17.38 | $ | 13.75 | $ | 13.63 | ||||||||||||
|
|
|
|
|
|
|
|
|
|
|
|
|
|||||||||||||
| Total return B |
5.52 | % | (2.39 | )% | 2.21 | % | 31.35 | % | 1.45 | % | 0.07 | %C | ||||||||||||
|
|
|
|
|
|
|
|
|
|
|
|
|
|||||||||||||
| Ratios and supplemental data: |
||||||||||||||||||||||||
| Net assets, end of period |
$ | 1,389,526 | $ | 2,123,334 | $ | 1,901,906 | $ | 1,625,535 | $ | 301,916 | $ | 146,859 | ||||||||||||
| Ratios to average net assets: |
||||||||||||||||||||||||
| Expenses, before reimbursements or recoupmentsD |
2.19 | % | 2.11 | % | 2.22 | % | 2.28 | % | 2.68 | %E | 14.54 | %E | ||||||||||||
| Expenses, net of reimbursements or recoupmentsD |
2.18 | % | 2.14 | % | 2.20 | % | 2.24 | % | 2.24 | %E | 2.24 | %E | ||||||||||||
| Net investment income (loss), before reimbursements or recoupments |
(1.70 | )% | (1.65 | )% | (1.69 | )% | (1.87 | )% | 0.15 | %E | (13.65 | )%E | ||||||||||||
| Net investment income (loss), net of reimbursements or recoupments |
(1.69 | )% | (1.68 | )% | (1.68 | )% | (1.84 | )% | 0.59 | %E | (1.36 | )%E | ||||||||||||
| Portfolio turnover rate |
22 | % | 19 | % | 37 | % | 25 | % | 1 | % | 27 | %F | ||||||||||||
| A | Commencement of operations. |
| B | Based on net asset value, which does not reflect the sales charge, redemption fee, or contingent deferred sales charge, if applicable. May include adjustments in accordance with U.S. GAAP and as such, the net asset value for reporting purposes and the returns based upon those net asset values may differ from the net asset value and returns for shareholder transactions. |
| C | Not annualized. |
| D | Expense ratios may exceed stated expense caps in Note 2 due in part to security lending expenses. |
| E | Annualized. |
| F | Portfolio turnover rate is for the period from December 1, 2011 through November 30, 2012. |
| G | The distributions from return of capital is calculated based on outstanding shares at the time of distribution. |
| H | Amount represents less than $0.01 per share. |
43
American Beacon Stephens Small Cap Growth FundSM
Financial Highlights
(For a share outstanding throughout the period)
| Institutional Class | ||||||||||||||||||||||||
| Year Ended December 31, | One Month Ended Dec 31, |
Year Ended November 30, |
||||||||||||||||||||||
| 2016 | 2015 | 2014 | 2013 | 2012 | 2012 F | |||||||||||||||||||
| Net asset value, beginning of period |
$ | 15.08 | $ | 16.57 | $ | 17.83 | $ | 12.99 | $ | 13.54 | $ | 13.14 | ||||||||||||
|
|
|
|
|
|
|
|
|
|
|
|
|
|||||||||||||
| Income (loss) from investment operations: |
||||||||||||||||||||||||
| Net investment income (loss) |
0.00 | H | (0.13 | ) | (0.07 | ) | (0.05 | ) | 0.06 | (0.04 | ) G | |||||||||||||
| Net gains (losses) from investments (both realized and unrealized) |
1.51 | (0.65 | ) | (0.49 | ) | 5.60 | 0.23 | 1.43 | ||||||||||||||||
|
|
|
|
|
|
|
|
|
|
|
|
|
|||||||||||||
| Total income (loss) from investment operations |
1.51 | (0.78 | ) | (0.56 | ) | 5.55 | 0.29 | 1.39 | ||||||||||||||||
|
|
|
|
|
|
|
|
|
|
|
|
|
|||||||||||||
| Less distributions: |
||||||||||||||||||||||||
| Dividends from net investment income |
— | — | — | (0.00 | )H | — | — | |||||||||||||||||
| Distributions from net realized gains |
(0.14 | ) | (0.71 | ) | (0.70 | ) | (0.67 | ) | (0.84 | ) | (0.99 | ) | ||||||||||||
| Distributions from return of capitalE |
— | — | — | (0.04 | ) | — | — | |||||||||||||||||
|
|
|
|
|
|
|
|
|
|
|
|
|
|||||||||||||
| Total distributions |
(0.14 | ) | (0.71 | ) | (0.70 | ) | (0.71 | ) | (0.84 | ) | (0.99 | ) | ||||||||||||
|
|
|
|
|
|
|
|
|
|
|
|
|
|||||||||||||
| Net asset value, end of period |
$ | 16.45 | $ | 15.08 | $ | 16.57 | $ | 17.83 | $ | 12.99 | $ | 13.54 | ||||||||||||
|
|
|
|
|
|
|
|
|
|
|
|
|
|||||||||||||
| Total return A |
9.98 | % | (4.69 | )% | (3.14 | )% | 42.93 | % | 2.15 | % B | 11.74 | % | ||||||||||||
|
|
|
|
|
|
|
|
|
|
|
|
|
|||||||||||||
| Ratios and supplemental data: |
||||||||||||||||||||||||
| Net assets, end of period |
$ | 450,286,537 | $ | 300,919,215 | $ | 359,958,471 | $ | 317,341,400 | $ | 130,341,476 | $ | 88,814,609 | ||||||||||||
| Ratios to average net assets: |
||||||||||||||||||||||||
| Expenses, before reimbursements or recoupmentsC |
1.09 | % | 1.08 | % | 1.08 | % | 1.11 | % | 1.20 | % D | 1.20 | % | ||||||||||||
| Expenses, net of reimbursements or recoupmentsC |
1.09 | % | 1.08 | % | 1.10 | % | 1.09 | % | 1.06 | % D | 1.10 | % | ||||||||||||
| Net investment income (loss), before reimbursements or recoupments |
(0.78 | )% | (0.67 | )% | (0.59 | )% | (0.73 | )% | 0.54 | % D | (0.84 | )% | ||||||||||||
| Net investment income (loss), net of. .reimbursements or recoupments |
(0.78 | )% | (0.67 | )% | (0.61 | )% | (0.71 | )% | 0.68 | % D | (0.74 | )% | ||||||||||||
| Portfolio turnover rate |
40 | % | 25 | % | 46 | % | 39 | % | 6 | % B | 45 | % | ||||||||||||
| A | Based on net asset value, which does not reflect the sales charge, redemption fee, or contingent deferred sales charge, if applicable. May include adjustments in accordance with U.S. GAAP and as such, the net asset value for reporting purposes and the returns based upon those net asset values may differ from the net asset value and returns for shareholder transactions. |
| B | Not annualized. |
| C | Expense ratios may exceed stated expense caps in Note 2 due in part to security lending expenses. |
| D | Annualized. |
| E | The distributions from return of capital is calculated based on outstanding shares at the time of distribution. |
| F | Prior to the reorganization on February 24, 2012, the Institutional and Investor Classes were known as Class I and Class A, respectively. |
| G | For the purposes of this calculation, the change in undistributed net investment income was derived by dividing the change in undistributed net investment income by shares outstanding at November 30, 2012. |
| H | Amount represents less than $0.01 per share. |
44
American Beacon Stephens Small Cap Growth FundSM
Financial Highlights
(For a share outstanding throughout the period)
| Y Class | ||||||||||||||||||||||||
| Year Ended December 31, | One Month Ended Dec 31, |
Feb 24A to Nov 30, |
||||||||||||||||||||||
| 2016 | 2015 | 2014 | 2013 | 2012 | 2012 | |||||||||||||||||||
| Net asset value, beginning of period |
$ | 15.02 | $ | 16.54 | $ | 17.81 | $ | 12.98 | $ | 13.54 | $ | 13.59 | ||||||||||||
|
|
|
|
|
|
|
|
|
|
|
|
|
|||||||||||||
| Income (loss) from investment operations: |
||||||||||||||||||||||||
| Net investment income (loss) |
(0.52 | ) | (0.14 | ) | (0.12 | ) | (0.04 | ) | 0.01 | (0.02 | ) | |||||||||||||
| Net gains (losses) from investments (both realized and unrealized) |
2.02 | (0.67 | ) | (0.45 | ) | 5.58 | 0.27 | (0.03 | ) | |||||||||||||||
|
|
|
|
|
|
|
|
|
|
|
|
|
|||||||||||||
| Total income (loss) from investment operations |
1.50 | (0.81 | ) | (0.57 | ) | 5.54 | 0.28 | (0.05 | ) | |||||||||||||||
|
|
|
|
|
|
|
|
|
|
|
|
|
|||||||||||||
| Less distributions: |
||||||||||||||||||||||||
| Dividends from net investment income |
— | — | — | (0.00 | ) I | — | — | |||||||||||||||||
| Distributions from net realized gains |
(0.14 | ) | (0.71 | ) | (0.70 | ) | (0.68 | ) | (0.84 | ) | — | |||||||||||||
| Distributions from return of capitalG |
— | — | — | (0.03 | ) | — | — | |||||||||||||||||
|
|
|
|
|
|
|
|
|
|
|
|
|
|||||||||||||
| Total distributions |
(0.14 | ) | (0.71 | ) | (0.70 | ) | (0.71 | ) | (0.84 | ) | — | |||||||||||||
|
|
|
|
|
|
|
|
|
|
|
|
|
|||||||||||||
| Net asset value, end of period.. |
$ | 16.38 | $ | 15.02 | $ | 16.54 | $ | 17.81 | $ | 12.98 | $ | 13.54 | ||||||||||||
|
|
|
|
|
|
|
|
|
|
|
|
|
|||||||||||||
| Total return B |
9.96 | % | (4.88 | )% | (3.20 | )% | 42.88 | % | 2.07 | % C | (0.37 | )%C | ||||||||||||
|
|
|
|
|
|
|
|
|
|
|
|
|
|||||||||||||
| Ratios and supplemental data: |
||||||||||||||||||||||||
| Net assets, end of period |
$ | 81,069,652 | $ | 142,980,166 | $ | 171,901,004 | $ | 208,196,284 | $ | 4,563,158 | $ | 2,698,530 | ||||||||||||
| Ratios to average net assets: |
||||||||||||||||||||||||
| Expenses, before reimbursements or recoupmentsD |
1.15 | % | 1.14 | % | 1.16 | % | 1.19 | % | 1.36 | % E | 2.05 | % E | ||||||||||||
| Expenses, net of reimbursements or recoupmentsD |
1.15 | % | 1.14 | % | 1.16 | % | 1.19 | % | 1.16 | % E | 1.21 | % E | ||||||||||||
| Net investment income (loss), before reimbursements or recoupments |
(0.81 | )% | (0.74 | )% | (0.67 | )% | (0.79 | )% | 0.19 | % E | (1.57 | )% E | ||||||||||||
| Net investment income (loss), net of reimbursements or recoupments |
(0.81 | )% | (0.74 | )% | (0.69 | )% | (0.78 | )% | 0.38 | % E | (0.73 | )%E | ||||||||||||
| Portfolio turnover rate |
40 | % | 25 | % | 46 | % | 39 | % | 6 | %C | 45 | %F | ||||||||||||
| A | Commencement of operations. |
| B | Based on net asset value, which does not reflect the sales charge, redemption fee, or contingent deferred sales charge, if applicable. May include adjustments in accordance with U.S. GAAP and as such, the net asset value for reporting purposes and the returns based upon those net asset values may differ from the net asset value and returns for shareholder transactions. |
| C | Not annualized. |
| D | Expense ratios may exceed stated expense caps in Note 2 due in part to security lending expenses. |
| E | Annualized. |
| F | Portfolio turnover rate is for the period from December 1, 2011 through November 30, 2012. |
| G | The distributions from return of capital is calculated based on outstanding shares at the time of distribution. |
| H | Prior to the reorganization on February 24, 2012, the Institutional and Investor Classes were known as Class I and Class A, respectively. |
| I | Amount represents less than $0.01 per share. |
45
American Beacon Stephens Small Cap Growth FundSM
Financial Highlights
(For a share outstanding throughout the period)
| Investor Class | ||||||||||||||||||||||||
| Year Ended December 31, | One Month Ended Dec 31, |
Year Ended November 30, |
||||||||||||||||||||||
| 2016 | 2015 | 2014 | 2013 | 2012 | 2012 F | |||||||||||||||||||
| Net asset value, beginning of period |
$ | 14.20 | $ | 15.71 | $ | 16.98 | $ | 12.42 | $ | 12.99 | $ | 12.67 | ||||||||||||
|
|
|
|
|
|
|
|
|
|
|
|
|
|||||||||||||
| Income (loss) from investment operations: |
||||||||||||||||||||||||
| Net investment income (loss) |
(0.41 | ) | (0.82 | ) | (0.16 | ) | (0.04 | ) | 0.02 | (0.06 | )G | |||||||||||||
| Net gains (losses) from investments (both realized and unrealized) |
1.80 | 0.02 | (0.41 | ) | 5.31 | 0.25 | 1.37 | |||||||||||||||||
|
|
|
|
|
|
|
|
|
|
|
|
|
|||||||||||||
| Total income (loss) from investment operations |
1.39 | (0.80 | ) | (0.57 | ) | 5.27 | 0.27 | 1.31 | ||||||||||||||||
|
|
|
|
|
|
|
|
|
|
|
|
|
|||||||||||||
| Less distributions: |
||||||||||||||||||||||||
| Dividends from net investment income |
— | — | — | (0.00 | ) H | — | — | |||||||||||||||||
| Distributions from net realized gains |
(0.14 | ) | (0.71 | ) | (0.70 | ) | (0.69 | ) | (0.84 | ) | (0.99 | ) | ||||||||||||
| Distributions from return of capitalE |
— | — | — | (0.02 | ) | — | — | |||||||||||||||||
|
|
|
|
|
|
|
|
|
|
|
|
|
|||||||||||||
| Total distributions |
(0.14 | ) | (0.71 | ) | (0.70 | ) | (0.71 | ) | (0.84 | ) | (0.99 | ) | ||||||||||||
|
|
|
|
|
|
|
|
|
|
|
|
|
|||||||||||||
| Net asset value, end of period.. |
$ | 15.45 | $ | 14.20 | $ | 15.71 | $ | 16.98 | $ | 12.42 | $ | 12.99 | ||||||||||||
|
|
|
|
|
|
|
|
|
|
|
|
|
|||||||||||||
| Total return A |
9.76 | % | (5.08 | )% | (3.35 | )% | 42.62 | % | 2.08 | % B | 11.44 | % | ||||||||||||
|
|
|
|
|
|
|
|
|
|
|
|
|
|||||||||||||
| Ratios and supplemental data: |
||||||||||||||||||||||||
| Net assets, end of period |
$ | 50,544,287 | $ | 55,921,959 | $ | 147,227,308 | $ | 169,799,314 | $ | 69,786,350 | $ | 67,505,875 | ||||||||||||
| Ratios to average net assets: |
||||||||||||||||||||||||
| Expenses, before reimbursements or recoupmentsC |
1.35 | % | 1.40 | % | 1.31 | % | 1.39 | % | 1.62 | % D | 1.56 | % | ||||||||||||
| Expenses, net of reimbursements or recoupmentsC |
1.35 | % | 1.39 | % | 1.37 | % | 1.35 | % | 1.34 | % D | 1.36 | % | ||||||||||||
| Net investment income (loss), before reimbursements or recoupments |
(1.02 | )% | (1.01 | )% | (0.81 | )% | (1.01 | )% | 0.23 | % D | (1.20 | )% | ||||||||||||
| Net investment income (loss), net of. .reimbursements or recoupments |
(1.02 | )% | (1.00 | )% | (0.88 | )% | (0.96 | )% | 0.50 | % D | (1.00 | )% | ||||||||||||
| Portfolio turnover rate |
40 | % | 25 | % | 46 | % | 39 | % | 6 | %B | 45 | % | ||||||||||||
| A | Based on net asset value, which does not reflect the sales charge, redemption fee, or contingent deferred sales charge, if applicable. May include adjustments in accordance with U.S. GAAP and as such, the net asset value for reporting purposes and the returns based upon those net asset values may differ from the net asset value and returns for shareholder transactions. |
| B | Not annualized. |
| C | Expense ratios may exceed stated expense caps in Note 2 due in part to security lending expenses. |
| D | Annualized. |
| E | The distributions from return of capital is calculated based on outstanding shares at the time of distribution. |
| F | Prior to the reorganization on February 24, 2012, the Institutional and Investor Classes were known as Class I and Class A, respectively. |
| G | For the purposes of this calculation, the change in undistributed net investment income was derived by dividing the change in undistributed net investment income by shares outstanding at November 30, 2012. |
| H | Amount represents less than $0.01 per share. |
46
American Beacon Stephens Small Cap Growth FundSM
Financial Highlights
(For a share outstanding throughout the period)
| A Class | ||||||||||||||||||||||||
| Year Ended December 31, | One Month Ended Dec 31, |
Feb 24A to Nov 30, |
||||||||||||||||||||||
| 2016 | 2015 | 2014 | 2013 | 2012 | 2012 | |||||||||||||||||||
| Net asset value, beginning of period |
$ | 14.10 | $ | 15.61 | $ | 16.91 | $ | 12.40 | $ | 12.98 | $ | 13.07 | ||||||||||||
|
|
|
|
|
|
|
|
|
|
|
|
|
|||||||||||||
| Income (loss) from investment operations: |
||||||||||||||||||||||||
| Net investment income (loss) |
(0.31 | ) | (0.19 | ) | (0.18 | ) | (0.10 | ) | 0.01 | (0.07 | ) | |||||||||||||
| Net gains (losses) from investments (both realized and unrealized) |
1.67 | (0.61 | ) | (0.42 | ) | 5.32 | 0.25 | (0.02 | ) | |||||||||||||||
| Total income (loss) from investment operations |
||||||||||||||||||||||||
|
|
|
|
|
|
|
|
|
|
|
|
|
|||||||||||||
| 1.36 | (0.80 | ) | (0.60 | ) | 5.22 | 0.26 | (0.09 | ) | ||||||||||||||||
|
|
|
|
|
|
|
|
|
|
|
|
|
|||||||||||||
| Less distributions: |
||||||||||||||||||||||||
| Dividends from net investment income |
(0.00 | ) I | — | — | (0.00 | ) I | — | — | ||||||||||||||||
| Distributions from net realized gains |
(0.14 | ) | (0.71 | ) | (0.70 | ) | (0.71 | ) | (0.84 | ) | — | |||||||||||||
| Distributions from return of capitalG |
— | — | — | (0.00 | ) I | — | — | |||||||||||||||||
|
|
|
|
|
|
|
|
|
|
|
|
|
|||||||||||||
| Total distributions |
(0.14 | ) | (0.71 | ) | (0.70 | ) | (0.71 | ) | (0.84 | ) | — | |||||||||||||
|
|
|
|
|
|
|
|
|
|
|
|
|
|||||||||||||
| Net asset value, end of period.. |
$ | 15.32 | $ | 14.10 | $ | 15.61 | $ | 16.91 | $ | 12.40 | $ | 12.98 | ||||||||||||
|
|
|
|
|
|
|
|
|
|
|
|
|
|||||||||||||
| Total return B |
9.61 | % | (5.11 | )% | (3.54 | )% | 42.28 | % | 2.01 | % C | (0.69 | )%C | ||||||||||||
|
|
|
|
|
|
|
|
|
|
|
|
|
|||||||||||||
| Ratios and supplemental data: |
||||||||||||||||||||||||
| Net assets, end of period |
$ | 7,029,682 | $ | 8,197,136 | $ | 9,701,510 | $ | 10,941,646 | $ | 3,130,886 | $ | 2,941,034 | ||||||||||||
| Ratios to average net assets: |
||||||||||||||||||||||||
| Expenses, before reimbursements or recoupmentsD |
1.46 | % | 1.44 | % | 1.51 | % | 1.57 | % | 1.79 | % E | 2.08 | % E | ||||||||||||
| Expenses, net of reimbursements or recoupmentsD |
1.46 | % | 1.48 | % | 1.52 | % | 1.59 | % | 1.58 | % E | 1.61 | % E | ||||||||||||
| Net investment income (loss), before reimbursements or recoupments |
(1.14 | )% | (1.03 | )% | (1.02 | )% | (1.18 | )% | 0.04 | % E | (1.68 | )% E | ||||||||||||
| Net investment income (loss), net of reimbursements or recoupments |
(1.14 | )% | (1.08 | )% | (1.03 | )% | (1.20 | )% | 0.25 | % E | (1.21 | )% E | ||||||||||||
| Portfolio turnover rate |
40 | % | 25 | % | 46 | % | 39 | % | 6 | %C | 45 | %F | ||||||||||||
| A | Commencement of operations. |
| B | Based on net asset value, which does not reflect the sales charge, redemption fee, or contingent deferred sales charge, if applicable. May include adjustments in accordance with U.S. GAAP and as such, the net asset value for reporting purposes and the returns based upon those net asset values may differ from the net asset value and returns for shareholder transactions. |
| C | Not annualized. |
| D | Expense ratios may exceed stated expense caps in Note 2 due in part to security lending expenses. |
| E | Annualized. |
| F | Portfolio turnover rate is for the period from December 1, 2011 through November 30, 2012. |
| G | The distributions from return of capital is calculated based on outstanding shares at the time of distribution. |
| H | Prior to the reorganization on February 24, 2012, the Institutional and Investor Classes were known as Class I and Class A, respectively. |
| I | Amount represents less than $0.01 per share. |
47
American Beacon Stephens Small Cap Growth FundSM
Financial Highlights
(For a share outstanding throughout the period)
| C Class | ||||||||||||||||||||||||
| Year Ended December 31, | One Month Ended Dec 31, |
February 24A to November 30, |
||||||||||||||||||||||
| 2016 | 2015 | 2014 | 2013 | 2012 | 2012 | |||||||||||||||||||
| Net asset value, beginning of period |
$ | 13.65 | $ | 15.26 | $ | 16.66 | $ | 12.32 | $ | 12.91 | $ | 13.07 | ||||||||||||
|
|
|
|
|
|
|
|
|
|
|
|
|
|||||||||||||
| Income (loss) from investment operations: |
||||||||||||||||||||||||
| Net investment (loss) |
(1.08 | ) | (0.31 | ) | (0.24 | ) | (0.13 | ) | 0.00 | (0.06 | ) | |||||||||||||
| Net gains (losses) from investments (both realized and unrealized) |
2.28 | (0.59 | ) | (0.46 | ) | 5.18 | 0.25 | (0.10 | ) | |||||||||||||||
| Total income (loss) from investment operations |
||||||||||||||||||||||||
|
|
|
|
|
|
|
|
|
|
|
|
|
|||||||||||||
| 1.20 | (0.90 | ) | (0.70 | ) | 5.05 | 0.25 | (0.16 | ) | ||||||||||||||||
|
|
|
|
|
|
|
|
|
|
|
|
|
|||||||||||||
| Less distributions: |
||||||||||||||||||||||||
| Dividends from net investment income |
— | — | — | (0.00 | ) I | — | — | |||||||||||||||||
| Distributions from net realized gains |
(0.14 | ) | (0.71 | ) | (0.70 | ) | (0.71 | ) | (0.84 | ) | — | |||||||||||||
| Distributions from return of capitalG |
— | — | — | — | — | — | ||||||||||||||||||
|
|
|
|
|
|
|
|
|
|
|
|
|
|||||||||||||
| Total distributions |
(0.14 | ) | (0.71 | ) | (0.70 | ) | (0.71 | ) | (0.84 | ) | — | |||||||||||||
|
|
|
|
|
|
|
|
|
|
|
|
|
|||||||||||||
| Net asset value, end of period |
$ | 14.71 | $ | 13.65 | $ | 15.26 | $ | 16.66 | $ | 12.32 | $ | 12.91 | ||||||||||||
|
|
|
|
|
|
|
|
|
|
|
|
|
|||||||||||||
| Total return B |
8.76 | % | (5.89 | )% | (4.20 | )% | 41.17 | % | 1.94 | % C | (1.22 | )%C | ||||||||||||
|
|
|
|
|
|
|
|
|
|
|
|
|
|||||||||||||
| Ratios and supplemental data: |
||||||||||||||||||||||||
| Net assets, end of period |
$ | 1,280,971 | $ | 2,348,424 | $ | 2,771,316 | $ | 2,446,766 | $ | 348,977 | $ | 343,410 | ||||||||||||
| Ratios to average net assets: |
||||||||||||||||||||||||
| Expenses, before reimbursements or recoupmentsD |
2.23 | % | 2.19 | % | 2.26 | % | 2.33 | % | 3.21 | % E | 6.15 | % E | ||||||||||||
| Expenses, net of reimbursements or recoupmentsD |
2.23 | % | 2.26 | % | 2.27 | % | 2.34 | % | 2.33 | % E | 2.35 | % E | ||||||||||||
| Net investment (loss), before reimbursements or recoupments |
(1.91 | )% | (1.79 | )% | (1.76 | )% | (1.93 | )% | (1.36 | )% E | (5.71 | )% E | ||||||||||||
| Net investment (loss), net of reimbursements or recoupments |
(1.91 | )% | (1.85 | )% | (1.77 | )% | (1.94 | )% | (0.48 | )% E | (1.91 | )% E | ||||||||||||
| Portfolio turnover rate |
40 | % | 25 | % | 46 | % | 39 | % | 6 | %C | 45 | %F | ||||||||||||
| A | Commencement of operations. |
| B | Based on net asset value, which does not reflect the sales charge, redemption fee, or contingent deferred sales charge, if applicable. May include adjustments in accordance with U.S. GAAP and as such, the net asset value for reporting purposes and the returns based upon those net asset values may differ from the net asset value and returns for shareholder transactions. |
| C | Not annualized. |
| D | Expense ratios may exceed stated expense caps in Note 2 due in part to security lending expenses. |
| E | Annualized. |
| F | Portfolio turnover rate is for the period from December 1, 2011 through November 30, 2012. |
| G | The distributions from return of capital is calculated based on outstanding shares at the time of distribution. |
| H | Prior to the reorganization on February 24, 2012, the Institutional and Investor Classes were known as Class I and Class A, respectively. |
| I | Amount represents less than $0.01 per share. |
48
American Beacon FundsSM
December 31, 2016 (Unaudited)
The Funds are required to provide certain tax information based upon the Fund’s income and distribution for the taxable year ended December 31, 2016. The information and distributions reported herein may differ from information and distributions taxable to the shareholders for the calendar year ended December 31, 2016.
The Funds designated the following items with regard to distributions paid during the year ended December 31, 2016. All designations are based on financial information available as of this annual report and, accordingly, are subject to change. For each item, it is the intention of the Fund to designate the maximum amount permitted under the Internal Revenue Code of 1986, as amended, and the regulations there under.
| Stephens Mid-Cap Growth Fund |
Stephens Small Cap Growth Fund |
|||||||
|
|
|
|
|
|||||
| Corporate Dividends Received Deduction |
79.02 | % | 63.28 | % | ||||
| Qualified Dividend Income |
0.00 | % | 0.00 | % | ||||
The Stephens Mid-Cap Growth Fund designated $4,642,123 as long-term capital gains distributions for the year ended December 31, 2016.
The Stephens Small Cap Growth Fund designated $4,821,208 as long-term capital gains distributions for the year ended December 31, 2016.
Shareholders received notification in January 2017 of the appropriate tax information necessary to prepare their 2016 income tax return.
49
American Beacon FundsSM
December 31, 2016(Unaudited)
American Beacon Advisors, Inc. (“American Beacon”) is a wholly-owned subsidiary of Astro AB Borrower, Inc. (“Borrower”). On January 31, 2017, the Board of Borrower and its sole shareholder, Astro AB Acquisition (“Acquisition”), approved an amendment to Borrower’s Certificate of Incorporation to change the name of Borrower to Resolute Investment Managers, Inc. Simultaneously with the name change of Borrower, the shareholders and the Boards of each of American Beacon’s indirect owners approved similar name changes, as follows: Astro AB Holdings, LLC (“Holdings”) became Resolute Investment Holdings, LLC; Astro AB Topco, Inc. became Resolute Topco, Inc.; and Astro AB Acquisition, Inc. became Resolute Acquisition, Inc. Amendments to each of the entities’ Articles of Incorporation, or, in the case of Holdings, the Certificate of Formation, were filed with the Delaware Secretary of State.
A summary of the name changes for the Astro Entities is set forth below:
Astro AB Holdings, LLC - Resolute Investment Holdings, LLC
Astro AB Topco, Inc. - Resolute Topco, Inc.
Astro AB Acquisiton, Inc. - Resolute Acquisiton, Inc.
Astro AB Borrower, Inc. - Resolute Investment Managers, Inc.
50
Trustees and Officers of the American Beacon FundsSM (Unaudited)
The Trustees and officers of the American Beacon Funds (the “Trust”) are listed below, together with their principal occupations during the past five years. Unless otherwise indicated, the address of each person listed below is 220 Las Colinas Boulevard East, Suite 1200, Irving, Texas 75039. Each Trustee oversees twenty-seven funds in the fund complex that includes the Trust and the American Beacon Select Funds. The Trust’s Statement of Additional Information contains additional information about the Trustees and is available without charge by calling 1-800-658-5811.
| Name, Age and Address |
Position, Term of |
Principal Occupation(s) During Past 5 Years and Current Directorships | ||
| INTERESTED TRUSTEES | Lifetime of Trust until removal, resignation or retirement* | |||
| Alan D. Feld** (80) | Trustee since 1996 | Sole Shareholder of a professional corporation which is a Partner in | ||
| the law firm of Akin, Gump, Strauss, Hauer & Feld, LLP (law firm) | ||||
| (1960-Present); Trustee, American Beacon Mileage Funds (1996-2012); | ||||
| Trustee, American Beacon Select Funds (1999-Present); Trustee, | ||||
| American Beacon Master Trust (1996-2012). | ||||
| NON-INTERESTED | Term | |||
| TRUSTEES | ||||
| Lifetime of Trust until | ||||
| removal resignation or | ||||
| retirement* | ||||
| Gilbert G. Alvarado (47) | Trustee since 2015 | Director, Kura MD, Inc. (local telehealth organization) (2015-present); | ||
| Vice President & CFO, Sierra Health Foundation (health conversion | ||||
| private foundation) (2006-Present) Vice President & CFO, Sierra Health | ||||
| Foundation: Center for Health Program Management (California public | ||||
| benefit corporation) (2012-Present); Director, Innovative North State | ||||
| (2012-Present); Director, Sacramento Regional Technology Alliance | ||||
| (2011-Present); Director, Women’s Empowerment (2009-2014); Trustee, | ||||
| American Beacon Select Funds (2015-Present). | ||||
| Josephe B. Armes (54) | Trustee since 2015 | Chairman & CEO, CSW Industrials f/k/a Capital Southwest Corporation | ||
| (investment company) (2013-Present); President & CEO, JBA | ||||
| Investment Partners (family investment vehicle) (2010-Present); | ||||
| Chief Operating Officer, Hicks Holdings, LLC (Hicks Family assets and | ||||
| investments) (2005-2010); Trustee, Baylor University Board of Regents | ||||
| (2001-2010); Director and Chair of Audit Committee, RSP Permian (oil | ||||
| and gas producer) (2013-Present); Trustee, American Beacon Select | ||||
| Funds (2015-Present). | ||||
| Gerard J. Arpey (58) | Trustee since 2012 | Director, The Home Depot, Inc. (2015-Present); Partner, Emerald | ||
| Creek Group (private equity firm) (2011-Present); Chairman and | ||||
| Chief Executive Officer, AMR Corp. and American Airlines; Inc. (2003- | ||||
| 2011); Director, S. C. Johnson & Son, Inc. (privately held company) | ||||
| (2008-present); Trustee, American Beacon Select Funds (2012-Present). | ||||
| Brenda A. Cline (56) | Trustee since 2004 | Executive Vice President, Chief Financial Officer, Treasurer and | ||
| Secretary, Kimbell Art Foundation (1993-Present); Director, Range | ||||
| Resources Corporation (oil and natural gas company) (2015-Present); | ||||
| Director, Tyler Technologies, Inc.(public sector software solutions | ||||
| company) (2014-Present); Trustee, American Beacon Mileage Funds | ||||
| (2004-2012); Trustee, American Beacon Select Funds (2004-Present); | ||||
| Trustee, American Beacon Master Trust (2004-2012). | ||||
| Eugene J. Duffy (62) | Trustee since 2008 | Managing Director, Institutional Services, Intercontinental Real Estate | ||
| Corporation (2014-Present); Principal and Executive Vice President, | ||||
| Paradigm Asset Management (1994-2014); Director, Sunrise Bank of | ||||
| Atlanta (2008-2013); Trustee, American Beacon Mileage Funds (2008- | ||||
| 2012); Trustee, American Beacon Select Funds (2008-Present); Trustee, | ||||
| American Beacon Master Trust (2008-2012). | ||||
51
Trustees and Officers of the American Beacon FundsSM (Unaudited)
| Name, Age and Address |
Position, Term of |
Principal Occupation(s) During Past 5 Years and Current Directorships | ||
| TRUSTEES (CONT.) | Term | |||
| M. Dunning (74) | Trustee since 2008 | Chairman Emeritus (2008-Present); Lockton Dunning Benefits | ||
| (consulting firm in employee benefits); Board Director, Oncor Electric | ||||
| Delivery Company LLC (2007-Present); Board Member, BancTec | ||||
| (2010-Present) (software consulting); Trustee, American Beacon | ||||
| Mileage Funds (2008-2012); Trustee, American Beacon Select Funds | ||||
| (2008-Present); Trustee, American Beacon Master Trust (2008-2012). | ||||
| Richard M. Massman (73) | Trustee since 2004 | Consultant and General Counsel Emeritus (2009-Present) and Senior | ||
| Chairman since 2008 | Vice President and General Counsel (1994-2009), Hunt Consolidated, | |||
| Inc. (holding company engaged in oil and gas exploration and | ||||
| production, refining, real estate, farming, ranching and venture | ||||
| capital activities); Trustee, American Beacon Mileage Funds (2004- | ||||
| 2012); Trustee, American Beacon Select Funds (2004-Present); Trustee, | ||||
| American Beacon Master Trust (2004-2012). | ||||
| Barbara J. McKenna, CFA (53) | Trustee since 2012 | Managing Principal, Longfellow Investment Management Company (2005-Present); Trustee, American Beacon Select Funds (2012-Present). | ||
| R. Gerald Turner (71) | Trustee since 2001 | President, Southern Methodist University (1995-Present); Director, J.C. | ||
| 225 Perkins Admin. Bldg. | Penney Company, Inc. (1996-Present); Director, Kronus Worldwide Inc. | |||
| Southern Methodist Univ. | (chemical manufacturing) (2003-Present); Trustee, American Beacon | |||
| Dallas, Texas 75275 | Mileage Funds (2001- 2012); Trustee, American Beacon Select Funds | |||
| (2001-Present); Trustee, American Beacon Master Trust (2001-2012). | ||||
| OFFICERS | ||||
| Gene. L. Needles, Jr. (62) | President since 2009 | President, CEO and Director, American Beacon Advisors, Inc. | ||
| Executive Vice | (2009-Present); President, CEO and Director, Astro AB Borrower, Inc. | |||
| President | (2015-Present); President, CEO and Director, Astro AB Acquisition, | |||
| since 2009 | Inc.(2015-Present); President, CEO and Director, Astro AB Topco, Inc. | |||
| (2015-Present), President, CEO and Director, Astro AB Holdings, LLC. | ||||
| (2015-Present); President, CEO and Director, Lighthouse Holdings, | ||||
| Inc.; (2009-2015); President and CEO, Lighthouse Holdings Parent, Inc. | ||||
| (2009-2015); Manager, President and CEO, American Private Equity | ||||
| Management, L.L.C. (2012-Present); President, American Beacon | ||||
| Cayman Managed Futures Strategy Fund, Ltd. (2014-Present). | ||||
| Rosemary K. Behan (57) | VP, Secretary and Chief Legal Officer since 2006 |
Secretary, American Beacon Advisors, Inc. (2006-Present); Secretary,Astro AB Borrower, Inc. (2015-Present); Secretary, Astro AB Acquisition, Inc. (2015- Present); Secretary, Astro AB Topco, Inc. (2015-Present); Secretary, Astro AB Holdings, LLC. (2015-Present); Secretary, Lighthouse Holdings, Inc. (2008- 2015); Secretary, Lighthouse Holdings Parent, Inc. (2008-2015); Secretary, American Private Equity Management, L.L.C. (2008-Present); Secretary, American Beacon Cayman Managed Futures Strategy Fund, Ltd. (2014-Present). | ||
| Brian E. Brett (56) | VP since 2004 | Vice President, Director of Sales, American Beacon Advisors, Inc. (2004-Present). | ||
| Paul B. Cavazos (47) | VP since 2016 | Chief Investment Officer and Vice President, Asset Management, | ||
| American Beacon Advisors, Inc. (2016-Present); Chief Investment | ||||
| Officer and Assistant Treasurer, DTE Energy (2007-2016); | ||||
| Erica Duncan (46) | VP since 2011 | Vice President, Marketing and Client Services, American Beacon | ||
| Advisors, Inc. (2011-Present); Supervisor, Brand Marketing, Invesco | ||||
| (2010-2011); | ||||
52
Trustees and Officers of the American Beacon FundsSM (Unaudited)
| Name, Age and Address |
Position, Term of |
Principal Occupation(s) During Past 5 Years and Current Directorships | ||
| OFFICERS | Term | |||
| Melinda G. Heika (55) | Treasurer since 2010 | Treasurer, American Beacon Advisors, Inc. (2010-Present); Treasurer, | ||
| Astro AB Borrower, Inc. (2015-Present); Treasurer, Astro AB Acquisition, | ||||
| Inc. (2015-Present); Treasurer, Astro AB Topco, Inc. (2015-Present); | ||||
| Treasurer, Astro AB Holdings, LLC. (2015-Present); Treasurer, Lighthouse | ||||
| Holdings, Inc. (2010-2015); Treasurer, Lighthouse Holdings Parent Inc., | ||||
| (2010-2015); Treasurer, American Private Equity Management, L.L.C. | ||||
| (2012-Present); Director and Treasurer, American Beacon Cayman | ||||
| Managed Futures Strategy Fund, Ltd. (2014-Present). | ||||
| One Year | ||||
| Terri L. McKinney (53) | VP since 2010 | Vice President, Enterprise Services (2009-Present) and Managing | ||
| Director (2003-2009), American Beacon Advisors, Inc. | ||||
| Jeffrey K. Ringdahl (41) | VP since 2010 | Chief Operating Officer, American Beacon Advisors, Inc. | ||
| (2010-Present); Manager and Senior Vice President, American Private | ||||
| Equity Management, L.L.C. (2012-Present); Senior Vice President and | ||||
| Director, Astro AB Borrower, Inc. (2015-Present); Senior Vice President | ||||
| and Director, Astro AB Acquisition, Inc. (2015-Present); Senior Vice | ||||
| President and Director, Astro AB Topco, Inc. (2015-Present), Senior Vice | ||||
| President and Director, Astro AB Holdings, LLC.(2015-Present); Senior | ||||
| Vice President, Lighthouse Holdings, Inc. (2013-2015); Senior Vice | ||||
| President, Lighthouse Holdings Parent, Inc. (2013-2015); Director and | ||||
| Vice President, American Beacon Cayman Managed Futures Strategy | ||||
| Fund, Ltd. (2014-Present); Vice President, Product Management, | ||||
| Touchstone Advisors, Inc. (2007-2010). | ||||
| Samuel J. Silver (53) | VP since 2011 | Chief Fixed Income Officer (2016–Present), Vice President, Fixed | ||
| Income Investments (2011-2016) and Senior Portfolio Manager, Fixed | ||||
| Income Investments (1999-2011), American Beacon Advisors, Inc. | ||||
| Christina E. Sears (45) | Chief Compliance | Chief Compliance Officer, American Beacon Advisors, Inc. | ||
| Officer since 2004 | (2004-Present); Chief Compliance Officer, American Private Equity | |||
| and Asst. Secretary | Management, L.L.C. (2012-Present). | |||
| since 1999 | ||||
| Sonia L. Bates (60) | Asst. Treasurer since 2011 | Director, Tax and Financial Reporting (2011-Present), Manager, Tax and Financial Reporting (2005-2010), American Beacon Advisors, Inc.; Asst. | ||
| Treasurer, Astro AB Borrower, Inc. (2015-Present); Asst. Treasurer, Astro | ||||
| AB Acquisition, Inc.(2015-Present); Asst. Treasurer, Astro AB Topco, | ||||
| Inc. (2015-Present); Asst. Treasurer, Astro AB Holdings, LLC.; Asst. | ||||
| Treasurer, Lighthouse Holdings, Inc. (2011-2015); Asst. Treasurer, | ||||
| Lighthouse Holdings Parent Inc. (2011-2015); Asst. Treasurer, American | ||||
| Private Equity Management, L.L.C. (2012-Present). | ||||
| Shelley D. Abrahams (42) | Assistant Secretary | Assistant Secretary, American Beacon Advisors, Inc. (2008-Present) | ||
| since 2008 | ||||
| Rebecca L. Harris (50) | Assistant Secretary | Assistant Secretary, American Beacon Advisors, Inc. (2011-Present) | ||
| since 2011 | ||||
| Diana N. Lai (41) | Assistant Secretary | Assistant Secretary, American Beacon Advisors, Inc. (2012-Present) | ||
| since 2012 | ||||
| Teresa A. Oxford (58) | Assistant Secretary | Assistant Secretary, American Beacon Advisors, Inc. (2015-Present) | ||
| since 2015 | ||||
| * | As of 11/12/2014, the Board adopted a retirement plan that requires Trustees to retire no later than the last day of the calendar year in which they reach the age of 75. |
| ** | Mr. Feld is deemed to be an “interested person” of the Trusts, as defined by the 1940 Act. Mr. Feld’s law firm of Akin, Gump, Strauss, Hauer & Feld LLP has provided legal services within the past two fiscal years to one or more of the Trust’s sub-advisors. |
53
American Beacon FundsSM
December 31, 2016 (Unaudited)
The American Beacon Funds recognize and respect the privacy of our shareholders. We are providing this notice to you so you will understand how shareholder information may be collected and used.
We may collect nonpublic personal information about you from one or more of the following sources:
| • | information we receive from you on applications or other forms; |
| • | information about your transactions with us or our service providers; and |
| • | information we receive from third parties. |
We do not disclose any nonpublic personal information about our customers or former customers to anyone, except as permitted by law.
We restrict access to your nonpublic personal information to those employees or service providers who need to know that information to provide products or services to you. To ensure the confidentiality of your nonpublic personal information, we maintain safeguards that comply with federal standards.
54
This page intentionally left blank.
55
This page intentionally left blank.
56

eDelivery is NOW AVAILABLE - Stop traditional mail delivery and receive your
shareholder reports and summary prospectus on-line. Sign up at
www.americanbeaconfunds.com
If you invest in the Fund through a financial institution, you may be able to receive the Fund’s regulatory mailings, such as the Prospectus, Annual Report and Semi-Annual Report, by e-mail. If you are interested in this option, please go to www.icsdelivery.com and search for your financial institution’s name or contact your financial institution directly.
To obtain more information about the Fund:
|
|
| |
| By E-mail: american_beacon.funds@ambeacon.com
|
On the Internet: Visit our website at www.americanbeaconfunds.com | |
|
| ||

|

| |
| By Telephone: Institutional, Y, and Investor Classes Call (800) 658-5811 |
By Mail: American Beacon Funds P.O. Box 219643 Kansas City, MO 64121-9643
| |
|
| ||
|
Availability of Quarterly Portfolio Schedules
In addition to the Schedule of Investments provided in each semi-annual and annual report, the Fund files a complete schedule of its portfolio holdings with the Securities and Exchange Commission (“SEC”) on Form N-Q as of the first and third fiscal quarters. The Fund’s Forms N-Q are available on the SEC’s website at www.sec.gov. The Forms N-Q may also be reviewed and copied at the SEC’s Public Reference Section, 100 F Street, NE, Washington, D.C. 20549-2736. Information regarding the operation of the SEC’s Public Reference Room may be obtained by calling (800)-SEC-0330. A complete schedule of the Fund’s portfolio holdings is also available at www.americanbeaconfunds.com approximately twenty days after the end of each month. |
Availability of Proxy Voting Policy and Records
A description of the policies and procedures the Fund uses to determine how to vote proxies relating to portfolio securities is available in the Fund’s Statement of Additional Information, is available free of charge on the Fund’s website www.americanbeaconfunds.com and by calling 1-800-967-9009 or by accessing the SEC’s website at www. sec.gov. The Fund’s proxy voting record for the most recent year ended June 30 is filed annually with the SEC on Form N-PX. The Fund’s Forms N-PX are available on the SEC’s website at www.sec.gov. The Fund’s proxy voting record may also be obtained by calling 1-800-967-9009. | |


Fund Service Providers:
|
CUSTODIAN |
TRANSFER AGENT | INDEPENDENT REGISTERED | DISTRIBUTOR | |||||||||
| State Street Bank and Trust |
Boston Financial Data Services | PUBLIC ACCOUNTING FIRM Ernst & Young LLP |
Foreside Fund Services, LLC | |||||||||
| Boston, Massachusetts |
Kansas City, Missouri | Dallas, Texas | Portland, Maine |
This report is prepared for shareholders of the American Beacon Funds and may be distributed to others only if preceded or accompanied by a current Prospectus of Summary Prospectus.
American Beacon Funds, American Beacon Stephens Mid-Cap Growth Fund and American Beacon Stephens Small Cap Growth Fund are service marks of American Beacon Advisors, Inc.
AR 10/16
ITEM 2. CODE OF ETHICS.
The Trust has adopted a code of ethics that applies to its principal executive and financial officers (the “Code”). The trust amended its code November 12, 2003 to disclose the removal of terminated Investment Companies. The Trust did not grant any waivers to the provisions of the Code during the period covered by the shareholder report presented in Item 1. The Code is filed herewith as Exhibit 99.CODE.ETH.
ITEM 3. AUDIT COMMITTEE FINANCIAL EXPERT.
The Trust’s Board of Trustees has determined that Ms. Brenda A. Cline, a member of the Trust’s Audit and Compliance Committee, is an “audit committee financial expert” as defined in Form N-CSR. Ms. Brenda Cline is “independent” as defined in Form N-CSR.
ITEM 4. PRINCIPAL ACCOUNTANT FEES AND SERVICES.
(a)
| Audit Fees |
Fiscal Year Ended | |||
| $262,494 | 12/31/2015 | |||
| $270,762 | 12/31/2016 | |||
(b)
| Audit-Related Fees |
Fiscal Year Ended | |||
| $0 | 12/31/2015 | |||
| $0 | 12/31/2016 | |||
(c)
| Tax Fees |
Fiscal Year Ended | |||
| $35,500 | 12/31/2015 | |||
| $58,474 | 12/31/2016 | |||
(d)
| All Other Fees |
Fiscal Year Ended | |||
| $0 | 12/31/2015 | |||
| $0 | 12/31/2016 | |||
e)(1) Pursuant to its charter, the Trust’s Audit and Compliance Committee shall have the following duties and powers pertaining to pre-approval of audit and non-audit services provided by the Trust’s principal accountant:
| • | to approve, prior to appointment, the engagement of auditors to annually audit and provide their opinion on the Trusts’ financial statements, and, in connection therewith, reviewing and evaluating matters potentially affecting the independence and capabilities of the auditors; |
| • | to approve, prior to appointment, the engagement of the auditors to provide non-audit services to the Trusts, an investment adviser to any series of the Trusts or any entity controlling, controlled by, or under common control with an investment adviser (“adviser affiliate”) that provides ongoing services to the Trusts, if the engagement relates directly to the operations and financial reporting of the Trusts; |
| • | to consider whether the non-audit services provided by a Trust’s auditor to an investment adviser or any adviser affiliate that provides ongoing services to a series of the Trusts, which services were not pre-approved by the Committee, are compatible with maintaining the auditor’s independence; |
| • | to review the arrangements for and scope of the annual audit and any special audits; and |
| • | to review and approving the fees proposed to be charged to the Trusts by the auditors for each audit and non-audit service. |
The Audit and Compliance Committee may delegate any portion of its authority, including the authority to grant pre-approvals of audit and permitted non-audit services, to a subcommittee of one or more members. Any decisions of the subcommittee to grant pre-approvals shall be presented to the full audit committee at its next regularly scheduled meeting.
(e)(2) None of the fees disclosed in paragraphs (b) through (d) above were approved by the audit committee pursuant to paragraph (c)(7)(i)(C) of Rule 2-01 of Regulation S-X.
(f) Not applicable.
| (g) |
Aggregate Non-Audit Fees for Services Rendered to the:
| Registrant |
Adviser | Adviser’s Affiliates Providing Ongoing Services to Registrant |
Fiscal Year Ended | |||||||
| $35,500 |
$ | 46,065 | N/A | 12/31/2015 | ||||||
| $58,474 |
$ | 215,882 | N/A | 12/31/2016 | ||||||
(h) Not applicable.
ITEM 5. AUDIT COMMITTEE OF LISTED REGISTRANTS.
Not applicable.
ITEM 6. SCHEDULE OF INVESTMENTS.
The schedules of investments for each series of the Trust are included in the shareholder reports presented in Item 1.
ITEM 7. DISCLOSURE OF PROXY VOTING POLICIES AND PROCEDURES FOR CLOSED-END MANAGEMENT INVESTMENT COMPANIES.
Not applicable.
ITEM 8. PORTFOLIO MANAGERS OF CLOSED-END MANAGEMENT INVESTMENT COMPANIES.
Not applicable.
ITEM 9. PURCHASES OF EQUITY SECURITIES BY CLOSED-END MANAGEMENT INVESTMENT COMPANY AND AFFILIATED PURCHASERS.
Not applicable.
ITEM 10. SUBMISSION OF MATTERS TO A VOTE OF SECURITY HOLDERS.
The Trust has made no material changes to the procedures by which shareholders may recommend nominees to the Trust’s Board of Trustees since the Trust last disclosed such procedures in Schedule 14A.
ITEM 11. CONTROLS AND PROCEDURES.
(a) Based upon an evaluation within 90 days of the filing date of this report, the principal executive and financial officers concluded that the disclosure controls and procedures of the Trust are effective.
(b) There were no changes in the Trust’s internal control over financial reporting during the second fiscal quarter of the period covered by this report that has materially affected, or is reasonably likely to materially affect, the Trust’s internal control over financial reporting.
ITEM 12. EXHIBITS.
(a)(1) Filed herewith as EX-99.CODE ETH.
(a)(2) A separate certification for each principal executive officer and principal financial officer of the Trust as required by Rule 30a-2(a) under the Investment Company Act of 1940 is attached hereto as EX-99.CERT.
(a)(3) Not applicable.
(b) The certifications required by Rule 30a-2(b) under the Investment Company Act of 1940 are attached hereto as EX-99.906CERT.
SIGNATURES
Pursuant to the requirements of the Securities Exchange Act of 1934 and the Investment Company Act of 1940, the registrant has duly caused this report to be signed on its behalf by the undersigned, thereunto duly authorized.
(Registrant): American Beacon Funds
| By | /s/ Gene L. Needles, Jr. | |
| Gene L. Needles, Jr. | ||
| President | ||
| American Beacon Funds | ||
Date: March 10, 2017
Pursuant to the requirements of the Securities Exchange Act of 1934 and the Investment Company Act of 1940, this report has been signed below by the following persons on behalf of the registrant and in the capacities and on the dates indicated.
| By | /s/ Gene L. Needles, Jr. | |
| Gene L. Needles, Jr. | ||
| President | ||
| American Beacon Funds | ||
Date: March 10, 2017
| By | /s/ Melinda G. Heika | |
| Melinda G. Heika | ||
| Treasurer | ||
| American Beacon Funds | ||
Date: March 10, 2017