UNITED STATES
SECURITIES AND EXCHANGE COMMISSION
Washington, D.C. 20549
FORM N-CSRS
CERTIFIED SHAREHOLDER REPORT OF REGISTERED
MANAGEMENT INVESTMENT COMPANIES
Investment Company Act file number: 811-04984
AMERICAN BEACON FUNDS
(Exact name of registrant as specified in charter)
4151 Amon Carter Boulevard, MD 2450
Fort Worth, Texas 76155
(Address of principal executive offices)-(Zip code)
Gene L. Needles, Jr., PRESIDENT
4151 Amon Carter Boulevard, MD 2450
Fort Worth, Texas 76155
(Name and address of agent for service)
Registrant’s telephone number, including area code: (817) 391-6100
Date of fiscal year end: December 31, 2013
Date of reporting period: June 30, 2013
ITEM 1. REPORTS TO STOCKHOLDERS.
The Bridgeway Large Cap Value Fund may invest in futures contracts, which are a type of derivative investment. Investing in derivatives could result in losing more than the amount invested. Investing in foreign securities entails additional risk not associated with domestic securities, such as currency fluctuations, economic and political instability and differences in accounting standards. The intrinsic value of stocks selected for the Fund may never be realized by the market, and the prices of value stocks may go down. While investing in value stocks may limit downside risk over time, the Fund may produce more modest gains than riskier stock funds as a trade-off for this potentially lower risk. The Holland Large Cap Growth Fund may invest in futures contracts, which are a type of derivative investment. Investing in derivatives could result in losing more than the amount invested. Investing in foreign securities entails additional risk not associated with domestic securities, such as currency fluctuations, economic and political instability and differences in accounting standards. Growth stocks typically are more volatile than value stocks; however, value stocks have a lower expected growth rate in earnings and sales. Because the Fund may invest in fewer companies than a more diversified portfolio, the fluctuating value of a single holding may have a greater impact on the value of the Fund. The Stephens Mid-Cap Growth and Stephens Small Cap Growth Funds may invest in futures contracts, which are a type of derivative investment. Investing in derivatives could result in losing more than the amount invested. Investing in foreign securities entails additional risk not associated with domestic securities, such as currency fluctuations, economic and political instability and differences in accounting standards. Investing in the securities of small and mid-capitalization companies involves greater risk and the possibility of greater price volatility than investing in larger capitalization and more established companies. Growth stocks typically are more volatile than value stocks; however, value stocks have a lower expected growth rate in earnings and sales. Please see the prospectus for a complete discussion of each Fund’s risks. There can be no assurances that the investment objectives of these Funds will be met.
Any opinions herein, including forecasts, reflect our judgment as of the end of the reporting period and are subject to change. The advisor’s strategies and the Fund’s portfolio composition will change depending on economic and market conditions. This report is not a complete analysis of market conditions and therefore, should not be relied upon as investment advice. Although economic and market information has been compiled from reliable sources, American Beacon Advisors, Inc. makes no representation as to the completeness or accuracy of the statements contained herein.
| American Beacon Funds | June 30, 2013 |

Even within a strong landscape for equities, we can see a significant amount of variation. That puts a premium on careful stock selection. American Beacon Advisors is proud to offer several equity funds that are sub-advised by some of the most highly respected investment teams in the nation.
For the six-month period ended June 30, 2013:
| • | American Beacon Bridgeway Large Cap Value Fund (Institutional Class) returned 17.35%. |
| • | American Beacon Holland Large Cap Growth Fund (Institutional Class) returned 13.05%. |
| • | American Beacon Stephens Small Cap Growth Fund (Institutional Class) returned 17.53%. |
| • | American Beacon Stephens Mid-Cap Growth Fund (Institutional Class) returned 13.02%. |
Thank you for your continued investment in the American Beacon Funds. For additional information about the Funds or to access your account information, please visit our website at www.americanbeaconfunds.com.
| Best Regards, |

|
| Gene L. Needles, Jr. |
| President |
| American Beacon Funds |
1
American Beacon Bridgeway Large Cap Value FundSM
June 30, 2013 (Unaudited)
2
American Beacon Bridgeway Large Cap Value FundSM
Performance Overview
June 30, 2013 (Unaudited)
3
American Beacon Holland Large Cap Growth FundSM
Performance Overview
June 30, 2013 (Unaudited)
4
American Beacon Holland Large Cap Growth FundSM
Performance Overview
June 30, 2013 (Unaudited)
5
American Beacon Stephens Small Cap Growth FundSM
Performance Overview
June 30, 2013 (Unaudited)
6
American Beacon Stephens Small Cap Growth FundSM
Performance Overview
June 30, 2013 (Unaudited)
7
American Beacon Stephens Mid-Cap Growth FundSM
Performance Overview
June 30, 2013 (Unaudited)
8
American Beacon Stephens Mid-Cap Growth FundSM
Performance Overview
June 30, 2013 (Unaudited)
9
American Beacon FundSM
Fund Expenses
June 30, 2013 (Unaudited)
Fund Expense Example
As a shareholder of the Fund, you incur two types of costs: (1) transaction costs, including sales charges (loads) on purchase payments and (2) ongoing costs, including management fees, administrative service fees, distribution (12b-1) fees, and other Fund expenses. The examples below are intended to help you understand the ongoing cost (in dollars) of investing in the Fund and to compare these costs with the ongoing costs of investing in other mutual funds.
The examples are based on an investment of $1,000 invested at the beginning of the period in each Class and held for the entire period from January 1, 2013 through June 30, 2013.
Actual Expenses
The “Actual” lines of the table provide information about actual account values and actual expenses. You may use the information in this line, together with the amount you invested, to estimate the expenses that you paid over the period. Simply divide your account value by $1,000 (for example, an $8,600 account value divided by $1,000 = 8.6), then multiply the result by the number in the first line under the heading “Expenses Paid During Period” to estimate the expenses you paid on your account during this period. Shareholders of the Investor and Institutional Classes that invest in the Fund through an IRA or Roth IRA may be subject to a custodial IRA fee of $15 that is typically deducted each December. If your account was subject to a custodial IRA fee during the period, your costs would have been $15 higher.
Hypothetical Example for Comparison Purposes
The “Hypothetical” lines of the table provide information about hypothetical account values and hypothetical expenses based on the Fund’s actual expense ratio and an assumed 5% per year rate of return before expenses (not the Fund’s actual return). You may compare the ongoing costs of investing in the Fund with other funds by contrasting this 5% hypothetical example and the 5% hypothetical examples that appear in the shareholder reports of the other funds. The hypothetical account values and expenses may not be used to estimate the actual ending account balance or expenses you paid for the period. Shareholders of the Investor and Institutional Classes that invest in the Fund through an IRA or Roth IRA may be subject to a custodial IRA fee of $15 that is typically deducted each December. If your account was subject to a custodial IRA fee during the period, your costs would have been $15 higher.
You should also be aware that the expenses shown in the table highlight only your ongoing costs and do not reflect any transaction costs charged by the Fund, such as sales charges (loads). Similarly, the expense examples for other funds do not reflect any transaction costs charged by those funds, such as sales charges (loads), redemption fees or exchange fees. Therefore, the “Hypothetical” lines of the table are useful in comparing ongoing costs only and will not help you determine the relative total costs of owning different funds. If you were subject to any transaction costs during the period, your costs would have been higher.
10
American Beacon FundSM
Fund Expenses
June 30, 2013 (Unaudited)
11
American Beacon Bridgeway Large Cap Value FundSM
Schedule of Investments
June 30, 2013 (Unaudited)
See accompanying notes
12
American Beacon Bridgeway Large Cap Value FundSM
Schedule of Investments
June 30, 2013 (Unaudited)
13
American Beacon Bridgeway Large Cap Value FundSM
Schedule of Investments
June 30, 2013 (Unaudited)
Percentages are stated as a percent of net assets.
| A | Non-income producing security. |
| B | REIT—Real Estate Investment Trust. |
Futures Contracts Open on June 30, 2013 (000’s):
| Description |
Type | Number of Contracts |
Expiration Date | Contract Value | Unrealized Appreciation (Depreciation) |
|||||||||||||||
| S&P 500 Mini E Index Futures |
Long | 21 | September, 2013 | $ | 1,679 | $ | 2 | |||||||||||||
|
|
|
|
|
|||||||||||||||||
| $ | 1,679 | $ | 2 | |||||||||||||||||
|
|
|
|
|
|||||||||||||||||
See accompanying notes
14
American Beacon Holland Large Cap Growth FundSM
Schedule of Investments
June 30, 2013 (Unaudited)
15
American Beacon Holland Large Cap Growth FundSM
Schedule of Investments
June 30, 2013 (Unaudited)
Percentages are stated as a percent of net assets.
| A | Non-income producing security. |
Futures Contracts Open on June 30, 2013 (000’s):
| Description |
Type | Number of Contracts |
Expiration Date | Contract Value | Unrealized Appreciation (Depreciation) |
|||||||||||||||
| S&P 500 Mini E Index Futures |
Long | 19 | September, 2013 | $ | 1,519 | $ | (22 | ) | ||||||||||||
|
|
|
|
|
|||||||||||||||||
| $ | 1,519 | $ | (22 | ) | ||||||||||||||||
|
|
|
|
|
|||||||||||||||||
See accompanying notes
16
American Beacon Stephens Small Cap Growth FundSM
Schedule of Investments
June 30, 2013 (Unaudited)
17
American Beacon Stephens Small Cap Growth FundSM
Schedule of Investments
June 30, 2013 (Unaudited)
See accompanying notes
18
American Beacon Stephens Mid-Cap Growth FundSM
Schedule of Investments
June 30, 2013 (Unaudited)
19
American Beacon Stephens Mid-Cap Growth FundSM
Schedule of Investments
June 30, 2013 (Unaudited)
| See accompanying notes 20 |
American Beacon FundsSM
Statements of Assets and Liabilities
June 30, 2013 (Unaudited) (in thousands, except share and per share amounts)
| Bridgeway Large Cap Value Fund |
Holland Large Cap Growth Fund |
Stephens Small Cap Growth Fund |
Stephens Mid- Cap Growth Fund |
|||||||||||||
| Assets: |
||||||||||||||||
| Investments in unaffiliated securities, at fair value A C |
$ | 65,867 | $ | 73,884 | $ | 369,345 | $ | 75,199 | ||||||||
| Investments in affiliated securities, at fair value B |
— | — | 27,703 | — | ||||||||||||
| Deposits with brokers for futures contracts |
70 | 67 | — | — | ||||||||||||
| Receivable for investments sold |
420 | — | 1,090 | 70 | ||||||||||||
| Dividends and interest receivable |
71 | 28 | 34 | 10 | ||||||||||||
| Receivable for fund shares sold |
520 | 19 | 15,329 | 361 | ||||||||||||
| Receivable for tax reclaims |
— | — | 1 | — | ||||||||||||
| Receivable for expense reimbursement (Note 2) |
12 | 7 | 13 | 7 | ||||||||||||
| Prepaid expenses |
25 | 13 | 65 | 38 | ||||||||||||
|
|
|
|
|
|
|
|
|
|||||||||
| Total assets |
66,985 | 74,018 | 413,580 | 75,685 | ||||||||||||
|
|
|
|
|
|
|
|
|
|||||||||
| Liabilities: |
||||||||||||||||
| Payable for investments purchased |
637 | — | 18,551 | — | ||||||||||||
| Payable upon return of securities loaned |
— | — | 35,692 | — | ||||||||||||
| Payable for fund shares redeemed |
2 | 16 | 2,345 | 4 | ||||||||||||
| Payable for variation margin from open futures contracts |
8 | 7 | — | — | ||||||||||||
| Management and investment advisory fees payable |
59 | 77 | 525 | 92 | ||||||||||||
| Administrative service and service fees payable |
21 | 41 | 131 | 31 | ||||||||||||
| Transfer agent fees payable |
5 | 2 | 5 | 5 | ||||||||||||
| Custody and fund accounting fees payable |
— | 1 | 5 | 2 | ||||||||||||
| Professional fees payable |
7 | 6 | 6 | 10 | ||||||||||||
| Trustee fees payable |
— | — | — | 2 | ||||||||||||
| Payable for prospectus and shareholder reports |
— | 11 | 4 | 7 | ||||||||||||
| Other liabilities |
— | 1 | — | — | ||||||||||||
|
|
|
|
|
|
|
|
|
|||||||||
| Total liabilities |
739 | 162 | 57,264 | 153 | ||||||||||||
|
|
|
|
|
|
|
|
|
|||||||||
| Net Assets |
$ | 66,246 | $ | 73,856 | $ | 356,316 | $ | 75,532 | ||||||||
|
|
|
|
|
|
|
|
|
|||||||||
| Analysis of Net Assets: |
||||||||||||||||
| Paid-in-capital |
55,489 | 47,293 | 293,062 | 58,732 | ||||||||||||
| Undistributed net investment income |
229 | 6 | 94 | (142 | ) | |||||||||||
| Accumulated net realized gain |
1,821 | 4,122 | 6,654 | 1,927 | ||||||||||||
| Unrealized appreciation of investments and futures contracts |
8,707 | 22,435 | 56,506 | 15,015 | ||||||||||||
|
|
|
|
|
|
|
|
|
|||||||||
| Net assets |
$ | 66,246 | $ | 73,856 | $ | 356,316 | $ | 75,532 | ||||||||
|
|
|
|
|
|
|
|
|
|||||||||
| Shares outstanding at no par value (unlimited shares authorized): |
||||||||||||||||
| Institutional Class |
2,162,435 | 77,837 | 12,863,261 | 2,164,576 | ||||||||||||
|
|
|
|
|
|
|
|
|
|||||||||
| Y Class |
354,757 | 4,758 | 1,365,886 | 61,882 | ||||||||||||
|
|
|
|
|
|
|
|
|
|||||||||
| Investor Class |
547,808 | 2,911,626 | 9,066,846 | 1,651,304 | ||||||||||||
|
|
|
|
|
|
|
|
|
|||||||||
| A Class |
465,279 | 23,584 | 471,573 | 685,894 | ||||||||||||
|
|
|
|
|
|
|
|
|
|||||||||
| C Class |
38,250 | 22,644 | 80,211 | 46,151 | ||||||||||||
|
|
|
|
|
|
|
|
|
|||||||||
| Net assets (not in thousands): |
||||||||||||||||
| Institutional Class |
$ | 40,221,397 | $ | 1,901,402 | $ | 195,755,190 | $ | 37,463,083 | ||||||||
|
|
|
|
|
|
|
|
|
|||||||||
| Y Class |
$ | 6,587,983 | $ | 116,111 | $ | 20,768,746 | $ | 1,071,010 | ||||||||
|
|
|
|
|
|
|
|
|
|||||||||
| Investor Class |
$ | 10,143,753 | $ | 70,726,252 | $ | 131,807,531 | $ | 25,643,623 | ||||||||
|
|
|
|
|
|
|
|
|
|||||||||
| A Class |
$ | 8,593,057 | $ | 570,184 | $ | 6,834,152 | $ | 10,644,747 | ||||||||
|
|
|
|
|
|
|
|
|
|||||||||
| C Class |
$ | 700,143 | $ | 541,985 | $ | 1,150,806 | $ | 709,524 | ||||||||
|
|
|
|
|
|
|
|
|
|||||||||
| Net asset value, offering and redemption price per share: |
||||||||||||||||
| Institutional Class |
$ | 18.60 | $ | 24.43 | $ | 15.22 | $ | 17.31 | ||||||||
|
|
|
|
|
|
|
|
|
|||||||||
| Y Class |
$ | 18.57 | $ | 24.41 | $ | 15.21 | $ | 17.31 | ||||||||
|
|
|
|
|
|
|
|
|
|||||||||
| Investor Class |
$ | 18.52 | $ | 24.29 | $ | 14.54 | $ | 15.53 | ||||||||
|
|
|
|
|
|
|
|
|
|||||||||
| A Class |
$ | 18.47 | $ | 24.18 | $ | 14.49 | $ | 15.52 | ||||||||
|
|
|
|
|
|
|
|
|
|||||||||
| A Class (offering price) |
$ | 19.60 | $ | 25.66 | $ | 15.38 | $ | 16.47 | ||||||||
|
|
|
|
|
|
|
|
|
|||||||||
| C Class |
$ | 18.30 | $ | 23.94 | $ | 14.35 | $ | 15.37 | ||||||||
|
|
|
|
|
|
|
|
|
|||||||||
| A Cost of investments in unaffiliated securities |
$ | 57,162 | $ | 51,427 | $ | 312,849 | $ | 60,184 | ||||||||
| B Cost of investments in affiliated securities |
$ | — | $ | — | $ | 27,703 | $ | — | ||||||||
| C Fair value of securities on loan |
$ | — | $ | — | $ | 34,837 | $ | — | ||||||||
21
American Beacon FundsSM
Statements of Operations
For the Six Months Ended June 30, 2013 (Unaudited) (in thousands)
| Bridgeway Large Cap Value Fund |
Holland Large Cap Growth Fund |
Stephens Small Cap Growth Fund |
Stephens Mid-Cap Growth Fund |
|||||||||||||
| Investment Income: |
||||||||||||||||
| Dividend income from unaffiliated securities (net of foreign taxes) A |
$ | 449 | $ | 377 | $ | 303 | $ | 137 | ||||||||
| Income derived from securities lending, net |
— | — | 142 | — | ||||||||||||
|
|
|
|
|
|
|
|
|
|||||||||
| Total investment income |
449 | 377 | 445 | 137 | ||||||||||||
|
|
|
|
|
|
|
|
|
|||||||||
| Expenses: |
||||||||||||||||
| Management and investment advisory fees (Note 2) |
101 | 160 | 979 | 180 | ||||||||||||
| Administrative service fees (Note 2): |
||||||||||||||||
| Institutional Class |
52 | 3 | 248 | 52 | ||||||||||||
| Y Class |
1 | — | 16 | 1 | ||||||||||||
| Investor Class |
6 | 105 | 144 | 32 | ||||||||||||
| A Class |
10 | 1 | 9 | 18 | ||||||||||||
| C Class |
1 | 1 | 2 | 1 | ||||||||||||
| Transfer agent fees: |
||||||||||||||||
| Institutional Class |
13 | — | 18 | 7 | ||||||||||||
| Y Class |
— | — | — | 1 | ||||||||||||
| Investor Class |
1 | 5 | 2 | 3 | ||||||||||||
| A Class |
— | — | — | 1 | ||||||||||||
| C Class |
— | — | — | 1 | ||||||||||||
| Custody and fund accounting fees |
5 | 6 | 12 | 3 | ||||||||||||
| Professional fees |
20 | 14 | 25 | 21 | ||||||||||||
| Registration fees and expenses |
49 | 57 | 54 | 46 | ||||||||||||
| Service fees (Note 2): |
||||||||||||||||
| Y Class |
— | — | 5 | — | ||||||||||||
| Investor Class |
7 | 131 | 180 | 40 | ||||||||||||
| A Class |
4 | — | 3 | 7 | ||||||||||||
| C Class |
— | — | 1 | — | ||||||||||||
| Distribution fees (Note 2): |
||||||||||||||||
| A Class |
6 | 1 | 6 | 12 | ||||||||||||
| C Class |
1 | 2 | 4 | 2 | ||||||||||||
| Prospectus and shareholder report expenses |
8 | 10 | 18 | 7 | ||||||||||||
| Trustee fees |
1 | 3 | 6 | 2 | ||||||||||||
| Other expenses |
2 | 3 | 5 | 3 | ||||||||||||
|
|
|
|
|
|
|
|
|
|||||||||
| Total expenses |
288 | 502 | 1,737 | 440 | ||||||||||||
|
|
|
|
|
|
|
|
|
|||||||||
| Net fees waived and expenses reimbursed (Note 2) |
(76 | ) | (41 | ) | (75 | ) | (45 | ) | ||||||||
|
|
|
|
|
|
|
|
|
|||||||||
| Net expenses |
212 | 461 | 1,662 | 395 | ||||||||||||
|
|
|
|
|
|
|
|
|
|||||||||
| Net investment income |
237 | (84 | ) | (1,217 | ) | (258 | ) | |||||||||
|
|
|
|
|
|
|
|
|
|||||||||
| Realized and unrealized gain (loss) from investments: |
||||||||||||||||
| Net realized gain (loss) from: |
||||||||||||||||
| Investments |
1,529 | 3,598 | 7,187 | 1,939 | ||||||||||||
| Commission recapture (Note 3) |
— | 2 | — | — | ||||||||||||
| Futures contracts |
(101 | ) | 234 | — | — | |||||||||||
| Change in net unrealized appreciation or (depreciation) of: |
||||||||||||||||
| Investments |
3,968 | 5,033 | 36,634 | 6,099 | ||||||||||||
| Futures contracts |
3 | (33 | ) | — | — | |||||||||||
|
|
|
|
|
|
|
|
|
|||||||||
| Net gain from investments |
5,399 | 8,834 | 43,821 | 8,038 | ||||||||||||
|
|
|
|
|
|
|
|
|
|||||||||
| Net increase in net assets resulting from operations |
$ | 5,636 | $ | 8,750 | $ | 42,604 | $ | 7,780 | ||||||||
|
|
|
|
|
|
|
|
|
|||||||||
| A Foreign taxes |
$ | — | $ | 2 | $ | — | $ | 1 | ||||||||
See accompanying notes
22
American Beacon FundsSM
Statements of Changes of Net Assets (in thousands)
| Bridgeway Large Cap Value Fund | Holland Large Cap Growth Fund |
|||||||||||||||||||
| Six Months Ended June 30, 2013 |
Six Months Ended Dec. 31, 2012 |
Year Ended June 30, 2012 |
Six Months Ended June 30, 2013 |
Year Ended Dec. 31, 2012 |
||||||||||||||||
| (unaudited) | (unaudited) | |||||||||||||||||||
| Increase (Decrease) in Net Assets: |
||||||||||||||||||||
| Operations: |
||||||||||||||||||||
| Net investment income (loss) |
$ | 237 | $ | 317 | $ | 455 | $ | (84 | ) | $ | 55 | |||||||||
| Net realized gain from investments and futures contracts |
1,428 | 1,722 | 2,132 | 3,834 | 4,191 | |||||||||||||||
| Change in net unrealized appreciation or (depreciation) from investments and futures contracts |
3,971 | 345 | (1,989 | ) | 5,000 | 2,958 | ||||||||||||||
|
|
|
|
|
|
|
|
|
|
|
|||||||||||
| Net increase in net assets resulting from operations |
5,636 | 2,384 | 598 | 8,750 | 7,204 | |||||||||||||||
|
|
|
|
|
|
|
|
|
|
|
|||||||||||
| Distributions to Shareholders: |
||||||||||||||||||||
| Net investment income: |
||||||||||||||||||||
| Institutional Class |
— | (486 | ) | (357 | )A | — | (6 | ) | ||||||||||||
| Y Class |
— | (1 | ) | — | — | — | ||||||||||||||
| Investor Class |
— | (8 | ) | — | — | (41 | ) | |||||||||||||
| A Class |
— | (6 | ) | — | — | (1 | ) | |||||||||||||
| C Class |
— | — | — | — | (1 | ) | ||||||||||||||
| Net realized gain from investments: |
||||||||||||||||||||
| Institutional Class |
— | — | — | — | (84 | ) | ||||||||||||||
| Y Class |
— | — | — | — | (1 | ) | ||||||||||||||
| Investor Class |
— | — | — | — | (3,479 | ) | ||||||||||||||
| A Class |
— | — | — | — | (27 | ) | ||||||||||||||
| C Class |
— | — | — | — | (15 | ) | ||||||||||||||
|
|
|
|
|
|
|
|
|
|
|
|||||||||||
| Net distributions to shareholders |
— | (501 | ) | (357 | ) | — | (3,655 | ) | ||||||||||||
|
|
|
|
|
|
|
|
|
|
|
|||||||||||
| Net increase (decrease) in net assets from capital share transactions |
33,085 | (1,818 | ) | (2,428 | ) | (3,852 | ) | 5,522 | ||||||||||||
|
|
|
|
|
|
|
|
|
|
|
|||||||||||
| Net increase (decrease) in net assets |
38,721 | 65 | (2,187 | ) | 4,898 | 9,071 | ||||||||||||||
|
|
|
|
|
|
|
|
|
|
|
|||||||||||
| Net Assets: |
||||||||||||||||||||
| Beginning of period |
27,525 | 27,460 | 29,647 | 68,958 | 59,887 | |||||||||||||||
|
|
|
|
|
|
|
|
|
|
|
|||||||||||
| End of Period * |
$ | 66,246 | $ | 27,525 | $ | 27,460 | $ | 73,856 | $ | 68,958 | ||||||||||
|
|
|
|
|
|
|
|
|
|
|
|||||||||||
| *Includes undistributed net investment income (loss) of |
$ | 229 | $ | 13 | $ | 200 | $ | 6 | $ | 6 | ||||||||||
|
|
|
|
|
|
|
|
|
|
|
|||||||||||
| A Formerly known as Class N |
||||||||||||||||||||
See accompanying notes
23
American Beacon FundsSM
Statements of Changes in Net Assets (in thousands)
| Stephens Small Cap Growth Fund | Stephens Mid-Cap Growth Fund | |||||||||||||||||||||||
| Six Months Ended June 30, 2013 |
One Month Ended Dec. 31, 2012 |
Year Ended Nov. 30, 2012 |
Six Months Ended June 30, 2013 |
One Month Ended Dec. 31, 2012 |
Year Ended Nov. 30, 2012 |
|||||||||||||||||||
| (unaudited) | (unaudited) | |||||||||||||||||||||||
| Increase (Decrease) in Net Assets: |
||||||||||||||||||||||||
| Operations: |
||||||||||||||||||||||||
| Net investment income (loss) |
$ | (1,217 | ) | $ | 95 | $ | (1,077 | ) | $ | (258 | ) | $ | 72 | $ | (274 | ) | ||||||||
| Net realized gain from investments and futures contracts |
7,187 | 254 | 13,655 | 1,939 | 64 | 1,325 | ||||||||||||||||||
| Change in net unrealized appreciation or (depreciation) from investments and futures contracts |
36,634 | 3,482 | (1,894 | ) | 6,099 | 665 | 3,884 | |||||||||||||||||
|
|
|
|
|
|
|
|
|
|
|
|
|
|||||||||||||
| Net increase in net assets resulting from operations |
42,604 | 3,831 | 10,684 | 7,780 | 801 | 4,935 | ||||||||||||||||||
|
|
|
|
|
|
|
|
|
|
|
|
|
|||||||||||||
| Distributions to Shareholders: |
||||||||||||||||||||||||
| Net investment income: |
||||||||||||||||||||||||
| Institutional Class |
— | — | — | A | — | — | — | A | ||||||||||||||||
| Investor Class |
— | — | — | B | — | — | — | B | ||||||||||||||||
| Net realized gain from investments: |
||||||||||||||||||||||||
| Institutional Class |
(500 | ) | (6,551 | ) | (4,196 | )A | (144 | ) | (157 | ) | — | A | ||||||||||||
| Y Class |
(29 | ) | (281 | ) | — | (4 | ) | (1 | ) | — | ||||||||||||||
| Investor Class |
(337 | ) | (4,449 | ) | (3,533 | )B | (94 | ) | (109 | ) | — | B | ||||||||||||
| A Class |
(15 | ) | (196 | ) | — | (44 | ) | (42 | ) | — | ||||||||||||||
| C Class |
(3 | ) | (22 | ) | — | (2 | ) | (2 | ) | — | ||||||||||||||
|
|
|
|
|
|
|
|
|
|
|
|
|
|||||||||||||
| Net distributions to shareholders |
(884 | ) | (11,499 | ) | (7,729 | ) | (288 | ) | (311 | ) | — | |||||||||||||
|
|
|
|
|
|
|
|
|
|
|
|
|
|||||||||||||
| Net increase in net assets from capital share transactions |
106,425 | 53,535 | 59,912 | 10,472 | 1,051 | 17,851 | ||||||||||||||||||
|
|
|
|
|
|
|
|
|
|
|
|
|
|||||||||||||
| Net increase in net assets |
148,145 | 45,867 | 62,867 | 17,964 | 1,541 | 22,786 | ||||||||||||||||||
|
|
|
|
|
|
|
|
|
|
|
|
|
|||||||||||||
| Net Assets: |
||||||||||||||||||||||||
| Beginning of period |
208,171 | 162,304 | 99,437 | 57,568 | 56,027 | 33,241 | ||||||||||||||||||
|
|
|
|
|
|
|
|
|
|
|
|
|
|||||||||||||
| End of Period * |
$ | 356,316 | $ | 208,171 | $ | 162,304 | $ | 75,532 | $ | 57,568 | $ | 56,027 | ||||||||||||
|
|
|
|
|
|
|
|
|
|
|
|
|
|||||||||||||
| *Includes undistributed net investment income (loss) of |
$ | 94 | $ | 95 | $ | — | $ | (142 | ) | $ | 72 | $ | — | |||||||||||
|
|
|
|
|
|
|
|
|
|
|
|
|
|||||||||||||
| A | Formerly known as Class I. |
| B | Formerly known as Class A. |
See accompanying notes
24
American Beacon FundsSM
Notes to Financial Statements
June 30, 2013 (Unaudited)
1. Organization and Significant Accounting Policies
American Beacon Funds (the “Trust”), which is comprised of twenty-four Funds, is organized as a Massachusetts business trust and is registered under the Investment Company Act of 1940, as amended (the “Act”), as a diversified, open-end management investment company. These financial statements and notes to the financial statements relate to the American Beacon Bridgeway Large Cap Value Fund, the American Beacon Holland Large Cap Growth Fund, the American Beacon Stephens Small Cap Growth Fund, and the American Beacon Stephens Mid-Cap Growth Fund, (each a “Fund” and collectively, the “Funds”), each a series of the Trust.
American Beacon Advisors, Inc. (the “Manager”) is a wholly-owned subsidiary of Lighthouse Holdings, Inc. and was organized in 1986 to provide business management, advisory, administrative and asset management consulting services to the Trust and other investors.
Class Disclosure
The Funds have multiple classes of shares designed to meet the needs of different groups of investors. The following table sets forth the differences amongst the classes:
| Class: |
Offered to: | |
| Institutional Class |
Investors making an initial investment of $250,000 | |
| Y Class |
Investors making an initial investment of $100,000 | |
| Investor Class |
General public and investors investing directly or through an intermediary | |
| A Class |
General public and investors investing through an intermediary with applicable sales charges | |
| C Class |
General public and investors investing through an intermediary with applicable sales charges |
Each class offered by the Trust has equal rights as to assets and voting privileges. Income and non-class specific expenses are allocated daily to each class on the basis of the relative net assets. Realized and unrealized capital gains and losses of each class are allocated daily based on the relative net assets of each class of the respective Fund. Class specific expenses, where applicable, currently include administrative service fees, service fees, and distribution fees and vary amongst the classes as described more fully in Note 2.
2. Transactions with Affiliates
Management Agreement
The Trust and the Manager are parties to a Management Agreement that obligates the Manager to provide or oversee the provision of all investment advisory, fund management, and securities lending services. As compensation for performing the duties required under the Management Agreement, the Manager receives from the Funds an annualized fee equal to 0.05% of the average daily net assets plus amounts paid by the Manager to the unaffiliated investment advisors hired by the Manager to direct investment activities for the Funds. Management fees paid by the Funds during the six months ended June 30, 2013 were as follows (in thousands):
| Management Fee Rate |
Management Fee |
Amounts paid to Investment Advisors |
Net Amounts Retained by Manager |
|||||||||||||
| Bridgeway Large Cap Value |
0.44 | % | $ | 101 | $ | 89 | $ | 12 | ||||||||
| Holland Large Cap Growth |
0.44 | % | 160 | 142 | 18 | |||||||||||
| Stephens Small Cap Growth |
0.70 | % | 979 | 894 | 85 | |||||||||||
| Stephens Mid-Cap Growth |
0.54 | % | 180 | 163 | 17 | |||||||||||
25
American Beacon FundsSM
Notes to Financial Statements
June 30, 2013 (Unaudited)
Administrative Services Agreement
The Manager and the Trust entered into an Administrative Services Agreement which obligates the Manager to provide or oversee administrative services to the Fund. As compensation for performing the duties required under the Administrative Services Agreement, the Manager receives an annualized fee of 0.30% of the average daily net assets of the Institutional, Y, and Investor Classes of the Fund and 0.40% of the average daily net assets of the A and C Classes of the Fund.
Distribution Plans
The Fund, except for the A, and C Classes of the Fund, has adopted a “defensive” Distribution Plan (the “Plan”) in accordance with Rule 12b-1 under the Act, pursuant to which no separate fees will be charged to the Fund for distribution purposes. However, the Plan authorizes the management and administrative service fees received by the Manager and the investment advisors hired by the Manager to be used for distribution purposes. Under this Plan, the Fund does not intend to compensate the Manager or any other party, either directly or indirectly, for the distribution of Fund shares.
Separate Distribution Plans (the “Distribution Plans”) have been adopted pursuant to Rule 12b-1 under the Act for the A and C Classes of the Fund. Under the Distribution Plans, as compensation for distribution assistance, the Manager receives an annual fee of 0.25% of the average daily net assets of the A Class and 1.00% of the average daily net assets of the C Class. The fee will be payable without regard to whether the amount of the fee is more or less than the actual expenses incurred in a particular month by the Manager for distribution assistance.
Service Plans
The Manager and the Trust entered into Service Plans that obligate the Manager to oversee additional shareholder servicing of the Y, Investor, A, and C Classes. As compensation for performing the duties required under the Service Plans, the Manager receives 0.10% of the average daily net assets of the Y Class, 0.15% of the average daily net assets of the A and C Classes, and up to 0.375% of the average daily net assets of the Investor Class of the Fund.
Investment in Affiliated Funds
The Funds may invest in the American Beacon Money Market Select Fund or the U.S. Government Money Market Select Fund (the “USG Select Fund”) (collectively, the “Select Funds”). The Select Funds and the Funds have the same investment advisor and therefore, are considered to be affiliated. The Manager serves as investment advisor to the Select Funds and receives from the Select Funds an annualized fee up to 0.09% of the average daily net assets of the Select Fund. During the six months ended June 30, 2013, the Manager earned $11,034 from the Stephens Small Cap Growth Fund’s investment in the Select Funds.
Interfund Lending Program
Pursuant to an exemptive order issued by the Securities and Exchange Commission (“SEC”), the Fund, along with other registered investment companies having management contracts with the Manager, may participate in an interfund lending program. This program provides an alternative credit facility allowing the Fund to borrow from other participating Funds. During the six months ended June 30, 2013, the Stephens Mid-Cap Growth Fund borrowed from the American Beacon Large Cap Value Fund $431,989 for one day at 0.81% with interest charges of $9.49 and the American Beacon Short-Term Bond Fund $246,690 for one day at 0.79% with interest charges of $5.34.
26
American Beacon FundsSM
Notes to Financial Statements
June 30, 2013 (Unaudited)
Expense Reimbursement Plan
The Manager contractually agreed to reimburse the following Funds to the extent that total annual fund operating expenses exceeded the Funds’ expense cap. For the period ended June 30, 2013, the Manager waived or reimbursed expenses as follows:
| Fund |
Class | Expense Cap | Waived or Reimbursed Expenses | Expiration | ||||||||||
| Bridgeway Large Cap Value |
Institutional | 0.84 | % | $ | 63,453 | 2016 | ||||||||
| Bridgeway Large Cap Value |
Y | 0.94 | % | 857 | 2016 | |||||||||
| Bridgeway Large Cap Value |
Investor | 1.22 | % | 5,496 | 2016 | |||||||||
| Bridgeway Large Cap Value |
A | 1.34 | % | 6,107 | 2016 | |||||||||
| Bridgeway Large Cap Value |
C | 2.09 | % | 346 | 2016 | |||||||||
| Holland Large Cap Growth |
Institutional | 0.89 | % | 1,275 | 2016 | |||||||||
| Holland Large Cap Growth |
Y | 0.99 | % | 41 | 2016 | |||||||||
| Holland Large Cap Growth |
Investor | 1.27 | % | 39,202 | 2016 | |||||||||
| Holland Large Cap Growth |
A | 1.39 | % | 262 | 2016 | |||||||||
| Holland Large Cap Growth |
C | 2.14 | % | 180 | 2016 | |||||||||
| Stephens Small Cap Growth |
Institutional | 1.09 | % | 20,648 | 2016 | |||||||||
| Stephens Small Cap Growth |
Y | 1.19 | % | 91 | 2016 | |||||||||
| Stephens Small Cap Growth |
Investor | 1.35 | % | 53,928 | 2016 | |||||||||
| Stephens Small Cap Growth |
A | 1.59 | % | 76 | 2016 | |||||||||
| Stephens Small Cap Growth |
C | 2.34 | % | 4 | 2016 | |||||||||
| Stephens Mid-Cap Growth |
Institutional | 0.99 | % | 24,437 | 2016 | |||||||||
| Stephens Mid-Cap Growth |
Y | 1.09 | % | 1,178 | 2016 | |||||||||
| Stephens Mid-Cap Growth |
Investor | 1.37 | % | 12,840 | 2016 | |||||||||
| Stephens Mid-Cap Growth |
A | 1.49 | % | 5,916 | 2016 | |||||||||
| Stephens Mid-Cap Growth |
C | 2.24 | % | 1,118 | 2016 | |||||||||
Of these amounts, $11,956, $7,013, $13,389 and $6,864 were receivable from the Manager at June 30, 2013 for the Bridgeway Large Cap Value, Holland Large Cap Growth, Stephens Small Cap Growth, and Stephens Mid-Cap Growth Funds, respectively. The Funds have adopted an Expense Reimbursement Plan whereby the Manager may seek repayment of fees waived or expenses reimbursed for a period of up to three years. However, reimbursement will occur only if the Class’ average net assets have grown or expenses have declined sufficiently to allow reimbursement without causing its expense ratio to exceed the previously agreed upon contractual expense limit. The reimbursed expenses above will expire in 2016. The carryover of excess expenses potentially reimbursable to the Manager is as follows:
| Fund |
Recovered Expenses | Excess Expense Carryover | Expiration of Reimbursed Expenses |
|||||||||
| Bridgeway Large Cap Value |
$ | — | $ | 125,600 | 2015 | |||||||
| Holland Large Cap Growth |
— | 62,458 | 2015 | |||||||||
| Stephens Small Cap Growth |
— | 30,434 | 2015 | |||||||||
| Stephens Mid-Cap Growth |
— | 15,532 | 2015 | |||||||||
For the period ended June 30, 2013, the Funds did not record a liability for potential reimbursements, due to the current assessment that a reimbursement is unlikely.
Sales Commissions
The Funds’ distributor, Foreside Fund Services, LLC (“Foreside”) may receive a portion of A Class sales charges from broker dealers and it may be used to offset distribution related expenses. During the six months ended April 30, 2013, Foreside collected $3,645, $272, $10,590 and $15,298 for the Bridgeway Large Cap Value, Holland Large Cap Growth, Stephens Small Cap Growth and Stephens Mid-Cap Growth Funds, respectively, from the sale of Class A shares.
A contingent deferred sales charge (“CDSC”) of 1.00% will be deducted with respect to Class C Shares redeemed within 12 months of purchase, unless waived as discussed in the Prospectus. Any applicable CDSC will be 1.00% of the lesser of the original purchase price or the value of the redemption of the Class C Shares
27
American Beacon FundsSM
Notes to Financial Statements
June 30, 2013 (Unaudited)
redeemed. During the six months ended June 30, 2013 CDSC fees of $395 were collected from the Stephens Small Cap Growth Fund.
3. Security Valuation and Fair Value Measurements
Investments are valued at the close of the New York Stock Exchange (the “Exchange”), normally 4 p.m. ET, each day that the Exchange is open for business. Equity securities, including exchange-traded funds (“ETFs”) for which market quotations are available are valued at the last sale price or official closing price (closing bid price or last evaluated quote if no sale has occurred) on the primary market or exchange on which they trade.
Investments in open-end mutual funds are valued at the closing net asset value (“NAV”) per share of the mutual fund on the day of valuation. Investment grade short-term obligations with 60 days or less to maturity are valued using the amortized cost method, which approximates fair value.
Securities for which the market prices are not readily available or are not reflective of the fair value of the security, as determined by the Manager, will be priced at fair value following procedures approved by the Trust’s Board of Trustees (the “Board”).
Futures contracts are valued based upon their quoted daily settlement prices. Upon entering into a futures contract, a Fund is required to deposit with its futures broker, an amount of cash or U.S. Government and Agency Obligations in accordance with the initial margin requirements of the broker or exchange. Futures contracts are marked to market daily and an appropriate payable or receivable for the change in value (“variation margin”) is recorded by the Fund. Gains or losses are recognized, but not considered realized until the contracts expire or are closed. Futures contracts involve, to varying degrees, risk of loss in excess of the variation margin disclosed on the Statement of Assets and Liabilities.
Valuation Inputs
Various inputs may be used to determine the fair value of the Fund’s investments. These inputs are summarized in three broad levels for financial statement purposes. The inputs or methodologies used to value securities are not necessarily an indication of the risk associated with investing in those securities.
| Level 1 | - | Quoted prices in active markets for identical securities. | ||||
| Level 2 | - | Prices determined using other significant observable inputs. These may include quoted prices for similar securities, interest rates, prepayment speeds, credit risk, and others. | ||||
| Level 3 | - | Prices determined using other significant unobservable inputs. Unobservable inputs reflect the Fund’s own assumptions about the factors market participants would use in pricing an investment, and would be based on the best information available. | ||||
Level 1 and Level 2 trading assets and trading liabilities, at fair value
Common stocks and financial derivative instruments, such as futures contracts that are traded on a national securities exchange, are stated at the last reported sale or settlement price on the day of valuation. To the extent these securities are actively traded and valuation adjustments are not applied, they are categorized as Level 1 of the fair value hierarchy. Preferred securities and other equities traded on inactive markets or valued by reference to similar instruments are also categorized as Level 2 of the fair value hierarchy.
Investments in registered open-end investment management companies will be valued based upon the NAVs of such investments and are categorized as Level 1 of the fair value hierarchy. Short-term investments
28
American Beacon FundsSM
Notes to Financial Statements
June 30, 2013 (Unaudited)
having a maturity of 60 days or less are generally valued at amortized cost which approximates fair value. These investments are categorized as Level 2 of the fair value hierarchy.
The Funds’ investments are summarized by level based on the inputs used to determine their values. U.S. Generally Accepted Accounting Principles (“U.S. GAAP”) also requires all transfers between levels to be disclosed. The end of period timing recognition has been adopted for the transfers between levels of each Fund’s assets and liabilities. During the six months ended June 30, 2013, there were no transfers between levels. As of June 30, 2013, the investments were classified as described below (in thousands):
| Bridgeway Large Cap Value Fund1 |
Level 1 | Level 2 | Level 3 | Total | ||||||||||||
| Common Stock |
$ | 63,794 | $ | — | $ | — | $ | 63,794 | ||||||||
| Short-Term Investments – Money Markets |
2,073 | — | — | 2,073 | ||||||||||||
|
|
|
|
|
|
|
|
|
|||||||||
| Total Investments in Securities |
$ | 65,867 | $ | — | $ | — | $ | 65,867 | ||||||||
|
|
|
|
|
|
|
|
|
|||||||||
| Derivative Financial Instruments2 |
||||||||||||||||
| Assets: |
||||||||||||||||
| Equity Contracts |
$ | 2 | $ | — | $ | — | $ | 2 | ||||||||
|
|
|
|
|
|
|
|
|
|||||||||
| Total |
$ | 2 | $ | — | $ | — | $ | 2 | ||||||||
|
|
|
|
|
|
|
|
|
|||||||||
Certain of the Fund’s assets are held at carrying amount, which approximates fair value for financial statement purposes. As of June 30, 2013, such assets are categorized within the disclosure hierarchy as follows:
| Level 1 | Level 2 | Level 3 | Total | |||||||||||||
| Assets: |
||||||||||||||||
| Deposits with brokers for futures contracts |
$ | 70 | $ | — | $ | — | $ | 70 | ||||||||
|
|
|
|
|
|
|
|
|
|||||||||
| Total |
$ | 70 | $ | — | $ | — | $ | 70 | ||||||||
|
|
|
|
|
|
|
|
|
|||||||||
| Holland Large Cap Growth Fund1 |
Level 1 | Level 2 | Level 3 | Total | ||||||||||||
| Common Stock |
$ | 72,292 | $ | — | $ | — | $ | 72,292 | ||||||||
| Short-Term Investments – Money Markets |
1,592 | — | — | 1,592 | ||||||||||||
|
|
|
|
|
|
|
|
|
|||||||||
| Total Investments in Securities |
$ | 73,884 | $ | — | $ | — | $ | 73,884 | ||||||||
|
|
|
|
|
|
|
|
|
|||||||||
| Derivative Financial Instruments2 |
||||||||||||||||
| Assets: |
||||||||||||||||
| Equity Contracts |
$ | (22 | ) | $ | — | $ | — | $ | (22 | ) | ||||||
|
|
|
|
|
|
|
|
|
|||||||||
| Total |
$ | (22 | ) | $ | — | $ | — | $ | (22 | ) | ||||||
|
|
|
|
|
|
|
|
|
|||||||||
Certain of the Fund’s assets are held at carrying amount, which approximates fair value for financial statement purposes. As of June 30, 2013, such assets are categorized within the disclosure hierarchy as follows:
| Level 1 | Level 2 | Level 3 | Total | |||||||||||||
| Assets: |
||||||||||||||||
| Deposits with brokers for futures contracts |
$ | 67 | $ | — | $ | — | $ | 67 | ||||||||
|
|
|
|
|
|
|
|
|
|||||||||
| Total |
$ | 67 | $ | — | $ | — | $ | 67 | ||||||||
|
|
|
|
|
|
|
|
|
|||||||||
| Stephens Small Cap Growth Fund1 |
Level 1 | Level 2 | Level 3 | Total | ||||||||||||
| Common Stock |
$ | 349,752 | $ | — | $ | — | $ | 349,752 | ||||||||
| Short-Term Investments – Money Markets |
11,604 | — | — | 11,604 | ||||||||||||
| Securities Lending Collateral Invested in Money Markets |
35,692 | — | — | 35,692 | ||||||||||||
|
|
|
|
|
|
|
|
|
|||||||||
| Total Investments in Securities |
$ | 397,048 | $ | — | $ | — | $ | 397,048 | ||||||||
|
|
|
|
|
|
|
|
|
|||||||||
| Stephens Mid-Cap Growth Fund1 |
Level 1 | Level 2 | Level 3 | Total | ||||||||||||
| Common Stock |
$ | 73,546 | $ | — | $ | — | $ | 73,546 | ||||||||
| Short-Term Investments – Money Markets |
1,653 | — | — | 1,653 | ||||||||||||
|
|
|
|
|
|
|
|
|
|||||||||
| Total Investments in Securities |
$ | 75,199 | $ | — | $ | — | $ | 75,199 | ||||||||
|
|
|
|
|
|
|
|
|
|||||||||
29
American Beacon FundsSM
Notes to Financial Statements
June 30, 2013 (Unaudited)
| 1 | Refer to the Schedules of Investments for industry information. |
| 2 | Derivative financial instruments financial futures contracts. Financial futures contracts are valued at the unrealized appreciation or (depreciation) on the instrument. |
Security Transactions and Investment Income
Security transactions are recorded on the trade date of the security purchase or sale. The Funds may purchase securities with delivery or payment to occur at a later date. At the time the Funds enters into a commitment to purchase a security, the transaction is recorded, and the value of the security is reflected in the NAV. The value of the security may vary with market fluctuations.
Dividend income, net of foreign taxes, is recorded on the ex-dividend date, except certain dividends from foreign securities which are recorded as soon as the information is available to the Funds. Interest income is earned from settlement date, recorded on the accrual basis, and adjusted, if necessary, for accretion of discounts and amortization of premiums. For financial and tax reporting purposes, realized gains and losses are determined on the basis of specific lot identification.
Dividends to Shareholders
Dividends from net investment income of the Funds normally will be declared and paid at least annually. Distributions, if any, of net realized capital gains are generally paid at least annually and recorded on the ex-dividend date.
Commission Recapture
The Funds have established brokerage commission recapture arrangements with certain brokers or dealers. If the Funds’ investment advisor chooses to execute a transaction through a participating broker, the broker rebates a portion of the commission back to the Fund. Any collateral benefit received through participation in the commission recapture program is directed exclusively to the Fund. This amount is reported with the net realized gain in the Funds’ Statement of Operations.
Allocation of Income, Expenses, Gains, and Losses
Income, expenses (other than those attributable to a specific class), gains, and losses are allocated daily to each class of shares based upon the relative proportion of net assets represented by such class. Operating expenses directly attributable to a specific class are charged against the operations of that class.
Use of Estimates
The preparation of financial statements in conformity with U.S. GAAP requires management to make estimates and assumptions that affect the amounts reported in the financial statements and accompanying notes. Actual results may differ from those estimated.
Other
Under the Trust’s organizational documents, its officers and trustees are indemnified against certain liability arising out of the performance of their duties to the Trust. In the normal course of business, the Trust enters into contracts that provide indemnification to the other party or parties against potential costs or liabilities. The Trust’s maximum exposure under these arrangements is dependent on claims that may be made in the future and, therefore, cannot be estimated. The Trust has had no prior claims or losses pursuant to any such agreement.
30
American Beacon FundsSM
Notes to Financial Statements
June 30, 2013 (Unaudited)
4. Securities and Other Investments
Real Estate Investment Trusts
The Funds may own shares of real estate investment trusts (“REITs”) which report information on the source of their distributions annually. The Funds re-characterize distributions received from REIT investments based on information provided by the REITs into the following categories: ordinary income, long-term capital gains, and return of capital. If information is not available on a timely basis from the REITs, the re-characterization will be estimated based on available information, which may include the previous year allocation. If new or additional information becomes available from the REITs at a later date, a re-characterization will be made the following year. These re-characterizations are not recorded for financial statement purposes, but as an adjustment to the calculation of taxable income.
Other Investment Company Securities and Other Exchange Traded Products
The Funds may invest in shares of other investment companies, including open-end funds, closed-end funds, business development companies, ETFs, exchange-traded notes (“ETNs”), unit investment trusts, and other investment companies of the Trust. The Funds may invest in investment company securities advised by the Manager or a sub-advisor. Investments in the securities of other investment companies may involve duplication of advisory fees and certain other expenses. By investing in another investment company, a Fund becomes a shareholder of that investment company. As a result, Fund shareholders indirectly will bear a Fund’s proportionate share of the fees and expenses paid by shareholders of the other investment company, in addition to the fees and expenses Fund shareholders directly bear in connection with the Fund’s own operations. These other fees and expenses are reflected as Acquired Fund Fees and Expenses and are included in the Fees and Expenses Table for the Fund in its Prospectus, if applicable. Investments in other investment companies may involve the payment of substantial premiums above the value of such issuer’s portfolio securities.
5. Derivative Financial Instruments
The Funds engage in various portfolio strategies using derivative contracts both to increase the returns of the Funds and/or to economically hedge their exposure to equity risks. These contracts may be transacted on an exchange or OTC.
Futures Contracts
Futures contracts obligate a purchaser to take delivery of a specific amount of an obligation underlying the futures contract at a specified time in the future for a specified price. Likewise, the seller incurs an obligation to deliver the specified amount of the underlying obligation against receipt of the specified price. Futures are traded on both U.S. and foreign commodities exchanges. Futures contracts will be traded for the same purposes as entering into forward contracts. The purchase of futures can serve as a long hedge, and the sale of futures can serve as a short hedge.
No price is paid upon entering into a futures contract. Instead, at the inception of a futures contract a Fund is required to deposit “initial deposit” consisting of cash or U.S. Government Securities in an amount set by the exchange on which the contract is traded and varying based on the volatility of the underlying asset. Margin must also be deposited when writing a call or put option on a futures contract, in accordance with applicable exchange rules. Unlike margin in securities transactions, initial margin on futures contracts does not represent a borrowing, but rather is in the nature of a performance bond or good-faith deposit that is returned to a Fund at the termination of the transaction if all contractual obligations have been satisfied. Under certain circumstances, such as periods of high volatility, a Fund may be required by a futures exchange to increase the level of its initial margin payment, and initial margin requirements might be increased generally in the future by regulatory action.
31
American Beacon FundsSM
Notes to Financial Statements
June 30, 2013 (Unaudited)
Subsequent “variation margin” payments are made to and from the futures broker daily as the value of the futures position varies, a process known as “marking-to-market.” Variation margin does not involve borrowing, but rather represents a daily settlement of a Fund’s obligations to or from a futures broker. When a Fund purchases or sells a futures contract, it is subject to daily variation margin calls that could be substantial in the event of adverse price movements. If a Fund has insufficient cash to meet daily variation margin requirements, it might need to sell securities at a time when such sales are disadvantageous.
Purchasers and sellers of futures contracts can enter into offsetting closing transactions, by selling or purchasing, respectively, an instrument identical to the instrument purchased or sold. Positions in futures contracts may be closed only on a futures exchange or board of trade that provides a secondary market. A Fund intends to enter into futures contracts only on exchanges or boards of trade where there appears to be a liquid secondary market. However, there can be no assurance that such a market will exist for a particular contract at a particular time. In such event, it may not be possible to close a futures contract.
Although futures contracts by their terms call for the actual delivery or acquisition of securities or currency, in most cases the contractual obligation is fulfilled before the date of the contract without having to make or take delivery of the securities or currency. The offsetting of a contractual obligation is accomplished by buying (or selling, as appropriate) on a commodities exchange an identical futures contract calling for delivery in the same month. Such a transaction, which is effected through a member of an exchange, cancels the obligation to make or take delivery of the securities or currency. Since all transactions in the futures market are made, offset or fulfilled through a clearinghouse associated with the exchange on which the contracts are traded, a Fund will incur brokerage fees when it purchases or sells futures contracts.
Under certain circumstances, futures exchanges may establish daily limits on the amount that the price of a futures contract can vary from the previous day’s settlement price; once that limit is reached, no trades may be made that day at a price beyond the limit. Daily price limits do not limit potential losses because prices could move to the daily limit for several consecutive days with little or no trading, thereby preventing liquidation of unfavorable positions.
If a Fund were unable to liquidate a futures contract due to the absence of a liquid secondary market or the imposition of price limits, it could incur substantial losses. A Fund would continue to be subject to market risk with respect to the position. In addition, a Fund would continue to be required to make daily variation margin payments and might be required to maintain the position being hedged by the futures contract or option thereon or to maintain cash or securities in a segregated account.
The ordinary spreads between prices in the cash and futures market, due to differences in the nature of those markets, are subject to distortions. First, all participants in the futures market are subject to initial deposit and variation margin requirements. Rather than meeting additional variation margin deposit requirements, investors may close futures contracts through offsetting transactions that could distort the normal relationship between the cash and futures markets. Second, the liquidity of the futures market depends on participants entering into offsetting transactions rather than making or taking delivery. To the extent participants decide to make or take delivery, liquidity in the futures market could be reduced, thus producing distortion. Third, from the point of view of speculators, the margin deposit requirements in the futures market are less onerous than margin requirements in the securities market. Therefore, increased participation by speculators in the futures market may cause temporary price distortions. Due to the possibility of distortion, a correct forecast of securities price or currency exchange rate trends by a sub-advisor may still not result in a successful transaction.
In addition, futures contracts entail risks. Although the use of such contracts may benefit a Fund, if investment judgment about the general direction of, for example, an index is incorrect, a Fund’s overall performance would be worse than if it had not entered into any such contract. In addition, there are differences between the securities and futures markets that could result in an imperfect correlation between the markets, causing a given transaction not to achieve its objectives.
32
American Beacon FundsSM
Notes to Financial Statements
June 30, 2013 (Unaudited)
The following is a summary of the Fund’s derivative financial instruments categorized by risk exposure (in thousands) (1) (3):
Fair Values of derivative financial instruments as of June 30, 2013 (000’s):
| Bridgeway Large Cap Value |
Holland Large Cap Growth |
|||||||||||
| Statements of Assets and Liabilities |
Derivative | |||||||||||
| Unrealized appreciation or (depreciation) of investments and futures contracts(2) |
Equity Contracts | $ | 2 | $ | (22 | ) | ||||||
The effect of derivative financial instruments during the six months ended June 30, 2013 (000’s):
| Statements of Operations |
||||||||||||
| Net realized gain (loss) from futures contracts |
Equity Contracts | (101 | ) | 234 | ||||||||
| Change in net unrealized appreciation or (depreciation) of futures contracts |
Equity Contracts | 3 | (33 | ) |
| (1) | See Note 3 in the Notes to Financial Statements for additional information. |
| (2) | Includes only current day’s variation margin as reported within the Statements of Assets and Liabilities. Cumulative appreciation or (depreciation) of futures contracts is reported in the Schedule of Investments footnotes. |
| (3) | The volume of derivative activity described above is reflective of the derivative activity through the current period of operations. |
For the six months ended June 30, 2013, the average quarterly balances of outstanding derivative financial instruments were as follows:
| Bridgeway Large Cap Value | Holland Large Cap Growth | |||||||
| Financial futures contracts: |
||||||||
| Average Number of Contracts Purchased |
5 | 3 | ||||||
| Average Number of Contracts Sold |
13 | 2 | ||||||
| Average Value of Contracts Purchased |
$ | 402,396 | $ | 260,520 | ||||
| Average Value of Contracts Sold |
$ | 968,604 | $ | 128,177 | ||||
Counterparty Credit Risk
A derivative contract may suffer a mark to market loss if the value of the contract decreases due to an unfavorable change in the market rates or values of the underlying instrument. Losses can also occur if the counterparty does not perform under the contract. With exchange traded futures, there is less counterparty credit risk to the Fund since the exchange or clearinghouse, as counterparty to such instruments, guarantees against a possible default. The clearinghouse stands between the buyer and the seller of the contract; therefore, the credit risk is limited to failure of the clearinghouse. While offset rights may exist under applicable law, a Fund does not have a contractual right of offset against a clearing broker or clearinghouse in the event of a default (including the bankruptcy or insolvency) of the clearing broker or clearinghouse. Additionally, credit risk exists in exchange traded futures with respect to initial and variation margin that is held in a clearing broker’s customer accounts. While clearing brokers are required to segregate customer margin from their own assets, in the event that a clearing broker becomes insolvent or goes into bankruptcy and at that time there is a shortfall in the aggregate amount of margin held by the clearing broker for all its clients, typically the shortfall would be allocated on a pro rata basis across all the clearing broker’s customers, potentially resulting in losses to the Fund.
6. Federal Income and Excise Taxes
It is the policy of the Funds to qualify as a regulated investment company (“RIC”), by complying with all applicable provisions of Subchapter M of the Internal Revenue Code, as amended, and to make distribution of taxable income sufficient to relieve it from substantially all federal income and excise taxes. For federal income tax purposes, each Fund is treated as a single entity for the purpose of determining such qualification.
The Funds do not have any unrecognized tax benefits in the accompanying financial statements. Each of the tax years in the four year period ended December 31, 2012 remains subject to examination by the Internal Revenue Service. If applicable, the Funds recognize interest accrued related to unrecognized tax benefits in interest expense and penalties in “Other expenses” on the Statement of Operations.
33
American Beacon FundsSM
Notes to Financial Statements
June 30, 2013 (Unaudited)
Dividends are categorized in accordance with income tax regulations which may treat certain transactions differently than U.S. GAAP. Accordingly, the character of distributions and composition of net assets for tax purposes may differ from those reflected in the accompanying financial statements.
The tax character of distributions paid were as follows (in thousands):
| Bridgeway Large Cap Value | Holland Large Cap Growth | |||||||||||||||||||
| Six Months Ended June 30, 2013 |
Six Months Ended December 31, 2012 |
Year Ended June 30, 2012 |
Six Months Ended June 30, 2013 |
Year Ended December 31, 2012 |
||||||||||||||||
| (unaudited) | (unaudited) | |||||||||||||||||||
| Distributions paid from: |
||||||||||||||||||||
| Ordinary income* |
||||||||||||||||||||
| Institutional Class |
$ | — | $ | 486 | $ | 357 | $ | — | $ | 6 | ||||||||||
| Y Class |
— | 1 | — | — | — | |||||||||||||||
| Investor Class |
— | 8 | — | — | 41 | |||||||||||||||
| A Class |
— | 6 | — | — | 1 | |||||||||||||||
| C Class |
— | — | — | — | 1 | |||||||||||||||
| Long-Term Capital Gain |
||||||||||||||||||||
| Institutional Class |
— | — | — | — | 84 | |||||||||||||||
| Y Class |
— | — | — | — | 1 | |||||||||||||||
| Investor Class |
— | — | — | — | 3,479 | |||||||||||||||
| A Class |
— | — | — | — | 27 | |||||||||||||||
| C Class |
— | — | — | — | 15 | |||||||||||||||
|
|
|
|
|
|
|
|
|
|
|
|||||||||||
| Total distributions paid |
$ | — | $ | 501 | $ | 357 | $ | — | $ | 3,655 | ||||||||||
|
|
|
|
|
|
|
|
|
|
|
|||||||||||
| Stephens Small Cap Growth | Stephens Mid-Cap Growth | |||||||||||||||||||||||
| Six Months Ended June 30, 2013 |
One Month Ended December 31, 2012 |
Year Ended November 30, 2012 |
Six Months Ended June 30, 2013 |
One Month Ended December 31, 2012 |
Year Ended November 30, 2012 |
|||||||||||||||||||
| (unaudited) | (unaudited) | |||||||||||||||||||||||
| Distributions paid from: |
||||||||||||||||||||||||
| Ordinary income* |
||||||||||||||||||||||||
| Institutional Class |
$ | — | $ | 27 | $ | — | $ | — | $ | — | $ | — | ||||||||||||
| Y Class |
— | 1 | — | — | — | — | ||||||||||||||||||
| Investor Class |
— | 18 | — | — | — | — | ||||||||||||||||||
| A Class |
— | 1 | — | — | — | — | ||||||||||||||||||
| C Class |
— | — | — | — | — | — | ||||||||||||||||||
| Long-Term Capital Gain |
||||||||||||||||||||||||
| Institutional Class |
500 | 6,524 | 4,196 | 144 | 157 | — | ||||||||||||||||||
| Y Class |
29 | 280 | — | 4 | 1 | — | ||||||||||||||||||
| Investor Class |
337 | 4,431 | 3,533 | 94 | 109 | — | ||||||||||||||||||
| A Class |
15 | 195 | — | 44 | 42 | — | ||||||||||||||||||
| C Class |
3 | 22 | — | 2 | 2 | — | ||||||||||||||||||
|
|
|
|
|
|
|
|
|
|
|
|
|
|||||||||||||
| Total distributions paid |
$ | 884 | $ | 11,499 | $ | 7,729 | $ | 288 | $ | 311 | $ | — | ||||||||||||
|
|
|
|
|
|
|
|
|
|
|
|
|
|||||||||||||
| * | For tax purposes, short-term capital gains are considered ordinary income distributions. |
As of June 30, 2013, the components of distributable earnings or (deficits) on a tax basis were as follows (in thousands):
| Bridgeway Large Cap Value |
Holland Large Cap Growth |
Stephens Small Cap Growth |
Stephens Mid-Cap Growth |
|||||||||||||
| Cost basis of investments for federal income tax purposes |
$ | 57,196 | $ | 51,605 | $ | 341,510 | $ | 60,238 | ||||||||
| Unrealized appreciation |
9,020 | 22,984 | 61,741 | 16,100 | ||||||||||||
| Unrealized depreciation |
(349 | ) | (705 | ) | (6,203 | ) | (1,139 | ) | ||||||||
|
|
|
|
|
|
|
|
|
|||||||||
| Net unrealized appreciation or (depreciation) |
8,671 | 22,279 | 55,538 | 14,961 | ||||||||||||
| Undistributed ordinary income |
230 | 190 | 94 | (142 | ) | |||||||||||
| Accumulated long-term gain or (loss) |
1,854 | 4,116 | 7,622 | 1,981 | ||||||||||||
| Other temporary differences |
2 | (22 | ) | — | — | |||||||||||
|
|
|
|
|
|
|
|
|
|||||||||
| Distributable earnings or (deficits) |
$ | 10,757 | $ | 26,563 | $ | 63,254 | $ | 16,800 | ||||||||
|
|
|
|
|
|
|
|
|
|||||||||
34
American Beacon FundsSM
Notes to Financial Statements
June 30, 2013 (Unaudited)
Financial reporting records are adjusted for permanent book/tax differences to reflect tax character. Financial records are not adjusted for temporary differences. The temporary differences between financial reporting and tax-basis reporting of unrealized appreciation or (depreciation) are attributable primarily to the tax deferral of losses from wash sales and the realization for tax purposes of unrealized gains or (losses) on certain derivative instruments.
Due to inherent differences in the recognition of income, expenses and realized gains or (losses) under U.S. GAAP and federal income tax regulations, permanent differences between book and tax reporting have been identified and appropriately reclassified on the Statement of Assets and Liabilities.
Accordingly, the following amounts represent current year permanent differences derived from the realization for tax purposes of unrealized gains or (losses) on certain derivative instruments and prior period adjustments to income and expense as of June 30, 2012 (in thousands):
| Bridgeway Large Cap Value |
Holland Large Cap Growth |
Stephens Small Cap Growth |
Stephens Mid-Cap Growth |
|||||||||||||
| Paid-in-capital |
$ | — | $ | — | $ | (1,217 | ) | $ | — | |||||||
| Undistributed net investment income |
(21 | ) | 83 | 1,217 | 44 | |||||||||||
| Accumulated net realized gain (loss) |
21 | (83 | ) | — | (44 | ) | ||||||||||
| Unrealized appreciation or (depreciation) of investments and futures contracts |
— | — | — | — | ||||||||||||
On December 22, 2010, the Regulated Investment Company Modernization Act of 2010 (the “RIC MOD”) was enacted, which changed various technical rules governing the tax treatment of regulated investment companies. The changes are generally effective for taxable years beginning after the date of enactment. One of the more prominent changes addresses capital loss carryforwards. Under the RIC MOD, each Fund will be permitted to carry forward capital losses incurred in taxable years beginning after the date of enactment for an unlimited period. However, any losses incurred during those future taxable years will be required to be utilized prior to the losses incurred in pre-enactment taxable years, which carry an expiration date. As a result of this ordering rule, pre-enactment capital loss carryforwards may be more likely to expire unused. Additionally, post-enactment capital loss carryforwards will retain their character as either short-term or long-term capital losses rather than being considered all short-term as permitted under previous regulation.
Finally, the RIC MOD contains several provisions aimed at preserving the character of distributions made by a fiscal year RIC during the portion of its taxable year ending after October 31 or December 31, reducing the circumstances under which a RIC might be required to file amended Forms 1099 to restate previously reported distributions. Except for the simplification provisions related to RIC qualification, the RIC MOD is effective for taxable years beginning after December 22, 2010. The provisions related to RIC qualification are effective for taxable years for which the extended due date of the tax return is after December 22, 2010.
As of June 30, 2013, the Fund had $0 net capital loss carryforwards
7. Investment Transactions
The aggregate cost of purchases and proceeds from sales and maturities of long-term investments during the year ended June 30, 2013 were as follows (in thousands):
| Bridgeway Large Cap Value |
Holland Large Cap Growth |
Stephens Small Cap Growth |
Stephens Mid-Cap Growth |
|||||||||||||
| Purchases (excluding U.S. government securities) |
$ | 39,608 | $ | 9,575 | $ | 153,910 | $ | 17,200 | ||||||||
| Sales and maturities (excluding U.S. government securities) |
8,493 | 12,363 | 50,115 | 8,731 | ||||||||||||
35
American Beacon FundsSM
Notes to Financial Statements
June 30, 2013 (Unaudited)
A summary of the Funds’ direct transactions in Select Funds for the year ended June 30, 2013 is set forth below (in thousands):
| Affiliate | December 31, 2012 Shares/Fair Value |
Purchases | Sales | June 30, 2013 Shares/Fair Value |
||||||||||||||||
| Stephens Small Cap Growth |
USG Select Fund | $ | 9,303 | $ | 87,424 | $ | 69,024 | $ | 27,703 | |||||||||||
8. Securities Lending
The Stephens Small Cap Growth Fund (“Fund”) may lend securities to approved borrowers, such as banks, brokers and other financial institutions. The borrower pledges cash or securities issued or guaranteed by the U.S. Government. The initial collateral received by the Fund should have a value of at least 102% of the current value of the loaned securities for securities traded on U.S. exchanges and a value of at least 105% for all other securities. The collateral is maintained thereafter in an amount equal to at least 100% of the current market value of the loaned securities. If the market value of the loaned securities falls below 100%, the borrower is required to delivery additional collateral to the Fund. Securities lending income, as disclosed in the Statements of Operations, represents the income earned from the investment of the cash collateral, the net of fees paid by and rebates paid to borrowers and less the fees paid to the securities lending agent, Brown Brothers Harriman (“BBH”), and the Fund’s investment adviser, American Beacon Advisors, Inc. for its administration and oversight functions, including oversight of the of the securities lending agent. During the term of the loan, the Fund earns dividend or interest income, or the equivalent, on the securities loaned but does not receive interest income on the securities received as collateral. Loans of securities are terminable at any time and the borrower, after notice, is required to return borrowed securities within the standard time period for settlement of securities transactions.
The market value of securities on loan and the value of the related collateral are shown separately in the Statements of Assets and Liabilities as a component of investments at value, and collateral on securities loaned at value, respectively. The cash collateral invested by the securities lending agent, BBH, if any, is disclosed in the Schedule of Investments.
Securities lending transactions are entered into by the Fund under Master Securities Lending Agreements (“MSLA”), which provide the right, in the event of default (including bankruptcy or insolvency) for the non-defaulting party to liquidate the collateral and calculate a net exposure to the defaulting party or request additional collateral. In the event that a borrower defaults, the Fund would offset the market value of the collateral received against the market value of the securities loaned. The value of the collateral is typically greater than that of the market value of the securities loaned, leaving the lender with a net amount payable to the defaulting party. However, bankruptcy or insolvency laws of a particular jurisdiction may impose restrictions on or prohibitions against such a right of offset in the event of a MSLA counterparty’s bankruptcy or insolvency. Under the MSLA, the Fund can reinvest cash collateral, or, upon an event of default, resell or repledge the collateral, and the borrower can resell or repledge the loaned securities.
The following table is a summary of Stephens Small Gap Growth Fund’s open securities lending agreements by counterparty which are subject to offset under a MSLA as of June 30, 2013 (in thousands):
| Counterparty |
Fair Value of Securities on Loan |
Non-Cash Collateral |
Cash Collateral Posted by Borrower Collateral1 |
Net Amount | ||||||||||||
| Barclays Capital, Inc. |
$ | 4,181,622 | $ | — | $ | 4,181,622 | $ | — | ||||||||
| BNP Paribas S.A. |
52,076 | — | 52,076 | — | ||||||||||||
| Citigroup Global Markets, Inc. |
4,679,163 | — | 4,679,163 | — | ||||||||||||
| Credit Suisse Securities (USA) LLC |
4,035,533 | — | 4,035,533 | — | ||||||||||||
| Deutsche Bank Securities, Inc. |
14,811,450 | — | 14,811,450 | — | ||||||||||||
| Goldman Sachs & Co. |
22,221,176 | — | 22,221,176 | — | ||||||||||||
| INC Financial Markets LLC |
317,608 | — | 317,608 | — | ||||||||||||
| JP Morgan Clearing Corp. |
3,252,528 | — | 3,252,528 | — | ||||||||||||
| Scotia Capital USA, Inc. |
600,362 | — | 600,362 | — | ||||||||||||
36
American Beacon FundsSM
Notes to Financial Statements
June 30, 2013 (Unaudited)
| Counterparty |
Fair Value of Securities on Loan |
Non-Cash Collateral |
Cash Collateral Posted by Borrower Collateral1 |
Net Amount | ||||||||||||
| SG Americas Securities LLC |
$ | 194,712 | $ | — | $ | 194,712 | $ | — | ||||||||
| USB Securities LLC |
489,686 | — | 489,686 | — | ||||||||||||
|
|
|
|
|
|
|
|
|
|||||||||
| Total |
$ | 34,837,256 | $ | — | $ | 34,837,256 | $ | — | ||||||||
|
|
|
|
|
|
|
|
|
|||||||||
| 1 | Excess of collateral received from the individual counterparty is not shown for financial reporting purposes. Collateral with a value of $35,692,310 has been received in connection with securities lending transactions. |
The risks of securities lending also include the risk that the borrower may not provide additional collateral when required, may not return the securities when due, or may default or otherwise become insolvent. To mitigate this risk, the Fund benefits from a borrower default indemnity provided by BBH. BBH’s indemnity allows for full replacement of securities lent. Also, the securities in which the collateral is invested may not perform sufficiently to cover the return collateral payments owed to borrowers. The Fund attempts to minimize this risk by limiting the investment of cash collateral to registered money market funds. In addition, delays may occur in the recovery of securities from borrowers, which could interfere with the Fund’s ability to vote proxies or to settle transactions. During the six months ended June 30, 2013, any securities on loan were collateralized by cash.
Cash collateral is listed on the Stephens Small Cap Growth Fund’s Schedule of Investments and is shown on the Statements of Assets and Liabilities. Income earned on these investments, grossed up by the securities lending fees paid to the Manager, is included in Income derived from securities lending on the Statements of Operations.
Non-cash collateral received by the Fund may not be sold or re-pledged except to satisfy a borrower default. Therefore, non-cash collateral is not included on the Fund’s Schedule of Investments or Statements of Assets and Liabilities.
9. Capital Share Transactions
The tables below summarize the activity in capital shares for each Class of the Fund (dollars and shares in thousands):
For the Six months Ended June 30, 2013
| Institutional Class | Y Class | Investor Class | ||||||||||||||||||||||
| Bridgeway Large Cap Value Fund |
Shares | Amount | Shares | Amount | Shares | Amount | ||||||||||||||||||
| Shares sold |
697 | $ | 12,491 | 353 | $ | 6,615 | 540 | $ | 9,759 | |||||||||||||||
| Reinvestment of dividends |
— | — | — | — | — | — | ||||||||||||||||||
| Shares redeemed |
(217 | ) | (3,925 | ) | (1 | ) | (12 | ) | (23 | ) | (411 | ) | ||||||||||||
|
|
|
|
|
|
|
|
|
|
|
|
|
|||||||||||||
| Net increase in shares outstanding |
480 | $ | 8,566 | 352 | $ | 6,603 | 517 | $ | 9,348 | |||||||||||||||
|
|
|
|
|
|
|
|
|
|
|
|
|
|||||||||||||
| A Class | C Class | |||||||||||||||
| Bridgeway Large Cap Value Fund |
Shares | Amount | Shares | Amount | ||||||||||||
| Shares sold |
456 | $ | 8,091 | 37 | $ | 673 | ||||||||||
| Reinvestment of dividends |
— | — | — | — | ||||||||||||
| Shares redeemed |
(10 | ) | (190 | ) | — | (6 | ) | |||||||||
|
|
|
|
|
|
|
|
|
|||||||||
| Net increase in shares outstanding |
446 | $ | 7,901 | 37 | $ | 667 | ||||||||||
|
|
|
|
|
|
|
|
|
|||||||||
37
American Beacon FundsSM
Notes to Financial Statements
June 30, 2013 (Unaudited)
| Institutional Class | Y Class | Investor Class | ||||||||||||||||||||||
| Holland Large Cap Growth Fund |
Shares | Amount | Shares | Amount | Shares | Amount | ||||||||||||||||||
| Shares sold |
5 | $ | 111 | 4 | $ | 85 | 53 | $ | 1,250 | |||||||||||||||
| Reinvestment of dividends |
— | — | — | — | — | — | ||||||||||||||||||
| Shares redeemed |
(2 | ) | (42 | ) | — | — | (235 | ) | (5,528 | ) | ||||||||||||||
|
|
|
|
|
|
|
|
|
|
|
|
|
|||||||||||||
| Net increase (decrease) in shares outstanding |
3 | $ | 69 | 4 | $ | 85 | (182 | ) | $ | (4,278 | ) | |||||||||||||
|
|
|
|
|
|
|
|
|
|
|
|
|
|||||||||||||
| A Class | C Class | |||||||||||||||
| Holland Large Cap Growth Fund |
Shares | Amount | Shares | Amount | ||||||||||||
| Shares sold |
5 | $ | 116 | 12 | $ | 294 | ||||||||||
| Reinvestment of dividends |
— | — | — | — | ||||||||||||
| Shares redeemed |
(3 | ) | (69 | ) | (3 | ) | (69 | ) | ||||||||
|
|
|
|
|
|
|
|
|
|||||||||
| Net increase in shares outstanding |
2 | $ | 47 | 9 | $ | 225 | ||||||||||
|
|
|
|
|
|
|
|
|
|||||||||
| Institutional Class | Y Class | Investor Class | ||||||||||||||||||||||
| Stephens Small Cap Growth Fund |
Shares | Amount | Shares | Amount | Shares | Amount | ||||||||||||||||||
| Shares sold |
4,043 | $ | 57,518 | 1,113 | $ | 16,159 | 4,189 | $ | 57,964 | |||||||||||||||
| Reinvestment of dividends |
34 | 488 | 1 | 24 | 24 | 334 | ||||||||||||||||||
| Shares redeemed |
(1,250 | ) | (17,965 | ) | (100 | ) | (1,452 | ) | (763 | ) | (10,388 | ) | ||||||||||||
|
|
|
|
|
|
|
|
|
|
|
|
|
|||||||||||||
| Net increase in shares outstanding |
2,827 | $ | 40,041 | 1,014 | $ | 14,731 | 3,450 | $ | 47,910 | |||||||||||||||
|
|
|
|
|
|
|
|
|
|
|
|
|
|||||||||||||
| A Class | C Class | |||||||||||||||
| Stephens Small Cap Growth Fund |
Shares | Amount | Shares | Amount | ||||||||||||
| Shares sold |
249 | $ | 3,466 | 56 | $ | 753 | ||||||||||
| Reinvestment of dividends |
1 | 13 | — | 3 | ||||||||||||
| Shares redeemed |
(31 | ) | (436 | ) | (4 | ) | (56 | ) | ||||||||
|
|
|
|
|
|
|
|
|
|||||||||
| Net increase in shares outstanding |
219 | $ | 3,043 | 52 | $ | 700 | ||||||||||
|
|
|
|
|
|
|
|
|
|||||||||
| Institutional Class | Y Class | Investor Class | ||||||||||||||||||||||
| Stephens Mid-Cap Growth Fund |
Shares | Amount | Shares | Amount | Shares | Amount | ||||||||||||||||||
| Shares sold |
281 | $ | 4,725 | 44 | $ | 731 | 479 | $ | 7,158 | |||||||||||||||
| Reinvestment of dividends |
8 | 142 | — | 3 | 6 | 90 | ||||||||||||||||||
| Shares redeemed |
(141 | ) | (2,362 | ) | (6 | ) | (111 | ) | (178 | ) | (2,620 | ) | ||||||||||||
|
|
|
|
|
|
|
|
|
|
|
|
|
|||||||||||||
| Net increase in shares outstanding |
148 | $ | 2,505 | 38 | $ | 623 | 307 | $ | 4,628 | |||||||||||||||
|
|
|
|
|
|
|
|
|
|
|
|
|
|||||||||||||
| A Class | C Class | |||||||||||||||
| Stephens Mid-Cap Growth Fund |
Shares | Amount | Shares | Amount | ||||||||||||
| Shares sold |
201 | $ | 2,998 | 24 | $ | 368 | ||||||||||
| Reinvestment of dividends |
2 | 26 | — | 2 | ||||||||||||
| Shares redeemed |
(45 | ) | (672 | ) | — | (6 | ) | |||||||||
|
|
|
|
|
|
|
|
|
|||||||||
| Net increase in shares outstanding |
158 | $ | 2,352 | 24 | $ | 364 | ||||||||||
|
|
|
|
|
|
|
|
|
|||||||||
For the Period Ended December 31, 2012
| Institutional Class | Y Class | Investor Class | ||||||||||||||||||||||
| Bridgeway Large Cap Value Fund |
Shares | Amount | Shares | Amount | Shares | Amount | ||||||||||||||||||
| Shares sold |
65 | $ | 1,021 | 2 | $ | 29 | 34 | $ | 540 | |||||||||||||||
| Reinvestment of dividends |
30 | 473 | — | 1 | 1 | 8 | ||||||||||||||||||
| Shares redeemed |
(233 | ) | (3,617 | ) | — | — | (19 | ) | (298 | ) | ||||||||||||||
|
|
|
|
|
|
|
|
|
|
|
|
|
|||||||||||||
| Net increase (decrease) in shares outstanding |
(138 | ) | $ | (2,123 | ) | 2 | $ | 30 | 16 | $ | 250 | |||||||||||||
|
|
|
|
|
|
|
|
|
|
|
|
|
|||||||||||||
| A Class | C Class | |||||||||||||||
| Bridgeway Large Cap Value Fund |
Shares | Amount | Shares | Amount | ||||||||||||
| Shares sold |
6 | $ | 90 | — | $ | 6 | ||||||||||
| Reinvestment of dividends |
— | 5 | — | — | ||||||||||||
| Shares redeemed |
(5 | ) | (75 | ) | — | (1 | ) | |||||||||
|
|
|
|
|
|
|
|
|
|||||||||
| Net increase in shares outstanding |
1 | $ | 20 | — | $ | 5 | ||||||||||
|
|
|
|
|
|
|
|
|
|||||||||
38
American Beacon FundsSM
Notes to Financial Statements
June 30, 2013 (Unaudited)
| Institutional Class | Y Class | Investor Class | ||||||||||||||||||||||
| Holland Large Cap Growth Fund |
Shares | Amount | Shares | Amount | Shares | Amount | ||||||||||||||||||
| Shares sold |
15 | $ | 345 | 2 | $ | 49 | 385 | $ | 8,615 | |||||||||||||||
| Reinvestment of dividends |
4 | 89 | — | 1 | 162 | 3,519 | ||||||||||||||||||
| Shares redeemed |
(3 | ) | (72 | ) | (1 | ) | (26 | ) | (353 | ) | (7,755 | ) | ||||||||||||
|
|
|
|
|
|
|
|
|
|
|
|
|
|||||||||||||
| Net increase in shares outstanding |
16 | $ | 362 | 1 | $ | 24 | 194 | $ | 4,379 | |||||||||||||||
|
|
|
|
|
|
|
|
|
|
|
|
|
|||||||||||||
| A Class | C Class | |||||||||||||||
| Holland Large Cap Growth Fund |
Shares | Amount | Shares | Amount | ||||||||||||
| Shares sold |
31 | $ | 687 | 12 | $ | 283 | ||||||||||
| Reinvestment of dividends |
1 | 18 | 1 | 15 | ||||||||||||
| Shares redeemed |
(11 | ) | (242 | ) | — | (4 | ) | |||||||||
|
|
|
|
|
|
|
|
|
|||||||||
| Net increase in shares outstanding |
21 | $ | 463 | 13 | $ | 294 | ||||||||||
|
|
|
|
|
|
|
|
|
|||||||||
| Institutional Class | Y Class | Investor Class | ||||||||||||||||||||||
| Stephens Small Cap Growth Fund |
Shares | Amount | Shares | Amount | Shares | Amount | ||||||||||||||||||
| Shares sold |
3,195 | $ | 42,178 | 155 | $ | 2,086 | 353 | $ | 4,515 | |||||||||||||||
| Reinvestment of dividends |
487 | 6,324 | 18 | 229 | 350 | 4,354 | ||||||||||||||||||
| Shares redeemed |
(203 | ) | (2,676 | ) | (21 | ) | (271 | ) | (281 | ) | (3,549 | ) | ||||||||||||
|
|
|
|
|
|
|
|
|
|
|
|
|
|||||||||||||
| Net increase in shares outstanding |
3,479 | $ | 45,826 | 152 | $ | 2,044 | 422 | $ | 5,320 | |||||||||||||||
|
|
|
|
|
|
|
|
|
|
|
|
|
|||||||||||||
| A Class | C Class | |||||||||||||||
| Stephens Small Cap Growth Fund |
Shares | Amount | Shares | Amount | ||||||||||||
| Shares sold |
15 | $ | 189 | — | $ | — | ||||||||||
| Reinvestment of dividends |
14 | 178 | 2 | 21 | ||||||||||||
| Shares redeemed |
(3 | ) | (42 | ) | — | — | ||||||||||
|
|
|
|
|
|
|
|
|
|||||||||
| Net increase in shares outstanding |
26 | $ | 325 | 2 | $ | 21 | ||||||||||
|
|
|
|
|
|
|
|
|
|||||||||
| Institutional Class | Y Class | Investor Class | ||||||||||||||||||||||
| Stephens Mid-Cap Growth Fund |
Shares | Amount | Shares | Amount | Shares | Amount | ||||||||||||||||||
| Shares sold |
12 | $ | 184 | 10 | $ | 148 | 80 | $ | 1,092 | |||||||||||||||
| Reinvestment of dividends |
10 | 155 | — | 1 | 7 | 101 | ||||||||||||||||||
| Shares redeemed |
(7 | ) | (110 | ) | — | — | (62 | ) | (855 | ) | ||||||||||||||
|
|
|
|
|
|
|
|
|
|
|
|
|
|||||||||||||
| Net increase in shares outstanding |
15 | $ | 229 | 10 | $ | 149 | 25 | $ | 338 | |||||||||||||||
|
|
|
|
|
|
|
|
|
|
|
|
|
|||||||||||||
| A Class | C Class | |||||||||||||||
| Stephens Mid-Cap Growth Fund |
Shares | Amount | Shares | Amount | ||||||||||||
| Shares sold |
38 | $ | 525 | 11 | $ | 150 | ||||||||||
| Reinvestment of dividends |
2 | 24 | — | 2 | ||||||||||||
| Shares redeemed |
(27 | ) | (366 | ) | — | — | ||||||||||
|
|
|
|
|
|
|
|
|
|||||||||
| Net increase in shares outstanding |
13 | $ | 183 | 11 | $ | 152 | ||||||||||
|
|
|
|
|
|
|
|
|
|||||||||
39
American Beacon Bridgeway Large Cap Value FundSM
(For a share outstanding throughout the period)
| Institutional ClassG | ||||||||||||||||||||||||
| Six Months |
Six Months Ended Dec. 31, |
Year Ended June 30, | ||||||||||||||||||||||
| 2013 | 2012 | 2012 | 2011 | 2010 | 2009 | |||||||||||||||||||
| (unaudited) | ||||||||||||||||||||||||
| Net asset value, beginning of period |
$ | 15.85 | $ | 14.80 | $ | 14.62 | $ | 11.44 | $ | 9.74 | $ | 13.63 | ||||||||||||
|
|
|
|
|
|
|
|
|
|
|
|
|
|||||||||||||
| Income from investment operations: |
||||||||||||||||||||||||
| Net investment income |
0.08 | 0.20 | 0.24 | 0.20 | B | 0.19 | B | 0.23 | B | |||||||||||||||
| Net gains (losses) on investments (both realized and unrealized) |
2.67 | 1.14 | 0.12 | 3.21 | 1.73 | (3.89 | ) | |||||||||||||||||
|
|
|
|
|
|
|
|
|
|
|
|
|
|||||||||||||
| Total income (loss) from investment operations |
2.75 | 1.34 | 0.36 | 3.41 | 1.92 | (3.66 | ) | |||||||||||||||||
|
|
|
|
|
|
|
|
|
|
|
|
|
|||||||||||||
| Less distributions: |
||||||||||||||||||||||||
| Dividends from net investment income |
— | (0.29 | ) | (0.18 | ) | (0.23 | ) | (0.22 | ) | (0.23 | ) | |||||||||||||
| Distributions from net realized gains |
— | — | — | — | — | — | ||||||||||||||||||
|
|
|
|
|
|
|
|
|
|
|
|
|
|||||||||||||
| Total distributions |
— | (0.29 | ) | (0.18 | ) | (0.23 | ) | (0.22 | ) | (0.23 | ) | |||||||||||||
|
|
|
|
|
|
|
|
|
|
|
|
|
|||||||||||||
| Net asset value, end of period |
$ | 18.60 | $ | 15.85 | $ | 14.80 | $ | 14.62 | $ | 11.44 | $ | 9.74 | ||||||||||||
|
|
|
|
|
|
|
|
|
|
|
|
|
|||||||||||||
| Total return C |
17.35 | %D | 9.04 | %D | 2.60 | % | 30.02 | % | 19.65 | % | (26.88 | )% | ||||||||||||
|
|
|
|
|
|
|
|
|
|
|
|
|
|||||||||||||
| Ratios and supplemental data: |
||||||||||||||||||||||||
| Net assets, end of period (in thousands) |
$ | 40,220 | $ | 26,669 | $ | 26,950 | $ | 29,647 | $ | 25,534 | $ | 27,996 | ||||||||||||
| Ratios to average net assets: |
||||||||||||||||||||||||
| Expenses, before reimbursements |
1.20 | %E | 1.73 | %E | 1.30 | % | 1.17 | % | 1.11 | % | 0.98 | % | ||||||||||||
| Expenses, net of reimbursements |
0.84 | %E | 0.84 | %E | 0.82 | % | 0.84 | % | 0.84 | % | 0.84 | % | ||||||||||||
| Net investment income (loss), before reimbursements |
0.81 | %E | 1.38 | %E | 1.17 | % | 1.17 | % | 1.32 | % | 2.06 | % | ||||||||||||
| Net investment income (loss), net of reimbursements |
1.17 | %E | 2.27 | %E | 1.66 | % | 1.50 | % | 1.58 | % | 2.20 | % | ||||||||||||
| Portfolio turnover rate |
19 | %D | 21 | %D | 36 | % | 43 | % | 49 | % | 65 | % | ||||||||||||
| A | Commencement of operations. |
| B | Per share amounts calculated based on average daily shares outstanding during the period. |
| C | Based on net asset value, which does not reflect the sales charge, redemption fee, or contingent deferred sales charge, if applicable. May include adjustments in accordance with accounting principles generally accepted in the United States of America and as such, the net asset value for reporting purposes and the returns based upon those net asset values may differ from the net asset value and returns for shareholder transactions. |
| D | Not annualized. |
| E | Annualized. |
| F | Portfolio turnover rate is for the period from July 1, 2011 to June 30, 2012. |
| G | Prior to the reorganization on February 3, 2012, the Institutional Class was known as Class N. |
40
American Beacon Bridgeway Large Cap Value FundSM
Financial Highlights
(For a share outstanding throughout the period)
| Y Class | Investor Class | A Class | C Class | |||||||||||||||||||||||||||||||||||||||||||
| Six Months Ended June 30, 2013 |
Six Months Ended Dec. 31, 2012 |
Feb. 3A to June 30, 2012 |
Six Months Ended June 30, 2013 |
Six Months Ended Dec. 31, 2012 |
Feb. 3A to June 30, 2012 |
Six Months Ended June 30, 2013 |
Six Months Ended Dec. 31, 2012 |
Feb. 3A to June 30, 2012 |
Six Months Ended June 30, 2013 |
Six Months Ended Dec. 31, 2012 |
Feb. 3A to June 30, 2012 |
|||||||||||||||||||||||||||||||||||
| (unaudited) | (unaudited) | (unaudited) | (unaudited) | |||||||||||||||||||||||||||||||||||||||||||
| $ | 15.84 | $ | 14.80 | $ | 14.46 | $ | 15.81 | $ | 14.78 | $ | 14.46 | $ | 15.78 | $ | 14.77 | $ | 14.46 | $ | 15.70 | $ | 14.73 | $ | 14.46 | |||||||||||||||||||||||
|
|
|
|
|
|
|
|
|
|
|
|
|
|
|
|
|
|
|
|
|
|
|
|
|
|||||||||||||||||||||||
| 0.14 | 0.07 | 0.09 | 0.15 | 0.12 | 0.03 | 0.16 | 0.15 | 0.01 | 0.18 | 0.09 | 0.02 | |||||||||||||||||||||||||||||||||||
| 2.59 | 1.26 | 0.25 | 2.56 | 1.19 | 0.29 | 2.53 | 1.15 | 0.30 | 2.42 | 1.17 | 0.25 | |||||||||||||||||||||||||||||||||||
|
|
|
|
|
|
|
|
|
|
|
|
|
|
|
|
|
|
|
|
|
|
|
|
|
|||||||||||||||||||||||
| 2.73 | 1.33 | 0.34 | 2.71 | 1.31 | 0.32 | 2.69 | 1.30 | 0.31 | 2.60 | 1.26 | 0.27 | |||||||||||||||||||||||||||||||||||
|
|
|
|
|
|
|
|
|
|
|
|
|
|
|
|
|
|
|
|
|
|
|
|
|
|||||||||||||||||||||||
| — | (0.29 | ) | — | — | (0.28 | ) | — | — | (0.29 | ) | — | — | (0.29 | ) | — | |||||||||||||||||||||||||||||||
| — | — | — | — | — | — | — | — | — | — | — | — | |||||||||||||||||||||||||||||||||||
|
|
|
|
|
|
|
|
|
|
|
|
|
|
|
|
|
|
|
|
|
|
|
|
|
|||||||||||||||||||||||
| — | (0.29 | ) | — | — | (0.28 | ) | — | — | (0.29 | ) | — | — | (0.29 | ) | — | |||||||||||||||||||||||||||||||
|
|
|
|
|
|
|
|
|
|
|
|
|
|
|
|
|
|
|
|
|
|
|
|
|
|||||||||||||||||||||||
| $ | 18.57 | $ | 15.84 | $ | 14.80 | $ | 18.52 | $ | 15.81 | $ | 14.78 | $ | 18.47 | $ | 15.78 | $ | 14.77 | $ | 18.30 | $ | 15.70 | $ | 14.73 | |||||||||||||||||||||||
|
|
|
|
|
|
|
|
|
|
|
|
|
|
|
|
|
|
|
|
|
|
|
|
|
|||||||||||||||||||||||
| 17.23 | %D | 8.98 | %D | 2.35 | %D | 17.14 | %D | 8.84 | %D | 2.21 | %D | 17.05 | %D | 8.78 | %D | 2.14 | %D | 16.56 | %D | 8.54 | %D | 1.87 | %D | |||||||||||||||||||||||
|
|
|
|
|
|
|
|
|
|
|
|
|
|
|
|
|
|
|
|
|
|
|
|
|
|||||||||||||||||||||||
| $ | 6,588 | $ | 36 | $ | 5 | $ | 10,144 | $ | 489 | $ | 215 | $ | 8,593 | $ | 311 | $ | 276 | $ | 700 | $ | 20 | $ | 14 | |||||||||||||||||||||||
| 1.15 | %E | 3.75 | %E | 144.38 | %E | 1.49 | %E | 2.26 | %E | 18.30 | %E | 1.58 | %E | 2.21 | %E | 15.39 | %E | 2.33 | %E | 6.81 | %E | 64.88 | %E | |||||||||||||||||||||||
| 0.94 | %E | 0.93 | %E | 0.94 | %E | 1.22 | %E | 1.21 | %E | 1.22 | %E | 1.34 | %E | 1.33 | %E | 1.34 | %E | 2.09 | %E | 1.77 | %E | 2.09 | %E | |||||||||||||||||||||||
| 0.69 | %E | (0.51 | )%E | (141.90 | )%E | 0.47 | %E | 1.00 | %E | (15.48 | )%E | 0.33 | %E | 0.90 | %E | (13.13 | )%E | (0.34 | )%E | (3.55 | )%E | (62.47 | )%E | |||||||||||||||||||||||
| 0.90 | %E | 2.31 | %E | 1.54 | %E | 0.75 | %E | 2.05 | %E | 1.59 | %E | 0.57 | %E | 1.78 | %E | 0.92 | %E | (0.10 | )%E | 1.49 | %E | 0.32 | %E | |||||||||||||||||||||||
| 19 | %D | 21 | %D | 36 | %F | 19 | %D | 21 | %D | 36 | %F | 19 | %D | 21 | %D | 36 | %F | 19 | %D | 21 | %D | 36 | %F | |||||||||||||||||||||||
41
American Beacon Holland Large Cap Growth FundSM
Financial Highlights
(For a share outstanding throughout the period)
| Institutional Class | Y Class | |||||||||||||||||||||||
| Six Months Ended June 30, |
Year Ended December 31, |
March 1A Dec. 31, |
Six Months Ended June 30, |
March 23A Dec. 31, |
||||||||||||||||||||
| 2013 | 2012 | 2011 | 2010 | 2013 | 2012 | |||||||||||||||||||
| (unaudited) | (unaudited) | |||||||||||||||||||||||
| Net asset value, beginning of period |
$ | 21.60 | $ | 20.30 | $ | 20.00 | $ | 17.88 | $ | 21.59 | $ | 23.00 | ||||||||||||
|
|
|
|
|
|
|
|
|
|
|
|
|
|||||||||||||
| Income from investment operations: |
||||||||||||||||||||||||
| Net investment income (loss) |
0.02 | 0.09 | B | (0.02 | )C | (0.01 | )C | (0.01 | ) | 0.09 | B | |||||||||||||
| Net gains (losses) on investments (both realized and unrealized) |
2.82 | 2.47 | 0.71 | 2.61 | 2.82 | (0.26 | ) | |||||||||||||||||
|
|
|
|
|
|
|
|
|
|
|
|
|
|||||||||||||
| Total income (loss) from investment operations |
2.84 | 2.56 | 0.69 | 2 .60 | 2.81 | (0.17 | ) | |||||||||||||||||
|
|
|
|
|
|
|
|
|
|
|
|
|
|||||||||||||
| Less distributions: |
||||||||||||||||||||||||
| Dividends from net investment income |
— | (0.08 | ) | — | — | — | (0.06 | ) | ||||||||||||||||
| Distributions from net realized gains on securities |
— | (1.18 | ) | (0.39 | ) | (0.48 | ) | — | (1.18 | ) | ||||||||||||||
|
|
|
|
|
|
|
|
|
|
|
|
|
|||||||||||||
| Total distributions |
— | (1.26 | ) | (0.39 | ) | (0.48 | ) | — | (1.24 | ) | ||||||||||||||
|
|
|
|
|
|
|
|
|
|
|
|
|
|||||||||||||
| Net asset value, end of period |
$ | 24.44 | $ | 21.60 | $ | 20.30 | $ | 20.00 | $ | 24.40 | $ | 21.59 | ||||||||||||
|
|
|
|
|
|
|
|
|
|
|
|
|
|||||||||||||
| Total return D |
13.10 | %E | 12.57 | % | 3.47 | % | 14.58 | %E | 13.06 | %E | (0.79 | )%E | ||||||||||||
|
|
|
|
|
|
|
|
|
|
|
|
|
|||||||||||||
| Ratios and supplemental data: |
||||||||||||||||||||||||
| Net assets, end of period (in thousands) |
$ | 1,902 | $ | 1,619 | $ | 1,193 | $ | 1,126 | $ | 116 | $ | 23 | ||||||||||||
| Ratios to average net assets: |
||||||||||||||||||||||||
| Expenses, before reimbursements |
1.03 | %F | 1.32 | % | 1.49 | % | 1.91 | %F | 1.07 | %F | 10.18 | %F | ||||||||||||
| Expenses, net of reimbursements |
0.89 | %F | 0.96 | % | 1.20 | % | 1.20 | %F | 0.99 | %F | 0.98 | %F | ||||||||||||
| Net investment income (loss), before expense reimbursements |
0.00 | %F | 0.07 | % | (0.38 | )% | (0.77 | )%F | 0.03 | %F | (8.77 | )%F | ||||||||||||
| Net investment income (loss), net of reimbursements |
0.15 | %F | 0.43 | % | (0.09 | )% | 0.06 | %F | 0.11 | %F | 0.43 | %F | ||||||||||||
| Portfolio turnover rate |
13 | %E | 18 | % | 12 | % | 18 | %E | 13 | %E | 18 | %G | ||||||||||||
| A | Commencement of operations. |
| B | For purposes of this calculation, the change in undistributed net investment income per share was derived by dividing the change in undistributed net investment income by average shares outstanding for the period. |
| C | The Predecessor Fund calculated the change in undistributed net investment income per share by dividing the change in undistributed net investment income by average shares outstanding for the period. |
| D | Based on net asset value, which does not reflect the sales charge, redemption fee, or contingent deferred sales charge, if applicable. May include adjustments in accordance with accounting principles generally accepted in the United States of America and as such, the net asset value for reporting purposes and the returns based upon those net asset values may differ from the net asset value and returns for shareholder transactions. |
| E | Not annualized. |
| F | Annualized. |
| G | Portfolio turnover rate is for the period from January 1, 2012 to December 31, 2012. |
42
American Beacon Holland Large Cap Growth FundSM
Financial Highlights
(For a share outstanding throughout the period)
| Investor Class | A Class | C Class | ||||||||||||||||||||||||||||||||||||||||||||
| Six Months Ended June 30, |
Year Ended December 31, | Six Months Ended June 30, |
Year Ended December 31, |
Feb. 1A Dec. 31, |
Six Months Ended June 30, |
March 23A Dec. 31, |
||||||||||||||||||||||||||||||||||||||||
| 2013 | 2012 | 2011 | 2010 | 2009 | 2008 | 2013 | 2012 | 2011 | 2010 | 2013 | 2012 | |||||||||||||||||||||||||||||||||||
| (unaudited) | (unaudited) | (unaudited) | ||||||||||||||||||||||||||||||||||||||||||||
| $ | 21.52 | $ | 20.24 | $ | 19.97 | $ | 17.94 | $ | 12.90 | $ | 19.81 | $ | 21.43 | $ | 20.23 | $ | 19.96 | $ | 17.40 | $ | 21.29 | $ | 22.90 | |||||||||||||||||||||||
|
|
|
|
|
|
|
|
|
|
|
|
|
|
|
|
|
|
|
|
|
|
|
|
|
|||||||||||||||||||||||
| (0.03 | ) | 0.02 | B | (0.05 | )C | (0.04 | )C | (0.02 | )C | (0.04 | )C | (0.04 | ) | 0.03 | B | (0.05 | )C | (0.04 | )C | (0.07 | ) | 0.01 | B | |||||||||||||||||||||||
| 2.80 | 2.45 | 0.71 | 2.55 | 5.06 | (6.86 | ) | 2.79 | 2.41 | 0.71 | 3 .08 | 2.72 | (0.38 | ) | |||||||||||||||||||||||||||||||||
|
|
|
|
|
|
|
|
|
|
|
|
|
|
|
|
|
|
|
|
|
|
|
|
|
|||||||||||||||||||||||
| 2.77 | 2.47 | 0.66 | 2.51 | 5.04 | (6.90 | ) | 2.75 | 2.44 | 0.66 | 3 .04 | 2.65 | (0.37 | ) | |||||||||||||||||||||||||||||||||
|
|
|
|
|
|
|
|
|
|
|
|
|
|
|
|
|
|
|
|
|
|
|
|
|
|||||||||||||||||||||||
| — | (0.01 | ) | — | — | — | — | — | (0.06 | ) | — | — | — | (0.06 | ) | ||||||||||||||||||||||||||||||||
| — | (1.18 | ) | (0.39 | ) | (0.48 | ) | — | (0.01 | ) | — | (1.18 | ) | (0.39 | ) | (0.48 | ) | — | (1.18 | ) | |||||||||||||||||||||||||||
|
|
|
|
|
|
|
|
|
|
|
|
|
|
|
|
|
|
|
|
|
|
|
|
|
|||||||||||||||||||||||
| — | (1.19 | ) | (0.39 | ) | (0.48 | ) | — | (0.01 | ) | — | (1.24 | ) | (0.39 | ) | (0.48 | ) | — | (1.24 | ) | |||||||||||||||||||||||||||
|
|
|
|
|
|
|
|
|
|
|
|
|
|
|
|
|
|
|
|
|
|
|
|
|
|||||||||||||||||||||||
| $ | 24.29 | $ | 21.52 | $ | 20.24 | $ | 19.97 | $ | 17.94 | $ | 12.90 | $ | 24.18 | $ | 21.43 | $ | 20.23 | $ | 19.96 | $ | 23.94 | $ | 21.29 | |||||||||||||||||||||||
|
|
|
|
|
|
|
|
|
|
|
|
|
|
|
|
|
|
|
|
|
|
|
|
|
|||||||||||||||||||||||
| 12.87 | %E | 12.18 | % | 3.33 | % | 14.03 | % | 39.07 | % | (34.83 | )% | 12.83 | %E | 11.99 | % | 3.33 | % | 17.51 | %E | 12.45 | %E | (1.65 | )%E | |||||||||||||||||||||||
|
|
|
|
|
|
|
|
|
|
|
|
|
|
|
|
|
|
|
|
|
|
|
|
|
|||||||||||||||||||||||
| $ | 70,737 | $ | 66,568 | $ | 58,682 | $ | 54,128 | $ | 50,341 | $ | 33,766 | $ | 571 | $ | 467 | $ | 13 | $ | 12 | $ | 542 | $ | 281 | |||||||||||||||||||||||
| 1.38 | %F | 1.44 | % | 1.64 | % | 1.77 | % | 1.69 | % | 1.71 | % | 1.49 | %F | 2.73 | % | 10.06 | % | 42.81 | %F | 2.24 | %F | 6.17 | %F | |||||||||||||||||||||||
| 1.27 | %F | 1.29 | % | 1.35 | % | 1.35 | % | 1.35 | % | 1.35 | % | 1.39 | %F | 1.38 | % | 1.40 | % | 1.40 | %F | 2.14 | %F | 2.12 | %F | |||||||||||||||||||||||
| (0.35 | )%F | (0.08 | )% | (0.53 | )% | (0.64 | )% | (0.45 | )% | (0.61 | )% | (0.45 | )%F | (0.97 | )% | (8.94 | )% | (41.83 | )%F | (1.19 | )%F | (3.85 | )%F | |||||||||||||||||||||||
| (0.23 | )%F | 0.07 | % | (0.24 | )% | (0.22 | )% | (0.11 | )% | (0.25 | )% | (0.35 | )%F | 0.37 | % | (0.28 | )% | (0.22 | )%F | (1.09 | )%F | 0.20 | %F | |||||||||||||||||||||||
| 13 | %E | 18 | % | 12 | % | 18 | % | 11 | % | 35 | % | 13 | %E | 18 | % | 12 | % | 18 | %E | 13 | %E | 18 | %G | |||||||||||||||||||||||
43
American Beacon Stephens Small Cap Growth FundSM
Financial Highlights
(For a share outstanding throughout the period)
| Institutional Class | ||||||||||||||||||||||||||||
| Six Months June 30, |
One Dec. 31, |
Year Ended November 30, | ||||||||||||||||||||||||||
| 2013 | 2012 | 2012A | 2011A | 2010A | 2009A | 2008A | ||||||||||||||||||||||
| (unaudited) | ||||||||||||||||||||||||||||
| Net asset value, beginning of period |
$ | 12.99 | $ | 13.54 | $ | 13.14 | $ | 12.03 | $ | 9.37 | $ | 7.09 | $ | 12.34 | ||||||||||||||
|
|
|
|
|
|
|
|
|
|
|
|
|
|
|
|||||||||||||||
| Income from investment operations: |
||||||||||||||||||||||||||||
| Net investment income (loss) |
(0.03 | ) | 0.06 | (0.04 | )I | (0.11 | )B | (0.09 | )B | (0.06 | ) | (0.04 | ) | |||||||||||||||
| Net gains (losses) from investments (both realized and unrealized) |
2.30 | 0.23 | 1.43 | 1.37 | 2.75 | 2.34 | (5.21 | ) | ||||||||||||||||||||
|
|
|
|
|
|
|
|
|
|
|
|
|
|
|
|||||||||||||||
| Total income (loss) from investment operations |
2.27 | 0.29 | 1.39 | 1.26 | 2.66 | 2.28 | (5.25 | ) | ||||||||||||||||||||
|
|
|
|
|
|
|
|
|
|
|
|
|
|
|
|||||||||||||||
| Less distributions: |
||||||||||||||||||||||||||||
| Dividends from net investment income |
— | — | — | — | — | — | — | |||||||||||||||||||||
| Distributions from net realized gains on securities |
(0.04 | ) | (0.84 | ) | (0.99 | ) | (0.15 | ) | — | — | — | |||||||||||||||||
|
|
|
|
|
|
|
|
|
|
|
|
|
|
|
|||||||||||||||
| Total distributions |
(0.04 | ) | (0.84 | ) | (0.99 | ) | (0.15 | ) | — | — | — | |||||||||||||||||
|
|
|
|
|
|
|
|
|
|
|
|
|
|
|
|||||||||||||||
| Redemption fees added to beneficial interests |
— | — | — | — | — | — | 0.00 | C | ||||||||||||||||||||
|
|
|
|
|
|
|
|
|
|
|
|
|
|
|
|||||||||||||||
| Net asset value, end of period |
$ | 15.22 | $ | 12.99 | $ | 13.54 | $ | 13.14 | $ | 12.03 | $ | 9.37 | $ | 7.09 | ||||||||||||||
|
|
|
|
|
|
|
|
|
|
|
|
|
|
|
|||||||||||||||
| Total return D |
17.53 | %E | 2.15 | %E | 11.74 | % | 10.49 | % | 28.39 | % | 32.16 | % | (42.54 | )% | ||||||||||||||
|
|
|
|
|
|
|
|
|
|
|
|
|
|
|
|||||||||||||||
| Ratios and supplemental data: |
||||||||||||||||||||||||||||
| Net assets, end of period (in thousands) |
$ | 195,754 | $ | 138,052 | $ | 88,815 | $ | 52,336 | $ | 39,169 | $ | 34,356 | $ | 13,792 | ||||||||||||||
| Ratios to average net assets: |
||||||||||||||||||||||||||||
| Expenses, before reimbursements |
1.11 | %F | 1.20 | %F | 1.20 | % | 1.15 | % | 1.35 | % | 1.65 | % | 1.46 | % | ||||||||||||||
| Expenses, net of reimbursements |
1.09 | %F | 1.06 | %F | 1.10 | % | 1.10 | % | 1.10 | % | 1.25 | % | 1.25 | % | ||||||||||||||
| Net investment income (loss), before reimbursements |
(0.79 | )%F | 0.54 | %F | (0.84 | )% | (0.91 | )% | (1.09 | )% | (1.33 | )% | (1.00 | )% | ||||||||||||||
| Net investment income (loss), net of reimbursements |
(0.77 | )%F | 0 .68 | %F | (0.74 | )% | (0.86 | )% | (0.84 | )% | (0.93 | )% | (0.79 | )% | ||||||||||||||
| Portfolio turnover rate |
18 | %E | 6 | %E | 45 | % | 36 | % | 66 | % | 35 | % | 43 | % | ||||||||||||||
| A | Prior to the reorganization on February 24, 2012, the Institutional Class and Investor Classes were known as Class I and Class A, respectively. |
| B | The Predecessor Fund calculated the change in undistributed net investment income per share by dividing the change in undistributed net investment income by average shares outstanding for the period. |
| C | Amount represents less than $0.01 per share. |
| D | Based on net asset value, which does not reflect the sales charge, redemption fee, or contingent deferred sales charge, if applicable. May include adjustments in accordance with accounting principles generally accepted in the United States of America and as such, the net asset value for reporting purposes and the returns based upon those net asset values may differ from the net asset value and returns for shareholder transactions. |
| E | Not annualized. |
| F | Annualized. |
| G | Portfolio turnover rate is for the period from December 1, 2011 through November 30, 2012. |
| H | Commencement of Operations. |
| I | For purposes of this calculation, the change in undistributed net investment income per share was derived by dividing the change in undistributed net investment income by shares outstanding at November 30, 2012. |
44
American Beacon Stephens Small Cap Growth FundSM
Financial Highlights
(For a share outstanding throughout the period)
| Y Class | Investor Class | A Class | ||||||||||||||||||||||||||||||||||||||||||||||||
| Six Months Ended June 30, |
One Month Ended Dec. 31, |
Feb. 24H to Nov. 30, |
Six Months June 30, |
One Month Ended Dec. 31, |
Year Ended November 30, | Six Months Ended June 30, |
One Month Ended Dec. 31, |
Feb. 24H to Nov. 30, |
||||||||||||||||||||||||||||||||||||||||||
| 2013 | 2012 | 2012 | 2013 | 2012 | 2012A | 2011A | 2010A | 2009A | 2008A | 2013 | 2012 | 2012 | ||||||||||||||||||||||||||||||||||||||
| (unaudited) | (unaudited) | (unaudited) | ||||||||||||||||||||||||||||||||||||||||||||||||
| $ | 12.98 | $ | 13.54 | $ | 13.59 | $ | 12.42 | $ | 12 .99 | $ | 12.67 | $ | 11.64 | $ | 9.09 | $ | 6.90 | $ | 12.03 | $ | 12.40 | $ | 12.98 | $ | 13.07 | |||||||||||||||||||||||||
|
|
|
|
|
|
|
|
|
|
|
|
|
|
|
|
|
|
|
|
|
|
|
|
|
|
|
|||||||||||||||||||||||||
| (0.03) | 0.01 | (0.02 | ) | 0.02 | 0 .02 | (0 .06 | )I | (0 .14 | )B | (0 .11 | )B | (0.09 | ) | (0.13 | ) | (0.03 | ) | 0.01 | (0.07 | ) | ||||||||||||||||||||||||||||||
| 2.30 | 0.27 | 13 .56 | 2.14 | 0 .25 | 1.37 | 1.32 | 2.66 | 2.28 | (5.00 | ) | 2 .16 | 0.25 | (0.02 | ) | ||||||||||||||||||||||||||||||||||||
|
|
|
|
|
|
|
|
|
|
|
|
|
|
|
|
|
|
|
|
|
|
|
|
|
|
|
|||||||||||||||||||||||||
| 2.27 | 0.28 | 13.54 | 2.16 | 0 .27 | 1.31 | 1.18 | 2.55 | 2.19 | (5.13 | ) | 2 .13 | 0.26 | (0.09 | ) | ||||||||||||||||||||||||||||||||||||
|
|
|
|
|
|
|
|
|
|
|
|
|
|
|
|
|
|
|
|
|
|
|
|
|
|
|
|||||||||||||||||||||||||
| — | — | — | — | — | — | — | — | — | — | — | — | — | ||||||||||||||||||||||||||||||||||||||
| (0.04) | (0.84 | ) | — | (0.04 | ) | (0.84 | ) | (0.99 | ) | (0.15 | ) | — | — | — | (0.04 | ) | (0.84 | ) | — | |||||||||||||||||||||||||||||||
|
|
|
|
|
|
|
|
|
|
|
|
|
|
|
|
|
|
|
|
|
|
|
|
|
|
|
|||||||||||||||||||||||||
| (0.04) | (0.84 | ) | — | (0.04 | ) | (0.84 | ) | (0.99 | ) | (0.15 | ) | — | — | — | (0.04 | ) | (0.84 | ) | — | |||||||||||||||||||||||||||||||
|
|
|
|
|
|
|
|
|
|
|
|
|
|
|
|
|
|
|
|
|
|
|
|
|
|
|
|||||||||||||||||||||||||
| — | — | — | — | — | — | 0 .00 | C | 0 .00 | C | 0 .00 | C | 0 .00 | C | — | — | — | ||||||||||||||||||||||||||||||||||
|
|
|
|
|
|
|
|
|
|
|
|
|
|
|
|
|
|
|
|
|
|
|
|
|
|
|
|||||||||||||||||||||||||
| $ | 15.21 | $ | 12.98 | $ | 13.54 | $ | 14.54 | $ | 12 .42 | $ | 12.99 | $ | 12.67 | $ | 11.64 | $ | 9.09 | $ | 6.90 | $ | 14.49 | $ | 12.40 | $ | 12.98 | |||||||||||||||||||||||||
|
|
|
|
|
|
|
|
|
|
|
|
|
|
|
|
|
|
|
|
|
|
|
|
|
|
|
|||||||||||||||||||||||||
| 17.54 | %E | 2.07 | %E | (0.37 | )%E | 17.45 | %E | 15.92 | %E | 11.44 | % | 10.15 | % | 28.05 | % | 31.74 | % | (42.64 | )% | 17.31 | %E | 2.01 | %E | (0.69 | )%E | |||||||||||||||||||||||||
|
|
|
|
|
|
|
|
|
|
|
|
|
|
|
|
|
|
|
|
|
|
|
|
|
|
|
|||||||||||||||||||||||||
| $ | 20,769 | $ | 4,563 | $ | 2,699 | $ | 131,808 | $ | 69,786 | $ | 67,506 | $ | 47,101 | $ | 45,911 | $ | 22,058 | $ | 19,854 | $ | 6,834 | $ | 3,131 | $ | 2,941 | |||||||||||||||||||||||||
| 1.19 | %F | 1.36 | %F | 2.05 | %F | 1.46 | %F | 1 .62 | %F | 1.56 | % | 1.40 | % | 1.60 | % | 1.91 | % | 1.69 | % | 1.59 | %F | 1.79 | %F | 2.08 | %F | |||||||||||||||||||||||||
| 1.19 | %F | 1.16 | %F | 1.21 | %F | 1.35 | %F | 1 .34 | %F | 1.36 | % | 1.35 | % | 1.35 | % | 1.50 | % | 1.50 | % | 1.59 | %F | 1.58 | %F | 1.61 | %F | |||||||||||||||||||||||||
| (0.87 | )%F | 0.19 | %F | (1.57 | )%F | (1.14 | )%F | 0 .23 | %F | (1.20 | )% | (1.16 | )% | (1.33 | )% | (1.59 | )% | (1.36 | )% | (1.27 | )%F | 0.04 | %F | (1.68 | )%F | |||||||||||||||||||||||||
| (0.86 | )%F | 0.38 | %F | (0.73 | )%F | (1.03 | )%F | 0 .50 | %F | (1.00 | )% | (1.11 | )% | (1.08 | )% | (1.18 | )% | (1.17 | )% | (1.27 | )%F | 0.25 | %F | (1.21 | )%F | |||||||||||||||||||||||||
| 18 | %E | 6 | %E | 45 | %G | 18 | %E | 6 | %E | 45 | % | 36 | % | 66 | % | 35 | % | 43 | % | 18 | %E | 6 | %E | 45 | %G | |||||||||||||||||||||||||
45
American Beacon Stephens Small Cap Growth FundSM
Financial Highlights
(For a share outstanding throughout the period)
| C Class | ||||||||||||
| Six Months Ended June 30, 2013 |
One Month Ended Dec. 31, 2012 |
Feb. 24H to Nov. 30, 2012 |
||||||||||
| (unaudited) | ||||||||||||
| Net asset value, beginning of period |
$ | 12.32 | $ | 12.91 | $ | 13.07 | ||||||
|
|
|
|
|
|
|
|||||||
| Income from investment operations: |
||||||||||||
| Net investment income (loss) |
(0.06 | ) | 0.00 | (0.06 | ) | |||||||
| Net gains (losses) from investments (both realized and unrealized) |
2.13 | 0.25 | (0.10 | ) | ||||||||
|
|
|
|
|
|
|
|||||||
| Total income (loss) from investment operations |
2.07 | 0.25 | (0.16 | ) | ||||||||
|
|
|
|
|
|
|
|||||||
| Less distributions: |
||||||||||||
| Dividends from net investment income |
— | — | — | |||||||||
| Distributions from net realized gains on securities |
(0.04 | ) | (0.84 | ) | — | |||||||
|
|
|
|
|
|
|
|||||||
| Total distributions |
(0.04 | ) | (0.84 | ) | — | |||||||
|
|
|
|
|
|
|
|||||||
| Redemption fees added to beneficial interests |
— | — | — | |||||||||
|
|
|
|
|
|
|
|||||||
| Net asset value, end of period |
$ | 14.35 | $ | 12.32 | $ | 12.91 | ||||||
|
|
|
|
|
|
|
|||||||
| Total return D |
16.86 | %E | 1.94 | % | (1.22 | )%E | ||||||
|
|
|
|
|
|
|
|||||||
| Ratios and supplemental data: |
||||||||||||
| Net assets, end of period (in thousands) |
$ | 1,151 | $ | 349 | $ | 343 | ||||||
| Ratios to average net assets: |
||||||||||||
| Expenses, before reimbursements |
2.34 | %F | 3.21 | %F | 6.15 | %F | ||||||
| Expenses, net of reimbursements |
2.34 | %F | 2.33 | %F | 2.35 | %F | ||||||
| Net investment income (loss), before reimbursements |
(2.01 | )%F | (1.36 | )%F | (5.71 | )%F | ||||||
| Net investment income (loss), net of reimbursements |
(2.01 | )%F | (0.48 | )%F | (1.91 | )%F | ||||||
| Portfolio turnover rate |
18 | %E | 6 | %E | 45 | %G | ||||||
| A | Prior to the reorganization on February 24, 2012, the Institutional Class and Investor Classes were known as Class I and Class A, respectively. |
| B | The Predecessor Fund calculated the change in undistributed net investment income per share by dividing the change in undistributed net investment income by average shares outstanding for the period. |
| C | Amount represents less than $0.01 per share. |
| D | Based on net asset value, which does not reflect the sales charge, redemption fee, or contingent deferred sales charge, if applicable. May include adjustments in accordance with accounting principles generally accepted in the United States of America and as such, the net asset value for reporting purposes and the returns based upon those net asset values may differ from the net asset value and returns for shareholder transactions. |
| E | Not annualized. |
| F | Annualized. |
| G | Portfolio turnover rate is for the period from December 1, 2011 through November 30, 2012. |
| H | Commencement of Operations. |
| I | For purposes of this calculation, the change in undistributed net investment income per share was derived by dividing the change in undistributed net D investment income by shares outstanding at November 30, 2012. |
46
This page intentionally left blank.
47
American Beacon Stephens Mid-Cap Growth FundSM
Financial Highlights
(For a share outstanding throughout the period)
| Institutional Class | ||||||||||||||||||||||||||||
| Six Months Ended June 30, 2013 |
One Month Ended Dec. 31, 2012 |
Year Ended November 30, | ||||||||||||||||||||||||||
| 2012B | 2011B | 2010B | 2009B | 2008B | ||||||||||||||||||||||||
| (unaudited) | ||||||||||||||||||||||||||||
| Net asset value, beginning of period |
$ | 15 .38 | $ | 15 .24 | $ | 13.69 | $ | 12.44 | $ | 9.63 | $ | 7.18 | $ | 13.39 | ||||||||||||||
|
|
|
|
|
|
|
|
|
|
|
|
|
|
|
|||||||||||||||
| Income from investment operations: |
||||||||||||||||||||||||||||
| Net investment income (loss) |
(0 .04 | ) | 0 .02 | 0.00 | C | (0 .10 | )D | (0.09 | )D | (0.07 | ) | (0.06 | ) | |||||||||||||||
| Net gains (losses) from investments (both realized and unrealized) |
2 .04 | 0 .20 | 1.55 | 1.35 | 2.90 | 2.52 | (6.15 | ) | ||||||||||||||||||||
|
|
|
|
|
|
|
|
|
|
|
|
|
|
|
|||||||||||||||
| Total income (loss) from investment operations |
2 .00 | 0 .22 | 1.55 | 1.25 | 2.81 | 2.45 | (6.21 | ) | ||||||||||||||||||||
|
|
|
|
|
|
|
|
|
|
|
|
|
|
|
|||||||||||||||
| Less distributions: |
||||||||||||||||||||||||||||
| Dividends from net investment income |
— | — | — | — | — | — | — | |||||||||||||||||||||
| Distributions from net realized gains on securities |
(0 .07 | ) | (0 .08 | ) | — | — | — | — | — | |||||||||||||||||||
|
|
|
|
|
|
|
|
|
|
|
|
|
|
|
|||||||||||||||
| Total distributions |
(0 .07 | ) | (0 .08 | ) | — | — | — | — | — | |||||||||||||||||||
|
|
|
|
|
|
|
|
|
|
|
|
|
|
|
|||||||||||||||
| Redemption fees added to beneficial interests |
— | — | — | — | — | — | 0 .00 | E | ||||||||||||||||||||
|
|
|
|
|
|
|
|
|
|
|
|
|
|
|
|||||||||||||||
| Net asset value, end of period |
$ | 17 .31 | $ | 15 .38 | $ | 15.24 | $ | 13.69 | $ | 12.44 | $ | 9.63 | $ | 7.18 | ||||||||||||||
|
|
|
|
|
|
|
|
|
|
|
|
|
|
|
|||||||||||||||
| Total return F |
13 .02 | %G | 1.43 | %G | 11.32 | % | 10.05 | % | 29.18 | % | 34.12 | % | (46.38 | )% | ||||||||||||||
|
|
|
|
|
|
|
|
|
|
|
|
|
|
|
|||||||||||||||
| Ratios and supplemental data: |
||||||||||||||||||||||||||||
| Net assets, end of period (in thousands) |
$ | 37,462 | $ | 31,005 | $ | 30,503 | $ | 13,208 | $ | 7,124 | $ | 4,552 | $ | 3,967 | ||||||||||||||
| Ratios to average net assets: |
||||||||||||||||||||||||||||
| Expenses, before reimbursements |
1.13 | %H | 1.31 | %H | 1.28 | % | 1.65 | % | 2.27 | % | 3.03 | % | 2.19 | % | ||||||||||||||
| Expenses, net of reimbursements |
0.99 | %H | 0.99 | %H | 1.03 | % | 1.25 | % | 1.25 | % | 1.25 | % | 1.25 | % | ||||||||||||||
| Net investment income (loss), before reimbursements |
(0.72 | )%H | 1.37 | %H | (0.62 | )% | (1.12 | )% | (1.81 | )% | (2.46 | )% | (1.57 | )% | ||||||||||||||
| Net investment income (loss), net of reimbursements |
(0.58 | )%H | 1.69 | %H | (0.37 | )% | (0.72 | )% | (0.79 | )% | (0.69 | )% | (0.63 | )% | ||||||||||||||
| Portfolio turnover rate |
13 | %G | 1 | %G | 27 | % | 30 | % | 20 | % | 29 | % | 32 | % | ||||||||||||||
| A | Commencement of operations. |
| B | Prior to the reorganization on February 24, 2012, the Institutional Class and Investor Classes were known as Class I and Class A, respectively. |
| C | For purposes of this calculation, the change in undistributed net investment income per share was derived by dividing the change in undistributed net investment income by average shares outstanding for the period. |
| D | The Predecessor Fund calculated the change in undistributed net investment income per share by dividing the change in undistributed net investment income by average shares outstanding for the period. |
| E | Amount represents less than $0.01 per share. |
| F | Based on net asset value, which does not reflect the sales charge, redemption fee, or contingent deferred sales charge, if applicable. May include adjustments in accordance with accounting principles generally accepted in the United States of America and as such, the net asset value for reporting purposes and the returns based upon those net asset values may differ from the net asset value and returns for shareholder transactions. |
| G | Not annualized. |
| H | Annualized. |
| I | Portfolio turnover rate is for the period from December 1, 2011 through November 30, 2012. |
48
American Beacon Stephens Mid-Cap Growth FundSM
Financial Highlights
(For a share outstanding throughout the period)
| Y Class | Investor Class | A Class | ||||||||||||||||||||||||||||||||||||||||||||||||
| Six Months Ended June 30, |
One Dec. 31, |
Feb. 24A Nov. 30, |
Six Months Ended June 30, |
One Dec. 31, |
Six Months Ended June 30, |
One Dec. 31, |
Feb. 24A Nov. 30, |
|||||||||||||||||||||||||||||||||||||||||||
| Year Ended November 30, | ||||||||||||||||||||||||||||||||||||||||||||||||||
| 2013 | 2012 | 2012 | 2013 | 2012 | 2012B | 2011B | 2010B | 2009B | 2008B | 2013 | 2012 | 2012 | ||||||||||||||||||||||||||||||||||||||
| (unaudited) | (unaudited) | (unaudited) | ||||||||||||||||||||||||||||||||||||||||||||||||
| $ | 15.38 | $ | 15.23 | $ | 15.09 | $ | 13 .83 | $ | 13 .72 | $ | 12.36 | $ | 11.26 | $ | 8.74 | $ | 6.53 | $ | 12.22 | $ | 13 .83 | $ | 13.72 | $ | 13.62 | |||||||||||||||||||||||||
|
|
|
|
|
|
|
|
|
|
|
|
|
|
|
|
|
|
|
|
|
|
|
|
|
|
|
|||||||||||||||||||||||||
| (0.04 | ) | 0.02 | (0.03 | ) | (0.02 | ) | 0 .02 | (0 .14 | )C | (0 .11 | )D | (0 .10 | )D | (0.07 | ) | (0.11 | ) | (0 .06 | ) | 0.02 | (0.05 | ) | ||||||||||||||||||||||||||||
| |
2 .04 |
|
0 .21 | 0 .17 | 1 .79 | 0 .17 | 1.50 | 1.21 | 2.62 | 2.28 | (5.58) | 1 .82 | 0 .17 | 0 .15 | ||||||||||||||||||||||||||||||||||||
|
|
|
|
|
|
|
|
|
|
|
|
|
|
|
|
|
|
|
|
|
|
|
|
|
|
|
|||||||||||||||||||||||||
| |
2 .00 |
|
0 .23 | 0 .14 | 1 .77 | 0 .19 | 1.36 | 1.10 | 2.52 | 2.21 | (5.69 | ) | 1 .76 | 0 .19 | 0 .10 | |||||||||||||||||||||||||||||||||||
|
|
|
|
|
|
|
|
|
|
|
|
|
|
|
|
|
|
|
|
|
|
|
|
|
|
|
|||||||||||||||||||||||||
| — | — | — | — | — | — | — | — | — | — | — | — | — | ||||||||||||||||||||||||||||||||||||||
| (0.07 | ) | (0 .08 | ) | — | (0.07 | ) | (0.08 | ) | — | — | — | — | — | (0.07 | ) | (0.08 | ) | — | ||||||||||||||||||||||||||||||||
|
|
|
|
|
|
|
|
|
|
|
|
|
|
|
|
|
|
|
|
|
|
|
|
|
|
|
|||||||||||||||||||||||||
| (0.07 | ) | (0.08 | ) | — | (0.07 | ) | (0.08 | ) | — | — | — | — | — | (0.07 | ) | (0.08 | ) | — | ||||||||||||||||||||||||||||||||
|
|
|
|
|
|
|
|
|
|
|
|
|
|
|
|
|
|
|
|
|
|
|
|
|
|
|
|||||||||||||||||||||||||
| — | — | — | — | — | — | — | 0 .00 | E | 0 .00 | E | 0 .00 | E | — | — | — | |||||||||||||||||||||||||||||||||||
|
|
|
|
|
|
|
|
|
|
|
|
|
|
|
|
|
|
|
|
|
|
|
|
|
|
|
|||||||||||||||||||||||||
| $ | 17.31 | $ | 15.38 | $ | 15.23 | $ | 15 .53 | $ | 13 .83 | $ | 13.72 | $ | 12.36 | $ | 11.26 | $ | 8.74 | $ | 6.53 | $ | 15 .52 | $ | 13.83 | $ | 13.72 | |||||||||||||||||||||||||
|
|
|
|
|
|
|
|
|
|
|
|
|
|
|
|
|
|
|
|
|
|
|
|
|
|
|
|||||||||||||||||||||||||
| 12.87 | %G | 1.50 | %G | 1.13 | %G | 12.81 | %G | 1.37 | %G | 11.00 | % | 9.77 | % | 28.83 | % | 33.84 | % | (46.56 | )% | 12.74 | %G | 1.37 | %G | 0.73 | %G | |||||||||||||||||||||||||
|
|
|
|
|
|
|
|
|
|
|
|
|
|
|
|
|
|
|
|
|
|
|
|
|
|
|
|||||||||||||||||||||||||
| $ | 1,071 | $ | 374 | $ | 222 | $ | 25,644 | $ | 18,585 | $ | 18,092 | $ | 20,034 | $ | 15,076 | $ | 9,637 | $ | 7,748 | $ | 10,645 | $ | 7,302 | $ | 7,063 | |||||||||||||||||||||||||
| 1.37 | %H | 1.53 | %H | 3.85 | %H | 1.49 | %H | 1.68 | %H | 1.67 | % | 1.91 | % | 2.52 | % | 3.32 | % | 2.42 | % | 1.61 | %H | 1.81 | %H | 1.83 | %H | |||||||||||||||||||||||||
| 1.09 | %H | 1.09 | %H | 1.09 | %H | 1.37 | %H | 1.37 | %H | 1.40 | % | 1.50 | % | 1.50 | % | 1.50 | % | 1.50 | % | 1.49 | %H | 1.49 | %H | 1.49 | %H | |||||||||||||||||||||||||
| (0.93 | )%H | 0.69 | %H | (3.09) | %H | (1.07) | %H | 0.94 | %H | (1.04 | )% | (1.35 | )% | (2.06 | )% | (2.75 | )% | (1.97 | )% | (1.20 | )%H | 0.86 | %H | (1.04 | )%H | |||||||||||||||||||||||||
| (0.66 | )%H | 1.13 | %H | (0.33) | %H | (0.95) | %H | 1.26 | %H | (0.76 | )% | (0.94 | )% | (1.04 | )% | (0.93 | )% | (1.05 | )% | (1.07 | )%H | 1.18 | %H | (0.70 | )%H | |||||||||||||||||||||||||
| 13 | %G | 1 | %G | 27 | %I | 13 | %G | 1 | %G | 27 | % | 30 | % | 20 | % | 29 | % | 32 | % | 13 | %G | 1 | %G | 27 | %I | |||||||||||||||||||||||||
49
American Beacon Stephens Mid-Cap Growth FundSM
Financial Highlights
(For a share outstanding throughout the period)
| C Class | ||||||||||||
| Six Months Ended June 30, 2013 |
One Month Ended Dec. 31, 2012 |
Feb. 24A to Nov. 30, 2012 |
||||||||||
| (unaudited) | ||||||||||||
| Net asset value, beginning of period |
$ | 13.75 | $ | 13.63 | $ | 13.62 | ||||||
| Income from investment operations: |
||||||||||||
| Net investment income (loss) |
(0 .09 | ) | 0 .02 | (0 .04 | ) | |||||||
| Net gains (losses) from investments (both realized and unrealized) |
1 .78 | 0 .18 | 0 .05 | |||||||||
|
|
|
|
|
|
|
|||||||
| Total income (loss) from investment operations |
1 .69 | 0 .20 | 0 .01 | |||||||||
|
|
|
|
|
|
|
|||||||
| Less distributions: |
||||||||||||
| Dividends from net investment income |
— | — | — | |||||||||
| Distributions from net realized gains on securities |
(0 .07 | ) | (0 .08 | ) | — | |||||||
|
|
|
|
|
|
|
|||||||
| Total distributions |
(0 .07 | ) | (0 .08 | ) | — | |||||||
|
|
|
|
|
|
|
|||||||
| Redemption fees added to beneficial interests |
— | — | — | |||||||||
|
|
|
|
|
|
|
|||||||
| Net asset value, end of period |
$ | 15 .37 | $ | 13 .75 | $ | 13 .63 | ||||||
|
|
|
|
|
|
|
|||||||
| Total return FD |
12.14%G | 1.45%G | 0.07%G | |||||||||
|
|
|
|
|
|
|
|||||||
| Ratios and supplemental data: |
||||||||||||
| Net assets, end of period (in thousands) |
$ | 710 | $ | 302 | $ | 147 | ||||||
| Ratios to average net assets: |
||||||||||||
| Expenses, before reimbursements |
2.66 | %H | 2.68 | %H | 14.54 | %H | ||||||
| Expenses, net of reimbursements |
2.24 | %H | 2.24 | %H | 2.24 | %H | ||||||
| Net investment income (loss), before reimbursements |
(2.24 | )%H | 0.15 | %H | (13.65 | )%H | ||||||
| Net investment income (loss), net of reimbursements |
(1.82 | )%H | 0.59 | %H | (1.36 | )%H | ||||||
| Portfolio turnover rate |
13 | %G | 1 | %G | 27 | %i | ||||||
| A | Commencement of operations. |
| B | Prior to the reorganization on February 24, 2012, the Institutional Class and Investor Classes were known as Class I and Class A, respectively. |
| C | For purposes of this calculation, the change in undistributed net investment income per share was derived by dividing the change in undistributed net investment income by average shares outstanding for the period. |
| D | The Predecessor Fund calculated the change in undistributed net investment income per share by dividing the change in undistributed net investment income by average shares outstanding for the period. |
| E | Amount represents less than $0.01 per share. |
| F | Based on net asset value, which does not reflect the sales charge, redemption fee, or contingent deferred sales charge, if applicable. May include adjustments in accordance with accounting principles generally accepted in the United States of America and as such, the net asset value for reporting purposes and the returns based upon those net asset values may differ from the net asset value and returns for shareholder transactions. |
| G | Not annualized. |
| H | Annualized. |
| I | Portfolio turnover rate is for the period from December 1, 2011 through November 30, 2012. |
50
Disclosure Regarding the Board of Trustees’ Approval of the Management
Agreements and Investment Advisory Agreements of the Funds (Unaudited)
At its May 29, 2013 meeting, the Board of Trustees (“Board”) considered the renewal of the Management Agreement between American Beacon Advisors, Inc. (“Manager”) and the American Beacon Funds (“Beacon Trust”) on behalf of each of their series (collectively, the “Funds”) and the renewal of each investment advisory agreement between the Manager and a subadvisor (each an “Investment Advisory Agreement”). The Management Agreement and the Investment Advisory Agreements are collectively referred to herein as the “Agreements.” In preparation for the Board’s consideration to renew and approve these Agreements, the Board and its Investment Committee undertook steps to gather and consider information furnished by the Manager, the subadvisors, Lipper, Inc. (“Lipper”) and Morningstar, Inc. (“Morningstar”). The Board, with the assistance of independent legal counsel, requested and received certain relevant information from the Manager and each subadvisor.
The Board, with the assistance of independent legal counsel, requested and received certain relevant information from the Manager.
In addition, the Board’s Investment Committee worked with Lipper to obtain relevant comparative information regarding the performance, fees and expenses of the Funds. The Investment Committee, for the benefit of all Trustees, sponsored a separate meeting on May 10, 2013 to consider the information provided by Lipper. Further, the Board took into consideration information furnished for the Board’s review and consideration throughout the year at regular Board and Investment Committee meetings, as well as information specifically prepared in connection with the renewal process.
| • | In connection with the Board’s consideration of the Management Agreement and each Investment Advisory Agreement, the Trustees received and evaluated such information as they deemed necessary. The information requested by the Board included, among other information, the following materials. For various reasons, a subadvisor may not have provided responses to each requested item. In these instances, the Board considered the materials that were received from such subadvisor. References herein to the “firm” refer to the Manager and/or each applicable subadvisor.a description of any significant changes (actual or anticipated) to principal activities, personnel, services provided to the Funds, or any other area, including how these changes might affect the Funds; |
| • | a copy of the firm’s most recent audited or unaudited financial statements, as well as Parts 1 and 2 of its Form ADV registration statement with the SEC; |
| • | a summary of any material pending or anticipated litigation or regulatory proceedings involving the firm or its personnel, including the results of any recent regulatory examination or independent audit; |
| • | a comparison of the performance of that portion of Fund assets managed or to be managed by each firm with the performance of other similar accounts managed by the firm, including a discussion of relative performance versus a peer group average and any actual or potential remedial measures if the firm’s longer-term performance was materially below that of the peer group; |
| • | any actual or anticipated economies of scale in relation to the services the firm provides or will provide to each Fund and whether the current fee rates charged or to be charged to each Fund reflect these economies of scale for the benefit of the Fund’s investors; |
| • | an analysis of compensation, including a comparison with fee rates charged to other clients for which similar services are provided, any proposed changes to the fee rate schedule, if applicable, and the effect of any fee waivers; |
| • | a description of any payments made or to be made by the subadvisors to the Manager to support a Fund’s marketing efforts; |
| • | a copy of the firm’s proxy voting policies and procedures and, if applicable, the name of the third-party voting service used by the firm; |
| • | an evaluation of any other benefits to the firm or Funds as a result of their relationship, if any; |
| • | confirmation that the firm’s financial condition would not impair its ability to provide high-quality advisory services to the Funds; |
| • | a description of the scope of portfolio management services provided or to be provided to the Funds, including whether such services differ from the services provided to other clients, including other registered investment companies, and any advantages or disadvantages that might accrue to the Funds due to the firm’s involvement in other activities; |
| • | a description of the personnel who are or will be assigned primary responsibility for managing the Funds, including any changes during the past year, and a discussion of the adequacy of current and projected staffing levels to service the Funds; |
| • | a description of the basis upon which portfolio managers are compensated, including any “incentive” arrangements, and a description of the oversight mechanisms used to prevent a portfolio manager whose compensation is tied to performance of a Fund from taking undue risks; |
| • | a description of the firm’s practices in monitoring the quality of portfolio holdings and in reviewing portfolio valuation, including any fair value determinations; |
| • | a description of the firm’s use of derivatives, short positions, leveraged trading strategies or other similar trading strategies for the Funds; |
| • | a discussion regarding the firm’s participation in third-party and/or proprietary “soft dollar” arrangements, if any, or other brokerage allocation policies with respect to Fund transactions; |
| • | a discussion of the firm’s methodology for obtaining best execution, including any plans to improve the quality of execution in the upcoming year, and the use of any affiliated broker-dealers; |
| • | a description of any actual or potential conflicts of interest anticipated in managing Fund assets; |
| • | a discussion of whether the firm has identified any investment or operational matters that likely present a high risk in managing Fund assets; |
| • | a description of the firm’s criteria for assessing counterparties and counterparty risk to the extent the firm enters into transactions with counterparties on a Fund’s behalf; |
51
Disclosure Regarding the Board of Trustees’ Approval of the Management
Agreements and Investment Advisory Agreements of the Funds (Unaudited)
| • | a description of trade allocation procedures among accounts managed by the firm; |
| • | a discussion of whether the firm utilizes “commission recapture” or “directed brokerage” arrangements for the benefit of the Funds or “step-out” transactions; |
| • | a discussion of whether the firm receives, or anticipates receiving, other compensation, including any payment for electronic communication network liquidity rebates with respect to the Funds; |
| • | a certification by the firm regarding the reasonable design of its compliance program; |
| • | a summary of the results of the firm’s most recent annual review of its compliance program and a discussion of any material compliance problems encountered by a subadvisor since the most recent annual review; |
| • | confirmation that the firm is prepared to provide to the Manager, directly or in summary form, any regulatory review comments that could have a material impact on services provided to the Funds; |
| • | a discussion of whether, due to the firm’s trading activities on behalf of the Funds, the firm would need to register, or qualify for exclusion from registration, as a commodity pool operator or commodity trading advisor pursuant to the recent amendments to Rule 4.5 under the Commodity Exchange Act with respect to the Funds and, if so, whether the firm would so register or be exempt; |
| • | information regarding the firm’s code of ethics, insider trading policy and disaster recovery plan, including a description of any material changes thereto and a related certification of compliance by the firm; |
| • | a description of the firm’s affiliation with any broker-dealer; |
| • | a discussion of any anticipated change in the firm’s controlling persons; and verification of the firm’s insurance coverage with regards to the services provided to the Funds. |
In addition, the Manager provided the following information specific to the renewal of the Management Agreement:
| • | a comparison of the performance of a share class of each Fund to comparable investment companies and appropriate indices, including comments on the relative performance of, as applicable, each subadvisor and each Fund versus the respective peer group average; |
| • | a discussion, if applicable, of any underperformance by a subadvisor relative to its peer group and what, if any, remedial measures the Manager has or intends to take; |
| • | a comparison of advisory fee rates and expense ratios for comparable mutual funds; |
| • | a profit/loss analysis of the Manager; |
| • | an analysis of any material complaints received from Fund shareholders; |
| • | a description of the extent to which the Manager monitors the investment activities and financial conditions of each subadvisor to the Funds; |
| • | a discussion of whether the Manager provides different types or levels of administrative and accounting related services to certain Funds; |
| • | a description of the Manager’s distribution activities with respect to promoting sales of Fund shares, including any revenue sharing practices; |
| • | a description of arrangements pursuant to which certain firms may make any direct or indirect payments to partially reimburse the Manager for its marketing or other expenses on behalf of the Funds; |
| • | a description of the Manager’s securities lending practices and the fees received from such practices; |
| • | a discussion of any rebate arrangements between the Manager and a service provider to the Funds pursuant to which the Manager receives direct or indirect benefits from the service provider; |
| • | a description of the portfolio turnover rate for each Fund and, as applicable, each subadvisor to a Fund; |
| • | a description of how expenses that are not readily identifiable to a particular Fund are allocated; and |
| • | confirmation that the Manager complies with applicable CFTC and National Futures Association rules and requirements for applicable Funds and a discussion regarding whether, due to the Manager’s trading activities on behalf of other Funds, the Manager would need to register, or qualify for exclusion from registration, as a commodity pool operator or commodity trading advisor pursuant to the recent amendment to Rule 4.5 under the Commodity Exchange Act with respect to the Funds and, if so, whether the firm would so register or be exempt. |
In connection with the Management Agreement and each Investment Advisory Agreement, the Board also obtained an analysis provided by Lipper that compared: (i) investment performance of each Fund versus comparable investment companies and appropriate indices; (ii) total Fund expenses of each Fund versus comparable mutual funds; and (iii) each Fund’s investment advisory fee rate versus comparable mutual funds. For certain Funds, the Board also considered information regarding the performance of the Manager and individual subadvisors with respect to their allocated portions of a Fund’s portfolio, net of management or subadvisory fees, as applicable, but not other Fund expenses. For each Fund with more than one class of shares, the class of shares used for comparative purposes was the class with the longest performance history, which in most cases was the Institutional Class. The Board also considered that the use of Institutional Class performance generally facilitates a meaningful comparison for expense and performance purposes.
Provided below is an overview of the primary factors the Trustees considered at the Investment Committee meeting on May 10, 2013 at which the Trustees reviewed the investment performance of the Manager and the primary factors considered by the Board at its May 29, 2013 meeting at which the Board considered the renewal of the Agreement.
52
Disclosure Regarding the Board of Trustees’ Approval of the Management
Agreements and Investment Advisory Agreements of the Funds (Unaudited)
The Board did not identify any particular information that was most relevant to its consideration to renew the Agreement, and each Trustee may have afforded different weight to the various factors. Legal counsel to the independent Trustees provided the Board with a memorandum regarding its responsibilities pertaining to the renewal of the Agreement. The memorandum explained the regulatory requirements surrounding the Trustees’ process for evaluating investment advisors and the terms of the contracts. Based on its evaluation, the Board unanimously concluded that the terms of the Agreement were reasonable and fair and that the renewal of the Agreement was in the best interests of the Funds and their shareholders.
Considerations With Respect to the Renewal of the Management Agreement and Each Investment Advisory Agreement.
In determining whether to renew the Management Agreement and each Investment Advisory Agreement on behalf of the Funds, the Trustees considered the best interests of each Fund separately. While the Management Agreement and the Investment Advisory Agreements for all of the Funds were considered at the May 29, 2013 meeting, the Board considered each Fund’s investment management and subadvisory relationships separately.
In each instance, the Board considered, among other things, the following factors: (1) the nature, extent and quality of the services provided; (2) the investment performance of a Fund and, as applicable, each subadvisor for a Fund; (3) the costs incurred by the Manager in rendering services to the Funds and its resulting profits or losses; (4) the extent to which economies of scale have been taken into account in setting each fee rate schedule; (5) whether fee rate levels reflect these economies of scale for the benefit of Fund investors; (6) comparisons of services and fee rates with contracts entered into by the Manager or a subadvisor or their affiliates with other clients (such as pension funds and other institutional funds); and (7) any other benefits derived or anticipated to be derived by the Manager or a subadvisor from their relationship with a Fund. The Trustees posed questions to various management personnel of the Manager regarding certain key aspects of the materials submitted in support of the renewal.
Nature, Extent and Quality of Services. With respect to the renewal of the Management Agreement, the Board considered, among other factors: each Fund’s long-term performance and the background and experience of key investment personnel at the Manager; the cost structure of the Funds; the Manager’s culture of compliance and support for compliance operations that reduce risks to the Funds; the Manager’s commitment to enhance the Funds’ product line and increase assets in the Funds; the Manager’s quality of services; the Manager’s active role in monitoring and, as appropriate, recommending additional or replacement subadvisors; the Manager’s commitment to training employees; and the Manager’s efforts to retain key employees and maintain staff levels.
With respect to the renewal of each Investment Advisory Agreement, the Trustees considered the level of staffing, quality, background and experience of each subadvisor’s investment personnel responsible for managing the Funds, the size of the subadvisor and the subadvisor’s ability to continue to attract and retain qualified investment personnel. The Board also considered the adequacy of the resources committed to the Funds by each subadvisor, and whether those resources were commensurate with the needs of the Funds and are sufficient to sustain appropriate levels of performance and compliance needs. In this regard, the Board considered the financial stability of each subadvisor. The Board also considered the subadvisors’ representations regarding their compliance programs and codes of ethics. Based on the foregoing information, the Board concluded that the nature, extent and quality of the management and advisory services provided by the Manager and each subadvisor were appropriate for each Fund and, thus, determined to renew the Management Agreement and the Investment Advisory Agreement for each Fund. Based on the foregoing information, the Board concluded that the nature, extent and quality of the management and advisory services provided by the Manager and each subadvisor were appropriate for each Fund and, thus, determined to renew the Management Agreement and the Investment Advisory Agreement for each Fund.
Investment Performance. The Board evaluated the comparative information provided by Lipper and the Manager regarding each Fund’s investment performance relative to its Lipper performance universe, Lipper performance group, and/or benchmark index(es). The Board considered the information provided by Lipper regarding its independent peer selection methodology to select all performance groups and universes. The Board also considered that the performance groups and universes selected by Lipper may not provide appropriate comparisons for each Fund. In addition, the Board considered the performance reports and discussions with management at Board and Committee meetings throughout the year. The Board also considered in each instance the Manager’s recommendation to continue to retain each subadvisor. A discussion regarding the Board’s considerations with respect to each Fund’s performance appears below under “Additional Considerations and Conclusions with Respect to Each Fund.”
Costs of the services Provided to the Funds and the Profits Realized by the Manager from its Relationship with the Funds. In analyzing the cost of services and profitability of the Manager, the Board considered the revenues earned and the expenses incurred by the Manager. The profits or losses were noted at both an aggregate level for all Funds and at an individual Fund level, with some Funds being profitable for the Manager and with the Manager sustaining losses with respect to other Funds. Although the Board noted that, in certain cases, the fee rates paid by other clients of the Manager are lower than the fee rates paid by the Funds, the difference reflects the greater level of responsibility and regulatory requirements associated with managing the Funds.
The Board also noted that the Manager proposed to continue the expense waivers and reimbursements for certain Funds and classes that were in place during the last fiscal year. The Board further considered that with respect to each Fund, the Management Agreement provides for the Manager to receive a management fee comprised of an annualized fee that is retained by the Manager plus the amount payable by the Manager to a subadvisor. The Board also considered that the Manager receives service and administrative fees to compensate the Manager for providing administrative services to the Funds and to compensate third-party administrators and broker-dealers for services to Fund shareholders. In addition, the Board considered that the Manager receives management fees for overseeing the securities lending program on behalf of various Funds. The Board also noted that certain classes of the Funds maintain higher expense ratios in order to compensate third-party distributors. In analyzing the cost of services for each subadvisor in connection with its investment advisory services to the Fund, the Board considered that, in many cases, the Manager has negotiated the lowest subadvisory fee rate a subadvisor charges for any comparable client
53
Disclosure Regarding the Board of Trustees’ Approval of the Management
Agreements and Investment Advisory Agreements of the Funds (Unaudited)
accounts. The Board did not request profitability data from the subadvisors because the Board did not view this data as imperative to its deliberations given the arm’s-length nature of the relationship between the Manager and the subadvisors with respect to the negotiation of subadvisory fee rates. In addition, the Board noted that subadvisors may not account for their profits on an account-by-account basis and, those that do, likely employ different methodologies in connection with these calculations.
Based on the foregoing information, the Board concluded that the profitability levels of the Manager were reasonable in light of the services performed by the Manager. A discussion regarding the Board’s considerations with respect to each Fund’s fee rates is set forth below under “Additional Considerations and Conclusions with Respect to Each Fund.”
Economies of Scale. In considering the reasonableness of the management and investment advisory fees rates, the Board considered whether economies of scale will be realized as the Funds grow and whether fee rate levels reflect these economies of scale for the benefit of Fund shareholders. In this regard, the Board considered that the Manager has negotiated breakpoints in many subadvisory fee rates. The Board also noted that, for purposes of determining the fee rates chargeable to the Funds, many subadvisors have agreed to take into account assets of AMR Corporation and its pension plans that are managed by the subadvisors. Thus, the Funds are able to receive lower effective fee rates.
In addition, the Board noted the Manager’s representation that many of the Funds benefit from economies of scale because comparably low fee rate levels are reflected in the current management and administration fee rates the Manager charges. The Board further noted the Manager’s representation that many of the Funds benefit from these comparably low fee rate levels despite not having yet reached an asset size at which economies of scale would traditionally be considered to exist, and the Manager’s belief that breakpoints are not appropriate at this time. Based on the foregoing information, the Board concluded that the Manager and subadvisor fee rate schedules for each Fund provide for a reasonable sharing of benefits from any economies of scale with the Funds.
Benefits Derived from the Relationship with the Funds. The Board considered the “fall-out” or ancillary benefits that accrue to the Manager and/or the subadvisors as a result of the advisory relationships with the Funds, including greater exposure in the marketplace with respect to the Manager’s or subadvisor’s investment process and expanding the level of assets under management by the Manager and the subadvisors.
In addition, the Manager noted that the Funds also derive benefits from their association with the Manager. Specifically, the Board noted the Manager’s representation that it provides services to most Funds at a lower than industry average cost. The Board considered that certain of the subadvisors reimburse the Manager for certain of its costs relating to distribution activities for the Funds. The Board also considered that the Funds did not pay commissions to any affiliated broker-dealer of the Manager or the relevant subadvisor during the most recent fiscal year ended December 31, 2012.
Based on the foregoing information, the Board concluded that the potential benefits accruing to the Manager and the subadvisors by virtue of their relationships with the Funds appear to be fair and reasonable.
Additional Considerations and Conclusions with Respect to Each Fund. The performance comparisons below were made versus each Fund’s Lipper performance universe median, Lipper performance group median and/or benchmark index. References below to each Fund’s Lipper performance group and Lipper performance universe are to the respective group or universe of comparable mutual funds included in the analysis provided by Lipper. A Lipper performance group consists of the Fund and a representative sample of funds with similar investment classifications and objectives as the Fund, as selected by Lipper. A Lipper performance universe is an expansion of the performance group, providing a broader view of performance across the Fund’s investment classification/objective and allowing for a more extensive comparison. In reviewing the performance, the Trustees viewed longer-term performance over a full market cycle, typically five years or longer, as the most important consideration, because relative performance over shorter periods may be significantly impacted by market or economic events that do not reflect manager skill.
The expense comparisons below were made versus each Fund’s Lipper expense universe median and Lipper expense group median. References below to each Fund’s expense group and expense universe are to the respective group or universe of comparable mutual funds included in the analysis by Lipper. A Lipper expense group consists of the Fund and a representative sample of funds with similar operating structures, as selected by Lipper. A Lipper expense universe includes all funds in the investment classification/objective with a similar load type to the share class of the Fund included in the Lipper comparative information and provides a broader view of expenses across the Fund’s investment classification/objective. The Trustees also considered a Fund’s Morningstar fee level category. In reviewing expenses, the Trustees considered the positive impact of fee waivers where applicable and the Manager’s agreement to continue the fee waivers. In addition, information regarding the use of soft dollars was requested from the Manager and all subadvisors and was considered by the Trustees.
Additional Considerations and Conclusions with Respect to the American Beacon Bridgeway Large Cap Value Fund. In considering the renewal of the Management Agreement and Investment Advisory Agreement for the American Beacon Bridgeway Large Cap Value Fund, the Trustees considered the following additional factors: (1) the American Beacon Bridgeway Large Cap Value Fund outperformed the Lipper performance universe median and Lipper performance group median for the one-, three- and five-year periods ended March 31, 2013; (2) the American Beacon Bridgeway Large Cap Value Fund acquired all of the assets of the Bridgeway Large Cap Value Fund, a series of Bridgeway Funds, Inc. (“Acquired Fund”), on February 3, 2012, and that the Fund’s performance prior to that date is that of the Acquired Fund; (3) the expense ratio of the Institutional Class of the Fund was lower than the median of its Lipper expense universe and Lipper expense group; and (4) the Institutional Class of the Fund was categorized by Morningstar as having an average expense ratio.
54
Disclosure Regarding the Board of Trustees’ Approval of the Management
Agreements and Investment Advisory Agreements of the Funds (Unaudited)
In considering the renewal of the Investment Advisory Agreement with Bridgeway Capital Management Inc. (“Bridgeway”), the Trustees considered the following additional factors: (1) representations by Bridgeway that, for fee rate comparison purposes, it does not manage other accounts comparable to the Fund; and (2) the Manager’s recommendation to continue to retain the subadvisor.
Based on these and other considerations, the Trustees: (1) concluded that the fees paid to the Manager and subadvisor under the Management and Investment Advisory Agreements are fair and reasonable; (2) determined that the Bridgeway Large Cap Value Fund and its shareholders would benefit from the Manager’s and subadvisor’s continued management of the Fund; and (3) approved the renewal of the Management and Investment Advisory Agreements with respect to the Bridgeway Large Cap Value Fund.
Additional Considerations and Conclusions with Respect to the American Beacon Holland Large Cap Growth Fund. In considering the renewal of the Management Agreement and Investment Advisory Agreement for the American Beacon Holland Large Cap Growth Fund, the Trustees considered the following additional factors: (1) the American Beacon Holland Large Cap Growth Fund outperformed the Lipper performance universe median and Lipper performance group median for the one- and three-year periods ended March 31, 2013; (2) the American Beacon Holland Large Cap Growth Fund acquired all of the assets of the Lou Holland Growth Fund, a series of the Forum Funds (“Acquired Fund”), on March 23, 2012, and that the Fund’s performance prior to that date is that of the Acquired Fund; (3) the expense ratio of the Institutional Class of the Fund was equal to the median of its Lipper expense group and higher than the median of its Lipper expense universe; and (4) the Institutional Class of the Fund was categorized by Morningstar as having an above average expense ratio.
In considering the renewal of the Investment Advisory Agreement with Holland Capital Management LLC (“Holland”), the Trustees considered the following additional factors: (1) representations by Holland regarding fee rates charged to other comparable clients; and (2) the Manager’s recommendation to continue to retain the subadvisor.
Based on these and other considerations, the Trustees: (1) concluded that the fees paid to the Manager and subadvisor under the Management and Investment Advisory Agreements are fair and reasonable; (2) determined that the American Beacon Holland Large Cap Growth Fund and its shareholders would benefit from the Manager’s and subadvisor’s continued management of the Fund; and (3) approved the renewal of the Management and Investment Advisory Agreements with respect to the American Beacon Holland Large Cap Growth Fund.
Additional Considerations and Conclusions with Respect to the American Beacon Stephens Mid-Cap Growth Fund. In considering the renewal of the Management Agreement for the American Beacon Stephens Mid-Cap Growth Fund, the Trustees considered the following additional factors: (1) the American Beacon Stephens Mid-Cap Growth Fund outperformed the Lipper performance universe median for the one-, three- and five-year periods ended March 31, 2013; (2) the American Beacon Stephens Mid-Cap Growth Fund outperformed the Lipper performance group median for the three- and five-year periods ended March 31, 2013, and was equal to the peer group median for the one-year period; (3) the American Beacon Stephens Mid-Cap Growth Fund acquired all of the assets of the Stephens Mid-Cap Growth Fund, a series of Professionally Managed Portfolios (“Acquired Fund”), on February 24, 2012, and that the Fund’s performance prior to that date is that of the Acquired Fund; (4) the expense ratio of the Institutional Class of the Fund was lower than the median of its Lipper expense universe and Lipper expense group; and (5) the Institutional Class of the Fund was categorized by Morningstar as having an average expense ratio.
In considering the renewal of the Investment Advisory Agreement with Stephens Investment Management Group, LLC (“Stephens”), the Trustees considered the following additional factors: (1) representations from Stephens regarding fee rates charged to other comparable clients; and (2) the Manager’s recommendation to continue to retain the subadvisor.
Based on these and other considerations, the Trustees: (1) concluded that the fees paid to the Manager and subadvisor under the Management and Investment Advisory Agreements are fair and reasonable; (2) determined that the American Beacon Stephens Mid-Cap Growth Fund and its shareholders would benefit from the Manager’s and subadvisor’s continued management of the Fund; and (3) approved the renewal of the Management and Investment Advisory Agreements with respect to the American Beacon Stephens Mid-Cap Growth Fund.
Additional Considerations and Conclusions with Respect to the American Beacon Stephens Stephens Small Cap Growth Fund. In considering the renewal of the Management Agreement for the American Beacon Stephens Small Cap Growth Fund, the Trustees considered the following additional factors: (1) the American Beacon Stephens Small Cap Growth Fund outperformed the Lipper performance universe median and Lipper performance group median for the one-, three- and five-year periods ended March 31, 2013; (2) the American Beacon Stephens Small Cap Growth Fund acquired all of the assets of Stephens Small Cap Growth Fund, a series of Professionally Managed Portfolios (“Acquired Fund”), on February 24, 2012, and that the Fund’s performance prior to that date is that of the Acquired Fund; (3) the expense ratio of the Institutional Class of the Fund was lower than the median of its Lipper expense universe; (4) the expense ratio of the Institutional Class of the Fund was higher than the median of its Lipper expense group; and (5) the Institutional Class of the Fund was categorized by Morningstar as having an average expense ratio.
In considering the renewal of the Investment Advisory Agreement with Stephens Investment Management Group, LLC (“Stephens”), the Trustees considered the following additional factors: (1) representations from Stephens regarding fee rates it charged to other comparable clients; and (2) the Manager’s recommendation to continue to retain the subadvisor.
Based on these and other considerations the Trustees: (1) concluded that the fees paid to the Manager and the subadvisor under the Management and Investment Advisory Agreements are fair and reasonable; (2) determined that the American Beacon Stephens Small Cap Growth Fund and its shareholders would benefit from the Manager’s and subadvisor’s continued management of the Fund; and (3) approved the renewal of the Management and Investment Advisory Agreements with respect to the American Beacon Stephens Small Cap Growth Fund.
55
This page intentionally left blank.
56
This page intentionally left blank.
57

eDelivery is NOW AVAILABLE- Stop traditional mail delivery and receive your
shareholder reports and summary prospectus on-line. Sign up at
www.americanbeaconfunds.com
If you invest in the Fund through a financial institution, you may be able to receive the Fund’s regulatory mailings, such as the Prospectus, Annual Report and Semi-Annual Report, by e-mail. If you are interested in this option, please go to www.icsdelivery.com and search for your financial institution’s name or contact your financial institution directly.
To obtain more information about the Fund:

|

| |||
| By E-mail: american_beacon.funds@ambeacon.com |
On the Internet: Visit our website at www.americanbeaconfunds.com | |||

|

| |||
|
By Telephone: Call (800) 658-5811 |
By Mail: American Beacon Funds P.O. Box 219643 Kansas City, MO 64121-9643 | |||
| Availability of Quarterly Portfolio Schedules
In addition to the Schedule of Investments provided in each semi-annual and
annual |
Availability of Proxy Voting Policy and Records
A description of the policies and procedures the Fund uses to determine how
to vote | |||
Fund Service Providers:
|
CUSTODIAN State Street Bank and Trust Boston, Massachusetts |
TRANSFER AGENT Boston Financial Data Services Kansas City, Missouri |
INDEPENDENT REGISTERED PUBLIC ACCOUNTING FIRM Ernst & Young LLP Dallas, Texas
|
DISTRIBUTOR Foreside Fund Services, LLC Portland, Maine |
This report is prepared for shareholders of the American Beacon Funds and may be distributed to others only if preceded or accompanied by a current Prospectus or Summary Prospectus.
American Beacon Funds, American Beacon Bridgeway Large Cap Value Fund, American Beacon Holland Large Cap Growth Fund, American Beacon Stephens Small Cap Growth Fund, and American Beacon Stephens Mid-Cap Growth Fund are service marks of American Beacon Advisors, Inc.
SAR 6/13
Investing in the securities of small capitalization companies involves greater risk and the possibility of greater price volatility than investing in larger capitalization and more established companies. Investing in foreign equities entails additional risk not associated with domestic equities, such as currency fluctuations, economic and political instability, and differences in accounting standards. Investing in derivatives may involve certain costs and risks such as liquidity, interest rate, market, credit, management and the risk that a position could not be closed when more advantageous. Investing in derivatives could result in losing more than the amount invested. Please see the prospectus for a complete discussion of these Funds’ risks. There can be no assurances that the investment objectives of these Funds will be met.
Any opinions herein, including forecasts, reflect our judgment as of the end of the reporting period and are subject to change. Each advisor’s strategies and each Fund’s portfolio composition will change depending on economic and market conditions. This report is not a complete analysis of market conditions and therefore, should not be relied upon as investment advice. Although economic and market information has been compiled from reliable sources, American Beacon Advisors, Inc. makes no representation as to the completeness or accuracy of the statements contained herein.
| American Beacon Funds | June 30, 2013 |
|
|
Dear Shareholders,
The first six months of 2013 have been very good for the stock market. Despite a dip in June, fueled by the possible end of the Federal Reserve’s quantitative easing program, the market had risen enough through May to make the first half of the year a profitable one overall.
The S&P 500 Index gained 13.82% over the first six months of 2013, with all ten industry sectors posting positive returns.
Meanwhile, the Russell 2000 Index, which consists of small-cap stocks, gained 15.86% over that same period. In the developed international markets, the MSCI EAFE Index returned 4.10%. |

American Beacon Advisors is proud to offer its shareholders several index funds that can take advantage of such broad-based market gains. For the six-month period ended June 30, 2013:
| • | American Beacon S&P 500 Index Fund (Institutional Class) returned 13.75%. |
| • | American Beacon Small Cap Index Fund (Institutional Class) returned 15.90%. |
| • | American Beacon International Equity Index Fund (Institutional Class) returned 3.32%. |
Thank you for your continued investment in the American Beacon Funds. For additional information about the Funds or to access your account information, please visit our website at www.americanbeaconfunds.com.
Sincerely,

Gene L. Needles, Jr.
President
American Beacon Funds
1
American Beacon S&P 500® Index Fund †
June 30, 2013 (Unaudited)
2
American Beacon S&P 500® Index Fund †
Performance Overview
June 30, 2013 (Unaudited)
3
American Beacon Small Cap Index FundSM
Performance Overview
June 30, 2013 (Unaudited)
4
American Beacon Small Cap Index FundSM
Performance Overview
June 30, 2013 (Unaudited)
5
American Beacon International Equity Index FundSM
Performance Overview
June 30, 2013 (Unaudited)
6
American Beacon International Equity Index FundSM
Performance Overview
June 30, 2013 (Unaudited)
7
American Beacon International Equity Index FundSM
Performance Overview
June 30, 2013 (Unaudited)
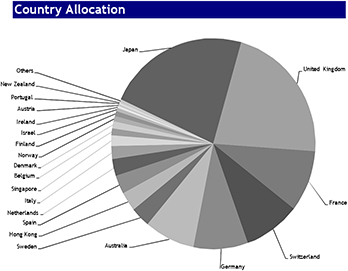
8
American Beacon FundsSM
Fund Expenses
June 30, 2013 (Unaudited)
Fund Expense Example
As a shareholder of a Fund, you incur two types of costs: (1) transaction costs and (2) ongoing costs, including management fees, administrative service fees, and other Fund expenses. The examples below are intended to help you understand the ongoing cost (in dollars) of investing in a particular Fund and to compare these costs with the ongoing costs of investing in other mutual funds. The examples are based on an investment of $1,000 invested at the beginning of the period and held for the entire period from January 1, 2013 through June 30, 2013.
Actual Expenses
The following table provides information about actual account values and actual expenses. You may use the information in this table, together with the amount you invested, to estimate the expenses that you paid over the period. Simply divide your account value by $1,000 (for example, an $8,600 account value divided by $1,000 = 8.6), then multiply the result by the number in the “Expenses Paid During Period” row to estimate the expenses you paid on your account during this period. Shareholders of the Institutional and Investor Classes that invest in a Fund through an IRA or Roth IRA may be subject to a custodial IRA fee of $15 that is typically deducted each December. If your account was subject to a custodial IRA fee during the period, your costs would have been $15 higher.
Actual
| Institutional Class |
S&P 500 Index |
Small Cap Index |
International Equity Index |
Investor Class |
S&P 500 Index |
|||||||||||||
| Beginning Account Value 1/1/13 |
$ | 1,000.00 | $ | 1,000.00 | $ | 1,000.00 | Beginning Account Value 1/1/13 | $ | 1,000.00 | |||||||||
| Ending Account Value 6/30/13 |
$ | 1,137.52 | $ | 1,159.02 | $ | 1,033.16 | Ending Account Value 6/30/13 | $ | 1,134.80 | |||||||||
| Expenses Paid During Period* 1/1/13—6/30/13 |
$ | 0.74 | $ | 1.02 | $ | 1.16 | Expenses Paid During Period* 1/1/13—6/30/13 |
$ | 3.23 | |||||||||
| Annualized Expense Ratio |
0.14 | % | 0.19 | % | 0.23 | % | Annualized Expense Ratio | 0.61 | % | |||||||||
Hypothetical Example for Comparison Purposes
The following table provides information about hypothetical account values and hypothetical expenses based on a Fund’s actual expense ratio and an assumed 5% per year rate of return before expenses (not the Fund’s actual return). You may compare the ongoing costs of investing in a particular Fund with other funds by contrasting this 5% hypothetical example and the 5% hypothetical examples that appear in the shareholder reports of the other funds. The hypothetical account values and expenses may not be used to estimate the actual ending account balance or expenses you paid for the period. Shareholders of the Institutional and Investor Classes that invest in a Fund through an IRA may be subject to a custodial IRA fee of $15 that is typically deducted each December. If your account was subject to a custodial IRA fee during the period, your costs would have been $15 higher.
You should also be aware that the expenses shown in the table highlight only your ongoing costs and do not reflect any transaction costs charged by a Fund. Similarly, the expense examples for other funds do not reflect any transaction costs charged by those funds, such as sales charges (loads), redemption fees or exchange fees. Therefore, the “Expenses Paid During Period” line of the table is useful in comparing ongoing costs only and will not help you determine the relative total costs of owning different funds. If you were subject to any transaction costs during the period, your costs would have been higher.
Hypothetical
| Institutional Class |
S&P 500 Index |
Small Cap Index |
International Equity Index |
Investor Class |
S&P 500 Index |
|||||||||||||
| Beginning Account Value 1/1/13 |
$ | 1,000.00 | $ | 1,000.00 | $ | 1,000.00 | Beginning Account Value 1/1/13 | $ | 1,000.00 | |||||||||
| Ending Account Value 6/30/13 |
$ | 1,024.10 | $ | 1,023.85 | $ | 1,023.65 | Ending Account Value 6/30/13 | $ | 1,021.77 | |||||||||
| Expenses Paid During Period* 1/1/13—6/30/13 |
$ | 0.70 | $ | 0.95 | $ | 1.15 | Expenses Paid During Period* 1/1/13—6/30/13 |
$ | 3.06 | |||||||||
| Annualized Expense Ratio |
0.14 | % | 0.19 | % | 0.23 | % | Annualized Expense Ratio | 0.61 | % | |||||||||
| * | Expenses are equal to each Fund’s annualized expense ratio for the six-month period multiplied by the average account value over the period, multiplied by the number derived by dividing the number of days in the most recent fiscal half-year (181) by days in the year (365) to reflect the half-year period. |
9
American Beacon FundsSM
Statements of Assets and Liabilities
June 30, 2013 (Unaudited) (in thousands, except share and per share amounts)
| S&P 500 Index Fund |
Small Cap Index Fund |
International Equity Index Fund |
||||||||||
| Assets: |
||||||||||||
| Investment in Portfolio, at fair value |
$ | 791,017 | $ | 200,202 | $ | 531,127 | ||||||
| Receivable for fund shares sold |
2,069 | 15 | 812 | |||||||||
| Prepaid expenses |
17 | 6 | 20 | |||||||||
|
|
|
|
|
|
|
|||||||
| Total assets |
793,103 | 200,223 | 531,959 | |||||||||
|
|
|
|
|
|
|
|||||||
| Liabilities: |
||||||||||||
| Payable for fund shares redeemed |
6 | 1 | 330 | |||||||||
| Administrative service and service fees payable (Note 2) |
40 | 7 | 15 | |||||||||
| Printing fees payable |
31 | 11 | 1 | |||||||||
| Professional fees payable |
25 | 16 | 12 | |||||||||
| Sub-administration fees payable |
— | 19 | 264 | |||||||||
| Transfer agent fees payable |
9 | — | — | |||||||||
| Trustee fees payable |
— | — | — | |||||||||
| Other liabilities |
1 | 1 | 2 | |||||||||
|
|
|
|
|
|
|
|||||||
| Total liabilities |
112 | 55 | 624 | |||||||||
|
|
|
|
|
|
|
|||||||
| Net Assets |
$ | 792,991 | $ | 200,168 | $ | 531,335 | ||||||
|
|
|
|
|
|
|
|||||||
| Analysis of Net Assets: |
||||||||||||
| Paid-in-capital |
637,930 | 182,940 | 564,552 | |||||||||
| Undistributed net investment income |
4,125 | 1,217 | 10,393 | |||||||||
| Accumulated net realized gain (loss) |
(52,100 | ) | (11,151 | ) | (82,485 | ) | ||||||
| Unrealized net appreciation (depreciation) of investments, foreign currency contracts, and futures contracts |
203,036 | 27,162 | 38,875 | |||||||||
|
|
|
|
|
|
|
|||||||
| Net assets |
$ | 792,991 | $ | 200,168 | $ | 531,335 | ||||||
|
|
|
|
|
|
|
|||||||
| Shares outstanding at no par value (unlimited shares authorized): |
||||||||||||
| Institutional Class |
35,124,156 | 12,771,778 | 53,284,772 | |||||||||
|
|
|
|
|
|
|
|||||||
| Investor Class |
1,086,170 | N/A | N/A | |||||||||
|
|
|
|
|
|
|
|||||||
| Net assets (not in thousands): |
||||||||||||
| Institutional Class |
$ | 769,417,351 | $ | 200,167,943 | $ | 531,335,060 | ||||||
|
|
|
|
|
|
|
|||||||
| Investor Class |
$ | 23,573,927 | $ | N/A | $ | N/A | ||||||
|
|
|
|
|
|
|
|||||||
| Net asset value, offering and redemption price per share: |
||||||||||||
| Institutional Class |
$ | 21.91 | $ | 15.67 | $ | 9.97 | ||||||
|
|
|
|
|
|
|
|||||||
| Investor Class |
$ | 21.70 | $ | N/A | $ | N/A | ||||||
|
|
|
|
|
|
|
|||||||
See accompanying notes
See accompanying Financial Statements of the respective Master Portfolios
10
American Beacon FundsSM
For the Six Months ended June 30, 2013 (Unaudited) (in thousands)
| S&P 500 Index Fund |
Small Cap Index Fund |
International Equity Index Fund |
||||||||||
| Investment Income (expense) Allocated From Portfolio: |
||||||||||||
| Dividend income (net of foreign taxes)A |
$ | 7,854 | $ | 1,257 | $ | 11,246 | ||||||
| Interest income |
9 | 3 | 1 | |||||||||
| Securities lending income |
— | 163 | — | |||||||||
| Portfolio expenses (net of fees waived)B |
(168 | ) | (64 | ) | (181 | ) | ||||||
| Other income |
— | — | 12 | |||||||||
|
|
|
|
|
|
|
|||||||
| Net investment income allocated from Portfolio |
7,695 | 1,359 | 11,078 | |||||||||
|
|
|
|
|
|
|
|||||||
| Fund Expenses: |
||||||||||||
| Administrative service fees (Note 2): |
||||||||||||
| Institutional Class |
181 | 52 | 134 | |||||||||
| Investor Class |
27 | — | — | |||||||||
| Sub-administrative service fees: |
||||||||||||
| Institutional Class |
— | 36 | 213 | |||||||||
| Transfer agent fees: |
||||||||||||
| Institutional Class |
15 | 3 | 13 | |||||||||
| Investor Class |
3 | — | — | |||||||||
| Custody and accounting fees |
6 | 6 | 6 | |||||||||
| Professional fees |
25 | 10 | 14 | |||||||||
| Registration fees |
21 | 2 | 6 | |||||||||
| Service fees—Investor Class (Note 2) |
27 | — | — | |||||||||
| Printing expense |
51 | 14 | 31 | |||||||||
| Trustee fees |
25 | 6 | 16 | |||||||||
| Insurance expense |
4 | 1 | 4 | |||||||||
| Other expenses |
9 | 2 | 12 | |||||||||
|
|
|
|
|
|
|
|||||||
| Total fund expenses |
394 | 132 | 449 | |||||||||
|
|
|
|
|
|
|
|||||||
| Net investment income |
7,301 | 1,227 | 10,629 | |||||||||
|
|
|
|
|
|
|
|||||||
| Realized and unrealized gain (loss) allocated from master portfolio |
||||||||||||
| Net realized gain (loss) from: |
||||||||||||
| Investments |
3,135 | 1,306 | (2,839 | ) | ||||||||
| Foreign currency transactions |
— | — | (478 | ) | ||||||||
| Futures contracts |
2,212 | 1,113 | 416 | |||||||||
| Change in net unrealized appreciation or (depreciation) of: |
||||||||||||
| Investments |
80,857 | 25,987 | 8,760 | |||||||||
| Futures contracts |
(361 | ) | (11 | ) | (35 | ) | ||||||
|
|
|
|
|
|
|
|||||||
| Net gain on investments |
85,843 | 28,395 | 5,824 | |||||||||
|
|
|
|
|
|
|
|||||||
| Net increase in net assets resulting from operations |
$ | 93,144 | $ | 29,622 | $ | 16,453 | ||||||
|
|
|
|
|
|
|
|||||||
| A Foreign taxes |
$ | 17 | $ | 2 | $ | 966 | ||||||
| B Fees waived by Master Portfolio |
$ | — | $ | 2 | $ | 1 | ||||||
See accompanying notes
See accompanying Financial Statements of the respective Master Portfolios
11
American Beacon FundsSM
Statements of Changes in Net Assets (in thousands)
| S&P 500 Index Fund | Small Cap Index Fund | International Equity Index Fund |
||||||||||||||||||||||
| Six Months ended June 30, 2013 |
Year ended December 31, 2012 |
Six Months ended June 30, 2013 |
Year ended December 31, 2012 |
Six Months ended June 30, 2013 |
Year ended December 31, 2012 |
|||||||||||||||||||
| (unaudited) | (unaudited) | (unaudited) | ||||||||||||||||||||||
| Increase (Decrease) in Net Assets: |
||||||||||||||||||||||||
| Operations: |
||||||||||||||||||||||||
| Net investment income |
$ | 7,301 | $ | 11,930 | $ | 1,227 | $ | 2,460 | $ | 10,629 | $ | 11,859 | ||||||||||||
| Net realized gain (loss) from investments, foreign currency, and futures contracts |
5,347 | 15,814 | 2,419 | 488 | (2,901 | ) | (30,284 | ) | ||||||||||||||||
| Change in net unrealized appreciation or depreciation of investments and futures contracts |
80,496 | 44,226 | 25,976 | 5,766 | 8,725 | 83,038 | ||||||||||||||||||
|
|
|
|
|
|
|
|
|
|
|
|
|
|||||||||||||
| Net increase in net assets resulting from operations |
93,144 | 71,970 | 29,622 | 8,714 | 16,453 | 64,613 | ||||||||||||||||||
|
|
|
|
|
|
|
|
|
|
|
|
|
|||||||||||||
| Distributions to Shareholders: |
||||||||||||||||||||||||
| Net investment income: |
||||||||||||||||||||||||
| Institutional Class |
(3,371 | ) | (11,794 | ) | — | (3,779 | ) | — | (11,845 | ) | ||||||||||||||
| Investor Class |
(77 | ) | (187 | ) | — | — | — | — | ||||||||||||||||
|
|
|
|
|
|
|
|
|
|
|
|
|
|||||||||||||
| Total distributions to shareholders |
(3,448 | ) | (11,981 | ) | — | (3,779 | ) | — | (11,845 | ) | ||||||||||||||
|
|
|
|
|
|
|
|
|
|
|
|
|
|||||||||||||
| Net increase (decrease) in net assets from capital share transactions |
35,664 | 169,151 | (16,114 | ) | 138,568 | 33,982 | 106,540 | |||||||||||||||||
|
|
|
|
|
|
|
|
|
|
|
|
|
|||||||||||||
| Net increase in net assets |
125,360 | 229,140 | 13,508 | 143,503 | 50,435 | 159,308 | ||||||||||||||||||
|
|
|
|
|
|
|
|
|
|
|
|
|
|||||||||||||
| Net Assets: |
||||||||||||||||||||||||
| Beginning of period |
667,631 | 438,491 | 186,660 | 43,157 | 480,900 | 321,592 | ||||||||||||||||||
|
|
|
|
|
|
|
|
|
|
|
|
|
|||||||||||||
| End of Period * |
$ | 792,991 | $ | 667,631 | $ | 200,168 | $ | 186,660 | $ | 531,335 | $ | 480,900 | ||||||||||||
|
|
|
|
|
|
|
|
|
|
|
|
|
|||||||||||||
| * Includes undistributed net investment income (loss) of |
$ | 4,125 | $ | 272 | $ | 1,217 | $ | (10 | ) | $ | 10,393 | $ | (236 | ) | ||||||||||
|
|
|
|
|
|
|
|
|
|
|
|
|
|||||||||||||
See accompanying notes
See accompanying Financial Statements of the respective Master Portfolios
12
American Beacon FundsSM
June 30, 2013 (Unaudited)
1. Organization and Significant Accounting Policies
American Beacon Funds (the “Trust”), which is comprised of twenty-four Funds, is organized as a Massachusetts business trust and is registered under the Investment Company Act of 1940, as amended (the “Act”), as a diversified, open-end management investment company. These financial statements and notes to the financial statements relate to the American Beacon S&P 500 Index Fund, the American Beacon Small Cap Index Fund and the American Beacon International Equity Index Fund (each a “Fund” and collectively, the “Funds”), each a series of the Trust.
American Beacon Advisors, Inc. (the “Manager”) is a wholly-owned subsidiary of Lighthouse Holdings, Inc. and was organized in 1986 to provide business management, advisory, administrative and asset management consulting services to the Trust and other investors.
Each Fund invests all of its investable assets in a corresponding portfolio. The State Street Equity 500 Index Portfolio, Master Small Cap Index Series and the Master International Index Series (each a “Portfolio” and collectively the “Portfolios”) are open-ended management investment companies registered under the Act. The value of such investment reflects each Fund’s proportionate interest in the net assets of the corresponding Portfolio.
| American Beacon: |
Portfolios: |
% of Portfolio Held by Fund at June 30, 2013 |
||||
| S&P 500 Index Fund |
State Street Equity 500 Index Portfolio | 34.0 | % | |||
| Small Cap Index Fund |
Master Small Cap Index Series | 30.0 | % | |||
| International Equity Index Fund |
Master International Index Series | 63.9 | % | |||
The financial statements of the Portfolios are included elsewhere in this report and should be read in conjunction with the Funds’ financial statements.
The following is a summary of the significant accounting policies followed by the Funds.
Class Disclosure
The S&P 500 Index Fund has two classes of shares designed to meet the needs of different groups of investors. The following table sets forth the differences amongst the classes:
| Class: |
Offered to: | |
| Institutional Class |
Investors making an initial investment of $250,000 | |
| Investor Class |
General public and investors investing through an intermediary |
Each class offered by the Trust has equal rights as to assets and voting privileges. Income and non-class specific expenses are allocated daily to each class on the basis of the relative net assets. Realized and unrealized capital gains and losses of each class are allocated daily based on the relative net assets of each class of the respective Fund. Class specific expenses, where applicable, currently include administrative service fees, service fees, and distribution fees and vary amongst the classes as described more fully in Note 2.
2. Transactions with Affiliates
Administrative Services Agreement
The Manager and the Trust entered into an Administrative Services Agreement which obligates the Manager to provide or oversee administrative services to each Fund. As compensation for performing the duties required under the Administrative Services Agreement, the Manager receives an annualized fee of 0.05% of the average daily net assets of the Institutional Class of the S&P 500 Index Fund, International Equity Index Fund
13
American Beacon FundsSM
Notes to Financial Statements
June 30, 2013 (Unaudited)
and the Small Cap Index Fund and an annualized fee of 0.25% of the average daily net assets of the Investor Class of the S&P 500 Index Fund.
Service Plans
The Manager and the Trust entered into a Service Plan that obligates the Manager to oversee additional shareholder servicing of the Investor Class of S&P 500 Index Fund. As compensation for performing the duties required under the Service Plan, the Manager receives up to 0.375% of the average daily net assets of the Investor Class of the S&P 500 Index Fund.
Sub-administration Agreement
The Trust, the Manager and BlackRock Advisors, LLC (“BlackRock”) entered into a Sub-administration Agreement that obligates BlackRock to provide certain other administrative services to the Small Cap Index Fund and the International Equity Index Fund. As compensation for performing these services, BlackRock receives an annualized fee of 0.08% of the average daily net assets of the Small Cap Index Fund and 0.12% of the average daily net assets of the International Equity Index Fund; however, the fee of each is reduced by the total expense ratio of its corresponding Portfolio, net of any fee waivers.
3. Security Valuation and Fair Value Measurements
U.S. Generally Accepted Accounting Principals (“U.S. GAAP”) defines fair market value as the price that a Fund would receive to sell an asset or pay to transfer a liability in an orderly transaction between market participants at the measurement date. The Funds’ policy is to fair value its financial instruments in the Portfolios at fair value based on the Fund’s apportionate interest in the net assets of the Portfolios. Valuation of securities held by the Portfolios is discussed in the accompanying Notes to the Financial Statements of the respective Portfolios attached.
Investment Income
Each Fund records its share of net investment income and realized and unrealized gains and losses from the security transactions of its corresponding Portfolio each day. All net investment income and realized and unrealized gains (losses) of each Portfolio are allocated pro rata among the investors in that Portfolio at the time of such determination.
Dividends to Shareholders
Dividends from net investment income of the Small Cap Index and International Equity Index Funds normally will be declared and paid annually. The S&P 500 Index Fund normally will declare and pay dividends quarterly. Distributions, if any, of net realized capital gains are generally paid annually and recorded on the ex-dividend date.
Allocation of Income, Expenses, Gains and Losses
Income, expenses (other than those attributable to a specific class), gains and losses are allocated daily to each class of shares based upon the relative proportion of net assets represented by such class. Operating expenses directly attributable to a specific class are charged against the operations of that class.
Valuation of Shares
The price per share is calculated on each day on which shares are offered for sale. NAV per share is computed by dividing the value of each Fund’s total assets (which includes the value of the Fund’s investments in its Portfolio) less liabilities, by the number of Fund shares outstanding.
14
American Beacon FundsSM
Notes to Financial Statements
June 30, 2013 (Unaudited)
Use of Estimates
The preparation of financial statements in conformity with U.S. GAAP requires management to make estimates and assumptions that affect the amounts reported in the financial statements and accompanying notes. Actual results may differ from those estimated.
Other
Under the Trust’s organizational documents, its officers and trustees are indemnified against certain liability arising out of the performance of their duties to the Trust. In the normal course of business, the Trust enters into contracts that provide indemnification to the other party or parties against potential costs or liabilities. The Trust’s maximum exposure under these arrangements is dependent on claims that may be made in the future and, therefore, cannot be estimated. The Trust has had no prior claims or losses pursuant to any such agreement.
4. Federal Income and Excise Taxes
It is the policy of each Fund to qualify as a regulated investment company (“RIC”), by complying with all applicable provisions of Subchapter M of the Internal Revenue Code, as amended, and to make distribution of taxable income sufficient to relieve it from substantially all federal income and excise taxes. For federal income tax purposes, each Fund is treated as a single entity for the purpose of determining such qualification.
The Funds do not have any unrecognized tax benefits in the accompanying financial statements. Each of the tax years in the four year period ended December 31, 2012 remains subject to examination by the Internal Revenue Service. If applicable, the Funds recognize interest accrued related to unrecognized tax benefits in interest expense and penalties in “Other expenses” on the Statements of Operations.
Dividends are categorized in accordance with income tax regulations which may treat certain transactions differently than U.S. GAAP. Accordingly, the character of distributions and composition of net assets for tax purposes may differ from those reflected in the accompanying financial statements.
The International Equity Index Fund may be subject to taxes imposed by countries in which it invests. Such taxes are generally based on returns of income earned or gains realized or repatriated. Taxes are accrued and applied to net investment income, net realized capital gains and net unrealized appreciation, as applicable, as the income is earned or capital gains are recorded.
The tax character of distributions paid during were as follows (in thousands):
| S&P 500 Index | Small Cap Index | International Equity Index | ||||||||||||||||||||||
| Six Months Ended June 30, 2013 |
Year Ended December 31, 2012 |
Six Months Ended June 30, 2013 |
Year Ended December 31, 2012 |
Six Months Ended June 30, 2013 |
Year Ended December 31, 2012 |
|||||||||||||||||||
| (unaudited) | (unaudited) | (unaudited) | ||||||||||||||||||||||
| Distributions paid from: |
||||||||||||||||||||||||
| Ordinary income |
||||||||||||||||||||||||
| Institutional Class |
$ | 3,371 | $ | 11,794 | $ | — | $ | 3,779 | $ | — | $ | 11,845 | ||||||||||||
| Investor Class |
77 | 87 | — | — | — | — | ||||||||||||||||||
|
|
|
|
|
|
|
|
|
|
|
|
|
|||||||||||||
| Total distributions paid |
$ | 3,448 | $ | 11,981 | $ | — | $ | 3,779 | $ | — | $ | 11,845 | ||||||||||||
|
|
|
|
|
|
|
|
|
|
|
|
|
|||||||||||||
On December 22, 2010, the Regulated Investment Company Modernization Act of 2010 (the “Act”) was enacted, which changed various technical rules governing the tax treatment of RICs. The changes are generally effective for taxable years beginning after the date of enactment. One of the more prominent changes addresses capital loss carryforwards. Under the Act, each Fund will be permitted to carry forward capital losses incurred in taxable years beginning after the date of enactment for an unlimited period. However, any losses incurred during those future taxable years will be required to be utilized prior to the losses incurred in pre-
15
American Beacon FundsSM
Notes to Financial Statements
June 30, 2013 (Unaudited)
enactment taxable years, which carry an expiration date. As a result of this ordering rule, pre-enactment capital loss carryforwards may be more likely to expire unused. Additionally, post-enactment capital loss carryforwards will retain their character as either short-term or long-term capital losses rather than being considered all short-term as permitted under previous regulation.
Finally, the Act contains several provisions aimed at preserving the character of distributions made by a fiscal year RIC during the portion of its taxable year ending after October 31 or December 31, reducing the circumstances under which a RIC might be required to file amended Forms 1099 to restate previously reported distributions. Except for the simplification provisions related to RIC qualification, the Act is effective for taxable years beginning after December 22, 2010. The provisions related to RIC qualification are effective for taxable years for which the extended due date of the tax return is after December 22, 2010.
Losses incurred for the year ended December 31, 2012 that will be carried forward under the provisions of the Act are as follows:
| Loss Carryforward Character | ||||||||||||
| Fund | Short term | Long term | Total | |||||||||
| S&P 500 Index Fund |
$ | — | $ | — | $ | — | ||||||
| Small Cap Index Fund |
— | — | — | |||||||||
| International Equity Index Fund |
1,358 | 40,074 | 41,432 | |||||||||
For the year ended December 31, 2012, the capital losses prior to the provisions of the Act which may be applied against any realized net taxable gains in each succeeding year or until their expiration dates, which ever occurs first are as follows (in thousands):
| Fund | 2016 | 2017 | 2018 | Total | ||||||||||||
| S&P 500 Index Fund |
$ | 3,294 | $ | 28,055 | $ | 4,955 | $ | 36,304 | ||||||||
| Small Cap Index Fund |
— | — | 2,620 | 2,620 | ||||||||||||
| International Equity Index Fund |
9,746 | 13,890 | 5,259 | 28,895 | ||||||||||||
5. Capital Share Transactions
The tables below summarize the activity in capital shares for each Class of the Funds (shares and dollars in thousands):
For the Six Months ended June 30, 2013
| Institutional Class | Investor Class | |||||||||||||||
| S&P 500 Index Fund |
Shares | Amount | Shares | Amount | ||||||||||||
| Shares sold |
3,404 | $ | 71,428 | 360 | $ | 7,607 | ||||||||||
| Reinvestment of dividends |
158 | 3,345 | 3 | 74 | ||||||||||||
| Shares redeemed |
(2,006 | ) | (42,067 | ) | (224 | ) | (4,723 | ) | ||||||||
|
|
|
|
|
|
|
|
|
|||||||||
| Net increase in shares outstanding |
1,556 | $ | 32,706 | 139 | $ | 2,958 | ||||||||||
|
|
|
|
|
|
|
|
|
|||||||||
| Institutional Class | ||||||||
| Small Cap Index Fund |
Shares | Amount | ||||||
| Shares sold |
3,125 | $ | 46,647 | |||||
| Reinvestment of dividends |
— | — | ||||||
| Shares redeemed |
(4,156 | ) | (62,761 | ) | ||||
|
|
|
|
|
|||||
| Net increase in shares outstanding |
(1,031 | ) | $ | (16,114 | ) | |||
|
|
|
|
|
|||||
16
American Beacon FundsSM
Notes to Financial Statements
June 30, 2013 (Unaudited)
| Institutional Class | ||||||||
| International Equity Index Fund |
Shares | Amount | ||||||
| Shares sold |
9,779 | $ | 98,110 | |||||
| Reinvestment of dividends |
— | — | ||||||
| Shares redeemed |
(6,315 | ) | (64,128 | ) | ||||
|
|
|
|
|
|||||
| Net increase in shares outstanding |
3,464 | $ | 33,982 | |||||
|
|
|
|
|
|||||
For the Year ended December 31, 2012
| Institutional Class | Investor Class | |||||||||||||||
| S&P 500 Index Fund |
Shares | Amount | Shares | Amount | ||||||||||||
| Shares sold |
13,072 | $ | 247,772 | 404 | $ | 7,440 | ||||||||||
| Reinvestment of dividends |
606 | 11,707 | 10 | 180 | ||||||||||||
| Shares redeemed |
(4,882 | ) | (90,024 | ) | (428 | ) | (7,924 | ) | ||||||||
|
|
|
|
|
|
|
|
|
|||||||||
| Net increase (decrease) in shares outstanding |
8,796 | $ | 169,455 | (14 | ) | $ | (304 | ) | ||||||||
|
|
|
|
|
|
|
|
|
|||||||||
| Institutional Class | ||||||||
| Small Cap Index Fund |
Shares | Amount | ||||||
| Shares sold |
22,782 | $ | 302,080 | |||||
| Reinvestment of dividends |
278 | 3,779 | ||||||
| Shares redeemed |
(12,896 | ) | (167,291 | ) | ||||
|
|
|
|
|
|||||
| Net increase in shares outstanding |
10,164 | $ | 138,568 | |||||
|
|
|
|
|
|||||
| Institutional Class | ||||||||
| International Equity Index Fund |
Shares | Amount | ||||||
| Shares sold |
19,602 | $ | 180,675 | |||||
| Reinvestment of dividends |
1,206 | 11,691 | ||||||
| Shares redeemed |
(9,455 | ) | (85,826 | ) | ||||
|
|
|
|
|
|||||
| Net increase in shares outstanding |
11,353 | $ | 106,540 | |||||
|
|
|
|
|
|||||
17
American Beacon S&P 500 Index Fund
(For a share outstanding throughout each period)
| Institutional Class | ||||||||||||||||||||||||
| Six Months June 30, |
Year Ended December 31, | |||||||||||||||||||||||
| 2013 | 2012 | 2011 | 2010 | 2009 | 2008 | |||||||||||||||||||
| (unaudited) | ||||||||||||||||||||||||
| Net asset value, beginning of period |
$ | 19.35 | $ | 17.05 | $ | 17.07 | $ | 15.15 | $ | 12.21 | $ | 19.85 | ||||||||||||
|
|
|
|
|
|
|
|
|
|
|
|
|
|||||||||||||
| Income from investment operations: |
||||||||||||||||||||||||
| Net investment income:A |
0.20 | 0.39 | 0.34 | 0.29 | 0.30 | 0.35 | ||||||||||||||||||
| Net gain (loss) from investments (both realized and unrealized) |
2.46 | 2.31 | 0.02 | 1.95 | 2.91 | (7.64 | ) | |||||||||||||||||
|
|
|
|
|
|
|
|
|
|
|
|
|
|||||||||||||
| Total income (loss) from investment operations |
2.66 | 2.70 | 0.32 | 2.24 | 3.21 | (7.29 | ) | |||||||||||||||||
|
|
|
|
|
|
|
|
|
|
|
|
|
|||||||||||||
| Less distributions: |
||||||||||||||||||||||||
| Dividends from net investment income |
(0.10 | ) | (0.40 | ) | (0.34 | ) | (0.32 | ) | (0.27 | ) | (0.35 | ) | ||||||||||||
| Tax return of capital |
— | — | (0 .00 | )B | — | — | — | |||||||||||||||||
|
|
|
|
|
|
|
|
|
|
|
|
|
|||||||||||||
| Total distributions |
(0.10 | ) | (0.40 | ) | (0.34 | ) | (0.32 | ) | (0.27 | ) | (0.35 | ) | ||||||||||||
|
|
|
|
|
|
|
|
|
|
|
|
|
|||||||||||||
| Net asset value, end of period |
$ | 21.91 | $ | 19.35 | $ | 17.05 | $ | 17.07 | $ | 15.15 | $ | 12.21 | ||||||||||||
|
|
|
|
|
|
|
|
|
|
|
|
|
|||||||||||||
| Total return C |
13.75 | %D | 15.87 | % | 1.92 | % | 14.96 | % | 26.70 | % | (37.08 | )% | ||||||||||||
|
|
|
|
|
|
|
|
|
|
|
|
|
|||||||||||||
| Ratios and supplemental data: |
||||||||||||||||||||||||
| Net assets, end of period (in thousands) |
$ | 769,417 | $ | 649,457 | $ | 422,337 | $ | 381,592 | $ | 316,975 | $ | 224,583 | ||||||||||||
| Ratios to average net assets:A |
||||||||||||||||||||||||
| Net investment income |
1.97 | %E | 2.19 | % | 1.95 | % | 1.90 | % | 2.39 | % | 2.23 | % | ||||||||||||
| Expenses, including expenses allocated from the master portfolio |
0.14 | %E | 0.15 | % | 0.16 | % | 0.13 | % | 0.15 | % | 0.13 | % | ||||||||||||
| A | The per share amounts and ratios reflect income and expenses assuming inclusion of the Fund’s proportionate share of the income and expenses of the State Street Equity 500 Index Portfolio. |
| B | The tax return of capital is calculated based upon outstanding shares at the time of distribution. Amounts are less than $0.01 per share. |
| C | May include adjustments with accounting principles generally accepted in the United States of America and as such, the net assets for financial reporting purposes and the returns based upon those net asset value may differ from the net asset value and returns for shareholder transactions. |
| D | Not annualized. |
| E | Annualized. |
18
American Beacon S&P 500 Index Fund
Financial Highlights
(For a share outstanding throughout each period)
| Investor Class | ||||||||||||||||||||||
| Six Months June 30, |
Year Ended December 31, | |||||||||||||||||||||
| 2013 | 2012 | 2011 | 2010 | 2009 | 2008 | |||||||||||||||||
| (unaudited) | ||||||||||||||||||||||
| $ | 19.19 | $ | 16.82 | $ | 16.88 | $ | 15.00 | $ | 12.06 | $ | 19.60 | |||||||||||
|
|
|
|
|
|
|
|
|
|
|
|
|
|||||||||||
| 0.19 | 0.68 | 0.22 | 0.15 | 0.33 | 0.33 | |||||||||||||||||
| 2.39 | 1.88 | 0.02 | 1.99 | 2.80 | (7.60 | ) | ||||||||||||||||
|
|
|
|
|
|
|
|
|
|
|
|
|
|||||||||||
| 2.58 | 2.56 | 0.24 | 2.14 | 3.13 | (7.27 | ) | ||||||||||||||||
|
|
|
|
|
|
|
|
|
|
|
|
|
|||||||||||
| (0.07 | ) | (0.19 | ) | (0.30 | ) | (0.26 | ) | (0.19 | ) | (0.27 | ) | |||||||||||
| — | — | (0 .00 | )B | — | — | — | ||||||||||||||||
|
|
|
|
|
|
|
|
|
|
|
|
|
|||||||||||
| (0.07 | ) | (0.19 | ) | (0.30 | ) | (0.26 | ) | (0.19 | ) | (0.27 | ) | |||||||||||
|
|
|
|
|
|
|
|
|
|
|
|
|
|||||||||||
| $ | 21.70 | $ | 19.19 | $ | 16.82 | $ | 16.88 | $ | 15.00 | $ | 12.06 | |||||||||||
|
|
|
|
|
|
|
|
|
|
|
|
|
|||||||||||
| 13.48 | %D | 15.25 | % | 1.44 | % | 14.43 | % | 26.26 | % | (37.35 | )% | |||||||||||
|
|
|
|
|
|
|
|
|
|
|
|
|
|||||||||||
| $ | 23,574 | $ | 18,174 | $ | 16,154 | $ | 17,707 | $ | 22,261 | $ | 12,915 | |||||||||||
| 1.50 | %E | 1.67 | % | 1.44 | % | 1.42 | % | 2.01 | % | 1.73 | % | |||||||||||
| 0.61 | %E | 0.63 | % | 0.64 | % | 0.60 | % | 0.60 | % | 0.62 | % | |||||||||||
19
American Beacon Small Cap Index FundSM
Financial Highlights
(For a share outstanding throughout each period)
| Institutional Class | ||||||||||||||||||||||||
| Six Months June 30, |
Year Ended December 31, | |||||||||||||||||||||||
| 2013 | 2012 | 2011 | 2010 | 2009 | 2008 | |||||||||||||||||||
| (unaudited) | ||||||||||||||||||||||||
| Net asset value, beginning of period |
$ | 13.52 | $ | 11.86 | $ | 12.64 | $ | 10.06 | $ | 8.00 | $ | 13.51 | ||||||||||||
|
|
|
|
|
|
|
|
|
|
|
|
|
|||||||||||||
| Income from investment operations: |
||||||||||||||||||||||||
| Net investment incomeA |
0.09 | 0.21 | 0.19 | 0.13 | 0.10 | 0.18 | ||||||||||||||||||
| Net gain (loss) from investments and futures transactions (both realized and unrealized) |
2.06 | 1.73 | (0.76 | ) | 2.59 | 2.08 | (4.78 | ) | ||||||||||||||||
|
|
|
|
|
|
|
|
|
|
|
|
|
|||||||||||||
| Total income (loss) from investment operations |
2.15 | 1.94 | (0.57 | ) | 2.72 | 2.18 | (4.60 | ) | ||||||||||||||||
|
|
|
|
|
|
|
|
|
|
|
|
|
|||||||||||||
| Less distributions: |
||||||||||||||||||||||||
| Dividends from net investment income |
— | (0.18 | ) | (0.21 | ) | (0.13 | ) | (0.11 | ) | (0.17 | ) | |||||||||||||
| Distributions from net realized gains on investments |
— | — | — | — | — | (0.61 | ) | |||||||||||||||||
| Tax return of capital |
— | (0.10 | )B | (0.00 | )B,C | (0.01 | )B | (0.01 | )B | (0.13 | )B | |||||||||||||
|
|
|
|
|
|
|
|
|
|
|
|
|
|||||||||||||
| Total distributions |
— | (0.28 | ) | (0.21 | ) | (0.14 | ) | (0.12 | ) | (0.91 | ) | |||||||||||||
|
|
|
|
|
|
|
|
|
|
|
|
|
|||||||||||||
| Net asset value, end of period |
$ | 15.67 | $ | 13.52 | $ | 11.86 | $ | 12.64 | $ | 10.06 | $ | 8.00 | ||||||||||||
|
|
|
|
|
|
|
|
|
|
|
|
|
|||||||||||||
| Total return D |
15.90 | %E | 16.36 | % | (4.54 | )% | 27.05 | % | 27.21 | % | (33.58 | )% | ||||||||||||
|
|
|
|
|
|
|
|
|
|
|
|
|
|||||||||||||
| Ratios and supplemental data: |
||||||||||||||||||||||||
| Net assets, end of period (in thousands) |
$ | 200,168 | $ | 186,660 | $ | 43,157 | $ | 93,138 | $ | 39,958 | $ | 31,552 | ||||||||||||
| Ratios to average net assets:A |
||||||||||||||||||||||||
| Net investment income |
1.18 | %F | 2.23 | % | 1.04 | % | 1.21 | % | 1.18 | % | 1.54 | % | ||||||||||||
| Expenses, including expenses allocated from the master portfolio |
0.19 | %F | 0.21 | % | 0.26 | % | 0.18 | % | 0.23 | % | 0.20 | % | ||||||||||||
| A | The per share amounts and ratios reflect income and expenses assuming inclusion of the Fund’s proportionate share of the income and expenses of the Master Small Cap Index Series. |
| B | The tax return of capital is calculated based upon outstanding shares at the time of distribution. |
| C | Amount is less than $0.01 per share |
| D | May include adjustments with accounting principles generally accepted in the United States of America and as such, the net assets for financial reporting purposes and the returns based upon those net asset value may differ from the net asset value and returns for shareholder transactions. |
| E | Not annualized. |
| F | Annualized. |
20
American Beacon International Equity Index FundSM
Financial Highlights
(For a share outstanding throughout each period)
| Institutional Class | ||||||||||||||||||||||||
| Six Months June 30, |
Year Ended December 31, | |||||||||||||||||||||||
| 2013 | 2012 | 2011 | 2010 | 2009 | 2008 | |||||||||||||||||||
| (unaudited) | ||||||||||||||||||||||||
| Net asset value, beginning of period |
$ | 9.65 | $ | 8.36 | $ | 9.87 | $ | 9.38 | $ | 7.46 | $ | 13.37 | ||||||||||||
|
|
|
|
|
|
|
|
|
|
|
|
|
|||||||||||||
| Income from investment operations: |
||||||||||||||||||||||||
| Net investment incomeA |
0.20 | 0.25 | 0.29 | 0.22 | 0.21 | 0.39 | ||||||||||||||||||
| Net gain (loss) from investments, foreign currency and futures transactions (both realized and unrealized) |
0.12 | 1.29 | (1.51 | ) | 0.49 | 1.93 | (6.00 | ) | ||||||||||||||||
|
|
|
|
|
|
|
|
|
|
|
|
|
|||||||||||||
| Total income (loss) from investment operations |
0.32 | 1.54 | (1.22 | ) | 0.71 | 2.14 | (5.61 | ) | ||||||||||||||||
|
|
|
|
|
|
|
|
|
|
|
|
|
|||||||||||||
| Less distributions: |
||||||||||||||||||||||||
| Dividends from net investment income |
— | (0.25 | ) | (0.29 | ) | (0.22 | ) | (0.22 | ) | (0.30 | ) | |||||||||||||
| Tax return of capital |
— | — | — | — | — | — | ||||||||||||||||||
|
|
|
|
|
|
|
|
|
|
|
|
|
|||||||||||||
| Total distributions |
— | (0.25 | ) | (0.29 | ) | (0.22 | ) | (0.22 | ) | (0.30 | ) | |||||||||||||
|
|
|
|
|
|
|
|
|
|
|
|
|
|||||||||||||
| Net asset value, end of period |
$ | 9.97 | $ | 9.65 | $ | 8.36 | $ | 9.87 | $ | 9.38 | $ | 7.46 | ||||||||||||
|
|
|
|
|
|
|
|
|
|
|
|
|
|||||||||||||
| Total return B |
3.32 | %C | 18.42 | % | (12.29 | )% | 7.57 | % | 28.72 | % | (41.85 | )% | ||||||||||||
|
|
|
|
|
|
|
|
|
|
|
|
|
|||||||||||||
| Ratios and supplemental data: |
||||||||||||||||||||||||
| Net assets, end of period (in thousands) |
$ | 531,335 | $ | 480,900 | $ | 321,592 | $ | 326,055 | $ | 280,110 | $ | 185,860 | ||||||||||||
| Ratios to average net assets:A |
||||||||||||||||||||||||
| Net investment income |
3.96 | %D | 3.28 | % | 3.26 | % | 2.66 | % | 2.66 | % | 3.58 | % | ||||||||||||
| Expenses, including expenses allocated from the master portfolio |
0.23 | %D | 0.19 | % | 0.24 | % | 0.21 | % | 0.23 | % | 0.19 | % | ||||||||||||
| A | The per share amounts and ratios reflect income and expenses assuming inclusion of the Fund’s proportionate share of the income and expenses of the Master International Index Series. |
| B | May include adjustments with accounting principles generally accepted in the United States of America and as such, the net assets for financial reporting purposes and the returns based upon those net asset value may differ from the net asset value and returns for shareholder transactions. |
| C | Not annualized. |
| D | Annualized. |
21
American Beacon FundsSM
Disclosure Regarding the Board of Trustees’ Approval of the
Management Agreements of the Funds (Unaudited)
At its May 29, 2013 meeting, the Board of Trustees (“Board”) considered the renewal of the Management Agreement (the “Agreement”) between American Beacon Advisors, Inc. (“Manager”) and the American Beacon Funds (“Beacon Trust”) on behalf of each of their series (collectively, the “Funds”). In preparation for the Board’s consideration to renew the Agreement, the Board and its Investment Committee undertook steps to gather and consider information furnished by the Manager, Lipper, Inc. (“Lipper”) and Morningstar, Inc. (“Morningstar”).
The Board, with the assistance of independent legal counsel, requested and received certain relevant information from the Manager.
In addition, the Board’s Investment Committee worked with Lipper to obtain relevant comparative information regarding the performance, fees and expenses of the Funds. The Investment Committee, for the benefit of all Trustees, sponsored a separate meeting on May 10, 2013 to consider the information provided by Lipper. Further, the Board took into consideration information furnished for the Board’s review and consideration throughout the year at regular Board and Investment Committee meetings, as well as information specifically prepared in connection with the renewal process.
In connection with the Board’s consideration of the Agreement, the Trustees received and evaluated such information as they deemed necessary. The information requested by the Board included, among other information, the following materials:
| • | a description of any significant changes (actual or anticipated) to principal activities, personnel, services provided to the Funds, or any other area, including how these changes might affect the Funds; |
| • | a copy of the Manager’s most recent audited or unaudited financial statements, as well as Parts 1 and 2 of its Form ADV registration statement with the SEC; |
| • | a summary of any material pending or anticipated litigation or regulatory proceedings involving the Manager or its personnel, including the results of any recent regulatory examination or independent audit; |
| • | a comparison of the performance of that portion of Fund assets managed or to be managed by the Manager with the performance of other similar accounts managed by the Manager, including a discussion of relative performance versus a peer group average and any actual or potential remedial measures if the Manager’s longer-term performance was materially below that of the peer group; |
| • | any actual or anticipated economies of scale in relation to the services the Manager provides or will provide to each Fund and whether the current fee rates charged or to be charged to each Fund reflect these economies of scale for the benefit of the Fund’s investors; |
| • | an analysis of compensation, including a comparison with fee rates charged to other clients for which similar services are provided, any proposed changes to the fee rate schedule, if applicable, and the effect of any fee waivers; |
| • | a copy of the Manager’s proxy voting policies and procedures and, if applicable, the name of the third-party voting service used by the Manager; |
| • | an evaluation of any other benefits to the Manager or Funds as a result of their relationship, if any; |
| • | confirmation that the Manager’s financial condition would not impair its ability to provide high-quality advisory services to the Funds; |
| • | a description of the scope of portfolio management services provided or to be provided to the Funds, including whether such services differ from the services provided to other clients, including other registered investment companies, and any advantages or disadvantages that might accrue to the Funds due to the Manager’s involvement in other activities; |
| • | a description of the personnel who are or will be assigned primary responsibility for managing the Funds, including any changes during the past year, and a discussion of the adequacy of current and projected staffing levels to service the Funds; |
| • | a description of the basis upon which portfolio managers are compensated, including any “incentive” arrangements, and a description of the oversight mechanisms used to prevent a portfolio manager whose compensation is tied to performance of a Fund from taking undue risks; |
| • | a description of the Manager’s practices in monitoring the quality of portfolio holdings and in reviewing portfolio valuation, including any fair value determinations; |
| • | a description of the Manager’s use of derivatives, short positions, leveraged trading strategies or other similar trading strategies for the Funds; |
| • | a discussion regarding the Manager’s participation in third-party and/or proprietary “soft dollar” arrangements, if any, or other brokerage allocation policies with respect to Fund transactions; |
| • | a discussion of the Manager’s methodology for obtaining best execution, including any plans to improve the quality of execution in the upcoming year, and the use of any affiliated broker-dealers; |
| • | a description of any actual or potential conflicts of interest anticipated in managing Fund assets; |
| • | a discussion of whether the Manager has identified any investment or operational matters that likely present a high risk in managing Fund assets; |
| • | a description of the Manager’s criteria for assessing counterparties and counterparty risk to the extent the Manager enters into transactions with counterparties on a Fund’s behalf; |
| • | a description of trade allocation procedures among accounts managed by the Manager; |
| • | a discussion of whether the Manager utilizes “commission recapture” or “directed brokerage” arrangements for the benefit of the Funds or “step-out” transactions; |
22
American Beacon FundsSM
Disclosure Regarding the Board of Trustees’ Approval of the
Management Agreements of the Funds (Unaudited)
| • | a discussion of whether the Manager receives, or anticipates receiving, other compensation, including any payment for electronic communication network liquidity rebates with respect to the Funds; |
| • | a certification by the Manager regarding the reasonable design of its compliance program; |
| • | a summary of the results of the Manager’s most recent annual review of its compliance program; |
| • | confirmation that the Manager is prepared to provide to the Manager, directly or in summary form, any regulatory review comments that could have a material impact on services provided to the Funds; |
| • | a discussion of whether, due to the Manager’s trading activities on behalf of the Funds, the Manager would need to register, or qualify for exclusion from registration, as a commodity pool operator or commodity trading advisor pursuant to the recent amendments to Rule 4.5 under the Commodity Exchange Act with respect to the Funds and, if so, whether the Manager would so register or be exempt; |
| • | information regarding the Manager’s code of ethics, insider trading policy and disaster recovery plan, including a description of any material changes thereto and a related certification of compliance by the Manager; |
| • | a description of the Manager’s affiliation with any broker-dealer; |
| • | a discussion of any anticipated change in the Manager’s controlling persons; and |
| • | verification of the Manager’s insurance coverage with regards to the services provided to the Funds. |
In addition, the Manager provided the following information specific to the renewal of the Management Agreement:
| • | a comparison of the performance of a share class of each Fund to comparable investment companies and appropriate indices, including comments on the relative performance of, as applicable, each subadvisor and each Fund versus the respective peer group average; |
| • | a discussion, if applicable, of any underperformance by a subadvisor relative to its peer group and what, if any, remedial measures the Manager has or intends to take; |
| • | a comparison of advisory fee rates and expense ratios for comparable mutual funds; |
| • | a profit/loss analysis of the Manager; |
| • | an analysis of any material complaints received from Fund shareholders; |
| • | a description of the extent to which the Manager monitors the investment activities and financial conditions of each subadvisor to the Funds; |
| • | a discussion of whether the Manager provides different types or levels of administrative and accounting related services to certain Funds; |
| • | a description of the Manager’s distribution activities with respect to promoting sales of Fund shares, including any revenue sharing practices; |
| • | a description of arrangements pursuant to which certain firms may make any direct or indirect payments to partially reimburse the Manager for its marketing or other expenses on behalf of the Funds; |
| • | a description of the Manager’s securities lending practices and the fees received from such practices; |
| • | a discussion of any rebate arrangements between the Manager and a service provider to the Funds pursuant to which the Manager receives direct or indirect benefits from the service provider; |
| • | a description of the portfolio turnover rate for each Fund; |
| • | a description of how expenses that are not readily identifiable to a particular Fund are allocated; and |
| • | confirmation that the Manager complies with applicable CFTC and National Futures Association rules and requirements for applicable Funds and a discussion regarding whether, due to the Manager’s trading activities on behalf of other Funds, the Manager would need to register, or qualify for exclusion from registration, as a commodity pool operator or commodity trading advisor pursuant to the recent amendment to Rule 4.5 under the Commodity Exchange Act with respect to the Funds and, if so, whether the Manager would so register or be exempt. |
In connection with the Agreement, the Board also obtained an analysis provided by Lipper that compared: (i) investment performance of each Fund versus comparable investment companies and appropriate indices; (ii) total Fund expenses of each Fund versus comparable mutual funds; and (iii) each Fund’s investment advisory fee rate versus comparable mutual funds. For certain Funds, the Board also considered information regarding the performance of the Manager with respect to its allocated portions of a Fund’s portfolio, net of management or subadvisory fees, as applicable, but not other Fund expenses. For each Fund with more than one class of shares, the class of shares used for comparative purposes was the class with the longest performance history, which in most cases was the Institutional Class. The Board also considered that the use of Institutional Class performance generally facilitates a meaningful comparison for expense and performance purposes.
Provided below is an overview of the primary factors the Trustees considered at the Investment Committee meeting on May 10, 2013 at which the Trustees reviewed the investment performance of the Manager and the primary factors considered by the Board at its May 29, 2013 meeting at which the Board considered the renewal of the Agreement.
The Board did not identify any particular information that was most relevant to its consideration to renew the Agreement, and each Trustee may have afforded different weight to the various factors. Legal counsel to the independent Trustees provided the Board with a memorandum regarding its responsibilities pertaining to the renewal of the Agreement. The memorandum explained the regulatory
23
American Beacon FundsSM
Disclosure Regarding the Board of Trustees’ Approval of the
Management Agreements of the Funds (Unaudited)
requirements surrounding the Trustees’ process for evaluating investment advisors and the terms of the contracts. Based on its evaluation, the Board unanimously concluded that the terms of the Agreement were reasonable and fair and that the renewal of the Agreement was in the best interests of the Funds and their shareholders.
Considerations With Respect to the Renewal of the Management Agreement
In determining whether to renew the Agreement on behalf of the Funds, the Trustees considered the best interests of each Fund separately. While the Agreement for all of the Funds was considered at the May 29, 2013 meeting, the Board considered each Fund’s investment management relationship separately.
In each instance, the Board considered, among other things, the following factors: (1) the nature, extent and quality of the services provided; (2) the investment performance of a Fund; and (3) the costs incurred by the Manager in rendering services to the Funds and its resulting profits or losses; (4) the extent to which economies of scale have been taken into account in setting each fee rate schedule; (5) whether fee rate levels reflect these economies of scale for the benefit of Fund investors; (6) comparisons of services and fee rates with contracts entered into by the Manager or its affiliates with other clients (such as pension funds and other institutional funds); and (7) any other benefits derived or anticipated to be derived by the Manager from its relationship with a Fund. The Trustees posed questions to various management personnel of the Manager regarding certain key aspects of the materials submitted in support of the renewal.
Nature, Extent and Quality of Services. With respect to the renewal of the Agreement, the Board considered, among other factors: each Fund’s long-term performance and the background and experience of key investment personnel at the Manager; the cost structure of the Funds; the Manager’s culture of compliance and support for compliance operations that reduce risks to the Funds; the Manager’s commitment to enhance the Funds’ product line and increase assets in the Funds; the Manager’s quality of services; the Manager’s commitment to training employees; and the Manager’s efforts to retain key employees and maintain staff levels.
Based on the foregoing information, the Board concluded that the nature, extent and quality of the management services provided by the Manager were appropriate for each Fund and, thus, determined to renew the Agreement.
Investment Performance. The Board evaluated the comparative information provided by Lipper and the Manager regarding each Fund’s investment performance relative to its Lipper performance universe, Lipper performance group, and/or benchmark index(es). The Board considered the information provided by Lipper regarding its independent peer selection methodology to select all performance groups and universes. The Board also considered that the performance groups and universes selected by Lipper may not provide appropriate comparisons for certain Funds. In addition, the Board considered the performance reports and discussions with management at Board and Committee meetings throughout the year. A discussion regarding the Board’s considerations with respect to each Fund’s performance appears below under “Additional Considerations and Conclusions with Respect to Each Fund.”
Costs of the Services Provided to the Funds and the Profits Realized by the Manager from its Relationship with the Funds. In analyzing the cost of services and profitability of the Manager, the Board considered the revenues earned and the expenses incurred by the Manager. The profits or losses were noted at both an aggregate level for all Funds and at an individual Fund level, with some Funds being profitable for the Manager and with the Manager sustaining losses with respect to other Funds. Although the Board noted that, in certain cases, the fee rates paid by other clients of the Manager are lower than the fee rates paid by the Funds, the difference reflects the greater level of responsibility and regulatory requirements associated with managing the Funds.
The Board also noted that the Manager proposed to continue the expense waivers and reimbursements for certain Funds and classes that were in place during the last fiscal year. The Board further considered that with respect to each Fund, the Agreement provides for the Manager to receive a management fee comprised of an annualized fee that is retained by the Manager plus the amount payable by the Manager to a subadvisor. The Board also considered that the Manager receives service and administrative fees to compensate the Manager for providing administrative services to the Funds and to compensate third-party administrators and broker-dealers for services to Fund shareholders. In addition, the Board considered that the Manager receives management fees for overseeing the securities lending program on behalf of various Funds. The Board also noted that certain classes of the Funds maintain higher expense ratios in order to compensate third-party distributors.
Based on the foregoing information, the Board concluded that the profitability levels of the Manager were reasonable in light of the services performed by the Manager. A discussion regarding the Board’s considerations with respect to each Fund’s fee rates is set forth below under “Additional Considerations and Conclusions with Respect to Each Fund.”
The Board noted the Manager’s representation that many of the Funds benefit from economies of scale because comparably low fee rate levels are reflected in the current management and administration fee rates the Manager charges. The Board further noted the Manager’s representation that many of the Funds benefit from these comparably low fee rate levels despite not having yet reached an asset size at which economies of scale would traditionally be considered to exist, and the Manager’s belief that breakpoints are not appropriate at this time. Based on the foregoing information, the Board concluded that the Manager fee rate schedules for each Fund provide for a reasonable sharing of benefits from any economies of scale with the Funds.
Benefits Derived from the Relationship with the Funds. The Board considered the “fall-out” or ancillary benefits that accrue to the Manager as a result of its advisory relationship with the Funds, including greater exposure in the marketplace with respect to the Manager’s investment process and expanding the level of assets under management by the Manager.
In addition, the Manager noted that the Funds also derive benefits from their association with the Manager. Specifically, the Board noted the Manager’s representation that it provides services to most Funds at a lower than industry average cost. The Board also
24
American Beacon FundsSM
Disclosure Regarding the Board of Trustees’ Approval of the
Management Agreements of the Funds (Unaudited)
considered that the Funds did not pay commissions to any affiliated broker-dealer of the Manager during the most recent fiscal year ended December 31, 2012.
Based on the foregoing information, the Board concluded that the potential benefits accruing to the Manager by virtue of its relationship with the Funds appear to be fair and reasonable.
Additional Considerations and Conclusions with Respect to Each Fund
The performance comparisons below were made versus each Fund’s Lipper performance universe median, Lipper performance group median and/or benchmark index. References below to each Fund’s Lipper performance group and Lipper performance universe are to the respective group or universe of comparable mutual funds included in the analysis provided by Lipper. A Lipper performance group consists of the Fund and a representative sample of funds with similar investment classifications and objectives as the Fund, as selected by Lipper. A Lipper performance universe is an expansion of the performance group, providing a broader view of performance across the Fund’s investment classification/objective and allowing for a more extensive comparison. In reviewing the performance, the Trustees viewed longer-term performance over a full market cycle, typically five years or longer, as the most important consideration, because relative performance over shorter periods may be significantly impacted by market or economic events that do not reflect manager skill.
The expense comparisons below were made versus each Fund’s Lipper expense universe median and Lipper expense group median. References below to each Fund’s expense group and expense universe are to the respective group or universe of comparable mutual funds included in the analysis by Lipper. A Lipper expense group consists of the Fund and a representative sample of funds with similar operating structures, as selected by Lipper. A Lipper expense universe includes all funds in the investment classification/objective with a similar load type to the share class of the Fund included in the Lipper comparative information and provides a broader view of expenses across the Fund’s investment classification/objective. The Trustees also considered a Fund’s Morningstar fee level category. In reviewing expenses, the Trustees considered the positive impact of fee waivers where applicable and the Manager’s agreement to continue the fee waivers. In addition, information regarding the use of soft dollars was requested from the Manager and was considered by the Trustees.
Additional Considerations and Conclusions with Respect to the American Beacon International Equity Index Fund
In considering the renewal of the Agreement for the American Beacon International Equity Index Fund, the Trustees considered the following additional factors: (1) the American Beacon International Equity Index Fund outperformed the Lipper performance universe median and Lipper performance group median for the one-, three- and five-year periods ended March 31, 2013; (2) the Fund’s expense ratio was lower than the median of its Lipper expense universe and Lipper expense group; and (3) the Institutional Class of the Fund was categorized by Morningstar as having a low expense ratio.
Based on these and other considerations, the Trustees: (1) concluded that the fees paid to the Manager under the Agreement are fair and reasonable; (2) determined that the Fund and its shareholders would benefit from the Manager’s continued management of the Fund; and (3) approved the renewal of the Management Agreement with respect to the American Beacon International Equity Index Fund.
Additional Considerations and Conclusions with Respect to the American Beacon S&P 500 Index Fund
In considering the renewal of the Agreement for the American Beacon S&P 500 Index Fund, the Trustees considered the following additional factors: (1) the American Beacon S&P 500 Index Fund outperformed the Lipper performance universe median for the one-, three- and five-year periods ended March 31, 2013; (2) the Fund outperformed the Lipper performance group median for the five-year period ended March 31, 2013, had performance equal to the three-year period, and underperformed for the one-year period; (3) the expense ratio of the Fund was lower than the median of its Lipper expense universe and Lipper expense group; and (4) the Institutional Class of the Fund was categorized by Morningstar as having a low expense ratio.
Based on these and other considerations, the Trustees: (1) concluded that the fees paid to the Manager under the Agreement are fair and reasonable; (2) determined that the Fund and its shareholders would benefit from the Manager’s continued management of the Fund; and (3) approved the renewal of the Agreement with respect to the American Beacon S&P 500 Index Fund.
Additional Considerations and Conclusions with Respect to the American Beacon Small Cap Index Fund
In considering the renewal of the Agreement for the American Beacon Small Cap Index Fund, the Trustees considered the following additional factors: (1) the American Beacon Small Cap Index Fund outperformed the Lipper performance universe median and Lipper performance group median for the one-, three- and five-year periods ended March 31, 2013; (2) the Fund’s expense ratio was lower than the median of its Lipper expense universe and Lipper expense group; and (3) the Institutional Class of the Fund was categorized by Morningstar as having a low expense ratio.
Based on these and other considerations, the Trustees: (1) concluded that the fees paid to the Manager under the Agreement are fair and reasonable; (2) determined that the Fund and its shareholders would benefit from the Manager’s continued management of the Fund; and (3) approved the renewal of the Agreement with respect to the American Beacon Small Cap Index Fund.
25

State Street Equity 500 Index Portfolio
Semi-Annual Report
June 30, 2013
26
State Street Equity 500 Index Portfolio
June 30, 2013 (Unaudited)
See Notes to Financial Statements.
27
State Street Equity 500 Index Portfolio
Portfolio of Investments — (continued)
June 30, 2013 (Unaudited)
See Notes to Financial Statements.
28
State Street Equity 500 Index Portfolio
Portfolio of Investments — (continued)
June 30, 2013 (Unaudited)
See Notes to Financial Statements.
29
State Street Equity 500 Index Portfolio
Portfolio of Investments — (continued)
June 30, 2013 (Unaudited)
See Notes to Financial Statements.
30
State Street Equity 500 Index Portfolio
Portfolio of Investments — (continued)
June 30, 2013 (Unaudited)
See Notes to Financial Statements.
31
State Street Equity 500 Index Portfolio
Portfolio of Investments — (continued)
June 30, 2013 (Unaudited)
Affiliates Table
Certain investments made by the Portfolio were made in securities affiliated with State Street and SSgA FM. Investments in State Street Corp., the holding company of State Street, were made according to its representative portion of the S&P 500® Index. The Portfolio also invested in the State Street Institutional Liquid Reserves Fund. Transactions in all affiliates for the period ending June 30, 2013 were as follows:
| Security Description |
Number of shares held at 12/31/12 |
Shares purchased for the six months ended 06/30/13 |
Shares sold for the six months ended 06/30/13 |
Number of shares held at 06/30/13 |
Value at 06/30/13 |
Income earned for the six months ended 06/30/13 |
Realized gain on shares sold |
|||||||||||||||||||||
| State Street Corp. |
72,725 | — | — | 72,725 | $ | 4,742,397 | $ | 37,817 | $ | — | ||||||||||||||||||
| State Street Institutional Liquid Reserves Fund |
25,053,183 | 163,572,583 | 136,141,379 | 52,484,387 | 52,484,387 | 26,120 | — | |||||||||||||||||||||
See Notes to Financial Statements.
32
State Street Equity 500 Index Portfolio
Statement of Assets and Liabilities
June 30, 2013 (Unaudited)
| State Street | ||||
| Equity 500 | ||||
| Index Portfolio | ||||
| Assets |
||||
| Investments in unaffiliated issuers at market value (identified cost $1,188,685,404) |
$ | 2,272,696,222 | ||
| Investments in non-controlled affiliates at market value (identified cost $54,874,161) (Note 4) |
57,226,784 | |||
|
|
|
|||
| Total investments at market value (identified cost $1,243,559,565) |
2,329,923,006 | |||
| Receivable for investment securities sold |
319,501 | |||
| Daily variation margin on futures contracts |
689,529 | |||
| Dividends and interest receivable |
2,828,988 | |||
| Dividend recievable from non-controlled affiliates (Note 4) |
18,909 | |||
|
|
|
|||
| Total assets |
2,333,779,933 | |||
| Liabilities |
||||
| Daily variation margin on futures contracts |
937,001 | |||
| Payable for withdrawals from portfolio |
4,436,729 | |||
| Management fees payable (Note 3) |
48,645 | |||
|
|
|
|||
| Total liabilities |
5,422,375 | |||
|
|
|
|||
| Net Assets |
$ | 2,328,357,558 | ||
|
|
|
|||
See Notes to Financial Statements.
33
State Street Equity 500 Index Portfolio
Six Months Ended June 30, 2013 (Unaudited)
| State Street | ||||
| Equity 500 | ||||
| Index Portfolio | ||||
| Investment Income |
||||
| Dividend income – unaffiliated issuers (net of foreign taxes withheld of $51,801 ) |
$ | 23,529,979 | ||
| Dividend income – non-controlled affiliated issuer |
63,937 | |||
| Interest |
937 | |||
|
|
|
|||
| Total investment income |
23,594,853 | |||
|
|
|
|||
| Expenses |
||||
| Management fees (Note 3) |
503,913 | |||
|
|
|
|||
| Total expenses |
503,913 | |||
|
|
|
|||
| Net Investment Income |
$ | 23,090,940 | ||
|
|
|
|||
| Realized and Unrealized Gain (Loss) |
||||
| Net realized gain on: |
||||
| Investments – unaffiliated issuers |
$ | 8,925,269 | ||
| Futures contracts |
6,612,377 | |||
|
|
|
|||
| 15,537,646 | ||||
| Net change in net unrealized appreciation (depreciation) on: |
||||
| Investments |
246,037,907 | |||
| Futures contracts |
(1,006,170 | ) | ||
|
|
|
|||
| 245,031,737 | ||||
|
|
|
|||
| Net realized and unrealized gain |
260,569,383 | |||
|
|
|
|||
| Net Increase in Net Assets Resulting from Operations |
$ | 283,660,323 | ||
|
|
|
|||
See Notes to Financial Statements.
34
State Street Equity 500 Index Portfolio
Statements of Changes in Net Assets
| Six Months Ended | For the | |||||||
| June 30, 2013 | Year Ended | |||||||
| (Unaudited) | December 31, 2012 | |||||||
| Increase (Decrease) in Net Assets From Operations: |
||||||||
| Net investment income |
$ | 23,090,940 | $ | 44,258,364 | ||||
| Net realized gain on investments and futures contracts |
15,537,646 | 59,782,429 | ||||||
| Net change in net unrealized appreciation on investments and futures contracts |
245,031,737 | 177,710,661 | ||||||
|
|
|
|
|
|||||
| Net increase in net assets from operations |
283,660,323 | 281,751,454 | ||||||
|
|
|
|
|
|||||
| Capital Transactions |
||||||||
| Contributions |
115,590,455 | 262,981,954 | ||||||
| Withdrawals |
(126,134,606 | ) | (315,020,063 | ) | ||||
|
|
|
|
|
|||||
| Net decrease in net assets from capital transactions |
(10,544,151 | ) | (52,038,109 | ) | ||||
|
|
|
|
|
|||||
| Net Increase in Net Assets |
273,116,172 | 229,713,345 | ||||||
| Net Assets |
||||||||
| Beginning of period |
2,055,241,386 | 1,825,528,041 | ||||||
|
|
|
|
|
|||||
| End of period |
$ | 2,328,357,558 | $ | 2,055,241,386 | ||||
|
|
|
|
|
|||||
See Notes to Financial Statements.
35
State Street Equity 500 Index Portfolio
The following table includes selected supplemental data and ratios to average net assets:
| Six Months Ended | ||||||||||||||||||||||||
| 6/30/13 | Year Ended | Year Ended | Year Ended | Year Ended | Year Ended | |||||||||||||||||||
| (Unaudited) | 12/31/12 | 12/31/11 | 12/31/10 | 12/31/09 | 12/31/08 | |||||||||||||||||||
| Supplemental Data and Ratios: |
||||||||||||||||||||||||
| Net assets, end of period |
2,328,358 | 2,055,241 | 1,825,528 | 2,098,137 | 1,893,386 | 1,522,208 | ||||||||||||||||||
| Ratios to average net assets: |
||||||||||||||||||||||||
| Operating expenses |
0.045 | %* | 0.045 | % | 0.045 | % | 0.045 | % | 0.045 | % | 0.045 | % | ||||||||||||
| Net investment income |
2.06 | %* | 2.26 | % | 2.04 | % | 1.99 | % | 2.28 | % | 2.30 | % | ||||||||||||
| Portfolio turnover rate(a) |
2 | % | 9 | % | 15 | % | 12 | % | 19 | % | 14 | % | ||||||||||||
| Total return(b) |
13.84 | % | 15.97 | % | 2.03 | % | 15.08 | % | 26.50 | % | (37.02 | )% | ||||||||||||
| (a) | The portfolio turnover rate excludes in-kind security transactions. |
| (b) | Results represent past performance and are not indicative of future results. |
| * | Annualized. |
See Notes to Financial Statements.
36
State Street Equity 500 Index Portfolio
June 30, 2013 (Unaudited)
1. Organization
State Street Master Funds (the “Trust”) is registered under the Investment Company Act of 1940, as amended (the “1940 Act”), as an open-end management investment company, and was organized as a business trust under the laws of the Commonwealth of Massachusetts on July 27, 1999. The Trust comprises ten investment portfolios: State Street Equity 500 Index Portfolio, State Street Equity 400 Index Portfolio, State Street Equity 2000 Index Portfolio, State Street Aggregate Bond Index Portfolio, State Street Money Market Portfolio, State Street Tax Free Money Market Portfolio, State Street Limited Duration Bond Portfolio, State Street Treasury Money Market Portfolio, State Street Treasury Plus Money Market Portfolio and State Street U.S. Government Money Market Portfolio. Information presented in these financial statements pertains only to the State Street Equity 500 Index Portfolio (the “Portfolio”).
At June 30, 2013, the following Portfolios were operational: the Portfolio, the State Street Money Market Portfolio, the State Street Tax Free Money Market Portfolio, the State Street U.S. Government Money Market Portfolio, the State Street Treasury Money Market Portfolio and the State Street Treasury Plus Money Market Portfolio. The Portfolio is authorized to issue an unlimited number of nontransferable beneficial interests.
The Portfolio’s investment objective is to replicate, as closely as possible, before expenses, the performance of the Standard & Poor’s 500 Composite Stock Price Index (the “S&P 500® Index”). The Portfolio uses a passive management strategy designed to track the performance of the S&P 500® Index. The S&P 500® Index is a well-known, unmanaged, stock index that includes common stocks of 500 companies from several industrial sectors representing a significant portion of the market value of all stocks publicly traded in the United States. There is no assurance that the Portfolio will achieve its objective.
2. Significant Accounting Policies
The following is a summary of the significant accounting policies consistently followed by the Portfolio in the preparation of its financial statements.
Security valuation – The Portfolio’s investments are valued each business day by independent pricing services. Equity securities for which market quotations are available are valued at the last sale price or official closing price (closing bid price if no sale has occurred) on the primary market or exchange on which they trade. Investments in other mutual funds are valued at the net asset value per share. Fixed income securities and options are valued on the basis of the closing bid price. Futures contracts are valued on the basis of the last sale price. Money market instruments maturing within 60 days of the valuation date are valued at amortized cost, a method by which each money market instrument is initially valued at cost, and thereafter a constant accretion or amortization of any discount or premium is recorded until maturity of the security. The Portfolio may value securities for which market quotations are not readily available at “fair value,” as determined in good faith pursuant to procedures established by the Board of Trustees.
The Portfolio adopted provisions surrounding fair value measurements and disclosures that defines fair value, establish a framework for measuring fair value in generally accepted accounting principles and expand disclosures about fair value measurements. These provisions apply to fair value measurements that are already required or permitted by other accounting standards and are intended to increase the
37
State Street Equity 500 Index Portfolio
Notes to Financial Statements — (continued)
June 30, 2013 (Unaudited)
consistency of those measurements and apply broadly to securities and other types of assets and liabilities. In accordance with these provisions, fair value is defined as the price that the Portfolio would receive upon selling an investment in a timely transaction to an independent buyer in the principal or most advantageous market of the investment. Various inputs are used in determining the value of the Portfolio’s investments.
The three tier hierarchy of inputs is summarized below:
| • | Level 1 – quoted prices in active markets for identical securities |
| • | Level 2 – other significant observable inputs (including quoted prices for similar securities, interest rates, prepayment speeds, credit risk, etc.) |
| • | Level 3 – significant unobservable inputs (including the Portfolio’s own assumptions in determining the fair value of investments) |
The inputs or methodology used for valuing securities are not an indication of the risk associated with investing in those securities.
The following is a summary of the inputs used, as of June 30, 2013, in valuing the Portfolio’s assets carried at fair value:
| Quoted Prices in | Significant Other | Significant | ||||||||||||||
| Active Markets for | Observable | Unobservable | ||||||||||||||
| Identical Assets | Inputs | Inputs | ||||||||||||||
| Description |
(Level 1) | (Level 2) | (Level 3) | Total | ||||||||||||
| ASSETS: |
||||||||||||||||
| INVESTMENTS: |
||||||||||||||||
| Common Stocks |
$ | 2,274,278,762 | $ | — | $ | — | $ | 2,274,278,762 | ||||||||
| U.S. Government Securities |
— | 3,159,857 | — | 3,159,857 | ||||||||||||
| Money Market Fund |
52,484,387 | — | — | 52,484,387 | ||||||||||||
|
|
|
|
|
|
|
|
|
|||||||||
| TOTAL INVESTMENTS |
2,326,763,149 | 3,159,857 | — | 2,329,923,006 | ||||||||||||
| OTHER ASSETS: |
||||||||||||||||
| Futures contracts |
(937,001 | ) | — | — | (937,001 | ) | ||||||||||
|
|
|
|
|
|
|
|
|
|||||||||
| TOTAL ASSETS |
$ | 2,325,826,148 | $ | 3,159,857 | $ | — | $ | 2,328,986,005 | ||||||||
|
|
|
|
|
|
|
|
|
|||||||||
The type of inputs used to value each security under the provisions surrounding fair value measurements and disclosures is identified in the Portfolio of Investments, which also includes a breakdown of the Portfolio’s investments by category.
For the six months ended June 30, 2013, there were no transfers between levels.
Securities transactions, investment income and expenses – Securities transactions are recorded on a trade date basis. Dividend income is recorded on the ex-dividend date. Interest income is recorded daily on the accrual basis and includes amortization of premium and accretion of discount on investments. Realized gains and losses from securities transactions are recorded on the basis of identified cost. Expenses are accrued daily based on average daily net assets. The effects of changes in foreign currency exchange rates on portfolio investments are included in the net realized and unrealized gains and losses on investments and foreign currency transactions on the Statement of Operations.
38
State Street Equity 500 Index Portfolio
Notes to Financial Statements — (continued)
June 30, 2013 (Unaudited)
All of the net investment income and realized and unrealized gains and losses from the security transactions of the Portfolio are allocated pro rata among the partners in the Portfolio on a daily basis based on each partner’s daily ownership percentage.
Federal income taxes – The Portfolio is not required to pay federal income taxes on its net investment income and net capital gains because it is treated as a partnership for federal income tax purposes. All interest, dividends, gains and losses of the Portfolio are deemed to have been “passed through” to the Portfolio’s partners in proportion to their holdings in the Portfolio, regardless of whether such items have been distributed by the Portfolio. Each partner is responsible for tax liability based on its distributive share; therefore, no provision has been made for federal income taxes.
The Portfolio has reviewed the tax positions for open years as of and during the year ended December 31, 2012, and determined it did not have a liability for any unrecognized tax expenses. The Portfolio recognizes interest and penalties, if any, related to tax liabilities as income tax expense in the Statement of Operations. As of June 30, 2013, tax years 2009 through 2012 remain subject to examination by the Portfolio’s major tax jurisdictions, which include the United States of America and the Commonwealth of Massachusetts.
At June 30, 2013, the tax cost of investments was $1,243,559,565 on a federal tax basis. The aggregate gross unrealized appreciation and gross unrealized depreciation was $ 1,110,681,006 and $ 24,317,565 respectively, resulting in net appreciation of $1,086,363,441 for all securities as computed on a federal income tax basis.
Futures – The Portfolio may enter into financial futures contracts as part of its strategy to track the performance of the S&P 500® Index. Upon entering into a futures contract, the Portfolio is required to deposit with the broker cash or securities in an amount equal to a certain percentage of the contract amount. Variation margin payments are made or received by the Portfolio each day, depending on the daily fluctuations in the value of the underlying security or index, and are recorded for financial statement purposes as unrealized gains or losses by the Portfolio, which is recorded on the Statement of Assets and Liabilities. The Portfolio recognizes a realized gain or loss when the contract is closed, which is recorded on the Statement of Operations. The Portfolio voluntarily segregates securities in an amount equal to the outstanding value of the open futures contracts in accordance with Securities and Exchange Commission requirements.
The Portfolio adopted provisions surrounding Derivatives and Hedging which requires qualitative disclosures about objectives and strategies for using derivatives, quantitative disclosures about fair value amounts of gains and losses on derivative instruments, and disclosures about credit-risk-related contingent features in derivative agreements.
The primary risks associated with the use of futures contracts are an imperfect correlation between the change in market value of the securities held by the Portfolio and the prices of futures contracts and the possibility of an illiquid market. To the extent permitted by the investment objective, restrictions and policies set forth in the Portfolio’s Prospectus and Statement of Additional Information, the Portfolio may participate in various derivative-based transactions. Derivative securities are instruments or agreements whose value is derived from an underlying security or index. The Portfolio’s use of derivatives includes futures. These instruments offer unique characteristics and risks that assist the Portfolio in meeting its investment objective. The Portfolio typically uses derivatives in two ways: cash equitization and return enhancement. Cash equitization is a technique that may be used by the Portfolio through the use of options
39
State Street Equity 500 Index Portfolio
Notes to Financial Statements — (continued)
June 30, 2013 (Unaudited)
and futures to earn “market-like” returns with the Portfolio’s excess and liquidity reserve cash balances and receivables. Return enhancement can be accomplished through the use of derivatives in the Portfolio. By purchasing certain instruments, the Portfolio may more effectively achieve the desired portfolio characteristics that assist in meeting the Portfolio’s investment objectives. Depending on how the derivatives are structured and utilized, the risks associated with them may vary widely. These risks are generally categorized as market risk, liquidity risk and counterparty or credit risk.
The following table, grouped into appropriate risk categories, discloses the amounts related to the Portfolio’s use of derivative instruments and hedging activities at June 30, 2013:
Asset Derivatives(1) (amounts in thousands)
| Equity Contracts Risk |
Total | |||||||
| Futures Contracts |
$ | (937,001 | ) | $ | (937,001 | ) | ||
| (1) | Portfolio of Investments: Unrealized appreciation of futures contracts. Only unsettled receivable/payable for variation margin is reported within Statement of Assets and Liabilities. |
Transactions in derivative instruments during the six months ended June 30, 2013, were as follows:
Realized Gain (Loss)(2) (amounts in thousands)
| Equity Contracts Risk |
Total | |||||||
| Futures Contracts |
$ | 6,612,377 | $ | 6,612,377 | ||||
Change in Appreciation (Depreciation)(3) (amounts in thousands)
| Equity Contracts Risk |
Total | |||||||
| Futures Contracts |
$ | 1,006,170 | $ | 1,006,170 | ||||
| (2) | Statement of Operations location: Net realized gain (loss) on: Futures contracts |
| (3) | Statement of Operations location: Net change in unrealized appreciation (depreciation) on: Futures contracts |
The average notional of futures outstanding during the six months ended June 30, 2013 was $44,035,248.
At June 30, 2013, the fund sold the following exchange traded futures contracts:
Financial Exchange Traded Futures Contracts
| Number of | Notional | Unrealized | ||||||||||||||||||
| Issue |
Exchange | Contracts | Expiration Date | Value | Depreciation | |||||||||||||||
| S&P 500 Financial Futures |
Chicago Mercantile Exchange | 678 | September 2013 | $ | 55,153,271 | $ | (937,001 | ) | ||||||||||||
Use of estimates – The Portfolio’s financial statements are prepared in accordance with U.S. generally accepted accounting principles, which require the use of management estimates. Actual results could differ from those estimates. It is reasonably possible that these differences could be material.
40
State Street Equity 500 Index Portfolio
Notes to Financial Statements — (continued)
June 30, 2013 (Unaudited)
Subsequent events – Management has determined that there are no subsequent events or transactions that would have materially impacted the Fund’s financial statements as presented.
3. Securities Transactions
For the six months ended June 30, 2013, purchases and sales of investment securities, excluding short-term investments, and futures contracts, aggregated to $40,249,683 and $45,700,068, respectively.
4. Related Party Fees and Transactions
The Portfolio has entered into an investment advisory agreement with SSgA Funds Management, Inc. (“SSgA FM” or the “Adviser”), a subsidiary of State Street Corporation and an affiliate of State Street Bank and Trust Company (“State Street”), under which SSgA FM directs the investments of the Portfolio in accordance with its investment objective, policies, and limitations. The Trust has contracted with State Street to provide custody, administration and transfer agent services to the Portfolio. In compensation for SSgA FM’s services as investment adviser and for State Street’s services as administrator, custodian and transfer agent (and for assuming ordinary operating expenses of the Portfolio, including ordinary legal, audit and trustees expense), State Street receives a unitary fee, calculated daily, at the annual rate of 0.045% of the Portfolio’s average daily net assets.
Certain investments made by the Portfolio were made in securities affiliated with State Street and SSgA FM. Investments in State Street Corporation, the holding company of State Street, were made according to its representative portion of the S&P 500® Index. The market value of this investment at June 30, 2013 is listed in the Portfolio of Investments.
5. Trustees’ Fees
Each Independent Trustee receives for his or her services a $100,000 retainer in addition to $5,000 for each in-person meeting and $1,250 for each telephonic meeting from the Trust. The Chairman receives an additional $30,000 annual retainer and the Audit Committee Chair receives an additional $10,000 annual retainer.
6. Indemnifications
The Trust’s organizational documents provide that its officers and trustees are indemnified against certain liabilities arising out of the performance of their duties to the Trust. In addition, both in some of its principal service contracts and in the normal course of its business, the Trust enters into contracts that provide indemnifications to other parties for certain types of losses or liabilities. The Trust’s maximum exposure under these arrangements is unknown as this could involve future claims against the Trust. Management does not expect any significant claims.
41
State Street Equity 500 Index Portfolio
General Information
June 30, 2013 (Unaudited)
Proxy Voting Policies and Procedures and Record
The Trust has adopted proxy voting procedures relating to portfolio securities held by the Portfolio. A description of the policies and procedures are available without charge, upon request, (i) by calling (877) 521-4083 or (ii) on the website of the Securities and Exchange Commission (the “SEC”) at www.sec.gov. Information on how the Portfolio voted proxies relating to portfolio securities during the most recent 12-month period ended June 30 is available by August 31 without charge, upon request, (i) by calling (877) 521-4083 or (ii) on the SEC’s website at www.sec.gov.
Quarterly Portfolio Schedule
The Trust files a complete schedule of portfolio holdings with the SEC for the first and third quarters of its fiscal year (as of March and September of each year) on Form N-Q. The Trust’s Forms N-Q are available on the SEC’s website at www.sec.gov. The Trust’s Forms N-Q may be reviewed and copied at the SEC’s Public Reference Room in Washington, D.C. and information on the operation of the Public Reference Room may be obtained by calling 1-800-SEC-0330. The most recent Form N-Q is available without charge, upon request, by calling (877) 521-4083.
42
JUNE 30, 2013
| SEMI-ANNUAL REPORT (UNAUDITED) |

|
Quantitative Master Series LLC
| • | Master International Index Series |
| • | Master Small Cap Index Series |
| Not FDIC Insured • May Lose Value • No Bank Guarantee |
| Series Portfolio Information as of June 30, 2013 | Quantitative Master Series LLC |
Derivative Financial Instruments
| 44 | QUANTITATIVE MASTER SERIES LLC | JUNE 30, 2013 |
| Schedule of Investments June 30, 2013 (Unaudited) | Master International Index Series | |
| (Percentages shown are based on Net Assets) |
Portfolio Abbreviations
| To simplify the listings of portfolio holdings in the Schedules of Investments, the names and descriptions of many of the securities have been abbreviated according to the following list: | ADR | American Depositary Receipts | GBP | British Pound | ||||
| AUD | Australian Dollar | REIT | Real Estate Investment Trust | |||||
| EUR | Euro | USD | US Dollar | |||||
| See Notes to Financial Statements. | ||||||
| QUANTITATIVE MASTER SERIES LLC | JUNE 30, 2013 | 45 | ||||
| Schedule of Investments (continued) | Master International Index Series (Percentages shown are based on Net Assets) |
| See Notes to Financial Statements. | ||||
| 46 | QUANTITATIVE MASTER SERIES LLC | JUNE 30, 2013 | ||
| Schedule of Investments (continued) | Master International Index Series (Percentages shown are based on Net Assets) |
| See Notes to Financial Statements. | ||||||
| QUANTITATIVE MASTER SERIES LLC | JUNE 30, 2013 | 47 | ||||
| Schedule of Investments (continued) | Master International Index Series (Percentages shown are based on Net Assets) |
| See Notes to Financial Statements. | ||||
| 48 | QUANTITATIVE MASTER SERIES LLC | JUNE 30, 2013 | ||
| Schedule of Investments (continued) | Master International Index Series (Percentages shown are based on Net Assets) |
| See Notes to Financial Statements. | ||||||
| QUANTITATIVE MASTER SERIES LLC | JUNE 30, 2013 | 49 | ||||
| Schedule of Investments (continued) | Master International Index Series (Percentages shown are based on Net Assets) |
| See Notes to Financial Statements. | ||||
| 50 | QUANTITATIVE MASTER SERIES LLC | JUNE 30, 2013 | ||
| Schedule of Investments (continued) | Master International Index Series (Percentages shown are based on Net Assets) |
| See Notes to Financial Statements. | ||||||
| QUANTITATIVE MASTER SERIES LLC | JUNE 30, 2013 | 51 | ||||
| Schedule of Investments (continued) | Master International Index Series (Percentages shown are based on Net Assets) |
Notes to Schedule of Investments
| * | As of June 30, 2013, gross unrealized appreciation and gross unrealized depreciation based on cost for federal income tax purposes were as follows: |
| Tax cost |
$ | 700,610,351 | ||
|
|
|
|||
| Gross unrealized appreciation |
$ | 201,007,021 | ||
| Gross unrealized depreciation |
(81,582,446 | ) | ||
|
|
|
|||
| Net unrealized appreciation |
$ | 119,424,575 | ||
|
|
|
| (a) | Non-income producing security. |
| (b) | Investments in issuers considered to be an affiliate of the Series during the six months ended June 30, 2013, for purposes of Section 2(a)(3) of the Investment Company Act of 1940, as amended, were as follows: |
| Affiliate |
Shares Held at December 31, 2012 |
Net Activity |
Shares Held at June 30, 2013 |
Income | ||||||||||||
| BlackRock Liquidity Funds, TempCash, Institutional Class |
— | 4,365,311 | 1 | 4,365,311 | $ | 1,102 | ||||||||||
| 1 | Represents net shares purchased. |
| See Notes to Financial Statements. | ||||
| 52 | QUANTITATIVE MASTER SERIES LLC | JUNE 30, 2013 | ||
| Schedule of Investments (continued) | Master International Index Series |
| (c) | Represents the current yield as of report date. |
| • | Financial futures contracts as of June 30, 2013 were as follows: |
| Unrealized | ||||||||||||||
| Contracts | Notional | Appreciation | ||||||||||||
| Purchased |
Issue |
Exchange |
Expiration |
Value | (Depreciation) | |||||||||
| 119 |
DJ Euro Stoxx 50 Index | Eurex | September 2013 | $ | 4,024,205 | $ | (92,969 | ) | ||||||
| 44 |
FTSE 100 Index | Euronext LIFFE | September 2013 | $ | 4,123,386 | (30,950 | ) | |||||||
| 41 |
Nikkei 225 Index | Singapore Exchange | September 2013 | $ | 2,816,218 | 73,369 | ||||||||
| 14 |
SPI 200 Index | Australian Securities Exchange | September 2013 | $ | 1,526,521 | 8,106 | ||||||||
|
|
|
|||||||||||||
| Total |
$ | (42,444 | ) | |||||||||||
|
|
|
|||||||||||||
| • | Foreign currency exchange contracts as of June 30, 2013 were as follows: |
| Currency | Currency | Settlement | Unrealized | |||||||||||
| Purchased |
Sold | Counterparty |
Date | Depreciation | ||||||||||
| AUD 646,343 |
USD | 600,000 | Deutsche Bank AG | 7/01/13 | $ | (8,887 | ) | |||||||
| EUR 766,754 |
USD | 1,000,000 | Deutsche Bank AG | 7/01/13 | (1,956 | ) | ||||||||
| GBP 327,890 |
USD | 500,000 | Deutsche Bank AG | 7/01/13 | (1,295 | ) | ||||||||
|
|
|
|||||||||||||
| Total |
$ | (12,138 | ) | |||||||||||
|
|
|
|||||||||||||
| • | Fair Value Measurements — Various inputs are used in determining the fair value of investments and derivative financial instruments. These inputs to valuation techniques are categorized into a disclosure hierarchy consisting of three broad levels for financial statement purposes as follows: |
| • | Level 1 — unadjusted price quotations in active markets/exchanges for identical assets or liabilities that the Series has the ability to access |
| • | Level 2 — other observable inputs (including, but not limited to, quoted prices for similar assets or liabilities in markets that are active, quoted prices for identical or similar assets or liabilities in markets that are not active, inputs other than quoted prices that are observable for the assets or liabilities (such as interest rates, yield curves, volatilities, prepayment speeds, loss severities, credit risks and default rates) or other market-corroborated inputs) |
| • | Level 3 — unobservable inputs based on the best information available in the circumstances, to the extent observable inputs are not available (including the Series’ own assumptions used in determining the fair value of investments and derivative financial instruments) |
The hierarchy gives the highest priority to unadjusted quoted prices in active markets for identical assets or liabilities (Level 1 measurements) and the lowest priority to unobservable inputs (Level 3 measurements). Accordingly, the degree of judgment exercised in determining fair value is greatest for instruments categorized in Level 3. The inputs used to measure fair value may fall into different levels of the fair value hierarchy. In such cases, for disclosure purposes, the fair value hierarchy classification is determined based on the lowest level input that is significant to the fair value measurement in its entirety.
Changes in valuation techniques may result in transfers into or out of an assigned level within the disclosure hierarchy. In accordance with the Series’ policy, transfers between different levels of the fair value disclosure hierarchy are deemed to have occurred as of the beginning of the reporting period. The categorization of a value determined for investments and derivative financial instruments is based on the pricing transparency of the investment and derivative financial instrument and is not necessarily an indication of the risks associated with investing in those securities. For information about the Series’ policy regarding valuation of investments and derivative financial instruments, please refer to Note 2 of the Notes to Financial Statements.
The following tables summarize the Series’ investments and derivative financial instruments categorized in the disclosure hierarchy as of June 30, 2013:
| Level 1 | Level 2 | Level 3 | Total | |||||||||||||
| Assets: |
||||||||||||||||
| Investments: |
||||||||||||||||
| Long-Term Investments: |
||||||||||||||||
| Common Stocks: |
||||||||||||||||
| Australia |
$ | 2,036,412 | $ | 62,823,545 | — | $ | 64,859,957 | |||||||||
| Austria |
— | 2,158,657 | — | 2,158,657 | ||||||||||||
| Belgium |
162,977 | 9,124,885 | — | 9,287,862 | ||||||||||||
| Denmark |
430,750 | 8,696,907 | — | 9,127,657 | ||||||||||||
| Finland |
— | 6,308,810 | — | 6,308,810 | ||||||||||||
| France |
586,638 | 73,887,683 | — | 74,474,321 | ||||||||||||
| Germany |
— | 70,042,081 | — | 70,042,081 | ||||||||||||
| Greece |
— | 267,994 | — | 267,994 | ||||||||||||
| Hong Kong |
— | 24,646,720 | — | 24,646,720 | ||||||||||||
| Ireland |
586,560 | 3,495,224 | — | 4,081,784 | ||||||||||||
| Israel |
— | 4,103,055 | — | 4,103,055 | ||||||||||||
| Italy |
— | 16,017,850 | — | 16,017,850 | ||||||||||||
| Japan |
56,786 | 183,834,856 | — | 183,891,642 | ||||||||||||
| Mexico |
— | 169,408 | — | 169,408 | ||||||||||||
| Netherlands |
1,080,188 | 23,260,532 | — | 24,340,720 | ||||||||||||
| New Zealand |
— | 974,999 | — | 974,999 | ||||||||||||
| Norway |
350,164 | 6,418,071 | — | 6,768,235 | ||||||||||||
| Portugal |
— | 1,416,849 | — | 1,416,849 | ||||||||||||
| See Notes to Financial Statements. | ||||||
| QUANTITATIVE MASTER SERIES LLC | JUNE 30, 2013 | 53 | ||||
| Schedule of Investments (concluded) | Master International Index Series |
| Level 1 | Level 2 | Level 3 | Total | |||||||||||||
| Common Stocks (concluded): |
||||||||||||||||
| Singapore |
— | $ | 13,510,171 | — | $ | 13,510,171 | ||||||||||
| Spain |
$ | 223,758 | 22,785,381 | — | 23,009,139 | |||||||||||
| Sweden |
— | 25,484,697 | — | 25,484,697 | ||||||||||||
| Switzerland |
340,857 | 74,856,520 | — | 75,197,377 | ||||||||||||
| United Kingdom |
210,081 | 175,084,234 | — | 175,294,315 | ||||||||||||
| Preferred Securities |
— | 201,931 | — | 201,931 | ||||||||||||
| Rights: |
||||||||||||||||
| Bermuda |
521 | — | — | 521 | ||||||||||||
| Spain |
32,863 | — | — | 32,863 | ||||||||||||
| Short-Term Securities |
4,365,311 | 4,365,311 | ||||||||||||||
|
|
|
|
|
|
|
|
|
|||||||||
| Total |
$ | 10,463,866 | $ | 809,571,060 | — | $ | 820,034,926 | |||||||||
|
|
|
|
|
|
|
|
|
|||||||||
| Level 1 | Level 2 | Level 3 | Total | |||||||||||||
| Derivative Financial Instruments1 |
||||||||||||||||
| Assets: |
||||||||||||||||
| Equity contracts |
$ | 81,475 | — | — | $ | 81,475 | ||||||||||
| Liabilities: |
||||||||||||||||
| Equity contracts |
(123,919 | ) | — | — | (123,919 | ) | ||||||||||
| Foreign currency exchange contracts |
— | $ | (12,138 | ) | — | (12,138 | ) | |||||||||
|
|
|
|
|
|
|
|
|
|||||||||
| Total |
$ | (42,444 | ) | $ | (12,138 | ) | — | $ | (54,582 | ) | ||||||
|
|
|
|
|
|
|
|
|
|||||||||
| 1 | Derivative financial instruments are financial futures contracts and foreign currency exchange contracts. Financial futures contracts and foreign currency exchange contracts are valued at the unrealized appreciation/depreciation on the instrument. |
Certain of the Series’ assets are held at carrying amount, which approximates fair value for financial statement purposes. As of June 30, 2013, such assets are categorized within the disclosure hierarchy as follows:
| Level 1 | Level 2 | Level 3 | Total | |||||||||||||
| Assets: |
||||||||||||||||
| Cash pledged for financial futures contracts |
$ | 840,000 | — | — | $ | 840,000 | ||||||||||
| Foreign currency at value |
5,547,756 | — | — | 5,547,756 | ||||||||||||
|
|
|
|
|
|
|
|
|
|||||||||
| Total |
$ | 6,387,756 | — | — | $ | 6,387,756 | ||||||||||
|
|
|
|
|
|
|
|
|
|||||||||
There were no transfers between levels during the six months ended June 30, 2013.
| See Notes to Financial Statements. | ||||
| 54 | QUANTITATIVE MASTER SERIES LLC | JUNE 30, 2013 | ||
| Schedule of Investments June 30, 2013 (Unaudited) |
(Percentages shown are based on Net Assets) |
| See Notes to Financial Statements. | ||||||
| QUANTITATIVE MASTER SERIES LLC | JUNE 30, 2013 | 55 | ||||
| Schedule of Investments (continued) |
(Percentages shown are based on Net Assets) |
| See Notes to Financial Statements. | ||||
| 56 | QUANTITATIVE MASTER SERIES LLC | JUNE 30, 2013 | ||
| Schedule of Investments (continued) | Master Small Cap Index Series (Percentages shown are based on Net Assets) |
| See Notes to Financial Statements. | ||||||
| QUANTITATIVE MASTER SERIES LLC | JUNE 30, 2013 | 57 | ||||
| Schedule of Investments (continued) | Master Small Cap Index Series (Percentages shown are based on Net Assets) |
| See Notes to Financial Statements. | ||||
| 58 | QUANTITATIVE MASTER SERIES LLC | JUNE 30, 2013 | ||
| Schedule of Investments (continued) | Master Small Cap Index Series (Percentages shown are based on Net Assets) |
| See Notes to Financial Statements. | ||||||
| QUANTITATIVE MASTER SERIES LLC | JUNE 30, 2013 | 59 | ||||
| Schedule of Investments (continued) | Master Small Cap Index Series (Percentages shown are based on Net Assets) |
| See Notes to Financial Statements. | ||||
| 60 | QUANTITATIVE MASTER SERIES LLC | JUNE 30, 2013 | ||
| Schedule of Investments (continued) | Master Small Cap Index Series (Percentages shown are based on Net Assets) |
| See Notes to Financial Statements. | ||||||
| QUANTITATIVE MASTER SERIES LLC | JUNE 30, 2013 | 61 | ||||
| Schedule of Investments (continued) | Master Small Cap Index Series (Percentages shown are based on Net Assets) |
| See Notes to Financial Statements. | ||||
| 62 | QUANTITATIVE MASTER SERIES LLC | JUNE 30, 2013 | ||
| Schedule of Investments (continued) | Master Small Cap Index Series (Percentages shown are based on Net Assets) |
| See Notes to Financial Statements. | ||||||
| QUANTITATIVE MASTER SERIES LLC | JUNE 30, 2013 | 63 | ||||
| Schedule of Investments (continued) | Master Small Cap Index Series (Percentages shown are based on Net Assets) |
| See Notes to Financial Statements. | ||||
| 64 | QUANTITATIVE MASTER SERIES LLC | JUNE 30, 2013 | ||
| Schedule of Investments (continued) | Master Small Cap Index Series (Percentages shown are based on Net Assets) |
| See Notes to Financial Statements. | ||||||
| QUANTITATIVE MASTER SERIES LLC | JUNE 30, 2013 | 65 | ||||
| Schedule of Investments (continued) | Master Small Cap Index Series (Percentages shown are based on Net Assets) |
| See Notes to Financial Statements. | ||||
| 66 | QUANTITATIVE MASTER SERIES LLC | JUNE 30, 2013 | ||
| Schedule of Investments (continued) | Master Small Cap Index Series (Percentages shown are based on Net Assets) |
| See Notes to Financial Statements. | ||||||
| QUANTITATIVE MASTER SERIES LLC | JUNE 30, 2013 | 67 | ||||
| Schedule of Investments (continued) | Master Small Cap Index Series (Percentages shown are based on Net Assets) |
| See Notes to Financial Statements. | ||||
| 68 | QUANTITATIVE MASTER SERIES LLC | JUNE 30, 2013 | ||
| Schedule of Investments (continued) | Master Small Cap Index Series (Percentages shown are based on Net Assets) |
| See Notes to Financial Statements. | ||||||
| QUANTITATIVE MASTER SERIES LLC | JUNE 30, 2013 | 69 | ||||
| Schedule of Investments (continued) | Master Small Cap Index Series (Percentages shown are based on Net Assets) |
| See Notes to Financial Statements. | ||||
| 70 | QUANTITATIVE MASTER SERIES LLC | JUNE 30, 2013 | ||
| Schedule of Investments (continued) | Master Small Cap Index Series (Percentages shown are based on Net Assets) |
| See Notes to Financial Statements. | ||||||
| QUANTITATIVE MASTER SERIES LLC | JUNE 30, 2013 | 71 | ||||
| Schedule of Investments (continued) | Master Small Cap Index Series (Percentages shown are based on Net Assets) |
| See Notes to Financial Statements. | ||||
| 72 | QUANTITATIVE MASTER SERIES LLC | JUNE 30, 2013 | ||
| Schedule of Investments (continued) | Master Small Cap Index Series |
Notes to Schedule of investments
| * | As of June 30, 2013, gross unrealized appreciation and gross unrealized depreciation based on cost for federal income tax purposes were as follows: |
| Tax cost |
$ | 581,429,921 | ||
|
|
|
|||
| Gross unrealized appreciation |
$ | 193,754,726 | ||
| Gross unrealized depreciation |
(32,696,679 | ) | ||
|
|
|
|||
| Net unrealized appreciation |
$ | 161,058,047 | ||
|
|
|
| (a) | Non-income producing security. |
| (b) | Security, or a portion of security, is on loan. |
| (c) | Investments in issuers considered to be an affiliate of the Series during the six months ended June 30, 2013, for purposes of Section 2(a)(3) of the Investment Company Act of 1940, as amended, were as follows: |
| Shares/ | Shares/ | |||||||||||||||||||||||||||
| Beneficial | Shares/ | Beneficial | ||||||||||||||||||||||||||
| Interest Held | Beneficial | Interest Held | Value | |||||||||||||||||||||||||
| at December 31, | Interest | Shares | at June 30, | at June 30, | Realized | |||||||||||||||||||||||
| Affiliate |
2012 | Purchased | Sold | 2013 | 2013 | Income | Loss | |||||||||||||||||||||
| BlackRock Kelso Capital Corp. |
24,999 | 10,688 | (1,791 | ) | 33,896 | $ | 317,267 | $ | 15,490 | $ | (1,010 | ) | ||||||||||||||||
| BlackRock Liquidity Funds, Temp Fund, Institutional Class |
20,512,415 | 1,830,034 | 1 | — | 22,342,449 | $ | 22,342,449 | $ | 9,180 | — | ||||||||||||||||||
| BlackRock Liquidity Series LLC, Money Market Series |
$ | 36,877,998 | $ | 39,876,418 | 1 | — | $ | 76,754,416 | $ | 76,754,416 | $ | 510,502 | — | |||||||||||||||
| PennyMac Financial Services, Inc. |
— | 5,696 | — | 5,696 | $ | 121,154 | — | — | ||||||||||||||||||||
| PennyMac Mortgage Investment Trust |
27,689 | 899 | — | 28,588 | $ | 601,777 | $ | 32,592 | — | |||||||||||||||||||
| 1 | Represents net shares/beneficial interest purchased. |
| (d) | All or a portion of security has been pledged in connection with open financial futures contracts. |
| (e) | Other interests represent beneficial interests in liquidation trusts and other reorganization or private entities. |
| (f) | Warrants entitle the Series to purchase a predetermined number of shares of common stock and are non-income producing. The purchase price and number of shares are subject to adjustment under certain conditions until the expiration date of the warrants, if any. |
| (g) | Represents the current yield as of report date. |
| (h) | Security was purchased with the cash collateral from loaned securities. The Series may withdraw up to 25% of its investment daily, although the manager of the BlackRock Liquidity Series LLC, Money Market Series, in its sole discretion, may permit an investor to withdraw more than 25% on any one day. |
| • | Financial futures contracts as of June 30, 2013 were as follows: |
| Contracts Purchased |
Issue | Exchange | Expiration | Notional Value |
Unrealized Appreciation |
|||||||||||||||
| 179 |
Russell 2000 E-Mini | ICE Futures US Indices | September 2013 | $ | 17,447,130 | $ | 111,576 | |||||||||||||
| • | For Series compliance purposes, the Series’ industry classifications refer to any one or more of the industry sub-classifications used by one or more widely recognized market indexes or rating group indexes, and/or as defined by Series management. These definitions may not apply for purposes of this report, which may combine such industry sub-classifications for reporting ease. |
| • | Fair Value Measurements — Various inputs are used in determining the fair value of investments and derivative financial instruments. These inputs to valuation techniques are categorized into a disclosure hierarchy consisting of three broad levels for financial statement purposes as follows: |
| • | Level 1 — unadjusted price quotations in active markets/exchanges for identical assets or liabilities that the Series has the ability to access |
| • | Level 2 — other observable inputs (including, but not limited to, quoted prices for similar assets or liabilities in markets that are active, quoted prices for identical or similar assets or liabilities in markets that are not active, inputs other than quoted prices that are observable for the assets or liabilities (such as interest rates, yield curves, volatilities, prepayment speeds, loss severities, credit risks and default rates) or other market-corroborated inputs) |
| • | Level 3 — unobservable inputs based on the best information available in the circumstances, to the extent observable inputs are not available (including the Series’ own assumptions used in determining the fair value of investments and derivative financial instruments) |
The hierarchy gives the highest priority to unadjusted quoted prices in active markets for identical assets or liabilities (Level 1 measurements) and the lowest priority to unobservable inputs (Level 3 measurements). Accordingly, the degree of judgment exercised in determining fair value is greatest for instruments categorized in Level 3. The inputs used to measure fair value may fall into different levels of the fair value hierarchy. In such cases, for disclosure purposes, the fair value hierarchy classification is determined based on the lowest level input that is significant to the fair value measurement in its entirety.
Changes in valuation techniques may result in transfers into or out of an assigned level within the disclosure hierarchy. In accordance with the Series’ policy, transfers between different levels of the fair value disclosure hierarchy are deemed to have occurred as of the beginning of the reporting period. The categorization of a value determined for investments and derivative financial instruments is based on the pricing transparency of the investment and derivative financial instrument and is not necessarily an indication of the risks associated with investing in those securities. For information about the Series’ policy regarding valuation of investments and derivative financial instruments, please refer to Note 2 of the Notes to Financial Statements.
| See Notes to Financial Statements. | ||||||
| QUANTITATIVE MASTER SERIES LLC | JUNE 30, 2013 | 73 | ||||
| Schedule of Investments (concluded) | Master Small Cap Index Series |
The following tables summarize the Series’ investments and derivative financial instruments categorized in the disclosure hierarchy as of June 30, 2013:
| Level 1 | Level 2 | Level 3 | Total | |||||||||||||
| Assets: |
||||||||||||||||
| Investments: |
||||||||||||||||
| Long-Term Investments1 |
$ | 643,391,103 | — | — | $ | 643,391,103 | ||||||||||
| Short-Term Securities |
22,342,449 | $ | 76,754,416 | — | 99,096,865 | |||||||||||
|
|
|
|
|
|
|
|
|
|||||||||
| Total |
$ | 665,733,552 | $ | 76,754,416 | — | $ | 742,487,968 | |||||||||
|
|
|
|
|
|
|
|
|
|||||||||
| 1 | See above Schedule of Investments for values in each industry. |
| Level 1 | Level 2 | Level 3 | Total | |||||||||||||
| Derivative Financial Instruments2 |
||||||||||||||||
| Assets: |
||||||||||||||||
| Equity contracts |
$ | 111,576 | — | — | $ | 111,576 | ||||||||||
| 2 | Derivative financial instruments are financial futures contracts, which are valued at the unrealized appreciation/depreciation on the instrument. |
Certain of the Series’ assets and/or liabilities are held at carrying amount, which approximates fair value for financial statement purposes. As of June 30, 2013, such assets and liabilities are categorized within the disclosure hierarchy as follows:
| Level 1 | Level 2 | Level 3 | Total | |||||||||||||
| Assets: |
||||||||||||||||
| Cash |
$ | 638,202 | — | — | $ | 638,202 | ||||||||||
| Cash pledged for financial futures contracts |
886,000 | — | — | 886,000 | ||||||||||||
| Liabilities: |
||||||||||||||||
| Collateral on securities loaned at value |
— | $ | (76,754,416 | ) | — | (76,754,416 | ) | |||||||||
|
|
|
|
|
|
|
|
|
|||||||||
| Total |
$ | 1,524,202 | $ | (76,754,416 | ) | — | $ | (75,230,214 | ) | |||||||
|
|
|
|
|
|
|
|
|
|||||||||
There were no transfers between levels during the six months ended June 30, 2013.
| See Notes to Financial Statements. | ||||
| 74 | QUANTITATIVE MASTER SERIES LLC | JUNE 30, 2013 | ||
Statements of Assets and Liabilities
| Master | Master | |||||||
| International | Small Cap | |||||||
| June 30, 2013 (Unaudited) |
Index Series | Index Series | ||||||
| Assets |
||||||||
| Investments at value — unaffiliated1,2 |
$ | 815,669,615 | $ | 642,350,905 | ||||
| Investments at value — affiliated3 |
4,365,311 | 100,137,063 | ||||||
| Cash |
— | 638,202 | ||||||
| Cash pledged for financial futures contracts |
840,000 | 886,000 | ||||||
| Foreign currency at value4 |
5,547,756 | — | ||||||
| Dividends receivable |
5,320,486 | 845,993 | ||||||
| Investments sold receivable |
38,326 | 58,170,380 | ||||||
| Contributions receivable from investors |
462,432 | — | ||||||
| Variation margin receivable |
185,038 | — | ||||||
| Securities lending income receivable — affiliated |
— | 62,683 | ||||||
| Prepaid expenses |
965 | 814 | ||||||
|
|
|
|
|
|||||
| Total assets |
832,429,929 | 803,092,040 | ||||||
|
|
|
|
|
|||||
| Liabilities |
||||||||
| Collateral on securities loaned at value |
— | 76,754,416 | ||||||
| Investments purchased payable |
— | 57,713,478 | ||||||
| Unrealized depreciation on foreign currency exchange contracts |
12,138 | — | ||||||
| Other affiliates payable |
7,083 | 5,236 | ||||||
| Investment advisory fees payable |
6,827 | 4,368 | ||||||
| Directors’ fees payable |
5,288 | 357 | ||||||
| Variation margin payable |
— | 43,736 | ||||||
| Withdrawals payable to investors |
— | 8,168,415 | ||||||
| Other accrued expenses payable |
61,253 | 151,116 | ||||||
|
|
|
|
|
|||||
| Total liabilities |
92,589 | 142,841,122 | ||||||
|
|
|
|
|
|||||
| Net Assets |
$ | 832,337,340 | $ | 660,250,918 | ||||
|
|
|
|
|
|||||
| Net Assets Consist of |
||||||||
| Investors’ capital |
$ | 671,062,911 | $ | 480,980,215 | ||||
| Net unrealized appreciation/depreciation |
161,274,429 | 179,270,703 | ||||||
|
|
|
|
|
|||||
| Net Assets |
$ | 832,337,340 | $ | 660,250,918 | ||||
|
|
|
|
|
|||||
| 1 Investments at cost — unaffiliated |
$ | 654,241,039 | $ | 463,238,753 | ||||
| 2 Securities loaned at value |
— | $ | 74,337,068 | |||||
| 3 Investments at cost — affiliated |
$ | 4,365,311 | $ | 100,090,088 | ||||
| 4 Foreign currency at cost |
$ | 5,699,287 | — | |||||
| See Notes to Financial Statements. | ||||||
| QUANTITATIVE MASTER SERIES LLC | JUNE 30, 2013 | 75 | ||||
| Master | Master | |||||||
| International | Small Cap | |||||||
| Six Months Ended June 30, 2013 (Unaudited) |
Index Series | Index Series | ||||||
| Investment Income |
||||||||
| Dividends — unaffiliated |
$ | 19,017,063 | $ | 3,967,275 | ||||
| Foreign taxes withheld |
(1,511,921 | ) | (6,078 | ) | ||||
| Securities lending — affiliated — net |
— | 510,502 | ||||||
| Dividends — affiliated |
1,102 | 57,262 | ||||||
|
|
|
|
|
|||||
| Total income |
17,506,244 | 4,528,961 | ||||||
|
|
|
|
|
|||||
| Expenses |
||||||||
| Investment advisory |
41,730 | 32,538 | ||||||
| Accounting services |
73,605 | 60,185 | ||||||
| Custodian |
52,216 | 73,515 | ||||||
| Professional |
29,866 | 31,745 | ||||||
| Directors |
13,738 | 8,642 | ||||||
| Printing |
2,352 | 1,671 | ||||||
| Miscellaneous |
5,146 | 3,681 | ||||||
|
|
|
|
|
|||||
| Total expenses |
218,653 | 211,977 | ||||||
| Less fees waived and/or reimbursed by Manager |
(894 | ) | (7,827 | ) | ||||
|
|
|
|
|
|||||
| Total expenses after fees waived and/or reimbursed |
217,759 | 204,150 | ||||||
|
|
|
|
|
|||||
| Net investment income |
17,288,485 | 4,324,811 | ||||||
|
|
|
|
|
|||||
| Realized and Unrealized Gain (Loss) |
||||||||
| Net realized gain (loss) from: |
||||||||
| Investments — unaffiliated |
(4,442,906 | ) | 21,663,604 | |||||
| Investments — affiliated |
— | (1,010 | ) | |||||
| Financial futures contracts |
636,951 | 3,396,796 | ||||||
| Foreign currency transactions |
(768,351 | ) | (127 | ) | ||||
|
|
|
|
|
|||||
| (4,574,306 | ) | 25,059,263 | ||||||
|
|
|
|
|
|||||
| Net change in unrealized appreciation/depreciation on: |
||||||||
| Investments |
14,038,018 | 65,332,033 | ||||||
| Financial futures contracts |
(161,546 | ) | (306,471 | ) | ||||
| Foreign currency translations |
(300,486 | ) | 5 | |||||
|
|
|
|
|
|||||
| 13,575,986 | 65,025,567 | |||||||
|
|
|
|
|
|||||
| Total realized and unrealized gain |
9,001,680 | 90,084,830 | ||||||
|
|
|
|
|
|||||
| Net Increase in Net Assets Resulting from Operations |
$ | 26,290,165 | $ | 94,409,641 | ||||
|
|
|
|
|
|||||
| See Notes to Financial Statements. | ||||
| 76 | QUANTITATIVE MASTER SERIES LLC | JUNE 30, 2013 | ||
Statements of Changes in Net Assets
| Master International Index Series | Master Small Cap Index Series | |||||||||||||||
| Six Months Ended | Six Months Ended | |||||||||||||||
| June 30, | Year Ended | June 30, | Year Ended | |||||||||||||
| 2013 | December 31, | 2013 | December 31, | |||||||||||||
| Increase (Decrease) in Net Assets: |
(Unaudited) | 2012 | (Unaudited) | 2012 | ||||||||||||
| Operations |
||||||||||||||||
| Net investment income |
$ | 17,288,485 | $ | 22,971,640 | $ | 4,324,811 | $ | 10,865,791 | ||||||||
| Net realized gain (loss) |
(4,574,306 | ) | (61,304,658 | ) | 25,059,263 | 7,464,862 | ||||||||||
| Net change in unrealized appreciation/depreciation |
13,575,986 | 182,573,315 | 65,025,567 | 65,437,618 | ||||||||||||
|
|
|
|
|
|
|
|
|
|||||||||
| Net increase in net assets resulting from operations |
26,290,165 | 144,240,297 | 94,409,641 | 83,768,271 | ||||||||||||
|
|
|
|
|
|
|
|
|
|||||||||
| Capital Transactions |
||||||||||||||||
| Proceeds from contributions |
133,752,779 | 279,030,661 | 107,183,969 | 389,096,894 | ||||||||||||
| Value of withdrawals |
(85,849,233 | ) | (520,908,247 | ) | (123,113,984 | ) | (420,147,450 | ) | ||||||||
|
|
|
|
|
|
|
|
|
|||||||||
| Net increase (decrease) in net assets derived from capital transactions |
47,903,546 | (241,877,586 | ) | (15,930,015 | ) | (31,050,556 | ) | |||||||||
|
|
|
|
|
|
|
|
|
|||||||||
| Net Assets |
||||||||||||||||
| Total increase (decrease) in net assets |
74,193,711 | (97,637,289 | ) | 78,479,626 | 52,717,715 | |||||||||||
| Beginning of period |
758,143,629 | 855,780,918 | 581,771,292 | 529,053,577 | ||||||||||||
|
|
|
|
|
|
|
|
|
|||||||||
| End of period |
$ | 832,337,340 | $ | 758,143,629 | $ | 660,250,918 | $ | 581,771,292 | ||||||||
|
|
|
|
|
|
|
|
|
|||||||||
| See Notes to Financial Statements. | ||||||
| QUANTITATIVE MASTER SERIES LLC | JUNE 30, 2013 | 77 | ||||
| Financial Highlights | Master International Index Series |
| Six Months Ended June 30, 2013 (Unaudited) |
||||||||||||||||||||||||
| Year Ended December 31, | ||||||||||||||||||||||||
| 2012 | 2011 | 2010 | 2009 | 2008 | ||||||||||||||||||||
| Total Investment Return |
||||||||||||||||||||||||
| Total investment return |
3.42 | %1 | 19.01 | % | (12.34 | )% | 7.66 | % | 28.99 | % | (41.94 | )% | ||||||||||||
|
|
|
|
|
|
|
|
|
|
|
|
|
|||||||||||||
| Ratios to Average Net Assets |
||||||||||||||||||||||||
| Total expenses |
0.05 | %2 | 0.06 | % | 0.08 | % | 0.11 | % | 0.09 | % | 0.11 | % | ||||||||||||
|
|
|
|
|
|
|
|
|
|
|
|
|
|||||||||||||
| Total expenses after fees waived and/or reimbursed |
0.05 | %2 | 0.06 | % | 0.08 | % | 0.10 | % | 0.09 | % | 0.10 | % | ||||||||||||
|
|
|
|
|
|
|
|
|
|
|
|
|
|||||||||||||
| Net investment income |
4.15 | %2 | 3.36 | % | 3.38 | % | 2.73 | % | 2.98 | % | 3.54 | % | ||||||||||||
|
|
|
|
|
|
|
|
|
|
|
|
|
|||||||||||||
| Supplemental Data |
||||||||||||||||||||||||
| Net assets, end of period (000) |
$ | 832,337 | $ | 758,144 | $ | 855,781 | $ | 922,700 | $ | 749,280 | $ | 706,119 | ||||||||||||
|
|
|
|
|
|
|
|
|
|
|
|
|
|||||||||||||
| Portfolio turnover |
3 | % | 21 | % | 6 | % | 8 | % | 30 | % | 30 | % | ||||||||||||
|
|
|
|
|
|
|
|
|
|
|
|
|
|||||||||||||
Master Small Cap Index Series
| Six Months Ended June 30, 2013 (Unaudited) |
||||||||||||||||||||||||
| Year Ended December 31, | ||||||||||||||||||||||||
| 2012 | 2011 | 2010 | 2009 | 2008 | ||||||||||||||||||||
| Total Investment Return |
||||||||||||||||||||||||
| Total investment return |
15.99 | %1 | 16.52 | % | (4.30 | )% | 27.19 | % | 27.37 | % | (33.57 | )% | ||||||||||||
|
|
|
|
|
|
|
|
|
|
|
|
|
|||||||||||||
| Ratios to Average Net Assets |
||||||||||||||||||||||||
| Total expenses |
0.07 | %2 | 0.14 | % | 0.09 | % | 0.12 | % | 0.09 | % | 0.08 | % | ||||||||||||
|
|
|
|
|
|
|
|
|
|
|
|
|
|||||||||||||
| Total expenses after fees waived and/or reimbursed and fees paid indirectly |
0.06 | %2 | 0.08 | % | 0.07 | % | 0.08 | % | 0.07 | % | 0.07 | % | ||||||||||||
|
|
|
|
|
|
|
|
|
|
|
|
|
|||||||||||||
| Net investment income |
1.33 | %2 | 2.13 | % | 1.46 | % | 1.27 | % | 1.27 | % | 1.60 | % | ||||||||||||
|
|
|
|
|
|
|
|
|
|
|
|
|
|||||||||||||
| Supplemental Data |
||||||||||||||||||||||||
| Net assets, end of period (000) |
$ | 660,251 | $ | 581,771 | $ | 529,054 | $ | 338,172 | $ | 229,637 | $ | 344,720 | ||||||||||||
|
|
|
|
|
|
|
|
|
|
|
|
|
|||||||||||||
| Portfolio turnover |
18 | % | 68 | % | 31 | % | 42 | % | 43 | % | 42 | % | ||||||||||||
|
|
|
|
|
|
|
|
|
|
|
|
|
|||||||||||||
| 1 | Aggregate total investment return. |
| 2 | Annualized. |
| See Notes to Financial Statements. | ||||
| 78 | QUANTITATIVE MASTER SERIES LLC | JUNE 30, 2013 | ||
| Notes to Financial Statements (Unaudited) | Quantitative Master Series LLC |
| QUANTITATIVE MASTER SERIES LLC | JUNE 30, 2013 | 79 |
| Notes to Financial Statements (continued) | Quantitative Master Series LLC |
| 80 | QUANTITATIVE MASTER SERIES LLC | JUNE 30, 2013 |
| Notes to Financial Statements (continued) | Quantitative Master Series LLC |
| QUANTITATIVE MASTER SERIES LLC | JUNE 30, 2013 | 81 |
| Notes to Financial Statements (continued) | Quantitative Master Series LLC |
| 82 | QUANTITATIVE MASTER SERIES LLC | JUNE 30, 2013 |
| Notes to Financial Statements (continued) | Quantitative Master Series LLC |
| QUANTITATIVE MASTER SERIES LLC | JUNE 30, 2013 | 83 |
| Notes to Financial Statements (continued) | Quantitative Master Series LLC |
| 84 | QUANTITATIVE MASTER SERIES LLC | JUNE 30, 2013 |
| Notes to Financial Statements (concluded) | Quantitative Master Series LLC |
| QUANTITATIVE MASTER SERIES LLC | JUNE 30, 2013 | 85 |
| Disclosure of Investment Advisory Agreement and Sub-Advisory Agreement |
Master International Index Series |
| 86 | QUANTITATIVE MASTER SERIES LLC | JUNE 30, 2013 |
| Disclosure of Investment Advisory Agreement and Sub-Advisory Agreement (continued) |
Master International Index Series |
| QUANTITATIVE MASTER SERIES LLC | JUNE 30, 2013 | 87 |
| Disclosure of Investment Advisory Agreement and Sub-Advisory Agreement (continued) |
Master International Index Series |
| 88 | QUANTITATIVE MASTER SERIES LLC | JUNE 30, 2013 |
| Disclosure of Investment Advisory Agreement and Sub-Advisory Agreement (concluded) |
Master International Index Series |
| QUANTITATIVE MASTER SERIES LLC | JUNE 30, 2013 | 89 |
| Disclosure of Investment Advisory Agreement and Sub-Advisory Agreement |
Master Small Cap Index Series |
| 90 | QUANTITATIVE MASTER SERIES LLC | JUNE 30, 2013 |
| Disclosure of Investment Advisory Agreement and Sub-Advisory Agreement (continued) |
Master Small Cap Index Series |
| QUANTITATIVE MASTER SERIES LLC | JUNE 30, 2013 | 91 |
| Disclosure of Investment Advisory Agreement and Sub-Advisory Agreement (continued) |
Master Small Cap Index Series |
| 92 | QUANTITATIVE MASTER SERIES LLC | JUNE 30, 2013 |
| Disclosure of Investment Advisory Agreement and Sub-Advisory Agreement (concluded) |
Master Small Cap Index Series |
| QUANTITATIVE MASTER SERIES LLC | JUNE 30, 2013 | 93 |
Officers and Directors
| 94 | QUANTITATIVE MASTER SERIES LLC | JUNE 30, 2013 |
This page intentionally left blank.
| QUANTITATIVE MASTER SERIES LLC | JUNE 30, 2013 | 95 |
This page intentionally left blank.
| 96 | QUANTITATIVE MASTER SERIES LLC | JUNE 30, 2013 |
This page intentionally left blank.
| QUANTITATIVE MASTER SERIES LLC | JUNE 30, 2013 | 97 |

eDelivery is NOW AVAILABLE- Stop traditional mail delivery and receive your
shareholder reports and summary prospectus on-line. Sign up at
www.americanbeaconfunds.com
If you invest in the Fund through a financial institution, you may be able to receive the Fund’s regulatory mailings, such as the Prospectus, Annual Report and Semi-Annual Report, by e-mail. If you are interested in this option, please go to www.icsdelivery.com and search for your financial institution’s name or contact your financial institution directly.
To obtain more information about the Fund:

|

| |||
|
By E-mail: american_beacon.funds@ambeacon.com |
On the Internet: Visit our website at www.americanbeaconfunds.com | |||

|

| |||
|
By Telephone: Call (800) 658-5811 |
By Mail: American Beacon Funds P.O. Box 219643 Kansas City, MO 64121 | |||
| Availability of Quarterly Portfolio Schedules
In addition to the Schedule of Investments provided in each semi-annual and
annual |
Availability of Proxy Voting Policy and Records
A description of the policies and procedures that the Funds use to determine
how to | |||
Fund Service Providers:
|
CUSTODIAN State Street Bank and Trust Boston, Massachusetts |
TRANSFER AGENT Boston Financial Data Services Kansas City, Missouri
|
INDEPENDENT REGISTERED PUBLIC ACCOUNTING FIRM Ernst & Young LLP Dallas, Texas |
DISTRIBUTOR Foreside Fund Services, LLC Portland, Maine |
This report is prepared for shareholders of the American Beacon Funds and may be distributed to others only if preceded or accompanied by a current Prospectus or Summary Prospectus.
American Beacon Funds, American Beacon Small Cap Index Fund, and American Beacon International Equity Index Fund are service marks of American Beacon Advisors, Inc.
SAR 6/13
Investing in debt securities entails interest rate risk, which is the risk that debt securities will decrease in value with increases in market interest rates. Credit risk is the risk that the issuer of a bond will fail to make timely payment of interest or principal; and the decline in an issuer’s credit rating can cause the price of its bonds to go down. In a period of sustained deflation, the inflation-indexed securities may not pay any income and may suffer a loss. A security backed by the U.S. Treasury is guaranteed only as to the timely payment of interest and principal when held to maturity. The market prices for such securities are not guaranteed and will fluctuate. They are also subject to credit risk and interest rate risk. Please see the prospectus for a complete discussion of the Fund’s risks. There can be no assurances that the investment objectives of this Fund will be met.
Any opinions herein, including forecasts, reflect our judgment as of the end of the reporting period and are subject to change. Each advisor’s strategies and the Fund’s portfolio composition will change depending on economic and market conditions. This report is not a complete analysis of market conditions and therefore, should not be relied upon as investment advice. Although economic and market information has been compiled from reliable sources, American Beacon Advisors, Inc. makes no representation as to the completeness or accuracy of the statements contained herein.
| American Beacon Funds | June 30, 2013 |

| • | For the six-month period ended June 30, 2013, the American Beacon Treasury Inflation Protected Securities Fund (Institutional Class) returned -5.29%, outperforming the Lipper Treasury Inflation Protected Securities Index by 160 basis points (1.60%). |
American Beacon’s roots as a pension fund manager make us acutely aware of the importance of protecting our shareholders against inflation. Although we are known primarily for our actively managed equity funds, we bring that same level of expertise to a Fund designed more for inflation protection.
Thank you for your continued investment in the American Beacon Funds. For additional information about the Funds or to access your account information, please visit our website at www.americanbeaconfunds.com.
| Best Regards, |

|
| Gene L. Needles, Jr. President American Beacon Funds |
1
American Beacon Treasury Inflation Protected Securities FundSM
June 30, 2013 (Unaudited)
2
American Beacon Treasury Inflation Protected Securities FundSM
Performance Overview
June 30, 2013 (Unaudited)
3
American Beacon Treasury Inflation Protected Securities FundSM
Fund Expenses
June 30, 2013 (Unaudited)
4
American Beacon Treasury Inflation Protected Securities FundSM
June 30, 2013 (Unaudited)
| Par Amount | Fair Value | |||||||
| (000’s) | (000’s) | |||||||
| U.S. TREASURY INFLATION PROTECTED SECURITY OBLIGATIONS - 99.16% |
||||||||
| 1.25%, Due 4/15/2014A |
$ | 1,797 | $ | 1,821 | ||||
| 2.00%, Due 7/15/2014A |
7,586 | 7,831 | ||||||
| 1.625%, Due 1/15/2015A |
14,221 | 14,786 | ||||||
| 0.50%, Due 4/15/2015A |
6,996 | 7,171 | ||||||
| 2.00%, Due 1/15/2016A |
8,043 | 8,638 | ||||||
| 0.125%, Due 4/15/2016A |
23,003 | 23,594 | ||||||
| 2.50%, Due 7/15/2016A |
2,228 | 2,463 | ||||||
| 2.375%, Due 1/15/2017A |
3,073 | 3,406 | ||||||
| 0.125%, Due 4/15/2017A |
24,372 | 25,006 | ||||||
| 0.125%, Due 4/15/2018A |
12,489 | 12,811 | ||||||
| 1.375%, Due 7/15/2018A |
3,284 | 3,586 | ||||||
| 2.125%, Due 1/15/2019A |
11,968 | 13,534 | ||||||
| 1.875%, Due 7/15/2019A |
4,422 | 4,985 | ||||||
| 1.375%, Due 1/15/2020A |
18,340 | 19,982 | ||||||
| 0.625%, Due 7/15/2021A |
24,643 | 25,434 | ||||||
| 0.125%, Due 1/15/2022A |
25,043 | 24,529 | ||||||
| 0.125%, Due 7/15/2022A |
15,021 | 14,682 | ||||||
| 0.125%, Due 1/15/2023A |
7,803 | 7,565 | ||||||
|
|
|
|||||||
| Total U.S. Treasury Obligations (Cost $231,590) |
221,824 | |||||||
|
|
|
|||||||
| Shares | ||||||||
| SHORT-TERM INVESTMENTS - 0.55% (Cost $1,236) |
||||||||
| JPMorgan U.S. Government Money Market Fund, Capital Class |
1,235,612 | 1,236 | ||||||
|
|
|
|||||||
| TOTAL INVESTMENTS - 99.71% (Cost $232,826) |
223,060 | |||||||
| OTHER ASSETS, NET OF LIABILITIES - 0.29% |
646 | |||||||
|
|
|
|||||||
| TOTAL NET ASSETS - 100.00% |
$ | 223,706 | ||||||
|
|
|
|||||||
Percentages are stated as a percent of net assets.
| A | Inflation-Indexed. |
See accompanying notes
5
American Beacon Treasury Inflation Protected Securities FundSM
Statement of Assets and Liabilities
June 30, 2013 (Unaudited) (in thousands, except share and per share amounts)
| Assets: |
||||
| Investments in unaffiliated securities, at fair valueA |
$ | 223,060 | ||
| Dividends and interest receivable |
729 | |||
| Receivable for fund shares sold |
254 | |||
| Receivable for expense reimbursement (Note 2) |
19 | |||
| Prepaid expenses |
73 | |||
|
|
|
|||
| Total assets |
224,135 | |||
|
|
|
|||
| Liabilities: |
||||
| Payable for fund shares redeemed |
301 | |||
| Management and investment advisory fees payable |
44 | |||
| Administrative service and service fees payable |
33 | |||
| Transfer agent fees payable |
10 | |||
| Custody and fund accounting fees payable |
3 | |||
| Professional fees payable |
26 | |||
| Prospectus and shareholder reports fees payable |
10 | |||
| Trustee fees payable |
2 | |||
|
|
|
|||
| Total liabilities |
429 | |||
|
|
|
|||
| Net assets |
$ | 223,706 | ||
|
|
|
|||
| Analysis of Net Assets: |
||||
| Paid-in-capital |
234,011 | |||
| Undistributed net investment income |
(310 | ) | ||
| Accumulated net realized loss |
(229 | ) | ||
| Unrealized depreciation of investments |
(9,766 | ) | ||
|
|
|
|||
| Net assets |
$ | 223,706 | ||
|
|
|
|||
| Shares outstanding at no par value (unlimited shares authorized): |
||||
| Institutional Class |
19,815,180 | |||
|
|
|
|||
| Y Class |
83,546 | |||
|
|
|
|||
| Investor Class |
1,519,579 | |||
|
|
|
|||
| A Class |
79,969 | |||
|
|
|
|||
| C Class |
40,103 | |||
|
|
|
|||
| Net assets (not in thousands): |
||||
| Institutional Class |
$ | 205,939,755 | ||
|
|
|
|||
| Y Class |
$ | 871,947 | ||
|
|
|
|||
| Investor Class |
$ | 15,662,551 | ||
|
|
|
|||
| A Class |
$ | 825,386 | ||
|
|
|
|||
| C Class |
$ | 406,081 | ||
|
|
|
|||
| Net asset value, offering and redemption price per share: |
||||
| Institutional Class |
$ | 10.39 | ||
|
|
|
|||
| Y Class |
$ | 10.44 | ||
|
|
|
|||
| Investor Class |
$ | 10.31 | ||
|
|
|
|||
| A Class (offering price $10.83) |
$ | 10.32 | ||
|
|
|
|||
| C Class |
$ | 10.13 | ||
|
|
|
| A Cost of investments in unaffiliated securities |
$ | 232,826 |
See accompanying notes
6
American Beacon Treasury Inflation Protected Securities FundSM
Statement of Operations
For the Six Months ended June 30, 2013 (Unaudited) (in thousands)
| Investment Income: |
||||
| Interest income |
$ | 56 | ||
|
|
|
|||
| Total investment income |
56 | |||
|
|
|
|||
| Expenses: |
||||
| Management and investment advisory fees (Note 2) |
113 | |||
| Administrative service fees (Note 2): |
||||
| Institutional Class |
151 | |||
| Y Class |
2 | |||
| Investor Class |
27 | |||
| A Class |
2 | |||
| C Class |
1 | |||
| Transfer agent fees: |
||||
| Institutional Class |
20 | |||
| Investor Class |
2 | |||
| Custody and fund accounting fees |
17 | |||
| Professional fees |
24 | |||
| Registration fees and expenses |
40 | |||
| Service fees (Note 2): |
||||
| Investor Class |
22 | |||
| A Class |
1 | |||
| Distribution fees (Note 2): |
||||
| A Class |
1 | |||
| C Class |
2 | |||
| Prospectus and shareholder report expenses |
20 | |||
| Insurance fees |
3 | |||
| Trustee fees |
9 | |||
| Other expenses |
6 | |||
|
|
|
|||
| Total expenses |
463 | |||
|
|
|
|||
| Net fees waived and expenses reimbursed (Note 2) |
(97 | ) | ||
|
|
|
|||
| Net expenses |
366 | |||
|
|
|
|||
| Net investment income |
(310 | ) | ||
|
|
|
|||
| Realized and unrealized gain (loss) on investments: |
||||
| Net realized gain (loss) from: |
||||
| Investments |
38 | |||
| Change in net unrealized appreciation or (depreciation) from: |
||||
| Investments |
(12,384 | ) | ||
|
|
|
|||
| Net loss on investments |
(12,346 | ) | ||
|
|
|
|||
| Net decrease in net assets resulting from operations |
$ | (12,656 | ) | |
|
|
|
See accompanying notes
7
American Beacon Treasury Inflation Protected Securities FundSM
Statement of Changes of Net Assets (in thousands)
| Six Months Ended June 30, 2013 |
Year Ended December 31, 2012 |
|||||||
| (unaudited) | ||||||||
| Increase (Decrease) in Net Assets: |
||||||||
| Operations: |
||||||||
| Net investment income |
$ | (310 | ) | $ | 1,804 | |||
| Net realized gain from investments |
38 | 11,031 | ||||||
| Change in net unrealized depreciation from investments |
(12,384 | ) | (1,096 | ) | ||||
|
|
|
|
|
|||||
| Net increase (decrease) in net assets resulting from operations |
(12,656 | ) | 11,739 | |||||
|
|
|
|
|
|||||
| Distributions to Shareholders: |
||||||||
| Net investment income: |
||||||||
| Institutional Class |
— | (1,723 | ) | |||||
| Y Class |
— | (4 | ) | |||||
| Investor Class |
— | (76 | ) | |||||
| A Class |
— | (1 | ) | |||||
| Net realized gain on investments: |
||||||||
| Institutional Class |
— | (9,136 | ) | |||||
| Y Class |
— | (45 | ) | |||||
| Investor Class |
— | (853 | ) | |||||
| A Class |
— | (35 | ) | |||||
| C Class |
— | (13 | ) | |||||
| Tax Return of Capital: |
||||||||
| Institutional Class |
— | (2,844 | ) | |||||
| Y Class |
— | (15 | ) | |||||
| Investor Class |
— | (274 | ) | |||||
| A Class |
— | (12 | ) | |||||
| C Class |
— | (4 | ) | |||||
|
|
|
|
|
|||||
| Net distributions to shareholders |
— | (15,035 | ) | |||||
|
|
|
|
|
|||||
| Net increase (decrease) in net assets from capital share transactions |
12,551 | (1,299 | ) | |||||
|
|
|
|
|
|||||
| Net (decrease) in net assets |
(105 | ) | (4,595 | ) | ||||
|
|
|
|
|
|||||
| Net Assets: |
||||||||
| Beginning of period |
223,811 | 228,406 | ||||||
|
|
|
|
|
|||||
| End of Period * |
$ | 223,706 | $ | 223,811 | ||||
|
|
|
|
|
|||||
| * Includes undistributed net investment (loss) of |
$ | (310 | ) | $ | — | |||
|
|
|
|
|
|||||
See accompanying notes
8
American Beacon Treasury Inflation Protected Securities FundSM
Notes to Financial Statements
June 30, 2013 (Unaudited)
1. Organization and Significant Accounting Policies
American Beacon Funds (the “Trust”) which is comprised of twenty-four Funds, is organized as a Massachusetts business trust and is registered under the Investment Company Act of 1940, as amended, (the “Act”) as an open-end management investment company. These financial statements and notes to the financial statements relate to the American Beacon Treasury Inflation Protected Securities Fund (the “Fund”), a series of the Trust.
American Beacon Advisors, Inc. (the “Manager”) is a wholly-owned subsidiary of Lighthouse Holdings, Inc. and was organized in 1986 to provide business management, advisory, administrative and asset management consulting services to the Trust and other investors.
Class Disclosure
The Fund has multiple classes of shares designed to meet the needs of different groups of investors. The following table sets forth the differences amongst the classes:
| Class: |
Offered to: | |
| Institutional Class | Investors making an initial investment of $250,000 | |
| Y Class | Investors making an initial investment of $100,000 | |
| Investor Class | General public and investors investing through an intermediary | |
| A Class | General public and investors investing through an intermediary with applicable sales charges | |
| C Class | General public and investors investing through an intermediary with applicable sales charges |
Each class offered by the Trust has equal rights as to assets and voting privileges. Income and non-class specific expenses are allocated daily to each class on the basis of the relative net assets. Realized and unrealized capital gains and losses of each class are allocated daily based on the relative net assets of each class of the respective Fund. Class specific expenses, where applicable, currently include administrative service fees, service fees, and distribution fees and vary amongst the classes as described more fully in Note 2.
2. Transactions with Affiliates
Management Agreement
The Trust and the Manager are parties to a Management Agreement that obligates the Manager to provide or oversee the provision of all investment advisory and portfolio management services. Investment assets of the Fund may be managed by multiple investment advisors which have entered into separate investment advisory agreements with the Manager. As compensation for performing the duties required under the Management Agreement, the Manager receives from the Fund an annualized fee equal to 0.05% of the average daily net assets plus amounts paid by the Manager to the investment advisors hired by the Manager to direct investment activities of the Fund. Management fees paid during the six months ended June 30, 2013 were as follows:
| Management Fee Rate |
Management Fee | Amounts paid to Investment Sub-Advisors |
Net Amount Retained by Manager | |||
| 0.10% | $113,455 | $58,096 | $55,359 |
Administrative Services Agreement
The Manager and the Trust entered into an Administrative Services Agreement which obligates the Manager to provide or oversee administrative services to the Fund. As compensation for performing the duties required under the Administrative Services Agreement, the Manager receives an annualized fee of 0.15% of the
9
American Beacon Treasury Inflation Protected Securities FundSM
Notes to Financial Statements
June 30, 2013 (Unaudited)
average daily net assets of the Institutional Class, 0.30% of the average daily net assets of the Y and Investor Classes and 0.40% of the average daily net assets of the A and C Classes of the Fund.
Distribution Plans
The Trust, except for the A Class of the Fund, has adopted a “defensive” Distribution Plan (the “Plan”) in accordance with Rule 12b-1 under the Act, pursuant to which no separate fees will be charged to the Fund for distribution purposes. However, the Plan authorizes the management and administrative service fees received by the Manager and the investment advisors hired by the Manager to be used for distribution purposes. Under this Plan, the Trust does not intend to compensate the Manager or any other party, either directly or indirectly, for the distribution of Trust shares.
A separate Distribution Plan (the “Distribution Plan”) has been adopted pursuant to Rule 12b-1 under the Act for the A and C Classes of the Fund. Under the Distribution Plan, as compensation for distribution assistance, the Manager receives an annual fee of 0.25% of the average daily net assets of the A Class and 1.00% of the average daily net assets of the C Classes of the Fund. The fee will be payable without regard to whether the amount of the fee is more or less than the actual expenses incurred in a particular month by the Manager for distribution assistance.
Services Plan
The Manager and the Trust entered into a Service Plan which obligates the Manager to oversee additional shareholder servicing of the Y, Investor, A, and C Classes of the Fund. As compensation for performing the duties required under the Service Plan, the Manager receives an annualized fee of 0.10% of the average daily net assets of the Y Class, 0.15% of the average daily net assets of the A and C Classes, and up to 0.375% of the average daily net assets of the Investor Class of the Fund. Service fees for the Y and C Classes for the six months ended June 30, 2013 were less than $500.
Interfund Lending Program
Pursuant to an exemptive order by the Securities and Exchange Commission (“SEC”), the Funds, along with other registered investment companies having management contracts with the Manager, may participate in an interfund lending program. This program provides an alternative credit facility allowing the Funds to borrow from other participating Funds. For the six months ended June 30, 2013, the Fund did not utilize the credit facility.
Expense Reimbursement Plan
The Manager contractually agreed to reimburse a portion of its Administrative Service fee for the Institutional Class and other expenses of the Y, Investor, A, and C Classes. Of these amounts $18,619 was receivable from the Manager at June 30, 2013. For the six months ended June 30, 2013, the Manager reimbursed expenses as follows:
| Expense Cap and Limits | ||||||||||||||||
| Class |
4/27/12 to 5/1/13 |
5/2/13 to 4/30/14 |
Waived or Reimbursed Expenses |
Expiration | ||||||||||||
| Institutional |
0.10 | %* | 0.10 | %* | $ | 89,425 | 2016 | |||||||||
| Y |
0.61 | % | 0.61 | % | 17 | 2016 | ||||||||||
| Investor |
0.69 | % | 0.69 | % | 7,772 | 2016 | ||||||||||
| A |
1.00 | % | 1.00 | % | 151 | 2016 | ||||||||||
| C |
1.78 | % | 1.78 | % | 8 | 2016 | ||||||||||
| * | Expense reduction. |
10
American Beacon Treasury Inflation Protected Securities FundSM
Notes to Financial Statements
June 30, 2013 (Unaudited)
The Fund has adopted an Expense Reimbursement Plan whereby the Manager may seek repayment of fees waived or expenses reimbursed for a period of up to three years. However, reimbursement will occur only if the Class’s average net assets have grown or expenses have declined sufficiently to allow reimbursement without causing its expense ratio to exceed the previously agreed upon contractual expense limit. The carryover of excess expenses potentially reimbursable to the Manager, but not recorded as a liability is $195,591, $238,084 and $246,503 will expire in 2013, 2014, and 2015 respectively. The Fund has not recorded a liability for these potential reimbursements, due to the current assessment that reimbursements are unlikely.
Sales Commissions
The Fund’s distributor, Foreside Fund Services, LLC (“Foreside”) may receive a portion of A Class sales charges from broker dealers and it may be used to offset distribution related expenses. For the six months ended June 30, 2013, Foreside collected $2,560 from the sale of Class A Shares.
A contingent deferred sales charge (“CDSC”) of 1.00% will be deducted with respect to Class C Shares redeemed within 12 months of purchase, unless waived as discussed in the Prospectus. Any applicable CDSC will be 1.00% of the lesser of the original purchase price or the value of the redemption of the Class C Shares redeemed. For the period ended June 30, 2013, CDSC fees were not collected for the Treasury Inflation Protected Securities Fund.
3. Security Valuation and Fair Value Measurements
Investments are valued at the close of the New York Stock Exchange (the “Exchange”), normally 4 p.m. ET, each day that the Exchange is open for business.
Debt securities (other than short-term securities) normally are valued on the basis of prices provided by an independent pricing service and may take into account appropriate factors such as institution-size trading in similar groups of securities, yield, quality, coupon rate, maturity, type of issue, trading characteristics and other market data. The prices of debt securities may be determined using quotes obtained from brokers.
Investments in open-end mutual funds are valued at the closing net asset value (“NAV”) per share of the mutual fund on the day of valuation. Investment grade short-term obligations with 60 days or less to maturity are valued using the amortized cost method, which approximates fair value.
Securities for which market prices are not readily available or are not reflective of the fair value of the security, as determined by the Manager, will be priced at fair value following procedures approved by the Board of Trustees (the “Board”).
Valuation Inputs
Various inputs may be used to determine the value of the Fund’s investments. These inputs are summarized in three broad levels for financial statement purposes. The inputs or methodologies used to value securities are not necessarily an indication of the risk associated with investing in those securities.
| Level 1 – |
Quoted prices in active markets for identical securities. | |||
| Level 2 – |
Prices determined using other significant observable inputs. These may include quoted prices for similar securities, interest rates, prepayment speeds, credit risk, and others. Level 2 securities are fixed-income securities that are valued using observable inputs as stated above. | |||
| Level 3 – |
Prices determined using other significant unobservable inputs. Unobservable inputs reflect the Fund’s own assumptions about the factors market participants would use in pricing an investment, and would be based on the best information available. | |||
11
American Beacon Treasury Inflation Protected Securities FundSM
Notes to Financial Statements
June 30, 2013 (Unaudited)
Level 1 and Level 2 trading assets and trading liabilities, at fair value
Fixed income securities including corporate, U.S. government agencies, and U.S. treasury obligations, are normally valued by pricing service providers that use broker dealer quotations, reported trades or valuation estimates from their internal pricing models. The service providers’ internal models use inputs that are observable such as issuer details, interest rates, yield curves, prepayment speeds, credit risks/spreads, default rates, and quoted prices for similar assets. Securities that use similar valuation techniques and inputs as described above are categorized as Level 2 of the fair value hierarchy.
Fixed income securities purchased on a delayed-delivery basis are marked to market daily until settlement at the forward settlement date are categorized as Level 2 of the fair value hierarchy.
Investments in registered open-end investment management companies will be valued based upon the NAVs of such investments and are categorized as Level 1 of the fair value hierarchy. Short-term investments having a maturity of 60 days or less are generally valued at amortized cost which approximates fair value. These investments are categorized as Level 2 of the fair value hierarchy.
The Fund’s investments are summarized by level based on the inputs used to determine their values. U.S. Generally Accepted Accounting Principles (“U.S. GAAP”) also requires all significant transfers between any levels to be disclosed. During the six months ended June 30, 2013, there were no transfers between levels. As of June 30, 2013, the investments were classified as described below (in thousands):
| Level 1 | Level 2 | Level 3 | Total | |||||||||||||
| U.S. Treasury Inflation Protection Security Obligations |
$ | — | $ | 221,824 | $ | — | $ | 221,824 | ||||||||
| Short-Term Investments – Money Markets |
1,236 | — | — | 1,236 | ||||||||||||
|
|
|
|
|
|
|
|
|
|||||||||
| Total Investments |
$ | 1,236 | $ | 221,824 | $ | — | $ | 223,060 | ||||||||
|
|
|
|
|
|
|
|
|
|||||||||
Security Transactions and Investment Income
Security transactions are recorded on the trade date of the security purchase or sale. The Fund may purchase securities with delivery or payment to occur at a later date. At the time the Fund enters into a commitment to purchase a security, the transaction is recorded, and the value of the security is reflected in the NAV. The value of the security may vary with market fluctuations.
Dividend income is recorded on the ex-dividend date. Interest income is earned from settlement date, recorded on the accrual basis, and adjusted, if necessary, for accretion of discounts and amortization of premiums. For financial and tax reporting purposes, realized gains and losses are determined on the basis of specific lot identification.
Dividends to Shareholders
Dividends from net investment income of the Fund normally will be declared and paid at least semi-annually. Distributions, if any, of net realized capital gains are generally paid at least annually and recorded on the ex-dividend date.
Allocation of Income, Expenses, Gains, and Losses
Income, expenses (other than those attributable to a specific class), gains, and losses are allocated daily to each class of shares based up on the relative proportion of net assets represented by such class. Operating expenses directly attributable to a specific class are charged against the operations of that class.
12
American Beacon Treasury Inflation Protected Securities FundSM
Notes to Financial Statements
June 30, 2013 (Unaudited)
Use of Estimates
The preparation of financial statements in conformity with U.S. GAAP requires management to make estimates and assumptions that affect the amounts reported in the financial statements and accompanying notes. Actual results may differ from those estimated.
Other
Under the Trust’s organizational documents, its officers and directors are indemnified against certain liability arising out of the performance of their duties to the Trust. In the normal course of business, the Trust enters into contracts that provide indemnification to the other party or parties against potential costs or liabilities. The Trust’s maximum exposure under these arrangements is dependent on claims that may be made in the future and, therefore, cannot be estimated. The Trust has had no prior claims or losses pursuant to any such agreement.
4. Securities and Other Investments
Treasury Inflation Protected Securities
Inflation-indexed bonds are fixed-income securities whose principal value is periodically adjusted to the rate of inflation. Interest is accrued based on the principal value, which is adjusted for inflation. Any increase in the principal amount of an inflation-indexed bond is recorded as interest income, even though principal is not received until maturity.
Other Investment Company Securities and Other Exchange Traded Products
The Funds may invest in shares of other investment companies, including open-end funds, closed-end funds, business development companies, ETFs, exchange-traded notes (“ETNs”), unit investment trusts, and other investment companies of the Trust. The Funds may invest in investment company securities advised by the Manager or a sub-advisor. Investments in the securities of other investment companies may involve duplication of advisory fees and certain other expenses. By investing in another investment company, a Fund becomes a shareholder of that investment company. As a result, Fund shareholders indirectly will bear a Fund’s proportionate share of the fees and expenses paid by shareholders of the other investment company, in addition to the fees and expenses Fund shareholders directly bear in connection with the Fund’s own operations. These other fees and expenses are reflected as Acquired Fund Fees and Expenses and are included in the Fees and Expenses Table for the Fund in its Prospectus, if applicable. Investments in other investment companies may involve the payment of substantial premiums above the value of such issuer’s portfolio securities.
5. Federal Income and Excise Taxes
It is the policy of the Fund to qualify as a regulated investment company (“RIC”), by complying with all applicable provisions of Subchapter M of the Internal Revenue Code, as amended, and to make distribution of taxable income sufficient to relieve it from substantially all federal income and excise taxes. For federal income tax purposes, the Fund is treated as a single entity for the purpose of determining such qualification.
The Fund does not have any unrecognized tax benefits in the accompanying financial statements. Each of the tax years in the four year period ended December 31, 2012 remains subject to examination by the Internal Revenue Service. If applicable, the Fund recognizes interest accrued related to unrecognized tax benefits in interest expense and penalties in “Other expense” on the Statement of Operations.
13
American Beacon Treasury Inflation Protected Securities FundSM
Notes to Financial Statements
June 30, 2013 (Unaudited)
Dividends are categorized in accordance with income tax regulations which may treat certain transactions differently than U.S. GAAP. Accordingly, the character of distributions and composition of net assets for tax purposes may differ from those reflected in the accompanying financial statements.
The tax character of distributions paid were as follows (in thousands):
| Six Months Ended June 30, 2013 |
Year Ended December 31, 2012 |
|||||||
| (unaudited) | ||||||||
| Distributions paid from: |
||||||||
| Ordinary income:* |
||||||||
| Institutional Class |
$ | — | $ | 1,723 | ||||
| Y Class |
— | 4 | ||||||
| Investor Class |
— | 76 | ||||||
| A Class |
— | 1 | ||||||
| C Class |
— | — | ||||||
| Long-Term Capital Gain: |
||||||||
| Institutional Class |
— | 9,136 | ||||||
| Y Class |
— | 45 | ||||||
| Investor Class |
— | 853 | ||||||
| A Class |
— | 35 | ||||||
| C Class |
— | 13 | ||||||
| Tax return of capital: |
||||||||
| Institutional Class |
— | 2,844 | ||||||
| Y Class |
— | 15 | ||||||
| Investor Class |
— | 274 | ||||||
| A Class |
— | 12 | ||||||
| C Class |
— | 4 | ||||||
|
|
|
|
|
|||||
| Total distributions paid |
$ | — | $ | 15,035 | ||||
|
|
|
|
|
|||||
| * | For tax purposes, short-term capital gains distributions are considered ordinary income distributions. |
As of June 30, 2013, the components of distributable earnings or (deficits) on a tax basis were as follows (in thousands):
| Cost basis of investments for federal income tax purposes |
$ | 233,669 | ||
| Unrealized appreciation |
6 | |||
| Unrealized depreciation |
(10,615 | ) | ||
|
|
|
|||
| Net unrealized appreciation or (depreciation) |
(10,609 | ) | ||
| Undistributed ordinary income |
(310 | ) | ||
| Undistributed long-term gain or (loss) |
614 | |||
| Other temporary differences |
— | |||
|
|
|
|||
| Distributable earnings or (deficits) |
$ | (10,305 | ) | |
|
|
|
Financial reporting records are adjusted for permanent book/tax differences to reflect tax character. Financial records are not adjusted for temporary differences. The temporary differences between financial reporting and tax-basis reporting of unrealized appreciation or (depreciation) are attributable primarily to the tax deferral of losses from wash sales.
On December 22, 2010, the Regulated Investment Company Modernization Act of 2010 (the “RIC MOD”) was enacted, which changed various technical rules governing the tax treatment of RICs. The changes are generally effective for taxable years beginning after the date of enactment. One of the more prominent changes addresses capital loss carryforwards. Under RIC MOD, each Fund will be permitted to carry forward capital losses incurred in taxable years beginning after the date of enactment for an unlimited period. However, any losses incurred during those future taxable years will be required to be utilized prior to the losses incurred in pre-enactment taxable years, which carry an expiration date. As a result of this ordering rule, pre-enactment capital loss carryforwards may be more likely to expire unused. Additionally, post-
14
American Beacon Treasury Inflation Protected Securities FundSM
Notes to Financial Statements
June 30, 2013 (Unaudited)
enactment capital loss carryforwards will retain their character as either short-term or long-term capital losses rather than being considered all short-term as permitted under previous regulation.
Finally, the Act contains several provisions aimed at preserving the character of distributions made by a fiscal year RIC during the portion of its taxable year ending after October 31 or December 31, reducing the circumstances under which a RIC might be required to file amended Forms 1099 to restate previously reported distributions. Except for the simplification provisions related to RIC qualification, the Act is effective for taxable years beginning after December 22, 2010. The provisions related to RIC qualification are effective for taxable years for which the extended due date of the tax return is after December 22, 2010.
As of June 30, 2013, the Fund did not have capital loss carryforward positions.
6. Investment Transactions
Purchases and proceeds from sales of investments for the six months ended June 30, 2013, excluding short-term investments, were $310,311,929 and $300,223,208, respectively. These amounts also represent purchases and sales of U.S. Government securities.
7. Capital Share Transactions
The tables below summarize the activity in capital shares (dollars and shares in thousands):
For the Six Months Ended June 30, 2013
| Institutional Class | Y Class | Investor Class | ||||||||||||||||||||||
| Shares | Amount | Shares | Amount | Shares | Amount | |||||||||||||||||||
| Shares sold |
5,928 | $ | 64,738 | 30 | $ | 336 | 206 | $ | 2,212 | |||||||||||||||
| Reinvestment of dividends |
— | — | — | — | — | — | ||||||||||||||||||
| Shares redeemed |
(4,548 | ) | (49,507 | ) | (42 | ) | (455 | ) | (469 | ) | (5,030 | ) | ||||||||||||
|
|
|
|
|
|
|
|
|
|
|
|
|
|||||||||||||
| Net increase (decrease) in shares outstanding |
1,380 | $ | 15,231 | (12 | ) | $ | (119 | ) | (263 | ) | $ | (2,818 | ) | |||||||||||
|
|
|
|
|
|
|
|
|
|
|
|
|
|||||||||||||
| A Class | C Class | |||||||||||||||
| Shares | Amount | Shares | Amount | |||||||||||||
| Shares sold |
30 | $ | 328 | 12 | $ | 132 | ||||||||||
| Reinvestment of dividends |
— | — | — | — | ||||||||||||
| Shares redeemed |
(18 | ) | (196 | ) | — | (7 | ) | |||||||||
|
|
|
|
|
|
|
|
|
|||||||||
| Net increase in shares outstanding |
12 | $ | 132 | 12 | $ | 125 | ||||||||||
|
|
|
|
|
|
|
|
|
|||||||||
15
American Beacon Treasury Inflation Protected Securities FundSM
Notes to Financial Statements
June 30, 2013 (Unaudited)
For the Year Ended December 31, 2012
| Institutional Class | Y Class | Investor Class | ||||||||||||||||||||||
| Shares | Amount | Shares | Amount | Shares | Amount | |||||||||||||||||||
| Shares sold |
21,592 | $ | 247,304 | 53 | $ | 609 | 729 | $ | 8,264 | |||||||||||||||
| Reinvestment of dividends |
1,136 | 12,544 | 6 | 64 | 102 | 1,113 | ||||||||||||||||||
| Shares redeemed |
(22,834 | ) | (261,530 | ) | (8 | ) | (97 | ) | (840 | ) | (9,525 | ) | ||||||||||||
|
|
|
|
|
|
|
|
|
|
|
|
|
|||||||||||||
| Net increase (decrease) in shares outstanding |
(106 | ) | $ | (1,682 | ) | 51 | $ | 576 | (9 | ) | $ | (148 | ) | |||||||||||
|
|
|
|
|
|
|
|
|
|
|
|
|
|||||||||||||
| A Class | C Class | |||||||||||||||
| Shares | Amount | Shares | Amount | |||||||||||||
| Shares sold |
28 | $ | 326 | 3 | $ | 32 | ||||||||||
| Reinvestment of dividends |
3 | 32 | 1 | 17 | ||||||||||||
| Shares redeemed |
(40 | ) | (452 | ) | — | — | ||||||||||
|
|
|
|
|
|
|
|
|
|||||||||
| Net increase (decrease) in shares outstanding |
(9 | ) | $ | (94 | ) | 4 | $ | 49 | ||||||||
|
|
|
|
|
|
|
|
|
|||||||||
16
This page intentionally left blank.
17
American Beacon Treasury Inflation Protected Securities FundSM
(For a share outstanding throughout the period)
| Institutional Class | Y Class | |||||||||||||||||||||||||||||||
| Six | Six | |||||||||||||||||||||||||||||||
| Months | Months | |||||||||||||||||||||||||||||||
| Ended | Ended | Year Ended | ||||||||||||||||||||||||||||||
| June 30, | Year Ended December 31, | June 30, | Dec. 31, | |||||||||||||||||||||||||||||
| 2013 | 2012 | 2011 | 2010 | 2009A | 2008 | 2013 | 2012 | |||||||||||||||||||||||||
| (unaudited) | (unaudited) | |||||||||||||||||||||||||||||||
| Net asset value, beginning of period |
$ | 10 .97 | $ | 11.16 | $ | 10.51 | $ | 10.16 | $ | 9.20 | $ | 10.18 | $ | 11.03 | $ | 11.24 | ||||||||||||||||
|
|
|
|
|
|
|
|
|
|
|
|
|
|
|
|
|
|||||||||||||||||
| Income from investment operations: |
||||||||||||||||||||||||||||||||
| Net investment income (loss) |
(0 .01 | ) | 0.04 | 0.28 | 0.16 | 0.06 | 0.80 | (0.04 | ) | 0.09 | ||||||||||||||||||||||
| Net gains (losses) from investments (both realized and unrealized) |
(0 .57 | ) | 0.49 | 0.67 | 0.35 | 0.95 | (0.98 | ) | (0.55 | ) | 0.41 | |||||||||||||||||||||
|
|
|
|
|
|
|
|
|
|
|
|
|
|
|
|
|
|||||||||||||||||
| Total income (loss) from investment operations |
(0 .58 | ) | 0.53 | 0.95 | 0.51 | 1.01 | (0.18 | ) | (0.59 | ) | 0.50 | |||||||||||||||||||||
|
|
|
|
|
|
|
|
|
|
|
|
|
|
|
|
|
|||||||||||||||||
| Less distributions: |
||||||||||||||||||||||||||||||||
| Dividends from net investment income |
— | (0.07 | ) | (0.29 | ) | (0.16 | ) | (0.05 | ) | (0.80 | ) | — | (0.06 | ) | ||||||||||||||||||
| Distributions from net realized gains on securities |
— | (0.49 | ) | — | — | — | — | — | (0.49 | ) | ||||||||||||||||||||||
| Tax return of capital |
— | (0 .16 | )B | (0 .01 | )B | — | — | — | — | (0.16 | )B | |||||||||||||||||||||
|
|
|
|
|
|
|
|
|
|
|
|
|
|
|
|
|
|||||||||||||||||
| Total distributions |
— | (0.72 | ) | (0.30 | ) | (0.16 | ) | (0.05 | ) | (0.80 | ) | — | (0.71 | ) | ||||||||||||||||||
|
|
|
|
|
|
|
|
|
|
|
|
|
|
|
|
|
|||||||||||||||||
| Net asset value, end of period |
$ | 10 .39 | $ | 10.97 | $ | 11.16 | $ | 10.51 | $ | 10.16 | $ | 9.20 | $ | 10.44 | $ | 11.03 | ||||||||||||||||
|
|
|
|
|
|
|
|
|
|
|
|
|
|
|
|
|
|||||||||||||||||
| Total return C |
(5.29 | )%D | 4.80 | % | 9.14 | % | 5.03 | % | 11.00 | % | (2.09 | )% | (5.35 | )%D | 4.42 | % | ||||||||||||||||
|
|
|
|
|
|
|
|
|
|
|
|
|
|
|
|
|
|||||||||||||||||
| Ratios and supplemental data: |
||||||||||||||||||||||||||||||||
| Net assets, end of period (in thousands) |
$ | 205,940 | $ | 202,274 | $ | 206,864 | $ | 157,195 | $ | 155,833 | $ | 140,189 | $ | 872 | $ | 1,051 | ||||||||||||||||
| Ratios to average net assets (annualized): |
||||||||||||||||||||||||||||||||
| Expenses, before reimbursements |
0 .38 | %E | 0.37 | % | 0.36 | % | 0.35 | % | 0.36 | % | 0.29 | % | 0.61 | %E | 0.62 | % | ||||||||||||||||
| Expenses, net of reimbursements |
0 .29 | %E | 0.27 | % | 0.26 | % | 0.25 | % | 0.26 | % | 0.25 | % | 0.61 | %E | 0.61 | % | ||||||||||||||||
| Net investment income (loss), before reimbursements |
(0.31 | )%E | 0.64 | % | 2.24 | % | 1.40 | % | 0.59 | % | 5.15 | % | (0.68 | )%E | 0.81 | % | ||||||||||||||||
| Net investment income (loss), net of reimbursements |
(0.22 | )%E | 0.74 | % | 2.34 | % | 1.50 | % | 0.69 | % | 5.19 | % | (0.67 | )%E | 0.82 | % | ||||||||||||||||
| Portfolio turnover rate |
136 | %D | 286 | % | 381 | % | 214 | % | 180 | % | 128 | % | 136 | %D | 286 | % | ||||||||||||||||
| A | Standish Mellon Asset Management Company, LLC was added as an investment advisor on December 11, 2009. |
| B | The tax return of capital is calculated based on outstanding shares at the time of distribution. |
| C | Based on net asset value, which does not reflect the sales charge, redemption fee, or contingent deferred sales charge, if applicable. May include adjustments in accordance with accounting principles generally accepted in the United States of America and as such, the net asset value for reporting purposes and the returns based upon those net asset values may differ from the net asset value and returns for shareholder transactions. |
| D | Not annualized. |
| E | Annualized. |
| F | Portfolio turnover rate is for the period from January 1 through December 31, 2010. |
| G | Portfolio turnover rate is for the period from January 1 through December 31, 2009. |
18
American Beacon Treasury Inflation Protected Securities FundSM
Financial Highlights
(For a share outstanding throughout the period)
| Investor Class | A Class | |||||||||||||||||||||||||||||||||||||||||||
| Six | Six | |||||||||||||||||||||||||||||||||||||||||||
| Mar. 1 | Months | Mar. 2 | Months | May 17 | ||||||||||||||||||||||||||||||||||||||||
| to | Ended | to | Ended | Year Ended | to | |||||||||||||||||||||||||||||||||||||||
| Dec. 31, | June 30, | Year Ended December 31, | Dec. 31, | June 30, | December 31, | Dec. 31, | ||||||||||||||||||||||||||||||||||||||
| 2011 | 2010 | 2013 | 2012 | 2011 | 2010 | 2009A | 2013 | 2012 | 2011 | 2010 | ||||||||||||||||||||||||||||||||||
| (unaudited) | (unaudited) | |||||||||||||||||||||||||||||||||||||||||||
| $ | 10.60 | $ | 10.25 | $ | 10 .90 | $ | 11.12 | $ | 10.48 | $ | 10.13 | $ | 9 .25 | $ | 10.93 | $ | 11.15 | $ | 10.54 | $ | 10.35 | |||||||||||||||||||||||
|
|
|
|
|
|
|
|
|
|
|
|
|
|
|
|
|
|
|
|
|
|
|
|||||||||||||||||||||||
| 0.26 | 0.05 | (0.05 | ) | 0.06 | 0.24 | 0.06 | 0.14 | (0.02 | ) | 0.00 | 0.10 | 0 .04 | ||||||||||||||||||||||||||||||||
| 0.65 | 0.35 | (0.54 | ) | 0.42 | 0.66 | 0.41 | 0.79 | (0.59 | ) | 0.45 | 0.76 | 0 .19 | ||||||||||||||||||||||||||||||||
|
|
|
|
|
|
|
|
|
|
|
|
|
|
|
|
|
|
|
|
|
|
|
|||||||||||||||||||||||
| 0.91 | 0.40 | (0.59 | ) | 0.48 | 0.90 | 0.47 | 0.93 | (0.61 | ) | 0.45 | 0.86 | 0 .23 | ||||||||||||||||||||||||||||||||
|
|
|
|
|
|
|
|
|
|
|
|
|
|
|
|
|
|
|
|
|
|
|
|||||||||||||||||||||||
| (0.26 | ) | (0 .05 | ) | — | (0.05 | ) | (0.25 | ) | (0.12 | ) | (0.05 | ) | — | (0.02 | ) | (0.24 | ) | (0 .04 | ) | |||||||||||||||||||||||||
| — | — | — | (0.49 | ) | — | — | — | — | (0.49 | ) | — | — | ||||||||||||||||||||||||||||||||
| (0.01 | )B | — | — | (0 .16 | )B | (0 .01 | )B | — | — | — | (0.16 | )B | (0.01 | )B | — | |||||||||||||||||||||||||||||
|
|
|
|
|
|
|
|
|
|
|
|
|
|
|
|
|
|
|
|
|
|
|
|||||||||||||||||||||||
| (0.27 | ) | (0 .05 | ) | — | (0.70 | ) | (0.26 | ) | (0.12 | ) | (0.05 | ) | — | (0.67 | ) | (0.25 | ) | (0.04 | ) | |||||||||||||||||||||||||
|
|
|
|
|
|
|
|
|
|
|
|
|
|
|
|
|
|
|
|
|
|
|
|||||||||||||||||||||||
| $ | 11.24 | $ | 10.60 | $ | 10 .31 | $ | 10.90 | $ | 11.12 | $ | 10.48 | $ | 10.13 | $ | 10.32 | $ | 10.93 | $ | 11.15 | $ | 10.54 | |||||||||||||||||||||||
|
|
|
|
|
|
|
|
|
|
|
|
|
|
|
|
|
|
|
|
|
|
|
|||||||||||||||||||||||
| 8.66 | % | 3.89 | %D | (5.41 | )%D | 4.32 | % | 8.67 | % | 4.62 | % | 10.05 | %D | (5.58 | )%D | 4.07 | % | 8.17 | % | 2.23 | %D | |||||||||||||||||||||||
|
|
|
|
|
|
|
|
|
|
|
|
|
|
|
|
|
|
|
|
|
|
|
|||||||||||||||||||||||
| $ | 501 | $ | 365 | $ | 15,663 | $ | 19,438 | $ | 19,920 | $ | 15,262 | $ | 5,868 | $ | 825 | $ | 741 | $ | 855 | $ | 155 | |||||||||||||||||||||||
| 1.04 | % | 0.60 | %E | 0 .78 | %E | 0.77 | % | 0.77 | % | 0.75 | % | 0.81 | %E | 1.04 | %E | 1.07 | % | 1.32 | % | 0.99 | %E | |||||||||||||||||||||||
| 0.63 | % | 0.60 | %E | 0 .69 | %E | 0.69 | % | 0.68 | % | 0.64 | % | 0.65 | %E | 1.00 | %E | 1.01 | % | 1.03 | % | 0.99 | %E | |||||||||||||||||||||||
| 1.80 | % | 0.85 | %E | (0.93 | )%E | 0.44 | % | 2.24 | % | 1.06 | % | 3.04 | %E | (0.89 | )%E | 0.07 | % | 0.88 | % | 0.55 | %E | |||||||||||||||||||||||
| 2.21 | % | 0.85 | %E | (0.84 | )%E | 0.53 | % | 2.32 | % | 1.17 | % | 3.20 | %E | (0.85 | )%E | 0.13 | % | 1.17 | % | 0.55 | %E | |||||||||||||||||||||||
| 381 | % | 214 | %F | 136 | %D | 286 | % | 381 | % | 214 | % | 180 | %G | 136 | %D | 286 | % | 381 | % | 214 | %F | |||||||||||||||||||||||
19
American Beacon Treasury Inflation Protected Securities FundSM
Financial Highlights
(For a share outstanding throughout the period)
| C Class | ||||||||||||||||
| Six | ||||||||||||||||
| Months | Sept. 1 | |||||||||||||||
| Ended | Year Ended | to | ||||||||||||||
| June 30, | December 31, | Dec. 31, | ||||||||||||||
| 2013 | 2012 | 2011 | 2010 | |||||||||||||
| (unaudited) | ||||||||||||||||
| Net asset value, beginning of period |
$ | 10.77 | $ | 11.06 | $ | 10.46 | $ | 10.38 | ||||||||
|
|
|
|
|
|
|
|
|
|||||||||
| Income from investment operations: |
||||||||||||||||
| Net investment income (loss) |
(0 .06 | ) | (0.05 | ) | 0.13 | 0 .00 | ||||||||||
| Net gains (losses) from investments (both realized and unrealized) |
(0 .58 | ) | 0.41 | 0.65 | 0 .08 | |||||||||||
|
|
|
|
|
|
|
|
|
|||||||||
| Total income (loss) from investment operations |
(0 .64 | ) | 0.36 | 0.78 | 0 .08 | |||||||||||
|
|
|
|
|
|
|
|
|
|||||||||
| Less distributions: |
||||||||||||||||
| Dividends from net investment income |
— | — | (0.17 | ) | — | |||||||||||
| Distributions from net realized gains on securities |
— | (0.49 | ) | — | — | |||||||||||
| Tax return of capital |
— | (0.16 | )B | (0.01 | )B | — | ||||||||||
|
|
|
|
|
|
|
|
|
|||||||||
| Total distributions |
— | (0.65 | ) | (0.18 | ) | — | ||||||||||
|
|
|
|
|
|
|
|
|
|||||||||
| Net asset value, end of period |
$ | 10.13 | $ | 10.77 | $ | 11.06 | $ | 10.46 | ||||||||
|
|
|
|
|
|
|
|
|
|||||||||
| Total return C |
(5.94 | )%D | 3.26 | % | 7.47 | % | 0.77 | %D | ||||||||
|
|
|
|
|
|
|
|
|
|||||||||
| Ratios and supplemental data: |
||||||||||||||||
| Net assets, end of period (in thousands) |
$ | 406 | $ | 307 | $ | 266 | $ | 153 | ||||||||
| Ratios to average net assets (annualized): |
||||||||||||||||
| Expenses, before reimbursements |
1.78 | %E | 1.79 | % | 2.62 | % | 1.77 | %E | ||||||||
| Expenses, net of reimbursements |
1.78 | %E | 1.77 | % | 1.79 | % | 1.77 | %E | ||||||||
| Net investment income (loss), before reimbursements |
(1.73 | )%E | (0.61 | )% | 0.25 | % | (0.05 | )%E | ||||||||
| Net investment income (loss), net of reimbursements |
(1.73 | )%E | (0.59 | )% | 1.08 | % | (0.05 | )%E | ||||||||
| Portfolio turnover rate |
136 | %D | 286 | % | 381 | % | 214 | %F | ||||||||
| A | Standish Mellon Asset Management Company, LLC was added as an investment advisor on December 11, 2009. |
| B | The tax return of capital is calculated based on outstanding shares at the time of distribution. |
| C | Based on net asset value, which does not reflect the sales charge, redemption fee, or contingent deferred sales charge, if applicable. May include adjustments in accordance with accounting principles generally accepted in the United States of America and as such, the net asset value for reporting purposes and the returns based upon those net asset values may differ from the net asset value and returns for shareholder transactions. |
| D | Not annualized. |
| E | Annualized. |
| F | Portfolio turnover rate is for the period from January 1 through December 31, 2010. |
| G | Portfolio turnover rate is for the period from January 1 through December 31, 2009. |
20
Disclosure Regarding the Board of Trustees’ Approval of the Management
Agreements and Investment Advisory Agreements of the Funds (Unaudited)
At its May 29, 2013 meeting, the Board of Trustees (“Board”) considered the renewal of the Management Agreement between American Beacon Advisors, Inc. (“Manager”) and the American Beacon Funds (“Beacon Trust”) on behalf of each of their series (collectively, the “Funds”) and the renewal of each investment advisory agreement between the Manager and a subadvisor (each an “Investment Advisory Agreement”). The Management Agreement and the Investment Advisory Agreements are collectively referred to herein as the “Agreements.” In preparation for the Board’s consideration to renew and approve these Agreements, the Board and its Investment Committee undertook steps to gather and consider information furnished by the Manager, the subadvisors, Lipper, Inc. (“Lipper”) and Morningstar, Inc. (“Morningstar”). The Board, with the assistance of independent legal counsel, requested and received certain relevant information from the Manager and each subadvisor.
In addition, the Board’s Investment Committee worked with Lipper to obtain relevant comparative information regarding the performance, fees and expenses of the Funds. The Investment Committee, for the benefit of all Trustees, sponsored a separate meeting on May 10, 2013 to consider the information provided by Lipper. Further, the Board took into consideration information furnished for the Board’s review and consideration throughout the year at regular Board and Investment Committee meetings, as well as information specifically prepared in connection with the renewal process.
In connection with the Board’s consideration of the Management Agreement and each Investment Advisory Agreement, the Trustees received and evaluated such information as they deemed necessary. The information requested by the Board included, among other information, the following materials. For various reasons, a subadvisor may not have provided responses to each requested item. In these instances, the Board considered the materials that were received from such subadvisor. References herein to the “firm” refer to the Manager and/or each applicable subadvisor.
| • | a description of any significant changes (actual or anticipated) to principal activities, personnel, services provided to the Funds, or any other area, including how these changes might affect the Funds; |
| • | a copy of the firm’s most recent audited or unaudited financial statements, as well as Parts 1 and 2 of its Form ADV registration statement with the SEC; |
| • | a summary of any material pending or anticipated litigation or regulatory proceedings involving the firm or its personnel, including the results of any recent regulatory examination or independent audit; |
| • | a comparison of the performance of that portion of Fund assets managed or to be managed by each firm with the performance of other similar accounts managed by the firm, including a discussion of relative performance versus a peer group average and any actual or potential remedial measures if the firm’s longer-term performance was materially below that of the peer group; |
| • | any actual or anticipated economies of scale in relation to the services the firm provides or will provide to each Fund and whether the current fee rates charged or to be charged to each Fund reflect these economies of scale for the benefit of the Fund’s investors; |
| • | an analysis of compensation, including a comparison with fee rates charged to other clients for which similar services are provided, any proposed changes to the fee rate schedule, if applicable, and the effect of any fee waivers; |
| • | a description of any payments made or to be made by the subadvisors to the Manager to support a Fund’s marketing efforts; |
| • | a copy of the firm’s proxy voting policies and procedures and, if applicable, the name of the third-party voting service used by the firm; |
| • | an evaluation of any other benefits to the firm or Funds as a result of their relationship, if any; |
| • | confirmation that the firm’s financial condition would not impair its ability to provide high-quality advisory services to the Funds; |
| • | a description of the scope of portfolio management services provided or to be provided to the Funds, including whether such services differ from the services provided to other clients, including other registered investment companies, and any advantages or disadvantages that might accrue to the Funds due to the firm’s involvement in other activities; |
| • | a description of the personnel who are or will be assigned primary responsibility for managing the Funds, including any changes during the past year, and a discussion of the adequacy of current and projected staffing levels to service the Funds; |
| • | a description of the basis upon which portfolio managers are compensated, including any “incentive” arrangements, and a description of the oversight mechanisms used to prevent a portfolio manager whose compensation is tied to performance of a Fund from taking undue risks; |
| • | a description of the firm’s practices in monitoring the quality of portfolio holdings and in reviewing portfolio valuation, including any fair value determinations; |
| • | a description of the firm’s use of derivatives, short positions, leveraged trading strategies or other similar trading strategies for the Funds; |
| • | a discussion regarding the firm’s participation in third-party and/or proprietary “soft dollar” arrangements, if any, or other brokerage allocation policies with respect to Fund transactions; |
| • | a discussion of the firm’s methodology for obtaining best execution, including any plans to improve the quality of execution in the upcoming year, and the use of any affiliated broker-dealers; |
| • | a description of any actual or potential conflicts of interest anticipated in managing Fund assets; |
| • | a discussion of whether the firm has identified any investment or operational matters that likely present a high risk in managing Fund assets; |
21
Disclosure Regarding the Board of Trustees’ Approval of the Management
Agreements and Investment Advisory Agreements of the Funds (Unaudited)
| • | a description of the firm’s criteria for assessing counterparties and counterparty risk to the extent the firm enters into transactions with counterparties on a Fund’s behalf; |
| • | a description of trade allocation procedures among accounts managed by the firm; |
| • | a discussion of whether the firm utilizes “commission recapture” or “directed brokerage” arrangements for the benefit of the Funds or “step-out” transactions; |
| • | a discussion of whether the firm receives, or anticipates receiving, other compensation, including any payment for electronic communication network liquidity rebates with respect to the Funds; |
| • | a certification by the firm regarding the reasonable design of its compliance program; |
| • | a summary of the results of the firm’s most recent annual review of its compliance program and a discussion of any material compliance problems encountered by a subadvisor since the most recent annual review; |
| • | confirmation that the firm is prepared to provide to the Manager, directly or in summary form, any regulatory review comments that could have a material impact on services provided to the Funds; |
| • | a discussion of whether, due to the firm’s trading activities on behalf of the Funds, the firm would need to register, or qualify for exclusion from registration, as a commodity pool operator or commodity trading advisor pursuant to the recent amendments to Rule 4.5 under the Commodity Exchange Act with respect to the Funds and, if so, whether the firm would so register or be exempt; |
| • | information regarding the firm’s code of ethics, insider trading policy and disaster recovery plan, including a description of any material changes thereto and a related certification of compliance by the firm; |
| • | a description of the firm’s affiliation with any broker-dealer; |
| • | a discussion of any anticipated change in the firm’s controlling persons; and |
| • | verification of the firm’s insurance coverage with regards to the services provided to the Funds. |
| • | In addition, the Manager provided the following information specific to the renewal of the Management Agreement: |
| • | a comparison of the performance of a share class of each Fund to comparable investment companies and appropriate indices, including comments on the relative performance of, as applicable, each subadvisor and each Fund versus the respective peer group average; |
| • | a discussion, if applicable, of any underperformance by a subadvisor relative to its peer group and what, if any, remedial measures the Manager has or intends to take; |
| • | a comparison of advisory fee rates and expense ratios for comparable mutual funds; |
| • | a profit/loss analysis of the Manager; |
| • | an analysis of any material complaints received from Fund shareholders; |
| • | a description of the extent to which the Manager monitors the investment activities and financial conditions of each subadvisor to the Funds; |
| • | a discussion of whether the Manager provides different types or levels of administrative and accounting related services to certain Funds; |
| • | a description of the Manager’s distribution activities with respect to promoting sales of Fund shares, including any revenue sharing practices; |
| • | a description of arrangements pursuant to which certain firms may make any direct or indirect payments to partially reimburse the Manager for its marketing or other expenses on behalf of the Funds; |
| • | a description of the Manager’s securities lending practices and the fees received from such practices; |
| • | a discussion of any rebate arrangements between the Manager and a service provider to the Funds pursuant to which the Manager receives direct or indirect benefits from the service provider; |
| • | a description of the portfolio turnover rate for each Fund and, as applicable, each subadvisor to a Fund; |
| • | a description of how expenses that are not readily identifiable to a particular Fund are allocated; and |
| • | confirmation that the Manager complies with applicable CFTC and National Futures Association rules and requirements for applicable Funds and a discussion regarding whether, due to the Manager’s trading activities on behalf of other Funds, the Manager would need to register, or qualify for exclusion from registration, as a commodity pool operator or commodity trading advisor pursuant to the recent amendment to Rule 4.5 under the Commodity Exchange Act with respect to the Funds and, if so, whether the firm would so register or be exempt. |
In connection with the Management Agreement and each Investment Advisory Agreement, the Board also obtained an analysis provided by Lipper that compared: (i) investment performance of each Fund versus comparable investment companies and appropriate indices; (ii) total Fund expenses of each Fund versus comparable mutual funds; and (iii) each Fund’s investment advisory fee rate versus comparable mutual funds. For certain Funds, the Board also considered information regarding the performance of the Manager and individual subadvisors with respect to their allocated portions of a Fund’s portfolio, net of management or subadvisory fees, as applicable, but not other Fund expenses. For each Fund with more than one class of shares, the class of shares used for comparative purposes was the
22
Disclosure Regarding the Board of Trustees’ Approval of the Management
Agreements and Investment Advisory Agreements of the Funds (Unaudited)
class with the longest performance history, which in most cases was the Institutional Class. The Board also considered that the use of Institutional Class performance generally facilitates a meaningful comparison for expense and performance purposes.
Provided below is an overview of the primary factors the Trustees considered at the Investment Committee meeting on May 10, 2013 at which the Trustees reviewed the investment performance of the Manager and each subadvisor and the primary factors considered by the Board at its May 29, 2013 meeting at which the Board considered the renewal of the Management Agreement and Investment Advisory Agreements.
The Board did not identify any particular information that was most relevant to its consideration to renew or approve each Agreement, and each Trustee may have afforded different weight to the various factors. Legal counsel to the independent Trustees provided the Board with a memorandum regarding its responsibilities pertaining to the renewal and approval of each Agreement. The memorandum explained the regulatory requirements surrounding the Trustees’ process for evaluating investment advisors and the terms of the contracts. Based on its evaluation, the Board unanimously concluded that the terms of each Agreement were reasonable and fair and that the renewal and approval of each Agreement was in the best interests of the Funds and their shareholders.
Considerations With Respect to the Renewal of the Management Agreement and each Investment Advisory Agreement
In determining whether to renew the Management Agreement and each Investment Advisory Agreement on behalf of the Funds, the Trustees considered the best interests of each Fund separately. While the Management Agreement and the Investment Advisory Agreements for all of the Funds were considered at the May 29, 2013 meeting, the Board considered each Fund’s investment management and subadvisory relationships separately.
In each instance, the Board considered, among other things, the following factors: (1) the nature, extent and quality of the services provided; (2) the investment performance of a Fund and, as applicable, each subadvisor for a Fund; (3) the costs incurred by the Manager in rendering services to the Funds and its resulting profits or losses; (4) the extent to which economies of scale have been taken into account in setting each fee rate schedule; (5) whether fee rate levels reflect these economies of scale for the benefit of Fund investors; (6) comparisons of services and fee rates with contracts entered into by the Manager or a subadvisor or their affiliates with other clients (such as pension funds and other institutional funds); and (7) any other benefits derived or anticipated to be derived by the Manager or a subadvisor from their relationship with a Fund. The Trustees posed questions to various management personnel of the Manager regarding certain key aspects of the materials submitted in support of the renewal.
Nature, Extent and Quality of Services. With respect to the renewal of the Management Agreement, the Board considered, among other factors: each Fund’s long-term performance and the background and experience of key investment personnel at the Manager; the cost structure of the Funds; the Manager’s culture of compliance and support for compliance operations that reduce risks to the Funds; the Manager’s commitment to enhance the Funds’ product line and increase assets in the Funds; the Manager’s quality of services; the Manager’s active role in monitoring and, as appropriate, recommending additional or replacement subadvisors; the Manager’s commitment to training employees; and the Manager’s efforts to retain key employees and maintain staff levels.
With respect to the renewal of each Investment Advisory Agreement, the Trustees considered the level of staffing, quality, background and experience of each subadvisor’s investment personnel responsible for managing the Funds, the size of the subadvisor and the subadvisor’s ability to continue to attract and retain qualified investment personnel. The Board also considered the adequacy of the resources committed to the Funds by each subadvisor, and whether those resources were commensurate with the needs of the Funds and are sufficient to sustain appropriate levels of performance and compliance needs. In this regard, the Board considered the financial stability of each subadvisor. The Board also considered the subadvisors’ representations regarding their compliance programs and codes of ethics. Based on the foregoing information, the Board concluded that the nature, extent and quality of the management and advisory services provided by the Manager and each subadvisor were appropriate for each Fund and, thus, determined to renew the Management Agreement and the Investment Advisory Agreement for each Fund.
Investment Performance. The Board evaluated the comparative information provided by Lipper and the Manager regarding each Fund’s investment performance relative to its Lipper performance universe, Lipper performance group, and/or benchmark index(es). The Board considered the information provided by Lipper regarding its independent peer selection methodology to select all performance groups and universes. The Board also considered that the performance groups and universes selected by Lipper may not provide appropriate comparisons for each Fund. In addition, the Board considered the performance reports and discussions with management at Board and Committee meetings throughout the year. The Board also considered in each instance the Manager’s recommendation to continue to retain each subadvisor. A discussion regarding the Board’s considerations with respect to each Fund’s performance appears below under “Additional Considerations and Conclusions with Respect to Each Fund.”
Costs of the Services Provided to the Fund and the Profits Realized by the Manager from its Relationship with the Funds. In analyzing the cost of services and profitability of the Manager, the Board considered the revenues earned and the expenses incurred by the Manager. The profits or losses were noted at both an aggregate level for all Funds and at an individual Fund level, with some Funds being profitable for the Manager and with the Manager sustaining losses with respect to other Funds. Although the Board noted that, in certain cases, the fee rates paid by other clients of the Manager are lower than the fee rates paid by the Funds, the difference reflects the greater level of responsibility and regulatory requirements associated with managing the Funds.
The Board also noted that the Manager proposed to continue the expense waivers and reimbursements for certain Funds and classes that were in place during the last fiscal year. The Board further considered that with respect to each Fund, the Management
23
Disclosure Regarding the Board of Trustees’ Approval of the Management
Agreements and Investment Advisory Agreements of the Funds (Unaudited)
Agreement provides for the Manager to receive a management fee comprised of an annualized fee that is retained by the Manager plus the amount payable by the Manager to a subadvisor. The Board also considered that the Manager receives service and administrative fees to compensate the Manager for providing administrative services to the Funds and to compensate third-party administrators and broker-dealers for services to Fund shareholders. In addition, the Board considered that the Manager receives management fees for overseeing the securities lending program on behalf of various Funds. The Board also noted that certain classes of the Funds maintain higher expense ratios in order to compensate third-party distributors.
In analyzing the cost of services for each subadvisor in connection with its investment advisory services to the Fund, the Board considered that, in many cases, the Manager has negotiated the lowest subadvisory fee rate a subadvisor charges for any comparable client accounts. The Board did not request profitability data from the subadvisors because the Board did not view this data as imperative to its deliberations given the arm’s-length nature of the relationship between the Manager and the subadvisors with respect to the negotiation of subadvisory fee rates. In addition, the Board noted that subadvisors may not account for their profits on an account-by-account basis and, those that do, likely employ different methodologies in connection with these calculations.
Based on the foregoing information, the Board concluded that the profitability levels of the Manager were reasonable in light of the services performed by the Manager. A discussion regarding the Board’s considerations with respect to each Fund’s fee rates is set forth below under “Additional Considerations and Conclusions with Respect to Each Fund.”
Economies of Scale. In considering the reasonableness of the management and investment advisory fees rates, the Board considered whether economies of scale will be realized as the Funds grow and whether fee rate levels reflect these economies of scale for the benefit of Fund shareholders. In this regard, the Board considered that the Manager has negotiated breakpoints in many subadvisory fee rates. The Board also noted that, for purposes of determining the fee rates chargeable to the Funds, many subadvisors have agreed to take into account assets of AMR Corporation and its pension plans that are managed by the subadvisors. Thus, the Funds are able to receive lower effective fee rates.
In addition, the Board noted the Manager’s representation that many of the Funds benefit from economies of scale because comparably low fee rate levels are reflected in the current management and administration fee rates the Manager charges. The Board further noted the Manager’s representation that many of the Funds benefit from these comparably low fee rate levels despite not having yet reached an asset size at which economies of scale would traditionally be considered to exist, and the Manager’s belief that breakpoints are not appropriate at this time. Based on the foregoing information, the Board concluded that the Manager and subadvisor fee rate schedules for each Fund provide for a reasonable sharing of benefits from any economies of scale with the Funds.
Benefits Derived from the Relationship with the Funds. The Board considered the “fall-out” or ancillary benefits that accrue to the Manager and/or the subadvisors as a result of the advisory relationships with the Funds, including greater exposure in the marketplace with respect to the Manager’s or subadvisor’s investment process and expanding the level of assets under management by the Manager and the subadvisors.
In addition, the Manager noted that the Funds also derive benefits from their association with the Manager. Specifically, the Board noted the Manager’s representation that it provides services to most Funds at a lower than industry average cost. The Board considered that certain of the subadvisors reimburse the Manager for certain of its costs relating to distribution activities for the Funds. The Board also considered that the Funds did not pay commissions to any affiliated broker-dealer of the Manager or the relevant subadvisor during the most recent fiscal year ended December 31, 2012.
Based on the foregoing information, the Board concluded that the potential benefits accruing to the Manager and the subadvisors by virtue of their relationships with the Funds appear to be fair and reasonable.
Additional Considerations and Conclusions with Respect to each Fund. The performance comparisons below were made versus each Fund’s Lipper performance universe median, Lipper performance group median and/or benchmark index. References below to each Fund’s Lipper performance group and Lipper performance universe are to the respective group or universe of comparable mutual funds included in the analysis provided by Lipper. A Lipper performance group consists of the Fund and a representative sample of funds with similar investment classifications and objectives as the Fund, as selected by Lipper. A Lipper performance universe is an expansion of the performance group, providing a broader view of performance across the Fund’s investment classification/objective and allowing for a more extensive comparison. In reviewing the performance, the Trustees viewed longer-term performance over a full market cycle, typically five years or longer, as the most important consideration, because relative performance over shorter periods may be significantly impacted by market or economic events that do not reflect manager skill.
The expense comparisons below were made versus each Fund’s Lipper expense universe median and Lipper expense group median. References below to each Fund’s expense group and expense universe are to the respective group or universe of comparable mutual funds included in the analysis by Lipper. A Lipper expense group consists of the Fund and a representative sample of funds with similar operating structures, as selected by Lipper. A Lipper expense universe includes all funds in the investment classification/objective with a similar load type to the share class of the Fund included in the Lipper comparative information and provides a broader view of expenses across the Fund’s investment classification/objective. The Trustees also considered a Fund’s Morningstar fee level category. In reviewing expenses, the Trustees considered the positive impact of fee waivers where applicable and the Manager’s agreement to continue the fee waivers. In addition, information regarding the use of soft dollars was requested from the Manager and all subadvisors and was considered by the Trustees.
24
Disclosure Regarding the Board of Trustees’ Approval of the Management
Agreements and Investment Advisory Agreements of the Funds (Unaudited)
Additional Considerations and Conclusions with Respect to the American Beacon Treasury Inflation Protected Securities Fund. In considering the renewal of the Management Agreement for the American Beacon Treasury Inflation Protected Securities Fund, the Trustees considered the following additional factors: (1) the American Beacon Treasury Inflation Protected Securities Fund underperformed the Lipper performance universe median and Lipper performance group median for the one-, three- and five-year periods ended March 31, 2013; (2) the Manager’s representation that the Fund’s performance relative to its benchmark index may be more appropriate as compared to the peer universe because the peer universe funds generally have longer duration and invest in Treasury Inflation Protection Securities (“TIPS”), nominal Treasuries and foreign inflation-linked bonds, whereas the American Beacon Treasury Inflation Protected Securities Fund may invest only in U.S. TIPS; (3) the Fund underperformed its benchmark index for the one-, three- and five-year periods ended March 31, 2013; (4) the expense ratio of the Institutional Class of Fund shares was lower than the median of its Lipper expense universe and Lipper expense group; and (5) the Institutional Class of the Fund was categorized by Morningstar as having a low expense ratio.
In considering the renewal of the Investment Advisory Agreement with NISA Investment Advisors LLC (“NISA”) and Standish Mellon Asset Management LLC (“Standish”), the Trustees considered the following additional factors: (1) NISA underperformed the Lipper performance universe median for the one-, three- and five-year periods ended March 31, 2013; (2) Standish underperformed the Lipper performance universe median for the one- and three-year periods ended March 31, 2013; (3) the Manager’s explanation that NISA’s and Standish’s underperformance was due in part to their focus on shorter duration TIPS; (4) NISA outperformed its applicable benchmark index for the one-, three- and five-year periods ended March 31, 2013; (5) Standish outperformed its applicable benchmark index for the three-year period ended March 31, 2013, but underperformed its benchmark index for the one-year period; (6) representations by each subadvisor regarding fee rates charged by the subadvisor to other comparable clients; and (7) the Manager’s recommendation to continue to retain each subadvisor.
Based on these and other considerations, the Trustees: (1) concluded that the fees paid to the Manager and the subadvisors under the Agreements are fair and reasonable; (2) determined that the American Beacon Treasury Inflation Protected Securities Fund and its shareholders would benefit from the Manager’s and subadvisors’ continued management of the Fund; and (3) approved the renewal of the Management and Investment Advisory Agreements with respect to the American Beacon Treasury Inflation Protected Securities Fund.
25

eDelivery is NOW AVAILABLE- Stop traditional mail delivery and receive your
shareholder reports and summary prospectus on-line. Sign up at
www.americanbeaconfunds.com
If you invest in the Fund through a financial institution, you may be able to receive the Fund’s regulatory mailings, such as the Summary Prospectus, Annual Report and Semi-Annual Report, by e-mail. If you are interested in this option, please go to www.icsdelivery.com and search for your financial institution’s name or contact your financial institution directly.
To obtain more information about the Fund:

|

| |||
| By E-mail: american_beacon.funds@ambeacon.com |
On the Internet: Visit our website at www.americanbeaconfunds.com | |||

|

| |||
|
By Telephone: Call (800) 658-5811 |
By Mail: American Beacon Funds P.O. Box 219643 Kansas City, MO 64121-9643 | |||
| Availability of Quarterly Portfolio Schedules
In addition to the Schedule of Investments provided in each semi-annual and
annual |
Availability of Proxy Voting Policy and Records
A description of the policies and procedures the Fund uses to determine how
to | |||
Fund Service Providers:
|
CUSTODIAN State Street Bank and Trust Boston, Massachusetts
|
TRANSFER AGENT Boston Financial Data Services Kansas City, Missouri
|
INDEPENDENT REGISTERED PUBLIC ACCOUNTING FIRM Ernst & Young LLP Dallas, Texas
|
DISTRIBUTOR Foreside Fund Services, LLC Portland, Maine |
This report is prepared for shareholders of the American Beacon Funds and may be distributed to others only if preceded or accompanied by a current Prospectus or Summary Prospectus.
American Beacon Funds and American Beacon Treasury Inflation Protected Securities Fund are service marks of American Beacon Advisors, Inc.
SAR 6/13
ITEM 2. CODE OF ETHICS.
The Trust did not amend the code of ethics that applies to its principal executive and financial officers (the “Code”) nor did it grant any waivers to the provisions of the Code during the period covered by the shareholder report presented in Item 1.
ITEM 3. AUDIT COMMITTEE FINANCIAL EXPERT.
Not applicable.
ITEM 4. PRINCIPAL ACCOUNTANT FEES AND SERVICES.
Not applicable.
ITEM 5. AUDIT COMMITTEE OF LISTED REGISTRANTS.
Not applicable.
ITEM 6. SCHEDULE OF INVESTMENTS.
The schedules of investments for each series of the Trust are included in the shareholder report presented in Item 1.
ITEM 7. DISCLOSURE OF PROXY VOTING POLICIES AND PROCEDURES FOR CLOSED-END MANAGEMENT INVESTMENT COMPANIES.
Not Applicable.
ITEM 8. PORTFOLIO MANAGERS OF CLOSED-END MANAGEMENT INVESTMENT COMPANIES.
Not applicable.
ITEM 9. PURCHASES OF EQUITY SECURITIES BY CLOSED-END MANAGEMENT INVESTMENT COMPANY AND AFFILIATED PURCHASERS.
Not Applicable.
ITEM 10. SUBMISSION OF MATTERS TO A VOTE OF SECURITY HOLDERS.
The Trust has made no material changes to the procedures by which shareholders may recommend nominees to the Trust’s Board of Trustees since the Trust last disclosed such procedures in Schedule 14A.
ITEM 11. CONTROLS AND PROCEDURES.
(a) Based upon an evaluation within 90 days of the filing date of this report, the principal executive and financial officers concluded that the disclosure controls and procedures of the Trust are effective.
(b) There were no changes in the Trust’s internal control over financial reporting during the second fiscal quarter of the period covered by this report that has materially affected, or is reasonably likely to materially affect, the Trust’s internal control over financial reporting.
ITEM 12. EXHIBITS.
(a)(1) Not Applicable.
(a)(2) A separate certification for each principal executive officer and principal financial officer of the Trust as required by Rule 30a-2(a) under the Investment Company Act of 1940 is attached hereto as EX-99.CERT.
(a)(3) Not Applicable.
(b) The certifications required by Rule 30a-2(b) under the Investment Company Act of 1940 are attached hereto as EX-99.906CERT.
SIGNATURES
Pursuant to the requirements of the Securities Exchange Act of 1934 and the Investment Company Act of 1940, the registrant has duly caused this report to be signed on its behalf by the undersigned, thereunto duly authorized.
(Registrant): American Beacon Funds
| By | /s/ Gene L. Needles, Jr. | |
| Gene L. Needles, Jr. President | ||
Date: September 6, 2013
| By | /s/ Melinda G. Heika | |
| Melinda G. Heika Treasurer |
Date: September 6, 2013
Pursuant to the requirements of the Securities Exchange Act of 1934 and the Investment Company Act of 1940, this report has been signed below by the following persons on behalf of the registrant and in the capacities and on the dates indicated.
| By | /s/ Gene L. Needles, Jr. | |
| Gene L. Needles, Jr. President |
Date: September 6, 2013
| By | /s/ Melinda G. Heika | |
| Melinda G. Heika Treasurer |
Date: September 6, 2013