MFS MULTIMARKET INCOME TRUST N-CSR
UNITED STATES
SECURITIES AND EXCHANGE COMMISSION
Washington, D.C. 20549
FORM N-CSR
CERTIFIED SHAREHOLDER REPORT OF
REGISTERED MANAGEMENT INVESTMENT COMPANIES
Investment Company Act file number 811-04975
MFS MULTIMARKET INCOME TRUST
(Exact name of registrant as specified in charter)
111 Huntington Avenue, Boston, Massachusetts 02199
(Address of principal executive offices) (Zip code)
Christopher R. Bohane
Massachusetts Financial Services Company
111 Huntington Avenue
Boston, Massachusetts 02199
(Name and address of agents for service)
Registrant’s telephone number, including area code: (617) 954-5000
Date of fiscal year end: October 31
Date of reporting
period: October 31, 2021
| ITEM 1. |
REPORTS TO STOCKHOLDERS. |
Item 1(a):
Annual Report
October 31, 2021
MFS® Multimarket
Income Trust
MANAGED DISTRIBUTION POLICY DISCLOSURE
The MFS Multimarket Income Trust’s (the fund) Board of
Trustees adopted a managed distribution policy. The fund seeks to pay monthly distributions based on an annual rate of 8.00% of the fund’s average monthly net asset value. The primary purpose of the managed distribution policy is to provide
shareholders with a constant, but not guaranteed, fixed minimum rate of distribution each month. You should not draw any conclusions about the fund’s investment performance from the amount of the current distribution or from the terms of the
fund’s managed distribution policy. The Board may amend or terminate the managed distribution policy at any time without prior notice to fund shareholders. The amendment or termination of the managed distribution policy could have an adverse
effect on the market price of the fund’s shares.
With each distribution, the fund will issue a notice to
shareholders and an accompanying press release which will provide detailed information regarding the amount and composition of the distribution and other related information. The amounts and sources of distributions reported in the notice to
shareholders are only estimates and are not being provided for tax reporting purposes. The actual amounts and sources of the amounts for tax reporting purposes will depend upon the fund’s investment experience during its fiscal year and may be
subject to changes based on tax regulations. The fund will send you a Form 1099-DIV for the calendar year that will tell you how to report these distributions for federal income tax purposes. Please refer to “Tax Matters and
Distributions” under Note 2 of the Notes to Financial Statements for information regarding the tax character of the fund’s distributions.
Under a managed distribution policy the fund may at times
distribute more than its net investment income and net realized capital gains; therefore, a portion of your distribution may result in a return of capital. A return of capital may occur, for example, when some or all of the money that you invested
in the fund is paid back to you. Any such returns of capital will decrease the fund’s total assets and, therefore, could have the effect of increasing the fund’s expense ratio. In addition, in order to make the level of distributions
called for under its managed distribution policy, the fund may have to sell portfolio securities at a less than opportune time. A return of capital does not necessarily reflect the fund’s investment performance and should not be confused with
‘yield’ or ‘income’. The fund’s total return in relation to changes in net asset value is presented in the Financial Highlights.
MFS® Multimarket
Income Trust
New York Stock Exchange Symbol:
MMT
|
1
|
|
2
|
|
5
|
|
8
|
|
11
|
|
22
|
|
23
|
|
24
|
|
25
|
|
55
|
|
56
|
|
58
|
|
59
|
|
60
|
|
62
|
|
78
|
|
80
|
|
81
|
|
86
|
|
90
|
|
90
|
|
90
|
|
90
|
|
90
|
|
91
|
NOT FDIC INSURED • MAY LOSE VALUE
• NO BANK GUARANTEE
LETTER FROM THE CEO
Dear Shareholders:
After experiencing dramatic swings in the early days of the
coronavirus pandemic, global equity markets have performed strongly over the past year. Though the speedy development of vaccines brightened the economic and market outlook, uncertainty remains as variants of the virus appear, the effectiveness of
vaccines appears to wane over time, and their uneven distribution impacts the developing world.
After having taken aggressive steps to
cushion the economic and market fallout related to the virus, some global central banks have begun to recalibrate monetary policy. For example, the U.S. Federal Reserve has begun to taper its bond buying, which has pushed up Treasury yields,
particularly on the short end of the yield curve. Having passed a $1.9 trillion stimulus package in March and a $1.1 trillion infrastructure bill in November, the U.S. Congress aims to approve additional stimulus later this year. Production and
transportation bottlenecks and labor shortages stemming from the pandemic have fueled a rise in inflation.
Since midyear, global economic growth has
moderated, with the spread of the Delta variant of the coronavirus and a regulatory crackdown in China featuring prominently. Stress in China’s property development sector has also contributed to a slowdown there. Tightening global energy and
raw materials supplies are a further concern for investors.
The policy measures put in place to counteract the
pandemic’s effects have helped build a supportive environment and are encouraging economic recovery; however, if markets disconnect from fundamentals, they can sow the seeds of instability. As such, recent dramatic increases in speculative
trading in cryptocurrencies, special purpose acquisition companies (SPACs), and the like bear watching.
In the aftermath of the crisis, we could see societal changes
as households, businesses, and governments adjust to a new reality, and any such alterations could affect the investment landscape. For investors, events such as the COVID-19 outbreak demonstrate the importance of having a deep understanding of
company fundamentals, and we have built our global research platform to do just that.
At MFS®, we put our clients’ assets to work responsibly by carefully navigating the increasing complexity of global markets and economies. Guided by our commitment to long-term
investing, we tune out the noise and aim to uncover what we believe are the best, most durable investment opportunities in the market. Our unique global investment platform combines collective expertise, long-term discipline, and thoughtful risk
management to create sustainable value for investors over time.
Respectfully,
Michael W.
Roberge
Chief Executive Officer
MFS Investment Management
December 15, 2021
The opinions expressed in this letter are subject to change and
may not be relied upon for investment advice. No forecasts can be guaranteed.
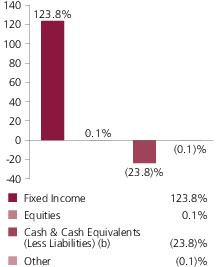
Portfolio structure at value (v)
Portfolio structure reflecting equivalent exposure of derivative positions
(i)
Fixed income sectors (i)
| High
Yield Corporates |
64.5%
|
| Emerging
Markets Bonds |
29.6%
|
| Investment
Grade Corporates |
22.7%
|
| Commercial
Mortgage-Backed Securities |
1.8%
|
| Collateralized
Debt Obligations |
1.5%
|
| Municipal
Bonds |
0.8%
|
| Asset-Backed
Securities |
0.6%
|
| Non-U.S.
Government Bonds |
(5.7)%
|
| U.S.
Treasury Securities |
(20.5)%
|
Portfolio facts (i)
| Average
Duration (d) |
5.3
|
| Average
Effective Maturity (m) |
8.1 yrs.
|
Portfolio Composition -
continued
Composition including fixed income credit quality (a)(i)
| AAA
|
2.8%
|
| AA
|
5.3%
|
| A
|
7.3%
|
| BBB
|
26.1%
|
| BB
|
41.5%
|
| B
|
30.3%
|
| CCC
|
9.3%
|
| CC
|
0.1%
|
| C
(o) |
0.0%
|
| D
(o) |
0.0%
|
| U.S.
Government |
1.1%
|
| Not
Rated |
(28.5)%
|
| Non-Fixed
Income |
0.1%
|
| Cash
& Cash Equivalents (Less Liabilities) (b) |
(25.3)%
|
| Other
|
29.9%
|
| (a)
|
For all
securities other than those specifically described below, ratings are assigned to underlying securities utilizing ratings from Moody’s, Fitch, and Standard & Poor’s rating agencies and applying the following hierarchy: If all three
agencies provide a rating, the middle rating (after dropping the highest and lowest ratings) is assigned; if two of the three agencies rate a security, the lower of the two is assigned. If none of the 3 rating agencies above assign a rating, but the
security is rated by DBRS Morningstar, then the DBRS Morningstar rating is assigned. If none of the 4 rating agencies listed above rate the security, but the security is rated by the Kroll Bond Rating Agency (KBRA), then the KBRA rating is assigned.
Ratings are shown in the S&P and Fitch scale (e.g., AAA). Securities rated BBB or higher are considered investment grade. All ratings are subject to change. U.S. Government includes securities issued by the U.S. Department of the Treasury. Not
Rated includes fixed income securities and fixed income derivatives that have not been rated by any rating agency. |
Non-Fixed Income includes equity securities (including
convertible bonds and equity derivatives) and/or commodity-linked derivatives. The fund may or may not have held all of these instruments on this date. The fund is not rated by these agencies.
| (b)
|
Cash
& Cash Equivalents (less liabilities) includes any cash, investments in money market funds, short-term securities, and other assets less liabilities. Liabilities include the value of outstanding borrowings made by the fund for leverage
transactions. Cash & Cash Equivalents is negative due to these borrowings. Please see the Statement of Assets and Liabilities for additional information related to the fund’s cash position and other assets and liabilities. Please see Note
6 in the Notes to Financial Statements for more information on the fund's outstanding borrowings. |
| (d)
|
Duration is
a measure of how much a bond’s price is likely to fluctuate with general changes in interest rates, e.g., if rates rise 1.00%, a bond with a 5-year duration is likely to lose about 5.00% of its value due to the interest rate move.
|
Portfolio Composition -
continued
| (i)
|
For
purposes of this presentation, the components include the value of securities, and reflect the impact of the equivalent exposure of derivative positions, if any. These amounts may be negative from time to time. Equivalent exposure is a calculated
amount that translates the derivative position into a reasonable approximation of the amount of the underlying asset that the portfolio would have to hold at a given point in time to have the same price sensitivity that results from the
portfolio’s ownership of the derivative contract. When dealing with derivatives, equivalent exposure is a more representative measure of the potential impact of a position on portfolio performance than value. The bond component will include
any accrued interest amounts. |
| (m)
|
In
determining each instrument’s effective maturity for purposes of calculating the fund’s dollar-weighted average effective maturity, MFS uses the instrument’s stated maturity or, if applicable, an earlier date on which MFS believes
it is probable that a maturity-shortening device (such as a put, pre-refunding or prepayment) will cause the instrument to be repaid. Such an earlier date can be substantially shorter than the instrument’s stated maturity. |
| (v)
|
For
purposes of this presentation, market value of fixed income and/or equity derivatives, if any, is included in Cash & Cash Equivalents. |
Where the fund holds convertible bonds, they are treated as
part of the equity portion of the portfolio.
Other
includes equivalent exposure from currency derivatives and/or any offsets to derivative positions and may be negative.
Percentages are based on net assets as of October 31,
2021.
The portfolio is actively managed and current
holdings may be different.
Management Review
Summary of Results
For the twelve months ended October 31, 2021, shares of the MFS
Multimarket Income Trust (fund) provided a total return of 7.18%, at net asset value, and a total return of 25.80%, at market value. This compares with a return of 10.53% for the fund’s benchmark, the Bloomberg U.S. Corporate High-Yield Bond
2% Issuer Capped Index (formerly Bloomberg Barclays U.S. High-Yield Corporate Bond 2% Issuer Capped Index). Over the same period, the fund’s other benchmark, the MFS Multimarket Income Trust Blended Index (Blended Index), generated a return of
6.09%. The Blended Index reflects the blended returns of various fixed income market indices, with percentage allocations to each index designed to resemble the fixed income allocations of the fund. The market indices and related percentage
allocations used to compile the Blended Index are set forth in the Performance Summary.
The performance commentary below is based on the net asset
value performance of the fund, which reflects the performance of the underlying pool of assets held by the fund. The total return at market value represents the return earned by owners of the shares of the fund, which are traded publicly on the
exchange.
Market Environment
Over the past year, the global economy was buffeted by an array
of crosscurrents as it adjusted to the ebbs and flows of the pandemic. Among the supportive currents were ample fiscal stimulus, loose monetary policy and the rollout of several highly effective coronavirus vaccines. Negative currents included the
rapid spread of the Delta variant, widespread global production bottlenecks and a surge in inflation. After experiencing a burst of exceptionally strong economic activity as the global economy began to reopen, growth slowed lately as shortages of
raw materials, labor, intermediate goods and even energy in some countries, disrupted supply chains.
Amid rising inflation, markets anticipated a transition from an
exceptionally accommodative environment to a more mixed monetary landscape ahead. Indeed, several central banks in emerging markets have already tightened policy and the US Federal Reserve indicated it will reduce the pace of its asset purchases
beginning in November. The European Central Bank, the Bank of Japan and the People's Bank of China are expected to maintain accommodative policies. Sovereign bond yields moved modestly higher late in the period amid higher inflation, signs of a
crest in the Delta variant wave and on expectations of a tighter Fed.
A harsher Chinese regulatory environment toward industries such
as online gaming, food delivery and education increased market volatility as has stress in China's highly leveraged property development sector. Trade relations between the United States and China remained quite strained despite a change in
presidential administrations.
Signs of excess investor
enthusiasm continued to be seen in pockets of the market such as “meme stocks” popular with users of online message boards, cryptocurrencies and heavy retail participation in the market for short-dated options.
Management Review -
continued
Factors Affecting Performance
Relative to the Blended Index, the fund's
greater-than-benchmark exposure to the industrials sector, along with its lesser exposure to both the mortgage-backed securities (MBS) agency fixed rate and treasury sectors, strengthened relative returns. Strong bond selection within both the
financial institutions and government-related sovereign sectors, particularly within “BBB” -rated(r) bonds, was another source of relative strength. Additionally, the fund's duration(d) stance also supported relative performance.
Conversely, bond selection within the industrials sector,
mainly within “BB” and “CCC” -rated bonds, detracted from relative performance. The fund's yield curve(y) positioning also weakened relative results.
The fund employs leverage and, to the extent that investments
are purchased through the use of leverage, the fund’s net asset value may increase or decrease at a greater rate than a comparable unleveraged fund. During the reporting period, the use of leverage was a contributor to relative
performance.
The fund has a managed distribution policy,
the primary purpose of which is to provide shareholders with a constant, but not guaranteed, fixed minimum rate of distribution each month. This policy had no material impact on the fund's investment strategies during its most recent fiscal year.
The level of distributions paid by the fund pursuant to its managed distribution policy may cause the fund's NAV per share to decline more so than if the policy were not in place, including if distributions are in excess of fund returns. For the
twelve months ended October 31, 2021, the tax character of dividends paid pursuant to the managed distribution policy includes an ordinary income distribution of $18,349,942 and a tax return of capital distribution of $12,050,739. See “Managed
Distribution Policy Disclosure” in the inside cover page of this Annual Report for additional details regarding the policy and related implications for the fund and shareholders.
Respectfully,
Portfolio Manager(s)
Robert Spector, Ward Brown, David Cole, Pilar Gomez-Bravo, Andy
Li, Henry Peabody, Matt Ryan, and Michael Skatrud
Note to
Shareholders: Effective June 30, 2021, Robert Persons is no longer a Portfolio Manager of the fund.
| (d)
|
Duration is
a measure of how much a bond’s price is likely to fluctuate with general changes in interest rates, e.g., if rates rise 1.00%, a bond with a 5-year duration is likely to lose about 5.00% of its value. |
| (r)
|
Securities
rated “BBB”, “Baa”, or higher are considered investment grade; securities rated “BB”, “Ba”, or below are considered non-investment grade. Ratings are assigned to underlying securities utilizing
ratings from Moody's, Fitch, and Standard & Poor's and applying the following hierarchy: If all three agencies provide a rating, the middle rating (after dropping the highest and lowest ratings) is assigned; if two of the three agencies rate a
security, the lower of the two is assigned. If none of the 3 rating agencies above assign a rating, but the security is rated by DBRS Morningstar, then the DBRS Morningstar rating is assigned. If none |
Management Review -
continued
of the 4 rating agencies listed above rate the security,
but the security is rated by the Kroll Bond Rating Agency (KBRA), then the KBRA rating is assigned. Ratings are shown in the S&P and Fitch scale (e.g., AAA). For securities that are not rated by any of the rating agencies, the security is
considered Not Rated.
| (y)
|
A yield
curve graphically depicts the yields of different maturity bonds of the same credit quality and type; a normal yield curve is upward sloping, with short-term rates lower than long-term rates. |
The views expressed in this report are those of the portfolio
manager(s) only through the end of the period of the report as stated on the cover and do not necessarily reflect the views of MFS or any other person in the MFS organization. These views are subject to change at any time based on market or other
conditions, and MFS disclaims any responsibility to update such views. These views may not be relied upon as investment advice or an indication of trading intent on behalf of any MFS portfolio. References to specific securities are not
recommendations of such securities, and may not be representative of any MFS portfolio’s current or future investments.
Performance Summary THROUGH
10/31/21
The following chart illustrates the
fund’s historical performance in comparison to its benchmark(s). Performance results reflect the percentage change in net asset value and market value, including reinvestment of fund distributions. Benchmarks are unmanaged and may not be
invested in directly. Benchmark returns do not reflect commissions or expenses. (See Notes to Performance Summary.)
Performance data shown represents past performance and is no
guarantee of future results. Investment return and principal value fluctuate so your shares, when sold, may be worth more or less than the original cost; current performance may be lower or higher than quoted. The performance shown does not reflect
the deduction of taxes, if any, that a shareholder would pay on fund distributions or the sale of fund shares.
Growth of a Hypothetical $10,000 Investment
Average Annual
Total Returns through 10/31/21
| |
Inception
Date |
1-yr
|
5-yr
|
10-yr
|
| Market
Value (r) |
3/12/87
|
25.80%
|
11.08%
|
8.49%
|
| Net
Asset Value (r) |
3/12/87
|
7.18%
|
6.86%
|
6.91%
|
Comparative benchmark(s)
| |
|
|
|
| Bloomberg
U.S. Corporate High-Yield Bond 2% Issuer Capped Index (f) |
10.53%
|
6.38%
|
6.78%
|
| MFS
Multimarket Income Trust Blended Index (f)(w) |
6.09%
|
5.05%
|
5.36%
|
| Bloomberg
Global Aggregate Credit Index (f) |
1.30%
|
4.03%
|
3.36%
|
| Bloomberg
U.S. Government/Mortgage Bond Index (f) |
(1.64)%
|
2.37%
|
2.33%
|
| JPMorgan
Emerging Markets Bond Index Global (f) |
4.06%
|
3.89%
|
5.02%
|
| (f)
|
Source:
FactSet Research Systems Inc. |
| (r)
|
Includes
reinvestment of all distributions. Market value references New York Stock Exchange Price. |
Performance Summary -
continued
| (w)
|
As of
October 31, 2021, the MFS Multimarket Income Trust Blended Index (a custom index) was comprised of 50% Bloomberg U.S. Corporate High-Yield Bond 2% Issuer Capped Index, 20% JPMorgan Emerging Markets Bond Index Global, 20% Bloomberg Global Aggregate
Credit Index, and 10% Bloomberg U.S. Government/Mortgage Bond Index. |
Benchmark Definition(s)
Bloomberg Global Aggregate Credit Index(a) (formerly Bloomberg Barclays Global Aggregate Credit Index) – a subset of the Global Aggregate Index, and contains investment grade credit securities from the U.S.
Aggregate, Pan-European Aggregate, Asian-Pacific Aggregate, Eurodollar, 144A, and Euro-Yen indices. Credit securities are publicly issued corporate and specified foreign debentures and secured notes that meet the specified maturity, liquidity and
quality requirements.
Bloomberg U.S. Corporate High-Yield
Bond 2% Issuer Capped Index(a) (formerly Bloomberg Barclays U.S. High-Yield Corporate Bond 2% Issuer Capped Index) – a component of the Bloomberg U.S. Corporate High-Yield
Bond Index, which measures performance of non-investment grade, fixed rate debt. The index limits the maximum exposure to any one issuer to 2%.
Bloomberg U.S. Government/Mortgage Bond Index(a) (formerly Bloomberg Barclays U.S. Government/Mortgage Bond Index) – measures debt issued by the U.S. Government, and its agencies, as well as mortgage-backed pass-through
securities of Ginnie Mae (GNMA), Fannie Mae (FNMA), and Freddie Mac (FHLMC).
JPMorgan Emerging Markets Bond Index Global – measures
the performance of U.S. dollar-denominated debt instruments issued by emerging market sovereign and quasi-sovereign entities: Brady bonds, loans, Eurobonds.
It is not possible to invest directly in an index.
| (a)
|
Source:
Bloomberg Index Services Limited. BLOOMBERG® is a trademark and service mark of Bloomberg Finance L.P. and its affiliates (collectively “Bloomberg”). Bloomberg
or Bloomberg's licensors own all proprietary rights in the Bloomberg Indices. Bloomberg neither approves or endorses this material, or guarantees the accuracy or completeness of any information herein, or makes any warranty, express or implied, as
to the results to be obtained therefrom and, to the maximum extent allowed by law, neither shall have any liability or responsibility for injury or damages arising in connection therewith. |
Notes to Performance Summary
The fund’s shares may trade at a discount or premium to
net asset value. When fund shares trade at a premium, buyers pay more than the net asset value underlying fund shares, and shares purchased at a premium would receive less than the amount paid for them in the event of the fund’s concurrent
liquidation.
The fund's target annual distribution rate
is calculated based on an annual rate of 8.00% of the fund's average monthly net asset value, not a fixed share price, and the fund's dividend amount will fluctuate with changes in the fund's average monthly net assets.
Net asset values and performance results based on net asset
value per share do not include adjustments made for financial reporting purposes in accordance with U.S. generally accepted accounting principles and may differ from amounts reported in the Statement of Assets and Liabilities or the Financial
Highlights.
Performance Summary -
continued
From time to time the fund may receive proceeds from litigation
settlements, without which performance would be lower.
In accordance with Section 23(c) of the Investment Company
Act of 1940, the fund hereby gives notice that it may from time to time repurchase shares of the fund in the open market at the option of the Board of Trustees and on such terms as the Trustees shall determine.
Investment Objective,
Principal Investment Strategies and Principal Risks
Investment Objective
The fund’s investment objective is to seek high current
income, but may also consider capital appreciation. The fund’s objective may be changed without shareholder approval.
Principal Investment Strategies
The fund normally invests at least 80% of its net assets in
fixed income securities. This policy may not be changed without shareholder approval.
MFS (Massachusetts Financial Services Company, the fund's
investment adviser) considers debt instruments of all types to be fixed income securities.
MFS normally invests the fund’s assets in corporate bonds
of U.S. and/or foreign issuers, U.S. Government securities, foreign government securities, mortgage-backed securities and other securitized instruments of U.S. and foreign issuers, and/or debt instruments of issuers located in emerging market
countries. MFS allocates the fund’s assets across these categories with a view toward broad diversification across and within these categories. MFS may also invest the fund’s assets in equity securities.
MFS may invest up to 100% of the fund’s assets in below
investment grade quality debt instruments.
MFS normally
invests the fund's assets across different industries, sectors, countries, and regions, but MFS may invest a significant percentage of the fund’s assets in issuers in a single industry, sector, country, or region.
The fund seeks to make a monthly distribution at an annual
fixed rate of 8.00% of the fund’s average monthly net asset value.
While MFS may use derivatives for any investment purpose, to
the extent MFS uses derivatives, MFS expects to use derivatives primarily to increase or decrease exposure to a particular market, segment of the market, or security, to increase or decrease interest rate or currency exposure, or as alternatives to
direct investments.
MFS uses an active bottom-up
investment approach to buying and selling investments for the fund. Investments are selected primarily based on fundamental analysis of individual issuers and/or instruments in light of the issuer’s financial condition and market, economic,
political, and regulatory conditions. Factors considered for debt instruments may include the instrument’s credit quality, collateral characteristics, and indenture provisions, and the issuer’s management ability, capital structure,
leverage, and ability to meet its current obligations. Factors considered for equity securities may include analysis of an issuer’s earnings, cash flows, competitive position, and management ability. MFS may also consider environmental,
social, and governance (ESG) factors in its fundamental investment analysis where MFS believes such factors could materially impact the economic value of an issuer or instrument. ESG factors considered may include, but are not limited to, climate
change, resource depletion, an issuer's governance structure and practices, data protection and privacy issues, and
Investment Objective, Principal
Investment Strategies and Principal Risks - continued
diversity and labor practices. Quantitative screening tools that
systematically evaluate the structure of a debt instrument and its features or the valuation, price and earnings momentum, earnings quality, and other factors of the issuer of an equity security may also be considered.
The fund may use leverage by borrowing up to 33 1/3% of the
fund’s assets, including borrowings for investment purposes, and investing the proceeds pursuant to its investment strategies. If approved by the fund’s Board of Trustees, the fund may use leverage by other methods.
MFS may engage in active and frequent trading in pursuing the
fund's principal investment strategies.
In response to
market, economic, political, or other conditions, MFS may depart from the fund’s principal investment strategies by temporarily investing for defensive purposes.
Principal Investment Types
The principal investment types in which the fund may invest
are:
Debt Instruments:
Debt instruments represent obligations of corporations, governments, and other entities to repay money borrowed, or other instruments believed to have debt-like characteristics. The issuer or borrower usually pays a fixed, variable, or floating rate
of interest, and must repay the amount borrowed, usually at the maturity of the instrument. Debt instruments generally trade in the over-the-counter market and can be less liquid than other types of investments, particularly during adverse market
and economic conditions. During certain market conditions, debt instruments in some or many segments of the debt market can trade at a negative interest rate (i.e., the price to purchase the debt instrument is more than the present value of expected
interest payments and principal due at the maturity of the instrument). Some debt instruments, such as zero coupon bonds or payment-in-kind bonds, do not pay current interest. Other debt instruments, such as certain mortgage-backed securities and
other securitized instruments, make periodic payments of interest and/or principal. Some debt instruments are partially or fully secured by collateral supporting the payment of interest and principal.
Corporate Bonds: Corporate
bonds are debt instruments issued by corporations or similar entities.
U.S. Government Securities:
U.S. Government securities are securities issued or guaranteed as to the payment of principal and interest by the U.S. Treasury, by an agency or instrumentality of the U.S. Government, or by a U.S. Government-sponsored entity. Certain U.S.
Government securities are not supported as to the payment of principal and interest by the full faith and credit of the U.S. Treasury or the ability to borrow from the U.S. Treasury. Some U.S. Government securities are supported as to the payment of
principal and interest only by the credit of the entity issuing or guaranteeing the security. U.S. Government securities include mortgage-backed securities and other types of securitized instruments guaranteed by the U.S. Treasury, by an agency or
instrumentality of the U.S. Government, or by a U.S. Government-sponsored entity.
Investment Objective, Principal
Investment Strategies and Principal Risks - continued
Foreign Government Securities:
Foreign government securities are debt instruments issued, guaranteed, or supported, as to the payment of principal and interest, by foreign governments, foreign government agencies, foreign semi-governmental entities or supranational entities, or
debt instruments issued by entities organized and operated for the purpose of restructuring outstanding foreign government securities. Foreign government securities may not be supported as to the payment of principal and interest by the full faith
and credit of the foreign government.
Securitized
Instruments: Securitized instruments are debt instruments that generally provide payments of principal and interest based on the terms of the instrument and cash flows generated by the underlying assets. Underlying
assets include residential and commercial mortgages, debt instruments, loans, leases, and receivables. Securitized instruments are issued by trusts or other special purpose entities that hold the underlying assets. Certain securitized instruments
offer multiple classes that differ in terms of their priority to receive principal and/or interest payments under the terms of the instrument. Securitized instruments include mortgage-backed securities, collateralized debt obligations, and other
asset-backed securities. Certain mortgage-backed securities are issued on a delayed delivery or forward commitment basis where payment and delivery take place at a future date.
Equity Securities: Equity
securities represent an ownership interest, or the right to acquire an ownership interest, in a company or other issuer. Different types of equity securities provide different voting and dividend rights and priorities in the event of bankruptcy of
the issuer. Equity securities include common stocks, preferred stocks, securities convertible into stocks, equity interests in real estate investment trusts (REITs), and depositary receipts for such securities.
Derivatives: Derivatives are
financial contracts whose value is based on the value of one or more underlying indicators or the difference between underlying indicators. Underlying indicators may include a security or other financial instrument, asset, currency, interest rate,
credit rating, commodity, volatility measure, or index. Derivatives often involve a counterparty to the transaction. Derivatives include futures, forward contracts, options, swaps, and certain complex structured securities.
Principal Risks
The share price of the fund will change daily based on changes
in market, economic, industry, political, regulatory, geopolitical, environmental, public health, and other conditions. As with any mutual fund, the fund may not achieve its objective and/or you could lose money on your investment in the fund. An
investment in the fund is not a bank deposit and is not insured or guaranteed by the Federal Deposit Insurance Corporation or any other governmental agency. The significance of any specific risk to an investment in the fund will vary over time
depending on the composition of the fund's portfolio, market conditions, and other factors. You should read all of the risk information below carefully, because any one or more of these risks may result in losses to the fund.
The principal risks of investing in the fund are:
Investment Objective, Principal
Investment Strategies and Principal Risks - continued
Investment Selection Risk: MFS'
investment analysis and its selection of investments may not produce the intended results and/or can lead to an investment focus that results in the fund underperforming other funds with similar investment strategies and/or underperforming the
markets in which the fund invests. In addition, MFS or the fund's other service providers may experience disruptions or operating errors that could negatively impact the fund.
Debt Market Risk: Debt markets
can be volatile and can decline significantly in response to, or investor perceptions of, issuer, market, economic, industry, political, regulatory, geopolitical, environmental, public health, and other conditions. These conditions can affect a
single instrument, issuer, or borrower, a particular type of instrument, issuer, or borrower, a segment of the debt markets, or debt markets generally. Certain changes or events, such as political, social, or economic developments, including
increasing and negative interest rates or the U.S. government's inability at times to agree on a long-term budget and deficit reduction plan (which has in the past resulted and may in the future result in a government shutdown); market closures
and/or trading halts; government or regulatory actions, including the imposition of tariffs or other protectionist actions and changes in fiscal, monetary, or tax policies; natural disasters; outbreaks of pandemic and epidemic diseases; terrorist
attacks; war; and other geopolitical changes or events can have a dramatic adverse effect on debt markets and may lead to periods of high volatility and reduced liquidity in a debt market or a segment of a debt market.
Interest Rate Risk: The price
of a debt instrument typically changes in response to interest rate changes. Interest rates can change in response to the supply and demand for credit, government and/or central bank monetary policy and action, inflation rates, and other factors. In
general, the price of a debt instrument falls when interest rates rise and rises when interest rates fall. The current period of historically low interest rates may heighten the risks associated with rising interest rates because there may be a
greater likelihood of interest rates increasing and interest rates may increase rapidly. Interest rate risk is generally greater for fixed-rate instruments than floating-rate instruments and for instruments with longer maturities, or that do not pay
current interest. In addition, short-term and long-term interest rates, and interest rates in different countries, do not necessarily move in the same direction or by the same amount. An instrument’s reaction to interest rate changes depends
on the timing of its interest and principal payments and the current interest rate for each of those time periods. The price of an instrument trading at a negative interest rate responds to interest rate changes like other debt instruments; however,
an instrument purchased at a negative interest rate is expected to produce a negative return if held to maturity. Changes in government and/or central bank monetary policy may affect the level of interest rates. To the extent the fund invests in
fixed-rate instruments, fluctuations in the market price of such investments may not affect interest income derived from those instruments, but may nonetheless affect the fund's share price, especially if the instrument has a longer
maturity.
Credit Risk: The price of a debt instrument depends, in part, on the issuer's or borrower's credit quality or ability to pay principal and interest when due. The price of a debt instrument is likely to fall if an issuer or borrower
defaults on its obligation to pay principal or interest, if the instrument's credit rating is downgraded by a credit rating agency, or based on other changes in, or perceptions of, the financial condition of the issuer or borrower. For certain types
of instruments, including derivatives, the
Investment Objective, Principal
Investment Strategies and Principal Risks - continued
price of the instrument depends in part on the credit quality of the
counterparty to the transaction. For other types of debt instruments, including securitized instruments, the price of the debt instrument also depends on the credit quality and adequacy of the underlying assets or collateral as well as whether there
is a security interest in the underlying assets or collateral. Enforcing rights, if any, against the underlying assets or collateral may be difficult.
Below investment grade quality debt instruments can involve a
substantially greater risk of default or can already be in default, and their values can decline significantly over short periods of time. Below investment grade quality debt instruments are regarded as having predominantly speculative
characteristics with respect to capacity to pay interest and principal. Below investment grade quality debt instruments tend to be more sensitive to adverse news about the issuer, or the market or economy in general, than higher quality debt
instruments. The market for below investment grade quality debt instruments can be less liquid, especially during periods of recession or general market decline.
Foreign Risk: Investments in
securities of foreign issuers, securities of companies with significant foreign exposure, and foreign currencies can involve additional risks relating to market, economic, industry, political, regulatory, geopolitical, environmental, public health,
and other conditions. Political, social, diplomatic, and economic developments, U.S. and foreign government action such as the imposition of currency or capital blockages, controls, or tariffs, economic and trade sanctions or embargoes, security
trading suspensions, entering or exiting trade or other intergovernmental agreements, or the expropriation or nationalization of assets in a particular country, can cause dramatic declines in certain or all securities with exposure to that country
and other countries. In the event of nationalization, expropriation, confiscation or other government action, intervention, or restriction, the fund could lose its entire investment in a particular foreign issuer or country. Economies and financial
markets are interconnected, which increases the likelihood that conditions in one country or region can adversely impact issuers in different countries and regions. Less stringent regulatory, accounting, auditing, and disclosure requirements for
issuers and markets are more common in certain foreign countries. Enforcing legal rights can be difficult, costly, and slow in certain foreign countries and with respect to certain types of investments, and can be particularly difficult against
foreign governments. Changes in currency exchange rates can significantly impact the financial condition of a company or other issuer with exposure to multiple countries as well as affect the U.S. dollar value of foreign currency investments and
investments denominated in foreign currencies. Additional risks of foreign investments include trading, settlement, custodial, and other operational risks, and withholding and other taxes. These factors can make foreign investments, especially those
tied economically to emerging and frontier markets (emerging markets that are early in their development), more volatile and less liquid than U.S. investments. In addition, foreign markets can react differently to market, economic, industry,
political, regulatory, geopolitical, environmental, public health, and other conditions than the U.S. market.
Emerging Markets Risk:
Investments tied economically to emerging markets, especially frontier markets, can involve additional and greater risks than the risks associated with investments in developed markets. Emerging markets typically have less developed economies and
markets, greater custody and operational risk, less developed legal, regulatory, and accounting systems, less trading volume, less stringent
Investment Objective, Principal
Investment Strategies and Principal Risks - continued
investor protection and disclosure standards, less reliable settlement
practices, greater government involvement in the economy than developed countries, and greater risk of new or inconsistent government treatment of or restrictions on issuers and instruments. Financial and other disclosures by emerging market issuers
may be considerably less reliable than disclosures made by issuers in developed markets. In addition, the Public Company Accounting Oversight Board, which regulates auditors of U.S. public companies, is unable to inspect audit work papers in certain
emerging market countries. Emerging markets can also be subject to greater political, social, geopolitical, and economic instability and more susceptible to environmental problems. In addition, many emerging market countries with less established
health care systems have experienced outbreaks of pandemics or contagious diseases from time to time. These factors can make emerging market investments more volatile and less liquid than investments in developed markets.
Currency Risk: Changes in
currency exchange rates can significantly impact the financial condition of a company or other issuer with exposure to multiple countries. In addition, a decline in the value of a foreign currency relative to the U.S. dollar reduces the value of the
foreign currency and investments denominated in that currency. In addition, the use of foreign exchange contracts to reduce foreign currency exposure can eliminate some or all of the benefit of an increase in the value of a foreign currency versus
the U.S. dollar. The value of foreign currencies relative to the U.S. dollar fluctuates in response to, among other factors, interest rate changes, intervention (or failure to intervene) by the U.S. or foreign governments, central banks, or
supranational entities such as the International Monetary Fund, the imposition of currency controls, and other political or regulatory conditions in the U.S. or abroad. Foreign currency values can decrease significantly both in the short term and
over the long term in response to these and other conditions.
Focus Risk: Issuers in a single
industry, sector, country, or region can react similarly to market, currency, political, economic, regulatory, geopolitical, environmental, public health, and other conditions. These conditions include business environment changes; economic factors
such as fiscal, monetary, and tax policies; inflation and unemployment rates; and government and regulatory changes. The fund's performance will be affected by the conditions in the industries, sectors, countries and regions to which the fund is
exposed.
Prepayment/Extension Risk: Many types of debt instruments, including mortgage-backed securities, securitized instruments, certain corporate bonds, and municipal housing bonds, and certain derivatives, are subject to the risk of prepayment and/or
extension. Prepayment occurs when unscheduled payments of principal are made or the instrument is called or redeemed prior to an instrument’s maturity. When interest rates decline, the instrument is called, or for other reasons, these debt
instruments may be repaid more quickly than expected. As a result, the holder of the debt instrument may not be able to reinvest the proceeds at the same interest rate or on the same terms, reducing the potential for gain. When interest rates
increase or for other reasons, these debt instruments may be repaid more slowly than expected, increasing the potential for loss. In addition, prepayment rates are difficult to predict and the potential impact of prepayment on the price of a debt
instrument depends on the terms of the instrument.
Investment Objective, Principal
Investment Strategies and Principal Risks - continued
Equity Market Risk: Equity
markets can be volatile and can decline significantly in response to, or investor perceptions of, issuer, market, economic, industry, political, regulatory, geopolitical, environmental, public health, and other conditions. These conditions can
affect a single issuer or type of security, issuers within a broad market sector, industry or geographic region, or the equity markets in general. Different parts of the market and different types of securities can react differently to these
conditions. For example, the stocks of growth companies can react differently from the stocks of value companies, and the stocks of large cap companies can react differently from the stocks of small cap companies. Certain changes or events, such as
political, social, or economic developments, including increasing or negative interest rates or the U.S. government's inability at times to agree on a long-term budget and deficit reduction plan (which has in the past resulted and may in the future
result in a government shutdown); market closures and/or trading halts; government or regulatory actions, including the imposition of tariffs or other protectionist actions and changes in fiscal, monetary, or tax policies; natural disasters;
outbreaks of pandemic and epidemic diseases; terrorist attacks; war; and other geopolitical changes or events, can have a dramatic adverse effect on equity markets and may lead to periods of high volatility in an equity market or a segment of an
equity market.
Company Risk: Changes in the financial condition of a company or other issuer, changes in specific market, economic, industry, political, regulatory, geopolitical, environmental, public health, and other conditions that affect a
particular type of investment or issuer, and changes in general market, economic, political, regulatory, geopolitical, environmental, public health, and other conditions can adversely affect the prices of investments. The prices of securities of
smaller, less well-known issuers can be more volatile than the prices of securities of larger issuers or the market in general.
Leveraging Risk: If the fund
utilizes investment leverage, there can be no assurance that such a leveraging strategy will be successful during any period in which it is employed. The use of leverage is a speculative investment technique that results in greater volatility in the
fund’s net asset value. To the extent that investments are purchased with the proceeds from the borrowings from a bank, the issuance of preferred shares, or the creation of tender option bonds, the fund’s net asset value will increase or
decrease at a greater rate than a comparable unleveraged fund. If the investment income or gains earned from the investments purchased with the proceeds from the borrowings from a bank, the issuance of preferred shares, or the creation of tender
option bonds, fails to cover the expenses of leveraging, the fund’s net asset value is likely to decrease more quickly than if the fund weren’t leveraged. In addition, the fund’s distributions could be reduced. The fund is
currently required under the under the Investment Company Act of 1040 (the “1940 Act”) to maintain asset coverage of 200% on outstanding preferred shares and 300% on outstanding indebtedness. The fund may be required to sell a portion of
its investments at a time when it may be disadvantageous to do so in order to redeem preferred shares or to reduce outstanding indebtedness to comply with asset coverage or other restrictions including those imposed by the 1940 Act and the rating
agencies that rate the preferred shares. The expenses of leveraging are paid by the holders of common shares. Borrowings from a bank or preferred shares may have a stated maturity. If this leverage is not extended prior to maturity or replaced with
the same or a different form of leverage, distributions to common shareholders may be decreased.
Investment Objective, Principal
Investment Strategies and Principal Risks - continued
Certain transactions and investment strategies can result in
leverage. Because movements in a fund’s share price generally correlate over time with the fund’s net asset value, the market price of a leveraged fund will also tend to be more volatile than that of a comparable unleveraged fund. The
costs of an offering of preferred shares and/or borrowing program would be borne by shareholders.
Under the terms of any loan agreement or of a purchase
agreement between the fund and the investor in the preferred shares, as the case may be, the fund may be required to, among other things, limit its ability to pay distributions in certain circumstances, incur additional debts, engage in certain
transactions, and pledge some or all of its assets. Such agreements could limit the fund’s ability to pursue its investment strategies. The terms of any loan agreement or purchase agreement could be more or less restrictive than those
described.
Under guidelines generally required by a
rating agency providing a rating for any preferred shares, the fund may be required to, among other things, maintain certain asset coverage requirements, restrict certain investments and practices, and adopt certain redemption requirements relating
to preferred shares. Such guidelines or the terms of a purchase agreement between a fund and the investor in the preferred shares could limit the fund’s ability to pursue its investment strategies. The guidelines imposed with respect to
preferred shares by a rating agency or an investor in the preferred shares could be more or less restrictive than those described.
Managed Distribution Plan Risk:
The fund may not be able to maintain a monthly distribution at an annual fixed rate of up to 8.00% of the fund’s average monthly net asset value due to many factors, including but not limited to, changes in
market returns, fluctuations in market interest rates, and other factors. If income from the fund’s investments is less than the amount needed to make a monthly distribution, portfolio investments may be sold at less than opportune times to
fund the distribution. Distributions that are treated as tax return of capital will have the effect of reducing the fund’s assets and could increase the fund’s expense ratio. If a portion of the fund’s distributions represents
returns of capital over extended periods, the fund’s assets may be reduced over time to levels where the fund is no longer viable and might be liquidated.
Derivatives Risk: Derivatives
can be highly volatile and involve risks in addition to, and potentially greater than, the risks of the underlying indicator(s). Gains or losses from derivatives can be substantially greater than the derivatives’ original cost and can
sometimes be unlimited. Derivatives can involve leverage. Derivatives can be complex instruments and can involve analysis and processing that differs from that required for other investment types used by the fund. If the value of a derivative does
not change as expected relative to the value of the market or other indicator to which the derivative is intended to provide exposure, the derivative may not have the effect intended. Derivatives can also reduce the opportunity for gains or result
in losses by offsetting positive returns in other investments. Derivatives can be less liquid than other types of investments.
Anti-Takeover Provisions Risk:
The fund’s declaration of trust includes provisions that could limit the ability of other persons or entities to acquire control of the fund, to convert the fund to an open-end fund, or to change the
composition of the fund’s Board of Trustees. These provisions could reduce the opportunities for shareholders to sell their shares at a premium over the then-current market price.
Investment Objective, Principal
Investment Strategies and Principal Risks - continued
Market Discount/Premium Risk:
The market price of shares of the fund will be based on factors such as the supply and demand for shares in the market and general market, economic, industry, political or regulatory conditions. Whether shareholders
will realize gains or losses upon the sale of shares of the fund will depend on the market price of shares at the time of the sale, not on the fund’s net asset value. The market price may be lower or higher than the fund’s net asset
value. Shares of closed-end funds frequently trade at a discount to their net asset value.
Counterparty and Third Party Risk: Transactions involving a counterparty other than the issuer of the instrument, including clearing organizations, or a third party responsible for servicing the instrument or effecting the transaction, are subject to the
credit risk of the counterparty or third party, and to the counterparty’s or third party’s ability or willingness to perform in accordance with the terms of the transaction. If a counterparty or third party fails to meet its contractual
obligations, goes bankrupt, or otherwise experiences a business interruption, the fund could miss investment opportunities, lose value on its investments, or otherwise hold investments it would prefer to sell, resulting in losses for the
fund.
Liquidity Risk: Certain investments and types of investments are subject to restrictions on resale, may trade in the over-the-counter market, or may not have an active trading market due to adverse market, economic, industry, political,
regulatory, geopolitical, environmental, public health, and other conditions, including investors trying to sell large quantities of a particular investment or type of investment, or lack of market makers or other buyers for a particular investment
or type of investment. At times, all or a significant portion of a market may not have an active trading market. Without an active trading market, it may be difficult to value, and it may not be possible to sell, these investments and the fund could
miss other investment opportunities and hold investments it would prefer to sell, resulting in losses for the fund. In addition, the fund may have to sell certain of these investments at prices or times that are not advantageous in order to meet
redemptions or other cash needs, which could result in dilution of remaining investors' interests in the fund. The prices of illiquid securities may be more volatile than more liquid investments.
Defensive Investing Risk: When
MFS invests defensively, different factors could affect the fund’s performance and the fund may not achieve its investment objective. In addition, the defensive strategy may not work as intended.
Frequent Trading Risk: Frequent
trading increases transaction costs, which may reduce the Fund's return. Frequent trading can also result in the realization of a higher percentage of short-term capital gains and a lower percentage of long-term capital gains as compared to a fund
that trades less frequently. Because short-term capital gains are distributed as ordinary income, this would generally increase your tax liability unless you hold your shares through a tax-advantaged or tax-exempt vehicle.
Investment Restrictions
The Fund has adopted the following policies which cannot be
changed without the approval of the holders of a majority of its shares as defined currently in the 1940 Act to be the lesser of (i) 67% or more of the voting securities present at a meeting at which holders of voting securities representing more
than 50% of the outstanding voting securities are present or represented by proxy, or (ii) more than 50% of the
Investment Objective, Principal
Investment Strategies and Principal Risks - continued
outstanding voting securities (“Majority Shareholder Vote”).
Except for fundamental investment restriction (1), these investment restrictions are adhered to at the time of purchase or utilization of assets; a subsequent change in circumstances will not be considered to result in a violation of policy.
The Fund may not:
| (1)
|
borrow
money except to the extent not prohibited by the 1940 Act and exemptive orders granted under such Act. |
| (2)
|
underwrite
securities issued by other persons, except that all or any portion of the assets of the Fund may be invested in one or more investment companies, to the extent not prohibited by the 1940 Act and exemptive orders granted under such Act, and except
insofar as the Fund may technically be deemed an underwriter under the Securities Act of 1933, as amended, in selling a portfolio security. |
| (3)
|
issue any
senior securities except to the extent not prohibited by the 1940 Act and exemptive orders granted under such Act. For purposes of this restriction, collateral arrangements with respect to any type of swap, option, Forward Contracts and Futures
Contracts and collateral arrangements with respect to initial and variation margin are not deemed to be the issuance of a senior security. |
| (4)
|
make loans
except to the extent not prohibited by the 1940 Act and exemptive orders granted under such Act. |
| (5)
|
purchase
or sell real estate (excluding securities secured by real estate or interests therein and securities of companies, such as real estate investment trusts, which deal in real estate or interests therein), interests in oil, gas or mineral leases,
commodities or commodity contacts (excluding currencies and any type of option, Futures Contracts and Forward Contracts) in the ordinary course of its business. The Fund reserves the freedom of action to hold and to sell real estate, mineral leases,
commodities or commodity contracts (including currencies and any type of option, Futures Contracts and Forward Contracts) acquired as a result of the ownership of securities. |
| (6)
|
purchase
any securities of an issuer in a particular industry if as a result 25% or more of its total assets (taken at market value at the time of purchase) would be invested in securities of issuers whose principal business activities are in the same
industry, except that the Fund may invest up to 40% of the value of its assets in each of the electric utility and telephone industries. |
For purposes of investment restriction (5), investments in
certain types of derivative instruments whose value is related to commodities or commodity contracts, including swaps and structured notes, are not considered commodities or commodity contracts.
For purposes of fundamental investment restriction (6),
investments in securities issued or guaranteed by the U.S. Government or its agencies or instrumentalities and tax-exempt obligations issued or guaranteed by a U.S. territory or possession, a state or local government, or a political subdivision of
any of the foregoing, are not considered an investment in any particular industry.
Investment Objective, Principal
Investment Strategies and Principal Risks - continued
For purposes of fundamental investment restriction (6),
investments in other investment companies are not considered an investment in any particular industry and portfolio securities held by an underlying fund in which the Fund may invest are not considered to be securities purchased by the Fund.
For purposes of fundamental investment restriction (6), MFS
uses a customized set of industry groups for classifying securities based on classifications developed by third party providers.
Effects of Leverage
The following table is furnished in response to requirements
of the Securities and Exchange Commission (the “SEC”). It is designed to, among other things, illustrate the effects of leverage through the use of senior securities, as that term is defined under Section 18 of the Investment Company Act
of 1940 (the “1940 Act”), on fund total return, assuming investment portfolio total returns (consisting of income and changes in the value of investments held in a fund’s portfolio) of –10%, –5%, 0%, 5% and 10%. The
table below assumes the fund’s continued use of line of credit borrowings (“leverage”), as applicable, as of October 31, 2021, as a percentage of total assets (including assets attributable to such leverage), the estimated annual
effective interest expense rate payable by the fund on such line of credit borrowings (based on market conditions as of October 31, 2021), and the annual return that the fund’s portfolio would need to experience (net of expenses) in order to
cover such costs. The information below does not reflect the fund’s possible use of certain other forms of economic leverage through the use of other instruments or transactions not considered to be senior securities under the 1940 Act, if
any.
The assumed investment portfolio returns in the
table below are hypothetical figures and are not necessarily indicative of the investment portfolio returns experienced or expected to be experienced by the fund. Your actual returns may be greater or less than those appearing below. In addition,
actual borrowing expenses associated with line of credit borrowings used by the fund may vary frequently and may be significantly higher or lower than the rate used for the example below.
| Line
of Credit Borrowings as a Percentage of Total Assets (Including Assets Attributable to Leverage) |
21.28%
|
| Estimated
Annual Effective Rate of Interest Expense on Line of Credit Borrowings |
0.70%
|
| Annual
Return Fund Portfolio Must Experience (net of expenses) to Cover Estimated Annual Effective Interest Expense on Line of Credit Borrowings |
0.15%
|
| Assumed
Return on Portfolio (Net of Expenses) |
-10.00%
|
-5.00%
|
0.00%
|
5.00%
|
10.00%
|
| Corresponding
Return to Shareholder |
-12.89%
|
-6.54%
|
-0.19%
|
6.16%
|
12.51%
|
The table reflects hypothetical
performance of the fund’s portfolio and not the actual performance of the fund’s shares, the value of which is determined by market forces and other factors.
Should the fund elect to add additional leverage to its
portfolio, any benefits of such additional leverage cannot be fully achieved until the proceeds resulting from the use of such leverage have been received by the fund and invested in accordance with the fund’s investment objectives and
policies. The fund’s willingness to use additional leverage, and the extent to which leverage is used at any time, will depend on many factors.
Portfolio
Managers' Profiles
| Portfolio
Manager |
Primary
Role |
Since
|
Title
and Five Year History |
| Robert
Spector |
Lead
Portfolio Manager |
2017
|
Investment
Officer of MFS; employed in the investment management area of MFS since 2011. |
| Ward
Brown |
Emerging
Markets Debt Instruments Portfolio Manager |
2012
|
Investment
Officer of MFS; employed in the investment management area of MFS since 2005. |
| David
Cole |
Below
Investment Grade Debt Instruments Portfolio Manager |
2006
|
Investment
Officer of MFS; employed in the investment management area of MFS since 2004. |
| Pilar
Gomez-Bravo |
Debt
Instruments Portfolio Manager |
2013
|
Investment
Officer of MFS; employed in the investment management area of MFS since 2013. |
| Andy
Li |
Investment
Grade Debt Instruments Portfolio Manager |
2019
|
Investment
Officer of MFS; employed in the investment management area of MFS since 2018; Portfolio Manager of Man GLG from 2014 to 2018. |
| Henry
Peabody |
Investment
Grade Debt Instruments Portfolio Manager |
2019
|
Investment
Officer of MFS; employed in the investment management area of MFS since 2019; Portfolio Manager and Analyst at Eaton Vance Management from 2014 to 2019. |
| Matt
Ryan |
Emerging
Markets Debt Instruments Portfolio Manager |
2004
|
Investment
Officer of MFS; employed in the investment management area of MFS since 1997. |
| Michael
Skatrud |
Below
Investment Grade Debt Instruments Portfolio Manager |
2018
|
Investment
Officer of MFS; employed in the investment management area of MFS since 2013. |
The following information in this annual report is a summary of
certain changes since October 31, 2020. This information may not reflect all of the changes that have occurred since you purchased this fund.
Effective June 30, 2021, Robert Persons is no longer a
Portfolio Manager of the fund.
Dividend Reinvestment And
Cash Purchase Plan
The fund offers a Dividend
Reinvestment and Cash Purchase Plan (the “Plan”) that allows common shareholders to reinvest either all of the distributions paid by the fund or only the long-term capital gains. Generally, purchases are made at the market price unless
that price exceeds the net asset value (the shares are trading at a premium). If the shares are trading at a premium, the fund will issue shares at a price of either the net asset value or 95% of the market price, whichever is greater. You can also
buy shares on a quarterly basis in any amount $100 and over. Computershare Trust Company, N.A. (the Transfer Agent for the fund) (the “Plan Agent”) will purchase shares under the Plan on the 15th of January, April, July, and October or
shortly thereafter. You may obtain a copy of the Plan by contacting the Plan Agent at 1-800-637-2304 any business day from 9 a.m. to 5 p.m. Eastern time or by visiting the Plan Agent's Web site at www.computershare.com/investor.
If shares are registered in your own name, new shareholders
will automatically participate in the Plan, unless you have indicated that you do not wish to participate. If your shares are in the name of a brokerage firm, bank, or other nominee, you can ask the firm or nominee to participate in the Plan on your
behalf. If the nominee does not offer the Plan, you may wish to request that your shares be re-registered in your own name so that you can participate. There is no service charge to reinvest distributions, nor are there brokerage charges for shares
issued directly by the fund. However, when shares are bought on the New York Stock Exchange or otherwise on the open market, each participant pays a pro rata share of the transaction expenses, including commissions. The tax status of dividends and
capital gain distributions does not change whether received in cash or reinvested in additional shares – the automatic reinvestment of distributions does not relieve you of any income tax that may be payable (or required to be withheld) on the
distributions.
If your shares are held directly with the
Plan Agent, you may withdraw from the Plan at any time by contacting the Plan Agent. Please have available the name of the fund and your account number. For certain types of registrations, such as corporate accounts, instructions must be submitted
in writing. Please call for additional details. When you withdraw from the Plan, you can receive the value of the reinvested shares in one of three ways: your full shares will be held in your account, the Plan Agent will sell your shares and send
the proceeds to you, or you may transfer your full shares to your investment professional who can hold or sell them. Additionally, the Plan Agent will sell your fractional shares and send the proceeds to you.
If you have any questions, contact the Plan Agent by calling
1-800-637-2304, visit the Plan Agent’s Web site at www.computershare.com/investor, or by writing to the Plan Agent at P.O. Box 505005, Louisville, KY 40233-5005.
Portfolio of
Investments
10/31/21
The Portfolio of Investments is a complete list of all
securities owned by your fund. It is categorized by broad-based asset classes.
| Issuer
|
|
|
Shares/Par
|
Value
($) |
| Bonds
– 123.8% |
| Aerospace
& Defense – 1.6% |
| Bombardier,
Inc., 7.5%, 3/15/2025 (n) |
|
$
|
518,000 |
$
531,597 |
| Bombardier,
Inc., 7.125%, 6/15/2026 (n) |
|
|
277,000 |
290,504 |
| F-Brasile
S.p.A./F-Brasile U.S. LLC, 7.375%, 8/15/2026 (n) |
|
|
805,000 |
817,075 |
| Lockheed
Martin Corp., 2.8%, 6/15/2050 |
|
|
679,000 |
689,706 |
| Moog,
Inc., 4.25%, 12/15/2027 (n) |
|
|
1,040,000 |
1,070,566 |
| TransDigm,
Inc., 6.25%, 3/15/2026 (n) |
|
|
675,000 |
704,531 |
| TransDigm,
Inc., 6.375%, 6/15/2026 |
|
|
570,000 |
589,237 |
| TransDigm,
Inc., 5.5%, 11/15/2027 |
|
|
665,000 |
680,794 |
| TransDigm,
Inc., 4.625%, 1/15/2029 |
|
|
493,000 |
489,919 |
| |
|
|
|
$5,863,929 |
| Airlines
– 0.1% |
| National
Express Group PLC, 4.25%, 11/26/2069 |
|
GBP
|
265,000 |
$
370,901 |
| Asset-Backed
& Securitized – 3.9% |
| Arbor
Multi-Family Mortgage Securities Trust, Inc., 2021-MF2, “A5”, 2.513%, 6/15/2054 (n) |
|
$
|
490,000 |
$
501,788 |
| Arbor
Realty Trust, Inc., CLO, 2021-FL1, “C”, FLR, 2.09% (LIBOR - 1mo. + 2%), 12/15/2035 (n) |
|
|
100,000 |
100,000 |
| Arbor
Realty Trust, Inc., CLO, 2021-FL2, “C”, FLR, 2.04% (LIBOR - 1mo. + 1.95%), 5/15/2036 (n) |
|
|
471,500 |
471,935 |
| Barclays
Commercial Mortgage Securities LLC, 2020-C7, “XA”, 1.627%, 4/15/2053 (i) |
|
|
995,183 |
99,784 |
| Bayview
Financial Revolving Mortgage Loan Trust, FLR, 1.687% (LIBOR - 1mo. + 1.6%), 12/28/2040 (n) |
|
|
634,126 |
697,635 |
| BBCMS
Mortgage Trust, 2021-C10, “XA”, 1.309%, 7/15/2054 (i) |
|
|
998,634 |
96,934 |
| BBCMS
Mortgage Trust, 2021-C9, “XA”, 1.64%, 2/15/2054 (i) |
|
|
6,630,627 |
795,608 |
| Benchmark
Mortgage Trust, 2021-B23, “XA”, 1.277%, 2/15/2054 (i) |
|
|
4,059,407 |
370,262 |
| Benchmark
Mortgage Trust, 2021-B24, “XA”, 1.155%, 3/15/2054 (i) |
|
|
2,046,778 |
169,883 |
| Benchmark
Mortgage Trust, 2021-B26, “XA”, 0.999%, 6/15/2054 (i) |
|
|
7,106,714 |
469,924 |
| Benchmark
Mortgage Trust, 2021-B27, “XA”, 1.272%, 7/15/2054 (i) |
|
|
7,161,673 |
680,613 |
| Business
Jet Securities LLC, 2020-1A, “A”, 2.981%, 11/15/2035 (n) |
|
|
374,654 |
376,653 |
| Business
Jet Securities LLC, 2021-1A, “B”, 2.918%, 4/15/2036 (n) |
|
|
89,506 |
89,868 |
Portfolio of
Investments – continued
| Issuer
|
|
|
Shares/Par
|
Value
($) |
| Bonds
– continued |
| Asset-Backed
& Securitized – continued |
| Capital
Automotive, 2020-1A, “A4”, REIT, 3.19%, 2/15/2050 (n) |
|
$
|
145,086 |
$
147,037 |
| Capital
Automotive, 2020-1A, “B1”, REIT, 4.17%, 2/15/2050 (n) |
|
|
437,500 |
446,865 |
| CF
Hippolyta Issuer LLC, 2020-1, “B1”, 2.28%, 7/15/2060 (n) |
|
|
93,191 |
93,725 |
| Commercial
Mortgage Pass-Through Certificates, 2021-BN32, “XA”, 0.784%, 4/15/2054 (i) |
|
|
3,627,842 |
210,437 |
| Crest
Ltd., CDO, 7%, (0.001% cash or 7% PIK) 1/28/2040 (a)(p) |
|
|
3,372,294 |
34 |
| HarbourView
CLO VII Ltd., 7RA, “B”, FLR, 1.822% (LIBOR - 3mo. + 1.7%), 7/18/2031 (n) |
|
|
2,500,000 |
2,480,825 |
| Lehman
Brothers Commercial Conduit Mortgage Trust, 0.912%, 2/18/2030 (i) |
|
|
29,639 |
2 |
| LoanCore
Ltd., 2021-CRE5, “AS”, FLR, 1.84% (LIBOR - 1mo. + 1.75%), 7/15/2036 (n) |
|
|
938,000 |
938,289 |
| LoanCore
Ltd., 2021-CRE5, “B”, FLR, 2.09% (LIBOR - 1mo. + 2%), 7/15/2036 (n) |
|
|
464,500 |
464,500 |
| MF1
CLO Ltd., 2020-FL3, “AS”, FLR, 3.014% (LIBOR - 1mo. + 2.85%), 7/15/2035 (z) |
|
|
571,500 |
579,182 |
| MF1
CLO Ltd., 2021-FL5, “C”, FLR, 1.864% (LIBOR - 1mo. + 1.7%), 7/15/2036 (n) |
|
|
401,500 |
401,376 |
| MF1
Multi-Family Housing Mortgage Loan Trust, 2021-FL5, “D”, FLR, 2.664% (LIBOR - 1mo. + 2.5%), 7/15/2036 (n) |
|
|
745,000 |
743,903 |
| Morgan
Stanley Capital I Trust, 2021-L5, “XA”, 1.301%, 5/15/2054 (i) |
|
|
1,827,226 |
171,425 |
| Morgan
Stanley Capital I Trust, 2021-L6, “XA”, 1.239%, 6/15/2054 (i) |
|
|
2,792,230 |
238,193 |
| Multi-Family
Housing Mortgage, MF1-2021, “B”, FLR, 1.735% (LIBOR - 1mo. + 1.65%), 7/16/2036 (n) |
|
|
1,000,000 |
999,920 |
| PFP
III Ltd., 2021-7, “B”, FLR, 1.485% (LIBOR - 1mo. + 1.4%), 4/14/2038 (n) |
|
|
163,992 |
163,286 |
| PFP
III Ltd., 2021-7, “C”, FLR, 1.736% (LIBOR - 1mo. + 1.65%), 4/14/2038 (n) |
|
|
199,990 |
199,006 |
| Securitized
Term Auto Receivable Trust, 2019-CRTA, “C”, 2.849%, 3/25/2026 (n) |
|
|
223,153 |
226,232 |
| TPG
Real Estate Finance, 2021-FL4, “B”, FLR, 1.935% (LIBOR - 1mo. + 1.85%), 3/15/2038 (n) |
|
|
340,000 |
339,046 |
| Wells
Fargo Commercial Mortgage Trust, 2021-C59, “XA”, 1.553%, 4/15/2054 (i) |
|
|
2,333,367 |
265,485 |
| Wells
Fargo Commercial Mortgage Trust, 2021-C60, 1.559%, 8/15/2054 (i) |
|
|
1,997,671 |
235,445 |
| |
|
|
|
$14,265,100 |
Portfolio of
Investments – continued
| Issuer
|
|
|
Shares/Par
|
Value
($) |
| Bonds
– continued |
| Automotive
– 2.3% |
| Daimler
AG, 0.75%, 9/10/2030 |
|
EUR
|
110,000 |
$
129,679 |
| Daimler
Finance North America LLC, 1.45%, 3/02/2026 (n) |
|
$
|
377,000 |
375,215 |
| Dana,
Inc., 5.375%, 11/15/2027 |
|
|
513,000 |
537,367 |
| Dana,
Inc., 5.625%, 6/15/2028 |
|
|
176,000 |
186,120 |
| Dana,
Inc., 4.25%, 9/01/2030 |
|
|
325,000 |
328,884 |
| Dornoch
Debt Merger Sub Inc., 6.625%, 10/15/2029 (n) |
|
|
445,000 |
438,881 |
| Ferrari
N.V., 1.5%, 5/27/2025 |
|
EUR
|
416,000 |
496,927 |
| Ford
Motor Co., 5.113%, 5/03/2029 |
|
$
|
480,000 |
533,400 |
| Ford
Motor Co., 4.75%, 1/15/2043 |
|
|
535,000 |
584,359 |
| Hyundai
Capital America, 2%, 6/15/2028 (n) |
|
|
325,000 |
316,695 |
| Hyundai
Capital America, 6.375%, 4/08/2030 (n) |
|
|
626,000 |
793,965 |
| IAA
Spinco, Inc., 5.5%, 6/15/2027 (n) |
|
|
745,000 |
773,869 |
| Panther
BR Aggregator 2 LP/Panther Finance Co., Inc., 8.5%, 5/15/2027 (n) |
|
|
1,025,000 |
1,088,827 |
| PM
General Purchaser LLC, 9.5%, 10/01/2028 (n) |
|
|
320,000 |
333,600 |
| Real
Hero Merger Sub 2, Inc., 6.25%, 2/01/2029 (n) |
|
|
490,000 |
503,475 |
| Volkswagen
International Finance N.V., 3.5% to 3/20/2030, FLR (EUR Swap Rate - 15yr. + 3.06%) to 3/20/2050, FLR (EUR Swap Rate - 15yr. + 3.81%) to 12/29/2166 |
|
EUR
|
525,000 |
651,251 |
| Wheel
Pros, Inc., 6.5%, 5/15/2029 (n) |
|
$
|
445,000 |
433,319 |
| |
|
|
|
$8,505,833 |
| Broadcasting
– 2.3% |
| Advantage
Sales & Marketing, Inc., 6.5%, 11/15/2028 (n) |
|
$
|
680,000 |
$
707,200 |
| Discovery,
Inc., 4.125%, 5/15/2029 |
|
|
219,000 |
243,191 |
| Gray
Escrow II, Inc., 5.375%, 11/15/2031 (n) |
|
|
1,070,000 |
1,080,700 |
| iHeartCommunications,
Inc., 8.375%, 5/01/2027 |
|
|
635,000 |
676,275 |
| Nexstar
Escrow Corp., 5.625%, 7/15/2027 (n) |
|
|
410,000 |
432,550 |
| Prosus
N.V., 1.539%, 8/03/2028 |
|
EUR
|
150,000 |
173,974 |
| Prosus
N.V., 3.68%, 1/21/2030 (n) |
|
$
|
251,000 |
258,079 |
| Prosus
N.V., 3.061%, 7/13/2031 (n) |
|
|
325,000 |
315,443 |
| Scripps
Escrow II, Inc., 5.875%, 7/15/2027 (n) |
|
|
875,000 |
888,125 |
| Summer
(BC) Bidco B LLC, 5.5%, 10/31/2026 (n) |
|
|
565,000 |
574,887 |
| Summer
BC Holdco S.à r.l., “A”, 9.25%, 10/31/2027 |
|
EUR
|
207,242 |
259,408 |
| Univision
Communications, Inc., 4.5%, 5/01/2029 (n) |
|
$
|
1,280,000 |
1,294,976 |
| WMG
Acquisition Corp., 3.875%, 7/15/2030 (n) |
|
|
1,512,000 |
1,566,810 |
| |
|
|
|
$8,471,618 |
| Brokerage
& Asset Managers – 1.4% |
| Aretec
Escrow Issuer, Inc., 7.5%, 4/01/2029 (n) |
|
$
|
330,000 |
$
341,550 |
| Banco
BTG Pactual S.A. (Cayman Islands Branch), 4.5%, 1/10/2025 (n) |
|
|
894,000 |
908,527 |
| Intercontinental
Exchange, Inc., 3%, 9/15/2060 |
|
|
342,000 |
332,268 |
| London
Stock Exchange Group PLC, 0.25%, 4/06/2028 |
|
EUR
|
240,000 |
273,358 |
Portfolio of
Investments – continued
| Issuer
|
|
|
Shares/Par
|
Value
($) |
| Bonds
– continued |
| Brokerage
& Asset Managers – continued |
| Low
Income Investment Fund, 3.386%, 7/01/2026 |
|
$
|
185,000 |
$
193,133 |
| Low
Income Investment Fund, 3.711%, 7/01/2029 |
|
|
490,000 |
520,345 |
| LPL
Holdings, Inc., 4.625%, 11/15/2027 (n) |
|
|
970,000 |
999,100 |
| LPL
Holdings, Inc., 4%, 3/15/2029 (n) |
|
|
676,000 |
689,520 |
| NFP
Corp., 4.875%, 8/15/2028 (n) |
|
|
545,000 |
553,175 |
| NFP
Corp., 6.875%, 8/15/2028 (n) |
|
|
215,000 |
218,428 |
| |
|
|
|
$5,029,404 |
| Building
– 2.7% |
| ABC
Supply Co., Inc., 4%, 1/15/2028 (n) |
|
$
|
1,465,000 |
$
1,485,144 |
| CRH
America Finance, Inc., 4.5%, 4/04/2048 (n) |
|
|
451,000 |
562,769 |
| GYP
Holding III Corp., 4.625%, 5/01/2029 (n) |
|
|
865,000 |
854,187 |
| Holcim
Finance (Luxembourg) S.A., 0.625%, 4/06/2030 |
|
EUR
|
430,000 |
485,866 |
| Holcim
Sterling Finance (Netherlands) B.V., 2.25%, 4/04/2034 |
|
GBP
|
380,000 |
511,567 |
| Interface,
Inc., 5.5%, 12/01/2028 (n) |
|
$
|
760,000 |
788,500 |
| New
Enterprise Stone & Lime Co., Inc., 5.25%, 7/15/2028 (n) |
|
|
335,000 |
337,975 |
| New
Enterprise Stone & Lime Co., Inc., 9.75%, 7/15/2028 (n) |
|
|
406,000 |
435,435 |
| Park
River Holdings, Inc., 5.625%, 2/01/2029 (n) |
|
|
480,000 |
447,600 |
| Patrick
Industries, Inc., 7.5%, 10/15/2027 (n) |
|
|
715,000 |
765,944 |
| SRM
Escrow Issuer LLC, 6%, 11/01/2028 (n) |
|
|
700,000 |
728,000 |
| SRS
Distribution, Inc., 6.125%, 7/01/2029 (n) |
|
|
530,000 |
545,237 |
| Standard
Industries, Inc., 4.375%, 7/15/2030 (n) |
|
|
735,000 |
735,000 |
| Standard
Industries, Inc., 3.375%, 1/15/2031 (n) |
|
|
165,000 |
153,000 |
| Vulcan
Materials Co., 3.5%, 6/01/2030 |
|
|
550,000 |
599,980 |
| White
Cap Buyer LLC, 6.875%, 10/15/2028 (n) |
|
|
410,000 |
423,325 |
| |
|
|
|
$9,859,529 |
| Business
Services – 2.6% |
| Ascend
Learning LLC, 6.875%, 8/01/2025 (n) |
|
$
|
465,000 |
$
473,138 |
| Austin
BidCo, Inc., 7.125%, 12/15/2028 (n) |
|
|
425,000 |
438,813 |
| Equinix,
Inc., REIT, 1%, 3/15/2033 |
|
EUR
|
325,000 |
366,826 |
| Euronet
Worldwide, Inc., 1.375%, 5/22/2026 |
|
|
420,000 |
493,148 |
| Fiserv,
Inc., 4.4%, 7/01/2049 |
|
$
|
226,000 |
272,906 |
| HealthEquity,
Inc., 4.5%, 10/01/2029 (n) |
|
|
660,000 |
667,425 |
| Iron
Mountain, Inc., 5.25%, 3/15/2028 (n) |
|
|
375,000 |
390,938 |
| Iron
Mountain, Inc., 5.25%, 7/15/2030 (n) |
|
|
467,000 |
487,646 |
| Iron
Mountain, Inc., REIT, 4.875%, 9/15/2027 (n) |
|
|
640,000 |
659,610 |
| Nexi
S.p.A., 2.125%, 4/30/2029 |
|
EUR
|
270,000 |
308,218 |
| Nielsen
Finance LLC, 4.5%, 7/15/2029 (n) |
|
$
|
880,000 |
860,420 |
| NXP
Semiconductors N.V., 3.4%, 5/01/2030 (n) |
|
|
598,000 |
642,663 |
| Paysafe
Finance PLC, 4%, 6/15/2029 (n) |
|
|
670,000 |
634,825 |
| Switch
Ltd., 3.75%, 9/15/2028 (n) |
|
|
851,000 |
846,745 |
| Switch
Ltd., 4.125%, 6/15/2029 (n) |
|
|
255,000 |
256,275 |
Portfolio of
Investments – continued
| Issuer
|
|
|
Shares/Par
|
Value
($) |
| Bonds
– continued |
| Business
Services – continued |
| Tencent
Holdings Ltd., 3.8%, 2/11/2025 |
|
$
|
700,000 |
$
745,248 |
| Verscend
Escrow Corp., 9.75%, 8/15/2026 (n) |
|
|
530,000 |
561,434 |
| Visa,
Inc., 4.15%, 12/14/2035 |
|
|
465,000 |
559,021 |
| |
|
|
|
$9,665,299 |
| Cable
TV – 5.3% |
| CCO
Holdings LLC, 4.25%, 1/15/2034 (n) |
|
$
|
295,000 |
$
286,094 |
| CCO
Holdings LLC/CCO Holdings Capital Corp., 4.75%, 3/01/2030 (n) |
|
|
1,845,000 |
1,904,962 |
| CCO
Holdings LLC/CCO Holdings Capital Corp., 4.5%, 8/15/2030 (n) |
|
|
555,000 |
564,923 |
| CCO
Holdings LLC/CCO Holdings Capital Corp., 4.25%, 2/01/2031 (n) |
|
|
1,170,000 |
1,164,735 |
| Charter
Communications Operating LLC/Charter Communications Operating Capital Corp., 6.384%, 10/23/2035 |
|
|
347,000 |
450,684 |
| Charter
Communications Operating LLC/Charter Communications Operating Capital Corp., 4.8%, 3/01/2050 |
|
|
271,000 |
308,020 |
| CSC
Holdings LLC, 5.75%, 1/15/2030 (n) |
|
|
1,300,000 |
1,282,710 |
| CSC
Holdings LLC, 4.125%, 12/01/2030 (n) |
|
|
935,000 |
895,263 |
| DISH
DBS Corp., 7.75%, 7/01/2026 |
|
|
285,000 |
316,706 |
| DISH
DBS Corp., 5.125%, 6/01/2029 |
|
|
465,000 |
447,563 |
| Eutelsat
S.A., 2.25%, 7/13/2027 |
|
EUR
|
400,000 |
481,488 |
| Eutelsat
S.A., 1.5%, 10/13/2028 |
|
|
400,000 |
467,891 |
| Intelsat
Jackson Holdings S.A., 5.5%, 8/01/2023 (a)(d) |
|
$
|
470,000 |
236,175 |
| Intelsat
Jackson Holdings S.A., 9.75%, 7/15/2025 (a)(d)(n) |
|
|
310,000 |
155,775 |
| LCPR
Senior Secured Financing DAC, 6.75%, 10/15/2027 (n) |
|
|
795,000 |
834,750 |
| LCPR
Senior Secured Financing DAC, 5.125%, 7/15/2029 (n) |
|
|
220,000 |
221,650 |
| Sirius
XM Holdings, Inc., 3.875%, 9/01/2031 (n) |
|
|
830,000 |
797,323 |
| Sirius
XM Radio, Inc., 4%, 7/15/2028 (n) |
|
|
640,000 |
644,608 |
| Sirius
XM Radio, Inc., 5.5%, 7/01/2029 (n) |
|
|
1,410,000 |
1,521,037 |
| Telenet
Finance Luxembourg S.A., 5.5%, 3/01/2028 (n) |
|
|
1,200,000 |
1,251,600 |
| Time
Warner Cable, Inc., 4.5%, 9/15/2042 |
|
|
210,000 |
229,553 |
| Videotron
Ltd., 5.375%, 6/15/2024 (n) |
|
|
135,000 |
144,956 |
| Videotron
Ltd., 5.125%, 4/15/2027 (n) |
|
|
1,450,000 |
1,498,938 |
| Videotron
Ltd., 3.625%, 6/15/2029 (n) |
|
|
276,000 |
277,380 |
| Virgin
Media Finance PLC, 5%, 7/15/2030 (n) |
|
|
815,000 |
810,385 |
| Virgin
Media Vendor Financing Notes IV DAC, 5%, 7/15/2028 (n) |
|
|
1,020,000 |
1,035,902 |
| Ziggo
Bond Finance B.V., 5.125%, 2/28/2030 (n) |
|
|
1,220,000 |
1,234,640 |
| |
|
|
|
$19,465,711 |
Portfolio of
Investments – continued
| Issuer
|
|
|
Shares/Par
|
Value
($) |
| Bonds
– continued |
| Chemicals
– 2.0% |
| Alpek
SAB de C.V., 3.25%, 2/25/2031 (n) |
|
$
|
400,000 |
$
396,004 |
| Axalta
Coating Systems Ltd., 4.75%, 6/15/2027 (n) |
|
|
357,000 |
366,818 |
| Axalta
Coating Systems Ltd., 3.375%, 2/15/2029 (n) |
|
|
810,000 |
771,452 |
| Consolidated
Energy Finiance S.A., 5.625%, 10/15/2028 (n) |
|
|
686,000 |
682,639 |
| Element
Solutions, Inc., 3.875%, 9/01/2028 (n) |
|
|
874,000 |
873,196 |
| Herens
Holdco S.à r.l., 4.75%, 5/15/2028 (n) |
|
|
605,000 |
600,190 |
| Ingevity
Corp., 3.875%, 11/01/2028 (n) |
|
|
856,000 |
840,977 |
| LSF11
A5 HoldCo LLC, 6.625%, 10/15/2029 (n) |
|
|
445,000 |
445,354 |
| S.P.C.M.
S.A., 3.125%, 3/15/2027 (n) |
|
|
210,000 |
207,638 |
| S.P.C.M.
S.A., 3.375%, 3/15/2030 (n) |
|
|
709,000 |
693,047 |
| Sasol
Financing (USA) LLC, 4.375%, 9/18/2026 |
|
|
558,000 |
567,095 |
| Sasol
Financing (USA) LLC, 5.5%, 3/18/2031 |
|
|
600,000 |
616,380 |
| SCIL
IV LLC/SCIL USA Holdings LLC, 4.375%, 11/01/2026 |
|
EUR
|
270,000 |
313,815 |
| |
|
|
|
$7,374,605 |
| Computer
Software – 1.0% |
| Camelot
Finance S.A., 4.5%, 11/01/2026 (n) |
|
$
|
585,000 |
$
607,669 |
| Clarivate
Science Holdings Corp., 4.875%, 7/01/2029 (n) |
|
|
785,000 |
781,624 |
| Microsoft
Corp., 2.525%, 6/01/2050 |
|
|
529,000 |
520,314 |
| Microsoft
Corp., 2.675%, 6/01/2060 |
|
|
61,000 |
60,658 |
| Microsoft
Corp., 3.041%, 3/17/2062 |
|
|
293,000 |
315,132 |
| PTC,
Inc., 3.625%, 2/15/2025 (n) |
|
|
310,000 |
315,045 |
| PTC,
Inc., 4%, 2/15/2028 (n) |
|
|
580,000 |
587,975 |
| VeriSign,
Inc., 4.75%, 7/15/2027 |
|
|
405,000 |
423,995 |
| |
|
|
|
$3,612,412 |
| Computer
Software - Systems – 1.2% |
| Apple,
Inc., 4.5%, 2/23/2036 |
|
$
|
263,000 |
$
328,696 |
| CommScope
Holding Co., Inc., 7.125%, 7/01/2028 (n) |
|
|
170,000 |
167,663 |
| Fair
Isaac Corp., 5.25%, 5/15/2026 (n) |
|
|
1,455,000 |
1,622,325 |
| Fair
Isaac Corp., 4%, 6/15/2028 (n) |
|
|
56,000 |
56,560 |
| SS&C
Technologies Holdings, Inc., 5.5%, 9/30/2027 (n) |
|
|
1,050,000 |
1,105,125 |
| Twilio,
Inc., 3.625%, 3/15/2029 |
|
|
525,000 |
530,250 |
| Viavi
Solutions, Inc., 3.75%, 10/01/2029 (n) |
|
|
835,000 |
828,988 |
| |
|
|
|
$4,639,607 |
| Conglomerates
– 2.4% |
| Amsted
Industries Co., 5.625%, 7/01/2027 (n) |
|
$
|
920,000 |
$
956,800 |
| BWX
Technologies, Inc., 4.125%, 6/30/2028 (n) |
|
|
220,000 |
222,750 |
| BWX
Technologies, Inc., 4.125%, 4/15/2029 (n) |
|
|
1,007,000 |
1,021,853 |
| Carrier
Global Corp., 3.577%, 4/05/2050 |
|
|
342,000 |
370,501 |
| EnerSys,
4.375%, 12/15/2027 (n) |
|
|
395,000 |
414,750 |
| Gates
Global LLC, 6.25%, 1/15/2026 (n) |
|
|
585,000 |
604,744 |
| Granite
Holdings U.S. Acquisition Co., 11%, 10/01/2027 (n) |
|
|
485,000 |
531,075 |
Portfolio of
Investments – continued
| Issuer
|
|
|
Shares/Par
|
Value
($) |
| Bonds
– continued |
| Conglomerates
– continued |
| Griffon
Corp., 5.75%, 3/01/2028 |
|
$
|
815,000 |
$
851,675 |
| Grupo
KUO S.A.B. de C.V., 5.75%, 7/07/2027 (n) |
|
|
805,000 |
827,138 |
| Madison
IAQ LLC, 5.875%, 6/30/2029 (n) |
|
|
560,000 |
555,800 |
| Stevens
Holding Co., Inc., 6.125%, 10/01/2026 (n) |
|
|
705,000 |
759,638 |
| TriMas
Corp., 4.125%, 4/15/2029 (n) |
|
|
1,623,000 |
1,643,287 |
| |
|
|
|
$8,760,011 |
| Construction
– 1.0% |
| Empire
Communities Corp., 7%, 12/15/2025 (n) |
|
$
|
520,000 |
$
538,200 |
| Mattamy
Group Corp., 5.25%, 12/15/2027 (n) |
|
|
230,000 |
239,200 |
| Mattamy
Group Corp., 4.625%, 3/01/2030 (n) |
|
|
645,000 |
654,244 |
| Shea
Homes LP/Shea Homes Funding Corp., 4.75%, 2/15/2028 (n) |
|
|
870,000 |
876,525 |
| Taylor
Morrison Communities, Inc., 5.75%, 1/15/2028 (n) |
|
|
395,000 |
434,863 |
| Taylor
Morrison Communities, Inc., 5.125%, 8/01/2030 (n) |
|
|
385,000 |
408,100 |
| Weekley
Homes LLC/Weekley Finance Corp., 4.875%, 9/15/2028 (n) |
|
|
659,000 |
682,065 |
| |
|
|
|
$3,833,197 |
| Consumer
Products – 1.3% |
| Energizer
Holdings, Inc., 4.375%, 3/31/2029 (n) |
|
$
|
770,000 |
$
737,852 |
| JAB
Holdings B.V., 1%, 7/14/2031 |
|
EUR
|
400,000 |
449,434 |
| JAB
Holdings B.V., 2.25%, 12/19/2039 |
|
|
300,000 |
362,713 |
| Mattel,
Inc., 3.375%, 4/01/2026 (n) |
|
$
|
570,000 |
586,376 |
| Mattel,
Inc., 5.875%, 12/15/2027 (n) |
|
|
342,000 |
367,650 |
| Mattel,
Inc., 5.45%, 11/01/2041 |
|
|
220,000 |
259,600 |
| Prestige
Consumer Healthcare, Inc., 5.125%, 1/15/2028 (n) |
|
|
655,000 |
682,838 |
| Prestige
Consumer Healthcare, Inc., 3.75%, 4/01/2031 (n) |
|
|
285,000 |
275,360 |
| Reckitt
Benckiser Treasury Services PLC, 3%, 6/26/2027 (n) |
|
|
396,000 |
421,319 |
| SWF
Escrow Issuer Corp., 6.5%, 10/01/2029 (n) |
|
|
555,000 |
529,836 |
| |
|
|
|
$4,672,978 |
| Consumer
Services – 2.6% |
| AA
Bond Co. Ltd., 3.25%, 7/31/2028 |
|
GBP
|
270,000 |
$
374,012 |
| Allied
Universal Holdco LLC, 6.625%, 7/15/2026 (n) |
|
$
|
228,000 |
239,544 |
| Allied
Universal Holdco LLC, 9.75%, 7/15/2027 (n) |
|
|
450,000 |
483,750 |
| Allied
Universal Holdco LLC, 6%, 6/01/2029 (n) |
|
|
400,000 |
393,654 |
| ANGI
Group LLC, 3.875%, 8/15/2028 (n) |
|
|
775,000 |
757,562 |
| Arches
Buyer, Inc., 6.125%, 12/01/2028 (n) |
|
|
650,000 |
657,312 |
| Booking
Holdings, Inc., 0.5%, 3/08/2028 |
|
EUR
|
100,000 |
115,340 |
| Garda
World Security Corp., 4.625%, 2/15/2027 (n) |
|
$
|
230,000 |
228,275 |
| GoDaddy,
Inc., 3.5%, 3/01/2029 (n) |
|
|
1,167,000 |
1,129,072 |
| GW
B-CR Security Corp., 9.5%, 11/01/2027 (n) |
|
|
501,000 |
539,827 |
| Match
Group Holdings II LLC, 3.625%, 10/01/2031 (n) |
|
|
55,000 |
53,391 |
Portfolio of
Investments – continued
| Issuer
|
|
|
Shares/Par
|
Value
($) |
| Bonds
– continued |
| Consumer
Services – continued |
| Match
Group, Inc., 5%, 12/15/2027 (n) |
|
$
|
445,000 |
$
463,913 |
| Match
Group, Inc., 4.625%, 6/01/2028 (n) |
|
|
890,000 |
924,781 |
| Match
Group, Inc., 4.125%, 8/01/2030 (n) |
|
|
270,000 |
277,763 |
| Realogy
Group LLC, 9.375%, 4/01/2027 (n) |
|
|
525,000 |
574,219 |
| Realogy
Group LLC, 5.75%, 1/15/2029 (n) |
|
|
215,000 |
222,794 |
| Toll
Road Investors Partnership II LP, Capital Appreciation, NPFG, 0%, 2/15/2027 (n) |
|
|
1,052,000 |
840,678 |
| TriNet
Group, Inc., 3.5%, 3/01/2029 (n) |
|
|
1,037,000 |
1,039,717 |
| WASH
Multifamily Acquisition, Inc., 5.75%, 4/15/2026 (n) |
|
|
440,000 |
454,850 |
| |
|
|
|
$9,770,454 |
| Containers
– 1.5% |
| ARD
Finance S.A., 6.5%, (6.5% cash or 7.25% PIK) 6/30/2027 (n)(p) |
|
$
|
420,000 |
$
439,950 |
| Ardagh
Metal Packaging, 3.25%, 9/01/2028 (n) |
|
|
375,000 |
367,031 |
| Ardagh
Metal Packaging, 4%, 9/01/2029 (n) |
|
|
665,000 |
661,276 |
| Ardagh
Packaging Finance PLC/Ardagh MP Holdings USA, Inc., 5.25%, 8/15/2027 (n) |
|
|
940,000 |
937,650 |
| Can-Pack
S.A., 3.875%, 11/15/2029 (n) |
|
|
976,000 |
968,680 |
| Crown
Americas LLC/Crown Americas Capital Corp. V, 4.25%, 9/30/2026 |
|
|
900,000 |
959,067 |
| Crown
Americas LLC/Crown Americas Capital Corp. VI, 4.75%, 2/01/2026 |
|
|
240,000 |
247,272 |
| DS
Smith PLC, 2.875%, 7/26/2029 |
|
GBP
|
220,000 |
312,040 |
| Greif,
Inc., 6.5%, 3/01/2027 (n) |
|
$
|
620,000 |
644,800 |
| |
|
|
|
$5,537,766 |
| Electrical
Equipment – 0.3% |
| CommScope
Technologies LLC, 5%, 3/15/2027 (n) |
|
$
|
1,040,000 |
$
964,953 |
| Electronics
– 1.6% |
| Broadcom,
Inc., 4.15%, 11/15/2030 |
|
$
|
201,000 |
$
220,980 |
| Broadcom,
Inc., 3.469%, 4/15/2034 (n) |
|
|
404,000 |
416,799 |
| Broadcom,
Inc., 3.137%, 11/15/2035 (n) |
|
|
363,000 |
356,762 |
| Broadcom,
Inc., 3.187%, 11/15/2036 (n) |
|
|
10,000 |
9,830 |
| Diebold
Nixdorf, Inc., 8.5%, 4/15/2024 |
|
|
160,000 |
159,800 |
| Diebold
Nixdorf, Inc., 9.375%, 7/15/2025 (n) |
|
|
404,000 |
435,310 |
| Entegris,
Inc., 4.375%, 4/15/2028 (n) |
|
|
285,000 |
295,331 |
| Entegris,
Inc., 3.625%, 5/01/2029 (n) |
|
|
787,000 |
792,903 |
| Infineon
Technologies AG, 1.625%, 6/24/2029 |
|
EUR
|
300,000 |
368,541 |
| Sensata
Technologies B.V., 5.625%, 11/01/2024 (n) |
|
$
|
710,000 |
782,775 |
| Sensata
Technologies B.V., 5%, 10/01/2025 (n) |
|
|
655,000 |
717,500 |
| Sensata
Technologies, Inc., 4.375%, 2/15/2030 (n) |
|
|
625,000 |
659,616 |
Portfolio of
Investments – continued
| Issuer
|
|
|
Shares/Par
|
Value
($) |
| Bonds
– continued |
| Electronics
– continued |
| Synaptics,
Inc., 4%, 6/15/2029 (n) |
|
$
|
770,000 |
$
777,700 |
| |
|
|
|
$5,993,847 |
| Emerging
Market Quasi-Sovereign – 7.6% |
| Abu
Dhabi Crude Oil Pipeline, 3.65%, 11/02/2029 |
|
$
|
1,100,000 |
$
1,215,522 |
| Banco
de Reservas de la Republica Dominicana, 7%, 2/01/2023 (n) |
|
|
946,000 |
986,205 |
| China
Construction Bank Corp., Hong Kong Branch, 1.25%, 8/04/2025 |
|
|
1,050,000 |
1,035,731 |
| China
Construction Bank Corp., Hong Kong Branch, 4.25% to 2/27/2024, FLR (CMT - 5yr. + 1.88%) to 2/27/2029 |
|
|
964,000 |
1,017,864 |
| Emirates
Development Bank PJSC, 1.639%, 6/15/2026 |
|
|
800,000 |
797,000 |
| Empresa
Nacional del Petroleo (Republic of Chile), 3.75%, 8/05/2026 (n) |
|
|
423,000 |
436,132 |
| Empresa
Nacional del Petroleo (Republic of Chile), 3.75%, 8/05/2026 |
|
|
806,000 |
831,022 |
| EQUATE
Petrochemical B.V. (State of Kuwait), 4.25%, 11/03/2026 |
|
|
1,034,000 |
1,127,143 |
| Eskom
Holdings SOC Ltd. (Republic of South Africa), 6.35%, 8/10/2028 (n) |
|
|
1,052,000 |
1,130,984 |
| Export-Import
Bank of India, 3.375%, 8/05/2026 |
|
|
1,366,000 |
1,437,037 |
| First
Abu Dhabi Bank PJSC, 0.125%, 2/16/2026 |
|
EUR
|
435,000 |
500,597 |
| Gaz
Capital S.A. (Russian Federation), 4.95%, 2/06/2028 (n) |
|
$
|
492,000 |
540,856 |
| Indian
Railway Finance Corp., 2.8%, 2/10/2031 (n) |
|
|
700,000 |
674,068 |
| Industrial
& Commercial Bank of China Macau, 2.875% to 9/12/2024, FLR (CMT - 5yr. + 1.65%) to 9/12/2029 |
|
|
700,000 |
717,584 |
| Ipoteka
Bank (Republic of Uzbekistan), 5.5%, 11/19/2025 |
|
|
1,000,000 |
1,036,250 |
| MDGH
- GMTN B.V. (United Arab Emirates), 2.5%, 11/07/2024 |
|
|
508,000 |
528,320 |
| MDGH
- GMTN B.V. (United Arab Emirates), 2.875%, 11/07/2029 (n) |
|
|
1,091,000 |
1,133,276 |
| MDGH
- GMTN B.V. (United Arab Emirates), 1%, 3/10/2034 |
|
EUR
|
540,000 |
621,056 |
| MDGH
- GMTN RSC Ltd. (United Arab Emirates), 2.5%, 6/03/2031 |
|
$
|
660,000 |
664,340 |
| NAK
Naftogaz Ukraine via Standard Bank London Holdings PLC, 7.625%, 11/08/2026 (n) |
|
|
869,000 |
855,208 |
| Office
Cherifien des Phosphates S.A. (Kingdom of Morocco), 6.875%, 4/25/2044 (n) |
|
|
373,000 |
446,586 |
| Office
Cherifien des Phosphates S.A. (Kingdom of Morocco), 5.125%, 6/23/2051 (n) |
|
|
600,000 |
584,100 |
| Ooredoo
International Finance Ltd. (State of Qatar), 2.625%, 4/08/2031 |
|
|
370,000 |
373,297 |
| Petroleos
Mexicanos, 6.49%, 1/23/2027 |
|
|
904,000 |
960,961 |
Portfolio of
Investments – continued
| Issuer
|
|
|
Shares/Par
|
Value
($) |
| Bonds
– continued |
| Emerging
Market Quasi-Sovereign – continued |
| Petroleos
Mexicanos, 5.35%, 2/12/2028 |
|
$
|
1,000,000 |
$
998,110 |
| Petroleos
Mexicanos, 6.75%, 9/21/2047 |
|
|
1,593,000 |
1,409,009 |
| PT
Pertamina (Persero) (Republic of Indonesia), 3.65%, 7/30/2029 |
|
|
376,000 |
398,518 |
| PT
Pertamina (Persero) (Republic of Indonesia), 6.5%, 11/07/2048 (n) |
|
|
900,000 |
1,191,833 |
| Qatar
Petroleum, 2.25%, 7/12/2031 |
|
|
544,000 |
535,840 |
| Qatar
Petroleum, 3.125%, 7/12/2041 |
|
|
355,000 |
358,263 |
| QNB
Finance Ltd. (State of Qatar), 2.75%, 2/12/2027 |
|
|
547,000 |
567,895 |
| Southern
Gas Corridor CJSC (Republic of Azerbaijan), 6.875%, 3/24/2026 |
|
|
1,367,000 |
1,601,386 |
| State
Oil Company of the Azerbaijan Republic, 6.95%, 3/18/2030 |
|
|
1,152,000 |
1,408,292 |
| |
|
|
|
$28,120,285 |
| Emerging
Market Sovereign – 11.0% |
| Arab
Republic of Egypt, 6.588%, 2/21/2028 |
|
$
|
1,087,000 |
$
1,066,151 |
| Arab
Republic of Egypt, 6.375%, 4/11/2031 (n) |
|
EUR
|
1,011,000 |
1,101,152 |
| Arab
Republic of Egypt, 7.903%, 2/21/2048 |
|
$
|
1,120,000 |
985,107 |
| Dominican
Republic, 5.875%, 1/30/2060 (n) |
|
|
2,234,000 |
2,189,320 |
| Federal
Republic of Nigeria, 8.747%, 1/21/2031 (n) |
|
|
920,000 |
990,150 |
| Federative
Republic of Brazil, 10%, 1/01/2023 |
|
BRL
|
13,499,000 |
2,338,222 |
| Government
of Oman, 7%, 1/25/2051 |
|
$
|
600,000 |
624,924 |
| Government
of Ukraine, 7.75%, 9/01/2023 |
|
|
1,061,000 |
1,129,988 |
| Government
of Ukraine, 7.253%, 3/15/2033 (n) |
|
|
1,729,000 |
1,759,842 |
| Government
of Ukraine, GDP Linked Bond, 1.258%, 5/31/2040 |
|
|
824,000 |
867,293 |
| Hellenic
Republic (Republic of Greece), 3.875%, 3/12/2029 |
|
EUR
|
1,932,000 |
2,686,721 |
| Kingdom
of Morocco, 1.375%, 3/30/2026 |
|
|
758,000 |
873,514 |
| Kingdom
of Morocco, 3%, 12/15/2032 (n) |
|
$
|
448,000 |
424,874 |
| Oriental
Republic of Uruguay, 8.25%, 5/21/2031 |
|
UYU
|
40,000,000 |
898,631 |
| Republic
of Angola, 8.25%, 5/09/2028 |
|
$
|
491,000 |
493,573 |
| Republic
of Argentina, 1.125%, 7/09/2035 |
|
|
1,047,289 |
323,099 |
| Republic
of Benin, 6.875%, 1/19/2052 |
|
EUR
|
800,000 |
926,293 |
| Republic
of Chile, 4.7%, 9/01/2030 |
|
CLP
|
855,000,000
|
960,686 |
| Republic
of Chile, 3.1%, 1/22/2061 |
|
$
|
672,000 |
619,403 |
| Republic
of Cote d'Ivoire, 5.25%, 3/22/2030 |
|
EUR
|
1,150,000 |
1,365,647 |
| Republic
of Ghana, 8.125%, 3/26/2032 (n) |
|
$
|
593,000 |
521,840 |
| Republic
of Guatemala, 6.125%, 6/01/2050 (n) |
|
|
1,592,000 |
1,867,416 |
| Republic
of Hungary, 7.625%, 3/29/2041 |
|
|
488,000 |
803,385 |
| Republic
of Kenya, 8%, 5/22/2032 (n) |
|
|
776,000 |
842,876 |
| Republic
of Paraguay, 5.6%, 3/13/2048 |
|
|
1,049,000 |
1,193,238 |
| Republic
of Romania, 2%, 12/08/2026 (n) |
|
EUR
|
1,011,000 |
1,232,995 |
Portfolio of
Investments – continued
| Issuer
|
|
|
Shares/Par
|
Value
($) |
| Bonds
– continued |
| Emerging
Market Sovereign – continued |
| Republic
of Romania, 2.124%, 7/16/2031 (n) |
|
EUR
|
1,200,000 |
$
1,358,013 |
| Republic
of Serbia, 2.05%, 9/23/2036 (n) |
|
|
800,000 |
858,945 |
| Republic
of Sri Lanka, 6.125%, 6/03/2025 |
|
$
|
668,000 |
430,860 |
| Republic
of Turkey, 4.75%, 1/26/2026 |
|
|
521,000 |
498,753 |
| Russian
Federation, 4.75%, 5/27/2026 |
|
|
1,000,000 |
1,121,250 |
| Russian
Federation, 4.25%, 6/23/2027 |
|
|
1,000,000 |
1,107,778 |
| Russian
Federation, 4.375%, 3/21/2029 |
|
|
400,000 |
450,768 |
| State
of Qatar, 4%, 3/14/2029 (n) |
|
|
533,000 |
600,286 |
| State
of Qatar, 4.817%, 3/14/2049 (n) |
|
|
1,404,000 |
1,804,983 |
| State
of Qatar, 4.4%, 4/16/2050 |
|
|
203,000 |
247,414 |
| Sultanate
of Oman, 6%, 8/01/2029 |
|
|
750,000 |
803,594 |
| United
Mexican States, 2.659%, 5/24/2031 |
|
|
1,021,000 |
985,367 |
| United
Mexican States, 4.75%, 4/27/2032 |
|
|
736,000 |
825,314 |
| United
Mexican States, 3.771%, 5/24/2061 |
|
|
753,000 |
693,325 |
| |
|
|
|
$40,872,990 |
| Energy
- Independent – 3.8% |
| Apache
Corp., 5.35%, 7/01/2049 |
|
$
|
210,000 |
$
241,092 |
| Ascent
Resources Utica Holdings LLC/ARU Finance Corp., 7%, 11/01/2026 (n) |
|
|
165,000 |
170,363 |
| Ascent
Resources Utica Holdings LLC/ARU Finance Corp., 5.875%, 6/30/2029 (n) |
|
|
300,000 |
303,684 |
| Callon
Petroleum Co., 6.125%, 10/01/2024 |
|
|
165,000 |
162,781 |
| Callon
Petroleum Co., 8%, 8/01/2028 (n) |
|
|
290,000 |
292,175 |
| CNX
Resources Corp., 6%, 1/15/2029 (n) |
|
|
680,000 |
717,400 |
| Comstock
Resources, Inc., 6.75%, 3/01/2029 (n) |
|
|
680,000 |
731,000 |
| Continental
Resources, Inc., 4.9%, 6/01/2044 |
|
|
160,000 |
181,544 |
| Diamondback
Energy, Inc., 4.4%, 3/24/2051 |
|
|
530,000 |
610,800 |
| Encino
Acquisition Partners Holdings LLC, 8.5%, 5/01/2028 (n) |
|
|
380,000 |
397,100 |
| Energean
Israel Finance Ltd., 4.875%, 3/30/2026 |
|
|
846,000 |
859,536 |
| EQT
Corp., 5%, 1/15/2029 |
|
|
591,000 |
656,568 |
| Leviathan
Bond Ltd., 6.125%, 6/30/2025 (n) |
|
|
1,270,000 |
1,368,425 |
| Medco
Bell Pte. Ltd., 6.375%, 1/30/2027 (n) |
|
|
498,000 |
510,201 |
| Murphy
Oil Corp., 5.875%, 12/01/2027 |
|
|
225,000 |
234,281 |
| Occidental
Petroleum Corp., 5.875%, 9/01/2025 |
|
|
575,000 |
638,250 |
| Occidental
Petroleum Corp., 5.5%, 12/01/2025 |
|
|
585,000 |
643,500 |
| Occidental
Petroleum Corp., 6.625%, 9/01/2030 |
|
|
555,000 |
679,126 |
| Occidental
Petroleum Corp., 6.45%, 9/15/2036 |
|
|
280,000 |
356,300 |
| Occidental
Petroleum Corp., 6.6%, 3/15/2046 |
|
|
405,000 |
518,202 |
| Ovintiv,
Inc., 6.5%, 2/01/2038 |
|
|
130,000 |
176,276 |
| Range
Resources Corp., 8.25%, 1/15/2029 (n) |
|
|
540,000 |
609,660 |
| SM
Energy Co., 5.625%, 6/01/2025 |
|
|
235,000 |
235,587 |
Portfolio of
Investments – continued
| Issuer
|
|
|
Shares/Par
|
Value
($) |
| Bonds
– continued |
| Energy
- Independent – continued |
| SM
Energy Co., 6.5%, 7/15/2028 |
|
$
|
260,000 |
$
273,000 |
| Southwestern
Energy Co., 6.45%, 1/23/2025 |
|
|
177,800 |
193,802 |
| Southwestern
Energy Co., 8.375%, 9/15/2028 |
|
|
310,000 |
345,650 |
| Southwestern
Energy Co., 5.375%, 3/15/2030 |
|
|
345,000 |
363,968 |
| Tengizchevroil
Finance Co. International Ltd., 4%, 8/15/2026 (n) |
|
|
422,000 |
452,020 |
| Tengizchevroil
Finance Co. International Ltd., 4%, 8/15/2026 |
|
|
1,025,000 |
1,097,916 |
| |
|
|
|
$14,020,207 |
| Energy
- Integrated – 1.0% |
| BP
Capital Markets B.V., 0.933%, 12/04/2040 |
|
EUR
|
199,000 |
$
212,307 |
| Cenovus
Energy, Inc., 2.65%, 1/15/2032 |
|
$
|
428,000 |
417,415 |
| Eni
S.p.A., 4%, 9/12/2023 (n) |
|
|
329,000 |
347,411 |
| Eni
S.p.A., 4.25%, 5/09/2029 (n) |
|
|
379,000 |
429,533 |
| Eni
S.p.A., 2.625% to 1/13/2026, FLR (EUR Swap Rate - 5yr. + 3.167%) to 1/13/2031, FLR (EUR Swap Rate - 5yr. + 3.417%) to 1/13/2046, FLR (EUR Swap Rate - 5yr. + 4.167%) to 1/13/2170 |
|
EUR
|
137,000 |
164,509 |
| Eni
S.p.A., 2.75%, 5/11/2170 |
|
|
540,000 |
625,001 |
| Galp
Energia SGPS S.A., 2%, 1/15/2026 |
|
|
700,000 |
846,820 |
| MOL
PLC, 1.5%, 10/08/2027 |
|
|
420,000 |
497,528 |
| OMV
AG, 2.5% to 9/01/2026, FLR (EUR Swap Rate - 5yr. + 2.82%) to 9/01/2030, FLR (EUR Swap Rate - 5yr. + 3.82%) to 9/01/2070 |
|
|
200,000 |
241,315 |
| |
|
|
|
$3,781,839 |
| Entertainment
– 2.3% |
| AMC
Entertainment Holdings, Inc., 12%, (10% cash or 12% PIK) 6/15/2026 (n)(p) |
|
$
|
230,000 |
$
228,850 |
| Boyne
USA, Inc., 4.75%, 5/15/2029 (n) |
|
|
805,000 |
823,113 |
| Carnival
Corp. PLC, 7.625%, 3/01/2026 (n) |
|
|
1,155,000 |
1,216,896 |
| Carnival
Corp. PLC, 5.75%, 3/01/2027 (n) |
|
|
545,000 |
554,538 |
| Carnival
Corp. PLC, 6%, 5/01/2029 (n) |
|
|
165,000 |
164,897 |
| Cedar
Fair LP/Canada's Wonderland Co./Magnum Management Corp./Millennium Operations LLC, 5.375%, 4/15/2027 |
|
|
390,000 |
401,700 |
| Cedar
Fair LP/Canada's Wonderland Co./Magnum Management Corp./Millennium Operations LLC, 5.25%, 7/15/2029 |
|
|
215,000 |
222,789 |
| Live
Nation Entertainment, Inc., 5.625%, 3/15/2026 (n) |
|
|
802,000 |
829,067 |
| Live
Nation Entertainment, Inc., 3.75%, 1/15/2028 (n) |
|
|
375,000 |
371,250 |
| Motion
Bondco DAC, 6.625%, 11/15/2027 (n) |
|
|
650,000 |
650,000 |
| NCL
Corp. Ltd., 3.625%, 12/15/2024 (n) |
|
|
370,000 |
348,263 |
| NCL
Corp. Ltd., 5.875%, 3/15/2026 (n) |
|
|
410,000 |
411,025 |
Portfolio of
Investments – continued
| Issuer
|
|
|
Shares/Par
|
Value
($) |
| Bonds
– continued |
| Entertainment
– continued |
| Royal
Caribbean Cruises Ltd., 4.25%, 7/01/2026 (n) |
|
$
|
592,000 |
$
574,240 |
| Royal
Caribbean Cruises Ltd., 5.5%, 4/01/2028 (n) |
|
|
830,000 |
844,525 |
| SeaWorld
Parks & Entertainment, 5.25%, 8/15/2029 (n) |
|
|
855,000 |
871,031 |
| |
|
|
|
$8,512,184 |
| Financial
Institutions – 4.6% |
| Adler
Group S.A., 2.25%, 4/27/2027 |
|
EUR
|
500,000 |
$
500,981 |
| Adler
Group S.A., 2.25%, 1/14/2029 |
|
|
400,000 |
395,352 |
| ADO
Properties S.A., 3.25%, 8/05/2025 |
|
|
200,000 |
213,571 |
| AerCap
Ireland Capital DAC/AerCap Global Aviation Trust, 3.65%, 7/21/2027 |
|
$
|
1,230,000 |
1,303,717 |
| AerCap
Ireland Capital DAC/AerCap Global Aviation Trust, 3.3%, 1/30/2032 |
|
|
182,000 |
185,232 |
| AerCap
Ireland Capital DAC/AerCap Global Aviation Trust, 3.85%, 10/29/2041 |
|
|
150,000 |
155,294 |
| Atrium
European Real Estate Ltd., 3.625% to 11/04/2026, FLR (EUR Swap Rate - 5yr. + 3.625%) to 11/04/2031, FLR (EUR Swap Rate - 5yr. + 4.625%) to 5/04/2170 |
|
EUR
|
350,000 |
374,761 |
| Avation
Capital S.A., 8.25%, (8.25% cash or 9% PIK) 10/31/2026 (n)(p) |
|
$
|
401,388 |
333,152 |
| Avolon
Holdings Funding Ltd., 5.25%, 5/15/2024 (n) |
|
|
640,000 |
693,339 |
| Avolon
Holdings Funding Ltd., 4.375%, 5/01/2026 (n) |
|
|
363,000 |
391,709 |
| Avolon
Holdings Funding Ltd., 2.528%, 11/18/2027 (n) |
|
|
531,000 |
521,401 |
| Canary
Wharf Group, 3.375%, 4/23/2028 |
|
GBP
|
433,000 |
599,243 |
| Credit
Acceptance Corp., 5.125%, 12/31/2024 (n) |
|
$
|
805,000 |
823,113 |
| CTP
B.V., 2.125%, 10/01/2025 |
|
EUR
|
809,000 |
986,608 |
| CTP
B.V., 0.75%, 2/18/2027 |
|
|
200,000 |
229,018 |
| CTP
N.V., 1.25%, 6/21/2029 |
|
|
310,000 |
354,289 |
| CTP
N.V., 1.5%, 9/27/2031 |
|
|
550,000 |
621,379 |
| EXOR
N.V., 0.875%, 1/19/2031 |
|
|
275,000 |
309,984 |
| Freedom
Mortgage Corp., 7.625%, 5/01/2026 (n) |
|
$
|
695,000 |
677,625 |
| GE
Capital International Funding Co., 3.373%, 11/15/2025 |
|
|
683,000 |
736,856 |
| Global
Aircraft Leasing Co. Ltd., 6.5%,(6.5% cash or 7.25% PIK) 9/15/2024 (n)(p) |
|
|
1,613,509 |
1,566,475 |
| Howard
Hughes Corp., 4.125%, 2/01/2029 (n) |
|
|
955,000 |
955,965 |
| Logicor
Financing S.à r.l., 0.875%, 1/14/2031 |
|
EUR
|
175,000 |
191,793 |
| Nationstar
Mortgage Holdings, Inc., 6%, 1/15/2027 (n) |
|
$
|
730,000 |
762,850 |
| OneMain
Finance Corp., 6.875%, 3/15/2025 |
|
|
395,000 |
440,919 |
| OneMain
Finance Corp., 8.875%, 6/01/2025 |
|
|
359,000 |
388,169 |
| OneMain
Finance Corp., 7.125%, 3/15/2026 |
|
|
395,000 |
448,325 |
| PennyMac
Financial Services, Inc., 5.75%, 9/15/2031 (n) |
|
|
390,000 |
383,663 |
| Samhallsbyggnadsbolaget
i Norden AB, 2.625%, 3/14/2170 |
|
EUR
|
200,000 |
224,842 |
| VGP
Group LLC, 1.5%, 4/08/2029 |
|
|
500,000 |
563,249 |
Portfolio of
Investments – continued
| Issuer
|
|
|
Shares/Par
|
Value
($) |
| Bonds
– continued |
| Financial
Institutions – continued |
| Vonovia
SE, 1.5%, 6/14/2041 |
|
EUR
|
400,000 |
$
455,615 |
| Vonovia
SE, 1.625%, 9/01/2051 |
|
|
200,000 |
219,085 |
| |
|
|
|
$17,007,574 |
| Food
& Beverages – 4.0% |
| Anheuser-Busch
InBev Worldwide, Inc., 4.375%, 4/15/2038 |
|
$
|
209,000 |
$
246,324 |
| Anheuser-Busch
InBev Worldwide, Inc., 5.55%, 1/23/2049 |
|
|
331,000 |
464,284 |
| Aramark
Services, Inc., 6.375%, 5/01/2025 (n) |
|
|
1,304,000 |
1,372,317 |
| Bacardi
Ltd., 5.15%, 5/15/2038 (n) |
|
|
425,000 |
525,369 |
| Central
American Bottling Corp., 5.75%, 1/31/2027 (n) |
|
|
900,000 |
932,715 |
| Constellation
Brands, Inc., 4.75%, 12/01/2025 |
|
|
313,000 |
352,679 |
| Constellation
Brands, Inc., 3.15%, 8/01/2029 |
|
|
638,000 |
677,740 |
| Constellation
Brands, Inc., 2.25%, 8/01/2031 |
|
|
393,000 |
384,451 |
| JBS
Finance Luxembourg S.à r.l., 3.625%, 1/15/2032 (n) |
|
|
1,000,000 |
987,340 |
| JBS
USA Lux S.A./JBS USA Finance, Inc., 6.75%, 2/15/2028 (n) |
|
|
1,135,000 |
1,222,974 |
| JBS
USA Lux S.A./JBS USA Finance, Inc., 5.5%, 1/15/2030 (n) |
|
|
455,000 |
498,225 |
| JDE
Peet's N.V., 0.5%, 1/16/2029 |
|
EUR
|
280,000 |
315,937 |
| Kraft
Heinz Co., 4.25%, 3/01/2031 |
|
$
|
1,100,000 |
1,242,368 |
| Lamb
Weston Holdings, Inc., 4.125%, 1/31/2030 (n) |
|
|
1,290,000 |
1,291,225 |
| PepsiCo,
Inc., 0.75%, 10/14/2033 |
|
EUR
|
314,000 |
359,441 |
| Performance
Food Group Co., 5.5%, 10/15/2027 (n) |
|
$
|
760,000 |
792,300 |
| Post
Holdings, Inc., 5.625%, 1/15/2028 (n) |
|
|
550,000 |
574,035 |
| Post
Holdings, Inc., 4.625%, 4/15/2030 (n) |
|
|
550,000 |
552,750 |
| Primo
Water Holding, Inc., 4.375%, 4/30/2029 (n) |
|
|
540,000 |
535,179 |
| PT
Indofood CBP Sukses Makmur Tbk, 3.398%, 6/09/2031 |
|
|
760,000 |
755,566 |
| U.S.
Foods Holding Corp., 4.75%, 2/15/2029 (n) |
|
|
825,000 |
834,710 |
| |
|
|
|
$14,917,929 |
| Gaming
& Lodging – 4.8% |
| Boyd
Gaming Corp., 4.75%, 12/01/2027 |
|
$
|
695,000 |
$
716,058 |
| Boyd
Gaming Corp., 4.75%, 6/15/2031 (n) |
|
|
280,000 |
288,052 |
| Caesars
Entertainment, Inc., 4.625%, 10/15/2029 (n) |
|
|
565,000 |
567,712 |
| CCM
Merger, Inc., 6.375%, 5/01/2026 (n) |
|
|
605,000 |
633,737 |
| Colt
Merger Sub, Inc., 5.75%, 7/01/2025 (n) |
|
|
442,000 |
464,432 |
| Colt
Merger Sub, Inc., 8.125%, 7/01/2027 (n) |
|
|
610,000 |
683,230 |
| Hilton
Domestic Operating Co., Inc., 3.75%, 5/01/2029 (n) |
|
|
855,000 |
855,000 |
| Hilton
Domestic Operating Co., Inc., 3.625%, 2/15/2032 (n) |
|
|
1,122,000 |
1,094,634 |
| International
Game Technology PLC, 4.125%, 4/15/2026 (n) |
|
|
1,040,000 |
1,068,600 |
| International
Game Technology PLC, 6.25%, 1/15/2027 (n) |
|
|
230,000 |
258,750 |
| Las
Vegas Sands Corp., 3.9%, 8/08/2029 |
|
|
449,000 |
456,884 |
| Marriott
International, Inc., 2.85%, 4/15/2031 |
|
|
282,000 |
284,003 |
| Marriott
Ownership Resorts, Inc., 4.5%, 6/15/2029 (n) |
|
|
675,000 |
675,000 |
| MGM
China Holdings Ltd., 5.875%, 5/15/2026 (n) |
|
|
370,000 |
369,815 |
| MGM
China Holdings Ltd., 4.75%, 2/01/2027 (n) |
|
|
245,000 |
235,690 |
Portfolio of
Investments – continued
| Issuer
|
|
|
Shares/Par
|
Value
($) |
| Bonds
– continued |
| Gaming
& Lodging – continued |
| MGM
Growth Properties LLC, 4.625%, 6/15/2025 (n) |
|
$
|
675,000 |
$
725,625 |
| MGM
Growth Properties LLC, 5.75%, 2/01/2027 |
|
|
275,000 |
313,500 |
| MGM
Growth Properties LLC, 3.875%, 2/15/2029 (n) |
|
|
529,000 |
560,222 |
| MGM
Resorts International, 5.5%, 4/15/2027 |
|
|
380,000 |
409,450 |
| Penn
National Gaming, Inc., 4.125%, 7/01/2029 (n) |
|
|
715,000 |
697,125 |
| Scientific
Games Corp., 8.625%, 7/01/2025 (n) |
|
|
170,000 |
183,464 |
| Scientific
Games Corp., 8.25%, 3/15/2026 (n) |
|
|
395,000 |
418,700 |
| Scientific
Games International, Inc., 7%, 5/15/2028 (n) |
|
|
470,000 |
507,811 |
| VICI
Properties LP, REIT, 4.25%, 12/01/2026 (n) |
|
|
485,000 |
502,378 |
| VICI
Properties LP, REIT, 3.75%, 2/15/2027 (n) |
|
|
790,000 |
811,725 |
| Whitbread
Group PLC, 3%, 5/31/2031 |
|
GBP
|
225,000 |
309,860 |
| Wyndham
Hotels & Resorts, Inc., 4.375%, 8/15/2028 (n) |
|
$
|
1,038,000 |
1,072,306 |
| Wynn
Las Vegas LLC/Wynn Las Vegas Capital Corp., 5.25%, 5/15/2027 (n) |
|
|
460,000 |
466,325 |
| Wynn
Macau Ltd., 5.5%, 1/15/2026 (n) |
|
|
395,000 |
371,249 |
| Wynn
Macau Ltd., 5.625%, 8/26/2028 (n) |
|
|
1,104,000 |
1,030,452 |
| Wynn
Resorts Finance LLC/Wynn Resorts Capital Corp., 5.125%, 10/01/2029 (n) |
|
|
565,000 |
566,412 |
| |
|
|
|
$17,598,201 |
| Industrial
– 1.3% |
| APi
Escrow Corp., 4.75%, 10/15/2029 (n) |
|
$
|
605,000 |
$
615,587 |
| CPI
Property Group S.A., 2.75%, 1/22/2028 |
|
GBP
|
300,000 |
413,066 |
| CPI
Property Group S.A., 3.75% to 7/27/2028, FLR (EUR Swap Rate - 5yr. + 4.338%) to 7/27/2033, FLR (EUR Swap Rate - 5yr. + 4.588%) to 7/27/2048, FLR (EUR Swap Rate - 5yr. + 5.338%) to 1/27/2170 |
|
EUR
|
320,000 |
346,815 |
| Dar
Al-Arkan Sukuk Co. Ltd., 6.875%, 2/26/2027 |
|
$
|
1,000,000 |
1,047,580 |
| Dycom
Industries, Inc., 4.5%, 4/15/2029 (n) |
|
|
765,000 |
776,475 |
| Trustees
of the University of Pennsylvania, 2.396%, 10/01/2050 |
|
|
966,000 |
947,592 |
| Williams
Scotsman International, Inc., 4.625%, 8/15/2028 (n) |
|
|
822,000 |
849,742 |
| |
|
|
|
$4,996,857 |
| Insurance
– 0.8% |
| AIA
Group Ltd., 0.88% to 9/09/2028, FLR (EUR Swap Rate - 5yr. + 1.1%) to 9/09/2033 |
|
EUR
|
270,000 |
$
305,756 |
| Argentum
Zurich Insurance, 3.5% to 10/01/2026, FLR (EURIBOR - 3mo. + 3.95%) to 10/01/2046 |
|
|
185,000 |
240,552 |
| Aviva
PLC, 3.875% to 7/03/2024, FLR (EUR Swap Rate - 5yr. + 3.48%) to 7/03/2044 |
|
|
350,000 |
440,100 |
| Aviva
PLC, 4% to 6/03/2035, FLR (GBP Government Yield - 5yr. + 4.7%) to 6/03/2055 |
|
GBP
|
392,000 |
583,470 |
| Credit
Agricole Assurances S.A., 2%, 7/17/2030 |
|
EUR
|
100,000 |
119,328 |
Portfolio of
Investments – continued
| Issuer
|
|
|
Shares/Par
|
Value
($) |
| Bonds
– continued |
| Insurance
– continued |
| Credit
Agricole Assurances S.A., 1.5%, 10/06/2031 |
|
EUR
|
600,000 |
$
680,713 |
| Swiss
Life Finance I Ltd., 0.5%, 9/15/2031 |
|
|
383,000 |
431,107 |
| Zurich
Finance (Ireland) DAC, 1.875% to 9/17/2030, FLR (EURIBOR - 3mo. + 2.95%) to 9/17/2050 |
|
|
300,000 |
358,123 |
| |
|
|
|
$3,159,149 |
| Insurance
- Health – 0.2% |
| UnitedHealth
Group, Inc., 4.625%, 7/15/2035 |
|
$
|
509,000 |
$
629,409 |
| Insurance
- Property & Casualty – 1.1% |
| Alliant
Holdings Intermediate LLC, 6.75%, 10/15/2027 (n) |
|
$
|
1,025,000 |
$
1,058,312 |
| AssuredPartners,
Inc., 5.625%, 1/15/2029 (n) |
|
|
475,000 |
471,438 |
| Berkshire
Hathaway, Inc., 0.5%, 1/15/2041 |
|
EUR
|
175,000 |
179,513 |
| GTCR
(AP) Finance, Inc., 8%, 5/15/2027 (n) |
|
$
|
215,000 |
226,288 |
| Hartford
Financial Services Group, Inc., 3.6%, 8/19/2049 |
|
|
526,000 |
584,150 |
| Marsh
& McLennan Cos., Inc., 2.25%, 11/15/2030 |
|
|
316,000 |
315,826 |
| Progressive
Corp., 4.125%, 4/15/2047 |
|
|
283,000 |
347,718 |
| QBE
Insurance Group Ltd., 2.5% to 9/13/2028, FLR (GBP Government Yield - 5yr. + 2.061%) to 9/13/2038 |
|
GBP
|
335,000 |
442,517 |
| Willis
North America, Inc., 3.875%, 9/15/2049 |
|
$
|
405,000 |
449,567 |
| |
|
|
|
$4,075,329 |
| International
Market Quasi-Sovereign – 0.7% |
| Electricite
de France S.A., 2.875% to 3/15/2027, FLR (EUR Swap Rate - 5yr. + 3.373%) to 3/15/2031, FLR (EUR Swap Rate - 5yr. + 3.623%) to 3/15/2047, FLR (EUR Swap Rate - 5yr. + 4.373%) to 3/15/2070 |
|
EUR
|
600,000 |
$
709,712 |
| Electricite
de France S.A., 5.875% to 1/22/2029, FLR (GBP Swap Rate - 15yr. + 3.046%) to 1/22/2049, FLR (GBP Swap Rate - 15yr. + 3.796%) to 12/31/2165 |
|
GBP
|
400,000 |
606,372 |
| Electricite
de France S.A., 2.625% to 6/01/2028, FLR (EUR Swap Rate - 5yr. + 2.86%) to 6/01/2033, FLR (EUR Swap Rate - 5yr. + 3.11%) to 6/01/2048, FLR (EUR Swap Rate - 5yr. + 3.86%) to 6/01/2170 |
|
EUR
|
400,000 |
463,047 |
| La
Banque Postale S.A. (Republic of France), 0.875% to 1/26/2026, FLR (EUR Swap Rate - 5yr. + 1.38%) to 1/26/2031 |
|
|
200,000 |
230,260 |
| Ontario
Teachers' Cadillac Fairview Properties, 2.5%, 10/15/2031 (n) |
|
$
|
425,000 |
425,888 |
| |
|
|
|
$2,435,279 |
Portfolio of
Investments – continued
| Issuer
|
|
|
Shares/Par
|
Value
($) |
| Bonds
– continued |
| International
Market Sovereign – 1.8% |
| Commonwealth
of Australia, 1.75%, 6/21/2051 |
|
AUD
|
6,427,000 |
$
3,827,880 |
| Government
of Bermuda, 2.375%, 8/20/2030 (n) |
|
$
|
239,000 |
236,610 |
| Government
of Japan, 2.4%, 3/20/2037 |
|
JPY
|
24,900,000 |
286,675 |
| Republic
of Italy, 1.7%, 9/01/2051 |
|
EUR
|
2,073,000 |
2,300,005 |
| |
|
|
|
$6,651,170 |
| Leisure
& Toys – 0.1% |
| Ubisoft
Entertainment S.A., 0.878%, 11/24/2027 |
|
EUR
|
200,000 |
$
226,548 |
| Local
Authorities – 0.2% |
| Province
of Alberta, 4.5%, 12/01/2040 |
|
CAD
|
410,000 |
$
413,803 |
| Province
of British Columbia, 2.95%, 6/18/2050 |
|
|
315,000 |
267,055 |
| |
|
|
|
$680,858 |
| Machinery
& Tools – 0.3% |
| CNH
Industrial Capital LLC, 1.875%, 1/15/2026 |
|
$
|
255,000 |
$
257,156 |
| Sarens
Finance Co. N.V., 5.75%, 2/21/2027 |
|
EUR
|
211,000 |
239,618 |
| Terex
Corp., 5%, 5/15/2029 (n) |
|
$
|
690,000 |
703,800 |
| |
|
|
|
$1,200,574 |
| Major
Banks – 3.6% |
| Australia
and New Zealand Banking Group Ltd., 2.57%, 11/25/2035 (n) |
|
$
|
563,000 |
$
542,639 |
| Banco
de Sabadell S.A., 2%, 1/17/2030 |
|
EUR
|
500,000 |
569,365 |
| Bank
of America Corp., 3.5%, 4/19/2026 |
|
$
|
904,000 |
976,172 |
| Bank
of America Corp., 0.694% to 3/22/2030, FLR (EURIBOR - 3mo. + 0.79%) to 3/22/2031 |
|
EUR
|
330,000 |
373,420 |
| Bank
of America Corp., 2.687% to 4/22/2031, FLR (SOFR + 1.32%) to 4/22/2032 |
|
$
|
721,000 |
729,959 |
| Barclays
PLC, 1.125% to 3/22/2026, FLR (EUR Swap Rate - 5yr. + 1.55%) to 3/22/2031 |
|
EUR
|
230,000 |
264,427 |
| CaixaBank
S.A., 2.75% to 7/14/2023, FLR (EUR Swap Rate - 5yr. + 2.35%) to 7/14/2028 |
|
|
200,000 |
239,900 |
| Commonwealth
Bank of Australia, 2.688%, 3/11/2031 (n) |
|
$
|
688,000 |
680,790 |
| Credit
Suisse Group AG, 3.091% to 5/14/2031, FLR (SOFR + 1.73%) to 5/14/2032 (n) |
|
|
250,000 |
254,540 |
| Deutsche
Bank AG, 3.729% to 1/14/2031, FLR (SOFR + 2.757%) to 1/14/2032 |
|
|
400,000 |
410,017 |
| Goldman
Sachs Group, Inc., 2.383% to 7/21/2031, FLR (SOFR + 1.248%) to 7/21/2032 |
|
|
506,000 |
497,358 |
| HSBC
Holdings PLC, 2.099% to 6/04/2025, FLR (SOFR + 1.929%) to 6/04/2026 |
|
|
645,000 |
653,011 |
| JPMorgan
Chase & Co., 2.95%, 10/01/2026 |
|
|
1,137,000 |
1,202,991 |
| JPMorgan
Chase & Co., 4.26%, 2/22/2048 |
|
|
300,000 |
368,038 |
Portfolio of
Investments – continued
| Issuer
|
|
|
Shares/Par
|
Value
($) |
| Bonds
– continued |
| Major
Banks – continued |
| Mitsubishi
UFJ Financial Group, Inc., 1.412%, 7/17/2025 |
|
$
|
926,000 |
$
924,033 |
| Morgan
Stanley, 3.125%, 7/27/2026 |
|
|
982,000 |
1,043,247 |
| Morgan
Stanley, 1.593% to 5/04/2026, FLR (SOFR + 0.879%) to 5/04/2027 |
|
|
902,000 |
893,594 |
| Morgan
Stanley, 1.102%, 4/29/2033 |
|
EUR
|
315,000 |
362,207 |
| Natwest
Group PLC, 1.043% to 9/14/2027, FLR (EUR Swap Rate - 5yr. + 1.27%) to 9/14/2032 |
|
|
130,000 |
147,417 |
| Nordea
Bank Abp, 0.625% to 8/18/2026, FLR (EUR Swap Rate - 5yr. + 0.92%) to 8/18/2031 |
|
|
490,000 |
561,294 |
| Nordea
Bank Abp, 2.408% to 12/09/2027, FLR (GBP Government Yield - 5yr. + 1.3%) to 12/09/2032 |
|
GBP
|
200,000 |
264,006 |
| UniCredit
S.p.A., 2.2% to 7/22/2026, FLR (EURIBOR - 3mo. + 2.55%) to 7/22/2027 |
|
EUR
|
610,000 |
741,457 |
| Wells
Fargo & Co., 2.125%, 9/24/2031 |
|
GBP
|
470,000 |
638,526 |
| |
|
|
|
$13,338,408 |
| Medical
& Health Technology & Services – 5.1% |
| 180
Medical, Inc., 3.875%, 10/15/2029 (n) |
|
$
|
765,000 |
$
769,313 |
| Alcon,
Inc., 3.8%, 9/23/2049 (n) |
|
|
200,000 |
225,877 |
| Avantor
Funding, Inc., 4.625%, 7/15/2028 (n) |
|
|
992,000 |
1,029,150 |
| BCPE
Cycle Merger Sub II, Inc., 10.625%, 7/15/2027 (n) |
|
|
490,000 |
508,105 |
| Becton
Dickinson Euro Finance S.à r.l., 0.334%, 8/13/2028 |
|
EUR
|
111,000 |
125,588 |
| Becton
Dickinson Euro Finance S.à r.l., 1.213%, 2/12/2036 |
|
|
100,000 |
113,777 |
| Becton
Dickinson Euro Finance S.à r.l., 1.336%, 8/13/2041 |
|
|
160,000 |
178,135 |
| Catalent,
Inc., 3.125%, 2/15/2029 (n) |
|
$
|
1,308,000 |
1,270,395 |
| Charles
River Laboratories International, Inc., 3.75%, 3/15/2029 (n) |
|
|
1,499,000 |
1,513,990 |
| CHS/Community
Health Systems, Inc., 6.625%, 2/15/2025 (n) |
|
|
505,000 |
525,200 |
| CHS/Community
Health Systems, Inc., 8%, 12/15/2027 (n) |
|
|
120,000 |
130,050 |
| CHS/Community
Health Systems, Inc., 6.125%, 4/01/2030 (n) |
|
|
765,000 |
751,964 |
| DaVita,
Inc., 4.625%, 6/01/2030 (n) |
|
|
475,000 |
477,356 |
| DaVita,
Inc., 3.75%, 2/15/2031 (n) |
|
|
477,000 |
451,958 |
| Encompass
Health Corp., 5.75%, 9/15/2025 |
|
|
235,000 |
239,994 |
| Encompass
Health Corp., 4.625%, 4/01/2031 |
|
|
435,000 |
442,613 |
| HCA,
Inc., 5.875%, 2/15/2026 |
|
|
830,000 |
945,162 |
| HCA,
Inc., 5.25%, 6/15/2026 |
|
|
471,000 |
534,099 |
| HCA,
Inc., 3.5%, 9/01/2030 |
|
|
1,055,000 |
1,109,491 |
| HCA,
Inc., 5.125%, 6/15/2039 |
|
|
287,000 |
355,550 |
| HealthSouth
Corp., 5.125%, 3/15/2023 |
|
|
274,000 |
274,000 |
| IQVIA
Holdings, Inc., 5%, 10/15/2026 (n) |
|
|
835,000 |
857,921 |
| IQVIA
Holdings, Inc., 5%, 5/15/2027 (n) |
|
|
1,165,000 |
1,207,604 |
| LifePoint
Health, Inc., 4.375%, 2/15/2027 (n) |
|
|
115,000 |
113,850 |
| LifePoint
Health, Inc., 5.375%, 1/15/2029 (n) |
|
|
190,000 |
186,200 |
Portfolio of
Investments – continued
| Issuer
|
|
|
Shares/Par
|
Value
($) |
| Bonds
– continued |
| Medical
& Health Technology & Services – continued |
| Memorial
Sloan-Kettering Cancer Center, 2.955%, 1/01/2050 |
|
$
|
406,000 |
$
418,500 |
| MPH
Acquisition Holdings LLC, 5.5%, 9/01/2028 (n) |
|
|
420,000 |
417,074 |
| New
York Society for the Relief of the Ruptured & Crippled, 2.667%, 10/01/2050 |
|
|
750,000 |
714,044 |
| ProMedica
Toledo Hospital, “B”, AGM, 6.015%, 11/15/2048 |
|
|
400,000 |
586,457 |
| Regional
Care/LifePoint Health, Inc., 9.75%, 12/01/2026 (n) |
|
|
470,000 |
495,850 |
| Syneos
Health, Inc., 3.625%, 1/15/2029 (n) |
|
|
1,010,000 |
996,870 |
| Thermo
Fisher Scientific, Inc., 1.75%, 10/15/2028 |
|
|
519,000 |
511,312 |
| US
Acute Care Solutions LLC, 6.375%, 3/01/2026 (n) |
|
|
485,000 |
503,187 |
| |
|
|
|
$18,980,636 |
| Medical
Equipment – 0.5% |
| Mozart
Debt Merger Sub, Inc., 5.25%, 10/01/2029 (n) |
|
$
|
550,000 |
$
558,250 |
| Teleflex,
Inc., 4.625%, 11/15/2027 |
|
|
885,000 |
917,081 |
| Thermo
Fisher Scientific (Finance I) Co., 1.125%, 10/18/2033 |
|
EUR
|
310,000 |
359,890 |
| Thermo
Fisher Scientific (Finance I) Co., 2%, 10/18/2051 |
|
|
170,000 |
209,673 |
| |
|
|
|
$2,044,894 |
| Metals
& Mining – 2.9% |
| Anglo
American Capital PLC, 5.625%, 4/01/2030 (n) |
|
$
|
371,000 |
$
443,775 |
| Baffinland
Iron Mines Corp./Baffinland Iron Mines LP, 8.75%, 7/15/2026 (n) |
|
|
790,000 |
836,784 |
| Coeur
Mining, Inc., 5.125%, 2/15/2029 (n) |
|
|
805,000 |
779,964 |
| Compass
Minerals International, Inc., 6.75%, 12/01/2027 (n) |
|
|
675,000 |
714,656 |
| Eldorado
Gold Corp., 6.25%, 9/01/2029 (n) |
|
|
615,000 |
624,410 |
| First
Quantum Minerals Ltd., 6.875%, 3/01/2026 (n) |
|
|
400,000 |
416,500 |
| First
Quantum Minerals Ltd., 6.875%, 10/15/2027 (n) |
|
|
463,000 |
494,253 |
| First
Quantum Minerals Ltd., 6.875%, 10/15/2027 |
|
|
600,000 |
640,500 |
| FMG
Resources Ltd., 4.375%, 4/01/2031 (n) |
|
|
800,000 |
810,000 |
| Freeport-McMoRan,
Inc., 4.375%, 8/01/2028 |
|
|
380,000 |
395,664 |
| Freeport-McMoRan,
Inc., 5.25%, 9/01/2029 |
|
|
605,000 |
662,172 |
| Glencore
Funding LLC, 2.85%, 4/27/2031 (n) |
|
|
465,000 |
465,604 |
| GrafTech
Finance, Inc., 4.625%, 12/15/2028 (n) |
|
|
497,000 |
501,970 |
| Kaiser
Aluminum Corp., 4.625%, 3/01/2028 (n) |
|
|
1,042,000 |
1,054,712 |
| Kaiser
Aluminum Corp., 4.5%, 6/01/2031 (n) |
|
|
400,000 |
392,040 |
| Novelis
Corp., 3.25%, 11/15/2026 (n) |
|
|
281,000 |
280,298 |
| Novelis
Corp., 4.75%, 1/30/2030 (n) |
|
|
645,000 |
670,800 |
| Novelis
Corp., 3.875%, 8/15/2031 (n) |
|
|
338,000 |
329,989 |
| Petra
Diamonds US$ Treasury PLC, 10.5%, (0% cash or 10.5% PIK) 3/08/2026 (n)(p) |
|
|
236,414 |
243,211 |
| |
|
|
|
$10,757,302 |
Portfolio of
Investments – continued
| Issuer
|
|
|
Shares/Par
|
Value
($) |
| Bonds
– continued |
| Midstream
– 4.3% |
| AI
Candelaria Spain SLU, 7.5%, 12/15/2028 (n) |
|
$
|
457,000 |
$
491,846 |
| Cheniere
Energy Partners LP, 4.5%, 10/01/2029 |
|
|
310,000 |
330,981 |
| Cheniere
Energy, Inc., 4%, 3/01/2031 (n) |
|
|
845,000 |
878,814 |
| DT
Midstream, Inc., 4.125%, 6/15/2029 (n) |
|
|
543,000 |
546,882 |
| DT
Midstream, Inc., 4.375%, 6/15/2031 (n) |
|
|
908,000 |
919,949 |
| Enbridge,
Inc., 5.375%, 9/27/2077 |
|
CAD
|
570,000 |
482,450 |
| EnLink
Midstream Partners LP, 5.625%, 1/15/2028 (n) |
|
$
|
487,000 |
516,382 |
| Enterprise
Products Partners LP, 3.125%, 7/31/2029 |
|
|
328,000 |
349,747 |
| EQM
Midstream Partners LP, 6%, 7/01/2025 (n) |
|
|
176,000 |
190,960 |
| EQM
Midstream Partners LP, 6.5%, 7/01/2027 (n) |
|
|
60,000 |
66,750 |
| EQM
Midstream Partners LP, 5.5%, 7/15/2028 |
|
|
1,305,000 |
1,437,366 |
| EQM
Midstream Partners LP, 4.5%, 1/15/2029 (n) |
|
|
325,000 |
334,344 |
| Galaxy
Pipeline Assets Bidco Ltd., 2.16%, 3/31/2034 (n) |
|
|
527,000 |
513,313 |
| Genesis
Energy LP/Genesis Energy Finance Corp., 6.25%, 5/15/2026 |
|
|
636,500 |
615,814 |
| GNL
Quintero S.A., 4.634%, 7/31/2029 (n) |
|
|
498,836 |
537,246 |
| Northriver
Midstream Finance LP, 5.625%, 2/15/2026 (n) |
|
|
835,000 |
862,137 |
| Peru
LNG, 5.375%, 3/22/2030 |
|
|
1,047,000 |
887,202 |
| Plains
All American Pipeline LP/PAA Finance Corp., 3.55%, 12/15/2029 |
|
|
744,000 |
776,276 |
| Sabine
Pass Liquefaction LLC, 5%, 3/15/2027 |
|
|
285,000 |
323,173 |
| Sabine
Pass Liquefaction LLC, 4.2%, 3/15/2028 |
|
|
400,000 |
443,522 |
| Sabine
Pass Liquefaction LLC, 4.5%, 5/15/2030 |
|
|
507,000 |
577,712 |
| Targa
Resources Partners LP/Targa Resources Finance Corp., 6.875%, 1/15/2029 |
|
|
955,000 |
1,069,600 |
| Targa
Resources Partners LP/Targa Resources Finance Corp., 4.875%, 2/01/2031 |
|
|
330,000 |
355,816 |
| Targa
Resources Partners LP/Targa Resources Finance Corp., 4%, 1/15/2032 (n) |
|
|
265,000 |
273,472 |
| Venture
Global Calcasieu Pass LLC, 3.875%, 8/15/2029 (n) |
|
|
505,000 |
513,838 |
| Venture
Global Calcasieu Pass LLC, 4.125%, 8/15/2031 (n) |
|
|
505,000 |
522,650 |
| Western
Midstream Operating LP, 5.3%, 2/01/2030 |
|
|
580,000 |
635,825 |
| Western
Midstream Operation LP, 4.65%, 7/01/2026 |
|
|
220,000 |
237,600 |
| Western
Midstream Operation LP, 5.5%, 8/15/2048 |
|
|
180,000 |
214,880 |
| |
|
|
|
$15,906,547 |
| Municipals
– 0.8% |
| Massachusetts
Educational Financing Authority, Education Loan Subordinate Rev., “A”, 2.641%, 7/01/2037 |
|
$
|
565,000 |
$
569,640 |
| Michigan
Finance Authority Hospital Rev. (Trinity Health Credit Group), 3.384%, 12/01/2040 |
|
|
605,000 |
660,355 |
| New
Jersey Economic Development Authority State Pension Funding Rev., “A”, NPFG, 7.425%, 2/15/2029 |
|
|
526,000 |
666,686 |
Portfolio of
Investments – continued
| Issuer
|
|
|
Shares/Par
|
Value
($) |
| Bonds
– continued |
| Municipals
– continued |
| Oklahoma
Development Finance Authority, Health System Rev. (OU Medicine Project), “C”, 5.45%, 8/15/2028 |
|
$
|
209,000 |
$
234,870 |
| Puerto
Rico Industrial, Tourist, Educational, Medical & Environmental Control Facilities Financing Authority Rev. (Cogeneration Facilities - AES Puerto Rico Project), 9.12%, 6/01/2022 |
|
|
95,000 |
97,375 |
| State
of Florida, “A”, 2.154%, 7/01/2030 |
|
|
691,000 |
689,742 |
| |
|
|
|
$2,918,668 |
| Natural
Gas - Distribution – 0.2% |
| National
Grid PLC, 1.125%, 1/14/2033 |
|
GBP
|
487,000 |
$
594,004 |
| NiSource,
Inc., 2.95%, 9/01/2029 |
|
$
|
306,000 |
318,572 |
| |
|
|
|
$912,576 |
| Natural
Gas - Pipeline – 0.4% |
| APT
Pipelines Ltd., 0.75%, 3/15/2029 |
|
EUR
|
440,000 |
$
497,212 |
| APT
Pipelines Ltd., 1.25%, 3/15/2033 |
|
|
435,000 |
491,298 |
| APT
Pipelines Ltd., 2.5%, 3/15/2036 |
|
GBP
|
390,000 |
526,340 |
| |
|
|
|
$1,514,850 |
| Network
& Telecom – 1.0% |
| AT&T,
Inc., 4.25%, 6/01/2043 |
|
GBP
|
270,000 |
$
464,065 |
| AT&T,
Inc., 3.5%, 9/15/2053 |
|
$
|
499,000 |
506,924 |
| Front
Range BidCo, Inc., 6.125%, 3/01/2028 (n) |
|
|
670,000 |
653,943 |
| Iliad
Holding S.A.S., 5.125%, 10/15/2026 |
|
EUR
|
280,000 |
332,691 |
| Iliad
Holding S.A.S., 7%, 10/15/2028 (n) |
|
$
|
574,000 |
591,519 |
| Lorca
Telecom Bondco S.A.U., 4%, 9/18/2027 |
|
EUR
|
420,000 |
488,482 |
| Verizon
Communications, Inc., 2.1%, 3/22/2028 |
|
$
|
273,000 |
273,756 |
| Verizon
Communications, Inc., 4%, 3/22/2050 |
|
|
292,000 |
334,831 |
| |
|
|
|
$3,646,211 |
| Oil
Services – 0.5% |
| Halliburton
Co., 5%, 11/15/2045 |
|
$
|
291,000 |
$
360,514 |
| MV24
Capital B.V., 6.748%, 6/01/2034 |
|
|
933,770 |
963,193 |
| Solaris
Midstream Holding LLC, 7.625%, 4/01/2026 (n) |
|
|
370,000 |
390,239 |
| |
|
|
|
$1,713,946 |
| Oils
– 0.9% |
| Neste
Oyj, 0.75%, 3/25/2028 |
|
EUR
|
400,000 |
$
456,627 |
| PBF
Holding Co. LLC/PBF Finance Corp., 7.25%, 6/15/2025 |
|
$
|
985,000 |
771,299 |
| PBF
Holding Co. LLC/PBF Finance Corp., 6%, 2/15/2028 |
|
|
415,000 |
300,794 |
| Puma
International Financing S.A., 5%, 1/24/2026 |
|
|
1,338,000 |
1,343,085 |
| Thaioil
Treasury Center Co. Ltd., 5.375%, 11/20/2048 (n) |
|
|
359,000 |
410,192 |
| |
|
|
|
$3,281,997 |
Portfolio of
Investments – continued
| Issuer
|
|
|
Shares/Par
|
Value
($) |
| Bonds
– continued |
| Other
Banks & Diversified Financials – 2.9% |
| Alpha
Bank, 4.25%, 2/13/2030 |
|
EUR
|
740,000 |
$
842,403 |
| Bangkok
Bank (Hong Kong), 4.05%, 3/19/2024 (n) |
|
$
|
1,046,000 |
1,116,992 |
| Bank
Hapoalim B.M., 3.255% to 1/21/2027, FLR (CMT - 5yr. + 2.155%) to 1/21/2032 (n) |
|
|
343,000 |
342,578 |
| Bank
of Cyprus PCL, 2.5% to 6/24/2026, FLR (EUR Swap Rate - 5yr. + 2.785%) to 6/24/2027 |
|
EUR
|
650,000 |
730,368 |
| Banque
Fédérative du Crédit Mutuel, 0.625%, 11/03/2028 |
|
|
300,000 |
344,442 |
| Belfius
Bank S.A., 1.25% to 4/6/2029, FLR (EUR Swap Rate - 5yr. + 1.3%) to 4/06/2034 |
|
|
300,000 |
340,442 |
| Deutsche
Bank AG, 1.875% to 12/22/2027, FLR (SONIA + 1.634%) to 12/22/2028 |
|
GBP
|
100,000 |
133,352 |
| Deutsche
Bank AG, 1.375% to 2/17/2031, FLR (EURIBOR - 3mo. + 1.5%) to 2/17/2032 |
|
EUR
|
200,000 |
230,553 |
| Groupe
BPCE S.A., 4.5%, 3/15/2025 (n) |
|
$
|
652,000 |
710,107 |
| Groupe
des Assurances du Credit Mutuel, 1.875%, 4/21/2042 |
|
EUR
|
300,000 |
345,117 |
| Intesa
Sanpaolo S.p.A., 2.625%, 3/11/2036 |
|
GBP
|
570,000 |
772,247 |
| KBC
Group N.V., 0.625%, 12/07/2031 |
|
EUR
|
500,000 |
568,532 |
| Macquarie
Group Ltd., 0.35%, 3/03/2028 |
|
|
350,000 |
396,226 |
| Macquarie
Group Ltd., 0.95%, 5/21/2031 |
|
|
650,000 |
740,964 |
| Stichting
AK Rabobank Certificaten, 19.436%, 3/29/2071 |
|
|
770,000 |
1,235,967 |
| UBS
AG, 5.125%, 5/15/2024 |
|
$
|
981,000 |
1,064,950 |
| Virgin
Money UK PLC, 5.125% to 12/11/2025, FLR (GBP Government Yield - 5yr. + 5.25%) to 12/11/2030 |
|
GBP
|
525,000 |
782,794 |
| |
|
|
|
$10,698,034 |
| Personal
Computers & Peripherals – 0.3% |
| NCR
Corp., 5%, 10/01/2028 (n) |
|
$
|
840,000 |
$
850,500 |
| NCR
Corp., 5.125%, 4/15/2029 (n) |
|
|
405,000 |
414,145 |
| |
|
|
|
$1,264,645 |
| Pharmaceuticals
– 1.6% |
| Bausch
Health Companies, Inc., 6.125%, 4/15/2025 (n) |
|
$
|
1,341,000 |
$
1,365,835 |
| Bausch
Health Companies, Inc., 5%, 1/30/2028 (n) |
|
|
1,055,000 |
973,786 |
| Bausch
Health Companies, Inc., 5%, 2/15/2029 (n) |
|
|
415,000 |
380,763 |
| Endo
Luxembourg Finance Co I S.à r.l., 6.125%, 4/01/2029 (n) |
|
|
380,000 |
374,300 |
| Jazz
Securities DAC, 4.375%, 1/15/2029 (n) |
|
|
985,000 |
1,012,088 |
| Organon
Finance 1 LLC, 4.125%, 4/30/2028 (n) |
|
|
540,000 |
547,425 |
| Organon
Finance 1 LLC, 5.125%, 4/30/2031 (n) |
|
|
715,000 |
737,472 |
| Par
Pharmaceutical, Inc., 7.5%, 4/01/2027 (n) |
|
|
405,000 |
408,544 |
| |
|
|
|
$5,800,213 |
Portfolio of
Investments – continued
| Issuer
|
|
|
Shares/Par
|
Value
($) |
| Bonds
– continued |
| Pollution
Control – 0.6% |
| GFL
Environmental, Inc., 4%, 8/01/2028 (n) |
|
$
|
380,000 |
$
370,500 |
| GFL
Environmental, Inc., 3.5%, 9/01/2028 (n) |
|
|
435,000 |
432,825 |
| GFL
Environmental, Inc., 4.75%, 6/15/2029 (n) |
|
|
220,000 |
221,922 |
| GFL
Environmental, Inc., 4.375%, 8/15/2029 (n) |
|
|
285,000 |
282,269 |
| Stericycle,
Inc., 3.875%, 1/15/2029 (n) |
|
|
775,000 |
763,375 |
| |
|
|
|
$2,070,891 |
| Precious
Metals & Minerals – 0.3% |
| IAMGOLD
Corp., 5.75%, 10/15/2028 (n) |
|
$
|
570,000 |
$
559,312 |
| Taseko
Mines Ltd., 7%, 2/15/2026 (n) |
|
|
380,000 |
392,825 |
| |
|
|
|
$952,137 |
| Printing
& Publishing – 0.3% |
| Cimpress
N.V., 7%, 6/15/2026 (n) |
|
$
|
770,000 |
$
799,837 |
| Mav
Acquisition Corp., 8%, 8/01/2029 (n) |
|
|
450,000 |
437,625 |
| |
|
|
|
$1,237,462 |
| Railroad
& Shipping – 0.4% |
| Wabtec
Transportation Netherlands B.V., 1.25%, 12/03/2027 |
|
EUR
|
666,000 |
$
780,443 |
| Watco
Cos. LLC/Watco Finance Corp., 6.5%, 6/15/2027 (n) |
|
$
|
685,000 |
727,813 |
| |
|
|
|
$1,508,256 |
| Real
Estate - Office – 0.3% |
| Corporate
Office Property LP, REIT, 2.25%, 3/15/2026 |
|
$
|
391,000 |
$
397,585 |
| Corporate
Office Property LP, REIT, 2%, 1/15/2029 |
|
|
197,000 |
191,082 |
| Corporate
Office Property LP, REIT, 2.75%, 4/15/2031 |
|
|
393,000 |
394,514 |
| |
|
|
|
$983,181 |
| Real
Estate - Other – 0.9% |
| EPR
Properties, REIT, 3.6%, 11/15/2031 |
|
$
|
333,000 |
$
333,814 |
| InterMed
Holdings Ltd., 5.875%, 10/01/2028 (n) |
|
|
835,000 |
872,575 |
| Lexington
Realty Trust Co., 2.7%, 9/15/2030 |
|
|
506,000 |
508,016 |
| Sun
Communities, Inc., 2.7%, 7/15/2031 |
|
|
243,000 |
243,791 |
| W.P.
Carey, Inc., REIT, 2.4%, 2/01/2031 |
|
|
756,000 |
745,901 |
| XHR
LP, REIT, 4.875%, 6/01/2029 (n) |
|
|
665,000 |
682,257 |
| |
|
|
|
$3,386,354 |
| Real
Estate - Retail – 0.4% |
| Brixmor
Operating Partnership LP, REIT, 4.05%, 7/01/2030 |
|
$
|
473,000 |
$
522,799 |
| Hammerson
Ireland Finance DAC, 1.75%, 6/03/2027 |
|
EUR
|
352,000 |
405,227 |
| Regency
Centers Corp., 3.7%, 6/15/2030 |
|
$
|
289,000 |
316,730 |
| STORE
Capital Corp., REIT, 2.75%, 11/18/2030 |
|
|
316,000 |
316,121 |
| |
|
|
|
$1,560,877 |
Portfolio of
Investments – continued
| Issuer
|
|
|
Shares/Par
|
Value
($) |
| Bonds
– continued |
| Retailers
– 0.9% |
| Bath
& Body Works, Inc., 5.25%, 2/01/2028 |
|
$
|
1,405,000 |
$
1,514,590 |
| Home
Depot, Inc., 4.875%, 2/15/2044 |
|
|
248,000 |
327,401 |
| Kohl's
Corp., 3.375%, 5/01/2031 |
|
|
428,000 |
434,516 |
| MercadoLibre,
Inc., 3.125%, 1/14/2031 |
|
|
480,000 |
453,024 |
| Victoria's
Secret & Co., 4.625%, 7/15/2029 (n) |
|
|
615,000 |
617,706 |
| |
|
|
|
$3,347,237 |
| Specialty
Chemicals – 0.2% |
| Univar
Solutions USA, Inc., 5.125%, 12/01/2027 (n) |
|
$
|
657,000 |
$
684,923 |
| Specialty
Stores – 0.9% |
| Group
1 Automotive, Inc., 4%, 8/15/2028 (n) |
|
$
|
804,000 |
$
804,161 |
| Magic
Mergeco, Inc., 5.25%, 5/01/2028 (n) |
|
|
385,000 |
388,850 |
| Magic
Mergeco, Inc., 7.875%, 5/01/2029 (n) |
|
|
455,000 |
459,550 |
| Nordstrom,
Inc., 4.25%, 8/01/2031 |
|
|
348,000 |
347,878 |
| Penske
Automotive Group Co., 3.75%, 6/15/2029 |
|
|
982,000 |
976,609 |
| PetSmart,
Inc./PetSmart Finance Corp., 4.75%, 2/15/2028 (n) |
|
|
250,000 |
256,875 |
| PetSmart,
Inc./PetSmart Finance Corp., 7.75%, 2/15/2029 (n) |
|
|
250,000 |
270,180 |
| |
|
|
|
$3,504,103 |
| Supermarkets
– 0.5% |
| Albertsons
Cos. LLC/Safeway, Inc., 4.625%, 1/15/2027 (n) |
|
$
|
875,000 |
$
915,731 |
| Albertsons
Cos. LLC/Safeway, Inc., 3.5%, 3/15/2029 (n) |
|
|
560,000 |
551,984 |
| Loblaw
Cos. Ltd., 4.86%, 9/12/2023 |
|
CAD
|
421,000 |
357,911 |
| |
|
|
|
$1,825,626 |
| Supranational
– 0.6% |
| International
Bank for Reconstruction and Development, 4.25%, 6/24/2025 |
|
AUD
|
405,000 |
$
332,404 |
| West
African Development Bank, 4.7%, 10/22/2031 |
|
$
|
463,000 |
504,096 |
| West
African Development Bank, 4.7%, 10/22/2031 (n) |
|
|
806,000 |
877,541 |
| West
African Development Bank, 2.75%, 1/22/2033 |
|
EUR
|
307,000 |
374,503 |
| |
|
|
|
$2,088,544 |
| Telecommunications
- Wireless – 2.7% |
| Altice
France S.A., 6%, 2/15/2028 (n) |
|
$
|
885,000 |
$
840,750 |
| American
Tower Corp., REIT, 3.8%, 8/15/2029 |
|
|
353,000 |
387,816 |
| Crown
Castle International Corp., 3.7%, 6/15/2026 |
|
|
314,000 |
339,116 |
| Millicom
International Cellular S.A., 4.5%, 4/27/2031 (n) |
|
|
1,025,000 |
1,051,917 |
| Rogers
Communications, Inc., 3.7%, 11/15/2049 |
|
|
339,000 |
351,868 |
| SBA
Communications Corp., 3.875%, 2/15/2027 |
|
|
655,000 |
675,488 |
| SBA
Communications Corp., 3.125%, 2/01/2029 (n) |
|
|
1,030,000 |
988,800 |
| Sprint
Capital Corp., 6.875%, 11/15/2028 |
|
|
800,000 |
1,011,552 |
| Sprint
Corp., 7.125%, 6/15/2024 |
|
|
290,000 |
327,700 |
Portfolio of
Investments – continued
| Issuer
|
|
|
Shares/Par
|
Value
($) |
| Bonds
– continued |
| Telecommunications
- Wireless – continued |
| Sprint
Corp., 7.625%, 3/01/2026 |
|
$
|
1,280,000 |
$
1,534,592 |
| Telefonica
Celular del Paraguay S.A., 5.875%, 4/15/2027 (n) |
|
|
900,000 |
933,750 |
| Vantage
Towers AG, 0.75%, 3/31/2030 |
|
EUR
|
200,000 |
227,596 |
| Vodafone
Group PLC, 3.375%, 8/08/2049 |
|
GBP
|
210,000 |
330,816 |
| Vodafone
Group PLC, 3.25% to 9/04/2026, FLR (CMT - 5yr. + 2.447%) to 9/04/2031, FLR (CMT - 5yr. + 2.697%) to 9/04/2046, FLR (CMT - 5yr. + 3.447%) to 6/04/2081 |
|
$
|
978,000 |
978,460 |
| |
|
|
|
$9,980,221 |
| Telephone
Services – 0.2% |
| TELUS
Corp., 2.85%, 11/13/2031 |
|
CAD
|
825,000 |
$
654,014 |
| Tobacco
– 0.4% |
| British
American Tobacco PLC, 3.75% to 9/27/2029, FLR (EUR Swap Rate - 5yr. + 3.952%) to 9/27/2034, FLR (EUR Swap Rate - 5yr. + 4.202%) to 9/27/2049, FLR (EUR Swap Rate - 5yr. + 4.952%) to 12/29/2149 |
|
EUR
|
330,000 |
$
375,186 |
| British
American Tobacco PLC, 3% to 12/27/2026, FLR (EUR Swap Rate - 5yr. + 3.372%) to 12/27/2031, FLR (EUR Swap Rate - 5yr. + 3.622%) to 12/27/2046, FLR (EUR Swap Rate - 5yr. + 4.372%) to 9/27/2170 |
|
|
425,000 |
483,316 |
| Vector
Group Ltd., 10.5%, 11/01/2026 (n) |
|
$
|
370,000 |
390,654 |
| Vector
Group Ltd., 5.75%, 2/01/2029 (n) |
|
|
430,000 |
427,850 |
| |
|
|
|
$1,677,006 |
| Transportation
- Services – 0.6% |
| Element
Fleet Management Corp., 1.6%, 4/06/2024 (n) |
|
$
|
837,000 |
$
842,689 |
| ERAC
USA Finance LLC, 7%, 10/15/2037 (n) |
|
|
175,000 |
260,731 |
| Promontoria
Holding 264 B.V., 6.75%, 8/15/2023 |
|
EUR
|
540,000 |
622,199 |
| Rumo
Luxembourg S.à r.l., 5.875%, 1/18/2025 |
|
$
|
606,000 |
625,755 |
| |
|
|
|
$2,351,374 |
| U.S.
Treasury Obligations – 1.1% |
| U.S.
Treasury Bonds, 2.375%, 11/15/2049 (f) |
|
$
|
3,674,000 |
$
4,019,873 |
| Utilities
- Electric Power – 4.8% |
| Adani
Green Energy (UP) Ltd./Prayatna Developers Private Ltd., 6.25%, 12/10/2024 (n) |
|
$
|
1,601,000 |
$
1,717,713 |
| Calpine
Corp., 4.5%, 2/15/2028 (n) |
|
|
690,000 |
698,977 |
| Calpine
Corp., 5.125%, 3/15/2028 (n) |
|
|
875,000 |
870,625 |
| Clearway
Energy Operating LLC, 4.75%, 3/15/2028 (n) |
|
|
345,000 |
365,010 |
| Clearway
Energy Operating LLC, 3.75%, 2/15/2031 (n) |
|
|
1,295,000 |
1,282,050 |
| ContourGlobal
Power Holdings S.A., 3.125%, 1/01/2028 |
|
EUR
|
326,000 |
374,951 |
| Enel
Finance International N.V., 0.5%, 6/17/2030 |
|
|
410,000 |
466,034 |
| Enel
Finance International N.V., 0.875%, 9/28/2034 |
|
|
550,000 |
621,156 |
Portfolio of
Investments – continued
| Issuer
|
|
|
Shares/Par
|
Value
($) |
| Bonds
– continued |
| Utilities
- Electric Power – continued |
| Enel
Finance International N.V., 4.75%, 5/25/2047 (n) |
|
$
|
271,000 |
$
342,697 |
| Enel
S.p.A., 2.25% to 3/10/2027, FLR (EUR Swap Rate - 5yr. + 2.679%) to 3/10/2032, FLR (EUR Swap Rate - 5yr. + 2.929%) to 3/10/2047, FLR (EUR Swap Rate - 5yr. + 3.679%) to 3/10/2070 |
|
EUR
|
425,000 |
508,898 |
| Enel
S.p.A., 8.75% to 9/24/2023, FLR (Swap Rate - 5yr. + 5.88%) to 9/24/2043, FLR (Swap Rate - 5yr. + 6.63%) to 9/24/2073 (n) |
|
$
|
500,000 |
565,100 |
| Enel
S.p.A., 1.875% to 9/08/2030, FLR (EUR Swap Rate - 5yr. + 2.011%) to 9/08/2035, FLR (EUR Swap Rate - 5yr. + 2.261%) to 9/08/2050, FLR (EUR Swap Rate - 5yr. + 3.011%) to 3/08/2170 |
|
EUR
|
475,000 |
534,708 |
| ENGIE
Energía Chile S.A., 4.5%, 1/29/2025 (n) |
|
$
|
1,023,000 |
1,100,081 |
| Evergy,
Inc., 2.9%, 9/15/2029 |
|
|
418,000 |
435,676 |
| Jersey
Central Power & Light Co., 2.75%, 3/01/2032 (n) |
|
|
186,000 |
190,115 |
| Listrindo
Capital B.V., 4.95%, 9/14/2026 |
|
|
910,000 |
930,930 |
| Mong
Duong Finance Holdings B.V., 5.125%, 5/07/2029 |
|
|
594,000 |
589,545 |
| NextEra
Energy, Inc., 4.25%, 7/15/2024 (n) |
|
|
278,000 |
294,319 |
| NextEra
Energy, Inc., 4.25%, 9/15/2024 (n) |
|
|
107,000 |
112,618 |
| NextEra
Energy, Inc., 4.5%, 9/15/2027 (n) |
|
|
780,000 |
834,444 |
| Pacific
Gas & Electric Co., 4.95%, 7/01/2050 |
|
|
310,000 |
343,115 |
| ReNew
Power Private Ltd., 5.875%, 3/05/2027 |
|
|
632,000 |
660,950 |
| Southern
California Edison Co., 3.65%, 2/01/2050 |
|
|
277,000 |
298,700 |
| Star
Energy Geothermal (Wayang Windu) Ltd., 6.75%, 4/24/2033 |
|
|
720,443 |
805,095 |
| TerraForm
Global Operating LLC, 6.125%, 3/01/2026 (n) |
|
|
460,000 |
471,624 |
| TerraForm
Power Operating LLC, 5%, 1/31/2028 (n) |
|
|
1,015,000 |
1,080,975 |
| TerraForm
Power Operating LLC, 4.75%, 1/15/2030 (n) |
|
|
350,000 |
362,593 |
| Virginia
Electric & Power Co., 3.5%, 3/15/2027 |
|
|
507,000 |
552,785 |
| Virginia
Electric & Power Co., 2.875%, 7/15/2029 |
|
|
348,000 |
366,163 |
| |
|
|
|
$17,777,647 |
| Total
Bonds (Identified Cost, $452,109,907) |
|
$
457,932,189 |
| Common
Stocks – 0.1% |
| Construction
– 0.0% |
|
| ICA
Tenedora, S.A. de C.V. (a)(u) |
|
127,848 |
$
105,567 |
| Energy
- Independent – 0.0% |
|
| Frontera
Energy Corp. (a) |
|
20,290 |
$
141,827 |
| Oil
Services – 0.1% |
|
| LTRI
Holdings LP (a)(u) |
|
520 |
$
149,547 |
Portfolio of
Investments – continued
| Issuer
|
|
|
Shares/Par
|
Value
($) |
| Common
Stocks – continued |
| Precious
Metals & Minerals – 0.0% |
|
| Petra
Diamonds Ltd. (a) |
|
3,575,762 |
$
75,851 |
| Total
Common Stocks (Identified Cost, $2,038,018) |
|
$
472,792 |
| |
Strike
Price |
First
Exercise |
|
|
| Warrants
– 0.0% |
|
|
|
|
| Forest
& Paper Products – 0.0% |
| Appvion
Holdings Corp. - Tranche A (1 share for 1 warrant, Expiration 6/13/23) (a) |
$11.50
|
8/24/18
|
332 |
$
3 |
| Appvion
Holdings Corp. - Tranche B (1 share for 1 warrant, Expiration 6/13/23) (a) |
13.23
|
8/24/18
|
332 |
3 |
| |
|
|
|
$6 |
| Other
Banks & Diversified Financials – 0.0% |
| Avation
Capital S.A. (1 share for 1 warrant, Expiration 10/31/26) (a)(u) |
GBP
1.14 |
3/16/21
|
7,000 |
$
1,613 |
| Total
Warrants (Identified Cost, $0) |
|
$
1,619 |
| |
|
|
|
|
| Investment
Companies (h) – 2.4% |
| Money
Market Funds – 2.4% |
|
| MFS
Institutional Money Market Portfolio, 0.04% (v) (Identified Cost, $8,752,593) |
|
|
8,752,593 |
$
8,752,593 |
| |
| |
| Other
Assets, Less Liabilities – (26.3)% |
|
(97,341,019)
|
| Net
Assets – 100.0% |
$369,818,174
|
| (a)
|
Non-income
producing security. |
| (d)
|
In
default. |
| (f)
|
All or a
portion of the security has been segregated as collateral for open futures contracts. |
| (h)
|
An
affiliated issuer, which may be considered one in which the fund owns 5% or more of the outstanding voting securities, or a company which is under common control. At period end, the aggregate values of the fund's investments in affiliated issuers
and in unaffiliated issuers were $8,752,593 and $458,406,600, respectively. |
| (i)
|
Interest
only security for which the fund receives interest on notional principal (Par amount). Par amount shown is the notional principal and does not reflect the cost of the security. |
| (n)
|
Securities
exempt from registration under Rule 144A of the Securities Act of 1933. These securities may be sold in the ordinary course of business in transactions exempt from registration, normally to qualified institutional buyers. At period end, the
aggregate value of these securities was $253,147,729, representing 68.5% of net assets. |
| (p)
|
Payment-in-kind
(PIK) security for which interest income may be received in additional securities and/or cash. |
| (u)
|
The
security was valued using significant unobservable inputs and is considered level 3 under the fair value hierarchy. For further information about the fund’s level 3 holdings, please see Note 2 in the Notes to Financial Statements.
|
Portfolio of
Investments – continued
| (v)
|
Affiliated issuer that is
available only to investment companies managed by MFS. The rate quoted for the MFS Institutional Money Market Portfolio is the annualized seven-day yield of the fund at period end. |
| (z)
|
Restricted
securities are not registered under the Securities Act of 1933 and are subject to legal restrictions on resale. These securities generally may be resold in transactions exempt from registration or to the public if the securities are subsequently
registered. Disposal of these securities may involve time-consuming negotiations and prompt sale at an acceptable price may be difficult. The fund holds the following restricted securities: |
| Restricted
Securities |
Acquisition
Date |
Cost
|
Value
|
| MF1
CLO Ltd., 2020-FL3, “AS”, FLR, 3.014% (LIBOR - 1mo. + 2.85%), 7/15/2035 |
6/12/20
|
$571,500
|
$579,182
|
| %
of Net assets |
|
|
0.2%
|
| The
following abbreviations are used in this report and are defined: |
| AGM
|
Assured
Guaranty Municipal |
| CDO
|
Collateralized
Debt Obligation |
| CLO
|
Collateralized
Loan Obligation |
| CMT
|
Constant
Maturity Treasury |
| EURIBOR
|
Euro
Interbank Offered Rate |
| FLR
|
Floating
Rate. Interest rate resets periodically based on the parenthetically disclosed reference rate plus a spread (if any). The period-end rate reported may not be the current rate. All reference rates are USD unless otherwise noted. |
| LIBOR
|
London
Interbank Offered Rate |
| NPFG
|
National
Public Finance Guarantee Corp. |
| PCL
|
Public
Company Limited |
| REIT
|
Real
Estate Investment Trust |
| SOFR
|
Secured
Overnight Financing Rate |
| SONIA
|
Sterling
Overnight Index Average |
| Abbreviations
indicate amounts shown in currencies other than the U.S. dollar. All amounts are stated in U.S. dollars unless otherwise indicated. A list of abbreviations is shown below: |
| AUD
|
Australian
Dollar |
| BRL
|
Brazilian
Real |
| CAD
|
Canadian
Dollar |
| CHF
|
Swiss
Franc |
| CLP
|
Chilean
Peso |
| CZK
|
Czech
Koruna |
| EUR
|
Euro
|
| GBP
|
British
Pound |
| HUF
|
Hungarian
Forint |
| JPY
|
Japanese
Yen |
| KRW
|
South
Korean Won |
| MXN
|
Mexican
Peso |
| NOK
|
Norwegian
Krone |
| NZD
|
New
Zealand Dollar |
| PLN
|
Polish
Zloty |
| SEK
|
Swedish
Krona |
| SGD
|
Singapore
Dollar |
| THB
|
Thai Baht
|
| UYU
|
Uruguayan
Peso |
Portfolio of
Investments – continued
Derivative Contracts at 10/31/21
| Forward
Foreign Currency Exchange Contracts |
Currency
Purchased |
Currency
Sold |
Counterparty
|
Settlement
Date |
Unrealized
Appreciation
(Depreciation) |
| Asset
Derivatives |
| GBP
|
276,983
|
USD
|
375,466
|
Deutsche
Bank AG |
1/14/2022
|
$3,715
|
| HUF
|
222,803,000
|
USD
|
713,682
|
State
Street Bank Corp. |
1/14/2022
|
28
|
| KRW
|
1,105,086,000
|
USD
|
940,411
|
Citibank
N.A. |
11/05/2021
|
5,203
|
| MXN
|
36,856,956
|
USD
|
1,757,713
|
Goldman
Sachs International |
1/14/2022
|
12,387
|
| NOK
|
33,541,000
|
USD
|
3,905,248
|
Deutsche
Bank AG |
1/14/2022
|
62,402
|
| NZD
|
367,000
|
USD
|
255,333
|
State
Street Bank Corp. |
1/14/2022
|
7,336
|
| SEK
|
32,413,000
|
USD
|
3,711,700
|
Goldman
Sachs International |
1/14/2022
|
67,060
|
| SGD
|
54,000
|
USD
|
39,826
|
HSBC
Bank |
1/14/2022
|
206
|
| THB
|
61,675,000
|
USD
|
1,847,663
|
JPMorgan
Chase Bank N.A. |
11/18/2021
|
10,717
|
| USD
|
2,486,292
|
BRL
|
13,731,966
|
Goldman
Sachs International |
12/02/2021
|
67,255
|
| USD
|
10,571,935
|
EUR
|
9,002,755
|
Barclays
Bank PLC |
11/12/2021
|
162,731
|
| USD
|
4,681,861
|
EUR
|
4,030,858
|
Deutsche
Bank AG |
1/14/2022
|
13,228
|
| USD
|
488,016
|
EUR
|
421,307
|
JPMorgan
Chase Bank N.A. |
1/14/2022
|
48
|
| USD
|
641,837
|
EUR
|
551,312
|
Morgan
Stanley Capital Services, Inc. |
1/14/2022
|
3,294
|
| USD
|
849,133
|
EUR
|
727,000
|
State
Street Bank Corp. |
1/14/2022
|
7,105
|
| USD
|
347,688
|
EUR
|
299,304
|
UBS
AG |
1/14/2022
|
1,027
|
| USD
|
184,937
|
GBP
|
134,000
|
HSBC
Bank |
1/14/2022
|
1,495
|
| USD
|
726,418
|
PLN
|
2,861,000
|
JPMorgan
Chase Bank N.A. |
1/14/2022
|
10,523
|
| |
|
|
|
|
|
$435,760
|
| Liability
Derivatives |
| AUD
|
6,793,000
|
USD
|
5,111,957
|
Brown
Brothers Harriman |
1/14/2022
|
$(692)
|
| AUD
|
115,000
|
USD
|
86,732
|
HSBC
Bank |
1/14/2022
|
(202)
|
| CAD
|
106,000
|
USD
|
85,879
|
Deutsche
Bank AG |
1/14/2022
|
(216)
|
| CAD
|
3,627,000
|
USD
|
2,946,892
|
State
Street Bank Corp. |
1/14/2022
|
(15,762)
|
| CZK
|
20,211,000
|
USD
|
914,690
|
Citibank
N.A. |
1/14/2022
|
(6,732)
|
| EUR
|
1,215,533
|
USD
|
1,411,679
|
JPMorgan
Chase Bank N.A. |
1/14/2022
|
(3,820)
|
| EUR
|
363,905
|
USD
|
421,542
|
Morgan
Stanley Capital Services, Inc. |
1/14/2022
|
(59)
|
| EUR
|
677,000
|
USD
|
792,082
|
NatWest
Markets PLC |
1/14/2022
|
(7,965)
|
| EUR
|
3,191,000
|
USD
|
3,734,316
|
State
Street Bank Corp. |
1/14/2022
|
(38,426)
|
| EUR
|
227,551
|
USD
|
263,921
|
UBS
AG |
1/14/2022
|
(365)
|
| GBP
|
370,114
|
USD
|
508,910
|
Deutsche
Bank AG |
1/14/2022
|
(2,237)
|
| JPY
|
170,661,000
|
USD
|
1,533,917
|
JPMorgan
Chase Bank N.A. |
1/14/2022
|
(35,116)
|
| NZD
|
2,587,000
|
USD
|
1,862,459
|
State
Street Bank Corp. |
1/14/2022
|
(10,889)
|
| PLN
|
2,861,000
|
USD
|
718,808
|
Citibank
N.A. |
1/14/2022
|
(2,912)
|
| USD
|
4,955,846
|
AUD
|
6,792,040
|
Citibank
N.A. |
1/14/2022
|
(154,696)
|
| USD
|
877,040
|
AUD
|
1,214,557
|
JPMorgan
Chase Bank N.A. |
1/14/2022
|
(36,831)
|
| USD
|
819,726
|
AUD
|
1,110,398
|
Merrill
Lynch International |
1/14/2022
|
(15,772)
|
| USD
|
809,457
|
AUD
|
1,083,667
|
State
Street Bank Corp. |
1/14/2022
|
(5,928)
|
| USD
|
4,149,109
|
CAD
|
5,215,157
|
Citibank
N.A. |
1/14/2022
|
(65,476)
|
| USD
|
5,310
|
CHF
|
4,919
|
Merrill
Lynch International |
1/14/2022
|
(75)
|
| USD
|
557,877
|
EUR
|
481,823
|
Deutsche
Bank AG |
1/14/2022
|
(181)
|
Portfolio of
Investments – continued
| Forward
Foreign Currency Exchange Contracts - continued |
Currency
Purchased |
Currency
Sold |
Counterparty
|
Settlement
Date |
Unrealized
Appreciation
(Depreciation) |
| Liability
Derivatives - continued |
| USD
|
44,327,042
|
EUR
|
38,308,391
|
JPMorgan
Chase Bank N.A. |
1/14/2022
|
$(42,629)
|
| USD
|
3,135,930
|
GBP
|
2,301,755
|
Deutsche
Bank AG |
1/14/2022
|
(15,097)
|
| USD
|
7,209,950
|
GBP
|
5,294,512
|
JPMorgan
Chase Bank N.A. |
1/14/2022
|
(38,060)
|
| USD
|
1,782,848
|
JPY
|
203,449,000
|
State
Street Bank Corp. |
1/14/2022
|
(3,908)
|
| USD
|
934,731
|
KRW
|
1,105,086,000
|
JPMorgan
Chase Bank N.A. |
11/05/2021
|
(10,882)
|
| USD
|
3,915,343
|
NOK
|
33,541,000
|
JPMorgan
Chase Bank N.A. |
1/14/2022
|
(52,306)
|
| USD
|
255,531
|
NZD
|
367,000
|
Goldman
Sachs International |
1/14/2022
|
(7,138)
|
| USD
|
3,713,110
|
SEK
|
32,413,000
|
JPMorgan
Chase Bank N.A. |
1/14/2022
|
(65,650)
|
| |
|
|
|
|
|
$(640,022)
|
| Futures
Contracts |
| Description
|
Long/
Short |
Currency
|
Contracts
|
Notional
Amount |
Expiration
Date |
Value/Unrealized
Appreciation
(Depreciation) |
| Asset
Derivatives |
| Interest
Rate Futures |
|
|
| Euro-Bund
10 yr |
Short
|
EUR
|
123
|
$23,904,644
|
December
– 2021 |
$518,884
|
| Long
Gilt 10 yr |
Short
|
GBP
|
38
|
6,496,455
|
December
– 2021 |
7,148
|
| U.S.
Treasury Note 10 yr |
Short
|
USD
|
600
|
78,421,875
|
December
– 2021 |
1,625,322
|
| U.S.
Treasury Ultra Bond |
Long
|
USD
|
19
|
3,731,719
|
December
– 2021 |
7,005
|
| U.S.
Treasury Ultra Note 10 yr |
Short
|
USD
|
178
|
25,815,563
|
December
– 2021 |
428,907
|
| |
|
|
|
|
|
$2,587,266
|
| Liability
Derivatives |
| Interest
Rate Futures |
|
|
| Euro-Bobl
5 yr |
Long
|
EUR
|
25
|
$3,865,663
|
December
– 2021 |
$(57,280)
|
| Euro-Buxl
30 yr |
Short
|
EUR
|
19
|
4,590,036
|
December
– 2021 |
(100,824)
|
| U.S.
Treasury Bond |
Long
|
USD
|
104
|
16,727,750
|
December
– 2021 |
(188,468)
|
| U.S.
Treasury Note 5 yr |
Long
|
USD
|
33
|
4,017,750
|
December
– 2021 |
(61,476)
|
| |
|
|
|
|
|
$(408,048)
|
At October 31, 2021, the fund had
cash collateral of $650,000 and other liquid securities with an aggregate value of $1,736,400 to cover any collateral or margin obligations for certain derivative contracts. Restricted cash and/or deposits with brokers in the Statement of Assets and
Liabilities are comprised of cash collateral.
See Notes to
Financial Statements
Financial Statements
Statement of Assets and Liabilities
At 10/31/21
This statement represents your fund’s balance sheet,
which details the assets and liabilities comprising the total value of the fund.
| Assets
|
|
| Investments
in unaffiliated issuers, at value (identified cost, $454,147,925) |
$458,406,600
|
| Investments
in affiliated issuers, at value (identified cost, $8,752,593) |
8,752,593
|
| Cash
|
443
|
| Restricted
cash for |
|
| Forward
foreign currency exchange contracts |
650,000
|
| Receivables
for |
|
| Forward
foreign currency exchange contracts |
435,760
|
| Net
daily variation margin on open futures contracts |
197,323
|
| Investments
sold |
1,045,716
|
| Interest
|
5,430,492
|
| Other
assets |
9,647
|
| Total
assets |
$474,928,574
|
| Liabilities
|
|
| Notes
payable |
$100,000,000
|
| Payables
for |
|
| Forward
foreign currency exchange contracts |
640,022
|
| Investments
purchased |
4,026,153
|
| Payable
to affiliates |
|
| Investment
adviser |
25,865
|
| Administrative
services fee |
648
|
| Transfer
agent and dividend disbursing costs |
5,649
|
| Payable
for independent Trustees' compensation |
4,389
|
| Accrued
interest expense |
60,062
|
| Deferred
country tax expense payable |
160,470
|
| Accrued
expenses and other liabilities |
187,142
|
| Total
liabilities |
$105,110,400
|
| Net
assets |
$369,818,174
|
| Net
assets consist of |
|
| Paid-in
capital |
$374,920,764
|
| Total
distributable earnings (loss) |
(5,102,590)
|
| Net
assets |
$369,818,174
|
| Shares
of beneficial interest outstanding |
60,423,038
|
| Net
asset value per share (net assets of $369,818,174 / 60,423,038 shares of beneficial interest outstanding) |
$6.12
|
See Notes to Financial
Statements
Financial Statements
Statement of Operations
Year ended 10/31/21
This statement describes how much your fund earned in
investment income and accrued in expenses. It also describes any gains and/or losses generated by fund operations.
| Net
investment income (loss) |
|
| Income
|
|
| Interest
|
$20,255,819
|
| Dividends
|
283,116
|
| Other
|
16,059
|
| Dividends
from affiliated issuers |
6,015
|
| Foreign
taxes withheld |
(8,893)
|
| Total
investment income |
$20,552,116
|
| Expenses
|
|
| Management
fee |
$2,463,618
|
| Transfer
agent and dividend disbursing costs |
95,321
|
| Administrative
services fee |
59,532
|
| Independent
Trustees' compensation |
19,778
|
| Stock
exchange fee |
59,221
|
| Custodian
fee |
46,386
|
| Shareholder
communications |
148,805
|
| Audit
and tax fees |
86,048
|
| Legal
fees |
16,159
|
| Interest
expense and fees |
783,226
|
| Miscellaneous
|
61,053
|
| Total
expenses |
$3,839,147
|
| Net
investment income (loss) |
$16,712,969
|
Statement of
Operations – continued
| Realized
and unrealized gain (loss) |
| Realized
gain (loss) (identified cost basis) |
|
| Unaffiliated
issuers (net of $66,993 country tax) |
$15,470,234
|
| Affiliated
issuers |
193
|
| Written
options |
103,772
|
| Futures
contracts |
(95,726)
|
| Swap
agreements |
(2,468)
|
| Forward
foreign currency exchange contracts |
532,955
|
| Foreign
currency |
(32,544)
|
| Net
realized gain (loss) |
$15,976,416
|
| Change
in unrealized appreciation or depreciation |
|
| Unaffiliated
issuers (net of $2,543 decrease in deferred country tax) |
$(8,090,459)
|
| Affiliated
issuers |
(193)
|
| Futures
contracts |
2,262,910
|
| Forward
foreign currency exchange contracts |
(693,170)
|
| Translation
of assets and liabilities in foreign currencies |
(21,436)
|
| Net
unrealized gain (loss) |
$(6,542,348)
|
| Net
realized and unrealized gain (loss) |
$9,434,068
|
| Change
in net assets from operations |
$26,147,037
|
See Notes to Financial
Statements
Financial Statements
Statements of Changes in Net Assets
These statements describe the increases and/or decreases in
net assets resulting from operations, any distributions, and any shareholder transactions.
| |
Year
ended |
| |
10/31/21
|
10/31/20
|
| Change
in net assets |
|
|
| From
operations |
|
|
| Net
investment income (loss) |
$16,712,969
|
$17,899,273
|
| Net
realized gain (loss) |
15,976,416
|
2,363,900
|
| Net
unrealized gain (loss) |
(6,542,348)
|
(3,870,128)
|
| Change
in net assets from operations |
$26,147,037
|
$16,393,045
|
| Distributions
to shareholders |
$(18,349,942)
|
$(21,730,896)
|
| Tax
return of capital distributions to shareholders |
$(12,050,739)
|
$(9,307,914)
|
| Change
in net assets from fund share transactions |
$1,436,638
|
$(20,578,380)
|
| Total
change in net assets |
$(2,817,006)
|
$(35,224,145)
|
| Net
assets |
|
|
| At
beginning of period |
372,635,180
|
407,859,325
|
| At
end of period |
$369,818,174
|
$372,635,180
|
See Notes to Financial
Statements
Financial Statements
Statement of Cash Flows
Year ended 10/31/21
This statement provides a summary of cash flows from
investment activity for the fund.
| Cash
flows from operating activities: |
|
| Change
in net assets from operations |
$26,147,037
|
| Adjustments
to reconcile change in net assets from operations to net cash provided by operating activities: |
|
| Purchase
of investment securities |
(339,797,569)
|
| Proceeds
from disposition of investment securities |
351,521,238
|
| Proceeds
from disposition of short-term investments, net |
428,866
|
| Realized
gain/loss on investments |
(15,537,227)
|
| Unrealized
appreciation/depreciation on investments |
8,093,195
|
| Unrealized
appreciation/depreciation on foreign currency contracts |
693,170
|
| Net
amortization/accretion of income |
561,581
|
| Increase
in interest receivable |
(242,594)
|
| Increase
in accrued expenses and other liabilities |
58,683
|
| Increase
in receivable for net daily variation margin on open futures contracts |
(103,058)
|
| Decrease
in other assets |
609
|
| Decrease
in interest payable |
(8,082)
|
| Net
cash provided by operating activities |
$31,815,849
|
| Cash
flows from financing activities: |
|
| Distributions
paid in cash |
$(29,174,142)
|
| Repurchase
of shares of beneficial interest |
(2,432,964)
|
| Net
cash used by financing activities |
$(31,607,106)
|
| Net
increase in cash and restricted cash |
$208,743
|
| Cash
and restricted cash: |
|
| Beginning
of period |
$441,700
|
| End
of period |
$650,443
|
Supplemental disclosure of cash flow
information:
Non-cash financing activities not included
herein consist of reinvestment of dividends and distributions of $1,436,638.
Cash paid during the year ended October 31, 2021 for interest
was $791,308.
See Notes to Financial Statements
Financial
Statements
Financial Highlights
The financial highlights table is intended to help you
understand the fund's financial performance for the past 5 years. Certain information reflects financial results for a single fund share. The total returns in the table represent the rate that an investor would have earned (or lost) on an investment
in the fund share class (assuming reinvestment of all distributions) held for the entire period.
| |
Year
ended |
| |
10/31/21
|
10/31/20
|
10/31/19
|
10/31/18
|
10/31/17
|
| Net
asset value, beginning of period |
$6.19
|
$6.37
|
$6.06
|
$6.67
|
$6.73
|
| Income
(loss) from investment operations |
| Net
investment income (loss) (d) |
$0.28
|
$0.29
|
$0.28
|
$0.25
|
$0.30(c)
|
| Net
realized and unrealized gain (loss) |
0.15
|
(0.01)
|
0.50
|
(0.38)
|
0.15
|
| Total
from investment operations |
$0.43
|
$0.28
|
$0.78
|
$(0.13)
|
$0.45
|
| Less
distributions declared to shareholders |
| From
net investment income |
$(0.30)
|
$(0.34)
|
$(0.29)
|
$(0.29)
|
$(0.31)
|
| From
tax return of capital |
(0.20)
|
(0.15)
|
(0.21)
|
(0.22)
|
(0.23)
|
| Total
distributions declared to shareholders |
$(0.50)
|
$(0.49)
|
$(0.50)
|
$(0.51)
|
$(0.54)
|
| Net
increase from repurchase of capital shares |
$—
|
$0.03
|
$0.03
|
$0.03
|
$0.03
|
| Net
asset value, end of period (x) |
$6.12
|
$6.19
|
$6.37
|
$6.06
|
$6.67
|
| Market
value, end of period |
$6.58
|
$5.67
|
$6.01
|
$5.24
|
$6.16
|
| Total
return at market value (%) |
25.80
|
2.77
|
25.05
|
(7.01)
|
12.50
|
| Total
return at net asset value (%) (j)(s)(x) |
7.18
|
5.86
|
14.60
|
(0.68)
|
8.06(c)
|
Ratios
(%) (to average net assets)
and Supplemental data: |
| Expenses
(f) |
1.01
|
1.17
|
1.56
|
1.33
|
1.10(c)
|
| Net
investment income (loss) |
4.40
|
4.63
|
4.54
|
4.00
|
4.45(c)
|
| Portfolio
turnover |
70
|
78
|
65
|
47
|
50
|
| Net
assets at end of period (000 omitted) |
$369,818
|
$372,635
|
$407,859
|
$407,535
|
$471,461
|
| Supplemental
Ratios (%): |
| Ratios
of expenses to average net assets excluding interest expense and fees (f) |
0.81
|
0.84
|
0.84
|
0.80
|
0.78(c)
|
| Senior
Securities: |
| Total
notes payable outstanding (000 omitted) |
$100,000
|
$100,000
|
$100,000
|
$100,000
|
$100,000
|
| Asset
coverage per $1,000 of indebtedness (k) |
$4,698
|
$4,726
|
$5,079
|
$5,075
|
$5,715
|
See Notes to Financial Statements
Financial
Highlights – continued
| (c)
|
Amount reflects
a one-time reimbursement of expenses by the custodian (or former custodian) without which net investment income and performance would be lower and expenses would be higher. |
| (d)
|
Per share
data is based on average shares outstanding. |
| (f)
|
Ratios do
not reflect reductions from fees paid indirectly, if applicable. |
| (j)
|
Total return
at net asset value is calculated using the net asset value of the fund, not the publicly traded price and therefore may be different than the total return at market value. |
| (k)
|
Calculated
by subtracting the fund's total liabilities (not including notes payable) from the fund's total assets and dividing this number by the notes payable outstanding and then multiplying by 1,000. |
| (s)
|
From time to
time the fund may receive proceeds from litigation settlements, without which performance would be lower. |
| (x)
|
The
net asset values and total returns at net asset value have been calculated on net assets which include adjustments made in accordance with U.S. generally accepted accounting principles required at period end for financial reporting purposes.
|
See Notes to Financial Statements
Notes to Financial
Statements
(1) Business and Organization
MFS Multimarket Income Trust (the fund) is organized as a
Massachusetts business trust and is registered under the Investment Company Act of 1940, as amended, as a diversified closed-end management investment company.
The fund is an investment company and accordingly follows the
investment company accounting and reporting guidance of the Financial Accounting Standards Board (FASB) Accounting Standards Codification Topic 946 Financial Services - Investment Companies.
(2) Significant Accounting Policies
General — The preparation
of financial statements in conformity with U.S. generally accepted accounting principles requires management to make estimates and assumptions that affect the reported amounts of assets and liabilities, and disclosure of contingent assets and
liabilities at the date of the financial statements and the reported amounts of increases and decreases in net assets from operations during the reporting period. Actual results could differ from those estimates. In the preparation of these
financial statements, management has evaluated subsequent events occurring after the date of the fund’s Statement of Assets and Liabilities through the date that the financial statements were issued.
The fund invests in high-yield securities rated below investment grade. Investments in below investment grade quality securities can involve a substantially greater risk of default or can already be in default, and their values can decline
significantly. Below investment grade quality securities tend to be more sensitive to adverse news about the issuer, or the market or economy in general, than higher quality debt instruments. The fund invests
in foreign securities, including securities of emerging market issuers. Investments in foreign securities are vulnerable to the effects of changes in the relative values of the local currency and the U.S. dollar and to the effects of changes in each
country’s market, economic, industrial, political, regulatory, geopolitical, environmental, public health, and other conditions. Investments in emerging markets can involve additional and greater risks than the risks associated with
investments in developed foreign markets. Emerging markets can have less developed markets, greater custody and operational risk, less developed legal, regulatory, accounting, and auditing systems, and greater political, social, and economic
instability than developed markets.
Certain of the
fund's investments, including its investments in derivatives, as well as any debt issued by the fund and other contractual arrangements of the fund may be based on reference interest rates such as the London Interbank Offered Rate
(“LIBOR”). In 2017, the regulatory authority that oversees financial services firms in the United Kingdom announced plans to transition away from LIBOR by the end of 2021. In March 2021, the administrator of LIBOR announced the extension
of the publication of the more commonly used U.S. dollar LIBOR settings to the end of June 2023. Although the full impacts of the transition away from LIBOR are not fully known, the transition may result in, among other things, an increase in
volatility or illiquidity of the markets for instruments that currently rely on LIBOR to determine interest rates and this could have an adverse impact on the fund's performance. With respect to the fund's accounting for investments, including its
investments in derivatives, as well as any debt issued by the fund and other contractual arrangements of the fund that undergo reference rate-related modifications as a result of the transition, management will rely upon the relief provided by FASB
Codification Topic 848 – Reference Rate Reform (Topic 848).
Notes to Financial
Statements - continued
The guidance in Topic 848 permits the fund to disregard the GAAP accounting
requirements around certain contract modifications resulting from the LIBOR transition such that for contracts considered in scope, the fund can account for those modified contracts as a continuation of the existing contracts. While still evaluating
the impact to the fund of the June 30, 2023 discontinuation of the more commonly used U.S. dollar LIBOR settings, management has concluded that the December 31, 2021 planned cessation of the one-week and two-month U.S. dollar LIBOR tenors along with
certain other non-U.S. dollar denominated LIBOR settings will not have a material impact on the fund.
Balance Sheet Offsetting
— The fund's accounting policy with respect to balance sheet offsetting is that, absent an event of default by the counterparty or a termination of the agreement, the International Swaps and Derivatives Association (ISDA) Master Agreement, or
similar agreement, does not result in an offset of reported amounts of financial assets and financial liabilities in the Statement of Assets and Liabilities across transactions between the fund and the applicable counterparty. The fund's right to
setoff may be restricted or prohibited by the bankruptcy or insolvency laws of the particular jurisdiction to which a specific master netting agreement counterparty is subject. Balance sheet offsetting disclosures, to the extent applicable to the
fund, have been included in the fund’s Significant Accounting Policies note under the captions for each of the fund’s in-scope financial instruments and transactions.
Investment Valuations
— Equity securities, including restricted equity securities, are generally valued at the last sale or official closing price on their primary market or exchange as provided by a third-party pricing
service. Equity securities, for which there were no sales reported that day, are generally valued at the last quoted daily bid quotation on their primary market or exchange as provided by a third-party pricing service. Debt instruments and floating rate loans, including restricted debt instruments, are generally valued at an evaluated or composite bid as provided by a third-party pricing service. Short-term instruments with a maturity
at issuance of 60 days or less may be valued at amortized cost, which approximates market value. Exchange-traded options are generally valued at the last sale or official closing price on their primary
exchange as provided by a third-party pricing service. Exchange-traded options for which there were no sales reported that day are generally valued at the last daily bid quotation on their primary exchange as provided by a third-party pricing
service. For put options, the position may be valued at the last daily ask quotation if there are no trades reported during the day. Options not traded on an exchange are generally valued at a broker/dealer bid quotation. Foreign currency options
are generally valued at valuations provided by a third-party pricing service. Futures contracts are generally valued at last posted settlement price on their primary exchange as provided by a third-party
pricing service. Futures contracts for which there were no trades that day for a particular position are generally valued at the closing bid quotation on their primary exchange as provided by a third-party pricing service. Forward foreign currency exchange contracts are generally valued at the mean of bid and asked prices for the time period interpolated from rates provided by a third-party pricing service for proximate time
periods. Swap agreements are generally valued using valuations provided by a third-party pricing service, which for cleared swaps includes an evaluation of any trading activity at the clearinghouses. Open-end investment companies are generally valued at net asset value per share. Securities and other assets generally valued on the basis of information from a third-party
pricing service may also be valued at a broker/dealer bid quotation. In determining values, third-party pricing services can
Notes to Financial
Statements - continued
utilize both transaction data and market information such as yield, quality,
coupon rate, maturity, type of issue, trading characteristics, and other market data. The values of foreign securities and other assets and liabilities expressed in foreign currencies are converted to U.S. dollars using the mean of bid and asked
prices for rates provided by a third-party pricing service.
The Board of Trustees has delegated primary responsibility for
determining or causing to be determined the value of the fund’s investments (including any fair valuation) to the adviser pursuant to valuation policies and procedures approved by the Board. If the adviser determines that reliable market
quotations are not readily available, investments are valued at fair value as determined in good faith by the adviser in accordance with such procedures under the oversight of the Board of Trustees. Under the fund’s valuation policies and
procedures, market quotations are not considered to be readily available for most types of debt instruments and floating rate loans and many types of derivatives. These investments are generally valued at fair value based on information from
third-party pricing services. In addition, investments may be valued at fair value if the adviser determines that an investment’s value has been materially affected by events occurring after the close of the exchange or market on which the
investment is principally traded (such as foreign exchange or market) and prior to the determination of the fund’s net asset value, or after the halt of trading of a specific security where trading does not resume prior to the close of the
exchange or market on which the security is principally traded. The adviser generally relies on third-party pricing services or other information (such as the correlation with price movements of similar securities in the same or other markets; the
type, cost and investment characteristics of the security; the business and financial condition of the issuer; and trading and other market data) to assist in determining whether to fair value and at what value to fair value an investment. The value
of an investment for purposes of calculating the fund’s net asset value can differ depending on the source and method used to determine value. When fair valuation is used, the value of an investment used to determine the fund’s net asset
value may differ from quoted or published prices for the same investment. There can be no assurance that the fund could obtain the fair value assigned to an investment if it were to sell the investment at the same time at which the fund determines
its net asset value per share.
Various inputs are used in
determining the value of the fund's assets or liabilities. These inputs are categorized into three broad levels. In certain cases, the inputs used to measure fair value may fall into different levels of the fair value hierarchy. In such cases, an
investment's level within the fair value hierarchy is based on the lowest level of input that is significant to the fair value measurement. The fund's assessment of the significance of a particular input to the fair value measurement in its entirety
requires judgment, and considers factors specific to the investment. Level 1 includes unadjusted quoted prices in active markets for identical assets or liabilities. Level 2 includes other significant observable market-based inputs (including quoted
prices for similar securities, interest rates, prepayment speed, and credit risk). Level 3 includes unobservable inputs, which may include the adviser's own assumptions in determining the fair value of investments. Other financial instruments are
derivative instruments, such as futures contracts and forward foreign currency exchange contracts. The following is a summary of the levels used as of October 31, 2021 in valuing the fund's assets or liabilities:
Notes to Financial
Statements - continued
| Financial
Instruments |
Level
1 |
Level
2 |
Level
3 |
Total
|
| Equity
Securities: |
|
|
|
|
| United
States |
$—
|
$6
|
$149,547
|
$149,553
|
| Canada
|
141,827
|
—
|
—
|
141,827
|
| Mexico
|
—
|
—
|
105,567
|
105,567
|
| United
Kingdom |
75,851
|
—
|
1,613
|
77,464
|
| U.S.
Treasury Bonds & U.S. Government Agencies & Equivalents |
—
|
4,019,873
|
—
|
4,019,873
|
| Non
- U.S. Sovereign Debt |
—
|
80,168,268
|
—
|
80,168,268
|
| Municipal
Bonds |
—
|
2,918,668
|
—
|
2,918,668
|
| U.S.
Corporate Bonds |
—
|
240,938,254
|
—
|
240,938,254
|
| Commercial
Mortgage-Backed Securities |
—
|
6,650,046
|
—
|
6,650,046
|
| Asset-Backed
Securities (including CDOs) |
—
|
7,615,054
|
—
|
7,615,054
|
| Foreign
Bonds |
—
|
115,622,026
|
—
|
115,622,026
|
| Mutual
Funds |
8,752,593
|
—
|
—
|
8,752,593
|
| Total
|
$8,970,271
|
$457,932,195
|
$256,727
|
$467,159,193
|
| Other
Financial Instruments |
|
|
|
|
| Futures
Contracts – Assets |
$2,587,266
|
$—
|
$—
|
$2,587,266
|
| Futures
Contracts – Liabilities |
(408,048)
|
—
|
—
|
(408,048)
|
| Forward
Foreign Currency Exchange Contracts – Assets |
—
|
435,760
|
—
|
435,760
|
| Forward
Foreign Currency Exchange Contracts – Liabilities |
—
|
(640,022)
|
—
|
(640,022)
|
For further information regarding
security characteristics, see the Portfolio of Investments.
The following is a reconciliation of level 3 assets for which
significant unobservable inputs were used to determine fair value. The table presents the activity of level 3 securities held at the beginning and the end of the period.
| |
Equity
Securities |
| Balance
as of 10/31/20 |
$146,911
|
| Change
in unrealized appreciation or depreciation |
2,636
|
| Transfers
into level 3 |
105,567
|
| Received
as part of a corporate action |
1,613
|
| Balance
as of 10/31/21 |
$256,727
|
The net change in unrealized
appreciation or depreciation from investments held as level 3 at October 31, 2021 is $2,636. At October 31, 2021, the fund held three level 3 securities.
Foreign Currency Translation
— Purchases and sales of foreign investments, income, and expenses are converted into U.S. dollars based upon currency exchange rates prevailing on the respective dates of such transactions or on the reporting date for foreign denominated
receivables and payables. Gains and losses attributable to foreign
Notes to Financial
Statements - continued
currency exchange rates on sales of securities are recorded for financial
statement purposes as net realized gains and losses on investments. Gains and losses attributable to foreign exchange rate movements on receivables, payables, income and expenses are recorded for financial statement purposes as foreign currency
transaction gains and losses. That portion of both realized and unrealized gains and losses on investments that results from fluctuations in foreign currency exchange rates is not separately disclosed.
Derivatives — The fund
uses derivatives primarily to increase or decrease exposure to a particular market or segment of the market, or security, to increase or decrease interest rate or currency exposure, or as alternatives to direct investments. Derivatives are used for
hedging or non-hedging purposes. While hedging can reduce or eliminate losses, it can also reduce or eliminate gains. When the fund uses derivatives as an investment to increase market exposure, or for hedging purposes, gains and losses from
derivative instruments may be substantially greater than the derivative’s original cost.
The derivative instruments used by the fund during the period
were written options, purchased options, futures contracts, forward foreign currency exchange contracts, and swap agreements. Depending on the type of derivative, a fund may exit a derivative position by entering into an offsetting transaction with
a counterparty or exchange, negotiating an agreement with the derivative counterparty, or novating the position to a third party. The fund may be unable to promptly close out a futures position in instances where the daily fluctuation in the price
for that type of future exceeds the daily limit set by the exchange. The fund's period end derivatives, as presented in the Portfolio of Investments and the associated Derivative Contract tables, generally are indicative of the volume of its
derivative activity during the period.
The following
table presents, by major type of derivative contract, the fair value, on a gross basis, of the asset and liability components of derivatives held by the fund at October 31, 2021 as reported in the Statement of Assets and Liabilities:
| |
|
Fair
Value (a) |
| Risk
|
Derivative
Contracts |
Asset
Derivatives |
Liability
Derivatives |
| Interest
Rate |
Futures
Contracts |
$2,587,266
|
$(408,048)
|
| Foreign
Exchange |
Forward
Foreign Currency Exchange Contracts |
435,760
|
(640,022)
|
| Total
|
|
$3,023,026
|
$(1,048,070)
|
| (a)
|
Values
presented in this table for futures contracts correspond to the values reported in the Portfolio of Investments. Only the current day net variation margin for futures contracts is separately reported within the Statement of Assets and Liabilities.
|
Notes to Financial
Statements - continued
The following table presents, by major type of derivative
contract, the realized gain (loss) on derivatives held by the fund for the year ended October 31, 2021 as reported in the Statement of Operations:
| Risk
|
Futures
Contracts |
Swap
Agreements |
Forward
Foreign
Currency
Exchange
Contracts |
Unaffiliated
Issuers
(Purchased
Options) |
Written
Options |
| Interest
Rate |
$(95,726)
|
$—
|
$—
|
$—
|
$—
|
| Foreign
Exchange |
—
|
—
|
532,955
|
—
|
—
|
| Credit
|
—
|
(2,468)
|
—
|
(251,806)
|
103,772
|
| Total
|
$(95,726)
|
$(2,468)
|
$532,955
|
$(251,806)
|
$103,772
|
The following table presents, by
major type of derivative contract, the change in unrealized appreciation or depreciation on derivatives held by the fund for the year ended October 31, 2021 as reported in the Statement of Operations:
| Risk
|
Futures
Contracts |
Forward
Foreign
Currency
Exchange
Contracts |
| Interest
Rate |
$2,262,910
|
$—
|
| Foreign
Exchange |
—
|
(693,170)
|
| Total
|
$2,262,910
|
$(693,170)
|
Derivative counterparty credit risk
is managed through formal evaluation of the creditworthiness of all potential counterparties. On certain, but not all, uncleared derivatives, the fund attempts to reduce its exposure to counterparty credit risk whenever possible by entering into an
ISDA Master Agreement on a bilateral basis. The ISDA Master Agreement gives each party to the agreement the right to terminate all transactions traded under such agreement if there is a specified deterioration in the credit quality of the other
party. Upon an event of default or a termination of the ISDA Master Agreement, the non-defaulting party has the right to close out all transactions traded under such agreement and to net amounts owed under each agreement to one net amount payable by
one party to the other. This right to close out and net payments across all transactions traded under the ISDA Master Agreement could result in a reduction of the fund's credit risk to such counterparty equal to any amounts payable by the fund under
the applicable transactions, if any.
Collateral and
margin requirements differ by type of derivative. For cleared derivatives (e.g., futures contracts, cleared swaps, and exchange-traded options), margin requirements are set by the clearing broker and the clearing house and collateral, in the form of
cash or securities, is posted by the fund directly with the clearing broker. Collateral terms are counterparty agreement specific for uncleared derivatives (e.g., forward foreign currency exchange contracts, uncleared swap agreements, and uncleared
options) and collateral, in the form of cash and securities, is held in segregated accounts with the fund's custodian in connection with these agreements. For derivatives traded under an ISDA Master Agreement, which contains a collateral support
annex, the collateral requirements are netted across all transactions traded under such counterparty-specific agreement and an amount is posted from one party to the other to collateralize such obligations. Cash that has been segregated or
Notes to Financial
Statements - continued
delivered to cover the fund's collateral or margin obligations under
derivative contracts, if any, will be reported separately in the Statement of Assets and Liabilities as restricted cash for uncleared derivatives and/or deposits with brokers for cleared derivatives. Securities pledged as collateral or margin for
the same purpose, if any, are noted in the Portfolio of Investments. The fund may be required to make payments of interest on uncovered collateral or margin obligations with the broker. Any such payments are included in “Interest expense and
fees” in the Statement of Operations.
Written Options — In exchange for a premium, the fund wrote call options on securities for which it anticipated the price would decline and also wrote put options on securities for which it anticipated the price would increase.
At the time the option was written, the fund believed the premium received exceeded the potential loss that could result from adverse price changes in the options’ underlying securities. In a written option, the fund as the option writer
grants the buyer the right to purchase from, or sell to, the fund a specified number of shares or units of a particular security, currency or index at a specified price within a specified period of time.
The premium received is initially recorded as a liability in
the Statement of Assets and Liabilities. The option is subsequently marked-to-market daily with the difference between the premium received and the market value of the written option being recorded as unrealized appreciation or depreciation. When a
written option expires, the fund realizes a gain equal to the amount of the premium received. The difference between the premium received and the amount paid on effecting a closing transaction is considered a realized gain or loss. When a written
call option is exercised, the premium received is offset against the proceeds to determine the realized gain or loss. When a written put option is exercised, the premium reduces the cost basis of the security purchased by the fund.
At the initiation of the written option contract, for exchange
traded options, the fund is required to deposit securities or cash as collateral with the custodian for the benefit of the broker or directly with the clearing broker, based on the type of option. For uncleared options, the fund may post collateral
subject to the terms of an ISDA Master Agreement as generally described above if the market value of the options contract moves against it. The fund, as writer of an option, may have no control over whether the underlying securities may be sold
(call) or purchased (put) and, as a result, bears the market risk of an unfavorable change in the price of the securities underlying the written option. Losses from writing options can exceed the premium received and can exceed the potential loss
from an ordinary buy and sell transaction. Although the fund’s market risk may be significant, the maximum counterparty credit risk to the fund is equal to the market value of any collateral posted to the broker. For uncleared options, this
risk is mitigated in cases where there is an ISDA Master Agreement between the fund and the counterparty providing for netting as described above.
Purchased Options — The
fund purchased call and put options for a premium. Purchased call and put options entitle the holder to buy and sell a specified number of shares or units of a particular security, currency or index at a specified price at a specified date or within
a specified period of time. Purchasing call options may hedge against an anticipated increase in the dollar cost of securities or currency to be acquired or increase the fund’s exposure to an underlying instrument. Purchasing put options may
hedge against an anticipated decline in the value of portfolio securities or currency or decrease the fund's exposure to an underlying instrument.
Notes to Financial
Statements - continued
The premium paid is initially recorded as an investment in the
Statement of Assets and Liabilities. That investment is subsequently marked-to-market daily with the difference between the premium paid and the market value of the purchased option being recorded as unrealized appreciation or depreciation. Premiums
paid for purchased call and put options which have expired are treated as realized losses on investments in the Statement of Operations. Upon the exercise or closing of a purchased call option, the premium paid is added to the cost of the security
or financial instrument purchased. Upon the exercise or closing of a purchased put option, the premium paid is offset against the proceeds on the sale of the underlying security or financial instrument in order to determine the realized gain or loss
on investments.
Whether or not the option is exercised,
the fund's maximum risk of loss from purchasing an option is the amount of premium paid. All option contracts involve credit risk if the counterparty to the option contract fails to perform. For uncleared options, this risk is mitigated in cases
where there is an ISDA Master Agreement between the fund and the counterparty providing for netting as described above and, where applicable, by the posting of collateral by the counterparty to the fund to cover the fund’s exposure to the
counterparty under such ISDA Master Agreement.
Futures
Contracts — The fund entered into futures contracts which may be used to hedge against or obtain broad market exposure, interest rate exposure, currency exposure, or to manage duration. A futures contract
represents a commitment for the future purchase or sale of an asset at a specified price on a specified date.
Upon entering into a futures contract, the fund is required to
deposit with the broker, either in cash or securities, an initial margin in an amount equal to a specified percentage of the notional amount of the contract. Subsequent payments (variation margin) are made or received by the fund each day, depending
on the daily fluctuations in the value of the contract, and are recorded for financial statement purposes as unrealized gain or loss by the fund until the contract is closed or expires at which point the gain or loss on futures contracts is
realized.
The fund bears the risk of interest rates,
exchange rates or securities prices moving unexpectedly, in which case, the fund may not achieve the anticipated benefits of the futures contracts and may realize a loss. While futures contracts may present less counterparty risk to the fund since
the contracts are exchange traded and the exchange’s clearinghouse guarantees payments to the broker, there is still counterparty credit risk due to the insolvency of the broker. The fund’s maximum risk of loss due to counterparty credit
risk is equal to the margin posted by the fund to the broker plus any gains or minus any losses on the outstanding futures contracts.
Forward Foreign Currency Exchange Contracts — The fund entered into forward foreign currency exchange contracts for the purchase or sale of a specific foreign currency at a fixed price on a future date. These contracts may be used to hedge the fund’s
currency risk or for non-hedging purposes. For hedging purposes, the fund may enter into contracts to deliver or receive foreign currency that the fund will receive from or use in its normal investment activities. The fund may also use contracts to
hedge against declines in the value of foreign currency denominated securities due to unfavorable exchange rate movements. For non-hedging purposes, the fund may enter into contracts with the intent of changing the relative exposure of the
fund’s portfolio of securities to different currencies to take advantage of anticipated exchange rate changes.
Notes to Financial
Statements - continued
Forward foreign currency exchange contracts are adjusted by the
daily exchange rate of the underlying currency and any unrealized gains or losses are recorded as a receivable or payable for forward foreign currency exchange contracts until the contract settlement date. On contract settlement date, any gain or
loss on the contract is recorded as realized gains or losses on forward foreign currency exchange contracts.
Risks may arise upon entering into these contracts from
unanticipated movements in the value of the contract and from the potential inability of counterparties to meet the terms of their contracts. Generally, the fund’s maximum risk due to counterparty credit risk is the unrealized gain on the
contract due to the use of Continuous Linked Settlement, a multicurrency cash settlement system for the centralized settlement of foreign transactions. This risk is mitigated in cases where there is an ISDA Master Agreement between the fund and the
counterparty providing for netting as described above and, where applicable, by the posting of collateral by the counterparty to the fund to cover the fund’s exposure to the counterparty under such ISDA Master Agreement.
Swap Agreements — During
the period the fund entered into swap agreements. Swap agreements generally involve a periodic exchange of cash payments on a net basis, at specified intervals or upon the occurrence of specified events, between the fund and a counterparty. Certain
swap agreements may be entered into as a bilateral contract (“uncleared swaps”) while others are required to be centrally cleared (“cleared swaps”). In a cleared swap transaction, the ultimate counterparty to the transaction
is a clearinghouse (the “clearinghouse”). The contract is transferred and accepted by the clearinghouse immediately following execution of the swap contract with an executing broker. Thereafter, throughout the term of the cleared swap,
the fund interfaces indirectly with the clearinghouse through a clearing broker and has counterparty risk to the clearing broker as well.
Both cleared and uncleared swap agreements are marked to market
daily. The value of uncleared swap agreements is reported in the Statement of Assets and Liabilities as “Uncleared swaps, at value” which includes any related interest accruals to be paid or received by the fund. For cleared swaps,
payments (variation margin) are made or received by the fund each day, depending on the daily fluctuations in the value of the cleared swap, such that only the current day net receivable or payable for variation margin is reported in the Statement
of Assets and Liabilities.
For both cleared and uncleared
swaps, the periodic exchange of net cash payments, at specified intervals or upon the occurrence of specified events as stipulated by the agreement, is recorded as realized gain or loss on swap agreements in the Statement of Operations. Premiums
paid or received at the inception of the agreements are amortized using the effective interest method over the term of the agreement as realized gain or loss on swap agreements in the Statement of Operations. A liquidation payment received or made
upon early termination is recorded as a realized gain or loss on swap agreements in the Statement of Operations. The change in unrealized appreciation or depreciation on swap agreements in the Statement of Operations reflects the aggregate change
over the reporting period in the value of swaps net of any unamortized premiums paid or received.
Risks related to swap agreements include the possible lack of a
liquid market, unfavorable market and interest rate movements of the underlying instrument and the failure of the counterparty to perform under the terms of the agreements. The fund's maximum risk of loss from counterparty credit risk is the
discounted net value of the
Notes to Financial
Statements - continued
cash flows to be received from/paid to the counterparty over the contract's
remaining life, to the extent that the amount is positive. To address counterparty risk, uncleared swap agreements are limited to only highly-rated counterparties. Risk is further reduced by having an ISDA Master Agreement between the fund and the
counterparty providing for netting as described above and, where applicable, by the posting of collateral by the counterparty to the fund to cover the fund’s exposure to the counterparty under such ISDA Master Agreement. The fund's
counterparty risk due to cleared swaps is mitigated by the fact that the clearinghouse is the true counterparty to the transaction and the regulatory requirement safeguards in the event of a clearing broker bankruptcy.
The fund entered into credit default swap agreements in order
to manage its exposure to the market or certain sectors of the market, to reduce its credit risk exposure to defaults of corporate and sovereign issuers or to create exposure to corporate or sovereign issuers to which it is not otherwise exposed. In
a credit default swap agreement, the protection buyer can make an upfront payment and will make a stream of payments to the protection seller based on a fixed percentage applied to the agreement notional amount in exchange for the right to receive a
specified return upon the occurrence of a defined credit event on the reference obligation (which may be either a single security or a basket of securities issued by corporate or sovereign issuers) and, with respect to the cases where physical
settlement applies, the delivery by the buyer to the seller of a defined deliverable obligation. Although agreement-specific, credit events generally consist of a combination of the following: bankruptcy, failure to pay, restructuring, obligation
acceleration, obligation default, or repudiation/moratorium, each as defined in the 2003 ISDA Credit Derivatives Definitions as amended by the relevant agreement. Restructuring is generally not applicable when the reference obligation is issued by a
North American corporation and obligation acceleration, obligation default, or repudiation/moratorium are generally only applicable when the reference obligation is issued by a sovereign entity or an entity in an emerging country. Upon determination
of the final price for the deliverable obligation (or upon delivery of the deliverable obligation in the case of physical settlement), the difference between the value of the deliverable obligation and the swap agreement’s notional amount is
recorded as realized gain or loss on swap agreements in the Statement of Operations.
Loans and Other Direct Debt Instruments — The fund invests in loans and loan participations or other receivables. These investments may include standby financing commitments, including revolving credit facilities, which contractually obligate the fund
to supply additional cash to the borrower on demand. The fund generally provides this financial support in order to preserve its existing investment or to obtain a more senior secured interest in the assets of the borrower. Loan participations
involve a risk of insolvency of the lending bank or other financial intermediary.
Statement of Cash Flows —
Information on financial transactions which have been settled through the receipt or disbursement of cash or restricted cash is presented in the Statement of Cash Flows. Cash as presented in the fund's Statement of Assets and Liabilities includes
cash on hand at the fund's custodian bank and does not include any short-term investments. Restricted cash is presented in the fund's Statement of Assets and Liabilities as restricted cash for uncleared derivatives and/or deposits with brokers for
cleared derivatives and represents cash that has been segregated or delivered to cover the fund's collateral or margin obligations under derivative contracts.
Notes to Financial
Statements - continued
The following table provides a reconciliation of cash and
restricted cash reported within the Statement of Assets and Liabilities with that shown in the Statement of Cash Flows:
| |
10/31/21
|
| Cash
|
$443
|
| Restricted
cash |
650,000
|
| Restricted
cash included in deposits with brokers |
—
|
| Total
cash and restricted cash in the Statement of Cash Flows |
$650,443
|
Indemnifications — Under the fund's organizational documents, its officers and Trustees may be indemnified against certain liabilities and expenses arising out of the performance of their duties to the fund. Additionally, in the
normal course of business, the fund enters into agreements with service providers that may contain indemnification clauses. The fund's maximum exposure under these agreements is unknown as this would involve future claims that may be made against
the fund that have not yet occurred.
Investment
Transactions and Income — Investment transactions are recorded on the trade date. Some securities may be purchased or sold on an extended settlement basis, which means
that the receipt or delivery of the securities by the fund and related payments occur at a future date, usually beyond the customary settlement period.
Interest income is recorded on the accrual basis. All premium and discount is
amortized or accreted for financial statement purposes in accordance with U.S. generally accepted accounting principles. Dividends received in cash are recorded on the ex-dividend date. Certain dividends from foreign securities will be recorded when
the fund is informed of the dividend if such information is obtained subsequent to the ex-dividend date. Dividend and interest payments received in additional securities are recorded on the ex-dividend or ex-interest date in an amount equal to the
value of the security on such date. The fund earns certain fees in connection with its floating rate loan purchasing activities. These fees are in addition to interest payments earned and may include amendment fees, commitment fees, facility fees,
consent fees, and prepayment fees. Commitment fees are recorded on an accrual basis as income in the accompanying financial statements. Debt obligations may be placed on non-accrual status or set to accrue at a rate of interest less than the
contractual coupon when the collection of all or a portion of interest has become doubtful. Interest income for those debt obligations may be further reduced by the write-off of the related interest receivables when deemed uncollectible.
The fund may receive proceeds from litigation settlements. Any
proceeds received from litigation involving portfolio holdings are reflected in the Statement of Operations in realized gain/loss if the security has been disposed of by the fund or in unrealized gain/loss if the security is still held by the fund.
Any other proceeds from litigation not related to portfolio holdings are reflected as other income in the Statement of Operations.
To mitigate the counterparty credit risk on TBA transactions,
mortgage dollar rolls, and other types of forward settling mortgage-backed and asset-backed security transactions, the fund whenever possible enters into a Master Securities Forward Transaction Agreement (“MSFTA”) on a bilateral basis
with each of the counterparties with whom it undertakes a significant volume of transactions. The MSFTA gives each party to the agreement the right to terminate all transactions traded under such agreement if there is a specified deterioration in
the credit quality of the other party.
Notes to Financial
Statements - continued
Upon an event of default or a termination of the MSFTA, the non-defaulting
party has the right to close out all transactions traded under such agreement and to net amounts owed under each transaction to one net amount payable by one party to the other. This right to close out and net payments across all transactions traded
under the MSFTA could result in a reduction of the fund's credit risk to such counterparty equal to any amounts payable by the fund under the applicable transactions, if any.
For mortgage-backed and asset-backed securities traded under a
MSFTA, the collateral and margining requirements are contract specific. Collateral amounts across all transactions traded under such agreement are netted and an amount is posted from one party to the other to collateralize such obligations. Cash
that has been pledged to cover the fund's collateral or margin obligations under a MSFTA, if any, will be reported separately on the Statement of Assets and Liabilities as restricted cash. Securities pledged as collateral or margin for the same
purpose, if any, are noted in the Portfolio of Investments.
Tax Matters and Distributions
— The fund intends to qualify as a regulated investment company, as defined under Subchapter M of the Internal Revenue Code, and to distribute all of its taxable income, including realized capital gains. As a result, no provision for federal
income tax is required. The fund’s federal tax returns, when filed, will remain subject to examination by the Internal Revenue Service for a three year period. Management has analyzed the fund’s tax positions taken on federal and state
tax returns for all open tax years and does not believe that there are any uncertain tax positions that require recognition of a tax liability. Foreign taxes, if any, have been accrued by the fund in the accompanying financial statements in
accordance with the applicable foreign tax law. Foreign income taxes may be withheld by certain countries in which the fund invests. Additionally, capital gains realized by the fund on securities issued in or by certain foreign countries may be
subject to capital gains tax imposed by those countries.
Distributions to shareholders are recorded on the ex-dividend
date. The fund seeks to pay monthly distributions based on an annual rate of 8.00% of the fund’s average monthly net asset value. As a result, distributions may exceed actual earnings which may result in a tax return of capital. Income and
capital gain distributions are determined in accordance with income tax regulations, which may differ from U.S. generally accepted accounting principles. Certain capital accounts in the financial statements are periodically adjusted for permanent
differences in order to reflect their tax character. These adjustments have no impact on net assets or net asset value per share. Temporary differences which arise from recognizing certain items of income, expense, gain or loss in different periods
for financial statement and tax purposes will reverse at some time in the future.
Book/tax differences primarily relate to defaulted bonds,
amortization and accretion of debt securities, straddle loss deferrals, and derivative transactions.
Notes to Financial
Statements - continued
The tax character of distributions declared to shareholders for
the last two fiscal years is as follows:
| |
Year
ended
10/31/21 |
Year
ended
10/31/20 |
| Ordinary
income (including any short-term capital gains) |
$18,349,942
|
$21,730,896
|
| Tax
return of capital (b) |
12,050,739
|
9,307,914
|
| Total
distributions |
$30,400,681
|
$31,038,810
|
| (b)
|
Distributions
in excess of tax basis earnings and profits are reported in the financial statements as a tax return of capital. |
The federal tax cost and the tax basis components of
distributable earnings were as follows:
| As
of 10/31/21 |
|
| Cost
of investments |
$468,940,325
|
| Gross
appreciation |
11,900,362
|
| Gross
depreciation |
(11,706,538)
|
| Net
unrealized appreciation (depreciation) |
$
193,824 |
| Capital
loss carryforwards |
(5,158,640)
|
| Other
temporary differences |
(137,774)
|
| Total
distributable earnings (loss) |
$
(5,102,590) |
As of October 31, 2021, the fund had capital loss carryforwards
available to offset future realized gains. These net capital losses may be carried forward indefinitely and their character is retained as short-term and/or long-term losses. Such losses are characterized as follows:
(3) Transactions with
Affiliates
Investment Adviser — The fund has an investment advisory agreement with MFS to provide overall investment management and related administrative services and facilities to the fund. The
management fee is computed daily and paid monthly at an annual rate of 0.34% of the fund’s average daily net assets and 5.40% of gross income. Gross income is calculated based on tax elections that generally include the accretion of discount
and exclude the amortization of premium, which may differ from investment income reported in the Statement of Operations. The management fee, from net assets and gross income, incurred for the year ended October 31, 2021 was equivalent to an annual
effective rate of 0.65% of the fund’s average daily net assets.
Transfer Agent — The fund
engages Computershare Trust Company, N.A. (“Computershare”) as the sole transfer agent for the fund. MFS Service Center, Inc. (MFSC) monitors and supervises the activities of Computershare for an agreed upon fee approved by the Board of
Trustees. For the year ended October 31, 2021, these fees paid to MFSC amounted to $33,747.
Administrator — MFS
provides certain financial, legal, shareholder communications, compliance, and other administrative services to the fund. Under an administrative services agreement, the fund reimburses MFS the costs incurred to provide these
Notes to Financial
Statements - continued
services. The fund is charged an annual fixed amount of $17,500 plus a fee
based on average daily net assets. The administrative services fee incurred for the year ended October 31, 2021 was equivalent to an annual effective rate of 0.0157% of the fund's average daily net assets.
Trustees’ and Officers’ Compensation — The fund pays compensation to independent Trustees in the form of a retainer, attendance fees, and additional compensation to Board and Committee chairpersons. The fund does not pay compensation directly to
Trustees or officers of the fund who are also officers of the investment adviser, all of whom receive remuneration from MFS for their services to the fund. Certain officers and Trustees of the fund are officers or directors of MFS and
MFSC.
Prior to December 31, 2001, the fund had an
unfunded defined benefit plan (“DB plan”) for independent Trustees. As of December 31, 2001, the Board took action to terminate the DB plan with respect to then-current and any future independent Trustees, such that the DB plan covers
only certain of those former independent Trustees who retired on or before December 31, 2001. The DB plan resulted in a pension expense of $4,088 and is included in “Independent Trustees’ compensation” in the Statement of
Operations for the year ended October 31, 2021. The liability for deferred retirement benefits payable to those former independent Trustees under the DB plan amounted to $4,379 at October 31, 2021, and is included in “Payable for independent
Trustees’ compensation” in the Statement of Assets and Liabilities.
Other — The fund invests
in the MFS Institutional Money Market Portfolio which is managed by MFS and seeks current income consistent with preservation of capital and liquidity. This money market fund does not pay a management fee to MFS but does incur investment and
operating costs.
The fund is permitted to engage
in purchase and sale transactions with funds and accounts for which MFS serves as investment adviser or sub-adviser (“cross-trades”) pursuant to a policy adopted by the Board of Trustees. This policy has been designed to ensure that
cross-trades conducted by the fund comply with Rule 17a-7 under the Investment Company Act of 1940. During the year ended October 31, 2021, the fund engaged in purchase transactions pursuant to this policy, which amounted to $12,092.
(4) Portfolio Securities
For the year ended October 31, 2021, purchases and sales of
investments, other than purchased option transactions and short-term obligations, were as follows:
| |
Purchases
|
Sales
|
| U.S.
Government securities |
$11,358,118
|
$14,149,759
|
| Non-U.S.
Government securities |
312,623,982
|
322,033,279
|
(5) Shares of Beneficial
Interest
The fund's Declaration of Trust permits the
Trustees to issue an unlimited number of full and fractional shares of beneficial interest. The Trustees have authorized the repurchase by the fund of up to 10% annually of its own shares of beneficial interest.
During the year ended October 31, 2021, the fund did not repurchase any
shares. The
Notes to Financial
Statements - continued
fund repurchased 3,788,454 shares of beneficial interest during the year ended
October 31, 2020 at an average price per share of $5.43 and a weighted average discount of 9.05% per share. Transactions in fund shares were as follows:
| |
Year
ended
10/31/21 |
|
Year
ended
10/31/20 |
| |
Shares
|
Amount
|
|
Shares
|
Amount
|
| Shares
issued to shareholders in reinvestment of distributions |
229,540
|
$1,436,638
|
|
—
|
$—
|
| Capital
shares repurchased |
—
|
—
|
|
(3,788,454)
|
(20,578,380)
|
| Net
change |
229,540
|
$1,436,638
|
|
(3,788,454)
|
$(20,578,380)
|
(6) Loan Agreement
The fund has a credit agreement with a bank for a revolving
secured line of credit that can be drawn upon up to $100,000,000. At October 31, 2021, the fund had outstanding borrowings under this agreement in the amount of $100,000,000, which are secured by a lien on the fund’s assets. The loan’s
carrying value in the fund’s Statement of Assets and Liabilities approximates its fair value. The loan value as of the reporting date is considered level 2 under the fair value hierarchy. The credit agreement matures on August 19, 2022.
Borrowings under the agreement can be made for liquidity or leverage purposes. Interest is charged at a rate per annum equal to LIBOR plus an agreed upon spread with the option to choose LIBOR periods of overnight, 1, 3, or 6 months, or at the
option of the borrower an alternate base rate plus an agreed upon spread. The fund incurred interest expense of $779,817 during the period, which is included in “Interest expense and fees” in the Statement of Operations. The fund may
also be charged a commitment fee based on the average daily unused portion of the line of credit. The fund did not incur a commitment fee during the period. For the year ended October 31, 2021, the average loan balance was $100,000,000 at a weighted
average annual interest rate of 0.78%. The fund is subject to certain covenants including, but not limited to, requirements with respect to asset coverage, portfolio diversification and liquidity.
(7) Investments in Affiliated Issuers
An affiliated issuer may be considered one in which the fund
owns 5% or more of the outstanding voting securities, or a company which is under common control. For the purposes of this report, the following were affiliated issuers:
| Affiliated
Issuers |
Beginning
Value |
Purchases
|
Sales
Proceeds |
Realized
Gain
(Loss) |
Change
in
Unrealized
Appreciation or
Depreciation |
Ending
Value |
| MFS
Institutional Money Market Portfolio |
$9,181,652
|
$316,346,689
|
$316,775,748
|
$193
|
$(193)
|
$8,752,593
|
| Affiliated
Issuers |
Dividend
Income |
Capital
Gain
Distributions |
| MFS
Institutional Money Market Portfolio |
$6,015
|
$—
|
Notes to Financial
Statements - continued
(8) Impacts of COVID-19
The pandemic related to the global spread of novel coronavirus
disease (COVID-19), which was first detected in December 2019, has resulted in significant disruptions to global business activity and the global economy, as well as the economies of individual countries, the financial performance of individual
companies and sectors, and the securities and commodities markets in general. Multiple surges in cases globally, the availability and widespread adoption of vaccines, and the emergence of variant strains of the virus continue to create uncertainty
as to the future and long-term impacts resulting from the pandemic including impacts to the prices and liquidity of the fund's investments and the fund's performance.
Report of Independent
Registered Public Accounting Firm
To the Shareholders
and the Board of Trustees of MFS Multimarket Income Trust
Opinion on the Financial Statements
We have audited the accompanying statement of assets and
liabilities of MFS Multimarket Income Trust (the “Fund”), including the portfolio of investments, as of October 31, 2021, and the related statements of operations and cash flows for the year then ended, the statements of changes in net
assets for each of the two years in the period then ended, the financial highlights for each of the five years in the period then ended and the related notes (collectively referred to as the “financial statements”). In our opinion, the
financial statements present fairly, in all material respects, the financial position of the Fund at October 31, 2021, the results of its operations and its cash flows for the year then ended, the changes in its net assets for each of the two years
in the period then ended and its financial highlights for each of the five years in the period then ended, in conformity with U.S. generally accepted accounting principles.
Basis for Opinion
These financial statements are the responsibility of the
Fund’s management. Our responsibility is to express an opinion on the Fund’s financial statements based on our audits. We are a public accounting firm registered with the Public Company Accounting Oversight Board (United States)
(“PCAOB”) and are required to be independent with respect to the Fund in accordance with the U.S. federal securities laws and the applicable rules and regulations of the Securities and Exchange Commission and the PCAOB.
We conducted our audits in accordance with the standards of the
PCAOB. Those standards require that we plan and perform the audit to obtain reasonable assurance about whether the financial statements are free of material misstatement, whether due to error or fraud. The Fund is not required to have, nor were we
engaged to perform, an audit of the Fund’s internal control over financial reporting. As part of our audits, we are required to obtain an understanding of internal control over financial reporting but not for the purpose of expressing an
opinion on the effectiveness of the Fund’s internal control over financial reporting. Accordingly, we express no such opinion.
Report of Independent
Registered Public Accounting Firm – continued
Our audits included performing procedures to assess the risks
of material misstatement of the financial statements, whether due to error or fraud, and performing procedures that respond to those risks. Such procedures included examining, on a test basis, evidence regarding the amounts and disclosures in the
financial statements. Our procedures included confirmation of securities owned as of October 31, 2021, by correspondence with the custodian and others or by other appropriate auditing procedures where replies from others were not received. Our
audits also included evaluating the accounting principles used and significant estimates made by management, as well as evaluating the overall presentation of the financial statements. We believe that our audits provide a reasonable basis for our
opinion.
We have served as
the auditor of one or more MFS investment companies since 1993.
Boston, Massachusetts
December 15, 2021
Results of Shareholder
Meeting (unaudited)
At the annual meeting of shareholders of MFS Multimarket
Income Trust, which was held on October 7, 2021, the following action was taken:
Item 1: To elect the following
individuals as Trustees:
| |
|
Number
of Shares |
| Nominee
|
|
For
|
|
Withheld
Authority |
| John
A. Caroselli |
|
39,116,214.495
|
|
7,054,871.139
|
| James
W. Kilman, Jr. |
|
39,127,758.840
|
|
7,043,326.794
|
| Clarence
Otis, Jr. |
|
39,041,490.685
|
|
7,129,594.949
|
Trustees and
Officers — Identification and Background
The Trustees and Officers of the Trust, as of December 1,
2021, are listed below, together with their principal occupations during the past five years. (Their titles may have varied during that period.) The address of each Trustee and Officer is 111 Huntington Avenue, Boston, Massachusetts
02199-7618.
| Name,
Age |
|
Position(s)
Held with Fund |
|
Trustee/Officer
Since(h) |
|
Term
Expiring |
|
Number
of MFS
Funds
overseen
by the
Trustee |
|
Principal
Occupations
During
the Past
Five Years |
|
Other
Directorships
During
the Past
Five Years (j) |
| INTERESTED
TRUSTEES |
|
|
Robert
J. Manning (k)
(age 58) |
|
Trustee
|
|
February
2004 |
|
2022
|
|
135
|
|
Massachusetts
Financial Services Company, Non-Executive Chairman (since January 2021); Director; Chairman of the Board; Executive Chairman (January 2017-2020); Co-Chief Executive Officer (2015-2016) |
|
N/A
|
Michael
W. Roberge (k)
(age 55) |
|
Trustee
|
|
January
2021 |
|
2023
|
|
135
|
|
Massachusetts
Financial Services Company, Chairman (since January 2021); Chief Executive Officer (since January 2017); Director; President (until December 2018); Chief Investment Officer (until December 2018); Co-Chief Executive Officer (until December 2016)
|
|
N/A
|
| INDEPENDENT
TRUSTEES |
|
|
John
P. Kavanaugh
(age 67) |
|
Trustee
and Chair of Trustees |
|
January
2009 |
|
2023
|
|
135
|
|
Private
investor |
|
N/A
|
Steven
E. Buller
(age 70) |
|
Trustee
|
|
February
2014 |
|
2023
|
|
135
|
|
Private
investor |
|
N/A
|
John
A. Caroselli
(age 67) |
|
Trustee
|
|
March
2017 |
|
2024
|
|
135
|
|
Private
investor; JC Global Advisors, LLC (management consulting), President (since 2015) |
|
N/A
|
Maureen
R. Goldfarb
(age 66) |
|
Trustee
|
|
January
2009 |
|
2022
|
|
135
|
|
Private
investor |
|
N/A
|
Peter
D. Jones
(age 66) |
|
Trustee
|
|
January
2019 |
|
2023
|
|
135
|
|
Private
investor |
|
N/A
|
Trustees and Officers -
continued
| Name,
Age |
|
Position(s)
Held with Fund |
|
Trustee/Officer
Since(h) |
|
Term
Expiring |
|
Number
of MFS
Funds
overseen
by the
Trustee |
|
Principal
Occupations
During
the Past
Five Years |
|
Other
Directorships
During
the Past
Five Years (j) |
James
W. Kilman, Jr.
(age 60) |
|
Trustee
|
|
January
2019 |
|
2024
|
|
135
|
|
Burford
Capital Limited (finance and investment management), Senior Advisor (since May 3, 2021), Chief Financial Officer (2019 - May 2, 2021); KielStrand Capital LLC (family office), Chief Executive Officer (since 2016); Morgan Stanley & Co. (financial
services), Vice Chairman of Investment Banking, Co-Head of Diversified Financials Coverage – Financial Institutions Investment Banking Group (until 2016) |
|
Alpha-En
Corporation, Director (2016-2019) |
Clarence
Otis, Jr.
(age 65) |
|
Trustee
|
|
March
2017 |
|
2024
|
|
135
|
|
Private
investor |
|
VF
Corporation, Director; Verizon Communications, Inc., Director; The Travelers Companies, Director |
Maryanne
L. Roepke
(age 65) |
|
Trustee
|
|
May
2014 |
|
2022
|
|
135
|
|
Private
investor |
|
N/A
|
Laurie
J. Thomsen
(age 64) |
|
Trustee
|
|
March
2005 |
|
2022
|
|
135
|
|
Private
investor |
|
The
Travelers Companies, Director; Dycom Industries, Inc., Director |
| Name,
Age |
|
Position(s)
Held with
Fund |
|
Trustee/Officer
Since(h) |
|
Term
Expiring |
|
Number
of MFS
Funds
overseen
by the
Trustee |
|
Principal
Occupations
During
the Past
Five Years |
| OFFICERS
|
Christopher
R. Bohane (k)
(age 47) |
|
Assistant
Secretary and Assistant Clerk |
|
July
2005 |
|
N/A
|
|
135
|
|
Massachusetts
Financial Services Company, Senior Vice President and Associate General Counsel |
Trustees and Officers -
continued
| Name,
Age |
|
Position(s)
Held with
Fund |
|
Trustee/Officer
Since(h) |
|
Term
Expiring |
|
Number
of MFS
Funds
overseen
by the
Trustee |
|
Principal
Occupations
During
the Past
Five Years |
Kino
Clark (k)
(age 53) |
|
Assistant
Treasurer |
|
January
2012 |
|
N/A
|
|
135
|
|
Massachusetts
Financial Services Company, Vice President |
John
W. Clark, Jr. (k)
(age 54) |
|
Assistant
Treasurer |
|
April
2017 |
|
N/A
|
|
135
|
|
Massachusetts
Financial Services Company, Vice President (since March 2017); Deutsche Bank (financial services), Department Head - Treasurer's Office (until February 2017) |
Thomas
H. Connors (k)
(age 62) |
|
Assistant
Secretary and Assistant Clerk |
|
September
2012 |
|
N/A
|
|
135
|
|
Massachusetts
Financial Services Company, Vice President and Senior Counsel |
David
L. DiLorenzo (k)
(age 53) |
|
President
|
|
July
2005 |
|
N/A
|
|
135
|
|
Massachusetts
Financial Services Company, Senior Vice President |
Heidi
W. Hardin (k)
(age 54) |
|
Secretary
and Clerk |
|
April
2017 |
|
N/A
|
|
135
|
|
Massachusetts
Financial Services Company, Executive Vice President and General Counsel (since March 2017); Harris Associates (investment management), General Counsel (until January 2017) |
Brian
E. Langenfeld (k)
(age 48) |
|
Assistant
Secretary and Assistant Clerk |
|
June
2006 |
|
N/A
|
|
135
|
|
Massachusetts
Financial Services Company, Vice President and Senior Counsel |
Amanda
S. Mooradian (k)
(age 42) |
|
Assistant
Secretary and Assistant Clerk |
|
September
2018 |
|
N/A
|
|
135
|
|
Massachusetts
Financial Services Company, Assistant Vice President and Senior Counsel |
Susan
A. Pereira (k)
(age 51) |
|
Assistant
Secretary and Assistant Clerk |
|
July
2005 |
|
N/A
|
|
135
|
|
Massachusetts
Financial Services Company, Vice President and Assistant General Counsel |
Kasey
L. Phillips (k)
(age 50) |
|
Assistant
Treasurer |
|
September
2012 |
|
N/A
|
|
135
|
|
Massachusetts
Financial Services Company, Vice President |
Matthew
A. Stowe (k)
(age 47) |
|
Assistant
Secretary and Assistant Clerk |
|
October
2014 |
|
N/A
|
|
135
|
|
Massachusetts
Financial Services Company, Vice President and Assistant General Counsel |
Trustees and Officers -
continued
| Name,
Age |
|
Position(s)
Held with
Fund |
|
Trustee/Officer
Since(h) |
|
Term
Expiring |
|
Number
of MFS
Funds
overseen
by the
Trustee |
|
Principal
Occupations
During
the Past
Five Years |
Martin
J. Wolin (k)
(age 54) |
|
Chief
Compliance Officer |
|
July
2015 |
|
N/A
|
|
135
|
|
Massachusetts
Financial Services Company, Senior Vice President and Chief Compliance Officer |
James
O. Yost (k)
(age 61) |
|
Treasurer
|
|
September
1990 |
|
N/A
|
|
135
|
|
Massachusetts
Financial Services Company, Senior Vice President |
| (h)
|
Date
first appointed to serve as Trustee/Officer of an MFS Fund. Each Trustee has served continuously since appointment unless indicated otherwise. For the period from December 15, 2004 until February 22, 2005, Mr. Manning served as Advisory Trustee.
From January 2012 through December 2016, Messrs. DiLorenzo and Yost served as Treasurer and Deputy Treasurer of the Funds, respectively. |
| (j)
|
Directorships
or trusteeships of companies required to report to the Securities and Exchange Commission (i.e., “public companies”). |
| (k)
|
“Interested
person” of the Trust within the meaning of the Investment Company Act of 1940 (referred to as the 1940 Act), which is the principal federal law governing investment companies like the fund, as a result of a position with MFS. The address of
MFS is 111 Huntington Avenue, Boston, Massachusetts 02199-7618. |
The Trust holds annual shareholder meetings for the purpose of
electing Trustees, and Trustees are elected for fixed terms. The Board of Trustees is currently divided into three classes, each having a term of three years which term expires on the date of the third annual meeting following the election to office
of the Trustee’s class. Each year the term of one class expires. Each Trustee and officer will serve until next elected or his or her earlier death, resignation, retirement or removal. Under the terms of the Board's retirement policy, an
Independent Trustee shall retire at the end of the calendar year in which he or she reaches the earlier of 75 years of age or 15 years of service on the Board (or, in the case of any Independent Trustee who joined the Board prior to 2015, 20 years
of service on the Board).
Messrs. Buller, Kilman and Otis
and Ms. Roepke are members of the Trust’s Audit Committee.
Trustees and Officers -
continued
Each of the Interested Trustees and certain Officers hold
comparable officer positions with certain affiliates of MFS.
| Investment
Adviser |
Custodian
|
Massachusetts
Financial Services Company
111 Huntington Avenue
Boston, MA 02199-7618 |
State
Street Bank and Trust Company
1 Lincoln Street
Boston, MA 02111-2900 |
| Portfolio
Manager(s) |
Independent
Registered Public Accounting Firm |
Robert
Spector
Ward Brown
David Cole
Pilar Gomez-Bravo
Andy Li
Henry Peabody
Matt Ryan
Michael Skatrud |
Ernst &
Young LLP
200 Clarendon Street
Boston, MA 02116 |
Board Review of Investment
Advisory Agreement
MFS Multimarket Income Trust
The Investment Company Act of 1940 requires that both the full
Board of Trustees and a majority of the non-interested (“independent”) Trustees, voting separately, annually approve the continuation of the Fund’s investment advisory agreement with MFS. The Trustees consider matters bearing on
the Fund and its advisory arrangements at their meetings throughout the year, including a review of performance data at each regular meeting. In addition, the independent Trustees met several times by videoconference (in accordance with Securities
and Exchange Commission relief) over the course of three months beginning in May and ending in July, 2021 (“contract review meetings”) for the specific purpose of considering whether to approve the continuation of the investment advisory
agreement for the Fund and the other investment companies that the Board oversees (the “MFS Funds”). The independent Trustees were assisted in their evaluation of the Fund’s investment advisory agreement by independent legal
counsel, from whom they received separate legal advice and with whom they met separately from MFS during various contract review meetings. The independent Trustees were also assisted in this process by an independent consultant who was retained by
and reported to the independent Trustees.
In connection
with their deliberations regarding the continuation of the investment advisory agreement, the Trustees, including the independent Trustees, considered such information and factors as they believed, in light of the legal advice furnished to them and
their own business judgment, to be relevant. The investment advisory agreement for the Fund was considered separately, although the Trustees also took into account the common interests of all MFS Funds in their review. As described below, the
Trustees considered the nature, quality, and extent of the various investment advisory, administrative, and shareholder services performed by MFS under the existing investment advisory agreement and other arrangements with the Fund.
In connection with their contract review meetings, the Trustees
received and relied upon materials that included, among other items: (i) information provided by Broadridge Financial Solutions, Inc. (“Broadridge”), an independent third party, on the investment performance (based on net asset value) of
the Fund for various time periods ended December 31, 2020 and the investment performance (based on net asset value) of a group of funds with substantially similar investment classifications/objectives (the “Broadridge performance
universe”), (ii) information provided by Broadridge on the Fund’s advisory fees and other expenses and the advisory fees and other expenses of comparable funds identified by Broadridge as well as all other funds in the same investment
classification/category (the “Broadridge expense group and universe”), (iii) information provided by MFS on the advisory fees of portfolios of other clients of MFS, including institutional separate accounts and other clients, (iv)
information as to whether and to what extent applicable expense waivers, reimbursements or fee “breakpoints” are observed for the Fund, (v) information regarding MFS’ financial results and financial condition, including MFS’
and certain of its affiliates’ estimated profitability from services performed for the Fund and the MFS Funds as a whole, and compared to MFS’ institutional business, (vi) MFS’ views regarding the outlook for the mutual fund
industry and the strategic business plans of MFS, (vii) descriptions of various functions performed by MFS for the Funds, such as compliance monitoring and
Board Review of Investment
Advisory Agreement - continued
portfolio trading practices, and (viii) information regarding the overall
organization of MFS, including information about MFS’ senior management and other personnel providing investment advisory, administrative and other services to the Fund and the other MFS Funds. The comparative performance, fee and expense
information prepared and provided by Broadridge was not independently verified and the independent Trustees did not independently verify any information provided to them by MFS.
The Trustees’ conclusion as to the continuation of the
investment advisory agreement was based on a comprehensive consideration of all information provided to the Trustees and not the result of any single factor. Some of the factors that figured particularly in the Trustees’ deliberations are
described below, although individual Trustees may have evaluated the information presented differently from one another, giving different weights to various factors. It is also important to recognize that the fee arrangements for the Fund and other
MFS Funds are the result of years of review and discussion between the independent Trustees and MFS, that certain aspects of such arrangements may receive greater scrutiny in some years than in others, and that the Trustees’ conclusions may be
based, in part, on their consideration of these same arrangements during the course of the year and in prior years.
Based on information provided by Broadridge and MFS, the
Trustees reviewed the Fund’s total return investment performance as well as the Broadridge performance universe over various time periods. The Trustees placed particular emphasis on the total return performance of the Fund’s common
shares in comparison to the performance of funds in its Broadridge performance universe over the five-year period ended December 31, 2020, which the Trustees believed was a long enough period to reflect differing market conditions. The total return
performance of the Fund’s common shares ranked 12th out of a total of 22 funds in the Broadridge performance universe for this five-year period (a ranking of first place out of the total number of funds in the performance universe indicating
the best performer and a ranking of last place out of the total number of funds in the performance universe indicating the worst performer). The total return performance of the Fund’s common shares ranked 3rd out of a total of 25 funds for the
one-year period and 3rd out of a total of 23 funds for the three-year period ended December 31, 2020. Given the size of the Broadridge performance universe and information previously provided by MFS regarding differences between the Fund and other
funds in its Broadridge performance universe, the Trustees also reviewed the Fund’s performance in comparison to a custom benchmark developed by MFS. The Fund outperformed its custom benchmark for each of the one-, three- and five-year periods
ended December 31, 2020 (one-year: 9.9% total return for the Fund versus 7.5% total return for the benchmark; three-year: 8.3% total return for the Fund versus 5.8% total return for the benchmark; five-year: 9.1% total return for the Fund versus
7.2% total return for the benchmark). Because of the passage of time, these performance results may differ from the performance results for more recent periods, including those shown elsewhere in this report.
In the course of their deliberations, the Trustees took into
account information provided by MFS in connection with the contract review meetings, as well as during investment review meetings conducted with portfolio management personnel during the course of the year regarding the Fund’s performance.
After reviewing these and related factors, the Trustees concluded, within the context of their overall conclusions regarding the investment advisory agreement, that they were satisfied with MFS’ responses and efforts relating to investment
performance.
Board Review of Investment
Advisory Agreement - continued
In assessing the reasonableness of the Fund’s advisory
fee, the Trustees considered, among other information, the Fund’s advisory fee and the total expense ratio of the Fund’s common shares as a percentage of average daily net assets and the advisory fee and total expense ratios of the
Broadridge expense group based on information provided by Broadridge. The Trustees considered that, according to the data provided by Broadridge (which takes into account any fee reductions or expense limitations that were in effect during the
Fund’s last fiscal year), the Fund’s effective advisory fee rate and total expense ratio were each lower than the Broadridge expense group median.
The Trustees also considered the advisory fees charged by MFS
to any institutional separate accounts advised by MFS (“separate accounts”) and unaffiliated investment companies for which MFS serves as subadviser (“subadvised funds”) that have comparable investment strategies to the Fund,
if any. In comparing these fees, the Trustees considered information provided by MFS as to the generally broader scope of services provided by MFS to the Fund, as well as the more extensive regulatory burdens imposed on MFS in managing the Fund, in
comparison to separate accounts and subadvised funds.
The
Trustees considered that, as a closed-end fund, the Fund is unlikely to experience meaningful asset growth. As a result, the Trustees did not view the potential for realization of economies of scale as the Fund’s assets grow to be a material
factor in their deliberations. The Trustees noted that they would consider economies of scale in the future in the event the Fund experiences significant asset growth, such as through an offering of preferred shares (which is not currently
contemplated) or a material increase in the market value of the Fund’s portfolio securities.
The Trustees also considered information prepared by MFS
relating to MFS’ costs and profits with respect to the Fund, the MFS Funds considered as a group, and other investment companies and accounts advised by MFS, as well as MFS’ methodologies used to determine and allocate its costs to the
MFS Funds, the Fund and other accounts and products for purposes of estimating profitability.
After reviewing these and other factors described herein, the
Trustees concluded, within the context of their overall conclusions regarding the investment advisory agreement, that the advisory fees charged to the Fund represent reasonable compensation in light of the services being provided by MFS to the
Fund.
In addition, the Trustees considered MFS’
resources and related efforts to continue to retain, attract and motivate capable personnel to serve the Fund. The Trustees also considered current and developing conditions in the financial services industry, including the presence of large and
well-capitalized companies which are spending, and appear to be prepared to continue to spend, substantial sums to engage personnel and to provide services to competing investment companies. In this regard, the Trustees also considered the financial
resources of MFS and its ultimate parent, Sun Life Financial Inc. The Trustees also considered the advantages and possible disadvantages to the Fund of having an adviser that also serves other investment companies as well as other accounts.
The Trustees also considered the nature, quality, cost, and
extent of administrative services provided to the Fund by MFS under agreements other than the investment advisory agreement. The Trustees also considered the nature, extent and quality of certain other services MFS performs or arranges for on the
Fund’s behalf, which may include securities lending programs, directed expense payment programs, class action
Board Review of Investment
Advisory Agreement - continued
recovery programs, and MFS’ interaction with third-party service
providers, principally custodians and sub-custodians. The Trustees concluded that the various non-advisory services provided by MFS and its affiliates on behalf of the Fund were satisfactory.
The Trustees considered so-called “fall-out
benefits” to MFS such as reputational value derived from serving as investment manager to the MFS Funds. The Trustees also considered that MFS discontinued its historic practice of obtaining investment research from portfolio brokerage
commissions paid by certain MFS Funds effective January 2018, and directly pays or voluntarily reimburses a Fund, if applicable, for the costs of external research acquired through the use of the Fund’s portfolio brokerage commissions.
Based on their evaluation of factors that they deemed to be
material, including those factors described above, the Board of Trustees, including the independent Trustees, concluded that the Fund’s investment advisory agreement with MFS should be continued for an additional one-year period, commencing
August 1, 2021.
Proxy
Voting Policies and Information
MFS votes proxies on
behalf of the fund pursuant to proxy voting policies and procedures that are available without charge, upon request, by calling 1-800-225-2606, by visiting mfs.com/proxyvoting, or by visiting the SEC’s
Web site at http://www.sec.gov.
Information regarding how the fund voted proxies relating to
portfolio securities during the most recent twelve-month period ended June 30 is available by August 31 of each year without charge by visiting mfs.com/proxyvoting, or by visiting the SEC’s Web site at http://www.sec.gov.
Quarterly Portfolio Disclosure
The fund files a complete schedule of portfolio holdings with
the SEC for the first and third quarters of each fiscal year as an exhibit to its reports on Form N-PORT. The fund’s Form N-PORT reports are available on the SEC’s Web site at
http://www.sec.gov. A shareholder can obtain the portfolio holdings report for the first and third quarters of the fund's fiscal year at
mfs.com/closedendfunds by choosing the fund's name and then scrolling to the “Resources” section and clicking on the “Prospectus and Reports” tab.
Further Information
From time to time, MFS may post important information about the
fund or the MFS Funds on the MFS Web site (mfs.com). This information is available at https://www.mfs.com/announcements or at
mfs.com/closedendfunds by choosing the fund's name and then scrolling to the “Resources” section and clicking on the “Announcements” tab, if any.
Additional information about the fund (e.g., performance,
dividends and the fund’s price history) is also available at mfs.com/closedendfunds by choosing the fund's name, if any.
INFORMATION ABOUT FUND CONTRACTS AND LEGAL CLAIMS
The fund has entered into contractual arrangements with an
investment adviser, administrator, transfer agent, and custodian who each provide services to the fund. Unless expressly stated otherwise, shareholders are not parties to, or intended beneficiaries of these contractual arrangements, and these
contractual arrangements are not intended to create any shareholder right to enforce them against the service providers or to seek any remedy under them against the service providers, either directly or on behalf of the fund.
Under the Trust’s By-Laws and Declaration of Trust, any
claims asserted against or on behalf of the MFS Funds, including claims against Trustees and Officers, must be brought in state and federal courts located within the Commonwealth of Massachusetts.
Federal Tax Information (unaudited)
The
fund will notify shareholders of amounts for use in preparing 2021 income tax forms in January 2022. The following information is provided pursuant to provisions of the Internal Revenue Code.
The fund intends to pass through the maximum amount allowable
as Section 163(j) Interest Dividends as defined in Treasury Regulation §1.163(j)-1(b).
| FACTS
|
WHAT
DOES MFS DO WITH YOUR PERSONAL INFORMATION? |
| Why?
|
Financial
companies choose how they share your personal information. Federal law gives consumers the right to limit some but not all sharing. Federal law also requires us to tell you how we collect, share, and protect your personal information. Please read
this notice carefully to understand what we do. |
| What?
|
The types of
personal information we collect and share depend on the product or service you have with us. This information can include: |
| • Social
Security number and account balances |
| • Account
transactions and transaction history |
| • Checking
account information and wire transfer instructions |
| When
you are no longer our customer, we continue to share your information as described in this notice. |
| How?
|
All
financial companies need to share customers' personal information to run their everyday business. In the section below, we list the reasons financial companies can share their customers' personal information; the reasons MFS chooses to share; and
whether you can limit this sharing. |
Reasons
we can share your
personal information |
Does
MFS share? |
Can
you limit
this sharing? |
For
our everyday business purposes –
such as to process your transactions, maintain your
account(s), respond to court orders and legal
investigations, or report to credit bureaus |
Yes
|
No
|
For
our marketing purposes –
to offer our products and services to you |
No
|
We
don't share |
For
joint marketing with other
financial companies |
No
|
We
don't share |
For
our affiliates' everyday business purposes –
information about your transactions and experiences |
No
|
We
don't share |
For
our affiliates' everyday business purposes –
information about your creditworthiness |
No
|
We
don't share |
| For
nonaffiliates to market to you |
No
|
We
don't share |
| Questions?
|
Call
800-225-2606 or go to mfs.com. |
| Who
we are |
| Who
is providing this notice? |
MFS
Funds, MFS Investment Management, MFS Institutional Advisors, Inc., and MFS Heritage Trust Company. |
| What
we do |
How
does MFS
protect my personal
information? |
To
protect your personal information from unauthorized access and use, we use security measures that comply with federal law. These measures include procedural, electronic, and physical safeguards for the protection of the personal information we
collect about you. |
How
does MFS
collect my personal
information? |
We
collect your personal information, for example, when you |
| • open
an account or provide account information |
| • direct
us to buy securities or direct us to sell your securities |
| • make
a wire transfer |
| We
also collect your personal information from others, such as credit bureaus, affiliates, or other companies. |
| Why
can't I limit all sharing? |
Federal
law gives you the right to limit only |
| • sharing
for affiliates' everyday business purposes – information about your creditworthiness |
| • affiliates
from using your information to market to you |
| • sharing
for nonaffiliates to market to you |
| State
laws and individual companies may give you additional rights to limit sharing. |
| Definitions
|
| Affiliates
|
Companies
related by common ownership or control. They can be financial and nonfinancial companies. |
| •
MFS does not share personal information with affiliates, except for everyday business purposes as described on page one of this notice. |
| Nonaffiliates
|
Companies
not related by common ownership or control. They can be financial and nonfinancial companies. |
| •
MFS does not share with nonaffiliates so they can market to you. |
| Joint
marketing |
A
formal agreement between nonaffiliated financial companies that together market financial products or services to you. |
| •
MFS doesn't jointly market. |
| Other
important information |
| If
you own an MFS product or receive an MFS service in the name of a third party such as a bank or broker-dealer, their privacy policy may apply to you instead of ours. |
CONTACT US
TRANSFER AGENT, REGISTRAR, AND
DIVIDEND DISBURSING
AGENT
CALL
1-800-637-2304
9 a.m. to 5 p.m. Eastern time
WRITE
Computershare Trust Company, N.A.
P.O. Box 505005
Louisville, KY 40233-5005
New York Stock Exchange Symbol: MMT
A copy of the notice transmitted to the Registrant’s shareholders in reliance on Rule 30e-3 of the
Investment Company Act of 1940, as amended that contains disclosure specified by paragraph (c)(3) of Rule 30e-3 is attached hereto
as EX-99.30e-3Notice.
The Registrant has adopted a Code of Ethics (the “Code”) pursuant to Section 406 of the Sarbanes-Oxley Act and as defined in Form N-CSR that applies to the Registrant’s principal executive officer and principal financial and accounting officer. During the period covered by this report, the Registrant has not amended any provision in the
Code that relates to an element of the Code’s definition enumerated in paragraph (b) of Item 2 of this Form N-CSR. During the period covered by this report, the Registrant did not grant a waiver,
including an implicit waiver, from any provision of the Code.
A copy of the Code is filed as an exhibit to this Form
N-CSR.
| ITEM 3. |
AUDIT COMMITTEE FINANCIAL EXPERT. |
Messrs. Steven E. Buller, James Kilman, and Clarence Otis, Jr. and Ms. Maryanne L. Roepke, members of the Audit Committee, have been determined by
the Board of Trustees in their reasonable business judgment to meet the definition of “audit committee financial expert” as such term is defined in Form N-CSR. In addition, Messrs. Buller,
Kilman, and Otis and Ms. Roepke are “independent” members of the Audit Committee (as such term has been defined by the Securities and Exchange Commission in regulations implementing Section 407 of the Sarbanes-Oxley Act of 2002).
The Securities and Exchange Commission has stated that the designation of a person as an audit committee financial expert pursuant to this Item 3 on the Form N-CSR does not impose on such a person any duties,
obligations or liability that are greater than the duties, obligations or liability imposed on such person as a member of the Audit Committee and the Board of Trustees in the absence of such designation or identification.
| ITEM 4. |
PRINCIPAL ACCOUNTANT FEES AND SERVICES. |
Items 4(a) through 4(d) and 4(g):
The Board of Trustees
has appointed Ernst & Young LLP (“E&Y”) to serve as independent accountants to the Registrant (hereinafter the “Registrant” or the “Fund”). The tables below set forth the audit fees billed to the Fund as
well as fees for non-audit services provided to the Fund and/or to the Fund’s investment adviser, Massachusetts Financial Services Company (“MFS”) and to various entities either controlling,
controlled by, or under common control with MFS that provide ongoing services to the Fund (“MFS Related Entities”).
For the fiscal years ended October 31, 2021 and 2020, audit fees billed to the Fund by E&Y were as
follows:
|
|
|
|
|
|
|
|
|
| |
|
Audit Fees |
|
| |
|
2021 |
|
|
2020 |
|
| Fees billed by E&Y: |
|
|
|
|
|
|
|
|
| MFS Multimarket Income Trust |
|
|
61,052 |
|
|
|
60,220 |
|
For the fiscal years ended October 31, 2021 and 2020, fees billed by E&Y for audit-related, tax and other services
provided to the Fund and for audit-related, tax and other services provided to MFS and MFS Related Entities were as follows:
|
|
|
|
|
|
|
|
|
|
|
|
|
|
|
|
|
|
|
|
|
|
|
|
|
| |
|
Audit-Related Fees1 |
|
|
Tax Fees2 |
|
|
All Other Fees3 |
|
| |
|
2021 |
|
|
2020 |
|
|
2021 |
|
|
2020 |
|
|
2021 |
|
|
2020 |
|
| Fees billed by E&Y: |
|
|
|
|
|
|
|
|
|
|
|
|
|
|
|
|
|
|
|
|
|
|
|
|
| To MFS Multimarket Income Trust |
|
|
12,246 |
|
|
|
12,077 |
|
|
|
11,255 |
|
|
|
11,103 |
|
|
|
1,092 |
|
|
|
1,110 |
|
|
|
|
|
|
|
|
|
|
|
|
|
|
|
|
|
|
|
|
|
|
|
|
|
|
| |
|
Audit-Related Fees1 |
|
|
Tax Fees2 |
|
|
All Other Fees3 |
|
| |
|
2021 |
|
|
2020 |
|
|
2021 |
|
|
2020 |
|
|
2021 |
|
|
2020 |
|
| Fees billed by E&Y: |
|
|
|
|
|
|
|
|
|
|
|
|
|
|
|
|
|
|
|
|
|
|
|
|
| To MFS and MFS Related Entities of MFS Multimarket Income Trust* |
|
|
1,663,649 |
|
|
|
1,790,828 |
|
|
|
0 |
|
|
|
0 |
|
|
|
110,620 |
|
|
|
104,750 |
|
|
|
|
|
|
|
|
|
|
| |
|
Aggregate Fees for Non-audit Services |
|
| |
|
2021 |
|
|
2020 |
|
| Fees Billed by E&Y: |
|
|
|
|
|
|
|
|
| To MFS Multimarket Income Trust, MFS and MFS Related Entities# |
|
|
2,015,561 |
|
|
|
2,130,598 |
|
| * |
This amount reflects the fees billed to MFS and MFS Related Entities for
non-audit services relating directly to the operations and financial reporting of the Fund (portions of which services also related to the operations and financial reporting of other funds within the MFS Funds
complex). |
| # |
This amount reflects the aggregate fees billed by E&Y for non-audit
services rendered to the Fund and for non-audit services rendered to MFS and the MFS Related Entities. |
| 1 |
The fees included under “Audit-Related Fees” are fees related to assurance and related services that
are reasonably related to the performance of the audit or review of financial statements, but not reported under ‘‘Audit Fees,’’ including accounting consultations, agreed-upon procedure reports, attestation reports, comfort
letters and internal control reviews. |
| 2 |
The fees included under “Tax Fees” are fees associated with tax compliance, tax advice and tax
planning, including services relating to the filing or amendment of federal, state or local income tax returns, regulated investment company qualification reviews and tax distribution and analysis. |
| 3 |
The fees included under “All Other Fees” are fees for products and services provided by E&Y other
than those reported under “Audit Fees,” “Audit-Related Fees” and “Tax Fees,” including fees for services related to review of internal controls and review of Rule 38a-1 compliance
program. |
Item 4(e)(1):
Set
forth below are the policies and procedures established by the Audit Committee of the Board of Trustees relating to the pre-approval of audit and non-audit related
services:
To the extent required by applicable law, pre-approval by the Audit Committee of the Board is needed
for all audit and permissible non-audit services rendered to the Fund and all permissible non-audit services rendered to MFS or MFS Related Entities if the services
relate directly to the operations and financial reporting of the Registrant. Pre-approval is currently on an
engagement-by-engagement basis. In the event pre-approval of such services is necessary between regular meetings of the Audit
Committee and it is not
practical to wait to seek pre-approval at the next regular meeting of the Audit Committee, pre-approval of such
services may be referred to the Chair of the Audit Committee for approval; provided that the Chair may not pre-approve any individual engagement for such services exceeding $50,000 or multiple engagements for
such services in the aggregate exceeding $100,000 between such regular meetings of the Audit Committee. Any engagement pre-approved by the Chair between regular meetings of the Audit Committee shall be
presented for ratification by the entire Audit Committee at its next regularly scheduled meeting.
Item 4(e)(2):
None, or 0%, of the services relating to the Audit-Related Fees, Tax Fees and All Other Fees paid by the Fund and MFS and MFS Related Entities relating
directly to the operations and financial reporting of the Registrant disclosed above were approved by the audit committee pursuant to paragraphs (c)(7)(i)(C) of Rule 2-01 of Regulation S-X (which permits audit committee approval after the start of the engagement with respect to services other than audit, review or attest services, if certain conditions are satisfied).
Item 4(f):
Not applicable.
Item 4(h):
The Registrant’s Audit Committee
has considered whether the provision by a Registrant’s independent registered public accounting firm of non-audit services to MFS and MFS Related Entities that were not
pre-approved by the Committee (because such services were provided prior to the effectiveness of SEC rules requiring pre-approval or because such services did not relate
directly to the operations and financial reporting of the Registrant) was compatible with maintaining the independence of the independent registered public accounting firm as the Registrant’s principal auditors.
| ITEM 5. |
AUDIT COMMITTEE OF LISTED REGISTRANTS. |
The Registrant has an Audit Committee established in accordance with Section 3(a)(58)(A) of the Securities Exchange Act of 1934. The members of the Audit
Committee are Messrs. Steven E. Buller, James Kilman, and Clarence Otis, Jr. and Ms. Maryanne L. Roepke.
| ITEM 6. |
SCHEDULE OF INVESTMENTS |
A schedule of investments of the Registrant is included as part of the report to shareholders of the Registrant under Item 1(a) of this Form N-CSR.
| ITEM 7. |
DISCLOSURE OF PROXY VOTING POLICIES AND PROCEDURES FOR CLOSED-END
MANAGEMENT INVESTMENT COMPANIES. |
A copy of the proxy voting policies and procedures are attached hereto as EX-99.PROXYPOL.
| ITEM 8. |
PORTFOLIO MANAGERS OF CLOSED-END MANAGEMENT INVESTMENT COMPANIES.
|
Portfolio Manager(s)
Information regarding the portfolio manager(s) of the MFS Multimarket Income Trust (the “Fund”) is set forth below. Each portfolio manager is
primarily responsible for the day-to-day management of the Fund.
Robert Persons was no longer a portfolio manager of the Fund as of June 30, 2021.
|
|
|
|
|
|
|
| Portfolio Manager |
|
Primary Role |
|
Since |
|
Title and Five Year History |
| Robert Spector |
|
Lead Portfolio Manager |
|
2017 |
|
Investment Officer of MFS; employed in the investment area of MFS since 2011 |
|
|
|
|
| Ward Brown |
|
Emerging Markets Debt Instruments Portfolio Manager |
|
2012 |
|
Investment Officer of MFS; employed in the investment area of MFS since 2005 |
|
|
|
|
| David Cole |
|
Below Investment Grade Debt Instruments Portfolio Manager |
|
2006 |
|
Investment Officer of MFS; employed in the investment area of MFS since 2004 |
|
|
|
|
| Pilar Gomez-Bravo |
|
Debt Instruments Portfolio Manager |
|
2013 |
|
Investment Officer of MFS; employed in the investment area of MFS since 2013 |
|
|
|
|
| Andy Li |
|
Investment Grade Debt Instruments Portfolio Manager |
|
2019 |
|
Investment Officer of MFS; employed in the investment area of MFS since 2018; Portfolio Manager at Man GLG from 2014 to 2018 |
|
|
|
|
| Henry Peabody |
|
Investment Grade Debt Instruments Portfolio Manager |
|
2019 |
|
Employed in the investment area of MFS since July 2019; Vice President/Portfolio Manager at Eaton Vance Management from November 2014 to June 2019 |
|
|
|
|
| Matt Ryan |
|
Emerging Markets Debt Instruments Portfolio Manager |
|
2004 |
|
Investment Officer of MFS; employed in the investment area of MFS since 1997 |
|
|
|
|
| Michael Skatrud |
|
Below Investment Grade Debt Instruments Portfolio Manager |
|
2018 |
|
Investment Officer of MFS; Employed in the investment area of MFS since May 2013 |
Compensation
MFS’
philosophy is to align portfolio manager compensation with the goal to provide shareholders with long-term value through a collaborative investment process. Therefore, MFS uses long-term investment performance as well as contribution to the overall
investment process and collaborative culture as key factors in determining portfolio manager compensation. In addition, MFS seeks to maintain total compensation programs that are competitive in the asset management industry in each geographic market
where it has employees. MFS uses competitive compensation data to ensure that compensation practices are aligned with its goals of attracting, retaining, and motivating the highest-quality professionals.
MFS reviews portfolio manager compensation annually. In determining portfolio manager compensation, MFS uses quantitative means and qualitative means to help
ensure a sustainable investment process. As of December 31, 2020, portfolio manager total cash compensation is a combination of base salary and performance bonus:
Base Salary – Base salary generally represents a smaller percentage of portfolio manager total cash compensation than performance bonus.
Performance Bonus – Generally, the performance bonus represents more than a majority of portfolio manager total cash compensation.
The performance bonus is based on a combination of quantitative and qualitative factors, generally with more
weight given to the former and less weight given to the latter.
The quantitative portion is primarily based on the
pre-tax performance of accounts managed by the portfolio manager over a range of fixed-length time periods, intended to provide the ability to assess performance over time periods consistent with a full
market cycle and a strategy’s investment horizon. The fixed-length time periods include the portfolio manager’s full tenure on each fund and, when available, ten-, five-, and three-year periods. For
portfolio managers who have served for less than three years, shorter-term periods, including the one-year period, will also be considered, as will performance in previous roles, if any, held at the firm.
Emphasis is generally placed on longer performance periods when multiple performance periods are available. Performance is evaluated across the full set of strategies and portfolios managed by a given portfolio manager, relative to appropriate peer
group universes and/or representative indices (“benchmarks”). As of December 31, 2020, the following benchmarks were used to measure the following portfolio manager’s performance for the Fund:
|
|
|
|
|
| Fund |
|
Portfolio Manager |
|
Benchmark(s) |
| MFS Multimarket Income Trust |
|
Robert Spector |
|
Bloomberg Global Aggregate Credit Bond Index JP
Morgan Emerging Markets Bond Index Global Bloomberg U.S. High-Yield Corporate Bond 2% Issuer Capped Index
Bloomberg U.S. Government/Mortgage Bond Index |
| |
Ward Brown |
|
JPMorgan Emerging Markets Bond Index Global |
| |
David Cole |
|
Bloomberg U.S. High-Yield Corporate Bond 2% Issuer Capped Index
|
| |
Pilar Gomez-Bravo |
|
Bloomberg Global Aggregate Credit Bond Index
JPMorgan Emerging Markets Bond Index Global Bloomberg U.S.
High-Yield Corporate Bond 2% Issuer Capped Index Bloomberg U.S. Government/Mortgage Bond Index
|
| |
Andy Li |
|
Bloomberg Global Aggregate Credit Bond Index |
| |
Henry Peabody |
|
Bloomberg Global Aggregate Credit Bond Index |
| |
Matt Ryan |
|
JPMorgan Emerging Markets Bond Index Global |
| |
Michael Skatrud |
|
Bloomberg U.S. High-Yield Corporate Bond 2% Issuer Capped Index
|
Benchmarks may include versions and components of indices, custom indices, and linked indices that combine performance of
different indices for different portions of the time period, where appropriate.
The qualitative portion is based on the results
of an annual internal peer review process (where portfolio managers are evaluated by other portfolio managers, analysts, and traders) and management’s assessment of overall portfolio manager contribution to the MFS investment process and the
client experience (distinct from fund and other account performance).
The performance bonus is generally a combination of cash and a deferred cash award.
A deferred cash award is issued for a cash value and becomes payable over a three-year vesting period if the portfolio manager remains in the continuous employ of MFS or its affiliates. During the vesting period, the value of the unfunded deferred
cash award will fluctuate as though the portfolio manager had invested the cash value of the award in an MFS Fund(s) selected by the portfolio manager.
MFS Equity Plan – Portfolio managers also typically benefit from the opportunity to participate in the MFS Equity Plan. Equity interests are
awarded by management, on a discretionary basis, taking into account tenure at MFS, contribution to the investment process, and other factors.
Finally, portfolio managers also participate in benefit plans (including a defined contribution plan and health
and other insurance plans) and programs available generally to other employees of MFS. The percentage such benefits represent of any portfolio manager’s compensation depends upon the length of the individual’s tenure at MFS and salary
level, as well as other factors.
Ownership of Fund Shares
The following table shows the dollar range of equity securities of the Fund beneficially owned by the Fund’s portfolio manager(s) as of the Fund’s
fiscal year ended October 31, 2021. The following dollar ranges apply:
N. None
A. $1 – $10,000
B. $10,001
– $50,000
C. $50,001 – $100,000
D. $100,001 – $500,000
E.
$500,001 – $1,000,000
F. Over $1,000,000
|
|
|
| Name of Portfolio Manager |
|
Dollar Range of Equity Securities in
Fund |
| Robert Spector |
|
N |
| Ward Brown |
|
N |
| David Cole |
|
N |
| Pilar Gomez-Bravo |
|
N |
| Andy Li |
|
N |
| Henry Peabody |
|
N |
| Matt Ryan |
|
N |
| Michael Skatrud |
|
N |
Other Accounts
In addition to the Fund, each portfolio manager of the Fund is named as a portfolio manager of certain other accounts managed or
sub-advised by MFS or an affiliate. The number and assets of these accounts were as follows as of the Fund’s fiscal year ended October 31, 2021:
|
|
|
|
|
|
|
|
|
|
|
|
|
|
|
|
|
|
|
|
|
|
|
|
|
| |
|
Registered Investment
Companies* |
|
|
Other Pooled Investment
Vehicles |
|
|
Other Accounts |
|
| Name |
|
Number of
Accounts |
|
|
Total
Assets |
|
|
Number of
Accounts |
|
|
Total Assets |
|
|
Number of
Accounts |
|
|
Total Assets |
|
| Robert Spector |
|
|
7 |
|
|
$ |
4.7 billion |
|
|
|
12 |
|
|
$ |
5.4 billion |
|
|
|
50 |
|
|
$ |
3.0 billion |
|
| Ward Brown |
|
|
7 |
|
|
$ |
13.0 billion |
|
|
|
9 |
|
|
$ |
4.2 billion |
|
|
|
7 |
|
|
$ |
2.2 billion |
|
| David Cole |
|
|
14 |
|
|
$ |
11.2 billion |
|
|
|
8 |
|
|
$ |
6.8 billion |
|
|
|
6 |
|
|
$ |
404.7 million |
|
| Pilar Gomez-Bravo |
|
|
5 |
|
|
$ |
4.3 billion |
|
|
|
8 |
|
|
$ |
3.0 billion |
|
|
|
5 |
|
|
$ |
1.2 billion |
|
| Andy Li |
|
|
5 |
|
|
$ |
4.3 billion |
|
|
|
8 |
|
|
$ |
3.0 billion |
|
|
|
5 |
|
|
$ |
1.2 billion |
|
| Henry Peabody |
|
|
12 |
|
|
$ |
27.0 billion |
|
|
|
9 |
|
|
$ |
3.6 billion |
|
|
|
7 |
|
|
$ |
1.4 billion |
|
| Matt Ryan |
|
|
9 |
|
|
$ |
16.8 billion |
|
|
|
10 |
|
|
$ |
4.5 billion |
|
|
|
7 |
|
|
$ |
2.2 billion |
|
| Michael Skatrud |
|
|
13 |
|
|
$ |
11.1 billion |
|
|
|
8 |
|
|
$ |
1.3 billion |
|
|
|
4 |
|
|
$ |
320.4 million |
|
Advisory fees are not based upon performance of any of the accounts identified in the table above.
Potential Conflicts of Interest
MFS seeks to identify
potential conflicts of interest resulting from a portfolio manager’s management of both the Fund and other accounts, and has adopted policies and procedures designed to address such potential conflicts. There is no guarantee that MFS will be
successful in identifying or mitigating conflicts of interest.
The management of multiple funds and accounts (including accounts in which MFS or an
affiliate has an interest) gives rise to conflicts of interest if the funds and accounts have different objectives and strategies, benchmarks, time horizons, and fees, as a portfolio manager must allocate his or her time and investment ideas across
multiple funds and accounts. In certain instances, there are securities which are suitable for the Fund’s portfolio as well as for one or more other accounts advised by MFS or its subsidiaries (including accounts in which MFS or an affiliate
has an interest) with similar investment objectives. MFS’ trade allocation policies could have a detrimental effect on the Fund if the Fund’s orders do not get fully executed or are delayed in getting executed due to being aggregated with
those of other accounts advised by MFS or its subsidiaries. A portfolio manager may execute transactions for another fund or account that may adversely affect the value of the Fund’s investments. Investments selected for funds or accounts other
than the Fund may outperform investments selected for the Fund.
When two or more accounts are simultaneously engaged in the purchase or sale of the same
security, the securities are allocated among clients in a manner believed by MFS to be fair and equitable to each over time. Allocations may be based on many factors and may not always be pro rata based on assets managed. The allocation methodology
could have a detrimental effect on the price or availability of a security with respect to the Fund.
MFS and/or a portfolio manager may have a financial
incentive to allocate favorable or limited opportunity investments or structure the timing of investments to favor accounts other than the Fund; for instance, those that pay a higher advisory fee and/or have a performance adjustment, those that
include an investment by the portfolio manager, and/or those in which MFS, its officers and/or employees, and/or its affiliates own or have an interest.
To the extent permitted by applicable law, certain accounts may invest their assets in other accounts advised by
MFS or its affiliates, including accounts that are advised by one or more of the same portfolio manager(s), which could result in conflicts of interest relating to asset allocation, timing of purchases and redemptions, and increased profitability
for MFS, its affiliates, and/or its personnel, including portfolio managers.
| ITEM 9. |
PURCHASES OF EQUITY SECURITIES BY CLOSED-END MANAGEMENT INVESTMENT
COMPANY AND AFFILIATED PURCHASERS. |
MFS Multimarket Income Trust
|
|
|
|
|
|
|
|
|
|
|
|
|
|
|
|
|
| Period |
|
(a)
Total number
of Shares
Purchased |
|
|
(b)
Average
Price
Paid per
Share |
|
|
(c)
Total Number
of Shares
Purchased as
Part of Publicly
Announced
Plans or
Programs |
|
|
(d) Maximum
Number (or
Approximate
Dollar Value) of
Shares that May
Yet Be Purchased
under the
Plans
or Programs |
|
| 11/01/20-11/30/20 |
|
|
0 |
|
|
|
N/A |
|
|
|
0 |
|
|
|
5,123,395 |
|
| 12/01/20-12/31/20 |
|
|
0 |
|
|
|
N/A |
|
|
|
0 |
|
|
|
5,123,395 |
|
| 1/01/21-1/31/21 |
|
|
0 |
|
|
|
N/A |
|
|
|
0 |
|
|
|
5,123,395 |
|
| 2/01/21-2/28/21 |
|
|
0 |
|
|
|
N/A |
|
|
|
0 |
|
|
|
5,123,395 |
|
| 3/01/21-3/31/21 |
|
|
0 |
|
|
|
N/A |
|
|
|
0 |
|
|
|
5,123,395 |
|
| 4/01/21-4/30/21 |
|
|
0 |
|
|
|
N/A |
|
|
|
0 |
|
|
|
5,123,395 |
|
| 5/01/21-5/31/21 |
|
|
0 |
|
|
|
N/A |
|
|
|
0 |
|
|
|
5,123,395 |
|
| 6/01/21-6/30/21 |
|
|
0 |
|
|
|
N/A |
|
|
|
0 |
|
|
|
5,123,395 |
|
| 7/01/21-7/31/21 |
|
|
0 |
|
|
|
N/A |
|
|
|
0 |
|
|
|
5,123,395 |
|
| 8/01/21-8/31/21 |
|
|
0 |
|
|
|
N/A |
|
|
|
0 |
|
|
|
5,123,395 |
|
| 9/01/21-9/30/21 |
|
|
0 |
|
|
|
N/A |
|
|
|
0 |
|
|
|
5,123,395 |
|
| 10/1/21-10/31/21 |
|
|
0 |
|
|
|
N/A |
|
|
|
0 |
|
|
|
6,039,157 |
|
|
|
|
|
|
|
|
|
|
|
|
|
|
|
|
|
|
| Total |
|
|
0 |
|
|
|
N/A |
|
|
|
0 |
|
|
|
|
|
|
|
|
|
|
|
|
|
|
|
|
|
|
|
|
|
|
Note: The Board approved procedures to repurchase shares and reviews the results periodically. The notification to
shareholders of the program is part of the semi-annual and annual reports sent to shareholders. These annual programs begin on October 1st of each year. The programs conform to the conditions of Rule 10b-18 of
the Securities Exchange Act of 1934 and limit the aggregate number of shares that may be purchased in each annual period (October 1 through the following September 30) to 10% of the Registrant’s outstanding shares as of the first day of the
plan year (October 1). The aggregate number of shares available for purchase for the October 1, 2021 plan year is 6,039,157.
| ITEM 10. |
SUBMISSION OF MATTERS TO A VOTE OF SECURITY HOLDERS. |
There were no material changes to the procedures by which shareholders may send recommendations to the Board for nominees to the Registrant’s Board since
the Registrant last provided disclosure as to such procedures in response to the requirements of Item 407 (c)(2)(iv) of Regulation S-K or this Item.
| ITEM 11. |
CONTROLS AND PROCEDURES. |
| (a) |
Based upon their evaluation of the registrant’s disclosure controls and procedures (as defined in Rule 30a-3(c) under the Investment Company Act of 1940 (the “Act”)) as conducted within 90 days of the filing date of this Form N-CSR, the registrant’s principal
financial officer and principal executive officer have concluded that those disclosure controls and procedures provide reasonable assurance that the material information required to be disclosed by the registrant on this report is recorded,
processed, summarized and reported within the time periods specified in the Securities and Exchange Commission’s rules and forms. |
| (b) |
There were no changes in the registrant’s internal controls over financial reporting (as defined in Rule 30a-3(d) under the Act) that occurred during the period covered by the report that has materially affected, or is reasonably likely to materially affect, the registrant’s internal control over financial
reporting. |
| ITEM 12. |
DISCLOSURE OF SECURITIES LENDING ACTIVITIES FOR CLOSED-END
MANAGEMENT INVESTMENT COMPANIES. |
During the fiscal year ending October 31, 2021, there were no fees or income related to
securities lending activities of the Registrant.
|
|
|
| (a) |
|
(1) Any code of ethics, or amendment thereto, that is the subject of the
disclosure required by Item 2, to the extent that the registrant intends to satisfy the Item 2 requirements through filing of an exhibit: Attached hereto as EX-99.COE.
|
|
|
|
|
(2) A separate certification for each principal executive officer and
principal financial officer of the registrant as required by Rule 30a-2(a) under the Act (17 CFR 270.30a-2): Attached hereto as EX-99.302CERT. |
|
|
|
|
(3) Any written solicitation to purchase securities under Rule 23c-1 under the Act (17 CFR 270.23c-1) sent or given during the period covered by the report by or on behalf of the registrant to 10 or more persons. Not
applicable. |
|
|
|
|
(4) Change in the registrant’s independent public accountant. Not
applicable. |
| (b) |
If the report is filed under Section 13(a) or 15(d) of the Exchange Act, provide the certifications
required by Rule 30a-2(b) under the Act (17 CFR 270.30a-2(b)), Rule 13a-14(b) or Rule
15d-14(b) under the Exchange Act (17 CFR 240.13a-14(b) or 240.15d-14(b)) and Section 1350 of Chapter 63 of Title 18 of the
United States Code (18 |
|
|
|
|
|
U.S.C. 1350) as an exhibit. A certification furnished pursuant to this paragraph will not be deemed “filed” for the purposes of Section 18 of the Exchange Act (15 U.S.C. 78r), or otherwise subject to the liability of
that section. Such certification will not be deemed to be incorporated by reference into any filing under the Securities Act of 1933 or the Exchange Act, except to the extent that the registrant specifically incorporates it by reference. Attached
hereto as EX-99.906CERT. |
|
|
| (c) |
|
Registrant’s Rule 30e-3 Notice pursuant to Item 1(b) of Form N-CSR. Attached hereto as EX-99.30e-3Notice. |
|
|
| (d) |
|
Proxy Voting Policies and Procedures pursuant to Item 7 of Form N-CSR. Attached hereto as EX-99.PROXYPOL. |
|
|
| (e) |
|
Notices to Trust’s common shareholders in accordance with Investment Company Act Section 19(a) and Rule 19a-1. Attached hereto as EX-99.19a-1. |
Notice
A copy of the Amended and Restated Declaration of Trust of the Registrant is on file with the Secretary of State of the Commonwealth of Massachusetts and
notice is hereby given that this instrument is executed on behalf of the Registrant by an officer of the Registrant as an officer and not individually and the obligations of or arising out of this instrument are not binding upon any of the Trustees
or shareholders individually, but are binding only upon the assets and property of the respective constituent series of the Registrant.
SIGNATURES
Pursuant to the requirements of the Securities Exchange Act of 1934 and the Investment Company Act of 1940, the registrant has duly caused this report to be
signed on its behalf by the undersigned, thereunto duly authorized.
Registrant: MFS MULTIMARKET INCOME TRUST
|
|
|
| By (Signature and Title)* |
|
/S/ DAVID L. DILORENZO |
|
|
David L. DiLorenzo, President |
Date: December 15, 2021
Pursuant to the requirements of the Securities Exchange Act of 1934 and the Investment Company Act of 1940, this report has been signed below by the following
persons on behalf of the registrant and in the capacities and on the dates indicated.
|
|
|
| By (Signature and Title)* |
|
/S/ DAVID L. DILORENZO |
|
|
David L. DiLorenzo, President
(Principal Executive Officer) |
Date: December 15, 2021
|
|
|
| By (Signature and Title)* |
|
/S/ JAMES O. YOST |
|
|
James O. Yost, Treasurer
(Principal Financial Officer and Accounting
Officer) |
Date: December 15, 2021
| * |
Print name and title of each signing officer under his or her signature. |