|
Renee L. Wilm
Chief Legal Officer GCI Liberty, Inc. 12300 Liberty Blvd. Englewood, Colorado 80112 (720) 875-5900 |
| |
Renee L. Wilm
Chief Legal Officer Liberty Broadband Corporation 12300 Liberty Blvd. Englewood, Colorado 80112 (720) 875-5700 |
| |
John C. Malone
c/o Liberty Broadband Corporation 12300 Liberty Blvd. Englewood, Colorado 80112 (720) 875-5700 |
|
|
Samantha H. Crispin
Nicole Perez Beverly B. Reyes Baker Botts L.L.P. 30 Rockefeller Plaza New York, New York 10112 (212) 408-2500 |
| |
Jeffrey J. Rosen
Michael A. Diz Debevoise & Plimpton LLP 919 Third Avenue New York, New York 10022 (212) 909-6000 |
| |
Steven D. Miller
Sherman & Howard L.L.C. 633 Seventeenth Street, Suite 3000 Denver, Colorado 80202 (303) 297-2900 |
|
| | | ||||
|
TRANSACTION VALUATION*
|
| | |
AMOUNT OF FILING FEE**
|
|
|
$8,828,307,794
|
| | |
$1,145,915
|
|
| | | | | 1 | | | |
| | | | | 1 | | | |
| | | | | 1 | | | |
| | | | | 1 | | | |
| | | | | 2 | | | |
| | | | | 3 | | | |
| | | | | 4 | | | |
| | | | | 5 | | | |
| | | | | 6 | | | |
| | | | | 7 | | | |
| | | | | 7 | | | |
| | | | | 7 | | | |
| | | | | 8 | | | |
| | | | | 8 | | | |
| | | | | 8 | | | |
| | | | | 8 | | | |
| SIGNATURES | | | | | | | |
Exhibit (c)(1)
![]() |
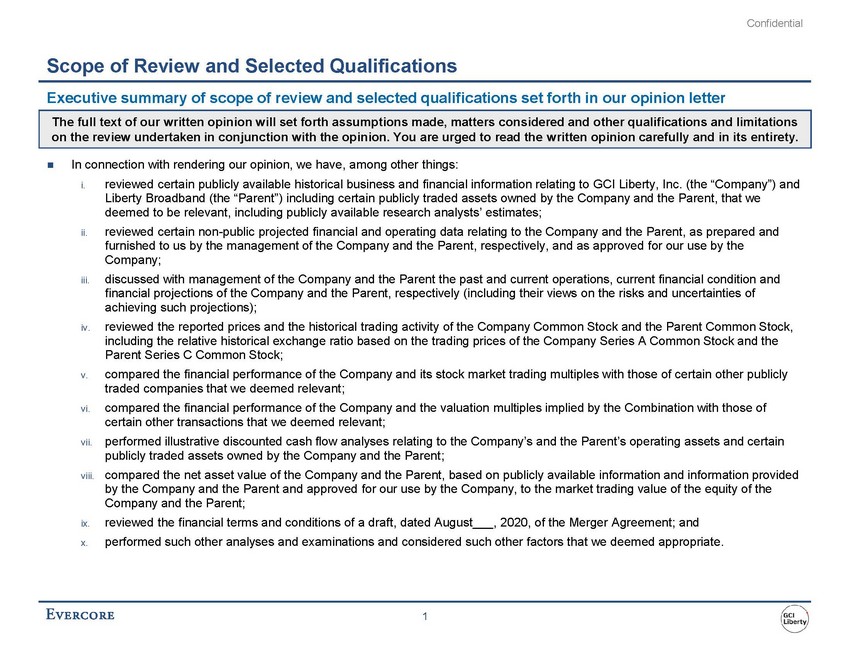
Project Eagle – Financial Analysis August 5, 2020 |
![]() |
Table of Contents I.Transaction Summary II.Financial Analysis Appendix 2 |
![]() |
I.Transaction Summary |
![]() |
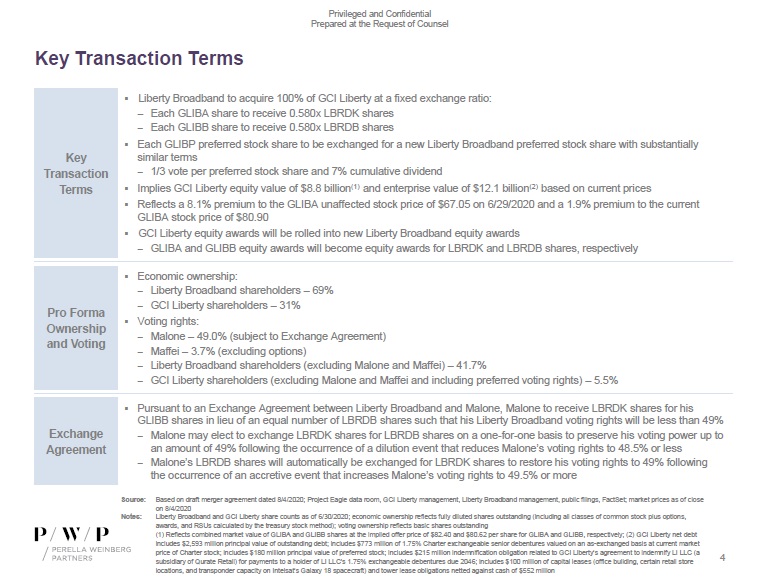
Key Transaction Terms Key Transaction Terms ▪ Liberty Broadband to acquire 100% of GCI Liberty at a fixed exchange ratio: – Each GLIBA share to receive 0.580x LBRDK shares – Each GLIBB share to receive 0.580x LBRDB shares ▪ Each GLIBP preferred stock share to be exchanged for a new Liberty Broadband preferred stock share with substantially similar terms – 1/3 vote per preferred stock share and 7% cumulative dividend ▪ Implies GCI Liberty equity value of $8.8 billion(1) and enterprise value of $12.1 billion(2) based on current prices ▪ Reflects a 8.1% premium to the GLIBA unaffected stock price of $67.05 on 6/29/2020 and a 1.9% premium to the current GLIBA stock price of $80.90 ▪ GCI Liberty equity awards will be rolled into new Liberty Broadband equity awards – GLIBA and GLIBB equity awards will become equity awards for LBRDK and LBRDB shares, respectively Pro Forma Ownership and Voting ▪ Economic ownership: – Liberty Broadband shareholders – 69% – GCI Liberty shareholders – 31% ▪ Voting rights: – Malone – 49.0% (subject to Exchange Agreement) – Maffei – 3.7% (excluding options) – Liberty Broadband shareholders (excluding Malone and Maffei) – 41.7% – GCI Liberty shareholders (excluding Malone and Maffei and including preferred voting rights) – 5.5% Exchange Agreement ▪ Pursuant to an Exchange Agreement between Liberty Broadband and Malone, Malone to receive LBRDK shares for his GLIBB shares in lieu of an equal number of LBRDB shares such that his Liberty Broadband voting rights will be less than 49% – Malone may elect to exchange LBRDK shares for LBRDB shares on a one-for-one basis to preserve his voting power up to an amount of 49% following the occurrence of a dilution event that reduces Malone’s voting rights to 48.5% or less – Malone’s LBRDB shares will automatically be exchanged for LBRDK shares to restore his voting rights to 49% following the occurrence of an accretive event that increases Malone’s voting rights to 49.5% or more Source: Based on draft merger agreement dated 8/4/2020; Project Eagle data room, GCI Liberty management, Liberty Broadband management, public filings, FactSet; market prices as of close on 8/4/2020 Notes:Liberty Broadband and GCI Liberty share counts as of 6/30/2020; economic ownership reflects fully diluted shares outstanding (including all classes of common stock plus options, awards, and RSUs calculated by the treasury stock method); voting ownership reflects basic shares outstanding (1) Reflects combined market value of GLIBA and GLIBB shares at the implied offer price of $82.40 and $80.62 per share for GLIBA and GLIBB, respectively; (2) GCI Liberty net debt includes $2,593 million principal value of outstanding debt; includes $773 million of 1.75% Charter exchangeable senior debentures valued on an as-exchanged basis at current market price of Charter stock; includes $180 million principal value of preferred stock; includes $215 million indemnification obligation related to GCI Liberty’s agreement to indemnify LI LLC (a subsidiary of Qurate Retail) for payments to a holder of LI LLC's 1.75% exchangeable debentures due 2046; includes $100 million of capital leases (office building, certain retail store4 |
![]() |
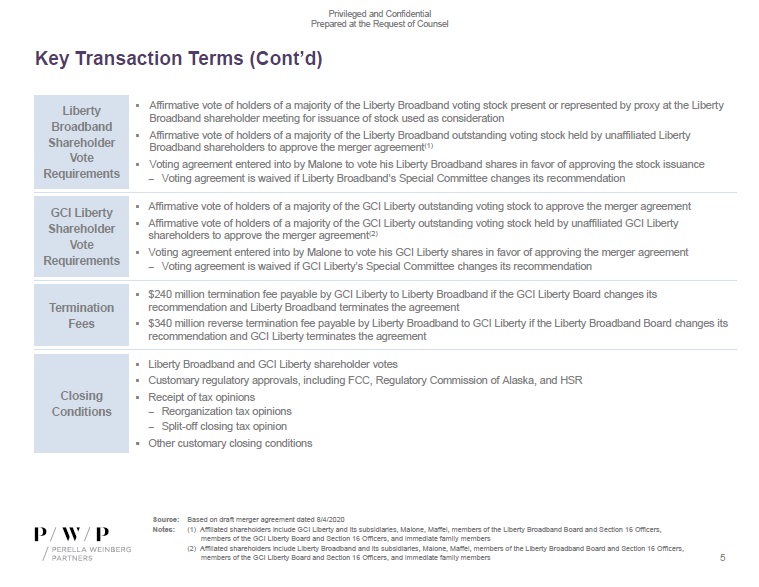
Key Transaction Terms (Cont’d) Liberty Broadband Shareholder Vote Requirements GCI Liberty Shareholder Vote Requirements ▪ Affirmative vote of holders of a majority of the Liberty Broadband voting stock present or represented by proxy at the Liberty Broadband shareholder meeting for issuance of stock used as consideration ▪ Affirmative vote of holders of a majority of the Liberty Broadband outstanding voting stock held by unaffiliated Liberty Broadband shareholders to approve the merger agreement(1) ▪ Voting agreement entered into by Malone to vote his Liberty Broadband shares in favor of approving the stock issuance – Voting agreement is waived if Liberty Broadband’s Special Committee changes its recommendation ▪ Affirmative vote of holders of a majority of the GCI Liberty outstanding voting stock to approve the merger agreement ▪ Affirmative vote of holders of a majority of the GCI Liberty outstanding voting stock held by unaffiliated GCI Liberty shareholders to approve the merger agreement(2) ▪ Voting agreement entered into by Malone to vote his GCI Liberty shares in favor of approving the merger agreement – Voting agreement is waived if GCI Liberty’s Special Committee changes its recommendation Termination Fees ▪ $240 million termination fee payable by GCI Liberty to Liberty Broadband if the GCI Liberty Board changes its recommendation and Liberty Broadband terminates the agreement ▪ $340 million reverse termination fee payable by Liberty Broadband to GCI Liberty if the Liberty Broadband Board changes its recommendation and GCI Liberty terminates the agreement Closing Conditions ▪ Liberty Broadband and GCI Liberty shareholder votes ▪ Customary regulatory approvals, including FCC, Regulatory Commission of Alaska, and HSR ▪ Receipt of tax opinions – Reorganization tax opinions – Split-off closing tax opinion ▪ Other customary closing conditions Source: Based on draft merger agreement dated 8/4/2020 Notes:(1) Affiliated shareholders include GCI Liberty and its subsidiaries, Malone, Maffei, members of the Liberty Broadband Board and Section 16 Officers, members of the GCI Liberty Board and Section 16 Officers, and immediate family members (2) Affiliated shareholders include Liberty Broadband and its subsidiaries, Malone, Maffei, members of the Liberty Broadband Board and Section 16 Officers, members of the GCI Liberty Board and Section 16 Officers, and immediate family members5 |
![]() |
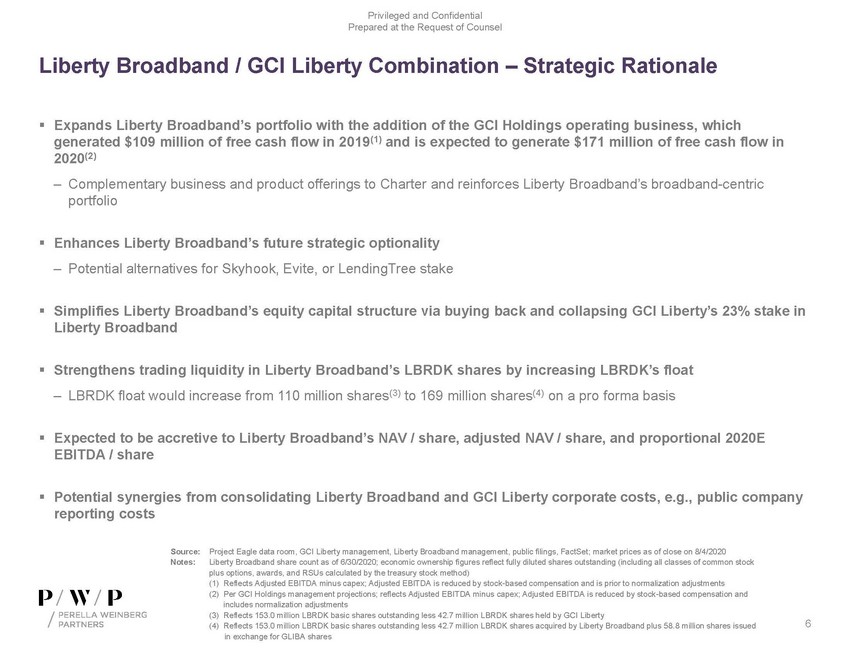
Liberty Broadband / GCI Liberty Combination – Strategic Rationale ▪ Expands Liberty Broadband’s portfolio with the addition of the GCI Holdings operating business, which generated $109 million of free cash flow in 2019(1) and is expected to generate $171 million of free cash flow in 2020(2) – Complementary business and product offerings to Charter and reinforces Liberty Broadband’s broadband-centric portfolio ▪ Enhances Liberty Broadband’s future strategic optionality – Potential alternatives for Skyhook, Evite, or LendingTree stake ▪ Simplifies Liberty Broadband’s equity capital structure via buying back and collapsing GCI Liberty’s 23% stake in Liberty Broadband ▪ Strengthens trading liquidity in Liberty Broadband’s LBRDK shares by increasing LBRDK’s float – LBRDK float would increase from 110 million shares(3) to 169 million shares(4) on a pro forma basis ▪ Expected to be accretive to Liberty Broadband’s NAV / share, adjusted NAV / share, and proportional 2020E EBITDA / share ▪ Potential synergies from consolidating Liberty Broadband and GCI Liberty corporate costs, e.g., public company reporting costs Source: Project Eagle data room, GCI Liberty management, Liberty Broadband management, public filings, FactSet; market prices as of close on 8/4/2020 Notes:Liberty Broadband share count as of 6/30/2020; economic ownership figures reflect fully diluted shares outstanding (including all classes of common stock plus options, awards, and RSUs calculated by the treasury stock method) (1) Reflects Adjusted EBITDA minus capex; Adjusted EBITDA is reduced by stock-based compensation and is prior to normalization adjustments (2) Per GCI Holdings management projections; reflects Adjusted EBITDA minus capex; Adjusted EBITDA is reduced by stock-based compensation and includes normalization adjustments (3) Reflects 153.0 million LBRDK basic shares outstanding less 42.7 million LBRDK shares held by GCI Liberty (4) Reflects 153.0 million LBRDK basic shares outstanding less 42.7 million LBRDK shares acquired by Liberty Broadband plus 58.8 million shares issued6 |
![]() |
II.Financial Analysis |
![]() |
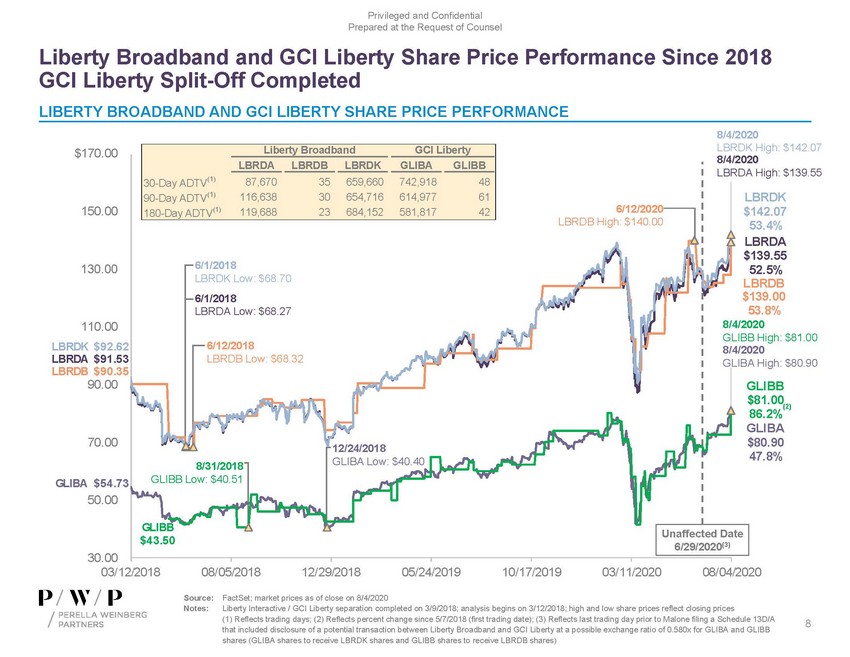
Liberty Broadband and GCI Liberty Share Price Performance Since 2018 GCI Liberty Split-Off Completed LIBERTY BROADBAND AND GCI LIBERTY SHARE PRICE PERFORMANCE $170.00 Liberty Broadband GCI Liberty 30-Day ADTV(1) 87,670 35 659,660 742,918 48 90-Day ADTV(1) 116,638 30 654,716 614,977 61 180-Day ADTV(1) 119,688 23 684,152 581,817 42 8/4/2020 LBRDK High: $142.07 8/4/2020 LBRDA High: $139.55 150.00 130.00 110.00 LBRDK $92.62 LBRDA $91.53 LBRDB $90.35 90.00 70.00 GLIBA $54.73 50.00 6/1/2018 LBRDK Low: $68.70 6/1/2018 LBRDA Low: $68.27 6/12/2018 LBRDB Low: $68.32 8/31/2018 GLIBB Low: $40.51 12/24/2018 GLIBA Low: $40.40 6/12/2020 LBRDB High: $140.00 LBRDK $142.07 53.4% LBRDA $139.55 52.5% LBRDB $139.00 53.8% 8/4/2020 GLIBB High: $81.00 8/4/2020 GLIBA High: $80.90 GLIBB $81.00 (2) 86.2% GLIBA $80.90 47.8% 30.00 GLIBB $43.50 Unaffected Date 6/29/2020(3) 03/12/2018 08/05/2018 12/29/2018 05/24/2019 10/17/2019 03/11/2020 08/04/2020 Source: FactSet; market prices as of close on 8/4/2020 Notes:Liberty Interactive / GCI Liberty separation completed on 3/9/2018; analysis begins on 3/12/2018; high and low share prices reflect closing prices (1) Reflects trading days; (2) Reflects percent change since 5/7/2018 (first trading date); (3) Reflects last trading day prior to Malone filing a Schedule 13D/A8 that included disclosure of a potential transaction between Liberty Broadband and GCI Liberty at a possible exchange ratio of 0.580x for GLIBA and GLIBB |
![]() |
Indexed Share Price Performance Since 6/29/2020 (Unaffected Date)(1) 35.0% 30.0% 25.0% 20.0% 15.0% 10.0% 5.0% TREE $336.88 23.5% GLIBA $80.90 20.7% CHTR $600.01 17.8% LBRDK $142.07 13.7% S&P 500 8.3% 0.0% (5.0%) 06/29/202007/06/202007/13/202007/20/202007/27/202008/04/2020 Unaffected Date(1) Source: FactSet; market prices as of close on 8/4/2020 Notes:(1) Reflects last trading day prior to Malone filing a Schedule 13D/A that included disclosure of a potential transaction between Liberty Broadband and GCI Liberty at a possible exchange ratio of 0.580x for GLIBA and GLIBB shares (GLIBA shares to receive LBRDK shares and GLIBB shares to receive LBRDB shares)9 |
![]() |
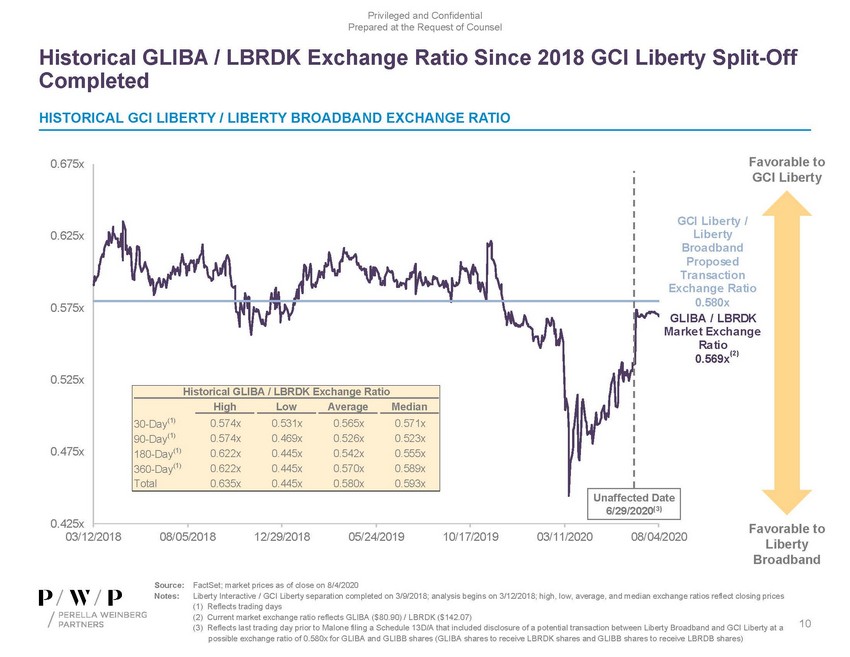
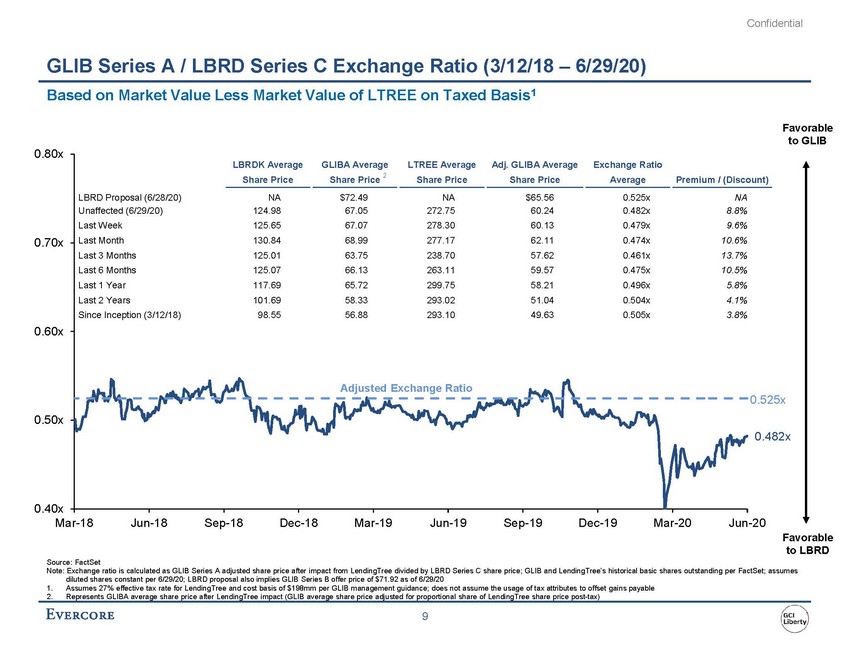
Historical GLIBA / LBRDK Exchange Ratio Since 2018 GCI Liberty Split-Off Completed HISTORICAL GCI LIBERTY / LIBERTY BROADBAND EXCHANGE RATIO 0.675x Favorable to GCI Liberty 0.625x 0.575x GCI Liberty / Liberty Broadband Proposed Transaction Exchange Ratio 0.580x GLIBA / LBRDK Market Exchange Ratio 0.525x 0.475x 0.425x Historical GLIBA / LBRDK Exchange Ratio High Low Average Median 30-Day(1) 0.574x 0.531x 0.565x 0.571x 90-Day(1) 0.574x 0.469x 0.526x 0.523x 180-Day(1) 0.622x 0.445x 0.542x 0.555x 360-Day(1) 0.622x 0.445x 0.570x 0.589x Total 0.635x 0.445x 0.580x 0.593x Unaffected Date 6/29/2020(3) 0.569x (2) Favorable to 03/12/2018 08/05/2018 12/29/2018 05/24/2019 10/17/2019 03/11/2020 08/04/2020 Liberty Broadband Source: FactSet; market prices as of close on 8/4/2020 Notes:Liberty Interactive / GCI Liberty separation completed on 3/9/2018; analysis begins on 3/12/2018; high, low, average, and median exchange ratios reflect closing prices (1) Reflects trading days (2) Current market exchange ratio reflects GLIBA ($80.90) / LBRDK ($142.07) (3) Reflects last trading day prior to Malone filing a Schedule 13D/A that included disclosure of a potential transaction between Liberty Broadband and GCI Liberty at a10 |
![]() |
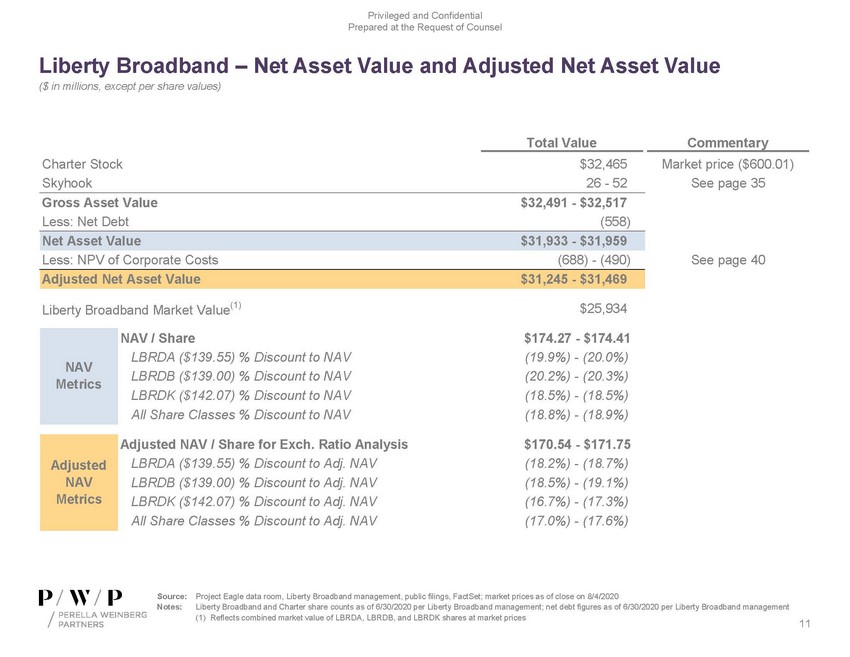
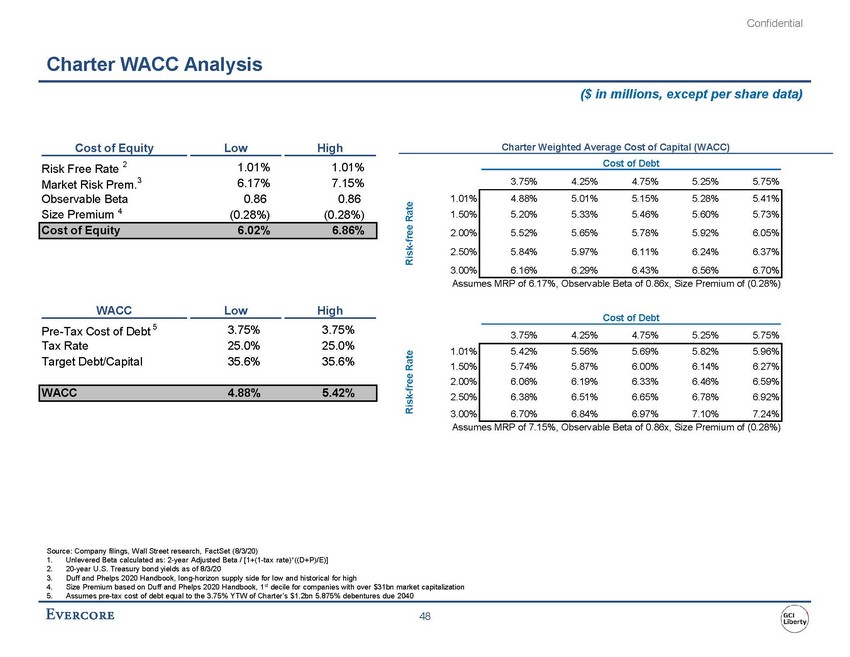
Liberty Broadband – Net Asset Value and Adjusted Net Asset Value ($ in millions, except per share values) Total Value Commentary Charter Stock $32,465 Market price ($600.01) Skyhook 26 - 52 See page 35 Gross Asset Value $32,491 - $32,517 Less: Net Debt (558) Net Asset Value $31,933 - $31,959 Less: NPV of Corporate Costs (688) - (490) See page 40 Adjusted Net Asset Value $31,245 - $31,469 Liberty Broadband Market Value(1) $25,934 NAV Metrics Adjusted NAV Metrics NAV / Share $174.27 - $174.41 LBRDA ($139.55) % Discount to NAV (19.9%) - (20.0%) LBRDB ($139.00) % Discount to NAV (20.2%) - (20.3%) LBRDK ($142.07) % Discount to NAV (18.5%) - (18.5%) All Share Classes % Discount to NAV (18.8%) - (18.9%) Adjusted NAV / Share for Exch. Ratio Analysis $170.54 - $171.75 LBRDA ($139.55) % Discount to Adj. NAV (18.2%) - (18.7%) LBRDB ($139.00) % Discount to Adj. NAV (18.5%) - (19.1%) LBRDK ($142.07) % Discount to Adj. NAV (16.7%) - (17.3%) All Share Classes % Discount to Adj. NAV (17.0%) - (17.6%) Source: Project Eagle data room, Liberty Broadband management, public filings, FactSet; market prices as of close on 8/4/2020 Notes:Liberty Broadband and Charter share counts as of 6/30/2020 per Liberty Broadband management; net debt figures as of 6/30/2020 per Liberty Broadband management (1) Reflects combined market value of LBRDA, LBRDB, and LBRDK shares at market prices 11 |
![]() |
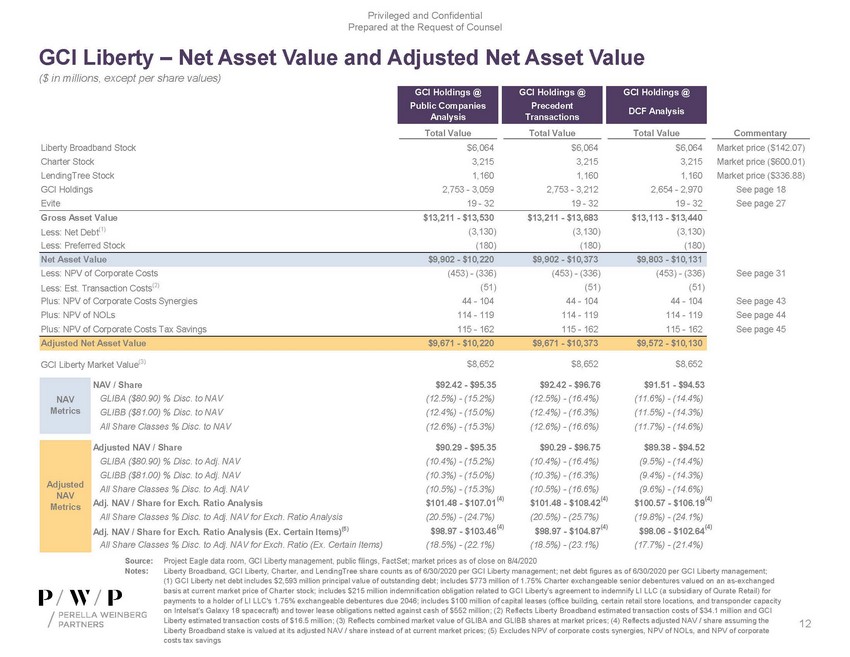
GCI Liberty – Net Asset Value and Adjusted Net Asset Value ($ in millions, except per share values) GCI Holdings @ GCI Holdings @ GCI Holdings @ Public Companies Analysis Precedent Transactions DCF Analysis Total Value Total Value Total Value Commentary Liberty Broadband Stock $6,064 $6,064 $6,064 Market price ($142.07) Charter Stock 3,215 3,215 3,215 Market price ($600.01) LendingTree Stock 1,160 1,160 1,160 Market price ($336.88) GCI Holdings 2,753 - 3,059 2,753 - 3,212 2,654 - 2,970 See page 18 Evite 19 - 32 19 - 32 19 - 32 See page 27 Gross Asset Value $13,211 - $13,530 $13,211 - $13,683 $13,113 - $13,440 Less: Net Debt(1) (3,130) (3,130) (3,130) Less: Preferred Stock (180) (180) (180) Net Asset Value $9,902 - $10,220 $9,902 - $10,373 $9,803 - $10,131 Less: NPV of Corporate Costs (453) - (336) (453) - (336) (453) - (336) See page 31 Less: Est. Transaction Costs(2) (51) (51) (51) Plus: NPV of Corporate Costs Synergies 44 - 104 44 - 104 44 - 104 See page 43 Plus: NPV of NOLs 114 - 119 114 - 119 114 - 119 See page 44 Plus: NPV of Corporate Costs Tax Savings 115 - 162 115 - 162 115 - 162 See page 45 Adjusted Net Asset Value $9,671 - $10,220 $9,671 - $10,373 $9,572 - $10,130 GCI Liberty Market Value(3) $8,652 $8,652 $8,652 NAV Metrics Adjusted NAV Metrics NAV / Share $92.42 - $95.35 $92.42 - $96.76 $91.51 - $94.53 Adjusted NAV / Share GLIBA ($80.90) % Disc. to Adj. NAV $90.29 - $95.35 (10.4%) - (15.2%) $90.29 - $96.75 (10.4%) - (16.4%) $89.38 - $94.52 (9.5%) - (14.4%) GLIBB ($81.00) % Disc. to Adj. NAV (10.3%) - (15.0%) (10.3%) - (16.3%) (9.4%) - (14.3%) All Share Classes % Disc. to Adj. NAV (10.5%) - (15.3%) (10.5%) - (16.6%) (9.6%) - (14.6%) Adj. NAV / Share for Exch. Ratio Analysis (4) $101.48 - $107.01 (4) $101.48 - $108.42 ( $100.57 - $106.19 All Share Classes % Disc. to Adj. NAV for Exch. Ratio Analysis Adj. NAV / Share for Exch. Ratio Analysis (Ex. Certain Items)(5) (20.5%) - (24.7%) (4) $98.97 - $103.46 (20.5%) - (25.7%) (4) $98.97 - $104.87 (19.8%) - (24.1%) ( $98.06 - $102.64 All Share Classes % Disc. to Adj. NAV for Exch. Ratio (Ex. Certain Items) (18.5%) - (22.1%) (18.5%) - (23.1%) (17.7%) - (21.4%) 4) 4) Source: Project Eagle data room, GCI Liberty management, public filings, FactSet; market prices as of close on 8/4/2020 Notes:Liberty Broadband, GCI Liberty, Charter, and LendingTree share counts as of 6/30/2020 per GCI Liberty management; net debt figures as of 6/30/2020 per GCI Liberty management; (1) GCI Liberty net debt includes $2,593 million principal value of outstanding debt; includes $773 million of 1.75% Charter exchangeable senior debentures valued on an as-exchanged basis at current market price of Charter stock; includes $215 million indemnification obligation related to GCI Liberty’s agreement to indemnify LI LLC (a subsidiary of Qurate Retail) for payments to a holder of LI LLC's 1.75% exchangeable debentures due 2046; includes $100 million of capital leases (office building, certain retail store locations, and transponder capacity on Intelsat’s Galaxy 18 spacecraft) and tower lease obligations netted against cash of $552 million; (2) Reflects Liberty Broadband estimated transaction costs of $34.1 million and GCI Liberty estimated transaction costs of $16.5 million; (3) Reflects combined market value of GLIBA and GLIBB shares at market prices; (4) Reflects adjusted NAV / share assuming the12 Liberty Broadband stake is valued at its adjusted NAV / share instead of at current market prices; (5) Excludes NPV of corporate costs synergies, NPV of NOLs, and NPV of corporate |
![]() |
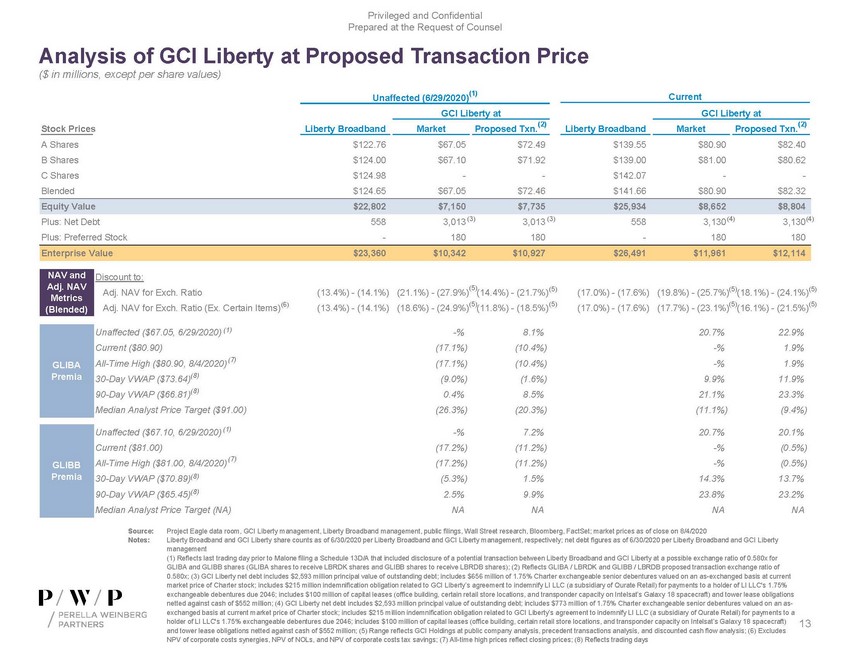
Analysis of GCI Liberty at Proposed Transaction Price ($ in millions, except per share values) Stock Prices A Shares Liberty Broadband $122.76 Market Prop $67.05 (2) sed Txn. $72.49 Liberty Broadband $139.55 Market Prop $80.90 (2) sed Txn. $82.40 $80.62 - $82.32 $8,804 B Shares $124.00 $67.10 $71.92 $139.00 $81.00 C Shares $124.98 - - $142.07 - Blended $124.65 $67.05 $72.46 $141.66 $80.90 Equity Value $22,802 $7,150 $7,735 $25,934 $8,652 Plus: Net Debt 558 3,013 (3) 3,013 (3) 558 3,130 (4) 3,130(4) Plus: Preferred Stock - 180 180 - 180 180 o o (5) ) (14.4%) - (21.7%)(17.0%) - (17.6 %) (19.8%) - (25.7%) (18.1%) - (24.1%) NAV and Adj. NAV Metrics Discount to: Adj. NAV for Exch. Ratio(13.4%) - (14.1%) (21.1%) - (27.9% (5) (5) (5) (Blended) Adj. NAV for Exch. Ratio (Ex. Certain Items)(6) (13.4%) - (14.1%) (18.6%) - (24.9%)(5)(11.8%) - (18.5%)(5) (17.0%) - (17.6%) (17.7%) - (23.1%)(5)(16.1%) - (21.5%)(5) Unaffected ($67.05, 6/29/2020) (1) -%8.1%20.7%22.9% Current ($80.90)(17.1%)(10.4%)-%1.9% GLIBA Premia All-Time High ($80.90, 8/4/2020) (7) 30-Day VWAP ($73.64)(8) 90-Day VWAP ($66.81)(8) (17.1%)(10.4%)-%1.9% (9.0%)(1.6%)9.9%11.9% 0.4%8.5%21.1%23.3% Median Analyst Price Target ($91.00)(26.3%)(20.3%)(11.1%)(9.4%) Unaffected ($67.10, 6/29/2020) (1) -%7.2%20.7%20.1% GLIBB Current ($81.00)(17.2%)(11.2%)-%(0.5%) All-Time High ($81.00, 8/4/2020) (7) (17.2%)(11.2%)-%(0.5%) Premia 30-Day VWAP ($70.89)(8) 90-Day VWAP ($65.45)(8) (5.3%)1.5%14.3%13.7% 2.5%9.9%23.8%23.2% Median Analyst Price Target (NA)NANANANA Source:Project Eagle data room, GCI Liberty management, Liberty Broadband management, public filings, Wall Street research, Bloomberg, FactSet; market prices as of close on 8/4/2020 Notes:Liberty Broadband and GCI Liberty share counts as of 6/30/2020 per Liberty Broadband and GCI Liberty management, respectively; net debt figures as of 6/30/2020 per Liberty Broadband and GCI Liberty management (1) Reflects last trading day prior to Malone filing a Schedule 13D/A that included disclosure of a potential transaction between Liberty Broadband and GCI Liberty at a possible exchange ratio of 0.580x for GLIBA and GLIBB shares (GLIBA shares to receive LBRDK shares and GLIBB shares to receive LBRDB shares); (2) Reflects GLIBA / LBRDK and GLIBB / LBRDB proposed transaction exchange ratio of 0.580x; (3) GCI Liberty net debt includes $2,593 million principal value of outstanding debt; includes $656 million of 1.75% Charter exchangeable senior debentures valued on an as-exchanged basis at current market price of Charter stock; includes $215 million indemnification obligation related to GCI Liberty’s agreement to indemnify LI LLC (a subsidiary of Qurate Retail) for payments to a holder of LI LLC's 1.75% exchangeable debentures due 2046; includes $100 million of capital leases (office building, certain retail store locations, and transponder capacity on Intelsat’s Galaxy 18 spacecraft) and tower lease obligations netted against cash of $552 million; (4) GCI Liberty net debt includes $2,593 million principal value of outstanding debt; includes $773 million of 1.75% Charter exchangeable senior debentures valued on an as-exchanged basis at current market price of Charter stock; includes $215 million indemnification obligation related to GCI Liberty’s agreement to indemnify LI LLC (a subsidiary of Qurate Retail) for payments to a holder of LI LLC's 1.75% exchangeable debentures due 2046; includes $100 million of capital leases (office building, certain retail store locations, and transponder capacity on Intelsat’s Galaxy 18 spacecraft)13 and tower lease obligations netted against cash of $552 million; (5) Range reflects GCI Holdings at public company analysis, precedent transactions analysis, and discounted cash flow analysis; (6) Excludes NPV of corporate costs synergies, NPV of NOLs, and NPV of corporate costs tax savings; (7) All-time high prices reflect closing prices; (8) Reflects trading days |
![]() |
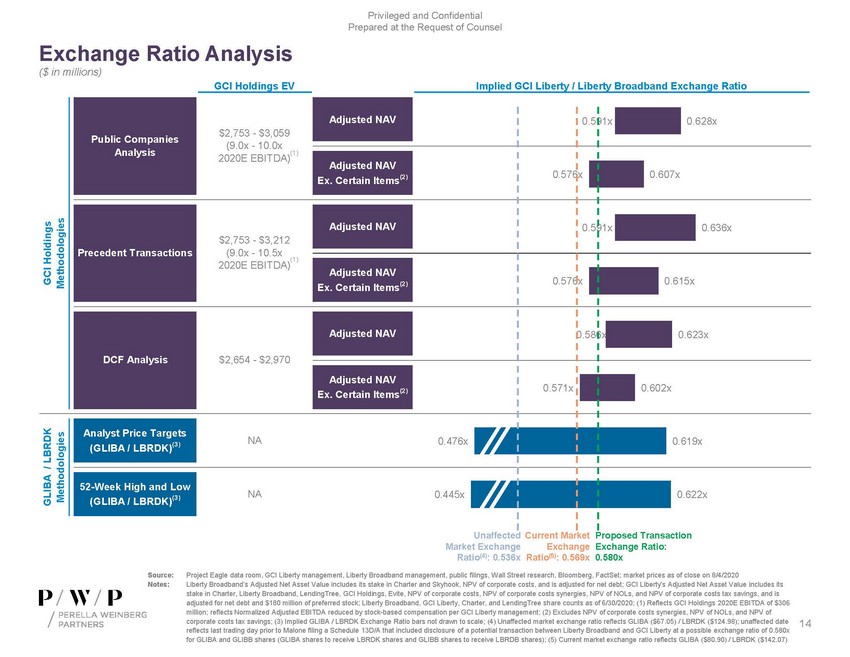
Exchange Ratio Analysis ($ in millions) GCI Holdings EV Implied GCI Liberty / Liberty Broadband Exchange Ratio Public Companies Analysis $2,753 - $3,059 (9.0x - 10.0x (1) Adjusted NAV 0.591x 0.628x 2020E EBITDA) Adjusted NAV Ex. Certain Items(2) 0.576x 0.607x GCI Holdings Methodologies $2,753 - $3,212 (9.0x - 10.5x (1) Adjusted NAV 0.591x 0.636x 2020E EBITDA) Adjusted NAV Ex. Certain Items(2) Adjusted NAV 0.576x 0.586x 0.615x 0.623x DCF Analysis $2,654 - $2,970 Adjusted NAV Ex. Certain Items(2) 0.571x 0.602x GLIBA / LBRDK Methodologies (GLIBA / LBRDK)(3)NA 52-Week High and Low (GLIBA / LBRDK)(3)NA 0.476x 0.445x 0.619x 0.622x Unaffected Current Market Proposed Transaction Market Exchange Exchange Exchange Ratio: Ratio(4): 0.536x Ratio(5): 0.569x 0.580x Source:Project Eagle data room, GCI Liberty management, Liberty Broadband management, public filings, Wall Street research, Bloomberg, FactSet; market prices as of close on 8/4/2020 Notes:Liberty Broadband’s Adjusted Net Asset Value includes its stake in Charter and Skyhook, NPV of corporate costs, and is adjusted for net debt; GCI Liberty’s Adjusted Net Asset Value includes its stake in Charter, Liberty Broadband, LendingTree, GCI Holdings, Evite, NPV of corporate costs, NPV of corporate costs synergies, NPV of NOLs, and NPV of corporate costs tax savings, and is adjusted for net debt and $180 million of preferred stock; Liberty Broadband, GCI Liberty, Charter, and LendingTree share counts as of 6/30/2020; (1) Reflects GCI Holdings 2020E EBITDA of $306 million; reflects Normalized Adjusted EBITDA reduced by stock-based compensation per GCI Liberty management; (2) Excludes NPV of corporate costs synergies, NPV of NOLs, and NPV of corporate costs tax savings; (3) Implied GLIBA / LBRDK Exchange Ratio bars not drawn to scale; (4) Unaffected market exchange ratio reflects GLIBA ($67.05) / LBRDK ($124.98); unaffected date 14 reflects last trading day prior to Malone filing a Schedule 13D/A that included disclosure of a potential transaction between Liberty Broadband and GCI Liberty at a possible exchange ratio of 0.580x for GLIBA and GLIBB shares (GLIBA shares to receive LBRDK shares and GLIBB shares to receive LBRDB shares); (5) Current market exchange ratio reflects GLIBA ($80.90) / LBRDK ($142.07) |
![]() |
Pro Forma Liberty Broadband – Accretion / (Dilution) Analysis ($ and shares in millions, except per share values) Issued to GCI Liberty Liberty Broadband Status Quo Shareholders(1) Shares Acquired Pro Forma Total FDSO 183.1 62.0 (42.7) 202.4 Assets Charter Stock $32,465 $35,680 Skyhook 26 - 52 26 - 52 LendingTree Stock - 1,160 GCI Holdings - 2,654 - 3,212 Evite - 19 - 32 Gross Asset Value $32,491 - $32,517 $39,540 - $40,136 Less: Net Debt(2) (558) (3,687) Less: Preferred Stock - (180) Net Asset Value $31,933 - $31,959 $35,672 - $36,268 Less: NPV of Corporate Costs (688) - (490) (1,141) - (826) Less: Est. Transaction Costs(3) - (51) Plus: NPV of Corporate Costs Synergies - 44 - 104 Plus: NPV of NOLs - 114 - 119 Plus: NPV of Corporate Costs Tax Savings - 115 - 162 Adjusted Net Asset Value $31,245 - $31,469 $34,753 - $35,778 NAV / Share $174.27 - $174.41 $175.92 - $178.83 Adjusted NAV / Share $170.54 - $171.75 $171.42 - $176.43 Adjusted NAV / Share Ex. Certain Items(4) 2020E Proportional EBITDA / Share(5) $170.54 - $171.75 $21.94 $170.08 - $174.54 $23.39 Market price ($336.88) See page 18 See page 27 See pages 31, 40 See page 43 See page 44 See page 45 Accretion / (Dilution)(6) +0.9% - +2.5% +0.5% - +2.7% (0.3%) - +1.6% +6.6% Source: Project Eagle data room, GCI Liberty management, Liberty Broadband management, public filings, FactSet; market prices as of close on 8/4/2020 Notes: Liberty Broadband, GCI Liberty, Charter, and LendingTree share counts as of 6/30/2020 per Liberty Broadband and GCI Liberty management; net debt figures as of 6/30/2020 per Liberty Broadband and GCI Liberty management; share counts reflect fully diluted shares outstanding (including all classes of common stock plus options, awards, and RSUs calculated by the Treasury Stock Method); (1) Reflects GLIBA / LBRDK and GLIBB / LBRDB proposed transaction exchange ratio of 0.580x; (2) GCI Liberty net debt includes $2,593 million principal value of outstanding debt; includes $773 million of 1.75% Charter exchangeable senior debentures valued on an as-exchanged basis at current market price of Charter stock; includes $215 million indemnification obligation related to GCI Liberty’s agreement to indemnify LI LLC (a subsidiary of Qurate Retail) for payments to a holder of LI LLC's 1.75% exchangeable debentures due 2046; includes $100 million of capital leases (office building, certain retail store locations, and transponder capacity on Intelsat’s Galaxy 18 spacecraft) and tower lease obligations netted against cash of $552 million; (3) Reflects Liberty Broadband estimated transaction costs of $34.1 million and GCI Liberty estimated transaction costs of $16.5 million; (4) Excludes NPV of corporate costs synergies, NPV of NOLs, and NPV of corporate costs tax savings; (5) Liberty Broadband’s standalone EBITDA per share includes proportionate Charter EBITDA and Skyhook EBITDA; pro forma EBITDA per share includes proportionate Charter EBITDA, proportionate LendingTree EBITDA, GCI Holdings EBITDA, Skyhook EBITDA, and Evite EBITDA; Charter and LendingTree EBITDA reflects Wall Street research estimates; GCI Holdings, Skyhook, and Evite EBITDA per Project Eagle data room, GCI Liberty management, and Liberty Broadband management; proportionate ownership stakes reflect fully diluted shares outstanding (including all classes of common stock plus options, awards, and RSUs calculated by the Treasury Stock Method; in the case of Charter, includes Advance/Newhouse’s Class B Common and Preferred Units on an as-converted basis); reflects EBITDA reduced by stock-15 based compensation for Charter, LendingTree, and GCI Holdings; does not include corporate costs; (6) Low end of range reflects low end of pro forma value compared to low end of status quo value; high end of range reflects high end of pro forma value compared to high end of status quo value |
![]() |
Appendix I PERELLA WEINBERG PARTNERS |
![]() |
A.GCI Liberty Analysis |
![]() |
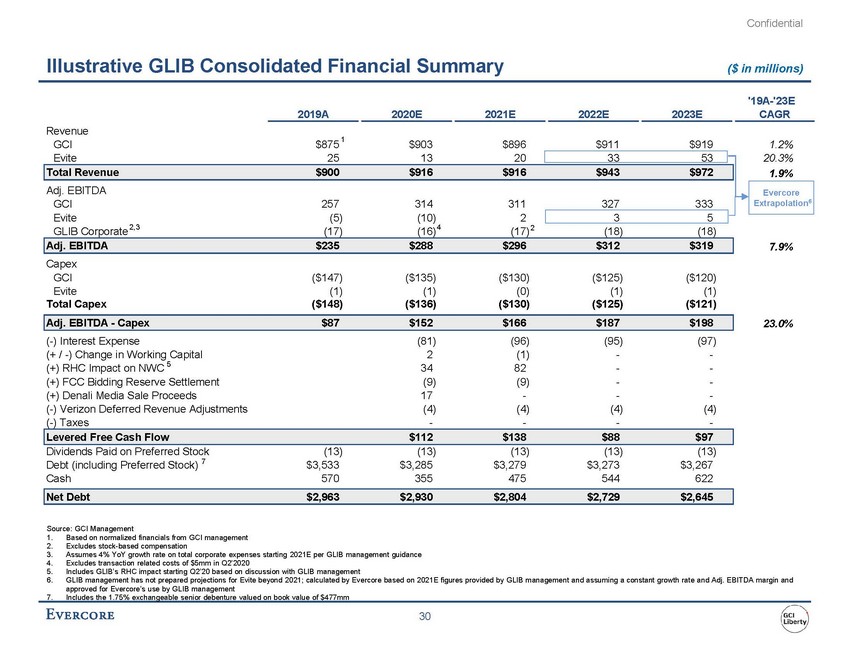
GCI Liberty – GCI Holdings Financial Analysis ($ in millions) GCI Holdings Valuation GCI Holdings (1) Methodology EV / 2020E EBITDA GCI Holdings Valuation Public Companies Analysis9.0x - 10.0x Precedent Transactions9.0x - 10.5x (2)(2) DCF Analysis8.7x - 9.7x $2,753 $2,753 $2,654 $3,059 $2,970 $3,212 Source: Project Eagle data room, GCI Liberty management; market prices as of close on 8/4/2020 Notes:(1) Reflects GCI Holdings 2020E EBITDA of $306 million; reflects Normalized Adjusted EBITDA reduced by stock-based compensation per GCI Liberty management (2) 2020E EBITDA multiple range implied based on DCF analysis using a discount rate of 6.4% – 7.4% and EBITDA exit multiples of 9.0x – 10.0x18 |
![]() |
GCI Liberty – GCI Holdings Financial Forecast ($ in millions) Historical(1) Management Forecast Source:Project Eagle data room, GCI Liberty management, public filings Notes:(1) Reflects normalized results (2) Reflects EBITDA not reduced by stock-based compensation (3) Reflects EBITDA reduced by stock-based compensation19 |
![]() |
Analysis of Selected Publicly Traded Companies ($ in billions, except per share values) Public Trading Comparables Share Price% ofEquityEnterprise EV / EBITDA(1) (8/4/2020) 52-Week High Value Value LTM 2020E GTT(7)$5.9939.6%0.43.79.610.6 Alaska Communications Systems$2.3182.8%0.10.34.4NA Source: Public filings, Wall Street research, FactSet; market prices as of close on 8/4/2020 Notes: (1) EBITDA reflects Core EBITDA (reduced by handset leasing D&A) for T-Mobile US; EBITDA reduced by stock-based compensation; LTM period reflected is as of latest publicly reported quarterly figures; (2) Pro forma for the sale of its operations in Puerto Rico and the U.S. Virgin Islands for $1.95 billion, announced on 10/9/2019; pro forma for the sale of Central European Media Enterprises for $1.1 billion, announced on 10/27/2019; (3) Pro forma for T-Mobile US’s acquisition of Sprint and the divestiture of Sprint’s prepaid business to DISH; includes opex synergies and cost to achieve synergies as forecasted by Wall Street research; pro forma for FCC Auction 103 payment; (4) Adjusted EBITDA excludes earnings from unconsolidated entities and interest and dividend income; (5) Net debt excludes collateralized indebtedness; pro forma for the acquisition of Service Electric Cable T.V., completed on 7/14/2020; pro forma for the sale of 49.99% of Lightpath Fiber Enterprise Business, announced on 7/28/2020; (6) Pro forma for the acquisition of Fidelity Communications, completed on 10/1/2019; pro forma for $400 million 20 |
![]() |
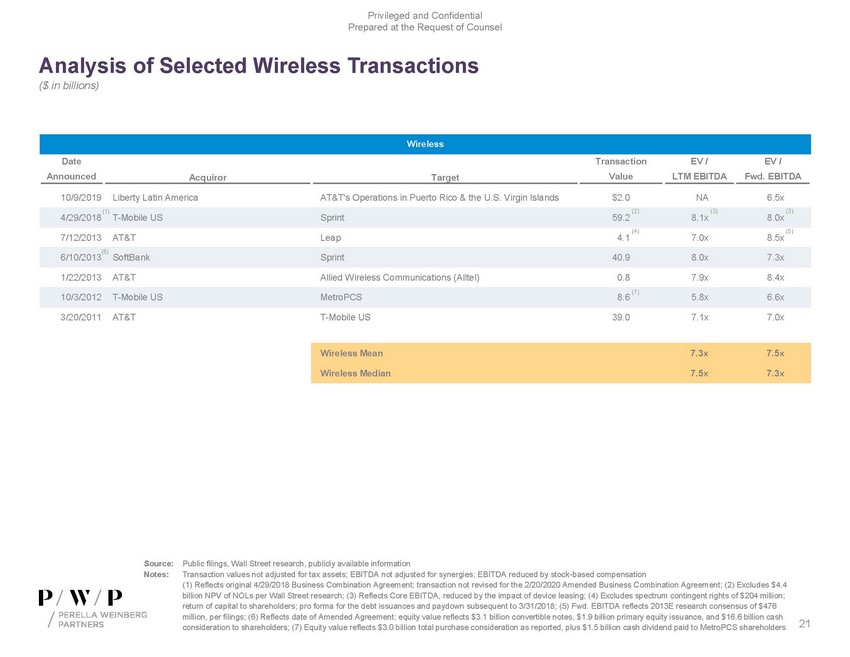
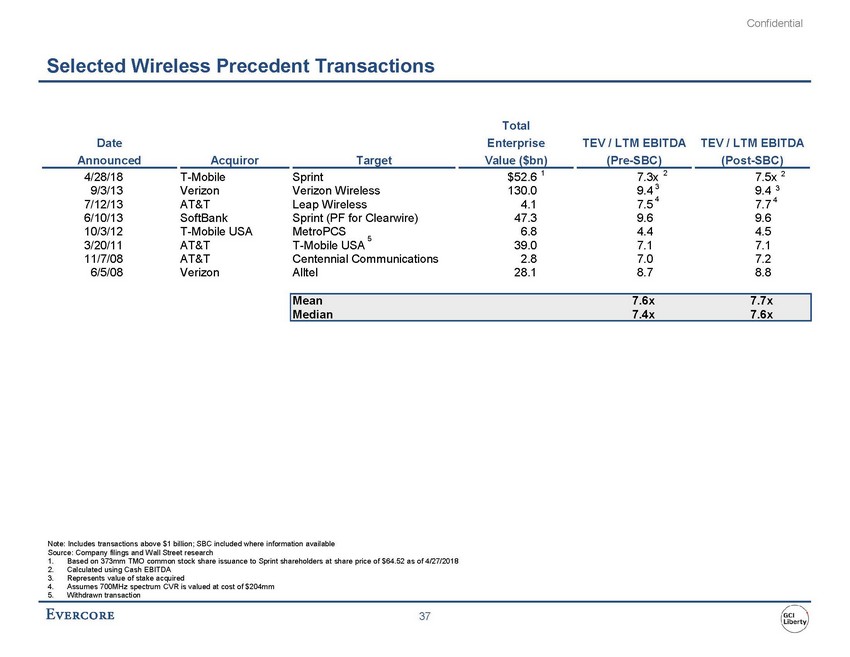
Analysis of Selected Wireless Transactions ($ in billions) Date Wireless Transaction EV / EV / Announced Acquiror Target Value LTM EBITDA Fwd. EBITDA Source: Public filings, Wall Street research, publicly available information Notes:Transaction values not adjusted for tax assets; EBITDA not adjusted for synergies; EBITDA reduced by stock-based compensation (1) Reflects original 4/29/2018 Business Combination Agreement; transaction not revised for the 2/20/2020 Amended Business Combination Agreement; (2) Excludes $4.4 billion NPV of NOLs per Wall Street research; (3) Reflects Core EBITDA, reduced by the impact of device leasing; (4) Excludes spectrum contingent rights of $204 million; return of capital to shareholders; pro forma for the debt issuances and paydown subsequent to 3/31/2018; (5) Fwd. EBITDA reflects 2013E research consensus of $476 million, per filings; (6) Reflects date of Amended Agreement; equity value reflects $3.1 billion convertible notes, $1.9 billion primary equity issuance, and $16.6 billion cash |
![]() |
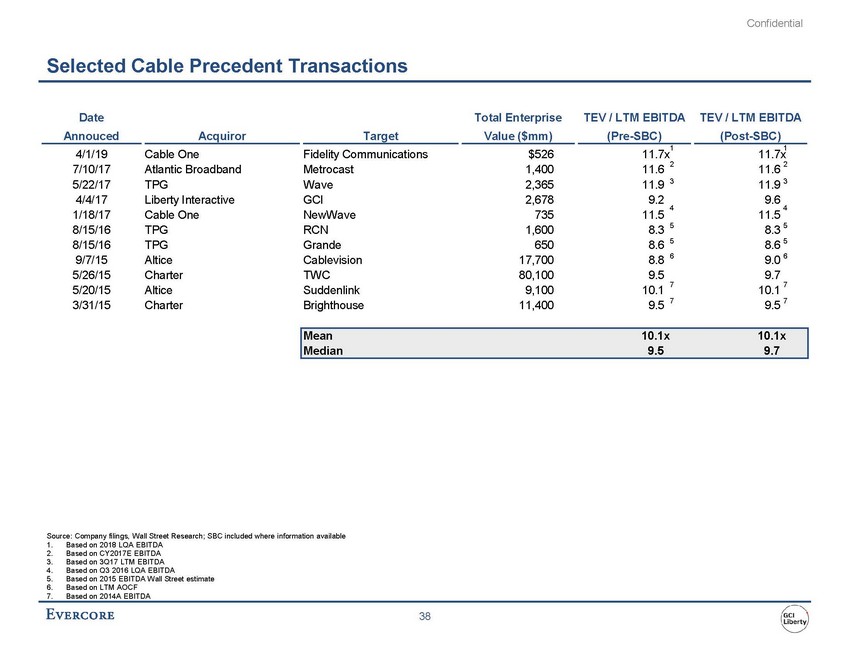
Analysis of Selected Cable / Broadband Transactions ($ in billions) 7/18/2012 BC Partners / CPPIBSuddenlink72.8%6.68.9x8.6x (4) Source: Public filings, Wall Street research, SNL Kagan, publicly available information Notes:Transaction values not adjusted for tax assets; EBITDA not adjusted for synergies; EBITDA reduced by stock-based compensation; (1) Rural is defined as having greater than 50% subscribers outside the top 50 DMAs; (2) Reflects % of residential broadband subscribers in DMAs outside the top 50 DMAs at the time of acquisition; Cogeco / Atlantic Broadband and BC Partners / Suddenlink based on available data as of Q4 2014; (3) Reflects amended transaction agreement;22 |
![]() |
Analysis of Selected Enterprise / Business Services Transactions and 2017 GCI Holdings Transaction ($ in billions) Enterprise / Business Services 2017 GCI Holdings Transaction Source: Public filings, Wall Street research, publicly available information Notes:Transaction values not adjusted for tax assets; EBITDA not adjusted for synergies; EBITDA reduced by stock-based compensation (1) Reflects EV / LQA EBITDA (2) Forward EBITDA reflects midpoint of management’s 2017 guidance reduced by LTM stock-based compensation23 |
![]() |
GCI Holdings – DCF Analysis ($ in millions) Financial Forecast Fiscal Year Ending December 31, Source: Project Eagle data room, GCI Liberty management, Bloomberg, FactSet; market prices as of close on 8/4/2020 Notes:Valuation as of 6/30/2020; assumes mid-year discounting convention (1) Reflects tax depreciation, tax amortization, and tax amortization from deferred loan costs; (2) Reflects 28.0% tax rate; (3) Reflects 2023E EBITDA adjusted for the termination of the Verizon 5G backhaul roaming agreement (net impact of $30 million); (4) Reflects WACC of 6.9%24 |
![]() |
GCI Holdings – WACC Analysis WACC Analysis Peer Beta Analysis Size Premium / (Discount)(7) Shentel 0.75 27.5% 21.6% 0.62 2.0x 1.44% Cable / Broadband Altice USA 1.17 143.2% 58.9% 0.56 4.8x Cost of Equity 8.96% Cable One 0.80 15.5% 13.5% 0.72 1.8x % Equity / Capitalization 55.00% Charter Communications 1.01 55.1% 35.5% 0.71 4.3x Comcast 0.87 52.3% 34.3% 0.63 2.7x Enterprise / Business Services Alaska Communications 0.79 139.4% 58.2% 0.39 2.3x Cogent 0.52 24.7% 19.8% 0.44 3.0x CenturyLink 0.96 304.1% 75.3% 0.29 3.7x Cost of Debt GTT 1.15 977.7% 90.7% 0.14 7.9x Cost of Debt (Pre-Tax) 5.00% Median 0.80 55.1% 35.5% 0.56 2.7x % Debt / Capitalization 45.00% Mean 0.84 152.7% 43.0% 0.50 3.2x % of Debt with Non-Tax-Deductible Interest 60.00% WACC Sensitivity Analysis Pre-Tax Cost of Debt5.00% Pre-Tax Cost of Debt Source:Public filings, Wall Street research, Bloomberg, FactSet, market data as of 8/4/2020 Notes:(1) Bloomberg unadjusted beta based on 2-year period and weekly data; (2) Assumes marginal tax rate of 25.0% for the peer set; (3) Reflects LTM net leverage; reflects EBITDA reduced by stock-based compensation; reflects Core EBITDA (reduced by handset leasing D&A) for T-Mobile US; (4) Based on average trailing 3-month yield of 20-year U.S. Government Bond; (5) Reflects 45% debt / capitalization; (6) Reflects Duff & Phelps supply-side long-term expected equity risk premium over 20-year Treasury bond with 100 bps increase (consistent with the 100 bps increase in the Duff & Phelps Recommended U.S. equity risk premium implemented on 3/25/2020); (7) Based on 2020 Duff & Phelps Cost of Capital Navigator; GCI Holdings equity value reflects implied enterprise value from DCF analysis less net25 debt of $1,306 million |
![]() |
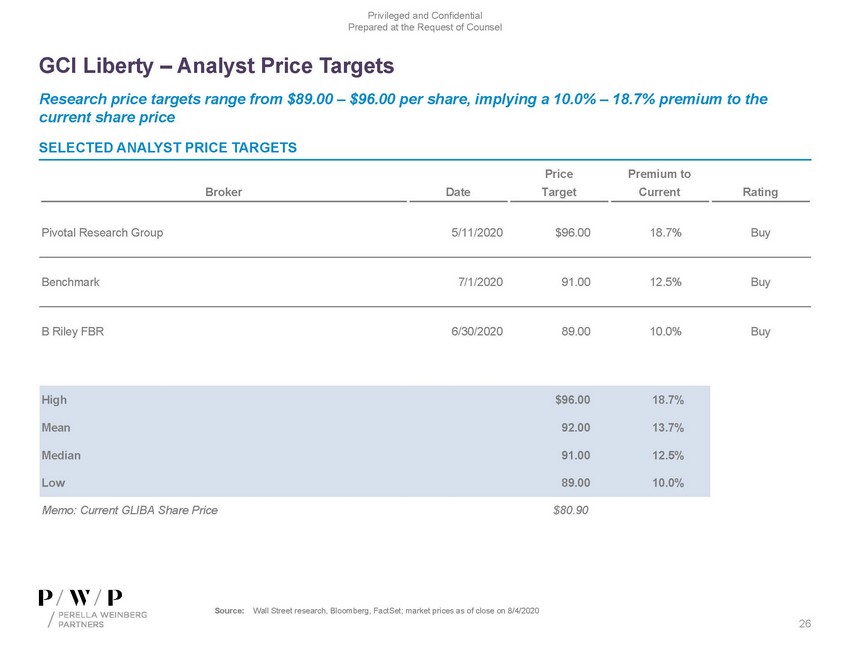
GCI Liberty – Analyst Price Targets Research price targets range from $89.00 – $96.00 per share, implying a 10.0% – 18.7% premium to the current share price SELECTED ANALYST PRICE TARGETS Broker Date Price Target Premium to Current Rating Pivotal Research Group 5/11/2020 $96.00 18.7% Buy Benchmark 7/1/2020 91.00 12.5% Buy B Riley FBR 6/30/2020 89.00 10.0% Buy Source: Wall Street research, Bloomberg, FactSet; market prices as of close on 8/4/2020 |
![]() |
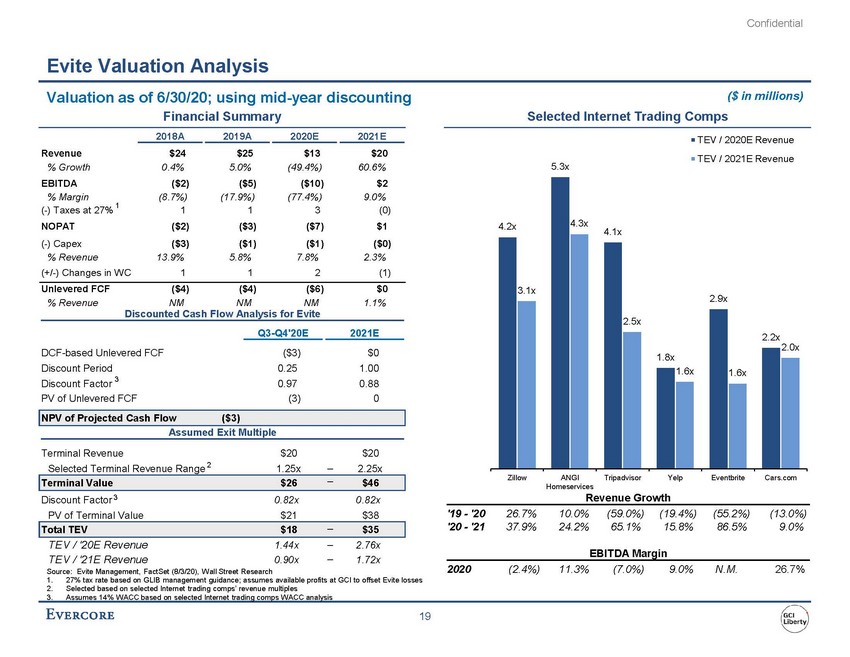
GCI Liberty – Evite Financial Analysis ($ in millions) Evite Valuation Evite Evite Methodology EV / 2020E Revenue(1) EV / 2020E EBITDA(2) Evite Valuation Public Companies Analysis1.5x - 2.0xNM - NM Precedent Transactions2.0x - 2.5xNM - NM $19 $25 $25 $32 Source: GCI Liberty management Notes:(1) Reflects Evite 2020E revenue of $13 million (2) Reflects Evite 2020E EBITDA of ($10) million |
![]() |
GCI Liberty – Evite Financial Forecast ($ in millions) |
![]() |
Consumer Internet – Analysis of Selected Publicly Traded Companies ($ in billions, except per share values) Public Trading Comparables (1) Share Price % 52-WeekEquityEnterprise EV / Revenue Revenue Growth EV / EBITDA (8/4/2020) High Value Value LTM 2020E 2020E 2021E '19A - '21E CAGR LTM 2020E Alphabet(2) $1,469.3594.1%$1,033.6$906.46.6x6.2x9.0%23.3%16.0%20.0x19.1x Source: Public filings, Wall Street research, FactSet, market prices as of close on 8/4/2020 Notes:Figures calendarized; EV / EBITDA multiples are marked as “NM” when negative or exceeding 40.0x; LTM period reflected is as of latest publicly reported quarterly figures (1) Reflects EBITDA reduced by stock-based compensation (2) Reflects blended share price; revenue metrics reflect Net Revenue; pro forma for the acquisition of a 6.6% stake in ADT, announced on 8/3/2020; pro forma for the acquisition of a 7.7% stake in Jio, announced on 7/15/2020; pro forma for the acquisition of Looker, completed on 2/12/2020; pro forma for the acquisition of FitBit, announced on 11/1/2019 (3) Pro forma for the acquisition of a 10.0% stake in Jio, completed on 7/7/2020 (4) Pro forma for acquisition of SinglePlatform, completed on 12/5/2019; pro forma for the acquisition of Bookatable, completed on 12/3/201929 |
![]() |
Consumer Internet – Analysis of Selected Precedent Transactions ($ in millions) Precedent Transactions DateTransaction EV / Revenue EV / EBITDA Announced Acquiror Target Value LTM Forward LTM Forward Source: Public filings, Wall Street research, publicly available sources, FactSet Notes:Transaction values not adjusted for tax assets; EBITDA not adjusted for synergies; EBITDA reduced by stock-based compensation; EV / EBITDA multiples are marked as “NM” when negative or exceeding 40.0x (1) Reflects 2018E revenue (2) Reflects 2016A metrics (3) Includes contingent consideration of ~$50 million (4) LTM revenue and EBITDA as of 9/30/201530 |
![]() |
GCI Liberty – GCI Liberty Inc. NPV of Corporate Costs ($ in millions) GCI Liberty Inc. Corporate Costs NPV of Corporate Costs(1) $385 Corporate Costs NPV Sensitivity Perpetuity Growth Rate Discount Rate 1.75% 2.00% 2.25% 6.35% $408 $429 $453 6.85% $368 $385 $404 7.35% $336 $349 $364 Source: Project Eagle data room, GCI Liberty management, Bloomberg, FactSet; market prices as of close on 8/4/2020 Notes:(1) Reflects discount rate of 6.85% and perpetuity growth rate of 2.00% (2) Reflects 27.0% tax rate 31 |
![]() |
GCI Liberty Inc. – WACC Analysis Source:Project Eagle data room, GCI Liberty management, public filings, Wall Street research, Bloomberg, FactSet, market data as of 8/4/2020 Notes:(1) Reflects U.S. Barra beta; (2) Reflects Duff & Phelps supply-side long-term expected equity risk premium over 20-year Treasury bond with 100 bps increase (consistent with the 100 bps increase in the Duff & Phelps Recommended U.S. equity risk premium implemented on 3/25/2020); (3) Based on average trailing 3-month yield of 20-year U.S. Government Bond; (4) Reflects current yield on GCI Liberty preferred stock outstanding32 |
![]() |
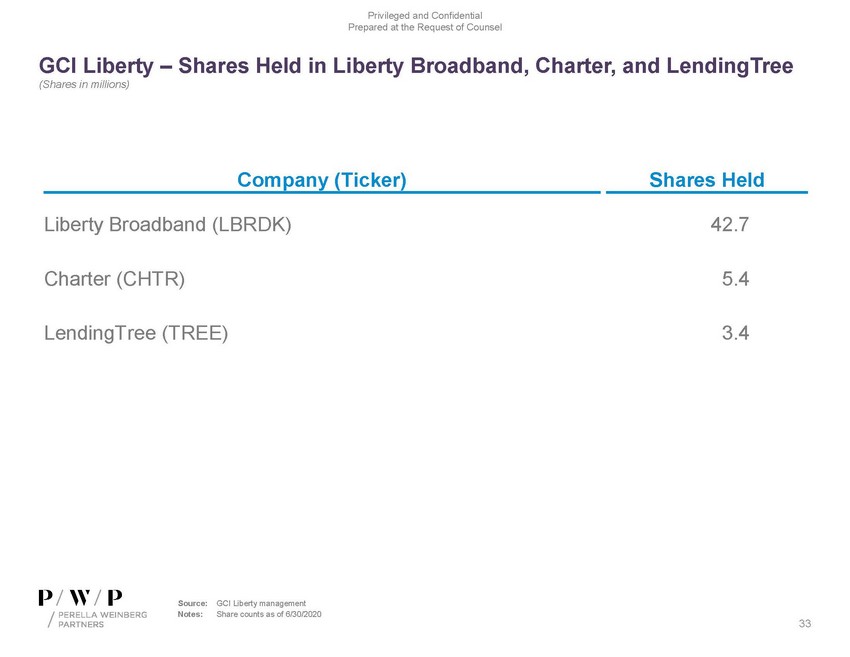
GCI Liberty – Shares Held in Liberty Broadband, Charter, and LendingTree (Shares in millions) Company (Ticker) Shares Held Liberty Broadband (LBRDK) 42.7 Charter (CHTR) 5.4 LendingTree (TREE) 3.4 Source: GCI Liberty management Notes:Share counts as of 6/30/2020 |
![]() |
B.Liberty Broadband Analysis |
![]() |
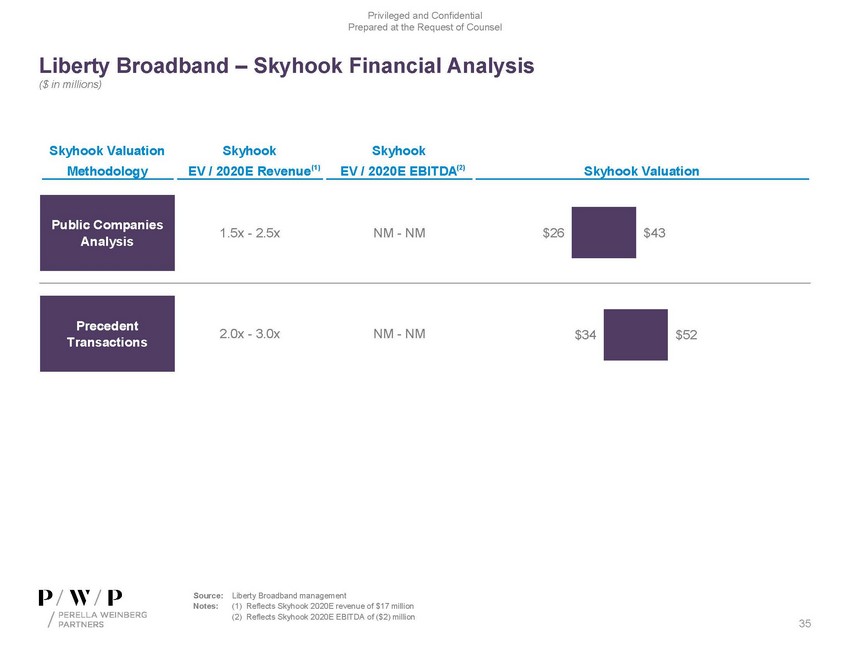
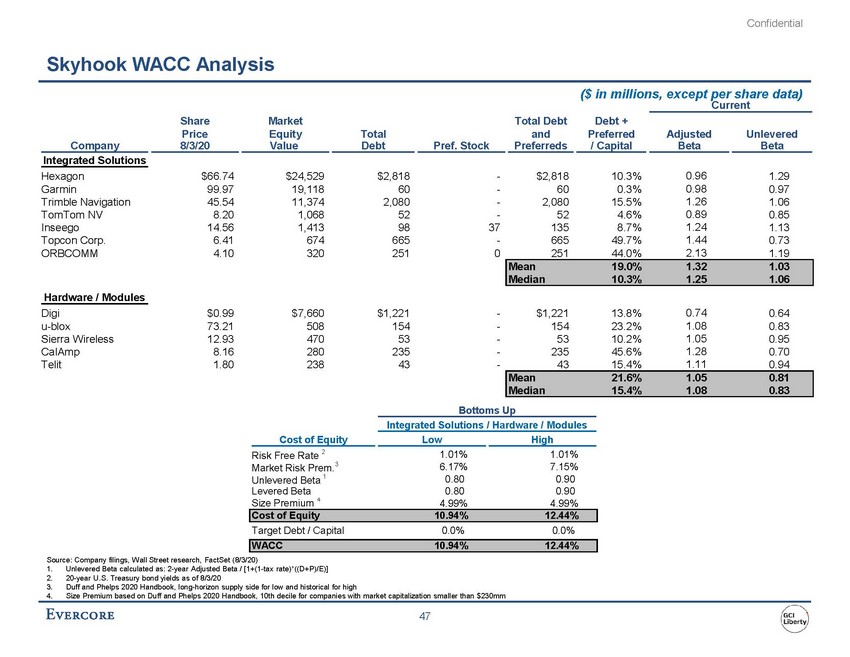
Liberty Broadband – Skyhook Financial Analysis ($ in millions) Skyhook Valuation Skyhook Skyhook Methodology EV / 2020E Revenue(1) EV / 2020E EBITDA(2) Skyhook Valuation Public Companies Analysis1.5x - 2.5xNM - NM Precedent Transactions2.0x - 3.0xNM - NM $26 $34 $43 $52 Source: Liberty Broadband management Notes:(1) Reflects Skyhook 2020E revenue of $17 million (2) Reflects Skyhook 2020E EBITDA of ($2) million |
![]() |
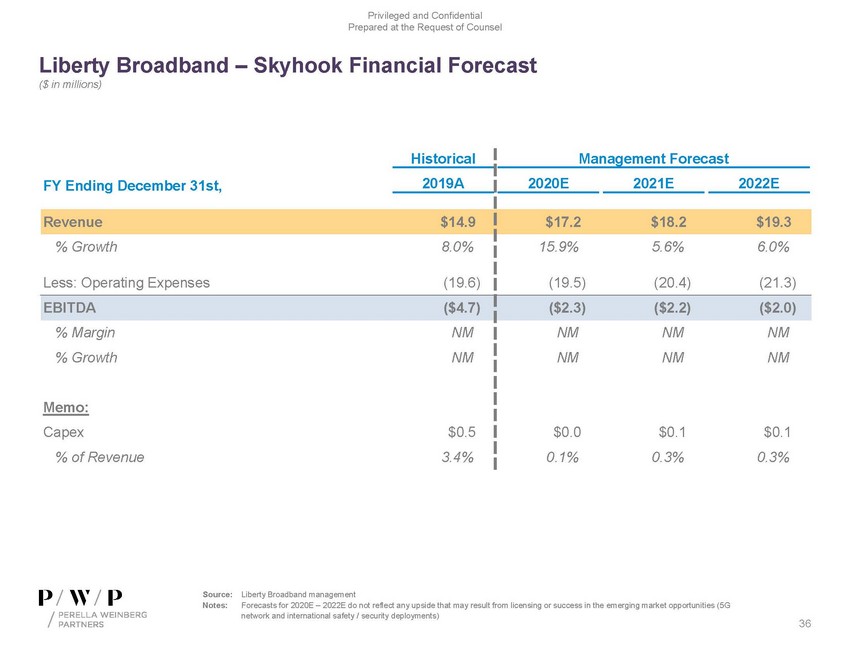
Liberty Broadband – Skyhook Financial Forecast ($ in millions) Source: Liberty Broadband management Notes:Forecasts for 2020E – 2022E do not reflect any upside that may result from licensing or success in the emerging market opportunities (5G |
![]() |
Location Services – Analysis of Selected Publicly Traded Companies ($ in billions, except per share values) Public Trading Comparables (1) Share Price % 52-WeekEquityEnterprise EV / Revenue 2019A - 2021E EV / EBITDA (8/4/2020) High Value Value LTM 2020E Revenue CAGR LTM 2020E Source: Public filings, Wall Street research, FactSet, market prices as of close on 8/4/2020 Notes:Figures calendarized; EV / EBITDA multiples are marked as “NM” when negative or exceeding 40.0x; LTM period reflected is as of latest publicly reported quarterly figures (1) Reflects EBITDA reduced by stock-based compensation (2) Pro forma for acquisition of Azteca Systems, completed Q4 2019 (3) Reflects EUR / USD exchange rate of 1.176x37 |
![]() |
Location Services – Analysis of Selected Precedent Transactions ($ in millions) Precedent Transactions DateTransaction EV / Revenue EV / EBITDA Announced Acquiror Target Value LTM Forward LTM Forward 8/3/2015German Auto ConsortiumNokia HERE$3,0722.6x2.2x(1) 25.2x13.9x 4/27/2015GB GroupLoqate203.8x(2) 2.7xNANA 6/1/2011Schneider ElectricTelvent2,0201.9x1.8x12.3x11.7x 10/27/2010NeustarQuova22NA1.4xNANA (3) 7/23/2007TomTomTele Atlas3,7319.5x7.0xNM33.5x 3/14/2007Pitney BowesMapInfo4082.4x2.1x19.5x14.0x Mean4.0x2.9x19.0x18.3x Median2.6x2.2x19.5x13.9x Source: Public filings, publicly available sources, Wall Street research, CapIQ, FactSet Notes:Transaction values not adjusted for tax assets; EBITDA not adjusted for synergies; EBITDA reduced by stock-based compensation; EV / EBITDA multiples are marked as “NM” when negative or exceeding 40.0x (1) Forward revenue reflects CY 2016 (2) LTM revenue reflects CY 2014 (3) Forward revenue reflects CY 200838 |
![]() |
Liberty Broadband – Analyst Price Targets Research price targets range from $155.00 – $187.00 per share, implying a 9.1% – 31.6% premium to the current share price SELECTED ANALYST PRICE TARGETS |
![]() |
Liberty Broadband – Liberty Broadband Corporation NPV of Corporate Costs ($ in millions) Liberty Broadband Corporate Costs NPV of Corporate Costs(1) $572 Corporate Costs NPV Sensitivity Perpetuity Growth Rate Discount Rate 1.75% 2.00% 2.25% 5.80% $610 $646 $688 6.30% $543 $572 $603 6.80% $490 $512 $537 |
![]() |
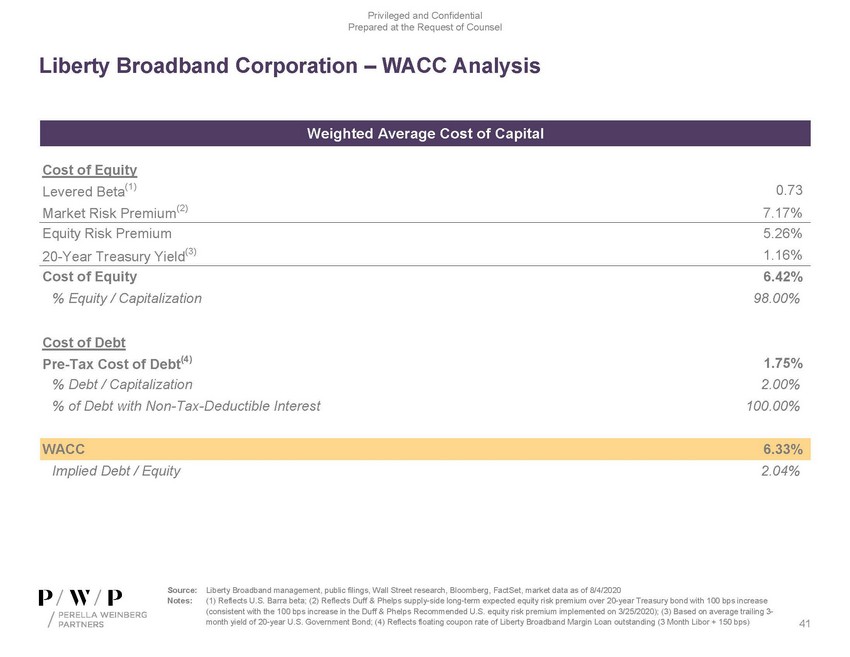
Liberty Broadband Corporation – WACC Analysis % Debt / Capitalization2.00% % of Debt with Non-Tax-Deductible Interest100.00% WACC6.33% Implied Debt / Equity2.04% Source: Liberty Broadband management, public filings, Wall Street research, Bloomberg, FactSet, market data as of 8/4/2020 Notes:(1) Reflects U.S. Barra beta; (2) Reflects Duff & Phelps supply-side long-term expected equity risk premium over 20-year Treasury bond with 100 bps increase (consistent with the 100 bps increase in the Duff & Phelps Recommended U.S. equity risk premium implemented on 3/25/2020); (3) Based on average trailing 3-month yield of 20-year U.S. Government Bond; (4) Reflects floating coupon rate of Liberty Broadband Margin Loan outstanding (3 Month Libor + 150 bps)41 |
![]() |
Privileged and Confidential Prepared at the Request of Counsel C.Pro Forma Financial Analysis |
![]() |
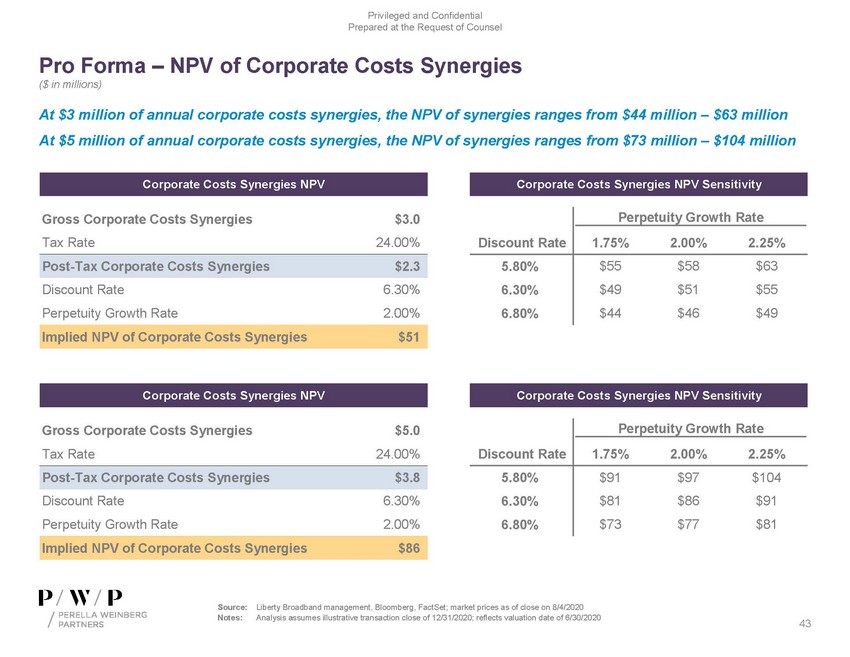
Pro Forma – NPV of Corporate Costs Synergies ($ in millions) At $3 million of annual corporate costs synergies, the NPV of synergies ranges from $44 million – $63 million At $5 million of annual corporate costs synergies, the NPV of synergies ranges from $73 million – $104 million Corporate Costs Synergies NPV Corporate Costs Synergies NPV Sensitivity Gross Corporate Costs Synergies $3.0 Perpetuity Growth Rate Tax Rate 24.00% Discount Rate 1.75% 2.00% 2.25% Post-Tax Corporate Costs Synergies $2.3 5.80% $55 $58 $63 Discount Rate 6.30% 6.30% $49 $51 $55 Perpetuity Growth Rate 2.00% 6.80% $44 $46 $49 Implied NPV of Corporate Costs Synergies $51 Corporate Costs Synergies NPV Corporate Costs Synergies NPV Sensitivity Gross Corporate Costs Synergies $5.0 Perpetuity Growth Rate Tax Rate 24.00% Discount Rate 1.75% 2.00% 2.25% Post-Tax Corporate Costs Synergies $3.8 5.80% $91 $97 $104 Discount Rate 6.30% 6.30% $81 $86 $91 Perpetuity Growth Rate 2.00% 6.80% $73 $77 $81 Implied NPV of Corporate Costs Synergies $86 Source: Liberty Broadband management, Bloomberg, FactSet; market prices as of close on 8/4/2020 Notes:Analysis assumes illustrative transaction close of 12/31/2020; reflects valuation date of 6/30/2020 |
![]() |
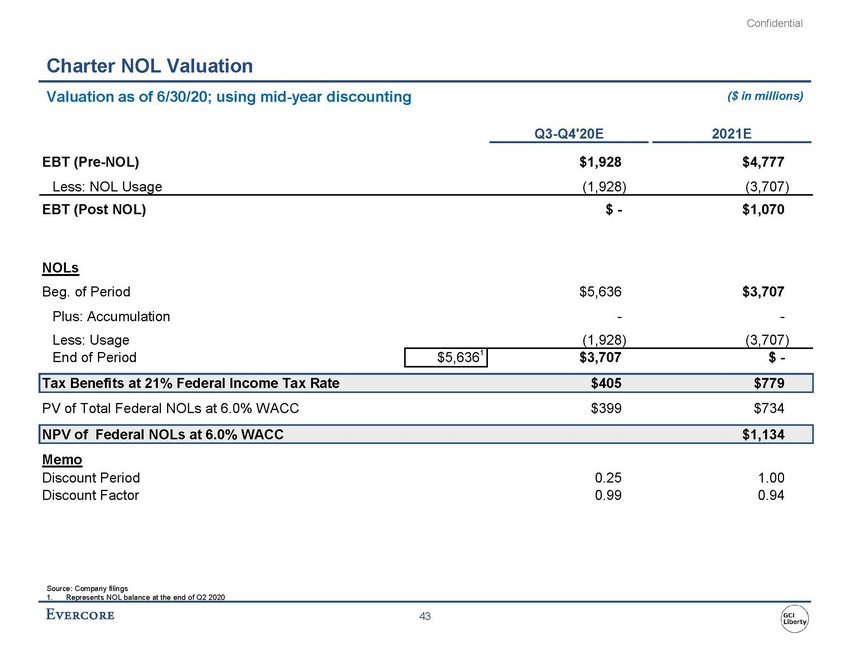
Pro Forma – NPV of Federal NOLs ($ in millions) NPV of Federal NOLs FY Ending December 31st 2020E 2021E 2022E 2023E 2024E 2025E 2026E 2027E 2028E NPV of Federal NOLs Sensitivity Discount Rate 5.80% $119 6.30% $117 6.80% $114 Source: Liberty Broadband management, Bloomberg, FactSet; market prices as of close on 8/4/2020 Notes:Analysis assumes illustrative transaction close of 12/31/2020; reflects valuation date of 6/30/2020 (1) Reflects discount rate of 6.30% |
![]() |
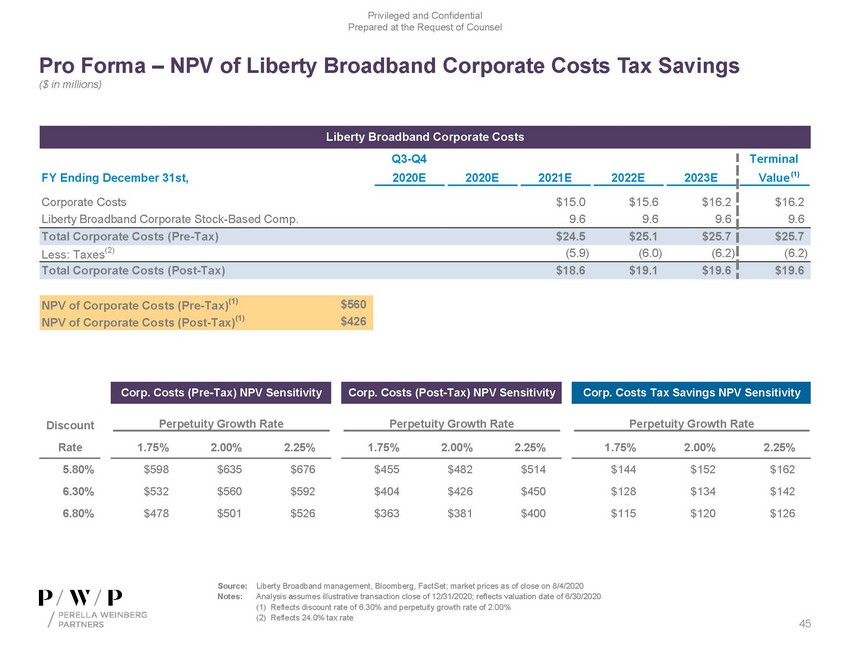
Pro Forma – NPV of Liberty Broadband Corporate Costs Tax Savings ($ in millions) Liberty Broadband Corporate Costs NPV of Corporate Costs (Pre-Tax)(1) $560 NPV of Corporate Costs (Post-Tax)(1) $426 Source: Liberty Broadband management, Bloomberg, FactSet; market prices as of close on 8/4/2020 |
![]() |
Legal Disclaimer This Presentation has been provided to you by Perella Weinberg Partners and its affiliates (collectively “Perella Weinberg Partners” or the “Firm”) and may not be used or relied upon for any purpose without the written consent of Perella Weinberg Partners. The information contained herein (the “Information”) is confidential. By accepting this Information, you agree that you and your directors, partners, officers, employees, attorney(s), agents and representatives agree to use it for informational purposes only and will not divulge any such Information to any other party. Reproduction of this Information, in whole or in part, is prohibited. These contents are proprietary and a product of Perella Weinberg Partners. The Information contained herein is not an offer to buy or sell or a solicitation of an offer to buy or sell any corporate advisory services or security or to participate in any corporate advisory services or trading strategy. Any decision regarding corporate advisory services or to invest in the investments described herein should be made after, as applicable, reviewing such definitive offering memorandum, conducting such investigations as you deem necessary and consulting the investor’s own investment, legal, accounting and tax advisors in order to make an independent determination of the suitability and consequences of an investment or service. The information used in preparing these materials may have been obtained from or through you or your representatives or from public sources. Perella Weinberg Partners assumes no responsibility for independent verification of such information and has relied on such information being complete and accurate in all material respects. To the extent such information includes estimates and/or forecasts of future financial performance (including estimates of potential cost savings and synergies) prepared by or reviewed or discussed with the managements of your company and/or other potential transaction participants or obtained from public sources, we have assumed that such estimates and forecasts have been reasonably prepared on bases reflecting the best currently available estimates and judgments of such managements (or, with respect to estimates and forecasts obtained from public sources, represent reasonable estimates). The Firm has no obligation (express or implied) to update any or all of the Information or to advise you of any changes; nor do we make any express or implied warranties or representations as to the completeness or accuracy or accept responsibility for errors. Nothing contained herein should be construed as tax, accounting or legal advice. You (and each of your employees, representatives or other agents) may disclose to any and all persons, without limitation of any kind, the tax treatment and tax structure of the transactions contemplated by these materials and all materials of any kind (including opinions or other tax analyses) that are provided to you relating to such tax treatment and structure. For this purpose, the tax treatment of a transaction is the purported or claimed U.S. federal income tax treatment of the transaction and the tax structure of a transaction is any fact that may be relevant to understanding the purported or claimed U.S. federal income tax treatment of the transaction. |
Exhibit (c)(2)
![]() |
Exhibit (c)(2) Confidential Presentation to the Special Committee August 5, 2020 |
![]() |
These materials have been prepared by Evercore Group L.L.C. (“Evercore”) for the Special Committee of the Board of Directors (the “Committee”) of GCI Liberty, Inc. (“GLIB” or the “Company”) to whom such materials are directly addressed and delivered and may not be used or relied upon for any purpose other than as specifically contemplated by a written agreement with Evercore. These materials are based on information provided by or on behalf of the Committee, including from Company management, and/or other potential transaction participants, or from public sources or otherwise reviewed by Evercore. Evercore assumes no responsibility for independent investigation or verification of such information and has relied on such information being complete and accurate in all material respects. To the extent such information includes estimates and forecasts of future financial performance prepared by or reviewed with the management of the Company and/or other potential transaction participants or obtained from public sources, Evercore has assumed that such estimates and forecasts have been reasonably prepared on bases reflecting the best currently available estimates and judgments of such management (or, with respect to estimates and forecasts obtained from public sources, represent reasonable estimates). No representation or warranty, express or implied, is made as to the accuracy or completeness of such information and nothing contained herein is, or shall be relied upon as, a representation, whether as to the past, the present or the future. These materials were designed for use by specific persons familiar with the business and affairs of the Company. These materials are not intended to provide the sole basis for evaluating, and should not be considered a recommendation with respect to, any transaction or other matter. These materials have been developed by and are proprietary to Evercore and were prepared exclusively for the benefit and internal use of the Committee (and, at the Committee’s request, the GLIB Board of Directors). These materials were compiled on a confidential basis for use by the Committee (and, at the Committee’s request, the GLIB Board of Directors) in evaluating the potential transaction described herein and not with a view to public disclosure or filing thereof under state or federal securities laws, and may not be reproduced, disseminated, quoted or referred to, in whole or in part, without the prior written consent of Evercore. These materials do not constitute an offer or solicitation to sell or purchase any securities and are not a commitment by Evercore (or any affiliate) to provide or arrange any financing for any transaction or to purchase any security in connection therewith. Evercore assumes no obligation to update or otherwise revise these materials. These materials may not reflect information known to other professionals in other business areas of Evercore and its affiliates. Evercore and its affiliates do not provide legal, accounting or tax advice. Accordingly, any statements contained herein as to tax matters were neither written nor intended by Evercore or its affiliates to be used and cannot be used by any taxpayer for the purpose of avoiding tax penalties that may be imposed on such taxpayer. Each person should seek legal, accounting and tax advice based on his, her or its particular circumstances from independent advisors regarding the impact of the transactions or matters described herein. |
![]() |
Table of Contents Section Transaction Overview GLIB Financial Analysis LBRD Financial Analysis Appendix I II III |
![]() |
I.Transaction Overview |
![]() |
Scope of Review and Selected Qualifications Executive summary of scope of review and selected qualifications set forth in our opinion letter The full text of our written opinion will set forth assumptions made, matters considered and other qualifications and limitations on the review undertaken in conjunction with the opinion. You are urged to read the written opinion carefully and in its entirety. In connection with rendering our opinion, we have, among other things: i. reviewed certain publicly available historical business and financial information relating to GCI Liberty, Inc. (the “Company”) and Liberty Broadband (the “Parent”) including certain publicly traded assets owned by the Company and the Parent, that we deemed to be relevant, including publicly available research analysts’ estimates; ii. reviewed certain non-public projected financial and operating data relating to the Company and the Parent, as prepared and furnished to us by the management of the Company and the Parent, respectively, and as approved for our use by the Company; iii. discussed with management of the Company and the Parent the past and current operations, current financial condition and financial projections of the Company and the Parent, respectively (including their views on the risks and uncertainties of achieving such projections); iv. reviewed the reported prices and the historical trading activity of the Company Common Stock and the Parent Common Stock, including the relative historical exchange ratio based on the trading prices of the Company Series A Common Stock and the Parent Series C Common Stock; v. compared the financial performance of the Company and its stock market trading multiples with those of certain other publicly traded companies that we deemed relevant; vi. compared the financial performance of the Company and the valuation multiples implied by the Combination with those of certain other transactions that we deemed relevant; vii. performed illustrative discounted cash flow analyses relating to the Company’s and the Parent’s operating assets and certain publicly traded assets owned by the Company and the Parent; viii. compared the net asset value of the Company and the Parent, based on publicly available information and information provided by the Company and the Parent and approved for our use by the Company, to the market trading value of the equity of the Company and the Parent; ix. reviewed the financial terms and conditions of a draft, dated August , 2020, of the Merger Agreement; and x. performed such other analyses and examinations and considered such other factors that we deemed appropriate. |
![]() |
Executive summary of scope of review and selected qualifications set forth in our opinion letter For purposes of our analysis and opinion, we have assumed and relied upon, without undertaking any independent verification of, the accuracy and completeness of the financial and other information publicly available and all of the information supplied or otherwise made available to, discussed with, or reviewed by us, and we have further relied upon the assurances of the managements of the Company and the Parent that they are not aware of any relevant information that has been omitted or that remains undisclosed to us or any facts or circumstances that would make such information inaccurate or misleading. We assume no responsibility or liability for such information or any independent verification thereof. With respect to the projected financial and operating data referred to above, we have assumed with the Special Committee’s consent that they have been reasonably prepared on bases reflecting the best currently available estimates and good faith judgments of the managements of the Company and the Parent as to the future financial performance of the Company and the Parent and the other matters covered thereby. We have relied, at the Special Committee’s direction and without independent verification, on the assessments of the managements of the Company and the Parent as to the future financial and operating performance of the Parent and the Company. We express no view as to the projected financial and operating data or any judgments, estimates or assumptions on which they are based. For purposes of our analysis and opinion, we have assumed, in all respects material to our analysis, that the final executed Merger Agreement will not differ from the draft Merger Agreement reviewed by us, that the representations and warranties of each party contained in the Merger Agreement are true and correct, that each party will perform all of the covenants and agreements required to be performed by it under the Merger Agreement and that all conditions to the consummation of the Combination will be satisfied without waiver or modification thereof. We have further assumed, in all respects material to our analysis, that all governmental, regulatory or other consents, approvals or releases necessary for the consummation of the Combination will be obtained without any delay, limitation, restriction or condition that would have an adverse effect on the Company, the Parent or the consummation of the Combination or reduce the contemplated benefits of the Combination to the holders of Company Common Stock. Further, as you are aware, the credit, financial and stock markets have been experiencing unusual volatility and we express no opinion or view as to any potential effects of such volatility on the parties to the Merger Agreement or the Combination. We have not conducted a physical inspection of the properties or facilities of the Company or the Parent and have not made or assumed any responsibility for making any independent valuation or appraisal of the assets or liabilities (including any contingent, derivative or other off-balance sheet assets and liabilities) of the Company or the Parent, nor have we evaluated the solvency or fair value of the Company or the Parent under any state or federal laws relating to bankruptcy, insolvency or similar matters. Our opinion is necessarily based upon information made available to us as of the date hereof and financial, economic, market and other conditions as they exist and as can be evaluated on the date hereof. It is understood that subsequent developments may affect this opinion and that we do not have any obligation to update, revise or reaffirm this opinion. |
![]() |
Executive summary of scope of review and selected qualifications set forth in our opinion letter We have not been asked to pass upon, and express no opinion with respect to, any matter other than the fairness to the holders of Company Common Stock, other than the Malone Group, the Maffei Group and their respective Affiliates and the Company Section 16 Officers, from a financial point of view, of the Common Exchange Ratio in the Merger. We do not express any view on, and our opinion does not address, the fairness of the proposed transaction to, or any consideration received in connection therewith by, the holders of any other securities or class of securities, creditors or other constituencies of the Company, nor as to the fairness of the amount or nature of any compensation to be paid or payable to any of the officers, directors or employees of the Company, or any class of such persons, whether relative to the Common Exchange Ratio or otherwise, nor do we express any view on, and our opinion does not address, the fairness of the Common Exchange Ratio to the holders of Company Series A Common Stock relative to the holders of Company Series B Common Stock, or vice versa. We have not been asked to, nor do we express any view on, and our opinion does not address, any other term or aspect of the Merger Agreement or the Combination, including, without limitation, the structure or form of the Combination, or any term or aspect of any other agreement or instrument contemplated by the Merger Agreement or entered into or amended in connection with the Merger Agreement. Our opinion does not address the relative merits of the Combination as compared to other business or financial strategies that might be available to the Company, nor does it address the underlying business decision of the Company to engage in the Combination. We do not express any view on, and our opinion does not address, what the value of the Parent Common Stock actually will be when issued or the prices at which the Company Common Stock or the Parent Common Stock will trade at any time, or whether any class or series of common stock or preferred stock will trade at different prices, including following announcement or consummation of the Combination. In arriving at our opinion, we were not authorized to solicit, and did not solicit, interest from any third party with respect to the acquisition of any or all of the Company Common Stock or any business combination or other extraordinary transaction involving the Company. Our opinion does not constitute a recommendation to the Special Committee, the Board of Directors or to any other persons in respect of the Combination, including as to how any holder of shares of the Company Common Stock should vote or act in respect of the Combination. We are not expressing any opinion as to the prices at which shares of Company Common Stock will trade at any time, as to the potential effects of volatility in the credit, financial and stock markets on the Company or the Combination or as to the impact of the Combination on the solvency or viability of the Company or the ability of the Company to pay its obligations when they come due. We are not legal, regulatory, accounting or tax experts and have assumed the accuracy and completeness of assessments by the Company and its advisors with respect to legal, regulatory, accounting and tax matters. |
![]() |
Proposal was received from Liberty Broadband on 6/28/20 and preliminary understanding with respect to the exchange ratio was made public pre-market open on 6/30/20 TermsDetails Exchange Ratio Form of Consideration 0.5800 Liberty Broadband (LBRD) Series C shares (non-voting) for each GCI Liberty (GLIB) Series A; 0.5800 Liberty Broadband (LBRD) Series B shares (10 votes) for each GCI Liberty (GLIB) Series B share LBRD Series C Common Shares (non-voting) and LBRD Series B Common Shares (10 votes) Implied Price $72.49/share for GLIB Series A (1 vote) based on LBRD Series C (non-voting) closing price of $124.98 on 6/29/20 $71.92/share for GLIB Series B (10 votes) based on LBRD Series B (10 votes) closing price of $124.00 on 6/29/20 Implied Premium Implies a 8.1% premium to GLIB Series A shareholders, based on GLIB Series A unaffected closing price of $67.05 as of 6/29/20 for publicly traded shares Implies a 7.2% premium to Series B shareholders, based on GLIB Series B unaffected closing price of $67.10 as of 6/29/20 for publicly traded shares 1 Aggregate premium to GLIB shareholders on a fully diluted basis of $585mm or $5.44 per GLIB Series A share and $4.82 per GLIB Series B share1 Implied Ownership in Pro Forma Company Liberty management (John Malone and Greg Maffei) economic ownership is 6.2% and voting interest is 66.6% 2 GLIB public economic ownership is 28.9% and voting interest is 3.9% LBRD public economic ownership is 64.8% and voting interest is 29.5% GLIB Series A Cumulative Redeemable Preferred Stock Rollover into a Liberty Broadband preferred instrument with same terms No conversion rights; voting rights with voting common (1/3 of a vote / share) Dividends, payable quarterly, accrue on a daily basis at a rate of 7.00% per annum If Liberty Broadband fails to pay dividend for any four quarterly periods, dividend rate increases by 2% annual rate until cured Mandatory redemption date of March, 2039 Source: FactSet (as of 6/29/20) 1.Unaffected closing price notional value for Series B shares indicated. Note that due to lack of liquidity and trading volume in LBRD Series B shares (average daily trading volume of less than 50 shares based on average daily trading volume for last 30 days), the implied consideration to be received by GLIB Series B shareholders should also be assessed by considering the value of the LBRD Series C shares which are highly liquid publicly traded shares 2.As proposed, it is contemplated that Mr. Malone would agree to receive shares of Liberty Broadband Series C common stock in lieu of an equal number of shares of Liberty Broadband Series B common stock he would be entitled to receive in the Potential Combination such that Mr. Malone would have beneficial ownership of not more than approximately 49% of Liberty Broadband’s aggregate outstanding voting power (“Target Voting Power”) immediately following the closing (which is equal to the aggregate voting power in Liberty Broadband beneficially owned by Mr. Malone). Mr. Malone would also have the right to exchange such shares of Liberty Broadband Series C common stock for Liberty Broadband Series B common stock, on a one-for-one basis, to preserve his Target Voting Power following the occurrence of any voting dilution events. Upon certain fundamental events, including certain mergers, split-or spin-offs, rights offerings and dividends, Mr. Malone will be entitled to certain economic rights associated with the shares of Liberty Broadband Series B common stock he otherwise would have received in the Potential Combination. Voting interest assumes exercise of all stock options by Liberty Management and exchange of all shares of Liberty Broadband Series C common stock for Liberty Broadband Series B common stock by John Malone |
![]() |
Proposal Summary History ($ in millions) LBRD Proposal GLIB Counter LBRD Revised GLIB Second Counter Proposal LBRD Second Counter Proposal LBRD Proposal (6/10) Proposal (6/19) Proposal (6/22) (6/24) (6/26) (6/28) Proposal Date 6/10/20 6/19/20 6/22/20 6/24/20 6/26/20 6/28/20 LBRD Series C Unaffected Share Price $132.64 1 GLIB Series A Unaffected Share Price $71.18 1 $130.581 $69.141 $129.36 $123.99 $124.171 $68.63 $65.89 $66.651 Implied Market Exchange Ratio at Proposal Date 0.537x 0.529x 0.531x 0.531x 0.537x Proposal Exchange Ratio 0.557x 0.585x 0.575x 0.585x 0.580x Implied GLIB Series A Offer Price $73.94 $76.39 $74.38 $72.53 $72.02 Purchase Premium to GLIB at Proposal (%) 3.9% 10.5% 8.4% 10.1% 8.1% Purchase Premium to GLIB at Proposal ($) $299 $788 $623 $712 $578 Implied GLIB FDSO 2 106.8 106.8 106.8 106.7 106.7 Implied GLIB Purchase Price at Proposal Date $7,895 $8,161 $7,943 $7,743 $7,687 Implied Economic Ownership for GLIB Shareholders 29.8% 30.8% 30.5% 30.8% 30.7% 0.5800 LBRD Series C Implied Voting Control for GLIB Shareholders 3 LBRD Series C Unaffected Share Price 4 GLIB Series A Unaffected Share Price 4 4.5% 4.5% 4.5% 4.5% 4.5% Value of Proposal as of 6/29/20 $124.98 $124.98 $124.98 $124.98 $124.98 $67.05 $67.05 $67.05 $67.05 $67.05 shares (non-voting) for 1 GLIB Series A share (1 vote); 0.5800 LBRD Series B shares (10 votes) for 1 GLIB Series B share (10 votes) Details on Page 6 Proposal Exchange Ratio 0.557x 0.585x 0.575x 0.585x 0.580x Implied GLIB Series A Offer Price $69.67 $73.11 $71.86 $73.11 $72.49 Purchase Premium to GLIB (6/29/20) (%) 3.9% 9.0% 7.2% 9.0% 8.1% Purchase Premium to GLIB (6/29/20) ($) $283 $656 $521 $656 $589 2 Implied GLIB FDSO 106.7 106.8 106.7 106.8 106.7 Implied GLIB Purchase Price (6/29/20) $7,432 $7,806 $7,670 $7,806 $7,738 Premium / (Discount) to Pre-tax NAV (%) 5 5 (11.2%) (6.7%) (8.3%) (6.7%) (7.5%) Premium / (Discount) to Post-tax NAV (%) 10.4% 15.9% 13.9% 15.9% 14.9% Source: FactSet (6/29/20), Company filings 1.Reflects closing price of securities one day prior to proposal date 2.Calculated using treasury stock method with implied GLIB Series A offer price; includes GLIB Series A and Series B 3.Voting interest relates to 1/3 vote per share attributable to holders of GLIB series A redeemable preferred 4.Reflects closing price as of 6/29/20 5. Represents the average of low and high of GLIB net asset value pre-tax and post-tax on Page 16, with GCI value range of $2.5bn - $3.0bn and Evite value range of $18mm-35mm |
![]() |
Liberty Broadband Proposal Unaffected Notional Value for GLIB Equity As of 6/29/20 ($ in millions) GLIB Series A LBRD Series C Share Price (6/29/20) $124.98 Proposal Exchange Ratio for LBRD Series C 0.5800x Implied GLIB Series A Offer Price $72.49 Implied GLIB Series A Purchase Premium (%) 8.1% Implied GLIB Series A FDSO 1 102.0 Implied GLIB Purchase Price for GLIB Series A Shares $7,392 GLIB Series B LBRD Series B Share Price (6/29/20) $124.00 3 Proposal Exchange Ratio for LBRD Series B 0.5800x 3 Implied GLIB Series B Offer Price $71.92 2 Implied GLIB Series B FDSO 4.8 Implied GLIB Purchase Price for GLIB Series B Shares $342 Implied Unaffected Notional GLIB Purchase Price as of 6/29/20 $7,735 Premium / (Discount) to Post-tax NAV (%) 4 4 14.9% Premium / (Discount) to Pre-tax NAV (%) (7.5%) Source: FactSet (6/29/20), Company filings Note: Voting interest assumes exercise of all stock options by Liberty Management 1.Calculated using treasury stock method with implied GLIB Series A offer price 2.Calculated using treasury stock method with implied GLIB Series B offer price 3.Unaffected closing price notional value for Series B shares indicated. Note that due to lack of liquidity and trading volume in LBRD Series B shares (average daily trading volume of less than 50 shares based on average daily trading volume for last 30 days), the implied consideration to be received by GLIB Series B shareholders should also be assessed by considering the value of the LBRD Series C shares which are highly liquid publicly traded shares 4. Represents the average of low and high of GLIB net asset value post-tax on Page 16, with GCI value range of $2.5bn - $3.0bn and Evite value range of $18mm-35mm |
![]() |
Liberty Broadband Proposal: Pro Forma Ownership Summary Pro Forma Statistics as of Unaffected Date (6/29/20) ($ in millions) Standalone Statistics LBRD Series C LBRD Series B LBRD Series A Pro Forma Statistics: LBRD Series C Issued to GLIB Series A; LBRD Series B Issued to GLIB Series B Source: FactSet (6/29/20), Company filings Note: Voting interest assumes exercise of all stock options by Liberty Management 1. Excludes float of 31.5% Series C shares held by GCI Liberty and not traded 2. Excludes new LBRD preferred shares issued for GLIB preferred shares 3. As proposed, it is contemplated that Mr. Malone would agree to receive shares of Liberty Broadband Series C common stock in l ieu of an equal number of shares of Liberty Broadband Series B common stock he would be entitled to receive in the Potential Combination such that Mr. Malone would have beneficial ownership of not more than approximately 4 9% of Liberty Broadband’s aggregate outstanding voting power (“Target Voting Power”) immediately following the closing (which is equal to the aggregate voting power in Liberty Broadband beneficially owned by Mr. Malone). M r. Malone would also have the right to exchange such shares of Liberty Broadband Series C common stock for Liberty Broadband Series B common stock, on a one-for-one basis, to preserve his Target Voting Power following the occurrence of any voting dilution events. Upon certain fundamental events, including certain mergers, split-or spin-offs, rights offerings and dividends, Mr. Malone will be entitled to certain economic rights associated with the shares of Liberty Broadband Series B common stock he otherwise would have received in the Potential Combination. Voting interest assumes exercise of all stock options by Liberty Management and exchange of all shares of Libert y Broadband Series C common stock for Liberty Broadband Series B common stock by John Malone 4. Voting interest relates to Series B shares issued to John Malone, Greg Maffei and their affiliates and public, and 1/3 vote per share attributable to holders of GLIB Series A redeemable preferred 5. Voting interest relates to 1/3 vote per share attributable to holders of GLIB Series A redeemable preferred |
![]() |
GLIB Series A / LBRD Series C Exchange Ratio (3/12/18 – 6/29/20) Based on Market Value GLIBA Average Share Price LBRDK Average Share Price Exchange Ratio AveragePremium / (Discount) Favorable 0.80x 0.70x LBRD Proposal (6/28/20) $72.49 NA 0.580x NA Unaffected (6/29/20) 67.05 124.98 0.536x 8.1% Last Week 67.07 125.65 0.534x 8.7% Last Month 68.99 130.84 0.527x 10.0% Last 3 Months 63.75 125.01 0.510x 13.8% Last 6 Months 66.13 125.07 0.527x 10.0% Last 1 Year 65.72 117.69 0.560x 3.6% Last 2 Years 58.33 101.69 0.577x 0.6% Since Inception (3/12/18) 56.88 98.55 0.581x (0.1%) to GLIB 0.60x Exchange Ratio 0.580x 0.536x 0.50x 0.40x Mar-18Jun-18Sep-18Dec-18Mar-19Jun-19Sep-19Dec-19Mar-20Jun-20 Favorable to LBRD Source: FactSet Note: LBRD proposal also implies GLIB Series B offer price of $71.92 as of 6/29/20 |
![]() |
GLIB Series A / LBRD Series C Exchange Ratio (3/12/18 – 6/29/20) Based on Market Value Less Market Value of LTREE on Taxed Basis1 Favorable to GLIB LBRDK Average Share Price GLIBA Average Share Price 2 LTREE Average Share Price Adj. GLIBA Average Share Price Exchange Ratio Average Premium / (Discount) LBRD Proposal (6/28/20) NA $72.49 NA $65.56 0.525x NA Unaffected (6/29/20) 124.98 67.05 272.75 60.24 0.482x 8.8% Last Week 125.65 67.07 278.30 60.13 0.479x 9.6% Last Month 130.84 68.99 277.17 62.11 0.474x 10.6% Last 3 Months 125.01 63.75 238.70 57.62 0.461x 13.7% Last 6 Months 125.07 66.13 263.11 59.57 0.475x 10.5% Last 1 Year 117.69 65.72 299.75 58.21 0.496x 5.8% Last 2 Years 101.69 58.33 293.02 51.04 0.504x 4.1% Since Inception (3/12/18) 98.55 56.88 293.10 49.63 0.505x 3.8% 0.70x 0.60x 0.50x Adjusted Exchange Ratio 0.525x 0.482x 0.40x Mar-18 Jun-18 Sep-18 Dec-18 Mar-19 Jun-19 Sep-19 Dec-19 Mar-20 Jun-20 Source: FactSet Favorable to LBRD Note: Exchange ratio is calculated as GLIB Series A adjusted share price after impact from LendingTree divided by LBRD Series C share price; GLIB and LendingTree’s historical basic shares outstanding per FactSet; assumes diluted shares constant per 6/29/20; LBRD proposal also implies GLIB Series B offer price of $71.92 as of 6/29/20 1.Assumes 27% effective tax rate for LendingTree and cost basis of $198mm per GLIB management guidance; does not assume the usage of tax attributes to offset gains payable 2.Represents GLIBA average share price after LendingTree impact (GLIB average share price adjusted for proportional share of LendingTree share price post-tax) |
![]() |
GLIB Historical Share Price Performance GLIB Series A Share Price $90.00 $80.00 $70.00 Public Exchange Ratio Announcement (Unaffected as of 6/29/20) Notional Value of Proposal as of 6/29/20 $72.49 1 Notional Value of Proposal as of 8/3/20: $81.37 2 Market Value as of 8/3/20: $80.03 $60.00 $50.00 Market Value as of 6/29/20 $67.05 $40.00 $30.00 Source: FactSet 1.$72.49 share price represents the implied GLIB Series A offer price on a fully diluted basis as of 6/29/20 from LBRD proposal 2.$81.37 share price represents the implied GLIB Series A offer price on a fully diluted basis as of 8/3/20 from LBRD proposal |
![]() |
Trading Performance Since 6/29/20 ($ in millions, except per share data) Proposal Summary (Notional Value)Share Price Reaction Unaffected 1-Day Current 19.4% (6/29) (6/30) (8/3) Exchange Ratio 0.580x 0.580x 0.580x LBRD Series C Share Price $124.98 $123.96 $140.29 12.2% 3.4% 6.1% 8.5% 8.5% 15.8% 7.9% Implied GLIB Series A Offer Price $72.49 $71.90 $81.37 Implied GLIB Series A Purchase Premium (%) 8.1% 1.1% 1.7% (0.8%) 0.0% 1.5% 0.2% 44 Implied GLIB Series A FDSO 1 102.0 102.0 102.1 LBRD Series C LBRD Series B GLIB Series A GLIB Series B Charter S&P 500 Implied GLIB Purchase Price for GLIB Series A Shares $7,392 $7,331 $8,305 LBRD Series B Share Price $124.00 $124.00 $128.24 Implied GLIB Series B Offer Price $71.92 $71.92 $74.38 Implied GLIB Series B Purchase Premium (%) (1.2%) (1.2%) 2.2% 1 Day (6/30) Since Exchange Ratio Announcement Unaffected (6/29) $124.98 $124.00 $67.05 $67.10 $509.22 3,053 1 Day (6/30) $123.96 $124.00 $71.12 $72.80 $510.04 3,100 Current (8/3) $140.29 $128.24 $80.03 $72.80 $589.70 3,295 Implied GLIB Series B FDSO 2 4.8 4.8 4.8 Illustrative Merger Spread5 Implied GLIB Purchase Price for GLIB Series B Shares $342 $342 $357 Implied GLIB Purchase Price $7,735 $7,674 $8,662 3.0% Net Debt (6/30/20) 3 $3,192 $3,192 $3,192 2.0% 1.7% Total Enterprise Value $10,926 $10,865 $11,854 1.0% 1.1% Source: FactSet 1. Calculated using treasury stock method with implied GLIB Series A offer price6/30/20 7/5/20 7/11/20 7/17/20 7/22/20 7/28/20 8/3/20 2. Calculated using treasury stock method with implied GLIB Series B offer price 3. Includes the 1.75% exchangeable senior debentures valued on a trading value basis as of 6/30/20; book value as of 6/30/20 of $477mm 4. Average daily trading volume fewer than 100 shares 5. Calculated as (0.580 proposal exchange ratio times LBRD Series C share price Minus GLIB Series A share price) / GLIB Series A share price 0.0% |
![]() |
Implied Premium / (Discount) for LBRD Shares within GLIB (6/29/20 – Unaffected) Implied valuation of LBRD from LBRD Proposal at different GCI valuations ($ in millions, except per share data) Purchase Equity and Enterprise Value Calculation Proposal Equity Value for GLIB $7,735 GLIB Purchase Premium $585 GLIB Series A Purchase Premium / Share $5.44 GLIB Series B Purchase Premium / Share $4.82 (+) Net Debt (6/30/20)1 $3,192 Proposal Enterprise Value for GLIB $10,926 Implied Valuation of LBRD from LBRD Proposal Assets Scenarios with Different GCI Value Range Proposal Enterprise Value for GLIB $10,926 $10,926 $10,926 $10,926 $10,926 $10,926 $10,926 Less: GCI Value Range 2 Less: Evite at Mid-point Value3 ($2,500) ($2,600) ($2,700) ($2,750) ($2,800) ($2,900) ($3,000) (27) (27) (27) (27) (27) (27) (27) Less: LendingTree (Post-tax) (799) (799) (799) (799) (799) (799) (799) Less: Charter at Look-through Price within LBRD 4 Less: NPV of Federal and Alaska State NOLs 5 Plus: NPV of Capitalized Corporate Expense 5 Less: NPV of RHC FY16-19 Settlement 5,6 (2,368) (2,368) (2,368) (2,368) (2,368) (2,368) (2,368) (134) (134) (134) (134) (134) (134) (134) 471 471 471 471 471 471 471 (114) (114) (114) (114) (114) (114) (114) Implied Value of LBRD Shares from Proposal $5,454 $5,354 $5,254 $5,204 $5,154 $5,054 $4,954 Value of LBRD Shares (Pre-tax) (6/29/20) $5,334 $5,334 $5,334 $5,334 $5,334 $5,334 $5,334 Implied Premium / (Discount) on Pre-tax LBRD 2.3% 0.4% (1.5%) (2.4%) (3.4%) (5.2%) (7.1%) Less: Potential Tax Leakage to GLIB in Taxable Sale (792) (792) (792) (792) (792) (792) (792) Value of LBRD Shares (Post-tax) (6/29/20) $4,542 $4,542 $4,542 $4,542 $4,542 $4,542 $4,542 % Deferred Tax Savings Delivered to GLIB 100.0% 100.0% 89.9% 83.6% 77.3% 64.7% 52.0% Implied Accretion / Dilution to LBRD NAV (%) (0.2%) 0.1% 0.5% 0.6% 0.8% 1.1% 1.5% Source: Company filings, FactSet (as of 6/29/20) 1.Net debt includes the 1.75% exchangeable senior debenture valued on a trading value basis of $657mm as of 6/30/20; book value as of 6/30/20 of $477mm; Includes preferred instrument of $178mm and finance lease and tower obligations of $100mm 2.GCI TEV range informed from trading comparable analysis, precedent transactions and discounted cash flow valuation analyses 3.Assumes the mid-point of Evite’s value based on DCF analysis with terminal range of 1.25x to 2.25x 4.Charter share price as of 6/29/20 is $509.22, which results in look-through price within LBRD of $441.93; Calculated as (LBRD Equity Value as of 6/29/20 Plus Net Debt Plus NPV of corporate expense Minus the mid-point of Skyhook valuation) divided by 54.1mm Charter shares within LBRD 5.Based on GLIB management projections 6. Assumes 0.12% discount rate for RHC FY16-19 Settlement impact based on 1-year treasury rate on 8/3/20 |
![]() |
Pro Forma LBRD NAV (Accretion / Dilution) Analysis (6/29/20 – Unaffected) Based on LBRD Proposal ($ in millions, except per share data) Pro Forma LBRD NAV (Accretion / Dilution) Analysis under Different GCI Value Range LBRD Pro Forma Net Asset Value LBRD Assets Source: FactSet (as of 6/29/20) Note: For illustrative purposes, we have analyzed the transaction assuming stock consideration; Charter valued at share price of $509.22 as of 6/29/20 on a pre-tax basis and LendingTree valued on a post-tax basis 1.Excludes new LBRD preferred shares issued for GLIB preferred shares 2.Assumes the mid-point of Skyhook’s value based on DCF analysis with terminal range of 1.5x to 3.5x 3.GCI TEV range informed from trading comparable analysis, precedent transactions and discounted cash flow valuation analyses 4.Assumes the mid-point of Evite’s value based on DCF analysis with terminal range of 1.25x to 2.25x 5.Includes transaction expenses after 6/30/20 6.Assumes 0.12% discount rate for RHC FY16-19 Settlement impact based on 1-year treasury rate on 8/3/20 7.Includes $178mm preferred stock and 1.75% exchangeable senior debenture valued on a trading value basis of $657mm as of 6/30/20; book value as of 6/30/20 of $477mm; includes finance lease and tower obligation of $100mm 8.Assumes the mid-point of $3-5mm annual run-rate synergies at 6.75% WACC, 4% perpetuity growth rate and 24% LBRD effective tax rate, per GLIB management guidance 9.Calculated using treasury stock method |
![]() |
GLIB Preferred Stock Rollover Considerations ($ in millions) A rollover of GLIB Preferred Stock into an instrument with the same economic terms at LBRD may be beneficial to Preferred Stockholders as the pro forma company has a greater scale, trading liquidity, improved credit profile and has a greater proportion of its value in highly liquid tradeable securities Equity ValueDebt / Capitalization1 $28,259 34% $7,149 GLIB (Unaffected) Pro forma LBRD (Current) 13% GLIB (Unaffected)Pro forma LBRD (Current) Cash & Cash Equivalents (6/30/20)Net Debt / Capitalization1 $552 $569 29% 12% GLIB (Unaffected) Pro forma LBRD (Current) GLIB (Unaffected) Pro forma LBRD (Current) Source: FactSet, company filings Note: Pro forma LBRD assumes 0.580 LBRD Series C shares for 1 GLIB Series A Shares; 0.5800 LBRD Series B Shares for 1 GLIB Series B Shares; unaffected as of 6/29/20 and current as of 8/3/20 1.Includes GLIB preferred shares and values senior exchangeable debentures valued on a trading value basis of $657mm as of 6/30/20; book value as of 6/30/20 of $477mm |
![]() |
II.GLIB Financial Analysis |
![]() |
GLIB Corporate Structure Overview ($ in millions, except per share data) Corporate Structure1Relative Valuation Liberty Management's O/S of LBRD Common Share Price Series A Series B Series C Diluted Shares Outstanding Series A Series B Series C Fully Diluted Shares Outstanding Unaffected (6/29/20) Current (8/3/20) GLIB LBRD GLIBLBRD $67.05 $122.76 67.10 124.00 - 124.98 101.9 26.5 4.7 2.5 - 154.0 5106.6 182.9 $80.03$137.82 72.80128.24 -140.29 102.126.5 4.82.5 -154.1 106.8183.1 Equity Value $7,149 $22,802 $8,515$25,585 Plus: Debt (6/30/20) 3,565 6574 Less: Cash (6/30/20) (552) (17) Net Debt without Preferred Stock $3,014 $556 Plus: Preferred Stock (6/30/20) 178 - Net Debt with Preferred Stock $3,192 $556 3,565 6574 (552) (17) $3,014$556 178-$3,192$556 Total Enterprise Value $10,341 $23,359 $11,707$26,142 Voting Control 2 2 49.9% Voting Control 2 35.6% Economic Ownership5.0% Economic Ownership 2 5.7% Liberty Management 23.3% 2.2%3 100.0% 100.0% 4 22.4% 100.0% MEV: $123.1bn TEV: $199.3bn 22.3% MEV: $4.2bn TEV: $4.1bn Indicates Publicly Traded Company Source: FactSet, Company Filings Note: Unless otherwise stated, all ownership figures are from the files shared by Liberty management; Shares for LBRD and GLIB include restricted shares, RSUs and beneficial ownership of shares that may be acquired upon exercise of stock options. Economic ownership treats options using treasury stock methodology 1.MEV and TEV are as of 6/29/20 (unaffected date) 2.Voting and economic ownership as of 6/29/20 (unaffected date); Basic shares, options and RSUs are sourced from the file shared by Liberty management on 6/28/20; Liberty Management refers to John Malone and Greg Maffei 3.Calculated as 5.4mm shares divided by the total number of Charter shares outstanding (241.8mm shares as of 6/29/20); 5.4mm shares as of 6/30/20 per GLIB management. Shares are subject to proxy held by LBRD 4.Advance/Newhouse Partnership granted LBRD 5 year irrevocable proxy to vote number of shares necessary to bring LBRD’s voting power to 25.01% (after giving effect to GLIB proxy), subject to cap of 7%. As of 6/30/20, no A/N shares are included as 25.01% cap is met by LBRD shares or GLIB proxy 5.Includes RSUs and options based on treasury stock method 6.Includes finance leases and tower obligations of $100mm; includes the 1.75% exchangeable senior debentures valued on a trading value basis of $657mm as of 6/30/20; book value as of 6/30/20 of $477mm |
![]() |
Sum-of-the-Parts Valuation of GLIB (6/29/20 – Unaffected) Assuming public assets at trading value ($ in millions, except per share data) Publicly Traded Securities Portfolio Share Price Company Name Shares (mm) (6/29/20) Untaxed Value Taxed Value Private Assets Company Name Total Enterprise Value Low High Low High 1 Evite $18 $35 $18 $35 GCI 2 2,500 3,000 2,500 3,000 Total Private Portfolio Asset Value $2,518 $3,035 $2,518 $3,035 Financial Assets & Liabilities (as of 6/30/20) Total Cash Total GCI Debt 3 LBRDK Margin Loan 1.75% Exchangeable Senior Debenture Due 2046 4 Indemnification Obligation Cumulative Redeemable Preferred Stock Less: Net Debt Less: NPV of GLIB Corporate Expense Plus: NPV of Federal and Alaska State NOLs Plus: NPV of RHC FY16-19 Settlement 5 $552 (1,394) (1,300) (657) (215) (178) ($3,192) (471) 134 114 Net Asset Value $8,107 $8,624 $6,474 $6,990 Source: Share prices per FactSet (as of 6/29/20), GLIB management, Wall Street Research Note: Assumes 6.75% WACC for NPV calculations; assumes 27% tax rate for Evite and GLIB corporate expense and 28% tax rate for GCI per GLIB management guidance; LBRD tax leakage of $792mm, Charter tax leakage of $701mm and LendingTree tax leakage of $140mm at 27% tax rate per GLIB management guidance 1.Assumes Evite’s value based on DCF analysis with terminal revenue multiple range of 1.25x to 2.25x 2.GCI TEV selected range is informed from trading comparables analysis, precedent transactions and discounted cash flow valuation analyses 3.Includes finance leases and tower obligation of $100mm 4.The 1.75% exchangeable senior debenture valued on a trading value basis as of 6/30/20; book value as of 6/30/20 of $477mm 5.Assumes 0.12% discount rate for RHC FY16-19 settlement impact based on 1-year treasury rate on 8/3/20 |
![]() |
GCI Financial Profile ($ in millions) Revenue Breakdown Financial Summary1Revenue by Segment 2019A '19A-'23E 2019A 2020E 2021E 2022E 2023E CAGR Voice 6% Wireless $261 $257 $265 $272 $280 1.8% % growth (0.8%) (1.4%) 3.0% 2.8% 3.0% Data 458 496 502 524 532 3.8% % growth 1.6% 8.2% 1.2% 4.5% 1.5% Vide 12% 30% Video 2 102 93 75 63 59 (13.1%) % growth (8.3%) (9.4%) (19.2%) (16.4%) (6.5%) Voice 53 58 55 52 49 (2.3%) % growth (7.7%) 8.2% (5.5%) (5.5%) (5.8%) Total Revenue $875 $903 $896 $911 $920 1.3% % growth (1.0%) 3.3% (0.8%) 1.7% 1.0% Gross Margin Wireless $192 $187 $192 $201 $207 2.0% % Margin 73.5% 72.8% 72.5% 73.8% 73.8% Data 381 420 430 447 456 4.6% % Margin 83.2% 84.8% 85.7% 85.3% 85.7% Video 37 39 32 33 28 (6.9%) % Margin 35.9% 41.9% 42.6% 52.4% 47.4% Voice 46 50 47 44 41 (3.1%) % Margin 87.0% 86.5% 86.1% 85.3% 84.4% Total Gross Margin $656 $696 $701 $725 $732 2.8% % margin 75.0% 77.1% 78.2% 79.6% 79.6% Data 52% Gross Margin by Segment 2019A Voi Video 7% Wireles s 29% Adj. EBITDA 3 $257 $3144 $311 $326 $333 6.7% % margin 29.4% 34.7% 34.7% 35.9% 36.2% Capex (147) (135) (130) (125) (120) % of revenue 16.8% 14.9% 14.5% 13.7% 13.0% Adj. EBITDA - Capex $110 $179 $181 $202 $213 18.0% % of revenue 12.6% 19.8% 20.2% 22.2% 23.2% Source: GCI Management (2020 Budget Presentation 3/6/20 and GCI July 2020 Update) 1.Financials for 2020 onwards reflect DMH sale, except gross margin 2.Video business segment includes DMH revenue 3.Excludes stock based compensation expense Data 58% 4. 2020E EBITDA pro forma for DMH sale is $314mm without stock based compensation and $307mm with stock based compensation |
![]() |
Valuation on a cash / debt free basis; does not include RHC FY16-FY19 receivables settlement $5.000 ($ in billions) $4.000 $3.000 $3.082 $2.899 $3.401 $3.296 $2.000 $2.623 $2.444 $2.665 $2.243 $1.000 $0.000 Key Metrics / Assumptions Implied TEV / 1 2020E EBITDA Trading Analysis (2020E EBITDA) 1 TEV / 2020E EBITDA of 8.5x to 10.0x 8.5x - 10.0x Trading Analysis (2021E EBITDA) 2 TEV / 2021E EBITDA of 8.0x to 9.5x 7.9x - 9.4x Precedent Transactions 3 TEV / LTM EBITDA of 9.0x to 11.5x 8.6x - 11.0x Discounted Cash Flow WACC range of 6.25% to 7.25%; Perpetuity Growth Rate of 1.5% to 2.5% 7.3x - 10.7x Source: GLIB Management Note: All valuation methodologies are pro forma for the DMH sale proceeds of $17mm 1.PF 2020E EBITDA for DMH sale and net of stock-based compensation is $307mm per GLIB management forecast 2.PF 2021E EBITDA for DMH sale and net of stock-based compensation is $303mm per GLIB management forecast 3. PF LTM EBITDA for DMH sale and net of stock-based compensation as of 6/30/20 is $294mm |
![]() |
Evite Valuation Analysis Valuation as of 6/30/20; using mid-year discounting ($ in millions) Financial SummarySelected Internet Trading Comps 2018A 2019A 2020E 2021E Revenue $24 $25 $13 $20 % Growth 0.4% 5.0% (49.4%) 60.6% EBITDA ($2) ($5) ($10) $2 % Margin (8.7%) (17.9%) (77.4%) 9.0% 5.3x TEV / 2020E Revenue TEV / 2021E Revenue (-) Taxes at 27% 1 1 1 3 (0) NOPAT ($2) ($3) ($7) $1 (-) Capex ($3) ($1) ($1) ($0) % Revenue 13.9% 5.8% 7.8% 2.3% (+/-) Changes in WC 1 1 2 (1) Unlevered FCF ($4) ($4) ($6) $0 % Revenue NM NM NM 1.1% Discounted Cash Flow Analysis for Evite DCF-based Unlevered FCF ($3) $0 Discount Period 0.25 1.00 Discount Factor 3 0.97 0.88 PV of Unlevered FCF (3) 0 NPV of Projected Cash Flow ($3) 4.2x 3.1x 4.3x 4.1x 2.5x 1.8x 2.9x 1.6x1.6x 2.2x 2.0x Assumed Exit Multiple Terminal Revenue$20$20 Selected Terminal Revenue Range 2 1.25x2.25x TEV / '20E Revenue 1.44x 2.76x TEV / '21E Revenue 0.90x 1.72x Source: Evite Management, FactSet (8/3/20), Wall Street Research 1. 27% tax rate based on GLIB management guidance; assumes available profits at GCI to offset Evite losses 2. Selected based on selected Internet trading comps’ revenue multiples EBITDA Margin 2020(2.4%)11.3%(7.0%)9.0%N.M.26.7% 3. Assumes 14% WACC based on selected Internet trading comps WACC analysis |
![]() |
GLIB Corporate Expense Valuation as of 6/30/20; using mid-year discounting ($ in millions) 2018A 2019A 2020E 2021E 2022E 2023E Personnel ($0.3) ($1.5) Legal (6.8) (2.9) Audit (3.9) (1.7) SEC Filing Printing (0.4) (0.1) Stockholder Expense (0.4) (0.2) Deal Costs (0.5) (0.0) Investor Relations (0.6) (0.4) Treasury Expense (0.0) (0.1) Misc. Operating Expenses (0.2) (0.2) General & Administrative (3.5) (2.9) Total Expense - Pre-Allocation ($16.5) ($10.0) Allocation of Rent ($0.8) ($0.3) Allocation of Services (5.3) (7.0) Assumes mid-point of 3-5% YoY growth rate on total corporate expenses starting 20211 and 0% YoY growth rate on stock based compensation starting 2022 per GLIB management guidance Total Corporate Expenses ($22.7) ($17.3) ($21.4) ($17.0) 1 ($17.6) ($18.4) Stock Based Compensation ($22.1) ($10.0) ($7.0) ($8.5) ($8.5) ($8.5) Net Impact ($44.8) ($27.3) ($28.4) ($25.5) ($26.1) ($26.8) (-) Taxes at 27% 2 12.1 7.4 7.7 6.9 7.1 7.2 Net Impact Post Tax ($32.7) ($19.9) ($20.7) ($18.6) ($19.1) ($19.6) NPV of GLIB Corp. Expense Q3-Q4'2020E 2021E 2022E 2023E Terminal Corporate Expense Plus SBC (Post Tax) ($8.4) ($18.6) ($19.1) ($19.6) ($19.6) Discount Period 0.25 1.00 2.00 3.00 3.00 Discount Factor 0.98 0.94 0.88 0.82 0.82 Terminal Year Corp. Expense and SBC ($501.4)3 PV of Corp. Expense and SBC ($8.2) ($17.4) ($16.7) ($16.1) ($412.2) NPV of Corp. Expense and SBC at 6.75% WACC ($470.7) Source: GLIB Management 1.Applies 4% growth rate to 2020E normalized pre-tax corporate expense of $16.3mm, excluding $5mm one-time cost in Q2’2020 2.27% Tax rate based on GLIB management guidance; assumes available profits at GCI to offset corporate expenses 3.Assumes 6.75% WACC and 2.7% weighted average perpetuity growth rate based on 2023E stock based compensation growth at 0% and total corporate expenses growth at midpoint of 3-5% per GLIB management guidance |
![]() |
III.LBRD Financial Analysis |
![]() |
LBRD Corporate Structure Overview Corporate Structure1 LBRD Total Enterprise Value Liberty Management's O/S of LBRD Unaffected (6/29/20) Current (8/3/20) Common Share Price Series A $122.76 $137.82 Series B 124.00 128.24 Series C 124.98 140.29 Series A 26.5 26.5 Series B 2.5 2.5 Series C 154.0 154.1 Fully Diluted Shares Outstandi g 5182.9 183.1 Equity Value $22,802 $25,585 Plus: Debt (6/30/20) 574 574 Less: Cash (6/30/20) (17) (17) Net Debt $556 $556 Total Enterprise Value $23,359 $26,142 Voting Control 2 2 49.9% Voting Control 2 35.6% Economic Ownership5.0% Economic Ownership 2 5.7% Liberty Management Diluted Shares Outstanding 23.3% 4 22.4% 2.2%3 100.0%n 100.0% 100.0% MEV: $123.1bn TEV: $199.3bn 22.3% MEV: $4.2bn TEV: $4.1bn Indicates Publicly Traded Company Source: FactSet, Company Filings Note: Unless otherwise stated, all ownership figures are from the files shared by Liberty management; Shares for LBRD and GLIB include restricted shares, RSUs and beneficial ownership of shares that may be acquired upon exercise of stock options. Economic ownership treats options using treasury stock methodology 1.MEV and TEV are as of 6/29/20 (unaffected date) 2.Voting and economic ownership as of 6/29/20 (unaffected date); Basic shares, options and RSUs are sourced from the file shared by Liberty management on 6/28/20; Liberty Management refers to John Malone and Greg Maffei 3.Calculated as 5.4mm shares divided by the total number of Charter shares outstanding (241.8mm shares as of 6/29/2020); 5.4mm shares as of 6/30/20 per GLIB management. Shares are subject to proxy held by LBRD 4.Advance/Newhouse Partnership granted LBRD 5 year irrevocable proxy to vote number of shares necessary to bring LBRD’s voting power to 25.01% (after giving effect to GLIB proxy), subject to cap of 7%. As of 6/30/20, no A/N shares are included as 25.01% cap is met by LBRD shares or GLIB proxy. 5.Includes RSUs and options based on treasury stock method |
![]() |
Sum-of-the-Parts Valuation of LBRD (6/29/20 – Unaffected) Assuming public assets at trading value ($ in millions) LBRD Net Asset Value Publicly Traded Securities Portfolio Share Price Company Name Shares (mm) (6/29/20) Untaxed Value Taxed Value Charter54.1$509.22 Total Publicly Traded Portfolio Asset Value $27,564 $27,564 $22,833 $22,833 Private Assets Source: FactSet (as of 6/29/20), LBRD management, Wall Street Research Note: Charter tax leakage of $4,731mm at 24% tax rate per page 29 of the appendix 1.Assumes Skyhook’s value based on DCF with terminal multiple range of 1.5x to 3.5x 2.Calculated as LBRD Equity Value as of 6/29/20 plus Net Debt minus the mid-point of Skyhook valuation plus NPV of LBRD Corporate Expense, divided by 54.1mm Charter shares within LBRD |
![]() |
Charter Standalone Financial Summary Financial Overview 2019A 2020E 2021E 2022E 2023E 2024E 2025E CAGR $650 ($ in millions, except per share data) Historical Share Price Performance Unaffected Total Revenue $45,764 $47,423 $49,559 $52,378 $55,257 $57,771 $60,024 4.6% % Growth 4.9% 3.6% 4.5% 5.7% 5.5% 4.6% 3.9% Adj. EBITDA $16,855 $17,868 $19,025 $20,811 $22,443 $23,464 $24,379 6.3% % Growth 5.0% 6.0% 6.5% 9.4% 7.8% 4.6% 3.9% % Margin 36.8% 37.7% 38.4% 39.7% 40.6% 40.6% 40.6% Capex ($7,195) ($6,927) ($6,994) ($7,149) ($7,390) ($7,726) ($8,028) 1.8% % of Revenue 15.7% 14.6% 14.1% 13.6% 13.4% 13.4% 13.4% Adj. EBITDA - Capex $9,660 $10,941 $12,031 $13,662 $15,053 $15,738 $16,351 9.2% % of Revenue 21.1% 23.1% 24.3% 26.1% 27.2% 27.2% 27.2% $550 $450 $350 $250 (6/29/20) $509.22 $589.70 Less: Interest Expense (3,963) (3,945) (4,099) (4,369) (4,714) (4,996) (5,216) Less: Cash Taxes (71) (50) (267) (1,845) (2,135) (2,232) (2,319) 1 Less: NWC / Other (1,018) (599) (198) (226) (275) (333) (388) LFCF $4,608 $6,347 $7,466 $7,222 $7,928 $8,176 $8,429 10.6% % Margin 10.1% 13.4% 15.1% 13.8% 14.3% 14.2% 14.0% 2 Less: Share Repurchase (6,873) (6,861) (12,332) (14,765) (14,813) (12,466) (12,268) $150 8/2/1812/26/185/21/1910/15/193/9/208/3/20 Public Market Overview Less: Other Financing Activities (1,136) 3 4 (492) (50) 4 (50) 4 (50) 4 (50) 4 Current Share Price 8/3/20 $589.70 FDSO 5 238.6 Equity Value $140,676 LFCF Post Share Repurchase ($3,401) ($1,006) ($4,916) ($7,593) ($6,935) ($4,340) ($3,889) Total Debt $78,416 $77,494 $81,355 $88,947 $95,882 $100,222 $104,112 Less: Cash ($3,483) ($1,555) ($500) ($500) ($500) ($500) ($500) Net Debt $74,933 $75,939 $80,855 $88,447 $95,382 $99,722 $103,612 Less: Cash & Equivalents (6/30/20) (2,097) Plus: Debt (6/30/20) 77,829 Total Enterprise Value $216,408 Metric Multiple Net Leverage 4.45x 4.25x 4.25x 4.25x 4.25x 4.25x 4.25x TEV / Adj. EBITDA 2020E $17,868 12.1x 2021E 19,025 11.4 NTM 18,495 11.7 1.NWC projections based on Wall Street research model assuming Charter trades at 11.7x NTM EBITDA and performs according to Wall Street consensus 3.Includes $885mm purchase of non-controlling interest and $154mm distributions of non-controlling interest 4.Assumes $0mm projected purchase of NCI; $150mm distribution of NCI and $100m proceeds from stock options each year 5.Includes common and preferred units held by Advanced/Newhouse Net Debt / LTM Adj. EBITDA $17,500 4.3x Company has provided long-term net leverage guidance of 4.0x – 4.5x |
![]() |
Illustrative implied equity value per share based on public information $900.00 Reference Data $846 $800.00 $735 $700.00 $600.00 $500.00 $590 1 Median: $620 $618 $600 $635 $491 $580 Current Share Price (8/3/20): $589.70 $400.00 $371 $425 $398 $374 $300.00 52-week High / LowAnalyst Price Targets Trading Analysis - EV / '20E EBITDA 2 Trading Analysis - EV/ '20E (EBITDA-Capex) 3 Precedent TransactionsDiscounted Cash Flow Key Metrics / High: 8/3/20 High: JP. Morgan (7/31/20) TEV / 2020E EBITDA of TEV / 2020E (EBITDA - TEV / LTM EBITDA4of Assumptions Low: 3/20/20 Low: Barclays (7/31/20) 9.5x to 12.5x Capex) of 15.0x to 20.0x 11.0x to 13.0x 6.5%; Terminal Exit Multiple of 9.5x to 12.5x Implied TEV / 2020E EBITDA2 12.1x - 9.1x 9.9x - 14.1x 9.5x - 12.5x 9.2x - 12.2x 10.8x - 12.7x 11.9x - 15.5x Source: Company Filings and Wall Street Research 1.Median analyst price target per Bloomberg as of 8/3/20 2.2020E adjusted EBITDA of $17.9 billion per Wall Street Research 3.2020E capex of $6.9 billion per Wall Street Research |
![]() |
Valuation as of 6/30/20; using mid-year discounting ($ in millions) 2018A 2019A 2020E 2021E 2022E 2023E Personnel($0.2)($1.1) Legal(0.9) (5.3) Audit (0.5) (0.7) SEC Filing Printing (0.1) (0.1) Stockholder Expense (0.2) (0.2) Investor Relations (0.4) (0.3) Treasury Expense (0.2) (0.1) Misc. Operating Expenses (0.0) (0.0) General & Administrative (1.4) (1.5) Total Expense - Pre-Allocation ($3.8) ($9.4) Allocation of Rent ($0.2) ($0.2) Allocation of Services (2.7) (2.7) Assumes mid-point of 3-5% YoY growth rate on total corporate expenses starting 20211 and 0% YoY growth rate on stock based compensation starting 2022 per LBRD management guidance Total Corporate Expenses($6.7)($12.2)($18.2)($15.0)1 ($15.6)($16.2) Stock Based Compensation($5.7)($10.5)($7.9)($9.6)($9.6)($9.6) Net Impact($12.4)($22.7)($26.1)($24.5)($25.1)($25.7) NPV of LBRD Corp. Expense Q3-Q4'2020E 2021E 2022E 2023E Terminal 2 Discount Factor0.980.940.880.820.82 Terminal Year Corp. Expense and SBC($623.2) PV of Corp. Expense and SBC($11.6)($23.0)($22.0)($21.2)($512.3) NPV of Corp. Expense and SBC at 6.75% WACC($590.1) Source: LBRD Management 1.Applies 4% growth rate to 2020E normalized pre-tax corporate expense of $14.4mm, excluding $3.8mm one-time cost in Q2’2020 2.Assumes 6.75% WACC and 2.5% weighted average perpetuity growth rate based on 2023E stock based compensation growth at 0% and total corporate expenses growth at mid point of 3 – 5% per LBRD management |
![]() |
Skyhook Valuation Analysis Valuation as of 6/30/20; using mid-year discounting Financial Summary 2018A2019A2020E2021E2022E 6.1x 5.7x ($ in millions) Selected Integrated Solutions Comps TEV / 2020E Revenue evenue $221 $15 $17 $18 $19 % Growth 70.0% (33.2%) 15.9% 5.6% 6.0% EBITDA$3($5)($2)($2)($2) % Margin14.2%(31.7%)(13.3%)(12.4%)(12.4%) Capex($0)($0)($0)($0)($0) 4.8x 4.4x 4.4x 4.1x 1.1x 0.9x 5.1x TEV / 2021E Revenue 4.1x 2.1x 1.8x 0.9x 0.8x % Revenue0.2%3.4%0.1%0.3%0.3% Hexagon Garmin Trimble TomTom4 Inseego Topcon ORBCOMM EBITDA - Capex$3($5)($2)($2)($2) Less: Changes in WC 3 (0) (1) (0) 0 Unlevered FCF $7 ($5) ($4) ($3) ($2) % Revenue29.4%NMNMNMNM Discounted Cash Flow Analysis for Skyhook Q3-Q4'20E 2021E 2022E DCF-based Unlevered FCF($5)($3) ($2) Discount Period0.251.002.00 Revenue Growth '19 - '20 (4.3%) (2.5%) (8.6%) (16.1%) 36.6% (13.3%) (9.3%) '20 - '21 7.8% 7.1% 8.7% 11.0% 23.1% 12.2% 11.9% EBITDA Margin 2020 32.4% 25.5% 21.5% 5.4% 5.6% 10.5% 21.3% Selected Hardware / Modules Solutions Comps Discount Factor 3 0.970.890.80 TEV / 2020E Revenue PV of Unlevered FCF(5)(2)(2) NPV of Projected Cash Flow($9) Assumed Exit Multiple 1.3x 1.2x 0.7x 0.7x 1.3x 1.2x TEV / 2021E Revenue Terminal Revenue$19$19 0.5x 0.5x Selected Terminal Multiple Range 2 1.5x3.5x Terminal Value$29$67 u-bloxSierra Wireless 5CalAmp 5Telit Discount Factor 3 0.75x0.75x PV of Terminal Value $22 $51 Total TEV$13$42 1. Includes licensing revenue2020 11.7% (2.7%) 7.9% 11.3% 2. Selected based on the integrated solutions and hardware / modules trading comps’ revenue multiples 3. Assumes 12% WACC based on selected integrated solutions comps and hardware / modules solutions comps WACC analysis 4. Pro forma revenue for TomTom divestiture of TomTom Telematics BV to Bridgestone Corp. Revenue Growth EBITDA Margin |
![]() |
Appendix |
![]() |
GLIB NAV Analysis with LBRD Shares Valued Based on Trading Value and Charter Shares Valued at Look-through Price within LBRD Value as of Unaffected Date (6/29/20) ($ in millions, except per share data) GLIB Net Asset Value Publicly Traded Securities Portfolio Shares Share Price Only LTREE Post-LBRD and LTREE Company Name (mm) (6/29/20) tax Post-tax LBRD42.7$124.98$5,334$4,542 Charter Communications5.4441.93 1 2,3682,368 LendingTree3.4272.75799799 Total Publicly Traded Portfolio Asset Value$8,502$7,709 Hypothetical Value of Private Assets GCI2 Evite & Other 3 $2,750$2,750 2727 Total Private Portfolio Asset Value$2,777$2,777 Financial Assets & Liabilities Total Cash$552$552 Total GCI Debt 4 5 (1,394)(1,394) Total Corporate Level Debt(1,957)(1,957) Net Debt(2,799)(2,799) Other Financial Obligations6 (393)(393) Total Debt, Cash, Other Financial Assets and Liabilities($3,192)($3,192) Plus: Capitalized Corporate Expense($471)($471) Plus: NOL Carryforward Value134134 7 Plus: NPV of RHC FY19 Settlement on NWC114114 Total Net Asset Value$7,865$7,072 Source: Company filings, Wall Street Research, FactSet (as of 6/29/20) 1.Calculated as ($23bn LBRD market equity Plus Net Debt Minus the mid-point of Skyhook valuation Plus NPV of Corporate Expense) divided by 54.1mm shares held by Charter within LBRD 2.Assumes the mid-point of GCI TEV range informed from the average value of trading analysis, precedent transactions and discounted cash flow valuation analyses 3.Assumes the mid-point of Evite’s value based on DCF analysis with terminal range of 1.25x to 2.25x 4.Includes finance leases and tower obligation of $100mm 5.Includes the 1.75% exchangeable senior debenture valued on a trading value basis of $657mm as of 6/30/20; book value as of 6/30/20 of $477mm 6.Includes indemnity to Qurate Retail and preferred stock |
![]() |
LBRD NAV Analysis with Charter Shares Valued Based on Trading Value Value as of Unaffected Date (6/29/20) ($ in millions, except per share data) LBRD Net Asset Value Publicly Traded Securities Portfolio Shares Share Price Company Name (mm) (6/29/20) Untaxed Value Charter 54.1 $509.22 $27,564 Total Publicly Traded Portfolio Asset Value $27,564 Hypothetical Value of Private Assets 2 Diluted Shares 183.1 NAV Per LBRD Share $144.44 Source: Company filings, Wall Street Research, FactSet (as of 6/29/20) 1.Assumes the mid-point of Skyhook’s value based on DCF analysis with terminal range of 1.5x to 3.5x |
![]() |
Potential Tax Leakage Due to Public Market Securities Held by GLIB and LBRD Value as of Unaffected Date (6/29/20)($ in millions, except per share data) Potential Tax Leakage for GLIB Securities Share Price Value of Shares Potential Tax Leakage Security Total Shares Price per Share Cost Basis (6/29/20) (as of 6/29/20) Gain Tax Leakage per GLIB Share LBRD42.7$56.23$2,400$124.98$5,334$2,934$792$7.43 Charter5.424.79133509.222,7292,5967016.57 1 LendingTree3.457.50198272.759397411401.31 Potential Tax Leakage for LBRD Securities Share Price Value of Shares Tax Leakage Security Total Shares Price per Share Cost Basis (6/29/20) (as of 6/29/20) Gain Tax Leakage per LBRD Share Charter54.1$145.07$7,852$509.22$27,564$19,712$4,731$25.86 Source: Company filings and GLIB management, FactSet (as of 6/29/20) Note: Assumes 27% tax rate for tax leakage on LBRD, Charter and LendingTree per GLIB management guidance; assumes 24% tax rate for tax leakage on Charter per LBRD management guidance 1.Adjusted to reflect free-up of $222mm of interest carryforward per Section 163(j) assuming a 30% limit to adjusted taxable income |
![]() |
Illustrative GLIB Consolidated Financial Summary ($ in millions) Revenue '19A-'23E 2019A 2020E 2021E 2022E 2023E CAGR GCI$875 1 $903$896$911$9191.2% Evite251320335320.3% Total Revenue$900$916$916$943$9721.9% Adj. EBITDA GCI257314311327333 Evite(5)(10)235 Evercore Extrapolation6 GLIB Corporate 2,3 (17)(16) 4 (17) 2 (18)(18) Adj. EBITDA$235$288$296$312$3197.9% Capex GCI($147)($135)($130)($125)($120) Evite(1)(1)(0)(1)(1) Total Capex($148)($136)($130)($125)($121) Adj. EBITDA - Capex$87$152$166$187$19823.0% (-) Interest Expense(81)(96)(95)(97) (+ / -) Change in Working Capital2(1)--(+) RHC Impact on NWC 5 3482--(+) FCC Bidding Reserve Settlement (9)(9)--(+) Denali Media Sale Proceeds17 ---(-) Verizon Deferred Revenue Adjustments(4)(4) (4)(4) (-) Taxes - ---Levered Free Cash Flow$112$138$88$97 Dividends Paid on Preferred Stock(13)(13)(13)(13)(13) Debt (including Preferred Stock) 7 $3,533$3,285$3,279$3,273$3,267 Cash570355475544622 Net Debt$2,963$2,930$2,804$2,729$2,645 Source: GCI Management 1.Based on normalized financials from GCI management 2.Excludes stock-based compensation 3.Assumes 4% YoY growth rate on total corporate expenses starting 2021E per GLIB management guidance 4.Excludes transaction related costs of $5mm in Q2’2020 5.Includes GLIB’s RHC impact starting Q2’20 based on discussion with GLIB management 6.GLIB management has not prepared projections for Evite beyond 2021; calculated by Evercore based on 2021E figures provided by GLIB management and assuming a constant growth rate and Adj. EBITDA margin and approved for Evercore’s use by GLIB management 7. Includes the 1.75% exchangeable senior debenture valued on book value of $477mm |
![]() |
Illustrative GLIB Financial Profile RevenueAdj. EBITDA1 ($ in millions) $895 $895 $916 $897 $934 $896 $235 $288$296 $235$255$263 % Growth GCI Evite 2019A2020E2021E 21.0% / 21.0%2.4% / 0.3%2.0% / (0.1%) $870 $903 $914 25 13 20 % Margin GCI Evite 2019A2020E2021E 26.3% / 26.3%31.4% / 28.5%32.3% / 29.3% $257 $314 $311 (5) (10) 2 Corporate - - - Corporate 23 (17) (16) (17) CapexAdj. EBITDA1 - Capex $152 $166 $148 $148 $136 $140 $130 $137 $87 $87 $115$126 % Revenue GCI Evite 2019A2020E2021E 16.6% / 16.6%14.8% / 15.6%13.9% / 15.3% $147 $135 $130 1 1 0 % Revenue GCI Evite 2019A2020E2021E 9.7% / 9.7%16.6% / 12.9%18.1% / 14.0% $110 $179 $181 (6) (11) 1 Corporate - - - Corporate 23 (17) (16) (17) Source: Wall Street Research, GLIB management projections and filings Management PlanWall Street Consensus Note: Management provided forecast for GCI through to 2023, Evite through to 2021 and corporate expense through to 2020 with guidance that corporate expense 2021-2023 grows at 3-5% annually; management plan is pro forma for DMH sale anticipated Q3 2020. Management has not prepared Evite forecast beyond 2021 1.Excludes stock based compensation 2.Excludes one-time acquisition cost of $5mm in Q2’2020 3. GLIB corporate expense assumes 4% YoY growth rate on normalized total corporate expenses starting 2021E per GLIB management guidance |
![]() |
GCI Benchmarking vs Public Comparables Wireless1 Data2 4.0% Revenue GrowthRevenue Growth 8.0% 0.0% (0.8%) (1.4%) 0.8% 1.9% 1.4%1.4% 2.7% 3.0% 5.2% 2.0%2.0% 6.3% 3.4% 3.5%3.2% 2.9% 1.3% (4.0%) (3.0%) 1(3.5%) (3.0%) (2.0%) (1.1%) (0.7%) (1.6%) GCI WirelessAT&T Wireless T-MobileUS CellularVerizon Wireless GCI ex-Wireless AlticeCable OneCharter Cable Comcast Cable Wow 50.0% Revenue Growth ('18-'19)Revenue Growth ('19 - '20) 2019 EBITDA Margin 42.7% 45.7% 50.0% Revenue Growth ('18-'19)Revenue Growth ('19 - '20) 2019 EBITDA Margin 43.7% 45.9% 25.0% 27.9%3 34.8% 25.2% 25.0% 30.0% 3 38.6% 41.6% 38.0% 0.0% GCI Wireless AT&T WirelessT-MobileUS CellularVerizon Wireless 0.0% GCI ex-Wireless Altice Cable One Charter Cable Comcast Cable Wow EV / '20E EBITDA6.8x10.4x4.4x7.4x EV / '20E EBITDA 9.4x 19.5x 12.1x 9.7x 6.5x Source: FactSet (as of 8/3/20), Company filings, Wall Street research, GCI Management Note: GCI pro forma for sale of DMH; TEV / ’20 EBITDA multiples based on consolidated company 1.T-Mobile PF wireless services revenue growth and PF margin based on Wall Street research; AT&T Wireless and Verizon Wireless segment information sourced from Wall Street Research 2.Comcast Cable 2019 EBITDA margin represents operating cash flow margin; Charter Cable and Comcast Cable segment information and Cable One pro forma sourced from Wall Street Research and company filings 3.GCI SG&A allocated proportionately between wireless and ex-wireless based on revenue to arrive at an illustrative EBITDA margin |
![]() |
Selected Public Wireless Companies ($ in millions, except per share data) ShareMarketTotalTEV /TEV / PriceEquityEnterprise EBITDA EBITDA - Capex 2 Company 8/3/20 Value Value 2020 2021 2020 2021 EBITDA1 Yield AT&T$29.62$212,287$379,5656.8x6.7x10.4x10.3x2.6x7.0% Verizon57.24 237,278 343,1247.47.112.111.72.34.3% 344 4, 54 T-Mobile106.88133,002200,14510.49.525.322.93.6NA U.S. Cellular29.752,6203,883 4.44.5 NM52.31.3NA Shentel50.352,5113,05911.811.026.624.92.10.6% Mean8.2x7.8x18.6x24.4x2.4x4.0% Median7.47.118.722.92.34.3% Source: FactSet (as of 8/3/20), Company filings, Wall Street Research Note: Balance sheet data as of 6/30/20 (T-Mobile, US Cellular as of 3/31/20) 1.LTM EBITDA as of 6/30/20; T-Mobile EBITDA as of 2019 2.Based on the latest dividend declared 3.Based on 373mm TMO common stock share issuance to Sprint shareholders 4.Based on Citi equity research report (4/2/20) PF core EBITDA; multiples of 8.2x and 8.0x for 2020 and 2021 at full run-rate synergies 5.Based on network capex |
![]() |
($ in millions, except per share data) Company 8/3/20 Value Value 2020 2021 2020 2021 EBITDA1 Yield 2 Comcast $42.88 $200,187 $288,676 9.7x 8.7x 14.1x 12.5x 2.8x 2.1% Charter 589.70 140,676 216,408 12.1 11.4 19.6 17.6 4.3 NA Altice USA 27.26 16,077 40,692 9.4 9.0 13.2 12.8 5.7 NA Cable One 1,862.41 10,814 12,424 19.5 18.1 34.3 30.3 2.6 0.5% WOW! 5.62 487 2,774 6.5 6.4 15.5 14.2 5.4 NA Mean 11.4x 10.7x 19.3x 17.5x 4.2x 1.3% Median 9.7 9.0 15.5 14.2 4.3 1.3% Source: FactSet (as of 8/3/20), Company filings, Wall Street Research Note: Balance sheet data as of 6/30/20 (Cable One, WOW! as of 3/31/20) 1.LTM EBITDA as of 6/30/20 2.Based on the latest dividend declared; Comcast declared $0.23 dividend / share on 7/30/20; Cable One declared $2.25 dividend / share on 5/15/20 |
![]() |
($ in millions, except per share data) Market Total Revenue Share Price Equity Enterprise TEV / Revenue Growth Company 8/3/20 Value Value 2020E 2021E '20 - '21 Zillow $67.76 $15,050 $14,712 4.2x 3.1x 37.9% ANGI Homeservices 15.92 7,883 7,774 5.3 4.3 24.2% Tripadvisor 20.36 2,731 2,658 4.1 2.5 65.1% Yelp 24.70 1,999 1,511 1.8 1.6 15.8% Eventbrite 8.73 801 428 2.9 1.6 86.5% Cars.com 8.77 589 1,171 2.2 2.0 9.0% Mean $4,842 $4,709 3.4x 2.5x 40.1% Median 2,365 2,085 3.5x 2.3x 24.2% |
![]() |
($ in millions, except per share data) Company 8/3/20 Value Value 2020E 2021E '20 - '21 Integrated Solutions |
![]() |
5 11/7/08 AT&T Centennial Communications 2.8 7.0 7.2 6/5/08 Verizon Alltel 28.1 8.7 8.8 Mean 7.6x 7.7x 7.4x 7.6x Note: Includes transactions above $1 billion; SBC included where information available Source: Company filings and Wall Street research 1.Based on 373mm TMO common stock share issuance to Sprint shareholders at share price of $64.52 as of 4/27/2018 2.Calculated using Cash EBITDA 3.Represents value of stake acquired 4.Assumes 700MHz spectrum CVR is valued at cost of $204mm 5.Withdrawn transaction |
![]() |
Date Annouced Acquiror Target Total Enterprise Value ($mm) TEV / LTM EBITDA (Pre-SBC) 1 TEV / LTM EBITDA (Post-SBC) 1 4/1/19 Cable One Fidelity Communications $526 11.7x 11.7x 7/10/17 Atlantic Broadband Metrocast 1,400 11.6 2 5/22/17 TPG Wave 2,365 11.9 3 11.6 2 11.9 3 4/4/17 Liberty Interactive GCI 2,678 9.2 9.6 44 1/18/17 Cable One NewWave 735 11.5 11.5 8/15/16 TPG RCN 1,600 8.3 5 8/15/16 TPG Grande 650 8.6 5 9/7/15 Altice Cablevision 17,700 8.8 6 8.3 5 8.6 5 9.0 6 7 7 5/20/15 Altice Suddenlink 9,100 10.1 10.1 3/31/15 Charter Brighthouse 11,400 9.5 7 9.5 7 Source: Company filings, Wall Street Research; SBC included where information available 1.Based on 2018 LQA EBITDA 2.Based on CY2017E EBITDA 3.Based on 3Q17 LTM EBITDA 4.Based on Q3 2016 LQA EBITDA 5.Based on 2015 EBITDA Wall Street estimate 6.Based on LTM AOCF 7.Based on 2014A EBITDA |
![]() |
Valuation as of 6/30/20; using mid-year discounting ($ in millions) Fiscal Year Ending Dec 31 Terminal Value (Perpetuity Growth) Terminal Cash Flow $123 Perpetuity Growth Rate 2.0% Terminal Value $2,646 Discount Factor 0.82x PV of Terminal Value $2,175 Total Implied TEV $2,659 Exit Perpetuity Growth 1.5% 2.0% 2.5% WACC (%) 6.75% 2,442 2,659 2,927 7.25% 2,243 2,421 2,636 Implied TEV / Terminal EBITDA Multiple 1.5%2.0%2.5% WACC (%) 6.75%8.19.010.1 7.25%7.48.29.1 Source: GCI 2020 Budget Presentation Long Range Plan Note: DCF analysis pro forma for DMH sale 1.Normalized Q1’2020 revenue and EBITDA reduced by RHC Maniilaq adjustment of $8.7mm 2.Represents YoY revenue growth rate from 2020E 3.Revenue and EBITDA reduced by $30mm because of reduced Verizon roaming contribution after 2023 4.Tax rate based on management guidance on GCI tax rate 5.Adjusted by $1mm capex savings from Verizon roaming beyond 2023 |
![]() |
Valuation as of 6/30/20; using mid-year discounting GLIB NOL Valuation ($ in millions) Federal NOLs Q3-Q4'20E 2021E 2022E 2023E 2024E 2025E 2026E 2027E Pre-2018 NOLs - (100% Utilization Allowed) $ - $ - $90 $119 $150 $ - $ - $ - Post-2018 NOLs - (80% Utilization Allowed) - - - - 19 136 126 - Federal Income Tax Rate 21% Pre-2018 NOL Benefits - $ - $19 $25 $32 $ - $ - $ - Post-2018 NOL Benefits - - - - 4 29 26 - Total Federal NOL Benefits $ - $ - $19 $25 $36 $29 $26 $ - PV of Total Federal NOLs at 6.75% WACC $ - $ - $17 $21 $27 $21 $18 $ - NPV of Federal NOLs at 6.75% WACC $103 State NOLs Alaska: Utilized During the Year $ - $ - $75 $100 $142 $143 $91 $ - State Tax Rate 9.4% Total Alaska NOL Benefits 1 $ - $ - $6 $7 $11 $11 $7 $ - PV of Total Alaska State NOLs at 6.75% WACC $ - $ - $5 $6 $8 $8 $5 $ - NPV of Alaska State NOLs at 6.75% WACC $31 NPV of Total Federal and State NOLs $134 Memo Discount Period 0.25 1.00 2.00 3.00 4.00 5.00 6.00 7.00 Discount Factor 0.98 0.94 0.88 0.82 0.77 0.72 0.68 0.63 GLIB RHC FY19 Valuation Q3-Q4'20E2021E RHC FY16-19 Settlement$57$57 Source: GCI Management 1.Calculated as (1-federal tax rate 21%) multiplied by Alaska state tax rate 9.4% 2. Assumes 0.12% discount rate for RHC FY16-19 Settlement impact based on 1-year treasury rate on 8/3/20 |
![]() |
Valuation as of 6/30/20; using mid-year discounting; Assumes merger with LBRD GLIB NOL Valuation ($ in millions) Federal NOLs Q3-Q4'20E 2021E 2022E 2023E 2024E 2025E 2026E 2027E Pre-2018 NOLs - (100% Utilization Allowed) $ - $ - $73 $102 $66 $152 $33 $ - Post-2018 NOLs - (80% Utilization Allowed) - - - - $122 $127 Federal Income Tax Rate 21% Pre-2018 NOL Benefits - $ - $15 $21 $14 $32 $7 $ - Post-2018 NOL Benefits - - - - - - 26 27 Total Federal NOL Benefits $ - $ - $15 $21 $14 $32 $33 $27 PV of Total Federal NOLs at 6.75% WACC $ - $ - $13 $18 $11 $23 $22 $17 NPV of Federal NOLs at 6.75% WACC $104 State NOLs Alaska: Utilized During the Year $ - $ - $61 $86 $55 $128 $130 $105 State Tax Rate 9.4% Total Alaska NOL Benefits 1 $ - $ - $5 $6 $4 $10 $10 $8 PV of Total Alaska State NOLs at 6.75% WACC $ - $ - $4 $5 $3 $7 $7 $5 NPV of Alaska State NOLs at 6.75% WACC $31 NPV of Total Federal and State NOLs $134 Memo Discount Period 0.25 1.00 2.00 3.00 4.00 5.00 6.00 7.00 Discount Factor 0.98 0.94 0.88 0.82 0.77 0.72 0.68 0.63 Source: GCI Management 1. Calculated as (1-federal tax rate 21%) multiplied by Alaska state tax rate 9.4% |
![]() |
Valuation as of 6/30/20; using mid-year discounting ($ in millions) Fiscal Year Ending Dec 31 Q1-Q2'20A Q3-Q4'20E 2021E 2022E 2023E 2024E 2025E Terminal Total Revenue $23,434 $23,989 $49,559 $52,378 $55,257 $57,771 $60,024 $60,024 % Growth 4.5% 1 5.7% 5.5% 4.6% 3.9% Adj. EBITDA $8,885 $8,983 $19,025 $20,811 $22,443 $23,464 $24,379 $24,379 % Margin 37.9% 37.4% 38.4% 39.7% 40.6% 40.6% 40.6% 40.6% (-) D&A (4,925) (4,897) (9,815) (9,747) (9,694) (10,135) (10,531) (8,028) % Revenue 21.0% 20.4% 19.8% 18.6% 17.5% 17.5% 17.5% (-) SBC (180) (149) (344) (363) (383) (401) (416) (416) EBIT $3,780 $3,937 $8,866 $10,701 $12,366 $12,928 $13,432 $15,935 % Margin 16.1% 16.4% 17.9% 20.4% 22.4% 22.4% 22.4% 26.5% (-) Taxes @ 25% (945) (984) (2,217) (2,675) (3,091) (3,232) (3,358) (3,984) NOPAT 2,835 2,953 6,650 8,025 9,274 9,696 10,074 11,951 (+) D&A 4,925 4,897 9,815 9,747 9,694 10,135 10,531 8,028 (-) Capex (3,338) (3,589) (6,994) (7,149) (7,390) (7,726) (8,028) (8,028) (+ / -) Change in Working Capital (58) (277) (198) (226) (275) (333) (388) (388) Unlevered Free Cash Flow $4,364 $3,984 $9,272 $10,398 $11,303 $11,772 $12,189 $11,564 Discount Period 0.25 1.00 2.00 3.00 4.00 5.00 Discount Factor 0.99 0.94 0.89 0.84 0.79 0.75 PV of Unlevered FCF (Assumed 6.0% WACC) $3,927 $8,748 $9,254 $9,490 $9,325 $9,109 NPV of Projected Cash Flow $49,852 Total Enterprise Value Implied Equity Value / Share 9.5x 11.0x 12.5x 9.5x 11.0x 12.5x WACC (%) WACC (%) 6.0% 217,949 244,491 271,032 6.0% 600.72 710.00 819.28 6.5% 213,003 238,867 264,730 6.5% 580.35 686.84 793.33 Source: Company Filings, Wall Street Research 1.Represents YoY revenue growth rate from 2020E Assumed Exit Multiple Terminal EBITDA $24,379 Terminal EBITDA Multiple 11.0x Terminal Value $268,171 Discount Factor 0.73x PV of Terminal Value $194,639 Total Enterprise Value $244,491 (+) Cash & Equivalents (6/30/20) 2,097 (-) Debt (6/30/20) (77,829) (+) NPV of NOL Benefits 1,134 Implied Equity Value $169,892 Implied FDSO 239.3 Implied Equity Value / Share $710.00 % Premium to Current 20.4% |
![]() |
Valuation as of 6/30/20; using mid-year discounting ($ in millions) Q3-Q4'20E 2021E EBT (Pre-NOL)$1,928$4,777 Less: NOL Usage(1,928)(3,707) EBT (Post NOL)$ -$1,070 NOLs Beg. of Period$5,636$3,707 Plus: Accumulation--Less: Usage(1,928)(3,707) End of Period$5,6361 $3,707$ - Tax Benefits at 21% Federal Income Tax Rate$405$779 PV of Total Federal NOLs at 6.0% WACC$399$734 NPV of Federal NOLs at 6.0% WACC$1,134 Memo Discount Period0.251.00 Discount Factor0.990.94 Source: Company filings 1. Represents NOL balance at the end of Q2 2020 |
![]() |
Indexed Stock Price Performance LBRD Series C shares, GLIB Series A shares and LendingTree Unaffected (6/29/20) Current (8/3/20) LBRDK Average GLIBA Average LTREE Average LBRDK Average GLIBA Average LTREE Average Share Price Share Price Share Price Share Price Share Price Share Price 40% 34.9% 51.5% 46.2% 22.5% 0% 1.9% (22.9%) (40%) Unaffected (6/29/20) Current (8/3/20) (80%) Mar-18 Jul-18 Nov-18 Mar-19 Jul-19 Nov-19 Mar-20 Aug-20 LBRDK GLIBA TREE Source: FactSet |
![]() |
GCI WACC Analysis Share Market Total Debt Debt + Price Equity Total Preferred and Preferred Adjusted Unlevered 1 ($ in millions, except per share data) Wireless Weighted Average Cost of Capital (WACC) 1 Unlevered Beta Target D/ EV Wireless AT&T $29.62 $212,287 $168,964 --$168,964 44.3% 0.89 0.56 Verizon 57.24 237,278 112,841 --112,841 32.2% 0.66 0.49 T-Mobile USA 106.88 133,002 68,255 --68,255 33.9% 0.85 0.62 U.S. Cellular 29.75 2,620 1,509 --1,509 36.5% 0.83 0.58 Shentel 50.35 2,511 704 --704 21.9% 0.83 0.69 Mean 33.8% 0.81 0.59 Median 33.9% 0.83 0.58 Cable Charter $589.70 $140,676 $77,829 --$77,829 35.6% 0.85 0.60 Comcast 42.88 200,187 106,500 1,256 105,300 34.5% 0.93 0.66 Altice USA 27.26 16,077 26,500 15 26,515 62.3% 1.03 0.46 Cable One 1,862.41 10,814 1,852 --1,852 14.6% 0.93 0.83 WOW! 5.62 487 2,323 --2,323 82.7% 1.20 0.26 Mean 45.9% 0.99 0.56 Target D/ EV Bottoms Up Bottoms Up Cable Wireless Cable Wireless 0.350.450.550.650.750.85 30.0%4.92%5.49%6.05%6.62%7.18%7.75% 35.0%4.97%5.53%6.08%6.64%7.20%7.75% 40.0%5.02%5.56%6.11%6.66%7.21%7.76% 45.0%5.06%5.60%6.14%6.68%7.22%7.76% 50.0%5.11%5.64%6.17%6.70%7.23%7.76% Assumes MRP of 6.2%, Cost of Debt of 5.6%, Size Premium of 1.5% Cost of Debt 3.00%4.00%5.00%6.00%7.00%8.00% Target D/ EV 35.0%5.43%5.68%5.93%6.18%6.44%6.69% 40.0%5.37%5.65%5.94%6.23%6.52%6.81% 45.0%5.30%5.63%5.95%6.27%6.60%6.92% 50.0%5.24%5.60%5.96%6.32%6.68%7.04% Assumes MRP of 6.2%, Unlevered beta of 0.55x, Size Premium of 1.5% Cable Weighted Average Cost of Capital (WACC) 1 Unlevered Beta 0.350.450.550.650.750.85 30.0%4.92%5.49%6.05%6.62%7.18%7.75% 35.0%4.97%5.53%6.08%6.64%7.20%7.75% 40.0%5.02%5.56%6.11%6.66%7.21%7.76% 45.0%5.06%5.60%6.14%6.68%7.22%7.76% 50.0%5.11%5.64%6.17%6.70%7.23%7.76% Risk Free Rate Cost of EquityLowHigh LowHigh 2 1.01% 1.01% Market Risk Prem.3 6.17% 7.15% Unlevered Beta 1 0.55 0.65 Levered Beta0.811.12 Size Premium 4 1.47%1.47% 1.01%1.01% 6.17%7.15% 0.550.65 0.720.96 1.47%1.47% Cost of Equity7.50%10.47% 6.92%9.36% Pre-Tax Cost of Debt WACCLowHigh LowHigh 5 5.6% 5.6% Tax Rate 28.0% 28.0% Target Debt/Capital 40.0% 50.0% 5.6%5.6% 28.0%28.0% 30.0%40.0% WACC6.11%7.25% 6.05%7.23% 70% Cable / 30% Wireless Based on Revenue6.09%7.24% 71% Cable / 29% Wireless Based on GM6.10%7.24% Assumes MRP of 6.2%, Cost of Debt of 5.6%, Size Premium of 1.5% Cost of Debt 3.00%4.00%5.00%6.00%7.00%8.00% Target D/ EV 35.0%5.43%5.68%5.93%6.18%6.44%6.69% 40.0%5.37%5.65%5.94%6.23%6.52%6.81% 45.0%5.30%5.63%5.95%6.27%6.60%6.92% 50.0%5.24%5.60%5.96%6.32%6.68%7.04% Assumes MRP of 6.2%, Unlevered beta of 0.55x, Size Premium of 1.5% 1.Unlevered Beta calculated as: 2-year Adjusted Beta / [1+(1-tax rate)*((D+P)/E)] 2.20-year U.S. Treasury bond yields as of 8/3/20 3.Duff and Phelps 2020 Handbook, long-horizon supply side for low and historical for high 4.Size Premium based on Duff and Phelps 2020 Handbook, 7th decile for companies with $1.0bn - $1.7bn market capitalization 5.Calculated as 20 year treasury rate plus BB rating communications companies’ corporate spread per FactSet |
![]() |
Evite WACC Analysis ($ in millions, except per share data) ShareMarketTotal DebtDebt + Current PriceEquityTotalandPreferredAdjustedUnlevered Company 8/3/20 Value Debt Pref. Stock Preferreds / Capital Beta Beta Zillow$67.76$15,050$2,279-$2,27913.1%1.681.46 Angie's List15.927,883242-2423.0%1.121.09 Tripadvisor20.362,731725-72521.0%1.391.10 Yelp24.701,999----1.281.28 Eventbrite8.73801----1.781.78 Cars.com8.77589639-63952.0%1.470.70 Mean14.9%1.451.24 Median8.1%1.431.19 Bottoms Up Internet Comps Cost of Equity Low High |
![]() |
($ in millions, except per share data) Current Company 8/3/20 Value Debt Pref. Stock Preferreds / Capital Beta Beta Integrated Solutions Bottoms Up Integrated Solutions / Hardware / Modules Cost of Equity Low High |
![]() |
($ in millions, except per share data) Cost of Equity Low High Risk Free Rate 2 1.01% 1.01% Market Risk Prem.3 6.17% 7.15% Observable Beta 0.86 0.86 Charter Weighted Average Cost of Capital (WACC) Cost of Debt 3.75%4.25%4.75%5.25%5.75% Risk-free Rate Size Premium 4 (0.28%) (0.28%) 1.50%5.20%5.33%5.46%5.60%5.73% Cost of Equity 6.02% 6.86% 2.00%5.52%5.65%5.78%5.92%6.05% 2.50%5.84%5.97%6.11%6.24%6.37% 3.00%6.16%6.29%6.43%6.56%6.70% Assumes MRP of 6.17%, Observable Beta of 0.86x, Size Premium of (0.28%) Cost of Debt 3.75% 4.25% 4.75% 5.25% 5.75% 1.01% 5.42% 5.56% 5.69% 5.82% 5.96% 1.50% 5.74% 5.87% 6.00% 6.14% 6.27% 2.00% 6.06% 6.19% 6.33% 6.46% 6.59% 2.50% 6.38% 6.51% 6.65% 6.78% 6.92% 3.00% 6.70% 6.84% 6.97% 7.10% 7.24% Risk-free Rate WACC 4.88% 5.42% Assumes MRP of 7.15%, Observable Beta of 0.86x, Size Premium of (0.28%) Source: Company filings, Wall Street research, FactSet (8/3/20) 1.Unlevered Beta calculated as: 2-year Adjusted Beta / [1+(1-tax rate)*((D+P)/E)] |
D!
M\@'Z @,"# (4 AT")@(O C@"00)+ E0"70)G G$">@*$ HX"F *B JP"M@+!
M LL"U0+@ NL"]0, PL#%@,A RT#. -# T\#6@-F W(#?@.* Y8#H@.N [H#
MQP/3 ^ #[ /Y! 8$$P0@!"T$.P1(!%4$8P1Q!'X$C 2:!*@$M@3$!-,$X03P
M!/X%#044%]@8&!A8&)P8W!D@&
M609J!GL&C :=!J\&P ;1!N,&]0<'!QD'*P<]!T\'80=T!X8'F0>L![\'T@?E
M!_@("P@?"#((1@A:"&X(@@B6"*H(O@C2".<(^PD0"24).@E/"60)>0F/":0)
MN@G/">4)^PH1"B<*/0I4"FH*@0J8"JX*Q0K<"O,+"PLB"SD+40MI"X +F NP
M"\@+X0OY#!(,*@Q##%P,=0R.#*<,P S9#/,-#0TF#4 -6@UT#8X-J0W##=X-
M^ X3#BX.20YD#G\.FPZV#M(.[@\)#R4/00]>#WH/E@^S#\\/[! )$"800Q!A
M$'X0FQ"Y$-<0]1$3$3$13Q%M$8P1JA')$>@2!Q(F$D429!*$$J,2PQ+C$P,3
M(Q-#$V,3@Q.D$\43Y10&%"<4211J%(L4K13.%/ 5$A4T%585>!6;%;T5X!8#
M%B86219L%H\6LA;6%OH7'1=!%V47B1>N%](7]Q@;&$ 891B*&*\8U1CZ&2 9
M11EK&9$9MQG=&@0:*AI1&G<:GAK%&NP;%!L[&V,;BANR&]H< APJ'%(<>QRC
M',P<]1T>'4<=:AZ4'KX>Z1\3'SX?:1^4'[\?ZB 5($$@
M;""8(,0@\"$<(4@A=2&A( &YXS'DJ>8EYYWI&
M>J5[!'MC>\)\(7R!?.%]07VA?@%^8G["?R-_A'_E@$> J($*@6N!S8(P@I*"
M](-7@[J$'82 A..%1X6KA@Z&
D!
M\@'Z @,"# (4 AT")@(O C@"00)+ E0"70)G G$">@*$ HX"F *B JP"M@+!
M LL"U0+@ NL"]0, PL#%@,A RT#. -# T\#6@-F W(#?@.* Y8#H@.N [H#
MQP/3 ^ #[ /Y! 8$$P0@!"T$.P1(!%4$8P1Q!'X$C 2:!*@$M@3$!-,$X03P
M!/X%#044%]@8&!A8&)P8W!D@&
M609J!GL&C :=!J\&P ;1!N,&]0<'!QD'*P<]!T\'80=T!X8'F0>L![\'T@?E
M!_@("P@?"#((1@A:"&X(@@B6"*H(O@C2".<(^PD0"24).@E/"60)>0F/":0)
MN@G/">4)^PH1"B<*/0I4"FH*@0J8"JX*Q0K<"O,+"PLB"SD+40MI"X +F NP
M"\@+X0OY#!(,*@Q##%P,=0R.#*<,P S9#/,-#0TF#4 -6@UT#8X-J0W##=X-
M^ X3#BX.20YD#G\.FPZV#M(.[@\)#R4/00]>#WH/E@^S#\\/[! )$"800Q!A
M$'X0FQ"Y$-<0]1$3$3$13Q%M$8P1JA')$>@2!Q(F$D429!*$$J,2PQ+C$P,3
M(Q-#$V,3@Q.D$\43Y10&%"<4211J%(L4K13.%/ 5$A4T%585>!6;%;T5X!8#
M%B86219L%H\6LA;6%OH7'1=!%V47B1>N%](7]Q@;&$ 891B*&*\8U1CZ&2 9
M11EK&9$9MQG=&@0:*AI1&G<:GAK%&NP;%!L[&V,;BANR&]H< APJ'%(<>QRC
M',P<]1T>'4<=:AZ4'KX>Z1\3'SX?:1^4'[\?ZB 5($$@
M;""8(,0@\"$<(4@A=2&A( &YXS'DJ>8EYYWI&
M>J5[!'MC>\)\(7R!?.%]07VA?@%^8G["?R-_A'_E@$> J($*@6N!S8(P@I*"
M](-7@[J$'82 A..%1X6KA@Z&6V^:Y?>KBOEX[+S&OESZ>'5QSL9L%<6")R8LT_JB8O7N8CJ9BEH
MKU:8EY=?6\[C:Y;+L;/)?$Y/S&OKX^HOC^O68_*WO>:^_P"C[XK[:U^9_5^K
MH$UKZ8<;;5G2S[W);7%UQY,>#0R;/6+7K:)K^F:Q%IZB9BOOM;V_MUU#MUO3
MO1Q;4[>SO[_(;L^Z+[.SDI[[5G%.**S%:16(BLSUU$?,S,]S*!X>7\HR\9N_
MV?CYO=]T\AI8>[4MEP9:YJ3BG),S'4QC]T1/S/[3W:?GCNZ7G.QR',6GVO(,^2^6+
D!
M\@'Z @,"# (4 AT")@(O C@"00)+ E0"70)G G$">@*$ HX"F *B JP"M@+!
M LL"U0+@ NL"]0, PL#%@,A RT#. -# T\#6@-F W(#?@.* Y8#H@.N [H#
MQP/3 ^ #[ /Y! 8$$P0@!"T$.P1(!%4$8P1Q!'X$C 2:!*@$M@3$!-,$X03P
M!/X%#044%]@8&!A8&)P8W!D@&
M609J!GL&C :=!J\&P ;1!N,&]0<'!QD'*P<]!T\'80=T!X8'F0>L![\'T@?E
M!_@("P@?"#((1@A:"&X(@@B6"*H(O@C2".<(^PD0"24).@E/"60)>0F/":0)
MN@G/">4)^PH1"B<*/0I4"FH*@0J8"JX*Q0K<"O,+"PLB"SD+40MI"X +F NP
M"\@+X0OY#!(,*@Q##%P,=0R.#*<,P S9#/,-#0TF#4 -6@UT#8X-J0W##=X-
M^ X3#BX.20YD#G\.FPZV#M(.[@\)#R4/00]>#WH/E@^S#\\/[! )$"800Q!A
M$'X0FQ"Y$-<0]1$3$3$13Q%M$8P1JA')$>@2!Q(F$D429!*$$J,2PQ+C$P,3
M(Q-#$V,3@Q.D$\43Y10&%"<4211J%(L4K13.%/ 5$A4T%585>!6;%;T5X!8#
M%B86219L%H\6LA;6%OH7'1=!%V47B1>N%](7]Q@;&$ 891B*&*\8U1CZ&2 9
M11EK&9$9MQG=&@0:*AI1&G<:GAK%&NP;%!L[&V,;BANR&]H< APJ'%(<>QRC
M',P<]1T>'4<=:AZ4'KX>Z1\3'SX?:1^4'[\?ZB 5($$@
M;""8(,0@\"$<(4@A=2&A( &YXS'DJ>8EYYWI&
M>J5[!'MC>\)\(7R!?.%]07VA?@%^8G["?R-_A'_E@$> J($*@6N!S8(P@I*"
M](-7@[J$'82 A..%1X6KA@Z&RIU=1RHP\.]>G]BF9C[_D##-PY7O>JW.)YIM_HZ?P]?XK93E6KU-5JJG^=%<3Q,?7ET
MFS-%VYN7Z]1VW=]XT
MG<>FV)QK^)?IN55V[M-$U51S$5],Q,\3].W%KGA\[3W1W8]E?PVT+?&WMQZ'
MA6MH9.+1>PZ\32:Z<>QJ=%VW-,VKU,\]?P]<_#Q5/,SSVB8\X;3\)MH;8\)?
M:DU+3-$Q\3/T;(UO0,"]177,V,"+%NJ+$
,XTTU'V
M >29
M ..]
,/B]I/@CXJC_MU=NZY8
M&P=/TZU38Q_.M8M&H1J-K'BJ.BU<[_#3V[4
#@&$WO"G1LC*
MQ\FNG)G)L:C=U*B[YE/5%RY/-5/IWHY[]/RE.+X98-C!Q\&_D9.HX./5:JMX
MV518FC]'$Q3%7%N.KM/$]7/[^[-D< P*YX0Z7>P JS=2G3L68\O$JO456X
MB+OF4QS-,S'$]NJ)BKIB(F>S/*:8CF?M3PD
M !1
D!
M\@'Z @,"# (4 AT")@(O C@"00)+ E0"70)G G$">@*$ HX"F *B JP"M@+!
M LL"U0+@ NL"]0, PL#%@,A RT#. -# T\#6@-F W(#?@.* Y8#H@.N [H#
MQP/3 ^ #[ /Y! 8$$P0@!"T$.P1(!%4$8P1Q!'X$C 2:!*@$M@3$!-,$X03P
M!/X%#044%]@8&!A8&)P8W!D@&
M609J!GL&C :=!J\&P ;1!N,&]0<'!QD'*P<]!T\'80=T!X8'F0>L![\'T@?E
M!_@("P@?"#((1@A:"&X(@@B6"*H(O@C2".<(^PD0"24).@E/"60)>0F/":0)
MN@G/">4)^PH1"B<*/0I4"FH*@0J8"JX*Q0K<"O,+"PLB"SD+40MI"X +F NP
M"\@+X0OY#!(,*@Q##%P,=0R.#*<,P S9#/,-#0TF#4 -6@UT#8X-J0W##=X-
M^ X3#BX.20YD#G\.FPZV#M(.[@\)#R4/00]>#WH/E@^S#\\/[! )$"800Q!A
M$'X0FQ"Y$-<0]1$3$3$13Q%M$8P1JA')$>@2!Q(F$D429!*$$J,2PQ+C$P,3
M(Q-#$V,3@Q.D$\43Y10&%"<4211J%(L4K13.%/ 5$A4T%585>!6;%;T5X!8#
M%B86219L%H\6LA;6%OH7'1=!%V47B1>N%](7]Q@;&$ 891B*&*\8U1CZ&2 9
M11EK&9$9MQG=&@0:*AI1&G<:GAK%&NP;%!L[&V,;BANR&]H< APJ'%(<>QRC
M',P<]1T>'4<=:AZ4'KX>Z1\3'SX?:1^4'[\?ZB 5($$@
M;""8(,0@\"$<(4@A=2&A( &YXS'DJ>8EYYWI&
M>J5[!'MC>\)\(7R!?.%]07VA?@%^8G["?R-_A'_E@$> J($*@6N!S8(P@I*"
M](-7@[J$'82 A..%1X6KA@Z& ULTO$;_2YKAWE<2QM=SLT#M*998PQ(3CU[5_VE-+T
M?XA3:$VC^();:SU*VT>ZUB.*'^S[6\N$1HH6)E$I)\R,%EC*@R*"PS6EK_QF
M&F?$W_A%=/\ #?B#7KZ&T@O;R:Q:S2"PBFDDC1I#//&QYB 0HPLBJLB@G:XR:RKG]CKPG=>#HM!
M:?6ETV'4KO4U07*[MUQ;2VSQ[MF[8(Y6QSNR 2QYS7^(?[:7A#P?X(US5-/;
M4-9NM*M)+JWMETZ\ACU,(ZQL8)C"4EC5V4/)%O5 )HOL$26^$DE0PW$LLI*AE8A6:H?'/Q8\;
M>#/C/K%P/%5_JVJ>%['7-*T@7=O:QKJ3)_9\W[Q(H!YDB1S22$1*"5M5^7'F
M!RVO_@3_ / 5=_FE\_(/\TOO_IGVU17R3X)^,GC[QIK^BZ/%\1M-N]/U+5)8
M?[7T-K;5)MB:?+<-#]H?3H+5B'1#^[B9D#,KG.#7/^'OVGO&^L^!?#DFD_$2
M3Q%>:Y8:>VM7*Z799\,W,
MV4L.DPVK1B>665+EHW51*A_
VM)I(I-+O#%8
M/<@>5'--Y(CB+L<)YA3?D%00PR?\#\;V_)B_X/X6_P T>H45XSXB_;H\#V/@
MV35])FU76SMM988(](O86NH9[A(!-$7A_>(K/@E V&PG#,H.M%^UOX/L=+:X
MU34&MV6:[#K9V%]>"VAM[AH'FGQ;JT"AEPS2*$5L@.P&XNS ]0HKQOP!^V-I
M?B[Q]_8E]8#2HYII[6UNQ<-<)<3)?SV<:G;& GF>3N#,V 7"Y)P3ZAX3\9Z;
MXXL;BZTJY^UV]K=S6,D@C95\Z%S'(HW ;MKJR[AD$@X)I+5
].T&;X+P^&=*\9:4\FK?;+ZW3
MP]JL,W]G0-<$M!:N-W[J#S%AWJ!MXQL)4!;QNNR?WQ4K?*_W:Z72!Z.S[M?<
MVK_A]_HSV*BOFK1;9;'_ ()E>(H5:1EAT'645I',CD"6Y&2Q)+'W)R:\E^-7
MQCUCQ-I=]I$.L1>*?#2Z#>LFH7&D00RV%VVCWIGLD/EAXS'Y<3$<2J)"DC-F
MA_:MTU_/_+^F5&-^6_6_Z??O^%]MON^BOAO1?BAKGPZ\3ZNVCRVNGQRWFI"\
MU,Z=%<3:3;OJEC'-
V_P!CMWFM+:%;A[/?&R85=HB9
M20#( >6^:NSTWXC>.?#/Q!FM;OQE>:Q8Z/XUL/#K17&GV<9OH+NTBE
-_$_P#9(\06W@>_T/0+^XOIO$&KV%U!?P0Q
M6DGAYH[6*SNKAW>8F2-[>-PL<<98&0@D@[E]*^+O[/;^/_#'AO2=)U2UTG3_
M _F(V-W9/>6-[#Y)B$ GQQ\4Z'IIL_":R:]I4FJ+'HWBA=5N=,"",F*[B,$1A?\ > 8!?YE8=!FI
M_"?[*NO67A#PUX9USQAIFI>&_"A66TMK/0GLYKB6,,(6GD>YE#!&;?M1$RRK
MDX&*N_"K]FC6/!U]X';7?$VDZS:_#VP>QTE+'0WL)GW0" O/(]S-O_=C[J!
M6.3G TCR\TK[=/2SW\[V\K6\PJ=.7Y^M_RM\]_(O_$S]K;PK\/[+Q)%#<2:
MAK7AVTNY_LAMYX+>[FMX//DMTNC$83*$P2BLSJ,DKP:GT[]K;P/J&F+-_:&I
M?:O,BA^P)HU])?.\D9E7R[<0^=*A1782(A0JC$' -<;\3?V);CXB^+/$FH1^
M*K?28?$4=RLGV/1Q#=R>;;- ([B2.9([F%-Q<"2+S