Press Release
Exhibit 99.1
|
|
|
| Media Contact: |
|
Steve Schrier, 331-332-2264 |
| Investor Contact: |
|
Heather Kos, 331-332-2406 |
| Web site: |
|
www.Navistar.com/newsroom |
NAVISTAR REPORTS THIRD QUARTER RESULTS
| |
• |
|
Reports third quarter net loss of $247 million |
| |
• |
|
Ends quarter with $1.09 billion in manufacturing cash |
| |
• |
|
Sees Class 8 order share jump to more than 20% in the quarter |
| |
• |
|
Expects Cummins ISB engine to drive medium-duty truck and bus recovery in 2014 |
| |
• |
|
Initiates new cost reduction actions projected to generate $50-$60 million in savings |
LISLE, Ill. (September 4, 2013) – Navistar International Corporation (NYSE: NAV) today announced a third quarter 2013 net loss of $247 million, or
$3.06 per diluted share, compared to third quarter 2012 net income of $84 million, or $1.22 per diluted share. Excluding discontinued operations, Navistar recorded a third quarter 2013 loss from continuing operations of $237 million, or $2.94 per
diluted share, compared to third quarter 2012 income from continuing operations of $80 million, or $1.16 per diluted share. Third quarter 2012 results included an income tax benefit of $188 million that primarily resulted from a change in the
company’s estimated annual effective tax rate.
The year-over-year decline was primarily driven by lower volumes in its core North
America truck business due to the impact of the company’s transition to SCR-based products and weaker industry conditions. This was partially offset by a $36 million reduction in engineering and product development costs and $14 million in
lower selling, general and administrative (SG&A) expenses.
Total revenue in the quarter was $2.9 billion, down 12 percent from the
third quarter of 2012. The decline reflects lower net sales across all classes of its core truck business, due to the impact of the company’s SCR emissions transition for both heavy- and medium-duty vehicles and a nine percent drop in overall
industry demand in North America during the quarter. This was partially offset by stronger year-over-year volumes in the South America engine business.
Navistar finished the third quarter 2013 with $1.09 billion in manufacturing cash and marketable securities, delivering at the high end of its
cash guidance range of $1.0 billion to $1.1 billion, as a result of strong cash management and working capital performance.
“We were
pleased with our strong cash performance in the quarter. We also continued to make solid progress on key elements of our Drive to Deliver turnaround plan, especially the on-time launches of our new Class 8 product offerings, which drove
Navistar’s order share up to more than 20 percent in the quarter, compared to 12 percent in the second quarter. We’re encouraged by the growing customer acceptance of our new products,” said Troy A. Clarke, Navistar’s president
and chief executive officer. “At the same time, we clearly need to accelerate progress with our financial results, and we are already implementing additional cost reduction and business improvement actions to counter our near-term volume
challenges. This includes resizing our company to match our current business environment.”
Earlier this month, the company began implementing new cost-reduction initiatives, including an
enterprise-wide reduction in force, which will impact a combined 500 salaried employees and long-term contractor positions globally. The company expects to complete nearly all of these job reductions by the end of its 2013 fiscal year, and projects
these and related activities will generate an additional $50 to $60 million in annual savings starting in its fiscal year 2014.
“These actions are always difficult, but we are committed to making tough choices to return Navistar to profitability,” Clarke
added.
The company is also dedicated to moving forward quickly on the next critical product strategy phase in its
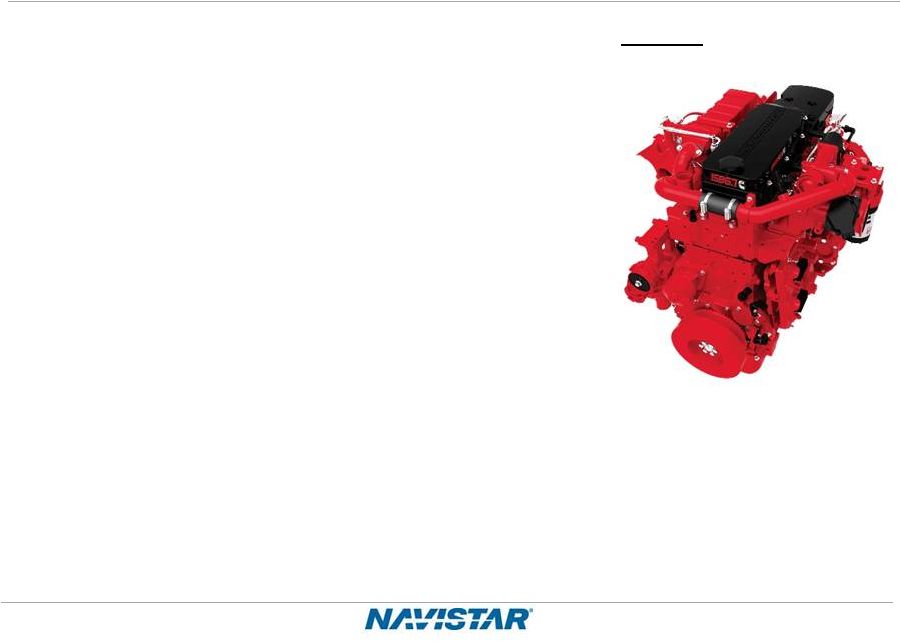
turnaround—offering selective catalytic reduction (SCR) emissions aftertreatment on its medium-duty vehicles. Just yesterday, Navistar announced plans to expand its medium-duty engine offerings to include the Cummins ISB 6.7-liter engine for
International® DuraStar® and IC Bus™ CE Series vehicles. The company’s first saleable units will be built this month and
Navistar has set an okay-to-ship date for trucks in late December.
“Adding the Cummins ISB allows us to get medium-duty SCR
offerings into the market faster while providing customers with a market-proven engine,” said Jack Allen, Navistar’s executive vice president and chief operating officer. “We expect it will open the door to new customers, while
strengthening demand with existing ones. In fact, a number of customers had already approached us about adding this choice. As a result, we’re convinced the ISB will put us on a positive path to recapture medium-duty truck and school bus sales
and market share.”
As for fourth quarter guidance, the company projects it will finish the year with manufacturing cash and
marketable securities in the range of $1.0 billion to $1.1 billion.
Summary of Financial Results:
|
|
|
|
|
|
|
|
|
|
|
|
|
|
|
|
|
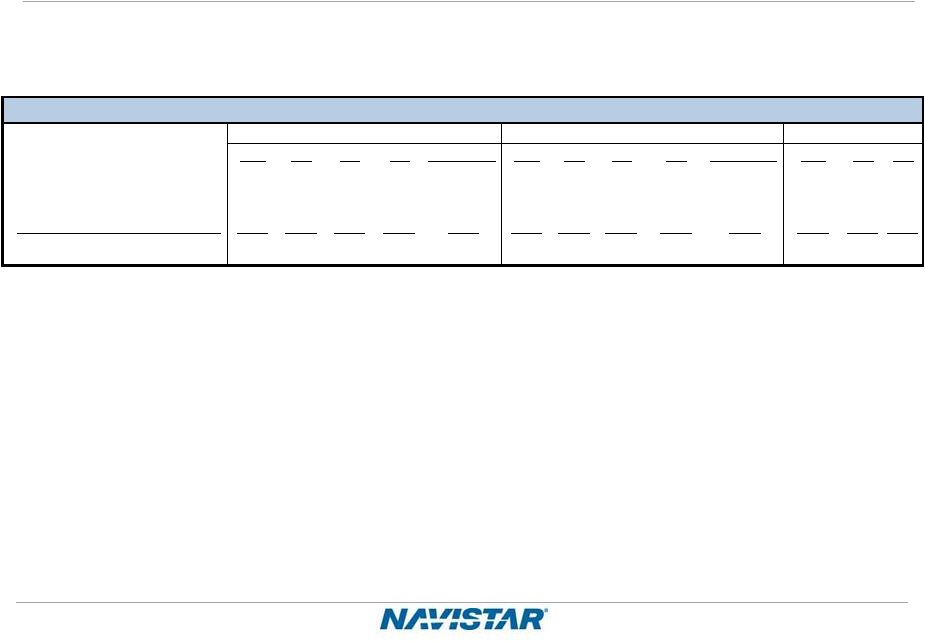
| |
|
Third Quarter |
|
|
First Nine Months |
|
| (in millions, except per share data) |
|
2013 |
|
|
2012 |
|
|
2013 |
|
|
2012 |
|
| Sales and revenues, net |
|
$ |
2,861 |
|
|
$ |
3,246 |
|
|
$ |
8,024 |
|
|
$ |
9,516 |
|
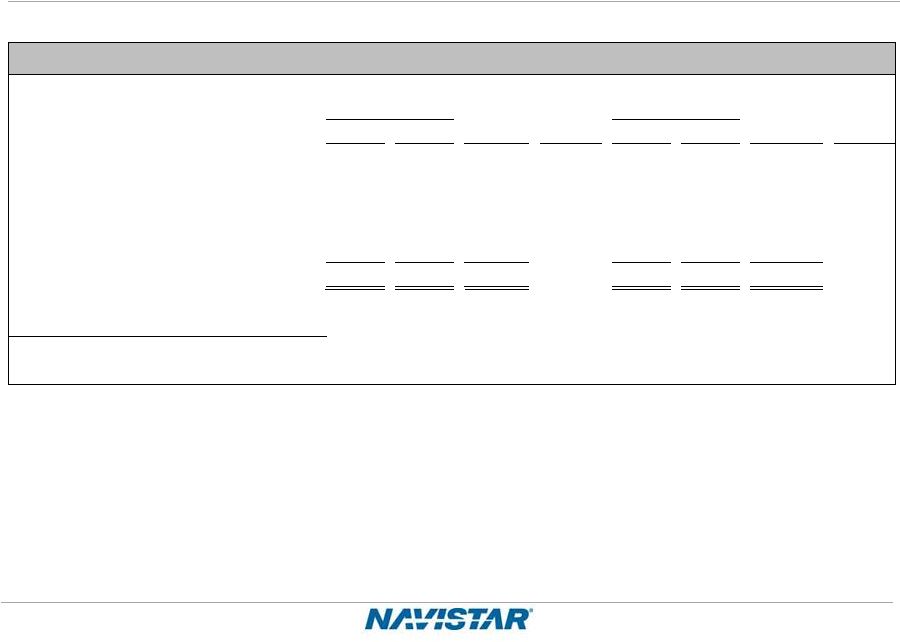
| Segment Results: |
|
|
|
|
|
|
|
|
|
|
|
|
|
|
|
|
| Truck |
|
$ |
(58 |
) |
|
$ |
(26 |
) |
|
$ |
(225 |
) |
|
$ |
(98 |
) |
| Engine |
|
|
(86 |
) |
|
|
(47 |
) |
|
|
(251 |
) |
|
|
(275 |
) |
| Parts |
|
|
76 |
|
|
|
73 |
|
|
|
253 |
|
|
|
164 |
|
| Financial Services |
|
|
23 |
|
|
|
22 |
|
|
|
64 |
|
|
|
75 |
|
|
|
|
|
|
| Loss from continuing operations before income taxes |
|
$ |
(211 |
) |
|
$ |
(96 |
) |
|
$ |
(617 |
) |
|
$ |
(554 |
) |
| Income (loss) from continuing operations, net of tax(A) |
|
|
(237 |
) |
|
|
80 |
|
|
|
(704 |
) |
|
|
(202 |
) |
| Net loss(A) |
|
|
(247 |
) |
|
|
84 |
|
|
|
(744 |
) |
|
|
(241 |
) |
|
|
|
|
|
| Diluted loss per share from continuing operations(A) |
|
$ |
(2.94 |
) |
|
$ |
1.16 |
|
|
$ |
(8.76 |
) |
|
$ |
(2.92 |
) |
| Diluted loss per share(A) |
|
|
(3.06 |
) |
|
|
1.22 |
|
|
|
(9.25 |
) |
|
|
(3.49 |
) |
| (A) |
Amounts attributable to Navistar International Corporation. |
SEGMENT REPORTING
Truck – For the third quarter 2013, the truck segment reported a loss of $58 million, compared with a $26 million loss for the same
period one year ago, on lower net sales of $1.92 billion, a 15 percent decrease year-over-year. The segment’s loss was primarily driven by a decline in traditional truck volumes due to lower industry conditions and the impact of the
company’s emissions transition, as well as lower military volumes and service revenue. The loss was partially offset by lower engineering and product development costs and lower SG&A expenses.
Engine – For the third quarter 2013, the engine segment reported a loss of $86 million, compared to a $47 million loss in third
quarter 2012. Net sales were 14 percent lower year-over-year at $723 million. The loss was driven by lower volumes in the United States and higher adjustments to pre-existing warranties and partially offset by reduced engineering and product
development costs.
Parts – For the third quarter 2013, the parts segment reported a profit of $76 million, a four percent
improvement versus third quarter 2012, despite a nine percent decline ($51 million) in net sales year-over-year. Lower SG&A expenses more than offset the impact of lower military parts sales.
Financial Services – For the third quarter 2013, the financial services segment profit was $23 million, up slightly versus third
quarter 2012, despite net revenues being down five percent year-over-year, as a result of the ongoing transition of retail loans to GE Capital. Overhead cost reductions more than offset the lower net interest margin amount.
About Navistar
Navistar International Corporation (NYSE:
NAV) is a holding company whose subsidiaries and affiliates produce International® brand commercial and military trucks, MaxxForce®
brand diesel engines, and IC Bus™ brand school and commercial buses. The company also provides truck and diesel engine service parts. Another affiliate offers financing services. Additional information is available at www.Navistar.com.
Forward-Looking Statement
Information provided
and statements contained in this report that are not purely historical are forward-looking statements within the meaning of Section 27A of the Securities Act of 1933, as amended, Section 21E of the Securities Exchange Act of 1934, as
amended, and the Private Securities Litigation Reform Act of 1995. Such forward-looking statements only speak as of the date of this report and the company assumes no obligation to update the information included in this report. Such forward-looking
statements include information concerning our possible or assumed future results of operations, including descriptions of our business strategy. These statements often include words such as “believe,” “expect,”
“anticipate,” “intend,” “plan,” “estimate,” or similar expressions. These statements are not guarantees of performance or results and they involve risks, uncertainties, and assumptions. For a further
description of these factors, see the risk factors set forth in our filings with the Securities and Exchange Commission, including our annual report on Form 10-K for the fiscal year ended October 31, 2012. Although we believe that these
forward-looking statements are based on reasonable assumptions, there are many factors that could affect our actual financial results or results of operations and could cause actual results to differ materially from those in the forward-looking
statements. All future written and oral forward-looking statements by us or persons acting on our behalf are expressly qualified in their entirety by the cautionary statements contained or referred to above. Except for our ongoing obligations to
disclose material information as required by the federal securities laws, we do not have any obligations or intention to release publicly any revisions to any forward-looking statements to reflect events or circumstances in the future or to reflect
the occurrence of unanticipated events.
Navistar International Corporation and Subsidiaries
Consolidated Statements of Operations
(Unaudited)
|
|
|
|
|
|
|
|
|
|
|
|
|
|
|
|
|
| |
|
Three Months Ended
July 31, |
|
|
Nine Months Ended
July 31, |
|
| (in millions, except per share data) |
|
2013 |
|
|
2012 |
|
|
2013 |
|
|
2012 |
|
| Sales and revenues |
|
|
|
|
|
|
|
|
|
|
|
|
|
|
|
|
| Sales of manufactured products, net |
|
$ |
2,820 |
|
|
$ |
3,204 |
|
|
$ |
7,905 |
|
|
$ |
9,387 |
|
| Finance revenues |
|
|
41 |
|
|
|
42 |
|
|
|
119 |
|
|
|
129 |
|
|
|
|
|
|
|
|
|
|
|
|
|
|
|
|
|
|
| Sales and revenues, net |
|
|
2,861 |
|
|
|
3,246 |
|
|
|
8,024 |
|
|
|
9,516 |
|
|
|
|
|
|
|
|
|
|
|
|
|
|
|
|
|
|
| Costs and expenses |
|
|
|
|
|
|
|
|
|
|
|
|
|
|
|
|
| Costs of products sold |
|
|
2,547 |
|
|
|
2,800 |
|
|
|
7,196 |
|
|
|
8,350 |
|
| Restructuring charges |
|
|
6 |
|
|
|
4 |
|
|
|
14 |
|
|
|
23 |
|
| Asset impairment charges |
|
|
17 |
|
|
|
— |
|
|
|
17 |
|
|
|
10 |
|
| Selling, general and administrative expenses |
|
|
308 |
|
|
|
322 |
|
|
|
905 |
|
|
|
1,049 |
|
| Engineering and product development costs |
|
|
99 |
|
|
|
135 |
|
|
|
310 |
|
|
|
402 |
|
| Interest expense |
|
|
76 |
|
|
|
59 |
|
|
|
240 |
|
|
|
182 |
|
| Other expense (income), net |
|
|
22 |
|
|
|
12 |
|
|
|
(35 |
) |
|
|
33 |
|
|
|
|
|
|
|
|
|
|
|
|
|
|
|
|
|
|
| Total costs and expenses |
|
|
3,075 |
|
|
|
3,332 |
|
|
|
8,647 |
|
|
|
10,049 |
|
| Equity in income (loss) of non-consolidated affiliates |
|
|
3 |
|
|
|
(10 |
) |
|
|
6 |
|
|
|
(21 |
) |
|
|
|
|
|
|
|
|
|
|
|
|
|
|
|
|
|
| Loss from continuing operations before income taxes |
|
|
(211 |
) |
|
|
(96 |
) |
|
|
(617 |
) |
|
|
(554 |
) |
| Income tax benefit (expense) |
|
|
(16 |
) |
|
|
188 |
|
|
|
(53 |
) |
|
|
387 |
|
|
|
|
|
|
|
|
|
|
|
|
|
|
|
|
|
|
| Income (loss) from continuing operations |
|
|
(227 |
) |
|
|
92 |
|
|
|
(670 |
) |
|
|
(167 |
) |
| Income (loss) from discontinued operations, net of tax |
|
|
(10 |
) |
|
|
4 |
|
|
|
(40 |
) |
|
|
(39 |
) |
|
|
|
|
|
|
|
|
|
|
|
|
|
|
|
|
|
| Net income (loss) |
|
|
(237 |
) |
|
|
96 |
|
|
|
(710 |
) |
|
|
(206 |
) |
| Less: Net income attributable to non-controlling interests |
|
|
10 |
|
|
|
12 |
|
|
|
34 |
|
|
|
35 |
|
|
|
|
|
|
|
|
|
|
|
|
|
|
|
|
|
|
| Net income (loss) attributable to Navistar International Corporation |
|
$ |
(247 |
) |
|
$ |
84 |
|
|
$ |
(744 |
) |
|
$ |
(241 |
) |
|
|
|
|
|
|
|
|
|
|
|
|
|
|
|
|
|
| Amounts attributable to Navistar International Corporation common shareholders: |
|
|
|
|
|
|
|
|
|
|
|
|
|
|
|
|
| Income (loss) from continuing operations, net of tax |
|
$ |
(237 |
) |
|
$ |
80 |
|
|
$ |
(704 |
) |
|
$ |
(202 |
) |
| Income (loss) from discontinued operations, net of tax |
|
|
(10 |
) |
|
|
4 |
|
|
|
(40 |
) |
|
|
(39 |
) |
|
|
|
|
|
|
|
|
|
|
|
|
|
|
|
|
|
| Net income (loss) |
|
$ |
(247 |
) |
|
$ |
84 |
|
|
$ |
(744 |
) |
|
$ |
(241 |
) |
|
|
|
|
|
|
|
|
|
|
|
|
|
|
|
|
|
| Earnings (loss) per share: |
|
|
|
|
|
|
|
|
|
|
|
|
|
|
|
|
| Basic: |
|
|
|
|
|
|
|
|
|
|
|
|
|
|
|
|
| Continuing operations |
|
$ |
(2.94 |
) |
|
$ |
1.16 |
|
|
$ |
(8.76 |
) |
|
$ |
(2.92 |
) |
| Discontinued operations |
|
|
(0.12 |
) |
|
|
0.06 |
|
|
|
(0.49 |
) |
|
|
(0.57 |
) |
|
|
|
|
|
|
|
|
|
|
|
|
|
|
|
|
|
|
|
$ |
(3.06 |
) |
|
$ |
1.22 |
|
|
$ |
(9.25 |
) |
|
$ |
(3.49 |
) |
|
|
|
|
|
|
|
|
|
|
|
|
|
|
|
|
|
| Diluted: |
|
|
|
|
|
|
|
|
|
|
|
|
|
|
|
|
| Continuing operations |
|
$ |
(2.94 |
) |
|
$ |
1.16 |
|
|
$ |
(8.76 |
) |
|
$ |
(2.92 |
) |
| Discontinued operations |
|
|
(0.12 |
) |
|
|
0.06 |
|
|
|
(0.49 |
) |
|
|
(0.57 |
) |
|
|
|
|
|
|
|
|
|
|
|
|
|
|
|
|
|
|
|
$ |
(3.06 |
) |
|
$ |
1.22 |
|
|
$ |
(9.25 |
) |
|
$ |
(3.49 |
) |
|
|
|
|
|
|
|
|
|
|
|
|
|
|
|
|
|
| Weighted average shares outstanding: |
|
|
|
|
|
|
|
|
|
|
|
|
|
|
|
|
| Basic |
|
|
80.6 |
|
|
|
68.7 |
|
|
|
80.4 |
|
|
|
69.1 |
|
| Diluted |
|
|
80.6 |
|
|
|
68.9 |
|
|
|
80.4 |
|
|
|
69.1 |
|
Navistar International Corporation and Subsidiaries
Consolidated Balance Sheets
|
|
|
|
|
|
|
|
|
| (in millions, except per share data) |
|
July 31,
2013 |
|
|
October 31,
2012 |
|
| |
|
(Unaudited) |
|
|
|
|
| ASSETS |
|
|
|
|
|
|
|
|
| Current assets |
|
|
|
|
|
|
|
|
| Cash and cash equivalents |
|
$ |
425 |
|
|
$ |
1,087 |
|
| Restricted cash and cash equivalents |
|
|
78 |
|
|
|
— |
|
| Marketable securities |
|
|
708 |
|
|
|
466 |
|
| Trade and other receivables, net |
|
|
777 |
|
|
|
749 |
|
| Finance receivables, net |
|
|
1,590 |
|
|
|
1,663 |
|
| Inventories |
|
|
1,336 |
|
|
|
1,537 |
|
| Deferred taxes, net |
|
|
77 |
|
|
|
74 |
|
| Other current assets |
|
|
273 |
|
|
|
261 |
|
|
|
|
|
|
|
|
|
|
| Total current assets |
|
|
5,264 |
|
|
|
5,837 |
|
| Restricted cash |
|
|
92 |
|
|
|
161 |
|
| Trade and other receivables, net |
|
|
30 |
|
|
|
94 |
|
| Finance receivables, net |
|
|
381 |
|
|
|
486 |
|
| Investments in non-consolidated affiliates |
|
|
80 |
|
|
|
62 |
|
| Property and equipment (net of accumulated depreciation and amortization of $2,393 and $2,228) |
|
|
1,714 |
|
|
|
1,660 |
|
| Goodwill |
|
|
255 |
|
|
|
280 |
|
| Intangible assets (net of accumulated amortization of $91 and $78) |
|
|
143 |
|
|
|
171 |
|
| Deferred taxes, net |
|
|
172 |
|
|
|
189 |
|
| Other noncurrent assets |
|
|
110 |
|
|
|
162 |
|
|
|
|
|
|
|
|
|
|
| Total assets |
|
$ |
8,241 |
|
|
$ |
9,102 |
|
|
|
|
|
|
|
|
|
|
| LIABILITIES and STOCKHOLDERS’ DEFICIT |
|
|
|
|
|
|
|
|
| Liabilities |
|
|
|
|
|
|
|
|
| Current liabilities |
|
|
|
|
|
|
|
|
| Notes payable and current maturities of long-term debt |
|
$ |
820 |
|
|
$ |
1,205 |
|
| Accounts payable |
|
|
1,546 |
|
|
|
1,686 |
|
| Other current liabilities |
|
|
1,569 |
|
|
|
1,462 |
|
|
|
|
|
|
|
|
|
|
| Total current liabilities |
|
|
3,935 |
|
|
|
4,353 |
|
| Long-term debt |
|
|
3,904 |
|
|
|
3,566 |
|
| Postretirement benefits liabilities |
|
|
3,285 |
|
|
|
3,405 |
|
| Deferred taxes, net |
|
|
38 |
|
|
|
42 |
|
| Other noncurrent liabilities |
|
|
1,012 |
|
|
|
996 |
|
|
|
|
|
|
|
|
|
|
| Total liabilities |
|
|
12,174 |
|
|
|
12,362 |
|
| Redeemable equity securities |
|
|
4 |
|
|
|
5 |
|
| Stockholders’ deficit |
|
|
|
|
|
|
|
|
| Series D convertible junior preference stock |
|
|
3 |
|
|
|
3 |
|
| Common stock (86.8 and 86.0 shares issued, respectively; and $0.10 par value per share and 220 shares authorized, at both
dates) |
|
|
9 |
|
|
|
9 |
|
| Additional paid in capital |
|
|
2,459 |
|
|
|
2,440 |
|
| Accumulated deficit |
|
|
(3,909 |
) |
|
|
(3,165 |
) |
| Accumulated other comprehensive loss |
|
|
(2,279 |
) |
|
|
(2,325 |
) |
| Common stock held in treasury, at cost (6.4 and 6.8 shares, respectively) |
|
|
(255 |
) |
|
|
(272 |
) |
|
|
|
|
|
|
|
|
|
| Total stockholders’ deficit attributable to Navistar International Corporation |
|
|
(3,972 |
) |
|
|
(3,310 |
) |
| Stockholders’ equity attributable to non-controlling interests |
|
|
35 |
|
|
|
45 |
|
|
|
|
|
|
|
|
|
|
| Total stockholders’ deficit |
|
|
(3,937 |
) |
|
|
(3,265 |
) |
|
|
|
|
|
|
|
|
|
| Total liabilities and stockholders’ deficit |
|
$ |
8,241 |
|
|
$ |
9,102 |
|
|
|
|
|
|
|
|
|
|
Navistar International Corporation and Subsidiaries
Condensed Consolidated Statements of Cash Flows
(Unaudited)
|
|
|
|
|
|
|
|
|
| |
|
Nine Months Ended
July 31, |
|
| (in millions) |
|
2013 |
|
|
2012 |
|
| Cash flows from operating activities |
|
|
|
|
|
|
|
|
| Net loss |
|
$ |
(710 |
) |
|
$ |
(206 |
) |
| Adjustments to reconcile net loss to cash provided by operating activities: |
|
|
|
|
|
|
|
|
| Depreciation and amortization |
|
|
225 |
|
|
|
209 |
|
| Depreciation of equipment leased to others |
|
|
105 |
|
|
|
37 |
|
| Deferred taxes, including change in valuation allowance |
|
|
19 |
|
|
|
(405 |
) |
| Impairment of property and equipment and intangible assets |
|
|
25 |
|
|
|
38 |
|
| Gain on sales of investments and businesses, net |
|
|
(13 |
) |
|
|
— |
|
| Amortization of debt issuance costs and discount |
|
|
43 |
|
|
|
31 |
|
| Stock-based compensation |
|
|
19 |
|
|
|
16 |
|
| Provision for doubtful accounts, net of recoveries |
|
|
16 |
|
|
|
— |
|
| Equity in loss of non-consolidated affiliates, net of dividends |
|
|
5 |
|
|
|
27 |
|
| Write-off of debt issuance cost and discount |
|
|
6 |
|
|
|
8 |
|
| Other non-cash operating activities |
|
|
(60 |
) |
|
|
5 |
|
| Changes in other assets and liabilities, exclusive of the effects of businesses acquired and disposed |
|
|
354 |
|
|
|
586 |
|
|
|
|
|
|
|
|
|
|
| Net cash provided by operating activities |
|
|
34 |
|
|
|
346 |
|
|
|
|
|
|
|
|
|
|
| Cash flows from investing activities |
|
|
|
|
|
|
|
|
| Purchases of marketable securities |
|
|
(1,070 |
) |
|
|
(672 |
) |
| Sales or maturities of marketable securities |
|
|
828 |
|
|
|
1,230 |
|
| Net change in restricted cash and cash equivalents |
|
|
(9 |
) |
|
|
48 |
|
| Capital expenditures |
|
|
(136 |
) |
|
|
(250 |
) |
| Purchases of equipment leased to others |
|
|
(351 |
) |
|
|
(49 |
) |
| Proceeds from sales of property and equipment |
|
|
22 |
|
|
|
12 |
|
| Investments in non-consolidated affiliates |
|
|
(25 |
) |
|
|
(18 |
) |
| Business acquisitions, net of cash received |
|
|
— |
|
|
|
(12 |
) |
| Proceeds from sales of affiliates |
|
|
50 |
|
|
|
1 |
|
| Acquisition of intangibles |
|
|
— |
|
|
|
(14 |
) |
|
|
|
|
|
|
|
|
|
| Net cash provided by (used in) investing activities |
|
|
(691 |
) |
|
|
276 |
|
|
|
|
|
|
|
|
|
|
| Cash flows from financing activities |
|
|
|
|
|
|
|
|
| Proceeds from issuance of securitized debt |
|
|
279 |
|
|
|
1,155 |
|
| Principal payments on securitized debt |
|
|
(501 |
) |
|
|
(1,532 |
) |
| Proceeds from issuance of non-securitized debt |
|
|
390 |
|
|
|
717 |
|
| Principal payments on non-securitized debt |
|
|
(438 |
) |
|
|
(582 |
) |
| Net increase (decrease) in notes and debt outstanding under revolving credit facilities |
|
|
87 |
|
|
|
(195 |
) |
| Principal payments under financing arrangements and capital lease obligations |
|
|
(55 |
) |
|
|
(30 |
) |
| Debt issuance costs |
|
|
(16 |
) |
|
|
(20 |
) |
| Proceeds from financed lease obligations |
|
|
276 |
|
|
|
— |
|
| Issuance of common stock |
|
|
14 |
|
|
|
— |
|
| Purchase of treasury stock |
|
|
— |
|
|
|
(75 |
) |
| Proceeds from exercise of stock options |
|
|
9 |
|
|
|
2 |
|
| Dividends paid by subsidiaries to non-controlling interest |
|
|
(35 |
) |
|
|
(44 |
) |
| Other financing activities |
|
|
4 |
|
|
|
(3 |
) |
|
|
|
|
|
|
|
|
|
| Net cash provided by (used in) financing activities |
|
|
14 |
|
|
|
(607 |
) |
|
|
|
|
|
|
|
|
|
| Effect of exchange rate changes on cash and cash equivalents |
|
|
(19 |
) |
|
|
(7 |
) |
|
|
|
|
|
|
|
|
|
| Increase (decrease) in cash and cash equivalents |
|
|
(662 |
) |
|
|
8 |
|
| Cash and cash equivalents at beginning of the period |
|
|
1,087 |
|
|
|
539 |
|
|
|
|
|
|
|
|
|
|
| Cash and cash equivalents at end of the period |
|
$ |
425 |
|
|
$ |
547 |
|
|
|
|
|
|
|
|
|
|
Navistar International Corporation and Subsidiaries
Segment Reporting
(Unaudited)
We define segment profit
(loss) as net income (loss) from continuing operations attributable to Navistar International Corporation excluding income tax benefit (expense). Operating results for interim reporting periods are not necessarily indicative of annual operating
results.
Beginning in the first quarter of 2013, the Company began reporting the operating results of WCC and certain operating results of Monaco as
discontinued operations in the Company’s consolidated statements of operations. The 2012 selected financial information has been restated to reflect this change.
The following tables present selected financial information for our reporting segments:
|
|
|
|
|
|
|
|
|
|
|
|
|
|
|
|
|
|
|
|
|
|
|
|
|
| (in millions) |
|
Truck |
|
|
Engine |
|
|
Parts |
|
|
Financial
Services(A) |
|
|
Corporate
and
Eliminations |
|
|
Total |
|
| Three Months Ended July 31, 2013 |
|
|
|
|
|
|
|
|
|
|
|
|
|
|
|
|
|
|
|
|
|
|
|
|
| External sales and revenues, net |
|
$ |
1,909 |
|
|
$ |
439 |
|
|
$ |
472 |
|
|
$ |
41 |
|
|
$ |
— |
|
|
$ |
2,861 |
|
| Intersegment sales and revenues |
|
|
15 |
|
|
|
284 |
|
|
|
19 |
|
|
|
20 |
|
|
|
(338 |
) |
|
|
— |
|
|
|
|
|
|
|
|
|
|
|
|
|
|
|
|
|
|
|
|
|
|
|
|
|
|
| Total sales and revenues, net |
|
$ |
1,924 |
|
|
$ |
723 |
|
|
$ |
491 |
|
|
$ |
61 |
|
|
$ |
(338 |
) |
|
$ |
2,861 |
|
|
|
|
|
|
|
|
|
|
|
|
|
|
|
|
|
|
|
|
|
|
|
|
|
|
| Income (loss) from continuing operations attributable to NIC, net of tax |
|
$ |
(58 |
) |
|
$ |
(86 |
) |
|
$ |
76 |
|
|
$ |
23 |
|
|
$ |
(192 |
) |
|
$ |
(237 |
) |
| Income tax expense |
|
|
— |
|
|
|
— |
|
|
|
— |
|
|
|
— |
|
|
|
(16 |
) |
|
|
(16 |
) |
|
|
|
|
|
|
|
|
|
|
|
|
|
|
|
|
|
|
|
|
|
|
|
|
|
| Segment profit (loss) |
|
$ |
(58 |
) |
|
$ |
(86 |
) |
|
$ |
76 |
|
|
$ |
23 |
|
|
$ |
(176 |
) |
|
$ |
(221 |
) |
|
|
|
|
|
|
|
|
|
|
|
|
|
|
|
|
|
|
|
|
|
|
|
|
|
| Depreciation and amortization(B) |
|
$ |
40 |
|
|
$ |
30 |
|
|
$ |
3 |
|
|
$ |
10 |
|
|
$ |
5 |
|
|
$ |
88 |
|
| Interest expense |
|
|
— |
|
|
|
— |
|
|
|
— |
|
|
|
17 |
|
|
|
59 |
|
|
|
76 |
|
| Equity in income of non-consolidated affiliates |
|
|
— |
|
|
|
3 |
|
|
|
— |
|
|
|
— |
|
|
|
— |
|
|
|
3 |
|
| Capital expenditures(B)(C) |
|
|
16 |
|
|
|
8 |
|
|
|
1 |
|
|
|
— |
|
|
|
4 |
|
|
|
29 |
|
|
|
|
|
|
|
|
| (in millions) |
|
Truck |
|
|
Engine |
|
|
Parts |
|
|
Financial
Services(A) |
|
|
Corporate
and
Eliminations |
|
|
Total |
|
| Three Months Ended July 31, 2012 |
|
|
|
|
|
|
|
|
|
|
|
|
|
|
|
|
|
|
|
|
|
|
|
|
| External sales and revenues, net |
|
$ |
2,250 |
|
|
$ |
441 |
|
|
$ |
513 |
|
|
$ |
42 |
|
|
$ |
— |
|
|
$ |
3,246 |
|
| Intersegment sales and revenues |
|
|
13 |
|
|
|
399 |
|
|
|
29 |
|
|
|
22 |
|
|
|
(463 |
) |
|
|
— |
|
|
|
|
|
|
|
|
|
|
|
|
|
|
|
|
|
|
|
|
|
|
|
|
|
|
| Total sales and revenues, net |
|
$ |
2,263 |
|
|
$ |
840 |
|
|
$ |
542 |
|
|
$ |
64 |
|
|
$ |
(463 |
) |
|
$ |
3,246 |
|
|
|
|
|
|
|
|
|
|
|
|
|
|
|
|
|
|
|
|
|
|
|
|
|
|
| Income (loss) from continuing operations attributable to NIC, net of tax |
|
$ |
(26 |
) |
|
$ |
(47 |
) |
|
$ |
73 |
|
|
$ |
22 |
|
|
$ |
58 |
|
|
$ |
80 |
|
| Income tax benefit |
|
|
— |
|
|
|
— |
|
|
|
— |
|
|
|
— |
|
|
|
188 |
|
|
|
188 |
|
|
|
|
|
|
|
|
|
|
|
|
|
|
|
|
|
|
|
|
|
|
|
|
|
|
| Segment profit (loss) |
|
$ |
(26 |
) |
|
$ |
(47 |
) |
|
$ |
73 |
|
|
$ |
22 |
|
|
$ |
(130 |
) |
|
$ |
(108 |
) |
|
|
|
|
|
|
|
|
|
|
|
|
|
|
|
|
|
|
|
|
|
|
|
|
|
| Depreciation and amortization(B) |
|
$ |
41 |
|
|
$ |
28 |
|
|
$ |
2 |
|
|
$ |
9 |
|
|
$ |
6 |
|
|
$ |
86 |
|
| Interest expense |
|
|
— |
|
|
|
— |
|
|
|
— |
|
|
|
20 |
|
|
|
39 |
|
|
|
59 |
|
| Equity in income (loss) of non-consolidated affiliates |
|
|
(12 |
) |
|
|
1 |
|
|
|
1 |
|
|
|
— |
|
|
|
— |
|
|
|
(10 |
) |
| Capital expenditures(B)(C) |
|
|
21 |
|
|
|
39 |
|
|
|
6 |
|
|
|
1 |
|
|
|
7 |
|
|
|
74 |
|
|
|
|
|
|
|
|
|
|
|
|
|
|
|
|
|
|
|
|
|
|
|
|
|
|
| (in millions) |
|
Truck |
|
|
Engine |
|
|
Parts |
|
|
Financial
Services(A) |
|
|
Corporate
and
Eliminations |
|
|
Total |
|
| Nine Months Ended July 31, 2013 |
|
|
|
|
|
|
|
|
|
|
|
|
|
|
|
|
|
|
|
|
|
|
|
|
| External sales and revenues, net |
|
$ |
5,080 |
|
|
$ |
1,309 |
|
|
$ |
1,516 |
|
|
$ |
119 |
|
|
$ |
— |
|
|
$ |
8,024 |
|
| Intersegment sales and revenues |
|
|
41 |
|
|
|
898 |
|
|
|
57 |
|
|
|
59 |
|
|
|
(1,055 |
) |
|
|
— |
|
|
|
|
|
|
|
|
|
|
|
|
|
|
|
|
|
|
|
|
|
|
|
|
|
|
| Total sales and revenues, net |
|
$ |
5,121 |
|
|
$ |
2,207 |
|
|
$ |
1,573 |
|
|
$ |
178 |
|
|
$ |
(1,055 |
) |
|
$ |
8,024 |
|
|
|
|
|
|
|
|
|
|
|
|
|
|
|
|
|
|
|
|
|
|
|
|
|
|
| Income (loss) from continuing operations attributable to NIC, net of tax |
|
$ |
(225 |
) |
|
$ |
(251 |
) |
|
$ |
253 |
|
|
$ |
64 |
|
|
$ |
(545 |
) |
|
$ |
(704 |
) |
| Income tax expense |
|
|
— |
|
|
|
— |
|
|
|
— |
|
|
|
— |
|
|
|
(53 |
) |
|
|
(53 |
) |
|
|
|
|
|
|
|
|
|
|
|
|
|
|
|
|
|
|
|
|
|
|
|
|
|
| Segment profit (loss) |
|
$ |
(225 |
) |
|
$ |
(251 |
) |
|
$ |
253 |
|
|
$ |
64 |
|
|
$ |
(492 |
) |
|
$ |
(651 |
) |
|
|
|
|
|
|
|
|
|
|
|
|
|
|
|
|
|
|
|
|
|
|
|
|
|
| Depreciation and amortization(B) |
|
$ |
174 |
|
|
$ |
102 |
|
|
$ |
8 |
|
|
$ |
29 |
|
|
$ |
17 |
|
|
$ |
330 |
|
| Interest expense |
|
|
— |
|
|
|
— |
|
|
|
— |
|
|
|
52 |
|
|
|
188 |
|
|
|
240 |
|
| Equity in income of non-consolidated affiliates |
|
|
— |
|
|
|
2 |
|
|
|
4 |
|
|
|
— |
|
|
|
— |
|
|
|
6 |
|
| Capital expenditures(B)(C) |
|
|
47 |
|
|
|
77 |
|
|
|
2 |
|
|
|
1 |
|
|
|
9 |
|
|
|
136 |
|
|
|
|
|
|
|
|
| (in millions) |
|
Truck |
|
|
Engine |
|
|
Parts |
|
|
Financial
Services(A) |
|
|
Corporate
and
Eliminations |
|
|
Total |
|
| Nine Months Ended July 31, 2012 |
|
|
|
|
|
|
|
|
|
|
|
|
|
|
|
|
|
|
|
|
|
|
|
|
| External sales and revenues, net |
|
$ |
6,677 |
|
|
$ |
1,301 |
|
|
$ |
1,409 |
|
|
$ |
129 |
|
|
$ |
— |
|
|
$ |
9,516 |
|
| Intersegment sales and revenues |
|
|
26 |
|
|
|
1,292 |
|
|
|
98 |
|
|
|
70 |
|
|
|
(1,486 |
) |
|
|
— |
|
|
|
|
|
|
|
|
|
|
|
|
|
|
|
|
|
|
|
|
|
|
|
|
|
|
| Total sales and revenues, net |
|
$ |
6,703 |
|
|
$ |
2,593 |
|
|
$ |
1,507 |
|
|
$ |
199 |
|
|
$ |
(1,486 |
) |
|
$ |
9,516 |
|
|
|
|
|
|
|
|
|
|
|
|
|
|
|
|
|
|
|
|
|
|
|
|
|
|
| Income (loss) from continuing operations attributable to NIC, net of tax |
|
$ |
(98 |
) |
|
$ |
(275 |
) |
|
$ |
164 |
|
|
$ |
75 |
|
|
$ |
(68 |
) |
|
$ |
(202 |
) |
| Income tax benefit |
|
|
— |
|
|
|
— |
|
|
|
— |
|
|
|
— |
|
|
|
387 |
|
|
|
387 |
|
|
|
|
|
|
|
|
|
|
|
|
|
|
|
|
|
|
|
|
|
|
|
|
|
|
| Segment profit (loss) |
|
$ |
(98 |
) |
|
$ |
(275 |
) |
|
$ |
164 |
|
|
$ |
75 |
|
|
$ |
(455 |
) |
|
$ |
(589 |
) |
|
|
|
|
|
|
|
|
|
|
|
|
|
|
|
|
|
|
|
|
|
|
|
|
|
| Depreciation and amortization(B) |
|
$ |
111 |
|
|
$ |
87 |
|
|
$ |
8 |
|
|
$ |
25 |
|
|
$ |
15 |
|
|
$ |
246 |
|
| Interest expense |
|
|
— |
|
|
|
— |
|
|
|
— |
|
|
|
67 |
|
|
|
115 |
|
|
|
182 |
|
| Equity in income (loss) of non-consolidated affiliates |
|
|
(27 |
) |
|
|
2 |
|
|
|
4 |
|
|
|
— |
|
|
|
— |
|
|
|
(21 |
) |
| Capital expenditures(B)(C) |
|
|
53 |
|
|
|
116 |
|
|
|
18 |
|
|
|
2 |
|
|
|
61 |
|
|
|
250 |
|
|
|
|
|
|
|
|
| (in millions) |
|
Truck(B) |
|
|
Engine |
|
|
Parts |
|
|
Financial
Services |
|
|
Corporate
and
Eliminations |
|
|
Total |
|
| Segment assets, as of: |
|
|
|
|
|
|
|
|
|
|
|
|
|
|
|
|
|
|
|
|
|
|
|
|
| July 31, 2013 |
|
$ |
2,052 |
|
|
$ |
1,581 |
|
|
$ |
657 |
|
|
$ |
2,444 |
|
|
$ |
1,507 |
|
|
$ |
8,241 |
|
| October 31, 2012 |
|
|
2,118 |
|
|
|
1,777 |
|
|
|
707 |
|
|
|
2,563 |
|
|
|
1,937 |
|
|
$ |
9,102 |
|
| (A) |
Total sales and revenues in the Financial Services segment include interest revenues of $47 million and $140 million for the three and nine months ended July 31, 2013, respectively, and $53 million and $168 million
for three and nine months ended July 31, 2012, respectively. |
| (B) |
The segment assets as of October 31, 2012 includes amounts related to discontinued operations. |
| (C) |
Exclusive of purchases of equipment leased to others. |
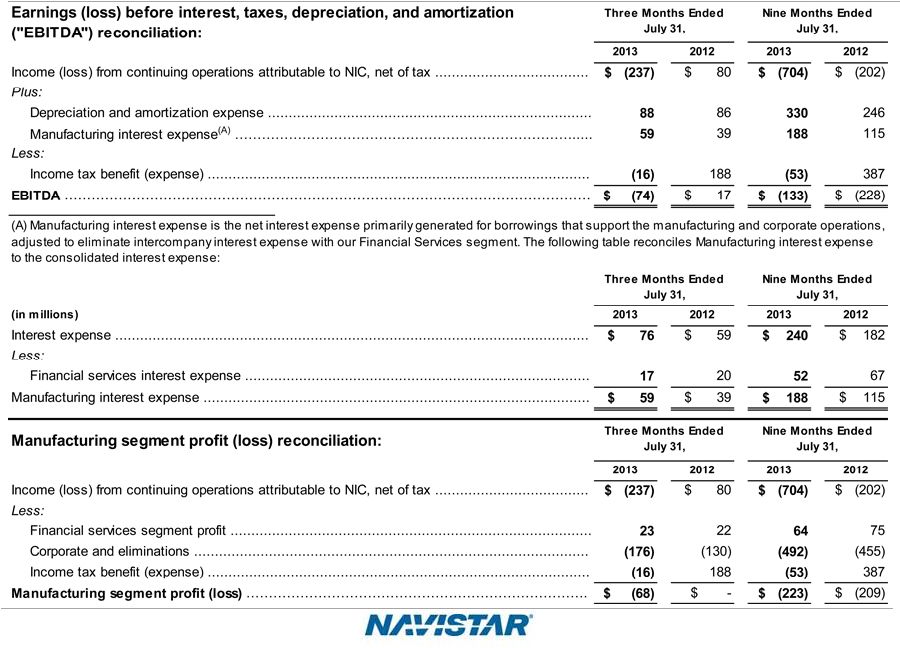
SEC Regulation G Non-GAAP Reconciliation
The financial measures presented below are unaudited and not in accordance with, or an alternative for, financial measures presented in accordance with U.S.
generally accepted accounting principles (“GAAP”). The non-GAAP financial information presented herein should be considered supplemental to, and not as a substitute for, or superior to, financial measures calculated in accordance with
GAAP.
Manufacturing cash, cash equivalents, and marketable securities represents the Company’s consolidated cash, cash equivalents, and
marketable securities excluding cash, cash equivalents, and marketable securities of our financial services operations. We include marketable securities with our cash and cash equivalents when assessing our liquidity position as our investments are
highly liquid in nature.
Manufacturing revenue represents the Sales of manufactured products, net, from the Company’s consolidated statements
of operations.
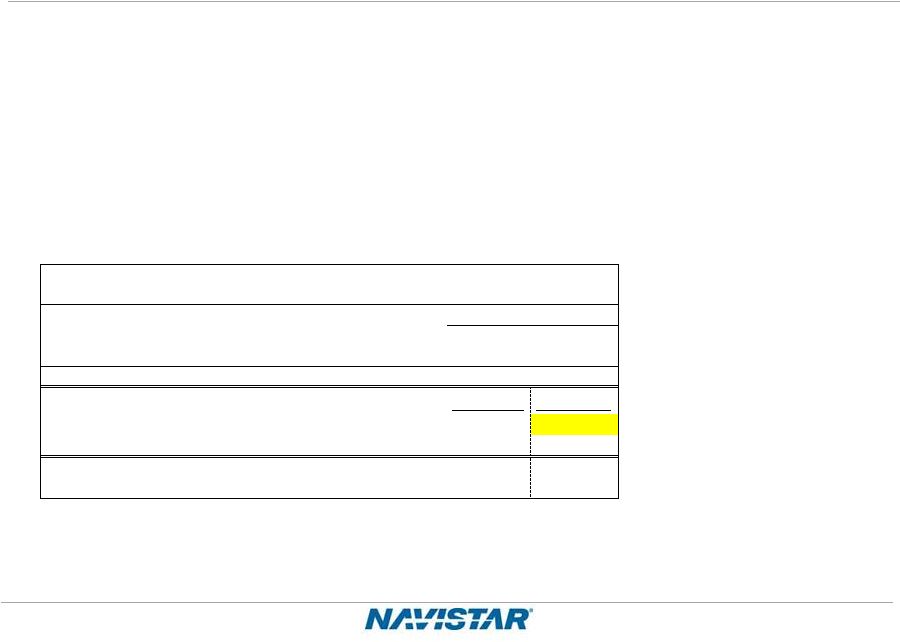
Manufacturing segment cash and cash equivalents and marketable securities reconciliation:
|
|
|
|
|
|
|
|
|
|
|
|
|
| |
|
As of July 31, 2013 |
|
| (in millions) |
|
Manufacturing
Operations |
|
|
Financial Services
Operations |
|
|
Consolidated
Balance Sheet |
|
| Assets |
|
|
|
|
|
|
|
|
|
|
|
|
| Cash and cash equivalents |
|
$ |
413 |
|
|
$ |
12 |
|
|
$ |
425 |
|
| Marketable securities |
|
|
674 |
|
|
|
34 |
|
|
|
708 |
|
|
|
|
|
|
|
|
|
|
|
|
|
|
| Total Cash and cash equivalents and Marketable securities |
|
$ |
1,087 |
|
|
$ |
46 |
|
|
$ |
1,133 |
|
|
|
|
|
|
|
|
|
|
|
|
|
|