UNITED STATES
SECURITIES AND EXCHANGE COMMISSION
Washington, D.C. 20549
FORM 8-K/A
(Amendment No. 1)
CURRENT REPORT
Pursuant to Section 13 or 15(d) of the
Securities Exchange Act of 1934
Date of Report (Date of earliest event reported): June 7, 2012
NAVISTAR INTERNATIONAL CORPORATION
(Exact name of registrant as specified in its charter)
Delaware | 1-9618 | 36-3359573 | ||
(State or other jurisdiction of incorporation or organization) |
(Commission File No.) |
(I.R.S. Employer Identification No.) |
2701 Navistar Drive Lisle, Illinois |
60532 | |
(Address of principal executive offices) | (Zip Code) |
Registrants telephone number, including area code (331) 332-5000
(Former name or former address, if changed since last report.)
Check the appropriate box below if the Form 8-K filing is intended to simultaneously satisfy the filing obligation of the registrant under any of the following provisions:
¨ | Written communications pursuant to Rule 425 under the Securities Act (17 CFR 230.425) |
¨ | Soliciting material pursuant to Rule 14a-12 under the Exchange Act (17 CFR 240.14a-12) |
¨ | Pre-commencement communications pursuant to Rule 14d-2(b) under the Exchange Act (17 CFR 240.14d-2(b)) |
¨ | Pre-commencement communications pursuant to Rule 13e-4(c) under the Exchange Act (17 CFR 240.13e-4(c)) |
Explanatory Note
Navistar International Corporation (the Company) is filing this Current Report on Form 8-K/A to correct the omission of certain Regulation G Non-GAAP reconciliation tables in the press release and slide presentation in the disclosure in Item 9.01, Financial Tables and Exhibits, in the Companys Current Report on Form 8-K filed with the SEC on June 7, 2012 (the Original Filing). The Original Filing inadvertently excluded the Regulation G Non-GAAP Reconciliation of the Companys revised 2012 guidance. The Regulation G Non-GAAP Reconciliation tables were added to Exhibit 99.1, Press Release, and Exhibit 99.2, Slide Presentation for Second Quarter Financial Results Web Cast to be held on June 7, 2012, and are included in this filing.
ITEM 2.02 | RESULTS OF OPERATIONS AND FINANCIAL CONDITION |
In accordance with General Instruction B.2. to Form 8-K, the following information shall not be deemed filed for purposes of Section 18 of the Securities Exchange Act of 1934, as amended, nor shall it be deemed incorporated by reference in any filing under the Securities Act of 1933, as amended, except as shall be expressly set forth by specific reference in such a filing.
The information regarding the results of operations and financial condition of Navistar International Corporation (the Company) responsive to this Item 2.02, and contained in Exhibit 99.1 filed herewith, is incorporated into this Item 2.02 by reference.
ITEM 7.01 | REGULATION FD DISCLOSURE |
In accordance with General Instruction B.2. to Form 8-K, the following information shall not be deemed filed for purposes of Section 18 of the Securities Exchange Act of 1934, as amended, nor shall it be deemed incorporated by reference in any filing under the Securities Act of 1933, as amended, except as shall be expressly set forth by specific reference in such a filing.
On June 6, 2012, the Company filed its Quarterly Report on Form 10-Q for the period ended April 30, 2012 with the Securities and Exchange Commission. The Companys press release announcing the filing is attached as Exhibit 99.1 to this Current Report and is incorporated by reference herein.
Navistar International Corporation (the Company), the nations largest combined commercial truck, school bus and mid-range diesel engine producer, will present via live web cast its fiscal 2012 second quarter financial results on Thursday, June 7th. A live web cast is scheduled at approximately 9:00 AM ET. Speakers on the web cast will include Daniel C. Ustian, Chairman, President and Chief Executive Officer, A. J. Cederoth, Executive Vice President and Chief Financial Officer, and other Company leaders. Copies of the slides containing financial and operating information to be used as part of the web cast are attached as Exhibit 99.2 to this Current Report and are incorporated by reference herein.
The web cast can be accessed through a link on the investor relations page of Navistars web site at http://ir.navistar.com/events.cfm. Investors are advised to log on to the website at least 15 minutes prior to the start of the web cast to allow sufficient time for downloading any necessary software. The web cast will be available for replay at the same address approximately three hours following its conclusion, and will remain available for a period of 10 days.
Navistar International Corporation (NYSE: NAV) is a holding company whose subsidiaries and affiliates produce International® brand commercial and military trucks, MaxxForce® brand diesel engines, IC Bus brand school and commercial buses, Monaco® RV brands of recreational vehicles, and Workhorse® brand chassis for motor homes and step vans. It also is a private-label designer and manufacturer of diesel engines for the pickup truck, van and SUV markets. The company also provides truck and diesel engine service parts. Another affiliate offers financing services. Additional information is available at www.navistar.com/newsroom.
ITEM 9.01. | FINANCIAL STATEMENTS AND EXHIBITS |
(d) Exhibits.
The following documents are filed herewith:
Exhibit No. |
Description | |
99.1 |
Press Release. | |
99.2 |
Slide Presentation for Second Quarter Financial Results Web Cast to be held on June 7, 2012. |
Forward Looking Statements
Information provided and statements contained in this report that are not purely historical are forward-looking statements within the meaning of Section 27A of the Securities Act of 1933, as amended, Section 21E of the Securities Exchange Act of 1934, as amended, and the Private Securities Litigation Reform Act of 1995. Such forward-looking statements only speak as of the date of this report and the company assumes no obligation to update the information included in this report. Such forward-looking statements include information concerning our possible or assumed future results of operations, including descriptions of our business strategy. These statements often include words such as believe, expect, anticipate, intend, plan, estimate, or similar expressions. These statements are not guarantees of performance or results and they involve risks, uncertainties, and assumptions. These statements are not guarantees of performance or results and they involve risks, uncertainties, and assumptions. For a further description of these factors, see the risk factors set forth in our filings with the Securities and Exchange Commission, including our annual report on Form 10-K for the fiscal year ended October 31, 2011 and quarterly reports for fiscal 2012. Although we believe that these forward-looking statements are based on reasonable assumptions, there are many factors that could affect our actual financial results or results of operations and could cause actual results to differ materially from those in the forward-looking statements. All future written and oral forward-looking statements by us or persons acting on our behalf are expressly qualified in their entirety by the cautionary statements contained or referred to above. Except for our ongoing obligations to disclose material information as required by the federal securities laws, we do not have any obligations or intention to release publicly any revisions to any forward-looking statements to reflect events or circumstances in the future or to reflect the occurrence of unanticipated events.
SIGNATURE
Pursuant to the requirements of the Securities Exchange Act of 1934, the registrant has duly caused this report to be signed on its behalf by the undersigned hereunto duly authorized.
NAVISTAR INTERNATIONAL CORPORATION (Registrant) | ||
By: | /s/ Andrew J. Cederoth | |
Name: |
Andrew J. Cederoth | |
Title: |
Executive Vice President and Chief Financial Officer |
Dated: June 7, 2012
EXHIBIT INDEX
Exhibit No. |
Description | |
99.1 |
Press Release. | |
99.2 |
Slide Presentation for Second Quarter Financial Results Web Cast to be held on June 7, 2012. |
Exhibit 99.1
Navistar International Corporation 2701 Navistar Dr. Lisle, IL 60532 USA |
P : 331-332-5000 W : navistar.com |
Media Contact: |
Karen Denning, 331-332-3535 | |||||
Investor Contact: |
Heather Kos, 331-332-2406 | |||||
Web site: |
www.Navistar.com/newsroom |
NAVISTAR ANNOUNCES MANAGEMENT REORGANIZATION, REPORTS SECOND
QUARTER RESULTS
| Management reorganization to drive improved execution around integration strategy |
| Second quarter loss driven by higher warranty, engine certification speculation |
| Company projects significant profit improvement in second half 2012 |
LISLE, Ill. (June 7, 2012) Navistar International Corporation (NYSE: NAV) today announced a management realignment designed to give further momentum to its strategy of great products, competitive cost and profitable growth. The company also released second quarter results and acknowledged that discussions with the U.S. Environmental Protection Agency (EPA) for its EGR-only 0.2 NOx emissions engine certification are ongoing.
Navistar reported a loss of $172 million, or $2.50 per diluted share, for the second quarter ended April 30, 2012. After pre-tax adjustments to exclude net impact of pre-existing warranty charges of $104 million related to 2010 emission standard engines, asset impairment charges of $38 million, engineering integration costs of $29 million, a charge of $10 million for non-conformance penalties, and the release of an $181 million income tax valuation allowance related to Canadian deferred tax assets, Navistars loss for the second quarter 2012 was $137 million, or a loss of $1.99 per diluted share.
Certainly, our first half performance was unacceptable. It included a warranty reserve to repair early 2010 and 2011 vehicles, said Daniel C. Ustian, Navistar chairman, president and chief executive officer. We were also affected by speculation surrounding our engine certification for our Class 8 engine, which is why we are working tirelessly with the U.S. EPA to get resolution.
Based on its second quarter 2012 results, the company updated its guidance for adjusted manufacturing segment profit for fiscal year ending October 31, 2012, to be between $600 million and $750 million. This equates to adjusted net income attributable to Navistar International Corporation to be between breakeven and $140 million, or $0 to $2.00 adjusted diluted earnings per share. This expectation also includes the absorption of approximately $90 million in higher post retirement health care costs.
Going forward, weve identified a path for delivering strong profits in the second half of 2012, Ustian said. Historically, the second half is stronger across our businesses, and we expect to build on this with improved market share in North America, stronger global performance and further cost reductions across all operations.
Additionally, were making management and operational structure changes to align our organization in a more effective manner to drive these results.
Troy Clarke, currently president of Navistar Asia Pacific, will assume responsibility for all Navistars operations in the newly-created role of President, Truck and Engine, under which the Truck, Engine, Parts, Product Development and Purchasing organizations will have the opportunity to integrate and deliver the highest quality products and services. Jack Allen will become president of North America Truck and Parts, an expansion of his current role, and Engine Group President Eric Tech will expand his role to become president of Global Truck and Engine, responsible for all of our business operations outside of North America. The changes will take effect July 1, following Board approval.
I am confident that our new management structure will lead to greater planning and execution around our integration strategy, further enabling us to deliver enterprise-wide profitability, leverage assets more effectively, streamline decision making and bring renewed energy to our team, Ustian said.
FINANCIALS
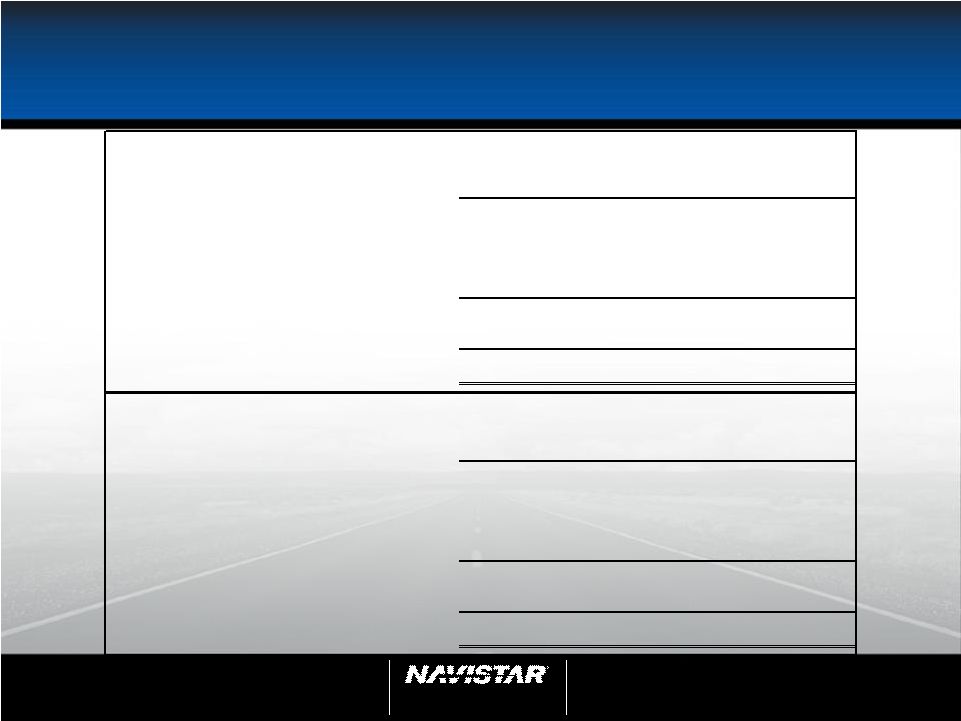
Second Quarter | Six Months | |||||||||||||||
(in millions, except per share data) | 2012 | 2011 | 2012 | 2011 | ||||||||||||
Sales and revenues, net |
$ | 3,298 | $ | 3,355 | $ | 6,350 | $ | 6,098 | ||||||||
Segment Results: |
||||||||||||||||
Truck |
$ | (89 | ) | $ | 92 | $ | (130 | ) | $ | 124 | ||||||
Engine |
(108 | ) | 2 | (228 | ) | (6 | ) | |||||||||
Parts |
41 | 74 | 91 | 130 | ||||||||||||
|
|
|
|
|
|
|
|
|||||||||
Manufacturing segment profit (loss)(A) |
$ | (156 | ) | $ | 168 | $ | (267 | ) | $ | 248 | ||||||
|
|
|
|
|
|
|
|
|||||||||
Income (loss) before income taxes |
$ | (295 | ) | $ | 93 | $ | (516 | ) | $ | 99 | ||||||
Net income (loss) attributable to Navistar International Corporation |
(172 | ) | 74 | (325 | ) | 68 | ||||||||||
Diluted earnings (loss) per share attributable to Navistar International Corporation |
(2.50 | ) | 0.93 | (4.69 | ) | 0.87 | ||||||||||
Adjusted net income (loss) attributable to Navistar International Corporation(A) |
(137 | ) | 102 | (201 | ) | 123 | ||||||||||
Adjusted diluted earnings (loss) per share attributable to Navistar International Corporation(A) |
(1.99 | ) | 1.30 | (2.90 | ) | 1.59 |
(A) | Non-GAAP measure, see SEC Regulation G Non-GAAP Reconciliation for additional information. |
Consolidated net sales and revenues of $3.3 billion declined slightly in the second quarter of 2012, versus the year-ago second quarter, which reflects higher net sales in the truck segment that were more than offset by lower net sales in the engine and parts segments. In the year-ago second quarter, Navistar reported sales and revenues of $3.4 billion and net income of $74 million, or $0.93 per diluted share. Adjusted to exclude engineering integration costs and charges for pre-existing warranties, the company reported income of $102 million, or $1.30 diluted earnings per share.
For the six months ended April 30, 2012, Navistar reported a loss of $325 million, equal to $4.69 per diluted share. After adjustments to exclude the impact of the items previously discussed above, Navistars loss for the first half of 2012 is $201 million, equal to $2.90 per diluted share.
Truck For the second quarter 2012, the truck segment recorded a loss of $89 million, compared with a year-ago second quarter profit of $92 million. Results included unfavorable shifts in military product mix reflective of lower military budgets, industry-wide higher commodity and fuel costs, an asset impairment charge of $28 million relating to the companys decision to idle its Workhorse Custom Chassis business, and a charge for $24 million for certain extended warranty costs.
The segment sales increased 4 percent due to increased volumes in traditional markets and strong volume in South America. Traditional and worldwide chargeouts were up, partially offset by lower military sales and shifts in military product mix.
Engine For the second quarter 2012, the engine segment recorded a loss of $108 million, compared with a year-ago second quarter profit of $2 million. Segment sales decreased by 6 percent due to lower sales volumes in South America and a pre-buy of pre-Euro V emissions engines in prior quarters. The segment results include $78 million in pre-existing warranty costs primarily for 2010 emission standard engines.
The engine segment also announced it received government approval for its engine joint venture with Chinese company Anhui Jianghuai Automobile Co (JAC).
Parts For the second quarter 2012, the parts segment recorded $41 million in profit, compared with a year-ago second quarter profit of $74 million. The decrease in profitability year-over-year is driven by a decrease in military sales, a shift in military order mix and an asset impairment charge of $10 million for Uptime Parts related to the Workhorse Custom Chassis business.
Financial Services For the second quarter 2012, the financial services segment recorded $26 million in profit, compared with a year-ago second quarter profit of $40 million. Earnings from the companys financial services segment will continue to slowly decline as its U.S. retail loan portfolio liquidates, reflecting the U.S. retail financing now provided by GE Capital.
MANAGEMENT CHANGES
Troy Clarke assumes the newly created position of president, Truck and Engine, accountable for all Navistar operations. In his current role as president of Navistar Asia Pacific, Clarke led the development of joint ventures in China and India, and worked across regions to execute Navistars global growth strategy. He joined Navistar in January 2010 after a 35-year tenure at General Motors where he held numerous leadership positions, including group president of GM North America, president of GM Asia Pacific, president and managing director of GM Mexico, and vice president of manufacturing and labor relations.
Jack Allen is expanding his role as president of North America Truck to now include the Parts business. He will leverage the natural integration between Truck and Parts as well as his previous experience as Parts president. Allen is a 30-year Navistar veteran and was Engine president from 2004 2008, where he led major initiatives including the acquisition of Brazilian engine producer MWM Motores Diesel Ltd.
Eric Tech is expanding his role from Engine president to become president of Global Truck and Engine, responsible for all of our business operations outside of North America. Tech joined Navistar six years ago from Ford Motor Company, and he has been instrumental in creating Navistars Pure Power Technology business.
About Navistar
Navistar International Corporation (NYSE: NAV) is a holding company whose subsidiaries and affiliates produce International® brand commercial and military trucks, MaxxForce® brand diesel engines, IC Bus brand school and commercial buses, Monaco® RV brands of recreational vehicles, and Workhorse® brand chassis for motor homes and step vans. It also is a private-label designer and manufacturer of diesel engines for the pickup truck, van and SUV markets. The company also provides truck and diesel engine service parts. Another affiliate offers financing services. Additional information is available at www.Navistar.com/newsroom.
Forward-Looking Statement
Information provided and statements contained in this report that are not purely historical are forward-looking statements within the meaning of Section 27A of the Securities Act of 1933, as amended, Section 21E of the Securities Exchange Act of 1934, as amended, and the Private Securities Litigation Reform Act of 1995. Such forward-looking statements only speak as of the date of this report and the company assumes no obligation to update the information included in this report. Such forward-looking statements include information concerning our possible or assumed future results of operations, including descriptions of our business strategy. These statements often include words such as believe, expect, anticipate, intend, plan, estimate, or similar expressions. These statements are not guarantees of performance or results and they involve risks, uncertainties, and assumptions. These statements are not guarantees of performance or results and they involve risks, uncertainties, and assumptions. For a further description of these factors, see the risk factors set forth in our filings with the Securities and Exchange Commission, including our annual report on Form 10-K for the fiscal year ended October 31, 2011 and quarterly reports for fiscal 2012. Although we believe that these forward-looking statements are based on reasonable assumptions, there are many factors that could affect our actual financial results or results of operations and could cause actual results to differ materially from those in the forward-looking statements. All future written and oral forward-looking statements by us or persons acting on our behalf are expressly qualified in their entirety by the cautionary statements contained or referred to above. Except for our ongoing obligations to disclose material information as required by the federal securities laws, we do not have any obligations or intention to release publicly any revisions to any forward-looking statements to reflect events or circumstances in the future or to reflect the occurrence of unanticipated events.
Navistar International Corporation and Subsidiaries
Consolidated Statements of Operations
(Unaudited)
Three Months Ended | Six Months Ended | |||||||||||||||
April 30, | April 30, | |||||||||||||||
(in millions, except per share data) | 2012 | 2011 | 2012 | 2011 | ||||||||||||
Sales and revenues |
||||||||||||||||
Sales of manufactured products, net |
$ | 3,255 | $ | 3,298 | $ | 6,263 | $ | 5,991 | ||||||||
Finance revenues |
43 | 57 | 87 | 107 | ||||||||||||
|
|
|
|
|
|
|
|
|||||||||
Sales and revenues, net |
3,298 | 3,355 | 6,350 | 6,098 | ||||||||||||
|
|
|
|
|
|
|
|
|||||||||
Costs and expenses |
||||||||||||||||
Costs of products sold |
2,944 | 2,701 | 5,642 | 4,900 | ||||||||||||
Restructuring charges |
20 | 2 | 20 | 24 | ||||||||||||
Impairment of intangible assets |
38 | | 38 | | ||||||||||||
Selling, general and administrative expenses |
378 | 354 | 740 | 672 | ||||||||||||
Engineering and product development costs |
134 | 137 | 271 | 266 | ||||||||||||
Interest expense |
62 | 62 | 123 | 125 | ||||||||||||
Other expense (income), net |
13 | (10 | ) | 21 | (21 | ) | ||||||||||
|
|
|
|
|
|
|
|
|||||||||
Total costs and expenses |
3,589 | 3,246 | 6,855 | 5,966 | ||||||||||||
Equity in loss of non-consolidated affiliates |
(4 | ) | (16 | ) | (11 | ) | (33 | ) | ||||||||
|
|
|
|
|
|
|
|
|||||||||
Income (loss) before income taxes |
(295 | ) | 93 | (516 | ) | 99 | ||||||||||
Income tax benefit (expense) |
133 | (5 | ) | 214 | (5 | ) | ||||||||||
|
|
|
|
|
|
|
|
|||||||||
Net income (loss) |
(162 | ) | 88 | (302 | ) | 94 | ||||||||||
Less: Net income attributable to non-controlling interests |
10 | 14 | 23 | 26 | ||||||||||||
|
|
|
|
|
|
|
|
|||||||||
Net income (loss) attributable to Navistar International Corporation |
$ | (172 | ) | $ | 74 | $ | (325 | ) | $ | 68 | ||||||
|
|
|
|
|
|
|
|
|||||||||
Earnings (loss) per share attributable to Navistar International Corporation: |
||||||||||||||||
Basic |
$ | (2.50 | ) | $ | 1.01 | $ | (4.69 | ) | $ | 0.93 | ||||||
Diluted |
(2.50 | ) | 0.93 | (4.69 | ) | 0.87 | ||||||||||
Weighted average shares outstanding: |
||||||||||||||||
Basic |
68.7 | 73.0 | 69.3 | 72.8 | ||||||||||||
Diluted |
68.7 | 78.6 | 69.3 | 77.3 |
Navistar International Corporation and Subsidiaries
Consolidated Balance Sheets
April 30, | October 31, | |||||||
2012 | 2011 | |||||||
(in millions, except per share data) | (Unaudited) | |||||||
ASSETS |
||||||||
Current assets |
||||||||
Cash and cash equivalents |
$ | 400 | $ | 539 | ||||
Restricted cash |
| 100 | ||||||
Marketable securities |
337 | 718 | ||||||
Trade and other receivables, net |
845 | 1,219 | ||||||
Finance receivables, net |
2,066 | 2,198 | ||||||
Inventories |
1,948 | 1,714 | ||||||
Deferred taxes, net |
479 | 474 | ||||||
Other current assets |
303 | 273 | ||||||
|
|
|
|
|||||
Total current assets |
6,378 | 7,235 | ||||||
Restricted cash |
145 | 227 | ||||||
Trade and other receivables, net |
114 | 122 | ||||||
Finance receivables, net |
574 | 715 | ||||||
Investments in non-consolidated affiliates |
58 | 60 | ||||||
Property and equipment (net of accumulated depreciation and amortization of $2,159 and $2,056, at the respective dates) |
1,690 | 1,570 | ||||||
Goodwill |
295 | 319 | ||||||
Intangible assets (net of accumulated amortization of $97 and $99, at the respective dates) |
178 | 234 | ||||||
Deferred taxes, net |
1,759 | 1,583 | ||||||
Other noncurrent assets |
193 | 226 | ||||||
|
|
|
|
|||||
Total assets |
$ | 11,384 | $ | 12,291 | ||||
|
|
|
|
|||||
LIABILITIES and STOCKHOLDERS EQUITY (DEFICIT) |
||||||||
Liabilities |
||||||||
Current liabilities |
||||||||
Notes payable and current maturities of long-term debt |
$ | 1,509 | $ | 1,379 | ||||
Accounts payable |
1,927 | 2,122 | ||||||
Other current liabilities |
1,284 | 1,297 | ||||||
|
|
|
|
|||||
Total current liabilities |
4,720 | 4,798 | ||||||
Long-term debt |
2,988 | 3,477 | ||||||
Postretirement benefits liabilities |
3,095 | 3,210 | ||||||
Deferred taxes, net |
59 | 59 | ||||||
Other noncurrent liabilities |
929 | 719 | ||||||
|
|
|
|
|||||
Total liabilities |
11,791 | 12,263 | ||||||
Redeemable equity securities |
5 | 5 | ||||||
Stockholders equity (deficit) |
||||||||
Series D convertible junior preference stock |
3 | 3 | ||||||
Common stock ($0.10 par value per share, 220.0 shares authorized, and 75.4 shares issued, at both dates) |
8 | 7 | ||||||
Additional paid in capital |
2,272 | 2,253 | ||||||
Accumulated deficit |
(480 | ) | (155 | ) | ||||
Accumulated other comprehensive loss |
(1,982 | ) | (1,944 | ) | ||||
Common stock held in treasury, at cost (6.8 and 4.9 shares, at the respective dates) |
(276 | ) | (191 | ) | ||||
|
|
|
|
|||||
Total stockholders deficit attributable to Navistar International Corporation |
(455 | ) | (27 | ) | ||||
Stockholders equity attributable to non-controlling interests |
43 | 50 | ||||||
|
|
|
|
|||||
Total stockholders equity (deficit) |
(412 | ) | 23 | |||||
|
|
|
|
|||||
Total liabilities and stockholders equity (deficit) |
$ | 11,384 | $ | 12,291 | ||||
|
|
|
|
Navistar International Corporation and Subsidiaries
Condensed Consolidated Statements of Cash Flows
(Unaudited)
Six Months Ended | ||||||||
April 30, | ||||||||
(in millions) | 2012 | 2011 | ||||||
Cash flows from operating activities |
||||||||
Net income (loss) |
$ | (302 | ) | $ | 94 | |||
Adjustments to reconcile net income (loss) to cash provided by operating activities: |
||||||||
Depreciation and amortization |
136 | 143 | ||||||
Depreciation of equipment leased to others |
24 | 18 | ||||||
Deferred taxes, including change in valuation allowance |
(203 | ) | (5 | ) | ||||
Impairment of intangible assets |
38 | | ||||||
Amortization of debt issuance costs and discount |
19 | 22 | ||||||
Stock-based compensation |
14 | 31 | ||||||
Equity in loss of non-consolidated affiliates, net of dividends |
15 | 35 | ||||||
Write-off of debt issuance cost and discount |
8 | | ||||||
Other non-cash operating activities |
2 | 5 | ||||||
Changes in other assets and liabilities, exclusive of the effects of businesses acquired and disposed |
298 | (117 | ) | |||||
|
|
|
|
|||||
Net cash provided by operating activities |
49 | 226 | ||||||
|
|
|
|
|||||
Cash flows from investing activities |
||||||||
Purchases of marketable securities |
(563 | ) | (721 | ) | ||||
Sales or maturities of marketable securities |
944 | 569 | ||||||
Net change in restricted cash and cash equivalents |
182 | (8 | ) | |||||
Capital expenditures |
(176 | ) | (185 | ) | ||||
Purchase of equipment leased to others |
(28 | ) | (23 | ) | ||||
Proceeds from sales of property and equipment |
6 | 23 | ||||||
Investments in non-consolidated affiliates |
(17 | ) | (27 | ) | ||||
Proceeds from sales of affiliates |
1 | 6 | ||||||
Business acquisitions, net of cash received |
(10 | ) | (1 | ) | ||||
Acquisition of intangibles |
(14 | ) | (7 | ) | ||||
|
|
|
|
|||||
Net cash provided by (used in) investing activities |
325 | (374 | ) | |||||
|
|
|
|
|||||
Cash flows from financing activities |
||||||||
Proceeds from issuance of securitized debt |
281 | 348 | ||||||
Principal payments on securitized debt |
(666 | ) | (334 | ) | ||||
Proceeds from issuance of non-securitized debt |
555 | 61 | ||||||
Principal payments on non-securitized debt |
(537 | ) | (64 | ) | ||||
Net increase (decrease) in notes and debt outstanding under revolving credit facilities |
2 | (12 | ) | |||||
Principal payments under financing arrangements and capital lease obligations |
(20 | ) | (48 | ) | ||||
Debt issuance costs |
(15 | ) | (5 | ) | ||||
Purchase of treasury stock |
(75 | ) | | |||||
Proceeds from exercise of stock options |
2 | 28 | ||||||
Dividends paid by subsidiaries to non-controlling interest |
(34 | ) | (32 | ) | ||||
Other financing activities |
(3 | ) | | |||||
|
|
|
|
|||||
Net cash used in financing activities |
(510 | ) | (58 | ) | ||||
|
|
|
|
|||||
Effect of exchange rate changes on cash and cash equivalents |
(3 | ) | 11 | |||||
|
|
|
|
|||||
Decrease in cash and cash equivalents |
(139 | ) | (195 | ) | ||||
Cash and cash equivalents at beginning of the period |
539 | 585 | ||||||
|
|
|
|
|||||
Cash and cash equivalents at end of the period |
$ | 400 | $ | 390 | ||||
|
|
|
|
Navistar International Corporation and Subsidiaries
Segment Reporting
(Unaudited)
We define segment profit (loss) as net income (loss) attributable to Navistar International Corporation excluding income tax benefit (expense). Our results from interim periods are not necessarily indicative of results for a full year. Selected financial information is as follows:
Corporate | ||||||||||||||||||||||||
Financial | and | |||||||||||||||||||||||
(in millions) | Truck (A) | Engine | Parts (A) | Services(B) | Eliminations | Total | ||||||||||||||||||
Three Months Ended April 30, 2012 |
||||||||||||||||||||||||
External sales and revenues, net |
$ | 2,353 | $ | 440 | $ | 462 | $ | 43 | $ | | $ | 3,298 | ||||||||||||
Intersegment sales and revenues |
2 | 454 | 34 | 24 | (514 | ) | | |||||||||||||||||
|
|
|
|
|
|
|
|
|
|
|
|
|||||||||||||
Total sales and revenues, net |
$ | 2,355 | $ | 894 | $ | 496 | $ | 67 | $ | (514 | ) | $ | 3,298 | |||||||||||
|
|
|
|
|
|
|
|
|
|
|
|
|||||||||||||
Net income (loss) attributable to NIC |
$ | (89 | ) | $ | (108 | ) | $ | 41 | $ | 26 | $ | (42 | ) | $ | (172 | ) | ||||||||
Income tax benefit |
| | | | 133 | 133 | ||||||||||||||||||
|
|
|
|
|
|
|
|
|
|
|
|
|||||||||||||
Segment profit (loss) |
$ | (89 | ) | $ | (108 | ) | $ | 41 | $ | 26 | $ | (175 | ) | $ | (305 | ) | ||||||||
|
|
|
|
|
|
|
|
|
|
|
|
|||||||||||||
Depreciation and amortization |
$ | 35 | $ | 30 | $ | 4 | $ | 8 | $ | 5 | $ | 82 | ||||||||||||
Interest expense |
| | | 22 | 40 | 62 | ||||||||||||||||||
Equity in income (loss) of non-consolidated affiliates |
(6 | ) | | 2 | | | (4 | ) | ||||||||||||||||
Capital expenditures(C) |
16 | 36 | 5 | 1 | 15 | 73 | ||||||||||||||||||
Three Months Ended April 30, 2011 |
||||||||||||||||||||||||
External sales and revenues, net |
$ | 2,262 | $ | 524 | $ | 512 | $ | 57 | $ | | $ | 3,355 | ||||||||||||
Intersegment sales and revenues |
9 | 431 | 50 | 26 | (516 | ) | | |||||||||||||||||
|
|
|
|
|
|
|
|
|
|
|
|
|||||||||||||
Total sales and revenues, net |
$ | 2,271 | $ | 955 | $ | 562 | $ | 83 | $ | (516 | ) | $ | 3,355 | |||||||||||
|
|
|
|
|
|
|
|
|
|
|
|
|||||||||||||
Net income (loss) attributable to NIC |
$ | 92 | $ | 2 | $ | 74 | $ | 40 | $ | (134 | ) | $ | 74 | |||||||||||
Income tax expense |
| | | | (5 | ) | (5 | ) | ||||||||||||||||
|
|
|
|
|
|
|
|
|
|
|
|
|||||||||||||
Segment profit (loss) |
$ | 92 | $ | 2 | $ | 74 | $ | 40 | $ | (129 | ) | $ | 79 | |||||||||||
|
|
|
|
|
|
|
|
|
|
|
|
|||||||||||||
Depreciation and amortization |
$ | 38 | $ | 30 | $ | 3 | $ | 6 | $ | 4 | $ | 81 | ||||||||||||
Interest expense |
| | | 26 | 36 | 62 | ||||||||||||||||||
Equity in income (loss) of non-consolidated affiliates |
(17 | ) | (2 | ) | 3 | | | (16 | ) | |||||||||||||||
Capital expenditures(C) |
22 | 52 | 3 | | 13 | 90 | ||||||||||||||||||
Six Months Ended April 30, 2012 |
||||||||||||||||||||||||
External sales and revenues, net |
$ | 4,507 | $ | 860 | $ | 896 | $ | 87 | $ | | $ | 6,350 | ||||||||||||
Intersegment sales and revenues |
13 | 893 | 69 | 48 | (1,023 | ) | | |||||||||||||||||
|
|
|
|
|
|
|
|
|
|
|
|
|||||||||||||
Total sales and revenues, net |
$ | 4,520 | $ | 1,753 | $ | 965 | $ | 135 | $ | (1,023 | ) | $ | 6,350 | |||||||||||
|
|
|
|
|
|
|
|
|
|
|
|
|||||||||||||
Net income (loss) attributable to NIC |
$ | (130 | ) | $ | (228 | ) | $ | 91 | $ | 53 | $ | (111 | ) | $ | (325 | ) | ||||||||
Income tax expense |
| | | | 214 | 214 | ||||||||||||||||||
|
|
|
|
|
|
|
|
|
|
|
|
|||||||||||||
Segment profit (loss) |
$ | (130 | ) | $ | (228 | ) | $ | 91 | $ | 53 | $ | (325 | ) | $ | (539 | ) | ||||||||
|
|
|
|
|
|
|
|
|
|
|
|
|||||||||||||
Depreciation and amortization |
$ | 69 | $ | 59 | $ | 6 | $ | 16 | $ | 10 | $ | 160 | ||||||||||||
Interest expense |
| | | 47 | 76 | 123 | ||||||||||||||||||
Equity in income (loss) of non-consolidated affiliates |
(15 | ) | 1 | 3 | | | (11 | ) | ||||||||||||||||
Capital expenditures(C) |
32 | 76 | 12 | 2 | 54 | 176 |
Corporate | ||||||||||||||||||||||||
Financial | and | |||||||||||||||||||||||
Truck (A) | Engine | Parts (A) | Services(B) | Eliminations | Total | |||||||||||||||||||
Six Months Ended April 30, 2011 |
||||||||||||||||||||||||
External sales and revenues, net |
$ | 4,053 | $ | 980 | $ | 958 | $ | 107 | $ | | $ | 6,098 | ||||||||||||
Intersegment sales and revenues |
18 | 758 | 99 | 49 | (924 | ) | | |||||||||||||||||
|
|
|
|
|
|
|
|
|
|
|
|
|||||||||||||
Total sales and revenues, net |
$ | 4,071 | $ | 1,738 | $ | 1,057 | $ | 156 | $ | (924 | ) | $ | 6,098 | |||||||||||
|
|
|
|
|
|
|
|
|
|
|
|
|||||||||||||
Net income (loss) attributable to NIC |
$ | 124 | $ | (6 | ) | $ | 130 | $ | 72 | $ | (252 | ) | $ | 68 | ||||||||||
Income tax expense |
| | | | (5 | ) | (5 | ) | ||||||||||||||||
|
|
|
|
|
|
|
|
|
|
|
|
|||||||||||||
Segment profit (loss) |
$ | 124 | $ | (6 | ) | $ | 130 | $ | 72 | $ | (247 | ) | $ | 73 | ||||||||||
|
|
|
|
|
|
|
|
|
|
|
|
|||||||||||||
Depreciation and amortization |
$ | 75 | $ | 59 | $ | 5 | $ | 13 | $ | 9 | $ | 161 | ||||||||||||
Interest expense |
| | | 56 | 69 | 125 | ||||||||||||||||||
Equity in income (loss) of non-consolidated affiliates |
(35 | ) | (2 | ) | 4 | | | (33 | ) | |||||||||||||||
Capital expenditures(C) |
38 | 84 | 4 | | 59 | 185 | ||||||||||||||||||
As of April 30, 2012 |
||||||||||||||||||||||||
Segment assets |
$ | 2,685 | $ | 1,823 | $ | 698 | $ | 3,043 | $ | 3,135 | $ | 11,384 | ||||||||||||
As of October 31, 2011 |
||||||||||||||||||||||||
Segment assets |
2,771 | 1,849 | 700 | 3,580 | 3,391 | 12,291 |
(A) | See Note 2, Restructurings and Impairments, for further discussion. |
(B) | Total sales and revenues in the Financial Services segment include interest revenues of $66 million and $133 million for the three and six months ended April 30, 2012, respectively, and $82 million and $153 million for the three and six months ended April 30, 2011, respectively. |
(C) | Exclusive of purchases of equipment leased to others. |
SEC Regulation G Non-GAAP Reconciliation
The financial measures presented below of adjusted income (loss) and adjusted diluted earnings(loss) per share attributable to Navistar International Corporation, manufacturing segment profit (loss), and adjusted manufacturing segment profit (loss) are unaudited and not in accordance with, or an alternative for, financial measures presented in accordance with U.S. generally accepted accounting principles (GAAP). The non-GAAP financial information presented herein should be considered supplemental to, and not as a substitute for, or superior to, financial measures calculated in accordance with GAAP.
We believe manufacturing segment profit (loss), which includes the segment profits(losses) of our Truck, Engine, and Parts reporting segments, provides meaningful information of our core manufacturing business and therefore we use it to supplement our GAAP reporting by identifying items that may not be related to the core manufacturing business. We have chosen to provide this supplemental information to investors, analysts and other interested parties to enable them to perform additional analyses of operating results, to illustrate the results of operations giving effect to the non-GAAP adjustments shown in the below reconciliation, and to provide an additional measure of performance.
In addition, we believe that adjusted income (loss) and adjusted diluted earnings (loss) per share attributable to Navistar International Corporation and manufacturing segment profit (loss) excluding certain items, which are not considered to be part of our ongoing business, improves the comparability of year to year results and is representative of our underlying performance. We have chosen to provide this supplemental information to investors, analysts and other interested parties to enable them to perform additional analyses of operating results, to illustrate the results of operations giving effect to the non-GAAP adjustments shown in the reconciliations below, and to provide an additional measure of performance.
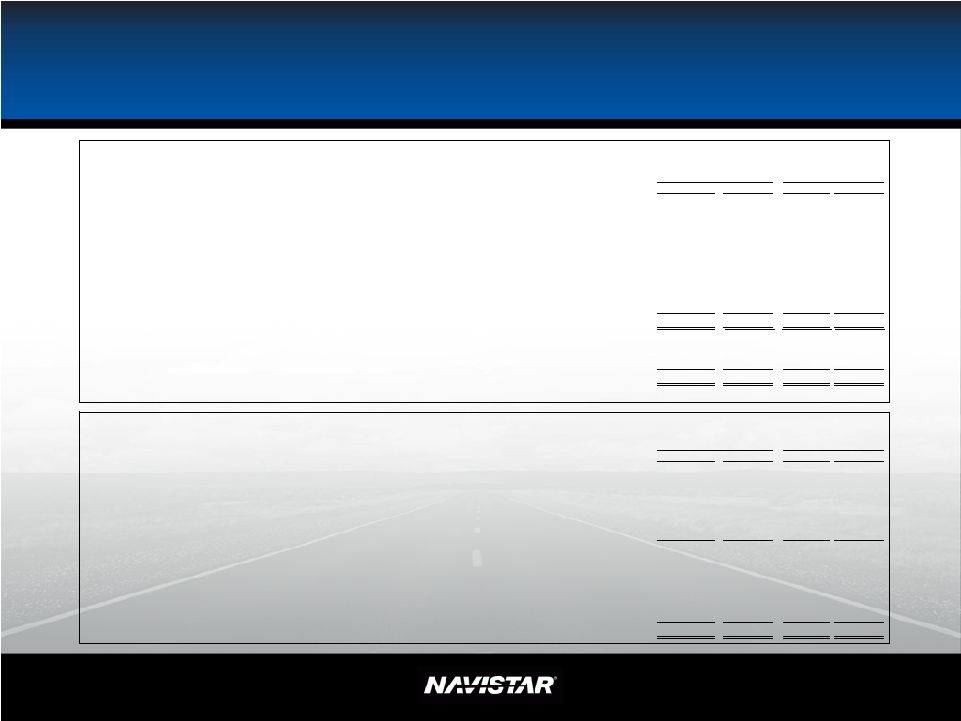
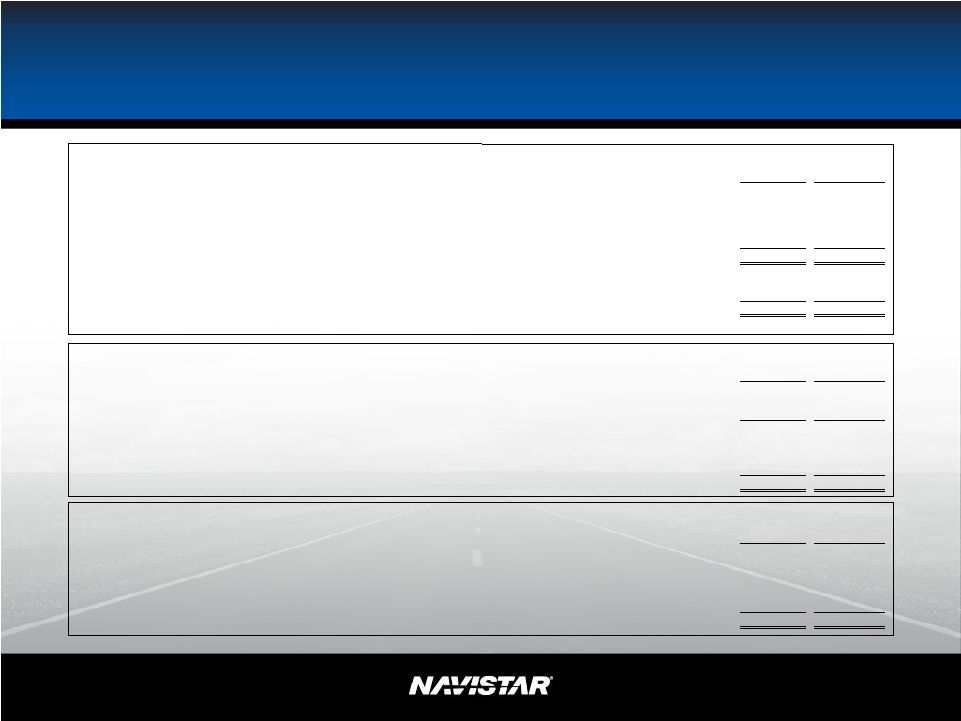
Adjusted net income (loss) and diluted earnings (loss) per share attributable to Navistar International Corporation reconciliation:
Three Months Ended | Six Months Ended | |||||||||||||||
April 30, | April 30, | |||||||||||||||
(in millions, except per share data) | 2012 | 2011 | 2012 | 2011 | ||||||||||||
Income (loss) attributable to Navistar International Corporation |
$ | (172 | ) | $ | 74 | $ | (325 | ) | $ | 68 | ||||||
Plus: |
||||||||||||||||
Engineering integration costs, net of tax(A) |
31 | 4 | 39 | 23 | ||||||||||||
Restructuring of North American manufacturing operations, net of tax(B) |
37 | | 37 | | ||||||||||||
Adjustments to pre-existing warranties, net of tax(C) |
138 | 24 | 219 | 32 | ||||||||||||
Charges for non-conformance penalties, net of tax(D) |
10 | | 10 | | ||||||||||||
Less: |
||||||||||||||||
Net impact of income tax valuation allowance release(E) |
181 | | 181 | | ||||||||||||
|
|
|
|
|
|
|
|
|||||||||
Adjusted net income (loss) attributable to Navistar International Corporation |
$ | (137 | ) | $ | 102 | $ | (2.01 | ) | $ | 123 | ||||||
|
|
|
|
|
|
|
|
|||||||||
Diluted earnings (loss) per share attributable to Navistar International Corporation |
$ | (2.50 | ) | $ | 0.93 | $ | (4.69 | ) | $ | 0.87 | ||||||
Effect of adjustments on diluted earnings (loss) per share attributable to Navistar International Corporation |
0.51 | 0.37 | 1.79 | 0.72 | ||||||||||||
|
|
|
|
|
|
|
|
|||||||||
Adjusted diluted earnings (loss) per share attributable to Navistar International Corporation |
$ | (1.99 | ) | $ | 1.30 | $ | (2.90 | ) | $ | 1.59 | ||||||
|
|
|
|
|
|
|
|
|||||||||
Diluted weighted shares outstanding |
68.7 | 78.6 | 69.3 | 77.3 |
Manufacturing segment profit (loss) and adjusted manufacturing segment profit reconciliation:
Three Months Ended | Six Months Ended | |||||||||||||||
April 30, | April 30, | |||||||||||||||
(in millions) | 2012 | 2011 | 2012 | 2011 | ||||||||||||
Net income (loss) attributable to Navistar International Corporation |
$ | (172 | ) | $ | 74 | $ | (325 | ) | $ | 68 | ||||||
Less: |
||||||||||||||||
Financial services segment profit |
26 | 40 | 53 | 72 | ||||||||||||
Corporate and eliminations |
(175 | ) | (129 | ) | (325 | ) | (247 | ) | ||||||||
Income tax benefit (expense) |
133 | (5 | ) | 214 | (5 | ) | ||||||||||
|
|
|
|
|
|
|
|
|||||||||
Manufacturing segment profit (loss) |
$ | (156 | ) | $ | 168 | $ | (267 | ) | $ | 248 | ||||||
Plus: |
||||||||||||||||
Engineering integration costs(A) |
11 | 3 | 19 | 21 | ||||||||||||
Restructuring of North American manufacturing operations(B) |
38 | | 38 | | ||||||||||||
Adjustments to pre-existing warranties(C) |
104 | 27 | 227 | 36 | ||||||||||||
Charges for non-conformance penalties(D) |
10 | | 10 | | ||||||||||||
|
|
|
|
|
|
|
|
|||||||||
Adjusted manufacturing segment profit |
$ | 7 | $ | 198 | $ | 27 | $ | 305 | ||||||||
|
|
|
|
|
|
|
|
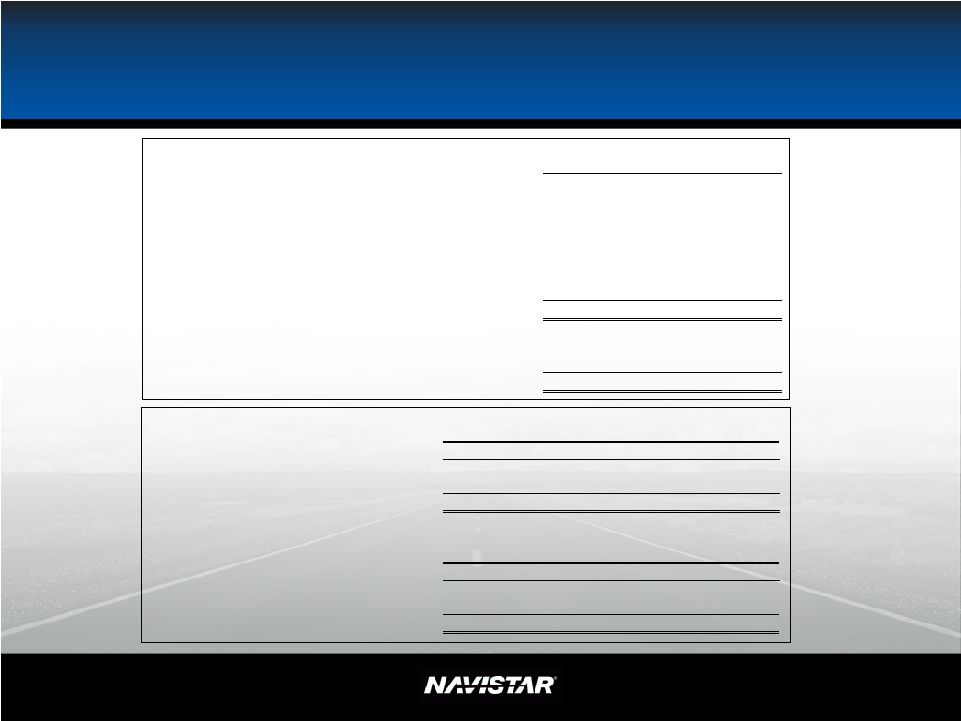
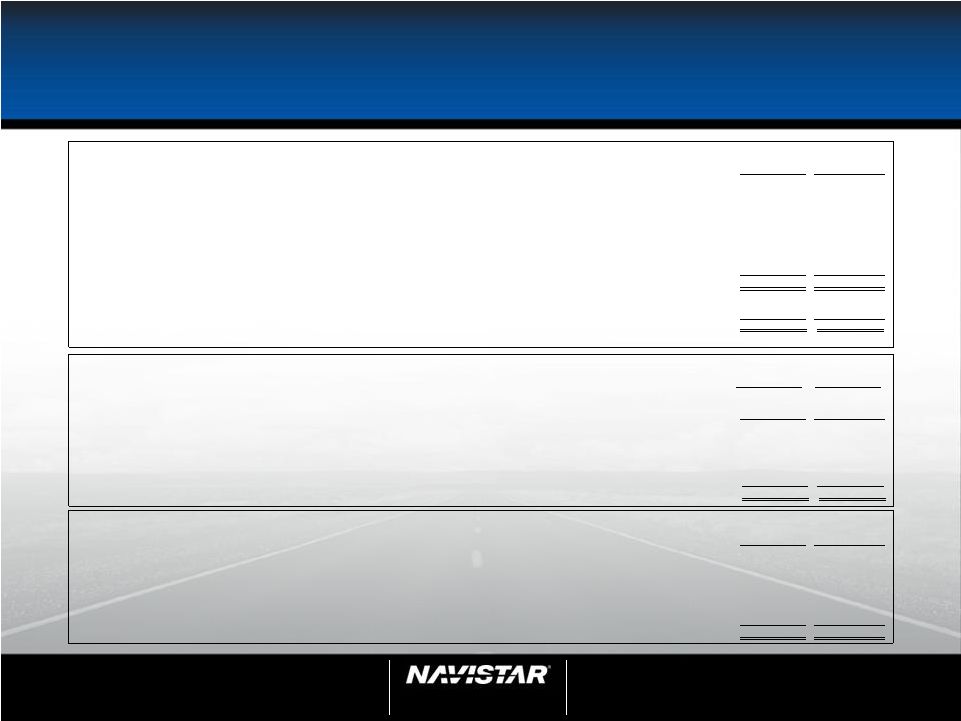
Revised 2012 Guidance
Adjusted net income and diluted earnings per share attributable to Navistar International Corporation reconciliation:
($ in millions, except per share data) | Lower | Upper | ||||||
Net income attributable to Navistar International Corporation |
$ | (200 | ) | $ | (60 | ) | ||
Plus: |
||||||||
Engineering integration costs, net of tax(A) |
87 | 87 | ||||||
Restructuring of North American manufacturing operations, net of tax(B) |
37 | 37 | ||||||
Adjustments to pre-existing warranties, net of tax(C) |
219 | 219 | ||||||
Charges for non-conformance penalties, net of tax(D) |
39 | 39 | ||||||
Less: |
||||||||
Net impact of valuation allowance release(E) |
181 | 181 | ||||||
|
|
|
|
|||||
Adjusted net income attributable to Navistar International Corporation |
$ | | $ | 140 | ||||
|
|
|
|
|||||
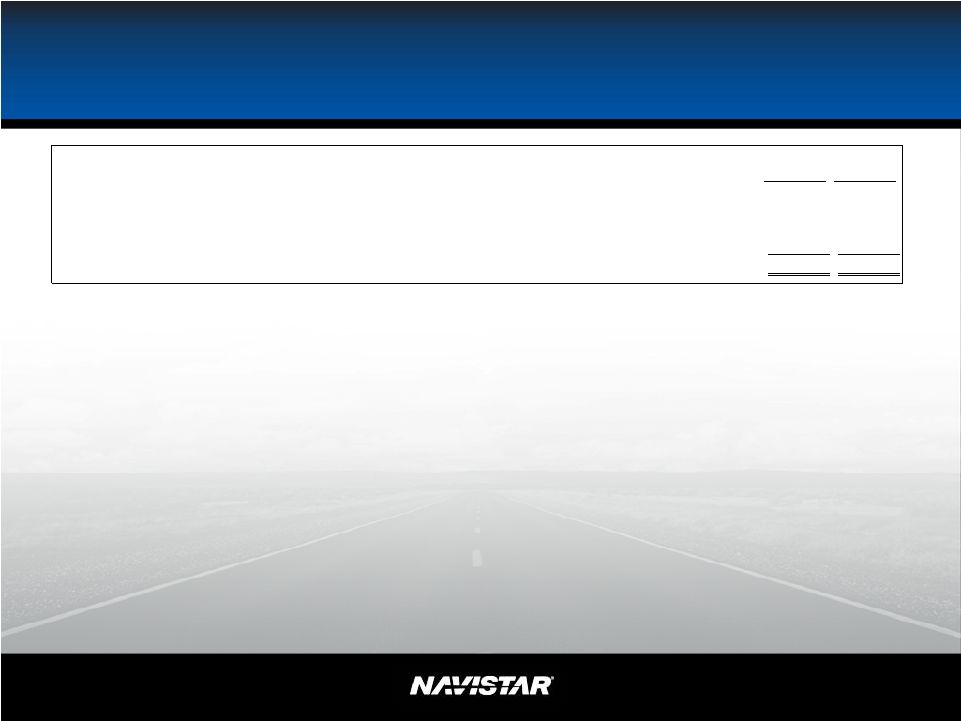
Diluted earnings per share attributable to Navistar International Corporation |
$ | (2.85 | ) | $ | (0.85 | ) | ||
Effect of adjustments on diluted earnings per share attributable to Navistar International Corporation |
2.85 | 2.85 | ||||||
|
|
|
|
|||||
Adjusted diluted earnings per share attributable to Navistar International Corporation |
$ | | $ | 2.00 | ||||
|
|
|
|
|||||
Approximate diluted average weighted shares outstanding |
69.8 | 69.8 |
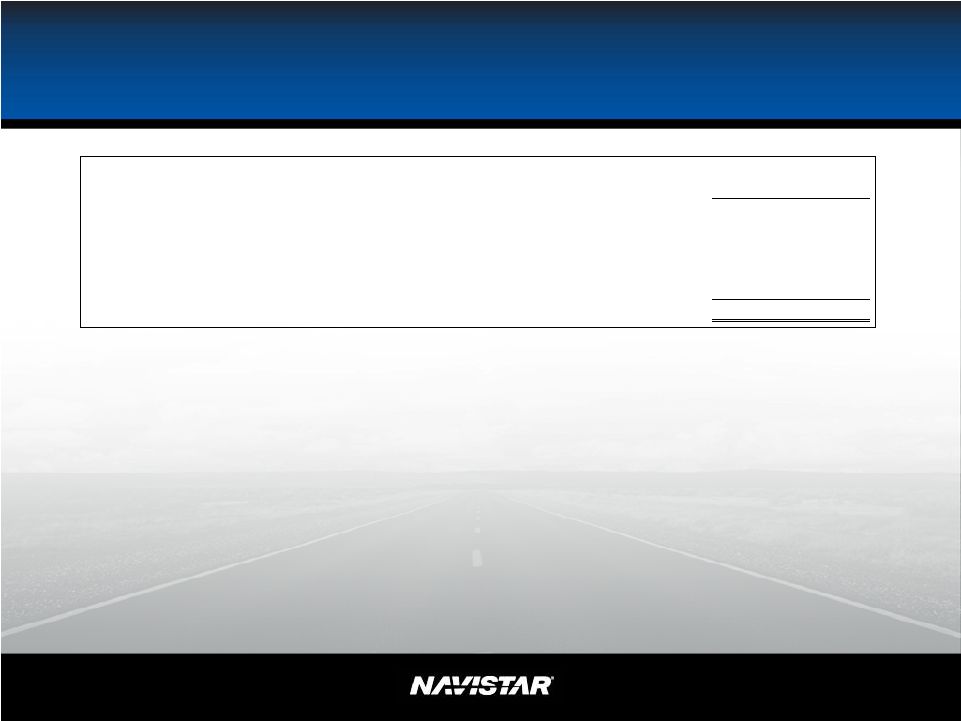
Revised 2012 Guidance
Manufacturing segment profit and adjusted manufacturing segment profit reconciliation:
($ in millions) | Lower | Upper | ||||||
Net income attributable to Navistar International Corporation |
$ | (200 | ) | $ | (60 | ) | ||
Less: Financial services segment profit, Corporate and eliminations, and income taxes |
(430 | ) | (440 | ) | ||||
|
|
|
|
|||||
Manufacturing segment profit |
230 | 380 | ||||||
Plus: |
||||||||
Engineering integration costs(A) |
65 | 65 | ||||||
Restructuring of North American manufacturing operations(B) |
38 | 38 | ||||||
Adjustments to pre-existing warranties (C) |
227 | 227 | ||||||
Charges for non-conformance penalties(D) |
40 | 40 | ||||||
|
|
|
|
|||||
Adjusted manufacturing segment profit |
$ | 600 | $ | 750 | ||||
|
|
|
|
(A) | Engineering integration costs relate to the consolidation of our truck and engine engineering operations, as well as the relocation of our world headquarters. For the three months ended April 30, 2012, the charges included restructuring charges of $20 million and other related costs of $9 million. The tax impact of the second quarter adjustments was income tax expense of $2 million. For the six months ended April 30, 2012, the charges included restructuring charges of $20 million and other related costs of $21 million. The tax impact of the first half adjustments was income tax benefit of $2 million. For the three and six months ended April 30, 2011, the charges included restructuring charges of $1 million and $19 million, respectively, and other related costs of $5 million and $7 million, respectively. For the three and six months ended April 30, 2011, the tax impact of the adjustments was income tax benefits of $2 million and $3 million, respectively. Our manufacturing operations, primarily our Truck segment, recognized charges of $11 million and $19 million relating to these actions in the three and six months ended April 30, 2012, respectively, compared to $3 million and $21 million in the three and six months ended April 30, 2011, respectively. For more information, see Note 2, Restructurings and Impairments, to the accompanying consolidated financial statements. |
(B) | Restructuring of North American manufacturing operations are charges primarily related to our ongoing restructuring plans related to our plans to close our Chatham, Ontario heavy truck plant and WCC chassis plant in Union City, Indiana, and to significantly scale back operations at our Monaco recreational vehicle headquarters and motor coach manufacturing plant in Coburg, Oregon. In the three and six months ended April 30, 2012, the charges included impairments of certain intangible assets of $38 million. The tax impact of the adjustments was an income tax benefit of $1 million. The Truck and Parts segments recognized charges of $28 million and $10 million, respectively. For more information, see Note 2, Restructurings and Impairments, to the accompanying consolidated financial statements. |
(C) | During the three and six months ended April 30, 2012, the Company incurred charges of $104 million and $227 million, respectively, for adjustments to pre-existing warranties. For the three and six months ended April 30, 2012, the tax impact of the adjustments was income tax expense of $34 million and income tax benefit of $8 million, respectively. During the three and six months ended April 30, 2011, the Company incurred charges of $27 million and $36 million, respectively. For the three and six months ended April 30, 2011, the tax impact of the adjustments was income tax benefits of $3 million and $4 million, respectively. For more information, see Note 1, Summary of Significant Accounting Policies, to the accompanying consolidated financial statements. |
(D) | In the three months ended April 30, 2012, the Company recorded charges totaling $10 million for NCPs for certain 13L engine sales that did not comply with emission standards, recognized in the Engine segment. The adjustment did not have a material impact on income taxes. For more information, see Note 12, Commitments and Contingencies, to the accompanying consolidated financial statements. |
(E) | In the three months ended April 30, 2012, we recognized an income tax benefit of $181 million from the release of a significant portion of our income tax valuation allowance on our Canadian deferred tax assets. For more information, see Note 9, Income Taxes, to the accompanying consolidated financial statements. |
The above charges, A through D, have been adjusted to reflect the impact of income taxes which are calculated based on the respective periods estimated annual effective tax rate. The income tax impact of the second quarter adjustments reflects the impact of a change in the quarter to the Companys estimated annual effective tax rate. The change is the result of updates to the forecasted earnings and the jurisdictional mix. The tax impact of the adjustments may be adjusted for future changes in the estimated annual effective tax rate.
1
2
nd
Quarter 2012 Earnings Presentation
June 7, 2012
Exhibit 99.2
NYSE: NAV
2
nd
Quarter 2012 Earnings Call
June 7, 2012 |
2
2
Safe Harbor
Statement
Information provided and statements contained in this report that are not purely
historical are forward- looking statements within the meaning of
Section 27A of the Securities Act of 1933, as amended,
Section
21E of the Securities Exchange Act of 1934, as amended, and the Private Securities
Litigation Reform Act of 1995. Such forward-looking statements only
speak as of the date of this report and the company assumes no obligation to
update the information included in this report. Such forward-looking
statements include information concerning our possible or assumed future
results of operations, including descriptions of our business strategy.
These statements often include words such as believe,
expect,
anticipate,
intend,
plan,
estimate,
or similar expressions. These statements
are not guarantees of performance or results and they involve risks, uncertainties,
and assumptions. These statements are not guarantees of performance or
results and they involve risks, uncertainties, and assumptions. For a
further description of these factors, see the risk factors set forth in our
filings with the Securities and Exchange Commission, including our annual
report on Form 10-K for the fiscal year ended October 31, 2011 and
quarterly reports for fiscal 2012. Although we believe that these
forward-looking statements are based on reasonable assumptions, there are many
factors that could affect our actual financial results or results of
operations and could cause actual results to differ
materially from those in the forward-looking statements. All future written and
oral forward-looking statements by us or persons acting on our behalf
are expressly qualified in their entirety by the cautionary statements
contained or referred to above. Except for our ongoing obligations to
disclose material information as required by the federal securities
laws, we do not have any obligations or
intention to release publicly any revisions to any forward-looking statements
to reflect events or circumstances in the future or to reflect the
occurrence of unanticipated events. NYSE: NAV
2
nd
Quarter 2012 Earnings Call
June 7, 2012 |
3
3
Other Cautionary Notes
The
financial
information
herein
contains
audited
and
unaudited
information
and
has
been
prepared
by
management
in
good
faith
and
based
on
data
currently
available
to
the
Company.
Certain
non-GAAP
measures
are
used
in
this
presentation
to
assist
the
reader
in
understanding
our
core
manufacturing
business.
We
believe
this
information
is
useful
and
relevant
to
assess
and
measure
the
performance
of
our
core
manufacturing
business
as
it
illustrates
manufacturing
performance
without
regard
to
selected
historical
legacy
costs
(i.e.
pension
and
other
postretirement
costs).
It
also
excludes
financial
services
and
other
items
that
may
not
be
related
to
the
core
manufacturing
business
or
underlying
results.
Measures
may
also
be
adjusted
to
exclude
certain
adjustments
which
are
not
considered
to
be
part
of
our
ongoing
business
and
are
not
representative
of
our
underlying
performance.
Management
often
uses
this
information
to
assess
and
measure
the
underlying
performance
of
our
operating
segments.
We
have
chosen
to
provide
this
supplemental
information
to
investors,
analysts,
and
other
interested
parties
to
enable
them
to
perform
additional
analyses
of
operating
results.
The
non-GAAP
numbers
are
reconciled
to
the
most
appropriate
GAAP
number
is
in
the
appendix
of
this
presentation.
NYSE: NAV
2
nd
Quarter 2012 Earnings Call
June 7, 2012 |
4
4
Agenda
2
nd
quarter results
Going forward
Driving integration
NYSE: NAV
2
nd
Quarter 2012 Earnings Call
June 7, 2012 |
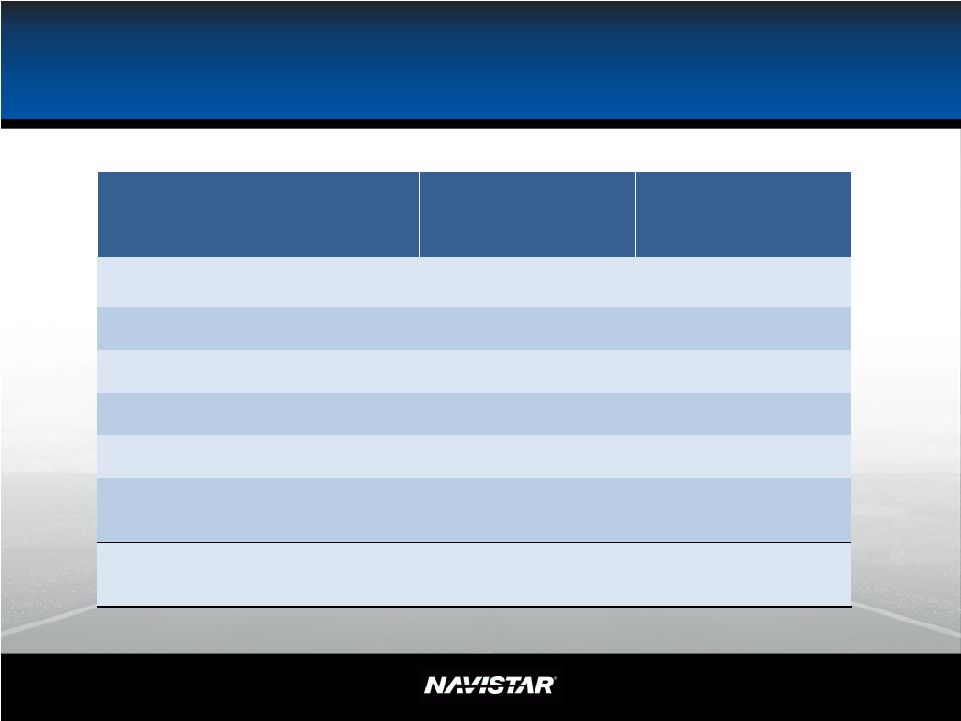
NYSE: NAV
2
nd
Quarter Results
Note:
This slide contains non-GAAP information; please see the REG G in
appendix for a detailed reconciliation.
* Attributable to Navistar International Corporation
2012 Q2
Actual
GAAP
2012 Q2
Actual
Adjusted Non-GAAP
Revenue (Billions)
$3.3
$3.3
Manufacturing Segment
Profit (Loss) (Millions)
$(156)
$7
Profit (Loss) Before Tax
(Millions)
$(295)
$(124)
Net Income (Loss)*
(Millions)
$(172)
$(137)
Diluted Earnings (Loss) Per
Share*
$(2.50)
$(1.99)
5 |
NYSE: NAV
Q2 Adjusted Manufacturing Segment Profit
Q2 Adj. Mfg Segment Profit
Truck & Parts
($Millions) $8
North America
~$43
Global
~($10)
Defense
~($5)
Other
~($20)
Engine & Parts
($1)
Adj. Mfg Segment Profit
$7
Note:
This slide contains non-GAAP information; please see the REG G in appendix for a
detailed reconciliation.
Seasonality
South America
Bus
North America
Market adjustments
Defense
BRIC
Investments in the
business
Future benefits
Affects of emissions
noise ? ?
Historically
stronger 2H
$300M -
$400M
Revenue
$20M margin
improvement
6
Q2 Factors |
NYSE: NAV
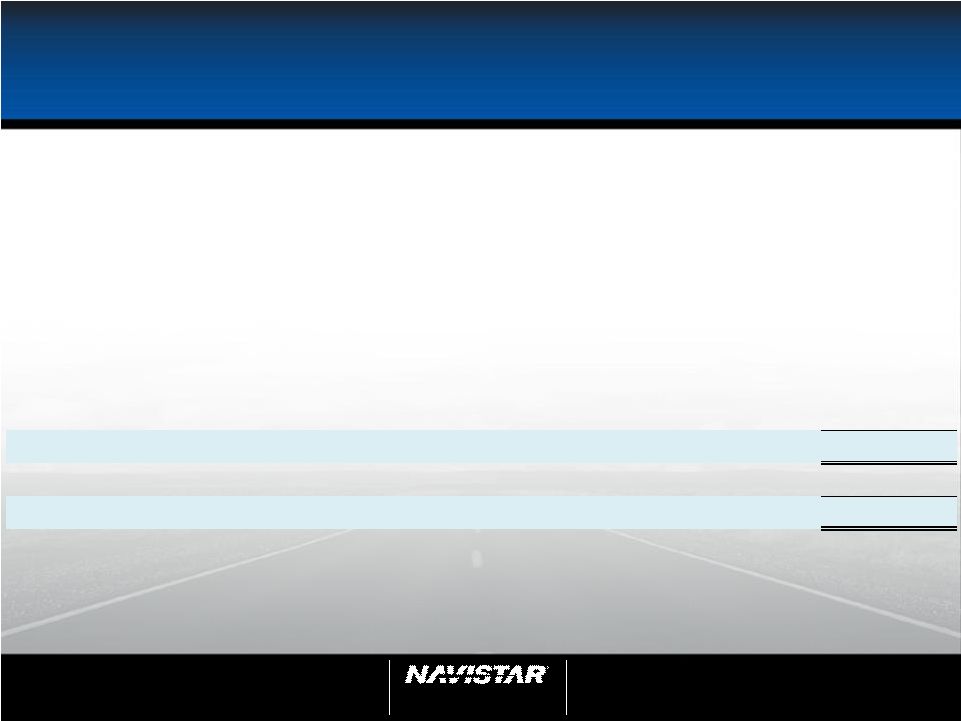
Q2 Income Statement
($ Millions)
Note:
This slide contains non-GAAP information; please see the REG G in
appendix for a detailed reconciliation.
(In millions)
Adj manufacturing segment profit
7
$
Adjustments:
Engineering integration
(11)
$
Restructuring of NA mfg ops
(38)
$
Adj to preexisting warranties
(104)
$
Charges for NCPs
(10)
$
Mfg segment profit as reported
(156)
$
NFC
26
$
Corporate items
(175)
$
Income before income tax excluding income
attributable to non-controlling interests
(305)
$
Income tax valuation allowance release
181
$
Income tax expense
(48)
$
Net loss
(172)
$
7
Q2 |
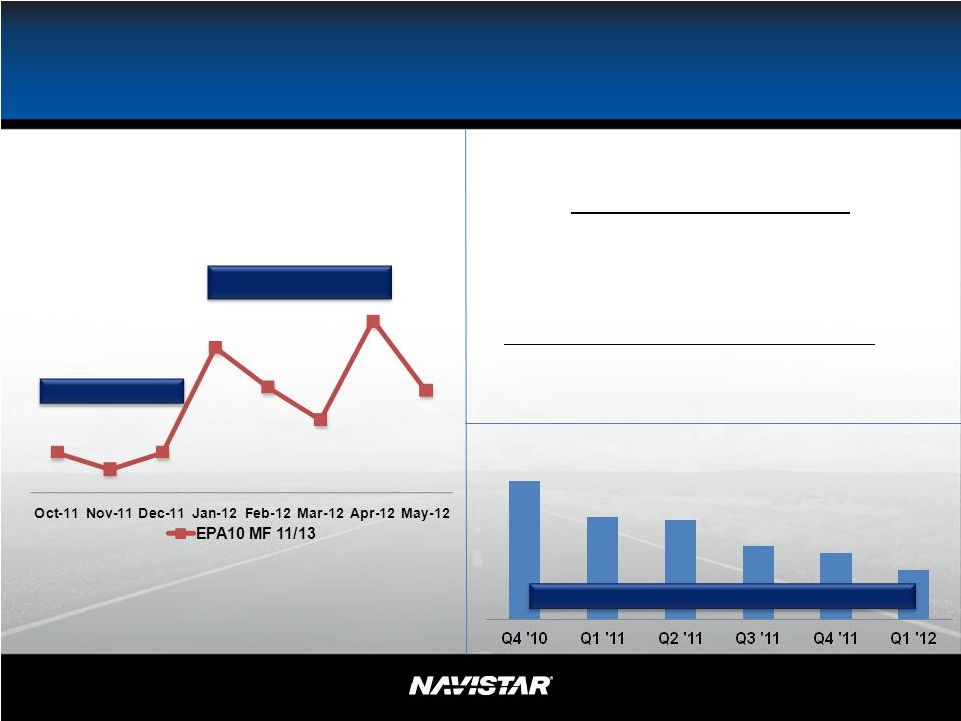
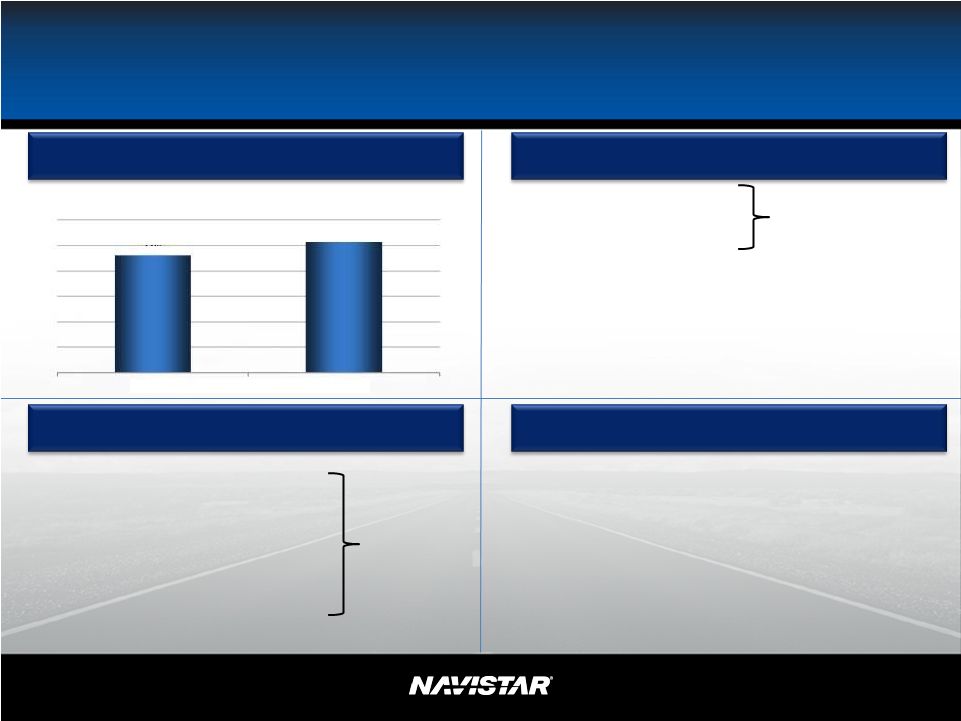
Additional Warranty Reserves
Adjustments for
Pre-Existing Warranty
EPA10 MF 11/13
Service Contracts
Other routine adjustments
$ 11M
Total Warranty
Monthly Spend per Unit in
Warranty by Spend Date
EPA10 MF11/13
Quality Trend by Build Quarter
R/1000
8
NYSE: NAV
64% improvement
Q1 Rate
Q2 Rate
$ 72M
$ 21M
$104M |
9
9
Q2 Manufacturing Cash Update
Note: This slide contains non-GAAP information, please see the Reg G in
appendix for detailed reconciliation. Note:
Capital Expenditures includes ~$16M related to Integrated
Product Development Center.
($ millions)
January 31, 2012 ending manufacturing cash and marketable securities¹
837
$
Adjusted manufacturing EBITDA
(168)
Change in net working capital²
41
Capital expenditures
(71)
Intercompany and other
42
April 30, 2012 ending manufacturing cash and marketable securities¹
681
$
Forecasted October 31, 2012 ending manufacturing cash and marketable
securities¹ $750 - $900
1
Includes cash from the consolidation of minority interests
2
NWC = A/R, Inventory, Other Current Assets, A/P & Other Current Liabilities
NYSE: NAV
2
nd
Quarter 2012 Earnings Call
June 7, 2012 |
NYSE: NAV
Going Forward
Note:
This slide contains non-GAAP information; please see the REG G in
appendix for a detailed reconciliation.
Q2 Adj. Mfg
Segment Profit
($Millions)
Estimate Second
Half 2012
($Millions)
Truck & Parts
$8
$425 -
$525
North America
~$43
Global
~($10)
Defense
~($5)
Other
~($20)
Engine & Parts
($1)
$150 -
$200
Adj. Mfg Segment Profit
$7
$575 -
$725
10 |
11
11
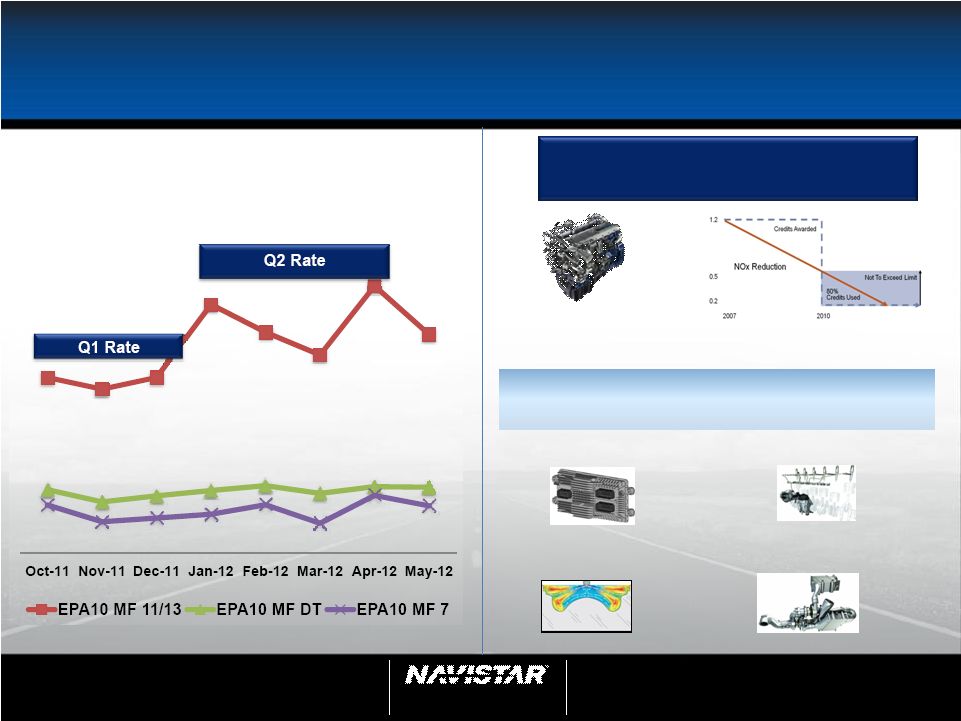
Going Forward
Warranty
Emissions
Building the foundation for our
future through integration
Development Strategy:
Provide time for
technology progress
EPA rewards providers for cleaning up
the environment sooner
Advanced EGR provides the Platform to
Continued Emissions Improvement
The best technology will continue to improve
Electronics and Control
Strategies
Advanced Fuel
Injection Technology
Higher injection pressure
3000 bar
Proprietary Combustion Bowl
Designs
More complete burn
Twin turbochargers
Air-Management Systems
Monthly Spend
per Unit in Warranty
by Spend Date
NYSE: NAV
2
nd
Quarter 2012 Earnings Call
June 7, 2012 |
12
12
2
nd
Quarter 2012 Earnings Call
June 7, 2012
Q2 2011
36%
Q2 2012
36%
2H 2012 Goal
36%-38%
Medium Truck
Going Forward
North America
Market Share
Combined Class 8 Truck
Q2 2011
45%
Q2 2012
48%
2H 2012 Goal
55%-58%
Q2 2011
19%
Q2 2012
18%
2H 2012 Goal
20%-22%
School Bus
(U.S. & Canada)
Severe Service
Heavy
NYSE: NAV |
13
13
Going Forward
North America
Economic growth
Low interest rates
Age of fleet
maintenance
costs versus new truck price
Used truck values to remain
good
Class 6
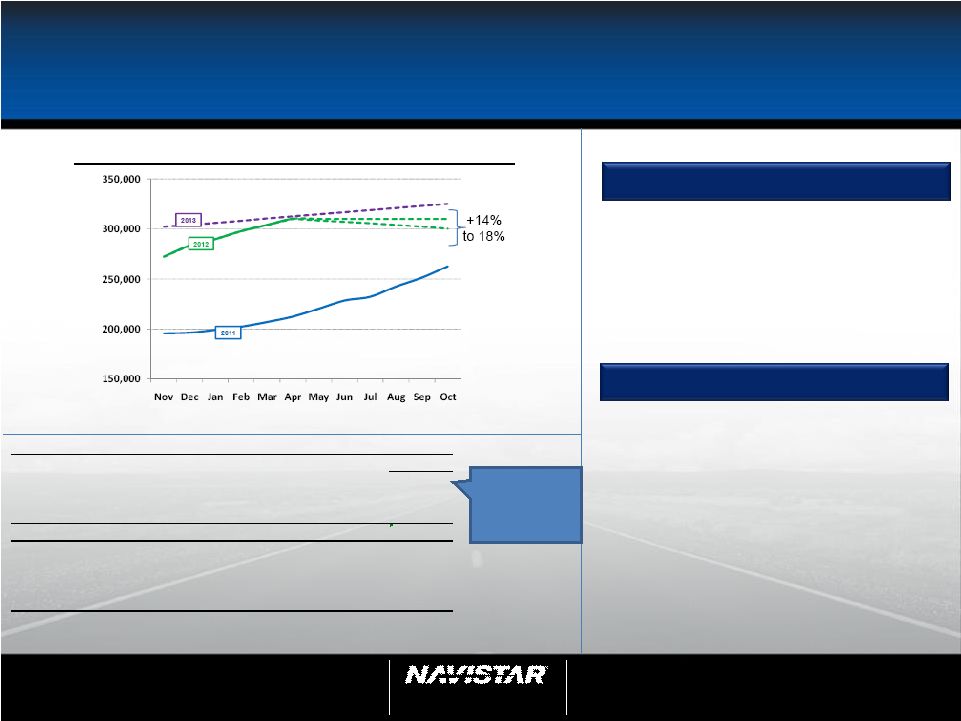
8 U.S. & Canada Industry
1
st
half at 323,000; Up 46%
yr/yr
2
nd
half at 300,000
310,000;
Up 14% -
18% yr/yr
Note: 12 month rolling average
2012 at 300,000
310,000
2013 at 325,000
345,000
ACTs
CY2013
Class 8
industry is
265,000
Reconciliation to ACT
2012
ACT*
242,500
CY to FY adjustment
(1,500)
Other misc. specialty vehicles Included in ACT
(3,500)
Total (ACT comparable Class 8 to Navistar)
237,500
Navistar Industry Retail Deliveries Combined Class 8 Trucks
216,500
Navistar difference from ACT:
21,000
~10%
*Source: ACT N.A. Commercial Vehicle Outlook - May, 2012
U.S. and Canadian Class 8 Truck Sales
NYSE: NAV
2
nd
Quarter 2012 Earnings Call
June 7, 2012 |
NYSE: NAV
Going Forward
North America
Margin Improvement
SG&A
Product Development
Manufacturing efficiencies
Pricing
Recover commodities
Material cost
Design/Content
3%-4%
Eliminate start-up related costs
Volume growth
Material cost
2
nd
half $1,000 cost per unit improvement
$1,400 Big Bore improvement by year end
Second half
$60M to $100M
run rate
improvement
Truck
Engine
Integration
Volume
14
1H
2H
23%
~27%
Traditional Market Share |
15
15
Going Forward
Defense
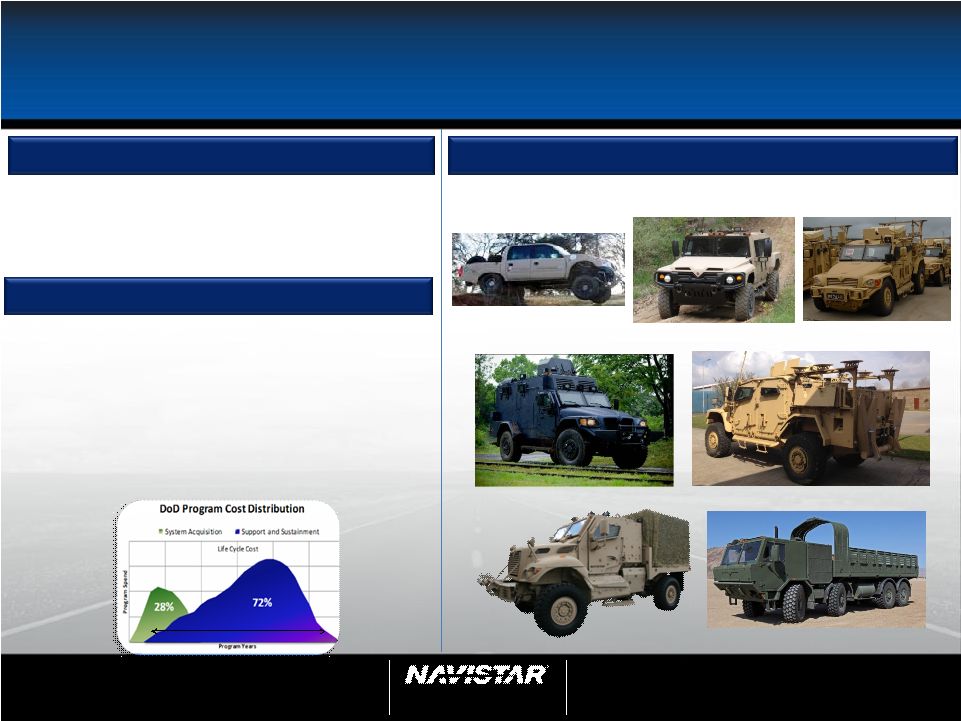
32,000+ vehicles
Make MRAP a program of record
Reset & FSR activity
STS / Post design services
FMS
U.K., Iraq, Afghanistan,
Singapore, Korea, etc.
~$425M first half ~40%
~$675M second half ~60%
FSR
Field Service Representative
STS
System Technical Support
FMS
Foreign Military Sales
Sustainment
Expanding
Capabilities
Through
Leveraging
FY2012
Goal
-
$1.1B
revenue
NYSE: NAV
2
nd
Quarter 2012 Earnings Call
June 7, 2012 |
16
16
Going Forward
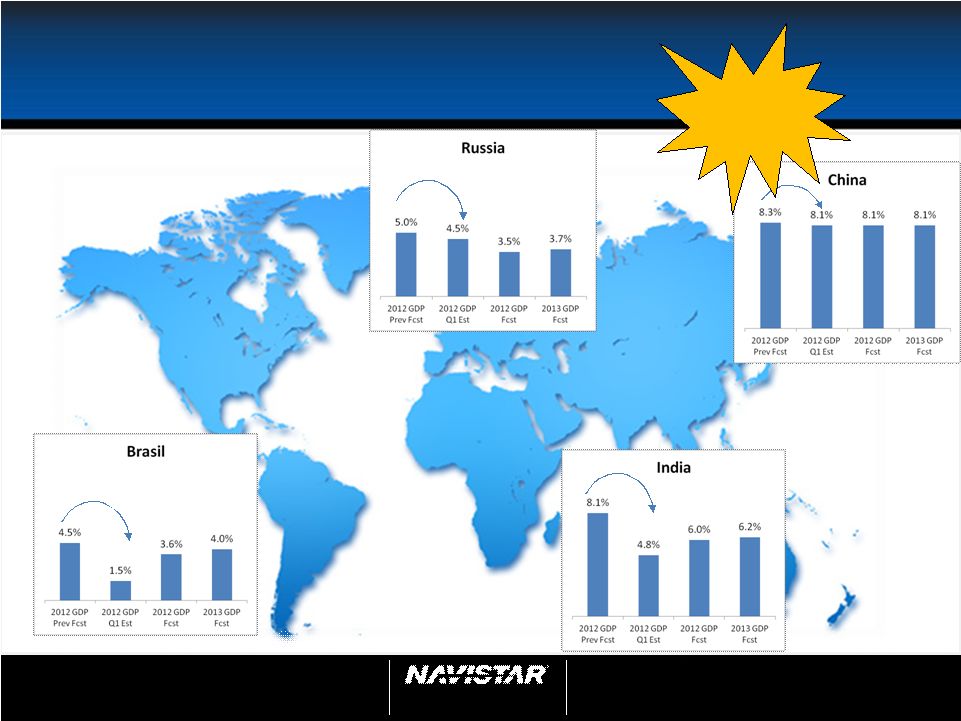
BRIC Economy
Source: Moodys Analytics & CSI Navistar
JAC/NAV
Engine JV
approved by
N.D.R.C.
NYSE: NAV
2
nd
Quarter 2012 Earnings Call
June 7, 2012 |
NYSE: NAV
Going Forward
Global
BRIC economies recover
Unsold inventory corrected
Improved
volumes
second
half
of
year
-
66%
improvement
1H
5,600 units
2H
9,300 units
Improved margins with increased volume and less
launch costs
Material cost maturing
$60M improvement in Global Truck
Neobus JV pending
17 |
18
18
$-
$200
$400
$600
$800
$1,000
$1,200
1H 2011
Actual
2H 2011
Actual
1H 2012
Actual
2H 2012
Goal
Going Forward
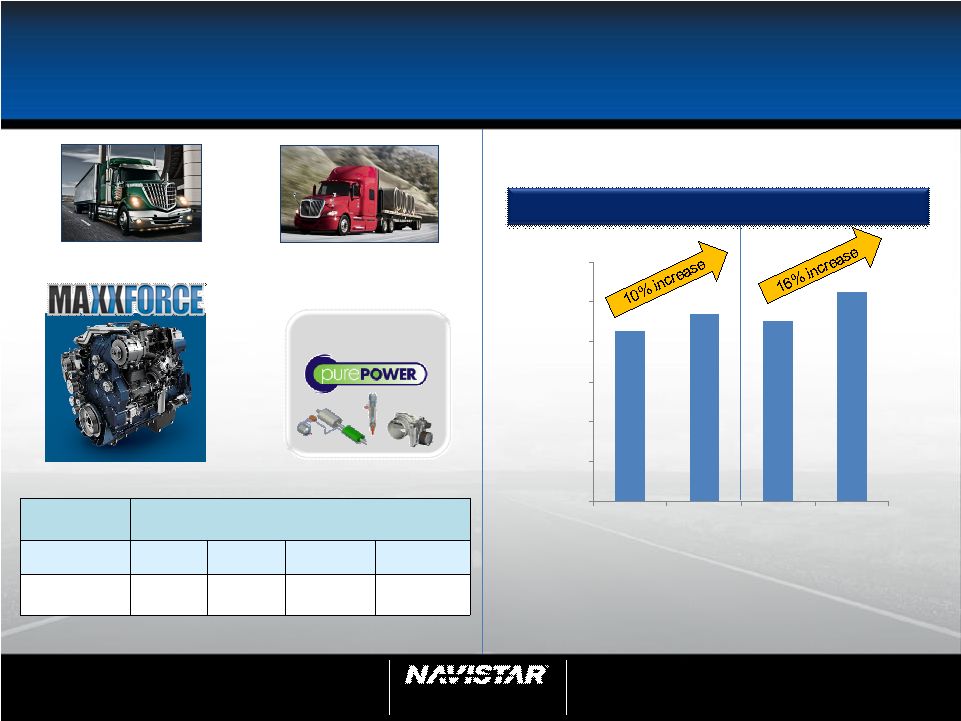
Parts
Commercial Parts Revenue
Parts
Segment
Three Months Ended April 30:
($ in millions)
2012
2011
$ change
% change
Commercial
Sales
$465
$445
$20
5%
ProStar+
®
with
MaxxForce
®
15
LoneStar
®
with
MaxxForce
®
13
Components
MaxxForce
®
15
NYSE: NAV
2
nd
Quarter 2012 Earnings Call
June 7, 2012 |
NYSE: NAV
Going Forward
Summary
Note:
This slide contains non-GAAP information; please see the REG G in
appendix for a detailed reconciliation.
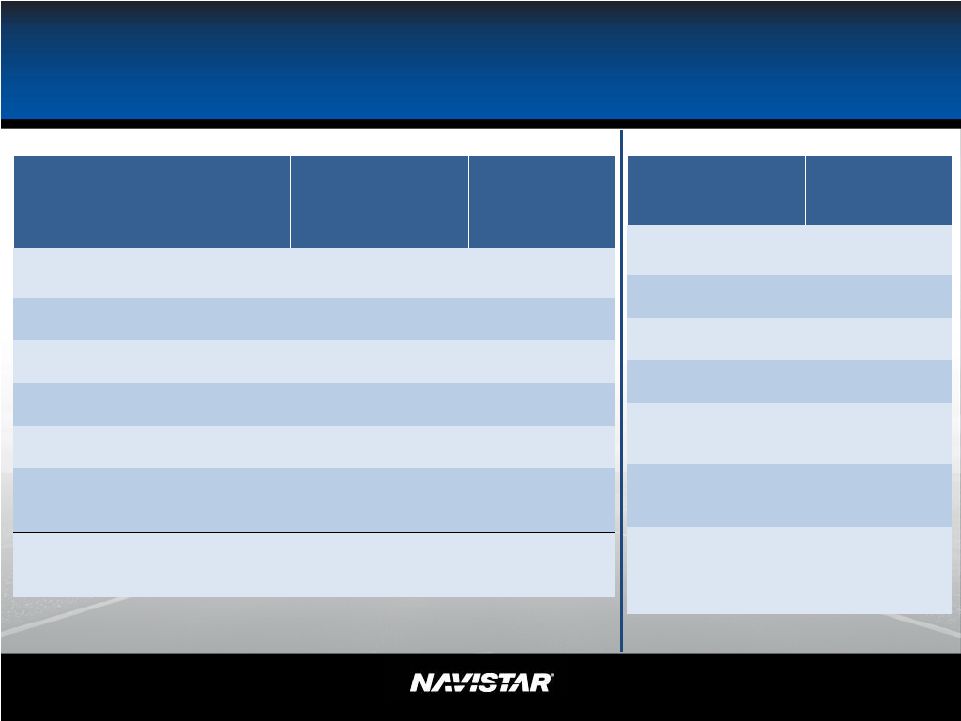
Q2 Adj. Mfg
Segment Profit
($Millions)
Estimate
Second Half
2012
($Millions)
Truck & Parts
$8
$425 -
$525
North America
~$43
Global
~($10)
Defense
~($5)
Other
~($20)
Engine & Parts
($1)
$150 -
$200
Adj. Mfg Segment Profit
$7
$575 -
$725
Full Year
Revenue
($Millions)
BRIC Economy
Brazil
~$200
India
~$200*
Diesels -
Brazil
~$200
North America
Parts
~$100
Defense
~$400
Impact of 1
Half North
America
$ ??
*non-consolidated
st
19 |
NYSE: NAV
Guidance
Note:
This slide contains non-GAAP information; please see the Reg G
disclosure in the appendix for a detailed reconciliation.
1
st
Half
(adjusted non-GAAP)
2nd Half
(adjusted non-GAAP)
Revised 2012
Guidance
(adjusted non-GAAP)
Revenue (Billions)
$6.4
$7.8
-
$8.4
$14.2
-
$14.8
Adj. Mfg. Segment Profit (Millions)
$27
$575
-
$725
$600
-
$750
Segment Margin %
-
7-8%
~4-5%
Adjusted Income/(Loss) Before Tax
(Millions)
($200)
$235
-
$380
$35
-
$180
Adjusted Net Income/(Loss) (Millions)
($201)
$200
-
$340
$0
-
$140
Adjusted EPS
($2.90)
$2.90
-
$4.90
$0.00
-
$2.00
20 |
NYSE: NAV
Looking Forward
Note:
This slide contains non-GAAP information; please see the Reg G
disclosure in the appendix for a detailed reconciliation.
2 Half
(adjusted non-GAAP)
Normalized
Annual Rate
at 300K units
(GAAP)
Revenue (Billions)
$7.8 -
$8.4
$15
-
$16
Adj. Mfg. Segment Profit (Millions)
$575
-
$725
$1.2
-
$1.4
Segment Margin %
7-8%
~8%
Adjusted Income/(Loss) Before Tax
(Millions)
$235
-
$380
$500
-
$700
Adjusted Net Income/(Loss) (Millions)
$200
-
$340
$375
-
$525
Adjusted EPS
$2.90
-
$4.90
$5.35
-
$7.50
21
nd |
22
22
2012 Outgoing Run Rate
Note:
This slide contains non-GAAP information; please see the REG G in
appendix for a detailed reconciliation.
2012 Outgoing
Run Rate
Strategic
Target
Truck
N.A. w/Parts
8-9%
9-10%
Truck
Global w/Parts
2-3%
6-8%
Engine
Worldwide w/Parts
7-8%
8-10%
Total Manufacturing Margin
~8%
~9%
NYSE: NAV
2
nd
Quarter 2012 Earnings Call
June 7, 2012 |
23
23
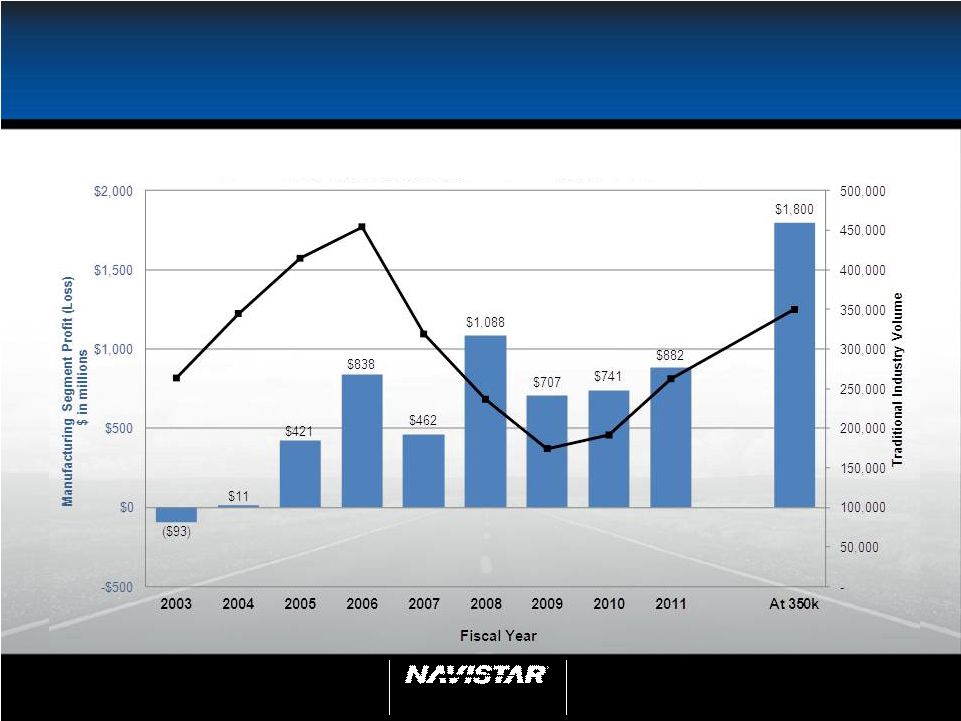
Goal of:
$20 billion in Revenue
$1.8 billion in Manufacturing Segment Profit at
average of cycle
Profitable at all points in the cycle
Focus is on reducing impact of cyclicality
Non-traditional/expansion markets
Grow parts
Strategy: Leveraging What We Have and
What Others Have Built
Note:
This slide contains non-GAAP information; please see the Reg G in
appendix for a detailed reconciliation.
Strategy: Control Our Destiny
Global growth
Engine
Hard part is over
Marketing
Product launches
Integration
NYSE: NAV
2
nd
Quarter 2012 Earnings Call
June 7, 2012 |
24
24
Adjusted Manufacturing Segment Profit
Note:
This slide contains non-GAAP information; please see the Reg G
disclosure in the appendix for a detailed reconciliation.
Adjusted Manufacturing Segment Profit (Loss)
NYSE: NAV
2
nd
Quarter 2012 Earnings Call
June 7, 2012 |
25
25
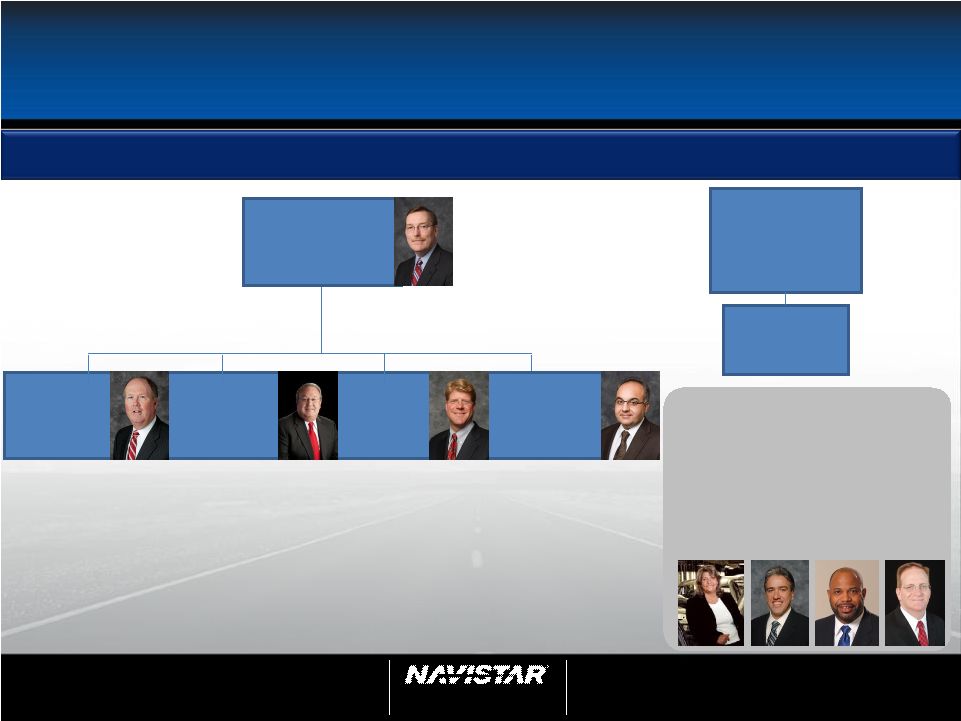
Driving Integration -
Leadership
Integration and building
great future leadership
Jan Allman
Persio Lisboa
Bill Osborne
Bob Walsh
Integration
Troy Clarke
President of Truck &
Engine
Dan Ustian
Chairman,
President & CEO
A. J. Cederoth
EVP & CFO
Support
Functions
Jack Allen
President
N.A. Truck &
Parts
Archie
Massicotte
President
Defense &
Manufacturing
Ramin
Younessi
Vice President
Product
Development,
Purchasing &
Quality
Eric Tech
President
Engine, Global
Truck & Parts
Effective July 1, 2012 following board of director approval.
NYSE: NAV
2
nd
Quarter 2012 Earnings Call
June 7, 2012 |
26
Appendix
NYSE: NAV
2
nd
Quarter 2012 Earnings Call
June 7, 2012 |
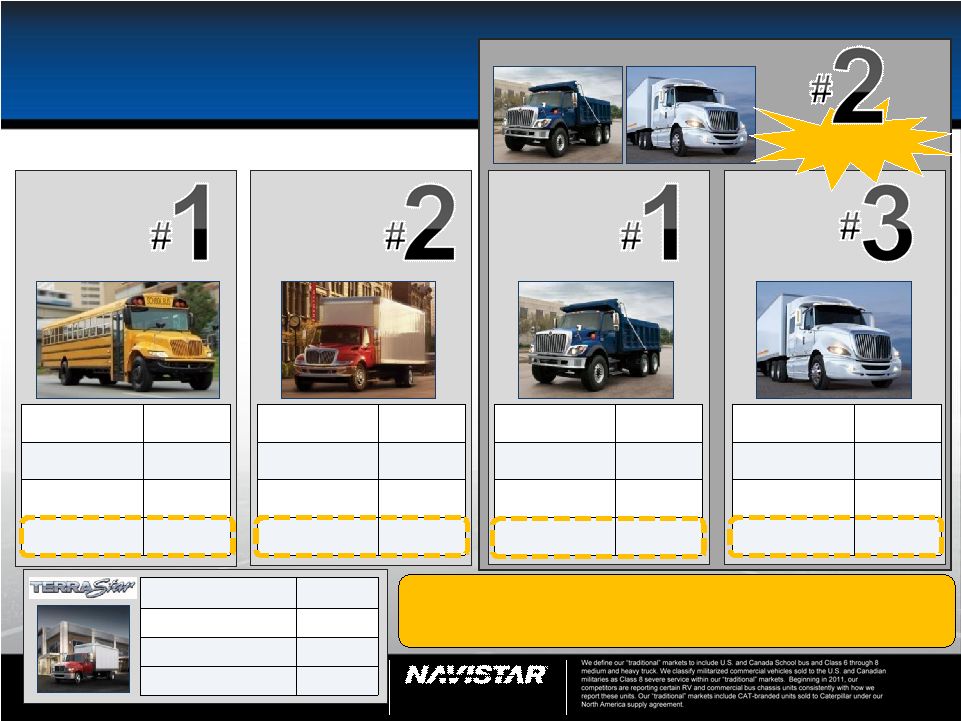
Medium
Truck
Great Products
Market Share
Severe Service
Truck
Heavy
Truck
FY10
59%
FY11
49%
Q212
48%
YTD 12
48%
FY10
38%
FY11
41%
Q212
36%
YTD 12
32%
FY10
40%
FY11
35%
Q212
30%
YTD 12
30%
FY10
24%
FY11
17%
Q212
15%
YTD 12
16%
Class 8
School
Bus
(U.S. & Canada)
School Bus & Combined Class 6-8 Market Share
FY10: 34%; FY11: 28%; Q212: 24%; YTD12:
23% 18% Market Share
Q212
Class 4-5
YTD 12
Industry
22K
Navistar
1,395
Market Share
~6%
27
NYSE: NAV
2
nd
Quarter 2012 Earnings Call
June 7, 2012 |
28
28
Supplemental Information -
Truck
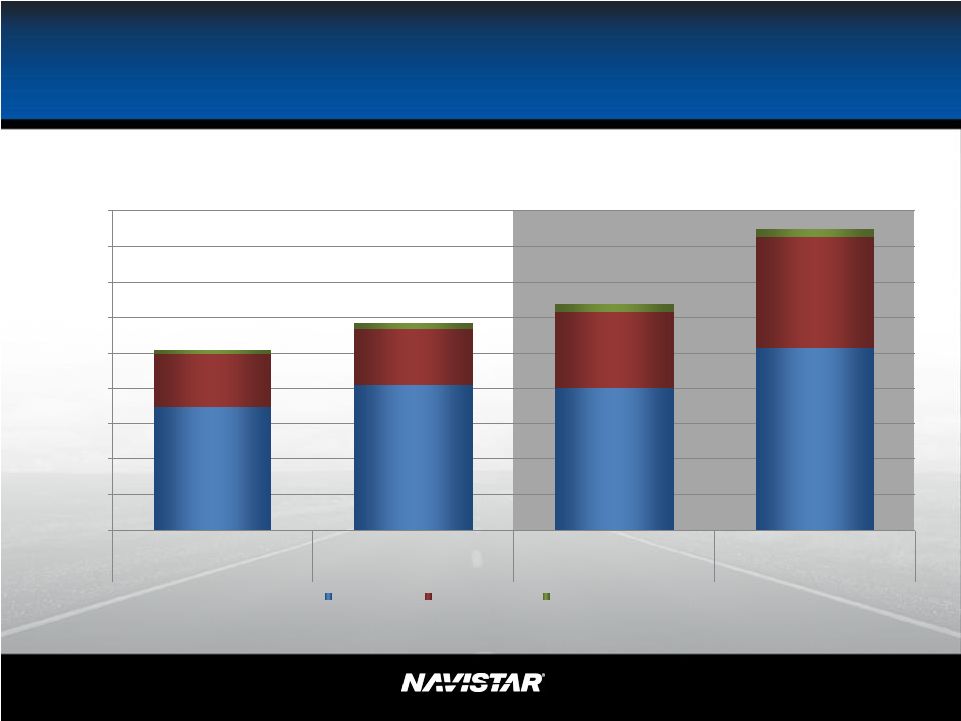
Worldwide Truck Chargeouts
NYSE: NAV
0
5,000
10,000
15,000
20,000
25,000
30,000
35,000
40,000
45,000
Actual
Actual
Forecast
Forecast
Q1
Q2
Q3
Q4
Traditional
Expansionary
Towables
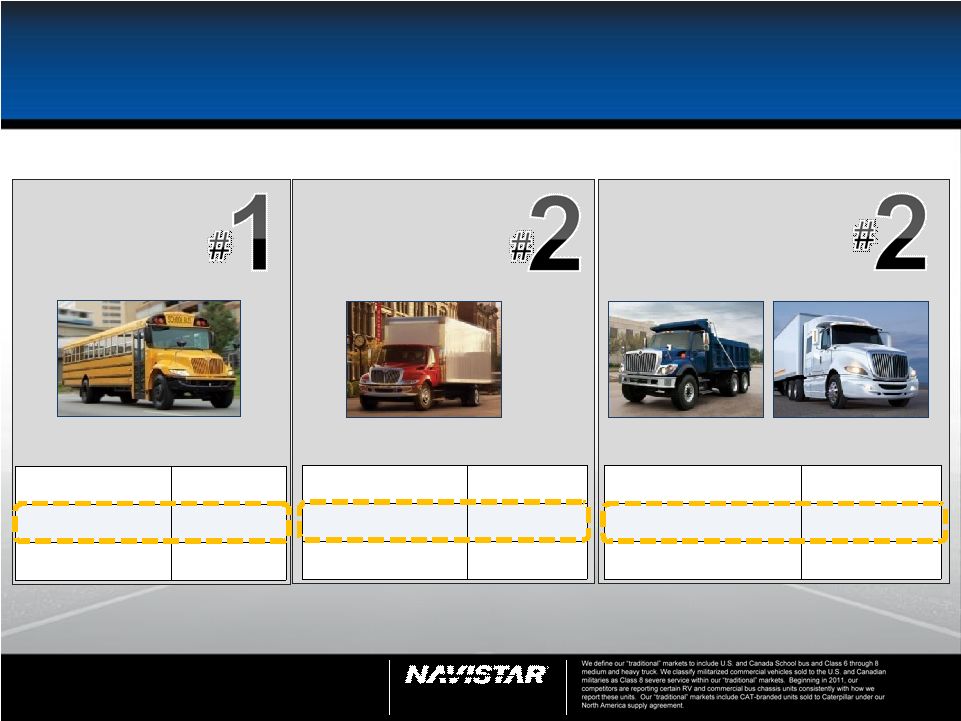
We define our traditional markets to include U.S. and Canada School bus and Class 6
through 8 medium and heavy truck. We classify militarized commercial vehicles sold to the U.S.
and Canadian militaries as Class 8 severe service within our traditional markets. Our traditional markets include CAT-branded units
sold to Caterpillar under our North America supply agreement. |
29
$507
$170
$2,123
$2,384
$725
$744
$-
$500
$1,000
$1,500
$2,000
$2,500
$3,000
$3,500
$4,000
Q2 2011
Q2 2012
Military
U.S. & Canada
ROW
65,000
50,700
0
10,000
20,000
30,000
40,000
50,000
60,000
70,000
Q2 2011
Q2 2012
25,600
28,400
0
5,000
10,000
15,000
20,000
25,000
30,000
Q2 2011
Q2 2012
$390
$139
$117
$31
$-
$100
$200
$300
$400
$500
$600
Q2 2011
Q2 2012
Truck
Parts
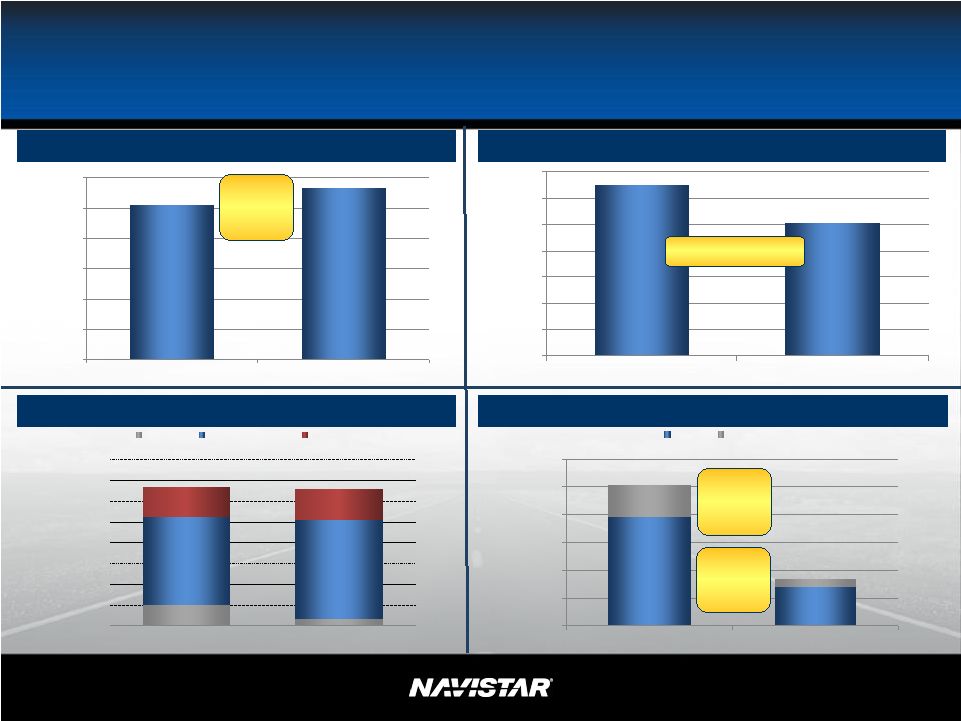
Q2 Operational Results
Consolidated
Revenues
($
in
millions)
Quarterly Truck Chargeouts
Quarterly Engine Shipments
Charge
outs
increased
11%
Military
Revenues
($
in
millions)
Engine shipments
decreased 22%
Truck
Revenues
decreased
64%
Parts
Revenues
decreased
74%
$3,355
$3,298
NYSE: NAV |
30
30
$1.30
$(1.99)
-$2.50
-$2.00
-$1.50
-$1.00
-$0.50
$0.00
$0.50
$1.00
$1.50
Q2 2011
Q2 2012
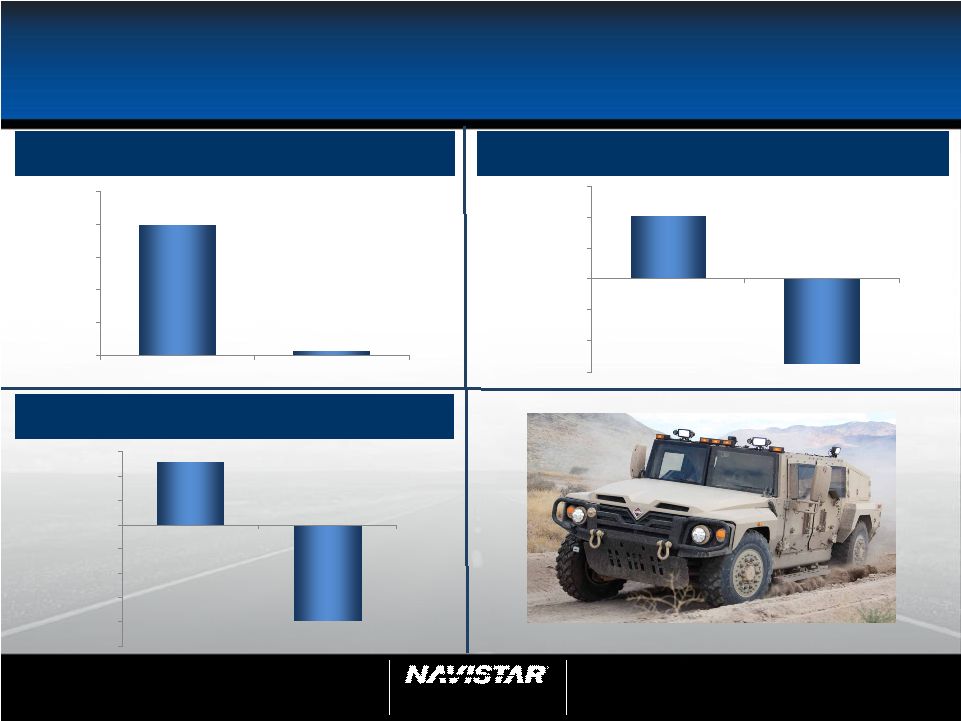
Year over Year
Financial Information:
Q2 Adj. Manufacturing Segment Profit (Loss)
($ in millions)
Q2 Adj. Earnings (Loss) Per Share
Q2 Adj. Net Income (Loss)
($ in millions)
Note:
This slide contains non-GAAP information; please see the REG G in
appendix for a detailed reconciliation.
$198
$7
$0
$50
$100
$150
$200
$250
Q2 2011
Q2 2012
$102
$(137)
-$150.0
-$100.0
-$50.0
$0.0
$50.0
$100.0
$150.0
Q2 2011
Q2 2012
NYSE: NAV
2
nd
Quarter 2012 Earnings Call
June 7, 2012 |
31
31
Market Share
U.S. & Canada School Bus and Class 6-8
We
define
our
traditional
markets
to
include
U.S.
and
Canada
School
bus
and
Class
6
through
8
medium
and
heavy
truck.
We
classify
militarized
commercial
vehicles
sold
to
the
U.S.
and
Canadian
militaries
as
Class
8
severe
service
within
our
traditional
markets.
Beginning
in
2011,
our
competitors
are
reporting
certain
RV
and
commercial
bus
chassis
units
consistently
with
how
we
report
these
units.
Our
traditional
markets
include
CAT-branded
units
sold
to
Caterpillar
under
our
North
America
supply
agreement.
Traditional Market Share
Q1
Q2
Q3
Q4
Full Year
Q1
Q2
Q3
Q4
Full Year
Q1
Q2
Q3
Q4
Full Year
School buses
60%
63%
53%
61%
59%
49%
45%
47%
53%
49%
48%
48%
Class 6 and 7 medium trucks
33%
44%
36%
36%
38%
36%
36%
46%
44%
41%
27%
36%
Class 8 heavy trucks
23%
22%
30%
20%
24%
17%
16%
17%
18%
17%
17%
15%
Class 8 severe service trucks
40%
41%
38%
40%
40%
33%
32%
36%
37%
35%
31%
30%
Combined Class 8
28%
28%
32%
25%
28%
21%
19%
21%
22%
21%
19%
18%
Total Traditional Market Share
33%
35%
35%
32%
34%
27%
26%
29%
29%
28%
22%
24%
Market Share - U.S. & Canada School Bus and Class 6-8
2010
2011
2012
NYSE: NAV
2
nd
Quarter 2012 Earnings Call
June 7, 2012 |
32
32
Worldwide Truck Chargeouts
We define our traditional
markets
to include U.S. and Canada School
bus and Class 6 through 8 medium
and heavy truck. We classify
militarized commercial vehicles
sold to the U.S. and Canadian
militaries as Class 8 severe service
within our traditional
markets. Our
traditional
markets include CAT-
branded units sold to Caterpillar
under our North America supply
agreement.
FISCAL YEAR 2010
Q1
Q2
Q3
Q4
FULL YEAR
BUS
3,100
3,000
2,400
3,900
12,400
MEDIUM
3,900
5,300
3,900
5,400
18,500
HEAVY
5,200
4,600
6,400
5,400
21,600
SEVERE
3,900
3,800
2,200
4,100
14,000
TOTAL
16,100
16,700
14,900
18,800
66,500
NON-TRADITIONAL MILITARY
100
200
1,000
100
1,400
EXPANSIONARY
3,900
4,500
4,700
6,000
19,100
WORLDWIDE TRUCK
20,100
21,400
20,600
24,900
87,000
FISCAL YEAR 2011
Q1
Q2
Q3
Q4
FULL YEAR
BUS
2,100
2,000
2,200
2,900
9,200
MEDIUM
4,600
7,200
7,400
7,900
27,100
HEAVY
4,700
5,200
6,800
9,000
25,700
SEVERE
2,700
3,200
3,700
3,700
13,300
TOTAL
14,100
17,600
20,100
23,500
75,300
NON-TRADITIONAL MILITARY
100
400
200
700
1,400
EXPANSIONARY
5,300
7,600
8,600
10,200
31,700
WORLDWIDE TRUCK
19,500
25,600
28,900
34,400
108,400
FISCAL YEAR 2012
Q1
Q2
Q3
Q4
FULL YEAR
BUS
1,700
2,600
4,300
MEDIUM
4,300
7,100
11,400
HEAVY
8,000
7,200
15,200
SEVERE
3,300
3,600
6,900
TOTAL
17,300
20,500
37,800
NON-TRADITIONAL MILITARY
200
400
600
EXPANSIONARY
7,400
7,500
14,900
WORLDWIDE TRUCK
24,900
28,400
53,300
Worldwide Truck Chargeouts
NYSE: NAV
2
nd
Quarter 2012 Earnings Call
June 7, 2012 |
33
33
Worldwide Engine Shipments
Navistar
Q1
Q2
Q3
Q4
Full Year
OEM sales - South America
30,700
34,600
33,600
33,900
132,800
Ford sales - U.S. and Canada
24,700
200
-
-
24,900
Other OEM sales
2,000
3,600
3,700
4,900
14,200
Intercompany sales
16,400
17,700
15,600
18,800
68,500
Total Shipments
73,800
56,100
52,900
57,600
240,400
Navistar
Q1
Q2
Q3
Q4
Full Year
OEM sales - South America
27,200
37,100
38,200
36,100
138,600
Other OEM sales
4,500
4,400
3,700
3,600
16,200
Intercompany sales
17,300
23,500
22,300
25,700
88,800
Total Shipments
49,000
65,000
64,200
65,400
243,600
Navistar
Q1
Q2
Q3
Q4
Full Year
OEM sales - South America
24,100
25,300
49,400
Other OEM sales
2,200
2,000
4,200
Intercompany sales
21,600
23,400
45,000
Total Shipments
47,900
50,700
-
-
98,600
2011
2010
Worldwide Engine Shipments
2012
NYSE: NAV
2
nd
Quarter 2012 Earnings Call
June 7, 2012 |
34
34
Order Receipts
U.S. & Canada
We
define
our
traditional
markets
to
include
U.S.
and
Canada
School
bus
and
Class
6
through
8
medium
and
heavy
truck.
We
classify
militarized
commercial
vehicles
sold
to
the
U.S.
and
Canadian
militaries
as
Class
8
severe
service
within
our
traditional
markets.
Our
traditional
markets
include
CAT-branded
units
sold
to
Caterpillar
under
our
North
America
supply
agreement.
2012
2011
Change
3,200
2,100
1,100
6,300
6,800
(500)
Class 8 heavy trucks
5,600
9,300
(3,700)
Class 8 severe service trucks
3,000
3,600
(600)
18,100
21,800
(3,700)
8,600
12,900
(4,300)
Order Receipts: U.S. & Canada (Units)
Three Months Ended
April 30,
Total "Traditional" Markets
Combined Class 8 (Heavy and Severe Service)
"Traditional" Markets
School buses
Class 6 and 7 medium trucks
NYSE: NAV
2
nd
Quarter 2012 Earnings Call
June 7, 2012 |
35
35
Navistar Financial Corporation
Note: profitability relates to total financial services
Profitability strong in 2012: $26M in Q2, $53M YTD
Expected to decline as U.S. retail loan portfolio runs off due to G.E. Capital
alliance
Long-term liquidity in place with better terms
$466M U.S. availability
Consolidating retail securitizations
Service leverage of 4.1 to 1 and declining as GE Capital alliance sources retail
originations $1.5B since inception
Retail Notes
Bank Facility
$840M facility refinanced in
December 2011, maturity
extended from 2012 to 2016
Funding for retail notes,
wholesale notes, retail
accounts, and dealer open
accounts
On balance sheet
Situation as of Apr 30, 2012
$1.1B funding facility (NFSC)
$320M available
NFSC wholesale trust
Variable portion matures July
2012
Public portions mature
October 2012 and October
2013
On balance sheet
Broader product offering
Enhanced ability to support
large fleets
Better access to less
expensive capital
Leveraging Assets & Controlling Our Destiny
NYSE: NAV
2
nd
Quarter 2012 Earnings Call
June 7, 2012 |
36
36
U.S. and Canada Dealer Stock Inventory*
*Includes U.S. and Canada Class 4-8 and school bus inventory, but does not
include U.S. IC Bus or Workhorse Custom Chassis inventory. NYSE: NAV
2
nd
Quarter 2012 Earnings Call
June 7, 2012 |
37
37
Frequently Asked Questions
Q1:
What is in your Dealcor debt?
A:
Dealcor debt is comprised of wholesale (floor plan) financing and also retail
financing on lease and rental fleets for company owned dealers.
Q2:
How many Dealcor dealers did you have as of April 30, 2012?
A:
Of our 272 primary NAFTA dealers, we have ownership interest in seven DealCor
dealers as of April 30, 2012. Q3:
How are your dealers doing?
A:
Our industry leading dealer network continues to improve in nearly all operational
and financial aspects of their business.
Considerable investments continue in facility upgrades, hours of service,
technician training, tooling and inventory as a direct result of our
proprietary engine line-up and expansion of our customer base. Additional fixed operations and facility preparedness,
concentrated on the increasing focus on CNG and LNG, continues at a rapid pace for
many of our domestic and Canadian dealers. Q4:
What kind of rates do you charge your dealers and customers?
A:
Generally, our rates vary (those with higher credit risk have always had to pay
higher interest rates) and are usually in line with the market.
Q5:
How do you fund your wholesale business?
A:
We
primarily
finance
our
wholesale
portfolio
through
NFC,
funded
with
traditional
private
or
public
securitizations,
and
through
NFCs
bank facility.
Q6:
How is your NFC portfolio performing?
A:
NFCs wholesale portfolio performed exceptionally well in 2011 and is
continuing to do well in 2012. NFCs retail notes portfolio in the U.S.
is in run-off mode now that Navistar Capital, the new GE Capital retail program, is financing retail customers.
Q7:
What is your total amount of capacity at NFC?
A:
As of April 30, 2012, total availability in our U.S. funding facilities is $466
million. NYSE: NAV
2
nd
Quarter 2012 Earnings Call
June 7, 2012 |
38
38
Frequently Asked Questions
Q8:
What
is
the
status
of
the
retail
financing
alliance
with
GE
Capital
in
the
United
States?
A:
Navistar
Capital
the
alliance
we
formed
with
GE
Capital
in
the
United
States
to
support
the
sale
of
Navistar
products
is
progressing
consistent
with
expectations.
Since
its
inception
in
2010,
the
alliance
has
funded
more
than
$1.5
billion
in
retail
financings.
Q9:
What
is
included
in
Corporate
and
Eliminations?
A:
The
primary
drivers
of
Corporate
and
Eliminations
are
Corporate
SG&A,
pension
and
OPEB
expense
(excluding
amounts
allocated
to
the
segments),
annual
incentive,
manufacturing
interest
expense,
and
the
elimination
of
intercompany
sales
and
profit
between
segments.
Q10:
What
is
the
current
Joint
Light
Tactical
Vehicle
(JLTV)
program
status?
A:
A
decision
for
the
Engineering,
Manufacturing
and
Development
(EMD)
phase
is
expected
by
the
end
of
the
summer.
Q11:
How
will
the
changing
Department
of
Defense
(DoD)
budget
affect
Navistar
in
FY
2012?
A:
The
coming
year
will
present
challenges,
but
Navistars
commercial
expertise
may
be
an
advantage
when
the
DoD
is
asked
to
do
more
with
less.
In
addition,
the
Company
continues
to
pursue
a
number
of
foreign
military
opportunities,
especially
in
the
Middle
East,
where
defense
spending
is
growing.
Finally,
the
Company
has
a
fleet
of
more
than
32,000
vehicles
in
operation
in
approximately
26
countries,
including
more
than
9,000
vehicles
operating
with
Afghan
Security
Forces.
These
vehicles
will
require
parts
and
sustainment
support
throughout
their
lifecycles.
NYSE: NAV
2
nd
Quarter 2012 Earnings Call
June 7, 2012 |
39
39
Frequently Asked Questions
Q12:
How does your FY 2012 Class 8 industry compare to ACT Research?
A:
Q13:
What
were
the
2010
emissions
requirements?
A:
Through
the
use
of
credits
manufacturers
can
go
to
a
maximum
of
0.50g
NOx
if
they
reduced
emissions
earlier
with
advanced
technology;
manufacturers
need
to
be
at
0.20g
NOx
if
they
chose
not
to
introduce
advanced
technologies
to
reduce
their
emissions
earlier.
For
many
years
Navistar
introduced
cleaner
emission
engines
than
EPA
requirements,
and
we
were
able
to
generate
some
credit
before
we
needed
to
reach
the
0.20g
NOx
standard.
Q14:
What
is
included
in
your
equity
in
loss
of
your
non-consolidated
affiliates?
A:
Equity
in
loss
of
non-consolidated
affiliates
is
derived
from
our
ownership
interests
in
partially-owned
affiliates
that
are
not
consolidated,
and
is
primarily
comprised
of
continued
investment
and
start-up
losses
associated
with
our
Mahindra
joint
ventures.
Q15:
What
is
your
net
income
attributable
to
non-controlling
interests?
A:
Net
income
attributable
to
non-controlling
interests
is
the
result
of
the
consolidation
of
subsidiaries
in
which
we
do
not
own
100%,
and
is
primarily
comprised
of
Ford's
non-controlling
interest
in
our
Blue
Diamond
Parts
joint
venture.
Reconciliation to ACT
2012
ACT*
242,500
CY to FY adjustment
(1,500)
Other misc. specialty vehicles Included in ACT
(3,500)
Total (ACT comparable Class 8 to Navistar)
237,500
Navistar Industry Retail Deliveries Combined Class 8 Trucks
216,500
Navistar difference from ACT:
21,000
~10%
*Source: ACT N.A. Commercial Vehicle Outlook - May, 2012
U.S. and Canadian Class 8 Truck Sales
NYSE: NAV
2
nd
Quarter 2012 Earnings Call
June 7, 2012 |
40
40
Frequently Asked Questions
Q16:
What
is
your
estimate
of
future
effective
tax
rates?
A:
We
would
estimate
future
effective
tax
rates
to
fall
in
the
upper
20%
to
low
30%
range.
For
FY
2012,
we
expect
our
annual
ETR
to
be
significantly
lower
than
expectations
based
on
the
geographical
mix
of
the
jurisdictions
recognizing
earnings
or
losses,
before
the
impact
of
the
valuation
allowances
release
during
this
quarter.
Q17:
What
is
your
expectation
for
future
cash
tax
payments?
A:
Our
cash
tax
payments
will
remain
low
in
FY
2012
and
will
gradually
increase
as
we
exhaust
available
NOLs
and
tax
credits
over
the next few years.
Q18:
What is the current balance of net operating losses as compared to other deferred tax
assets? A:
As
of
October
31,
2011
the
Company
has
U.S.
federal
net
operating
losses
(NOLs)
valued
at
$126
million,
state
NOLs
valued
at
$79
million
and
foreign
NOLs
valued
at
$102
million,
for
a
total
undiscounted
cash
value
of
$307
million.
In
addition
to
NOLs,
the
Company
has
accumulated
tax
credits
of
$208
million
and
other
deferred
tax
assets
of
$1.5
billion
resulting
in
net
deferred
tax
assets
of
approximately
$2
billion.
Q19:
When
do
you
expect
to
release
the
remaining
balance
of
valuation
allowances?
A:
We
released
an
additional
$181
million
during
the
quarter
related
to
our
Canadian
deferred
tax
assets.
The
Company
continues
to
evaluate
various
business
strategies
which
would
allow
us
to
realize
the
value
of
deferred
tax
assets
that
are
currently
subject
to
a
valuation
allowance.
To
the
extent
these
strategies
enable
us
to
demonstrate,
on
a
more-likely-than
not
basis,
that
we
will
be
able
to
realize
these
deferred
tax
assets
in
the
future,
we
will
then
release
the
associated
valuation
allowances.
Q20:
How
will
$2
billion
of
deferred
tax
assets
be
used
to
offset
future
taxable
income?
A:
Simply
put,
deferred
tax
assets
represent
the
value
of
future
tax
deductions
attributable
to
items
that
have
already
been
expensed
or
deducted
for
book
purposes.
The
most
commonly
understood
component
of
deferred
tax
assets
is
the
value
of
our
net
operating
losses,
which
will
serve
to
immediately
reduce
taxable
income
in
the
future.
In
addition,
we
have
several
other
major
components
of
deferred
taxes
which
will
reduce
taxable
income
in
the
future.
For
example,
the
Company
has
accrued
significant
OPEB,
pension
and
other
employee
benefit
expenses
during
prior
years
based
on
expected
payments
to
be
made
in
the
future.
As
these
payments
are
made,
the
Company
will
realize
tax
deductions
to
offset
future
taxable
income.
NYSE: NAV
2
nd
Quarter 2012 Earnings Call
June 7, 2012 |
41
41
Frequently Asked Questions
Q21:
How
would
future
tax
proposals
to
reduce
U.S.
tax
rates
impact
Navistar?
A:
While
lower
tax
rates
would
favorably
impact
future
tax
expense,
because
of
the
Companys
large
balance
of
deferred
tax
assets
we
would
incur
a
one-time
adverse
impact
to
our
P&L
to
reset/reduce
our
deferred
tax
balances
to
the
lower
statutory
rates.
We
estimate
that
for
every
1%
reduction
in
tax
rates,
we
would
incur
an
immediate,
one-time
tax
increase
of
$50
million.
Q22:
What
are
your
expected
2012
and
beyond
pension
funding
requirements?
A:
Current
forecasts
indicate
that
we
may
need
to
contribute
approximately
$189
million
in
2012
to
our
U.S.
and
Canadian
pension
plans.
Future
contributions
are
dependent
upon
a
number
of
factors,
principally
the
changes
in
values
of
plan
assets,
changes
in
interest
rates
and
the
impact
of
any
funding
relief
currently
under
consideration.
We
currently
expect
that
from
2013
through
2015,
the
Company
will
be
required
to
contribute
at
least
$210
million
per
year
to
the
plans,
depending
on
asset
performance
and
discount rates.
Q23:
What
causes
the
variance
between
manufacturing
cash
interest
payments
and
GAAP
interest
expense?
A:
The
main
variance
between
cash
and
GAAP
interest
results
from
our
manufacturing
segments
$1
billion
of
senior
unsecured
high
yield
notes
and
$570
million
of
senior
subordinated
convertible
notes.
As
a
result
of
this
issuance,
manufacturing
interest
expense
is
higher
than
cash
interest
payments
due
to
the
amortization
of
debt
issuance
costs
which
are
amortized
over
the
life
of
each
note,
amortization
of
the
original
issue
discount
of
the
high
yield
notes
and
amortization
of
the
embedded
call
option
in
the
convertible
notes.
The
timing
of
interest
payments
also
impacts
the
overall
variance
on
a
quarterly
basis,
but
not
on
a
fiscal
year
basis.
Q24:
What
should
we
assume
for
capital
expenditures
in
fiscal
2012?
A:
We
plan
to
continue
capital
spending
within
the
traditionally
guided
range
of
$250
million
to
$350
million
for
products
and
development.
Capital
spending
related
to
Engineering
Integration
is
funded
through
the
RZFBs
and
is
not
included
in
that
range.
NYSE: NAV
2
nd
Quarter 2012 Earnings Call
June 7, 2012 |
42
42
Frequently Asked Questions
Q25:
What are the $225 million of RZFBs Series 2010 due October 15, 2040 being used for?
A:
We
are
using
the
proceeds
to
invest
in
our
product
development
strategy
and
our
headquarter
consolidation.
Great
products
are
a
key
pillar
of
our
three
pronged
strategy.
Streamlining
and
improving
our
product
development
processes
will
continue
to
provide
competitive
advantages
for
us
in
the
marketplace.
The
funding
from
the
RZFBs
allowed
us
to
consolidate
many
facilities
into
a
new
facility
and
make
necessary
renovations
to
that
facility.
Additionally
we
are
investing
in
an
existing
facility,
which
includes
investments
in
equipment
and
technology
that
will
help
us
create
and
improve
our
product
development
process
and
thus
shareholder
value.
Q26:
Why did you use RZFB financing?
A:
The
RZFBs
are
a
cost
effective,
long-term
form
of
capital
that
is
complementary
to
our
capital
structure.
The
bonds
have
a
30
year
maturity
and
a
fixed
rate
coupon
of
6.50%
per
annum.
They
are
callable
at
par
any
time
after
10
years
(October
15,
2020).
Issuing
bonds
in
the
tax-exempt
market
gave
us
exposure
to
a
new
source
of
investors
that
we
wouldnt
otherwise
have
access
to
if
not
for
the
RZFB
program.
Q27:
What
are
the
differences
between
the
accounting
vs.
economic
dilution
on
your
convertible
debt?
A:
Please
see
the
presentation
on
the
IR
website
(http://ir.navistar.com/dilution.cfm)
entitled
Dilution
overview
resulting
from
the
Convertible
Notes
issued
on
October
2009.
NYSE: NAV
2
nd
Quarter 2012 Earnings Call
June 7, 2012 |
43
43
Frequently Asked Questions
Q28:
Why are the convertible debt holders no longer able to convert their notes?
A:
The
indenture
in
our
convertible
notes
contains
a
provision
that
allows
the
note
holders
to
convert
anytime
during
the
following
fiscal
quarter
should
the
price
of
Navistars
common
stock
close
130%
above
the
conversion
price
for
any
20
day
period
(consecutive
or
non-consecutive)
out
of
the
last
30
consecutive
day
trading
period
of
each
fiscal
quarter.
The
conversion
price
of
the
notes
is
$50.274
per
share
of
Navistars
common
stock
and
130%
of
the
conversion
price
equals
$65.356
per
share
of
Navistars
common
stock.
Since
Navistars
common
stock
closed
above
$65.356
per
share
for
more
than
20
trading
days
during
the
30
consecutive
trading
day
period
ending
on
April
30,
2011,
the
note
holders
had
the
right
to
convert
their
notes
any
time
from
May
2,
2011
through
July
31,
2011.
A
very
small
minority
of
note
holders
chose
to
convert
their
notes
during
the
conversion
period.
Navistar
opted
to
settle
the
conversion
in
cash
instead
of
shares,
therefore
there
was
a
40
trading
day
observation
period
to
determine
the
value
that
was
remitted
in
cash,
so
the
note
holders
did
not
receive
the
cash
for
almost
two
months
after
their
respective
conversion
notices
were
received.
Navistars
common
stock
did
not
close
above
$65.356
per
share
for
20
trading
days
(consecutive
or
non-consecutive)
during
the
30
day
consecutive
trading
day
period
ending
April
30,
2012,
therefore
the
note
holders
do
not
have
the
right
to
convert
their
notes,
however
that
threshold
could
be
triggered
once
again
in
the
future.
Q29:
Are
you
ready
for
the
2013
Greenhouse
Gas
(GHG)
regulation?
A:
Yes,
Navistar
is
ready
to
meet
the
standards
when
they
go
into
effect
January
2014.
As
a
leader
in
fuel
efficiency
and
in
delivering
innovative
technologies,
such
as
aerodynamics,
lighter
weight
vehicles,
fuel
efficient
engines,
hybrids,
plug-in
hybrids
and
electric
vehicles,
our
current
approach
is
to
consistently
deliver
the
most
practical
advance
technology
and
fuel-efficient
vehicles
to
our
customers.
Our
customer-focused
approach
aligns
Navistar
with
the
intent
of
the
new
proposed
GHG
rule,
and
provides
us
with
a
strong
basis
for
meeting
the
new
standards.
NYSE: NAV
2
nd
Quarter 2012 Earnings Call
June 7, 2012 |
44
44
Frequently Asked Questions
Q30:
How are you addressing the 2014 and future GHG regulations?
A:
Navistar
has
invested
in
the
development
of
fuel
efficient
engines,
powertrain
optimization,
and
unmatched
vehicle
level
aerodynamics
as
well
as
other
vehicle
level
attributes
that
result
in
the
lowering
fuel
consumption
or
the
CO2
of
the
entire
vehicle.
Further,
our
non-SCR
engines
have
an
advantage
where
we
do
not
release
any
N2O
in
the
environment,
which
is
one
of
the
GHG
elements
and
more
potent
than
CO2.
We
are
planning
on
meeting
the
GHG
standard
through
2016
with
no
changes
to
the
vehicle.
We
are
now
working
on
2017
GHG
standards
and
we
believe
that
we
will
meet
these
standards
with
minimum
changes.
Q31:
For
the
manufacturing
debt
currently
outstanding
in
your
most
recent
financial
statement
filings,
what
are
the
respective
maturity
dates
and
principal
amounts
outstanding?
A:
The
amounts
and
maturity
dates
are
as
follows
(the
values
shown
below
are
the
amounts
due
and
exclude
the
accounting
impact
of
any
OID
or
bifurcation):
8.25% Senior Notes due November 1, 2021
$900 million
3.0% Senior Subordinated Convertible Notes due October 15, 2014
$570 million
Debt of majority owned dealerships (various maturity dates)
$84 million
Financing arrangements and capital lease obligations (various maturity
dates) $137 million
Loan Agreement related to the 6.5% Tax Exempt Bonds due October 1, 2040
$225 million
Asset-Based Revolving Credit Facility due November 1, 2016
$100 million
Promissory Note due September 30, 2015
$36 million
Other (various maturity dates)
$49 million
Total
$2,101 million
NYSE: NAV
2
nd
Quarter 2012 Earnings Call
June 7, 2012 |
NYSE: NAV
Manufacturing Cash Flow
Beginning Mfg. Cash
1
Balance
Fiscal 2010
Fiscal 2011
Q1 -
2012
Q2 -
2012
October 31, 2009
$1,152
October 31, 2010
$1,100
October 31, 2011
$1,186
January 31, 2012
$837
Approximate Cash Flows:
From Operations
$409
$680
($142)
($72)
From Investing / (Cap Ex)
($350)
($485)
($125)
($75)
From Financing / (Debt Pay Down)
($110)
($106)
($85)
($2)
Exchange Rate Effect
($1)
($3)
$3
($7)
Net Cash Flow
($52)
$86
($349)
($156)
Ending Mfg. Cash
1
Balance:
October 31, 2010
$1,100
October 31, 2011
$1,186
January 31, 2012
$837
April 30, 2012
$681
1
Cash = Cash, Cash Equivalents & Marketable Securities
2
Includes cash from the consolidation of minority interests
45 |
NYSE: NAV
Outstanding Debt Balances
April 30,
2012
October 31,
2011
(in millions)
Manufacturing operations
8.25% Senior Notes, due 2021, net of unamortized discount of $29 and $33, respectively
............... $
871
$
967
3.0% Senior Subordinated Convertible Notes, due 2014, net of unamortized discount of $62 and
$73, respectively
...............................................................................................................................
508
497
Debt of majority-owned dealerships
..................................................................................................
84
94
Financing arrangements and capital lease obligations
..................................................................... 155
118
Loan Agreement related to 6.5% Tax Exempt Bonds, due 2040
...................................................... 225
225
Promissory Note
...............................................................................................................................
36
40
Asset-Based Credit Facility
...............................................................................................................
100
Other
.................................................................................................................................................
49
39
Total manufacturing operations
debt.........................................................................................
2,028
1,980
Less: Current
portion........................................................................................................................
230
99
Net long-term manufacturing operations debt
............................................................................ $
1,798
$
1,881
Financial Services operations
Asset-backed debt issued by consolidated SPEs, at variable rates, due serially through 2018
........ $
1,284
$
1,664
Bank revolvers, at fixed and variable rates, due dates from 2013 through 2017
..............................
1,060
1,072
Commercial paper, at variable rates, due serially through 2012
....................................................... 59
70
Borrowings secured by operating and finance leases, at various rates, due serially through 2017
.. 66
70
Total financial services operations debt
..................................................................................... 2,469
2,876
Less: Current
portion........................................................................................................................
1,279
1,280
Net long-term financial services operations debt
....................................................................... $
1,190
$
1,596
46 |
SEC
Regulation G Non-GAAP Reconciliation The
financial
measures
presented
below
are
unaudited
and
not
in
accordance
with,
or
an
alternative
for,
financial
measures
presented
in
accordance
with
U.S.
generally
accepted
accounting
principles
(GAAP).
The
non-GAAP
financial
information
presented
herein
should
be
considered
supplemental
to,
and
not
as
a
substitute
for,
or
superior
to,
financial
measures
calculated
in
accordance
with
GAAP.
Manufacturing
Segment
Results:
We
believe
manufacturing
segment
results,
which
includes
the
segment
results
of
our
Truck,
Engine,
and
Parts
reporting
segments,
provide
meaningful
information
of
our
core
manufacturing
business
and
therefore
we
use
it
to
supplement
our
GAAP
reporting
by
identifying
items
that
may
not
be
related
to
the
core
manufacturing
business.
Management
often
uses
this
information
to
assess
and
measure
the
performance
of
our
operating
segments.
We
have
chosen
to
provide
this
supplemental
information
to
investors,
analysts
and
other
interested
parties
to
enable
them
to
perform
additional
analyses
of
operating
results,
to
illustrate
the
results
of
operations
giving
effect
to
the
non-GAAP
adjustments
shown
in
the
below
reconciliation,
and
to
provide
an
additional
measure
of
performance.
Adjusted
Net
Income
and
Diluted
Earnings
Per
Share
Attributable
To
Navistar
International
Corporation
and
Adjusted
Manufacturing
Segment
Profit:
We
believe
that
adjusted
net
income,
diluted
earnings
per
share
attributable
to
Navistar
International
Corporation,
and
adjusted
manufacturing
segment
profit
excluding
certain
adjustments
which
are
not
considered
to
be
part
of
our
ongoing
business,
improve
the
comparability
of
year
to
year
results
and
are
representative
of
our
underlying
performance.
We
have
chosen
to
provide
this
supplemental
information
to
investors,
analysts,
and
other
interested
parties
to
enable
them
to
perform
additional
analyses
of
operating
results,
to
illustrate
the
results
of
operations
giving
effect
to
the
non-GAAP
adjustments
shown
in
the
below
reconciliations,
and
to
provide
an
additional
measure
of
performance.
Adjusted
Manufacturing
Earnings
Before
Interest,
Income
Taxes,
Depreciation,
and
Amortization
(EBITDA):
Adjusted
manufacturing
segment
EBITDA
is
defined
as
our
consolidated
net
income
(loss)
from
continuing
operations
minus
the
net
income
(loss)
from
our
financial
services
operations
plus
interest
expense,
income
taxes,
and
depreciation
and
amortization,
adjusted
to
exclude
certain
items
that
may
not
be
related
to
the
core
manufacturing
business.
EBITDA
is
a
measure
commonly
used
and
is
presented
to
aid
in
developing
an
understanding
of
the
ability
of
our
operations
to
generate
cash
for
debt
service
and
taxes,
as
well
as
cash
for
investments
in
working
capital,
capital
expenditures,
and
other
liquidity
needs.
This
information
is
presented
as
a
supplement
to
the
other
data
provided
because
it
provides
information
which
we
believe
is
useful
to
investors
for
additional
analysis.
EBITDA
should
not
be
considered
in
isolation
or
as
a
substitute
for
net
income,
cash
flows
from
operating
activities
or
other
consolidated
operations,
or
cash
flow
statement
data
prepared
in
accordance
with
GAAP,
or
as
a
measure
of
our
profitability
or
liquidity
as
determined
in
accordance
with
GAAP.
Manufacturing
Cash
Flow
and
Manufacturing
Cash,
Cash
Equivalents,
and
Marketable
Securities:
Manufacturing
cash
flow
is
used
and
is
presented
to
aid
in
developing
an
understanding
of
the
ability
of
our
operations
to
generate
cash
for
debt
service
and
taxes,
as
well
as
cash
for
investments
in
working
capital,
capital
expenditures
and
other
liquidity
needs.
This
information
is
presented
as
a
supplement
to
the
other
data
provided
because
it
provides
information
which
we
believe
is
useful
to
investors
for
additional
analysis.
Our
manufacturing
cash
flow
is
prepared
with
marketable
securities
being
treated
as
a
cash
equivalent.
Manufacturing
cash,
cash
equivalents,
and
marketable
securities
represents
the
Companys
consolidated
cash,
cash
equivalents,
and
marketable
securities
excluding
cash,
cash
equivalents,
and
marketable
securities
of
our
financial
services
operations.
We
include
marketable
securities
with
our
cash
and
cash
equivalents
when
assessing
our
liquidity
position
as
our
investments
are
highly
liquid
in
nature.
We
have
chosen
to
provide
this
supplemental
information
to
investors,
analysts
and
other
interested
parties
to
enable
them
to
perform
additional
analyses
of
operating
results,
to
illustrate
the
results
of
operations
giving
effect
to
the
non-GAAP
adjustments
shown
in
the
below
reconciliation,
and
to
provide
an
additional
measure
of
performance.
47 |
48
48
SEC Regulation G
Adjusted Manufacturing EBITDA
Three Months Ended April 30, 2012
($ millions)
Net loss attributable to NIC
(172)
$
Less income tax benefit
(143)
Add back impairment and restructuring of N.A. MFG Operations
49
Loss before income tax benefit
(266)
$
Less equity income from financial service operations
(18)
Loss before income tax benefit and equity income from financial service operations
(284)
$
Add back manufacturing interest expense
42
Manufacturing EBIT
(242)
$
Add back manufacturing depreciation and amortization¹
74
Adjusted manufacturing EBITDA
(168)
$
1
Includes depreciation of equipment leased to others and excludes debt issuance cost/discount
amortization Navistar International Corporation (Manufacturing operations with
financial services operations on a pre-tax equity basis)
NYSE: NAV
2
nd
Quarter 2012 Earnings Call
June 7, 2012 |
49
49
SEC Regulation G
Manufacturing Cash Fiscal Year Comparison
Manufacturing cash, cash equivalents, and marketable securities reconciliation:
(Dollars in Millions)
April 30,
2012
October 31,
2011
October 31,
2010
October 31,
2009
Manufacturing segment cash and cash equivalents
364
$
488
$
534
$
1,152
$
Financial services segment cash and cash equivalents
36
51
51
60
Consolidated cash and cash equivalents
400
$
539
$
585
$
1,212
$
Manufacturing marketable securities
317
$
698
$
566
$
-
$
Financial services segment marketable securities
20
20
20
-
Consolidated marketable securities
337
$
718
$
586
$
-
$
Manufacturing segment cash and cash equivalents
364
$
488
$
534
$
1,152
$
Manufacturing marketable securities
317
698
566
-
Manufacturing segment cash, cash equivalents and marketable securities
681
$
1,186
$
1,100
$
1,152
$
NYSE: NAV
2
nd
Quarter 2012 Earnings Call
June 7, 2012 |
50
50
SEC Regulation G
Manufacturing Cash
NYSE: NAV
2
nd
Quarter 2012 Earnings Call
June 7, 2012
Manufacturing
Operations
Financial
Services
Operations
Adjustments
Condensed
Consolidated
Cash Flows
($ in Millions)
For the year ended October 31, 2011
Cash flows from operations
680
200
-
880
Cash flows from investing / capital expenditures:
(485)
(206)
(132)
(823)
Cash flows from financing / debt pay down
(106)
6
-
(100)
Effect of exchange rate changes
(3)
-
-
(3)
Net cash flows
86
-
(132)
(46)
Beginning cash, cash equivalents and marketable
securities balance
1,100
71
(586)
585
Ending cash, cash equivalents and marketable securities
balance
1,186
71
(718)
539
Manufacturing segment cash flow reconciliation:
Manufacturing
Operations
Financial
Services
Operations
Adjustments
Condensed
Consolidated
Cash Flows
($ in Millions)
For the year ended October 31, 2010
Cash flows from operations
409
698
-
1,107
Cash flows from investing / capital expenditures:
(350)
492
(576)
(434)
Cash flows from financing / debt pay down
(110)
(1,180)
(10)
(1,300)
Effect of exchange rate changes
(1)
1
-
-
Net cash flows
(52)
11
(586)
(627)
Beginning cash, cash equivalents and marketable
securities balance
1,152
60
-
1,212
Ending cash, cash equivalents and marketable securities
balance
1,100
71
(586)
585
Manufacturing segment cash flow reconciliation: |
51
51
SEC Regulation G
Manufacturing Cash
NYSE: NAV
2
nd
Quarter 2012 Earnings Call
June 7, 2012
Manufacturing
Operations
Financial
Services
Operations
Adjustments
Condensed
Consolidated
Cash Flows
($ in Millions)
For the six months ended April 30, 2012
Cash flows from operations
(214)
263
-
49
Cash flows from investing / capital expenditures:
(200)
144
381
325
Cash flows from financing / debt pay down
(87)
(423)
-
(510)
Effect of exchange rate changes
(4)
1
-
(3)
Net cash flows
(505)
(15)
381
(139)
Beginning cash, cash equivalents and marketable
securities balance
1,186
71
(718)
539
Ending cash, cash equivalents and marketable securities
balance
681
56
(337)
400
Manufacturing segment cash flow reconciliation:
Manufacturing
Operations
Financial
Services
Operations
Adjustments
Condensed
Consolidated
Cash Flows
($ in Millions)
For the three months ended April 30, 2012
Cash flows from operations
(72)
2
-
(70)
Cash flows from investing / capital expenditures:
(75)
(3)
102
24
Cash flows from financing / debt pay down
(2)
(30)
(32)
Effect of exchange rate changes
(7)
(3)
-
(10)
Net cash flows
(156)
(34)
102
(88)
Beginning cash, cash equivalents and marketable
securities balance
837
90
(439)
488
Ending cash, cash equivalents and marketable securities
balance
681
56
(337)
400
Manufacturing segment cash flow reconciliation: |
NYSE: NAV
SEC Regulation G
Adjusted Net Income, Diluted EPS and Manufacturing Segment Profit
Three and Six Months Ended April 30, 2012 and 2011
52
Adjusted net income (loss) attributable to Navistar International Corporation reconciliation:
2012
2011
2012
2011
($ in millions, except per share data)
Net loss attributable to Navistar International Corporation
$ (172)
$ 74
$ (325)
$ 68
Plus:
Engineering integration costs, net of tax
(A)
31
4
39
23
Restructuring of North American manufacturing operations, net of
tax
(B)
37
-
37
-
Adjustments to pre-existing warranties, net of tax
(C)
138
24
219
32
Charges for non-conformance penalties, net of tax
(D)
10
-
10
-
Less:
Net impact of valuation allowance release
(E)
181
-
181
-
Adjusted net income (loss) attributable to Navistar International Corporation
$ (137)
$ 102
$ (201)
$ 123
Diluted loss per share attributable to Navistar International Corporation
$ (2.50)
$ 0.93
$(4.69)
$ 0.87
Effect of adjustments on diluted loss per share attributable to Navistar International Corporation
0.51
0.37
1.79
0.72
Adjusted diluted earnings (loss) per share attributable to Navistar International Corporation
$ (1.99)
$ 1.30
$(2.90)
$ 1.59
Diluted weighted shares outstanding
68.7
78.6
69.3
77.3
Manufacturing segment profit (loss) and adjusted manufacturing segment profit (loss)
reconciliation: 2012
2011
2012
2011
($ in millions)
Net loss attributable to Navistar International Corporation
$ (172)
$ 74
$ (325)
$ 68
Less:
Financial services segment profit
26
40
53
72
Corporate and eliminations
(175)
(129)
(325)
(247)
Income tax benefit (expense)
133
(5)
214
(5)
Manufacturing
segment
profit
(loss)
(156)
168
(267)
248
Plus:
Engineering integration costs
(A)
11
3
19
21
Restructuring of North American manufacturing operations
(B)
38
-
38
-
Adjustments to pre-existing warranties
(C)
104
27
227
36
Charges for non-conformance penalties
(D)
10
-
10
-
Adjusted
manufacturing
segment
profit
(loss)
$ 7
$ 198
$ 27
$ 305
Three Months Ended
April 30,
Three Months Ended
April 30,
Six Months Ended
April 30,
Six Months Ended
April 30,
See notes at slide #57. |
NYSE: NAV
SEC Regulation G
Adjusted Profit Before Tax
Three and Six Months Ended April 30, 2012
Profit (loss) before tax and adjusted profit (loss) before tax reconciliation:
($ in millions)
Profit (loss) before tax
Plus tax adjustments for:
Engineering integration costs
(A)
Restructuring of North American manufacturing operations
(B)
Adjustments to pre-existing warranties
(C)
Charges for non-conformance penalties
(D)
Adjusted profit (loss) before tax
$ (114)
$ (295)
29
38
104
10
Three Months Ended
April 30,2012
53
See notes at slide #57. |
NYSE: NAV
SEC Regulation G
Q2 Adjusted Manufacturing Segment Profit and
Second Half of 2012 Manufacturing Segment Profit
Second Half 2012 Manufacturing Segment Profit:
Lower
Truck
Engine
Parts
Total
Truck w/ Parts
300
$
125
$
425
$
Engine w/ Parts
100
$
50
150
Manufacturing Segment Profit
300
$
100
$
175
$
575
$
Upper
Truck
Engine
Parts
Total
Truck w/ Parts
375
$
150
$
525
$
Engine w/ Parts
150
$
50
200
Manufacturing Segment Profit
375
$
150
$
200
$
725
$
54
2012 Q2 Adjusted Manufacturing Segment Profit:
Truck
Engine
Parts
Total
Q2 Manufacturing Segment Profit
(89)
$
(108)
$
41
$
(156)
$
Plus:
Engineering integration costs
(A)
9
2
11
Restructuring of North American manufacturing operations
(B)
28
10
38
Adjustments to pre-existing warranties
(C)
26
78
104
Charges for non-conformance penalties
(D)
10
10
Q2 Adjusted Manufacturing Segment Profit
(26)
$
(18)
$
51
$
7
$
Truck w/ Parts
(26)
$
34
$
8
$
Engine w/ Parts
(18)
$
17
(1)
Q2 Adjusted Manufacturing Segment Profit
(26)
$
(18)
$
51
$
7
$
See notes at slide #57. |
SEC Regulation G
Second Half of 2012 Guidance
55
Adjusted net income and diluted earnings per share attributable to Navistar International Corporation
reconciliation: Lower
Upper
($ in millions, except per share data)
Net income attributable to Navistar International Corporation
$ 125
$ 265
Plus:
Engineering integration costs, net of tax
(A)
47
47
Charges for non-conformance penalties, net of tax
(D)
29
29
Adjusted net income attributable to Navistar International Corporation
$ 200
$ 340
Diluted earnings per share attributable to Navistar International Corporation
$ 1.80
$ 3.85
Effect
of
adjustments
on
diluted
earnings
per
share
attributable
to
Navistar
International
Corporation
1.10
1.05
Adjusted
diluted
earnings
per
share
attributable
to
Navistar
International
Corporation
$ 2.90
$ 4.90
Approximate diluted average weighted shares outstanding
68.7
68.7
Manufacturing segment profit and adjusted manufacturing segment profit reconciliation:
Lower
Upper
($ in millions)
Net income attributable to Navistar International Corporation
$ 125
$ 265
Less: Financial services segment profit, Corporate and eliminations, and income taxes
(375)
(385)
Manufacturing segment profit
500
650
Plus:
Engineering integration costs
(A)
45
45
Charges for non-conformance penalties
(D)
30
30
Adjusted manufacturing segment profit
$ 575
$ 725
Income (loss) before tax and adjusted income (loss) before tax reconciliation:
Lower
Upper
($ in millions)
Income (loss) before tax
$ 155
$ 300
Plus:
Engineering integration costs
(A)
50
50
Charges for non-conformance penalties
(D)
30
30
Adjusted income (loss) before tax
$ 235
$ 380
Second Half 2012 Guidance
Revised 2012 Guidance
NYSE: NAV
See notes at slide #57. |
NYSE: NAV
2nd
Quarter 2012 Earnings Call
June 7, 2012
SEC Regulation G
Revised 2012 Guidance
See notes at slide 57.
56
Adjusted net income and diluted earnings per share attributable to Navistar International Corporation
reconciliation: Lower
Upper
($ in millions, except per share data)
Net income attributable to Navistar International Corporation
(200)
(60)
Plus:
Engineering
integration
costs,
net
of
tax
(A)
87
87
Restructuring
of
North
American
manufacturing
operations,
net
of
tax
(B)
37
37
Adjustments
to
pre-existing
warranties,
net
of
tax
(C)
219
219
Charges
for
non-conformance
penalties,
net
of
tax
(D)
39
39
Less:
Net
impact
of
valuation
allowance
release
(E)
181
181
Adjusted net income attributable to Navistar International Corporation
-
140
Diluted earnings per share attributable to Navistar International Corporation
(2.85)
(0.85)
Effect
of
adjustments
on
diluted
earnings
per
share
attributable
to
Navistar
International Corporation
2.85
2.85
Adjusted diluted earnings per share attributable to Navistar International Corporation
-
2.00
Approximate diluted average weighted shares outstanding
69.8
69.8
Manufacturing segment profit and adjusted manufacturing segment profit reconciliation:
Lower
Upper
($ in millions)
Net income attributable to Navistar International Corporation
(200)
(60)
Less: Financial services segment profit, Corporate and eliminations, and income taxes
(430)
(440)
Manufacturing segment profit
230
380
Plus:
Engineering
integration
costs
(A)
65
65
Restructuring
of
North
American
manufacturing
operations
(B)
38
38
Adjustments
to
pre-existing
warranties
(C)
227
227
Charges
for
non-conformance
penalties
(D)
40
40
Adjusted manufacturing segment profit
600
750
Income (loss) before tax and adjusted income (loss) before tax reconciliation:
Lower
Upper
($ in millions)
Income (loss) before tax
(361)
(216)
Plus:
Engineering
integration
costs
(A)
91
91
Restructuring
of
North
American
manufacturing
operations
(B)
38
38
Adjustments
to
pre-existing
warranties
(C)
227
227
Charges
for
non-conformance
penalties
(D)
40
40
Adjusted income (loss) before tax
35
180
Revised 2012 Guidance
$
$
$
$
$
$
$
$
$
$
$
$
$
$
$
$ |
NYSE: NAV
SEC Regulation G
Notes
57
(A)
Engineering integration costs relate to the consolidation of our truck and engine engineering
operations, as well as the relocation of our world headquarters. For the three months ended
April 30, 2012, the charges included restructuring charges of $20 million and other related
costs of $9 million. The tax impact of the second quarter adjustments was income tax expense of $2
million. For the six months ended April 30, 2012, the charges included restructuring charges of
$20 million and other related costs of $21 million. The tax impact of the first half
adjustments was income tax benefit of $2 million. For the three and six months ended April 30, 2011,
the charges included restructuring charges of $1 million and $19 million, respectively, and
other related costs of $5 million and $7 million, respectively. For the three and six months
ended April 30, 2011, the tax impact of the adjustments was income tax benefits of $2 million and $3 million, respectively. Our
manufacturing operations, primarily our Truck segment, recognized charges of $11 million and $19
million relating to these actions in the three and six months ended April 30, 2012,
respectively, compared to $3 million and $21 million in the three and six months ended April 30,
2011, respectively.
(B)
Restructuring of North American manufacturing operations are charges primarily related to our ongoing
restructuring plans related to our plans to close our Chatham, Ontario heavy truck plant and
WCC chassis plant in Union City, Indiana, and to significantly scale back operations at our
Monaco recreational vehicle headquarters and motor coach manufacturing plant in Coburg, Oregon. In the three and six
months ended April 30, 2012, the charges included impairments of certain intangible assets of $38
million. The tax impact of the adjustments was an income tax benefit of $1 million. The Truck
and Parts segments recognized charges of $28 million and $10 million, respectively. During the
three and six months ended April 30, 2012, the Company incurred charges of $104 million and $227 million,
respectively, for adjustments to pre-existing warranties. (C)
During the three and six months ended April 30, 2012, the Company incurred charges of $104 million and
$227 million, respectively, for adjustments to pre-existing warranties. For the three and
six months ended April 30, 2012, the tax impact of the adjustments was income tax expense of
$34 million and income tax benefit of $8 million, respectively. During the three and six months ended April 30, 2011, the
Company incurred charges of $27 million and $36 million, respectively. For the three and six months
ended April 30, 2011, the tax impact of the adjustments was income tax benefits of $3 million
and $4 million, respectively.
(D)
In the three months ended April 30, 2012, the Company recorded charges totaling $10 million for NCPs
for certain 13L engine sales that did not comply with emission standards, recognized in the
Engine segment. The adjustment did not have a material impact on income taxes.
(E)
In the three months ended April 30, 2012, we recognized an income tax benefit of $181 million from the
release of a significant portion of our income tax valuation allowance on our Canadian deferred
tax assets. The above
charges, A through D, have been adjusted to reflect the impact of income taxes which are calculated based on the respective period's
estimated annual effective tax rate. The income tax impact of the second quarter adjustments reflects
the impact of a change in the quarter to the Company's estimated annual effective tax rate. The
change is the result of updates to the forecasted earnings and the jurisdictional mix. The tax
impact of the adjustments may be adjusted for future changes in the estimated annual effective tax
rate. |

NYSE: NAV
SEC Regulation G
Normalized Annual Rate at 300K Units
58
Manufacturing segment profit and adjusted manufacturing segment profit reconciliation:
Lower
Upper
(in millions)
Net income (loss) attributable to Navistar International Corporation
$ 375
$ 525
Less: Financial services segment profit, Corporate and eliminations, and income taxes
(825)
(875)
Manufacturing segment profit
$ 1,200
$ 1,400
Normalized Annual Rate at 300K Units |
NYSE: NAV
59
SEC Regulation G
Adjusted Manufacturing Segment Profit
2003-2011
2011
2010
2009
2008
2007
2006
2005
2004
2003
(in millions)
Net income (loss) attributable to Navistar International Corporation
$ 1,723
$ 223
$ 320
$ 134
$ (120)
$ 301
$ 139
$ (44)
$ (333)
Less:
Financial services segment profit (loss)
129
95
40
(24)
127
147
136
132
87
Corporate and eliminations
(571)
(590)
(519)
(478)
(662)
(590)
(412)
(178)
(310)
Income tax benefit (expense)
1,458
(23)
(37)
(57)
(47)
(94)
(6)
(9)
(17)
Manufacturing segment profit
$ 707
$ 741
$ 836
$ 693
$ 462
$ 838
$ 421
$ 11
$ (93)
Plus:
Ford settlement, restructuring and related charges (benefits)
(A)
-
-
(160)
37
-
-
-
-
-
Impairment of property, plant, and equipment
(B)
-
-
31
358
-
-
-
-
-
Engineering integration costs
(C)
51
-
-
-
-
-
-
-
-
Restructuring of North American manufacturing operations
(D)
124
-
-
-
-
-
-
-
-
Adjusted manufacturing segment profit
$ 882
$ 741
$ 707
$ 1,088
$ 462
$ 838
$ 421
$ 11
$ (93)
(B) Impairment of property, plant, and equipment in 2008 are related to
impairments to the asset groups in the Engine segments VEE Business Unit. The 2009 impairments relate to
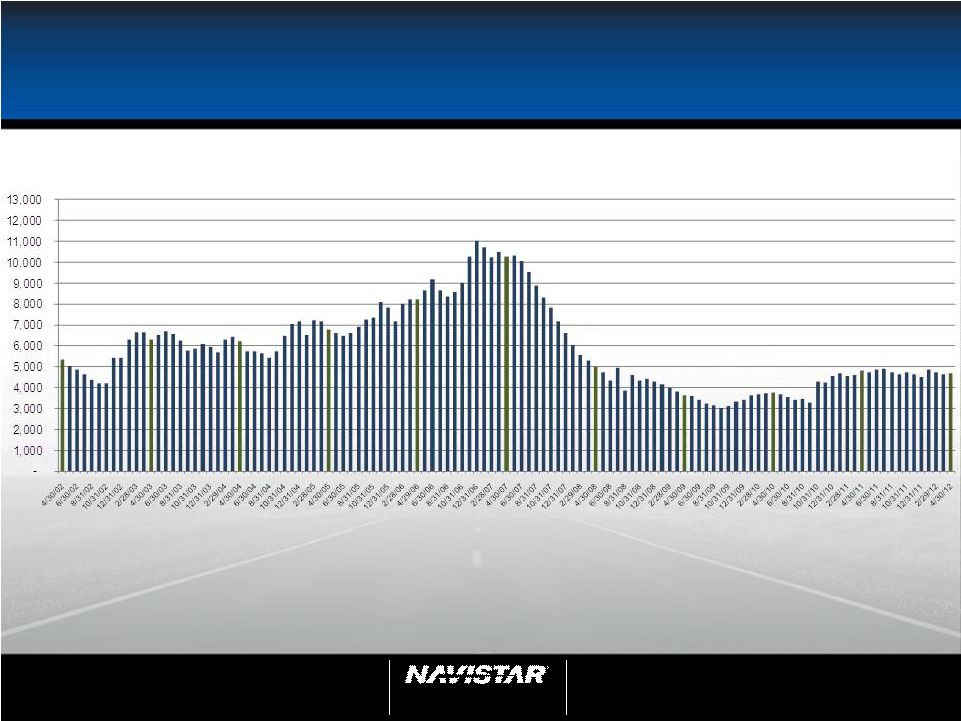
charges recognized by the Truck segment for impairments related to asset groups at
our Chatham and Conway facilities. (C) Engineering integration costs
relate to the consolidation of our truck and engine engineering operations, as well as the move of our world headquarters. These costs include
restructuring charges for activities at our Fort Wayne facility and other related
costs, including $51 million of engineering integration costs recognized by our manufacturing segment.
(D) Restructuring of North American manufacturing operations are charges
primarily related to our plans to close our Chatham, Ontario heavy truck plant and Workhorse chassis plant
in Union City, Indiana, and to significantly scale back operations at our Monaco
recreational vehicle headquarters and motor coach manufacturing plant in Coburg, Oregon. These costs
include restructuring charges, as well as impairment charges related to certain
intangible assets and property plant and equipment primarily related to these facilities, recognized by our
Truck segment.
Manufacturing segment profit and adjusted manufacturing segment profit
reconciliation: (A) Ford settlement, restructuring and related charges
(benefits) include the impact of our settlement with Ford in 2009 as well as charges and benefits recognized related to
restructuring activity at our Indianapolis Casting Corporation and Indianapolis
Engine Plant. The charges and benefits were recognized in our Engine segment. |
NYSE: NAV
60
SEC Regulation G
Margin Expansion
Approx.
Truck
Engine
Parts
Total
Truck
Engine
Parts
Total
Range
Truck - N.A. w/Parts
11,500
$
1,450
$
12,950
$
865
$
250
$
1,115
$
8-9%
Truck - Global w/Parts
1,400
150
1,550
15
30
45
2-3%
Engine - Worldwide w/Parts
3,000
$
850
3,850
150
$
150
300
7-8%
Total Consolidated
12,900
$
3,000
$
2,450
$
18,350
$
880
$
150
$
430
$
1,460
$
~8%
Approx.
Truck
Engine
Parts
Total
Truck
Engine
Parts
Total
Range
Truck - N.A. w/Parts
12,225
$
1,450
$
13,675
$
1,060
$
265
$
1,325
$
9-10%
Truck - Global w/Parts
1,800
160
1,960
85
30
115
6-8%
Engine - Worldwide w/Parts
3,475
$
880
4,355
200
$
160
360
8-10%
Total Consolidated
14,025
$
3,475
$
2,490
$
19,990
$
1,145
$
200
$
455
$
1,800
$
~9%
2012 Annualized Outgoing Run Rate
Sales
Segment Profit
Strategic Target
Sales
Segment Profit |
J?&3P9?\`P+3P@T6HC5%T:&SW?9E\OSXXU&=V[.-R
M]<5\T44`?57PN_:!\,^%_AAI6DZG#J,VK6%N\?EQ1#8Y#-L&XMQQM&<<5\_Z
MAXID\4?$2'7_`!=+)+#/>QR700;MD`<91%ST"\`5RM%`'TU\>/CKH'B_P$^B
M>&/[06XN+B-IC/"(U\I#NQD,>=P2MY/C!\,/B%X1L+/XF0/#>P`-(C0S,HD`
MP6C>(;@".<''7'.,U\CT46"Q].^/?C)X)T;X;7OA'X7VUQ&+J-H1,(FCCC5S
M^\.7.]F*[AG'?.>,5R_[-WQ)\*?#JSUF;7UOVU&^D14^SP!PL2`GJ6')+'\A
M7A5%`'T7\//B?X$T7X@^*O&.N_VI
OO`?B.XM[: MW_X2;?%`PVEXQO"#MNP3TXJA_:^H?\_]W_W^;_&C^U]0_P"?^[_[_-_C0)I, M1?A/?!VF?7GDG^9MVTJ7ST4X.-H^E/F^&,^KI?7VL7MR^J,D:0-(^_:(R3CK MT8G!_&F_VOJ'_/\`W?\`W^;_`!H_M?4/^?\`N_\`O\W^-&XVVHW-O;V$UQ,A M4-)'%A3N&1SCIZXZ8J:PT:_3+/:3M(W+,5QG_P"M69_:^H_\_P#=_P#?YO\` M&C^U]1_Y_P"[_P"_S?XTFK[@H)'8Z-82-?/#=P2Q+&BODCALD\`_A72VT$=M M"L4*[4'09S^M>4_VOJ/_`#_W?_?YO\:3^U]1_P"?^[_[_-_C18I61ZY7G_Q` M.-9A_P"O=?\`T)JP_P"U]1_Y_P"[_P"_S?XU7N+F:Y `:J.ZC-`&H+ MN&7B1<'_`&J1K:*3F-B/H:S,BE5ROW21]*!ER6SD7F-MP].]5R&4C H?\`7Q)_ MZ$:HYKG/%?Q)\+6/BG6+2ZU()<6]Y-%(OED[65R"/S%97_"T_"'_`$%!_P!^ MS0!W&:,BN'_X6GX0_P"@H/\`OV:/^%I^$/\`H*#_`+]F@#N,T9KB/^%I^$/^ M@H/^_9I/^%I^$/\`H*#_`+]F@#N,T9KA_P#A:?A#_H*#_OV:7_A:?A#_`*"@ M_P"_9H`[?-&:XC_A:7A#_H*C_OV:/^%I^$/^@H/^_9H`[?-&:XC_`(6EX0_Z M"H_[]FC_`(6EX0_Z"H_[]F@#N,TN17#?\+2\(?\`05'_`'[-'_"TO"'_`$%1 M_P!^S0!W.11FN&_X6EX0_P"@J/\`OV:/^%I^$/\`H*C_`+]F@#N $/^@J/^_9H_X6EX0_Z"H_[]F@#N $/^@J/^_9H`[G-&:X;_`(6EX0_Z"H_[]FC_`(6EX0_Z"H_[]F@# MN $/^@J/^_9H_X6EX0_Z"H_[]F@#N $/\` MH*C_`+]FC_A:7A#_`*"H_P"_9H`[G-&:X;_A:7A#_H*C_OV:/^%I>$/^@J/^ M_9H`[G-&:X;_`(6EX0_Z"H_[]FC_`(6EX0_Z"H_[]F@#N $/^@J M/^_9IR_%#P>>NKJ/^V;4`=;:'_2+W_KL/_1:58S7#P?$GP?%).[ZRF)7#KA" M>-JKSZ /H>]/?XH>#A]W6`?^V9JY[_`'?D3'8[7-.S7#?\+3\(?]!0?]^S M1_PM/PA_T%!_W[-04=SFC-<-_P`+3\(?]!0?]^S2_P#"TO"'_05'_?LT`=QF MC=7#?\+2\(?]!4?]^S1_PM+PA_T%1_W[-`'=`\49KAA\4_!__05'_?LT?\+2 M\(?]!4?]^S0!W.>:,UPW_"T_!_\`T%1_W[-+_P`+3\'_`/05'_?LT`=QFC-< M-_PM+PA_T%1_W[-'_"T_!_\`T%1_W[-`' $/\`H*C_`+]F@#M\T[-< M-_PM/PA_T%!_W[-'_"TO"'_05'_?LT`=QFES7#?\+3\(?]!0?]^S1_PM/PA_ MT%!_W[-`' ?Y7]EV2WFW9N\W-Q##MSGC_7;L\_=QCG(R:ZOP;_R M+GCO_L#1_P#IQLZY2@`HHK[J\(?`KPS#BQL/%GA^VAU^:R\N[N8)%,T4A" M?,KHJKN7RD_A(SORTF^1I`#X5HKU7PS\+KY_CS'X+CE^TII]Z'N;HVC*HMTP MY=HY$8#*X4;E:-F91EE8,>U_:T\,^&/!\/AG3?#.@6UA+/YLTUPD4H9E1(HU M02$[6SMRPY8'#'!D8N`?.M%?37[,_P`$WU2-/%/C*TB.D3(ILM/N(58W0W*X ME;<"5CRHP!@N,Y_=DB27]HCX>:'X5\1^`)/#.FVUK:W5Z+>:T14=I&4PJI"& M.263*C#?)*N<$H7D;S`#Y@HKZ_\`VD_AQX4\+_"FXO\`PYH%M9W4 %[G7O&WAV.X^VO$^G_;'W!H5 M8/O$6!M#,H^8D[UR-H0DR`'RA2U]??"SP7X4\8_$?Q7/;:#HDG@[1?)L+!;> MW::*[F!C8RFX<`NRBW0,HRA$K'+"1WE/"GPD\,>(/C;XDF.A_9/#?AG[):6U ME]FE2*]G$0+-*9#\^W`)`&)`T;DL&)D`/D"BOL_5O$?P=\*>(CX=U3P38V-M M8N;634=0T3='(4C4E8V\MY)7_>19+``JV_> VT+2S6_FPLL(?#> ME:WIO@^VCM+J&.>%+R!UD`'E8WJQY_U*<\AP7.6$KE_"OB+KWPCO/#EYH_PY M\-6U[K]QMM+21K:X5FS]G4-%_$TIV@*&VY*3$Y\S;.`?.M%?=_PQ^!_A?3?! M&C1>*/#%C-KJIYMVT\OV@^:71R"P`4@>6@V@%0-ZY<.[/\@?$KPP=$^*.N>' M=)M9'":@T-G;11RLY1VS%&H797=YNV;L^1;R3;<9'WO+VY[9S@XQ6375_#3_D8[S_`+`VK?\`INN*Y2@` MHHHH`****`"BBB@`HHHH`****`"BBB@`I:2B@`HHHH`****`"BBB@`HHHH`* M***`"BBB@`HHHH`****`"BBB@`HHHH`****`"BBB@`HHHH`****`"BBB@`HH MHH`****`"BBB@#J_BQ_R5/QE_P!AJ]_]'O7*5U?Q8_Y*GXR_[#5[_P"CWKE* M`"BBB@`HHHH`****`"BBB@`HHHH`****`"BBB@`HHHH`****`"BBB@`HHHH` M****`"BBB@`HHHH`****`"BBB@`HHHH`****`"BBB@`HHHH`****`"BBB@`H MHHH`ZOP;_P`BYX[_`.P-'_Z<;.N4KJ_!O_(N>._^P-'_`.G&SKE*`.K^%6@S M>)OB/X=TF"/?Y][&9!B-L1(=\C;9`4;"*QVL"#CG!^O_VB_BC_`,*\N?"O MV2P^V7_VTWC)/;_N6@$;QNJS$?)*?-&"F2!][Y6VO\B_"KQL_P`/_%T.OPV$ M5]-$AC6*0J!AB`_)5BI*;P"I4@L,EEW(]OXM_$G4?B7K-EJ&IV5C9M:VJVZK M;1\L>KL7/S$%BQ522%!P,DLS`'V^G@S2KSXEZ;\0=*%C ;61QL*LC`-' M=1.JG=)M_=Y)YC?AAMVO\_\`BCPY=_'+]HK5=/EDBM-$\/)]BN;JU61CY< C?#?X='R=4,T22:=9P+.OD$$B&0,&W-*[ M(2A!+@MOR'P_G7Q>C^,9\+WT'Q#ECGT2W2VN6D^Q0.@ED;"JDD<64D4[U8Y5 M>"-Q$D8D\:\5:[=>)O$>HZWJ$=M'=WTS3R);1"*,,3V4?S.23DDDDD^M^/\` M]H&[\<^$;K0M:\+:1(LJ`QS;Y"8)@(P)4YR"")\#/215.X*_F`'5:GX2^-OQ M+\(V":OJ6DZAHFH)!>PF6.WC*!Q$RN"L0="!,^< -4WH2I(W!P'J>#M#^,EC!J?Q"\-M;3MK-DUS/'' M`L;7>40B06VQ0TH,CLK!?F,4A&]9%\W%G_:!NU^'ESX0TOPMI&G:=-I[V"B! MY"(PZ(KL`3DDDW#9)))D0DL48R5/AC^T#XD\$:8FE26MCJ>DPI'';6QB2W\@ M!P7PT:C<74ODMN.XAB3A@X!V'A#Q5\4?C3]JL5L/# ]FWM%<_:Q,L4CL6>3R_*4, MQ+,V2<;CDAN0?#[3Q6\WCR'Q/XDTZRUN0W0N;NUEB6&*Z/? :)CEE"N?WT#' 5^)7QWU'XA:!9Z+K.B6,%BMU'<71MF_>R!44%8G=6\HEO-.X`D*RKR`_F' MBOX]ZKK'@*7PGI.@Z1H&G3IY 5JD]LT)FCD40H7$B1'",TA+?O2H)8$A]ZJ_B'PJ\;/\ M/_%T.OPV$5]-$AC6*0J!AB`_)5BI*;P"I4@L,EEW(_HJ_M!R2>.+?Q;>^$M- MN=:ALH[&.0SN%BC#!I#&"#M9]UP-QR0'C'1'\X`^E/BUXR\*:/JN@:!XNT3^ MUEU*8/%'+I[7*!MPC!C78P>4&0?(.0FX_>,:21?&G79_AC\);JZ\%Z?8V1B= M8(5BMB(K7S&.9%1$*9R YF=I)996+/([')9B>22222:A MHHH`ZOX:?\C'>?\`8&U;_P!-UQ7*5U?PT_Y&.\_[`VK?^FZXKE*`"BBB@`HH MHH`****`"BBB@`HHHH`****`"BBB@`HHHH`****`"BBB@`HHHH`****`"BBB M@`HHHH`****`"BBB@`HHHH`****`"BBB@`HHHH`****`"BBB@`HHHH`****` M"BBB@#J_BQ_R5/QE_P!AJ]_]'O7*5U?Q8_Y*GXR_[#5[_P"CWKE*`"BBB@`H MHHH`****`"BBB@`HHHH`****`"BBB@`HHHH`****`"BBB@`HHHH`****`"BB MB@`HHHH`****`"BBB@`HHHH`****`"BBB@`HHHH`****`"BBB@`HHHH`ZOP; M_P`BYX[_`.P-'_Z<;.N4KJ_!O_(N>._^P-'_`.G&SKE*`"BBB@`HHHH`**** M`"BBB@`HHHH`****`"BBB@`HHHH`****`"BBB@#J_AI_R,=Y_P!@;5O_`$W7 M% M] N4H`****`"BBB@`HHHH`****`"BBB@`HHHH` M****`"BBB@`HHHH`****`"BBB@`HHHH`****`"BBB@`HHHH`****`"BBB@`H MHHH`****`"BBB@`HHHH`****`"BBB@#J_!O_`"+GCO\`[`T?_IQLZY2M#3-5 MGTZRU:U@2)H]3M5M)BX)*H)HILK@\'="HYSP3[$9]`!1110`4444`%%%%`!1 M110`4444`%%%%`!1110`4444`%%%%`!1110!U?PT_P"1CO/^P-JW_INN*Y2M M#0]5GT:]DNK5(GDDM;BT(D!(V30O"YX(Y"R$CWQUZ5GT`%%%%`!1110`4444 M`%%%%`!1110`4444`%%%%`!1110`4444`%%%%`!1110`4444`%%%%`!1110` M4444`%%%%`!1110`4444`%%%%`!1110`4444`%%%%`!1110`4444`%%%%`'5 M_%C_`)*GXR_[#5[_`.CWKE***`"BBB@`HHHH`****`"BBB@`HHHH`****`"B MBB@`HHHH`****`"BBB@`HHHH`****`"BBB@`HHHH`****`"BBB@`HHHH`*** M*`"BBB@`HHHH`****`"BBB@`HHHH`****`"BBB@`HHHH`****`"BBB@`HHHH M`****`"BBB@`HHHH`****`"BBB@`HHHH`****`"BBB@`HHHH`****`"BBB@` MHHHH`****`"BBB@`HHHH`****`"BBB@`HHHH`****`"BBB@`HHHH`****`"B EBB@`HHHH`****`"BBB@`HHHH`****`"BBB@`HHHH`****`/_V3\_ ` end
P)Y/MQ7L7P>%IX9LKW4=5N
M8(S>MB+S&"<`?>.3T^8?E6%:24="HX:I%.Z-'XAQ)IWCZ::0;(7\N7/3("C/
M]:Z/P]XAAWW1MXW>.:5(]PS@`)GK_P`!K@/&FN3>(+^2Y:YMI-BF.)T4(&&/
M0$U/X4AODOU:>9?+D?>(TM5JG
M=B5FK'&\_9QZ!_\`"MGPS,+?62TH^3!!/IP151[295EC8VZLC=&VC/T]ZVO#
M5BKZM'%+);[9Q@<@8/O_`)ZXJ*J]QA%7DC9AF@ANTF69Y<,"6/R]_6O7?V?+
MHW<_B%V;=A;9?I_K:YRW^'UI);1)_:-HASYF
-\H'H*[==)M5/RQ
MK^0H73X%)P@]>!33LP,5'D)XXJ<&7'6M46L8)P@';I3_`+,N#D5?,*Q])^!_
M^1*\/_\`8/M__1:UMUB>!_\`D2O#_P#V#[?_`-%K6W4S^)DQV1EZA_R,WA'_
M`+"4G_I%
SG[-=Y_["
M%Q_\?^#"X_^.5U%%',^X61RQ\!>'B,&VNR/?4+C_XY2'P!
MX=)R;6ZS_P!?]Q_\Y%)#XVT&[4R:5?V^J0`[6FL)HYT5O[I96P#@@X]"*GMM*L[:9988=L
MBYP=S'MCN:==Z=:WD@DN(M[@;0=Q''X'WHC1S7ZJU*MK:>6^_0'/"^
MT32?+;YW(?\`A++'_GE<_P#?*_\`Q50S>/?"]HPCU77=,TN
Y%)#XVT&[4R:5?V^J0`[6FL)HYT5O[I96P#@@X]"*GMM
M*L[:9988=LBYP=S'MCN:==Z=:WD@DN(M[@;0=Q''X'WHC1S7ZJU*MK
M:>6^_0'/"^T32?+;YW(?^$LL?^>5S_WRO_Q50S>/?"]HPCU77=,TN