UNITED STATES
SECURITIES AND EXCHANGE COMMISSION
Washington, D.C. 20549
FORM N-CSR
CERTIFIED SHAREHOLDER REPORT
OF
REGISTERED MANAGEMENT INVESTMENT COMPANIES
Investment Company Act file
number: 811-04875
Name of Registrant: Royce
Value Trust, Inc.
Address of Registrant: 745
Fifth Avenue
New York, NY 10151
| Name and address
of agent for service: |
John E. Denneen,
Esq.
745 Fifth Avenue
New York, NY 10151 |
Registrant’s telephone
number, including area code: (212) 508-4500
Date of fiscal year end: December
31, 2018
Date of reporting period: January 1, 2018 – June 30, 2018
Item 1. Reports to Shareholders.
| |
|
JUNE 30, 2018 |
| |
|
|
| |
|
|
| |
|
|
| |
|
2018 Semiannual |
| |
|
Review and Report to Stockholders |
| |
|
|
| |
|
|
| |
|
|
| |
|
|
| |
|
|
| |
|
|
| |
|
|
| |
|
Royce Global Value Trust |
| |
|
|
|
| |
|
Royce Micro-Cap Trust |
| |
|
|
|
| |
|
Royce Value Trust |
| |
|
|
|
| |
|
|
|
| |
|
|
|
| |
|
|
|
| |
|
|
|
| |
|
|
|
| |
|
|
|
| |
|
|
|
| |
|
|
|
| |
|
|
|
| |
|
|
|
| |
|
|
|
| |
|
|
|
| |
|
|
|
| |
|
|
|
| |
|
|
|
| |
|
|
|
| |
|
|
|
| |
|
|
|
| |
|
|
|
| |
|
|
|
| |
|
|
|
| |
|
|
|
| |
|
roycefunds.com |
 |
| |
|
|
|
| |
|
|
|
| |
|
|
|
A Few Words on Closed-End Funds
Royce & Associates, LP manages three closed-end funds: Royce Global Value Trust, which invests primarily in
companies with headquarters outside of the United States, Royce Micro-Cap Trust, which invests primarily in
micro-cap securities; and Royce Value Trust, which invests primarily in small-cap securities. A closed-end fund is an
investment company whose shares are listed and traded on a stock exchange. Like all investment companies, including
open-end mutual funds, the assets of a closed-end fund are professionally managed in accordance with the investment
objectives and policies approved by the fund’s Board of Directors. A closed-end fund raises cash for investment by issuing
a fixed number of shares through initial and other public offerings that may include shelf offerings and periodic rights
offerings. Proceeds from the offerings are invested in an actively managed portfolio of securities. Investors wanting to buy
or sell shares of a publicly traded closed-end fund after the offerings must do so on a stock exchange, as with any publicly
traded stock. Shares of closed-end funds frequently trade at a discount to their net asset value. This is in contrast to open-end
mutual funds, which sell and redeem their shares at net asset value on a continuous basis.
A Closed-End Fund Can Offer Several Distinct Advantages
| • |
A closed-end fund does not issue redeemable securities or
offer its securities on a continuous basis, so it does not need to
liquidate securities or hold uninvested assets to meet investor
demands for cash redemptions. |
| |
|
| • |
In a closed-end fund, not having to meet investor redemption
requests or invest at inopportune times can be effective for
value managers who attempt to buy stocks when prices are
depressed and sell securities when prices are high. |
| |
|
| • |
A closed-end fund may invest in less liquid portfolio securities
because it is not subject to potential stockholder redemption
demands. This is potentially beneficial for Royce-managed
closed-end funds, with significant investments in small- and
micro-cap securities. |
| |
|
| • |
The fixed capital structure allows permanent leverage to be
employed as a means to enhance capital appreciation potential. |
| |
|
| • |
Royce Micro-Cap Trust and Royce Value Trust distribute capital
gains, if any, on a quarterly basis. Each of these Funds has adopted
a quarterly distribution policy for its common stock. |
We believe that the closed-end fund structure can be an
appropriate investment for a long-term investor who understands
the benefits of a more stable pool of capital.
Why Dividend Reinvestment Is Important
A very important component of an investor’s total return comes
from the reinvestment of distributions. By reinvesting distributions,
our investors can maintain an undiluted investment in a Fund. To
get a fair idea of the impact of reinvested distributions, please see
the charts on pages 54 and 55. For additional information on the
Funds’ Distribution Reinvestment and Cash Purchase Options
and the benefits for stockholders, please see page 56 or visit our
website at www.roycefunds.com.
Managed Distribution Policy
The Board of Directors of each of Royce Micro-Cap Trust and
Royce Value Trust has authorized a managed distribution policy
(“MDP”). Under the MDP, Royce Micro-Cap Trust and Royce
Value Trust pay quarterly distributions at an annual rate of 7%
of the average of the prior four quarter-end net asset values,
with the fourth quarter being the greater of these annualized
rates or the distribution required by IRS regulations. With each
distribution, the Fund will issue a notice to its stockholders and
an accompanying press release that provides detailed information
regarding the amount and composition of the distribution
(including whether any portion of the distribution represents a
return of capital) and other information required by a Fund’s
MDP. You should not draw any conclusions about a Fund’s
investment performance from the amount of distributions or
from the terms of a Fund’s MDP. A Fund’s Board of Directors
may amend or terminate the MDP at any time without prior
notice to stockholders; however, at this time there are no
reasonably foreseeable circumstances that might cause the
termination of any of the MDPs.
| This page is not part of the 2018 Semiannual Report to Stockholders |
| Table of Contents |
|
|
|
| |
|
|
|
| |
|
|
|
| Semiannual Review |
|
|
|
| |
|
|
|
| Letter to Our Stockholders |
|
2 |
|
| |
|
|
|
| Performance |
|
7 |
|
| |
|
|
|
| |
|
|
|
| Semiannual Report to Stockholders |
|
|
|
| |
|
|
|
| Royce Global Value Trust |
|
|
|
| |
|
|
|
Manager’s Discussion of Fund Performance |
|
8 |
|
| |
|
|
|
Schedule of Investments |
|
10 |
|
| |
|
|
|
Other Financial Statements |
|
14 |
|
| |
|
|
|
| Royce Micro-Cap Trust |
|
|
|
| |
|
|
|
Manager’s Discussion of Fund Performance |
|
22 |
|
| |
|
|
|
Schedule of Investments |
|
24 |
|
| |
|
|
|
Other Financial Statements |
|
29 |
|
| |
|
|
|
| Royce Value Trust |
|
|
|
| |
|
|
|
Manager’s Discussion of Fund Performance |
|
38 |
|
| |
|
|
|
Schedule of Investments |
|
40 |
|
| |
|
|
|
Other Financial Statements |
|
45 |
|
| |
|
|
|
| History Since Inception |
|
54 |
|
| |
|
|
|
| Distribution Reinvestment and Cash Purchase Options |
|
56 |
|
| |
|
|
|
| Directors and Officers |
|
57 |
|
| |
|
|
|
| Notes to Performance and Other Important Information |
|
58 |
|
| |
|
|
|
| Board Approval of Investment Advisory Agreements |
|
59 |
|

| This page is not part of the 2018 Semiannual Report to Stockholders |
Letter to Our Stockholders

SMALL-CAP’S FIRST HALF
Value Trails For Now
| During the first six months of 2018, small-cap stocks
enjoyed the good times bred by a bull market that at this
writing has not yet slowed down. Although the first half
began with higher volatility and stalled equities prices—and ended
with a series of wild days that made the bullish second quarter feel
more tumultuous than it was—the overall direction of U.S. markets
has remained positive, particularly for smaller stocks. For the year-to-date
period ended June 30, 2018, the small-cap Russell 2000 Index
gained 7.7%, well ahead of both the large-cap Russell 1000 (+2.9%)
and S&P 500 (+2.6%) Indexes, while making a new historical high
on June 20. Returns were even higher for micro-cap stocks—the
Russell Microcap Index advanced 10.7% for the same period. |
| This mostly welcome absolute and relative performance took
place against the backdrop of an accelerating U.S. economy, a
strong job market, and, in many cases, sterling corporate profit
growth while at the same time global economic progress slowed,
most notably in China and other large emerging markets. The
major non-U.S. indexes slipped deeper into negative territory
during the first half, as the combination of slower international
growth, rising emerging market instability, a stronger dollar, and
heightened trade war worries led investors to prefer all things
domestic. (In fact, 35 of the 45 non-U.S. small-cap markets that
we follow had declines in the first half of 2018, though only 26
were negative when measured in local currencies.) Still, growth
continued to skew positive outside the U.S., with the important
economies of Japan and Germany continuing to look solid. |
| Equity Indexes Average Annual Total Return as of 6/30/18 (%) |
| |
 |
Small-Cap is represented by Russell 2000; Small-Cap Value is represented by Russell 2000 Value, Small-Cap Growth is represented by Russell 2000 Growth, Large-Cap is represented by Russell 1000, Micro-Cap is represented by Russell Microcap. For
details on The Royce Funds’ performance in the period, please turn to the Managers’ Discussions that begin on page 8. Past performance is no guarantee of future results. |
| 2 | This page is not part of the 2018 Semiannual Report to Stockholders |
LETTER TO OUR STOCKHOLDERS
We expect a leadership shift in the form of a reversion to the mean that would favor
small-cap value outperforming small-cap growth over the next five years.
| In this context, then, you would expect a small-cap specialist
to be quite content, if not happy. This might especially be the
case considering that small-caps—as well as micro-caps—have
been true to their historical habit of outpacing larger companies
through an economic expansion. Yet as much as we were pleased
with first-half results, we find ourselves far from blissful. A closer
look at small-cap performance in the first half reveals some genuine
historical oddities in spite of all looking well on the surface. Our
main concern is the disconnect between the confidence of the
management teams we’ve been meeting with and the relatively
underwhelming performance for many cyclical industries. We
anticipated that stocks in these industries would do better owing
to their recent earnings strength and ongoing prospects as well as
to the healthy state of the U.S. economy (each, of course, being
related to the other). |
| |
| OBSTACLE ON THE TRACK |
| The Troublesome 10-Year Treasury Yield |
| Another related concern is the way in which the ongoing weakness of
the 10-year Treasury yield is at odds with the quickened pace of U.S.
economic growth—when the 10-year has been sluggish in the past,
it’s often been seen as a symptom of economic weakness, and not
without some justification. The fact that the economy has arguably
been some distance down the track to normal for at least a couple of
years remains a source of concern to us. |
| |
| Road to Normalization: Economy vs Markets |
| |
 |
| |
| 1 |
Quarterly data. Source: Bloomberg |
We invite you to consider the following five points: through the end
of June, the U.S. economy had grown for 109 consecutive months,
GDP growth has converged with its long-term average, unemployment
reached an 18-year low in June, personal consumption expenditure
inflation hit the Fed’s 2% target in May, and short rates were rising.
Additionally, we’re also seeing the early signs of inflation. Most are
registering in increased commodity, raw material, and other input
costs, which is historically familiar economic territory. History also
shows, however, that these developments are also typically coincident
with rising interest rates. So far, though, the 10-year Treasury yield has
stubbornly refused to acquiesce to history—making the 10-year the
major obstacle on the path back to normal in our view.
From our perspective as highly active, valuation-sensitive small-cap
specialists, the most frustrating have been those periods when
the 10-year yield has fallen back. It seems to us that nearly every time
it has declined over the last 18 months, the market has witnessed
a subsequent flight to high yield or growth stocks while value and
economically sensitive issues struggled to keep pace. It almost seems
as if investors became temporarily convinced that we had slipped
back into the 2010-2015 era of quantitative easing and zero interest
rates. We think it bears emphasizing that, for all its uncertainty, the
current environment could not be more different. Yet the disconnect
persisted into June.
The critical question, then, is, what happens next? More
pertinently for our investors, the question can be phrased in a more
specific way as, are we likely to see a shift in small-cap style and
sector leadership? We believe that we will. The second quarter saw
an admittedly short-term sign when the Russell 2000 Value Index
shook off five straight quarters of underperformance to outpace its
small-cap growth counterpart, up 8.3% versus 7.2%. But exactly
when, and under what conditions, a longer-running shift materializes
remains to be seen, of course. To be sure, the kind of leadership
change that we expect—from growth to value and from defensives to
cyclicals—seldom occurs without a fair bit of volatility. |
| This page is not part of the 2018 Semiannual Report to Stockholders | 3 |
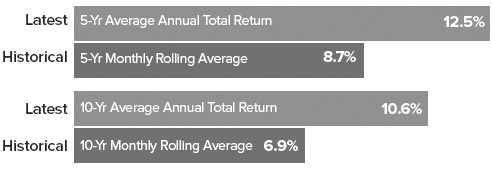
SMALL-CAP HIGHS
Returns, Valuations–and Risks
| Putting the issue of market turbulence aside for a moment, the
timing does seem apt to us for a change. First, the two-year
cumulative return at the end of June for the Russell 2000 was
46.5%—which is a wonderful, but sadly not a sustainable, pace.
Second, the one-, five-, and 10-year average annual total returns
for the small-cap index for the period ended June 30, 2018 were all
comfortably ahead of their long-term monthly rolling averages. |
| |
Recent Small-Cap Returns Higher Than History
Russell 2000 through 6/30/18 |
| |
 |
When we look at the same information for the Russell 2000
Growth Index, the contrast is even more stark, with its latest five-year
return significantly in excess of its historical rolling average.
This is one important reason why we expect a leadership shift in the
form of a reversion to the mean that would favor small-cap value
outperforming small-cap growth over the next five years.
The state of small-cap valuations also looks unsustainably high
to us, particularly if we see a continued, and more consistent, rise in
the 10-year yield. While the P/E ratio for the Russell 2000 did not
look especially rich at the end of June, another valuation metric, the
last twelve months enterprise value to earnings before interest and
taxes (EV/EBIT)—which we use most frequently when examining
companies—tells a different story, one that reveals higher-than-average
historical valuations. The currently elevated state of returns and
valuations could mean that we are entering a longish period of multiple
compression, which is one reason why we prefer select small-caps with
strong earnings prospects and/or modest valuations. If we see increased
volatility over the balance of the year, these types of stocks look better
positioned to cope with it effectively. |
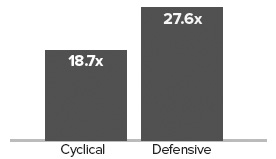
| Based on earnings and
cash flow quality—as well
as confident management
teams—we are seeing
superior fundamentals
in selected cyclical areas
that other investors are
avoiding. For example,
the supply/demand dynamics in a number of industries, such as
semiconductors & semiconductor equipment, transportation,
and chemicals, look favorable to us and do not appear to us
to be fully reflected in their current valuations. Many cyclical
companies appear much better positioned for intermediate-term
growth than defensive and/or growth stocks. While most of these
cyclical stocks have lagged the field over the last 18 months, they
are also more reasonably priced than defensives based on EV to
EBIT. We remain convinced that fundamentally strong small-cap
companies, especially those with attractive-to-reasonable valuations,
will become more appealing to investors as confidence in the U.S.
economy continues to build. |
| |
| |
Cyclicals Cheaper than Defensives
Median LTM EV/EBIT1 Ex. Negative EBIT
for Russell 2000 as of 6/30/18 |
 |
There’s a related point that may be equally important when
considering valuations: The sheer size and diversity of the small-cap
asset class means that there are almost always opportunities to
find what we think are promising or quality businesses trading at
attractive discounts. Based on EV/EBIT, the bottom three deciles of
the Russell 2000 were trading at sizable discounts compared to the
median for the index as a whole at the end of June. |
| |
Many Small-Caps Sell at a Significant Discount
Bottom Three Deciles in Russell 2000 Median LTM EV/EBIT1
Ex. Negative EBIT as of 6/30/18 |
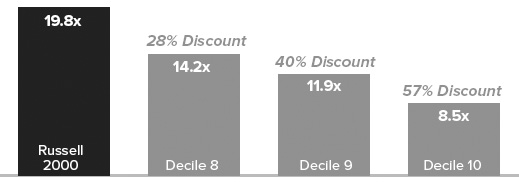 |
| 1 Last Twelve Months Enterprise Value/Earnings Before Interest and Taxes |
| 4 | This page is not part of the 2018 Semiannual Report to Stockholders |
LETTER TO OUR STOCKHOLDERS
VOLATILITY AND INTEREST RATES
Both On the Rise
During the first quarter, the Russell 2000 moved 1% or more in
33% of its trading days compared to 18% in all of 2017. Another
volatility measure, the CBOE Russell 2000 Volatility Index
(“RVX”), measures market expectations of near-term volatility
conveyed by Russell 2000 stock index option prices. The RVX has
averaged 24.0% per year since its inception on 1/2/04. Its average
in 2017 was 15.9%, and its year-to-date average through the end
of June 2018 was 17.5%. Eighteen months of lower volatility
suggests—strongly to us—that increased volatility is likely.
We also believe that the upward trend in rates is under way—and suspect that the 10-year yield will begin to move up more
consistently over the next year. We see both rising rates and
increased volatility as healthy. In fact, looking once more at history,
we find that periods of rising rates have been favorable for small-cap
stocks on both an absolute and relative basis. When the 10-Year
Treasury yield was rising, the Russell 2000 outperformed the large-cap
Russell 1000 in 70% of monthly rolling one-year periods for
the 20-year period ended 6/30/18, with an average one-year return
of 23.8% versus 19.2% for large-cap. Our expectations for absolute
small-cap returns are more modest, though we do expect this
historical relative return spread pattern to hold up. |
| |
How Have Small-Caps Performed When Rates Were Rising?
Russell 2000 vs Russell 1000 Trailing Monthly Rolling 1-Year Returns When
10-Year Treasury Yield was Rising From 6/30/98 through 6/30/18 |
| |
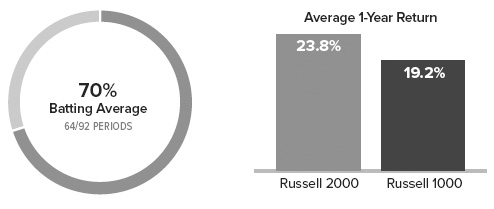 |
| 10-Year Treasury Yield rose in 92 of 229 periods |
| More specifically, we see rising rates as a phenomenon that
should also be helpful to risk-conscious active managers in the
small-cap space—primarily because it fosters an environment
where better balance sheet companies are likely to be rewarded
for their fiscal prudence. In other words, risk management
matters. This is relevant today because of the increased leverage—specifically financial leverage—within the Russell 2000. And
as rates continue to move up, the overall small-cap index looks
increasingly risky. As active managers, we have the ability to
screen and scrutinize small-cap businesses with better balance
sheets and shy away from those that we see as having excess
financial leverage. (It is worth mentioning that the market has
largely ignored better balance sheet companies for much of the
last 10 years.) Most of our strategies gravitate toward companies
with low debt. We would rather focus on companies that have
great operating leverage—but not financial leverage. With rising
rates, inflation, and economic growth becoming established, the
market seems to be transitioning into an environment that will
favor similar qualities. |
| |
| REASONS TO BE CHEERFUL |
| We are therefore of two minds about the current cycle. On the
one hand, we think that we could see some consolidation or a
correction—the latter certainly seems more probable now than it
did a year ago. Yet we remain optimistic about small-cap earnings
growth and like the fundamentals of our holdings across our
strategies in terms of balance sheets, cash flows, and earnings
strength. It is in cyclical areas, including Industrials, the more
cyclical precincts of technology, and Materials, and that we have
most often uncovered what we judge to be the best combination
of value, quality, and/or growth prospects. And this has always
been a function of our bottom-up process rather than a top down
view of the economy. |
| This page is not part of the 2018 Semiannual Report to Stockholders | 5 |
LETTER TO OUR STOCKHOLDERS
We see signs of progress that in our view place us squarely on the road to normalization,
which was evident in the modest increases in bond yields and the reemergence of
value’s leadership in 2018’s second quarter.
This is why many of our portfolios have had perennially higher
weightings in those sectors (and while others we manage have had
high weightings in Financials and Consumer Discretionary). We
also long ago developed the practice of leaning into those areas
of the asset class where we see excess pessimism. Investments in
industries that the rest of the market is abandoning have often
borne fruit, though we have learned through decades of small-cap
asset management that it usually requires a great deal of
patience—measured in years in many cases—before the arrival of a
bountiful harvest.
We think it’s worth noting that the three changes in the market
environment that we expect—lower returns, higher volatility, and |
| value/cyclical leadership—have all historically been coincident with
leadership for active management. We see signs of progress that in
our view place us squarely on the road to normalization, which was
evident in the modest increases in bond yields and the reemergence
of value’s leadership in 2018’s second quarter. There were other
equally positive signs in July, including stabilizing macro indicators
from outside the U.S., a welcome rebound in the performance
of many industrial companies, and ongoing earnings strength for
several cyclical areas. We expect to see more signs of normalizing
markets to emerge as the year goes on. |
 |
|
 |
|
 |
| Charles M. Royce |
|
Christopher D. Clark |
|
Francis D. Gannon |
| Chairman, |
|
Chief Executive Officer, and |
|
Co-Chief Investment Officer, |
| Royce & Associates, LP |
|
Co-Chief Investment Officer,
Royce & Associates, LP |
|
Royce & Associates, LP |
| |
|
|
|
|
| July 31, 2018 |
|
|
|
|
| 6 | This page is not part of the 2018 Semiannual Report to Stockholders |
Performance
| |
| |
NAV Average Annual Total Returns
As of June 30, 2018 (%) |
| |
|
YTD1 |
|
1-YR |
|
3-YR |
|
5-YR |
|
10-YR |
|
15-YR |
|
20-YR |
|
25-YR |
|
30-YR |
|
SINCE
INCEPTION |
|
INCEPTION
DATE |
| |
| Royce Global Value Trust |
|
-0.88 |
|
11.89 |
|
9.69 |
|
N/A |
|
N/A |
|
N/A |
|
N/A |
|
N/A |
|
N/A |
|
6.48 |
|
10/17/13 |
| |
| Royce Micro-Cap
Trust |
|
7.84 |
|
19.79 |
|
11.16 |
|
12.51 |
|
9.92 |
|
10.76 |
|
9.81 |
|
N/A |
|
N/A |
|
11.19 |
|
12/14/93 |
| |
| Royce Value
Trust |
|
2.78 |
|
14.37 |
|
12.03 |
|
11.45 |
|
8.81 |
|
10.04 |
|
9.15 |
|
10.53 |
|
10.97 |
|
10.74 |
|
11/26/86 |
| |
| |
| INDEX |
|
|
|
|
|
|
|
|
|
|
|
|
|
|
|
|
|
|
|
|
|
|
| |
| Russell Global
Small Cap Index |
|
0.67 |
|
12.38 |
|
8.52 |
|
9.65 |
|
6.87 |
|
10.10 |
|
7.65 |
|
N/A |
|
N/A |
|
N/A |
|
N/A |
| |
| Russell Microcap
Index |
|
10.71 |
|
20.21 |
|
10.49 |
|
12.78 |
|
10.63 |
|
9.44 |
|
N/A |
|
N/A |
|
N/A |
|
N/A |
|
N/A |
| |
| Russell 2000
Index |
|
7.66 |
|
17.57 |
|
10.96 |
|
12.46 |
|
10.60 |
|
10.50 |
|
8.03 |
|
9.59 |
|
9.85 |
|
N/A |
|
N/A |
| |
Important Performance and Risk Information
All performance information in this Review and Report reflects past performance, is presented on a total return basis, net of the Fund’s investment advisory fee, and reflects the reinvestment of distributions. Past performance is no guarantee of future results. Investment return and principal value of an investment will fluctuate, so that shares may be worth more or less than their original cost when sold. Current performance may be higher or lower than performance quoted. Current month-end performance may be obtained at www.roycefunds.com. The Funds are closed-end registered investment companies whose respective shares of common stock may trade at a discount to the net asset value. Shares of each Fund’s common stock are also subject to the market risk of investing in the underlying portfolio securities held by each Fund. Certain immaterial adjustments were made to the net assets of Royce Value Trust at 6/30/18, for financial reporting purposes, and as a result the total return based on that net asset value differs from the adjusted net asset value and total return reported in the Financial Highlights. All indexes referenced are unmanaged and capitalization-weighted. Each index’s returns include net reinvested dividends and/or interest income. Russell Investment Group is the source and owner of the trademarks, service marks and copyrights related to the Russell Indexes. Russell® is a trademark of Russell Investment Group. The Russell 2000 Index is an index of domestic small-cap stocks that measures the performance of the 2,000 smallest publicly traded U.S. companies in the Russell 3000 Index. The Russell Microcap Index includes 1,000 of the smallest securities in the small-cap Russell 2000 Index, along with the next smallest eligible securities as determined by Russell. The Russell Global Small Cap Index is an unmanaged, capitalization-weighted index of global small-cap stocks. The performance of an index does not represent exactly any particular investment, as you cannot invest directly in an index. Index returns include net reinvested dividends and/or interest income. Royce Value, Micro-Cap and Global Value Trust shares of common stock trade on the NYSE. Royce Fund Services, LLC (“RFS”) is a member of FINRA and files certain material with FINRA on behalf of each Fund. RFS is not an underwriter or distributor of any of the Funds.
This page is not part of the 2018 Semiannual Report to Stockholders | 7
| MANAGERS’ DISCUSSION |
| Royce Global Value Trust (RGT) |
 |
Chuck Royce
David Nadel
Chris Flynn |
| |
FUND PERFORMANCE
Royce Global Value Trust was
down 0.9% on a net asset value
(“NAV”) basis and 2.8% on a
market price basis for the year-to-date
period ended June 30, 2018,
in both cases underperforming
its unleveraged benchmark, the Russell Global Small Cap Index,
which rose 0.7% for the same period. While U.S. stocks generally
did well, most international indexes slipped into negative territory
during 2018’s first six months, as the combination of a modest
slowdown in international growth, rising emerging market instability, a
stronger dollar, and heightened trade war concerns all affected results. |
| WHAT WORKED... AND WHAT DIDN’T |
Six of the Fund’s 11 equity sectors detracted from first-half results. Led
by Consumer Discretionary and Industrials, their respective negative
impacts were somewhat modest. Vakrangee, which detracted most
at the position level, is an Indian company that operates a network
of outlets providing everyday transactional services to mostly rural
consumers, primarily in under-served areas. During the first quarter, the
company faced questions about corporate governance and its internal
investment policy, among other issues. Although Vakrangee refuted
these allegations, the cloud overhanging the firm’s credibility gave us
pause, and we exited our position in April. Burkhalter Holding is the
leading provider of electrical engineering services in Switzerland. Its
stock price was hurt by increasing talk that competition would pressure
pricing. Seeing these issues as more temporal than structural, we chose
to hold our shares during the first half.
The stock of California-based laser diode and equipment maker
Coherent underwent a correction in the first half after the company’s
announcement of slightly better-than-expected results came with a
more muted profit outlook. Already reducing our position in 2017,
we held our position in the first half in expectation of a recovery in
its previously strong profitability. The U.K.’s Clarkson is the world’s
largest ship broker. After a few difficult years, the company described
an improving environment for its business in hiring ships to transport
commodities in March. The firm then reversed course in April when it
issued a profit warning, which sent its shares into a tailspin. Thinking
about the long term, we added to our position in the first half.
Energy was the top-contributing sector in the first half, and the top
contributor at the industry level was energy equipment & services, as
the rebound for oil prices fed through to improved prospects for these
businesses. Norway’s TGS-NOPEC Geophysical, which provides
geoscience data to oil and gas companies worldwide, was the top
contributor in this industry and in the portfolio as a whole. Its revenue
and earnings were boosted by improving exploration and production
spending, higher oil prices, and the longer-term need for energy
companies to replenish reserves, which is driving increased spending
on seismic data. Virtu Financial uses its technology to act as a market
maker and liquidity provider to the global financial markets. Based
in New York City, the firm announced impressive first-quarter results
in profits and earnings thanks to increased market volatility and high
trading volumes. From the Industrials sector, Kirby Corporation has
the largest inland and coastal tank barge fleet in the U.S. and also
draws revenue from servicing and distributing industrial engines,
transmissions, parts, and oil field services equipment. The tank barge
markets seem to be recovering well, thanks to retirements of older
barges, limited new builds, and solid utilization rates. Kirby has also
benefited from two recent acquisitions over the last 18 months that are
allowing it to drive industry consolidation.
Relative to the Russell Global Small Cap, the major source of
underperformance was ineffective stock selection in the Information
Technology sector, most impactfully in the IT services and electronic
equipment, instruments & components industries. Stock picking
detracted in Health Care, particularly in the health care equipment &
supplies group. Conversely, stock selection was a strength versus the
benchmark in the Energy sector’s energy equipment & services
industry, while a smaller advantage came from stock picks in
Industrials, where the machinery group did best. |
| |
Top Contributors to Performance
Year-to-Date Through 6/30/18 (%)1 |
|
|
|
| |
|
|
|
|
| |
TGS-NOPEC Geophysical |
|
0.73 |
|
| |
|
|
| |
Virtu Financial Cl. A |
|
0.47 |
|
| |
|
|
| |
Kirby Corporation |
|
0.39 |
|
| |
|
|
| |
Bravura Solutions |
|
0.33 |
|
| |
|
|
| |
Nanometrics |
|
0.27 |
|
| |
|
|
| |
1 Includes dividends |
|
|
|
| |
|
|
|
|
| |
|
|
|
|
| |
Top Detractors from Performance
Year-to-Date Through 6/30/18 (%)2 |
|
|
|
| |
|
|
|
|
| |
Vakrangee |
|
-0.31 |
|
| |
|
|
| |
Burkhalter Holding |
|
-0.28 |
|
| |
|
|
| |
Coherent |
|
-0.26 |
|
| |
|
|
| |
Clarkson |
|
-0.24 |
|
| |
|
|
| |
ManpowerGroup |
|
-0.23 |
|
| |
|
|
| |
2 Net of dividends |
|
|
|
| |
|
|
|
|
| CURRENT POSITIONING AND OUTLOOK |
| The market’s recent behavior looks curious to us. We hear optimism
and solid progress from the management teams we meet with, see
solid earnings reports, and observe consistently strong macroeconomic
data. On the other hand, small-cap market leadership in the U.S. has
stubbornly remained with defensive and yield-oriented stocks, while
cyclicals have lagged. In addition, the rate of change in global growth
has slowed, as measured by global PMIs (the Purchasing Managers’
Index, an indicator of economic health for manufacturing and service
sectors), while the effects of tariffs are just now registering—and are
only likely to intensify before a resolution is reached. All of this raises
the degree of difficulty for U.S. equities to maintain their recent
performance pace and for non-U.S. stocks to rebound. We do believe,
however, that the portfolio holds companies that are well positioned
to execute effectively in a more challenging environment. |
| 8 | 2018 Semiannual Report to Stockholders |
| PERFORMANCE AND PORTFOLIO REVIEW |
|
SYMBOLS MARKET PRICE RGT NAV XRGTX |
|
| Performance |
| Average Annual Total Return (%) Through 6/30/18 |
| |
|
JAN-JUN 20181 |
|
1-YR |
|
3-YR |
|
SINCE INCEPTION (10/17/13) |
| |
| RGT (NAV) |
|
-0.88 |
|
11.89 |
|
9.69 |
|
6.48 |
| |
| 1 Not Annualized |
|
|
|
|
|
|
|
|
|
| Market Price Performance History Since Inception (10/17/13)
Cumulative Performance of Investment1 |
| |
|
1-YR |
|
5-YR |
|
10-YR |
|
15-YR |
|
20-YR |
|
SINCE INCEPTION (10/17/13) |
| |
| RGT |
|
10.5% |
|
N/A |
|
N/A |
|
N/A |
|
N/A |
|
24.4% |
| |
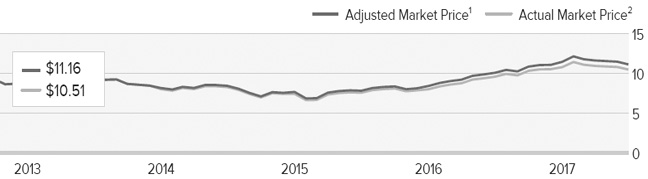
| 1 |
Reflects the cumulative performance experience of a continuous common stockholder who purchased one share at inception ($8.975 IPO) and reinvested all distributions. |
| 2 |
Reflects the actual month-end market price movement of one share as it has traded on NYSE and, prior to 12/1/03, on the Nasdaq. |
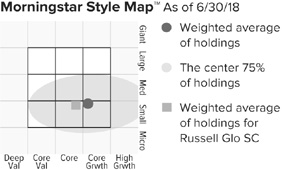
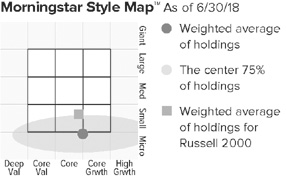
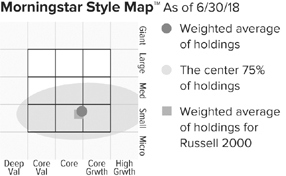
The Morningstar Style Map is the Morningstar Style Box™ with the center 75% of fund holdings plotted as the Morningstar
Ownership Zone™. The Morningstar Style Box is designed to reveal a
fund’s investment strategy. The Morningstar Ownership Zone provides
detail about a portfolio’s investment style by showing the range of
stock sizes and styles. The Ownership Zone is derived by plotting each
stock in the portfolio within the proprietary Morningstar Style Box.
Over time, the shape and location of a fund's ownership zone may vary.
See page 66 for additional information. |
|
| Top 10 Positions |
|
|
| % of Net Assets |
|
|
| |
|
|
| Kirby Corporation |
|
2.1 |
| |
| FLIR Systems |
|
2.1 |
| |
| TGS-NOPEC Geophysical |
|
1.6 |
| |
| Virtu Financial Cl. A |
|
1.5 |
| |
| Computer Modelling Group |
|
1.4 |
| |
| VZ Holding |
|
1.4 |
| |
| SEI Investments |
|
1.3 |
| |
| Spirax-Sarco Engineering |
|
1.3 |
| |
| Lazard Cl. A |
|
1.2 |
| |
| Raven Industries |
|
1.2 |
| |
|
| Portfolio Sector Breakdown |
|
|
| % of Net Assets |
|
|
| |
|
|
| Industrials |
|
28.1 |
| |
| Information Technology |
|
17.6 |
| |
| Financials |
|
15.3 |
| |
| Health Care |
|
8.8 |
| |
| Materials |
|
8.8 |
| |
| Consumer Discretionary |
|
6.7 |
| |
| Energy |
|
5.3 |
| |
| Real Estate |
|
2.6 |
| |
| Consumer Staples |
|
2.4 |
| |
| Telecommunication Services |
|
0.3 |
| |
| Utilities |
|
0.1 |
| |
| Cash and Cash Equivalents, Net of
Outstanding Line of Credit |
|
4.0 |
| |
|
| Calendar Year Total Returns (%) |
|
|
| |
|
|
| YEAR |
|
RGT |
| |
| 2017 |
|
31.1 |
| |
| 2016 |
|
11.1 |
| |
| 2015 |
|
-3.4 |
| |
| 2014 |
|
-6.2 |
| |
|
Portfolio Country Breakdown1,2
% of Net Assets |
|
|
| |
|
|
| |
| United States |
|
27.5 |
| |
| United Kingdom |
|
10.1 |
| |
| Canada |
|
9.8 |
| |
| Japan |
|
7.3 |
| |
| Australia |
|
4.9 |
| |
| Switzerland |
|
4.2 |
| |
| France |
|
3.7 |
| |
| 1 Represents countries that are 3% or more of net assets. |
| 2 Securities are categorized by the country of their headquarters. |
|
| Portfolio Diagnostics |
|
|
| |
|
|
| Fund Net Assets |
|
$129 million |
| |
| Number of Holdings |
|
260 |
| |
| Turnover Rate |
|
23% |
| |
| Net Asset Value |
|
$12.37 |
| |
| Market Price |
|
$10.51 |
| |
| Average Market Capitalization1 |
|
$1,855 million |
| |
| Weighted Average P/E Ratio2,3 |
|
20.0x |
| |
| Weighted Average P/B Ratio2 |
|
2.6x |
| |
| Active Share4 |
|
97% |
| |
| 1 |
Geometric Average. This weighted calculation uses each portfolio
holding’s market cap in a way designed to not skew the effect of
very large or small holdings; instead, it aims to better identify
the portfolio’s center, which Royce believes offers a more accurate
measure of average market cap than a simple mean or median. |
| 2 |
Harmonic Average. This weighted calculation evaluates a portfolio as if it were a single stock and measures it overall. It compares the total market value of the portfolio to the portfolio’s share in the earnings or book value, as the case may be, of its underlying stocks. |
| 3 |
The Fund’s P/E ratio calculation excludes companies with zero or negative earnings (7% of portfolio holdings as of 6/30/18). |
| 4 |
Active Share is the sum of the absolute values of the different weightings of each holding in the Fund versus each holding in the benchmark, divided by two. |
Important Performance and Risk Information
All performance information reflects past performance, is presented on a total return basis, net of the Fund’s investment advisory fee, and reflects the reinvestment of distributions. Past performance is no
guarantee of future results. Current performance may be higher or lower than performance quoted. Returns as of the most recent month-end may be obtained at www.roycefunds.com. The market price of the
Fund’s shares will fluctuate, so that shares may be worth more or less than their original cost when sold. The Fund invests primarily in securities of small- and mid-cap companies, which may involve considerably
more risk than investments in securities of larger-cap companies. The Fund’s broadly diversified portfolio does not ensure a profit or guarantee against loss. From time to time, the Fund may invest a significant
portion of its net assets in foreign securities, which may involve political, economic, currency and other risks not encountered in U.S. investments. Regarding the “Top Contributors” and “Top Detractors” tables shown
above, the sum of all contributors to, and all detractors from, performance for all securities in the portfolio would approximate the Fund’s year-to-date performance for 2018. |
| 2018 Semiannual Report to Stockholders | 9 |
| |
| Schedule of Investments |
|
|
|
|
|
|
|
|
| Common Stocks – 96.0% |
|
|
|
|
|
|
|
|
| |
|
|
SHARES
|
|
|
|
VALUE
|
|
| |
| |
|
|
|
|
|
|
|
|
| AUSTRALIA
– 4.9% |
|
|
|
|
|
|
|
|
ALS |
|
|
140,000 |
|
|
$ |
781,197 |
|
†Ausdrill |
|
|
109,800 |
|
|
|
149,108 |
|
†Bingo
Industries |
|
|
60,700 |
|
|
|
120,388 |
|
Bravura
Solutions |
|
|
475,000 |
|
|
|
1,128,391 |
|
Cochlear |
|
|
5,500 |
|
|
|
814,747 |
|
Hansen
Technologies |
|
|
335,000 |
|
|
|
780,938 |
|
HT&E |
|
|
53,400 |
|
|
|
99,192 |
|
Imdex 1 |
|
|
83,800 |
|
|
|
76,590 |
|
IPH |
|
|
365,000 |
|
|
|
1,202,026 |
|
NetComm Wireless 1 |
|
|
30,000 |
|
|
|
24,533 |
|
Seeing Machines 1 |
|
|
1,474,517 |
|
|
|
243,249 |
|
Tassal
Group |
|
|
23,000 |
|
|
|
70,297 |
|
†Technology
One |
|
|
285,000 |
|
|
|
896,386 |
|
| |
| Total (Cost $5,618,222)
|
|
|
|
|
|
|
6,387,042 |
|
| |
| |
|
|
|
|
|
|
|
|
| AUSTRIA
– 0.8% |
|
|
|
|
|
|
|
|
Mayr-Melnhof
Karton |
|
|
7,500 |
|
|
|
1,012,483
|
|
| |
| Total (Cost $893,160)
|
|
|
|
|
|
|
1,012,483
|
|
| |
| |
|
|
|
|
|
|
|
|
| BELGIUM
– 0.4% |
|
|
|
|
|
|
|
|
†Radisson
Hospitality 1 |
|
|
180,000 |
|
|
|
577,777
|
|
| |
| Total (Cost $505,978)
|
|
|
|
|
|
|
577,777
|
|
| |
| |
|
|
|
|
|
|
|
|
| BRAZIL
– 2.2% |
|
|
|
|
|
|
|
|
B3 |
|
|
32,847 |
|
|
|
173,314 |
|
Construtora
Tenda 1 |
|
|
20,000 |
|
|
|
122,763 |
|
†CVC
Brasil Operadora e Agencia de Viagens |
|
|
17,400 |
|
|
|
202,923 |
|
Direcional
Engenharia 1 |
|
|
40,900 |
|
|
|
62,895 |
|
Industrias
Romi |
|
|
51,900 |
|
|
|
73,516 |
|
International
Meal Company Alimentacao |
|
|
25,000 |
|
|
|
51,152 |
|
MRV
Engenharia e Participacoes |
|
|
21,700 |
|
|
|
67,411 |
|
OdontoPrev |
|
|
225,000 |
|
|
|
758,756 |
|
T4F
Entretenimento |
|
|
50,400 |
|
|
|
102,731 |
|
†Tegma
Gestao Logistica |
|
|
24,300 |
|
|
|
96,617 |
|
TOTVS |
|
|
168,000 |
|
|
|
1,179,024 |
|
| |
| Total (Cost $3,265,772)
|
|
|
|
|
|
|
2,891,102
|
|
| |
| |
|
|
|
|
|
|
|
|
| CANADA
– 9.8% |
|
|
|
|
|
|
|
|
Agnico
Eagle Mines 2 |
|
|
10,000 |
|
|
|
458,300 |
|
Altus
Group |
|
|
38,000 |
|
|
|
847,207 |
|
Calfrac
Well Services 1 |
|
|
45,800 |
|
|
|
194,397 |
|
Canaccord
Genuity Group |
|
|
92,000 |
|
|
|
508,059 |
|
†Canadian
Western Bank |
|
|
4,600 |
|
|
|
121,241 |
|
Computer Modelling Group |
|
|
234,000 |
|
|
|
1,797,741 |
|
E-L
Financial |
|
|
1,200 |
|
|
|
748,479 |
|
FirstService
Corporation |
|
|
10,300 |
|
|
|
783,212 |
|
Franco-Nevada
Corporation 2 |
|
|
12,800 |
|
|
|
934,656 |
|
Genworth
MI Canada |
|
|
13,000 |
|
|
|
423,033 |
|
Gluskin
Sheff + Associates |
|
|
23,000 |
|
|
|
287,270 |
|
Hudbay
Minerals |
|
|
13,000 |
|
|
|
72,800 |
|
Leucrotta
Exploration 1 |
|
|
41,900 |
|
|
|
62,468 |
|
Magellan
Aerospace |
|
|
14,000 |
|
|
|
171,027 |
|
Major
Drilling Group International 1 |
|
|
201,300 |
|
|
|
1,062,657 |
|
Morneau
Shepell |
|
|
50,000 |
|
|
|
1,033,735 |
|
North
American Construction Group |
|
|
31,000 |
|
|
|
184,450 |
|
Pan
American Silver 2 |
|
|
31,800 |
|
|
|
569,220 |
|
†Parex
Resources 1 |
|
|
18,700 |
|
|
|
353,048 |
|
Solium
Capital 1 |
|
|
66,000 |
|
|
|
577,842 |
|
Sprott |
|
|
520,600 |
|
|
|
1,203,837 |
|
†TORC
Oil & Gas |
|
|
22,400 |
|
|
|
125,064 |
|
Western
Forest Products |
|
|
101,250 |
|
|
|
206,405 |
|
| |
| Total (Cost $12,322,145)
|
|
|
|
|
|
|
12,726,148
|
|
| |
| |
|
|
|
|
|
|
|
|
| CHILE
– 0.1% |
|
|
|
|
|
|
|
|
SMU 1 |
|
|
318,400 |
|
|
|
93,805
|
|
| |
| Total (Cost $85,780)
|
|
|
|
|
|
|
93,805
|
|
| |
| |
|
|
|
|
|
|
|
|
| CHINA
– 1.4% |
|
|
|
|
|
|
|
|
†A-Living
Services 1 |
|
|
45,100 |
|
|
|
82,433 |
|
China
Communications Services |
|
|
303,600 |
|
|
|
192,323 |
|
China
Lesso Group Holdings |
|
|
150,100 |
|
|
|
95,276 |
|
Chinasoft
International |
|
|
130,900 |
|
|
|
102,109 |
|
Fufeng
Group |
|
|
275,100 |
|
|
|
123,777 |
|
Hua
Hong Semiconductor |
|
|
51,600 |
|
|
|
177,249 |
|
TravelSky
Technology |
|
|
300,000 |
|
|
|
873,738 |
|
Xtep
International Holdings |
|
|
180,100 |
|
|
|
123,271 |
|
| |
| Total (Cost $1,209,115)
|
|
|
|
|
|
|
1,770,176
|
|
| |
| |
|
|
|
|
|
|
|
|
| CYPRUS
– 0.1% |
|
|
|
|
|
|
|
|
†TCS
Group Holding GDR |
|
|
5,500 |
|
|
|
113,850
|
|
| |
| Total (Cost $114,206)
|
|
|
|
|
|
|
113,850
|
|
| |
| |
|
|
|
|
|
|
|
|
| DENMARK
– 1.2% |
|
|
|
|
|
|
|
|
Chr.
Hansen Holding |
|
|
5,500 |
|
|
|
508,108 |
|
Coloplast
Cl. B |
|
|
4,000 |
|
|
|
399,878 |
|
DFDS |
|
|
4,000 |
|
|
|
255,425 |
|
†Nilfisk
Holding 1 |
|
|
7,100 |
|
|
|
346,656 |
|
| |
| Total (Cost $1,091,309)
|
|
|
|
|
|
|
1,510,067
|
|
| |
| |
|
|
|
|
|
|
|
|
| EGYPT
– 0.4% |
|
|
|
|
|
|
|
|
†Commercial
International Bank (Egypt) |
|
|
23,800 |
|
|
|
112,548 |
|
Egyptian
Financial Group-Hermes |
|
|
|
|
|
|
|
|
Holding
Company 1 |
|
|
235,100 |
|
|
|
303,304 |
|
Oriental
Weavers |
|
|
82,300 |
|
|
|
56,354 |
|
| |
| Total (Cost $494,574)
|
|
|
|
|
|
|
472,206
|
|
| |
| |
|
|
|
|
|
|
|
|
| FINLAND
– 0.0% |
|
|
|
|
|
|
|
|
Ferratum |
|
|
1,300 |
|
|
|
24,594
|
|
| |
| Total (Cost $37,828)
|
|
|
|
|
|
|
24,594
|
|
| |
| |
|
|
|
|
|
|
|
|
| FRANCE
– 3.7% |
|
|
|
|
|
|
|
|
†Albioma |
|
|
3,100 |
|
|
|
69,942 |
|
Interparfums |
|
|
14,850 |
|
|
|
625,173 |
|
Neurones |
|
|
26,339 |
|
|
|
738,208 |
|
Rothschild
& Co |
|
|
33,000 |
|
|
|
1,115,658 |
|
†Sartorius
Stedim Biotech |
|
|
9,000 |
|
|
|
940,663 |
|
Synergie |
|
|
1,200 |
|
|
|
59,137 |
|
Thermador Groupe |
|
|
19,000 |
|
|
|
1,273,603 |
|
| |
| Total (Cost $3,335,183)
|
|
|
|
|
|
|
4,822,384
|
|
| |
| |
|
|
|
|
|
|
|
|
| GEORGIA
– 0.1% |
|
|
|
|
|
|
|
|
Bank
of Georgia Group |
|
|
3,400 |
|
|
|
84,583 |
|
†Georgia
Capital 1 |
|
|
3,400 |
|
|
|
46,217 |
|
| |
| Total (Cost $120,258)
|
|
|
|
|
|
|
130,800
|
|
| |
| |
|
|
|
|
|
|
|
|
| GERMANY
– 2.7% |
|
|
|
|
|
|
|
|
Amadeus
Fire |
|
|
8,000 |
|
|
|
864,172 |
|
Carl
Zeiss Meditec |
|
|
13,500 |
|
|
|
921,482 |
|
CompuGroup
Medical |
|
|
8,000 |
|
|
|
411,066 |
|
FinTech
Group 1 |
|
|
500 |
|
|
|
15,736 |
|
| 10 | 2018 Semiannual Report to Stockholders |
|
THE ACCOMPANYING NOTES ARE AN INTEGRAL PART OF THESE FINANCIAL STATEMENTS |
| June 30, 2018
(unaudited) |
| |
| Schedule
of Investments (continued) |
| |
|
SHARES
|
|
|
VALUE |
|
| |
| |
|
|
|
|
|
|
|
| GERMANY
(continued) |
|
|
|
|
|
|
|
MorphoSys
1 |
|
6,000 |
|
|
$ |
735,714 |
|
STRATEC
Biomedical |
|
5,051 |
|
|
|
394,613 |
|
VIB
Vermoegen |
|
4,700 |
|
|
|
120,202 |
|
| |
| Total (Cost $2,145,542)
|
|
|
|
|
|
3,462,985
|
|
| |
| |
|
|
|
|
|
|
|
| GREECE
– 0.2% |
|
|
|
|
|
|
|
JUMBO |
|
4,700 |
|
|
|
77,500 |
|
Sarantis |
|
5,800 |
|
|
|
50,122 |
|
†Star Bulk Carriers 1 |
|
8,000 |
|
|
|
102,880 |
|
| |
| Total (Cost $219,753)
|
|
|
|
|
|
230,502
|
|
| |
| |
|
|
|
|
|
|
|
| HONG KONG
– 1.3% |
|
|
|
|
|
|
|
HKBN |
|
150,000 |
|
|
|
230,958 |
|
I.T |
|
378,400 |
|
|
|
270,093 |
|
Pico
Far East Holdings |
|
526,500 |
|
|
|
213,402 |
|
Texhong
Textile Group |
|
47,600 |
|
|
|
71,834 |
|
Value
Partners Group |
|
894,500 |
|
|
|
706,880 |
|
Xinyi
Glass Holdings |
|
159,800 |
|
|
|
195,330 |
|
| |
| Total (Cost $1,440,404)
|
|
|
|
|
|
1,688,497
|
|
| |
| |
|
|
|
|
|
|
|
| INDIA
– 2.0% |
|
|
|
|
|
|
|
†AIA Engineering |
|
45,000 |
|
|
|
985,186 |
|
Borosil
Glass Works |
|
5,800 |
|
|
|
78,092 |
|
Dewan
Housing Finance |
|
21,500 |
|
|
|
199,577 |
|
†Jubilant Life Sciences |
|
16,300 |
|
|
|
166,890 |
|
Manappuram
Finance |
|
27,550 |
|
|
|
39,667 |
|
Mphasis |
|
2,400 |
|
|
|
37,831 |
|
†Phillips Carbon Black |
|
27,000 |
|
|
|
85,751 |
|
Radico
Khaitan |
|
24,000 |
|
|
|
144,669 |
|
Redington
India |
|
30,000 |
|
|
|
48,165 |
|
SH
Kelkar & Company |
|
200,000 |
|
|
|
656,790 |
|
†Sterlite Technologies |
|
35,000 |
|
|
|
140,506 |
|
| |
| Total (Cost $2,836,758)
|
|
|
|
|
|
2,583,124
|
|
| |
| |
|
|
|
|
|
|
|
| INDONESIA
– 0.4% |
|
|
|
|
|
|
|
Selamat
Sempurna |
|
5,500,000 |
|
|
|
502,791
|
|
| |
| Total (Cost $501,555)
|
|
|
|
|
|
502,791
|
|
| |
| |
|
|
|
|
|
|
|
| IRELAND
– 0.6% |
|
|
|
|
|
|
|
†C&C Group |
|
32,300 |
|
|
|
122,212 |
|
Irish
Residential Properties REIT |
|
62,500 |
|
|
|
100,723 |
|
Keywords
Studios |
|
25,000 |
|
|
|
588,609 |
|
| |
| Total (Cost $272,181)
|
|
|
|
|
|
811,544
|
|
| |
| |
|
|
|
|
|
|
|
| ISRAEL
– 0.1% |
|
|
|
|
|
|
|
Nova
Measuring Instruments 1,2 |
|
6,700 |
|
|
|
182,575
|
|
| |
| Total (Cost $126,148)
|
|
|
|
|
|
182,575
|
|
| |
| |
|
|
|
|
|
|
|
| ITALY
– 0.8% |
|
|
|
|
|
|
|
Anima
Holding |
|
7,400 |
|
|
|
39,804 |
|
DiaSorin |
|
7,500 |
|
|
|
855,706 |
|
Openjobmetis
1 |
|
15,900 |
|
|
|
178,624 |
|
| |
| Total (Cost $583,764)
|
|
|
|
|
|
1,074,134
|
|
| |
| |
|
|
|
|
|
|
|
| JAPAN
– 7.3% |
|
|
|
|
|
|
|
Ai
Holdings |
|
20,000 |
|
|
|
433,907 |
|
As
One |
|
15,000 |
|
|
|
1,041,864 |
|
EPS
Holdings |
|
34,600 |
|
|
|
742,534 |
|
Financial
Products Group |
|
10,000 |
|
|
|
129,070 |
|
†Fujitec Company |
|
46,000 |
|
|
|
567,132 |
|
Kyowa
Exeo |
|
7,000 |
|
|
|
183,923 |
|
Leopalace21 |
|
11,500 |
|
|
|
63,049 |
|
Mandom
Corporation |
|
1,200 |
|
|
|
37,393 |
|
Meitec Corporation |
|
25,750 |
|
|
|
1,237,321 |
|
Nitto
Kohki |
|
2,900 |
|
|
|
67,946 |
|
NS
Solutions |
|
7,000 |
|
|
|
176,589 |
|
NSD |
|
32,600 |
|
|
|
743,191 |
|
Open
House |
|
2,050 |
|
|
|
121,465 |
|
Pressance |
|
6,150 |
|
|
|
95,098 |
|
Relo
Group |
|
40,000 |
|
|
|
1,056,406 |
|
Sun
Frontier Fudousan |
|
3,650 |
|
|
|
43,220 |
|
TATERU |
|
4,400 |
|
|
|
72,688 |
|
†TKC Corporation |
|
23,000 |
|
|
|
857,969 |
|
Tokai
Corporation |
|
4,300 |
|
|
|
92,707 |
|
Trancom |
|
1,400 |
|
|
|
96,229 |
|
USS |
|
67,500 |
|
|
|
1,285,192 |
|
Yumeshin
Holdings |
|
6,950 |
|
|
|
72,880 |
|
Zenkoku
Hosho |
|
6,100 |
|
|
|
277,135 |
|
| |
| Total (Cost $7,684,846)
|
|
|
|
|
|
9,494,908
|
|
| |
| |
|
|
|
|
|
|
|
| MALAYSIA
– 0.2% |
|
|
|
|
|
|
|
Kossan
Rubber Industries |
|
98,100 |
|
|
|
204,967
|
|
| |
| Total (Cost $202,847)
|
|
|
|
|
|
204,967
|
|
| |
| |
|
|
|
|
|
|
|
| MEXICO
– 0.5% |
|
|
|
|
|
|
|
Becle |
|
200,000 |
|
|
|
288,214 |
|
Bolsa
Mexicana de Valores |
|
250,000 |
|
|
|
420,815 |
|
| |
| Total (Cost $789,517)
|
|
|
|
|
|
709,029
|
|
| |
| |
|
|
|
|
|
|
|
| NETHERLANDS
– 1.0% |
|
|
|
|
|
|
|
AMG
Advanced Metallurgical Group |
|
3,500 |
|
|
|
197,008 |
|
DP
Eurasia 1 |
|
119,700 |
|
|
|
250,231 |
|
†Intertrust |
|
50,000 |
|
|
|
888,696 |
|
| |
| Total (Cost $1,433,730)
|
|
|
|
|
|
1,335,935
|
|
| |
| |
|
|
|
|
|
|
|
| NEW ZEALAND
– 1.5% |
|
|
|
|
|
|
|
Fisher
& Paykel Healthcare |
|
102,875 |
|
|
|
1,037,494 |
|
Trade
Me Group |
|
300,000 |
|
|
|
946,865 |
|
| |
| Total (Cost $1,542,076)
|
|
|
|
|
|
1,984,359
|
|
| |
| |
|
|
|
|
|
|
|
| NORWAY
– 1.8% |
|
|
|
|
|
|
|
Kongsberg
Automotive 1 |
|
130,000 |
|
|
|
149,404 |
|
†Leroy Seafood Group |
|
12,300 |
|
|
|
82,883 |
|
Protector
Forsikring 1 |
|
8,950 |
|
|
|
72,968 |
|
TGS-NOPEC Geophysical |
|
55,000 |
|
|
|
2,025,944 |
|
| |
| Total (Cost $1,336,546)
|
|
|
|
|
|
2,331,199
|
|
| |
| |
|
|
|
|
|
|
|
| PERU
– 0.1% |
|
|
|
|
|
|
|
Ferreycorp |
|
93,200 |
|
|
|
66,693
|
|
| |
| Total (Cost $56,092)
|
|
|
|
|
|
66,693
|
|
| |
| |
|
|
|
|
|
|
|
| PHILIPPINES
– 0.1% |
|
|
|
|
|
|
|
Pryce
Corporation |
|
489,100 |
|
|
|
54,530 |
|
Robinsons
Retail Holdings |
|
69,200 |
|
|
|
103,085 |
|
| |
| Total (Cost $184,559)
|
|
|
|
|
|
157,615
|
|
| |
| |
|
|
|
|
|
|
|
| POLAND
– 0.2% |
|
|
|
|
|
|
|
Warsaw
Stock Exchange |
|
33,000 |
|
|
|
322,454
|
|
| |
| Total (Cost $459,764)
|
|
|
|
|
|
322,454
|
|
| |
| THE ACCOMPANYING
NOTES ARE AN INTEGRAL PART OF THESE FINANCIAL STATEMENTS |
|
2018 Semiannual
Report to Stockholders | 11 |
| |
| Schedule
of Investments (continued) |
| |
|
|
|
|
|
|
|
| |
|
SHARES
|
|
|
VALUE |
|
| |
| |
| PORTUGAL
– 0.3% |
|
|
|
|
|
|
|
Sonae |
|
313,400 |
|
|
$ |
376,968
|
|
| |
| Total (Cost $421,495)
|
|
|
|
|
|
376,968
|
|
| |
| |
|
|
|
|
|
|
|
| RUSSIA
– 0.5% |
|
|
|
|
|
|
|
Globaltrans
Investment GDR |
|
61,600 |
|
|
|
628,320
|
|
| |
| Total (Cost $408,649)
|
|
|
|
|
|
628,320
|
|
| |
| |
|
|
|
|
|
|
|
| SINGAPORE
– 1.2% |
|
|
|
|
|
|
|
CSE
Global |
|
591,850 |
|
|
|
186,786 |
|
†Midas Holdings 1,3 |
|
400,000 |
|
|
|
42,275 |
|
Sheng
Siong Group |
|
141,800 |
|
|
|
110,318 |
|
XP
Power |
|
24,000 |
|
|
|
1,118,093 |
|
Yanlord
Land Group |
|
134,300 |
|
|
|
156,724 |
|
| |
| Total (Cost $1,071,962)
|
|
|
|
|
|
1,614,196
|
|
| |
| |
|
|
|
|
|
|
|
| SOUTH AFRICA
– 0.7% |
|
|
|
|
|
|
|
Coronation
Fund Managers |
|
59,000 |
|
|
|
250,796 |
|
JSE |
|
15,000 |
|
|
|
177,266 |
|
Nampak
1 |
|
35,800 |
|
|
|
40,922 |
|
PSG
Group |
|
25,000 |
|
|
|
394,022 |
|
| |
| Total (Cost $1,039,463)
|
|
|
|
|
|
863,006
|
|
| |
| |
|
|
|
|
|
|
|
| SOUTH KOREA
– 1.1% |
|
|
|
|
|
|
|
†Amorepacific Corporation |
|
700 |
|
|
|
202,557 |
|
†Com2uS |
|
600 |
|
|
|
90,444 |
|
Eugene
Technology |
|
6,600 |
|
|
|
93,271 |
|
†Innocean Worldwide |
|
5,700 |
|
|
|
303,795 |
|
Interojo |
|
2,800 |
|
|
|
87,053 |
|
KIWOOM
Securities |
|
700 |
|
|
|
68,147 |
|
Koh
Young Technology |
|
1,200 |
|
|
|
109,825 |
|
Modetour
Network |
|
7,400 |
|
|
|
180,601 |
|
†S-1 Corporation |
|
2,600 |
|
|
|
225,823 |
|
| |
| Total (Cost $1,417,075)
|
|
|
|
|
|
1,361,516
|
|
| |
| |
|
|
|
|
|
|
|
| SPAIN
– 0.3% |
|
|
|
|
|
|
|
Atento
2 |
|
65,400 |
|
|
|
447,990
|
|
| |
| Total (Cost $622,537)
|
|
|
|
|
|
447,990
|
|
| |
| |
|
|
|
|
|
|
|
| SRI LANKA
– 0.2% |
|
|
|
|
|
|
|
National
Development Bank |
|
187,179 |
|
|
|
145,321 |
|
†Sampath Bank 1 |
|
28,368 |
|
|
|
54,299 |
|
Sunshine
Holdings |
|
154,025 |
|
|
|
51,568 |
|
| |
| Total (Cost $270,465)
|
|
|
|
|
|
251,188
|
|
| |
| |
|
|
|
|
|
|
|
| SWEDEN
– 2.7% |
|
|
|
|
|
|
|
Addtech
Cl. B |
|
18,960 |
|
|
|
419,557 |
|
Bravida
Holding |
|
120,000 |
|
|
|
953,248 |
|
Dustin
Group |
|
7,650 |
|
|
|
68,926 |
|
†Green Landscaping Holding 1 |
|
40,000 |
|
|
|
115,220 |
|
Hexpol |
|
110,000 |
|
|
|
1,144,612 |
|
Knowit |
|
7,000 |
|
|
|
134,736 |
|
†Lagercrantz Group |
|
60,000 |
|
|
|
653,809 |
|
| |
| Total (Cost $2,910,627)
|
|
|
|
|
|
3,490,108
|
|
| |
| |
|
|
|
|
|
|
|
| SWITZERLAND
– 4.2% |
|
|
|
|
|
|
|
Burkhalter
Holding |
|
10,000 |
|
|
|
847,218 |
|
Forbo
Holding |
|
110 |
|
|
|
164,617 |
|
†Kardex |
|
4,300 |
|
|
|
596,607 |
|
LEM
Holding |
|
500 |
|
|
|
747,248 |
|
Partners Group Holding |
|
1,800 |
|
|
|
1,322,327 |
|
VZ Holding |
|
5,600 |
|
|
|
1,764,314 |
|
| |
| Total (Cost $4,333,284)
|
|
|
|
|
|
5,442,331
|
|
| |
| |
|
|
|
|
|
|
|
| TAIWAN
– 0.3% |
|
|
|
|
|
|
|
Gourmet
Master |
|
12,177 |
|
|
|
117,822 |
|
Sitronix
Technology |
|
46,200 |
|
|
|
178,051 |
|
TCI |
|
6,185 |
|
|
|
95,548 |
|
| |
| Total (Cost $271,223)
|
|
|
|
|
|
391,421
|
|
| |
| |
|
|
|
|
|
|
|
| THAILAND
– 0.2% |
|
|
|
|
|
|
|
Beauty
Community |
|
205,600 |
|
|
|
75,712 |
|
Erawan
Group (The) |
|
377,300 |
|
|
|
71,747 |
|
Plan
B Media |
|
300,000 |
|
|
|
55,237 |
|
| |
| Total (Cost $246,746)
|
|
|
|
|
|
202,696
|
|
| |
| |
|
|
|
|
|
|
|
| TURKEY
– 0.1% |
|
|
|
|
|
|
|
Tat
Gida Sanayi |
|
72,350 |
|
|
|
68,824
|
|
| |
| Total (Cost $130,798)
|
|
|
|
|
|
68,824
|
|
| |
| |
|
|
|
|
|
|
|
| UKRAINE
– 0.3% |
|
|
|
|
|
|
|
†MHP GDR |
|
30,000 |
|
|
|
399,000 |
|
| |
| Total (Cost $411,612)
|
|
|
|
|
|
399,000
|
|
| |
| |
|
|
|
|
|
|
|
| UNITED
ARAB EMIRATES – 0.1% |
|
|
|
|
|
|
|
ADES
International Holding 1 |
|
8,100 |
|
|
|
103,275
|
|
| |
| Total (Cost $107,934)
|
|
|
|
|
|
103,275
|
|
| |
| |
|
|
|
|
|
|
|
| UNITED
KINGDOM – 10.1% |
|
|
|
|
|
|
|
Abcam |
|
28,000 |
|
|
|
492,953 |
|
Ashmore Group |
|
279,000 |
|
|
|
1,373,425 |
|
Biffa |
|
111,400 |
|
|
|
366,080 |
|
Clarkson |
|
40,600 |
|
|
|
1,232,383 |
|
Consort
Medical |
|
57,500 |
|
|
|
904,557 |
|
Conviviality
1,3 |
|
61,200 |
|
|
|
0 |
|
Diploma |
|
28,500 |
|
|
|
493,105 |
|
dotdigital
group |
|
142,200 |
|
|
|
140,751 |
|
Elementis |
|
200,000 |
|
|
|
667,266 |
|
Equiniti
Group |
|
331,000 |
|
|
|
1,078,988 |
|
Ferroglobe |
|
41,100 |
|
|
|
352,227 |
|
Ferroglobe
(Warranty Insurance Trust)1,3 |
|
41,100 |
|
|
|
0 |
|
†Go-Ahead Group |
|
4,200 |
|
|
|
88,022 |
|
Hilton
Food Group |
|
16,100 |
|
|
|
211,205 |
|
†Huntsworth |
|
151,800 |
|
|
|
241,407 |
|
ITE
Group |
|
380,341 |
|
|
|
401,564 |
|
†ITE Group (Rights) 1 |
|
665,596 |
|
|
|
209,943 |
|
Jupiter
Fund Management |
|
36,000 |
|
|
|
211,899 |
|
Polypipe
Group |
|
95,000 |
|
|
|
482,699 |
|
Restore |
|
58,500 |
|
|
|
398,380 |
|
RPC
Group |
|
23,000 |
|
|
|
227,111 |
|
SIG |
|
100,000 |
|
|
|
184,369 |
|
Spirax-Sarco Engineering |
|
19,000 |
|
|
|
1,634,907 |
|
Staffline
Group |
|
8,400 |
|
|
|
103,875 |
|
Stallergenes
Greer 1 |
|
10,800 |
|
|
|
387,196 |
|
Victrex |
|
22,500 |
|
|
|
865,294 |
|
†WANdisco 1 |
|
8,000 |
|
|
|
117,722 |
|
Xaar |
|
53,591 |
|
|
|
169,391 |
|
| |
| Total (Cost $12,593,083)
|
|
|
|
|
|
13,036,719
|
|
| |
| |
|
|
|
|
|
|
|
| UNITED
STATES – 27.5% |
|
|
|
|
|
|
|
Air Lease Cl. A |
|
36,460 |
|
|
|
1,530,226 |
|
| 12 | 2018
Semiannual Report to Stockholders |
|
THE ACCOMPANYING
NOTES ARE AN INTEGRAL PART OF THESE FINANCIAL STATEMENTS |
| June 30, 2018
(unaudited) |
| |
| Schedule
of Investments (continued) |
| |
|
SHARES |
|
|
VALUE |
|
| |
| |
|
|
|
|
|
|
|
| UNITED
STATES (continued) |
|
|
|
|
|
|
|
Brooks
Automation 2 |
|
18,100 |
|
|
$ |
590,422 |
|
CIRCOR
International 1 |
|
32,200 |
|
|
|
1,190,112 |
|
Cognex
Corporation |
|
10,748 |
|
|
|
479,468 |
|
Coherent
1 |
|
3,000 |
|
|
|
469,260 |
|
†comScore 1 |
|
24,000 |
|
|
|
523,200 |
|
Diebold
Nixdorf 2 |
|
28,800 |
|
|
|
344,160 |
|
Diodes
1 |
|
20,500 |
|
|
|
706,635 |
|
Dorian
LPG 1 |
|
4,475 |
|
|
|
34,189 |
|
EnerSys
2 |
|
11,000 |
|
|
|
821,040 |
|
Expeditors
International of Washington 2 |
|
13,300 |
|
|
|
972,230 |
|
FLIR Systems 2 |
|
51,500 |
|
|
|
2,676,455 |
|
Innospec
2,4 |
|
12,457 |
|
|
|
953,583 |
|
Kadant |
|
7,800 |
|
|
|
749,970 |
|
KBR
2 |
|
58,700 |
|
|
|
1,051,904 |
|
Kirby Corporation 1,2,4 |
|
32,900 |
|
|
|
2,750,440 |
|
Lazard Cl. A |
|
32,600 |
|
|
|
1,594,466 |
|
Lindsay Corporation |
|
13,700 |
|
|
|
1,328,763 |
|
Littelfuse |
|
4,000 |
|
|
|
912,720 |
|
ManpowerGroup |
|
8,800 |
|
|
|
757,328 |
|
MBIA
1,2,4 |
|
80,300 |
|
|
|
725,912 |
|
Nanometrics 1,2,4 |
|
35,600 |
|
|
|
1,260,596 |
|
National
Instruments 2,4 |
|
15,200 |
|
|
|
638,096 |
|
Popular |
|
13,100 |
|
|
|
592,251 |
|
Quaker
Chemical 2 |
|
6,069 |
|
|
|
939,906 |
|
Raven Industries |
|
40,000 |
|
|
|
1,538,000 |
|
Rogers
Corporation 1,2,4 |
|
4,800 |
|
|
|
535,008 |
|
SEACOR
Holdings 1 |
|
20,200 |
|
|
|
1,156,854 |
|
SEACOR
Marine Holdings 1 |
|
20,309 |
|
|
|
468,935 |
|
SEI Investments 2 |
|
27,600 |
|
|
|
1,725,552 |
|
Signet
Jewelers |
|
5,500 |
|
|
|
306,625 |
|
Standard
Motor Products |
|
11,200 |
|
|
|
541,408 |
|
Sun
Hydraulics 2 |
|
15,139 |
|
|
|
729,549 |
|
Tennant
Company 2 |
|
11,600 |
|
|
|
916,400 |
|
Valmont
Industries |
|
5,400 |
|
|
|
814,050 |
|
Virtu Financial Cl. A 2 |
|
74,300 |
|
|
|
1,972,665 |
|
World
Fuel Services |
|
12,000 |
|
|
|
244,920 |
|
| |
| Total (Cost $26,504,302)
|
|
|
|
|
|
35,543,298
|
|
| |
| |
|
|
|
|
|
|
|
| URUGUAY
– 0.3% |
|
|
|
|
|
|
|
Arcos Dorados Holdings Cl. A |
|
46,800 |
|
|
|
325,260
|
|
| |
| Total (Cost $351,426)
|
|
|
|
|
|
325,260
|
|
| |
| TOTAL COMMON
STOCKS |
|
|
|
|
|
|
|
| |
| (Cost $104,022,293)
|
|
|
|
|
$ |
124,221,861
|
|
| |
| |
|
|
|
|
|
|
|
| REPURCHASE
AGREEMENT– 10.2% |
|
|
|
|
|
|
|
Fixed Income Clearing Corporation, 0.35% dated 6/29/18, due 7/2/18, maturity value
$13,162,384 (collateralized by obligations of various U.S. Government Agencies,
1.375%
due 10/07/21, valued at $13,428,459) |
| |
| (Cost $13,162,000)
|
|
|
|
|
|
13,162,000
|
|
| |
| |
|
|
|
|
|
|
|
| TOTAL INVESTMENTS
– 106.2% |
|
|
|
|
|
|
|
| |
| (Cost $117,184,293)
|
|
|
|
|
|
137,383,861
|
|
| |
| |
|
|
|
|
|
|
|
| LIABILITIES
LESS CASH AND OTHER ASSETS – (6.2)% |
|
|
|
|
|
(7,996,878 |
) |
| |
|
|
|
|
|
|
| |
|
|
|
|
|
|
|
| |
| NET ASSETS
– 100.0% |
|
|
|
|
$ |
129,386,983
|
|
| |
| † |
New additions
in 2018. |
| 1 |
Non-income
producing. |
| 2 |
All or a portion
of these securities were pledged as collateral in connection with the Fund’s
revolving credit agreement at June 30, 2018. Total market value of pledged securities
at June 30, 2018, was $14,875,097. |
| 3 |
Securities
for which market quotations are not readily available represent 0.0% of net assets.
These securities have been valued at their fair value under procedures approved
by the Fund’s Board of Directors. These securities are defined as Level 3 securities
due to the use of significant unobservable inputs in the determination of fair value.
See Notes to Financial Statements. |
| 4 |
At June 30,
2018, a portion of these securities were rehypothecated in connection with the Fund’s revolving credit agreement in the aggregate amount of $5,000,988. |
| |
|
| |
Securities
of Global/International Funds are categorized by the country of their headquarters,
with the exception of exchange-traded funds. |
| |
|
| |
Bold indicates the Fund’s 20
largest equity holdings in terms of June 30, 2018, market value. |
| |
|
| |
TAX INFORMATION: The cost of total investments for Federal income tax purposes was $117,231,433.
At June 30, 2018, net unrealized appreciation for all securities was $ 20,152,428
consisting of aggregate gross unrealized appreciation of $27,931,533 and aggregate
gross unrealized depreciation of $7,779,105. The primary cause of the difference
between book and tax basis cost is the timing of the recognition of losses on securities
sold. |
| THE ACCOMPANYING
NOTES ARE AN INTEGRAL PART OF THESE FINANCIAL STATEMENTS |
|
2018 Semiannual
Report to Stockholders | 13 |
| Royce Global
Value Trust |
|
June 30, 2018
(unaudited) |
| |
| Statement
of Assets and Liabilities |
|
|
|
|
| |
|
|
|
|
| ASSETS: |
|
|
|
|
| Investments
at value |
|
$ |
124,221,861 |
|
| |
| Repurchase
agreements (at cost and value) |
|
|
13,162,000 |
|
| |
| Cash and foreign
currency |
|
|
27,900 |
|
| |
| Receivable
for investments sold |
|
|
2,202,571 |
|
| |
| Receivable
for dividends and interest |
|
|
294,102 |
|
| |
| Prepaid expenses
and other assets |
|
|
31,792 |
|
| |
| Total Assets
|
|
|
139,940,226
|
|
| |
| LIABILITIES: |
|
|
|
|
| Revolving
credit agreement |
|
|
8,000,000 |
|
| |
| Payable for
investments purchased |
|
|
2,377,338 |
|
| |
| Payable for
investment advisory fee |
|
|
136,299 |
|
| |
| Payable for
directors’ fees |
|
|
9,151 |
|
| |
| Payable for
interest expense |
|
|
2,192 |
|
| |
| Accrued expenses |
|
|
28,054 |
|
| |
| Deferred capital
gains tax |
|
|
209 |
|
| |
| Total Liabilities
|
|
|
10,553,243
|
|
| |
| Net Assets
|
|
$ |
129,386,983
|
|
| |
| ANALYSIS OF
NET ASSETS: |
|
|
|
|
| Paid-in capital
- $0.001 par value per share; 10,461,711 shares outstanding (150,000,000 shares authorized) |
|
$ |
117,980,744 |
|
| |
| Undistributed
net investment income (loss) |
|
|
(787,401 |
) |
| |
| Accumulated
net realized gain (loss) on investments and foreign currency |
|
|
(7,999,866 |
) |
| |
| Net unrealized
appreciation (depreciation) on investments and foreign currency |
|
|
20,193,506 |
|
| |
| Net Assets
(net asset value per share - $12.37) |
|
$ |
129,386,983
|
|
| |
| Investments
at identified cost |
|
$ |
104,022,293 |
|
| |
| 14 | 2018
Semiannual Report to Stockholders |
|
THE ACCOMPANYING
NOTES ARE AN INTEGRAL PART OF THESE FINANCIAL STATEMENTS |
| |
| Statement
of Changes in Net Assets |
|
|
|
|
|
|
|
|
| |
|
|
|
|
|
|
|
|
| |
|
SIX MONTHS ENDED |
|
|
|
|
| |
|
6/30/18 |
|
|
|
|
| |
|
(UNAUDITED) |
|
YEAR ENDED 12/31/17 |
| |
| |
|
|
|
|
|
|
|
|
| INVESTMENT
OPERATIONS: |
|
|
|
|
|
|
|
|
| Net investment
income (loss) |
|
$ |
411,907 |
|
|
$ |
241,105 |
|
| |
| Net realized
gain (loss) on investments and foreign currency |
|
|
5,981,008 |
|
|
|
6,555,345 |
|
| |
| Net change
in unrealized appreciation (depreciation) on investments and foreign currency |
|
|
(7,532,114 |
) |
|
|
24,156,512 |
|
| |
| Net increase
(decrease) in net assets from investment operations |
|
|
(1,139,199 |
) |
|
|
30,952,962
|
|
| |
| DISTRIBUTIONS: |
|
|
|
|
|
|
|
|
| Net investment
income |
|
|
– |
|
|
|
(1,145,697 |
) |
| |
| Net realized
gain on investments and foreign currency |
|
|
– |
|
|
|
– |
|
| |
| Total distributions
|
|
|
–
|
|
|
|
(1,145,697 |
) |
| |
| CAPITAL STOCK
TRANSACTIONS: |
|
|
|
|
|
|
|
|
| Reinvestment
of distributions |
|
|
– |
|
|
|
491,130 |
|
| |
| Total capital
stock transactions |
|
|
–
|
|
|
|
491,130
|
|
| |
| Net Increase
(Decrease) In Net Assets |
|
|
(1,139,199 |
) |
|
|
30,298,395
|
|
| |
| NET ASSETS: |
|
|
|
|
|
|
|
|
| |
| Beginning
of period |
|
|
130,526,182
|
|
|
|
100,227,787
|
|
| |
| End of
period (including undistributed net investment income (loss) of $(787,401) at 6/30/18
and $(1,199,309) at 12/31/17) |
|
$ |
129,386,983
|
|
|
$ |
130,526,182
|
|
| |
| THE ACCOMPANYING
NOTES ARE AN INTEGRAL PART OF THESE FINANCIAL STATEMENTS |
|
2018 Semiannual
Report to Stockholders | 15 |
| Royce Global
Value Trust |
|
Six Months
Ended June 30, 2018 (unaudited) |
| |
| Statement
of Operations |
|
|
|
|
| |
|
|
|
|
| INVESTMENT
INCOME: |
|
|
|
|
| INCOME: |
|
|
|
|
| Dividends |
|
$ |
1,627,362 |
|
| |
| Foreign withholding
tax |
|
|
(125,280 |
) |
| |
| Interest |
|
|
14,440 |
|
| |
| Rehypothecation
income |
|
|
9,719 |
|
| |
| Total income
|
|
|
1,526,241
|
|
| |
| EXPENSES: |
|
|
|
|
| |
| Investment
advisory fees |
|
|
824,678 |
|
| |
| Interest expense |
|
|
124,069 |
|
| |
| Custody and
transfer agent fees |
|
|
65,355 |
|
| |
| Stockholder
reports |
|
|
30,650 |
|
| |
| Professional
fees |
|
|
25,118 |
|
| |
| Administrative
and office facilities |
|
|
16,778 |
|
| |
| Directors’ fees |
|
|
15,562 |
|
| |
| Other expenses |
|
|
12,142 |
|
| |
| Total expenses
|
|
|
1,114,352
|
|
| |
| Compensating
balance credits |
|
|
(18 |
) |
| |
| Net expenses
|
|
|
1,114,334
|
|
| |
| Net investment
income (loss) |
|
|
411,907
|
|
| |
| REALIZED
AND UNREALIZED GAIN (LOSS) ON INVESTMENTS AND FOREIGN CURRENCY: |
|
|
|
|
| NET REALIZED
GAIN (LOSS): |
|
|
|
|
| |
| Investments |
|
|
6,005,916 |
|
| |
| Foreign currency
transactions |
|
|
(24,908 |
) |
| |
| NET CHANGE
IN UNREALIZED APPRECIATION (DEPRECIATION): |
|
|
|
|
| |
| Investments
and foreign currency translations |
|
|
(7,682,352 |
) |
| |
| Other assets
and liabilities denominated in foreign currency |
|
|
150,238 |
|
| |
| Net realized
and unrealized gain (loss) on investments and foreign currency |
|
|
(1,551,106 |
) |
| |
| NET INCREASE
(DECREASE) IN NET ASSETS FROM INVESTMENT OPERATIONS |
|
$ |
(1,139,199 |
) |
| |
| 16 | 2018
Semiannual Report to Stockholders |
|
THE ACCOMPANYING
NOTES ARE AN INTEGRAL PART OF THESE FINANCIAL STATEMENTS |
| Royce Global
Value Trust |
|
Six Months
Ended June 30, 2018 (unaudited) |
| |
| Statement
of Cash Flows |
|
|
|
|
| |
|
|
|
|
| CASH FLOWS
FROM OPERATING ACTIVITIES: |
|
|
|
|
| Net increase
(decrease) in net assets from investment operations |
|
$ |
(1,139,199 |
) |
| |
| Adjustments
to reconcile net increase (decrease) in net assets from investment operations to
net cash provided by operating activities: |
|
|
|
|
| |
Purchases
of long-term investments |
|
|
(27,799,230 |
) |
| |
Proceeds
from sales and maturities of long-term investments |
|
|
31,384,318 |
|
| |
Net
purchases, sales and maturities of short-term investments |
|
|
(3,831,000 |
) |
| |
Net
(increase) decrease in dividends and interest receivable and other assets |
|
|
(81,103 |
) |
| |
Net
increase (decrease) in interest expense payable, accrued expenses and other liabilities |
|
|
(207,827 |
) |
| |
Net
change in unrealized appreciation (depreciation) on investments |
|
|
7,682,352 |
|
| |
Net
realized gain (loss) on investments and foreign currency |
|
|
(5,981,008 |
) |
| |
| Net cash
provided by operating activities |
|
|
27,303
|
|
| |
| CASH FLOWS
FROM FINANCING ACTIVITIES: |
|
|
|
|
| Distributions |
|
|
– |
|
| |
| Reinvestment
of distributions |
|
|
– |
|
| |
| Net cash
used for financing activities |
|
|
–
|
|
| |
| INCREASE
(DECREASE) IN CASH: |
|
|
27,303
|
|
| |
| Cash and
foreign currency at beginning of period |
|
|
597 |
|
| |
| Cash and
foreign currency at end of period |
|
$ |
27,900
|
|
| |
| THE ACCOMPANYING
NOTES ARE AN INTEGRAL PART OF THESE FINANCIAL STATEMENTS |
|
2018 Semiannual
Report to Stockholders | 17 |
| |
| Financial
Highlights |
This table
is presented to show selected data for a share outstanding throughout each year
or other indicated period, and to assist stockholders in evaluating the Fund’s
performance for the periods presented. |
| |
|
SIX MONTHS |
|
YEARS ENDED |
|
|
|
|
| |
|
|
|
|
|
|
|
|
|
|
| |
|
ENDED 6/30/18 |
|
|
|
|
|
|
|
|
|
|
|
|
|
|
|
|
|
PERIOD ENDED |
| |
|
(UNAUDITED) |
|
12/31/17 |
|
12/31/16 |
|
12/31/15 |
|
12/31/14 |
|
12/31/13 1 |
| |
| Net Asset
Value, Beginning of Period |
|
$ |
12.48 |
|
|
$ |
9.62 |
|
|
$ |
8.81 |
|
|
$ |
9.25 |
|
|
$ |
10.05 |
|
|
$ |
9.78 |
|
| |
| INVESTMENT
OPERATIONS: |
|
|
|
|
|
|
|
|
|
|
|
|
|
|
|
|
|
|
|
|
|
|
|
|
| Net investment
income (loss) |
|
|
0.04 |
|
|
|
0.02 |
|
|
|
0.06 |
|
|
|
0.10 |
|
|
|
0.13 |
|
|
|
(0.00 |
) |
| |
| Net realized
and unrealized gain (loss) on investments and foreign currency |
|
|
(0.15 |
) |
|
|
2.96 |
|
|
|
0.90 |
|
|
|
(0.43 |
) |
|
|
(0.77 |
) |
|
|
0.27 |
|
| |
| Net increase
(decrease) in net assets from investment operations |
|
|
(0.11 |
) |
|
|
2.98 |
|
|
|
0.96 |
|
|
|
(0.33 |
) |
|
|
(0.64 |
) |
|
|
0.27 |
|
| |
| DISTRIBUTIONS: |
|
|
|
|
|
|
|
|
|
|
|
|
|
|
|
|
|
|
|
|
|
|
|
|
| Net investment
income |
|
|
– |
|
|
|
(0.11 |
) |
|
|
(0.14 |
) |
|
|
(0.10 |
) |
|
|
(0.15 |
) |
|
|
– |
|
| |
| Net realized
gain on investments and foreign currency |
|
|
– |
|
|
|
– |
|
|
|
– |
|
|
|
– |
|
|
|
– |
|
|
|
– |
|
| |
| Total distributions |
|
|
– |
|
|
|
(0.11 |
) |
|
|
(0.14 |
) |
|
|
(0.10 |
) |
|
|
(0.15 |
) |
|
|
–
|
|
| |
| CAPITAL STOCK
TRANSACTIONS: |
|
|
|
|
|
|
|
|
|
|
|
|
|
|
|
|
|
|
|
|
|
|
|
|
| Effect of
reinvestment of distributions by Common Stockholders |
|
|
– |
|
|
|
(0.01 |
) |
|
|
(0.01 |
) |
|
|
(0.01 |
) |
|
|
(0.01 |
) |
|
|
– |
|
| |
| Total capital stock transactions |
|
|
– |
|
|
|
(0.01 |
) |
|
|
(0.01 |
) |
|
|
(0.01 |
) |
|
|
(0.01 |
) |
|
|
– |
|
| |
| Net Asset
Value, End of Period |
|
$ |
12.37 |
|
|
$ |
12.48 |
|
|
$ |
9.62 |
|
|
$ |
8.81 |
|
|
$ |
9.25 |
|
|
$ |
10.05 |
|
| |
| Market
Value, End of Period |
|
$ |
10.51 |
|
|
$ |
10.81 |
|
|
$ |
8.04 |
|
|
$ |
7.45 |
|
|
$ |
8.04 |
|
|
$ |
8.89 |
|
| |
| TOTAL RETURN:
2 |
|
|
|
|
|
|
|
|
|
|
|
|
|
|
|
|
|
|
|
|
|
|
|
|
| Net Asset
Value |
|
|
(0.88 |
)%3 |
|
|
31.07 |
% |
|
|
11.12 |
% |
|
|
(3.44 |
)% |
|
|
(6.23 |
)% |
|
|
2.76 |
%3 |
| |
| Market Value |
|
|
(2.81 |
)%3 |
|
|
35.96 |
% |
|
|
9.77 |
% |
|
|
(6.06 |
)% |
|
|
(7.86 |
)% |
|
|
(0.95 |
)%3 |
| |
| RATIOS BASED
ON AVERAGE NET ASSETS: |
|
|
|
|
|
|
|
|
|
|
|
|
|
|
|
|
|
|
|
|
|
|
|
|
| Investment
advisory fee expense |
|
|
1.25 |
%4 |
|
|
1.25 |
% |
|
|
1.25 |
% |
|
|
1.25 |
% |
|
|
1.25 |
% |
|
|
1.25 |
%4 |
| |
| Other operating
expenses |
|
|
0.44 |
%4 |
|
|
0.42 |
% |
|
|
0.46 |
% |
|
|
0.43 |
% |
|
|
0.24 |
% |
|
|
0.37 |
%4 |
| |
| Total expenses
(net) |
|
|
1.69 |
%4 |
|
|
1.67 |
% |
|
|
1.71 |
% |
|
|
1.68 |
% |
|
|
1.49 |
% |
|
|
1.62 |
%4 |
| |
| Expenses excluding
interest expense |
|
|
1.50 |
%4 |
|
|
1.52 |
% |
|
|
1.57 |
% |
|
|
1.58 |
% |
|
|
1.49 |
% |
|
|
1.62 |
%4 |
| |
| Expenses prior
to balance credits |
|
|
1.69 |
%4 |
|
|
1.67 |
% |
|
|
1.71 |
% |
|
|
1.68 |
% |
|
|
1.49 |
% |
|
|
1.62 |
%4 |
| |
| Net investment income (loss) |
|
|
0.62 |
%4 |
|
|
0.21 |
% |
|
|
0.69 |
% |
|
|
1.03 |
% |
|
|
1.30 |
% |
|
|
(0.13 |
)%4 |
| |
| SUPPLEMENTAL
DATA: |
|
|
|
|
|
|
|
|
|
|
|
|
|
|
|
|
|
|
|
|
|
|
|
|
| Net Assets,
End of Period (in thousands) |
|
$ |
129,387 |
|
|
$ |
130,526 |
|
|
$ |
100,228 |
|
|
$ |
91,174 |
|
|
$ |
95,285 |
|
|
$ |
102,684 |
|
| |
| Portfolio
Turnover Rate |
|
|
23 |
% |
|
|
34 |
% |
|
|
59 |
% |
|
|
65 |
% |
|
|
43 |
% |
|
|
7 |
% |
| |
| REVOLVING
CREDIT AGREEMENT: |
|
|
|
|
|
|
|
|
|
|
|
|
|
|
|
|
|
|
|
|
|
|
|
|
| Asset coverage |
|
|
1717 |
% |
|
|
1732 |
% |
|
|
1353 |
% |
|
|
1240 |
% |
|
|
|
|
|
|
|
|
| |
| Asset coverage
per $1,000 |
|
|
17,173 |
|
|
|
17,316 |
|
|
|
13,528 |
|
|
|
12,397 |
|
|
|
|
|
|
|
|
|
| |
| 1 |
The Fund commenced
operations on October 18, 2013. |
| 2 |
The Market
Value Total Return is calculated assuming a purchase of Common Stock on the opening
of the first business day and a sale on the closing of the last business day of
each period. Dividends and distributions are assumed for the purposes of this calculation
to be reinvested at prices obtained under the Fund’s Distribution Reinvestment
and Cash Purchase Plan. Net Asset Value Total Return is calculated on the same basis,
except that the Fund’s net asset value is used on the purchase and sale dates
instead of market value. |
| 3 |
Not annualized |
| 4 |
Annualized |
| 18 | 2018
Semiannual Report to Stockholders |
|
THE ACCOMPANYING
NOTES ARE AN INTEGRAL PART OF THESE FINANCIAL STATEMENTS |
| Royce Global Value Trust |
| |
| Notes to Financial Statements (unaudited) |
| Summary of Significant Accounting Policies |
Royce Global Value Trust, Inc. (the “Fund”), is a diversified closed-end investment company that was incorporated under the laws of the
State of Maryland on February 14, 2011. The Fund commenced operations on October 18, 2013. |
The preparation of financial statements in conformity with accounting principles generally accepted in the United States of America
requires management to make estimates and assumptions that affect the reported amounts of assets and liabilities and the disclosure of
contingent assets and liabilities at the date of the financial statements and the reported amounts of income and expenses during the
reporting period. Actual results could differ from those estimates. |
The Fund is an investment company and accordingly follows the investment company accounting and reporting guidance of the
Financial Accounting Standards Board (FASB) Accounting Standard Codification Topic 946 “Financial Services-Investment Companies”. |
| VALUATION
OF INVESTMENTS: |
Securities are valued as of the close of trading on the New York Stock Exchange (NYSE) (generally 4:00 p.m. Eastern time) on the
valuation date. Securities that trade on an exchange, and securities traded on Nasdaq’s Electronic Bulletin Board, are valued at their last
reported sales price or Nasdaq official closing price taken from the primary market in which each security trades or, if no sale is reported
for such day, at their highest bid price. Other over-the-counter securities for which market quotations are readily available are valued at
their highest bid price, except in the case of some bonds and other fixed income securities which may be valued by reference to other
securities with comparable ratings, interest rates and maturities, using established independent pricing services. The Fund values its non-U.S. dollar denominated securities in U.S. dollars daily at the prevailing foreign currency exchange rates as quoted by a major bank.
Securities for which market quotations are not readily available are valued at their fair value in accordance with the provisions of the 1940
Act, under procedures approved by the Fund’s Board of Directors, and are reported as Level 3 securities. As a general principle, the fair
value of a security is the amount which the Fund might reasonably expect to receive for the security upon its current sale. However, in
light of the judgment involved in fair valuations, there can be no assurance that a fair value assigned to a particular security will be the
amount which the Fund might be able to receive upon its current sale. In addition, if, between the time trading ends on a particular security
and the close of the customary trading session on the NYSE, events occur that are significant and may make the closing price unreliable,
the Fund may fair value the security. The Fund uses an independent pricing service to provide fair value estimates for relevant non-U.S.
equity securities on days when the U.S. market volatility exceeds a certain threshold. This pricing service uses proprietary correlations it
has developed between the movement of prices of non-U.S. equity securities and indices of U.S.-traded securities, futures contracts and
other indications to estimate the fair value of relevant non-U.S. securities. When fair value pricing is employed, the prices of securities used
by the Fund may differ from quoted or published prices for the same security. Investments in money market funds are valued at net asset
value per share. |
Various inputs are used in determining the value of the Fund’s investments, as noted above. These inputs are summarized in the three
broad levels below: |
| Level 1 |
– |
quoted prices in active markets for identical securities. |
| Level 2 |
– |
other significant observable inputs (including quoted prices for similar securities, foreign securities that may be fair valued and
repurchase agreements). The table below includes all Level 2 securities. Any Level 2 securities with values based on quoted
prices for similar securities would be noted in the Schedule of Investments. |
| Level 3 |
– |
significant unobservable inputs (including last trade price before trading was suspended, or at a discount thereto for lack of
marketability or otherwise, market price information regarding other securities, information received from the company and/or
published documents, including SEC filings and financial statements, or other publicly available information). |
The inputs or methodology used for valuing securities are not necessarily an indication of the risk associated with investing in those
securities. |
The following is a summary of the inputs used to value the Fund’s investments as of June 30, 2018. For a detailed breakout of common
stocks by country, please refer to the Schedule of Investments. |
| |
|
|
|
|
|
|
|
|
|
|
|
|
|
|
|
| |
|
LEVEL 1 |
|
|
LEVEL 2 |
|
|
LEVEL 3 |
|
TOTAL |
| |
| Common Stocks |
|
|
$124,179,586 |
|
|
|
$– |
|
|
|
$42,275 |
|
|
|
$124,221,861 |
| |
| Cash Equivalents |
|
|
– |
|
|
|
13,162,000 |
|
|
|
– |
|
|
|
13,162,000 |
| |
Certain securities have transferred in and out of Level 1 and Level 2 measurements during the reporting period. The Fund recognizes
transfers between levels as of the end of the reporting period. For the six months ended June 30, 2018, securities valued at $59,393,938
were transferred from Level 2 to Level 1 within the fair value hierarchy.
| 2018 Semiannual Report to Stockholders | 19 |
| Royce Global
Value Trust |
| |
| Notes to Financial Statements (unaudited) (continued) |
VALUATION OF INVESTMENTS (continued):
Level 3 Reconciliation:
| |
|
|
BALANCE
AS OF 12/31/17 |
|
|
PURCHASES
|
|
|
SALES
|
|
|
REALIZED
GAIN (LOSS) |
|
|
UNREALIZED
GAIN (LOSS)1 |
|
|
|
BALANCE
AS OF 6/30/18 |
| |
| Common Stocks |
|
|
$0 |
|
|
$126,098 |
|
|
$84,433 |
|
|
$8,774 |
|
|
$(8,164) |
|
|
|
$42,275 |
| |
| 1 |
The net change in unrealized appreciation (depreciation) is included in the accompanying Statement of Operations. Change in unrealized appreciation (depreciation) includes net
unrealized appreciation (depreciation) resulting from changes in investment values during the reporting period and the reversal of previously recorded unrealized appreciation
(depreciation) when gains or losses are realized. Net realized gain (loss) from investments and foreign currency transactions is included in the accompanying Statement of Operations. |
| REPURCHASE
AGREEMENTS: |
The Fund may enter into repurchase agreements with institutions that the Fund’s investment adviser has determined are creditworthy.
The Fund restricts repurchase agreements to maturities of no more than seven days. Securities pledged as collateral for repurchase
agreements, which are held until maturity of the repurchase agreements, are marked-to-market daily and maintained at a value at least
equal to the principal amount of the repurchase agreement (including accrued interest). Repurchase agreements could involve certain
risks in the event of default or insolvency of the counter-party, including possible delays or restrictions upon the ability of the Fund to
dispose of its underlying securities. The remaining contractual maturity of the repurchase agreement held by the Fund at June 30, 2018 is
overnight and continuous. |
| FOREIGN CURRENCY: |
Net realized foreign exchange gains or losses arise from sales and maturities of short-term securities, sales of foreign currencies,
expiration of currency forward contracts, currency gains or losses realized between the trade and settlement dates on securities
transactions, and the difference between the amounts of dividends, interest, and foreign withholding taxes recorded on the Fund’s books
and the U.S. dollar equivalent of the amounts actually received or paid. Net unrealized foreign exchange gains and losses arise from
changes in the value of assets and liabilities, including investments in securities at the end of the reporting period, as a result of changes
in foreign currency exchange rates. |
| DISTRIBUTIONS
AND TAXES: |
As a qualified regulated investment company under Subchapter M of the Internal Revenue Code, the Fund is not subject to income
taxes to the extent that it distributes substantially all of its taxable income for its fiscal year. The Schedule of Investments includes
information regarding income taxes under the caption “Tax Information”. |
The Fund pays any dividends and capital gain distributions annually in December. Because federal income tax regulations differ from
generally accepted accounting principles, income and capital gain distributions determined in accordance with tax regulations may differ
from net investment income and realized gains recognized for financial reporting purposes. Accordingly, the character of distributions and
composition of net assets for tax purposes differ from those reflected in the accompanying financial statements. |
| CAPITAL GAINS TAXES: |
The Fund is subject to a tax imposed on short-term capital gains on securities of issuers domiciled in certain countries. The Fund
records an estimated deferred tax liability for gains in these securities that have been held for less than one year. This amount, if any, is
reported as deferred capital gains tax in the accompanying Statement of Assets and Liabilities, assuming those positions were disposed of
at the end of the period, and accounted for as a reduction in the market value of the security. |
| INVESTMENT
TRANSACTIONS AND RELATED INVESTMENT INCOME: |
Investment transactions are accounted for on the trade date. Dividend income is recorded on the ex-dividend date. Non-cash dividend
income is recorded at the fair market value of the securities received. Interest income is recorded on an accrual basis. Premiums and
discounts on debt securities are amortized using the effective yield-to-maturity method. Realized gains and losses from investment
transactions are determined on the basis of identified cost for book and tax purposes. |
| EXPENSES: |
The Fund incurs direct and indirect expenses. Expenses directly attributable to the Fund are charged to the Fund’s operations, while
expenses applicable to more than one of the Royce Funds are allocated equitably. Certain personnel, occupancy costs and other
administrative expenses related to the Funds are allocated by Royce & Associates (“Royce”) under an administration agreement and are
included in administrative and office facilities and professional fees. |
| COMPENSATING
BALANCE CREDITS: |
The Fund has an arrangement with its custodian bank, whereby a portion of the custodian’s fee is paid indirectly by credits earned on
the Fund’s cash on deposit with the bank. This deposit arrangement is an alternative to purchasing overnight investments. Conversely, the
Fund pays interest to the custodian on any cash overdrafts, to the extent they are not offset by credits earned on positive cash balances. |
| 20 | 2018 Semiannual Report to Stockholders |
| Royce Global
Value Trust |
| |
| Notes to Financial Statements (unaudited) (continued) |
| Capital
Stock: |
The Fund issued 46,290 shares of Common Stock as reinvestment of distributions for the year ended December 31, 2017. |
| Borrowings:
|
The Fund is party to a revolving credit agreement (the credit agreement) with BNP Paribas Prime Brokerage International, Limited
(BNPPI). The Fund pays a commitment fee of 0.50% per annum on the unused portion of the credit agreement. The credit agreement has a
360-day rolling term that resets daily; however, if the Fund exceeds certain net asset value triggers, the credit agreement may convert to a
60-day rolling term that resets daily. The Fund is required to pledge portfolio securities as collateral in an amount up to two times the loan
balance outstanding or as otherwise required by applicable regulatory standards and has granted a security interest in the securities
pledged to, and in favor of, BNPPI as security for the loan balance outstanding. If the Fund fails to meet certain requirements, or maintain
other financial covenants required under the credit agreement, the Fund may be required to repay immediately, in part or in full, the loan
balance outstanding under the credit agreement which may necessitate the sale of portfolio securities at potentially inopportune times.
BNPPI may terminate the credit agreement upon certain ratings downgrades of its corporate parent, which would result in the Fund’s
entire loan balance becoming immediately due and payable. The occurrence of such ratings downgrades may necessitate the sale of
portfolio securities at potentially inopportune times. The credit agreement also permits, subject to certain conditions, BNPPI to
rehypothecate portfolio securities pledged by the Fund up to the amount of the loan balance outstanding. The Fund continues to receive
payments in lieu of dividends and interest on rehypothecated securities. The Fund also has the right under the credit agreement to recall
the rehypothecated securities from BNPPI on demand. If BNPPI fails to deliver the recalled security in a timely manner, the Fund is
compensated by BNPPI for any fees or losses related to the failed delivery or, in the event a recalled security is not returned by BNPPI, the
Fund, upon notice to BNPPI, may reduce the loan balance outstanding by the value of the recalled security failed to be returned. The Fund
receives a portion of the fees earned by BNPPI in connection with the rehypothecation of portfolio securities. |
As of June 30, 2018, the Fund has outstanding borrowings of $8,000,000. During the six months ended June 30, 2018, the Fund
borrowed an average daily balance of $8,000,000 at a weighted average borrowing cost of 3.08%. The maximum amount outstanding
during the six months ended June 30, 2018 was $8,000,000. As of June 30, 2018, the aggregate value of rehypothecated securities was
$5,000,988. During the six months ended June 30, 2018, the Fund earned $9,719 in fees from rehypothecated securities. |
| Investment
Advisory Agreement: |
The investment advisory agreement between Royce and the Fund provides for fees to be paid at an annual rate of 1.25% of the Fund’s
average daily net assets. For the six months ended June 30, 2018, the Fund expensed Royce investment advisory fees totaling $824,678. |
| Purchases and Sales of Investment Securities: |
For the six months ended June 30, 2018, the costs of purchases and proceeds from sales of investment securities, other than short-term
securities, amounted to $29,931,891 and $33,031,431, respectively. |
Cross trades were executed by the Fund pursuant to Rule 17a-7 under the 1940 Act. Cross trading is the buying or selling of portfolio
securities between funds to which Royce serves as investment adviser. At its regularly scheduled quarterly meetings, the Board reviews
such transactions as of the most recent calendar quarter for compliance with the requirements and restrictions set forth by Rule 17a-7.
Cross trades for the six months ended June 30, 2018, were as follows: |
| COST
OF PURCHASES |
|
|
PROCEEDS
FROM SALES |
|
|
REALIZED
GAIN (LOSS) |
| |
| $– |
|
|
$425,880 |
|
|
$(22,161) |
| |
| 2018 Semiannual Report to Stockholders | 21 |
| |
|
MANAGERS’ DISCUSSION |
| Royce Micro-Cap Trust (RMT) |
|
|
 |
Chuck Royce
Jim Harvey
Chris Flynn |
FUND PERFORMANCE
A strong absolute performance
helped Royce Micro-Cap Trust
(“RMT”) to further solidify
advantages over both of its
unleveraged benchmarks, the
small-cap Russell 2000 and Russell
Microcap Indexes. RMT beat the Russell 2000 on both a net asset
value (“NAV”) and market price basis for the one-, three-, five-, 15-,
20-year, and since inception (12/14/93) periods ended June 30,
2018. It also outpaced the micro-cap index on both an NAV and
market price basis for the three- and 15-year periods ended June
30, 2018. (Data for the Russell Microcap Index goes back only to
6/30/00). The Fund advanced 7.8% on an NAV basis and 9.7%
based on market price for the year-to-date period ended June
30, 2018, outpacing the Russell 2000, which was up 7.7%, but
behind the 10.7% gain for the Russell Microcap for the same
period. |
| |
| WHAT WORKED... AND WHAT DIDN’T |
Though the market’s preference for higher growth and more yield-sensitive
equities created challenges for our approach, this was balanced
by the overall strength of micro-cap stocks, which were the best-performing
U.S. asset class in the first half of the year, along with select
stock selection advantages.
Seven of the portfolio’s 11 equity sectors made positive contributions
to performance, with Information Technology and Health Care
making outsized impacts, followed by Energy. Three sectors detracted
from first-half results—Materials, Industrials, and Consumer
Staples—though their collective negative impact was modest. This was
paralleled somewhat at the industry level, where two groups dominated
the positive contributors—electronic equipment, instruments &
components (Information Technology) and health care equipment &
supplies (Health Care)—and the impact of detractors, led by machinery
(Industrials) and pharmaceuticals (Health Care), was far more modest.
The portfolio’s top contributor at the position level, Mesa
Laboratories, is in the electronic equipment, instruments &
components group, though it does most of its business with hospitals,
pharmaceutical and medical device manufacturers, and research
laboratories by offering quality control and calibration products and
services. The company reported record revenues for its fiscal fourth
quarter and 2018, driven in part by strong results in each of its four
divisions and greater efficiencies from the firm’s proprietary operating
system that helped it to better manage inventories and speed up
deliveries. Three healthcare companies were also among RMT’s top
contributors in the first half, including medical device company
Surmodics, which specializes in coronary stents and catheters. The firm
recently engaged in an agreement with Abbot Laboratories that granted
exclusive global commercialization rights for the company’s SurVeil drug. Although we trimmed our position slightly in early July,
its extended pipeline of interesting products made us happy to hold a
sizable position at the end of June.
Collectors Universe, which provides authentication and grading
services to dealers and collectors of coins, trading cards, event tickets,
autographs, and historical and sports memorabilia, detracted most at
the position level. The company’s fiscal second quarter was slower than
was expected, as softness in coin submissions in China, weakness in
the vintage coin market, and a decline in modern coin sales at the U.S.
Mint all combined to adversely affect results. Shares of Sun Hydraulics,
which makes hydraulic and electronic valves, controls, and instruments
for industrial machinery and off-highway vehicles, saw its share price
tumble. Despite robust sales growth, the company’s margins and
earnings have been weaker than expected due to operating inefficiencies
incurred by a ramp up to meet strong demand, as well as higher
materials and commodity costs. We expect a reversal as the impact of
management’s corrective actions—which include price increases, new
supply agreements to ease constraints, and reduced temporary and
overtime labor—to take effect.
Relative to the Russell 2000, the Fund’s biggest advantage came from
savvy stock selection in the Energy sector’s energy equipment & services
industry, while stock picking was also a strength in the real estate
management & development group. A combination of superior stock
selection and our overweight gave us an additional, though slighter,
edge in Information Technology. Conversely, relative results were hurt
by a mix of larger exposure and stock selection miscues in Industrials.
Stock picking was an issue in the Materials sector, primarily in the
metals & mining group, while the portfolio’s cash position also
detracted from first-half performance. |
| |
Top Contributors to Performance
Year-to-Date Through 6/30/18 (%)1 |
|
|
|
| |
|
|
| Mesa Laboratories |
|
0.81 |
| |
| Surmodics |
|
0.76 |
| |
| Zafgen |
|
0.64 |
| |
| Mirati Therapeutics |
|
0.55 |
| |
| SEACOR Marine Holdings |
|
0.54 |
| |
| 1 Includes dividends |
|
|
| |
Top Detractors from Performance
Year-to-Date Through 6/30/18 (%)2 |
|
|
|
| |
|
|
| Collectors Universe |
|
-0.35 |
| |
| Sun Hydraulics |
|
-0.27 |
| |
| Aquinox Pharmaceuticals |
|
-0.26 |
| |
| Real Matters |
|
-0.22 |
| |
| U.S. Global Investors Cl. A |
|
-0.21 |
| |
| 2 Net of dividends |
| CURRENT POSITIONING AND OUTLOOK |
| The market’s recent behavior looks curious to us. We hear optimism
and solid progress from the management teams we meet with, see
solid earnings reports, and observe consistently strong macroeconomic
data. Yet small- and micro-cap market leadership has stubbornly
remained with defensive and yield-oriented stocks, while cyclicals
have lagged. We are therefore far from ebullient, as we anticipate that
increased volatility will accompany a shift in market leadership to
value/cyclical leadership. We are also mindful that these shifts rarely
occur without some turbulence, so we have sought to position the
portfolio for increased volatility and lower returns. |
| 22 | 2018 Semiannual Report to Stockholders |
|
| PERFORMANCE AND PORTFOLIO REVIEW |
SYMBOLS MARKET PRICE RMT NAV XOTCX |
|
| Performance |
|
|
|
|
|
|
|
|
|
|
|
|
|
|
|
|
| Average Annual Total Return (%) Through 6/30/18 |
|
|
|
|
|
|
|
|
|
|
|
|
| |
|
JAN-JUN 20181 |
|
1-YR |
|
3-YR |
|
5-YR |
|
10-YR |
|
15-YR |
|
20-YR |
|
SINCE INCEPTION (12/14/93) |
| |
| RMT (NAV) |
|
7.84 |
|
19.79 |
|
11.16 |
|
12.51 |
|
9.92 |
|
10.76 |
|
9.81 |
|
11.19 |
| |
| 1 Not Annualized |
|
|
|
|
|
|
|
|
|
|
|
|
|
|
|
|
|
| Market Price Performance History Since Inception (12/14/93) |
| Cumulative Performance of Investment1 |
|
|
|
|
|
|
|
|
| |
|
1-YR |
|
5-YR |
|
10-YR |
|
15-YR |
|
20-YR |
|
SINCE INCEPTION (12/14/93) |
| |
| RMT |
|
24.6% |
|
84.9% |
|
155.6% |
|
360.7% |
|
578.6% |
|
1103.3% |
| |
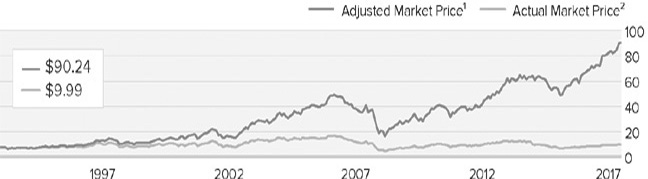
| 1 |
Reflects the cumulative performance experience of a continuous common stockholder who purchased one share at inception ($7.50 IPO),
reinvested all distributions and fully participated in the primary subscription of the Fund's 1994 rights offering. |
| 2 |
Reflects the actual month-end market price movement of one share as it has traded on NYSE and, prior to 12/1/03, on the Nasdaq. |
The Morningstar Style Map is the Morningstar Style Box™ with the center 75% of fund holdings plotted as the Morningstar Ownership Zone™. The Morningstar Style Box is designed to reveal a
fund’s investment strategy. The Morningstar Ownership Zone provides
detail about a portfolio’s investment style by showing the range of
stock sizes and styles. The Ownership Zone is derived by plotting each
stock in the portfolio within the proprietary Morningstar Style Box.
Over time, the shape and location of a fund’s ownership zone may vary.
See page 66 for additional information. |
|
| Top 10 Positions |
|
|
| % of Net Assets |
|
|
| |
|
|
| Mesa Laboratories |
|
2.2 |
| |
| Surmodics |
|
1.6 |
| |
| nLIGHT |
|
1.1 |
| |
| FRP Holdings |
|
1.1 |
| |
| Major Drilling Group International |
|
1.1 |
| |
| Kadant |
|
1.1 |
| |
| Zafgen |
|
1.1 |
| |
| SEACOR Marine Holdings |
|
1.1 |
| |
| Heritage-Crystal Clean |
|
1.0 |
| |
| Social Capital Hedosophia Holdings |
|
1.0 |
| |
|
| Portfolio Sector Breakdown |
|
|
| % of Net Assets |
|
|
| |
|
|
| Information Technology |
|
20.7 |
| |
| Industrials |
|
20.2 |
| |
| Financials |
|
13.9 |
| |
| Health Care |
|
13.4 |
| |
| Consumer Discretionary |
|
11.7 |
| |
| Energy |
|
8.7 |
| |
| Materials |
|
5.3 |
| |
| Real Estate |
|
3.5 |
| |
| Consumer Staples |
|
2.6 |
| |
| Utilities |
|
0.4 |
| |
| Telecommunication Services |
|
0.2 |
| |
| Preferred Stock |
|
0.4 |
| |
| Outstanding Line of Credit, Net of Cash
and Cash Equivalents |
|
-1.0 |
| |
|
| Calendar Year Total Returns (%) |
|
| |
|
|
| YEAR |
|
RMT |
| |
| 2017 |
|
17.7 |
| |
| 2016 |
|
22.0 |
| |
| 2015 |
|
-11.7 |
| |
| 2014 |
|
3.5 |
| |
| 2013 |
|
44.5 |
| |
| 2012 |
|
17.3 |
| |
| 2011 |
|
-7.7 |
| |
| 2010 |
|
28.5 |
| |
| 2009 |
|
46.5 |
| |
| 2008 |
|
-45.5 |
| |
| 2007 |
|
0.6 |
| |
| 2006 |
|
22.5 |
| |
| 2005 |
|
6.8 |
| |
| 2004 |
|
18.7 |
| |
| 2003 |
|
55.5 |
| |
|
| Portfolio Diagnostics |
|
|
| |
|
|
| Fund Net Assets |
|
$433 million |
| |
| Number of Holdings |
|
351 |
| |
| Turnover Rate |
|
10% |
| |
| Net Asset Value |
|
$10.90 |
| |
| Market Price |
|
$9.99 |
| |
| Net Leverage1 |
|
1.1% |
| |
| Average Market Capitalization2 |
|
$511 million |
| |
| Weighted Average P/B Ratio3 |
|
2.1x |
| |
| Active Share4 |
|
94% |
| |
| U.S. Investments (% of Net Assets) |
|
83.2% |
| |
| Non-U.S. Investments (% of Net Assets) |
|
17.8% |
| |
| |
| 1 |
Net leverage is the percentage, in excess of 100%, of the total value of
equity type investments, divided by net assets. |
| 2 |
Geometric Average. This weighted calculation uses each portfolio
holding’s market cap in a way designed to not skew the effect of
very large or small holdings; instead, it aims to better identify
the portfolio’s center, which Royce believes offers a more accurate
measure of average market cap than a simple mean or median. |
| 3 |
Harmonic Average. This weighted calculation evaluates a portfolio
as if it were a single stock and measures it overall. It compares the
total market value of the portfolio to the portfolio’s share in the
earnings or book value, as the case may be, of its underlying stocks. |
| 4 |
Active Share is the sum of the absolute values of the different
weightings of each holding in the Fund versus each holding in the
benchmark, divided by two. |
Important Performance and Risk Information
All performance information reflects past performance, is presented on a total return basis, net of the Fund’s investment advisory fee, and reflects the reinvestment of distributions. Past performance is no guarantee
of future results. Current performance may be higher or lower than performance quoted. Returns as of the most recent month-end may be obtained at www.roycefunds.com. Certain immaterial adjustments were
made to the net assets of Royce Micro-Cap Trust at 12/31/12 and 12/31/14 for financial reporting purposes, and as a result the net asset value originally calculated on that date and the total return based on that
net asset value differs from the adjusted net asset value and total return reported in the Financial Highlights. The market price of the Fund’s shares will fluctuate, so that shares may be worth more or less than their
original cost when sold. The Fund normally invests in micro-cap companies, which may involve considerably more risk than investments in securities of larger-cap companies. The Fund’s broadly diversified portfolio
does not ensure a profit or guarantee against loss. From time to time, the Fund may invest a significant portion of its net assets in foreign securities, which may involve political, economic, currency and other risks
not encountered in U.S. investments. Regarding the “Top Contributors” and “Top Detractors” tables shown above, the sum of all contributors to, and all detractors from, performance for all securities in the portfolio
would approximate the Fund’s year-to-date performance for 2018. |
| |
|
2018 Semiannual Report to Stockholders | 23 |
| |
| Schedule
of Investments |
|
|
|
|
|
|
| Common Stocks
– 100.6% |
|
|
|
|
|
|
| |
|
SHARES
|
|
|
VALUE |
| |
| |
|
|
|
|
|
|
| CONSUMER DISCRETIONARY – 11.7% |
|
|
|
|
|
|
| AUTO COMPONENTS
- 1.3% |
|
|
|
|
|
|
Fox
Factory Holding 1 |
|
5,300 |
|
|
$ |
246,715 |
Motorcar
Parts of America 1 |
|
54,800 |
|
|
|
1,025,308 |
Sebang
Global Battery |
|
50,500 |
|
|
|
1,434,119 |
Standard
Motor Products |
|
50,860 |
|
|
|
2,458,572 |
Stoneridge
1 |
|
7,500 |
|
|
|
263,550 |
Unique
Fabricating |
|
12,200 |
|
|
|
106,628 |
| |
|
|
|
|
|
| |
|
|
|
|
|
5,534,892
|
| |
|
|
|
|
|
| DISTRIBUTORS
- 0.6% |
|
|
|
|
|
|
Uni-Select |
|
33,800 |
|
|
|
537,602 |
Weyco
Group |
|
54,300 |
|
|
|
1,976,520 |
| |
|
|
|
|
|
| |
|
|
|
|
|
2,514,122
|
| |
|
|
|
|
|
| DIVERSIFIED
CONSUMER SERVICES - 1.1% |
|
|
|
|
|
|
Aspen
Group 1 |
|
141,520 |
|
|
|
1,057,154 |
Collectors
Universe 2,3 |
|
108,200 |
|
|
|
1,594,868 |
Liberty
Tax Cl. A |
|
142,900 |
|
|
|
1,153,918 |
Universal
Technical Institute 1 |
|
270,000 |
|
|
|
850,500 |
| |
|
|
|
|
|
| |
|
|
|
|
|
4,656,440
|
| |
|
|
|
|
|
| HOTELS, RESTAURANTS
& LEISURE - 1.6% |
|
|
|
|
|
|
Century
Casinos 1 |
|
222,500 |
|
|
|
1,946,875 |
Del
Taco Restaurants 1 |
|
8,200 |
|
|
|
116,276 |
Lindblad
Expeditions Holdings 1 |
|
254,000 |
|
|
|
3,365,500 |
Lindblad
Expeditions Holdings (Warrants) 1 |
|
18,100 |
|
|
|
49,775 |
Red
Lion Hotels 1 |
|
115,500 |
|
|
|
1,345,575 |
| |
|
|
|
|
|
| |
|
|
|
|
|
6,824,001
|
| |
|
|
|
|
|
| HOUSEHOLD
DURABLES - 2.5% |
|
|
|
|
|
|
AV
Homes 1 |
|
6,500 |
|
|
|
139,100 |
Cavco Industries 1,2,3 |
|
20,241 |
|
|
|
4,203,044 |
Ethan
Allen Interiors 2 |
|
18,100 |
|
|
|
443,450 |
Flexsteel
Industries 2 |
|
16,100 |
|
|
|
642,390 |
Lifetime
Brands 2 |
|
119,294 |
|
|
|
1,509,069 |
PICO
Holdings 2,3 |
|
121,200 |
|
|
|
1,411,980 |
Skyline
Champion |
|
63,700 |
|
|
|
2,232,048 |
Universal
Electronics 1 |
|
6,100 |
|
|
|
201,605 |
ZAGG
1 |
|
3,700 |
|
|
|
64,010 |
| |
|
|
|
|
|
| |
|
|
|
|
|
10,846,696
|
| |
|
|
|
|
|
| INTERNET
& DIRECT MARKETING RETAIL - 0.8% |
|
|
|
|
|
|
FTD
Companies 1 |
|
67,200 |
|
|
|
311,808 |
Gaia
Cl. A 1,2,3 |
|
125,000 |
|
|
|
2,531,250 |
Yatra
Online 1 |
|
105,000 |
|
|
|
562,800 |
| |
|
|
|
|
|
| |
|
|
|
|
|
3,405,858
|
| |
|
|
|
|
|
| LEISURE PRODUCTS
- 0.7% |
|
|
|
|
|
|
Clarus
Corporation 1 |
|
174,926 |
|
|
|
1,443,139 |
Nautilus
1 |
|
118,500 |
|
|
|
1,860,450 |
| |
|
|
|
|
|
| |
|
|
|
|
|
3,303,589
|
| |
|
|
|
|
|
| MEDIA - 0.8% |
|
|
|
|
|
|
†Chicken Soup For The Soul Entertainment 1 |
|
150,000 |
|
|
|
1,437,000 |
McClatchy
Company (The) Cl. A 1 |
|
69,313 |
|
|
|
689,664 |
New
Media Investment Group |
|
66,200 |
|
|
|
1,223,376 |
| |
|
|
|
|
|
| |
|
|
|
|
|
3,350,040
|
| |
|
|
|
|
|
| MULTILINE
RETAIL - 0.0% |
|
|
|
|
|
|
Tuesday
Morning 1,2,3 |
|
36,700 |
|
|
|
111,935
|
| |
|
|
|
|
|
| SPECIALTY RETAIL - 1.3% |
|
|
|
|
|
|
AutoCanada |
|
115,200 |
|
|
|
1,490,550 |
Barnes
& Noble Education 1 |
|
80,000 |
|
|
|
451,200 |
Destination
Maternity 1 |
|
212,000 |
|
|
|
1,233,840 |
Destination
XL Group 1 |
|
50,000 |
|
|
|
112,500 |
Haverty
Furniture |
|
30,000 |
|
|
|
648,000 |
Kirkland’s 1 |
|
11,000 |
|
|
|
128,040 |
†Lazydays Holdings 1 |
|
30,000 |
|
|
|
266,700 |
MarineMax
1 |
|
7,600 |
|
|
|
144,020 |
Sears
Hometown and Outlet Stores 1,2,3 |
|
269,700 |
|
|
|
566,370 |
Shoe
Carnival 2 |
|
21,028 |
|
|
|
682,359 |
Stage
Stores 2 |
|
15,000 |
|
|
|
36,150 |
| |
|
|
|
|
|
| |
|
|
|
|
|
5,759,729
|
| |
|
|
|
|
|
| TEXTILES,
APPAREL & LUXURY GOODS - 1.0% |
|
|
|
|
|
|
Crown
Crafts |
|
112,159 |
|
|
|
639,306 |
Culp |
|
32,900 |
|
|
|
807,695 |
J.G.
Boswell Company 4 |
|
2,490 |
|
|
|
1,668,798 |
YGM
Trading |
|
1,482,000 |
|
|
|
1,190,043 |
| |
|
|
|
|
|
| |
|
|
|
|
|
4,305,842
|
| |
| Total (Cost $48,461,878)
|
|
|
|
|
|
50,613,144
|
| |
| |
|
|
|
|
|
|
| CONSUMER
STAPLES – 2.6% |
|
|
|
|
|
|
| BEVERAGES
- 0.3% |
|
|
|
|
|
|
Crimson
Wine Group 1,4 |
|
58,124 |
|
|
|
537,647 |
Primo
Water 1 |
|
40,400 |
|
|
|
706,596 |
| |
|
|
|
|
|
| |
|
|
|
|
|
1,244,243
|
| |
|
|
|
|
|
| FOOD &
STAPLES RETAILING - 0.0% |
|
|
|
|
|
|
†Centric Health 1 |
|
807,600 |
|
|
|
175,078
|
| |
|
|
|
|
|
| FOOD PRODUCTS
- 2.2% |
|
|
|
|
|
|
AGT
Food and Ingredients |
|
25,800 |
|
|
|
300,655 |
Farmer
Bros. 1,2,3 |
|
62,600 |
|
|
|
1,912,430 |
John
B. Sanfilippo & Son 2,3 |
|
17,800 |
|
|
|
1,325,210 |
Landec
Corporation 1,2 |
|
75,610 |
|
|
|
1,126,589 |
Seneca
Foods Cl. A 1 |
|
81,087 |
|
|
|
2,189,349 |
Seneca
Foods Cl. B 1 |
|
40,400 |
|
|
|
1,082,720 |
SunOpta
1 |
|
176,281 |
|
|
|
1,480,760 |
| |
|
|
|
|
|
| |
|
|
|
|
|
9,417,713
|
| |
|
|
|
|
|
| HOUSEHOLD
PRODUCTS - 0.1% |
|
|
|
|
|
|
Central
Garden & Pet 1 |
|
12,000 |
|
|
|
521,760
|
| |
| Total (Cost $7,700,951)
|
|
|
|
|
|
11,358,794
|
| |
| |
|
|
|
|
|
|
| ENERGY
– 8.7% |
|
|
|
|
|
|
| ENERGY EQUIPMENT
& SERVICES - 5.2% |
|
|
|
|
|
|
Aspen
Aerogels 1 |
|
94,985 |
|
|
|
465,427 |
CARBO
Ceramics 1,2,3 |
|
70,000 |
|
|
|
641,900 |
CES
Energy Solutions |
|
25,000 |
|
|
|
85,384 |
Computer
Modelling Group |
|
437,700 |
|
|
|
3,362,697 |
Dawson
Geophysical 1 |
|
77,336 |
|
|
|
610,954 |
Era Group 1 |
|
329,800 |
|
|
|
4,270,910 |
Geospace
Technologies 1,2 |
|
9,500 |
|
|
|
133,570 |
Hornbeck
Offshore Services 1,2,3 |
|
460,000 |
|
|
|
1,821,600 |
Independence
Contract Drilling 1 |
|
134,400 |
|
|
|
553,728 |
Mammoth
Energy Services 1 |
|
4,500 |
|
|
|
152,820 |
Matrix
Service 1,2 |
|
33,700 |
|
|
|
618,395 |
Nabors
Industries |
|
34,000 |
|
|
|
217,940 |
Newpark
Resources 1 |
|
11,200 |
|
|
|
121,520 |
North
American Construction Group |
|
50,000 |
|
|
|
297,500 |
Pioneer
Energy Services 1,2 |
|
245,600 |
|
|
|
1,436,760 |
Precision
Drilling 1 |
|
108,600 |
|
|
|
360,552 |
Profire
Energy 1 |
|
175,000 |
|
|
|
591,500 |
SEACOR Marine Holdings 1 |
|
205,457 |
|
|
|
4,744,002 |
TerraVest
Industries |
|
209,000 |
|
|
|
1,600,905 |
Total
Energy Services |
|
25,700 |
|
|
|
227,159 |
Trican
Well Service 1 |
|
53,300 |
|
|
|
121,224 |
| |
|
|
|
|
|
| |
|
|
|
|
|
22,436,447
|
| |
|
|
|
|
|
| 24 | 2018
Semiannual Report to Stockholders |
|
THE ACCOMPANYING
NOTES ARE AN INTEGRAL PART OF THESE FINANCIAL STATEMENTS |
| June 30, 2018 (unaudited) |
| |
| Schedule of Investments (continued) |
| |
|
|
SHARES |
|
|
|
VALUE |
|
| |
| |
|
|
|
|
|
|
|
|
| ENERGY
(continued) |
|
|
|
|
|
|
|
|
| OIL, GAS
& CONSUMABLE FUELS - 3.5% |
|
|
|
|
|
|
|
|
Ardmore
Shipping 1 |
|
|
199,300 |
|
|
$ |
1,634,260 |
|
Cross
Timbers Royalty Trust |
|
|
67,631 |
|
|
|
979,973 |
|
Dorchester
Minerals L.P. |
|
|
153,963 |
|
|
|
3,171,638 |
|
Dorian
LPG 1 |
|
|
163,138 |
|
|
|
1,246,374 |
|
GeoPark 1 |
|
|
61,971 |
|
|
|
1,279,081 |
|
Hallador
Energy |
|
|
24,000 |
|
|
|
171,360 |
|
Leucrotta
Exploration 1 |
|
|
489,800 |
|
|
|
730,239 |
|
Pacific
Ethanol 1 |
|
|
134,300 |
|
|
|
349,180 |
|
Panhandle
Oil and Gas Cl. A |
|
|
5,500 |
|
|
|
105,050 |
|
Permian
Basin Royalty Trust |
|
|
176,333 |
|
|
|
1,645,187 |
|
Sabine
Royalty Trust |
|
|
59,548 |
|
|
|
2,801,733 |
|
StealthGas 1 |
|
|
229,664 |
|
|
|
902,580 |
|
†Teekay
Offshore Partners L.P. |
|
|
56,000 |
|
|
|
147,840 |
|
| |
|
|
|
|
|
|
|
| |
|
|
|
|
|
|
15,164,495
|
|
| |
| Total (Cost $33,689,668)
|
|
|
|
|
|
|
37,600,942
|
|
| |
| |
|
|
|
|
|
|
|
|
| FINANCIALS
– 13.9% |
|
|
|
|
|
|
|
|
| BANKS - 2.3% |
|
|
|
|
|
|
|
|
Bank
of N.T. Butterfield & Son |
|
|
43,810 |
|
|
|
2,002,993 |
|
Blue
Hills Bancorp |
|
|
50,000 |
|
|
|
1,110,000 |
|
Bryn
Mawr Bank |
|
|
25,000 |
|
|
|
1,157,500 |
|
Caribbean
Investment Holdings 1 |
|
|
735,635 |
|
|
|
169,900 |
|
Chemung
Financial |
|
|
31,000 |
|
|
|
1,553,410 |
|
Fauquier
Bankshares |
|
|
133,200 |
|
|
|
2,823,840 |
|
Live
Oak Bancshares 2,3 |
|
|
30,900 |
|
|
|
947,085 |
|
Midway
Investments 1,5 |
|
|
735,647 |
|
|
|
0 |
|
| |
|
|
|
|
|
|
|
| |
|
|
|
|
|
|
9,764,728
|
|
| |
|
|
|
|
|
|
|
| |
|
|
|
|
|
|
|
|
| CAPITAL MARKETS
- 8.6% |
|
|
|
|
|
|
|
|
ASA
Gold and Precious Metals |
|
|
171,150 |
|
|
|
1,745,730 |
|
†Ashford 1 |
|
|
10,000 |
|
|
|
648,000 |
|
Banca
Finnat Euramerica |
|
|
568,000 |
|
|
|
244,762 |
|
Bolsa
Mexicana de Valores |
|
|
1,068,000 |
|
|
|
1,797,724 |
|
Canaccord
Genuity Group |
|
|
203,300 |
|
|
|
1,122,700 |
|
Diamond
Hill Investment Group 2 |
|
|
3,584 |
|
|
|
696,837 |
|
†Donnelley
Financial Solutions 1 |
|
|
50,000 |
|
|
|
868,500 |
|
Dundee
Corporation Cl. A 1 |
|
|
413,200 |
|
|
|
496,601 |
|
Fiera
Capital Cl. A |
|
|
78,000 |
|
|
|
698,330 |
|
Founders
Advantage Capital |
|
|
53,400 |
|
|
|
76,770 |
|
GAIN
Capital Holdings 2 |
|
|
25,000 |
|
|
|
188,750 |
|
GMP
Capital |
|
|
332,800 |
|
|
|
726,533 |
|
Great
Elm Capital Group 1 |
|
|
515,200 |
|
|
|
1,854,720 |
|
Hamilton
Lane Cl. A 2 |
|
|
32,300 |
|
|
|
1,549,431 |
|
INTL
FCStone 1,2,3 |
|
|
63,727 |
|
|
|
3,295,323 |
|
JZ
Capital Partners 1 |
|
|
209,999 |
|
|
|
1,305,359 |
|
Manning
& Napier Cl. A |
|
|
136,600 |
|
|
|
423,460 |
|
Medley
Management Cl. A |
|
|
153,400 |
|
|
|
544,570 |
|
MVC
Capital |
|
|
219,900 |
|
|
|
2,089,050 |
|
OHA
Investment |
|
|
59,761 |
|
|
|
91,135 |
|
Pzena
Investment Management Cl. A |
|
|
6,100 |
|
|
|
56,181 |
|
Queen
City Investments 4 |
|
|
948 |
|
|
|
1,094,940 |
|
Silvercrest
Asset Management Group Cl. A |
|
|
203,300 |
|
|
|
3,313,790 |
|
Sprott |
|
|
1,414,533 |
|
|
|
3,270,970 |
|
U.S.
Global Investors Cl. A 2 |
|
|
439,454 |
|
|
|
707,521 |
|
Urbana
Corporation |
|
|
237,600 |
|
|
|
511,473 |
|
Value
Line |
|
|
136,074 |
|
|
|
3,224,954 |
|
Virtu
Financial Cl. A 2 |
|
|
86,200 |
|
|
|
2,288,610 |
|
†Vostok
New Ventures SDR 1 |
|
|
100,000 |
|
|
|
807,212 |
|
Warsaw
Stock Exchange |
|
|
52,900 |
|
|
|
516,904 |
|
Westaim
Corporation 1 |
|
|
45,000 |
|
|
|
110,219 |
|
Westwood
Holdings Group 2,3 |
|
|
12,400 |
|
|
|
738,296 |
|
| |
|
|
|
|
|
|
|
| |
|
|
|
|
|
|
37,105,355
|
|
| |
|
|
|
|
|
|
|
| CONSUMER FINANCE
- 0.6% |
|
|
|
|
|
|
|
|
Currency
Exchange International 1 |
|
|
7,000 |
|
|
|
160,803 |
|
EZCORP
Cl. A 1,2,3 |
|
|
201,000 |
|
|
|
2,422,050 |
|
| |
|
|
|
|
|
|
|
| |
|
|
|
|
|
|
2,582,853
|
|
| |
|
|
|
|
|
|
|
| DIVERSIFIED
FINANCIAL SERVICES - 0.1% |
|
|
|
|
|
|
|
|
Waterloo
Investment Holdings 1,5 |
|
|
806,000 |
|
|
|
241,800
|
|
| |
|
|
|
|
|
|
|
| INSURANCE
- 1.3% |
|
|
|
|
|
|
|
|
Hallmark
Financial Services 1,2 |
|
|
114,000 |
|
|
|
1,137,720 |
|
†Health
Insurance Innovations Cl. A 1 |
|
|
4,000 |
|
|
|
129,400 |
|
Heritage
Insurance Holdings |
|
|
6,600 |
|
|
|
110,022 |
|
State
Auto Financial |
|
|
43,200 |
|
|
|
1,292,112 |
|
Trupanion 1,2,3 |
|
|
82,300 |
|
|
|
3,176,780 |
|
| |
|
|
|
|
|
|
|
| |
|
|
|
|
|
|
5,846,034 |
|
| |
|
|
|
|
|
|
|
| INVESTMENT
COMPANIES - 1.0% |
|
|
|
|
|
|
|
|
†Social Capital Hedosophia Holdings |
|
|
438,850 |
|
|
|
4,410,442
|
|
| |
| Total (Cost $55,314,886)
|
|
|
|
|
|
|
59,951,212
|
|
| |
| |
|
|
|
|
|
|
|
|
| HEALTH
CARE – 13.4% |
|
|
|
|
|
|
|
|
| BIOTECHNOLOGY
- 4.3% |
|
|
|
|
|
|
|
|
Abeona
Therapeutics 1,2,3 |
|
|
142,221 |
|
|
|
2,275,536 |
|
Aquinox
Pharmaceuticals 1,2 |
|
|
145,397 |
|
|
|
385,302 |
|
Arcturus
Therapeutics 1 |
|
|
106,436 |
|
|
|
902,577 |
|
BioCryst
Pharmaceuticals 1 |
|
|
144,000 |
|
|
|
825,120 |
|
CareDx 1 |
|
|
56,000 |
|
|
|
685,440 |
|
Idera
Pharmaceuticals 1 |
|
|
464,490 |
|
|
|
613,127 |
|
Invitae
Corporation 1 |
|
|
156,412 |
|
|
|
1,149,628 |
|
Keryx
Biopharmaceuticals 1,2,3 |
|
|
117,725 |
|
|
|
442,646 |
|
Knight
Therapeutics 1 |
|
|
187,000 |
|
|
|
1,145,058 |
|
Mirati
Therapeutics 1 |
|
|
51,100 |
|
|
|
2,519,230 |
|
Theratechnologies 1 |
|
|
10,000 |
|
|
|
96,451 |
|
Zafgen 1 |
|
|
465,381 |
|
|
|
4,760,848 |
|
Zealand
Pharma 1 |
|
|
187,900 |
|
|
|
2,473,938 |
|
Zealand
Pharma ADR 1 |
|
|
10,000 |
|
|
|
126,800 |
|
| |
|
|
|
|
|
|
|
| |
|
|
|
|
|
|
18,401,701
|
|
| |
|
|
|
|
|
|
|
| HEALTH CARE
EQUIPMENT & SUPPLIES - 4.7% |
|
|
|
|
|
|
|
|
AtriCure
1,2 |
|
|
15,000 |
|
|
|
405,750 |
|
Atrion Corporation |
|
|
6,169 |
|
|
|
3,697,699 |
|
Chembio
Diagnostics 1 |
|
|
33,300 |
|
|
|
369,630 |
|
CryoLife 1 |
|
|
4,600 |
|
|
|
128,110 |
|
GenMark
Diagnostics 1 |
|
|
20,400 |
|
|
|
130,152 |
|
Inogen 1 |
|
|
5,400 |
|
|
|
1,006,182 |
|
Invacare
Corporation 2 |
|
|
54,100 |
|
|
|
1,006,260 |
|
†Invuity 1 |
|
|
13,400 |
|
|
|
52,260 |
|
LeMaitre
Vascular |
|
|
5,000 |
|
|
|
167,400 |
|
OraSure
Technologies 1,2,3 |
|
|
50,000 |
|
|
|
823,500 |
|
OrthoPediatrics
Corporation 1 |
|
|
33,300 |
|
|
|
887,112 |
|
STRATEC
Biomedical |
|
|
14,000 |
|
|
|
1,093,761 |
|
Surmodics 1 |
|
|
125,892 |
|
|
|
6,949,238 |
|
TearLab
Corporation 1,4 |
|
|
8,500 |
|
|
|
1,615 |
|
Utah Medical Products |
|
|
34,000 |
|
|
|
3,745,100 |
|
| |
|
|
|
|
|
|
|
| |
|
|
|
|
|
|
20,463,769
|
|
| |
|
|
|
|
|
|
|
| HEALTH CARE
PROVIDERS & SERVICES - 2.5% |
|
|
|
|
|
|
|
|
AAC
Holdings 1 |
|
|
89,400 |
|
|
|
837,678 |
|
Aceto
Corporation |
|
|
58,300 |
|
|
|
195,305 |
|
BioTelemetry 1 |
|
|
47,700 |
|
|
|
2,146,500 |
|
| THE
ACCOMPANYING NOTES ARE AN INTEGRAL PART OF THESE FINANCIAL STATEMENTS |
|
2018 Semiannual Report to Stockholders | 25 |
| |
| Schedule of Investments (continued) |
| |
|
|
SHARES
|
|
|
|
VALUE
|
|
| |
| |
|
|
|
|
|
|
|
|
| HEALTH
CARE (continued) |
|
|
|
|
|
|
|
|
| HEALTH CARE
PROVIDERS & SERVICES (continued) |
|
|
|
|
|
|
|
|
CRH
Medical 1 |
|
|
133,000 |
|
|
$ |
415,799 |
|
Cross
Country Healthcare 1 |
|
|
150,800 |
|
|
|
1,696,500 |
|
National
Research |
|
|
89,529 |
|
|
|
3,348,384 |
|
†PetIQ
Cl. A 1 |
|
|
25,000 |
|
|
|
671,500 |
|
Psychemedics
Corporation 2 |
|
|
37,500 |
|
|
|
721,500 |
|
U.S.
Physical Therapy |
|
|
10,000 |
|
|
|
960,000 |
|
| |
|
|
|
|
|
|
|
| |
|
|
|
|
|
|
10,993,166
|
|
| |
|
|
|
|
|
|
|
| HEALTH CARE
TECHNOLOGY - 1.0% |
|
|
|
|
|
|
|
|
Tabula
Rasa HealthCare 1 |
|
|
50,000 |
|
|
|
3,191,500 |
|
Vocera
Communications 1 |
|
|
33,100 |
|
|
|
989,359 |
|
| |
|
|
|
|
|
|
|
| |
|
|
|
|
|
|
4,180,859
|
|
| |
|
|
|
|
|
|
|
| LIFE SCIENCES
TOOLS & SERVICES - 0.5% |
|
|
|
|
|
|
|
|
NeoGenomics 1 |
|
|
125,000 |
|
|
|
1,638,750 |
|
Quanterix
Corporation 1 |
|
|
45,500 |
|
|
|
653,380 |
|
| |
|
|
|
|
|
|
|
| |
|
|
|
|
|
|
2,292,130
|
|
| |
|
|
|
|
|
|
|
| PHARMACEUTICALS
- 0.4% |
|
|
|
|
|
|
|
|
Agile
Therapeutics 1,2 |
|
|
80,000 |
|
|
|
39,520 |
|
Corium
International 1 |
|
|
4,900 |
|
|
|
39,249 |
|
Flex
Pharma 1 |
|
|
264,274 |
|
|
|
248,418 |
|
Theravance
Biopharma 1 |
|
|
59,009 |
|
|
|
1,338,324 |
|
| |
|
|
|
|
|
|
|
| |
|
|
|
|
|
|
1,665,511
|
|
| |
| Total (Cost $34,133,114)
|
|
|
|
|
|
|
57,997,136
|
|
| |
| |
|
|
|
|
|
|
|
|
| INDUSTRIALS
– 20.2% |
|
|
|
|
|
|
|
|
| AEROSPACE
& DEFENSE - 0.3% |
|
|
|
|
|
|
|
|
Astronics
Corporation 1 |
|
|
2,460 |
|
|
|
88,486 |
|
CPI
Aerostructures 1 |
|
|
11,800 |
|
|
|
123,900 |
|
FLYHT
Aerospace Solutions 1 |
|
|
191,680 |
|
|
|
173,506 |
|
Innovative
Solutions and Support 1 |
|
|
142,828 |
|
|
|
415,629 |
|
SIFCO
Industries 1 |
|
|
45,800 |
|
|
|
242,740 |
|
| |
|
|
|
|
|
|
|
| |
|
|
|
|
|
|
1,044,261
|
|
| |
|
|
|
|
|
|
|
| BUILDING PRODUCTS
- 1.3% |
|
|
|
|
|
|
|
|
Burnham
Holdings Cl. A 4 |
|
|
117,000 |
|
|
|
1,767,870 |
|
CSW
Industrials 1 |
|
|
20,000 |
|
|
|
1,057,000 |
|
DIRTT
Environmental Solutions 1 |
|
|
96,000 |
|
|
|
468,079 |
|
Insteel
Industries |
|
|
44,200 |
|
|
|
1,476,280 |
|
Patrick
Industries 1 |
|
|
17,250 |
|
|
|
980,662 |
|
| |
|
|
|
|
|
|
|
| |
|
|
|
|
|
|
5,749,891
|
|
| |
|
|
|
|
|
|
|
| COMMERCIAL
SERVICES & SUPPLIES - 2.1% |
|
|
|
|
|
|
|
|
Atento |
|
|
218,701 |
|
|
|
1,498,102 |
|
Civeo
Corporation 1 |
|
|
150,000 |
|
|
|
654,000 |
|
CompX
International Cl. A |
|
|
78,200 |
|
|
|
1,032,240 |
|
Heritage-Crystal Clean 1,2,3 |
|
|
223,477 |
|
|
|
4,491,888 |
|
Hudson
Technologies 1 |
|
|
50,000 |
|
|
|
100,500 |
|
Team 1,2,3 |
|
|
57,500 |
|
|
|
1,328,250 |
|
| |
|
|
|
|
|
|
|
| |
|
|
|
|
|
|
9,104,980
|
|
| |
|
|
|
|
|
|
|
| CONSTRUCTION
& ENGINEERING - 2.8% |
|
|
|
|
|
|
|
|
Ameresco
Cl. A 1 |
|
|
251,400 |
|
|
|
3,016,800 |
|
†Granite
Construction |
|
|
13,500 |
|
|
|
751,410 |
|
IES
Holdings 1 |
|
|
220,000 |
|
|
|
3,685,000 |
|
†Infrastructure
and Energy Alternatives 1 |
|
|
155,000 |
|
|
|
1,443,050 |
|
†Infrastructure
and Energy Alternatives (Warrants) 1 |
|
|
40,000 |
|
|
|
38,000 |
|
Northwest
Pipe 1,2 |
|
|
61,600 |
|
|
|
1,193,192 |
|
NV5
Global 1,2 |
|
|
27,400 |
|
|
|
1,898,820 |
|
| |
|
|
|
|
|
|
|
| |
|
|
|
|
|
|
12,026,272
|
|
| |
|
|
|
|
|
|
|
| ELECTRICAL
EQUIPMENT - 1.0% |
|
|
|
|
|
|
|
|
Encore
Wire 2 |
|
|
4,100 |
|
|
|
194,545 |
|
LSI
Industries |
|
|
147,412 |
|
|
|
787,180 |
|
Powell
Industries |
|
|
21,400 |
|
|
|
745,362 |
|
Power
Solutions International 1,2,3,4 |
|
|
21,100 |
|
|
|
195,175 |
|
Preformed
Line Products |
|
|
20,743 |
|
|
|
1,841,564 |
|
Revolution
Lighting Technologies 1,2,3 |
|
|
81,200 |
|
|
|
327,236 |
|
| |
|
|
|
|
|
|
|
| |
|
|
|
|
|
|
4,091,062
|
|
| |
|
|
|
|
|
|
|
| INDUSTRIAL
CONGLOMERATES - 0.9% |
|
|
|
|
|
|
|
|
Raven Industries 2 |
|
|
102,559 |
|
|
|
3,943,394
|
|
| |
|
|
|
|
|
|
|
| MACHINERY
- 7.7% |
|
|
|
|
|
|
|
|
CIRCOR International 1,2 |
|
|
104,800 |
|
|
|
3,873,408 |
|
Eastern
Company (The) |
|
|
39,750 |
|
|
|
1,114,987 |
|
Exco
Technologies |
|
|
85,400 |
|
|
|
577,497 |
|
Foster
(L.B.) Company 1,2,3 |
|
|
95,300 |
|
|
|
2,187,135 |
|
FreightCar
America 1 |
|
|
86,500 |
|
|
|
1,452,335 |
|
Global
Brass and Copper Holdings |
|
|
5,000 |
|
|
|
156,750 |
|
Graham
Corporation 2 |
|
|
75,150 |
|
|
|
1,939,621 |
|
Harsco
Corporation 1 |
|
|
4,400 |
|
|
|
97,240 |
|
Hurco
Companies |
|
|
36,866 |
|
|
|
1,649,754 |
|
Kadant |
|
|
49,800 |
|
|
|
4,788,270 |
|
Kornit
Digital 1 |
|
|
39,800 |
|
|
|
708,440 |
|
Lindsay
Corporation 2 |
|
|
32,600 |
|
|
|
3,161,874 |
|
Luxfer
Holdings 2 |
|
|
59,712 |
|
|
|
1,043,766 |
|
Lydall 1 |
|
|
1,800 |
|
|
|
78,570 |
|
NN |
|
|
45,300 |
|
|
|
856,170 |
|
Sun
Hydraulics |
|
|
74,000 |
|
|
|
3,566,060 |
|
Tennant
Company |
|
|
34,400 |
|
|
|
2,717,600 |
|
Titan
International |
|
|
212,200 |
|
|
|
2,276,906 |
|
Westport
Fuel Systems 1 |
|
|
454,500 |
|
|
|
1,149,885 |
|
| |
|
|
|
|
|
|
|
| |
|
|
|
|
|
|
33,396,268
|
|
| |
|
|
|
|
|
|
|
| MARINE - 1.3% |
|
|
|
|
|
|
|
|
Clarkson |
|
|
109,900 |
|
|
|
3,335,933 |
|
†Eagle
Bulk Shipping 1 |
|
|
450,000 |
|
|
|
2,448,000 |
|
| |
|
|
|
|
|
|
|
| |
|
|
|
|
|
|
5,783,933
|
|
| |
|
|
|
|
|
|
|
| PROFESSIONAL
SERVICES - 0.9% |
|
|
|
|
|
|
|
|
Acacia
Research 1,2 |
|
|
190,000 |
|
|
|
788,500 |
|
CBIZ 1 |
|
|
47,000 |
|
|
|
1,081,000 |
|
Franklin
Covey 1 |
|
|
40,100 |
|
|
|
984,455 |
|
GP
Strategies 1 |
|
|
7,600 |
|
|
|
133,760 |
|
IBI
Group 1 |
|
|
84,500 |
|
|
|
451,215 |
|
InnerWorkings 1 |
|
|
30,400 |
|
|
|
264,176 |
|
Kforce 2 |
|
|
2,800 |
|
|
|
96,040 |
|
Resources
Connection |
|
|
11,200 |
|
|
|
189,280 |
|
| |
|
|
|
|
|
|
|
| |
|
|
|
|
|
|
3,988,426
|
|
| |
|
|
|
|
|
|
|
| ROAD &
RAIL - 0.8% |
|
|
|
|
|
|
|
|
Marten
Transport |
|
|
5,500 |
|
|
|
128,975 |
|
Patriot
Transportation Holding 1,2 |
|
|
55,764 |
|
|
|
1,198,926 |
|
Universal
Logistics Holdings 2,3 |
|
|
77,600 |
|
|
|
2,037,000 |
|
| |
|
|
|
|
|
|
|
| |
|
|
|
|
|
|
3,364,901
|
|
| |
|
|
|
|
|
|
|
| TRADING COMPANIES
& DISTRIBUTORS - 1.1% |
|
|
|
|
|
|
|
|
Central
Steel & Wire 4 |
|
|
405 |
|
|
|
248,265 |
|
EnviroStar 2,3 |
|
|
44,300 |
|
|
|
1,785,290 |
|
Houston
Wire & Cable 1 |
|
|
331,418 |
|
|
|
2,817,053 |
|
| |
|
|
|
|
|
|
|
| |
|
|
|
|
|
|
4,850,608
|
|
| |
| Total (Cost $64,287,164)
|
|
|
|
|
|
|
87,343,996
|
|
| |
| |
|
|
|
|
|
|
|
|
| INFORMATION
TECHNOLOGY – 20.7% |
|
|
|
|
|
|
|
|
| COMMUNICATIONS
EQUIPMENT - 0.3% |
|
|
|
|
|
|
|
|
Clearfield 1 |
|
|
85,200 |
|
|
|
941,460 |
|
| 26 | 2018 Semiannual Report to Stockholders |
|
THE ACCOMPANYING
NOTES ARE AN INTEGRAL PART OF THESE FINANCIAL STATEMENTS |
| June 30, 2018 (unaudited) |
| |
| Schedule of Investments (continued) |
| |
|
|
SHARES
|
|
|
|
VALUE
|
|
| |
| |
|
|
|
|
|
|
|
|
| INFORMATION
TECHNOLOGY (continued) |
|
|
|
|
|
|
|
|
| COMMUNICATIONS
EQUIPMENT (continued) |
|
|
|
|
|
|
|
|
EMCORE
Corporation 1 |
|
|
8,300 |
|
|
$ |
41,915 |
|
Oclaro
1 |
|
|
32,600 |
|
|
|
291,118 |
|
PCTEL |
|
|
34,100 |
|
|
|
212,784 |
|
| |
|
|
|
|
|
|
|
| |
|
|
|
|
|
|
1,487,277
|
|
| |
|
|
|
|
|
|
|
| ELECTRONIC
EQUIPMENT, INSTRUMENTS & COMPONENTS - 8.3% |
|
|
|
|
|
|
|
|
Airgain
1,2 |
|
|
8,200 |
|
|
|
75,358 |
|
Bel
Fuse Cl. A |
|
|
67,705 |
|
|
|
1,448,887 |
|
†eMagin Corporation 1 |
|
|
125,000 |
|
|
|
225,000 |
|
†eMagin Corporation (Warrants) 1,5 |
|
|
50,000 |
|
|
|
12,500 |
|
ePlus
1 |
|
|
3,000 |
|
|
|
282,300 |
|
Fabrinet
1 |
|
|
2,200 |
|
|
|
81,158 |
|
FARO Technologies 1,2,3 |
|
|
76,800 |
|
|
|
4,174,080 |
|
Firan
Technology Group 1 |
|
|
25,000 |
|
|
|
40,695 |
|
HollySys
Automation Technologies |
|
|
51,900 |
|
|
|
1,149,066 |
|
Inficon
Holding |
|
|
3,220 |
|
|
|
1,643,654 |
|
LightPath
Technologies Cl. A 1 |
|
|
100,000 |
|
|
|
230,000 |
|
Mesa Laboratories 2,3 |
|
|
45,400 |
|
|
|
9,583,032 |
|
†nLIGHT 1,2,3 |
|
|
150,000 |
|
|
|
4,959,000 |
|
Novanta
1 |
|
|
37,600 |
|
|
|
2,342,480 |
|
Orbotech 1,2 |
|
|
69,600 |
|
|
|
4,301,280 |
|
†PAR Technology 1 |
|
|
20,000 |
|
|
|
353,600 |
|
PC
Connection |
|
|
43,716 |
|
|
|
1,451,371 |
|
Perceptron
1 |
|
|
8,500 |
|
|
|
89,675 |
|
Richardson
Electronics |
|
|
316,900 |
|
|
|
3,086,606 |
|
Rogers
Corporation 1,2 |
|
|
600 |
|
|
|
66,876 |
|
Vishay
Precision Group 1 |
|
|
10,000 |
|
|
|
381,500 |
|
| |
|
|
|
|
|
|
|
| |
|
|
|
|
|
|
35,978,118
|
|
| |
|
|
|
|
|
|
|
| INTERNET SOFTWARE
& SERVICES - 4.7% |
|
|
|
|
|
|
|
|
Amber
Road 1 |
|
|
25,000 |
|
|
|
235,250 |
|
Care.com
1,2,3 |
|
|
171,787 |
|
|
|
3,586,913 |
|
comScore
1 |
|
|
64,195 |
|
|
|
1,399,451 |
|
Etsy
1,2,3 |
|
|
56,200 |
|
|
|
2,371,078 |
|
IZEA
1,2,3 |
|
|
85,870 |
|
|
|
81,577 |
|
†Leaf Group 1 |
|
|
64,500 |
|
|
|
699,825 |
|
MINDBODY
Cl. A 1 |
|
|
38,900 |
|
|
|
1,501,540 |
|
QuinStreet
1 |
|
|
210,850 |
|
|
|
2,677,795 |
|
Real
Matters 1 |
|
|
255,000 |
|
|
|
1,105,617 |
|
Reis
2 |
|
|
25,000 |
|
|
|
545,000 |
|
Solium
Capital 1 |
|
|
317,500 |
|
|
|
2,779,770 |
|
Stamps.com
1 |
|
|
11,700 |
|
|
|
2,960,685 |
|
Support.com
1 |
|
|
105,600 |
|
|
|
300,960 |
|
| |
|
|
|
|
|
|
|
| |
|
|
|
|
|
|
20,245,461
|
|
| |
|
|
|
|
|
|
|
| IT SERVICES
- 0.5% |
|
|
|
|
|
|
|
|
Computer
Task Group 1 |
|
|
150,838 |
|
|
|
1,167,486 |
|
Conduent
1 |
|
|
30,000 |
|
|
|
545,100 |
|
Hackett
Group (The) |
|
|
27,700 |
|
|
|
445,139 |
|
Innodata
1 |
|
|
143,883 |
|
|
|
143,883 |
|
| |
|
|
|
|
|
|
|
| |
|
|
|
|
|
|
2,301,608
|
|
| |
|
|
|
|
|
|
|
| SEMICONDUCTORS
& SEMICONDUCTOR EQUIPMENT - 4.6% |
|
|
|
|
|
|
|
|
†Adesto Technologies 1 |
|
|
7,200 |
|
|
|
60,480 |
|
Alpha
& Omega Semiconductor 1 |
|
|
3,300 |
|
|
|
46,992 |
|
Amtech
Systems 1,2 |
|
|
92,184 |
|
|
|
557,713 |
|
Brooks
Automation |
|
|
91,500 |
|
|
|
2,984,730 |
|
CyberOptics
Corporation 1 |
|
|
43,000 |
|
|
|
748,200 |
|
†Everspin Technologies 1 |
|
|
5,900 |
|
|
|
52,628 |
|
FormFactor
1 |
|
|
22,869 |
|
|
|
304,158 |
|
Kulicke
& Soffa Industries |
|
|
77,200 |
|
|
|
1,838,904 |
|
Nanometrics
1 |
|
|
64,600 |
|
|
|
2,287,486 |
|
NeoPhotonics
Corporation 1,2,3 |
|
|
51,300 |
|
|
|
319,599 |
|
Nova
Measuring Instruments 1 |
|
|
68,000 |
|
|
|
1,853,000 |
|
PDF
Solutions 1 |
|
|
189,700 |
|
|
|
2,272,606 |
|
Photronics
1 |
|
|
231,900 |
|
|
|
1,849,402 |
|
Rudolph
Technologies 1 |
|
|
52,100 |
|
|
|
1,542,160 |
|
Silicon
Motion Technology ADR |
|
|
34,100 |
|
|
|
1,803,549 |
|
Ultra
Clean Holdings 1,2 |
|
|
49,900 |
|
|
|
828,340 |
|
Veeco
Instruments 1,2,3 |
|
|
17,500 |
|
|
|
249,375 |
|
Xcerra
Corporation 1 |
|
|
15,600 |
|
|
|
217,932 |
|
| |
|
|
|
|
|
|
|
| |
|
|
|
|
|
|
19,817,254
|
|
| |
|
|
|
|
|
|
|
| SOFTWARE -
1.5% |
|
|
|
|
|
|
|
|
Agilysys
1 |
|
|
170,587 |
|
|
|
2,644,098 |
|
American
Software Cl. A |
|
|
120,352 |
|
|
|
1,753,529 |
|
BSQUARE
Corporation 1 |
|
|
83,675 |
|
|
|
225,923 |
|
Monotype
Imaging Holdings |
|
|
15,000 |
|
|
|
304,500 |
|
Optiva
1 |
|
|
3,000 |
|
|
|
104,058 |
|
RealNetworks
1 |
|
|
100,171 |
|
|
|
370,633 |
|
Rubicon
Project 1 |
|
|
75,000 |
|
|
|
213,750 |
|
SeaChange
International 1 |
|
|
284,200 |
|
|
|
971,964 |
|
| |
|
|
|
|
|
|
|
| |
|
|
|
|
|
|
6,588,455
|
|
| |
|
|
|
|
|
|
|
| TECHNOLOGY
HARDWARE, STORAGE & PERIPHERALS - 0.8% |
|
|
|
|
|
|
|
|
AstroNova |
|
|
5,300 |
|
|
|
99,905 |
|
†Cray 1 |
|
|
19,700 |
|
|
|
484,620 |
|
Intevac
1 |
|
|
397,800 |
|
|
|
1,929,330 |
|
USA
Technologies 1 |
|
|
61,300 |
|
|
|
858,200 |
|
| |
|
|
|
|
|
|
|
| |
|
|
|
|
|
|
3,372,055
|
|
| |
| Total (Cost $58,957,346)
|
|
|
|
|
|
|
89,790,228
|
|
| |
| |
|
|
|
|
|
|
|
|
| MATERIALS
– 5.3% |
|
|
|
|
|
|
|
|
| CHEMICALS
- 1.8% |
|
|
|
|
|
|
|
|
Balchem
Corporation |
|
|
10,575 |
|
|
|
1,037,830 |
|
LSB
Industries 1 |
|
|
135,800 |
|
|
|
719,740 |
|
OMNOVA
Solutions 1 |
|
|
25,000 |
|
|
|
260,000 |
|
Quaker Chemical 2 |
|
|
24,400 |
|
|
|
3,778,828 |
|
Rayonier
Advanced Materials |
|
|
50,000 |
|
|
|
854,500 |
|
Trecora
Resources 1 |
|
|
89,600 |
|
|
|
1,330,560 |
|
| |
|
|
|
|
|
|
|
| |
|
|
|
|
|
|
7,981,458
|
|
| |
|
|
|
|
|
|
|
| CONSTRUCTION
MATERIALS - 0.3% |
|
|
|
|
|
|
|
|
Monarch
Cement 4 |
|
|
16,303 |
|
|
|
1,149,688 |
|
U.S.
Concrete 1 |
|
|
2,500 |
|
|
|
131,250 |
|
| |
|
|
|
|
|
|
|
| |
|
|
|
|
|
|
1,280,938
|
|
| |
|
|
|
|
|
|
|
| CONTAINERS
& PACKAGING - 0.3% |
|
|
|
|
|
|
|
|
UFP
Technologies 1 |
|
|
36,445 |
|
|
|
1,124,328
|
|
| |
|
|
|
|
|
|
|
| METALS &
MINING - 2.9% |
|
|
|
|
|
|
|
|
Alamos
Gold Cl. A |
|
|
186,044 |
|
|
|
1,059,955 |
|
Ampco-Pittsburgh
1 |
|
|
79,002 |
|
|
|
809,770 |
|
Haynes
International 2,3 |
|
|
27,400 |
|
|
|
1,006,676 |
|
Hudbay
Minerals |
|
|
62,200 |
|
|
|
348,320 |
|
Imdex
1 |
|
|
750,666 |
|
|
|
686,080 |
|
MAG
Silver 1 |
|
|
154,050 |
|
|
|
1,665,281 |
|
Major Drilling Group International 1 |
|
|
921,657 |
|
|
|
4,865,401 |
|
Olympic
Steel |
|
|
35,000 |
|
|
|
714,350 |
|
Pretium
Resources 1 |
|
|
80,000 |
|
|
|
588,446 |
|
Universal
Stainless & Alloy Products 1 |
|
|
15,300 |
|
|
|
362,151 |
|
Victoria
Gold 1 |
|
|
890,000 |
|
|
|
236,945 |
|
| |
|
|
|
|
|
|
|
| |
|
|
|
|
|
|
12,343,375
|
|
| |
| Total (Cost $18,563,369)
|
|
|
|
|
|
|
22,730,099
|
|
| |
| THE
ACCOMPANYING NOTES ARE AN INTEGRAL PART OF THESE FINANCIAL STATEMENTS |
|
2018 Semiannual Report to Stockholders | 27 |
| Royce Micro-Cap
Trust |
|
June 30, 2018 (unaudited) |
| |
| Schedule of Investments (continued) |
| |
|
|
SHARES
|
|
|
|
VALUE
|
|
| |
| |
|
|
|
|
|
|
|
|
| REAL ESTATE
– 3.5% |
|
|
|
|
|
|
|
|
| REAL ESTATE
MANAGEMENT & DEVELOPMENT - 3.5% |
|
|
|
|
|
|
|
|
Altus
Group |
|
|
87,000 |
|
|
$ |
1,939,657 |
|
FRP Holdings 1,2,3 |
|
|
76,500 |
|
|
|
4,953,375 |
|
Marcus
& Millichap 1,2 |
|
|
49,567 |
|
|
|
1,933,609 |
|
RMR
Group Cl. A |
|
|
34,900 |
|
|
|
2,737,905 |
|
Tejon Ranch 1,2 |
|
|
154,994 |
|
|
|
3,766,354 |
|
| |
| Total (Cost $9,399,137)
|
|
|
|
|
|
|
15,330,900
|
|
| |
| |
|
|
|
|
|
|
|
|
| TELECOMMUNICATION
SERVICES – 0.2% |
|
|
|
|
|
|
|
|
| DIVERSIFIED
TELECOMMUNICATION SERVICES - 0.2% |
|
|
|
|
|
|
|
|
ORBCOMM
1 |
|
|
67,100 |
|
|
|
677,710
|
|
| |
| Total (Cost $570,215)
|
|
|
|
|
|
|
677,710
|
|
| |
| |
|
|
|
|
|
|
|
|
| UTILITIES
– 0.4% |
|
|
|
|
|
|
|
|
| INDEPENDENT
POWER & RENEWABLE ELECTRICITY PRODUCER - 0.0% |
|
|
|
|
|
|
|
|
†Innergex Renewable Energy |
|
|
15,573 |
|
|
|
163,590
|
|
| |
|
|
|
|
|
|
|
| WATER UTILITIES
- 0.4% |
|
|
|
|
|
|
|
|
†AquaVenture Holdings 1 |
|
|
50,000 |
|
|
|
779,000 |
|
Global
Water Resources |
|
|
106,000 |
|
|
|
996,400 |
|
| |
|
|
|
|
|
|
|
| |
|
|
|
|
|
|
1,775,400
|
|
| |
| Total (Cost $1,514,639)
|
|
|
|
|
|
|
1,938,990
|
|
| |
| |
|
|
|
|
|
|
|
|
| TOTAL COMMON
STOCKS |
|
|
|
|
|
|
|
|
| |
| (Cost $332,592,367)
|
|
|
|
|
|
|
435,333,151
|
|
| |
| |
|
|
|
|
|
|
|
|
| PREFERRED
STOCK - 0.4% |
|
|
|
|
|
|
|
|
†Chicken Soup For The Soul Entertainment 9.75% |
|
|
80,000 |
|
|
|
1,991,200
|
|
| |
| (Cost $2,000,000)
|
|
|
|
|
|
|
1,991,200
|
|
| |
| |
|
|
|
|
|
|
|
|
| REPURCHASE
AGREEMENT– 8.1% |
|
|
|
|
|
|
|
|
| Fixed Income
Clearing Corporation, 0.35% dated 6/29/18, due 7/2/18, maturity value $34,960,020
(collateralized by obligations of various U.S. Government Agencies, 1.375% due 10/07/21,
valued at $35,658,523) |
| |
| (Cost $34,959,000)
|
|
|
|
|
|
|
34,959,000
|
|
| |
| |
|
|
|
|
|
|
|
|
| TOTAL INVESTMENTS
– 109.1% |
|
|
|
|
|
|
|
|
| |
| (Cost $369,551,367)
|
|
|
|
|
|
|
472,283,351
|
|
| |
| |
|
|
|
|
|
|
|
|
| LIABILITIES
LESS CASH AND OTHER ASSETS – (9.1)% |
|
|
|
|
|
|
(39,504,530 |
) |
| |
|
|
|
|
|
|
|
| |
|
|
|
|
|
|
|
|
| |
| NET ASSETS – 100.0% |
|
|
|
|
|
$ |
432,778,821
|
|
| |
| † |
New additions
in 2018. |
| 1 |
Non-income
producing. |
| 2 |
All or
a portion of these securities were pledged as collateral in connection with the
Fund’s revolving credit agreement at June 30, 2018. Total market value of pledged
securities at June 30, 2018, was $82,625,162. |
| 3 |
At June
30, 2018, a portion of these securities were rehypothecated in connection with the
Fund’s revolving credit agreement in the aggregate amount of $37,405,632. |
| 4 |
These securities
are defined as Level 2 securities due to fair value being based on quoted prices
for similar securities. See Notes to Financial Statements. |
| 5 |
Securities
for which market quotations are not readily available represent 0.1% of net assets.
These securities have been valued at their fair value under procedures approved
by the Fund’s Board of Directors. These securities are defined as Level 3 securities
due to the use of significant unobservable inputs in the determination of fair value.
See Notes to Financial Statements. |
| |
|
| |
Bold
indicates the Fund’s 20 largest equity holdings in terms of June 30, 2018,
market value. |
| |
|
| |
TAX
INFORMATION: The cost of total investments for Federal income tax purposes was $370,955,679.
At June 30, 2018, net unrealized appreciation for all securities was $101,327,672
consisting of aggregate gross unrealized appreciation of $146,842,892 and aggregate
gross unrealized depreciation of $45,515,220. The primary cause of the difference
between book and tax basis cost is the timing of the recognition of losses on securities
sold. |
| 28 | 2018 Semiannual Report to Stockholders |
|
THE ACCOMPANYING
NOTES ARE AN INTEGRAL PART OF THESE FINANCIAL STATEMENTS |
| Royce Micro-Cap
Trust |
|
June 30, 2018 (unaudited) |
| |
| Statement of Assets and Liabilities |
| ASSETS: |
|
|
|
|
|
| Investments
at value |
|
|
$ |
437,324,351 |
|
| |
| Repurchase
agreements (at cost and value) |
|
|
|
34,959,000 |
|
| |
| Cash and foreign
currency |
|
|
|
37,630 |
|
| |
| Receivable
for investments sold |
|
|
|
7,538,093 |
|
| |
| Receivable
for dividends and interest |
|
|
|
197,972 |
|
| |
| Prepaid expenses
and other assets |
|
|
|
35,148 |
|
| |
| Total Assets
|
|
|
|
480,092,194
|
|
| |
| LIABILITIES: |
|
|
|
|
|
| Revolving
credit agreement |
|
|
|
45,000,000 |
|
| |
| Payable for
investments purchased |
|
|
|
1,905,985 |
|
| |
| Payable for
investment advisory fee |
|
|
|
301,645 |
|
| |
| Payable for
directors’ fees |
|
|
|
28,273 |
|
| |
| Payable for
interest expense |
|
|
|
12,328 |
|
| |
| Accrued expenses |
|
|
|
65,142 |
|
| |
| Total Liabilities
|
|
|
|
47,313,373
|
|
| |
| Net Assets
|
|
|
$ |
432,778,821
|
|
| |
| ANALYSIS OF
NET ASSETS: |
|
|
|
|
|
| Paid-in capital
- $0.001 par value per share; 39,711,274 shares outstanding (150,000,000 shares authorized) |
|
|
$ |
334,988,734 |
|
| |
| Undistributed
net investment income (loss) |
|
|
|
(536,628 |
) |
| |
| Accumulated
net realized gain (loss) on investments and foreign currency |
|
|
|
9,731,364 |
|
| |
| Net unrealized
appreciation (depreciation) on investments and foreign currency |
|
|
|
102,732,734 |
|
| |
| Quarterly
distributions |
|
|
|
(14,137,383 |
) |
| |
| Net Assets
(net asset value per share - $10.90) |
|
|
$ |
432,778,821
|
|
| |
| Investments
at identified cost |
|
|
$ |
334,592,367 |
|
| |
| THE
ACCOMPANYING NOTES ARE AN INTEGRAL PART OF THESE FINANCIAL STATEMENTS |
|
2018 Semiannual Report to Stockholders | 29 |
| |
| Statement of Changes in Net Assets |
| |
|
|
SIX MONTHS
ENDED
6/30/18
(UNAUDITED) |
|
|
|
YEAR
ENDED 12/31/17 |
|
| |
| |
|
|
|
|
|
|
|
|
| INVESTMENT
OPERATIONS: |
|
|
|
|
|
|
|
|
| Net investment
income (loss) |
|
$ |
465,902 |
|
|
$ |
2,126,051 |
|
| |
| Net realized
gain (loss) on investments and foreign currency |
|
|
8,212,922 |
|
|
|
25,657,103 |
|
| |
| Net change
in unrealized appreciation (depreciation) on investments and foreign currency |
|
|
22,462,403 |
|
|
|
33,136,932 |
|
| |
| Net increase
(decrease) in net assets from investment operations |
|
|
31,141,227
|
|
|
|
60,920,086
|
|
| |
| DISTRIBUTIONS: |
|
|
|
|
|
|
|
|
| Net investment
income |
|
|
(517,428 |
)1 |
|
|
(2,282,512 |
) |
| |
| Net realized
gain on investments and foreign currency |
|
|
(5,793,500 |
)1 |
|
|
(24,135,451 |
) |
| |
| Return of
capital |
|
|
(7,826,455 |
)1 |
|
|
– |
|
| |
| Total distributions
|
|
|
(14,137,383 |
) |
|
|
(26,417,963 |
) |
| |
| CAPITAL STOCK
TRANSACTIONS: |
|
|
|
|
|
|
|
|
| Reinvestment
of distributions |
|
|
5,870,061 |
|
|
|
11,702,040 |
|
| |
| Total capital
stock transactions |
|
|
5,870,061
|
|
|
|
11,702,040
|
|
| |
| Net Increase
(Decrease) In Net Assets |
|
|
22,873,905
|
|
|
|
46,204,163
|
|
| |
| NET ASSETS: |
|
|
|
|
|
|
|
|
| |
| Beginning
of period |
|
|
409,904,916
|
|
|
|
363,700,753
|
|
| |
| End of
period (including undistributed net investment income (loss) of $(536,628) at 6/30/18
and $(1,002,531) at 12/31/17) |
|
$ |
432,778,821
|
|
|
$ |
409,904,916
|
|
| |
| 1Amounts
are subject to change and recharacterization at year end. |
| 30 | 2018 Semiannual Report to Stockholders |
|
THE ACCOMPANYING
NOTES ARE AN INTEGRAL PART OF THESE FINANCIAL STATEMENTS |
| Royce Micro-Cap
Trust |
|
Six Months Ended June 30, 2018 (unaudited) |
| INVESTMENT INCOME: |
|
|
|
|
| INCOME: |
|
|
|
|
| Dividends |
|
$ |
3,185,675 |
|
| |
| Foreign withholding
tax |
|
|
(64,172 |
) |
| |
| Interest |
|
|
40,458 |
|
| |
| Rehypothecation
income |
|
|
201,609 |
|
| |
| Total income
|
|
|
3,363,570
|
|
| |
| EXPENSES: |
|
|
|
|
| |
| Investment
advisory fees |
|
|
1,934,484 |
|
| |
| Interest expense |
|
|
697,887 |
|
| |
| Stockholder
reports |
|
|
60,385 |
|
| |
| Administrative
and office facilities |
|
|
54,131 |
|
| |
| Directors’ fees |
|
|
48,977 |
|
| |
| Custody and
transfer agent fees |
|
|
45,043 |
|
| |
| Professional
fees |
|
|
29,978 |
|
| |
| Other expenses |
|
|
26,982 |
|
| |
| Total expenses
|
|
|
2,897,867
|
|
| |
| Compensating
balance credits |
|
|
(199 |
) |
| |
| Net expenses
|
|
|
2,897,668
|
|
| |
| Net investment
income (loss) |
|
|
465,902
|
|
| |
| REALIZED
AND UNREALIZED GAIN (LOSS) ON INVESTMENTS AND FOREIGN CURRENCY: |
|
|
|
|
| NET REALIZED
GAIN (LOSS): |
|
|
|
|
| |
| Investments |
|
|
8,232,993 |
|
| |
| Foreign currency
transactions |
|
|
(20,071 |
) |
| |
| NET CHANGE
IN UNREALIZED APPRECIATION (DEPRECIATION): |
|
|
|
|
| |
| Investments
and foreign currency translations |
|
|
22,461,808 |
|
| |
| Other assets
and liabilities denominated in foreign currency |
|
|
595 |
|
| |
| Net realized
and unrealized gain (loss) on investments and foreign currency |
|
|
30,675,325
|
|
| |
| NET INCREASE
(DECREASE) IN NET ASSETS FROM INVESTMENT OPERATIONS |
|
$ |
31,141,227
|
|
| |
| THE
ACCOMPANYING NOTES ARE AN INTEGRAL PART OF THESE FINANCIAL STATEMENTS |
|
2018 Semiannual Report to Stockholders | 31 |
| Royce Micro-Cap
Trust |
|
Six Months Ended June 30, 2018 (unaudited) |
| CASH FLOWS FROM OPERATING ACTIVITIES: |
|
|
|
|
| Net increase (decrease) in net assets from investment operations |
|
$ |
31,141,227 |
|
| |
| Adjustments
to reconcile net increase (decrease) in net assets from investment operations to
net cash provided by operating activities: |
|
|
|
|
| |
Purchases
of long-term investments |
|
|
(40,220,664 |
) |
| |
Proceeds
from sales and maturities of long-term investments |
|
|
51,360,418 |
|
| |
Net
purchases, sales and maturities of short-term investments |
|
|
(3,529,000 |
) |
| |
Net
(increase) decrease in dividends and interest receivable and other assets |
|
|
119,955 |
|
| |
Net
increase (decrease) in interest expense payable, accrued expenses and other liabilities |
|
|
108,049 |
|
| |
Net
change in unrealized appreciation (depreciation) on investments |
|
|
(22,461,808 |
) |
| |
Net
realized gain (loss) on investments and foreign currency |
|
|
(8,212,922 |
) |
| |
| Net cash
provided by operating activities |
|
|
8,305,255
|
|
| |
| CASH FLOWS
FROM FINANCING ACTIVITIES: |
|
|
|
|
| Distributions |
|
|
(14,137,383 |
) |
| |
| Reinvestment
of distributions |
|
|
5,870,061 |
|
| |
| Net cash
used for financing activities |
|
|
(8,267,322 |
) |
| |
| INCREASE
(DECREASE) IN CASH: |
|
|
37,933
|
|
| |
| Payable
to custodian for cash and foreign currency overdrawn at beginning of period |
|
|
(303 |
) |
| |
| Cash and
foreign currency at end of period |
|
$ |
37,630
|
|
| |
| 32 | 2018 Semiannual Report to Stockholders |
|
THE ACCOMPANYING
NOTES ARE AN INTEGRAL PART OF THESE FINANCIAL STATEMENTS |
| |
| Financial
Highlights |
| This table
is presented to show selected data for a share of Common Stock outstanding throughout
each period, and to assist stockholders in evaluating the Fund’s performance
for the periods presented. |
| |
|
SIX MONTHS |
|
YEARS ENDED |
| |
|
|
|
|
|
|
| |
|
ENDED 6/30/18 |
|
|
|
|
|
|
|
|
|
|
|
|
|
|
|
|
|
|
|
|
| |
|
(UNAUDITED) |
|
12/31/17 |
|
12/31/16 |
|
12/31/15 |
|
12/31/14 |
|
12/31/13 |
| |
| Net Asset
Value, Beginning of Period |
|
$ |
10.48 |
|
|
$ |
9.63 |
|
|
$ |
8.59 |
|
|
$ |
11.33 |
|
|
$ |
14.12 |
|
|
$ |
10.93 |
|
| |
| INVESTMENT
OPERATIONS: |
|
|
|
|
|
|
|
|
|
|
|
|
|
|
|
|
|
|
|
|
|
|
|
|
| Net investment
income (loss) |
|
|
0.01 |
|
|
|
0.06 |
|
|
|
0.03 |
|
|
|
0.03 |
|
|
|
(0.01 |
) |
|
|
0.01 |
|
| |
| Net realized
and unrealized gain (loss) on investments and foreign currency |
|
|
0.78 |
|
|
|
1.52 |
|
|
|
1.70 |
|
|
|
(1.42 |
) |
|
|
0.25 |
|
|
|
4.64 |
|
| |
| Net increase
(decrease) in net assets from investment operations |
|
|
0.79 |
|
|
|
1.58 |
|
|
|
1.73 |
|
|
|
(1.39 |
) |
|
|
0.24 |
|
|
|
4.65 |
|
| |
| DISTRIBUTIONS: |
|
|
|
|
|
|
|
|
|
|
|
|
|
|
|
|
|
|
|
|
|
|
|
|
| Net investment
income |
|
|
(0.01 |
)1 |
|
|
(0.06 |
) |
|
|
(0.08 |
) |
|
|
(0.01 |
) |
|
|
(0.04 |
) |
|
|
(0.03 |
) |
| |
| Net realized
gain on investments and foreign currency |
|
|
(0.15 |
)1 |
|
|
(0.63 |
) |
|
|
(0.56 |
) |
|
|
(1.25 |
) |
|
|
(2.86 |
) |
|
|
(1.35 |
) |
| |
| Return of
capital |
|
|
(0.20 |
)1 |
|
|
– |
|
|
|
– |
|
|
|
– |
|
|
|
– |
|
|
|
– |
|
| |
| Total distributions
|
|
|
(0.36 |
) |
|
|
(0.69 |
) |
|
|
(0.64 |
) |
|
|
(1.26 |
) |
|
|
(2.90 |
) |
|
|
(1.38 |
) |
| |
| CAPITAL STOCK
TRANSACTIONS: |
|
|
|
|
|
|
|
|
|
|
|
|
|
|
|
|
|
|
|
|
|
|
|
|
| Effect of
reinvestment of distributions by Common Stockholders |
|
|
(0.01 |
) |
|
|
(0.04 |
) |
|
|
(0.05 |
) |
|
|
(0.09 |
) |
|
|
(0.13 |
) |
|
|
(0.08 |
) |
| |
| Total capital
stock transactions |
|
|
(0.01 |
) |
|
|
(0.04 |
) |
|
|
(0.05 |
) |
|
|
(0.09 |
) |
|
|
(0.13 |
) |
|
|
(0.08 |
) |
| |
| Net Asset
Value, End of Period |
|
$ |
10.90 |
|
|
$ |
10.48 |
|
|
$ |
9.63 |
|
|
$ |
8.59 |
|
|
$ |
11.33 |
|
|
$ |
14.12 |
|
| |
| Market
Value, End of Period |
|
$ |
9.99 |
|
|
$ |
9.44 |
|
|
$ |
8.16 |
|
|
$ |
7.26 |
|
|
$ |
10.08 |
|
|
$ |
12.61 |
|
| |
| TOTAL RETURN:
2 |
|
|
|
|
|
|
|
|
|
|
|
|
|
|
|
|
|
|
|
|
|
|
|
|
| Net Asset
Value |
|
|
7.84 |
%3 |
|
|
17.67 |
% |
|
|
21.98 |
% |
|
|
(11.64 |
)% |
|
|
3.46 |
% |
|
|
44.66 |
% |
| |
| Market Value |
|
|
9.72 |
%3 |
|
|
25.09 |
% |
|
|
22.30 |
% |
|
|
(16.06 |
)% |
|
|
3.06 |
% |
|
|
49.42 |
% |
| |
| RATIOS BASED
ON AVERAGE NET ASSETS: |
|
|
|
|
|
|
|
|
|
|
|
|
|
|
|
|
|
|
|
|
|
|
|
|
| Investment
advisory fee expense4 |
|
|
0.93 |
%5 |
|
|
0.49 |
% |
|
|
0.87 |
% |
|
|
0.93 |
% |
|
|
0.93 |
% |
|
|
0.82 |
% |
| |
| Other operating
expenses |
|
|
0.46 |
%5 |
|
|
0.40 |
% |
|
|
0.39 |
% |
|
|
0.35 |
% |
|
|
0.25 |
% |
|
|
0.29 |
% |
| |
| Total expenses
(net) |
|
|
1.39 |
%5 |
|
|
0.89 |
% |
|
|
1.26 |
% |
|
|
1.28 |
% |
|
|
1.18 |
% |
|
|
1.11 |
% |
| |
| Expenses net
of fee waivers and excluding interest expense |
|
|
1.05 |
%5 |
|
|
0.62 |
% |
|
|
1.02 |
% |
|
|
1.08 |
% |
|
|
1.05 |
% |
|
|
0.96 |
% |
| |
| Expenses prior
to fee waivers and balance credits |
|
|
1.39 |
%5 |
|
|
0.89 |
% |
|
|
1.26 |
% |
|
|
1.28 |
% |
|
|
1.18 |
% |
|
|
1.11 |
% |
| |
| Expenses prior
to fee waivers |
|
|
1.39 |
%5 |
|
|
0.89 |
% |
|
|
1.26 |
% |
|
|
1.28 |
% |
|
|
1.18 |
% |
|
|
1.11 |
% |
| |
| Net investment
income (loss) |
|
|
0.22 |
%5 |
|
|
0.56 |
% |
|
|
0.32 |
% |
|
|
0.26 |
% |
|
|
(0.09 |
)% |
|
|
0.08 |
% |
| |
| SUPPLEMENTAL
DATA: |
|
|
|
|
|
|
|
|
|
|
|
|
|
|
|
|
|
|
|
|
|
|
|
|
| Net Assets,
End of Period (in thousands) |
|
$ |
432,779 |
|
|
$ |
409,905 |
|
|
$ |
363,701 |
|
|
$ |
312,407 |
|
|
$ |
387,488 |
|
|
$ |
433,121 |
|
| |
| Portfolio
Turnover Rate |
|
|
10 |
% |
|
|
15 |
% |
|
|
26 |
% |
|
|
39 |
% |
|
|
41 |
% |
|
|
29 |
% |
| |
| REVOLVING
CREDIT AGREEMENT: |
|
|
|
|
|
|
|
|
|
|
|
|
|
|
|
|
|
|
|
|
|
|
|
|
| Asset coverage |
|
|
1062 |
% |
|
|
1011 |
% |
|
|
908 |
% |
|
|
794 |
% |
|
|
746 |
% |
|
|
1062 |
% |
| |
| Asset coverage
per $1,000 |
|
$ |
10,617 |
|
|
$ |
10,109 |
|
|
$ |
9,082 |
|
|
$ |
7,942 |
|
|
$ |
7,458 |
|
|
$ |
10,625 |
|
| |
| 1 |
Amounts are
subject to change and recharacterization at year end. |
| 2 |
The Market
Value Total Return is calculated assuming a purchase of Common Stock on the opening
of the first business day and a sale on the closing of the last business day of
each period. Dividends and distributions are assumed for the purposes of this calculation
to be reinvested at prices obtained under the Fund’s Distribution Reinvestment
and Cash Purchase Plan. Net Asset Value Total Return is calculated on the same basis,
except that the Fund’s net asset value is used on the purchase and sale dates
instead of market value. |
| 3 |
Not annualized |
| 4 |
The investment
advisory fee is calculated based on average net assets over a rolling 36-month basis,
while the above ratios of investment advisory fee expenses are based on the average
net assets over a 12-month basis. |
| 5 |
Annualized |
| THE ACCOMPANYING
NOTES ARE AN INTEGRAL PART OF THESE FINANCIAL STATEMENTS |
|
2018 Semiannual
Report to Stockholders | 33 |
Notes to Financial Statements (unaudited)
| Summary of Significant Accounting Policies |
Royce Micro-Cap Trust, Inc. (the “Fund”), is a diversified closed-end investment company that was incorporated under the laws of the
State of Maryland on September 9, 1993. The Fund commenced operations on December 14, 1993.
|
The preparation of financial statements in conformity with accounting principles generally accepted in the United States of America
requires management to make estimates and assumptions that affect the reported amounts of assets and liabilities and the disclosure of
contingent assets and liabilities at the date of the financial statements and the reported amounts of income and expenses during the
reporting period. Actual results could differ from those estimates. |
The Fund is an investment company and accordingly follows the investment company accounting and reporting guidance of the
Financial Accounting Standards Board (FASB) Accounting Standard Codification Topic 946 “Financial Services-Investment Companies”. |
| |
| VALUATION
OF INVESTMENTS: |
Securities are valued as of the close of trading on the New York Stock Exchange (NYSE) (generally 4:00 p.m. Eastern time) on the
valuation date. Securities that trade on an exchange, and securities traded on Nasdaq’s Electronic Bulletin Board, are valued at their last
reported sales price or Nasdaq official closing price taken from the primary market in which each security trades or, if no sale is reported
for such day, at their highest bid price. Other over-the-counter securities for which market quotations are readily available are valued at
their highest bid price, except in the case of some bonds and other fixed income securities which may be valued by reference to other
securities with comparable ratings, interest rates and maturities, using established independent pricing services. The Fund values its non-U.S. dollar denominated securities in U.S. dollars daily at the prevailing foreign currency exchange rates as quoted by a major bank.
Securities for which market quotations are not readily available are valued at their fair value in accordance with the provisions of the 1940
Act, under procedures approved by the Fund’s Board of Directors, and are reported as Level 3 securities. As a general principle, the fair
value of a security is the amount which the Fund might reasonably expect to receive for the security upon its current sale. However, in
light of the judgment involved in fair valuations, there can be no assurance that a fair value assigned to a particular security will be the
amount which the Fund might be able to receive upon its current sale. In addition, if, between the time trading ends on a particular security
and the close of the customary trading session on the NYSE, events occur that are significant and may make the closing price unreliable,
the Fund may fair value the security. The Fund uses an independent pricing service to provide fair value estimates for relevant non-U.S.
equity securities on days when the U.S. market volatility exceeds a certain threshold. This pricing service uses proprietary correlations it
has developed between the movement of prices of non-U.S. equity securities and indices of U.S.-traded securities, futures contracts and
other indications to estimate the fair value of relevant non-U.S. securities. When fair value pricing is employed, the prices of securities used
by the Fund may differ from quoted or published prices for the same security. Investments in money market funds are valued at net asset
value per share. |
Various inputs are used in determining the value of the Fund’s investments, as noted above. These inputs are summarized in the three
broad levels below: |
| Level 1 |
– |
quoted prices in active markets for identical securities. |
| Level 2 |
– |
other significant observable inputs (including quoted prices for similar securities, foreign securities that may be fair valued and
repurchase agreements). The table below includes all Level 2 securities. Level 2 securities with values based on quoted
prices for similar securities are noted in the Schedule of Investments. |
| Level 3 |
– |
significant unobservable inputs (including last trade price before trading was suspended, or at a discount thereto for lack of
marketability or otherwise, market price information regarding other securities, information received from the company and/or
published documents, including SEC filings and financial statements, or other publicly available information). |
The inputs or methodology used for valuing securities are not necessarily an indication of the risk associated with investing in those
securities. |
The following is a summary of the inputs used to value the Fund’s investments as of June 30, 2018. For a detailed breakout of common
stocks by sector classification, please refer to the Schedule of Investments. |
| |
|
|
|
|
|
|
|
|
|
|
|
|
|
|
|
|
| |
|
LEVEL 1 |
|
LEVEL 2 |
|
LEVEL 3 |
|
TOTAL |
|
| |
| Common Stocks |
|
|
$428,414,854 |
|
|
|
$ 6,663,997 |
|
|
|
$254,300 |
|
|
|
$435,333,151 |
|
| |
| Preferred Stocks |
|
|
1,991,200 |
|
|
|
– |
|
|
|
– |
|
|
|
1,991,200 |
|
| |
| Cash Equivalents |
|
|
– |
|
|
|
34,959,000 |
|
|
|
– |
|
|
|
34,959,000 |
|
| |
Certain securities have transferred in and out of Level 1 and Level 2 measurements during the reporting period. The Fund recognizes
transfers between levels as of the end of the reporting period. For the six months ended June 30, 2018, securities valued at $14,133,960
were transferred from Level 2 to Level 1 within the fair value hierarchy. |
34 | 2018 Semiannual Report to Stockholders
Notes to Financial Statements (unaudited) (continued)
VALUATION OF INVESTMENTS (continued):
|
Level 3 Reconciliation: |
| |
|
|
|
|
|
| |
BALANCE AS OF 12/31/17 |
PURCHASES |
REALIZED GAIN (LOSS) |
UNREALIZED GAIN (LOSS)1 |
BALANCE AS OF 6/30/18 |
| |
| Common Stocks |
$241,800 |
$0 |
$ – |
$12,500 |
$254,300 |
| |
| 1 |
The net change in unrealized appreciation (depreciation) is included in the accompanying Statement of Operations. Change in unrealized appreciation (depreciation) includes net
unrealized appreciation (depreciation) resulting from changes in investment values during the reporting period and the reversal of previously recorded unrealized appreciation
(depreciation) when gains or losses are realized. Net realized gain (loss) from investments and foreign currency transactions is included in the accompanying Statement of Operations. |
The following table summarizes the valuation techniques used and unobservable inputs approved by the Valuation Committee to
determine the fair value of certain Level 3 investments. The table does not include Level 3 investments with values derived utilizing prices
from prior transactions or third party pricing information with adjustments (e.g. broker quotes, pricing services, net asset values).
| |
|
|
FAIR
VALUE AT |
|
|
|
|
|
|
|
|
|
|
|
IMPACT
TO VALUATION FROM |
| |
|
|
6/30/18 |
|
|
VALUATION
TECHNIQUE(S) |
|
|
UNOBSERVABLE
INPUT(S) |
|
|
RANGE
AVERAGE |
|
|
AN INCREASE
IN INPUT1 |
| |
| Common Stocks |
|
|
$254,300 |
|
|
Discounted Present Value
Balance Sheet Analysis |
|
|
Liquidity
Discount |
|
|
30%-40% |
|
|
Decrease |
| |
| 1 |
This column represents the directional change in the fair value of the Level 3 investments that would result in an increase from the corresponding unobservable input. A decrease to the
unobservable input would have the opposite effect. Significant increases and decreases in these unobservable inputs in isolation could result in significantly higher or lower fair value
measurements. |
| REPURCHASE
AGREEMENTS: |
The Fund may enter into repurchase agreements with institutions that the Fund’s investment adviser has determined are creditworthy.
The Fund restricts repurchase agreements to maturities of no more than seven days. Securities pledged as collateral for repurchase
agreements, which are held until maturity of the repurchase agreements, are marked-to-market daily and maintained at a value at least
equal to the principal amount of the repurchase agreement (including accrued interest). Repurchase agreements could involve certain
risks in the event of default or insolvency of the counter-party, including possible delays or restrictions upon the ability of the Fund to
dispose of its underlying securities. The remaining contractual maturity of the repurchase agreement held by the Fund at June 30, 2018 is
overnight and continuous. |
| |
| FOREIGN CURRENCY: |
Net realized foreign exchange gains or losses arise from sales and maturities of short-term securities, sales of foreign currencies,
expiration of currency forward contracts, currency gains or losses realized between the trade and settlement dates on securities
transactions, and the difference between the amounts of dividends, interest, and foreign withholding taxes recorded on the Fund’s books
and the U.S. dollar equivalent of the amounts actually received or paid. Net unrealized foreign exchange gains and losses arise from
changes in the value of assets and liabilities, including investments in securities at the end of the reporting period, as a result of changes
in foreign currency exchange rates. |
| |
| TAXES: |
As a qualified regulated investment company under Subchapter M of the Internal Revenue Code, the Fund is not subject to income
taxes to the extent that it distributes substantially all of its taxable income for its fiscal year. The Schedule of Investments includes
information regarding income taxes under the caption “Tax Information”. |
| |
| DISTRIBUTIONS: |
The Fund pays quarterly distributions on the Fund’s Common Stock at the annual rate of 7% of the rolling average of the prior four
calendar quarter-end NAVs of the Fund’s Common Stock, with the fourth quarter distribution being the greater of 1.75% of the rolling
average or the distribution required by IRS regulations. Distributions to Common Stockholders are recorded on ex-dividend date. To the
extent that distributions in any year are not paid from long-term capital gains, net investment income or net short-term capital gains, they
will represent a return of capital. Distributions are determined in accordance with income tax regulations that may differ from accounting
principles generally accepted in the United States of America. Permanent book and tax differences relating to stockholder distributions will
result in reclassifications within the capital accounts. Undistributed net investment income may include temporary book and tax basis
differences, which will reverse in a subsequent period. Any taxable income or gain remaining undistributed at fiscal year end is distributed
in the following year. |
2018 Semiannual Report to Stockholders | 35
Notes to Financial Statements (unaudited) (continued)
| INVESTMENT TRANSACTIONS AND RELATED INVESTMENT INCOME: |
Investment transactions are accounted for on the trade date. Dividend income is recorded on the ex-dividend date. Non-cash dividend
income is recorded at the fair market value of the securities received. Interest income is recorded on an accrual basis. Premiums and
discounts on debt securities are amortized using the effective yield-to-maturity method. Realized gains and losses from investment
transactions are determined on the basis of identified cost for book and tax purposes. |
| |
| EXPENSES: |
The Fund incurs direct and indirect expenses. Expenses directly attributable to the Fund are charged to the Fund’s operations, while
expenses applicable to more than one of the Royce Funds are allocated equitably. Certain personnel, occupancy costs and other
administrative expenses related to the Funds are allocated by Royce & Associates (“Royce”) under an administration agreement and are
included in administrative and office facilities and professional fees. The Fund has adopted a deferred fee agreement that allows the
Directors to defer the receipt of all or a portion of directors’ fees otherwise payable. The deferred fees are invested in certain Royce Funds
until distributed in accordance with the agreement. |
| |
| COMPENSATING
BALANCE CREDITS: |
The Fund has an arrangement with its custodian bank, whereby a portion of the custodian’s fee is paid indirectly by credits earned on
the Fund’s cash on deposit with the bank. This deposit arrangement is an alternative to purchasing overnight investments. Conversely, the
Fund pays interest to the custodian on any cash overdrafts, to the extent they are not offset by credits earned on positive cash balances. |
| |
| Capital
Stock: |
The Fund issued 594,634 and 1,336,310 shares of Common Stock as reinvestment of distributions for the six months ended June 30,
2018 and the year ended December 31, 2017, respectively. |
| |
| Borrowings:
|
The Fund is party to a revolving credit agreement (the credit agreement) with BNP Paribas Prime Brokerage International, Limited
(BNPPI). The Fund pays a commitment fee of 0.50% per annum on the unused portion of the credit agreement. The credit agreement has a
360-day rolling term that resets daily; however, if the Fund exceeds certain net asset value triggers, the credit agreement may convert to a
60-day rolling term that resets daily. The Fund is required to pledge portfolio securities as collateral in an amount up to two times the loan
balance outstanding or as otherwise required by applicable regulatory standards and has granted a security interest in the securities
pledged to, and in favor of, BNPPI as security for the loan balance outstanding. If the Fund fails to meet certain requirements, or maintain
other financial covenants required under the credit agreement, the Fund may be required to repay immediately, in part or in full, the loan
balance outstanding under the credit agreement which may necessitate the sale of portfolio securities at potentially inopportune times.
BNPPI may terminate the credit agreement upon certain ratings downgrades of its corporate parent, which would result in the Fund’s
entire loan balance becoming immediately due and payable. The occurrence of such ratings downgrades may necessitate the sale of
portfolio securities at potentially inopportune times. The credit agreement also permits, subject to certain conditions, BNPPI to
rehypothecate portfolio securities pledged by the Fund up to the amount of the loan balance outstanding. The Fund continues to receive
payments in lieu of dividends and interest on rehypothecated securities. The Fund also has the right under the credit agreement to recall
the rehypothecated securities from BNPPI on demand. If BNPPI fails to deliver the recalled security in a timely manner, the Fund is
compensated by BNPPI for any fees or losses related to the failed delivery or, in the event a recalled security is not returned by BNPPI, the
Fund, upon notice to BNPPI, may reduce the loan balance outstanding by the value of the recalled security failed to be returned. The Fund
receives a portion of the fees earned by BNPPI in connection with the rehypothecation of portfolio securities. |
As of June 30, 2018, the Fund has outstanding borrowings of $45,000,000. During the six months ended June 30, 2018, the Fund
borrowed an average daily balance of $45,000,000 at a weighted average borrowing cost of 3.08%. The maximum amount outstanding
during the six months ended June 30, 2018 was $45,000,000. As of June 30, 2018, the aggregate value of rehypothecated securities
was $37,405,632. During the six months ended June 30, 2018, the Fund earned $201,609 in fees from rehypothecated securities. |
| |
| Investment
Advisory Agreement: |
As compensation for its services under the investment advisory agreement, Royce receives a fee comprised of a Basic Fee (“Basic Fee”)
and an adjustment to the Basic Fee based on the investment performance of the Fund in relation to the investment record of the Russell
2000. |
36 | 2018 Semiannual Report to Stockholders
Notes to Financial Statements (unaudited) (continued)
| Investment Advisory Agreement (continued): |
The Basic Fee is a monthly fee equal to 1/12 of 1% (1% on an annualized basis) of the average of the Fund’s month-end net assets for
the rolling 36-month period ending with such month (the “performance period”). The Basic Fee for each month is increased or decreased
at the rate of 1/12 of .05% for each percentage point that the investment performance of the Fund exceeds, or is exceeded by, the
percentage change in the investment record of the Russell 2000 for the performance period by more than two percentage points. The
performance period for each such month is a rolling 36-month period ending with such month. The maximum increase or decrease in the
Basic Fee for any month may not exceed 1/12 of .5%. Accordingly, for each month, the maximum monthly fee rate as adjusted for
performance is 1/12 of 1.5% and is payable if the investment performance of the Fund exceeds the percentage change in the investment
record of the Russell 2000 by 12 or more percentage points for the performance period, and the minimum monthly fee rate as adjusted
for performance is 1/12 of .5% and is payable if the percentage change in the investment record of the Russell 2000 exceeds the
investment performance of the Fund by 12 or more percentage points for the performance period. |
For the six rolling 36-month periods ended June 2018, the Fund’s investment performance ranged from 2% to 5% below the investment
performance of the Russell 2000. Accordingly, the net investment advisory fee consisted of a Basic Fee of $1,793,539 and a net
downward adjustment of $104,191 for the performance of the Fund relative to that of the Russell 2000. Additionally, investment advisory
fees for 2018 include $245,136 relating to an adjustment of prior periods’ performance fees. For the six months ended June 30, 2018,
the Fund expensed Royce investment advisory fees totaling $1,934,484. |
| |
| Purchases
and Sales of Investment Securities: |
For the six months ended June 30, 2018, the costs of purchases and proceeds from sales of investment securities, other than short-term
securities, amounted to $41,430,667 and $52,763,111, respectively. |
Cross trades were executed by the Fund pursuant to Rule 17a-7 under the 1940 Act. Cross trading is the buying or selling of portfolio
securities between funds to which Royce serves as investment adviser. At its regularly scheduled quarterly meetings, the Board reviews
such transactions as of the most recent calendar quarter for compliance with the requirements and restrictions set forth by Rule 17a-7.
Cross trades for the six months ended June 30, 2018, were as follows: |
| COST
OF PURCHASES |
|
|
PROCEEDS
FROM SALES |
|
|
REALIZED
GAIN (LOSS) |
| |
| $1,771,063 |
|
|
$ – |
|
|
$ – |
| |
2018 Semiannual Report to Stockholders | 37
| |
|
MANAGERS’ DISCUSSION |
| Royce Value Trust (RVT) |
|
|
 |
Chuck Royce
Chris Flynn
Lauren Romeo, CFA |
FUND PERFORMANCE
Following two consecutive years
of strong absolute and relative
performance, our oldest closed-end
portfolio fell behind each of its
unleveraged small-cap benchmarks in
the first half of 2018. Royce Value
Trust (“RVT”) advanced 2.8% on a net asset value (“NAV”)
basis and 1.4% on a market price basis for the year-to-date
period ended June 30, 2018, in both cases underperforming
the Russell 2000 and S&P SmallCap 600 Indexes, which had
respective increases of 7.7% and 9.4% for the same period. The
Fund maintained its longer-term relative advantages, outperforming
the Russell 2000 based on both NAV and market price for the three-,
20-, 25-, 30-year, and since inception (11/26/86) periods ended June
30, 2018. |
| |
| WHAT WORKED... AND WHAT DIDN’T |
Although the first half was challenging for our multi-discipline small-cap
core strategy with the market continuing to favor higher growth,
lower quality, and more yield-sensitive equities, nine of RVT’s 11
equity sectors nonetheless finished the period in the black. Energy,
which recovered significantly in the second quarter, was by far the top
contributor, while Consumer Discretionary and Consumer Staples
had only modest negative results.
At the industry level, the top contributor was energy equipment
& services (Energy) as the rebound for oil prices fed through
to improved prospects for these businesses. SEACOR Marine
Holdings, which provides global marine and support transportation
services to the energy industry, was the Fund’s top performer overall
and in this industry. Stronger operating results came from nearly all
of its geographic markets, which helped its shares to rise. Norway’s
TGS-NOPEC Geophysical, which provides geoscience data to oil and
gas companies worldwide, was also a significant contributor in this
industry and in the portfolio as a whole. Its revenue and earnings were
boosted by improving exploration and production spending, higher
oil prices, and the longer-term need for energy companies to replenish
reserves, which is driving increased spending on seismic data. Outside
of energy, Copart, the largest online salvage auction provider in the
U.S., saw higher volumes and revenue per car as market conditions
remained robust in the first half. Copart’s continuous improvement of
its virtual bidding platform is expanding the pool of potential buyers,
auction participants, and bids per car. A shift within its non-insurance
auto auction business toward dealers and financial institutions has
been lifting both average selling prices and gross margins higher.
Finally, the company has been supplementing its expanding European
footprint with the acquisition of a salvage operation in Finland,
augmenting its buyer base in Russia and the Baltic States. |
| RVT’s top-two contributors from both 2016 and 2017 made the
list of top detractors in 2018’s first half. The stock of laser diode and
equipment maker Coherent underwent a correction in the first half
after the company’s announcement of slightly better-than-expected
results came with a more muted profit outlook. Already reducing our
position in 2017, we sold additional shares in June 2018. Cognex
Corporation has a dominant position as the global leader in machine
vision technology. It was hurt by slackening demand in its consumer
electronics market, in particular by iPhone sales that were well below
expectations. We also suspect that many technology businesses with
global reach may have suffered amid concerns about the effect trade wars
would have on worldwide growth. We held our shares in the first half. |
| The largest negative effect on returns relative to the Russell 2000 came
from poor stock selection in Information Technology, most impactfully
in the electronic equipment, instruments & components group and in
Internet software & services companies. Stock selection also hurt in
Consumer Discretionary, while our underweight in Health Care,
especially in biotechnology, and our overweight in Industrials, most
notably in the machinery group, also detracted. Machinery was also the
biggest detractor for RVT at the industry level, due in large part to
disappointing performance from Sun Hydraulics. In fact, several
holdings in this group reported disappointing earnings and lackluster
guidance, due partially to margin compression caused by higher input
costs. We think that some of these margin issues should prove transitory
as manufacturers must first absorb these increased costs before realizing
higher product prices. Conversely, savvy stock selection gave RVT an
advantage in the Energy and Real Estate sectors, as did our lower
exposure to Utilities. |
| |
Top Contributors
to Performance
Year-to-Date Through 6/30/18 (%)1 |
|
|
|
| |
|
|
| SEACOR Marine Holdings |
|
0.48 |
| |
| TGS-NOPEC Geophysical |
|
0.39 |
| |
| Copart |
|
0.31 |
| |
| Wesco Aircraft Holdings |
|
0.25 |
| |
| FRP Holdings |
|
0.25 |
| |
| 1 Includes dividends |
|
|
| |
Top Detractors from
Performance
Year-to-Date Through 6/30/18 (%)2 |
|
|
|
| |
|
|
| Coherent |
|
-0.64 |
| |
| Cognex Corporation |
|
-0.37 |
| |
| Thor Industries |
|
-0.35 |
| |
| Sun Hydraulics |
|
-0.32 |
| |
| ManpowerGroup |
|
-0.27 |
| |
| 2 Net of dividends |
|
|
| CURRENT POSITIONING AND OUTLOOK |
| The market’s recent behavior looks curious to us. We hear optimism
and solid progress from the management teams we meet with, see
solid earnings reports, and observe consistently strong macroeconomic
data. On the other hand, small-cap market leadership has stubbornly
remained with defensive and yield-oriented stocks, while cyclicals
have lagged. Despite new highs for the Russell 2000, we are therefore
far from ebullient, as we anticipate that increased volatility will
accompany a shift in market leadership to value/cyclical leadership.
We are also mindful that these shifts rarely occur without some
turbulence. We have therefore sought to position the portfolio for
both lower small-cap returns and increased volatility. |
| 38 | 2018 Semiannual Report to Stockholders |
|
| PERFORMANCE AND PORTFOLIO REVIEW |
SYMBOLS MARKET PRICE RVT NAV XRVTX |
|
| Performance |
|
|
|
|
|
|
|
|
|
|
|
|
|
|
|
|
|
| Average Annual Total Return (%) Through 6/30/18 |
|
|
|
|
|
|
|
|
|
| |
|
JAN-JUN 20181 |
|
1-YR |
|
3-YR |
|
5-YR |
|
10-YR |
|
15-YR |
|
20-YR |
|
25-YR |
|
30-YR |
|
SINCE INCEPTION (11/26/86) |
|
| RVT (NAV) |
|
2.78 |
|
14.37 |
|
12.03 |
|
11.45 |
|
8.81 |
|
10.04 |
|
9.15 |
|
10.53 |
|
10.97 |
|
10.74 |
| |
| 1 Not Annualized |
|
|
|
|
|
|
|
|
|
|
|
|
|
|
|
|
| Market Price Performance History Since Inception (11/26/86) |
| Cumulative Performance of Investment through 6/30/181 |
|
|
|
|
|
|
|
|
| |
|
1-YR |
|
5-YR |
|
10-YR |
|
15-YR |
|
20-YR |
|
SINCE INCEPTION (11/26/86) |
| |
| RVT |
|
16.9% |
|
74.5% |
|
122.8% |
|
267.0% |
|
460.2% |
|
2058.6% |
| |

| 1 |
Reflects the cumulative performance of an investment made by a stockholder who purchased one share at inception ($10.00 IPO), reinvested
all distributions and fully participated in primary subscriptions of the Fund's rights offerings. |
| 2 |
Reflects the actual month-end market price movement of one share as it has traded on the NYSE. |
| |
|
The Morningstar Style Map is the Morningstar Style Box™ with the center 75% of fund holdings plotted as the Morningstar Ownership Zone™. The Morningstar Style Box is designed to reveal a
fund’s investment strategy. The Morningstar Ownership Zone provides
detail about a portfolio’s investment style by showing the range of
stock sizes and styles. The Ownership Zone is derived by plotting each
stock in the portfolio within the proprietary Morningstar Style Box.
Over time, the shape and location of a fund's ownership zone may vary.
See page 66 for additional information. |
|
| Top 10 Positions |
|
|
| % of Net Assets |
|
|
| |
|
|
| FLIR Systems |
|
2.1 |
| |
| HEICO Corporation |
|
1.9 |
| |
| Quaker Chemical |
|
1.4 |
| |
| Copart |
|
1.2 |
| |
| Sun Hydraulics |
|
1.2 |
| |
| Reliance Steel & Aluminum |
|
1.1 |
| |
| Cognex Corporation |
|
1.0 |
| |
| TGS-NOPEC Geophysical |
|
1.0 |
| |
| SEACOR Marine Holdings |
|
1.0 |
| |
| ANSYS |
|
0.9 |
| |
|
| Portfolio Sector Breakdown |
|
|
| % of Net Assets |
|
|
| |
|
|
| Industrials |
|
30.8 |
| |
| Information Technology |
|
19.3 |
| |
| Financials |
|
14.9 |
| |
| Consumer Discretionary |
|
8.8 |
| |
| Materials |
|
8.6 |
| |
| Energy |
|
7.0 |
| |
| Health Care |
|
4.4 |
| |
| Real Estate |
|
3.7 |
| |
| Consumer Staples |
|
1.6 |
| |
| Telecommunication Services |
|
0.5 |
| |
| Utilities |
|
0.4 |
| |
Cash and Cash Equivalents, Net of
Outstanding Line of Credit |
|
0.0 |
| |
|
| Calendar Year Total Returns (%) |
|
| |
|
|
| YEAR |
|
RVT |
| |
| 2017 |
|
19.4 |
| |
| 2016 |
|
26.8 |
| |
| 2015 |
|
-8.1 |
| |
| 2014 |
|
0.8 |
| |
| 2013 |
|
34.1 |
| |
| 2012 |
|
15.4 |
| |
| 2011 |
|
-10.1 |
| |
| 2010 |
|
30.3 |
| |
| 2009 |
|
44.6 |
| |
| 2008 |
|
-45.6 |
| |
| 2007 |
|
5.0 |
| |
| 2006 |
|
19.5 |
| |
| 2005 |
|
8.4 |
| |
| 2004 |
|
21.4 |
| |
| 2003 |
|
40.8 |
| |
|
| Portfolio Diagnostics |
|
|
| |
|
|
| Fund Net Assets |
|
$1,490 million |
| |
| Number of Holdings |
|
372 |
| |
| Turnover Rate |
|
17% |
| |
| Net Asset Value |
|
$17.34 |
| |
| Market Price |
|
$15.80 |
| |
| Average Market
Capitalization1 |
|
$1,914 million |
| |
| Weighted Average
P/E Ratio 2,3 |
|
21.7x |
| |
| Weighted Average P/B Ratio2 |
|
2.2x |
| |
| Active Share 4 |
|
91% |
| |
| U.S. Investments (% of Net Assets) |
|
83.1% |
| |
| Non-U.S. Investments (% of Net Assets) |
|
16.9% |
| |
| |
| 1 |
Geometric Average. This weighted calculation uses each portfolio
holding’s market cap in a way designed to not skew the effect of
very large or small holdings; instead, it aims to better identify
the portfolio’s center, which Royce believes offers a more accurate
measure of average market cap than a simple mean or median. |
| 2 |
Harmonic Average. This weighted calculation evaluates a portfolio
as if it were a single stock and measures it overall. It compares the
total market value of the portfolio to the portfolio’s share in the
earnings or book value, as the case may be, of its underlying stocks. |
| 3 |
The Fund’s P/E ratio calculation excludes companies with zero or
negative earnings (18% of portfolio holdings as of 6/30/18). |
| 4 |
Active Share is the sum of the absolute values of the different
weightings of each holding in the Fund versus each holding in the
benchmark, divided by two. |
Important Performance and Risk Information
All performance information reflects past performance, is presented on a total return basis, net of the Fund’s investment advisory fee, and reflects the reinvestment of distributions. Past performance is no
guarantee of future results. Current performance may be higher or lower than performance quoted. Returns as of the most recent month-end may be obtained at www.roycefunds.com. Certain immaterial
adjustments were made to the net assets of Royce Value Trust at 12/31/16 and 6/30/18 for financial reporting purposes, and as a result the net asset value originally calculated on that date and the total return
based on that net asset value differs from the adjusted net asset value and total return reported in the Financial Highlights. The market price of the Fund’s shares will fluctuate, so that shares may be worth more
or less than their original cost when sold. The Fund invests primarily in securities of small- and micro-cap companies, which may involve considerably more risk than investing in larger-cap companies. The Fund’s
broadly diversified portfolio does not ensure a profit or guarantee against loss. Regarding the “Top Contributors” and “Top Detractors” tables shown above, the sum of all contributors to, and all detractors from,
performance for all securities in the portfolio would approximate the Fund’s year-to date performance for 2018. |
| |
|
2018 Semiannual Report to Stockholders | 39 |
| Royce Value Trust |
| |
| |
| Schedule
of Investments |
| Common Stocks
– 100.0% |
| |
|
SHARES |
|
|
VALUE |
|
| |
| |
|
|
|
|
|
|
| CONSUMER
DISCRETIONARY – 8.8% |
|
|
|
|
|
|
| AUTO COMPONENTS
- 0.9% |
|
|
|
|
|
|
Dorman Products 1 |
|
61,400 |
|
$ |
4,194,234 |
|
Gentex
Corporation 2 |
|
62,500 |
|
|
1,438,750 |
|
LCI
Industries |
|
73,616 |
|
|
6,636,482 |
|
Sebang
Global Battery |
|
28,500 |
|
|
809,354 |
|
Standard
Motor Products |
|
13,391 |
|
|
647,321 |
|
| |
|
|
|
|
|
| |
|
|
|
|
13,726,141
|
|
| |
|
|
|
|
|
| AUTOMOBILES
- 0.6% |
|
|
|
|
|
|
Thor
Industries 2 |
|
93,230 |
|
|
9,079,670
|
|
| |
|
|
|
|
|
| DISTRIBUTORS
- 1.3% |
|
|
|
|
|
|
Connect
Group |
|
550,000 |
|
|
223,928 |
|
Core-Mark
Holding Company |
|
456,100 |
|
|
10,353,470 |
|
LKQ
Corporation 1 |
|
149,300 |
|
|
4,762,670 |
|
Weyco
Group |
|
97,992 |
|
|
3,566,909 |
|
| |
|
|
|
|
|
| |
|
|
|
|
18,906,977
|
|
| |
|
|
|
|
|
| DIVERSIFIED
CONSUMER SERVICES - 0.3% |
|
|
|
|
|
|
Collectors
Universe |
|
71,100 |
|
|
1,048,014 |
|
Houghton
Mifflin Harcourt 1 |
|
100,000 |
|
|
765,000 |
|
Liberty
Tax Cl. A |
|
151,573 |
|
|
1,223,952 |
|
Universal
Technical Institute 1 |
|
504,032 |
|
|
1,587,701 |
|
| |
|
|
|
|
|
| |
|
|
|
|
4,624,667
|
|
| |
|
|
|
|
|
| HOTELS, RESTAURANTS
& LEISURE - 0.3% |
|
|
|
|
|
|
†Inspired Entertainment 1,2 |
|
150,000 |
|
|
937,500 |
|
Lindblad
Expeditions Holdings 1 |
|
207,600 |
|
|
2,750,700 |
|
Rank
Group |
|
400,000 |
|
|
1,010,401 |
|
| |
|
|
|
|
|
| |
|
|
|
|
4,698,601
|
|
| |
|
|
|
|
|
| HOUSEHOLD
DURABLES - 1.6% |
|
|
|
|
|
|
Cavco
Industries 1 |
|
14,700 |
|
|
3,052,455 |
|
Ethan
Allen Interiors |
|
200,000 |
|
|
4,900,000 |
|
HG
Holdings 1,3,4 |
|
912,235 |
|
|
592,953 |
|
Natuzzi
ADR 1 |
|
2,096,300 |
|
|
3,375,043 |
|
PICO
Holdings |
|
409,400 |
|
|
4,769,510 |
|
†Purple Innovation 1 |
|
225,000 |
|
|
1,912,500 |
|
†Purple Innovation (Warrants) 1,5 |
|
750,000 |
|
|
411,000 |
|
Samson
Holding |
|
2,500,000 |
|
|
261,293 |
|
Skyline
Champion |
|
70,400 |
|
|
2,466,816 |
|
†TopBuild Corporation 1 |
|
20,300 |
|
|
1,590,302 |
|
| |
|
|
|
|
|
| |
|
|
|
|
23,331,872
|
|
| |
|
|
|
|
|
| INTERNET
& DIRECT MARKETING RETAIL - 0.4% |
|
|
|
|
|
|
CafePress
1 |
|
39,079 |
|
|
45,722 |
|
FTD
Companies 1 |
|
298,014 |
|
|
1,382,785 |
|
†Shutterfly 1 |
|
14,900 |
|
|
1,341,447 |
|
TripAdvisor
1 |
|
50,000 |
|
|
2,785,500 |
|
†zooplus 1 |
|
6,200 |
|
|
1,158,458 |
|
| |
|
|
|
|
|
| |
|
|
|
|
6,713,912
|
|
| |
|
|
|
|
|
| LEISURE PRODUCTS
- 0.7% |
|
|
|
|
|
|
Clarus
Corporation 1 |
|
90,000 |
|
|
742,500 |
|
Nautilus
1 |
|
574,500 |
|
|
9,019,650 |
|
| |
|
|
|
|
|
| |
|
|
|
|
9,762,150
|
|
| |
|
|
|
|
|
| MEDIA - 0.3% |
|
|
|
|
|
|
Global
Eagle Entertainment 1 |
|
110,000 |
|
|
277,200 |
|
Gray
Television 1 |
|
50,000 |
|
|
790,000 |
|
Liberty
Latin America Cl. C 1,2 |
|
96,500 |
|
|
1,870,170 |
|
Pico
Far East Holdings |
|
2,612,400 |
|
|
1,058,865 |
|
| |
|
|
|
|
|
| |
|
|
|
|
3,996,235
|
|
| |
|
|
|
|
|
| MULTILINE
RETAIL - 0.0% |
|
|
|
|
|
|
New
World Department Store China 1 |
|
377,500 |
|
|
87,090
|
|
| |
|
|
|
|
|
| SPECIALTY
RETAIL - 1.4% |
|
|
|
|
|
|
AutoCanada |
|
114,000 |
|
|
1,475,024 |
|
Barnes
& Noble |
|
67,000 |
|
|
425,450 |
|
Camping
World Holdings Cl. A 2,6 |
|
124,100 |
|
|
3,100,018 |
|
Container
Store Group (The) 1,2 |
|
158,200 |
|
|
1,330,462 |
|
Destination
Maternity 1 |
|
557,967 |
|
|
3,247,368 |
|
Duty
Free International |
|
2,000,000 |
|
|
293,578 |
|
I.T |
|
827,000 |
|
|
590,292 |
|
Monro |
|
134,000 |
|
|
7,785,400 |
|
Oriental
Watch Holdings |
|
967,900 |
|
|
310,889 |
|
Signet
Jewelers |
|
35,000 |
|
|
1,951,250 |
|
TravelCenters
of America LLC 1 |
|
62,500 |
|
|
218,750 |
|
| |
|
|
|
|
|
| |
|
|
|
|
20,728,481
|
|
| |
|
|
|
|
|
| TEXTILES,
APPAREL & LUXURY GOODS - 1.0% |
|
|
|
|
|
|
Culp |
|
29,400 |
|
|
721,770 |
|
J.G.
Boswell Company 4 |
|
3,940 |
|
|
2,640,588 |
|
Wolverine
World Wide |
|
322,300 |
|
|
11,206,371 |
|
YGM
Trading |
|
1,082,600 |
|
|
869,326 |
|
| |
|
|
|
|
|
| |
|
|
|
|
15,438,055
|
|
| |
| Total (Cost $132,337,096)
|
|
|
|
|
131,093,851
|
|
| |
| |
|
|
|
|
|
|
| CONSUMER
STAPLES – 1.6% |
|
|
|
|
|
|
| BEVERAGES
- 0.1% |
|
|
|
|
|
|
Compania
Cervecerias Unidas ADR 2 |
|
64,500 |
|
|
1,608,630
|
|
| |
|
|
|
|
|
| FOOD &
STAPLES RETAILING - 0.0% |
|
|
|
|
|
|
Conviviality
1,5 |
|
350,000 |
|
|
0 |
|
| |
|
|
|
|
|
| FOOD
PRODUCTS - 1.2% |
|
|
|
|
|
|
Cal-Maine
Foods 1,2 |
|
40,416 |
|
|
1,853,073 |
|
Farmer
Bros. 1 |
|
54,700 |
|
|
1,671,085 |
|
Nomad
Foods 1 |
|
125,000 |
|
|
2,398,750 |
|
Seneca
Foods Cl. A 1 |
|
225,429 |
|
|
6,086,583 |
|
Seneca
Foods Cl. B 1 |
|
13,840 |
|
|
370,912 |
|
SunOpta
1,2 |
|
50,000 |
|
|
420,000 |
|
Tootsie
Roll Industries 2 |
|
165,529 |
|
|
5,106,570 |
|
| |
|
|
|
|
|
| |
|
|
|
|
17,906,973
|
|
| |
|
|
|
|
|
| PERSONAL PRODUCTS
- 0.3% |
|
|
|
|
|
|
Inter
Parfums |
|
75,630 |
|
|
4,046,205
|
|
| |
| Total (Cost $18,703,637)
|
|
|
|
|
23,561,808
|
|
| |
| |
|
|
|
|
|
|
| ENERGY
– 7.0% |
|
|
|
|
|
|
| ENERGY EQUIPMENT
& SERVICES - 5.5% |
|
|
|
|
|
|
†C&J Energy Services 1 |
|
7,700 |
|
|
181,720 |
|
CARBO
Ceramics 1,2,6 |
|
78,000 |
|
|
715,260 |
|
Computer
Modelling Group |
|
594,350 |
|
|
4,566,185 |
|
Diamond
Offshore Drilling 1,2,6 |
|
214,000 |
|
|
4,464,040 |
|
Era
Group 1 |
|
564,693 |
|
|
7,312,774 |
|
Forum
Energy Technologies 1 |
|
249,431 |
|
|
3,080,473 |
|
Frank’s International 1,2 |
|
108,600 |
|
|
847,080 |
|
Helmerich
& Payne 2,6 |
|
94,000 |
|
|
5,993,440 |
|
ION
Geophysical 1,2,6 |
|
71,880 |
|
|
1,746,684 |
|
North
American Construction Group |
|
160,000 |
|
|
952,000 |
|
Oil
States International 1 |
|
10,000 |
|
|
321,000 |
|
Pason
Systems |
|
607,680 |
|
|
9,947,342 |
|
†Patterson-UTI Energy |
|
10,050 |
|
|
180,900 |
|
Precision
Drilling 1 |
|
93,900 |
|
|
311,748 |
|
RigNet
1 |
|
32,754 |
|
|
337,366 |
|
RPC |
|
12,800 |
|
|
186,496 |
|
SEACOR
Holdings 1 |
|
150,469 |
|
|
8,617,360 |
|
SEACOR Marine Holdings 1 |
|
638,834 |
|
|
14,750,677 |
|
TGS-NOPEC Geophysical |
|
419,370 |
|
|
15,447,642 |
|
| 40 | 2018
Semiannual Report to Stockholders |
THE ACCOMPANYING
NOTES ARE AN INTEGRAL PART OF THESE FINANCIAL STATEMENTS |
| June 30,
2018 (unaudited) |
| |
Schedule
of Investments (continued)
|
| |
|
SHARES
|
|
|
VALUE
|
|
| |
| |
|
|
|
|
|
|
| ENERGY
(continued) |
|
|
|
|
|
|
| ENERGY EQUIPMENT
& SERVICES (continued) |
|
|
|
|
|
|
Trican
Well Service 1 |
|
897,300 |
|
$ |
2,040,792 |
|
Unit
Corporation 1 |
|
15,000 |
|
|
383,400 |
|
| |
|
|
|
|
|
| |
|
|
|
|
82,384,379
|
|
| |
|
|
|
|
|
| OIL, GAS
& CONSUMABLE FUELS - 1.5% |
|
|
|
|
|
|
Dorchester
Minerals L.P. |
|
279,148 |
|
|
5,750,449 |
|
Dorian
LPG 1 |
|
394,936 |
|
|
3,017,311 |
|
GeoPark
1 |
|
53,200 |
|
|
1,098,048 |
|
Green
Plains |
|
145,984 |
|
|
2,671,507 |
|
†International Petroleum 1 |
|
100,000 |
|
|
669,886 |
|
New
Zealand Refining |
|
310,000 |
|
|
512,310 |
|
Pryce
Corporation |
|
3,000,000 |
|
|
334,473 |
|
San
Juan Basin Royalty Trust |
|
320,352 |
|
|
1,854,838 |
|
World
Fuel Services |
|
224,227 |
|
|
4,576,473 |
|
WPX
Energy 1 |
|
110,000 |
|
|
1,983,300 |
|
| |
|
|
|
|
|
| |
|
|
|
|
22,468,595
|
|
| |
| Total (Cost $96,379,369)
|
|
|
|
|
104,852,974
|
|
| |
| |
|
|
|
|
|
|
| FINANCIALS
– 14.9% |
|
|
|
|
|
|
| BANKS - 2.5% |
|
|
|
|
|
|
Banca
Sistema |
|
200,000 |
|
|
472,959 |
|
Bank
of N.T. Butterfield & Son |
|
178,416 |
|
|
8,157,179 |
|
Canadian
Western Bank |
|
279,500 |
|
|
7,366,733 |
|
Farmers
& Merchants Bank of Long Beach 4 |
|
1,080 |
|
|
8,807,400 |
|
Fauquier
Bankshares 2 |
|
160,800 |
|
|
3,408,960 |
|
First
Citizens BancShares Cl. A |
|
14,676 |
|
|
5,918,831 |
|
Webster
Financial |
|
40,300 |
|
|
2,567,110 |
|
| |
|
|
|
|
|
| |
|
|
|
|
36,699,172
|
|
| |
|
|
|
|
|
| CAPITAL MARKETS
- 7.5% |
|
|
|
|
|
|
Ares
Management L.P. |
|
489,600 |
|
|
10,134,720 |
|
Artisan
Partners Asset Management Cl. A |
|
270,500 |
|
|
8,155,575 |
|
ASA
Gold and Precious Metals |
|
199,821 |
|
|
2,038,174 |
|
Ashmore
Group |
|
1,354,000 |
|
|
6,665,294 |
|
Associated
Capital Group Cl. A 2 |
|
20,200 |
|
|
766,590 |
|
†Bolsa Mexicana de Valores |
|
1,723,106 |
|
|
2,900,438 |
|
Citadel
Capital 1 |
|
7,749,921 |
|
|
1,446,883 |
|
Cowen
1 |
|
62,706 |
|
|
868,478 |
|
Dundee
Corporation Cl. A 1 |
|
1,079,900 |
|
|
1,297,868 |
|
Edmond
de Rothschild (Suisse) |
|
153 |
|
|
2,641,927 |
|
GMP
Capital |
|
287,100 |
|
|
626,765 |
|
Hamilton
Lane Cl. A |
|
13,800 |
|
|
661,986 |
|
Jupiter
Fund Management |
|
230,000 |
|
|
1,353,800 |
|
Lazard
Cl. A |
|
89,835 |
|
|
4,393,830 |
|
Manning
& Napier Cl. A |
|
395,692 |
|
|
1,226,645 |
|
MarketAxess
Holdings |
|
51,600 |
|
|
10,209,576 |
|
Medley
Management Cl. A 2,6 |
|
109,500 |
|
|
388,725 |
|
Morningstar |
|
84,600 |
|
|
10,849,950 |
|
mutares |
|
7,000 |
|
|
94,008 |
|
MVC
Capital |
|
271,183 |
|
|
2,576,239 |
|
Oaktree
Capital Group LLC Cl. A |
|
145,700 |
|
|
5,922,705 |
|
Rothschild
& Co |
|
209,893 |
|
|
7,096,023 |
|
SEI
Investments |
|
148,500 |
|
|
9,284,220 |
|
Sprott |
|
1,927,000 |
|
|
4,456,000 |
|
TMX
Group |
|
40,700 |
|
|
2,668,030 |
|
U.S.
Global Investors Cl. A 2 |
|
520,551 |
|
|
838,087 |
|
Value
Partners Group |
|
5,453,000 |
|
|
4,309,243 |
|
Virtu
Financial Cl. A 2 |
|
189,000 |
|
|
5,017,950 |
|
Westwood
Holdings Group |
|
38,850 |
|
|
2,313,129 |
|
| |
|
|
|
|
|
| |
|
|
|
|
111,202,858
|
|
| |
|
|
|
|
|
| CONSUMER FINANCE
- 0.0% |
|
|
|
|
|
|
Currency
Exchange International 1 |
|
30,000 |
|
|
689,157
|
|
| |
|
|
|
|
|
| DIVERSIFIED
FINANCIAL SERVICES - 0.1% |
|
|
|
|
|
|
First
Pacific |
|
1,020,000 |
|
|
492,735 |
|
Waterloo
Investment Holdings 1,5 |
|
2,972,000 |
|
|
891,600 |
|
| |
|
|
|
|
|
| |
|
|
|
|
1,384,335
|
|
| |
|
|
|
|
|
| INSURANCE
- 3.0% |
|
|
|
|
|
|
E-L Financial |
|
22,500 |
|
|
14,033,982 |
|
Erie
Indemnity Cl. A |
|
25,000 |
|
|
2,931,500 |
|
Independence
Holding Company |
|
259,223 |
|
|
8,619,165 |
|
MBIA
1,2,6 |
|
942,400 |
|
|
8,519,296 |
|
ProAssurance
Corporation |
|
126,334 |
|
|
4,478,540 |
|
RLI
Corp. |
|
65,900 |
|
|
4,361,921 |
|
Trupanion
1 |
|
36,400 |
|
|
1,405,040 |
|
| |
|
|
|
|
|
| |
|
|
|
|
44,349,444
|
|
| |
|
|
|
|
|
| INVESTMENT
COMPANIES - 0.6% |
|
|
|
|
|
|
†Landcadia Holdings Cl. A 1 |
|
63,350 |
|
|
641,736 |
|
RIT
Capital Partners |
|
54,192 |
|
|
1,476,886 |
|
†Social Capital Hedosophia Holdings 1 |
|
680,918 |
|
|
6,843,226 |
|
| |
|
|
|
|
|
| |
|
|
|
|
8,961,848
|
|
| |
|
|
|
|
|
| THRIFTS &
MORTGAGE FINANCE - 1.2% |
|
|
|
|
|
|
BofI
Holding 1,2,6 |
|
16,300 |
|
|
666,833 |
|
Genworth
MI Canada |
|
220,795 |
|
|
7,184,886 |
|
Timberland
Bancorp |
|
288,857 |
|
|
10,785,920 |
|
Vestin
Realty Mortgage II 1,4 |
|
34 |
|
|
102,000 |
|
| |
|
|
|
|
|
| |
|
|
|
|
18,739,639
|
|
| |
| Total (Cost $175,742,781)
|
|
|
|
|
222,026,453
|
|
| |
| |
|
|
|
|
|
|
| HEALTH
CARE – 4.4% |
|
|
|
|
|
|
| BIOTECHNOLOGY
- 0.5% |
|
|
|
|
|
|
Keryx
Biopharmaceuticals 1,2,6 |
|
139,000 |
|
|
522,640 |
|
Sangamo
Therapeutics 1,2,6 |
|
65,815 |
|
|
934,573 |
|
Zealand
Pharma 1 |
|
408,857 |
|
|
5,383,112 |
|
| |
|
|
|
|
|
| |
|
|
|
|
6,840,325
|
|
| |
|
|
|
|
|
| HEALTH CARE
EQUIPMENT & SUPPLIES - 1.9% |
|
|
|
|
|
|
Atrion
Corporation |
|
15,750 |
|
|
9,440,550 |
|
DENTSPLY
SIRONA |
|
5,000 |
|
|
218,850 |
|
Haemonetics
1 |
|
6,400 |
|
|
573,952 |
|
Hill-Rom
Holdings |
|
5,000 |
|
|
436,700 |
|
Integer
Holdings 1 |
|
42,400 |
|
|
2,741,160 |
|
†LeMaitre Vascular |
|
26,000 |
|
|
870,480 |
|
Masimo
Corporation 1 |
|
50,000 |
|
|
4,882,500 |
|
Neogen
Corporation 1 |
|
22,400 |
|
|
1,796,256 |
|
Surmodics
1 |
|
138,500 |
|
|
7,645,200 |
|
| |
|
|
|
|
|
| |
|
|
|
|
28,605,648
|
|
| |
|
|
|
|
|
| HEALTH CARE
PROVIDERS & SERVICES - 0.2% |
|
|
|
|
|
|
Community
Health Systems 1 |
|
790,000 |
|
|
2,622,800
|
|
| |
|
|
|
|
|
| HEALTH CARE
TECHNOLOGY - 0.7% |
|
|
|
|
|
|
athenahealth
1,2,6 |
|
32,500 |
|
|
5,172,050 |
|
Medidata
Solutions 1 |
|
72,750 |
|
|
5,860,740 |
|
| |
|
|
|
|
|
| |
|
|
|
|
11,032,790
|
|
| |
|
|
|
|
|
| LIFE SCIENCES
TOOLS & SERVICES - 1.0% |
|
|
|
|
|
|
Bio-Rad
Laboratories Cl. A 1 |
|
34,198 |
|
|
9,867,491 |
|
Bio-Techne |
|
26,843 |
|
|
3,971,422 |
|
†PRA Health Sciences 1 |
|
16,000 |
|
|
1,493,760 |
|
| |
|
|
|
|
|
| |
|
|
|
|
15,332,673
|
|
| |
|
|
|
|
|
| PHARMACEUTICALS
- 0.1% |
|
|
|
|
|
|
Formosa
Laboratories |
|
275,000 |
|
|
492,481 |
|
| THE ACCOMPANYING
NOTES ARE AN INTEGRAL PART OF THESE FINANCIAL STATEMENTS |
2018 Semiannual
Report to Stockholders | 41 |
| Royce Value
Trust |
| |
| |
Schedule
of Investments (continued)
|
| |
|
SHARES
|
|
|
VALUE
|
|
| |
| |
|
|
|
|
|
|
| HEALTH
CARE (continued) |
|
|
|
|
|
|
| PHARMACEUTICALS
(continued) |
|
|
|
|
|
|
Theravance
Biopharma 1,2 |
|
34,291 |
|
$ |
777,720 |
|
| |
|
|
|
|
|
| |
|
|
|
|
1,270,201
|
|
| |
| Total (Cost $41,923,713)
|
|
|
|
|
65,704,437 |
|
| |
| |
|
|
|
|
|
|
| INDUSTRIALS
– 30.8% |
|
|
|
|
|
|
| AEROSPACE
& DEFENSE - 3.4% |
|
|
|
|
|
|
Austal |
|
788,670 |
|
|
1,085,599 |
|
Ducommun
1 |
|
117,200 |
|
|
3,878,148 |
|
HEICO Corporation |
|
260,346 |
|
|
18,987,052 |
|
HEICO Corporation Cl. A |
|
157,828 |
|
|
9,619,586 |
|
Hexcel
Corporation |
|
51,400 |
|
|
3,411,932 |
|
Magellan
Aerospace |
|
186,800 |
|
|
2,281,982 |
|
Teledyne
Technologies 1 |
|
5,900 |
|
|
1,174,454 |
|
Wesco
Aircraft Holdings 1 |
|
935,364 |
|
|
10,522,845 |
|
| |
|
|
|
|
|
| |
|
|
|
|
50,961,598
|
|
| |
|
|
|
|
|
| AIR FREIGHT
& LOGISTICS - 1.4% |
|
|
|
|
|
|
Expeditors
International of Washington |
|
143,000 |
|
|
10,453,300 |
|
Forward
Air |
|
170,750 |
|
|
10,087,910 |
|
| |
|
|
|
|
|
| |
|
|
|
|
20,541,210
|
|
| |
|
|
|
|
|
| BUILDING PRODUCTS
- 0.4% |
|
|
|
|
|
|
Burnham
Holdings Cl. B 4 |
|
36,000 |
|
|
543,960 |
|
Patrick
Industries 1 |
|
15,775 |
|
|
896,809 |
|
Simpson
Manufacturing |
|
59,900 |
|
|
3,725,181 |
|
| |
|
|
|
|
|
| |
|
|
|
|
5,165,950
|
|
| |
|
|
|
|
|
| COMMERCIAL
SERVICES & SUPPLIES - 3.3% |
|
|
|
|
|
|
Atento |
|
528,700 |
|
|
3,621,595 |
|
Biffa |
|
540,000 |
|
|
1,774,536 |
|
CECO
Environmental 1 |
|
99,028 |
|
|
608,032 |
|
CompX
International Cl. A |
|
211,100 |
|
|
2,786,520 |
|
Copart 1 |
|
313,000 |
|
|
17,703,280 |
|
Heritage-Crystal
Clean 1 |
|
146,527 |
|
|
2,945,193 |
|
Horizon
North Logistics |
|
500,000 |
|
|
1,000,266 |
|
†Interserve 1 |
|
450,000 |
|
|
377,119 |
|
Kimball
International Cl. B |
|
286,180 |
|
|
4,624,669 |
|
Mobile
Mini |
|
105,000 |
|
|
4,924,500 |
|
Ritchie
Bros. Auctioneers |
|
107,100 |
|
|
3,654,252 |
|
Steelcase
Cl. A |
|
40,000 |
|
|
540,000 |
|
UniFirst
Corporation |
|
22,270 |
|
|
3,939,563 |
|
| |
|
|
|
|
|
| |
|
|
|
|
48,499,525
|
|
| |
|
|
|
|
|
| CONSTRUCTION
& ENGINEERING - 3.2% |
|
|
|
|
|
|
EMCOR
Group 2,6 |
|
65,800 |
|
|
5,012,644 |
|
IES
Holdings 1 |
|
594,244 |
|
|
9,953,587 |
|
†Infrastructure and Energy Alternatives 1 |
|
500,000 |
|
|
4,655,000 |
|
†Infrastructure and Energy Alternatives |
|
|
|
|
|
|
(Warrants)
1,5 |
|
625,000 |
|
|
475,000 |
|
Jacobs
Engineering Group |
|
169,900 |
|
|
10,786,951 |
|
KBR |
|
337,400 |
|
|
6,046,208 |
|
Sterling
Construction 1,2,6 |
|
122,300 |
|
|
1,593,569 |
|
Valmont
Industries 2 |
|
65,345 |
|
|
9,850,759 |
|
| |
|
|
|
|
|
| |
|
|
|
|
48,373,718
|
|
| |
|
|
|
|
|
| ELECTRICAL
EQUIPMENT - 1.0% |
|
|
|
|
|
|
AZZ |
|
5,000 |
|
|
217,250 |
|
LSI
Industries |
|
263,000 |
|
|
1,404,420 |
|
Powell
Industries |
|
94,500 |
|
|
3,291,435 |
|
Preformed
Line Products |
|
91,600 |
|
|
8,132,248 |
|
Williams
Industrial Services Group 1,4 |
|
631,820 |
|
|
1,895,460 |
|
| |
|
|
|
|
|
| |
|
|
|
|
14,940,813
|
|
| |
|
|
|
|
|
| INDUSTRIAL
CONGLOMERATES - 0.7% |
|
|
|
|
|
|
A.
Soriano |
|
2,791,000 |
|
|
313,787 |
|
Raven
Industries |
|
251,725 |
|
|
9,678,826 |
|
| |
|
|
|
|
|
| |
|
|
|
|
9,992,613
|
|
| |
|
|
|
|
|
| MACHINERY
- 10.5% |
|
|
|
|
|
|
Chen
Hsong Holdings |
|
1,159,000 |
|
|
295,452 |
|
CIRCOR
International 1 |
|
143,184 |
|
|
5,292,081 |
|
Colfax
Corporation 1 |
|
82,242 |
|
|
2,520,717 |
|
Deutz |
|
115,000 |
|
|
888,375 |
|
Donaldson
Company |
|
193,559 |
|
|
8,733,382 |
|
Exco
Technologies |
|
110,000 |
|
|
743,848 |
|
Franklin
Electric |
|
129,300 |
|
|
5,831,430 |
|
Graco |
|
241,028 |
|
|
10,899,286 |
|
Hyster-Yale
Materials Handling Cl. A |
|
10,000 |
|
|
642,500 |
|
IDEX
Corporation |
|
53,900 |
|
|
7,356,272 |
|
John
Bean Technologies |
|
103,226 |
|
|
9,176,791 |
|
Kadant |
|
78,100 |
|
|
7,509,315 |
|
Kennametal |
|
160,100 |
|
|
5,747,590 |
|
Lincoln
Electric Holdings |
|
121,660 |
|
|
10,676,882 |
|
Lindsay
Corporation 2,6 |
|
80,000 |
|
|
7,759,200 |
|
NN |
|
308,700 |
|
|
5,834,430 |
|
Nordson
Corporation |
|
24,296 |
|
|
3,119,849 |
|
Proto
Labs 1 |
|
10,000 |
|
|
1,189,500 |
|
RBC Bearings 1 |
|
109,600 |
|
|
14,117,576 |
|
Sun Hydraulics |
|
366,118 |
|
|
17,643,227 |
|
Tennant
Company |
|
111,900 |
|
|
8,840,100 |
|
Titan
International |
|
173,100 |
|
|
1,857,363 |
|
Watts
Water Technologies Cl. A |
|
61,000 |
|
|
4,782,400 |
|
Westinghouse
Air Brake Technologies |
|
73,100 |
|
|
7,206,198 |
|
Woodward |
|
104,600 |
|
|
8,039,556 |
|
| |
|
|
|
|
|
| |
|
|
|
|
156,703,320
|
|
| |
|
|
|
|
|
| MARINE - 1.8% |
|
|
|
|
|
|
Clarkson |
|
371,100 |
|
|
11,264,466 |
|
Eagle
Bulk Shipping 1 |
|
320,478 |
|
|
1,743,400 |
|
Kirby Corporation 1 |
|
161,900 |
|
|
13,534,840 |
|
| |
|
|
|
|
|
| |
|
|
|
|
26,542,706
|
|
| |
|
|
|
|
|
| PROFESSIONAL
SERVICES - 1.5% |
|
|
|
|
|
|
ASGN
1,2 |
|
106,700 |
|
|
8,342,873 |
|
Heidrick
& Struggles International |
|
50,480 |
|
|
1,766,800 |
|
ManpowerGroup |
|
107,200 |
|
|
9,225,632 |
|
Quess
Corporation 1 |
|
15,720 |
|
|
261,113 |
|
Staffline
Group |
|
120,810 |
|
|
1,493,944 |
|
TrueBlue
1 |
|
56,245 |
|
|
1,515,803 |
|
| |
|
|
|
|
|
| |
|
|
|
|
22,606,165
|
|
| |
|
|
|
|
|
| ROAD &
RAIL - 1.8% |
|
|
|
|
|
|
Genesee
& Wyoming Cl. A 1 |
|
15,000 |
|
|
1,219,800 |
|
Knight-Swift
Transportation Holdings Cl. A 2 |
|
122,400 |
|
|
4,676,904 |
|
Landstar System |
|
116,760 |
|
|
12,750,192 |
|
Patriot
Transportation Holding 1 |
|
139,100 |
|
|
2,990,650 |
|
Saia
1,2,6 |
|
40,000 |
|
|
3,234,000 |
|
Universal
Logistics Holdings 2 |
|
78,916 |
|
|
2,071,545 |
|
| |
|
|
|
|
|
| |
|
|
|
|
26,943,091
|
|
| |
|
|
|
|
|
| TRADING COMPANIES
& DISTRIBUTORS - 1.8% |
|
|
|
|
|
|
Air
Lease Cl. A |
|
226,600 |
|
|
9,510,402 |
|
Central
Steel & Wire 4 |
|
4,862 |
|
|
2,980,406 |
|
Houston
Wire & Cable 1,3 |
|
877,363 |
|
|
7,457,585 |
|
SIG |
|
940,000 |
|
|
1,733,070 |
|
†SiteOne Landscape Supply 1 |
|
25,000 |
|
|
2,099,250 |
|
| 42 | 2018
Semiannual Report to Stockholders |
THE ACCOMPANYING
NOTES ARE AN INTEGRAL PART OF THESE FINANCIAL STATEMENTS |
| June 30,
2018 (unaudited) |
| |
Schedule
of Investments (continued)
|
| |
|
SHARES
|
|
|
VALUE
|
|
| |
| |
|
|
|
|
|
|
| INDUSTRIALS
(continued) |
|
|
|
|
|
|
| TRADING COMPANIES
& DISTRIBUTORS (continued) |
|
|
|
|
|
|
Watsco |
|
20,400 |
|
$ |
3,636,912 |
|
| |
|
|
|
|
|
| |
|
|
|
|
27,417,625
|
|
| |
| Total (Cost $270,653,334)
|
|
|
|
|
458,688,334
|
|
| |
| |
|
|
|
|
|
|
| INFORMATION
TECHNOLOGY – 19.3% |
|
|
|
|
|
|
| COMMUNICATIONS
EQUIPMENT - 0.3% |
|
|
|
|
|
|
ADTRAN
2 |
|
214,973 |
|
|
3,192,349 |
|
Mitel
Networks 1 |
|
100,000 |
|
|
1,097,000 |
|
| |
|
|
|
|
|
| |
|
|
|
|
4,289,349
|
|
| |
|
|
|
|
|
| ELECTRONIC
EQUIPMENT, INSTRUMENTS & COMPONENTS - 9.7% |
|
|
|
|
|
|
Anixter
International 1,2,6 |
|
63,795 |
|
|
4,038,224 |
|
Bel
Fuse Cl. B |
|
30,238 |
|
|
631,974 |
|
Cognex Corporation 2,6 |
|
350,600 |
|
|
15,640,266 |
|
Coherent
1 |
|
60,400 |
|
|
9,447,768 |
|
†eMagin Corporation (Warrants) 1,5 |
|
50,000 |
|
|
12,500 |
|
Fabrinet
1 |
|
285,600 |
|
|
10,535,784 |
|
FARO
Technologies 1 |
|
179,437 |
|
|
9,752,401 |
|
FLIR Systems |
|
611,637 |
|
|
31,786,775 |
|
Horiba |
|
12,000 |
|
|
839,995 |
|
IPG Photonics 1,2,6 |
|
51,100 |
|
|
11,274,193 |
|
Littelfuse |
|
13,900 |
|
|
3,171,702 |
|
National
Instruments |
|
261,850 |
|
|
10,992,463 |
|
†nLIGHT 1,2 |
|
34,400 |
|
|
1,137,264 |
|
Perceptron
1 |
|
357,700 |
|
|
3,773,735 |
|
Plexus
Corporation 1 |
|
150,600 |
|
|
8,966,724 |
|
Richardson
Electronics |
|
573,732 |
|
|
5,588,150 |
|
Rogers
Corporation 1 |
|
32,366 |
|
|
3,607,514 |
|
Seeing
Machines 1 |
|
20,131,784 |
|
|
3,321,116 |
|
TTM
Technologies 1,2,6 |
|
496,400 |
|
|
8,751,532 |
|
Wasion
Holdings |
|
1,500,000 |
|
|
814,469 |
|
| |
|
|
|
|
|
| |
|
|
|
|
144,084,549
|
|
| |
|
|
|
|
|
| INTERNET SOFTWARE
& SERVICES - 2.3% |
|
|
|
|
|
|
†Alarm.com Holdings 1 |
|
10,000 |
|
|
403,800 |
|
Care.com
1 |
|
110,000 |
|
|
2,296,800 |
|
comScore
1 |
|
390,836 |
|
|
8,520,225 |
|
†Etsy 1 |
|
61,100 |
|
|
2,577,809 |
|
HolidayCheck
Group 1 |
|
94,900 |
|
|
348,542 |
|
j2
Global |
|
81,820 |
|
|
7,086,430 |
|
QuinStreet
1 |
|
180,254 |
|
|
2,289,226 |
|
Rhythmone
1 |
|
97,457 |
|
|
218,652 |
|
Solium
Capital 1 |
|
187,400 |
|
|
1,640,721 |
|
Stamps.com
1 |
|
35,700 |
|
|
9,033,885 |
|
Support.com
1 |
|
216,766 |
|
|
617,783 |
|
| |
|
|
|
|
|
| |
|
|
|
|
35,033,873
|
|
| |
|
|
|
|
|
| IT SERVICES
- 0.7% |
|
|
|
|
|
|
Acxiom
Corporation 1 |
|
48,000 |
|
|
1,437,600 |
|
Conduent
1 |
|
20,000 |
|
|
363,400 |
|
CSE
Global |
|
3,450,000 |
|
|
1,088,807 |
|
Hackett
Group (The) |
|
417,266 |
|
|
6,705,465 |
|
Innodata
1 |
|
224,314 |
|
|
224,314 |
|
Unisys
Corporation 1 |
|
60,000 |
|
|
774,000 |
|
| |
|
|
|
|
|
| |
|
|
|
|
10,593,586
|
|
| |
|
|
|
|
|
| SEMICONDUCTORS
& SEMICONDUCTOR EQUIPMENT - 4.0% |
|
|
|
|
|
|
Advanced
Energy Industries 1 |
|
20,000 |
|
|
1,161,800 |
|
Brooks Automation 2,6 |
|
351,700 |
|
|
11,472,454 |
|
Cabot
Microelectronics |
|
38,400 |
|
|
4,130,304 |
|
Cohu |
|
143,350 |
|
|
3,513,508 |
|
Diodes
1 |
|
270,850 |
|
|
9,336,199 |
|
Entegris |
|
182,800 |
|
|
6,196,920 |
|
Kulicke
& Soffa Industries 2 |
|
66,200 |
|
|
1,576,884 |
|
MKS
Instruments |
|
42,010 |
|
|
4,020,357 |
|
Nova
Measuring Instruments 1 |
|
39,500 |
|
|
1,076,375 |
|
Photronics
1 |
|
183,700 |
|
|
1,465,008 |
|
Rudolph
Technologies 1,2 |
|
84,500 |
|
|
2,501,200 |
|
Silicon
Motion Technology ADR |
|
25,000 |
|
|
1,322,250 |
|
Teradyne |
|
130,000 |
|
|
4,949,100 |
|
†Universal Display |
|
11,650 |
|
|
1,001,900 |
|
Veeco
Instruments 1 |
|
17,500 |
|
|
249,375 |
|
Versum
Materials |
|
123,000 |
|
|
4,569,450 |
|
Xperi
2 |
|
60,000 |
|
|
966,000 |
|
| |
|
|
|
|
|
| |
|
|
|
|
59,509,084
|
|
| |
|
|
|
|
|
| SOFTWARE -
1.9% |
|
|
|
|
|
|
†Altair Engineering Cl. A 1 |
|
5,000 |
|
|
170,900 |
|
ANSYS 1,2,6 |
|
81,200 |
|
|
14,143,416 |
|
Manhattan
Associates 1 |
|
75,000 |
|
|
3,525,750 |
|
Monotype
Imaging Holdings |
|
117,700 |
|
|
2,389,310 |
|
Pegasystems |
|
15,200 |
|
|
832,960 |
|
PTC
1 |
|
8,600 |
|
|
806,766 |
|
RealNetworks
1 |
|
170,879 |
|
|
632,252 |
|
Rosetta
Stone 1 |
|
40,000 |
|
|
641,200 |
|
SS&C Technologies Holdings |
|
12,000 |
|
|
622,800 |
|
StatPro
Group |
|
400,000 |
|
|
907,989 |
|
TiVo |
|
81,900 |
|
|
1,101,555 |
|
†Workiva Cl. A 1 |
|
100,000 |
|
|
2,440,000 |
|
| |
|
|
|
|
|
| |
|
|
|
|
28,214,898
|
|
| |
|
|
|
|
|
| TECHNOLOGY
HARDWARE, STORAGE & PERIPHERALS - 0.4% |
|
|
|
|
|
|
Cray
1,2 |
|
102,500 |
|
|
2,521,500 |
|
Diebold
Nixdorf |
|
316,600 |
|
|
3,783,370 |
|
| |
|
|
|
|
|
| |
|
|
|
|
6,304,870
|
|
| |
| Total (Cost $186,393,537)
|
|
|
|
|
288,030,209
|
|
| |
| |
|
|
|
|
|
|
| MATERIALS
– 8.6% |
|
|
|
|
|
|
| CHEMICALS
- 3.3% |
|
|
|
|
|
|
Chase
Corporation |
|
36,100 |
|
|
4,232,725 |
|
FutureFuel
Corporation |
|
48,500 |
|
|
679,485 |
|
Hawkins |
|
86,178 |
|
|
3,046,392 |
|
†Ingevity Corporation 1 |
|
17,900 |
|
|
1,447,394 |
|
Innospec |
|
36,883 |
|
|
2,823,394 |
|
Minerals
Technologies |
|
120,993 |
|
|
9,116,823 |
|
NewMarket
Corporation |
|
11,000 |
|
|
4,449,500 |
|
Platform
Specialty Products 1 |
|
190,000 |
|
|
2,204,000 |
|
Quaker Chemical |
|
132,669 |
|
|
20,546,448 |
|
| |
|
|
|
|
|
| |
|
|
|
|
48,546,161
|
|
| |
|
|
|
|
|
| CONSTRUCTION
MATERIALS - 0.1% |
|
|
|
|
|
|
†China Resources Cement Holdings |
|
800,000 |
|
|
810,646
|
|
| |
|
|
|
|
|
| CONTAINERS
& PACKAGING - 0.3% |
|
|
|
|
|
|
Mayr-Melnhof
Karton |
|
34,000 |
|
|
4,589,921
|
|
| |
|
|
|
|
|
| METALS
& MINING - 4.5% |
|
|
|
|
|
|
Agnico
Eagle Mines |
|
15,000 |
|
|
687,450 |
|
Alamos
Gold Cl. A |
|
803,300 |
|
|
4,576,668 |
|
Ampco-Pittsburgh
1 |
|
36,966 |
|
|
378,901 |
|
Corsa
Coal 1 |
|
700,000 |
|
|
607,006 |
|
Ferroglobe |
|
50,000 |
|
|
428,500 |
|
Ferroglobe
(Warranty Insurance Trust) 1,5 |
|
49,300 |
|
|
0 |
|
Franco-Nevada
Corporation |
|
107,300 |
|
|
7,835,046 |
|
Gold
Fields ADR |
|
370,000 |
|
|
1,320,900 |
|
| THE ACCOMPANYING
NOTES ARE AN INTEGRAL PART OF THESE FINANCIAL STATEMENTS |
2018 Semiannual
Report to Stockholders | 43 |
| Royce Value
Trust |
June 30,
2018 (unaudited) |
| |
Schedule
of Investments (continued)
|
| |
|
SHARES
|
|
|
VALUE
|
|
| |
| |
|
|
|
|
|
|
| MATERIALS
(continued) |
|
|
|
|
|
|
| METALS &
MINING (continued) |
|
|
|
|
|
|
Haynes
International 2,6 |
|
113,900 |
|
$ |
4,184,686 |
|
Hecla
Mining |
|
321,300 |
|
|
1,118,124 |
|
Lundin
Mining |
|
640,000 |
|
|
3,558,666 |
|
MAG
Silver 1 |
|
198,900 |
|
|
2,150,109 |
|
Major
Drilling Group International 1 |
|
1,042,757 |
|
|
5,504,685 |
|
Mongolian
Mining 1 |
|
12,000,000 |
|
|
195,778 |
|
Pretium
Resources 1 |
|
165,000 |
|
|
1,213,669 |
|
Reliance Steel & Aluminum |
|
193,720 |
|
|
16,958,249 |
|
Royal
Gold |
|
16,600 |
|
|
1,541,144 |
|
Sandstorm
Gold 1 |
|
270,000 |
|
|
1,215,000 |
|
Synalloy
Corporation |
|
178,800 |
|
|
3,567,060 |
|
Tahoe
Resources 1 |
|
646,000 |
|
|
3,178,320 |
|
VanEck
Vectors Junior Gold Miners ETF |
|
8,000 |
|
|
261,600 |
|
Worthington
Industries |
|
148,000 |
|
|
6,211,560 |
|
| |
|
|
|
|
|
| |
|
|
|
|
66,693,121
|
|
| |
|
|
|
|
|
| PAPER &
FOREST PRODUCTS - 0.4% |
|
|
|
|
|
|
Neenah |
|
16,700 |
|
|
1,416,995 |
|
Stella-Jones |
|
142,000 |
|
|
5,172,768 |
|
| |
|
|
|
|
|
| |
|
|
|
|
6,589,763
|
|
| |
| Total (Cost $98,050,104)
|
|
|
|
|
127,229,612
|
|
| |
| |
|
|
|
|
|
|
| REAL ESTATE
– 3.7% |
|
|
|
|
|
|
| EQUITY REAL
ESTATE INVESTMENT TRUSTS (REITS) - 0.0% |
|
|
|
|
|
|
Irish
Residential Properties REIT |
|
250,000 |
|
|
402,891 |
|
New
York REIT |
|
15,000 |
|
|
273,600 |
|
| |
|
|
|
|
|
| |
|
|
|
|
676,491
|
|
| |
|
|
|
|
|
| REAL ESTATE
MANAGEMENT & DEVELOPMENT - 3.7% |
|
|
|
|
|
|
Altus
Group |
|
24,200 |
|
|
539,537 |
|
FirstService Corporation |
|
184,600 |
|
|
14,036,984 |
|
FRP Holdings 1 |
|
188,558 |
|
|
12,209,130 |
|
Kennedy-Wilson
Holdings |
|
111,300 |
|
|
2,353,995 |
|
Marcus
& Millichap 1 |
|
198,713 |
|
|
7,751,794 |
|
Real
Estate Investors |
|
1,000,000 |
|
|
706,066 |
|
RMR
Group Cl. A 2,6 |
|
27,200 |
|
|
2,133,840 |
|
St.
Joe Company (The) 1 |
|
197,000 |
|
|
3,536,150 |
|
Tejon Ranch 1,2 |
|
478,479 |
|
|
11,627,040 |
|
| |
|
|
|
|
|
| |
|
|
|
|
54,894,536
|
|
| |
| Total (Cost $33,757,570)
|
|
|
|
|
55,571,027
|
|
| |
| |
|
|
|
|
|
|
| TELECOMMUNICATION
SERVICES – 0.5% |
|
|
|
|
|
|
| DIVERSIFIED
TELECOMMUNICATION SERVICES - 0.1% |
|
|
|
|
|
|
China
Communications Services |
|
750,182 |
|
|
475,222 |
|
HKBN |
|
1,000,000 |
|
|
1,539,717 |
|
| |
|
|
|
|
|
| |
|
|
|
|
2,014,939
|
|
| |
|
|
|
|
|
| WIRELESS TELECOMMUNICATION
SERVICES - 0.4% |
|
|
|
|
|
|
Boingo
Wireless 1 |
|
50,000 |
|
|
1,129,500 |
|
Telephone
and Data Systems |
|
165,270 |
|
|
4,531,703 |
|
| |
|
|
|
|
|
| |
|
|
|
|
5,661,203
|
|
| |
| Total (Cost $6,378,985)
|
|
|
|
|
7,676,142
|
|
| |
| |
|
|
|
|
|
|
| UTILITIES
– 0.4% |
|
|
|
|
|
|
| GAS UTILITIES
- 0.3% |
|
|
|
|
|
|
UGI
Corporation |
|
73,800 |
|
|
3,842,766
|
|
| |
|
|
|
|
|
| INDEPENDENT
POWER & RENEWABLE ELECTRICITY PRODUCER - 0.1% |
|
|
|
|
|
|
†Vistra Energy 1 |
|
65,200 |
|
|
1,542,632
|
|
| |
| Total (Cost $4,181,537)
|
|
|
|
|
5,385,398
|
|
| |
| |
|
|
|
|
|
|
| TOTAL COMMON
STOCKS |
|
|
|
|
|
|
| |
| (Cost $1,064,501,663)
|
|
|
|
|
1,489,820,245
|
|
| |
| |
|
|
|
|
|
|
| REPURCHASE
AGREEMENT– 3.8% |
|
|
|
|
|
|
Fixed Income
Clearing Corporation, 0.35% dated 6/29/18, due 7/2/18, maturity value
$57,596,680
(collateralized by obligations of various U.S. Government Agencies, 1.75%
due
11/30/21, valued at $58,751,694) |
| |
| (Cost $57,595,000)
|
|
|
|
|
57,595,000
|
|
| |
| |
|
|
|
|
|
|
| TOTAL INVESTMENTS
– 103.8% |
|
|
|
|
|
|
| |
| (Cost $1,122,096,663)
|
|
|
|
|
1,547,415,245
|
|
| |
| |
|
|
|
|
|
|
| LIABILITIES
LESS CASH AND OTHER ASSETS – (3.8)% |
|
|
|
|
(57,109,348 |
) |
| |
|
|
|
|
|
| |
|
|
|
|
|
|
| |
| NET ASSETS
– 100.0% |
|
|
|
$ |
1,490,305,897
|
|
| |
| † |
New additions
in 2018. |
| 1 |
Non-income
producing. |
| 2 |
All or
a portion of these securities were pledged as collateral in connection with the
Fund’s revolving credit agreement at June 30, 2018. Total market value of pledged
securities at June 30, 2018, was $122,875,447. |
| 3 |
At June
30, 2018, the Fund owned 5% or more of the Company’s outstanding voting securities
thereby making the Company an Affiliated Company as that term is defined in the
Investment Company Act of 1940. See Notes to Financial Statements. |
| 4 |
These securities
are defined as Level 2 securities due to fair value being based on quoted prices
for similar securities. See Notes to Financial Statements. |
| 5 |
Securities
for which market quotations are not readily available represent 0.1% of net assets.
These securities have been valued at their fair value under procedures approved
by the Fund’s Board of Directors. These securities are defined as Level 3 securities
due to the use of significant unobservable inputs in the determination of fair value.
See Notes to Financial Statements. |
| 6 |
At June
30, 2018, a portion of these securities were rehypothecated in connection with the
Fund’s revolving credit agreement in the aggregate amount of $66,358,963. |
| |
|
| |
Bold
indicates the Fund’s 20 largest equity holdings in terms of June 30, 2018,
market value. |
| |
|
| |
TAX
INFORMATION: The cost of total investments for Federal income tax purposes was $1,122,991,077.
At June 30, 2018, net unrealized appreciation for all securities was $424,424,168
consisting of aggregate gross unrealized appreciation of $521,620,171 and aggregate
gross unrealized depreciation of $97,196,003. The primary cause of the difference
between book and tax basis cost is the timing of the recognition of losses on securities
sold. |
| 44 | 2018
Semiannual Report to Stockholders |
THE ACCOMPANYING
NOTES ARE AN INTEGRAL PART OF THESE FINANCIAL STATEMENTS |
| Royce Value
Trust |
|
June 30,
2018 (unaudited) |
| |
| Statement
of Assets and Liabilities |
| ASSETS: |
|
|
|
|
| Investments
at value |
|
|
|
|
| |
Non-Affiliated
Companies |
|
$ |
1,481,769,707 |
|
| |
Affiliated
Companies |
|
|
8,050,538 |
|
| |
| Repurchase
agreements (at cost and value) |
|
|
57,595,000 |
|
| |
| Cash and foreign
currency |
|
|
345,756 |
|
| |
| Receivable
for investments sold |
|
|
16,278,875 |
|
| |
| Receivable
for dividends and interest |
|
|
967,109 |
|
| |
| Prepaid expenses
and other assets |
|
|
774,384 |
|
| |
| Total Assets
|
|
|
1,565,781,369
|
|
| |
| LIABILITIES: |
|
|
|
|
| Revolving
credit agreement |
|
|
70,000,000 |
|
| |
| Payable for
investments purchased |
|
|
4,729,496 |
|
| |
| Payable for
investment advisory fee |
|
|
528,153 |
|
| |
| Payable for
directors’ fees |
|
|
55,268 |
|
| |
| Payable for
interest expense |
|
|
19,176 |
|
| |
| Accrued expenses |
|
|
141,245 |
|
| |
| Deferred capital
gains tax |
|
|
2,134 |
|
| |
| Total Liabilities
|
|
|
75,475,472
|
|
| |
| Net Assets
|
|
$ |
1,490,305,897
|
|
| |
| ANALYSIS OF
NET ASSETS: |
|
|
|
|
| Paid-in capital
- $0.001 par value per share; 85,916,727 shares outstanding (150,000,000 shares
authorized) |
|
$ |
1,027,312,345 |
|
| |
| Undistributed
net investment income (loss) |
|
|
9,835,467 |
|
| |
| Accumulated
net realized gain (loss) on investments and foreign currency |
|
|
77,928,483 |
|
| |
| Net unrealized
appreciation (depreciation) on investments and foreign currency |
|
|
425,339,463 |
|
| |
| Quarterly
distributions |
|
|
(50,109,861 |
) |
| |
| Net Assets
(net asset value per share - $17.35) |
|
$ |
1,490,305,897
|
|
| |
| Investments
at identified cost |
|
$ |
1,064,501,663 |
|
| |
| THE ACCOMPANYING
NOTES ARE AN INTEGRAL PART OF THESE FINANCIAL STATEMENTS |
|
2018 Semiannual
Report to Stockholders | 45 |
| |
| Statement
of Changes in Net Assets |
| |
|
|
|
|
|
|
|
|
| |
|
SIX MONTHS ENDED
6/30/18
(UNAUDITED) |
|
YEAR ENDED 12/31/17 |
| |
| |
|
|
|
|
|
|
|
|
| INVESTMENT
OPERATIONS: |
|
|
|
|
|
|
|
|
| Net investment
income (loss) |
|
$ |
11,560,590 |
|
|
$ |
10,969,682 |
|
| |
| Net realized
gain (loss) on investments and foreign currency |
|
|
73,709,218 |
|
|
|
81,750,067 |
|
| |
| Net change
in unrealized appreciation (depreciation) on investments and foreign currency |
|
|
(46,494,859 |
) |
|
|
146,329,916 |
|
| |
| Net increase
(decrease) in net assets from investment operations |
|
|
38,774,949
|
|
|
|
239,049,665
|
|
| |
| DISTRIBUTIONS: |
|
|
|
|
|
|
|
|
| Net investment
income |
|
|
(5,612,304 |
)1 |
|
|
(10,679,021 |
) |
| |
| Net realized
gain on investments and foreign currency |
|
|
(44,497,557 |
)1 |
|
|
(85,441,777 |
) |
| |
| Total distributions
|
|
|
(50,109,861 |
) |
|
|
(96,120,798 |
) |
| |
| CAPITAL STOCK
TRANSACTIONS: |
|
|
|
|
|
|
|
|
| Reinvestment
of distributions |
|
|
21,191,356 |
|
|
|
41,508,874 |
|
| |
| Total capital
stock transactions |
|
|
21,191,356
|
|
|
|
41,508,874
|
|
| |
| Net Increase
(Decrease) In Net Assets |
|
|
9,856,444
|
|
|
|
184,437,741
|
|
| |
| NET ASSETS: |
|
|
|
|
|
|
|
|
| |
| Beginning
of period |
|
|
1,480,449,453
|
|
|
|
1,296,011,712
|
|
| |
| End of
period (including undistributed net investment income (loss) of $9,835,467 at 6/30/18
and $(1,725,122) at 12/31/17) |
|
$ |
1,490,305,897
|
|
|
$ |
1,480,449,453
|
|
| |
| 1 |
Amounts are
subject to change and recharacterization at year end. |
| 46 | 2018
Semiannual Report to Stockholders |
|
THE ACCOMPANYING
NOTES ARE AN INTEGRAL PART OF THESE FINANCIAL STATEMENTS |
| Royce Value
Trust |
|
Six Months
Ended June 30, 2018 (unaudited) |
| INVESTMENT
INCOME: |
|
|
|
|
| INCOME: |
|
|
|
|
| Dividends |
|
$ |
16,504,205 |
|
| |
| Foreign withholding
tax |
|
|
(299,311 |
) |
| |
| Interest |
|
|
102,464 |
|
| |
| Rehypothecation
income |
|
|
179,246 |
|
| |
| Total income
|
|
|
16,486,604
|
|
| |
| EXPENSES: |
|
|
|
|
| |
| Investment
advisory fees |
|
|
3,129,134 |
|
| |
| Interest expense |
|
|
1,085,601 |
|
| |
| Stockholder
reports |
|
|
195,719 |
|
| |
| Administrative
and office facilities |
|
|
195,651 |
|
| |
| Custody and
transfer agent fees |
|
|
106,857 |
|
| |
| Directors’ fees |
|
|
96,159 |
|
| |
| Professional
fees |
|
|
50,760 |
|
| |
| Other expenses |
|
|
66,706 |
|
| |
| Total expenses
|
|
|
4,926,587
|
|
| |
| Compensating
balance credits |
|
|
(573 |
) |
| |
| Net expenses
|
|
|
4,926,014
|
|
| |
| Net investment
income (loss) |
|
|
11,560,590
|
|
| |
| |
| REALIZED
AND UNREALIZED GAIN (LOSS) ON INVESTMENTS AND FOREIGN CURRENCY: |
|
|
|
|
| NET REALIZED
GAIN (LOSS): |
|
|
|
|
| |
| Investments |
|
|
73,716,050 |
|
| |
| Foreign currency
transactions |
|
|
(6,832 |
) |
| |
| NET CHANGE
IN UNREALIZED APPRECIATION (DEPRECIATION): |
|
|
|
|
| |
| Investments
in Non-Affiliated Companies and foreign currency translations |
|
|
(47,455,088 |
) |
| |
| Investments
in Affiliated Companies |
|
|
939,879 |
|
| |
| Other assets
and liabilities denominated in foreign currency |
|
|
20,350 |
|
| |
| Net realized
and unrealized gain (loss) on investments and foreign currency |
|
|
27,214,359
|
|
| |
| NET INCREASE
(DECREASE) IN NET ASSETS FROM INVESTMENT OPERATIONS |
|
$ |
38,774,949
|
|
| |
| THE ACCOMPANYING
NOTES ARE AN INTEGRAL PART OF THESE FINANCIAL STATEMENTS |
|
2018 Semiannual
Report to Stockholders | 47 |
| Royce Value
Trust |
|
Six Months
Ended June 30, 2018 (unaudited) |
| CASH FLOWS
FROM OPERATING ACTIVITIES: |
|
|
|
|
| Net increase
(decrease) in net assets from investment operations |
|
$ |
38,774,949 |
|
| |
| Adjustments
to reconcile net increase (decrease) in net assets from investment operations to
net cash provided by operating activities: |
|
|
|
|
| |
Purchases
of long-term investments |
|
|
(254,511,184 |
) |
| |
Proceeds
from sales and maturities of long-term investments |
|
|
281,102,143 |
|
| |
Net
purchases, sales and maturities of short-term investments |
|
|
(8,928,000 |
) |
| |
Net
(increase) decrease in dividends and interest receivable and other assets |
|
|
24,789 |
|
| |
Net
increase (decrease) in interest expense payable, accrued expenses and other liabilities |
|
|
(78,323 |
) |
| |
Net
change in unrealized appreciation (depreciation) on investments |
|
|
46,515,209 |
|
| |
Net
realized gain (loss) on investments and foreign currency |
|
|
(73,709,218 |
) |
| |
| Net cash
provided by operating activities |
|
|
29,190,365
|
|
| |
| CASH FLOWS
FROM FINANCING ACTIVITIES: |
|
|
|
|
| Distributions |
|
|
(50,109,861 |
) |
| |
| Reinvestment
of distributions |
|
|
21,191,356 |
|
| |
| Net cash
used for financing activities |
|
|
(28,918,505 |
) |
| |
| INCREASE
(DECREASE) IN CASH: |
|
|
271,860
|
|
| |
| Cash and
foreign currency at beginning of period |
|
|
73,896
|
|
| |
| Cash and
foreign currency at end of period |
|
$ |
345,756
|
|
| |
| 48 | 2018
Semiannual Report to Stockholders |
|
THE ACCOMPANYING
NOTES ARE AN INTEGRAL PART OF THESE FINANCIAL STATEMENTS |
| |
| Financial
Highlights |
| This table
is presented to show selected data for a share of Common Stock outstanding throughout
each period, and to assist stockholders in evaluating the Fund’s performance
for the periods presented. |
| |
|
SIX MONTHS |
|
YEARS ENDED |
| |
|
|
|
|
|
|
| |
|
ENDED 6/30/18 |
|
|
|
|
|
|
|
|
|
|
|
|
|
|
|
|
|
|
|
|
| |
|
(UNAUDITED) |
|
12/31/17 |
|
12/31/16 |
|
12/31/15 |
|
12/31/14 |
|
12/31/13 |
| |
| Net Asset
Value, Beginning of Period |
|
$ |
17.50 |
|
|
$ |
15.85 |
|
|
$ |
13.56 |
|
|
$ |
16.24 |
|
|
$ |
18.17 |
|
|
$ |
15.40 |
|
| |
| INVESTMENT
OPERATIONS: |
|
|
|
|
|
|
|
|
|
|
|
|
|
|
|
|
|
|
|
|
|
|
|
|
| Net investment
income (loss) |
|
|
0.13 |
|
|
|
0.13 |
|
|
|
0.12 |
|
|
|
0.12 |
|
|
|
0.12 |
|
|
|
0.12 |
|
| |
| Net realized
and unrealized gain (loss) on investments and foreign currency |
|
|
0.34 |
|
|
|
2.74 |
|
|
|
3.27 |
|
|
|
(1.48 |
) |
|
|
(0.13 |
) |
|
|
4.89 |
|
| |
| Net increase
(decrease) in net assets from investment operations |
|
|
0.47 |
|
|
|
2.87 |
|
|
|
3.39 |
|
|
|
(1.36 |
) |
|
|
(0.01 |
) |
|
|
5.01 |
|
| |
| DISTRIBUTIONS: |
|
|
|
|
|
|
|
|
|
|
|
|
|
|
|
|
|
|
|
|
|
|
|
|
| Net investment
income |
|
|
(0.07 |
)1 |
|
|
(0.13 |
) |
|
|
(0.13 |
) |
|
|
(0.16 |
) |
|
|
(0.14 |
) |
|
|
(0.11 |
) |
| |
| Net realized
gain on investments and foreign currency |
|
|
(0.52 |
)1 |
|
|
(1.03 |
) |
|
|
(0.89 |
) |
|
|
(1.08 |
) |
|
|
(1.68 |
) |
|
|
(2.08 |
) |
| |
| Total distributions
|
|
|
(0.59 |
) |
|
|
(1.16 |
) |
|
|
(1.02 |
) |
|
|
(1.24 |
) |
|
|
(1.82 |
) |
|
|
(2.19 |
) |
| |
| CAPITAL STOCK
TRANSACTIONS: |
|
|
|
|
|
|
|
|
|
|
|
|
|
|
|
|
|
|
|
|
|
|
|
|
| Effect of
reinvestment of distributions by Common Stockholders |
|
|
(0.03 |
) |
|
|
(0.06 |
) |
|
|
(0.08 |
) |
|
|
(0.08 |
) |
|
|
(0.10 |
) |
|
|
(0.05 |
) |
| |
| Total capital
stock transactions |
|
|
(0.03 |
) |
|
|
(0.06 |
) |
|
|
(0.08 |
) |
|
|
(0.08 |
) |
|
|
(0.10 |
) |
|
|
(0.05 |
) |
| |
| Net Asset
Value, End of Period |
|
$ |
17.35 |
|
|
$ |
17.50 |
|
|
$ |
15.85 |
|
|
$ |
13.56 |
|
|
$ |
16.24 |
|
|
$ |
18.17 |
|
| |
| Market
Value, End of Period |
|
$ |
15.80 |
|
|
$ |
16.17 |
|
|
$ |
13.39 |
|
|
$ |
11.77 |
|
|
$ |
14.33 |
|
|
$ |
16.01 |
|
| |
| TOTAL RETURN:2 |
|
|
|
|
|
|
|
|
|
|
|
|
|
|
|
|
|
|
|
|
|
|
|
|
| Net Asset
Value |
|
|
2.84 |
%3 |
|
|
19.31 |
% |
|
|
26.87 |
% |
|
|
(8.09 |
)% |
|
|
0.78 |
% |
|
|
34.14 |
% |
| |
| Market Value |
|
|
1.36 |
%3 |
|
|
30.49 |
% |
|
|
23.48 |
% |
|
|
(9.59 |
)% |
|
|
0.93 |
% |
|
|
35.63 |
% |
| |
| RATIOS BASED
ON AVERAGE NET ASSETS: |
|
|
|
|
|
|
|
|
|
|
|
|
|
|
|
|
|
|
|
|
|
|
|
|
| Investment
advisory fee expense4 |
|
|
0.42 |
%5 |
|
|
0.43 |
% |
|
|
0.51 |
% |
|
|
0.50 |
% |
|
|
0.46 |
% |
|
|
0.54 |
% |
| |
| Other operating
expenses |
|
|
0.24 |
%5 |
|
|
0.22 |
% |
|
|
0.22 |
% |
|
|
0.18 |
% |
|
|
0.15 |
% |
|
|
0.25 |
% |
| |
| Total expenses
(net) |
|
|
0.66 |
%5 |
|
|
0.65 |
% |
|
|
0.73 |
% |
|
|
0.68 |
% |
|
|
0.61 |
% |
|
|
0.79 |
% |
| |
| Expenses net
of fee waivers and excluding interest expense |
|
|
0.52 |
%5 |
|
|
0.54 |
% |
|
|
0.62 |
% |
|
|
0.61 |
% |
|
|
0.55 |
% |
|
|
0.65 |
% |
| |
| Expenses prior
to fee waivers and balance credits |
|
|
0.66 |
%5 |
|
|
0.65 |
% |
|
|
0.73 |
% |
|
|
0.68 |
% |
|
|
0.61 |
% |
|
|
0.79 |
% |
| |
| Expenses prior
to fee waivers |
|
|
0.66 |
%5 |
|
|
0.65 |
% |
|
|
0.73 |
% |
|
|
0.68 |
% |
|
|
0.61 |
% |
|
|
0.79 |
% |
| |
| Net investment
income (loss) |
|
|
1.56 |
%5 |
|
|
0.80 |
% |
|
|
0.85 |
% |
|
|
0.78 |
% |
|
|
0.72 |
% |
|
|
0.70 |
% |
| |
| SUPPLEMENTAL
DATA: |
|
|
|
|
|
|
|
|
|
|
|
|
|
|
|
|
|
|
|
|
|
|
|
|
| Net Assets,
End of Period (in thousands) |
|
$ |
1,490,306 |
|
|
$ |
1,480,449 |
|
|
$ |
1,296,012 |
|
|
$ |
1,072,035 |
|
|
$ |
1,231,955 |
|
|
$ |
1,307,829 |
|
| |
| Portfolio
Turnover Rate |
|
|
17 |
% |
|
|
19 |
% |
|
|
28 |
% |
|
|
35 |
% |
|
|
40 |
% |
|
|
33 |
% |
| |
| REVOLVING
CREDIT AGREEMENT: |
|
|
|
|
|
|
|
|
|
|
|
|
|
|
|
|
|
|
|
|
|
|
|
|
| Asset coverage |
|
|
2229 |
% |
|
|
2215 |
% |
|
|
1951 |
% |
|
|
1631 |
% |
|
|
1860 |
% |
|
|
1289 |
% |
| |
| Asset coverage
per $1,000 |
|
$ |
22,290 |
|
|
$ |
22,149 |
|
|
$ |
19,514 |
|
|
$ |
16,315 |
|
|
$ |
18,599 |
|
|
$ |
12,889 |
|
| |
| 1 |
Amounts are
subject to change and recharacterization at year end. |
| 2 |
The Market
Value Total Return is calculated assuming a purchase of Common Stock on the opening
of the first business day and a sale on the closing of the last business day of
each period. Dividends and distributions are assumed for the purposes of this calculation
to be reinvested at prices obtained under the Fund’s Distribution Reinvestment
and Cash Purchase Plan. Net Asset Value Total Return is calculated on the same basis,
except that the Fund’s net asset value is used on the purchase and sale dates
instead of market value. |
| 3 |
Not annualized |
| 4 |
The investment
advisory fee is calculated based on average net assets over a rolling 60-month basis,
while the above ratios of investment advisory fee expenses are based on the average
net assets over a 12-month basis. |
| 5 |
Annualized |
| THE ACCOMPANYING
NOTES ARE AN INTEGRAL PART OF THESE FINANCIAL STATEMENTS |
|
2018 Semiannual
Report to Stockholders | 49 |
Notes to Financial Statements (unaudited)
| Summary
of Significant Accounting Policies: |
Royce Value
Trust, Inc. (the “Fund”), is a diversified closed-end investment company that was
incorporated under the laws of the State of Maryland on July 1, 1986. The Fund
commenced operations on November 26, 1986. |
The preparation
of financial statements in conformity with accounting principles generally accepted
in the United States of America requires management to make estimates and assumptions
that affect the reported amounts of assets and liabilities and the disclosure of
contingent assets and liabilities at the date of the financial statements and the
reported amounts of income and expenses during the reporting period. Actual results
could differ from those estimates. |
The Fund
is an investment company and accordingly follows the investment company accounting
and reporting guidance of the Financial Accounting Standards Board (FASB) Accounting
Standard Codification Topic 946 “Financial Services-Investment Companies”. |
| |
| VALUATION
OF INVESTMENTS: |
Securities
are valued as of the close of trading on the New York Stock Exchange (NYSE) (generally
4:00 p.m. Eastern time) on the valuation date. Securities that trade on an exchange,
and securities traded on Nasdaq’s Electronic Bulletin Board, are valued at
their last reported sales price or Nasdaq official closing price taken from the
primary market in which each security trades or, if no sale is reported for such
day, at their highest bid price. Other over-the-counter securities for which market
quotations are readily available are valued at their highest bid price, except
in the case of some bonds and other fixed income securities which may be valued
by reference to other securities with comparable ratings, interest rates and maturities,
using established independent pricing services. The Fund values its non-U.S. dollar
denominated securities in U.S. dollars daily at the prevailing foreign currency
exchange rates as quoted by a major bank. Securities for which market quotations
are not readily available are valued at their fair value in accordance with the
provisions of the 1940 Act, under procedures approved by the Fund’s Board
of Directors, and are reported as Level 3 securities. As a general principle, the
fair value of a security is the amount which the Fund might reasonably expect to
receive for the security upon its current sale. However, in light of the judgment
involved in fair valuations, there can be no assurance that a fair value assigned
to a particular security will be the amount which the Fund might be able to receive
upon its current sale. In addition, if, between the time trading ends on a particular
security and the close of the customary trading session on the NYSE, events occur
that are significant and may make the closing price unreliable, the Fund may fair
value the security. The Fund uses an independent pricing service to provide fair
value estimates for relevant non-U.S. equity securities on days when the U.S. market
volatility exceeds a certain threshold. This pricing service uses proprietary correlations
it has developed between the movement of prices of non-U.S. equity securities and
indices of U.S.-traded securities, futures contracts and other indications to estimate
the fair value of relevant non-U.S. securities. When fair value pricing is employed,
the prices of securities used by the Fund may differ from quoted or published prices
for the same security. Investments in money market funds are valued at net asset
value per share. |
Various
inputs are used in determining the value of the Fund’s investments, as noted
above. These inputs are summarized in the three broad levels below: |
| |
Level 1
|
– |
quoted
prices in active markets for identical securities. |
| |
Level 2
|
– |
other significant
observable inputs (including quoted prices for similar securities, foreign securities
that may be fair valued and repurchase agreements). The table below includes
all Level 2 securities. Level 2 securities with values based on quoted prices for
similar securities are noted in the Schedule of Investments. |
| |
Level 3
|
– |
significant
unobservable inputs (including last trade price before trading was suspended, or
at a discount thereto for lack of marketability or otherwise, market price
information regarding other securities, information received from the company and/or
published documents, including SEC filings and financial statements, or other publicly
available information). |
The inputs
or methodology used for valuing securities are not necessarily an indication of
the risk associated with investing in those securities. |
The following
is a summary of the inputs used to value the Fund’s investments as of June
30, 2018. For a detailed breakout of common stocks by sector classification, please
refer to the Schedule of Investments. |
| |
|
LEVEL 1 |
|
LEVEL 2 |
|
LEVEL 3 |
|
TOTAL |
|
| |
| Common Stocks |
|
|
$1,470,467,378 |
|
|
|
$17,562,767 |
|
|
|
$1,790,100 |
|
|
|
$1,489,820,245
|
|
| |
| Cash Equivalents |
|
|
– |
|
|
|
57,595,000 |
|
|
|
– |
|
|
|
57,595,000
|
|
| |
Certain
securities have transferred in and out of Level 1 and Level 2 measurements during
the reporting period. The Fund recognizes transfers between levels as of the end
of the reporting period. For the six months ended June 30, 2018, securities valued
at $592,953 were transferred from Level 1 to Level 2 and securities valued at $94,451,255
were transferred from Level 2 to Level 1 within the fair value hierarchy. |
| 50 | 2018
Semiannual Report to Stockholders |
Notes to Financial Statements (unaudited)
(continued)
VALUATION OF INVESTMENTS (continued):
Level 3 Reconciliation:
| |
BALANCE
AS OF 12/31/17 |
PURCHASES
|
REALIZED
GAIN (LOSS) |
UNREALIZED
GAIN (LOSS)1 |
BALANCE
AS OF 6/30/18 |
| |
| Common Stocks |
$891,600 |
$932,126 |
$ – |
$(33,626) |
$1,790,100 |
| |
| 1 |
The net
change in unrealized appreciation (depreciation) is included in the accompanying
Statement of Operations. Change in unrealized appreciation (depreciation) includes
net unrealized appreciation (depreciation) resulting from changes in investment
values during the reporting period and the reversal of previously recorded unrealized
appreciation (depreciation) when gains or losses are realized. Net realized gain
(loss) from investments and foreign currency transactions is included in the accompanying
Statement of Operations. |
The following
table summarizes the valuation techniques used and unobservable inputs approved
by the Valuation Committee to determine the fair value of certain Level 3 investments.
The table does not include Level 3 investments with values derived utilizing prices
from prior transactions or third party pricing information with adjustments (e.g.
broker quotes, pricing services, net asset values). |
| |
|
|
FAIR
VALUE AT |
|
|
|
|
|
|
|
|
|
|
|
IMPACT
TO VALUATION FROM |
| |
|
|
6/30/18
|
|
|
VALUATION
TECHNIQUE(S) |
|
|
UNOBSERVABLE
INPUT(S) |
|
|
RANGE
AVERAGE |
|
|
AN INCREASE
IN INPUT1 |
| |
| Common Stocks |
|
|
$1,790,100 |
|
|
Discounted
Present Value
Balance Sheet Analysis |
|
|
Liquidity
Discount |
|
|
30%-40% |
|
|
Decrease |
| |
| 1 |
This column
represents the directional change in the fair value of the Level 3 investments that
would result in an increase from the corresponding unobservable input. A decrease
to the unobservable input would have the opposite effect. Significant increases
and decreases in these unobservable inputs in isolation could result in significantly
higher or lower fair value measurements. |
| REPURCHASE
AGREEMENTS: |
The Fund
may enter into repurchase agreements with institutions that the Fund’s investment
adviser has determined are creditworthy. The Fund restricts repurchase agreements
to maturities of no more than seven days. Securities pledged as collateral for repurchase
agreements, which are held until maturity of the repurchase agreements, are marked-to-market
daily and maintained at a value at least equal to the principal amount of the repurchase
agreement (including accrued interest). Repurchase agreements could involve certain
risks in the event of default or insolvency of the counter-party, including possible
delays or restrictions upon the ability of the Fund to dispose of its underlying
securities. The remaining contractual maturity of the repurchase agreement held
by the Fund at June 30, 2018 is overnight and continuous. |
| |
| FOREIGN
CURRENCY: |
Net realized
foreign exchange gains or losses arise from sales and maturities of short-term securities,
sales of foreign currencies, expiration of currency forward contracts, currency
gains or losses realized between the trade and settlement dates on securities transactions,
and the difference between the amounts of dividends, interest, and foreign withholding
taxes recorded on the Fund’s books and the U.S. dollar equivalent of the amounts
actually received or paid. Net unrealized foreign exchange gains and losses arise
from changes in the value of assets and liabilities, including investments in securities
at the end of the reporting period, as a result of changes in foreign currency
exchange rates. |
| |
| TAXES: |
As a qualified
regulated investment company under Subchapter M of the Internal Revenue Code, the
Fund is not subject to income taxes to the extent that it distributes substantially
all of its taxable income for its fiscal year. The Schedule of Investments includes
information regarding income taxes under the caption “Tax Information”. |
| |
| CAPITAL
GAINS TAXES: |
The Fund
is subject to a tax imposed on short-term capital gains on securities of issuers
domiciled in certain countries. The Fund records an estimated deferred tax liability
for gains in these securities that have been held for less than one year. This amount,
if any, is reported as deferred capital gains tax in the accompanying Statement
of Assets and Liabilities, assuming those positions were disposed of at the end
of the period, and accounted for as a reduction in the market value of the security. |
| |
| DISTRIBUTIONS: |
The Fund
pays quarterly distributions on the Fund’s Common Stock at the annual rate
of 7% of the rolling average of the prior four calendar quarter-end NAVs of the
Fund’s Common Stock, with the fourth quarter distribution being the greater
of 1.75% of the rolling average or the distribution required by IRS regulations.
Distributions to Common Stockholders are recorded on ex-dividend date. To the extent
that distributions in any year are not paid from long-term capital gains, net investment
income or net short-term capital gains, they will represent a return of capital.
Distributions are determined in accordance with income tax regulations that may
differ from accounting principles generally accepted in the United States of America.
Permanent book and tax differences relating to stockholder distributions |
| 2018 Semiannual
Report to Stockholders | 51 |
Notes to Financial Statements (unaudited)
(continued)
| DISTRIBUTIONS
(continued): |
| will result
in reclassifications within the capital accounts. Undistributed net investment income
may include temporary book and tax basis differences, which will reverse in a subsequent
period. Any taxable income or gain remaining undistributed at fiscal year end is
distributed in the following year. |
| |
| INVESTMENT
TRANSACTIONS AND RELATED INVESTMENT INCOME: |
Investment
transactions are accounted for on the trade date. Dividend income is recorded on
the ex-dividend date. Non-cash dividend income is recorded at the fair market value
of the securities received. Interest income is recorded on an accrual basis. Premiums
and discounts on debt securities are amortized using the effective yield-to-maturity
method. Realized gains and losses from investment transactions are determined on
the basis of identified cost for book and tax purposes. |
| |
| EXPENSES: |
The Fund incurs
direct and indirect expenses. Expenses directly attributable to the Fund are charged
to the Fund’s operations, while expenses applicable to more than one of the
Royce Funds are allocated equitably. Certain personnel, occupancy costs and other
administrative expenses related to the Funds are allocated by Royce & Associates
(“Royce”) under an administration agreement and are included in administrative
and office facilities and professional fees. The Fund has adopted a deferred fee
agreement that allows the Directors to defer the receipt of all or a portion of
directors’ fees otherwise payable. The deferred fees are invested in certain
Royce Funds until distributed in accordance with the agreement. |
| |
| COMPENSATING
BALANCE CREDITS: |
The Fund has
an arrangement with its custodian bank, whereby a portion of the custodian’s
fee is paid indirectly by credits earned on the Fund’s cash on deposit with
the bank. This deposit arrangement is an alternative to purchasing overnight investments.
Conversely, the Fund pays interest to the custodian on any cash overdrafts, to
the extent they are not offset by credits earned on positive cash balances. |
| |
| Capital
Stock: |
The Fund issued
1,329,003 and 2,795,800 shares of Common Stock as reinvestment of distributions
for the six months ended June 30, 2018 and the year ended December 31, 2017, respectively. |
| |
| Borrowings:
|
The Fund is
party to a revolving credit agreement (the credit agreement) with BNP Paribas Prime
Brokerage International, Limited (BNPPI). The Fund pays a commitment fee of 0.50%
per annum on the unused portion of the credit agreement. The credit agreement has
a 360-day rolling term that resets daily; however, if the Fund exceeds certain
net asset value triggers, the credit agreement may convert to a 60-day rolling
term that resets daily. The Fund is required to pledge portfolio securities as collateral
in an amount up to two times the loan balance outstanding or as otherwise required
by applicable regulatory standards and has granted a security interest in the securities
pledged to, and in favor of, BNPPI as security for the loan balance outstanding.
If the Fund fails to meet certain requirements, or maintain other financial covenants
required under the credit agreement, the Fund may be required to repay immediately,
in part or in full, the loan balance outstanding under the credit agreement which
may necessitate the sale of portfolio securities at potentially inopportune times.
BNPPI may terminate the credit agreement upon certain ratings downgrades of its
corporate parent, which would result in the Fund’s entire loan balance becoming
immediately due and payable. The occurrence of such ratings downgrades may necessitate
the sale of portfolio securities at potentially inopportune times. The credit agreement
also permits, subject to certain conditions, BNPPI to rehypothecate portfolio securities
pledged by the Fund up to the amount of the loan balance outstanding. The Fund continues
to receive payments in lieu of dividends and interest on rehypothecated securities.
The Fund also has the right under the credit agreement to recall the rehypothecated
securities from BNPPI on demand. If BNPPI fails to deliver the recalled security
in a timely manner, the Fund is compensated by BNPPI for any fees or losses related
to the failed delivery or, in the event a recalled security is not returned by BNPPI,
the Fund, upon notice to BNPPI, may reduce the loan balance outstanding by the
value of the recalled security failed to be returned. The Fund receives a portion
of the fees earned by BNPPI in connection with the rehypothecation of portfolio
securities. |
As of June
30, 2018, the Fund has outstanding borrowings of $70,000,000. During the six months
ended June 30, 2018, the Fund borrowed an average daily balance of $70,000,000
at a weighted average borrowing cost of 3.08%. The maximum amount outstanding during
the six months ended June 30, 2018 was $70,000,000. As of June 30, 2018, the aggregate
value of rehypothecated securities was $66,358,963. During the six months ended
June 30, 2018, the Fund earned $179,246 in fees from rehypothecated securities. |
| 52 | 2018
Semiannual Report to Stockholders |
Notes to Financial Statements (unaudited)
(continued)
| Investment
Advisory Agreement: |
As compensation
for its services under the investment advisory agreement, Royce receives a fee comprised
of a Basic Fee (“Basic Fee”) and an adjustment to the Basic Fee based
on the investment performance of the Fund in relation to the investment record of
the S&P SmallCap 600 Index (“S&P 600”). |
The Basic
Fee is a monthly fee equal to 1/12 of 1% (1% on an annualized basis) of the average
of the Fund’s month-end net assets for the rolling 60-month period ending
with such month (the “performance period”). The Basic Fee for each month is increased
or decreased at the rate of 1/12 of .05% for each percentage point that the investment
performance of the Fund exceeds, or is exceeded by, the percentage change in the
investment record of the S&P 600 for the performance period by more than two
percentage points. The performance period for each such month is a rolling 60-month
period ending with such month. The maximum increase or decrease in the Basic Fee
for any month may not exceed 1/12 of .5%. Accordingly, for each month, the maximum
monthly fee rate as adjusted for performance is 1/12 of 1.5% and is payable if
the investment performance of the Fund exceeds the percentage change in the investment
record of the S&P 600 by 12 or more percentage points for the performance
period, and the minimum monthly fee rate as adjusted for performance is 1/12 of .5%
and is payable if the percentage change in the investment record of the S&P
600 exceeds the investment performance of the Fund by 12 or more percentage points
for the performance period. |
Notwithstanding
the foregoing, Royce is not entitled to receive any fee for any month when the investment
performance of the Fund for the rolling 36-month period ending with such month
is negative. In the event that the Fund’s investment performance for such a
performance period is less than zero, Royce will not be required to refund to the
Fund any fee earned in respect of any prior performance period. |
For the
six rolling 60-month periods ended June 2018, the Fund’s investment performance
ranged from 24% to 30% below the investment performance of the S&P 600. Accordingly,
the net investment advisory fee consisted of a Basic Fee of $6,258,272 and a net
downward adjustment of $3,129,138 for the performance of the Fund relative to that
of the S&P 600. For the six months ended June 30, 2018, the Fund expensed
Royce investment advisory fees totaling $3,129,134. |
| |
| Purchases
and Sales of Investment Securities: |
For the
six months ended June 30, 2018, the costs of purchases and proceeds from sales of
investment securities, other than short-term securities, amounted to $255,499,437
and $258,270,619, respectively. |
Cross trades
were executed by the Fund pursuant to Rule 17a-7 under the 1940 Act. Cross trading
is the buying or selling of portfolio securities between funds to which Royce serves
as investment adviser. At its regularly scheduled quarterly meetings, the Board
reviews such transactions as of the most recent calendar quarter for compliance
with the requirements and restrictions set forth by Rule 17a-7. Cross trades for
the six months ended June 30, 2018, were as follows: |
| COST
OF PURCHASES |
|
|
PROCEEDS
FROM SALES |
|
|
REALIZED
GAIN (LOSS) |
| |
| $8,376,878 |
|
|
$ – |
|
|
$ – |
| |
| Transactions
in Affiliated Companies: |
An “Affiliated
Company” as defined in the Investment Company Act of 1940, is a company in
which a fund owns 5% or more of the company’s outstanding voting securities
at any time during the period. The Fund held the following positions in shares
of such companies at June 30, 2018: |
| |
|
SHARES |
|
MARKET VALUE |
|
COST OF |
|
PROCEEDS |
|
REALIZED |
|
CHANGE IN NET
UNREALIZED
APPRECIATION |
|
DIVIDEND |
|
SHARES |
|
MARKET VALUE |
| AFFILIATED
COMPANY |
|
12/31/17 |
|
12/31/17 |
|
PURCHASES |
|
FROM SALES |
|
GAIN (LOSS) |
|
(DEPRECIATION) |
|
INCOME |
|
6/30/18 |
|
6/30/18 |
| |
| HG Holdings |
|
|
912,235 |
|
|
$ |
793,645 |
|
|
|
$ – |
|
|
|
$ – |
|
|
|
$ – |
|
|
$ |
(200,692) |
|
|
|
$ – |
|
|
|
912,235 |
|
|
$ |
592,953 |
|
| |
| Houston Wire
& Cable |
|
|
877,363 |
|
|
|
6,317,014 |
|
|
|
– |
|
|
|
– |
|
|
|
– |
|
|
|
1,140,571 |
|
|
|
– |
|
|
|
877,363 |
|
|
|
7,457,585 |
|
| |
| |
|
|
|
|
|
$ |
7,110,659 |
|
|
|
|
|
|
|
|
|
|
|
$ – |
|
|
$ |
939,879 |
|
|
|
$ – |
|
|
|
|
|
|
$ |
8,050,538 |
|
| |
| Subsequent
Events: |
On July
5, 2018, the Fund completed a rights offering of Common Stock to its stockholders
at the rate of one common share for each 10 rights held by stockholders of record
on May 30, 2018. The rights offering resulted in the issuance of 7,120,544 common
shares at a price of $15.33, and proceeds of $109,157,940 to the Fund prior to the
deduction of estimated expenses of $545,000. The net asset value per share of the
Fund’s Common Stock was reduced by approximately $0.16 per share as a result
of the issuance. |
| 2018 Semiannual
Report to Stockholders | 53 |
History Since Inception
| The following
table details the share accumulations by an initial investor in the Funds who reinvested
all distributions and participated fully in primary subscriptions for each of the
rights offerings. Full participation in distribution reinvestments and rights offerings
can maximize the returns available to a long-term investor. This table should be
read in conjunction with the Performance and Portfolio Reviews of the Funds. |
| HISTORY
|
|
|
|
|
AMOUNT
INVESTED |
|
|
PURCHASE
PRICE1 |
|
|
SHARES
|
|
|
NAV VALUE2 |
|
|
MARKET VALUE2 |
| |
|
Royce Global Value Trust |
|
|
|
|
|
|
|
|
|
|
|
|
|
|
|
| 10/17/13 |
|
Initial Purchase |
|
$ |
8,975 |
|
$ |
8.975 |
|
|
1,000 |
|
$ |
9,780 |
|
$ |
8,975 |
| |
| 12/11/14 |
|
Distribution
$0.15 |
|
|
|
|
|
7.970 |
|
|
19 |
|
|
9,426 |
|
|
8,193 |
| |
| 12/10/15 |
|
Distribution
$0.10 |
|
|
|
|
|
7.230 |
|
|
14 |
|
|
9,101 |
|
|
7,696 |
| |
| 12/9/16 |
|
Distribution
$0.14 |
|
|
|
|
|
7.940 |
|
|
18 |
|
|
10,111 |
|
|
8,446 |
| |
| 12/12/17 |
|
Distribution
$0.11 |
|
|
|
|
|
10.610 |
|
|
11 |
|
|
13,254 |
|
|
11,484 |
| |
| 6/30/18
|
|
|
|
$ |
8,975
|
|
|
|
|
|
1,062
|
|
$ |
13,137
|
|
$ |
11,162
|
| |
| |
|
|
|
|
|
|
|
|
|
|
|
|
|
|
|
|
|
|
Royce Micro-Cap Trust |
|
|
|
|
|
|
|
|
|
|
|
|
|
|
|
| 12/14/93 |
|
Initial Purchase |
|
$ |
7,500 |
|
$ |
7.500 |
|
|
1,000 |
|
$ |
7,250 |
|
$ |
7,500 |
| |
| 10/28/94 |
|
Rights Offering |
|
|
1,400 |
|
|
7.000 |
|
|
200 |
|
|
|
|
|
|
| |
| 12/19/94 |
|
Distribution
$0.05 |
|
|
|
|
|
6.750 |
|
|
9 |
|
|
9,163 |
|
|
8,462 |
| |
| 12/7/95 |
|
Distribution
$0.36 |
|
|
|
|
|
7.500 |
|
|
58 |
|
|
11,264 |
|
|
10,136 |
| |
| 12/6/96 |
|
Distribution
$0.80 |
|
|
|
|
|
7.625 |
|
|
133 |
|
|
13,132 |
|
|
11,550 |
| |
| 12/5/97 |
|
Distribution
$1.00 |
|
|
|
|
|
10.000 |
|
|
140 |
|
|
16,694 |
|
|
15,593 |
| |
| 12/7/98 |
|
Distribution
$0.29 |
|
|
|
|
|
8.625 |
|
|
52 |
|
|
16,016 |
|
|
14,129 |
| |
| 12/6/99 |
|
Distribution
$0.27 |
|
|
|
|
|
8.781 |
|
|
49 |
|
|
18,051 |
|
|
14,769 |
| |
| 12/6/00 |
|
Distribution
$1.72 |
|
|
|
|
|
8.469 |
|
|
333 |
|
|
20,016 |
|
|
17,026 |
| |
| 12/6/01 |
|
Distribution
$0.57 |
|
|
|
|
|
9.880 |
|
|
114 |
|
|
24,701 |
|
|
21,924 |
| |
| 2002 |
|
Annual distribution
total $0.80 |
|
|
|
|
|
9.518 |
|
|
180 |
|
|
21,297 |
|
|
19,142 |
| |
| 2003 |
|
Annual distribution
total $0.92 |
|
|
|
|
|
10.004 |
|
|
217 |
|
|
33,125 |
|
|
31,311 |
| |
| 2004 |
|
Annual distribution
total $1.33 |
|
|
|
|
|
13.350 |
|
|
257 |
|
|
39,320 |
|
|
41,788 |
| |
| 2005 |
|
Annual distribution
total $1.85 |
|
|
|
|
|
13.848 |
|
|
383 |
|
|
41,969 |
|
|
45,500 |
| |
| 2006 |
|
Annual distribution
total $1.55 |
|
|
|
|
|
14.246 |
|
|
354 |
|
|
51,385 |
|
|
57,647 |
| |
| 2007 |
|
Annual distribution
total $1.35 |
|
|
|
|
|
13.584 |
|
|
357 |
|
|
51,709 |
|
|
45,802 |
| |
| 2008 |
|
Annual distribution
total $1.19 3 |
|
|
|
|
|
8.237 |
|
|
578 |
|
|
28,205 |
|
|
24,807 |
| |
| 3/11/09 |
|
Distribution
$0.22 3 |
|
|
|
|
|
4.260 |
|
|
228 |
|
|
41,314 |
|
|
34,212 |
| |
| 12/2/10 |
|
Distribution
$0.08 |
|
|
|
|
|
9.400 |
|
|
40 |
|
|
53,094 |
|
|
45,884 |
| |
| 2011 |
|
Annual distribution
total $0.53 3 |
|
|
|
|
|
8.773 |
|
|
289 |
|
|
49,014 |
|
|
43,596 |
| |
| 2012 |
|
Annual distribution
total $0.51 |
|
|
|
|
|
9.084 |
|
|
285 |
|
|
57,501 |
|
|
49,669 |
| |
| 2013 |
|
Annual distribution
total $1.38 |
|
|
|
|
|
11.864 |
|
|
630 |
|
|
83,110 |
|
|
74,222 |
| |
| 2014 |
|
Annual distribution
total $2.90 |
|
|
|
|
|
10.513 |
|
|
1,704 |
|
|
86,071 |
|
|
76,507 |
| |
| 2015 |
|
Annual distribution
total $1.26 |
|
|
|
|
|
7.974 |
|
|
1,256 |
|
|
75,987 |
|
|
64,222 |
| |
| 2016 |
|
Annual distribution
total $0.64 |
|
|
|
|
|
7.513 |
|
|
779 |
|
|
92,689 |
|
|
78,540 |
| |
| 2017 |
|
Annual distribution
total $ 0.69 |
|
|
|
|
|
8.746 |
|
|
783 |
|
|
109,076 |
|
|
98,254 |
| |
| 2018 |
|
Year-to-Date
distribution total $0.36 |
|
|
|
|
|
9.876 |
|
|
383 |
|
|
|
|
|
|
| |
| 6/30/18
|
|
|
|
$ |
8,900
|
|
|
|
|
|
10,791
|
|
$ |
117,622
|
|
$ |
107,802
|
| |
| 1 |
The purchase
price used for annual distribution totals is a weighted average of the distribution
reinvestment prices for the year. |
| 2 |
Values
are stated as of December 31 of the year indicated, after reinvestment of distributions,
other than for initial purchase. |
| 3 |
Includes
a return of capital. |
| 54 | 2018
Semiannual Report to Stockholders |
History Since Inception (continued)
| HISTORY
|
|
|
|
|
|
|
AMOUNT
INVESTED |
|
|
|
PURCHASE
PRICE1 |
|
|
|
SHARES
|
|
|
|
NAV VALUE2
|
|
|
|
MARKET
VALUE2 |
| |
| Royce Value
Trust |
|
|
|
|
|
|
|
|
|
|
|
|
|
|
| 11/26/86 |
|
|
Initial Purchase |
|
|
$ |
10,000 |
|
|
$ |
10.000 |
|
|
|
1,000 |
|
|
$ |
9,280 |
|
|
$ |
10,000 |
| |
| 10/15/87 |
|
|
Distribution
$0.30 |
|
|
|
|
|
|
|
7.000 |
|
|
|
42 |
|
|
|
|
|
|
|
|
| |
| 12/31/87 |
|
|
Distribution
$0.22 |
|
|
|
|
|
|
|
7.125 |
|
|
|
32 |
|
|
|
8,578 |
|
|
|
7,250 |
| |
| 12/27/88 |
|
|
Distribution
$0.51 |
|
|
|
|
|
|
|
8.625 |
|
|
|
63 |
|
|
|
10,529 |
|
|
|
9,238 |
| |
| 9/22/89 |
|
|
Rights Offering |
|
|
|
405 |
|
|
|
9.000 |
|
|
|
45 |
|
|
|
|
|
|
|
|
| |
| 12/29/89 |
|
|
Distribution
$0.52 |
|
|
|
|
|
|
|
9.125 |
|
|
|
67 |
|
|
|
12,942 |
|
|
|
11,866 |
| |
| 9/24/90 |
|
|
Rights Offering |
|
|
|
457 |
|
|
|
7.375 |
|
|
|
62 |
|
|
|
|
|
|
|
|
| |
| 12/31/90 |
|
|
Distribution
$0.32 |
|
|
|
|
|
|
|
8.000 |
|
|
|
52 |
|
|
|
11,713 |
|
|
|
11,074 |
| |
| 9/23/91 |
|
|
Rights Offering |
|
|
|
638 |
|
|
|
9.375 |
|
|
|
68 |
|
|
|
|
|
|
|
|
| |
| 12/31/91 |
|
|
Distribution
$0.61 |
|
|
|
|
|
|
|
10.625 |
|
|
|
82 |
|
|
|
17,919 |
|
|
|
15,697 |
| |
| 9/25/92 |
|
|
Rights Offering |
|
|
|
825 |
|
|
|
11.000 |
|
|
|
75 |
|
|
|
|
|
|
|
|
| |
| 12/31/92 |
|
|
Distribution
$0.90 |
|
|
|
|
|
|
|
12.500 |
|
|
|
114 |
|
|
|
21,999 |
|
|
|
20,874 |
| |
| 9/27/93 |
|
|
Rights Offering |
|
|
|
1,469 |
|
|
|
13.000 |
|
|
|
113 |
|
|
|
|
|
|
|
|
| |
| 12/31/93 |
|
|
Distribution
$1.15 |
|
|
|
|
|
|
|
13.000 |
|
|
|
160 |
|
|
|
26,603 |
|
|
|
25,428 |
| |
| 10/28/94 |
|
|
Rights Offering |
|
|
|
1,103 |
|
|
|
11.250 |
|
|
|
98 |
|
|
|
|
|
|
|
|
| |
| 12/19/94 |
|
|
Distribution
$1.05 |
|
|
|
|
|
|
|
11.375 |
|
|
|
191 |
|
|
|
27,939 |
|
|
|
24,905 |
| |
| 11/3/95 |
|
|
Rights Offering |
|
|
|
1,425 |
|
|
|
12.500 |
|
|
|
114 |
|
|
|
|
|
|
|
|
| |
| 12/7/95 |
|
|
Distribution
$1.29 |
|
|
|
|
|
|
|
12.125 |
|
|
|
253 |
|
|
|
35,676 |
|
|
|
31,243 |
| |
| 12/6/96 |
|
|
Distribution
$1.15 |
|
|
|
|
|
|
|
12.250 |
|
|
|
247 |
|
|
|
41,213 |
|
|
|
36,335 |
| |
| 1997 |
|
|
Annual distribution
total $1.21 |
|
|
|
|
|
|
|
15.374 |
|
|
|
230 |
|
|
|
52,556 |
|
|
|
46,814 |
| |
| 1998 |
|
|
Annual distribution
total $1.54 |
|
|
|
|
|
|
|
14.311 |
|
|
|
347 |
|
|
|
54,313 |
|
|
|
47,506 |
| |
| 1999 |
|
|
Annual distribution
total $1.37 |
|
|
|
|
|
|
|
12.616 |
|
|
|
391 |
|
|
|
60,653 |
|
|
|
50,239 |
| |
| 2000 |
|
|
Annual distribution
total $1.48 |
|
|
|
|
|
|
|
13.972 |
|
|
|
424 |
|
|
|
70,711 |
|
|
|
61,648 |
| |
| 2001 |
|
|
Annual distribution
total $1.49 |
|
|
|
|
|
|
|
15.072 |
|
|
|
437 |
|
|
|
81,478 |
|
|
|
73,994 |
| |
| 2002 |
|
|
Annual distribution
total $1.51 |
|
|
|
|
|
|
|
14.903 |
|
|
|
494 |
|
|
|
68,770 |
|
|
|
68,927 |
| |
| 1/28/03 |
|
|
Rights Offering |
|
|
|
5,600 |
|
|
|
10.770 |
|
|
|
520 |
|
|
|
|
|
|
|
|
| |
| 2003 |
|
|
Annual distribution
total $1.30 |
|
|
|
|
|
|
|
14.582 |
|
|
|
516 |
|
|
|
106,216 |
|
|
|
107,339 |
| |
| 2004 |
|
|
Annual distribution
total $1.55 |
|
|
|
|
|
|
|
17.604 |
|
|
|
568 |
|
|
|
128,955 |
|
|
|
139,094 |
| |
| 2005 |
|
|
Annual distribution
total $1.61 |
|
|
|
|
|
|
|
18.739 |
|
|
|
604 |
|
|
|
139,808 |
|
|
|
148,773 |
| |
| 2006 |
|
|
Annual distribution
total $1.78 |
|
|
|
|
|
|
|
19.696 |
|
|
|
693 |
|
|
|
167,063 |
|
|
|
179,945 |
| |
| 2007 |
|
|
Annual distribution
total $1.85 |
|
|
|
|
|
|
|
19.687 |
|
|
|
787 |
|
|
|
175,469 |
|
|
|
165,158 |
| |
| 2008 |
|
|
Annual distribution
total $1.72 3 |
|
|
|
|
|
|
|
12.307 |
|
|
|
1,294 |
|
|
|
95,415 |
|
|
|
85,435 |
| |
| 3/11/09 |
|
|
Distribution
$0.32 3 |
|
|
|
|
|
|
|
6.071 |
|
|
|
537 |
|
|
|
137,966 |
|
|
|
115,669 |
| |
| 12/2/10 |
|
|
Distribution
$0.03 |
|
|
|
|
|
|
|
13.850 |
|
|
|
23 |
|
|
|
179,730 |
|
|
|
156,203 |
| |
| 2011 |
|
|
Annual distribution
total $0.78 3 |
|
|
|
|
|
|
|
13.043 |
|
|
|
656 |
|
|
|
161,638 |
|
|
|
139,866 |
| |
| 2012 |
|
|
Annual distribution
total $0.80 |
|
|
|
|
|
|
|
13.063 |
|
|
|
714 |
|
|
|
186,540 |
|
|
|
162,556 |
| |
| 2013 |
|
|
Annual distribution
total $2.19 4 |
|
|
|
|
|
|
|
16.647 |
|
|
|
1,658 |
|
|
|
250,219 |
|
|
|
220,474 |
| |
| 2014 |
|
|
Annual distribution
total $1.82 |
|
|
|
|
|
|
|
14.840 |
|
|
|
1,757 |
|
|
|
252,175 |
|
|
|
222,516 |
| |
| 2015 |
|
|
Annual distribution
total $1.24 |
|
|
|
|
|
|
|
12.725 |
|
|
|
1,565 |
|
|
|
231,781 |
|
|
|
201,185 |
| |
| 2016 |
|
|
Annual distribution
total $1.02 |
|
|
|
|
|
|
|
12.334 |
|
|
|
1,460 |
|
|
|
293,880 |
|
|
|
248,425 |
| |
| 2017 |
|
|
Annual distribution
total $1.16 |
|
|
|
|
|
|
|
14.841 |
|
|
|
1,495 |
|
|
|
350,840 |
|
|
|
324,176 |
| |
| 2018 |
|
|
Year-to-Date
distribution total $0.59 |
|
|
|
|
|
|
|
15.962 |
|
|
|
748 |
|
|
|
|
|
|
|
|
| |
| 6/30/18
|
|
|
|
|
|
$ |
21,922
|
|
|
|
|
|
|
|
20,796
|
|
|
$ |
360,603
|
|
|
$ |
328,577
|
| |
| 1 |
The purchase
price used for annual distribution totals is a weighted average of the distribution
reinvestment prices for the year. |
| 2 |
Values are
stated as of December 31 of the year indicated, after reinvestment of distributions,
other than for initial purchase. |
| 3 |
Includes a
return of capital. |
| 4 |
Includes Royce
Global Value Trust spin-off of $1.40 per share. |
| 2018 Semiannual
Report to Stockholders | 55 |
Distribution
Reinvestment and Cash Purchase Options
| Why should
I reinvest my distributions? |
| By reinvesting
distributions, a stockholder can maintain an undiluted investment in the Fund. The
regular reinvestment of distributions has a significant impact on stockholder returns.
In contrast, the stockholder who takes distributions in cash is penalized when
shares are issued below net asset value to other stockholders. |
| |
| How does
the reinvestment of distributions from the Royce closed-end funds work? |
| The Funds
automatically issue shares in payment of distributions unless you indicate otherwise.
The shares are generally issued at the lower of the market price or net asset value
on the valuation date. |
| |
| How does
this apply to registered stockholders? |
| If your shares
are registered directly with a Fund, your distributions are automatically reinvested
unless you have otherwise instructed the Funds’ transfer agent, Computershare,
in writing, in which case you will receive your distribution in cash. A registered
stockholder also may have the option to receive the distribution in the form of
a stock certificate. |
| |
| What if
my shares are held by a brokerage firm or a bank? |
| If your shares
are held by a brokerage firm, bank, or other intermediary as the stockholder of
record, you should contact your brokerage firm or bank to be certain that it is
automatically reinvesting distributions on your behalf. If they are unable to reinvest
distributions on your behalf, you should have your shares registered in your name
in order to participate. |
| |
| What other
features are available for registered stockholders? |
| The Distribution
Reinvestment and Cash Purchase Plans also allow registered stockholders to make
optional cash purchases of shares of a Fund’s common stock directly through
Computershare on a monthly basis, and to deposit certificates representing your
RVT and RMT shares with Computershare for safekeeping. (RGT does not issue shares
in certificated form). Plan participants are subject to a $0.75 service fee for
each voluntary cash purchase under the Plans. The Funds’ investment adviser
absorbed all commissions on optional cash purchases under the Plans through June
30, 2018. |
| |
| How do
the Plans work for registered stockholders? |
| Computershare
maintains the accounts for registered stockholders in the Plans and sends written
confirmation of all transactions in the account. Shares in the account of each participant
will be held by Computershare in non-certificated form in the name of the participant,
and each participant will be able to vote those shares at a stockholder meeting
or by proxy. A participant may also send stock certificates for RVT and RMT held
by them to Computershare to be held in non-certificated form. RGT does not issue
shares in certificated form. There is no service fee charged to participants for
reinvesting distributions. If a participant elects to sell shares from a Plan account,
Computershare will deduct a $2.50 service fee from the sale transaction. The Funds’ investment adviser absorbed all commissions on optional sales under the Plans
through June 30, 2018. If a nominee is the registered owner of your shares, the
nominee will maintain the accounts on your behalf. |
| |
| How can
I get more information on the Plans? |
| You can call
an Investor Services Representative at (800) 221-4268 or you can request a copy
of the Plan for your Fund from Computershare. All correspondence (including notifications)
should be directed to: [Name of Fund] Distribution Reinvestment and Cash Purchase
Plan, c/o Computershare, PO Box 43078, Providence, RI 02940-3078, telephone (800)
426-5523 (from 9:00 A.M. to 5:00 P.M.). |
| 56 | 2018
Semiannual Report to Stockholders |
Directors
and Officers
| All Directors
and Officers may be reached c/o The Royce Funds, 745 Fifth Avenue, New York, NY
10151 |
| Charles
M. Royce, Director1 |
| Age: 78 |
Number of Funds Overseen: 22 | Tenure: Since 1982 |
| Non-Royce
Directorships: Director of Oxford Square Capital Corp. |
| Principal
Occupation(s) During Past Five Years: Chairman of the Board of Managers
of Royce & Associates, LP (“Royce”), the Funds’ investment
adviser; Chief Executive Officer (1972–June 2016), President (1972-June 2014)
of Royce. |
| |
| Christopher
D. Clark, Director1, President |
| Age: 53 |
Number of Funds Overseen: 22 | Tenure: Since 2014 |
| Principal
Occupation(s) During Past Five Years: Chief Executive Officer (since
July 2016), President (since July 2014), Co-Chief Investment Officer (Since January
2014), Managing Director of Royce, a Member of the Board of Managers of Royce,
having been employed by Royce since May 2007. |
| |
| |
| |
| Patricia
W. Chadwick, Director |
| Age: 69 |
Number of Funds Overseen: 22 | Tenure: Since 2009 |
| Non-Royce
Directorships: Trustee of ING Mutual Funds and Director of Wisconsin
Energy Corp. |
| Principal
Occupation(s) During Past 5 Years: Consultant and President of Ravengate
Partners LLC (since 2000). |
| |
| Christopher
C. Grisanti, Director |
| Age 56 | Number
of Funds Overseen: 22 | Tenure: Since 2017 |
| Non-Royce
Directorships: None |
| Principal
Occupation(s) During Past Five Years: Co-Founder and Chief Executive
Officer of Grisanti Capital Management LLC, an investment advisory firm (since
1999). Mr. Grisanti’s prior business experience includes serving as Director
of Research and Portfolio Manager at Spears Benzak, Salomon & Farrell (from
1994 to 1999) and a senior associate at the law firm of Simpson, Thacher &
Bartlett (from 1988 to 1994). |
| |
| Stephen
L. Isaacs, Director |
| Age: 78 |
Number of Funds Overseen: 22 | Tenure: Since 1989 |
| Non-Royce
Directorships: None |
| Principal
Occupation(s) During Past Five Years: Attorney and President of Health
Policy Associates, Inc., consultants. Mr. Isaacs’s prior business experience
includes having served as President of the Center for Health and Social Policy
(from 1996 to 2012); Director of Columbia University Development Law and Policy
Program and Professor at Columbia University (until August 1996). |
| |
| Arthur
S. Mehlman, Director |
| Age: 76 |
Number of Funds Overseen: 41 | Tenure: Since 2004 |
| Non-Royce
Directorships: Director/Trustee of registered investment companies constituting
the 19 Legg Mason Funds. |
| Principal
Occupation(s) During Past Five Years: Director of The League for People
with Disabilities, Inc.; Director of University of Maryland Foundation (non-profits).
Formerly: Director of Municipal Mortgage & Equity, LLC (from October 2004
to April 1, 2011); Director of University of Maryland College Park Foundation (non-profit)
(from 1998 to 2005); Partner, KPMG LLP (international accounting firm) (from 1972
to 2002); Director of Maryland Business Roundtable for Education (from July 1984
to June 2002). |
| |
| David L.
Meister, Director |
| Age: 78 |
Number of Funds Overseen: 22 | Tenure: Since 1982 |
| Non-Royce
Directorships: None |
| Principal
Occupation(s) During Past Five Years: Consultant. Chairman and Chief
Executive Officer of The Tennis Channel (from June 2000 to March 2005). Mr. Meister’s prior business experience includes having served as Chief Executive Officer
of Seniorlife.com, a consultant to the communications industry, President of Financial
News Network, Senior Vice President of HBO, President of Time-Life Films, and Head
of Broadcasting for Major League Baseball. |
| |
| G. Peter
O’Brien, Director |
| Age: 72 |
Number of Funds Overseen: 41 | Tenure: Since 2001 |
| Non-Royce
Directorships: Director/Trustee of registered investment companies
constituting the 19 Legg Mason Funds. |
| Principal
Occupation(s) During Past Five Years: Trustee Emeritus of Colgate University
(since 2005); Board Member of Hill House, Inc. (since 1999); Formerly Director of
TICC Capital Corp. (from 2003-2017): Trustee of Colgate University (from 1996 to
2005), President of Hill House, Inc. (from 2001 to 2005) and Managing Director/Equity
Capital Markets Group of Merrill Lynch & Co. (from 1971 to 1999). |
| |
| Michael
K. Shields, Director |
| Age: 60 |
Number of Funds Overseen: 22 | Tenure: Since 2015 |
| Principal
Occupation(s) During Past Five Years: President and Chief Executive
Officer of Piedmont Trust Company, a private North Carolina trust company (since
May 2012). Mr. Shields’s prior business experience includes owning Shields Advisors,
an investment consulting firm (from April 2010 to June 2012). |
| |
| |
| |
| Francis
D. Gannon, Vice President |
| Age: 50 |
Tenure: Since 2014 |
| Principal
Occupation(s) During Past Five Years: Co-Chief Investment Officer (since
January 2014) and Managing Director of Royce, having been employed by Royce since
September 2006. |
| |
| Daniel
A. O’Byrne, Vice President |
| Age: 55 |
Tenure: Since 1994 |
| Principal
Occupation(s) During Past Five Years: Principal and Vice President of
Royce, having been employed by Royce since October 1986. |
| |
| Peter K.
Hoglund, Treasurer |
| Age: 52 |
Tenure: Since 2015 |
| Principal
Occupation(s) During Past Five Years: Chief Financial Officer, Chief
Administrative Officer, and Managing Director of Royce, having been employed by
Royce since December 2014. Prior to joining Royce, Mr. Hoglund spent more than 20
years with Munder Capital Management in Birmingham, MI, serving as Managing Director
and Chief Financial Officer and overseeing all financial aspects of the firm. He
began his career at Munder as a portfolio manager. |
| |
| John E.
Denneen, Secretary and Chief Legal Officer |
| Age: 51 |
Tenure: 1996-2001 and Since 2002 |
| Principal
Occupation(s) During Past Five Years: General Counsel, Managing Director,
and, since June 2015, a Member of the Board of Managers of Royce. Chief Legal and
Compliance Officer and Secretary of Royce. |
| |
| Lisa Curcio,
Chief Compliance Officer |
| Age: 58 |
Tenure: Since 2004 |
| Principal
Occupation(s) During Past Five Years: Chief Compliance Officer of The
Royce Funds (since October 2004) and Compliance Officer of Royce (since June 2004). |
| 1 |
Interested Director. |
|
Director will hold office until their successors have been duly elected and qualified
or until their earlier resignation or removal. |
| 2018 Semiannual
Report to Stockholders | 57 |
Notes to Performance and Other Important
Information
| The thoughts
expressed in this Review and Report concerning recent market movements and
future prospects for small company stocks are solely the opinion of Royce at June
30, 2018, and, of course, historical market trends are not necessarily indicative
of future market movements. Statements regarding the future prospects for particular
securities held in the Funds’ portfolios and Royce’s investment intentions
with respect to those securities reflect Royce’s opinions as of June 30, 2018
and are subject to change at any time without notice. There can be no assurance
that securities mentioned in this Review and Report will be included in
any Royce-managed portfolio in the future. Investments in securities of micro-cap,
small-cap and/or mid-cap companies may involve considerably more risk than investments
in securities of larger-cap companies. All publicly released material information
is always disclosed by the Funds on the website at www.roycefunds.com. |
| Sector weightings
are determined using the Global Industry Classification Standard (“GICS”).
GICS was developed by, and is the exclusive property of, Standard & Poor’s
Financial Services LLC (“S&P”) and MSCI Inc. (“MSCI”).
GICS is the trademark of S&P and MSCI. “Global Industry Classification
Standard (GICS)” and “GICS Direct” are service marks of S&P
and MSCI. |
| All indexes
referred to are unmanaged and capitalization weighted. Each index’s returns
include net reinvested dividends and/or interest income. Frank Russell Company (“Russell”) is the source and owner of the trademarks, service marks and
copyrights related to the Russell Indexes. Russell® is a trademark of Frank Russell
Company. Neither Russell nor its licensors accept any liability for any errors or
omissions in the Russell Indexes and / or Russell ratings or underlying data and
no party may rely on any Russell Indexes and / or Russell ratings and / or underlying
data contained in this communication. No further distribution of Russell Data is
permitted without Russell’s express written consent. Russell does not promote,
sponsor or endorse the content of this communication. The Russell 2000 Index is
an index of domestic small-cap stocks. It measures the performance of the 2,000
smallest publicly traded U.S. companies in the Russell 3000 Index. The Russell 2000
Value and Growth Indexes consist of the respective value and growth stocks within
the Russell 2000 as determined by Russell Investments. The Russell Microcap Index
includes 1,000 of the smallest securities in the Russell 2000 Index along with
the next smallest eligible securities as determined by Russell. The Russell 1000
Index is an index of domestic large-cap stocks. It measures the performance of the
1,000 largest publicly traded companies in the Russell 3000 Index. The Russell Midcap
Index measures the performance of the mid-cap segment of the U.S. equity universe.
It includes approximately 800 of the smallest securities in the Russell 1000 Index.
The Russell Global Small Cap Index is an unmanaged, capitalization-weighted index
of global small-cap stocks. The Russell Global ex-U.S. Small Cap Index is an index
of global small-cap stocks, excluding the United States. The S&P SmallCap 500
and 600 are indexes of U.S. large-cap and small-cap stocks, respectively, selected
by Standard & Poor’s based on market size, liquidity, and industry grouping,
among other factors. The CBOE Russell 2000 Volatility Index (RVX) measures market
expectations of near-term volatility conveyed by Russell 2000 stock index option
prices. The performance of an index does not represent exactly any particular investment,
as you cannot invest directly in an index. Returns for the market indexes used in
this report were based on information supplied to Royce by Russell Investments. |
| The Price-Earnings,
or P/E, Ratio is calculated by dividing a company’s share price by its trailing
12-month earnings-per share (EPS). The Price-to-Book, or P/B, Ratio is calculated
by dividing a company’s share price by its book value per share. For the Morningstar
Small Blend Category: © 2017 Morningstar. All Rights Reserved. The information regarding
the category in this piece is: (1) is proprietary to Morningstar and/or its content
providers; (2) may not be copied or distributed; and (3) is not warranted to be
accurate, complete or timely. Neither Morningstar nor its content providers are
responsible for any damages or losses arising from any use of this information.
The Morningstar Style Map uses proprietary scores of a stock’s value and growth
characteristics to determine its placement in one of the five categories listed
on the horizontal axis. These characteristics are then compared to those of other
stocks within the same market capitalization band. Each is scored from zero to 100
for both value and growth attributes. The value score is subtracted from the growth
score to determine the overall style score. For the vertical, market cap axis, Morningstar
subdivides into size groups. Giant-cap stocks are defined as those that account
for the top 40% of the capitalization of each style zone; large-cap stocks represent
the next 30%; mid-cap stocks the next 20%; small-cap stocks the next 7%; micro-cap
stocks the smallest 3%. The Royce Funds is a service mark of The Royce Funds. Distributor:
Royce Fund Services, LLC. |
| Forward-Looking
Statements |
| This material
contains forward-looking statements within the meaning of the Securities
Exchange Act of 1934, as amended (the “Exchange Act”), that involve risks
and uncertainties, including, among others, statements as to: |
| • |
the Funds’ future operating results |
| • |
the prospects
of the Funds’ portfolio companies |
| • |
the impact
of investments that the Funds have made or may make |
| • |
the dependence
of the Funds’ future success on the general economy and its impact on the
companies and industries in which the Funds invest, and |
| • |
the ability
of the Funds’ portfolio companies to achieve their objectives. |
| This Review
and Report uses words such as “anticipates,” “believes,”
“expects,” “future,” “intends,” and similar expressions
to identify forward-looking statements. Actual results may differ materially from
those projected in the forward-looking statements for any reason. |
| The Royce
Funds have based the forward-looking statements included in this Review and
Report on information available to us on the date of the report, and we assume
no obligation to update any such forward-looking statements. Although The Royce
Funds undertake no obligation to revise or update any forward-looking statements,
whether as a result of new information, future events or otherwise, you are advised
to consult any additional disclosures that we may make through future stockholder
communications or reports. |
| |
| Authorized Share Transactions |
| Royce Global
Value Trust, Royce Micro-Cap Trust, and Royce Value Trust may each repurchase up
to 5% of the issued and outstanding shares of its respective common stock during
the year ending December 31, 2017. Any such repurchases would take place at then
prevailing prices in the open market or in other transactions. Common stock repurchases
would be effected at a price per share that is less than the share’s then
current net asset value. |
| Royce Global
Value Trust, Royce Micro-Cap Trust, and Royce Value Trust are also authorized to
offer their common stockholders an opportunity to subscribe for additional shares
of their common stock through rights offerings at a price per share that may be
less than the share’s then current net asset value. The timing and terms of
any such offerings are within each Board’s discretion. |
| |
| Annual
Certifications |
| As required,
the Funds have submitted to the New York Stock Exchange (“NYSE”) for
the annual certification of the Funds’ Chief Executive Officer that he is
not aware of any violation of the NYSE’s listing standards. The Funds also
have included the certification of the Funds’ Chief Executive Officer and
Chief Financial Officer required by section 302 of the Sarbanes-Oxley Act of 2002
as exhibits to the Funds’ form N-CSR for the period ended December 31, 2016,
filed with the Securities and Exchange Commission. |
| |
| Proxy Voting
|
| A copy of
the policies and procedures that The Royce Funds use to determine how to vote proxies
relating to portfolio securities and information regarding how each of The Royce
Funds voted proxies relating to portfolio securities during the most recent 12-month
period ended June 30 is available, without charge, on The Royce Funds’ website
at www.roycefunds.com, by calling (800) 221-4268 (toll-free) and on the website
of the Securities and Exchange Commission (“SEC”), at www.sec.gov. |
| |
| Form N-Q Filing |
| The Funds
file their complete schedules of investments with the SEC for the first and third
quarters of each fiscal year on Form N-Q. The Funds’ Forms N-Q are available
on the SEC’s website at www.sec.gov. The Royce Funds’ holdings are also
on the Funds’ website approximately 15 to 20 days after each calendar quarter
end and remain available until the next quarter’s holdings are posted. The
Funds’ Forms N-Q may also be reviewed and copied at the SEC’s Public
Reference Room in Washington, D.C. To find out more about this public service, call
the SEC at (800) 732-0330. The Funds’ complete schedules of investments are
updated quarterly, and are available at www.roycefunds.com. |
| 58 | 2018
Semiannual Report to Stockholders |
Board Approval of Investment Advisory Agreements
| At meetings
held on June 4-5, 2018, the Funds’ respective Boards of Directors, including
all of the non-interested directors, approved the continuation of investment advisory
agreements (each, an “Investment Advisory Agreement” and collectively,
the “Investment Advisory Agreements”) between Royce & Associates,
LP (“R&A”) and each of Royce Value Trust, Inc., Royce Micro-Cap
Trust, Inc., and Royce Global Value Trust, Inc. (each, a “Fund” and collectively,
the “Funds”). In reaching these decisions, each Board reviewed the materials
provided by R&A, which included, among other things, information prepared
internally by R&A and independently by Broadridge Financial Solutions, Inc.
(“Broadridge”) using the database and methodology of Morningstar Associates,
LLC (“Morningstar”) containing detailed investment advisory fee, expense
ratio, and investment performance comparisons for the Funds with other funds in
their respective “peer groups”, information regarding the past performance
of the Funds and other registered investment companies managed by R&A and
a memorandum outlining the legal duties of each Board prepared by independent counsel
to the non-interested directors. R&A also provided the directors with an analysis
of its profitability with respect to providing investment advisory services to
each of the Funds. In addition, each Board took into account information furnished
throughout the year at regular Board meetings, including reports on investment
performance, stockholder services, regulatory compliance, brokerage commissions
and research, and brokerage and other execution products and services provided
to the Funds. Each Board also considered other matters it deemed important to the
approval process, such as allocation of brokerage commissions, “soft dollar” research services R&A receives and other direct and indirect benefits
to R&A and its affiliates, from their relationship with the relevant Fund.
The directors also met throughout the year with investment advisory personnel from
R&A. Each Board also noted R&A’s efforts to provide enhanced analytical
tools to its investment staff along with the ongoing meetings conducted by R&A’s Co-Chief Investment Officers with portfolio managers experiencing performance
challenges in an attempt to address such challenges. Each Board, in its deliberations,
recognized that, for many of the Funds’ stockholders, the decision to purchase
Fund shares included a decision to select R&A as the investment adviser and
that there was a strong association in the minds of Fund stockholders between
R&A and each Fund. In considering factors relating to the approval of the continuance
of the Investment Advisory Agreements, the non-interested directors received assistance
and advice from, and met separately with, their independent counsel. While all three
of the Investment Advisory Agreements were considered at the same Board meetings,
the Boards dealt with each agreement separately. Among other factors, the directors
considered the following: |
| |
| The nature,
extent and quality of services provided by R&A: |
| Each Board
considered the following factors to be of fundamental importance to its consideration
of whether to approve the continuance of the Investment Advisory Agreement: (i)
R&A’s more than 40 years of value investing experience and track record;
(ii) the history of long-tenured R&A portfolio managers managing the Funds;
(iii) R&A’s focus on mid-cap, small-cap and micro-cap value investing;
(iv) the consistency of R&A’s approach to managing the Funds and open-end
mutual funds over more than 40 years; (v) the integrity and high ethical standards
adhered to at R&A; (vi) R&A’s specialized experience in the area
of trading small- and micro-cap securities; (vii) R&A’s historical ability
to attract and retain portfolio management talent and (viii) R&A’s focus
on stockholder interests as exemplified by expansive stockholder reporting and
communications. The Boards also noted that R&A’s compensation policy arrangements
strongly encourage portfolio manager investment in each Fund that they manage. Each
Board reviewed the services that R&A provides to each Fund, including, but
not limited to, managing each Fund’s investments in accordance with the stated
policies of each Fund. Each Board considered the fact that R&A provided certain
administrative services to the Funds at cost pursuant to the Administration Agreement
between the Funds and R&A. Each Board determined that the services to be provided
to each Fund by R&A would be the same as those that it previously provided
to the relevant Fund. The Boards also took into consideration the histories, reputations
and backgrounds of R&A’s portfolio managers for the Funds, finding that
these would likely have an impact on
the continued success of the Funds. Lastly, each Board noted R&A’s ability
to attract and retain qualified and experienced personnel. The directors concluded
that the investment advisory services provided by R&A to each Fund compared
favorably to services provided by R&A to other R&A client accounts, including
other funds, in both nature and quality, and that the scope of services provided
by R&A would continue to be suitable for the Funds. |
| |
| Investment
performance of the Funds and R&A: |
| Although the
registered investment companies managed by R&A currently span a wider risk
spectrum than they have historically, R&A generally emphasizes a risk-averse
approach to investing. In light of that approach, each Board believes that risk-adjusted
performance continues to be the most appropriate measure of each Fund’s investment
performance. One measure of risk-adjusted performance the Boards use in their review
of the Funds’ performance is the Sharpe Ratio. The Sharpe Ratio is a risk-adjusted
measure of performance developed by Nobel Laureate William Sharpe. It is calculated
by dividing a Fund’s annualized excess returns by its annualized standard
deviation to determine reward per unit of risk. The higher the Sharpe Ratio, the
better a Fund’s historical risk-adjusted performance. The Boards attach primary
importance to risk-adjusted performance over relatively long periods of time, typically
3 to 10 years. It was noted, however, that Royce Global Value Trust, Inc. (“RGT”) had less than five full calendar years of performance because its inception
date was October 18, 2013. |
| |
| Overall, the
Boards noted that financial markets were marked by increased return dispersion,
declining correlation, and a steepening yield curve in 2017, just as they were
in 2016. Similar to 2016, small-cap stocks enjoyed a very strong year in 2017 as
a result of these factors. Unlike 2016, defensive and growth stocks outperformed
cyclical and value stocks in 2017. Notwithstanding the market leadership of defensive
and growth stocks in 2017, each of Royce Value Trust, Inc. (“RVT”) and
Royce Micro-Cap Trust, Inc. (“RMT”) still enjoyed solid risk-adjusted
performance in 2017. While each Board recognized that the solid performance of RVT
and RMT in 2017 is not dispositive, it also noted that such performance during
the more historically customary market environment that prevailed in 2017 was
also not insignificant. The Boards noted that RVT and RMT also generally underperformed
their respective peers, as evidenced by their Sharpe Ratios, from approximately
March 2009 through the end of 2015. This post-2008 market period was marked by historically
low interest rates and significant U.S. Federal Reserve market intervention. During
this period, highly leveraged, non-earning companies and yield-oriented securities
(e.g., master limited partnerships, real estate investment trusts, and utilities)
generally outperformed the higher quality companies (e.g., those with solid balance
sheets, low leverage, the ability to generate and effectively allocate free cash
flow, and strong returns on invested capital) and cyclical companies favored by
RVT and RMT. The directors also noted, however, that the relative performance for
each of RVT and RMT during the more historically customary market cycle preceding
the 2008 financial crisis was quite strong. Using data provided by Broadridge, the
Sharpe Ratio for RVT placed in the 1st, 1st, 3rd, and 4th quartiles within the
Morningstar Small Blend category while the Sharpe Ratio for RMT placed in the 2nd,
4th, 4th, and 4th quartiles within the Morningstar Small Blend category for the
1-year, 3-year, 5-year, and 10-year periods, respectively, ended December 31, 2017.
The relevant Boards further noted that the use of leverage by each of RVT and RMT
through preferred stock (prior to November 15, 2012) and borrowings resulted in
higher volatility and worse down market performance. The 2017 market environment
also enabled RGT to outperform its peers in 2017 as evidenced by its Sharpe Ratio.
Using data provided by Broadridge, the Sharpe Ratio for RGT placed in the 1st and
2nd quartiles within the Morningstar World Small/Mid Stock category for the 1-year
and 3-year periods, respectively, ended December 31, 2017. The Board noted the inherent
limitations of using 1-year and 3-year Sharpe Ratios in evaluating RGT’s investment
performance. |
| 2018 Semiannual
Report to Stockholders | 59 |
Board Approval of Investment Advisory Agreements
| In addition
to each Fund’s risk–adjusted performance, the Boards also reviewed and
considered the absolute total returns and down market performance for each Fund
and the long-term performance records of each of RVT and RMT for periods of 10
years and longer. The Boards further noted that R&A manages a number of funds
that invest in micro-cap, small-cap, and mid-cap issuers, many of which had outperformed
their benchmark indexes and their competitors during the periods prior to the
U.S. Federal Reserve’s near zero interest rate policy and related market interventions
and during 2017 as noted above. Although each Board recognized that past performance
is not necessarily an indicator of future results, it found that R&A had the
necessary qualifications, experience and track record in managing micro-cap, small-cap,
and mid-cap securities to manage the relevant Fund. Each Board determined that R&A continued to be an appropriate investment adviser for the relevant Fund
and concluded that the relevant Fund’s performance supported the approval
of the continuance of its Investment Advisory Agreement. |
| |
| Cost of
the services provided and profits realized by R&A from its relationship with
the Funds: |
| Each Board
considered the cost of the services provided by R&A and profits realized by
R&A from its relationship with each Fund. As part of the analysis, each Board
discussed with R&A its methodology in allocating its costs to each Fund and
concluded that R&A’s allocations were reasonable. The RVT Board noted
that RVT was not profitable to R&A during the year ended December 31, 2017.
The Boards of RMT and RGT concluded that R&A’s profits during the year
ended December 31, 2017 in respect of RMT and RGT, respectively, were reasonable
in relation to the nature and quality of services provided. |
| |
| The extent
to which economies of scale would be realized as the Funds grow and whether fee
levels would reflect such economies of scale: |
| Each Board
considered whether there have been economies of scale in respect of the management
of each Fund, whether each Fund has appropriately benefited from any economies
of scale and whether there is potential for realization of any further economies
of scale. Each Board noted the time and effort involved in managing portfolios of
micro-, small- and mid-cap stocks and that they did not involve the same efficiencies
as do portfolios of large-cap stocks. The directors noted that, as closed-end funds,
the Funds generally would not be expected to have significant inflows of capital
that might produce increasing economies of scale. Each Board concluded that the
current fee structure for each Fund was reasonable, that stockholders sufficiently
participated in economies of scale and that no changes were currently necessary. |
| |
| Comparison
of services to be rendered and fees to be paid to those under other investment
advisory contracts, such as contracts of the same and other investment advisers
or other clients: |
| Each Board
reviewed the investment advisory fee paid by each Fund and compared both the services
to be rendered and the fees to be paid under the Investment Advisory Agreements
to other contracts of R&A and to contracts of other investment advisers to
registered investment companies investing in small- and micro-cap stocks, as provided
by Morningstar. The Boards noted that the contractual advisory fee rate for RVT
and RMT was lower than the median of its Broadridge-assigned peers while the contractual
advisory fee rate for RGT was higher than the median of its Broadridge-assigned
peers. Each Board further noted the importance of the net expense ratio in measuring
a fund’s efficiency, particularly in light of the variations in the mutual
fund industry as to which entity is responsible for particular types of expenses. |
| |
| In the case
of RVT, its Board noted that it had a 1.00% basic fee that is subject to adjustment
up or down (up to 0.50% in either direction) based on its performance versus the
S&P 600 SmallCap Index over a rolling period of 60 months. The fee is charged
on average net assets over that rolling period. As a result, in a rising market,
the fee will be smaller than a fee calculated on the current year’s average
net assets, and vice versa. The Board determined that the performance adjustment
feature continued to serve as an appropriate incentive to R&A to manage RVT
for the benefit of its long-term common stockholders. The Board also noted that
the fee arrangement, which also includes a provision for no fee in periods where
RVT’s trailing three-year performance is negative, requires R&A to measure
RVT’s performance monthly against the S&P 600, an unmanaged index. Instead
of receiving a set fee regardless of its performance, R&A is penalized for
poor performance. The Board noted that RVT’s net expense ratio of 0.65% placed
it in the 1st quartile within its Broadridge-assigned peer group for 2017. In the
case of RMT, the Board noted that it also had a 1.00% basic fee subject to adjustment
up or down based on its performance versus the Russell 2000 Index over a rolling
36 month period. The fee is charged on average net assets over that rolling period.
As a result, in a rising market, the fee will be smaller than a fee calculated
on the current year’s average net assets, and vice versa. The Board determined
that the performance adjustment feature continued to serve as an incentive to R&A to manage RMT for the benefit of its long-term common stockholders. The Board
noted that RMT’s net expense ratio of 0.89% placed it in the 1st quartile
within its Broadridge-assigned peer group for 2017. The directors further noted
that RMT’s net expense ratio was actually 22 basis points lower than the median
of its Broadridge-assigned peer group and 45 basis points lower than the average
expense ratio for the 44 non-institutional, non-ETF domestic funds with weighted
average market capitalizations of less than $1 billion within the Morningstar database..
Finally, in the case of RGT, the Board noted that its net expense ratio of 1.67%
placed it in the 4th quartile within its Broadridge-assigned peer group for 2017,
44 basis points above the peer group median. The directors noted, however, that
RGT had the lowest weighted average market capitalization within that peer group. |
| |
| The Boards
also noted that R&A manages the Funds in an active fashion. The industry accepted
metric for measuring how actively an equity portfolio is managed is called “active
share.” In particular, active share measures how much the holdings of an equity
portfolio differ from the holdings of its appropriate passive benchmark index. At
the extremes, a portfolio with no holdings in common with the benchmark would
have 100% active share, while a portfolio that is identical to the benchmark would
have 0% active share. R&A presented a chart to the Boards which demonstrated
that funds with high active share scores had higher expense ratios than funds with
lower active share scores due to the resources required for the active management
of those funds. R&A also provided a 2018 article from a mutual fund news website
to each Board that indicated that R&A’s open-end funds had the third
highest asset-weighted active share among the open-end fund complexes that were
examined (excluding all ETFs, all money market funds, and all funds-of-funds). The
Boards noted that the active shares for RVT, RMT, and RGT were 89%, 95%, and 97%,
respectively, for the calendar year ended December 31, 2017. |
| |
| Each Board
also considered fees charged by R&A to institutional and other clients
and noted that, given the greater levels of services that R&A provides to
registered investment companies such as the Funds as compared to other accounts,
the base investment advisory fee for RVT and RMT and the advisory fee for RGT compared
favorably to the investment advisory fees charged to those other accounts. |
| |
| No single
factor was cited as determinative to the decision of the directors. Rather, after
weighing all of the considerations and conclusions discussed above, each entire
Board, including all of the non-interested directors, approved the continuation
of the relevant Investment Advisory Agreement, concluding that the continuation
of such agreements was in the best interest of the shareholders of the respective
Funds and that each Fund’s investment advisory fee rate was reasonable in
relation to the services provided. |
| 60 | 2018
Semiannual Report to Stockholders |
| |
|
|
|
|
|
| |
|
|
|
|
|
| |
|
|
|
|
|
| |
|
|
|
|
|
| |
 |
|
| |
|
|
|
|
|
| |
|
|
|
|
|
| |
|
|
|
|
|
| |
About The Royce Funds |
|
|
Contact Us |
|
| |
|
|
|
|
|
| |
|
|
|
|
|
| |
Unparalleled Knowledge + Experience
Pioneers in small-cap investing, with 40+ years
of experience, depth of knowledge, and focus.
Independent Thinking
The confidence to go against consensus, the insight
to uncover opportunities others might miss, and the
tenacity to stay the course through market cycles.
Specialized Approaches
Strategies that use value, core, or growth investment
approaches to select micro-cap, small-cap, and
mid-cap companies.
Unwavering Commitment
Our team of 18 portfolio managers have significant
personal investments in the strategies they manage. |
|
|
GENERAL INFORMATION
General Royce Funds information including
an overview of our firm and Funds
(800) 221-4268 |
|
| |
|
|
|
|
| |
|
|
COMPUTERSHARE
Transfer Agent and Registrar
Speak with a representative about:
• Your account, transactions, and forms
(800) 426-5523 |
|
| |
|
|
|
|
| |
|
|
FINANCIAL ADVISORS AND BROKER-DEALERS
Speak with your regional Royce contact regarding:
• Information about our firm, strategies, and Funds
• Fund Materials
(800) 337-6923 |
|
| |
| |
|
|
|
|
|
| |
|
|
|
|
|
| |
|
|
|
|
|
| |
 |
|
|
 |
 |
| |
|
|
|
|
|
| |
|
|
|
|
|
Item 2. Code(s) of Ethics. Not applicable to this semi-annual report.
Item 3. Audit Committee Financial Expert. Not applicable to this semi-annual
report.
Item 4. Principal Accountant Fees and Services. Not applicable to this semi-annual
report.
Item 5. Audit Committee of Listed Registrants. Not applicable to this semi-annual
report.
Item 6. Investments.
(a) See Item 1.
(b) Not applicable.
Item 7. Disclosure of Proxy Voting Policies and Procedures for Closed-End Management
Investment Companies. Not applicable to this semi-annual report.
Item 8. Portfolio Managers of Closed-End Management Investment Companies.
Not applicable to this semi-annual report.
Item 9. Purchases of Equity Securities by Closed-End Management Investment Company
and Affiliated Purchasers. Not Applicable
Item 10. Submission of Matters to a Vote of Security Holders. Not Applicable.
Item 11. Controls and Procedures.
(a) Disclosure Controls and Procedures. The Principal Executive and Financial Officers
concluded that the Registrant’s Disclosure Controls and Procedures are effective
based on their evaluation of the Disclosure Controls and Procedures as of a date
within 90 days of the filing date of this report.
(b) Internal Control over Financial Reporting. There were no significant changes
in Registrant’s internal control over financial reporting or in other factors
that could significantly affect this control subsequent to the date of the evaluation,
including any corrective actions with regard to significant deficiencies and material
weaknesses during the second fiscal quarter of the period covered by this report.
Item 12. Exhibits. Attached hereto.
(a)(1) Not applicable to this semi-annual
report.
(a)(2) Separate certifications by the Registrant’s Principal Executive Officer
and Principal Financial Officer as required by Rule 30a-2(a) under the Investment
Company Act of 1940.
(a)(3) Not Applicable
(b) Separate certifications by the Registrant’s Principal Executive Officer
and Principal Financial Officer, pursuant to Section 906 of the Sarbanes-Oxley Act
of 2002 and required by Rule 30a-2(b) under the Investment Company Act of 1940.
Pursuant to the requirements of the Securities Exchange Act of 1934 and the Investment
Company Act of 1940, the registrant has duly caused this report to be signed on
its behalf by the undersigned, thereunto duly authorized.
ROYCE VALUE TRUST, INC.
BY: /s/ Christopher D. Clark
Christopher D. Clark
President
Date: August 29, 2018
Pursuant to the requirements of the Securities
Exchange Act of 1934 and the Investment Company Act of 1940, this report has been
signed below by the following persons on behalf of the registrant and in the capacities
and on the dates indicated.
| ROYCE VALUE TRUST, INC. |
|
ROYCE VALUE TRUST, INC. |
| |
|
|
| |
|
|
| BY: /s/ Christopher D. Clark |
|
BY: /s/ Peter K. Hoglund |
| Christopher
D. Clark |
|
Peter K.
Hoglund |
| President
|
|
Chief Financial
Officer |
| |
|
|
| Date: August
29, 2018 |
|
Date: August
29, 2018 |