UNITED STATES
SECURITIES AND EXCHANGE COMMISSION
Washington, D.C. 20549
FORM N-CSR
CERTIFIED SHAREHOLDER REPORT
OF
REGISTERED MANAGEMENT INVESTMENT COMPANIES
Investment Company Act File
Number: 811-04875
Name of Registrant: Royce
Value Trust, Inc.
Address of Registrant: 745
Fifth Avenue
New York, NY 10151
| Name and address
of agent for service: |
|
John E. Denneen, Esquire
745 Fifth Avenue
New York, NY 10151 |
Registrant’s telephone
number, including area code: (212) 508-4500
Date of fiscal year end: December
31
Date of reporting period: January 1, 2015 – December 31, 2015
Item 1. Reports to Shareholders.
| |
|
DECEMBER 31, 2015 |
| |
|
|
| |
|
|
| |
|
|
| |
|
2015 Annual |
| |
|
Review and Report to Stockholders |
| |
|
|
| |
|
|
| |
|
|
| |
|
|
| |
|
|
| |
|
|
| |
|
|
| |
|
Royce Global Value Trust |
| |
|
|
| |
|
Royce Micro-Cap Trust |
|
| |
|
|
| |
|
Royce Value Trust |
| |
|
|
|
| |
|
|
|
| |
|
|
|
| |
|
|
|
| |
|
|
|
| |
|
|
|
| |
|
|
|
| |
|
|
|
| |
|
|
|
| |
|
|
|
| |
|
|
|
| |
|
|
|
| |
|
|
|
| |
|
|
|
| |
|
|
|
| |
|
roycefunds.com |
 |
| |
|
|
|
| |
|
|
|
| |
|
|
|
A Few Words on Closed-End Funds
Royce & Associates, LLC manages
three closed-end funds: Royce Value Trust, which invests primarily in small-cap
securities; Royce Micro-Cap Trust, which invests primarily in micro-cap securities;
and Royce Global Value Trust, which invests in both U.S. and non-U.S. small-cap
stocks. A closed-end fund is an investment company whose shares are listed and
traded on a stock exchange. Like all investment companies, including open-end mutual
funds, the assets of a closed-end fund are professionally managed in accordance
with the investment objectives and policies approved by the fund’s Board of
Directors. A closed-end fund raises cash for investment by issuing a fixed number
of shares through initial and other public offerings that may include shelf offerings
and periodic rights offerings. Proceeds from the offerings are invested in an actively
managed portfolio of securities. Investors wanting to buy or sell shares of a publicly
traded closed-end fund after the offerings must do so on a stock exchange, as with
any publicly traded stock. Shares of closed-end funds frequently trade at a discount
to their net asset value. This is in contrast to open-end mutual funds, which sell
and redeem their shares at net asset value on a continuous basis.
|
A Closed-End Fund Can Offer Several Distinct Advantages |
| |
|
|
| • |
|
A closed-end
fund does not issue redeemable securities or offer its securities on a continuous
basis, so it does not need to liquidate securities or hold uninvested assets to
meet investor demands for cash redemptions. |
| |
|
|
| • |
|
In a closed-end
fund, not having to meet investor redemption requests or invest at inopportune times
can be effective for value managers who attempt to buy stocks when prices are depressed
and sell securities when prices are high. |
| |
|
|
| • |
|
A closed-end
fund may invest in less liquid portfolio securities because it is not subject to
potential stockholder redemption demands. This is potentially beneficial for Royce-managed
closed-end funds, which invest primarily in small- and micro-cap securities. |
| |
|
|
| • |
|
The fixed
capital structure allows permanent leverage to be employed as a means to enhance
capital appreciation potential. |
| |
|
|
| • |
|
Royce Value
Trust and Royce Micro-Cap Trust distribute capital gains on a quarterly basis. Each
of these Funds has adopted a quarterly distribution policy for its common stock. |
| |
|
|
We believe that the closed-end fund structure can be an appropriate investment for
a long-term investor who understands the benefits of a more stable pool of capital. |
Why Dividend
Reinvestment Is Important
A very important component of an investor’s total
return comes from the reinvestment of distributions. By reinvesting distributions,
our investors can maintain an undiluted investment in a Fund. To get a fair idea
of the impact of reinvested distributions, please see the charts on pages 12 and
13. For additional information on the Funds’ Distribution Reinvestment and
Cash Purchase Options and the benefits for stockholders, please see page 14 or visit
our website at www.roycefunds.com.
Managed Distribution Policy
The
Board of Directors of each of Royce Value Trust and Royce Micro-Cap Trust has authorized
a managed distribution policy (“MDP”). Under the MDP, Royce Value Trust
and Royce Micro-Cap Trust pay quarterly distributions at an annual rate of 7% of
the average of the prior four quarter-end net asset values, with the fourth quarter
being the greater of these annualized rates or the distribution required by IRS
regulations. With each distribution, the Fund will issue a notice to its stockholders
and an accompanying press release that provides detailed information regarding the
amount and composition of the distribution (including whether any portion of the
distribution represents a return of capital) and other information required by a
Fund’s MDP. You should not draw any conclusions about a Fund’s investment
performance from the amount of distributions or from the terms of a Fund’s
MDP. A Fund’s Board of Directors may amend or terminate the MDP at any time
without prior notice to stockholders; however, at this time there are no reasonably
foreseeable circumstances that might cause the termination of any of the MDPs. |
This page is not part of the
2015 Annual Report to Stockholders
| Table of Contents |
|
|
|
| |
|
|
|
| |
|
|
|
| Annual Review |
|
|
|
| |
|
|
|
| Letter to Our Stockholders |
|
2 |
|
| |
|
|
|
| Performance |
|
5 |
|
| |
|
|
|
| |
|
|
|
| Annual Report to Stockholders |
|
|
|
| |
|
|
|
| Managers’ Discussions of Fund Performance |
|
|
|
| |
|
|
|
Royce Global Value Trust |
|
6 |
|
| |
|
|
|
Royce Micro-Cap Trust |
|
8 |
|
| |
|
|
|
Royce Value Trust |
|
10 |
|
| |
|
|
|
| History Since Inception |
|
12 |
|
| |
|
|
|
| Distribution Reinvestment and Cash Purchase Options |
|
14 |
|
| |
|
|
|
| Schedules of Investments and Other Financial Statements |
|
|
|
| |
|
|
|
Royce Global Value Trust |
|
15 |
|
| |
|
|
|
Royce Micro-Cap Trust |
|
29 |
|
| |
|
|
|
Royce Value Trust |
|
44 |
|
|
|
|
|
| Directors and Officers |
|
61 |
|
| |
|
|
|
| Notes to Performance and Other Important Information |
|
62 |
|
| |
|
|
|
| Results of Stockholders Meeting |
|
64 |
|

| This page is not part of the 2015 Annual Report to Stockholders |
Letter to Our Stockholders

GOODBYE TO ALL THAT
It was the sort of year that, when you first look at the final
equity market returns, might seem unexceptional, almost
quiet. It is only when plugged into the context of the long,
mostly bullish market since March 2009 that 2015’s more muted
results begin to make more sense—one could even be forgiven
for wondering why the losses for the major domestic stock
indexes were not steeper than they were at the end of December,
considering the heights to which most indexes ascended
following the end of the Financial Crisis. Yet the mostly single-digit
losses that marked 2015 were the first negative calendar-year
returns for small-caps since 2011 (as measured by the Russell 2000
Index). For their part, large-caps, as measured by the Russell 1000
and S&P 500 Indexes, had low single-digit positive returns.
An equally important contextual piece is the larger macro
situation—and few stock market cycles have been shaped as deeply
as the current period has been by forces beyond the companies
themselves. So while factors such as interest rates, commodity prices,
technological innovation, consumer confidence, and the like always
influence the movement of share prices to some extent, the fragility of
the global economy in the years following the crisis has resulted in levels
of central bank and other government interventions not seen since The
Great Depression. These actions were almost assuredly necessary to
keep the economy afloat. At the same time, however, these policies—particularly zero interest rates and quantitative easing—had significant
unintended consequences. And only now, a full seven years after |
the tumult, is the situation in the U.S. slouching toward something
resembling the Old Normal—that is, a business cycle in which access
to credit is more constrained, borrowing has a cost (however low) and
both financial health and profitable execution are likely to matter to
investors. To be sure, the road back has proved both longer and
more winding than any of us could have foreseen at almost any
point over the last seven years. At this writing in January of 2016
we know the path in front of us will have its own share of formidable challenges as we embark on the latest leg of the journey.
As equity investors, we find ourselves in a curious, ambiguous place.
The number of risks affecting share prices (among other things) is long
and somewhat chilling: Weak commodity prices, flagging currency
in China, elevated credit concerns, and geopolitical instability. By
year-end, the spread between the U.S. 10-Year note and the Two-Year
note—which, when it inverts, often signals recession—had narrowed
to a point near the bottom of its six-year range at about 122 basis
points. Still far from inverted, it is worth keeping an eye on. We
also saw widening credit spreads, a growing number of defaults, and
additional signs of a potential credit crunch, especially in the energy
industry. Our concerns over credit only intensified in light of the
market’s mild reaction to the Fed’s hike on December 16. The situation
is of particular interest and concern to us as small-cap specialists. As has
been the case historically, a significant deterioration in access to capital
would likely have a larger negative impact on small-caps, especially
those carrying excess leverage. Of course, this development could also
produce an advantage for more conservatively capitalized small-cap
businesses—and we own plenty across our value, core, and growth
|
| 2 | This page is not part of the 2015 Annual Report to Stockholders
|
strategies. This is one facet of what we believe is a strong case for
disciplined, contrarian, bottom-up small-cap approaches that put
a premium on managing risk. More widespread success for these
kinds of approaches would be a welcome departure from 2015, to
which we are happy to say, “Goodbye and good riddance.”
“A WILD RIDE TO NOWHERE”
Our own Charlie Dreifus described 2015 as “a wild ride to nowhere.”
We can think of no more fitting way to characterize the year, which
was distinguished by high volatility and broadly divergent sector and
industry results. The market’s indecision and frustration displayed
itself with 19 crossings back and forth over the flat line for the S&P
500. There were single-digit gains in 2015 for a few global and domestic
indexes—and single-digit losses for several more. The important
exceptions to the downward trend were the Nasdaq Composite, U.S.
large-caps, and European issues—small-caps in particular. The Nasdaq
Composite was the clear domestic leader in 2015, while the large-cap
Russell 1000 and S&P 500 just barely escaped a volatile and bearish
December to finish with modestly positive results.
Within our chosen specialty of small-cap stocks, there were
strong returns within the Russell 2000 for Health Care and discrete,
more growth-oriented pockets of Information Technology that were
accompanied by losses for each of the index’s eight remaining equity
sectors, including Energy, Materials, Industrials, and Consumer
Discretionary. Along with Information Technology, those four
sectors have been among our largest portfolios weightings and/or
|
substantial overweights versus all three of our closed-end Funds’
respective benchmarks over the last few years. One can get a sense
of how confounding 2015 was by noting the confluence of losses
for Energy and Consumer Discretionary in the Russell 2000, which
defied the historical trend of low energy prices creating widespread
demand for discretionary purchases. Indeed, traditional retail stocks
were a particular source of red ink for the sector, in spite of consumer
confidence remaining high and select, mostly large online companies
scoring significant successes. In fact, the 4.4% decline for the Russell
2000 masks just how challenging it was to find strong small-cap
performers, especially outside the bio-pharma complex. The difficulty
becomes clearer in the context of the small-cap index’s decline of 10.1%
on an equal-weighted basis in 2015. (Similarly, the S&P 500 was also
down on an equal-weighted basis, falling 2.2% for the calendar year.)
Looking within small-cap from a style perspective reveals another
year in which the Russell 2000 Growth Index, which was down
1.4%, outpaced the Russell 2000 Value Index, which lost 7.5%. Yet
small-cap value actually fared better than its growth sibling during the
third-quarter correction, losing 10.7% versus 13.1%. Perhaps more
interestingly—to us, at least—small-cap value led from the July 17,
2015 high for small-cap non-earners through year-end, falling 8.0%
compared to an 11.3% decline for small-cap growth. Down and flat
markets have historically favored value, as well as other valuation-focused
approaches, so it was reassuring to see that pattern recur,
however briefly, in 2015. The last decade, after all, has belonged to
small-cap growth. The Russell 2000 Growth beat the Russell 2000 |
|
| Equity Indexes As of December 31, 2015 (%) |
| |
|
|
| • |
|
The Calendar Year Was a Wild Ride To Nowhere—2015 saw single-digit losses for a number of global and domestic indexes. The important
exceptions to these mostly modest equity declines came from U.S. large-caps, the Nasdaq Composite, international small-caps, and European
issues (especially small-caps). |
| |
|
|
| • |
|
Longer-Term Perspective—Returns Moving Lower Toward More Historically Typical Levels—Three- and five-year returns remained higher than
their long-term rolling averages but were down noticeably from where they were for the same periods through 6/30/15. Large-cap led for the
three- and five-year periods ended 12/31/15, followed for both periods by the Russell Midcap, Russell Microcap, and Russell 2000. The Russell
2000 Growth outpaced the Russell 2000 Value for the three- and five-year periods ended 12/31/15. |
| |
| |
|
1-YR |
|
3-YR |
|
5-YR |
|
10-YR |
| |
| Russell 2000 |
|
-4.41 |
|
11.65 |
|
9.19 |
|
6.80 |
| |
| Russell 2000 Value |
|
-7.47 |
|
9.06 |
|
7.67 |
|
5.57 |
| |
| Russell 2000 Growth |
|
-1.38 |
|
14.28 |
|
10.67 |
|
7.95 |
| |
| S&P 500 |
|
1.38 |
|
15.13 |
|
12.57 |
|
7.31 |
| |
| Russell 1000 |
|
0.92 |
|
15.01 |
|
12.44 |
|
7.40 |
| |
| Nasdaq Composite |
|
5.73 |
|
18.37 |
|
13.55 |
|
8.55 |
| |
| Russell Midcap |
|
-2.44 |
|
14.18 |
|
11.44 |
|
8.00 |
| |
| Russell Microcap |
|
-5.16 |
|
12.70 |
|
9.23 |
|
5.13 |
| |
| Russell Global ex-U.S. Small Cap |
|
0.50 |
|
4.32 |
|
1.87 |
|
4.40 |
| |
| Russell Global ex-U.S. Large Cap |
|
-5.02 |
|
2.07 |
|
1.40 |
|
3.25 |
| |
| Russell Europe Small Cap |
|
9.37 |
|
10.97 |
|
6.69 |
|
5.76 |
| |
| |
| For details on The Royce Funds’ performance in the period, please turn to the Managers’ Discussions that begin on page 8. |
| This page is not part of the 2015 Annual Report to Stockholders | 3 |
LETTER TO OUR STOCKHOLDERS
Value for the third consecutive year as of the end of 2015, and
finished ahead in seven of the last 10 calendar years, resulting in a
historically wide margin of outperformance on a trailing 10-year basis
through the end of 2015. As long-time believers in mean reversion,
we suspect that leadership from value will be the more likely
relative performance pattern going forward. (Certainly that has
been the case through January—the Russell 2000 Value Index has
thus far held up better than its growth counterpart.)
WHERE ARE WE NOW?
The question is: Where are we now? We first want to stress that while
the equity and other capital markets are under pressure, not all the
news is grim. Several notable bright spots are present that militate
against the rising wave of recessionary anxieties: job growth in the
U.S. remains steady, while real incomes, as well as expectations, have
risen. Perhaps more important is the fact that household formations
picked up in 2015 and many expect them to rise again in 2016.
The economy also received a probable boost late in December
when the government passed a budget deal that increased
spending and put business tax credits in place. These moves,
which could add as much as 0.7% to U.S. GDP in 2016, could
also help areas as diverse as technology, defense, consumer, and
nonresidential construction. With so much of the global spotlight
on China, it’s also worth mentioning that the U.S. economy remains by far the world’s largest—and has little dependence on that of China.
That being said, many investors are understandably anxious over
the “4 Cs” of commodities, currency, credit, and China—worries
that were intense even before the massive sell-off that opened 2016.
As mentioned, we peg the troubled state of the credit markets as the
greatest concern for small-cap investors, especially in the near term.
Yet we also believe that these uncertain conditions offer fertile
ground for disciplined stock pickers (though January’s ground
probably felt more like quicksand for many). The driving force
behind each of our distinct investment strategies—value, growth,
|
and core—is a bottom-up approach, the result of our firm conviction
that deep knowledge of companies and their industry dynamics
ultimately matters more than the larger macro picture. While the
last five years have not been kind to these approaches, we think the
seismic shifts in the markets of late are another sign that the next five
years will be different.
In addition to the tightening credit climate, we think that the
world is moving out of an intensely macro-focused phase into a
more historically typical period that will feature lower equity returns.
Long-term returns for the Russell 2000 have shifted from spectacular
highs to levels more in line with their historical averages. We think
returns for the next three-to-five years will be positive, but lower
than, or close to, their long-term average. In this environment,
we expect leadership to come from companies with low leverage,
high returns on invested capital, and other financial and/or
operational strengths, which should bode well for many of our
holdings in more cyclical areas. So while there may be additional
pain for many small-caps in the initial phase of a significant credit
or other market-rocking event, we think financially self-supporting
companies should emerge in far better condition than their more
highly leveraged and/or less profitable peers. Earnings will matter.
Their increasing importance should cause a shift in small-cap
leadership away from unprofitable or money-losing businesses
toward profitable ones. We see earnings growth, as opposed to P/E expansion, driving market returns as stocks seek to regain their
balance later in 2016.
To be sure, we saw evidence of positive change during January
2016. As equity prices were falling at an alarming rate, our three
closed-end portfolios held up very well. In fact, each outpaced
their respective benchmarks in January. In addition, Royce Value
Trust outperformed the Russell 2000 on an NAV basis for the one-year
period ended January 31, 2016. While not wanting to make
too much of a short-term period, these developments bolster our
optimism for better times ahead.
|
 |
|
 |
|
 |
| Charles M.
Royce |
|
Christopher
D. Clark |
|
Francis D.
Gannon |
| Chief Executive Officer, |
|
President and Co-Chief Investment Officer, |
|
Co-Chief Investment Officer, |
| Royce & Associates, LLC |
|
Royce & Associates, LLC |
|
Royce & Associates, LLC |
| |
|
|
|
|
| January 31, 2016
|
|
|
|
|
| 4 | This page is not part of the 2015 Annual Report to Stockholders
|
Performance
| |
| |
| NAV Average Annual Total Returns |
| As of December 31, 2015 (%) |
| |
|
|
|
|
|
|
|
|
|
|
|
|
|
|
|
|
SINCE |
|
INCEPTION |
| |
|
|
1-YR |
|
3-YR |
|
5-YR |
|
10-YR |
|
15-YR |
|
20-YR
|
|
25-YR
|
|
INCEPTION
|
|
DATE |
| |
| Royce Global Value Trust |
|
-3.44 |
|
N/A |
|
N/A |
|
N/A |
|
N/A |
|
N/A |
|
N/A |
|
-3.21 |
|
10/17/13 |
| |
| Royce Micro-Cap Trust |
|
-11.72 |
|
9.73 |
|
7.43 |
|
6.12 |
|
9.30 |
|
10.01 |
|
N/A |
|
10.33 |
|
12/14/93 |
| |
| Royce Value Trust |
|
-8.09 |
|
7.51 |
|
5.22 |
|
5.19 |
|
7.57 |
|
9.30 |
|
11.12 |
|
10.03 |
|
11/26/86 |
| |
| INDEX |
|
|
|
|
|
|
|
|
|
|
|
|
|
|
|
|
|
|
| |
| Russell 2000 Index |
|
-4.41 |
|
11.65 |
|
9.19 |
|
6.80 |
|
7.28 |
|
8.03 |
|
10.50 |
|
N/A |
|
N/A |
| |
| Russell Microcap Index |
|
-5.16 |
|
12.70 |
|
9.23 |
|
5.13 |
|
7.99 |
|
N/A |
|
N/A |
|
N/A |
|
N/A |
| |
| Russell Global Small Cap Index |
|
-1.78 |
|
6.91 |
|
4.35 |
|
5.10 |
|
7.65 |
|
N/A |
|
N/A |
|
N/A |
|
N/A |
| |
Important Performance and Risk Information
All performance information in this Review and Report reflects past performance, is presented on a total return basis, net of the Fund’s investment advisory fee, and reflects the reinvestment of distributions.
Past performance is no guarantee of future results. Investment return and principal value of an investment will fluctuate, so that shares may be worth more or less than their original cost when sold. Current
performance may be higher or lower than performance quoted. Current month-end performance may be obtained at www.roycefunds.com. The Funds are closed-end registered investment companies whose
respective shares of common stock may trade at a discount to the net asset value. Shares of each Fund’s common stock are also subject to the market risk of investing in the underlying portfolio securities held by
each Fund. Certain immaterial adjustments were made to the net assets of Royce Micro-Cap Trust at 12/31/12, as well as 12/31/14, for financial reporting purposes, and as a result the net asset value originally
calculated on that date and the total return based on that net asset value differs from the adjusted net asset value and total return reported in the Financial Highlights. All indexes referenced are unmanaged and
capitalization-weighted. Each index’s returns include net reinvested dividends and/or interest income. Russell Investment Group is the source and owner of the trademarks, service marks and copyrights related
to the Russell Indexes. Russell® is a trademark of Russell Investment Group. The Russell 2000 Index is an index of domestic small-cap stocks that measures the performance of the 2,000 smallest publicly traded
U.S. companies in the Russell 3000 Index. The Russell Microcap Index includes 1,000 of the smallest securities in the small-cap Russell 2000 Index, along with the next smallest eligible securities as determined
by Russell. The Russell Global Small Cap Index is an unmanaged, capitalization-weighted index of global small-cap stocks. The performance of an index does not represent exactly any particular investment, as
you cannot invest directly in an index. Index returns include net reinvested dividends and/or interest income. Royce Value, Micro-Cap and Global Value Trust shares of common stock trade on the NYSE. Royce Fund
Services, Inc (“RFS”) is a member of FINRA and has filed this Review and Report with FINRA on behalf of each Fund. RFS is not an underwriter or distributor of any of the Funds.
This page is not part of the 2015 Annual Report to Stockholders | 5
|
MANAGER’S DISCUSSION |
| Royce Global Value Trust (RGT) |
 |
| Chuck Royce |
| |
FUND PERFORMANCE
Royce Global Value Trust (NYSE:
RGT) fell 3.4% on an NAV (net
asset value) basis and lost 6.1% on a market price basis in 2015,
lagging its unleveraged benchmark,
the Russell Global Small Cap Index, which declined 1.8% for the
same period. The Fund struggled on a relative basis through much
of the year. For the year-to-date period ended June 30, 2015, RGT
gained 5.6% on an NAV basis and 3.4% on a market price basis versus
a gain of 6.4% for the Russell Global Small Cap for the same period.
Stocks then suffered a sweeping correction in the third quarter, with
many global and domestic indexes enduring double-digit losses. The
Fund underperformed in the third quarter, down 12.4% on an NAV
basis and 15.6% on a market price basis versus a decline of 11.6% for
the Russell Global Small Cap Index. During the fourth quarter, RGT
participated fully when stocks first rebounded in October, slipped
behind its benchmark in November, and held its value better when
markets turned down again in December. For the fourth quarter as a
whole, the Fund increased 4.3% based on NAV and advanced 7.7% based on market price while the Russell Global Small Cap rose 4.4%. |
| WHAT WORKED...
AND WHAT DIDN’T |
In many cases, the most important factor for our holdings was what
did not happen—economies across the globe failed to accelerate
with the kind of speed that would drive investors toward the more
cyclical areas where we have been most actively investing. This effect
was particularly noticeable for holdings in Materials, Information
Technology, and Energy—three economically sensitive sectors that
also posted the most significant net losses in 2015. A certain pace of
growth must be present to key more robust performance for many
cyclical businesses, and we simply did not see enough of it in 2015.
Against this backdrop, we continued to focus on companies that in
our analyses showed a combination of attractive valuation, balance
sheet strength, and/or promising growth prospects.
Net losses for the Information Technology sector were spread across
a number of positions and industry groups. The largest net losses for
the latter came from software, electronic equipment, instruments
& components, and semiconductors & semiconductor equipment
companies. However, the portfolio’s most significant detractor at the
industry level was the metals & mining group. On the positive side,
Health Care made a notable positive contribution, driven by strong
net gains in the health care equipment & supplies group.
At the position level, New World Department Store China
posted the largest net losses, its sales slowed by the decelerating
economy on the mainland. We held a small position at year-end.
Dundee Corporation is a holding company based in Toronto
that is involved in investment advisory, corporate finance, energy, resources, agriculture, real estate, and infrastructure. The company
also holds investment portfolios in these areas. Its stock was hurt by
significant exposure to the weakened commodity markets in 2015.
Liking its long-term prospects, we built our stake in 2015. We acted
similarly, though on a larger scale, with top-10 holding Genworth
MI Canada. Shares of this residential mortgage insurer often move
with energy prices, and ongoing concerns about mortgage losses in
the energy-dominated western Canada continued to push its price
down. True to our contrarian nature, we suspect the bulk of those
losses have already been priced in.
RGT’s top contributor was Japan’s Relo Holdings, which provides
corporate fringe benefit outsourcing services, including maintenance
and management services for expatriates’ homes. We like its niche
business, history of raising dividends, and steady company growth
throughout 2015. We took gains at various times through the year.
Italy’s De’Longhi owns a collection of consumer brands in the
domestic appliance market, such as coffee makers, food processors,
electric ovens, kettles, toasters, and more. Growing revenues and
expanding margins, driven in part by the increasing popularity of its
home espresso machines, helped draw investors to its shares. We held a good-sized position at year-end.
On a relative basis, the Fund was hurt most by Information
Technology, mostly by ineffective stock selection in the software and
semiconductors & semiconductor equipment industries. Conversely,
stock selection was a strength both in Industrials and Health Care versus the Russell Global Small Cap. |
| |
Top Contributors
to Performance
For 2015(%)1 |
|
|
|
| |
| |
Relo Holdings |
|
0.70 |
|
| |
|
|
| |
De’Longhi |
|
0.58 |
|
| |
|
|
| |
Santen Pharmaceutical |
|
0.45 |
|
| |
|
|
| |
Value Partners Group |
|
0.41 |
|
| |
|
|
| |
VZ Holding |
|
0.38 |
|
| |
|
|
| |
1
Includes dividends |
|
|
|
| |
Top Detractors
from Performance
For 2015(%)2 |
|
|
|
| |
| |
New World Department Store China |
|
-0.68 |
|
| |
|
|
| |
Dundee Corporation Cl. A |
|
-0.55 |
|
| |
|
|
| |
Genworth MI Canada |
|
-0.47 |
|
| |
|
|
| |
Stallergenes |
|
-0.40 |
|
| |
|
|
| |
Coronation Fund Managers |
|
-0.34 |
|
| |
|
|
| |
2
Net of dividends |
|
|
|
| CURRENT POSITIONING AND OUTLOOK |
| We expect reversals in a number of trends that should help benefit
many portfolio holdings over the next few years. Our own research
and regular meetings with confident management teams have made
us comfortable with a contrarian, pro-cyclical bias for the portfolio.
Moreover, we suspect that the protracted leadership of growth over
value stocks is likely to reverse in 2016 and that companies with better
balance sheets will do well in an environment of elevated corporate
bond spreads. We also expect the combined effects of these reversals to
put the market’s focus squarely on the attributes we emphasize, which
we think are overdue for recovery. |
| 6 | 2015 Annual Report to Stockholders |
| PERFORMANCE AND PORTFOLIO REVIEW |
|
SYMBOLS MARKET PRICE RGT NAV XRGTX |
| Performance |
| Average Annual Total Return (%) Through 12/31/15 |
| |
|
JUL-DEC 20151 |
|
1-YR |
|
SINCE INCEPTION (10/17/13) |
| |
| RGT (NAV) |
|
-8.58 |
|
-3.44 |
|
-3.21 |
| |
| 1Not Annualized |
|
|
|
|
|
|
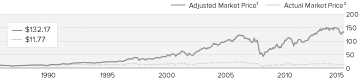
Market Price Performance History Since Inception (10/17/13)
Cumulative Performance of Investment1
| |
|
|
1-YR |
|
|
5-YR |
|
10-YR |
|
15-YR |
|
20-YR |
|
SINCE INCEPTION (10/17/13) |
| |
| RGT |
|
-6.1% |
|
|
N/A |
|
N/A |
|
N/A |
|
N/A |
|
-14.3% |
| |
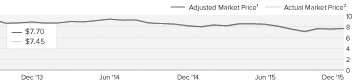
| 1 |
Reflects the cumulative performance experience of a continuous common stockholder who purchased one share at inception ($8.975 IPO) and
reinvested all distributions. |
| 2 |
Reflects the actual month-end market price movement of one share as it has traded on NYSE. |
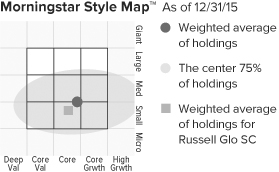
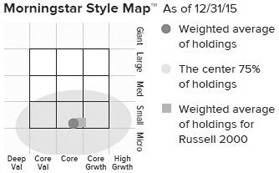
The Morningstar Style Map is the Morningstar Style BoxTM
with the center 75% of fund holdings plotted as the Morningstar
Ownership ZoneTM The Morningstar Style Box is designed to reveal a
fund’s investment strategy. The Morningstar Ownership Zone provides
detail about a portfolio’s investment style by showing the range of
stock sizes and styles. The Ownership Zone is derived by plotting each
stock in the portfolio within the proprietary Morningstar Style Box.
Over time, the shape and location of a fund's ownership zone may vary.
See page 58 for additional information. |
|
| Top 10 Positions |
|
|
| % of Net Assets |
|
|
| |
|
|
| Santen Pharmaceutical |
|
1.8 |
| |
| Consort Medical |
|
1.7 |
| |
| Virbac |
|
1.7 |
| |
| Mayr-Melnhof Karton |
|
1.7 |
| |
| Clarkson |
|
1.7 |
| |
| Genworth MI Canada |
|
1.6 |
| |
| VZ Holding |
|
1.6 |
| |
| Spirax-Sarco Engineering |
|
1.5 |
| |
| Shimano |
|
1.5 |
| |
| Relo Holdings |
|
1.4 |
| |
|
| Portfolio Sector Breakdown |
|
|
| % of Net Assets |
|
|
| |
|
|
| Industrials |
|
24.3 |
| |
| Financials |
|
23.4 |
| |
| Information Technology |
|
16.7 |
| |
| Consumer Discretionary |
|
14.8 |
| |
| Health Care |
|
12.4 |
| |
| Materials |
|
10.4 |
| |
| Energy |
|
2.7 |
| |
| Consumer Staples |
|
2.3 |
| |
| Outstanding Line of Credit, Net of Cash and Cash Equivalents |
|
-7.0 |
| |
|
| Calendar
Year Total Returns (%) |
|
|
| |
|
|
| YEAR |
|
RGT |
| |
| 2015 |
|
-3.4 |
| |
| 2014 |
|
-6.2 |
| |
|
| Portfolio Country Breakdown1,2 |
|
|
| % of Net Assets |
|
|
| |
|
|
| |
| United Kingdom |
|
15.2 |
| |
| Japan |
|
15.0 |
| |
| United States |
|
12.7 |
| |
| Canada |
|
8.5 |
| |
| France |
|
8.1 |
| |
| Switzerland |
|
7.1 |
| |
| Hong Kong |
|
5.7 |
| |
| Germany |
|
5.7 |
| |
| 1 |
Represents countries that are 3% or more of net assets. |
| 2 |
Securities are categorized by the country of their headquarters. |
|
| Portfolio Diagnostics |
|
|
| |
|
|
| Fund Net Assets |
|
$91 million |
| |
| Number of Holdings |
|
272 |
| |
| Turnover Rate |
|
65% |
| |
| Net Asset Value |
|
$8.81 |
| |
| Market Price |
|
$7.45 |
| |
| Net Leverage1 |
|
7% |
| |
| Average Market Capitalization2 |
|
$1,367 million |
| |
| Weighted Average P/E Ratio3,4 |
|
18.7x |
| |
| Weighted Average P/B Ratio3 |
|
2.3x |
| |
| Active Share5 |
|
97% |
| |
| 1 |
Net leverage is the percentage, in excess of 100%, of the total value of equity type investments, divided by net assets. |
| 2 |
Geometric Average. This weighted calculation uses each portfolio holding’s market cap in a way designed to not skew the effect of
very large or small holdings; instead, it aims to better identify
the portfolio’s center, which Royce believes offers a more accurate
measure of average market cap than a simple mean or median. |
| 3 |
Harmonic Average. This weighted calculation evaluates a portfolio as if it were a single stock and measures it overall. It compares the total market value of the portfolio to the portfolio’s share in the earnings or book value, as the case may be, of its underlying stocks. |
| 4 |
The Fund’s P/E ratio calculation excludes companies with zero or negative earnings (7% of portfolio holdings as of 12/31/15). |
| 5 |
Active Share is the sum of the absolute values of the different weightings of each holding in the Fund versus each holding in the benchmark, divided by two. |
Important Performance and Risk Information
All performance information reflects past performance, is presented on a total return basis, net of the Fund’s investment advisory fee, and reflects the reinvestment of distributions. Past performance is no
guarantee of future results. Current performance may be higher or lower than performance quoted. Returns as of the most recent month-end may be obtained at www.roycefunds.com. The market price of the
Fund’s shares will fluctuate, so that shares may be worth more or less than their original cost when sold. The Fund invests primarily in securities of small- and micro-cap companies, which may involve considerably
more risk than investments in securities of larger-cap companies. The Fund’s broadly diversified portfolio does not ensure a profit or guarantee against loss. From time to time, the Fund may invest a significant
portion of its net assets in foreign securities, which may involve political, economic, currency and other risks not encountered in U.S. investments. Regarding the “Top Contributors” and “Top Detractors” tables shown
on page 10, the sum of all contributors to, and all detractors from, performance for all securities in the portfolio would approximate the Fund’s year-to-date performance for 2015.
|
| 2015 Annual Report to Stockholders | 7 |
| MANAGER’S DISCUSSION |
| Royce Micro-Cap Trust (RMT) |
 |
| Chuck Royce |
| |
FUND PERFORMANCE
Royce Micro-Cap Trust (NYSE:
RMT) was down 11.7% on an
NAV (net asset value) basis and
fell 16.1% on a market price
basis in 2015. These results trailed
those for each of its unleveraged benchmarks, the small-cap Russell
2000 Index, which lost 4.4%, and the Russell Microcap Index, which
declined 5.2% for the same period. The Fund struggled versus its
benchmarks throughout the year. For the year-to-date period ended
June 30, 2015, RMT was down 0.5% on an NAV basis and fell
4.2% based on its market price while the Russell 2000 Index gained
4.8% and the Russell Microcap Index increased 6.0% for the same
period. During the widespread correction in the third quarter, the
Fund lost 13.8% on an NAV basis and lost 14.0% on a market price
basis, compared to declines of 11.9% for the Russell 2000 and 13.8%
for the Russell Microcap. Stock prices then revived somewhat in the
fourth quarter, when RMT increased 2.9% on an NAV basis and
1.8% on a market price basis versus respective gains of 3.6% and
3.7% for the Russell 2000 and Microcap Indexes.
For a sense of how challenging the year was for small and micro-cap
stocks (and the active managers who pick them), consider that
the Russell 2000 lost 10.1% on an equal-weighted basis in 2015.
This shows just how hard it was to find stocks that grew appreciably
by year-end, especially in the more economically sensitive, cyclical
areas of the market that have been our primary focus over the last few
years. In this climate, we continued to focus on companies that in our
analyses showed a combination of attractive valuation, balance sheet
strength, and/or promising growth prospects. The Fund outperformed
the Russell 2000 on an NAV basis for the 15-, 20-year, and since
inception (12/14/93) periods ended December 31, 2015 while
also beating the Russell Microcap on an NAV basis for the 10- and
15-year periods ended December 31, 2015. (Returns for the Russell
Microcap only go back to 2000.) RMT’s average annual NAV total
return since inception was 10.3%.
WHAT WORKED... AND WHAT DIDN’T
Seven of the portfolio’s 10 sectors were in the red at year-end (versus
eight of 10 in negative territory for the Russell 2000). Financials
detracted most by a wide margin, hampered mostly by net losses in
the capital markets industry. This group includes asset managers, a
business we believe we know well and in which we have many years
of investment experience. So while we were disappointed in overall
results for the group in 2015, we nonetheless think highly of both the
recovery potential and long-term prospects for our holdings in the
industry. Two of RMT’s five biggest detractors came from that group.
Dundee Corporation is a holding company based in Toronto that is
involved in investment advisory, corporate finance, energy, resources, agriculture, real estate, and infrastructure. The company also holds
investment portfolios in these areas. Its stock was hurt by significant
exposure to the weakened commodity markets in 2015. Based in
Greenwich, CT., Fifth Street Asset Management is a credit-focused
asset manager that also specializes in providing credit solutions to
small- and mid-sized businesses. The volatile market of the second
half challenged its business and slowed revenues. We built positions in
both companies through much of the year.
Industrials was also a sore spot in 2015, with net losses coming
from several industry groups. It is a large and highly diverse sector—home to RMT’s two biggest contributors—Frontier Services Group
and Integrated Electrical Services, and its second-largest detractor,
Universal Truckload Services. Frontier Services Group is a Hong
Kong-based company with a base of operations in Nairobi that
provides logistical services in Africa and benefited in part from the
investor perception that asset growth can help fund FSG’s plan to
expand its logistics network. The largest detractor to relative performance versus the Russell 2000
on a sector basis in 2015 was Financials. Several developments
negatively impacted results, including an underweight in banks, an
overweight and poor stock selection in capital markets, and ineffective
stock picking in the consumer finance and diversified financial
services industries. Information Technology, where we were hurt by
stock selection misses in the Internet software & services industry, also
detracted from calendar-year results relative to the small-cap index.
We received a relative advantage from our underweight in Energy as
well as modest stock selection success in Health Care and Industrials. |
| |
|
|
Top Contributors to Performance
For 2015 (%)1 |
|
|
| |
|
|
| Frontier Services Group |
|
0.59 |
| |
| Integrated Electrical Services |
|
0.54 |
| |
| Diamond Hill Investment Group |
|
0.34 |
| |
| Envivio |
|
0.32 |
| |
| Hackett Group (The) |
|
0.28 |
| |
| 1 Includes dividends |
|
|
| |
|
|
Top Detractors from Performance
For 2015 (%)2 |
|
|
| |
|
|
| Dundee Corporation Cl. A |
|
-0.43 |
| |
| Universal Truckload Services |
|
-0.41 |
| |
| Fifth Street Asset Management Cl. A |
|
-0.39 |
| |
| Qumu Corporation |
|
-0.38 |
| |
| LeapFrog Enterprises Cl. A |
|
-0.35 |
| |
| 2 Net of dividends |
|
|
CURRENT POSITIONING AND OUTLOOK
We expect reversals in a number of trends that should help benefit
many portfolio holdings over the next few years. Our own research
and regular meetings with confident management teams have made
us comfortable with a contrarian, pro-cyclical bias for the portfolio.
Moreover, we suspect that the protracted leadership of growth over
value stocks is likely to reverse in 2016 and believe that companies
with better balance sheets will do well in an environment of elevated
corporate bond spreads. We also expect the combined effects of
these reversals to put the market’s focus squarely on the attributes we
emphasize, which we think are overdue for recovery. |
| 8 | 2015 Annual Report to Stockholders |
| PERFORMANCE AND PORTFOLIO REVIEW |
|
SYMBOLS
MARKET PRICE RMT NAV XOTCX |
| |
|
Performance |
| Average Annual Total Return (%) Through 12/31/15 |
| |
| |
|
JUL-DEC 20151 |
|
1-YR |
|
3-YR |
|
5-YR |
|
10-YR |
|
15-YR |
|
20-YR |
|
SINCE INCEPTION (12/14/93) |
| |
| RMT (NAV) |
|
-11.26 |
|
-11.72 |
|
9.73 |
|
7.43 |
|
6.12 |
|
9.30 |
|
10.01 |
|
10.33 |
| |
| 1 Not Annualized |
| |
Market Price Performance History Since Inception (12/14/93) |
| Cumulative Performance of Investment1 |
| |
|
1-YR |
|
5-YR |
|
10-YR |
|
15-YR |
|
20-YR |
|
SINCE INCEPTION (12/14/93) |
| |
| RMT |
|
-16.1% |
|
39.9% |
|
41.1% |
|
277.1% |
|
533.4% |
|
616.8% |
| |
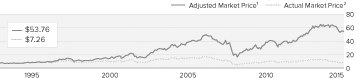 |
| 1 |
Reflects the cumulative performance experience of a continuous common stockholder who purchased one share at inception ($7.50 IPO),
reinvested all distributions
and fully participated in the primary subscription of the Fund’s 1994 rights offering. |
| 2 |
Reflects the actual month-end market price movement of one share as it has traded on NYSE and, prior to 12/1/03, on the Nasdaq. |
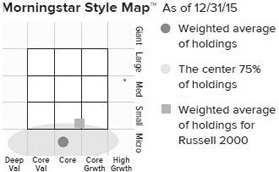
| The Morningstar Style Map is the Morningstar Style BoxTM
with the center 75% of fund holdings plotted as the Morningstar
Ownership ZoneTM. The Morningstar Style Box is designed to reveal a
fund’s investment strategy. The Morningstar Ownership Zone provides
detail about a portfolio’s investment style by showing the range of
stock sizes and styles. The Ownership Zone is derived by plotting each
stock in the portfolio within the proprietary Morningstar Style Box.
Over time, the shape and location of a fund’s ownership zone may vary.
See page 58 for additional information. |
| Top 10 Positions |
|
|
| % of Net Assets |
|
|
| |
|
|
| Integrated Electrical Services |
|
2.0 |
| |
| SurModics |
|
1.8 |
| |
| Seneca Foods |
|
1.3 |
| |
| Atrion Corporation |
|
1.2 |
| |
| Zealand Pharma |
|
1.1 |
| |
| Newport Corporation |
|
1.0 |
| |
| Orbotech |
|
0.9 |
| |
| Care.com |
|
0.9 |
| |
| Cross Country Healthcare |
|
0.9 |
| |
| FRP Holdings |
|
0.9 |
| |
| Portfolio Sector Breakdown |
|
|
| % of Net Assets |
|
|
| |
|
|
| Information Technology |
|
26.2 |
| |
| Financials |
|
18.6 |
| |
| Industrials |
|
16.1 |
| |
| Health Care |
|
16.1 |
| |
| Consumer Discretionary |
|
15.1 |
| |
| Materials |
|
5.6 |
| |
| Consumer Staples |
|
3.0 |
| |
| Energy |
|
2.7 |
| |
| Utilities |
|
0.3 |
| |
| Telecommunication Services |
|
0.1 |
| |
| Miscellaneous |
|
4.9 |
| |
| Preferred Stock |
|
0.4 |
| |
| Outstanding Line of Credit, Net of Cash
and Cash Equivalents |
|
-9.1 |
| |
| Calendar Year Total Returns (%) |
|
|
| |
|
|
| YEAR |
|
RMT |
| |
| 2015 |
|
-11.7 |
| |
| 2014 |
|
3.5 |
| |
| 2013 |
|
44.5 |
| |
| 2012 |
|
17.3 |
| |
| 2011 |
|
-7.7 |
| |
| 2010 |
|
28.5 |
| |
| 2009 |
|
46.5 |
| |
| 2008 |
|
-45.5 |
| |
| 2007 |
|
0.6 |
| |
| 2006 |
|
22.5 |
| |
| 2005 |
|
6.8 |
| |
| 2004 |
|
18.7 |
| |
| 2003 |
|
55.5 |
| |
| 2002 |
|
-13.8 |
| |
| 2001 |
|
23.4 |
| |
| Portfolio Diagnostics |
|
|
| |
|
|
| Fund Net Assets |
|
$312 million |
| |
| Number of Holdings |
|
358 |
| |
| Turnover Rate |
|
39% |
| |
| Net Asset Value |
|
$8.59 |
| |
| Market Price |
|
$7.26 |
| |
| Net Leverage1 |
|
9% |
| |
| Average Market Capitalization2 |
|
$306 million |
| |
| Weighted Average P/E Ratio3,4 |
|
17.3x |
| |
| Weighted Average P/B Ratio3 |
|
1.6x |
| |
| Active Share5 |
|
95% |
| |
| U.S. Investments (% of Net Assets) |
|
92.6% |
| |
| Non-U.S. Investments (% of Net Assets) |
|
16.5% |
| |
| 1 |
Net leverage is the percentage, in excess of 100%, of the total value of
equity type investments, divided by net assets. |
| |
| 2 |
Geometric Average. This weighted calculation uses each portfolio
holding’s market cap in a way designed to not skew the effect of
very large or small holdings; instead, it aims to better identify
the portfolio’s center, which Royce believes offers a more accurate
measure of average market cap than a simple mean or median. |
|
| 3 |
Harmonic Average. This weighted calculation evaluates a portfolio
as if it were a single stock and measures it overall. It compares the
total market value of the portfolio to the portfolio’s share in the
earnings or book value, as the case may be, of its underlying stocks. |
| |
| 4 |
The Fund’s P/E ratio calculation excludes companies with zero or
negative earnings (28% of portfolio holdings as of 12/31/15). |
| |
| 5 |
Active Share is the sum of the absolute values of the different
weightings of each holding in the Fund versus each holding in the
benchmark, divided by two. |
| Important Performance and Risk Information |
| |
| All performance information reflects past performance, is presented on a total return basis, net of the Fund’s investment advisory fee, and reflects the reinvestment of distributions. Past performance is no
guarantee of future results. Current performance may be higher or lower than performance quoted. Returns as of the most recent month-end may be obtained at www.roycefunds.com. Certain immaterial
adjustments were made to the net assets of Royce Micro-Cap Trust at 12/31/12 and 12/31/14 for financial reporting purposes, and as a result the net asset value originally calculated on that date and the total
return based on that net asset value differs from the adjusted net asset value and total return reported in the Financial Highlights. The market price of the Fund’s shares will fluctuate, so that shares may be worth
more or less than their original cost when sold. The Fund normally invests in micro-cap companies, which may involve considerably more risk than investments in securities of larger-cap companies. The Fund’s
broadly diversified portfolio does not ensure a profit or guarantee against loss. From time to time, the Fund may invest a significant portion of its net assets in foreign securities, which may involve political,
economic, currency and other risks not encountered in U.S. investments. Regarding the “Top Contributors” and “Top Detractors” tables shown on page 8, the sum of all contributors to, and all detractors from,
performance for all securities in the portfolio would approximate the Fund’s year-to-date performance for 2015. |
| 2015 Annual Report to Stockholders | 9 |
| |
|
MANAGER’S DISCUSSION |
| Royce Value Trust (RVT) |
|
|
 |
| Chuck Royce |
| FUND PERFORMANCE |
Royce Value Trust (NYSE:
RVT) fell 8.1% on an NAV (net
asset value) basis and 9.6% on
a market price basis in 2015,
behind both of its unleveraged
small-cap benchmarks. For the same period, the Russell 2000 was
down 4.4% while the S&P SmallCap 600 slid 2.0%. For the year-to-date
period ended June 30, 2015, RVT gained 1.7% on an NAV basis
and 0.3% based on its market price versus respective gains of 4.8%
and 4.2% for the Russell 2000 and S&P SmallCap 600. The third
quarter saw a significant correction for equities. In this challenging
environment, the Fund was down 12.4% on an NAV basis and
14.6% on a market price basis. For the same period, the Russell 2000
fell 11.9% and the S&P SmallCap 600 was down 9.3%. Stocks then
rallied in the fourth quarter through most of October and November.
For the quarter as a whole, RVT advanced 3.2% based on NAV and
5.6% based on market price while the Russell 2000 increased 3.6%
and the S&P SmallCap 600 rose 3.7%.
For a sense of how challenging the year was for small-cap stocks (and
the active managers who pick them), consider that the Russell 2000
lost 10.1% on an equal-weighted basis in 2015. This shows just how
hard it was to find stocks that grew appreciably by year-end, especially
in the more economically sensitive, cyclical areas of the market that
have been our primary focus over the last few years. In this climate,
we continued to focus on companies that in our analyses showed a
combination of attractive valuation, balance sheet strength, and/or
promising growth prospects. On an NAV and market price basis, the
Fund outperformed the Russell 2000 for the 15-, 20-, 25-year, and
since inception (11/26/86) periods ended December 31, 2015 while
trailing the S&P SmallCap 600. RVT’s average annual NAV total
return for the since inception period was 10.0%. |
| |
| |
| WHAT WORKED... AND WHAT DIDN’T |
| Six of the Fund’s 10 equity sectors finished the year in negative
territory, which compares favorably to the eight of 10 detracting
sectors in the Russell 2000. Industrials, where we were substantially
overweight at the end of 2015, detracted most on an absolute basis.
It also hurt relative performance, but our disadvantage resulted from
greater exposure to the sector—stock selection was a net positive versus
the benchmark. On an industry level, the sector’s largest net losses in
Industrials came from machinery stocks, which was also a significant
overweight. Long-time holding Kennametal makes tools and tooling
systems, focusing on the metalworking, mining, oil, and energy
industries, all of which faced sluggish industry conditions in 2015. |
The Financials, Energy, Information Technology, Consumer
Discretionary, and Materials sectors also posted notable net losses. At
the industry level, significant detractors other than machinery included electronic equipment, instruments & components, energy
equipment & services, and capital markets. Slumping commodity
prices and slowing industrial activity on a near-global scale were major
factors behind poor performance for these areas. Modest net gains
came from Health Care and Consumer Staples. |
At the position level, RVT’s biggest detractor was Dundee
Corporation, a holding company based in Toronto that is involved in
investment advisory, corporate finance, energy, resources, agriculture,
real estate, and infrastructure. The Company also holds investment
portfolios in these areas. Its stock was hurt by its large exposure to the
commodity markets. Confident in its long-term potential, we added
shares in 2015. We did the same with our position in Tejon Ranch.
Based in Lebec, CA., Tejon is a diversified real estate development and
agribusiness company that is also one of the largest private landowners
in the Golden State. Reduced revenues in its commodity-based
farming and mineral resources businesses, as well as increased expenses
across several business units, drove investors away from its shares.
The largest detractor to relative performance on a sector basis in
2015 was Information Technology, where poor stock selection in the
electronic equipment, instruments & components and semiconductors
& semiconductor equipment industries hurt most. The combination
of an underweight in banks, an overweight in capital markets, and
poor stock selection in insurance all hampered relative results in
Financials. Health Care’s modest net gain in the portfolio was
mitigated by our significant underweight in the sector (particularly in
biotech)—it detracted from results relative to the Russell 2000. We
were pleased, however, with our stock-picking strength in Materials
and Consumer Discretionary—two highly challenged sectors in which
we sought to high-grade positions in 2015. |
Top Contributors to Performance
For 2015 (%)1 |
|
|
|
| |
|
|
|
| Hackett Group (The) |
|
0.59 |
|
| |
| American Woodmark |
|
0.35 |
|
| |
| On Assignment |
|
0.30 |
|
| |
| MarketAxess Holdings |
|
0.30 |
|
| |
| John Bean Technologies |
|
0.24 |
|
| |
| 1 Includes dividends |
|
|
|
Top Detractors from Performance
For 2015 (%)2 |
|
|
|
| |
|
|
|
| Dundee Corporation Cl. A |
|
-0.37 |
|
| |
| Tejon Ranch |
|
-0.28 |
|
| |
| Kennametal |
|
-0.25 |
|
| |
| Greenlight Capital Re Cl. A |
|
-0.25 |
|
| |
| UTi Worldwide |
|
-0.25 |
|
| |
| 2 Net of dividends |
|
|
|
CURRENT POSITIONING AND OUTLOOK
We expect reversals in a number of trends that should help benefit
many portfolio holdings over the next few years. Our own research
and regular meetings with confident management teams have made
us comfortable with a contrarian, pro-cyclical bias for the portfolio.
Moreover, we suspect that the protracted leadership of growth over
value stocks is likely to reverse in 2016 and believe that companies
with better balance sheets will do well in an environment of elevated
corporate bond spreads. We also expect the combined effects of
these reversals to put the market’s focus squarely on the attributes we
emphasize, which we think are overdue for recovery. |
| 10 | 2015 Annual Report to Stockholders |
| PERFORMANCE AND PORTFOLIO REVIEW |
|
SYMBOLS MARKET PRICE RVT NAV XRVTX |
| Performance |
|
|
|
|
|
|
|
|
|
|
|
|
| Average Annual Total Return (%) Through 12/31/15 |
|
|
|
|
|
|
|
|
| |
|
JUL-DEC 20151 |
|
1-YR |
|
3-YR |
|
5-YR |
|
10-YR |
|
15-YR
|
|
20-YR |
|
25-YR |
|
SINCE INCEPTION (11/26/86) |
| |
| RVT (NAV) |
|
-9.62 |
|
-8.09 |
|
7.51 |
|
5.22 |
|
5.19 |
|
7.57 |
|
9.30 |
|
11.12 |
|
10.03 |
| |
| 1 Not Annualized |
|
|
|
|
|
|
|
|
|
|
Market Price Performance History Since Inception (11/26/86) |
| Cumulative Performance of Investment through 12/31/151 |
| |
|
1-YR |
|
5-YR |
|
10-YR |
|
15-YR |
|
20-YR |
|
SINCE INCEPTION (11/26/86) |
| |
| RVT |
|
-9.6% |
|
28.8% |
|
35.3% |
|
198.7% |
|
489.3% |
|
1221.7% |
| |
| |
 |
| 1 |
Reflects the cumulative performance of an investment made by a stockholder who purchased one share at inception ($10.00 IPO), reinvested
all distributions and fully participated in primary subscriptions of the Fund’s rights offerings. |
| 2 |
Reflects the actual month-end market price movement of one share as it has traded on the NYSE. |
The Morningstar Style Map is the Morningstar Style BoxTM with the center 75% of fund holdings plotted as the Morningstar Ownership ZoneTM. The Morningstar Style Box is designed to reveal a fund’s investment strategy. The Morningstar Ownership Zone provides
detail about a portfolio’s investment style by showing the range of
stock sizes and styles. The Ownership Zone is derived by plotting each
stock in the portfolio within the proprietary Morningstar Style Box.
Over time, the shape and location of a fund’s ownership zone may vary.
See page 58 for additional information. |
| Top 10 Positions |
|
|
| % of Net Assets |
|
|
| |
|
|
| HEICO Corporation |
|
1.1 |
| |
| Nautilus |
|
1.0 |
| |
| Hackett Group (The) |
|
1.0 |
| |
| Ash Grove Cement Cl. B |
|
1.0 |
| |
| SEI Investments |
|
1.0 |
| |
| On Assignment |
|
1.0 |
| |
| Woodward |
|
1.0 |
| |
| Coherent |
|
1.0 |
| |
| MarketAxess Holdings |
|
0.9 |
| |
| Reliance Steel & Aluminum |
|
0.9 |
| |
| Portfolio Sector Breakdown |
|
|
| % of Net Assets |
|
|
| |
|
|
| Industrials |
|
28.1 |
| |
| Information Technology |
|
20.7 |
| |
| Financials |
|
19.3 |
| |
| Consumer Discretionary |
|
12.6 |
| |
| Materials |
|
7.6 |
| |
| Health Care |
|
5.2 |
| |
| Energy |
|
3.7 |
| |
| Consumer Staples |
|
2.4 |
| |
| Telecommunication Services |
|
0.5 |
| |
| Utilities |
|
0.1 |
| |
| Miscellaneous |
|
5.0 |
| |
| Outstanding Line of Credit, Net of Cash
and Cash Equivalents |
|
-5.2 |
| |
| Calendar Year Total Returns (%) |
|
|
| |
|
|
| YEAR |
|
RVT |
| |
| 2015 |
|
-8.1 |
| |
| 2014 |
|
0.8 |
| |
| 2013 |
|
34.1 |
| |
| 2012 |
|
15.4 |
| |
| 2011 |
|
-10.1 |
| |
| 2010 |
|
30.3 |
| |
| 2009 |
|
44.6 |
| |
| 2008 |
|
-45.6 |
| |
| 2007 |
|
5.0 |
| |
| 2006 |
|
19.5 |
| |
| 2005 |
|
8.4 |
| |
| 2004 |
|
21.4 |
| |
| 2003 |
|
40.8 |
| |
| 2002 |
|
-15.6 |
| |
| 2001 |
|
15.2 |
| |
| Portfolio Diagnostics |
|
|
| |
|
|
| Fund Net Assets |
|
$1,072 million |
| |
| Number of Holdings |
|
493 |
| |
| Turnover Rate |
|
35% |
| |
| Net Asset Value |
|
$13.56 |
| |
| Market Price |
|
$11.77 |
| |
| Net Leverage1 |
|
5% |
| |
| Average Market Capitalization2 |
|
$1,166 million |
| |
| Weighted Average P/E Ratio3,4 |
|
18.1x |
| |
| Weighted Average P/B Ratio3 |
|
1.8x |
| |
| Active Share5 |
|
90% |
| |
| U.S. Investments (% of Net Assets) |
|
86.7% |
| |
| Non-U.S. Investments (% of Net Assets) |
|
18.5% |
| |
| 1 |
Net leverage is the percentage, in excess of 100%, of the total value of
equity type investments, divided by net assets. |
| |
| 2 |
Geometric Average. This weighted calculation uses each portfolio
holding’s market cap in a way designed to not skew the effect of
very large or small holdings; instead, it aims to better identify
the portfolio’s center, which Royce believes offers a more accurate
measure of average market cap than a simple mean or median. |
| |
| 3 |
Harmonic Average. This weighted calculation evaluates a portfolio
as if it were a single stock and measures it overall. It compares the
total market value of the portfolio to the portfolio’s share in the
earnings or book value, as the case may be, of its underlying stocks. |
| |
| 4 |
The Fund’s P/E ratio calculation excludes companies with zero or
negative earnings (12% of portfolio holdings as of 12/31/15). |
| |
| 5 |
Active Share is the sum of the absolute values of the different
weightings of each holding in the Fund versus each holding in the
benchmark, divided by two. |
| Important Performance and Risk Information |
| |
All performance information reflects past performance, is presented on a total return basis, net of the Fund’s investment advisory fee, and reflects the reinvestment of distributions. Past performance is no
guarantee of future results. Current performance may be higher or lower than performance quoted. Returns as of the most recent month-end may be obtained at www.roycefunds.com. The market price of the
Fund’s shares will fluctuate, so that shares may be worth more or less than their original cost when sold. The Fund invests primarily in securities of small- and micro-cap companies, which may involve considerably
more risk than investing in larger-cap companies. The Fund’s broadly diversified portfolio does not ensure a profit or guarantee against loss. Regarding the “Top Contributors” and “Top Detractors” tables shown on
page 6, the sum of all contributors to, and all detractors from, performance for all securities in the portfolio would approximate the Fund’s year-to date performance for 2015. |
| 2015 Annual Report to Stockholders | 11 |
History Since Inception
The following table details the share accumulations by an initial investor in the Funds who reinvested all distributions and participated
fully in primary subscriptions for each of the rights offerings. Full participation in distribution reinvestments and rights offerings can
maximize the returns available to a long-term investor. This table should be read in conjunction with the Performance and Portfolio
Reviews of the Funds.
| HISTORY |
|
|
|
AMOUNT INVESTED |
|
PURCHASE PRICE1 |
|
SHARES |
|
NAV VALUE2 |
|
MARKET VALUE2 |
|
| |
| Royce Global Value Trust |
| 10/17/13 |
|
Initial Purchase |
|
$ |
8,975 |
|
$ |
8.975 |
|
|
1,000 |
|
$ |
9,780 |
|
$ |
8,975 |
|
| |
| 12/11/14 |
|
Distribution $0.15 |
|
|
|
|
|
7.970 |
|
|
19 |
|
|
9,426 |
|
|
8,193 |
|
| |
| 12/10/15 |
|
Distribution $0.10 |
|
|
|
|
|
7.230 |
|
|
14 |
|
|
|
|
|
|
|
| |
| 12/31/15 |
|
|
|
$ |
8,975 |
|
|
|
|
|
1,033 |
|
$ |
9,101 |
|
$ |
7,696 |
|
| |
Royce Micro-Cap Trust |
| 12/14/93 |
|
Initial Purchase |
|
$ |
7,500 |
|
$ |
7.500 |
|
|
1,000 |
|
$ |
7,250 |
|
$ |
7,500 |
|
| |
| 10/28/94 |
|
Rights Offering |
|
|
1,400 |
|
|
7.000 |
|
|
200 |
|
|
|
|
|
|
|
| |
| 12/19/94 |
|
Distribution $0.05 |
|
|
|
|
|
6.750 |
|
|
9 |
|
|
9,163 |
|
|
8,462 |
|
| |
| 12/7/95 |
|
Distribution $0.36 |
|
|
|
|
|
7.500 |
|
|
58 |
|
|
11,264 |
|
|
10,136 |
|
| |
| 12/6/96 |
|
Distribution $0.80 |
|
|
|
|
|
7.625 |
|
|
133 |
|
|
13,132 |
|
|
11,550 |
|
| |
| 12/5/97 |
|
Distribution $1.00 |
|
|
|
|
|
10.000 |
|
|
140 |
|
|
16,694 |
|
|
15,593 |
|
| |
| 12/7/98 |
|
Distribution $0.29 |
|
|
|
|
|
8.625 |
|
|
52 |
|
|
16,016 |
|
|
14,129 |
|
| |
| 12/6/99 |
|
Distribution $0.27 |
|
|
|
|
|
8.781 |
|
|
49 |
|
|
18,051 |
|
|
14,769 |
|
| |
| 12/6/00 |
|
Distribution $1.72 |
|
|
|
|
|
8.469 |
|
|
333 |
|
|
20,016 |
|
|
17,026 |
|
| |
| 12/6/01 |
|
Distribution $0.57 |
|
|
|
|
|
9.880 |
|
|
114 |
|
|
24,701 |
|
|
21,924 |
|
| |
| 2002 |
|
Annual distribution total $0.80 |
|
|
|
|
|
9.518 |
|
|
180 |
|
|
21,297 |
|
|
19,142 |
|
| |
| 2003 |
|
Annual distribution total $0.92 |
|
|
|
|
|
10.004 |
|
|
217 |
|
|
33,125 |
|
|
31,311 |
|
| |
| 2004 |
|
Annual distribution total $1.33 |
|
|
|
|
|
13.350 |
|
|
257 |
|
|
39,320 |
|
|
41,788 |
|
| |
| 2005 |
|
Annual distribution total $1.85 |
|
|
|
|
|
13.848 |
|
|
383 |
|
|
41,969 |
|
|
45,500 |
|
| |
| 2006 |
|
Annual distribution total $1.55 |
|
|
|
|
|
14.246 |
|
|
354 |
|
|
51,385 |
|
|
57,647 |
|
| |
| 2007 |
|
Annual distribution total $1.35 |
|
|
|
|
|
13.584 |
|
|
357 |
|
|
51,709 |
|
|
45,802 |
|
| |
| 2008 |
|
Annual distribution total $1.193 |
|
|
|
|
|
8.237 |
|
|
578 |
|
|
28,205 |
|
|
24,807 |
|
| |
| 3/11/09 |
|
Distribution $0.223 |
|
|
|
|
|
4.260 |
|
|
228 |
|
|
41,314 |
|
|
34,212 |
|
| |
| 12/2/10 |
|
Distribution $0.08 |
|
|
|
|
|
9.400 |
|
|
40 |
|
|
53,094 |
|
|
45,884 |
|
| |
| 2011 |
|
Annual distribution total $0.533 |
|
|
|
|
|
8.773 |
|
|
289 |
|
|
49,014 |
|
|
43,596 |
|
| |
| 2012 |
|
Annual distribution total $0.51 |
|
|
|
|
|
9.084 |
|
|
285 |
|
|
57,501 |
|
|
49,669 |
|
| |
| 2013 |
|
Annual distribution total $1.38 |
|
|
|
|
|
11.864 |
|
|
630 |
|
|
83,110 |
|
|
74,222 |
|
| |
| 2014 |
|
Annual distribution total $2.90 |
|
|
|
|
|
10.513 |
|
|
1,704 |
|
|
86,071 |
|
|
76,507 |
|
| |
| 2015 |
|
Annual distribution total $1.26 |
|
|
|
|
|
7.974 |
|
|
1,256 |
|
|
|
|
|
|
|
| |
| 12/31/15 |
|
|
|
$ |
8,900 |
|
|
|
|
|
8,846 |
|
$ |
75,987 |
|
$ |
64,222 |
|
| |
| 1 |
The purchase price used for annual distribution totals is a weighted average of the distribution reinvestment prices for the year. |
| 2 |
Values are stated as of December 31 of the year indicated, after reinvestment of distributions, other than for initial purchase. |
| 3 |
Includes a return of capital. |
| 12 | 2015 Annual Report to Stockholders |
| HISTORY |
|
|
|
AMOUNT INVESTED |
|
PURCHASE PRICE1 |
|
SHARES |
|
NAV VALUE2 |
|
MARKET VALUE2 |
|
| |
|
Royce Value Trust |
| 11/26/86 |
|
Initial Purchase |
|
$ |
10,000 |
|
$ |
10.000 |
|
|
1,000 |
|
$ |
9,280 |
|
$ |
10,000 |
|
| |
| 10/15/87 |
|
Distribution $0.30 |
|
|
|
|
|
7.000 |
|
|
42 |
|
|
|
|
|
|
|
| |
| 12/31/87 |
|
Distribution $0.22 |
|
|
|
|
|
7.125 |
|
|
32 |
|
|
8,578 |
|
|
7,250 |
|
| |
| 12/27/88 |
|
Distribution $0.51 |
|
|
|
|
|
8.625 |
|
|
63 |
|
|
10,529 |
|
|
9,238 |
|
| |
| 9/22/89 |
|
Rights Offering |
|
|
405 |
|
|
9.000 |
|
|
45 |
|
|
|
|
|
|
|
| |
| 12/29/89 |
|
Distribution $0.52 |
|
|
|
|
|
9.125 |
|
|
67 |
|
|
12,942 |
|
|
11,866 |
|
| |
| 9/24/90 |
|
Rights Offering |
|
|
457 |
|
|
7.375 |
|
|
62 |
|
|
|
|
|
|
|
| |
| 12/31/90 |
|
Distribution $0.32 |
|
|
|
|
|
8.000 |
|
|
52 |
|
|
11,713 |
|
|
11,074 |
|
| |
| 9/23/91 |
|
Rights Offering |
|
|
638 |
|
|
9.375 |
|
|
68 |
|
|
|
|
|
|
|
| |
| 12/31/91 |
|
Distribution $0.61 |
|
|
|
|
|
10.625 |
|
|
82 |
|
|
17,919 |
|
|
15,697 |
|
| |
| 9/25/92 |
|
Rights Offering |
|
|
825 |
|
|
11.000 |
|
|
75 |
|
|
|
|
|
|
|
| |
| 12/31/92 |
|
Distribution $0.90 |
|
|
|
|
|
12.500 |
|
|
114 |
|
|
21,999 |
|
|
20,874 |
|
| |
| 9/27/93 |
|
Rights Offering |
|
|
1,469 |
|
|
13.000 |
|
|
113 |
|
|
|
|
|
|
|
| |
| 12/31/93 |
|
Distribution $1.15 |
|
|
|
|
|
13.000 |
|
|
160 |
|
|
26,603 |
|
|
25,428 |
|
| |
| 10/28/94 |
|
Rights Offering |
|
|
1,103 |
|
|
11.250 |
|
|
98 |
|
|
|
|
|
|
|
| |
| 12/19/94 |
|
Distribution $1.05 |
|
|
|
|
|
11.375 |
|
|
191 |
|
|
27,939 |
|
|
24,905 |
|
| |
| 11/3/95 |
|
Rights Offering |
|
|
1,425 |
|
|
12.500 |
|
|
114 |
|
|
|
|
|
|
|
| |
| 12/7/95 |
|
Distribution $1.29 |
|
|
|
|
|
12.125 |
|
|
253 |
|
|
35,676 |
|
|
31,243 |
|
| |
| 12/6/96 |
|
Distribution $1.15 |
|
|
|
|
|
12.250 |
|
|
247 |
|
|
41,213 |
|
|
36,335 |
|
| |
| 1997 |
|
Annual distribution total $1.21 |
|
|
|
|
|
15.374 |
|
|
230 |
|
|
52,556 |
|
|
46,814 |
|
| |
| 1998 |
|
Annual distribution total $1.54 |
|
|
|
|
|
14.311 |
|
|
347 |
|
|
54,313 |
|
|
47,506 |
|
| |
| 1999 |
|
Annual distribution total $1.37 |
|
|
|
|
|
12.616 |
|
|
391 |
|
|
60,653 |
|
|
50,239 |
|
| |
| 2000 |
|
Annual distribution total $1.48 |
|
|
|
|
|
13.972 |
|
|
424 |
|
|
70,711 |
|
|
61,648 |
|
| |
| 2001 |
|
Annual distribution total $1.49 |
|
|
|
|
|
15.072 |
|
|
437 |
|
|
81,478 |
|
|
73,994 |
|
| |
| 2002 |
|
Annual distribution total $1.51 |
|
|
|
|
|
14.903 |
|
|
494 |
|
|
68,770 |
|
|
68,927 |
|
| |
| 1/28/03 |
|
Rights Offering |
|
|
5,600 |
|
|
10.770 |
|
|
520 |
|
|
|
|
|
|
|
| |
| 2003 |
|
Annual distribution total $1.30 |
|
|
|
|
|
14.582 |
|
|
516 |
|
|
106,216 |
|
|
107,339 |
|
| |
| 2004 |
|
Annual distribution total $1.55 |
|
|
|
|
|
17.604 |
|
|
568 |
|
|
128,955 |
|
|
139,094 |
|
| |
| 2005 |
|
Annual distribution total $1.61 |
|
|
|
|
|
18.739 |
|
|
604 |
|
|
139,808 |
|
|
148,773 |
|
| |
| 2006 |
|
Annual distribution total $1.78 |
|
|
|
|
|
19.696 |
|
|
693 |
|
|
167,063 |
|
|
179,945 |
|
| |
| 2007 |
|
Annual distribution total $1.85 |
|
|
|
|
|
19.687 |
|
|
787 |
|
|
175,469 |
|
|
165,158 |
|
| |
| 2008 |
|
Annual distribution total $1.723 |
|
|
|
|
|
12.307 |
|
|
1,294 |
|
|
95,415 |
|
|
85,435 |
|
| |
| 3/11/09 |
|
Distribution $0.323 |
|
|
|
|
|
6.071 |
|
|
537 |
|
|
137,966 |
|
|
115,669 |
|
| |
| 12/2/10 |
|
Distribution $0.03 |
|
|
|
|
|
13.850 |
|
|
23 |
|
|
179,730 |
|
|
156,203 |
|
| |
| 2011 |
|
Annual distribution total $0.783 |
|
|
|
|
|
13.043 |
|
|
656 |
|
|
161,638 |
|
|
139,866 |
|
| |
| 2012 |
|
Annual distribution total $0.80 |
|
|
|
|
|
13.063 |
|
|
714 |
|
|
186,540 |
|
|
162,556 |
|
| |
| 2013 |
|
Annual distribution total $2.194 |
|
|
|
|
|
16.647 |
|
|
1,658 |
|
|
250,219 |
|
|
220,474 |
|
| |
| 2014 |
|
Annual distribution total $1.82 |
|
|
|
|
|
14.840 |
|
|
1,757 |
|
|
252,175 |
|
|
222,516 |
|
| |
| 2015 |
|
Annual distribution total $1.24 |
|
|
|
|
|
12.725 |
|
|
1,565 |
|
|
|
|
|
|
|
| |
| 12/31/15 |
|
|
|
$ |
21,922 |
|
|
|
|
|
17,093 |
|
$ |
231,781 |
|
$ |
201,185 |
|
| |
| 1 |
The purchase price used for annual distribution totals is a weighted average of the distribution reinvestment prices for the year. |
| 2 |
Values are stated as of December 31 of the year indicated, after reinvestment of distributions, other than for initial purchase. |
| 3 |
Includes a return of capital. |
| 4 |
Includes Royce Global Value Trust spin-off of $1.40 per share. |
| 2015 Annual Report to Stockholders | 13 |
Distribution Reinvestment and Cash Purchase Options
Why should I reinvest my distributions?
By reinvesting distributions, a stockholder can maintain an undiluted
investment in the Fund. The regular reinvestment of distributions
has a significant impact on stockholder returns. In contrast, the
stockholder who takes distributions in cash is penalized when shares
are issued below net asset value to other stockholders. |
| |
How does the reinvestment of distributions from the Royce
closed-end funds work?
The Funds automatically issue shares in payment of distributions
unless you indicate otherwise. The shares are generally issued at the
lower of the market price or net asset value on the valuation date. |
| |
How does this apply to registered stockholders?
If your shares are registered directly with a Fund, your distributions
are automatically reinvested unless you have otherwise instructed
the Funds’ transfer agent, Computershare, in writing, in which case
you will receive your distribution in cash. A registered stockholder
also may have the option to receive the distribution in the form of a
stock certificate. |
| |
What if my shares are held by a brokerage firm or
a bank?
If your shares are held by a brokerage firm, bank, or other
intermediary as the stockholder of record, you should contact
your brokerage firm or bank to be certain that it is automatically
reinvesting distributions on your behalf. If they are unable to
reinvest distributions on behalf, you should have your shares
registered in your name in order to participate. |
| |
What other features are available for registered
stockholders?
The Distribution Reinvestment and Cash Purchase Plans also allow
registered stockholders to make optional cash purchases of shares
of a Fund’s common stock directly through Computershare on a
monthly basis, and to deposit certificates representing your RVT and
RMT shares with Computershare for safekeeping. (RGT does not
issue shares in certificated form). Plan participants are subject to a
$0.75 service fee for each voluntary cash purchase under the Plans.
The Funds’ investment adviser absorbed all commissions on optional
cash purchases under the Plans through December 31, 2015. |
| |
How do the Plans work for registered stockholders?
Computershare maintains the accounts for registered stockholders
in the Plans and sends written confirmation of all transactions in
the account. Shares in the account of each participant will be held
by Computershare in non-certificated form in the name of the
participant, and each participant will be able to vote those shares
at a stockholder meeting or by proxy. A participant may also send
stock certificates for RVT and RMT held by them to Computershare
to be held in non-certificated form. RGT does not issue shares in
certificated form. There is no service fee charged to participants for
reinvesting distributions. If a participant elects to sell shares from a
Plan account, Computershare will deduct a $2.50 service fee from
the sale transaction. The Funds’ investment adviser absorbed all
commissions on optional sales under the Plans through December
31, 2015. If a nominee is the registered owner of your shares, the
nominee will maintain the accounts on your behalf. |
| |
How can I get more information on the Plans?
You can call an Investor Services Representative at (800) 221-4268 or
you can request a copy of the Plan for your Fund from Computershare.
All correspondence (including notifications) should be directed to:
[Name of Fund] Distribution Reinvestment and Cash Purchase Plan,
c/o Computershare, PO Box 43078, Providence, RI 02940-3078,
telephone (800) 426-5523 (from 9:00 A.M. to 5:00 P.M.). |
| 14 | 2015 Annual Report to Stockholders |
| Royce Global
Value Trust |
|
December
31, 2015 |
| |
| Schedule
of Investments |
| Common Stocks
– 107.0% |
| |
|
SHARES
|
|
|
|
VALUE
|
| |
| |
|
|
|
|
|
|
| AUSTRALIA
– 1.3% |
|
|
|
|
|
|
ALS |
|
10,785 |
|
|
$ |
29,422 |
†Austal |
|
78,100 |
|
|
|
88,894 |
†Genworth Mortgage Insurance Australia |
|
215,900 |
|
|
|
430,388 |
Imdex
1 |
|
473,700 |
|
|
|
68,611 |
Medusa
Mining 1 |
|
82,600 |
|
|
|
21,727 |
†Platinum Asset Management |
|
37,000 |
|
|
|
216,069 |
TFS
Corporation |
|
143,945 |
|
|
|
165,231 |
Webjet |
|
35,600 |
|
|
|
142,154 |
| |
| Total (Cost
$1,328,337) |
|
|
|
|
|
1,162,496
|
| |
| |
|
|
|
|
|
|
| AUSTRIA
– 2.2% |
|
|
|
|
|
|
Mayr-Melnhof Karton |
|
12,309 |
|
|
|
1,531,756 |
Semperit
AG Holding |
|
11,000 |
|
|
|
369,268 |
†UBM Development |
|
2,200 |
|
|
|
86,945 |
| |
| Total (Cost
$1,992,208) |
|
|
|
|
|
1,987,969
|
| |
| |
|
|
|
|
|
|
| BELGIUM
– 0.6% |
|
|
|
|
|
|
BHF
Kleinwort Benson Group 1 |
|
55,000 |
|
|
|
341,510 |
Van
de Velde |
|
3,436 |
|
|
|
234,236 |
| |
| Total (Cost
$439,862) |
|
|
|
|
|
575,746
|
| |
| |
|
|
|
|
|
|
| BRAZIL
– 2.2% |
|
|
|
|
|
|
Brasil
Brokers Participacoes 1 |
|
205,000 |
|
|
|
67,637 |
CETIP - Mercados Organizados |
|
113,000 |
|
|
|
1,067,176 |
T4F
Entretenimento 1 |
|
184,500 |
|
|
|
144,445 |
TOTVS |
|
98,000 |
|
|
|
764,196 |
| |
| Total (Cost
$3,191,202) |
|
|
|
|
|
2,043,454
|
| |
| |
|
|
|
|
|
|
| CANADA
– 8.5% |
|
|
|
|
|
|
Agnico
Eagle Mines 2 |
|
20,000 |
|
|
|
525,600 |
AirBoss
of America |
|
7,600 |
|
|
|
95,954 |
†Altus Group |
|
13,000 |
|
|
|
182,171 |
†Cameco Corporation 2 |
|
24,500 |
|
|
|
302,085 |
Canyon
Services Group |
|
24,200 |
|
|
|
71,182 |
†Chorus Aviation Cl. A |
|
17,100 |
|
|
|
69,206 |
†Cogeco Cable |
|
1,500 |
|
|
|
66,962 |
Computer
Modelling Group |
|
108,000 |
|
|
|
700,903 |
†Dream Global Real Estate Investment Trust |
|
12,300 |
|
|
|
76,981 |
†Dundee Corporation Cl. A 1 |
|
120,000 |
|
|
|
395,461 |
†Exco Technologies |
|
5,000 |
|
|
|
61,140 |
FLYHT
Aerospace Solutions 1 |
|
140,000 |
|
|
|
23,271 |
Franco-Nevada
Corporation 2 |
|
10,200 |
|
|
|
466,650 |
†Genworth MI Canada |
|
75,000 |
|
|
|
1,441,787 |
†Gluskin Sheff + Associates |
|
28,200 |
|
|
|
424,518 |
†goeasy |
|
8,300 |
|
|
|
113,670 |
†Intertape Polymer Group |
|
8,400 |
|
|
|
113,461 |
Magellan
Aerospace |
|
27,400 |
|
|
|
318,812 |
Major
Drilling Group International |
|
110,500 |
|
|
|
349,780 |
†Morguard Real Estate Investment Trust |
|
7,700 |
|
|
|
75,792 |
†Morneau Shepell |
|
11,600 |
|
|
|
121,391 |
Pan
American Silver 2 |
|
63,700 |
|
|
|
414,050 |
†RDM Corporation |
|
30,400 |
|
|
|
86,342 |
†Richelieu Hardware |
|
2,100 |
|
|
|
102,989 |
†Richmont Mines 1 |
|
23,700 |
|
|
|
76,077 |
†Solium Capital 1 |
|
28,900 |
|
|
|
146,202 |
Sprott |
|
280,600 |
|
|
|
482,639 |
†TMX Group |
|
14,000 |
|
|
|
362,116 |
Total
Energy Services |
|
7,100 |
|
|
|
69,579 |
| |
| Total (Cost
$11,695,157) |
|
|
|
|
|
7,736,771
|
| |
| |
|
|
|
|
|
|
| CHINA
– 1.9% |
|
|
|
|
|
|
†China Lilang |
|
93,400 |
|
|
|
68,895 |
Daphne
International Holdings 1 |
|
1,383,000 |
|
|
|
230,408 |
Daqo
New Energy ADR 1,2 |
|
6,400 |
|
|
|
106,560 |
Noah
Holdings ADR 1,2 |
|
16,700 |
|
|
|
466,431 |
Pacific
Online |
|
593,100 |
|
|
|
178,369 |
†TravelSky Technology |
|
345,000 |
|
|
|
566,159 |
Xtep
International Holdings |
|
157,700 |
|
|
|
83,795 |
| |
| Total (Cost
$2,358,843) |
|
|
|
|
|
1,700,617
|
| |
| |
|
|
|
|
|
|
| CYPRUS
– 0.2% |
|
|
|
|
|
|
Globaltrans
Investment GDR 1 |
|
42,000 |
|
|
|
191,455
|
| |
| Total (Cost
$212,014) |
|
|
|
|
|
191,455
|
| |
| |
|
|
|
|
|
|
| DENMARK
– 2.5% |
|
|
|
|
|
|
Chr.
Hansen Holding |
|
11,500 |
|
|
|
719,302 |
†Coloplast Cl. B |
|
4,500 |
|
|
|
363,225 |
†Columbus |
|
77,700 |
|
|
|
75,628 |
SimCorp |
|
8,000 |
|
|
|
451,173 |
Zealand
Pharma 1 |
|
32,400 |
|
|
|
710,069 |
| |
| Total (Cost
$1,687,221) |
|
|
|
|
|
2,319,397
|
| |
| |
|
|
|
|
|
|
| FINLAND
– 2.0% |
|
|
|
|
|
|
BasWare |
|
1,600 |
|
|
|
64,725 |
Nokian Renkaat |
|
30,500 |
|
|
|
1,083,366 |
†Powerflute |
|
52,900 |
|
|
|
69,396 |
Vaisala
Cl. A |
|
24,498 |
|
|
|
636,736 |
| |
| Total (Cost
$1,988,602) |
|
|
|
|
|
1,854,223
|
| |
| |
|
|
|
|
|
|
| FRANCE
– 8.1% |
|
|
|
|
|
|
aufeminin
1 |
|
2,100 |
|
|
|
55,839 |
†Cegedim 1 |
|
2,500 |
|
|
|
86,947 |
†Chargeurs |
|
7,700 |
|
|
|
75,231 |
†Gaztransport Et Technigaz |
|
26,000 |
|
|
|
1,099,578 |
†HighCo |
|
9,700 |
|
|
|
101,591 |
Lectra |
|
6,100 |
|
|
|
80,193 |
Manutan
International |
|
8,100 |
|
|
|
431,362 |
Neurones |
|
25,950 |
|
|
|
491,179 |
Nexity |
|
16,500 |
|
|
|
731,107 |
Prodware |
|
7,700 |
|
|
|
66,264 |
Rothschild
& Co |
|
33,000 |
|
|
|
842,212 |
†Thermador Groupe |
|
7,100 |
|
|
|
670,428 |
Vetoquinol |
|
24,700 |
|
|
|
1,057,652 |
Virbac |
|
6,600 |
|
|
|
1,572,848 |
| |
| Total (Cost
$7,443,064) |
|
|
|
|
|
7,362,431
|
| |
| |
|
|
|
|
|
|
| GERMANY
– 5.7% |
|
|
|
|
|
|
†ADLER Real Estate 1 |
|
17,200 |
|
|
|
265,266 |
†Allgeier SE |
|
4,300 |
|
|
|
79,145 |
†Balda |
|
27,200 |
|
|
|
67,782 |
†Bertrandt |
|
7,000 |
|
|
|
840,134 |
†Carl Zeiss Meditec |
|
17,500 |
|
|
|
542,106 |
†CompuGroup Medical |
|
10,000 |
|
|
|
366,783 |
†Fielmann |
|
7,000 |
|
|
|
514,747 |
KUKA |
|
8,000 |
|
|
|
719,692 |
†KWS Saat |
|
1,800 |
|
|
|
539,953 |
†Leifheit |
|
1,400 |
|
|
|
75,282 |
| THE ACCOMPANYING
NOTES ARE AN INTEGRAL PART OF THESE FINANCIAL STATEMENTS |
|
2015 Annual
Report to Stockholders | 15 |
| Royce Global
Value Trust |
| |
| |
| Schedule
of Investments (continued) |
| |
|
SHARES |
|
|
|
VALUE |
| |
| |
|
|
|
|
|
|
| GERMANY
(continued) |
|
|
|
|
|
|
LPKF
Laser & Electronics |
|
15,500 |
|
|
$ |
120,524 |
†msg life 1 |
|
40,700 |
|
|
|
80,131 |
mutares |
|
8,300 |
|
|
|
158,763 |
†SQS Software Quality Systems |
|
7,900 |
|
|
|
69,299 |
†STRATEC Biomedical |
|
8,000 |
|
|
|
528,414 |
Tomorrow
Focus 1 |
|
29,000 |
|
|
|
111,787 |
†VIB Vermoegen |
|
4,700 |
|
|
|
87,007 |
XING |
|
300 |
|
|
|
55,298 |
| |
| Total (Cost
$4,783,019) |
|
|
|
|
|
5,222,113
|
| |
| |
|
|
|
|
|
|
| GREECE
– 0.3% |
|
|
|
|
|
|
†Aegean Marine Petroleum Network |
|
5,000 |
|
|
|
41,800 |
Hellenic
Exchanges - Athens Stock Exchange |
|
28,000 |
|
|
|
161,112 |
StealthGas
1,2 |
|
17,000 |
|
|
|
58,310 |
| |
| Total (Cost
$333,095) |
|
|
|
|
|
261,222
|
| |
| |
|
|
|
|
|
|
| HONG KONG
– 5.7% |
|
|
|
|
|
|
Anxin-China
Holdings 1,3 |
|
2,500,000 |
|
|
|
18,710 |
China
Metal International Holdings |
|
430,000 |
|
|
|
131,772 |
First
Pacific |
|
180,000 |
|
|
|
119,229 |
Great
Eagle Holdings |
|
250,000 |
|
|
|
814,508 |
I.T |
|
438,500 |
|
|
|
116,073 |
Le
Saunda Holdings |
|
295,460 |
|
|
|
67,858 |
Luk
Fook Holdings (International) |
|
120,100 |
|
|
|
253,947 |
Midland
Holdings 1 |
|
1,400,000 |
|
|
|
563,986 |
New
World Department Store China |
|
2,159,700 |
|
|
|
328,448 |
Oriental
Watch Holdings |
|
2,223,000 |
|
|
|
326,453 |
Pico
Far East Holdings |
|
1,053,300 |
|
|
|
285,419 |
†Samson Holding |
|
589,100 |
|
|
|
72,754 |
Television
Broadcasts |
|
81,000 |
|
|
|
332,874 |
Texwinca
Holdings |
|
302,000 |
|
|
|
314,916 |
Tse
Sui Luen Jewellery (International) |
|
142,400 |
|
|
|
42,260 |
Value Partners Group |
|
1,080,000 |
|
|
|
1,247,692 |
†VST Holdings |
|
366,600 |
|
|
|
99,038 |
YGM
Trading |
|
169,400 |
|
|
|
106,684 |
| |
| Total (Cost
$6,663,603) |
|
|
|
|
|
5,242,621
|
| |
| |
|
|
|
|
|
|
| INDIA
– 2.2% |
|
|
|
|
|
|
†Bajaj Finance |
|
11,000 |
|
|
|
999,940 |
†Kewal Kiran Clothing |
|
6,500 |
|
|
|
215,660 |
†Motherson Sumi Systems |
|
120,000 |
|
|
|
529,253 |
†Videocon d2h ADR 1 |
|
27,400 |
|
|
|
243,312 |
| |
| Total (Cost
$1,913,481) |
|
|
|
|
|
1,988,165
|
| |
| |
|
|
|
|
|
|
| INDONESIA
– 0.1% |
|
|
|
|
|
|
Supra
Boga Lestari 1 |
|
3,945,000 |
|
|
|
95,836
|
| |
| Total (Cost
$198,065) |
|
|
|
|
|
95,836
|
| |
| |
|
|
|
|
|
|
| IRELAND
– 0.6% |
|
|
|
|
|
|
†Ardmore Shipping 2 |
|
14,100 |
|
|
|
179,352 |
†Keywords Studios |
|
75,000 |
|
|
|
225,511 |
†Trinity Biotech ADR Cl. A |
|
10,000 |
|
|
|
117,600 |
| |
| Total (Cost
$521,325) |
|
|
|
|
|
522,463
|
| |
| |
|
|
|
|
|
|
| ISRAEL
– 0.2% |
|
|
|
|
|
|
†Nova Measuring Instruments 1,2,4 |
|
16,600 |
|
|
|
162,680
|
| |
| Total (Cost
$181,238) |
|
|
|
|
|
162,680
|
| |
| |
|
|
|
|
|
|
| ITALY
– 2.8% |
|
|
|
|
|
|
†Azimut Holding |
|
20,000 |
|
|
|
493,744 |
†Banca Sistema 1 |
|
29,800 |
|
|
|
125,286 |
De’Longhi |
|
25,000 |
|
|
|
748,348 |
†DiaSorin |
|
14,000 |
|
|
|
732,100 |
†Recordati |
|
16,800 |
|
|
|
438,534 |
| |
| Total (Cost
$2,087,759) |
|
|
|
|
|
2,538,012
|
| |
| |
|
|
|
|
|
|
| JAPAN
– 15.0% |
|
|
|
|
|
|
†CRE |
|
9,400 |
|
|
|
178,708 |
†Daifuku |
|
4,400 |
|
|
|
74,917 |
†Descente |
|
6,100 |
|
|
|
77,397 |
EPS
Holdings |
|
10,700 |
|
|
|
117,605 |
FamilyMart |
|
8,200 |
|
|
|
381,014 |
Freund
Corporation |
|
9,500 |
|
|
|
111,243 |
GCA
Savvian |
|
9,900 |
|
|
|
101,193 |
†Horiba |
|
17,500 |
|
|
|
675,532 |
Itoki
Corporation |
|
19,400 |
|
|
|
138,218 |
†Leopalace21 Corporation 1 |
|
29,400 |
|
|
|
158,855 |
†Meitec Corporation |
|
33,700 |
|
|
|
1,152,671 |
Milbon |
|
3,100 |
|
|
|
126,525 |
MISUMI Group |
|
81,800 |
|
|
|
1,126,465 |
†Nihon Kohden |
|
18,500 |
|
|
|
445,803 |
Nishikawa
Rubber |
|
8,200 |
|
|
|
132,273 |
Nitto
Kohki |
|
6,300 |
|
|
|
134,489 |
†Outsourcing |
|
3,200 |
|
|
|
84,102 |
†Pasona Group |
|
9,700 |
|
|
|
69,238 |
†Poletowin Pitcrew Holdings |
|
9,000 |
|
|
|
85,117 |
†Pressance Corporation |
|
4,800 |
|
|
|
159,061 |
Relo Holdings |
|
10,600 |
|
|
|
1,271,789 |
Santen Pharmaceutical |
|
102,000 |
|
|
|
1,677,435 |
Shimano |
|
9,100 |
|
|
|
1,393,770 |
SPARX
Group |
|
54,200 |
|
|
|
127,748 |
Sun
Frontier Fudousan |
|
14,700 |
|
|
|
107,706 |
†Takara Leben |
|
13,000 |
|
|
|
72,098 |
†Tenpos Busters |
|
3,900 |
|
|
|
64,511 |
†TOTO |
|
20,700 |
|
|
|
725,771 |
Trancom |
|
19,600 |
|
|
|
1,086,106 |
†Trend Micro |
|
20,000 |
|
|
|
811,305 |
†USS |
|
45,000 |
|
|
|
677,055 |
Zuiko
Corporation |
|
4,400 |
|
|
|
171,453 |
| |
| Total (Cost
$11,367,976) |
|
|
|
|
|
13,717,173
|
| |
| |
|
|
|
|
|
|
| MALAYSIA
– 0.3% |
|
|
|
|
|
|
CB
Industrial Product Holding |
|
141,000 |
|
|
|
67,289 |
Media
Prima |
|
199,500 |
|
|
|
59,091 |
†Scientex |
|
57,800 |
|
|
|
131,093 |
| |
| Total (Cost
$280,444) |
|
|
|
|
|
257,473
|
| |
| |
|
|
|
|
|
|
| MEXICO
– 0.8% |
|
|
|
|
|
|
Bolsa
Mexicana de Valores |
|
250,000 |
|
|
|
332,037 |
†Consorcio ARA SAB de CV |
|
393,300 |
|
|
|
136,923 |
Fresnillo |
|
15,000 |
|
|
|
156,997 |
†Grupo SIMEC Ser. B 1 |
|
33,100 |
|
|
|
73,423 |
| |
| Total (Cost
$860,344) |
|
|
|
|
|
699,380
|
| |
| |
|
|
|
|
|
|
| NETHERLANDS
– 0.1% |
|
|
|
|
|
|
†Lucas Bols Holding |
|
2,700 |
|
|
|
65,362
|
| |
| Total (Cost
$58,086) |
|
|
|
|
|
65,362
|
| |
| 16 | 2015
Annual Report to Stockholders |
|
THE ACCOMPANYING
NOTES ARE AN INTEGRAL PART OF THESE FINANCIAL STATEMENTS |
| |
| Schedule
of Investments (continued) |
|
| |
|
SHARES
|
|
|
|
VALUE
|
| |
| |
|
|
|
|
|
|
| NEW ZEALAND
– 0.8% |
|
|
|
|
|
|
†Fisher & Paykel Healthcare |
|
75,000 |
|
|
$ |
455,262 |
Trade
Me Group |
|
83,000 |
|
|
|
235,654 |
| |
| Total (Cost $678,639) |
|
|
|
|
|
690,916
|
| |
| |
|
|
|
|
|
|
| NORWAY
– 1.0% |
|
|
|
|
|
|
Ekornes |
|
45,000 |
|
|
|
502,519 |
†Kongsberg Automotive 1 |
|
134,500 |
|
|
|
94,353 |
†Medistim |
|
13,000 |
|
|
|
78,588 |
TGS-NOPEC
Geophysical |
|
15,000 |
|
|
|
237,273 |
| |
| Total (Cost
$1,241,734) |
|
|
|
|
|
912,733
|
| |
| |
|
|
|
|
|
|
| PHILIPPINES
– 0.8% |
|
|
|
|
|
|
Universal
Robina |
|
195,000 |
|
|
|
769,549
|
| |
| Total (Cost
$565,195) |
|
|
|
|
|
769,549
|
| |
| |
|
|
|
|
|
|
| POLAND
– 0.3% |
|
|
|
|
|
|
†Warsaw Stock Exchange |
|
33,000 |
|
|
|
302,208 |
| |
| Total (Cost
$459,764) |
|
|
|
|
|
302,208
|
| |
| |
|
|
|
|
|
|
| SINGAPORE
– 1.0% |
|
|
|
|
|
|
†ARA Asset Management |
|
255,000 |
|
|
|
211,104 |
†Asian Pay Television Trust |
|
202,600 |
|
|
|
91,267 |
Parkson
Retail Asia |
|
274,300 |
|
|
|
51,265 |
†XP Power |
|
20,100 |
|
|
|
430,696 |
†Yoma Strategic Holdings 1 |
|
323,400 |
|
|
|
104,991 |
| |
| Total (Cost
$1,084,408) |
|
|
|
|
|
889,323
|
| |
| |
|
|
|
|
|
|
| SOUTH AFRICA
– 1.6% |
|
|
|
|
|
|
Cashbuild |
|
17,500 |
|
|
|
339,027 |
Coronation
Fund Managers |
|
59,000 |
|
|
|
201,502 |
JSE |
|
15,000 |
|
|
|
123,850 |
Metrofile
Holdings |
|
314,100 |
|
|
|
94,261 |
†Net 1 UEPS Technologies 1 |
|
10,500 |
|
|
|
141,855 |
PSG
Group |
|
36,500 |
|
|
|
526,431 |
| |
| Total (Cost
$1,407,649) |
|
|
|
|
|
1,426,926
|
| |
| |
|
|
|
|
|
|
| SOUTH KOREA
– 0.3% |
|
|
|
|
|
|
Eugene
Technology |
|
12,336 |
|
|
|
135,585 |
Huvis
Corporation |
|
3,900 |
|
|
|
25,693 |
†ISC |
|
1,809 |
|
|
|
43,563 |
Koh
Young Technology |
|
3,000 |
|
|
|
97,653 |
| |
| Total (Cost
$370,666) |
|
|
|
|
|
302,494
|
| |
| |
|
|
|
|
|
|
| SPAIN
– 0.2% |
|
|
|
|
|
|
Atento 1,2 |
|
21,500 |
|
|
|
209,410
|
| |
| Total (Cost
$304,802) |
|
|
|
|
|
209,410
|
| |
| |
|
|
|
|
|
|
| SWEDEN
– 0.8% |
|
|
|
|
|
|
†Addtech Cl. B |
|
27,000 |
|
|
|
458,577 |
†Dustin Group 1 |
|
15,100 |
|
|
|
116,380 |
†Hoist Finance 1 |
|
7,900 |
|
|
|
82,448 |
†Proact IT Group |
|
4,700 |
|
|
|
77,159 |
| |
| Total (Cost
$633,741) |
|
|
|
|
|
734,564
|
| |
| |
|
|
|
|
|
|
| SWITZERLAND
– 7.1% |
|
|
|
|
|
|
†Belimo Holding |
|
300 |
|
|
|
733,137 |
†Burckhardt Compression Holding |
|
2,075 |
|
|
|
636,333 |
†Burkhalter Holding |
|
4,500 |
|
|
|
487,400 |
†dorma+kaba Holding |
|
800 |
|
|
|
542,796 |
Forbo
Holding |
|
675 |
|
|
|
791,156 |
†Inficon Holding |
|
1,700 |
|
|
|
542,270 |
†LEM Holding |
|
1,000 |
|
|
|
752,239 |
†Partners Group Holding |
|
1,600 |
|
|
|
574,457 |
†VZ Holding |
|
4,850 |
|
|
|
1,428,192 |
| |
| Total (Cost
$6,053,580) |
|
|
|
|
|
6,487,980
|
| |
| |
|
|
|
|
|
|
| TAIWAN
– 0.8% |
|
|
|
|
|
|
†Flytech Technology |
|
37,680 |
|
|
|
108,413 |
†Hota Industrial Manufacturing |
|
17,500 |
|
|
|
63,976 |
Kinik
Company |
|
48,500 |
|
|
|
75,110 |
Lumax
International |
|
87,400 |
|
|
|
115,490 |
Shih
Her Technologies |
|
85,600 |
|
|
|
89,551 |
†Sporton International |
|
15,300 |
|
|
|
93,412 |
Taiwan
Paiho |
|
54,200 |
|
|
|
119,405 |
UDE
Corporation |
|
63,400 |
|
|
|
63,520 |
| |
| Total (Cost
$867,356) |
|
|
|
|
|
728,877
|
| |
| |
|
|
|
|
|
|
| TURKEY
– 0.4% |
|
|
|
|
|
|
Mardin
Cimento Sanayii |
|
300,000 |
|
|
|
380,590
|
| |
| Total (Cost
$752,323) |
|
|
|
|
|
380,590
|
| |
| |
|
|
|
|
|
|
| UNITED
ARAB EMIRATES – 0.7% |
|
|
|
|
|
|
Aramex |
|
750,000 |
|
|
|
640,872
|
| |
| Total (Cost
$652,528) |
|
|
|
|
|
640,872
|
| |
| |
|
|
|
|
|
|
| UNITED
KINGDOM – 15.2% |
|
|
|
|
|
|
Ashmore Group |
|
279,000 |
|
|
|
1,053,520 |
†Berendsen |
|
30,000 |
|
|
|
474,434 |
†BrainJuicer Group |
|
9,400 |
|
|
|
49,392 |
†Character Group |
|
11,400 |
|
|
|
78,551 |
Clarkson |
|
45,600 |
|
|
|
1,510,809 |
†Computacenter |
|
9,000 |
|
|
|
113,262 |
Consort Medical |
|
92,500 |
|
|
|
1,574,819 |
†Conviviality |
|
24,000 |
|
|
|
78,927 |
†Diploma |
|
40,000 |
|
|
|
447,705 |
e2v
technologies |
|
150,000 |
|
|
|
497,238 |
Elementis |
|
175,000 |
|
|
|
589,880 |
†Exova Group |
|
175,000 |
|
|
|
373,816 |
†Fidessa Group |
|
30,000 |
|
|
|
884,567 |
†Finsbury Food Group |
|
45,500 |
|
|
|
75,795 |
Hargreaves
Services |
|
11,000 |
|
|
|
41,981 |
†ITE Group |
|
250,000 |
|
|
|
581,054 |
Jupiter
Fund Management |
|
108,000 |
|
|
|
714,069 |
Mattioli
Woods |
|
8,900 |
|
|
|
84,486 |
Norcros |
|
54,360 |
|
|
|
160,559 |
Pendragon |
|
144,600 |
|
|
|
99,534 |
†Polypipe Group |
|
117,000 |
|
|
|
601,793 |
†Real Estate Investors |
|
71,700 |
|
|
|
73,976 |
Rotork |
|
89,000 |
|
|
|
239,307 |
Senior |
|
130,000 |
|
|
|
439,847 |
Spirax-Sarco Engineering |
|
28,989 |
|
|
|
1,396,487 |
†Stallergenes Greer 1 |
|
10,800 |
|
|
|
375,538 |
Trifast |
|
82,700 |
|
|
|
152,276 |
†Vertu Motors |
|
66,300 |
|
|
|
75,249 |
†Victrex |
|
18,000 |
|
|
|
475,019 |
†Xaar |
|
65,000 |
|
|
|
402,473 |
†Zeal Network |
|
2,500 |
|
|
|
105,641 |
| |
| Total (Cost
$14,984,922) |
|
|
|
|
|
13,822,004
|
| |
| THE ACCOMPANYING
NOTES ARE AN INTEGRAL PART OF THESE FINANCIAL STATEMENTS |
|
2015 Annual Report to Stockholders | 17 |
| Royce Global
Value Trust |
|
December
31, 2015 |
| |
| |
| Schedule
of Investments (continued) |
| |
|
SHARES |
|
|
|
VALUE |
|
| |
| |
|
|
|
|
|
|
|
| UNITED STATES – 12.7% |
|
|
|
|
|
|
|
Brooks
Automation 2 |
|
18,100 |
|
|
$ |
193,308 |
|
†Century Casinos 1 |
|
2,900 |
|
|
|
22,562 |
|
Commercial
Metals 2 |
|
42,000 |
|
|
|
574,980 |
|
Diebold
2,4 |
|
28,800 |
|
|
|
866,592 |
|
Diodes
1,2,4 |
|
20,500 |
|
|
|
471,090 |
|
EnerSys
2 |
|
11,000 |
|
|
|
615,230 |
|
Expeditors
International of Washington 2 |
|
10,000 |
|
|
|
451,000 |
|
Fairchild
Semiconductor International 1,2 |
|
24,600 |
|
|
|
509,466 |
|
†FLIR Systems |
|
14,100 |
|
|
|
395,787 |
|
Greif
Cl. A |
|
8,700 |
|
|
|
268,047 |
|
Hallador
Energy 2 |
|
18,600 |
|
|
|
84,816 |
|
Innospec
2,4 |
|
12,457 |
|
|
|
676,540 |
|
KBR 2 |
|
59,200 |
|
|
|
1,001,664 |
|
†Kirby Corporation 1 |
|
8,900 |
|
|
|
468,318 |
|
Nanometrics
1,2,4 |
|
44,500 |
|
|
|
673,730 |
|
†National Instruments |
|
19,000 |
|
|
|
545,110 |
|
Quaker
Chemical 2 |
|
8,400 |
|
|
|
648,984 |
|
Rogers
Corporation 1,2,4 |
|
6,000 |
|
|
|
309,420 |
|
Schnitzer
Steel Industries Cl. A 2 |
|
19,100 |
|
|
|
274,467 |
|
SEACOR
Holdings 1,2,4 |
|
6,000 |
|
|
|
315,360 |
|
†SEI Investments 2 |
|
15,000 |
|
|
|
786,000 |
|
Sensient
Technologies 2,4 |
|
9,500 |
|
|
|
596,790 |
|
Sun
Hydraulics 2 |
|
15,139 |
|
|
|
480,360 |
|
Tennant
Company 2 |
|
6,200 |
|
|
|
348,812 |
|
| |
| Total (Cost
$13,085,342) |
|
|
|
|
|
11,578,433
|
|
| |
| |
|
|
|
|
|
|
|
| TOTAL COMMON
STOCKS |
|
|
|
|
|
|
|
| |
| (Cost $104,727,594)
|
|
|
|
|
|
97,583,938
|
|
| |
| |
|
|
|
|
|
|
|
| REPURCHASE
AGREEMENT – 1.9% |
|
|
|
|
|
|
|
| Fixed Income
Clearing Corporation, 0.03% dated 12/31/15, due 1/4/16, maturity value $1,703,006
(collateralized by obligations of various U.S. Government Agencies, 1.625% due 7/31/20,
valued at $1,737,169) |
|
|
|
|
|
|
|
| |
| (Cost $1,703,000)
|
|
|
|
|
|
1,703,000
|
|
| |
| |
|
|
|
|
|
|
|
| TOTAL INVESTMENTS – 108.9% |
|
|
|
|
|
|
|
| |
| (Cost $106,430,594)
|
|
|
|
|
|
99,286,938
|
|
| |
| |
|
|
|
|
|
|
|
| LIABILITIES
LESS CASH AND OTHER ASSETS – (8.9)% |
|
|
|
|
|
(8,113,378
|
) |
| |
|
|
|
|
|
|
| |
|
|
|
|
|
|
|
| |
| NET ASSETS
– 100.0% |
|
|
|
|
$ |
91,173,560
|
|
| |
| |
| † |
New additions in 2015. |
| 1 |
Non-income producing. |
| 2 |
All or a portion
of these securities were pledged as collateral in connection with the revolving
credit agreement at December 31, 2015. Total market value of pledged securities
at December 31, 2015, was $12,402,589. |
| 3 |
A security
for which market quotations are not readily available represents 0.0% of net assets.
This security has been valued at its fair value under procedures approved by the
Fund’s Board of Directors. This security is defined as a Level 3 security due to the use of significant unobservable
inputs in the determination of fair value. See Notes to Financial Statements. |
| 4 |
At December
31, 2015, a portion of these securities were rehypothecated in connection with the
Fund’s revolving credit agreement in the aggregate amount of $3,933,961. |
| |
Securities
of Global/International Funds are categorized by the country of their headquarters,
with the exception of exchange-traded funds.
|
| |
Bold indicates
the Fund’s 20 largest equity holdings in terms of December 31, 2015, market value.
|
| |
TAX INFORMATION:
The cost of total investments for Federal income tax purposes was $108,211,627.
At December 31, 2015, net unrealized depreciation for all securities was $8,924,689,
consisting of aggregate gross unrealized appreciation of $7,516,891 and aggregate
gross unrealized depreciation of $16,441,580. The primary difference between book
and tax basis cost is the timing of the recognition of losses on securities sold
and mark-to-market of Passive Foreign Investment Companies.
|
| |
| 18 | 2015
Annual Report to Stockholders |
|
THE ACCOMPANYING
NOTES ARE AN INTEGRAL PART OF THESE FINANCIAL STATEMENTS |
| Royce Global
Value Trust |
|
December
31, 2015 |
| |
|
|
| |
| Statement
of Assets and Liabilities |
|
|
| |
|
|
| ASSETS: |
|
|
|
|
|
| Investments at value |
|
|
$ |
97,583,938 |
|
| |
| Repurchase
agreements (at cost and value) |
|
|
|
1,703,000 |
|
| |
| Cash and foreign
currency |
|
|
|
4,162 |
|
| |
| Receivable
for investments sold |
|
|
|
628,783 |
|
| |
| Receivable
for dividends and interest |
|
|
|
160,417 |
|
| |
| Prepaid expenses
and other assets |
|
|
|
42,990 |
|
| |
| Total Assets
|
|
|
|
100,123,290
|
|
| |
| LIABILITIES: |
|
|
|
|
|
| Revolving
credit agreement |
|
|
|
8,000,000 |
|
| |
| Payable for
investments purchased |
|
|
|
755,165 |
|
| |
| Payable for
investment advisory fee |
|
|
|
97,446 |
|
| |
| Payable for
directors’ fees |
|
|
|
9,953 |
|
| |
| Payable for
interest expense |
|
|
|
692 |
|
| |
| Accrued expenses |
|
|
|
68,933 |
|
| |
| Deferred capital
gains tax |
|
|
|
17,541 |
|
| |
| Total Liabilities
|
|
|
|
8,949,730
|
|
| |
| Net Assets
|
|
|
$ |
91,173,560
|
|
| |
| ANALYSIS OF
NET ASSETS: |
|
|
|
|
|
| Paid-in capital
- $0.001 par value per share; 10,344,899 shares outstanding (150,000,000 shares
authorized) |
|
|
$ |
116,929,670 |
|
| |
| Undistributed
net investment income (loss) |
|
|
|
(224,615 |
) |
| |
| Accumulated
net realized gain (loss) on investments and foreign currency |
|
|
|
(18,359,656 |
) |
| |
| Net unrealized
appreciation (depreciation) on investments and foreign currency |
|
|
|
(7,171,839 |
) |
| |
| Net Assets
(net asset value per share - $8.81) |
|
|
$ |
91,173,560
|
|
| |
| Investments
at identified cost |
|
|
$ |
104,727,594 |
|
| |
| THE ACCOMPANYING
NOTES ARE AN INTEGRAL PART OF THESE FINANCIAL STATEMENTS |
|
2015 Annual
Report to Stockholders | 19 |
| Royce Global
Value Trust |
| |
| |
| Statement
of Changes in Net Assets |
|
| |
|
YEAR ENDED 12/31/15 |
|
|
YEAR ENDED 12/31/14 |
|
| |
| |
|
|
|
|
|
|
|
|
| INVESTMENT
OPERATIONS: |
|
|
|
|
|
|
|
|
| Net investment
income (loss) |
|
$ |
985,324 |
|
|
$ |
1,335,060 |
|
| |
| Net realized
gain (loss) on investments and foreign currency |
|
|
(11,820,601 |
) |
|
|
(6,230,541 |
) |
| |
| Net change
in unrealized appreciation (depreciation) on investments and foreign currency |
|
|
7,399,963 |
|
|
|
(1,573,933 |
) |
| |
| Net increase
(decrease) in net assets from investment operations |
|
|
(3,435,314
|
) |
|
|
(6,469,414
|
) |
| |
| DISTRIBUTIONS: |
|
|
|
|
|
|
|
|
| Net investment
income |
|
|
(1,029,597 |
) |
|
|
(1,533,038 |
) |
| |
| Net realized
gain on investments and foreign currency |
|
|
– |
|
|
|
– |
|
| |
| Total distributions
|
|
|
(1,029,597
|
) |
|
|
(1,533,038
|
) |
| |
| CAPITAL STOCK
TRANSACTIONS: |
|
|
|
|
|
|
|
|
| Reinvestment
of distributions |
|
|
353,733 |
|
|
|
603,492 |
|
| |
| Total capital
stock transactions |
|
|
353,733
|
|
|
|
603,492
|
|
| |
| Net Increase
(Decrease) In Net Assets |
|
|
(4,111,178
|
) |
|
|
(7,398,960
|
) |
| |
| NET ASSETS: |
|
|
|
|
|
|
|
|
| |
| Beginning
of year |
|
|
95,284,738
|
|
|
|
102,683,698
|
|
| |
End of
year (including undistributed net investment income (loss) of $(224,615) at 12/31/15
and $(199,302) at 12/31/14) |
|
$ |
91,173,560
|
|
|
$ |
95,284,738
|
|
| |
| 20 | 2015
Annual Report to Stockholders |
|
THE ACCOMPANYING
NOTES ARE AN INTEGRAL PART OF THESE FINANCIAL STATEMENTS |
| Royce Global
Value Trust |
|
Year Ended
December 31, 2015 |
| |
|
|
| |
| Statement
of Operations |
|
|
| INVESTMENT
INCOME: |
|
|
|
|
| INCOME: |
|
|
|
|
| Dividends |
|
$ |
2,827,456 |
|
| |
| Foreign withholding
tax |
|
|
(230,967 |
) |
| |
| Interest |
|
|
29 |
|
| |
| Rehypothecation
income |
|
|
2,675 |
|
| |
| Securities
lending |
|
|
247 |
|
| |
| Total income
|
|
|
2,599,440
|
|
| |
| EXPENSES: |
|
|
|
|
| |
| Investment
advisory fees |
|
|
1,198,138 |
|
| |
| Custody and
transfer agent fees |
|
|
115,281 |
|
| |
| Interest expense |
|
|
98,993 |
|
| |
| Stockholder
reports |
|
|
84,590 |
|
| |
| Professional
fees |
|
|
37,180 |
|
| |
| Directors’ fees |
|
|
29,648 |
|
| |
| Administrative
and office facilities |
|
|
15,090 |
|
| |
| Other expenses |
|
|
35,196 |
|
| |
| Total expenses
|
|
|
1,614,116
|
|
| |
| Net investment
income (loss) |
|
|
985,324
|
|
| |
| REALIZED
AND UNREALIZED GAIN (LOSS) ON INVESTMENTS AND FOREIGN CURRENCY: |
|
|
|
|
| NET REALIZED
GAIN (LOSS): |
|
|
|
|
| |
| Investments |
|
|
(11,798,475 |
) |
| |
| Foreign currency
transactions |
|
|
(22,126 |
) |
| |
| NET CHANGE
IN UNREALIZED APPRECIATION (DEPRECIATION): |
|
|
|
|
| |
| Investments
and foreign currency translations |
|
|
7,425,832 |
|
| |
| Other assets
and liabilities denominated in foreign currency |
|
|
(25,869 |
) |
| |
| Net realized
and unrealized gain (loss) on investments and foreign currency |
|
|
(4,420,638
|
) |
| |
| NET INCREASE
(DECREASE) IN NET ASSETS FROM INVESTMENT OPERATIONS |
|
$ |
(3,435,314
|
) |
| |
| THE ACCOMPANYING
NOTES ARE AN INTEGRAL PART OF THESE FINANCIAL STATEMENTS |
|
2015 Annual
Report to Stockholders | 21 |
| Royce Global
Value Trust |
|
Year Ended
December 31, 2015 |
| |
|
|
| |
| Statement
of Cash Flows |
|
|
| CASH FLOWS
FROM OPERATING ACTIVITIES: |
|
|
|
|
| Net increase
(decrease) in net assets from investment operations |
|
$ |
(3,435,314 |
) |
| |
| Adjustments
to reconcile net increase (decrease) in net assets from investment operations to
net cash used for operating activities: |
|
|
|
|
| |
Purchases of long-term investments |
|
|
(71,402,917 |
) |
| |
Proceeds from
sales and maturities of long-term investments |
|
|
65,164,724 |
|
| |
Net purchases,
sales and maturities of short-term investments |
|
|
(1,703,000 |
) |
| |
Net (increase)
decrease in dividends and interest receivable and other assets |
|
|
(47,563 |
) |
| |
Net increase
(decrease) in interest expense payable, accrued expenses and other liabilities |
|
|
24,832 |
|
| |
Net change
in unrealized appreciation (depreciation) on investments |
|
|
(7,425,832 |
) |
| |
Net realized
gain (loss) on investments and foreign currency |
|
|
11,820,601 |
|
| |
| Net cash
used for operating activities |
|
|
(7,004,469
|
) |
| |
| CASH FLOWS
FROM FINANCING ACTIVITIES: |
|
|
|
|
| Net increase
(decrease) in revolving credit agreement |
|
|
8,000,000 |
|
| |
| Distributions |
|
|
(1,029,597 |
) |
| |
| Reinvestment
of distributions |
|
|
353,733 |
|
| |
| Net cash
provided by financing activities |
|
|
7,324,136
|
|
| |
| INCREASE
(DECREASE) IN CASH: |
|
|
319,667
|
|
| |
| Cash and
foreign currency at beginning of year |
|
|
(315,505
|
) |
| |
| Cash and
foreign currency at end of year |
|
$ |
4,162 |
|
| |
| 22 | 2015
Annual Report to Stockholders |
|
THE ACCOMPANYING
NOTES ARE AN INTEGRAL PART OF THESE FINANCIAL STATEMENTS |
| Royce Global
Value Trust |
| |
| |
| Financial
Highlights |
| This table
is presented to show selected data for a share outstanding throughout each period,
and to assist stockholders in evaluating the Fund’s performance for the periods
presented. |
| |
| |
|
YEARS ENDED |
|
PERIOD ENDED |
| |
|
|
|
|
|
| |
|
12/31/15 |
|
12/31/14 |
|
12/31/131 |
| |
| Net Asset
Value, Beginning of Period |
|
$ |
9.25 |
|
|
$ |
10.05 |
|
|
$ |
9.78 |
|
| |
| INVESTMENT
OPERATIONS: |
|
|
|
|
|
|
|
|
|
|
|
|
| Net investment
income (loss) |
|
|
0.10 |
|
|
|
0.13 |
|
|
|
(0.00 |
) |
| |
| Net realized
and unrealized gain (loss) on investments and foreign currency |
|
|
(0.43 |
) |
|
|
(0.77 |
) |
|
|
0.27 |
|
| |
| Net increase
(decrease) in net assets from investment operations |
|
|
(0.33 |
) |
|
|
(0.64 |
) |
|
|
0.27 |
|
| |
| DISTRIBUTIONS: |
|
|
|
|
|
|
|
|
|
|
|
|
| Net investment
income |
|
|
(0.10 |
) |
|
|
(0.15 |
) |
|
|
– |
|
| |
| Net realized
gain on investments and foreign currency |
|
|
– |
|
|
|
– |
|
|
|
– |
|
| |
| Total distributions
|
|
|
(0.10 |
) |
|
|
(0.15 |
) |
|
|
– |
|
| |
| CAPITAL STOCK
TRANSACTIONS: |
|
|
|
|
|
|
|
|
|
|
|
|
| Effect of
reinvestment of distributions by Common Stockholders |
|
|
(0.01 |
) |
|
|
(0.01 |
) |
|
|
– |
|
| |
| Total capital
stock transactions |
|
|
(0.01 |
) |
|
|
(0.01 |
) |
|
|
– |
|
| |
| Net Asset
Value, End of Period |
|
$ |
8.81 |
|
|
$ |
9.25 |
|
|
$ |
10.05 |
|
| |
| Market
Value, End of Period |
|
$ |
7.45 |
|
|
$ |
8.04 |
|
|
$ |
8.89 |
|
| |
| TOTAL RETURN:
2 |
|
|
|
|
|
|
|
|
|
|
|
|
| Net Asset
Value |
|
|
(3.44 |
)% |
|
|
(6.23 |
)% |
|
|
2.76 |
% 3 |
| Market Value |
|
|
(6.06 |
)% |
|
|
(7.86 |
)% |
|
|
(0.95 |
)% 3 |
| |
| RATIOS BASED
ON AVERAGE NET ASSETS: |
|
|
|
|
|
|
|
|
|
|
|
|
| Investment
advisory fee expense |
|
|
1.25 |
% |
|
|
1.25 |
% |
|
|
1.25 |
% 4 |
| |
| Other operating
expenses |
|
|
0.43 |
% |
|
|
0.24 |
% |
|
|
0.37 |
% 4 |
| |
| Total expenses
(net) |
|
|
1.68 |
% |
|
|
1.49 |
% |
|
|
1.62 |
% 4 |
| |
| Expenses excluding
interest expense |
|
|
1.58 |
% |
|
|
1.49 |
% |
|
|
1.62 |
% 4 |
| |
| Expenses prior
to balance credits |
|
|
1.68 |
% |
|
|
1.49 |
% |
|
|
1.62 |
% 4 |
| |
| Net investment
income (loss) |
|
|
1.03 |
% |
|
|
1.30 |
% |
|
|
(0.13 |
)% 4 |
| |
| SUPPLEMENTAL
DATA: |
|
|
|
|
|
|
|
|
|
|
|
|
| Net Assets
End of Period (in thousands) |
|
$ |
91,174 |
|
|
$ |
95,285 |
|
|
$ |
102,684 |
|
| |
| Portfolio
Turnover Rate |
|
|
65 |
% |
|
|
43 |
% |
|
|
7 |
% |
| |
| REVOLVING
CREDIT AGREEMENT: |
|
|
|
|
|
|
|
|
|
|
|
|
| Asset coverage |
|
|
1240 |
% |
|
|
|
|
|
|
|
|
| |
| Asset coverage
per $1,000 |
|
|
12,397 |
|
|
|
|
|
|
|
|
|
| |
| 1 |
The Fund commenced
operations on October 18, 2013. |
| 2 |
The Market
Value Total Return is calculated assuming a purchase of Common Stock on the opening
of the first business day and a sale on the closing of the last business day of
each period. Dividends and distributions are assumed for the purposes of this calculation
to be reinvested at prices obtained under the Fund’s Distribution Reinvestment
and Cash Purchase Plan. Net Asset Value Total Return is calculated on the same basis,
except that the Fund’s net asset value is used on the purchase and sale dates
instead of market value. |
| 3 |
Not annualized |
| 4 |
Annualized |
| THE ACCOMPANYING
NOTES ARE AN INTEGRAL PART OF THESE FINANCIAL STATEMENTS |
|
2015 Annual
Report to Stockholders | 23 |
Royce Global Value Trust
Notes to Financial Statements
Summary of Significant Accounting Policies
Royce Global Value Trust, Inc. (the “Fund”),
is a diversified closed-end investment company that was incorporated under the laws
of the State of Maryland on February 14, 2011. The Fund commenced operations on
October 18, 2013.
The preparation of financial statements
in conformity with accounting principles generally accepted in the United States
of America requires management to make estimates and assumptions that affect the
reported amounts of assets and liabilities and the disclosure of contingent assets
and liabilities at the date of the financial statements and the reported amounts
of income and expenses during the reporting period. Actual results could differ
from those estimates.
The Fund is an investment company and accordingly
follows the investment company accounting and reporting guidance of the Financial
Accounting Standards Board (FASB) Accounting Standard Codification Topic 946 “Financial
Services-Investment Companies”.
VALUATION OF INVESTMENTS:
Securities
are valued as of the close of trading on the New York Stock Exchange (NYSE) (generally
4:00 p.m. Eastern time) on the valuation date. Securities that trade on an exchange,
and securities traded on Nasdaq’s Electronic Bulletin Board, are valued at
their last reported sales price or Nasdaq official closing price taken from the
primary market in which each security trades or, if no sale is reported for such
day, at their highest bid price. Other over-the-counter securities for which market
quotations are readily available are valued at their highest bid price, except in
the case of some bonds and other fixed income securities which may be valued by
reference to other securities with comparable ratings, interest rates and maturities,
using established independent pricing services. The Fund values its non-U.S. dollar
denominated securities in U.S. dollars daily at the prevailing foreign currency
exchange rates as quoted by a major bank. Securities for which market quotations
are not readily available are valued at their fair value in accordance with the
provisions of the 1940 Act, under procedures approved by the Fund’s Board of
Directors, and are reported as Level 3 securities. As a general principle, the fair
value of a security is the amount which the Fund might reasonably expect to receive
for the security upon its current sale. However, in light of the judgment involved
in fair valuations, there can be no assurance that a fair value assigned to a particular
security will be the amount which the Fund might be able to receive upon its current
sale. In addition, if, between the time trading ends on a particular security and
the close of the customary trading session on the NYSE, events occur that are significant
and may make the closing price unreliable, the Fund may fair value the security.
The Fund uses an independent pricing service to provide fair value estimates for
relevant non-U.S. equity securities on days when the U.S. market volatility exceeds
a certain threshold. This pricing service uses proprietary correlations it has developed
between the movement of prices of non-U.S. equity securities and indices of U.S.-traded
securities, futures contracts and other indications to estimate the fair value of
relevant non-U.S. securities. When fair value pricing is employed, the prices of
securities used by the Fund may differ from quoted or published prices for the same
security. Investments in money market funds are valued at net asset value per share.
Various inputs are used in determining the value of the Fund’s investments,
as noted above. These inputs are summarized in the three broad levels below:
| |
Level
1 |
– |
quoted prices
in active markets for identical securities. |
| |
Level 2 |
– |
other significant
observable inputs (including quoted prices for similar securities, foreign securities
that may be fair valued and repurchase agreements). The table below includes all
Level 2 securities. Any Level 2 securities with values based on quoted prices for
similar securities would be noted in the Schedule of Investments. |
| |
Level
3 |
– |
significant
unobservable inputs (including last trade price before trading was suspended, or
at a discount thereto for lack of marketability or otherwise, market price information
regarding other securities, information received from the company and/or published
documents, including SEC filings and financial statements, or other publicly available
information). |
The inputs or methodology used for valuing
securities are not necessarily an indication of the risk associated with investing
in those securities.
The following is a summary of the inputs
used to value the Fund’s investments as of December 31, 2015. For a detailed
breakout of common stocks by country, please refer to the Schedule of Investments.
| |
|
LEVEL
1 |
|
LEVEL
2 |
|
LEVEL
3 |
|
TOTAL
|
| |
| Common Stocks |
|
$21,678,424 |
|
$75,886,804 |
|
$18,710 |
|
$97,583,938
|
| |
| Cash Equivalents |
|
– |
|
1,703,000 |
|
– |
|
1,703,000
|
| |
For the year ended December 31, 2015, certain
securities have transferred in and out of Level 1, Level 2 and Level 3 measurements.
The Fund recognizes transfers between levels as of the end of the reporting period.
At December 31, 2015, securities valued at $42,260 were transferred from Level 2
to Level 1 and securities valued at $18,710 were transferred from Level 2 to Level
3 within the fair value hierarchy.
24 | 2015 Annual Report to Stockholders
Royce Global Value Trust
Notes to
Financial Statements (continued)
VALUATION OF INVESTMENTS (continued):
Level 3 Reconciliation:
| |
|
|
|
|
|
REALIZED
AND UNREALIZED |
|
|
| |
|
BALANCE
AS OF 12/31/14 |
|
TRANSFERS
IN |
|
GAIN
(LOSS)1 |
|
BALANCE
AS OF 12/31/15 |
| |
| Common Stocks |
|
$ – |
|
$18,710 |
|
$ – |
|
$18,710 |
| |
| 1 |
The net change
in unrealized appreciation (depreciation) is included in the accompanying Statement
of Operations. Change in unrealized appreciation (depreciation) includes net unrealized
appreciation (depreciation) resulting from changes in investment values during the
reporting period and the reversal of previously recorded unrealized appreciation
(depreciation) when gains or losses are realized. Net realized gain (loss) from
investments and foreign currency transactions is included in the accompanying Statement
of Operations. |
REPURCHASE AGREEMENTS:
The Fund may enter
into repurchase agreements with institutions that the Fund’s investment adviser
has determined are creditworthy. The Fund restricts repurchase agreements to maturities
of no more than seven days. Securities pledged as collateral for repurchase agreements,
which are held until maturity of the repurchase agreements, are marked-to-market
daily and maintained at a value at least equal to the principal amount of the repurchase
agreement (including accrued interest). Repurchase agreements could involve certain
risks in the event of default or insolvency of the counter-party, including possible
delays or restrictions upon the ability of the Fund to dispose of its underlying
securities. The remaining contractual maturity of the repurchase agreement held
by the Fund at December 31, 2015 is overnight and continuous.
FOREIGN CURRENCY:
Net realized foreign
exchange gains or losses arise from sales and maturities of short-term securities,
sales of foreign currencies, expiration of currency forward contracts, currency
gains or losses realized between the trade and settlement dates on securities transactions,
and the difference between the amounts of dividends, interest, and foreign withholding
taxes recorded on the Fund’s books and the U.S. dollar equivalent of the amounts
actually received or paid. Net unrealized foreign exchange gains and losses arise
from changes in the value of assets and liabilities, including investments in securities
at the end of the reporting period, as a result of changes in foreign currency exchange
rates.
SECURITIES LENDING:
The Fund loans securities
through a lending agent to qualified institutional investors for the purpose of
realizing additional income. Collateral for the Fund on all securities loaned is
accepted in cash and cash equivalents and invested temporarily by the custodian.
The collateral maintained is at least 100% of the current market value of the loaned
securities. The market value of the loaned securities is determined at the close
of business of the Fund and any additional required collateral is delivered to the
Fund on the next business day. The Fund retains the risk of any loss on the securities
on loan as well as incurring the potential loss on investments purchased with cash
collateral received for securities lending. The Fund’s securities lending income
consists of the income earned on investing cash collateral, plus any premium payments
received for lending certain securities, less any rebates paid to borrowers and
lending agent fees associated with the loan. The lending agent is not affiliated
with Royce. No securities were on loan at December 31, 2015.
DISTRIBUTIONS AND TAXES:
As a qualified
regulated investment company under Subchapter M of the Internal Revenue Code, the
Fund is not subject to income taxes to the extent that it distributes substantially
all of its taxable income for its fiscal year. The Schedule of Investments includes
information regarding income taxes under the caption “Tax Information”.
The Fund pays any dividends and capital
gain distributions annually in December. Because federal income tax regulations
differ from generally accepted accounting principles, income and capital gain distributions
determined in accordance with tax regulations may differ from net investment income
and realized gains recognized for financial reporting purposes. Accordingly, the
character of distributions and composition of net assets for tax purposes differ
from those reflected in the accompanying financial statements.
CAPITAL GAINS TAXES:
The Fund is subject
to a tax imposed on short-term capital gains on securities of issuers domiciled
in certain countries. The Fund records an estimated deferred tax liability for these
securities that have been held for less than one year. This amount, if any, is reported
as deferred capital gains tax in the accompanying Statement of Assets and Liabilities,
assuming those positions were disposed of at the end of the period, and accounted
for as a reduction in the market value of the security.
INVESTMENT TRANSACTIONS AND RELATED INVESTMENT
INCOME:
Investment transactions are accounted for on the trade date. Dividend
income is recorded on the ex-dividend date. Non-cash dividend income is recorded
at the fair market value of the securities received. Interest income is recorded
on an accrual basis. Premium and discounts on debt securities are amortized using
the effective yield-to-maturity method. Realized gains and losses from investment
transactions are determined on the basis of identified cost for book and tax purposes.
2015 Annual Report to Stockholders | 25
Royce Global Value Trust
Notes to Financial Statements (continued)
EXPENSES:
The Fund incurs direct and
indirect expenses. Expenses directly attributable to the Fund are charged to the
Fund’s operations, while expenses applicable to more than one of the Royce
Funds are allocated equitably. Certain personnel, occupancy costs and other administrative
expenses related to the Funds are allocated by Royce & Associates, LLC (“Royce”) under an administration agreement and are included in administrative and
office facilities and professional fees.
COMPENSATING BALANCE CREDITS:
The Fund
has an arrangement with its custodian bank, whereby a portion of the custodian’s
fee is paid indirectly by credits earned on the Fund’s cash on deposit with
the bank. This deposit arrangement is an alternative to purchasing overnight investments.
Conversely, the Fund pays interest to the custodian on any cash overdrafts, to the
extent they are not offset by credits earned on positive cash balances.
Capital Stock:
The Fund issued
48,927 and 75,721 shares of Common Stock as reinvestment of distributions for the
years ended December 31, 2015 and December 31, 2014, respectively.
Borrowings:
The Fund has entered
into a revolving credit agreement (the credit agreement) with BNP Paribas Prime
Brokerage Inc. (BNPP). The Fund pays a commitment fee of 0.50% per annum on the
unused portion of the credit agreement. The credit agreement has a 360-day rolling
term that resets daily; however, if the Fund exceeds certain net asset value triggers,
the credit agreement may convert to a 60-day rolling term that resets daily. The
Fund is required to pledge portfolio securities as collateral in an amount up to
two times the loan balance outstanding and has granted a security interest in the
securities pledged to, and in favor of, BNPP as security for the loan balance outstanding.
If the Fund fails to meet certain requirements, or maintain other financial covenants
required under the credit agreement, the Fund may be required to repay immediately,
in part or in full, the loan balance outstanding under the credit agreement necessitating
the sale of portfolio securities at potentially inopportune times. The credit agreement
also permits, subject to certain conditions, BNPP to rehypothecate portfolio securities
pledged by the Fund up to the amount of the loan balance outstanding. The Fund continues
to receive payments in lieu of dividends and interest on rehypothecated securities.
The Fund also has the right under the credit agreement to recall the rehypothecated
securities from BNPP on demand. If BNPP fails to deliver the recalled security in
a timely manner, the Fund is compensated by BNPP for any fees or losses related
to the failed delivery or, in the event a recalled security is not returned by BNPP,
the Fund, upon notice to BNPP, may reduce the loan balance outstanding by the amount
of the recalled security failed to be returned. The Fund receives a portion of the
fees earned by BNPP in connection with the rehypothecation of portfolio securities.
As of December 31, 2015, the Fund has outstanding borrowings of $8,000,000. During
the year ended December 31, 2015, the Fund borrowed an average daily balance of
$7,693,151 at a weighted average borrowing cost of 1.27%. The maximum amount outstanding
during the year ended December 31, 2015 was $8,000,000. As of December 31, 2015,
the aggregate value of rehypothecated securities was $3,933,961. During the year
ended December 31, 2015, the Fund earned $2,675 in fees from rehypothecated securities.
Investment Advisory Agreement:
The Investment Advisory Agreement between Royce and the Fund provides for fees to
be paid at an annual rate of 1.25% of the Fund’s average daily net assets.
For the year ended December 31, 2015, the Fund accrued and paid Royce investment
advisory fees totaling $1,198,138.
Purchases and Sales of Investment Securities:
For the year ended December 31, 2015, the costs of purchases and proceeds
from sales of investment securities, other than short-term securities, amounted
to $72,146,832 and $65,666,166, respectively.
Cross trades were executed by the Fund pursuant
to Rule 17a-7 under the 1940 Act. Cross trading is the buying or selling of portfolio
securities between funds to which R&A serves as investment adviser. At its
regularly scheduled quarterly meetings, the Board reviews such transactions as of
the most recent calendar quarter for compliance with the requirements and restrictions
set forth by Rule 17a-7. Cross trades for the year ended December 31, 2015, were
as follows:
| PURCHASES
|
|
SALES
|
|
REALIZED
GAIN (LOSS) |
| |
| $10,074,569 |
|
$1,041,581 |
|
$(148,026) |
| |
Tax Information:
Distributions
during the years ended December 31, 2015 and 2014, were characterized as follows
for tax purposes:
|
ORDINARY INCOME |
|
LONG-TERM
CAPITAL GAINS |
| |
| 2015 |
|
2014 |
|
2015 |
|
2014 |
| |
| $1,029,597 |
|
$1,533,038 |
|
$ – |
|
$ – |
| |
26 | 2015 Annual Report to Stockholders
Royce Global Value Trust
Tax Information (continued):
The tax basis components of distributable
earnings at December 31, 2015, were as follows:
| |
|
UNDISTRIBUTED
LONG-TERM |
|
|
|
QUALIFIED
LATE YEAR |
|
|
| UNDISTRIBUTED
|
|
CAPITAL
GAINS OR |
|
NET UNREALIZED
|
|
ORDINARY
AND |
|
TOTAL
|
| ORDINARY
|
|
(CAPITAL
LOSSES |
|
APPRECIATION
|
|
POST-OCTOBER
LOSS |
|
DISTRIBUTABLE
|
| INCOME
|
|
NOT SUBJECT
TO EXPIRATION) |
|
(DEPRECIATION)1 |
|
DEFERRALS2 |
|
EARNINGS
|
| |
| $23,117 |
|
$(16,563,303) |
|
$(8,952,873) |
|
$(263,051) |
|
$(25,756,110) |
| |
| 1 |
Includes timing
differences on foreign currency, recognition of losses on securities sold and mark-to-market
of Passive Foreign Investment Companies. |
| 2 |
Under the
current tax law, capital losses and qualified late year ordinary losses incurred
after October 31 may be deferred and treated as occurring on the first day of the
following fiscal year. |
For financial
reporting purposes, capital accounts and distributions to stockholders are adjusted
to reflect the tax character of permanent book/tax differences. For the year ended
December 31, 2015, the Fund recorded the following permanent reclassifications,
which relate primarily to current publicly traded partnerships, foreign currency
transactions, foreign capital gains tax and gains from the sale of Passive Foreign
Investment Companies. Results of operations and net assets were not affected by
these reclassifications.
| UNDISTRIBUTED
NET |
|
ACCUMULATED
NET |
| INVESTMENT
INCOME |
|
REALIZED
GAIN (LOSS) |
| |
| $18,961 |
|
$(18,961) |
| |
Management has analyzed the Fund’s
tax positions taken on federal income tax returns for all open tax years (2013-2015)
and has concluded that as of December 31, 2015, no provision for income tax is required
in the Fund’s financial statements.
2015 Annual Report to Stockholders | 27
Royce Global Value Trust
Report of Independent Registered Public
Accounting Firm
To the Board of Directors and Stockholders
of Royce Global Value Trust, Inc.:
In our opinion, the accompanying statement of assets and liabilities, including the schedule of investments, and the related statement of
operations, of changes in net assets, and of cash flows and the financial highlights present fairly, in all material respects, the financial
position of Royce Global Value Trust, Inc. (the “Fund”) at December 31, 2015, the results of its operations, the changes in its net assets, its cash flows and its financial highlights for the year then ended, in conformity with accounting principles generally accepted in the United States of America. These financial statements and financial highlights (hereafter referred to as “financial statements”) are the responsibility of the Funds' management. Our responsibility is to express an opinion on these financial statements based on our audit. We conducted our audit of these financial statements in accordance with the standards of the Public Company Accounting Oversight Board (United States). Those standards require that we plan and perform the audit to obtain reasonable assurance about whether the financial
statements are free of material misstatement. An audit includes examining, on a test basis, evidence supporting the amounts and disclosures in the financial statements, assessing the accounting principles used and significant estimates made by management, and evaluating the overall financial statement presentation. We believe that our audit, which included confirmation of securities at December 31, 2015 by correspondence with the custodian and brokers, provide a reasonable basis for our opinion. The statement of changes in net assets for the year ended December 31, 2014 and the financial highlights for each of the fiscal periods presented in the period ended December 31, 2014 were audited by other independent accountants whose report dated February 23, 2015 expressed an unqualified
opinion on those statements.
| PricewaterhouseCoopers
LLP |
| Baltimore,
Maryland |
| February 23,
2016 |
28 | 2015 Annual Report to Stockholders
| Royce Micro-Cap
Trust |
|
December
31, 2015 |
| |
| Schedule
of Investments |
|
|
|
|
|
| Common Stocks
– 108.7% |
|
|
|
|
|
| |
|
SHARES
|
|
|
VALUE
|
| |
| |
|
|
|
|
|
| CONSUMER
DISCRETIONARY – 15.1% |
|
|
|
|
|
| AUTO COMPONENTS
- 2.6% |
|
|
|
|
|
Drew
Industries 1,2 |
|
32,800 |
|
$ |
1,997,192 |
Fuel
Systems Solutions 3 |
|
86,000 |
|
|
420,540 |
Global
& Yuasa Battery |
|
50,500 |
|
|
1,753,292 |
Motorcar
Parts of America 3 |
|
45,100 |
|
|
1,524,831 |
Standard Motor Products |
|
61,853 |
|
|
2,353,507 |
| |
|
|
|
|
| |
|
|
|
|
8,049,362
|
| |
|
|
|
|
| DISTRIBUTORS
- 1.3% |
|
|
|
|
|
†Fenix Parts 3 |
|
351,200 |
|
|
2,384,648 |
Weyco
Group |
|
59,600 |
|
|
1,594,896 |
| |
|
|
|
|
| |
|
|
|
|
3,979,544
|
| |
|
|
|
|
| DIVERSIFIED
CONSUMER SERVICES - 2.2% |
|
|
|
|
|
American
Public Education 3 |
|
73,200 |
|
|
1,362,252 |
Capella
Education |
|
1,300 |
|
|
60,086 |
Collectors
Universe |
|
96,100 |
|
|
1,489,550 |
Liberty Tax Cl. A 1 |
|
108,264 |
|
|
2,579,931 |
Lincoln
Educational Services 3 |
|
100,000 |
|
|
199,000 |
†Universal Technical Institute |
|
270,000 |
|
|
1,258,200 |
| |
|
|
|
|
| |
|
|
|
|
6,949,019
|
| |
|
|
|
|
| HOTELS, RESTAURANTS
& LEISURE - 0.9% |
|
|
|
|
|
†Century
Casinos 3 |
|
196,822 |
|
|
1,531,275 |
†Lindblad
Expeditions Holdings 3 |
|
122,400 |
|
|
1,359,864 |
| |
|
|
|
|
| |
|
|
|
|
2,891,139
|
| |
|
|
|
|
| HOUSEHOLD
DURABLES - 2.4% |
|
|
|
|
|
Cavco
Industries 3 |
|
20,391 |
|
|
1,698,774 |
Ethan
Allen Interiors 1 |
|
50,100 |
|
|
1,393,782 |
Flexsteel
Industries 1 |
|
20,900 |
|
|
923,362 |
iRobot
Corporation 1,2,3 |
|
15,000 |
|
|
531,000 |
Lifetime
Brands 1 |
|
130,794 |
|
|
1,734,328 |
Stanley
Furniture 3 |
|
93,468 |
|
|
260,776 |
Universal
Electronics 3 |
|
15,100 |
|
|
775,385 |
| |
|
|
|
|
| |
|
|
|
|
7,317,407
|
| |
|
|
|
|
| INTERNET
& CATALOG RETAIL - 1.2% |
|
|
|
|
|
Blue
Nile 1,2,3 |
|
59,400 |
|
|
2,205,522 |
FTD
Companies 3 |
|
61,500 |
|
|
1,609,455 |
| |
|
|
|
|
| |
|
|
|
|
3,814,977
|
| |
|
|
|
|
| LEISURE PRODUCTS
- 0.9% |
|
|
|
|
|
Nautilus
3 |
|
128,600 |
|
|
2,150,192 |
Smith
& Wesson Holding Corporation 1,3 |
|
31,700 |
|
|
696,766 |
Sturm,
Ruger & Co. |
|
1,100 |
|
|
65,571 |
| |
|
|
|
|
| |
|
|
|
|
2,912,529
|
| |
|
|
|
|
| MEDIA - 0.7% |
|
|
|
|
|
†New
Media Investment Group |
|
52,800 |
|
|
1,027,488 |
Rentrak
Corporation 3 |
|
24,800 |
|
|
1,178,744 |
| |
|
|
|
|
| |
|
|
|
|
2,206,232
|
| |
|
|
|
|
| SPECIALTY
RETAIL - 1.5% |
|
|
|
|
|
Destination
Maternity |
|
245,500 |
|
|
2,140,760 |
Kirkland’s |
|
7,900 |
|
|
114,550 |
MarineMax
3 |
|
5,400 |
|
|
99,468 |
Shoe
Carnival 1 |
|
31,628 |
|
|
733,770 |
Stage
Stores 1 |
|
15,000 |
|
|
136,650 |
Systemax
1,2,3 |
|
74,000 |
|
|
636,400 |
TravelCenters
of America LLC 3 |
|
2,900 |
|
|
27,260 |
West
Marine 3 |
|
86,000 |
|
|
730,140 |
| |
|
|
|
|
| |
|
|
|
|
4,618,998
|
| |
|
|
|
|
| TEXTILES,
APPAREL & LUXURY GOODS - 1.4% |
|
|
|
|
|
Crown
Crafts |
|
135,459 |
|
|
1,150,047 |
Culp |
|
32,900 |
|
|
837,963 |
J.G.
Boswell Company 4 |
|
2,490 |
|
|
1,556,250 |
YGM
Trading |
|
1,482,000 |
|
|
933,332 |
| |
|
|
|
|
| |
|
|
|
|
4,477,592
|
| |
| Total (Cost
$44,856,058) |
|
|
|
|
47,216,799
|
| |
| |
|
|
|
|
|
| CONSUMER
STAPLES – 3.0% |
|
|
|
|
|
| BEVERAGES
- 0.2% |
|
|
|
|
|
Crimson
Wine Group 3,4 |
|
58,124 |
|
|
501,610
|
| |
|
|
|
|
| FOOD PRODUCTS
- 2.8% |
|
|
|
|
|
Binggrae
3 |
|
18,078 |
|
|
1,050,086 |
Farmer
Bros. 1,3 |
|
45,100 |
|
|
1,455,377 |
John
B. Sanfilippo & Son |
|
21,700 |
|
|
1,172,451 |
Landec
Corporation 3 |
|
75,610 |
|
|
894,466 |
Limoneira
Company |
|
6,400 |
|
|
95,616 |
Seneca Foods Cl. A 3 |
|
51,400 |
|
|
1,489,572 |
Seneca Foods Cl. B 3 |
|
42,500 |
|
|
1,356,600 |
SunOpta
3 |
|
162,081 |
|
|
1,108,634 |
Waterloo
Investment Holdings 3,5 |
|
806,207 |
|
|
225,738 |
| |
|
|
|
|
| |
|
|
|
|
8,848,540
|
| |
| Total (Cost
$6,932,220) |
|
|
|
|
9,350,150
|
| |
| |
|
|
|
|
|
| ENERGY
– 2.7% |
|
|
|
|
|
| ENERGY EQUIPMENT
& SERVICES - 1.6% |
|
|
|
|
|
Canadian
Energy Services & Technology |
|
25,000 |
|
|
70,102 |
Dawson
Geophysical 3 |
|
73,654 |
|
|
254,843 |
†Era Group 3 |
|
212,435 |
|
|
2,368,650 |
Geospace
Technologies 1,3 |
|
9,500 |
|
|
133,665 |
Gulf
Island Fabrication |
|
103,216 |
|
|
1,079,639 |
Matrix
Service 1,3 |
|
25,300 |
|
|
519,662 |
Newpark
Resources 3 |
|
8,000 |
|
|
42,240 |
North
American Energy Partners |
|
50,000 |
|
|
86,500 |
Pioneer
Energy Services 1,2,3 |
|
57,500 |
|
|
124,775 |
Tesco
Corporation 1 |
|
58,000 |
|
|
419,920 |
| |
|
|
|
|
| |
|
|
|
|
5,099,996
|
| |
|
|
|
|
| OIL, GAS
& CONSUMABLE FUELS - 1.1% |
|
|
|
|
|
Ardmore
Shipping |
|
15,500 |
|
|
197,160 |
†Dorchester
Minerals L.P. |
|
106,127 |
|
|
1,049,596 |
Permian
Basin Royalty Trust |
|
266,333 |
|
|
1,347,645 |
StealthGas
3 |
|
186,085 |
|
|
638,272 |
| |
|
|
|
|
| |
|
|
|
|
3,232,673
|
| |
| Total (Cost
$13,283,624) |
|
|
|
|
8,332,669
|
| |
| |
|
|
|
|
|
| FINANCIALS
– 18.6% |
|
|
|
|
|
| BANKS - 2.3% |
|
|
|
|
|
Bank
of N.T. Butterfield & Son |
|
438,100 |
|
|
854,295 |
BCB
Holdings 3 |
|
526,221 |
|
|
65,939 |
Blue
Hills Bancorp |
|
50,000 |
|
|
765,500 |
Bryn
Mawr Bank |
|
25,000 |
|
|
718,000 |
Chemung
Financial 1 |
|
31,000 |
|
|
857,460 |
Fauquier
Bankshares 1 |
|
140,200 |
|
|
2,147,864 |
First
Bancorp (The) |
|
40,200 |
|
|
822,894 |
Peapack-Gladstone
Financial |
|
53,606 |
|
|
1,105,356 |
| |
|
|
|
|
| |
|
|
|
|
7,337,308
|
| |
|
|
|
|
| CAPITAL MARKETS
- 9.1% |
|
|
|
|
|
ASA
Gold and Precious Metals |
|
206,150 |
|
|
1,478,095 |
BHF
Kleinwort Benson Group 3 |
|
160,000 |
|
|
993,482 |
Cowen
Group 3 |
|
100,000 |
|
|
383,000 |
Diamond
Hill Investment Group 1 |
|
11,179 |
|
|
2,112,831 |
Dundee
Corporation Cl. A 3 |
|
435,000 |
|
|
1,433,548 |
| THE ACCOMPANYING
NOTES ARE AN INTEGRAL PART OF THESE FINANCIAL STATEMENTS |
|
2015 Annual
Report to Stockholders | 29 |
| |
| Schedule
of Investments (continued) |
|
|
|
|
|
| |
|
|
|
|
|
| |
|
SHARES
|
|
|
VALUE
|
| |
| |
|
|
|
|
|
| FINANCIALS
(continued) |
|
|
|
|
|
| CAPITAL MARKETS
(continued) |
|
|
|
|
|
EQT
Holdings |
|
43,150 |
|
$ |
643,961 |
Fiera
Capital Cl. A |
|
78,000 |
|
|
639,243 |
†Fifth
Street Asset Management Cl. A |
|
259,503 |
|
|
845,980 |
INTL
FCStone 1,3 |
|
41,727 |
|
|
1,396,185 |
JZ
Capital Partners |
|
247,999 |
|
|
1,401,518 |
Manning
& Napier Cl. A |
|
170,600 |
|
|
1,448,394 |
Medley
Management Cl. A |
|
153,400 |
|
|
872,846 |
MVC Capital 1 |
|
372,400 |
|
|
2,744,588 |
Newtek
Business Services |
|
58,500 |
|
|
837,720 |
OHA
Investment |
|
204,620 |
|
|
777,556 |
Queen
City Investments 4 |
|
948 |
|
|
1,232,400 |
Silvercrest Asset Management Group Cl. A |
|
213,600 |
|
|
2,539,704 |
Sprott |
|
1,268,333 |
|
|
2,181,566 |
U.S.
Global Investors Cl. A |
|
646,254 |
|
|
756,117 |
Urbana
Corporation |
|
237,600 |
|
|
353,730 |
Westwood
Holdings Group 1 |
|
18,300 |
|
|
953,247 |
ZAIS Group Holdings Cl. A 1,2,3 |
|
265,818 |
|
|
2,461,475 |
| |
|
|
|
|
| |
|
|
|
|
28,487,186
|
| |
|
|
|
|
| CONSUMER FINANCE
- 0.4% |
|
|
|
|
|
EZCORP
Cl. A 1,2,3 |
|
201,000 |
|
|
1,002,990 |
J.G.
Wentworth Company Cl. A 3 |
|
135,000 |
|
|
243,000 |
| |
|
|
|
|
| |
|
|
|
|
1,245,990
|
| |
|
|
|
|
| DIVERSIFIED
FINANCIAL SERVICES - 1.6% |
|
|
|
|
|
Banca
Finnat Euramerica |
|
910,000 |
|
|
426,671 |
GAIN
Capital Holdings |
|
25,000 |
|
|
202,750 |
PICO
Holdings 1,2,3 |
|
153,700 |
|
|
1,586,184 |
Value
Line |
|
169,000 |
|
|
2,269,670 |
Warsaw
Stock Exchange |
|
52,900 |
|
|
484,449 |
| |
|
|
|
|
| |
|
|
|
|
4,969,724
|
| |
|
|
|
|
| INSURANCE
- 2.0% |
|
|
|
|
|
†eHealth
1,2,3 |
|
100,000 |
|
|
998,000 |
Hallmark
Financial Services 3 |
|
114,000 |
|
|
1,332,660 |
Independence
Holding Company |
|
100,080 |
|
|
1,386,108 |
State
Auto Financial 1 |
|
73,264 |
|
|
1,508,506 |
United
Fire Group 1 |
|
29,603 |
|
|
1,134,091 |
| |
|
|
|
|
| |
|
|
|
|
6,359,365
|
| |
|
|
|
|
| REAL ESTATE
INVESTMENT TRUSTS (REITS) - 0.5% |
|
|
|
|
|
BRT
Realty Trust 3 |
|
230,331 |
|
|
1,460,298
|
| |
|
|
|
|
| REAL ESTATE
MANAGEMENT & DEVELOPMENT - 2.7% |
|
|
|
|
|
AV
Homes 3 |
|
87,400 |
|
|
1,119,594 |
Forestar
Group 1,2,3 |
|
53,000 |
|
|
579,820 |
FRP Holdings 1,3 |
|
83,981 |
|
|
2,850,315 |
Griffin
Industrial Realty |
|
47,746 |
|
|
1,245,693 |
Hopefluent
Group Holdings |
|
1,400,000 |
|
|
384,106 |
Marcus
& Millichap 3 |
|
1,800 |
|
|
52,452 |
Tejon
Ranch 1,2,3 |
|
112,162 |
|
|
2,147,902 |
Tejon
Ranch (Warrants) 3 |
|
13,146 |
|
|
92 |
| |
|
|
|
|
| |
|
|
|
|
8,379,974
|
| |
| Total (Cost
$67,156,570) |
|
|
|
|
58,239,845
|
| |
| |
|
|
|
|
|
| HEALTH
CARE – 16.1% |
|
|
|
|
|
| BIOTECHNOLOGY
- 4.1% |
|
|
|
|
|
†Abeona
Therapeutics 3 |
|
299,643 |
|
|
1,006,800 |
Aquinox
Pharmaceuticals 1,2,3 |
|
18,622 |
|
|
232,403 |
ARIAD
Pharmaceuticals 1,2,3 |
|
114,102 |
|
|
713,138 |
†Avalanche
Biotechnologies 3 |
|
168,246 |
|
|
1,601,702 |
ChemoCentryx
3 |
|
33,300 |
|
|
269,730 |
Fortress
Biotech 3 |
|
147,400 |
|
|
411,246 |
†Invitae
Corporation 3 |
|
144,936 |
|
|
1,189,925 |
Keryx
Biopharmaceuticals 3 |
|
271,725 |
|
|
1,372,211 |
Sangamo
BioSciences 3 |
|
191,785 |
|
|
1,750,997 |
†Stemline
Therapeutics 3 |
|
159,179 |
|
|
1,004,419 |
Zealand Pharma 3 |
|
151,000 |
|
|
3,309,274 |
| |
|
|
|
|
| |
|
|
|
|
12,861,845
|
| |
|
|
|
|
| HEALTH CARE
EQUIPMENT & SUPPLIES - 7.0% |
|
|
|
|
|
†Analogic
Corporation |
|
17,200 |
|
|
1,420,720 |
AngioDynamics
1,3 |
|
106,061 |
|
|
1,287,580 |
Atrion Corporation 1 |
|
9,760 |
|
|
3,720,512 |
Cerus
Corporation 1,2,3 |
|
140,000 |
|
|
884,800 |
Cynosure
Cl. A 3 |
|
1,500 |
|
|
67,005 |
Derma
Sciences 3 |
|
74,958 |
|
|
342,558 |
Exactech
1,2,3 |
|
127,200 |
|
|
2,308,680 |
Inogen
3 |
|
5,400 |
|
|
216,486 |
Invacare
Corporation 1 |
|
44,300 |
|
|
770,377 |
STRATEC
Biomedical |
|
14,000 |
|
|
924,724 |
†SurModics 3 |
|
282,000 |
|
|
5,716,140 |
Symmetry
Surgical 3 |
|
2,975 |
|
|
27,370 |
Syneron
Medical 3 |
|
69,200 |
|
|
533,532 |
TearLab
Corporation 3 |
|
85,000 |
|
|
118,150 |
Trinity
Biotech ADR Cl. A |
|
100,500 |
|
|
1,181,880 |
Utah
Medical Products |
|
38,100 |
|
|
2,230,374 |
| |
|
|
|
|
| |
|
|
|
|
21,750,888
|
| |
|
|
|
|
| HEALTH CARE
PROVIDERS & SERVICES - 3.8% |
|
|
|
|
|
Aceto
Corporation 1 |
|
79,600 |
|
|
2,147,608 |
Addus
HomeCare 3 |
|
29,500 |
|
|
686,760 |
CorVel
Corporation 1,2,3 |
|
40,000 |
|
|
1,756,800 |
Cross Country Healthcare 3 |
|
175,400 |
|
|
2,874,806 |
Landauer |
|
33,743 |
|
|
1,110,820 |
National
Research Cl. A |
|
40,033 |
|
|
642,129 |
PharMerica
Corporation 1,2,3 |
|
40,000 |
|
|
1,400,000 |
Psychemedics
Corporation |
|
37,500 |
|
|
380,250 |
U.S.
Physical Therapy |
|
12,600 |
|
|
676,368 |
| |
|
|
|
|
| |
|
|
|
|
11,675,541
|
| |
|
|
|
|
| HEALTH CARE
TECHNOLOGY - 0.1% |
|
|
|
|
|
Vocera
Communications 3 |
|
33,100 |
|
|
403,820
|
| |
|
|
|
|
| PHARMACEUTICALS
- 1.1% |
|
|
|
|
|
Agile
Therapeutics 1,2,3 |
|
80,000 |
|
|
780,800 |
Lipocine
3 |
|
90,467 |
|
|
1,169,738 |
Repros
Therapeutics 3 |
|
129,000 |
|
|
156,090 |
Theravance
Biopharma 3 |
|
83,509 |
|
|
1,368,713 |
| |
|
|
|
|
| |
|
|
|
|
3,475,341
|
| |
| Total (Cost
$40,357,258) |
|
|
|
|
50,167,435
|
| |
| |
|
|
|
|
|
| INDUSTRIALS
– 16.1% |
|
|
|
|
|
| AEROSPACE
& DEFENSE - 0.4% |
|
|
|
|
|
CPI
Aerostructures 3 |
|
9,500 |
|
|
92,435 |
FLYHT
Aerospace Solutions 3 |
|
1,916,800 |
|
|
318,613 |
Innovative
Solutions and Support 3 |
|
142,828 |
|
|
394,205 |
SIFCO
Industries 3 |
|
45,800 |
|
|
435,100 |
| |
|
|
|
|
| |
|
|
|
|
1,240,353
|
| |
|
|
|
|
| AIR FREIGHT
& LOGISTICS - 0.2% |
|
|
|
|
|
Frontier
Services Group 3 |
|
3,009,086 |
|
|
687,591
|
| |
|
|
|
|
| BUILDING PRODUCTS
- 1.6% |
|
|
|
|
|
AAON
1 |
|
21,200 |
|
|
492,264 |
Apogee
Enterprises |
|
15,900 |
|
|
691,809 |
Burnham
Holdings Cl. A 4 |
|
117,000 |
|
|
1,924,650 |
| 30 | 2015
Annual Report to Stockholders |
|
THE ACCOMPANYING
NOTES ARE AN INTEGRAL PART OF THESE FINANCIAL STATEMENTS |
| |
| Schedule
of Investments (continued) |
|
|
|
|
|
| |
|
|
|
|
|
| |
|
SHARES
|
|
|
VALUE
|
| |
| |
|
|
|
|
|
| INDUSTRIALS
(continued) |
|
|
|
|
|
| BUILDING PRODUCTS
(continued) |
|
|
|
|
|
Insteel
Industries |
|
60,500 |
|
$ |
1,265,660 |
Patrick
Industries 3 |
|
16,900 |
|
|
735,150 |
| |
|
|
|
|
| |
|
|
|
|
5,109,533
|
| |
|
|
|
|
| COMMERCIAL
SERVICES & SUPPLIES - 1.9% |
|
|
|
|
|
†Atento
3 |
|
159,501 |
|
|
1,553,540 |
CompX
International Cl. A |
|
107,500 |
|
|
1,225,500 |
Heritage-Crystal Clean 1,2,3 |
|
235,077 |
|
|
2,491,816 |
Team
1,3 |
|
17,500 |
|
|
559,300 |
| |
|
|
|
|
| |
|
|
|
|
5,830,156
|
| |
|
|
|
|
| CONSTRUCTION
& ENGINEERING - 3.9% |
|
|
|
|
|
Ameresco
Cl. A 3 |
|
275,700 |
|
|
1,723,125 |
Integrated Electrical Services 3 |
|
568,594 |
|
|
6,294,335 |
Layne
Christensen 1,2,3 |
|
50,000 |
|
|
263,000 |
MYR
Group 1,2,3 |
|
92,300 |
|
|
1,902,303 |
Northwest
Pipe 3 |
|
101,800 |
|
|
1,139,142 |
Orbit
Garant Drilling 3 |
|
1,492,500 |
|
|
787,400 |
| |
|
|
|
|
| |
|
|
|
|
12,109,305
|
| |
|
|
|
|
| ELECTRICAL
EQUIPMENT - 1.2% |
|
|
|
|
|
Encore
Wire 1 |
|
18,400 |
|
|
682,456 |
LSI
Industries |
|
93,012 |
|
|
1,133,816 |
Orion
Energy Systems 3 |
|
170,000 |
|
|
368,900 |
Powell
Industries |
|
28,400 |
|
|
739,252 |
†Power
Solutions International 1,2,3 |
|
7,100 |
|
|
129,575 |
Preformed
Line Products |
|
17,243 |
|
|
725,930 |
| |
|
|
|
|
| |
|
|
|
|
3,779,929
|
| |
|
|
|
|
| INDUSTRIAL
CONGLOMERATES - 0.5% |
|
|
|
|
|
Raven
Industries 1 |
|
93,400 |
|
|
1,457,040
|
| |
|
|
|
|
| MACHINERY
- 3.7% |
|
|
|
|
|
CIRCOR
International 1 |
|
1,100 |
|
|
46,365 |
Columbus
McKinnon |
|
5,300 |
|
|
100,170 |
Eastern
Company (The) |
|
39,750 |
|
|
745,312 |
Foster
(L.B.) Company 1 |
|
99,300 |
|
|
1,356,438 |
Graham
Corporation 1 |
|
81,150 |
|
|
1,364,943 |
Hurco
Companies |
|
57,266 |
|
|
1,520,985 |
Kadant |
|
34,300 |
|
|
1,392,923 |
Luxfer
Holdings ADR |
|
59,712 |
|
|
587,566 |
NN |
|
103,900 |
|
|
1,656,166 |
Pfeiffer
Vacuum Technology |
|
6,000 |
|
|
611,343 |
Sun
Hydraulics |
|
8,200 |
|
|
260,186 |
Tennant
Company 1,2 |
|
33,500 |
|
|
1,884,710 |
Twin
Disc |
|
7,000 |
|
|
73,640 |
| |
|
|
|
|
| |
|
|
|
|
11,600,747
|
| |
|
|
|
|
| MARINE - 0.1% |
|
|
|
|
|
Clarkson |
|
13,000 |
|
|
430,713
|
| |
|
|
|
|
| PROFESSIONAL
SERVICES - 1.5% |
|
|
|
|
|
Acacia
Research 1 |
|
63,700 |
|
|
273,273 |
CBIZ
3 |
|
47,000 |
|
|
463,420 |
Franklin
Covey 3 |
|
68,400 |
|
|
1,145,016 |
Heidrick
& Struggles International |
|
46,300 |
|
|
1,260,286 |
Kforce
1 |
|
3,200 |
|
|
80,896 |
Mistras
Group 3 |
|
4,100 |
|
|
78,269 |
Navigant
Consulting 3 |
|
5,100 |
|
|
81,906 |
Resources
Connection |
|
20,000 |
|
|
326,800 |
RPX
Corporation 3 |
|
104,900 |
|
|
1,153,900 |
| |
|
|
|
|
| |
|
|
|
|
4,863,766
|
| |
|
|
|
|
| ROAD &
RAIL - 0.6% |
|
|
|
|
|
Marten
Transport |
|
3,300 |
|
|
58,410 |
†Patriot
Transportation Holding 1,3 |
|
29,460 |
|
|
683,472 |
Universal
Truckload Services 1 |
|
77,600 |
|
|
1,089,504 |
| |
|
|
|
|
| |
|
|
|
|
1,831,386
|
| |
|
|
|
|
| TRADING COMPANIES
& DISTRIBUTORS - 0.3% |
|
|
|
|
|
Houston
Wire & Cable |
|
172,075 |
|
|
908,556
|
| |
|
|
|
|
| TRANSPORTATION
INFRASTRUCTURE - 0.2% |
|
|
|
|
|
Touax
3 |
|
53,197 |
|
|
578,121
|
| |
| Total (Cost
$46,088,814) |
|
|
|
|
50,427,196
|
| |
| |
|
|
|
|
|
| INFORMATION
TECHNOLOGY – 26.2% |
|
|
|
|
|
| COMMUNICATIONS
EQUIPMENT - 1.6% |
|
|
|
|
|
Alliance
Fiber Optic Products 3 |
|
72,000 |
|
|
1,091,520 |
Applied
Optoelectronics 1,2,3 |
|
7,500 |
|
|
128,700 |
Bel
Fuse Cl. A |
|
67,705 |
|
|
985,785 |
CalAmp
Corporation 3 |
|
5,500 |
|
|
109,615 |
Ceragon
Networks 3 |
|
29,700 |
|
|
35,937 |
†Clearfield
3 |
|
78,500 |
|
|
1,052,685 |
ClearOne |
|
25,000 |
|
|
323,250 |
Extreme
Networks 3 |
|
124,000 |
|
|
505,920 |
KVH
Industries 3 |
|
8,900 |
|
|
83,838 |
Oclaro
3 |
|
152,300 |
|
|
530,004 |
PCTEL |
|
34,100 |
|
|
155,155 |
Sandvine
Corporation 3 |
|
22,700 |
|
|
58,074 |
| |
|
|
|
|
| |
|
|
|
|
5,060,483
|
| |
|
|
|
|
| ELECTRONIC
EQUIPMENT, INSTRUMENTS & COMPONENTS - 9.2% |
|
|
|
|
|
Agilysys
3 |
|
170,587 |
|
|
1,704,164 |
Deswell
Industries |
|
524,371 |
|
|
749,851 |
DTS
3 |
|
73,500 |
|
|
1,659,630 |
Electro
Rent |
|
171,800 |
|
|
1,580,560 |
ePlus
3 |
|
2,700 |
|
|
251,802 |
Fabrinet
3 |
|
2,200 |
|
|
52,404 |
†FARO
Technologies 1,2,3 |
|
60,000 |
|
|
1,771,200 |
HollySys
Automation Technologies |
|
56,700 |
|
|
1,257,606 |
Inficon
Holding |
|
3,600 |
|
|
1,148,336 |
LRAD
Corporation 3 |
|
853,456 |
|
|
1,698,377 |
Mercury
Systems 3 |
|
47,500 |
|
|
872,100 |
Mesa Laboratories 1,2 |
|
27,900 |
|
|
2,776,050 |
Newport Corporation 1,2,3 |
|
204,423 |
|
|
3,244,193 |
Orbotech 1,2,3 |
|
134,000 |
|
|
2,965,420 |
PC
Connection |
|
43,716 |
|
|
989,730 |
Perceptron
3 |
|
8,500 |
|
|
66,215 |
Richardson
Electronics |
|
330,900 |
|
|
1,876,203 |
Rofin-Sinar
Technologies 3 |
|
85,100 |
|
|
2,278,978 |
Rogers
Corporation 1,3 |
|
1,600 |
|
|
82,512 |
Vishay
Precision Group 3 |
|
158,000 |
|
|
1,788,560 |
| |
|
|
|
|
| |
|
|
|
|
28,813,891
|
| |
|
|
|
|
| INTERNET SOFTWARE
& SERVICES - 4.8% |
|
|
|
|
|
Actua
Corporation 3 |
|
52,096 |
|
|
596,499 |
Care.com 1,2,3 |
|
401,654 |
|
|
2,875,843 |
†IZEA 3,4 |
|
798,700 |
|
|
315,486 |
Marchex
Cl. B |
|
85,000 |
|
|
330,650 |
QuinStreet
3 |
|
392,400 |
|
|
1,683,396 |
RealNetworks
3 |
|
244,000 |
|
|
1,037,000 |
Reis |
|
25,000 |
|
|
593,250 |
SciQuest
3 |
|
108,000 |
|
|
1,400,760 |
†Solium
Capital 3 |
|
186,300 |
|
|
942,473 |
Stamps.com
3 |
|
9,900 |
|
|
1,085,139 |
Support.com
3 |
|
880,658 |
|
|
889,465 |
Textura
Corporation 1,2,3 |
|
71,600 |
|
|
1,545,128 |
| THE ACCOMPANYING
NOTES ARE AN INTEGRAL PART OF THESE FINANCIAL STATEMENTS |
|
2015 Annual
Report to Stockholders | 31 |
| |
| Schedule
of Investments (continued) |
|
|
|
|
|
|
|
| |
|
|
|
|
|
|
|
| |
|
SHARES
|
|
|
|
VALUE
|
|
| |
| |
|
|
|
|
|
|
|
| INFORMATION
TECHNOLOGY (continued) |
|
|
|
|
|
|
|
| INTERNET SOFTWARE
& SERVICES (continued) |
|
|
|
|
|
|
|
United
Online 3 |
|
132,800 |
|
|
$ |
1,565,712 |
|
| |
|
|
|
|
|
|
| |
|
|
|
|
|
14,860,801
|
|
| |
|
|
|
|
|
|
| IT SERVICES
- 2.2% |
|
|
|
|
|
|
|
Cass
Information Systems 1 |
|
29,150 |
|
|
|
1,500,059 |
|
Computer
Task Group 1 |
|
333,633 |
|
|
|
2,208,650 |
|
Hackett
Group (The) |
|
111,100 |
|
|
|
1,785,377 |
|
Innodata
3 |
|
437,275 |
|
|
|
1,246,234 |
|
Sykes
Enterprises 3 |
|
2,900 |
|
|
|
89,262 |
|
| |
|
|
|
|
|
|
| |
|
|
|
|
|
6,829,582
|
|
| |
|
|
|
|
|
|
| SEMICONDUCTORS
& SEMICONDUCTOR EQUIPMENT - 4.1% |
|
|
|
|
|
|
|
Amtech
Systems 3 |
|
160,284 |
|
|
|
1,003,378 |
|
Brooks
Automation 1 |
|
131,200 |
|
|
|
1,401,216 |
|
Cascade
Microtech 3 |
|
105,200 |
|
|
|
1,709,500 |
|
GSI
Technology 3 |
|
60,000 |
|
|
|
223,200 |
|
Intermolecular
3 |
|
240,000 |
|
|
|
556,800 |
|
IXYS
Corporation |
|
18,800 |
|
|
|
237,444 |
|
Kulicke
& Soffa Industries 3 |
|
88,000 |
|
|
|
1,026,960 |
|
MoSys
1,2,3 |
|
402,275 |
|
|
|
438,480 |
|
Nanometrics
3 |
|
50,800 |
|
|
|
769,112 |
|
Nova
Measuring Instruments 3 |
|
117,900 |
|
|
|
1,155,420 |
|
Photronics
3 |
|
186,000 |
|
|
|
2,315,700 |
|
Rudolph
Technologies 3 |
|
2,900 |
|
|
|
41,238 |
|
Sigma
Designs 3 |
|
62,700 |
|
|
|
396,264 |
|
Silicon
Motion Technology ADR |
|
35,300 |
|
|
|
1,107,008 |
|
Ultra
Clean Holdings 3 |
|
57,000 |
|
|
|
291,840 |
|
Xcerra
Corporation 3 |
|
26,200 |
|
|
|
158,510 |
|
| |
|
|
|
|
|
|
| |
|
|
|
|
|
12,832,070
|
|
| |
|
|
|
|
|
|
| SOFTWARE -
3.1% |
|
|
|
|
|
|
|
American
Software Cl. A |
|
122,752 |
|
|
|
1,249,615 |
|
BSQUARE
Corporation 3 |
|
83,675 |
|
|
|
509,581 |
|
†Computer
Modelling Group |
|
276,500 |
|
|
|
1,794,443 |
|
Gigamon
3 |
|
3,600 |
|
|
|
95,652 |
|
Model
N 3 |
|
95,000 |
|
|
|
1,060,200 |
|
PSI
3 |
|
34,000 |
|
|
|
478,291 |
|
Rubicon
Project 3 |
|
60,500 |
|
|
|
995,225 |
|
SeaChange
International 3 |
|
295,300 |
|
|
|
1,990,322 |
|
TiVo
3 |
|
151,600 |
|
|
|
1,308,308 |
|
| |
|
|
|
|
|
|
| |
|
|
|
|
|
9,481,637
|
|
| |
|
|
|
|
|
|
| TECHNOLOGY
HARDWARE, STORAGE & PERIPHERALS - 1.2% |
|
|
|
|
|
|
|
Intevac
3 |
|
251,700 |
|
|
|
1,185,507 |
|
Kortek |
|
135,007 |
|
|
|
1,332,127 |
|
Silicon
Graphics International 3 |
|
106,400 |
|
|
|
627,760 |
|
TransAct
Technologies |
|
78,600 |
|
|
|
674,388 |
|
| |
|
|
|
|
|
|
| |
|
|
|
|
|
3,819,782
|
|
| |
| Total (Cost
$83,689,269) |
|
|
|
|
|
81,698,246
|
|
| |
| |
|
|
|
|
|
|
|
| MATERIALS
– 5.6% |
|
|
|
|
|
|
|
| CHEMICALS
- 1.3% |
|
|
|
|
|
|
|
Balchem
Corporation 1 |
|
11,775 |
|
|
|
715,920 |
|
FutureFuel
Corporation |
|
85,262 |
|
|
|
1,151,037 |
|
Quaker
Chemical 1 |
|
27,400 |
|
|
|
2,116,924 |
|
| |
|
|
|
|
|
|
| |
|
|
|
|
|
3,983,881
|
|
| |
|
|
|
|
|
|
| CONSTRUCTION
MATERIALS - 0.7% |
|
|
|
|
|
|
|
Ash
Grove Cement 4 |
|
8,000 |
|
|
|
1,664,000 |
|
Monarch
Cement 4 |
|
16,303 |
|
|
|
489,090 |
|
| |
|
|
|
|
|
|
| |
|
|
|
|
|
2,153,090
|
|
| |
|
|
|
|
|
|
| CONTAINERS
& PACKAGING - 0.5% |
|
|
|
|
|
|
|
UFP
Technologies 3 |
|
62,236 |
|
|
|
1,482,461
|
|
| |
|
|
|
|
|
|
| METALS &
MINING - 3.1% |
|
|
|
|
|
|
|
Alamos
Gold Cl. A |
|
236,044 |
|
|
|
776,180 |
|
Ampco-Pittsburgh |
|
92,252 |
|
|
|
946,506 |
|
Central
Steel & Wire 4 |
|
788 |
|
|
|
429,476 |
|
Comstock
Mining 3 |
|
938,634 |
|
|
|
375,360 |
|
Exeter
Resource 3 |
|
1,271,700 |
|
|
|
413,303 |
|
Haynes
International 1 |
|
19,000 |
|
|
|
697,110 |
|
Hecla
Mining |
|
44,518 |
|
|
|
84,139 |
|
Horsehead
Holding Corporation 1,2,3 |
|
11,900 |
|
|
|
24,395 |
|
Imdex
3 |
|
525,666 |
|
|
|
76,137 |
|
MAG
Silver 3 |
|
96,050 |
|
|
|
678,113 |
|
Major Drilling Group International |
|
796,857 |
|
|
|
2,522,392 |
|
Materion
Corporation |
|
50,000 |
|
|
|
1,400,000 |
|
Olympic
Steel |
|
70,000 |
|
|
|
810,600 |
|
Pretium
Resources 3 |
|
90,000 |
|
|
|
452,699 |
|
Universal
Stainless & Alloy Products 3 |
|
6,100 |
|
|
|
56,669 |
|
Victoria
Gold 3 |
|
890,000 |
|
|
|
99,696 |
|
| |
|
|
|
|
|
|
| |
|
|
|
|
|
9,842,775
|
|
| |
| Total (Cost
$18,953,830) |
|
|
|
|
|
17,462,207
|
|
| |
| |
|
|
|
|
|
|
|
| TELECOMMUNICATION
SERVICES – 0.1% |
|
|
|
|
|
|
|
| DIVERSIFIED
TELECOMMUNICATION SERVICES - 0.1% |
|
|
|
|
|
|
|
ORBCOMM
3 |
|
45,800 |
|
|
|
331,592
|
|
| |
| Total (Cost
$283,906) |
|
|
|
|
|
331,592
|
|
| |
| |
|
|
|
|
|
|
|
| UTILITIES
– 0.3% |
|
|
|
|
|
|
|
| GAS UTILITIES
- 0.1% |
|
|
|
|
|
|
|
Shizuoka
Gas |
|
40,000 |
|
|
|
255,668
|
|
| |
|
|
|
|
|
|
| INDEPENDENT
POWER & RENEWABLE ELECTRICITY PRODUCER - 0.0% |
|
|
|
|
|
|
|
Alterra
Power 3 |
|
450,000 |
|
|
|
149,599
|
|
| |
|
|
|
|
|
|
| WATER UTILITIES
- 0.2% |
|
|
|
|
|
|
|
GWR
Global Water Resources |
|
106,000 |
|
|
|
580,675
|
|
| |
| Total (Cost
$936,784) |
|
|
|
|
|
985,942
|
|
| |
| |
|
|
|
|
|
|
|
| MISCELLANEOUS6 – 4.9% |
|
|
|
|
|
|
|
| |
| Total (Cost
$16,516,798) |
|
|
|
|
|
15,224,770
|
|
| |
| |
|
|
|
|
|
|
|
| TOTAL COMMON
STOCKS |
|
|
|
|
|
|
|
| |
| (Cost $339,055,131) |
|
|
|
|
|
339,436,851
|
|
| |
| |
|
|
|
|
|
|
|
| PREFERRED STOCK - 0.4% |
|
|
|
|
|
|
|
Seneca Foods
Conv. 3,4 |
|
45,409 |
|
|
|
1,315,499
|
|
| |
| (Cost $578,719)
|
|
|
|
|
|
1,315,499
|
|
| |
| |
|
|
|
|
|
|
|
| REPURCHASE
AGREEMENT– 4.6% |
|
|
|
|
|
|
|
|
Fixed Income Clearing Corporation, 0.03% dated 12/31/15, due 1/4/16, maturity value
$14,418,048 (collateralized by obligations of various U.S. Government Agencies,
1.625% due 7/31/20, valued at $14,708,363) |
| |
| (Cost $14,418,000)
|
|
|
|
|
|
14,418,000
|
|
| |
| |
|
|
|
|
|
|
|
| TOTAL INVESTMENTS
– 113.7% |
|
|
|
|
|
|
|
| |
| (Cost $354,051,850)
|
|
|
|
|
|
355,170,350
|
|
| |
| |
|
|
|
|
|
|
|
| LIABILITIES
LESS CASH AND OTHER ASSETS – (13.7)% |
|
|
|
|
|
(42,763,258 |
) |
| |
|
|
|
|
|
|
| |
|
|
|
|
|
|
|
| |
| NET ASSETS
– 100.0% |
|
|
|
|
$ |
312,407,092
|
|
| |
| 32 | 2015
Annual Report to Stockholders |
|
THE ACCOMPANYING
NOTES ARE AN INTEGRAL PART OF THESE FINANCIAL STATEMENTS |
| |
| † |
New additions
in 2015. |
| 1 |
All or
a portion of these securities were pledged as collateral in connection with the
revolving credit agreement at December 31, 2015. Total market value of pledged securities
at December 31, 2015, was $82,340,578. |
| 2 |
At December
31, 2015, a portion of these securities were rehypothecated in connection with the
Fund’s revolving credit agreement in the aggregate amount of $29,125,481. |
| 3 |
Non-income
producing. |
| 4 |
These securities
are defined as Level 2 securities due to fair value being based on quoted prices
for similar securities. See Notes to Financial Statements. |
| 5 |
A security
for which market quotations are not readily available represents 0.1% of net assets.
This security has been valued at its fair value under procedures approved by the
Fund’s Board of Directors. This security is defined as a Level 3 security due
to the use of significant unobservable inputs in the determination of fair value.
See Notes to Financial Statements. |
| 6 |
Includes
securities first acquired in 2015 and less than 1% of net assets. |
| |
|
| |
Bold
indicates the Fund’s 20 largest equity holdings in terms of December 31, 2015,
market value. |
| |
|
| |
TAX
INFORMATION: The cost of total investments for Federal income tax purposes was
$355,802,750. At December 31, 2015, net unrealized depreciation for all securities
was $632,400, consisting of aggregate gross unrealized appreciation of $64,839,661
and aggregate gross unrealized depreciation of $65,472,061. The primary difference
between book and tax basis cost is the timing of the recognition of losses on securities
sold, investments in publicly traded partnerships and mark-to-market of Passive
Foreign Investment Companies. |
| |
| THE ACCOMPANYING
NOTES ARE AN INTEGRAL PART OF THESE FINANCIAL STATEMENTS |
|
2015 Annual
Report to Stockholders | 33 |
| Royce Micro-Cap
Trust |
|
December
31, 2015 |
| |
|
|
| |
| Statement
of Assets and Liabilities |
|
|
| ASSETS: |
|
|
|
|
| Investments
at value |
|
$ |
340,752,350 |
|
| |
| Repurchase
agreements (at cost and value) |
|
|
14,418,000 |
|
| |
| Cash and foreign
currency |
|
|
50,124 |
|
| |
| Receivable
for investments sold |
|
|
3,346,488 |
|
| |
| Receivable
for dividends and interest |
|
|
567,218 |
|
| |
| Prepaid expenses
and other assets |
|
|
30,554 |
|
| |
| Total Assets
|
|
|
359,164,734
|
|
| |
| LIABILITIES: |
|
|
|
|
| |
| Revolving
credit agreement |
|
|
45,000,000 |
|
| |
| Payable for
investments purchased |
|
|
1,423,302 |
|
| |
| Payable for
investment advisory fee |
|
|
192,194 |
|
| |
| Payable for
directors’ fees |
|
|
29,609 |
|
| |
| Payable for
interest expense |
|
|
3,892 |
|
| |
| Accrued expenses |
|
|
108,645 |
|
| |
| Total Liabilities
|
|
|
46,757,642
|
|
| |
| Net Assets
|
|
$ |
312,407,092
|
|
| |
| ANALYSIS OF
NET ASSETS: |
|
|
|
|
| Paid-in capital - $0.001 par value per share; 36,374,786 shares outstanding (150,000,000 shares authorized) |
|
$ |
306,854,627 |
|
| |
| Undistributed
net investment income (loss) |
|
|
(116,177 |
) |
| |
| Accumulated
net realized gain (loss) on investments and foreign currency |
|
|
4,552,877 |
|
| |
| Net unrealized
appreciation (depreciation) on investments and foreign currency |
|
|
1,115,765 |
|
| |
| Net Assets
(net asset value per share - $8.59) |
|
$ |
312,407,092
|
|
| |
| Investments
at identified cost |
|
$ |
339,633,850 |
|
| |
| 34 | 2015
Annual Report to Stockholders |
|
THE ACCOMPANYING
NOTES ARE AN INTEGRAL PART OF THESE FINANCIAL STATEMENTS |
| Royce Micro-Cap
Trust |
| |
| |
| Statement
of Changes in Net Assets |
| |
|
YEAR ENDED 12/31/15 |
|
YEAR ENDED 12/31/14 |
| |
| |
|
|
|
|
|
|
|
|
| INVESTMENT
OPERATIONS: |
|
|
|
|
|
|
|
|
| Net investment
income (loss) |
|
$ |
917,928 |
|
|
$ |
(382,932 |
) |
| |
| Net realized
gain (loss) on investments and foreign currency |
|
|
21,372,239 |
|
|
|
94,504,058 |
|
| |
| Net change
in unrealized appreciation (depreciation) on investments and foreign currency |
|
|
(71,062,194 |
) |
|
|
(85,903,074 |
) |
| |
| Net increase
(decrease) in net assets from investment operations |
|
|
(48,772,027 |
) |
|
|
8,218,052
|
|
| |
| DISTRIBUTIONS: |
|
|
|
|
|
|
|
|
| Net investment
income |
|
|
(399,672 |
) |
|
|
(1,343,094 |
) |
| |
| Net realized
gain on investments and foreign currency |
|
|
(43,520,307 |
) |
|
|
(89,530,419 |
) |
| |
| Total distributions
|
|
|
(43,919,979 |
) |
|
|
(90,873,513 |
) |
| |
| CAPITAL STOCK
TRANSACTIONS: |
|
|
|
|
|
|
|
|
| Reinvestment
of distributions |
|
|
17,611,123 |
|
|
|
37,022,256 |
|
| |
| Total capital
stock transactions |
|
|
17,611,123
|
|
|
|
37,022,256
|
|
| |
| Net Increase
(Decrease) In Net Assets |
|
|
(75,080,883 |
) |
|
|
(45,633,205 |
) |
| |
| NET ASSETS: |
|
|
|
|
|
|
|
|
| |
| Beginning
of year |
|
|
387,487,975
|
|
|
|
433,121,180
|
|
| |
| End of
year (including undistributed net investment income (loss) of $(116,177) at 12/31/15
and $(1,763,387) at 12/31/14) |
|
$ |
312,407,092
|
|
|
$ |
387,487,975
|
|
| |
| THE ACCOMPANYING
NOTES ARE AN INTEGRAL PART OF THESE FINANCIAL STATEMENTS |
|
2015 Annual
Report to Stockholders | 35 |
| Royce Micro-Cap
Trust |
|
Year Ended
December 31, 2015 |
| |
|
|
| |
| Statement
of Operations |
|
|
| INVESTMENT
INCOME: |
|
|
|
|
| INCOME: |
|
|
|
|
| Dividends |
|
$ |
5,352,830 |
|
| |
| Foreign withholding
tax |
|
|
(90,772 |
) |
| |
| Interest |
|
|
312 |
|
| |
| Rehypothecation
income |
|
|
258,203 |
|
| |
| Total income
|
|
|
5,520,573
|
|
| |
| EXPENSES: |
|
|
|
|
| |
| Investment
advisory fees |
|
|
3,350,257 |
|
| |
| Interest expense |
|
|
737,528 |
|
| |
| Stockholder
reports |
|
|
139,562 |
|
| |
| Custody and
transfer agent fees |
|
|
99,018 |
|
| |
| Directors’ fees |
|
|
93,378 |
|
| |
| Administrative
and office facilities |
|
|
58,985 |
|
| |
| Professional
fees |
|
|
57,082 |
|
| |
| Other expenses |
|
|
66,835 |
|
| |
| Total expenses
|
|
|
4,602,645
|
|
| |
| Net investment
income (loss) |
|
|
917,928
|
|
| |
| REALIZED
AND UNREALIZED GAIN (LOSS) ON INVESTMENTS AND FOREIGN CURRENCY: |
|
|
|
|
| NET REALIZED
GAIN (LOSS): |
|
|
|
|
| |
| Investments |
|
|
21,372,172 |
|
| |
| Foreign currency
transactions |
|
|
67 |
|
| |
| NET CHANGE
IN UNREALIZED APPRECIATION (DEPRECIATION): |
|
|
|
|
| |
| Investments
and foreign currency translations |
|
|
(71,065,569 |
) |
| |
| Other assets
and liabilities denominated in foreign currency |
|
|
3,375 |
|
| |
| Net realized
and unrealized gain (loss) on investments and foreign currency |
|
|
(49,689,955 |
) |
| |
| NET INCREASE
(DECREASE) IN NET ASSETS FROM INVESTMENT OPERATIONS |
|
$ |
(48,772,027 |
) |
| |
| 36 | 2015
Annual Report to Stockholders |
|
THE ACCOMPANYING
NOTES ARE AN INTEGRAL PART OF THESE FINANCIAL STATEMENTS |
| Royce Micro-Cap
Trust |
|
Year Ended
December 31, 2015 |
| |
|
|
| |
| Statement
of Cash Flows |
|
|
| CASH FLOWS
FROM OPERATING ACTIVITIES: |
|
|
|
|
| Net increase
(decrease) in net assets from investment operations |
|
$ |
(48,772,027 |
) |
| |
| Adjustments
to reconcile net increase (decrease) in net assets from investment operations to
net cash provided by operating activities: |
|
|
|
|
| |
Purchases
of long-term investments |
|
|
(146,887,346 |
) |
| |
Proceeds
from sales and maturities of long-term investments |
|
|
199,467,869 |
|
| |
Net
purchases, sales and maturities of short-term investments |
|
|
(11,762,000 |
) |
| |
Net
(increase) decrease in dividends and interest receivable and other assets |
|
|
(232,001 |
) |
| |
Net
increase (decrease) in interest expense payable, accrued expenses and other liabilities |
|
|
(149,031 |
) |
| |
Net
change in unrealized appreciation (depreciation) on investments |
|
|
71,065,569 |
|
| |
Net
realized gain (loss) on investments and foreign currency |
|
|
(21,372,239 |
) |
| |
| Net cash
provided by operating activities |
|
|
41,358,794
|
|
| |
| CASH FLOWS
FROM FINANCING ACTIVITIES: |
|
|
|
|
| Net increase
(decrease) in revolving credit agreement |
|
|
(15,000,000 |
) |
| |
| Distributions |
|
|
(43,919,979 |
) |
| |
| Reinvestment
of distributions |
|
|
17,611,123 |
|
| |
| Net cash
used for financing activities |
|
|
(41,308,856 |
) |
| |
| INCREASE
(DECREASE) IN CASH: |
|
|
49,938
|
|
| |
| Cash and
foreign currency at beginning of year |
|
|
186 |
|
| |
| Cash and
foreign currency at end of year |
|
$ |
50,124
|
|
| |
| THE ACCOMPANYING
NOTES ARE AN INTEGRAL PART OF THESE FINANCIAL STATEMENTS |
|
2015 Annual
Report to Stockholders | 37 |
| Royce Micro-Cap
Trust |
| |
| |
| Financial
Highlights |
| This table
is presented to show selected data for a share of Common Stock outstanding throughout
each period, and to assist stockholders in evaluating the Fund’s performance
for the periods presented. |
| |
|
YEARS ENDED |
| |
|
|
| |
|
12/31/15 |
|
12/31/14 |
|
12/31/13 |
|
12/31/12 |
|
12/31/11 |
| |
| Net Asset
Value, Beginning of Period |
|
$ |
11.33 |
|
|
$ |
14.12 |
|
|
$ |
10.93 |
|
|
$ |
9.86 |
|
|
$ |
11.34 |
|
| |
| INVESTMENT
OPERATIONS: |
|
|
|
|
|
|
|
|
|
|
|
|
|
|
|
|
|
|
|
|
| Net investment
income (loss) |
|
|
0.03 |
|
|
|
(0.01 |
) |
|
|
0.01 |
|
|
|
0.15 |
|
|
|
0.04 |
|
| |
| Net realized
and unrealized gain (loss) on investments and foreign currency |
|
|
(1.42 |
) |
|
|
0.25 |
|
|
|
4.64 |
|
|
|
1.58 |
|
|
|
(0.82 |
) |
| |
| Total investment
operations |
|
|
(1.39 |
) |
|
|
0.24 |
|
|
|
4.65 |
|
|
|
1.73 |
|
|
|
(0.78 |
) |
| |
| DISTRIBUTIONS
TO PREFERRED STOCKHOLDERS: |
|
|
|
|
|
|
|
|
|
|
|
|
|
|
|
|
|
|
|
|
| |
| Net investment
income |
|
|
– |
|
|
|
– |
|
|
|
– |
|
|
|
(0.02 |
) |
|
|
(0.02 |
) |
| |
| Net realized
gain on investments and foreign currency |
|
|
– |
|
|
|
– |
|
|
|
– |
|
|
|
(0.09 |
) |
|
|
(0.11 |
) |
| |
| Total distributions
to Preferred Stockholders |
|
|
–
|
|
|
|
–
|
|
|
|
–
|
|
|
|
(0.11 |
) |
|
|
(0.13 |
) |
| |
Net Increase (Decrease) in Net Assets Applicable to Common Stockholders from Investment
Operations |
|
|
(1.39 |
) |
|
|
0.24 |
|
|
|
4.65 |
|
|
|
1.62 |
|
|
|
(0.91 |
) |
| |
| DISTRIBUTIONS
TO COMMON STOCKHOLDERS: |
|
|
|
|
|
|
|
|
|
|
|
|
|
|
|
|
|
|
|
|
| |
| Net investment
income |
|
|
(0.01 |
) |
|
|
(0.04 |
) |
|
|
(0.03 |
) |
|
|
(0.08 |
) |
|
|
(0.05 |
) |
| |
| Net realized
gain on investments and foreign currency |
|
|
(1.25 |
) |
|
|
(2.86 |
) |
|
|
(1.35 |
) |
|
|
(0.43 |
) |
|
|
(0.24 |
) |
| |
| Return of
capital |
|
|
– |
|
|
|
– |
|
|
|
– |
|
|
|
– |
|
|
|
(0.24 |
) |
| |
| Total distributions
to Common Stockholders |
|
|
(1.26 |
) |
|
|
(2.90 |
) |
|
|
(1.38 |
) |
|
|
(0.51 |
) |
|
|
(0.53 |
) |
| |
| CAPITAL STOCK
TRANSACTIONS: |
|
|
|
|
|
|
|
|
|
|
|
|
|
|
|
|
|
|
|
|
| Effect of
reinvestment of distributions by Common Stockholders |
|
|
(0.09 |
) |
|
|
(0.13 |
) |
|
|
(0.08 |
) |
|
|
(0.04 |
) |
|
|
(0.04 |
) |
| |
| Total capital
stock transactions |
|
|
(0.09 |
) |
|
|
(0.13 |
) |
|
|
(0.08 |
) |
|
|
(0.04 |
) |
|
|
(0.04 |
) |
| |
| Net Asset
Value, End of Period |
|
$ |
8.59 |
|
|
$ |
11.33 |
|
|
$ |
14.12 |
|
|
$ |
10.93 |
|
|
$ |
9.86 |
|
| |
| Market
Value, End of Period |
|
$ |
7.26 |
|
|
$ |
10.08 |
|
|
$ |
12.61 |
|
|
$ |
9.45 |
|
|
$ |
8.77 |
|
| |
| TOTAL RETURN:
1 |
|
|
|
|
|
|
|
|
|
|
|
|
|
|
|
|
|
|
|
|
| Net Asset
Value |
|
|
(11.64 |
)% |
|
|
3.46 |
% |
|
|
44.66 |
% |
|
|
17.23 |
% |
|
|
(7.69 |
)% |
| Market Value |
|
|
(16.06 |
)% |
|
|
3.06 |
% |
|
|
49.42 |
% |
|
|
13.95 |
% |
|
|
(4.99 |
)% |
| |
| RATIOS BASED
ON AVERAGE NET ASSETS APPLICABLE TO COMMON STOCKHOLDERS: |
|
|
|
|
|
|
|
|
|
|
|
|
|
|
|
|
|
|
|
|
| Investment
advisory fee expense 2 |
|
|
0.93 |
% |
|
|
0.93 |
% |
|
|
0.82 |
% |
|
|
1.12 |
% |
|
|
0.97 |
% |
| |
| Other operating
expenses |
|
|
0.35 |
% |
|
|
0.25 |
% |
|
|
0.29 |
% |
|
|
0.18 |
% |
|
|
0.15 |
% |
| |
| Total expenses
(net) 3 |
|
|
1.28 |
% |
|
|
1.18 |
% |
|
|
1.11 |
% |
|
|
1.30 |
% |
|
|
1.12 |
% |
| |
| Expenses net
of fee waivers and excluding interest expense |
|
|
1.08 |
% |
|
|
1.05 |
% |
|
|
0.96 |
% |
|
|
1.27 |
% |
|
|
1.12 |
% |
| |
| Expenses prior
to fee waivers and balance credits |
|
|
1.28 |
% |
|
|
1.18 |
% |
|
|
1.11 |
% |
|
|
1.32 |
% |
|
|
1.15 |
% |
| |
| Expenses prior
to fee waivers |
|
|
1.28 |
% |
|
|
1.18 |
% |
|
|
1.11 |
% |
|
|
1.32 |
% |
|
|
1.15 |
% |
| |
| Net investment
income (loss) |
|
|
0.26 |
% |
|
|
(0.09 |
)% |
|
|
0.08 |
% |
|
|
1.46 |
% |
|
|
0.40 |
% |
| |
| SUPPLEMENTAL
DATA: |
|
|
|
|
|
|
|
|
|
|
|
|
|
|
|
|
|
|
|
|
| Net Assets
Applicable to Common Stockholders, End of Period (in thousands) |
|
$ |
312,407 |
|
$ |
387,488 |
|
$ |
433,121 |
|
$ |
318,545 |
|
$ |
279,292 |
| |
| Liquidation
Value of Preferred Stock, End of Period (in thousands) |
|
|
|
|
|
|
|
|
|
|
|
|
|
|
|
|
|
$ |
60,000 |
| |
| Portfolio
Turnover Rate |
|
|
39 |
% |
|
41 |
% |
|
29 |
% |
|
28 |
% |
|
30% |
| |
| PREFERRED
STOCK: |
|
|
|
|
|
|
|
|
|
|
|
|
|
|
|
|
|
|
|
|
| Total shares
outstanding |
|
|
|
|
|
|
|
|
|
|
|
|
|
|
|
|
|
|
2,400,000 |
| |
| Asset coverage
per share |
|
|
|
|
|
|
|
|
|
|
|
|
|
|
|
|
|
$ |
141.37 |
| |
| Liquidation preference per share |
|
|
|
|
|
|
|
|
|
|
|
|
|
|
|
|
|
$ |
25.00 |
| |
| Average month-end
market value per share |
|
|
|
|
|
|
|
|
|
|
|
|
|
|
|
|
|
$ |
25.41 |
| |
| REVOLVING
CREDIT AGREEMENT: |
|
|
|
|
|
|
|
|
|
|
|
|
|
|
|
|
|
|
|
|
| Asset coverage |
|
|
794 |
% |
|
746 |
% |
|
1062 |
% |
|
808 |
% |
|
|
|
| |
| Asset coverage
per $1,000 |
|
$ |
7,942 |
|
$ |
7,458 |
|
$ |
10,625 |
|
$ |
8,079 |
|
|
|
|
| |
| 1 |
The Market
Value Total Return is calculated assuming a purchase of Common Stock on the opening
of the first business day and a sale on the closing of the last business day of
each period. Dividends and distributions are assumed for the purposes of this calculation
to be reinvested at prices obtained under the Fund’s Distribution Reinvestment
and Cash Purchase Plan. Net Asset Value Total Return is calculated on the same basis,
except that the Fund’s net asset value is used on the purchase and sale dates
instead of market value. |
| 2 |
The investment
advisory fee is calculated based on average net assets over a rolling 36-month basis,
while the above ratios of investment advisory fee expenses are based on the average
net assets applicable to Common Stockholders over a 12-month basis. |
| 3 |
Expense
ratios based on total average net assets including liquidation value of Preferred
Stock were 1.10% and 0.93% for the years ended December 31, 2012 and 2011, respectively. |
| 38 | 2015
Annual Report to Stockholders |
|
THE ACCOMPANYING
NOTES ARE AN INTEGRAL PART OF THESE FINANCIAL STATEMENTS |
| Notes to
Financial Statements |
| |
| Summary
of Significant Accounting Policies |
Royce Micro-Cap Trust, Inc. (the “Fund”), is a diversified closed-end investment company that was incorporated under the laws of the State of Maryland on September 9, 1993. The Fund commenced operations on December 14, 1993. |
The preparation of financial statements in conformity with accounting principles generally accepted in the United States of America requires management to make estimates and assumptions that affect the reported amounts of assets and liabilities and the disclosure of contingent assets and liabilities at the date of the financial statements and the reported amounts of income and expenses during the reporting period. Actual results could differ from those estimates. |
The Fund is an investment company and accordingly follows the investment company accounting and reporting guidance of the Financial Accounting Standards Board (FASB) Accounting Standard Codification Topic 946 “Financial Services-Investment Companies”. |
| |
| VALUATION
OF INVESTMENTS: |
Securities are valued as of the close of trading on the New York Stock Exchange (NYSE) (generally 4:00 p.m. Eastern time) on the valuation date. Securities that trade on an exchange, and securities traded on Nasdaq’s Electronic Bulletin Board, are valued at their last reported sales price or Nasdaq official closing price taken from the primary market in which each security trades or, if no sale is reported for such day, at their highest bid price. Other over-the-counter securities for which market quotations are readily available are valued at their highest bid price, except in the case of some bonds and other fixed income securities which may be valued by reference to other securities with comparable ratings, interest rates and maturities, using established independent pricing services. The Fund values its non-U.S. dollar denominated securities in U.S. dollars daily at the prevailing foreign currency exchange rates as quoted by a major bank. Securities for which market quotations are not readily available are valued at their fair value in accordance with the provisions of the 1940 Act, under procedures approved by the Fund’s Board of Directors, and are reported as Level 3 securities. As a general principle, the fair value of a security is the amount which the Fund might reasonably expect to receive for the security upon its current sale. However, in light of the judgment involved in fair valuations, there can be no assurance that a fair value assigned to a particular security will be the amount which the Fund might be able to receive upon its current sale. In addition, if, between the time trading ends on a particular security and the close of the customary trading session on the NYSE, events occur that are significant and may make the closing price unreliable, the Fund may fair value the security. The Fund uses an independent pricing service to provide fair value estimates for relevant non-U.S. equity securities on days when the U.S. market volatility exceeds a certain threshold. This pricing service uses proprietary correlations it has developed between the movement of prices of non-U.S. equity securities and indices of U.S.-traded securities, futures contracts and other indications to estimate the fair value of relevant non-U.S. securities. When fair value pricing is employed, the prices of securities used by the Fund may differ from quoted or published prices for the same security. Investments in money market funds are valued at net asset value per share. |
Various inputs are used in determining the value of the Fund’s investments, as noted above. These inputs are summarized in the three
broad levels below: |
| |
|
Level 1 |
– |
quoted
prices in active markets for identical securities. |
| |
|
Level 2 |
– |
other significant
observable inputs (including quoted prices for similar securities, foreign securities
that may be fair valued and repurchase agreements). The table below includes all
Level 2 securities. Level 2 securities with values based on quoted prices for similar
securities are noted in the Schedule of Investments. |
| |
|
Level 3 |
– |
significant
unobservable inputs (including last trade price before trading was suspended, or
at a discount thereto for lack of marketability or otherwise, market price information
regarding other securities, information received from the company and/or published
documents, including SEC filings and financial statements, or other publicly available
information). |
The inputs
or methodology used for valuing securities are not necessarily an indication of
the risk associated with investing in those securities. |
The following is a summary
of the inputs used to value the Fund’s investments as of December 31, 2015. For a detailed breakout of common stocks by sector
classification, please refer to the Schedule of Investments. |
| |
|
LEVEL 1 |
|
LEVEL 2 |
|
LEVEL 3 |
|
TOTAL |
| |
| Common Stocks |
|
$ |
313,789,996 |
|
|
$ |
25,421,117 |
|
|
$ |
225,738 |
|
|
$ |
339,436,851
|
|
| |
| Preferred
Stocks |
|
|
– |
|
|
|
1,315,499 |
|
|
|
– |
|
|
|
1,315,499
|
|
| |
| Cash Equivalents |
|
|
– |
|
|
|
14,418,000 |
|
|
|
– |
|
|
|
14,418,000
|
|
| |
For the
year ended December 31, 2015, certain securities have transferred in and out of
Level 1 and Level 2 measurements. The Fund recognizes transfers between levels as
of the end of the reporting period. At December 31, 2015, securities valued at $643,961
were transferred from Level 2 to Level 1 within the fair value hierarchy. |
| 2015 Annual
Report to Stockholders | 39 |
| Royce Micro-Cap
Trust |
Notes to
Financial Statements (continued) |
| |
| VALUATION
OF INVESTMENTS (continued): |
|
Level 3 Reconciliation: |
| |
|
|
|
|
|
|
|
|
|
|
|
|
|
|
|
|
| |
|
|
|
|
|
|
|
|
|
REALIZED AND UNREALIZED |
|
|
|
|
| |
|
BALANCE AS OF 12/31/14 |
|
SALES |
|
GAIN (LOSS)1 |
|
BALANCE AS OF 12/31/15 |
| |
| Common Stocks |
|
|
$325,702 |
|
|
|
$1 |
|
|
|
$(99,963) |
|
|
|
$225,738 |
|
| |
| 1 |
The net
change in unrealized appreciation (depreciation) is included in the accompanying
Statement of Operations. Change in unrealized appreciation (depreciation) includes
net unrealized appreciation (depreciation) resulting from changes in investment
values during the reporting period and the reversal of previously recorded unrealized
appreciation (depreciation) when gains or losses are realized. Net realized gain
(loss) from investments and foreign currency transactions is included in the accompanying
Statement of Operations. |
| The following
table summarizes the valuation techniques used and unobservable inputs approved
by the Valuation Committee to determine the fair value of certain, material Level
3 investments. The table does not include Level 3 investments with values derived
utilizing prices from prior transactions or third party pricing information with
adjustments (e.g. broker quotes, pricing services, net asset values). |
| |
|
FAIR VALUE AT |
|
|
|
|
|
|
|
|
|
|
|
|
|
IMPACT TO VALUATION FROM |
| |
|
12/31/15 |
|
VALUATION TECHNIQUE(S) |
|
UNOBSERVABLE INPUT(S) |
|
RANGE AVERAGE |
|
AN INCREASE IN INPUT 1 |
| |
| Common Stocks |
|
$ |
225,738 |
|
|
|
Discounted
Present Value
Balance Sheet Analysis |
|
|
|
Liquidity
Discount |
|
|
|
30%-40% |
|
|
|
Decrease |
|
| |
| 1 |
This column
represents the directional change in the fair value of the Level 3 investments that
would result in an increase from the corresponding unobservable input. A decrease
to the unobservable input would have the opposite effect. Significant increases
and decreases in these unobservable inputs in isolation could result in significantly
higher or lower fair value measurements. |
| REPURCHASE
AGREEMENTS: |
The Fund
may enter into repurchase agreements with institutions that the Fund’s investment
adviser has determined are creditworthy. The Fund restricts repurchase agreements
to maturities of no more than seven days. Securities pledged as collateral for repurchase
agreements, which are held until maturity of the repurchase agreements, are marked-to-market
daily and maintained at a value at least equal to the principal amount of the repurchase
agreement (including accrued interest). Repurchase agreements could involve certain
risks in the event of default or insolvency of the counter-party, including possible
delays or restrictions upon the ability of the Fund to dispose of its underlying
securities. The remaining contractual maturity of the repurchase agreement held
by the Fund at December 31, 2015 is overnight and continuous. |
| |
| FOREIGN CURRENCY: |
Net realized
foreign exchange gains or losses arise from sales and maturities of short-term securities,
sales of foreign currencies, expiration of currency forward contracts, currency
gains or losses realized between the trade and settlement dates on securities transactions,
and the difference between the amounts of dividends, interest, and foreign withholding
taxes recorded on the Fund’s books and the U.S. dollar equivalent of the amounts
actually received or paid. Net unrealized foreign exchange gains and losses arise
from changes in the value of assets and liabilities, including investments in securities
at the end of the reporting period, as a result of changes in foreign currency exchange
rates. |
| |
| TAXES: |
As a qualified
regulated investment company under Subchapter M of the Internal Revenue Code, the
Fund is not subject to income taxes to the extent that it distributes substantially
all of its taxable income for its fiscal year. The Schedule of Investments includes
information regarding income taxes under the caption “Tax Information”. |
| |
| DISTRIBUTIONS: |
The Fund pays
quarterly distributions on the Fund’s Common Stock at the annual rate of 7%
of the rolling average of the prior four calendar quarter-end NAVs of the Fund’s Common Stock, with the fourth quarter distribution being the greater of 1.75%
of the rolling average or the distribution required by IRS regulations.
Prior to November 15, 2012, distributions to Preferred Stockholders were accrued
daily and paid quarterly. Distributions to Common Stockholders are recorded on ex-dividend
date. Distributable capital gains and/or net investment income were first allocated
to Preferred Stockholder distributions, with any excess allocable to Common Stockholders.
If capital gains and/or net investment income were allocated to both Preferred and
Common Stockholders, the tax character of such allocations was proportional. To
the extent that distributions are not paid from long-term capital gains, net investment
income or net short-term capital gains, they will represent a return of capital.
Distributions are determined in accordance with income tax regulations that may
differ from accounting principles generally accepted in the United States of America.
Permanent book and tax differences relating to stockholder distributions will result
in reclassifications within the capital accounts. Undistributed net investment income
may include temporary book and tax basis differences, which will reverse in a subsequent
period. Any taxable income or gain remaining undistributed at fiscal year end is
distributed in the following year. |
| 40 | 2015
Annual Report to Stockholders |
| Royce Micro-Cap
Trust |
| |
| Notes to
Financial Statements (continued) |
| INVESTMENT
TRANSACTIONS AND RELATED INVESTMENT INCOME: |
Investment
transactions are accounted for on the trade date. Dividend income is recorded on
the ex-dividend date. Non-cash dividend income is recorded at the fair market value
of the securities received. Interest income is recorded on an accrual basis. Premium
and discounts on debt securities are amortized using the effective yield-to-maturity
method. Realized gains and losses from investment transactions are determined on
the basis of identified cost for book and tax purposes. |
| |
| EXPENSES: |
The Fund
incurs direct and indirect expenses. Expenses directly attributable to the Fund
are charged to the Fund’s operations, while expenses applicable to more than one of the
Royce Funds are allocated equitably. Certain personnel, occupancy costs and other
administrative expenses related to the Funds are allocated by Royce & Associates,
LLC (“Royce”) under an administration agreement and are included in administrative
and office facilities and professional fees. The Fund has adopted a deferred fee
agreement that allows the Directors to defer the receipt of all or a portion of
directors’ fees otherwise payable. The deferred fees are invested in certain
Royce Funds until distributed in accordance with the agreement. |
| |
| COMPENSATING
BALANCE CREDITS: |
The Fund
has an arrangement with its custodian bank, whereby a portion of the custodian’s
fee is paid indirectly by credits earned on the Fund’s cash on deposit with
the bank. This deposit arrangement is an alternative to purchasing overnight investments.
Conversely, the Fund pays interest to the custodian on any cash overdrafts, to the
extent they are not offset by credits earned on positive cash balances. |
| |
| Capital
Stock: |
The Fund
issued 2,189,322 and 3,505,620 shares of Common Stock as reinvestment of distributions
for years ended December 31, 2015 and December 31, 2014, respectively. |
| |
| Borrowings:
|
The Fund
has entered into a revolving credit agreement (the credit agreement) with BNP Paribas
Prime Brokerage Inc. (BNPP). The Fund pays a commitment fee of 0.50% per annum on
the unused portion of the credit agreement. The credit agreement has a 360-day rolling
term that resets daily; however, if the Fund exceeds certain net asset value triggers,
the credit agreement may convert to a 60-day rolling term that resets daily. The
Fund is required to pledge portfolio securities as collateral in an amount up to
two times the loan balance outstanding and has granted a security interest in the
securities pledged to, and in favor of, BNPP as security for the loan balance outstanding.
If the Fund fails to meet certain requirements, or maintain other financial covenants
required under the credit agreement, the Fund may be required to repay immediately,
in part or in full, the loan balance outstanding under the credit agreement necessitating
the sale of portfolio securities at potentially inopportune times. The credit agreement
also permits, subject to certain conditions, BNPP to rehypothecate portfolio securities
pledged by the Fund up to the amount of the loan balance outstanding. The Fund continues
to receive payments in lieu of dividends and interest on rehypothecated securities.
The Fund also has the right under the credit agreement to recall the rehypothecated
securities from BNPP on demand. If BNPP fails to deliver the recalled security in
a timely manner, the Fund is compensated by BNPP for any fees or losses related
to the failed delivery or, in the event a recalled security is not returned by BNPP,
the Fund, upon notice to BNPP, may reduce the loan balance outstanding by the amount
of the recalled security failed to be returned. The Fund receives a portion of the
fees earned by BNPP in connection with the rehypothecation of portfolio securities. |
As of December 31, 2015, the Fund has outstanding borrowings of $45,000,000. During
the year ended December 31, 2015, the Fund borrowed an average daily balance of $57,698,630
at a weighted average borrowing cost of 1.26%. The maximum amount outstanding during
the year ended December 31, 2015 was $60,000,000. As of December 31, 2015, the aggregate
value of rehypothecated securities was $29,125,481. During the year ended December
31, 2015, the Fund earned $258,203 in fees from rehypothecated securities. |
| |
| Investment
Advisory Agreement: |
As compensation
for its services under the Investment Advisory Agreement, Royce receives a fee comprised
of a Basic Fee (“Basic Fee”) and an adjustment to the Basic Fee based
on the investment performance of the Fund in relation to the investment record of
the Russell 2000. |
The Basic
Fee is a monthly fee equal to 1/12 of 1% (1% on an annualized basis) of the average
of the Fund’s month-end net assets applicable to Common Stockholders, plus
the liquidation value of outstanding Preferred Stock through October 31, 2015, for
the rolling 36-month period ending with such month (the “performance period”). The
Basic Fee for each month is increased or decreased at the rate of 1/12 of .05% for
each percentage point that the investment performance of the Fund exceeds, or is
exceeded by, the percentage change in the investment record of the Russell 2000
for the performance period by more than two percentage points. The performance period
for each such month is a rolling 36-month period ending with such month. The maximum
increase or decrease in the Basic Fee for any month may not exceed 1/12 of .5%. Accordingly,
for each month, the maximum monthly fee rate as adjusted for performance is 1/12 |
| 2015 Annual
Report to Stockholders | 41 |
| Royce Micro-Cap
Trust |
| |
| Notes to
Financial Statements (continued) |
| Investment
Advisory Agreement (continued): |
of 1.5%
and is payable if the investment performance of the Fund exceeds the percentage
change in the investment record of the Russell 2000 by 12 or more percentage points
for the performance period, and the minimum monthly fee rate as adjusted for performance
is 1/12 of .5% and is payable if the percentage change in the investment record of
the Russell 2000 exceeds the investment performance of the Fund by 12 or more percentage
points for the performance period. |
For the
twelve rolling 36-month periods in 2015, the Fund’s investment performance
ranged from 1% to 10% below the investment performance of the Russell 2000. Accordingly,
the net investment advisory fee consisted of a Basic Fee of $3,847,073 and a net
downward adjustment of $496,816 for the performance of the Fund relative to that
of the Russell 2000. For the year ended December 31, 2015, the Fund accrued and
paid Royce investment advisory fees totaling $3,350,257. |
| |
| Purchases
and Sales of Investment Securities: |
For the
year ended December 31, 2015, the costs of purchases and proceeds from sales of
investment securities, other than short-term securities, amounted to $146,797,402
and $180,593,359, respectively.
Cross trades were executed by the Fund pursuant to
Rule 17a-7 under the 1940 Act. Cross trading is the buying or selling of portfolio
securities between funds to which R&A serves as investment adviser. At its
regularly scheduled quarterly meetings, the Board reviews such transactions as of
the most recent calendar quarter for compliance with the requirements and restrictions
set forth by Rule 17a-7. Cross trades for the year ended December 31, 2015, were
as follows: |
|
PURCHASES |
|
|
SALES |
|
REALIZED GAIN (LOSS) |
| |
| |
$27,582,337 |
|
|
|
|
$3,448,609 |
|
|
|
$(1,067,717) |
|
| |
| Tax Information:
|
Distributions
during the years ended December 31, 2015 and 2014, were characterized as follows
for tax purposes: |
|
ORDINARY INCOME |
|
LONG-TERM CAPITAL GAINS |
| |
| 2015 |
|
|
|
2014 |
|
|
|
2015 |
|
|
|
2014 |
|
| |
| $7,501,533 |
|
|
|
$15,250,124 |
|
|
|
$36,418,446 |
|
|
|
$75,623,389 |
|
| |
The tax basis components of distributable
earnings at December 31, 2015, were as follows:
| |
|
|
|
UNDISTRIBUTED LONG-TERM |
|
|
|
|
|
QUALIFIED LATE YEAR |
|
|
|
|
|
UNDISTRIBUTED |
|
CAPITAL GAINS OR |
|
NET UNREALIZED |
|
ORDINARY AND |
|
TOTAL |
|
ORDINARY |
|
(CAPITAL LOSSES |
|
APPRECIATION |
|
POST-OCTOBER LOSS |
|
DISTRIBUTABLE |
|
INCOME |
|
NOT SUBJECT TO EXPIRATION) |
|
(DEPRECIATION) 1 |
|
DEFERRALS 2 |
|
EARNINGS |
| |
| |
$510,737 |
|
|
|
$6,312,289 |
|
|
|
$(635,134) |
|
|
|
$(635,427) |
|
|
|
$5,552,465 |
|
| |
| 1 |
Includes
timing differences on foreign currency, recognition of losses on securities sold,
publicly traded partnerships and mark-to-market of Passive Foreign Investment Companies. |
| 2 |
Under the
current tax law, capital losses and qualified late year ordinary losses incurred
after October 31 may be deferred and treated as occurring on the first day of the
following fiscal year. |
For financial
reporting purposes, capital accounts and distributions to stockholders are adjusted
to reflect the tax character of permanent book/tax differences. For the year ended
December 31, 2015, the Fund recorded the following permanent reclassifications,
which relate primarily to current investments in publicly traded partnerships and
Trusts, foreign currency transactions, dividend redesignations and gains from the
sale of Passive Foreign Investment Companies. Results of operations and net assets
were not affected by these reclassifications. |
|
UNDISTRIBUTED NET |
|
ACCUMULATED NET |
|
|
|
|
|
INVESTMENT INCOME |
|
REALIZED GAIN (LOSS) |
|
PAID-IN CAPITAL |
| |
| |
$1,128,953 |
|
|
|
$(684,544) |
|
|
|
$(444,409) |
|
| |
Management has analyzed the Fund’s tax positions taken on federal income tax returns for all open tax years (2012-2015) and has
concluded that as of December 31, 2015, no provision for income tax is required in the Fund’s financial statements. |
| 42 | 2015
Annual Report to Stockholders |
| Royce Micro-Cap
Trust |
| |
| Report
of Independent Registered Public Accounting Firm |
| To the
Board of Directors and Stockholders of Royce Micro-Cap Trust, Inc.: |
| |
In our opinion, the accompanying statement of assets and liabilities, including the schedule of investments, and the related statement of
operations, of changes in net assets, and of cash flows and the financial highlights present fairly, in all material respects, the financial
position of Royce Micro-Cap Trust, Inc. (the “Fund”) at December 31, 2015, the results of its operations, the changes in its net assets, its cash flows and its financial highlights for the year then ended, in conformity with accounting principles generally accepted in the United
States of America. These financial statements and financial highlights (hereafter referred to as “financial statements”) are the responsibility of the Funds’ management. Our responsibility is to express an opinion on these financial statements based on our audit. We conducted
our audit of these financial statements in accordance with the standards of the Public Company Accounting Oversight Board (United
States). Those standards require that we plan and perform the audit to obtain reasonable assurance about whether the financial
statements are free of material misstatement. An audit includes examining, on a test basis, evidence supporting the amounts and
disclosures in the financial statements, assessing the accounting principles used and significant estimates made by management, and
evaluating the overall financial statement presentation. We believe that our audit, which included confirmation of securities at December
31, 2015 by correspondence with the custodian and brokers, provide a reasonable basis for our opinion. The statement of changes in net
assets for the year ended December 31, 2014 and the financial highlights for each of the fiscal periods presented in the period ended
December 31, 2014 were audited by other independent accountants whose report dated February 23, 2015 expressed an unqualified
opinion on those statements.
|
| PricewaterhouseCoopers
LLP |
| Baltimore,
Maryland |
| February 23,
2016 |
| 2015 Annual
Report to Stockholders | 43 |
| |
| Schedule
of Investments |
|
|
|
|
|
|
| Common Stocks
– 105.2% |
|
|
|
|
|
|
| |
|
SHARES
|
|
|
|
VALUE
|
| |
| |
|
|
|
|
|
|
| CONSUMER
DISCRETIONARY – 12.6% |
|
|
|
|
|
|
| AUTO COMPONENTS
- 1.4% |
|
|
|
|
|
|
Drew
Industries |
|
94,616 |
|
|
$ |
5,761,168 |
Gentex
Corporation |
|
302,970 |
|
|
|
4,850,550 |
Global
& Yuasa Battery |
|
28,500 |
|
|
|
989,481 |
MRF |
|
800 |
|
|
|
482,523 |
Selamat
Sempurna |
|
1,816,700 |
|
|
|
627,466 |
Standard
Motor Products |
|
50,391 |
|
|
|
1,917,378 |
| |
|
|
|
|
|
| |
|
|
|
|
|
14,628,566
|
| |
|
|
|
|
|
| AUTOMOBILES
- 1.3% |
|
|
|
|
|
|
Thor Industries 1 |
|
168,010 |
|
|
|
9,433,761 |
Winnebago
Industries |
|
211,400 |
|
|
|
4,206,860 |
| |
|
|
|
|
|
| |
|
|
|
|
|
13,640,621
|
| |
|
|
|
|
|
| DISTRIBUTORS
- 1.1% |
|
|
|
|
|
|
Core-Mark Holding Company |
|
115,200 |
|
|
|
9,439,488 |
Weyco
Group |
|
97,992 |
|
|
|
2,622,266 |
| |
|
|
|
|
|
| |
|
|
|
|
|
12,061,754
|
| |
|
|
|
|
|
| DIVERSIFIED
CONSUMER SERVICES - 1.7% |
|
|
|
|
|
|
American
Public Education 2 |
|
39,400 |
|
|
|
733,234 |
Collectors
Universe |
|
62,400 |
|
|
|
967,200 |
DeVry
Education Group |
|
52,054 |
|
|
|
1,317,487 |
†Liberty Tax Cl. A |
|
144,740 |
|
|
|
3,449,154 |
†LifeLock 1,2,3 |
|
142,000 |
|
|
|
2,037,700 |
Lincoln
Educational Services 2 |
|
430,600 |
|
|
|
856,894 |
Regis
Corporation 1,2 |
|
210,400 |
|
|
|
2,977,160 |
Sotheby’s |
|
138,200 |
|
|
|
3,560,032 |
Universal
Technical Institute |
|
534,032 |
|
|
|
2,488,589 |
| |
|
|
|
|
|
| |
|
|
|
|
|
18,387,450
|
| |
|
|
|
|
|
| HOTELS, RESTAURANTS
& LEISURE - 0.2% |
|
|
|
|
|
|
Century
Casinos 2 |
|
183,160 |
|
|
|
1,424,985 |
Thomas
Cook (India) |
|
120,000 |
|
|
|
369,030 |
Tropicana
Entertainment 2,4 |
|
16,100 |
|
|
|
272,895 |
| |
|
|
|
|
|
| |
|
|
|
|
|
2,066,910
|
| |
|
|
|
|
|
| HOUSEHOLD
DURABLES - 2.2% |
|
|
|
|
|
|
Ethan
Allen Interiors |
|
288,700 |
|
|
|
8,031,634 |
Flexsteel
Industries |
|
18,500 |
|
|
|
817,330 |
Harman
International Industries |
|
28,600 |
|
|
|
2,694,406 |
Mohawk
Industries 1,2 |
|
22,400 |
|
|
|
4,242,336 |
Natuzzi
ADR 2 |
|
2,096,300 |
|
|
|
3,375,043 |
NVR
2 |
|
660 |
|
|
|
1,084,380 |
Samson
Holding |
|
2,500,000 |
|
|
|
308,752 |
Stanley
Furniture 2,5 |
|
1,012,235 |
|
|
|
2,824,136 |
| |
|
|
|
|
|
| |
|
|
|
|
|
23,378,017
|
| |
|
|
|
|
|
| INTERNET
& CATALOG RETAIL - 0.3% |
|
|
|
|
|
|
Blue
Nile 2 |
|
53,500 |
|
|
|
1,986,455 |
Manutan
International |
|
12,200 |
|
|
|
649,706 |
| |
|
|
|
|
|
| |
|
|
|
|
|
2,636,161
|
| |
|
|
|
|
|
| LEISURE PRODUCTS
- 1.1% |
|
|
|
|
|
|
LeapFrog
Enterprises Cl. A 2 |
|
162,000 |
|
|
|
115,020 |
Nautilus 2 |
|
656,600 |
|
|
|
10,978,352 |
Shimano |
|
3,500 |
|
|
|
536,065 |
| |
|
|
|
|
|
| |
|
|
|
|
|
11,629,437
|
| |
|
|
|
|
|
| MEDIA - 0.9% |
|
|
|
|
|
|
E.W.
Scripps Company Cl. A |
|
139,260 |
|
|
|
2,645,940 |
Harte-Hanks |
|
136,730 |
|
|
|
443,005 |
McClatchy
Company (The) Cl. A 2 |
|
557,400 |
|
|
|
674,454 |
New
Media Investment Group |
|
46,800 |
|
|
|
910,728 |
Pico
Far East Holdings |
|
3,484,400 |
|
|
|
944,189 |
Rentrak
Corporation 2 |
|
15,400 |
|
|
|
731,962 |
T4F
Entretenimento 2 |
|
263,617 |
|
|
|
206,386 |
Technicolor |
|
30,000 |
|
|
|
242,759 |
Television
Broadcasts |
|
58,400 |
|
|
|
239,998 |
Wiley
(John) & Sons Cl. A |
|
55,980 |
|
|
|
2,520,779 |
| |
|
|
|
|
|
| |
|
|
|
|
|
9,560,200
|
| |
|
|
|
|
|
| MULTILINE
RETAIL - 0.0% |
|
|
|
|
|
|
New
World Department Store China |
|
1,447,500 |
|
|
|
220,136 |
Parkson
Retail Asia |
|
345,800 |
|
|
|
64,629 |
| |
|
|
|
|
|
| |
|
|
|
|
|
284,765
|
| |
|
|
|
|
|
| SPECIALTY
RETAIL - 1.4% |
|
|
|
|
|
|
Buckle
(The) 1 |
|
130,595 |
|
|
|
4,019,714 |
Destination
Maternity |
|
420,376 |
|
|
|
3,665,679 |
Genesco
2 |
|
57,115 |
|
|
|
3,245,846 |
I.T |
|
1,127,000 |
|
|
|
298,322 |
Oriental
Watch Holdings |
|
967,900 |
|
|
|
142,138 |
Systemax
2 |
|
194,000 |
|
|
|
1,668,400 |
TravelCenters
of America LLC 2 |
|
62,500 |
|
|
|
587,500 |
USS |
|
35,000 |
|
|
|
526,598 |
West
Marine 2 |
|
131,100 |
|
|
|
1,113,039 |
| |
|
|
|
|
|
| |
|
|
|
|
|
15,267,236
|
| |
|
|
|
|
|
| TEXTILES,
APPAREL & LUXURY GOODS - 1.0% |
|
|
|
|
|
|
Crown
Crafts |
|
118,041 |
|
|
|
1,002,168 |
Culp |
|
29,400 |
|
|
|
748,818 |
J.G.
Boswell Company 4 |
|
3,940 |
|
|
|
2,462,500 |
Kewal
Kiran Clothing |
|
2,000 |
|
|
|
66,357 |
Movado
Group |
|
79,161 |
|
|
|
2,035,229 |
Pacific
Textiles Holdings |
|
350,000 |
|
|
|
540,160 |
Stella
International Holdings |
|
150,000 |
|
|
|
371,102 |
Van
de Velde |
|
10,000 |
|
|
|
681,713 |
Wolverine
World Wide 1 |
|
148,500 |
|
|
|
2,481,435 |
YGM
Trading |
|
1,082,600 |
|
|
|
681,798 |
| |
|
|
|
|
|
| |
|
|
|
|
|
11,071,280
|
| |
| Total (Cost $122,068,088) |
|
|
|
|
|
134,612,397
|
| |
| |
|
|
|
|
|
|
| CONSUMER
STAPLES – 2.4% |
|
|
|
|
|
|
| BEVERAGES
- 0.3% |
|
|
|
|
|
|
Compania
Cervecerias Unidas ADR |
|
134,000 |
|
|
|
2,902,440
|
| |
|
|
|
|
|
| FOOD PRODUCTS
- 2.0% |
|
|
|
|
|
|
Alico
1 |
|
27,000 |
|
|
|
1,044,630 |
Binggrae
2 |
|
14,000 |
|
|
|
813,210 |
Cal-Maine
Foods |
|
88,216 |
|
|
|
4,087,929 |
Farmer
Bros. 2 |
|
40,000 |
|
|
|
1,290,800 |
Industrias
Bachoco ADR |
|
41,895 |
|
|
|
2,062,491 |
Sanderson
Farms 1 |
|
7,500 |
|
|
|
581,400 |
Seneca
Foods Cl. A 2 |
|
229,255 |
|
|
|
6,643,810 |
Seneca
Foods Cl. B 2 |
|
13,840 |
|
|
|
441,773 |
SunOpta
2 |
|
143,559 |
|
|
|
981,943 |
Tootsie
Roll Industries 1 |
|
109,859 |
|
|
|
3,470,446 |
Waterloo
Investment Holdings 2,6 |
|
598,676 |
|
|
|
167,629 |
| |
|
|
|
|
|
| |
|
|
|
|
|
21,586,061
|
| |
|
|
|
|
|
| PERSONAL PRODUCTS
- 0.1% |
|
|
|
|
|
|
Inter
Parfums |
|
5,700 |
|
|
|
135,774 |
Nu
Skin Enterprises Cl. A 1 |
|
31,000 |
|
|
|
1,174,590 |
| |
|
|
|
|
|
| |
|
|
|
|
|
1,310,364
|
| |
| Total (Cost
$22,016,530) |
|
|
|
|
|
25,798,865
|
| |
| |
|
|
|
|
|
|
| ENERGY
– 3.7% |
|
|
|
|
|
|
| ENERGY EQUIPMENT
& SERVICES - 3.1% |
|
|
|
|
|
|
CARBO
Ceramics 1 |
|
53,000 |
|
|
|
911,600 |
| 44 | 2015
Annual Report to Stockholders |
|
THE ACCOMPANYING
NOTES ARE AN INTEGRAL PART OF THESE FINANCIAL STATEMENTS |
| |
| Schedule
of Investments (continued) |
|
|
|
|
|
|
| |
|
|
|
|
|
|
| |
|
SHARES
|
|
|
|
VALUE
|
| |
| |
|
|
|
|
|
|
| ENERGY
(continued) |
|
|
|
|
|
|
| ENERGY EQUIPMENT
& SERVICES (continued) |
|
|
|
|
|
|
Ensign
Energy Services |
|
134,000 |
|
|
$ |
714,693 |
Era
Group 2 |
|
356,000 |
|
|
|
3,969,400 |
Gulf
Island Fabrication |
|
32,964 |
|
|
|
344,804 |
Helmerich
& Payne |
|
95,660 |
|
|
|
5,122,593 |
ION
Geophysical 2 |
|
1,078,200 |
|
|
|
542,442 |
Oil
States International 2 |
|
51,233 |
|
|
|
1,396,099 |
Pason
Systems |
|
388,380 |
|
|
|
5,442,428 |
SEACOR Holdings 2 |
|
170,469 |
|
|
|
8,959,851 |
TGS-NOPEC
Geophysical |
|
181,470 |
|
|
|
2,870,533 |
Trican
Well Service 2 |
|
897,300 |
|
|
|
415,026 |
Unit
Corporation 2 |
|
254,579 |
|
|
|
3,105,864 |
| |
|
|
|
|
|
| |
|
|
|
|
|
33,795,333
|
| |
|
|
|
|
|
| OIL, GAS
& CONSUMABLE FUELS - 0.6% |
|
|
|
|
|
|
Green
Plains |
|
98,000 |
|
|
|
2,244,200 |
Permian
Basin Royalty Trust |
|
161,000 |
|
|
|
814,660 |
World
Fuel Services |
|
66,600 |
|
|
|
2,561,436 |
WPX
Energy 2 |
|
110,000 |
|
|
|
631,400 |
| |
|
|
|
|
|
| |
|
|
|
|
|
6,251,696
|
| |
| Total (Cost
$60,383,624) |
|
|
|
|
|
40,047,029
|
| |
| |
|
|
|
|
|
|
| FINANCIALS
– 19.3% |
|
|
|
|
|
|
| BANKS - 2.3% |
|
|
|
|
|
|
Bank
of N.T. Butterfield & Son |
|
1,784,161 |
|
|
|
3,479,114 |
BCB
Holdings 2 |
|
209,426 |
|
|
|
26,243 |
Blue
Hills Bancorp |
|
104,180 |
|
|
|
1,594,996 |
†Canadian Western Bank |
|
279,500 |
|
|
|
4,722,635 |
Farmers
& Merchants Bank of Long Beach 4 |
|
1,200 |
|
|
|
7,488,000 |
Fauquier
Bankshares |
|
160,800 |
|
|
|
2,463,456 |
First
Citizens BancShares Cl. A |
|
17,026 |
|
|
|
4,395,602 |
| |
|
|
|
|
|
| |
|
|
|
|
|
24,170,046
|
| |
|
|
|
|
|
| CAPITAL MARKETS
- 8.8% |
|
|
|
|
|
|
AllianceBernstein
Holding L.P. |
|
24,500 |
|
|
|
584,325 |
Ares
Management L.P. |
|
375,900 |
|
|
|
4,860,387 |
Artisan
Partners Asset Management Cl. A |
|
223,200 |
|
|
|
8,048,592 |
ASA
Gold and Precious Metals |
|
324,821 |
|
|
|
2,328,967 |
Ashmore
Group |
|
1,144,000 |
|
|
|
4,319,809 |
Azimut
Holding |
|
17,500 |
|
|
|
432,026 |
BHF
Kleinwort Benson Group 2 |
|
148,761 |
|
|
|
923,697 |
CETIP
- Mercados Organizados |
|
430,000 |
|
|
|
4,060,936 |
Citadel
Capital 2 |
|
11,799,921 |
|
|
|
2,396,137 |
Cowen
Group 2 |
|
250,824 |
|
|
|
960,656 |
Dundee
Corporation Cl. A 2 |
|
1,079,900 |
|
|
|
3,558,823 |
Eaton
Vance 1 |
|
40,500 |
|
|
|
1,313,415 |
Edmond
de Rothschild (Suisse) |
|
133 |
|
|
|
2,204,273 |
Federated Investors Cl. B |
|
334,390 |
|
|
|
9,580,274 |
GAMCO
Investors Cl. A |
|
20,200 |
|
|
|
627,008 |
GCA
Savvian |
|
11,513 |
|
|
|
117,681 |
Jupiter
Fund Management |
|
230,000 |
|
|
|
1,520,704 |
Lazard
Cl. A |
|
87,435 |
|
|
|
3,935,449 |
Manning
& Napier Cl. A |
|
465,492 |
|
|
|
3,952,027 |
Medley
Management Cl. A |
|
109,500 |
|
|
|
623,055 |
mutares |
|
9,266 |
|
|
|
177,241 |
MVC
Capital |
|
324,200 |
|
|
|
2,389,354 |
Newtek
Business Services |
|
65,900 |
|
|
|
943,688 |
Partners
Group Holding |
|
1,075 |
|
|
|
385,963 |
Rothschild
& Co |
|
196,893 |
|
|
|
5,025,022 |
SEI Investments |
|
198,905 |
|
|
|
10,422,622 |
Sprott |
|
590,000 |
|
|
|
1,014,815 |
U.S.
Global Investors Cl. A |
|
520,551 |
|
|
|
609,045 |
Value
Partners Group |
|
5,453,000 |
|
|
|
6,299,687 |
Virtus
Investment Partners |
|
24,920 |
|
|
|
2,927,103 |
VZ
Holding |
|
2,000 |
|
|
|
588,945 |
Westwood
Holdings Group |
|
54,573 |
|
|
|
2,842,708 |
ZAIS
Group Holdings Cl. A 1,2 |
|
492,300 |
|
|
|
4,558,698 |
| |
|
|
|
|
|
| |
|
|
|
|
|
94,533,132
|
| |
|
|
|
|
|
| CONSUMER FINANCE
- 0.1% |
|
|
|
|
|
|
EZCORP
Cl. A 2 |
|
213,000 |
|
|
|
1,062,870
|
| |
|
|
|
|
|
| DIVERSIFIED
FINANCIAL SERVICES - 2.5% |
|
|
|
|
|
|
Banca
Finnat Euramerica |
|
500,000 |
|
|
|
234,435 |
First
Pacific |
|
1,020,000 |
|
|
|
675,631 |
MarketAxess Holdings |
|
90,000 |
|
|
|
10,043,100 |
Morningstar |
|
84,600 |
|
|
|
6,802,686 |
PICO
Holdings 2 |
|
409,400 |
|
|
|
4,225,008 |
Sofina |
|
19,698 |
|
|
|
2,210,780 |
TMX
Group |
|
91,000 |
|
|
|
2,353,754 |
| |
|
|
|
|
|
| |
|
|
|
|
|
26,545,394
|
| |
|
|
|
|
|
| INSURANCE
- 2.1% |
|
|
|
|
|
|
Alleghany
Corporation 2 |
|
2,709 |
|
|
|
1,294,712 |
Atlas
Financial Holdings 2 |
|
9,500 |
|
|
|
189,050 |
eHealth
2 |
|
20,000 |
|
|
|
199,600 |
E-L
Financial |
|
16,500 |
|
|
|
8,299,487 |
Erie
Indemnity Cl. A |
|
25,000 |
|
|
|
2,391,000 |
Greenlight
Capital Re Cl. A 2 |
|
240,561 |
|
|
|
4,500,896 |
Independence
Holding Company |
|
332,964 |
|
|
|
4,611,551 |
ProAssurance
Corporation |
|
17,139 |
|
|
|
831,756 |
†WMIH 2 |
|
77,742 |
|
|
|
201,352 |
| |
|
|
|
|
|
| |
|
|
|
|
|
22,519,404
|
| |
|
|
|
|
|
| INVESTMENT
COMPANIES - 0.3% |
|
|
|
|
|
|
RIT
Capital Partners |
|
130,500 |
|
|
|
3,231,286
|
| |
|
|
|
|
|
| REAL ESTATE
MANAGEMENT & DEVELOPMENT - 2.2% |
|
|
|
|
|
|
AV
Homes 2 |
|
66,100 |
|
|
|
846,741 |
Forestar
Group 2 |
|
122,000 |
|
|
|
1,334,680 |
FRP
Holdings 2 |
|
212,958 |
|
|
|
7,227,794 |
Kennedy-Wilson
Holdings |
|
101,300 |
|
|
|
2,439,304 |
Marcus
& Millichap 2 |
|
41,680 |
|
|
|
1,214,555 |
St.
Joe Company (The) 2 |
|
177,000 |
|
|
|
3,276,270 |
Sun
Frontier Fudousan |
|
17,600 |
|
|
|
128,954 |
Tejon
Ranch 2 |
|
358,000 |
|
|
|
6,855,700 |
Tejon
Ranch (Warrants) 2 |
|
96,561 |
|
|
|
676 |
| |
|
|
|
|
|
| |
|
|
|
|
|
23,324,674
|
| |
|
|
|
|
|
| THRIFTS &
MORTGAGE FINANCE - 1.0% |
|
|
|
|
|
|
Genworth
MI Canada |
|
284,395 |
|
|
|
5,467,159 |
Timberland
Bancorp 5 |
|
444,200 |
|
|
|
5,512,522 |
Vestin
Realty Mortgage II 2 |
|
53,557 |
|
|
|
139,248 |
| |
|
|
|
|
|
| |
|
|
|
|
|
11,118,929
|
| |
| Total (Cost $208,767,123) |
|
|
|
|
|
206,505,735
|
| |
| |
|
|
|
|
|
|
| HEALTH CARE – 5.2% |
|
|
|
|
|
|
| BIOTECHNOLOGY
- 0.9% |
|
|
|
|
|
|
ARIAD
Pharmaceuticals 1,2,3 |
|
140,000 |
|
|
|
875,000 |
Keryx
Biopharmaceuticals 2 |
|
70,000 |
|
|
|
353,500 |
Myriad
Genetics 1,2 |
|
7,973 |
|
|
|
344,115 |
Sangamo
BioSciences 2 |
|
120,315 |
|
|
|
1,098,476 |
Zealand Pharma 2 |
|
334,307 |
|
|
|
7,326,579 |
| |
|
|
|
|
|
| |
|
|
|
|
|
9,997,670
|
| |
|
|
|
|
|
| THE ACCOMPANYING
NOTES ARE AN INTEGRAL PART OF THESE FINANCIAL STATEMENTS |
|
2015 Annual
Report to Stockholders | 45 |
| |
| Schedule
of Investments (continued) |
|
|
|
|
|
|
| |
|
|
|
|
|
|
| |
|
SHARES
|
|
|
|
VALUE
|
| |
| |
|
|
|
|
|
|
| HEALTH
CARE (continued) |
|
|
|
|
|
|
| HEALTH CARE
EQUIPMENT & SUPPLIES - 2.2% |
|
|
|
|
|
|
Analogic
Corporation |
|
53,335 |
|
|
$ |
4,405,471 |
Atrion
Corporation 1 |
|
17,079 |
|
|
|
6,510,515 |
bioMerieux |
|
4,000 |
|
|
|
477,001 |
Cerus
Corporation 2 |
|
156,600 |
|
|
|
989,712 |
Derma
Sciences 2 |
|
87,142 |
|
|
|
398,239 |
DiaSorin |
|
7,000 |
|
|
|
366,050 |
IDEXX
Laboratories 1,2,3 |
|
114,822 |
|
|
|
8,372,820 |
Invacare
Corporation |
|
38,900 |
|
|
|
676,471 |
Trinity
Biotech ADR Cl. A |
|
82,800 |
|
|
|
973,728 |
| |
|
|
|
|
|
| |
|
|
|
|
|
23,170,007
|
| |
|
|
|
|
|
| HEALTH CARE
PROVIDERS & SERVICES - 0.3% |
|
|
|
|
|
|
Aceto
Corporation |
|
42,255 |
|
|
|
1,140,040 |
Addus
HomeCare 2 |
|
22,200 |
|
|
|
516,816 |
Landauer |
|
50,000 |
|
|
|
1,646,000 |
| |
|
|
|
|
|
| |
|
|
|
|
|
3,302,856
|
| |
|
|
|
|
|
| HEALTH CARE
TECHNOLOGY - 0.2% |
|
|
|
|
|
|
Medidata
Solutions 2 |
|
40,000 |
|
|
|
1,971,600
|
| |
|
|
|
|
|
| LIFE SCIENCES
TOOLS & SERVICES - 1.1% |
|
|
|
|
|
|
Bio-Rad
Laboratories Cl. A 2 |
|
19,858 |
|
|
|
2,753,510 |
Bio-Techne |
|
58,743 |
|
|
|
5,286,870 |
PAREXEL
International 2 |
|
56,600 |
|
|
|
3,855,592 |
| |
|
|
|
|
|
| |
|
|
|
|
|
11,895,972
|
| |
|
|
|
|
|
| PHARMACEUTICALS
- 0.5% |
|
|
|
|
|
|
Lipocine
2 |
|
55,866 |
|
|
|
722,347 |
Medicines
Company (The) 2 |
|
58,000 |
|
|
|
2,165,720 |
Theravance
Biopharma 2 |
|
63,291 |
|
|
|
1,037,340 |
Vetoquinol |
|
10,000 |
|
|
|
428,199 |
Virbac |
|
3,000 |
|
|
|
714,931 |
| |
|
|
|
|
|
| |
|
|
|
|
|
5,068,537
|
| |
| Total (Cost $36,084,199) |
|
|
|
|
|
55,406,642
|
| |
| |
|
|
|
|
|
|
| INDUSTRIALS
– 28.1% |
|
|
|
|
|
|
| AEROSPACE
& DEFENSE - 1.8% |
|
|
|
|
|
|
Ducommun
2 |
|
117,200 |
|
|
|
1,900,984 |
FLYHT
Aerospace Solutions 2 |
|
1,683,400 |
|
|
|
279,816 |
HEICO Corporation |
|
140,338 |
|
|
|
7,628,774 |
HEICO Corporation Cl. A |
|
80,808 |
|
|
|
3,975,754 |
Hexcel
Corporation |
|
47,500 |
|
|
|
2,206,375 |
Magellan
Aerospace |
|
122,779 |
|
|
|
1,428,591 |
Teledyne
Technologies 2 |
|
20,600 |
|
|
|
1,827,220 |
| |
|
|
|
|
|
| |
|
|
|
|
|
19,247,514
|
| |
|
|
|
|
|
| AIR FREIGHT
& LOGISTICS - 2.0% |
|
|
|
|
|
|
Expeditors
International of Washington |
|
158,900 |
|
|
|
7,166,390 |
Forward Air |
|
209,750 |
|
|
|
9,021,347 |
Hub
Group Cl. A 1,2,3 |
|
149,400 |
|
|
|
4,922,730 |
| |
|
|
|
|
|
| |
|
|
|
|
|
21,110,467
|
| |
|
|
|
|
|
| BUILDING PRODUCTS
- 0.8% |
|
|
|
|
|
|
American
Woodmark 2 |
|
89,635 |
|
|
|
7,169,007 |
Burnham
Holdings Cl. B 4 |
|
36,000 |
|
|
|
592,200 |
Patrick
Industries 2 |
|
14,750 |
|
|
|
641,625 |
Polypipe
Group |
|
103,000 |
|
|
|
529,783 |
| |
|
|
|
|
|
| |
|
|
|
|
|
8,932,615
|
| |
|
|
|
|
|
| COMMERCIAL
SERVICES & SUPPLIES - 2.8% |
|
|
|
|
|
|
Atento
2 |
|
159,200 |
|
|
|
1,550,608 |
Brady
Corporation Cl. A |
|
45,900 |
|
|
|
1,054,782 |
CompX
International Cl. A |
|
211,100 |
|
|
|
2,406,540 |
Copart
2 |
|
178,360 |
|
|
|
6,779,464 |
dorma+kaba
Holding |
|
600 |
|
|
|
407,097 |
Heritage-Crystal
Clean 2 |
|
152,527 |
|
|
|
1,616,786 |
InnerWorkings
2 |
|
114,000 |
|
|
|
855,000 |
Kimball
International Cl. B |
|
286,180 |
|
|
|
2,795,979 |
Ritchie Bros. Auctioneers |
|
401,794 |
|
|
|
9,687,253 |
Societe
BIC |
|
2,000 |
|
|
|
329,082 |
Steelcase
Cl. A |
|
155,330 |
|
|
|
2,314,417 |
| |
|
|
|
|
|
| |
|
|
|
|
|
29,797,008
|
| |
|
|
|
|
|
| CONSTRUCTION
& ENGINEERING - 2.6% |
|
|
|
|
|
|
EMCOR
Group 1,3 |
|
134,400 |
|
|
|
6,456,576 |
Integrated
Electrical Services 2 |
|
677,482 |
|
|
|
7,499,726 |
Jacobs
Engineering Group 1,2 |
|
164,900 |
|
|
|
6,917,555 |
KBR |
|
286,192 |
|
|
|
4,842,368 |
Northwest
Pipe 2 |
|
117,800 |
|
|
|
1,318,182 |
Sterling
Construction 2 |
|
212,735 |
|
|
|
1,293,429 |
| |
|
|
|
|
|
| |
|
|
|
|
|
28,327,836
|
| |
|
|
|
|
|
| ELECTRICAL
EQUIPMENT - 1.2% |
|
|
|
|
|
|
AZZ |
|
21,600 |
|
|
|
1,200,312 |
Franklin
Electric |
|
104,600 |
|
|
|
2,827,338 |
Global
Power Equipment Group |
|
631,820 |
|
|
|
2,198,734 |
Powell
Industries |
|
94,500 |
|
|
|
2,459,835 |
Preformed
Line Products |
|
91,600 |
|
|
|
3,856,360 |
| |
|
|
|
|
|
| |
|
|
|
|
|
12,542,579
|
| |
|
|
|
|
|
| INDUSTRIAL
CONGLOMERATES - 0.4% |
|
|
|
|
|
|
A.
Soriano |
|
2,791,000 |
|
|
|
378,430 |
Carlisle
Companies 1 |
|
11,400 |
|
|
|
1,011,066 |
Raven
Industries |
|
226,725 |
|
|
|
3,536,910 |
| |
|
|
|
|
|
| |
|
|
|
|
|
4,926,406
|
| |
|
|
|
|
|
| MACHINERY
- 10.2% |
|
|
|
|
|
|
Burckhardt
Compression Holding |
|
8,400 |
|
|
|
2,575,997 |
Chen
Hsong Holdings |
|
1,159,000 |
|
|
|
267,690 |
China
Metal International Holdings |
|
554,524 |
|
|
|
169,932 |
CIRCOR
International |
|
104,004 |
|
|
|
4,383,769 |
CLARCOR |
|
92,500 |
|
|
|
4,595,400 |
Columbus
McKinnon |
|
69,775 |
|
|
|
1,318,748 |
Deutz |
|
115,000 |
|
|
|
460,288 |
Donaldson
Company |
|
193,559 |
|
|
|
5,547,401 |
Federal
Signal |
|
166,280 |
|
|
|
2,635,538 |
Graco |
|
94,276 |
|
|
|
6,794,471 |
Graham
Corporation |
|
20,568 |
|
|
|
345,954 |
Hurco
Companies |
|
25,952 |
|
|
|
689,285 |
Hyster-Yale
Materials Handling Cl. A |
|
18,415 |
|
|
|
965,867 |
IDEX
Corporation |
|
67,400 |
|
|
|
5,163,514 |
John
Bean Technologies |
|
121,826 |
|
|
|
6,070,590 |
Kennametal |
|
160,100 |
|
|
|
3,073,920 |
Lincoln
Electric Holdings |
|
61,360 |
|
|
|
3,183,970 |
Lindsay
Corporation 1 |
|
80,000 |
|
|
|
5,792,000 |
Luxfer
Holdings ADR |
|
28,100 |
|
|
|
276,504 |
Lydall
2 |
|
30,680 |
|
|
|
1,088,526 |
Mueller
Water Products Cl. A |
|
33,600 |
|
|
|
288,960 |
NN |
|
308,700 |
|
|
|
4,920,678 |
Nordson
Corporation |
|
24,296 |
|
|
|
1,558,588 |
RBC
Bearings 2 |
|
109,600 |
|
|
|
7,079,064 |
Semperit
AG Holding |
|
2,940 |
|
|
|
98,695 |
Spirax-Sarco
Engineering |
|
7,600 |
|
|
|
366,115 |
Sun
Hydraulics |
|
103,118 |
|
|
|
3,271,934 |
Tennant
Company |
|
103,900 |
|
|
|
5,845,414 |
Valmont
Industries 1 |
|
67,855 |
|
|
|
7,193,987 |
WABCO
Holdings 2 |
|
43,400 |
|
|
|
4,438,084 |
| 46 | 2015
Annual Report to Stockholders |
|
THE ACCOMPANYING
NOTES ARE AN INTEGRAL PART OF THESE FINANCIAL STATEMENTS |
| |
| Schedule
of Investments (continued) |
|
|
|
|
|
|
| |
|
|
|
|
|
|
| |
|
SHARES
|
|
|
|
VALUE
|
| |
| |
|
|
|
|
|
|
| INDUSTRIALS
(continued) |
|
|
|
|
|
|
| MACHINERY
(continued) |
|
|
|
|
|
|
Wabtec
Corporation |
|
83,560 |
|
|
$ |
5,942,787 |
†Watts Water Technologies Cl. A |
|
61,000 |
|
|
|
3,029,870 |
Woodward |
|
208,400 |
|
|
|
10,349,144 |
| |
|
|
|
|
|
| |
|
|
|
|
|
109,782,684
|
| |
|
|
|
|
|
| MARINE - 0.8% |
|
|
|
|
|
|
Clarkson |
|
198,700 |
|
|
|
6,583,284 |
Kirby
Corporation 2 |
|
41,100 |
|
|
|
2,162,682 |
| |
|
|
|
|
|
| |
|
|
|
|
|
8,745,966
|
| |
|
|
|
|
|
| PROFESSIONAL
SERVICES - 3.0% |
|
|
|
|
|
|
Acacia
Research |
|
55,600 |
|
|
|
238,524 |
Advisory
Board (The) 1,2,3 |
|
150,277 |
|
|
|
7,455,242 |
Franklin
Covey 2 |
|
60,000 |
|
|
|
1,004,400 |
Heidrick
& Struggles International |
|
66,480 |
|
|
|
1,809,586 |
ICF
International 2 |
|
27,196 |
|
|
|
967,090 |
ManpowerGroup |
|
83,858 |
|
|
|
7,068,391 |
On Assignment 1,2,3 |
|
230,695 |
|
|
|
10,369,740 |
Robert
Half International |
|
19,032 |
|
|
|
897,168 |
TrueBlue
2 |
|
70,250 |
|
|
|
1,809,640 |
Volt
Information Sciences 2 |
|
65,000 |
|
|
|
529,100 |
| |
|
|
|
|
|
| |
|
|
|
|
|
32,148,881
|
| |
|
|
|
|
|
| ROAD &
RAIL - 1.5% |
|
|
|
|
|
|
Genesee
& Wyoming Cl. A 2 |
|
20,000 |
|
|
|
1,073,800 |
†Knight Transportation |
|
122,400 |
|
|
|
2,965,752 |
Landstar
System |
|
118,960 |
|
|
|
6,977,004 |
†Saia 1,2 |
|
141,890 |
|
|
|
3,157,052 |
Trancom |
|
6,647 |
|
|
|
368,334 |
Universal
Truckload Services |
|
78,916 |
|
|
|
1,107,981 |
| |
|
|
|
|
|
| |
|
|
|
|
|
15,649,923
|
| |
|
|
|
|
|
| TRADING COMPANIES
& DISTRIBUTORS - 0.8% |
|
|
|
|
|
|
†Houston Wire & Cable |
|
598,871 |
|
|
|
3,162,039 |
Kloeckner
& Co |
|
31,300 |
|
|
|
271,976 |
MISUMI
Group |
|
30,000 |
|
|
|
413,129 |
MSC
Industrial Direct Cl. A 1 |
|
79,993 |
|
|
|
4,501,206 |
| |
|
|
|
|
|
| |
|
|
|
|
|
8,348,350
|
| |
|
|
|
|
|
| TRANSPORTATION
INFRASTRUCTURE - 0.2% |
|
|
|
|
|
|
Hopewell
Highway Infrastructure |
|
1,012,000 |
|
|
|
485,075 |
Touax
2 |
|
40,040 |
|
|
|
435,137 |
Wesco
Aircraft Holdings 2 |
|
68,400 |
|
|
|
818,748 |
| |
|
|
|
|
|
| |
|
|
|
|
|
1,738,960
|
| |
| Total (Cost $210,534,829) |
|
|
|
|
|
301,299,189
|
| |
| |
|
|
|
|
|
|
| INFORMATION
TECHNOLOGY – 20.7% |
|
|
|
|
|
|
| COMMUNICATIONS
EQUIPMENT - 0.6% |
|
|
|
|
|
|
ADTRAN
1,3 |
|
259,273 |
|
|
|
4,464,681 |
Alliance
Fiber Optic Products 2 |
|
63,200 |
|
|
|
958,112 |
Bel
Fuse Cl. B |
|
30,238 |
|
|
|
522,815 |
Extreme
Networks 2 |
|
80,000 |
|
|
|
326,400 |
| |
|
|
|
|
|
| |
|
|
|
|
|
6,272,008
|
| |
|
|
|
|
|
| ELECTRONIC
EQUIPMENT, INSTRUMENTS & COMPONENTS - 9.8% |
|
|
|
|
|
|
Agilysys
2 |
|
165,125 |
|
|
|
1,649,599 |
Anixter
International 1,2,3 |
|
70,895 |
|
|
|
4,281,349 |
Benchmark
Electronics 2 |
|
125,500 |
|
|
|
2,594,085 |
Cognex
Corporation 1 |
|
166,400 |
|
|
|
5,619,328 |
Coherent 2 |
|
158,536 |
|
|
|
10,322,279 |
Dolby
Laboratories Cl. A |
|
57,840 |
|
|
|
1,946,316 |
DTS
2 |
|
225,000 |
|
|
|
5,080,500 |
ePlus
2 |
|
6,800 |
|
|
|
634,168 |
Fabrinet
2 |
|
46,950 |
|
|
|
1,118,349 |
FARO
Technologies 2 |
|
115,200 |
|
|
|
3,400,704 |
FEI
Company |
|
82,100 |
|
|
|
6,550,759 |
FLIR Systems |
|
302,000 |
|
|
|
8,477,140 |
HollySys
Automation Technologies |
|
51,082 |
|
|
|
1,132,999 |
IPG
Photonics 1,2,3 |
|
53,890 |
|
|
|
4,804,832 |
Kimball
Electronics 2 |
|
214,635 |
|
|
|
2,358,839 |
LRAD
Corporation 2 |
|
751,544 |
|
|
|
1,495,573 |
Mercury
Systems 2 |
|
38,200 |
|
|
|
701,352 |
Methode
Electronics |
|
29,200 |
|
|
|
929,436 |
National
Instruments |
|
261,850 |
|
|
|
7,512,476 |
Newport Corporation 2 |
|
541,000 |
|
|
|
8,585,670 |
Orbotech
2 |
|
4,000 |
|
|
|
88,520 |
PC
Connection |
|
16,301 |
|
|
|
369,055 |
Perceptron
2 |
|
357,700 |
|
|
|
2,786,483 |
Plexus
Corporation 2 |
|
176,100 |
|
|
|
6,149,412 |
Richardson
Electronics |
|
573,732 |
|
|
|
3,253,060 |
Rofin-Sinar
Technologies 2 |
|
226,971 |
|
|
|
6,078,283 |
Rogers
Corporation 2 |
|
57,066 |
|
|
|
2,942,894 |
TTM
Technologies 1,2,3 |
|
496,400 |
|
|
|
3,231,564 |
Vishay
Precision Group 2 |
|
78,826 |
|
|
|
892,310 |
| |
|
|
|
|
|
| |
|
|
|
|
|
104,987,334
|
| |
|
|
|
|
|
| INTERNET SOFTWARE
& SERVICES - 1.8% |
|
|
|
|
|
|
Actua
Corporation 2 |
|
152,253 |
|
|
|
1,743,297 |
Care.com
2 |
|
395,900 |
|
|
|
2,834,644 |
†IZEA 2,4 |
|
701,300 |
|
|
|
277,014 |
j2
Global |
|
28,610 |
|
|
|
2,355,175 |
QuinStreet
2 |
|
488,232 |
|
|
|
2,094,515 |
RealNetworks
2 |
|
376,750 |
|
|
|
1,601,188 |
Spark
Networks 1,2,3 |
|
394,100 |
|
|
|
1,517,285 |
Stamps.com
2 |
|
33,600 |
|
|
|
3,682,896 |
Support.com
2 |
|
1,324,295 |
|
|
|
1,337,538 |
Textura
Corporation 2 |
|
19,000 |
|
|
|
410,020 |
Tomorrow
Focus 2 |
|
44,900 |
|
|
|
173,077 |
United
Online 2 |
|
133,971 |
|
|
|
1,579,518 |
| |
|
|
|
|
|
| |
|
|
|
|
|
19,606,167
|
| |
|
|
|
|
|
| IT SERVICES
- 2.4% |
|
|
|
|
|
|
Computer
Task Group |
|
223,700 |
|
|
|
1,480,894 |
Convergys
Corporation 1 |
|
121,000 |
|
|
|
3,011,690 |
eClerx
Services |
|
18,000 |
|
|
|
383,825 |
Hackett Group (The) |
|
671,366 |
|
|
|
10,788,852 |
Hexaware
Technologies |
|
130,000 |
|
|
|
478,325 |
Innodata
2 |
|
314,314 |
|
|
|
895,795 |
MAXIMUS |
|
107,500 |
|
|
|
6,046,875 |
Net
1 UEPS Technologies 2 |
|
15,000 |
|
|
|
202,650 |
Persistent
Systems |
|
40,000 |
|
|
|
387,854 |
Prodware |
|
20,100 |
|
|
|
172,976 |
Sykes
Enterprises 2 |
|
24,294 |
|
|
|
747,769 |
TravelSky
Technology |
|
200,000 |
|
|
|
328,208 |
Unisys
Corporation 2 |
|
94,000 |
|
|
|
1,038,700 |
| |
|
|
|
|
|
| |
|
|
|
|
|
25,964,413
|
| |
|
|
|
|
|
| SEMICONDUCTORS
& SEMICONDUCTOR EQUIPMENT - 2.7% |
|
|
|
|
|
|
Amtech
Systems 2 |
|
141,471 |
|
|
|
885,609 |
Brooks
Automation |
|
116,100 |
|
|
|
1,239,948 |
Cascade
Microtech 2 |
|
61,800 |
|
|
|
1,004,250 |
Diodes
2 |
|
270,850 |
|
|
|
6,224,133 |
Exar
Corporation 2 |
|
157,576 |
|
|
|
965,941 |
Intermolecular 2 |
|
165,448 |
|
|
|
383,839 |
Kopin
Corporation 2 |
|
242,200 |
|
|
|
658,784 |
| THE ACCOMPANYING
NOTES ARE AN INTEGRAL PART OF THESE FINANCIAL STATEMENTS |
|
2015 Annual
Report to Stockholders | 47 |
| |
| Schedule
of Investments (continued) |
|
|
|
|
|
|
|
| |
|
|
|
|
|
|
|
| |
|
SHARES
|
|
|
|
VALUE
|
|
| |
| |
|
|
|
|
|
|
|
| INFORMATION
TECHNOLOGY (continued) |
|
|
|
|
|
|
|
| SEMICONDUCTORS
& SEMICONDUCTOR EQUIPMENT (continued) |
|
|
|
|
|
|
|
Kulicke
& Soffa Industries 2 |
|
77,400 |
|
|
$ |
903,258 |
|
MKS
Instruments |
|
170,510 |
|
|
|
6,138,360 |
|
MoSys
1,2,3 |
|
337,000 |
|
|
|
367,330 |
|
Nanometrics
2 |
|
166,750 |
|
|
|
2,524,595 |
|
Photronics
2 |
|
157,700 |
|
|
|
1,963,365 |
|
Teradyne |
|
130,000 |
|
|
|
2,687,100 |
|
Tessera
Technologies |
|
65,930 |
|
|
|
1,978,559 |
|
Ultra
Clean Holdings 2 |
|
50,300 |
|
|
|
257,536 |
|
Veeco
Instruments 1,2,3 |
|
28,300 |
|
|
|
581,848 |
|
| |
|
|
|
|
|
| |
|
|
|
|
|
28,764,455 |
|
| |
|
|
|
|
|
|
| SOFTWARE -
2.5% |
|
|
|
|
|
|
|
American
Software Cl. A |
|
88,490 |
|
|
|
900,828 |
|
ANSYS 1,2,3 |
|
95,000 |
|
|
|
8,787,500 |
|
Blackbaud |
|
31,400 |
|
|
|
2,068,004 |
|
Computer
Modelling Group |
|
313,200 |
|
|
|
2,032,620 |
|
Mentor
Graphics |
|
149,923 |
|
|
|
2,761,582 |
|
Model
N 2 |
|
104,000 |
|
|
|
1,160,640 |
|
Monotype
Imaging Holdings |
|
153,740 |
|
|
|
3,634,414 |
|
PSI
2 |
|
52,500 |
|
|
|
738,537 |
|
PTC
2 |
|
25,000 |
|
|
|
865,750 |
|
SeaChange
International 2 |
|
247,069 |
|
|
|
1,665,245 |
|
SimCorp |
|
9,300 |
|
|
|
524,488 |
|
TiVo
2 |
|
133,200 |
|
|
|
1,149,516 |
|
TOTVS |
|
50,000 |
|
|
|
389,896 |
|
| |
|
|
|
|
|
|
| |
|
|
|
|
|
26,679,020 |
|
| |
|
|
|
|
|
|
| TECHNOLOGY
HARDWARE, STORAGE & PERIPHERALS - 0.9% |
|
|
|
|
|
|
|
Diebold
1 |
|
266,600 |
|
|
|
8,021,994 |
|
Intevac
2 |
|
114,000 |
|
|
|
536,940 |
|
Kortek |
|
99,000 |
|
|
|
976,842 |
|
Silicon
Graphics International 2 |
|
93,600 |
|
|
|
552,240 |
|
| |
|
|
|
|
|
|
| |
|
|
|
|
|
10,088,016 |
|
| |
| Total (Cost
$188,389,488) |
|
|
|
|
|
222,361,413
|
|
| |
| |
|
|
|
|
|
|
|
| MATERIALS
– 7.6% |
|
|
|
|
|
|
|
| CHEMICALS
- 2.0% |
|
|
|
|
|
|
|
C.
Uyemura & Co. |
|
13,100 |
|
|
|
557,573 |
|
†Dyadic International 2,4 |
|
75,000 |
|
|
|
135,000 |
|
FutureFuel
Corporation |
|
48,500 |
|
|
|
654,750 |
|
Hawkins |
|
86,178 |
|
|
|
3,082,587 |
|
Innospec |
|
44,838 |
|
|
|
2,435,152 |
|
Intrepid
Potash 2 |
|
356,498 |
|
|
|
1,051,669 |
|
Minerals
Technologies |
|
87,093 |
|
|
|
3,994,085 |
|
Quaker Chemical |
|
109,669 |
|
|
|
8,473,027 |
|
Umicore |
|
12,500 |
|
|
|
522,516 |
|
Victrex |
|
12,000 |
|
|
|
316,680 |
|
| |
|
|
|
|
|
|
| |
|
|
|
|
|
21,223,039 |
|
| |
|
|
|
|
|
|
| CONSTRUCTION
MATERIALS - 1.0% |
|
|
|
|
|
|
|
Ash Grove Cement Cl. B 4 |
|
50,518 |
|
|
|
10,507,744
|
|
| |
|
|
|
|
|
|
| CONTAINERS
& PACKAGING - 0.8% |
|
|
|
|
|
|
|
Greif
Cl. A |
|
100,344 |
|
|
|
3,091,599 |
|
Mayr-Melnhof
Karton |
|
32,700 |
|
|
|
4,069,251 |
|
UFP
Technologies 2 |
|
54,709 |
|
|
|
1,303,168 |
|
| |
|
|
|
|
|
|
| |
|
|
|
|
|
8,464,018
|
|
| |
|
|
|
|
|
|
| METALS &
MINING - 3.8% |
|
|
|
|
|
|
|
Alamos
Gold Cl. A |
|
464,366 |
|
|
|
1,526,968 |
|
Ampco-Pittsburgh |
|
56,516 |
|
|
|
579,854 |
|
Central
Steel & Wire 4 |
|
4,862 |
|
|
|
2,649,887 |
|
Exeter
Resource 2 |
|
475,000 |
|
|
|
154,375 |
|
Franco-Nevada
Corporation |
|
108,000 |
|
|
|
4,941,000 |
|
Gold
Fields ADR |
|
865,000 |
|
|
|
2,396,050 |
|
Haynes
International |
|
113,900 |
|
|
|
4,178,991 |
|
Hecla
Mining |
|
660,000 |
|
|
|
1,247,400 |
|
Imdex
2 |
|
700,000 |
|
|
|
101,388 |
|
Lundin
Mining 2 |
|
640,000 |
|
|
|
1,757,606 |
|
Major
Drilling Group International |
|
406,543 |
|
|
|
1,286,882 |
|
Pan
American Silver |
|
130,430 |
|
|
|
847,795 |
|
Pretium
Resources 2 |
|
246,000 |
|
|
|
1,237,378 |
|
Reliance Steel & Aluminum |
|
171,270 |
|
|
|
9,918,246 |
|
Seabridge
Gold 1,2,3 |
|
282,000 |
|
|
|
2,337,780 |
|
Synalloy
Corporation |
|
178,800 |
|
|
|
1,230,144 |
|
Vista
Gold 2 |
|
124,000 |
|
|
|
34,038 |
|
Worthington
Industries |
|
148,000 |
|
|
|
4,460,720 |
|
| |
|
|
|
|
|
|
| |
|
|
|
|
|
40,886,502
|
|
| |
|
|
|
|
|
|
| PAPER &
FOREST PRODUCTS - 0.0% |
|
|
|
|
|
|
|
TFS
Corporation |
|
251,185 |
|
|
|
288,330
|
|
| |
| Total (Cost
$77,065,012) |
|
|
|
|
|
81,369,633
|
|
| |
| |
|
|
|
|
|
|
|
| TELECOMMUNICATION
SERVICES – 0.5% |
|
|
|
|
|
|
|
| WIRELESS TELECOMMUNICATION
SERVICES - 0.5% |
|
|
|
|
|
|
|
Spok
Holdings |
|
18,595 |
|
|
|
340,661 |
|
Telephone
and Data Systems |
|
208,270 |
|
|
|
5,392,110 |
|
| |
| Total (Cost $5,721,184) |
|
|
|
|
|
5,732,771 |
|
| |
| |
|
|
|
|
|
|
|
| UTILITIES
– 0.1% |
|
|
|
|
|
|
|
| GAS UTILITIES
- 0.1% |
|
|
|
|
|
|
|
Shizuoka
Gas |
|
110,000 |
|
|
|
703,087 |
|
Toho
Gas |
|
60,000 |
|
|
|
387,471 |
|
| |
|
|
|
|
|
|
| |
|
|
|
|
|
1,090,558
|
|
| |
|
|
|
|
|
|
| MULTI-UTILITIES
- 0.0% |
|
|
|
|
|
|
|
Just
Energy Group 1 |
|
20,600 |
|
|
|
146,672
|
|
| |
| Total (Cost
$1,234,657) |
|
|
|
|
|
1,237,230
|
|
| |
| |
|
|
|
|
|
|
|
| MISCELLANEOUS7 – 5.0% |
|
|
|
|
|
|
|
| |
| Total (Cost $56,093,347) |
|
|
|
|
|
53,074,549
|
|
| |
| |
|
|
|
|
|
|
|
| TOTAL COMMON
STOCKS |
|
|
|
|
|
|
|
| |
| (Cost $988,358,081)
|
|
|
|
|
|
1,127,445,453
|
|
| |
| |
|
|
|
|
|
|
|
| REPURCHASE
AGREEMENT– 1.0% |
|
|
|
|
|
|
|
|
Fixed Income Clearing Corporation, 0.03% dated 12/31/15, due 1/4/16, maturity value $10,727,036 (collateralized by obligations of various U.S. Government Agencies, 1.625%
due 7/31/20, valued at $10,943,663) |
| |
| (Cost $10,727,000)
|
|
|
|
|
|
10,727,000
|
|
| |
| |
|
|
|
|
|
|
|
| TOTAL INVESTMENTS
– 106.2% |
|
|
|
|
|
|
|
| |
| (Cost $999,085,081)
|
|
|
|
|
|
1,138,172,453
|
|
| |
| |
|
|
|
|
|
|
|
| LIABILITIES
LESS CASH AND OTHER ASSETS – (6.2)% |
|
|
|
|
|
(66,137,707 |
) |
| |
|
|
|
|
|
|
| |
| |
| NET ASSETS
– 100.0% |
|
|
|
|
$ |
1,072,034,746
|
|
| |
| 48 | 2015
Annual Report to Stockholders |
|
THE ACCOMPANYING
NOTES ARE AN INTEGRAL PART OF THESE FINANCIAL STATEMENTS |
| |
| † |
New additions
in 2015. |
| 1 |
All or
a portion of these securities were pledged as collateral in connection with the
revolving credit agreement at December 31, 2015. Total market value of pledged securities
at December 31, 2015, was $116,154,894. |
| 2 |
Non-income
producing. |
| 3 |
At December
31, 2015, a portion of these securities were rehypothecated in connection with the
Fund’s revolving credit agreement in the aggregate amount of $55,161,255. |
| 4 |
These securities
are defined as Level 2 securities due to fair value being based on quoted prices
for similar securities. See Notes to Financial Statements. |
| 5 |
At December
31, 2015, the Fund owned 5% or more of the Company’s outstanding voting securities
thereby making the Company an Affiliated Company as that term is defined in the
Investment Company Act of 1940. See Notes to Financial Statements. |
| 6 |
A security
for which market quotations are not readily available represents 0.0% of net assets.
This security has been valued at its fair value under procedures approved by the
Fund’s Board of Directors. This security is defined as a Level 3 security due
to the use of significant unobservable inputs in the determination of fair value.
See Notes to Financial Statements. |
| 7 |
Includes
securities first acquired in 2015 and less than 1% of net assets. |
| |
|
| |
Bold
indicates the Fund’s 20 largest equity holdings in terms of December 31, 2015,
market value. |
| |
|
| |
TAX
INFORMATION: The cost of total investments for Federal income tax purposes was
$1,001,534,253. At December 31, 2015, net unrealized appreciation for all securities
was $136,638,200, consisting of aggregate gross unrealized appreciation of $278,258,206 and aggregate
gross unrealized depreciation of $141,620,006. The primary difference between book and
tax basis cost is the timing of the recognition of losses on securities sold, investments
in publicly traded partnerships and Trusts and mark-to-market of Passive Foreign Investment
Companies. |
| |
| THE ACCOMPANYING
NOTES ARE AN INTEGRAL PART OF THESE FINANCIAL STATEMENTS |
|
2015 Annual Report to Stockholders | 49 |
| Royce Value
Trust |
|
December
31, 2015 |
| |
| Statement
of Assets and Liabilities |
|
|
|
|
| |
|
|
|
|
| ASSETS: |
|
|
|
|
| Investments
at value |
|
|
|
|
| |
Non-Affiliated
Companies |
|
$ |
1,119,108,795 |
|
| |
Affiliated
Companies |
|
|
8,336,658 |
|
| |
| Repurchase
agreements (at cost and value) |
|
|
10,727,000 |
|
| |
| Cash and foreign
currency |
|
|
214,267 |
|
| |
| Receivable
for investments sold |
|
|
3,210,183 |
|
| |
| Receivable
for dividends and interest |
|
|
1,307,487 |
|
| |
| Prepaid expenses
and other assets |
|
|
552,797 |
|
| |
| Total Assets
|
|
|
1,143,457,187
|
|
| |
| LIABILITIES: |
|
|
|
|
| Revolving
credit agreement |
|
|
70,000,000 |
|
| |
| Payable for
investments purchased |
|
|
562,307 |
|
| |
| Payable for
investment advisory fee |
|
|
493,311 |
|
| |
| Payable for
directors’ fees |
|
|
57,368 |
|
| |
| Payable for
interest expense |
|
|
6,054 |
|
| |
| Accrued expenses |
|
|
252,267 |
|
| |
| Deferred capital
gains tax |
|
|
51,134 |
|
| |
| Total Liabilities
|
|
|
71,422,441
|
|
| |
| Net Assets
|
|
$ |
1,072,034,746
|
|
| |
| ANALYSIS OF
NET ASSETS: |
|
|
|
|
| Paid-in capital
- $0.001 par value per share; 79,051,762 shares outstanding (150,000,000 shares authorized) |
|
$ |
929,036,835 |
|
| |
| Undistributed
net investment income (loss) |
|
|
(1,047,919 |
) |
| |
| Accumulated
net realized gain (loss) on investments and foreign currency |
|
|
5,044,187 |
|
| |
| Net unrealized
appreciation (depreciation) on investments and foreign currency |
|
|
139,001,643 |
|
| |
| Net Assets
(net asset value per share - $13.56) |
|
$ |
1,072,034,746
|
|
| |
| Investments
at identified cost |
|
$ |
988,358,081 |
|
| |
| 50 | 2015
Annual Report to Stockholders |
|
THE ACCOMPANYING
NOTES ARE AN INTEGRAL PART OF THESE FINANCIAL STATEMENTS |
Royce Value Trust
| |
| Statement
of Changes in Net Assets |
| |
|
YEAR ENDED 12/31/15 |
|
YEAR ENDED 12/31/14 |
| |
| |
|
|
|
|
|
|
|
|
| INVESTMENT
OPERATIONS: |
|
|
|
|
|
|
|
|
| Net investment
income (loss) |
|
$ |
9,193,108 |
|
|
$ |
9,123,977 |
|
| |
| Net realized
gain (loss) on investments and foreign currency |
|
|
43,117,817 |
|
|
|
130,855,526 |
|
| |
| Net change
in unrealized appreciation (depreciation) on investments and foreign currency |
|
|
(157,435,228 |
) |
|
|
(140,388,974 |
) |
| |
| Net increase
(decrease) in net assets from investment operations |
|
|
(105,124,303 |
) |
|
|
(409,471 |
) |
| |
| DISTRIBUTIONS: |
|
|
|
|
|
|
|
|
| Net investment
income |
|
|
(12,151,910 |
) |
|
|
(10,008,114 |
) |
| |
| Net realized
gain on investments and foreign currency |
|
|
(83,306,926 |
) |
|
|
(123,263,927 |
) |
| |
| Total distributions
|
|
|
(95,458,836 |
) |
|
|
(133,272,041 |
) |
| |
| CAPITAL STOCK
TRANSACTIONS: |
|
|
|
|
|
|
|
|
| Reinvestment
of distributions |
|
|
40,663,247 |
|
|
|
57,806,861 |
|
| |
| Total capital
stock transactions |
|
|
40,663,247
|
|
|
|
57,806,861
|
|
| |
| Net Increase
(Decrease) In Net Assets |
|
|
(159,919,892 |
) |
|
|
(75,874,651 |
) |
| |
| NET ASSETS: |
|
|
|
|
|
|
|
|
| |
| Beginning
of year |
|
|
1,231,954,638
|
|
|
|
1,307,829,289
|
|
| |
| End of
year (including undistributed net investment income (loss) of $(1,047,919) at 12/31/15
and $2,286,303 at 12/31/14) |
|
$ |
1,072,034,746
|
|
|
$ |
1,231,954,638
|
|
| |
| THE ACCOMPANYING
NOTES ARE AN INTEGRAL PART OF THESE FINANCIAL STATEMENTS |
|
2015 Annual
Report to Stockholders | 51 |
| Royce Value
Trust |
|
Year Ended
December 31, 2015 |
| INVESTMENT
INCOME: |
|
|
|
|
| INCOME: |
|
|
|
|
| Dividends |
|
|
|
|
| |
Non-Affiliated
Companies |
|
$ |
17,125,813 |
|
| |
Affiliated
Companies |
|
|
137,702 |
|
| |
| Foreign withholding
tax |
|
|
(398,966 |
) |
| |
| Interest |
|
|
44,593 |
|
| |
| Rehypothecation
income |
|
|
358,817 |
|
| |
| Securities
lending |
|
|
668 |
|
| |
| Total income
|
|
|
17,268,627
|
|
| |
| EXPENSES: |
|
|
|
|
| |
| Investment
advisory fees |
|
|
5,891,150 |
|
| |
| Interest expense |
|
|
899,029 |
|
| |
| Stockholder
reports |
|
|
430,339 |
|
| |
| Custody and
transfer agent fees |
|
|
233,579 |
|
| |
| Administrative
and office facilities |
|
|
190,523 |
|
| |
| Directors’ fees |
|
|
180,221 |
|
| |
| Professional
fees |
|
|
113,995 |
|
| |
| Other expenses |
|
|
136,775 |
|
| |
| Total expenses
|
|
|
8,075,611
|
|
| |
| Compensating
balance credits |
|
|
(92 |
) |
| |
| Net expenses
|
|
|
8,075,519
|
|
| |
| Net investment
income (loss) |
|
|
9,193,108
|
|
| |
| REALIZED
AND UNREALIZED GAIN (LOSS) ON INVESTMENTS AND FOREIGN CURRENCY: |
|
|
|
|
| NET REALIZED
GAIN (LOSS): |
|
|
|
|
| |
| Investments |
|
|
42,996,570 |
|
| |
| Foreign currency
transactions |
|
|
121,247 |
|
| |
| NET CHANGE
IN UNREALIZED APPRECIATION (DEPRECIATION): |
|
|
|
|
| |
| Investments
and foreign currency translations |
|
|
(157,609,448 |
) |
| |
| Other assets
and liabilities denominated in foreign currency |
|
|
174,220 |
|
| |
| Net realized
and unrealized gain (loss) on investments and foreign currency |
|
|
(114,317,411 |
) |
| |
| NET INCREASE
(DECREASE) IN NET ASSETS FROM INVESTMENT OPERATIONS |
|
$ |
(105,124,303 |
) |
| |
| 52 | 2015
Annual Report to Stockholders |
|
THE ACCOMPANYING
NOTES ARE AN INTEGRAL PART OF THESE FINANCIAL STATEMENTS |
| Royce Value
Trust |
|
Year Ended
December 31, 2015 |
| CASH FLOWS
FROM OPERATING ACTIVITIES: |
|
|
|
|
|
| Net increase
(decrease) in net assets from investment operations |
|
|
$ |
(105,124,303 |
) |
| |
| Adjustments
to reconcile net increase (decrease) in net assets from investment operations to
net cash provided by operating activities: |
|
|
|
|
|
| |
Purchases
of long-term investments |
|
|
|
(421,650,687 |
) |
| |
Proceeds
from sales and maturities of long-term investments |
|
|
|
448,806,816 |
|
| |
Net
purchases, sales and maturities of short-term investments |
|
|
|
18,828,000 |
|
| |
Net
(increase) decrease in dividends and interest receivable and other assets |
|
|
|
(321,915 |
) |
| |
Net
increase (decrease) in interest expense payable, accrued expenses and other liabilities |
|
|
|
(145,507 |
) |
| |
Net
change in unrealized appreciation (depreciation) on investments |
|
|
|
157,609,448 |
|
| |
Net
realized gain (loss) on investments and foreign currency |
|
|
|
(43,117,817 |
) |
| |
| Net cash
provided by operating activities |
|
|
|
54,884,035
|
|
| |
| CASH FLOWS
FROM FINANCING ACTIVITIES: |
|
|
|
|
|
| Distributions |
|
|
|
(95,458,836 |
) |
| |
| Reinvestment
of distributions |
|
|
|
40,663,247 |
|
| |
| Net cash
used for financing activities |
|
|
|
(54,795,589 |
) |
| |
| INCREASE
(DECREASE) IN CASH: |
|
|
|
88,446
|
|
| |
| Cash and
foreign currency at beginning of year |
|
|
|
125,821
|
|
| |
| Cash and
foreign currency at end of year |
|
|
$ |
214,267
|
|
| |
| THE ACCOMPANYING
NOTES ARE AN INTEGRAL PART OF THESE FINANCIAL STATEMENTS |
|
2015 Annual
Report to Stockholders | 53 |
Royce Value Trust
This table is presented to show selected
data for a share of Common Stock outstanding throughout each period, and to assist
stockholders in evaluating the Fund’s performance for the periods presented.
| |
|
|
YEARS ENDED |
| |
|
|
|
| |
|
|
12/31/15 |
|
12/31/14 |
|
12/31/13 |
|
12/31/12 |
|
12/31/11 |
| |
| Net Asset
Value, Beginning of Period |
|
|
$ |
16.24 |
|
|
$ |
18.17 |
|
|
$ |
15.40 |
|
|
$ |
14.18 |
|
|
$ |
16.73 |
|
| |
| INVESTMENT
OPERATIONS: |
|
|
|
|
|
|
|
|
|
|
|
|
|
|
|
|
|
|
|
|
|
| Net investment
income (loss) |
|
|
|
0.12 |
|
|
|
0.12 |
|
|
|
0.12 |
|
|
|
0.23 |
|
|
|
0.10 |
|
| |
| Net realized
and unrealized gain (loss) on investments and foreign currency |
|
|
|
(1.48 |
) |
|
|
(0.13 |
) |
|
|
4.89 |
|
|
|
2.02 |
|
|
|
(1.62 |
) |
| |
| Total investment
operations |
|
|
|
(1.36 |
) |
|
|
(0.01 |
) |
|
|
5.01 |
|
|
|
2.25 |
|
|
|
(1.52 |
) |
| |
| DISTRIBUTIONS
TO PREFERRED STOCKHOLDERS: |
|
|
|
|
|
|
|
|
|
|
|
|
|
|
|
|
|
|
|
|
|
| Net investment
income |
|
|
|
– |
|
|
|
– |
|
|
|
– |
|
|
|
(0.04 |
) |
|
|
(0.03 |
) |
| |
| Net realized
gain on investments and foreign currency |
|
|
|
– |
|
|
|
– |
|
|
|
– |
|
|
|
(0.13 |
) |
|
|
(0.16 |
) |
| |
| Total distributions
to Preferred Stockholders |
|
|
|
–
|
|
|
|
–
|
|
|
|
–
|
|
|
|
(0.17 |
) |
|
|
(0.19 |
) |
| |
Net Increase
(Decrease) in Net Assets Applicable to Common Stockholders from Investment Operations
|
|
|
|
(1.36 |
) |
|
|
(0.01 |
) |
|
|
5.01 |
|
|
|
2.08 |
|
|
|
(1.71 |
) |
| |
| DISTRIBUTIONS
TO COMMON STOCKHOLDERS: |
|
|
|
|
|
|
|
|
|
|
|
|
|
|
|
|
|
|
|
|
|
| Net investment
income |
|
|
|
(0.16 |
) |
|
|
(0.14 |
) |
|
|
(0.11 |
) |
|
|
(0.17 |
) |
|
|
(0.08 |
) |
| |
| Net realized
gain on investments and foreign currency |
|
|
|
(1.08 |
) |
|
|
(1.68 |
) |
|
|
(2.08 |
) |
|
|
(0.63 |
) |
|
|
(0.43 |
) |
| |
| Return of
capital |
|
|
|
– |
|
|
|
– |
|
|
|
– |
|
|
|
– |
|
|
|
(0.27 |
) |
| |
| Total distributions
to Common Stockholders |
|
|
|
(1.24 |
) |
|
|
(1.82 |
) |
|
|
(2.19 |
) |
|
|
(0.80 |
) |
|
|
(0.78 |
) |
| |
| CAPITAL STOCK
TRANSACTIONS: |
|
|
|
|
|
|
|
|
|
|
|
|
|
|
|
|
|
|
|
|
|
| Effect of
reinvestment of distributions by Common Stockholders |
|
|
|
(0.08 |
) |
|
|
(0.10 |
) |
|
|
(0.05 |
) |
|
|
(0.06 |
) |
|
|
(0.06 |
) |
| |
| Total capital
stock transactions |
|
|
|
(0.08 |
) |
|
|
(0.10 |
) |
|
|
(0.05 |
) |
|
|
(0.06 |
) |
|
|
(0.06 |
) |
| |
| Net Asset
Value, End of Period |
|
|
$ |
13.56 |
|
|
$ |
16.24 |
|
|
$ |
18.17 |
|
|
$ |
15.40 |
|
|
$ |
14.18 |
|
| |
| Market
Value, End of Period |
|
|
$ |
11.77 |
|
|
$ |
14.33 |
|
|
$ |
16.01 |
|
|
$ |
13.42 |
|
|
$ |
12.27 |
|
| |
| TOTAL RETURN:1 |
|
|
|
|
|
|
|
|
|
|
|
|
|
|
|
|
|
|
|
|
|
| Net Asset
Value |
|
|
|
(8.09 |
)% |
|
|
0.78 |
% |
|
|
34.14 |
% |
|
|
15.41 |
% |
|
|
(10.06 |
)% |
| |
| Market Value |
|
|
|
(9.59 |
)% |
|
|
0.93 |
% |
|
|
35.63 |
% |
|
|
16.22 |
% |
|
|
(10.46 |
)% |
| |
RATIOS BASED
ON AVERAGE NET ASSETS APPLICABLE TO COMMON STOCKHOLDERS: |
|
|
|
|
|
|
|
|
|
|
|
|
|
|
|
|
|
|
|
|
|
| Investment
advisory fee expense2 |
|
|
|
0.50 |
% |
|
|
0.46 |
% |
|
|
0.54 |
% |
|
|
0.56 |
% |
|
|
0.86 |
% |
| |
| Other operating
expenses |
|
|
|
0.18 |
% |
|
|
0.15 |
% |
|
|
0.25 |
% |
|
|
0.15 |
% |
|
|
0.12 |
% |
| |
| Total expenses
(net)3 |
|
|
|
0.68 |
% |
|
|
0.61 |
% |
|
|
0.79 |
% |
|
|
0.71 |
% |
|
|
0.98 |
% |
| |
| Expenses net
of fee waivers and excluding interest expense |
|
|
|
0.61 |
% |
|
|
0.55 |
% |
|
|
0.65 |
% |
|
|
0.68 |
% |
|
|
0.98 |
% |
| |
| Expenses prior
to fee waivers and balance credits |
|
|
|
0.68 |
% |
|
|
0.61 |
% |
|
|
0.79 |
% |
|
|
0.71 |
% |
|
|
0.98 |
% |
| |
| Expenses prior
to fee waivers |
|
|
|
0.68 |
% |
|
|
0.61 |
% |
|
|
0.79 |
% |
|
|
0.71 |
% |
|
|
0.98 |
% |
| |
| Net investment
income (loss) |
|
|
|
0.78 |
% |
|
|
0.72 |
% |
|
|
0.70 |
% |
|
|
1.57 |
% |
|
|
0.63 |
% |
| |
| SUPPLEMENTAL
DATA: |
|
|
|
|
|
|
|
|
|
|
|
|
|
|
|
|
|
|
|
|
|
| Net Assets
Applicable to Common Stockholders, End of Period (in thousands) |
|
|
$ |
1,072,035 |
|
|
$ |
1,231,955 |
|
|
$ |
1,307,829 |
|
|
$ |
1,082,426 |
|
|
$ |
966,640 |
|
| |
| Liquidation
Value of Preferred Stock, End of Period (in thousands) |
|
|
|
|
|
|
|
|
|
|
|
|
|
|
|
|
|
|
$ |
220,000 |
|
| |
| Portfolio
Turnover Rate |
|
|
|
35 |
% |
|
|
40 |
% |
|
|
33 |
% |
|
|
25 |
% |
|
|
26 |
% |
| |
| PREFERRED
STOCK: |
|
|
|
|
|
|
|
|
|
|
|
|
|
|
|
|
|
|
|
|
|
| Total shares
outstanding |
|
|
|
|
|
|
|
|
|
|
|
|
|
|
|
|
|
|
|
8,800,000 |
|
| |
| Asset coverage
per share |
|
|
|
|
|
|
|
|
|
|
|
|
|
|
|
|
|
|
$ |
134.88 |
|
| |
| Liquidation
preference per share |
|
|
|
|
|
|
|
|
|
|
|
|
|
|
|
|
|
|
$ |
25.00 |
|
| |
| Average month-end
market value per share |
|
|
|
|
|
|
|
|
|
|
|
|
|
|
|
|
|
|
$ |
25.37 |
|
| |
| REVOLVING
CREDIT AGREEMENT: |
|
|
|
|
|
|
|
|
|
|
|
|
|
|
|
|
|
|
|
|
|
| Asset coverage |
|
|
|
1631 |
% |
|
|
1860 |
% |
|
|
1289 |
% |
|
|
822 |
% |
|
|
|
|
| |
| Asset coverage
per $1,000 |
|
|
$ |
16,315 |
|
|
$ |
18,599 |
|
|
$ |
12,889 |
|
|
$ |
8,216 |
|
|
|
|
|
| |
| 1 |
The Market
Value Total Return is calculated assuming a purchase of Common Stock on the opening
of the first business day and a sale on the closing of the last business day of
each period. Dividends and distributions are assumed for the purposes of this calculation
to be reinvested at prices obtained under the Fund’s Distribution Reinvestment
and Cash Purchase Plan. Net Asset Value Total Return is calculated on the same basis,
except that the Fund’s net asset value is used on the purchase and sale dates
instead of market value. |
| 2 |
The investment
advisory fee is calculated based on average net assets over a rolling 60-month basis,
while the above ratios of investment advisory fee expenses are based on the average
net assets applicable to Common Stockholders over a 12-month basis. |
| 3 |
Expense ratios
based on total average net assets including liquidation value of Preferred Stock
were 0.60% and 0.82% for the years ended December 31, 2012 and 2011, respectively. |
| 54 | 2015
Annual Report to Stockholders |
|
THE ACCOMPANYING
NOTES ARE AN INTEGRAL PART OF THESE FINANCIAL STATEMENTS |
Royce Value Trust
Notes to Financial Statements
Summary of Significant Accounting Policies:
Royce Value
Trust, Inc. (the “Fund”), is a diversified closed-end investment company that was
incorporated under the laws of the State of Maryland on July 1, 1986. The Fund commenced
operations on November 26, 1986.
The preparation
of financial statements in conformity with accounting principles generally accepted
in the United States of America requires management to make estimates and assumptions
that affect the reported amounts of assets and liabilities and the disclosure of
contingent assets and liabilities at the date of the financial statements and the
reported amounts of income and expenses during the reporting period. Actual results
could differ from those estimates.
The Fund is
an investment company and accordingly follows the investment company accounting
and reporting guidance of the Financial Accounting Standards Board (FASB) Accounting
Standard Codification Topic 946 “Financial Services-Investment Companies”.
VALUATION OF INVESTMENTS:
Securities
are valued as of the close of trading on the New York Stock Exchange (NYSE) (generally
4:00 p.m. Eastern time) on the valuation date. Securities that trade on an exchange,
and securities traded on Nasdaq’s Electronic Bulletin Board, are valued at
their last reported sales price or Nasdaq official closing price taken from the
primary market in which each security trades or, if no sale is reported for such
day, at their highest bid price. Other over-the-counter securities for which market
quotations are readily available are valued at their highest bid price, except in
the case of some bonds and other fixed income securities which may be valued by
reference to other securities with comparable ratings, interest rates and maturities,
using established independent pricing services. The Fund values its non-U.S. dollar
denominated securities in U.S. dollars daily at the prevailing foreign currency
exchange rates as quoted by a major bank. Securities for which market quotations
are not readily available are valued at their fair value in accordance with the
provisions of the 1940 Act, under procedures approved by the Fund’s Board of
Directors, and are reported as Level 3 securities. As a general principle, the fair
value of a security is the amount which the Fund might reasonably expect to receive
for the security upon its current sale. However, in light of the judgment involved
in fair valuations, there can be no assurance that a fair value assigned to a particular
security will be the amount which the Fund might be able to receive upon its current
sale. In addition, if, between the time trading ends on a particular security and
the close of the customary trading session on the NYSE, events occur that are significant
and may make the closing price unreliable, the Fund may fair value the security.
The Fund uses an independent pricing service to provide fair value estimates for
relevant non-U.S. equity securities on days when the U.S. market volatility exceeds
a certain threshold. This pricing service uses proprietary correlations it has developed
between the movement of prices of non-U.S. equity securities and indices of U.S.-traded
securities, futures contracts and other indications to estimate the fair value of
relevant non-U.S. securities. When fair value pricing is employed, the prices of
securities used by the Fund may differ from quoted or published prices for the same
security. Investments in money market funds are valued at net asset value per share.
Various inputs are used in determining the value of the
Fund’s investments, as noted above. These inputs are summarized in the three
broad levels below:
| |
|
Level 1
|
– |
quoted prices
in active markets for identical securities. |
| |
|
Level 2
|
– |
other significant
observable inputs (including quoted prices for similar securities, foreign securities
that may be fair valued and repurchase agreements). The table below includes all
Level 2 securities. Level 2 securities with values based on quoted prices for similar
securities are noted in the Schedule of Investments. |
| |
|
Level 3
|
– |
significant
unobservable inputs (including last trade price before trading was suspended, or
at a discount thereto for lack of marketability or otherwise, market price information
regarding other securities, information received from the company and/or published
documents, including SEC filings and financial statements, or other publicly available
information). |
The inputs
or methodology used for valuing securities are not necessarily an indication of
the risk associated with investing in those securities.
The following is a summary of the inputs used to value the Fund’s investments as of December 31, 2015. For a detailed breakout of
common stocks by sector classification, please refer to the Schedule of Investments.
| |
|
LEVEL 1 |
|
LEVEL 2 |
|
LEVEL 3 |
|
TOTAL |
| |
| Common Stocks |
|
$ |
1,007,975,908 |
|
|
$ |
119,301,916 |
|
|
$ |
167,629 |
|
|
$ |
1,127,445,453
|
|
| |
| Cash Equivalents |
|
|
– |
|
|
|
10,727,000 |
|
|
|
– |
|
|
|
10,727,000
|
|
| |
For the year
ended December 31, 2015, certain securities have transferred in and out of Level
1 and Level 2 measurements. The Fund recognizes transfers between levels as of the
end of the reporting period. At December 31, 2015, securities valued at $267,690
were transferred from Level 2 to Level 1 within the fair value hierarchy.
| 2015 Annual
Report to Stockholders | 55 |
Royce Value Trust
Notes to Financial Statements (continued)
VALUATION OF INVESTMENTS (continued):
Level 3 Reconciliation:
| |
|
|
BALANCE
AS OF 12/31/14 |
|
|
SALES
|
|
|
REALIZED
AND UNREALIZED
GAIN (LOSS)1 |
|
|
BALANCE
AS OF 12/31/15 |
|
| |
| Common Stocks |
|
|
$ 270,001 |
|
|
$ 1 |
|
|
$(102,371) |
|
|
$167,629 |
|
| |
| Preferred Stocks |
|
|
1,216,350 |
|
|
724,062 |
|
|
(492,288) |
|
|
– |
|
| |
| 1 |
The net change
in unrealized appreciation (depreciation) is included in the accompanying Statement
of Operations. Change in unrealized appreciation (depreciation) includes net unrealized
appreciation (depreciation) resulting from changes in investment values during the
reporting period and the reversal of previously recorded unrealized appreciation
(depreciation) when gains or losses are realized. Net realized gain (loss) from
investments and foreign currency transactions is included in the accompanying Statement
of Operations. |
REPURCHASE AGREEMENTS:
The Fund may
enter into repurchase agreements with institutions that the Fund’s investment adviser has determined are creditworthy. The
Fund restricts repurchase agreements to maturities of no more than seven days. Securities
pledged as collateral for repurchase agreements, which are held until maturity of
the repurchase agreements, are marked-to-market daily and maintained at a value
at least equal to the principal amount of the repurchase agreement (including accrued
interest). Repurchase agreements could involve certain risks in the event of default
or insolvency of the counter-party, including possible delays or restrictions upon
the ability of the Fund to dispose of its underlying securities. The remaining contractual
maturity of the repurchase agreement held by the Fund at December 31, 2015 is overnight
and continuous.
FOREIGN CURRENCY:
Net realized
foreign exchange gains or losses arise from sales and maturities of short-term securities,
sales of foreign currencies, expiration of currency forward contracts, currency
gains or losses realized between the trade and settlement dates on securities transactions,
and the difference between the amounts of dividends, interest, and foreign withholding
taxes recorded on the Fund’s books and the U.S. dollar equivalent of the amounts
actually received or paid. Net unrealized foreign exchange gains and losses arise
from changes in the value of assets and liabilities, including investments in securities
at the end of the reporting period, as a result of changes in foreign currency exchange
rates.
SECURITIES LENDING:
The Fund loans securities through a lending agent to qualified institutional investors for the purpose of realizing additional income.
Collateral for the Fund on all securities loaned is accepted in cash and cash equivalents and invested temporarily by the custodian. The
collateral maintained is at least 100% of the current market value of the loaned securities. The market value of the loaned securities is
determined at the close of business of the Fund and any additional required collateral is delivered to the Fund on the next business day.
The Fund retains the risk of any loss on the securities on loan as well as incurring the potential loss on investments purchased with cash
collateral received for securities lending. The Fund’s securities lending income consists of the income earned on investing cash collateral,
plus any premium payments received for lending certain securities, less any rebates paid to borrowers and lending agent fees associated
with the loan. The lending agent is not affiliated with Royce. No securities were on loan at December 31, 2015.
TAXES:
As a qualified
regulated investment company under Subchapter M of the Internal Revenue Code, the
Fund is not subject to income taxes to the extent that it distributes substantially
all of its taxable income for its fiscal year. The Schedule of Investments includes
information regarding income taxes under the caption “Tax Information”.
CAPITAL GAINS TAXES:
The Fund is
subject to a tax imposed on short-term capital gains on securities of issuers domiciled
in certain countries. The Fund records an estimated deferred tax liability for these
securities that have been held for less than one year. This amount, if any, is reported
as deferred capital gains tax in the accompanying Statement of Assets and Liabilities,
assuming those positions were disposed of at the end of the period, and accounted
for as a reduction in the market value of the security.
DISTRIBUTIONS:
The Fund pays quarterly distributions on the Fund’s Common Stock at the annual rate of 7% of the rolling average of the prior four
calendar quarter-end NAVs of the Fund’s Common Stock, with the fourth quarter distribution being the greater of 1.75% of the rolling
average or the distribution required by IRS regulations. Prior to November 15, 2012, distributions to Preferred Stockholders were accrued
daily and paid quarterly. Distributions to Common Stockholders are recorded on ex-dividend date. Distributable capital gains and/or net
investment income were first allocated to Preferred Stockholder distributions, with any excess allocable to Common Stockholders. If
capital gains and/or net investment income were allocated to both Preferred and Common Stockholders, the tax character of such
allocations was proportional. To the extent that distributions are not paid from long-term capital gains, net investment income or
net short-term
capital gains, they will represent a return of capital. Distributions are determined in accordance with income tax regulations that may
| 56 | 2015
Annual Report to Stockholders |
Royce Value Trust
Notes to Financial Statements (continued)
DISTRIBUTIONS (continued):
differ from accounting principles generally accepted in the United States of America. Permanent
book and tax differences relating to stockholder distributions will result in reclassifications
within the capital accounts. Undistributed net investment income may include temporary
book and tax basis differences, which will reverse in a subsequent period. Any taxable
income or gain remaining undistributed at fiscal year end is distributed in the
following year.
INVESTMENT TRANSACTIONS AND RELATED INVESTMENT INCOME:
Investment
transactions are accounted for on the trade date. Dividend income is recorded on
the ex-dividend date. Non-cash dividend income is recorded at the fair market value
of the securities received. Interest income is recorded on an accrual basis. Premium
and discounts on debt securities are amortized using the effective yield-to-maturity
method. Realized gains and losses from investment transactions are determined on
the basis of identified cost for book and tax purposes.
EXPENSES:
The Fund incurs direct and indirect expenses. Expenses directly attributable to the Fund are charged to the Fund’s operations, while
expenses applicable to more than one of the Royce Funds are allocated equitably. Certain personnel, occupancy costs and other
administrative expenses related to the Funds are allocated by Royce & Associates, LLC (“Royce”) under an administration agreement and are included in administrative and office facilities and professional fees. The Fund has adopted a deferred fee agreement that allows the
Directors to defer the receipt of all or a portion of directors’ fees otherwise payable. The deferred fees are invested in certain Royce Funds until distributed in accordance with the agreement.
COMPENSATING BALANCE CREDITS:
The Fund has
an arrangement with its custodian bank, whereby a portion of the custodian’s
fee is paid indirectly by credits earned on the Fund’s cash on deposit with
the bank. This deposit arrangement is an alternative to purchasing overnight investments.
Conversely, the Fund pays interest to the custodian on any cash overdrafts, to the
extent they are not offset by credits earned on positive cash balances.
Capital Stock:
The Fund issued
3,183,214 and 3,894,284 shares of Common Stock as reinvestment of distributions
for the years ended December 31, 2015 and December 31, 2014, respectively.
Borrowings:
The Fund has
entered into a revolving credit agreement (the credit agreement) with BNP Paribas
Prime Brokerage Inc. (BNPP). The Fund pays a commitment fee of 0.50% per annum on
the unused portion of the credit agreement. The credit agreement has a 360-day rolling
term that resets daily; however, if the Fund exceeds certain net asset value triggers,
the credit agreement may convert to a 60-day rolling term that resets daily. The
Fund is required to pledge portfolio securities as collateral in an amount up to
two times the loan balance outstanding and has granted a security interest in the
securities pledged to, and in favor of, BNPP as security for the loan balance outstanding.
If the Fund fails to meet certain requirements, or maintain other financial covenants
required under the credit agreement, the Fund may be required to repay immediately,
in part or in full, the loan balance outstanding under the credit agreement necessitating
the sale of portfolio securities at potentially inopportune times. The credit agreement
also permits, subject to certain conditions, BNPP to rehypothecate portfolio securities
pledged by the Fund up to the amount of the loan balance outstanding. The Fund continues
to receive payments in lieu of dividends and interest on rehypothecated securities.
The Fund also has the right under the credit agreement to recall the rehypothecated
securities from BNPP on demand. If BNPP fails to deliver the recalled security in
a timely manner, the Fund is compensated by BNPP for any fees or losses related
to the failed delivery or, in the event a recalled security is not returned by BNPP,
the Fund, upon notice to BNPP, may reduce the loan balance outstanding by the amount
of the recalled security failed to be returned. The Fund receives a portion of the
fees earned by BNPP in connection with the rehypothecation of portfolio securities.
As of December
31, 2015, the Fund has outstanding borrowings of $70,000,000. During the year ended
December 31, 2015, the Fund borrowed an average daily balance of $70,000,000 at
a weighted average borrowing cost of 1.27%. The maximum amount outstanding during
the year ended December 31, 2015 was $70,000,000. As of December 31, 2015, the aggregate
value of rehypothecated securities was $55,161,255. During the year ended December
31, 2015, the Fund earned $358,817 in fees from rehypothecated securities.
Investment Advisory Agreement:
As compensation
for its services under the Investment Advisory Agreement, Royce receives a fee comprised
of a Basic Fee (“Basic Fee”) and an adjustment to the Basic Fee based
on the investment performance of the Fund in relation to the investment record of
the S&P SmallCap 600 Index (“S&P 600”).
The Basic Fee is a monthly fee equal to 1/12 of 1% (1% on an annualized basis) of the average of the Fund’s month-end net assets
applicable to Common Stockholders, plus the liquidation value of outstanding Preferred Stock, for the rolling 60-month period ending with
| 2015 Annual
Report to Stockholders | 57 |
Royce Value Trust
Notes to Financial Statements (continued)
Investment Advisory Agreement (continued):
such month (the “performance period”). The Basic Fee for each month is increased or decreased at the rate of 1/12 of .05% for each
percentage point that the investment performance of the Fund exceeds, or is exceeded by, the percentage change in the investment
record of the S&P 600 for the performance period by more than two percentage points. The performance period for each such month is a
rolling 60-month period ending with such month. The maximum increase or decrease in the Basic Fee for any month may not exceed 1/12
of .5%. Accordingly, for each month, the maximum monthly fee rate as adjusted for performance is 1/12 of 1.5% and is payable if the
investment performance of the Fund exceeds the percentage change in the investment record of the S&P 600 by 12 or more percentage
points for the performance period, and the minimum monthly fee rate as adjusted for performance is 1/12 of .5% and is payable if the
percentage change in the investment record of the S&P 600 exceeds the investment performance of the Fund by 12 or more percentage
points for the performance period.
Notwithstanding
the foregoing, Royce is not entitled to receive any fee for any month when the investment
performance of the Fund for the rolling 36-month period ending with such month is
negative. In the event that the Fund’s investment performance for such a performance period is less than zero, Royce will
not be required to refund to the Fund any fee earned in respect of any prior performance
period.
For the twelve
rolling 60-month periods in 2015, the Fund’s investment performance ranged from 37% to 52% below the investment performance of the
S&P 600. Accordingly, the net investment advisory fee consisted of a Basic
Fee of $11,782,299 and a net downward adjustment of $5,891,149 for the performance
of the Fund relative to that of the S&P 600. For the year ended December 31,
2015, the Fund accrued and paid Royce investment advisory fees totaling $5,891,150.
Purchases and Sales of Investment Securities:
For the year
ended December 31, 2015, the costs of purchases and proceeds from sales of investment
securities, other than short-term securities, amounted to $416,979,288 and $441,694,010,
respectively.
Cross trades
were executed by the Fund pursuant to Rule 17a-7 under the 1940 Act. Cross trading
is the buying or selling of portfolio securities between funds to which R&A
serves as investment adviser. At its regularly scheduled quarterly meetings, the
Board reviews such transactions as of the most recent calendar quarter for compliance
with the requirements and restrictions set forth by Rule 17a-7. Cross trades for
the year ended December 31, 2015, were as follows:
| PURCHASES
|
|
|
SALES
|
|
|
REALIZED
GAIN (LOSS) |
| |
| $85,028,140 |
|
|
$44,242,674 |
|
|
$17,998,274 |
| |
Tax Information:
Distributions
during the years ended December 31, 2015 and 2014, were characterized as follows
for tax purposes:
|
ORDINARY INCOME |
|
|
LONG-TERM CAPITAL GAINS |
| |
| 2015 |
|
|
2014 |
|
|
2015 |
|
|
2014 |
| |
| $16,352,099 |
|
|
$29,761,905 |
|
|
$79,106,737 |
|
|
$103,510,136 |
| |
The tax basis components of distributable
earnings at December 31, 2015, were as follows:
UNDISTRIBUTED
ORDINARY
INCOME |
|
UNDISTRIBUTED
LONG-TERM
CAPITAL GAINS OR
(CAPITAL LOSSES
NOT SUBJECT TO EXPIRATION) |
|
NET UNREALIZED
APPRECIATION
(DEPRECIATION)1 |
|
QUALIFIED
LATE YEAR
ORDINARY AND
POST-OCTOBER LOSS
DEFERRALS2 |
|
TOTAL
DISTRIBUTABLE
EARNINGS |
| |
| $8,993 |
|
$7,183,938 |
|
$136,552,471 |
|
$(747,491) |
|
$142,997,911 |
| |
| 1 |
Includes timing differences on foreign currency, recognition of losses on securities
sold, investments in publicly traded partnerships and Trusts and mark-to-market
of Passive Foreign Investment Companies. |
| 2 |
Under the
current tax law, capital losses and qualified late year ordinary losses incurred
after October 31 may be deferred and treated as occurring on the first day of the
following fiscal year. |
For financial
reporting purposes, capital accounts and distributions to stockholders are adjusted
to reflect the tax character of permanent book/tax differences. For the year ended
December 31, 2015, the Fund recorded the following permanent reclassifications,
which relate primarily to current Real Estate Investment Trusts, publicly traded
partnerships and Trusts, foreign currency transactions, foreign capital gains tax,
dividend redesignations and gains from the sale of Passive Foreign Investment Companies.
Results of operations and net assets were not affected by these reclassifications.
UNDISTRIBUTED
NET
INVESTMENT INCOME |
|
ACCUMULATED
NET
REALIZED GAIN (LOSS) |
|
PAID-IN
CAPITAL |
| |
| $(375,420) |
|
$(18,688) |
|
$394,108 |
| |
Management has analyzed the Fund’s tax positions taken on federal income tax returns for all open tax years (2012-2015) and has
concluded that as of December 31, 2015, no provision for income tax is required in the Fund’s financial statements.
| 58 | 2015
Annual Report to Stockholders |
Royce Value Trust
Notes to Financial Statements (continued)
Transactions in Affiliated Companies:
An “Affiliated Company” as defined in the Investment Company Act of 1940, is a company in which a fund owns 5% or more of the
company’s outstanding voting securities at any time during the period. The Fund effected the following transactions in shares of such
companies for the year ended December 31, 2015:
| AFFILIATED
COMPANY |
|
SHARES
12/31/14 |
|
|
MARKET
VALUE
12/31/14 |
|
COST
OF
PURCHASES |
|
COST
OF
SALES |
|
REALIZED
GAIN (LOSS) |
|
DIVIDEND
INCOME |
|
SHARES
12/31/15 |
|
MARKET
VALUE
12/31/15 |
| |
| Stanley Furniture |
|
1,012,235 |
|
|
$2,773,524 |
|
– |
|
– |
|
– |
|
– |
|
1,012,235 |
|
$2,824,136 |
| |
| Timberland
Bancorp |
|
444,200 |
|
|
4,708,520 |
|
– |
|
– |
|
– |
|
$137,702 |
|
444,200 |
|
5,512,522 |
| |
| |
|
|
|
|
$7,482,044
|
|
|
|
|
|
|
|
$137,702
|
|
|
|
$8,336,658
|
| |
| 2015 Annual
Report to Stockholders | 59 |
Royce Value Trust
Report of Independent Registered Public
Accounting Firm
To the Board of Directors and Stockholders
of Royce Value Trust, Inc.:
In our opinion, the accompanying statement of assets and liabilities, including the schedule of investments, and the related statement of
operations, of changes in net assets, and of cash flows and the financial highlights present fairly, in all material respects, the financial
position of Royce Value Trust, Inc. (the “Fund”) at December 31, 2015, the results of its operations, the changes in its net assets, its cash
flows and its financial highlights for the year then ended, in conformity with accounting principles generally accepted in the United States
of America. These financial statements and financial highlights (hereafter referred to as “financial statements”) are the responsibility of the
Funds’ management. Our responsibility is to express an opinion on these financial statements based on our audit. We conducted our audit
of these financial statements in accordance with the standards of the Public Company Accounting Oversight Board (United States). Those
standards require that we plan and perform the audit to obtain reasonable assurance about whether the financial statements are free of
material misstatement. An audit includes examining, on a test basis, evidence supporting the amounts and disclosures in the financial
statements, assessing the accounting principles used and significant estimates made by management, and evaluating the overall financial
statement presentation. We believe that our audit, which included confirmation of securities at December 31, 2015 by correspondence
with the custodian and brokers, provide a reasonable basis for our opinion. The statement of changes in net assets for the year ended
December 31, 2014 and the financial highlights for each of the fiscal periods presented in the period ended December 31, 2014 were
audited by other independent accountants whose report dated February 23, 2015 expressed an unqualified opinion on those statements.
PricewaterhouseCoopers LLP
Baltimore, Maryland
February 23, 2016
| 60 | 2015
Annual Report to Stockholders |
Directors and Officers
All Directors and Officers may be reached
c/o The Royce Funds, 745 Fifth Avenue, New York, NY 10151
Charles M. Royce, Director1
Age: 76
| Number of Funds Overseen: 25 | Tenure: Since 1982
Non-Royce Directorships: Director
of TICC Capital Corp.
Principal Occupation(s) During Past Five Years: Chief Executive
Officer and a Member of the Board of Managers of Royce & Associates, LLC (“Royce”),
the Trust’s investment adviser.
Christopher D. Clark, Trustee1, President
Age: 50 | Number of Funds Overseen: 25 | Tenure: Since 2014
Principal Occupation(s)
During Past Five Years: President (since July 2014), Co-Chief Investment Officer
(since January 2014), Managing Director and, since June 2015, a Member of the Board
of Managers of Royce, having been employed by Royce since May 2007.
Patricia W. Chadwick, Director
Age: 67
| Number of Funds Overseen: 25 | Tenure: Since 2009
Non-Royce Directorships: Trustee
of ING Mutual Funds and Director of Wisconsin Energy Corp.
Principal Occupation(s)
During Past 5 Years: Consultant and President of Ravengate Partners LLC (since 2000).
Richard M. Galkin, Director
Age: 77 |
Number of Funds Overseen: 25 | Tenure: Since 1982
Non-Royce Directorships: None
Principal Occupation(s) During Past Five Years: Private investor. Mr. Galkin’s
prior business experience includes having served as President of Richard M. Galkin
Associates, Inc., telecommunications consultants, President of Manhattan Cable Television
(a subsidiary of Time, Inc.), President of Haverhills Inc. (another Time, Inc. subsidiary),
President of Rhode Island Cable Television, and Senior Vice President of Satellite
Television Corp. (a subsidiary of Comsat).
Stephen L. Isaacs, Director
Age: 76 |
Number of Funds Overseen: 25 | Tenure: Since 1989
Non-Royce Directorships: None
Principal Occupation(s) During Past Five Years: Attorney and President of Health
Policy Associates, Inc., consultants. Mr. Isaacs’s prior business experience
includes having served as President of the Center for Health and Social Policy (from
1996 to 2012); Director of Columbia University Development Law and Policy Program
and Professor at Columbia University (until August 1996).
Arthur S. Mehlman, Director
Age: 73 |
Number of Funds Overseen: 46 | Tenure: Since 2004
Non-Royce Directorships: Director/Trustee
of registered investment companies constituting the 18 Legg Mason Funds.
Principal
Occupation(s) During Past Five Years: Director of The League for People with Disabilities,
Inc.; Director of University of Maryland Foundation (non-profits). Formerly: Director
of Municipal Mortgage & Equity, LLC (from October 2004 to April 1, 2011); Director
of University of Maryland College Park Foundation (non-profit) (from 1998 to 2005);
Partner, KPMG LLP (international accounting firm) (from 1972 to 2002); Director
of Maryland Business Roundtable for Education (from July 1984 to June 2002).
David L. Meister, Director
Age: 76 |
Number of Funds Overseen: 25 | Tenure: Since 1982
Non-Royce Directorships: None
Principal Occupation(s) During Past Five Years: Consultant. Chairman and Chief Executive
Officer of The Tennis Channel (from June 2000 to March 2005). Mr. Meister’s
prior business experience includes having served as Chief Executive Officer of Seniorlife.com,
a consultant to the communications industry, President of Financial News Network,
Senior Vice President of HBO, President of Time-Life Films, and Head of Broadcasting
for Major League Baseball.
G. Peter O’Brien, Director
Age:
70 | Number of Funds Overseen: 46 | Tenure: Since 2001
Non-Royce Directorships:
Director/Trustee of registered investment companies constituting the 18 Legg Mason
Funds; Director of TICC Capital Corp.
Principal Occupation(s) During Past Five
Years: Trustee Emeritus of Colgate University (since 2005); Board Member of Hill
House, Inc. (since 1999); Formerly: Trustee of Colgate University (from 1996 to
2005), President of Hill House, Inc. (from 2001 to 2005) and Managing Director/Equity
Capital Markets Group of Merrill Lynch & Co. (from 1971 to 1999).
Michael K. Shields, Director
Age: 57
| Number of Funds Overseen: 25 | Tenure: Since 2015
Principal Occupation(s) During
Past Five Years: President and Chief Executive Officer of Piedmont Trust Company,
a private North Carolina trust company (since May 2012). Mr. Shields’s prior
business experience includes owning Shields Advisors, an investment consulting firm
(from April 2010 to June 2012).
Francis D. Gannon, Vice President
Age:
48 | Tenure: Since 2014
Principal Occupation(s) During Past Five Years: Co-Chief
Investment Officer (since January 2014) and Managing Director of Royce, having been
employed by Royce since September 2006.
Daniel A. O’Byrne, Vice President
Age: 53 | Tenure: Since 1994
Principal Occupation(s) During Past Five Years: Principal
and Vice President of Royce, having been employed by Royce since October 1986.
Peter K. Hoglund, Treasurer
Age: 49 |
Tenure: Since 2015
Principal Occupation(s) During Past Five Years: Principal, Chief
Financial Officer, and Chief Administrative Officer of Royce, having been employed
by Royce since December 2014. Prior to joining Royce, Mr. Hoglund spent more than
20 years with Munder Capital Management in Birmingham, MI, serving as Managing Director
and Chief Financial Officer and overseeing all financial aspects of the firm. He
began his career at Munder as a portfolio manager.
John E. Denneen, Secretary and Chief Legal
Officer
Age: 48 | Tenure: 1996-2001 and Since 2002
Principal Occupation(s) During
Past Five Years: General Counsel and, since June 2015, a Member of the Board of
Managers of Royce; Chief Legal and Compliance Officer and Secretary of Royce; Secretary
and Chief Legal Officer of The Royce Funds.
Lisa Curcio, Chief Compliance Officer
Age: 56 | Tenure: Since 2004
Principal Occupation(s) During Past Five Years: Chief
Compliance Officer of The Royce Funds (since October 2004) and Compliance Officer
of Royce (since June 2004).
1 Interested Director.
Director will
hold office until their successors have been duly elected and qualified or until
their earlier resignation or removal.
2015 Annual Report to Stockholders | 61
Notes to Performance and Other Important
Information
The thoughts expressed in this Review and
Report concerning recent market movements and future prospects for small company
stocks are solely the opinion of Royce at December 31, 2015, and, of course, historical
market trends are not necessarily indicative of future market movements. Statements
regarding the future prospects for particular securities held in the Funds’
portfolios and Royce’s investment intentions with respect to those securities
reflect Royce’s opinions as of December 31, 2015 and are subject to change
at any time without notice. There can be no assurance that securities mentioned in this Review and Report will be included in any Royce-managed portfolio in the
future. Investments in securities of micro-cap, small-cap and/or mid-cap companies
may involve considerably more risk than investments in securities of larger-cap
companies. All publicly released material information is always disclosed by the
Funds on the website at www.roycefunds.com.
Sector weightings are determined using the
Global Industry Classification Standard (“GICS”). GICS was developed by, and is
the exclusive property of, Standard & Poor’s Financial Services LLC (“S&P”) and MSCI Inc. (“MSCI”). GICS is the trademark of S&P and MSCI. “Global
Industry Classification Standard (GICS)” and “GICS Direct” are service marks of
S&P and MSCI.
All indexes referred to are unmanaged and
capitalization weighted. Each index’s returns include net reinvested dividends
and/or interest income. Russell Investment Group is the source and owner of the
trademarks, service marks, and copyrights related to the Russell Indexes. Russell®
is a trademark of Russell Investment Group. The Russell 2000 Index is an index of
domestic small-cap stocks. It measures the performance of the 2,000 smallest publicly
traded U.S. companies in the Russell 3000 Index. The Russell 2000 Value and Growth
indexes consist of the respective value and growth stocks within the Russell 2000
as determined by Russell Investments. The Russell Microcap Index includes 1,000
of the smallest securities in the Russell 2000 Index along with the next smallest
eligible securities as determined by Russell. The Russell 1000 Index is an index
of domestic large-cap stocks. It measures the performance of the 1,000 largest publicly
traded companies in the Russell 3000 Index. The Russell Midcap Index measures the
performance of the mid-cap segment of the U.S. equity universe. It includes approximately
800 of the smallest securities in the Russell 1000 Index. The Russell Global Small
Cap Index is an unmanaged, capitalization-weighted index of global small-cap stocks.
The Russell Global ex-U.S. Large Cap Index is an index of global large-cap stocks,
excluding the United States. The Russell Global ex-U.S. Small Cap Index is an index
of global small-cap stocks, excluding the United States. The S&P 500 and SmallCap
600 are indexes of U.S. large- and small-cap stocks, respectively, selected by Standard
& Poor’s based on market size, liquidity, and industry grouping, among
other factors. The Nasdaq Composite is an index of the more than 3,000 common equities
listed on the Nasdaq stock exchange. The performance of an index does not represent
exactly any particular investment, as you cannot invest directly in an index. Returns
for the market indexes used in this report were based on information supplied to
Royce by Russell Investments.
The Price-Earnings, or P/E, Ratio is calculated
by dividing a company’s share price by its trailing 12-month earnings-per share
(EPS). The Price-to-Book, or P/B, Ratio is calculated by dividing a company’s
share price by its book value per share. The Morningstar Style Map uses proprietary
scores of a stock’s value and growth characteristics to determine its placement
in one of the five categories listed on the horizontal axis. These characteristics
are then compared to those of other stocks within the same market capitalization
band. Each is scored from zero to 100 for both value and growth attributes. The
value score is subtracted from the growth score to determine the overall style score.
For the vertical, market cap axis, Morningstar subdivides into size groups. Giant-cap
stocks are defined as those that account for the top 40% of the capitalization of
each style zone; large-cap stocks represent the next 30%; mid-cap stocks the next
20%; small-cap stocks the next 7%; micro-cap stocks the smallest 3%. The Royce Funds
is a service mark of The Royce Funds. Distributor: Royce Fund Services, Inc.
Forward-Looking Statements
This material contains forward-looking statements
within the meaning of the Securities Exchange Act of 1934, as amended (the “Exchange
Act”), that involve risks and uncertainties, including, among others, statements
as to:
| • |
the Funds’ future operating results |
| • |
the prospects
of the Funds’ portfolio companies |
| • |
the impact
of investments that the Funds have made or may make |
| • |
the dependence
of the Funds’ future success on the general economy and its impact on the companies
and industries in which the Funds invest, and |
| • |
the ability of the Funds’ portfolio
companies to achieve their objectives. |
This Review and Report uses words such as
“anticipates,” “believes,” “expects,” “future,” “intends,” and similar expressions
to identify forward-looking statements. Actual results may differ materially from
those projected in the forward-looking statements for any reason.
The Royce Funds have based the forward-looking
statements included in this Review and Report on information available to us on
the date of the report, and we assume no obligation to update any such forward-looking
statements. Although The Royce Funds undertake no obligation to revise or update
any forward-looking statements, whether as a result of new information, future events
or otherwise, you are advised to consult any additional disclosures that we may
make through future stockholder communications or reports.
Authorized Share Transactions
Royce Value Trust, Royce Micro-Cap Trust,
and Royce Global Value Trust may each repurchase up to 5% of the issued and outstanding
shares of its respective common stock during the year ending December 31, 2015.
Any such repurchases would take place at then prevailing prices in the open market
or in other transactions. Common stock repurchases would be effected at a price
per share that is less than the share’s then current net asset value.
Royce Value Trust, Royce Micro-Cap Trust,
and Royce Global Value Trust are also authorized to offer their common stockholders
an opportunity to subscribe for additional shares of their common stock through
rights offerings at a price per share that may be less than the share’s then
current net asset value. The timing and terms of any such offerings are within each
Board’s discretion.
Annual Certifications
As required, the Funds have submitted to
the New York Stock Exchange (“NYSE”) for the annual certification of the Funds’
Chief Executive Officer that he is not aware of any violation of the NYSE’s
listing standards. The Funds also have included the certification of the Funds’
Chief Executive Officer and Chief Financial Officer required by section 302 of the
Sarbanes-Oxley Act of 2002 as exhibits to the Funds’ form N-CSR for the period
ended December 31, 2015, filed with the Securities and Exchange Commission.
62 | 2015 Annual Report to Stockholders
Notes to Performance and Other Important
Information (continued)
Proxy Voting
A copy of the policies and procedures that
The Royce Funds use to determine how to vote proxies relating to portfolio securities
and information regarding how each of The Royce Funds voted proxies relating to
portfolio securities during the most recent 12-month period ended June 30 is available,
without charge, on The Royce Funds’ website at www.roycefunds.com, by calling
(800) 221-4268 (toll-free) and on the website of the Securities and Exchange Commission
(“SEC”), at www.sec.gov.
Form N-Q Filing
The Funds file their complete schedules
of investments with the SEC for the first and third quarters of each fiscal year
on Form N-Q. The Funds’ Forms N-Q are available on the SEC’s website at
www.sec.gov. The Royce Funds’ holdings are also on the Funds’ website
approximately 15 to 20 days after each calendar quarter end and remain available
until the next quarter’s holdings are posted. The Funds’ Forms N-Q may
also be reviewed and copied at the SEC’s Public Reference Room in Washington,
D.C. To find out more about this public service, call the SEC at (800) 732-0330.
The Funds’ complete schedules of investments are updated quarterly, and are
available at www.roycefunds.com.
2015 Annual Report to Stockholders | 63
Results of Stockholders Meetings
Royce Value Trust, Inc.
At the 2015 Annual Meeting of Stockholders
held on September 24, 2015, the Fund’s stockholders elected three Directors,
consisting of:
| |
|
VOTES
FOR |
|
VOTES
WITHHELD |
| |
| Charles M.
Royce |
|
60,125,642 |
|
5,450,793 |
| |
| G. Peter O’Brien |
|
60,024,887 |
|
5,551,548 |
| |
| David L. Meister |
|
59,781,734 |
|
5,794,701 |
| |
Royce Micro-Cap Trust, Inc.
At the 2015 Annual Meeting of Stockholders
held on September 24, 2015, the Fund’s stockholders elected three Directors,
consisting of:
| |
|
VOTES
FOR |
|
VOTES
WITHHELD |
| |
| Charles M.
Royce |
|
30,149,093 |
|
405,166 |
| |
| G. Peter O’Brien |
|
30,006,654 |
|
547,605 |
| |
| David L. Meister |
|
29,990,136 |
|
564,123 |
| |
Royce Global Value Trust, Inc.
At the 2015 Annual Meeting of Stockholders
held on September 24, 2015, the Fund’s stockholders elected three Directors,
consisting of:
| |
|
VOTES
FOR |
|
VOTES
WITHHELD |
| |
| Charles M.
Royce |
|
8,639,282 |
|
466,513 |
| |
| G. Peter O’Brien |
|
8,635,385 |
|
470,410 |
| |
| David L. Meister |
|
8,576,649 |
|
529,146 |
| |
| 64 | 2015 Annual Report to Stockholders |
| |
|
|
|
|
| |
|
|
|
|
| |
|
|
|
|
| |
|
|
|
|
| |
|
|
|
|
| |
 |
|
| |
|
|
|
|
| |
|
|
|
|
| |
|
|
|
|
| |
About The Royce Funds |
|
Contact Us |
|
| |
|
|
|
|
| |
|
|
|
|
| |
Wealth
of Experience
With approximately $19 billion in total assets under management, Royce & Associates is
committed to the same investment principles that have served us well for more than 40
years. Chuck Royce, our Chief Executive Officer, enjoys one of the longest tenures of any
active mutual fund manager. Royce’s investment staff also includes 24 portfolio managers
and analysts and seven traders. |
|
GENERAL INFORMATION
General Royce Funds information including
an overview of our firm and Funds
(800) 221-4268 |
|
| |
|
|
|
|
| |
|
|
|
|
| |
Multiple
Funds, Common Focus
Our goal is to offer both individual and institutional investors the best available micro-cap,
small-cap, and/or mid-cap portfolios. We have chosen to concentrate on smaller-company
investing by providing investors with a range of funds that take full advantage of this large
and diverse sector. |
|
COMPUTERSHARE
Transfer Agent and Registrar
Speak with a representative about:
• Your account, transactions, and forms
(800) 426-5523 |
|
| |
|
|
|
|
| |
|
|
|
|
| |
Consistent
Discipline
Our approach emphasizes paying close attention to risk and maintaining the same
discipline, regardless of market movements and trends. The price we pay for a security
must be below our appraisal of its current worth. This requires a thorough analysis of
the financial and business dynamics of an enterprise, as though we were purchasing the
entire company. |
|
FINANCIAL ADVISORS AND BROKER-DEALERS
Speak with your regional Royce contact regarding:
• Information about our firm, strategies, and Funds
• Fund Materials
(800) 337-6923 |
|
| |
|
|
|
|
| |
Co-Ownership
of Funds
It is important that our employees and shareholders share a common financial goal. Our
officers, employees, and their families currently have approximately $111 million invested in
The Royce Funds and are often among the largest individual shareholders.
|
|
|
|
| |
|
|
roycefunds.com |
|
| |
|
|
|
|
| |
|
|
|
|
| |
|
|
|
|
| |
|
|
|
|
| |
 |
|
 |
 |
| |
|
|
|
|
| |
|
|
|
|
Item 2. Code(s) of Ethics. As of the end of the period covered by this report,
the Registrant had adopted a code of ethics, as defined in Item 2 of Form N-CSR,
applicable to its principal executive officer, principal financial officer, principal
accounting officer or controller, or persons performing similar functions. A
copy of this code of ethics is filed as an exhibit to this Form N-CSR. No substantive
amendments were approved or waivers were granted to this code of ethics during the
period covered by this report.
Item 3. Audit Committee Financial Expert.
| (a)(1) |
|
The Board
of Directors of the Registrant has determined that it has an audit committee financial
expert. |
| |
|
|
| (a)(2) |
|
Arthur
S. Mehlman and Patricia W. Chadwick were designated by the Board of Directors as
the Registrant’s Audit Committee Financial Experts, effective April 15, 2004
and April 8, 2010, respectively. Mr. Mehlman and Ms. Chadwick are “independent” as defined under Item 3 of Form N-CSR. |
Item 4. Principal Accountant Fees and
Services.
| (a) |
|
Audit Fees: |
| |
|
Year ended
December 31, 2015 - $43,500 |
| |
|
Year ended
December 31, 2014 - $43,500 |
| |
|
|
| (b) |
|
Audit-Related
Fees: |
| |
|
Year ended
December 31, 2015 - $0 |
| |
|
Year ended
December 31, 2014 - $0 |
| |
|
|
| (c) |
|
Tax Fees: |
| |
|
Year ended
December 31, 2015 - $7,200 - Preparation of tax returns |
| |
|
Year ended
December 31, 2014 - $7,200 - Preparation of tax returns |
| |
|
|
| (d) |
|
All Other
Fees: |
| |
|
Year ended
December 31, 2015 - $0 |
| |
|
Year ended
December 31, 2014 - $0 |
(e)(1) Annual Pre-Approval: On an annual basis, the Registrant’s independent
auditor submits to the Audit Committee a schedule of proposed audit, audit-related,
tax and other non-audit services to be rendered to the Registrant and/or investment
adviser(s) for the following year that require pre-approval by the Audit Committee.
This schedule provides a description of each type of service that is expected to
require pre-approval and the maximum fees that can be paid for each such service
without further Audit Committee approval. The Audit Committee then reviews and determines
whether to approve the types of scheduled services and the projected fees for them.
Any subsequent revision to already pre-approved services or fees (including fee
increases) are presented for consideration at the next regularly scheduled Audit
Committee meeting, as needed.
If subsequent to the annual pre-approval of services and fees by the Audit Committee,
the Registrant or one of its affiliates determines that it would like to engage
the Registrant’s independent auditor to perform a service not already pre-approved,
the request is to be submitted to the Registrant’s Chief Financial Officer,
and if he or she determines that the service fits within the independence guidelines
(e.g., it is not a prohibited service), he or she will then arrange for a discussion
of the proposed service and fee to be included on the agenda for the next regularly
scheduled Audit Committee meeting so that pre-approval can be considered.
Interim Pre-Approval: If, in the judgment of the Registrant’s Chief Financial
Officer, a proposed engagement needs to commence before the next regularly scheduled
Audit Committee meeting, he or she shall submit a written summary of the proposed
engagement to all members of the Audit Committee, outlining the services, the estimated
maximum cost, the category of the services (e.g., audit, audit-related, tax or other)
and the rationale for engaging the Registrant’s independent auditor to perform
the services. To the extent the proposed engagement involves audit, audit-related
or tax services, any individual member of the Audit Committee who is an independent
Board member is authorized to pre-approve the engagement. To the extent the proposed
engagement involves non-audit services other than audit-related or tax, the Chairman
of the Audit Committee is authorized to pre-approve the engagement. The Registrant’s Chief Financial Officer will arrange for this interim review and
coordinate with the appropriate member(s) of the Committee. The independent auditor
may not commence the engagement under consideration until the Registrant’s
Chief Financial Officer has informed the auditor in writing that pre-approval has
been obtained from the Audit Committee or an individual member who is an independent
Board member. The member of the Audit Committee who pre-approves any engagements
in between regularly scheduled Audit Committee meetings is to report, for informational
purposes only, any pre-approval decisions to the Audit Committee at its next regularly
scheduled meeting.
| (e)(2) |
|
Not Applicable |
| |
|
|
| (f) |
|
Not Applicable |
| |
|
|
| (g) |
|
Year ended
December 31, 2015 - $7,200 |
| |
|
Year ended
December 31, 2014 - $7,200 |
| |
|
|
| (h) |
|
No such services
were rendered during 2015 or 2014. |
Item 5. Audit Committee of Listed Registrants. The Registrant has a
separately designated standing audit committee established in accordance with Section
3(a)(58)(A) of the Securities Exchange Act of 1934. Patricia W. Chadwick, Richard
M. Galkin, Stephen L. Isaacs, Arthur S. Mehlman, David L. Meister and G. Peter O’Brien are members of the Registrant’s audit committee.
Item 6. Investments.
(a) See Item 1.
(b) Not applicable.
Item 7. Disclosure of Proxy Voting Policies and Procedures for Closed-End
Management Investment Companies.
June 5, 2003, as amended
Through November 6, 2015
Royce & Associates
Proxy Voting Guidelines and Procedures
These procedures apply to Royce & Associates,
LLC (“Royce”) and all funds and other client accounts for which it is
responsible for voting proxies, including all open and closed-end registered investment
companies (“The Royce Funds”), limited partnerships, limited liability
companies, separate accounts, other accounts for which it acts as investment adviser
and any accounts for which it acts as sub-adviser that have delegated proxy voting
authority to Royce. Such authority is determined at the inception of each client
account and generally: (i) is specifically authorized in the applicable investment
management agreement or other written instrument or (ii) where not specifically
authorized, is granted to Royce where general investment discretion is given to
it in the applicable investment management agreement. The Boards of Trustees/Directors
of The Royce Funds (the “Boards”) have delegated all proxy voting decisions
to Royce subject to these policies and procedures. Notwithstanding the above, from
time to time the Boards may reserve voting authority for specific securities.
Receipt of Proxy Material. Under
the oversight of the Head of Administration, a Trade Processing Assistant designated
by him is responsible for monitoring receipt of all proxies and
seeking to ensure that proxies are received
for all securities for which Royce has proxy voting responsibility. Royce is not
responsible for voting proxies it does not receive. The Head of Administration or
his designee use Glass Lewis’ ballot reconciliation tool that is directly tied
to the daily holdings provided to them by Royce. Proxies are voted electronically
and hard copies of any research notes made on the proxy material are stored.
Voting of Proxies. Once proxy material has
been received, it is then promptly reviewed by the designated Trade Processing Assistant
to evaluate the issues presented. The Head of Administration or his designee, in
consultation with a Co-Chief Investment Officer, develops and updates a list of
matters Royce treats as “regularly recurring” and is responsible for ensuring
that the designated Trade Processing Assistant has an up-to-date list of these matters
at all times, including instructions from a Royce Co-Chief Investment Officer on
how to vote on those matters on behalf of Royce clients. Examples of “regularly
recurring” matters include non-contested elections of directors and non-contested
approval of independent auditors. Non-“regularly recurring” matters are
brought to the attention of the portfolio manager(s) for the account(s) involved
by the designated Administrative Assistant, and, after giving some consideration
to advisories from Glass Lewis & Co., an independent third party research firm,
the portfolio manager directs that such matters be voted in a way that he or she
believes should better protect or enhance the value of the investment. Portfolio
Managers may instruct the Head of Administration that they do not want the regularly
recurring matters to be voted in accordance with the standing instructions for their
accounts and individual voting instructions on all votes, both regularly recurring
and non-regularly recurring, will be obtained from such Portfolio Managers.
| |
a. |
|
From time
to time, it is possible that one Royce portfolio manager will decide (i) to vote
shares held in client accounts he or she manages differently from the vote of another
Royce portfolio manager whose client accounts hold the same security or (ii) to
abstain from voting on behalf of client accounts he or she manages when another
Royce portfolio manager is casting votes on behalf of other Royce client accounts. |
| |
|
|
|
| |
|
|
The designated
Trade Processing Assistant reviews all proxy votes collected from Royce’s portfolio
managers prior to such votes being cast. If any difference exists among the voting
instructions given by Royce’s portfolio managers, as described above, the designated
Trade Processing Assistant then presents these proposed votes to the Head of Administration,
or his designee, and a Co-Chief Investment Officer. A Co-Chief Investment Officer,
after consulting with the relevant portfolio managers, either reconciles the votes
or authorizes the casting of differing votes by different portfolio managers. The
Head of Administration, or his designee, maintains a log of all votes including
when different portfolio managers have cast differing votes, that describes the
rationale for allowing such differing votes and contains the initials of both a
Co-Chief Investment Officer and Head of Administration, or his designee, allowing
such differing votes. The Head of Administration, or his designee, performs a weekly
review of all votes cast by Royce to confirm that any conflicting votes were properly
handled in accordance with the above-described procedures. |
| |
b. |
|
There are
many circumstances that might cause Royce to vote against an issuer’s board
of directors or “management” proposal. These would include, among others,
excessive compensation, unusual management stock options, preferential voting and
poison pills. The portfolio managers decide these issues on a case-by-case basis
as described above. |
| |
|
|
|
| |
c. |
|
A portfolio
manager may, on occasion, determine to take no action on a proxy or a specific proxy
item and not submit a vote when he or she concludes that the potential benefit of
voting is outweighed by the cost, when it is not in the client account’s best
interest to vote. |
| |
|
|
|
| |
d. |
|
When a
client has authorized Royce to vote proxies on its behalf, Royce will generally
not accept instructions from the clients regarding how to vote proxies. |
| |
|
|
|
| |
e. |
|
If a security
is on loan under The Royce Funds’ Securities Lending Program with State Street
Bank and Trust Company (“Loaned Securities”), the Head of Administration,
or his designee, will recall the Loaned Securities and request that they be delivered
within the customary settlement period after the notice, to permit the exercise
of their voting rights if the number of shares of the security on loan would have
a material effect on The Royce Funds’ voting power at the up-coming stockholder
meeting. A material effect is defined for this purpose as any case where the Loaned
Securities are 1% or more of a class of a company’s outstanding equity securities.
A quarterly report detailing any exceptions that occur in recalling Loaned Securities
will be given to the Boards. |
Custodian banks are authorized to release
all proxy ballots held for Royce client account portfolios to Glass Lewis &
Co. for voting, utilizing the Viewpoint proxy voting platform. Substantially all
portfolio companies utilize Broadridge to collect their proxy votes.
Under the oversight of the Head of Administration,
or his designee, the designated Trade Processing Assistant is responsible for voting
all proxies in a timely manner. Votes are returned to Broadridge using Viewpoint
as ballots are received, generally two weeks before the scheduled meeting date.
The issuer can thus see that the shares were voted, but the actual vote cast is
not released to the company until 4:00 pm on the day before the meeting. If proxies
must be mailed, they go out at least ten business days before the meeting date.
Conflicts of Interest. The designated Trade
Processing Assistant reviews reports generated by Royce’s portfolio management
system (“Quest PMS”) that set forth by record date, any security held
in a Royce client account which is issued by a (i) public company that is, or a
known affiliate of which is, a separate account client of Royce (including sub-advisory
relationships), (ii) public company, or a known affiliate of a public company, that
has invested in a privately-offered pooled vehicle managed by Royce or (iii) public
company, or a known affiliate of a public company, by which the spouse of a Royce
employee or an immediate family member of a Royce employee living in the household
of such employee is employed, for the purpose of identifying any potential proxy
votes that could present a conflict of interest for Royce. The Compliance Department
develops and updates the list of such public companies or their known
affiliates and this list is used by Quest
PMS to generate these daily reports. This list also contains information regarding
the source of any potential conflict relating to such companies. Potential conflicts
identified on the “conflicts reports” are brought to the attention of
the Compliance Department by the designated Trade Processing Assistant. An R&A
Compliance Officer then reviews them to determine if business or personal relationships
exist between Royce, its officers, managers or employees and the company that could
present a material conflict of interest. Any such identified material conflicts
are voted by Royce in accordance with the recommendation given by an independent
third party research firm (Glass Lewis & Co.). The Trade Processing Assistant
under the supervision of the Head of Administration, maintains a log of all such
conflicts identified, the analysis of the conflict and the vote ultimately cast.
Each entry in this log is signed by a Co-Chief Investment Officer before the relevant
votes are cast.
Recordkeeping. A record of the issues and
how they are voted is stored in the Viewpoint system for 7 years. Copies of all
physically executed proxy cards, all proxy statements (with it being permissible
to rely on proxy statements filed and available on Edgar) and any other documents
created or reviewed that are material to making a decision on how to vote proxies
are retained by the Trade Processing Assistant in an easily accessible place for
a period of not less than six years from the end of the fiscal year during which
the last entry was made on such record, the first two years at Royce’s office.
In addition, copies of each written client request for information on how Royce
voted proxies on behalf of that client, and a copy of any written response by Royce
to any (written or oral) client request for information on how Royce voted proxies
on behalf of that client will be maintained by Royce’s Head of Administration
and/or Royce’s Director of Alternative Investments, or their designee (depending
on who received such request) for a period of not less than six years from the end
of the fiscal year during which the last entry was made on such record, the first
two years at Royce’s office. Royce’s Compliance Department shall maintain
a copy of any proxy voting policies and procedures in effect at any time within
the last five years.
Disclosure. Royce’s proxy voting procedures
will be disclosed to clients upon commencement of a client account. Thereafter,
proxy voting records and procedures are generally disclosed to those clients for
which Royce has authority to vote proxies as set forth below:
| |
- |
|
The Royce
Funds – proxy voting records are disclosed annually on Form N-PX (with such
voting records also available at www.roycefunds.com). Proxy voting procedures are
available in the Statement of Additional Information for the open-end funds, in
the annual report on Form N-CSR for the closed-end funds and at www.roycefunds.com. |
| |
- |
|
Limited
Liability Company and Limited Partnership Accounts – proxy voting records are
disclosed to members/partners upon request and proxy voting procedures (along with
a summary thereof) are provided to members/partners annually (and are available
at www.roycefunds.com). |
| |
- |
|
Separate
Accounts – proxy voting records and procedures are disclosed to separate account
clients annually. |
| Royce &
Associates, LLC |
|
|
|
|
|
|
| PROXY VOTING
GUIDELINES ON REGULARLY RECURRING MATTERS (revised 4/30/2015) |
|
|
| |
|
|
|
|
|
|
| |
|
Initialed
by Co-Chief Investment Officer |
| |
| |
|
|
|
|
|
|
| Elect Directors |
|
For |
|
|
|
|
| Limit Number
of Directors |
|
|
|
For |
|
|
| Directors
Fees, General (Foreign) |
|
For |
|
|
|
|
| |
|
|
|
|
|
|
| Ratify or
appoint Accountants or Auditors |
|
For |
|
|
|
|
| |
|
|
|
|
|
|
| |
| |
|
|
|
|
|
|
| On positions
we own less than 5% of the outstanding shares of the issuer |
|
|
|
|
|
|
| Where Management
and the Proxy Advisor have both voted “For” |
|
|
|
|
|
|
| |
|
|
|
|
|
|
| Employee/Non-employee/Director
stock option (Incentive) Plans |
|
For |
|
|
|
|
| Say on Pay1 |
|
For |
|
|
|
|
| Frequency
of Say on Pay |
|
|
|
|
|
Abstain |
| |
|
|
|
|
|
|
| |
| |
|
|
|
|
|
|
| Differing
Recommendations from Management and Proxy Advisor |
|
|
|
|
|
|
| on positions
less than 5% of the outstanding shares of the issuer |
|
|
|
|
|
|
| |
|
|
|
|
|
|
| Employee/Non-employee/Director
stock option (Incentive) Plans |
|
|
|
|
|
Abstain |
| Say on Pay |
|
|
|
|
|
Abstain |
| Frequency
of Say on Pay |
|
|
|
|
|
Abstain |
| |
|
|
|
|
|
|
| |
| |
|
|
|
|
|
|
| Limit Directors
Liability |
|
|
|
|
|
Abstain * |
| Eliminate
Directors Liability |
|
|
|
|
|
Abstain * |
| |
|
|
|
|
|
|
| Reduce Par
Value of Stock |
|
For |
|
|
|
|
| |
|
|
|
|
|
|
| Increase Authorized
Shares or Shares Outstanding |
|
For |
|
|
|
|
| |
|
|
|
|
|
|
| Classified
(Tiered) Board |
|
|
|
Against |
|
|
| Eliminate/Declassify
classified (Tiered) Board |
|
For |
|
|
|
|
| |
|
|
|
|
|
|
| Deferred Compensation
Plan |
|
For |
|
|
|
|
| |
|
|
|
|
|
|
| Name Change
of Company |
|
For |
|
|
|
|
| |
|
|
|
|
|
|
| Profit Sharing
Plan |
|
For |
|
|
|
|
| |
|
|
|
|
|
|
| CERES (Coalition
for Environmentally Responsible |
|
|
|
|
|
|
| Economies)
or Valdez/McBride Principles |
|
|
|
Abstain |
|
|
| |
|
|
|
|
|
|
| Any Other
Business |
|
|
|
Against |
|
|
| |
|
|
|
|
|
|
| Adjourn Meeting
to Solicit Additional Proxies |
|
For |
|
|
|
|
| |
|
|
|
|
|
|
| Approve Profits/Dividends
(Foreigns) |
|
For |
|
|
|
|
| |
|
|
|
|
|
|
| Issue Accounts
& Reports (Foreigns) |
|
For |
|
|
|
|
| |
|
|
|
|
|
|
| Approve Auditors
Fees |
|
For |
|
|
|
|
| |
|
|
|
|
|
|
*except if we own 5% or more of the outstanding
shares of the issuer, look at each proposal and ask PM to provide voting instructions.
Item 8. Portfolio Managers of Closed-End
Management Investment Companies.
(a)(1) Portfolio Managers of Closed-End
Management Investment Companies (information as of December 31, 2015)
| Name |
Title |
Length of Service |
Principal Occupation(s) During Past 5 Years |
| Charles M.
Royce |
President
and member of the Board of Directors of the Registrant |
Since 1986 |
Chief Executive
Officer and member of the Board of Managers of Royce & Associates, LLC (“Royce”), investment adviser to the Registrant, Member of the boards of directors/trustees
of the Registrant, Royce Micro-Cap Trust, Inc. (“RMT”), Royce Global Value Trust,
Inc., The Royce Fund, and Royce Capital Fund (collectively, “The Royce Funds”). |
| Chris E. Flynn |
Assistant
Portfolio Manager* |
Since April
1, 2007 |
Assistant
Portfolio Manager of the Registrant (since April 1, 2007); and Principal, Portfolio
Manager and Senior Analyst at Royce (since 1993). |
| David A. Nadel |
Assistant
Portfolio Manager* |
Since April
1, 2007 |
Assistant
Portfolio Manager of the Registrant (since April 1, 2007); Director of International
Research at Royce (since 2010); Portfolio Manager and Senior Analyst at Royce (since 2006); Senior Portfolio Manager at Neuberger Berman Inc. (2004-2006); and Senior
Analyst at Pequot Capital Management, Inc. (2001-2003). |
| Lauren A.
Romeo |
Assistant
Portfolio Manager* |
Since May
1, 2009 |
Assistant
Portfolio of the Registrant (since May 1, 2009); Portfolio Manager and Analyst at
Royce (since 2004); Portfolio Manager at Dalton, Grenier, Hartman & Maher (since
2001); an Analyst with Legg Mason Funds Management (2000-2001); and an Analyst with
T. Rowe Price Group (1996-2000). |
* Assistant Portfolio Managers may have investment discretion over a portion of the
Registrant’s portfolio subject to the supervision of Registrant’s Portfolio
Manager.
(a)(2) Other Accounts Managed by Portfolio
Manager and Potential Conflicts of Interest (information as of December 31, 2015)
Other Accounts
Name of
Portfolio
Manager |
Type of Account |
Number of
Accounts
Managed |
Total
Assets
Managed |
Number of
Accounts
Managed for which
Advisory Fee is
Performance-Based |
Value of
Managed Accounts for
which Advisory Fee is Performance
Based |
| Charles M.
Royce |
|
|
|
|
|
| |
Registered
investment companies |
10 |
10,590,228,257 |
2 |
1,384,441,392 |
| |
Private pooled
investment vehicles |
1 |
23,017,789 |
1 |
23,017,789 |
| |
Other accounts* |
12 |
46,735,901 |
- |
- |
| |
|
|
|
|
|
| Chris E. Flynn |
|
|
|
|
|
| |
Registered
investment companies |
7 |
5,058,411,775 |
2 |
1,384,441,392 |
| |
Private pooled
investment vehicles |
- |
- |
- |
- |
| |
Other accounts* |
- |
- |
- |
- |
| |
|
|
|
|
|
| David A. Nadel |
|
|
|
|
|
| |
Registered
investment companies |
5 |
1,259,741,902 |
1 |
1,072,034,600 |
| |
Private pooled
investment vehicles |
- |
- |
- |
- |
| |
Other accounts* |
- |
- |
- |
- |
| |
|
|
|
|
|
| Lauren A.
Romeo |
|
|
|
|
|
| |
Registered
investment companies |
4 |
6,765,070,708 |
1 |
1,072,034,600 |
| |
Private pooled
investment vehicles |
2 |
457,744,973 |
- |
- |
| |
Other accounts* |
- |
- |
- |
- |
*Other accounts include all other accounts
managed by the Portfolio Manager in either a professional or personal capacity except
for personal accounts subject to pre-approval and reporting requirements under the
Registrant’s Rule 17j-1 Code of Ethics.
Conflicts of Interest
The fact that
a Portfolio Manager has day-to-day management responsibility for more than one client
account may create actual, potential or only apparent conflicts of interest. For
example, the Portfolio Manager may have an opportunity to purchase securities of
limited availability. In this circumstance, the Portfolio Manager is expected to
review each account’s investment guidelines, restrictions, tax considerations,
cash balances, liquidity needs and other factors to determine the suitability of
the investment for each account and to ensure that his or her managed accounts are
treated equitably. The Portfolio Manager may also decide to purchase or sell the
same security for multiple managed accounts at approximately the same time. To address
any conflicts that this situation may create, the Portfolio Manager will generally
combine managed account orders (i.e., enter a “bunched” order) in an effort to obtain
best execution or a more favorable commission rate. In addition, if orders to buy
or sell a security for multiple accounts managed by common Portfolio Managers on
the same day are executed at different prices or commission rates, the transactions
will generally be allocated by Royce & Associates, LLC (“Royce”)
to each of such managed accounts at the weighted average execution price and commission.
In circumstances where a pre-allocated bunched order is not completely filled, each
account will normally receive a pro-rated portion of the securities based upon the
account’s level of participation in the order. Royce may under certain circumstances
allocate securities in a manner other than pro-rata if it determines that the allocation
is fair and equitable under the circumstances and does not discriminate against
any account.
As described
below, there is a revenue-based component of each Portfolio Manager’s Performance-Related
Variable Compensation and the Portfolio Managers also receive Firm-Related Variable
Compensation based on revenues (adjusted for certain imputed expenses) generated
by Royce. In addition, Charles M. Royce receives variable compensation based on
Royce’s retained pre-tax profits from operations. As a result, the Portfolio
Managers may receive a greater relative benefit from activities that increase the
value to Royce of The Royce Funds and/or other Royce client accounts, including,
but not limited to, increases in sales of Registrant’s shares and assets under
management.
Also, as described
above, the Portfolio Managers generally manage more than one client account, including,
among others, registered investment company accounts, separate accounts and private
pooled accounts managed on behalf of institutions (e.g., pension funds, endowments
and foundations) and for high-net-worth individuals. The appearance of a conflict
of interest may arise where Royce has an incentive, such as a performance-based
management fee (or any other variation in the level of fees payable by the Registrant
or other Royce client accounts to Royce), which relates to the management of one
or more of The Royce Funds or accounts with respect to which the same Portfolio
Manager has day-to-day management responsibilities. Except as described below, no
Royce Portfolio Manager’s compensation is tied to performance fees earned by
Royce for the management of any one client account. Although variable and other
compensation derived from Royce revenues or profits is impacted to some extent,
the impact is relatively minor given the small percentage of Royce firm assets under
management for which Royce receives performance-measured revenue. Notwithstanding
the above, the Performance-Related Variable Compensation paid to Charles M. Royce
as Portfolio Manager of two registered investment company accounts (the Registrant
and RMT) is based, in part, on performance-based fee revenues. The Registrant and
RMT pay Royce a fulcrum fee that is adjusted up or down depending on the performance
of the Fund relative to its benchmark index.
Finally, conflicts
of interest may arise when a Portfolio Manager personally buys, holds or sells securities
held or to be purchased or sold for the Registrant or other Royce client account
or personally buys, holds or sells the shares of one or more of The Royce Funds.
To address this, Royce has adopted a written Code of Ethics designed to prevent
and detect personal trading activities that may interfere or conflict with client
interests (including Registrant’s stockholders’ interests). Royce generally
does not permit its Portfolio Managers to purchase small- or micro-cap securities
for their personal investment portfolios.
Royce and
The Royce Funds have adopted certain compliance procedures which are designed to
address the above-described types of conflicts. However, there is no guarantee that
such procedures will detect each and every situation in which a conflict arises.
(a)(3) Description of Portfolio Manager
Compensation Structure (information as of December 31, 2014)
Royce seeks
to maintain a compensation program that is competitively positioned to attract and
retain high-caliber investment professionals. All Portfolio Managers, receive from
Royce a base salary, Performance-Related Variable Compensation (generally the largest
element of each Portfolio Manager’s compensation with the exception of Charles
M. Royce), Firm-Related Variable Compensation based primarily on registered investment
company and other client account revenues generated by Royce and a benefits package.
Portfolio Manager compensation is reviewed and may be modified from time to time
as appropriate to reflect changes in the market, as well as to adjust the factors
used to determine variable compensation. Except as described below, each Portfolio
Manager’s compensation consists of the following elements:
| |
- |
|
BASE SALARY.
Each Portfolio Manager is paid a base salary. In setting the base salary, Royce
seeks to be competitive in light of the particular Portfolio Manager’s experience
and responsibilities. |
| |
|
|
|
| |
- |
|
PERFORMANCE-RELATED
VARIABLE COMPENSATION. Each Portfolio Manager receives quarterly Performance-Related
Variable Compensation that is either asset-based, or revenue-based and therefore
in part based on the value of the net assets of the account for which he or she
is being compensated, determined with reference to each of the registered investment
company and other client accounts they are managing. The revenue used to determine
the quarterly Performance-Related Variable Compensation received by Charles M. Royce
that relates to each of the Registrant and RMT is performance-based fee revenue.
For all Portfolio Managers, the Performance-Related Variable Compensation applicable
to the registered investment company accounts managed by the Portfolio Manager is
subject to downward adjustment or elimination based on a combination of 3-year,
5-year risk and 10-year risk-adjusted pre-tax returns of such accounts relative
to all small-cap objective funds with three years of history tracked by Morningstar
(as of December 31, 2015 there were 425 such funds tracked by Morningstar), the
5-year absolute returns of such accounts relative to 5-year U.S. Treasury Notes
and absolute returns over the prior full market cycle and current cycle to date
vs. the accounts’ benchmark. The Performance-Related Variable Compensation
applicable to non-registered investment company accounts managed by a Portfolio
Manager is not subject to performance-related adjustment. |
Payment of the Performance-Related Variable
Compensation may be deferred, and any amounts deferred are forfeitable, if the Portfolio
Manager is terminated by Royce with or without cause or resigns. The amount of the
deferred Performance-Related Variable Compensation will appreciate or depreciate
during the deferral period, based on the total return performance of one or more
Royce-managed registered investment company accounts selected by the Portfolio Manager
at the beginning of the deferral period. The amount deferred will depend on the
Portfolio Manager’s total direct, indirect beneficial and deferred unvested
investments in the Royce registered investment company account for which he or she
is receiving portfolio management compensation.
| |
- |
|
FIRM-RELATED
VARIABLE COMPENSATION. Each Portfolio Manager receives quarterly variable compensation
based on Royce’s net revenues. |
| |
|
|
|
| |
- |
|
BENEFIT PACKAGE.
Each Portfolio Manager also receives benefits standard for all Royce employees,
including health care and other insurance benefits, and participation in Royce’s
401(k) Plan and Money Purchase Pension Plan. From time to time, on a purely discretionary
basis, Portfolio Managers may also receive options to acquire stock in Royce’s
parent company, Legg Mason, Inc. Those options typically represent a relatively
small portion of a Portfolio Managers’ overall compensation. |
Charles M. Royce, in addition to the above-described
compensation, also receive variable compensation based on Royce’s retained
pre-tax operating profit. This variable compensation, along with the Performance-Related
Variable Compensation and Firm-Related Variable Compensation, generally represents
the most significant element of Mr. Royce’s compensation. A portion of the
above-described compensation payable to Mr. Royce relates to his responsibilities
as Royce’s Chief Executive Officer and President of The Royce Funds.
(a)(4) Dollar Range of Equity Securities
in Registrant Beneficially Owned by Portfolio Manager (information as of December
31, 2015)
The following
table shows the dollar range of the Registrant’s shares owned beneficially
and of record by the Portfolio Managers, including investments by his immediate
family members sharing the same household and amounts invested through retirement
and deferred compensation plans.
| Portfolio
Manager |
Dollar
Range of Registrant’s Shares Beneficially Owned |
| Charles M.
Royce |
Over $1,000,000 |
| Chris E. Flynn |
$100,001 to
$500,000 |
| David A. Nadel |
None |
| Lauren A.
Romeo |
$100,001 to
$500,000 |
(b) Not Applicable
Item 9. Purchases of Equity Securities by Closed-End Management Investment Company
and Affiliated Purchasers. Not Applicable
Item 10. Submission of Matters to a Vote of Security Holders. Not Applicable.
Item 11. Controls and Procedures.
(a) Disclosure Controls and Procedures. The Principal Executive and Financial Officers
concluded that the Registrant’s Disclosure Controls and Procedures are effective
based on their evaluation of the Disclosure Controls and Procedures as of a date
within 90 days of the filing date of this report.
(b) Internal Control over Financial Reporting. There were no significant changes
in Registrant’s internal control over financial reporting or in other factors
that could significantly affect this control subsequent to the date of the evaluation,
including any corrective actions with regard to significant deficiencies and material
weaknesses during the second fiscal quarter of the period covered by this report.
Item 12. Exhibits. Attached hereto.
(a)(1) The Registrant’s code
of ethics pursuant to Item 2 of Form N-CSR.
(a)(2) Separate certifications by the Registrant’s Principal Executive
Officer and Principal Financial Officer as required by Rule 30a-2(a) under the Investment
Company Act of 1940.
(a)(3) Not Applicable
(b) Separate certifications by the Registrant’s Principal Executive Officer
and Principal Financial Officer, pursuant to Section 906 of the Sarbanes-Oxley Act
of 2002 and required by Rule 30a-2(b) under the Investment Company Act of 1940.
Pursuant to the requirements of the Securities Exchange Act of 1934 and the Investment
Company Act of 1940, the registrant has duly caused this report to be signed on
its behalf by the undersigned, thereunto duly authorized.
ROYCE VALUE TRUST, INC.
| BY: |
/s/ Christopher D. Clark |
|
| |
|
|
| |
Christopher
D. Clark |
|
| |
President
|
|
| |
|
|
| Date: March
2, 2016 |
|
| |
|
|
Pursuant to the requirements of the Securities
Exchange Act of 1934 and the Investment Company Act of 1940, this report has been
signed below by the following persons on behalf of the registrant and in the capacities
and on the dates indicated.
| ROYCE VALUE TRUST, INC. |
ROYCE VALUE
TRUST, INC. |
| |
|
|
|
|
|
| BY: |
/s/ Christopher
D. Clark |
|
|
BY: |
/s/ Peter
K. Hoglund |
| |
Christopher
D. Clark |
|
|
|
Peter K.
Hoglund |
| |
President
|
|
|
|
Treasurer
|
| |
|
|
|
|
|
| Date: March
2, 2016 |
|
|
Date: March
2, 2016 |
| |
|
|
|
|
|
EX-12
2
e39163-rvt_ex12a1.htm
EXHIBITS
Item 12(a)(1):
September 2003, as revised
through March 9, 2015
CODE OF ETHICS
FOR COVERED OFFICERS OF THE ROYCE FUNDS
The Boards of Directors/Trustees of The
Royce Fund, Royce Capital Fund, Royce Value Trust, Inc., Royce Micro-Cap Trust,
Inc., and Royce Global Value Trust, Inc. (each, a “Fund” and collectively,
“The Royce Funds”) have adopted the following Code of Ethics (the “Code”) applicable to its President, Chief Financial Officer and Manager of Fund
Accounting (“Covered Officers”) of The Royce Funds to ensure the continuing
integrity of financial reporting and transactions. The names of the Covered Officers
covered by the Code are listed on Schedule A hereto.
I. Separate Code
This Code is the sole code of ethics adopted
by the Funds for purposes of Section 406 of the Sarbanes-Oxley Act of 2002. The
Funds’ and Royce & Associates, LLC’s (“R&A”), the
investment adviser to The Royce Funds, code of ethics under Rule 17j-1 under the
Investment Company Act of 1940 (the “Investment Company Act”) are separate
requirements applying to the Covered Officers and others, and are not part of this
Code. In addition to this Code, the Investment Company Act, and the Investment Advisers
Act of 1940 (the “Advisers Act”) and rules promulgated thereunder contain
numerous specific provisions designed to protect the Funds from conflicts of interest
and overreaching. Any conduct by Covered Officers required by specific Investment
Company Act or Advisers Act provisions or the rules thereunder is presumed to be
in compliance with this Code. Each Covered Officer is accountable for his or her
adherence to this Code. Any violation of this Code by a Covered Officer may result
in disciplinary action, including immediate dismissal.
II. Requirements
All Covered Officers must:
| |
1. |
|
Engage in
and promote honest and ethical conduct, including the ethical handling of actual
or apparent conflicts of interest between personal and professional relationships; |
| |
2. |
|
Act responsibly
in producing and produce, full, fair, accurate, timely and understandable disclosure
in reports and documents that the Funds file with, or submit to, the Securities
and Exchange Commission (the “SEC”) and in other public communications
made by each of the Funds; |
| |
|
|
|
| |
3. |
|
Comply with
applicable governmental laws, rules and regulations; |
| |
|
|
|
| |
4. |
|
Promptly report
suspected material violations of this Code, including violations of securities laws
or other laws, rules and regulations applicable to a Fund, to R&A’s General
Counsel and the Fund’s Audit Committee. |
Each Covered Officer must act with integrity,
including being honest and candid while still maintaining the confidentiality of
information where required by law, and place the interests of The Royce Funds before
the Covered Officer’s own personal interests.
Each Covered Officer is required to familiarize
himself or herself with the disclosure requirements applicable to each of the Funds
and must not knowingly misrepresent or fail to disclose, or cause others to misrepresent
or fail to disclose, material facts about a Fund to others, including but not limited
to officers of and counsel to The Royce Funds, and their respective independent
directors, independent auditors and governmental regulators.
III. Avoidance of Conflicts
The overarching principle of this Code is
that the personal interests of a Covered Officer should not be placed improperly
before the interests of The Royce Funds. As a result, each Covered Officer must:
(i) handle any actual or apparent conflict of interest in an ethical manner, (ii)
not use his or her personal influence or personal relationships to influence investment
decisions or financial reporting by a Fund whereby the Covered Officer would benefit
personally (directly or indirectly) to the detriment of the Fund; (iii) not cause
a Fund to take action, or fail to take action, for the personal benefit of the Covered
Officer rather than the benefit of such Fund; and (iv) not use for his or her personal
benefit (directly or indirectly) any material non-public knowledge pertaining to
a Fund.
Although typically not presenting an opportunity
for improper personal benefit, conflicts arise from, or as a result of, the contractual
relationship between The Royce Funds and R&A, of which the Covered Officers
are also officers and/or employees. As a result, this Code recognizes that the Covered
Officers will, in the normal course of their duties (whether formally for a Fund
or for R&A, or for both), be involved in establishing policies and implementing
decisions that will have different effects on R&A and the Fund. The participation
of the Covered Officers in such activities is inherent in the contractual relationship
between each of The Royce Funds and R&A and is consistent with the performance
by the Covered Officers of their duties as officers and/or employees of The Royce
Funds. Thus, if performed in conformity with the provisions of the Investment Company
Act and the Advisers Act, such activities will be deemed to have been handled ethically.
The following conflict of interest situations
must be disclosed by a Covered Officer to, and pre-approved in writing by, the General
Counsel if material. Examples of these include:
| |
• |
|
service as
a director on the board of any public company; |
| |
|
|
|
| |
• |
|
any ownership
interest in, or any consulting or employment relationship with, any of The Royce
Funds’ service providers, other than its investment adviser, principal underwriter,
administrator or any affiliated person thereof; or |
| |
|
|
|
| |
• |
|
a direct or
indirect financial interest in commissions, transaction charges or spreads paid
by any Fund for effecting portfolio transactions. |
IV. Materiality
In the event a Covered Officer has any doubt
as to (i) whether a suspected violation of this Code would be considered material,
(ii) whether information relating to a Fund is of a material nature and therefore
subject to public disclosure, (iii) whether non-public knowledge pertaining to a
Fund is material in nature, or (iv) whether a particular conflict of interest is
material, he or she should seek the advice of R&A’s General Counsel.
V. Compliance and Annual Acknowledgment
Each Covered Officer is required: (i) upon
receipt of the Code, to sign and submit to R&A’s General Counsel an acknowledgment
stating that he or she has received, read and understands the Code; (ii) annually
thereafter to submit a statement to R&A’s General Counsel confirming that
he or she has received, read and understands the Code and has complied with the
requirements of the Code; (iii) not to retaliate against any employee subordinate
to the Covered Officer for reports of potential violations that are made in good
faith; and (iv) to notify R&A’s General Counsel, as appropriate, if the
Covered Officer observes any irregularities or violations of this Code.
VI. Enforcement of the Code
The Royce Funds will adhere to the following
procedures when investigating and enforcing this Code: (i) R&A’s General
Counsel will take all appropriate action to investigate any potential violations
reported to him or her; (ii) if R&A’s General Counsel determines that
a violation has occurred, he or she will take all appropriate disciplinary or preventive
action and inform the Fund’s Board of Directors/Trustees of his or her decision;
(iii) all changes to or waivers of this Code will, to the extent required, be disclosed
on Form N-CSR or otherwise as required by SEC rules; and (iv) any waiver sought
by the President of The Royce Funds will be considered by The Royce Funds’
Audit Committees prior to approval of the waiver.
VII. Amendments
Except with respect to Schedule A hereto,
which may be updated at any time, this Code may be amended only by the Board of
Directors/Trustees of each Fund at a meeting of such Board duly called for that
purpose.
VIII. Confidentiality
All reports and records prepared or maintained
pursuant to this Code will be considered confidential and will be maintained and
protected accordingly. Except as otherwise required by law or this Code, such matters
shall not be disclosed to anyone other than the appropriate Board and its counsel
and R&A and its affiliated persons.
IX. Internal Use
The Code is intended solely for internal
use by The Royce Funds and does not constitute the admission, by or on behalf of
any Fund, as to any fact, circumstances or legal conclusion.
Date: September 17, 2003, as revised through
March 9, 2015
SCHEDULE A
Charles M. Royce
Peter Hoglund
Mary Macchia
EX-12
3
e39163-rvt_ex12a2.htm
Item 12(a)(2):
CERTIFICATIONS
I, Christopher D. Clark, certify that:
1. I have reviewed this report on Form N-CSR of Royce Value Trust, Inc.;
2. Based on my knowledge, this report does
not contain any untrue statement of a material fact or omit to state a material
fact necessary to make the statements made, in light of the circumstances under
which such statements were made, not misleading with respect to the period covered
by this report;
3. Based on my knowledge, the financial
statements, and other financial information included in this report, fairly present
in all material respects the financial condition, results of operations, changes
in net assets, and cash flows (if the financial statements are required to include
a statement of cash flows) of the registrant as of, and for, the periods presented
in this report;
4. The registrant’s other certifying
officer and I are responsible for establishing and maintaining disclosure controls
and procedures (as defined in Rule 30a-3(c) under the Investment Company Act of
1940) and internal control over financial reporting (as defined in Rule 30a-3(d)
under the Investment Company Act of 1940) for the registrant and have:
a) designed such disclosure controls and
procedures, or caused such disclosure controls and procedures to be designed under
our supervision, to ensure that material information relating to the registrant,
including its consolidated subsidiaries, is made known to us by others within those
entities, particularly during the period in which this report is being prepared;
b) designed such internal control over financial
reporting, or caused such internal control over financial reporting to be designed
under our supervision, to provide reasonable assurance regarding the reliability
of financial reporting and the preparation of financial statements for external
purposes in accordance with generally accepted accounting principles;
c) evaluated the effectiveness of the registrant’s disclosure controls and procedures and presented in this report our conclusions
about the effectiveness of the disclosure controls and procedures, as of a date
within 90 days prior to the filing date of this report based on such evaluation;
and
d) disclosed in this report any change in
the registrant’s internal control over financial reporting that occurred during
the second fiscal quarter of the period covered by this report that has materially
affected, or is reasonably likely to materially affect, the registrant’s internal
control over financial reporting; and
5. The registrant’s other certifying
officer and I have disclosed to the registrant’s auditors and the audit committee
of the registrant’s board of directors (or persons performing the equivalent
functions):
a) all significant deficiencies and material
weaknesses in the design or operation of internal control over financial reporting
which are reasonably likely to adversely affect the registrant’s ability to
record, process, summarize, and report financial information; and
b) any fraud, whether or not material, that
involves management or other employees who have a significant role in the registrant’s internal control over financial reporting.
Date: March 2, 2016
/s/ Christopher D. Clark
Christopher D. Clark
President
Item 12(a)(2):
CERTIFICATIONS
I, Peter K. Hoglund, certify that:
1. I have reviewed this report on Form N-CSR of Royce Value Trust, Inc.;
2. Based on my knowledge, this report does
not contain any untrue statement of a material fact or omit to state a material
fact necessary to make the statements made, in light of the circumstances under
which such statements were made, not misleading with respect to the period covered
by this report;
3. Based on my knowledge, the financial
statements, and other financial information included in this report, fairly present
in all material respects the financial condition, results of operations, changes
in net assets, and cash flows (if the financial statements are required to include
a statement of cash flows) of the registrant as of, and for, the periods presented
in this report;
4. The registrant’s other certifying
officer and I are responsible for establishing and maintaining disclosure controls
and procedures (as defined in Rule 30a-3(c) under the Investment Company Act of
1940) and internal control over financial reporting (as defined in Rule 30a-3(d)
under the Investment Company Act of 1940) for the registrant and have:
a) designed such disclosure controls and
procedures, or caused such disclosure controls and procedures to be designed under
our supervision, to ensure that material information relating to the registrant,
including its consolidated subsidiaries, is made known to us by others within those
entities, particularly during the period in which this report is being prepared;
b) designed such internal control over financial
reporting, or caused such internal control over financial reporting to be designed
under our supervision, to provide reasonable assurance regarding the reliability
of financial reporting and the preparation of financial statements for external
purposes in accordance with generally accepted accounting principles;
c) evaluated the effectiveness of the registrant’s disclosure controls and procedures and presented in this report our conclusions
about the effectiveness of the disclosure controls and procedures, as of a date
within 90 days prior to the filing date of this report based on such evaluation;
and
d) disclosed in this report any change in
the registrant’s internal control over financial reporting that occurred during
the second fiscal quarter of the period covered by this report that has materially
affected, or is reasonably likely to materially affect, the registrant’s internal
control over financial reporting; and
5. The registrant’s other certifying
officer and I have disclosed to the registrant’s auditors and the audit committee
of the registrant’s board of directors (or persons performing the equivalent
functions):
a) all significant deficiencies and material
weaknesses in the design or operation of internal control over financial reporting
which are reasonably likely to adversely affect the registrant’s ability to
record, process, summarize, and report financial information; and
b) any fraud, whether or not material, that
involves management or other employees who have a significant role in the registrant’s internal control over financial reporting.
Date: March 2, 2016
/s/ Peter K. Hoglund
Peter K. Hoglund
Treasurer
EX-12
4
e39163-rvt_ex12b.htm
Item 12(b):
CERTIFICATION PURSUANT
TO 18 U.S.C. SECTION 1350,
AS ADOPTED PURSUANT TO
SECTION 906 OF THE SARBANES-OXLEY
ACT OF 2002
Name of Issuer: ROYCE VALUE TRUST, INC.
In connection with the Report on Form N-CSR
of the above-named issuer that is accompanied by this certification, the undersigned
hereby certifies, to his knowledge, that:
1. The Report fully complies with the requirements
of Section 13(a) or 15 (d) of the Securities Exchange Act of 1934; and
2. The information contained in the Report
fairly presents, in all materials respects, the financial condition and results
of operations of the issuer.
| |
|
|
| Date: March
2, 2016 |
|
|
| |
|
/s/ Christopher
D. Clark |
| |
|
Christopher
D. Clark |
| |
|
President |
| |
|
|
| |
|
|
Item 12(b):
CERTIFICATION PURSUANT
TO 18 U.S.C. SECTION 1350,
AS ADOPTED PURSUANT TO
SECTION 906 OF THE SARBANES-OXLEY
ACT OF 2002
Name of Issuer: ROYCE VALUE TRUST, INC.
In connection with the Report on Form N-CSR
of the above-named issuer that is accompanied by this certification, the undersigned
hereby certifies, to his knowledge, that:
1. The Report fully complies with the requirements
of Section 13(a) or 15 (d) of the Securities Exchange Act of 1934; and
2. The information contained in the Report
fairly presents, in all materials respects, the financial condition and results
of operations of the issuer.
| |
|
|
| Date: March
2, 2016 |
|
|
| |
|
/s/ Peter
K. Hoglund |
| |
|
Peter K. Hoglund |
| |
|
Treasurer |
| |
|
|
| |
|
|
| |
|
|
| |
|
|
| |
|
|
| |
|
|
| |
|
|
GRAPHIC
5
e39163_1215ann01.jpg
begin 644 e39163_1215ann01.jpg
M_]C_X 02D9)1@ ! @$"6 )8 #_X6*'17AI9@ 34T *@ @ !P$2 ,
M ! $ $: 4 ! 8@$; 4 ! :@$H , ! ( $Q
M ( 4 <@$R ( 4 AH=I 0 ! G ,@ )8
M 0 E@ !061O8F4@4&AO=&]S:&]P(#7U5F9VAI:FML;6YO8W1U=G=X>7
MI[?'U^?W$0 " @$"! 0#! 4&!P<&!34! (1 R$Q$@1!46%Q(A,%,H&1%*&Q
M0B/!4M'P,R1BX7*"DD-3%6-S-/$E!A:BLH,')C7"TD235*,79$55-G1EXO*S
MA,/3=>/S1I2DA;25Q-3D]*6UQ=7E]59F=H:6IK;&UN;V)S='5V=WAY>GM\?_
MV@ , P$ A$#$0 _ /4V,:QC6,:&,: &-:( X; 55_4F5!YR*+ZMA(D5NM!
M'^D:[%%_L_K['_Z17$SC#2? )*1-RJ7/J;6X6"\.[W,75_HV>E;+ S'L;6'.O]CG;
M,AEWI_J_^"]?8DIV\3+HS*?6QW;ZR8!VN;Y_1L#7=T#+ZBVNHMQHLRG^HVEC
MI#=[-S"ZX_290RUGZ6Q Z&_97901J;[B-> TLT_Z:H=3]0YO3Q7ZCW669GZ&
MHM;ZFUF4?3<^WV^[=Z?O=Z?OWI*98GUHS;J]UN RM\Q RL=TC3W?SWL=N_P?
MO5IO6(.ZB[,QGNC_1O=7OJ_?K6)TI[*LT=1M]*O'9D9&+=F!QJ%CR:ZZK+*W.
MV.8ZRIU/Z7U'OR/3]/\ 1LK]5*>I%E9L-8<#8T!SF3[@UTAKBW]UVQZDN3^K
MO4Z\KJV1U#T6"GJ;W?9\JMX>7!I?CT59+(_0[J>G/?C^@^RC^<]7]/D+K$E-
M/J75,?IK:77M>[UW/8P, .M=-^<[=NV
MNL5,W[-QK9OOAWM9ZE]5?Z/U%1^N+MK>FN["_(_' ZBP?])RL9;-F1TUHD;:
M@T?]O]/_ /(I*=7)R:L6MMEQ(:ZRNH0"?=:]F/5]'_A;6*;'LL8U['!S' .:
MYID$'4.:0J/61NJQ6$P'9>.?\RQMW_HM9[^HY/3^CM@-Q:L*H,OOL99>:Q72
M+]_V/$&[T_3_ -/D8W_GM)3T"SQUSIS[_L^-8LV'%+:,A]30RFJP,#_2&Y_YC2SV8_VCTDE-VRVJIN^U[:VDM;N<
M0!N>176W7\Y]CFL8JMO5*B\4X0^VY#FBS94X;6L<-U5M]WT*JK?\%].V[_ U
M6^G:IYAILLHQ+Z++6VO%@>UI+&.I+::;*M[WY=GJV8[F-P&5[,6O=B85MF:]GZ&C^=Q<>BOUTIZ=A<6@N&U
MQ W-!F#X2H8V35E4BZDDL)1_:
M4<2C[/CLJTEHUCB2=SO^D4E+UY--E0M:[V%Q8"06^X.]+;#PUW\Y[455:*6V
MXVQY,"US]#!EMIM;_P!)J?.S\; I%M[C+W"NFMNK[+'3LHH9_A+7[?\ T8_]
M&Q)396>.N=/L<6XCGYKFB9QF.M9IIL^TL'V1MG_!OOWK,MP.K]7R'U]3:_&Q
M[*-]-+#6_'I>7;-F4#9NZEG>G^EV6XW['QOT?LS;?T]F]7BX];Q:RMHM%8J%
M@: [8W5M0RMGN_/L>[8QJHYG7<#$L96XNLWAAWUC^R=C?T]W]
MAE5R2G__T/3,O/IPC6[(!90\EKL@QZ=9B6>N^?T;;/HML_F]_L_PE:L:$>(*
MRNM9/2L5KLG+ROL=M%)L=G^SK;:_4_39'J)*;+=S.N],HJ>6U-
MZ?D[J0XAOMLZ>S'>ZJ=K_3:Z]C/ZZ%]7L ]-IS;+Z'56D-<7N#2?397M])MP
M=8^QOK-OR-G\W5]I_1HU-V(;!U$65Q7C7"K(F*_5]SGO^CZ?Z*G>JW31<
M>CY[79M67-;W/>RWU6ML>PO=Z=FY[F8^US=M;_TF^NR__#I*;O0[*O2N8YP%
MKLK*+6$C<6LN?27-;^XW;M6?D=1Q<7)Z=F90?34S(S:M6.>X.]2REK]M+;7M
MJ?L_G?YO8I8]& SJ6#D7&]F37=U 4%M>ZEPNR'[V7W>E9Z.YQ8^G]-1O_EK(
M^M&(^O"_5'O8\X62-K'. +GX^3?DOM@_I?5LR?6]W^%_2I*>EQG8.16+<'%>
M,=WNJNQGULKM:>+&/QKV^HS_ (U9PON>_=/536X^QOH%I /YCW$>I[?ZBZ##
M^R#'8S#+#CU34P5D%H],FE]?M_.J>QU;_P"6J^:RUV0P^H0P-.UK:[7&?SBY
M]%U=?]A]:2G/FH"8S6D#EPR)_P"ACV-5AG3GY?IY MMK?CN)H-A;8TZ?SGM]
M.W;^8^M_I6?OIGOM9]&N^P#ES&6F;7VV
M-]OL_MH.3U6VG/RLCI74\6Q@>TC"R[F-J=+0ZUO3[J[6.9ZKW;['Y%635Z_\
MS_AZV)2_2@[&R\7I.9:U]Y?]NP,AEK35:&;\3(QL>HL9M9BX+V.]#]+Z>_?5
M9^A_1[_3>HLSCEM8 /L>0_%=M+CJP,?KOKJVNVV_F^HS_A;%D79F)=B^D]F%
MDTN-CR'Y%3+:@X_:&^T#(HW4/^E;7D_3HKO_ .+U>AXS,;I6,QMHR2]@L?DM
M<'^JY_O=?Z[6U_:/4G^?V?I4E-3ZR469&,6L;O?71E65MB7;O0?CM])O[_ZS
ML]J?,MILR>FN8[VOK%E9B);ZV"./S?YVM9.3]9,EU^'D7/.'7F4;L;%H8VW)
M+KK*6XC'9&1_D^EV9LM95ZOL_P"&]15[6YO5OLMW3^F?:V9#A:,_J3OM3*0^
MEN17=3@V6T8U/NR,6KU,+Z%E&BR,C"ZPTXF!DS=469%>54QU
ME+'5O$--[-N-8_VN9;B_:/5])/0[#Q/6;GWL,93:ZKLES Y]EE530T$BNOUK
M?4LK972S^;_15H73,#K3,UN7GY=;A]G94_#I#Q4Q^ZVY[J6[VL]OJ4XK+;*?
M5?3B?X/UE3Z@_$=EY--UF+8VO(]8UN#LJV;,?[$:OV;C%MCG.:ZW^=]5FS_
M_P"B2G*Z?11F8]5;\IW6'9?K,RO2W&MK-_W)M9
M;375ZRV0I^DLK24V^G]8K:[(
MIZ75G=5>;++IM9Z%3!9;:_95D9K<-EE#+'65L]'[59Z=?_!JR+?K!DY3L9S\
M; # 'N-0=DNVS]$6W#"K8_\ ._HMRL8%19U#.@NB6[6NU W;K3M)]W\X^Q4[
MMM>/2];[5;L]'UO0_2_TBSZ%B4Z^/5912
M6VWV93@2[U+0P.@F=GZO517M9_Q:!T:S,LZ7C/SK&W93F VV,;L:2=?:Q1=U
M3#>3BMM]3((>T[&.+0YGJ-?N> ^NGWTW;/4L]_I6?Z-6L< 5EHT#7. 'D'$)
M*<7'OZP^Z_#&;B-OJ+KSC8U;K;12][]E?VF^ZG&9?ZC+:-]N-^9_-HK.@MRG
M5W]1:+#;BNQ\NJ[]+:3;M]1K,MAJKHJV^I7?3AXU%61_UMBIXQZTW"ZJ,!EI
MR+'9(PG$U?9V6'+S:M]+'Q QOIXM-.4V6-_FK:LS*_9E_VC'M?D>G;D6I*=H>A14&MV54U@,:!#6M ]
MC&#\UO[JI=VZK)L:T.:QGI/9BN:?:ZBZK(R^D^_>SU_5QWVU_X.Q:'4>I
M=3Q\EKO3Q,7I]=U;+,G,NV./
M4^STO5(FP'%KLQ&WQNV5?M"V]F1;C.]7]7K_ $7H_IE6R,3(R,#)LSNIVX;:
M7-NL!>QUC*JZMG4:\IN&0QGVBB^S]'C6_JGZIFX[_M"61@]'R+\QSW9.9=@5
MAMX])]MA:+'9]N'58^OT\AM[7LH]"G])Z?I^FM)V+6]U%M7366#,W'*?>0VR
MIEK:_6#FEM[GNL]"FM]#';/T-22FG3@T_LYSL OZIE8F8]X.0_T]][ [!#Z+T7#Z7CMKIQJ:'UM-+'5:DTL<_[/ZMCFL<^Z
MQA];)_[LV6?SO\ZJUO5LNI]U/K]/KLJO=[!8^RP4$.K^A^E^D_5J/324Z OHKR:FL(BQEEK=H]I8+0]U@V?O^HW^NJW2Z:6?5
M[)^S8QQ:
MZMS+*:\C_N17ZR2F9'3/M>"W+LO%S\G*=0VGU12[;D[V_:S5[-C+WX_H^L]E
M5EOZ/_@T'J]9M&W;N:<;,83$@%M%584\0X P_J]]HHNNNO=1>W=_VHHHN_P*?/M=71EN_P=>)U![M=-P-7I_\ 19:DI%]3*C;?
MU#J.ZZH7O:UV*^RRRO>UE;;LIOVA]CW.OV-V?\$MKJM%]PK]%E;RW=)LI%\3
M'T=U^-L_\$5#I-GV7J'V"MH/J@NLU@,;13BZL9_PMF8Q;EC!8W:20/%I+3_G
M-A)3EXV#:+ZS?7462=P^SL;P-S/>RZS9[_Y*UD.NEM9D.>=(]SW._P"K)53J
M&9>+&8&!M=FV@.'EEV/37;
MD.LRK16RMM9>RRW$KVV^H]C;K&5V-NWOR*/M/V:FO]$@T7?6RBT5E@?398YO
MVC(K]6[=[(]"CIWZGBXK/?2RO+R_YW]/9E>G]/1PJR>H5T/L=?9C5.:^ZV-[
M_P!)CV,?9Z3:Z]VVO\VMG\VJG6>K9]75Z^EXP=3CE@(?1'VA^0\7745,]:C(
MQ?L[OLMGK_\ :C_#?T2G)24ULOJO7,EM+68-M657=9%%FQ]3F5NK?]ILR*;Z
M,1K\']%ZE=MFS[5[,;[5]FL5SI7UBS+^GVV]3;CXSRP_9+<>WU:[B&EUC\?;
M^DL;5[??4RRG9_A=_JU4K#%5V)^SL>G(R'76QU'*? KW"PNZC59=OV/_ $HO
MQ7X^#ZM7JO\ 2_F_6MK-U[J?U>>ZKIF;D.LR;+/T6+B^I;;ZC6N>WU,;$%N]
MC/YW9EU/QM]?JV,_1)*>=P^J=,QF=,QKNGO;U>^C%QSC9(=ZK!AAUU.3=3;Z
M6)13395?DU6_:?6L9_@_YZNKHL5F;F7!M^2*G8[BUV,P.V%H)K=LV?9=S_T?
M^$^V44?\(_WK#R_K'T[J&3TGI_3J;:J:,MC<2Z\"NK*J%=W3[QTVZRS?D^A5
ME>KO_D>G_/VT5W=#@AISW;CND<2L-KJ+JWLV_:.I
MV>QU;Z+-GI>F^O\ P22F3;OK9DY%)KJQ\?%KN=ZIL#@ZVD$[',8?4?C/ZUDMW-%+<3UWUQMILM=^D?37^BK^@I6'H%V-
MEY?INSVX]IJR&.%E[FV5EK'5MJR"[T_3W_I-NRG_ MB'5B8N8X,Z?AC$Q,:
MUKWN-(95<0ZNU_V6NNVESGM=C5L^TW8_H6?X'UDE+NR,'/LZEC8V6USKFM87
MT$V%L;JK/;0?\&YNQ_\ VW8LY^%TBO)LK]/(=C9; Q]9<:['.I?6Y[7_ &FV
MFQS_1K!POJ]]8.K=(INS^LY'3++VMOKP^G,9170YPFJDN+7Y%C*F.
M8RVCU:JO^N?IDE.FUQ+KG8W27MRGL=^EL+=PW;]K&Y#RYFQK['_H*;OT6^S]
M&K73K.KW4S?57A/;:?4I<'6DMW>H\LM:^FK]-6[]&YGKLI_PGZ2FVE<_A]5Z
M[T;ZS#HW4L8%G[+Z@TM<=@R\1]=NUS=KW,W?I:_H_SG^$].S]'Z3_TB
M2E?9NJV.=ZV:VMA!#1CTAK@?WB_)LS&._P"V5CY?U?ZK<[T6OINH9RO?Z=3/\'5LK0,SZP=%./94,XM]5CFMNQ@;'-EI_2U.JKOKWL^FSVO
M24ZE5-5+-E+&ULYVL :/N:LW+Z-=D]7JSSDS34*]N,X6>QU;K'NLQ[*,C':Q
MV0VWT[_6IR?597L_FOT:S.F971NF9+KAG76"VIK?09CVP\SO;FY(]*ZZ[/M_
MPF5OK]>OZ=7Z.M;V#U+&SVN=CBT!D3ZU-M!UF"UN572Y[?;^8DI__]+L_K1F
MX8>,1M-5O5ZZVWX!R)K9[K/1MKHSV.K=B9-C&;&?IJ=[WT_SOO3](OMMNR,/
M#S;=^/N(IRW5Y(:POLIKW/8ZCJ/J;Z'[V9=]EE?\WO5KJW2LS+O?;C/IA]+6
M%ES207UN?=3OV_2K]5[/^+_G/TO\RLZZ_,Z(VS(KQ;[V5M8;'V!^58*SE^GE
M-KR?4MR;&UX3_M&-1_-L9^GN_P ,Q)2?J.)=595D78X:3^K'*QKCOG*OIW,^
MS9+6,]"W)*,.'0PYN+Z@@$;6VLL]W[NUU;7(/_.0F^BBK%.0])25O3NF8M73.FW76>M1#<-PL>Q[S2&W/8\T%C;*O
MT6^S'M_0/V?S:Q_K#>RK"R6GZ63B936M\0^FW(L_S?T:NYV>YU].;=AL!P7%
M]%MOVM@87M=3=:]PP?2KK]&Q^^ZW?55^?Z:H=&OZ=CMW?RMN,MM<
M_P!+R _JN*UYAS\.YS-PVN=-];K/9_(8:76;?])6N@24I8>>S[+UK'RJVV>G
MD6M9E"C=+WO8_'QGY&P;?L];1]*VRNNFS_AK5N+#S[:7YM[,G,& W#LQ[S:^
M&M=46W?H_5MVL_2[8<" [,P;,NBW?ML^D[(_1O_ ,#;_HUK
MGJ^%T_ R\S)SJL)F1>6XMETO8W973CM'IA['V5[JM[_TE?\ .)*7P:QA8C,F
MZ_[%T[$$OI=4<4-VNR3Z7H5_H6U_K./[J?4^T/QO\)ZBY[ZK7].^JO0GW5]+#;,+
MI=-&?;8RMQ]6U]WVC#]';Z=?V+U<9^5U++9ZOZ#^C>I?9^CW^A]0Z=F=,PW5
M>EMNI;?^A811O+_TGHO1=]K_ $N-^AOXG7^N6.QZ\;IS+*-K&$/LBG,.0++WV6&RFKT2S-QKG6M]!C
ML?)IJR:\G'R?LN9Z7K>ACW_H;+M3I^+U?H#C9
M^FKNQOYK^RF^RV^Y[?7K_25.M:W;3?1]FQ[<9GKUYEK_
M .=L]'T?YU)3N]8RCB]-?5E6"R[)(I:*F/#BVQS*'^E74^RWUMN)193E8;L#?ZV2^ME].0[*H^S_
M &NVO/\ M>#]K]'$HRKM6;?CXO[/Z;13TRAS;;G/J%KW#W;\A_JY.+AX>#]*
MS];S[;/3?7_0;_YM)3:ZE@V9'UHPL['..X]/HMI?DV$EU-M@J]US:FL8^[[/
M=7]GQ[LBG]'F7Y'^#]YGX-C65VY_UCR-K;17[#BX];K9]/[/[,?U=[G^ST?M
M&_>L/$QKGY.)D>G7?7C8C/
M\)]#4;5T3$:*W=2J<[+L=G-)<+=U.0'&^S&IK_1TU9.Z]K,O;:]];[OT]EB2
MDE'3\/IO6\7,QLBW+LS7W8.59?D/M(<6.SZHKG:YE;SZS?1<^
MKU?5KK_GZ5E?5AUCQ1;9!<[I>!J-)UR]=J2D./F5X9+_A6?I/T?\VK
MMEKG9#<9C0X%I?<73HVSHAV=%> !C7-KGZ9-<&)GV.PK,!];OY>
MY7;S\;,#Z:\W+G,ON:
MV[)JM8X5?H/6^SO_ $F_[4SV*ODV%N<^EME;Q4S<:['NJ8U[SZCW.HONZB]]
MNVS?[ND[_?\ TE6\W"OR^L9F/377#F8=EKK-PE@.:-U;FA^ZVJVNO8S]%L_G
M/459W0,K$&5D9F94*7NWE^0^:&,)_F_0MK9LV_0]:S+M]3\__!I*:+<*\6-M
M8RNPZE]9K90UPM[[&;_YFVVM5LGZOXV!C_::' -.UKF4Y%N$7[RVIK:+
M:,JC&;>Y[V>CZM?Z>STZ=]7\XK_4/3Z8[%%%=UPS'LPG />\55N#W.RW,DIR_JR_I;>H8U7307AM>C:UKGUN?ZE]#O>S^?HS_??T[&K
M6ZDDIXUAQ<)M.5U VESQB55._G179ZOIN^W>ATW]*^JVU^+_W8_1V(
M=F#;TK/PW8=[S^T&.H9Z[/5OK..R[*_4F75XE.'ZGZ:FWU&U4?S5V^CTU>Z%
M7^TLW'S[@^^G%J(PM[0UM+7;12]S6NV69F1CM;;98QK_ $_4_1,QJ?Z1+/ZM
M;;]8+>E66T5].QSCV9%UFSV';=>_%_6!97ZU^W#?]#]'B66>C^G_ $M24Y>1
M7BT?;,/J&4^K ZI4_P"U=1L:\N8,@?9\9CNJ_9ST^^BRKTF.]V-]E]*G'?FY
MWZ-1IZ >CU,P[6/+7^U@#*\K%N8QCOT3L9GV#J5MKJF?T7)LZA^B]/'JR,NS
M9Z7G6R_TG5;G1OZC57EY
M./\ 0Q<>K=Z'3<#]);B?K/4_U;]#34;U&WH?3\&OIX/3<;U&V9./Z0]5U64\
M8V+9>ZRBR[#HP/U?$^UY6-]JZC9C6?H;O2]3(2F[TK$;D=(R/JWU/'NPIT^#TG#ZF+GYC'.
M]-PJJOW$6MLK<]X?7D[[NI56X^[9ONRZOIW5?8<3]+794;C?6:[*KOR<:QQQ
MZ9KOJ=COL98=LMQF9)IQ+38T,R.FOJINMS T0ZACO6R,RYCFNS7X#;A8F6
MXX^1B=8LQLJF,HWWV>E^EW5V574_:_6WM_F[68='V;_K7Z197U>I^TY/5\G!
M<*&7YU;J@\.>YKA6W(<_,W.9ZC\?[9ZWHWN]3&SO2PK?Z/0DIW<[ZNEI%>$Y
MC.EVV"S*P7.-3:G!S;F]0Z9?2TV8F51=7Z_V?^BY%OZ7]6O]:ZZIB]3Q*'O+J15@LHLRKW/:]A%1
M#+'&RES/;ZON]6N^OU_YW_"*CTE[#B=.Q[?T+\X,REZ'Z%*;GU?L<;,JG>YU=#<9E+7.+MK#CU.T+B?I/+_
M '(E65T'!QAU)C*L)O4'@[O3%=M]MA?BMHKMK)AAO#!:]]E9;?CW66'#Q
M,3(9_-ORK$E.@VW R?K'@=0QW^H;L++QP\$Q+;<*WT7U._FKZ]MOJ,VLM_P=
MR!]6JSMQZG AIZ3A!VL'G)VZC^2JV#A.Q*<>QK@U@ZN?LA!)+J&UNZ94Q[W%
M_J?JU?\ .6/L];TZ[OYQ7?JNUSJL>XS(Z9AU$?RF'):^=?W@DIP>JW=4NJNQ
MQ5C6,.' ;@'6^MM?
MJ]CG,]1_NW>F])3;NPLS*R>IG%N:V7MJ]&P$L+_1Q7^J][-MOI;'_IL7_M5Z
M--?K55>MZEOH]=3&6BB[U:JW>@ TMV!]4MN+*V?S/Z4NJLK_ .!]3_A'MA7X
MQSNIT>JUEWVAI+=P#H=CXH:]K2J?2\#$'4V9-5#0ZG&;7]H:.[8H?2^YO\X]
MCJW[V/24_P#_U/2>I7MIIJ!]ZRL7.RKOK;:#D-^
MP>C;C48TD.-U!QK-AYE_KVOJR?LWI79/I5VU_S5:2GI(L_:U_IPUQQJ?_\ ?5BC+LZB
M\YG3'"I^7@T68[\BMQ:T.?:[=;4UU3G>UWT?5]_[Z@SHO6QELS7Y^/9E5U^B
M+'XUI]CMIMAC,^JGU+GUL>[]#Z?^CK24\[T7IC>JMOR\FTLQ<9^-3@XP#6LJ
M;/0VRUWNL=[&L5D=.R32:GYKVS_HJJ6M!G=N8RVK(_.]_OWJ>4QU-?V@
M/#KJ:;&L?9W=M#YVLV-]WI;[=B2GEN@9=&3]81Z-MPKI9DY=S,ICJC7ZAIJK
M9C4V^FZK%NJ=]K?OI99ZOZ:VZ[[3[.QMOKJK%CC+26M!:)U>YM;./Y3URW2L
M[*JSS;D..5[P#ZW,G_K6Q)3*W]0MJP6/<';1]H>VBQVZOZ
M#FTNM]+W5_IO3KW^]67WV,SGM:W>7"EC1,1)N?:[=!^A4W?_ "T9[<;/Q[J+
M6>ICV;Z+6/'M>-:K6P?S/IUI*>.Z]E96']6CUSIC0<;%N;=L!W[/Z?
MV>STO2MO9_E/U?Y[%?9_W%Q:DW2L>J:,J7VDVUV[@P.NNO?LM:ZUCV[/MF7Z
M?KW[F?Y.Z;5]I_0?J&5A:'2,_*Q:ATS)QC?E8[&49V,!N]6P!OK9V+DN_5\I
MF7Z]61D595N/DT,L]7*]]WZ2ET;'R^FY)90<9QLMNI;D,I]&D58U---_43CM
MM=Z+FYC?LN6[?^M?9L3^C^IZJ2GM!8QSG-:X.I]?S;#M;T^C;;573M;6]K['G#8 /6VX_ZE]K
MV49-=.3^KV>CZ'\_#ZU];;UI^7]7Z, FS%NVYU][O3;70PTY'JUEGZ3U3BVW.].MN)U&BS"RL'Z=]M
MF^S_ -.4E)+W95/2LAWJ!V1BULO=CL%K:[&E[2W HQX]/%^W5C[#C^WU_\
M#T8%?JVVY&_@FOIUN35;D6VUW9#[*W7.!;4-GJV4TM#:V4=/Q*F5UL]W\^]^
M]8M]];L6F]PM:RK.P[+:[Z+J"6BWTQ;^N-K>_P#6KJ[=F_(M]C+;-^5;8FQ!
MTMV3>\]2#F7/.9EW7Y&Z,>JW:^G%;:_91T^S-K_6?09]F_[3?:+*J<;UDIZC
M"PZ<5MSJG6/^TVNR'NM>^P[GQ[:_5+O2I8QK*ZJ:_P!%6N.^IM;,:W(Z>8->
M/DAU]KW$_K#;+NGV[[K/YY^9DX&)G;=_J?:LOT_H8OI+>==7BUY/2^D7/NZA
M>;[&66O-K*;K-[VMM>_U75U,M_P5=-_H?X>OW_I*GU>Q:<*MN,^"S&=9;D76
MCTB;&ES*\BRNQ]MO\W799^FL_2O^T9W_ '']5*=3%:;NN9N4"#5353B-@\6@
MVY.3_P"!Y&'_ &_55S"M%N.U[0?3XJW(M
M=C/##86.GTO>+7_87N;Z?I^S?C,K_P _P#2)34^ON;7A?57.ST:6Z
M2Y[OS-?I,;7ZMM__ '6KO>M:QE5O4JO5I!?16;,>XB2'.)JO:S]W:ST_^W5E
M_6NB^_[$S'K=;<#DE@: 7 _9,IC'-WEK/=:^NGW^S],K.!B-P^H4X&/F'[-@
MX5=;, EL@;G5TY+H8VQS?3I]#^<_P7[_ *GJ)2'#;75U"B]Q KLZ>_T6BNRC>U[J+FV5[&96/4VF[99
M?]I9;Z?I>CZJT68[K1AXK2 ZWIE[ 3P"?LC1I_;0^AEUV50]]^RLX]5].$ [
M>#Z-5-CK\C<[UJJ_5_1,>S^>]6Q)2UV!7@/QL=EM]K:KL0N=:Z6AIL?1C,II
M8*\;'])K?1_5Z:O5_1_:/6N_2*>/BUOKL9D655LR2ZC%9!<191=G7.]KCLLK
M;3M_1_\ !6I?6&C+:^W-F<>D83F-!TW59C,G*]5OYWZ%E'H^WV?ITU0#NH=-
MMF'MR>HUP- :R^[=I[?SZ:$E+7=&L&.ZZZ[IP9#7"W["!K_@W?TH[OW?_/:$
M>CBJJO"I+\:C]GYK/LP#2&FU^.=OO=E.]OO_ .U%C/\ 1?HUH]9=G&VBK$8V
M=PXPVQI9<,'#]8:?3:_P
MWJ5V6+(P,*MN9TQF2TM>S'+V%HB@N!]2K&9ZEGJ-LKK_ %AF/73Z%7V?]#Z?
MT$E-SIV#]GRF8F0\W75X58LN$C<_?8ZZT>[?7ON=O8W=^C0QT+#MZK=-N4-E
M-89MRLANV7V%VQPO_P )L]__ :T6M!ZP]\ZMQF"/)S[/_()VOK9U1['$-?;
M2PU@F"[8ZWU?3'YWI[Z_4_XRM)3D8_U?9DW-.7DVY/V;>&>NRFZ6&_)-;7.R
MZM6UC &M$NL9OC_ (3^<1,)
MS3=:V07 21W_ )W)_P#(J8OJHHNMN>*ZZ7/=:]^@:V?4W.<[\W8[VS$Z?DVT6;@[^=^Q_H]OI[+O3?_ #?J56[1VW8EE3"X
M[ZO2:8]VUP<[#L=OVN]GOJ=_PZP\&IT])QZMOK68[+OTH<&6D5-9Z>ZKWXME
M;>G8]E=^S]#_ ,*MGUZ<:YU60_=E;=UM&,;+GN#OIN^R4L_5OTKJ_P!;8RKU
M7_I?T22DEV14ZTY=9%@H#\BN# <12QM;=W[KVY:5>:,1GI-&/L<3M#*
MH&5>XQN=:^Y[J&5_X2VO_C%1=CW@8S&=/S[64^F++'.Q9M;66V4[VOS,?98R
MZFC>_P!#])6ST;&?Z,6.&MZ@W%:RVO,<&>E5G[07/K:Y]F=ZM;G49[,;?Z_V
M7!N_I^;?;E_9OT.1BI2;J%%.7ENQ:;'X>;;E?:<3,:!-=M>+14][JK1LM]3$
MNMI]&^OT]GJ_X3TU+HU6)U"XOI:W]G]/8W$PVDE[GL(JO?;=8[\V_9C/]+>^
MRVNJG(N_I'I*C]9*<[]H5'TV559&>RBI]I:X6UNPLG[1^A86V/\ TH94W%<[
M]9LI]/\ F;E8P.H8O3+2^^QM>.:GET%Q %3+,RS9M9^LV/9Z^2^W_P!#/^]/
M$QZTIZ9YAS;;\W%PZQ'I69;:7,?D5V_H,6O\
MI'J5K5R\JC-P\S"IN^S9-F._W/T]-SF0YSGCV_JV^OU]COT7Z/\ ?6>,FN_I
M.%D8P;4W)Q:GY#P-VQKV5>@PUL+K;GVNGZE61Z7HY%]
M>TV9'3\ICGMMM>UGV?&LK:8MOCT3J5E>X5LQ;;353LJJST/4RJ?T?Z@_?U
M_1,=V1?G7.(==01@DL AKK15G9]E=KCNO]N1C4>K9]/]GKFJKF_6WJF6<+(V
M8S3^GM9[I%UC+V.K]1G\^S Z#BU[?YJG)_2>I;^DI24]GU;(Z9@]"MO;CL?@
MV-JKO97^B Q[WLQ[;B:F[V5X^/?9?_UO_!_36+T&ES+[ND.!]'%R+V8<@%S<
M6GTJFWW63^E=6[;@X+[7;_T'J>E_D^U;=./A8QJ^K]^[)JNPO1#KMIWU4_H'
MUW[&UL]2RJ_]SW[+5A=$KOMP,?"II.0,U_J961D[GAU#+3Z->1ZD.OV83*Z7
M^S9D765_I;/UJY)3HWYF)T[J>3AV#T79UM#<9P VM-E+]UC-/T>QO2G?]=KH
M_?5G#R'8=8M^S.(O'K9#Y ;CT .^S5;';;K';*_3KHII^G_.>DE8TYC\NT,]
M)OKMQKG6&-U%39M?4YO_ EMOY_\WO4\-_VQS0&C8^S[18=-6L/IXS-NW\VV
MK]%9_AOL?J_X1)3:N^S/R\%V0PMR?>ZANI+7>G%NXU_H_P";<]OZ3V*T&#U7
M6;B20&[9T$2?:W^5N]RS>JUM?U'IS7[O3R/M&*[:2QP]2HY&ZNVLLMILVXC_
M -+4_P!1#L9F]*KLMI^RO:Y\!V3:ZEQ8 [TVORFT7OL/= )RG^O?NKSJL+U6
MM>[]'9ZBO-S<#$K;BNZ=?C4R(K9C%];23_W2;D5M]WYR2D'6>I8&7TJUF'F4
M6O-E3"&6L/\ AJF6,T=]/;N9L_?0.FLL?UC%+B"RL]7:FACA96?5K];8&/\ 8\;]EJPVY[\+/]IKIL:>J5LLR2]E
M!L?DXV70VZ]K'-_F7W/24]59CUVVTVNG=0XN9!TES75G:6.VN<=/T5KKW?G_P AZ6=1D796
M$^D-C&O]:S?(#JS5D8SPQS6O_2L^T-L_X1)32Z2"WJMKA]"RE[!K.M&5EMNP/#J*-^:][J[)?^ER*[\=H? >VO)K]6VQC/YG^:]17']'P
M+ \6L?=ZC2QWJV6/@$1^C]1[O2=_+JV)*?_6]+ZJYS>EYCF1O;186[M1(8Z-
MWT5GT8YMQ>GVV7.LOPLDMW-(]SF?:,![+7!O^#KML^A_A*EIYP#L+(:Z2TU/
M! !)C:9VM;[G(>,V[UA:#^K6TM+6$06V2]]CG?\ &MM;_P!M)*:N:,LYU[<6
ML6N=12UP-KJ2&E^3N?6^MK_TK?W-U/\ QS$(4]4(&_$=OC5PS+8G^KNW-_[<
M5YK7#JESS(:ZBIC"8VEP=D/G_-;U:P.B
MDWW9&9B,QBZP&NNC*N>US0&LW95.W%HM_F]VVQF0CX]]O4'7,Q\]I;CO]*RW
M'K9'J ?I*M]KLEN^GYOI_F?^3_ $:4XS_0KQ,'IYO]3,Z>PC+MP;K=PK+MGV9CJ?3_ $V7
ML_PC?5Q:_7^S>ED?9K4>C'ZA8 _&MS<6EPE['4N+G.X+['VW^NY[O;[U?95M
M#7MR,R_U /T..PUUDD>Y['6!M=+/SOZ0Q#MP\)V5]#]981ZOJY0I>&GZ&[[)
MZEC]W_")*:3>G]8>YKK,_JC@T@AK=C0X _1L_5\=^W^UO_X5%=TL9F0S[9@Y
M>6QMK)#[[:ZZYG]9]&_.?5?Z'_!T>M5].K]*CWNZ20:V783+@XL;ZESK"7M&
M[9MW56.RZ^/:Z
MYEGKN8QWZ-_4K,N_T_U14^BXPP^E4X]!+JJ3KKNNR**V>L
M_P#G,6K^;_2Y&/Z3]-R^KMZG9AM?B-QLAAOLS*:[-SLJX,=C-;CWV.>ZEV,W
M[199OM9^C?1ZV/Z"%@X^=F.Z?TY]KNFXS<>UU5-+&?:@S%MIHV9.59Z]3/M?
MJTV9=%%7\[C_ -+L24GZBZE_1[Z#8USLR_'HM(@;Z'6UMR]O'ZJS!KS=_P"9
M]EHR+OYC]'5I9MR<1N-TNBVW]+5_-4^G3&QE;G-:^YC;8K-LL)W6!_N:UE?^EW_SM?ZK7^FOJ24YG3,=N9B_6+"JNLQF
MW93F-R")L:+,/"=ZOZ3=^_[&?X.GTZ_T*;I?2W8!R7N](G(M^TN--3Z6M-E&
M0ZRGTKKLI[=MCW7_ ,[Z>_)?^BK]ZETUF3C]6ZMA'6W+QZ,RMA,Q86/P;ZWV
M?1?;^JXEEEO_ _^B5Q[\F^K+KVM;D"U[&#L"<8/J:[4^YOJ-:]Z2F'4S_P5O\ GK'^IYRAC8=C&%^1=3C56/M<[2EM-5]V
M1K=ZGHX-3_ .:I].W_ UM*W-=Z+&EGV0O:'-9;;9>ZRUX=[_ $LBU^VS])_1_P":
M])&PQ]G'K@NS])Z/IN_\.Y[_P#1+/W"NC+LZE953A>Q
MGVOU0T6;,;[-=97L;;9M997=Z=;?\';ZOJ5V4^BL_)_QA] Z?D/IRAD/OIR-
MMM3*FAYV;[ STW6>VUV6[UG[/^O>C_1ZTIZ;K;LC[%1?:WT68UC,G(N;J:ZV
MO:R^MNQV_?\ 8[;_ %+MNSTZ[?\ 2HN'T)N%8VVK*ONL8-N[*+;W:@-/Z>UG
MVEN[;N].N]E7_!JE4S+^LF'9;DFS!PGFRC[ US#8\-=9CY'V^S;9L]5GLJHQ
MK/T/](]>^RRK[*NHX?4<+,9DX5^5MOLL=<]A-];1+7T46X%GVEWI/>ZQC[NG
M58UWI?3>DIU;\M^(]OKMLMJU_P#H?S/YQ1/6^D![
M:OME/K/^A0'@VDQNVMQ_Y]S_ .1Z:X["ZMU%F115U,?:KLJFYUE#\FVMLUBR
MUS/LCZFN9D>G0_U,9]&S]+[/T%:Z+]LLQ\5PS.FEC:V!]M>,ZN]C1+F6-V_H
M;'V8_I_IVUT>S]']-)3K-OM>Z&4.#9 +["&C;&KF-]]G^?76I4X]5'J>D-OJ
MO-C]29<[Z1]Q.WC\U4<-W2\K(L;C4.IL%3++'AKJ"0]]]/IOV^G;ZE=F+;O]
M1B/8,?"JFS*?37.GJ/#R3^Z'7^I8_=^XDI/D8V-E5&C)J9?2Z-U=C0]I@[A+
M'RWZ2HO^KG0W1LPZZ(,SCS09_K8II1;,]XI??M&+C5@E^1E>P!K3[G^C+7[-
MN_\ GGT(];;*02\ONFW8UG]AB2FF_HC16UF+G9N(6F0]MYN=\_
MVD,YCO\ ,6C6US6-:]V]P #GD 21^=#?WE$W4&W[.7M];;O-4C=M)V[]GTMG
MM38^-C8S2W'K;4TF2U@ $_ )*?_7]0R;?0Q[+CQ4QSSI.C1N52CJ&+3TRK(#
MG/J/Z/';!-EFI936QC]KWVV-;_Y-6HW/8_)8YU#,603BM:7,=2]O\ W*NV[\FUOZ.S]'7CV78U=>1<
ME,<3"S[LT=3SZJ;LE@C%K;8=F,U[1ZU=?Z)WJ9+_ *%V7_A*OT===%>_U#.Q
MO5O=Z>'0RP "ZYKH>!](5-M%&_>Z?^MU_P#"(G4^I'"=34VBVP7N#'7UAA93
MN[W.24YEO2\1X#'1;Z@?
M_.4/NK=7Z7^$IQ/T_P#.YN-;AU>I]0R.JW'!PJ6W8?J>CN>?;D6L/Z=KF#9O
MZ7T_Z>>[U6?;I8?3!;B>E>_%Q 3D9P;ZTW._3Y'JLQM^1ZC
MO4]>VW[/5C^_]&DITZ<["NM?CTY%=EU1+;*FO#GM(^EZC)WM^E^J^#@.Z9CMQ19=E^L^)+65A@,OM?^JUT-9_A+?4?OONR+/YU)2?
MJ3\JK%-V-;11Z1#[7Y(/IBINMVYS7U^E[/=ZOYBSV^JZTM<\W1ZSWL<7#;^>Y_Z']RBK
M]!_P:2G(&.WIUXZB,JRQUCACLHUGJ?:'LM]&JNV[U
M*L:N]>H]9^L>1E8F+OS;;V/R*I'HDU[*,3"==_-WX[/1I;=DVWU59EGV
MC[%7_I=GZX_7C#J^M.(S&=.E-G%9=TK(RNG/L]1N VK*'V>6EE=K;'.P/2KWO_IU=>/C8U?J>CTJS
M%9]H5CJ?3BVG&+RYU#<^ZJRN_'LKQGW6T/R,5WVW&]>RE
M_P!B]+U/2L]6^KV9^ESJBW.R;J@,RDS198ZO=92_IV567_8;*Y])E%WVBG)J
M]*K)M_G\FZ'38+QD^JVO[1Z#WT-]C^H9^54W^:]>K_N
M+6DI6/TW/^VW]6P+*,CJ%+SC9M5S#3ZYQS;7BW6Y&*/T.8[!RF>J[[-D8EWZ
M#TL7%_1>C=/7^GY?0,?KE7J&M\.JJ#'6$7G=0RC(KK_T.2[TW;WLI9?_ (59
M>)G95?1.K]7;<^_"LHOV6>UK[+L4'!;G8SZ]SO2SJ:*-_J[/1R*'W5?J^1ZB
MY'IO1W%]3TJGW8^_*ROYW]'_
M ).R$I[+"ZM93U/J.2W"L=C8QJPV6VW45[G%SK7V?K%M=C;LS(RZJO3L_P )
M371^CN]6JNYB?6CZO74U-S,YF#EXK@+L;-L;CWLLV[-MU-KF^IO8_P#,]2E_
M^#4/JW3A=3Z%F8.469-%^1EBVATBX5777/I^VM+O7KRK:7>M[_L]M?Z/V>I6
MLW&80:L/,?;U"VO-^Q?IB!ZM-+[:6_:/8[[=^K9[K\^RW]#Z]?\ Q22G2R.L
M=/S,7;@5V/Q^FV->[.8:A50VD>KZPLRKJO6QK*&NILLQ]_ZO;:N$WY_5.O\
M5.M=18ZC%JQ6]1/3:K#:75,IIOKKMR&M]'#;E,QZO4?;^GV>M5BT?X:OJK^G
M-SJ+NEXWIYF/U9A:76B(?TRRG#>VQX87?9\RFIC:\EE5GV/,_6:?M+,FKT>7
MQK:>FLSVV7V-MLQR^VDMOLR2_(M-'V/J64S#?Z-_\YB_K%7ZU<_$R/TGZMZ*
M4^D8_P!7\.OI[<7):S*O=0[%ORGM+;'4VDOR,>NQKC?1C>]WH4-O_5_T7^B7
MCW4\)N*_'98;"UNX6.JK_FL
M^KO7\/KN*;\.B[&90?3=3>P,+=/;'INMI_ZUO]6K_"5U^Q<_^PK,?,QL#)OL
MKMV''HLK!L9?6U[7TWM99ZO[/RNG?SM]+*OLN1?]DS_4_5[?LB4[/U<+>G/?
MT:RIM%CS;E8K:F,92Z@&EKWT,H<^NG]-D-_0.]_O_P (S](M]H?6
M/*NZ)9GMLPKOAT^I]IR/0H2
MGH>KXM.5@6UVX574=HWLQ;MNUSF_1VNL;8UEG^C?_P!0LG$^K6+94YE-MN-C
MD/:[T,EUN\NM^TNWFQNSU*K?699ZE=MMOVC])V&EN[W;_3]B2G-9]7BP.J9<65?HG5EI<1
MNIN&71ZE-F_^;>SWOHR*69/VB_URS^NI=6ZF,#'K+ VS(R;6XV(QQVL=<^=@NMU]*INU[[/S_
M &>E0R[)?319S5^?C^K]MS;[J,A]#GWXUAOQ7[<=U>/]MPQ@/RK68]]F17Z>
M%UC[6.)]HJIQ[:_P!6_I%J2FS_ ,S\S.J/[;SSD%[7,-%8>:@US_4_[4VW/=:U
MGZ#U6>AZF/\ HK:;%JX73NG=(9CX>(ZRH N+:&N<\.WES[K'U/\ 4].OUK?5
M?8WT]CUGX/5;LMQQNF=:QLG*VBWT,RH&\,>'.8VQN+9@;',^E_1/4V?SG^E6
MMTNG+J;;]LJ:+W.!=>U_J>K_ "O=72ZG;_H-OIU?X/>DI__0].LP\>W*JRK&
M[[<<.%)).UI>-K[&USZ?J[/T?K;?5]+U*_H6VJ&;1B/;ONQZ\BPC8QKVM<7'
MLSWAWM1[+:ZF%]AVM$#YD[6M:/SG/<=K&J%+'EQNM$6.$-;^XW]S^O\ Z7_S
M!)3@9.1T'I?4:.EN?=AY#VB]]]!Q__:2[]"DIZ/HO3FTU
MMRK*6T6.K;5CT!H'V?&;'HX0V_G^WU,K_A_^!HQTNI]'Z&_U\_-8RASJ]F5E
M;O2W5#Z5>58"QEU&T;?3R/4K7*#ZQ#I?U@P>DG*NLRK0+\JG+M>&U-O+*\;I
MV/CA^;?D]2]-_P!"_,MH]7]-_P"%.\MIJNK].YC;&$@EKP'"6D/8=KOW7MW-
M24\T_JE+:7XG1GNQ\:7NNZOD-LLJ]7=^DK>][F9%CW3_ $AUU-%=3/3Q[_\
M1SRL/J[\3[3@^GG-=35L^R9=V+ZSB3Z]C7N=F4,8_?ZE=N^S)_[L_06GU/I^
M7?1<<>YUE[@/1ILM?12W7W;GX#:\E_L_??8K/3F9->#15E?S]; RP[S9N+?9
MZGJO:Q[_ %(]3W-24Y>;?FU8#LG)Q*<3'QVS9;=8^^]E;!_.?JS-WJZ;O7^V
M_H?Y^Q3Z#=U$AM5U+G8P8=N8_(;MNM=[=GI^E^D_G$7KUO3
MJV4',<\65O-U&QS6[36-J_)]2C&O\ 5IMH=8RG^CV^I3^L?SJ2G#^OWU-QNJ!_
M5:Z&69#*35:&LL-QU;Z63C_9GL=?DX[=S&47,M]5L9_0<_*Z-;=6:L,
M%G3*L['=C67-=999:RA_NR<1^3:]EOZ?&S/YNNJST/27J=61E6?2Q74G_A'L
M_P#1+KES_P#C!P;,CHQNKJ+VT_S[ZWEEHJ):+&M?]GR_U?\ PV5_-?HJ?^$>
MDIZ:EYMI986.K+VAQ8Z-S9$[';2YNYJY[K'_ #>P7&JZNZG-L+G8S<9KO6O?
M;Z[G48GYE_OMNLNI=^J8UF1ZV3Z/K>HB_5CKG3I]-MQ*+G8UMFT"YAG+L^UYGI_K"M9V)G8#G769?Z"NO'6G37;T+JMF-U2JQM&;E.NR>J4L8'VV/K?L^SNK;
M1E4_HLFRG+R<)O\ .?T/&QOM65>MO&ZA]24QV5=DU7MR+:K26UNQ,[(
M&W[5M_F,');L_5\3[+Z/ZK]IN@<"_'ZW9?8?2&.+\BK(LWC%-5SO4.1?M/H?
M;^F/LR:65W.J]? R?5KN_GOLZOZ!C]!J=E]'L=B.#@?08&EMVUKFTTY5MC7Y
M-[*]SG?I,IFS_!^BCLH_'?5D_S
M5O\ UK^;JR$E.#A9'7NJ=:=C_5ZQN!@85;L?(S,K;=DD6UUYF/F?L]YK=7]K
MLN]?&LL_G/T_VRO]%7A5V;^AW=89GMLR,_+P_M'V9C1:TBQU#=N7E65V78F-
ML=FNOQ?LM=7V:M^)ZE./6J/7/J]UG$LQ#0U[X8:*?V8VZ@8]0)L&/OQ;VW7N
M][]EV8^O&_X.BVVSU>BI^M'2^EX]&/U2E_1JVU[:3DMJK8_8&MH]1^KOI]$R.G66UBP/LS&UUXF/32_8R?YV^O(=1].ST;[;%J]?L
MHZGT?[9TB]V1=BVE^/D8!;>66FNS$>_8Q_Z793E/WUUO]97LW-Z-D]).1E,;
MG=.N$^F*79 ?M.[^C,KM?9L=7O\ YK]'L7/85]K9EV?Z.K*M^P5UW^G]EN^SW_;>VZ,SI%%1IZ?2['V;:R+66,L<&
M#;7^DRAZV0UK/\)OL6.6X7UCI>PY^+FYF&;*\=^-8STL@%C+:_M-7Z=S?3<[
M9=]FM_TEM?I>I]GIPZZWLN;F_LZG$S<2'5NRFE[&V-'O?0U^?BX[MK?HW/=[
M/YSU$E/HZR/K-U''P.FE^1>_&J>]C;+:@XV!FYN_9ZI6]@#"ZM[_ %L>V^C9NK=_AO\ IKE.I7=5S?K#
M]K9@Y3A@[?LE1QQ8VNT"[]*ZRW)PJFO=7;ZEWV?)?]I9;TVK^=P[TE.UE]&Z
ME_S>KZ5B^@YUD_:K;)>1O<6;2UM5F0:OZ1N#+=[WW,N]]-N13_25M=%ZGG9=#!E,I?>'
M%F1Z#@TUGW%GKXKK+_1]K=FRO+RO?_X'K)*>)^K ^ON-UFS]M8AMQM]-'Q
M,2O$K-=;[7M+MTW6/N<- (%F0^RS;[?WESW5.JV/ILZA0'#-PAL;TJYPAMI9
M?9;ZC<2[T.H77XK?2QZ?M%E55O\ W9]1:/0L+!%5?4\6O)Q?M5>N/?:]P@G<
MR<=U^3CUN:UOZ'T7?HZ/T/\ -^Q)3__1]-R\+'S&MKR6^I4T[C4Z"QQ&K"]O
MYWIO_25_\)^D0QTK":W:P65MX#:[;6 ?U178W:KSU<5*<+K=#OK'E8O2L?)RC@!H
M& &>]UP)OJR^JY65D?3PL:FO[-1[_6NLR\:_U?UO&]76Z9]4L[I>0!A58E/3
MF-$81=8XV.:YK_6R+-K:W9>YN]F9Z/JX_IUTU?HO46E]6,8/IMZLXEWV]V_&
M+GN>!CP/3=5ZI=Z5659OS*ZJ_2V46X]/I5^AZ:W$E/'5= PZ>MGK'5F4U66Y
M5EOVC)L)>Y[#NPF8E/J.QJJ<;&I;MR7_ *W^BM_0XM%JU_K!]8*>FU65TVL=
MF5U79!K)!VMHK-_Z?_1LL>:*_P#B[?T2-UWIN;GUL9A9'V5S@ZF^UI+7BBTL
M-YQ;6AWHY?Z%GHVN997_ #G\A5E?5^F_G/4KNOKM2G0Z9?F/]?'S=K[L6P5^O6"UEC7-9]K*L
M1SFEP%M3&6UXW1&6_O\ OOMJ_P ';6N@^KWUAQ;BT/^GO?;;CV_Z*W]&M;';EXKVTN;7TUY'MKK^S
M/=!,>VVQ^.YS7/\ ^ZROW4=2R.GMQ:LFO[6WVWV958+GM<#O#!@9&/\ 9;?=
M[+6?0_T:2GSG$ZMUG H^Q8F.,W##B\4^OA,>+#_A66X#W5^ZSW/JMJRO]+7?
M3=77:MKI/1*/K/T3(Z5U#*S3=2^LMKRJFUUUM8-M+:68KVUY#6M_1V7^NRVS
M9_-U5^Q)O3NM4V/IR,;.JV$_I#G5V4V"?:YK\W'R]OT?8Q]WK_Z1/3CUX.6<
MNQK<;,8/T63]HP&WAKAL_ZL8E?[.L:WTQ5A5L:"UH;_2QU
M+I6=E^HYC;OM#:,BG]+_ #URVLWKO3NH8CL3I&?BYN8\MG%9?5ZME8<#DUU-
M+MOK64"WT_4;Z/\ I-E:R[>G=5Z7F_\ .(5MHK>U@S,.B[5Q=--5V;ZM8ISK
ML2S(?;D9'VO%_0[/^X/ZXE.-]@^NC[+7M;G=/ORK,+#S,>JYY>6UAXI:'NF,?]5PO3;7]'8QM:2G
MTOI?UOP>HYK\)^/=@V5L#R[*=0UI+C KJ]+)NLM?H_Z%>QG^$^G5ZF\O(Z>I
MU9+VLOZG>RQP ;ZV\ZGW;1]IP
MG17E8N'2W>[Z+/49_-_SG^D24][EY+<7%MR'"14TN@D-&G[UC]K*V_RW^QBY
M3)^VW]1LZ34VO*^V8[,NO*%CR[>QXMJO-S7W?8L>W]9KPW48GZ)_]A'K^LF-
MUK&;5F8K:>EY8JJMR76UO:+[BUV/@^BYCZ\BSZ#,NO\ 25T^IZ=M=M7VCT2=
M0S,*FBG QL@]2#_4M=B_::2_(WNW5XS[AV2,''PK>HY%E%5-^9DT79=65Z0W>ICXKK,6ES*KV5O=G7?9OM'\[5
MZG\ZNZPZVV!N'AS( E^W[-8Y_H.W6.W_P"$_P!)_-K)'7>F9H#,
MU^)32RPL>ZVYA:_:&[OLPR:6?:<9SW>CZS?26UC9>)EUFS$OKR*P=I?4\/$C
M\W8E3^CL8OGM))3]4CC3A+5?*R22GZI3KY5224_522^54
MDE/U4DOE5))3]5)M5\K))*?JI5,G"PK;O6O<\/+0V/6L8V!N_P $VQM6[W_3
MV+Y@224_3+<;I#L*PU/K;A;7B[TWCT=L?IO5:/T'T?YWU%C].^K7U?8PNP.J
M7OQW:L93DL]-HG\PT-;N:V?\(^Q?/R22GZ1HZ)BUV@X_4""VQ;'3\;$Q<1E&$2ZAD[";'6G4R[]-<^VQ_^>OEY))3]
M4IU\JI)*?J3+^R_9K?MGI_9=I];UH]/9'O\ 5]3V>GM^EO6%L_Q>NQ2!^R/L
MQK<#M..&>GO&_5GM]/UMO_75\\))*?H*CZO?4=Q<_%M;!B?1S[@W^3[:LK8@
M9'U5^JI86W]5N;26D;7Y;"-IF?TENZW_ ,%7@B22GVNKZL_XK _]'FXCG-'
MS6S&@9NV7-W-^@MCI^!]36M%.)DX+VMK:"*74!Y8/1V;LBH_:MG]#_PW_<=?
M/B22GZ5P?^:VVO\ 9WV';IZ7H>E$2W;Z?I?R_3V[?^#6H-OYL?)?*R22G__9
M_^UFL%!H;W1O'1)D%L:6=N96YU;0 ]%4VQI8V5(;W)Z06QI9VX '9&5F
M875L= EV97)T06QI9VYE;G5M #T53;&EC959E7!E96YU;0 !%%4VQI8V5"1T-O;&]R5'EP
M90 !.;VYE "71O<$]U='-E=&QO;F< "FQE9G1/=71S971L
M;VYG QB;W1T;VU/=71S971L;VYG MR:6=H=$]U='-E
M=&QO;F< #A"24T$$0 0$ .$))3004 $ 3A"24T$
M# !A=0 $ $ MP P B4 !A60 8 '_V/_@ !!*1DE&
M $" 0!( $@ /_M Q!9&]B95]#30 #_^X #D%D;V)E &2 ?_; (0
M# @(" D(# D)#!$+"@L1%0\,# \5&!,3%1,3&!$,# P,# P1# P,# P,# P,
M# P,# P,# P,# P,# P,# P,# $-"PL-#@T0#@X0% X.#A04#@X.#A01# P,
M# P1$0P,# P,#!$,# P,# P,# P,# P,# P,# P,# P,# P,# P,_\ $0@
MMP$ P$B (1 0,1 ?_= 0 $/_$ 3\ $% 0$! 0$! , 0($
M!08'" D*"P$ 04! 0$! 0$ 0 " P0%!@<("0H+$ !! $# @0"
M!0<&" 4###,! (1 P0A$C$%05%A$R)Q@3(&%)&AL4(C)!52P6(S-'*"T4,'
M)9)3\.'Q8W,U%J*R@R9$DU1D1<*C=#87TE7B9?*SA,/3=>/S1B>4I(6TE<34
MY/2EM<75Y?569G:&EJ:VQM;F]C='5V=WAY>GM\?7Y_<1 (" 0($! ,$!08'
M!P8%-0$ A$#(3$2!$%187$B$P4R@9$4H;%"(\%2T? S)&+A7U5F9VAI:FML;6YO8G-T=79W>'EZ>WQ__: P# 0 "$0,1 #\ ]38QK&-8
MQH8QH 8UH@ #AL!57]294'G(HOJV$B16ZT$?Z1KL47^S^OL?_I%<3.,-)\ D
MI$W*I<^IM;A8+PYS'L@MVMC<_>#]'W,59F=
MDIEB?6C-NKW6X#*WS$#*QW2-/=_/>QV[_!^]6F]9S'#7&K8?!V143_5]KC[E
M1+:P\M<7$,)8]CKVOVO'+/TV,7;V_P#!O1?3P2)] ./))JG3_P!A4E-I_5__ (I#
M?CXS&^W':/-E#7'Y;<= Z?5CG(#;7MP7B]@I8VHXYL.MK:_M&&_&;D>HUGZ;
M&_24_P"#OKM24]'5DBS(MQBPM?2UCG'3:?4W?0/TG;?3_<3MS,1V4[#;:QV2
MQN]]((+FMF-SVCZ'/YRJ]/R*\K-RZ/]&]U>^K]^M8
MG2GLJS1U&WTJ\=F1D8MV8'&H6/)KKJLLK<[8YCK*G4_I?4>_(]/T_P!&ROU4
MIZD65FPUAP-C0'.9/N#72&N+?W7;'J2Y/ZN]3KRNK9'4/18*>IO=]GRJWAY<
M&E^/15DLC]#NIZ<]^/Z#[*/YSU?T^0NL24T^I=4Q^FMI=>U[O7<]C P ZUTW
MYSMVYS?\#B6_]<5?J'U@Q.G.P&7U7.=U%[:ZQ4S?LW&MF^^'>UGJ7U5_H_45
M'ZXNVMZ:[L+\C\<#J+!_TG*QELV9'36B1MJ#1_V_T_\ \BDIURQC7L<',< YKFF00=0YI"H]9&ZK%83 =EXY_S
M+&W?^BUGOZCD]/Z.V W%JPJ@R^^QEEYK%=(OW_8\0;O3]/\ T^1C?^>TE/0+
M/'7.G/O^SXUAR[H)VX['6M$';#[ZQ]FJ]W^FNK6+GM+<:UQP\KK^=2UKA7DG
M;CN>3CL;^@K;]@:YM>4[(]F-9=^@O]_T%M8'4:;3]DQZS8<4MHR'U-#*:K P
M/](;G_F-+/9C_:/224W;+:JF[[7MK:2UNYQ &YY%=;=?SGV.:QBJV]4J+Q3A
M#[;D.:+-E3AM:QPW56WW?0JJM_P7T[;O\#5;Z=JGF&FRRC$OHLM;:\6![6DL
M8ZDMR:G6V CT_P!+6STOY:P'XO7>BWYMV XY.-:UYIILJWO?EV>K9CN8W 97
MLQ:]V)A6V9KV?H:/YW%QZ*_72GIV%Q:"X;7$#@7"BL7D.N#&BQPX+H]Y']I1Q*/L^.RK26C6.))W._Z124O7
MDTV5"UKO87%@)!;[@[TML/#7?SGM155HI;;C;'DP+7/T,&6VFUO_ $FI\[/Q
ML"D6WN,O<*Z:VZOLL=.RBAG^$M?M_P#1C_T;$E-E9XZYT^QQ;B.?FN:)G&8Z
MUFFFS[2P?9&V?\&^_>LRW ZOU?(?7U-K\;'LHWTTL-;\>EY=LV90-F[J6=Z?
MZ79;C?L?&_1^S-M_3V;U>+CUO%K*VBT5BH6!H#MC=6URT#V-66"'#^M])O^:B)))*4DH6755 .M>VL.[\^Q[MC&JCF
M==P,2QE;BZS>&'?6-S&^I=7@U[[)V-_3W?V&57)*?__0],R\^G"-;L@%E#R6
MNR#'IUF)9Z[Y_1ML^BVS^;W^S_"5JQH1X@K*ZUD]*Q6NRO3ML;=0ZRWZ%E7_ !7IV*DRO+Q&LNP[/2H?MM-F(PY&(^LS9N_9N[[5
MB>ON=Z?[.MMK]3]-D>HDILMW,Z[TRBIY;4WI^3NI#B&^VSI[,=[JIVO]-KKV
M,_KH7U>P#TVG-LOH=5:0UQ>X-)]-E>WTFW!UC[&^LV_(V?S=7VG]&C4W8AL'
M4197%>-<*LASAZ8K]7W.>_Z/I_HJ=ZK=-%QZ/GM=FU9VI^S^=_F]BECT8#.I8.1<;V9-=
MW4!06U[J7"[(?O9?=Z5GH[G%CZ?TU&_^6LCZT8CZ\+]4>]CSA9(VLZJ[&?6RNUIXL8_&O;ZC/\
MC5G"^Y[]T]5-;C[&^@6D _F/<1ZGM_J+H,/[(,=C,,L./5-3!606CTR:7U^W
M\ZI['5O_ ):KYK+79##ZA# T[6MKM<9_.+GT75U_V'UI*<^:@)C-:0.7#(G_
M *&/8U6&=.?E^GD"VVM^.XF@V%MC3I_.>WT[=OYCZW^E9^^F>^UGT:[[ .7,
M99Q_4?E-L_Z"TZZQ6.22[DESCKY;W/VI*F7X-UAJ?CW/KQ,B#!97^C99Z9M?;8US764Y'KV_I?TOI^G3Z2J]+ZE
MT6OJ-S[^H449-5F;0<9]C 8^U.O=:[>6OK=[V^S^V@Y/5;:<_*R.E=3Q;&![
M2,++N8VITM#K6]/NKM8YGJO=OL?D59-7K_S/^'K8E+]*#L;+Q>DYEK7WE_V[
M R&6M-5H9OQ,C&QZBQFUF+@O8[T/TOI[]]5GZ']'O]-ZBS..6U@ ^QY#\5VT
MN.K Q^N^NK:[;;^;ZC/^%L61=F8EV+Z3V8632XV/(?D5,MJ#C]H;[0,BC=0_
MZ5M>3].BN_\ XO5Z'C,QNE8S&VC)+V"Q^2UP?ZKG^]U_KM;7]H]2?Y_9^E24
MU/K)19D8Q:QN]]=&596V)=N]!^.WTF_O_K.SVI\RVFS)Z:YCO:^L65F(EOK8
M(X_-_G:UDY/UDR77X>1<\X=>91NQL6AC;PQE-KJNR7,#GV655-#02*Z_6M]2RME=+/YO]%6A=,P.M,S6Y>?
MEUN'V=E3\.D/%3'[K;GNI;O:SV^I3BLMLI]5].)_@_65/J#\1V7DTW68MC:\
MCUC6X.RK9LQ_L1J_9N,6V.C]E]7U7[\5E7^'_ $B%]FLM80,7/Z@ZMD-=:]F#
M0^2YP9912<2QS&;MK?7PKMG_ !B!TUS\?/Z;Z/2\7H_VC(MQ\RFIK'.?^J'/
MJXU!V2[;/T1;<,*MC_P [
M^BW*Q@5%G4,Z"Z);M:[4#=NM.TGW?SC[%3MR\^MMM^7;B]/UG
M_%H'1K,RSI>,_.L;=E.8#;8QNQI)U]K%%W5,-Y.*VWU,@A[3L8XM#F>HU^YX
M#ZZ??3=L]2SW^E9_HU:QP!66C0-0<0DIQ<>_K#[K\,9N(V^HNO.-C5NM
MM%+WOV5_:;[J<9E_J,MHWVXWYG\VBLZ"W*=7?U%HL-N*['RZKOTMI-NWU&LR
MV&JNBK;ZE=].'C459'_6V*GC'K3<+JHP&6G(L=DC"<35]G98U^1Z=N1:DIVAZ%%0:W9536 QH$-:T#V,8/S6_NJEUS/R,#"%V.&%SGAA
MWNAT$._HU.GVO+>X-KQ\3U*?5>_^<_,6.WIO0D
M]F*YI]KJ+JLC+Z3[][/7]7'?;7_@[%H=1ZEU/'R6N]/$Q>GUW5LLRO\ 1>C^F5;(Q,C(P,FS.ZG;AMI-;^J?JF;CO^T)9&#T?(OS'/=DYEV!6&WCTGVV%HL=GVX=5CZ_3R&WM>
MRCT*?TGI^GZ:TG8M;W46U=-98,S<ZST*:WT,=L_0U
M)*:=.#3^SG.P"_JF5B9CW@Y#_3WWL#L$-R;G5_I/L%!8SU6,]3U,-G^'5[HO
M1.VNG&IH?6TTL=5J32QS_L_JV.:QS[K&'ULG_NS99_._SJK6]6RZGW4^
MOT^NRJ]WL%C[+!00YS7OQJVUV?;-Q9^A^@__ $JT.G-::[;VW7W-R;#:T9#2
MPU@AK1134ZJA]=#-GL]1N_\ X1)3_]'K?K9T?)RKQ?7#\?,I9T[)8SVVUNLO
MK.'GU6#Z7[/NL?D>E^C4?2-/5,+K^9D^EA8U-C+:W/94*!8RL4V9OOKK?397
M55LQ:Z/U?-RO\+3_ #&QU]]M737Y%=9N%#FV6TP#NK!_2GW%O\PW]9]GZ3]
MLVCZJX/2,O)S,&BFK&.#Z(#6%U_JM>_(?;ZON==ZOZ'Z7Z3]6H]-)3H"^BO)
MJ:PB+&66MVCVE@M#W6#9^_ZC?ZZK=+II9]7LG[-C'%IR/7NKK(K:Z+MU@W-Q
M7W5>S?Z/T_4V5^]5NHY6+@VVWO C"Z?DO%8]C?39:VMS6Z/;6W:W9]"Q/TG(
M&#]7KJ[,=U%.._TZC )L-C_3W[?2Q_TGVA[JW,LIKR/^Y%?K)*9D=,^UX+KUFT;=NYIQLQA,2
M6T55A3Q#@##^KWVBBZZYS&V565-+V-+A5O\ M;_]!Z]U%[=W_:BBB[_ I\^U
MU=&6[_!UXG4'NUTW U>G_P!%EJ2D7U,J-M_4.H[KJA>]K78K[++*][65MNRF
M_:'V/H?8*V@^J
M"ZS6 QM%.+JQG_"V9C%N6,%C=I) \6DM/^+3_VIN_X"C+NH2G(=3EX>678]-=N0ZS*M%;*VUE[++<2O;;ZCV-NL
M978V[>_(H^T_9J:_T2#1=];*+166!]-ECF_:,BOU;MWLCT*.G?J>+BL]]+*\
MO+_G?T]F5Z?T]'"K)ZA70^QU]F-4YK[K8WO_ $F/8Q]GI-KKW;:_S:V?S:J=
M9ZMGU=7KZ7C!U..6 A]$?:'Y#Q==14SUJ,C%^SN^RV>O_P!J/\-_1*J_P!+^;]:VLW7NI_5
MY[JNF9N0ZS)LL_18N+ZEMOJ-:Y[?4QL06[V,_G=F74_&WU^K8S]$DIYW#ZIT
MS&9TS&NZ>]O5[Z,7'.-DAWJL&&'74Y-U-OI8E%--E5^35;]I]:QG^#_GJZNB
MQ69N9<&WY(J=CN+78S [86@FMVS9]EW/_1_X3[911_PC_>L/+^L?3NH9/2>G
M].IMJIHRV-Q+KP*ZLJH5W=/O'3;K+-^3Z%65ZN_^1Z?\_;17=T."&G/=N.YS
M7W%GD/6RM_\ Y]K:DIQ,2CI...HW?6"]^7Z&2<5S+F-9CN;35^T*_0Z=B,:R
MW9C7[?T_VJZRRG]!_/>FM2WKF+C4FCH.,S*ZR[
M%;90Y^.RKU/TU7I*%V/<7EC*:F6MQJF,QOS&>F_(R?
MT-B?&S[;P:KL@X50G9Z1Q*PVNHNK>S;]HZG9['5OHLV>EZ;Z_P#!)*9-N^MF
M3D4FNK'Q\6NYWJFP.#K:03L@78V7E^F[/;CVFK(8X67N;966L=6V
MK(+O3]/?^DV[*?\ "V(=6)BYC@SI^&,3$QK6O>XTAE5Q#J[7_9:Z[:7.>UV-
M6S[3=C^A9_@?624N[(P<^SJ6-C9;7.N:UA?0386QNJL]M!_P;F['_P#;=BSG
MX72*\FROT\AV-EL#'UEQKLK?4W_M[]&L'"^KWU@ZMTBF
M[/ZSD=,LO:V^O#Z
MW*>QWZ6PMW#=OVL;D/+F;&OL?^@IN_1;[/T:M=.LZO=3-]5>$]MI]2EP=:2W
M=ZCRRUKZ:OTU;OT;F>NRG_"?I*;:5S^'U7KO1OK,.C=1R']6P;F4MHR2*F6,
MLMQM-UUWZ2Y_V;]873_M/'<'&NN^S:YS/;39!ED>G=O]
M:]%OZUDN=?3CMJ98REKF279-C+W;IQ\O#Z>VWTV,V_SKQGZ94&GH6+E?:>JXN?
M@1DG*93E-=;C-R'#^E_:<$Y>+W_1?;,O]7_P-=/HU>ET'VC%ZQ@6?LOJ#2UQ
MV#+Q'UV[7-VO
M+\FS,8[_ +96/E_5_JMSO1:^FZAES'-=G.LRP^J&^OZ^/=^B;?O]7TV8WV>J
MO]%^D^FM9E^#T;%95G]0 U>[ULRUK7.+W.M<-UA9[*]_IU,_P=6RM S/K!T4
MX]E0SBWU6.:V[&!LSZ;/:])3J54U4LV4L;6SG:P!H^YJSK/.3--0KVXSA9['5NL>ZS'LHR,=K'9#;?3O]:G)]5E>S^:_1K,Z9E=
M&Z9DNN&==8+:FM]!F/;#S.]N;DCTKKKL^W_"96^OUZ_IU?HZUO8/4L;/:YV.
M+0&1/K4VT'68+6Y5=+GM]OYB2G__TNS^M&;AAXQ&TU6]7KK;?@'(FMGNL]&V
MNC/8ZMV)DV,9L9^FIWO?3_.^]/TB^VV[(P\/-MWX^XBG+=7DAK"^RFO<]CJ.
MH^IOH?O9EWV65_S>]6NK=*S,N]]N,^F'TM867-)!?6Y]U._;]*OU7L_XO^<_
M2_S*SKK\SHC;,BO%OO96UAL?8'Y5@K.7Z>4VO)]2W)L;7A/^T8U'\VQGZ>[_
M S$E)^HXEU5E61=CAI/ZLW] _9_-K'^L-[*L+):?I
M9.)E-:WQ#Z;UU-UKW#!]*NOT;'[
M[K=]57Y_IJAUSJ6&/JQFC-;]ER+\2YN.RTL>XQC"#1=C?::+67.V?GU^I_X&
MDIU<;'#/K$+]-UM66=)X:_IV.W=_*VXRVUS_ $O(#^JXK7F'/P[G,W#:YTWU
MNL]G\AAI=9M_TE:Z!)2EAY[/LO6L?*K;9Z>1:UF4*-TO>]C\?&?D;!M^SUM'
MTK;*ZZ;/^&M6XL//MI?FWLRRJREU53J:6[K/L^2W^DVW7_H/YI5^KY&/U$NJQK/6QLC
M)IQYAP(#LS!LRZ+=^VSZ3LC]&_\ P-O^C6N>KX73\#+S,G.JPF9%Y;BV72]C
M=E=..T>F'L?97NJWO_25_P XDI?!K&%B,R;K_L73L02^EU1Q0W:[)/I>A7^A
M;7^LX_NI]3[0_&_PGJ+GOJM?T[ZJ]!R>N]0@T9N4!7:V+KW[W,IOO^T;F_:*
M+;F/R&5TU_T:KU/UFU6^M=B]P]/>W+
M_P #ZGKUI*<#K?4?JY9T#U\3&=5F_6-A;T]K:BRU]WT\4O>S^CM^TMJMW;_^
M['[]BZ/IF)=0YC]WJ64O]1N1DLVX#,K9]NQ_L]/IY%WVO\ 2XWZ&_B=
M?ZY8['KQNG,LHVL80^QS'N$BIV6QQJ]V.S=6_=]G])]5GJ?:/\"DIED?LKIE
MO6.N77/RQD,KJ%>UT@NW5-Q,/(_[MVFBKT\?TV5>E2^[W_IEF=$9]8^I8%F5
MTK[%7TS/)%U&4U]A>X$8V593E>IENR?T3'5?:\ZK];LI_P"3Z\>SU+7^M76,
MW,OQ.A-QZ*MZ&/?^AL
MNU.GXO5^@-P^C=.PZ[ND8M8=?U'(O;6[W6;\AM>-55]-C;++F;_3I_P?JU_X
M1*<_I?6>K='ZV_HO5:JF8U@K^QFLL(:;WOJQG_J]&([T+LAGV3)>[%_09EN+
M_@^QC[G"RX!U;?4V"N<'_JUA]8];JN93DONQ,&V
MG/LQ.E9@)-@WTO1R+:/49Z-GZ:N[&_FOYRPN-E9K>I,Q6/IQ[
M*;[+;[GM]>O])4ZUK=M-]'V;'MQF>O7F6O\ YVST?1_G4E.[UC*.+TU]658+
M+LDBEHJ8\.+;',H?Z5=3[+=S?6VUO]5GZ?T:_4K]18_2.DU]8Z"QE?4.J8KF
MWOM^TLNNJL!<=S\-K\QOJY=&*W;B^OD4?I+*?4K_ ,)4J#;NI]0%_5#0++;3
M3979?D?X/WF?@V-97
M;G_6/(VMM%?L.+CUNMGT_L_LQ_5WN?[/1^T;]ZP\3%P^E78IR;17T_)-]KPZ
MLVNM<+!G459=3V6W7>IZN?DXF1Z==]>-B,_PGT-1M71,1HK=U*ISLNQVX_9[*V,KM
MKS#]-S&UV-9;=[[-_P#WRM;V1FXN,6BZP->\PQG+W$]JZFS99_8:DI,[03,1
MJL?/OZ>,>^[$P1U')S*JS930UC++:K!9]F?E66&O]7]EWOL^A^D].K\Q7L?J
M5.1>,?T[*GOK-M0N;L+V-=Z=KF5O/K-]%SZO5]6NO^?I65]6'6/%%MD%SNEX
M&HTG7+UVI*0X^97AES*^F]/P'- =%MEF,"9]GZ2WIE3'<_X/U%I#K+J7V4YU
M(KOK%#B*7FUD95KL/'_2V5XO^%9^D_1_S:NV6N=D-QF-#@6E]Q=P&&6L$?G/
MM?\ ]"NU<_U>BNC+S**:Q54W
MV^WW*NVPOR<_#88?=DAA(F6L^SXC[[-T>WVOV,_X6RI:&+?BY%#;<2QEM&K6
M/J(X.I]HK#:G@[BV=HRJ;]MO[O
MI>EZB'9T5X &-J_(!]&SUZZIC7O/J/[>7Y#YH
M8PG^;]"VMFS;]#UK,NWU/S_\&DIHMPKQ8VUC*[#J7UFME#7!P_P&6[HE.Q^W
M^:W9#/\ CZUL_5>RX=.#OT=M;,>MM-]'\Q8*S=2P5.=9=9N9755ZWOL9O_F;
M;:U6R?J_C8&/]IH< T[6N93D6X1?O+:FMHMHRJ,9M[GO9Z/JU_I[/3IWU?SB
MO]0]/ICL445W7#,>S"< ][Q56X/<[+&UYS,K)/TK<@.Z:^S)=L?8W]:9^D9O^A7_ *)=:N;P'YO[7Q!EV-M)=F"G
MTFAM;*0,;TL>K;_.>C_-VOM_2?:/5_P:Z1)2EA=:^KWVWJ5/4ZF5V6U5&I]=
MAVDAI=;5Z-K6N?6Y_J7T.][/Y^C/]]_3L:M;J22GC6'%PFTY74#:7/&)54[^
M=%Q_1W5Y=GJ^F[[=Z'3?TKZK;7XO_=C]'8AV8-O2L_#=AWO/[08ZAGKL]6^L
MX[+LK]29=7B4X?J?IJ;?4;51_-7;Z/35[H5?[2S)99Z/Z?\ 2U)3EY%>+1]LP^H93ZL#JE3_ +5U&QKR
MY@R!]GQF.ZK]G/3[Z+*O28[W8WV7TJ<=^;G?HU&GH!Z/4S#M8\M?[6 ,KRL6
MYC&._1.QF?8.I6VNJ9_1K(R[-GI=S8&FMS7-#@X06G@SIM\MRHW9)QZ=;+_2=5N=&_J-5>7DX_P!#%QZMWH=-P/TEN)^L]3_5
MOT--1O4;>A]/P:^G@]-QO4;9DX_I#U7593QC8ME[K*++L.C _5\3[7E8WVKJ
M-F-9^AN]+U,A*;O2L1N1TC(^K?4\>[!R,PWW=/9F-KLV.'T37G4C9G9E-W^4
M?4M9]JV7?]JOLUV0LG'^L^5]CK^K?7:,K'SF97IM-+FUL=6W](_%NMM?;]I8
MQCV_JU3?UW#?B_9_Z15ZG3X/23ONZE5;C
M[MF^[+J^G=5]AQ/TM=E1N-]9KLJN_)QK'''IFN^IV.^QEAVRW&9DFG$MS;J7
M>AD=4NH95L_5<+%HKLOS,I*:G4L'+;T:G$OQ&U-OK^Q]/&29%63D;?\ *74'
MT-R*.E>C>QM73J<*Z_\ 6,GTZ_1_P!L+,R,IY-C0S(Z:^JFZW,#1#J&.];(S
M+F.:[-?@-R++:W^ECXF1=F]/R:?05YN%B9;CCY&)UBS&RJ8RC??9Z7Z7=795
M=3]K];>W^;M9AT?9O^M?I%E?5ZG[3D]7R<%PH9?G5NJ#PY[FN%;C>[U,;.]+"M_H]"2G=SOJZ6D5X3F,Z7;8+,K!\NIQ\.+HJ! #:ANV>E6';
MZ]H_FFL24\W?@V9=]F5FW5#J&56[#-F*-GI8^YCLG'JLTR,BVNZMC/5R7_S_
M *GHXF(SU:LNWT%ME?6LVK'#JL&W%QLDXY=N95D6.R&7>D[_ +M54U95O^%L
MLM^TY'I79"NYEV":ZYWZ%];JV^KZU7Z!GHX.)Z7H?H4IN
M?5^QQLRJ=[G5T-QF4M#N],5
MVWVV%SF-]-C?6R!U#'?
MZANPLO'#P3$MMPK?1?4[^:OKVV^HS:RW_!W('U:K.W'J<"&GI.$':P>"2G!ZK=U2ZJ['%6-8PYSJ,FJ^QU9MM_0OK?[&6
MXSF>@_'9_P #CT9-O]+NV8.B[.LZC]KNMP[<%U6$=M-QK,^G:[>ZOT++/:U]
M6S]+Z-G_ :CFC[1G78^$US\W#R'>LU@?!%SL;,9NM96]K=]./72_?9C_P"$
MV6V?I*D?+8*NG91>US=V%U.QXVKT; 2PO]'%?ZKWLVV^EL?^FQ?^U7HTU^M55ZWJ6^CUU,9:*+O5JK=Z
M #2W8'U2VXLK9_,_I2ZJRO\ X'U/^$>V%?C'.ZG1ZK67?:&DMW .AV/BAKVM
M*I]+P,0=39DU4-#J<9M?VAH[MBA]+[F_SCV.K?O8])3_ /_4])ZE>VFFH%S0
MZV^FIH=W+GMW-;'Y_I[WK*Q<[*N^MMH.0W[!Z-N-1C20XW4'&MR+_2^B[;]J
M?3ZW_!U_Z3U+3?6FRRK%P[*6[[VYE3<=NWM;[_ .;K
M6/F8^9]7>I.RL.VO)SNHGUE=D
M^E7;7_-5I*>DBS]K7^G#7'&I]S@2/YS([ M_ZI9G6>GV=6ZCC]/R;V;*&_:F
M,;6[^<&ZNN_VY++-]#OYG_![_P!]6*,NSJ+SF=,<*GY>#19COR*W%K0Y]KMU
MM375.=[7?1]7W_OJ#.B];&6S-?GX]F577Z(L?C6GV.VFV&,SZJ?4N?6Q[OT/
MI_Z.M)3SO1>F-ZJV_+R;2S%QGXU.#C -:RIMS<;,>S:T^G9CL=F/J93_ $9_
M\W^E^Q=/^S=._.=6,.[)#WAV':^X55OL>73BM/IX]#;+7>ZQWL:Q61T[)-)J
M?FO;/^BJI:T&=VYC+:LC\[W^_>IY3'4U_: \.NIIL:Q]G=VT/G:S8WW>EOMV
M)*>6Z!ET9/UA'HVW"NEF3EW,RF.J-?J&FJMF-3;Z;JL6ZIWVM^^EEGJ_IK;K
MOM/L[&V^NJL6.,M):T%HG5[FULX_E/7+=*SLJK/-N0XY7MR[;'$-:[:3TBQV
MS8[PL
MKZS9'I=+..UXK?U"VK!8]P=M'VA[:+';J_H.;2ZWTO=7^F].O?[U9??8S.>U
MK=Y<*6-$Q$FY]KMT'Z%3=_\ +1GMQL_'NHM9ZF/9OHM8\>UXUJM;!_,^G6DI
MX[KV5E8?U:/7.F-!QL6YMVP%S7&JE[?L_I_9[/2]*V]G^4_5_GL5]G_<7%J3
M=*QZIHRI?:3;7;N# ZZZ]^RUKK6/;L^V9?I^O?N9_D[IM7VG]!^H96%H=(S\
MK%J'3,G&-^5CL91G8P&[U; &^MG8N2[]7RF9?KU9&15E6X^30RSUT%C'.<-@ ];;C_J7VO91DUTY/ZO9Z/H?S\/K7UMO6GY
M?U?HP";,6[;G7WN]-M=##3D>K66?I/5S6[F8FW^:[&OOLSI<;-]OVVBS ]1OZ2K[79]#8LGK>7BXG7LGK+:3H'9&+
M6R]V.P6MKL:7M+<"C'CT\7[=6/L./[?7_P /1@5^K;;D;^":^G6Y-5N1;;7=
MD/LK=K932T-K91T_$J976SW?S[W[UBWWUNQ:;W"UK*L[#LMKOHNH)
M:+?3%OZXVM[_ -:NKMV;\BWV,MLWY5MB;$'2W9-[SU(.9<\YF7=?D;HQZK=K
MZ<5MK]E'3[,VO]9]!GV;_M-]HLJIQO62GJ,+#IQ6W.J=8_[3:[(>ZU[[#N?'
MMK]4N]*EC&LKJIK_ $5:X[ZFULQK+7D]+Z1<^[J%YOL99:\VLINLWO:VU[_5=74RW
M_!5TW^A_AZ_?^DJ?5[%IPJVXSX+,9UEN1=:/2)L:7,KR+*['VV_S==EGZ:S]
M*_[1G?\ =CLH9E78UM5[YOI^G[-^
M,RO_ #_ -(E-3Z^YM>%]5MUMP.26!H!<#]DR
MF,6L]UKZZ??[/TRLX&(W#ZA3@8^8?LV#A5ULP"6R!N=73DNAC;'-].GT/
MYS_!?O\ J>HE(<-M=74*+W$"NSI[]SAQMJL8_P#Z+C_ +8Z;TWIUOJ8
M[*<.FG+]-[1:*[*-[7NHN;97L9E8]3:;MEE_VEEOI^EZ/JK19CNM&'BM(#K>
MF7L!/ )^R-&G]M#Z&7795#WW[*SCU7TX0#MX/HU4V.OR-SO6JK]7]$Q[/Y[U
M;$E+78%> _&QV6WVMJNQ"YUKI:&FQ]&,RFE@KQL?TFM]']7IJ]7]']H]:[](
MIX^+6^NQF1956S)+J,5D%Q%E%V=<[VN.RRMM.W]'_P %:E]8:,MK[C[?9^G35 .ZATVV8>W)ZC7 T!K+[MVGM_/IH24M
M=T:P8[KKKNG!D-<+?L(&O^#=_2CN_=_\]H1Z.*JJ\*DOQJ/V?FL^S -(:;7X
MYV^]V4[V^_\ [46,_P!%^C6CUEV<;:*L1C9W!S;+1OJ]3GX_4K,OUF5F?L]K3977=
M]+'I9_AFV?Z):_3NEU8#K"QM7OB'5TLJ=_*#W4AK;&_V%G_5I[C#;&EEPP&N#'7.L<';Z\UKZZ/^L5^DS]*MC/Z=C7]
M,.+>;',J8"RW<3I798LC PJVYG3&9+2U[,HVRNO\ 6&8]=/H5?9_T/I_024W.G8/V?*9B9#S==7A5BRX2
M-S]]CKK1[M]>^YV]C=WZ-#'0L.WJMTVY0V4UAFW*R&[9?87;'"__ FSW_\
M!K1:T'K#WSJW&8(\G/L_\@G:^MG5'L<0U]M+#6"8+MCK?5],?G>GOK]3_C*T
ME.1C_5]F33;D_9MX9Z[*;I8;\DUM<[+IR+&O97LJ]6I]3[:Z_P!,M+#P
MZJ^E.PZ*FX[!ZU;6, :T2ZQF^/\ A/YQ$PG--UK9!^IW_#
MK#P:G3TG'JV^M9CLN_2AP9:14UGI[JO?BV5MZ=CV5W[/T/\ PJV?7IQKG59#
M]V5MW6T8QLN>X.^F[[)2S]6_2NK_ %MC*O5?^E_1)*279%3K3EUD6"@/R*X,
M!Q%+&UMW?NO;EI5YHQ&>DUS?2QX8^QQ.T,J@95[C&YUK[GNH97_A+:_^,5%V
M/>!C,9T_/M93Z8LL<[%FUM9;93O:_,Q]EC+J:-[_ $/TE;/1L9_HQ8X:WJ#<
M5K+:\QP9Z56?M!<^MKGV9WJUN=1GLQM_K_9<&[^GYM]N7]F_0Y&*E)NH44Y>
M6[%IL?AYMN5]IQ,QH$UVUXM%3WNJM&RWU,2ZVGT;Z_3V>K_A/34NC58G4+B^
MEK?V?T]C<3#:27N>PBJ]]MUCOS;]F,_TM[[+:ZJDJ/UDISOVA4?395
M5D9[**GVEKA;6["R?M'Z%A;8_P#2AE3<5SOUFRGT_P"9N5C ZAB],M+[[&UX
MYJ>707$ 5,LS+-FUGZS8]GKY+[?_ $,_[T\3'K2GIER_2>KU9^%9AL:YMF\Y
M&2W1[F'-MOS<7#K$>E9EMII6M7+RJ,W#S,*F[[-DV8[_<
M_3TW.9#G.>/;^K;Z_7V._1?H_P!]9XR:[^DX61C!M3W)I?0\/%]U+756;L
M.]CL2BZ^RZ]^;F>O]KLQOVAZ?J59'I>CD7U[39D=/RF.>VVU[6?9\:RMIBV]
MSRG&Q?MNM@=$Q.F79.1C,>,/"9OQ,
M)C1+;W5?K637ZG\]E7TNKIK]7^;WY?\ W*N24U1T?H%O5NH=&?CM9BG!IL91
M675LW-?DUYMM-5.RJIS=^$U_IL9_X&N7RFGI5EV+D8WZI@85^/B.#K#D56UT
MU.VV7.LLKMQ\NSJ&'95A[/0]3*I_1_J#]_7]$QW9%^=N:JN;];>J99PLC9C-/Z>UGND76,O8ZOU&?S[,#H.
M+7M_FJS'MN)J;O97CX
M]]E__6_\']-8O0:7,ONZ0X'T<7(O9AR 7-Q:?2J;?=9/Z5U;MN#@OM=O_0>I
MZ7^3[5MTX^%C&KZOW[LFJ["]$.NVG?53^@?7?L;6SU+*K_W/?LM6%T2N^W Q
M\*FDY S7^IE9&3N>'4,M/HUY'J0Z_9A,KI?[-F1=97^EL_6KDE.C?F8G3NIY
M.'8/1=G6T-QG #:TV4OW6,T_1[&]*=_UVNC]]6MD/D!N/0
M [[-5L=MNL=LK].NBFGZ?\YZ25C3F/R[0STF^NW&N=88W45-FU]3F_\ "6V_
MG_S>]3PW_;'- :-C[/M%ATU:P^GC,V[?S;:OT5G^&^Q^K_A$E-J[[,_+P79#
M"W)][J&ZDM=Z<6[C7^C_ )MSV_I/8K08/5=9N)) ;MG01)]K?Y6[W+-ZK6U_
M4>G-?N]/(^T8KMI+'#U*CD;J[:RRVFS;B/\ TM3_ %$.QF;TJNRVG[*]KGP'
M9-KJ7%@#O3:_*;1>^QS/^$KM_P )^E24MCN>SJ?2JWJ72.K?5MN1+L[&Q>HU'[/D5"^L>NYC:ZJ[/<6NR&L8W97L_FKO7I_G&6(F'
MA7X[L7(KP'$8CLDUUX]T G*?Z]^ZO.JPO5:U[OT=GJ*\W-P,2MN*[IU^-3(B
MMF,7UM)/_=)N16WW?G)*0=9ZE@9?2K68>91:\V5,(9:P_P"&J98S1WT]NYFS
M]] Z:RQ_6,4N(+*SU=P\9.90RO\ Z+KUH8^#T#*!?BT4$LL:]YJ:&.%E9]6O
MUM@8_P!CQOV6K#;GOPL_VFNFQIZI6RS)+V4&Q^3C9=#;KVLK;4#/9U-MD?^ -4L2W,LKJNM
MR<:RMT!YI8[:YQT_16NO=^?_ "'I9U&1=E83Z0V,:_UK-\@.K-61C/#'-:_]
M*S[0VS_A$E-+I(+>JVN'T+*7L&LZT966US?[/VA;:QL?IN9Z[ \.HHWYKWNK
MLE_Z7(KOQVA\![:\FOU;;&,_F?YKU%K98^ 1'Z/U'N]
M)W\NK8DI_];TOJKG-Z7F.9&]M%A;NU$ACHW?16?1CFW%Z?;9]C[/^%24Y(Z1U4W!WV.
M@L+B7N.=E,=#W;[&^QM^[<_])Z?\UO5K Z*3?=D9F(S&+K :ZZ,JY[7- :S=
ME4[<6BW^;W;;&9"/CWV]0=MD>H!^DJWVNR6[Z=S?5_1^Q_
MZ/\ G/50FX?6<1UF1E=8-N(RIQ>'8];2US3O]1KJA[F^G^9_Y/\ 1I3C/]"O
M$P>GF_U,SI[",NW!NMW"LNV?9F.I]/\ 39>S_"-]7%K]?[-Z61]FM1Z,?J%@
M#\:W-Q:7"7L=2XN<[@OL?;?Z[GN]OO5]E6T->W(S+_4 _0X[#7621[GL=8&U
MTL_._I#$.W#PG97T/UEA'J^KE"EX:?H;OLGJ6/W?\(DII-Z?UA[FNLS^J.#2
M"&MV-#@#]&S]7QW[?[6__A45W2QF9#/MF#EY;&VLD/OMKKKF?UGT;\Y]5_H?
M\'1ZU7TZOTJ/>[I)!K9=A,N#BQOJ7.L)>T;MFW=58YS=S/SDU=/3&L#;[\>Q
M^KA--A_E%K?TOOV_0;^>DII?63[!3<,?(RV%V'2+:S]HO
MM8]GVFO#P_LO]%Q<9:>(QF0UC^GY%)V@?H'LN;%<[+&/Q7Y+=GLW^GZM'L>N
M+Z]UIO0_K;D=+Z$RJJBYM'VK"=6X8PRR?69F[J+<=V'LK^Q_:KZOT/I?I+O5
MR*JTE/7XN,[UF8],[FP^UUA#G#W%[+KX]KKF6>NYC'?HW]2LR[_3_5%3Z+C#
M#Z53CT$NJI-S6&L$>J?6OH9=ZNNZ[(HK9ZS_ .BTB!OH=;6W+V\?JK,&O-W_ )GV6C(N_F/T=5RC[4/J[N-@QRN'[=WI5V[+7_R++5D.9@_M\]!98;;*FLHJJL?ZUH98TY?5
M<[+?=ZEFW)Q&XW2Z+;?TM7\U3Z=-RZ'K/J5X;&5N[TBL?ZGG*&-AV,87Y%U.-58^USM*6TU7W9%S:G/9ZMWJ>C@U/\ YJGT[?\
M#6TK=R;''K'3+MFZF_'R*7& 0'6?9;V-U_>9C6_V&/6!T?JU?3>H8OU?OM%+
M\1UN%5>0WT[F8[*?L53WQNQK;\?,PF7W?X?+POL]/_")3H>M>[]KUXUWHL:6
M?9"]HN"YS2T"MCB[VT,:S8
MS9[/TGH^F[_P[GO_ -$L_<*Z,NSJ5E5.%[&?:_5#19LQOLUUE>QMMFUEE=WI
MUM_P=OJ^I793Z*S\G_&'T#I^0^G*&0^^G(VVU,J:'G9OL#/3=9[;79;O6?L_
MZ]Z/]'K2GINMNR/L5%]K?19C6,R;*/L#7,-CPUUF/D?;[-MFSU6>RJC&L_0_TCU[[+*OLJZCA]1PLQF3A
M7Y6V^RQUSV$WUM$M?11;@6?:7>D][K&/NZ=5C7>E]-Z2G5ORWXCV^NVRVIS7
M>ZBE]A:X%NT/%!NM][7_ .A_,_G%$];Z0'MJ^V4^L_Z% >#:3&[:W'_GW/\
MY'IKCL+JW469%%74Q]JNRJ;G64/R;:VS6++7,^R/J:YF1Z=#_4QGT;/TOL_0
M5KHOVRS'Q7#,Z:6-K8'VUXSJ[V-$N98W;^AL?9C^G^G;71[/T?TTE.LV^U[H
M90X-D OL(:-L:N8WWV?Y]=:E3CU4>IZ0V^J\V/U)ESOI'W$[>/S51PW=+RLB
MQN-0ZFP5,LL>&NH)#WWT^F_;Z=OJ5V8MN_U&(]@Q\*J;,I]-H\/)/[H=?
MZEC]W[B2D^1C8V54:,FIE]+HW5V-#VF#N$L?+?I*B_ZN=#=&S#KH@S./-!G^
MMBFE%LSWBE]^T8N-6"7Y&5[ &M/N?Z,M?LV[_P">?0CUMLI!+R^YSB 7R#I^
M]Z;=C6?V&)*:;^B-%;68N=FXA:9#VWFYWS_:0SF._P Q:-;7-8UKW;W .>0
M!)'YT-_>43=0;?LY>WUMN\U2-VTG;OV?2V>U-CXV-C-+<>MM329+6 3\ DI
M_]?U#)M]#'LN/%3'/.DZ-&Y5*.H8M/3*L@.<^H_H\=L$V6:EE-;&/VO?;8UO
M_DU9S,NC$H-M^K3#6L W.>YVC*:V?X2RS\QBSNCV4]1NMZC<]C\ECG4,Q9!.
M*UI/9=C5UY%R4QQ,+/NS1U//JINR6",6MMAV8
MS7M'K5U_HG>IDO\ H79?^$J_1UUT5[_4,[&]6]WIX=#+ +KFNAX'TA4VT4;
M][I_ZW7_ ,(B=3ZD<)U-3:+;!>X,=?6&%E.YS*F67M?8RS;NL]GI56J[34RF
ML5LF&]SJ23JYSC^K;IZ
MEA],%N)Z5[\7$!.1G!OK3<[]/D>JS&WY'J.]3U[;?L]6/[_T:2G3ISL*ZU^/
M3D5V75$MLJ:\.>TCZ7J,G>WZ7YR'C=.QL=S#C'8Q@V%C0TAVV6M]2QS77?HO
MS&^K[$]6=3E8M>3A$9%5I8 6F"&N+=SG;OI8].?;B/O&UM;;7O&0YUK38[]'2SIN%MR?3]/W^O[/9
M_I?TJAU#J7U?Z979TC+R+7G(:*GL-MEMLW_H::1998^]EMS/5>S;_@Z;+[?Y
M>M7B4E[;ZKK2USS='K/>QQ<-OY[G_H?W**OT'_!I*<@8[>G7CJ(RK+'6.&.R
MAS+[;+)/JG'Q:[\EVZQ[6>I]H>RWT:J[;O4JQJ[UYR[-ZCUGZQY&5B8N_-MO
M8_(JD>B37LHQ,)UW\W?CL]&EMV3;?55F6?:/L5?^EV?KC]>,.KZTXC,9US&=
M.;F8MN0&!P^T6-;C-=31=LW_ &.[^=N_PK/593ZBN] O=BYN#C4MJ??=46]+
MQA+&-KJ86Y&?F?H[+V?H-E6'L]7(R_YO,R;O3^UXZ4V<5EW2LC*Z<^SU&X#:
MLH?9Y:65VML<[ ]*O>_^G5UX^-C5^IZ/2K,5GVA6.I].+:<8MRK#GF]K;;*7
M%IQ[+G4-S[JK*[\>RO&?=;0_(Q7?;<;U[*7_ &+TO4]*SU;ZO9GZ7.J+<[)N
MJ S*3-%ECJ]UE+^G959?]ALKGTF47?:*YOK5WL
M9OQY@O&3ZK:_M'H/?0WV/ZAGY53?YKUZO^XM:2E8_3<_[;?U; LHR.H4O.-F
MU7,-/KG'-M>+=;D8H_0YCL'*9ZKOLV1B7?H/2Q<7]%Z-T]?Z?E] Q^N5>H:W
MPZJH,=81>=U#*,BNO_0Y+O3=O>REE_\ A5EXF=E5]$ZOU=MS[\*RB_99[6OL
MNQ0<%N=C/KW.]+.IHHW^KL]'(H?=5^KY'J+D>F]%Q\/*Z93?ZUV8RQN1DMLW
MTM^TO%%N,\83@VU[<7U/2J?=C[\K*_G?T?\ D[(2GLL+JUE/4^HY+<*QV-C&
MK#9;;=17N<7.M?9^L6UV-NS,C+JJ].S_ E-='Z.[U:J[F)]:/J]=34W,SF8
M.7BN NQLVQN/>RS;LVW4VN;ZF]C_ ,SU*7_X-0^K=.%U/H69@Y19DT7Y&6+:
M'2+A5==<^G[:TN]>O*MI=ZWO^SVU_H_9ZE:S<9A!JP\Q]O4+:\W[%^F('JTT
MOMI;]H]COMWZMGNOS[+?T/KU_P#%)*=+(ZQT_,Q=N!78_'Z;8U[LYAJ%5#:1
MZOK"S*NJ];&LH:ZFRS'W_J]MJX3?G]4Z_P!4ZUU%CJ,6K%;U$]-JL-I=4RFF
M^NNW(:WT<-N4S'J]1]OZ?9ZU6+1_AJ^JOZGF8_5F%I=:(A_3+*<
M-[;'AA=]GS*:F-KR656?8\S]9I^TLR:O1Y?&MIZ:S/;9?8VVS'+[:2V^S)+\
MBTT?8^I93,-_HW_SF+^L5?K5S\3(_2?JWHI3Z1C_ %?PZ^GMQTML=3:2_(QZ[&N-]&-[W>A0V_]7_1?Z)>/=3PFXK\=EAL+6[A8ZJO^:QRZ
MRVVRZS'-WZ7UJ;=GZ*IF57]HN]+&K]*^SU[ZN]?P^NXIOPZ+L9E!]-U-[ PM
MT]L>FZVG_K6_U:O\)77[%S_["LQ\S&P,F^RNW8<>BRL&QE];7M?3>UEGJ_L_
M*Z=_.WTLJ^RY%_V3/]3]7M^R)3L_5PMZ<]_1K*FT6/-N5BMJ8QE+J :6O?0R
MASZZ?TV0W] [W^__ C/TBWUQ_U@ZKTWI?3R^C*K=?97?98S(R-E;\G^9N];U;%+!ZA]8\J[HEF>VS"MSKG6Y&$',TH9CW
MG^8%7VFJO[3]G^T?:AZOBTY6!;7;A5=1VC>S%NV[7
M.;]':ZQMC66?Z-__ %"R<3ZM8ME3F4VVXV.0]KO0R76[RZW[2[>;&[/4JM]9
MEGJ5VVV_:/TERZ"ZFJ^LU7,;96[Z3' $&-?+ ZIEQ95^B=66EQ&ZFX9='J4V;_YM[/>^C(I9D_:+
M_5Q_YM6NG8E]>1E79K&69'JO;CY6UN\XSG>O3C[V_I=E#K'5[+/ZZEU;J8P,
M>LL#;,C)M;C8C'':QUSYV"ZW7TJF[7OL_/\ 9Z5#+LE]-%G-7Y^/ZOVW-ONH
MR'T.??C6&_%?MQW5X_VW#& _*M9CWV9%?IX5SE8^OU'UOL=7?D9S]CZ;*KOL?HV_I/UWUJUJ=)R7/NL?4_P!3TZ_6M]5]C?3V/6?@]5NRW'&Z9UK&RS/>'>U'LMKJ87V':T0/F3M:UH
M_.<]QVL:H4L>7&ZT18X0UO[C?W/Z_P#I?_,$E.!DY'0>E]1HZ6Y]V'D/:+WW
MT%S,:G<758WVC>[['6R^UEE.'3;5:SU&?Z6RGU;/5;\RC";A^O<6"I]V=U05
MD%F/7[K?1^S,:S[??7[*?L[/T7])V?S-=L/K)5T+IV/E]?SVM9:V@4N
