UNITED STATES
SECURITIES AND EXCHANGE COMMISSION
Washington, D.C. 20549
FORM N-CSR
CERTIFIED SHAREHOLDER REPORT OF REGISTERED
MANAGEMENT INVESTMENT COMPANIES
Investment Company Act file number 811-4861
Fidelity Garrison Street Trust
(Exact name of registrant as specified in charter)
245 Summer St., Boston, Massachusetts 02210
(Address of principal executive offices) (Zip code)
Marc Bryant, Secretary
245 Summer St.
Boston, Massachusetts 02210
(Name and address of agent for service)
Registrant's telephone number, including area code:
617-563-7000
Date of fiscal year end: | December 31 |
|
|
Date of reporting period: | December 31, 2017 |
Item 1.
Reports to Stockholders
|
Fidelity® VIP Investment Grade Central Fund Annual Report December 31, 2017 |
 |
Contents
|
Board Approval of Investment Advisory Contracts and Management Fees |
To view a fund's proxy voting guidelines and proxy voting record for the 12-month period ended June 30, visit http://www.fidelity.com/proxyvotingresults or visit the Securities and Exchange Commission's (SEC) web site at http://www.sec.gov.
You may also call 1-800-544-8544 to request a free copy of the proxy voting guidelines.
Standard & Poor's, S&P and S&P 500 are registered service marks of The McGraw-Hill Companies, Inc. and have been licensed for use by Fidelity Distributors Corporation.
Other third-party marks appearing herein are the property of their respective owners.
All other marks appearing herein are registered or unregistered trademarks or service marks of FMR LLC or an affiliated company. © 2018 FMR LLC. All rights reserved.
A fund files its complete schedule of portfolio holdings with the SEC for the first and third quarters of each fiscal year on Form N-Q. Forms N-Q are available on the SEC’s web site at http://www.sec.gov. A fund's Forms N-Q may be reviewed and copied at the SEC’s Public Reference Room in Washington, DC. Information regarding the operation of the SEC's Public Reference Room may be obtained by calling 1-800-SEC-0330.
Performance: The Bottom Line
Average annual total return reflects the change in the value of an investment, assuming reinvestment of distributions from dividend income and capital gains (the profits earned upon the sale of securities that have grown in value, if any) and assuming a constant rate of performance each year. The hypothetical investment and the average annual total returns do not reflect the deduction of taxes that a shareholder would pay on fund distributions or the redemption of fund shares. During periods of reimbursement by Fidelity, a fund’s total return will be greater than it would be had the reimbursement not occurred. How a fund did yesterday is no guarantee of how it will do tomorrow.
Average Annual Total Returns
| For the periods ended December 31, 2017 | Past 1 year | Past 5 years | Past 10 years |
| Fidelity VIP Investment Grade Central Fund | 4.46% | 2.81% | 4.87% |
$10,000 Over 10 Years
Let's say hypothetically that $10,000 was invested in Fidelity® VIP Investment Grade Central Fund on December 31, 2007.
The chart shows how the value of your investment would have changed, and also shows how the Bloomberg Barclays U.S. Aggregate Bond Index performed over the same period.
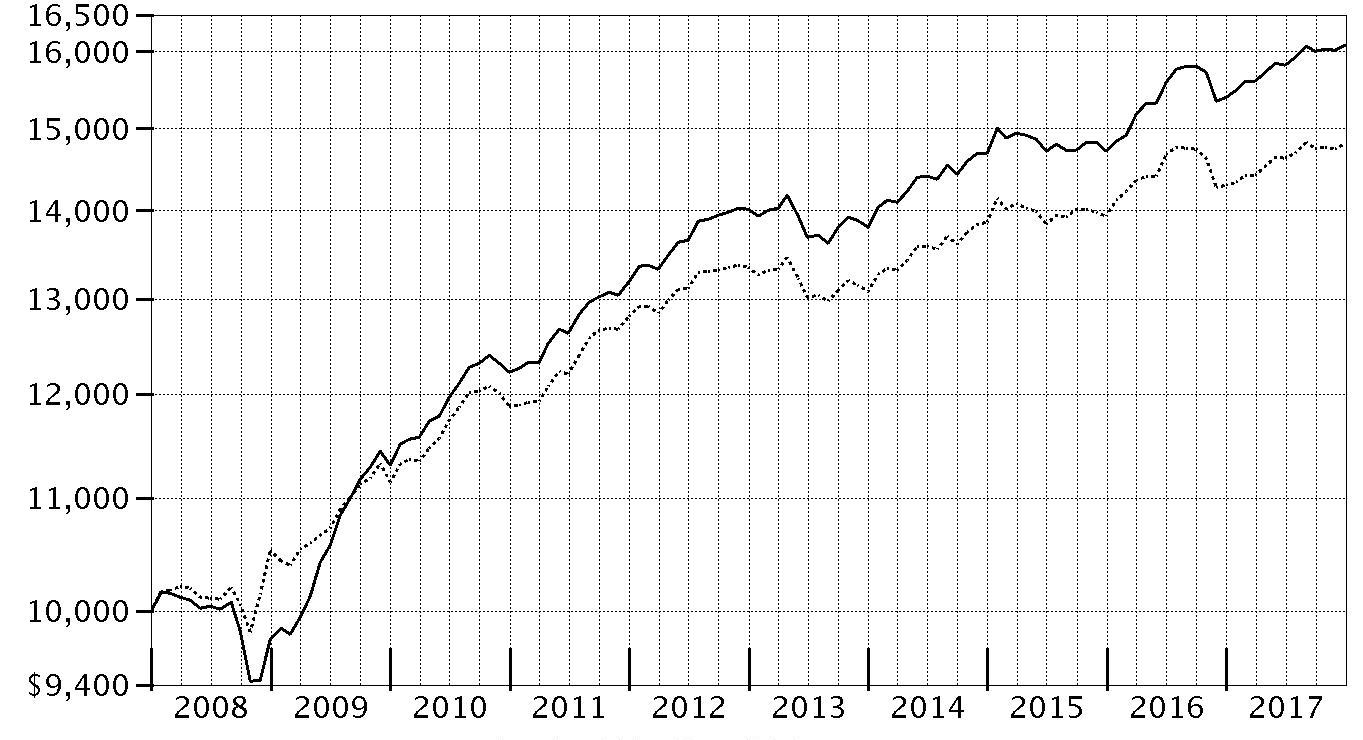
| Period Ending Values | ||
|
| $16,091 | Fidelity VIP Investment Grade Central Fund |
|
| $14,811 | Bloomberg Barclays U.S. Aggregate Bond Index |
Management's Discussion of Fund Performance
Market Recap: U.S. taxable investment-grade bonds advanced solidly in 2017, as the asset class spent the majority of the year in recovery mode from its steep post-election sell-off in late 2016. The Bloomberg Barclays U.S. Aggregate Bond Index gained 3.54% for the year. Longer-term bond yields declined through early September – despite two policy-rate hikes – as it became clear that changes to tax, health care and fiscal policies proposed by the Trump administration would take time to develop and implement. Yields then ticked higher from October through year-end, amid efforts by the U.S. Federal Reserve to gradually reduce its balance sheet, and economic strength that led to a policy-rate hike in December. Bond yields rose further following tax reform passed by Congress late in 2017 that boosted expectations for near-term economic growth and reinforced the rate-hike cycle. Within the Bloomberg Barclays index, investment-grade corporate bonds led all major market segments, up 6.42%. U.S. Treasuries returned 2.31%, outperforming most sovereign bonds. Securitized sectors, with the exception of asset-backed securities, slightly topped Treasuries. Outside the index, riskier, non-core fixed-income segments led the broader market, while Treasury Inflation-Protected Securities (TIPS) gained 3.01%, according to Bloomberg Barclays. Comments from Co-Portfolio Managers Ford O'Neil and Celso Munoz: For the year, the fund returned 4.46%, solidly outpacing the benchmark Bloomberg Barclays U.S. Aggregate Bond Index. Certain allocation decisions meaningfully boosted the fund’s relative results, particularly its emphasis on credit-sensitive spread sectors – non-U.S. Treasury securities with higher yields and enhanced credit risk. Investments in non-U.S. government agency issues from Mexico and Brazil tied to the energy sector proved to be advantageous. These securities enjoyed substantial gains as oil prices rallied and investors generally sought higher-yielding alternatives to U.S. bonds. Certain taxable municipal bond holdings, led by securities backed by the state of Illinois and the city of Chicago, also contributed. Our approach to the investment-grade corporate segment panned out fairly well, as our larger-than-index exposure to this segment was a source of outperformance, although the more significant contribution came from our selections among such securities. Significantly overweighting financials, particularly U.S. and European banks and real estate investment trusts, added value. That said, underweighting bright spots within the industrial sector curbed results, as did owning poor-performing bonds of Teva Pharmaceuticals.The views expressed above reflect those of the portfolio manager(s) only through the end of the period as stated on the cover of this report and do not necessarily represent the views of Fidelity or any other person in the Fidelity organization. Any such views are subject to change at any time based upon market or other conditions and Fidelity disclaims any responsibility to update such views. These views may not be relied on as investment advice and, because investment decisions for a Fidelity fund are based on numerous factors, may not be relied on as an indication of trading intent on behalf of any Fidelity fund.
Investment Summary (Unaudited)
Quality Diversification (% of fund's net assets)
| As of December 31, 2017 | ||
| U.S. Government and U.S. Government Agency Obligations | 64.4% | |
| AAA | 0.3% | |
| AA | 0.9% | |
| A | 6.0% | |
| BBB | 21.5% | |
| BB and Below | 6.3% | |
| Short-Term Investments and Net Other Assets | 0.6% | |

We have used ratings from Moody's Investors Service, Inc. Where Moody's® ratings are not available, we have used S&P® ratings. All ratings are as of the date indicated and do not reflect subsequent changes. Securities rated BB or below were rated investment grade at the time of acquisition.
Asset Allocation (% of fund's net assets)
| As of December 31, 2017*,** | ||
| Corporate Bonds | 30.7% | |
| U.S. Government and U.S. Government Agency Obligations | 64.4% | |
| Asset-Backed Securities | 0.7% | |
| CMOs and Other Mortgage Related Securities | 0.6% | |
| Municipal Bonds | 1.8% | |
| Other Investments | 1.2% | |
| Short-Term Investments and Net Other Assets (Liabilities) | 0.6% | |

* Foreign investments - 8.5%
** Futures and Swaps - 0.0%
Percentages in the above tables are adjusted for the effect of TBA Sale Commitments.
Percentages shown as 0.0% may reflect amounts less than 0.05%.
Investments December 31, 2017
Showing Percentage of Net Assets
| Nonconvertible Bonds - 30.7% | |||
| Principal Amount | Value | ||
| CONSUMER DISCRETIONARY - 2.5% | |||
| Automobiles - 0.8% | |||
| General Motors Co. 3.5% 10/2/18 | $3,528,000 | $3,564,681 | |
| General Motors Financial Co., Inc.: | |||
| 3.2% 7/13/20 | 10,000,000 | 10,135,083 | |
| 3.25% 5/15/18 | 1,860,000 | 1,866,985 | |
| 3.5% 7/10/19 | 4,187,000 | 4,249,701 | |
| 4.2% 3/1/21 | 5,411,000 | 5,626,699 | |
| 4.25% 5/15/23 | 2,080,000 | 2,175,403 | |
| 4.375% 9/25/21 | 15,702,000 | 16,515,041 | |
| 44,133,593 | |||
| Diversified Consumer Services - 0.1% | |||
| Ingersoll-Rand Global Holding Co. Ltd.: | |||
| 2.875% 1/15/19 | 416,000 | 418,127 | |
| 4.25% 6/15/23 | 2,932,000 | 3,123,894 | |
| 3,542,021 | |||
| Hotels, Restaurants & Leisure - 0.1% | |||
| McDonald's Corp.: | |||
| 2.75% 12/9/20 | 910,000 | 919,373 | |
| 3.7% 1/30/26 | 2,400,000 | 2,501,103 | |
| 3,420,476 | |||
| Media - 1.5% | |||
| 21st Century Fox America, Inc. 7.75% 12/1/45 | 3,169,000 | 5,023,276 | |
| AOL Time Warner, Inc. 2.95% 7/15/26 | 12,000,000 | 11,346,654 | |
| Charter Communications Operating LLC/Charter Communications Operating Capital Corp.: | |||
| 4.464% 7/23/22 | 5,742,000 | 5,990,182 | |
| 4.908% 7/23/25 | 3,860,000 | 4,102,968 | |
| 5.375% 5/1/47 | 6,172,000 | 6,323,262 | |
| 6.484% 10/23/45 | 1,700,000 | 1,980,563 | |
| Time Warner Cable, Inc.: | |||
| 4% 9/1/21 | 7,363,000 | 7,582,702 | |
| 4.5% 9/15/42 | 556,000 | 521,228 | |
| 5.5% 9/1/41 | 1,700,000 | 1,770,584 | |
| 5.875% 11/15/40 | 1,500,000 | 1,626,328 | |
| 6.55% 5/1/37 | 18,635,000 | 21,902,003 | |
| 6.75% 7/1/18 | 4,425,000 | 4,522,938 | |
| 7.3% 7/1/38 | 3,781,000 | 4,736,273 | |
| 8.25% 4/1/19 | 7,716,000 | 8,246,127 | |
| 85,675,088 | |||
| TOTAL CONSUMER DISCRETIONARY | 136,771,178 | ||
| CONSUMER STAPLES - 1.7% | |||
| Beverages - 0.8% | |||
| Anheuser-Busch InBev Finance, Inc.: | |||
| 2.65% 2/1/21 | 9,870,000 | 9,918,656 | |
| 3.3% 2/1/23 | 10,630,000 | 10,876,104 | |
| 4.7% 2/1/36 | 10,065,000 | 11,287,436 | |
| 4.9% 2/1/46 | 11,511,000 | 13,329,261 | |
| 45,411,457 | |||
| Food & Staples Retailing - 0.1% | |||
| CVS Health Corp. 3.5% 7/20/22 | 2,525,000 | 2,571,684 | |
| Walgreens Boots Alliance, Inc.: | |||
| 2.7% 11/18/19 | 2,460,000 | 2,474,656 | |
| 3.3% 11/18/21 | 2,918,000 | 2,966,390 | |
| 8,012,730 | |||
| Tobacco - 0.8% | |||
| Altria Group, Inc. 4% 1/31/24 | 2,227,000 | 2,362,114 | |
| Imperial Tobacco Finance PLC: | |||
| 3.75% 7/21/22 (a) | 4,804,000 | 4,963,851 | |
| 4.25% 7/21/25 (a) | 4,804,000 | 5,036,022 | |
| Reynolds American, Inc.: | |||
| 2.3% 6/12/18 | 2,110,000 | 2,112,468 | |
| 3.25% 6/12/20 | 939,000 | 954,053 | |
| 4% 6/12/22 | 3,228,000 | 3,372,289 | |
| 4.45% 6/12/25 | 2,341,000 | 2,495,515 | |
| 5.7% 8/15/35 | 1,215,000 | 1,447,339 | |
| 5.85% 8/15/45 | 9,320,000 | 11,628,845 | |
| 6.15% 9/15/43 | 4,000,000 | 5,137,103 | |
| 7.25% 6/15/37 | 2,962,000 | 4,105,514 | |
| 43,615,113 | |||
| TOTAL CONSUMER STAPLES | 97,039,300 | ||
| ENERGY - 5.9% | |||
| Energy Equipment & Services - 0.2% | |||
| El Paso Pipeline Partners Operating Co. LLC 5% 10/1/21 | 1,517,000 | 1,616,743 | |
| Halliburton Co.: | |||
| 3.8% 11/15/25 | 2,467,000 | 2,563,248 | |
| 4.85% 11/15/35 | 2,154,000 | 2,414,829 | |
| Noble Holding International Ltd.: | |||
| 5.75% 3/16/18 | 342,000 | 343,112 | |
| 7.7% 4/1/25 (b) | 2,180,000 | 1,825,750 | |
| 8.7% 4/1/45 (b) | 2,104,000 | 1,667,420 | |
| 10,431,102 | |||
| Oil, Gas & Consumable Fuels - 5.7% | |||
| Amerada Hess Corp. 7.875% 10/1/29 | 2,544,000 | 3,170,710 | |
| Anadarko Finance Co. 7.5% 5/1/31 | 6,883,000 | 8,832,073 | |
| Anadarko Petroleum Corp.: | |||
| 4.85% 3/15/21 | 1,620,000 | 1,710,627 | |
| 5.55% 3/15/26 | 3,337,000 | 3,743,165 | |
| 6.45% 9/15/36 | 1,002,000 | 1,226,468 | |
| 6.6% 3/15/46 | 4,530,000 | 5,822,183 | |
| Canadian Natural Resources Ltd.: | |||
| 1.75% 1/15/18 | 1,762,000 | 1,761,685 | |
| 3.8% 4/15/24 | 6,783,000 | 6,983,996 | |
| 5.85% 2/1/35 | 2,497,000 | 2,925,382 | |
| Cenovus Energy, Inc. 4.25% 4/15/27 | 5,557,000 | 5,542,066 | |
| Columbia Pipeline Group, Inc.: | |||
| 2.45% 6/1/18 | 894,000 | 894,526 | |
| 3.3% 6/1/20 | 4,379,000 | 4,441,277 | |
| 4.5% 6/1/25 | 1,336,000 | 1,422,173 | |
| DCP Midstream LLC: | |||
| 4.75% 9/30/21 (a) | 3,739,000 | 3,860,518 | |
| 5.35% 3/15/20 (a) | 3,724,000 | 3,882,270 | |
| DCP Midstream Operating LP: | |||
| 3.875% 3/15/23 | 1,771,000 | 1,759,931 | |
| 5.6% 4/1/44 | 1,227,000 | 1,217,798 | |
| Duke Energy Field Services 6.45% 11/3/36 (a) | 2,477,000 | 2,656,583 | |
| Empresa Nacional de Petroleo 4.375% 10/30/24 (a) | 3,540,000 | 3,701,584 | |
| Enable Midstream Partners LP: | |||
| 2.4% 5/15/19 (b) | 1,253,000 | 1,245,704 | |
| 3.9% 5/15/24 (b) | 1,322,000 | 1,329,741 | |
| Enbridge Energy Partners LP: | |||
| 4.2% 9/15/21 | 4,399,000 | 4,572,274 | |
| 4.375% 10/15/20 | 3,093,000 | 3,223,138 | |
| Enbridge, Inc.: | |||
| 4.25% 12/1/26 | 1,773,000 | 1,853,416 | |
| 5.5% 12/1/46 | 2,046,000 | 2,458,103 | |
| EnLink Midstream Partners LP 2.7% 4/1/19 | 6,288,000 | 6,281,879 | |
| Enterprise Products Operating LP: | |||
| 1.65% 5/7/18 | 1,969,000 | 1,966,369 | |
| 2.55% 10/15/19 | 863,000 | 865,625 | |
| 3.7% 2/15/26 | 4,800,000 | 4,913,688 | |
| 3.75% 2/15/25 | 2,900,000 | 2,989,515 | |
| Kinder Morgan Energy Partners LP 6.55% 9/15/40 | 460,000 | 537,424 | |
| Marathon Petroleum Corp. 5.125% 3/1/21 | 2,187,000 | 2,346,962 | |
| Nakilat, Inc. 6.067% 12/31/33 (a) | 1,808,000 | 2,106,682 | |
| Petrobras Global Finance BV: | |||
| 4.375% 5/20/23 | 7,020,000 | 6,942,569 | |
| 5.625% 5/20/43 | 6,681,000 | 5,970,409 | |
| 7.25% 3/17/44 | 24,245,000 | 25,214,800 | |
| Petrobras International Finance Co. Ltd. 5.375% 1/27/21 | 13,384,000 | 13,919,360 | |
| Petroleos Mexicanos: | |||
| 3.5% 7/23/20 | 32,555,000 | 32,994,493 | |
| 3.5% 1/30/23 | 3,410,000 | 3,338,390 | |
| 4.5% 1/23/26 | 6,809,000 | 6,796,744 | |
| 4.625% 9/21/23 | 7,350,000 | 7,561,313 | |
| 4.875% 1/24/22 | 3,398,000 | 3,541,566 | |
| 4.875% 1/18/24 | 4,539,000 | 4,702,177 | |
| 5.375% 3/13/22 (a) | 2,700,000 | 2,862,000 | |
| 5.5% 1/21/21 | 3,601,000 | 3,820,661 | |
| 5.5% 6/27/44 | 2,492,000 | 2,292,540 | |
| 5.625% 1/23/46 | 8,402,000 | 7,776,051 | |
| 6% 3/5/20 | 1,625,000 | 1,724,125 | |
| 6.375% 1/23/45 | 4,048,000 | 4,069,657 | |
| 6.5% 3/13/27 (a) | 4,830,000 | 5,279,190 | |
| 6.5% 6/2/41 | 7,675,000 | 7,893,738 | |
| 6.75% 9/21/47 | 4,975,000 | 5,193,154 | |
| 6.75% 9/21/47 (a) | 5,130,000 | 5,354,951 | |
| 8% 5/3/19 | 2,537,000 | 2,709,516 | |
| Phillips 66 Co. 4.3% 4/1/22 | 3,770,000 | 4,006,419 | |
| Phillips 66 Partners LP 2.646% 2/15/20 | 375,000 | 374,972 | |
| Plains All American Pipeline LP/PAA Finance Corp. 3.65% 6/1/22 | 1,784,000 | 1,794,185 | |
| Southwestern Energy Co. 6.7% 1/23/25 (b) | 2,509,000 | 2,606,224 | |
| Spectra Energy Capital, LLC 3.3% 3/15/23 | 5,000,000 | 4,988,121 | |
| The Williams Companies, Inc.: | |||
| 3.7% 1/15/23 | 1,208,000 | 1,201,960 | |
| 4.55% 6/24/24 | 13,337,000 | 13,837,138 | |
| Western Gas Partners LP: | |||
| 4.65% 7/1/26 | 8,532,000 | 8,866,919 | |
| 5.375% 6/1/21 | 6,322,000 | 6,703,195 | |
| Williams Partners LP: | |||
| 3.6% 3/15/22 | 3,522,000 | 3,602,280 | |
| 3.9% 1/15/25 | 1,216,000 | 1,239,051 | |
| 4% 11/15/21 | 1,605,000 | 1,659,658 | |
| 4.3% 3/4/24 | 5,449,000 | 5,705,936 | |
| 4.5% 11/15/23 | 1,751,000 | 1,851,535 | |
| 320,640,532 | |||
| TOTAL ENERGY | 331,071,634 | ||
| FINANCIALS - 12.4% | |||
| Banks - 6.0% | |||
| Bank of America Corp.: | |||
| 2.25% 4/21/20 | 3,337,000 | 3,339,129 | |
| 2.6% 1/15/19 | 1,033,000 | 1,036,468 | |
| 3.004% 12/20/23 (a)(b) | 23,141,000 | 23,198,162 | |
| 3.419% 12/20/28 (a)(b) | 5,663,000 | 5,664,471 | |
| 3.5% 4/19/26 | 5,024,000 | 5,135,198 | |
| 3.95% 4/21/25 | 4,125,000 | 4,264,747 | |
| 4.2% 8/26/24 | 6,867,000 | 7,229,895 | |
| 4.25% 10/22/26 | 4,261,000 | 4,489,175 | |
| Barclays PLC: | |||
| 2% 3/16/18 | 17,646,000 | 17,646,106 | |
| 2.75% 11/8/19 | 3,581,000 | 3,588,699 | |
| 3.25% 1/12/21 | 4,610,000 | 4,654,270 | |
| 4.375% 1/12/26 | 6,221,000 | 6,471,209 | |
| Citigroup, Inc.: | |||
| 2.7% 10/27/22 | 9,998,000 | 9,889,828 | |
| 3.875% 3/26/25 | 9,500,000 | 9,722,417 | |
| 4.05% 7/30/22 | 1,800,000 | 1,873,203 | |
| 5.5% 9/13/25 | 4,860,000 | 5,473,718 | |
| Citizens Bank NA 2.55% 5/13/21 | 1,560,000 | 1,554,074 | |
| Citizens Financial Group, Inc. 4.15% 9/28/22 (a) | 4,857,000 | 5,036,344 | |
| Credit Suisse Group Funding Guernsey Ltd.: | |||
| 2.75% 3/26/20 | 4,667,000 | 4,684,922 | |
| 3.75% 3/26/25 | 4,660,000 | 4,753,904 | |
| 3.8% 9/15/22 | 7,240,000 | 7,467,365 | |
| 3.8% 6/9/23 | 8,582,000 | 8,849,243 | |
| Discover Bank: | |||
| 4.2% 8/8/23 | 2,849,000 | 2,991,340 | |
| 7% 4/15/20 | 2,309,000 | 2,516,622 | |
| Fifth Third Bancorp: | |||
| 2.875% 7/27/20 | 3,000,000 | 3,031,511 | |
| 4.5% 6/1/18 | 1,179,000 | 1,190,485 | |
| 8.25% 3/1/38 | 4,319,000 | 6,590,839 | |
| HBOS PLC 6.75% 5/21/18 (a) | 2,600,000 | 2,644,074 | |
| HSBC Holdings PLC 4.25% 3/14/24 | 2,200,000 | 2,297,613 | |
| HSBC U.S.A., Inc. 1.625% 1/16/18 | 3,721,000 | 3,720,725 | |
| Huntington Bancshares, Inc. 7% 12/15/20 | 1,004,000 | 1,122,656 | |
| Intesa Sanpaolo SpA: | |||
| 5.017% 6/26/24 (a) | 3,027,000 | 3,098,788 | |
| 5.71% 1/15/26 (a) | 6,992,000 | 7,364,209 | |
| JPMorgan Chase & Co.: | |||
| 2.75% 6/23/20 | 5,755,000 | 5,804,890 | |
| 2.95% 10/1/26 | 8,028,000 | 7,883,211 | |
| 3.875% 9/10/24 | 43,751,000 | 45,627,795 | |
| 4.125% 12/15/26 | 14,080,000 | 14,849,093 | |
| MUFG Americas Holdings Corp. 2.25% 2/10/20 | 4,493,000 | 4,468,354 | |
| Rabobank Nederland 4.375% 8/4/25 | 7,451,000 | 7,863,448 | |
| Regions Bank 6.45% 6/26/37 | 7,720,000 | 9,859,748 | |
| Regions Financial Corp. 3.2% 2/8/21 | 2,833,000 | 2,882,213 | |
| Royal Bank of Scotland Group PLC: | |||
| 5.125% 5/28/24 | 20,522,000 | 21,762,684 | |
| 6% 12/19/23 | 8,517,000 | 9,397,161 | |
| 6.1% 6/10/23 | 11,522,000 | 12,685,787 | |
| 6.125% 12/15/22 | 8,239,000 | 9,029,434 | |
| Synchrony Bank 3% 6/15/22 | 4,542,000 | 4,522,932 | |
| 339,228,159 | |||
| Capital Markets - 4.1% | |||
| Affiliated Managers Group, Inc.: | |||
| 3.5% 8/1/25 | 5,541,000 | 5,601,685 | |
| 4.25% 2/15/24 | 4,287,000 | 4,519,298 | |
| Credit Suisse AG 6% 2/15/18 | 6,486,000 | 6,515,397 | |
| Deutsche Bank AG: | |||
| 4.25% 10/14/21 | 1,906,000 | 1,982,936 | |
| 4.5% 4/1/25 | 10,381,000 | 10,532,745 | |
| Deutsche Bank AG London Branch 1.875% 2/13/18 | 24,542,000 | 24,538,319 | |
| Deutsche Bank AG New York Branch 3.3% 11/16/22 | 7,404,000 | 7,365,257 | |
| Goldman Sachs Group, Inc.: | |||
| 2.876% 10/31/22 (b) | 22,903,000 | 22,834,849 | |
| 3.691% 6/5/28 (b) | 41,645,000 | 42,234,799 | |
| 5.25% 7/27/21 | 1,125,000 | 1,219,142 | |
| 5.95% 1/18/18 | 755,000 | 756,191 | |
| 6.15% 4/1/18 | 5,954,000 | 6,014,454 | |
| IntercontinentalExchange, Inc. 2.75% 12/1/20 | 1,628,000 | 1,647,293 | |
| Lazard Group LLC 4.25% 11/14/20 | 3,307,000 | 3,444,251 | |
| Moody's Corp.: | |||
| 3.25% 1/15/28 (a) | 2,386,000 | 2,358,071 | |
| 4.875% 2/15/24 | 2,240,000 | 2,459,992 | |
| Morgan Stanley: | |||
| 2.125% 4/25/18 | 4,257,000 | 4,256,984 | |
| 2.65% 1/27/20 | 15,070,000 | 15,137,224 | |
| 3.125% 7/27/26 | 21,964,000 | 21,657,813 | |
| 3.625% 1/20/27 | 11,000,000 | 11,254,818 | |
| 3.7% 10/23/24 | 3,281,000 | 3,389,600 | |
| 4.875% 11/1/22 | 7,751,000 | 8,345,346 | |
| 5% 11/24/25 | 1,047,000 | 1,145,395 | |
| 5.75% 1/25/21 | 3,512,000 | 3,826,820 | |
| Peachtree Corners Funding Trust 3.976% 2/15/25 (a) | 5,000,000 | 5,147,076 | |
| Thomson Reuters Corp. 3.85% 9/29/24 | 3,379,000 | 3,502,004 | |
| UBS AG Stamford Branch 2.35% 3/26/20 | 1,450,000 | 1,448,757 | |
| UBS Group Funding Ltd. 4.125% 9/24/25 (a) | 5,261,000 | 5,519,834 | |
| 228,656,350 | |||
| Consumer Finance - 0.7% | |||
| AerCap Ireland Capital Ltd./AerCap Global Aviation Trust 3.5% 5/26/22 | 1,724,000 | 1,749,405 | |
| Discover Financial Services: | |||
| 3.85% 11/21/22 | 5,040,000 | 5,176,098 | |
| 3.95% 11/6/24 | 2,847,000 | 2,907,553 | |
| 4.1% 2/9/27 | 3,673,000 | 3,762,369 | |
| Ford Motor Credit Co. LLC: | |||
| 2.24% 6/15/18 | 5,000,000 | 5,004,714 | |
| 2.875% 10/1/18 | 4,500,000 | 4,526,459 | |
| Hyundai Capital America: | |||
| 2% 3/19/18 (a) | 6,308,000 | 6,306,013 | |
| 2.875% 8/9/18 (a) | 1,921,000 | 1,924,991 | |
| Synchrony Financial: | |||
| 3% 8/15/19 | 1,459,000 | 1,469,005 | |
| 3.75% 8/15/21 | 2,203,000 | 2,258,756 | |
| 4.25% 8/15/24 | 2,218,000 | 2,299,278 | |
| 37,384,641 | |||
| Diversified Financial Services - 0.3% | |||
| Brixmor Operating Partnership LP: | |||
| 3.25% 9/15/23 | 5,952,000 | 5,830,422 | |
| 3.875% 8/15/22 | 5,542,000 | 5,677,637 | |
| 4.125% 6/15/26 | 2,032,000 | 2,048,943 | |
| Voya Financial, Inc. 3.125% 7/15/24 | 2,851,000 | 2,824,721 | |
| 16,381,723 | |||
| Insurance - 1.3% | |||
| AIA Group Ltd. 2.25% 3/11/19 (a) | 913,000 | 907,663 | |
| American International Group, Inc.: | |||
| 3.3% 3/1/21 | 2,355,000 | 2,400,533 | |
| 3.75% 7/10/25 | 8,311,000 | 8,566,840 | |
| 4.875% 6/1/22 | 3,597,000 | 3,910,834 | |
| Aon Corp. 5% 9/30/20 | 1,402,000 | 1,492,888 | |
| Liberty Mutual Group, Inc. 5% 6/1/21 (a) | 4,093,000 | 4,377,091 | |
| Marsh & McLennan Companies, Inc. 4.8% 7/15/21 | 2,278,000 | 2,435,196 | |
| Massachusetts Mutual Life Insurance Co. 4.5% 4/15/65 (a) | 5,285,000 | 5,610,111 | |
| MetLife, Inc. 4.75% 2/8/21 | 1,477,000 | 1,581,212 | |
| Metropolitan Life Global Funding I 3% 1/10/23 (a) | 2,636,000 | 2,657,305 | |
| Pacific LifeCorp 5.125% 1/30/43 (a) | 5,252,000 | 5,922,051 | |
| Prudential Financial, Inc.: | |||
| 2.3% 8/15/18 | 599,000 | 600,003 | |
| 7.375% 6/15/19 | 1,250,000 | 1,342,179 | |
| Teachers Insurance & Annuity Association of America 4.9% 9/15/44 (a) | 5,347,000 | 6,110,985 | |
| TIAA Asset Management Finance LLC: | |||
| 2.95% 11/1/19 (a) | 1,222,000 | 1,233,542 | |
| 4.125% 11/1/24 (a) | 1,771,000 | 1,868,630 | |
| Unum Group: | |||
| 3.875% 11/5/25 | 4,860,000 | 4,975,452 | |
| 4% 3/15/24 | 5,930,000 | 6,173,877 | |
| 5.625% 9/15/20 | 2,889,000 | 3,109,924 | |
| 5.75% 8/15/42 | 7,278,000 | 8,898,590 | |
| 74,174,906 | |||
| TOTAL FINANCIALS | 695,825,779 | ||
| HEALTH CARE - 1.7% | |||
| Biotechnology - 0.2% | |||
| AbbVie, Inc.: | |||
| 2.9% 11/6/22 | 4,038,000 | 4,045,675 | |
| 3.2% 11/6/22 | 4,580,000 | 4,650,143 | |
| 8,695,818 | |||
| Health Care Equipment & Supplies - 0.2% | |||
| Becton, Dickinson & Co. 2.675% 12/15/19 | 1,156,000 | 1,160,037 | |
| Zimmer Biomet Holdings, Inc. 2% 4/1/18 | 9,035,000 | 9,038,279 | |
| 10,198,316 | |||
| Health Care Providers & Services - 0.5% | |||
| HCA Holdings, Inc.: | |||
| 3.75% 3/15/19 | 6,803,000 | 6,862,526 | |
| 4.25% 10/15/19 | 11,265,000 | 11,504,381 | |
| 4.75% 5/1/23 | 215,000 | 221,450 | |
| 5.875% 3/15/22 | 260,000 | 278,200 | |
| 6.5% 2/15/20 | 7,140,000 | 7,568,400 | |
| Medco Health Solutions, Inc. 4.125% 9/15/20 | 2,723,000 | 2,825,496 | |
| 29,260,453 | |||
| Life Sciences Tools & Services - 0.0% | |||
| Thermo Fisher Scientific, Inc.: | |||
| 2.4% 2/1/19 | 712,000 | 713,687 | |
| 4.15% 2/1/24 | 1,093,000 | 1,159,184 | |
| 1,872,871 | |||
| Pharmaceuticals - 0.8% | |||
| Actavis Funding SCS: | |||
| 2.35% 3/12/18 | 11,511,000 | 11,519,975 | |
| 3% 3/12/20 | 3,962,000 | 3,997,423 | |
| 3.45% 3/15/22 | 6,868,000 | 6,977,460 | |
| Mylan NV: | |||
| 2.5% 6/7/19 | 2,445,000 | 2,442,254 | |
| 3.15% 6/15/21 | 5,002,000 | 5,029,436 | |
| 3.95% 6/15/26 | 2,549,000 | 2,569,670 | |
| Perrigo Finance PLC 3.5% 12/15/21 | 449,000 | 457,206 | |
| Teva Pharmaceutical Finance Netherlands III BV: | |||
| 2.2% 7/21/21 | 3,623,000 | 3,309,165 | |
| 2.8% 7/21/23 | 2,593,000 | 2,257,666 | |
| 3.15% 10/1/26 | 3,088,000 | 2,548,906 | |
| Zoetis, Inc. 3.25% 2/1/23 | 1,649,000 | 1,674,148 | |
| 42,783,309 | |||
| TOTAL HEALTH CARE | 92,810,767 | ||
| INDUSTRIALS - 0.5% | |||
| Airlines - 0.0% | |||
| Continental Airlines, Inc. 6.795% 8/2/18 | 83,660 | 84,914 | |
| Northwest Airlines, Inc. pass-thru trust certificates 7.027% 11/1/19 | 1,961,759 | 2,111,048 | |
| U.S. Airways pass-thru trust certificates: | |||
| 6.85% 1/30/18 | 126,567 | 127,833 | |
| 8.36% 1/20/19 | 589,554 | 601,346 | |
| 2,925,141 | |||
| Trading Companies & Distributors - 0.5% | |||
| Air Lease Corp.: | |||
| 2.125% 1/15/18 | 2,155,000 | 2,154,857 | |
| 2.625% 9/4/18 | 4,630,000 | 4,643,625 | |
| 3% 9/15/23 | 877,000 | 870,068 | |
| 3.375% 6/1/21 | 2,523,000 | 2,576,970 | |
| 3.75% 2/1/22 | 4,522,000 | 4,671,749 | |
| 3.875% 4/1/21 | 3,180,000 | 3,293,468 | |
| 4.25% 9/15/24 | 3,565,000 | 3,740,162 | |
| 4.75% 3/1/20 | 3,519,000 | 3,682,179 | |
| 25,633,078 | |||
| TOTAL INDUSTRIALS | 28,558,219 | ||
| INFORMATION TECHNOLOGY - 0.0% | |||
| Electronic Equipment & Components - 0.0% | |||
| Tyco Electronics Group SA 2.375% 12/17/18 | 832,000 | 833,866 | |
| Technology Hardware, Storage & Peripherals - 0.0% | |||
| Hewlett Packard Enterprise Co. 6.35% 10/15/45 (b) | 589,000 | 623,092 | |
| TOTAL INFORMATION TECHNOLOGY | 1,456,958 | ||
| MATERIALS - 0.5% | |||
| Chemicals - 0.1% | |||
| The Dow Chemical Co.: | |||
| 4.125% 11/15/21 | 3,587,000 | 3,760,696 | |
| 4.25% 11/15/20 | 1,196,000 | 1,248,986 | |
| 5,009,682 | |||
| Metals & Mining - 0.4% | |||
| BHP Billiton Financial (U.S.A.) Ltd.: | |||
| 6.25% 10/19/75 (a)(b) | 1,921,000 | 2,079,483 | |
| 6.75% 10/19/75 (a)(b) | 4,773,000 | 5,572,907 | |
| Corporacion Nacional del Cobre de Chile (Codelco): | |||
| 3.625% 8/1/27 (a) | 1,696,000 | 1,697,849 | |
| 4.5% 8/13/23 (a) | 9,000,000 | 9,599,760 | |
| 4.5% 8/1/47 (a) | 1,720,000 | 1,848,381 | |
| Vale Overseas Ltd. 4.375% 1/11/22 | 3,818,000 | 3,947,812 | |
| 24,746,192 | |||
| TOTAL MATERIALS | 29,755,874 | ||
| REAL ESTATE - 3.2% | |||
| Equity Real Estate Investment Trusts (REITs) - 1.9% | |||
| Alexandria Real Estate Equities, Inc.: | |||
| 2.75% 1/15/20 | 879,000 | 882,658 | |
| 4.6% 4/1/22 | 1,403,000 | 1,489,651 | |
| American Campus Communities Operating Partnership LP 3.75% 4/15/23 | 1,184,000 | 1,214,168 | |
| American Tower Corp. 2.8% 6/1/20 | 9,000,000 | 9,055,520 | |
| AvalonBay Communities, Inc. 3.625% 10/1/20 | 1,872,000 | 1,926,934 | |
| Boston Properties, Inc. 3.85% 2/1/23 | 4,708,000 | 4,904,001 | |
| Camden Property Trust: | |||
| 2.95% 12/15/22 | 1,607,000 | 1,607,023 | |
| 4.25% 1/15/24 | 3,408,000 | 3,581,868 | |
| Corporate Office Properties LP 5% 7/1/25 | 3,156,000 | 3,370,328 | |
| DDR Corp.: | |||
| 3.625% 2/1/25 | 2,629,000 | 2,585,402 | |
| 3.9% 8/15/24 | 758,000 | 763,458 | |
| 4.25% 2/1/26 | 1,807,000 | 1,838,282 | |
| 4.625% 7/15/22 | 2,855,000 | 3,009,768 | |
| Duke Realty LP: | |||
| 3.625% 4/15/23 | 2,123,000 | 2,174,418 | |
| 3.75% 12/1/24 | 1,576,000 | 1,627,168 | |
| 3.875% 10/15/22 | 3,512,000 | 3,653,515 | |
| Equity One, Inc. 3.75% 11/15/22 | 5,500,000 | 5,633,769 | |
| ERP Operating LP: | |||
| 2.375% 7/1/19 | 2,683,000 | 2,689,509 | |
| 4.75% 7/15/20 | 2,827,000 | 2,979,766 | |
| Health Care REIT, Inc. 2.25% 3/15/18 | 1,731,000 | 1,731,668 | |
| Lexington Corporate Properties Trust 4.4% 6/15/24 | 1,441,000 | 1,451,538 | |
| Omega Healthcare Investors, Inc.: | |||
| 4.375% 8/1/23 | 6,023,000 | 6,107,802 | |
| 4.5% 1/15/25 | 2,677,000 | 2,674,521 | |
| 4.5% 4/1/27 | 16,195,000 | 15,841,983 | |
| 4.75% 1/15/28 | 6,382,000 | 6,324,417 | |
| 4.95% 4/1/24 | 1,354,000 | 1,414,238 | |
| 5.25% 1/15/26 | 5,686,000 | 5,890,837 | |
| Retail Opportunity Investments Partnership LP: | |||
| 4% 12/15/24 | 978,000 | 958,476 | |
| 5% 12/15/23 | 737,000 | 768,171 | |
| Weingarten Realty Investors 3.375% 10/15/22 | 812,000 | 818,477 | |
| WP Carey, Inc. 4% 2/1/25 | 5,360,000 | 5,419,185 | |
| 104,388,519 | |||
| Real Estate Management & Development - 1.3% | |||
| Brandywine Operating Partnership LP: | |||
| 3.95% 2/15/23 | 5,510,000 | 5,620,292 | |
| 3.95% 11/15/27 | 3,676,000 | 3,647,699 | |
| 4.1% 10/1/24 | 4,251,000 | 4,320,077 | |
| 4.55% 10/1/29 | 4,524,000 | 4,623,613 | |
| Digital Realty Trust LP: | |||
| 3.4% 10/1/20 | 4,915,000 | 5,011,729 | |
| 3.95% 7/1/22 | 3,320,000 | 3,467,865 | |
| 4.75% 10/1/25 | 3,533,000 | 3,840,090 | |
| 5.25% 3/15/21 | 1,953,000 | 2,095,058 | |
| Liberty Property LP: | |||
| 3.375% 6/15/23 | 2,202,000 | 2,230,938 | |
| 4.125% 6/15/22 | 2,007,000 | 2,107,700 | |
| 4.4% 2/15/24 | 4,876,000 | 5,201,556 | |
| 4.75% 10/1/20 | 4,185,000 | 4,401,614 | |
| Mack-Cali Realty LP: | |||
| 3.15% 5/15/23 | 4,988,000 | 4,638,426 | |
| 4.5% 4/18/22 | 1,218,000 | 1,220,243 | |
| Post Apartment Homes LP 3.375% 12/1/22 | 790,000 | 800,759 | |
| Tanger Properties LP: | |||
| 3.125% 9/1/26 | 2,589,000 | 2,463,736 | |
| 3.75% 12/1/24 | 2,960,000 | 2,974,782 | |
| 3.875% 12/1/23 | 1,792,000 | 1,826,308 | |
| Ventas Realty LP: | |||
| 3.125% 6/15/23 | 1,289,000 | 1,289,349 | |
| 3.5% 2/1/25 | 6,443,000 | 6,489,513 | |
| 4.125% 1/15/26 | 1,557,000 | 1,624,623 | |
| 4.375% 2/1/45 | 763,000 | 785,498 | |
| Ventas Realty LP/Ventas Capital Corp.: | |||
| 2% 2/15/18 | 2,696,000 | 2,695,847 | |
| 4% 4/30/19 | 1,357,000 | 1,381,592 | |
| 74,758,907 | |||
| TOTAL REAL ESTATE | 179,147,426 | ||
| TELECOMMUNICATION SERVICES - 0.7% | |||
| Diversified Telecommunication Services - 0.7% | |||
| AT&T, Inc.: | |||
| 2.45% 6/30/20 | 3,187,000 | 3,183,306 | |
| 3.6% 2/17/23 | 6,635,000 | 6,786,467 | |
| 4.5% 3/9/48 | 10,800,000 | 10,110,413 | |
| 5.875% 10/1/19 | 4,711,000 | 4,990,755 | |
| Verizon Communications, Inc.: | |||
| 5.012% 4/15/49 | 1,664,000 | 1,743,621 | |
| 5.012% 8/21/54 | 9,569,000 | 9,753,108 | |
| 5.5% 3/16/47 | 3,802,000 | 4,328,339 | |
| 40,896,009 | |||
| UTILITIES - 1.6% | |||
| Electric Utilities - 1.1% | |||
| Duquesne Light Holdings, Inc.: | |||
| 5.9% 12/1/21 (a) | 2,664,000 | 2,945,226 | |
| 6.4% 9/15/20 (a) | 7,513,000 | 8,215,218 | |
| Eversource Energy: | |||
| 1.45% 5/1/18 | 1,125,000 | 1,123,218 | |
| 2.8% 5/1/23 | 5,110,000 | 5,083,917 | |
| FirstEnergy Corp.: | |||
| 4.25% 3/15/23 | 11,729,000 | 12,248,769 | |
| 7.375% 11/15/31 | 5,897,000 | 7,950,521 | |
| FirstEnergy Solutions Corp. 6.05% 8/15/21 | 7,286,000 | 3,023,690 | |
| IPALCO Enterprises, Inc.: | |||
| 3.45% 7/15/20 | 7,767,000 | 7,844,670 | |
| 3.7% 9/1/24 (a) | 2,157,000 | 2,154,558 | |
| LG&E and KU Energy LLC 3.75% 11/15/20 | 525,000 | 541,610 | |
| Nevada Power Co. 6.5% 5/15/18 | 3,165,000 | 3,219,335 | |
| NV Energy, Inc. 6.25% 11/15/20 | 1,238,000 | 1,359,522 | |
| PG&E Corp. 2.4% 3/1/19 | 600,000 | 600,316 | |
| Progress Energy, Inc. 4.4% 1/15/21 | 4,274,000 | 4,479,847 | |
| TECO Finance, Inc. 5.15% 3/15/20 | 1,545,000 | 1,625,976 | |
| 62,416,393 | |||
| Gas Utilities - 0.0% | |||
| Southern Natural Gas Co./Southern Natural Issuing Corp. 4.4% 6/15/21 | 1,182,000 | 1,236,814 | |
| Independent Power and Renewable Electricity Producers - 0.1% | |||
| Emera U.S. Finance LP: | |||
| 2.15% 6/15/19 | 1,201,000 | 1,196,219 | |
| 2.7% 6/15/21 | 1,182,000 | 1,179,003 | |
| 3.55% 6/15/26 | 1,891,000 | 1,895,925 | |
| 4,271,147 | |||
| Multi-Utilities - 0.4% | |||
| Dominion Resources, Inc. 3 month U.S. LIBOR + 2.300% 3.6328% 9/30/66 (b)(c) | 15,230,000 | 14,335,238 | |
| Puget Energy, Inc.: | |||
| 6% 9/1/21 | 4,807,000 | 5,317,651 | |
| 6.5% 12/15/20 | 1,534,000 | 1,698,024 | |
| Wisconsin Energy Corp. 3 month U.S. LIBOR + 2.113% 3.5284% 5/15/67 (b)(c) | 1,426,000 | 1,378,785 | |
| 22,729,698 | |||
| TOTAL UTILITIES | 90,654,052 | ||
| TOTAL NONCONVERTIBLE BONDS | |||
| (Cost $1,670,912,288) | 1,723,987,196 | ||
| U.S. Government and Government Agency Obligations - 43.4% | |||
| U.S. Treasury Inflation-Protected Obligations - 7.9% | |||
| U.S. Treasury Inflation-Indexed Bonds: | |||
| 0.75% 2/15/45 | $50,425,687 | $50,818,641 | |
| 0.875% 2/15/47 | 3,177,891 | 3,311,244 | |
| 1% 2/15/46 | 13,522,850 | 14,485,247 | |
| 1.375% 2/15/44 | 47,176,843 | 54,610,262 | |
| U.S. Treasury Inflation-Indexed Notes: | |||
| 0.125% 7/15/24 | 58,506,342 | 57,871,549 | |
| 0.125% 7/15/26 | 38,691,904 | 37,848,424 | |
| 0.25% 1/15/25 | 51,230,082 | 50,825,190 | |
| 0.375% 1/15/27 | 42,029,711 | 41,774,857 | |
| 0.375% 7/15/27 | 65,039,220 | 64,763,720 | |
| 0.625% 1/15/26 | 62,285,400 | 63,350,989 | |
| TOTAL U.S. TREASURY INFLATION-PROTECTED OBLIGATIONS | 439,660,123 | ||
| U.S. Treasury Obligations - 35.5% | |||
| U.S. Treasury Bonds: | |||
| 3% 5/15/45 (d)(e) | 42,484,000 | 44,568,030 | |
| 3% 11/15/45 | 38,163,000 | 40,034,863 | |
| 3% 2/15/47 | 113,300,000 | 119,024,154 | |
| 3% 5/15/47 | 49,138,000 | 51,605,154 | |
| U.S. Treasury Notes: | |||
| 1.125% 2/28/19 | 220,000,000 | 218,185,196 | |
| 1.25% 3/31/21 | 27,924,000 | 27,232,639 | |
| 1.25% 10/31/21 | 264,057,000 | 255,788,818 | |
| 1.75% 12/31/20 | 11,000,000 | 10,922,705 | |
| 1.875% 3/31/22 | 249,649,000 | 246,811,150 | |
| 1.875% 7/31/22 | 250,804,000 | 247,377,935 | |
| 2% 12/31/21 | 437,319,000 | 435,071,921 | |
| 2.125% 7/31/24 | 122,131,000 | 120,652,570 | |
| 2.125% 11/30/24 | 41,481,000 | 40,926,586 | |
| 2.25% 10/31/24 | 35,630,000 | 35,457,249 | |
| 2.25% 12/31/24 | 98,685,000 | 98,128,931 | |
| TOTAL U.S. TREASURY OBLIGATIONS | 1,991,787,901 | ||
| TOTAL U.S. GOVERNMENT AND GOVERNMENT AGENCY OBLIGATIONS | |||
| (Cost $2,439,436,187) | 2,431,448,024 | ||
| U.S. Government Agency - Mortgage Securities - 20.8% | |||
| Fannie Mae - 10.8% | |||
| 12 month U.S. LIBOR + 1.480% 3.312% 7/1/34 (b)(c) | 29,876 | 30,972 | |
| 12 month U.S. LIBOR + 1.553% 3.322% 6/1/36 (b)(c) | 36,079 | 37,060 | |
| 12 month U.S. LIBOR + 1.725% 2.592% 6/1/42 (b)(c) | 303,975 | 313,954 | |
| 12 month U.S. LIBOR + 1.728% 3.418% 11/1/36 (b)(c) | 376,877 | 392,230 | |
| 12 month U.S. LIBOR + 1.745% 3.398% 7/1/35 (b)(c) | 29,994 | 31,222 | |
| 12 month U.S. LIBOR + 1.788% 3.413% 2/1/36 (b)(c) | 265,588 | 277,182 | |
| 12 month U.S. LIBOR + 1.800% 3.562% 7/1/41 (b)(c) | 271,303 | 286,327 | |
| 12 month U.S. LIBOR + 1.805% 3.029% 10/1/41 (b)(c) | 84,889 | 88,580 | |
| 12 month U.S. LIBOR + 1.815% 3.565% 11/1/40 (b)(c) | 79,113 | 82,723 | |
| 12 month U.S. LIBOR + 1.818% 3.015% 9/1/41 (b)(c) | 177,387 | 186,642 | |
| 12 month U.S. LIBOR + 1.818% 3.257% 7/1/41 (b)(c) | 219,646 | 229,606 | |
| 12 month U.S. LIBOR + 1.820% 3.445% 12/1/35 (b)(c) | 182,860 | 192,225 | |
| 12 month U.S. LIBOR + 1.830% 3.36% 10/1/41 (b)(c) | 150,070 | 155,132 | |
| 12 month U.S. LIBOR + 1.900% 3.745% 7/1/37 (b)(c) | 38,327 | 39,749 | |
| 12 month U.S. LIBOR + 1.906% 3.688% 5/1/36 (b)(c) | 173,833 | 183,150 | |
| 12 month U.S. LIBOR + 1.932% 3.695% 9/1/36 (b)(c) | 276,848 | 291,257 | |
| 6 month U.S. LIBOR + 1.313% 2.747% 5/1/34 (b)(c) | 343,469 | 349,412 | |
| 6 month U.S. LIBOR + 1.383% 2.752% 9/1/33 (b)(c) | 258,922 | 263,676 | |
| 6 month U.S. LIBOR + 1.556% 3.047% 10/1/33 (b)(c) | 13,197 | 13,586 | |
| 6 month U.S. LIBOR + 1.565% 2.94% 7/1/35 (b)(c) | 18,095 | 18,596 | |
| U.S. TREASURY 1 YEAR INDEX + 1.945% 3.04% 10/1/33 (b)(c) | 312,787 | 325,540 | |
| U.S. TREASURY 1 YEAR INDEX + 2.208% 3.083% 3/1/35 (b)(c) | 17,830 | 18,842 | |
| U.S. TREASURY 1 YEAR INDEX + 2.232% 3.034% 8/1/36 (b)(c) | 744,533 | 788,584 | |
| U.S. TREASURY 1 YEAR INDEX + 2.295% 3.54% 10/1/33 (b)(c) | 32,517 | 34,344 | |
| U.S. TREASURY 1 YEAR INDEX + 2.475% 3.414% 5/1/35 (b)(c) | 71,696 | 76,132 | |
| 2.5% 11/1/31 to 1/1/43 | 32,274,672 | 32,119,179 | |
| 3% 11/1/24 to 1/1/48 | 192,528,247 | 194,468,864 | |
| 3.5% 12/1/20 to 6/1/47 | 145,027,907 | 149,643,459 | |
| 3.5% 1/1/48 (f) | 9,250,000 | 9,500,869 | |
| 4% 11/1/31 to 10/1/47 | 99,549,590 | 104,625,981 | |
| 4.5% 5/1/25 to 2/1/47 | 35,172,299 | 37,652,425 | |
| 4.5% 1/1/48 (f) | 9,200,000 | 9,788,369 | |
| 5% 9/1/20 to 11/1/44 | 20,281,652 | 21,974,289 | |
| 5.5% 3/1/18 to 3/1/41 | 20,488,184 | 22,722,195 | |
| 6% 10/1/34 to 1/1/42 | 15,319,851 | 17,191,986 | |
| 6.5% 5/1/18 to 8/1/36 | 1,692,981 | 1,923,012 | |
| 7% 11/1/23 to 8/1/32 | 474,666 | 533,027 | |
| 7.5% 9/1/22 to 11/1/31 | 345,253 | 396,896 | |
| 8% 1/1/30 to 3/1/30 | 2,065 | 2,341 | |
| 8.5% 3/1/25 to 6/1/25 | 420 | 483 | |
| TOTAL FANNIE MAE | 607,250,098 | ||
| Freddie Mac - 6.1% | |||
| 12 month U.S. LIBOR + 1.375% 3.04% 3/1/36 (b)(c) | 86,101 | 88,823 | |
| 12 month U.S. LIBOR + 1.877% 3.212% 4/1/41 (b)(c) | 154,571 | 161,735 | |
| 12 month U.S. LIBOR + 1.880% 3.22% 9/1/41 (b)(c) | 170,356 | 177,856 | |
| 12 month U.S. LIBOR + 1.910% 3.277% 6/1/41 (b)(c) | 176,093 | 184,216 | |
| 12 month U.S. LIBOR + 1.910% 3.411% 5/1/41 (b)(c) | 165,267 | 173,163 | |
| 12 month U.S. LIBOR + 1.910% 3.588% 5/1/41 (b)(c) | 227,842 | 238,808 | |
| 12 month U.S. LIBOR + 1.910% 3.685% 6/1/41 (b)(c) | 205,929 | 215,838 | |
| 12 month U.S. LIBOR + 2.160% 3.66% 11/1/35 (b)(c) | 91,672 | 96,829 | |
| 12 month U.S. LIBOR + 2.197% 3.771% 3/1/33 (b)(c) | 2,004 | 2,106 | |
| 6 month U.S. LIBOR + 1.655% 3.147% 4/1/35 (b)(c) | 163,933 | 169,913 | |
| 6 month U.S. LIBOR + 2.755% 4.205% 10/1/35 (b)(c) | 53,103 | 56,388 | |
| U.S. TREASURY 1 YEAR INDEX + 2.248% 2.972% 1/1/35 (b)(c) | 42,714 | 44,873 | |
| 2.5% 7/1/31 | 1,862,872 | 1,864,777 | |
| 3% 10/1/28 to 1/1/47 | 102,018,084 | 102,654,783 | |
| 3.5% 3/1/32 to 5/1/46 | 131,529,480 | 136,328,526 | |
| 3.5% 1/1/48 (f) | 1,700,000 | 1,746,238 | |
| 4% 6/1/24 to 6/1/47 | 60,033,363 | 63,251,743 | |
| 4.5% 7/1/25 to 1/1/45 | 21,050,800 | 22,564,447 | |
| 5% 1/1/35 to 6/1/41 | 3,606,612 | 3,943,255 | |
| 5.5% 1/1/38 to 6/1/41 | 5,611,009 | 6,229,625 | |
| 6% 4/1/32 to 8/1/37 | 875,589 | 986,518 | |
| 7.5% 5/1/26 to 11/1/31 | 38,665 | 44,620 | |
| 8% 4/1/27 to 5/1/27 | 2,691 | 3,103 | |
| 8.5% 9/1/26 to 1/1/28 | 8,528 | 9,608 | |
| TOTAL FREDDIE MAC | 341,237,791 | ||
| Ginnie Mae - 3.9% | |||
| 3.5% 1/15/41 to 7/15/43 | 12,460,294 | 12,940,284 | |
| 4% 2/15/40 to 5/20/47 | 50,781,556 | 53,547,517 | |
| 4.5% 5/15/39 to 5/20/41 | 15,194,422 | 16,303,772 | |
| 5% 3/15/39 to 4/15/41 | 2,389,461 | 2,597,866 | |
| 6.5% 4/15/35 to 11/15/35 | 80,096 | 92,557 | |
| 7% 1/15/28 to 7/15/32 | 1,055,241 | 1,221,650 | |
| 7.5% 4/15/22 to 10/15/28 | 244,086 | 278,482 | |
| 8% 3/15/30 to 9/15/30 | 14,632 | 17,663 | |
| 8.5% 3/15/30 | 1,815 | 1,897 | |
| 3% 12/20/42 to 12/20/46 | 81,817,682 | 82,690,761 | |
| 3.5% 1/1/48 (f) | 50,000 | 51,712 | |
| 3.5% 1/1/48 (f) | 45,400,000 | 46,954,705 | |
| TOTAL GINNIE MAE | 216,698,866 | ||
| TOTAL U.S. GOVERNMENT AGENCY - MORTGAGE SECURITIES | |||
| (Cost $1,169,513,996) | 1,165,186,755 | ||
| Asset-Backed Securities - 0.7% | |||
| Accredited Mortgage Loan Trust Series 2005-1 Class M1, 1 month U.S. LIBOR + 0.705% 2.2571% 4/25/35 (b)(c) | $234,160 | $233,824 | |
| Airspeed Ltd. Series 2007-1A Class C1, 1 month U.S. LIBOR + 2.500% 3.977% 6/15/32 (a)(b)(c)(g) | 1,714,995 | 1,035,362 | |
| Ameriquest Mortgage Securities, Inc. pass-thru certificates: | |||
| Series 2003-10 Class M1, 1 month U.S. LIBOR + 1.050% 2.6021% 12/25/33 (b)(c) | 11,737 | 11,489 | |
| Series 2004-R2 Class M3, 1 month U.S. LIBOR + 0.825% 2.3771% 4/25/34 (b)(c) | 31,593 | 29,354 | |
| Argent Securities, Inc. pass-thru certificates: | |||
| Series 2003-W7 Class A2, 1 month U.S. LIBOR + 0.780% 2.3321% 3/25/34 (b)(c) | 16,878 | 16,128 | |
| Series 2004-W11 Class M2, 1 month U.S. LIBOR + 1.050% 2.6021% 11/25/34 (b)(c) | 149,622 | 150,895 | |
| Series 2004-W7 Class M1, 1 month U.S. LIBOR + 0.825% 2.3771% 5/25/34 (b)(c) | 155,352 | 155,905 | |
| Series 2006-W4 Class A2C, 1 month U.S. LIBOR + 0.160% 1.7121% 5/25/36 (b)(c) | 379,148 | 145,554 | |
| Asset Backed Securities Corp. Home Equity Loan Trust Series 2004-HE2 Class M1, 1 month U.S. LIBOR + 0.825% 2.1536% 4/25/34 (b)(c) | 467,295 | 448,318 | |
| Blackbird Capital Aircraft Series 2016-1A: | |||
| Class A, 4.213% 12/16/41 (a) | 9,264,937 | 9,568,577 | |
| Class AA, 2.487% 12/16/41 (a) | 2,243,646 | 2,222,828 | |
| Capital Auto Receivables Asset Trust Series 2016-1 Class A3, 1.73% 4/20/20 | 4,129,505 | 4,126,280 | |
| Carrington Mortgage Loan Trust Series 2007-RFC1 Class A3, 1 month U.S. LIBOR + 0.140% 1.4686% 12/25/36 (b)(c) | 635,000 | 535,793 | |
| Countrywide Home Loans, Inc.: | |||
| Series 2003-BC1 Class B1, 1 month U.S. LIBOR + 5.250% 6.8021% 3/25/32 (b)(c) | 11,075 | 11,471 | |
| Series 2004-3 Class M4, 1 month U.S. LIBOR + 1.455% 3.0071% 4/25/34 (b)(c) | 18,031 | 17,301 | |
| Series 2004-4 Class M2, 1 month U.S. LIBOR + 0.795% 2.3471% 6/25/34 (b)(c) | 26,568 | 26,669 | |
| Series 2004-7 Class AF5, 5.868% 1/25/35 | 390,078 | 394,692 | |
| Credit Suisse First Boston Mortgage Securities Corp. Series 2003-5 Class A2, 1 month U.S. LIBOR + 0.700%2.0286% 12/25/33 (b)(c) | 11,595 | 11,269 | |
| DB Master Finance LLC Series 2017-1A: | |||
| Class A2I, 3.629% 11/20/47 (a) | 3,561,000 | 3,571,906 | |
| Class A2II, 4.03% 11/20/47 (a) | 6,028,000 | 6,167,844 | |
| Fannie Mae Series 2004-T5 Class AB3, 1 month U.S. LIBOR + 0.392% 2.054% 5/28/35 (b)(c) | 13,702 | 13,205 | |
| Fieldstone Mortgage Investment Corp. Series 2004-3 Class M5, 1 month U.S. LIBOR + 2.175% 3.7271% 8/25/34 (b)(c) | 71,945 | 69,594 | |
| First Franklin Mortgage Loan Trust Series 2004-FF2 Class M3, 1 month U.S. LIBOR + 0.825% 2.3771% 3/25/34 (b)(c) | 616 | 549 | |
| Ford Credit Floorplan Master Owner Trust Series 2015-1 Class B, 1.62% 1/15/20 | 5,416,000 | 5,415,402 | |
| Fremont Home Loan Trust Series 2005-A: | |||
| Class M3, 1 month U.S. LIBOR + 0.735% 2.2871% 1/25/35 (b)(c) | 334,000 | 330,706 | |
| Class M4, 1 month U.S. LIBOR + 1.020% 2.5721% 1/25/35 (b)(c) | 122,221 | 96,635 | |
| GCO Education Loan Funding Master Trust II Series 2007-1A Class C1L, 3 month U.S. LIBOR + 0.380% 1.8421% 2/25/47 (a)(b)(c) | 105,671 | 100,738 | |
| GSAMP Trust Series 2004-AR1 Class B4, 5.5% 6/25/34 (a) | 48,440 | 4,044 | |
| Home Equity Asset Trust Series 2003-3 Class M1, 1 month U.S. LIBOR + 1.290% 2.8421% 8/25/33 (b)(c) | 113,356 | 112,075 | |
| HSI Asset Securitization Corp. Trust Series 2007-HE1 Class 2A3, 1 month U.S. LIBOR + 0.190% 1.7421% 1/25/37 (b)(c) | 407,528 | 281,449 | |
| MASTR Asset Backed Securities Trust Series 2007-HE1 Class M1, 1 month U.S. LIBOR + 0.300% 1.6286% 5/25/37 (b)(c) | 89,027 | 26,090 | |
| Merrill Lynch Mortgage Investors Trust: | |||
| Series 2003-OPT1 Class M1, 1 month U.S. LIBOR + 0.975% 2.5271% 7/25/34 (b)(c) | 6,598 | 6,505 | |
| Series 2006-FM1 Class A2B, 1 month U.S. LIBOR + 0.110% 1.4375% 4/25/37 (b)(c) | 771 | 475 | |
| Series 2006-OPT1 Class A1A, 1 month U.S. LIBOR + 0.520% 2.0721% 6/25/35 (b)(c) | 184,073 | 178,605 | |
| Morgan Stanley ABS Capital I Trust: | |||
| Series 2004-HE6 Class A2, 1 month U.S. LIBOR + 0.680% 2.2321% 8/25/34 (b)(c) | 20,187 | 19,564 | |
| Series 2004-NC6 Class M3, 1 month U.S. LIBOR + 2.175% 3.7271% 7/25/34 (b)(c) | 41,519 | 40,853 | |
| Series 2004-NC8 Class M6, 1 month U.S. LIBOR + 1.875% 3.4271% 9/25/34 (b)(c) | 49,170 | 49,587 | |
| Series 2005-NC1 Class M1, 1 month U.S. LIBOR + 0.660% 2.2121% 1/25/35 (b)(c) | 35,692 | 34,931 | |
| New Century Home Equity Loan Trust Series 2005-4 Class M2, 1 month U.S. LIBOR + 0.510% 2.0621% 9/25/35 (b)(c) | 503,000 | 499,232 | |
| Park Place Securities, Inc.: | |||
| Series 2004-WCW1: | |||
| Class M3, 1 month U.S. LIBOR + 1.875% 3.2036% 9/25/34 (b)(c) | 163,238 | 164,623 | |
| Class M4, 1 month U.S. LIBOR + 2.175% 3.5036% 9/25/34 (b)(c) | 241,000 | 218,307 | |
| Series 2005-WCH1 Class M4, 1 month U.S. LIBOR + 1.245% 2.7971% 1/25/36 (b)(c) | 520,000 | 522,504 | |
| Salomon Brothers Mortgage Securities VII, Inc. Series 2003-HE1 Class A, 1 month U.S. LIBOR + 0.800% 2.3521% 4/25/33 (b)(c) | 1,796 | 1,657 | |
| Saxon Asset Securities Trust Series 2004-1 Class M1, 1 month U.S. LIBOR + 0.795% 2.1225% 3/25/35 (b)(c) | 161,924 | 158,429 | |
| SLM Private Credit Student Loan Trust Series 2004-A Class C, 3 month U.S. LIBOR + 0.950% 2.5385% 6/15/33 (b)(c) | 21,227 | 21,205 | |
| Structured Asset Investment Loan Trust Series 2004-8 Class M5, 1 month U.S. LIBOR + 1.725% 3.2771% 9/25/34 (b)(c) | 11,449 | 11,238 | |
| Terwin Mortgage Trust Series 2003-4HE Class A1, 1 month U.S. LIBOR + 0.860% 2.1886% 9/25/34 (b)(c) | 10,148 | 9,719 | |
| TOTAL ASSET-BACKED SECURITIES | |||
| (Cost $36,978,172) | 37,269,380 | ||
| Collateralized Mortgage Obligations - 0.2% | |||
| Private Sponsor - 0.0% | |||
| Bear Stearns ALT-A Trust floater Series 2005-1 Class A1, 1 month U.S. LIBOR + 0.560% 2.1121% 1/25/35 (b)(c) | 152,011 | 152,700 | |
| Merrill Lynch Alternative Note Asset Trust floater Series 2007-OAR1 Class A1, 1 month U.S. LIBOR + 0.170% 1.4079% 2/25/37 (b)(c) | 94,795 | 93,479 | |
| Opteum Mortgage Acceptance Corp. floater Series 2005-3 Class APT, 1 month U.S. LIBOR + 0.290% 1.6186% 7/25/35 (b)(c) | 141,076 | 139,534 | |
| RESI Finance LP/RESI Finance DE Corp. floater Series 2003-B Class B5, 1 month U.S. LIBOR + 2.350% 3.5961% 6/10/35 (a)(b)(c) | 33,607 | 24,167 | |
| Sequoia Mortgage Trust floater Series 2004-6 Class A3B, 6 month U.S. LIBOR + 0.880% 2.3127% 7/20/34 (b)(c) | 5,949 | 5,877 | |
| TOTAL PRIVATE SPONSOR | 415,757 | ||
| U.S. Government Agency - 0.2% | |||
| Fannie Mae planned amortization class: | |||
| Series 1999-54 Class PH, 6.5% 11/18/29 | 287,581 | 301,562 | |
| Series 1999-57 Class PH, 6.5% 12/25/29 | 299,771 | 336,574 | |
| Ginnie Mae guaranteed REMIC pass-thru certificates: | |||
| sequential payer Series 2013-H06 Class HA, 1.65% 1/20/63 (h) | 4,342,940 | 4,308,203 | |
| Series 2007-35 Class SC, 40.200% - 1 month U.S. LIBOR 31.2553% 6/16/37 (b)(i) | 31,103 | 54,418 | |
| Series 2015-H21 Class JA, 2.5% 6/20/65 (h) | 4,739,670 | 4,746,666 | |
| TOTAL U.S. GOVERNMENT AGENCY | 9,747,423 | ||
| TOTAL COLLATERALIZED MORTGAGE OBLIGATIONS | |||
| (Cost $10,072,717) | 10,163,180 | ||
| Commercial Mortgage Securities - 0.6% | |||
| Bayview Commercial Asset Trust floater: | |||
| Series 2005-4A: | |||
| Class A2, 1 month U.S. LIBOR + 0.390% 1.9421% 1/25/36 (a)(b)(c) | 296,280 | 277,572 | |
| Class M1, 1 month U.S. LIBOR + 0.450% 2.0021% 1/25/36 (a)(b)(c) | 61,992 | 57,681 | |
| Class M2, 1 month U.S. LIBOR + 0.470% 2.0221% 1/25/36 (a)(b)(c) | 18,702 | 17,256 | |
| Class M3, 1 month U.S. LIBOR + 0.500% 2.0521% 1/25/36 (a)(b)(c) | 27,186 | 24,862 | |
| Series 2007-1 Class A2, 1 month U.S. LIBOR + 0.270% 1.8221% 3/25/37 (a)(b)(c) | 79,190 | 73,599 | |
| Series 2007-2A: | |||
| Class A1, 1 month U.S. LIBOR + 0.270% 1.5079% 7/25/37 (a)(b)(c) | 84,942 | 81,091 | |
| Class A2, 1 month U.S. LIBOR + 0.320% 1.5579% 7/25/37 (a)(b)(c) | 79,506 | 75,221 | |
| Class M2, 1 month U.S. LIBOR + 0.410% 1.6479% 7/25/37 (a)(b)(c) | 44,170 | 36,106 | |
| Class M3, 1 month U.S. LIBOR + 0.490% 1.7279% 7/25/37 (a)(b)(c) | 35,417 | 28,480 | |
| Series 2007-3: | |||
| Class A2, 1 month U.S. LIBOR + 0.290% 1.5279% 7/25/37 (a)(b)(c) | 115,761 | 108,027 | |
| Class M1, 1 month U.S. LIBOR + 0.310% 1.5479% 7/25/37 (a)(b)(c) | 47,423 | 44,265 | |
| Class M2, 1 month U.S. LIBOR + 0.340% 1.5779% 7/25/37 (a)(b)(c) | 49,855 | 46,310 | |
| Class M3, 1 month U.S. LIBOR + 0.370% 1.6079% 7/25/37 (a)(b)(c) | 108,951 | 93,699 | |
| Class M4, 1 month U.S. LIBOR + 0.500% 1.7379% 7/25/37 (a)(b)(c) | 172,182 | 143,575 | |
| Class M5, 1 month U.S. LIBOR + 0.600% 1.8379% 7/25/37 (a)(b)(c) | 47,421 | 36,871 | |
| CGBAM Commercial Mortgage Trust Series 2015-SMRT Class D, 3.768% 4/10/28 (a) | 2,236,000 | 2,256,833 | |
| CSMC Series 2015-TOWN: | |||
| Class B, 1 month U.S. LIBOR + 1.900% 3.1503% 3/15/28 (a)(b)(c) | 870,000 | 870,001 | |
| Class C, 1 month U.S. LIBOR + 2.250% 3.5003% 3/15/28 (a)(b)(c) | 848,000 | 848,000 | |
| Class D, 1 month U.S. LIBOR + 3.200% 4.4503% 3/15/28 (a)(b)(c) | 1,283,000 | 1,283,796 | |
| GAHR Commercial Mortgage Trust Series 2015-NRF: | |||
| Class BFX, 3.4949% 12/15/34 (a)(b) | 4,550,000 | 4,602,602 | |
| Class CFX, 3.4949% 12/15/34 (a)(b) | 3,823,000 | 3,849,110 | |
| Class DFX, 3.4949% 12/15/34 (a)(b) | 3,240,000 | 3,251,757 | |
| MSCG Trust Series 2016-SNR: | |||
| Class A, 3.4596% 11/15/34 (a)(b) | 5,439,000 | 5,407,390 | |
| Class B, 4.181% 11/15/34 (a) | 1,920,000 | 1,923,800 | |
| Class C, 5.205% 11/15/34 (a) | 1,346,000 | 1,366,678 | |
| Providence Place Group Ltd. Partnership Series 2000-C1 Class A2, 7.75% 7/20/28 (a) | 4,244,727 | 5,192,150 | |
| TOTAL COMMERCIAL MORTGAGE SECURITIES | |||
| (Cost $31,276,662) | 31,996,732 | ||
| Municipal Securities - 1.8% | |||
| California Gen. Oblig.: | |||
| Series 2009, 7.35% 11/1/39 | $805,000 | $1,208,080 | |
| 6.65% 3/1/22 | 4,360,000 | 4,949,298 | |
| 7.5% 4/1/34 | 5,055,000 | 7,485,545 | |
| 7.55% 4/1/39 | 6,085,000 | 9,575,417 | |
| Chicago Gen. Oblig. (Taxable Proj.): | |||
| Series 2008 B, 5.63% 1/1/22 | 880,000 | 893,658 | |
| Series 2010 C1, 7.781% 1/1/35 | 10,090,000 | 12,090,847 | |
| Series 2012 B, 5.432% 1/1/42 | 1,205,000 | 1,160,427 | |
| Illinois Gen. Oblig.: | |||
| Series 2003: | |||
| 4.35% 6/1/18 | 1,008,000 | 1,015,066 | |
| 4.95% 6/1/23 | 4,950,000 | 5,165,523 | |
| 5.1% 6/1/33 | 4,805,000 | 4,797,024 | |
| Series 2010-1, 6.63% 2/1/35 | 12,290,000 | 13,638,459 | |
| Series 2010-3: | |||
| 5.547% 4/1/19 | 120,000 | 123,186 | |
| 6.725% 4/1/35 | 9,480,000 | 10,527,919 | |
| 7.35% 7/1/35 | 5,540,000 | 6,405,182 | |
| Series 2010-5, 6.2% 7/1/21 | 1,808,000 | 1,891,747 | |
| Series 2011: | |||
| 5.665% 3/1/18 | 4,465,000 | 4,489,290 | |
| 5.877% 3/1/19 | 14,325,000 | 14,771,367 | |
| Series 2013, 3.14% 12/1/18 | 1,270,000 | 1,270,864 | |
| TOTAL MUNICIPAL SECURITIES | |||
| (Cost $97,621,541) | 101,458,899 | ||
| Bank Notes - 1.2% | |||
| Capital One NA: | |||
| 1.65% 2/5/18 | 20,761,000 | 20,760,439 | |
| 2.95% 7/23/21 | 5,645,000 | 5,678,055 | |
| Discover Bank: | |||
| (Delaware) 3.2% 8/9/21 | 6,841,000 | 6,939,064 | |
| 3.1% 6/4/20 | 6,380,000 | 6,455,323 | |
| 8.7% 11/18/19 | 1,503,000 | 1,652,474 | |
| KeyBank NA: | |||
| 2.25% 3/16/20 | 9,000,000 | 8,973,093 | |
| 6.95% 2/1/28 | 800,000 | 1,010,480 | |
| PNC Bank NA 2.3% 6/1/20 | 1,450,000 | 1,448,478 | |
| RBS Citizens NA 2.5% 3/14/19 | 2,751,000 | 2,757,321 | |
| Regions Bank 7.5% 5/15/18 | 13,237,000 | 13,502,032 | |
| TOTAL BANK NOTES | |||
| (Cost $68,535,605) | 69,176,759 | ||
| Shares | Value | ||
| Money Market Funds - 3.0% | |||
| Fidelity Cash Central Fund, 1.36% (j) | |||
| (Cost $167,730,286) | 167,710,423 | 167,743,965 | |
| TOTAL INVESTMENT IN SECURITIES - 102.4% | |||
| (Cost $5,692,077,454) | 5,738,430,890 | ||
| NET OTHER ASSETS (LIABILITIES) - (2.4)% | (133,348,651) | ||
| NET ASSETS - 100% | $5,605,082,239 |
| TBA Sale Commitments | ||
| Principal Amount | Value | |
| Fannie Mae | ||
| 3% 1/1/48 | ||
| (Proceeds $6,205,813) | $(6,200,000) | $(6,202,203) |
Swaps
| Underlying Reference | Rating(1) | Maturity Date | Clearinghouse/Counterparty | Fixed Payment Received/(Paid) | Payment Frequency | Notional Amount(2) | Value(1) | Upfront Premium Received/(Paid) | Unrealized Appreciation/(Depreciation) |
| Credit Default Swaps | |||||||||
| Sell Protection | |||||||||
| Ameriquest Mortgage Securities Inc Series 2004-R11 Class M9 | C | Dec. 2034 | Bank of America | 4.25% | Monthly | $64,579 | $(62,626) | $0 | $(62,626) |
(1) Ratings are presented for credit default swaps in which the Fund has sold protection on the underlying referenced debt. Ratings for an underlying index represent a weighted average of the ratings of all securities included in the index. The credit rating or value can be measures of the current payment/performance risk. Ratings are from Moody's Investors Service, Inc. Where Moody's® ratings are not available, S&P® ratings are disclosed and are indicated as such. All ratings are as of the report date and do not reflect subsequent changes.
(2) The notional amount of each credit default swap where the Fund has sold protection approximates the maximum potential amount of future payments that the Fund could be required to make if a credit event were to occur.
Legend
(a) Security exempt from registration under Rule 144A of the Securities Act of 1933. These securities may be resold in transactions exempt from registration, normally to qualified institutional buyers. At the end of the period, the value of these securities amounted to $225,458,642 or 4.0% of net assets.
(b) Coupon rates for floating and adjustable rate securities reflect the rates in effect at period end.
(c) Coupon is indexed to a floating interest rate which may be multiplied by a specified factor and/or subject to caps or floors.
(d) Security or a portion of the security has been segregated as collateral for open bi-lateral over-the-counter (OTC) swaps. At period end, the value of securities pledged amounted to $95,464.
(e) Security or a portion of the security has been segregated as collateral for mortgage-backed or asset-backed securities purchased on a delayed delivery or when-issued basis. At period end, the value of securities pledged amounted to $74,483.
(f) Security or a portion of the security purchased on a delayed delivery or when-issued basis.
(g) Level 3 security
(h) Represents an investment in an underlying pool of reverse mortgages which typically do not require regular principal and interest payments as repayment is deferred until a maturity event.
(i) Coupon is inversely indexed to a floating interest rate multiplied by a specified factor. The price may be considerably more volatile than the price of a comparable fixed rate security.
(j) Affiliated fund that is generally available only to investment companies and other accounts managed by Fidelity Investments. The rate quoted is the annualized seven-day yield of the fund at period end. A complete unaudited listing of the fund's holdings as of its most recent quarter end is available upon request. In addition, each Fidelity Central Fund's financial statements, which are not covered by the Fund's Report of Independent Registered Public Accounting Firm, are available on the SEC's website or upon request.
Affiliated Central Funds
Information regarding fiscal year to date income earned by the Fund from investments in Fidelity Central Funds is as follows:
| Fund | Income earned |
| Fidelity Cash Central Fund | $2,909,800 |
| Total | $2,909,800 |
Amounts in the income column in the above table include any capital gain distributions from underlying funds, which are presented in the corresponding line-item in the Statement of Operations if applicable.
Investment Valuation
The following is a summary of the inputs used, as of December 31, 2017, involving the Fund's assets and liabilities carried at fair value. The inputs or methodology used for valuing securities may not be an indication of the risk associated with investing in those securities. For more information on valuation inputs, and their aggregation into the levels used below, please refer to the Investment Valuation section in the accompanying Notes to Financial Statements.
| Valuation Inputs at Reporting Date: | ||||
| Description | Total | Level 1 | Level 2 | Level 3 |
| Investments in Securities: | ||||
| Corporate Bonds | $1,723,987,196 | $-- | $1,723,987,196 | $-- |
| U.S. Government and Government Agency Obligations | 2,431,448,024 | -- | 2,431,448,024 | -- |
| U.S. Government Agency - Mortgage Securities | 1,165,186,755 | -- | 1,165,186,755 | -- |
| Asset-Backed Securities | 37,269,380 | -- | 36,234,018 | 1,035,362 |
| Collateralized Mortgage Obligations | 10,163,180 | -- | 10,163,180 | -- |
| Commercial Mortgage Securities | 31,996,732 | -- | 31,996,732 | -- |
| Municipal Securities | 101,458,899 | -- | 101,458,899 | -- |
| Bank Notes | 69,176,759 | -- | 69,176,759 | -- |
| Money Market Funds | 167,743,965 | 167,743,965 | -- | -- |
| Total Investments in Securities: | $5,738,430,890 | $167,743,965 | $5,569,651,563 | $1,035,362 |
| Derivative Instruments: | ||||
| Liabilities | ||||
| Swaps | $(62,626) | $-- | $(62,626) | $-- |
| Total Liabilities | $(62,626) | $-- | $(62,626) | $-- |
| Total Derivative Instruments: | $(62,626) | $-- | $(62,626) | $-- |
| Other Financial Instruments: | ||||
| TBA Sale Commitments | $(6,202,203) | $-- | $(6,202,203) | $-- |
| Total Other Financial Instruments: | $(6,202,203) | $-- | $(6,202,203) | $-- |
Value of Derivative Instruments
The following table is a summary of the Fund's value of derivative instruments by primary risk exposure as of December 31, 2017. For additional information on derivative instruments, please refer to the Derivative Instruments section in the accompanying Notes to Financial Statements.
| Primary Risk Exposure / Derivative Type | Value | |
| Asset | Liability | |
| Credit Risk | ||
| Swaps(a) | $0 | $(62,626) |
| Total Credit Risk | 0 | (62,626) |
| Total Value of Derivatives | $0 | $(62,626) |
(a) For bi-lateral over-the-counter (OTC) swaps, reflects gross value which is presented in the Statement of Assets and Liabilities in the bi-lateral OTC swaps, at value line-items.
See accompanying notes which are an integral part of the financial statements.
Financial Statements
Statement of Assets and Liabilities
| December 31, 2017 | ||
| Assets | ||
| Investment in securities, at value — See accompanying schedule: Unaffiliated issuers (cost $5,524,347,168) | $5,570,686,925 | |
| Fidelity Central Funds (cost $167,730,286) | 167,743,965 | |
| Total Investment in Securities (cost $5,692,077,454) | $5,738,430,890 | |
| Receivable for investments sold | 1,175,478 | |
| Receivable for TBA sale commitments | 6,205,813 | |
| Receivable for fund shares sold | 29,312 | |
| Interest receivable | 38,525,491 | |
| Distributions receivable from Fidelity Central Funds | 146,444 | |
| Total assets | 5,784,513,428 | |
| Liabilities | ||
| Payable for investments purchased | ||
| Regular delivery | $104,229,206 | |
| Delayed delivery | 68,041,891 | |
| TBA sale commitments, at value | 6,202,203 | |
| Payable for fund shares redeemed | 38,392 | |
| Distributions payable | 843,026 | |
| Bi-lateral OTC swaps, at value | 62,626 | |
| Other payables and accrued expenses | 13,845 | |
| Total liabilities | 179,431,189 | |
| Net Assets | $5,605,082,239 | |
| Net Assets consist of: | ||
| Paid in capital | $5,563,628,842 | |
| Undistributed net investment income | 2,972,707 | |
| Accumulated undistributed net realized gain (loss) on investments | (7,813,730) | |
| Net unrealized appreciation (depreciation) on investments | 46,294,420 | |
| Net Assets, for 53,249,084 shares outstanding | $5,605,082,239 | |
| Net Asset Value, offering price and redemption price per share ($5,605,082,239 ÷ 53,249,084 shares) | $105.26 |
See accompanying notes which are an integral part of the financial statements.
Statement of Operations
| Year ended December 31, 2017 | ||
| Investment Income | ||
| Interest | $142,302,337 | |
| Income from Fidelity Central Funds | 2,909,800 | |
| Total income | 145,212,137 | |
| Expenses | ||
| Custodian fees and expenses | $82,027 | |
| Independent trustees' fees and expenses | 19,417 | |
| Total expenses before reductions | 101,444 | |
| Expense reductions | (48,088) | 53,356 |
| Net investment income (loss) | 145,158,781 | |
| Realized and Unrealized Gain (Loss) | ||
| Net realized gain (loss) on: | ||
| Investment securities: | ||
| Unaffiliated issuers | 14,046,003 | |
| Fidelity Central Funds | 36,041 | |
| Futures contracts | 134,294 | |
| Swaps | (105,203) | |
| Total net realized gain (loss) | 14,111,135 | |
| Change in net unrealized appreciation (depreciation) on: | ||
| Investment securities: | ||
| Unaffiliated issuers | 66,976,019 | |
| Fidelity Central Funds | (36,041) | |
| Futures contracts | 229,770 | |
| Swaps | 107,122 | |
| Delayed delivery commitments | 776,680 | |
| Total change in net unrealized appreciation (depreciation) | 68,053,550 | |
| Net gain (loss) | 82,164,685 | |
| Net increase (decrease) in net assets resulting from operations | $227,323,466 |
See accompanying notes which are an integral part of the financial statements.
Statement of Changes in Net Assets
| Year ended December 31, 2017 | Year ended December 31, 2016 | |
| Increase (Decrease) in Net Assets | ||
| Operations | ||
| Net investment income (loss) | $145,158,781 | $142,382,334 |
| Net realized gain (loss) | 14,111,135 | 11,373,066 |
| Change in net unrealized appreciation (depreciation) | 68,053,550 | 52,343,743 |
| Net increase (decrease) in net assets resulting from operations | 227,323,466 | 206,099,143 |
| Distributions to shareholders from net investment income | (150,350,808) | (139,322,055) |
| Distributions to shareholders from net realized gain | (24,485,599) | (55,196,827) |
| Total distributions | (174,836,407) | (194,518,882) |
| Share transactions | ||
| Proceeds from sales of shares | 633,714,833 | 301,340,992 |
| Reinvestment of distributions | 174,366,683 | 194,145,570 |
| Cost of shares redeemed | (120,993,297) | (253,096,192) |
| Net increase (decrease) in net assets resulting from share transactions | 687,088,219 | 242,390,370 |
| Total increase (decrease) in net assets | 739,575,278 | 253,970,631 |
| Net Assets | ||
| Beginning of period | 4,865,506,961 | 4,611,536,330 |
| End of period | $5,605,082,239 | $4,865,506,961 |
| Other Information | ||
| Undistributed net investment income end of period | $2,972,707 | $9,462,706 |
| Shares | ||
| Sold | 6,036,399 | 2,809,199 |
| Issued in reinvestment of distributions | 1,661,013 | 1,848,305 |
| Redeemed | (1,149,806) | (2,421,060) |
| Net increase (decrease) | 6,547,606 | 2,236,444 |
See accompanying notes which are an integral part of the financial statements.
Financial Highlights
Fidelity VIP Investment Grade Central Fund
| Years ended December 31, | 2017 | 2016 | 2015 | 2014 | 2013 |
| Selected Per–Share Data | |||||
| Net asset value, beginning of period | $104.18 | $103.71 | $106.70 | $103.29 | $108.89 |
| Income from Investment Operations | |||||
| Net investment income (loss)A | 2.887 | 3.167 | 3.292 | 3.178 | 2.829 |
| Net realized and unrealized gain (loss) | 1.693 | 1.659 | (3.071) | 3.336 | (4.398) |
| Total from investment operations | 4.580 | 4.826 | .221 | 6.514 | (1.569) |
| Distributions from net investment income | (2.985) | (3.096) | (3.137) | (3.104) | (2.826) |
| Distributions from net realized gain | (.515) | (1.260) | (.074) | – | (1.205) |
| Total distributions | (3.500) | (4.356) | (3.211) | (3.104) | (4.031) |
| Net asset value, end of period | $105.26 | $104.18 | $103.71 | $106.70 | $103.29 |
| Total ReturnB | 4.46% | 4.70% | .18% | 6.37% | (1.46)% |
| Ratios to Average Net AssetsC,D | |||||
| Expenses before reductionsE | -% | -% | -% | -% | -% |
| Expenses net of fee waivers, if anyE | -% | -% | -% | -% | -% |
| Expenses net of all reductionsE | -% | -% | -% | -% | -% |
| Net investment income (loss) | 2.75% | 3.00% | 3.11% | 3.01% | 2.68% |
| Supplemental Data | |||||
| Net assets, end of period (000 omitted) | $5,605,082 | $4,865,507 | $4,611,536 | $4,393,843 | $3,945,749 |
| Portfolio turnover rateF | 110% | 162% | 248% | 151% | 333% |
A Calculated based on average shares outstanding during the period.
B Total returns would have been lower if certain expenses had not been reduced during the applicable periods shown.
C Fees and expenses of any underlying Fidelity Central Funds are not included in the Fund's expense ratio. The Fund indirectly bears its proportionate share of the expenses of any underlying Fidelity Central Funds.
D Expense ratios reflect operating expenses of the Fund. Expenses before reductions do not reflect amounts reimbursed by the investment adviser or reductions from expense offset arrangements and do not represent the amount paid by the Fund during periods when reimbursements or reductions occur. Expenses net of fee waivers reflect expenses after reimbursement by the investment adviser but prior to reductions from expense offset arrangements. Expenses net of all reductions represent the net expenses paid by the Fund.
E Amount represents less than .005%.
F Amount does not include the portfolio activity of any underlying Fidelity Central Funds.
See accompanying notes which are an integral part of the financial statements.
Notes to Financial Statements
For the period ended December 31, 2017
1. Organization.
Fidelity VIP Investment Grade Central Fund (the Fund) is a fund of Fidelity Garrison Street Trust (the Trust) and is authorized to issue an unlimited number of shares. Shares of the Fund are only offered to other investment companies and accounts managed by Fidelity Management & Research Company (FMR), or its affiliates (the Investing Funds). The Trust is registered under the Investment Company Act of 1940, as amended (the 1940 Act), as an open-end management investment company organized as a Massachusetts business trust.
2. Investments in Fidelity Central Funds.
The Fund invests in Fidelity Central Funds, which are open-end investment companies generally available only to other investment companies and accounts managed by the investment adviser and its affiliates. The Fund's Schedule of Investments lists each of the Fidelity Central Funds held as of period end, if any, as an investment of the Fund, but does not include the underlying holdings of each Fidelity Central Fund. As an Investing Fund, the Fund indirectly bears its proportionate share of the expenses of the underlying Fidelity Central Funds.
The Money Market Central Funds seek preservation of capital and current income and are managed by Fidelity Investments Money Management, Inc. (FIMM), an affiliate of the investment adviser. Annualized expenses of the Money Market Central Funds as of their most recent shareholder report date are less than .005%.
A complete unaudited list of holdings for each Fidelity Central Fund is available upon request or at the Securities and Exchange Commission (the SEC) website at www.sec.gov. In addition, the financial statements of the Fidelity Central Funds, which are not covered by the Fund's Report of Independent Registered Public Accounting Firm, are available on the SEC website or upon request.
3. Significant Accounting Policies.
The Fund is an investment company and applies the accounting and reporting guidance of the Financial Accounting Standards Board (FASB) Accounting Standards Codification Topic 946 Financial Services – Investments Companies. The financial statements have been prepared in conformity with accounting principles generally accepted in the United States of America (GAAP), which require management to make certain estimates and assumptions at the date of the financial statements. Actual results could differ from those estimates. Subsequent events, if any, through the date that the financial statements were issued have been evaluated in the preparation of the financial statements. The following summarizes the significant accounting policies of the Fund:
Investment Valuation. Investments are valued as of 4:00 p.m. Eastern time on the last calendar day of the period. The Board of Trustees (the Board) has delegated the day to day responsibility for the valuation of the Fund's investments to the Fair Value Committee (the Committee) established by the Fund's investment adviser. In accordance with valuation policies and procedures approved by the Board, the Fund attempts to obtain prices from one or more third party pricing vendors or brokers to value its investments. When current market prices, quotations or currency exchange rates are not readily available or reliable, investments will be fair valued in good faith by the Committee, in accordance with procedures adopted by the Board. Factors used in determining fair value vary by investment type and may include market or investment specific events, changes in interest rates and credit quality. The frequency with which these procedures are used cannot be predicted and they may be utilized to a significant extent. The Committee oversees the Fund's valuation policies and procedures and reports to the Board on the Committee's activities and fair value determinations. The Board monitors the appropriateness of the procedures used in valuing the Fund's investments and ratifies the fair value determinations of the Committee.
The Fund categorizes the inputs to valuation techniques used to value its investments into a disclosure hierarchy consisting of three levels as shown below:
- Level 1 – quoted prices in active markets for identical investments
- Level 2 – other significant observable inputs (including quoted prices for similar investments, interest rates, prepayment speeds, etc.)
- Level 3 – unobservable inputs (including the Fund's own assumptions based on the best information available)
Valuation techniques used to value the Fund's investments by major category are as follows:
Debt securities, including restricted securities, are valued based on evaluated prices received from third party pricing vendors or from brokers who make markets in such securities. Corporate bonds, bank notes, municipal securities and U.S. government and government agency obligations are valued by pricing vendors who utilize matrix pricing which considers yield or price of bonds of comparable quality, coupon, maturity and type or by broker-supplied prices. Asset backed securities, collateralized mortgage obligations, commercial mortgage securities and U.S. government agency mortgage securities are valued by pricing vendors who utilize matrix pricing which considers prepayment speed assumptions, attributes of the collateral, yield or price of bonds of comparable quality, coupon, maturity and type or by broker-supplied prices. Brokers which make markets in asset backed securities, collateralized mortgage obligations and commercial mortgage securities may also consider such factors as the structure of the issue, cash flow assumptions, the value of underlying assets as well as any guarantees. Swaps are marked-to-market daily based on valuations from third party pricing vendors, registered derivatives clearing organizations (clearinghouses) or broker-supplied valuations. These pricing sources may utilize inputs such as interest rate curves, credit spread curves, default possibilities and recovery rates. When independent prices are unavailable or unreliable, debt securities and swaps may be valued utilizing pricing methodologies which consider similar factors that would be used by third party pricing vendors. Debt securities and swaps are generally categorized as Level 2 in the hierarchy but may be Level 3 depending on the circumstances.
Investments in open-end mutual funds, including the Fidelity Central Funds, are valued at their closing net asset value (NAV) each business day and are categorized as Level 1 in the hierarchy.
Changes in valuation techniques may result in transfers in or out of an assigned level within the disclosure hierarchy. The aggregate value of investments by input level as of December 31, 2017 is included at the end of the Fund's Schedule of Investments.
Investment Transactions and Income. For financial reporting purposes, the Fund's investment holdings and NAV include trades executed through the end of the last business day of the period. The NAV per share for processing shareholder transactions is calculated as of the close of business of the New York Stock Exchange (NYSE), normally 4:00 p.m. Eastern time and includes trades executed through the end of the prior business day. Gains and losses on securities sold are determined on the basis of identified cost and includes proceeds received from litigation. Income and capital gain distributions from Fidelity Central Funds, if any, are recorded on the ex-dividend date. Interest income is accrued as earned and includes coupon interest and amortization of premium and accretion of discount on debt securities as applicable. The principal amount on inflation-indexed securities is periodically adjusted to the rate of inflation and interest is accrued based on the principal amount. The adjustments to principal due to inflation are reflected as increases or decreases to Interest in the accompanying Statement of Operations. Debt obligations may be placed on non-accrual status and related interest income may be reduced by ceasing current accruals and writing off interest receivables when the collection of all or a portion of interest has become doubtful based on consistently applied procedures. A debt obligation is removed from non-accrual status when the issuer resumes interest payments or when collectability of interest is reasonably assured.
Expenses. Expenses directly attributable to a fund are charged to that fund. Expenses attributable to more than one fund are allocated among the respective funds on the basis of relative net assets or other appropriate methods. Expense estimates are accrued in the period to which they relate and adjustments are made when actual amounts are known.
Income Tax Information and Distributions to Shareholders. Each year, the Fund intends to qualify as a regulated investment company under Subchapter M of the Internal Revenue Code, including distributing substantially all of its taxable income and realized gains. As a result, no provision for U.S. Federal income taxes is required. As of December 31, 2017, the Fund did not have any unrecognized tax benefits in the financial statements; nor is the Fund aware of any tax positions for which it is reasonably possible that the total amounts of unrecognized tax benefits will significantly change in the next twelve months. The Fund files a U.S. federal tax return, in addition to state and local tax returns as required. The Fund's federal income tax returns are subject to examination by the Internal Revenue Service (IRS) for a period of three fiscal years after they are filed. State and local tax returns may be subject to examination for an additional fiscal year depending on the jurisdiction.
Dividends are declared and recorded daily and paid monthly from net investment income. Distributions from realized gains, if any, are declared and recorded on the ex-dividend date. Income and capital gain distributions are determined in accordance with income tax regulations, which may differ from GAAP.
Capital accounts within the financial statements are adjusted for permanent book-tax differences. These adjustments have no impact on net assets or the results of operations. Capital accounts are not adjusted for temporary book-tax differences which will reverse in a subsequent period.
Book-tax differences are primarily due to futures contracts, swaps, market discount, capital loss carryforwards, and losses deferred due to wash sales and excise tax regulations.
As of period end, the cost and unrealized appreciation (depreciation) in securities, and derivatives if applicable, for federal income tax purposes were as follows:
| Gross unrealized appreciation | $94,422,172 |
| Gross unrealized depreciation | (44,419,787) |
| Net unrealized appreciation (depreciation) | $50,002,385 |
| Tax Cost | $5,688,369,467 |
The tax-based components of distributable earnings as of period end were as follows:
| Capital loss carryforward | $(7,002,906) |
| Net unrealized appreciation (depreciation) on securities and other investments | $50,002,385 |
Capital loss carryforwards are only available to offset future capital gains of the Fund to the extent provided by regulations and may be limited. Under the Regulated Investment Company Modernization Act of 2010 (the Act), the Fund is permitted to carry forward capital losses incurred in taxable years beginning after December 22, 2010 for an unlimited period and such capital losses are required to be used prior to any losses that expire. The capital loss carryforward information presented below, including any applicable limitation, is estimated as of fiscal period end and is subject to adjustment.
| No expiration | |
| Short-term | $(7,002,906) |
| Total no expiration | $(7,002,906) |
The tax character of distributions paid was as follows:
| December 31, 2017 | December 31, 2016 | |
| Ordinary Income | $150,350,808 | $ 148,257,947 |
| Long-term Capital Gains | 24,485,599 | 46,260,935 |
| Total | $174,836,407 | $ 194,518,882 |
Delayed Delivery Transactions and When-Issued Securities. During the period, the Fund transacted in securities on a delayed delivery or when-issued basis. Payment and delivery may take place after the customary settlement period for that security. The price of the underlying securities and the date when the securities will be delivered and paid for are fixed at the time the transaction is negotiated. The securities purchased on a delayed delivery or when-issued basis are identified as such in the Fund's Schedule of Investments. The Fund may receive compensation for interest forgone in the purchase of a delayed delivery or when-issued security. With respect to purchase commitments, the Fund identifies securities as segregated in its records with a value at least equal to the amount of the commitment. Losses may arise due to changes in the value of the underlying securities or if the counterparty does not perform under the contract's terms, or if the issuer does not issue the securities due to political, economic, or other factors.
To-Be-Announced (TBA) Securities and Mortgage Dollar Rolls. During the period, the Fund transacted in TBA securities that involved buying or selling mortgage-backed securities (MBS) on a forward commitment basis. A TBA transaction typically does not designate the actual security to be delivered and only includes an approximate principal amount; however delivered securities must meet specified terms defined by industry guidelines, including issuer, rate and current principal amount outstanding on underlying mortgage pools. The Fund may enter into a TBA transaction with the intent to take possession of or deliver the underlying MBS, or the Fund may elect to extend the settlement by entering into either a mortgage or reverse mortgage dollar roll. Mortgage dollar rolls are transactions where a fund sells TBA securities and simultaneously agrees to repurchase MBS on a later date at a lower price and with the same counterparty. Reverse mortgage dollar rolls involve the purchase and simultaneous agreement to sell TBA securities on a later date at a lower price. Transactions in mortgage dollar rolls and reverse mortgage dollar rolls are accounted for as purchases and sales and may result in an increase to the Fund's portfolio turnover rate.
Purchases and sales of TBA securities involve risks similar to those discussed above for delayed delivery and when-issued securities. Also, if the counterparty in a mortgage dollar roll or a reverse mortgage dollar roll transaction files for bankruptcy or becomes insolvent, the Fund's right to repurchase or sell securities may be limited. Additionally, when a fund sells TBA securities without already owning or having the right to obtain the deliverable securities (an uncovered forward commitment to sell), it incurs a risk of loss because it could have to purchase the securities at a price that is higher than the price at which it sold them. A fund may be unable to purchase the deliverable securities if the corresponding market is illiquid.
TBA securities subject to a forward commitment to sell at period end are included at the end of the Fund's Schedule of Investments under the caption "TBA Sale Commitments." The proceeds and value of these commitments are reflected in the Fund's Statement of Assets and Liabilities as Receivable for TBA sale commitments and TBA sale commitments, at value, respectively.
Restricted Securities. The Fund may invest in securities that are subject to legal or contractual restrictions on resale. These securities generally may be resold in transactions exempt from registration or to the public if the securities are registered. Disposal of these securities may involve time-consuming negotiations and expense, and prompt sale at an acceptable price may be difficult. Information regarding restricted securities is included at the end of the Fund's Schedule of Investments.
New Accounting Pronouncement. In March 2017, the Financial Accounting Standards Board (FASB) issued an Accounting Standards Update (ASU), ASU 2017-08, which amends the amortization period for certain callable debt securities that are held at a premium. The amendment requires the premium to be amortized to the earliest call date. The amendments do not require an accounting change for securities held at a discount. The ASU is effective for annual periods beginning after December 15, 2018. Management is currently evaluating the potential impact of these changes to the financial statements.
4. Derivative Instruments.
Risk Exposures and the Use of Derivative Instruments. The Fund's investment objective allows the Fund to enter into various types of derivative contracts, including futures contracts and swaps. Derivatives are investments whose value is primarily derived from underlying assets, indices or reference rates and may be transacted on an exchange or over-the-counter (OTC). Derivatives may involve a future commitment to buy or sell a specified asset based on specified terms, to exchange future cash flows at periodic intervals based on a notional principal amount, or for one party to make one or more payments upon the occurrence of specified events in exchange for periodic payments from the other party.
The Fund used derivatives to increase returns, to gain exposure to certain types of assets and to manage exposure to certain risks as defined below. The success of any strategy involving derivatives depends on analysis of numerous economic factors, and if the strategies for investment do not work as intended, the Fund may not achieve its objectives.
The Fund's use of derivatives increased or decreased its exposure to the following risks:
| Credit Risk | Credit risk relates to the ability of the issuer of a financial instrument to make further principal or interest payments on an obligation or commitment that it has to the Fund. |
| Interest Rate Risk | Interest rate risk relates to the fluctuations in the value of interest-bearing securities due to changes in the prevailing levels of market interest rates. |
The Fund is also exposed to additional risks from investing in derivatives, such as liquidity risk and counterparty credit risk. Liquidity risk is the risk that the Fund will be unable to close out the derivative in the open market in a timely manner. Counterparty credit risk is the risk that the counterparty will not be able to fulfill its obligation to the Fund. Derivative counterparty credit risk is managed through formal evaluation of the creditworthiness of all potential counterparties. On certain OTC derivatives such as bi-lateral swaps, the Fund attempts to reduce its exposure to counterparty credit risk by entering into an International Swaps and Derivatives Association, Inc. (ISDA) Master Agreement with each of its counterparties. The ISDA Master Agreement gives the Fund the right to terminate all transactions traded under such agreement upon the deterioration in the credit quality of the counterparty beyond specified levels. The ISDA Master Agreement gives each party the right, upon an event of default by the other party or a termination of the agreement, to close out all transactions traded under such agreement and to net amounts owed under each transaction to one net payable by one party to the other. To mitigate counterparty credit risk on bi-lateral OTC derivatives, the Fund receives collateral in the form of cash or securities once the Fund's net unrealized appreciation on outstanding derivative contracts under an ISDA Master Agreement exceeds certain applicable thresholds, subject to certain minimum transfer provisions. The collateral received is held in segregated accounts with the Fund's custodian bank in accordance with the collateral agreements entered into between the Fund, the counterparty and the Fund's custodian bank. The Fund could experience delays and costs in gaining access to the collateral even though it is held by the Fund's custodian bank. The Fund's maximum risk of loss from counterparty credit risk related to bi-lateral OTC derivatives is generally the aggregate unrealized appreciation and unpaid counterparty payments in excess of any collateral pledged by the counterparty to the Fund. The Fund may be required to pledge collateral for the benefit of the counterparties on bi-lateral OTC derivatives in an amount not less than each counterparty's unrealized appreciation on outstanding derivative contracts, subject to certain minimum transfer provisions, and any such pledged collateral is identified in the Schedule of Investments. Exchange-traded futures contracts are not covered by the ISDA Master Agreement; however counterparty credit risk related to exchange-traded futures contracts may be mitigated by the protection provided by the exchange on which they trade.
Investing in derivatives may involve greater risks than investing in the underlying assets directly and, to varying degrees, may involve risk of loss in excess of any initial investment and collateral received and amounts recognized in the Statement of Assets and Liabilities. In addition, there may be the risk that the change in value of the derivative contract does not correspond to the change in value of the underlying instrument.
Net Realized Gain (Loss) and Change in Net Unrealized Appreciation (Depreciation) on Derivatives. The table below, which reflects the impacts of derivatives on the financial performance of the Fund, summarizes the net realized gain (loss) and change in net unrealized appreciation (depreciation) for derivatives during the period as presented in the Statement of Operations.
| Primary Risk Exposure / Derivative Type | Net Realized Gain (Loss) | Change in Net Unrealized Appreciation (Depreciation) |
| Credit Risk | ||
| Swaps | $(105,203) | $107,128 |
| Interest Rate Risk | ||
| Futures Contracts | 134,294 | 229,770 |
| Totals | $29,091 | $336,898 |
A summary of the value of derivatives by primary risk exposure as of period end is included at the end of the Schedule of Investments.
Futures Contracts. A futures contract is an agreement between two parties to buy or sell a specified underlying instrument for a fixed price at a specified future date. The Fund used futures contracts to manage its exposure to the bond market and fluctuations in interest rates.
Upon entering into a futures contract, a fund is required to deposit either cash or securities (initial margin) with a clearing broker in an amount equal to a certain percentage of the face value of the contract. Futures contracts are marked-to-market daily and subsequent daily payments (variation margin) are made or received by a fund depending on the daily fluctuations in the value of the futures contracts and are recorded as unrealized appreciation or (depreciation). This receivable and/or payable, if any, is included in daily variation margin on futures contracts in the Statement of Assets and Liabilities. Realized gain or (loss) is recorded upon the expiration or closing of a futures contract. The net realized gain (loss) and change in net unrealized appreciation (depreciation) on futures contracts during the period is presented in the Statement of Operations.
Any open futures contracts at period end are presented in the Schedule of Investments under the caption "Futures Contracts". The notional amount at value reflects each contract's exposure to the underlying instrument or index at period end.
Swaps. A swap is a contract between two parties to exchange future cash flows at periodic intervals based on a notional principal amount. A bi-lateral OTC swap is a transaction between a fund and a dealer counterparty where cash flows are exchanged between the two parties for the life of the swap.
Bi-lateral OTC swaps are marked-to-market daily and changes in value are reflected in the Statement of Assets and Liabilities in the bi-lateral OTC swaps at value line items. Any upfront premiums paid or received upon entering a bi-lateral OTC swap to compensate for differences between stated terms of the swap and prevailing market conditions (e.g. credit spreads, interest rates or other factors) are recorded in net unrealized appreciation (depreciation) in the Statement of Assets and Liabilities and amortized to realized gain or (loss) ratably over the term of the swap. Any unamortized upfront premiums are presented in the Schedule of Investments.
Payments are exchanged at specified intervals, accrued daily commencing with the effective date of the contract and recorded as realized gain or (loss). Some swaps may be terminated prior to the effective date and realize a gain or loss upon termination. The net realized gain (loss) and change in net unrealized appreciation (depreciation) on swaps during the period is presented in the Statement of Operations.
Any open swaps at period end are included in the Schedule of Investments under the caption "Swaps" and are representative of volume of activity during the period.
Credit Default Swaps. Credit default swaps enable the Fund to buy or sell protection against specified credit events on a single-name issuer or a traded credit index. Under the terms of a credit default swap the buyer of protection (buyer) receives credit protection in exchange for making periodic payments to the seller of protection (seller) based on a fixed percentage applied to a notional principal amount. In return for these payments, the seller will be required to make a payment upon the occurrence of one or more specified credit events. The Fund enters into credit default swaps as a seller to gain credit exposure to an issuer and/or as a buyer to obtain a measure of protection against defaults of an issuer. Periodic payments are made over the life of the contract by the buyer provided that no credit event occurs.
For credit default swaps on most corporate and sovereign issuers, credit events include bankruptcy, failure to pay or repudiation/moratorium. For credit default swaps on corporate or sovereign issuers, the obligation that may be put to the seller is not limited to the specific reference obligation described in the Schedule of Investments. For credit default swaps on asset-backed securities, a credit event may be triggered by events such as failure to pay principal, maturity extension, rating downgrade or write-down. For credit default swaps on asset-backed securities, the reference obligation described represents the security that may be put to the seller. For credit default swaps on a traded credit index, a specified credit event may affect all or individual underlying securities included in the index.
As a seller, if an underlying credit event occurs, the Fund will pay a net settlement amount of cash equal to the notional amount of the swap less the recovery value of the reference obligation or underlying securities comprising an index. Only in the event of the industry's inability to value the underlying asset will the Fund be required to take delivery of the reference obligation or underlying securities comprising an index and pay an amount equal to the notional amount of the swap.
As a buyer, if an underlying credit event occurs, the Fund will receive a net settlement amount of cash equal to the notional amount of the swap less the recovery value of the reference obligation or underlying securities comprising an index. Only in the event of the industry's inability to value the underlying asset will the Fund be required to deliver the reference obligation or underlying securities comprising an index in exchange for payment of an amount equal to the notional amount of the swap.
Typically, the value of each credit default swap and credit rating disclosed for each reference obligation in the Schedule of Investments, where the Fund is the seller, can be used as measures of the current payment/performance risk of the swap. As the value of the swap changes as a positive or negative percentage of the total notional amount, the payment/performance risk may decrease or increase, respectively. In addition to these measures, the investment adviser monitors a variety of factors including cash flow assumptions, market activity and market sentiment as part of its ongoing process of assessing payment/performance risk.
5. Purchases and Sales of Investments.
Purchases and sales of securities, other than short-term securities and U.S. government securities, aggregated $260,227,989 and $775,667,425, respectively.
6. Fees and Other Transactions with Affiliates.
Management Fee and Expense Contract. Fidelity Investments Money Management, Inc. (the investment adviser), an affiliate of FMR, provides the Fund with investment management services. The Fund does not pay any fees for these services. Pursuant to the Fund's management contract with the investment adviser, FMR pays the investment adviser a portion of the management fees it receives from the Investing Funds. In addition, under an expense contract, FMR also pays all other expenses of the Fund, excluding custody fees, the compensation of the independent Trustees, and certain miscellaneous expenses such as proxy and shareholder meeting expenses.
Interfund Trades. The Fund may purchase from or sell securities to other Fidelity Funds under procedures adopted by the Board. The procedures have been designed to ensure these interfund trades are executed in accordance with Rule 17a-7 of the 1940 Act. Interfund trades are included within the respective purchases and sales amounts shown in the Purchases and Sales of Investments note.
7. Security Lending.
The Fund lends portfolio securities from time to time in order to earn additional income. On the settlement date of the loan, the Fund receives collateral (in the form of U.S. Treasury obligations, letters of credit and/or cash) against the loaned securities and maintains collateral in an amount not less than 100% of the market value of the loaned securities during the period of the loan. The market value of the loaned securities is determined at the close of business of the Fund and any additional required collateral is delivered to the Fund on the next business day. The Fund or borrower may terminate the loan at any time, and if the borrower defaults on its obligation to return the securities loaned because of insolvency or other reasons, the Fund may apply collateral received from the borrower against the obligation. The Fund may experience delays and costs in recovering the securities loaned. Any cash collateral received is maintained at the Fund's custodian and/or invested in cash equivalents. At period end, there were no security loans outstanding. Security lending income represents the income earned on investing cash collateral, less rebates paid to borrowers, plus any premium payments received for lending certain types of securities. Security lending income is presented in the Statement of Operations as a component of interest income. Total security lending income during the period amounted to $38,824.
8. Expense Reductions.
FMR has voluntarily agreed to reimburse a portion of the Fund's operating expenses. For the period, the reimbursement reduced the expenses by $14,385.
In addition, through arrangements with the Fund's custodian, credits realized as a result of certain uninvested cash balances were used to reduce the Fund's expenses. During the period, these credits reduced the Fund's custody expenses by $33,703.
9. Other.
The Fund's organizational documents provide former and current trustees and officers with a limited indemnification against liabilities arising in connection with the performance of their duties to the Fund. In the normal course of business, the Fund may also enter into contracts that provide general indemnifications. The Fund's maximum exposure under these arrangements is unknown as this would be dependent on future claims that may be made against the Fund. The risk of material loss from such claims is considered remote.
At the end of the period, mutual funds managed by FMR or its affiliates were the owners of record of all of the outstanding shares of the Fund according to the following schedule.
| Fund | Ownership % |
| VIP Asset Manager Portfolio | 6.8% |
| VIP Asset Manager: Growth Portfolio | 0.7% |
| VIP Balanced Portfolio | 20.9% |
| VIP Investment Grade Bond Portfolio | 71.6% |
10. Credit Risk.
The Fund invests a portion of its assets in structured securities of issuers backed by commercial and residential mortgage loans, credit card receivables and automotive loans. The value and related income of these securities is sensitive to changes in economic conditions, including delinquencies and/or defaults.
Report of Independent Registered Public Accounting Firm
To the Trustees of Fidelity Garrison Street Trust and Shareholders of Fidelity® VIP Investment Grade Central Fund:
Opinion on the Financial Statements and Financial Highlights
We have audited the accompanying statement of assets and liabilities of Fidelity® VIP Investment Grade Central Fund (the "Fund"), a fund of Fidelity Garrison Street Trust, including the schedule of investments, as of December 31, 2017, and the related statement of operations for the year then ended, the statement of changes in net assets for each of the two years in the period then ended, the financial highlights for each of the five years in the period then ended, and the related notes. In our opinion, the financial statements and financial highlights present fairly, in all material respects, the financial position of the Fund as of December 31, 2017, and the results of its operations for the year then ended, the changes in its net assets for each of the two years in the period then ended, and the financial highlights for each of the five years in the period then ended, in conformity with accounting principles generally accepted in the United States of America.
Basis for Opinion
These financial statements and financial highlights are the responsibility of the Fund's management. Our responsibility is to express an opinion on the Fund's financial statements and financial highlights based on our audits. We are a public accounting firm registered with the Public Company Accounting Oversight Board (United States) (PCAOB) and are required to be independent with respect to the Fund in accordance with the U.S. federal securities laws and the applicable rules and regulations of the Securities and Exchange Commission and the PCAOB.
We conducted our audits in accordance with the standards of the PCAOB. Those standards require that we plan and perform the audit to obtain reasonable assurance about whether the financial statements and financial highlights are free of material misstatement, whether due to error or fraud. The Fund is not required to have, nor were we engaged to perform, an audit of its internal control over financial reporting. As part of our audits we are required to obtain an understanding of internal control over financial reporting but not for the purpose of expressing an opinion on the effectiveness of the Fund’s internal control over financial reporting. Accordingly, we express no such opinion.
Our audits included performing procedures to assess the risks of material misstatement of the financial statements and financial highlights, whether due to error or fraud, and performing procedures that respond to those risks. Such procedures included examining, on a test basis, evidence regarding the amounts and disclosures in the financial statements and financial highlights. Our audits also included evaluating the accounting principles used and significant estimates made by management, as well as evaluating the overall presentation of the financial statements and financial highlights. Our procedures included confirmation of securities owned as of December 31, 2017, by correspondence with the custodians and brokers; when replies were not received from brokers, we performed other auditing procedures. We believe that our audits provide a reasonable basis for our opinion.
DELOITTE & TOUCHE LLP
Boston, Massachusetts
February 16, 2018
We have served as the auditor of one or more of the Fidelity investment companies since 1999.
Trustees and Officers
The Trustees, Members of the Advisory Board (if any), and officers of the trust and fund, as applicable, are listed below. The Board of Trustees governs the fund and is responsible for protecting the interests of shareholders. The Trustees are experienced executives who meet periodically throughout the year to oversee the fund's activities, review contractual arrangements with companies that provide services to the fund, oversee management of the risks associated with such activities and contractual arrangements, and review the fund's performance. Each of the Trustees oversees 238 funds.
The Trustees hold office without limit in time except that (a) any Trustee may resign; (b) any Trustee may be removed by written instrument, signed by at least two-thirds of the number of Trustees prior to such removal; (c) any Trustee who requests to be retired or who has become incapacitated by illness or injury may be retired by written instrument signed by a majority of the other Trustees; and (d) any Trustee may be removed at any special meeting of shareholders by a two-thirds vote of the outstanding voting securities of the trust. Each Trustee who is not an interested person (as defined in the 1940 Act) of the trust and the fund is referred to herein as an Independent Trustee. Each Independent Trustee shall retire not later than the last day of the calendar year in which his or her 75th birthday occurs. The Independent Trustees may waive this mandatory retirement age policy with respect to individual Trustees. Officers and Advisory Board Members hold office without limit in time, except that any officer or Advisory Board Member may resign or may be removed by a vote of a majority of the Trustees at any regular meeting or any special meeting of the Trustees. Except as indicated, each individual has held the office shown or other offices in the same company for the past five years.
The fund’s Statement of Additional Information (SAI) includes more information about the Trustees. To request a free copy, call Fidelity at 1-800-544-8544.
Experience, Skills, Attributes, and Qualifications of the Trustees. The Governance and Nominating Committee has adopted a statement of policy that describes the experience, qualifications, attributes, and skills that are necessary and desirable for potential Independent Trustee candidates (Statement of Policy). The Board believes that each Trustee satisfied at the time he or she was initially elected or appointed a Trustee, and continues to satisfy, the standards contemplated by the Statement of Policy. The Governance and Nominating Committee also engages professional search firms to help identify potential Independent Trustee candidates who have the experience, qualifications, attributes, and skills consistent with the Statement of Policy. From time to time, additional criteria based on the composition and skills of the current Independent Trustees, as well as experience or skills that may be appropriate in light of future changes to board composition, business conditions, and regulatory or other developments, have also been considered by the professional search firms and the Governance and Nominating Committee. In addition, the Board takes into account the Trustees' commitment and participation in Board and committee meetings, as well as their leadership of standing and ad hoc committees throughout their tenure.
In determining that a particular Trustee was and continues to be qualified to serve as a Trustee, the Board has considered a variety of criteria, none of which, in isolation, was controlling. The Board believes that, collectively, the Trustees have balanced and diverse experience, qualifications, attributes, and skills, which allow the Board to operate effectively in governing the fund and protecting the interests of shareholders. Information about the specific experience, skills, attributes, and qualifications of each Trustee, which in each case led to the Board's conclusion that the Trustee should serve (or continue to serve) as a trustee of the fund, is provided below.
Board Structure and Oversight Function. Abigail P. Johnson is an interested person and currently serves as Chairman. The Trustees have determined that an interested Chairman is appropriate and benefits shareholders because an interested Chairman has a personal and professional stake in the quality and continuity of services provided to the fund. Independent Trustees exercise their informed business judgment to appoint an individual of their choosing to serve as Chairman, regardless of whether the Trustee happens to be independent or a member of management. The Independent Trustees have determined that they can act independently and effectively without having an Independent Trustee serve as Chairman and that a key structural component for assuring that they are in a position to do so is for the Independent Trustees to constitute a substantial majority for the Board. The Independent Trustees also regularly meet in executive session. Marie L. Knowles serves as Chairman of the Independent Trustees and as such (i) acts as a liaison between the Independent Trustees and management with respect to matters important to the Independent Trustees and (ii) with management prepares agendas for Board meetings.
Fidelity® funds are overseen by different Boards of Trustees. The fund's Board oversees Fidelity's investment-grade bond, money market, asset allocation and certain equity funds, and other Boards oversee Fidelity's high income, sector and other equity funds. The asset allocation funds may invest in Fidelity® funds that are overseen by such other Boards. The use of separate Boards, each with its own committee structure, allows the Trustees of each group of Fidelity® funds to focus on the unique issues of the funds they oversee, including common research, investment, and operational issues. On occasion, the separate Boards establish joint committees to address issues of overlapping consequences for the Fidelity® funds overseen by each Board.
The Trustees operate using a system of committees to facilitate the timely and efficient consideration of all matters of importance to the Trustees, the fund, and fund shareholders and to facilitate compliance with legal and regulatory requirements and oversight of the fund's activities and associated risks. The Board, acting through its committees, has charged FMR and its affiliates with (i) identifying events or circumstances the occurrence of which could have demonstrably adverse effects on the fund's business and/or reputation; (ii) implementing processes and controls to lessen the possibility that such events or circumstances occur or to mitigate the effects of such events or circumstances if they do occur; and (iii) creating and maintaining a system designed to evaluate continuously business and market conditions in order to facilitate the identification and implementation processes described in (i) and (ii) above. Because the day-to-day operations and activities of the fund are carried out by or through FMR, its affiliates, and other service providers, the fund's exposure to risks is mitigated but not eliminated by the processes overseen by the Trustees. While each of the Board's committees has responsibility for overseeing different aspects of the fund's activities, oversight is exercised primarily through the Operations and Audit Committees. In addition, an ad hoc Board committee of Independent Trustees has worked with FMR to enhance the Board's oversight of investment and financial risks, legal and regulatory risks, technology risks, and operational risks, including the development of additional risk reporting to the Board. Appropriate personnel, including but not limited to the fund's Chief Compliance Officer (CCO), FMR's internal auditor, the independent accountants, the fund's Treasurer and portfolio management personnel, make periodic reports to the Board's committees, as appropriate, including an annual review of Fidelity's risk management program for the Fidelity® funds. The responsibilities of each standing committee, including their oversight responsibilities, are described further under "Standing Committees of the Trustees."
Interested Trustees*:
Correspondence intended for a Trustee who is an interested person may be sent to Fidelity Investments, 245 Summer Street, Boston, Massachusetts 02210.
Name, Year of Birth; Principal Occupations and Other Relevant Experience+
Abigail P. Johnson (1961)
Year of Election or Appointment: 2009
Trustee
Chairman of the Board of Trustees
Ms. Johnson also serves as Trustee of other Fidelity® funds. Ms. Johnson serves as Chairman (2016-present), Chief Executive Officer (2014-present), and Director (2007-present) of FMR LLC (diversified financial services company), President of Fidelity Financial Services (2012-present) and President of Personal, Workplace and Institutional Services (2005-present). Ms. Johnson is Chairman and Director of FMR Co., Inc. (investment adviser firm, 2011-present) and Chairman and Director of FMR (investment adviser firm, 2011-present). Previously, Ms. Johnson served as Vice Chairman (2007-2016) and President (2013-2016) of FMR LLC, President and a Director of FMR (2001-2005), a Trustee of other investment companies advised by FMR, Fidelity Investments Money Management, Inc. (investment adviser firm), and FMR Co., Inc. (2001-2005), Senior Vice President of the Fidelity® funds (2001-2005), and managed a number of Fidelity® funds. Ms. Abigail P. Johnson and Mr. Arthur E. Johnson are not related.
Jennifer Toolin McAuliffe (1959)
Year of Election or Appointment: 2016
Trustee
Ms. McAuliffe also serves as Trustee of other Fidelity® funds. Ms. McAuliffe previously served as a Member of the Advisory Board of certain Fidelity® funds (2016) and as Co-Head of Fixed Income of Fidelity Investments Limited (now known as FIL Limited (FIL)) (diversified financial services company). Earlier roles at FIL included Director of Research for FIL’s credit and quantitative teams in London, Hong Kong and Tokyo. Ms. McAuliffe also was the Director of Research for taxable and municipal bonds at Fidelity Investments Money Management, Inc. Ms. McAuliffe is also a director or trustee of several not-for-profit entities.
* Determined to be an “Interested Trustee” by virtue of, among other things, his or her affiliation with the trust or various entities under common control with FMR.
+ The information includes the Trustee's principal occupation during the last five years and other information relating to the experience, attributes, and skills relevant to the Trustee's qualifications to serve as a Trustee, which led to the conclusion that the Trustee should serve as a Trustee for the fund.
Independent Trustees:
Correspondence intended for an Independent Trustee may be sent to Fidelity Investments, P.O. Box 55235, Boston, Massachusetts 02205-5235.
Name, Year of Birth; Principal Occupations and Other Relevant Experience+
Elizabeth S. Acton (1951)
Year of Election or Appointment: 2013
Trustee
Ms. Acton also serves as Trustee of other Fidelity® funds. Prior to her retirement in April 2012, Ms. Acton was Executive Vice President, Finance (2011-2012), Executive Vice President, Chief Financial Officer (2002-2011), and Treasurer (2004-2005) of Comerica Incorporated (financial services). Prior to joining Comerica, Ms. Acton held a variety of positions at Ford Motor Company (1983-2002), including Vice President and Treasurer (2000-2002) and Executive Vice President and Chief Financial Officer of Ford Motor Credit Company (1998-2000). Ms. Acton currently serves as a member of the Board of Directors and Audit and Finance Committees of Beazer Homes USA, Inc. (homebuilding, 2012-present). Previously, Ms. Acton served as a Member of the Advisory Board of certain Fidelity® funds (2013-2016).
John Engler (1948)
Year of Election or Appointment: 2014
Trustee
Mr. Engler also serves as Trustee of other Fidelity® funds. He serves on the board of directors for Universal Forest Products (manufacturer and distributor of wood and wood-alternative products, 2003-present) and K12 Inc. (technology-based education company, 2012-present). Previously, Mr. Engler served as a Member of the Advisory Board of certain Fidelity® funds (2014-2016), president of the Business Roundtable (2011-2017), a trustee of The Munder Funds (2003-2014), president and CEO of the National Association of Manufacturers (2004-2011), member of the Board of Trustees of the Annie E. Casey Foundation (2004-2015), and as governor of Michigan (1991-2003). He is a past chairman of the National Governors Association.
Albert R. Gamper, Jr. (1942)
Year of Election or Appointment: 2006
Trustee
Mr. Gamper also serves as Trustee of other Fidelity® funds. Prior to his retirement in December 2004, Mr. Gamper served as Chairman of the Board of CIT Group Inc. (commercial finance). During his tenure with CIT Group Inc. Mr. Gamper served in numerous senior management positions, including Chairman (1987-1989; 1999-2001; 2002-2004), Chief Executive Officer (1987-2004), and President (2002-2003). Mr. Gamper currently serves as a member of the Board of Directors of Public Service Enterprise Group (utilities, 2000-present), and Member of the Board of Trustees of Barnabas Health Care System (1997-present). Previously, Mr. Gamper served as Chairman (2012-2015) and Vice Chairman (2011-2012) of the Independent Trustees of certain Fidelity® funds and as Chairman of the Board of Governors, Rutgers University (2004-2007).
Robert F. Gartland (1951)
Year of Election or Appointment: 2010
Trustee
Mr. Gartland also serves as Trustee of other Fidelity® funds. Mr. Gartland is Chairman and an investor in Gartland & Mellina Group Corp. (consulting, 2009-present). Previously, Mr. Gartland served as a partner and investor of Vietnam Partners LLC (investments and consulting, 2008-2011). Prior to his retirement, Mr. Gartland held a variety of positions at Morgan Stanley (financial services, 1979-2007), including Managing Director (1987-2007), and Chase Manhattan Bank (1975-1978).
Arthur E. Johnson (1947)
Year of Election or Appointment: 2008
Trustee
Vice Chairman of the Independent Trustees
Mr. Johnson also serves as Trustee of other Fidelity® funds. Mr. Johnson serves as a member of the Board of Directors of Eaton Corporation plc (diversified power management, 2009-present) and Booz Allen Hamilton (management consulting, 2011-present). Prior to his retirement, Mr. Johnson served as Senior Vice President of Corporate Strategic Development of Lockheed Martin Corporation (defense contractor, 1999-2009). He previously served on the Board of Directors of IKON Office Solutions, Inc. (1999-2008), AGL Resources, Inc. (holding company, 2002-2016), and Delta Airlines (2005-2007). Mr. Arthur E. Johnson is not related to Ms. Abigail P. Johnson.
Michael E. Kenneally (1954)
Year of Election or Appointment: 2009
Trustee
Mr. Kenneally also serves as Trustee of other Fidelity® funds. Prior to his retirement, Mr. Kenneally served as Chairman and Global Chief Executive Officer of Credit Suisse Asset Management. Before joining Credit Suisse, he was an Executive Vice President and Chief Investment Officer for Bank of America Corporation. Earlier roles at Bank of America included Director of Research, Senior Portfolio Manager and Research Analyst, and Mr. Kenneally was awarded the Chartered Financial Analyst (CFA) designation in 1991.
Marie L. Knowles (1946)
Year of Election or Appointment: 2001
Trustee
Chairman of the Independent Trustees
Ms. Knowles also serves as Trustee of other Fidelity® funds. Prior to Ms. Knowles' retirement in June 2000, she served as Executive Vice President and Chief Financial Officer of Atlantic Richfield Company (ARCO) (diversified energy, 1996-2000). From 1993 to 1996, she was a Senior Vice President of ARCO and President of ARCO Transportation Company (pipeline and tanker operations). Ms. Knowles currently serves as a Director and Chairman of the Audit Committee of McKesson Corporation (healthcare service, since 2002). Ms. Knowles is a member of the Board of the Santa Catalina Island Company (real estate, 2009-present). Ms. Knowles is a Member of the Investment Company Institute Board of Governors and a Member of the Governing Council of the Independent Directors Council (2014-present). She also serves as a member of the Advisory Board for the School of Engineering of the University of Southern California. Previously, Ms. Knowles served as a Director of Phelps Dodge Corporation (copper mining and manufacturing, 1994-2007), URS Corporation (engineering and construction, 2000-2003) and America West (airline, 1999-2002). Ms. Knowles previously served as Vice Chairman of the Independent Trustees of certain Fidelity® funds (2012-2015).
Mark A. Murray (1954)
Year of Election or Appointment: 2016
Trustee
Mr. Murray also serves as Trustee of other Fidelity® funds. Mr. Murray is Vice Chairman (2013-present) of Meijer, Inc. (regional retail chain). Previously, Mr. Murray served as a Member of the Advisory Board of certain Fidelity® funds (2016) and as Co-Chief Executive Officer (2013-2016) and President (2006-2013) of Meijer, Inc. Mr. Murray serves as a member of the Board of Directors and Nuclear Review and Public Policy and Responsibility Committees of DTE Energy Company (diversified energy company, 2009-present). Mr. Murray also serves as a member of the Board of Directors of Spectrum Health (not-for-profit health system, 2015-present). Mr. Murray previously served as President of Grand Valley State University (2001-2006), Treasurer for the State of Michigan (1999-2001), Vice President of Finance and Administration for Michigan State University (1998-1999), and a member of the Board of Directors and Audit Committee and Chairman of the Nominating and Corporate Governance Committee of Universal Forest Products, Inc. (manufacturer and distributor of wood and wood-alternative products, 2004-2016). Mr. Murray is also a director or trustee of many community and professional organizations.
+ The information includes the Trustee's principal occupation during the last five years and other information relating to the experience, attributes, and skills relevant to the Trustee's qualifications to serve as a Trustee, which led to the conclusion that the Trustee should serve as a Trustee for the fund.
Advisory Board Members and Officers:
Correspondence intended for an officer may be sent to Fidelity Investments, 245 Summer Street, Boston, Massachusetts 02210. Officers appear below in alphabetical order.
Name, Year of Birth; Principal Occupation
Elizabeth Paige Baumann (1968)
Year of Election or Appointment: 2017
Anti-Money Laundering (AML) Officer
Ms. Baumann also serves as AML Officer of other funds. She is Chief AML Officer (2012-present) and Senior Vice President (2014-present) of FMR LLC (diversified financial services company) and is an employee of Fidelity Investments. Previously, Ms. Baumann served as AML Officer of the funds (2012-2016), and Vice President (2007-2014) and Deputy Anti-Money Laundering Officer (2007-2012) of FMR LLC.
Marc R. Bryant (1966)
Year of Election or Appointment: 2015
Secretary and Chief Legal Officer (CLO)
Mr. Bryant also serves as Secretary and CLO of other funds. Mr. Bryant serves as CLO, Secretary, and Senior Vice President of Fidelity Management & Research Company (investment adviser firm, 2015-present) and FMR Co., Inc. (investment adviser firm, 2015-present); Secretary of Fidelity SelectCo, LLC (investment adviser firm, 2015-present) and Fidelity Investments Money Management, Inc. (investment adviser firm, 2015-present); and CLO of Fidelity Management & Research (Hong Kong) Limited and FMR Investment Management (UK) Limited (investment adviser firms, 2015-present) and Fidelity Management & Research (Japan) Limited (investment adviser firm, 2016-present). He is Senior Vice President and Deputy General Counsel of FMR LLC (diversified financial services company). Previously, Mr. Bryant served as Secretary and CLO of Fidelity Rutland Square Trust II (2010-2014) and Assistant Secretary of Fidelity's Fixed Income and Asset Allocation Funds (2013-2015). Prior to joining Fidelity Investments, Mr. Bryant served as a Senior Vice President and the Head of Global Retail Legal for AllianceBernstein L.P. (2006-2010), and as the General Counsel for ProFund Advisors LLC (2001-2006).
Jonathan Davis (1968)
Year of Election or Appointment: 2010
Assistant Treasurer
Mr. Davis also serves as Assistant Treasurer of other funds. Mr. Davis serves as Assistant Treasurer of FMR Capital, Inc. (2017-present) and is an employee of Fidelity Investments. Previously, Mr. Davis served as Vice President and Associate General Counsel of FMR LLC (diversified financial services company, 2003-2010).
Adrien E. Deberghes (1967)
Year of Election or Appointment: 2010
Assistant Treasurer
Mr. Deberghes also serves as an officer of other funds. He serves as Assistant Treasurer of FMR Capital, Inc. (2017-present), Executive Vice President of Fidelity Investments Money Management, Inc. (FIMM) (investment adviser firm, 2016-present), and is an employee of Fidelity Investments (2008-present). Prior to joining Fidelity Investments, Mr. Deberghes was Senior Vice President of Mutual Fund Administration at State Street Corporation (2007-2008), Senior Director of Mutual Fund Administration at Investors Bank & Trust (2005-2007), and Director of Finance for Dunkin' Brands (2000-2005). Previously, Mr. Deberghes served in other fund officer roles.
Stephanie J. Dorsey (1969)
Year of Election or Appointment: 2013
President and Treasurer
Ms. Dorsey also serves as an officer of other funds. Ms. Dorsey serves as Assistant Treasurer of FMR Capital, Inc. (2017-present), is an employee of Fidelity Investments (2008-present), and has served in other fund officer roles. Prior to joining Fidelity Investments, Ms. Dorsey served as Treasurer (2004-2008) of the JPMorgan Mutual Funds and Vice President (2004-2008) of JPMorgan Chase Bank.
Howard J. Galligan III (1966)
Year of Election or Appointment: 2014
Chief Financial Officer
Mr. Galligan also serves as Chief Financial Officer of other funds. Mr. Galligan serves as President of Fidelity Pricing and Cash Management Services (FPCMS) (2014-present) and as a Director of Strategic Advisers, Inc. (investment adviser firm, 2008-present). Previously, Mr. Galligan served as Chief Administrative Officer of Asset Management (2011-2014) and Chief Operating Officer and Senior Vice President of Investment Support for Strategic Advisers, Inc. (2003-2011).
Colm A. Hogan (1973)
Year of Election or Appointment: 2016
Assistant Treasurer
Mr. Hogan also serves as an officer of other funds. Mr. Hogan serves as Assistant Treasurer of FMR Capital, Inc. (2017-present) and is an employee of Fidelity Investments (2005-present).
Chris Maher (1972)
Year of Election or Appointment: 2013
Assistant Treasurer
Mr. Maher serves as Assistant Treasurer of other funds. Mr. Maher is Vice President of Valuation Oversight, serves as Assistant Treasurer of FMR Capital, Inc. (2017-present), and is an employee of Fidelity Investments. Previously, Mr. Maher served as Vice President of Asset Management Compliance (2013), Vice President of the Program Management Group of FMR (investment adviser firm, 2010-2013), and Vice President of Valuation Oversight (2008-2010).
John B. McGinty, Jr. (1962)
Year of Election or Appointment: 2016
Chief Compliance Officer
Mr. McGinty also serves as Chief Compliance Officer of other funds. Mr. McGinty is Senior Vice President of Asset Management Compliance for Fidelity Investments and is an employee of Fidelity Investments (2016-present). Mr. McGinty previously served as Vice President, Senior Attorney at Eaton Vance Management (investment management firm, 2015-2016), and prior to Eaton Vance as global CCO for all firm operations and registered investment companies at GMO LLC (investment management firm, 2009-2015). Before joining GMO LLC, Mr. McGinty served as Senior Vice President, Deputy General Counsel for Fidelity Investments (2007-2009).
Rieco E. Mello (1969)
Year of Election or Appointment: 2017
Assistant Treasurer
Mr. Mello also serves as Assistant Treasurer of other funds. Mr. Mello serves as Assistant Treasurer of FMR Capital, Inc. (2017-present) and is an employee of Fidelity Investments (1995-present).
Jamie Pagliocco (1964)
Year of Election or Appointment: 2017
Vice President
Mr. Pagliocco also serves as Vice President of other funds. Mr. Pagliocco serves as Chief Investment Officer of FMR's Bond Group (2017-present) and is an employee of Fidelity Investments (2001-present).
Jason P. Pogorelec (1975)
Year of Election or Appointment: 2015
Assistant Secretary
Mr. Pogorelec also serves as Assistant Secretary of other funds. Mr. Pogorelec serves as Vice President, Associate General Counsel (2010-present) and is an employee of Fidelity Investments (2006-present).
Nancy D. Prior (1967)
Year of Election or Appointment: 2014
Vice President
Ms. Prior also serves as Vice President of other funds. Ms. Prior serves as a Director of FMR Investment Management (UK) Limited (investment adviser firm, 2015-present), President (2016-present) and Director (2014-present) of Fidelity Investments Money Management, Inc. (FIMM) (investment adviser firm), President, Fixed Income (2014-present), Vice Chairman of FIAM LLC (investment adviser firm, 2014-present), and is an employee of Fidelity Investments (2002-present). Previously, Ms. Prior served as Vice President of Fidelity's Money Market Funds (2012-2014), President, Money Market and Short Duration Bond Group of Fidelity Management & Research (FMR) (investment adviser firm, 2013-2014), President, Money Market Group of FMR (2011-2013), Managing Director of Research (2009-2011), Senior Vice President and Deputy General Counsel (2007-2009), and Assistant Secretary of certain Fidelity® funds (2008-2009).
Stacie M. Smith (1974)
Year of Election or Appointment: 2013
Assistant Treasurer
Ms. Smith also serves as an officer of other funds. Ms. Smith serves as Assistant Treasurer of FMR Capital, Inc. (2017-present), is an employee of Fidelity Investments (2009-present), and has served in other fund officer roles. Prior to joining Fidelity Investments, Ms. Smith served as Senior Audit Manager of Ernst & Young LLP (accounting firm, 1996-2009). Previously, Ms. Smith served as Deputy Treasurer of certain Fidelity® funds (2013-2016).
Marc L. Spector (1972)
Year of Election or Appointment: 2016
Deputy Treasurer
Mr. Spector also serves as an officer of other funds. Mr. Spector serves as Assistant Treasurer of FMR Capital, Inc. (2017-present) and is an employee of Fidelity Investments (2016-present). Prior to joining Fidelity Investments, Mr. Spector served as Director at the Siegfried Group (accounting firm, 2013-2016), and prior to Siegfried Group as audit senior manager at Deloitte & Touche (accounting firm, 2005-2013).
Renee Stagnone (1975)
Year of Election or Appointment: 2016
Assistant Treasurer
Ms. Stagnone also serves as an officer of other funds. Ms. Stagnone serves as Assistant Treasurer of FMR Capital, Inc. (2017-present) and is an employee of Fidelity Investments (1997-present). Previously, Ms. Stagnone served as Deputy Treasurer of certain Fidelity® funds (2013-2016).
Shareholder Expense Example
As a shareholder of the Fund, you incur two types of costs: (1) transaction costs and (2) ongoing costs, including other Fund expenses. This Example is intended to help you understand your ongoing costs (in dollars) of investing in the Fund and to compare these costs with the ongoing costs of investing in other mutual funds.
The Example is based on an investment of $1,000 invested at the beginning of the period and held for the entire period (July 1, 2017 to December 31, 2017).
Actual Expenses
The first line of the accompanying table provides information about actual account values and actual expenses. You may use the information in this line, together with the amount you invested, to estimate the expenses that you paid over the period. Simply divide your account value by $1,000.00 (for example, an $8,600 account value divided by $1,000.00 = 8.6), then multiply the result by the number in the first line under the heading entitled "Expenses Paid During Period" to estimate the expenses you paid on your account during this period. In addition, the Fund, as a shareholder in the underlying Fidelity Central Funds, will indirectly bear its pro-rata share of the fees and expenses incurred by the underlying Fidelity Central Funds. These fees and expenses are not included in the Fund's annualized expense ratio used to calculate the expense estimate in the table below.
Hypothetical Example for Comparison Purposes
The second line of the accompanying table provides information about hypothetical account values and hypothetical expenses based on the Fund's actual expense ratio and an assumed rate of return of 5% per year before expenses, which is not the Fund's actual return. The hypothetical account values and expenses may not be used to estimate the actual ending account balance or expenses you paid for the period. You may use this information to compare the ongoing costs of investing in the Fund and other funds. To do so, compare this 5% hypothetical example with the 5% hypothetical examples that appear in the shareholder reports of the other funds. In addition, the Fund, as a shareholder in the underlying Fidelity Central Funds, will indirectly bear its pro-rata share of the fees and expenses incurred by the underlying Fidelity Central Funds. These fees and expenses are not included in the Fund's annualized expense ratio used to calculate the expense estimate in the table below.
Please note that the expenses shown in the table are meant to highlight your ongoing costs only and do not reflect any transaction costs. Therefore, the second line of the table is useful in comparing ongoing costs only, and will not help you determine the relative total costs of owning different funds.
| Annualized Expense Ratio-A | Beginning Account Value July 1, 2017 | Ending Account Value December 31, 2017 | Expenses Paid During Period-B July 1, 2017 to December 31, 2017 |
|
| Actual | .0017% | $1,000.00 | $1,017.00 | $.01 |
| Hypothetical-C | $1,000.00 | $1,025.20 | $.01 |
A Annualized expense ratio reflects expenses net of applicable fee waivers.
B Expenses are equal to the Fund's annualized expense ratio, multiplied by the average account value over the period, multiplied by 184/365 (to reflect the one-half year period).
C 5% return per year before expenses
Board Approval of Investment Advisory Contracts and Management Fees
VIP Investment Grade Central Fund
Each year, the Board of Trustees, including the Independent Trustees (together, the Board), votes on the renewal of the management contract with Fidelity Investments Money Management, Inc. (FIMM) and the sub-advisory agreements (together, the Advisory Contracts) for the fund. FIMM and the sub-advisers are referred to herein as the Investment Advisers. The Board, assisted by the advice of fund counsel and Independent Trustees' counsel, requests and considers a broad range of information relevant to the renewal of the Advisory Contracts throughout the year.
The Board meets regularly and, at each of its meetings, covers an extensive agenda of topics and materials and considers factors that are relevant to its annual consideration of the renewal of the fund's Advisory Contracts, including the services and support provided to the fund and its shareholders. The Board has established four standing committees (Committees) — Operations, Audit, Fair Valuation, and Governance and Nominating — each composed of and chaired by Independent Trustees with varying backgrounds, to which the Board has assigned specific subject matter responsibilities in order to enhance effective decision-making by the Board. The Operations Committee, of which all of the Independent Trustees are members, meets regularly throughout the year and considers, among other matters, information specifically related to the annual consideration of the renewal of the fund's Advisory Contracts. The Board, acting directly and through its Committees, requests and receives information concerning the annual consideration of the renewal of the fund's Advisory Contracts. The Board also meets as needed to review matters specifically related to the Board's annual consideration of the renewal of the Advisory Contracts. Members of the Board may also meet with trustees of other Fidelity funds through ad hoc joint committees to discuss certain matters relevant to all of the Fidelity funds.
At its September 2017 meeting, the Board unanimously determined to renew the fund's Advisory Contracts. In reaching its determination, the Board considered all factors it believed relevant and reached a determination, with the assistance of fund counsel and Independent Trustees' counsel and through the exercise of its business judgment, that the renewal of the Advisory Contracts was in the best interests of the fund and its shareholders and the fact that no fee is payable under the management contract was fair and reasonable.
Nature, Extent, and Quality of Services Provided. The Board considered Fidelity's staffing as it relates to the fund, including the backgrounds of investment personnel of Fidelity, and also considered the fund's investment objective, strategies, and related investment philosophy. The Independent Trustees also had discussions with senior management of Fidelity's investment operations and investment groups. The Board considered the structure of the investment personnel compensation program and whether this structure provides appropriate incentives to act in the best interests of the fund. Resources Dedicated to Investment Management and Support Services. The Board reviewed the general qualifications and capabilities of Fidelity's investment staff, including its size, education, experience, and resources, as well as Fidelity's approach to recruiting, managing, and compensating investment personnel. The Board noted that Fidelity has continued to increase the resources devoted to non-U.S. offices, including expansion of Fidelity's global investment organization. The Board also noted that Fidelity's analysts have extensive resources, tools and capabilities that allow them to conduct sophisticated quantitative and fundamental analysis, as well as credit analysis of issuers, counterparties and guarantors. Further, the Board considered that Fidelity's investment professionals have sufficient access to global information and data so as to provide competitive investment results over time, and that those professionals also have access to sophisticated tools that permit them to assess portfolio construction and risk and performance attribution characteristics continuously, as well as to transmit new information and research conclusions rapidly around the world. Additionally, in its deliberations, the Board considered Fidelity's trading, risk management, compliance, and technology and operations capabilities and resources, which are integral parts of the investment management process. Administrative Services. The Board considered (i) the nature, extent, quality, and cost of advisory and administrative services performed by the Investment Advisers and their affiliates under the Advisory Contracts and under separate agreements covering transfer agency, pricing and bookkeeping, and securities lending services for the fund; (ii) the nature and extent of the supervision of third party service providers, principally custodians, subcustodians, and pricing vendors; and (iii) the resources devoted to, and the record of compliance with, the fund's compliance policies and procedures. Investment Performance. The Board considered whether the fund has operated in accordance with its investment objective, as well as its record of compliance with its investment restrictions. The Board reviewed the fund's absolute investment performance, as well as the fund's relative investment performance. In this regard, the Board noted that the fund is designed to offer a liquid investment option for other Fidelity funds and accounts and ultimately to enhance the performance of those funds and accounts.Based on its review, the Board concluded that the nature, extent, and quality of services provided to the fund under the Advisory Contracts should continue to benefit the shareholders of the fund. Competitiveness of Management Fee and Total Expense Ratio. The Board considered that while the fund does not pay a management fee, Fidelity Management & Research Company (FMR) pays FIMM a management fee for providing services to the fund and that FMR receives fees for providing services to funds that invest in the fund. The Board also noted that FMR bears all expenses of the fund, except expenses related to the fund's investment activities (primarily custody expenses). Based on its review, the Board concluded that the management fee received for providing services to the fund and the fund's total expense ratio were reasonable in light of the services that the fund and its shareholders receive and the other factors considered. Costs of the Services and Profitability. The Board considered the level of Fidelity's profits in respect of all the Fidelity funds, as well as the profitability of the funds that invest in this fund.PricewaterhouseCoopers LLP (PwC), independent registered public accounting firm and auditor to Fidelity and certain Fidelity funds, has been engaged annually by the Board as part of the Board's assessment of Fidelity's profitability analysis. PwC's engagement includes the review and assessment of the methodologies used by Fidelity in determining the revenues and expenses attributable to Fidelity's mutual fund business, and completion of agreed-upon procedures in respect of the mathematical accuracy of the fund profitability information and its conformity to established allocation methodologies. After considering PwC's reports issued under the engagement and information provided by Fidelity, the Board concluded that while other allocation methods may also be reasonable, Fidelity's profitability methodologies are reasonable in all material respects.The Board also reviewed Fidelity's non-fund businesses and potential fall-out benefits related to the mutual fund business as well as cases where Fidelity's affiliates may benefit from or be related to the fund's business.The Board concluded that the costs of the services provided by and the profits realized by Fidelity in connection with the operation of the fund were not relevant to the renewal of the Advisory Contracts because the fund pays no advisory fees and FMR bears all expenses of the fund, except expenses related to the fund's investment activities. Economies of Scale. The Board concluded that because the fund pays no advisory fees and FMR bears all expenses of the fund, except expenses related to the fund's investment activities, economies of scale cannot be realized by the fund. Additional Information Requested by the Board. In order to develop fully the factual basis for consideration of the Fidelity funds' advisory contracts, the Board requested and received additional information on certain topics, including: (i) Fidelity's fund profitability methodology, profitability trends for certain funds, and the impact of certain factors on fund profitability results; (ii) portfolio manager changes that have occurred during the past year and the amount of the investment that each portfolio manager has made in the Fidelity fund(s) that he or she manages; (iii) Fidelity's compensation structure for portfolio managers, research analysts, and other key personnel, including its effects on fund profitability, the rationale for the compensation structure, and the extent to which current market conditions have affected retention and recruitment; (iv) the arrangements with and compensation paid to certain fund sub-advisers on behalf of the Fidelity funds; (v) the terms of Fidelity's contractual and voluntary expense cap and waiver arrangements with the funds; (vi) the methodology with respect to competitive fund data and peer group classifications; (vii) Fidelity's transfer agent fee, expense, and service structures for different funds and classes relative to competitive trends, and the impact of the increased use of omnibus accounts; (viii) Fidelity's long-term expectations for its offerings in the workplace investing channel; (ix) new developments in the retail and institutional marketplaces and the competitive positioning of the funds relative to other investment products and services; (x) the approach to considering "fall-out" benefits; (xi) the impact of money market reform on Fidelity's money market funds, including with respect to costs and profitability; (xii) the funds' share class structures and distribution channels, including the impact of the Department of Labor's new fiduciary rule on the funds' distribution arrangements; and (xiii) explanations regarding the relative total expense ratios of certain funds and classes, total expense competitive trends and methodologies for total expense competitive comparisons, and actions that might be taken by Fidelity to reduce total expense ratios for certain classes. In addition, the Board considered its discussions with Fidelity throughout the year regarding enhanced information security initiatives and the funds' fair valuation policies.Based on its evaluation of all of the conclusions noted above, and after considering all factors it believed relevant, the Board concluded that the advisory fee structures are fair and reasonable, and that the fund's Advisory Contracts should be renewed.
![]()
Corporate Headquarters
245 Summer St.
Boston, MA 02210
www.fidelity.com
VIGC-ANN-0218
1.831202.111
Item 2.
Code of Ethics
As of the end of the period, December 31, 2017, Fidelity Garrison Street Trust (the trust) has adopted a code of ethics, as defined in Item 2 of Form N-CSR, that applies to its President and Treasurer and its Chief Financial Officer. A copy of the code of ethics is filed as an exhibit to this Form N-CSR.
Item 3.
Audit Committee Financial Expert
The Board of Trustees of the trust has determined that Elizabeth S. Acton is an audit committee financial expert, as defined in Item 3 of Form N-CSR. Ms. Acton is independent for purposes of Item 3 of Form N-CSR.
Item 4.
Principal Accountant Fees and Services
Fees and Services
The following table presents fees billed by Deloitte & Touche LLP, the member firms of Deloitte Touche Tohmatsu, and their respective affiliates (collectively, “Deloitte Entities”) in each of the last two fiscal years for services rendered to VIP Investment Grade Central Fund (the “Fund”):
Services Billed by Deloitte Entities
December 31, 2017 FeesA
| Audit Fees | Audit-Related Fees | Tax Fees | All Other Fees |
VIP Investment Grade Central Fund | $167,000 | $300 | $7,100 | $4,400 |
December 31, 2016 FeesA,B
| Audit Fees | Audit-Related Fees | Tax Fees | All Other Fees |
VIP Investment Grade Central Fund | $167,000 | $200 | $7,000 | $4,600 |
A Amounts may reflect rounding.
B Certain amounts have been reclassified to align with current period presentation.
The following table presents fees billed by Deloitte Entities that were required to be approved by the Audit Committee for services that relate directly to the operations and financial reporting of the Fund and that are rendered on behalf of Fidelity Management & Research Company (“FMR”) and entities controlling, controlled by, or under common control with FMR (not including any sub-adviser whose role is primarily portfolio management and is subcontracted with or overseen by another investment adviser) that provide ongoing services to the Fund (“Fund Service Providers”):
Services Billed by Deloitte Entities
| December 31, 2017A | December 31, 2016A |
Audit-Related Fees | $- | $35,000 |
Tax Fees | $25,000 | $- |
All Other Fees | $- | $- |
A Amounts may reflect rounding.
“Audit-Related Fees” represent fees billed for assurance and related services that are reasonably related to the performance of the fund audit or the review of the fund's financial statements and that are not reported under Audit Fees.
“Tax Fees” represent fees billed for tax compliance, tax advice or tax planning that relate directly to the operations and financial reporting of the fund.
“All Other Fees” represent fees billed for services provided to the fund or Fund Service Provider, a significant portion of which are assurance related, that relate directly to the operations and financial reporting of the fund, excluding those services that are reported under Audit Fees, Audit-Related Fees or Tax Fees.
Assurance services must be performed by an independent public accountant.
* * *
The aggregate non-audit fees billed by Deloitte Entities for services rendered to the Fund, FMR (not including any sub-adviser whose role is primarily portfolio management and is subcontracted with or overseen by another investment adviser), and any Fund Service Provider for each of the last two fiscal years of the Fund are as follows:
Billed By | December 31, 2017A | December 31, 2016A |
Deloitte Entities | $315,000 | $275,000 |
A Amounts may reflect rounding.
The trust's Audit Committee has considered non-audit services that were not pre-approved that were provided by Deloitte Entities to Fund Service Providers to be compatible with maintaining the independence of Deloitte Entities in its audit of the Fund, taking into account representations from Deloitte Entities, in accordance with Public Company Accounting Oversight Board rules, regarding its independence from the Fund and its related entities and FMR’s review of the appropriateness and permissibility under applicable law of such non-audit services prior to their provision to the Fund Service Providers.
Audit Committee Pre-Approval Policies and Procedures
The trust’s Audit Committee must pre-approve all audit and non-audit services provided by a fund’s independent registered public accounting firm relating to the operations or financial reporting of the fund. Prior to the commencement of any audit or non-audit services to a fund, the Audit Committee reviews the services to determine whether they are appropriate and permissible under applicable law.
The Audit Committee has adopted policies and procedures to, among other purposes, provide a framework for the Committee’s consideration of non-audit services by the audit firms that audit the Fidelity funds. The policies and procedures require that any non-audit service provided by a fund audit firm to a Fidelity fund and any non-audit service provided by a fund auditor to a Fund Service Provider that relates directly to the operations and financial reporting of a Fidelity fund (“Covered Service”) are subject to approval by the Audit Committee before such service is provided.
All Covered Services must be approved in advance of provision of the service either: (i) by formal resolution of the Audit Committee, or (ii) by oral or written approval of the service by the Chair of the Audit Committee (or if the Chair is unavailable, such other member of the Audit Committee as may be designated by the Chair to act in the Chair’s absence). The approval contemplated by (ii) above is permitted where the Treasurer determines that action on such an engagement is necessary before the next meeting of the Audit Committee.
Non-audit services provided by a fund audit firm to a Fund Service Provider that do not relate directly to the operations and financial reporting of a Fidelity fund are reported to the Audit Committee on a periodic basis.
Non-Audit Services Approved Pursuant to Rule 2-01(c)(7)(i)(C) and (ii) of Regulation S-X (“De Minimis Exception”)
There were no non-audit services approved or required to be approved by the Audit Committee pursuant to the De Minimis Exception during the Fund’s last two fiscal years relating to services provided to (i) the Fund or (ii) any Fund Service Provider that relate directly to the operations and financial reporting of the Fund.
Item 5.
Audit Committee of Listed Registrants
Not applicable.
Item 6.
Investments
(a)
Not applicable.
(b)
Not applicable
Item 7.
Disclosure of Proxy Voting Policies and Procedures for Closed-End Management Investment Companies
Not applicable.
Item 8.
Portfolio Managers of Closed-End Management Investment Companies
Not applicable.
Item 9.
Purchase of Equity Securities by Closed-End Management Investment Company and Affiliated Purchasers
Not applicable.
Item 10.
Submission of Matters to a Vote of Security Holders
There were no material changes to the procedures by which shareholders may recommend nominees to the trust’s Board of Trustees.
Item 11.
Controls and Procedures
(a)(i) The President and Treasurer and the Chief Financial Officer have concluded that the trust’s disclosure controls and procedures (as defined in Rule 30a-3(c) under the Investment Company Act) provide reasonable assurances that material information relating to the trust is made known to them by the appropriate persons, based on their evaluation of these controls and procedures as of a date within 90 days of the filing date of this report.
(a)(ii) There was no change in the trust’s internal control over financial reporting (as defined in Rule 30a-3(d) under the Investment Company Act) that occurred during the second fiscal quarter of the period covered by this report that has materially affected, or is reasonably likely to materially affect, the trust’s internal control over financial reporting.
Item 12.
Exhibits
(a) | (1) | Code of Ethics pursuant to Item 2 of Form N-CSR is filed and attached hereto as EX-99.CODE ETH. |
(a) | (2) | Certification pursuant to Rule 30a-2(a) under the Investment Company Act of 1940 (17 CFR 270.30a-2(a)) is filed and attached hereto as Exhibit 99.CERT. |
(a) | (3) | Not applicable. |
(b) |
| Certification pursuant to Rule 30a-2(b) under the Investment Company Act of 1940 (17 CFR 270.30a-2(b)) is furnished and attached hereto as Exhibit 99.906CERT. |
SIGNATURES
Pursuant to the requirements of the Securities Exchange Act of 1934 and the Investment Company Act of 1940, the registrant has duly caused this report to be signed on its behalf by the undersigned, thereunto duly authorized.
Fidelity Garrison Street Trust
By: | /s/Stephanie J. Dorsey |
| Stephanie J. Dorsey |
| President and Treasurer |
|
|
Date: | February 26, 2018 |
Pursuant to the requirements of the Securities Exchange Act of 1934 and the Investment Company Act of 1940, this report has been signed below by the following persons on behalf of the registrant and in the capacities and on the dates indicated.
By: | /s/Stephanie J. Dorsey |
| Stephanie J. Dorsey |
| President and Treasurer |
|
|
Date: | February 26, 2018 |
By: | /s/Howard J. Galligan III |
| Howard J. Galligan III |
| Chief Financial Officer |
|
|
Date: | February 26, 2018 |