UNITED STATES
SECURITIES AND EXCHANGE COMMISSION
Washington, D.C. 20549
FORM N-CSR
CERTIFIED SHAREHOLDER REPORT
OF
REGISTERED MANAGEMENT INVESTMENT COMPANIES
| Investment Company Act file number: | 811-04526 | |
|
Name of Registrant: |
Vanguard Quantitative Funds | |
|
Address of Registrant: |
P.O. Box 2600 | |
| Valley Forge, PA 19482 | ||
|
Name and address of agent for service: |
Anne E. Robinson, Esquire | |
| P.O. Box 876 | ||
| Valley Forge, PA 19482 | ||
|
Registrant’s telephone number, including area code: (610) 669-1000 | ||
|
Date of fiscal year end: September 30 | ||
|
Date of reporting period: October 1, 2017 – September 30, 2018 | ||
|
Item 1: Reports to Shareholders | ||

Annual Report | September 30, 2018
Vanguard Growth and Income Fund
Vanguard’s Principles for Investing Success
We want to give you the best chance of investment success. These principles, grounded in Vanguard’s research and experience, can put you on the right path.
Goals. Create clear, appropriate investment goals.
Balance. Develop a suitable asset allocation using broadly diversified funds. Cost. Minimize cost.
Discipline. Maintain perspective and long-term discipline.
A single theme unites these principles: Focus on the things you can control.
We believe there is no wiser course for any investor.
| Contents | |
| Your Fund’s Performance at a Glance. | 1 |
| CEO’s Perspective. | 3 |
| Advisors’ Report. | 5 |
| Fund Profile. | 9 |
| Performance Summary. | 11 |
| Financial Statements. | 13 |
| Your Fund’s After-Tax Returns. | 38 |
| About Your Fund’s Expenses. | 39 |
| Trustees Approve Advisory Arrangements. | 41 |
| Glossary. | 43 |
Please note: The opinions expressed in this report are just that—informed opinions. They should not be considered promises
or advice. Also, please keep in mind that the information and opinions cover the period through the date on the front of this
report. Of course, the risks of investing in your fund are spelled out in the prospectus.
See the Glossary for definitions of investment terms used in this report.
Your Fund’s Performance at a Glance
• Vanguard Growth and Income Fund returned more than 18% for the 12 months ended September 30, 2018, ahead of its benchmark and the average return of its peers.
• The fund invests in U.S. large- and mid-capitalization stocks and seeks a total return greater than that of the Standard & Poor’s 500 Index. Three independent advisors manage the fund, each responsible for its own portfolio.
• In general, growth stocks outpaced their value counterparts during the fiscal year.
• Six of the fund’s 11 industry sectors contributed to performance relative to the benchmark: industrials, energy, information technology, utilities, consumer staples, and materials.
• Health care, consumer discretionary, and financials detracted modestly from relative performance.
• For the ten years ended September 30, 2018, the fund’s average annual return trailed that of its benchmark but outpaced its peer average.
| Total Returns: Fiscal Year Ended September 30, 2018 | |
| Total | |
| Returns | |
| Vanguard Growth and Income Fund | |
| Investor Shares | 18.56% |
| Admiral™ Shares | 18.65 |
| S&P 500 Index | 17.91 |
| Large-Cap Core Funds Average | 15.62 |
| Large-Cap Core Funds Average: Derived from data provided by Lipper, a Thomson Reuters Company. | |
| Admiral Shares carry lower expenses and are available to investors who meet certain account-balance requirements. |
| Total Returns: Ten Years Ended September 30, 2018 | |
| Average | |
| Annual Return | |
| Growth and Income Fund Investor Shares | 11.52% |
| S&P 500 Index | 11.97 |
| Large-Cap Core Funds Average | 10.36 |
| Large-Cap Core Funds Average: Derived from data provided by Lipper, a Thomson Reuters Company. |
The figures shown represent past performance, which is not a guarantee of future results. (Current
performance may be lower or higher than the performance data cited. For performance data current to the
most recent month-end, visit our website at vanguard.com/performance.) Note, too, that both investment
returns and principal value can fluctuate widely, so an investor’s shares, when sold, could be worth more
or less than their original cost.
1
| Expense Ratios | |||
| Your Fund Compared With Its Peer Group | |||
| Investor | Admiral | Peer Group | |
| Shares | Shares | Average | |
| Growth and Income Fund | 0.34% | 0.23% | 1.03% |
The fund expense ratios shown are from the prospectus dated January 26, 2018, and represent estimated costs for the current fiscal year.
For the fiscal year ended September 30, 2018, the fund’s expense ratios were 0.33% for Investor Shares and 0.23% for Admiral Shares.
The peer-group expense ratio is derived from data provided by Lipper, a Thomson Reuters Company, and captures information through
year-end 2017.
Peer group: Large-Cap Core Funds.
2
CEO’s Perspective

Tim Buckley
President and Chief Executive Officer
Dear Shareholder,
Over the years, I’ve found that prudent investors exhibit a common trait: discipline. No matter how the markets move or what new investing fad hits the headlines, those who stay focused on their goals and tune out the noise are set up for long-term success.
The prime gateway to investing is saving, and you don’t usually become a saver without a healthy dose of discipline. Savers make the decision to sock away part of their income, which means spending less and delaying gratification, no matter how difficult that may be.
Of course, disciplined investing extends beyond diligent saving. The financial markets, in the short term especially, are unpredictable; I have yet to meet the investor who can time them perfectly. It takes discipline to resist the urge to go all-in when markets are frothy or to retreat when things look bleak.
Staying put with your investments is one strategy for handling volatility. Another, rebalancing, requires even more discipline because it means steering your money away from strong performers and toward poorer performers.
Patience—a form of discipline—is also the friend of long-term investors. Higher returns are the potential reward for weathering the market’s turbulence and uncertainty.
3
We have been enjoying one of the longest bull markets in history, but it won’t continue forever. Prepare yourself now for how you will react when volatility comes back. Don’t panic. Don’t chase returns or look for answers outside the asset classes you trust. And be sure to rebalance periodically, even when there’s turmoil.
Whether you’re a master of self-control, get a boost from technology, or work with a professional advisor, know that discipline
is necessary to get the most out of your investment portfolio. And know that Vanguard is with you for the entire ride.
Thank you for your continued loyalty.
Sincerely,

Mortimer J. Buckley
President and Chief Executive Officer
October 18, 2018
| Market Barometer | |||
| Average Annual Total Returns | |||
| Periods Ended September 30, 2018 | |||
| One Year | Three Years | Five Years | |
| Stocks | |||
| Russell 1000 Index (Large-caps) | 17.76% | 17.07% | 13.67% |
| Russell 2000 Index (Small-caps) | 15.24 | 17.12 | 11.07 |
| Russell 3000 Index (Broad U.S. market) | 17.58 | 17.07 | 13.46 |
| FTSE All-World ex US Index (International) | 2.13 | 10.18 | 4.51 |
| Bonds | |||
| Bloomberg Barclays U.S. Aggregate Bond Index | |||
| (Broad taxable market) | -1.22% | 1.31% | 2.16% |
| Bloomberg Barclays Municipal Bond Index | |||
| (Broad tax-exempt market) | 0.35 | 2.24 | 3.54 |
| FTSE Three-Month U. S. Treasury Bill Index | 1.57 | 0.80 | 0.48 |
| CPI | |||
| Consumer Price Index | 2.28% | 1.99% | 1.52% |
4
Advisors’ Report
Vanguard Growth and Income Fund’s Investor Shares returned 18.56% for the 12 months ended September 30, 2018. The Admiral Shares returned 18.65%. The Standard & Poor’s 500 Index returned 17.91%, and the average return of large-capitalization core funds was 15.62%.
Your fund is managed by three independent advisors, a strategy that enhances the fund’s diversification by providing exposure to distinct yet complementary investment approaches. It is not uncommon for different advisors to have different views about individual securities or the broader investment environment.
The advisors, the percentage of fund assets each manages, and brief descriptions of their investment strategies are presented in the table below. The advisors have also prepared a discussion of the investment environment that existed during the fiscal year and of how the portfolio’s positioning reflects this assessment. (Please note that Los Angeles Capital’s discussion refers to industry sectors as defined by Russell classifications, rather than by the Global Industry Classification Standard used elsewhere in this report.) These comments were prepared on October 16, 2018.
| Vanguard Growth and Income Fund Investment Advisors | |||
| Fund Assets Managed | |||
| Investment Advisor | % | $ Million | Investment Strategy |
| Vanguard Quantitative Equity | 33 | 3,738 | Employs a quantitative fundamental management |
| Group | approach, using models that assess valuation, growth | ||
| prospects, management decisions, market | |||
| sentiment, and earnings and balance-sheet quality of | |||
| companies as compared with their peers. | |||
| Los Angeles Capital | 33 | 3,713 | Employs a quantitative model that emphasizes stocks |
| with characteristics investors are currently seeking | |||
| and underweights stocks with characteristics | |||
| investors are currently avoiding. The portfolio’s sector | |||
| weights, size, and style characteristics may differ | |||
| modestly from the benchmark in a risk-controlled | |||
| manner. | |||
| D. E. Shaw Investment | 32 | 3,711 | Employs quantitative models that seek to capture |
| Management, L.L.C. | predominantly bottom-up stock-specific return | ||
| opportunities. The portfolio’s sector weights, size, | |||
| and style characteristics may differ modestly from the | |||
| benchmark in a risk-controlled manner. | |||
| Cash Investments | 2 | 261 | These short-term reserves are invested by Vanguard |
| in equity index products to simulate investments in | |||
| stocks. Each advisor also may maintain a modest | |||
| cash position. | |||
5
Vanguard Quantitative Equity Group
Portfolio Managers:
James P. Stetler
Binbin Guo, Principal,
Head of Alpha Equity Investments
Global markets continued to advance over the 12 months. U.S. stocks led the way as increasing profits and a strong economy outweighed investor concerns about rising interest rates, higher inflation, and trade tensions. Large-capitalization stocks outperformed small-caps, and growth stocks outpaced value stocks.
Emerging markets stocks were in negative territory, hurt by trade tensions and a rising dollar. Results in Europe and the Asia-Pacific region were muted in part because of these countries’ greater economic dependence on emerging markets.
The Federal Reserve raised rates in September 2018—its eighth increase since the current tightening cycle began—and signaled more hikes to come. Attention is now focused on the pace of rate increases, with many analysts expecting another one in December and three in 2019.
Although overall performance is affected by macroeconomic factors, our approach to investing focuses on specific fundamentals. We believe that attractive stocks exhibit five key characteristics: high quality—healthy balance sheets and steady cash-flow generation; effective use of capital with sound investment policies that favor internal over external funding; consistent earnings growth with the ability to grow earnings year after year; strong market sentiment; and reasonable valuation.
Using these five themes, we generate a daily composite stock ranking, seeking to capitalize on market inefficiencies. We then monitor our portfolio and adjust when appropriate to maximize expected returns and minimize exposure to risks that our research indicates don’t improve returns (such as industry selection and other risks relative to the benchmark).
Over the period, our growth and quality models contributed significantly to relative performance; management decisions also contributed. Valuation and sentiment detracted. Our strongest sector results were in information technology, industrials, and energy. Our worst were in consumer discretionary, materials, and telecommunication services.
At the individual stock level, the largest contributions came from overweighted positions in Advanced Micro Devices, Align Technology, Marathon Oil, and Valero Energy. Our portfolio also benefited from an underweight position in General Electric. Overweight positions in Nektar Therapeutics, Albemarle, and AT&T, as well as underweight positions in Amazon.com and Netflix, hurt performance.
We believe that our approach will benefit investors over the long term and feel that the fund offers a strong mix of stocks with attractive valuation and growth characteristics relative to its benchmark.
6
Los Angeles Capital
Portfolio Managers:
Thomas D. Stevens, CFA,
Chairman and Principal
Hal W. Reynolds, CFA,
Chief Investment Officer and Principal
The S&P 500 Index rose 17.91% for the 12 months ended September 30, 2018, led by U.S. large-capitalization growth stocks, which outperformed value stocks by almost 17%. Market volatility rose from 2017 lows but remained well below historic levels. Although growth stocks’ advantage over value stocks rose to levels generally not seen since the dot-com years of the late 1990s, two observations are worth noting. First, unlike during the previous period, returns were driven in large part by more than 20% earnings growth, the result of increased capital spending spurred by corporate tax cuts. Second, despite growth stocks’ outperformance, investor sentiment toward value stocks has increased because of their more favorable valuations and a belief that U.S. economic growth rates will carry over into the coming year.
An analysis of equity factors shows that long-term price momentum was again rewarded, as stocks with the best returns over the previous one- and three-year periods did particularly well. Mega-cap growth stocks continued to outperform. However, the returns of multinational companies that derive a large portion of their sales overseas weakened on a strengthening dollar. Among growth stocks, speculative companies with the highest long-term growth prospects outperformed; so did inexpensive companies with favorable book multiples but with higher earnings quality, as investors began to diversify their portfolios and hedge their positions to riskier growth investments.
The portfolio’s tilt toward stocks with favorable one-year momentum and lower exposure to intrinsic value contributed to returns. Overweight exposures to quality measures such as analyst insight and earnings quality also contributed significantly. A smaller-cap tilt, a tilt toward peer momentum, and an overweight to foreign revenue detracted. Overweightings of growth-related sectors such as health care and technology contributed significantly to returns, while stock selection in financials, energy, and transportation detracted.
The portfolio trimmed but maintained an overweight to technology, and it shifted into health care, retail, and transportation and out of basic materials and utilities. It increased its exposure to management quality factors such as earnings quality and transcript quality and reduced its exposure to dividend yield, foreign revenue, and higher levels of financial risk from leverage and pension risk.
The portfolio is now positioned toward companies with strong price and peer momentum and favorable quality measures such as analyst sentiment and robust cash earnings. In terms of sectors, the portfolio’s largest overweights are to
7
health care, retail, and real estate; the largest underweights are to consumer staples, financials, and utilities.
D. E. Shaw Investment
Management, L.L.C.
Portfolio Manager:
Philip Kearns, Ph.D., Managing Director
The S&P 500 Index gained 17.91% over the period in a broad-based rally, during which all sectors posted positive returns. However, a brief but large reversal, followed by two months of volatility, interrupted this strong overall performance before the market resumed its rise. Although we actively monitor market activities, we generally do not make investment decisions based on a subjective analysis of the investment environment.
Our quantitative equity investment process deploys both alpha models that seek to forecast individual stock returns and risk models that seek to mitigate active exposures to industries, sectors, and common risk factors. However, the resulting portfolios may exhibit small-to-moderate active exposures to industries, sectors, and risk factors as a by-product of our focus on bottom-up stock selection.
Therefore, we generally attribute portfolio performance to three major sources: bottom-up stock selection based on our forecasts; exposure to industry groups; and exposure to risk factors such as value, growth, and market capitalization. Our analysis indicates that stock selection contributed the most to relative performance over the period, with exposure to industry groups—in particular, underweight exposure to the vertically integrated major oil industry risk factor and overweight exposure to building supplies—detracting most.
The three largest single-stock contributors to performance were underweight positions in General Electric and Facebook and an overweight position in Apple. The three largest single-stock detractors were underweight positions in Amazon.com and Microsoft and an overweight position in Realogy Holdings.
In our view, the U.S. economy will continue to expand. However, there are reasons to be cautious about equity markets’ prospects for performance. The new year began with optimism about the effects of new tax legislation on corporate earnings, and that seemed to propel U.S. stocks higher. But this confidence has at times appeared to be fragile, as the February market drop illustrated. Although stocks continued to rise after that brief downturn, some challenges remain, among them concerns about rising interest rates, a possible trade war with China, and the threat of inflation caused by unusually low unemployment.
8
Growth and Income Fund
Fund Profile
As of September 30, 2018
| Share-Class Characteristics | ||
| Investor | Admiral | |
| Shares | Shares | |
| Ticker Symbol | VQNPX | VGIAX |
| Expense Ratio1 | 0.34% | 0.23% |
| 30-Day SEC Yield | 1.53% | 1.62% |
| Portfolio Characteristics | |||
| DJ | |||
| U.S. Total | |||
| S&P 500 | Market | ||
| Fund | Index | FA Index | |
| Number of Stocks | 1,139 | 506 | 3,825 |
| Median Market Cap | $89.9B | $113.8B | $73.9B |
| Price/Earnings Ratio | 22.2x | 21.5x | 21.0x |
| Price/Book Ratio | 3.6x | 3.3x | 3.1x |
| Return on Equity | 16.3% | 16.2% | 14.9% |
| Earnings Growth Rate | 8.5% | 8.2% | 8.5% |
| Dividend Yield | 1.7% | 1.8% | 1.7% |
| Foreign Holdings | 0.2% | 0.0% | 0.0% |
| Turnover Rate | 83% | — | — |
| Short-Term Reserves | 0.2% | — | — |
| Volatility Measures | ||
| DJ | ||
| U.S. Total | ||
| S&P 500 | Market | |
| Index | FA Index | |
| R-Squared | 0.99 | 0.99 |
| Beta | 1.00 | 0.99 |
| These measures show the degree and timing of the fund’s | ||
| fluctuations compared with the indexes over 36 months. | ||
| Sector Diversification (% of equity exposure) | |
| Fund | |
| Consumer Discretionary | 12.8% |
| Consumer Staples | 6.8 |
| Energy | 6.3 |
| Financials | 12.7 |
| Health Care | 15.5 |
| Industrials | 9.9 |
| Information Technology | 26.6 |
| Materials | 1.9 |
| Real Estate | 3.3 |
| Telecommunication Services | 2.0 |
| Utilities | 2.2 |
Sector categories are based on the Global Industry Classification
Standard (“GICS”), except for the “Other” category (if applicable),
which includes securities that have not been provided a GICS
classification as of the effective reporting period.
| Ten Largest Holdings (% of total net assets) | ||
| Apple Inc. | Technology | |
| Hardware, Storage & | ||
| Peripherals | 4.4% | |
| Microsoft Corp. | Systems Software | 3.6 |
| Amazon.com Inc. | Internet & Direct | |
| Marketing Retail | 3.6 | |
| Alphabet Inc. | Internet Software & | |
| Services | 3.0 | |
| JPMorgan Chase & Co. | Diversified Banks | 1.3 |
| Home Depot Inc. | Home Improvement | |
| Retail | 1.2 | |
| Merck & Co. Inc. | Pharmaceuticals | 1.2 |
| Berkshire Hathaway Inc. Multi-Sector Holdings | 1.1 | |
| Johnson & Johnson | Pharmaceuticals | 1.1 |
| Visa Inc. | Data Processing & | |
| Outsourced Services | 1.1 | |
| Top Ten | 21.6% | |
| The holdings listed exclude any temporary cash investments and | ||
| equity index products. | ||
1 The expense ratios shown are from the prospectus dated January 26, 2018, and represent estimated costs for the current fiscal year. For the fiscal year ended September 30, 2018, the expense ratios were 0.33% for Investor Shares and 0.23% for Admiral Shares.
9
Growth and Income Fund
Investment Focus
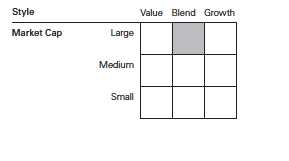
10
Growth and Income Fund
Performance Summary
All of the returns in this report represent past performance, which is not a guarantee of future results that may be achieved by the fund. (Current performance may be lower or higher than the performance data cited. For performance data current to the most recent month-end, visit our website at vanguard.com/performance.) Note, too, that both investment returns and principal value can fluctuate widely, so an investor’s shares, when sold, could be worth more or less than their original cost. The returns shown do not reflect taxes that a shareholder would pay on fund distributions or on the sale of fund shares.
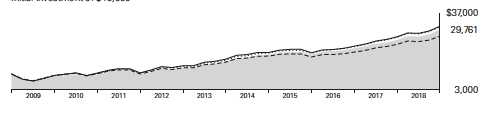
Cumulative Performance: September 30, 2008, Through September 30, 2018
Initial Investment of $10,000
| Average Annual Total Returns | |||||
| Periods Ended September 30, 2018 | |||||
| Final Value | |||||
| One | Five | Ten | of a $10,000 | ||
| Year | Years | Years | Investment | ||
| Growth and Income Fund*Investor | |||||
| Shares | 18.56% | 14.08% | 11.52% | $29,761 | |
| • • • • • • • • | S&P 500 Index | 17.91 | 13.95 | 11.97 | 30,962 |
| – – – – | Dow Large-Cap Jones Core U.S. Funds Total Stock Average Market | 15.62 | 11.86 | 10.36 | 26,799 |
| Float Adjusted Index | 17.58 | 13.42 | 12.05 | 31,191 | |
| Large-Cap Core Funds Average: Derived from data provided by Lipper, a Thomson Reuters Company. | |||||
| Final Value | ||||
| One | Five | Ten | of a $50,000 | |
| Year | Years | Years | Investment | |
| Growth and Income Fund Admiral Shares | 18.65% | 14.20% | 11.65% | $150,481 |
| S&P 500 Index | 17.91 | 13.95 | 11.97 | 154,811 |
| Dow Jones U.S. Total Stock Market Float | ||||
| Adjusted Index | 17.58 | 13.42 | 12.05 | 155,955 |
See Financial Highlights for dividend and capital gains information.
11
Growth and Income Fund
Fiscal-Year Total Returns (%): September 30, 2008, Through September 30, 2018
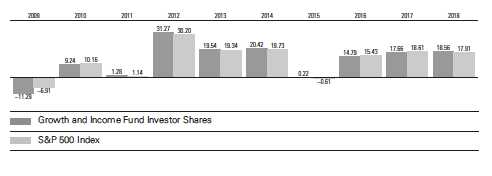
12
Growth and Income Fund
Financial Statements
Statement of Net Assets
As of September 30, 2018
The fund reports a complete list of its holdings in regulatory filings four times in each fiscal year, at the quarter-ends. For the second and fourth fiscal quarters, the lists appear in the fund’s semiannual and annual reports to shareholders. For the first and third fiscal quarters, the fund files the lists with the Securities and Exchange Commission on Form N-Q. Shareholders can look up the fund’s Forms N-Q on the SEC’s website at sec.gov. Forms N-Q may also be reviewed and copied at the SEC’s Public Reference Room (see the back cover of this report for further information).
| Market | |||
| Value• | |||
| Shares | ($000) | ||
| Common Stocks (97.5%)1 | |||
| Consumer Discretionary (12.5%) | |||
| * | Amazon.com Inc. | 203,824 | 408,259 |
| Home Depot Inc. | 671,760 | 139,155 | |
| * | Booking Holdings Inc. | 28,834 | 57,207 |
| Walt Disney Co. | 467,161 | 54,630 | |
| Yum! Brands Inc. | 548,051 | 49,823 | |
| Lowe’s Cos. Inc. | 403,284 | 46,305 | |
| TJX Cos. Inc. | 376,510 | 42,177 | |
| Marriott International Inc. | |||
| Class A | 298,527 | 39,414 | |
| McDonald’s Corp. | 217,959 | 36,462 | |
| Comcast Corp. Class A | 1,009,938 | 35,762 | |
| Best Buy Co. Inc. | 440,255 | 34,939 | |
| NIKE Inc. Class B | 366,860 | 31,080 | |
| * | Netflix Inc. | 82,043 | 30,695 |
| Kohl’s Corp. | 314,631 | 23,456 | |
| H&R Block Inc. | 886,559 | 22,829 | |
| Ralph Lauren Corp. | |||
| Class A | 165,483 | 22,762 | |
| Ross Stores Inc. | 204,710 | 20,287 | |
| * | O’Reilly Automotive Inc. | 56,687 | 19,689 |
| Darden Restaurants Inc. | 175,857 | 19,554 | |
| Macy’s Inc. | 558,236 | 19,388 | |
| Aptiv plc | 211,625 | 17,755 | |
| PulteGroup Inc. | 697,821 | 17,285 | |
| Target Corp. | 176,981 | 15,611 | |
| Tiffany & Co. | 96,723 | 12,474 | |
| * | Charter Communications | ||
| Inc. Class A | 33,668 | 10,972 | |
| Expedia Group Inc. | 77,970 | 10,174 | |
| * | Chipotle Mexican Grill Inc. | ||
| Class A | 21,140 | 9,609 | |
| * | DISH Network Corp. | ||
| Class A | 268,059 | 9,586 | |
| BorgWarner Inc. | 221,896 | 9,493 | |
| News Corp. Class B | 692,466 | 9,418 | |
| Omnicom Group Inc. | 123,315 | 8,388 | |
| News Corp. Class A | 607,100 | 8,008 | |
| * | Ulta Beauty Inc. | 25,550 | 7,208 |
| * | TripAdvisor Inc. | 137,750 | 7,035 |
| Tractor Supply Co. | 76,910 | 6,990 | |
| Starbucks Corp. | 119,913 | 6,816 | |
| DR Horton Inc. | 159,590 | 6,731 | |
| Hilton Worldwide | |||
| Holdings Inc. | 71,912 | 5,809 | |
| * | AutoZone Inc. | 7,460 | 5,787 |
| CBS Corp. Class B | 99,258 | 5,702 | |
| Dollar General Corp. | 51,820 | 5,664 | |
| Advance Auto Parts Inc. | 30,770 | 5,179 | |
| Goodyear Tire & Rubber | |||
| Co. | 208,000 | 4,865 | |
| VF Corp. | 47,920 | 4,478 | |
| Las Vegas Sands Corp. | 74,800 | 4,438 | |
| Restaurant Brands | |||
| International Inc. | 69,700 | 4,132 | |
| Tapestry Inc. | 76,915 | 3,866 | |
| Wynn Resorts Ltd. | 23,900 | 3,037 | |
| PVH Corp. | 19,300 | 2,787 | |
| Wyndham Hotels & | |||
| Resorts Inc. | 46,185 | 2,566 | |
| Garmin Ltd. | 35,264 | 2,470 | |
| Hyatt Hotels Corp. Class A | 31,000 | 2,467 | |
| Delphi Technologies plc | 72,302 | 2,267 | |
| * | Michael Kors Holdings Ltd. | 31,797 | 2,180 |
| * | Liberty Media Corp-Liberty | ||
| SiriusXM Class C | 46,200 | 2,007 | |
| * | Crocs Inc. | 73,999 | 1,575 |
| L Brands Inc. | 49,220 | 1,491 | |
| Brunswick Corp. | 20,400 | 1,367 | |
| * | Fossil Group Inc. | 55,900 | 1,301 |
| * | Liberty Media Corp-Liberty | ||
| SiriusXM Class A | 26,900 | 1,169 | |
| Yum China Holdings Inc. | 31,800 | 1,116 | |
| * | Burlington Stores Inc. | 5,700 | 929 |
| Graham Holdings Co. | |||
| Class B | 1,527 | 885 |
13
Growth and Income Fund
| Market | |||
| Value• | |||
| Shares | ($000) | ||
| Altice USA Inc. Class A | 44,700 | 811 | |
| Foot Locker Inc. | 15,000 | 765 | |
| Gap Inc. | 26,090 | 753 | |
| Genuine Parts Co. | 7,400 | 736 | |
| Sirius XM Holdings Inc. | 113,300 | 716 | |
| Nordstrom Inc. | 10,900 | 652 | |
| Gentex Corp. | 30,100 | 646 | |
| * | Groupon Inc. Class A | 166,700 | 628 |
| Bloomin’ Brands Inc. | 30,900 | 611 | |
| * | Hilton Grand Vacations Inc. | 18,000 | 596 |
| * | Sally Beauty Holdings Inc. | 31,000 | 570 |
| * | Liberty Expedia Holdings | ||
| Inc. Class A | 11,900 | 560 | |
| La-Z-Boy Inc. | 17,500 | 553 | |
| * | Hibbett Sports Inc. | 28,600 | 538 |
| * | SeaWorld Entertainment Inc. | 16,200 | 509 |
| Hasbro Inc. | 4,800 | 505 | |
| * | Wayfair Inc. | 3,300 | 487 |
| * | Michaels Cos. Inc. | 29,900 | 485 |
| * | ServiceMaster Global | ||
| Holdings Inc. | 7,500 | 465 | |
| Carter’s Inc. | 4,500 | 444 | |
| Dick’s Sporting Goods Inc. | 12,200 | 433 | |
| * | Murphy USA Inc. | 4,500 | 385 |
| * | Deckers Outdoor Corp. | 3,100 | 368 |
| * | Express Inc. | 32,630 | 361 |
| * | Sleep Number Corp. | 9,700 | 357 |
| Gannett Co. Inc. | 35,500 | 355 | |
| Dana Inc. | 18,400 | 344 | |
| Wyndham Destinations Inc. | 7,800 | 338 | |
| Tenneco Inc. | 7,800 | 329 | |
| *,^ | Under Armour Inc. Class A | 14,900 | 316 |
| Royal Caribbean Cruises Ltd. | 2,347 | 305 | |
| * | LKQ Corp. | 9,067 | 287 |
| Cable One Inc. | 305 | 269 | |
| Pier 1 Imports Inc. | 174,100 | 261 | |
| * | American Outdoor Brands | ||
| Corp. | 16,400 | 255 | |
| * | Liberty Global plc Class A | 7,700 | 223 |
| * | Taylor Morrison Home Corp. | ||
| Class A | 12,300 | 222 | |
| * | GCI Liberty Inc. - Class A | 3,900 | 199 |
| * | NVR Inc. | 80 | 198 |
| * | Visteon Corp. | 2,100 | 195 |
| * | Vitamin Shoppe Inc. | 18,900 | 189 |
| BJ’s Restaurants Inc. | 2,400 | 173 | |
| Nutrisystem Inc. | 4,370 | 162 | |
| Brinker International Inc. | 3,000 | 140 | |
| New Media Investment | |||
| Group Inc. | 8,200 | 129 | |
| * | Vista Outdoor Inc. | 6,345 | 113 |
| * | Urban Outfitters Inc. | 2,622 | 107 |
| * | Adtalem Global Education | ||
| Inc. | 2,200 | 106 |
| Cheesecake Factory Inc. | 1,900 | 102 | |
| Columbia Sportswear Co. | 1,000 | 93 | |
| * | Fiat Chrysler Automobiles NV | 5,200 | 91 |
| Shoe Carnival Inc. | 2,300 | 89 | |
| Sinclair Broadcast Group Inc. | |||
| Class A | 2,800 | 79 | |
| Core-Mark Holding Co. Inc. | 2,300 | 78 | |
| * | Liberty TripAdvisor Holdings | ||
| Inc. Class A | 4,800 | 71 | |
| Movado Group Inc. | 1,600 | 67 | |
| Pool Corp. | 400 | 67 | |
| ^ | Big 5 Sporting Goods Corp. 11,800 | 60 | |
| Cato Corp. Class A | 2,000 | 42 | |
| * | IMAX Corp. | 1,400 | 36 |
| * | Career Education Corp. | 2,300 | 34 |
| Signet Jewelers Ltd. | 500 | 33 | |
| Entravision Communications | |||
| Corp. Class A | 6,600 | 32 | |
| Extended Stay America Inc. | 1,500 | 30 | |
| * | Kirkland’s Inc. | 3,000 | 30 |
| Ethan Allen Interiors Inc. | 1,200 | 25 | |
| Libbey Inc. | 2,800 | 24 | |
| DSW Inc. Class A | 700 | 24 | |
| * | Biglari Holdings Inc. Class B | 110 | 20 |
| * | MDC Partners Inc. Class A | 4,600 | 19 |
| International Speedway Corp. | |||
| Class A | 400 | 18 | |
| * | Nautilus Inc. | 1,200 | 17 |
| * | America’s Car-Mart Inc. | 200 | 16 |
| Tile Shop Holdings Inc. | 2,100 | 15 | |
| * | Horizon Global Corp. | 2,100 | 15 |
| * | Liberty Media Corp-Liberty | ||
| Formula One | 400 | 15 | |
| Bassett Furniture Industries | |||
| Inc. | 689 | 15 | |
| * | Playa Hotels & Resorts NV | 1,500 | 14 |
| * | Monarch Casino & Resort | ||
| Inc. | 300 | 14 | |
| Lennar Corp. Class B | 300 | 12 | |
| * | American Public Education Inc. | 300 | 10 |
| * | Biglari Holdings Inc. | 10 | 9 |
| * | Modine Manufacturing Co. | 605 | 9 |
| * | Cambium Learning Group Inc. | 710 | 8 |
| Ruth’s Hospitality Group Inc. | 260 | 8 | |
| * | M/I Homes Inc. | 300 | 7 |
| Lions Gate Entertainment | |||
| Corp. Class A | 268 | 7 | |
| * | Bojangles’ Inc. | 400 | 6 |
| Tailored Brands Inc. | 200 | 5 | |
| International Game | |||
| Technology plc | 194 | 4 | |
| Emerald Expositions Events | |||
| Inc. | 200 | 3 | |
| BBX Capital Corp. Class A | 419 | 3 | |
14
Growth and Income Fund
| Market | |||
| Value• | |||
| Shares | ($000) | ||
| Bed Bath & Beyond Inc. | 200 | 3 | |
| * | Potbelly Corp. | 200 | 2 |
| * | FTD Cos. Inc. | 600 | 2 |
| 1,427,492 | |||
| Consumer Staples (6.6%) | |||
| PepsiCo Inc. | 730,481 | 81,668 | |
| Procter & Gamble Co. | 979,694 | 81,540 | |
| Costco Wholesale Corp. | 309,216 | 72,629 | |
| Walmart Inc. | 765,139 | 71,854 | |
| Philip Morris International | |||
| Inc. | 592,504 | 48,313 | |
| Estee Lauder Cos. Inc. | |||
| Class A | 268,430 | 39,008 | |
| Sysco Corp. | 472,121 | 34,583 | |
| Colgate-Palmolive Co. | 503,144 | 33,685 | |
| Coca-Cola Co. | 688,529 | 31,803 | |
| Walgreens Boots Alliance | |||
| Inc. | 433,110 | 31,574 | |
| Mondelez International Inc. | |||
| Class A | 711,400 | 30,562 | |
| Conagra Brands Inc. | 836,195 | 28,406 | |
| * | Monster Beverage Corp. | 472,628 | 27,545 |
| Clorox Co. | 155,978 | 23,461 | |
| Constellation Brands Inc. | |||
| Class A | 97,750 | 21,077 | |
| Kroger Co. | 720,330 | 20,969 | |
| Kellogg Co. | 296,750 | 20,778 | |
| Archer-Daniels-Midland Co. | 296,224 | 14,891 | |
| Kimberly-Clark Corp. | 102,600 | 11,659 | |
| Altria Group Inc. | 139,815 | 8,432 | |
| JM Smucker Co. | 54,081 | 5,549 | |
| Molson Coors Brewing Co. | |||
| Class B | 74,900 | 4,606 | |
| Church & Dwight Co. Inc. | 60,340 | 3,582 | |
| * | US Foods Holding Corp. | 108,882 | 3,356 |
| Lamb Weston Holdings Inc. | 38,900 | 2,591 | |
| * | Keurig Dr Pepper Inc. | 43,505 | 1,008 |
| Coca-Cola European | |||
| Partners plc | 13,700 | 623 | |
| * | Performance Food Group | ||
| Co. | 13,200 | 440 | |
| Cal-Maine Foods Inc. | 7,800 | 377 | |
| * | Post Holdings Inc. | 2,600 | 255 |
| * | Sprouts Farmers Market | ||
| Inc. | 6,900 | 189 | |
| * | Herbalife Nutrition Ltd. | 2,900 | 158 |
| McCormick & Co. Inc. | 1,200 | 158 | |
| Cott Corp. | 8,800 | 142 | |
| * | Boston Beer Co. Inc. | ||
| Class A | 400 | 115 | |
| * | TreeHouse Foods Inc. | 2,000 | 96 |
| Nu Skin Enterprises Inc. | |||
| Class A | 900 | 74 | |
| * | United Natural Foods Inc. | 2,100 | 63 |
| * | Simply Good Foods Co. | 3,100 | 60 |
| * | USANA Health Sciences | ||
| Inc. | 500 | 60 | |
| Dean Foods Co. | 5,400 | 38 | |
| Hormel Foods Corp. | 900 | 35 | |
| Flowers Foods Inc. | 1,800 | 34 | |
| * | Avon Products Inc. | 7,900 | 17 |
| * | Central Garden & Pet Co. | ||
| Class A | 507 | 17 | |
| Bunge Ltd. | 100 | 7 | |
| * | Natural Grocers by Vitamin | ||
| Cottage Inc. | 207 | 4 | |
| Vector Group Ltd. | 105 | 1 | |
| * | Adecoagro SA | 100 | 1 |
| 758,093 | |||
| Energy (6.2%) | |||
| Chevron Corp. | 935,483 | 114,391 | |
| Exxon Mobil Corp. | 1,164,834 | 99,034 | |
| Occidental Petroleum | |||
| Corp. | 1,022,014 | 83,979 | |
| ConocoPhillips | 878,131 | 67,967 | |
| Anadarko Petroleum Corp. | 780,491 | 52,613 | |
| Phillips 66 | 364,564 | 41,094 | |
| Marathon Oil Corp. | 1,291,496 | 30,066 | |
| Valero Energy Corp. | 244,881 | 27,855 | |
| Cabot Oil & Gas Corp. | 1,156,991 | 26,055 | |
| ONEOK Inc. | 343,503 | 23,286 | |
| HollyFrontier Corp. | 309,730 | 21,650 | |
| Kinder Morgan Inc. | 987,550 | 17,509 | |
| EOG Resources Inc. | 126,890 | 16,187 | |
| * | Concho Resources Inc. | 85,703 | 13,091 |
| Pioneer Natural Resources | |||
| Co. | 64,780 | 11,284 | |
| Schlumberger Ltd. | 158,916 | 9,681 | |
| Halliburton Co. | 197,153 | 7,991 | |
| Marathon Petroleum Corp. | 80,435 | 6,432 | |
| Baker Hughes a GE Co. | 141,723 | 4,795 | |
| Helmerich & Payne Inc. | 64,068 | 4,406 | |
| * | Newfield Exploration Co. | 141,316 | 4,074 |
| Williams Cos. Inc. | 134,500 | 3,657 | |
| Hess Corp. | 48,629 | 3,481 | |
| National Oilwell Varco Inc. | 75,400 | 3,248 | |
| Peabody Energy Corp. | 34,300 | 1,222 | |
| * | QEP Resources Inc. | 104,182 | 1,179 |
| * | Oceaneering International | ||
| Inc. | 30,000 | 828 | |
| * | California Resources Corp. | 17,000 | 825 |
| PBF Energy Inc. Class A | 10,900 | 544 | |
| * | Continental Resources Inc. | 6,000 | 410 |
| * | Energen Corp. | 4,315 | 372 |
| Cameco Corp. | 23,700 | 270 | |
| * | Bristow Group Inc. | 17,600 | 214 |
| * | Keane Group Inc. | 14,300 | 177 |
| * | Rowan Cos. plc Class A | 9,216 | 174 |
| * | Dril-Quip Inc. | 3,200 | 167 |
| Murphy Oil Corp. | 4,500 | 150 | |
15
Growth and Income Fund
| Market | ||||
| Value• | ||||
| Shares | ($000) | |||
| Plains GP Holdings LP | ||||
| Class A | 5,300 | 130 | ||
| CNX Resources Corp. | 8,900 | 127 | ||
| McDermott International Inc. | 6,700 | 124 | ||
| * | PDC Energy Inc. | 2,500 | 122 | |
| * | Exterran Corp. | 3,800 | 101 | |
| * | Helix Energy Solutions Group | |||
| Inc. | 8,700 | 86 | ||
| * | Superior Energy Services Inc. | 7,100 | 69 | |
| * | Oasis Petroleum Inc. | 4,000 | 57 | |
| Mammoth Energy Services | ||||
| Inc. | 1,700 | 49 | ||
| * | Matrix Service Co. | 1,300 | 32 | |
| * | CONSOL Energy Inc. | 700 | 29 | |
| * | Denbury Resources Inc. | 4,600 | 29 | |
| * | W&T Offshore Inc. | 2,600 | 25 | |
| Devon Energy Corp. | 600 | 24 | ||
| Encana Corp. | 1,700 | 22 | ||
| * | Earthstone Energy Inc. | |||
| Class A | 2,092 | 20 | ||
| Range Resources Corp. | 1,000 | 17 | ||
| ^ | Aegean Marine Petroleum | |||
| Network Inc. | 11,740 | 17 | ||
| * | KLX Energy Services | |||
| Holdings Inc. | 520 | 17 | ||
| * | Cactus Inc. Class A | 400 | 15 | |
| Cosan Ltd. | 1,700 | 11 | ||
| * | Transocean Ltd. | 800 | 11 | |
| * | Tellurian Inc. | 1,100 | 10 | |
| * | Bonanza Creek Energy Inc. | 300 | 9 | |
| Archrock Inc. | 600 | 7 | ||
| * | Covia Holdings Corp. | 800 | 7 | |
| * | Ocean Rig UDW Inc. | 200 | 7 | |
| * | Talos Energy Inc. | 200 | 7 | |
| SM Energy Co. | 200 | 6 | ||
| * | ION Geophysical Corp. | 300 | 5 | |
| * | Energy XXI Gulf Coast Inc. | 500 | 4 | |
| * | Hornbeck Offshore Services | |||
| Inc. | 700 | 4 | ||
| Antero Midstream GP LP | 100 | 2 | ||
| * | Overseas Shipholding Group | |||
| Inc. Class A | 513 | 2 | ||
| 701,562 | ||||
| Financials (12.4%) | ||||
| JPMorgan Chase & Co. | 1,312,776 | 148,134 | ||
| * | Berkshire Hathaway Inc. | |||
| Class B | 600,478 | 128,568 | ||
| Bank of America Corp. | 3,785,760 | 111,528 | ||
| Wells Fargo & Co. | 1,954,157 | 102,711 | ||
| Progressive Corp. | 1,046,670 | 74,355 | ||
| Citigroup Inc. | 1,011,306 | 72,551 | ||
| Allstate Corp. | 392,051 | 38,695 | ||
| Goldman Sachs Group Inc. | 167,930 | 37,657 | ||
| S&P Global Inc. | 178,981 | 34,971 | ||
| T. Rowe Price Group Inc. | 313,041 | 34,178 | |
| * | E*TRADE Financial Corp. | 635,734 | 33,306 |
| Morgan Stanley | 702,024 | 32,693 | |
| Intercontinental Exchange | |||
| Inc. | 436,133 | 32,662 | |
| Capital One Financial Corp. | 334,056 | 31,712 | |
| SunTrust Banks Inc. | 444,592 | 29,694 | |
| Comerica Inc. | 302,638 | 27,298 | |
| Synchrony Financial | 814,846 | 25,325 | |
| Aflac Inc. | 534,720 | 25,169 | |
| Torchmark Corp. | 285,398 | 24,741 | |
| Fifth Third Bancorp | 784,678 | 21,908 | |
| M&T Bank Corp. | 130,720 | 21,509 | |
| PNC Financial Services | |||
| Group Inc. | 155,220 | 21,139 | |
| Regions Financial Corp. | 1,124,114 | 20,627 | |
| Prudential Financial Inc. | 167,490 | 16,970 | |
| Ameriprise Financial Inc. | 108,640 | 16,042 | |
| State Street Corp. | 186,076 | 15,589 | |
| Moody’s Corp. | 90,303 | 15,099 | |
| Discover Financial Services | 177,027 | 13,534 | |
| Cboe Global Markets Inc. | 136,951 | 13,142 | |
| Willis Towers Watson plc | 91,500 | 12,896 | |
| CME Group Inc. | 72,550 | 12,349 | |
| Arthur J Gallagher & Co. | 163,721 | 12,187 | |
| Hartford Financial Services | |||
| Group Inc. | 237,710 | 11,876 | |
| Jefferies Financial Group | |||
| Inc. | 516,339 | 11,339 | |
| American Express Co. | 86,331 | 9,193 | |
| BlackRock Inc. | 18,310 | 8,630 | |
| * | SVB Financial Group | 26,980 | 8,386 |
| MetLife Inc. | 172,890 | 8,077 | |
| Northern Trust Corp. | 77,725 | 7,938 | |
| Cincinnati Financial Corp. | 99,414 | 7,636 | |
| People’s United Financial | |||
| Inc. | 431,829 | 7,393 | |
| Nasdaq Inc. | 82,267 | 7,059 | |
| Affiliated Managers Group | |||
| Inc. | 51,460 | 7,036 | |
| Huntington Bancshares Inc. | 299,972 | 4,476 | |
| US Bancorp | 81,735 | 4,316 | |
| Bank of New York Mellon | |||
| Corp. | 84,025 | 4,284 | |
| Zions Bancorporation | 83,720 | 4,199 | |
| American International | |||
| Group Inc. | 75,370 | 4,013 | |
| Everest Re Group Ltd. | 14,929 | 3,411 | |
| Franklin Resources Inc. | 98,825 | 3,005 | |
| Ares Capital Corp. | 161,500 | 2,776 | |
| Lincoln National Corp. | 40,960 | 2,771 | |
| Aon plc | 16,950 | 2,607 | |
| First American Financial | |||
| Corp. | 48,074 | 2,480 |
16
Growth and Income Fund
| Market | |||
| Value• | |||
| Shares | ($000) | ||
| Unum Group | 62,131 | 2,427 | |
| Navient Corp. | 133,800 | 1,804 | |
| MSCI Inc. Class A | 8,100 | 1,437 | |
| Voya Financial Inc. | 25,800 | 1,281 | |
| Raymond James Financial | |||
| Inc. | 13,800 | 1,270 | |
| Signature Bank | 7,700 | 884 | |
| First Hawaiian Inc. | 31,118 | 845 | |
| Credicorp Ltd. | 2,600 | 580 | |
| Bank of NT Butterfield & | |||
| Son Ltd. | 10,900 | 565 | |
| East West Bancorp Inc. | 7,500 | 453 | |
| American Equity Investment | |||
| Life Holding Co. | 12,400 | 438 | |
| PacWest Bancorp | 8,800 | 419 | |
| Fidelity National Financial Inc. | 9,700 | 382 | |
| Axis Capital Holdings Ltd. | 6,600 | 381 | |
| BrightSphere Investment | |||
| Group plc | 30,300 | 376 | |
| * | FCB Financial Holdings Inc. | ||
| Class A | 7,600 | 360 | |
| * | eHealth Inc. | 11,600 | 328 |
| Argo Group International | |||
| Holdings Ltd. | 5,135 | 324 | |
| BGC Partners Inc. Class A | 24,700 | 292 | |
| TCF Financial Corp. | 11,900 | 283 | |
| LPL Financial Holdings Inc. | 4,100 | 264 | |
| MFA Financial Inc. | 34,400 | 253 | |
| First Horizon National Corp. | 14,530 | 251 | |
| * | Green Dot Corp. Class A | 2,600 | 231 |
| Beneficial Bancorp Inc. | 13,200 | 223 | |
| * | Arch Capital Group Ltd. | 7,300 | 218 |
| Invesco Ltd. | 8,890 | 203 | |
| United Community Banks | |||
| Inc. | 6,900 | 192 | |
| State Bank Financial Corp. | 6,300 | 190 | |
| * | Athene Holding Ltd. Class A | 3,300 | 170 |
| Apollo Investment Corp. | 29,400 | 160 | |
| Hanover Insurance Group | |||
| Inc. | 1,200 | 148 | |
| BankUnited Inc. | 4,121 | 146 | |
| * | First BanCorp | 16,000 | 146 |
| Hancock Whitney Corp. | 3,000 | 143 | |
| Marsh & McLennan Cos. | |||
| Inc. | 1,700 | 141 | |
| Community Bank System | |||
| Inc. | 2,200 | 134 | |
| Travelers Cos. Inc. | 1,030 | 134 | |
| AXA Equitable Holdings Inc. | 6,000 | 129 | |
| * | Flagstar Bancorp Inc. | 4,000 | 126 |
| Primerica Inc. | 1,000 | 121 | |
| Trustmark Corp. | 3,100 | 104 | |
| Great Western Bancorp Inc. | 2,399 | 101 | |
| Hilltop Holdings Inc. | 4,200 | 85 |
| Meridian Bancorp Inc. | 4,800 | 82 | |
| Washington Federal Inc. | 2,535 | 81 | |
| Synovus Financial Corp. | 1,700 | 78 | |
| Kearny Financial Corp. | 5,381 | 75 | |
| Ameris Bancorp | 1,600 | 73 | |
| Capitol Federal Financial Inc. | 5,400 | 69 | |
| Erie Indemnity Co. Class A | 500 | 64 | |
| TPG RE Finance Trust Inc. | 3,133 | 63 | |
| Loews Corp. | 1,200 | 60 | |
| * | Blucora Inc. | 1,400 | 56 |
| Exantas Capital Corp. | 4,700 | 52 | |
| Wintrust Financial Corp. | 600 | 51 | |
| IBERIABANK Corp. | 591 | 48 | |
| Assured Guaranty Ltd. | 1,100 | 46 | |
| First Midwest Bancorp Inc. | 1,700 | 45 | |
| ^ | Prospect Capital Corp. | 6,100 | 45 |
| * | Credit Acceptance Corp. | 100 | 44 |
| Walker & Dunlop Inc. | 763 | 40 | |
| Hanmi Financial Corp. | 1,574 | 39 | |
| First Financial Northwest Inc. | 2,300 | 38 | |
| First Busey Corp. | 1,200 | 37 | |
| Old Second Bancorp Inc. | 2,000 | 31 | |
| Oaktree Specialty Lending | |||
| Corp. | 6,200 | 31 | |
| Home BancShares Inc. | 1,400 | 31 | |
| PennantPark Investment Corp. | 4,100 | 31 | |
| * | HomeStreet Inc. | 1,100 | 29 |
| Central Pacific Financial Corp. | 1,100 | 29 | |
| Granite Point Mortgage Trust | |||
| Inc. | 1,400 | 27 | |
| Green Bancorp Inc. | 1,200 | 27 | |
| * | Bancorp Inc. | 2,758 | 26 |
| Hope Bancorp Inc. | 1,600 | 26 | |
| Brookline Bancorp Inc. | 1,500 | 25 | |
| Cathay General Bancorp | 600 | 25 | |
| FirstCash Inc. | 300 | 25 | |
| SEI Investments Co. | 381 | 23 | |
| * | World Acceptance Corp. | 200 | 23 |
| Oppenheimer Holdings Inc. | |||
| Class A | 700 | 22 | |
| Peapack Gladstone Financial | |||
| Corp. | 700 | 22 | |
| * | MBIA Inc. | 2,000 | 21 |
| * | PHH Corp. | 1,900 | 21 |
| Golub Capital BDC Inc. | 1,000 | 19 | |
| Fidelity Southern Corp. | 725 | 18 | |
| * | Western Alliance Bancorp | 300 | 17 |
| * | Veritex Holdings Inc. | 600 | 17 |
| Investment Technology Group | |||
| Inc. | 700 | 15 | |
| * | Atlas Financial Holdings Inc. | 1,379 | 14 |
| Nelnet Inc. Class A | 239 | 14 | |
| Opus Bank | 483 | 13 | |
| Flushing Financial Corp. | 500 | 12 |
17
Growth and Income Fund
| Market | ||||
| Value• | ||||
| Shares | ($000) | |||
| Home Bancorp Inc. | 276 | 12 | ||
| Webster Financial Corp. | 200 | 12 | ||
| Principal Financial Group Inc. | 200 | 12 | ||
| Oxford Square Capital Corp. | 1,552 | 11 | ||
| 1st Source Corp. | 200 | 11 | ||
| PJT Partners Inc. | 200 | 10 | ||
| PennantPark Floating Rate | ||||
| Capital Ltd. | 700 | 9 | ||
| Employers Holdings Inc. | 200 | 9 | ||
| Old Republic International Corp. | 400 | 9 | ||
| PCSB Financial Corp. | 400 | 8 | ||
| ProAssurance Corp. | 139 | 7 | ||
| Banner Corp. | 100 | 6 | ||
| Access National Corp. | 200 | 5 | ||
| Cadence BanCorp Class A | 200 | 5 | ||
| First Mid-Illinois Bancshares | ||||
| Inc. | 120 | 5 | ||
| * | SmartFinancial Inc. | 198 | 5 | |
| Maiden Holdings Ltd. | 1,600 | 5 | ||
| First Connecticut Bancorp Inc. | 152 | 4 | ||
| Garrison Capital Inc. | 500 | 4 | ||
| Newtek Business Services | ||||
| Corp. | 100 | 2 | ||
| New York Mortgage Trust Inc. | 300 | 2 | ||
| * | Donnelley Financial Solutions | |||
| Inc. | 100 | 2 | ||
| THL Credit Inc. | 207 | 2 | ||
| * | Cowen Inc. Class A | 100 | 2 | |
| 1,412,961 | ||||
| Health Care (15.1%) | ||||
| Merck & Co. Inc. | 1,959,652 | 139,018 | ||
| Johnson & Johnson | 897,214 | 123,968 | ||
| UnitedHealth Group Inc. | 382,719 | 101,819 | ||
| Bristol-Myers Squibb Co. | 1,617,485 | 100,414 | ||
| Eli Lilly & Co. | 831,175 | 89,193 | ||
| AbbVie Inc. | 895,027 | 84,652 | ||
| Pfizer Inc. | 1,391,002 | 61,301 | ||
| Humana Inc. | 178,257 | 60,344 | ||
| Anthem Inc. | 201,496 | 55,220 | ||
| Zoetis Inc. | 524,594 | 48,032 | ||
| HCA Healthcare Inc. | 286,136 | 39,807 | ||
| * | Align Technology Inc. | 94,213 | 36,858 | |
| * | Illumina Inc. | 99,314 | 36,454 | |
| * | Vertex Pharmaceuticals | |||
| Inc. | 169,180 | 32,608 | ||
| Agilent Technologies Inc. | 459,904 | 32,442 | ||
| Medtronic plc | 329,565 | 32,419 | ||
| Cigna Corp. | 153,992 | 32,069 | ||
| * | IQVIA Holdings Inc. | 235,486 | 30,552 | |
| Baxter International Inc. | 338,500 | 26,095 | ||
| * | ABIOMED Inc. | 56,952 | 25,614 | |
| Allergan plc | 134,070 | 25,538 | ||
| Amgen Inc. | 112,332 | 23,285 | ||
| Danaher Corp. | 211,138 | 22,942 | ||
| * | Intuitive Surgical Inc. | 39,883 | 22,893 |
| ResMed Inc. | 178,210 | 20,555 | |
| Stryker Corp. | 112,270 | 19,948 | |
| * | Varian Medical Systems | ||
| Inc. | 170,851 | 19,123 | |
| Thermo Fisher Scientific | |||
| Inc. | 77,933 | 19,022 | |
| Cardinal Health Inc. | 337,510 | 18,226 | |
| * | Cerner Corp. | 254,980 | 16,423 |
| Abbott Laboratories | 222,581 | 16,329 | |
| * | Centene Corp. | 112,351 | 16,266 |
| McKesson Corp. | 118,437 | 15,711 | |
| * | Edwards Lifesciences Corp. | 81,002 | 14,102 |
| Becton Dickinson and Co. | 51,543 | 13,453 | |
| * | IDEXX Laboratories Inc. | 53,344 | 13,318 |
| Gilead Sciences Inc. | 168,635 | 13,020 | |
| * | DaVita Inc. | 174,216 | 12,479 |
| CVS Health Corp. | 157,215 | 12,376 | |
| * | WellCare Health Plans Inc. | 37,830 | 12,124 |
| Cooper Cos. Inc. | 43,374 | 12,021 | |
| * | Nektar Therapeutics | ||
| Class A | 196,035 | 11,950 | |
| Quest Diagnostics Inc. | 103,790 | 11,200 | |
| * | Celgene Corp. | 122,218 | 10,937 |
| * | Boston Scientific Corp. | 279,183 | 10,749 |
| * | Waters Corp. | 50,803 | 9,890 |
| * | Regeneron Pharmaceuticals | ||
| Inc. | 22,430 | 9,063 | |
| Dentsply Sirona Inc. | 232,416 | 8,771 | |
| * | Hologic Inc. | 193,370 | 7,924 |
| AmerisourceBergen Corp. | |||
| Class A | 80,586 | 7,432 | |
| Perrigo Co. plc | 103,190 | 7,306 | |
| * | Express Scripts Holding Co. | 70,702 | 6,717 |
| * | Mettler-Toledo International | ||
| Inc. | 10,922 | 6,651 | |
| * | Molina Healthcare Inc. | 43,500 | 6,468 |
| Aetna Inc. | 31,829 | 6,457 | |
| Zimmer Biomet Holdings | |||
| Inc. | 48,610 | 6,391 | |
| * | Incyte Corp. | 87,480 | 6,043 |
| * | Alexion Pharmaceuticals Inc. 42,525 | 5,911 | |
| * | Biogen Inc. | 14,454 | 5,107 |
| Patterson Cos. Inc. | 92,120 | 2,252 | |
| * | QIAGEN NV | 49,900 | 1,890 |
| * | Mylan NV | 46,200 | 1,691 |
| Bruker Corp. | 50,200 | 1,679 | |
| * | Insulet Corp. | 13,748 | 1,457 |
| * | Neurocrine Biosciences Inc. | 10,900 | 1,340 |
| * | Mallinckrodt plc | 40,800 | 1,196 |
| * | Horizon Pharma plc | 57,000 | 1,116 |
| * | Myriad Genetics Inc. | 22,663 | 1,043 |
| *,^ | Dynavax Technologies Corp. | 73,500 | 911 |
| * | Masimo Corp. | 7,300 | 909 |
18
Growth and Income Fund
| Market | |||
| Value• | |||
| Shares | ($000) | ||
| * | AMAG Pharmaceuticals Inc. | 45,400 | 908 |
| * | MyoKardia Inc. | 13,000 | 848 |
| * | Endo International plc | 44,900 | 756 |
| * | BioMarin Pharmaceutical Inc. | 6,500 | 630 |
| * | PTC Therapeutics Inc. | 13,200 | 620 |
| * | Premier Inc. Class A | 12,610 | 577 |
| * | Allscripts Healthcare | ||
| Solutions Inc. | 39,100 | 557 | |
| * | Intercept Pharmaceuticals | ||
| Inc. | 3,900 | 493 | |
| * | Haemonetics Corp. | 4,200 | 481 |
| * | Assertio Therapeutics Inc. | 76,900 | 452 |
| * | Bausch Health Cos. Inc. | 16,900 | 434 |
| * | Editas Medicine Inc. | 11,506 | 366 |
| *,^ | Sorrento Therapeutics Inc. | 81,659 | 359 |
| * | Spark Therapeutics Inc. | 6,407 | 350 |
| * | United Therapeutics Corp. | 2,700 | 345 |
| * | Pacira Pharmaceuticals Inc. | 6,100 | 300 |
| * | Henry Schein Inc. | 3,300 | 281 |
| * | LivaNova plc | 2,100 | 260 |
| * | Ionis Pharmaceuticals Inc. | 5,000 | 258 |
| * | Momenta Pharmaceuticals | ||
| Inc. | 9,400 | 247 | |
| * | CareDx Inc. | 7,800 | 225 |
| * | Tenet Healthcare Corp. | 7,500 | 213 |
| * | Triple-S Management Corp. | ||
| Class B | 10,004 | 189 | |
| * | Amicus Therapeutics Inc. | 15,400 | 186 |
| * | Eagle Pharmaceuticals Inc. | 2,435 | 169 |
| * | Halozyme Therapeutics Inc. | 8,800 | 160 |
| * | Ophthotech Corp. | 66,680 | 157 |
| * | Varex Imaging Corp. | 5,058 | 145 |
| * | HMS Holdings Corp. | 3,200 | 105 |
| *,^ | MannKind Corp. | 52,800 | 97 |
| * | Retrophin Inc. | 3,000 | 86 |
| * | OraSure Technologies Inc. | 5,242 | 81 |
| * | uniQure NV | 2,200 | 80 |
| * | Exelixis Inc. | 4,300 | 76 |
| * | Zogenix Inc. | 1,349 | 67 |
| Universal Health Services Inc. | |||
| Class B | 500 | 64 | |
| * | Aquinox Pharmaceuticals | ||
| Inc. | 20,300 | 60 | |
| * | Catalent Inc. | 1,300 | 59 |
| * | AngioDynamics Inc. | 2,600 | 57 |
| * | Quidel Corp. | 800 | 52 |
| * | Neogen Corp. | 700 | 50 |
| * | Omeros Corp. | 2,000 | 49 |
| * | Sangamo Therapeutics Inc. | 2,700 | 46 |
| * | Nevro Corp. | 800 | 46 |
| * | Lannett Co. Inc. | 9,500 | 45 |
| * | Tivity Health Inc. | 1,400 | 45 |
| * | Agenus Inc. | 19,800 | 42 |
| *,^ | Rockwell Medical Inc. | 9,898 | 42 |
| * | Select Medical Holdings | ||
| Corp. | 2,200 | 41 | |
| Encompass Health Corp. | 500 | 39 | |
| * | Medpace Holdings Inc. | 600 | 36 |
| * | Genomic Health Inc. | 500 | 35 |
| * | Edge Therapeutics Inc. | 41,800 | 34 |
| * | Solid Biosciences Inc. | 700 | 33 |
| * | Strongbridge Biopharma plc | 6,200 | 30 |
| *,^ | Aurinia Pharmaceuticals Inc. | 4,500 | 30 |
| * | Taro Pharmaceutical | ||
| Industries Ltd. | 300 | 30 | |
| * | Vanda Pharmaceuticals Inc. | 1,100 | 25 |
| * | GenMark Diagnostics Inc. | 3,300 | 24 |
| * | Madrigal Pharmaceuticals Inc. | 100 | 21 |
| * | CytomX Therapeutics Inc. | 1,129 | 21 |
| * | Insys Therapeutics Inc. | 2,000 | 20 |
| * | ArQule Inc. | 3,400 | 19 |
| * | Prothena Corp. plc | 1,400 | 18 |
| * | Acorda Therapeutics Inc. | 900 | 18 |
| * | Intersect ENT Inc. | 600 | 17 |
| * | Jazz Pharmaceuticals plc | 100 | 17 |
| * | Rigel Pharmaceuticals Inc. | 5,200 | 17 |
| * | Novus Therapeutics Inc. | 3,477 | 16 |
| * | Accelerate Diagnostics Inc. | 700 | 16 |
| * | Amneal Pharmaceuticals Inc. | 700 | 16 |
| * | Stemline Therapeutics Inc. | 922 | 15 |
| Meridian Bioscience Inc. | 1,000 | 15 | |
| * | athenahealth Inc. | 100 | 13 |
| * | Portola Pharmaceuticals Inc. | 500 | 13 |
| * | Arbutus Biopharma Corp. | 1,300 | 12 |
| * | BioScrip Inc. | 3,700 | 12 |
| * | Foamix Pharmaceuticals Ltd. | 2,000 | 11 |
| * | Radius Health Inc. | 600 | 11 |
| * | Menlo Therapeutics Inc. | 900 | 9 |
| * | Enanta Pharmaceuticals Inc. | 100 | 9 |
| * | Oxford Immunotec Global plc | 500 | 8 |
| * | ChemoCentryx Inc. | 600 | 8 |
| * | Enzo Biochem Inc. | 1,760 | 7 |
| * | Otonomy Inc. | 2,600 | 7 |
| * | Chimerix Inc. | 1,834 | 7 |
| * | Addus HomeCare Corp. | 100 | 7 |
| * | Cutera Inc. | 200 | 7 |
| * | Puma Biotechnology Inc. | 136 | 6 |
| * | Cross Country Healthcare Inc. | 700 | 6 |
| * | Arrowhead Pharmaceuticals | ||
| Inc. | 300 | 6 | |
| Computer Programs & | |||
| Systems Inc. | 200 | 5 | |
| * | Lexicon Pharmaceuticals Inc. | 500 | 5 |
| * | STAAR Surgical Co. | 110 | 5 |
| * | Catalyst Pharmaceuticals Inc. | 1,229 | 5 |
| * | BioCryst Pharmaceuticals Inc. | 600 | 5 |
| * | Civitas Solutions Inc. | 300 | 4 |
| * | Dermira Inc. | 400 | 4 |
| * | Advaxis Inc. | 4,600 | 4 |
19
Growth and Income Fund
| Market | ||||
| Value• | ||||
| Shares | ($000) | |||
| * | AcelRx Pharmaceuticals Inc. | 1,100 | 4 | |
| * | Heron Therapeutics Inc. | 129 | 4 | |
| * | RTI Surgical Inc. | 802 | 4 | |
| * | Accuray Inc. | 800 | 4 | |
| * | Adverum Biotechnologies Inc. | 500 | 3 | |
| * | MEDNAX Inc. | 53 | 3 | |
| * | Ra Pharmaceuticals Inc. | 100 | 2 | |
| * | Concert Pharmaceuticals Inc. | 100 | 2 | |
| 1,721,524 | ||||
| Industrials (9.6%) | ||||
| Boeing Co. | 254,849 | 94,778 | ||
| Raytheon Co. | 328,460 | 67,880 | ||
| Lockheed Martin Corp. | 171,305 | 59,265 | ||
| Caterpillar Inc. | 309,434 | 47,186 | ||
| Honeywell International | ||||
| Inc. | 253,210 | 42,134 | ||
| WW Grainger Inc. | 105,384 | 37,665 | ||
| Expeditors International | ||||
| of Washington Inc. | 502,900 | 36,978 | ||
| Harris Corp. | 214,238 | 36,251 | ||
| Waste Management Inc. | 390,049 | 35,245 | ||
| Norfolk Southern Corp. | 169,937 | 30,674 | ||
| CSX Corp. | 411,238 | 30,452 | ||
| Emerson Electric Co. | 341,224 | 26,131 | ||
| Southwest Airlines Co. | 406,350 | 25,377 | ||
| General Electric Co. | 2,226,932 | 25,142 | ||
| 3M Co. | 112,685 | 23,744 | ||
| AMETEK Inc. | 260,530 | 20,613 | ||
| * | United Rentals Inc. | 125,947 | 20,605 | |
| Robert Half International | ||||
| Inc. | 290,795 | 20,466 | ||
| Union Pacific Corp. | 122,730 | 19,984 | ||
| Eaton Corp. plc | 228,887 | 19,851 | ||
| Ingersoll-Rand plc | 192,748 | 19,718 | ||
| * | United Continental | |||
| Holdings Inc. | 217,427 | 19,364 | ||
| Cintas Corp. | 90,600 | 17,922 | ||
| Kansas City Southern | 131,654 | 14,914 | ||
| KAR Auction Services Inc. | 246,300 | 14,702 | ||
| General Dynamics Corp. | 70,054 | 14,342 | ||
| PACCAR Inc. | 202,283 | 13,794 | ||
| JB Hunt Transport | ||||
| Services Inc. | 115,010 | 13,679 | ||
| United Parcel Service Inc. | ||||
| Class B | 113,482 | 13,249 | ||
| Fastenal Co. | 227,330 | 13,190 | ||
| Northrop Grumman Corp. | 40,815 | 12,954 | ||
| Roper Technologies Inc. | 41,254 | 12,220 | ||
| CH Robinson Worldwide | ||||
| Inc. | 122,177 | 11,964 | ||
| Masco Corp. | 325,300 | 11,906 | ||
| United Technologies Corp. | 84,720 | 11,845 | ||
| ^ | Fortive Corp. | 132,970 | 11,219 | |
| Spirit AeroSystems | |||
| Holdings Inc. Class A | 121,600 | 11,147 | |
| Textron Inc. | 145,166 | 10,375 | |
| Pentair plc | 219,904 | 9,533 | |
| Rockwell Automation Inc. | 50,823 | 9,530 | |
| Dun & Bradstreet Corp. | 62,358 | 8,887 | |
| Fortune Brands Home & | |||
| Security Inc. | 169,200 | 8,859 | |
| Illinois Tool Works Inc. | 57,828 | 8,161 | |
| Jacobs Engineering Group | |||
| Inc. | 104,700 | 8,010 | |
| * | Quanta Services Inc. | 220,886 | 7,373 |
| Huntington Ingalls | |||
| Industries Inc. | 26,469 | 6,778 | |
| Allison Transmission | |||
| Holdings Inc. | 120,400 | 6,262 | |
| * | Copart Inc. | 106,911 | 5,509 |
| Canadian Pacific Railway | |||
| Ltd. | 25,100 | 5,320 | |
| Republic Services Inc. | |||
| Class A | 72,870 | 5,295 | |
| nVent Electric plc | 164,005 | 4,454 | |
| Equifax Inc. | 25,725 | 3,359 | |
| * | HD Supply Holdings Inc. | 77,500 | 3,316 |
| Acuity Brands Inc. | 17,306 | 2,721 | |
| L3 Technologies Inc. | 12,200 | 2,594 | |
| * | Verisk Analytics Inc. Class A | 21,220 | 2,558 |
| Cummins Inc. | 13,201 | 1,928 | |
| ManpowerGroup Inc. | 17,000 | 1,461 | |
| Xylem Inc. | 16,680 | 1,332 | |
| AO Smith Corp. | 22,210 | 1,185 | |
| Owens Corning | 18,300 | 993 | |
| * | Continental Building | ||
| Products Inc. | 25,200 | 946 | |
| * | Gardner Denver Holdings | ||
| Inc. | 27,400 | 777 | |
| Macquarie Infrastructure | |||
| Corp. | 15,879 | 733 | |
| Insperity Inc. | 6,000 | 708 | |
| Moog Inc. Class A | 7,800 | 671 | |
| BWX Technologies Inc. | 9,500 | 594 | |
| ArcBest Corp. | 11,600 | 563 | |
| * | AECOM | 16,700 | 545 |
| * | MRC Global Inc. | 26,587 | 499 |
| * | Armstrong World Industries | ||
| Inc. | 6,900 | 480 | |
| Pitney Bowes Inc. | 64,300 | 455 | |
| MSC Industrial Direct Co. | |||
| Inc. Class A | 4,900 | 432 | |
| Hubbell Inc. Class B | 2,600 | 347 | |
| Trinity Industries Inc. | 9,000 | 330 | |
| TransUnion | 4,400 | 324 | |
| Brady Corp. Class A | 7,400 | 324 |
20
Growth and Income Fund
| Market | |||
| Value• | |||
| Shares | ($000) | ||
| Old Dominion Freight Line | |||
| Inc. | 2,000 | 323 | |
| * | Rexnord Corp. | 9,300 | 286 |
| * | Air Transport Services | ||
| Group Inc. | 11,700 | 251 | |
| Rockwell Collins Inc. | 1,700 | 239 | |
| Landstar System Inc. | 1,790 | 218 | |
| Graco Inc. | 4,700 | 218 | |
| * | WESCO International Inc. | 3,200 | 197 |
| * | AerCap Holdings NV | 3,400 | 196 |
| Copa Holdings SA Class A | 2,400 | 192 | |
| EnerSys | 2,100 | 183 | |
| * | Civeo Corp. | 43,700 | 181 |
| * | NOW Inc. | 9,800 | 162 |
| * | TriNet Group Inc. | 2,600 | 146 |
| * | SPX FLOW Inc. | 2,800 | 146 |
| * | Masonite International Corp. | 2,020 | 130 |
| * | Builders FirstSource Inc. | 7,700 | 113 |
| Quad/Graphics Inc. | 5,300 | 110 | |
| Federal Signal Corp. | 3,900 | 104 | |
| * | WABCO Holdings Inc. | 800 | 94 |
| Lincoln Electric Holdings Inc. | 1,000 | 93 | |
| Oshkosh Corp. | 1,300 | 93 | |
| * | Advanced Disposal Services | ||
| Inc. | 3,200 | 87 | |
| Navigant Consulting Inc. | 3,600 | 83 | |
| EMCOR Group Inc. | 1,100 | 83 | |
| Hexcel Corp. | 1,200 | 81 | |
| Spartan Motors Inc. | 5,100 | 75 | |
| Hillenbrand Inc. | 1,400 | 73 | |
| * | Colfax Corp. | 2,000 | 72 |
| * | Mistras Group Inc. | 3,189 | 69 |
| ACCO Brands Corp. | 5,500 | 62 | |
| * | NCI Building Systems Inc. | 4,000 | 61 |
| * | GMS Inc. | 2,600 | 60 |
| * | Harsco Corp. | 1,900 | 54 |
| * | LB Foster Co. Class A | 2,557 | 53 |
| * | Stericycle Inc. | 800 | 47 |
| Donaldson Co. Inc. | 800 | 47 | |
| Allegion plc | 509 | 46 | |
| Curtiss-Wright Corp. | 300 | 41 | |
| Timken Co. | 800 | 40 | |
| H&E Equipment Services Inc. | 1,000 | 38 | |
| * | Armstrong Flooring Inc. | 2,060 | 37 |
| * | Milacron Holdings Corp. | 1,800 | 36 |
| * | USA Truck Inc. | 1,800 | 36 |
| Universal Forest Products Inc. | 1,000 | 35 | |
| * | SPX Corp. | 1,000 | 33 |
| * | ARC Document Solutions Inc. | 11,400 | 32 |
| Briggs & Stratton Corp. | 1,500 | 29 | |
| * | YRC Worldwide Inc. | 3,000 | 27 |
| * | KLX Inc. | 420 | 26 |
| * | Univar Inc. | 800 | 25 |
| Greenbrier Cos. Inc. | 400 | 24 | |
| Toro Co. | 400 | 24 |
| * | Aerojet Rocketdyne Holdings | |||
| Inc. | 620 | 21 | ||
| Knoll Inc. | 800 | 19 | ||
| Global Brass & Copper | ||||
| Holdings Inc. | 500 | 18 | ||
| * | Titan Machinery Inc. | 1,100 | 17 | |
| Heidrick & Struggles | ||||
| International Inc. | 500 | 17 | ||
| DMC Global Inc. | 400 | 16 | ||
| * | Sparton Corp. | 1,099 | 16 | |
| * | Meritor Inc. | 800 | 16 | |
| * | Babcock & Wilcox | |||
| Enterprises Inc. | 14,464 | 15 | ||
| Titan International Inc. | 1,900 | 14 | ||
| Kaman Corp. | 200 | 13 | ||
| Systemax Inc. | 371 | 12 | ||
| Carlisle Cos. Inc. | 100 | 12 | ||
| * | Huron Consulting Group Inc. | 226 | 11 | |
| * | Textainer Group Holdings Ltd. | 800 | 10 | |
| * | Genco Shipping & Trading Ltd. | 600 | 8 | |
| Albany International Corp. | 100 | 8 | ||
| * | FTI Consulting Inc. | 100 | 7 | |
| Universal Logistics Holdings | ||||
| Inc. | 186 | 7 | ||
| Quanex Building Products | ||||
| Corp. | 375 | 7 | ||
| * | DXP Enterprises Inc. | 157 | 6 | |
| * | CECO Environmental Corp. | 780 | 6 | |
| * | Vivint Solar Inc. | 1,000 | 5 | |
| CRA International Inc. | 100 | 5 | ||
| * | Gibraltar Industries Inc. | 100 | 5 | |
| * | Lydall Inc. | 100 | 4 | |
| * | HC2 Holdings Inc. | 678 | 4 | |
| Mobile Mini Inc. | 94 | 4 | ||
| Rush Enterprises Inc. Class A | 100 | 4 | ||
| Caesarstone Ltd. | 195 | 4 | ||
| LSC Communications Inc. | 207 | 2 | ||
| Arconic Inc. | 100 | 2 | ||
| * | PGT Innovations Inc. | 100 | 2 | |
| 1,098,599 | ||||
| Information Technology (26.1%) | ||||
| Apple Inc. | 2,251,353 | 508,220 | ||
| Microsoft Corp. | 3,623,738 | 414,447 | ||
| * | Alphabet Inc. Class A | 155,719 | 187,965 | |
| * | Alphabet Inc. Class C | 127,810 | 152,537 | |
| Visa Inc. Class A | 805,785 | 120,940 | ||
| NVIDIA Corp. | 394,703 | 110,919 | ||
| * | Facebook Inc. Class A | 623,571 | 102,553 | |
| * | Adobe Systems Inc. | 366,386 | 98,906 | |
| Mastercard Inc. Class A | 413,641 | 92,081 | ||
| QUALCOMM Inc. | 945,834 | 68,128 | ||
| Cisco Systems Inc. | 1,173,251 | 57,079 | ||
| Intel Corp. | 1,203,537 | 56,915 | ||
| Fidelity National | ||||
| Information Services Inc. | 486,160 | 53,025 | ||
21
Growth and Income Fund
| Market | |||
| Value• | |||
| Shares | ($000) | ||
| Intuit Inc. | 223,943 | 50,925 | |
| * | VeriSign Inc. | 289,070 | 46,286 |
| Accenture plc Class A | 266,886 | 45,424 | |
| NetApp Inc. | 464,717 | 39,915 | |
| HP Inc. | 1,516,999 | 39,093 | |
| * | Citrix Systems Inc. | 334,373 | 37,169 |
| Automatic Data | |||
| Processing Inc. | 240,600 | 36,249 | |
| * | Cadence Design Systems | ||
| Inc. | 720,068 | 32,633 | |
| * | Micron Technology Inc. | 705,607 | 31,915 |
| Broadridge Financial | |||
| Solutions Inc. | 240,635 | 31,752 | |
| * | Advanced Micro Devices | ||
| Inc. | 921,068 | 28,452 | |
| * | PayPal Holdings Inc. | 297,174 | 26,104 |
| * | Red Hat Inc. | 186,569 | 25,426 |
| * | salesforce.com Inc. | 156,719 | 24,923 |
| Total System Services Inc. | 241,713 | 23,867 | |
| International Business | |||
| Machines Corp. | 149,716 | 22,639 | |
| Seagate Technology plc | 475,400 | 22,510 | |
| Cognizant Technology | |||
| Solutions Corp. Class A | 285,740 | 22,045 | |
| * | Synopsys Inc. | 217,133 | 21,411 |
| * | Electronic Arts Inc. | 173,844 | 20,946 |
| Oracle Corp. | 366,310 | 18,887 | |
| Activision Blizzard Inc. | 223,110 | 18,561 | |
| DXC Technology Co. | 196,600 | 18,386 | |
| Xilinx Inc. | 226,132 | 18,129 | |
| Broadcom Inc. | 69,347 | 17,110 | |
| Texas Instruments Inc. | 157,510 | 16,899 | |
| * | F5 Networks Inc. | 83,602 | 16,672 |
| KLA-Tencor Corp. | 153,618 | 15,625 | |
| Juniper Networks Inc. | 517,458 | 15,508 | |
| Paychex Inc. | 197,062 | 14,514 | |
| Analog Devices Inc. | 154,600 | 14,294 | |
| * | eBay Inc. | 403,443 | 13,322 |
| * | Autodesk Inc. | 68,860 | 10,750 |
| Motorola Solutions Inc. | 79,655 | 10,366 | |
| Applied Materials Inc. | 233,000 | 9,005 | |
| FLIR Systems Inc. | 128,530 | 7,901 | |
| Western Digital Corp. | 110,914 | 6,493 | |
| NXP Semiconductors NV | 68,000 | 5,814 | |
| Western Union Co. | 294,327 | 5,610 | |
| * | Fiserv Inc. | 67,908 | 5,594 |
| * | CoreLogic Inc. | 92,200 | 4,556 |
| Symantec Corp. | 190,943 | 4,063 | |
| * | Akamai Technologies Inc. | 54,700 | 4,001 |
| * | ANSYS Inc. | 19,978 | 3,730 |
| * | Take-Two Interactive | ||
| Software Inc. | 26,600 | 3,671 | |
| Skyworks Solutions Inc. | 38,645 | 3,506 | |
| Versum Materials Inc. | 81,360 | 2,930 | |
| * | Palo Alto Networks Inc. | 12,100 | 2,726 |
| * | Twitter Inc. | 94,200 | 2,681 |
| * | VMware Inc. Class A | 17,000 | 2,653 |
| * | Arista Networks Inc. | 7,150 | 1,901 |
| * | Zynga Inc. Class A | 465,500 | 1,867 |
| * | Black Knight Inc. | 31,057 | 1,613 |
| * | GoDaddy Inc. Class A | 19,300 | 1,609 |
| * | Flex Ltd. | 112,000 | 1,469 |
| Maxim Integrated Products | |||
| Inc. | 23,900 | 1,348 | |
| Amphenol Corp. Class A | 14,270 | 1,342 | |
| *,^ | Match Group Inc. | 20,000 | 1,158 |
| InterDigital Inc. | 13,900 | 1,112 | |
| * | IAC/InterActiveCorp | 4,788 | 1,038 |
| * | SINA Corp. | 14,600 | 1,014 |
| Kulicke & Soffa Industries | |||
| Inc. | 33,200 | 792 | |
| * | Yelp Inc. Class A | 16,000 | 787 |
| Perspecta Inc. | 30,600 | 787 | |
| * | Yext Inc. | 23,100 | 547 |
| * | NetScout Systems Inc. | 21,100 | 533 |
| * | Atlassian Corp. plc Class A | 5,400 | 519 |
| Leidos Holdings Inc. | 7,500 | 519 | |
| * | MicroStrategy Inc. Class A | 3,307 | 465 |
| LogMeIn Inc. | 4,900 | 437 | |
| * | Tower Semiconductor Ltd. | 19,550 | 425 |
| * | First Solar Inc. | 8,300 | 402 |
| CA Inc. | 8,731 | 385 | |
| * | Unisys Corp. | 18,100 | 369 |
| Hollysys Automation | |||
| Technologies Ltd. | 13,600 | 291 | |
| * | Qorvo Inc. | 3,600 | 277 |
| * | Zebra Technologies Corp. | 1,500 | 265 |
| * | SolarEdge Technologies Inc. | 6,700 | 252 |
| * | Fortinet Inc. | 2,700 | 249 |
| * | Cirrus Logic Inc. | 6,400 | 247 |
| * | Manhattan Associates Inc. | 4,100 | 224 |
| * | Cree Inc. | 5,900 | 223 |
| * | ARRIS International plc | 8,500 | 221 |
| * | NCR Corp. | 7,200 | 205 |
| * | Mellanox Technologies Ltd. | 2,500 | 184 |
| Xperi Corp. | 11,800 | 175 | |
| * | InterXion Holding NV | 2,600 | 175 |
| * | Photronics Inc. | 17,200 | 169 |
| * | Synaptics Inc. | 3,700 | 169 |
| * | Cornerstone OnDemand Inc. 2,974 | 169 | |
| * | Conduent Inc. | 7,100 | 160 |
| Shutterstock Inc. | 2,809 | 153 | |
| Dolby Laboratories Inc. | |||
| Class A | 2,100 | 147 | |
| Genpact Ltd. | 4,600 | 141 | |
| * | CommScope Holding Co. | ||
| Inc. | 4,500 | 138 | |
| Sabre Corp. | 5,300 | 138 | |
| NIC Inc. | 8,500 | 126 | |
| * | BlackBerry Ltd. | 10,500 | 120 |
22
Growth and Income Fund
| Market | |||
| Value• | |||
| Shares | ($000) | ||
| * | Rudolph Technologies Inc. | 4,802 | 117 |
| Teradyne Inc. | 3,147 | 116 | |
| * | Advanced Energy Industries | ||
| Inc. | 2,009 | 104 | |
| * | Trimble Inc. | 2,100 | 91 |
| Amdocs Ltd. | 1,316 | 87 | |
| * | Luxoft Holding Inc. Class A | 1,800 | 85 |
| * | Casa Systems Inc. | 5,100 | 75 |
| NVE Corp. | 682 | 72 | |
| Cohu Inc. | 2,700 | 68 | |
| * | Calix Inc. | 8,061 | 65 |
| Progress Software Corp. | 1,800 | 64 | |
| * | XO Group Inc. | 1,821 | 63 |
| * | Rambus Inc. | 5,700 | 62 |
| * | MoneyGram International Inc. | 11,600 | 62 |
| * | EchoStar Corp. Class A | 1,300 | 60 |
| * | Net 1 UEPS Technologies Inc. | 7,500 | 60 |
| * | 3D Systems Corp. | 3,100 | 59 |
| * | Etsy Inc. | 1,117 | 57 |
| * | CommVault Systems Inc. | 800 | 56 |
| * | Coupa Software Inc. | 700 | 55 |
| * | Knowles Corp. | 3,200 | 53 |
| j2 Global Inc. | 597 | 49 | |
| * | Alpha & Omega | ||
| Semiconductor Ltd. | 4,100 | 48 | |
| * | Lattice Semiconductor Corp. | 5,900 | 47 |
| Booz Allen Hamilton Holding | |||
| Corp. Class A | 900 | 45 | |
| * | Rubicon Project Inc. | 12,285 | 44 |
| * | Sanmina Corp. | 1,500 | 41 |
| * | SPS Commerce Inc. | 400 | 40 |
| * | Zix Corp. | 6,500 | 36 |
| Entegris Inc. | 1,200 | 35 | |
| * | Anixter International Inc. | 481 | 34 |
| * | LivePerson Inc. | 1,300 | 34 |
| Convergys Corp. | 1,409 | 33 | |
| * | Immersion Corp. | 3,000 | 32 |
| Avnet Inc. | 700 | 31 | |
| * | Web.com Group Inc. | 1,100 | 31 |
| * | Euronet Worldwide Inc. | 300 | 30 |
| * | RingCentral Inc. Class A | 300 | 28 |
| Travelport Worldwide Ltd. | 1,600 | 27 | |
| * | Model N Inc. | 1,700 | 27 |
| * | A10 Networks Inc. | 4,045 | 25 |
| Science Applications | |||
| International Corp. | 300 | 24 | |
| * | CyberArk Software Ltd. | 300 | 24 |
| * | DHI Group Inc. | 11,400 | 24 |
| * | Aspen Technology Inc. | 200 | 23 |
| * | Endurance International | ||
| Group Holdings Inc. | 2,413 | 21 | |
| MAXIMUS Inc. | 300 | 20 | |
| Monotype Imaging Holdings | |||
| Inc. | 847 | 17 | |
| *,^ | VirnetX Holding Corp. | 3,500 | 16 |
| * | Amkor Technology Inc. | 2,100 | 16 | |
| * | QuinStreet Inc. | 1,142 | 16 | |
| * | Ribbon Communications Inc. | 2,091 | 14 | |
| Vishay Intertechnology Inc. | 700 | 14 | ||
| * | Aerohive Networks Inc. | 3,000 | 12 | |
| * | Syntel Inc. | 300 | 12 | |
| Daktronics Inc. | 1,566 | 12 | ||
| * | Glu Mobile Inc. | 1,530 | 11 | |
| * | Apptio Inc. Class A | 300 | 11 | |
| * | Quotient Technology Inc. | 700 | 11 | |
| Hackett Group Inc. | 500 | 10 | ||
| * | Acxiom Holdings Inc. | 203 | 10 | |
| * | Care.com Inc. | 400 | 9 | |
| TE Connectivity Ltd. | 100 | 9 | ||
| * | Yandex NV Class A | 200 | 7 | |
| * | ViaSat Inc. | 100 | 6 | |
| Pegasystems Inc. | 100 | 6 | ||
| * | Fitbit Inc. Class A | 1,100 | 6 | |
| * | Acacia Communications Inc. | 100 | 4 | |
| * | TechTarget Inc. | 200 | 4 | |
| * | KEMET Corp. | 200 | 4 | |
| Ituran Location and Control Ltd. | 100 | 3 | ||
| Benchmark Electronics Inc. | 100 | 2 | ||
| Diebold Nixdorf Inc. | 500 | 2 | ||
| * | Brightcove Inc. | 100 | 1 | |
| 2,977,041 | ||||
| Materials (1.8%) | ||||
| Air Products & | ||||
| Chemicals Inc. | 217,033 | 36,255 | ||
| CF Industries Holdings Inc. | 522,910 | 28,467 | ||
| Freeport-McMoRan Inc. | 1,831,632 | 25,496 | ||
| LyondellBasell Industries | ||||
| NV Class A | 246,043 | 25,222 | ||
| Nucor Corp. | 347,481 | 22,048 | ||
| Praxair Inc. | 117,023 | 18,809 | ||
| DowDuPont Inc. | 161,921 | 10,413 | ||
| WestRock Co. | 152,200 | 8,134 | ||
| Sealed Air Corp. | 200,600 | 8,054 | ||
| Avery Dennison Corp. | 28,400 | 3,077 | ||
| Newmont Mining Corp. | 101,072 | 3,052 | ||
| Celanese Corp. Class A | 20,500 | 2,337 | ||
| Methanex Corp. | 29,100 | 2,302 | ||
| * | Berry Global Group Inc. | 46,300 | 2,240 | |
| Huntsman Corp. | 72,700 | 1,980 | ||
| Graphic Packaging | ||||
| Holding Co. | 139,200 | 1,950 | ||
| Chemours Co. | 49,000 | 1,933 | ||
| Mosaic Co. | 19,073 | 620 | ||
| Sherwin-Williams Co. | 850 | 387 | ||
| Reliance Steel & | ||||
| Aluminum Co. | 4,300 | 367 | ||
| Packaging Corp. of | ||||
| America | 2,795 | 307 | ||
| * | AdvanSix Inc. | 8,800 | 299 | |
| Domtar Corp. | 5,700 | 297 | ||
23
Growth and Income Fund
| Market | |||
| Value• | |||
| Shares | ($000) | ||
| * | Allegheny Technologies | ||
| Inc. | 8,800 | 260 | |
| Louisiana-Pacific Corp. | 9,628 | 255 | |
| WR Grace & Co. | 3,310 | 237 | |
| Valvoline Inc. | 10,900 | 234 | |
| Ball Corp. | 3,102 | 136 | |
| Wheaton Precious Metals | |||
| Corp. | 7,500 | 131 | |
| Mercer International Inc. | 7,600 | 128 | |
| Olin Corp. | 4,500 | 116 | |
| * | SunCoke Energy Inc. | 9,652 | 112 |
| Ecolab Inc. | 700 | 110 | |
| International Flavors & | |||
| Fragrances Inc. | 700 | 97 | |
| * | Verso Corp. | 2,700 | 91 |
| * | Constellium NV Class A | 6,500 | 80 |
| * | Resolute Forest Products | ||
| Inc. | 5,400 | 70 | |
| * | Flotek Industries Inc. | 27,668 | 66 |
| Trinseo SA | 800 | 63 | |
| Steel Dynamics Inc. | 1,300 | 59 | |
| Ferroglobe plc | 6,644 | 54 | |
| * | Cleveland-Cliffs Inc. | 3,400 | 43 |
| * | Coeur Mining Inc. | 7,900 | 42 |
| United States Steel Corp. | 1,200 | 37 | |
| Nexa Resources SA | 2,900 | 35 | |
| ^ | Israel Chemicals Ltd. | 5,361 | 32 |
| * | Ryerson Holding Corp. | 1,900 | 22 |
| Silgan Holdings Inc. | 700 | 19 | |
| * | Crown Holdings Inc. | 200 | 10 |
| Orion Engineered Carbons | |||
| SA | 100 | 3 | |
| * | TimkenSteel Corp. | 200 | 3 |
| * | Intrepid Potash Inc. | 685 | 2 |
| Core Molding Technologies | |||
| Inc. | 200 | 1 | |
| *,§ | Ferroglobe R&W Trust | 48,731 | — |
| 206,594 | |||
| Other (0.2%) | |||
| SPDR S&P 500 ETF Trust | 71,400 | 20,758 | |
| *,§ | Biosante Pharmaceutical | ||
| Inc. CVR | 4,189 | — | |
| 20,758 | |||
| Real Estate (3.2%) | |||
| Simon Property Group Inc. | 323,883 | 57,247 | |
| Prologis Inc. | 414,545 | 28,103 | |
| * | SBA Communications | ||
| Corp. Class A | 142,569 | 22,901 | |
| Extra Space Storage Inc. | 261,913 | 22,692 | |
| Equity Residential | 334,750 | 22,181 | |
| Host Hotels & Resorts | |||
| Inc. | 1,046,271 | 22,076 | |
| * | CBRE Group Inc. Class A | 424,084 | 18,702 |
| Ventas Inc. | 342,110 | 18,604 | |
| Duke Realty Corp. | 633,894 | 17,984 | |
| Apartment Investment & | |||
| Management Co. | 360,690 | 15,917 | |
| American Tower Corp. | 94,135 | 13,678 | |
| AvalonBay Communities | |||
| Inc. | 74,870 | 13,563 | |
| HCP Inc. | 497,300 | 13,089 | |
| Weyerhaeuser Co. | 302,674 | 9,768 | |
| Vornado Realty Trust | 132,750 | 9,691 | |
| Mid-America Apartment | |||
| Communities Inc. | 85,740 | 8,589 | |
| Regency Centers Corp. | 128,700 | 8,323 | |
| Crown Castle | |||
| International Corp. | 67,887 | 7,558 | |
| Public Storage | 34,898 | 7,036 | |
| UDR Inc. | 165,850 | 6,705 | |
| Boston Properties Inc. | 53,440 | 6,578 | |
| Essex Property Trust Inc. | 20,641 | 5,092 | |
| ^ | Realogy Holdings Corp. | 140,700 | 2,904 |
| Brixmor Property Group | |||
| Inc. | 86,400 | 1,513 | |
| CoreCivic Inc. | 57,700 | 1,404 | |
| Sun Communities Inc. | 9,863 | 1,001 | |
| Liberty Property Trust | 21,300 | 900 | |
| Equity LifeStyle Properties | |||
| Inc. | 8,976 | 866 | |
| Federal Realty Investment | |||
| Trust | 6,230 | 788 | |
| Kimco Realty Corp. | 46,900 | 785 | |
| Douglas Emmett Inc. | 18,800 | 709 | |
| Iron Mountain Inc. | 10,900 | 376 | |
| American Homes 4 Rent | |||
| Class A | 16,900 | 370 | |
| GEO Group Inc. | 12,012 | 302 | |
| * | Equity Commonwealth | 8,900 | 286 |
| Hudson Pacific Properties | |||
| Inc. | 7,400 | 242 | |
| SL Green Realty Corp. | 1,900 | 185 | |
| Highwoods Properties Inc. | 2,700 | 128 | |
| InfraREIT Inc. | 5,700 | 121 | |
| CubeSmart | 4,000 | 114 | |
| Healthcare Trust of | |||
| America Inc. Class A | 4,100 | 109 | |
| Empire State Realty Trust | |||
| Inc. | 5,047 | 84 | |
| Forest City Realty Trust | |||
| Inc. Class A | 2,900 | 73 | |
| Spirit Realty Capital Inc. | 7,946 | 64 | |
| STORE Capital Corp. | 2,000 | 56 | |
| Outfront Media Inc. | 2,200 | 44 | |
| Piedmont Office Realty | |||
| Trust Inc. Class A | 2,200 | 42 | |
| STAG Industrial Inc. | 1,200 | 33 | |
| Columbia Property Trust | |||
| Inc. | 1,358 | 32 | |
| * | Retail Value Inc. | 910 | 30 |
24
Growth and Income Fund
| Market | ||||
| Value• | ||||
| Shares | ($000) | |||
| American Campus | ||||
| Communities Inc. | 600 | 25 | ||
| Senior Housing Properties | ||||
| Trust | 1,400 | 25 | ||
| Kite Realty Group Trust | 1,200 | 20 | ||
| Spirit MTA REIT | 1,580 | 18 | ||
| UMH Properties Inc. | 1,100 | 17 | ||
| Monmouth Real Estate | ||||
| Investment Corp. | 700 | 12 | ||
| * | St. Joe Co. | 500 | 8 | |
| DDR Corp. | 562 | 7 | ||
| Realty Income Corp. | 100 | 6 | ||
| Front Yard Residential Corp. | 400 | 4 | ||
| Brookfield Property REIT Inc. | ||||
| Class A | 169 | 4 | ||
| Park Hotels & Resorts Inc. | 100 | 3 | ||
| * | Cushman & Wakefield plc | 193 | 3 | |
| VEREIT Inc. | 300 | 2 | ||
| CorePoint Lodging Inc. | 95 | 2 | ||
| RE/MAX Holdings Inc. Class A | 32 | 1 | ||
| 369,795 | ||||
| Telecommunication Services (1.7%) | ||||
| AT&T Inc. | 3,096,516 | 103,981 | ||
| Verizon Communications | ||||
| Inc. | 1,461,194 | 78,013 | ||
| CenturyLink Inc. | 594,410 | 12,602 | ||
| * | Zayo Group Holdings Inc. | 33,300 | 1,156 | |
| * | T-Mobile US Inc. | 11,650 | 818 | |
| * | Boingo Wireless Inc. | 5,200 | 181 | |
| * | Intelsat SA | 4,643 | 139 | |
| * | Globalstar Inc. | 101,800 | 52 | |
| * | Vonage Holdings Corp. | 2,600 | 37 | |
| 196,979 | ||||
| Utilities (2.1%) | ||||
| NextEra Energy Inc. | 256,113 | 42,925 | ||
| NRG Energy Inc. | 1,132,644 | 42,361 | ||
| Exelon Corp. | 569,563 | 24,867 | ||
| FirstEnergy Corp. | 660,148 | 24,538 | ||
| AES Corp. | 1,516,679 | 21,234 | ||
| American Electric Power | ||||
| Co. Inc. | 238,200 | 16,884 | ||
| Entergy Corp. | 197,210 | 16,000 | ||
| Dominion Energy Inc. | 167,361 | 11,762 | ||
| Public Service Enterprise | ||||
| Group Inc. | 160,203 | 8,457 | ||
| Southern Co. | 155,100 | 6,762 | ||
| Ameren Corp. | 85,800 | 5,424 | ||
| CenterPoint Energy Inc. | 185,310 | 5,124 | ||
| Evergy Inc. | 86,350 | 4,742 | ||
| Pinnacle West Capital | ||||
| Corp. | 38,341 | 3,036 | ||
| Duke Energy Corp. | 23,350 | 1,868 | ||
| WEC Energy Group Inc. | 18,490 | 1,234 | ||
| Xcel Energy Inc. | 24,042 | 1,135 | ||
| Market | |||
| Value• | |||
| Shares | ($000) | ||
| Portland General Electric | |||
| Co. | 20,218 | 922 | |
| Avangrid Inc. | 13,600 | 652 | |
| UGI Corp. | 10,000 | 555 | |
| National Fuel Gas Co. | 8,600 | 482 | |
| TerraForm Power Inc. | |||
| Class A | 29,200 | 337 | |
| MDU Resources Group Inc. | 11,101 | 285 | |
| Atmos Energy Corp. | 2,550 | 239 | |
| * | Atlantic Power Corp. | 99,700 | 219 |
| Edison International | 2,472 | 167 | |
| Fortis Inc. | 4,700 | 152 | |
| DTE Energy Co. | 870 | 95 | |
| Atlantica Yield plc | 2,800 | 58 | |
| Chesapeake Utilities Corp. | 388 | 33 | |
| MGE Energy Inc. | 100 | 6 | |
| Eversource Energy | 100 | 6 | |
| OGE Energy Corp. | 100 | 4 | |
| Consolidated Edison Inc. | 40 | 3 | |
| NiSource Inc. | 100 | 3 | |
| 242,571 | |||
| Total Common Stocks | |||
| (Cost $8,509,956) | 11,133,969 | ||
| Temporary Cash Investments (2.6%)1 | |||
| Money Market Fund (2.5%) | |||
| 2,3 | Vanguard Market | ||
| Liquidity Fund, 2.209% | 2,799,580 | 279,958 | |
| Face | |||
| Amount | |||
| ($000) | |||
| U. S. Government and Agency Obligations (0.1%) | |||
| United States Treasury Bill, | |||
| 1.962%, 10/11/18 | 4,630 | 4,627 | |
| 4 | United States Treasury Bill, | ||
| 1.982%, 10/18/18 | 5,000 | 4,995 | |
| 4 | United States Treasury Bill, | ||
| 2.078%, 11/15/18 | 600 | 598 | |
| 4 | United States Treasury Bill, | ||
| 2.133%, 1/3/19 | 372 | 370 | |
| 4 | United States Treasury Bill, | ||
| 2.284%, 2/21/19 | 5,000 | 4,955 | |
| 15,545 | |||
| Total Temporary Cash Investments | |||
| (Cost $295,516) | 295,503 | ||
| Total Investments (100.1%) | |||
| (Cost $8,805,472) | 11,429,472 | ||
25
Growth and Income Fund
| Amount | |
| ($000) | |
| Other Assets and Liabilities (-0.1%) | |
| Other Assets | |
| Investment in Vanguard | 577 |
| Receivables for Investment Securities Sold | 24,893 |
| Receivables for Accrued Income | 9,557 |
| Receivables for Capital Shares Issued | 4,808 |
| Other Assets 5 | 5,960 |
| Total Other Assets | 45,795 |
| Liabilities | |
| Payables for Investment Securities | |
| Purchased | (30,819) |
| Collateral for Securities on Loan | (2,973) |
| Payables to Investment Advisor | (2,474) |
| Payables for Capital Shares Redeemed | (6,695) |
| Payables to Vanguard | (9,272) |
| Variation Margin Payable—Futures | |
| Contracts | (84) |
| Total Liabilities | (52,317) |
| Net Assets (100%) | 11,422,950 |
| At September 30, 2018, net assets consisted of: | |
| Amount | |
| ($000) | |
| Paid-in Capital | 8,258,105 |
| Undistributed Net Investment Income | 40,592 |
| Accumulated Net Realized Gains | 499,543 |
| Unrealized Appreciation (Depreciation) | |
| Investment Securities | 2,624,000 |
| Futures Contracts | 710 |
| Net Assets | 11,422,950 |
| Amount | |
| ($000) | |
| Investor Shares—Net Assets | |
| Applicable to 56,199,548 outstanding | |
| $.001 par value shares of beneficial | |
| interest (unlimited authorization) | 2,931,748 |
| Net Asset Value Per Share— | |
| Investor Shares | $52.17 |
| Admiral Shares—Net Assets | |
| Applicable to 99,704,433 outstanding | |
| $.001 par value shares of beneficial | |
| interest (unlimited authorization) | 8,491,202 |
| Net Asset Value Per Share— | |
| Admiral Shares | $85.16 |
• See Note A in Notes to Financial Statements.
* Non-income-producing security.
^ Includes partial security positions on loan to broker-dealers.
The total value of securities on loan is $2,852,000.
§ Security value determined using significant unobservable inputs.
1 The fund invests a portion of its cash reserves in equity
markets through the use of index futures contracts. After
giving effect to futures investments, the fund’s effective
common stock and temporary cash investment positions
represent 99.9% and 0.2%, respectively, of net assets.
2 Affiliated money market fund available only to Vanguard funds
and certain trusts and accounts managed by Vanguard. Rate
shown is the 7-day yield.
3 Includes $2,973,000 of collateral received for securities on loan.
4 Securities with a value of $6,756,000 have been segregated
as initial margin for open futures contracts.
5 Cash of $5,154,000 has been segregated as initial margin for
open futures contracts.
CVR—Contingent Value Rights.
REIT—Real Estate Investment Trust.
| Derivative Financial Instruments Outstanding as of Period End | ||||
| Futures Contracts | ||||
| ($000) | ||||
| Value and | ||||
| Number of | Unrealized | |||
| Long (Short) | Notional | Appreciation | ||
| Expiration | Contracts | Amount | (Depreciation) | |
| Long Futures Contracts | ||||
| E-mini S&P 500 Index | December 2018 | 1,860 | 271,467 | 710 |
See accompanying Notes, which are an integral part of the Financial Statements.
26
Growth and Income Fund
Statement of Operations
| Year Ended | |
| September 30, 2018 | |
| ($000) | |
| Investment Income | |
| Income | |
| Dividends1 | 187,039 |
| Interest 2 | 4,729 |
| Securities Lending—Net | 147 |
| Total Income | 191,915 |
| Expenses | |
| Investment Advisory Fees—Note B | |
| Basic Fee | 10,438 |
| Performance Adjustment | 180 |
| The Vanguard Group—Note C | |
| Management and Administrative—Investor Shares | 6,085 |
| Management and Administrative—Admiral Shares | 9,221 |
| Marketing and Distribution—Investor Shares | 403 |
| Marketing and Distribution—Admiral Shares | 562 |
| Custodian Fees | 175 |
| Auditing Fees | 27 |
| Shareholders’ Reports and Proxy—Investor Shares | 112 |
| Shareholders’ Reports and Proxy—Admiral Shares | 84 |
| Trustees’ Fees and Expenses | 17 |
| Total Expenses | 27,304 |
| Net Investment Income | 164,611 |
| Realized Net Gain (Loss) | |
| Investment Securities Sold 2 | 565,575 |
| Futures Contracts | 37,041 |
| Realized Net Gain (Loss) | 602,616 |
| Change in Unrealized Appreciation (Depreciation) | |
| Investment Securities 2 | 1,065,512 |
| Futures Contracts | (3,508) |
| Change in Unrealized Appreciation (Depreciation) | 1,062,004 |
| Net Increase (Decrease) in Net Assets Resulting from Operations | 1,829,231 |
| 1 Dividends are net of foreign withholding taxes of $23,000. | |
| 2 Interest income, realized net gain (loss), and change in unrealized appreciation (depreciation) from an affiliated company of the fund | |
| were $4,496,000, ($2,000), and ($46,000), respectively. Purchases and sales are for temporary cash investment purposes. | |
See accompanying Notes, which are an integral part of the Financial Statements.
27
Growth and Income Fund
Statement of Changes in Net Assets
| Year Ended September 30, | ||
| 2018 | 2017 | |
| ($000) | ($000) | |
| Increase (Decrease) in Net Assets | ||
| Operations | ||
| Net Investment Income | 164,611 | 136,920 |
| Realized Net Gain (Loss) | 602,616 | 448,835 |
| Change in Unrealized Appreciation (Depreciation) | 1,062,004 | 616,233 |
| Net Increase (Decrease) in Net Assets Resulting from Operations | 1,829,231 | 1,201,988 |
| Distributions | ||
| Net Investment Income | ||
| Investor Shares | (39,117) | (53,480) |
| Admiral Shares | (115,046) | (81,075) |
| Realized Capital Gain1 | ||
| Investor Shares | (119,262) | (131,717) |
| Admiral Shares | (313,418) | (184,783) |
| Total Distributions | (586,843) | (451,055) |
| Capital Share Transactions | ||
| Investor Shares | (386,108) | (112,815) |
| Admiral Shares | 569,816 | 2,725,083 |
| Net Increase (Decrease) from Capital Share Transactions | 183,708 | 2,612,268 |
| Total Increase (Decrease) | 1,426,096 | 3,363,201 |
| Net Assets | ||
| Beginning of Period | 9,996,854 | 6,633,653 |
| End of Period2 | 11,422,950 | 9,996,854 |
1 Includes fiscal 2018 and 2017 short-term gain distributions totaling $184,624,000 and $13,413,000, respectively. Short-term gain
distributions are treated as ordinary income dividends for tax purposes.
2 Net Assets—End of Period includes undistributed (overdistributed) net investment income of $40,592,000 and $30,143,000.
See accompanying Notes, which are an integral part of the Financial Statements.
28
Growth and Income Fund
Financial Highlights
| Investor Shares | |||||
| For a Share Outstanding | Year Ended September 30, | ||||
| Throughout Each Period | 2018 | 2017 | 2016 | 2015 | 2014 |
| Net Asset Value, Beginning of Period | $46.50 | $42.16 | $39.55 | $42.69 | $36.02 |
| Investment Operations | |||||
| Net Investment Income | .7111 | .7921 | .852 | .729 | .671 |
| Net Realized and Unrealized Gain (Loss) | |||||
| on Investments | 7.650 | 6.346 | 4.813 | (.541) | 6.639 |
| Total from Investment Operations | 8.361 | 7.138 | 5.665 | .188 | 7.310 |
| Distributions | |||||
| Dividends from Net Investment Income | (. 668) | (.799) | (.790) | (.724) | (. 640) |
| Distributions from Realized Capital Gains | (2.023) | (1.999) | (2.265) | (2.604) | — |
| Total Distributions | (2.691) | (2.798) | (3.055) | (3.328) | (.640) |
| Net Asset Value, End of Period | $52.17 | $46.50 | $42.16 | $39.55 | $42.69 |
| Total Return2 | 18.56% | 17.66% | 14.79% | 0.22% | 20.42% |
| Ratios/Supplemental Data | |||||
| Net Assets, End of Period (Millions) | $2,932 | $2,982 | $2,801 | $2,691 | $2,979 |
| Ratio of Total Expenses to Average Net Assets3 | 0.33% | 0.34% | 0.34% | 0.34% | 0.37% |
| Ratio of Net Investment Income to | |||||
| Average Net Assets | 1.45% | 1.80% | 2.09% | 1.70% | 1.67% |
| Portfolio Turnover Rate | 83% | 96% | 96% | 116% | 133% |
1 Calculated based on average shares outstanding.
2 Total returns do not include account service fees that may have applied in the periods shown. Fund prospectuses provide information
about any applicable account service fees.
3 Includes performance-based investment advisory fee increases (decreases) of 0.00%, 0.00%, 0.00%, 0.00%, and 0.02%.
See accompanying Notes, which are an integral part of the Financial Statements.
29
Growth and Income Fund
Financial Highlights
| Admiral Shares | |||||
| For a Share Outstanding | Year Ended September 30, | ||||
| Throughout Each Period | 2018 | 2017 | 2016 | 2015 | 2014 |
| Net Asset Value, Beginning of Period | $75.93 | $68.83 | $64.57 | $69.71 | $58.82 |
| Investment Operations | |||||
| Net Investment Income | 1.2421 | 1.3621 | 1.466 | 1.272 | 1.176 |
| Net Realized and Unrealized Gain (Loss) | |||||
| on Investments | 12.473 | 10.384 | 7.855 | (.897) | 10.833 |
| Total from Investment Operations | 13.715 | 11.746 | 9.321 | .375 | 12.009 |
| Distributions | |||||
| Dividends from Net Investment Income | (1.182) | (1.384) | (1.364) | (1.264) | (1.119) |
| Distributions from Realized Capital Gains | (3.303) | (3.262) | (3.697) | (4.251) | — |
| Total Distributions | (4.485) | (4.646) | (5.061) | (5.515) | (1.119) |
| Net Asset Value, End of Period | $85.16 | $75.93 | $68.83 | $64.57 | $69.71 |
| Total Return2 | 18.65% | 17.81% | 14.91% | 0.31% | 20.55% |
| Ratios/Supplemental Data | |||||
| Net Assets, End of Period (Millions) | $8,491 | $7,015 | $3,833 | $3,177 | $2,917 |
| Ratio of Total Expenses to Average Net Assets3 | 0.23% | 0.23% | 0.23% | 0.23% | 0.26% |
| Ratio of Net Investment Income to | |||||
| Average Net Assets | 1.55% | 1.91% | 2.20% | 1.81% | 1.78% |
| Portfolio Turnover Rate | 83% | 96% | 96% | 116% | 133% |
1 Calculated based on average shares outstanding.
2 Total returns do not include account service fees that may have applied in the periods shown. Fund prospectuses provide information
about any applicable account service fees.
3 Includes performance-based investment advisory fee increases (decreases) of 0.00%, 0.00%, 0.00%, 0.00%, and 0.02%.
See accompanying Notes, which are an integral part of the Financial Statements.
30
Growth and Income Fund
Notes to Financial Statements
Vanguard Growth and Income Fund is registered under the Investment Company Act of 1940 as an open-end investment company, or mutual fund. The fund offers two classes of shares: Investor Shares and Admiral Shares. Investor Shares are available to any investor who meets the fund’s minimum purchase requirements. Admiral Shares are designed for investors who meet certain administrative, service, and account-size criteria.
A. The following significant accounting policies conform to generally accepted accounting principles for U.S. investment companies. The fund consistently follows such policies in preparing its financial statements.
1. Security Valuation: Securities are valued as of the close of trading on the New York Stock Exchange (generally 4 p.m., Eastern time) on the valuation date. Equity securities are valued at the latest quoted sales prices or official closing prices taken from the primary market in which each security trades; such securities not traded on the valuation date are valued at the mean of the latest quoted bid and asked prices. Securities for which market quotations are not readily available, or whose values have been materially affected by events occurring before the fund’s pricing time but after the close of the securities’ primary markets, are valued by methods deemed by the board of trustees to represent fair value. Investments in Vanguard Market Liquidity Fund are valued at that fund’s net asset value. Temporary cash investments are valued using the latest bid prices or using valuations based on a matrix system (which considers such factors as security prices, yields, maturities, and ratings), both as furnished by independent pricing services.
2. Futures Contracts: The fund uses index futures contracts to a limited extent, with the objective of maintaining full exposure to the stock market while maintaining liquidity. The fund may purchase or sell futures contracts to achieve a desired level of investment, whether to accommodate portfolio turnover or cash flows from capital share transactions. The primary risks associated with the use of futures contracts are imperfect correlation between changes in market values of stocks held by the fund and the prices of futures contracts, and the possibility of an illiquid market. Counterparty risk involving futures is mitigated because a regulated clearinghouse is the counterparty instead of the clearing broker. To further mitigate counterparty risk, the fund trades futures contracts on an exchange, monitors the financial strength of its clearing brokers and clearinghouse, and has entered into clearing agreements with its clearing brokers. The clearinghouse imposes initial margin requirements to secure the fund’s performance and requires daily settlement of variation margin representing changes in the market value of each contract. Any assets pledged as initial margin for open contracts are noted in the Statement of Net Assets.
Futures contracts are valued at their quoted daily settlement prices. The notional amounts of the contracts are not recorded in the Statement of Net Assets. Fluctuations in the value of the contracts are recorded in the Statement of Net Assets as an asset (liability) and in the Statement of Operations as unrealized appreciation (depreciation) until the contracts are closed, when they are recorded as realized futures gains (losses).
During the year ended September 30, 2018, the fund’s average investments in long and short futures contracts represented 2% and 0% of net assets, respectively, based on the average of the notional amounts at each quarter-end during the period.
3. Federal Income Taxes: The fund intends to continue to qualify as a regulated investment company and distribute all of its taxable income. Management has analyzed the fund’s tax positions taken for all open federal income tax years (September 30, 2015–2018), and has concluded that no provision for federal income tax is required in the fund’s financial statements.
31
Growth and Income Fund
4. Distributions: Distributions to shareholders are recorded on the ex-dividend date. Distributions are determined on a tax basis and may differ from net investment income and realized capital gains for financial reporting purposes.
5. Securities Lending: To earn additional income, the fund lends its securities to qualified institutional borrowers. Security loans are subject to termination by the fund at any time, and are required to be secured at all times by collateral in an amount at least equal to the market value of securities loaned. Daily market fluctuations could cause the value of loaned securities to be more or less than the value of the collateral received. When this occurs, the collateral is adjusted and settled before the opening of the market on the next business day. The fund further mitigates its counterparty risk by entering into securities lending transactions only with a diverse group of prequalified counterparties, monitoring their financial strength, and entering into master securities lending agreements with its counterparties. The master securities lending agreements provide that, in the event of a counterparty’s default (including bankruptcy), the fund may terminate any loans with that borrower, determine the net amount owed, and sell or retain the collateral up to the net amount owed to the fund; however, such actions may be subject to legal proceedings. While collateral mitigates counterparty risk, in the event of a default, the fund may experience delays and costs in recovering the securities loaned. The fund invests cash collateral received in Vanguard Market Liquidity Fund, and records a liability in the Statement of Net Assets for the return of the collateral, during the period the securities are on loan. Securities lending income represents fees charged to borrowers plus income earned on invested cash collateral, less expenses associated with the loan. During the term of the loan, the fund is entitled to all distributions made on or in respect of the loaned securities.
6. Credit Facility: The fund and certain other funds managed by The Vanguard Group (“Vanguard”) participate in a $3.1 billion committed credit facility provided by a syndicate of lenders pursuant to a credit agreement that may be renewed annually; each fund is individually liable for its borrowings, if any, under the credit facility. Borrowings may be utilized for temporary and emergency purposes, and are subject to the fund’s regulatory and contractual borrowing restrictions. The participating funds are charged administrative fees and an annual commitment fee of 0.10% of the undrawn amount of the facility; these fees are allocated to the funds based on a method approved by the fund’s board of trustees and included in Management and Administrative expenses on the fund’s Statement of Operations. Any borrowings under this facility bear interest at a rate based upon the higher of the one-month London Interbank Offered Rate, federal funds effective rate, or overnight bank funding rate plus an agreed-upon spread.
The fund had no borrowings outstanding at September 30, 2018, or at any time during the period then ended.
7. Other: Dividend income is recorded on the ex-dividend date. Interest income includes income distributions received from Vanguard Market Liquidity Fund and is accrued daily. Premiums and discounts on debt securities purchased are amortized and accreted, respectively, to interest income over the lives of the respective securities. Security transactions are accounted for on the date securities are bought or sold. Costs used to determine realized gains (losses) on the sale of investment securities are those of the specific securities sold.
Each class of shares has equal rights as to assets and earnings, except that each class separately bears certain class-specific expenses related to maintenance of shareholder accounts (included in Management and Administrative expenses), shareholder reporting, and the proxy. Marketing and
32
Growth and Income Fund
distribution expenses are allocated to each class of shares based on a method approved by the board of trustees. Income, other non-class-specific expenses, and gains and losses on investments are allocated to each class of shares based on its relative net assets.
B. The investment advisory firms D. E. Shaw Investment Management, L.L.C., and Los Angeles Capital Management and Equity Research, Inc., each provide investment advisory services to a portion of the fund for a fee calculated at an annual percentage rate of average net assets managed by the advisor. The basic fee of D. E. Shaw Investment Management, L.L.C., is subject to quarterly adjustments based on performance relative to the S&P 500 Index for the preceding three years. The basic fee of Los Angeles Capital Management and Equity Research, Inc., is subject to quarterly adjustments based on performance relative to the S&P 500 Index for the preceding five years.
Vanguard provides investment advisory services to a portion of the fund as described below; the fund paid Vanguard advisory fees of $1,303,000 for the year ended September 30, 2018.
For the year ended September 30, 2018, the aggregate investment advisory fee paid to all advisors represented an effective annual basic rate of 0.10% of the fund’s average net assets, before an increase of $180,000 (0.00%) based on performance.
C. In accordance with the terms of a Funds’ Service Agreement (the “FSA”) between Vanguard and the fund, Vanguard furnishes to the fund investment advisory, corporate management, administrative, marketing, and distribution services at Vanguard’s cost of operations (as defined by the FSA). These costs of operations are allocated to the fund based on methods and guidelines approved by the board of trustees. Vanguard does not require reimbursement in the current period for certain costs of operations (such as deferred compensation/benefits and risk/insurance costs); the fund’s liability for these costs of operations is included in Payables to Vanguard on the Statement of Net Assets. All other costs of operations payable to Vanguard are generally settled twice a month.
Upon the request of Vanguard, the fund may invest up to 0.40% of its net assets as capital in Vanguard. At September 30, 2018, the fund had contributed to Vanguard capital in the amount of $577,000, representing 0.01% of the fund’s net assets and 0.23% of Vanguard’s capitalization. The fund’s trustees and officers are also directors and employees, respectively, of Vanguard.
D. Various inputs may be used to determine the value of the fund’s investments. These inputs are summarized in three broad levels for financial statement purposes. The inputs or methodologies used to value securities are not necessarily an indication of the risk associated with investing in those securities.
Level 1—Quoted prices in active markets for identical securities.
Level 2—Other significant observable inputs (including quoted prices for similar securities, interest rates, prepayment speeds, credit risk, etc.).
Level 3—Significant unobservable inputs (including the fund’s own assumptions used to determine
the fair value of investments). Any investments valued with significant unobservable inputs are
noted on the Statement of Net Assets.
33
Growth and Income Fund
The following table summarizes the market value of the fund’s investments as of September 30, 2018, based on the inputs used to value them:
| Level 1 | Level 2 | Level 3 | |
| Investments | ($000) | ($000) | ($000) |
| Common Stocks | 11,122,750 | 11,219 | —1 |
| Temporary Cash Investments | 279,958 | 15,545 | — |
| Futures Contracts—Liabilities 2 | (84) | — | — |
| Total | 11,402,624 | 26,764 | — |
| 1 Amount is less than $500. | |||
| 2 Represents variation margin on the last day of the reporting period. |
E. Permanent differences between book-basis and tax-basis components of net assets are reclassified among capital accounts in the financial statements to reflect their tax character. These reclassifications have no effect on net assets or net asset value per share. As of period end, the following permanent differences primarily attributable to the accounting for passive foreign investment companies, and distributions in connection with fund share redemptions were reclassified to the following accounts:
| Amount | |
| ($000) | |
| Paid-in Capital | 34,889 |
| Undistributed (Overdistributed) Net Investment Income | 1 |
| Accumulated Net Realized Gains (Losses) | (34,890) |
Temporary differences between book-basis and tax-basis components of accumulated net earnings (losses) arise when certain items of income, gain, or loss are recognized in different periods for financial statement and tax purposes; these differences will reverse at some time in the future. The differences are primarily related to the tax deferral of losses on wash sales; the realization of unrealized gains or losses on certain futures contracts, and unrealized gains on passive foreign investment companies. As of period end, the tax-basis components of accumulated net earnings (losses) are detailed in the table as follows:
| Amount | |
| ($000) | |
| Undistributed Ordinary Income | 242,188 |
| Undistributed Long-Term Gains | 319,475 |
| Capital Loss Carryforwards (Non-expiring) | — |
| Net Unrealized Gains (Losses) | 2,611,600 |
34
Growth and Income Fund
As of September 30, 2018, gross unrealized appreciation and depreciation for investments and derivatives based on cost for U.S. federal income tax purposes were as follows:
| Amount | |
| ($000) | |
| Tax Cost | 8,817,872 |
| Gross Unrealized Appreciation | 2,744,765 |
| Gross Unrealized Depreciation | (133,165) |
| Net Unrealized Appreciation (Depreciation) | 2,611,600 |
F. During the year ended September 30, 2018, the fund purchased $8,660,635,000 of investment securities and sold $8,920,026,000 of investment securities, other than temporary cash investments.
G. Capital share transactions for each class of shares were:
| Year Ended September 30, | ||||
| 2018 | 2017 | |||
| Amount | Shares | Amount | Shares | |
| ($000) | (000) | ($000) | (000) | |
| Investor Shares | ||||
| Issued | 291,736 | 5,976 | 277,033 | 6,367 |
| Issued in Lieu of Cash Distributions | 152,825 | 3,204 | 179,760 | 4,259 |
| Redeemed | (830,669) | (17,104) | (569,608) | (12,950) |
| Net Increase (Decrease)—Investor Shares | (386,108) | (7,924) | (112,815) | (2,324) |
| Admiral Shares | ||||
| Issued | 1,319,661 | 16,602 | 3,081,615 | 41,593 |
| Issued in Lieu of Cash Distributions | 407,603 | 5,233 | 247,827 | 3,595 |
| Redeemed | (1,157,448) | (14,518) | (604,359) | (8,482) |
| Net Increase (Decrease)—Admiral Shares | 569,816 | 7,317 | 2,725,083 | 36,706 |
H. Management has determined that no events or transactions occurred subsequent to September 30, 2018, that would require recognition or disclosure in these financial statements.
35
Report of Independent Registered
Public Accounting Firm
To the Board of Trustees of Vanguard Quantitative Funds and Shareholders of Vanguard Growth and Income Fund
Opinion on the Financial Statements
We have audited the accompanying statement of net assets of Vanguard Growth and Income Fund (constituting Vanguard Quantitative Funds, hereafter referred to as the “Fund”) as of September 30, 2018, the related statement of operations for the year ended September 30, 2018, the statement of changes in net assets for each of the two years in the period ended September 30, 2018, including the related notes, and the financial highlights for each of the five years in the period ended September 30, 2018 (collectively referred to as the “financial statements”). In our opinion, the financial statements present fairly, in all material respects, the financial position of the Fund as of September 30, 2018, the results of its operations for the year then ended, the changes in its net assets for each of the two years in the period ended September 30, 2018 and the financial highlights for each of the five years in the period ended September 30, 2018 in conformity with accounting principles generally accepted in the United States of America.
Basis for Opinion
These financial statements are the responsibility of the Fund’s management. Our responsibility is to express an opinion on the Fund’s financial statements based on our audits. We are a public accounting firm registered with the Public Company Accounting Oversight Board (United States) (“PCAOB”) and are required to be independent with respect to the Fund in accordance with the U.S. federal securities laws and the applicable rules and regulations of the Securities and Exchange Commission and the PCAOB.
We conducted our audits of these financial statements in accordance with the standards of the PCAOB. Those standards require that we plan and perform the audit to obtain reasonable assurance about whether the financial statements are free of material misstatement, whether due to error or fraud.
Our audits included performing procedures to assess the risks of material misstatement of the financial statements, whether due to error or fraud, and performing procedures that respond to those risks. Such procedures included examining, on a test basis, evidence regarding the amounts and disclosures in the financial statements. Our audits also included evaluating the accounting principles used and significant estimates made by management, as well as evaluating the overall presentation of the financial statements. Our procedures included confirmation of securities owned as of September 30, 2018 by correspondence with the custodian and brokers and by agreement to the underlying ownership records of the transfer agent; when replies were not received from brokers, we performed other auditing procedures. We believe that our audits provide a reasonable basis for our opinion.
/s/PricewaterhouseCoopers LLP
Philadelphia, Pennsylvania
November 15, 2018
We have served as the auditor of one or more investment companies in The Vanguard Group of
Funds since 1975.
36

Special 2018 tax information (unaudited) for Vanguard Growth and Income Fund
This information for the fiscal year ended September 30, 2018, is included pursuant to provisions of
the Internal Revenue Code.
The fund distributed $269,585,000 as capital gain dividends (20% rate gain distributions) to
shareholders during the fiscal year.
For nonresident alien shareholders, 100% of short-term capital gain dividends distributed by the
fund are qualified short-term capital gains.
The fund distributed $168,195,000 of qualified dividend income to shareholders during the
fiscal year.
For corporate shareholders, 43.2% of investment income (dividend income plus short-term gains,
if any) qualifies for the dividends-received deduction.
37
Your Fund’s After-Tax Returns
This table presents returns for your fund both before and after taxes. The after-tax returns are shown in two ways: (1) assuming that an investor owned the fund during the entire period and paid taxes on the fund’s distributions, and (2) assuming that an investor paid taxes on the fund’s distributions and sold all shares at the end of each period.
Calculations are based on the highest individual federal income tax and capital gains tax rates in effect at the times of the distributions and the hypothetical sales. State and local taxes were not considered. After-tax returns reflect any qualified dividend income, using actual prior-year figures and estimates for 2018. (In the example, returns after the sale of fund shares may be higher than those assuming no sale. This occurs when the sale would have produced a capital loss. The calculation assumes that the investor received a tax deduction for the loss.)
The table shows returns for Investor Shares only; returns for other share classes will differ. Please note that your actual after-tax returns will depend on your tax situation and may differ from those shown. Also note that if you own the fund in a tax-deferred account, such as an individual retirement account or a 401(k) plan, this information does not apply to you. Such accounts are not subject to current taxes.
Finally, keep in mind that a fund’s performance—whether before or after taxes—does not guarantee future results.
| Average Annual Total Returns: Growth and Income Fund Investor Shares | |||
| Periods Ended September 30, 2018 | |||
| One | Five | Ten | |
| Year | Years | Years | |
| Returns Before Taxes | 18.56% | 14.08% | 11.52% |
| Returns After Taxes on Distributions | 16.66 | 12.44 | 10.55 |
| Returns After Taxes on Distributions and Sale of Fund Shares | 11.53 | 10.85 | 9.31 |
38
About Your Fund’s Expenses
As a shareholder of the fund, you incur ongoing costs, which include costs for portfolio management, administrative services, and shareholder reports (like this one), among others. Operating expenses, which are deducted from a fund’s gross income, directly reduce the investment return of the fund.
A fund’s expenses are expressed as a percentage of its average net assets. This figure is known as the expense ratio. The following examples are intended to help you understand the ongoing costs (in dollars) of investing in your fund and to compare these costs with those of other mutual funds. The examples are based on an investment of $1,000 made at the beginning of the period shown and held for the entire period.
The accompanying table illustrates your fund’s costs in two ways:
• Based on actual fund return. This section helps you to estimate the actual expenses that you paid over the period. The ”Ending Account Value“ shown is derived from the fund‘s actual return, and the third column shows the dollar amount that would have been paid by an investor who started with $1,000 in the fund. You may use the information here, together with the amount you invested, to estimate the expenses that you paid over the period.
To do so, simply divide your account value by $1,000 (for example, an $8,600 account value divided by $1,000 = 8.6), then multiply the result by the number given for your fund under the heading ”Expenses Paid During Period.“
• Based on hypothetical 5% yearly return. This section is intended to help you compare your fund‘s costs with those of other mutual funds. It assumes that the fund had a yearly return of 5% before expenses, but that the expense ratio is unchanged. In this case—because the return used is not the fund’s actual return—the results do not apply to your investment. The example is useful in making comparisons because the Securities and Exchange Commission requires all mutual funds to calculate expenses based on a 5% return. You can assess your fund’s costs by comparing this hypothetical example with the hypothetical examples that appear in shareholder reports of other funds.
Note that the expenses shown in the table are meant to highlight and help you compare ongoing costs only and do not reflect transaction costs incurred by the fund for buying and selling securities. Further, the expenses do not include any purchase, redemption, or account service fees described in the fund prospectus. If such fees were applied to your account, your costs would be higher. Your fund does not carry a “sales load.”
The calculations assume no shares were bought or sold during the period. Your actual costs may have been higher or lower, depending on the amount of your investment and the timing of any purchases or redemptions.
You can find more information about the fund’s expenses, including annual expense ratios, in the Financial Statements section of this report. For additional information on operating expenses and other shareholder costs, please refer to your fund’s current prospectus.
39
| Six Months Ended September 30, 2018 | |||
| Beginning | Ending | Expenses | |
| Account Value | Account Value | Paid During | |
| Growth and Income Fund | 3/31/2018 | 9/30/2018 | Period |
| Based on Actual Fund Return | |||
| Investor Shares | $1,000.00 | $1,119.45 | $1.70 |
| Admiral Shares | 1,000.00 | 1,119.72 | 1.22 |
| Based on Hypothetical 5% Yearly Return | |||
| Investor Shares | $1,000.00 | $1,023.46 | $1.62 |
| Admiral Shares | 1,000.00 | 1,023.92 | 1.17 |
The calculations are based on expenses incurred in the most recent six-month period. The fund’s annualized six-month expense ratios for
that period are 0.32% for Investor Shares and 0.23% for Admiral Shares. The dollar amounts shown as “Expenses Paid” are equal to the
annualized expense ratio multiplied by the average account value over the period, multiplied by the number of days in the most recent
six-month period, then divided by the number of days in the most recent 12-month period (183/365).
40
Trustees Approve Advisory Arrangements
The board of trustees of Vanguard Growth and Income Fund has renewed the fund’s investment advisory arrangements with D. E. Shaw Investment Management, L.L.C. (DESIM); Los Angeles Capital Management and Equity Research, Inc. (LA Capital); and The Vanguard Group, Inc. (Vanguard), through its Quantitative Equity Group. The board determined that renewing the fund’s advisory arrangements was in the best interests of the fund and its shareholders.
The board based its decision upon an evaluation of each advisor’s investment staff, portfolio management process, and performance. This evaluation included information provided to the board by Vanguard’s Portfolio Review Department, which is responsible for fund and advisor oversight and product management. The Portfolio Review Department met regularly with the advisors and made monthly presentations to the board during the fiscal year that directed the board’s focus to relevant information and topics.
The board, or an investment committee made up of board members, also received information throughout the year during advisor presentations. For each advisor presentation, the board was provided with letters and reports that included information about, among other things, the advisory firm and the advisor’s assessment of the investment environment, portfolio performance, and portfolio characteristics.
In addition, the board received monthly reports, which included a Market and Economic Report, a Fund Dashboard Monthly Summary, and a Fund Performance Report.
Prior to their meeting, the trustees were provided with a memo and materials that summarized the information they received over the course of the year. They also considered the factors discussed below, among others. However, no single factor determined whether the board approved the arrangements. Rather, it was the totality of the circumstances that drove the board’s decision.
Nature, extent, and quality of services
The board reviewed the quality of each advisor’s investment management services provided to the fund since 2011, and took into account the organizational depth and stability of each advisor. The board considered the following:
DESIM. Founded in 2005, DESIM is a global investment management and technology development firm. The advisor employs quantitative models that seek to capture predominantly “bottom-up” stock-specific return opportunities while aiming to control overall portfolio risk and characteristics, such as size, sector weights, and style, to be similar to those of the benchmark. DESIM focuses on return drivers that it considers “idiosyncratic,” or those that other quantitative managers tend to overlook, and de-emphasizes the use of traditional factors such as value, growth, and momentum, as these factors are more subject to crowding from other quantitative managers. DESIM has managed a portion of the fund since 2011.
LA Capital. LA Capital was formed in 2002 from the equity portion of Wilshire Asset Management. The advisor employs a controlled, dynamic, investment model, gradually assigning new prices to key equity risks as market conditions evolve and investor preferences shift. The price of factor risk evolves over time in a way that can be captured in a model, similar to changes in cost of capital. The model uses more than 50 factors to actively weight stocks, including value, momentum, quality, sector, and market capitalization factors. The advisor applies statistical techniques to reduce noise in the factor returns, and it looks for velocity and acceleration of the cleansed factor performance over the prior six months. LA Capital has managed a portion of the fund since 2011.
41
Vanguard. Vanguard has been managing investments for more than four decades. The Quantitative Equity Group adheres to a sound, disciplined investment management process; the team has considerable experience, stability, and depth. Vanguard has managed a portion of the fund since 2011.
The board concluded that each advisor’s experience, stability, depth, and performance, among other factors, warranted continuation of the advisory arrangements.
Investment performance
The board considered the investment performance of each advisor’s subportfolio since each advisor began managing a portion of the fund in 2011, including any periods of outperformance or underperformance compared with a relevant benchmark index and peer group. The board concluded that the performance was such that the advisory arrangements should continue. Information about the fund’s most recent performance can be found in the Performance Summary section of this report.
Cost
The board concluded that the fund’s expense ratio was well below the average expense ratio charged by funds in its peer group and that the fund’s advisory expense rate was also well below the peer-group average. Information about the fund’s expense ratio appears in the About Your Fund’s Expenses section of this report as well as in the Financial Statements section, which also includes information about the fund’s advisory expense rate.
The board did not consider the profitability of DESIM and LA Capital in determining whether to approve the advisory fees, because the firms are independent of Vanguard, and the advisory fees are the result of arm’s-length negotiations. The board does not conduct a profitability analysis of Vanguard because of Vanguard’s unique “at-cost” structure. Unlike most other mutual fund management companies, Vanguard is owned by the funds it oversees and produces “profits” only in the form of reduced expenses for fund shareholders.
The benefit of economies of scale
The board concluded that the fund’s shareholders benefit from economies of scale because of breakpoints in the advisory fee schedules for DESIM and LA Capital. The breakpoints reduce the effective rate of the fee as the fund’s assets managed by each advisor increase. The board also concluded that the fund’s at-cost arrangement with Vanguard ensures that the fund will realize economies of scale as it grows, with the cost to shareholders declining as the fund’s assets managed by Vanguard increase.
The board will consider whether to renew the advisory arrangements again after a one-year period.
42
Glossary
30-Day SEC Yield. A fund’s 30-day SEC yield is derived using a formula specified by the U.S. Securities and Exchange Commission. Under the formula, data related to the fund’s security holdings in the previous 30 days are used to calculate the fund’s hypothetical net income for that period, which is then annualized and divided by the fund’s estimated average net assets over the calculation period. For the purposes of this calculation, a security’s income is based on its current market yield to maturity (for bonds), its actual income (for asset-backed securities), or its projected dividend yield (for stocks). Because the SEC yield represents hypothetical annualized income, it will differ—at times significantly—from the fund’s actual experience. As a result, the fund’s income distributions may be higher or lower than implied by the SEC yield.
Beta. A measure of the magnitude of a fund’s past share-price fluctuations in relation to the ups and downs of a given market index. The index is assigned a beta of 1.00. Compared with a given index, a fund with a beta of 1.20 typically would have seen its share price rise or fall by 12% when the index rose or fell by 10%. For this report, beta is based on returns over the past 36 months for both the fund and the index. Note that a fund’s beta should be reviewed in conjunction with its R-squared (see definition). The lower the R-squared, the less correlation there is between the fund and the index, and the less reliable beta is as an indicator of volatility.
Dividend Yield. Dividend income earned by stocks, expressed as a percentage of the aggregate market value (or of net asset value, for a fund). The yield is determined by dividing the amount of the annual dividends by the aggregate value (or net asset value) at the end of the period. For a fund, the dividend yield is based solely on stock holdings and does not include any income produced by other investments.
Earnings Growth Rate. The average annual rate of growth in earnings over the past five years for the stocks now in a fund.
Equity Exposure. A measure that reflects a fund’s investments in stocks and stock futures. Any holdings in short-term reserves are excluded.
Expense Ratio. A fund’s total annual operating expenses expressed as a percentage of the fund’s average net assets. The expense ratio includes management and administrative expenses, but does not include the transaction costs of buying and selling portfolio securities.
Foreign Holdings. The percentage of a fund represented by securities or depositary receipts of companies based outside the United States.
Inception Date. The date on which the assets of a fund (or one of its share classes) are first invested in accordance with the fund’s investment objective. For funds with a subscription period, the inception date is the day after that period ends. Investment performance is measured from the inception date.
Median Market Cap. An indicator of the size of companies in which a fund invests; the midpoint of market capitalization (market price x shares outstanding) of a fund’s stocks, weighted by the proportion of the fund’s assets invested in each stock. Stocks representing half of the fund’s assets have market capitalizations above the median, and the rest are below it.
Price/Book Ratio. The share price of a stock divided by its net worth, or book value, per share.
For a fund, the weighted average price/book ratio of the stocks it holds.
43
Price/Earnings Ratio. The ratio of a stock’s current price to its per-share earnings over the past year. For a fund, the weighted average P/E of the stocks it holds. P/E is an indicator of market expectations about corporate prospects; the higher the P/E, the greater the expectations for a company’s future growth.
R-Squared. A measure of how much of a fund’s past returns can be explained by the returns from the market in general, as measured by a given index. If a fund’s total returns were precisely synchronized with an index’s returns, its R-squared would be 1.00. If the fund’s returns bore no relationship to the index’s returns, its R-squared would be 0. For this report, R-squared is based on returns over the past 36 months for both the fund and the index.
Return on Equity. The annual average rate of return generated by a company during the past five years for each dollar of shareholder’s equity (net income divided by shareholder’s equity). For a fund, the weighted average return on equity for the companies whose stocks it holds.
Short-Term Reserves. The percentage of a fund invested in highly liquid, short-term securities that can be readily converted to cash.
Turnover Rate. An indication of the fund’s trading activity. Funds with high turnover rates incur higher transaction costs and may be more likely to distribute capital gains (which may be taxable to investors). The turnover rate excludes in-kind transactions, which have minimal impact on costs.
44
The Global Industry Classification Standard (“GICS”) was developed by and is the exclusive property and a service mark
of MSCI Inc. (“MSCI”) and Standard and Poor’s, a division of McGraw-Hill Companies, Inc. (“S&P”), and is licensed for use
by Vanguard. Neither MSCI, S&P nor any third party involved in making or compiling the GICS or any GICS classification
makes any express or implied warranties or representations with respect to such standard or classification (or the results
to be obtained by the use thereof), and all such parties hereby expressly disclaim all warranties of originality, accuracy,
completeness, merchantability or fitness for a particular purpose with respect to any such standard or classification.
Without limiting any of the foregoing, in no event shall MSCI, S&P, any of its affiliates or any third party involved in
making or compiling the GICS or any GICS classification have any liability for any direct, indirect, special, punitive,
consequential or any other damages (including lost profits) even if notified of the possibility of such damages.
45
This page intentionally left blank.
The People Who Govern Your Fund
The trustees of your mutual fund are there to see that the fund is operated and managed in your best interests since, as a shareholder, you are a part owner of the fund. Your fund’s trustees also serve on the board of directors of The Vanguard Group, Inc., which is owned by the Vanguard funds and provides services to them on an at-cost basis.
A majority of Vanguard’s board members are independent, meaning that they have no affiliation with Vanguard or the funds they oversee, apart from the sizable personal investments they have made as private individuals. The independent board members have distinguished backgrounds in business, academia, and public service. Each of the trustees and executive officers oversees 211 Vanguard funds.
Information for each trustee and executive officer of the fund appears below. The mailing address of the trustees and officers is P.O. Box 876, Valley Forge, PA 19482. More information about the trustees is in the Statement of Additional Information, which can be obtained, without charge, by contacting Vanguard at 800-662-7447, or online at vanguard.com.
Interested Trustees1
F. William McNabb III
Born in 1957. Trustee since July 2009. Principal occupation(s) during the past five years and other experience: chairman of the board (January 2010–present) of Vanguard and of each of the investment companies served by Vanguard, trustee (2009–present) of each of the investment companies served by Vanguard, and director (2008–present) of Vanguard. Chief executive officer and president (2008–2017) of Vanguard and each of the investment companies served by Vanguard, managing director (1995–2008) of Vanguard, and director (1997–2018) of Vanguard Marketing Corporation. Director (2018–present) of UnitedHealth Group.
Mortimer J. Buckley
Born in 1969. Trustee since January 2018. Principal occupation(s) during the past five years and other experience: chief executive officer (January 2018–present) of Vanguard; chief executive officer, president, and trustee (January 2018–present) of each of the investment companies served by Vanguard; president and director (2017–present) of Vanguard; and president (February 2018–present) of Vanguard Marketing Corporation. Chief investment officer (2013–2017), managing director (2002–2017), head of the Retail Investor Group (2006–2012), and chief information officer (2001–2006) of Vanguard. Chairman of the board (2011–2017) of the Children’s Hospital of Philadelphia.
Independent Trustees
Emerson U. Fullwood
Born in 1948. Trustee since January 2008. Principal occupation(s) during the past five years and other experience: executive chief staff and marketing officer for North America and corporate vice president (retired 2008) of Xerox Corporation (document management products and services). Former president of the Worldwide Channels Group, Latin America, and Worldwide Customer Service and executive chief staff officer of Developing Markets of Xerox. Executive in residence and 2009–2010 Distinguished Minett Professor at the Rochester Institute of Technology. Lead director of SPX FLOW, Inc. (multi-industry manufacturing). Director of the University of Rochester Medical Center, the Monroe Community College Foundation, the United Way of Rochester, North Carolina A&T University, and Roberts Wesleyan College. Trustee of the University of Rochester.
Amy Gutmann
Born in 1949. Trustee since June 2006. Principal occupation(s) during the past five years and other experience: president (2004–present) of the University of Pennsylvania. Christopher H. Browne Distinguished Professor of Political Science, School of Arts and Sciences, and professor of communication, Annenberg School for Communication, with secondary faculty appointments in the Department of Philosophy, School of Arts and Sciences, and at the Graduate School of Education, University of Pennsylvania. Trustee of the National Constitution Center.
1 Mr. McNabb and Mr. Buckley are considered “interested persons,” as defined in the Investment Company Act of 1940, because
they are officers of the Vanguard funds.
JoAnn Heffernan Heisen
Born in 1950. Trustee since July 1998. Principal occupation(s) during the past five years and other experience: corporate vice president of Johnson & Johnson (pharmaceuticals/medical devices/consumer products) and member of its executive committee (1997–2008). Chief global diversity officer (retired 2008), vice president and chief information officer (1997–2006), controller (1995–1997), treasurer (1991–1995), and assistant treasurer (1989–1991) of Johnson & Johnson. Director of Skytop Lodge Corporation (hotels) and the Robert Wood Johnson Foundation. Member of the advisory board of the Institute for Women’s Leadership at Rutgers University.
F. Joseph Loughrey
Born in 1949. Trustee since October 2009. Principal occupation(s) during the past five years and other experience: president and chief operating officer (retired 2009) and vice chairman of the board (2008–2009) of Cummins Inc. (industrial machinery). Chairman of the board of Hillenbrand, Inc. (specialized consumer services), Oxfam America, and the Lumina Foundation for Education. Director of the V Foundation for Cancer Research. Member of the advisory council for the College of Arts and Letters and chair of the advisory board to the Kellogg Institute for International Studies, both at the University of Notre Dame.
Mark Loughridge
Born in 1953. Trustee since March 2012. Principal occupation(s) during the past five years and other experience: senior vice president and chief financial officer (retired 2013) of IBM (information technology services). Fiduciary member of IBM’s Retirement Plan Committee (2004–2013), senior vice president and general manager (2002–2004) of IBM Global Financing, vice president and controller (1998–2002) of IBM, and a variety of other prior management roles at IBM. Member of the Council on Chicago Booth.
Scott C. Malpass
Born in 1962. Trustee since March 2012. Principal occupation(s) during the past five years and other experience: chief investment officer (1989–present) and vice president (1996–present) of the University of Notre Dame. Assistant professor of finance at the Mendoza College of Business, University of Notre Dame, and member of the Notre Dame 403(b) Investment Committee. Chairman of the board of TIFF Advisory Services, Inc. Member of the board of Catholic Investment Services, Inc. (investment advisors), the board of advisors for Spruceview Capital Partners, and the board of superintendence of the Institute for the Works of Religion.
Deanna Mulligan
Born in 1963. Trustee since January 2018. Principal occupation(s) during the past five years and other experience: president (2010–present) and chief executive officer (2011–present) of The Guardian Life Insurance Company of America. Chief operating officer (2010–2011) and executive vice president (2008–2010) of Individual Life and Disability of The Guardian Life Insurance Company of America. Member of the board of The Guardian Life Insurance Company of America, the American Council of Life Insurers, the Partnership for New York City (business leadership), and the Committee Encouraging Corporate Philanthropy. Trustee of the Economic Club of New York and the Bruce Museum (arts and science). Member of the Advisory Council for the Stanford Graduate School of Business.
André F. Perold
Born in 1952. Trustee since December 2004. Principal occupation(s) during the past five years and other experience: George Gund Professor of Finance and Banking, Emeritus at the Harvard Business School (retired 2011). Chief investment officer and co-managing partner of HighVista Strategies LLC (private investment firm). Overseer of the Museum of Fine Arts Boston.
Sarah Bloom Raskin
Born in 1961. Trustee since January 2018. Principal occupation(s) during the past five years and other experience: deputy secretary (2014–2017) of the United States Department of the Treasury. Governor (2010–2014) of the Federal Reserve Board. Commissioner (2007–2010) of financial regulation for the State of Maryland. Member of the board of directors (2012–2014) of Neighborhood Reinvestment Corporation. Director of i(x) Investments, LLC.
Peter F. Volanakis
Born in 1955. Trustee since July 2009. Principal occupation(s) during the past five years and other experience: president and chief operating officer (retired 2010) of Corning Incorporated (communications equipment) and director of Corning Incorporated (2000–2010) and Dow Corning (2001–2010). Director (2012) of SPX Corporation (multi-industry manufacturing). Overseer of the Amos Tuck School of Business Administration, Dartmouth College (2001–2013). Chairman of the board of trustees of Colby-Sawyer College. Member of the Board of Hypertherm Inc. (industrial cutting systems, software, and consumables).
Executive Officers
Glenn Booraem
Born in 1967. Principal occupation(s) during the past five years and other experience: principal of Vanguard. Investment stewardship officer (2017–present), treasurer (2015–2017), controller (2010–2015), and assistant controller (2001–2010) of each of the investment companies served by Vanguard.
Christine M. Buchanan
Born in 1970. Principal occupation(s) during the past five years and other experience: principal of Vanguard and global head of Fund Administration at Vanguard. Treasurer (2017–present) of each of the investment companies served by Vanguard. Partner (2005–2017) at KPMG LLP (audit, tax, and advisory services).
Brian Dvorak
Born in 1973. Principal occupation(s) during the past five years and other experience: principal of Vanguard. Chief compliance officer (2017–present) of Vanguard and each of the investment companies served by Vanguard. Assistant vice president (2017–present) of Vanguard Marketing Corporation. Vice president and director of Enterprise Risk Management (2011–2013) at Oppenheimer Funds, Inc.
Thomas J. Higgins
Born in 1957. Principal occupation(s) during the past five years and other experience: principal of Vanguard. Chief financial officer (2008–present) and treasurer (1998–2008) of each of the investment companies served by Vanguard.
Peter Mahoney
Born in 1974. Principal occupation(s) during the past five years and other experience: principal of Vanguard. Controller (2015–present) of each of the investment companies served by Vanguard. Head of International Fund Services (2008–2014) at Vanguard.
Anne E. Robinson
Born in 1970. Principal occupation(s) during the past five years and other experience: general counsel (2016–present) of Vanguard. Secretary (2016–present) of Vanguard and of each of the investment companies served by Vanguard. Managing director (2016–present) of Vanguard. Director and senior vice president (2016–2018) of Vanguard Marketing Corporation. Managing director and general counsel of Global Cards and Consumer Services (2014–2016) at Citigroup. Counsel (2003–2014) at American Express.
Michael Rollings
Born in 1963. Principal occupation(s) during the past five years and other experience: finance director (2017–present) and treasurer (2017) of each of the investment companies served by Vanguard. Managing director (2016–present) of Vanguard. Chief financial officer (2016–present) of Vanguard. Director (2016–present) of Vanguard Marketing Corporation. Executive vice president and chief financial officer (2006–2016) of MassMutual Financial Group.
| Vanguard Senior Management Team | |
| Joseph Brennan | Chris D. McIsaac |
| Mortimer J. Buckley | James M. Norris |
| Gregory Davis | Thomas M. Rampulla |
| John James | Karin A. Risi |
| Martha G. King | Anne E. Robinson |
| John T. Marcante | Michael Rollings |
| Chairman Emeritus and Senior Advisor | |
| John J. Brennan | |
| Chairman, 1996–2009 | |
| Chief Executive Officer and President, 1996–2008 | |
| Founder | |
| John C. Bogle | |
| Chairman and Chief Executive Officer, 1974–1996 | |
 | |
| P.O. Box 2600 | |
| Valley Forge, PA 19482-2600 | |
| Connect with Vanguard® > vanguard.com | |
| Fund Information > 800-662-7447 | Source for Bloomberg Barclays indexes: Bloomberg |
| Direct Investor Account Services > 800-662-2739 | Index Services Limited. Copyright 2018, Bloomberg. All |
| rights reserved. | |
| Institutional Investor Services > 800-523-1036 | |
| CFA® is a registered trademark owned by CFA Institute. | |
| Text Telephone for People | |
| Who Are Deaf or Hard of Hearing > 800-749-7273 | |
| This material may be used in conjunction | |
| with the offering of shares of any Vanguard | |
| fund only if preceded or accompanied by | |
| the fund’s current prospectus. | |
| All comparative mutual fund data are from Lipper, a | |
| Thomson Reuters Company, or Morningstar, Inc., unless | |
| otherwise noted. | |
| You can obtain a free copy of Vanguard’s proxy voting | |
| guidelines by visiting vanguard.com/proxyreporting or by | |
| calling Vanguard at 800-662-2739. The guidelines are | |
| also available from the SEC’s website, sec.gov. In | |
| addition, you may obtain a free report on how your fund | |
| voted the proxies for securities it owned during the 12 | |
| months ended June 30. To get the report, visit either | |
| vanguard.com/proxyreporting or sec.gov. | |
| You can review and copy information about your fund at | |
| the SEC’s Public Reference Room in Washington, D.C. To | |
| find out more about this public service, call the SEC at | |
| 202-551-8090. Information about your fund is also | |
| available on the SEC’s website, and you can receive | |
| copies of this information, for a fee, by sending a | |
| request in either of two ways: via email addressed to | |
| publicinfo@sec.gov or via regular mail addressed to the | |
| Public Reference Section, Securities and Exchange | |
| Commission, Washington, DC 20549-1520. | |
| © 2018 The Vanguard Group, Inc. | |
| All rights reserved. | |
| Vanguard Marketing Corporation, Distributor. | |
| Q930 112018 | |
Item 2: Code of Ethics. The Registrant has adopted a code of ethics that applies to the Registrant’s principal executive officer, principal financial officer, principal accounting officer or controller or persons performing similar functions. The Code of Ethics was amended during the reporting period covered by this report to make certain technical, non-material changes.
Item 3: Audit Committee Financial Expert. All members of the Audit Committee have been determined by the Registrant’s Board of Trustees to be Audit Committee Financial Experts and to be independent: JoAnn Heffernan Heisen, F. Joseph Loughrey, Mark Loughridge, Sarah Bloom Raskin, and Peter F. Volanakis.
Item 4: Principal Accountant Fees and Services.
(a) Audit Fees.
Audit Fees of the Registrant
Fiscal Year Ended September 30, 2018: $27,000
Fiscal Year Ended September 30, 2017: $27,000
Aggregate Audit Fees of Registered Investment Companies in the Vanguard Group.
Fiscal Year Ended September 30, 2018: $9,734,277
Fiscal Year Ended September 30, 2017: $8,424,459
Includes fees billed in connection with audits of the Registrant, other registered investment companies in the Vanguard complex, The Vanguard Group, Inc. and Vanguard Marketing Corporation.
(b) Audit-Related Fees.
Fiscal Year Ended September 30, 2018: $5,581,336
Fiscal Year Ended September 30, 2017: $3,194,093
Includes fees billed in connection with assurance and related services provided to the Registrant, other registered investment companies in the Vanguard complex, The Vanguard Group, Inc., and Vanguard Marketing Corporation.
(c) Tax Fees.
Fiscal Year Ended September 30, 2018: $347,985
Fiscal Year Ended September 30, 2017: $274,313
Includes fees billed in connection with tax compliance, planning, and advice services provided to the Registrant, other registered investment companies in the Vanguard complex, The Vanguard Group, Inc., and Vanguard Marketing Corporation.
(d) All Other Fees.
Fiscal Year Ended September 30, 2018: $0
Fiscal Year Ended September 30, 2017: $0
Includes fees billed for services related to tax reported information provided to the Registrant, other registered investment companies in the Vanguard complex, The Vanguard Group, Inc., and Vanguard Marketing Corporation.
(e) (1) Pre-Approval Policies. The policy of the Registrant’s Audit Committee is to consider and, if appropriate, approve before the principal accountant is engaged for such services, all specific audit and non-audit services provided to: the Registrant, other registered investment companies in the Vanguard complex, The Vanguard Group, Inc., and entities controlled by The Vanguard Group, Inc. that provide ongoing services to the Registrant. In making a determination, the Audit Committee considers whether the services are consistent with maintaining the principal accountant’s independence.
In the event of a contingency situation in which the principal accountant is needed to provide services in between scheduled Audit Committee meetings, the Chairman of the Audit Committee would be called on to consider and, if appropriate, pre-approve audit or permitted non-audit services in an amount sufficient to complete services through the next Audit Committee meeting, and to determine if such services would be consistent with maintaining the accountant’s independence. At the next scheduled Audit Committee meeting, services and fees would be presented to the Audit Committee for formal consideration, and, if appropriate, approval by the entire Audit Committee. The Audit Committee would again consider whether such services and fees are consistent with maintaining the principal accountant’s independence.
The Registrant’s Audit Committee is informed at least annually of all audit and non-audit services provided by the principal accountant to the Vanguard complex, whether such services are provided to: the Registrant, other registered investment companies in the Vanguard complex, The Vanguard Group, Inc., or other entities controlled by The Vanguard Group, Inc. that provide ongoing services to the Registrant.
(2) No percentage of the principal accountant’s fees or services were approved pursuant to the waiver provision of paragraph (c)(7)(i)(C) of Rule 2-01 of Regulation S-X.
(f) For the most recent fiscal year, over 50% of the hours worked under the principal accountant’s engagement were not performed by persons other than full-time, permanent employees of the principal accountant.
(g) Aggregate Non-Audit Fees.
Fiscal Year Ended September 30, 2018: $347,985
Fiscal Year Ended September 30, 2017: $274,313
Includes fees billed for non-audit services provided to the Registrant, other registered investment companies in the Vanguard complex, The Vanguard Group, Inc., and Vanguard Marketing Corporation.
(h) For the most recent fiscal year, the Audit Committee has determined that the provision of all non-audit services was consistent with maintaining the principal accountant’s independence.
Item 5: Audit Committee of Listed Registrants.
The Registrant is a listed issuer as defined in rule 10A-3 under the Securities Exchange Act of 1934 (“Exchange Act”). The Registrant has a separately-designated standing audit committee established in accordance with Section 3(a)(58)(A) of the Exchange Act. The Registrant’s audit committee members are: JoAnn Heffernan Heisen, F. Joseph Loughrey, Mark Loughridge, Sarah Bloom Raskin, and Peter F. Volanakis.
Item 6: Investments.
Not Applicable.
Item 7: Disclosure of Proxy Voting Policies and Procedures for Closed-End Management Investment
Companies.
Not Applicable.
Item 8: Portfolio Managers of Closed-End Management Investment Companies.
Not Applicable.
Item 9: Purchase of Equity Securities by Closed-End Management Investment Company and
Affiliated Purchasers.
Not Applicable.
Item 10: Submission of Matters to a Vote of Security Holders.
Not Applicable.
Item 11: Controls and Procedures.
(a) Disclosure Controls and Procedures. The Principal Executive and Financial Officers concluded that the Registrant’s Disclosure Controls and Procedures are effective based on their evaluation of the Disclosure Controls and Procedures as of a date within 90 days of the filing date of this report.
(b) Internal Control Over Financial Reporting. There were no significant changes in Registrant’s Internal Control Over Financial Reporting or in other factors that could significantly affect this control subsequent to the date of the evaluation, including any corrective actions with regard to significant deficiencies and material weaknesses.
Item 12: Disclosure of Securities Lending Activities for Closed-End Management
Investment Companies.
Not Applicable.
Item 13: Exhibits.
(a) Code of Ethics.
(b) Certifications.
Pursuant to the requirements of the Securities Exchange Act of 1934 and the Investment Company Act of 1940, the registrant has duly caused this report to be signed on its behalf by the undersigned, thereunto duly authorized.
| VANGUARD QUANTITATIVE FUNDS | |
| BY: | /s/ MORTIMER J. BUCKLEY* |
| MORTIMER J. BUCKLEY | |
| CHIEF EXECUTIVE OFFICER | |
| Date: November 16, 2018 | |
Pursuant to the requirements of the Securities Exchange Act of 1934 and the Investment Company Act of 1940, this report has been signed below by the following persons on behalf of the registrant and in the capacities and on the dates indicated.
| VANGUARD QUANTITATIVE FUNDS | |
| BY: | /s/ MORTIMER J. BUCKLEY * |
| MORTIMER J. BUCKLEY | |
| CHIEF EXECUTIVE OFFICER | |
|
Date: November 16, 2018 | |
|
|
VANGUARD QUANTITATIVE FUNDS |
| BY: | /s/ THOMAS J. HIGGINS* |
| THOMAS J. HIGGINS | |
| CHIEF FINANCIAL OFFICER | |
|
Date: November 16, 2018 | |
* By: /s/ Anne E. Robinson
Anne E. Robinson, pursuant to a Power of Attorney filed on January 18, 2018 see file Number
33-32216, Incorporated by Reference.