Exhibit 99.2

First Quarter Fiscal 2016
Supplemental Operating and Financial Data
for the Quarter Ended July 31, 2015
|
CONTACT:
Cindy Bradehoft
Director of Investor Relations
Direct Dial: 952-401-4835
E-Mail: cbradehoft@iret.com
|
1400 31st Avenue SW, Suite 60
Minot, ND 58701
Tel: 701.837.4738
Fax: 701.838.7785
www.iret.com
|
Supplemental Financial and Operating Data
Table of Contents
July 31, 2015
|
Page
|
|
|
Company Background and Highlights
|
2
|
|
Property Cost by Segment and by State
|
5
|
|
Key Financial Data
|
|
|
Condensed Consolidated Balance Sheets
|
6
|
|
Condensed Consolidated Statements of Operations
|
7
|
|
Funds From Operations
|
8
|
|
Adjusted Earnings Before Interest, Taxes, Depreciation and Amortization (Adjusted EBITDA)
|
9
|
|
Capital Analysis
|
|
|
Long-Term Mortgage Debt Analysis
|
10
|
|
Long-Term Mortgage Debt Detail
|
11-12
|
|
Capital Analysis
|
13
|
|
Portfolio Analysis
|
|
|
Same-Store Properties Net Operating Income Summary
|
14
|
|
Net Operating Income Detail
|
15-16
|
|
Same-Store Properties and All Properties Occupancy Levels by Segment
|
17
|
|
Tenant Analysis
|
|
|
Multi-Family Residential Summary
|
18
|
|
Commercial Leasing Summary
|
19-20
|
|
10 Largest Commercial Tenants - Based on Annualized Base Rent
|
21
|
|
Commercial Lease Expirations
|
22
|
|
Growth and Strategy
|
|
|
Development Placed in Service Summary
|
23
|
|
Development in Progress Summary
|
24
|
|
Acquisitions and Development Liquidity Profile
|
25
|
|
Definitions
|
26
|
1
Company Background and Highlights
First Quarter Fiscal 2016
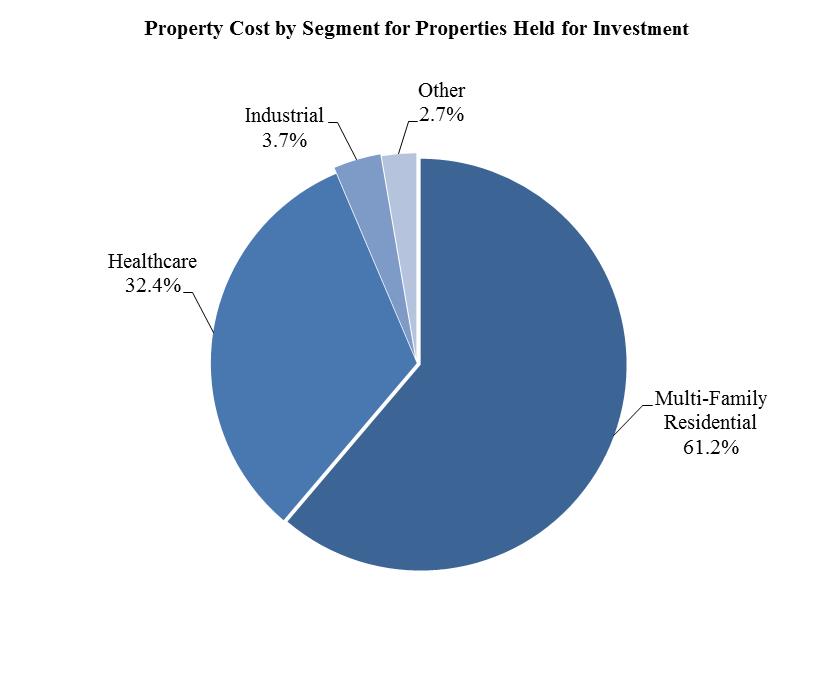
Investors Real Estate Trust is a self-administered, equity real estate investment trust (REIT) investing in a portfolio of income-producing properties located primarily in the upper Midwest. Our portfolio consists of multi-family residential; healthcare, including senior housing, and industrial segments.
During the first quarter of fiscal year 2016, we placed into service the 72-unit Chateau II multi-family residential property in Minot, North Dakota; the 57,624 square foot Edina 6565 France SMC III healthcare expansion project in Edina, Minnesota; and the final 72 units of the 288-unit Renaissance Heights multi-family residential property in Williston, North Dakota, in which we have an approximately 70% interest.
Also during the first quarter of fiscal year 2016, we sold an office property in Minneapolis, Minnesota, for a sale price of $7.0 million.
We experienced generally stable trends across our apartment investments during the first quarter of fiscal year 2016. Same-store net operating income was flat and occupancy slipped 0.5% to 93.5% at quarter end on same store-assets when compared to the same period in the prior fiscal year. According to AXIOMetrics Inc., the national apartment occupancy rate declined 0.11% to 95.2% during July 2015, which matches the level of three months ago. However, our ability to maintain occupancy levels and raise rents remains dependent on continued healthy employment and wage growth. We have continued to observe considerable multi-family development activity in our markets, and as this new construction is completed and leased, we will experience increased competition for residents. However, based on information available to us, apartment developers in our markets are currently seeing increases in construction costs for potential new apartment developments, which may slow new developments in our markets. The U.S. economic outlook through 2017 is forecasted to be good according to U.S. Bureau of Labor Statistics and Moody’s Analytics. Businesses are adding jobs and for the first time in this phase of the economic cycle we are seeing meaningful wage growth. There is an attitudinal shift also occurring toward renting by professional millennials and to lesser, although growing degree, by baby boomers. These trends are beneficial to apartment owners.
Our healthcare segment consists of medical office properties and senior housing facilities. The medical office sector remains stable with high occupancy and modest rent increases. Our senior housing assets continue to benefit from the strengthening recovery in the housing market, as occupancy trends are closely aligned with the ability of seniors to sell their homes in anticipation of moving to a senior care facility.
The industrial property market continues to improve. Our industrial properties are located primarily in the Minneapolis market, and same-store occupancy remained at 100%. The demand for bulk warehouse and manufacturing space in our markets is healthy, with rents generally rising.
We are in process of selling substantially all of our office and retail properties. In an update to our previously-announced strategic plan, we are narrowing our property focus. Sale proceeds are intended to be used toward portfolio deleveraging and investments in multi-family residential and healthcare.
In the first quarter of fiscal year 2016, IRET paid its 177th consecutive quarterly distribution. The $0.1300 per share/unit distribution was payable on July 1, 2015. Subsequent to the end of the first quarter of fiscal year 2016, on September 2, 2015, the Company’s Board of Trustees declared a regular quarterly distribution of $0.1300 per share and unit on the Company’s common shares of beneficial interest and the limited partnership units of IRET Properties, payable October 1, 2015 to common shareholders and unitholders of record on September 15, 2015. Also on September 2, 2015, the Company’s Board of Trustees’ declared a distribution of $0.5156 per share on the Company’s Series A preferred shares of beneficial interest, payable September 30, 2015 to Series A preferred shareholders of record on September 15, 2015, and declared a distribution of $0.4968 per share on the Company’s Series B preferred shares of beneficial interest, payable September 30, 2015 to Series B preferred shareholders of record on September 15, 2015.
As of July 31, 2015, IRET holds for investment a portfolio of 181 properties consisting of 100 multi-family residential properties, 64 healthcare properties (including senior housing), 7 industrial properties and 10 other commercial properties. IRET’s common shares are publicly traded on the New York Stock Exchange (NYSE: IRET).
2
Company Snapshot
(as of July 31, 2015)
|
Company Headquarters
|
Minot, North Dakota
|
|
Fiscal Year-End
|
April 30
|
|
Reportable Segments
|
Multi-Family Residential, Healthcare, Industrial
|
|
Total Properties Held for Investment
|
181
|
|
Total Units Held for Investment (multi-family residential properties)
|
12,027
|
|
Total Square Feet Held for Investment (commercial properties)
|
4.4 million
|
|
Common Shares Outstanding (thousands)
|
125,520
|
|
Limited Partnership Units Outstanding (thousands)
|
13,921
|
|
Common Share Distribution - Quarter/Annualized
|
$0.13/$0.52
|
|
Dividend Yield
|
7.2%
|
|
Total Capitalization (see p.14 for detail)
|
$2.4 billion
|
Investor Information
(as of July 31, 2015)
Board of Trustees
|
Jeffrey L. Miller
|
Trustee and Chairman
|
|
John D. Stewart
|
Trustee, Vice Chairman, and Chair of Nominating and Governance Committee
|
|
Jeffrey K. Woodbury
|
Trustee, Chair of Audit Committee
|
|
Linda J. Hall
|
Trustee, Chair of Compensation Committee
|
|
Jeffrey P. Caira
|
Trustee
|
|
Terrance P. Maxwell
|
Trustee
|
|
Pamela J. Moret
|
Trustee
|
|
Stephen L. Stenehjem
|
Trustee
|
|
Timothy P. Mihalick
|
Trustee, President and Chief Executive Officer
|
Management
|
Timothy P. Mihalick
|
President and Chief Executive Officer; Trustee
|
|
Diane K. Bryantt
|
Executive Vice President and Chief Operating Officer
|
|
Ted E. Holmes
|
Executive Vice President and Chief Financial Officer
|
|
Michael A. Bosh
|
Executive Vice President, General Counsel and Assistant Secretary
|
|
Mark Reiling
|
Executive Vice President and Chief Investment Officer
|
|
Andrew Martin
|
Senior Vice President, Residential Property Management
|
|
Charles A. Greenberg
|
Senior Vice President, Commercial Asset Management
|
Corporate Headquarters:
1400 31st Avenue SW, Suite 60
Post Office Box 1988
Minot, North Dakota 58702-1988
Trading Symbol: IRET
Stock Exchange Listing: NYSE
Investor Relations Contact:
Cindy Bradehoft
cbradehoft@iret.com
3
Common Share Data (NYSE: IRET)
|
1st Quarter
Fiscal Year 2016
|
4th Quarter
Fiscal Year 2015
|
3rd Quarter
Fiscal Year 2015
|
2nd Quarter
Fiscal Year 2015
|
1st Quarter
Fiscal Year 2015
|
||||||||||||||||
|
High Closing Price
|
$
|
7.44
|
$
|
8.31
|
$
|
8.60
|
$
|
8.59
|
$
|
9.21
|
||||||||||
|
Low Closing Price
|
$
|
6.93
|
$
|
7.09
|
$
|
8.05
|
$
|
7.49
|
$
|
8.52
|
||||||||||
|
Average Closing Price
|
$
|
7.22
|
$
|
7.52
|
$
|
8.35
|
$
|
8.11
|
$
|
8.82
|
||||||||||
|
Closing Price at end of quarter
|
$
|
7.21
|
$
|
7.17
|
$
|
8.25
|
$
|
8.40
|
$
|
8.52
|
||||||||||
|
Common Share Distributions—annualized
|
$
|
0.520
|
$
|
0.520
|
$
|
0.520
|
$
|
0.520
|
$
|
0.520
|
||||||||||
|
Closing Dividend Yield - annualized
|
7.2
|
%
|
7.3
|
%
|
6.3
|
%
|
6.2
|
%
|
6.1
|
%
|
||||||||||
|
Closing common shares outstanding (thousands)
|
125,520
|
124,456
|
122,134
|
119,809
|
114,763
|
|||||||||||||||
|
Closing limited partnership units outstanding (thousands)
|
13,921
|
14,000
|
14,398
|
14,731
|
17,975
|
|||||||||||||||
|
Closing market value of outstanding common shares, plus imputed closing market value of outstanding limited partnership units (thousands)
|
$
|
1,005,370
|
$
|
992,729
|
$
|
1,126,389
|
$
|
1,130,136
|
$
|
1,130,928
|
||||||||||
Certain statements in these supplemental disclosures are “forward-looking statements” within the meaning of the Private Securities Litigation Reform Act of 1995. Such statements involve known and unknown risks, uncertainties and other factors that may cause actual results to differ materially from projected results. Such risks, uncertainties and other factors include, but are not limited to: intentions and expectations regarding future distributions on our common shares and units, fluctuations in interest rates, the effect of government regulation, the availability of capital, changes in general and local economic and real estate market conditions, competition, our ability to attract and retain skilled personnel, and those risks and uncertainties detailed from time to time in our filings with the Securities and Exchange Commission, including our 2015 Form 10-K. We assume no obligation to update or supplement forward-looking statements that become untrue because of subsequent events.
First Quarter Fiscal 2016 Development Placed in Service
 |
 |
|
Chateau II
Minot, ND
|
Chateau II
Minot, ND
|
4
First Quarter Fiscal 2016
Percentage of Total Property Cost by State for Properties Held for Investment
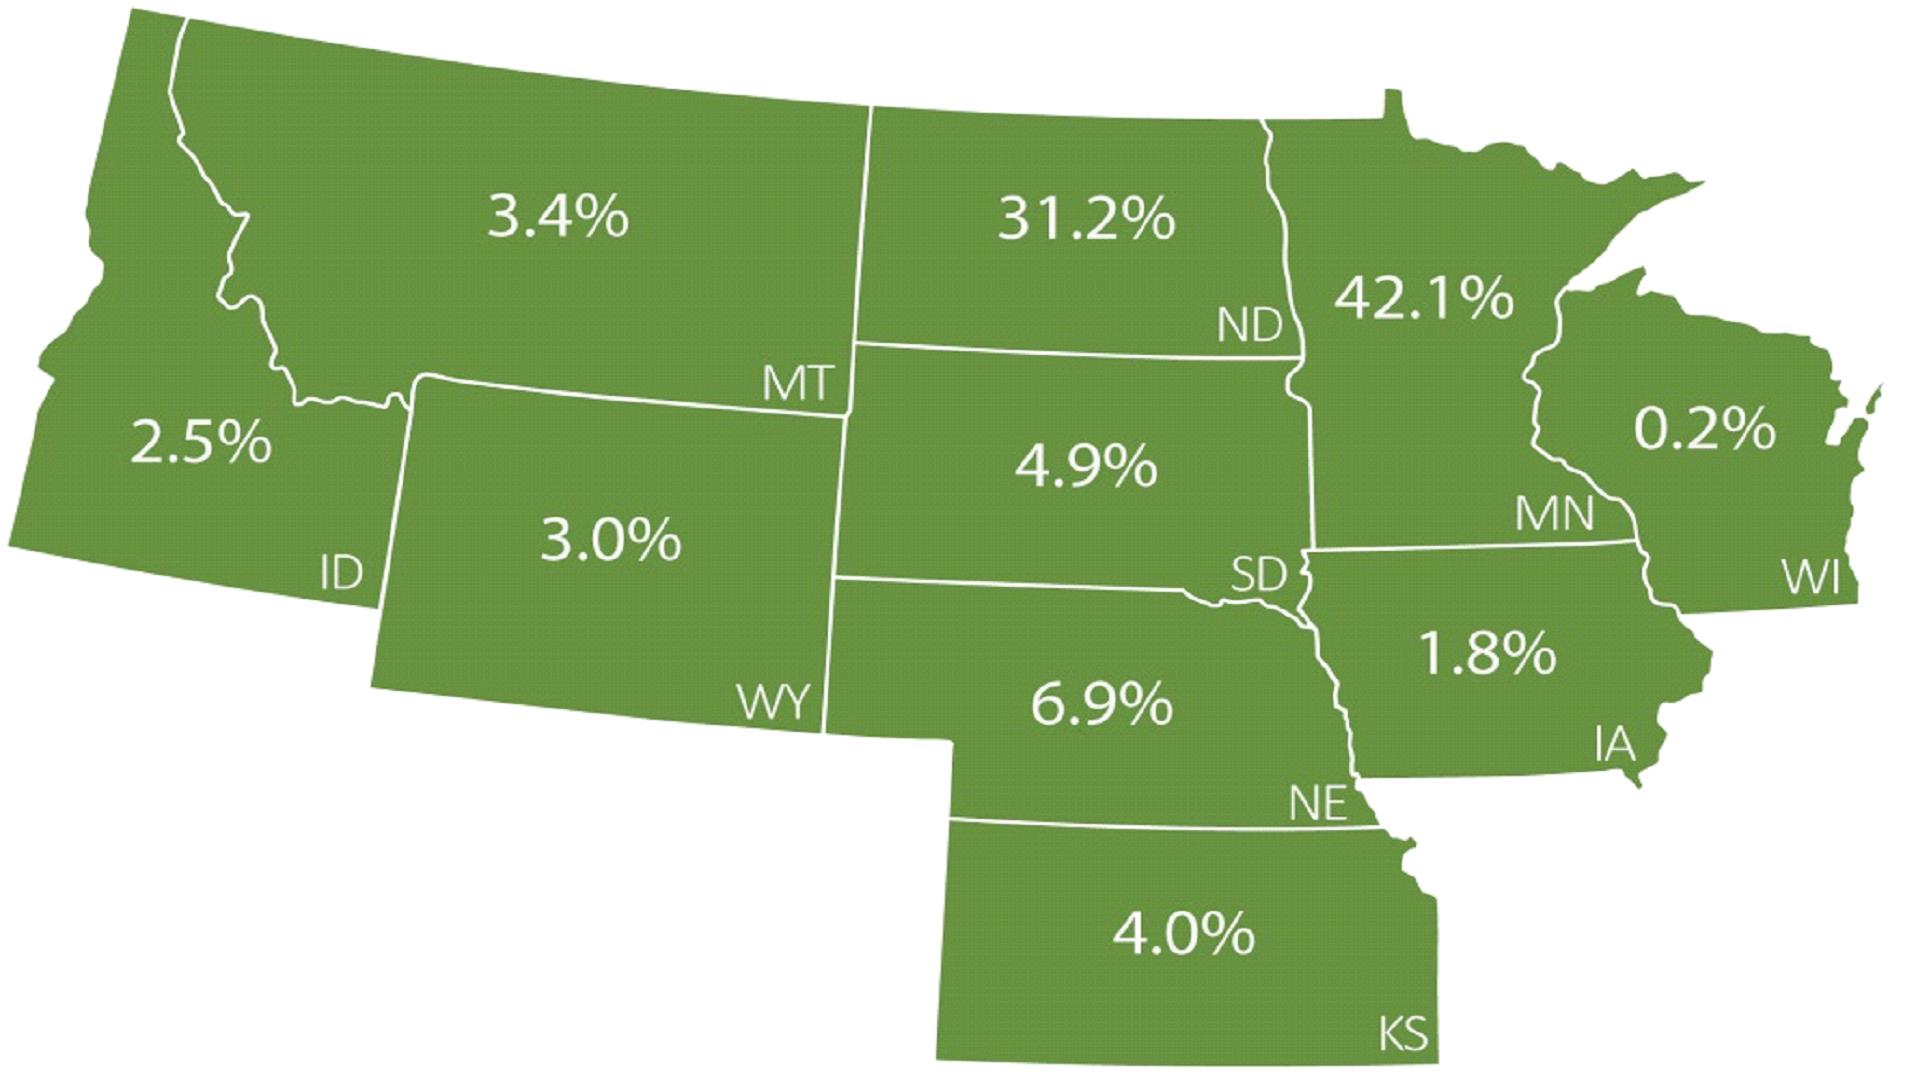
5
INVESTORS REAL ESTATE TRUST AND SUBSIDIARIES
CONDENSED CONSOLIDATED BALANCE SHEETS (unaudited)
(in thousands)
|
7/31/2015
|
4/30/2015
|
1/31/2015(1)
|
10/31/2014(1)
|
7/31/2014(1)
|
||||||||||||||||
|
ASSETS
|
||||||||||||||||||||
|
Real estate investments
|
||||||||||||||||||||
|
Property owned
|
$
|
1,618,948
|
$
|
1,546,367
|
$
|
2,093,148
|
$
|
2,013,770
|
$
|
2,025,327
|
||||||||||
|
Less accumulated depreciation
|
(325,536
|
)
|
(313,308
|
)
|
(439,153
|
)
|
(426,545
|
)
|
(435,317
|
)
|
||||||||||
|
1,293,412
|
1,233,059
|
1,653,995
|
1,587,225
|
1,590,010
|
||||||||||||||||
|
Development in progress
|
133,794
|
153,994
|
114,005
|
146,390
|
131,862
|
|||||||||||||||
|
Unimproved land
|
24,542
|
25,827
|
27,675
|
24,947
|
24,772
|
|||||||||||||||
|
Total real estate investments
|
1,451,748
|
1,412,880
|
1,795,675
|
1,758,562
|
1,746,644
|
|||||||||||||||
|
Assets held for sale
|
453,217
|
463,103
|
44,259
|
41,183
|
6,508
|
|||||||||||||||
|
Cash and cash equivalents
|
44,770
|
48,970
|
52,148
|
52,999
|
60,620
|
|||||||||||||||
|
Other investments
|
329
|
329
|
329
|
329
|
329
|
|||||||||||||||
|
Receivable arising from straight-lining of rents, net of allowance
|
15,612
|
15,617
|
27,169
|
27,425
|
27,286
|
|||||||||||||||
|
Accounts receivable, net of allowance
|
3,650
|
2,865
|
5,574
|
3,719
|
7,013
|
|||||||||||||||
|
Real estate deposits
|
6,614
|
2,489
|
7,494
|
4,924
|
3,741
|
|||||||||||||||
|
Prepaid and other assets
|
2,224
|
3,174
|
5,580
|
2,263
|
3,428
|
|||||||||||||||
|
Intangible assets, net of accumulated amortization
|
25,179
|
26,213
|
28,475
|
29,745
|
31,478
|
|||||||||||||||
|
Tax, insurance, and other escrow
|
8,858
|
10,073
|
11,277
|
16,338
|
20,451
|
|||||||||||||||
|
Property and equipment, net of accumulated depreciation
|
1,464
|
1,542
|
1,619
|
1,598
|
1,641
|
|||||||||||||||
|
Goodwill
|
1,718
|
1,718
|
1,940
|
1,940
|
1,951
|
|||||||||||||||
|
Deferred charges and leasing costs, net of accumulated amortization
|
9,290
|
8,864
|
19,803
|
20,445
|
20,677
|
|||||||||||||||
|
TOTAL ASSETS
|
$
|
2,024,673
|
$
|
1,997,837
|
$
|
2,001,342
|
$
|
1,961,470
|
$
|
1,931,767
|
||||||||||
|
LIABILITIES, REDEEMABLE NONCONTROLLING INTERESTS AND EQUITY
|
||||||||||||||||||||
|
LIABILITIES
|
||||||||||||||||||||
|
Liabilities held for sale
|
$
|
308,812
|
$
|
321,393
|
$
|
0
|
$
|
0
|
$
|
0
|
||||||||||
|
Accounts payable and accrued expenses
|
60,506
|
56,399
|
69,901
|
67,037
|
62,517
|
|||||||||||||||
|
Revolving line of credit
|
83,500
|
60,500
|
50,500
|
40,500
|
35,500
|
|||||||||||||||
|
Mortgages payable
|
669,734
|
668,112
|
1,006,179
|
1,013,161
|
1,017,574
|
|||||||||||||||
|
Construction debt and other
|
165,873
|
144,111
|
132,210
|
107,731
|
83,666
|
|||||||||||||||
|
TOTAL LIABILITIES
|
1,288,425
|
1,250,515
|
1,258,790
|
1,228,429
|
1,199,257
|
|||||||||||||||
|
REDEEMABLE NONCONTROLLING INTERESTS – CONSOLIDATED REAL ESTATE ENTITIES
|
6,361
|
6,368
|
6,340
|
6,373
|
6,313
|
|||||||||||||||
|
EQUITY
|
||||||||||||||||||||
|
Investors Real Estate Trust shareholders’ equity
|
||||||||||||||||||||
|
Series A Preferred Shares of Beneficial Interest
|
27,317
|
27,317
|
27,317
|
27,317
|
27,317
|
|||||||||||||||
|
Series B Preferred Shares of Beneficial Interest
|
111,357
|
111,357
|
111,357
|
111,357
|
111,357
|
|||||||||||||||
|
Common Shares of Beneficial Interest
|
957,707
|
951,868
|
935,287
|
918,221
|
884,415
|
|||||||||||||||
|
Accumulated distributions in excess of net income
|
(452,971
|
)
|
(438,432
|
)
|
(430,282
|
)
|
(420,036
|
)
|
(407,052
|
)
|
||||||||||
|
Total Investors Real Estate Trust shareholders’ equity
|
643,410
|
652,110
|
643,679
|
636,859
|
616,037
|
|||||||||||||||
|
Noncontrolling interests – Operating Partnership
|
56,120
|
58,325
|
61,177
|
63,207
|
84,250
|
|||||||||||||||
|
Noncontrolling interests – consolidated real estate entities
|
30,357
|
30,519
|
31,356
|
26,602
|
25,910
|
|||||||||||||||
|
Total equity
|
729,887
|
740,954
|
736,212
|
726,668
|
726,197
|
|||||||||||||||
|
TOTAL LIABILITIES, REDEEMABLE NONCONTROLLING INTERESTS AND EQUITY
|
$
|
2,024,673
|
$
|
1,997,837
|
$
|
2,001,342
|
$
|
1,961,470
|
$
|
1,931,767
|
||||||||||
| (1) | Period has not been revised to reflect assets and liabilities classified as held for sale at July 31, 2015. |
6
INVESTORS REAL ESTATE TRUST AND SUBSIDIARIES
CONDENSED CONSOLIDATED STATEMENTS OF OPERATIONS (unaudited)
(in thousands, except per share data)
|
Three Months Ended
|
||||||||||||||||||||
|
OPERATING RESULTS
|
7/31/2015
|
4/30/2015
|
1/31/2015
|
10/31/2014
|
7/31/2014
|
|||||||||||||||
|
Real estate revenue
|
$
|
49,918
|
$
|
50,252
|
$
|
51,976
|
$
|
50,346
|
$
|
48,421
|
||||||||||
|
Real estate expenses
|
18,400
|
18,699
|
19,118
|
17,764
|
18,252
|
|||||||||||||||
|
Net operating income
|
31,518
|
31,553
|
32,858
|
32,582
|
30,169
|
|||||||||||||||
|
TRS senior housing revenue
|
1,038
|
921
|
963
|
843
|
793
|
|||||||||||||||
|
TRS senior housing expenses
|
(769
|
)
|
(754
|
)
|
(825
|
)
|
(725
|
)
|
(693
|
)
|
||||||||||
|
Depreciation/amortization
|
(13,443
|
)
|
(13,428
|
)
|
(12,837
|
)
|
(13,075
|
)
|
(12,435
|
)
|
||||||||||
|
Administrative expenses
|
(2,454
|
)
|
(2,516
|
)
|
(2,754
|
)
|
(2,890
|
)
|
(3,664
|
)
|
||||||||||
|
Other expenses
|
(424
|
)
|
(332
|
)
|
(488
|
)
|
(578
|
)
|
(612
|
)
|
||||||||||
|
Impairment of real estate investments
|
(1,285
|
)
|
0
|
(540
|
)
|
(1,803
|
)
|
(2,320
|
)
|
|||||||||||
|
Interest expense
|
(9,196
|
)
|
(10,361
|
)
|
(10,009
|
)
|
(9,954
|
)
|
(9,747
|
)
|
||||||||||
|
Interest and other income
|
607
|
904
|
670
|
696
|
686
|
|||||||||||||||
|
Income before (loss) gain on sale of real estate and other investments and (loss) income from discontinued operations
|
5,592
|
5,987
|
7,038
|
5,096
|
2,177
|
|||||||||||||||
|
(Loss) gain on sale of real estate and other investments
|
(175
|
)
|
6,904
|
951
|
1,231
|
(2,993
|
)
|
|||||||||||||
|
Income (loss) income from continuing operations
|
5,417
|
12,891
|
7,989
|
6,327
|
(816
|
)
|
||||||||||||||
|
(Loss) income from discontinued operations
|
(690
|
)
|
971
|
1,162
|
(457
|
)
|
617
|
|||||||||||||
|
Net income (loss)
|
$
|
4,727
|
$
|
13,862
|
$
|
9,151
|
$
|
5,870
|
$
|
(199
|
)
|
|||||||||
|
Net (income) loss attributable to noncontrolling interest – Operating Partnership
|
(186
|
)
|
(908
|
)
|
(657
|
)
|
(363
|
)
|
402
|
|||||||||||
|
Net income attributable to noncontrolling interests – consolidated real estate entities
|
(1
|
)
|
(2,201
|
)
|
(123
|
)
|
(393
|
)
|
(354
|
)
|
||||||||||
|
Net income (loss) attributable to Investors Real Estate Trust
|
4,540
|
10,753
|
8,371
|
5,114
|
(151
|
)
|
||||||||||||||
|
Dividends to preferred shareholders
|
(2,879
|
)
|
(2,878
|
)
|
(2,879
|
)
|
(2,878
|
)
|
(2,879
|
)
|
||||||||||
|
NET INCOME (LOSS) AVAILABLE TO COMMON SHAREHOLDERS
|
$
|
1,661
|
$
|
7,875
|
$
|
5,492
|
$
|
2,236
|
$
|
(3,030
|
)
|
|||||||||
|
Per Share Data
|
||||||||||||||||||||
|
Earnings (loss) per common share from continuing operations – Investors Real Estate Trust – basic & diluted
|
$
|
.02
|
$
|
.06
|
$
|
.04
|
$
|
.02
|
$
|
(.03
|
)
|
|||||||||
|
(Loss) earnings per common share from discontinued operations – Investors Real Estate Trust – basic & diluted
|
(.01
|
)
|
.01
|
.01
|
.00
|
.00
|
||||||||||||||
|
Net income (loss) per common share – basic & diluted
|
$
|
.01
|
$
|
.07
|
$
|
.05
|
$
|
.02
|
$
|
(.03
|
)
|
|||||||||
|
Percentage of Revenues
|
||||||||||||||||||||
|
Real estate expenses
|
36.9
|
%
|
37.2
|
%
|
36.8
|
%
|
35.3
|
%
|
37.7
|
%
|
||||||||||
|
Depreciation/amortization
|
26.9
|
%
|
26.7
|
%
|
24.7
|
%
|
26.0
|
%
|
25.7
|
%
|
||||||||||
|
General and administrative
|
4.9
|
%
|
5.0
|
%
|
5.3
|
%
|
5.7
|
%
|
7.6
|
%
|
||||||||||
|
Interest
|
18.4
|
%
|
20.6
|
%
|
19.3
|
%
|
19.8
|
%
|
20.1
|
%
|
||||||||||
|
Income from discontinued operations
|
(1.4
|
%)
|
1.9
|
%
|
2.2
|
%
|
(0.9
|
%)
|
1.3
|
%
|
||||||||||
|
Net (loss) income
|
9.5
|
%
|
27.6
|
%
|
17.6
|
%
|
11.7
|
%
|
(0.4
|
%)
|
||||||||||
|
Ratios
|
||||||||||||||||||||
|
Adjusted EBITDA(1)/Interest expense
|
2.28
|
x
|
2.41
|
x
|
2.53
|
x
|
2.48
|
x
|
2.29
|
x
|
||||||||||
|
Adjusted EBITDA(1)/Interest expense plus preferred distributions
|
1.95
|
x
|
2.05
|
x
|
2.14
|
x
|
2.10
|
x
|
1.94
|
x
|
||||||||||
| (1) | See Definitions on page 26. Adjusted EBITDA is a non-GAAP measure; see page 9 for a reconciliation of Adjusted EBITDA to net income. |
7
INVESTORS REAL ESTATE TRUST AND SUBSIDIARIES
FUNDS FROM OPERATIONS (unaudited)
(in thousands, except per share and unit data)
|
Three Months Ended
|
||||||||||||||||||||
|
7/31/2015
|
4/30/2015
|
1/31/2015
|
10/31/2014
|
7/31/2014
|
||||||||||||||||
|
Funds From Operations(1)
|
||||||||||||||||||||
|
Net income (loss) attributable to Investors Real Estate Trust
|
$
|
4,540
|
$
|
10,753
|
$
|
8,371
|
$
|
5,114
|
$
|
(151
|
)
|
|||||||||
|
Less dividends to preferred shareholders
|
(2,879
|
)
|
(2,878
|
)
|
(2,879
|
)
|
(2,878
|
)
|
(2,879
|
)
|
||||||||||
|
Net income (loss) available to common shareholders
|
1,661
|
7,875
|
5,492
|
2,236
|
(3,030
|
)
|
||||||||||||||
|
Adjustments:
|
||||||||||||||||||||
|
Noncontrolling interests – Operating Partnership
|
186
|
908
|
657
|
363
|
(402
|
)
|
||||||||||||||
|
Depreciation and amortization
|
18,259
|
18,083
|
17,706
|
17,624
|
17,037
|
|||||||||||||||
|
Impairment of real estate investments
|
1,725
|
0
|
540
|
3,245
|
2,320
|
|||||||||||||||
|
(Loss) gain on depreciable property sales
|
175
|
(4,890
|
)
|
(951
|
)
|
(1,231
|
)
|
2,993
|
||||||||||||
|
FFO applicable to common shares and Units
|
$
|
22,006
|
$
|
21,976
|
$
|
23,444
|
$
|
22,237
|
$
|
18,918
|
||||||||||
|
FFO per share and unit - basic and diluted
|
$
|
0.16
|
$
|
0.16
|
$
|
0.17
|
$
|
0.17
|
$
|
0.14
|
||||||||||
|
Adjusted funds from operations(1)
|
||||||||||||||||||||
|
FFO applicable to common shares and Units
|
$
|
22,006
|
$
|
21,976
|
$
|
23,444
|
$
|
22,237
|
$
|
18,918
|
||||||||||
|
Adjustments:
|
||||||||||||||||||||
|
Tenant improvements at same-store properties
|
(191
|
)
|
(2,939
|
)
|
(1,984
|
)
|
(542
|
)
|
(2,169
|
)
|
||||||||||
|
Leasing costs at same-store properties
|
(336
|
)
|
(684
|
)
|
(358
|
)
|
(699
|
)
|
(578
|
)
|
||||||||||
|
Recurring capital expenditures(1)
|
(1,636
|
)
|
(1,342
|
)
|
(1,865
|
)
|
(1,567
|
)
|
(1,386
|
)
|
||||||||||
|
Straight-line rents
|
242
|
198
|
184
|
(103
|
)
|
(268
|
)
|
|||||||||||||
|
Non-real estate depreciation
|
101
|
100
|
94
|
96
|
99
|
|||||||||||||||
|
Default interest
|
1,550
|
528
|
0
|
0
|
0
|
|||||||||||||||
|
Share-based compensation expense(2)
|
66
|
280
|
260
|
601
|
1,073
|
|||||||||||||||
|
AFFO applicable to common shares and Units
|
$
|
21,802
|
$
|
18,117
|
$
|
19,775
|
$
|
20,023
|
$
|
15,689
|
||||||||||
|
AFFO per share and unit - basic and diluted
|
$
|
0.16
|
$
|
0.13
|
$
|
0.15
|
$
|
0.15
|
$
|
0.12
|
||||||||||
|
Weighted average shares and units
|
138,806
|
137,412
|
135,315
|
133,295
|
131,332
|
|||||||||||||||
| (1) | See Definitions on page 26. |
| (2) | Three months ended 7/31/14 revised to include trustee share-based compensation expense. |
8
INVESTORS REAL ESTATE TRUST AND SUBSIDIARIES
ADJUSTED EARNINGS BEFORE INTEREST, TAXES, DEPRECIATION AND AMORTIZATION (ADJUSTED EBITDA) (unaudited)
(in thousands)
|
Three Months Ended
|
||||||||||||||||||||
|
7/31/2015
|
4/30/2015
|
1/31/2015
|
10/31/2014
|
7/31/2014
|
||||||||||||||||
|
Adjusted EBITDA(1)
|
||||||||||||||||||||
|
Net income (loss) income attributable to Investors Real Estate Trust
|
$
|
4,540
|
$
|
10,753
|
$
|
8,371
|
$
|
5,114
|
$
|
(151
|
)
|
|||||||||
|
Adjustments:
|
||||||||||||||||||||
|
Noncontrolling interests – Operating Partnership
|
186
|
908
|
657
|
363
|
(402
|
)
|
||||||||||||||
|
Income (loss) before noncontrolling interests – Operating Partnership
|
4,726
|
11,661
|
9,028
|
5,477
|
(553
|
)
|
||||||||||||||
|
Add:
|
||||||||||||||||||||
|
Interest expense
|
14,961
|
15,162
|
14,595
|
14,599
|
14,664
|
|||||||||||||||
|
Depreciation/amortization related to real estate investments
|
17,511
|
17,266
|
16,834
|
16,814
|
16,198
|
|||||||||||||||
|
Amortization related to non-real estate investments
|
795
|
867
|
916
|
840
|
872
|
|||||||||||||||
|
Amortization related to real estate revenues(2)
|
54
|
50
|
50
|
66
|
65
|
|||||||||||||||
|
Impairment of real estate investments
|
1,725
|
0
|
540
|
3,245
|
2,320
|
|||||||||||||||
|
Less:
|
||||||||||||||||||||
|
Interest income
|
(556
|
)
|
(557
|
)
|
(561
|
)
|
(560
|
)
|
(560
|
)
|
||||||||||
|
Loss (gain) on sale of real estate and other investments
|
175
|
(4,890
|
)
|
(951
|
)
|
(1,231
|
)
|
2,993
|
||||||||||||
|
Adjusted EBITDA
|
$
|
39,391
|
39,559
|
40,451
|
39,250
|
35,999
|
||||||||||||||
| (1) | See Definitions on page 26. |
| (2) | Included in real estate revenue in the Statement of Operations. |
9
INVESTORS REAL ESTATE TRUST AND SUBSIDIARIES
LONG-TERM MORTGAGE DEBT* ANALYSIS
(in thousands)
Debt Maturity Schedule
Annual Expirations
|
|
Future Maturities of Mortgage Debt
|
|||||||||||||||||||
|
Fiscal Year
|
Fixed Debt
|
Variable Debt
|
Total Debt
|
Weighted
Average(1)
|
% of
Total Debt
|
|||||||||||||||
|
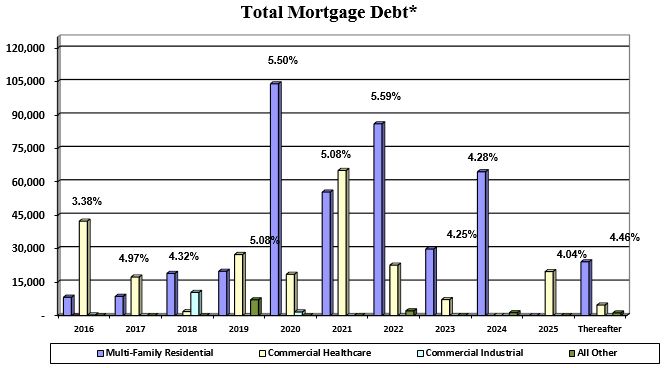
2016 (remainder)
|
$
|
50,789
|
$
|
0
|
$
|
50,789
|
3.38
|
%
|
7.6
|
%
|
||||||||||
|
2017
|
18,342
|
7,500
|
25,842
|
4.97
|
%
|
3.9
|
%
|
|||||||||||||
|
2018
|
18,042
|
13,000
|
31,042
|
4.32
|
%
|
4.6
|
%
|
|||||||||||||
|
2019
|
36,329
|
17,954
|
54,283
|
5.08
|
%
|
8.1
|
%
|
|||||||||||||
|
2020
|
111,949
|
12,114
|
124,063
|
5.50
|
%
|
18.5
|
%
|
|||||||||||||
|
2021
|
120,518
|
0
|
120,518
|
5.08
|
%
|
18.0
|
%
|
|||||||||||||
|
2022
|
110,726
|
0
|
110,726
|
5.59
|
%
|
16.5
|
%
|
|||||||||||||
|
2023
|
36,968
|
0
|
36,968
|
4.25
|
%
|
5.5
|
%
|
|||||||||||||
|
2024
|
65,797
|
0
|
65,797
|
4.28
|
%
|
9.8
|
%
|
|||||||||||||
|
2025
|
19,727
|
0
|
19,727
|
4.04
|
%
|
3.0
|
%
|
|||||||||||||
|
Thereafter
|
29,979
|
0
|
29,979
|
4.46
|
%
|
4.5
|
%
|
|||||||||||||
|
Total maturities
|
$
|
619,166
|
$
|
50,568
|
$
|
669,734
|
4.89
|
%
|
100.0
|
%
|
||||||||||
| (1) | Weighted average interest rate of debt that matures in fiscal year. |
|
7/31/2015
|
4/30/2015
|
1/31/2015(1)
|
10/31/2014(1)
|
7/31/2014(1)
|
||||||||||||||||
|
Balances Outstanding
|
||||||||||||||||||||
|
Mortgage
|
||||||||||||||||||||
|
Fixed rate
|
$
|
619,166
|
$
|
629,770
|
$
|
927,724
|
$
|
949,002
|
$
|
972,142
|
||||||||||
|
Variable rate
|
50,568
|
38,342
|
78,455
|
64,159
|
45,432
|
|||||||||||||||
|
Mortgage total
|
$
|
669,734
|
$
|
668,112
|
$
|
1,006,179
|
$
|
1,013,161
|
$
|
1,017,574
|
||||||||||
|
Weighted Average Interest Rates Secured
|
4.89
|
%
|
4.95
|
%
|
5.17
|
%
|
5.26
|
%
|
5.32
|
%
|
||||||||||
| (1) | Periods have not been restated to exclude mortgages held for sale. |
10
INVESTORS REAL ESTATE TRUST AND SUBSIDIARIES
LONG-TERM MORTGAGE DEBT* DETAIL AS OF JULY 31, 2015
(in thousands)
|
Property
|
Maturity Date
|
Fiscal 2016
|
Fiscal 2017
|
Fiscal 2018
|
Fiscal 2019
|
Thereafter
|
Total(1)
|
||||||||||||||||||
|
Multi-Family Residential
|
|||||||||||||||||||||||||
|
Landmark - Grand Forks, ND(2)
|
8/24/2015
|
$
|
1,556
|
$
|
0
|
$
|
0
|
$
|
0
|
$
|
0
|
$
|
1,556
|
||||||||||||
|
Regency Park Estates - St Cloud, MN
|
1/1/2016
|
6,642
|
0
|
0
|
0
|
0
|
6,642
|
||||||||||||||||||
|
Pebble Springs – Bismarck, ND
|
7/1/2016
|
0
|
752
|
0
|
0
|
0
|
752
|
||||||||||||||||||
|
Southview – Minot, ND
|
7/1/2016
|
0
|
1,029
|
0
|
0
|
0
|
1,029
|
||||||||||||||||||
|
Homestead Gardens I – Rapid City, SD
|
7/11/2016
|
0
|
6,810
|
0
|
0
|
0
|
6,810
|
||||||||||||||||||
|
River Ridge – Bismarck, ND
|
6/30/2017
|
0
|
0
|
13,000
|
0
|
0
|
13,000
|
||||||||||||||||||
|
Evergreen II – Isanti, MN
|
11/1/2017
|
0
|
0
|
2,055
|
0
|
0
|
2,055
|
||||||||||||||||||
|
Ponds – Sartell, MN
|
11/1/2017
|
0
|
0
|
3,826
|
0
|
0
|
3,826
|
||||||||||||||||||
|
Homestead Gardens II - Rapid City, SD
|
6/1/2018
|
0
|
0
|
0
|
3,395
|
0
|
3,395
|
||||||||||||||||||
|
Plaza - Minot, ND
|
8/1/2018
|
0
|
0
|
0
|
5,315
|
0
|
5,315
|
||||||||||||||||||
|
Greenfield - Omaha, NE
|
2/1/2019
|
0
|
0
|
0
|
3,539
|
0
|
3,539
|
||||||||||||||||||
|
Grand Gateway - St. Cloud, MN
|
3/1/2019
|
0
|
0
|
0
|
5,314
|
0
|
5,314
|
||||||||||||||||||
|
Brooklyn Heights - Minot, ND
|
4/1/2019
|
0
|
0
|
0
|
680
|
0
|
680
|
||||||||||||||||||
|
Colton Heights - Minot, ND
|
4/1/2019
|
0
|
0
|
0
|
383
|
0
|
383
|
||||||||||||||||||
|
Pines - Minot, ND
|
4/1/2019
|
0
|
0
|
0
|
109
|
0
|
109
|
||||||||||||||||||
|
Summit Park - Minot, ND
|
4/1/2019
|
0
|
0
|
0
|
943
|
0
|
943
|
||||||||||||||||||
|
Terrace Heights - Minot, ND
|
4/1/2019
|
0
|
0
|
0
|
157
|
0
|
157
|
||||||||||||||||||
|
Summary of Debt due after Fiscal 2019
|
0
|
0
|
0
|
0
|
363,896
|
363,896
|
|||||||||||||||||||
|
Sub-Total Multi-Family Residential
|
$
|
8,198
|
$
|
8,591
|
$
|
18,881
|
$
|
19,835
|
$
|
363,896
|
$
|
419,401
|
|||||||||||||
|
Healthcare
|
|||||||||||||||||||||||||
|
Edgewood Vista – Fargo, ND
|
2/25/2016
|
11,700
|
0
|
0
|
0
|
0
|
11,700
|
||||||||||||||||||
|
Edgewood Vista – Fremont, NE
|
2/25/2016
|
544
|
0
|
0
|
0
|
0
|
544
|
||||||||||||||||||
|
Edgewood Vista – Hastings, NE
|
2/25/2016
|
561
|
0
|
0
|
0
|
0
|
561
|
||||||||||||||||||
|
Edgewood Vista – Hermantown I, MN
|
2/25/2016
|
15,037
|
0
|
0
|
0
|
0
|
15,037
|
||||||||||||||||||
|
Edgewood Vista – Kalispell, MT
|
2/25/2016
|
562
|
0
|
0
|
0
|
0
|
562
|
||||||||||||||||||
|
Edgewood Vista – Missoula, MT
|
2/25/2016
|
799
|
0
|
0
|
0
|
0
|
799
|
||||||||||||||||||
|
Edgewood Vista – Omaha, NE
|
2/25/2016
|
356
|
0
|
0
|
0
|
0
|
356
|
||||||||||||||||||
|
Edgewood Vista – Virginia, MN
|
2/25/2016
|
12,791
|
0
|
0
|
0
|
0
|
12,791
|
||||||||||||||||||
|
Airport Medical – Bloomington, MN
|
6/1/2016
|
0
|
342
|
0
|
0
|
0
|
342
|
||||||||||||||||||
|
Park Dental – Brooklyn Center, MN
|
6/1/2016
|
0
|
196
|
0
|
0
|
0
|
196
|
||||||||||||||||||
|
Sartell 2000 23rd St S – Sartell, MN
|
12/1/2016
|
0
|
1,367
|
0
|
0
|
0
|
1,367
|
||||||||||||||||||
|
Billings 2300 Grant Road – Billings, MT
|
12/31/2016
|
0
|
1,167
|
0
|
0
|
0
|
1,167
|
||||||||||||||||||
|
Missoula 3050 Great Northern Ave – Missoula, MT
|
12/31/2016
|
0
|
1,202
|
0
|
0
|
0
|
1,202
|
||||||||||||||||||
|
High Pointe Health Campus – Lake Elmo, MN
|
4/1/2017
|
0
|
7,500
|
0
|
0
|
0
|
7,500
|
||||||||||||||||||
|
Edgewood Vista – Billings, MT
|
4/10/2017
|
0
|
1,769
|
0
|
0
|
0
|
1,769
|
||||||||||||||||||
|
Edgewood Vista – East Grand Forks, MN
|
4/10/2017
|
0
|
2,695
|
0
|
0
|
0
|
2,695
|
||||||||||||||||||
|
Edgewood Vista – Sioux Falls, SD
|
4/10/2017
|
0
|
1,013
|
0
|
0
|
0
|
1,013
|
||||||||||||||||||
|
St Michael Clinic – St. Michael, MN
|
4/1/2018
|
0
|
0
|
1,781
|
0
|
0
|
1,781
|
||||||||||||||||||
|
Garden View Medical – St. Paul, MN
|
6/30/2018
|
0
|
0
|
0
|
5,605
|
0
|
5,605
|
||||||||||||||||||
|
Ritchie Medical Plaza – St. Paul, MN
|
6/30/2018
|
0
|
0
|
0
|
7,035
|
0
|
7,035
|
||||||||||||||||||
|
Spring Creek - American Falls - American Falls, ID
|
9/1/2018
|
0
|
0
|
0
|
2,054
|
0
|
2,054
|
||||||||||||||||||
|
Spring Creek - Eagle - Eagle, ID
|
9/1/2018
|
0
|
0
|
0
|
1,890
|
0
|
1,890
|
||||||||||||||||||
|
Spring Creek - Meridian - Meridian, ID
|
9/1/2018
|
0
|
0
|
0
|
3,122
|
0
|
3,122
|
||||||||||||||||||
|
Spring Creek - Soda Springs - Soda Springs, ID
|
9/1/2018
|
0
|
0
|
0
|
739
|
0
|
739
|
||||||||||||||||||
11
INVESTORS REAL ESTATE TRUST AND SUBSIDIARIES
LONG-TERM MORTGAGE DEBT* DETAIL AS OF APRIL 30, 2015 (continued)
(in thousands)
|
Property
|
Maturity Date
|
Fiscal 2016
|
Fiscal 2017
|
Fiscal 2018
|
Fiscal 2019
|
Thereafter
|
Total(1)
|
||||||||||||||||||
|
Healthcare - continued
|
|||||||||||||||||||||||||
|
Health East St John & Woodwinds - Maplewood & Woodbury, MN
|
2/1/2019
|
$
|
0
|
$
|
0
|
$
|
0
|
$
|
6,950
|
$
|
0
|
$
|
6,950
|
||||||||||||
|
Summary of Debt due after Fiscal 2019
|
0
|
0
|
0
|
0
|
137,770
|
137,770
|
|||||||||||||||||||
|
Sub-Total Healthcare
|
$
|
42,350
|
$
|
17,251
|
$
|
1,781
|
$
|
27,395
|
$
|
137,770
|
$
|
226,547
|
|||||||||||||
|
Industrial
|
|||||||||||||||||||||||||
|
Stone Container - Fargo, ND
|
12/1/2015
|
108
|
0
|
0
|
0
|
0
|
108
|
||||||||||||||||||
|
Stone Container - Fargo, ND
|
12/1/2015
|
133
|
0
|
0
|
0
|
0
|
133
|
||||||||||||||||||
|
Urbandale 3900 106th Street – Urbandale, IA
|
7/5/2017
|
0
|
0
|
10,380
|
0
|
0
|
10,380
|
||||||||||||||||||
|
Summary of Debt due after Fiscal 2019
|
0
|
0
|
0
|
0
|
1,580
|
1,580
|
|||||||||||||||||||
|
Sub-Total Industrial
|
$
|
241
|
$
|
0
|
$
|
10,380
|
$
|
0
|
$
|
1,580
|
$
|
12,201
|
|||||||||||||
|
All Other
|
|||||||||||||||||||||||||
|
Plaza 16 - Minot, ND
|
8/1/2018
|
0
|
0
|
0
|
7,053
|
0
|
7,053
|
||||||||||||||||||
|
Summary of Debt due after Fiscal 2019
|
0
|
0
|
0
|
0
|
4,532
|
4,532
|
|||||||||||||||||||
|
Sub-Total All Other
|
$
|
0
|
$
|
0
|
$
|
0
|
$
|
7,053
|
$
|
4,532
|
$
|
11,585
|
|||||||||||||
|
Total
|
$
|
50,789
|
$
|
25,842
|
$
|
31,042
|
$
|
54,283
|
$
|
507,778
|
$
|
669,734
|
|||||||||||||
| * | Mortgage debt does not include the Company’s multi-bank line of credit or construction loans. The line of credit has a maturity date of September 1, 2017; as of July 31, 2015, the Company had borrowings of $83.5 million outstanding under this line. Construction loans and other debt totaled $165.9 million as of July 31, 2015. |
| (1) | Totals are principal balances as of July 31, 2015. |
| (2) | Loan was paid off subsequent to July 31, 2015. |
12
INVESTORS REAL ESTATE TRUST AND SUBSIDIARIES
CAPITAL ANALYSIS
(in thousands, except per share and unit amounts)
|
Three Months Ended
|
||||||||||||||||||||
|
7/31/2015
|
4/30/2015
|
1/31/2015
|
10/31/2014
|
7/31/2014
|
||||||||||||||||
|
Equity Capitalization
|
||||||||||||||||||||
|
Common shares outstanding
|
125,520
|
124,456
|
122,134
|
119,809
|
114,763
|
|||||||||||||||
|
Operating partnership (OP) units outstanding
|
13,921
|
14,000
|
14,398
|
14,731
|
17,975
|
|||||||||||||||
|
Total common shares and OP units outstanding
|
139,441
|
138,456
|
136,532
|
134,540
|
132,738
|
|||||||||||||||
|
Market price per common share (closing price at end of period)
|
$
|
7.21
|
$
|
7.17
|
$
|
8.25
|
$
|
8.40
|
$
|
8.52
|
||||||||||
|
Equity capitalization-common shares and OP units
|
$
|
1,005,370
|
$
|
992,730
|
$
|
1,126,389
|
$
|
1,130,136
|
$
|
1,130,928
|
||||||||||
|
Recorded book value of preferred shares
|
$
|
138,674
|
$
|
138,674
|
$
|
138,674
|
$
|
138,674
|
$
|
138,674
|
||||||||||
|
Total equity capitalization
|
$
|
1,144,044
|
$
|
1,131,404
|
$
|
1,265,063
|
$
|
1,268,810
|
$
|
1,269,602
|
||||||||||
|
Debt Capitalization
|
||||||||||||||||||||
|
Total debt
|
$
|
1,211,621
|
$
|
1,178,851
|
$
|
1,188,218
|
$
|
1,160,628
|
$
|
1,135,892
|
||||||||||
|
Total capitalization
|
$
|
2,355,665
|
$
|
2,310,255
|
$
|
2,453,281
|
$
|
2,429,438
|
$
|
2,405,494
|
||||||||||
|
Total debt to total capitalization
|
0.51:1
|
0.51:1
|
0.48:1
|
0.48:1
|
0.47:1
|
|||||||||||||||
|
Three Months Ended
|
||||||||||||||||||||
|
7/31/2015
|
4/30/2015
|
1/31/2015
|
10/31/2014
|
7/31/2014
|
||||||||||||||||
|
Earnings to fixed charges(1)
|
1.18
|
x
|
1.57
|
x
|
1.41
|
x
|
1.30
|
x
|
(2)
|
|||||||||||
|
Earnings to combined fixed charges and preferred distributions(1)
|
1.01
|
x
|
1.34
|
x
|
1.19
|
x
|
1.10
|
x
|
(2)
|
|||||||||||
|
Debt service coverage ratio(1)
|
1.63
|
x
|
1.64
|
x
|
1.70
|
x
|
1.71
|
x
|
1.57
|
x
|
||||||||||
|
Distribution Data
|
||||||||||||||||||||
|
Common shares and units outstanding at record date
|
138,576
|
137,596
|
135,490
|
133,527
|
130,795
|
|||||||||||||||
|
Total common distribution paid
|
$
|
18,015
|
$
|
17,879
|
$
|
17,613
|
$
|
17,358
|
$
|
17,004
|
||||||||||
|
Common distribution per share and unit
|
$
|
.1300
|
$
|
.1300
|
$
|
.1300
|
$
|
.1300
|
$
|
.1300
|
||||||||||
|
Payout ratio (FFO per share and unit basis)(1)
|
81.3
|
%
|
81.3
|
%
|
76.5
|
%
|
76.5
|
%
|
92.9
|
%
|
||||||||||
|
Payout ratio (AFFO per share and unit basis)(1)
|
81.3
|
%
|
100.0
|
%
|
86.7
|
%
|
86.7
|
%
|
108.3
|
%
|
||||||||||
| (1) | See Definitions on page 26. |
| (2) |
Due to non-cash asset impairment and loss on sale charges of $5.3 million in the three months ended July 31, 2014, earnings were inadequate to cover fixed charges and combined fixed charges and preferred distributions by $2.2 million and $5.1 million, respectively. Excluding the asset impairment and loss on sale charges, the ratios of earnings to fixed charges and earnings to combined fixed charges and preferred distributions would have been 1.20 and 1.01, respectively, for the three months ended July 31, 2014.
|
13
INVESTORS REAL ESTATE TRUST AND SUBSIDIARIES
SAME-STORE PROPERTIES NET OPERATING INCOME SUMMARY
(in thousands)
|
Same-Store Properties(1)
|
||||||||||||
|
Three Months Ended
July 31,
|
||||||||||||
|
Segment
|
2015
|
2014
|
%
Change
|
|||||||||
|
Multi-Family Residential
|
$
|
14,403
|
$
|
14,388
|
0.1
|
%
|
||||||
|
Healthcare
|
11,378
|
11,160
|
2.0
|
%
|
||||||||
|
Industrial
|
1,259
|
1,152
|
9.3
|
%
|
||||||||
|
All Other
|
896
|
746
|
20.1
|
%
|
||||||||
|
$
|
27,936
|
$
|
27,446
|
1.8
|
%
|
|||||||
| (1) | See list of properties excluded from same-store properties on page ii. |
14
INVESTORS REAL ESTATE TRUST AND SUBSIDIARIES
NET OPERATING INCOME DETAIL
(in thousands)
|
Three Months Ended July 31, 2015
|
||||||||||||||||||||||||
|
Reporting Segments
|
||||||||||||||||||||||||
|
Multi-Family
Residential
|
Healthcare
|
Industrial
|
All Other
|
Corporate and
Other
|
Total
|
|||||||||||||||||||
|
Real estate rental revenue
|
||||||||||||||||||||||||
|
Same-store(1)
|
$
|
26,129
|
$
|
15,107
|
$
|
1,572
|
$
|
1,123
|
$
|
0
|
$
|
43,931
|
||||||||||||
|
Non-same-store
|
5,250
|
599
|
5
|
88
|
0
|
5,987
|
||||||||||||||||||
|
Total
|
31,379
|
15,706
|
1,622
|
1,211
|
0
|
49,918
|
||||||||||||||||||
|
Real estate expenses
|
||||||||||||||||||||||||
|
Same-store(1)
|
11,726
|
3,729
|
313
|
227
|
0
|
15,995
|
||||||||||||||||||
|
Non-same-store
|
2,196
|
103
|
83
|
23
|
0
|
2,405
|
||||||||||||||||||
|
Total
|
13,922
|
3,832
|
396
|
250
|
0
|
18,400
|
||||||||||||||||||
|
Net operating income (NOI)
|
||||||||||||||||||||||||
|
Same-store(1)
|
14,403
|
11,378
|
1,259
|
896
|
0
|
27,936
|
||||||||||||||||||
|
Non-same-store
|
3,054
|
496
|
(33
|
)
|
65
|
0
|
3,582
|
|||||||||||||||||
|
Net operating income
|
$
|
17,457
|
$
|
11,874
|
$
|
1,226
|
$
|
961
|
$
|
0
|
$
|
31,518
|
||||||||||||
|
Reconciliation of NOI to net income (loss) available to common shareholders
|
||||||||||||||||||||||||
|
TRS senior housing revenue
|
$
|
0
|
$
|
0
|
$
|
0
|
$
|
0
|
$
|
1,038
|
$
|
1,038
|
||||||||||||
|
TRS senior housing expenses
|
0
|
0
|
0
|
0
|
(769
|
)
|
(769
|
)
|
||||||||||||||||
|
Depreciation/amortization
|
(7,593
|
)
|
(4,829
|
)
|
(460
|
)
|
(461
|
)
|
(100
|
)
|
(13,443
|
)
|
||||||||||||
|
Administrative expenses
|
0
|
0
|
0
|
0
|
(2,454
|
)
|
(2,454
|
)
|
||||||||||||||||
|
Other expenses
|
0
|
0
|
0
|
0
|
(424
|
)
|
(424
|
)
|
||||||||||||||||
|
Impairment of real estate investments
|
0
|
0
|
0
|
0
|
(1,285
|
)
|
(1,285
|
)
|
||||||||||||||||
|
Interest expense
|
(5,923
|
)
|
(3,509
|
)
|
(233
|
)
|
(161
|
)
|
630
|
(9,196
|
)
|
|||||||||||||
|
Interest and other income
|
0
|
0
|
0
|
0
|
607
|
607
|
||||||||||||||||||
|
Income (loss) before loss on sale of real estate and other investments and loss from discontinued operations
|
3,941
|
3,536
|
533
|
339
|
(2,757
|
)
|
5,592
|
|||||||||||||||||
|
Loss on sale of real estate and other investments
|
0
|
0
|
0
|
(175
|
)
|
0
|
(175
|
)
|
||||||||||||||||
|
Income (loss) from continuing operations
|
3,941
|
3,536
|
533
|
164
|
(2,757
|
)
|
5,417
|
|||||||||||||||||
|
Loss from discontinued operations
|
0
|
0
|
0
|
(690
|
)
|
0
|
(690
|
)
|
||||||||||||||||
|
Net income (loss)
|
3,941
|
3,536
|
533
|
(526
|
)
|
(2,757
|
)
|
4,727
|
||||||||||||||||
|
Net income attributable to noncontrolling interests – Operating Partnership
|
0
|
0
|
0
|
0
|
(186
|
)
|
(186
|
)
|
||||||||||||||||
|
Net income attributable to noncontrolling interests – consolidated real estate entities
|
0
|
0
|
0
|
0
|
(1
|
)
|
(1
|
)
|
||||||||||||||||
|
Net income (loss) attributable to Investors Real Estate Trust
|
3,941
|
3,536
|
533
|
(526
|
)
|
(2,944
|
)
|
4,540
|
||||||||||||||||
|
Dividends to preferred shareholders
|
0
|
0
|
0
|
0
|
(2,879
|
)
|
(2,879
|
)
|
||||||||||||||||
|
NET INCOME (LOSS) AVAILABLE TO COMMON SHAREHOLDERS
|
$
|
3,941
|
$
|
3,536
|
$
|
533
|
$
|
(526
|
)
|
$
|
(5,823
|
)
|
$
|
1,661
|
||||||||||
| (1) | See list of properties excluded from same-store properties on page ii. |
15
INVESTORS REAL ESTATE TRUST AND SUBSIDIARIES
NET OPERATING INCOME DETAIL
(in thousands)
|
Three Months Ended July 31, 2014
|
||||||||||||||||||||||||
|
Reporting Segments
|
||||||||||||||||||||||||
|
Multi-Family
Residential
|
Healthcare
|
Industrial
|
All Other
|
Corporate and
Other
|
Total
|
|||||||||||||||||||
|
Real estate rental revenue
|
||||||||||||||||||||||||
|
Same-store(1)
|
$
|
25,824
|
$
|
15,374
|
$
|
1,497
|
$
|
1,145
|
$
|
0
|
$
|
43,840
|
||||||||||||
|
Non-same-store
|
1,903
|
828
|
73
|
1,777
|
0
|
4,581
|
||||||||||||||||||
|
Total
|
27,727
|
16,202
|
1,570
|
2,922
|
0
|
48,421
|
||||||||||||||||||
|
Real estate expenses
|
||||||||||||||||||||||||
|
Same-store(1)
|
11,436
|
4,214
|
345
|
399
|
0
|
16,394
|
||||||||||||||||||
|
Non-same-store
|
785
|
142
|
105
|
826
|
0
|
1,858
|
||||||||||||||||||
|
Total
|
12,221
|
4,356
|
450
|
1,225
|
0
|
18,252
|
||||||||||||||||||
|
Net operating income (NOI)
|
||||||||||||||||||||||||
|
Same-store(1)
|
14,388
|
11,160
|
1,152
|
746
|
0
|
27,446
|
||||||||||||||||||
|
Non-same-store
|
1,118
|
686
|
(32
|
)
|
951
|
0
|
2,723
|
|||||||||||||||||
|
Net operating income
|
$
|
15,506
|
$
|
11,846
|
$
|
1,120
|
$
|
1,697
|
$
|
0
|
$
|
30,169
|
||||||||||||
|
Reconciliation of NOI to net income (loss) available to common shareholders
|
||||||||||||||||||||||||
|
TRS senior housing revenue
|
$
|
0
|
$
|
0
|
$
|
0
|
$
|
0
|
$
|
793
|
$
|
793
|
||||||||||||
|
TRS senior housing expenses
|
0
|
0
|
0
|
0
|
(693
|
)
|
(693
|
)
|
||||||||||||||||
|
Depreciation/amortization
|
(5,925
|
)
|
(5,010
|
)
|
(391
|
)
|
(1,025
|
)
|
(84
|
)
|
(12,435
|
)
|
||||||||||||
|
Administrative expenses
|
0
|
0
|
0
|
0
|
(3,664
|
)
|
(3,664
|
)
|
||||||||||||||||
|
Other expenses
|
0
|
0
|
0
|
0
|
(612
|
)
|
(612
|
)
|
||||||||||||||||
|
Impairment of real estate investments
|
0
|
0
|
0
|
(1,566
|
)
|
(754
|
)
|
(2,320
|
)
|
|||||||||||||||
|
Interest expense
|
(5,445
|
)
|
(3,668
|
)
|
(202
|
)
|
(534
|
)
|
102
|
(9,747
|
)
|
|||||||||||||
|
Interest and other income
|
0
|
0
|
0
|
0
|
686
|
686
|
||||||||||||||||||
|
Income (loss) before loss on sale of real estate and other investments and income from discontinued operations
|
4,136
|
3,168
|
527
|
(1,428
|
)
|
(4,226
|
)
|
2,177
|
||||||||||||||||
|
Loss on sale of real estate and other investments
|
0
|
0
|
(1,793
|
)
|
(24
|
)
|
(1,176
|
)
|
(2,993
|
)
|
||||||||||||||
|
Income (loss) from continuing operations
|
4,136
|
3,168
|
(1,266
|
)
|
(1,452
|
)
|
(5,402
|
)
|
(816
|
)
|
||||||||||||||
|
Income from discontinued operations
|
0
|
0
|
0
|
617
|
0
|
617
|
||||||||||||||||||
|
Net income (loss)
|
4,136
|
3,168
|
(1,266
|
)
|
(835
|
)
|
(5,402
|
)
|
(199
|
)
|
||||||||||||||
|
Net loss attributable to noncontrolling interests – Operating Partnership
|
0
|
0
|
0
|
0
|
402
|
402
|
||||||||||||||||||
|
Net income attributable to noncontrolling interests – consolidated real estate entities
|
0
|
0
|
0
|
0
|
(354
|
)
|
(354
|
)
|
||||||||||||||||
|
Net income (loss) attributable to Investors Real Estate Trust
|
4,136
|
3,168
|
(1,266
|
)
|
(835
|
)
|
(5,354
|
)
|
(151
|
)
|
||||||||||||||
|
Dividends to preferred shareholders
|
0
|
0
|
0
|
0
|
(2,879
|
)
|
(2,879
|
)
|
||||||||||||||||
|
NET INCOME (LOSS) AVAILABLE TO COMMON SHAREHOLDERS
|
$
|
4,136
|
$
|
3,168
|
$
|
(1,266
|
)
|
$
|
(835
|
)
|
$
|
(8,233
|
)
|
$
|
(3,030
|
)
|
||||||||
| (1) | See list of properties excluded from same-store properties on page ii. |
16
INVESTORS REAL ESTATE TRUST AND SUBSIDIARIES
SAME-STORE PROPERTIES AND ALL PROPERTIES OCCUPANCY LEVELS BY SEGMENT
July 31, 2015 vs. July 31, 2014
|
Segments
|
Same-Store Properties
|
All Properties
|
||||||||||||||
|
July 31, 2015
|
July 31, 2014
|
July 31, 2015
|
July 31, 2014
|
|||||||||||||
|
Multi-Family Residential
|
93.5%
|
94.0%
|
91.2%
|
|
93.4%
|
|
||||||||||
|
Healthcare
|
96.0%
|
|
96.6%
|
94.7%
|
96.6%
|
|
||||||||||
|
Industrial
|
100.0%
|
|
100.0%
|
84.3%
|
100.0%
|
|
||||||||||

17
INVESTORS REAL ESTATE TRUST AND SUBSIDIARIES
MULTI-FAMILY RESIDENTIAL SUMMARY(2)
|
Three Months Ended
|
||||||||||||||||||||
|
07/31/15
|
04/30/15
|
01/31/15
|
10/31/14
|
07/31/14
|
||||||||||||||||
|
Number of Units
|
12,027
|
11,844
|
11,765
|
11,292
|
11,080
|
|||||||||||||||
|
Average Investment Per Unit
|
||||||||||||||||||||
|
Same-Store
|
$
|
69,992
|
$
|
66,741
|
$
|
66,466
|
$
|
66,233
|
$
|
65,956
|
||||||||||
|
Non-Same-Store
|
149,281
|
146,337
|
143,999
|
133,763
|
125,239
|
|||||||||||||||
|
All Properties
|
$
|
81,180
|
$
|
79,617
|
$
|
77,723
|
$
|
74,190
|
$
|
71,326
|
||||||||||
|
Average Scheduled Rent(1) per Unit
|
||||||||||||||||||||
|
Same-Store
|
$
|
861
|
$
|
843
|
$
|
841
|
$
|
835
|
$
|
825
|
||||||||||
|
Non-Same-Store
|
1,445
|
1,452
|
1,390
|
1,320
|
1,220
|
|||||||||||||||
|
All Properties
|
$
|
944
|
$
|
942
|
$
|
920
|
$
|
892
|
$
|
861
|
||||||||||
|
Total Receipts per Unit
|
||||||||||||||||||||
|
Same-Store
|
$
|
848
|
$
|
838
|
$
|
835
|
$
|
844
|
$
|
820
|
||||||||||
|
Non-Same-Store
|
1,037
|
1,062
|
1,087
|
1,121
|
1,067
|
|||||||||||||||
|
All Properties
|
$
|
875
|
$
|
874
|
$
|
871
|
$
|
877
|
$
|
842
|
||||||||||
|
Total Recurring Capital Expenditures per Unit(1)
|
$
|
159
|
$
|
136
|
$
|
119
|
$
|
158
|
$
|
139
|
||||||||||
|
Occupancy%
|
||||||||||||||||||||
|
Same-Store
|
93.5
|
%
|
94.7
|
%
|
94.0
|
%
|
95.6
|
%
|
93.8
|
%
|
||||||||||
|
Non-Same-Store
|
77.7
|
%
|
78.6
|
%
|
77.1
|
%
|
87.6
|
%
|
89.5
|
%
|
||||||||||
|
All Properties
|
91.2
|
%
|
92.0
|
%
|
91.3
|
%
|
94.6
|
%
|
93.4
|
%
|
||||||||||
|
Operating Expenses as a % of Scheduled Rent
|
||||||||||||||||||||
|
Same-Store
|
44.4
|
%
|
44.2
|
%
|
46.0
|
%
|
43.7
|
%
|
46.0
|
%
|
||||||||||
|
Non-Same-Store
|
31.9
|
%
|
30.0
|
%
|
27.0
|
%
|
28.8
|
%
|
29.5
|
%
|
||||||||||
|
All Properties
|
41.7
|
%
|
40.7
|
%
|
41.8
|
%
|
41.1
|
%
|
43.9
|
%
|
||||||||||
| (1) | See Definitions on page 32. |
| (2) |
Previously reported amounts are not revised for discontinued operations or changes in the composition of the same-store properties pool.
|
18
INVESTORS REAL ESTATE TRUST AND SUBSIDIARIES
COMMERCIAL LEASING SUMMARY (Same-Store Properties)
Commercial Leasing Activity
During fiscal year 2016, we have executed new and renewal commercial leases for our same-store rental properties on 61,372 square feet for the three months ended July 31, 2015. Despite our leasing efforts, occupancy in our same-store healthcare and industrial portfolios decreased to 97.0% as of July 31, 2015, down from 97.4% as of July 31, 2014.
The total leasing activity for our same-store healthcare and industrial properties, expressed in square feet of leases signed during the period, and the resulting occupancy levels, are as follows:
Three Months Ended July 31, 2015 and 2014
|
Square Feet of
New Leases(1)
|
Square Feet of
Leases Renewed(1)
|
Total
Square Feet of
Leases Executed(1)
|
Occupancy
|
|||||||||||||||||||||||||||||
|
Segments
|
2015
|
2014
|
2015
|
2014
|
2015
|
2014
|
2015
|
2014
|
||||||||||||||||||||||||
|
Healthcare
|
1,624
|
8,947
|
46,422
|
39,016
|
48,046
|
47,963
|
96.0
|
%
|
96.6
|
%
|
||||||||||||||||||||||
|
Industrial
|
0
|
0
|
13,326
|
0
|
13,326
|
0
|
100.0
|
%
|
100.0
|
%
|
||||||||||||||||||||||
|
Total
|
1,624
|
8,947
|
59,748
|
39,016
|
61,372
|
47,963
|
97.0
|
%
|
97.4
|
%
|
||||||||||||||||||||||
| (1) | The leasing activity presented is based on leases signed or executed for our same-store rental properties during the period and is not intended to coincide with the commencement of rental revenue in accordance with GAAP. Prior periods reflect amounts previously reported and exclude retroactive adjustments for properties reclassified to discontinued operations or non-same-store in the current period. |
New Leases
The following table sets forth the average effective rents and the estimated costs of tenant improvements and leasing commissions, on a per square foot basis, that we are obligated to fulfill under the new leases signed for our same-store healthcare and industrial properties:
Three Months Ended July 31, 2015 and 2014
|
Square Feet of
New Leases(1)
|
Average Term
in Years
|
Average
Effective Rent(2)
|
Estimated Tenant
Improvement Cost per
Square Foot(1)
|
Leasing
Commissions per
Square Foot(1)
|
||||||||||||||||||||||||||||||||||||
|
2015
|
2014
|
2015
|
2014
|
2015
|
2014
|
2015
|
2014
|
2015
|
2014
|
|||||||||||||||||||||||||||||||
|
Healthcare
|
1,624
|
8,947
|
16.5
|
8.6
|
23.64
|
21.10
|
35.00
|
29.69
|
10.00
|
9.10
|
||||||||||||||||||||||||||||||
|
Industrial
|
0
|
0
|
0
|
0
|
0
|
0
|
0
|
0
|
0
|
0
|
||||||||||||||||||||||||||||||
|
Total
|
1,624
|
8,947
|
16.5
|
8.6
|
$
|
23.64
|
$
|
21.10
|
$
|
35.00
|
$
|
29.69
|
$
|
10.00
|
$
|
9.10
|
||||||||||||||||||||||||
| (1) | The leasing activity presented is based on leases signed or executed for our same-store rental properties during the period and is not intended to coincide with the commencement of rental revenue in accordance with GAAP. Prior periods reflect amounts previously reported and exclude retroactive adjustments for properties reclassified to discontinued operations or non-same-store in the current period. Tenant improvements and leasing commissions presented are based on square feet leased during the period. |
| (2) | Effective rents represent average annual base rental payments, on a straight-line basis for the term of each lease, excluding operating expense reimbursements. The underlying leases contain various expense structures including gross, modified gross, net and triple net. |
19
INVESTORS REAL ESTATE TRUST AND SUBSIDIARIES
COMMERCIAL LEASING SUMMARY (Same-Store Properties)
Lease Renewals
The following table summarizes our lease renewal activity within our same-store healthcare and industrial segments (square feet data in thousands):
Three Months Ended July 31, 2015 and 2014
|
Square Feet of Leases
Renewed(1)
|
Percent of Expiring
Leases Renewed(2)
|
Average Term
in Years
|
Weighted Average
Growth (Decline)
in Effective Rents(3)
|
Estimated
Tenant Improvement
Cost per Square
Foot(1)
|
Leasing
Commissions per
Square Foot(1)
|
|||||||||||||||||||||||||||||||||||||||||||
|
2015
|
2014
|
2015
|
2014
|
2015
|
2014
|
2015
|
2014
|
2015
|
2014
|
2015
|
2014
|
|||||||||||||||||||||||||||||||||||||
|
Healthcare
|
46,422
|
39,016
|
86.5
|
%
|
90.7
|
%
|
8.4
|
5.6
|
15.3
|
%
|
4.5
|
%
|
15.23
|
5.03
|
6.30
|
2.01
|
||||||||||||||||||||||||||||||||
|
Industrial
|
13,326
|
0
|
0
|
%
|
0
|
%
|
5.1
|
0
|
3.7
|
%
|
0
|
%
|
1.00
|
0
|
1.11
|
0
|
||||||||||||||||||||||||||||||||
|
Total
|
59,748
|
39,016
|
86.5
|
%
|
90.7
|
%
|
7.9
|
5.6
|
14.4
|
%
|
4.5
|
%
|
$
|
12.06
|
$
|
5.03
|
$
|
5.14
|
$
|
2.01
|
||||||||||||||||||||||||||||
| (1) | The leasing activity presented is based on leases signed or executed for our same-store rental properties during the period and is not intended to coincide with the commencement of rental revenue in accordance with GAAP. Prior periods reflect amounts previously reported and exclude retroactive adjustments for properties reclassified to discontinued operations or non-same-store in the current period. Tenant improvements and leasing commissions are based on square feet leased during the period. |
| (2) |
Renewal percentage of expiring leases is based on square footage of renewed leases and not the number of leases renewed. The category of renewed leases does not include leases that have become month-to-month leases, as the month-to-month leases are considered lease amendments.
|
| (3) | Represents the percentage change in effective rent between the original leases and the renewal leases. Effective rents represent average annual base rental payments, on a straight-line basis for the term of each lease, excluding operating expense reimbursements. The underlying leases contain various expense structures including gross, modified gross, net and triple net. |
Lease Expirations
Our ability to maintain and improve occupancy rates, and base rents, primarily depends upon our continuing ability to re-lease expiring space. The following table reflects the in-service portfolio lease expiration schedule of our consolidated healthcare and industrial properties, including square footage and annualized base rent for expiring leases, as of July 31, 2015.
|
Fiscal Year of Lease Expiration
|
# of Leases
|
Square Footage of
Expiring Leases(2)
|
Percentage of Total
Commercial
Segments
Leased Square
Footage
|
Annualized Base
Rent of Expiring
Leases at Expiration(3)
|
Percentage of Total
Commercial
Segments
Annualized Base Rent
|
|||||||||||||||
|
2016 (remainder)(1)
|
44
|
644,628
|
16.6
|
%
|
$
|
7,253,739
|
13.8
|
%
|
||||||||||||
|
2017
|
28
|
194,940
|
5.0
|
%
|
2,967,374
|
5.6
|
%
|
|||||||||||||
|
2018
|
20
|
177,701
|
4.6
|
%
|
4,208,723
|
8.0
|
%
|
|||||||||||||
|
2019
|
21
|
350,052
|
9.0
|
%
|
4,802,740
|
9.1
|
%
|
|||||||||||||
|
2020
|
13
|
166,159
|
4.3
|
%
|
1,931,422
|
3.7
|
%
|
|||||||||||||
|
2021
|
17
|
98,512
|
2.5
|
%
|
1,931,600
|
3.7
|
%
|
|||||||||||||
|
2022
|
38
|
1,286,404
|
33.2
|
%
|
16,542,928
|
31.4
|
%
|
|||||||||||||
|
2023
|
12
|
480,309
|
12.4
|
%
|
2,295,072
|
4.4
|
%
|
|||||||||||||
|
2024
|
26
|
201,244
|
5.2
|
%
|
4,101,477
|
7.8
|
%
|
|||||||||||||
|
2025
|
5
|
76,691
|
2.0
|
%
|
1,634,465
|
3.1
|
%
|
|||||||||||||
|
Thereafter
|
14
|
200,747
|
5.2
|
%
|
4,953,209
|
9.4
|
%
|
|||||||||||||
|
Totals
|
238
|
3,877,387
|
100.0
|
%
|
$
|
52,622,749
|
100.0
|
%
|
||||||||||||
| (1) | Includes month-to-month leases. As of July 31, 2015 month-to-month leases accounted for 308,027 square feet of which 286,854 square feet were located in five senior housing facilities in Wyoming. |
| (2) |
Assuming that none of the tenants exercise renewal or termination options, and including leases renewed prior to expiration. Also excludes 99,535 square feet of space occupied by IRET, of which 98,174 square feet is income producing real estate operated within a Taxable REIT Subsidiary.
|
| (3) |
Annualized Base Rent is monthly scheduled rent as of July 1, 2015, multiplied by 12.
|
Because of the different property types in the Company’s commercial portfolio and the dispersed locations of a substantial portion of the portfolio’s properties in secondary and tertiary markets, information on current market rents is difficult to obtain, is highly subjective, and is often not directly comparable between properties. As a result, the Company believes that the increase or decrease in effective rent on its recent leases is the most objective and meaningful information available regarding rent trends and the relationship between rents on leases expiring in the near-term and current market rents across the Company’s markets. The Company believes that rents on its new and renewed leases generally approximate market rents.
20
INVESTORS REAL ESTATE TRUST AND SUBSIDIARIES
10 LARGEST COMMERCIAL TENANTS – BASED ON ANNUALIZED BASE RENT(1)
as of July 31, 2015
|
Tenant
|
Number of
Properties
|
Average
Remaining
Lease Term
in Months
|
% of Total
Commercial
Segments’
Minimum
Rents
|
Aggregate
Rentable
Square Feet
|
% of Aggregate
Occupied
Square
Feet
|
|||||||||||||||
|
Affiliates of Edgewood Vista
|
33
|
62
|
15.1
|
%(2)
|
1,521,147
|
39.4
|
% | |||||||||||||
|
Fairview Health Services
|
10
|
35
|
4.0
|
%
|
254,985
|
6.6%
|
%
|
|||||||||||||
|
St. Luke’s Hospital of Duluth, Inc.
|
6
|
28
|
3.7
|
%
|
198,775
|
5.2%
|
% | |||||||||||||
|
Applied Underwriters
|
3
|
19
|
2.6
|
%
|
141,724
|
3.7%
|
% | |||||||||||||
|
HealthEast Care System
|
1
|
43
|
1.8
|
%
|
114,316
|
3.0%
|
% | |||||||||||||
|
Microsoft (NASDAQ: MSFT)
|
1
|
41
|
1.5
|
%
|
122,040
|
3.2%
|
% | |||||||||||||
|
Arcadis Corporate Services, Inc.
|
1
|
12
|
1.4
|
%
|
71,430
|
1.9%
|
% | |||||||||||||
|
Nebraska Orthopaedic Hospital(3)
|
1
|
164
|
1.4
|
%
|
61,758
|
1.6%
|
% | |||||||||||||
|
State of Idaho Department of Health and Welfare
|
2
|
31
|
1.2
|
%
|
103,342
|
2.7
|
% | |||||||||||||
|
Affiliates of Siemens USA (NYSE: SI)
|
1
|
15
|
1.2
|
%
|
78,360
|
2.0
|
% | |||||||||||||
|
Total/Weighted Average
|
45
|
33.9
|
%
|
2,667,877
|
69.3
|
% | ||||||||||||||
| (1) | See Definitions on page 32. |
| (2) | If held for sale properties were excluded, Affiliates of Edgewood Vista percentage of total commercial segments’ minimum rents as of July 1, 2015 would be 31.6%. |
| (3) | The tenant in the Company’s Nebraska Orthopaedic Hospital property has exercised its option to purchase the property. The Company and its tenant are currently engaged in an arbitration proceeding pursuant to the lease agreement to determine the purchase price. The Company currently can give no assurance that the sale of the property pursuant to the purchase option will be completed. |
21
INVESTORS REAL ESTATE TRUST AND SUBSIDIARIES
COMMERCIAL LEASE EXPIRATIONS
as of July 31, 2015
|
(dollars in thousands except average rental rates)
|
||||||||||||||||||||||||
|
Fiscal Year
|
Number of
Leases
|
Rentable
Square Feet(1)
|
% of Rentable
Square Feet
|
Annualized
Rent(2)
|
Average
Rental
Rate
|
% of
Annualized
Base Rent
|
||||||||||||||||||
|
Healthcare
|
||||||||||||||||||||||||
|
2016(remainder)(3)
|
43
|
449,553
|
15.8
|
%
|
$
|
6,202
|
$
|
13.80
|
13.1
|
%
|
||||||||||||||
|
2017
|
27
|
125,340
|
4.4
|
%
|
2,594
|
20.69
|
5.5
|
%
|
||||||||||||||||
|
2018
|
19
|
167,999
|
5.9
|
%
|
4,150
|
24.70
|
8.7
|
%
|
||||||||||||||||
|
2019
|
15
|
192,457
|
6.7
|
%
|
3,969
|
20.62
|
8.3
|
%
|
||||||||||||||||
|
2020
|
12
|
64,592
|
2.3
|
%
|
1.334
|
20.66
|
2.8
|
%
|
||||||||||||||||
|
2021 and thereafter
|
106
|
1,846,608
|
64.9
|
%
|
29,255
|
15.84
|
61.6
|
%
|
||||||||||||||||
|
222
|
2,846,549
|
100.0
|
%
|
$
|
47,504
|
$
|
16.69
|
100.0
|
%
|
|||||||||||||||
|
Industrial
|
||||||||||||||||||||||||
|
2016(remainder)(4)
|
1
|
195,075
|
18.9
|
%
|
$
|
1,052
|
$
|
5.39
|
20.5
|
%
|
||||||||||||||
|
2017
|
1
|
69,600
|
6.8
|
%
|
374
|
5.37
|
7.3
|
%
|
||||||||||||||||
|
2018
|
1
|
9,702
|
0.9
|
%
|
58
|
6.02
|
1.1
|
%
|
||||||||||||||||
|
2019
|
6
|
157,595
|
15.3
|
%
|
834
|
5.29
|
16.3
|
%
|
||||||||||||||||
|
2020
|
1
|
101,567
|
9.9
|
%
|
597
|
5.88
|
11.7
|
%
|
||||||||||||||||
|
2021 and thereafter
|
6
|
497,299
|
48.2
|
%
|
2,204
|
4.43
|
43.1
|
%
|
||||||||||||||||
|
16
|
1,030,838
|
100.0
|
%
|
$
|
5.119
|
$
|
4.97
|
100.0
|
%
|
|||||||||||||||
|
Total
|
||||||||||||||||||||||||
|
2016(remainder)(5)
|
44
|
644,628
|
16.6
|
%
|
$
|
7,254
|
$
|
11.25
|
13.8
|
%
|
||||||||||||||
|
2017
|
28
|
194,940
|
5.0
|
%
|
2,968
|
15.22
|
5.6
|
%
|
||||||||||||||||
|
2018
|
20
|
177,701
|
4.6
|
%
|
4,208
|
23.68
|
8.0
|
%
|
||||||||||||||||
|
2019
|
21
|
350,052
|
9.0
|
%
|
4,803
|
13.72
|
9.1
|
%
|
||||||||||||||||
|
20120
|
13
|
166,159
|
4.3
|
%
|
1,931
|
11.62
|
3.7
|
%
|
||||||||||||||||
|
2021 and thereafter
|
112
|
2,343,907
|
60.5
|
%
|
31,459
|
13.42
|
59.8
|
%
|
||||||||||||||||
|
238
|
3,877,387
|
100.0
|
%
|
$
|
52,623
|
$
|
13.57
|
100.0
|
%
|
|||||||||||||||
| (1) | Excludes 99,535 square feet of space occupied by IRET, of which 98,174 square feet is income producing real estate operated within a Taxable REIT Subsidiary. |
| (2) | Annualized Base Rent is monthly scheduled rent as of July 1, 2015 (cash basis), multiplied by 12. |
| (3) | Includes month-to-month leases. As of July 31, 2015 month-to-month leases accounted for 99,535 square feet. |
| (4) | The industrial segment has no month-to-month leases in place as of July 31, 2015. |
| (5) | Includes month-to-month leases. As of July 31, 2015 month-to-month leases accounted for 99,535 square feet. |
22
INVESTORS REAL ESTATE TRUST AND SUBSIDIARIES
FISCAL 2016 DEVELOPMENT PLACED IN SERVICE SUMMARY
as of July 31, 2015
(dollars in thousands)
|
Property
|
Location
|
Segment Type
|
Date Placed in
Service
|
Rentable
Square
Feet/Units
|
Occupancy
At
Date Placed
in Service
|
July 31,
2015
Occupancy
|
Development
Cost
|
||||||||||||||||||
|
Chateau II
|
Minot, ND
|
Multi-Family Residential
|
June 1, 2015
|
72
|
27.8
|
%
|
41.7
|
%
|
$
|
14,600
|
|||||||||||||||
|
Edina 6565 France SMC III
|
Edina, MN
|
Healthcare
|
June 1, 2015
|
57,624
|
24.5
|
%
|
24.5
|
%
|
28,816
|
||||||||||||||||
|
Renaissance Heights(1)
|
Williston, ND
|
Multi-Family Residential
|
July 27, 2015
|
288
|
42.4
|
%
|
42.4
|
%
|
62,339
|
||||||||||||||||
|
Total Square Feet
|
57,624
|
$
|
105,755
|
||||||||||||||||||||||
|
Total Units
|
360
|
||||||||||||||||||||||||
| (1) | The Company is currently an approximately 70.0% partner in the joint venture entity constructing this project; the anticipated total cost amount given is the total cost to the joint venture entity. |
23
INVESTORS REAL ESTATE TRUST AND SUBSIDIARIES
FISCAL 2015 DEVELOPMENT IN PROGRESS SUMMARY
as of July 31, 2015
(dollars in thousands)
|
(in thousands)
|
(in fiscal years)
|
|||||||||||||||||||||||
|
Project Name and Location
|
Planned Segment
|
Rentable
Square Feet
or Number of
Units
|
Percentage
Leased
or Committed
|
Anticipated
Total Cost
|
Costs as of
July 31, 2015
|
Anticipated Construction Completion
|
||||||||||||||||||
|
Minot Southgate Retail - Minot, ND
|
Other
|
7,963 sq ft
|
0
|
%
|
$ |
2,923
|
$
|
2,550
|
2Q 2016
|
|||||||||||||||
|
PrairieCare Medical - Brooklyn Park, MN
|
Healthcare
|
70,756 sq ft
|
100
|
%
|
24,251
|
23,424
|
2Q 2016
|
|||||||||||||||||
|
Cardinal Point - Grand Forks, ND
|
Multi-Family Residential
|
251 units
|
10.4
|
%
|
40,042
|
33,704
|
3Q 2016
|
|||||||||||||||||
|
Deer Ridge – Jamestown, ND
|
Multi-Family Residential
|
163 units
|
11.7
|
%
|
24,519
|
20,627
|
3Q 2016
|
|||||||||||||||||
|
71 France Phases I, II & III- Edina, MN(1)
|
Multi-Family Residential
|
241 units
|
27.0
|
%
|
73,290
|
50,455
|
1Q 2017
|
|||||||||||||||||
|
Monticello Crossings Phase I – Monticello, MN(2)
|
Multi-Family Residential
|
136 units
|
0
|
%
|
19,097
|
1,978
|
2Q 2017
|
|||||||||||||||||
|
Other
|
n/a
|
n/a
|
|
n/a
|
|
n/a
|
|
2,790
|
n/a
|
|
||||||||||||||
|
$
|
184,122
|
$
|
135,528
|
|||||||||||||||||||||
| (1) | The project will be constructed in three phases by a joint venture entity in which the Company has an approximately 52.6% interest. The anticipated total cost amount given is the total cost to the joint venture entity. The anticipated total cost includes approximately 21,772 square feet of retail space. |
| (2) | This project will be constructed in two phases with approximately 202 units and an anticipated total cost of $31.5 million. |
24
INVESTORS REAL ESTATE TRUST AND SUBSIDIARIES
ACQUISITIONS AND DEVELOPMENT LIQUIDITY PROFILE
as of July 31, 2015
(in millions)
|
Sources of Liquidity
|
Liquidity Needs
|
||||||||
|
Liquidity Source
|
Amount
|
Liquidity Need
|
Amount
|
||||||
|
Cash on balance sheet as of 7/31/15(1)
|
$
|
45
|
Acquisitions(4)
|
$
|
72
|
||||
|
Line of credit availability(2)
|
$
|
16
|
Development(5)
|
$
|
2
|
||||
|
Disposition proceeds(3)
|
$
|
200
|
|||||||
|
Estimated new debt on Acquisitions
|
$
|
4
|
|||||||
|
Total Potential Liquidity
|
$
|
265
|
Total Liquidity Needs
|
$
|
74
|
||||
|
Excess Liquidity / (Need)
|
$
|
191
|
|||||||
|
Capital Sources
|
|||||||||
|
Three Months Ended 7/31/15
|
FY2015
|
||||||||
|
Capital Source
|
Proceeds
Generated
|
Capital Source
|
Proceeds
Generated
|
||||||
|
Sale of common shares under dividend reinvestment and share purchase plan
|
$
|
1
|
Sale of common shares under dividend reinvestment and share purchase plan
|
$
|
49
|
||||
|
Proceeds from sales of real estate and discontinued operations
|
$
|
7
|
Proceeds from sales of real estate and discontinued operations
|
$
|
74
|
||||
|
Total Capital Generated
|
$
|
8
|
Total Capital Generated
|
$
|
123
|
||||
| (1) | Includes compensating balances of $14 million |
| (2) | Line of credit of $100 million less $84 million drawn as of 7/31/15 |
| (3) | Disposition proceeds consists of $373 million of estimated gross proceeds, less estimated outstanding debt and estimated closing costs of $173 million from closed and pending sales for the period from 7/31/15 through 9/9/15. No assurances can be given that pending transactions will be completed on terms currently proposed, or at all. |
| (4) | Acquisitions amount consists of estimated gross costs for closed and pending acquisitions for the period from 7/31/15 through 9/9/15. No assurances can be given that pending transactions will be completed on terms currently proposed, or at all. |
| (5) | Development in progress of $298 million less construction loans closed or committed of $146 million = IRET equity required of $152 million. IRET equity required of $152 million less $150 million invested as of 7/31/15 = amount remaining to be invested of $2 million. |
25
Definitions
July 31, 2015
Adjusted EBITDA is earnings before interest, taxes, depreciation, amortization, gain/loss on sale of real estate and other investments, impairment of real estate investments, gain/loss on extinguishment of debt and gain/loss from involuntary conversion. We consider Adjusted EBITDA to be an appropriate supplemental performance measure because it permits investors to view income from operations without the effect of depreciation, the cost of debt, or non-operating gains and losses. Adjusted EBITDA is a non-GAAP measure. Adjusted EBITDA as calculated by us is not comparable to Adjusted EBITDA reported by other REITs that do not define Adjusted EBITDA exactly as we do.
Adjusted funds from operations (AFFO) is calculated by subtracting from Funds from operations (FFO) (1) tenant improvements and leasing costs at same-store properties, and recurring capital expenditures that are capitalized and amortized and are necessary to maintain our properties and revenue stream and (2) straight line rents, then adding (3) non-real estate depreciation and amortization and (4) share-based compensation expense. We may also subtract from FFO certain unusual non-recurring items that do not produce cash available for distribution to shareholders. Our calculation subtracts from FFO leasing commissions and tenant improvements at same-store properties only, since we consider tenant improvement and leasing cost levels at non-same-store properties unrepresentative of expected levels at same-store properties. Previously-reported AFFO amounts are not revised for changes in the composition of the same-store properties pool. AFFO is included herein because we consider it to be a measure of a REIT's ability to incur and service debt and to pay distributions to its shareholders. AFFO is a non-GAAP and non-standardized measure, and may be calculated differently by other REITs.
Annualized base rent (ABR) is calculated as monthly base rent (cash basis) per the lease, as of the reporting period, multiplied by 12.
Debt to total market capitalization is total debt from the balance sheet divided by the sum of total debt from the balance sheet plus the market value of shares outstanding at the end of the period.
Debt service coverage ratio is computed by dividing Adjusted EBITDA by interest expense and principal amortization.
Funds from operations (FFO) - The National Association of Real Estate Investment Trusts, Inc. (NAREIT) defines FFO as “net income (computed in accordance with generally accepted accounting principles, excluding gains (or losses) from sales of property, plus real estate depreciation and amortization, and adjustments for unconsolidated partnerships and joint ventures. Adjustments for unconsolidated partnerships and joint ventures will be calculated to reflect funds from operations on the same basis.” In addition, in October 2011 NAREIT clarified its computation of FFO to exclude impairment charges for all periods presented. FFO is a non-GAAP measure. We consider FFO, which is a standard supplemental measure for equity real estate investment trusts, helpful to investors because it facilitates an understanding of the operating performance of properties without giving effect to impairment write-downs and to real estate depreciation and amortization, which assumes that the value of real estate assets diminishes predictably over time. Since real estate values instead historically rise or fall with market conditions, we believe that FFO provides investors and management with a more accurate indication of our financial and operating results.
Net Operating Income (NOI) is total real estate revenues and gain on involuntary conversion less real estate expenses (which consist of utilities, maintenance, real estate taxes, insurance and property management expenses). We believe that NOI is an important supplemental measure of operating performance for a REIT’s operating real estate because it provides a measure of core operations that is unaffected by depreciation, amortization, financing and general and administrative expense. NOI does not represent cash generated by operating activities in accordance with GAAP and should not be considered an alternative to net income, net income available for common shareholders or cash flow from operating activities as a measure of financial performance.
Payout ratio (FFO per share and unit basis) - The ratio of the current quarterly or annual distribution rate per common share and unit divided by quarterly or annual FFO per share and unit.
Ratio of earnings to fixed charges - The ratio of earnings to fixed charges is computed by dividing earnings by fixed charges. For this purpose, earnings consist of income from continuing operations plus fixed charges and preferred distributions, less adjustments for noncontrolling interests - consolidated real estate entities, capitalized interest and preferred distributions. Fixed charges consist of mortgage and loan interest expense, whether expensed or capitalized, the amortization of debt expense and capitalized interest.
Ratio of earnings to combined fixed charges and preferred distributions - The ratio of earnings to combined fixed charges and preferred distributions is computed by dividing earnings by combined fixed charges and preferred distributions. For this purpose, earnings consist of income from continuing operations plus fixed charges and preferred distributions, less adjustments for noncontrolling interests - consolidated real estate entities, capitalized interest and preferred distributions. Combined fixed charges and preferred distributions consist of fixed charges (mortgage and loan interest expense, whether expensed or capitalized, the amortization of debt expense and capitalized interest) and preferred distributions.
Recurring capital expenditures are expenditures (excluding capital expenditures recoverable from tenants and capital expenditures at properties sold during the period) made on a regular or recurring basis to maintain a property’s competitive position within its market, generally with a depreciable life of 5 to 12 years, but excluding (a) capital expenditures made in the year of acquisition and in subsequent periods until the property is classified as same-store (i.e., excluding capital expenditures on non-same-store properties), (b) improvements associated with the expansion or re-development of a building, (c) renovations to a building which change the underlying classification of the building (for example, from industrial to office or Class C office to Class A office) or (d) capital improvements that represent the addition of something new to a property, rather than the replacement of an existing item.
Scheduled rent revenue is the total possible revenue from all leasable units and square footage, with occupied space valued at contract rates pursuant to leases and vacant units or square footage at market rates.
Same-store properties are properties owned or in service for the entirety of the periods being compared (except for properties for which significant redevelopment or expansion occurred during either of the periods being compared, and properties sold or classified as held for sale), and, in the case of development or re-development properties, which have achieved a target level of occupancy of 90% for multi-family residential properties and 85% for office, healthcare, industrial and retail properties.
26