UNITED STATES
SECURITIES AND EXCHANGE COMMISSION
WASHINGTON, D.C. 20549
FORM
CURRENT REPORT
Pursuant to Section 13 or 15(d) of
the Securities Exchange Act of 1934
Date of Report (Date of Earliest Event Reported):
(Exact Name of Registrant as Specified in its Charter)
|
|
| ||
(State or Other Jurisdiction of Incorporation) |
(Commission File No.) | (I.R.S. Employer Identification No.) |
(Address of Principal Executive Offices, Including Zip Code)
(Registrant’s Telephone Number, Including Area Code)
Check the appropriate box below if the Form 8-K filing is intended to simultaneously satisfy the filing obligation of the registrant under any of the following provisions:
(Title of Each Class) |
(Trading Symbol) |
(Name of Each Exchange | ||
Indicate by check mark whether the registrant is an emerging growth company as defined in Rule 405 of the Securities Act of 1933 (§230.405 of this chapter) or Rule 12b-2 of the Securities Exchange Act of 1934 (§240.12b-2 of this chapter).
Emerging growth company
If an emerging growth company, indicate by check mark if the registrant has elected not to use the extended transition period for complying with any new or revised financial accounting standards provided pursuant to Section 13(a) of the Exchange Act. ☐
Item 2.02 | Results of Operations and Financial Condition. |
On May 17, 2023, Viasat, Inc. released its financial results for the fourth quarter and fiscal year 2023 in a letter to shareholders that is available on the investor relations section of its website. A copy of the press release announcing the release of financial results is furnished herewith as Exhibit 99.1 and a copy of the letter to shareholders is furnished herewith as Exhibit 99.2.
The information contained herein and in the accompanying exhibits shall not be incorporated by reference into any filing of the registrant, whether made before or after the date hereof, regardless of any general incorporation language in such filing, unless expressly incorporated by specific reference to such filing. The information in this report, including the exhibit hereto, shall not be deemed to be “filed” for purposes of Section 18 of the Securities Exchange Act of 1934, as amended, or otherwise subject to the liabilities of that section or Sections 11 and 12(a)(2) of the Securities Act of 1933, as amended.
Item 9.01 | Financial Statements and Exhibits. |
(d) | Exhibits |
Exhibit Number |
Description of Exhibit | |
99.1 | ||
99.2 | Viasat, Inc. fourth quarter and fiscal year 2023 letter to shareholders dated May 17, 2023 | |
104 | Cover Page Interactive Data File (embedded within the Inline XBRL document) |
1
SIGNATURES
Pursuant to the requirements of the Securities Exchange Act of 1934, the registrant has duly caused this report to be signed on its behalf by the undersigned hereunto duly authorized.
Date: May 17, 2023 | Viasat, Inc. | |||
By: | /s/ Brett Church | |||
Brett Church | ||||
Associate General Counsel |
2
Exhibit 99.1
Viasat Releases Fourth Quarter and Fiscal Year 2023 Financial Results
CARLSBAD., Calif., May 17, 2023 Viasat Inc. (NASDAQ: VSAT), a global leader in satellite communications, today published its fourth quarter and fiscal year 2023 financial results in a letter to shareholders, which is now posted to the Investor Relations section of the website.
As previously announced, Viasat will host a conference call today, Wednesday May 17, 2023 at 2:00 p.m. Pacific Time / 5:00 p.m. Eastern Time. The dial in numbers for the conference are U.S. (646) 307-1963 and International (800) 715-9871. Please reference conference ID 7699396.
Participants can also listen to the live webcast from the Investor Relations section of the website. The call will be archived and available on the site for approximately one month immediately following the conference call.
About Viasat
Viasat is a global communications company that believes everyone and everything in the world can be connected. For more than 35 years, Viasat has helped shape how consumers, businesses, governments and militaries around the world communicate. Today, the Company is developing the ultimate global communications network to power high-quality, secure, affordable, fast connections to impact peoples lives anywhere they areon the ground, in the air or at sea. To learn more about Viasat, visit: www.viasat.com, go to Viasats Corporate Blog, or follow the Company on social media at: Facebook, Instagram, LinkedIn, Twitter or YouTube.
Copyright © 2023 Viasat, Inc. All rights reserved. Viasat, the Viasat logo and the Viasat signal are registered trademarks of Viasat, Inc. All other product or company names mentioned are used for identification purposes only and may be trademarks of their respective owners.
Viasat, Inc. Contacts
Deb Green, Public RelationsCorporate, +1 (678) 395-0122, deb.green@viasat.com
Paul Froelich/Peter Lopez, Investor Relations, +1 (760) 476-2633, IR@viasat.com
Exhibit 99.2
Q4 FY23 SHAREHOLDER LETTER
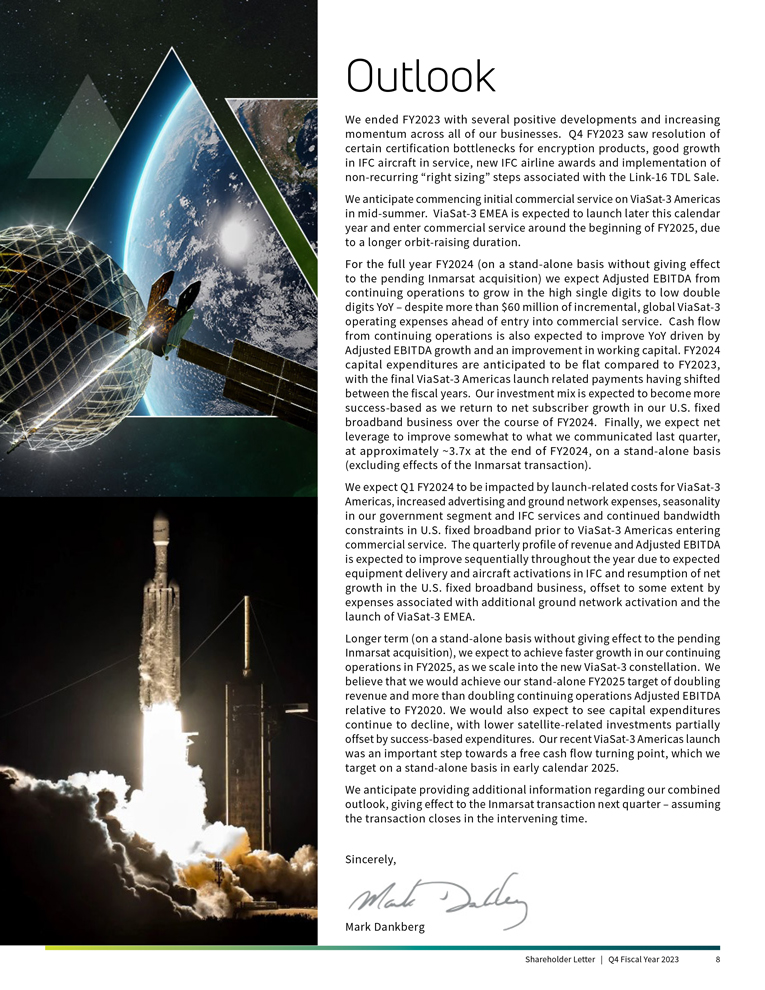
Fellow Shareholders, On April 30, 2023 at 8:26 PM EDT, ViaSat-3 Americas lifted off from Kennedy Space Center, launching Viasat into its next era as a global communications services company, delivering high-volume, affordable bandwidth across mobility, consumer, enterprise and government applications. ViaSat-3 Americas has since successfully deployed its solar arrays and arrived at its final orbital location earlier this week. Commencement of commercial services is expected in mid-summer. The successful launch marked a great way to begin fiscal year 2024 (FY2024), with more to come. The ViaSat-3 EMEA satellite is now on pace to launch later this calendar year, with the ViaSat-3 APAC satellite not much further behind. Once deployed the ViaSat-3 constellation is expected to increase our space network capacity by a factor of 8x. The beginning of the ViaSat-3 era coincides with several other important strategic developments. At the outset of Q4 FY2023 we completed the sale of our Link-16 Tactical Data Links business (Link-16 TDL Business) for approximately $1.9 billion (Link-16 TDL Sale), which yielded a gain of $1.7 billion. A portion of the proceeds was applied to repay outstanding borrowings under our revolving credit facility, with the remainder increasing our liquidity to $2.0 billion at fiscal year-end. Our planned acquisition of Inmarsat is also nearing completion, as we continue to work constructively with Inmarsat and regulators towards an anticipated closing by month end. We believe the transaction will diversify our satellite services revenue sources with a greater emphasis on global mobility, leverage complementary space systems, deliver more service options sooner for customers, and enable operational and capital synergies. The transaction is expected to be accretive to Adjusted EBITDA and free cash flow on a per share basis, with incremental value creation opportunities from integration and execution of our combined strategy. Our financial results for continuing operations exclude the results from our Link-16 TDL Business in all periods. Financial results for the Link-16 TDL Business are presented as discontinued operations and include the impact of the $1.7 billion gain on the Link-16 TDL Sale. Right-sizing charges associated with stranded costs following the Link-16 TDL Sale are included in our financial results for continuing operations and excluded from Adjusted EBITDA from continuing operations. Our total results of operations include both continuing operations and discontinued operations. FY2023 presented a challenging macro environment including ViaSat-3 program costs ahead of its delayed launch, bandwidth constraints on our fixed broadband business, government security product certification delays and supply chain bottlenecks, and delayed delivery of new Boeing and Airbus aircraft to our airline customers that slowed monetization of healthy award volumes. Nonetheless, we achieved new records in awards and revenue from continuing operations for FY2023 at $2.8 billion and $2.6 billion respectively. Consolidated FY2023 net income of $1.1 billion was lifted significantly by the gain from the Link-16 TDL Sale. Our net loss from continuing operations increased to $218 million while Adjusted EBITDA from continuing operations grew to $501 million, an increase of over 5% YoY. In Q4 FY2023, we saw revenue from continuing operations grow 10% YoY to $666 million with our net loss from continuing operations increasing modestly to $62 million. Adjusted EBITDA from continuing operations grew 21% YoY to $124 million, led by Government Systems and commercial air in-flight connectivity (IFC) businesses, partially offset by lower fixed broadband revenue as we allocated a greater proportion of our bandwidth to significant growth in IFC service demand. We also implemented actions to reduce stranded costs associated with the Link-16 TDL Sale that are expected to save the company approximately $40 million annually. We exited the fiscal year building momentum in both government and satellite services. In Government Systems, the U.S. government resumed issuing certifications for new cybersecurity products, which drove significant YoY revenue growth in the quarter. We grew our in service IFC commercial fleet to 2,230 aircraft, added Etihad Airways as a new airline partner and expanded Delta Air Lines free Wi-Fi initiative, which increased bandwidth demand, and revenue, along with greater passenger engagement. We continued market testing and analysis of new ViaSat-3 era fixed broadband plans offering significantly higher speeds and more bandwidth per subscriber. Entering FY2024 we also welcomed a new member of our leadership team, K. Guru Gowrappan, who joins as President. Gurus previous position was CEO of Verizon Media, the former media division of Verizon that included Yahoo, AOL, Huffington Post, Techcrunch and other media brands. He is a highly accomplished leader with expertise in integrating large technology operations, operating scaled internet platforms and creating powerful global partnerships. Guru further strengthens a team already energized by the transformational opportunities afforded by our global mobility strategy and the pending Inmarsat acquisition. Reaching this vital inflection point has been long in the making, but our team is well-prepared and ready to deliver. Shareholder Letter | Q4 Fiscal Year 2023 1
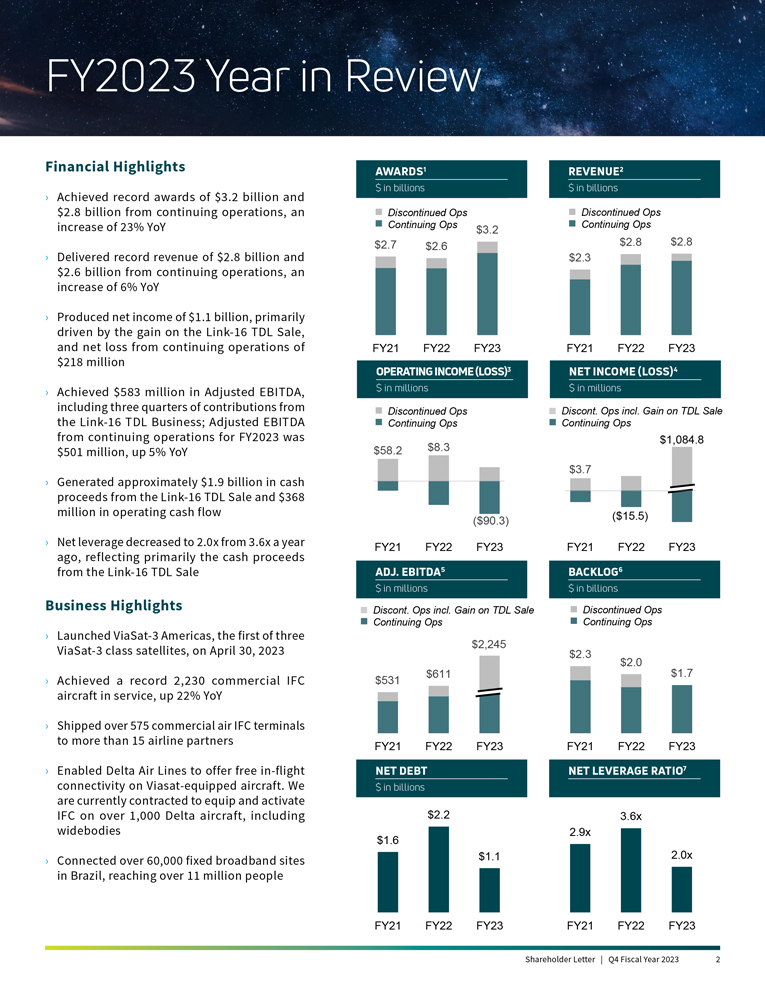
FY2023 Year in Review Financial Highlights AWARDS1 REVENUE2 $ in billions $ in billions Achieved record awards of $3.2 billion and $2.8 billion from continuing operations, an Discontinued Ops Discontinued Ops increase of 23% YoY Continuing Ops $3.2 Continuing Ops $2.7 $2.6 $2.8 $2.8 Achieved record revenue of $2.8 billion and $2.3 $2.6 billion from continuing operations, an increase of 6% YoY Produced net income of $1.1 billion, primarily driven by the gain on the Link-16 TDL Sale, and net loss from continuing operations of FY21 FY22 FY23 FY21 FY22 FY23 $218 million OPERATING INCOME (LOSS)3 NET INCOME (LOSS)4 Achieved $583 million in Adjusted EBITDA, $ in millions $ in millions including three quarters of contributions from Discontinued Ops Discont. Ops incl. Gain on TDL Sale the Link-16 TDL Business; Adjusted EBITDA Continuing Ops Continuing Ops from continuing operations for FY2023 was $1,084.8 $501 million, up 5% YoY $58.2 $8.3 $3.7 Generated approximately $1.9 billion in cash proceeds from the Link-16 TDL Sale and $368 million in operating cash flow ($15.5) ($90.3) Net leverage decreased to 2.0x from 3.6x a year FY21 FY22 FY23 FY21 FY22 FY23 ago, reflecting primarily the cash proceeds from the Link-16 TDL Sale ADJ. EBITDA5 BACKLOG6 $ in millions $ in billions Business Highlights Discont. Ops incl. Gain on TDL Sale Discontinued Ops Continuing Ops Continuing Ops Launched ViaSat-3 Americas, the first of three $2,245 ViaSat-3 class satellites, on April 30, 2023 $2.3 $2.0 $611 $1.7 Achieved a record 2,230 commercial IFC $531 aircraft in service, up 22% YoY Shipped over 575 commercial air IFC terminals to more than 15 airline partners FY21 FY22 FY23 FY21 FY22 FY23 Enabled Delta Air Lines to offer free in-flight NET DEBT NET LEVERAGE RATIO7 connectivity on Viasat-equipped aircraft. We $ in billions are currently contracted to equip and activate IFC on over 1,000 Delta aircraft, including $2.2 3.6x widebodies 2.9x $1.6 Connected over 60,000 fixed broadband sites $1.1 2.0x in Brazil, reaching over 11 million people FY21 FY22 FY23 FY21 FY22 FY23 Shareholder Letter|Q4 Fiscal Year 2023 2
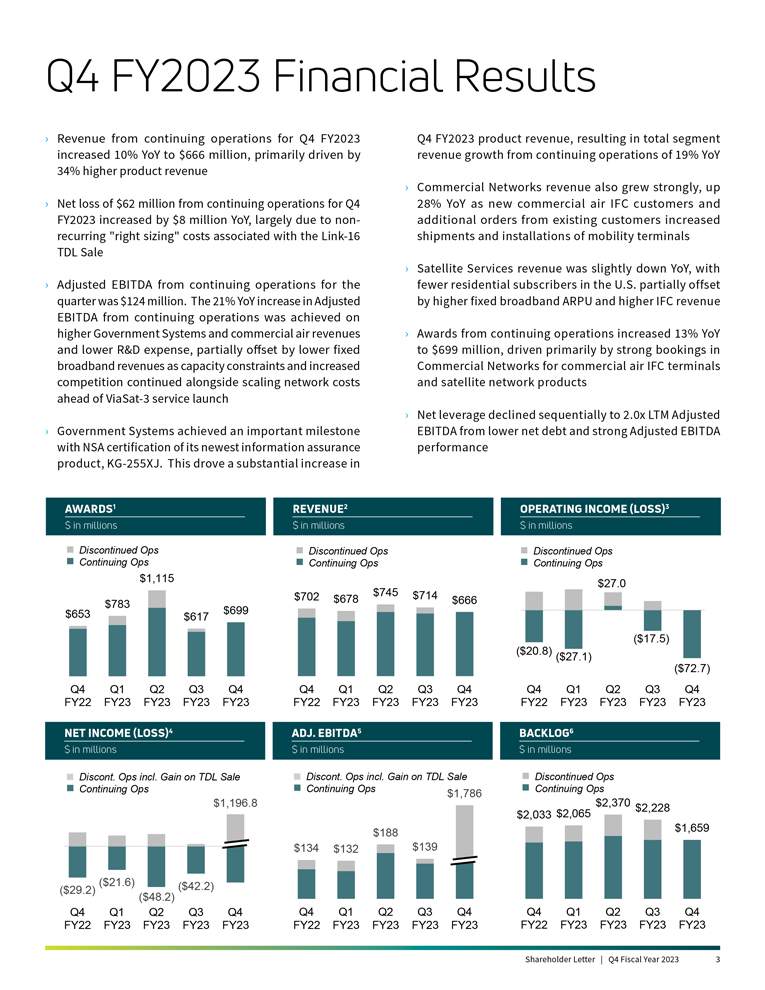
Q4 FY2023 Financial Results Revenue from continuing operations for Q4 FY2023 Q4 FY2023 product revenue, resulting in total segment increased 10% YoY to $666 million, primarily driven by revenue growth from continuing operations of 19% YoY 34% higher product revenue Commercial Networks revenue also grew strongly, up Net loss of $62 million from continuing operations for Q4 28% YoY as new commercial air IFC customers and FY2023 increased by $8 million YoY, largely due to non- additional orders from existing customers increased recurring restructuring costs associated with the Link-16 shipments and installations of mobility terminals TDL Sale Satellite Services revenue was slightly down YoY, with Adjusted EBITDA from continuing operations for the fewer residential subscribers in the U.S. partially offset quarter was $124 million. The 21% YoY increase in Adjusted by higher fixed broadband ARPU and higher IFC revenue EBITDA from continuing operations was achieved on higher government and commercial air revenues and lower Awards from continuing operations increased 13% YoY R&D expense, partially offset by lower fixed broadband to $699 million, driven primarily by strong bookings in revenues as capacity constraints and increased competition Commercial Networks for commercial air IFC terminals continued alongside scaling network costs ahead of ViaSat-3 and satellite network products service launch Net leverage declined sequentially to 2.0x LTM Adjusted Government Systems achieved an important milestone EBITDA from lower net debt and strong Adjusted EBITDA with NSA certification of its newest information assurance performance product, KG-255XJ. This drove a substantial increase in AWARDS1 REVENUE2 OPERATING INCOME (LOSS)3 $ in millions $ in millions $ in millions Discontinued Ops Discontinued Ops Discontinued Ops Continuing Ops Continuing Ops Continuing Ops $1,115 $27.0 $702 $745 $714 $783 $699 $678 $666 $653 $617 ($20.8) ($17.5) ($27.1) ($72.7) Q4 Q1 Q2 Q3 Q4 Q4 Q1 Q2 Q3 Q4 Q4 Q1 Q2 Q3 Q4 FY22 FY23 FY23 FY23 FY23 FY22 FY23 FY23 FY23 FY23 FY22 FY23 FY23 FY23 FY23 NET INCOME (LOSS)4 ADJ. EBITDA5 BACKLOG6 $ in millions $ in millions $ in millions Discont. Ops incl. Gain on TDL Sale Discont. Ops incl. Gain on TDL Sale Discontinued Ops Continuing Ops Continuing Ops $1,786 Continuing Ops $1,196.8 $2,370 $2,228 $2,033 $2,065 $188 $1,659 $134 $132 $139 ($21.6) ($42.2) ($29.2) ($48.2) Q4 Q1 Q2 Q3 Q4 Q4 Q1 Q2 Q3 Q4 Q4 Q1 Q2 Q3 Q4 FY22 FY23 FY23 FY23 FY23 FY22 FY23 FY23 FY23 FY23 FY22 FY23 FY23 FY23 FY23 Shareholder Letter | Q4 Fiscal Year 2023 3
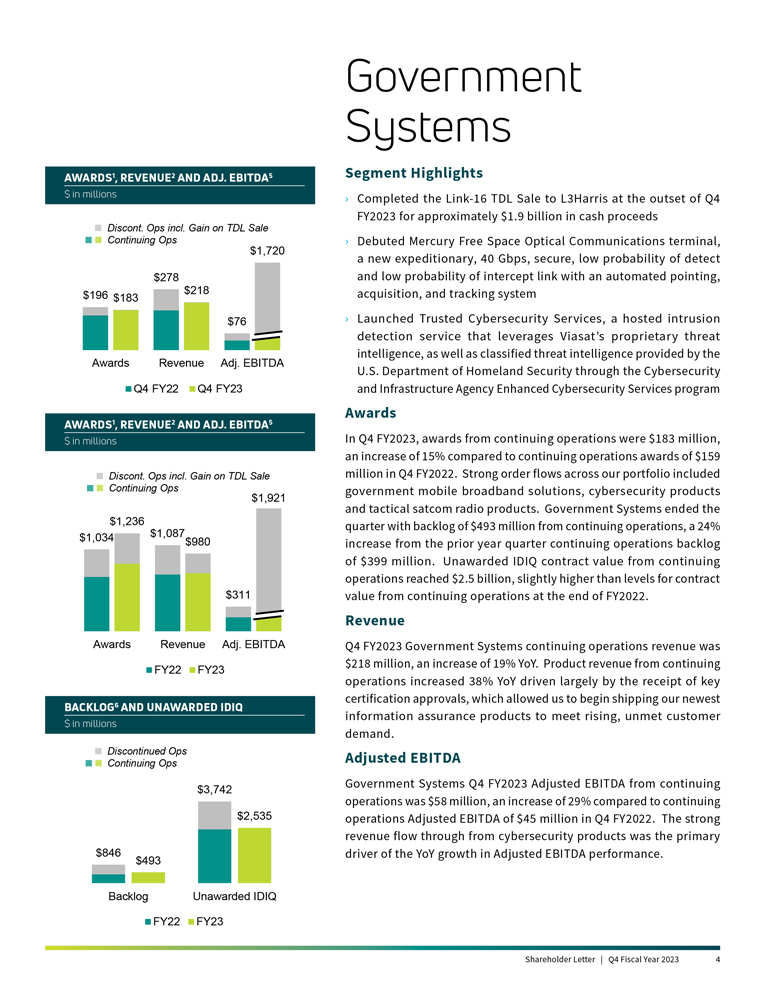
Government Systems AWARDS1, REVENUE2 AND ADJ. EBITDA5 Segment Highlights $ in millions Completed the Link-16 TDL Sale to L3Harris at the outset of Q4 FY2023 for approximately $1.9 billion in cash proceeds Discont. Ops incl. Gain on TDL Sale Continuing Ops $1,720 Debuted Mercury Free Space Optical Communications terminal, a new expeditionary, 40 Gbps, secure, low probability of detect $278 and low probability of intercept link with an automated pointing, $196 $218 acquisition, and tracking system $183 $76 Launched Trusted Cybersecurity Services, a hosted intrusion detection service that leverages Viasats proprietary threat intelligence, as well as classified threat intelligence provided by the Awards Revenue Adj. EBITDA U.S. Department of Homeland Security through the Cybersecurity Q4 FY22 Q4 FY23 and Infrastructure Agency Enhanced Cybersecurity Services program 1 2 5 Awards AWARDS , REVENUE AND ADJ. EBITDA $ in millions In Q4 FY2023, awards from continuing operations were $183 million, an increase of 15% compared to continuing operations awards of $159 Discont. Ops incl. Gain on TDL Sale million in Q4 FY2022. Strong order flows across our portfolio included Continuing Ops government mobile broadband solutions, cybersecurity products $1,921 and tactical satcom radio products. Government Systems ended the $1,236 $1,087 quarter with backlog of $493 million from continuing operations, a 24% $1,034 $980 increase from the prior year quarter continuing operations backlog of $399 million. Unawarded IDIQ contract value from continuing operations reached $2.5 billion, slightly higher than levels for contract $311 value from continuing operations at the end of FY2022. Revenue Awards Revenue Adj. EBITDA Q4 FY2023 Government Systems continuing operations revenue was $218 million, an increase of 19% YoY. Product revenue from continuing FY22 FY23 operations increased 38% YoY driven largely by the receipt of key certification approvals, which allowed us to begin shipping our newest BACKLOG6 AND UNAWARDED IDIQ information assurance products to meet rising, unmet customer $ in millions demand. Discontinued Ops Adjusted EBITDA Continuing Ops $3,742 Government Systems Q4 FY2023 Adjusted EBITDA from continuing operations was $58 million, an increase of 29% compared to continuing $2,535 operations Adjusted EBITDA of $45 million in Q4 FY2022. The strong revenue flow through from cybersecurity products was the primary $846 driver of the YoY growth in Adjusted EBITDA performance. $493 Backlog Unawarded IDIQ FY22 FY23 Shareholder Letter | Q4 Fiscal Year 2023 4
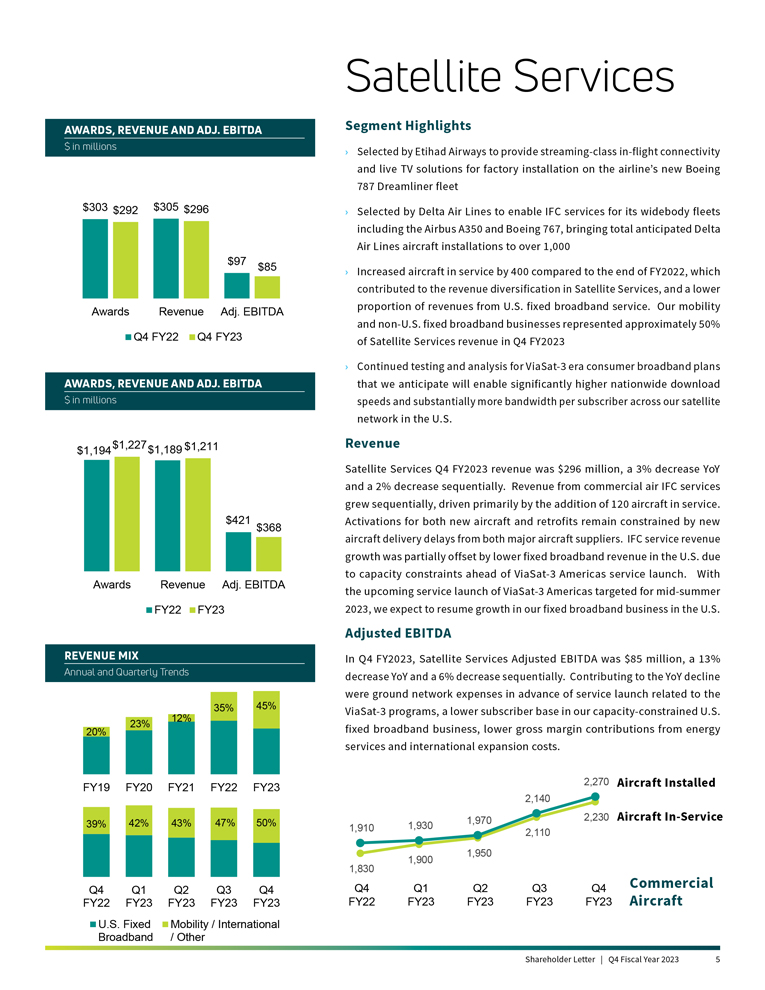
Satellite Services AWARDS, REVENUE AND ADJ. EBITDA Segment Highlights $ in millions Selected by Etihad Airways to provide streaming-class in-flight connectivity and live TV solutions for factory installation on the airlines new Boeing 787 Dreamliner fleet $303 $292 $305 $296 Selected by Delta Air Lines to enable IFC services for its widebody fleets including the Airbus A350 and Boeing 767, bringing total anticipated Delta Air Lines aircraft installations to over 1,000 $97 $85 Increased aircraft in service by 400 compared to the end of FY2022, which contributed to the revenue diversification in Satellite Services, and a lower Awards Revenue Adj. EBITDA proportion of revenues from U.S. fixed broadband service. Our mobility and non-U.S. fixed broadband businesses represented approximately 50% Q4 FY22 Q4 FY23 of Satellite Services revenue in Q4 FY2023 Continued testing and analysis for ViaSat-3 era consumer broadband plans AWARDS, REVENUE AND ADJ. EBITDA that we anticipate will enable significantly higher nationwide download $ in millions speeds and substantially more bandwidth per subscriber across our satellite network in the U.S. $1,227 $1,211 Revenue $1,194 $1,189 Satellite Services Q4 FY2023 revenue was $296 million, a 3% decrease YoY and a 2% decrease sequentially. Revenue from commercial air IFC services grew sequentially, driven primarily by the addition of 120 aircraft in service. $421 Activations for both new aircraft and retrofits remain constrained by new $368 aircraft delivery delays from both major aircraft suppliers. IFC service revenue growth was partially offset by lower fixed broadband revenue in the U.S. due to capacity constraints ahead of ViaSat-3 Americas service launch. With Awards Revenue Adj. EBITDA the upcoming service launch of ViaSat-3 Americas targeted for mid-summer FY22 FY23 2023, we expect to resume growth in our fixed broadband business in the U.S. Adjusted EBITDA REVENUE MIX In Q4 FY2023, Satellite Services Adjusted EBITDA was $85 million, a 13% Annual and Quarterly Trends decrease YoY and a 6% decrease sequentially. Contributing to the YoY decline were ground network expenses in advance of service launch related to the 35% 45% ViaSat-3 programs, a lower subscriber base in our capacity-constrained U.S. 12% 23% fixed broadband business, lower gross margin contributions from energy 20% services and international expansion costs. FY19 FY20 FY21 FY22 FY23 2,270 Aircraft Installed 2,140 1,970 2,230 Aircraft In-Service 39% 42% 43% 47% 50% 1,930 1,910 2,110 1,950 1,900 1,830 Q4 Q1 Q2 Q3 Q4 Commercial Q4 Q1 Q2 Q3 Q4 FY22 FY23 FY23 FY23 FY23 FY22 FY23 FY23 FY23 FY23 Aircraft U.S. Fixed Mobility / International Broadband / Other Shareholder Letter | Q4 Fiscal Year 2023 5
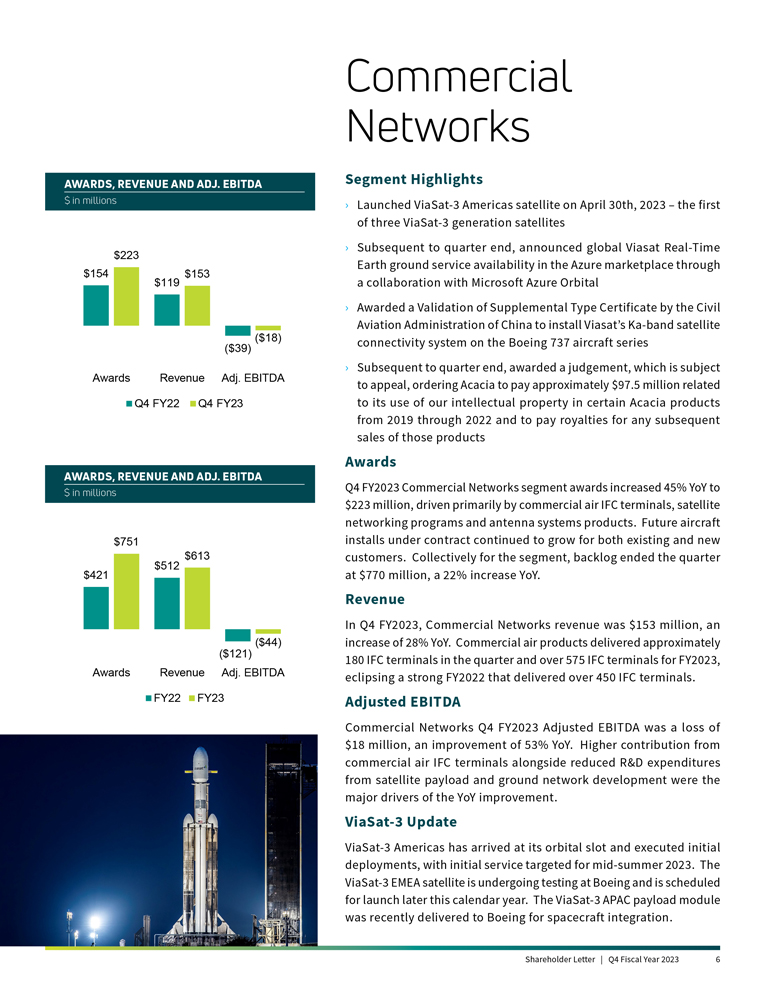
Commercial Networks AWARDS, REVENUE AND ADJ. EBITDA Segment Highlights $ in millions Launched ViaSat-3 Americas satellite on April 30th, 2023 the first of three ViaSat-3 generation satellites Subsequent to quarter end, announced global Viasat Real-Time $223 Earth ground service availability in the Azure marketplace through $154 $153 $119 a collaboration with Microsoft Azure Orbital Awarded a Validation of Supplemental Type Certificate by the Civil Aviation Administration of China to install Viasats Ka-band satellite ($18) connectivity system on the Boeing 737 aircraft series ($39) Subsequent to quarter end, awarded a judgement, which is subject Awards Revenue Adj. EBITDA to appeal, ordering Acacia to pay approximately $97.5 million related Q4 FY22 Q4 FY23 to its use of our intellectual property in certain Acacia products from 2019 through 2022 and to pay royalties for any subsequent sales of those products Awards AWARDS, REVENUE AND ADJ. EBITDA $ in millions Q4 FY2023 Commercial Networks segment awards increased 45% YoY to $223 million, driven primarily by commercial air IFC terminals, satellite networking programs and antenna systems products. Future aircraft $751 installs under contract continued to grow for both existing and new $613 customers. Collectively for the segment, backlog ended the quarter $512 $421 at $770 million, a 22% increase YoY. Revenue In Q4 FY2023, Commercial Networks revenue was $153 million, an ($121) ($44) increase of 28% YoY. Commercial air products delivered approximately 180 IFC terminals in the quarter and over 575 IFC terminals for FY2023, Awards Revenue Adj. EBITDA eclipsing a strong FY2022 that delivered over 450 IFC terminals. FY22 FY23 Adjusted EBITDA Commercial Networks Q4 FY2023 Adjusted EBITDA was a loss of $18 million, an improvement of 53% YoY. Higher contribution from commercial air IFC terminals alongside reduced R&D expenditures from satellite payload and ground network development were the major drivers of the YoY improvement. ViaSat-3 Update ViaSat-3 Americas has arrived at its orbital slot and executed initial deployments, with initial service targeted for mid-summer 2023. The ViaSat-3 EMEA satellite is undergoing testing at Boeing and is scheduled for launch later this calendar year. The ViaSat-3 APAC payload module was recently delivered to Boeing for spacecraft integration. Shareholder Letter | Q4 Fiscal Year 2023 6
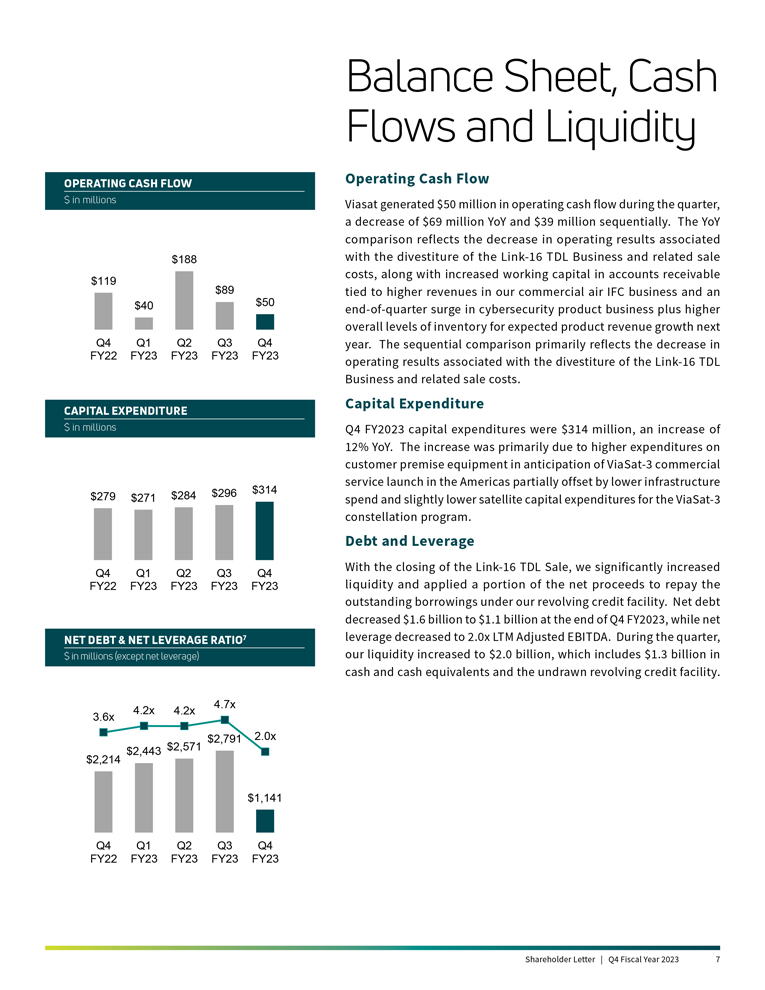
Balance Sheet, Cash Flows and Liquidity OPERATING CASH FLOW Operating Cash Flow $ in millions Viasat generated $50 million in operating cash flow during the quarter, a decrease of $69 million YoY and $39 million sequentially. The YoY comparison reflects the decrease in operating results associated $188 with the divestiture of the Link-16 TDL Business and related sale costs, along with increased working capital in accounts receivable $119 $89 $50 tied to higher revenues in our commercial air IFC business and an $40 end-of-quarter surge in cybersecurity product business plus higher overall levels of inventory for expected product revenue growth next Q4 Q1 Q2 Q3 Q4 year. The sequential comparison primarily reflects the decrease in FY22 FY23 FY23 FY23 FY23 operating results associated with the divestiture of the Link-16 TDL Business and related sale costs. Capital Expenditure CAPITAL EXPENDITURE $ in millions Q4 FY2023 capital expenditures were $314 million, an increase of 12% YoY. The increase was primarily due to higher expenditures on customer premise equipment in anticipation of ViaSat-3 commercial service launch in the Americas partially offset by lower infrastructure $284 $296 $314 $279 $271 spend and slightly lower satellite capital expenditures for the ViaSat-3 constellation program. Debt and Leverage With the closing of the Link-16 TDL Sale, we significantly increased Q4 Q1 Q2 Q3 Q4 FY22 FY23 FY23 FY23 FY23 liquidity and applied a portion of the net proceeds to repay the outstanding borrowings under our revolving credit facility. Net debt decreased $1.6 billion to $1.1 billion at the end of Q4 FY2023, while net NET DEBT & NET LEVERAGE RATIO7 leverage decreased to 2.0x LTM Adjusted EBITDA. During the quarter, $ in millions (except net leverage) our liquidity increased to $2.0 billion, which includes $1.3 billion in cash and cash equivalents and the undrawn revolving credit facility. 4.7x 4.2x 4.2x 3.6x $2,791 2.0x $2,443 $2,571 $2,214 $1,141 Q4 Q1 Q2 Q3 Q4 FY22 FY23 FY23 FY23 FY23 Shareholder Letter | Q4 Fiscal Year 2023 7
Outlook We ended FY2023 with several positive developments and increasing momentum across all of our businesses. Q4 FY2023 saw resolution of certain certification bottlenecks for encryption products, good growth in IFC aircraft in service, new IFC airline awards and implementation of non-recurring right sizing steps associated with the Link-16 TDL Sale. We anticipate commencing initial commercial service on ViaSat-3 Americas in mid-summer. ViaSat-3 EMEA is expected to launch later this calendar year and enter commercial service around the beginning of FY2025, due to a longer orbit-raising duration. For the full year FY2024 (on a stand-alone basis without giving effect to the pending Inmarsat acquisition) we expect Adjusted EBITDA from continuing operations to grow in the high single digits to low double digits YoY despite increasing global ViaSat-3 operating expenses ahead of entry into commercial service. Cash flow from continuing operations is also expected to improve YoY driven by Adjusted EBITDA growth and an improvement in working capital. FY2024 capital expenditures are anticipated to be flat compared to FY2023, with the final ViaSat-3 Americas launch related payments having shifted between the fiscal years. Our investment mix is expected to become more success-based as we return to net subscriber growth in our U.S. fixed broadband business over the course of FY2024. Finally, we expect net leverage to improve somewhat to what we communicated last quarter, at approximately ~3.7x at the end of FY2024, on a stand-alone basis (excluding effects of the Inmarsat transaction). We expect Q1 FY2024 to be impacted by launch-related costs for ViaSat-3 Americas, increased advertising and ground network expenses, seasonality in our government segment and IFC services and continued bandwidth constraints in U.S. fixed broadband prior to ViaSat-3 Americas entering commercial service. The quarterly profile of revenue and Adjusted EBITDA is expected to improve sequentially throughout the year due to expected equipment delivery and aircraft activations in IFC and resumption of net growth in the U.S. fixed broadband business, offset to some extent by expenses associated with additional ground network activation and the launch of ViaSat-3 EMEA. Longer term (on a stand-alone basis without giving effect to the pending Inmarsat acquisition), we expect to achieve faster growth in our continuing operations in FY2025, as we scale into the new ViaSat-3 constellation. We believe that we would achieve our stand-alone FY2025 target of doubling revenue and more than doubling continuing operations Adjusted EBITDA relative to FY2020. We would also expect to see capital expenditures continue to decline, with lower satellite-related investments partially offset by success-based expenditures. Our recent ViaSat-3 Americas launch was an important step towards a free cash flow turning point, which we target on a stand-alone basis shortly after ViaSat-3 EMEA enters commercial service. We anticipate providing additional information regarding our combined outlook, giving effect to the Inmarsat transaction next quarter assuming the transaction closes in the intervening time. Sincerely, Mark Dankberg Shareholder Letter | Q4 Fiscal Year 2023 8
Endnotes 1. Due to the consummation of the Link-16 TDL Sale at the outset of Q4 FY2023, awards include continuing and discontinued operations except for Q4 FY2023, which only includes continuing operations. 2. Due to the consummation of the Link-16 TDL Sale at the outset of Q4 FY2023, revenue includes both continuing and discontinued operations except for Q4 FY2023, which only includes continuing operations. Satellite Services and Commercial Networks revenue is not impacted by the discontinued operations. 3. Due to the consummation of the Link-16 TDL Sale at the outset of Q4 FY2023, operating income (loss) includes both continuing and discontinued operations except for Q4 FY2023, which only includes continuing operations. 4. Due to the consummation of the Link-16 TDL Sale at the outset of Q4 FY2023, net income (loss) as used herein is defined as net income (loss) attributable to Viasat, Inc. common stockholders, and includes net income (loss) from both continuing and discontinued operations. The Q4 FY2023 gain on the Link-16 Sale is included in discontinued operations. 5. A reconciliation of Adjusted EBITDA to net income (loss) attributable to Viasat, Inc. is provided at the end of this letter. Adjusted EBITDA includes Adjusted EBITDA from both continuing and discontinued operations. On the Satellite Services and Commercial Networks segment pages, Adjusted EBITDA is only applicable to continuing operations; however, for all three segments Adjusted EBITDA includes certain corporate and other indirect costs previously allocated to the discontinued operations that have been reallocated across all three segments for the periods presented. 6. Due to the consummation of the Link-16 TDL Sale at the outset of Q4 FY2023, backlog includes both continuing and discontinued operations except for FY2023, which only includes continuing operations. 7. Net leverage ratio is defined as principal amount of total debt less cash and cash equivalents divided by LTM Adjusted EBITDA. Shareholder Letter | Q4 Fiscal Year 2023 9
Forward Looking Statements This shareholder letter contains forward-looking statements regarding future events and our future results that are subject to the safe harbors created under the Securities Act of 1933 and the Securities Exchange Act of 1934. Forward-looking statements include, among others, statements that refer to satellite construction and launch activities, including expectations regarding completion, launch and deployment of our ViaSat-3 class satellites and capacity constraints prior to commencement of commercial service; the expected net cash proceeds, use of proceeds and other benefits of the Link-16 TDL Sale; the proposed acquisition of Inmarsat (the Inmarsat Transaction) and statements regarding the expected timing, financing and benefits thereof; the satisfaction of regulatory and other closing conditions to the Inmarsat Transaction; projections of earnings, revenue, net leverage, capital investments, costs, expected cost savings, or other financial items, including financial guidance and outlook and expectations for performance and results of operations for the remainder of FY2023 and beyond; the performance and anticipated benefits of our ViaSat-3 class satellites; anticipated trends in our business or key markets; the ability to capitalize on awards received and unawarded IDIQ contract vehicles; future economic conditions; the development, demand, customer acceptance and anticipated performance of technologies, products or services; our plans, objectives and strategies for future operations; international growth and expansion opportunities; statements regarding existing and prospective orders from current and new IFC customers; and other characterizations of future events or circumstances, are forward-looking statements. Readers are cautioned that these forward-looking statements are only predictions and are subject to risks, uncertainties and assumptions that are difficult to predict. Factors that could cause actual results to differ materially include: risks and uncertainties related to the Inmarsat Transaction, including the failure to obtain, or delays in obtaining, required regulatory approvals or clearances; the risk that any such approval may result in the imposition of conditions that could adversely affect us or the expected benefits of the Inmarsat Transaction; the failure to satisfy any of the closing conditions to the Inmarsat Transaction on a timely basis or at all; any adverse impact on our business as a result of uncertainty surrounding the Inmarsat Transaction or on the business of Inmarsat as a result of uncertainty surrounding the Inmarsat Transaction; the nature, cost and outcome of any legal proceedings related to the Inmarsat Transaction; the occurrence of any event, change or other circumstances that could give rise to the termination of the definitive agreement for the Inmarsat Transaction, including in circumstances requiring us to pay a termination fee with respect to the Inmarsat Transaction; the risk that our stock price may decline significantly if the Inmarsat Transaction is not consummated; the failure to obtain the necessary debt financing arrangements set forth in the commitment letters received in connection with the Inmarsat Transaction; risks that the Inmarsat Transaction disrupts current plans and operations or diverts managements attention from its ongoing business; the effect of the announcement of the Inmarsat Transaction on our ability to retain and hire key personnel and maintain relationships with our customers, suppliers and others with whom we do business; our ability to successfully integrate Inmarsat operations, technologies and employees; our ability to realize anticipated benefits and synergies of the Inmarsat Transaction, including the expectation of enhancements to our products and services, greater revenue or growth opportunities, operating efficiencies and cost savings; our ability to ensure continued performance and market growth of our business following the closing of the Inmarsat Transaction and Link-16 TDL Sale; our ability to realize the anticipated benefits of the ViaSat-3 class satellites and any future satellite we may construct or acquire; unexpected expenses related to our satellite projects; our ability to successfully implement our business plan for our broadband services on our anticipated timeline or at all; capacity constraints in our business in the lead-up to the launch of commercial services on our ViaSat-3 satellites; risks associated with the construction, launch and operation of satellites, including the effect of any anomaly, operational failure or degradation in satellite performance; the impact of the COVID-19 pandemic on our business, suppliers, consumers, customers, and employees or the overall economy; our ability to successfully develop, introduce and sell new technologies, products and services; audits by the U.S. Government; changes in the global business environment and economic conditions; delays in approving U.S. Government budgets and cuts in government defense expenditures; our reliance on U.S. Government contracts, and on a small number of contracts which account for a significant percentage of our revenues; reduced demand for products and services as a result of continued constraints on capital spending by customers; changes in relationships with, or the financial condition of, key customers or suppliers; our reliance on a limited number of third parties to manufacture and supply our products; increased competition; introduction of new technologies and other factors affecting the communications and defense industries generally; the effect of adverse regulatory changes (including changes affecting spectrum availability or permitted uses) on our ability to sell or deploy our products and services; changes in the way others use spectrum; our inability to access additional spectrum, use spectrum for additional purposes, and/or operate satellites at additional orbital locations; competing uses of the same spectrum or orbital locations that we utilize or seek to utilize; the effect of recent changes to U.S. tax laws; our level of indebtedness and ability to comply with applicable debt covenants; our involvement in litigation, including intellectual property claims and litigation to protect our proprietary technology; and our dependence on a limited number of key employees. In addition, please refer to the risk factors contained in our SEC filings available at www. sec.gov, including our most recent Annual Report on Form 10-K and Quarterly Reports on Form 10-Q. Readers are cautioned not to place undue reliance on any forward-looking statements, which speak only as of the date on which they are made. We undertake no obligation to revise or update any forward-looking statements for any reason. Shareholder Letter | Q4 Fiscal Year 2023 10
Use of Non-GAAP Financial Information To supplement Viasats consolidated financial statements presented in accordance with generally accepted accounting principles (GAAP), Viasat uses non-GAAP net income (loss) attributable to Viasat, Inc. and Adjusted EBITDA, measures Viasat believes are appropriate to enhance an overall understanding of Viasats past financial performance and prospects for the future. We believe the non-GAAP results provide useful information to both management and investors by excluding specific expenses that we believe are not indicative of our core operating results. In addition, since we have historically reported non-GAAP results to the investment community, we believe the inclusion of non-GAAP numbers provides consistency in our financial reporting and facilitates comparisons to Viasats historical operating results. Further, these non-GAAP results are among the primary indicators that management uses as a basis for evaluating the operating performance of our segments, allocating resources to such segments, planning and forecasting in future periods. The presentation of this additional information is not meant to be considered in isolation or as a substitute for measures of financial performance prepared in accordance with GAAP. A reconciliation of specific adjustments to GAAP results is provided in the tables below. Copyright © 2023 Viasat, Inc. All rights reserved. Viasat, the Viasat logo and the Viasat signal are registered trademarks of Viasat, Inc. All other product or company names mentioned are used for identification purposes only and may be trademarks of their respective owners. Shareholder Letter | Q4 Fiscal Year 2023 11
Viasat Fourth Quarter Fiscal Year 2023 Results
Financial Results
(In millions, except per share data) | Q4 FY23 | Q4 FY22 | Year-Over-Year Change |
FY23 | FY22 | Year-Over-Year Change |
||||||||||||||||||||||
Revenues from continuing operations |
$666.1 | $606.7 | 10% | $2,556.2 | $2,417.2 | 6% | ||||||||||||||||||||||
Revenues from discontinued operations |
| $95.0 | * | $247.1 | $370.5 | (33)% | ||||||||||||||||||||||
Total |
$666.1 | $701.7 | (5)% | $2,803.2 | $2,787.6 | 1% | ||||||||||||||||||||||
Net income (loss) (8) |
$1,196.8 | ($29.2) | * | $1,084.8 | ($15.5) | * | ||||||||||||||||||||||
Non-GAAP net income (loss) (1), (9) |
$13.3 | $4.8 | 177% | ($0.6) | $88.2 | * | ||||||||||||||||||||||
Adjusted EBITDA (9) |
$124.2 | $134.4 | (8)% | $583.2 | $611.2 | (5)% | ||||||||||||||||||||||
Diluted per share net income (loss) (1) |
$15.56 | ($0.39) | * | $14.29 | ($0.21) | * | ||||||||||||||||||||||
Non-GAAP diluted per share net income (loss) (1), (2) |
$0.17 | $0.06 | 183% | ($0.01) | $1.18 | * | ||||||||||||||||||||||
Fully diluted weighted average shares (2) |
76.9 | 74.6 | 3% | 75.9 | 73.4 | 3% | ||||||||||||||||||||||
New contract awards (3), (6) |
$699.0 | $652.9 | 7% | $3,213.4 | $2,648.5 | 21% | ||||||||||||||||||||||
Sales backlog from continuing operations (4) |
$1,658.9 | $1,585.4 | 5% | $1,658.9 | $1,585.4 | 5% | ||||||||||||||||||||||
Sales backlog from discontinued operations (4) |
| $447.3 | * | | $447.3 | * | ||||||||||||||||||||||
Total (4) |
$1,658.9 | $2,032.7 | ** | $1,658.9 | $2,032.7 | ** | ||||||||||||||||||||||
Segment Results |
|
|||||||||||||||||||||||||||
(In millions) |
Q4 FY23 | Q4 FY22 | |
Year-Over-Year Change |
|
FY23 | FY22 | |
Year-Over-Year Change |
|
||||||||||||||||||
Satellite Services |
||||||||||||||||||||||||||||
New contract awards (3) |
$292.3 | $303.1 | (4)% | $1,226.8 | $1,193.6 | 3% | ||||||||||||||||||||||
Revenues |
$295.7 | $304.9 | (3)% | $1,210.7 | $1,188.8 | 2% | ||||||||||||||||||||||
Operating profit (loss) (5), (7) |
($27.9) | ($4.2) | 572% | ($41.0) | $31.6 | * | ||||||||||||||||||||||
Adjusted EBITDA (7) |
$84.6 | $97.2 | (13)% | $368.3 | $420.6 | (12)% | ||||||||||||||||||||||
Commercial Networks |
||||||||||||||||||||||||||||
New contract awards |
$223.3 | $153.9 | 45% | $750.7 | $420.9 | 78% | ||||||||||||||||||||||
Revenues |
$152.6 | $119.0 | 28% | $612.6 | $512.1 | 20% | ||||||||||||||||||||||
Operating profit (loss) (5), (7) |
($54.9) | ($61.3) | (10)% | ($145.3) | ($209.1) | (31)% | ||||||||||||||||||||||
Adjusted EBITDA (7) |
($18.0) | ($38.8) | (53)% | ($44.5) | ($120.6) | (63)% | ||||||||||||||||||||||
Government Systems |
||||||||||||||||||||||||||||
New contract awards (6) |
$183.4 | $195.9 | (6)% | $1,235.9 | $1,034.0 | 20% | ||||||||||||||||||||||
Revenues from continuing operations |
$217.8 | $182.8 | 19% | $732.8 | $716.3 | 2% | ||||||||||||||||||||||
Revenues from discontinued operations |
| $95.0 | * | $247.1 | $370.5 | (33)% | ||||||||||||||||||||||
Total |
$217.8 | $277.8 | (22)% | $979.8 | $1,086.7 | (10)% | ||||||||||||||||||||||
Operating profit (loss) from continuing operations (5), (7) |
$17.6 | $24.7 | (29)% | $60.2 | $93.1 | (35)% | ||||||||||||||||||||||
Operating profit (loss) from discontinued operations (5) |
| $27.9 | * | $65.7 | $121.5 | (46)% | ||||||||||||||||||||||
Operating profit (loss) (5), (7) |
$17.6 | $52.5 | (67)% | $125.9 | $214.6 | (41)% | ||||||||||||||||||||||
Adjusted EBITDA (7), (9) |
$57.6 | $75.9 | (24)% | $259.3 | $311.3 | (17)% | ||||||||||||||||||||||
Adjusted EBITDA from continuing operations (7) |
$57.6 | $44.6 | 29% | $177.3 | $175.9 | 1% |
(1) | Attributable to Viasat, Inc. common stockholders. |
(2) | As the three and twelve months ended March 31, 2023 and March 31, 2022 financial information resulted in a net loss from continuing operations, the weighted average number of shares used to calculate basic and diluted net loss per share is the same, as diluted shares would be anti-dilutive. However, as the non-GAAP financial information for the three months ended March 31, 2023 and for the three and twelve months ended March 31, 2022 resulted in non-GAAP net income, 78.0 million, 75.5 million and 74.8 million, respectively, diluted weighted average number of shares were used instead to calculate non-GAAP diluted net income per share. |
(3) | Awards exclude future revenue under recurring consumer commitment arrangements. |
(4) | Amounts include certain backlog adjustments due to contract changes and amendments. Our backlog includes contracts with subscribers for fixed broadband services in our Satellite Services segment. Backlog does not include anticipated purchase orders and requests for the installation of in-flight connectivity systems or future recurring in-flight internet service revenues under our commercial in-flight internet agreements in our Commercial Networks and Satellite Services segments, respectively. |
(5) | Before corporate and amortization of acquired intangible assets. |
(6) | Amounts include awards from discontinued operations of $384.4 million for the twelve months ended March 31, 2023. |
(7) | These amounts were recasted to include certain corporate and other indirect costs previously allocated to the discontinued business that have been reallocated across all three segments for the periods presented. |
(8) | Net income (loss) as used herein is defined as net income (loss) attributable to Viasat, Inc. common stockholders, and includes net income (loss) from both continuing and discontinued operations. |
(9) | Amounts include both continuing and discontinued operations, excluding the Q4 FY2023 gain on the Link-16 TDL Sale. |
* | Percentage not meaningful. |
** | Amounts are not comparable due to the Link-16 TDL Sale. |
Shareholder Letter | Q4 Fiscal Year 2023 12
Viasat Fourth Quarter Fiscal Year 2023 Results (cont.)
Condensed Consolidated Statements of Operations
(Unaudited)
(In thousands, except per share data)
Three months ended | Twelve months ended | |||||||||||||||
March 31, 2023 | March 31, 2022 | March 31, 2023 | March 31, 2022 | |||||||||||||
Revenues: |
||||||||||||||||
Product revenues |
$ | 271,357 | $ | 202,371 | $ | 954,126 | $ | 860,726 | ||||||||
Service revenues |
394,742 | 404,376 | 1,602,032 | 1,556,453 | ||||||||||||
|
|
|
|
|
|
|
|
|
|
|
| |||||
Total revenues |
666,099 | 606,747 | 2,556,158 | 2,417,179 | ||||||||||||
Operating expenses: |
||||||||||||||||
Cost of product revenues |
207,968 | 164,405 | 736,446 | 699,549 | ||||||||||||
Cost of service revenues |
284,084 | 271,641 | 1,098,308 | 1,011,726 | ||||||||||||
Selling, general and administrative |
206,965 | 171,594 | 718,626 | 640,842 | ||||||||||||
Independent research and development |
32,298 | 39,877 | 128,923 | 149,474 | ||||||||||||
Amortization of acquired intangible assets |
7,476 | 7,870 | 29,811 | 28,729 | ||||||||||||
|
|
|
|
|
|
|
|
|
|
|
| |||||
Income (loss) from operations |
(72,692 | ) | (48,640 | ) | (155,956 | ) | (113,141 | ) | ||||||||
Interest (expense) income, net |
4,504 | (11,611 | ) | (7,297 | ) | (28,887 | ) | |||||||||
Other income, net |
| | 1,098 | 4,118 | ||||||||||||
|
|
|
|
|
|
|
|
|
|
|
| |||||
Income (loss) from continuing operations before income taxes |
(68,188 | ) | (60,251 | ) | (162,155 | ) | (137,910 | ) | ||||||||
(Provision for) benefit from income taxes from continuing operations |
9,627 | 14,551 | (49,418 | ) | 36,517 | |||||||||||
Equity in income (loss) of unconsolidated affiliates, net |
(13 | ) | (25 | ) | (66 | ) | (281 | ) | ||||||||
|
|
|
|
|
|
|
|
|
|
|
| |||||
Net income (loss) from continuing operations |
(58,574 | ) | (45,725 | ) | (211,639 | ) | (101,674 | ) | ||||||||
Net income (loss) from discontinued operations, net of tax |
1,258,342 | 24,070 | 1,302,387 | 99,191 | ||||||||||||
|
|
|
|
|
|
|
|
|
|
|
| |||||
Net income (loss) |
$ | 1,199,768 | $ | (21,655 | ) | $ | 1,090,748 | $ | (2,483 | ) | ||||||
|
|
|
|
|
|
|
|
|
|
|
| |||||
Less: net income (loss) attributable to noncontrolling interest, net of tax |
2,930 | 7,525 | 5,942 | 13,051 | ||||||||||||
|
|
|
|
|
|
|
|
|
|
|
| |||||
Net income (loss) attributable to Viasat, Inc. |
$ | 1,196,838 | $ | (29,180 | ) | $ | 1,084,806 | $ | (15,534 | ) | ||||||
|
|
|
|
|
|
|
|
|
|
|
| |||||
Diluted net income (loss) per share attributable to Viasat, Inc. common stockholders |
$ | 15.56 | $ | (0.39 | ) | $ | 14.29 | $ | (0.21 | ) | ||||||
|
|
|
|
|
|
|
|
|
|
|
| |||||
Diluted common equivalent shares (1) |
76,921 | 74,585 | 75,915 | 73,397 |
AN ITEMIZED RECONCILIATION BETWEEN NET INCOME (LOSS) ATTRIBUTABLE TO VIASAT, INC.
ON A GAAP BASIS AND NON-GAAP BASIS IS AS FOLLOWS:
(In thousands, except per share data) | Three months ended | Twelve months ended | ||||||||||||||
March 31, 2023 | March 31, 2022 | March 31, 2023 | March 31, 2022 | |||||||||||||
GAAP net income (loss) attributable to Viasat, Inc. |
$ | 1,196,838 | $ | (29,180 | ) | $ | 1,084,806 | $ | (15,534 | ) | ||||||
Amortization of acquired intangible assets |
7,476 | 7,870 | 29,811 | 28,729 | ||||||||||||
Stock-based compensation expense |
19,518 | 22,132 | 84,459 | 86,808 | ||||||||||||
Acquisition and transaction related expenses (2) |
53,416 | 14,613 | 93,548 | 33,965 | ||||||||||||
Gain on the Link-16 TDL Sale |
(1,661,891 | ) | | (1,661,891 | ) | | ||||||||||
Other income, net |
| | | (4,118 | ) | |||||||||||
Income tax effect (3) |
397,984 | (10,613 | ) | 368,692 | (41,649 | ) | ||||||||||
|
|
|
|
|
|
|
|
|
|
|
| |||||
Non-GAAP net income (loss) attributable to Viasat, Inc. (4) |
$ | 13,341 | $ | 4,822 | $ | (575 | ) | $ | 88,201 | |||||||
|
|
|
|
|
|
|
|
|
|
|
| |||||
Non-GAAP diluted net income (loss) per share attributable to Viasat, Inc. common stockholders |
$ | 0.17 | $ | 0.06 | $ | (0.01 | ) | $ | 1.18 | |||||||
|
|
|
|
|
|
|
|
|
|
|
| |||||
Diluted common equivalent shares (1) |
77,998 | 75,549 | 75,915 | 74,768 |
AN ITEMIZED RECONCILIATION BETWEEN NET INCOME (LOSS) ATTRIBUTABLE TO VIASAT, INC.
AND ADJUSTED EBITDA IS AS FOLLOWS:
(In thousands) | Three months ended | Twelve months ended | ||||||||||||||
March 31, 2023 | March 31, 2022 | March 31, 2023 | March 31, 2022 | |||||||||||||
GAAP net income (loss) attributable to Viasat, Inc. |
$ | 1,196,838 | $ | (29,180 | ) | $ | 1,084,806 | $ | (15,534 | ) | ||||||
Provision for (benefit from) income taxes |
393,922 | (10,768 | ) | 474,574 | (14,237 | ) | ||||||||||
Interest expense (income), net |
(4,504 | ) | 11,611 | 7,297 | 28,887 | |||||||||||
Depreciation and amortization |
126,897 | 125,959 | 500,377 | 495,447 | ||||||||||||
Stock-based compensation expense |
19,518 | 22,132 | 84,459 | 86,808 | ||||||||||||
Acquisition and transaction related expenses (2) |
53,416 | 14,613 | 93,548 | 33,965 | ||||||||||||
Gain on the Link-16 TDL Sale |
(1,661,891 | ) | | (1,661,891 | ) | | ||||||||||
Other income, net |
| | | (4,118 | ) | |||||||||||
|
|
|
|
|
|
|
|
|
|
|
| |||||
Adjusted EBITDA (4) |
$ | 124,196 | $ | 134,367 | $ | 583,170 | $ | 611,218 | ||||||||
|
|
|
|
|
|
|
|
|
|
|
|
(1) | As the three and twelve months ended March 31, 2023 and March 31, 2022 financial information resulted in a net loss from continuing operations, the weighted average number of shares used to calculate basic and diluted net loss per share is the same, as diluted shares would be anti-dilutive. However, as the non-GAAP financial information for the three months ended months ended March 31, 2023 and for the three and twelve months ended March 31, 2022 resulted in non-GAAP net income, diluted weighted average number of shares were used instead to calculate non-GAAP diluted net income per share. |
(2) | Costs typically consist of acquisition, integration, and disposition related costs. |
(3) | The income tax effect is calculated using the tax rate applicable for the non-GAAP adjustments. |
(4) | Amounts include both continuing and discontinued operations, excluding the Q4 FY2023 gain on the Link-16 TDL Sale. |
AN ITEMIZED RECONCILIATION BETWEEN NET INCOME (LOSS) ATTRIBUTABLE TO VIASAT, INC.
AND ADJUSTED EBITDA FROM CONTINUING OPERATIONS IS AS FOLLOWS:
(In thousands) | Three months ended | Twelve months ended | ||||||||||||||
March 31, 2023 | March 31, 2022 | March 31, 2023 | March 31, 2022 | |||||||||||||
GAAP net income (loss) from continuing operations attributable to Viasat, Inc. |
$ | (61,504 | ) | $ | (53,250 | ) | $ | (217,581 | ) | $ | (114,725 | ) | ||||
Provision for (benefit from) income taxes |
(9,627 | ) | (14,551 | ) | 49,418 | (36,517 | ) | |||||||||
Interest expense (income), net |
(4,504 | ) | 11,611 | 7,297 | 28,887 | |||||||||||
Depreciation and amortization |
126,897 | 122,949 | 493,571 | 483,341 | ||||||||||||
Stock-based compensation expense |
19,518 | 21,687 | 82,112 | 84,981 | ||||||||||||
Acquisition and transaction related expenses (2) |
53,416 | 14,613 | 86,296 | 33,965 | ||||||||||||
Other income, net |
| | | (4,118 | ) | |||||||||||
|
|
|
|
|
|
|
|
|
|
|
| |||||
Adjusted EBITDA from continuing operations |
$ | 124,196 | $ | 103,059 | $ | 501,113 | $ | 475,814 | ||||||||
|
|
|
|
|
|
|
|
|
|
|
|
AN ITEMIZED RECONCILIATION BETWEEN NET INCOME (LOSS) ATTRIBUTABLE TO VIASAT, INC.
AND ADJUSTED EBITDA FROM DISCONTINUED OPERATIONS IS AS FOLLOWS:
(In thousands) | Three months ended | Twelve months ended | ||||||||||||||
March 31, 2023 | March 31, 2022 | March 31, 2023 | March 31, 2022 | |||||||||||||
GAAP net income (loss) from discontinued operations attributable to Viasat, Inc. |
$ | 1,258,342 | $ | 24,070 | $ | 1,302,387 | $ | 99,191 | ||||||||
Provision for (benefit from) income taxes |
403,549 | 3,783 | 425,156 | 22,280 | ||||||||||||
Interest expense (income), net |
| | | | ||||||||||||
Depreciation and amortization |
| 3,010 | 6,806 | 12,106 | ||||||||||||
Stock-based compensation expense |
| 445 | 2,347 | 1,827 | ||||||||||||
Acquisition and transaction related expenses (2) |
| | 7,252 | | ||||||||||||
Gain on the Link-16 TDL Sale |
(1,661,891 | ) | | (1,661,891 | ) | | ||||||||||
Other income, net |
| | | | ||||||||||||
|
|
|
|
|
|
|
|
|
|
|
| |||||
Adjusted EBITDA from discontinued operations |
$ | | $ | 31,308 | $ | 82,057 | $ | 135,404 | ||||||||
|
|
|
|
|
|
|
|
|
|
|
|
Shareholder Letter | Q4 Fiscal Year 2023 13
Viasat Fourth Quarter Fiscal Year 2023 Results (cont.)
AN ITEMIZED RECONCILIATION BETWEEN SEGMENT OPERATING PROFIT (LOSS) FROM CONTINUING OPERATIONS BEFORE
CORPORATE AND AMORTIZATION OF ACQUIRED INTANGIBLE ASSETS AND ADJUSTED EBITDA IS AS FOLLOWS:
(In thousands)
Three months ended March 31, 2023 | Three months ended March 31, 2022 | |||||||||||||||||||||||||||||||
Satellite Services |
Commercial Networks |
Government Systems |
Total | Satellite Services |
Commercial Networks |
Government Systems |
Total | |||||||||||||||||||||||||
Segment operating profit (loss) before corporate and amortization of acquired intangible assets |
$ | (27,903 | ) | $ | (54,877 | ) | $ | 17,564 | $ | (65,216 | ) | $ | (4,155 | ) | $ | (61,293 | ) | $ | 24,678 | $ | (40,770 | ) | ||||||||||
Depreciation (5) |
77,874 | 11,309 | 12,749 | 101,932 | 76,234 | 11,676 | 12,596 | 100,506 | ||||||||||||||||||||||||
Stock-based compensation expense |
6,719 | 6,755 | 6,044 | 19,518 | 7,783 | 8,393 | 5,511 | 21,687 | ||||||||||||||||||||||||
Other amortization |
7,863 | 3,622 | 6,004 | 17,489 | 8,628 | 2,460 | 3,485 | 14,573 | ||||||||||||||||||||||||
Acquisition and transaction related expenses (2) |
20,128 | 15,149 | 18,139 | 53,416 | 8,799 | | 5,814 | 14,613 | ||||||||||||||||||||||||
Other income, net |
| | | | | | | | ||||||||||||||||||||||||
Equity in income (loss) of unconsolidated affiliates, net |
(13 | ) | | | (13 | ) | (25 | ) | | | (25 | ) | ||||||||||||||||||||
Noncontrolling interest |
(60 | ) | | (2,870 | ) | (2,930 | ) | (60 | ) | | (7,465 | ) | (7,525 | ) | ||||||||||||||||||
|
|
|
|
|
|
|
|
|
|
|
|
|
|
|
|
|
|
|
|
|
|
|
| |||||||||
Adjusted EBITDA from continuing operations |
$ | 84,608 | $ | (18,042 | ) | $ | 57,630 | $ | 124,196 | $ | 97,204 | $ | (38,764 | ) | $ | 44,619 | $ | 103,059 | ||||||||||||||
|
|
|
|
|
|
|
|
|
|
|
|
|
|
|
|
|
|
|
|
|
|
|
| |||||||||
Adjusted EBITDA from discontinued operations (6) |
| | | | | | 31,308 | 31,308 | ||||||||||||||||||||||||
|
|
|
|
|
|
|
|
|
|
|
|
|
|
|
|
|
|
|
|
|
|
|
| |||||||||
Adjusted EBITDA (6) |
$ | 84,608 | $ | (18,042 | ) | $ | 57,630 | $ | 124,196 | $ | 97,204 | $ | (38,764 | ) | $ | 75,927 | $ | 134,367 | ||||||||||||||
|
|
|
|
|
|
|
|
|
|
|
|
|
|
|
|
|
|
|
|
|
|
|
| |||||||||
Twelve months ended March 31, 2023 | Twelve months ended March 31, 2022 | |||||||||||||||||||||||||||||||
Satellite Services |
Commercial Networks |
Government Systems |
Total | Satellite Services |
Commercial Networks |
Government Systems |
Total | |||||||||||||||||||||||||
Segment operating profit (loss) before corporate and amortization of acquired intangible assets |
$ | (41,045 | ) | $ | (145,319 | ) | $ | 60,219 | $ | (126,145 | ) | $ | 31,559 | $ | (209,093 | ) | $ | 93,122 | $ | (84,412 | ) | |||||||||||
Depreciation (5) |
309,889 | 44,939 | 48,827 | 403,655 | 300,848 | 47,265 | 48,863 | 396,976 | ||||||||||||||||||||||||
Stock-based compensation expense |
28,560 | 27,844 | 25,708 | 82,112 | 32,016 | 31,105 | 21,860 | 84,981 | ||||||||||||||||||||||||
Other amortization |
31,567 | 11,303 | 17,235 | 60,105 | 33,208 | 10,091 | 14,337 | 57,636 | ||||||||||||||||||||||||
Acquisition and transaction related expenses (2) |
39,639 | 15,672 | 30,985 | 86,296 | 23,430 | | 10,535 | 33,965 | ||||||||||||||||||||||||
Other income, net |
| 1,098 | | 1,098 | | | | | ||||||||||||||||||||||||
Equity in income (loss) of unconsolidated affiliates, net |
(66 | ) | | | (66 | ) | (281 | ) | | | (281 | ) | ||||||||||||||||||||
Noncontrolling interest |
(240 | ) | | (5,702 | ) | (5,942 | ) | (220 | ) | | (12,831 | ) | (13,051 | ) | ||||||||||||||||||
|
|
|
|
|
|
|
|
|
|
|
|
|
|
|
|
|
|
|
|
|
|
|
| |||||||||
Adjusted EBITDA from continuing operations |
$ | 368,304 | $ | (44,463 | ) | $ | 177,272 | $ | 501,113 | $ | 420,560 | $ | (120,632 | ) | $ | 175,886 | $ | 475,814 | ||||||||||||||
|
|
|
|
|
|
|
|
|
|
|
|
|
|
|
|
|
|
|
|
|
|
|
| |||||||||
Adjusted EBITDA from discontinued operations (6) |
| | 82,057 | 82,057 | | | 135,404 | 135,404 | ||||||||||||||||||||||||
|
|
|
|
|
|
|
|
|
|
|
|
|
|
|
|
|
|
|
|
|
|
|
| |||||||||
Adjusted EBITDA (6) |
$ | 368,304 | $ | (44,463 | ) | $ | 259,329 | $ | 583,170 | $ | 420,560 | $ | (120,632 | ) | $ | 311,290 | $ | 611,218 | ||||||||||||||
|
|
|
|
|
|
|
|
|
|
|
|
|
|
|
|
|
|
|
|
|
|
|
|
(5) | Depreciation expenses not specifically recorded in a particular segment have been allocated based on other indirect allocable costs, which management believes is a reasonable method. |
(6) | A reconciliation of Adjusted EBITDA and Adjusted EBITDA from discontinued operations is presented on the previous pages. |
Shareholder Letter | Q4 Fiscal Year 2023 14
Viasat Fourth Quarter Fiscal Year 2023 Results (cont.)
Condensed Consolidated Balance Sheets
(Unaudited)
(In thousands)
As of | As of | |||||||
Assets | March 31, 2023 | March 31, 2022 | ||||||
Current assets: |
||||||||
Cash and cash equivalents |
$ | 1,348,854 | $ | 310,459 | ||||
Restricted cash |
30,532 | | ||||||
Accounts receivable, net |
419,934 | 312,172 | ||||||
Inventories |
268,563 | 197,864 | ||||||
Prepaid expenses and other current assets |
176,629 | 141,386 | ||||||
Current asset of discontinued operations |
| 197,591 | ||||||
|
|
|
|
|
| |||
Total current assets |
2,244,512 | 1,159,472 | ||||||
Property, equipment and satellites, net |
4,378,283 | 3,704,991 | ||||||
Operating lease right-of-use assets |
281,757 | 343,339 | ||||||
Other acquired intangible assets, net |
201,205 | 236,043 | ||||||
Goodwill |
158,542 | 168,710 | ||||||
Other assets |
466,038 | 699,280 | ||||||
Non-current assets of discontinued operations |
| 77,511 | ||||||
|
|
|
|
|
| |||
Total assets |
$ | 7,730,337 | $ | 6,389,346 | ||||
|
|
|
|
|
|
As of | As of | |||||||
Liabilities and Equity | March 31, 2023 | March 31, 2022 | ||||||
Current liabilities: |
||||||||
Accounts payable |
$ | 271,548 | $ | 200,673 | ||||
Accrued and other liabilities |
647,232 | 482,564 | ||||||
Current portion of long-term debt |
37,939 | 34,911 | ||||||
Current liabilities of discontinued operations |
| 52,273 | ||||||
|
|
|
|
|
| |||
Total current liabilities | 956,719 | 770,421 | ||||||
Senior notes |
1,689,186 | 1,686,225 | ||||||
Other long-term debt |
732,315 | 764,991 | ||||||
Non-current operating lease liabilities |
273,006 | 316,178 | ||||||
Other liabilities |
218,542 | 153,156 | ||||||
Non-current liabilities of discontinued operations |
| 15,781 | ||||||
|
|
|
|
|
| |||
Total liabilities | 3,869,768 | 3,706,752 | ||||||
|
|
|
|
|
| |||
Total Viasat, Inc. stockholders equity |
3,824,310 | 2,633,866 | ||||||
Noncontrolling interest in subsidiary |
36,259 | 48,728 | ||||||
|
|
|
|
|
| |||
Total equity | 3,860,569 | 2,682,594 | ||||||
|
|
|
|
|
| |||
Total liabilities and equity | $ | 7,730,337 | $ | 6,389,346 | ||||
|
|
|
|
|
|
Shareholder Letter | Q4 Fiscal Year 2023 15
Viasat Financial Reconciliation Prior Periods
AN ITEMIZED RECONCILIATION BETWEEN NET INCOME (LOSS) ATTRIBUTABLE TO VIASAT, INC.
AND ADJUSTED EBITDA IS AS FOLLOWS:
(In thousands) | Three months ended | Twelve Months Ended | ||||||||||||||
December 31, 2022 | September 30, 2022 | June 30, 2022 | March 31, 2021 | |||||||||||||
GAAP net income (loss) attributable to Viasat, Inc. |
$ | (42,228 | ) | $ | (48,240 | ) | $ | (21,564 | ) | $ | 3,691 | |||||
Provision for (benefit from) income taxes |
14,656 | 76,758 | (10,762 | ) | 9,441 | |||||||||||
Interest expense (income), net |
8,222 | (2,171 | ) | 5,750 | 32,247 | |||||||||||
Depreciation and amortization |
124,993 | 124,400 | 124,087 | 397,102 | ||||||||||||
Stock-based compensation expense |
21,135 | 22,574 | 21,232 | 84,879 | ||||||||||||
Acquisition and transaction related expenses (1) |
12,113 | 14,947 | 13,072 | 3,328 | ||||||||||||
Other income, net |
| | | | ||||||||||||
|
|
|
|
|
|
|
|
|
|
|
| |||||
Adjusted EBITDA (2) |
$ | 138,891 | $ | 188,268 | $ | 131,815 | $ | 530,688 | ||||||||
|
|
|
|
|
|
|
|
|
|
|
| |||||
AN ITEMIZED RECONCILIATION BETWEEN NET INCOME (LOSS) ATTRIBUTABLE TO VIASAT, INC. AND ADJUSTED EBITDA FROM CONTINUING OPERATIONS IS AS FOLLOWS: |
| |||||||||||||||
(In thousands) | Three months ended | Twelve Months Ended | ||||||||||||||
December 31, 2022 | September 30, 2022 | June 30, 2022 | March 31, 2021 | |||||||||||||
GAAP net income (loss) from continuing operations attributable to Viasat, Inc. |
$ | (46,561 | ) | $ | (70,427 | ) | $ | (39,089 | ) | $ | (79,860 | ) | ||||
Provision for (benefit from) income taxes |
5,212 | 76,646 | (22,813 | ) | (11,194 | ) | ||||||||||
Interest expense (income), net |
8,222 | (2,171 | ) | 5,750 | 32,247 | |||||||||||
Depreciation and amortization |
124,993 | 121,024 | 120,657 | 387,126 | ||||||||||||
Stock-based compensation expense |
20,455 | 21,875 | 20,264 | 82,128 | ||||||||||||
Acquisition and transaction related expenses (1) |
9,815 | 9,993 | 13,072 | 3,328 | ||||||||||||
Other income, net |
| | | | ||||||||||||
|
|
|
|
|
|
|
|
|
|
|
| |||||
Adjusted EBITDA from continuing operations |
$ | 122,136 | $ | 156,940 | $ | 97,841 | $ | 413,775 | ||||||||
|
|
|
|
|
|
|
|
|
|
|
|
AN ITEMIZED RECONCILIATION BETWEEN NET INCOME (LOSS) ATTRIBUTABLE TO VIASAT, INC. AND ADJUSTED EBITDA FROM DISCONTINUED OPERATIONS IS AS FOLLOWS: |
| |||||||||||||||
(In thousands) | Three months ended | Twelve Months Ended | ||||||||||||||
December 31, 2022 | September 30, 2022 | June 30, 2022 | March 31, 2021 | |||||||||||||
GAAP net income (loss) from discontinued operations attributable to Viasat, Inc. |
$ | 4,333 | $ | 22,187 | $ | 17,525 | $ | 83,551 | ||||||||
Provision for (benefit from) income taxes |
9,444 | 112 | 12,051 | 20,635 | ||||||||||||
Interest expense (income), net |
| | | | ||||||||||||
Depreciation and amortization |
| 3,376 | 3,430 | 9,976 | ||||||||||||
Stock-based compensation expense |
680 | 699 | 968 | 2,751 | ||||||||||||
Acquisition and transaction related expenses (1) |
2,298 | 4,954 | | | ||||||||||||
Other income, net |
| | | | ||||||||||||
|
|
|
|
|
|
|
|
|
|
|
| |||||
Adjusted EBITDA from discontinued operations |
$ | 16,755 | $ | 31,328 | $ | 33,974 | $ | 116,913 | ||||||||
|
|
|
|
|
|
|
|
|
|
|
|
(1) | Costs typically consist of acquisition, integration, and disposition related costs. |
(2) | Amounts include Adjusted EBITDA from both continuing and discontinued operations. |
Shareholder Letter | Q4 Fiscal Year 2023 16
3Y^27?(E#4XN4Z9G083&K8-%7UN07TMQ*]K%77'WWB83J>;%L2V
M(DMNV-#N])$SKLLK)EH&DGU
M,++M5P'BF-R7D?%'!?
U_5EB_V]-_HT7^/,L[O
M/^7]G_Q&Y_FK-:Y=7I8(FB)HB:(FB)HB:(FB)HB:(FB)HB:(FB)HB:(FB)HB
M:(FB)HB:(FB)HB:(FB)HB:(FB)HB:(FB)HB:(FB)HB:(FB)HB:(FB)HB:(FB
M)HB:(FB)HB:(FB)HB:(FB)HB:(FB)HB:(FB)HB:(FB)HB:(FB)HB:(FB+8O$
M_P D5?\ _678I_T4LOU9?_4 _P!$/\XU9X/^6[O^+-_F9%KHU>E@::(FB)HB
M:(FB)HB:(FB)HB:(FB+?E_FU/^5.PG_Z2W-/_P !JK6)[R_V,?W[?OK<'1/_
M .\V_P"1D_Q'+]%N\_W%N/\ WEV'_BCVM2L]8>E=?S?HG?O3]Y?CY,Y&R./5Q;S,\KQ:/97]I'I*N+25+4N<9
MBXX-=4PF8[7Q!ML43RU7P:MJ5K$(;>9[(AP . J:G[I*Q^_VGMO5+IU[J%G!
M+=/IF
*[]O:)8]T-EV_.=Y.
M-8!C'%K/89\QQID"Y!BMO+A%Z$7(VB&LKHE/9W<81>FU\4I4.+*4QCOFRH
M"&K+X68NG>P%QM:X9A0CN[P.1./:NK]"=K#M+B^OF1LU0"C\AJTT^5A@">8!
M(KP-#025U2*[K\Y?_.*N]>)W3]\DKBO$7Y9\;]I4&ZXHAE(9DQ0MN3IMDQ+Y
M6NV8LH&G0C19];!IF34>EX:DGVU)IX%7;FT=--EIWGR?I9Z.]#:>$?!C_"IR
M7'?63
U5/$]7LC )31TQ]->E4547;>XZ=KMAJCW,M'
M$N8*FH(P]\+&MR[!W#M6&*?58VMCE<6MH]CL13"C7$\U=O>4.%L\QSDSCNXI>(JZHS/$9[=KCMK+Q_B?#Z6Y;K;-E/;S@@6L-V.;C2
MDWZC9(A+MK9^V+>>UT>*&X:62@NJ#Q%7N/WERIU3U&QU7>=U>:=*R:U<(P'-
M-6FD,;30\Z$$>\M2NL@6NEL:Y"_R3G:Q_P ^WN^_Y&>U_5EB_P!O3?Z-%_CS
M+.[S_E_9_P#$;G^:LUKEU>E@B:(FB)HB:(FB)HB:(FB)HB:(FB)HB:(FB)HB
M:(FB)HB:(FB)HB:(FB)HB:(FB)HB:(FB)HB:(FB)HB:(FB)HB:(FB)HB:(FB
M)HB:(FB)HB:(FB)HB:(FB)HB:(FB)HB:(FB)HB:(FB)HB:(FB)HB:(FB)HB:
M(MB\3_)%7_\ UEV*?]%++]67_P!0#_1#_.-6>#_EN[_BS?YF1:Z-7I8&FB)H
MB:(FB)HB:(FB)HB:(FB)HB:(FB+PJ(2;*B*B^:*FZ+_H+HH@D&HXKX^UC?UN
MQ_WIO_6Z\Y6]@4SSY_GN^$KZ VVVFS8 "+\ $13^8*)J( '!>7/>_%Y)/>:K
M(O$_*_(O!G)&&\O<2Y;;X+R/@%W&R#%,II'_ $)U981NH2$A(3CS:^?&,X\N
M(^#D:9%=<9> VS(5E7%O#=0N@N&AT3A0@^[_ *.(59INI7ND7L>H:?(Z*[B=
MF:X<01]_L(-014$$$A9&[HNZOG;O*YE@B:(FB)HB:
M(FB)HB:(FB)HB:(FB)HB:(FB)HB:(FB)HB:(FB)HB:(FB)HB:(FB)HB:(FB)
MHB:(FB)HB:(FB)HB:(FB)HB:(FB)HB:(FB)HB:(FB)HB:(FB)HB:(FB)HB:(
MFB)HB:(FB)HB:(FB)HB:(FB)HB:(MB\3_)%7_P#UEV*?]%++]67_ -0#_1#_
M #C5G@_Y;N_XLW^9D6NC5Z6!JI4O^[5-_P"]BK_\?CZ\/]0^A3H/TS?2OT2?
M\X![WNYCL:[<>W[.>V+D%CCS)\TYB (Y<,_'V^/LBN@@C$R^ENX<
M54LJ]ISU6@!U>GIZNE51=2;6TVSU.\EBO&9V-948D8U[B%V-U8W-K.U]%MKO
M1I?*GDGRN.5CJC+6E'M<./8*KJC_ /L0C]6O_"
Z,5]-,?
MNU6F=Z:7'HVZ+W3H0!#'._*!R87$L'O-HH;ZN2Q9;&N0O\DYVL?\^WN^_P"1
MGM?U98O]O3?Z-%_CS+.[S_E_9_\ $;G^:LUKEU>E@B:(FB)HB:(FB)HB:(FB
M)HB:(FB)HB:(FB)HB:(FB)HB:(FB)HB:(FB)HB:(FB)HB:(FB)HB:(FB)HB:
M(FB)HB:(FB)HB:(FB)HB:(FB)HB:(FB)HB:(FB)HB:(FB)HB:(FB)HB:(FB)
MHB:(FB)HB:(FB)HB:(MB\3_)%7__ %EV*?\ 12R_5E_]0#_1#_.-6>#_ );N
M_P"+-_F9%KHU>E@:J5+_ +M4W_O8J_\ Q^/KP_U#Z%.@_3-]*[S7^=;?_$B=
MJO\ SAG_ /DIR_6LMC_[1F_R7_6"ZGZ\?_;EG_I/_4*Z*>MH+E)-$31$T1-$
M31%VN/\ -./_ (IWNR_^D/A?_*">L"WW_P#*P?Y0_>*Z$Z!_[2O?\A_UV+2G
M]6G_ "FO?-_SC,\_\8CZR3;_ /L>W_R3?O!:RZB__>FH?Z3)_CN6O/5Y6$)H
MB:(M]?T6/HX9+]03.8W,O,M?;8UV?8'>(U<31616V?-V1U;PE(X^P^8"M2&,
M\#T]*_0^C6V?*BR3;EN6\>;G=IX$0L-27"QM6V-I':L)+6- J>=!18YK^KR:]J\^K3
M-:R2>1SR!6@S$FF)/;VK!VJM6=-$6_/L0_S@#G;L+[:,,[9,)X!XCSS&\*M<
MPM(&391?YC67DTLQRJURR6S-BU+I0/VG,MW&FS!!ZFA'J3J12+$]4VI;ZI>N
MO'RO:YP& I3 =GGJWWW^&F9O"HJGDS9
62]CF-D\(.>(D4>RI+