EXHIBIT 99.3

July 28, 2022 Fiscal Q3 2022 Earnings Call FieldReport
Important Cautions Regarding Forward - Looking Statements NASDAQ:CLFD 2 Forward - looking statements contained herein and in any related presentation or in the related Earnings Release are made pursuant to the safe harbor provisions of the Private Litigation Reform Act of 1995. Words such as “may,” “will,” “expect,” “believe,” “anticipate,” “estimate,” “outlook,” or “continue” or comparable terminology are intended to identify forward - looking statements. Such forward looking statements include, for example, statements about the Company’s future revenue and operating performance, anticipated shipping on backlog and future lead times, future availability of components and materials from the Company’s supply chain, the impact of the Rural Digital Opportunity Fund (RDOF) or other government programs on the demand for the Company’s products or timing of customer orders, the Company’s ability to add capacity to meet expected future demand, and trends in and growth of the FTTx markets, market segments or customer purchases and other statements that are not historical facts. These statements are based upon the Company's current expectations and judgments about future developments in the Company's business. Certain important factors could have a material impact on the Company's performance, including, without limitation: adverse global economic conditions and geopolitical issues could have a negative effect on our business, and results of operations and financial condition; our planned growth may strain our business infrastructure, which could adversely affect our operations and financial condition; the acquisition of Nestor Cables and integration activities could adversely affect our operating results; the COVID - 19 pandemic has significantly impacted worldwide economic conditions and could have a material adverse effect on our business, financial condition and operating results; we rely on single - source suppliers, which could cause delays, increases in costs or prevent us from completing customer orders; fluctuations in product and labor costs which may not be able to be passed on to customers that could decrease margins; we depend on the availability of sufficient supply of certain materials, such as fiber optic cable and resins for plastics, and global disruptions in the supply chain for these materials could prevent us from meeting customer demand for our products; we rely on our manufacturing operations to produce product to ship to customers and manufacturing constraints and disruptions could result in decreased future revenue; a significant percentage of our sales in the last three fiscal years have been made to a small number of customers; further consolidation among our customers may result in the loss of some customers and may reduce sales during the pendency of business combinations and related integration activities; we may be subject to risks associated with acquisitions; product defects or the failure of our products to meet specifications could cause us to lose customers and sales or to incur unexpected expenses; we are dependent on key personnel; cyber - security incidents on our information technology systems, including ransomware, data breaches or computer viruses, could disrupt our business operations, damage our reputation, and potentially lead to litigation; our business is dependent on interdependent management information systems; to compete effectively, we must continually improve existing products and introduce new products that achieve market acceptance; changes in government funding programs may cause our customers and prospective customers to delay, reduce, or accelerate purchases, leading to unpredictable and irregular purchase cycles; intense competition in our industry may result in price reductions, lower gross profits and loss of market share; our success depends upon adequate protection of our patent and intellectual property rights; if the telecommunications market does not expand as we expect, our business may not grow as fast as we expect; we face risks associated with expanding our sales outside of the United States; and other factors set forth in Part I, Item IA. Risk Factors of Clearfield's Annual Report on Form 10 - K for the year ended September 30, 2021 as well as other filings with the Securities and Exchange Commission. The Company undertakes no obligation to update these statements to reflect actual events unless required by law. © Copyright 2022 Clearfield, Inc. All Rights Reserved.

NASDAQ:CLFD 3 Introduction & Highlights
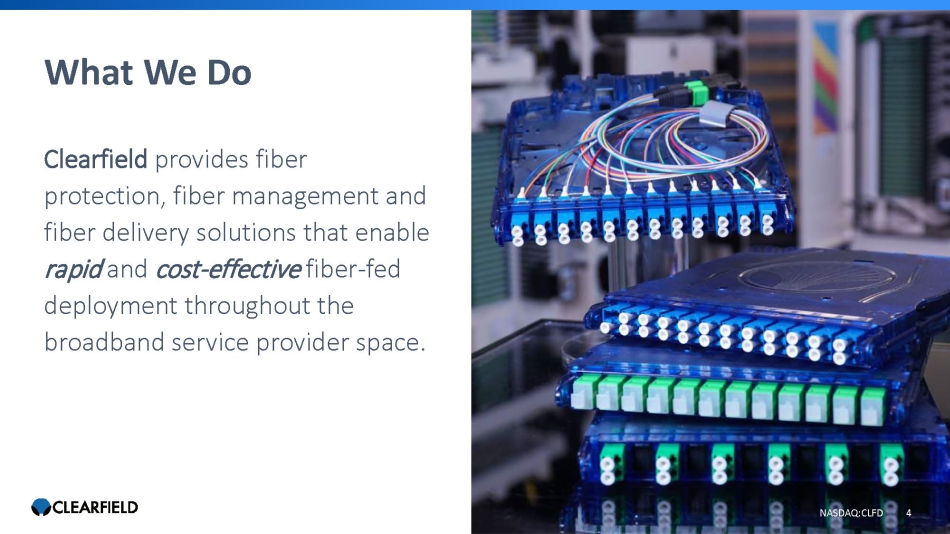
What We Do Clearfield provides fiber protection, fiber management and fiber delivery solutions that enable rapid and cost - effective fiber - fed deployment throughout the broadband service provider space. NASDAQ:CLFD 4

OUR MISSION: Enabling the Lifestyle Better Broadband Provides NASDAQ:CLFD 5
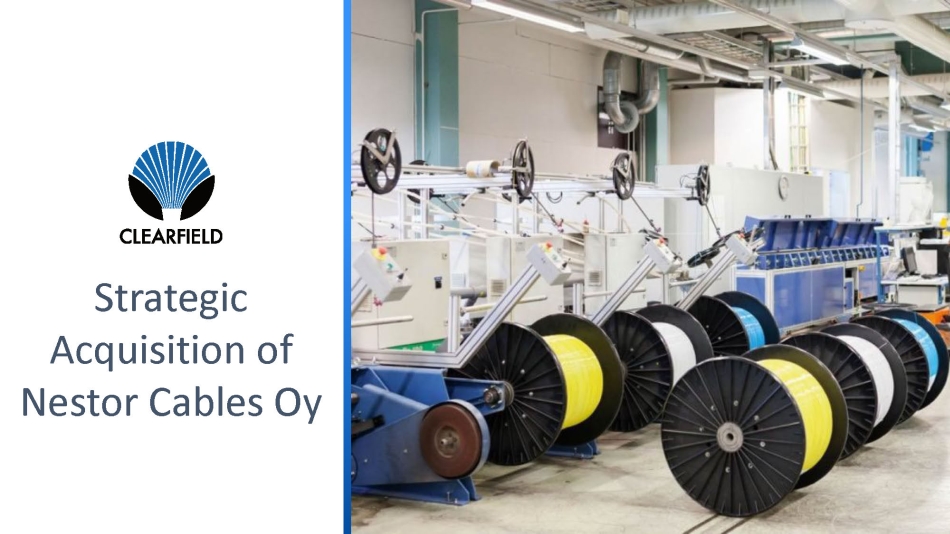
NASDAQ:CLFD 6 Strategic Acquisition of Nestor Cables Oy
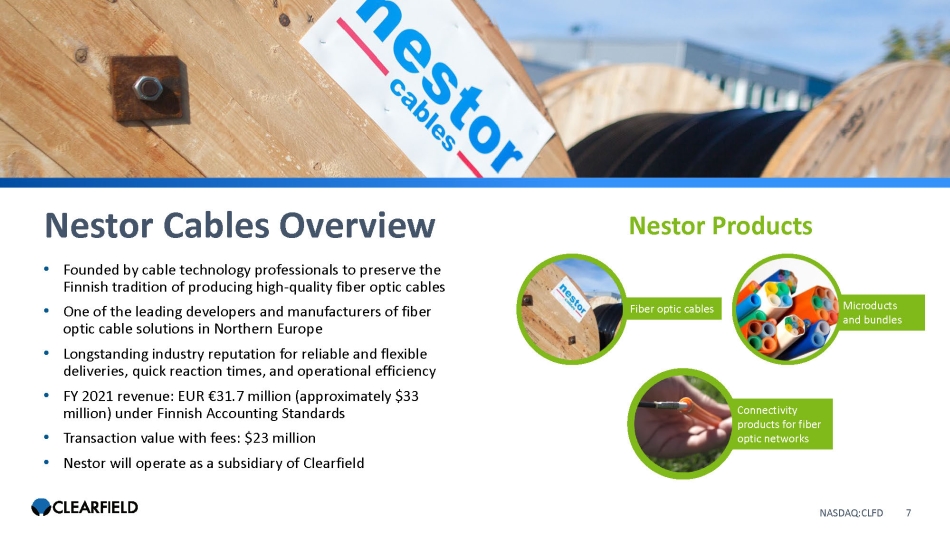
Nestor Cables Overview NASDAQ:CLFD 7 • Founded by cable technology professionals to preserve the Finnish tradition of producing high - quality fiber optic cables • One of the leading developers and manufacturers of fiber optic cable solutions in Northern Europe • Longstanding industry reputation for r eliable and flexible deliveries, quick reaction times, and operational efficiency • FY 2021 revenue: EUR €31.7 million (approximately $33 million) under Finnish Accounting Standards • Transaction value with fees : $23 million • Nestor will operate as a subsidiary of Clearfield Nestor Products Connectivity products for fiber optic networks Microducts and bundles Fiber optic cables
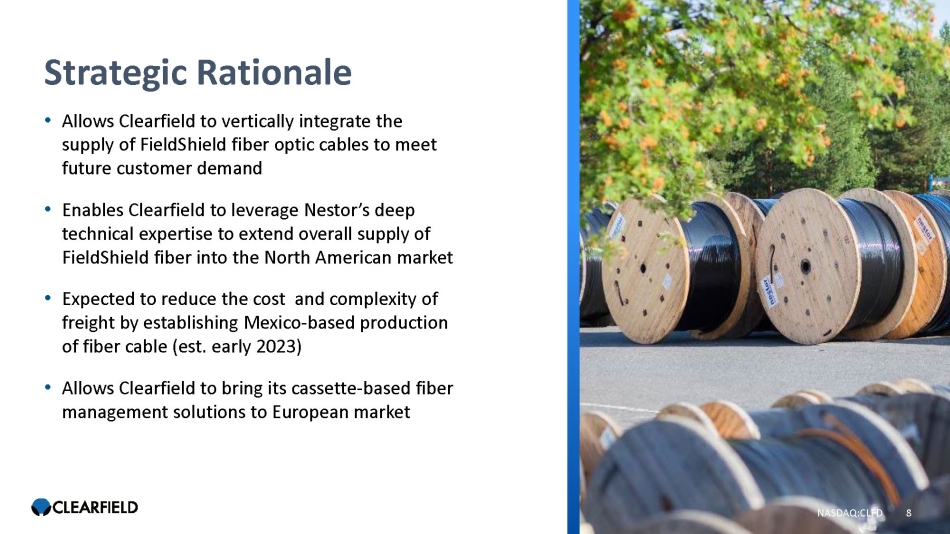
NASDAQ:CLFD 8 Strategic Rationale • Allows Clearfield to vertically integrate the supply of FieldShield fiber optic cables to meet future customer demand • Enables Clearfield to leverage Nestor’s deep technical expertise to extend overall supply of FieldShield fiber into the North American market • Expected to reduce the cost and complexity of freight by establishing Mexico - based production of fiber cable (est. early 2023) • Allows Clearfield to bring its cassette - based fiber management solutions to European market
NASDAQ:CLFD 9 Financial Performance

Quarterly Net Sales $27.1 $29.7 $38.7 $45.2 $51.1 $53.5 $71.3 $- $10.0 $20.0 $30.0 $40.0 $50.0 $60.0 $70.0 $80.0 Q1 21 Q2 21 Q3 21 Q4 21 Q1 22 Q2 22 Q3 22 Revenue in Millions FINANCIAL PERFORMANCE 84% Q3 2022 Growth Rate $71.3M Q3 2022 Net Sales NASDAQ:CLFD 10
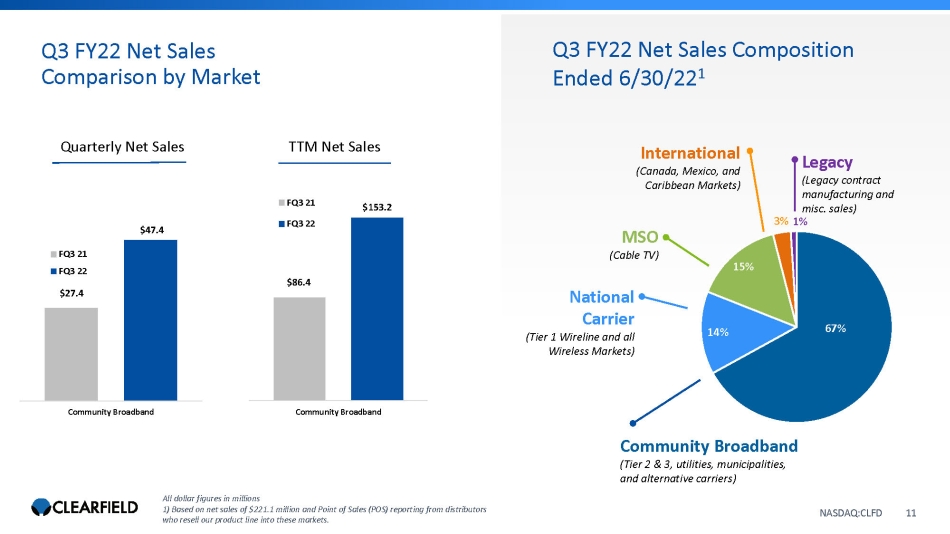
Q3 FY22 Net Sales Comparison by Market NASDAQ:CLFD All dollar figures in millions 1) Based on net sales of $221.1 million and Point of Sales (POS) reporting from distributors who resell our product line into these markets. Q3 FY22 Net Sales Composition Ended 6/30/22 1 Legacy (Legacy contract manufacturing and misc. sales) 67% 14% 15% 3% 1% $86.4 $153.2 Community Broadband FQ3 21 FQ3 22 Quarterly Net Sales TTM Net Sales Community Broadband (Tier 2 & 3, utilities, municipalities, and alternative carriers) National Carrier (Tier 1 Wireline and all Wireless Markets) MSO (Cable TV) International (Canada, Mexico, and Caribbean Markets) NASDAQ:CLFD 11 $27.4 $47.4 Community Broadband FQ3 21 FQ3 22

$3.4 $4.4 $2.9 $0.6 $9.8 $11.0 $2.5 $0.6 National Carrier MSO International Legacy FQ3 21 FQ3 22 Q3 FY22 Net Sales Comparison by Market NASDAQ:CLFD All dollar figures in millions 1) Based on net sales of $221.1 million and Point of Sales (POS) reporting from distributors who resell our product line into these markets. Q3 FY22 Net Sales Composition Ended 6/30/22 1 Legacy (Legacy contract manufacturing and misc. sales) 67% 14% 15% 3% 1% $11.6 $15.0 $7.1 $2.8 $20.9 $34.5 $9.5 $3.0 National Carrier MSO International Legacy FQ3 21 FQ3 22 Quarterly Net Sales TTM Net Sales Community Broadband (Tier 2 & 3, utilities, municipalities, and alternative carriers) National Carrier (Tier 1 Wireline and all Wireless Markets) MSO (Cable TV) International (Canada, Mexico, and Caribbean Markets) NASDAQ:CLFD 12
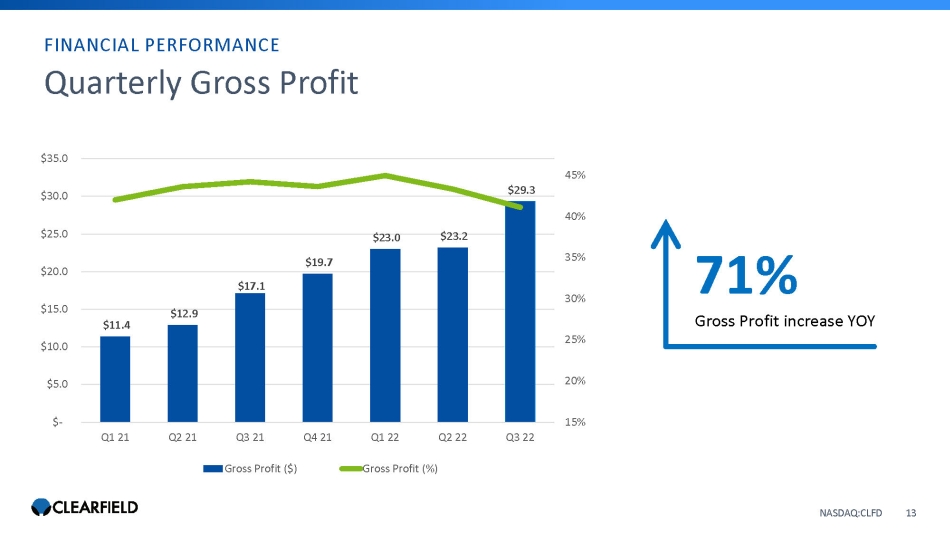
Quarterly Gross Profit $11.4 $12.9 $17.1 $19.7 $23.0 $23.2 $29.3 15% 20% 25% 30% 35% 40% 45% $- $5.0 $10.0 $15.0 $20.0 $25.0 $30.0 $35.0 Q1 21 Q2 21 Q3 21 Q4 21 Q1 22 Q2 22 Q3 22 Gross Profit ($) Gross Profit (%) FINANCIAL PERFORMANCE 71% Gross Profit increase YOY NASDAQ:CLFD 13
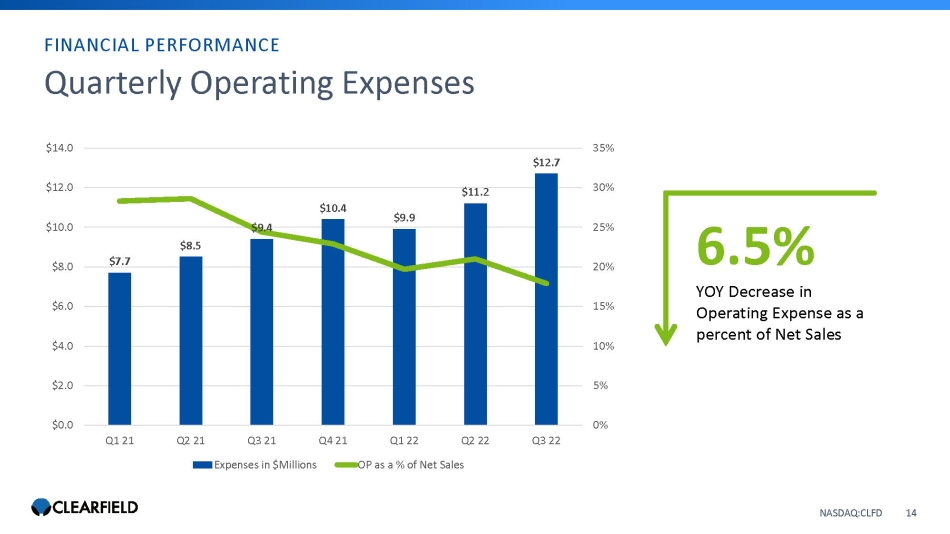
$7.7 $8.5 $9.4 $10.4 $9.9 $11.2 $12.7 0% 5% 10% 15% 20% 25% 30% 35% $0.0 $2.0 $4.0 $6.0 $8.0 $10.0 $12.0 $14.0 Q1 21 Q2 21 Q3 21 Q4 21 Q1 22 Q2 22 Q3 22 Expenses in $Millions OP as a % of Net Sales FINANCIAL PERFORMANCE 6.5% YOY Decrease in Operating Expense as a percent of Net Sales NASDAQ:CLFD 14 Quarterly Operating Expenses
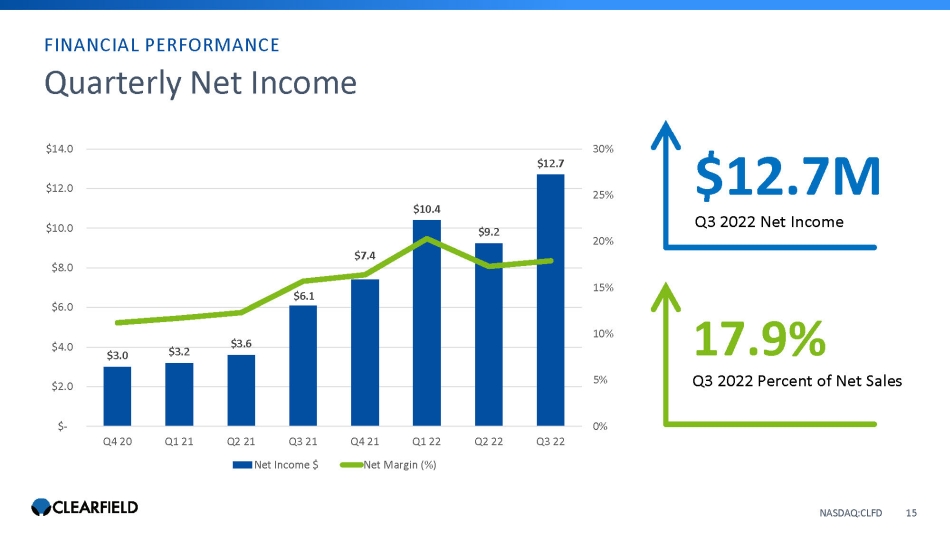
$3.0 $3.2 $3.6 $6.1 $7.4 $10.4 $9.2 $12.7 0% 5% 10% 15% 20% 25% 30% $- $2.0 $4.0 $6.0 $8.0 $10.0 $12.0 $14.0 Q4 20 Q1 21 Q2 21 Q3 21 Q4 21 Q1 22 Q2 22 Q3 22 Net Income $ Net Margin (%) $12.7M Q3 2022 Net Income 17.9% Q3 2022 Percent of Net Sales FINANCIAL PERFORMANCE NASDAQ:CLFD 15 Quarterly Net Income

NASDAQ:CLFD 16 Business Update & Outlook

Our Value Proposition – Removing Obstacles 1. Craft - friendly – requires less skilled labor and overall labor time 2. Designed to reduce permitting and right - of - way 3. Faster turn - up time for quicker revenue per subscriber NASDAQ:CLFD 17
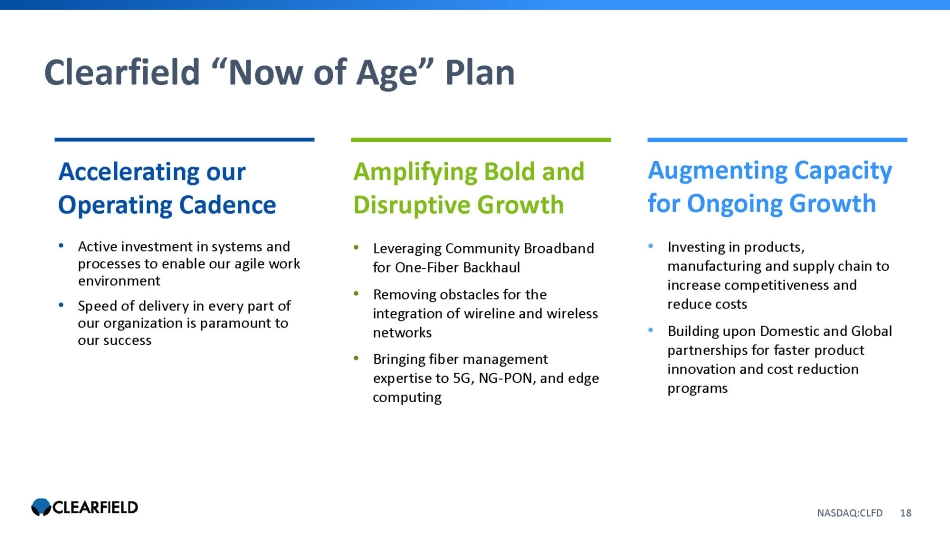
Clearfield “Now of Age” Plan NASDAQ:CLFD 18 Augmenting Capacity for Ongoing Growth • Investing in products, manufacturing and supply chain to increase competitiveness and reduce costs • Building upon Domestic and Global partnerships for faster product innovation and cost reduction programs Accelerating our Operating Cadence • Active investment in systems and processes to enable our agile work environment • Speed of delivery in every part of our organization is paramount to our success Amplifying Bold and Disruptive Growth • Leveraging Community Broadband for One - Fiber Backhaul • Removing obstacles for the integration of wireline and wireless networks • Bringing fiber management expertise to 5G, NG - PON, and edge computing

NASDAQ:CLFD 19 Accelerating our Operating Cadence NASDAQ:CLFD 19

NASDAQ:CLFD 20 Amplifying Bold and Disruptive Growth NASDAQ:CLFD 20

NASDAQ:CLFD 21 Augmenting Capacity for Ongoing Growth NASDAQ:CLFD 21
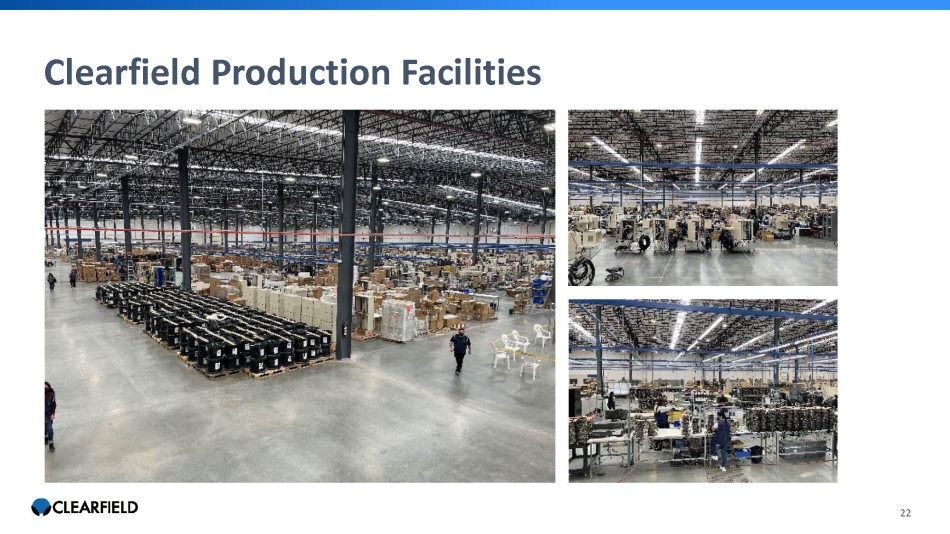
Clearfield Production Facilities NASDAQ:CLFD 22
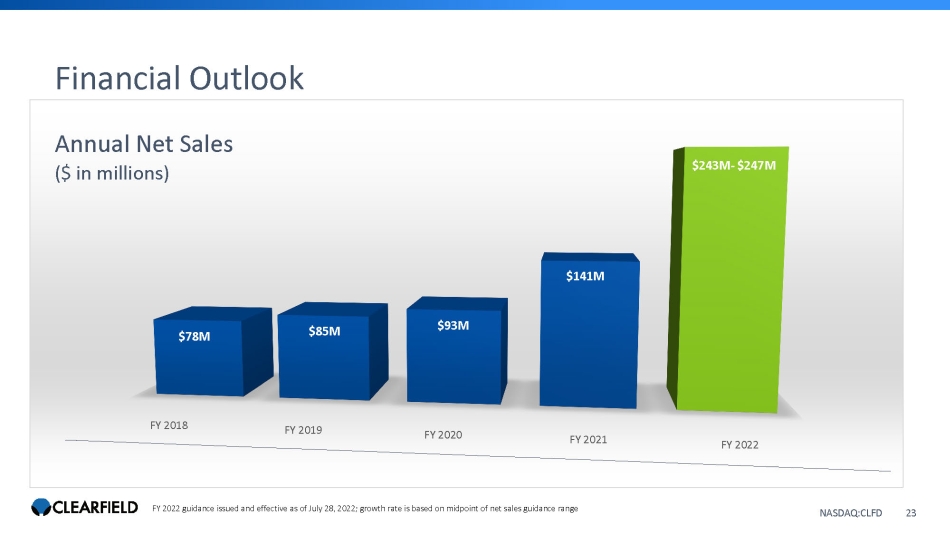
FY 2018 FY 2019 FY 2020 FY 2021 FY 2022 $78M $85M $93M $141M $243M - $247M NASDAQ:CLFD FY 2022 guidance issued and effective as of July 28, 2022; growth rate is based on midpoint of net sales guidance range Financial Outlook Annual Net Sales ($ in millions) NASDAQ:CLFD 23
Q&A NASDAQ:CLFD 24 Cheri Beranek PRESIDENT & CEO Dan Herzog CHIEF FINANCIAL OFFICER
NASDAQ:CLFD 25 Contact Us COMPANY CONTACT: Cheri Beranek President & CEO Clearfield, Inc. IR@seeclearfield.com INVESTOR RELATIONS: Matt Glover and Sophie Pearson Gateway Investor Relations (949) 574 - 3860 CLFD@gatewayir.com