EXHIBIT 99.2
FieldReport / Fiscal Q2 2020 Earnings Call / April 23, 2020 NASDAQ:CLFD The Industry Leader in Craft Friendly Fiber Optic Management and Connectivity Solutions Fiscal Q2 2020 Earnings Call FieldReport
FieldReport / Fiscal Q2 2020 Earnings Call / April 23, 2020 NASDAQ:CLFD Important Cautions Regarding Forward - Looking Statements Forward - looking statements contained herein and in any related presentation or in the related FieldReport are made pursuant to the safe harbor provisions of the Private Litigation Reform Act of 1995. Words such as “may,” “will,” “expect,” “believe,” “anticipate,” “est ima te,” “outlook,” or “continue” or comparable terminology are intended to identify forward - looking statements. Such forward looking statements includ e, for example, statements about the expected impact of COVID - 19 and related economic uncertainty, the Company’s future revenue and operating pe rformance, and trends in and growth of the FTTx markets, market segments or customer purchases and other statements that are not historical facts. These statements are based upon the Company's current expectations and judgments about future developments in the Company's busines s. Certain important factors could have a material impact on the Company's performance, including, without limitation: the as yet - unknown i mpact of COVID - 19 and related economic uncertainty; to compete effectively, we must continually improve existing products and introduce new pro duc ts that achieve market acceptance; our expected growth is based upon the expansion of the telecommunications market; our operating results ma y f luctuate significantly from quarter to quarter, which may make budgeting for expenses difficult and may negatively affect the market p ric e of our common stock; our success depends upon adequate protection of our patent and intellectual property rights; intense competition in ou r i ndustry may result in price reductions, lower gross profits and loss of market share; we rely on single - source suppliers, which could cause delays, in creases in costs or prevent us from completing customer orders, all of which could materially harm our business; a significant percentage of our sales in th e last three fiscal years have been made to a small number of customers, and the loss of these major customers or significant decline in business with the se major customers would adversely affect us; further consolidation among our customers may result in the loss of some customers and may reduce sal es during the pendency of business combinations and related integration activities; we may be subject to risks associated with acquisitions th at could adversely affect future operating results; product defects or the failure of our products to meet specifications could cause us to lose cu stomers and sales or to incur unexpected expenses; we are dependent upon key personnel; we face risks associated with expanding our sales outside of the United States; our business is dependent on effective management information systems and information technology infrastructure; our results of o per ations could be adversely affected by economic conditions and the effects of these conditions on our customers’ businesses; changes in govern men t funding programs may cause our customers and prospective customers to delay or reduce purchases; and other factors set forth in Part I, Item I A. Risk Factors of Clearfield's Annual Report on Form 10 - K for the year ended September 30, 2019 as well as other filings with the Securities and E xchange Commission. The Company undertakes no obligation to update these statements to reflect actual events unless required by law. © Copyright 2020 Clearfield, Inc. All Rights Reserved. NASDAQ:CLFD 2

FieldReport / Fiscal Q2 2020 Earnings Call / April 23, 2020 NASDAQ:CLFD Welcome Cheri Beranek PRESIDENT & CEO NASDAQ:CLFD 3
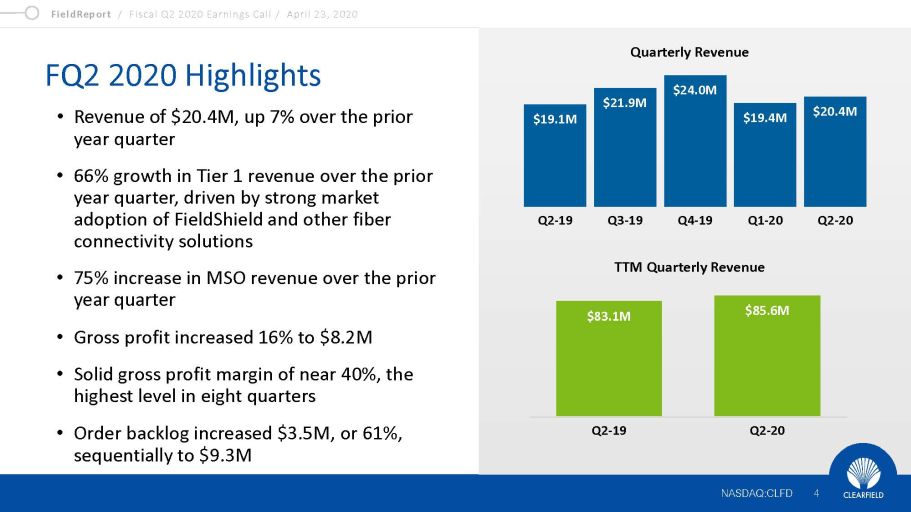
FieldReport / Fiscal Q2 2020 Earnings Call / April 23, 2020 NASDAQ:CLFD FQ2 2020 Highlights NASDAQ:CLFD 4 • Revenue of $20.4M, up 7% over the prior year quarter • 66% growth in Tier 1 revenue over the prior year quarter, driven by strong market adoption of FieldShield and other fiber connectivity solutions • 75% increase in MSO revenue over the prior year quarter • Gross profit increased 16% to $8.2M • Solid gross profit margin of near 40%, the highest level in eight quarters • Order backlog increased $3.5M, or 61%, sequentially to $9.3M $19.1M $21.9M $24.0M $19.4M $20.4M Q2-19 Q3-19 Q4-19 Q1-20 Q2-20 Quarterly Revenue TTM Quarterly Revenue $83.1M $85.6M Q2-19 Q2-20
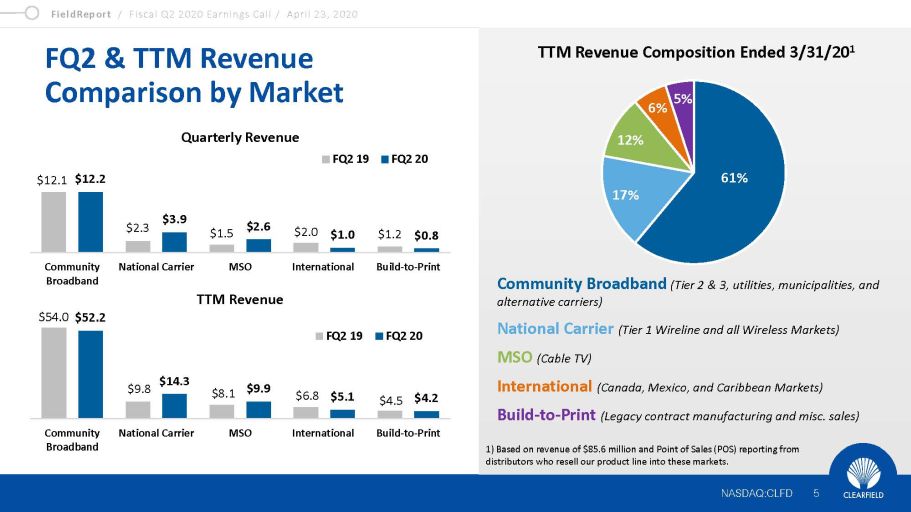
FieldReport / Fiscal Q2 2020 Earnings Call / April 23, 2020 NASDAQ:CLFD FQ2 & TTM Revenue Comparison by Market NASDAQ:CLFD 5 1) Based on revenue of $85.6 million and Point of Sales (POS) reporting from distributors who resell our product line into these markets. TTM Revenue Composition Ended 3/31/20 1 Community Broadband (Tier 2 & 3, utilities, municipalities, and alternative carriers) National Carrier (Tier 1 Wireline and all Wireless Markets) MSO (Cable TV) International (Canada, Mexico, and Caribbean Markets) Build - to - Print (Legacy contract manufacturing and misc. sales) 61% 17% 12% 6% 5% $54.0 $9.8 $8.1 $6.8 $4.5 $52.2 $14.3 $9.9 $5.1 $4.2 Community Broadband National Carrier MSO International Build-to-Print FQ2 19 FQ2 20 Quarterly Revenue TTM Revenue $12.1 $2.3 $1.5 $2.0 $1.2 $12.2 $3.9 $2.6 $1.0 $0.8 Community Broadband National Carrier MSO International Build-to-Print FQ2 19 FQ2 20
FieldReport / Fiscal Q2 2020 Earnings Call / April 23, 2020 NASDAQ:CLFD Financial Update Dan Herzog CHIEF FINANCIAL OFFICER NASDAQ:CLFD 6
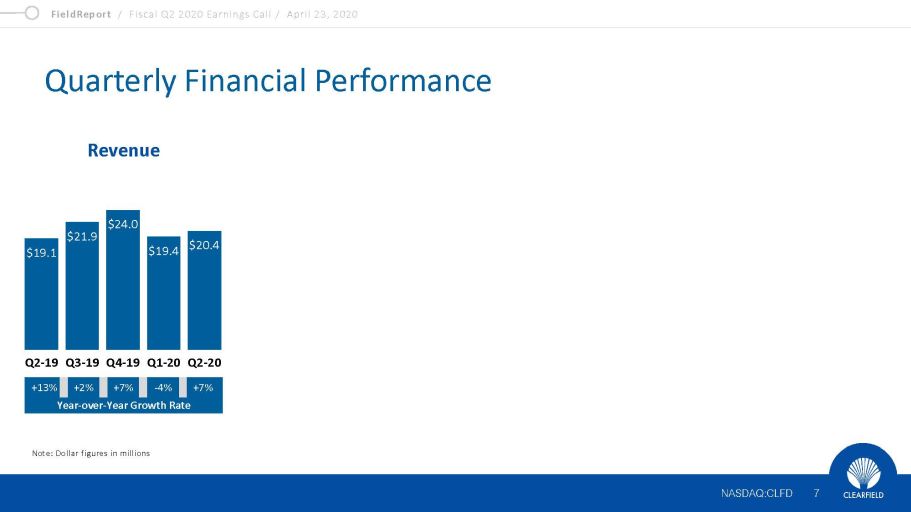
FieldReport / Fiscal Q2 2020 Earnings Call / April 23, 2020 NASDAQ:CLFD Quarterly Financial Performance 7 NASDAQ:CLFD Note: Dollar figures in millions $19.1 $21.9 $24.0 $19.4 $20.4 Q2-19 Q3-19 Q4-19 Q1-20 Q2-20 Revenue +13% +2% +7% - 4% +7% Year - over - Year Growth Rate
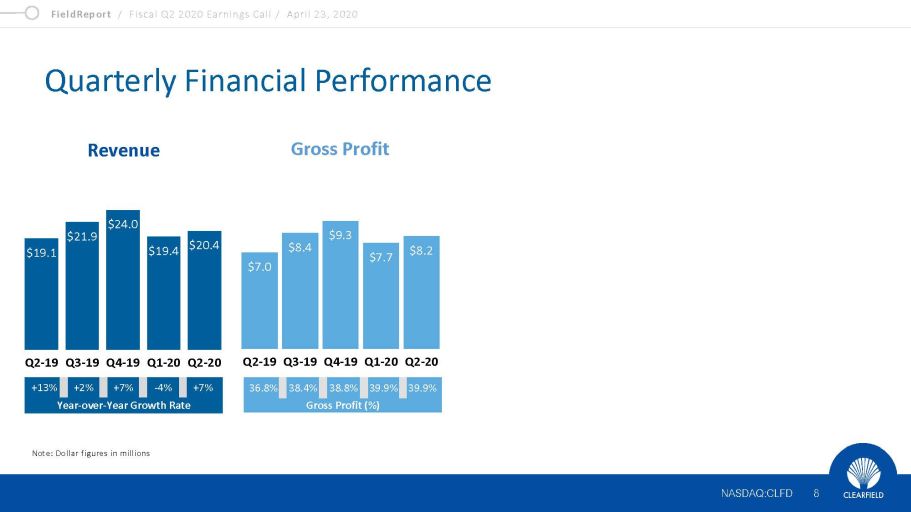
FieldReport / Fiscal Q2 2020 Earnings Call / April 23, 2020 NASDAQ:CLFD Quarterly Financial Performance 8 NASDAQ:CLFD Note: Dollar figures in millions $19.1 $21.9 $24.0 $19.4 $20.4 Q2-19 Q3-19 Q4-19 Q1-20 Q2-20 Revenue +13% +2% +7% - 4% +7% Year - over - Year Growth Rate $7.0 $8.4 $9.3 $7.7 $8.2 Q2-19 Q3-19 Q4-19 Q1-20 Q2-20 Gross Profit 36.8% 38.4% 38.8% 39.9% 39.9% Gross Profit (%)
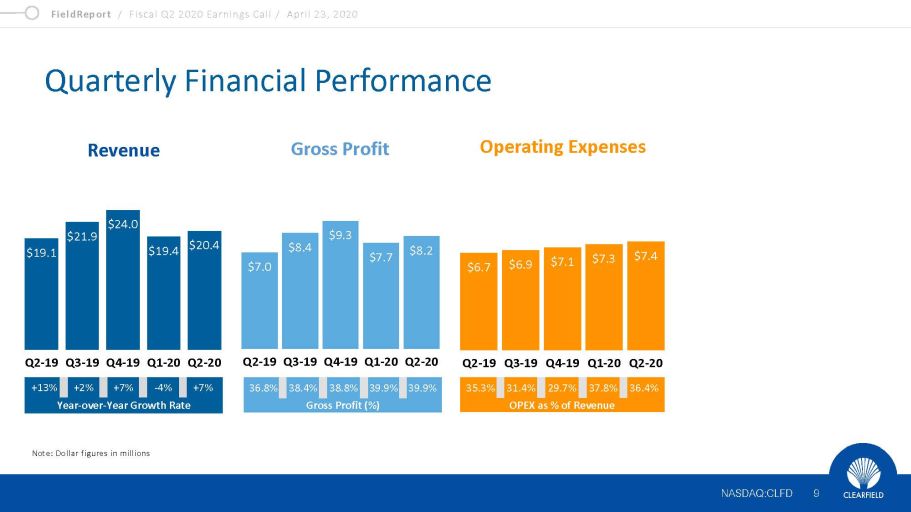
FieldReport / Fiscal Q2 2020 Earnings Call / April 23, 2020 NASDAQ:CLFD Quarterly Financial Performance 9 NASDAQ:CLFD Note: Dollar figures in millions $19.1 $21.9 $24.0 $19.4 $20.4 Q2-19 Q3-19 Q4-19 Q1-20 Q2-20 Revenue +13% +2% +7% - 4% +7% Year - over - Year Growth Rate $7.0 $8.4 $9.3 $7.7 $8.2 Q2-19 Q3-19 Q4-19 Q1-20 Q2-20 Gross Profit 36.8% 38.4% 38.8% 39.9% 39.9% Gross Profit (%) 35.3% 31.4% 29.7% 37.8% 36.4% OPEX as % of Revenue $6.7 $6.9 $7.1 $7.3 $7.4 Q2-19 Q3-19 Q4-19 Q1-20 Q2-20 Operating Expenses
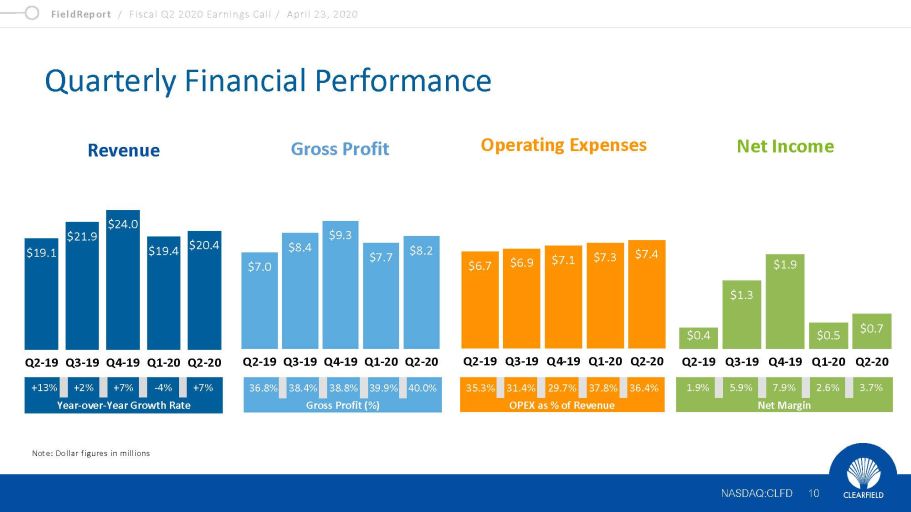
FieldReport / Fiscal Q2 2020 Earnings Call / April 23, 2020 NASDAQ:CLFD Quarterly Financial Performance 10 NASDAQ:CLFD Note: Dollar figures in millions $19.1 $21.9 $24.0 $19.4 $20.4 Q2-19 Q3-19 Q4-19 Q1-20 Q2-20 Revenue +13% +2% +7% - 4% +7% Year - over - Year Growth Rate $7.0 $8.4 $9.3 $7.7 $8.2 Q2-19 Q3-19 Q4-19 Q1-20 Q2-20 Gross Profit 36.8% 38.4% 38.8% 39.9% 40.0% Gross Profit (%) 35.3% 31.4% 29.7% 37.8% 36.4% OPEX as % of Revenue $6.7 $6.9 $7.1 $7.3 $7.4 Q2-19 Q3-19 Q4-19 Q1-20 Q2-20 Operating Expenses 1.9% 5.9% 7.9% 2.6% 3.7% Net Margin $0.4 $1.3 $1.9 $0.5 $0.7 Q2-19 Q3-19 Q4-19 Q1-20 Q2-20 Net Income
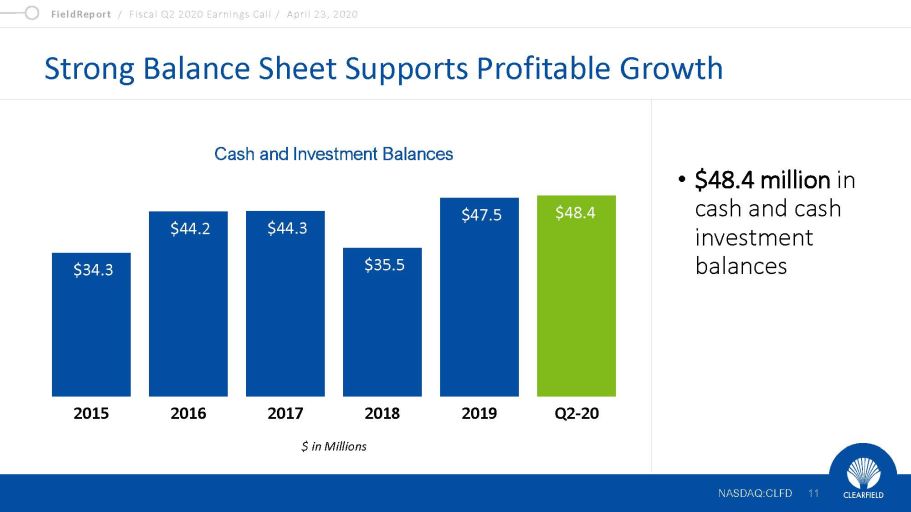
FieldReport / Fiscal Q2 2020 Earnings Call / April 23, 2020 NASDAQ:CLFD Strong Balance Sheet Supports Profitable Growth • $48.4 million in cash and cash investment balances NASDAQ:CLFD 11 $ in Millions Cash and Investment Balances $34.3 $44.2 $44.3 $35.5 $47.5 2015 2016 2017 2018 2019 Q2-20 $48.4 TK [2]2
FieldReport / Fiscal Q2 2020 Earnings Call / April 23, 2020 NASDAQ:CLFD Clearfield’s ‘Coming of Age’ Plan NASDAQ:CLFD 12 Expanding Core Community Broadband Business Attracting utilities, co - ops and CLECs as they enter underserved communities, maintaining a steady growth rate
FieldReport / Fiscal Q2 2020 Earnings Call / April 23, 2020 NASDAQ:CLFD Clearfield’s ‘Coming of Age’ Plan NASDAQ:CLFD 13 Expanding Core Community Broadband Business Attracting utilities, co - ops and CLECs as they enter underserved communities, maintaining a steady growth rate Enhancing Competitive Position and Operational Effectiveness Investing in products, manufacturing and supply chain to increase competitiveness and maintain and reduce costs
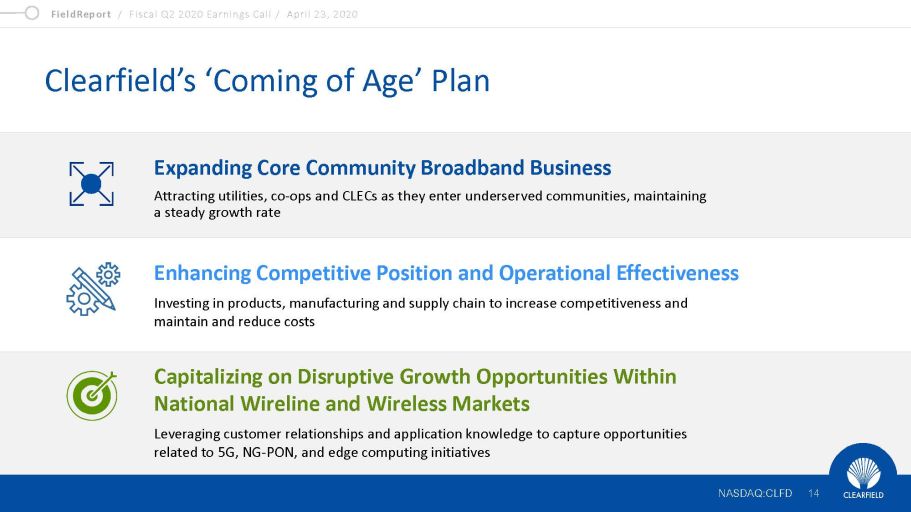
FieldReport / Fiscal Q2 2020 Earnings Call / April 23, 2020 NASDAQ:CLFD Clearfield’s ‘Coming of Age’ Plan NASDAQ:CLFD 14 Expanding Core Community Broadband Business Attracting utilities, co - ops and CLECs as they enter underserved communities, maintaining a steady growth rate Enhancing Competitive Position and Operational Effectiveness Investing in products, manufacturing and supply chain to increase competitiveness and maintain and reduce costs Capitalizing on Disruptive Growth Opportunities Within National Wireline and Wireless Markets Leveraging customer relationships and application knowledge to capture opportunities related to 5G, NG - PON, and edge computing initiatives
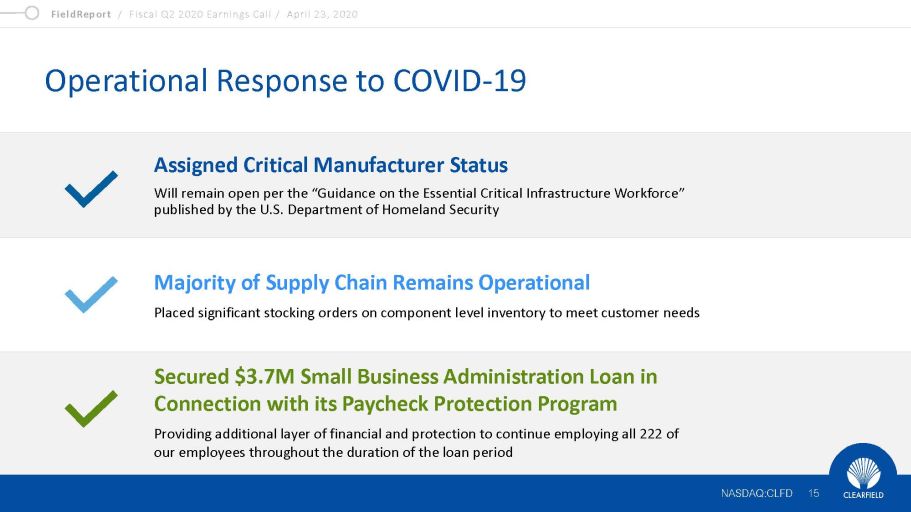
FieldReport / Fiscal Q2 2020 Earnings Call / April 23, 2020 NASDAQ:CLFD Operational Response to COVID - 19 NASDAQ:CLFD 15 Assigned Critical Manufacturer Status Will remain open per the “Guidance on the Essential Critical Infrastructure Workforce” published by the U.S. Department of Homeland Security Majority of Supply Chain Remains Operational Placed significant stocking orders on component level inventory to meet customer needs Secured $3.7M Small Business Administration Loan in Connection with its Paycheck Protection Program Providing additional layer of financial and protection to continue employing all 222 of our employees throughout the duration of the loan period
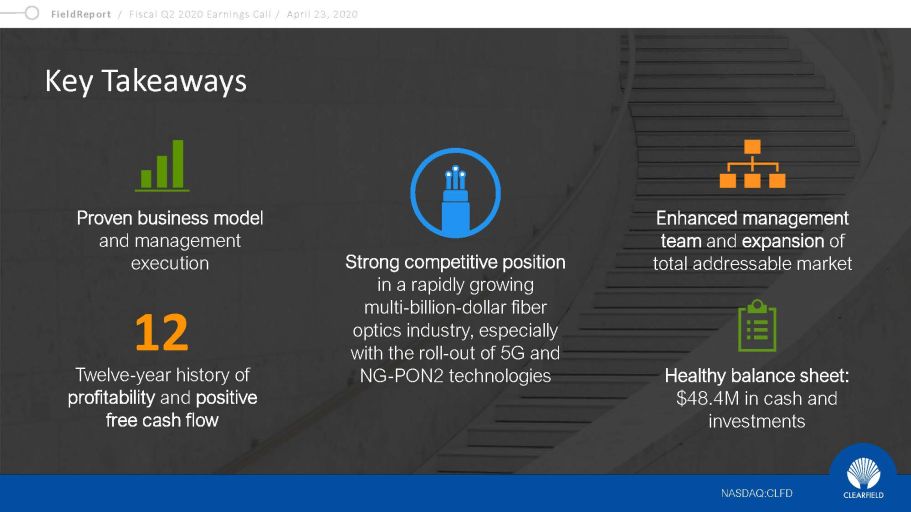
FieldReport / Fiscal Q2 2020 Earnings Call / April 23, 2020 NASDAQ:CLFD Key Takeaways Proven business model and management execution Enhanced management team and expansion of total addressable market Strong competitive position in a rapidly growing multi - billion - dollar fiber optics industry, especially with the roll - out of 5G and NG - PON2 technologies Healthy balance sheet: $48.4M in cash and investments Twelve - year history of profitability and positive free cash flow 12 NASDAQ:CLFD TK [2]1

FieldReport / Fiscal Q2 2020 Earnings Call / April 23, 2020 NASDAQ:CLFD Q&A Cheri Beranek PRESIDENT & CEO NASDAQ:CLFD 17 Dan Herzog CHIEF FINANCIAL OFFICER

FieldReport / Fiscal Q2 2020 Earnings Call / April 23, 2020 NASDAQ:CLFD 18 NASDAQ:CLFD

FieldReport / Fiscal Q2 2020 Earnings Call / April 23, 2020 NASDAQ:CLFD Thank You Cheri Beranek PRESIDENT & CEO NASDAQ:CLFD 19
FieldReport / Fiscal Q2 2020 Earnings Call / April 23, 2020 NASDAQ:CLFD Contact Us NASDAQ:CLFD 20 COMPANY CONTACT: Cheri Beranek President & CEO Clearfield, Inc. IR@clfd.net INVESTOR RELATIONS: Matt Glover and Tom Colton Gateway Investor Relations (949) 574 - 3860 CLFD@gatewayir.com