UNITED STATES
SECURITIES AND EXCHANGE COMMISSION
Washington, D.C. 20549
FORM 8-K
CURRENT REPORT
Pursuant to Section 13 or 15(d) of the
Securities Exchange Act of 1934
Date of Report: April 27, 2017
(Date of earliest event reported)
CLEARFIELD, INC.
(Exact Name of Registrant as Specified in Charter)
Minnesota | 000-16106 | 41-1347235 | ||
(State or Other Jurisdiction of Incorporation)
|
(Commission File No.) | (IRS Employer Identification No.) |
7050 Winnetka Avenue North, Suite 100, Brooklyn Park, Minnesota 55428
(Address of Principal Executive Offices)(Zip Code)
(763) 476-6866
(Registrant’s Telephone Number, Including Area Code)
Not Applicable
(Former Name or Former Address, if Changed Since Last Report)
Check the appropriate box below if the Form 8-K filing is intended to simultaneously satisfy the filing obligation of the registrant under any of the following provisions:
o Written communications pursuant to Rule 425 under the Securities Act (17 CFR 230.425)
o Soliciting material pursuant to Rule 14a-12 under the Exchange Act (17 CFR 240.14a-12)
o Pre-commencement communications pursuant to Rule 14d-2(b) under the Exchange Act (17 CFR 240.14d-2(b))
o Pre-commencement communications pursuant to Rule 13e-4(c) under the Exchange Act (17 CFR 240.13e-4(c))
Indicate by check mark whether the registrant is an emerging growth company as defined in Rule 405 of the Securities Act of 1933 (17 CFR §230.405) or Rule 12b-2 of the Securities Exchange Act of 1934 (17 CFR §240.12b-2). Emerging growth company ☐
If an emerging growth company, indicate by check mark if the registrant has elected not to use the extended transition period for complying with any new or revised financial accounting standards provided pursuant to Section 13(a) of the Exchange Act. ☐
Items under Sections 1 and 3 through 7 are not applicable and therefore omitted.
Item 2.02 | Results of Operations and Financial Condition. |
Clearfield, Inc. (the “Company”) hereby furnishes as Exhibit 99.1 a press release issued on April 27, 2017 disclosing material non-public information regarding its results of operations for the second quarter ended March 31, 2017.
In the April 27, 2017 earnings release, the Company directs readers to a page of its website to access an investor communication entitled “FY17 Q2 FieldReport,” which is furnished hereto as Exhibit 99.2. The FY17 Q2 FieldReport consists of a slide presentation and a related embedded audio recording of remarks by Cheryl Beranek, the Company’s President and Chief Executive Officer, and Daniel Herzog, the Company’s Chief Financial Officer, discussing the second quarter ended March 31, 2017 results, as well as the business and prospects of the Company.
Item 8.01 | Other Events. |
As described above, the Company made the FY17 Q2 FieldReport, furnished hereto as Exhibit 99.2, available on its website on April 27, 2017. The Company is not including the information on its website as a part of, or incorporating it by reference into, this Current Report on Form 8-K.
Item 9.01 | Financial Statements and Exhibits. |
Exhibit No. | Description | |
99.1 | Press Release Issued by Clearfield, Inc. on April 27, 2017. | |
99.2 | FY17 Q2 FieldReport – Presentation dated April 27, 2017 and Transcript of Remarks of Cheryl Beranek, President and Chief Executive Officer, and Daniel Herzog, Chief Financial Officer, of Clearfield, Inc. |
SIGNATURES
Pursuant to the requirements of the Securities Exchange Act of 1934, the registrant has duly caused this report to be signed on its behalf by the undersigned hereunto duly authorized.
CLEARFIELD, INC. | ||
By | /s/ Daniel Herzog | |
Daniel Herzog, Chief Financial Officer |
Dated: April 27, 2017
EXHIBIT 99.1
Clearfield Reports Fiscal Second Quarter 2017 Results
Company Experiences Continued Growth in Tier 1 Markets
MINNEAPOLIS, April 27, 2017 (GLOBE NEWSWIRE) -- Clearfield, Inc. (NASDAQ:CLFD), the specialist in fiber management and connectivity platforms for communication service providers, reported results for the fiscal second quarter ended March 31, 2017.
Fiscal Q2 2017 Financial Summary | |||||||||||
(in millions except per share data and percentages) | Q2 2017 | vs. Q2 2016 | Change | Change (%) | |||||||
Revenue | $ | 17.7 | $ | 16.9 | $ | 0.8 | 4 | % | |||
Gross Profit ($) | $ | 7.4 | $ | 7.3 | $ | 0.1 | 2 | % | |||
Gross Profit (%) | 42.2 | % | 43.0 | % | -0.8 | % | -2 | % | |||
Income from Operations | $ | 1.3 | $ | 2.1 | $ | (0.8 | ) | -40 | % | ||
Income Tax Expense | $ | 0.4 | $ | 0.7 | $ | (0.3 | ) | -37 | % | ||
Net Income | $ | 0.9 | $ | 1.5 | $ | (0.6 | ) | -39 | % | ||
Net Income per Diluted Share | $ | 0.07 | $ | 0.11 | $ | (0.04 | ) | -36 | % | ||
Fiscal Q2 YTD 2017 Financial Summary | |||||||||||
(in millions except per share data and percentages) | 2017 YTD | vs. 2016 YTD | Change | Change (%) | |||||||
Revenue | $ | 35.9 | $ | 32.6 | $ | 3.3 | 10 | % | |||
Gross Profit ($) | $ | 14.7 | $ | 14.0 | $ | 0.7 | 5 | % | |||
Gross Profit (%) | 40.8 | % | 42.8 | % | -2.0 | % | -5 | % | |||
Income from Operations | $ | 2.5 | $ | 4.1 | $ | (1.6 | ) | -40 | % | ||
Income Tax Expense | $ | 0.8 | $ | 1.2 | $ | (0.4 | ) | -34 | % | ||
Net Income | $ | 1.8 | $ | 3.0 | $ | (1.2 | ) | -40 | % | ||
Net Income per Diluted Share | $ | 0.13 | $ | 0.22 | $ | (0.09 | ) | -41 | % | ||
Fiscal Q2 2017 Financial Results
Revenue for the second quarter of fiscal 2017 increased 4% to $17.7 million from $16.9 million in the same year-ago quarter. The improvement was primarily due to increased deployments by the Company’s wireline customers in both domestic and international markets.
Gross profit increased 2% to $7.4 million, or 42.2% of revenue, from $7.3 million, or 43.0% of revenue, in the second fiscal quarter of 2016. The increase in gross profit was due to increased volume. Gross profit percent for the quarter is consistent with Company outlook and is up sequentially over the first quarter of fiscal 2017.
Operating expenses were $6.2 million, an increase of 20% compared to $5.1 million in the same year-ago quarter. The increase was primarily due to additional personnel supporting sales as well as an acceleration of the Company’s investment in product certification testing that precedes sales into the Tier 1 markets.
Income from operations decreased 40% to $1.3 million for the second quarter of fiscal 2017 from $2.1 million in the same year-ago quarter. Income tax expense decreased 37% to $433,000 for the second quarter of fiscal 2017 from $690,000 in the same year-ago quarter. The Company recognized a net tax benefit of $54,000 for the quarter ended March 31, 2016 as a result of the adoption in the fourth quarter of fiscal 2016 of a new accounting pronouncement related to the income tax accounting for stock-based compensation. This net tax benefit and related effects are reflected in the table above and the accompanying financial statements. Net income decreased 39% to $0.9 million for the second quarter of fiscal 2017, or $0.07 per diluted share, from $1.5 million, or $0.11 per diluted share, in the same year-ago quarter.
During the quarter ended March 31, 2017, cash, cash equivalents and investments remained consistent at $43 million when compared to the end of the prior quarter. The Company had no debt at quarter end.
During the quarter, the Company repurchased 2,991 shares of its stock under the stock repurchase program. Additionally, on April 25, 2017, the Company’s board of directors increased the previously approved stock repurchase program by an additional $4 million to $12 million, from the previous $8 million. In the third quarter through April 25, 2017, the Company has repurchased an additional $750,000 in share value, and has approximately $10.1 million remaining authorized in the program at April 25, 2017.
Order backlog (defined as purchase orders received but not yet fulfilled) at March 31, 2017 increased 64% to $6.0 million from $3.6 million at December 31, 2016, and decreased 27% from $8.2 million at March 31, 2016.
Fiscal Six Month 2017 Financial Results
Revenue increased 10% to $35.9 million for the six month period ending March 31, 2017 from $32.6 million during the same period in fiscal 2016.
Gross profit was $14.7 million, or 40.8% of revenue, for the six month period ending March 31, 2017, an increase of 5% from $14.0 million, 42.8% of revenue, during the same period in fiscal 2016.
Operating expenses increased 24% to $12.2 million for the six month period ending March 31, 2017 from $9.8 million during the same period in fiscal 2016.
Income from operations totaled $2.5 million for the six month period ending March 31, 2017 compared to $4.1 million during the same period in fiscal 2016.
Net income totaled $1.8 million, or $0.13 per diluted share, for the six month period ending March 31, 2017, a decrease of 40% from $3.0 million, or $0.22 per diluted share, during the same period in fiscal 2016.
Management Commentary
“Revenue growth of 4% for second quarter and 10% year-to-date is beneath our expectation for this six month period,” said Clearfield CEO, Cheri Beranek. “While momentum in our international markets has been renewed and our progress along our Tier 1 initiatives has been accelerating, we did experience a noticeable dip in demand for our solutions from our customers in the wireless market. We see this as a short-term shift in procurement as these carriers reduce their near-term capital expenditures in preparation for the enhancement of optical fiber required for higher speed networks. In addition, momentum within our alternative carrier markets has stalled consistent with the market speculation that has surrounded this customer group. Due to the volatility of this market space, we are unable to forecast when we may see strong demand re-establish itself here.
“I want to assure shareholders that while it is unfortunate that the short-term volatility of spend among these two groups is reflected in our year-to-date performance, I do not want it to mask the strong execution of Clearfield’s strategy to establish ourselves as a key supplier of fiber management and distribution products for all broadband service providers, regardless of size or network type.
“Yet, based on the strong Tier 1 performance, and the re-establishment of our international business momentum, we are reiterating our revenue outlook for the year at 15%. However, revenue will be more concentrated in fourth quarter than what has traditionally been the norm.
“Moreover, based upon our success to date, we are enhancing our commitment to grow our Tier 1 business. To date, we have been expanding our sales and engineering departments and have invested in the certification programs necessary to secure meaningful projects in these markets. As a testament to our early success, we recently announced that we were awarded NEBS Level 3 certification for our FieldSmart fiber management platform. While this independent certification certainly strengthens our supplier position within the Tier 1 community, it is only one of many that we look to achieve as we validate our entire platform to these service providers and begin to aggressively sell our products into their networks. Looking ahead to the second half of fiscal 2017, we will be increasing our investments to achieve additional certifications for our other products.
“For the year, we expect gross profit in the 40-42% range, operating expenses outside of costs associated with the defense of patent infringement claims in the 33-35% range, and income from operations of 5-9% of revenue. While this is lower than our historical norm, the opportunity within the Tier 1 markets is encouraging, and we see an aggressive pursuit of business in the Tier 1 markets to be warranted.
“The execution of these and other initiatives should enable us to further scale our business, enhance our market position, and continue our track record of delivering profits for our shareholders. The expansion of our stock repurchase program is evidence of our confidence in this strategy. We remain committed to exploring all options available to Clearfield to serve our customers and enhance shareholder value.”
FieldReport
Clearfield issued its FieldReport for fiscal Q2 2017, which is available in the investor relations section of the Company’s website or by clicking here. Comprised of presentation slides with audio and video, the report provides additional insight into Clearfield’s financial and operational performance.
About Clearfield, Inc.
Clearfield, Inc. (NASDAQ:CLFD) designs, manufactures and distributes fiber optic management, protection and delivery products for communications networks. Our “fiber to the anywhere” platform serves the unique requirements of leading incumbent local exchange carriers (traditional carriers), competitive local exchange carriers (alternative carriers), and MSO/cable TV companies, while also catering to the broadband needs of the utility/municipality, enterprise, data center and military markets.
Clearfield offers the industry’s only fiber management and delivery platform that simplifies the fiber to the ‘x’ (FTTx) equation with the promise of a design methodology that addresses each network’s unique requirements, while building simplicity into the design and delivering the lowest total cost of ownership.
Based on the patented Clearview Cassette, Clearfield’s unique single-architected, modular fiber management platform is designed to further lower the cost of broadband deployment and maintenance by consolidating, protecting and distributing incoming and outgoing fiber circuits, enabling customers to scale their operations as their subscriber revenues increase. Headquartered in Minneapolis, MN, Clearfield deploys more than a million fiber ports each year. For more information, visit www.SeeClearfield.com.
Cautionary Statement Regarding Forward-Looking Information
Forward-looking statements contained herein and in the FieldReport are made pursuant to the safe harbor provisions of the Private Litigation Reform Act of 1995. Words such as “may,” “will,” “expect,” “believe,” “anticipate,” “estimate,” “outlook,” or “continue” or comparable terminology are intended to identify forward-looking statements. Such forward looking statements include, for example, statements about the Company’s future revenue and operating performance, growth of the FTTx markets, effectiveness of the Company’s sales and marketing strategies and organization, utilization of manufacturing capacity, and the development and marketing of products. These statements are based upon the Company's current expectations and judgments about future developments in the Company's business. Certain important factors could have a material impact on the Company's performance, including, without limitation: our success depends upon adequate protection of our patent and intellectual property rights and our ability to successfully defend against claims of infringement; our results of operations could be adversely affected now that the stimulus funds of the American Recovery and Reinvestment Act are fully allocated and projections are nearing completion; National Broadband Plan’s transitioning from the USF to the CAF program may cause our customers and prospective customers to delay or reduce purchases; a significant percentage of our sales in the last three fiscal years have been made to a small number of customers, and the loss of these major customers would adversely affect us; intense competition in our industry may result in price reductions, lower gross profits and loss of market share; our results of operations could be adversely affected by economic conditions and the effects of these conditions on our customers’ businesses; our operating results may fluctuate significantly from quarter to quarter, which may make budgeting for expenses difficult and may negatively affect the market price of our common stock; to compete effectively, we must continually improve existing products and introduce new products that achieve market acceptance; we may face circumstances in the future that will result in impairment charges, including, but not limited to, significant goodwill impairment charges; we rely on single-source suppliers, which could cause delays, increases in costs or prevent us from completing customer orders, all of which could materially harm our business; we face risks associated with expanding our sales outside of the United States; further consolidation among our customers may result in the loss of some customers and may reduce sales during the pendency of business combinations and related integration activities; we are dependent on key personnel; product defects or the failure of our products to meet specifications could cause us to lose customers and sales or to incur unexpected expenses; and other factors set forth in Part I, Item IA. Risk Factors of Clearfield's Annual Report on Form 10-K for the year ended September 30, 2016 as well as other filings with the Securities and Exchange Commission. The Company undertakes no obligation to update these statements to reflect actual events.
CLEARFIELD, INC. | |||||||||||||||
CONDENSED STATEMENTS OF OPERATIONS | |||||||||||||||
UNAUDITED | |||||||||||||||
Three Months Ended | Six Months Ended | ||||||||||||||
March 31 | March 31 | ||||||||||||||
2017 | 2016 | 2017 | 2016 | ||||||||||||
Revenues | $ | 17,651,771 | $ | 16,947,187 | $ | 35,917,933 | $ | 32,636,902 | |||||||
Cost of sales | 10,208,957 | 9,666,738 | 21,266,399 | 18,679,657 | |||||||||||
Gross profit | 7,442,814 | 7,280,449 | 14,651,534 | 13,957,245 | |||||||||||
Operating expenses | |||||||||||||||
Selling, general and administrative | 6,162,178 | 5,136,952 | 12,179,702 | 9,833,967 | |||||||||||
Income from operations | 1,280,636 | 2,143,497 | 2,471,832 | 4,123,278 | |||||||||||
Interest income | 59,885 | 39,169 | 112,619 | 72,708 | |||||||||||
Income before income taxes | 1,340,521 | 2,182,666 | 2,584,451 | 4,195,986 | |||||||||||
Income tax expense | 433,000 | 689,687 | 800,000 | 1,215,553 | |||||||||||
Net income | $ | 907,521 | $ | 1,492,979 | $ | 1,784,451 | $ | 2,980,433 | |||||||
Net income per share: | |||||||||||||||
Basic | $ | 0.07 | $ | 0.11 | $ | 0.13 | $ | 0.22 | |||||||
Diluted | $ | 0.07 | $ | 0.11 | $ | 0.13 | $ | 0.22 | |||||||
Weighted average shares outstanding: | |||||||||||||||
Basic | 13,589,109 | 13,309,181 | 13,578,178 | 13,298,874 | |||||||||||
Diluted | 13,803,697 | 13,581,810 | 13,797,126 | 13,578,430 |
CLEARFIELD, INC. | |||||
CONDENSED BALANCED SHEETS | |||||
(Unaudited) March 31, 2017 | (Audited) September 30, 2016 | ||||
Assets | |||||
Current Assets | |||||
Cash and cash equivalents | $ | 22,483,013 | $ | 28,014,321 | |
Short-term investments | 5,813,150 | 5,527,075 | |||
Accounts receivable, net | 8,114,221 | 7,999,210 | |||
Inventories | 9,970,877 | 8,373,155 | |||
Other current assets | 974,990 | 1,198,917 | |||
Total current assets | 47,356,251 | 51,112,678 | |||
Property, plant and equipment, net | 6,024,930 | 5,780,814 | |||
Other Assets | |||||
Long-term investments | 15,015,000 | 10,703,000 | |||
Goodwill | 2,570,511 | 2,570,511 | |||
Other | 438,720 | 428,310 | |||
Total other assets | 18,024,231 | 13,701,821 | |||
Total Assets | $ | 71,405,412 | $ | 70,595,313 | |
Liabilities and Shareholders’ Equity | |||||
Current Liabilities | |||||
Accounts payable | $ | 2,361,377 | $ | 2,573,292 | |
Accrued compensation | 2,627,890 | 4,697,138 | |||
Accrued expenses | 54,793 | 75,306 | |||
Total current liabilities | 5,044,060 | 7,345,736 | |||
Other Liabilities | |||||
Deferred taxes – long-term | 411,779 | 411,779 | |||
Deferred rent | 248,887 | 243,755 | |||
Total other liabilities | 660,666 | 655,534 | |||
Total Liabilities | 5,704,726 | 8,001,270 | |||
Commitment and contingencies | |||||
Shareholders’ Equity | |||||
Common stock | 141,441 | 141,263 | |||
Additional paid-in capital | 58,642,529 | 57,320,515 | |||
Retained earnings | 6,916,716 | 5,132,265 | |||
Total Shareholders’ Equity | 65,700,686 | 62,594,043 | |||
Total Liabilities and Shareholders’ Equity | $ | 71,405,412 | $ | 70,595,313 |
CLEARFIELD, INC. | |||||||||
CONDENSED STATEMENTS OF CASH FLOWS | |||||||||
UNAUDITED | |||||||||
Six Months Ended March 31, | Six Months Ended March 31, | ||||||||
2017 | 2016 | ||||||||
Cash flows from operating activities: | |||||||||
Net income | $ | 1,784,451 | $ | 2,980,433 | |||||
Adjustments to reconcile net income to cash provided by operating activities: | |||||||||
Depreciation and amortization | 800,136 | 706,176 | |||||||
Deferred income taxes | - | 1,125,507 | |||||||
(Gain) loss on disposal of assets | (5,100 | ) | 1,390 | ||||||
Stock-based compensation expense | 1,183,911 | 473,193 | |||||||
Changes in operating assets and liabilities: | |||||||||
Accounts receivable, net | (115,011 | ) | (1,843,207 | ) | |||||
Inventories | (1,597,722 | ) | (919,675 | ) | |||||
Other current assets | 234,201 | (207,489 | ) | ||||||
Accounts payable and accrued expenses | (2,296,544 | ) | 713,999 | ||||||
Net cash (used in) provided by operating activities | (11,678 | ) | 3,030,327 | ||||||
Cash flows from investing activities: | |||||||||
Purchases of property, plant and equipment and intangible assets | (1,064,936 | ) | (421,637 | ) | |||||
Proceeds from sale of property, plant and equipment | 5,100 | - | |||||||
Purchase of investments | (10,166,075 | ) | (3,820,075 | ) | |||||
Proceeds from maturities of investments | 5,568,000 | 3,858,000 | |||||||
Net cash used in investing activities | (5,657,911 | ) | (383,712 | ) | |||||
Cash flows from financing activities: | |||||||||
Repurchase of common stock | (49,352 | ) | (333,761 | ) | |||||
Proceeds from issuance of common stock under employee stock purchase plan | 169,500 | 118,013 | |||||||
Proceeds from issuance of common stock | 28,459 | 84,738 | |||||||
Tax withholding related to vesting of restricted stock grants and exercise of stock options | (10,326 | ) | (36,223 | ) | |||||
Net cash provided by (used in) financing activities | 138,281 | (167,233 | ) | ||||||
(Decrease) increase in cash and cash equivalents | (5,531,308 | ) | 2,479,382 | ||||||
Cash and cash equivalents at beginning of period | 28,014,321 | 18,071,210 | |||||||
Cash and cash equivalents at end of period | $ | 22,483,013 | $ | 20,550,592 | |||||
Supplemental cash flow information | |||||||||
Cash paid during the year for income taxes | $ | 416,750 | $ | 83,884 | |||||
Non-cash financing activities | |||||||||
Cashless exercise of stock options | $ | 34,268 | $ | 234,460 |
Investor Relations Contact:
Matt Glover and Najim Mostamand
Liolios Group, Inc.
949-574-3860
CLFD@liolios.com
EXHIBIT 99.2
Hello, this is Cheri Beranek, President and CEO of Clearfield. Welcome to our fiscal second quarter 2017 FieldReport. Before we begin today, I’d like to provide some important cautions regarding forward - looking statements made during today’s presentation.
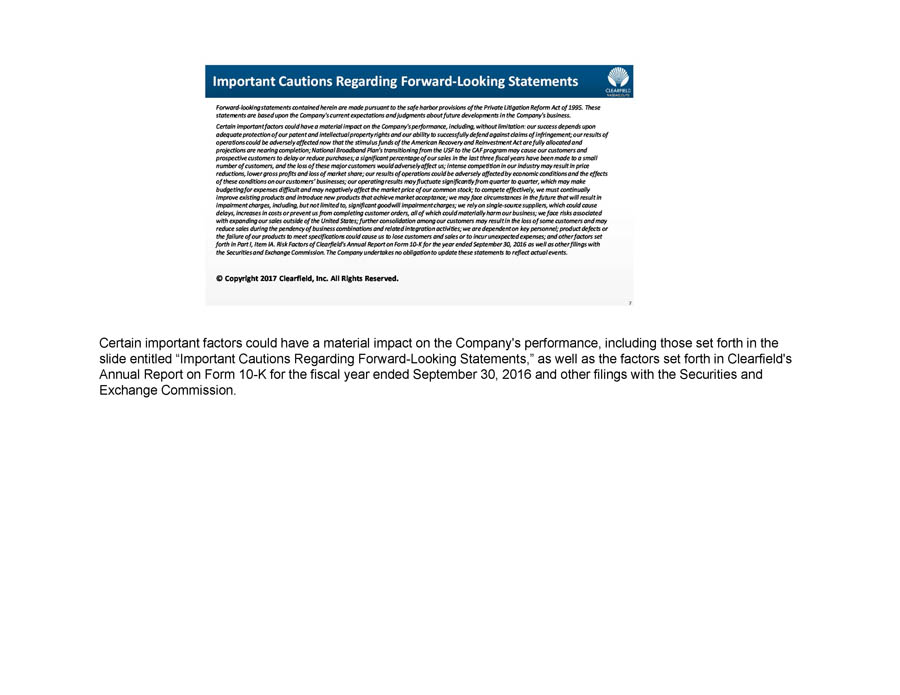
Certain important factors could have a material impact on the Company's performance, including those set forth in the slide entitled “Important Cautions Regarding Forward - Looking Statements,” as well as the factors set forth in Clearfield's Annual Report on Form 10 - K for the fiscal year ended September 30, 2016 and other filings with the Securities and Exchange Commission.
Once again, we have proven our commitment to expanding our presence in the Tier 1 market, with more than 11% of our revenue in the quarter coming from this customer segment. Our growth in this market has been very encouraging, as reflected by the increased amount of orders, as well as the fact that we were able to achieve an important industry certification. As reported earlier this week, certification to Level 3 NEBS will enable us to more aggressively pursue additional Tier 1 business. Yet revenue growth of 4% for second quarter and 10% year - to - date is beneath our expectation and plan for this six month period. We did experience a noticeable dip in demand for our solutions from our customers in the wireless market. We see this as a short - term shift in procurement patterns as these carriers reduce their near - term capital expenditures in preparation for the enhancement of the optical fiber required for higher speed networks. In addition, momentum within our alternative carrier markets has stalled, but it is important to note that this is consistent with the market speculation that has surrounded this customer group. I want to assure shareholders that while it is unfortunate that the short - term volatility of spend among these two groups is reflected in our year - to - date performance, I do not want it to mask the strong execution of Clearfield’s strategy to establish ourselves as a key supplier of fiber management and distribution products for all broadband service providers, regardless of size or network type. But before I discuss our operational results, growth strategies, and future outlook in greater detail, I would like to turn the presentation over to our CFO, Dan Herzog, who will walk us through our full financial performance for the second quarter of fiscal 2017.
Thank you, Cheri. Now, looking at our financial results in more detail…
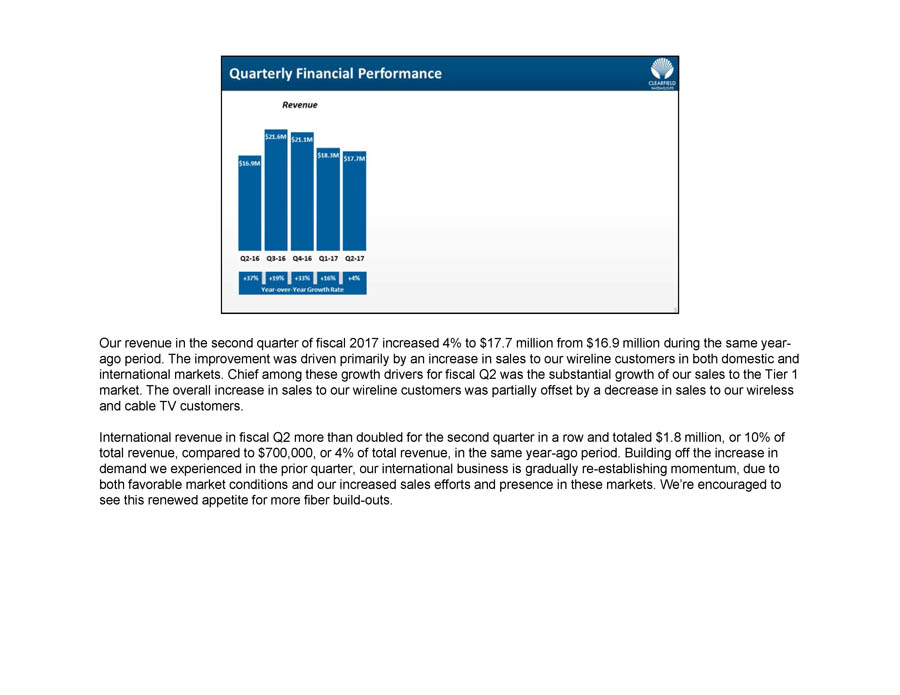
Our revenue in the second quarter of fiscal 2017 increased 4% to $17.7 million from $16.9 million during the same year - ago period. The improvement was driven primarily by an increase in sales to our wireline customers in both domestic and international markets. Chief among these growth drivers for fiscal Q2 was the substantial growth of our sales to the Tier 1 market. The overall increase in sales to our wireline customers was partially offset by a decrease in sales to our wireless and cable TV customers. International revenue in fiscal Q2 more than doubled for the second quarter in a row and totaled $1.8 million, or 10% of total revenue, compared to $700,000, or 4% of total revenue, in the same year - ago period. Building off the increase in demand we experienced in the prior quarter, our international business is gradually re - establishing momentum, due to both favorable market conditions and our increased sales efforts and presence in these markets. We’re encouraged to see this renewed appetite for more fiber build - outs.
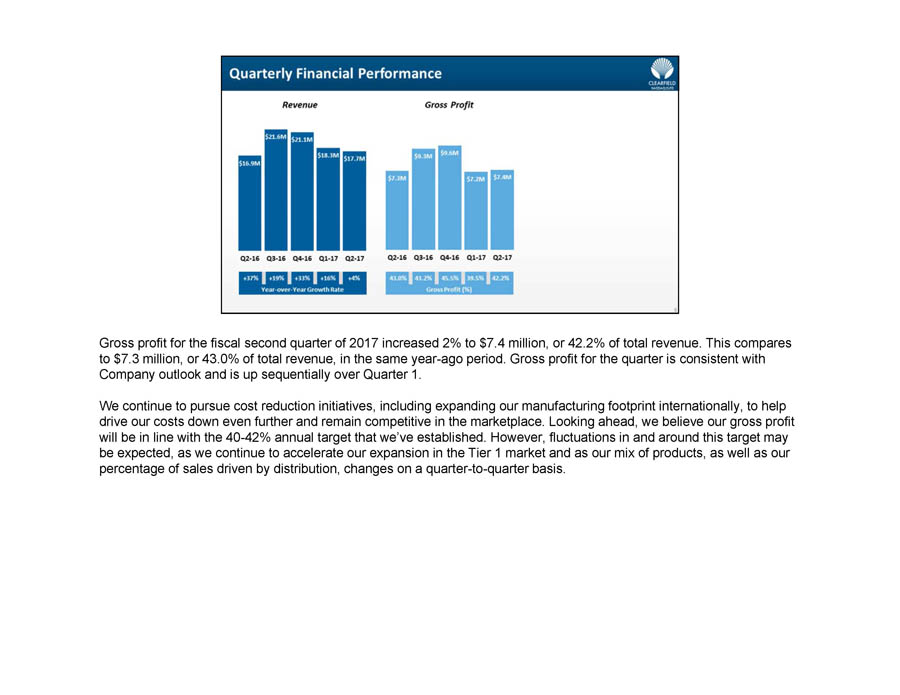
Gross profit for the fiscal second quarter of 2017 increased 2% to $7.4 million, or 42.2% of total revenue. This compares to $7.3 million, or 43.0% of total revenue, in the same year - ago period. Gross profit for the quarter is consistent with Company outlook and is up sequentially over Quarter 1. We continue to pursue cost reduction initiatives, including expanding our manufacturing footprint internationally, to help drive our costs down even further and remain competitive in the marketplace. Looking ahead, we believe our gross profit will be in line with the 40 - 42% annual target that we’ve established. However, fluctuations in and around this target may be expected, as we continue to accelerate our expansion in the Tier 1 market and as our mix of products, as well as our percentage of sales driven by distribution, changes on a quarter - to - quarter basis.
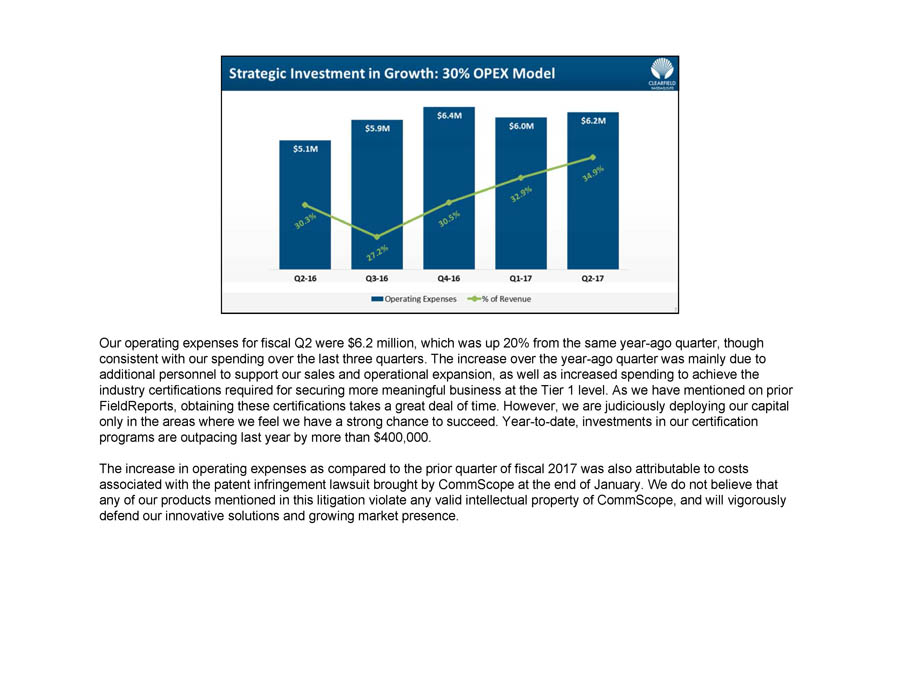
Our operating expenses for fiscal Q2 were $6.2 million, which was up 20% from the same year - ago quarter, though consistent with our spending over the last three quarters. The increase over the year - ago quarter was mainly due to additional personnel to support our sales and operational expansion, as well as increased spending to achieve the industry certifications required for securing more meaningful business at the Tier 1 level. As we have mentioned on prior FieldReports, obtaining these certifications takes a great deal of time. However, we are judiciously deploying our capital only in the areas where we feel we have a strong chance to succeed. Year - to - date, investments in our certification programs are outpacing last year by more than $400,000. The increase in operating expenses as compared to the prior quarter of fiscal 2017 was also attributable to costs associated with the patent infringement lawsuit brought by CommScope at the end of January. We do not believe that any of our products mentioned in this litigation violate any valid intellectual property of CommScope, and will vigorously defend our innovative solutions and growing market presence.
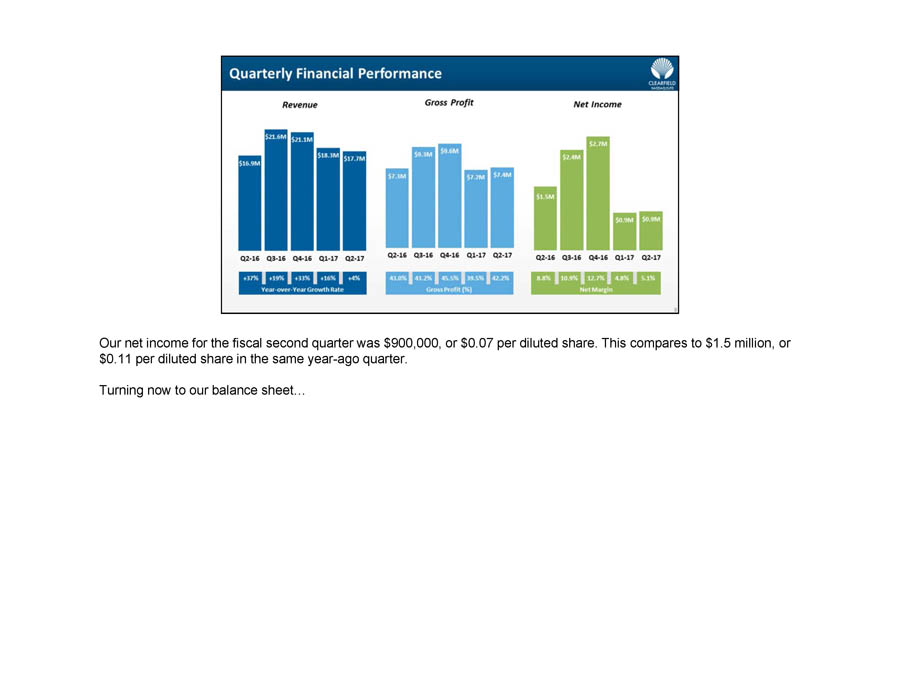
Our net income for the fiscal second quarter was $900,000, or $0.07 per diluted share. This compares to $1.5 million, or $0.11 per diluted share in the same year - ago quarter. Turning now to our balance sheet…
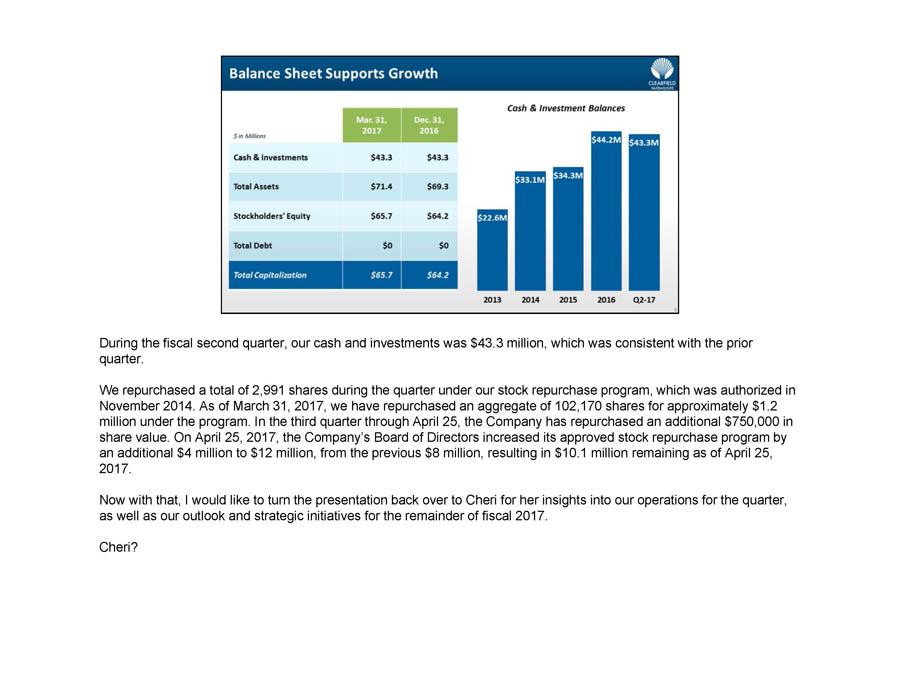
During the fiscal second quarter, our cash and investments was $43.3 million, which was consistent with the prior quarter. We repurchased a total of 2,991 shares during the quarter under our stock repurchase program, which was authorized in November 2014. As of March 31, 2017, we have repurchased an aggregate of 102,170 shares for approximately $1.2 million under the program. In the third quarter through April 25, the Company has repurchased an additional $750,000 in share value. On April 25, 2017, the Company’s Board of Directors increased its approved stock repurchase program by an additional $4 million to $12 million, from the previous $8 million, resulting in $10.1 million remaining as of April 25, 2017. Now with that, I would like to turn the presentation back over to Cheri for her insights into our operations for the quarter, as well as our outlook and strategic initiatives for the remainder of fiscal 2017. Cheri?
Thanks, Dan.
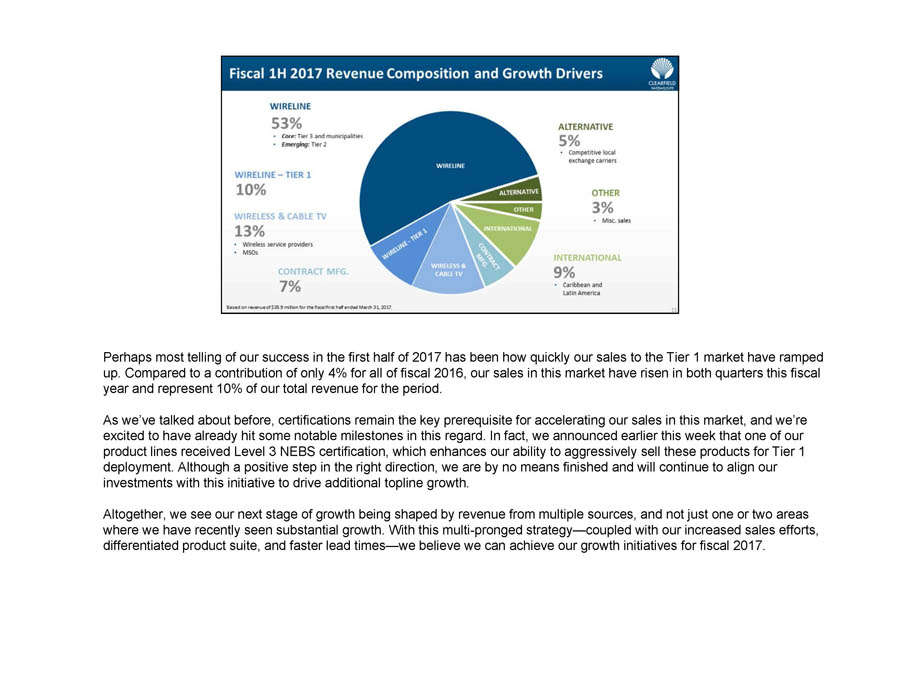
Perhaps most telling of our success in the first half of 2017 has been how quickly our sales to the Tier 1 market have ramped up . Compared to a contribution of only 4 % for all of fiscal 2016 , our sales in this market have risen in both quarters this fiscal year and represent 10 % of our total revenue for the period . As we’ve talked about before, certifications remain the key prerequisite for accelerating our sales in this market, and we’re excited to have already hit some notable milestones in this regard. In fact, we announced earlier this week that one of our product lines received Level 3 NEBS certification, which enhances our ability to aggressively sell these products for Tier 1 deployment. Although a positive step in the right direction, we are by no means finished and will continue to align our investments with this initiative to drive additional topline growth. Altogether, we see our next stage of growth being shaped by revenue from multiple sources, and not just one or two areas where we have recently seen substantial growth. With this multi - pronged strategy — coupled with our increased sales efforts, differentiated product suite, and faster lead times — we believe we can achieve our growth initiatives for fiscal 2017.
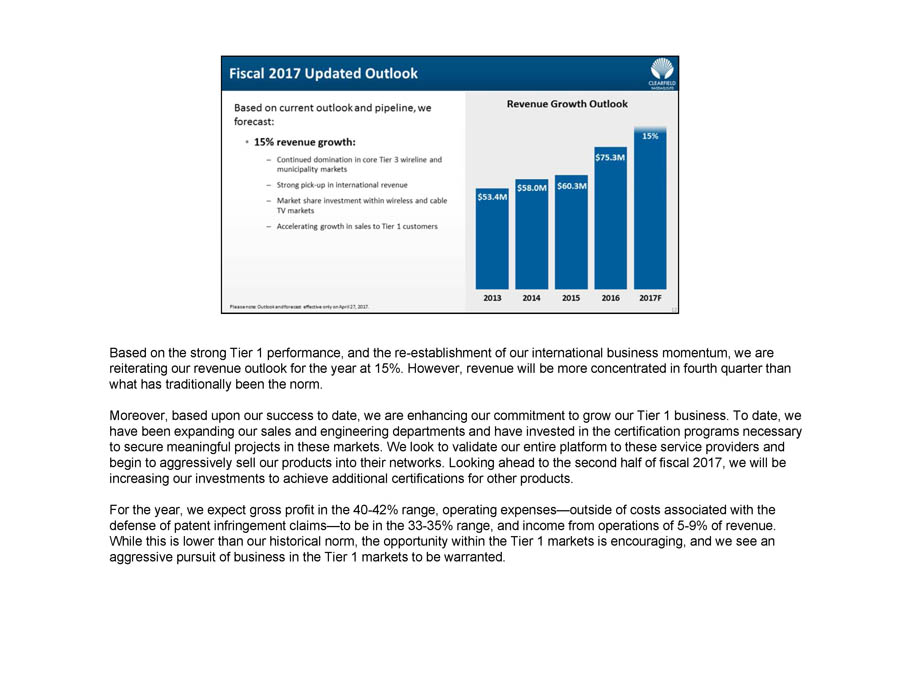
Based on the strong Tier 1 performance, and the re - establishment of our international business momentum, we are reiterating our revenue outlook for the year at 15%. However, revenue will be more concentrated in fourth quarter than what has traditionally been the norm. Moreover, based upon our success to date, we are enhancing our commitment to grow our Tier 1 business. To date, we have been expanding our sales and engineering departments and have invested in the certification programs necessary to secure meaningful projects in these markets. We look to validate our entire platform to these service providers and begin to aggressively sell our products into their networks. Looking ahead to the second half of fiscal 2017, we will be increasing our investments to achieve additional certifications for other products. For the year, we expect gross profit in the 40 - 42 % range, operating expenses — outside of costs associated with the defense of patent infringement claims — to be in the 33 - 35 % range, and income from operations of 5 - 9 % of revenue . While this is lower than our historical norm, the opportunity within the Tier 1 markets is encouraging, and we see an aggressive pursuit of business in the Tier 1 markets to be warranted .
The execution of these and other initiatives should enable us to further scale our business, enhance our market position, and continue our track record of delivering profits for our shareholders. The expansion of our stock repurchase program is evidence of our confidence in this strategy. We remain committed to exploring all options available to Clearfield to serve our customers and enhance shareholder value. In closing, we encourage you to review today’s earnings release and filings, and we welcome any questions you may have about our financial performance, operations, products or industry. Please send any inquiries you may have to CLFD@liolios.com. We will post the most relevant questions and answers in the ‘For Investors’ section of our website. This wraps up today’s FieldReport. Thank you for your interest and support, and we look forward to speaking again with you soon.
,'FM+4A)8-4^B" \@!/$$TJP&1,>Y-KI(3RD],F6%#_>J#2E:!F'['
M+_*R6]*ICDIJ,0J\E6_R3XY*PA5BN)[>175VBD7[$R$AA7;[0R8EWL41ZHF
M639_V6'ZU_YIR^P6-4T/A
MPO,%XP346YC'^ZI/V9E'\C9D&(D&D$Q*&TK3A+??H^YN8[,AAQN)*\ 1NK_#
M7X6S'LQV_FMTO5NFNLV+7=I(P%;NV;C*!_.FW/\ U94S)R#BC?\ $TP/#),O
M(UX6N(7: 0I]=NH[Z21/41F]3_=EQ\<.*H-=%UV> QC3[E FD7]H8
MS;VUM"DLT2"*UMDMV>XE0NGPRW$TD?\ L\53WS#Y:>1[DV.G+OH5Q;1&.-1^
M_8Q+%$M/]V>F'5?\C%4#K/E_5I=4U*%H;R5-1GAEMY+>.T,7!$A5/5O;E)+J
MS>SDB=UX_P#1O^\=\51L6FWMEJ1_RQKFMR93,_P!%
MRX0 3PD*Q6M
HOOBKO47WQ5WJ+[XJ[U%]\5=ZB^^*N]1??%6GGBC1I)
M&"(H+,[$ #J6)Q5M9490RFJD5!&X(/?%6^:^^*J<-W;3\_1D$GI.8Y.)KQ=
M?M(W^4N*JGJ+BJV.XAE021.)(V^RZ$,I[;,N*J4^HV%O(D5Q6VM;J*>X@
M_OHHV#,F_'X@/\KX<557OK..=+>2>-+B7>*%F4.W^I&3S;%57F/?%7
XJ
MDJZ;KNE:;J&GOIT]]<7^CV]I%+ 4:,3PPW$,L4TCNC)P]5/3?C^]_P!?%61>
M4]*>S;4I[FV$5Q- ;2?5
M+ZWN>#V\?,J_UN&9/V_]])BJ6ZAH&LR:G?0S0W -'C,CQRK,OUADC:.3T_2G^/G_P 9,52^'0M47\MWT4VPCU)K:2,6
MJLO$,SNRQJ]?3X\6Q5":KY/U'5KJ:"0RVMI<:G