UNITED STATES
SECURITIES AND EXCHANGE COMMISSION
Washington, D.C. 20549
FORM N-CSR
CERTIFIED SHAREHOLDER REPORT OF REGISTERED MANAGEMENT
INVESTMENT COMPANIES
|
Investment Company Act file number:
|
811-04710
|
|
Exact name of registrant as specified in charter:
|
The Asia Pacific Fund, Inc.
|
|
Address of principal executive offices:
|
48 Wall Street – 22nd Floor
New York, NY 10005
|
|
Name and address of agent for service:
|
Hoyt M. Peters
c/o AST Fund Solutions, LLC
48 Wall Street – 22nd Floor
New York, NY 10005
|
|
Registrant's telephone number, including area code:
|
212-269-5550
|
|
Date of fiscal year end:
|
3/31/2018
|
|
Date of reporting period:
|
9/30/2017
|
Item 1 – Reports to Stockholders

The Asia Pacific Fund, Inc.
Semi-Annual Report
September 30, 2017
September 30, 2017
Directors
Michael J. Downey, Chairman
Jessica M. Bibliowicz
Robert F. Gunia
Duncan M. McFarland
David G. P. Scholfield
Christopher Sykes
William G. Tung
Officers
King Lun Au, President
Frank J. Maresca, Treasurer and Chief Financial Officer
Hoyt M. Peters, Secretary
Ann Marie Swanson, Chief Compliance Officer
Investment Manager
Value Partners Hong Kong Limited
9th Floor, Nexxus Building
41 Connaught Road Central
Hong Kong
Administrator
AST Fund Solutions, LLC
48 Wall Street – 22nd Floor
New York, NY 10005
Custodian
The Bank of New York Mellon
One Wall Street
New York, NY 10286
Transfer Agent
American Stock Transfer & Trust Company, LLC
6201 15th Avenue
Brooklyn, NY 11219
Independent Registered Public Accounting Firm
KPMG LLP
345 Park Avenue
New York, NY 10154
Legal Counsel
Stradley Ronon Stevens & Young, LLP
2005 Market Street, Suite 2600
Philadelphia, PA 19103
Notice is hereby given in accordance with Section 23(c) of the Investment Company Act of 1940 that The Asia Pacific Fund, Inc. (the “Fund”) may purchase, from time to time, shares of its common stock at market prices.
The accompanying financial statements as of September 30, 2017 were not audited and, accordingly, no opinion is expressed on them
This report, including the financial statements herein, is transmitted to the shareholders of the Fund for their information. This is not a prospectus, circular or representation intended for use in the purchase of shares of the Fund or any securities mentioned in this report.
The Asia Pacific Fund, Inc.
48 Wall Street – 22nd Floor
New York, NY 10005
For general information on the Fund, please call (toll-free) Pristine Advisers, our shareholders’ servicing agent, toll-free at:
1-(888) 4-ASIA-PAC (1-888-427-4272).
Current information about the Fund is available on its website (http://www.asiapacificfund.com). This website includes monthly updates of the Fund’s performance and other data as well as the Manager’s quarterly presentation of performance and asset allocations and comments on the current Asian outlook.
CUSIP: 044901106
NYSE: APB
www.asiapacificfund.com
The Asia Pacific Fund, Inc.
CONTENTS
|
Fund Statistics
|
1
|
|
Report of the Investment Manager
|
2
|
|
Portfolio of Investments
|
6
|
|
Statement of Assets and Liabilities
|
12
|
|
Statement of Operations
|
12
|
|
Statement of Changes in Net Assets
|
13
|
|
Notes to Financial Statements
|
13
|
|
Financial Highlights
|
18
|
|
Board of Directors Approval of Continuance of Investment Management Agreement
|
20
|
|
Supplemental Proxy Information
|
23
|
|
Dividend Reinvestment Plan
|
24
|
|
Additional Information
|
25
|
The Asia Pacific Fund, Inc.
As of September 30, 2017 (Unaudited)
As of September 30, 2017 (Unaudited)
Fund Statistics
OUR TOLL-FREE LINE:
1-888-4-ASIA-PAC
1-888-427-4272
OUR TOLL-FREE LINE:
1-888-4-ASIA-PAC
1-888-427-4272
For further information on the Fund (including monthly fact sheets), please call or visit the Fund’s website of www.asiapacificfund.com.
|
Statistics
|
|
|
Total Net Assets
|
$151,014,723
|
|
Shares Outstanding
|
10,344,072
|
|
Net Asset Value
|
$14.60
|
|
Equity
|
99.8%(a)
|
|
Total Return Performance (US Dollar terms)
|
||
|
Period
|
Market Price(b)
|
NAV(c)
|
|
3 months
|
7.4%
|
5.8%
|
|
6 months
|
13.5%
|
12.7%
|
|
1 Year
|
34.2%
|
21.1%
|
|
3 Years (d)
|
9.8%
|
7.8%
|
|
5 Years (d)
|
7.8%
|
6.4%
|
|
10 Years (d)
|
1.6%
|
1.1%
|
|
Other Information
|
|
|
Ticker Symbol
|
APB
|
|
Primary Exchange
|
NYSE
|
|
Dividend Repurchase Program
|
Yes
|
|
Portfolio Characteristics
|
|
|
Top Ten Equity Holdings
(% of Total Net Assets) |
|
|
Samsung Electronics Co. Ltd.
|
8.2%
|
|
China Construction Bank Corp. (Class “H” Shares)
|
5.2%
|
|
Longfor Properties Co. Ltd.
|
4.6%
|
|
KB Financial Group, Inc.
|
2.8%
|
|
PetroChina Co. Ltd. (Class “H” Shares)
|
2.7%
|
|
China Resources Power Holdings Co. Ltd.
|
2.4%
|
|
Far East Horizon Ltd.
|
2.2%
|
|
Ping An Insurance Group Co. of China Ltd. (Class “H” Shares)
|
2.2%
|
|
Midea Group Co. Ltd.
|
2.1%
|
|
Yangtze Optical Fibre and Cable Joint Stock Ltd. Co. (Class “H” Shares)
|
2.1%
|
|
Sector Breakdown: Top Ten Industries
(% of Total Net Assets) |
|
|
Real Estate
|
14.7%
|
|
Consumer Discretionary
|
12.4%
|
|
Industrials
|
12.2%
|
|
Banking
|
11.5%
|
|
Information Technology
|
11.2%
|
|
Technology Hardware & Equipment
|
8.6%
|
|
Insurance
|
5.3%
|
|
Utilities
|
5.1%
|
|
Telecommunication Services
|
3.6%
|
Footnote section
|
(a)
|
Expressed as a percentage of total investments.
|
|
(b)
|
Total investment return is calculated assuming a purchase of common stock at the current market value on the first day and a sale at the current market value on the last day of each period reported. Dividends and distributions are assumed, for purposes of this calculation, to be reinvested at prices obtained under the Fund’s dividend reinvestment plan. These calculations do not include brokerage commissions.
|
|
(c)
|
This information represents the historical net asset value (NAV) per share performance of the Fund. NAV per share performance is calculated assuming reinvestment of dividends and distributions. Because NAV per share performance does not reflect market price, it is not the same as total investment return.
|
|
(d)
|
Average annual return.
|
1
REPORT OF THE INVESTMENT MANAGER
For the period March 31, 2017 to September 30, 2017 (Unaudited)
For the period March 31, 2017 to September 30, 2017 (Unaudited)
During the six-month period ended September 30, 2017, the Fund’s net asset value (NAV) per share increased by US$1.64, from US$12.96 to US$14.60. In percentage terms, the Fund’s NAV total return increased by 12.7%. This compares with an increase of 15.7% by its reference benchmark index, the MSCI All Countries Asia Ex-Japan Index. The Fund’s share price was up by 13.5% over the period, from US$12.23 to US$13.88.
The chart below illustrates the Fund’s net asset value performance per share during the period:
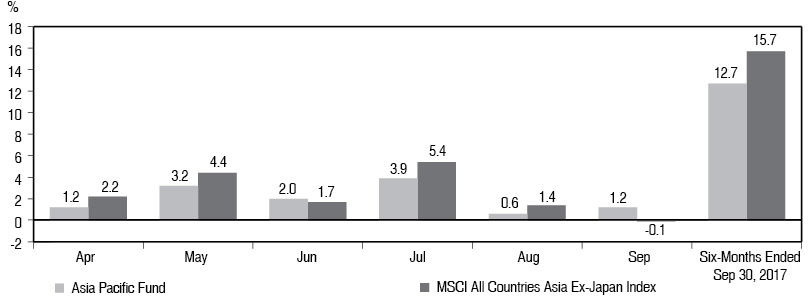
Source: Bank of New York Mellon & Reuters for NAV and market price respectively, MSCI for Index, data as of September 30, 2017. The source of market price data was changed from Bloomberg to Reuters & Bank of New York Mellon in November 2016.
2
Local Currencies versus the US Dollar
March 31, 2017 – September 30, 2017
March 31, 2017 – September 30, 2017
|
Currency
US$/Local rate |
Mar 31,
2017 |
Sep 30,
2017 |
Mar 31, 2017 to
Sep 30, 2017 Change %* |
|||||||||
|
North Asia
|
||||||||||||
|
Chinese Renminbi
|
6.89
|
6.64
|
3.75
|
|||||||||
|
Hong Kong Dollar
|
7.77
|
7.81
|
-0.50
|
|||||||||
|
South Korean Won
|
1,118.30
|
1,145.35
|
-2.36
|
|||||||||
|
New Taiwan Dollar
|
30.34
|
,30.32
|
0.06
|
|||||||||
|
ASEAN
|
||||||||||||
|
Thai Baht
|
34.36
|
33.35
|
3.04
|
|||||||||
|
Malaysian Ringgit
|
4.43
|
4.22
|
4.81
|
|||||||||
|
Philippines Peso
|
50.18
|
50.80
|
-1.23
|
|||||||||
|
Singapore Dollar
|
1.40
|
1.36
|
2.90
|
|||||||||
|
Indonesian Rupiah
|
13,325.50
|
13,469.00
|
-1.07
|
|||||||||
|
South Asia
|
||||||||||||
|
Sri Lankan Rupee
|
152.13
|
153.10
|
-0.64
|
|||||||||
|
Indian Rupee
|
64.94
|
65.32
|
-0.59
|
|||||||||
|
Vietnamese Dong
|
22,755.00
|
22,726.50
|
0.13
|
|||||||||
Source: Morningstar (Value Partners)
|
*
|
A negative figure denotes a depreciation of the local currency vs the USD (and vice-versa).
|
STOCK MARKET PERFORMANCE
March 31, 2017 – September 30, 2017
March 31, 2017 – September 30, 2017
|
Country - Index
|
Market Change %
Local |
Market Change %
US Dollar |
|
North Asia
|
||
|
MSCI Hong Kong
|
13.2
|
12.7
|
|
MSCI Taiwan
|
10.4
|
10.5
|
|
MSCI Korea
|
16.0
|
13.3
|
|
MSCI China
|
27.5
|
27.0
|
|
ASEAN
|
|
|
|
MSCI Singapore
|
5.5
|
8.6
|
|
MSCI Malaysia
|
2.2
|
7.1
|
|
MSCI Thailand
|
10.1
|
13.4
|
|
MSCI Indonesia
|
8.8
|
7.6
|
|
MSCI Philippines
|
11.9
|
10.6
|
|
South Asia
|
|
|
|
MSCI Sri Lanka
|
15.6
|
14.9
|
|
MSCI India
|
6.6
|
5.9
|
|
MSCI Vietnam
|
9.8
|
9.9
|
|
MSCI All Countries Asia Ex-Japan
|
16.1
|
15.7
|
Source: Morningstar (Value Partners)
3
COUNTRY ALLOCATION*
|
Country
|
Mar 31, 2017
% |
Jun 30, 2017
% |
Sep 30, 2017
% |
|
North Asia
|
79.2%
|
78.2%
|
83.9%
|
|
Hong Kong/China/Macau
|
54.3%
|
53.9%
|
58.2%
|
|
South Korea
|
17.7%
|
15.1%
|
15.9%
|
|
Taiwan
|
7.2%
|
9.2%
|
9.8%
|
|
ASEAN
|
12.9%
|
13.9%
|
12.2%
|
|
Singapore
|
4.3%
|
4.2%
|
1.9%
|
|
Thailand
|
1.4%
|
1.5%
|
2.5%
|
|
Indonesia
|
4.0%
|
5.2%
|
5.5%
|
|
Malaysia
|
2.4%
|
2.1%
|
1.3%
|
|
Philippines
|
0.8%
|
0.9%
|
1.0%
|
|
South Asia
|
3.9%
|
4.2%
|
1.6%
|
|
India
|
3.9%
|
4.2%
|
1.6%
|
|
Cash & Other
|
4.0%
|
3.7%
|
2.3%
|
Source: AST Fund Solutions, LLC
|
*
|
Rounded up to nearest tenth of one percent
|
OVERVIEW
In the six-month period ended September 30, 2017, the Asia ex-Japan market recorded a strong rally supported by external demand recovery and solid corporate earnings. The MSCI Asia ex-Japan Index was up 15.7% while the Fund gained 12.7% during the period.
China and Hong Kong markets buoyed by capital flows
The Hong Kong and China stock markets extended their strong uptrend on favorable capital flows and upbeat first-half earnings announcements, which saw the earnings per share (EPS) of the MSCI China Index increasing 22% year-on-year, one of the highest in global emerging markets. Southbound capital remained sanguine in part owing to robust offshore investment demand and the premium of A-shares over H-shares, which stood at 41% as at September 23, 2017. As a result, in the first half of 2017, an average RMB1.3 billion of southbound capital flowed into Hong Kong daily, accounting for about 13% of the turnover in the Hong Kong stock market.
Previously, foreign exchange controls made it difficult for mainland Chinese investors to diversify their investments overseas. That said though, the southbound flow through the Stock Connect program has become a key channel for mainland investors such as insurance companies to invest in offshore assets. We believe the southbound flow will continue and support offshore China equities since mainland investors are more familiar with the companies listed in the Hong Kong market, and offshore China markets are trading at a discount to the onshore A-share market.
In terms of overseas capital flows, foreign investment allocations to China remain subdued as foreign investors are still wary of the Chinese market, overplaying the risks of a hard landing. However, as China’s economy maintains a healthy growth momentum and there is a continued policy focus to deleverage the Chinese financial system, we expect foreign investors to attach greater importance to the China market, which is favorable for China stocks in the long run.
Policy push – a market stabilizer
China’s reform efforts continued and significant progress was made in some areas, including the loosening of its one-child policy, environmental initiatives and anti-corruption campaigns. However, the progress of other pro-growth items in the reform agenda, such as reform of state-owned enterprises, Hukou (a government system of household registration required by law in mainland China and Taiwan) and tax reforms were slower than expected. The stock market momentum is expected to stay positive as China is expected to speed up these reforms after the 19th Party Congress.
Meanwhile, deleveraging stayed a key theme throughout 2017 as risk-prevention was highlighted as a policy priority in the fifth Central Financial Work Conference (CFWC) held in mid-July. The CFWC set the scene for the financial sector’s development in the next five years. Regulators are now required to take a “pro-active” approach to manage risks, that is, to curb risks before they materialize. We believe that the call for tighter risk prevention is a key step to ensure the health of the China market in the long haul.
Korea’s economic recovery intact amid geopolitical tensions
In South Korea, the ongoing nuclear provocation from North Korea continued to pose a threat to the country’s financial markets, escalating the risks of capital outflows. Yet, South Korea’s economic recovery remains intact with the government still forecasting its gross domestic product (GDP) to expand by a healthy 3% this year. Meanwhile, export growth remained strong with the September reading surging 35% year-on-year owing to higher memory chip and steel product sales, representing a ninth consecutive month of double-digit growth and the longest stretch of expansion since 2011.
4
PORTFOLIO STRATEGY
From a portfolio perspective, we have retained our core exposures in China, Hong Kong and South Korea where the strongest earnings recovery was found in the region thus far in 2017. For sectors, we maintained our exposures in technology hardware companies and real estate developers; our stock picks within these sectors contributed the most to our portfolio performance over the period.
The top sector performer was technology. Among technology names, share prices of a Chinese optical fiber company and a leading South Korea technology hardware company rallied. The share price of our holdings in the China optical fiber company doubled during the period driven by strong first-half 2017 results, while its margin improvement also beat market expectation. The company gave positive guidance on its earnings outlook supported by tight supply of optical fiber in China and its leading position in the industry, thanks to its integrated business model. Our holding in the largest South Korean technology hardware company was also among the top contributors driven by strong earnings results. The company’s operating profit grew 42% in the second quarter to a quarterly record high. Its leading positions in memory chips and OLED panels also continued to add strength to earnings, and its outlook remains positive supported by robust demand for smart devices.
In real estate, our key holding in a China developer was another top performance contributor, as supported by its solid results. The company announced strong contract sales in the first half of 2017 and had revised up the sales target by 50% for the year 2017 (from RMB100 billion to 150 billion). Both gross margin and profit recorded a solid jump while its recurring income, a key driver to boost earnings and drive stable cash flow, was up 29% year-on-year in the first half of 2017. The company also declared its first-ever interim dividend of RMB0.2 per share, making it a solid conviction for our dividend strategy.
So far 2017 has been a constructive year for Asia ex-Japan equities driven by the strongest earnings upward revision in six years. In particular, companies with strong earnings growth in the information technology sector had a resilient first half and were the key performance attributors for the index. However, these companies were deemed to be challenging for equity dividend investors as they are generally trading at high multiples and pay almost zero dividends. They are unsuitable candidates for our dividend strategy and became the key factor for our performance gap year-to-date.
OUTLOOK
Looking forward, we remain positive on Asia ex-Japan equities despite their strong market performance year-to-date. We expect the region’s 2017 earnings growth (currently forecasted to be 21.9% vs. the forecast of 13.2% in January) will continue to be the fundamental driver, this together with improvement in cash flow generation are supportive for dividend growth within the region. Although the 12-month forward price-to-earnings (P/E) ratio of the MSCI Asia ex Japan index has normalized to 13.1 times, it is still trading at an attractive level relative to developed markets and most emerging countries.
Value Partners Hong Kong Limited
October 12, 2017
Past performance does not guarantee future results and current performance may be lower or higher than the past performance data quoted. The investment return and principal value will fluctuate, and shares, when sold, may be worth more or less than the original cost. Index returns do not include the effect of any sales charges, fund operating expenses or taxes. An investment cannot be made directly in an index.
Unless specified, all information contained in this report is quoted as of September 30, 2017. The views expressed are the views of Value Partners Hong Kong Limited only and are subject to change based on market and other conditions. The information provided does not constitute investment advice and it should not be relied on as such. All material has been obtained from sources believed to be reliable, but its accuracy is not guaranteed. This material contains certain statements that may be deemed forward-looking statements. Please note that any such statements are not guarantees of any future performance and actual results or developments may differ materially from those projected. Any securities mentioned above are for illustrative purpose only, and not a recommendation to invest or divest.
5
THE ASIA PACIFIC FUND, INC.
Portfolio of Investments
as of September 30, 2017
(Unaudited)
Portfolio of Investments
as of September 30, 2017
(Unaudited)
|
Shares |
Description |
Value
(Note 1) |
|||||
|
LONG-TERM INVESTMENTS—97.7%
|
|||||||
|
COMMON STOCKS—87.7%
|
|||||||
|
CHINA (INCLUDING HONG KONG AND MACAU SARs)—57.0%
|
|||||||
|
291,500
|
BOC Hong Kong Holdings Ltd.
|
$
|
1,416,154
|
||||
|
(Banking)
|
|||||||
|
666,000
|
China Communications Construction Co. Ltd. (Class “H” Shares)
|
831,264
|
|||||
|
(Industrials)
|
|||||||
|
China Construction Bank Corp. (Class “H” Shares)
|
7,920,406
|
||||||
|
(Banking)
|
|||||||
|
292,000
|
China Life Insurance Co. Ltd. (Class “H” Shares)
|
869,092
|
|||||
|
(Insurance)
|
|||||||
|
2,794,000
|
China Lilang Ltd.
|
2,328,453
|
|||||
|
(Consumer Discretionary)
|
|||||||
|
1,258,000
|
China Machinery Engineering Corp. (Class “H” Shares)
|
785,888
|
|||||
|
(Industrials)
|
|||||||
|
208,000
|
China Overseas Land & Investment Ltd.
|
676,327
|
|||||
|
(Real Estate)
|
|||||||
|
1,251,000
|
China Power International Development Ltd.
|
411,576
|
|||||
|
(Utilities)
|
|||||||
|
1,988,622
|
China Resources Power Holdings Co. Ltd.
|
3,589,478
|
|||||
|
(Utilities)
|
|||||||
|
1,460,000
|
China State Construction International Holdings Ltd.
|
2,126,939
|
|||||
|
(Industrials)
|
|||||||
|
1,164,000
|
China Tian Lun Gas Holdings Ltd.
|
843,392
|
|||||
|
(Utilities)
|
|||||||
|
1,346,685
|
Chongqing Changan Automobile Co. Ltd. (Class “B” Shares)
|
1,780,846
|
|||||
|
(Consumer Discretionary)
|
|||||||
|
1,873,000
|
Chongqing Rural Commercial Bank Co Ltd. (Class “H” Shares)
|
1,186,869
|
|||||
|
(Banking)
|
|||||||
|
223,000
|
Chow Sang Sang Holdings International Ltd.
|
510,996
|
|||||
|
(Consumer Discretionary)
|
|||||||
|
3,704,000
|
CIFI Holdings Group Co. Ltd.
|
2,062,625
|
|||||
|
(Real Estate)
|
|||||||
|
276,156
|
CK Asset Holdings Ltd.
|
|
2,285,509
|
||||
|
(Real Estate)
|
|||||||
|
81,656
|
CK Hutchison Holdings Ltd.
|
1,043,749
|
|||||
|
(Industrials)
|
|||||||
|
1,250,000
|
Convenience Retail Asia Ltd.
|
595,269
|
|||||
|
(Consumer Staples)
|
|||||||
|
25,940,000
|
CSI Properties Ltd.
|
1,261,867
|
|||||
|
(Real Estate)
|
|||||||
|
1,666,000
|
Datang International Power Generation Co. Ltd. (Class “H” Stock)*
|
533,181
|
|||||
|
(Utilities)
|
|||||||
|
1,946,000
|
Ecogreen International Group Ltd.
|
373,675
|
|||||
|
(Materials)
|
|||||||
|
1,424,000
|
EGL Holdings Co. Ltd.
|
246,096
|
|||||
|
(Consumer Discretionary)
|
|||||||
|
5,749,277
|
Far East Consortium International Ltd.
|
3,032,288
|
|||||
|
(Real Estate)
|
|||||||
|
3,570,000
|
Far East Horizon Ltd.
|
3,354,473
|
|||||
|
(Financials)
|
|||||||
|
2,397,000
|
FSE Engineering Holdings Ltd.
|
760,991
|
|||||
|
(Industrials)
|
|||||||
|
1,990,000
|
Goldpac Group Ltd.
|
649,611
|
|||||
|
(Technology Hardware & Equipment)
|
|||||||
|
423,000
|
Haitian International Holdings Ltd.
|
1,215,673
|
|||||
|
(Industrials)
|
|||||||
|
178,500
|
Hengan International Group Co. Ltd.
|
1,652,101
|
|||||
|
(Consumer Staples)
|
|||||||
|
1,348,000
|
HKBN Ltd.
|
1,408,121
|
|||||
|
(Telecommunication Services)
|
|||||||
|
926,000
|
Hopefluent Group Holdings Ltd.
|
472,981
|
|||||
|
(Real Estate)
|
|||||||
|
560,799
|
Huayu Automotive Systems Co. Ltd. (Class “A” Shares)
|
1,903,718
|
|||||
|
(Consumer Discretionary)
|
|||||||
|
8,000
|
Jiangnan Group Ltd.
|
476
|
|||||
|
(Industrials)
|
|||||||
|
661,000
|
Jinmao Hotel and Jinmao China Hotel Investments and Management Ltd.
|
421,396
|
|||||
|
(Real Estate)
|
|||||||
See Notes to Financial Statements.
6
|
Shares |
Description |
Value
(Note 1) |
|||||
|
CHINA (INCLUDING HONG KONG AND MACAU SARs)—(continued)
|
|||||||
|
1,622,000
|
Lee & Man Chemical Co. Ltd.
|
$
|
894,928
|
||||
|
(Materials)
|
|||||||
|
2,726,000
|
Longfor Properties Co. Ltd.
|
6,874,674
|
|||||
|
(Real Estate)
|
|||||||
|
467,300
|
Midea Group Co. Ltd. (Class “A” Shares)
|
3,108,627
|
|||||
|
(Consumer Discretionary)
|
|||||||
|
2,840,000
|
Nameson Holdings Ltd.
|
665,318
|
|||||
|
(Consumer Discretionary)
|
|||||||
|
4,547,054
|
Oi Wah Pawnshop Credit Holdings Ltd.
|
244,478
|
|||||
|
(Diversified Financial Services)
|
|||||||
|
6,404,000
|
PetroChina Co. Ltd. (Class “H” Shares)
|
4,058,042
|
|||||
|
(Energy)
|
|||||||
|
434,000
|
Ping An Insurance Group Co. of China Ltd. (Class “H” Shares)
|
3,330,726
|
|||||
|
(Insurance)
|
|||||||
|
4,534,000
|
Qingdao Port International Co. Ltd. (Class “H” Shares)
|
2,890,486
|
|||||
|
(Industrials)
|
|||||||
|
3,137,000
|
SITC International Holdings Co. Ltd.
|
2,843,202
|
|||||
|
(Industrials)
|
|||||||
|
4,521,699
|
Skyworth Digital Holdings Ltd.
|
2,309,588
|
|||||
|
(Consumer Discretionary)
|
|||||||
|
418,500
|
SmarTone Telecommunications Holdings Ltd.
|
501,990
|
|||||
|
(Telecommunication Services)
|
|||||||
|
1,555,000
|
Springland International Holdings Ltd.
|
276,697
|
|||||
|
(Consumer Staples)
|
|||||||
|
1,125,000
|
Times Property Holdings Ltd
|
1,155,013
|
|||||
|
(Real Estate)
|
|||||||
|
2,428,000
|
TK Group Holdings Ltd.
|
1,209,089
|
|||||
|
(Industrials)
|
|||||||
|
551,000
|
WH Group Ltd.
|
585,450
|
|||||
|
(Consumer Staples)
|
|||||||
|
3,244,000
|
Wonderful Sky Financial Group Holdings Ltd.
|
764,115
|
|||||
|
(Consumer Discretionary)
|
|||||||
|
1,939,660
|
Xinjiang Goldwind Science & Technology Co. Ltd. (Class “H” Shares)
|
2,423,458
|
|||||
|
(Industrials)
|
|||||||
|
722,000
|
Xtep International Holdings Ltd.
|
|
248,628
|
||||
|
(Consumer Discretionary)
|
|||||||
|
812,000
|
Yangtze Optical Fibre and Cable Joint Stock Ltd. Co. (Class “H” Shares)
|
3,097,650
|
|||||
|
(Information Technology)
|
|||||||
|
86,033,639
|
|||||||
|
INDIA—1.6%
|
|||||||
|
100,452
|
Bharti Infratel Ltd.
|
612,677
|
|||||
|
(Telecommunication Services)
|
|||||||
|
32,419
|
Indiabulls Housing Finance Ltd.
|
598,923
|
|||||
|
(Banking)
|
|||||||
|
235,102
|
Power Grid Corp. of India Ltd.
|
759,438
|
|||||
|
(Utilities)
|
|||||||
|
132,032
|
Sterlite Technologies Ltd.
|
452,066
|
|||||
|
(Information Technology)
|
|||||||
|
2,423,104
|
|||||||
|
INDONESIA—5.5%
|
|||||||
|
1,275,000
|
Acset Indonusa Tbk PT
|
280,199
|
|||||
|
(Industrials)
|
|||||||
|
5,510,900
|
Cikarang Listrindo Tbk PT
|
460,299
|
|||||
|
(Utilities)
|
|||||||
|
3,267,600
|
Pembangunan Perumahan Perser
|
560,409
|
|||||
|
(Industrials)
|
|||||||
|
1,576,100
|
PT Adhi Karya Persero Tbk
|
234,034
|
|||||
|
(Industrials)
|
|||||||
|
9,242,100
|
PT Bank Pan Indonesia Tbk*
|
782,240
|
|||||
|
(Banking)
|
|||||||
|
20,658,300
|
PT Bekasi Fajar Industrial Estate Tbk
|
417,184
|
|||||
|
(Real Estate)
|
|||||||
|
3,508,600
|
PT Indosat Tbk
|
1,628,090
|
|||||
|
(Telecommunication Services)
|
|||||||
|
2,420,900
|
PT Link Net Tbk
|
930,148
|
|||||
|
(Telecommunication Services)
|
|||||||
|
3,454,600
|
PT Media Nusantara Citra Tbk
|
338,560
|
|||||
|
(Consumer Discretionary)
|
|||||||
|
192,700
|
PT Metropolitan Land Tbk
|
4,922
|
|||||
|
(Real Estate)
|
|||||||
|
1,482,800
|
PT Nusa Raya Cipta Tbk
|
45,577
|
|||||
|
(Industrials)
|
|||||||
|
58,714,000
|
PT Panin Financial Tbk*
|
1,063,644
|
|||||
|
(Insurance)
|
|||||||
|
5,334,800
|
PT Waskita Karya Persero Tbk
|
703,042
|
|||||
|
(Industrials)
|
|||||||
See Notes to Financial Statements.
7
THE ASIA PACIFIC FUND, INC.
Portfolio of Investments
as of September 30, 2017
(Unaudited) Continued
Portfolio of Investments
as of September 30, 2017
(Unaudited) Continued
|
Shares |
Description |
Value
(Note 1) |
|||||
|
INDONESIA—(continued)
|
|||||||
|
1,492,800
|
PT XL Axiata Tbk*
|
$
|
414,513
|
||||
|
(Telecommunication Services)
|
|||||||
|
15,689,700
|
Puradelta Lestari Tbk PT
|
232,975
|
|||||
|
(Real Estate)
|
|||||||
|
5,582,900
|
Total Bangun Persada Tbk PT
|
310,875
|
|||||
|
(Industrials)
|
|||||||
|
8,406,711
|
|||||||
|
MALAYSIA—1.3%
|
|||||||
|
552,800
|
CB Industrial Product Holding Bhd
|
250,053
|
|||||
|
(Industrials)
|
|||||||
|
297,901
|
Cimb Group Holdings Bhd
|
444,470
|
|||||
|
(Banking)
|
|||||||
|
2,075,025
|
Mah Sing Group Bhd
|
732,217
|
|||||
|
(Real Estate)
|
|||||||
|
801,600
|
UOA Development Bhd
|
491,686
|
|||||
|
(Real Estate)
|
|||||||
|
1,918,426
|
|||||||
|
PHILIPPINES—1.0%
|
|||||||
|
160,100
|
EEI Corp.
|
43,870
|
|||||
|
(Industrials)
|
|||||||
|
4,505,000
|
Megaworld Corp.
|
463,807
|
|||||
|
(Real Estate)
|
|||||||
|
436,820
|
Metropolitan Bank & Trust Co.
|
743,805
|
|||||
|
(Banking)
|
|||||||
|
1,989,900
|
Pryce Corp.*
|
258,533
|
|||||
|
(Energy)
|
|||||||
|
1,510,015
|
|||||||
|
SINGAPORE—3.1%
|
|||||||
|
663,956
|
AIMS AMP Capital Industrial REIT
|
690,168
|
|||||
|
(Real Estate Investment Trusts)
|
|||||||
|
1,497,800
|
Asian Pay Television Trust
|
629,397
|
|||||
|
(Consumer Discretionary)
|
|||||||
|
345,400
|
BOC Aviation Ltd.
|
1,874,771
|
|||||
|
(Industrials)
|
|||||||
|
614,373
|
CapitaLand Retail China Trust
|
726,948
|
|||||
|
(Real Estate Investment Trusts)
|
|||||||
|
353,400
|
China Jinjiang Environment Holding Co. Ltd.
|
205,821
|
|||||
|
(Utilities)
|
|||||||
|
861,400
|
Viva Industrial Trust
|
600,113
|
|||||
|
(Real Estate)
|
|||||||
|
4,727,218
|
|||||||
|
SOUTH KOREA—6.0%
|
|||||||
|
18,217
|
Amotech Co. Ltd.*
|
|
623,483
|
||||
|
(Information Technology)
|
|||||||
|
55,342
|
BH Co. Ltd.*
|
1,070,263
|
|||||
|
(Information Technology)
|
|||||||
|
6,354
|
E-MART, Inc.
|
1,156,685
|
|||||
|
(Consumer Staples)
|
|||||||
|
14,705
|
Fila Korea Ltd.
|
879,463
|
|||||
|
(Consumer Discretionary)
|
|||||||
|
502
|
Hyundai Robotics Co Ltd.*
|
186,713
|
|||||
|
(Information Technology)
|
|||||||
|
85,689
|
KB Financial Group, Inc.
|
4,197,104
|
|||||
|
(Banking)
|
|||||||
|
27,292
|
Korea Electric Power Corp.
|
929,312
|
|||||
|
(Utilities)
|
|||||||
|
9,043,023
|
|||||||
|
TAIWAN—9.8%
|
|||||||
|
165,000
|
Accton Technology Corp.
|
530,520
|
|||||
|
(Information Technology)
|
|||||||
|
236,340
|
Advanced Semiconductor Engineering, Inc.
|
289,151
|
|||||
|
(Information Technology)
|
|||||||
|
383,000
|
Basso Industry Corp.
|
1,067,257
|
|||||
|
(Consumer Discretionary)
|
|||||||
|
139,000
|
Chilisin Electronics Corp.
|
392,376
|
|||||
|
(Information Technology)
|
|||||||
|
417,000
|
ChipMOS Technologies, Inc.
|
406,356
|
|||||
|
(Information Technology)
|
|||||||
|
1,307,000
|
CTBC Financial Holding Co. Ltd.
|
818,922
|
|||||
|
(Banking)
|
|||||||
|
254,178
|
Flexium Interconnect, Inc.
|
972,321
|
|||||
|
(Information Technology)
|
|||||||
|
899,000
|
Inventec Corp.
|
664,081
|
|||||
|
(Information Technology)
|
|||||||
|
343,000
|
Kerry TJ Logistics Co. Ltd.
|
410,030
|
|||||
|
(Industrials)
|
|||||||
|
1,721,000
|
King Yuan Electronics Co. Ltd.
|
1,688,423
|
|||||
|
(Information Technology)
|
|||||||
|
99,000
|
Merry Electronics Co. Ltd.
|
623,566
|
|||||
|
(Information Technology)
|
|||||||
|
546,000
|
Pegatron Corp.
|
1,417,036
|
|||||
|
(Information Technology)
|
|||||||
|
195,000
|
Primax Electronics Ltd.
|
482,291
|
|||||
|
(Information Technology)
|
|||||||
See Notes to Financial Statements.
8
|
Shares |
Description |
Value
(Note 1) |
|||||
|
TAIWAN—(continued)
|
|||||||
|
262,000
|
Quanta Computer, Inc.
|
$
|
603,074
|
||||
|
(Information Technology)
|
|||||||
|
17,848
|
Silicon Motion Technology Corp. ADR
|
857,240
|
|||||
|
(Information Technology)
|
|||||||
|
21,955
|
Superalloy Industrial Co. Ltd.
|
65,791
|
|||||
|
(Consumer Discretionary)
|
|||||||
|
798,000
|
Taiwan Sakura Corp.
|
1,007,895
|
|||||
|
(Consumer Discretionary)
|
|||||||
|
347,000
|
Taiwan Semiconductor Manufacturing Co. Ltd.
|
2,477,427
|
|||||
|
(Information Technology)
|
|||||||
|
14,773,757
|
|||||||
|
THAILAND—2.4%
|
|||||||
|
2,659,900
|
AP Thailand PCL
|
626,093
|
|||||
|
(Real Estate)
|
|||||||
|
214,700
|
Bangkok Bank PCL NVDR
|
1,200,646
|
|||||
|
(Banking)
|
|||||||
|
18,600
|
Kang Yong Electric PCL
|
271,053
|
|||||
|
(Consumer Discretionary)
|
|||||||
|
959,600
|
Supalai PCL
|
667,548
|
|||||
|
(Real Estate)
|
|||||||
|
1,162,800
|
Toa Paint Thailand PCL*
|
836,798
|
|||||
|
(Materials)
|
|||||||
|
3,602,138
|
|||||||
|
TOTAL COMMON STOCKS (cost $118,396,741)
|
132,438,031
|
||||||
|
PREFERENCE STOCKS—9.9%
|
|||||||
|
SOUTH KOREA
|
|||||||
|
16,854
|
Samsung Fire & Marine Insurance Co. Ltd.
|
2,678,158
|
|||||
|
(Insurance)
|
|||||||
|
6,845
|
Samsung Electronics Co. Ltd.
|
12,323,211
|
|||||
|
(Technology Hardware & Equipment)
|
|||||||
|
Total Preference Stocks (cost $10,579,470)
|
15,001,369
|
||||||
|
Units |
Description |
Value
(Note 1) |
|||||
|
RIGHTS*—0.0%
|
|||||||
|
TAIWAN
|
|||||||
|
12,840
|
Chilisin Electronics Corp., expiring 10/12/2017 (cost $0)
|
$
|
6,860
|
||||
|
(Information Technology)
|
|||||||
|
WARRANTS*—0.1%
|
|||||||
|
MALAYSIA—0.0%
|
|||||||
|
423,637
|
Mah Sing Group Bhd, expiring 02/21/20
|
13,043
|
|||||
|
(Real Estate)
|
|||||||
|
SINGAPORE—0.0%
|
|||||||
|
286,063
|
Ezion Holdings Ltd., expiring 04/24/20(1)
|
0
|
|||||
|
(Energy)
|
|||||||
|
THAILAND—0.1%
|
|||||||
|
239,900
|
Supalai Public Company Ltd., expiring 10/20/2018
|
138,113
|
|||||
|
(Real Estate)
|
|||||||
|
Total Warrants (cost $89,239)
|
151,156
|
||||||
|
Total Long-Term Investments (cost $129,065,450)
|
147,597,416
|
||||||
|
Shares
|
|||||||
|
SHORT-TERM INVESTMENT—0.2%
|
|||||||
|
MONEY MARKET MUTUAL FUND
|
|||||||
|
227,173
|
JPMorgan Prime Money Market Fund/Premier (cost $227,173)
|
227,173
|
|||||
|
Total Investments—97.9% (cost $129,292,623) (Note 5)
|
147,824,589
|
||||||
|
Other assets in excess of liabilities—2.1%
|
3,190,134
|
||||||
|
Net Assets—100.0%
|
$
|
151,014,723
|
|||||
|
*
|
Non-income producing security.
|
|
(1)
|
The value of this security was determined using significant unobservable inputs and is reported as a Level 3 security in the Fair Value Measurements table located at the end of the Portfolio of Investments.
|
The following abbreviation is used in the quarterly report:
|
ADR
|
American Depositary Receipt
|
See Notes to Financial Statements.
9
THE ASIA PACIFIC FUND, INC.
Portfolio of Investments
as of September 30, 2017
(Unaudited) Continued
Portfolio of Investments
as of September 30, 2017
(Unaudited) Continued
Fair Value Measurements:
Various inputs are used in determining the value of the Fund’s investments. These inputs are summarized in the three broad levels listed below.
Level 1—unadjusted quoted prices generally in active markets for identical securities.
Level 2—quoted prices for similar securities, interest rates and yield curves, prepayment speeds, foreign currency exchange rates and other observable inputs.
Level 3—unobservable inputs for securities valued in accordance with Board approved fair valuation procedures.
The following is a summary of the inputs used as of September 30, 2017 in valuing such portfolio securities:
|
Level 1
|
Level 2
|
Level 3
|
||||||||||
|
Investments in Securities
|
||||||||||||
|
Common Stocks
|
||||||||||||
|
China (including Hong Kong and Macau SARs)
|
$
|
86,033,639
|
$
|
—
|
$
|
—
|
||||||
|
India
|
2,423,104
|
—
|
—
|
|||||||||
|
Indonesia
|
8,406,711
|
—
|
—
|
|||||||||
|
Malaysia
|
1,918,426
|
—
|
—
|
|||||||||
|
Philippines
|
1,510,015
|
—
|
—
|
|||||||||
|
Singapore
|
4,727,218
|
—
|
—
|
|||||||||
|
South Korea
|
9,043,023
|
—
|
—
|
|||||||||
|
Taiwan
|
14,773,757
|
—
|
—
|
|||||||||
|
Thailand
|
1,200,646
|
2,401,492
|
—
|
|||||||||
|
Preference Stocks
|
||||||||||||
|
South Korea
|
15,001,369
|
—
|
—
|
|||||||||
|
Rights
|
||||||||||||
|
Taiwan
|
—
|
6,860
|
—
|
|||||||||
|
Warrants
|
||||||||||||
|
Malaysia
|
13,043
|
—
|
—
|
|||||||||
|
Singapore
|
—
|
—
|
0
|
|||||||||
|
Thailand
|
—
|
138,113
|
—
|
|||||||||
|
Money Market Mutual Fund
|
227,173
|
—
|
—
|
|||||||||
|
Total
|
$
|
145,278,124
|
$
|
2,546,465
|
$
|
0
|
||||||
During the period, there were no transfers between Level 1, Level 2 and Level 3 to report.
Industry Classification:
The industry classification of investments and other assets in excess of liabilities shown as a percentage of net assets as of September 30, 2017 were as follows:
|
Real Estate
|
14.7%
|
|
Industrials
|
13.8
|
|
Banking
|
12.8
|
|
Consumer Discretionary
|
12.2
|
|
Information Technology
|
11.2
|
|
Technology Hardware & Equipment
|
8.6
|
|
Insurance
|
5.3
|
|
Utilities
|
5.1
|
|
Telecommunication Services
|
3.6
|
|
Energy
|
2.9
|
|
Consumer Staples
|
2.8
|
|
Financials
|
2.2
|
|
Materials
|
1.4
|
|
Real Estate Investment Trusts
|
0.9
|
|
Diversified Financial Services
|
0.2
|
|
Money Market Mutual Fund
|
0.2
|
|
97.9
|
|
|
Other assets in excess of liabilities
|
2.1
|
|
100.0%
|
See Notes to Financial Statements.
10
The Fund invested in derivative instruments during the reporting period. The primary type of risk associated with these derivative instruments is equity risk. The effect of such derivative instruments on the Fund’s financial position and financial performance as reflected in the Statement of Assets and Liabilities and Statement of Operations is presented in the summary below.
Fair values of derivative instruments as of September 30, 2017 as presented in the Statement of Assets and Liabilities:
|
Asset Derivatives
|
Liability Derivatives
|
|||||||||||||
|
Derivatives not accounted for as hedging instruments,
carried at fair value |
Balance
Sheet Location |
Fair Value
|
Balance
Sheet Location |
Fair Value
|
||||||||||
|
Equity contracts
|
Investments
|
$
|
151,156
|
—
|
$
|
—
|
||||||||
The effects of derivative instruments on the Statement of Operations for the six months ended September 30, 2017 are as follows:
For the six months ended September 30, 2017, the Fund did not have any realized gain or (loss) on derivatives recognized in income on the Statement of Operations.
| Change in Unrealized Appreciation or (Depreciation) on Derivatives Recognized in Income |
|||||
|
Derivatives not accounted for as hedging instruments,
carried at fair value |
Warrants*
|
||||
|
Equity contracts
|
$
|
31,063
|
|||
|
*
|
Included in net change in unrealized (depreciation) on investments in the Statement of Operations.
|
See Notes to Financial Statements.
11
|
THE ASIA PACIFIC FUND, INC.
Statement of Assets and Liabilities as of September 30, 2017 (Unaudited) |
||||
|
Assets
|
||||
|
Investments at value:
|
||||
|
Investments, at value (cost $129,292,623)
|
$
|
147,824,589
|
||
|
Cash
|
2,165,020
|
|||
|
Foreign currency, at value (cost $680,947)
|
697,868
|
|||
|
Receivable for investments sold
|
2,071,010
|
|||
|
Dividends and interest receivable
|
378,011
|
|||
|
Prepaid expenses
|
87,157
|
|||
|
Total Assets
|
153,223,655
|
|||
|
Liabilities
|
||||
|
Payable for investments purchased
|
1,824,192
|
|||
|
Accrued expenses and other liabilities
|
273,598
|
|||
|
Investment management fee payable
|
95,015
|
|||
|
Administration Fee Payable
|
16,127
|
|||
|
Total Liabilities
|
2,208,932
|
|||
|
Net Assets
|
$
|
151,014,723
|
||
|
Net assets were comprised of:
|
||||
|
Common stock, at par
|
$
|
103,441
|
||
|
Paid-in capital in excess of par
|
126,998,926
|
|||
|
127,102,367
|
||||
|
Undistributed net investment income
|
2,667,542
|
|||
|
Accumulated net realized gain on investment and foreign currency transactions
|
2,695,040
|
|||
|
Net unrealized appreciation on investments and foreign currencies
|
18,549,774
|
|||
|
Net assets, September 30, 2017
|
$
|
151,014,723
|
||
|
Net asset value per share ($151,014,723 ÷ 10,344,072 shares of common stock outstanding)
|
$
|
14.60
|
||
|
THE ASIA PACIFIC FUND, INC.
Statement of Operations Six Months Ended September 30, 2017 (Unaudited) |
||||
|
Net Investment Income
|
||||
|
Income
|
||||
|
Dividends (net of foreign withholding taxes of $298,131)
|
$
|
4,043,325
|
||
|
Total income
|
4,043,325
|
|||
|
Expenses
|
||||
|
Investment management fee
|
650,305
|
|||
|
Administration fee
|
100,699
|
|||
|
Legal fees and expenses
|
175,000
|
|||
|
Custodian and accounting fees
|
140,000
|
|||
|
Directors' fees and board expenses
|
134,000
|
|||
|
Reports to shareholders
|
42,000
|
|||
|
Audit fee
|
26,000
|
|||
|
Registration fees
|
13,000
|
|||
|
Transfer agent's fees and expenses
|
9,000
|
|||
|
Miscellaneous
|
126,723
|
|||
|
Total expenses
|
1,416,727
|
|||
|
Less: Management Fee Waiver
|
(7,774
|
)
|
||
|
Net expenses
|
1,408,953
|
|||
|
Net investment income
|
2,634,372
|
|||
|
Realized And Unrealized Gain (Loss) On Investments And Foreign Currency Transactions
|
||||
|
Net realized gain on:
|
||||
|
Investment transactions
|
5,108,863
|
|||
|
Foreign currency transactions
|
39,604
|
|||
|
5,148,467
|
||||
|
Net change in unrealized appreciation (depreciation) on:
|
||||
|
Investments
|
9,155,403
|
|||
|
Foreign currencies
|
(27,694
|
)
|
||
|
9,127,709
|
||||
|
Net gain on investment and foreign currency transactions
|
14,276,176
|
|||
|
Net Increase In Net Assets Resulting From Operations
|
$
|
16,910,548
|
||
See Notes to Financial Statements.
12
THE ASIA PACIFIC FUND, INC.
Statement of Changes in Net Assets
(Unaudited)
Statement of Changes in Net Assets
(Unaudited)
|
Increase in Net Assets
|
Six Months Ended September 30,
2017 |
Year Ended March 31, 2017
|
||||||
|
Operations
|
||||||||
|
Net investment income
|
$
|
2,634,372
|
$
|
2,266,747
|
||||
|
Net realized gain on investment and foreign currency transactions
|
5,148,467
|
1,183,203
|
||||||
|
Net change in unrealized appreciation on investments and foreign currencies
|
9,127,709
|
16,548,696
|
||||||
|
Net increase in net assets resulting from operations
|
16,910,548
|
19,998,646
|
||||||
|
Dividends from net investment income
|
—
|
(2,275,979
|
)
|
|||||
|
Total increase
|
16,910,548
|
17,722,667
|
||||||
|
Net Assets:
|
||||||||
|
Beginning of period
|
134,104,175
|
116,381,508
|
||||||
|
End of period (a)
|
$
|
151,014,723
|
$
|
134,104,175
|
||||
|
(a) Includes undistributed net investment income of:
|
$
|
2,667,542
|
$
|
33,170
|
||||
THE ASIA PACIFIC FUND, INC.
Notes to Financial Statements
(Unaudited)
Notes to Financial Statements
(Unaudited)
The Asia Pacific Fund, Inc. (the “Fund”) is registered under the Investment Company Act of 1940, as amended, as a diversified, closed-end, management investment company. The Fund’s investment objective is to achieve long-term capital appreciation through investment of at least 80% of investable assets in equity securities of companies in the Asia Pacific countries (excluding Japan).
Note 1. Accounting Policies
The Fund follows investment company accounting and reporting guidance of the Financial Accounting Standards Board (“FASB”) Accounting Standard Codification Topic 946 Financial Services—Investment Companies. The following accounting policies conform to U.S. generally accepted accounting principles. The Fund consistently follows such policies in the preparation of its financial statements.
Securities Valuation: The Fund holds portfolio securities and other assets that are fair valued at the close of each day the New York Stock Exchange (“NYSE”) is open for trading. Fair value is the price that would be received to sell an asset or paid to transfer a liability in an orderly transaction between market participants on the measurement date and is in compliance FASB ASC 820-10-50. The Board of Directors (the “Board”) has adopted Valuation Procedures for security valuation under which specified fair valuation responsibilities have been delegated to the Investment Manager, Value Partners Hong Kong Limited. Under the current Valuation Procedures, the established Valuation Committee is responsible for supervising the valuation of portfolio securities, other assets and liabilities under specified circumstances. The Valuation Procedures permit the Fund to utilize independent pricing vendor services, quotations from market makers and alternative valuation methods when market quotations are not readily available or not deemed representative of fair value. A record of the Valuation Committee’s actions is subject to the Board’s review, approval, and ratification at its next regularly-scheduled quarterly meeting.
Various inputs determine how the Fund’s investments are valued, all of which are categorized according to the three broad levels (Level 1, 2, or 3) detailed in the table following the Portfolio of Investments.
See Notes to Financial Statements.
13
THE ASIA PACIFIC FUND, INC.
Notes to Financial Statements
(Unaudited) Continued
Notes to Financial Statements
(Unaudited) Continued
Common stocks and preference shares, exchange-traded funds, and derivative instruments such as futures or options that are traded on a securities exchange are valued at the last sale price as of the close of trading on the applicable exchange where the security principally trades. Securities traded via NASDAQ are valued at the NASDAQ official closing price. To the extent these securities are valued at the last sale price or NASDAQ official closing price, they are classified as Level 1 of the fair value hierarchy.
In the event that no sale or official closing price on the valuation date exists, these securities are generally valued at the mean between the last reported bid and ask prices, or at the last bid price in absence of an ask price. These securities are classified as Level 2 of the fair value hierarchy.
For common stocks and preference shares traded on foreign securities exchanges, certain valuation adjustments will be applied when events occur after the close of the security’s foreign market and before the Fund’s normal pricing time. These securities are valued using pricing vendor services that provide adjustment factors based on information such as local closing price, relevant general and sector indices, currency fluctuations, depositary receipts, and futures, as applicable. Securities valued using such model prices are classified as Level 2 in the fair value hierarchy.
Investments in open-end, non-exchange-traded mutual funds are valued at their net asset values as of the close of the NYSE on the date of valuation. These securities are classified as Level 1 in the fair value hierarchy since they may be purchased or sold at their net asset value on the date of valuation.
Securities, other assets and liabilities that cannot be priced using the methods described above are valued based on pricing methodologies approved by the Board. In the event that unobservable inputs are used when determining such valuations, the securities will be classified as Level 3 of the fair value hierarchy.
When determining the fair value of securities, some of the factors influencing the valuation include: the nature of any restrictions on disposition of the securities; assessment of the general liquidity of the securities; the issuer’s financial condition and the markets in which it does business; the cost of the investment; the size of the holding and the capitalization of the issuer; the prices of any recent transactions or bids/offers for such securities or any comparable securities; any available analyst media or other reports or information deemed reliable by the investment manager regarding the issuer or the markets or industry in which it operates. Using fair value to price securities may result in a value that is different from a security’s most recent closing price and from the price used by other mutual funds to calculate their net asset values.
Foreign Currency Translation: The books and records of the Fund are maintained in U.S. dollars. Foreign currency amounts are translated into U.S. dollars on the following basis:
(i) market value of investment securities, other assets and liabilities—at the current rates of exchange.
(ii) purchases and sales of investment securities, income and expenses—at the rates of exchange prevailing on the respective dates of such transactions.
Although the net assets of the Fund are presented at the foreign exchange rates and market values at the close of the fiscal period, the Fund does not isolate that portion of the results of operations arising as a result of changes in the foreign exchange rates from the fluctuations arising from changes in the market prices of long-term portfolio securities held at fiscal period end. Similarly, the Fund does not isolate the effect of changes in foreign exchange rates from the fluctuations arising from changes in the market prices of long-term portfolio securities sold during the fiscal period. Accordingly, these realized foreign currency gains or losses are included in the reported net realized gains or losses on investment transactions. Notwithstanding the above, the Fund does isolate the effect of fluctuations in foreign currency exchange rates when determining the gain (loss) upon the sale or maturity of foreign currency denominated debt obligations; such amounts are included in net realized gains (losses) on foreign currency transactions.
14
Net realized gains (losses) on foreign currency transactions represent net foreign exchange gains (losses) from holdings of foreign currencies, forward currency contracts, disposition of foreign currencies, currency gains (losses) realized between the trade and settlement dates on security transactions, and the difference between the amounts of interest, dividends and foreign withholding taxes recorded on the Fund’s books and the U.S. dollar equivalent amounts actually received or paid. Net unrealized currency gains (losses) from valuing foreign currency denominated assets and liabilities (other than investments) at fiscal period end exchange rates are reflected as a component of unrealized appreciation (depreciation) on foreign currencies.
Foreign security and currency transactions may involve certain considerations and risks not typically associated with those of U.S. companies as a result of, among other factors, the level of governmental supervision and regulation of foreign securities markets and the possibility of political or economic instability.
Real Estate Investment Trusts (“REITs”): The Fund’s positions in non-U.S. REITs are treated as passive foreign investment companies for U.S. tax purposes.
Stock Index Futures Contracts: A stock index futures contract is an agreement to purchase (long) or sell (short) an agreed amount of securities at a set price for delivery on a future date. Upon entering into a stock index futures contract, the Fund is required to pledge to the broker an amount of cash and/or other assets equal to a certain percentage of the contract amount. This amount is known as the “initial margin.” Subsequent payments known as “variation margin,” are made or received by the Fund each day, depending on the daily fluctuations in the value of the underlying security. Such variation margin is recorded for financial statement purposes on a daily basis as unrealized gain or loss. When the contract expires or is closed, the gain or loss is realized and is presented in the Statement of Operations as net realized gain or loss on stock index futures contracts.
The Fund may utilize stock index futures contracts for hedging and investment purposes. Should market prices for the futures contracts or the underlying assets move in ways not anticipated by the Fund, losses may result. The use of futures contracts involves the risk of imperfect correlation in movements in the price of futures contracts and the underlying assets being hedged or the exposures desired by the Fund.
Securities Transactions and Net Investment Income: Securities transactions are recorded on the trade date. Realized and unrealized gains (losses) from securities and currency transactions are calculated on the identified cost basis. Dividend income is recorded on the ex-dividend date, and interest income is recorded on an accrual basis. Expenses are recorded on the accrual basis which may require the use of certain estimates by management. Actual results may differ from such estimates.
Dividends and Distributions: Dividends from net investment income, if any, are declared and paid at least annually in a manner that qualifies for the dividends-paid deduction. The Fund’s current intention is to distribute at least annually any current year net capital gains in excess of net capital loss carryforwards in a manner that avoids income and excise taxes being imposed on the Fund. Dividends and distributions are recorded on the ex-dividend date. The Fund may choose to satisfy the foregoing by making distributions in cash, additional Fund shares, or both.
The Fund could determine in the future to retain net long-term capital gains in respect of any fiscal year without affecting the ability of the Fund to qualify as a regulated investment company. In that case, the Fund would be subject to taxation on the retained amount and shareholders subject to U.S. federal income taxation would be required to include in income for tax purposes their shares of the undistributed amount and would be entitled to credits or refunds against their U.S. federal income tax liabilities with respect to their proportionate shares of the tax paid by the Fund.
Income distributions and capital gain distributions are determined in accordance with income tax regulations, which may differ from U.S. generally accepted accounting principles.
Taxes: It is the Fund’s current intention to continue to meet the requirements under subchapter M of the U.S. Internal Revenue Code of 1986, as amended applicable to regulated investment companies and to distribute all of
15
THE ASIA PACIFIC FUND, INC.
Notes to Financial Statements
(Unaudited) Continued
Notes to Financial Statements
(Unaudited) Continued
its taxable income and net capital gains to shareholders. Therefore, no federal income tax provision is required. If the Fund determines in the future to retain taxable capital gains, the Fund will provide for all required taxes.
Withholding tax on foreign dividends and interest and foreign capital gains tax is accrued in accordance with the Fund’s understanding of the applicable country’s tax rules and rates.
Management has analyzed the Fund’s tax positions taken on income tax returns for all open tax years and has concluded that as of March 31, 2017, no provision for income tax is required in the Fund’s financial statements. The Fund’s federal and state income and federal excise tax returns for tax years for which the applicable statutes of limitations have not expired are subject to examination by the Internal Revenue Service and state departments of revenue.
Estimates: The preparation of the financial statements requires management to make estimates and assumptions that affect the reported amounts and disclosures in the financial statements. Actual results could differ from those estimates.
Note 2. Investment Management and Administration Agreements
The Fund has a management agreement with Value Partners Hong Kong Limited (the “Investment Manager”), and an administration agreement with AST Fund Solutions, LLC (the “Administrator”).
The investment management fee is computed weekly and payable monthly at the following annual rates: 1.00% of the Fund’s average weekly net assets up to $100 million and 0.70% of such assets in excess of $100 million.
Effective on January 12, 2017, the Investment Manager has voluntarily agreed to waive a portion of its fee entitled to be received from the Fund so that such fee does not exceed the lesser of 0.90% of the Fund’s average weekly net assets or the current prevailing effective rate under the terms of the management agreement. For the six months ended September 30, 2017, such waiver in fees amounted to $7,774.
The administration fee is also computed weekly and payable monthly at the following annual rates: 0.15% of the Fund’s average weekly net assets up to $100 million and 0.12% of such assets in excess of $100 million. Such fee is subject to an annual minimum of $150,000.
Pursuant to the agreements, the Investment Manager provides continuous supervision of the investment portfolio and the Administrator provides occupancy and certain clerical, administrative and accounting services for the Fund. The Investment Manager and the Administrator each pays the cost of compensation of certain officers of the Fund. The Fund bears all other costs and expenses.
Note 3. Portfolio Securities
Cost of purchases and proceeds from sales of investment securities, other than short-term investments, for the six months ended September 30, 2017 aggregated $62,894,885 and $58,655,610 respectively.
Note 4. Tax Information
The United States federal income tax basis of the Fund’s investments and the net unrealized depreciation as of September 31, 2017 were as follows:
|
Tax Basis
|
Appreciation
|
Depreciation
|
|
$129,855,488
|
$23,811,168
|
$(5,842,067)
|
|
Net Unrealized Depreciation
|
Other Cost Basis Adjustments
|
Total Net Unrealized Depreciation
|
|
$17,969,101
|
$—
|
$17,969,101
|
The difference between book basis and tax basis was primarily attributable to deferred losses on wash sales and investments in passive foreign investment companies. Other cost basis adjustments are primarily attributable to appreciation/depreciation of foreign currencies.
Under the Regulated Investment Company Modernization Act of 2010 (the “Act”), the Fund is permitted to carryforward capital losses realized on or after April 1, 2011 (“post-enactment losses”) for an unlimited period. Post-enactment losses are required to be utilized before the utilization of losses incurred prior to the effective date of the Act. As a result of this ordering rule, capital
16
loss carryforwards related to taxable years ending before March 31, 2012 (“pre-enactment losses”) may have an increased likelihood to expire unused. The Fund utilized approximately $938,000 of its pre-enactment losses to offset net taxable gains realized in the fiscal year ended March 31, 2017. No capital gains distributions are expected to be paid to shareholders until net gains have been realized in excess of such losses. As of March 31, 2017, the pre-enactment and post-enactment losses were approximately:
|
Post-Enactment Losses:
|
$
|
0
|
||
|
Pre-Enactment Losses:
|
||||
|
Expiring 2018
|
$
|
2,195,000
|
Management has analyzed the Fund’s tax positions taken on federal, state and local income tax returns for all open tax years and has concluded that no provision for income tax is required in the Fund’s financial statements for the current reporting period. The Fund’s U.S. federal, state and local income and federal excise tax returns for tax years for which the applicable statutes of limitations have not expired are subject to examination by the U.S. Internal Revenue Service and state departments of revenue.
Note 5. Capital
There are 30 million shares of $0.01 par value common stock authorized.
Note 6. New Accounting Pronouncements
On October 13, 2016, the Securities and Exchange Commission (the “SEC”) adopted new rules and forms and amended existing rules and forms which are intended to modernize and enhance the reporting and disclosure of information by registered investment companies and to improve the quality of information that funds provide to investors, including modifications to Regulation S-X which would require standardized, enhanced disclosure about derivatives in investment company financial statements. The compliance dates of the modifications to Regulation S-X are August 1, 2017 and other amendments and rules are generally June 1, 2018 and December 1, 2018. Management is currently evaluating the impacts to the financial statement disclosures.
17
THE ASIA PACIFIC FUND, INC.
Financial Highlights
Financial Highlights
|
Per Share Operating Performance:
|
Six Months Ended September 30, 2017 (unaudited) |
Year Ended March 31, |
||||||||||
|
2017
|
2016
|
|||||||||||
|
Net asset value, beginning of period
|
$
|
12.96
|
$
|
11.25
|
$
|
13.07
|
||||||
|
Net investment income
|
0.25
|
0.22
|
0.20
|
|||||||||
|
Net realized and unrealized gain (loss) on investment and foreign currency transactions
|
1.39
|
1.71
|
(1.51
|
)
|
||||||||
|
Total from investment operations
|
1.64
|
1.93
|
(1.31
|
)
|
||||||||
|
Less dividends:
|
||||||||||||
|
Dividends from net investment income
|
—
|
(0.22
|
)
|
(0.51
|
)
|
|||||||
|
Net asset value, end of period
|
$
|
14.60
|
$
|
12.96
|
$
|
11.25
|
||||||
|
Market value, end of period
|
$
|
13.88
|
$
|
12.23
|
$
|
9.61
|
||||||
|
Total investment return(a):
|
26.74
|
%
|
30.04
|
%
|
(12.79
|
)%
|
||||||
|
Ratios to Average Net Assets:
|
||||||||||||
|
Total expenses (including loan interest and waiver/reimbursement)(c)
|
1.97
|
%(b)(d)
|
2.07
|
%
|
2.08
|
%(b)
|
||||||
|
Total expenses (including loan interest and excluding waiver/reimbursement)(c)
|
1.98
|
%(d)
|
2.08
|
%
|
2.08
|
%(b)
|
||||||
|
Net investment income, including waiver/reimbursement
|
3.68
|
%(d)
|
1.84
|
%
|
1.62
|
%
|
||||||
|
Supplemental Data:
|
||||||||||||
|
Average net assets (000 omitted)
|
$
|
142,972
|
$
|
123,051
|
$
|
130,218
|
||||||
|
Portfolio turnover rate
|
43
|
%(e)
|
66
|
%
|
69
|
%
|
||||||
|
Net assets, end of period (000 omitted)
|
$
|
151,015
|
$
|
134,104
|
$
|
116,382
|
||||||
|
(a)
|
Total investment return is calculated assuming a purchase of common stock at the current market value on the first day and a sale at the current market value on the last day of each fiscal period reported. Dividends and distributions, if any, are assumed, for purposes of this calculation, to be reinvested at prices obtained under the Fund’s dividend reinvestment plan. These calculations do not include brokerage commissions.
|
|
(b)
|
The expense ratios without loan interest expense would have been 2.07%, 2.05% and 2.11% for the fiscal years ended March 31, 2016, 2015 and 2013, respectively. No loan interest was incurred during the six months ended September 30, 2017 and fiscal years ended March 31, 2017 and 2014. The impact of the advisory waiver for the six months ended September 30, 2017 was 0.01%.
|
|
(c)
|
Does not include expenses of the underlying funds in which the Fund invests.
|
|
(d)
|
Annualized.
|
|
(e)
|
Not annualized.
|
|
Shown above is selected data for a share of common stock outstanding-total investment return, ratios to average net assets and other supplemental data for the periods indicated. This information has been determined based upon information provided in the financial statements and market price data for the Fund’s share of common stock.
|
See Notes to Financial Statements.
18
THE ASIA PACIFIC FUND, INC.
Financial Highlights
Financial Highlights
|
Year Ended March 31,
|
||||||||||||
|
Per Share Operating Performance:
|
2015
|
2014
|
2013
|
|||||||||
|
Net asset value, beginning of period
|
$
|
11.50
|
$
|
11.92
|
$
|
11.67
|
||||||
|
Net investment income (loss)
|
0.23
|
(0.02
|
)
|
(0.03
|
)
|
|||||||
|
Net realized and unrealized gain (loss) on investment and foreign currency transactions
|
1.34
|
(0.40
|
)
|
0.28
|
||||||||
|
Total from investment operations
|
1.57
|
(0.42
|
)
|
0.25
|
||||||||
|
Less dividends:
|
||||||||||||
|
Dividends from net investment income
|
—
|
—
|
—
|
|||||||||
|
Net asset value, end of period
|
$
|
13.07
|
$
|
11.50
|
$
|
11.92
|
||||||
|
Market value, end of period
|
$
|
11.61
|
$
|
10.33
|
$
|
10.76
|
||||||
|
Total investment return(a):
|
12.39
|
%
|
(4.00
|
)%
|
1.70
|
%
|
||||||
|
Ratios to Average Net Assets:
|
||||||||||||
|
Total expenses (including loan interest and waiver/reimbursement)(c)
|
2.05
|
%(b)
|
2.33
|
%
|
2.16
|
%(b)
|
||||||
|
Total expenses (including loan interest and excluding waiver/reimbursement)(c)
|
2.05
|
%(b)
|
2.33
|
%
|
2.16
|
%(b)
|
||||||
|
Net investment income (loss), including waiver/reimbursement
|
1.83
|
%
|
(0.18
|
)%
|
(0.28
|
)%
|
||||||
|
Supplemental Data:
|
||||||||||||
|
Average net assets (000 omitted)
|
$
|
129,506
|
$
|
119,204
|
$
|
117,996
|
||||||
|
Portfolio turnover rate
|
76
|
%
|
175
|
%
|
180
|
%
|
||||||
|
Net assets, end of period (000 omitted)
|
$
|
135,243
|
$
|
118,991
|
$
|
123,269
|
||||||
|
(a)
|
Total investment return is calculated assuming a purchase of common stock at the current market value on the first day and a sale at the current market value on the last day of each fiscal period reported. Dividends and distributions, if any, are assumed, for purposes of this calculation, to be reinvested at prices obtained under the Fund’s dividend reinvestment plan. These calculations do not include brokerage commissions.
|
|
(b)
|
The expense ratios without loan interest expense would have been 2.07%, 2.05% and 2.11% for the fiscal years ended March 31, 2016, 2015 and 2013, respectively. No loan interest was incurred during the six months ended September 30, 2017 and fiscal years ended March 31, 2017 and 2014. The impact of the advisory waiver for the six months ended September 30, 2017 was 0.01%.
|
|
(c)
|
Does not include expenses of the underlying funds in which the Fund invests.
|
|
(d)
|
Annualized.
|
|
(e)
|
Not annualized.
|
|
Shown above is selected data for a share of common stock outstanding-total investment return, ratios to average net assets and other supplemental data for the periods indicated. This information has been determined based upon information provided in the financial statements and market price data for the Fund’s share of common stock.
|
See Notes to Financial Statements.
19
Board of Directors Approval of Continuance of Investment Management Agreement
with Value Partners (Hong Kong) Limited (Unaudited)
with Value Partners (Hong Kong) Limited (Unaudited)
At a meeting held on May 22, 2017, the Board of Directors of the Fund (the “Board”), including all of the disinterested directors (the “Directors”), approved the continuance of the investment management agreement (the “Investment Management Agreement”), which is dated as of October 1, 2013, between the Fund and Value Partners (Hong Kong) Limited (the “Investment Manager”). Prior to acting on the continuance of the Investment Management Agreement, the Directors considered the factors discussed below.
Factors Considered by the Board
Prior to consideration of the continuance of the Investment Management Agreement, the Directors had evaluated information provided by the Investment Manager. They reviewed the terms of the Investment Management Agreement with the Investment Manager and with Stradley Ronon, legal counsel who are independent of the Investment Manager and who advised the Board on the relevant legal standards.
Based on their experience gained as Fund Directors, the Directors considered their knowledge of the nature and quality of the services provided to the Fund by the Investment Manager. The Directors noted that they receive presentations at regular Board meetings from the Investment Manager on the investment results of the Fund and review extensive materials and information provided by the Investment Manager.
The Directors also considered all other factors they believed relevant, including the specific matters described below. In their deliberations, the Directors did not identify any particular information that was all-important or controlling, and each Director attributed different weights to the various factors.
The Directors determined that the selection of the Investment Manager to manage the Fund and the overall arrangements between the Fund and the Investment Manager, including the investment management fee, as provided in the Investment Management Agreement, were fair and reasonable in light of the services performed, expenses incurred and such other matters as the Directors considered relevant in the exercise of their reasonable judgment.
The material factors and conclusions that formed the basis for the Directors’ determinations include the following:
Nature, Extent and Quality of Services Provided by the Investment Manager
The Directors considered the scope and quality of services provided by the Investment Manager under the Investment Management Agreement, including the quality of the investment research capabilities of the Investment Manager and the other resources it has dedicated to performing services for the Fund. They noted the professional experience of the Fund’s portfolio management team and other senior personnel of the Investment Manager. The Directors concluded that they were satisfied with the nature, extent and quality of services provided to the Fund under the Investment Management Agreement.
Costs of Services Provided and Profitability
The Directors considered the Investment Manager’s expenses and assets under management for 2016 and the 2016 estimated profitability for the Investment Manager. The Directors reviewed the assumptions and methods of allocation of estimated costs of managing the Fund in 2016 and in preparing Fund-specific profitability data as set forth in the supporting materials prepared by the Investment Manager.
The Directors recognized that it is difficult to make comparisons of profitability from fund advisory contracts because comparative information is not generally publicly available and is affected by numerous factors. The Directors focused on the profitability of the Investment Manager’s relationship with the Fund before taxes. The Directors concluded that they were satisfied that the Investment Manager’s level of profitability from its relationship with the Fund was not unreasonable.
20
Fall-Out Benefits
The Directors considered the benefits to the Investment Manager from its relationship with the Fund other than fees payable under the Investment Management Agreement. They considered the Investment Manager’s representation that it did not engage in any traditional soft dollar arrangements whereby it would receive brokerage and research services from brokers and dealers that execute purchases and sales of securities on behalf of its clients, including the Fund, on an agency basis. The Directors believe that the Investment Manager may derive reputational and other benefits from its association with the Fund.
Investment Results
The Directors considered the investment results of the Fund as compared to other funds investing in Asia Pacific countries ex-Japan as provided by Morningstar, Inc. (the “Morningstar Universe”) and as compared to the MSCI All Countries Combined Asia Ex-Japan Gross Index (the “Index”). The Directors reviewed information showing performance of the Fund as compared to funds in the Morningstar peer group and other funds managed by Value Partners for the one-year period ending March 31, 2017 and for the period over which Value Partners has been Investment Manager to the Fund (October 1, 2013 through March 31, 2017). Such analyses were updated by Value Partners to reflect comparable performance information through the respective periods ended April 30, 2017 and included with the meeting materials. The Directors noted that the Fund’s NAV performance had been higher than that of the Index since Value Partners became Investment Manager but was slightly lower than the Index for the one-year and year-to-date return. They also noted that the Fund’s NAV return was markedly higher than the other funds in the Morningstar peer group since Value Partners became Investment Manager to the Fund. The Directors considered that the Fund’s investment performance was above average in general based upon a number of measurements provided.
Advisory Fees
The Directors considered the advisory fee rate paid by the Fund to the Investment Manager and information prepared by Lipper, Inc. and Morningstar, Inc. concerning fee rates paid by other funds in the same category as the Fund, that is, “Pacific Ex Japan Funds.” The Directors recognized that it is difficult to make comparisons of advisory fees because there are variations in the services that are included in the fees paid by other funds. Nonetheless, the Directors noted that the Fund’s advisory fee as a percentage of average net assets was lower than the advisory fees of the comparable funds provided by Morningstar, Inc. The Directors also considered that the investment advisory fees that the Investment Manager charges the only other investment company it manages with investment policies similar to the Fund’s were higher than the Fund’s and that the fee charged by the Investment Manager as sub-advisor to a U.S. registered fund with similar investment policies was the same as or lower than the net fee paid by the Fund, after accounting for the Fund’s contractual management fee waiver. The Board discussed the fact that effective January 2017, the Investment Manager agreed to a contractual waiver to waive a portion of its fee. The Investment Manager represented that it does not advise any separate accounts with investment policies similar to the Fund’s, although it does manage a high yielding dividend fund offered outside the US.
21
Board of Directors Approval of Continuance of Investment Management Agreement
with Value Partners (Hong Kong) Limited (Unaudited) Continued
with Value Partners (Hong Kong) Limited (Unaudited) Continued
Economies of Scale
The Directors considered that the Fund is a closed-end fund and that it was not expected to have meaningful asset growth absent a rights offering or an acquisition. In such circumstances, they did not view the potential for realization of economies of scale as the Fund’s assets grow to be a meaningful factor in their deliberations. The Directors noted, however, that the advisory fee schedule for the Fund contains a breakpoint at $100 million so that, when assets exceed the breakpoint, the fee rate is reduced from 1.00% to 0.70% on the incremental assets. Further it was noted that effective January 12, 2017, the Investment Manager has been contractually waiving its fee to the extent it exceeds 0.90% of average weekly net assets of the Fund for assets under $100 million. The Directors concluded that the Fund’s breakpoint arrangements established a reasonable basis for realizing economies of scale should they exist.
22
Supplemental Proxy Information (Unaudited)
An Annual Meeting of Stockholders was held on October 10, 2017. At such meeting the stockholders elected the two Class I Directors.
|
1)
|
Election of Class I Directors:
|
|
Affirmative
votes cast |
Shares
Withheld |
Shares
Abstained |
|
|
Michael J. Downey
|
7,114,975
|
2,088,906
|
381,971
|
|
Duncan M. McFarland
|
7,115,325
|
2,088,906
|
381,621
|
|
2)
|
Approve, on an advisory basis, the steps necessary to narrow materially or eliminate the Fund’s discount to net asset value.
|
|
Affirmative
votes cast |
Votes
Against |
Shares
Abstained |
|
|
7,428,255
|
462,676
|
36,295
|
23
Dividend Reinvestment Plan (Unaudited)
Shareholders may elect to have all distributions of dividends and capital gains automatically re-invested in Fund shares (“Shares”) pursuant to the Fund’s Dividend Reinvestment Plan (“the Plan”). Shareholders who do not participate in the Plan will receive all distributions in cash paid by check in United States Dollars mailed directly to the shareholders of record (or if the shares are held in street or other nominee name, then to the nominee) by the custodian, as dividend disbursing agent. Shareholders who wish to participate in the Plan should complete the attached enrollment card or contact the Fund at 1-(800) 937-5449.
After the Fund declares a dividend or determines to make a capital gains distribution, if (1) the market price is lower than net asset value, the participants in the Plan will receive the equivalent in Shares valued at the market price determined as of the time of purchase (generally, following the payment date of the dividend or distribution); or if (2) the market price of Shares on the payment date of the dividend or distribution is equal to or exceeds their net asset value, participants will be issued Shares at the higher of net asset value or 95% of the market price.
There is no charge to participants for reinvesting dividends or capital gain distributions, except for certain brokerage commissions, as described below. The Plan Agent is American Stock Transfer & Trust Co., LLC. The Plan Agent’s fees for the handling of the reinvestment of dividends and distributions will be paid by the Fund. There will be no brokerage commissions charged with respect to shares issued directly by the Fund. However, each participant will pay a pro rata share of brokerage commissions incurred with respect to the Plan Agent’s open market purchases in connection with the reinvestment of dividends and distributions. The automatic reinvestment of dividends and distributions will not relieve participants of any federal income tax that may be payable on such dividends or distributions.
The Fund reserves the right to amend or terminate the Plan upon 90 days’ written notice to shareholders of the Fund.
Participants in the Plan may withdraw from the Plan upon written notice to the Plan Agent and will receive certificates for whole Shares and cash for fractional Shares.
24
Additional Information (Unaudited)
Availability of Quarterly Portfolio Schedule
The Fund is required to file its complete schedule of portfolio holdings with the Securities and Exchange Commission (“SEC”) on Form N-Q for its first and third fiscal quarters and within 60 days of the fiscal quarter end. Once filed, the Fund’s Form N-Q is available without charge on the SEC’s website (http//www.sec.gov) or by calling the Fund toll free at 1-(888) 4-ASIA-PAC (1-888-427-4272). Copies of the Fund’s Form N-Q may also be obtained by visiting the SEC’s Public Reference Room in Washington, DC (please call the SEC at 800-732-0330 for information on the operation of the Public Reference Room).
Proxy Voting
Information regarding the Fund’s proxy voting policies and procedures and its proxy voting record for the 12-month period ending June 30 of each year is filed with the SEC on Form N-PX no later than August 31 of each year. The Fund’s Form N-PX is available without charge, upon request, by calling the Fund at its toll free number 1-(888) 4-ASIA-PAC (1-888-472-4272) and on the SEC’s website (http//www.sec.gov) or on or through the Fund’s website address (www.asiapacificfund.com).
25
Additional Information
The Fund is required to file its complete schedule of portfolio holdings with the Securities and Exchange Commission (“SEC”) on Form N-Q for its first and third fiscal quarters and within 60 days of the fiscal quarter end. Once filed, the Fund’s Form N-Q is available without charge on the SEC’s website (http//www.sec.gov) or by calling the Fund toll free at 1-(888) 4-ASIA-PAC (1-888-427-4272). Copies of the Fund’s Form N-Q may also be obtained by visiting the SEC’s Public Reference Room in Washington, DC (please call the SEC at (800) 732-0330 for information on the operation of the Public Reference Room).
Information regarding the Fund’s proxy voting policies and procedures and its proxy voting record for the 12-month period ending June 30 of each year is filed with the SEC on Form N-PX no later than August 31 of each year. The Fund’s Form N-PX is available without charge, upon request, by calling the Fund at its toll free number 1-(888) 4-ASIA-PAC and on the SEC’s website (http//www.sec.gov) or on or through the Fund’s website address (www.asiapacificfund.com).
26
|
Item 2
|
–
|
Code of Ethics – Not required, as this is not an annual filing.
|
||||
|
Item 3
|
–
|
Audit Committee Financial Expert – Not required, as this is not an annual filing.
|
||||
|
Item 4
|
–
|
Principal Accountant Fees and Services – Not required, as this is not an annual filing.
|
||||
|
Item 5
|
–
|
Audit Committee of Listed Registrants – Not required, as this is not an annual filing.
|
||||
|
Item 6
|
–
|
Schedule of Investments – The schedule is included as part of the report to shareholders filed under Item 1 of this Form.
|
||||
|
Item 7
|
–
|
Disclosure of Proxy Voting Policies and Procedures for Closed-End Management Investment Companies – Not required, as this is not an annual filing.
|
||||
|
Item 8
|
–
|
Portfolio Managers of Closed-End Management Investment Companies – Not required, as this is not an annual filing.
|
||||
|
Item 9
|
–
|
Purchases of Equity Securities by Closed-End Management Investment Company and Affiliated Purchasers – There were no purchases made by or on behalf of the registrant or any "affiliated purchaser," as defined in Rule 10b-18(a) (3) under the Securities Exchange Act of 1934, as amended, of shares of the registrant's equity securities made in the period covered by this report.
|
||||
|
Item 10
|
–
|
Submission of Matters to a Vote of Security Holders – Not applicable.
|
||||
|
Item 11
|
–
|
Controls and Procedures
|
||||
|
(a)
|
It is the conclusion of the registrant's principal executive officer and principal financial officer that the effectiveness of the registrant's current disclosure controls and procedures (such disclosure controls and procedures having been evaluated within 90 days of the date of this filing) provide reasonable assurance that the information required to be disclosed by the registrant has been recorded, processed, summarized and reported within the time period specified in the Commission's rules and forms and that the information required to be disclosed by the registrant has been accumulated and communicated to the registrant's principal executive officer and principal financial officer in order to allow timely decisions regarding required disclosure.
|
|||||
|
(b)
|
There has been no significant change in the registrant's internal control over financial reporting that occurred during the registrant's most recent fiscal quarter of the period covered by this report that has materially affected, or is likely to materially affect, the registrant's internal control over financial reporting.
|
|||||
|
Item 12
|
–
|
Exhibits
|
||||
|
(a)
|
(1) Code of Ethics – Not required, as this is not an annual filing.
|
|||||
|
(2) Certifications pursuant to Section 302 of the Sarbanes-Oxley Act – Attached hereto as Exhibit EX-99.CERT.
|
||||||
|
(3) Any written solicitation to purchase securities under Rule 23c-1. – Not applicable.
|
||||||
|
(b)
|
Certifications pursuant to Section 906 of the Sarbanes-Oxley Act – Attached hereto as Exhibit EX-99.906CERT.
|
|||||
SIGNATURES
Pursuant to the requirements of the Securities Exchange Act of 1934 and the Investment Company Act of 1940, the registrant has duly caused this report to be signed on its behalf by the undersigned, thereunto duly authorized.
|
(Registrant)
|
The Asia Pacific Fund, Inc.
|
|
|
By (Signature and Title)*
|
/s/ Hoyt M. Peters
|
|
|
Hoyt M Peters
|
||
|
Secretary
|
||
|
Date
|
November 20, 2017
|
Pursuant to the requirements of the Securities Exchange Act of 1934 and the Investment Company Act of 1940, this report has been signed below by the following persons on behalf of the registrant and in the capacities and on the dates indicated.
|
By (Signature and Title)*
|
/s/ Dr. King Lun Au
|
|
|
Dr. King Lun Au
|
||
|
President and Principal Executive Officer
|
||
|
Date
|
November 20, 2017
|
|
|
By (Signature and Title)*
|
/s/ Frank J. Maresca
|
|
|
Frank J. Maresca
|
||
|
Treasurer and Principal Financial Officer
|
||
|
Date
|
November 20, 2017
|
|
*
|
Print the name and title of each signing officer under his or her signature.
|