UNITED STATES
SECURITIES AND EXCHANGE COMMISSION
Washington, D.C. 20549
FORM N-CSR
CERTIFIED SHAREHOLDER REPORT OF REGISTERED
MANAGEMENT INVESTMENT COMPANIES
Investment Company Act file number 811-4707
Fidelity Advisor Series II
(Exact name of registrant as specified in charter)
245 Summer St., Boston, MA 02210
(Address of principal executive offices) (Zip code)
Marc Bryant, Secretary
245 Summer St.
Boston, Massachusetts 02210
(Name and address of agent for service)
Registrant's telephone number, including area code:
617-563-7000
| Date of fiscal year end: | October 31 |
| | |
| Date of reporting period: | April 30, 2017 |
Item 1.
Reports to Stockholders
|
Fidelity Advisor® Municipal Income Fund Semi-Annual Report April 30, 2017 |
 |
Contents
To view a fund's proxy voting guidelines and proxy voting record for the 12-month period ended June 30, visit http://www.fidelity.com/proxyvotingresults or visit the Securities and Exchange Commission's (SEC) web site at http://www.sec.gov.
You may also call 1-877-208-0098 to request a free copy of the proxy voting guidelines.
Standard & Poor's, S&P and S&P 500 are registered service marks of The McGraw-Hill Companies, Inc. and have been licensed for use by Fidelity Distributors Corporation.
Other third-party marks appearing herein are the property of their respective owners.
All other marks appearing herein are registered or unregistered trademarks or service marks of FMR LLC or an affiliated company. © 2017 FMR LLC. All rights reserved.
This report and the financial statements contained herein are submitted for the general information of the shareholders of the Fund. This report is not authorized for distribution to prospective investors in the Fund unless preceded or accompanied by an effective prospectus.
A fund files its complete schedule of portfolio holdings with the SEC for the first and third quarters of each fiscal year on Form N-Q. Forms N-Q are available on the SEC’s web site at http://www.sec.gov. A fund's Forms N-Q may be reviewed and copied at the SEC’s Public Reference Room in Washington, DC. Information regarding the operation of the SEC's Public Reference Room may be obtained by calling 1-800-SEC-0330.
For a complete list of a fund's portfolio holdings, view the most recent holdings listing, semiannual report, or annual report on Fidelity's web site at http://www.fidelity.com, http://www.institutional.fidelity.com, or http://www.401k.com, as applicable.
NOT FDIC INSURED •MAY LOSE VALUE •NO BANK GUARANTEE
Neither the Fund nor Fidelity Distributors Corporation is a bank.
Investment Summary (Unaudited)
Top Five States as of April 30, 2017
| % of fund's net assets | % of fund's net assets 6 months ago | |
| Illinois | 15.6 | 18.3 |
| Florida | 11.2 | 12.2 |
| Texas | 10.5 | 10.0 |
| California | 9.1 | 9.1 |
| New York | 6.2 | 6.8 |
Top Five Sectors as of April 30, 2017
| % of fund's net assets | % of fund's net assets 6 months ago | |
| General Obligations | 33.0 | 34.9 |
| Transportation | 22.7 | 17.7 |
| Health Care | 14.1 | 18.1 |
| Education | 8.1 | 3.5 |
| Escrowed/Pre-Refunded | 6.0 | 7.3 |
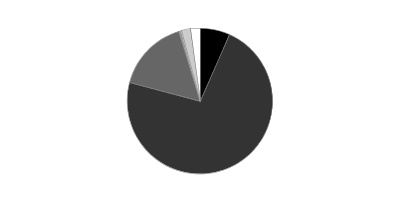
Quality Diversification (% of fund's net assets)
| As of April 30, 2017 | ||
| AAA | 6.7% | |
| AA,A | 72.4% | |
| BBB | 16.2% | |
| BB and Below | 0.5% | |
| Not Rated | 2.2% | |
| Short-Term Investments and Net Other Assets | 2.0% | |
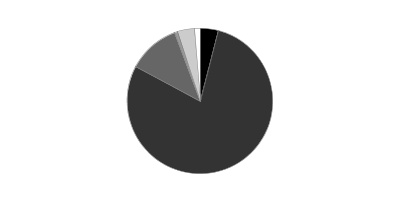
| As of October 31, 2016 | ||
| AAA | 4.0% | |
| AA,A | 78.8% | |
| BBB | 11.5% | |
| BB and Below | 0.8% | |
| Not Rated | 3.7% | |
| Short-Term Investments and Net Other Assets | 1.2% | |
We have used ratings from Moody's Investors Service, Inc. Where Moody's® ratings are not available, we have used S&P® ratings. All ratings are as of the date indicated and do not reflect subsequent changes.
Investments April 30, 2017 (Unaudited)
Showing Percentage of Net Assets
| Municipal Bonds - 97.8% | |||
| Principal Amount | Value | ||
| Alabama - 0.2% | |||
| Montgomery Med. Clinic Facilities 5% 3/1/33 | 1,000,000 | 1,075,250 | |
| Univ. of Alabama at Birmingham Hosp. Rev. Series 2008 A, 5.75% 9/1/22 (Pre-Refunded to 9/1/18 @ 100) | 1,000,000 | 1,062,890 | |
| TOTAL ALABAMA | 2,138,140 | ||
| Alaska - 0.2% | |||
| Alaska Int'l. Arpts. Revs. Series 2016 B, 5% 10/1/35 | 2,600,000 | 2,916,160 | |
| Arizona - 1.5% | |||
| Arizona Board of Regents Ctfs. of Prtn. Series 2015 A, 5% 6/1/22 | 1,925,000 | 2,223,625 | |
| Arizona Ctfs. of Prtn. Series 2010 A: | |||
| 5% 10/1/18 (FSA Insured) | $1,000,000 | $1,055,170 | |
| 5.25% 10/1/20 (FSA Insured) | 1,600,000 | 1,749,920 | |
| 5.25% 10/1/21 (FSA Insured) | 850,000 | 929,433 | |
| 5.25% 10/1/26 (FSA Insured) | 500,000 | 546,100 | |
| 5.25% 10/1/28 (FSA Insured) | 1,600,000 | 1,746,720 | |
| Glendale Gen. Oblig. Series 2015, 4% 7/1/20 (FSA Insured) | 400,000 | 431,268 | |
| Maricopa County Indl. Dev. Auth. Sr. Living Facilities Series 2016: | |||
| 5.75% 1/1/36 (a) | 155,000 | 147,664 | |
| 6% 1/1/48 (a) | 555,000 | 532,461 | |
| Maricopa County Poll. Cont. Rev. (Southern California Edison Co. Proj.) Series 2000 A, 5% 6/1/35 | 700,000 | 761,936 | |
| Mesa Util. Sys. Rev. Series 2017, 4% 7/1/25 | 5,000,000 | 5,660,900 | |
| Pima County Swr. Sys. Rev. Series 2012 A, 5% 7/1/26 | 500,000 | 579,580 | |
| Salt Verde Finl. Corp. Sr. Gas Rev.: | |||
| Series 2007, 5.5% 12/1/29 | 1,000,000 | 1,226,100 | |
| 5.25% 12/1/22 | 1,500,000 | 1,746,585 | |
| Scottsdale Indl. Dev. Auth. Hosp. Rev. (Scottsdale Healthcare Proj.) Series 2006 C, 5% 9/1/35 (FSA Insured) | 205,000 | 224,698 | |
| TOTAL ARIZONA | 19,562,160 | ||
| California - 9.0% | |||
| Bay Area Toll Auth. San Francisco Bay Toll Bridge Rev. Bonds: | |||
| Series A, 2.95%, tender 4/1/26 (b) | 1,980,000 | 2,027,500 | |
| Series B, 2.85%, tender 4/1/25 (b) | 1,620,000 | 1,658,119 | |
| Series C, 2.1%, tender 4/1/22 (b) | 1,510,000 | 1,518,245 | |
| California Gen. Oblig.: | |||
| Series 2007, 5.625% 5/1/20 | 20,000 | 20,065 | |
| Series 2016, 5% 9/1/29 | 630,000 | 751,048 | |
| 5% 11/1/24 | 2,400,000 | 2,446,872 | |
| 5% 8/1/29 | 1,590,000 | 1,894,517 | |
| 5% 9/1/31 | 1,440,000 | 1,694,549 | |
| 5.25% 12/1/33 | 20,000 | 20,055 | |
| 5.25% 4/1/35 | 2,200,000 | 2,516,206 | |
| 5.25% 3/1/38 | 1,280,000 | 1,320,499 | |
| 5.25% 11/1/40 | 700,000 | 786,240 | |
| 5.5% 8/1/30 | 2,000,000 | 2,106,380 | |
| 5.5% 3/1/40 | 1,000,000 | 1,110,020 | |
| 5.6% 3/1/36 | 400,000 | 446,176 | |
| 6% 3/1/33 | 3,460,000 | 3,905,856 | |
| 6% 4/1/38 | 5,300,000 | 5,795,020 | |
| 6% 11/1/39 | 11,700,000 | 13,119,093 | |
| 6.5% 4/1/33 | 1,535,000 | 1,694,087 | |
| California Health Facilities Fing. Auth. Rev.: | |||
| (Catholic Healthcare West Proj.) Series 2009 E, 5.625% 7/1/25 | 2,000,000 | 2,166,720 | |
| (Providence Health and Svcs. Proj.) Series C, 6.5% 10/1/38 (Pre-Refunded to 10/1/18 @ 100) | 25,000 | 26,933 | |
| California Pub. Works Board Lease Rev.: | |||
| (Coalinga State Hosp. Proj.) Series 2013 E, 5% 6/1/26 | 2,400,000 | 2,789,208 | |
| (Dept. of Forestry & Fire Protection Proj.) Series 2007 E: | |||
| 5% 11/1/19 | 1,600,000 | 1,631,168 | |
| 5% 11/1/21 | 1,760,000 | 1,794,109 | |
| (Office of Emergency Svcs. Proj.) Series 2007 A, 5% 3/1/22 | 1,000,000 | 1,002,730 | |
| (Porterville Developmental Ctr. Hsg. Expansion and Recreation Complex Proj.) Series 2009 C, 6.25% 4/1/34 (Pre-Refunded to 4/1/19 @ 100) | 1,700,000 | 1,870,561 | |
| (Various Cap. Projs.): | |||
| Series 2012 A, 5% 4/1/24 | 3,190,000 | 3,662,854 | |
| Series 2012 G, 5% 11/1/24 | 650,000 | 754,657 | |
| Series 2009 G1, 5.75% 10/1/30 (Pre-Refunded to 10/1/19 @ 100) | 600,000 | 666,048 | |
| Series 2009 I: | |||
| 6.125% 11/1/29 (Pre-Refunded to 11/1/19 @ 100) | 400,000 | 449,640 | |
| 6.375% 11/1/34 (Pre-Refunded to 11/1/19 @ 100) | 1,000,000 | 1,130,240 | |
| Series 2010 A, 5.75% 3/1/30 (Pre-Refunded to 3/1/20 @ 100) | 1,000,000 | 1,128,800 | |
| California Statewide Cmntys. Dev. Auth. Series 2016: | |||
| 3.25% 5/15/31 | 520,000 | 499,528 | |
| 5% 5/15/29 | 1,250,000 | 1,415,850 | |
| 5% 5/15/30 | 1,000,000 | 1,125,190 | |
| Folsom Cordova Union School District No. 4 Series A, 0% 10/1/31 (Nat'l. Pub. Fin. Guarantee Corp. Insured) | 1,835,000 | 1,095,752 | |
| Golden State Tobacco Securitization Corp. Tobacco Settlement Rev. Series 2017 A1: | |||
| 5% 6/1/21 | 465,000 | 521,879 | |
| 5% 6/1/22 | 650,000 | 741,338 | |
| 5% 6/1/23 | 745,000 | 859,842 | |
| 5% 6/1/24 | 420,000 | 489,497 | |
| Long Beach Unified School District Series 2009, 5.5% 8/1/29 | 60,000 | 65,710 | |
| Los Angeles Dept. Arpt. Rev. Series 2016 B: | |||
| 5% 5/15/32 (c) | 1,830,000 | 2,105,214 | |
| 5% 5/15/33 (c) | 1,620,000 | 1,854,009 | |
| 5% 5/15/46 (c) | 6,400,000 | 7,137,920 | |
| Los Angeles Muni. Impt. Corp. Lease Rev. Series 2012 C, 5% 3/1/25 | 1,455,000 | 1,663,531 | |
| Los Angeles Wastewtr. Sys. Rev. Series 2009 A, 5.75% 6/1/34 | 890,000 | 973,811 | |
| Madera County Ctfs. of Prtn. (Children's Hosp. Central California Proj.) Series 2010, 5.375% 3/15/36 | 1,000,000 | 1,073,570 | |
| Monterey County Pub. Impt. Corp. Ctfs. of Prtn. Series 2007, 5% 8/1/19 (AMBAC Insured) | 1,000,000 | 1,009,570 | |
| Oakland Gen. Oblig. Series 2012, 5% 1/15/24 | 2,500,000 | 2,819,500 | |
| Palomar Health Rev. Series 2016, 5% 11/1/31 | 1,000,000 | 1,098,240 | |
| Poway Unified School District: | |||
| (District #2007-1 School Facilities Proj.) Series 2008 A, 0% 8/1/32 | 1,000,000 | 561,670 | |
| Series B, 0% 8/1/39 | 3,700,000 | 1,464,571 | |
| Poway Unified School District Pub. Fing. 5% 9/1/24 | 1,000,000 | 1,161,330 | |
| Sacramento City Fing. Auth. Rev. Series A, 0% 12/1/26 (Nat'l. Pub. Fin. Guarantee Corp. Insured) | 800,000 | 593,040 | |
| Sacramento Muni. Util. District Elec. Rev. Series 2012 Y, 5% 8/15/28 | 2,200,000 | 2,556,840 | |
| San Bernardino County Ctfs. of Prtn. (Arrowhead Proj.) Series 2009 A, 5.25% 8/1/26 | 1,000,000 | 1,074,840 | |
| San Diego Convention Ctr. Expansion Series 2012 A, 5% 4/15/24 | 2,200,000 | 2,547,776 | |
| San Diego Unified School District Series 2008 E, 0% 7/1/47 (d) | 1,300,000 | 741,130 | |
| San Francisco City & County Arpts. Commission Int'l. Arpt. Rev. Series 2014 A, 5% 5/1/44 (c) | 2,200,000 | 2,410,320 | |
| San Jose Int'l. Arpt. Rev. Series 2017 A: | |||
| 5% 3/1/20 (c) | 2,080,000 | 2,287,459 | |
| 5% 3/1/23 (c) | 1,500,000 | 1,745,445 | |
| 5% 3/1/24 (c) | 1,700,000 | 1,999,013 | |
| 5% 3/1/26 (c) | 1,750,000 | 2,070,233 | |
| San Marcos Unified School District Series 2010 B, 0% 8/1/47 | 11,900,000 | 3,039,260 | |
| Santa Monica-Malibu Unified School District Series 1999, 0% 8/1/20 (Nat'l. Pub. Fin. Guarantee Corp. Insured) | 1,000,000 | 948,390 | |
| Union Elementary School District Series A, 0% 9/1/20 (Nat'l. Pub. Fin. Guarantee Corp. Insured) | 1,000,000 | 947,720 | |
| Washington Township Health Care District Gen. Oblig. Series 2013 B, 5.5% 8/1/38 | 1,000,000 | 1,204,240 | |
| Washington Township Health Care District Rev. Series 2010 A, 5.25% 7/1/30 | 1,100,000 | 1,188,572 | |
| West Contra Costa Unified School District Series 2012, 5% 8/1/26 | 2,000,000 | 2,299,400 | |
| TOTAL CALIFORNIA | 121,295,415 | ||
| Colorado - 0.9% | |||
| Colorado Health Facilities Auth. (Parkview Med. Ctr., Inc. Proj.) Series 2016: | |||
| 4% 9/1/36 | 1,300,000 | 1,304,979 | |
| 5% 9/1/46 | 1,300,000 | 1,430,065 | |
| Colorado Health Facilities Auth. Retirement Hsg. Rev. (Liberty Heights Proj.) Series B, 0% 7/15/20 (Escrowed to Maturity) | 1,200,000 | 1,141,788 | |
| Colorado Health Facilities Auth. Rev. (Valley View Hosp. Proj.) Series 2008, 5.75% 5/15/36 | 2,000,000 | 2,060,700 | |
| Colorado Univ. Co. Hosp. Auth. Rev. Bonds: | |||
| Series 2017C-1, 4%, tender 3/1/20 (b) | 2,155,000 | 2,281,822 | |
| Series 2017C-2, 5%, tender 3/1/22 (b) | 1,615,000 | 1,838,597 | |
| E-470 Pub. Hwy. Auth. Rev.: | |||
| Series 2000 B, 0% 9/1/20 (Nat'l. Pub. Fin. Guarantee Corp. Insured) | 1,500,000 | 1,409,910 | |
| Series 2010 C, 5.25% 9/1/25 | 1,000,000 | 1,073,010 | |
| TOTAL COLORADO | 12,540,871 | ||
| Connecticut - 0.4% | |||
| Connecticut Health & Edl. Facilities Auth. Rev. Series 2016 K, 4% 7/1/46 | 1,520,000 | 1,519,924 | |
| Eastern Connecticut Resources Recovery Auth. Solid Waste Rev. (Wheelabrator Lisbon Proj.) Series A, 5.5% 1/1/20 (c) | 2,190,000 | 2,221,054 | |
| New Haven Gen. Oblig. Series 2016 A: | |||
| 5% 8/15/20 (FSA Insured) | 1,000,000 | 1,091,510 | |
| 5% 8/15/26 (FSA Insured) | 500,000 | 577,415 | |
| TOTAL CONNECTICUT | 5,409,903 | ||
| District Of Columbia - 0.6% | |||
| District of Columbia Rev. Series B, 4.75% 6/1/32 | 500,000 | 538,975 | |
| Metropolitan Washington Arpts. Auth. Dulles Toll Road Rev. Series 2009 B: | |||
| 0% 10/1/28 (Assured Guaranty Corp. Insured) | 2,000,000 | 1,322,180 | |
| 0% 10/1/33 (Assured Guaranty Corp. Insured) | 5,000,000 | 2,576,950 | |
| Metropolitan Washington DC Arpts. Auth. Sys. Rev.: | |||
| Series 2012 A, 5% 10/1/22 (c) | 1,450,000 | 1,680,086 | |
| Series 2014 A, 5% 10/1/23 (c) | 1,990,000 | 2,326,628 | |
| TOTAL DISTRICT OF COLUMBIA | 8,444,819 | ||
| Florida - 11.2% | |||
| Brevard County School Board Ctfs. of Prtn. Series 2015 C, 5% 7/1/26 | 750,000 | 885,195 | |
| Broward County Arpt. Sys. Rev.: | |||
| Series 2012 P-1, 5% 10/1/22 (c) | 965,000 | 1,109,547 | |
| Series 2012 P-2, 5% 10/1/21 | 685,000 | 782,859 | |
| Series A: | |||
| 5% 10/1/23 (c) | 1,425,000 | 1,665,127 | |
| 5% 10/1/28 (c) | 500,000 | 571,840 | |
| 5% 10/1/31 (c) | 1,000,000 | 1,124,730 | |
| 5% 10/1/32 (c) | 400,000 | 447,708 | |
| Broward County School Board Ctfs. of Prtn.: | |||
| (Broward County School District Proj.) Series 2016 A, 5% 7/1/28 | 670,000 | 791,920 | |
| Series 2012 A, 5% 7/1/24 | 4,400,000 | 5,055,776 | |
| Series 2015 A: | |||
| 5% 7/1/24 | 325,000 | 383,799 | |
| 5% 7/1/26 | 1,200,000 | 1,420,188 | |
| 5% 7/1/27 | 1,000,000 | 1,173,820 | |
| Series 2015 B, 5% 7/1/24 | 815,000 | 962,450 | |
| Series 2016, 5% 7/1/32 | 430,000 | 495,446 | |
| Citizens Property Ins. Corp.: | |||
| Series 2011 A1, 5% 6/1/20 | 1,000,000 | 1,108,070 | |
| Series 2012 A1, 5% 6/1/21 | 2,100,000 | 2,386,083 | |
| Collier County Indl. Dev. Auth. Healthcare Facilities Rev. (NCH Healthcare Sys. Proj.) Series 2011, 6.25% 10/1/39 | 2,560,000 | 2,892,058 | |
| Duval County School Board Ctfs. of Prtn.: | |||
| Series 2015 B, 5% 7/1/28 | 2,060,000 | 2,399,962 | |
| Series 2016 A: | |||
| 5% 7/1/31 | 1,305,000 | 1,507,001 | |
| 5% 7/1/33 | 1,340,000 | 1,530,159 | |
| Florida Board of Ed. Pub. Ed. Cap. Outlay Series A, 5.5% 6/1/38 | 400,000 | 422,128 | |
| Florida Mid-Bay Bridge Auth. Rev.: | |||
| Series 2015 A, 5% 10/1/35 | 1,000,000 | 1,107,680 | |
| Series 2015 C, 5% 10/1/40 | 1,000,000 | 1,079,690 | |
| Florida Muni. Pwr. Agcy. Rev.: | |||
| (Requirements Pwr. Supply Proj.) Series 2016 A: | |||
| 5% 10/1/30 | 350,000 | 410,463 | |
| 5% 10/1/31 | 380,000 | 443,601 | |
| (St. Lucie Proj.) Series 2012 A, 5% 10/1/26 | 600,000 | 688,554 | |
| Series 2009 A, 6.25% 10/1/31 (Pre-Refunded to 10/1/19 @ 100) | 500,000 | 560,970 | |
| Greater Orlando Aviation Auth. Arpt. Facilities Rev. Series 2016: | |||
| 5% 10/1/20 (c) | 200,000 | 221,710 | |
| 5% 10/1/21 (c) | 1,545,000 | 1,741,833 | |
| 5% 10/1/22 (c) | 1,000,000 | 1,144,280 | |
| 5% 10/1/23 (c) | 2,545,000 | 2,954,032 | |
| Halifax Hosp. Med. Ctr. Rev.: | |||
| 4% 6/1/27 | 205,000 | 217,038 | |
| 5% 6/1/24 | 275,000 | 320,697 | |
| 5% 6/1/26 | 250,000 | 290,490 | |
| 5% 6/1/46 | 425,000 | 453,773 | |
| Highlands County Health Facilities Auth. Rev. (Adventist Health Sys./Sunbelt, Inc. Prog.) Series 2008 B, 6% 11/15/37 | 2,000,000 | 2,193,000 | |
| Hillsborough County Indl. Dev. Auth. Indl. Dev. Rev. (Health Facilities/Univ. Cmnty. Hosp. Proj.) Series 2008 B, 8% 8/15/32 (Pre-Refunded to 8/15/19 @ 101) | 1,000,000 | 1,162,900 | |
| Jacksonville Sales Tax Rev. Series 2012, 5% 10/1/25 | 1,000,000 | 1,148,140 | |
| Lake County School Board Ctfs. of Prtn. Series 2014 A, 5% 6/1/30 (FSA Insured) | 600,000 | 677,628 | |
| Lee County Arpt. Rev. Series 2011 A, 5.375% 10/1/32 (c) | 1,050,000 | 1,157,930 | |
| Miami-Dade County Aviation Rev.: | |||
| Series 2010 A, 5.375% 10/1/41 | 1,500,000 | 1,669,245 | |
| Series 2010, 5.5% 10/1/30 | 760,000 | 859,081 | |
| Series 2012 A: | |||
| 5% 10/1/21 (c) | 1,900,000 | 2,160,148 | |
| 5% 10/1/22 (c) | 1,000,000 | 1,154,780 | |
| 5% 10/1/31 (c) | 1,500,000 | 1,688,655 | |
| Series 2014 A: | |||
| 5% 10/1/28 (c) | 1,000,000 | 1,147,020 | |
| 5% 10/1/36 (c) | 3,100,000 | 3,433,126 | |
| 5% 10/1/37 | 1,825,000 | 2,042,723 | |
| Series 2015 A, 5% 10/1/35 (c) | 2,100,000 | 2,332,953 | |
| Miami-Dade County Cap. Asset Acquisition Series 2012 A, 5% 10/1/23 | 750,000 | 864,840 | |
| Miami-Dade County Expressway Auth.: | |||
| Series 2014 A, 5% 7/1/44 | 500,000 | 549,445 | |
| Series 2014 B, 5% 7/1/28 | 1,000,000 | 1,150,220 | |
| Series A: | |||
| 5% 7/1/32 | 4,300,000 | 4,943,366 | |
| 5% 7/1/33 | 3,650,000 | 4,174,213 | |
| Miami-Dade County School Board Ctfs. of Prtn.: | |||
| Series 2008 A, 5% 8/1/21 (AMBAC Insured) | 2,000,000 | 2,086,200 | |
| Series 2015 A: | |||
| 5% 5/1/27 (FSA Insured) | 780,000 | 914,956 | |
| 5% 5/1/29 | 4,075,000 | 4,684,824 | |
| Series 2015 B: | |||
| 5% 5/1/27 | 4,650,000 | 5,418,041 | |
| 5% 5/1/28 | 2,530,000 | 2,928,171 | |
| Series 2016 A, 5% 5/1/30 | 3,620,000 | 4,187,037 | |
| Series 2016 B, 5% 8/1/26 | 1,595,000 | 1,906,248 | |
| Miami-Dade County Transit Sales Surtax Rev. Series 2012, 5% 7/1/42 | 300,000 | 332,718 | |
| Miami-Dade County Wtr. & Swr. Rev. Series 2008 A, 5.25% 10/1/22 (FSA Insured) | 4,000,000 | 4,726,520 | |
| North Brevard County Hosp. District Rev.: | |||
| 5.75% 10/1/38 | 600,000 | 626,004 | |
| 5.75% 10/1/38 (Pre-Refunded to 10/1/18 @ 100) | 1,500,000 | 1,599,135 | |
| Orange County Health Facilities Auth. Series 2012 A, 5% 10/1/42 | 2,350,000 | 2,507,709 | |
| Orange County School Board Ctfs. of Prtn.: | |||
| Series 2015 C, 5% 8/1/30 | 1,500,000 | 1,754,625 | |
| Series 2016 C, 5% 8/1/33 | 3,770,000 | 4,335,198 | |
| Palm Beach County Arpt. Sys. Rev. Series 2016: | |||
| 5% 10/1/34 (c) | 4,505,000 | 5,004,559 | |
| 5% 10/1/35 (c) | 4,745,000 | 5,247,211 | |
| 5% 10/1/36 (c) | 4,980,000 | 5,490,400 | |
| Palm Beach County Health Facilities Auth. Hosp. Rev. Series 2014, 5% 12/1/31 | 500,000 | 544,320 | |
| Palm Beach County School Board Ctfs. of Prtn.: | |||
| Series 2014 B, 5% 8/1/22 | 2,000,000 | 2,326,480 | |
| Series 2015 D: | |||
| 5% 8/1/28 | 680,000 | 796,525 | |
| 5% 8/1/29 | 2,330,000 | 2,710,536 | |
| 5% 8/1/30 | 2,405,000 | 2,786,265 | |
| 5% 8/1/31 | 2,415,000 | 2,784,423 | |
| South Florida Wtr. Mgmt. District Ctfs. of Prtn. Series 2015: | |||
| 5% 10/1/27 | 1,500,000 | 1,775,505 | |
| 5% 10/1/29 | 1,000,000 | 1,165,550 | |
| 5% 10/1/32 | 1,165,000 | 1,335,195 | |
| South Lake County Hosp. District (South Lake Hosp., Inc.) Series 2009 A, 6% 4/1/29 | 1,400,000 | 1,491,938 | |
| Tallahassee Health Facilities Rev.: | |||
| (Tallahassee Memorial Healthcare, Inc. Proj.) Series 2016 A, 5% 12/1/41 | 1,100,000 | 1,168,497 | |
| Series 2015 A, 5% 12/1/40 | 300,000 | 318,177 | |
| Tampa Tax Allocation (H. Lee Moffitt Cancer Ctr. Proj.) Series 2012 A, 5% 9/1/25 | 410,000 | 468,737 | |
| Volusia County School Board Ctfs. of Prtn.: | |||
| (Florida Master Lease Prog.) Series 2016 A, 5% 8/1/29 (Build America Mutual Assurance Insured) | 1,000,000 | 1,166,170 | |
| (Master Lease Prog.) Series 2014 B, 5% 8/1/26 | 340,000 | 400,428 | |
| TOTAL FLORIDA | 150,248,392 | ||
| Georgia - 1.6% | |||
| Burke County Indl. Dev. Auth. Poll. Cont. Rev. Bonds (Oglethorpe Pwr. Corp. Vogtle Proj.) Series 2013 A, 2.4%, tender 4/1/20 (b) | 1,120,000 | 1,127,224 | |
| Colquitt County Dev. Auth. Rev.: | |||
| Series A, 0% 12/1/21 (Escrowed to Maturity) | 1,100,000 | 1,016,125 | |
| Series C, 0% 12/1/21 (Escrowed to Maturity) | 1,800,000 | 1,662,750 | |
| DeKalb County Hosp. Auth. Rev. (DeKalb Med. Ctr., Inc. Proj.) Series 2010: | |||
| 6% 9/1/30 | 1,400,000 | 1,532,930 | |
| 6.125% 9/1/40 | 2,385,000 | 2,580,689 | |
| Main Street Natural Gas, Inc. Georgia Gas Proj. Rev. Series A, 5.5% 9/15/21 | 930,000 | 1,059,577 | |
| Metropolitan Atlanta Rapid Transit Auth. Sales Tax Rev. Third Series 2009 A, 5.25% 7/1/36 | 2,500,000 | 2,704,150 | |
| Private Colleges & Univs. Auth. Rev. (The Savannah College of Art and Design Projs.) Series 2014: | |||
| 5% 4/1/30 | 800,000 | 893,792 | |
| 5% 4/1/44 | 3,815,000 | 4,057,443 | |
| Richmond County Hosp. Auth. (Univ. Health Svcs., Inc. Proj.) Series 2009, 5.5% 1/1/36 (Pre-Refunded to 1/1/19 @ 100) | 2,600,000 | 2,791,776 | |
| Washington Wilkes Payroll Dev. Auth. Rev. Series C, 0% 12/1/21 (Escrowed to Maturity) | 2,310,000 | 2,143,588 | |
| TOTAL GEORGIA | 21,570,044 | ||
| Hawaii - 0.6% | |||
| Hawaii Arpts. Sys. Rev. Series 2015 A, 5% 7/1/45 (c) | 5,370,000 | 5,917,257 | |
| State of Hawaii Dept. of Trans. Series 2013, 5% 8/1/22 (c) | 1,575,000 | 1,807,391 | |
| TOTAL HAWAII | 7,724,648 | ||
| Idaho - 0.2% | |||
| Idaho Health Facilities Auth. Rev.: | |||
| (St. Luke's Health Sys. Proj.) Series 2008 A, 6.75% 11/1/37 | 1,200,000 | 1,285,536 | |
| (Trinity Health Group Proj.) 2008 B, 6.25% 12/1/33 (Pre-Refunded to 12/1/18 @ 100) | 400,000 | 432,524 | |
| Series 2015 ID, 5% 12/1/24 | 1,000,000 | 1,198,290 | |
| TOTAL IDAHO | 2,916,350 | ||
| Illinois - 15.6% | |||
| Chicago Board of Ed.: | |||
| Series 1999 A: | |||
| 0% 12/1/18 (Nat'l. Pub. Fin. Guarantee Corp. Insured) | 1,000,000 | 957,520 | |
| 5.25% 12/1/21 (Nat'l. Pub. Fin. Guarantee Corp. Insured) | 470,000 | 505,527 | |
| Series 2008 C: | |||
| 5.25% 12/1/23 | 360,000 | 320,234 | |
| 5.25% 12/1/24 | 245,000 | 214,456 | |
| Series 2010 F, 5% 12/1/20 | 195,000 | 177,487 | |
| Series 2011 A: | |||
| 5% 12/1/41 | 2,190,000 | 1,759,840 | |
| 5.25% 12/1/41 | 605,000 | 485,186 | |
| Series 2012 A, 5% 12/1/42 | 1,415,000 | 1,128,250 | |
| Series 2015 C, 5.25% 12/1/39 | 300,000 | 243,753 | |
| Series 2016 B, 6.5% 12/1/46 | 150,000 | 140,322 | |
| Chicago Midway Arpt. Rev.: | |||
| Series 2014 A, 5% 1/1/28 (c) | 4,200,000 | 4,719,792 | |
| Series 2016 A, 5% 1/1/28 (c) | 2,000,000 | 2,257,440 | |
| Series 2016 B: | |||
| 5% 1/1/36 | 400,000 | 444,476 | |
| 5% 1/1/37 | 500,000 | 554,020 | |
| 5% 1/1/46 | 1,275,000 | 1,391,867 | |
| Chicago O'Hare Int'l. Arpt. Rev.: | |||
| Series 2011 C, 6.5% 1/1/41 (Pre-Refunded to 1/1/21 @ 100) | 2,335,000 | 2,769,544 | |
| Series 2012 A, 5% 1/1/22 (c) | 1,140,000 | 1,293,079 | |
| Series 2013 D, 5% 1/1/27 | 2,200,000 | 2,492,314 | |
| Series 2015 A: | |||
| 5% 1/1/25 (c) | 905,000 | 1,057,013 | |
| 5% 1/1/31 (c) | 1,040,000 | 1,147,671 | |
| 5% 1/1/32 (c) | 2,100,000 | 2,302,587 | |
| Series 2015 C, 5% 1/1/24 (c) | 1,435,000 | 1,668,159 | |
| Series 2016 B, 5% 1/1/34 | 1,200,000 | 1,349,652 | |
| Series 2016 G, 5% 1/1/42 (c) | 700,000 | 756,770 | |
| Chicago Transit Auth.: | |||
| Series 2014, 5.25% 12/1/49 | 5,000,000 | 5,476,800 | |
| Series 2017, 5% 12/1/46 | 700,000 | 754,642 | |
| Cmnty. College District #525 Gen. Oblig.: | |||
| 5.75% 6/1/28 | 625,000 | 652,869 | |
| 5.75% 6/1/28 (Pre-Refunded to 6/1/18 @ 100) | 375,000 | 394,088 | |
| Cook County Forest Preservation District Series 2012 C, 5% 12/15/21 | 1,000,000 | 1,108,800 | |
| Cook County Gen. Oblig.: | |||
| Series 2006 B, 5% 11/15/18 (Nat'l. Pub. Fin. Guarantee Corp. Insured) | 1,000,000 | 1,020,300 | |
| Series 2010 A: | |||
| 5.25% 11/15/22 | 690,000 | 760,421 | |
| 5.25% 11/15/33 | 3,250,000 | 3,475,355 | |
| Series 2012 C, 5% 11/15/24 | 1,700,000 | 1,895,075 | |
| Series 2016 A: | |||
| 5% 11/15/27 | 1,560,000 | 1,761,770 | |
| 5% 11/15/28 | 1,900,000 | 2,134,232 | |
| 5% 11/15/30 | 1,000,000 | 1,110,410 | |
| Illinois Fin. Auth. Hosp. Rev. (KishHealth Sys. Proj.) Series 2008, 5.75% 10/1/35 (Pre-Refunded to 10/1/18 @ 100) | 1,600,000 | 1,703,408 | |
| Illinois Fin. Auth. Rev.: | |||
| (Advocate Health Care Proj.) Series 2008 D, 6.5% 11/1/38 (Pre-Refunded to 11/1/18 @ 100) | 1,000,000 | 1,080,130 | |
| (Central DuPage Health Proj.) Series 2009 B, 5.375% 11/1/39 | 1,200,000 | 1,288,356 | |
| (Depaul Univ. Proj.) Series 2016 A: | |||
| 5% 10/1/30 | 1,000,000 | 1,155,800 | |
| 5% 10/1/35 | 2,000,000 | 2,248,960 | |
| (Edward Hosp. Obligated Group Proj.) Series 2008 A, 5.5% 2/1/40 (Pre-Refunded to 2/1/18 @ 100) | 1,485,000 | 1,535,653 | |
| (Palos Cmnty. Hosp. Proj.) Series 2010 C: | |||
| 5.375% 5/15/25 | 5,000,000 | 5,512,850 | |
| 5.375% 5/15/30 | 1,110,000 | 1,213,541 | |
| (Presence Health Proj.) Series 2016 C, 5% 2/15/26 | 600,000 | 669,924 | |
| (Provena Health Proj.) Series 2010 A, 6% 5/1/28 (Pre-Refunded to 5/1/20 @ 100) | 2,700,000 | 3,072,357 | |
| (Rush Univ. Med. Ctr. Proj.): | |||
| Series 2009 D, 6.625% 11/1/39 (Pre-Refunded to 5/1/19 @ 100) | 705,000 | 782,374 | |
| Series B, 5.25% 11/1/35 (Pre-Refunded to 11/1/18 @ 100) | 2,905,000 | 3,088,567 | |
| (Silver Cross Hosp. and Med. Ctr. Proj.) Series 2008 A, 5.5% 8/15/30 | 350,000 | 361,680 | |
| (Southern Illinois Healthcare Enterprises, Inc. Proj.) Series 2005, 5.25% 3/1/30 | 1,100,000 | 1,192,400 | |
| Bonds (Ascension Health Cr. Group Proj.) Series 2012 E2, 1.75%, tender 4/1/21 (b) | 440,000 | 439,996 | |
| Series 2008 A, 5.625% 1/1/37 (Pre-Refunded to 1/1/18 @ 100) | 5,115,000 | 5,274,588 | |
| Series 2009 A, 7.25% 11/1/38 (Pre-Refunded to 11/1/18 @ 100) | 700,000 | 764,953 | |
| Series 2010 A: | |||
| 5.5% 8/15/24 (Pre-Refunded to 2/15/20 @ 100) | 545,000 | 608,313 | |
| 5.75% 8/15/29 (Pre-Refunded to 2/15/20 @ 100) | 360,000 | 404,276 | |
| Series 2012 A: | |||
| 5% 5/15/20 | 500,000 | 548,575 | |
| 5% 5/15/23 | 300,000 | 339,354 | |
| Series 2012: | |||
| 4% 9/1/32 | 1,315,000 | 1,301,561 | |
| 5% 9/1/32 | 1,900,000 | 2,010,808 | |
| 5% 9/1/38 | 2,300,000 | 2,378,016 | |
| 5% 11/15/43 | 820,000 | 871,619 | |
| Series 2013: | |||
| 5% 11/15/24 | 500,000 | 570,320 | |
| 5% 11/15/27 | 100,000 | 111,747 | |
| 5% 5/15/43 | 1,700,000 | 1,785,476 | |
| Series 2015 A: | |||
| 5% 11/15/21 | 600,000 | 684,624 | |
| 5% 11/15/45 | 455,000 | 490,344 | |
| Series 2015 C: | |||
| 5% 8/15/35 | 1,035,000 | 1,111,083 | |
| 5% 8/15/44 | 5,600,000 | 5,930,456 | |
| Series 2016 A: | |||
| 5% 8/15/22 | 1,000,000 | 1,112,500 | |
| 5% 7/1/24 | 1,395,000 | 1,631,285 | |
| 5% 7/1/31 | 510,000 | 573,322 | |
| 5% 7/1/33 | 650,000 | 722,592 | |
| 5% 8/15/35 | 510,000 | 542,681 | |
| 5% 8/15/36 | 2,035,000 | 2,154,149 | |
| 5.25% 8/15/31 | 600,000 | 669,972 | |
| Series 2016 B, 5% 8/15/32 | 5,000,000 | 5,638,650 | |
| Series 2016 C: | |||
| 4% 2/15/36 | 400,000 | 362,508 | |
| 5% 2/15/30 | 3,000,000 | 3,268,650 | |
| 5% 2/15/41 | 1,800,000 | 1,880,622 | |
| Illinois Gen. Oblig.: | |||
| Series 2006: | |||
| 5% 1/1/19 | 1,000,000 | 1,035,760 | |
| 5.5% 1/1/31 | 1,400,000 | 1,500,170 | |
| Series 2010: | |||
| 5% 1/1/18 | 1,900,000 | 1,935,929 | |
| 5% 1/1/21 (FSA Insured) | 500,000 | 529,055 | |
| 5% 1/1/23 (FSA Insured) | 1,300,000 | 1,373,489 | |
| Series 2012 A, 5% 1/1/33 | 800,000 | 803,576 | |
| Series 2012: | |||
| 5% 8/1/19 | 465,000 | 485,948 | |
| 5% 8/1/21 | 400,000 | 422,808 | |
| 5% 3/1/23 | 1,000,000 | 1,051,070 | |
| 5% 8/1/23 | 700,000 | 742,665 | |
| 5% 3/1/28 | 220,000 | 224,998 | |
| 5% 3/1/36 | 1,000,000 | 997,510 | |
| Series 2013 A, 5% 4/1/35 | 300,000 | 299,283 | |
| Series 2013: | |||
| 5% 1/1/22 | 2,925,000 | 3,037,700 | |
| 5.5% 7/1/24 | 1,000,000 | 1,083,410 | |
| 5.5% 7/1/25 | 745,000 | 801,233 | |
| Series 2014: | |||
| 5% 2/1/22 | 1,060,000 | 1,120,346 | |
| 5% 4/1/28 | 200,000 | 206,114 | |
| 5% 5/1/32 | 500,000 | 504,105 | |
| 5.25% 2/1/29 | 1,600,000 | 1,669,968 | |
| 5.25% 2/1/30 | 1,300,000 | 1,341,574 | |
| 5.25% 2/1/31 | 435,000 | 449,168 | |
| Series 2016: | |||
| 5% 6/1/25 | 1,515,000 | 1,595,128 | |
| 5% 6/1/26 | 210,000 | 220,301 | |
| 5% 2/1/27 | 1,490,000 | 1,557,721 | |
| 5% 2/1/28 | 1,200,000 | 1,249,716 | |
| 5% 2/1/29 | 1,125,000 | 1,165,309 | |
| 5% 2/1/26 | 415,000 | 431,579 | |
| Illinois Health Facilities Auth. Rev. (Delnor-Cmnty. Hosp. Proj.): | |||
| Series 2002 D, 5.25% 5/15/32 (FSA Insured) | 2,000,000 | 2,068,640 | |
| 5.25% 5/15/32 (FSA Insured) | 360,000 | 372,355 | |
| Illinois Muni. Elec. Agcy. Pwr. Supply Series 2015 A: | |||
| 5% 2/1/26 | 7,545,000 | 8,819,652 | |
| 5% 2/1/31 | 795,000 | 897,945 | |
| Illinois Toll Hwy. Auth. Toll Hwy. Rev.: | |||
| Series 2015 A: | |||
| 5% 1/1/37 | 700,000 | 777,623 | |
| 5% 1/1/40 | 2,300,000 | 2,542,972 | |
| Series 2015 B, 5% 1/1/40 | 1,300,000 | 1,445,574 | |
| Series 2016 A: | |||
| 5% 12/1/31 | 400,000 | 459,288 | |
| 5% 12/1/32 | 2,400,000 | 2,740,032 | |
| Joliet School District #86 Gen. Oblig. Series 2002, 0% 11/1/19 (FSA Insured) | 2,000,000 | 1,910,680 | |
| Kane, McHenry, Cook & DeKalb Counties Unit School District #300: | |||
| 0% 12/1/17 (AMBAC Insured) | 905,000 | 899,389 | |
| 6.5% 1/1/20 (AMBAC Insured) | 385,000 | 433,622 | |
| 6.5% 1/1/20 (Escrowed to Maturity) | 650,000 | 740,318 | |
| Kendall, Kane & Will Counties Cmnty. Unit School District #308 Series 2016, 5% 2/1/36 | 3,400,000 | 3,706,238 | |
| Lake County Cmnty. High School District #117, Antioch Series 2000 B, 0% 12/1/20 (Nat'l. Pub. Fin. Guarantee Corp. Insured) | 1,805,000 | 1,656,160 | |
| McHenry & Kane Counties Cmnty. Consolidated School District #158 Series 2004, 0% 1/1/24 (FSA Insured) | 800,000 | 666,488 | |
| Metropolitan Pier & Exposition: | |||
| (McCormick Place Expansion Proj.): | |||
| Series 1994 A, 0% 6/15/19 (Nat'l. Pub. Fin. Guarantee Corp. Insured) | 3,710,000 | 3,527,320 | |
| Series 1996 A, 0% 6/15/23 (Nat'l. Pub. Fin. Guarantee Corp. Insured) | 1,000,000 | 824,500 | |
| Series 2002 A: | |||
| 0% 12/15/30 (Nat'l. Pub. Fin. Guarantee Corp. Insured) | 5,900,000 | 3,296,861 | |
| 0% 6/15/36 (Nat'l. Pub. Fin. Guarantee Corp. Insured) | 1,080,000 | 438,588 | |
| Series 2010 B1: | |||
| 0% 6/15/43 (FSA Insured) | 5,310,000 | 1,530,661 | |
| 0% 6/15/44 (FSA Insured) | 4,700,000 | 1,288,411 | |
| 0% 6/15/45 (FSA Insured) | 2,600,000 | 677,638 | |
| 0% 6/15/47 (FSA Insured) | 2,085,000 | 490,955 | |
| Series 2012 B, 0% 12/15/51 | 2,900,000 | 407,508 | |
| Series A: | |||
| 0% 6/15/22 (Nat'l. Pub. Fin. Guarantee Corp. Insured) | 1,265,000 | 1,086,774 | |
| 0% 12/15/24 (Nat'l. Pub. Fin. Guarantee Corp. Insured) | 3,090,000 | 2,381,278 | |
| Series 2002 A: | |||
| 0% 12/15/33 (Nat'l. Pub. Fin. Guarantee Corp. Insured) | 5,730,000 | 2,700,033 | |
| 0% 12/15/34 (Nat'l. Pub. Fin. Guarantee Corp. Insured) | 1,540,000 | 685,223 | |
| Quincy Hosp. Rev. Series 2007, 5% 11/15/18 | 1,000,000 | 1,021,760 | |
| Univ. of Illinois Rev.: | |||
| (Auxiliary Facilities Sys. Proj.) Series 1999 A, 0% 4/1/20 (Nat'l. Pub. Fin. Guarantee Corp. Insured) | 1,600,000 | 1,503,424 | |
| Series 2010 A: | |||
| 5% 4/1/25 | 1,000,000 | 1,082,640 | |
| 5.25% 4/1/30 | 1,000,000 | 1,087,890 | |
| Series 2013: | |||
| 6% 10/1/42 | 900,000 | 1,032,633 | |
| 6.25% 10/1/38 | 900,000 | 1,053,954 | |
| Will County Cmnty. Unit School District #365-U: | |||
| 0% 11/1/19 (Escrowed to Maturity) | 790,000 | 763,551 | |
| 0% 11/1/19 (FSA Insured) | 5,085,000 | 4,843,513 | |
| TOTAL ILLINOIS | 209,468,485 | ||
| Indiana - 2.0% | |||
| Indiana Fin. Auth. Health Sys. Rev. (Sisters of Saint Francis Health Svcs., Inc. Obligated Group Proj.) Series 2009 A, 5.25% 11/1/39 | 1,000,000 | 1,070,110 | |
| Indiana Fin. Auth. Rev.: | |||
| (Trinity Health Cr. Group Proj.) Series 2009 A, 5.25% 12/1/38 | 2,000,000 | 2,156,720 | |
| Series 2012: | |||
| 5% 3/1/30 | 675,000 | 732,382 | |
| 5% 3/1/41 | 1,290,000 | 1,385,279 | |
| Series 2015 A, 5.25% 2/1/32 | 1,040,000 | 1,214,710 | |
| Series 2016: | |||
| 5% 9/1/23 | 450,000 | 520,871 | |
| 5% 9/1/26 | 225,000 | 264,168 | |
| 5% 9/1/27 | 650,000 | 756,210 | |
| 5% 9/1/29 | 500,000 | 572,930 | |
| Indiana Fin. Auth. Wastewtr. Util. Rev. (CWA Auth. Proj.): | |||
| Series 2012 A, 5% 10/1/24 | 400,000 | 462,804 | |
| Series 2015 A: | |||
| 5% 10/1/28 | 1,000,000 | 1,182,240 | |
| 5% 10/1/45 | 4,340,000 | 4,906,674 | |
| Indianapolis Local Pub. Impt. Series 2016: | |||
| 4% 1/1/34 (c) | 1,000,000 | 1,013,760 | |
| 5% 1/1/21 (c) | 810,000 | 904,778 | |
| 5% 1/1/22 (c) | 1,590,000 | 1,809,595 | |
| 5% 1/1/23 (c) | 540,000 | 623,786 | |
| Purdue Univ. Ctfs. of Prtn. Series 2016 A, 5% 7/1/30 | 3,000,000 | 3,559,260 | |
| Univ. of Southern Indiana Rev. Series J, 5.75% 10/1/28 (Assured Guaranty Corp. Insured) | 2,695,000 | 2,968,569 | |
| TOTAL INDIANA | 26,104,846 | ||
| Iowa - 0.4% | |||
| Iowa Fin. Auth. Health Facilities Rev. Series 2008 A, 5.625% 8/15/37 (Pre-Refunded to 8/15/19 @ 100) | 1,200,000 | 1,322,664 | |
| Iowa Higher Ed. Ln. Auth. Rev. (Grinnell College Proj.) Series 2017, 5% 12/1/46 | 2,880,000 | 3,322,656 | |
| TOTAL IOWA | 4,645,320 | ||
| Kansas - 0.6% | |||
| Johnson City Usd # 232 Series 2015 A, 5% 9/1/22 | 585,000 | 684,222 | |
| Kansas Dev. Fin. Agcy. (Adventist Health Sys./Sunbelt Obligated Group Proj.) Series 2009 C, 5.75% 11/15/38 | 1,900,000 | 2,071,190 | |
| Wyandotte County/Kansas City Unified Govt. Util. Sys. Rev.: | |||
| Series 2012 A, 5% 9/1/26 | 1,950,000 | 2,229,357 | |
| Series 2016 A: | |||
| 5% 9/1/40 | 1,400,000 | 1,554,770 | |
| 5% 9/1/45 | 1,800,000 | 1,992,132 | |
| TOTAL KANSAS | 8,531,671 | ||
| Kentucky - 0.2% | |||
| Ashland Med. Ctr. Rev. (Ashland Hosp. Corp. d/b/a Kings Daughters Med. Ctr. Proj.) Series 2016 A, 5% 2/1/29 | 1,000,000 | 1,089,290 | |
| Louisville & Jefferson County Series 2013 A: | |||
| 5.5% 10/1/33 | 500,000 | 579,345 | |
| 5.75% 10/1/38 | 1,355,000 | 1,567,396 | |
| TOTAL KENTUCKY | 3,236,031 | ||
| Louisiana - 0.9% | |||
| Louisiana Citizens Property Ins. Corp. Assessment Rev. Series 2015, 5% 6/1/20 | 1,250,000 | 1,381,100 | |
| Louisiana Pub. Facilities Auth. Hosp. Rev. (Franciscan Missionaries of Our Lady Health Sys. Proj.) Series 2009, 6.75% 7/1/39 (Pre-Refunded to 7/1/19 @ 100) | 400,000 | 446,116 | |
| Louisiana Pub. Facilities Auth. Rev. (Tulane Univ. of Louisiana Proj.) Series 2016 A: | |||
| 5% 12/15/25 | 185,000 | 220,017 | |
| 5% 12/15/26 | 1,000,000 | 1,193,630 | |
| 5% 12/15/29 | 1,085,000 | 1,263,103 | |
| New Orleans Aviation Board Rev.: | |||
| (North Term. Proj.) Series 2015 B: | |||
| 5% 1/1/27 (c) | 1,400,000 | 1,598,548 | |
| 5% 1/1/30 (c) | 2,335,000 | 2,611,744 | |
| 5% 1/1/40 (c) | 1,400,000 | 1,512,616 | |
| Series 2007 A, 5.25% 1/1/19 (FSA Insured) (c) | 1,570,000 | 1,603,614 | |
| TOTAL LOUISIANA | 11,830,488 | ||
| Maine - 0.7% | |||
| Maine Health & Higher Ed. Facilities Auth. Rev. (Eastern Maine Healthcare Systems Proj.) Series 2013, 5% 7/1/43 | 400,000 | 405,688 | |
| Maine Health & Higher Edl. Facilities Auth. Rev.: | |||
| Series 2008 D: | |||
| 5.75% 7/1/38 | 770,000 | 808,700 | |
| 5.75% 7/1/38 (Pre-Refunded to 7/1/18 @ 100) | 330,000 | 348,044 | |
| Series 2016 A: | |||
| 4% 7/1/41 | 455,000 | 387,028 | |
| 4% 7/1/46 | 600,000 | 494,052 | |
| 5% 7/1/41 | 1,600,000 | 1,616,304 | |
| 5% 7/1/46 | 4,970,000 | 5,002,355 | |
| Maine Tpk. Auth. Tpk. Rev. Series 2015, 5% 7/1/38 | 670,000 | 759,077 | |
| TOTAL MAINE | 9,821,248 | ||
| Maryland - 0.7% | |||
| Baltimore Proj. Rev. (Wtr. Projs.) Series 2009 A: | |||
| 5.375% 7/1/34 (Pre-Refunded to 7/1/19 @ 100) | 185,000 | 201,757 | |
| 5.375% 7/1/34 (Pre-Refunded to 7/1/19 @ 100) | 315,000 | 343,889 | |
| City of Westminster Series 2016: | |||
| 5% 11/1/27 | 1,000,000 | 1,135,850 | |
| 5% 11/1/31 | 1,245,000 | 1,387,304 | |
| Maryland Econ. Dev. Corp. (Purple Line Lt. Rail Proj.) Series 2016 D, 5% 3/31/41 (c) | 1,815,000 | 1,990,383 | |
| Maryland Health & Higher Edl. Facilities Auth. Rev.: | |||
| (Doctors Cmnty. Hosp. Proj.) Series 2010, 5.75% 7/1/38 (Pre-Refunded to 7/1/20 @ 100) | 1,010,000 | 1,150,087 | |
| (Univ. of Maryland Med. Sys. Proj.): | |||
| Series 2008 F, 5.25% 7/1/21 | 1,000,000 | 1,046,660 | |
| Series 2010, 5.125% 7/1/39 (Pre-Refunded to 7/1/19 @ 100) | 900,000 | 977,742 | |
| (Upper Chesapeake Hosp. Proj.) Series 2008 C, 5.5% 1/1/18 (Escrowed to Maturity) | 130,000 | 133,905 | |
| Series 2010, 5.625% 7/1/30 (Pre-Refunded to 7/1/20 @ 100) | 500,000 | 567,420 | |
| Series 2016 A: | |||
| 4% 7/1/42 | 275,000 | 267,328 | |
| 5% 7/1/35 | 120,000 | 127,044 | |
| TOTAL MARYLAND | 9,329,369 | ||
| Massachusetts - 2.5% | |||
| Massachusetts Bay Trans. Auth. Sales Tax Rev. Series 2015 A: | |||
| 5% 7/1/40 | 310,000 | 350,737 | |
| 5% 7/1/45 | 305,000 | 343,912 | |
| Massachusetts Dev. Fin. Agcy. Rev.: | |||
| (Boston College Proj.) Series T: | |||
| 5% 7/1/37 | 2,000,000 | 2,319,520 | |
| 5% 7/1/38 | 3,240,000 | 3,748,453 | |
| 5% 7/1/42 | 1,875,000 | 2,158,688 | |
| (Boston Univ. Proj.) Series U4, 5.7% 10/1/40 (Pre-Refunded to 10/1/19 @ 100) | 1,400,000 | 1,552,446 | |
| (Wentworth Institute of Technology Proj.) Series 2017, 5% 10/1/28 | 1,055,000 | 1,189,038 | |
| Series 2011 I, 6.75% 1/1/36 | 1,000,000 | 1,140,230 | |
| Series 2015 D, 5% 7/1/44 | 890,000 | 942,501 | |
| Series 2016 A, 5% 1/1/47 | 2,395,000 | 2,613,328 | |
| Massachusetts Gen. Oblig.: | |||
| Series 2016 A, 5% 3/1/46 | 445,000 | 497,813 | |
| Series 2016 B: | |||
| 5% 7/1/31 | 470,000 | 556,363 | |
| 5% 7/1/36 | 3,000,000 | 3,459,210 | |
| Massachusetts Health & Edl. Facilities Auth. Rev. (CareGroup, Inc. Proj.) Series 2008 E1, 5.125% 7/1/33 (Pre-Refunded to 7/1/18 @ 100) | 1,000,000 | 1,048,080 | |
| Massachusetts Port Auth. Rev.: | |||
| Series 2016 A, 5% 7/1/34 | 2,260,000 | 2,625,510 | |
| Series 2016 B: | |||
| 4% 7/1/46 (c) | 5,200,000 | 5,243,524 | |
| 5% 7/1/43 (c) | 3,185,000 | 3,524,967 | |
| TOTAL MASSACHUSETTS | 33,314,320 | ||
| Michigan - 2.0% | |||
| Detroit Swr. Disp. Rev. Series 2001 E, 5.75% 7/1/31 (Pre-Refunded to 7/1/18 @ 100) | 385,000 | 406,283 | |
| Detroit Wtr. Supply Sys. Rev. Series 2006 B, 7% 7/1/36 (Pre-Refunded to 7/1/19 @ 100) | 1,000,000 | 1,125,180 | |
| Grand Rapids Pub. Schools: | |||
| Series 2016, 5% 5/1/26 (FSA Insured) | 3,065,000 | 3,687,011 | |
| 5% 5/1/20 (FSA Insured) | 480,000 | 528,566 | |
| Lansing Board of Wtr. & Lt. Util. Rev. 5.5% 7/1/41 | 500,000 | 570,815 | |
| Michigan Bldg. Auth. Rev.: | |||
| (Facilities Prog.): | |||
| Series 2015 I, 5% 4/15/30 | 5,000,000 | 5,773,750 | |
| Series 2016 I, 5% 4/15/24 | 295,000 | 350,259 | |
| 5% 4/15/33 | 2,500,000 | 2,838,750 | |
| Michigan Fin. Auth. Rev.: | |||
| Series 2012 A: | |||
| 4.125% 6/1/32 (Pre-Refunded to 6/1/22 @ 100) | 1,150,000 | 1,293,451 | |
| 5% 6/1/21 (Escrowed to Maturity) | 350,000 | 399,767 | |
| 5% 6/1/27 (Pre-Refunded to 6/1/22 @ 100) | 500,000 | 583,650 | |
| 5% 6/1/39 (Pre-Refunded to 6/1/22 @ 100) | 1,100,000 | 1,284,030 | |
| Series 2012, 5% 11/15/42 | 2,175,000 | 2,357,156 | |
| Michigan Hosp. Fin. Auth. Rev.: | |||
| (McLaren Health Care Corp. Proj.) Series 2008 A, 5.75% 5/15/38 (Pre-Refunded to 5/15/18 @ 100) | 1,000,000 | 1,049,450 | |
| Bonds (Ascension Health Cr. Group Proj.) Series F5: | |||
| 1.9%, tender 4/1/21 (b) | 1,855,000 | 1,865,462 | |
| 2.4%, tender 3/15/23 (b) | 725,000 | 737,746 | |
| 6.5% 12/1/33 (Pre-Refunded to 12/1/18 @ 100) | 435,000 | 471,349 | |
| 6.5% 12/1/33 (Pre-Refunded to 12/1/18 @ 100) | 80,000 | 86,357 | |
| Portage Pub. Schools Series 2016, 5% 11/1/33 | 1,130,000 | 1,284,098 | |
| Royal Oak Hosp. Fin. Auth. Hosp. Rev. (William Beaumont Hosp. Proj.) Series 2009 V, 8.25% 9/1/39 (Pre-Refunded to 9/1/18 @ 100) | 600,000 | 657,054 | |
| TOTAL MICHIGAN | 27,350,184 | ||
| Minnesota - 0.5% | |||
| Duluth Independent School District #709 Ctfs. of Prtn. Series 2009 B, 4% 3/1/20 | 1,620,000 | 1,687,635 | |
| Minneapolis & Saint Paul Hsg. & Redev. Auth. Health Care Sys. Rev. (Allina Health Sys. Proj.) Series 2017 A, 5% 11/15/23 | 1,500,000 | 1,775,310 | |
| Minneapolis Health Care Sys. Rev.: | |||
| 6.5% 11/15/38 | 845,000 | 902,528 | |
| 6.5% 11/15/38 (Pre-Refunded to 11/15/18 @ 100) | 155,000 | 167,865 | |
| Minnesota Gen. Oblig. 5% 8/1/22 (Pre-Refunded to 8/1/17 @ 100) | 25,000 | 25,249 | |
| St. Louis Park Health Care Facilities Rev. (Park Nicollet Health Svcs. Proj.) Series 2009, 5.75% 7/1/39 (Pre-Refunded to 7/1/19 @ 100) | 1,600,000 | 1,761,328 | |
| TOTAL MINNESOTA | 6,319,915 | ||
| Missouri - 0.2% | |||
| Missouri Health & Edl. Facilities Auth. Edl. Facilities Rev. Series 2015 B: | |||
| 3.125% 2/1/27 | 200,000 | 198,250 | |
| 3.25% 2/1/28 | 200,000 | 198,380 | |
| 4% 2/1/40 | 100,000 | 100,134 | |
| 5% 2/1/29 | 1,240,000 | 1,406,334 | |
| 5% 2/1/36 | 400,000 | 437,528 | |
| 5% 2/1/45 | 600,000 | 647,874 | |
| TOTAL MISSOURI | 2,988,500 | ||
| Nebraska - 0.5% | |||
| Central Plains Energy Proj. Rev. (Nebraska Gas Proj.) Series 2007 B, 1.207% 12/1/17 (b) | 555,000 | 553,751 | |
| Douglas County Hosp. Auth. #2 Health Facilities Rev. 6% 8/15/24 | 740,000 | 750,686 | |
| Nebraska Pub. Pwr. District Rev.: | |||
| Series 2016 A, 5% 1/1/41 | 2,000,000 | 2,235,060 | |
| Series 2016 B, 5% 1/1/40 | 1,130,000 | 1,263,713 | |
| Omaha Arpt. Auth. Arpt. Rev.: | |||
| Series 2017 A: | |||
| 5% 12/15/22 (c) | 750,000 | 868,958 | |
| 5% 12/15/23 (c) | 750,000 | 879,645 | |
| Series 2017 C, 5% 12/15/21 (c) | 410,000 | 468,257 | |
| TOTAL NEBRASKA | 7,020,070 | ||
| Nevada - 1.4% | |||
| Clark County Arpt. Rev. (Sub Lien Proj.) Series 2017 A-1: | |||
| 5% 7/1/20 (c) | 1,375,000 | 1,523,459 | |
| 5% 7/1/21 (c) | 1,370,000 | 1,552,621 | |
| Clark County McCarran Int'l. Arpt. Passenger Facility Charge Rev.: | |||
| ( Clark County Arpt. Rev. Proj.) Series 2017 B: | |||
| 5% 7/1/20 (c) | 1,960,000 | 2,171,621 | |
| 5% 7/1/23 (c) | 3,000,000 | 3,509,700 | |
| (Clark County Arpt. Rev. Proj.) Series 2017 B: | |||
| 5% 7/1/21 (c) | 2,405,000 | 2,725,587 | |
| 5% 7/1/22 (c) | 2,250,000 | 2,596,095 | |
| Las Vegas Valley Wtr. District Wtr. Impt. Gen. Oblig. Series 2016 B, 5% 6/1/36 | 4,530,000 | 5,202,524 | |
| TOTAL NEVADA | 19,281,607 | ||
| New Hampshire - 0.7% | |||
| New Hampshire Bus. Fin. Auth. Rev. Series 2009 A, 6.125% 10/1/39 (Pre-Refunded to 10/1/19 @ 100) | 1,830,000 | 2,045,391 | |
| New Hampshire Health & Ed. Facilities Auth. Rev.: | |||
| Series 2007, 5% 10/1/37 | 255,000 | 258,111 | |
| Series 2012: | |||
| 4% 7/1/32 | 400,000 | 402,396 | |
| 5% 7/1/27 | 500,000 | 542,730 | |
| Series 2016: | |||
| 3% 10/1/20 | 110,000 | 114,569 | |
| 4% 10/1/38 | 480,000 | 476,573 | |
| 5% 10/1/22 | 1,000,000 | 1,123,620 | |
| 5% 10/1/29 | 2,675,000 | 3,012,585 | |
| 5% 10/1/38 | 1,200,000 | 1,298,184 | |
| TOTAL NEW HAMPSHIRE | 9,274,159 | ||
| New Jersey - 4.7% | |||
| New Jersey Ctfs. of Prtn. Series 2009 A, 5.25% 6/15/28 (Pre-Refunded to 6/15/19 @ 100) | 1,000,000 | 1,086,360 | |
| New Jersey Econ. Dev. Auth. Rev.: | |||
| (New Jersey Gen. Oblig. Proj.): | |||
| Series 2015 XX, 5% 6/15/25 | 1,995,000 | 2,109,353 | |
| Series 2017 B: | |||
| 5% 11/1/23 | 7,200,000 | 7,680,312 | |
| 5% 11/1/24 | 2,800,000 | 2,985,360 | |
| Series 2009 AA: | |||
| 5.5% 12/15/29 | 330,000 | 350,981 | |
| 5.5% 12/15/29 (Pre-Refunded to 6/15/19 @ 100) | 670,000 | 731,352 | |
| Series 2013 NN, 5% 3/1/27 | 11,810,000 | 12,237,640 | |
| Series 2013: | |||
| 5% 3/1/23 | 3,270,000 | 3,483,793 | |
| 5% 3/1/24 | 3,000,000 | 3,159,210 | |
| 5% 3/1/25 | 300,000 | 314,013 | |
| Series 2015 XX, 5% 6/15/22 | 640,000 | 681,504 | |
| Series 2016 AAA, 5% 6/15/41 | 865,000 | 862,552 | |
| Series 2016 BBB: | |||
| 5% 6/15/21 | 1,000,000 | 1,064,510 | |
| 5% 6/15/22 | 1,620,000 | 1,725,057 | |
| 5% 6/15/23 | 2,600,000 | 2,771,678 | |
| 6% 12/15/34 (Pre-Refunded to 12/15/18 @ 100) | 25,000 | 26,496 | |
| New Jersey Edl. Facility Series 2016 A, 5% 7/1/31 | 1,000,000 | 1,105,910 | |
| New Jersey Health Care Facilities Fing. Auth. Rev.: | |||
| Series 2008, 6.625% 7/1/38 (Pre-Refunded to 7/1/18 @ 100) | 1,700,000 | 1,810,092 | |
| Series 2016 A: | |||
| 5% 7/1/20 | 500,000 | 547,325 | |
| 5% 7/1/21 | 65,000 | 72,526 | |
| 5% 7/1/22 | 65,000 | 73,493 | |
| 5% 7/1/23 | 230,000 | 262,637 | |
| 5% 7/1/24 | 180,000 | 206,914 | |
| 5% 7/1/25 | 195,000 | 224,104 | |
| 5% 7/1/26 | 65,000 | 74,669 | |
| 5% 7/1/27 | 100,000 | 113,680 | |
| 5% 7/1/28 | 365,000 | 424,031 | |
| 5% 7/1/29 | 700,000 | 782,824 | |
| 5% 7/1/30 | 275,000 | 305,487 | |
| New Jersey Trans. Trust Fund Auth.: | |||
| Series 2005 B, 5.25% 12/15/22 (AMBAC Insured) | 400,000 | 439,676 | |
| Series 2010 D, 5.25% 12/15/23 | 6,295,000 | 6,874,329 | |
| Series 2014 AA, 5% 6/15/23 | 5,250,000 | 5,650,103 | |
| Series 2016 A: | |||
| 5% 6/15/27 | 400,000 | 431,876 | |
| 5% 6/15/29 | 1,650,000 | 1,755,485 | |
| Series 2016 A-2, 5% 6/15/23 | 1,050,000 | 1,143,251 | |
| TOTAL NEW JERSEY | 63,568,583 | ||
| New Mexico - 0.2% | |||
| New Mexico Edl. Assistance Foundation Series 2010 A1, 5% 12/1/19 | 2,000,000 | 2,184,300 | |
| New York - 6.2% | |||
| Dorm. Auth. New York Univ. Rev.: | |||
| Series 2017 4% 12/1/20 (a) | 1,000,000 | 1,053,470 | |
| Series 2017: | |||
| 4% 12/1/21 (a) | 1,100,000 | 1,165,549 | |
| 5% 12/1/22 (a) | 1,700,000 | 1,891,862 | |
| Hudson Yards Infrastructure Corp. New York Rev. Series 2012 A, 5.75% 2/15/47 | 2,700,000 | 3,063,906 | |
| MTA Hudson Rail Yards Trust Oblig. Series 2016 A, 5% 11/15/56 | 3,400,000 | 3,683,118 | |
| New York City Gen. Oblig.: | |||
| Series 2008: | |||
| 5.25% 8/15/27 | 400,000 | 421,140 | |
| 5.25% 8/15/27 (Pre-Refunded to 8/15/18 @ 100) | 1,100,000 | 1,159,741 | |
| Series 2009: | |||
| 5.625% 4/1/29 | 25,000 | 27,104 | |
| 5.625% 4/1/29 (Pre-Refunded to 4/1/19 @ 100) | 255,000 | 277,216 | |
| Series 2012 A1, 5% 8/1/24 | 1,300,000 | 1,480,648 | |
| Series 2012 E, 5% 8/1/24 | 5,000,000 | 5,707,200 | |
| Series 2012 G1, 5% 4/1/25 | 2,500,000 | 2,868,025 | |
| Series 2014 J, 5% 8/1/23 | 1,425,000 | 1,695,935 | |
| Series 2015 C, 5% 8/1/27 | 700,000 | 827,358 | |
| New York City Muni. Wtr. Fin. Auth. Wtr. & Swr. Sys. Rev.: | |||
| Series 2009 CC, 5% 6/15/34 | 2,100,000 | 2,185,344 | |
| Series 2009 FF 2, 5.5% 6/15/40 | 3,000,000 | 3,264,150 | |
| Series 2011 EE, 5.375% 6/15/43 | 4,000,000 | 4,520,960 | |
| Series 2013 CC, 5% 6/15/47 | 4,000,000 | 4,443,920 | |
| New York City Transitional Fin. Auth. Bldg. Aid Rev.: | |||
| Series 2009 S3: | |||
| 5.25% 1/15/34 | 2,500,000 | 2,663,275 | |
| 5.25% 1/15/39 | 1,000,000 | 1,063,560 | |
| Series 2009 S4: | |||
| 5.5% 1/15/39 | 850,000 | 909,815 | |
| 5.75% 1/15/39 | 1,600,000 | 1,722,112 | |
| Series 2015 S1, 5% 7/15/43 | 5,000,000 | 5,591,600 | |
| Series 2015 S2, 5% 7/15/35 | 1,770,000 | 2,017,287 | |
| New York City Transitional Fin. Auth. Rev. Series 2015 E1, 5% 2/1/41 | 510,000 | 573,995 | |
| New York Dorm. Auth. Personal Income Tax Rev.: | |||
| (Ed. Proj.) Series 2008 B, 5.75% 3/15/36 | 3,400,000 | 3,684,002 | |
| 5% 2/15/34 | 1,100,000 | 1,168,882 | |
| New York Dorm. Auth. Sales Tax Rev. Series 2016 A: | |||
| 5% 3/15/31 | 1,830,000 | 2,179,567 | |
| 5% 3/15/32 | 800,000 | 946,992 | |
| 5% 3/15/34 | 1,300,000 | 1,522,482 | |
| New York Metropolitan Trans. Auth. Dedicated Tax Fund Rev. Series 2009 B, 5% 11/15/34 | 1,200,000 | 1,307,772 | |
| New York Metropolitan Trans. Auth. Rev.: | |||
| Series 2010 D, 5.25% 11/15/40 | 1,400,000 | 1,564,108 | |
| Series 2012 D, 5% 11/15/25 | 4,600,000 | 5,371,926 | |
| Series 2014 B, 5% 11/15/44 | 1,500,000 | 1,660,860 | |
| Series 2015 A1, 5% 11/15/45 | 2,600,000 | 2,901,886 | |
| Series 2016, 6.5% 11/15/28 | 190,000 | 205,436 | |
| New York Thruway Auth. Gen. Rev. Series 2013 A, 5% 5/1/19 | 1,800,000 | 1,935,882 | |
| New York Trans. Dev. Corp. (Laguardia Arpt. Term. Redev. Proj.) Series 2016 A, 5% 7/1/41 (c) | 2,100,000 | 2,250,465 | |
| Rockland County Gen. Oblig. Series 2014 A, 4% 3/1/23 (FSA Insured) | 1,125,000 | 1,239,694 | |
| Tobacco Settlement Fing. Corp. Series 2013 B, 5% 6/1/21 | 15,000 | 15,019 | |
| Triborough Bridge & Tunnel Auth. Revs. Series 2015 A, 5.25% 11/15/45 | 1,000,000 | 1,147,250 | |
| TOTAL NEW YORK | 83,380,513 | ||
| North Carolina - 0.4% | |||
| Nash Health Care Sys. Health Care Facilities Rev.: | |||
| Series 2012, 5% 11/1/41 | 800,000 | 847,776 | |
| 5% 11/1/30 (FSA Insured) | 1,275,000 | 1,328,537 | |
| North Carolina Med. Care Cmnty. Health Series 2017, 5% 10/1/33 (e) | 560,000 | 634,178 | |
| North Carolina Med. Care Commission Health Care Facilities Rev. (Rex Healthcare Proj.) Series 2010 A, 5% 7/1/30 | 1,600,000 | 1,737,568 | |
| North Carolina Muni. Pwr. Agcy. #1 Catawba Elec. Rev. Series 2009 A: | |||
| 5% 1/1/30 | 285,000 | 302,317 | |
| 5% 1/1/30 (Pre-Refunded to 1/1/19 @ 100) | 715,000 | 761,868 | |
| TOTAL NORTH CAROLINA | 5,612,244 | ||
| North Dakota - 0.3% | |||
| Cass County Health Care Facilities Rev. (Essentia Health Obligated Group Proj.) Series 2008, 5.125% 2/15/37 (Assured Guaranty Corp. Insured) | 750,000 | 802,800 | |
| McLean County Solid Waste Facilities Rev. (Great River Energy Projs.) Series 2010 B, 5.15% 7/1/40 | 2,300,000 | 2,462,334 | |
| TOTAL NORTH DAKOTA | 3,265,134 | ||
| Ohio - 1.4% | |||
| Akron Bath Copley Hosp. District Rev. Series 2016, 5.25% 11/15/46 | 1,500,000 | 1,642,395 | |
| American Muni. Pwr., Inc. Rev.: | |||
| (Greenup Hydroelectric Proj.) Series 2016, 5% 2/15/46 | 1,900,000 | 2,104,725 | |
| (Prairie State Energy Campus Proj.) Series 2015, 5% 2/15/28 | 2,000,000 | 2,285,960 | |
| Columbus City School District 5% 12/1/29 | 300,000 | 358,149 | |
| Franklin County Hosp. Facilities Rev. (Ohiohealth Corp. Proj.) Series 2015, 5% 5/15/40 | 1,600,000 | 1,758,560 | |
| Hamilton County Convention Facilities Auth. Rev. Series 2014, 5% 12/1/26 | 670,000 | 761,857 | |
| Lake County Hosp. Facilities Rev.: | |||
| Series 2015, 5% 8/15/29 | 400,000 | 453,876 | |
| 5.75% 8/15/38 | 165,000 | 172,709 | |
| 5.75% 8/15/38 (Pre-Refunded to 8/15/18 @ 100) | 835,000 | 884,774 | |
| Lucas County Hosp. Rev. (ProMedica Healthcare Oblig. Group Proj.) Series 2011 A, 6.5% 11/15/37 | 1,200,000 | 1,429,464 | |
| Muskingum County Hosp. Facilities (Genesis Healthcare Sys. Obligated Group Proj.) Series 2013, 5% 2/15/48 | 2,000,000 | 2,070,880 | |
| Ohio Tpk. Commission Tpk. Rev. (Infastructure Proj.) Series 2005 A, 0% 2/15/42 | 2,600,000 | 921,362 | |
| Ross County Hosp. Facilities Rev. (Adena Health Sys. Proj.) Series 2008, 5.75% 12/1/35 | 1,400,000 | 1,464,162 | |
| Scioto County Hosp. Facilities Rev. Series 2016, 5% 2/15/34 | 445,000 | 492,241 | |
| Univ. of Akron Gen. Receipts Series 2016 A, 5% 1/1/35 | 1,995,000 | 2,242,699 | |
| TOTAL OHIO | 19,043,813 | ||
| Oklahoma - 0.3% | |||
| Oklahoma City Pub. Property Auth. Hotel Tax Rev. Series 2015: | |||
| 5% 10/1/29 | 700,000 | 795,571 | |
| 5% 10/1/39 | 150,000 | 164,094 | |
| Oklahoma Dev. Fin. Auth. Rev. (Saint John Health Sys. Proj.) Series 2012, 5% 2/15/42 | 1,775,000 | 1,885,618 | |
| Oklahoma Pwr. Auth. Pwr. Supply Sys. Rev. Series 2014 A, 5% 1/1/38 | 1,295,000 | 1,431,817 | |
| TOTAL OKLAHOMA | 4,277,100 | ||
| Oregon - 0.1% | |||
| Yamhill County School District #029J Newberg 5.5% 6/15/19 (Nat'l. Pub. Fin. Guarantee Corp. Insured) | 1,000,000 | 1,090,910 | |
| Pennsylvania - 5.9% | |||
| Allegheny County Hosp. Dev. Auth. Rev. (Univ. of Pittsburgh Med. Ctr. Proj.) Series 2009 A, 5.625% 8/15/39 | 1,100,000 | 1,199,627 | |
| Centre County Hosp. Auth. Rev. (Mount Nittany Med. Ctr. Proj.) Series 2011, 7% 11/15/46 (Pre-Refunded to 11/15/21 @ 100) | 500,000 | 619,340 | |
| Cumberland County Muni. Auth. Rev. (Dickinson College Proj.) Series 2017, 5% 5/1/47 | 4,920,000 | 5,476,403 | |
| Dauphin County Gen. Auth. (Pinnacle Health Sys. Proj.) Series 2016 A: | |||
| 5% 6/1/21 | 350,000 | 394,723 | |
| 5% 6/1/22 | 500,000 | 573,900 | |
| 5% 6/1/23 | 500,000 | 582,010 | |
| Lehigh County Gen. Purp. Auth. Rev. (Muhlenberg College Proj.) Series 2017, 5% 2/1/39 | 2,585,000 | 2,895,872 | |
| Monroe County Hosp. Auth. Rev. Series 2016, 5% 7/1/41 | 1,000,000 | 1,081,600 | |
| Montgomery County Higher Ed. & Health Auth. Hosp. Rev. (Abington Memorial Hosp. Proj.) Series 2012 A, 5% 6/1/24 | 600,000 | 684,000 | |
| Montgomery County Higher Ed. & Health Auth. Rev.: | |||
| Series 2014 A, 5% 10/1/25 | 1,045,000 | 1,171,863 | |
| Series 2016 A: | |||
| 5% 10/1/28 | 1,515,000 | 1,671,545 | |
| 5% 10/1/36 | 1,140,000 | 1,205,710 | |
| 5% 10/1/40 | 700,000 | 735,910 | |
| Northampton County Gen. Purp. Auth. Hosp. Rev.: | |||
| (St Lukes Hosp. & Health Ntw Proj.) Series 2016 A, 5% 8/15/36 | 745,000 | 822,316 | |
| Series 2016 A, 5% 8/15/46 | 5,125,000 | 5,585,276 | |
| Pennsylvania Gen. Oblig. Series 2016: | |||
| 5% 2/1/21 | 2,590,000 | 2,911,756 | |
| 5% 2/1/22 | 2,720,000 | 3,118,045 | |
| 5% 2/1/23 | 2,665,000 | 3,103,046 | |
| 5% 2/1/24 | 3,000,000 | 3,527,850 | |
| Pennsylvania Higher Edl. Facilities Auth. Rev. Series 2016, 5% 5/1/28 | 500,000 | 580,460 | |
| Philadelphia Gas Works Rev.: | |||
| Series 2016, 5% 10/1/20 | 695,000 | 770,199 | |
| Series 9: | |||
| 5.25% 8/1/40 | 490,000 | 528,387 | |
| 5.25% 8/1/40 (Pre-Refunded to 8/1/20 @ 100) | 310,000 | 349,088 | |
| 5% 10/1/19 | 310,000 | 335,364 | |
| Philadelphia School District Series 2016 D: | |||
| 5% 9/1/25 | 8,790,000 | 9,822,473 | |
| 5% 9/1/26 | 9,180,000 | 10,244,146 | |
| 5% 9/1/27 | 9,690,000 | 10,895,242 | |
| Scranton-Lackawanna Health & Welfare Auth. Rev. (Marywood Univ. Proj.) Series 2016, 5% 6/1/36 | 4,000,000 | 3,971,880 | |
| Westmoreland County Muni. Auth. Muni. Svc. Rev. Series A, 0% 8/15/21 (Nat'l. Pub. Fin. Guarantee Corp. Insured) | 5,000,000 | 4,572,050 | |
| TOTAL PENNSYLVANIA | 79,430,081 | ||
| Rhode Island - 1.0% | |||
| Rhode Island Comm Corp. Rev. Series 2016 A: | |||
| 5% 6/15/21 | 3,000,000 | 3,386,850 | |
| 5% 6/15/22 | 5,000,000 | 5,747,000 | |
| Rhode Island Health & Edl. Bldg. Corp. Higher Ed. Facilities Rev.: | |||
| Series 2016 B: | |||
| 5% 9/1/31 | 140,000 | 150,916 | |
| 5% 9/1/36 | 1,400,000 | 1,473,472 | |
| Series 2016: | |||
| 5% 5/15/34 | 1,000,000 | 1,070,480 | |
| 5% 5/15/39 | 1,000,000 | 1,054,990 | |
| TOTAL RHODE ISLAND | 12,883,708 | ||
| South Carolina - 2.8% | |||
| Beaufort-Jasper Wtr. & Swr. Sys. Series 2016 B, 5% 3/1/20 | 735,000 | 813,719 | |
| Horry County School District (South Carolina Gen. Oblig. Proj.) Series 2016, 5% 3/1/23 | 1,490,000 | 1,766,231 | |
| Lancaster County School District ( South Carolina Gen. Oblig. Proj.) Series 2017, 5% 3/1/23 | 1,000,000 | 1,185,390 | |
| Scago Edl. Facilities Corp. for Colleton School District (School District of Colleton County Proj.) Series 2015, 5% 12/1/26 | 1,400,000 | 1,615,782 | |
| South Carolina Jobs-Econ. Dev. Auth. Econ. Dev. Rev. Series 2013, 5% 11/1/27 | 1,400,000 | 1,597,932 | |
| South Carolina Ports Auth. Ports Rev.: | |||
| Series 2015 (AMT), 5% 7/1/45 (c) | 5,215,000 | 5,635,120 | |
| Series 2015, 5.25% 7/1/55 (c) | 6,000,000 | 6,539,340 | |
| South Carolina Pub. Svc. Auth. Rev.: | |||
| Series 2012 B, 5% 12/1/20 | 2,500,000 | 2,747,675 | |
| Series 2013 E, 5.5% 12/1/53 | 6,100,000 | 6,598,736 | |
| Series 2014 A: | |||
| 5% 12/1/49 | 1,340,000 | 1,413,392 | |
| 5.5% 12/1/54 | 2,500,000 | 2,717,850 | |
| Series 2014 C, 5% 12/1/46 | 720,000 | 763,265 | |
| Series 2015 A, 5% 12/1/50 | 2,175,000 | 2,306,849 | |
| Series 2015 E, 5.25% 12/1/55 | 1,100,000 | 1,191,498 | |
| South Carolina Trans. Infrastructure Bank Rev. Series 2015 A, 5% 10/1/23 | 600,000 | 712,158 | |
| TOTAL SOUTH CAROLINA | 37,604,937 | ||
| Tennessee - 0.2% | |||
| Jackson Hosp. Rev. 5.75% 4/1/41 | 270,000 | 278,991 | |
| Memphis-Shelby County Arpt. Auth. Arpt. Rev. Series 2010 B, 5.75% 7/1/24 (c) | 1,600,000 | 1,760,128 | |
| TOTAL TENNESSEE | 2,039,119 | ||
| Texas - 10.5% | |||
| Aledo Independent School District Series 2016, 5% 2/15/43 | 1,500,000 | 1,701,555 | |
| Austin Arpt. Sys. Rev. Series 2014: | |||
| 5% 11/15/28 (c) | 500,000 | 569,505 | |
| 5% 11/15/39 (c) | 1,700,000 | 1,864,016 | |
| 5% 11/15/44 (c) | 4,405,000 | 4,808,718 | |
| Austin Cmnty. College District Pub. Facilities Lease Rev. (Round Rock Campus Proj.) Series 2008, 5.5% 8/1/20 (Pre-Refunded to 8/1/18 @ 100) | 1,000,000 | 1,056,010 | |
| Austin Wtr. & Wastewtr. Sys. Rev. Series 2016, 5% 11/15/37 | 1,400,000 | 1,613,094 | |
| Central Reg'l. Mobility Auth.: | |||
| Series 2015 A: | |||
| 5% 1/1/28 | 1,300,000 | 1,491,997 | |
| 5% 1/1/31 | 475,000 | 534,874 | |
| 5% 1/1/45 | 1,000,000 | 1,093,750 | |
| Series 2016: | |||
| 5% 1/1/40 | 1,000,000 | 1,099,430 | |
| 5% 1/1/46 | 685,000 | 750,445 | |
| Comal County Tex Series 2017, 4% 2/1/23 | 1,660,000 | 1,858,420 | |
| Comal Independent School District 5.25% 2/1/23 | 35,000 | 36,089 | |
| Corpus Christi Util. Sys. Rev. 5% 7/15/23 | 1,600,000 | 1,835,888 | |
| Cypress-Fairbanks Independent School District: | |||
| Series 2014 C, 5% 2/15/44 | 1,100,000 | 1,234,068 | |
| Series 2016, 5% 2/15/27 | 795,000 | 962,689 | |
| Dallas Area Rapid Transit Sales Tax Rev. Series 2016 A, 5% 12/1/33 | 700,000 | 810,334 | |
| Dallas County Cmnty. College Series 2016, 5% 2/15/26 | 10,040,000 | 12,157,737 | |
| Dallas Fort Worth Int'l. Arpt. Rev.: | |||
| Series 2012 D, 5% 11/1/42 (c) | 400,000 | 428,880 | |
| Series 2012 H, 5% 11/1/42 (c) | 1,000,000 | 1,072,200 | |
| Series 2014 D, 5% 11/1/23 (c) | 575,000 | 670,427 | |
| Dallas Independent School District Bonds Series 2016 B6, 5%, tender 2/15/22 (b) | 825,000 | 942,604 | |
| Frisco Independent School District Series 2008 A, 6% 8/15/33 | 1,200,000 | 1,275,660 | |
| Grand Parkway Trans. Corp. Series 2013 B: | |||
| 5% 4/1/53 | 220,000 | 245,212 | |
| 5.25% 10/1/51 | 8,500,000 | 9,666,030 | |
| 5.5% 4/1/53 | 1,000,000 | 1,115,150 | |
| Harris County Gen. Oblig. Series 2002, 0% 8/15/24 (Nat'l. Pub. Fin. Guarantee Corp. Insured) | 1,000,000 | 858,240 | |
| Houston Arpt. Sys. Rev.: | |||
| Series 2011 A, 5% 7/1/24 (c) | 1,250,000 | 1,388,938 | |
| Series 2012 A, 5% 7/1/23 (c) | 600,000 | 676,524 | |
| Lewisville Independent School District 0% 8/15/19 | 2,340,000 | 2,279,534 | |
| Love Field Arpt. Modernization Rev.: | |||
| Series 2015: | |||
| 5% 11/1/26 (c) | 1,000,000 | 1,176,030 | |
| 5% 11/1/28 (c) | 3,325,000 | 3,847,391 | |
| Series 2017: | |||
| 5% 11/1/22 (c) | 750,000 | 860,213 | |
| 5% 11/1/23 (c) | 1,100,000 | 1,277,496 | |
| 5% 11/1/29 (c) | 1,250,000 | 1,452,975 | |
| 5% 11/1/36 (c) | 1,000,000 | 1,119,430 | |
| Newark Higher Ed. Fin. Corp. (Abilene Christian Univ. Proj.) Series 2016 A, 5% 4/1/27 | 720,000 | 837,965 | |
| North Texas Tollway Auth. Rev.: | |||
| Series 2008 I, 6.2% 1/1/42 (Assured Guaranty Corp. Insured) | 1,100,000 | 1,342,649 | |
| Series 2009 A, 6.25% 1/1/39 (Pre-Refunded to 1/1/19 @ 100) | 1,465,000 | 1,587,298 | |
| Series 2009, 6.25% 1/1/39 | 335,000 | 360,654 | |
| Series 2011 A: | |||
| 5.5% 9/1/41 | 2,300,000 | 2,648,588 | |
| 6% 9/1/41 | 1,200,000 | 1,415,484 | |
| Series 2011 D, 5% 9/1/28 | 2,300,000 | 2,636,053 | |
| Series 2014 A: | |||
| 5% 1/1/23 | 400,000 | 466,712 | |
| 5% 1/1/25 | 1,000,000 | 1,181,410 | |
| Series 2015 A, 5% 1/1/32 | 655,000 | 742,606 | |
| Series 2015 B, 5% 1/1/40 | 2,000,000 | 2,211,140 | |
| Series 2016 A, 5% 1/1/36 | 1,250,000 | 1,414,938 | |
| 6% 1/1/24 | 230,000 | 237,383 | |
| Northside Independent School District Bonds 2%, tender 6/1/21 (b) | 495,000 | 499,455 | |
| San Antonio Arpt. Sys. Rev. 5.25% 7/1/18 (FSA Insured) (c) | 2,505,000 | 2,519,855 | |
| San Antonio Elec. & Gas Sys. Rev.: | |||
| Series 2012, 5.25% 2/1/25 | 800,000 | 983,072 | |
| Series 2016, 5% 2/1/21 | 1,225,000 | 1,388,660 | |
| San Antonio Independent School District Series 2016, 5% 8/15/31 | 850,000 | 1,004,190 | |
| Tarrant County Cultural Ed. Facilities Fin. Corp. Hosp. Rev.: | |||
| (Hendrick Med. Ctr. Proj.) Series 2009 B, 5.25% 9/1/28 (Assured Guaranty Corp. Insured) | 1,235,000 | 1,331,083 | |
| 5.75% 11/15/24 (Pre-Refunded to 11/15/18 @ 100) | 480,000 | 513,994 | |
| 5.75% 11/15/24 (Pre-Refunded to 11/15/18 @ 100) | 620,000 | 664,894 | |
| Tarrant County Cultural Ed. Facilities Fin. Corp. Rev. Series 2016 A, 5% 2/15/25 | 165,000 | 196,706 | |
| Texas Gen. Oblig.: | |||
| Series 2016 A, 5% 4/1/23 | 4,580,000 | 5,432,155 | |
| Series 2017 A, 5% 10/1/33 | 2,700,000 | 3,217,023 | |
| Series 2017 B, 5% 10/1/31 | 10,000,000 | 12,085,200 | |
| 5% 4/1/25 (Pre-Refunded to 4/1/18 @ 100) | 75,000 | 77,741 | |
| Texas Private Activity Bond Surface Trans. Corp.: | |||
| (LBJ Infrastructure Group LLC IH-635 Managed Lanes Proj.) Series 2010, 7% 6/30/40 | 1,200,000 | 1,360,608 | |
| Series 2013, 6.75% 6/30/43 (c) | 2,400,000 | 2,697,120 | |
| Texas State Univ. Sys. Fing. Rev. Series 2017 A: | |||
| 5% 3/15/28 | 1,280,000 | 1,552,000 | |
| 5% 3/15/29 | 1,035,000 | 1,244,929 | |
| Univ. of Houston Univ. Revs. Series 2017 A: | |||
| 5% 2/15/26 | 3,170,000 | 3,844,259 | |
| 5% 2/15/32 | 1,545,000 | 1,788,430 | |
| 5% 2/15/33 | 1,000,000 | 1,151,710 | |
| 5% 2/15/34 | 1,000,000 | 1,145,900 | |
| 5% 2/15/35 | 1,000,000 | 1,140,940 | |
| 5% 2/15/36 | 2,000,000 | 2,275,300 | |
| Univ. of North Texas Univ. Rev. Series 2017 A, 5% 4/15/32 | 5,000,000 | 5,873,450 | |
| Univ. of Texas Board of Regents Sys. Rev. Series 2016 D, 5% 8/15/21 | 935,000 | 1,075,708 | |
| Univ. of Texas Permanent Univ. Fund Rev. Series 2016 B, 5% 7/1/29 | 395,000 | 471,113 | |
| Waller Independent School District 5.5% 2/15/28 (Pre-Refunded to 2/15/18 @ 100) | 1,670,000 | 1,729,936 | |
| TOTAL TEXAS | 140,179,864 | ||
| Utah - 1.3% | |||
| Salt Lake City Arpt. Rev. Series 2017 A: | |||
| 5% 7/1/22 (c) | 400,000 | 462,380 | |
| 5% 7/1/27 (c) | 1,645,000 | 1,982,455 | |
| 5% 7/1/29 (c) | 700,000 | 831,936 | |
| 5% 7/1/30 (c) | 500,000 | 589,890 | |
| 5% 7/1/31 (c) | 600,000 | 702,690 | |
| 5% 7/1/32 (c) | 700,000 | 814,478 | |
| 5% 7/1/33 (c) | 800,000 | 925,544 | |
| 5% 7/1/34 (c) | 700,000 | 805,259 | |
| 5% 7/1/35 (c) | 800,000 | 916,568 | |
| 5% 7/1/36 (c) | 1,100,000 | 1,255,177 | |
| 5% 7/1/37 (c) | 800,000 | 909,896 | |
| 5% 7/1/42 (c) | 4,800,000 | 5,419,728 | |
| Utah Associated Muni. Pwr. Sys. Rev. (Payson Pwr. Proj.) 5% 9/1/20 | 850,000 | 942,404 | |
| Utah Transit Auth. Sales Tax Rev. Series 2008 A, 5.25% 6/15/38 (Pre-Refunded to 6/15/18 @ 100) | 1,200,000 | 1,257,300 | |
| TOTAL UTAH | 17,815,705 | ||
| Vermont - 0.1% | |||
| Vermont Edl. & Health Bldg. Fin. Agcy. Rev. (Champlain College Proj.) Series 2016 A: | |||
| 5% 10/15/41 | 600,000 | 620,538 | |
| 5% 10/15/46 | 1,000,000 | 1,030,350 | |
| TOTAL VERMONT | 1,650,888 | ||
| Virginia - 1.2% | |||
| Fredericksburg Econ. Dev. Auth. Rev. Series 2014, 5% 6/15/30 | 1,250,000 | 1,407,388 | |
| Stafford County Econ. Dev. Auth. Hosp. Facilities Rev. Series 2016: | |||
| 4% 6/15/37 | 120,000 | 118,201 | |
| 5% 6/15/30 | 400,000 | 450,796 | |
| 5% 6/15/33 | 425,000 | 468,792 | |
| 5% 6/15/34 | 805,000 | 881,411 | |
| Univ. of Virginia Gen. Rev. Series 2017 A, 5% 4/1/38 | 9,200,000 | 10,810,276 | |
| Virginia College Bldg. Auth. Edl. Facilities Rev. Series 2015 A, 5% 1/1/40 | 500,000 | 563,230 | |
| Winchester Econ. Dev. Auth. Series 2015, 5% 1/1/44 | 1,000,000 | 1,093,210 | |
| TOTAL VIRGINIA | 15,793,304 | ||
| Washington - 4.9% | |||
| Chelan County Pub. Util. District #1 Columbia River-Rock Island Hydro-Elec. Sys. Rev. Series 1997 A, 0% 6/1/17 (Nat'l. Pub. Fin. Guarantee Corp. Insured) | 1,000,000 | 999,130 | |
| King County Swr. Rev. Series 2009, 5.25% 1/1/42 (Pre-Refunded to 1/1/19 @ 100) | 780,000 | 834,327 | |
| Port of Seattle Rev.: | |||
| Series 2016 B, 5% 10/1/30 (c) | 1,000,000 | 1,161,290 | |
| Series 2016: | |||
| 5% 2/1/25 | 500,000 | 595,640 | |
| 5% 2/1/30 | 1,000,000 | 1,172,940 | |
| Port of Seattle Spl. Facility Rev. Series 2013, 5% 6/1/24 (c) | 560,000 | 638,814 | |
| Seattle Gen. Oblig. Series 2016 A, 5% 4/1/24 | 4,990,000 | 6,023,229 | |
| Spokane Pub. Facilities District Hotel/Motel Tax & Sales/Use Tax Rev. Series 2013 B, 5% 12/1/27 | 1,500,000 | 1,723,875 | |
| Washington Gen. Oblig.: | |||
| Series 2013 D, 5% 2/1/21 | 5,695,000 | 6,464,793 | |
| Series 2015 C: | |||
| 5% 2/1/33 | 670,000 | 770,949 | |
| 5% 2/1/34 | 1,000,000 | 1,144,690 | |
| Series 2017 D: | |||
| 5% 2/1/33 | 900,000 | 1,056,888 | |
| 5% 2/1/36 | 18,305,000 | 21,193,321 | |
| Series R 2017 A, 5% 8/1/33 | 6,115,000 | 7,133,331 | |
| Series R 97A, 0% 7/1/19 (Escrowed to Maturity) | 1,200,000 | 1,170,120 | |
| Series R-2015 B, 5% 7/1/24 | 1,000,000 | 1,208,100 | |
| Series R-2017 A: | |||
| 5% 8/1/27 | 400,000 | 487,232 | |
| 5% 8/1/28 | 400,000 | 483,536 | |
| 5% 8/1/30 | 400,000 | 475,524 | |
| Washington Health Care Facilities Auth. Rev.: | |||
| (Catholic Health Initiatives Proj.) Series 2008 D, 6.375% 10/1/36 | 3,000,000 | 3,172,140 | |
| (MultiCare Health Sys. Proj.) Series 2008 B, 6% 8/15/39 (Pre-Refunded to 8/15/19 @ 100) | 1,000,000 | 1,109,450 | |
| (Overlake Hosp. Med. Ctr.) Series 2010, 5.7% 7/1/38 | 2,270,000 | 2,506,875 | |
| (Seattle Children's Hosp. Proj.) Series 2009, 5.625% 10/1/38 (Pre-Refunded to 10/1/19 @ 100) | 1,400,000 | 1,548,190 | |
| Series 2015, 5% 1/1/27 | 700,000 | 814,968 | |
| Washington Higher Ed. Facilities Auth. Rev. (Whitworth Univ. Proj.) Series 2016 A: | |||
| 5% 10/1/36 | 1,000,000 | 1,079,770 | |
| 5% 10/1/40 | 570,000 | 603,938 | |
| TOTAL WASHINGTON | 65,573,060 | ||
| West Virginia - 0.3% | |||
| West Virginia Econ. Dev. Auth. Solid Waste Disp. Facilities Rev. Bonds (Appalachian Pwr. Co. Amos Proj.) Series 2011 A, 1.7%, tender 9/1/20 (b)(c) | 1,360,000 | 1,340,008 | |
| West Virginia Hosp. Fin. Auth. Hosp. Rev. (West Virginia United Health Sys. Proj.) Series 2008 E, 5.625% 6/1/35 (Pre-Refunded to 12/1/18 @ 100) | 1,000,000 | 1,071,560 | |
| West Virginia Univ. Revs. (West Virginia Univ. Projs.) Series 2014 A, 5% 10/1/44 | 1,100,000 | 1,216,688 | |
| TOTAL WEST VIRGINIA | 3,628,256 | ||
| Wisconsin - 0.6% | |||
| Pub. Fin. Auth. Sr Liv Rev.: | |||
| ( Mary's Woods At Marylhurst, Inc. Proj.) Series 2017 B-1 3.95% 11/15/24 (a) | 80,000 | 80,306 | |
| (Mary's Woods At Marylhurst, Inc. Proj.): | |||
| Series 2017 A: | |||
| 5% 5/15/21 (a) | 300,000 | 325,599 | |
| 5% 5/15/28 (a) | 300,000 | 322,533 | |
| 5.25% 5/15/37 (a) | 80,000 | 84,535 | |
| 5.25% 5/15/42 (a) | 100,000 | 105,175 | |
| 5.25% 5/15/47 (a) | 95,000 | 99,528 | |
| 5.25% 5/15/52 (a) | 185,000 | 193,062 | |
| Series 2017 B-2, 3.5% 11/15/23 (a) | 105,000 | 105,204 | |
| Series 2017 B-3, 3% 11/15/22 (a) | 145,000 | 145,280 | |
| Pub. Fin. Auth. Wis Edl. Facilities Series 2016: | |||
| 5% 1/1/37 | 1,100,000 | 1,107,964 | |
| 5% 1/1/42 | 900,000 | 901,251 | |
| Wisconsin Health & Edl. Facilities: | |||
| Series 2014, 4% 5/1/33 | 510,000 | 483,373 | |
| Series 2016 A, 5% 2/15/42 | 1,000,000 | 1,065,760 | |
| Series 2016, 5% 2/15/29 | 435,000 | 498,371 | |
| Wisconsin Health & Edl. Facilities Auth. Rev.: | |||
| (Agnesian HealthCare, Inc. Proj.): | |||
| Series 2010: | |||
| 5.5% 7/1/40 | 500,000 | 543,075 | |
| 5.75% 7/1/30 | 500,000 | 552,930 | |
| Series 2013 B, 5% 7/1/36 | 925,000 | 1,002,857 | |
| Series 2012, 5% 6/1/27 | 300,000 | 330,135 | |
| TOTAL WISCONSIN | 7,946,938 | ||
| Wyoming - 0.1% | |||
| Campbell County Solid Waste Facilities Rev. (Basin Elec. Pwr. Coop. - Dry Fork Station Facilities Proj.) Series 2009 A, 5.75% 7/15/39 | 1,700,000 | 1,814,835 | |
| TOTAL MUNICIPAL BONDS | |||
| (Cost $1,281,466,535) | 1,312,066,407 | ||
| Municipal Notes - 0.2% | |||
| California - 0.1% | |||
| San Jose Int'l. Arpt. Rev. Participating VRDN Series 2017, 1.1% 5/5/17 (Liquidity Facility Citibank NA) (b)(c)(f) | 1,400,000 | $1,400,000 | |
| Kentucky - 0.1% | |||
| Kentucky Pub. Trans. BAN Series 2013 A, 5% 7/1/17 | 1,500,000 | 1,508,310 | |
| TOTAL MUNICIPAL NOTES | |||
| (Cost $2,907,211) | 2,908,310 | ||
| TOTAL INVESTMENT PORTFOLIO - 98.0% | |||
| (Cost $1,284,373,746) | 1,314,974,717 | ||
| NET OTHER ASSETS (LIABILITIES) - 2.0% | 26,355,938 | ||
| NET ASSETS - 100% | $1,341,330,655 |
Security Type Abbreviations
BAN – BOND ANTICIPATION NOTE
VRDN – Variable Rate Demand Note (A debt instrument that is payable upon demand, either daily, weekly or monthly)
Legend
(a) Security exempt from registration under Rule 144A of the Securities Act of 1933. These securities may be resold in transactions exempt from registration, normally to qualified institutional buyers. At the end of the period, the value of these securities amounted to $6,252,228 or 0.5% of net assets.
(b) Coupon rates for floating and adjustable rate securities reflect the rates in effect at period end.
(c) Private activity obligations whose interest is subject to the federal alternative minimum tax for individuals.
(d) Security initially issued in zero coupon form which converts to coupon form at a specified rate and date. The rate shown is the rate at period end.
(e) Security or a portion of the security purchased on a delayed delivery or when-issued basis.
(f) Provides evidence of ownership in one or more underlying municipal bonds.
Affiliated Central Funds
Information regarding fiscal year to date income earned by the Fund from investments in Fidelity Central Funds is as follows:
| Fund | Income earned |
| Fidelity Municipal Cash Central Fund | $35,798 |
| Total | $35,798 |
Investment Valuation
All investments are categorized as Level 2 under the Fair Value Hierarchy. The inputs or methodology used for valuing securities may not be an indication of the risk associated with investing in those securities. For more information on valuation inputs please refer to the Investment Valuation section in the accompanying Notes to Financial Statements.
Other Information
The distribution of municipal securities by revenue source, as a percentage of total Net Assets, is as follows (Unaudited):
| General Obligations | 33.0% |
| Transportation | 22.7% |
| Health Care | 14.1% |
| Education | 8.1% |
| Escrowed/Pre-Refunded | 6.0% |
| Electric Utilities | 5.2% |
| Others* (Individually Less Than 5%) | 10.9% |
| 100.0% |
* Includes net other assets
See accompanying notes which are an integral part of the financial statements.
Financial Statements
Statement of Assets and Liabilities
| April 30, 2017 (Unaudited) | ||
| Assets | ||
| Investment in securities, at value — See accompanying schedule: Unaffiliated issuers (cost $1,284,373,746) | $1,314,974,717 | |
| Cash | 15,112,133 | |
| Receivable for fund shares sold | 1,727,629 | |
| Interest receivable | 15,108,322 | |
| Distributions receivable from Fidelity Central Funds | 3,788 | |
| Prepaid expenses | 740 | |
| Receivable from investment adviser for expense reductions | 19,817 | |
| Other receivables | 6,236 | |
| Total assets | 1,346,953,382 | |
| Liabilities | ||
| Payable for investments purchased | ||
| Regular delivery | $916,809 | |
| Delayed delivery | 667,139 | |
| Payable for fund shares redeemed | 2,346,689 | |
| Distributions payable | 860,925 | |
| Accrued management fee | 398,483 | |
| Distribution and service plan fees payable | 184,574 | |
| Other affiliated payables | 206,608 | |
| Other payables and accrued expenses | 41,500 | |
| Total liabilities | 5,622,727 | |
| Net Assets | $1,341,330,655 | |
| Net Assets consist of: | ||
| Paid in capital | $1,309,495,800 | |
| Undistributed net investment income | 616,149 | |
| Accumulated undistributed net realized gain (loss) on investments | 617,735 | |
| Net unrealized appreciation (depreciation) on investments | 30,600,971 | |
| Net Assets | $1,341,330,655 | |
| Calculation of Maximum Offering Price | ||
| Class A: | ||
| Net Asset Value and redemption price per share ($253,099,995 ÷ 19,457,027 shares) | $13.01 | |
| Maximum offering price per share (100/96.00 of $13.01) | $13.55 | |
| Class M: | ||
| Net Asset Value and redemption price per share ($163,227,727 ÷ 12,510,014 shares) | $13.05 | |
| Maximum offering price per share (100/96.00 of $13.05) | $13.59 | |
| Class C: | ||
| Net Asset Value and offering price per share ($115,649,187 ÷ 8,869,540 shares)(a) | $13.04 | |
| Class I: | ||
| Net Asset Value, offering price and redemption price per share ($809,353,746 ÷ 62,558,417 shares) | $12.94 |
(a) Redemption price per share is equal to net asset value less any applicable contingent deferred sales charge.
See accompanying notes which are an integral part of the financial statements.
Statement of Operations
| Six months ended April 30, 2017 (Unaudited) | ||
| Investment Income | ||
| Interest | $21,718,873 | |
| Income from Fidelity Central Funds | 35,798 | |
| Total income | 21,754,671 | |
| Expenses | ||
| Management fee | $2,228,785 | |
| Transfer agent fees | 1,017,871 | |
| Distribution and service plan fees | 1,235,895 | |
| Accounting fees and expenses | 122,552 | |
| Custodian fees and expenses | 5,400 | |
| Independent trustees' fees and expenses | 2,446 | |
| Registration fees | 67,235 | |
| Audit | 29,469 | |
| Legal | 1,489 | |
| Miscellaneous | 4,270 | |
| Total expenses before reductions | 4,715,412 | |
| Expense reductions | (119,912) | 4,595,500 |
| Net investment income (loss) | 17,159,171 | |
| Realized and Unrealized Gain (Loss) | ||
| Net realized gain (loss) on: | ||
| Investment securities: | ||
| Unaffiliated issuers | 720,396 | |
| Total net realized gain (loss) | 720,396 | |
| Change in net unrealized appreciation (depreciation) on investment securities | (32,559,043) | |
| Net gain (loss) | (31,838,647) | |
| Net increase (decrease) in net assets resulting from operations | $(14,679,476) |
See accompanying notes which are an integral part of the financial statements.
Statement of Changes in Net Assets
| Six months ended April 30, 2017 (Unaudited) | Year ended October 31, 2016 | |
| Increase (Decrease) in Net Assets | ||
| Operations | ||
| Net investment income (loss) | $17,159,171 | $32,593,562 |
| Net realized gain (loss) | 720,396 | 14,308,316 |
| Change in net unrealized appreciation (depreciation) | (32,559,043) | (3,015,733) |
| Net increase (decrease) in net assets resulting from operations | (14,679,476) | 43,886,145 |
| Distributions to shareholders from net investment income | (17,128,912) | (32,549,100) |
| Distributions to shareholders from net realized gain | (13,766,589) | (7,430,609) |
| Total distributions | (30,895,501) | (39,979,709) |
| Share transactions - net increase (decrease) | 168,492,200 | 202,876,476 |
| Total increase (decrease) in net assets | 122,917,223 | 206,782,912 |
| Net Assets | ||
| Beginning of period | 1,218,413,432 | 1,011,630,520 |
| End of period | $1,341,330,655 | $1,218,413,432 |
| Other Information | ||
| Undistributed net investment income end of period | $616,149 | $585,890 |
See accompanying notes which are an integral part of the financial statements.
Financial Highlights — Fidelity Advisor Municipal Income Fund Class A
| Six months ended (Unaudited) April 30, | Years ended October 31, | |||||
| 2017 | 2016 | 2015 | 2014 | 2013 | 2012 | |
| Selected Per–Share Data | ||||||
| Net asset value, beginning of period | $13.53 | $13.47 | $13.59 | $13.00 | $13.74 | $12.95 |
| Income from Investment Operations | ||||||
| Net investment income (loss)A | .177 | .389 | .438 | .462 | .453 | .460 |
| Net realized and unrealized gain (loss) | (.366) | .159 | (.076) | .682 | (.738) | .789 |
| Total from investment operations | (.189) | .548 | .362 | 1.144 | (.285) | 1.249 |
| Distributions from net investment income | (.176) | (.390) | (.439) | (.461) | (.451) | (.457) |
| Distributions from net realized gain | (.155) | (.098) | (.043) | (.093) | (.004) | (.002) |
| Total distributions | (.331) | (.488) | (.482) | (.554) | (.455) | (.459) |
| Net asset value, end of period | $13.01 | $13.53 | $13.47 | $13.59 | $13.00 | $13.74 |
| Total ReturnB,C,D | (1.35)% | 4.11% | 2.71% | 9.02% | (2.12)% | 9.77% |
| Ratios to Average Net AssetsE,F | ||||||
| Expenses before reductions | .82%G | .81% | .81% | .79% | .77% | .77% |
| Expenses net of fee waivers, if any | .80%G | .80% | .80% | .79% | .77% | .77% |
| Expenses net of all reductions | .80%G | .80% | .80% | .79% | .77% | .77% |
| Net investment income (loss) | 2.75%G | 2.86% | 3.25% | 3.49% | 3.36% | 3.42% |
| Supplemental Data | ||||||
| Net assets, end of period (000 omitted) | $253,100 | $397,834 | $374,081 | $325,539 | $335,492 | $430,231 |
| Portfolio turnover rateH | 40%G | 22% | 14% | 10% | 12% | 6% |
A Calculated based on average shares outstanding during the period.
B Total returns for periods of less than one year are not annualized.
C Total returns would have been lower if certain expenses had not been reduced during the applicable periods shown.
D Total returns do not include the effect of the sales charges.
E Fees and expenses of any underlying Fidelity Central Funds are not included in the Fund's expense ratio. The Fund indirectly bears its proportionate share of the expenses of any underlying Fidelity Central Funds.
F Expense ratios reflect operating expenses of the class. Expenses before reductions do not reflect amounts reimbursed by the investment adviser or reductions from expense offset arrangements and do not represent the amount paid by the class during periods when reimbursements or reductions occur. Expenses net of fee waivers reflect expenses after reimbursement by the investment adviser but prior to reductions from expense offset arrangements. Expenses net of all reductions represent the net expenses paid by the class.
G Annualized
H Amount does not include the portfolio activity of any underlying Fidelity Central Funds.
See accompanying notes which are an integral part of the financial statements.
Financial Highlights — Fidelity Advisor Municipal Income Fund Class M
| Six months ended (Unaudited) April 30, | Years ended October 31, | |||||
| 2017 | 2016 | 2015 | 2014 | 2013 | 2012 | |
| Selected Per–Share Data | ||||||
| Net asset value, beginning of period | $13.58 | $13.51 | $13.63 | $13.03 | $13.77 | $12.99 |
| Income from Investment Operations | ||||||
| Net investment income (loss)A | .177 | .392 | .443 | .466 | .454 | .462 |
| Net realized and unrealized gain (loss) | (.375) | .169 | (.079) | .691 | (.739) | .778 |
| Total from investment operations | (.198) | .561 | .364 | 1.157 | (.285) | 1.240 |
| Distributions from net investment income | (.177) | (.393) | (.441) | (.464) | (.451) | (.458) |
| Distributions from net realized gain | (.155) | (.098) | (.043) | (.093) | (.004) | (.002) |
| Total distributions | (.332) | (.491) | (.484) | (.557) | (.455) | (.460) |
| Net asset value, end of period | $13.05 | $13.58 | $13.51 | $13.63 | $13.03 | $13.77 |
| Total ReturnB,C,D | (1.41)% | 4.20% | 2.72% | 9.10% | (2.12)% | 9.67% |
| Ratios to Average Net AssetsE,F | ||||||
| Expenses before reductions | .80%G | .79% | .79% | .78% | .77% | .76% |
| Expenses net of fee waivers, if any | .80%G | .79% | .79% | .78% | .77% | .76% |
| Expenses net of all reductions | .80%G | .79% | .79% | .78% | .77% | .76% |
| Net investment income (loss) | 2.74%G | 2.87% | 3.26% | 3.51% | 3.37% | 3.42% |
| Supplemental Data | ||||||
| Net assets, end of period (000 omitted) | $163,228 | $181,049 | $170,263 | $204,607 | $207,208 | $247,622 |
| Portfolio turnover rateH | 40%G | 22% | 14% | 10% | 12% | 6% |
A Calculated based on average shares outstanding during the period.
B Total returns for periods of less than one year are not annualized.
C Total returns would have been lower if certain expenses had not been reduced during the applicable periods shown.
D Total returns do not include the effect of the sales charges.
E Fees and expenses of any underlying Fidelity Central Funds are not included in the Fund's expense ratio. The Fund indirectly bears its proportionate share of the expenses of any underlying Fidelity Central Funds.
F Expense ratios reflect operating expenses of the class. Expenses before reductions do not reflect amounts reimbursed by the investment adviser or reductions from expense offset arrangements and do not represent the amount paid by the class during periods when reimbursements or reductions occur. Expenses net of fee waivers reflect expenses after reimbursement by the investment adviser but prior to reductions from expense offset arrangements. Expenses net of all reductions represent the net expenses paid by the class.
G Annualized
H Amount does not include the portfolio activity of any underlying Fidelity Central Funds.
See accompanying notes which are an integral part of the financial statements.
Financial Highlights — Fidelity Advisor Municipal Income Fund Class C
| Six months ended (Unaudited) April 30, | Years ended October 31, | |||||
| 2017 | 2016 | 2015 | 2014 | 2013 | 2012 | |
| Selected Per–Share Data | ||||||
| Net asset value, beginning of period | $13.57 | $13.50 | $13.62 | $13.03 | $13.77 | $12.98 |
| Income from Investment Operations | ||||||
| Net investment income (loss)A | .129 | .287 | .339 | .363 | .351 | .358 |
| Net realized and unrealized gain (loss) | (.375) | .169 | (.078) | .681 | (.739) | .788 |
| Total from investment operations | (.246) | .456 | .261 | 1.044 | (.388) | 1.146 |
| Distributions from net investment income | (.129) | (.288) | (.338) | (.361) | (.348) | (.354) |
| Distributions from net realized gain | (.155) | (.098) | (.043) | (.093) | (.004) | (.002) |
| Total distributions | (.284) | (.386) | (.381) | (.454) | (.352) | (.356) |
| Net asset value, end of period | $13.04 | $13.57 | $13.50 | $13.62 | $13.03 | $13.77 |
| Total ReturnB,C,D | (1.78)% | 3.41% | 1.94% | 8.19% | (2.86)% | 8.92% |
| Ratios to Average Net AssetsE,F | ||||||
| Expenses before reductions | 1.57%G | 1.56% | 1.56% | 1.55% | 1.54% | 1.54% |
| Expenses net of fee waivers, if any | 1.55%G | 1.55% | 1.55% | 1.55% | 1.54% | 1.54% |
| Expenses net of all reductions | 1.55%G | 1.55% | 1.55% | 1.55% | 1.54% | 1.53% |
| Net investment income (loss) | 1.99%G | 2.10% | 2.50% | 2.74% | 2.60% | 2.65% |
| Supplemental Data | ||||||
| Net assets, end of period (000 omitted) | $115,649 | $137,050 | $117,528 | $118,088 | $123,530 | $155,834 |
| Portfolio turnover rateH | 40%G | 22% | 14% | 10% | 12% | 6% |
A Calculated based on average shares outstanding during the period.
B Total returns for periods of less than one year are not annualized.
C Total returns would have been lower if certain expenses had not been reduced during the applicable periods shown.
D Total returns do not include the effect of the contingent deferred sales charge.
E Fees and expenses of any underlying Fidelity Central Funds are not included in the Fund's expense ratio. The Fund indirectly bears its proportionate share of the expenses of any underlying Fidelity Central Funds.
F Expense ratios reflect operating expenses of the class. Expenses before reductions do not reflect amounts reimbursed by the investment adviser or reductions from expense offset arrangements and do not represent the amount paid by the class during periods when reimbursements or reductions occur. Expenses net of fee waivers reflect expenses after reimbursement by the investment adviser but prior to reductions from expense offset arrangements. Expenses net of all reductions represent the net expenses paid by the class.
G Annualized
H Amount does not include the portfolio activity of any underlying Fidelity Central Funds.
See accompanying notes which are an integral part of the financial statements.
Financial Highlights — Fidelity Advisor Municipal Income Fund Class I
| Six months ended (Unaudited) April 30, | Years ended October 31, | |||||
| 2017 | 2016 | 2015 | 2014 | 2013 | 2012 | |
| Selected Per–Share Data | ||||||
| Net asset value, beginning of period | $13.46 | $13.40 | $13.51 | $12.93 | $13.67 | $12.89 |
| Income from Investment Operations | ||||||
| Net investment income (loss)A | .190 | .420 | .470 | .493 | .481 | .490 |
| Net realized and unrealized gain (loss) | (.364) | .160 | (.067) | .674 | (.735) | .782 |
| Total from investment operations | (.174) | .580 | .403 | 1.167 | (.254) | 1.272 |
| Distributions from net investment income | (.191) | (.422) | (.470) | (.494) | (.482) | (.490) |
| Distributions from net realized gain | (.155) | (.098) | (.043) | (.093) | (.004) | (.002) |
| Total distributions | (.346) | (.520) | (.513) | (.587) | (.486) | (.492) |
| Net asset value, end of period | $12.94 | $13.46 | $13.40 | $13.51 | $12.93 | $13.67 |
| Total ReturnB,C | (1.24)% | 4.38% | 3.03% | 9.27% | (1.90)% | 10.00% |
| Ratios to Average Net AssetsD,E | ||||||
| Expenses before reductions | .57%F | .56% | .57% | .54% | .54% | .53% |
| Expenses net of fee waivers, if any | .55%F | .55% | .55% | .54% | .54% | .53% |
| Expenses net of all reductions | .55%F | .55% | .55% | .54% | .54% | .53% |
| Net investment income (loss) | 2.99%F | 3.10% | 3.50% | 3.75% | 3.60% | 3.66% |
| Supplemental Data | ||||||
| Net assets, end of period (000 omitted) | $809,354 | $502,479 | $346,521 | $312,038 | $290,117 | $362,588 |
| Portfolio turnover rateG | 40%F | 22% | 14% | 10% | 12% | 6% |
A Calculated based on average shares outstanding during the period.
B Total returns for periods of less than one year are not annualized.
C Total returns would have been lower if certain expenses had not been reduced during the applicable periods shown.
D Fees and expenses of any underlying Fidelity Central Funds are not included in the Fund's expense ratio. The Fund indirectly bears its proportionate share of the expenses of any underlying Fidelity Central Funds.
E Expense ratios reflect operating expenses of the class. Expenses before reductions do not reflect amounts reimbursed by the investment adviser or reductions from expense offset arrangements and do not represent the amount paid by the class during periods when reimbursements or reductions occur. Expenses net of fee waivers reflect expenses after reimbursement by the investment adviser but prior to reductions from expense offset arrangements. Expenses net of all reductions represent the net expenses paid by the class.
F Annualized
G Amount does not include the portfolio activity of any underlying Fidelity Central Funds.
See accompanying notes which are an integral part of the financial statements.
Notes to Financial Statements (Unaudited)
For the period ended April 30, 2017
1. Organization.
Fidelity Advisor Municipal Income Fund (the Fund) is a fund of Fidelity Advisor Series II (the Trust) and is authorized to issue an unlimited number of shares. The Trust is registered under the Investment Company Act of 1940, as amended (the 1940 Act), as an open-end management investment company organized as a Massachusetts business trust. The Fund offers Class A, Class M (formerly Class T), Class C and Class I shares, each of which has equal rights as to assets and voting privileges. Each class has exclusive voting rights with respect to matters that affect that class.
After the close of business on June 24, 2016, all outstanding Class B shares were converted to Class A shares. All prior fiscal period dollar and share amounts for Class B presented in the Notes to Financial Statements are for the period November 1, 2015 through June 24, 2016.
2. Investments in Fidelity Central Funds.
The Fund invests in Fidelity Central Funds, which are open-end investment companies generally available only to other investment companies and accounts managed by the investment adviser and its affiliates. The Fund's Schedule of Investments lists each of the Fidelity Central Funds held as of period end, if any, as an investment of the Fund, but does not include the underlying holdings of each Fidelity Central Fund. As an Investing Fund, the Fund indirectly bears its proportionate share of the expenses of the underlying Fidelity Central Funds.
The Money Market Central Funds seek preservation of capital and current income and are managed by Fidelity Investments Money Management, Inc. (FIMM), an affiliate of the investment adviser. Annualized expenses of the Money Market Central Funds as of their most recent shareholder report date are less than .005%.
A complete unaudited list of holdings for each Fidelity Central Fund is available upon request or at the Securities and Exchange Commission (the SEC) website at www.sec.gov. In addition, the financial statements of the Fidelity Central Funds are available on the SEC website or upon request.
3. Significant Accounting Policies.
The Fund is an investment company and applies the accounting and reporting guidance of the Financial Accounting Standards Board (FASB) Accounting Standards Codification Topic 946 Financial Services – Investments Companies. The financial statements have been prepared in conformity with accounting principles generally accepted in the United States of America (GAAP), which require management to make certain estimates and assumptions at the date of the financial statements. Actual results could differ from those estimates. Subsequent events, if any, through the date that the financial statements were issued have been evaluated in the preparation of the financial statements. The following summarizes the significant accounting policies of the Fund:
Investment Valuation. Investments are valued as of 4:00 p.m. Eastern time on the last calendar day of the period. The Board of Trustees (the Board) has delegated the day to day responsibility for the valuation of the Fund's investments to the Fair Value Committee (the Committee) established by the Fund's investment adviser. In accordance with valuation policies and procedures approved by the Board, the Fund attempts to obtain prices from one or more third party pricing vendors or brokers to value its investments. When current market prices, quotations or currency exchange rates are not readily available or reliable, investments will be fair valued in good faith by the Committee, in accordance with procedures adopted by the Board. Factors used in determining fair value vary by investment type and may include market or investment specific events, changes in interest rates and credit quality. The frequency with which these procedures are used cannot be predicted and they may be utilized to a significant extent. The Committee oversees the Fund's valuation policies and procedures and reports to the Board on the Committee's activities and fair value determinations. The Board monitors the appropriateness of the procedures used in valuing the Fund's investments and ratifies the fair value determinations of the Committee.
The Fund categorizes the inputs to valuation techniques used to value its investments into a disclosure hierarchy consisting of three levels as shown below:
- Level 1 – quoted prices in active markets for identical investments
- Level 2 – other significant observable inputs (including quoted prices for similar investments, interest rates, prepayment speeds, etc.)
- Level 3 – unobservable inputs (including the Fund's own assumptions based on the best information available)
Valuation techniques used to value the Fund's investments by major category are as follows:
Debt securities, including restricted securities, are valued based on evaluated prices received from third party pricing vendors or from brokers who make markets in such securities. Municipal securities are valued by pricing vendors who utilize matrix pricing which considers yield or price of bonds of comparable quality, coupon, maturity and type or by broker-supplied prices. When independent prices are unavailable or unreliable, debt securities may be valued utilizing pricing methodologies which consider similar factors that would be used by third party pricing vendors. Debt securities are generally categorized as Level 2 in the hierarchy but may be Level 3 depending on the circumstances.
Investments in open-end mutual funds, including the Fidelity Central Funds, are valued at their closing net asset value (NAV) each business day and are categorized as Level 1 in the hierarchy.
Changes in valuation techniques may result in transfers in or out of an assigned level within the disclosure hierarchy.
Investment Transactions and Income. For financial reporting purposes, the Fund's investment holdings and NAV include trades executed through the end of the last business day of the period. The NAV per share for processing shareholder transactions is calculated as of the close of business of the New York Stock Exchange (NYSE), normally 4:00 p.m. Eastern time and includes trades executed through the end of the prior business day. Gains and losses on securities sold are determined on the basis of identified cost. Income and capital gain distributions from Fidelity Central Funds, if any, are recorded on the ex-dividend date. Interest income is accrued as earned and includes coupon interest and amortization of premium and accretion of discount on debt securities as applicable. Debt obligations may be placed on non-accrual status and related interest income may be reduced by ceasing current accruals and writing off interest receivables when the collection of all or a portion of interest has become doubtful based on consistently applied procedures. A debt obligation is removed from non-accrual status when the issuer resumes interest payments or when collectability of interest is reasonably assured.
Class Allocations and Expenses. Investment income, realized and unrealized capital gains and losses, common expenses of the Fund, and certain fund-level expense reductions, if any, are allocated daily on a pro-rata basis to each class based on the relative net assets of each class to the total net assets of the Fund. Each class differs with respect to transfer agent and distribution and service plan fees incurred. Certain expense reductions may also differ by class. For the reporting period, the allocated portion of income and expenses to each class as a percent of its average net assets may vary due to the timing of recording these transactions in relation to fluctuating net assets of the classes. Expenses directly attributable to a fund are charged to that fund. Expenses attributable to more than one fund are allocated among the respective funds on the basis of relative net assets or other appropriate methods. Expense estimates are accrued in the period to which they relate and adjustments are made when actual amounts are known.
Income Tax Information and Distributions to Shareholders. Each year, the Fund intends to qualify as a regulated investment company under Subchapter M of the Internal Revenue Code, including distributing substantially all of its taxable income and realized gains. As a result, no provision for U.S. Federal income taxes is required. The Fund files a U.S. federal tax return, in addition to state and local tax returns as required. The Fund's federal income tax returns are subject to examination by the Internal Revenue Service (IRS) for a period of three fiscal years after they are filed. State and local tax returns may be subject to examination for an additional fiscal year depending on the jurisdiction.
Dividends are declared and recorded daily and paid monthly from net investment income. Distributions from realized gains, if any, are declared and recorded on the ex-dividend date. Income dividends and capital gain distributions are declared separately for each class. Income and capital gain distributions are determined in accordance with income tax regulations, which may differ from GAAP.
Capital accounts within the financial statements are adjusted for permanent book-tax differences. These adjustments have no impact on net assets or the results of operations. Capital accounts are not adjusted for temporary book-tax differences which will reverse in a subsequent period.
Book-tax differences are primarily due to market discount and deferred trustees compensation.
The Fund purchases municipal securities whose interest, in the opinion of the issuer, is free from federal income tax. There is no assurance that the IRS will agree with this opinion. In the event the IRS determines that the issuer does not comply with relevant tax requirements, interest payments from a security could become federally taxable, possibly retroactively to the date the security was issued.
The federal tax cost of investment securities and unrealized appreciation (depreciation) as of period end were as follows:
| Gross unrealized appreciation | $44,412,677 |
| Gross unrealized depreciation | (13,456,475) |
| Net unrealized appreciation (depreciation) on securities | $30,956,202 |
| Tax cost | $1,284,018,515 |
Delayed Delivery Transactions and When-Issued Securities. During the period, the Fund transacted in securities on a delayed delivery or when-issued basis. Payment and delivery may take place after the customary settlement period for that security. The price of the underlying securities and the date when the securities will be delivered and paid for are fixed at the time the transaction is negotiated. The securities purchased on a delayed delivery or when-issued basis are identified as such in the Fund's Schedule of Investments. The Fund may receive compensation for interest forgone in the purchase of a delayed delivery or when-issued security. With respect to purchase commitments, the Fund identifies securities as segregated in its records with a value at least equal to the amount of the commitment. Losses may arise due to changes in the value of the underlying securities or if the counterparty does not perform under the contract's terms, or if the issuer does not issue the securities due to political, economic, or other factors.
Restricted Securities. The Fund may invest in securities that are subject to legal or contractual restrictions on resale. These securities generally may be resold in transactions exempt from registration or to the public if the securities are registered. Disposal of these securities may involve time-consuming negotiations and expense, and prompt sale at an acceptable price may be difficult. Information regarding restricted securities is included at the end of the Fund's Schedule of Investments.
New Accounting Pronouncement. In March 2017, the Financial Accounting Standards Board (FASB) issued an Accounting Standards Update (ASU), ASU 2017-08, which amends the amortization period for certain callable debt securities that are held at a premium. The amendment requires the premium to be amortized to the earliest call date. The amendments do not require an accounting change for securities held at a discount. The ASU is effective for annual periods beginning after December 15, 2019. Management is currently evaluating the potential impact of these changes to the financial statements.
4. Purchases and Sales of Investments.
Purchases and sales of securities, other than short-term securities, aggregated $383,115,633 and $240,142,684, respectively.
5. Fees and Other Transactions with Affiliates.
Management Fee. Fidelity Management & Research Company (the investment adviser) and its affiliates provide the Fund with investment management related services for which the Fund pays a monthly management fee. The management fee is the sum of an individual fund fee rate that is based on an annual rate of .25% of the Fund's average net assets and an annualized group fee rate that averaged .11% during the period. The group fee rate is based upon the average net assets of all the mutual funds advised by the investment adviser, including any mutual funds previously advised by the investment adviser that are currently advised by Fidelity SelectCo, LLC, an affiliate of the investment adviser. The group fee rate decreases as assets under management increase and increases as assets under management decrease. For the reporting period, the total annualized management fee rate was .36% of the Fund's average net assets.
Distribution and Service Plan Fees. In accordance with Rule 12b-1 of the 1940 Act, the Fund has adopted separate Distribution and Service Plans for each class of shares. Certain classes pay Fidelity Distributors Corporation (FDC), an affiliate of the investment adviser, separate Distribution and Service Fees, each of which is based on an annual percentage of each class' average net assets. In addition, FDC may pay financial intermediaries for selling shares of the Fund and providing shareholder support services. For the period, the Distribution and Service Fee rates, total fees and amounts retained by FDC were as follows:
| Distribution Fee | Service Fee | Total Fees | Retained by FDC |
|
| Class A | -% | .25% | $412,652 | $9,657 |
| Class M | -% | .25% | 212,064 | – |
| Class C | .75% | .25% | 611,179 | 77,538 |
| $1,235,895 | $87,195 |
Sales Load. FDC may receive a front-end sales charge of up to 4.00% for selling Class A shares and Class M shares, some of which is paid to financial intermediaries for selling shares of the Fund. Depending on the holding period, FDC may receive contingent deferred sales charges levied on Class A, Class M, and Class C redemptions. The deferred sales charges are 1.00% for Class C shares, .75% for certain purchases of Class A shares and .25% for certain purchases of Class M shares.
For the period, sales charge amounts retained by FDC were as follows:
| Retained by FDC |
|
| Class A | $14,425 |
| Class M | 3,981 |
| Class C(a) | 12,827 |
| $31,233 |
(a) When Class C shares are initially sold, FDC pays commissions from its own resources to financial intermediaries through which the sales are made.
Transfer Agent Fees. Fidelity Investments Institutional Operations Company, Inc. (FIIOC), an affiliate of the investment adviser, is the transfer, dividend disbursing and shareholder servicing agent for the Fund. FIIOC receives account fees and asset-based fees that vary according to the account size and type of account of the shareholders of the respective classes of the Fund. FIIOC pays for typesetting, printing and mailing of shareholder reports, except proxy statements. For the period, transfer agent fees for each class were as follows:
| Amount | % of Class-Level Average Net Assets(a) |
|
| Class A | $268,534 | .16 |
| Class M | 124,161 | .15 |
| Class C | 99,023 | .16 |
| Class I | 526,153 | .17 |
| $1,017,871 |
(a) Annualized
Accounting Fees. Fidelity Service Company, Inc. (FSC), an affiliate of the investment adviser, maintains the Fund's accounting records. The fee is based on the level of average net assets for each month.
Interfund Trades. The Fund may purchase from or sell securities to other Fidelity Funds under procedures adopted by the Board. The procedures have been designed to ensure these interfund trades are executed in accordance with Rule 17a-7 of the 1940 Act. Interfund trades are included within the respective purchases and sales amounts shown in the Purchases and Sales of Investments note.
6. Committed Line of Credit.
The Fund participates with other funds managed by the investment adviser or an affiliate in a $4.25 billion credit facility (the "line of credit") to be utilized for temporary or emergency purposes to fund shareholder redemptions or for other short-term liquidity purposes. The Fund has agreed to pay commitment fees on its pro-rata portion of the line of credit, which amounted to $2,070 and is reflected in Miscellaneous expenses on the Statement of Operations. During the period, the Fund did not borrow on this line of credit.
7. Expense Reductions.
The investment adviser voluntarily agreed to reimburse each class to the extent annual operating expenses exceeded certain levels of average net assets as noted in the table below. Some expenses, for example interest expense, including commitment fees, are excluded from this reimbursement.
The following classes were in reimbursement during the period:
| Expense Limitations | Reimbursement | |
| Class A | .80% | $28,831 |
| Class M | .80% | 130 |
| Class C | 1.55% | 13,672 |
| Class I | .55% | 68,504 |
| $111,137 |
In addition, through arrangements with the Fund's custodian, credits realized as a result of certain uninvested cash balances were used to reduce the Fund's expenses. During the period, these credits reduced the Fund's custody expenses by $5,400.
In addition, during the period the investment adviser reimbursed and/or waived a portion of fund-level operating expenses in the amount of $3,375.
8. Distributions to Shareholders.
Distributions to shareholders of each class were as follows:
| Six months ended April 30, 2017 | Year ended October 31, 2016 |
|
| From net investment income | ||
| Class A | $4,504,871 | $11,430,094 |
| Class M | 2,309,099 | 5,088,206 |
| Class B | – | 40,433 |
| Class C | 1,215,810 | 2,775,558 |
| Class I | 9,099,132 | 13,214,809 |
| Total | $17,128,912 | $32,549,100 |
| From net realized gain | ||
| Class A | $4,461,010 | $2,737,715 |
| Class M | 2,062,872 | 1,238,857 |
| Class B | – | 21,921 |
| Class C | 1,520,681 | 861,022 |
| Class I | 5,722,026 | 2,571,094 |
| Total | $13,766,589 | $7,430,609 |
9. Share Transactions.
Share transactions for each class were as follows and may contain automatic conversions between classes or exchanges between affiliated funds:
| Shares | Shares | Dollars | Dollars | |
| Six months ended April 30, 2017 | Year ended October 31, 2016 | Six months ended April 30, 2017 | Year ended October 31, 2016 | |
| Class A | ||||
| Shares sold | 2,306,278 | 8,172,855 | $29,830,297 | $111,082,108 |
| Reinvestment of distributions | 634,288 | 925,359 | 8,167,880 | 12,571,741 |
| Shares redeemed | (12,878,389) | (7,480,454) | (165,962,092) | (101,888,648) |
| Net increase (decrease) | (9,937,823) | 1,617,760 | $(127,963,915) | $21,765,201 |
| Class M | ||||
| Shares sold | 774,140 | 1,738,732 | $10,056,880 | $23,802,963 |
| Reinvestment of distributions | 299,946 | 399,450 | 3,875,892 | 5,443,122 |
| Shares redeemed | (1,900,829) | (1,406,154) | (24,609,837) | (19,233,053) |
| Net increase (decrease) | (826,743) | 732,028 | $(10,677,065) | $10,013,032 |
| Class B | ||||
| Shares sold | – | 4,634 | $– | $62,699 |
| Reinvestment of distributions | – | 3,379 | – | 45,427 |
| Shares redeemed | – | (249,168) | – | (3,404,715) |
| Net increase (decrease) | – | (241,155) | $– | $(3,296,589) |
| Class C | ||||
| Shares sold | 445,324 | 2,706,356 | $5,773,572 | $36,910,696 |
| Reinvestment of distributions | 174,657 | 217,205 | 2,254,690 | 2,956,187 |
| Shares redeemed | (1,852,548) | (1,527,402) | (24,033,888) | (20,855,277) |
| Net increase (decrease) | (1,232,567) | 1,396,159 | $(16,005,626) | $19,011,606 |
| Class I | ||||
| Shares sold | 34,873,079 | 18,349,252 | $447,084,031 | $249,013,755 |
| Reinvestment of distributions | 845,379 | 908,351 | 10,834,464 | 12,290,257 |
| Shares redeemed | (10,485,615) | (7,799,446) | (134,779,689) | (105,920,786) |
| Net increase (decrease) | 25,232,843 | 11,458,157 | $323,138,806 | $155,383,226 |
10. Other.
The Fund's organizational documents provide former and current trustees and officers with a limited indemnification against liabilities arising in connection with the performance of their duties to the Fund. In the normal course of business, the Fund may also enter into contracts that provide general indemnifications. The Fund's maximum exposure under these arrangements is unknown as this would be dependent on future claims that may be made against the Fund. The risk of material loss from such claims is considered remote.
Shareholder Expense Example
As a shareholder of the Fund, you incur two types of costs: (1) transaction costs, including sales charges (loads) on purchase payments or redemption proceeds, and (2) ongoing costs, including management fees, distribution and/or service (12b-1) fees and other Fund expenses. This Example is intended to help you understand your ongoing costs (in dollars) of investing in the Fund and to compare these costs with the ongoing costs of investing in other mutual funds.
The Example is based on an investment of $1,000 invested at the beginning of the period and held for the entire period (November 1, 2016 to April 30, 2017).
Actual Expenses
The first line of the accompanying table for each class of the Fund provides information about actual account values and actual expenses. You may use the information in this line, together with the amount you invested, to estimate the expenses that you paid over the period. Simply divide your account value by $1,000.00 (for example, an $8,600 account value divided by $1,000.00 = 8.6), then multiply the result by the number in the first line for a class of the Fund under the heading entitled "Expenses Paid During Period" to estimate the expenses you paid on your account during this period. In addition, the Fund, as a shareholder in the underlying Fidelity Central Funds, will indirectly bear its pro-rata share of the fees and expenses incurred by the underlying Fidelity Central Funds. These fees and expenses are not included in the Fund's annualized expense ratio used to calculate the expense estimate in the table below.
Hypothetical Example for Comparison Purposes
The second line of the accompanying table for each class of the Fund provides information about hypothetical account values and hypothetical expenses based on a Class' actual expense ratio and an assumed rate of return of 5% per year before expenses, which is not the Class' actual return. The hypothetical account values and expenses may not be used to estimate the actual ending account balance or expenses you paid for the period. You may use this information to compare the ongoing costs of investing in the Fund and other funds. To do so, compare this 5% hypothetical example with the 5% hypothetical examples that appear in the shareholder reports of the other funds. In addition, the Fund, as a shareholder in the underlying Fidelity Central Funds, will indirectly bear its pro-rata share of the fees and expenses incurred by the underlying Fidelity Central Funds. These fees and expenses are not included in the Fund's annualized expense ratio used to calculate the expense estimate in the table below.
Please note that the expenses shown in the table are meant to highlight your ongoing costs only and do not reflect any transaction costs. Therefore, the second line of the table is useful in comparing ongoing costs only, and will not help you determine the relative total costs of owning different funds. In addition, if these transactional costs were included, your costs would have been higher.
| Annualized Expense Ratio-A | Beginning Account Value November 1, 2016 | Ending Account Value April 30, 2017 | Expenses Paid During Period-B November 1, 2016 to April 30, 2017 |
|
| Class A | .80% | |||
| Actual | $1,000.00 | $986.50 | $3.94 | |
| Hypothetical-C | $1,000.00 | $1,020.83 | $4.01 | |
| Class M | .80% | |||
| Actual | $1,000.00 | $985.90 | $3.94 | |
| Hypothetical-C | $1,000.00 | $1,020.83 | $4.01 | |
| Class C | 1.55% | |||
| Actual | $1,000.00 | $982.20 | $7.62 | |
| Hypothetical-C | $1,000.00 | $1,017.11 | $7.75 | |
| Class I | .55% | |||
| Actual | $1,000.00 | $987.60 | $2.71 | |
| Hypothetical-C | $1,000.00 | $1,022.07 | $2.76 |
A Annualized expense ratio reflects expenses net of applicable fee waivers.
B Expenses are equal to each Class' annualized expense ratio, multiplied by the average account value over the period, multiplied by 181/365 (to reflect the one-half year period).
C 5% return per year before expenses
![]()
HIM-SANN-0617
1.703467.119
Item 2.
Code of Ethics
Not applicable.
Item 3.
Audit Committee Financial Expert
Not applicable.
Item 4.
Principal Accountant Fees and Services
Not applicable.
Item 5.
Audit Committee of Listed Registrants
Not applicable.
Item 6.
Investments
(a)
Not applicable.
(b)
Not applicable
Item 7.
Disclosure of Proxy Voting Policies and Procedures for Closed-End Management Investment Companies
Not applicable.
Item 8.
Portfolio Managers of Closed-End Management Investment Companies
Not applicable.
Item 9.
Purchase of Equity Securities by Closed-End Management Investment Company and Affiliated Purchasers
Not applicable.
Item 10.
Submission of Matters to a Vote of Security Holders
There were no material changes to the procedures by which shareholders may recommend nominees to the Fidelity Advisor Series II’s Board of Trustees.
Item 11.
Controls and Procedures
(a)(i) The President and Treasurer and the Chief Financial Officer have concluded that the Fidelity Advisor Series II’s (the “Trust”) disclosure controls and procedures (as defined in Rule 30a-3(c) under the Investment Company Act) provide reasonable
assurances that material information relating to the Trust is made known to them by the appropriate persons, based on their evaluation of these controls and procedures as of a date within 90 days of the filing date of this report.
(a)(ii) There was no change in the Trust’s internal control over financial reporting (as defined in Rule 30a-3(d) under the Investment Company Act) that occurred during the second fiscal quarter of the period covered by this report that has materially affected, or is reasonably likely to materially affect, the Trust’s internal control over financial reporting.
Item 12.
Exhibits
(a) | (1) | Not applicable. |
(a) | (2) | Certification pursuant to Rule 30a-2(a) under the Investment Company Act of 1940 (17 CFR 270.30a-2(a)) is filed and attached hereto as Exhibit 99.CERT. |
(a) | (3) | Not applicable. |
(b) | Certification pursuant to Rule 30a-2(b) under the Investment Company Act of 1940 (17 CFR 270.30a-2(b)) is furnished and attached hereto as Exhibit 99.906CERT. |
SIGNATURES
Pursuant to the requirements of the Securities Exchange Act of 1934 and the Investment Company Act of 1940, the registrant has duly caused this report to be signed on its behalf by the undersigned, thereunto duly authorized.
Fidelity Advisor Series II
By: | /s/Stephanie J. Dorsey |
Stephanie J. Dorsey | |
President and Treasurer | |
Date: | June 26, 2017 |
Pursuant to the requirements of the Securities Exchange Act of 1934 and the Investment Company Act of 1940, this report has been signed below by the following persons on behalf of the registrant and in the capacities and on the dates indicated.
By: | /s/Stephanie J. Dorsey |
Stephanie J. Dorsey | |
President and Treasurer | |
Date: | June 26, 2017 |
By: | /s/Howard J. Galligan III |
Howard J. Galligan III | |
Chief Financial Officer | |
Date: | June 26, 2017 |